annual report 2014/2015 - asset management ubs funds annual report 2014/2015 investment fund under...
TRANSCRIPT
ab Asset managementUBS Funds
Annual Report 2014/2015
Investment Fund under Luxembourg Law
R.C.S. Luxembourg N° B 154 210
Audited annual report as of 31 March 2015
UBS (Lux) Bond FundUBS (Lux) Bond Fund – AUDUBS (Lux) Bond Fund – CADUBS (Lux) Bond Fund – CHFUBS (Lux) Bond Fund – Convert Europe (EUR)UBS (Lux) Bond Fund – EURUBS (Lux) Bond Fund – Euro High Yield (EUR)UBS (Lux) Bond Fund – Full Cycle Asian Bond (USD)UBS (Lux) Bond Fund – GBPUBS (Lux) Bond Fund – Global (CHF)UBS (Lux) Bond Fund – USD


1
Audited annual report as of 31 March 2015
Table of contents Page ISIN
Management and Administration 2Features of the Fund 4Independent auditor’s report 10
UBS (Lux) Bond Fund 12UBS (Lux) Bond Fund – AUD 14 P-dist/ LU0035338242 P-acc/ LU0035338325 N-acc/ LU0415156602 F-acc/ LU0415157832 Q-dist/ LU0415157915 Q-acc/ LU0415158053 I-A1-acc/ LU0415158210 I-X-acc/ LU0415159374UBS (Lux) Bond Fund – CAD 21 P-dist/ LU0033047795 P-acc/ LU0033048686 F-acc/ LU0415160620 Q-dist/ LU0415160893 Q-acc/ LU0415160976 UBS (Lux) Bond Fund – CHF 25 P-dist/ LU0010001286 P-acc/ LU0010001369 N-acc/ LU0415162758 F-dist/ LU0415163483 F-acc/ LU0415163566 I-A1-acc/ LU0415164028UBS (Lux) Bond Fund – Convert Europe (EUR) 32 P-dist/ LU0108060624 P-acc/ LU0108066076 Q-acc/ LU0358408184 K-1-acc/ LU0415178242 F-acc/ LU0415178838 I-A1-acc/ LU0415179133 I-X-dist/ LU0415179992 I-X-acc/ LU0415180065 (CHF hedged) P-acc/ LU0776290768 I-A1-dist/ LU0804734944UBS (Lux) Bond Fund – EUR 38 P-dist/ LU0033049577 P-acc/ LU0033050237 N-acc/ LU0168863511 Q-acc/ LU0358407707 F-dist/ LU0415166312 F-acc/ LU0415166403UBS (Lux) Bond Fund – Euro High Yield (EUR) 45 P-dist/ LU0085995990 P-acc/ LU0086177085 Q-acc/ LU0358408267 N-dist/ LU0415180495 K-1-acc/ LU0415180909 F-acc/ LU0415181469 I-A1-acc/ LU0415181899 I-B-acc/ LU0415182517 I-X-acc/ LU0415182780 P-mdist/ LU0417441200 (CHF hedged) P-acc/ LU0776290842 I-B-mdist/ LU0908558249 (USD hedged) P-mdist/ LU0937166394 (AUD hedged) P-mdist/ LU0945635778 (CAD hedged) P-mdist/ LU0945635851 (RMB hedged) P-mdist/ LU0968750884 (HKD hedged) P-mdist/ LU0973218331 (SGD hedged) P-mdist/ LU0989134753 (USD hedged) P-acc/ LU0994471687 (GBP hedged) P-mdist/ LU0997192736 (RMB hedged) K-1-acc/ LU1004765415 (USD hedged) K-1-acc/ LU1004765761 (HKD hedged) K-1-acc/ LU1023284265 (RMB hedged) K-1-mdist/ LU1030385881 P-6%-mdist/ LU1076698254UBS (Lux) Bond Fund – Full Cycle Asian Bond (USD) 63 P-mdist/ LU0464244259 P-acc/ LU0464244333 K-1-acc/ LU0464244929 F-acc/ LU0464245496 I-A1-acc/ LU0464245819 I-X-dist/ LU0464246627 I-X-acc/ LU0464246890 (SGD hedged) P-mdist/ LU0464247435 (SGD hedged) P-acc/ LU0464247518 (EUR hedged) P-dist/ LU0464250496 (EUR hedged) P-acc/ LU0464250652 (EUR hedged) N-acc/ LU0464250819 (EUR hedged) F-acc/ LU0464251627 (SGD hedged) F-acc/ LU0964819261UBS (Lux) Bond Fund – GBP 72 P-dist/ LU0035345882 P-acc/ LU0035346187 F-acc/ LU0415169761 I-A2-acc/ LU0415170777UBS (Lux) Bond Fund – Global (CHF) 79 P-dist/ LU0071005408 P-acc/ LU0071006638 I-B-acc/ LU0415185379 U-X-acc/ LU0415185700 (EUR hedged) P-dist/ LU0487186123 (EUR hedged) P-acc/ LU0487186396 (JPY hedged) P-acc/ LU0817644254 (JPY hedged) P-dist/ LU0817644841UBS (Lux) Bond Fund – USD 88 P-dist/ LU0035346344 P-acc/ LU0035346773 F-acc/ LU0415176030
Notes to the Financial Statements 95Global Exposure (unaudited) 103Securities Lending (unaudited) 104
Sales restrictions
Units of this fund may not be offered, sold or distributed within the United States of America.
Internet address
http://www.ubs.com/1/e/globalam/funds.html

2
UBS (Lux) Bond FundAnnual Report as of 31 March 2015
Management and Administration
Management Company
UBS Fund Management (Luxembourg) S.A.,33A, avenue J.F. Kennedy,L-1855 LuxembourgR.C.S. Luxembourg N° B 154 210
Board of Directors
Andreas Schlatter, ChairmanGroup Managing Director, UBS AG, Basel and Zurich
Mario Cueni, MemberGroup Managing Director, UBS AG, Basel and Zurich
Martin Thommen, MemberManaging Director, UBS AG, Basel and Zurich
Gilbert Schintgen, MemberManaging Director, UBS Fund Management(Luxembourg) S.A., Luxembourg
Christian Eibel, MemberExecutive Director, UBS AG, Basel and Zurich
Portfolio Manager
UBS (Lux) Bond Fund – AUDUBS Global Asset Management (Australia) Ltd., Sydney
UBS (Lux) Bond Fund – Euro High Yield (EUR)UBS Global Asset Management (UK) Ltd., London
UBS (Lux) Bond Fund – CADUBS (Lux) Bond Fund – CHFUBS (Lux) Bond Fund – Convert Europe (EUR)UBS (Lux) Bond Fund – EURUBS (Lux) Bond Fund – GBPUBS (Lux) Bond Fund – Global (CHF)UBS (Lux) Bond Fund – USDUBS AG, UBS Global Asset Management,Basel and Zurich
UBS (Lux) Bond Fund – Full Cycle Asian Bond (USD)UBS Global Asset Management (Singapore) Ltd., Singapore
Custodian Bank and main paying agent
UBS (Luxembourg) S.A.,33A, avenue J.F. Kennedy,L-1855 Luxembourg
Sales agency
UBS AG, Basel and Zurich
Administrative agent
UBS Fund Services (Luxembourg) S.A.,33A, avenue J.F. Kennedy,L-1855 Luxembourg
Independent Auditor of the Fund and theManagement Company
ERNST & YOUNG S.A.,7, Rue Gabriel Lippmann,Parc d’Activité Syrdall 2,L-5365 Munsbach
Sale in Switzerland
RepresentativeUBS Fund Management (Switzerland) AG,Aeschenplatz 6, CH-4002 Basel
Paying agentsUBS AG, Aeschenvorstadt 1, CH-4002 BaselUBS AG, Bahnhofstrasse 45, CH-8098 Zurichand its offices in Switzerland
The sales prospectus, the KIID, management regulations, annual and semi-annual reports as well as the portfolio movements of the investment fund mentioned in this publication are available free of charge from UBS AG, P.O. Box, CH-4002 Basel and from UBS Fund Management (Switzerland) AG, P.O. Box, CH-4002 Basel.

3
UBS (Lux) Bond FundAnnual Report as of 31 March 2015
Sale in Germany
Paying and information agentUBS Deutschland AG,Bockenheimer Landstrasse 2-4,D-60306 Frankfurt am Main
The sales prospectus, the KIID, management regulations, annual and semi-annual reports as well as the portfolio movements of the investment fund mentioned in this publication are available free of charge from UBS Deutschland AG, Bockenheimer Landstr. 2-4, D-60306 Frankfurt am Main.
Sale in Liechtenstein
Representative and Paying agentLiechtensteinische Landesbank AG,Städtle 44, FL-9490 Vaduz
Sale in Hong Kong
Units of the following subfunds may not be distributed in Hong Kong:
UBS (Lux) Bond Fund – AUDUBS (Lux) Bond Fund – CADUBS (Lux) Bond Fund – CHFUBS (Lux) Bond Fund – Convert Europe (EUR)UBS (Lux) Bond Fund – EURUBS (Lux) Bond Fund – GBPUBS (Lux) Bond Fund – Global (CHF)UBS (Lux) Bond Fund – USD
Sale in Austria, in Chile, in Cyprus, in Denmark, in Finland, in France, in Greece, in Italy, in Japan, in Malta, in the Netherlands, in Norway, in Peru, in Portugal, in Singapore*, in South Korea, in Spain, in Sweden, in Taiwan and in the United Kingdom* Restricted foreign scheme
Units of this fund may be sold in these countries.
The sales prospectus, the KIID, management regulations, annual and semi-annual reports as well as the portfolio movements of the investment fund mentioned in this publication are available free of charge at the sales agencies and at the registered office of the Management Company.

4
UBS (Lux) Bond FundAnnual Report as of 31 March 2015
Features of the Fund
UBS (Lux) Bond Fund (hereinafter called “the fund”) offers investors a range of different subfunds (“umbrella structure”) which invest in accordance with the invest-ment policy described in the sales prospectus. The sales prospectus, which contains specific details on each subfund, will be updated on the inception of each new subfund.
The fund was established as an open-ended invest-ment fund without legally independent status in the form of a collective investment fund (fonds commun de placement, FCP) pursuant to Part I of the Luxembourg law relating to undertakings for collective investment of 30 March 1988 and adapted in April 2005 to conform to Part I of the Luxembourg Law of 20 December 2002 on undertakings for collective investment (hereinafter “Law of 2002”). Since 1 July 2011 the Fund is subject to the law of 17 December 2010. It was originally established under the title SBC Bond Portfolio in compliance with the Management Regulations approved by the board of directors of UBS Bond Fund Management Company S.A. (formerly SBC Bond Portfolio Management Company S.A.) on 26 June 1991. The SBC Bond Portfolio was renamed as UBS (Lux) Bond Fund on 1 April 1999. The activities of UBS Bond Fund Management S.A. in its capacity as Management Company of the UBS (Lux) Bond Fund ended on 14 November 2010. On 15 November 2010 UBS Fund Management (Luxembourg) S.A. assumed the function of Management Company. The Management Regulations were initially lodged with the Com-mercial and Company Register of the District Court in Luxembourg on 1 July 1991, and amendments to them were published on 10 September, 3 October 2007, 15 November 2010, on 1 July 2011 and most recently on 27 August 2012 published in the Luxembourg “Mémorial”.
The fund’s Management Regulations may be amended in observance of the provisions of the law. Each amend-ment deposited is announced in the “Mémorial”. The new Management Regulations come into force on the date they are signed by the Management Company and the Custodian Bank. The consolidated version is held by the Commercial and Company Register of the District Court in Luxembourg for inspection.
The fund has no legal personality as an investment fund. The entire net assets of each subfund are the undivided property of all investors who have equal rights in pro-portion to the number of units which they hold. These assets are separate from the assets of the Management Company. The securities and other assets of the fund
are managed by UBS Fund Management (Luxembourg) S.A. as separte trust assets in the interests and for the account of the unitholders.
The management regulations give the Management Company the authority to establish different subfunds for the fund as well as different classes with specific characteristics within these subfunds. The sales prospec-tus will be updated each time a new subfund or an addi-tional unit class is launched.
As at 31 March 2015, the following subfunds are active:
UBS (Lux) Bond Fund Currency of account– AUD AUD
– CAD CAD
– CHF CHF
– Convert Europe (EUR) EUR
– EUR EUR
– Euro High Yield (EUR) EUR
– Full Cycle Asian Bond (USD) USD
– GBP GBP
– Global (CHF) CHF
– USD USD
Not all the types of unit class described below have to be offered at all times. Information on which unit classes are available for which subfund can be obtained from the Administrative Agent or at www.ubs.com/funds.
Units are issued as registered units only.
“P“
Units in classes with “P” in their name are available to all investors. Their smallest tradable unit is 0.001. Unless the Management Company decides otherwise, the initial issue price of these units amounts to AUD 100, CAD 100, CHF 100, CZK 2,000, EUR 100, GBP 100, HKD 1,000, JPY 10,000, PLN 500, RMB 1,000, RUB 3,500, SEK 700, SGD 100, USD 100 or ZAR 1,000.
“N”
Units in classes with “N” in their name (units with restric-tions on the distribution partners or countries) are issued exclusively through sales agents domiciled in Spain, Italy, Portugal and Germany authorised by UBS AG, as well as, where appropriate, through sales agents in further distribution countries, provided this has been decided by the Board of Directors. Their smallest tradable unit is 0.001. Unless the Management Company decides oth-erwise, the initial issue price of these units amounts to

5
UBS (Lux) Bond FundAnnual Report as of 31 March 2015
AUD 100, CAD 100, CHF 100, CZK 2,000, EUR 100, GBP 100, HKD 1,000, JPY 10,000, PLN 500, RMB 1,000, RUB 3,500, SEK 700, SGD 100, USD 100 or ZAR 1,000.
“K-1“
Units in classes with “K-1” in their name are available to all investors. Their smallest tradable unit is 0.1. Unless the Management Company decides otherwise, the ini-tial issue price of these units amounts to AUD 5 million, CAD 5 million, CHF 5 million, CZK 100 million, EUR 3 million, GBP 2.5 million, HKD 40 million, JPY 500 million, PLN 25 million, RMB 35 million, RUB 175 million, SEK 35 million, SGD 5 million or USD 5 million or ZAR 40 million.
“K-X”
Units in classes with “K-X” in their name are exclu-sively reserved for investors who have signed a written agreement on investing in one or more subfunds of this umbrella fund with UBS AG or UBS Global Asset Management (a business division of UBS AG). The costs for asset management, fund administration (comprising the costs of the Management Company, administration and Custodian Bank) and distribution are charged to investors under the aforementioned agreements. Their smallest tradable unit is 0.001. Unless the Management Company decides otherwise, the initial issue price of these units amounts to AUD 100, CAD 100, CHF 100, CZK 2,000, EUR 100, GBP 100, HKD 1,000, JPY 10,000, PLN 500, RMB 1,000, RUB 3,500, SEK 700, SGD 100, USD 100 or ZAR 1,000.
“F”
Units in classes with “F” in their name are exclusively available to UBS AG or one of its affiliated companies. The units may only be acquired by UBS AG or one of its subsidiaries for their own account or as part of dis-cretionary asset management mandates concluded with UBS AG or one of its subsidiaries. In the latter case, the units will be returned to the Fund at the prevailing net asset value at no charge upon termination of the man-date. The smallest tradable unit of these units is 0.001. Unless the Management Company decides otherwise, the initial issue price of these units amounts to AUD 100, CAD 100, CHF 100, CZK 2,000, EUR 100, GBP 100, HKD 1,000, JPY 10,000, PLN 500, RMB 1,000, RUB 3,500, SEK 700, SGD 100, USD 100 or ZAR 1,000.
“Q”
Units in classes with “Q” in their name are available i) for distribution in an eligible country as defined by
“List A”; or ii) to investors domiciled in other countries, if they are
professionals of the financial sector and a written agreement exists with UBS AG; and who make the following investments in their own name and:
(a) on their own behalf; (b) on behalf of their clients within a (discretionary)
asset management agreement; or
(c) on behalf of their clients within the framework of an advisory relationship established in writing, in return for payment; or
(d) on behalf of a collective investment managed by a professional of the financial sector.
In cases (b), (c) and (d), said professional has been duly authorised by the supervisory authority to which he/she is subject to carry out such transactions, and is domi-ciled in an eligible country as defined by “List B” or is operating in their own name and on behalf of another professional of the financial sector who has been autho-rised in writing by UBS AG and is domiciled in one of the countries covered by “List B” or “List C” in cases (b) and (c) respectively.
Admission of investors in further distribution countries (changes to lists A, B and C) shall be decided by the Board of Directors at its sole discretion and disclosed on www.ubs.com/funds.
The smallest tradable unit of these units is 0.001. Unless the Management Company decides otherwise, the initial issue price of these units amounts to AUD 100, CAD 100, CHF 100, CZK 2,000, EUR 100, GBP 100, HKD 1,000, JPY 10,000, PLN 500, RMB 1,000, RUB 3,500, SEK 700, SGD 100, USD 100 or ZAR 1,000.
“I-A1”
Units in classes with “I-A1” in their name are exclusively reserved for institutional investors within the meaning of Article 174 (2) (c) of the Law of 2010. Their smallest tradable unit is 0.001. Unless the Management Company decides otherwise, the initial issue price of these units amounts to AUD 100, CAD 100, CHF 100, CZK 2,000, EUR 100, GBP 100, HKD 1,000, JPY 10,000, PLN 500, RMB 1,000, RUB 3,500, SEK 700, SGD 100, USD 100 or ZAR 1,000.
“I-A2”
Units in classes with “I-A2” in their name are exclusively reserved for institutional investors within the meaning of Article 174 (2) (c) of the Law of 2010. Their smallest trad-able unit is 0.001. Unless the Management Company decides otherwise, the initial issue price of these units amounts to AUD 100, CAD 100, CHF 100, CZK 2,000, EUR 100, GBP 100, HKD 1,000, JPY 10,000, PLN 500, RMB 1,000, RUB 3,500, SEK 700, SGD 100, USD 100 or ZAR 1,000. The minimum subscription amount for these units is AUD 10 million, CAD 10 million, CHF 10 million, CZK 200 million, EUR 5 million, GBP 5 million, HKD 80 million, JPY 1 billion, PLN 50 million, RMB 70 million, RUB 350 million, SEK 70 million, SGD 10 million, USD 10 million or ZAR 80 million.
Upon subscription(i) a minimum subscription must be made pursuant to
the list above, or(ii) based on a written agreement of the institutional
investor with UBS AG (or with one of its authorised counterparties), the investor’s total assets managed

6
UBS (Lux) Bond FundAnnual Report as of 31 March 2015
by UBS or its portfolio in collective capital investments of UBS must be more than CHF 30 million (or the corresponding currency equivalent).
“I-A3”
Units in classes with “I-A3” in their name are exclusively reserved for institutional investors within the meaning of Article 174 (2) (c) of the Law of 2010. Their smallest trad-able unit is 0.001. Unless the Management Company decides otherwise, the initial issue price of these units amounts to AUD 100, CAD 100, CHF 100, CZK 2,000, EUR 100, GBP 100, HKD 1,000, JPY 10,000, PLN 500, RMB 1,000, RUB 3,500, SEK 700, SGD 100, USD 100 or ZAR 1,000. The minimum subscription amount for these units is AUD 30 million, CAD 30 million, CHF 30 million, CZK 600 million, EUR 20 million, GBP 20 million, HKD 240 million, JPY 3 billion, PLN 150 million, RMB 210 million, RUB 1.05 billion, SEK 210 million, SGD 30 million, USD 30 million or ZAR 240 million.
Upon subscription(i) a minimum subscription must be made pursuant to
the list above, or(ii) based on a written agreement of the institutional
investor with UBS AG (or with one its authorised counterparties), the investor’s total assets managed by UBS or its portfolio in collective capital investments of UBS must be more than CHF 100,000,000 (or the corresponding currency equivalent).
“I-B”
Units in classes with “I-B” in their name are exclusively reserved for institutional investors within the meaning of Article 174 (2) (c) of the Law of 2010 who have signed a written agreement on investing in one or more subfunds of this umbrella fund with UBS AG or one of its autho-rised counterparties. A fee covering the costs for fund administration (comprising the costs of the Management Company, administration and Custodian Bank) is charged directly to the subfund. The costs for asset management and distribution are charged to investors under the aforementioned agreements. Their small-est tradable unit is 0.001. Unless the Management Company decides otherwise, the initial issue price of these units amounts to AUD 100, CAD 100, CHF 100, CZK 2,000, EUR 100, GBP 100, HKD 1,000, JPY 10,000, PLN 500, RMB 1,000, RUB 3,500, SEK 700, SGD 100, USD 100 or ZAR 1,000.
“I-X”
Units in classes with “I-X” in their name are exclusively reserved for institutional investors within the mean-ing of Article 174 (2) (c) of the Law of 2010 who have signed a written agreement on investing in one or more subfunds of this umbrella fund with UBS AG or one of its authorised counterparties. The costs for asset management, Fund administration (comprising the costs of the Management Company, administration and Custo-dian Bank) and distribution are charged to investors under the aforementioned agreements. Their smallest tradable
unit is 0.001. Unless the Management Company decides otherwise, the initial issue price of these units amounts to AUD 100, CAD 100, CHF 100, CZK 2,000, EUR 100, GBP 100, HKD 1,000, JPY 10,000, PLN 500, RMB 1,000, RUB 3,500, SEK 700, SGD 100 or USD 100.
“U-X”
Units in classes with “U-X” in their name are exclusively reserved for institutional investors within the meaning of Article 174 (2) (c) of the Law of 2010 who have signed a written agreement on investing in one or more subfunds of this umbrella fund with UBS AG or one of its authorised counterparties. The costs for asset management, fund administration (comprising the costs of the Management Company, administration and Custodian Bank) and distribution are charged to inves-tors under the aforementioned agreements. This unit class is exclusively geared towards financial products (i.e. fund of funds or other pooled structures in accor-dance with different legislation). Their smallest tradable unit is 0.001. Unless the Management Company decides otherwise, the initial issue price of these units amounts to AUD 10,000, CAD 10,000, CHF 10,000, CZK 200,000, EUR 10,000, GBP 10,000, HKD 100,000, JPY 1 million, PLN 50,000, RMB 100,000, RUB 350,000, SEK 70,000, SGD 10,000, USD 10,000 or ZAR 100,000.
Additional characteristics:
“UKdist”
The aforementioned unit classes can be issued as those with “UKdist” in their name. In these cases, the Man-agement Company intends to distribute a sum which corresponds to 100% of the reportable income within the meaning of the UK reporting fund rules when the unit classes are subject to the reporting fund rules. The Management Company does not intend to make avail-able taxable values in other countries for this unit class, as these unit classes are intended for investors whose investment in the unit class is liable to tax in the UK.
Currency
The unit classes may be denominated in AUD, CAD, CHF, CZK, EUR, GBP, HKD, JPY, PLN, RMB, RUB, SEK, SGD, USD or ZAR. For unit classes issued in the currency of account of the respective subfund, the respective currency will not be included in the unit class name. The currency of account features in the name of the relevant subfund.
“hedged”
For unit classes whose reference currencies are not identical to the currency of account of the subfund, and which have “hedged” in their name (“unit classes in foreign currencies”), the fluctuation risk of the reference currency price for those unit classes is hedged against the currency of account of the subfund. Provision is made for the amount of the hedging to be in principle between 90% and 110% of the total net

UBS (Lux) Bond FundAnnual Report as of 31 March 2015
7
assets of the unit class in foreign currency. Changes in the market value of the portfolio, as well as subscrip-tions and redemptions of unit classes in foreign curren-cies, can result in the hedging temporarily surpassing the aforementioned range.
The hedging described has no effect on possible cur-rency risks resulting from investments denominated in a currency other than the subfund’s currency of account.
“DH”
In unit classes with “DH” (duration hedged) in their name, derivative instruments (e.g. exchange-traded interest-rate futures or OTC interest-rate swaps) are held to reduce the duration of the net asset value of the DH unit class, with the value not falling below zero. For this, these positions and the associated earnings or losses are considered exclusively for calculating the net asset value of the DH unit classes. Duration is an instrument for measuring the price elasticity of bonds with regard to interest-rate fluctuations. The higher the duration of a bond portfolio, the stronger its market value reacts to interest changes; the lower the duration of a bond portfolio, the weaker its market value reacts to interest changes. The duration of the net asset value of DH unit classes will not be higher than that of unit classes with-out “DH” in their name. Therefore, the net asset value of DH unit classes will react to interest changes in the same way or not as strongly as the net asset value of unit classes without “DH” in their name.
In the “DH” unit classes for the subfund “UBS (Lux) Bond Fund – Full Cycle Asian Bond (USD)”, only the part of the portfolio invested in USD-denominated securities is hedged as described. The unit classes bearing “DH” in their name therefore remain subject to the interest risks of all those portions of the portfolio invested in non USD-denominated securities. Since the part of the portfolio invested in USD-denominated securities may be subject to fluctuation over time, the entire duration of unit classes with “DH” in their name may not, in certain cases, be longer than that of the subfund.
“RMB hedged”
Investors should note that the renminbi (ISO 4217 cur-rency code: CNY), the official currency of the People’s Republic of China (the “PRC”), is traded on two markets, namely as onshore RMB (CNY) in mainland China and offshore RMB (CNH) outside mainland China.
Units in classes with “RMB hedged” in their name are units whose net asset value is calculated in offshore RMB (CNH).
Onshore RMB (CNY) is not a freely convertible currency and is subject to foreign exchange control policies and repatriation restrictions imposed by the PRC government. Offshore RMB (CNH), on the other hand, may be traded freely against other currencies, particularly EUR, CHF and
USD. This means the exchange rate between offshore RMB (CNH) and other currencies is determined on the basis of supply and demand relating to the respective currency pair.
RMB convertibility between offshore RMB (CNH) and onshore RMB (CNY) is a regulated currency process sub-ject to foreign exchange control policies and repatriation restrictions imposed by the PRC government in coordina-tion with offshore regulatory or governmental agencies (e.g. the Hong Kong Monetary Authority).
Prior to investing in RMB classes, investors should bear in mind that the requirements relating to regulatory reporting and fund accounting of offshore RMB (CNH) are not clearly regulated. Furthermore, investors should be aware that offshore RMB (CNH) and onshore RMB (CNY) have different exchange rates against other cur-rencies. The value of offshore RMB (CNH) can potentially differ significantly from that of onshore RMB (CNY) due to a number of factors including, without limitation, for-eign exchange control policies and repatriation restric-tions imposed by the PRC government at certain times, as well as other external market forces. Any devaluation of offshore RMB (CNH) could adversely affect the value of investors’ investments in the RMB classes. Investors should therefore take these factors into account when calculating the conversion of their investments and the ensuing returns from offshore RMB (CNH) into their target currency.
Prior to investing in RMB classes, investors should also bear in mind that the availability and tradability of RMB classes, and the conditions under which they may be available or traded, depend to a large extent on the polit-ical and regulatory developments in the PRC. Thus, no guarantee can be given that offshore RMB (CNH) or the RMB classes will be offered and/or traded in future, nor can there be any guarantee as to the conditions under which offshore RMB (CNH) and/or RMB classes may be made available or traded. In particular, since the cur-rency of account of the relevant subfunds offering the RMB classes would be in a currency other than offshore RMB (CNH), the ability of the relevant subfund to make redemption payments in offshore RMB (CNH) would be subject to the subfund’s ability to convert its currency of account into offshore RMB (CNH), which may be restricted by the availability of offshore RMB (CNH) or other circumstances beyond the control of the Management Company.
Potential investors should be aware of the risks of rein-vestment, which could arise if the RMB class has to be liquidated early due to political and/or regulatory cir-cumstances. This does not apply to the reinvestment risk due to liquidation of a unit class and/or the subfund in accordance with the section “Liquidation and merger of the Fund and its subfunds or unit classes; merger of subfunds” of the prospectus.

UBS (Lux) Bond FundAnnual Report as of 31 March 2015
8
“acc”
For unit classes with “-acc” in their name, income is not distributed unless the Management Company decides otherwise.
“dist”
For unit classes with “-dist” in their name, income is distributed unless the Management Company decides otherwise.
“qdist”
Units in classes with “-qdist” in their name may make quarterly distributions, excluding fees and expenses. They may also make distributions out of capital and realised capital gains. Distributions out of capital result in the reduction of an investor’s original capital invested in the subfund. Furthermore, any distributions from the income and/or involving the capital and/or capital gains will result in an immediate reduction in the net asset value per unit of the subfund. Investors in certain countries may be subject to higher tax rates on distributed capital than on any capital gains from the sale of fund units. Some investors may therefore choose to invest in the accumulating (-acc) instead of the distributing (-dist, -qdist) unit classes. Investors may be taxed on income and capital arising from accumulating (-acc) unit classes at a later point in time than is the case with distributing (-dist) unit classes. Investors should seek their own tax advice.
“mdist”
Unit classes with “-mdist” in their name may make monthly distributions excluding fees and expenses. They may also make distributions out of capital and realised capital gains. Distributions out of capital result in the reduction of an investor’s original capital invested in the subfund. Also, any distributions from the income and/or involving the capital and/or capital gains result in an immediate reduction of the net asset value per unit of the subfund. Investors in certain countries may be subject to higher tax rates on distributed capital than on any capital gains from the sale of fund units. Some investors may therefore prefer to subscribe to accumulating (-acc) rather than distributing (-dist, -mdist) unit classes. Investors may be taxed on income and capital arising from accumulating (-acc) unit classes at a later point in time than is the case with distributing (-dist) unit classes. Investors should seek their own tax advice. The maximum issuing commission for units in classes with “-mdist” in their name is 6%.
“2%”, “4%”, “6%”, “8%”
Units in classes with “2%” / “4%” / “6%” / “8%” in their name may make monthly (-mdist), quarterly (-qdist) or annual (-dist) distributions at the respective afore-mentioned annual percentage rates, gross of fees and expenses. The distribution amount is calculated based on the net asset value of the respective unit class at the end of the month (in the case of monthly distributions), financial quarter (in the case of quarterly distributions) or financial year (in the case of annual distributions). These unit classes are suitable for investors who wish for more stable distributions, unrelated to past or expected returns or income.
Distributions can thus also be made out of capital and realised capital gains. Distributions out of capital result in the reduction of an investor’s original capital invested in the subfund. Also, any distributions from the income and/or involving the capital and/or capital gains result in an immediate reduction of the net asset value per unit of the Subfund. Investors in certain countries may be subject to higher tax rates on distributed capital than on any capital gains from the sale of fund units. Some investors may therefore choose to invest in the accu-mulating (-acc) instead of the distributing (-dist, -qdist, -mdist) unit classes. Investors may be taxed at a later point in time on income and capital arising on accumu-lating (-acc) unit classes compared to distributing (-dist, -qdist, -mdist) unit classes. Investors should seek their own tax advice.
The fund is not subject to any restrictions with regard to the size of its net assets, the number of units, number of subfunds and number of unit classes as well as the duration of the fund and its subfunds.
The fund forms a legal entity. With respect to the unitholders, however, each subfund is regarded as being separate from the others. The assets of a subfund may only be used to offset the liabilities which the subfund concerned has assumed.
The acquisition of fund units implies acceptance of themanagement regulations by the unitholder.
The Management Regulations do not provide for a general meeting of the unitholders.
The fund’s financial year ends on the last day of March.
The issue and redemption price of each subfund is announced in Luxembourg at the registered office of the Management Company and at the Custodian Bank.
Furthermore, a Key Investor Information (KIID) document is made available to investors before subscribing to units.

UBS (Lux) Bond FundAnnual Report as of 31 March 2015
9
Information on whether a subfund of the fund is listed on the Luxembourg Stock Exchange can be obtained from the Administrative Agent or the Luxembourg Stock Exchange website (www.bourse.lu).
The national laws of the countries concerned shall apply to the issue and redemption of units of the fund.
Only the information contained in the sales prospectus and in one of the documents referred to therein shall be deemed to be valid.
The annual and semi-annual reports are available free of charge to unitholders at the registered office of the Management Company and the Custodian Bank.
No subscription may be accepted on the basis of the financial reports. Subscriptions are accepted only on the basis of the current prospectus accompanied by the latest annual report and the latest semi-annual report if available.
The figures stated in the report are historical and not necessarily indicative of future performance.

UBS (Lux) Bond FundAnnual Report as of 31 March 2015
10
To the Unitholders of
UBS (Lux) Bond Fund33A, avenue J.F. Kennedy,L-1855 Luxembourg
We have audited the accompanying financial statements of UBS (Lux) Bond Fund and of each of its subfunds, which comprise the statement of net assets and the statement of investments and other net assets as of 31 March 2015 and the statement of operations and the statement of changes in net assets for the year then ended, and a summary of significant accounting policies and other explanatory information.
Board of Directors of the Management Companyresponsibility for the financial statements
The Board of Directors of the Management Company is responsible for the preparation and fair presenta-tion of these financial statements in accordance with Luxembourg legal and regulatory requirements relat-ing to the preparation and presentation of the financial statements and for such internal control as the Board of Directors of the management company determines is necessary to enable the preparation and presentation of financial statements that are free from material misstate-ment, whether due to fraud or error.
Responsibility of the “réviseur d’entreprises agréé”
Our responsibility is to express an opinion on these financial statements based on our audit. We conducted our audit in accordance with International Standards on Auditing as adopted for Luxembourg by the “Commission de Surveillance du Secteur Financier”. Those standards require that we comply with ethical requirements and plan and perform the audit to obtain reasonable assurance about whether the financial statements are free from material misstatement.
An audit involves performing procedures to obtain audit evidence about the amounts and disclosures in the financial statements. The procedures selected depend on the judgement of the “réviseur d’entreprises agréé”, including the assessment of the risks of material misstate-ment of the financial statements, whether due to fraud or error. In making those risk assessments, the “réviseur d’entreprises agréé” considers internal control relevant to the entity’s preparation and fair presentation of the financial statements in order to design audit procedures that are appropriate in the circumstances, but not for the purpose of expressing an opinion on the effectiveness of the entity’s internal control. An audit also includes eval-uating the appropriateness of accounting policies used and the reasonableness of accounting estimates made by the Board of Directors of the management company, as well as evaluating the overall presentation of the financial statements.
We believe that the audit evidence we have obtained is sufficient and appropriate to provide a basis for our audit opinion.
Independent auditor’s report

UBS (Lux) Bond FundAnnual Report as of 31 March 2015
11
Opinion
In our opinion, the financial statements give a true and fair view of the financial position of UBS (Lux) Bond Fund and of each of its subfunds as of 31 March 2015, and of the results of their operations and changes in their net assets for the year then ended in accordance with Luxembourg legal and regulatory requirements relating to the preparation and presentation of the financial statements.
Other matter
Supplementary information included in the annual report has been reviewed in the context of our mandate but has not been subject to specific audit procedures carried out in accordance with the standards described above. Consequently, we express no opinion on such information. However, we have no observation to make concerning such information in the context of the financial statements taken as a whole.
Luxembourg, 28 July 2015
ERNST & YOUNGSociété AnonymeCabinet de révision agréé
N. Faber

12 The notes are an integral part of the fi nancial statements.
UBS (Lux) Bond FundAnnual Report as of 31 March 2015
Consolidated Statement of Net Assets EURAssets 31.3.2015Investments in securities, cost 7 698 636 619.61Investments in securities, unrealized appreciation (depreciation) 428 751 566.25Total investments in securities (Note 1) 8 127 388 185.86Cash at banks, deposits on demand and deposit accounts 421 263 053.03Time deposits and fiduciary deposits 3 857 121.99Other liquid assets (Margins) 2 356 086.10Receivable on securities sales (Note 1) 39 943 332.44Receivable on subscriptions 67 375 273.75Interest receivable on securities 113 453 921.50Interest receivable on liquid assets 601.87Unrealized gain (loss) on financial futures (Note 1) -747 536.80Unrealized gain (loss) on forward foreign exchange contracts (Note 1) 152 443 651.08Unrealized gain (loss) on swaps (Note 1) -1 681 830.78Total Assets 8 925 651 860.04
LiabilitiesInterest payable on bank overdraft -12.44Payable on securities purchases (Note 1) -149 226 694.65Payable on redemptions -23 179 838.66Provisions for flat fee (Note 2) -3 813 201.50Provisions for taxe d’abonnement (Note 3) -944 602.88Total provisions -4 757 804.38Total Liabilities -177 164 350.13
Net assets at the end of the financial year 8 748 487 509.91
* As at 31 March 2015, cash amount serves as collateral for the counterparty UBS AG London for an amount of CHF 1 400 000.
*
UBS (Lux) Bond Fund

The notes are an integral part of the fi nancial statements. 13
UBS (Lux) Bond FundAnnual Report as of 31 March 2015
Consolidated Statement of Operations EURIncome 1.4.2014-31.3.2015Interest on liquid assets 240 856.45Interest on securities 343 219 068.31Interest received on swaps (Note 1) 1 950 406.83Income on securities lending (Note 14) 5 746 319.13Other income 2 113 000.56Total income 353 269 651.28
ExpensesInterest paid on swaps (Note 1) -1 210 363.46Cost on securities lending (Note 14) -2 298 527.52Flat fee (Note 2) -80 372 505.29Taxe d’abonnement (Note 3) -3 561 533.23Interest on cash and bank overdraft -4 587.89Total expenses -87 447 517.39
Net income (loss) on investments 265 822 133.89
Realized gain (loss) (Note 1)Realized gain (loss) on market-priced securities without options 96 005 062.00Realized gain (loss) on options -1 078 077.94Realized gain (loss) on yield-evaluated securities and money market instruments 900 913.89Realized gain (loss) on financial futures -9 297 424.30Realized gain (loss) on forward foreign exchange contracts 299 633 982.17Realized gain (loss) on swaps -1 063 718.89Realized result on subscriptions/redemptions (Note 5) 4 561 931.30Total realized gain (loss) on investments 389 662 668.23Realized gain (loss) on foreign exchange 27 568 749.97Total realized gain (loss) 417 231 418.20
Net realized gain (loss) of the financial year 683 053 552.09
Changes in unrealized appreciation (depreciation) (Note 1)Unrealized appreciation (depreciation) on market-priced securities without options 211 725 980.66Unrealized appreciation (depreciation) on yield-evaluated securities and money market instruments -129 752.91Unrealized appreciation (depreciation) on financial futures -1 400 067.69Unrealized appreciation (depreciation) on forward foreign exchange contracts 143 080 050.36Unrealized appreciation (depreciation) on swaps -572 208.26Total changes in unrealized appreciation (depreciation) 352 704 002.16
Net increase (decrease) in net assets as a result of operations 1 035 757 554.25

14 The notes are an integral part of the fi nancial statements.
UBS (Lux) Bond Fund – AUDAnnual Report as of 31 March 2015
UBS (Lux) Bond Fund – AUD
Three-year comparison
ISIN 31.3.2015 31.3.2014 31.3.2013Net assets in AUD 387 753 845.70 380 675 397.38 499 382 542.57Class F-acc1 LU0415157832Units outstanding 11 860.0000 13 710.0000 -Net asset value per unit in AUD 480.11 436.78 -Issue and redemption price per unit in AUD2 480.11 436.78 -Class I-A1-acc3 LU0415158210Units outstanding 3 400.0000 5 921.0000 -Net asset value per unit in AUD 112.74 102.68 -Issue and redemption price per unit in AUD2 112.74 102.68 -Class I-X-acc4 LU0415159374Units outstanding 3 304.6670 - -Net asset value per unit in AUD 100.83 - -Issue and redemption price per unit in AUD2 100.83 - -Class N-acc LU0415156602Units outstanding 9 192.4730 4 790.3170 751.6600Net asset value per unit in AUD 113.45 103.94 100.60Issue and redemption price per unit in AUD2 113.45 103.94 100.60Class P-acc LU0035338325Units outstanding 484 270.4250 538 729.9450 767 408.2411Net asset value per unit in AUD 475.17 434.89 420.50Issue and redemption price per unit in AUD2 475.17 434.89 420.50Class P-dist LU0035338242Units outstanding 1 161 826.8010 1 186 284.8910 1 492 194.0510Net asset value per unit in AUD 122.68 117.22 118.36Issue and redemption price per unit in AUD2 122.68 117.22 118.36Class Q-acc5 LU0415158053Units outstanding 68 343.1750 2 193.3510 -Net asset value per unit in AUD 112.06 102.17 -Issue and redemption price per unit in AUD2 112.06 102.17 -Class Q-dist6 LU0415157915Units outstanding - 100.0000 -Net asset value per unit in AUD - 100.61 -Issue and redemption price per unit in AUD2 - 100.61 -
1 First NAV: 10.7.20132 See note 13 First NAV: 14.11.20134 First NAV: 2.3.20155 First NAV: 13.12.20136 For the period from 3.2.2014 to 23.2.2015 the unit class Q-dist was in circulation.
Performance
Currency 2014/2015 2013/2014 2012/2013Class F-acc AUD 9.9% - -Class I-A1-acc AUD 9.8% - -Class I-X-acc1 AUD - - -Class N-acc AUD 9.1% 3.3% -Class P-acc AUD 9.3% 3.4% 7.1%Class P-dist AUD 9.3% 3.4% 7.1%Class Q-acc AUD 9.7% - -
Historical performance is no indicator of current or future performance.The performance data does not take account of any commissions and costs charged when subscribing and redeeming units.The performance data were not audited.The subfund does not have a benchmark.
1 Due to the recent launch, there are no data for the calculation of the performance.

The notes are an integral part of the fi nancial statements. 15
UBS (Lux) Bond Fund – AUDAnnual Report as of 31 March 2015
Report of the Portfolio Manager
In Australia, three-year government bonds now trade below the cash rate and closed the reporting year from 1 April 2014 to 31 March 2015 at a low of 1.78% with highs at 3.02% back in March 2014; ten-year government bonds closed the reporting year at 2.31% and similarly with highs at 4.19% back in March 2014. The RBA held the cash rate at 2.50% over the major-ity of the reporting year and with little evidence of the domestic economy accelerating, cut to an all-time low of 2.25% as at February 2015. Thus with no prospect of a meaningful change in current circumstances it is very likely that the RBA will cut the cash rate to 2% in the coming months.
In the reporting year the subfund posted a positive return. Duration management (short duration stance) towards the end of the reporting year detracted, while both yield curve strategy and sector management added to overall performance. From a positioning standpoint we remain cautious in treasuries and government-related securities and favor securitized and corporate securities.
Structure of the Securities Portfolio
Geographical Breakdown as a % of net assetsAustralia 77.09Germany 7.19Supranationals 5.60United States 3.34United Kingdom 2.18France 1.48Norway 0.41New Zealand 0.41Canada 0.26Total 97.96
Economic Breakdown as a % of net assetsBanks & credit institutions 22.24Countries & central governments 17.70Finance & holding companies 13.73Cantons, federal states 10.66Public, non-profit institutions 6.64Supranational organisations 5.60Miscellaneous unclassified companies 4.46Traffic & transportation 4.29Mortgage & funding institutions 3.94Energy & water supply 1.95Real Estate 1.91Insurance 1.30Healthcare & social services 0.90Aerospace industry 0.84Electrical devices & components 0.54Petroleum 0.53Miscellaneous consumer goods 0.41Retail trade, department stores 0.32Total 97.96

16 The notes are an integral part of the fi nancial statements.
UBS (Lux) Bond Fund – AUDAnnual Report as of 31 March 2015
Statement of Net Assets AUDAssets 31.3.2015Investments in securities, cost 358 458 206.32Investments in securities, unrealized appreciation (depreciation) 21 397 772.89Total investments in securities (Note 1) 379 855 979.21Cash at banks, deposits on demand and deposit accounts 237.25Time deposits and fiduciary deposits 5 422 539.46Other liquid assets (Margins) 80 638.59Receivable on subscriptions 731 669.35Interest receivable on securities 4 791 367.47Unrealized gain (loss) on financial futures (Note 1) 152 569.67Total Assets 391 035 001.00
LiabilitiesPayable on securities purchases (Note 1) -2 409 528.00Payable on redemptions -673 768.17Provisions for flat fee (Note 2) -150 030.89Provisions for taxe d’abonnement (Note 3) -47 828.24Total provisions -197 859.13Total Liabilities -3 281 155.30
Net assets at the end of the financial year 387 753 845.70
Statement of Operations AUDIncome 1.4.2014-31.3.2015Interest on liquid assets 120 339.64Interest on securities 19 153 443.00Total income 19 273 782.64
ExpensesFlat fee (Note 2) -3 387 960.67Taxe d’abonnement (Note 3) -190 199.17Interest on cash and bank overdraft -134.14Total expenses -3 578 293.98
Net income (loss) on investments 15 695 488.66
Realized gain (loss) (Note 1)Realized gain (loss) on market-priced securities without options 4 068 998.53Realized gain (loss) on financial futures -1 974 425.79Realized result on subscriptions/redemptions (Note 5) 16 309.83Total realized gain (loss) on investments 2 110 882.57Total realized gain (loss) 2 110 882.57
Net realized gain (loss) of the financial year 17 806 371.23
Changes in unrealized appreciation (depreciation) (Note 1)Unrealized appreciation (depreciation) on market-priced securities without options 15 865 254.70Unrealized appreciation (depreciation) on yield-evaluated securities and money market instruments 261 390.00Unrealized appreciation (depreciation) on financial futures -18 293.21Total changes in unrealized appreciation (depreciation) 16 108 351.49
Net increase (decrease) in net assets as a result of operations 33 914 722.72

The notes are an integral part of the fi nancial statements. 17
UBS (Lux) Bond Fund – AUDAnnual Report as of 31 March 2015
Statement of Changes in Net Assets AUD 1.4.2014-31.3.2015Net assets at the beginning of the financial year 380 675 397.38Subscriptions 111 342 350.45Redemptions -132 351 387.65Total net subscriptions (redemptions) -21 009 037.20Dividend paid -5 827 237.20Net income (loss) on investments 15 695 488.66Total realized gain (loss) 2 110 882.57Total changes in unrealized appreciation (depreciation) 16 108 351.49Net increase (decrease) in net assets as a result of operations 33 914 722.72Net assets at the end of the financial year 387 753 845.70
Development of the outstanding units
1.4.2014-31.3.2015Class F-accNumber of units outstanding at the beginning of the financial year 13 710.0000Number of units issued 1 645.0000Number of units redeemed -3 495.0000Number of units outstanding at the end of the financial year 11 860.0000Class I-A1-accNumber of units outstanding at the beginning of the financial year 5 921.0000Number of units issued 5 309.5120Number of units redeemed -7 830.5120Number of units outstanding at the end of the financial year 3 400.0000Class I-X-accNumber of units outstanding at the beginning of the financial year 0.0000Number of units issued 3 304.6670Number of units redeemed 0.0000Number of units outstanding at the end of the financial year 3 304.6670Class N-accNumber of units outstanding at the beginning of the financial year 4 790.3170Number of units issued 7 128.7390Number of units redeemed -2 726.5830Number of units outstanding at the end of the financial year 9 192.4730Class P-accNumber of units outstanding at the beginning of the financial year 538 729.9450Number of units issued 176 670.9590Number of units redeemed -231 130.4790Number of units outstanding at the end of the financial year 484 270.4250Class P-distNumber of units outstanding at the beginning of the financial year 1 186 284.8910Number of units issued 184 169.4940Number of units redeemed -208 627.5840Number of units outstanding at the end of the financial year 1 161 826.8010Class Q-accNumber of units outstanding at the beginning of the financial year 2 193.3510Number of units issued 68 438.8460Number of units redeemed -2 289.0220Number of units outstanding at the end of the financial year 68 343.1750Class Q-distNumber of units outstanding at the beginning of the financial year 100.0000Number of units issued 1 460.4460Number of units redeemed -1 560.4460Number of units outstanding at the end of the financial year 0.0000
Annual Distribution
UBS (Lux) Bond Fund Ex-Date Pay-Date Currency Amount per unit– AUD P-dist 2.6.2014 5.6.2014 AUD 5.04– AUD Q-dist 2.6.2014 5.6.2014 AUD 0.77

18 The notes are an integral part of the fi nancial statements.
UBS (Lux) Bond Fund – AUDAnnual Report as of 31 March 2015
Statement of Investments in Securities and other Net Assets as of 31 March 2015
Description Quantity/ Valuation in AUD as a % Nominal Unrealized gain of net (loss) on Futures/ assets Options/Forward Exchange Contracts/ Swaps (Note 1)
Transferable securities and money market instruments listed on an official stock exchange
Mortgage Backed Securities, floating rate
AUD
AUD MEDALLION TRUST-SUB FLR 13-22.08.45 3 500 000.00 3 628 275.00 0.94Total AUD 3 628 275.00 0.94
Total Mortgage Backed Securities, floating rate 3 628 275.00 0.94
Notes, fixed rate
AUD
AUD AUSTRALIA 5.50000% 11-21.04.23 6 600 000.00 8 198 124.00 2.11AUD INTL BANK FOR RECONSTRUCTION & DEVT 5.75000% 10-01.10.20 500 000.00 584 670.00 0.15AUD NETWORK RAIL INFRASTRUCTURE FINANCE 6.00000% 06-15.11.16 2 000 000.00 2 120 280.00 0.55AUD NEW SOUTH WALES TREASURY CORP 6.00000% 11-01.03.22 7 000 000.00 8 605 940.00 2.22AUD NEW SOUTH WALES TREASURY CORP 4.00000% 13-20.04.23 6 400 000.00 7 085 248.00 1.83AUD QUEENSLAND TREASURY CORP 5.75000% 11-22.07.24 5 200 000.00 6 453 148.00 1.66AUD SUNCORP-METWAY LTD 4.75000% 12-06.12.16 5 000 000.00 5 193 150.00 1.34AUD SYDNEY AIRPORT FINANCE CO PTY LTD 7.75000% 11-06.07.18 2 500 000.00 2 841 475.00 0.73AUD TREASURY CORP OF VICTORIA 6.00000% 09-15.06.20 2 800 000.00 3 324 692.00 0.86Total AUD 44 406 727.00 11.45
Total Notes, fixed rate 44 406 727.00 11.45
Notes, floating rate
AUD
AUD AUSTRALIA & NEW ZEALAND BANKG-SUB 3M BBSW+275BP 12-20.06.22 19 000.00 1 956 019.81 0.50Total AUD 1 956 019.81 0.50
Total Notes, floating rate 1 956 019.81 0.50
Medium term notes, fixed rate
AUD
AUD ANGLO AMERICAN CAPITAL PLC 5.75000% 13-27.11.18 2 500 000.00 2 665 750.00 0.69AUD BARCLAYS BANK PLC 4.50000% 14-04.04.19 3 500 000.00 3 675 525.00 0.95AUD BHP BILLITON FINANCE LTD 3.75000% 12-18.10.17 1 000 000.00 1 028 730.00 0.26AUD COMMONWEALTH BANK OF AUSTRALIA 5.75000% 12-25.01.17 6 000 000.00 6 367 740.00 1.64AUD COMMONWEALTH PROPERTY OFFICE FUND 7.25000% 11-11.03.16 1 000 000.00 1 039 280.00 0.27AUD COMPAGNIE DE FINANCEMENT FONCIER 5.5000% 05-22.09.15 2 600 000.00 2 635 282.00 0.68AUD EUROPEAN INVESTMENT BANK 6.50000% 09-07.08.19 6 500 000.00 7 611 565.00 1.96AUD EUROPEAN INVESTMENT BANK 5.00000% 12-22.08.22 500 000.00 577 330.00 0.15AUD EXPORT DEVELOPMENT CANADA 3.25000% 12-08.08.17 1 000 000.00 1 026 140.00 0.26AUD GE CAPITAL AUSTRALIA FUNDING PTY LTD 6.00000% 05-15.04.15 4 000 000.00 4 005 640.00 1.03AUD HYPOTHEKENBANK FRANKFURT AG 6.00000% 06-30.11.16 5 000 000.00 5 233 800.00 1.35AUD INTERNATIONAL FINANCE CORP 3.50000% 13-06.06.18 3 900 000.00 4 059 900.00 1.05AUD INTL BK FOR RECONST&DEVT WORLD BK-REG-S 2.50000% 15-12.03.20 2 400 000.00 2 411 376.00 0.62AUD INTL BK FOR RECONSTR & DEVT WORLD BANK 3.75000% 14-23.01.19 5 100 000.00 5 378 358.00 1.39AUD JPMORGAN CHASE & CO 4.10000% 13-17.05.18 3 500 000.00 3 619 595.00 0.93AUD KOMMUNALBANKEN AS 2.60000% 15-04.09.20 1 600 000.00 1 599 840.00 0.41AUD KREDITANSTALT FUER WIEDERAUFBAU 6.25000% 09-04.12.19 2 900 000.00 3 396 770.00 0.88AUD KREDITANSTALT FUER WIEDERAUFBAU 6.00000% 10-20.08.20 4 500 000.00 5 302 575.00 1.37AUD KREDITANSTALT FUER WIEDERAUFBAU 6.25000% 11-23.02.18 5 000 000.00 5 577 650.00 1.44AUD KREDITANSTALT FUER WIEDERAUFBAU-REG-S 2.40000% 15-02.07.20 2 400 000.00 2 396 376.00 0.62AUD LANDWIRTSCHAFTLICHE RENTENBANK 4.25000% 13-24.01.23 2 000 000.00 2 210 200.00 0.57AUD METROPOLITAN LIFE GLOBAL FUNDING-REG-S 4.75000% 12-28.09.17 1 900 000.00 1 988 350.00 0.51AUD MORGAN STANLEY 7.62500% 11-03.03.16 3 000 000.00 3 126 300.00 0.81AUD NATIONAL WLTH MGT HLD 5.25000% 12-07.12.17 2 800 000.00 2 972 340.00 0.77AUD PERTH AIRPORT PTY LTD 6.00000% 13-23.07.20 1 200 000.00 1 345 380.00 0.35AUD PERTH AIRPORT PTY LTD 5.50000% 14-25.03.21 1 100 000.00 1 211 980.00 0.31AUD QUEENSLAND TREASURY CORP-144A-REG-S 3.50000% 12-21.09.17 7 000 000.00 7 253 470.00 1.87AUD SPI AUSTRALIA ASSETS PTY LTD 6.25000% 12-21.02.17 2 000 000.00 2 117 720.00 0.55AUD SUNCORP GROUP LTD 4.00000% 12-09.11.17 3 200 000.00 3 318 272.00 0.85AUD TOYOTA FINANCE AUSTRALIA LTD 4.25000% 14-15.05.19 1 100 000.00 1 162 381.00 0.30AUD WESTPAC BANKING CORP 4.50000% 14-25.02.19 3 500 000.00 3 720 780.00 0.96Total AUD 100 036 395.00 25.80
Total Medium term notes, fixed rate 100 036 395.00 25.80
Medium term notes, floating rate
AUD
AUD SPI AUSTRALIA ASSETS PTY 7.250%/RATING LINKED 10-12.08.15 800 000.00 811 504.00 0.21Total AUD 811 504.00 0.21
Total Medium term notes, floating rate 811 504.00 0.21
Bonds, fixed rate
AUD
AUD AUSTRALIA 4.50000% 09-15.04.20 3 500 000.00 3 943 170.00 1.02AUD AUSTRALIA 4.75000% 11-21.04.27 8 200 000.00 10 153 732.00 2.62AUD AUSTRALIA 5.50000% 10-21.01.18 4 000 000.00 4 414 240.00 1.14AUD AUSTRALIA 5.75000% 07-15.05.21 6 000 000.00 7 299 660.00 1.88AUD AUSTRALIA 5.75000% 10-15.07.22 6 500 000.00 8 085 870.00 2.09AUD AUSTRALIA-REG-S 2.75000% 14-21.06.35 2 500 000.00 2 481 600.00 0.64AUD AUSTRALIA-REG-S 3.75000% 14-21.04.37 4 500 000.00 5 187 465.00 1.34AUD AUSTRALIA-REG-S 4.50000% 13-21.04.33 7 800 000.00 9 793 212.00 2.53

The notes are an integral part of the fi nancial statements. 19
UBS (Lux) Bond Fund – AUDAnnual Report as of 31 March 2015
AUD CROWN GROUP FINANCE LTD 5.75000% 12-18.07.17 2 400 000.00 2 531 928.00 0.65AUD QUEENSLAND TREASURY CORP 6.00000% 11-21.07.22 5 800 000.00 7 111 496.00 1.83AUD QUEENSLAND TREASURY CORP-REG-S 4.00000% 12-21.06.19 5 000 000.00 5 363 800.00 1.38AUD QUEENSLAND TREASURY CORP-144A-REG-S 4.75000% 14-21.07.25 5 600 000.00 6 530 440.00 1.68AUD WESTPAC BANKING CORP 5.75000% 12-06.02.17 11 600 000.00 12 321 520.00 3.18Total AUD 85 218 133.00 21.98
Total Bonds, fixed rate 85 218 133.00 21.98
Bonds, floating rate
AUD
AUD AUSTRALIA 1.000%/CPI LINKED 14-21.11.18 8 500 000.00 9 068 990.00 2.34Total AUD 9 068 990.00 2.34
Total Bonds, floating rate 9 068 990.00 2.34
Total Transferable securities and money market instruments listed on an official stock exchange 245 126 043.81 63.22
Transferable securities and money market instruments traded on another regulated market
Domestic Certificates of Deposits, Fixed Rate
AUD
AUD COMMONWEALTH BANK OF AUSTRALIA CD 4.25000% 24.04.14-24.04.19 3 000 000.00 3 162 480.00 0.81AUD COMMONWEALTH BANK OF AUSTRALIA CD 3.75000% 18.07.14-18.10.19 1 500 000.00 1 551 270.00 0.40Total AUD 4 713 750.00 1.21
Total Domestic Certificates of Deposits, Fixed Rate 4 713 750.00 1.21
Mortgage Backed Securities, fixed rate
AUD
AUD MEDALLION TRUST-SUB 6.50000% 11-22.11.42 2 500 000.00 2 600 650.00 0.67Total AUD 2 600 650.00 0.67
Total Mortgage Backed Securities, fixed rate 2 600 650.00 0.67
Notes, fixed rate
AUD
AUD GE CAPITAL AUSTRALIA FUNDING PTY LTD 7.00000% 10-08.10.15 2 000 000.00 2 046 620.00 0.53AUD LANDWIRTSCHAFTLICHE RENTENBANK 6.25000% 11-13.04.18 1 300 000.00 1 455 493.00 0.38AUD LANDWIRTSCHAFTLICHE RENTENBANK 5.50000% 12-29.03.22 1 000 000.00 1 181 960.00 0.30AUD NEW SOUTH WALES TREASURY CORP 5.00000% 12-20.08.24 2 000 000.00 2 397 560.00 0.62AUD SYDNEY AIRPORT FINANCE CO PTY LTD 8.00000% 10-06.07.15 2 000 000.00 2 026 520.00 0.52AUD TASMANIAN PUBLIC FINANCE 6.00000% 09-15.06.20 6 000 000.00 7 083 960.00 1.83AUD TASMANIAN PUBLIC FINANCE 4.25000% 13-08.03.22 1 800 000.00 1 990 296.00 0.51AUD WESTERN AUSTRALIAN TREASURY-REG-S 5.00000% 13-23.07.25 5 090 000.00 6 074 711.40 1.57Total AUD 24 257 120.40 6.26
Total Notes, fixed rate 24 257 120.40 6.26
Medium term notes, fixed rate
AUD
AUD ADANI ABBOT POINT TERMINAL PTY LTD 5.75000% 13-01.11.18 2 000 000.00 2 087 600.00 0.54AUD AIRSERVICES AUSTRALIA 4.75000% 13-19.11.20 1 100 000.00 1 206 502.00 0.31AUD AMP CAPITAL SHOPPING CENTRE FD 7.50000% 10-28.04.15 800 000.00 802 808.00 0.21AUD AURIZON NETWORK PTY LTD 5.75000% 13-28.10.20 1 500 000.00 1 654 770.00 0.43AUD AUSTRALIA PACIFIC AIRPORTS PTY LTD 6.00000% 05-14.12.15 500 000.00 510 630.00 0.13AUD AUSTRALIA PACIFIC AIRPORTS MELBOUNRE 7.00000% 10-25.08.16 2 100 000.00 2 219 070.00 0.57AUD AUSTRALIA PACIFIC AIRPORTS MELB-STEP-DOWN 5.000% 13-04.06.20 1 500 000.00 1 617 030.00 0.42AUD AUSTRALIAN CAPITAL TERRITORY 4.25000% 12-22.05.20 1 500 000.00 1 644 450.00 0.42AUD BHP BILLITON FINANCE LTD-REG-S 3.00000% 15-30.03.20 2 300 000.00 2 286 338.00 0.59AUD BRISBANE AIRPORT CORP LTD 8.00000% 11-09.07.19 600 000.00 710 820.00 0.18AUD CALTEX AUSTRALIA LTD 7.25000% 11-23.11.18 1 800 000.00 2 040 804.00 0.53AUD CFS RETAIL PROPERTY TRUST GROUP 7.25000% 10-02.05.16 3 000 000.00 3 149 520.00 0.81AUD CITIGROUP INC 4.75000% 13-05.02.18 1 000 000.00 1 049 660.00 0.27AUD COMPAGNIE DE FINANCEMENT FONCIER 6.25000% 07-30.01.17 2 900 000.00 3 087 398.00 0.80AUD CONNECTEAST FINANCE PTY LTD 5.75000% 13-02.09.20 2 400 000.00 2 640 432.00 0.68AUD CROWN GROUP FINANCE LTD-REG-S 4.50000% 14-18.11.19 1 600 000.00 1 647 888.00 0.43AUD DEXUS FINANCE PROPERTY GROUP LTD 8.75000% 10-21.04.17 2 000 000.00 2 225 800.00 0.57AUD DOWNER GROUP FINANCE PTY 5.75000% 13-29.11.18 1 500 000.00 1 598 370.00 0.41AUD DOWNER GROUP FINANCE PTY LTD 4.50000% 15-11.03.22 900 000.00 902 169.00 0.23AUD ETSA UTILITIES FINANCE 6.75000% 11-29.09.16 2 000 000.00 2 112 920.00 0.55AUD EXPORT FINANCE&INSURANCE CORP 6.00000% 10-12.11.20 1 600 000.00 1 888 368.00 0.49AUD FONTERRA CO-OPERATIVE GROUP LTD 4.50000% 14-30.06.21 1 500 000.00 1 596 345.00 0.41AUD INTER-AMERICAN DEVELOPMENT BANK 3.75000% 12-25.07.22 1 000 000.00 1 070 390.00 0.28AUD LANDWIRTSCHAFTLICHE RENTEBANK 5.50000% 12-09.03.20 1 000 000.00 1 143 070.00 0.29AUD MC FINANCE AUSTRALIA PTY-REG-S 4.75000% 13-17.12.18 1 000 000.00 1 064 230.00 0.27AUD METROPOLITAN LIFE GLOBAL FUNDING-REG-S 4.50000% 14-16.04.19 3 000 000.00 3 151 920.00 0.81AUD NEW ZEALAND MILK AUSTRALIA PTY LTD 6.25000% 11-11.07.16 2 000 000.00 2 091 420.00 0.54AUD POWERCOR AUSTRALIA LLC 5.75000% 12-27.04.17 2 000 000.00 2 108 480.00 0.54AUD QPH FINANCE CO PTY LTD 5.75000% 13-29.07.20 1 600 000.00 1 768 496.00 0.46AUD TOYOTA FINANCE AUSTRALIA LTD 4.25000% 13-26.02.18 3 300 000.00 3 452 460.00 0.89AUD TRANSURBAN FINANCE COMPANY STEP-UP 11-08.06.16 2 000 000.00 2 083 380.00 0.54AUD UNIVERSITY OF MELBOURNE 4.25000% 14-30.06.21 1 000 000.00 1 074 530.00 0.28AUD UNIVERSITY OF SYDNEY 4.75000% 14-16.04.21 2 200 000.00 2 422 992.00 0.62AUD WESTFIELD RETAIL TRUST 7.00000% 11-18.10.16 4 000 000.00 4 251 600.00 1.10AUD WOOLWORTHS LTD 6.75000% 11-22.03.16 1 200 000.00 1 249 764.00 0.32Total AUD 65 612 424.00 16.92
Total Medium term notes, fixed rate 65 612 424.00 16.92
Description Quantity/ Valuation in AUD as a % Nominal Unrealized gain of net (loss) on Futures/ assets Options/Forward Exchange Contracts/ Swaps (Note 1)

20 The notes are an integral part of the fi nancial statements.
UBS (Lux) Bond Fund – AUDAnnual Report as of 31 March 2015
Medium term notes, floating rate
AUD
AUD DBNGP FINANCE CO 6.000%/RATING LINKED 12-11.10.19 2 700 000.00 2 928 474.00 0.75AUD NATIONAL WLTH MGT HLD-SUB 6.75000%/3M BBSW+163BP 06-16.06.26 3 000 000.00 3 096 180.00 0.80Total AUD 6 024 654.00 1.55
Total Medium term notes, floating rate 6 024 654.00 1.55
Bonds, fixed rate
AUD
AUD AUSTRALIAN CAPITAL TERRITORY 4.25000% 13-11.04.22 2 000 000.00 2 223 780.00 0.57AUD NATIONAL AUSTRALIA BANK LTD 4.25000% 14-20.05.19 5 000 000.00 5 272 550.00 1.36AUD SUNCORP METWAY LTD-REG-S 3.75000% 14-05.11.19 2 200 000.00 2 282 434.00 0.59AUD UNITED ENERGY LTD 6.25000% 12-11.04.17 2 400 000.00 2 536 224.00 0.65AUD WESTERN AUSTRALIAN TREASURY CORP 8.00000% 01-15.07.17 8 000 000.00 9 073 360.00 2.34AUD WESTERN AUSTRALIAN TREASURY CORP 6.00000% 05-16.10.23 5 500 000.00 6 880 995.00 1.78Total AUD 28 269 343.00 7.29
Total Bonds, fixed rate 28 269 343.00 7.29
Total Transferable securities and money market instruments traded on another regulated market 131 477 941.40 33.90
Transferable securities and money market instruments not listed on an official stock exchange and not traded on another regulated market
Medium term notes, fixed rate
AUD
AUD AUSTRALIAN RAIL TRACK CORP LTD 3.75000% 14-05.12.19 1 000 000.00 1 028 220.00 0.27AUD LGFV PROGRAM TRUST-REG-S 4.31000% 14-12.11.21 2 100 000.00 2 223 774.00 0.57Total AUD 3 251 994.00 0.84
Total Medium term notes, fixed rate 3 251 994.00 0.84
Total Transferable securities and money market instruments not listed on an official stock exchange and not traded on another regulated market 3 251 994.00 0.84
Total investments in securities 379 855 979.21 97.96
Derivative instruments
Derivative instruments listed on an official stock exchange
Financial Futures on bonds
AUD AUSTRALIA 3YR BOND FUTURE 15.06.15 -260.00 -114 247.40 -0.03AUD AUSTRALIAN 10Y BOND FUTURE 15.06.15 179.00 266 817.07 0.07Total Financial Futures on bonds 152 569.67 0.04
Total Derivative instruments listed on an official stock exchange 152 569.67 0.04
Total Derivative instruments 152 569.67 0.04
Time deposits and fiduciary deposits 5 422 539.46 1.40Cash at banks, deposits on demand and deposit accounts and other liquid assets 80 875.84 0.02Other assets and liabilities 2 241 881.52 0.58
Total net assets 387 753 845.70 100.00
Description Quantity/ Valuation in AUD as a % Nominal Unrealized gain of net (loss) on Futures/ assets Options/Forward Exchange Contracts/ Swaps (Note 1)
The notes are an integral part of the fi nancial statements. 21
UBS (Lux) Bond Fund – CADAnnual Report as of 31 March 2015
UBS (Lux) Bond Fund – CAD
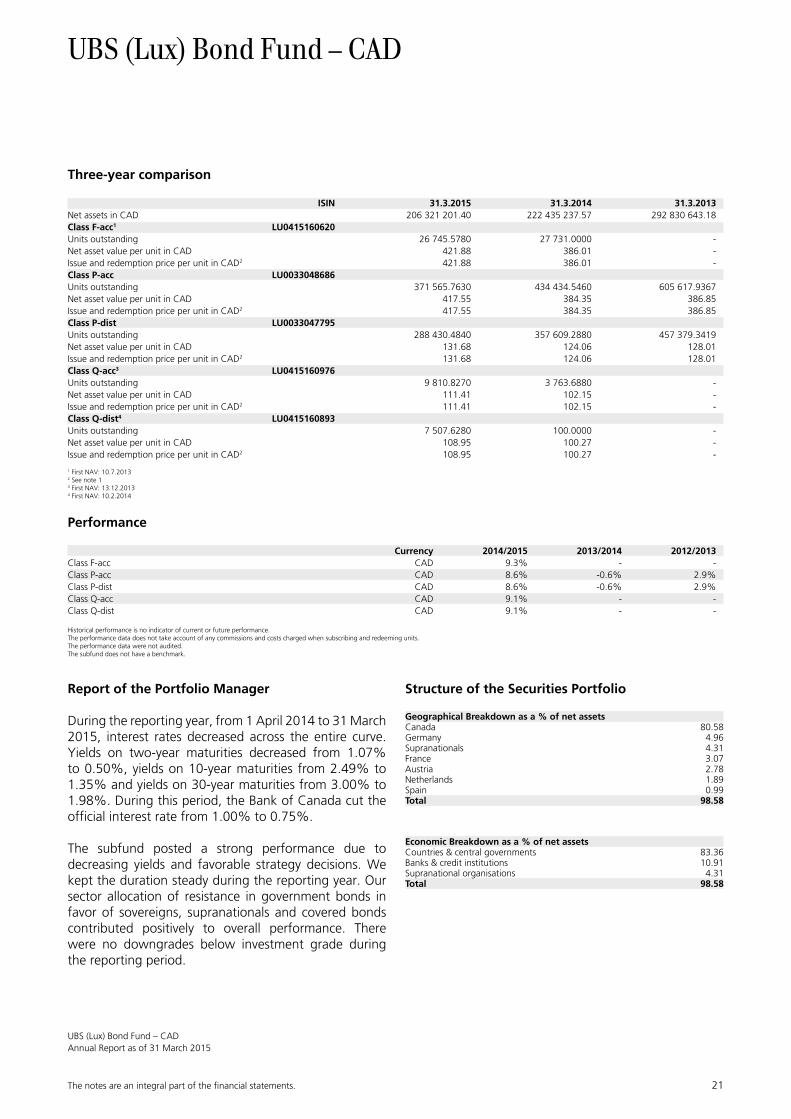
Three-year comparison
ISIN 31.3.2015 31.3.2014 31.3.2013Net assets in CAD 206 321 201.40 222 435 237.57 292 830 643.18Class F-acc1 LU0415160620Units outstanding 26 745.5780 27 731.0000 -Net asset value per unit in CAD 421.88 386.01 -Issue and redemption price per unit in CAD2 421.88 386.01 -Class P-acc LU0033048686Units outstanding 371 565.7630 434 434.5460 605 617.9367Net asset value per unit in CAD 417.55 384.35 386.85Issue and redemption price per unit in CAD2 417.55 384.35 386.85Class P-dist LU0033047795Units outstanding 288 430.4840 357 609.2880 457 379.3419Net asset value per unit in CAD 131.68 124.06 128.01Issue and redemption price per unit in CAD2 131.68 124.06 128.01Class Q-acc3 LU0415160976Units outstanding 9 810.8270 3 763.6880 -Net asset value per unit in CAD 111.41 102.15 -Issue and redemption price per unit in CAD2 111.41 102.15 -Class Q-dist4 LU0415160893Units outstanding 7 507.6280 100.0000 -Net asset value per unit in CAD 108.95 100.27 -Issue and redemption price per unit in CAD2 108.95 100.27 -
1 First NAV: 10.7.20132 See note 13 First NAV: 13.12.20134 First NAV: 10.2.2014
Performance
Currency 2014/2015 2013/2014 2012/2013Class F-acc CAD 9.3% - -Class P-acc CAD 8.6% -0.6% 2.9%Class P-dist CAD 8.6% -0.6% 2.9%Class Q-acc CAD 9.1% - -Class Q-dist CAD 9.1% - -
Historical performance is no indicator of current or future performance.The performance data does not take account of any commissions and costs charged when subscribing and redeeming units.The performance data were not audited.The subfund does not have a benchmark.
Report of the Portfolio Manager
During the reporting year, from 1 April 2014 to 31 March 2015, interest rates decreased across the entire curve. Yields on two-year maturities decreased from 1.07% to 0.50%, yields on 10-year maturities from 2.49% to 1.35% and yields on 30-year maturities from 3.00% to 1.98%. During this period, the Bank of Canada cut the official interest rate from 1.00% to 0.75%.
The subfund posted a strong performance due to decreasing yields and favorable strategy decisions. We kept the duration steady during the reporting year. Our sector allocation of resistance in government bonds in favor of sovereigns, supranationals and covered bonds contributed positively to overall performance. There were no downgrades below investment grade during the reporting period.
Structure of the Securities Portfolio
Geographical Breakdown as a % of net assetsCanada 80.58Germany 4.96Supranationals 4.31France 3.07Austria 2.78Netherlands 1.89Spain 0.99Total 98.58
Economic Breakdown as a % of net assetsCountries & central governments 83.36Banks & credit institutions 10.91Supranational organisations 4.31Total 98.58

22 The notes are an integral part of the fi nancial statements.
UBS (Lux) Bond Fund – CADAnnual Report as of 31 March 2015
Statement of Net Assets CADAssets 31.3.2015Investments in securities, cost 189 805 787.63Investments in securities, unrealized appreciation (depreciation) 13 588 171.57Total investments in securities (Note 1) 203 393 959.20Cash at banks, deposits on demand and deposit accounts 1 033 015.90Receivable on securities sales (Note 1) 2 614 841.87Receivable on subscriptions 39 251.07Interest receivable on securities 1 517 535.43Interest receivable on liquid assets 273.19Total Assets 208 598 876.66
LiabilitiesPayable on securities purchases (Note 1) -1 908 555.66Payable on redemptions -265 895.99Provisions for flat fee (Note 2) -78 561.77Provisions for taxe d’abonnement (Note 3) -24 661.84Total provisions -103 223.61Total Liabilities -2 277 675.26
Net assets at the end of the financial year 206 321 201.40
Statement of Operations CADIncome 1.4.2014-31.3.2015Interest on liquid assets 11 414.90Interest on securities 6 269 223.72Income on securities lending (Note 14) 119 604.11Total income 6 400 242.73
ExpensesCost on securities lending (Note 14) -47 841.64Flat fee (Note 2) -1 840 996.61Taxe d’abonnement (Note 3) -102 179.79Total expenses -1 991 018.04
Net income (loss) on investments 4 409 224.69
Realized gain (loss) (Note 1)Realized gain (loss) on market-priced securities without options 1 393 648.33Total realized gain (loss) on investments 1 393 648.33Total realized gain (loss) 1 393 648.33
Net realized gain (loss) of the financial year 5 802 873.02
Changes in unrealized appreciation (depreciation) (Note 1)Unrealized appreciation (depreciation) on market-priced securities without options 11 774 865.97Total changes in unrealized appreciation (depreciation) 11 774 865.97
Net increase (decrease) in net assets as a result of operations 17 577 738.99

The notes are an integral part of the fi nancial statements. 23
UBS (Lux) Bond Fund – CADAnnual Report as of 31 March 2015
Statement of Changes in Net Assets CAD 1.4.2014-31.3.2015Net assets at the beginning of the financial year 222 435 237.57Subscriptions 21 811 376.63Redemptions -54 515 123.41Total net subscriptions (redemptions) -32 703 746.78Dividend paid -988 028.38Net income (loss) on investments 4 409 224.69Total realized gain (loss) 1 393 648.33Total changes in unrealized appreciation (depreciation) 11 774 865.97Net increase (decrease) in net assets as a result of operations 17 577 738.99Net assets at the end of the financial year 206 321 201.40
Development of the outstanding units
1.4.2014-31.3.2015Class F-accNumber of units outstanding at the beginning of the financial year 27 731.0000Number of units issued 10 819.5780Number of units redeemed -11 805.0000Number of units outstanding at the end of the financial year 26 745.5780Class P-accNumber of units outstanding at the beginning of the financial year 434 434.5460Number of units issued 34 156.5520Number of units redeemed -97 025.3350Number of units outstanding at the end of the financial year 371 565.7630Class P-distNumber of units outstanding at the beginning of the financial year 357 609.2880Number of units issued 18 258.1210Number of units redeemed -87 436.9250Number of units outstanding at the end of the financial year 288 430.4840Class Q-accNumber of units outstanding at the beginning of the financial year 3 763.6880Number of units issued 6 086.4860Number of units redeemed -39.3470Number of units outstanding at the end of the financial year 9 810.8270Class Q-distNumber of units outstanding at the beginning of the financial year 100.0000Number of units issued 7 916.4090Number of units redeemed -508.7810Number of units outstanding at the end of the financial year 7 507.6280
Annual Distribution
UBS (Lux) Bond Fund Ex-Date Pay-Date Currency Amount per unit– CAD P-dist 2.6.2014 5.6.2014 CAD 2.88– CAD Q-dist 2.6.2014 5.6.2014 CAD 0.38

24 The notes are an integral part of the fi nancial statements.
UBS (Lux) Bond Fund – CADAnnual Report as of 31 March 2015
Statement of Investments in Securities and other Net Assets as of 31 March 2015
Description Quantity/ Valuation in CAD as a % Nominal Unrealized gain of net (loss) on Futures/ assets Options/Forward Exchange Contracts/ Swaps (Note 1)
Transferable securities and money market instruments listed on an official stock exchange
Notes, fixed rate
CAD
CAD AUSTRIA, REPUBLIC OF-144A 5.37500% 04-01.12.34 2 500 000.00 3 315 700.00 1.61Total CAD 3 315 700.00 1.61
Total Notes, fixed rate 3 315 700.00 1.61
Medium term notes, fixed rate
CAD
CAD ASIAN DEVELOPMENT BANK 4.75000% 07-15.06.17 6 000 000.00 6 494 616.42 3.15CAD BANK NEDERLANDSE GEMEENTEN NV 4.37500% 05-13.05.15 1 500 000.00 1 505 505.00 0.73CAD CAISSE FRANCAISE DE FINANCEMENT LOCAL 5.00000% 05-09.03.20 5 500 000.00 6 342 369.00 3.07CAD INSTITUTO DE CREDITO OFICIAL 4.53000% 06-17.03.16 2 000 000.00 2 031 975.06 0.98CAD NEDERLANDSE WATERSCHAPSBANK NV 5.20000% 05-31.03.25 2 000 000.00 2 384 231.14 1.16Total CAD 18 758 696.62 9.09
Total Medium term notes, fixed rate 18 758 696.62 9.09
Medium term notes, floating rate
CAD
CAD LANDESBANK BADEN-WUERTTEMBERG 6M CDOR+14BP 05-10.12.15 6 500 000.00 6 508 047.00 3.15Total CAD 6 508 047.00 3.15
Total Medium term notes, floating rate 6 508 047.00 3.15
Bonds, fixed rate
CAD
CAD AUSTRIA, REPUBLIC OF 5.00000% 05-20.12.24 2 000 000.00 2 418 500.00 1.17CAD CANADA, GOVERNMENT 1.25000% 12-01.03.18 7 000 000.00 7 158 339.72 3.47CAD CANADA, GOVERNMENT 1.25000% 13-01.09.18 6 000 000.00 6 149 536.26 2.98CAD CANADA, GOVERNMENT 1.50000% 11-01.03.17 8 000 000.00 8 153 421.52 3.95CAD CANADA, GOVERNMENT 1.50000% 12-01.06.23 4 800 000.00 4 923 756.87 2.39CAD CANADA, GOVERNMENT 1.50000% 12-01.09.17 13 500 000.00 13 826 353.05 6.70CAD CANADA, GOVERNMENT 1.50000% 13-01.02.17 5 000 000.00 5 090 500.00 2.47CAD CANADA, GOVERNMENT 1.75000% 13-01.03.19 2 000 000.00 2 089 878.48 1.01CAD CANADA, GOVERNMENT 1.75000% 14-01.09.19 3 000 000.00 3 138 221.13 1.52CAD CANADA, GOVERNMENT 2.25000% 14-01.06.25 1 000 000.00 1 083 428.57 0.52CAD CANADA, GOVERNMENT 2.50000% 13-01.06.24 4 500 000.00 4 979 564.95 2.41CAD CANADA, GOVERNMENT 2.75000% 11-01.06.22 6 000 000.00 6 705 500.34 3.25CAD CANADA, GOVERNMENT 2.75000% 11-01.09.16 3 500 000.00 3 610 530.45 1.75CAD CANADA, GOVERNMENT 2.75000% 14-01.12.64 1 100 000.00 1 370 797.47 0.67CAD CANADA, GOVERNMENT 3.25000% 10-01.06.21 7 000 000.00 7 995 738.10 3.88CAD CANADA, GOVERNMENT 3.50000% 09-01.06.20 7 000 000.00 7 958 750.66 3.86CAD CANADA, GOVERNMENT 3.50000% 11-01.12.45 8 500 000.00 11 435 262.50 5.54CAD CANADA, GOVERNMENT 3.75000% 08-01.06.19 8 000 000.00 9 031 192.00 4.38CAD CANADA, GOVERNMENT 4.00000% 06-01.06.17 2 000 000.00 2 150 897.12 1.04CAD CANADA, GOVERNMENT 4.00000% 08-01.06.41 8 000 000.00 11 260 414.96 5.46CAD CANADA, GOVERNMENT 4.25000% 07-01.06.18 6 500 000.00 7 260 699.22 3.52CAD CANADA, GOVERNMENT 5.00000% 04-01.06.37 7 300 000.00 11 305 829.38 5.48CAD CANADA, GOVERNMENT 5.75000% 01-01.06.33 6 600 000.00 10 566 723.09 5.12CAD CANADA, GOVERNMENT 5.75000% 98-01.06.29 7 500 000.00 11 336 933.25 5.49CAD CANADA, GOVERNMENT 8.00000% 92-01.06.23 1 500 000.00 2 301 334.49 1.12CAD INTER-AMERICAN DEVELOPMENT BANK 4.40000% 06-26.01.26 2 000 000.00 2 402 941.62 1.17CAD KREDITANSTALT FUER WIEDERAUFBAU 5.05000% 05-04.02.25 3 000 000.00 3 732 480.00 1.81Total CAD 169 437 525.20 82.13
Total Bonds, fixed rate 169 437 525.20 82.13
Total Transferable securities and money market instruments listed on an official stock exchange 198 019 968.82 95.98
Transferable securities and money market instruments traded on another regulated market
Bonds, fixed rate
CAD
CAD CANADA, GOVERNMENT 1.25000% 14-01.08.17 4 000 000.00 4 070 053.32 1.97CAD CANADA, GOVERNMENT 2.75000% 14-01.12.48 1 100 000.00 1 303 937.06 0.63Total CAD 5 373 990.38 2.60
Total Bonds, fixed rate 5 373 990.38 2.60
Total Transferable securities and money market instruments traded on another regulated market 5 373 990.38 2.60
Total investments in securities 203 393 959.20 98.58
Cash at banks, deposits on demand and deposit accounts and other liquid assets 1 033 015.90 0.50Other assets and liabilities 1 894 226.30 0.92
Total net assets 206 321 201.40 100.00

The notes are an integral part of the fi nancial statements. 25
UBS (Lux) Bond Fund – CHFAnnual Report as of 31 March 2015
UBS (Lux) Bond Fund – CHF
Three-year comparison
ISIN 31.3.2015 31.3.2014 31.3.2013Net assets in CHF 533 945 266.59 504 182 460.64 667 487 023.38Class F-acc1 LU0415163566Units outstanding 52 728.8610 7 291.7630 -Net asset value per unit in CHF 2 633.22 2 529.37 -Issue and redemption price per unit in CHF2 2 633.22 2 529.37 -Class F-dist1 LU0415163483Units outstanding 5 065.0000 8 185.0000 -Net asset value per unit in CHF 1 212.82 1 181.61 -Issue and redemption price per unit in CHF2 1 212.82 1 181.61 -Class I-A1-acc LU0415164028Units outstanding 111 531.0000 140 819.0000 32 283.0000Net asset value per unit in CHF 105.97 102.00 100.45Issue and redemption price per unit in CHF2 105.97 102.00 100.45Class N-acc LU0415162758Units outstanding 2 346.2750 122.7100 122.7100Net asset value per unit in CHF 104.58 101.26 100.29Issue and redemption price per unit in CHF2 104.58 101.26 100.29Class P-acc LU0010001369Units outstanding 95 674.7160 122 435.3340 180 144.7410Net asset value per unit in CHF 2 602.11 2 516.72 2 490.34Issue and redemption price per unit in CHF2 2 602.11 2 516.72 2 490.34Class P-dist LU0010001286Units outstanding 106 623.3020 130 604.9630 182 684.8622Net asset value per unit in CHF 1 199.88 1 175.73 1 180.23Issue and redemption price per unit in CHF2 1 199.88 1 175.73 1 180.23
1 First NAV: 10.7.20132 See note 1
Performance
Currency 2014/2015 2013/2014 2012/2013Class F-acc CHF 4.1% - -Class F-dist CHF 4.1% - -Class I-A1-acc CHF 3.9% 1.5% -Class N-acc CHF 3.3% 1.0% -Class P-acc CHF 3.4% 1.1% 3.5%Class P-dist CHF 3.4% 1.1% 3.5%
Historical performance is no indicator of current or future performance.The performance data does not take account of any commissions and costs charged when subscribing and redeeming units.The performance data were not audited.The subfund does not have a benchmark.

26 The notes are an integral part of the fi nancial statements.
UBS (Lux) Bond Fund – CHFAnnual Report as of 31 March 2015
Report of the Portfolio Manager
Swiss capital market interest rates fell continuously in the year under review from 1 April 2014 to 31 March 2015 and were even temporarily negative in the short- and medium-maturity ranges from January 2015. The Swiss National Bank (SNB) continued its expansive monetary policy. They reduced interest rates in two steps from 0% to -0.75% with a target range of most recently -0.25% to -1.25% and removed the minimum exchange rate of 1.20 francs to the euro on 15 January 2015.
The subfund made a positive contribution thanks to far lower risk-free interest rates and narrower credit risk premiums. Duration, i.e. the weighted average maturity of the subfund, was predominantly at an average of 0.6 years. The subfund benefited from sector allocation and, above all, from stock picking (mainly in the public sector and in financials).
Structure of the Securities Portfolio
Geographical Breakdown as a % of net assetsFrance 14.41Netherlands 14.09United States 13.15Supranationals 8.38Australia 6.24United Kingdom 5.42Austria 4.53Chile 3.38Sweden 2.72South Korea 2.52Luxembourg 2.37Canada 2.32Germany 2.08Ireland 1.68Spain 1.51Cayman Islands 1.35Jersey 1.31Mexico 1.13Russian Federation (CIS) 1.06Poland 0.99Denmark 0.98Switzerland 0.85Finland 0.69India 0.69Curacao 0.69Italy 0.60Brazil 0.55New Zealand 0.53Slovakia 0.53Bermuda 0.53Norway 0.44Hong Kong 0.39Kazakhstan 0.34South Africa 0.26Peru 0.13Total 98.84
Economic Breakdown as a % of net assetsBanks & credit institutions 49.29Finance & holding companies 17.30Supranational organisations 8.38Petroleum 2.73Public, non-profit institutions 2.53Energy & water supply 2.45Telecommunications 2.28Traffic & transportation 2.20Countries & central governments 2.13Mortgage & funding institutions 1.98Tobacco & alcohol 1.69Cantons, federal states 1.39Food & soft drinks 0.72Pharmaceuticals, cosmetics & medical products 0.69Cities & municipal authorities 0.53Insurance 0.48Computer hardware & network equipment providers 0.48Electrical devices & components 0.44Building industry & materials 0.40Real Estate 0.39Lodging, catering & leisure 0.27Miscellaneous unclassified companies 0.09Total 98.84

The notes are an integral part of the fi nancial statements. 27
UBS (Lux) Bond Fund – CHFAnnual Report as of 31 March 2015
Statement of Net Assets CHFAssets 31.3.2015Investments in securities, cost 499 885 569.17Investments in securities, unrealized appreciation (depreciation) 27 881 823.33Total investments in securities (Note 1) 527 767 392.50Cash at banks, deposits on demand and deposit accounts 5 007 674.82Receivable on securities sales (Note 1) 268 455.00Receivable on subscriptions 286 795.14Interest receivable on securities 5 072 849.08Unrealized gain (loss) on swaps (Note 1) -2 317 952.51Total Assets 536 085 214.03
LiabilitiesPayable on securities purchases (Note 1) -137 900.33Payable on redemptions -1 783 205.97Provisions for flat fee (Note 2) -167 778.74Provisions for taxe d’abonnement (Note 3) -51 062.40Total provisions -218 841.14Total Liabilities -2 139 947.44
Net assets at the end of the financial year 533 945 266.59
Statement of Operations CHFIncome 1.4.2014-31.3.2015Interest on securities 12 150 730.41Interest received on swaps (Note 1) 45 838.39Income on securities lending (Note 14) 40 461.92Other income 4 157.00Total income 12 241 187.72
ExpensesInterest paid on swaps (Note 1) -860 070.55Cost on securities lending (Note 14) -16 184.77Flat fee (Note 2) -4 158 487.64Taxe d’abonnement (Note 3) -216 110.62Interest on cash and bank overdraft -489.65Total expenses -5 251 343.23
Net income (loss) on investments 6 989 844.49
Realized gain (loss) (Note 1)Realized gain (loss) on market-priced securities without options 9 653 814.82Realized gain (loss) on swaps -706 093.96Realized result on subscriptions/redemptions (Note 5) 472 692.49Total realized gain (loss) on investments 9 420 413.35Realized gain (loss) on foreign exchange -101.00Total realized gain (loss) 9 420 312.35
Net realized gain (loss) of the financial year 16 410 156.84
Changes in unrealized appreciation (depreciation) (Note 1)Unrealized appreciation (depreciation) on market-priced securities without options 4 795 671.84Unrealized appreciation (depreciation) on swaps -1 234 877.88Total changes in unrealized appreciation (depreciation) 3 560 793.96
Net increase (decrease) in net assets as a result of operations 19 970 950.80
* As at 31 March 2015, cash amount serves as collateral for the counterparty UBS AG London for an amount of CHF 1 400 000.
*

28 The notes are an integral part of the fi nancial statements.
UBS (Lux) Bond Fund – CHFAnnual Report as of 31 March 2015
Statement of Changes in Net Assets CHF 1.4.2014-31.3.2015Net assets at the beginning of the financial year 504 182 460.64Subscriptions 251 466 525.65Redemptions -239 599 792.58Total net subscriptions (redemptions) 11 866 733.07Dividend paid -2 074 877.92Net income (loss) on investments 6 989 844.49Total realized gain (loss) 9 420 312.35Total changes in unrealized appreciation (depreciation) 3 560 793.96Net increase (decrease) in net assets as a result of operations 19 970 950.80Net assets at the end of the financial year 533 945 266.59
Development of the outstanding units
1.4.2014-31.3.2015Class F-accNumber of units outstanding at the beginning of the financial year 7 291.7630Number of units issued 81 413.6110Number of units redeemed -35 976.5130Number of units outstanding at the end of the financial year 52 728.8610Class F-distNumber of units outstanding at the beginning of the financial year 8 185.0000Number of units issued 3 928.0000Number of units redeemed -7 048.0000Number of units outstanding at the end of the financial year 5 065.0000Class I-A1-accNumber of units outstanding at the beginning of the financial year 140 819.0000Number of units issued 56 316.0000Number of units redeemed -85 604.0000Number of units outstanding at the end of the financial year 111 531.0000Class N-accNumber of units outstanding at the beginning of the financial year 122.7100Number of units issued 9 862.4740Number of units redeemed -7 638.9090Number of units outstanding at the end of the financial year 2 346.2750Class P-accNumber of units outstanding at the beginning of the financial year 122 435.3340Number of units issued 9 289.0270Number of units redeemed -36 049.6450Number of units outstanding at the end of the financial year 95 674.7160Class P-distNumber of units outstanding at the beginning of the financial year 130 604.9630Number of units issued 6 153.9120Number of units redeemed -30 135.5730Number of units outstanding at the end of the financial year 106 623.3020
Annual Distribution
UBS (Lux) Bond Fund Ex-Date Pay-Date Currency Amount per unit– CHF F-dist 2.6.2014 5.6.2014 CHF 16.83– CHF P-dist 2.6.2014 5.6.2014 CHF 15.37

The notes are an integral part of the fi nancial statements. 29
UBS (Lux) Bond Fund – CHFAnnual Report as of 31 March 2015
Statement of Investments in Securities and other Net Assets as of 31 March 2015
Description Quantity/ Valuation in CHF as a % Nominal Unrealized gain of net (loss) on Futures/ assets Options/Forward Exchange Contracts/ Swaps (Note 1)
Transferable securities and money market instruments listed on an official stock exchange
Notes, fixed rate
CHF
CHF AMERICA MOVIL SAB DE CV 1.12500% 12-12.09.18 2 200 000.00 2 264 900.00 0.42CHF AT&T INC-REG-S 1.37500% 14-04.12.24 2 000 000.00 2 099 000.00 0.39CHF BANCO DE CHILE 1.12500% 13-23.05.18 1 650 000.00 1 701 150.00 0.32CHF BANCO DE CREDITO E INVERSIONES 1.12500% 14-26.06.19 1 200 000.00 1 231 200.00 0.23CHF BANCO NACIONAL DE DESENV ECO&SOC 2.75000% 11-15.12.16 1 200 000.00 1 208 400.00 0.23CHF BHARTI AIRTEL INTL NETHERLANDS BV 3.00000% 14-31.03.20 1 600 000.00 1 719 200.00 0.32CHF CENTRAL AMERICAN BANK ECO INTEGRAT 1.50000% 13-04.02.20 1 500 000.00 1 588 500.00 0.30CHF EUROPEAN INVESTMENT BANK 1.62500% 14-04.02.25 3 000 000.00 3 445 500.00 0.65CHF KAZAKHSTAN TEMIR ZHOLY JSC 3.63800% 14-20.06.22 2 000 000.00 1 827 000.00 0.34CHF PHILIP MORRIS INTERNATIONAL INC 1.00000% 11-06.12.16 2 000 000.00 2 039 000.00 0.38CHF PHILIP MORRIS INTERNATIONAL INC 2.00000% 11-06.12.21 2 800 000.00 3 151 400.00 0.59CHF PHILIP MORRIS INTERNATIONAL INC 1.62500% 14-16.05.24 3 500 000.00 3 853 500.00 0.72CHF SB CAPITAL SA FOR SBERBANK LPN 3.10000% 12-14.09.15 2 000 000.00 1 973 000.00 0.37CHF SB CAPITAL SA FOR SBERBANK LPN 2.06500% 13-28.02.17 1 950 000.00 1 781 325.00 0.33CHF SLOVAKIA, REPUBLIC OF 2.12500% 12-25.04.18 2 000 000.00 2 149 000.00 0.40CHF SOCIETE GENERALE SA 0.87500% 13-19.06.18 1 250 000.00 1 282 500.00 0.24CHF TEVA PHARMACEUTICAL FINANCE IV BV 1.50000% 12-25.10.18 3 500 000.00 3 659 250.00 0.69CHF VTB CAPITAL SA LPN 3.15000% 12-16.12.16 2 000 000.00 1 845 000.00 0.35Total CHF 38 818 825.00 7.27
Total Notes, fixed rate 38 818 825.00 7.27
Medium term notes, fixed rate
CHF
CHF ABN AMRO BANK NV 2.50000% 12-16.02.17 2 000 000.00 2 094 000.00 0.39CHF ACCOR SA-REG-S 1.75000% 14-27.06.22 1 350 000.00 1 439 100.00 0.27CHF ACHMEA BANK NV 3.50000% 07-22.08.17 1 600 000.00 1 724 800.00 0.32CHF AUCKLAND COUNCIL 1.50000% 14-28.11.25 2 500 000.00 2 848 750.00 0.53CHF AUSNET SERVICES HOLDINGS PTY LTD 1.50000% 12-21.02.17 3 000 000.00 3 073 500.00 0.58CHF AUSNET SERVICES HOLDINGS PTY LTD 1.12500% 12-18.04.19 2 000 000.00 2 065 000.00 0.39CHF AUSTRALIA & NEW ZEALAND BANKING GROUP 2.00000% 10-08.07.16 3 000 000.00 3 087 900.00 0.58CHF AUSTRALIA & NEW ZEALAND BANKING GROUP 1.50000% 12-13.02.19 1 600 000.00 1 697 600.00 0.32CHF BANCO BILBAO VIZCAYA ARGENTAIRA CHILE 1.37500% 14-09.05.17 500 000.00 506 250.00 0.09CHF BANCO DE CREDITO E INVERSIONES 1.25000% 13-26.09.16 500 000.00 506 500.00 0.09CHF BANCO DE CREDITO E INVERSIONES-REG-S 0.87500% 14-23.11.18 1 500 000.00 1 514 250.00 0.28CHF BANCO DO BRASIL CAYMAN 2.50000% 13-20.06.19 1 700 000.00 1 741 650.00 0.33CHF BANCO SANTANDER CHILE SA 1.00000% 14-31.07.17 3 000 000.00 3 051 000.00 0.57CHF BANK NEDERLANDSE GEMEENTEN NV 2.50000% 05-21.07.25 3 000 000.00 3 720 000.00 0.70CHF BANK NEDERLANDSE GEMEENTEN NV 2.25000% 05-14.10.20 6 000 000.00 6 819 000.00 1.28CHF BANK NEDERLANDSE GEMEENTEN NV 2.12500% 10-06.11.18 5 000 000.00 5 460 000.00 1.02CHF BANK NEDERLANDSE GEMEENTEN NV 1.25000% 14-30.04.24 2 000 000.00 2 201 000.00 0.41CHF BANK OF AMERICA CORP 2.50000% 05-28.09.17 5 000 000.00 5 307 500.00 0.99CHF BANQUE FEDERATIVE DU CREDIT MUTUEL 2.00000% 14-22.05.24 2 500 000.00 2 762 500.00 0.52CHF BANQUE PSA FINANCE 3.25000% 12-25.09.15 1 000 000.00 1 015 400.00 0.19CHF BARCLAYS BANK PLC 2.50000% 11-29.03.16 2 500 000.00 2 567 500.00 0.48CHF BAT INTERNATIONAL FINANCE PLC-REG-S 0.62500% 14-08.09.21 1 600 000.00 1 655 200.00 0.31CHF BAT INTERNATIONAL FINANCE PLC-REG-S 1.37500% 14-08.09.26 2 000 000.00 2 151 000.00 0.40CHF BAYERISCHE LANDESBANK-SUB 3.12500% 06-12.10.16 1 210 000.00 1 215 445.00 0.23CHF BNP PARIBAS 1.87500% 12-12.09.22 4 000 000.00 4 450 000.00 0.83CHF BPCE SA 1.50000% 14-30.04.21 1 500 000.00 1 573 500.00 0.29CHF CAISSE D’AMORTIS DE LA DETTE SOCIALE 2.50000% 11-09.12.25 1 000 000.00 1 235 000.00 0.23CHF CAISSE D’AMORTIS DE LA DETTE SOCIALE 2.37500% 11-19.04.23 4 835 000.00 5 695 630.00 1.07CHF CAISSE DE REFINANCEMENT DE L’HABITAT 2.50000% 11-29.03.21 5 000 000.00 5 712 500.00 1.07CHF CAISSE DE REFINANCEMENT DE L’HABITAT 1.87500% 12-23.05.22 2 500 000.00 2 815 000.00 0.53CHF CANADIAN IMPERIAL BANK OF COMMERCE 1.00000% 12-13.02.19 3 000 000.00 3 148 500.00 0.59CHF CENTRAL AMERICAN BANK ECO INTEGRAT 1.87500% 14-25.02.22 2 500 000.00 2 731 250.00 0.51CHF CHINA CONSTRUCT BK ASIA CORP LTD 1.37500% 14-28.05.19 2 000 000.00 2 069 000.00 0.39CHF CITIGROUP INC 3.12500% 06-27.09.21 3 800 000.00 4 484 000.00 0.84CHF COMMONWEALTH BANK OF AUSTRALIA 1.50000% 12-13.09.19 5 000 000.00 5 355 000.00 1.00CHF COMMONWEALTH BANK OF AUSTRALIA 1.50000% 14-07.02.22 5 000 000.00 5 422 500.00 1.02CHF COMPAGNIE DE FINANCEMENT FONCIER 2.37500% 05-24.08.18 5 000 000.00 5 460 000.00 1.02CHF COMPAGNIE DE FINANCEMENT FONCIER 2.87500% 09-10.09.19 5 000 000.00 5 685 000.00 1.06CHF CORPORACION ANDINA DE FOMENTO 1.50000% 13-13.08.20 2 500 000.00 2 676 250.00 0.50CHF CORPORACION ANDINA DE FOMENTO 2.00000% 14-05.02.24 5 300 000.00 5 983 700.00 1.12CHF CORPORACION ANDINA DE FOMENTO-REG-S 1.50000% 14-01.12.28 1 500 000.00 1 642 500.00 0.31CHF CREDIT AGRICOLE HOME LOAN 1.12500% 14-05.06.24 1 250 000.00 1 348 125.00 0.25CHF CREDIT AGRICOLE HOME LOAN SFH 0.50000% 15-16.03.27 1 500 000.00 1 527 000.00 0.29CHF CREDIT AGRICOLE SA 1.25000% 14-17.07.20 2 500 000.00 2 640 000.00 0.49CHF CREDIT AGRICOLE SA LONDON-REG-S 1.00000% 14-08.10.21 1 800 000.00 1 879 200.00 0.35CHF CREDIT AGRICOLE SA LONDON 0.62500% 15-15.09.23 2 000 000.00 2 014 000.00 0.38CHF CREDIT SUISSE LONDON BRANCH-REG-S 1.00000% 14-24.09.21 1 500 000.00 1 579 500.00 0.30CHF CREDIT SUISSE NEW YORK BRANCH-SUB 4.87500% 08-14.03.18 4 000 000.00 4 532 000.00 0.85CHF DANSKE BANK AS 2.25000% 10-12.09.17 3 000 000.00 3 189 000.00 0.60CHF DEUTSCHE BAHN FINANCE BV 1.75000% 10-03.06.20 3 000 000.00 3 258 000.00 0.61CHF DEUTSCHE BAHN FINANCE BV 1.50000% 11-18.12.17 5 000 000.00 5 237 500.00 0.98CHF DEUTSCHE BANK AG 0.62500% 15-19.12.23 1 400 000.00 1 420 650.00 0.27CHF EUROPEAN INVESTMENT BANK 2.37500% 05-10.07.20 5 000 000.00 5 717 500.00 1.07CHF EUROPEAN INVESTMENT BANK 1.50000% 12-02.08.24 2 000 000.00 2 261 000.00 0.42CHF EXPORT IMPORT BANK OF INDIA 3.50000% 11-13.04.16 1 750 000.00 1 806 175.00 0.34CHF EXPORT-IMPORT BANK OF KOREA 1.12500% 14-03.09.19 1 500 000.00 1 548 750.00 0.29CHF GAS NATURAL FINANCE BV 2.12500% 13-08.02.19 1 800 000.00 1 919 700.00 0.36CHF GAZ CAPITAL SA/GAZPROM LPN 2.85000% 13-25.10.19 2 600 000.00 2 256 800.00 0.42CHF GDF SUEZ 1.12500% 12-09.10.20 1 250 000.00 1 315 625.00 0.25CHF GDF SUEZ 1.50000% 11-20.10.17 2 000 000.00 2 074 000.00 0.39

30 The notes are an integral part of the fi nancial statements.
UBS (Lux) Bond Fund – CHFAnnual Report as of 31 March 2015
CHF GDF SUEZ 1.62500% 12-09.10.24 1 600 000.00 1 764 000.00 0.33CHF GENERAL ELECTRIC CAPITAL CORP 3.37500% 06-19.06.18 1 000 000.00 1 112 500.00 0.21CHF GENERAL ELECTRIC CAPITAL CORP 4.50000% 08-09.10.18 5 000 000.00 5 782 500.00 1.08CHF GLENCORE FINANCE EUROPE SA 2.62500% 12-03.12.18 1 500 000.00 1 628 250.00 0.30CHF GLENCORE FINANCE EUROPE SA 2.12500% 13-23.12.19 1 200 000.00 1 296 600.00 0.24CHF GOLDMAN SACHS GROUP INC 1.25000% 14-11.09.19 1 000 000.00 1 050 000.00 0.20CHF HEATHROW FUNDING LTD 2.50000% 12-08.02.17 3 800 000.00 3 976 700.00 0.74CHF HOLCIM OVERSEAS FINANCE LTD 3.37500% 11-10.06.21 2 400 000.00 2 834 400.00 0.53CHF HSBC BANK PLC 1.87500% 10-01.09.16 3 000 000.00 3 090 000.00 0.58CHF HSBC BANK PLC 2.75000% 07-03.04.17 4 500 000.00 4 781 250.00 0.90CHF HSBC FINANCE CORP 3.25000% 06-14.07.16 5 000 000.00 5 220 500.00 0.98CHF HSBC SFH FRANCE SA-REG-S 2.37500% 10-07.09.18 3 000 000.00 3 270 000.00 0.61CHF ING BANK NV 1.87500% 10-29.08.18 2 950 000.00 3 157 975.00 0.59CHF INSTITUTO DE CREDITO OFICIAL 3.25000% 07-28.06.24 3 000 000.00 3 616 500.00 0.68CHF ITALY, REPUBLIC OF 2.50000% 06-30.01.18 3 000 000.00 3 216 000.00 0.60CHF JPMORGAN CHASE & CO 0.50000% 15-04.12.23 2 000 000.00 2 035 000.00 0.38CHF JPMORGAN CHASE & CO-REG-S 1.12500% 14-06.11.20 1 500 000.00 1 579 500.00 0.30CHF KOMMUNALKREDIT AUSTRIA AG 2.37500% 05-15.03.17 1 600 000.00 1 536 000.00 0.29CHF KOREA GAS CORPORATION 2.87500% 11-11.10.19 2 000 000.00 2 247 000.00 0.42CHF KOREA NATIONAL OIL CORP 1.87500% 12-08.03.17 2 000 000.00 2 071 000.00 0.39CHF KOREA RAILROAD CORP 1.50000% 13-02.12.19 4 000 000.00 4 260 000.00 0.80CHF KREDITANSTALT FUER WIEDERAUFBAU 2.50000% 05-25.08.25 2 000 000.00 2 486 000.00 0.47CHF LANSFORSAKRINGAR HYPOTEK AB-REG-S 0.87500% 14-16.09.24 250 000.00 262 625.00 0.05CHF MACQUARIE BANK LTD 0.62500% 15-04.09.23 2 500 000.00 2 491 250.00 0.47CHF METROPOLITAN LIFE GLOBAL FUNDING-REG-S 0.75000% 14-17.04.19 4 000 000.00 4 114 000.00 0.77CHF METROPOLITAN LIFE GLOBAL FUNDING-REG-S 1.00000% 14-19.09.22 5 000 000.00 5 220 000.00 0.98CHF MFINANCE FRANCE SA 2.50000% 13-08.10.18 2 000 000.00 2 087 000.00 0.39CHF NATIONAL AUSTRALIA BANK LTD 1.12500% 12-07.11.18 3 000 000.00 3 132 000.00 0.59CHF NATIONAL AUSTRALIA BANK LTD 1.50000% 14-07.02.24 2 500 000.00 2 801 250.00 0.52CHF NEDERLANDSE WATERSCHAPSBANK NV 2.37500% 05-19.08.20 5 000 000.00 5 695 000.00 1.07CHF NEDERLANDSE WATERSCHAPSBANK NV 2.25000% 10-03.09.19 5 000 000.00 5 572 500.00 1.04CHF NETWORK RAIL INFRASTRUCTURE FINANCE 2.750% 06-06.10.21 4 000 000.00 4 742 000.00 0.89CHF NEW YORK LIFE FUNDINGS 2.37500% 06-22.02.16 5 500 000.00 5 637 500.00 1.06CHF NEW YORK LIFE GLOBAL FUNDING-REG-S 0.50000% 14-13.05.19 2 400 000.00 2 433 600.00 0.46CHF NEW YORK LIFE GLOBAL FUNDING 0.37500% 15-02.02.22 1 250 000.00 1 275 000.00 0.24CHF NORDEA BANK AB 0.87500% 13-25.09.18 2 500 000.00 2 590 000.00 0.49CHF NYKREDIT BANK A/S 1.75000% 12-26.09.16 2 000 000.00 2 052 000.00 0.38CHF OESTER POSTSPARKASSE BAWAG AG-SUB 4.50000% 00-16.10.15 2 000 000.00 2 039 000.00 0.38CHF ONTARIO, PROVINCE OF 2.37500% 10-07.05.20 4 000 000.00 4 528 000.00 0.85CHF PETROLEOS MEXICANOS 2.50000% 12-10.04.19 3 500 000.00 3 785 250.00 0.71CHF PKO FINANCE AB LPN 2.53600% 12-21.12.15 2 500 000.00 2 550 000.00 0.48CHF PKO FINANCE AB LPN 3.53800% 11-07.07.16 2 000 000.00 2 087 800.00 0.39CHF POHJOLA BANK PLC 1.00000% 14-14.07.21 3 500 000.00 3 687 250.00 0.69CHF POLAND, REPUBLIC OF 2.25000% 12-15.05.18 3 000 000.00 3 222 000.00 0.60CHF POLAND, REPUBLIC OF-REG-S 1.00000% 14-17.09.21 2 000 000.00 2 083 000.00 0.39CHF PRINCIPAL FINANCIAL GLOBAL FUNDING LLC 3.12500% 06-29.06.16 1 500 000.00 1 560 300.00 0.29CHF QUEBEC, PROVINCE OF 1.12500% 13-22.02.23 2 000 000.00 2 163 000.00 0.41CHF RABOBANK NEDERLAND NV 3.50000% 07-31.08.23 1 000 000.00 1 254 500.00 0.23CHF RABOBANK NEDERLAND NV 3.62500% 09-02.07.19 5 000 000.00 5 740 000.00 1.07CHF RABOBANK NEDERLAND NV 2.00000% 10-16.09.21 5 000 000.00 5 552 500.00 1.04CHF RABOBANK NEDERLAND NV 1.12500% 14-08.04.21 1 000 000.00 1 052 500.00 0.20CHF RESEAU FERRE DE FRANCE SA 3.00000% 09-24.04.19 4 000 000.00 4 494 000.00 0.84CHF ROYAL BANK OF CANADA 0.62500% 14-09.04.19 2 500 000.00 2 567 500.00 0.48CHF ROYAL BANK OF SCOTLAND PLC 2.75000% 10-08.10.15 2 500 000.00 2 537 000.00 0.48CHF STATE BANK OF INDIA LONDON 3.37500% 11-22.02.16 500 000.00 513 450.00 0.10CHF STATNETT SF 2.62500% 06-15.12.17 2 200 000.00 2 366 100.00 0.44CHF SWEDBANK MORTGAGE AB 1.62500% 10-08.12.17 3 000 000.00 3 163 500.00 0.59CHF SWEDISH EXPORT CREDIT CORP 3.00000% 09-27.02.18 3 500 000.00 3 857 000.00 0.72CHF TELEFONICA EMISIONES SA 2.71800% 12-14.12.18 1 000 000.00 1 094 000.00 0.20CHF TELEFONICA EMISIONES SAU 2.59500% 13-23.10.20 3 000 000.00 3 358 500.00 0.63CHF TELSTRA CORP LTD 1.75000% 11-14.12.18 2 000 000.00 2 123 000.00 0.40CHF TOTAL CAPITAL INTERNATIONAL SA-REG-S 1.00000% 14-29.08.24 1 400 000.00 1 493 100.00 0.28CHF UNICREDIT BANK (IRELAND) PLC 4.25000% 12-19.10.22 1 200 000.00 1 425 600.00 0.27CHF UNICREDIT BANK (IRELAND) PLC 3.375% 12-25.10.17 3 500 000.00 3 794 000.00 0.71CHF VEB FINANCE PLC LPN 3.75000% 11-17.02.16 3 850 000.00 3 746 050.00 0.70CHF VINCI SA 2.12500% 11-15.12.17 2 000 000.00 2 117 000.00 0.40CHF VTB BANK OJSC VIA VTB CAPITAL SA 2.90000% 13-25.05.18 2 185 000.00 1 891 117.50 0.35CHF WELLS FARGO & CO-REG-S 0.62500% 14-03.09.20 2 500 000.00 2 565 000.00 0.48CHF WESTPAC BANKING CORP 0.50000% 15-02.02.22 2 000 000.00 2 055 000.00 0.38Total CHF 372 472 117.50 69.76
Total Medium term notes, fixed rate 372 472 117.50 69.76
Medium term notes, floating rate
CHF
CHF ALLIANZ SE 3.25000%/VAR 14-PRP 2 400 000.00 2 569 200.00 0.48CHF ROYAL BANK OF SCOTLAND PLC/THE-SUB 9.375%/VAR 12-16.03.22 3 400 000.00 3 927 000.00 0.74Total CHF 6 496 200.00 1.22
Total Medium term notes, floating rate 6 496 200.00 1.22
Bonds, fixed rate
CHF
CHF APPLE INC-REG-S 0.75000% 15-25.02.30 2 500 000.00 2 563 750.00 0.48CHF BANCO DE CHILE 1.50000% 13-03.12.19 2 150 000.00 2 265 025.00 0.42CHF BANCO SANTANDER CHILE SA 2.25000% 10-16.12.15 3 000 000.00 3 045 000.00 0.57CHF BANCO SANTANDER CHILE 1.75000% 13-26.09.19 2 000 000.00 2 091 000.00 0.39CHF BP CAPITAL MARKETS PLC-REG-S 1.75000% 14-28.02.24 1 700 000.00 1 892 100.00 0.36CHF CAISSE FRANCAISE DE FINANCEMENT LOCAL 2.50000% 09-02.05.18 5 000 000.00 5 440 000.00 1.02CHF CENTRAL AMERICAN BK ECO INTEGRAT 1.12500% 14-24.02.23 1 600 000.00 1 664 000.00 0.31CHF EBN BV 2.12500% 10-27.04.20 3 000 000.00 3 327 000.00 0.62CHF EL FONDO MIVIVIENDA 1.25000% 14-13.06.18 700 000.00 710 850.00 0.13CHF ELECTRICITE DE FRANCE 4.00000% 09-27.03.17 4 000 000.00 4 328 000.00 0.81CHF EMPRESA NACIONAL DE PETROLEO SA-REG-S 2.87500% 13-05.12.18 2 000 000.00 2 108 000.00 0.40CHF EUROPEAN INVESTMENT BANK 1.37500% 13-21.02.28 3 000 000.00 3 426 000.00 0.64
Description Quantity/ Valuation in CHF as a % Nominal Unrealized gain of net (loss) on Futures/ assets Options/Forward Exchange Contracts/ Swaps (Note 1)
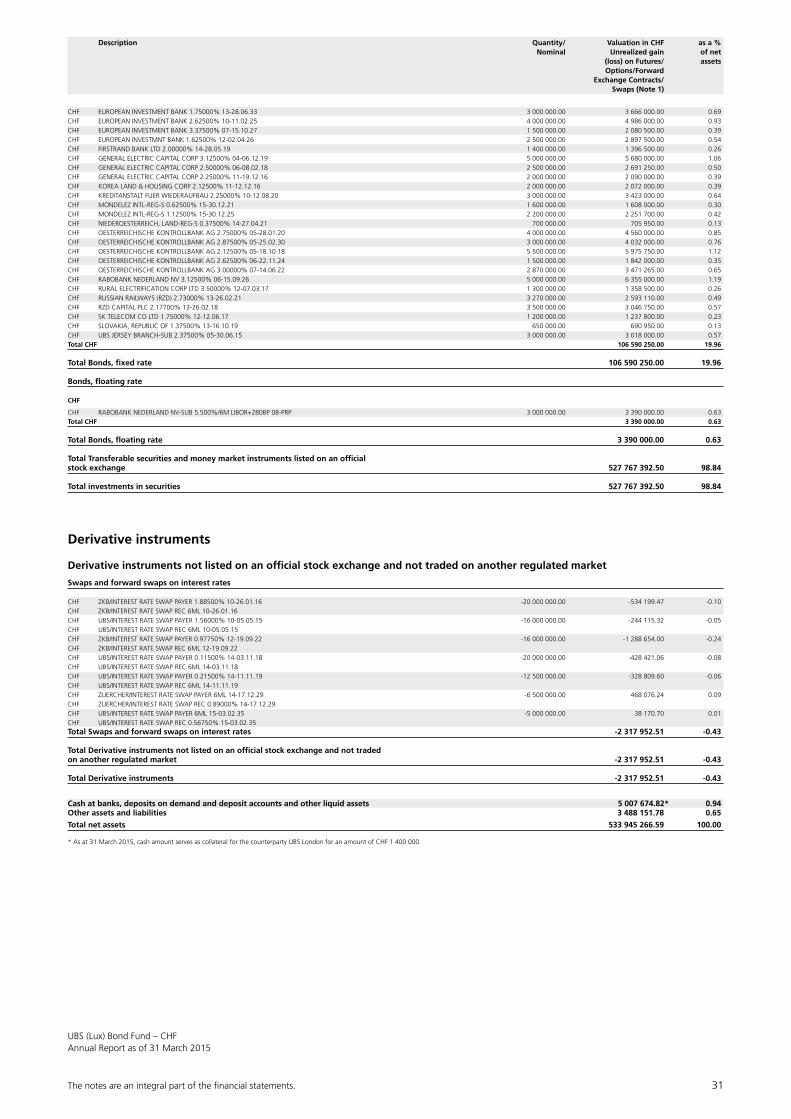
The notes are an integral part of the fi nancial statements. 31
UBS (Lux) Bond Fund – CHFAnnual Report as of 31 March 2015
CHF EUROPEAN INVESTMENT BANK 1.75000% 13-28.06.33 3 000 000.00 3 666 000.00 0.69CHF EUROPEAN INVESTMENT BANK 2.62500% 10-11.02.25 4 000 000.00 4 986 000.00 0.93CHF EUROPEAN INVESTMENT BANK 3.37500% 07-15.10.27 1 500 000.00 2 080 500.00 0.39CHF EUROPEAN INVESTMNT BANK 1.62500% 12-02.04.26 2 500 000.00 2 897 500.00 0.54CHF FIRSTRAND BANK LTD 2.00000% 14-28.05.19 1 400 000.00 1 396 500.00 0.26CHF GENERAL ELECTRIC CAPITAL CORP 3.12500% 04-06.12.19 5 000 000.00 5 680 000.00 1.06CHF GENERAL ELECTRIC CAPITAL CORP 2.50000% 06-08.02.18 2 500 000.00 2 691 250.00 0.50CHF GENERAL ELECTRIC CAPITAL CORP 2.25000% 11-19.12.16 2 000 000.00 2 090 000.00 0.39CHF KOREA LAND & HOUSING CORP 2.12500% 11-12.12.16 2 000 000.00 2 072 000.00 0.39CHF KREDITANSTALT FUER WIEDERAUFBAU 2.25000% 10-12.08.20 3 000 000.00 3 423 000.00 0.64CHF MONDELEZ INTL-REG-S 0.62500% 15-30.12.21 1 600 000.00 1 608 000.00 0.30CHF MONDELEZ INTL-REG-S 1.12500% 15-30.12.25 2 200 000.00 2 251 700.00 0.42CHF NIEDEROESTERREICH, LAND-REG-S 0.37500% 14-27.04.21 700 000.00 705 950.00 0.13CHF OESTERREICHISCHE KONTROLLBANK AG 2.75000% 05-28.01.20 4 000 000.00 4 560 000.00 0.85CHF OESTERREICHISCHE KONTROLLBANK AG 2.87500% 05-25.02.30 3 000 000.00 4 032 000.00 0.76CHF OESTERREICHISCHE KONTROLLBANK AG 2.12500% 05-18.10.18 5 500 000.00 5 975 750.00 1.12CHF OESTERREICHISCHE KONTROLLBANK AG 2.62500% 06-22.11.24 1 500 000.00 1 842 000.00 0.35CHF OESTERREICHISCHE KONTROLLBANK AG 3.00000% 07-14.06.22 2 870 000.00 3 471 265.00 0.65CHF RABOBANK NEDERLAND NV 3.12500% 06-15.09.26 5 000 000.00 6 355 000.00 1.19CHF RURAL ELECTRIFICATION CORP LTD 3.50000% 12-07.03.17 1 300 000.00 1 358 500.00 0.26CHF RUSSIAN RAILWAYS (RZD) 2.73000% 13-26.02.21 3 270 000.00 2 593 110.00 0.49CHF RZD CAPITAL PLC 2.17700% 13-26.02.18 3 500 000.00 3 046 750.00 0.57CHF SK TELECOM CO LTD 1.75000% 12-12.06.17 1 200 000.00 1 237 800.00 0.23CHF SLOVAKIA, REPUBLIC OF 1.37500% 13-16.10.19 650 000.00 690 950.00 0.13CHF UBS JERSEY BRANCH-SUB 2.37500% 05-30.06.15 3 000 000.00 3 018 000.00 0.57Total CHF 106 590 250.00 19.96
Total Bonds, fixed rate 106 590 250.00 19.96
Bonds, floating rate
CHF
CHF RABOBANK NEDERLAND NV-SUB 5.500%/6M LIBOR+280BP 08-PRP 3 000 000.00 3 390 000.00 0.63Total CHF 3 390 000.00 0.63
Total Bonds, floating rate 3 390 000.00 0.63
Total Transferable securities and money market instruments listed on an official stock exchange 527 767 392.50 98.84
Total investments in securities 527 767 392.50 98.84
Derivative instruments
Derivative instruments not listed on an official stock exchange and not traded on another regulated market
Swaps and forward swaps on interest rates
CHF ZKB/INTEREST RATE SWAP PAYER 1.88500% 10-26.01.16 -20 000 000.00 -534 199.47 -0.10CHF ZKB/INTEREST RATE SWAP REC 6ML 10-26.01.16CHF UBS/INTEREST RATE SWAP PAYER 1.56000% 10-05.05.15 -16 000 000.00 -244 115.32 -0.05CHF UBS/INTEREST RATE SWAP REC 6ML 10-05.05.15 CHF ZKB/INTEREST RATE SWAP PAYER 0.97750% 12-19.09.22 -16 000 000.00 -1 288 654.00 -0.24CHF ZKB/INTEREST RATE SWAP REC 6ML 12-19.09.22 CHF UBS/INTEREST RATE SWAP PAYER 0.11500% 14-03.11.18 -20 000 000.00 -428 421.06 -0.08CHF UBS/INTEREST RATE SWAP REC 6ML 14-03.11.18CHF UBS/INTEREST RATE SWAP PAYER 0.21500% 14-11.11.19 -12 500 000.00 -328 809.60 -0.06CHF UBS/INTEREST RATE SWAP REC 6ML 14-11.11.19CHF ZUERCHER/INTEREST RATE SWAP PAYER 6ML 14-17.12.29 -6 500 000.00 468 076.24 0.09CHF ZUERCHER/INTEREST RATE SWAP REC 0.89000% 14-17.12.29CHF UBS/INTEREST RATE SWAP PAYER 6ML 15-03.02.35 -5 000 000.00 38 170.70 0.01CHF UBS/INTEREST RATE SWAP REC 0.56750% 15-03.02.35 Total Swaps and forward swaps on interest rates -2 317 952.51 -0.43
Total Derivative instruments not listed on an official stock exchange and not traded on another regulated market -2 317 952.51 -0.43
Total Derivative instruments -2 317 952.51 -0.43
Cash at banks, deposits on demand and deposit accounts and other liquid assets 5 007 674.82* 0.94Other assets and liabilities 3 488 151.78 0.65
Total net assets 533 945 266.59 100.00
* As at 31 March 2015, cash amount serves as collateral for the counterparty UBS London for an amount of CHF 1 400 000.
Description Quantity/ Valuation in CHF as a % Nominal Unrealized gain of net (loss) on Futures/ assets Options/Forward Exchange Contracts/ Swaps (Note 1)

32 The notes are an integral part of the fi nancial statements.
UBS (Lux) Bond Fund – Convert Europe (EUR)Annual Report as of 31 March 2015
UBS (Lux) Bond Fund – Convert Europe (EUR)
Three-year comparison
ISIN 31.3.2015 31.3.2014 31.3.2013Net assets in EUR 802 156 355.21 565 962 948.38 343 074 144.69Class (CHF hedged) P-acc LU0776290768Units outstanding 276 738.2600 240 671.2580 59 931.8900Net asset value per unit in CHF 136.78 128.87 115.80Issue and redemption price per unit in CHF1 137.46 129.51 116.38Class F-acc2 LU0415178838Units outstanding 87 122.7900 47 461.5470 -Net asset value per unit in EUR 169.24 156.62 -Issue and redemption price per unit in EUR1 170.09 157.40 -Class I-A1-acc3 LU0415179133Units outstanding 171 629.8000 185 276.8000 -Net asset value per unit in EUR 122.33 113.32 -Issue and redemption price per unit in EUR1 122.94 113.89 -Class I-A1-dist LU0804734944Units outstanding 227 029.4040 266 029.4040 283 434.5040Net asset value per unit in EUR 130.99 123.92 111.71Issue and redemption price per unit in EUR1 131.64 124.54 112.27Class I-X-acc4 LU0415180065Units outstanding 183 872.3980 323 872.3980 -Net asset value per unit in EUR 119.55 110.19 -Issue and redemption price per unit in EUR1 120.15 110.74 -Class I-X-dist5 LU0415179992Units outstanding 3 318 418.5430 1 056 214.9180 -Net asset value per unit in EUR 116.72 109.94 -Issue and redemption price per unit in EUR1 117.30 110.49 -Class K-1-acc LU0415178242Units outstanding 0.2000 0.2000 0.5000Net asset value per unit in EUR 5 154 886.50 4 801 993.40 4 273 989.48Issue and redemption price per unit in EUR1 5 180 660.93 4 826 003.37 4 295 359.43Class P-acc LU0108066076Units outstanding 1 365 449.1140 1 760 118.3720 1 831 361.3620Net asset value per unit in EUR 165.09 154.99 139.03Issue and redemption price per unit in EUR1 165.92 155.76 139.73Class P-dist LU0108060624Units outstanding 106 968.9680 178 858.5360 188 638.7250Net asset value per unit in EUR 150.04 142.06 129.67Issue and redemption price per unit in EUR1 150.79 142.77 130.32Class Q-acc LU0358408184Units outstanding 279 902.5850 174 080.8450 170 515.6340Net asset value per unit in EUR 173.62 161.54 143.60Issue and redemption price per unit in EUR1 174.49 162.35 144.32
1 See note 12 First NAV: 10.7.20133 The unit class I-A1-acc was in circulation until 14.9.2012, relaunch as per 24.4.2013.4 First NAV: 27.5.20135 First NAV: 16.5.2013
Performance
Currency 2014/2015 2013/2014 2012/2013Class (CHF hedged) P-acc CHF 6.1% 11.3% -Class F-acc EUR 8.1% - -Class I-A1-acc EUR 8.0% - -Class I-A1-dist EUR 8.0% 13.0% -Class I-X-acc EUR 8.5% - -Class I-X-dist EUR 8.5% - -Class K-1-acc EUR 7.3% 12.4% 12.4%Class P-acc EUR 6.5% 11.5% 11.5%Class P-dist EUR 6.5% 11.5% 11.5%Class Q-acc EUR 7.5% 12.5% 12.5%
Historical performance is no indicator of current or future performance.The performance data does not take account of any commissions and costs charged when subscribing and redeeming units.The performance data were not audited.The subfund does not have a benchmark.

The notes are an integral part of the fi nancial statements. 33
UBS (Lux) Bond Fund – Convert Europe (EUR)Annual Report as of 31 March 2015
Report of the Portfolio Manager
The reporting year from 1 April 2014 to 31 March 2015 can be characterized as an investor-friendly year as the renewed quantitative easing brought much liquidity to the markets and pushed many prices up. Convertible bond valuations decreased slightly during the report-ing year but the strong equity markets still generated a strongly positive performance for convertible bonds.
In the reporting year, the subfund posted a strongly positive return. Our positioning concentrated toward the bonds in the market which were more affected by the cheapening and liquidity pressure some years ago and which recovered nicely. The subfund’s short duration strategy remained unchanged.
Structure of the Securities Portfolio
Geographical Breakdown as a % of net assetsNetherlands 17.19France 9.88Germany 9.36Jersey 7.82United Kingdom 7.76Luxembourg 7.19Italy 7.07United Arab Emirates 5.22Austria 4.37Spain 3.34Belgium 3.00Switzerland 2.88Portugal 1.76Cayman Islands 1.46Finland 1.02Cyprus 0.99Hungary 0.92Norway 0.90Sweden 0.48Bermuda 0.03Total 92.64
Economic Breakdown as a % of net assetsFinance & holding companies 31.25Real Estate 13.14Petroleum 6.12Miscellaneous unclassified companies 5.88Banks & credit institutions 5.86Telecommunications 5.83Traffic & transportation 4.16Mining, coal & steel 3.95Building industry & materials 2.42Investment funds 1.94Lodging, catering & leisure 1.92Internet, software & IT services 1.40Insurance 1.15Non-ferrous metals 1.02Electrical devices & components 1.00Energy & water supply 0.94Agriculture & fishery 0.90Mortgage & funding institutions 0.90Aerospace industry 0.81Mechanical engineering & industrial equipment 0.79Biotechnology 0.73Miscellaneous services 0.50Precious metals & stones 0.03Total 92.64
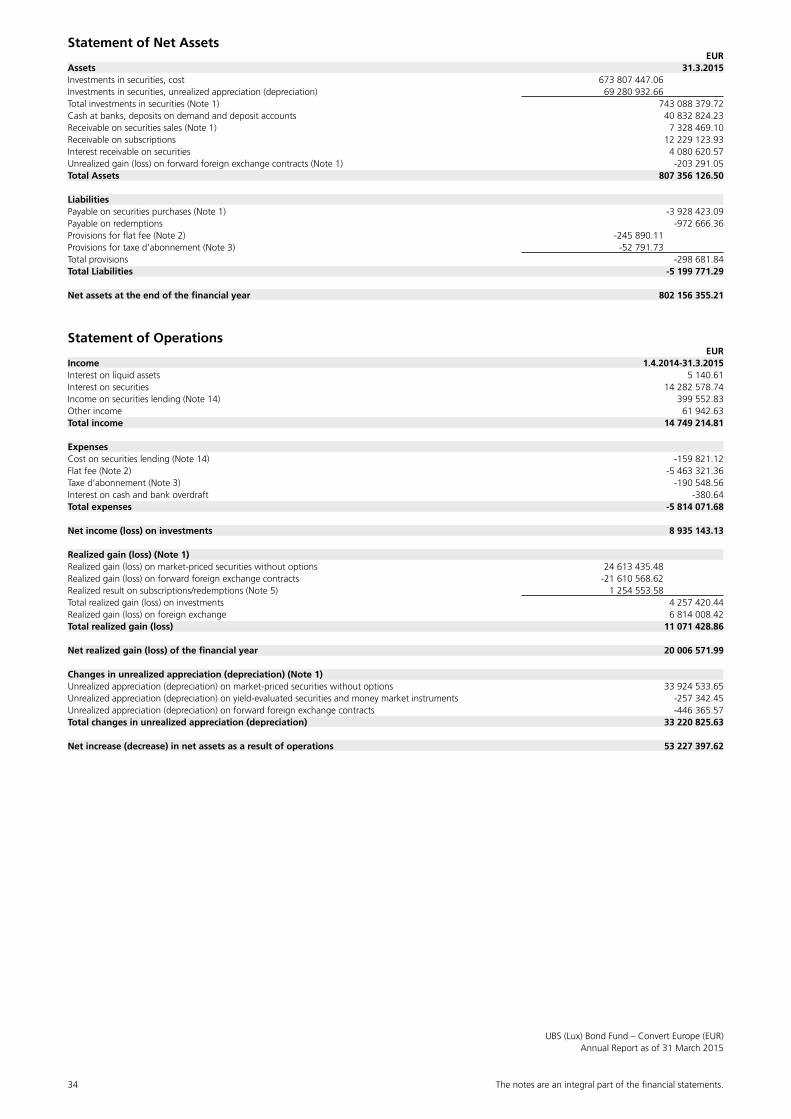
34 The notes are an integral part of the fi nancial statements.
UBS (Lux) Bond Fund – Convert Europe (EUR)Annual Report as of 31 March 2015
Statement of Net Assets EURAssets 31.3.2015Investments in securities, cost 673 807 447.06Investments in securities, unrealized appreciation (depreciation) 69 280 932.66Total investments in securities (Note 1) 743 088 379.72Cash at banks, deposits on demand and deposit accounts 40 832 824.23Receivable on securities sales (Note 1) 7 328 469.10Receivable on subscriptions 12 229 123.93Interest receivable on securities 4 080 620.57Unrealized gain (loss) on forward foreign exchange contracts (Note 1) -203 291.05Total Assets 807 356 126.50
LiabilitiesPayable on securities purchases (Note 1) -3 928 423.09Payable on redemptions -972 666.36Provisions for flat fee (Note 2) -245 890.11Provisions for taxe d’abonnement (Note 3) -52 791.73Total provisions -298 681.84Total Liabilities -5 199 771.29
Net assets at the end of the financial year 802 156 355.21
Statement of Operations EURIncome 1.4.2014-31.3.2015Interest on liquid assets 5 140.61Interest on securities 14 282 578.74Income on securities lending (Note 14) 399 552.83Other income 61 942.63Total income 14 749 214.81
ExpensesCost on securities lending (Note 14) -159 821.12Flat fee (Note 2) -5 463 321.36Taxe d’abonnement (Note 3) -190 548.56Interest on cash and bank overdraft -380.64Total expenses -5 814 071.68
Net income (loss) on investments 8 935 143.13
Realized gain (loss) (Note 1)Realized gain (loss) on market-priced securities without options 24 613 435.48Realized gain (loss) on forward foreign exchange contracts -21 610 568.62Realized result on subscriptions/redemptions (Note 5) 1 254 553.58Total realized gain (loss) on investments 4 257 420.44Realized gain (loss) on foreign exchange 6 814 008.42Total realized gain (loss) 11 071 428.86
Net realized gain (loss) of the financial year 20 006 571.99
Changes in unrealized appreciation (depreciation) (Note 1)Unrealized appreciation (depreciation) on market-priced securities without options 33 924 533.65Unrealized appreciation (depreciation) on yield-evaluated securities and money market instruments -257 342.45Unrealized appreciation (depreciation) on forward foreign exchange contracts -446 365.57Total changes in unrealized appreciation (depreciation) 33 220 825.63
Net increase (decrease) in net assets as a result of operations 53 227 397.62

The notes are an integral part of the fi nancial statements. 35
UBS (Lux) Bond Fund – Convert Europe (EUR)Annual Report as of 31 March 2015
Statement of Changes in Net Assets EUR 1.4.2014-31.3.2015Net assets at the beginning of the financial year 565 962 948.38Subscriptions 459 474 116.12Redemptions -271 315 815.97Total net subscriptions (redemptions) 188 158 300.15Dividend paid -5 192 290.94Net income (loss) on investments 8 935 143.13Total realized gain (loss) 11 071 428.86Total changes in unrealized appreciation (depreciation) 33 220 825.63Net increase (decrease) in net assets as a result of operations 53 227 397.62Net assets at the end of the financial year 802 156 355.21
Development of the outstanding units
1.4.2014-31.3.2015Class (CHF hedged) P-accNumber of units outstanding at the beginning of the financial year 240 671.2580Number of units issued 94 867.0240Number of units redeemed -58 800.0220Number of units outstanding at the end of the financial year 276 738.2600Class F-accNumber of units outstanding at the beginning of the financial year 47 461.5470Number of units issued 71 398.0710Number of units redeemed -31 736.8280Number of units outstanding at the end of the financial year 87 122.7900Class I-A1-accNumber of units outstanding at the beginning of the financial year 185 276.8000Number of units issued 43 984.0000Number of units redeemed -57 631.0000Number of units outstanding at the end of the financial year 171 629.8000Class I-A1-distNumber of units outstanding at the beginning of the financial year 266 029.4040Number of units issued 32 600.0000Number of units redeemed -71 600.0000Number of units outstanding at the end of the financial year 227 029.4040Class I-X-accNumber of units outstanding at the beginning of the financial year 323 872.3980Number of units issued 50 000.0000Number of units redeemed -190 000.0000Number of units outstanding at the end of the financial year 183 872.3980Class I-X-distNumber of units outstanding at the beginning of the financial year 1 056 214.9180Number of units issued 2 391 351.0970Number of units redeemed -129 147.4720Number of units outstanding at the end of the financial year 3 318 418.5430Class K-1-accNumber of units outstanding at the beginning of the financial year 0.2000Number of units issued 0.0000Number of units redeemed 0.0000Number of units outstanding at the end of the financial year 0.2000Class P-accNumber of units outstanding at the beginning of the financial year 1 760 118.3720Number of units issued 559 486.2570Number of units redeemed -954 155.5150Number of units outstanding at the end of the financial year 1 365 449.1140Class P-distNumber of units outstanding at the beginning of the financial year 178 858.5360Number of units issued 77 642.7840Number of units redeemed -149 532.3520Number of units outstanding at the end of the financial year 106 968.9680Class Q-accNumber of units outstanding at the beginning of the financial year 174 080.8450Number of units issued 365 380.4090Number of units redeemed -259 558.6690Number of units outstanding at the end of the financial year 279 902.5850
Annual Distribution
UBS (Lux) Bond Fund Ex-Date Pay-Date Currency Amount per unit– Convert Europe (EUR) I-A1-dist 2.6.2014 5.6.2014 EUR 2.62– Convert Europe (EUR) P-dist 2.6.2014 5.6.2014 EUR 1.22– Convert Europe (EUR) I-X-dist 2.6.2014 5.6.2014 EUR 2.40

36 The notes are an integral part of the fi nancial statements.
UBS (Lux) Bond Fund – Convert Europe (EUR)Annual Report as of 31 March 2015
Statement of Investments in Securities and other Net Assets as of 31 March 2015
Description Quantity/ Valuation in EUR as a % Nominal Unrealized gain of net (loss) on Futures/ assets Options/Forward Exchange Contracts/ Swaps (Note 1)
Transferable securities and money market instruments listed on an official stock exchange
Bonds cum warrant, fixed rate
USD
USD SIEMENS FINANCIERINGSMAATSCHAPPIJ NV 1.65000% 12-16.08.19 15 000 000.00 16 026 536.31 2.00Total USD 16 026 536.31 2.00
Total Bonds cum warrant, fixed rate 16 026 536.31 2.00
Convertible bonds, fixed rate
CHF
CHF BALOISE HOLDING 1.50000% 09-17.11.16 8 725 000.00 9 257 727.27 1.15CHF BKW AG-REG-S 0.12500% 14-30.09.20 7 760 000.00 7 531 805.27 0.94CHF SCHINDLER HOLDING LTD-REG-S 0.37500% 13-05.06.17 6 475 000.00 6 331 703.84 0.79Total CHF 23 121 236.38 2.88
EUR
EUR AABAR INVESTMENTS PJSC-REG-S 4.00000% 11-27.05.16 18 700 000.00 26 278 362.00 3.28EUR AABAR INVESTMENTS PJSC-REG-S 1.00000% 15-27.03.22 15 400 000.00 15 610 980.00 1.95EUR ABENGOA SA-REG-S 6.25000% 13-17.01.19 6 300 000.00 8 108 100.00 1.01EUR ALCATEL-LUCENT-REG-S 4.25000% 13-01.07.18 5 155 655.00 19 649 988.03 2.45EUR ALSTRIA OFFICE REIT AG-REG-S 2.75000% 13-14.06.18 3 200 000.00 4 309 760.00 0.54EUR AMORIM ENERGIA BV-REG-S 3.37500% 13-03.06.18 9 800 000.00 9 569 700.00 1.19EUR ARCANDOR AG *DEFAULT* 8.87500% 08-11.07.13 2 500 000.00 0.25 0.00EUR ASTALDI SPA-REG-S 4.50000% 13-31.01.19 6 400 000.00 7 720 000.00 0.96EUR BENI STABILI SPA SIIQ-REG-S 2.62500% 13-17.04.19 6 400 000.00 7 879 808.00 0.98EUR COFINIMMO-REG-S 2.00000% 13-20.06.18 53 500.00 6 483 755.79 0.81EUR CONWERT IMMOBILIEN INVEST SE 5.25000% 10-01.02.16 6 500 000.00 7 361 250.00 0.92EUR CONWERT IMMOBILIEN INVEST SE-REG-S 4.50000% 12-06.09.18 6 300 000.00 7 607 250.00 0.95EUR DEUTSCHE EUROSHOP AG-REG-S 1.75000% 12-20.11.17 5 400 000.00 7 843 500.00 0.98EUR DEUTSCHE POST AG-REG-S 0.60000% 12-06.12.19 8 200 000.00 11 532 726.00 1.44EUR DRILLISCH AG-REG-S 0.75000% 13-12.12.18 5 100 000.00 8 555 250.00 1.07EUR ETABLISSEMENTS MAUREL & PROM-REG-S 1.62500% 14-01.07.19 485 580.00 7 177 188.22 0.89EUR IMMOFINANZ AG 4.25000% 11-08.03.18 4 170 000.00 20 053 389.48 2.50EUR INTL CONSOLIDATED AIRLINES GROUP-REG-S 1.75000% 13-31.05.18 3 300 000.00 6 499 350.00 0.81EUR KLOECKNER & CO FINANCIAL SERVICES SA 2.50000% 11-22.12.17 6 750 000.00 6 726 375.00 0.84EUR MARINE HARVEST ASA-REG-S 0.87500% 14-06.05.19 6 100 000.00 7 228 500.00 0.90EUR MISARTE 3.25000% 10-01.01.16 79 200.00 14 552 444.96 1.81EUR NEXANS SA 4.00000% 09-01.01.16 147 000.00 8 000 387.62 1.00EUR OUTOKUMPU OYJ-REG-S 3.25000% 15-26.02.20 6 900 000.00 8 174 085.00 1.02EUR PARPUBLICA PART PUBLICAS SGPS SA 5.25000% 10-28.09.17 12 700 000.00 14 117 574.00 1.76EUR PIERRE ET VACANCES-REG-S 3.50000% 14-01.10.19 183 838.00 6 847 265.23 0.85EUR PT JERSEY LTD-REG-S 0.50000% 14-19.11.19 6 500 000.00 7 746 375.00 0.97EUR SACYR VALLEHERMOSO SA-REG-S 4.00000% 14-08.05.19 3 700 000.00 3 622 300.00 0.45EUR SAF-HOLLAND SA-REG-S 1.00000% 14-12.09.20 6 300 000.00 8 283 240.00 1.03EUR SALZGITTER FINANCE BV 2.00000% 10-08.11.17 12 000 000.00 14 460 000.00 1.80EUR SCHEMATRENTAQUATTRO SPA-REG-S 0.25000% 13-29.11.16 6 300 000.00 7 042 392.00 0.88EUR SGL CARBON SE 3.50000% 09-30.06.16 8 750 000.00 8 734 687.50 1.09EUR SOCIETA INIZIATIVE AUTOSTRADALI E SERVI 2.62500% 05-30.06.17 5 149 410.00 5 899 936.50 0.73EUR TAG IMMOBILIEN AG 6.50000% 10-10.12.15 375 037.00 4 820 621.82 0.60EUR UNIBAIL-RODAMCO SE-REG-S 0.75000% 12-01.01.18 52 550.00 15 028 426.49 1.87EUR VASTNED RETAIL-REG-S 1.87500% 14-10.04.19 6 700 000.00 7 280 622.00 0.91EUR VOLKSWAGEN INTERNATIONAL FIN-REG-S-SUB 5.50000% 12-09.11.15 13 700 000.00 19 056 700.00 2.38EUR WERELDHAVE NV-REG-S 1.00000% 14-22.05.19 6 400 000.00 6 986 688.00 0.87Total EUR 356 848 978.89 44.49
GBP
GBP BALFOUR BEATTY FINANCE NO.2 LTD-REG-S 1.87500% 13-03.12.18 4 700 000.00 6 274 887.51 0.78GBP INTU JERSEY-REG-S 2.50000% 12-04.10.18 4 900 000.00 7 625 358.17 0.95GBP PHP FINANCE JERSEY LTD-REG-S 4.25000% 14-20.05.19 5 200 000.00 8 000 575.91 1.00Total GBP 21 900 821.59 2.73
USD
USD AFRICAN MINERALS *DEFAULT* 8.50000% 12-10.02.17 8 800 000.00 229 422.72 0.03USD APERAM-REG-S 0.62500% 14-08.07.21 7 200 000.00 7 964 245.81 0.99USD HOLDGROVE LTD-REG-S 1.00000% 12-24.09.17 8 400 000.00 7 906 480.45 0.99USD LUKOIL INTERNATIONAL FINANCE BV 2.62500% 10-16.06.15 4 900 000.00 4 509 916.20 0.56USD PREMIER OIL FINANCE (JERSEY) LTD-REG-S 2.50000% 12-27.07.18 9 425 000.00 7 614 504.89 0.95USD QIAGEN NV-REG-S 0.87500% 14-19.03.21 5 600 000.00 5 856 797.02 0.73USD SIEM INDUSTRIES INC 1.00000% 12-12.09.19 8 800 000.00 7 693 363.12 0.96USD VEDANTA RESOURCES JERSEY LTD 5.50000% 09-13.07.16 8 100 000.00 7 221 368.72 0.90Total USD 48 996 098.93 6.11
Total Convertible bonds, fixed rate 450 867 135.79 56.21
Convertible bonds, zero coupon
CHF
CHF BNP PARIBAS ARBITRAGE ISSUANCE BV 0.00000% 14-03.04.17 12 550 000.00 13 610 179.18 1.69CHF GOLDMAN SACHS INTERNATIONAL 0.00000% 15-26.02.18 14 430 000.00 15 541 099.38 1.94Total CHF 29 151 278.56 3.63
EUR
EUR E ON BETEILIGUNGEN GMBH REG-S 0.00000% 14-01.10.18 6 800 000.00 7 420 160.00 0.92EUR JP MORGAN STRUCTURED PRODUCTS BV-REG-S 0.00000% 14-25.09.17 12 870 000.00 15 295 570.29 1.91EUR NOMURA BANK INTERNATIONAL PLC-REG-S 0.00000% 15-26.02.18 12 300 000.00 14 539 830.00 1.81EUR ORPAR SA-REG-S 0.00000% 15-15.07.19 7 800 000.00 8 003 970.00 1.00

The notes are an integral part of the fi nancial statements. 37
UBS (Lux) Bond Fund – Convert Europe (EUR)Annual Report as of 31 March 2015
EUR RAG-STIFTUNG-REG-S 0.00000% 14-31.12.18 6 300 000.00 6 885 900.00 0.86EUR RAG-STIFTUNG-REG-S 0.00000% 15-18.02.21 13 500 000.00 14 964 750.00 1.87EUR SG ISSUER-REG-S 0.00000% 15-05.03.18 13 700 000.00 15 807 060.00 1.97Total EUR 82 917 240.29 10.34
GBP
GBP BNP PARIBAS ARBITRAGE ISSUANCE BV-REG-S 0.00000% 15-19.03.18 9 000 000.00 14 018 573.05 1.75Total GBP 14 018 573.05 1.75
SEK
SEK GOLDMAN SACHS INTERNATIONAL 0.00000% 15-12.03.18 127 600 000.00 15 842 837.50 1.97Total SEK 15 842 837.50 1.97
Total Convertible bonds, zero coupon 141 929 929.40 17.69
Convertible bonds, floating rate
EUR
EUR AGEASFINLUX SA-REG-S-SUB 3M EURIBOR+135BP 02-PRP 23 500 000.00 14 863 750.00 1.85EUR BNP PARIBAS FORTIS SA-SUB 3M EURIBOR+200BP 07-PRP 23 750 000.00 17 575 000.00 2.19EUR MAGNOLIA FINANCE LTD-SUB 4.00000%/3M EURIBOR+550 BP 06-PRP 10 900 000.00 10 831 875.00 1.35EUR OPUS SECURITIES SA 3.95000%/3M EURIBOR+300BP 06-29.10.49 4 330 000.00 4 061 540.00 0.51Total EUR 47 332 165.00 5.90
Total Convertible bonds, floating rate 47 332 165.00 5.90
Total Transferable securities and money market instruments listed on an official stock exchange 656 155 766.50 81.80
Transferable securities and money market instruments traded on another regulated market
Convertible bonds, fixed rate
EUR
EUR AZIMUT HOLDING SPA-REG-S-SUB 2.12500% 13-25.11.20 7 500 000.00 9 610 425.00 1.20EUR HUNGARIAN STATE HOLDING CO-REG-S 3.37500% 13-02.04.19 7 000 000.00 7 383 250.00 0.92EUR MELIA HOTELES INTERNATIONAL SA-REG-S 4.50000% 13-04.04.18 5 400 000.00 8 586 000.00 1.07EUR TELECOM ITALIA SPA-REG-S 1.12500% 15-26.03.22 18 500 000.00 18 533 916.61 2.31Total EUR 44 113 591.61 5.50
GBP
GBP ST MODWEN PROPERTIES JERSEY LTD-REG-S 2.87500% 14-06.03.19 5 900 000.00 8 595 285.41 1.07GBP SVG CAPITAL PLC 8.25000% 08-05.06.16 6 150 000.00 9 053 169.34 1.13GBP UNITE JERSEY ISSUER LTD-REG-S 2.50000% 13-10.10.18 3 600 000.00 6 054 869.13 0.75Total GBP 23 703 323.88 2.95
USD
USD POLARCUS LTD 2.87500% 11-27.04.16 8 700 000.00 4 050 279.33 0.51USD YANDEX NV 1.12500% 15-15.12.18 14 650 000.00 11 228 761.22 1.40Total USD 15 279 040.55 1.91
Total Convertible bonds, fixed rate 83 095 956.04 10.36
Convertible bonds, zero coupon
SEK
SEK INDUSTRIVARDEN AB-REG-S 0.00000% 14-15.05.19 32 000 000.00 3 836 657.18 0.48Total SEK 3 836 657.18 0.48
Total Convertible bonds, zero coupon 3 836 657.18 0.48
Total Transferable securities and money market instruments traded on another regulated market 86 932 613.22 10.84
Total investments in securities 743 088 379.72 92.64
Forward Foreign Exchange contracts
Forward Foreign Exchange contracts (Purchase/Sale)
CHF 33 010 000.00 EUR 31 008 465.56 20.4.2015 649 131.58 0.08CHF 510 000.00 EUR 479 432.80 20.4.2015 9 672.76 0.00EUR 71 141 945.50 GBP 51 500 000.00 22.5.2015 31 833.39 0.00EUR 57 621 698.00 CHF 61 000 000.00 22.5.2015 -936 870.12 -0.12EUR 14 125 050.00 USD 15 000 000.00 22.5.2015 168 294.58 0.02EUR 2 240 900.00 NOK 20 000 000.00 22.5.2015 -64 933.68 -0.01EUR 2 459 865.00 HUF 750 000 000.00 22.5.2015 -37 226.48 0.00EUR 2 875 550.00 NOK 25 000 000.00 22.5.2015 -6 742.10 0.00USD 3 000 000.00 EUR 2 734 932.00 22.5.2015 56 419.08 0.01CHF 335 000.00 EUR 320 930.10 20.4.2015 345.12 0.00EUR 18 788 350.00 SEK 175 000 000.00 29.5.2015 -107 663.04 -0.01CHF 195 000.00 EUR 186 721.69 20.4.2015 289.26 0.00USD 3 200 000.00 EUR 2 949 376.71 22.5.2015 28 064.45 0.00EUR 3 450 126.50 CHF 3 600 000.00 22.5.2015 -5 789.00 0.00CHF 3 605 000.00 EUR 3 445 421.84 20.4.2015 11 883.15 0.00Total Forward Foreign Exchange contracts (Purchase/Sale) -203 291.05 -0.03
Cash at banks, deposits on demand and deposit accounts and other liquid assets 40 832 824.23 5.09Other assets and liabilities 18 438 442.31 2.30
Total net assets 802 156 355.21 100.00
Description Quantity/ Valuation in EUR as a % Nominal Unrealized gain of net (loss) on Futures/ assets Options/Forward Exchange Contracts/ Swaps (Note 1)

38 The notes are an integral part of the fi nancial statements.
UBS (Lux) Bond Fund – EURAnnual Report as of 31 March 2015
UBS (Lux) Bond Fund – EUR
Three-year comparison
ISIN 31.3.2015 31.3.2014 31.3.2013Net assets in EUR 447 871 231.56 473 901 510.16 641 438 644.64Class F-acc1 LU0415166403Units outstanding 43 768.8250 62 747.7380 -Net asset value per unit in EUR 404.56 365.28 -Issue and redemption price per unit in EUR2 404.56 365.28 -Class F-dist1 LU0415166312Units outstanding 17 795.0000 24 650.0000 -Net asset value per unit in EUR 144.41 133.11 -Issue and redemption price per unit in EUR2 144.41 133.11 -Class N-acc LU0168863511Units outstanding 37 197.4770 54 733.9200 63 545.3150Net asset value per unit in EUR 15.71 14.31 13.79Issue and redemption price per unit in EUR2 15.71 14.31 13.79Class P-acc LU0033050237Units outstanding 788 258.3880 902 223.0560 1 370 956.0841Net asset value per unit in EUR 400.40 363.69 349.45Issue and redemption price per unit in EUR2 400.40 363.69 349.45Class P-dist LU0033049577Units outstanding 708 705.7850 840 599.6000 1 158 337.0112Net asset value per unit in EUR 142.56 132.53 130.87Issue and redemption price per unit in EUR2 142.56 132.53 130.87Class Q-acc LU0358407707Units outstanding 68 993.7570 54 321.4610 76 143.1130Net asset value per unit in EUR 150.12 135.82 129.97Issue and redemption price per unit in EUR2 150.12 135.82 129.97
1 First NAV: 10.07.20132 See note 1
Performance
Currency 2014/2015 2013/2014 2012/2013Class F-acc EUR 10.8% - -Class F-dist EUR 10.7% - -Class N-acc EUR 9.8% 3.8% 6.2%Class P-acc EUR 10.1% 4.1% 6.5%Class P-dist EUR 10.1% 4.1% 6.5%Class Q-acc EUR 10.5% 4.5% 7.0%
Historical performance is no indicator of current or future performance.The performance data does not take account of any commissions and costs charged when subscribing and redeeming units.The performance data were not audited.The subfund does not have a benchmark.

The notes are an integral part of the fi nancial statements. 39
UBS (Lux) Bond Fund – EURAnnual Report as of 31 March 2015
Report of the Portfolio Manager
Over the reporting year, from 1 April 2014 to 31 March 2015, interest rates in the Eurozone reached new histori-cal lows as the European Central Bank (“ECB”) entered further into the realms of unconventional monetary policy in order to combat disinflation and low growth. Specifically, the ECB lowered official interest rates and took the deposit rate into negative territory at -0.20%. They also embarked on an aggressive asset purchase program with the aim of buying EUR 60bn of sovereign, covered and asset backed securities each month until March 2017 or until inflation is back at their target of 2%. Given the political structure of the Eurozone and ongoing disagreements regarding individual country structural reform programs, the bulk of the credit risk from the asset purchase program would remain on national central bank balance sheets rather than being distributed across the Eurosystem. With the monetary policy stimulus and corresponding weakness of the euro, there were tentative signs that economic growth and inflation were beginning to pick up in February and March. The new left-leaning Greek government and their desire to restructure official sector debt remained a key concern for markets and the Eurozone late in the year.
The subfund posted a positive return in the reporting year. The strong rally in interest rates was the main driver of performance. Performance was enhanced through tactical positioning in Spanish and Italian sovereign bonds and a strategic positon in covered bonds. On the interest rate side, the subfund maintained a structural curve flattening bias which contributed as yield curves in the Eurozone flattened on the ECB’s announcements.
Structure of the Securities Portfolio
Geographical Breakdown as a % of net assetsItaly 16.44Germany 15.62France 14.25Spain 11.37Netherlands 7.87Ireland 4.24United Kingdom 4.10Supranationals 3.97Belgium 3.90United States 3.83Canada 1.89Australia 1.67Norway 1.64Luxembourg 1.36Sweden 1.25Japan 1.21New Zealand 0.94Finland 0.85Switzerland 0.80Curacao 0.68Slovenia 0.21Mexico 0.20Portugal 0.20Total 98.49
Economic Breakdown as a % of net assetsCountries & central governments 53.32Banks & credit institutions 18.93Finance & holding companies 7.20Supranational organisations 3.97Cantons, federal states 2.90Mortgage & funding institutions 2.45Pharmaceuticals, cosmetics & medical products 1.70Public, non-profit institutions 1.70Vehicles 1.21Investment funds 1.10Energy & water supply 0.91Tobacco & alcohol 0.87Petroleum 0.85Electrical devices & components 0.56Insurance 0.35Telecommunications 0.20Computer hardware & network equipment providers 0.16Building industry & materials 0.11Total 98.49

40 The notes are an integral part of the fi nancial statements.
UBS (Lux) Bond Fund – EURAnnual Report as of 31 March 2015
Statement of Net Assets EURAssets 31.3.2015Investments in securities, cost 385 695 401.38Investments in securities, unrealized appreciation (depreciation) 55 407 451.68Total investments in securities (Note 1) 441 102 853.06Cash at banks, deposits on demand and deposit accounts 5 219 327.94Other liquid assets (Margins) 1 454 794.00Receivable on securities sales (Note 1) 519 813.61Receivable on subscriptions 227 461.05Interest receivable on securities 6 030 770.09Unrealized gain (loss) on financial futures (Note 1) -484 494.00Total Assets 454 070 525.75
LiabilitiesInterest payable on bank overdraft -12.44Payable on securities purchases (Note 1) -4 931 540.33 Payable on redemptions -1 044 116.33Provisions for flat fee (Note 2) -170 261.47Provisions for taxe d’abonnement (Note 3) -53 363.62Total provisions -223 625.09Total Liabilities -6 199 294.19
Net assets at the end of the financial year 447 871 231.56
Statement of Operations EURIncome 1.4.2014-31.3.2015Interest on liquid assets 180.17Interest on securities 13 514 084.08Income on securities lending (Note 14) 193 465.26Other income 26 102.39Total income 13 733 831.90
ExpensesCost on securities lending (Note 14) -77 386.10Flat fee (Note 2) -3 944 518.54Taxe d’abonnement (Note 3) -214 433.39Interest on cash and bank overdraft -802.48Total expenses -4 237 140.51
Net income (loss) on investments 9 496 691.39
Realized gain (loss) (Note 1)Realized gain (loss) on market-priced securities without options 19 711 351.49Realized gain (loss) on financial futures -5 131 677.40Total realized gain (loss) on investments 14 579 674.09Realized gain (loss) on foreign exchange 75.07Total realized gain (loss) 14 579 749.16
Net realized gain (loss) of the financial year 24 076 440.55
Changes in unrealized appreciation (depreciation) (Note 1)Unrealized appreciation (depreciation) on market-priced securities without options 20 455 178.57Unrealized appreciation (depreciation) on yield-evaluated securities and money market instruments 10 300.33Unrealized appreciation (depreciation) on financial futures -302 692.30Total changes in unrealized appreciation (depreciation) 20 162 786.60
Net increase (decrease) in net assets as a result of operations 44 239 227.15

The notes are an integral part of the fi nancial statements. 41
UBS (Lux) Bond Fund – EURAnnual Report as of 31 March 2015
Statement of Changes in Net Assets EUR 1.4.2014-31.3.2015Net assets at the beginning of the financial year 473 901 510.16Subscriptions 70 694 703.99Redemptions -138 406 268.69Total net subscriptions (redemptions) -67 711 564.70Dividend paid -2 557 941.05Net income (loss) on investments 9 496 691.39Total realized gain (loss) 14 579 749.16Total changes in unrealized appreciation (depreciation) 20 162 786.60Net increase (decrease) in net assets as a result of operations 44 239 227.15Net assets at the end of the financial year 447 871 231.56
Development of the outstanding units
1.4.2014-31.3.2015Class F-accNumber of units outstanding at the beginning of the financial year 62 747.7380Number of units issued 14 438.6150Number of units redeemed -33 417.5280Number of units outstanding at the end of the financial year 43 768.8250Class F-distNumber of units outstanding at the beginning of the financial year 24 650.0000Number of units issued 20 115.0000Number of units redeemed -26 970.0000Number of units outstanding at the end of the financial year 17 795.0000Class N-accNumber of units outstanding at the beginning of the financial year 54 733.9200Number of units issued 2 807.2120Number of units redeemed -20 343.6550Number of units outstanding at the end of the financial year 37 197.4770Class P-accNumber of units outstanding at the beginning of the financial year 902 223.0560Number of units issued 137 405.3430Number of units redeemed -251 370.0110Number of units outstanding at the end of the financial year 788 258.3880Class P-distNumber of units outstanding at the beginning of the financial year 840 599.6000Number of units issued 47 787.2400Number of units redeemed -179 681.0550Number of units outstanding at the end of the financial year 708 705.7850Class Q-accNumber of units outstanding at the beginning of the financial year 54 321.4610Number of units issued 23 147.6030Number of units redeemed -8 475.3070Number of units outstanding at the end of the financial year 68 993.7570
Annual Distribution
UBS (Lux) Bond Fund Ex-Date Pay-Date Currency Amount per unit– EUR F-dist 2.6.2014 5.6.2014 EUR 2.76– EUR P-dist 2.6.2014 5.6.2014 EUR 3.10

42 The notes are an integral part of the fi nancial statements.
UBS (Lux) Bond Fund – EURAnnual Report as of 31 March 2015
Statement of Investments in Securities and other Net Assets as of 31 March 2015
Description Quantity/ Valuation in EUR as a % Nominal Unrealized gain of net (loss) on Futures/ assets Options/Forward Exchange Contracts/ Swaps (Note 1)
Transferable securities and money market instruments listed on an official stock exchange
Notes, fixed rate
EUR
EUR ITALY, REPUBLIC OF 4.50000% 10-01.03.26 8 300 000.00 10 949 775.00 2.45EUR PFIZER INC 4.75000% 09-03.06.16 2 600 000.00 2 740 530.00 0.61Total EUR 13 690 305.00 3.06
Total Notes, fixed rate 13 690 305.00 3.06
Notes, floating rate
EUR
EUR CNP ASSURANCES-SUB 6.000%/VAR 10-14.09.40 1 300 000.00 1 545 518.00 0.34Total EUR 1 545 518.00 0.34
Total Notes, floating rate 1 545 518.00 0.34
Medium term notes, fixed rate
EUR
EUR ABBEY NATIONAL TREASURY SERV PLC 4.37500% 11-24.01.18 1 000 000.00 1 120 870.00 0.25EUR ABBEY NATIONAL TREASURY SERVICES-REG-S 2.62500% 13-16.07.20 3 100 000.00 3 394 686.00 0.76EUR AGENCE FRANCE LOCALE-REG-S 0.37500% 15-20.03.22 2 800 000.00 2 794 680.00 0.62EUR ANHEUSER-BUSCH INBEV SA 4.00000% 10-26.04.18 2 000 000.00 2 224 100.00 0.50EUR APPLE INC 1.00000% 14-10.11.22 700 000.00 714 938.00 0.16EUR BANK OF AMERICA CORP-REG-S 2.50000% 13-27.07.20 3 300 000.00 3 576 870.00 0.80EUR BANK OF IRELAND MORTGAGE BANK 3.62500% 13-02.10.20 2 300 000.00 2 716 323.00 0.61EUR BP CAPITAL MARKETS PLC 2.17700% 14-28.09.21 1 110 000.00 1 200 897.90 0.27EUR CAISSE D’AMORTISSEMENT DE LA DETTE SOC 3.62500% 06-25.04.16 3 000 000.00 3 118 110.00 0.70EUR CAIXA GERAL DE DEPOSITOS SA 3.00000% 14-15.01.19 800 000.00 879 704.00 0.20EUR COCA-COLA HBC FINANCE BV 2.37500% 13-18.06.20 2 100 000.00 2 235 912.00 0.50EUR COMPAGNIE DE FINANCEMENT FONCIER 2.00000% 14-07.05.24 2 300 000.00 2 618 343.00 0.58EUR DNB BOLIGKREDITT AS 3.87500% 11-16.06.21 1 300 000.00 1 586 013.00 0.35EUR EADS FINANCE BV 4.62500% 09-12.08.16 2 500 000.00 2 650 250.00 0.59EUR EUROPEAN FINANCIAL STABILITY FAC-REG-S 1.12500% 12-30.11.17 3 700 000.00 3 818 918.00 0.85EUR EUROPEAN FINANCIAL STABILITY FAC-REG-S 1.25000% 13-05.02.18 1 900 000.00 1 972 029.00 0.44EUR EUROPEAN FINANCIAL STABILITY FAC-REG-S 1.87500% 13-23.05.23 1 750 000.00 1 996 312.50 0.45EUR EUROPEAN INVESTMENT BANK 3.62500% 11-15.01.21 5 500 000.00 6 664 900.00 1.49EUR EUROPEAN UNION-REG-S 2.50000% 12-04.11.27 2 650 000.00 3 344 618.00 0.75EUR FCE BANK PLC-REG-S 1.75000% 13-21.05.18 1 900 000.00 1 966 177.00 0.44EUR FMS WERTMANAGEMENT-REG-S 1.37500% 12-15.01.20 4 200 000.00 4 484 844.00 1.00EUR GAZ CAPITAL SA/GAZPROM LPN 6.60500% 07-13.02.18 1 100 000.00 1 151 865.00 0.26EUR GE CAPITAL EUROPEAN FUNDING 4.62500% 07-22.02.27 3 000 000.00 4 211 601.00 0.94EUR GLAXOSMITHKLINE CAPITAL PLC-REG-S 0.62500% 14-02.12.19 2 100 000.00 2 119 215.00 0.47EUR GOLDMAN SACHS GROUP INC 4.50000% 07-30.01.17 2 100 000.00 2 259 129.60 0.50EUR HSBC FRANCE 1.87500% 13-16.01.20 1 800 000.00 1 912 680.00 0.43EUR ING GROEP NV 4.75000% 07-31.05.17 1 600 000.00 1 753 856.00 0.39EUR INSTITUTO DE CREDITO OFICIAL-REG-S 4.87500% 12-30.07.17 4 500 000.00 4 974 975.00 1.11EUR ITALY, REPUBLIC OF 5.75000% 01-25.07.16 12 500 000.00 13 390 000.00 2.99EUR KBC BANK NV-REG-S 1.25000% 13-28.05.20 1 300 000.00 1 369 498.00 0.31EUR KREDITANSTALT FUER WIEDERAUFBAU 1.25000% 12-17.10.19 3 500 000.00 3 712 030.00 0.83EUR LLOYDS BANK PLC-REG-S 1.87500% 13-10.10.18 1 800 000.00 1 889 604.00 0.42EUR NATIONAL AUSTRALIA BANK LTD 1.87500% 12-13.01.23 2 200 000.00 2 433 662.00 0.54EUR ONTARIO, PROVINCE OF 4.00000% 09-03.12.19 4 900 000.00 5 772 445.00 1.29EUR PHILIP MORRIS INTERNATIONAL INC 2.87500% 14-03.03.26 1 450 000.00 1 688 177.00 0.38EUR POHJOLA BANK PLC 2.62500% 12-20.03.17 1 000 000.00 1 048 100.00 0.23EUR RABOBANK INTERNATIONAL 4.00000% 12-11.01.22 3 600 000.00 4 383 252.00 0.98EUR ROBERT BOSCH GMBH-REG-S 1.75000% 14-08.07.24 2 300 000.00 2 507 138.00 0.56EUR ROYAL BANK OF SCOTLAND PLC 4.00000% 11-15.03.16 1 500 000.00 1 556 145.00 0.35EUR ROYAL BANK OF SCOTLAND GROUP PLC-REG-S 1.50000% 13-28.11.16 3 600 000.00 3 659 090.40 0.82EUR SANOFI-REG-S 1.75000% 14-10.09.26 1 700 000.00 1 831 257.00 0.41EUR SKANDINAVISKA ENSKILDA BANKEN AB 1.62500% 13-04.11.20 2 700 000.00 2 910 816.00 0.65EUR SLOVENIA, REPUBLIC OF-REG-S 4.37500% 11-18.01.21 800 000.00 962 120.00 0.21EUR SPAREBANKEN 1 BOLIGKREDITT-REG-S 1.50000% 13-20.01.20 3 800 000.00 4 037 386.00 0.90EUR STOCKHOLMS LANS LANDSTING 2.12500% 12-12.09.22 2 400 000.00 2 701 224.00 0.60EUR TEVA PHARMACEUTICAL FINANCE IV BV 2.87500% 12-15.04.19 2 800 000.00 3 043 376.00 0.68EUR TOYOTA MOTOR CORP-REG-S 2.37500% 13-01.02.23 4 800 000.00 5 405 184.00 1.21EUR UNICREDIT SPA-REG-S 2.75000% 13-31.01.20 900 000.00 1 009 008.00 0.22EUR WESTPAC BANKING CORP-REG-S 1.37500% 13-17.04.20 3 700 000.00 3 904 869.00 0.87EUR WESTPAC SECURITIES NZ LTD-REG-S 0.87500% 14-24.06.19 4 100 000.00 4 212 545.00 0.94Total EUR 146 889 743.40 32.80
Total Medium term notes, fixed rate 146 889 743.40 32.80
Medium term notes, floating rate
EUR
EUR BARCLAYS BANK PLC-SUB 4.75000%/3M EURIBOR+71BP 05-PRP 1 400 000.00 1 437 100.00 0.32EUR DNB BANK ASA-REG-S-SUB 3.000%/12M EUSA5+177BP 13-26.09.23 1 620 000.00 1 716 098.40 0.38EUR ELECTRICITE DE FRANCE SA-REG-S-SUB 4.250%/VAR 13-PRP 800 000.00 866 672.00 0.20EUR TOTAL SA-REG-S-SUB 2.250%/VAR 15-PRP 800 000.00 805 000.00 0.18Total EUR 4 824 870.40 1.08
Total Medium term notes, floating rate 4 824 870.40 1.08

The notes are an integral part of the fi nancial statements. 43
UBS (Lux) Bond Fund – EURAnnual Report as of 31 March 2015
Bonds, fixed rate
EUR
EUR AMERICA MOVIL SAB DE CV 1.00000% 14-04.06.18 900 000.00 915 525.00 0.20EUR BANCO BILBAO VIZCAYA ARGENTARIA SA 3.50000% 12-05.12.17 2 800 000.00 3 054 548.00 0.68EUR BELGIUM, KINGDOM OF 4.50000% 11-28.03.26 9 700 000.00 13 850 727.00 3.09EUR CREDIT AGRICOLE SA-REG-S-SUB 2.62500% 15-17.03.27 1 300 000.00 1 330 459.00 0.30EUR CREDIT SUISSE GUERNSEY LTD-REG-S 0.75000% 14-17.09.21 3 500 000.00 3 580 710.00 0.80EUR DANSKE BANK OYJ 1.62500% 12-27.09.19 2 600 000.00 2 774 070.00 0.62EUR FRANCE, REPUBLIC OF 4.75000% 03-25.04.35 3 300 000.00 5 642 835.00 1.26EUR FRANCE, REPUBLIC OF-OAT 5.75000% 01-25.10.32 5 800 000.00 10 491 910.00 2.34EUR FRANCE, REPUBLIC OF-OAT 8.25000% 92-25.04.22 6 500 000.00 10 183 550.00 2.27EUR FRANCE, REPUBLIC OF-OAT 3.75000% 05-25.04.21 3 100 000.00 3 784 945.00 0.84EUR FRANCE, REPUBLIC OF-OAT 4.00000% 06-25.10.38 5 360 000.00 8 775 660.00 1.96EUR FRANCE, REPUBLIC OF-OAT 3.50000% 10-25.04.20 5 300 000.00 6 229 885.00 1.39EUR GERMAN POSTAL PENSIONS SEC 3.75000% 05-18.01.21 5 300 000.00 6 396 517.00 1.43EUR GERMANY, REPUBLIC OF 1.50000% 13-15.02.23 4 600 000.00 5 132 220.00 1.15EUR GERMANY, REPUBLIC OF 4.75000% 98-04.07.28 2 992 000.00 4 713 148.00 1.05EUR GERMANY, REPUBLIC OF 5.50000% 00-04.01.31 5 700 000.00 10 122 288.00 2.26EUR GERMANY, REPUBLIC OF 4.00000% 05-04.01.37 3 600 000.00 6 171 480.00 1.38EUR GERMANY, REPUBLIC OF 4.25000% 07-04.07.39 4 700 000.00 8 649 269.00 1.93EUR GERMANY, REPUBLIC OF 2.50000% 12-04.07.44 4 183 000.00 6 349 794.00 1.42EUR GERMANY, REPUBLIC OF 0.75000% 12-24.02.17 500 000.00 509 475.00 0.11EUR IRELAND, REPUBLIC OF 4.50000% 04-18.04.20 2 400 000.00 2 913 000.00 0.65EUR IRELAND, REPUBLIC OF 5.50000% 12-18.10.17 2 400 000.00 2 738 280.00 0.61EUR ITALY, REPUBLIC OF 3.75000% 06-01.08.21 8 750 000.00 10 316 687.50 2.30EUR ITALY, REPUBLIC OF 4.50000% 08-01.03.19 6 000 000.00 6 955 500.00 1.55EUR ITALY, REPUBLIC OF BTP 3.75000% 10-01.03.21 1 700 000.00 1 995 545.00 0.45EUR ITALY, REPUBLIC OF-BTP 4.00000% 05-01.02.37 8 000 000.00 10 865 600.00 2.43EUR ITALY, REPUBLIC OF-BTP 4.75000% 08-01.08.23 6 900 000.00 8 903 760.00 1.99EUR ITALY, REPUBLIC OF-BTP 5.50000% 12-01.09.22 700 000.00 924 000.00 0.21EUR ITALY, REPUBLIC OF-BTP-144A-REG-S 3.250% 14-01.09.46 1 941 000.00 2 457 208.95 0.55EUR KREDITANSTALT FUER WIEDERAUFBAU 0.87500% 12-13.10.17 11 000 000.00 11 277 640.00 2.52EUR MEDIOBANCA SPA-REG-S 1.12500% 14-17.06.19 1 300 000.00 1 351 207.00 0.30EUR NETHERLANDS, KINGDOM OF THE 5.50000% 98-15.01.28 2 214 253.00 3 613 306.62 0.81EUR NETHERLANDS, KINGDOM OF THE 3.25000% 11-15.07.21 11 500 000.00 13 817 825.00 3.08EUR NORDRHEIN-WESTFALEN, STATE OF 3.75000% 05-03.03.17 4 200 000.00 4 506 180.00 1.01EUR PETROBRAS GLOBAL FINANCE BV 3.75000% 14-14.01.21 2 100 000.00 1 843 821.00 0.41EUR RABOBANK NEDERLAND NV-SUB 3.87500% 13-25.07.23 3 000 000.00 3 519 480.00 0.79EUR ROYAL BANK OF CANADA-REG-S 1.25000% 13-29.10.18 2 600 000.00 2 706 184.00 0.60EUR SPAIN, KINGDOM OF 4.90000% 07-30.07.40 5 700 000.00 9 075 597.00 2.03EUR SPAIN, KINGDOM OF 4.10000% 08-30.07.18 4 500 000.00 5 065 335.00 1.13EUR SPAIN, KINGDOM OF 4.00000% 10-30.04.20 9 600 000.00 11 237 760.00 2.51EUR SPAIN, KINGDOM OF 5.50000% 02-30.07.17 4 000 000.00 4 495 800.00 1.00EUR SPAIN, KINGDOM OF-144A-REG-S 3.80000% 14-30.04.24 10 600 000.00 13 016 270.00 2.91Total EUR 252 255 002.07 56.32
Total Bonds, fixed rate 252 255 002.07 56.32
Bonds, zero coupon
EUR
EUR ITALY, REPUBLIC OF 0.00000% 14-30.08.16 4 500 000.00 4 491 945.00 1.00Total EUR 4 491 945.00 1.00
Total Bonds, zero coupon 4 491 945.00 1.00
Bonds, floating rate
EUR
EUR CITIGROUP INC-SUB 4.750%/3M EURIBOR+140BP 04-10.02.19 2 500 000.00 2 499 575.00 0.56EUR GDF SUEZ-SUB 3.875%/VAR 13-PRP 1 300 000.00 1 379 950.00 0.31EUR JPMORGAN CHASE BANK-SUB 4.37500%/1M EURIBOR+90BP 06-30.11.21 3 500 000.00 3 690 820.00 0.82EUR LAFARGE SA-REG-S 5.000%/RATING LINKED 10-13.04.18 450 000.00 509 656.50 0.11EUR ORIGIN ENERGY FINANCE LTD-REG-S-SUB 4.000%/VAR 14-16.09.74 1 200 000.00 1 151 808.00 0.26EUR RWE AG-SUB 4.625%/VAR 10-PRP 1 800 000.00 1 821 960.00 0.41EUR SIEMENS FINANCIERING-SUB 5.250%/3M EURIBOR+225BP 06-14.09.66 1 350 000.00 1 432 323.00 0.32Total EUR 12 486 092.50 2.79
Total Bonds, floating rate 12 486 092.50 2.79
Total Transferable securities and money market instruments listed on an official stock exchange 436 183 476.37 97.39
UCITS/Other UCIs in accordance with Article 41 (1) e) of the amended Luxembourg law of 17 December 2010
Investment certificates, open end
Luxembourg
EUR UBS (LUX) BOND SICAV - EUR INFLATION-LINKED (EUR) U-X-ACC 378.11 4 919 376.69 1.10Total Luxembourg 4 919 376.69 1.10
Total Investment certificates, open end 4 919 376.69 1.10
Total UCITS/Other UCIs in accordance with Article 41 (1) e) of the amended Luxembourg law of 17 December 2010 4 919 376.69 1.10
Total investments in securities 441 102 853.06 98.49
Description Quantity/ Valuation in EUR as a % Nominal Unrealized gain of net (loss) on Futures/ assets Options/Forward Exchange Contracts/ Swaps (Note 1)

44 The notes are an integral part of the fi nancial statements.
UBS (Lux) Bond Fund – EURAnnual Report as of 31 March 2015
Derivative instruments
Derivative instruments listed on an official stock exchange
Financial Futures on bonds
EUR EURO-BUND FUTURE 08.06.15 -69.00 -2 730.00 0.00EUR EURO-BUXL FUTURE 08.06.15 -41.00 -460 020.00 -0.10EUR EURO-BOBL FUTURE 08.06.15 -124.00 -33 360.00 -0.01EUR EURO BTP ITALY GOVERMENT FUTURE 08.06.15 88.00 11 616.00 0.00Total Financial Futures on bonds -484 494.00 -0.11
Total Derivative instruments listed on an official stock exchange -484 494.00 -0.11
Total Derivative instruments -484 494.00 -0.11
Cash at banks, deposits on demand and deposit accounts and other liquid assets 6 674 121.94 1.49Other assets and liabilities 578 750.56 0.13
Total net assets 447 871 231.56 100.00
Description Quantity/ Valuation in EUR as a % Nominal Unrealized gain of net (loss) on Futures/ assets Options/Forward Exchange Contracts/ Swaps (Note 1)

The notes are an integral part of the fi nancial statements. 45
UBS (Lux) Bond Fund – Euro High Yield (EUR)Annual Report as of 31 March 2015
UBS (Lux) Bond Fund – Euro High Yield (EUR)
Three-year comparison
ISIN 31.3.2015 31.3.2014 31.3.2013Net assets in EUR 5 761 737 193.69 3 169 958 488.07 899 218 946.45Class (AUD hedged) P-mdist1 LU0945635778Units outstanding 4 229 217.5600 1 484 757.7660 -Net asset value per unit in AUD 102.62 105.00 -Issue and redemption price per unit in AUD2 102.62 105.00 -Class (CAD hedged) P-mdist1 LU0945635851Units outstanding 938 283.2970 574 638.3080 -Net asset value per unit in CAD 102.84 105.37 -Issue and redemption price per unit in CAD2 102.84 105.37 -Class (CHF hedged) P-acc LU0776290842Units outstanding 267 187.8370 175 811.2360 145 963.1570Net asset value per unit in CHF 136.59 132.02 119.30Issue and redemption price per unit in CHF2 136.59 132.02 119.30Class (GBP hedged) P-mdist3 LU0997192736Units outstanding 363 564.4610 73 458.4890 -Net asset value per unit in GBP 98.81 101.75 -Issue and redemption price per unit in GBP2 98.81 101.75 -Class (HKD hedged) K-1-acc4 LU1023284265Units outstanding - 4.0000 -Net asset value per unit in HKD - 40 588 846.29 -Issue and redemption price per unit in HKD2 - 40 588 846.29 -Class (HKD hedged) P-mdist5 LU0973218331Units outstanding 1 648 901.0740 726 749.9240 -Net asset value per unit in HKD 1 000.30 1 029.90 -Issue and redemption price per unit in HKD2 1 000.30 1 029.90 -Class (RMB hedged) K-1-acc6 LU1004765415Units outstanding - 2.1000 -Net asset value per unit in CNH - 35 846 747.82 -Issue and redemption price per unit in CNH2 - 35 846 747.82 -Class (RMB hedged) K-1-mdist7 LU1030385881Units outstanding 4.1000 1.8000 -Net asset value per unit in CNH 35 110 831.26 35 274 622.37 -Issue and redemption price per unit in CNH2 35 110 831.26 35 274 622.37 -Class (RMB hedged) P-mdist8 LU0968750884Units outstanding 1 044 694.3200 1 051 695.8800 -Net asset value per unit in CNH 1 025.96 1 036.06 -Issue and redemption price per unit in CNH2 1 025.96 1 036.06 -Class (SGD hedged) P-mdist9 LU0989134753Units outstanding 4 997 588.2970 1 562 948.5980 -Net asset value per unit in SGD 99.36 101.94 -Issue and redemption price per unit in SGD2 99.36 101.94 -Class (USD hedged) K-1-acc10 LU1004765761Units outstanding 4.0000 5.4000 -Net asset value per unit in USD 5 332 152.82 5 100 658.07 -Issue and redemption price per unit in USD2 5 332 152.82 5 100 658.07 -Class (USD hedged) P-acc11 LU0994471687Units outstanding 1 584 660.5300 713 133.1320 -Net asset value per unit in USD 107.86 103.77 -Issue and redemption price per unit in USD2 107.86 103.77 -
1 First NAV: 9.7.2013 2 See note 1 3 First NAV: 16.12.2013 4 For the period from 18.2.2014 to 1.12.2014 the unit class (HKD hedged) K-1-acc was in circulation 5 First NAV: 11.10.2013 6 For the period from 16.1.2014 to 10.10.2014 the unit class (RMB hedged) K-1-acc was in circulation 7 First NAV: 20.2.2014 8 First NAV: 1.10.2013 9 First NAV: 20.11.201310 First NAV: 17.1.201411 First NAV: 27.11.2013
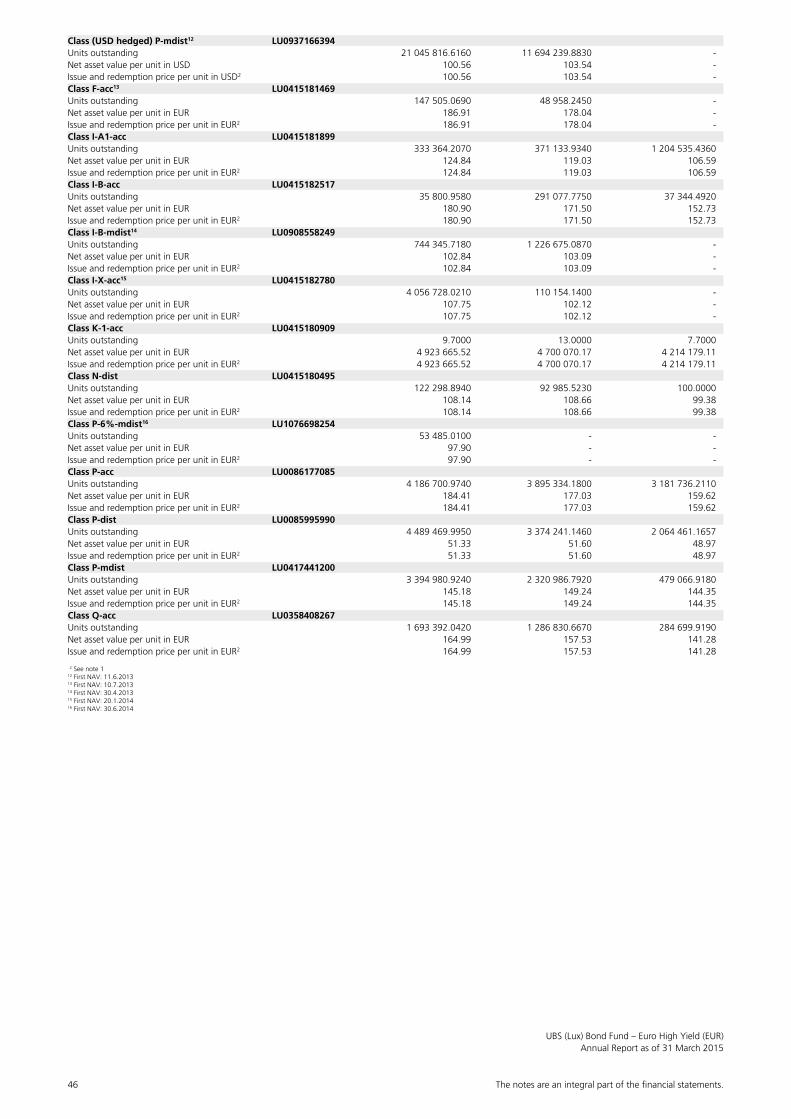
46 The notes are an integral part of the fi nancial statements.
UBS (Lux) Bond Fund – Euro High Yield (EUR)Annual Report as of 31 March 2015
Class (USD hedged) P-mdist12 LU0937166394Units outstanding 21 045 816.6160 11 694 239.8830 -Net asset value per unit in USD 100.56 103.54 -Issue and redemption price per unit in USD2 100.56 103.54 -Class F-acc13 LU0415181469Units outstanding 147 505.0690 48 958.2450 -Net asset value per unit in EUR 186.91 178.04 -Issue and redemption price per unit in EUR2 186.91 178.04 -Class I-A1-acc LU0415181899Units outstanding 333 364.2070 371 133.9340 1 204 535.4360Net asset value per unit in EUR 124.84 119.03 106.59Issue and redemption price per unit in EUR2 124.84 119.03 106.59Class I-B-acc LU0415182517Units outstanding 35 800.9580 291 077.7750 37 344.4920Net asset value per unit in EUR 180.90 171.50 152.73Issue and redemption price per unit in EUR2 180.90 171.50 152.73Class I-B-mdist14 LU0908558249Units outstanding 744 345.7180 1 226 675.0870 -Net asset value per unit in EUR 102.84 103.09 -Issue and redemption price per unit in EUR2 102.84 103.09 -Class I-X-acc15 LU0415182780Units outstanding 4 056 728.0210 110 154.1400 -Net asset value per unit in EUR 107.75 102.12 -Issue and redemption price per unit in EUR2 107.75 102.12 -Class K-1-acc LU0415180909Units outstanding 9.7000 13.0000 7.7000Net asset value per unit in EUR 4 923 665.52 4 700 070.17 4 214 179.11Issue and redemption price per unit in EUR2 4 923 665.52 4 700 070.17 4 214 179.11Class N-dist LU0415180495Units outstanding 122 298.8940 92 985.5230 100.0000Net asset value per unit in EUR 108.14 108.66 99.38Issue and redemption price per unit in EUR2 108.14 108.66 99.38Class P-6%-mdist16 LU1076698254Units outstanding 53 485.0100 - -Net asset value per unit in EUR 97.90 - -Issue and redemption price per unit in EUR2 97.90 - -Class P-acc LU0086177085Units outstanding 4 186 700.9740 3 895 334.1800 3 181 736.2110Net asset value per unit in EUR 184.41 177.03 159.62Issue and redemption price per unit in EUR2 184.41 177.03 159.62Class P-dist LU0085995990Units outstanding 4 489 469.9950 3 374 241.1460 2 064 461.1657Net asset value per unit in EUR 51.33 51.60 48.97Issue and redemption price per unit in EUR2 51.33 51.60 48.97Class P-mdist LU0417441200Units outstanding 3 394 980.9240 2 320 986.7920 479 066.9180Net asset value per unit in EUR 145.18 149.24 144.35Issue and redemption price per unit in EUR2 145.18 149.24 144.35Class Q-acc LU0358408267Units outstanding 1 693 392.0420 1 286 830.6670 284 699.9190Net asset value per unit in EUR 164.99 157.53 141.28Issue and redemption price per unit in EUR2 164.99 157.53 141.28
2 See note 112 First NAV: 11.6.201313 First NAV: 10.7.201314 First NAV: 30.4.201315 First NAV: 20.1.201416 First NAV: 30.6.2014
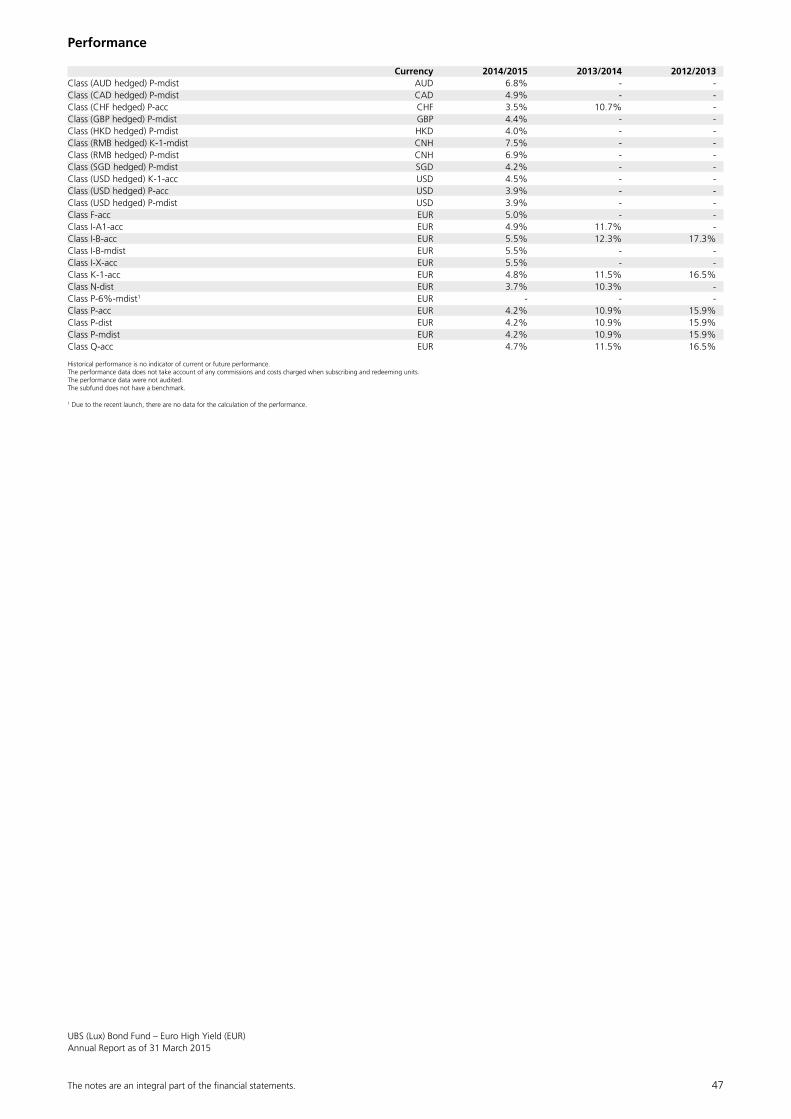
The notes are an integral part of the fi nancial statements. 47
UBS (Lux) Bond Fund – Euro High Yield (EUR)Annual Report as of 31 March 2015
Performance
Currency 2014/2015 2013/2014 2012/2013Class (AUD hedged) P-mdist AUD 6.8% - -Class (CAD hedged) P-mdist CAD 4.9% - -Class (CHF hedged) P-acc CHF 3.5% 10.7% -Class (GBP hedged) P-mdist GBP 4.4% - -Class (HKD hedged) P-mdist HKD 4.0% - -Class (RMB hedged) K-1-mdist CNH 7.5% - -Class (RMB hedged) P-mdist CNH 6.9% - -Class (SGD hedged) P-mdist SGD 4.2% - -Class (USD hedged) K-1-acc USD 4.5% - -Class (USD hedged) P-acc USD 3.9% - -Class (USD hedged) P-mdist USD 3.9% - -Class F-acc EUR 5.0% - -Class I-A1-acc EUR 4.9% 11.7% -Class I-B-acc EUR 5.5% 12.3% 17.3%Class I-B-mdist EUR 5.5% - -Class I-X-acc EUR 5.5% - -Class K-1-acc EUR 4.8% 11.5% 16.5%Class N-dist EUR 3.7% 10.3% -Class P-6%-mdist1 EUR - - -Class P-acc EUR 4.2% 10.9% 15.9%Class P-dist EUR 4.2% 10.9% 15.9%Class P-mdist EUR 4.2% 10.9% 15.9%Class Q-acc EUR 4.7% 11.5% 16.5%
Historical performance is no indicator of current or future performance.The performance data does not take account of any commissions and costs charged when subscribing and redeeming units.The performance data were not audited.The subfund does not have a benchmark.
1 Due to the recent launch, there are no data for the calculation of the performance.

48 The notes are an integral part of the fi nancial statements.
UBS (Lux) Bond Fund – Euro High Yield (EUR)Annual Report as of 31 March 2015
Report of the Portfolio Manager
In the reporting year, from 1 April 2014 to 31 March 2015, the market generated strong positive returns against the backdrop of the ECB continuing to provide stimulus measures. Industry performance was almost positive across all sectors with BB and B-rated bonds outperforming CCC and below rated bonds. Through the year new issuance remained strong as we saw more issuers coming to the market to take advantage of low funding rates.
The subfund posted a positive return in the reporting year. This can largely be attributed to our allocation in Banks and our preference for Retail and Insurance. Throughout the period we maintained a resistance to Metals & Mining and Steels, based on valuation con-cerns, particularly when we consider the high leverage and excess capacity in these sectors. We also remained reluctant in BB-rated bonds and kept our preference in B-rated bonds.
Structure of the Securities Portfolio
Geographical Breakdown as a % of net assetsNetherlands 14.05United Kingdom 13.56Luxembourg 13.34France 10.92Italy 9.21Germany 7.22United States 5.68Ireland 3.35Spain 3.08Jersey 2.21Switzerland 1.72Sweden 1.41Portugal 1.04Austria 0.85Cayman Islands 0.73Canada 0.50Denmark 0.41Croatia 0.39Mexico 0.24Norway 0.23Poland 0.21Australia 0.16Czech Republic 0.15Belgium 0.14Finland 0.09Hungary 0.09Brazil 0.06Japan 0.04Total 91.08
Economic Breakdown as a % of net assetsFinance & holding companies 28.76Banks & credit institutions 15.39Telecommunications 9.11Miscellaneous unclassified companies 6.57Miscellaneous services 4.42Energy & water supply 2.71Insurance 2.66Chemicals 2.30Building industry & materials 2.14Mining, coal & steel 1.99Petroleum 1.54Healthcare & social services 1.42Mortgage & funding institutions 1.31Traffic & transportation 1.23Food & soft drinks 1.17Vehicles 1.06Packaging industry 0.98Real Estate 0.83Internet, software & IT services 0.78Lodging, catering & leisure 0.78Retail trade, department stores 0.67Electrical devices & components 0.65Aerospace industry 0.54Computer hardware & network equipment providers 0.47Pharmaceuticals, cosmetics & medical products 0.40Miscellaneous trading companies 0.40Non-ferrous metals 0.26Forestry, paper & pulp products 0.19Textiles, garments & leather goods 0.18Mechanical engineering & industrial equipment 0.13Miscellaneous consumer goods 0.04Total 91.08

The notes are an integral part of the fi nancial statements. 49
UBS (Lux) Bond Fund – Euro High Yield (EUR)Annual Report as of 31 March 2015
Statement of Net Assets EURAssets 31.3.2015Investments in securities, cost 5 011 226 034.90Investments in securities, unrealized appreciation (depreciation) 236 537 797.19Total investments in securities (Note 1) 5 247 763 832.09Cash at banks, deposits on demand and deposit accounts 343 546 513.01Receivable on securities sales (Note 1) 20 364 892.07Receivable on subscriptions 52 381 055.23Interest receivable on securities 85 817 591.86Unrealized gain (loss) on forward foreign exchange contracts (Note 1) 155 908 984.65Unrealized gain (loss) on swaps (Note 1) 253 403.50Total Assets 5 906 036 272.41
LiabilitiesPayable on securities purchases (Note 1) -123 052 792.82Payable on redemptions -17 827 503.56Provisions for flat fee (Note 2) -2 757 498.00Provisions for taxe d’abonnement (Note 3) -661 284.34Total provisions -3 418 782.34Total Liabilities -144 299 078.72
Net assets at the end of the financial year 5 761 737 193.69
Statement of Operations EURIncome 1.4.2014-31.3.2015Interest on liquid assets 127 295.69Interest on securities 254 169 105.77Interest received on swaps (Note 1) 1 751 023.91Income on securities lending (Note 14) 4 469 117.57Other income 1 985 133.25Total income 262 501 676.19
ExpensesInterest paid on swaps (Note 1) -197 375.37Cost on securities lending (Note 14) -1 787 646.92Flat fee (Note 2) -55 168 897.11Taxe d’abonnement (Note 3) -2 413 978.49Interest on cash and bank overdraft -1 504.09Total expenses -59 569 401.98
Net income (loss) on investments 202 932 274.21
Realized gain (loss) (Note 1)Realized gain (loss) on market-priced securities without options 18 050 721.05Realized gain (loss) on options -482 563.19Realized gain (loss) on yield-evaluated securities and money market instruments 900 913.89Realized gain (loss) on forward foreign exchange contracts 343 659 841.20Realized gain (loss) on swaps -120 369.56Realized result on subscriptions/redemptions (Note 5) 2 294 699.92Total realized gain (loss) on investments 364 303 243.31Realized gain (loss) on foreign exchange 20 643 526.19Total realized gain (loss) 384 946 769.50
Net realized gain (loss) of the financial year 587 879 043.71
Changes in unrealized appreciation (depreciation) (Note 1)Unrealized appreciation (depreciation) on market-priced securities without options 121 011 520.43Unrealized appreciation (depreciation) on yield-evaluated securities and money market instruments -68 640.86Unrealized appreciation (depreciation) on forward foreign exchange contracts 148 391 823.26Unrealized appreciation (depreciation) on swaps 253 403.50Total changes in unrealized appreciation (depreciation) 269 588 106.33
Net increase (decrease) in net assets as a result of operations 857 467 150.04

50 The notes are an integral part of the fi nancial statements.
UBS (Lux) Bond Fund – Euro High Yield (EUR)Annual Report as of 31 March 2015
Statement of Changes in Net Assets EUR 1.4.2014-31.3.2015Net assets at the beginning of the financial year 3 169 958 488.07Subscriptions 4 809 118 338.97Redemptions -2 838 621 827.03Total net subscriptions (redemptions) 1 970 496 511.94Dividend paid -236 184 956.36Net income (loss) on investments 202 932 274.21Total realized gain (loss) 384 946 769.50Total changes in unrealized appreciation (depreciation) 269 588 106.33Net increase (decrease) in net assets as a result of operations 857 467 150.04Net assets at the end of the financial year 5 761 737 193.69
Development of the outstanding units
1.4.2014-31.3.2015Class (AUD hedged) P-mdistNumber of units outstanding at the beginning of the financial year 1 484 757.7660Number of units issued 4 231 238.3180Number of units redeemed -1 486 778.5240Number of units outstanding at the end of the financial year 4 229 217.5600Class (CAD hedged) P-mdistNumber of units outstanding at the beginning of the financial year 574 638.3080Number of units issued 582 868.2070Number of units redeemed -219 223.2180Number of units outstanding at the end of the financial year 938 283.2970Class (CHF hedged) P-accNumber of units outstanding at the beginning of the financial year 175 811.2360Number of units issued 191 862.7810Number of units redeemed -100 486.1800Number of units outstanding at the end of the financial year 267 187.8370Class (GBP hedged) P-mdistNumber of units outstanding at the beginning of the financial year 73 458.4890Number of units issued 332 373.3090Number of units redeemed -42 267.3370Number of units outstanding at the end of the financial year 363 564.4610Class (HKD hedged) K-1-accNumber of units outstanding at the beginning of the financial year 4.0000Number of units issued 1.3000Number of units redeemed -5.3000Number of units outstanding at the end of the financial year 0.0000Class (HKD hedged) P-mdistNumber of units outstanding at the beginning of the financial year 726 749.9240Number of units issued 1 500 261.2100Number of units redeemed -578 110.0600Number of units outstanding at the end of the financial year 1 648 901.0740Class (RMB hedged) K-1-accNumber of units outstanding at the beginning of the financial year 2.1000Number of units issued 0.0000Number of units redeemed -2.1000Number of units outstanding at the end of the financial year 0.0000Class (RMB hedged) K-1-mdistNumber of units outstanding at the beginning of the financial year 1.8000Number of units issued 2.3000Number of units redeemed 0.0000Number of units outstanding at the end of the financial year 4.1000Class (RMB hedged) P-mdistNumber of units outstanding at the beginning of the financial year 1 051 695.8800Number of units issued 779 208.0400Number of units redeemed -786 209.6000Number of units outstanding at the end of the financial year 1 044 694.3200Class (SGD hedged) P-mdistNumber of units outstanding at the beginning of the financial year 1 562 948.5980Number of units issued 4 878 494.7890Number of units redeemed -1 443 855.0900Number of units outstanding at the end of the financial year 4 997 588.2970Class (USD hedged) K-1-accNumber of units outstanding at the beginning of the financial year 5.4000Number of units issued 4.2000Number of units redeemed -5.6000Number of units outstanding at the end of the financial year 4.0000Class (USD hedged) P-accNumber of units outstanding at the beginning of the financial year 713 133.1320Number of units issued 1 793 022.1540Number of units redeemed -921 494.7560Number of units outstanding at the end of the financial year 1 584 660.5300

The notes are an integral part of the fi nancial statements. 51
UBS (Lux) Bond Fund – Euro High Yield (EUR)Annual Report as of 31 March 2015
Class (USD hedged) P-mdistNumber of units outstanding at the beginning of the financial year 11 694 239.8830Number of units issued 20 299 394.1630Number of units redeemed -10 947 817.4300Number of units outstanding at the end of the financial year 21 045 816.6160Class F-accNumber of units outstanding at the beginning of the financial year 48 958.2450Number of units issued 133 536.6930Number of units redeemed -34 989.8690Number of units outstanding at the end of the financial year 147 505.0690Class I-A1-accNumber of units outstanding at the beginning of the financial year 371 133.9340Number of units issued 303 425.0320Number of units redeemed -341 194.7590Number of units outstanding at the end of the financial year 333 364.2070Class I-B-accNumber of units outstanding at the beginning of the financial year 291 077.7750Number of units issued 78 037.8260Number of units redeemed -333 314.6430Number of units outstanding at the end of the financial year 35 800.9580Class I-B-mdistNumber of units outstanding at the beginning of the financial year 1 226 675.0870Number of units issued 29 254.0220Number of units redeemed -511 583.3910Number of units outstanding at the end of the financial year 744 345.7180Class I-X-accNumber of units outstanding at the beginning of the financial year 110 154.1400Number of units issued 5 431 746.7950Number of units redeemed -1 485 172.9140Number of units outstanding at the end of the financial year 4 056 728.0210Class K-1-accNumber of units outstanding at the beginning of the financial year 13.0000Number of units issued 2.2000Number of units redeemed -5.5000Number of units outstanding at the end of the financial year 9.7000Class N-distNumber of units outstanding at the beginning of the financial year 92 985.5230Number of units issued 58 685.7560Number of units redeemed -29 372.3850Number of units outstanding at the end of the financial year 122 298.8940Class P-6%-mdistNumber of units outstanding at the beginning of the financial year 0.0000Number of units issued 55 394.4540Number of units redeemed -1 909.4440Number of units outstanding at the end of the financial year 53 485.0100Class P-accNumber of units outstanding at the beginning of the financial year 3 895 334.1800Number of units issued 3 629 635.2760Number of units redeemed -3 338 268.4820Number of units outstanding at the end of the financial year 4 186 700.9740Class P-distNumber of units outstanding at the beginning of the financial year 3 374 241.1460Number of units issued 2 540 850.6870Number of units redeemed -1 425 621.8380Number of units outstanding at the end of the financial year 4 489 469.9950Class P-mdistNumber of units outstanding at the beginning of the financial year 2 320 986.7920Number of units issued 2 818 277.8430Number of units redeemed -1 744 283.7110Number of units outstanding at the end of the financial year 3 394 980.9240Class Q-accNumber of units outstanding at the beginning of the financial year 1 286 830.6670Number of units issued 1 291 406.9110Number of units redeemed -884 845.5360Number of units outstanding at the end of the financial year 1 693 392.0420
Annual Distribution
UBS (Lux) Bond Fund Ex-Date Pay-Date Currency Amount per unit– Euro High Yield (EUR) N-dist 2.6.2014 5.6.2014 EUR 4.40– Euro High Yield (EUR) P-dist 2.6.2014 5.6.2014 EUR 2.36

52 The notes are an integral part of the fi nancial statements.
UBS (Lux) Bond Fund – Euro High Yield (EUR)Annual Report as of 31 March 2015
Monthly Distribution
UBS (Lux) Bond Fund Ex-Date Pay-Date Currency Amount per unit– Euro High Yield (EUR) (AUD hedged) P-mdist 15.4.2014 22.4.2014 AUD 0.81– Euro High Yield (EUR) (AUD hedged) P-mdist 15.5.2014 20.5.2014 AUD 0.81– Euro High Yield (EUR) (AUD hedged) P-mdist 16.6.2014 19.6.2014 AUD 0.81– Euro High Yield (EUR) (AUD hedged) P-mdist 15.7.2014 18.7.2014 AUD 0.81– Euro High Yield (EUR) (AUD hedged) P-mdist 18.8.2014 21.8.2014 AUD 0.81– Euro High Yield (EUR) (AUD hedged) P-mdist 15.9.2014 18.9.2014 AUD 0.81– Euro High Yield (EUR) (AUD hedged) P-mdist 15.10.2014 20.10.2014 AUD 0.72– Euro High Yield (EUR) (AUD hedged) P-mdist 17.11.2014 20.11.2014 AUD 0.72– Euro High Yield (EUR) (AUD hedged) P-mdist 15.12.2014 18.12.2014 AUD 0.72– Euro High Yield (EUR) (AUD hedged) P-mdist 15.1.2015 20.1.2015 AUD 0.72– Euro High Yield (EUR) (AUD hedged) P-mdist 18.2.2015 25.2.2015 AUD 0.72– Euro High Yield (EUR) (AUD hedged) P-mdist 16.3.2015 19.3.2015 AUD 0.72– Euro High Yield (EUR) (CAD hedged) P-mdist 15.4.2014 22.4.2014 CAD 0.65– Euro High Yield (EUR) (CAD hedged) P-mdist 15.5.2014 20.5.2014 CAD 0.65– Euro High Yield (EUR) (CAD hedged) P-mdist 16.6.2014 19.6.2014 CAD 0.65– Euro High Yield (EUR) (CAD hedged) P-mdist 15.7.2014 18.7.2014 CAD 0.65– Euro High Yield (EUR) (CAD hedged) P-mdist 18.8.2014 21.8.2014 CAD 0.65– Euro High Yield (EUR) (CAD hedged) P-mdist 15.9.2014 18.9.2014 CAD 0.65– Euro High Yield (EUR) (CAD hedged) P-mdist 15.10.2014 20.10.2014 CAD 0.60– Euro High Yield (EUR) (CAD hedged) P-mdist 17.11.2014 20.11.2014 CAD 0.60– Euro High Yield (EUR) (CAD hedged) P-mdist 15.12.2014 18.12.2014 CAD 0.60– Euro High Yield (EUR) (CAD hedged) P-mdist 15.1.2015 20.1.2015 CAD 0.60– Euro High Yield (EUR) (CAD hedged) P-mdist 18.2.2015 25.2.2015 CAD 0.60– Euro High Yield (EUR) (CAD hedged) P-mdist 16.3.2015 19.3.2015 CAD 0.60– Euro High Yield (EUR) (GBP hedged) P-mdist 15.4.2014 22.4.2014 GBP 0.62– Euro High Yield (EUR) (GBP hedged) P-mdist 15.5.2014 20.5.2014 GBP 0.62– Euro High Yield (EUR) (GBP hedged) P-mdist 16.6.2014 19.6.2014 GBP 0.62– Euro High Yield (EUR) (GBP hedged) P-mdist 15.7.2014 18.7.2014 GBP 0.62– Euro High Yield (EUR) (GBP hedged) P-mdist 18.8.2014 21.8.2014 GBP 0.62– Euro High Yield (EUR) (GBP hedged) P-mdist 15.9.2014 18.9.2014 GBP 0.62– Euro High Yield (EUR) (GBP hedged) P-mdist 15.10.2014 20.10.2014 GBP 0.58– Euro High Yield (EUR) (GBP hedged) P-mdist 17.11.2014 20.11.2014 GBP 0.58– Euro High Yield (EUR) (GBP hedged) P-mdist 15.12.2014 18.12.2014 GBP 0.58– Euro High Yield (EUR) (GBP hedged) P-mdist 15.1.2015 20.1.2015 GBP 0.58– Euro High Yield (EUR) (GBP hedged) P-mdist 18.2.2015 25.2.2015 GBP 0.58– Euro High Yield (EUR) (GBP hedged) P-mdist 16.3.2015 19.3.2015 GBP 0.58– Euro High Yield (EUR) (HKD hedged) P-mdist 15.4.2014 22.4.2014 HKD 5.97– Euro High Yield (EUR) (HKD hedged) P-mdist 15.5.2014 20.5.2014 HKD 5.97– Euro High Yield (EUR) (HKD hedged) P-mdist 16.6.2014 19.6.2014 HKD 5.97– Euro High Yield (EUR) (HKD hedged) P-mdist 15.7.2014 18.7.2014 HKD 5.97– Euro High Yield (EUR) (HKD hedged) P-mdist 18.8.2014 21.8.2014 HKD 5.97– Euro High Yield (EUR) (HKD hedged) P-mdist 15.9.2014 18.9.2014 HKD 5.97– Euro High Yield (EUR) (HKD hedged) P-mdist 15.10.2014 20.10.2014 HKD 5.48– Euro High Yield (EUR) (HKD hedged) P-mdist 17.11.2014 20.11.2014 HKD 5.48– Euro High Yield (EUR) (HKD hedged) P-mdist 15.12.2014 18.12.2014 HKD 5.48– Euro High Yield (EUR) (HKD hedged) P-mdist 15.1.2015 20.1.2015 HKD 5.48– Euro High Yield (EUR) (HKD hedged) P-mdist 18.2.2015 25.2.2015 HKD 5.48– Euro High Yield (EUR) (HKD hedged) P-mdist 16.3.2015 19.3.2015 HKD 5.48– Euro High Yield (EUR) (RMB hedged) K-1-mdist 15.4.2014 22.4.2014 CNH 232 690.54– Euro High Yield (EUR) (RMB hedged) K-1-mdist 15.5.2014 20.5.2014 CNH 232 690.54– Euro High Yield (EUR) (RMB hedged) K-1-mdist 16.6.2014 19.6.2014 CNH 232 690.54– Euro High Yield (EUR) (RMB hedged) K-1-mdist 15.7.2014 18.7.2014 CNH 232 690.54– Euro High Yield (EUR) (RMB hedged) K-1-mdist 18.8.2014 21.8.2014 CNH 232 690.54– Euro High Yield (EUR) (RMB hedged) K-1-mdist 15.9.2014 18.9.2014 CNH 232 690.54– Euro High Yield (EUR) (RMB hedged) K-1-mdist 15.10.2014 20.10.2014 CNH 216 066.19– Euro High Yield (EUR) (RMB hedged) K-1-mdist 17.11.2014 20.11.2014 CNH 216 066.19– Euro High Yield (EUR) (RMB hedged) K-1-mdist 15.12.2014 18.12.2014 CNH 216 066.19– Euro High Yield (EUR) (RMB hedged) K-1-mdist 15.1.2015 20.1.2015 CNH 216 066.19– Euro High Yield (EUR) (RMB hedged) K-1-mdist 18.2.2015 25.2.2015 CNH 216 066.19– Euro High Yield (EUR) (RMB hedged) K-1-mdist 16.3.2015 19.3.2015 CNH 216 066.19– Euro High Yield (EUR) (RMB hedged) P-mdist 15.4.2014 22.4.2014 CNH 6.83– Euro High Yield (EUR) (RMB hedged) P-mdist 15.5.2014 20.5.2014 CNH 6.83– Euro High Yield (EUR) (RMB hedged) P-mdist 16.6.2014 19.6.2014 CNH 6.83– Euro High Yield (EUR) (RMB hedged) P-mdist 15.7.2014 18.7.2014 CNH 6.83– Euro High Yield (EUR) (RMB hedged) P-mdist 18.8.2014 21.8.2014 CNH 6.83– Euro High Yield (EUR) (RMB hedged) P-mdist 15.9.2014 18.9.2014 CNH 6.83– Euro High Yield (EUR) (RMB hedged) P-mdist 15.10.2014 20.10.2014 CNH 6.25– Euro High Yield (EUR) (RMB hedged) P-mdist 17.11.2014 20.11.2014 CNH 6.25– Euro High Yield (EUR) (RMB hedged) P-mdist 15.12.2014 18.12.2014 CNH 6.25– Euro High Yield (EUR) (RMB hedged) P-mdist 15.1.2015 20.1.2015 CNH 6.25– Euro High Yield (EUR) (RMB hedged) P-mdist 18.2.2015 25.2.2015 CNH 6.25– Euro High Yield (EUR) (RMB hedged) P-mdist 16.3.2015 19.3.2015 CNH 6.25– Euro High Yield (EUR) (SGD hedged) P-mdist 15.4.2014 22.4.2014 SGD 0.58– Euro High Yield (EUR) (SGD hedged) P-mdist 15.5.2014 20.5.2014 SGD 0.58– Euro High Yield (EUR) (SGD hedged) P-mdist 16.6.2014 19.6.2014 SGD 0.58– Euro High Yield (EUR) (SGD hedged) P-mdist 15.7.2014 18.7.2014 SGD 0.58– Euro High Yield (EUR) (SGD hedged) P-mdist 18.8.2014 21.8.2014 SGD 0.58– Euro High Yield (EUR) (SGD hedged) P-mdist 15.9.2014 18.9.2014 SGD 0.58
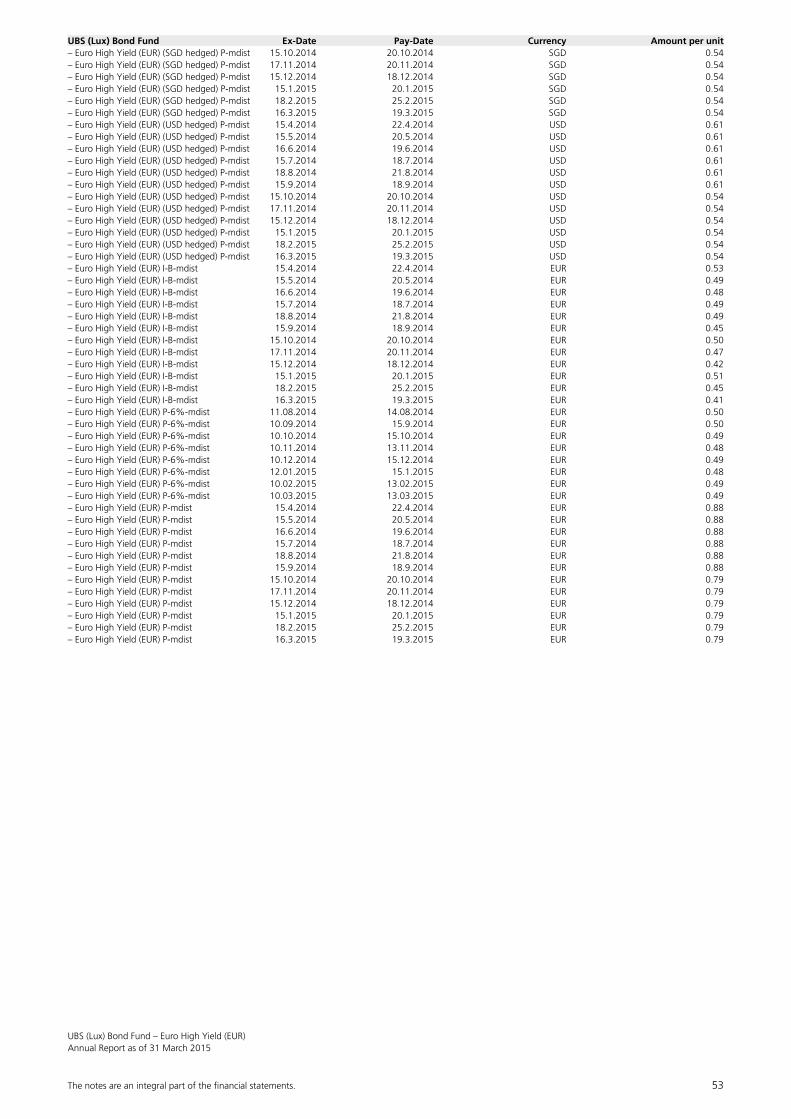
The notes are an integral part of the fi nancial statements. 53
UBS (Lux) Bond Fund – Euro High Yield (EUR)Annual Report as of 31 March 2015
UBS (Lux) Bond Fund Ex-Date Pay-Date Currency Amount per unit– Euro High Yield (EUR) (SGD hedged) P-mdist 15.10.2014 20.10.2014 SGD 0.54– Euro High Yield (EUR) (SGD hedged) P-mdist 17.11.2014 20.11.2014 SGD 0.54– Euro High Yield (EUR) (SGD hedged) P-mdist 15.12.2014 18.12.2014 SGD 0.54– Euro High Yield (EUR) (SGD hedged) P-mdist 15.1.2015 20.1.2015 SGD 0.54– Euro High Yield (EUR) (SGD hedged) P-mdist 18.2.2015 25.2.2015 SGD 0.54– Euro High Yield (EUR) (SGD hedged) P-mdist 16.3.2015 19.3.2015 SGD 0.54– Euro High Yield (EUR) (USD hedged) P-mdist 15.4.2014 22.4.2014 USD 0.61– Euro High Yield (EUR) (USD hedged) P-mdist 15.5.2014 20.5.2014 USD 0.61– Euro High Yield (EUR) (USD hedged) P-mdist 16.6.2014 19.6.2014 USD 0.61– Euro High Yield (EUR) (USD hedged) P-mdist 15.7.2014 18.7.2014 USD 0.61– Euro High Yield (EUR) (USD hedged) P-mdist 18.8.2014 21.8.2014 USD 0.61– Euro High Yield (EUR) (USD hedged) P-mdist 15.9.2014 18.9.2014 USD 0.61– Euro High Yield (EUR) (USD hedged) P-mdist 15.10.2014 20.10.2014 USD 0.54– Euro High Yield (EUR) (USD hedged) P-mdist 17.11.2014 20.11.2014 USD 0.54– Euro High Yield (EUR) (USD hedged) P-mdist 15.12.2014 18.12.2014 USD 0.54– Euro High Yield (EUR) (USD hedged) P-mdist 15.1.2015 20.1.2015 USD 0.54– Euro High Yield (EUR) (USD hedged) P-mdist 18.2.2015 25.2.2015 USD 0.54– Euro High Yield (EUR) (USD hedged) P-mdist 16.3.2015 19.3.2015 USD 0.54– Euro High Yield (EUR) I-B-mdist 15.4.2014 22.4.2014 EUR 0.53– Euro High Yield (EUR) I-B-mdist 15.5.2014 20.5.2014 EUR 0.49– Euro High Yield (EUR) I-B-mdist 16.6.2014 19.6.2014 EUR 0.48– Euro High Yield (EUR) I-B-mdist 15.7.2014 18.7.2014 EUR 0.49– Euro High Yield (EUR) I-B-mdist 18.8.2014 21.8.2014 EUR 0.49– Euro High Yield (EUR) I-B-mdist 15.9.2014 18.9.2014 EUR 0.45– Euro High Yield (EUR) I-B-mdist 15.10.2014 20.10.2014 EUR 0.50– Euro High Yield (EUR) I-B-mdist 17.11.2014 20.11.2014 EUR 0.47– Euro High Yield (EUR) I-B-mdist 15.12.2014 18.12.2014 EUR 0.42– Euro High Yield (EUR) I-B-mdist 15.1.2015 20.1.2015 EUR 0.51– Euro High Yield (EUR) I-B-mdist 18.2.2015 25.2.2015 EUR 0.45– Euro High Yield (EUR) I-B-mdist 16.3.2015 19.3.2015 EUR 0.41– Euro High Yield (EUR) P-6%-mdist 11.08.2014 14.08.2014 EUR 0.50– Euro High Yield (EUR) P-6%-mdist 10.09.2014 15.9.2014 EUR 0.50– Euro High Yield (EUR) P-6%-mdist 10.10.2014 15.10.2014 EUR 0.49– Euro High Yield (EUR) P-6%-mdist 10.11.2014 13.11.2014 EUR 0.48– Euro High Yield (EUR) P-6%-mdist 10.12.2014 15.12.2014 EUR 0.49– Euro High Yield (EUR) P-6%-mdist 12.01.2015 15.1.2015 EUR 0.48– Euro High Yield (EUR) P-6%-mdist 10.02.2015 13.02.2015 EUR 0.49– Euro High Yield (EUR) P-6%-mdist 10.03.2015 13.03.2015 EUR 0.49– Euro High Yield (EUR) P-mdist 15.4.2014 22.4.2014 EUR 0.88– Euro High Yield (EUR) P-mdist 15.5.2014 20.5.2014 EUR 0.88– Euro High Yield (EUR) P-mdist 16.6.2014 19.6.2014 EUR 0.88– Euro High Yield (EUR) P-mdist 15.7.2014 18.7.2014 EUR 0.88– Euro High Yield (EUR) P-mdist 18.8.2014 21.8.2014 EUR 0.88– Euro High Yield (EUR) P-mdist 15.9.2014 18.9.2014 EUR 0.88– Euro High Yield (EUR) P-mdist 15.10.2014 20.10.2014 EUR 0.79– Euro High Yield (EUR) P-mdist 17.11.2014 20.11.2014 EUR 0.79– Euro High Yield (EUR) P-mdist 15.12.2014 18.12.2014 EUR 0.79– Euro High Yield (EUR) P-mdist 15.1.2015 20.1.2015 EUR 0.79– Euro High Yield (EUR) P-mdist 18.2.2015 25.2.2015 EUR 0.79– Euro High Yield (EUR) P-mdist 16.3.2015 19.3.2015 EUR 0.79

54 The notes are an integral part of the fi nancial statements.
UBS (Lux) Bond Fund – Euro High Yield (EUR)Annual Report as of 31 March 2015
Statement of Investments in Securities and other Net Assets as of 31 March 2015
Description Quantity/ Valuation in EUR as a % Nominal Unrealized gain of net (loss) on Futures/ assets Options/Forward Exchange Contracts/ Swaps (Note 1)
Transferable securities and money market instruments listed on an official stock exchange
Notes, fixed rate
AUD
AUD R&R ICE CREAM LTD-REG-S 8.25000% 14-15.05.20 3 650 000.00 2 551 313.74 0.04Total AUD 2 551 313.74 0.04
EUR
EUR ABENGOA GREENFIELD SA-REG-S 5.50000% 14-01.10.19 3 770 000.00 3 487 400.80 0.06EUR ALTICE FINCO SA-REG-S 9.00000% 13-15.06.23 3 430 000.00 3 981 372.50 0.07EUR ARDAGH FINANCE HOLDINGS SA-REG-S 8.37500% 14-15.06.19 7 110 611.00 7 254 174.23 0.13EUR ARDAGH PACKAGING FINANCE PLC-REG-S 9.25000% 10-15.10.20 6 995 000.00 7 496 541.50 0.13EUR ARDAGH PACKAGING FINANCE/MP-REG-S 4.25000% 14-15.01.22 20 030 000.00 20 440 014.10 0.35EUR BAGGOT SECURITIES LTD-REG-S 10.24000% 13-PRP 22 350 000.00 23 460 348.00 0.41EUR CEGEDIM SA-REG-S 6.75000% 13-01.04.20 6 790 000.00 7 378 421.40 0.13EUR CELANESE US HOLDINGS LLC 3.25000% 14-15.10.19 14 030 000.00 14 725 186.50 0.26EUR CEMEX ESPANA LUXEMBOURG-REG-S 9.87500% 12-30.04.19 4 170 000.00 4 649 174.70 0.08EUR CEMEX FINANCE LLC-REG-S 5.25000% 14-01.04.21 2 760 000.00 2 877 520.80 0.05EUR CEMEX SAB DE CV-REG-S 4.37500% 15-05.03.23 6 210 000.00 6 218 507.70 0.11EUR CERAMTEC GROUP GMBH-REG-S 8.25000% 13-15.08.21 14 674 000.00 16 102 367.16 0.28EUR CLEOPATRA FINANCE LTD-REG-S 4.12500% 15-15.02.20 6 000 000.00 6 048 960.00 0.10EUR CLEOPATRA FINANCE LTD-REG-S 4.75000% 15-15.02.23 13 825 000.00 14 068 320.00 0.24EUR CMA CGM SA-REG-S 8.87500% 13-15.12.18 3 520 000.00 3 737 148.80 0.06EUR EACCESS LTD-REG-S 8.37500% 11-01.04.18 2 375 000.00 2 469 810.00 0.04EUR FINDUS BONDCO SA-REG-S 9.12500% 13-01.07.18 6 336 000.00 6 708 746.88 0.12EUR FINMECCANICA SPA 4.87500% 05-24.03.25 6 479 000.00 7 557 429.55 0.13EUR FMC FINANCE VII SA 5.25000% 11-15.02.21 2 225 000.00 2 657 250.75 0.05EUR FMC FINANCE VIII SA-REG-S 5.25000% 12-31.07.19 2 740 000.00 3 178 865.80 0.06EUR GALAPAGOS HOLDING SA-REG-S 7.00000% 14-15.06.22 8 190 000.00 7 823 825.10 0.14EUR GCL HOLDINGS SCA-REG-S 9.37500% 11-15.04.18 3 540 000.00 3 697 742.40 0.06EUR HEIDELBERGCEMENT FINANCE BV 8.50000% 09-31.10.19 14 557 000.00 19 084 954.85 0.33EUR HEIDELBERGCEMENT FINANCE BV 7.50000% 10-03.04.20 34 201 000.00 44 112 449.80 0.77EUR HEIDELBERGER DRUCKMASCHINEN-REG-S 9.25000% 11-15.04.18 1 085 000.00 1 125 166.70 0.02EUR HUNTSMAN INTERNATIONAL LLC 5.12500% 14-15.04.21 12 840 000.00 13 537 083.60 0.23EUR INEOS GROUP HOLDINGS SA-REG-S 6.50000% 13-15.08.18 33 490 000.00 34 411 979.70 0.60EUR INEOS GROUP HOLDINGS SA-REG-S 5.75000% 14-15.02.19 4 640 000.00 4 681 806.40 0.08EUR INTERXION HOLDING NV-REG-S 6.00000% 13-15.07.20 14 000 000.00 15 057 000.00 0.26EUR IVS F. S.P.A-REG-S 7.12500% 13-01.04.20 9 760 000.00 10 261 566.40 0.18EUR KERLING PLC-REG-S 10.62500% 10-01.02.17 10 305 000.00 10 487 295.45 0.18EUR KLEOPATRA HOLDGS 1 SCA-REG-S-SUB (PIK) 10.25000% 13-15.08.17 5 369 826.00 5 665 166.43 0.10EUR LOCK AS-REG-S 7.00000% 14-15.08.21 12 105 000.00 13 063 473.90 0.23EUR MANUTENCOOP FACILITY MANAGEMENT-REG-S 8.50000% 13-01.08.20 10 325 000.00 9 661 618.75 0.17EUR MATTERHORN FINANCING&CY SCA-REG-S (PIK) 9.00000% 13-15.04.19 13 273 000.00 13 517 355.93 0.23EUR MATTERHORN MIDCO & CY SCA-REG-S 7.75000% 12-15.02.20 1 175 000.00 1 247 673.75 0.02EUR NOVAFIVES SAS-REG-S 4.50000% 14-30.06.21 6 480 000.00 6 383 707.20 0.11EUR OI EUROPEAN GROUP BV-REG-S 6.75000% 10-15.09.20 17 655 000.00 21 240 200.85 0.37EUR PETROBRAS GLOBAL FINANCE BV 3.25000% 12-01.04.19 17 080 000.00 15 171 310.00 0.26EUR PETROBRAS GLOBAL FINANCE BV 4.25000% 12-02.10.23 6 800 000.00 5 974 820.00 0.10EUR PETROBRAS GLOBAL FINANCE BV 4.75000% 14-14.01.25 13 450 000.00 12 034 791.00 0.21EUR PLAY FINANCE 2 SA-REG-S 5.25000% 14-01.02.19 6 710 000.00 6 935 590.20 0.12EUR REXEL SA-REG-S 5.12500% 13-15.06.20 5 810 000.00 6 245 750.00 0.11EUR SB CAPITAL SA FOR SBERBANK-REG-S LPN 3.35240% 14-15.11.19 18 600 000.00 16 535 586.00 0.29EUR SCHAEFFLER FINANCE BV-REG-S 3.25000% 14-15.05.19 8 440 000.00 8 623 654.40 0.15EUR SCHAEFFLER FINANCE BV-REG-S 3.25000% 15-15.05.25 12 715 000.00 12 684 865.45 0.22EUR SCHAEFFLER HOLDING FINANCE-REG-S (PIK) 6.87500% 13-15.08.18 24 869 000.00 25 972 188.84 0.45EUR SMURFIT KAPPA AQUISITION-REG-S 4.12500% 13-30.01.20 4 470 000.00 4 918 028.10 0.09EUR TELENET FINANCE III LUXEMBOURG-REG-S 11-15.02.21 9 100 000.00 9 651 278.00 0.17EUR TELENET FINANCE V LUXEMBOURG SCA-REG-S 6.75000% 12-15.08.24 5 470 000.00 6 120 164.20 0.11EUR TELENET FINANCE V LUXEMBOURG SCA-REG-S 6.25000% 12-15.08.22 7 506 000.00 8 176 661.10 0.14EUR TRIONISTA HOLDCO GMBH-REG-S 5.00000% 13-30.04.20 3 890 000.00 4 064 816.60 0.07EUR TRIONISTA TOPCO GMBH-REG-S-SUB 6.87500% 13-30.04.21 23 260 000.00 25 038 692.20 0.43EUR UNILABS SUBHOLDING AB-REG-S 8.50000% 13-15.07.18 6 290 000.00 6 554 809.00 0.11EUR UNITYMEDIA KABELBW GMBH-REG-S 9.50000% 12-15.03.21 42 877 000.00 48 345 961.35 0.84EUR UNITYMEDIA KABELBW GMBH-REG-S 5.50000%12-15.09.22 27 930 000.00 27 072 046.26 0.47EUR UNITYMEDIA KABELBW GMBH-REG-S 5.75000% 12-15.01.23 8 790 000.00 8 593 323.75 0.15EUR UPC HOLDING BV-REG-S 6.37500% 12-15.09.22 20 625 000.00 22 124 643.75 0.38EUR UPC HOLDING BV-REG-S 6.75000% 13-15.03.23 12 325 000.00 13 458 653.50 0.23EUR UPCB FINANCE II-REG-S 11-01.07.20 4 283 000.00 4 450 251.15 0.08EUR VIRIDIAN GROUP FUNDCO II-REG-S 7.50000% 15-01.03.20 22 635 000.00 23 165 564.40 0.40EUR VRX ESCROW CORP-REG-S 4.50000% 15-15.05.23 21 865 000.00 21 994 659.45 0.38EUR WIND ACQUISITION FINANCE SA-REG-S 4.00000% 15-15.07.20 10 280 000.00 10 351 548.80 0.18EUR WMG ACQUISITION CORP-REG-S 6.25000% 12-15.01.21 2 436 000.00 2 236 467.24 0.04Total EUR 756 053 753.12 13.12
GBP
GBP AA BOND CO LTD-REG-S 9.50000% 13-31.07.19 8 810 000.00 13 478 591.84 0.23GBP ARROW GLOBAL FINANCE PLC-REG-S 7.87500% 13-01.03.20 6 665 000.00 9 667 750.00 0.17GBP HASTINGS INSURANCE GROUP FINANCE-REG-S 8.00000% 13-21.10.20 12 010 000.00 17 517 255.23 0.31GBP KEYSTONE FINANCING PLC-REG-S 14-15.10.19 11 715 000.00 17 143 007.86 0.30GBP NEW LOOK BONDCO I PLC-REG-S 8.75000% 13-14.05.18 18 550 000.00 26 852 371.34 0.47GBP NWEN FINANCE PLC-REG-S 5.87500% 13-21.06.21 5 970 000.00 8 838 122.10 0.15GBP RZD CAPITAL PLC LPN 7.48700% 11-25.03.31 9 550 000.00 11 176 973.97 0.19GBP TRAVELEX FINANCING PLC-REG-S-SUB 8.00000% 13-01.08.18 13 960 000.00 20 137 029.64 0.35GBP VIRGIN MEDIA FINANCE PLC-REG-S 6.37500% 14-15.10.24 3 820 000.00 5 680 822.12 0.10Total GBP 130 491 924.10 2.27
SEK
SEK NORCELL SWEDEN HOLDING 3 AB 5.25000% 14-04.11.19 55 000 000.00 6 192 542.39 0.11Total SEK 6 192 542.39 0.11

The notes are an integral part of the fi nancial statements. 55
UBS (Lux) Bond Fund – Euro High Yield (EUR)Annual Report as of 31 March 2015
USD
USD ABENGOA FINANCE SAU-144A 8.87500% 10-01.11.17 8 060 000.00 7 654 748.61 0.13USD AGROKOR DD-144A 8.87500% 12-01.02.20 4 500 000.00 4 576 340.79 0.08USD ALCOA INC 5.12500% 14-01.10.24 15 000 000.00 14 948 491.63 0.26USD ALTICE FINANCING SA-144A 6.62500% 15-15.02.23 1 800 000.00 1 726 256.98 0.03USD AMERICAN AXLE & MANUFACTURING INC 6.25000% 13-15.03.21 5 870 000.00 5 752 490.69 0.10USD ARDAGH PACKAGING FINANCE/MP-144A 6.25000% 14-31.01.19 4 890 000.00 4 575 837.99 0.08USD CLEOPATRA FINANCE LTD-144A 6.25000% 15-15.02.22 4 000 000.00 3 640 595.91 0.06USD CLEOPATRA FINANCE LTD-144A 6.50000% 15-15.02.25 4 000 000.00 3 594 040.97 0.06USD MECCANICA HOLDINGS USA INC-REG-S 6.25000% 09-15.07.19 7 770 000.00 8 048 533.52 0.14USD PETROBRAS GLOBAL FINANCE BV 3.25000% 14-17.03.17 9 400 000.00 8 092 707.70 0.14USD TESCO PLC-144A 6.15000% 07-15.11.37 8 250 000.00 8 118 921.79 0.14USD UBS AG STAMFORD-SUB 7.62500% 12-17.08.22 10 090 000.00 11 394 719.68 0.20USD VIMPELCOM HOLDINGS BV-REG-S 5.20000% 13-13.02.19 5 700 000.00 4 864 477.65 0.09USD VIMPELCOM HOLDINGS-REG-S 6.25460% 11-01.03.17 5 300 000.00 4 908 273.75 0.09USD VIMPELCOM HOLDINGS-REG-S 7.50430% 11-01.03.22 4 600 000.00 4 099 739.29 0.07Total USD 95 996 176.95 1.67
Total Notes, fixed rate 991 285 710.30 17.21
Notes, floating rate
EUR
EUR FUERSTENBERG CAPITAL GMBH-SUB 5.344%/VAR 05-PRP 7 348 000.00 6 980 600.00 0.12EUR GROUPAMA VAR-REG-S-SUB 7.875%/3M EURIBOR+536BP 09-27.10.39 9 100 000.00 10 484 929.00 0.18EUR INTESA SANPAOLO SPA-SUB 8.375%/3M EURIBOR+687.1BP 09-PRP 2 400 000.00 2 878 152.00 0.05EUR INTESA SANPAOLO SPA-SUB 9.500%/VAR 10-PRP 15 800 000.00 17 084 856.00 0.30EUR LCH CLEARNET SA VIA FRESHWAT-SUB 6.576%/3M EURIBOR+210BP PRP 5 900 000.00 6 219 426.00 0.11EUR THOMAS COOK GROUP PLC 6.750%/RATING LINKED 10-22.06.15 4 350 000.00 4 379 754.00 0.07EUR VEOLIA ENVIRONNEMENT-SUB VAR 13-PRP 6 000 000.00 6 357 420.00 0.11Total EUR 54 385 137.00 0.94
GBP
GBP BANK OF SCOTLAND 7.286/VAR 01-PRP 1 776 000.00 2 589 732.31 0.04GBP EQUINITI NEWCO 2 PLC-REG-S 3M LIBOR+575BP 13-15.12.18 1 600 000.00 2 056 737.44 0.04GBP HASTINGS INSURANCE GROUP-REG-S 3M LIBOR+600BP 13-21.10.19 5 480 000.00 7 579 239.98 0.13GBP LIVERPOOL VICTORIA FRIENDLY-REG-S-SUB 6.500%/VAR 13-22.05.43 11 995 000.00 17 335 382.97 0.30GBP TRAVELEX FINANCING PLC-REG-S 3M LIBOR+600BP 13-01.08.18 3 730 000.00 5 167 369.10 0.09Total GBP 34 728 461.80 0.60
USD
USD AEGON NV-SUB VAR/10YR CMS+10BP 04-31.12.PRP 7 310 000.00 5 819 413.41 0.10USD AG INSURANCE SA/NV-REG-S-SUB 6.750%/VAR 13-PRP 5 800 000.00 5 866 154.56 0.10USD CREDIT AGRICOLE SA-REG-S-SUB 7.875%/VAR 14-PRP 3 800 000.00 3 743 583.80 0.07USD CREDIT SUISSE GROUP AG-REG-S-SUB 7.500%/VAR 11-PRP 14 220 000.00 14 207 289.39 0.25USD CREDIT SUISSE GROUP AG-REG-S-SUB 6.250%/VAR 14-PRP 9 600 000.00 8 782 033.52 0.15USD KONINKLIJKE KPN NV-REG-S-SUB 7.000%/VAR 13-28.03.73 5 200 000.00 5 223 240.23 0.09USD LA MONDIALE VIE--REG-S-SUB 7.625%/6Y+100BP 13-PRP 12 415 000.00 12 802 246.28 0.22USD NORDEA BANK AB-REG-S-SUB 6.125%/VAR 14-PRP 9 450 000.00 9 079 391.06 0.16USD STANDARD CHARTERED PLC-REG-S-SUB 6.500%/VAR 15-PRP 1 645 000.00 1 543 144.79 0.03Total USD 67 066 497.04 1.17
Total Notes, floating rate 156 180 095.84 2.71
Medium term notes, fixed rate
EUR
EUR ABENGOA FINANCE SAU-REG-S 8.87500% 13-05.02.18 7 569 000.00 7 828 919.46 0.14EUR ABENGOA SA 8.50000% 10-31.03.16 2 750 000.00 2 835 497.50 0.05EUR AGROKOR DD-REG-S 9.12500% 12-01.02.20 10 145 000.00 11 226 254.10 0.19EUR ALTICE FINANCING SA-REG-S 5.25000% 15-15.02.23 3 010 000.00 3 182 774.00 0.06EUR ARCELORMITTAL-REG-S 3.00000% 14-25.03.19 15 190 000.00 15 627 927.70 0.27EUR ARCELORMITTAL-REG-S 2.87500% 14-06.07.20 10 165 000.00 10 266 243.40 0.18EUR ARCELORMITTAL-REG-S 3.12500% 15-14.01.22 9 500 000.00 9 494 300.00 0.16EUR ARCELORMITTAL-REG-S 3.00000% 15-09.04.21 10 415 000.00 10 351 260.20 0.18EUR AREVA SA 3.50000% 10-22.03.21 4 400 000.00 4 598 000.00 0.08EUR AREVA SA 4.87500% 09-23.09.24 27 100 000.00 30 230 592.00 0.52EUR AREVA SA-REG-S 3.12500% 14-20.03.23 34 000 000.00 34 446 080.00 0.60EUR BANCA POPOLARE DI VICENZA SCPA-REG-S 5.00000% 13-25.10.18 2 710 000.00 2 908 263.60 0.05EUR BANCA POPOLARE DI VICENZA SCPA-REG-S 2.75000% 15-20.03.20 3 845 000.00 3 825 582.75 0.07EUR BANCO COMERCIAL PORTUGUES SA-REG-S 3.37500% 14-27.02.17 6 500 000.00 6 642 870.00 0.12EUR BANCO POPOLARE SC REG-S-SUB 6.00000% 10-05.11.20 21 228 000.00 23 673 041.04 0.41EUR BANCO POPOLARE SC REG-S-SUB 6.37500% 11-31.05.21 6 690 000.00 7 642 589.10 0.13EUR BANCO POPOLARE SC REG-S 2.37500% 14-22.01.18 7 000 000.00 7 152 880.00 0.12EUR BANCO POPOLARE SC-REG-S 3.50000% 14-14.03.19 17 970 000.00 19 019 987.10 0.33EUR BANCO POPOLARE SCARL 5.47300% 09-12.11.16 2 270 000.00 2 365 158.40 0.04EUR BANCO POPOLARE SCARL-SUB 4.75000% 10-28.04.17 3 940 000.00 4 059 023.46 0.07EUR BANK FUER ARBEIT UND WIRTS AG-REG-S-SUB 8.12500% 13-30.10.23 4 700 000.00 5 733 671.00 0.10EUR BANK OF IRELAND-SUB 10.00000% 10-12.02.20 3 430 000.00 4 358 912.60 0.08EUR BANK OF IRELAND-SUB 10.00000% 11-30.07.16 10 945 000.00 11 832 420.60 0.21EUR BANKIA SA-REG-S 3.50000% 14-17.01.19 6 400 000.00 6 970 368.00 0.12EUR BEFESA ZINC ASER SA -REG-S 8.87500% 11-15.05.18 9 042 000.00 9 467 697.36 0.16EUR BOMBARDIER INC-REG S 6.12500% 10-15.05.21 6 170 000.00 6 545 506.20 0.11EUR BOPARAN FINANCE PLC-REG-S 4.37500% 14-15.07.21 7 070 000.00 6 468 555.10 0.11EUR BPE FINANCIACIONES SA-SUB 6.87300% 10-22.10.20 2 200 000.00 2 491 390.00 0.04EUR BPE FINANCIACIONES SA-REG-S 2.00000% 15-03.02.20 7 000 000.00 7 047 950.00 0.12EUR BRISA CONCESSAO RODOVIARIA SA-REG-S 3.87500% 14-01.04.21 3 600 000.00 4 088 484.00 0.07EUR CAMPOFRIO FOOD GROUP SA-REG-S 3.37500% 15-15.03.22 7 580 000.00 7 672 703.40 0.13EUR CE ENERGY AS-REG-S 7.00000% 14-01.02.21 8 235 000.00 8 390 806.20 0.15EUR CERVED TECHNOLOGIES SPA-REG-S-SUB 8.00000% 13-15.01.21 9 180 000.00 9 974 896.20 0.17EUR CNH INDUSTRIAL FINANCE EUROPE SA 6.25000% 11-09.03.18 21 960 000.00 24 630 555.60 0.43EUR CNH INDUSTRIAL FINANCE EUROPE SA-REG-S 2.75000% 14-18.03.19 2 900 000.00 2 967 251.00 0.05EUR CO-OPERATIVE BANK-REG-S 2.37500% 12-23.10.15 30 620 000.00 30 045 875.00 0.52EUR COMMERZBANK AG-SUB 6.37500% 11-22.03.19 14 202 000.00 16 537 234.86 0.29EUR COMMERZBANK AG-SUB 7.75000% 11-16.03.21 23 900 000.00 29 977 770.00 0.52
Description Quantity/ Valuation in EUR as a % Nominal Unrealized gain of net (loss) on Futures/ assets Options/Forward Exchange Contracts/ Swaps (Note 1)

56 The notes are an integral part of the fi nancial statements.
UBS (Lux) Bond Fund – Euro High Yield (EUR)Annual Report as of 31 March 2015
Description Quantity/ Valuation in EUR as a % Nominal Unrealized gain of net (loss) on Futures/ assets Options/Forward Exchange Contracts/ Swaps (Note 1)
EUR DUFRY FINANCE SCA-REG-S 4.50000% 14-15.07.22 3 100 000.00 3 303 794.00 0.06EUR EDP FINANCE BV-REG-S 2.62500% 14-18.01.22 4 675 000.00 4 954 050.75 0.09EUR FIAT CHRYSLER FINANCE EUROPE 7.37500% 11-09.07.18 9 300 000.00 10 755 729.00 0.19EUR FIAT CHRYSLER FINANCE EUROPE-REG-S 7.00000% 12-23.03.17 4 430 000.00 4 864 184.30 0.08EUR FIAT CHRYSLER FINANCE EUROPE-REG-S 6.62500% 13-15.03.18 15 886 000.00 17 898 120.76 0.31EUR FIAT CHRYSLER FINANCE EUROPE-REG-S 6.75000% 13-14.10.19 31 240 000.00 36 844 456.00 0.64EUR FIAT CHRYSLER FINANCE EUROPE-REG-S 4.75000% 14-22.03.21 8 390 000.00 9 302 244.70 0.16EUR FIAT CHRYSLER FINANCE EUROPE-REG-S 4.75000% 14-15.07.22 4 650 000.00 5 206 698.00 0.09EUR FIAT FINANCE NORTH AMERICA INC 5.62500% 07-12.06.17 5 100 000.00 5 485 611.00 0.10EUR FINANCIERE GAILLON 8 SAS REG-S 7.00000% 14-30.09.19 4 520 000.00 4 607 507.20 0.08EUR FINMECCANICA FINANCE SA 4.50000% 13-19.01.21 16 850 000.00 18 866 271.00 0.33EUR FRESENIUS FINANCE BV-REG-S 3.00000% 14-01.02.21 13 670 000.00 14 902 213.80 0.26EUR GAZ CAPITAL SA/GAZPROM LPN 6.60500% 07-13.02.18 3 220 000.00 3 371 823.00 0.06EUR GAZ CAPITAL SA/GAZPROM LPN-REG-S 3.75500% 12-15.03.17 15 080 000.00 14 770 709.20 0.26EUR GAZ CAPITAL SA/GAZPROM-REG-S LPN 3.38900% 13-20.03.20 6 250 000.00 5 769 312.50 0.10EUR GAZ CAPITAL SA/GAZPROM-REG-S LPN 3.70000% 13-25.07.18 14 650 000.00 14 037 337.00 0.24EUR GAZPROM OAO-REG-S LPN 3.60000% 14-26.02.21 13 090 000.00 12 030 888.10 0.21EUR GREIF LUXEMBOURG FINANCE SCA-REG-S 7.37500% 11-15.07.21 4 940 000.00 5 816 850.00 0.10EUR HEIDELBERGCEMENT FINANCE BV-REG-S 9.50000% 11-15.12.18 7 300 000.00 9 464 158.00 0.16EUR INTESA SANPAOLO SPA-REG-S-SUB 6.62500% 13-13.09.23 6 728 000.00 8 634 984.32 0.15EUR INTESA SANPAOLO SPA-REG-S-SUB 3.92800% 14-15.09.26 3 480 000.00 3 828 696.00 0.07EUR KRAUSSMAFFEI GROUP GMBH-REG-S 8.75000% 12-15.12.20 4 210 000.00 4 158 692.73 0.07EUR LAFARGE SA STEP-UP 09-16.12.19 23 170 000.00 28 077 869.40 0.49EUR LAFARGE SA STEP-UP 10-29.11.18 9 570 000.00 11 151 442.50 0.19EUR LAFARGE SA-REG-S 4.75000% 13-30.09.20 7 880 000.00 9 388 626.00 0.16EUR MATTERHORN MOBILE SA-REG-S 8.25000% 12-15.02.20 9 550 000.00 10 280 193.00 0.18EUR MOL HUNGARIAN OIL AND GAS PLC 5.87500% 10-20.04.17 4 840 000.00 5 225 264.00 0.09EUR MPT OPERATING PARTNERSHIP LP/FIN CORP 5.75000% 13-01.10.20 5 215 000.00 5 656 554.05 0.10EUR NOVO BANCO SA-REG-S 4.75000% 13-15.01.18 6 400 000.00 6 544 128.00 0.11EUR NOVO BANCO SA-REG-S 4.00000% 14-21.01.19 6 400 000.00 6 461 760.00 0.11EUR NOVO BANCO SA-REG-S 6.87500% 11-15.07.16 2 000 000.00 2 045 360.00 0.04EUR NOVO BANCO SA-REG-S 5.87500% 12-09.11.15 8 100 000.00 8 100 000.00 0.14EUR OBRASCON HUARTE LAIN SA 8.75000% 11-15.03.18 3 755 000.00 3 921 759.55 0.07EUR OTE PLC 3.50000% 14-09.07.20 6 585 000.00 5 858 081.85 0.10EUR OTE PLC 4.62500% 06-20.05.16 8 500 000.00 8 355 840.00 0.15EUR OTE PLC-REG-S 7.87500% 13-07.02.18 15 856 000.00 16 093 998.56 0.28EUR PETROBRAS GLOBAL FINANCE BV 4.87500% 11-07.03.18 19 900 000.00 18 863 409.00 0.33EUR PEUGEOT SA-REG-S 6.50000% 13-18.01.19 15 667 000.00 18 257 381.78 0.32EUR PEUGEOT SA-REG-S 7.37500% 13-06.03.18 23 020 000.00 26 728 522.00 0.46EUR PORTUGAL TELECOM INTL FINANCE BV 4.50000% 05-16.06.25 8 513 000.00 8 219 897.41 0.14EUR PORTUGAL TELECOM INTL FINANCE BV 5.87500% 12-17.04.18 7 245 000.00 7 535 959.20 0.13EUR PORTUGAL TELECOM INTL FINANCE BV-REG-S 4.62500% 13-08.05.20 11 710 000.00 11 442 309.40 0.20EUR PPC FINANCE PLC-REG-S 4.75000% 14-01.05.17 13 070 000.00 9 933 461.40 0.17EUR PPC FINANCE PLC-REG-S 5.50000% 14-01.05.19 8 778 000.00 6 327 972.42 0.11EUR PT PORTUGAL SGPS-REG-S 6.25000% 12-26.07.16 6 986 000.00 7 224 432.18 0.13EUR RAIFFEISEN BANK INTL AG-REG-S-SUB 6.00000% 13-16.10.23 500 000.00 444 455.00 0.01EUR RAIFFEISENLANDESBANK NIED-REG-S-SUB 5.87500% 13-27.11.23 4 900 000.00 3 915 198.00 0.07EUR REN FINANCE B V-REG-S 4.75000% 13-16.10.20 6 545 000.00 7 765 511.60 0.13EUR ROYAL BANK OF SCOTLAND PLC-REG-S-SUB STEP-UP/DOWN 05-PRP 25 854 000.00 25 789 365.00 0.45EUR SAMVARDHANA MOTHER AUTO SYS GROUP-REG-S 4.12500% 14-15.07.21 8 620 000.00 8 790 503.60 0.15EUR SCHAEFFLER FINANCE BV-REG-S 3.50000% 14-15.05.22 31 040 000.00 31 922 777.60 0.55EUR SNS BANK NV-SUB *DEFAULT* 6.25000% 10-26.10.20 1 300 000.00 65 000.00 0.00EUR TECHEM AG-REG-S 6.12500% 12-01.10.19 1 210 000.00 1 287 113.30 0.02EUR TECHEM ENERGY METERING SERV-REG-S-SUB 7.87500% 12-01.10.20 19 045 000.00 20 952 356.75 0.36EUR TELECOM ITALIA FINANCE SA 7.75000% 03-24.01.33 15 100 000.00 22 605 908.00 0.39EUR TELECOM ITALIA SPA 5.37500% 04-29.01.19 6 100 000.00 6 914 838.00 0.12EUR TELECOM ITALIA SPA 5.25000% 10-10.02.22 26 600 000.00 31 402 364.00 0.54EUR TELECOM ITALIA SPA-REG-S 4.00000% 12-21.01.20 16 100 000.00 17 585 547.00 0.31EUR TELECOM ITALIA SPA-REG-S 4.87500% 13-25.09.20 20 080 000.00 22 907 063.20 0.40EUR TELECOM ITALIA SPA-REG-S 4.50000% 14-25.01.21 20 650 000.00 23 167 028.50 0.40EUR TELECOM ITALIA SPA-REG-S 3.25000% 15-16.01.23 11 245 000.00 11 914 077.50 0.21EUR TESCO CORP TREASURY SERVICES PLC-REG-S 1.37500% 14-01.07.19 17 400 000.00 17 062 962.00 0.30EUR TESCO CORPORATE TREASURY SERVICES PLC 2.12500% 13-12.11.20 6 200 000.00 6 244 578.00 0.11EUR TESCO CORPORATE TREASURY SERVICES-REG-S 2.50000% 14-01.07.24 8 900 000.00 8 951 887.00 0.16EUR TESCO PLC 5.12500% 07-10.04.47 5 130 000.00 5 945 670.00 0.10EUR THOMAS COOK FINANCE PLC-REG-S 7.75000% 13-15.06.20 8 990 000.00 9 664 789.40 0.17EUR THYSSENKRUPP AG 4.00000% 13-27.08.18 4 810 000.00 5 196 531.60 0.09EUR THYSSENKRUPP AG-REG-S 1.75000% 15-25.11.20 12 110 000.00 12 036 371.20 0.21EUR THYSSENKRUPP AG-REG-S 2.50000% 15-25.02.25 19 270 000.00 19 154 572.70 0.33EUR THYSSENKRUPP AG-REG-S 3.12500% 14-25.10.19 15 025 000.00 15 885 481.75 0.28EUR UNICREDITO ITALIANO SPA-SUB 6.70000% 08-05.06.18 6 140 000.00 6 991 618.00 0.12EUR UNITYMEDIA HESSEN/NRW GMBH-REG-S 5.62500% 13-15.04.23 8 748 000.00 8 535 178.65 0.15EUR UNITYMEDIA KABELBW GMBH-REG-S 5.12500% 13-21.01.23 21 390 000.00 20 630 334.15 0.36EUR VENETO BANCA SCPA 4.00000% 14-20.05.19 9 510 000.00 9 846 083.40 0.17EUR VIRGIN MEDIA FINANCE PLC-REG-S 4.50000% 15-15.01.25 9 520 000.00 9 929 169.60 0.17EUR WEPA HYGIENEPRODUKTE GMBH-REG-S 6.50000% 13-15.05.20 5 300 000.00 5 755 959.00 0.10Total EUR 1 272 408 137.49 22.09
GBP
GBP BOPARAN FINANCE PLC-REG-S 5.25000% 14-15.07.19 6 740 000.00 8 572 335.65 0.15GBP EDU UK BONDCO PLC-REG-S 8.87500% 13-15.09.18 10 462 000.00 14 569 777.96 0.25GBP EQUINITI NEWCO 2 PLC-REG-S 7.12500% 13-15.12.18 7 230 000.00 9 431 791.48 0.16GBP FINMECCANICA SPA 8.00000% 09-16.12.19 8 385 000.00 13 829 162.25 0.24GBP GHD BONDCO PLC REG-S 7.00000% 14-15.04.20 9 460 000.00 11 767 925.64 0.21GBP JERROLD FINCO PLC-REG-S 9.75000% 13-15.09.18 15 582 000.00 23 816 162.17 0.41GBP MARLIN INTERMEDIATE HOLDINGS LTD-REG-S 10.50000% 13-01.08.20 2 940 000.00 4 497 150.94 0.08GBP PETROBRAS GLOBAL FINANCE BV 6.25000% 11-14.12.26 5 200 000.00 6 176 526.25 0.11GBP PRIORY GROUP NO 3 PLC-REG-S 7.00000% 11-15.02.18 1 510 000.00 1 325 021.08 0.02GBP TELECOM ITALIA SPA 6.37500% 04-24.06.19 3 750 000.00 5 782 397.04 0.10GBP TELECOM ITALIA SPA 7.37500% 09-15.12.17 5 150 000.00 7 997 394.05 0.14GBP TESCO PLC 5.50000% 02-13.12.19 1 630 000.00 2 483 224.88 0.04GBP TESCO PLC 6.12500% 09-24.02.22 7 930 000.00 12 414 836.45 0.22GBP VIRGIN MEDIA SECURE FIN PLC-REG-S 5.12500% 28.01.15-15.01.25 5 785 000.00 8 297 493.40 0.14Total GBP 130 961 199.24 2.27

The notes are an integral part of the fi nancial statements. 57
UBS (Lux) Bond Fund – Euro High Yield (EUR)Annual Report as of 31 March 2015
USD
USD ALTICE FINCO SA-144A-SUB 7.62500% 15-15.02.25 3 780 000.00 3 607 541.90 0.06USD RZD CAPITAL PLC/RUSSIAN RAILWAYS LPN 5.73900% 10-03.04.17 2 500 000.00 2 324 837.06 0.04Total USD 5 932 378.96 0.10
Total Medium term notes, fixed rate 1 409 301 715.69 24.46
Medium term notes, floating rate
CHF
CHF RAIFFEISEN BANK INTL-SUB 4.000%/SFSW5+361.75BP 13-24.05.23 1 800 000.00 1 326 046.36 0.02Total CHF 1 326 046.36 0.02
EUR
EUR ARCELORMITTAL 4.625%/RATING LINKED 10-17.11.17 8 242 000.00 9 090 266.64 0.16EUR ARCELORMITTAL-REG-S 4.500%/RATING LINKED 12-29.03.18 6 775 000.00 7 529 125.25 0.13EUR ASS GENERALI-REG-S-SUB 7.750%/3M EURIBOR+711.3BP 12-12.12.42 5 500 000.00 7 125 250.00 0.12EUR BANK OF IRELAND-REG-S-SUB 4.25%/VAR 14-11.06.24 22 680 000.00 23 411 883.60 0.41EUR BANKIA SA-REG-S-SUB 4.000%/VAR 14-22.05.24 18 400 000.00 18 680 232.00 0.32EUR BAYERISCHE LANDESBK-SUB 4.50000%/3M EURIBOR+81BP 07-07.02.19 10 750 000.00 9 708 217.50 0.17EUR BILBAO LUXEMBOURG SA-REG-S (PIK) VAR 13-01.12.18 3 000 000.00 3 143 460.00 0.06EUR CAIXABANK-REG-S-SUB 5.000%/EUSA5+395BP 13-14.11.23 7 500 000.00 8 141 400.00 0.14EUR CASINO GUICHARD PERRACHON SA-REG-S-SUB 4.87000%/VAR 13-PRP 9 100 000.00 9 547 720.00 0.17EUR CREDIT AGRICOLE SA 7.87500%/3M EURIBOR+642.4BP 09-PRP 3 000 000.00 3 611 070.00 0.06EUR DEPFA BANK PLC-SUB 3M EURIBOR+20BP 05-15.12.15 8 550 000.00 8 330 008.50 0.15EUR DEXIA CREDIT LOCAL FR-SUB 4.375%/3M EURIBOR+72BP 07-12.02.19 4 650 000.00 3 880 657.50 0.07EUR DEXIA CREDIT LOCAL SA-SUB 3M EURIBOR+65BP 07-10.07.17 5 400 000.00 4 696 596.00 0.08EUR GENERALI FINANCE BV-REG-S-SUB 4.596%/3M EURIBOR+350BP 14-PRP 14 550 000.00 15 259 312.50 0.27EUR HBOS EURO FINANCE LP-SUB 7.627%/3M EURIBOR+287.5BP-PRP 3 110 000.00 3 026 869.70 0.05EUR HBOS PLC-SUB 5.125%/3M EURIBOR+188BP 03-PRP 1 950 000.00 1 967 025.45 0.03EUR INEOS FINANCE PLC-REG-S 3M EURIBOR+600BP 12-15.02.19 4 710 000.00 4 805 142.00 0.08EUR NATIONAL WESTMINSTER BANK PLC-SUB 6.62500%/FLR 99-05.10.PRP 2 530 000.00 2 395 277.50 0.04EUR ORANGE SA REG-S-SUB 5.000%/VAR 14-PRP 3 200 000.00 3 644 704.00 0.06EUR ORIGIN ENERGY FINANCE LTD-SUB 7.875%/VAR 11-16.06.71 8 770 000.00 9 489 140.00 0.17EUR RAIFFEISEN BANK INT-REG-S-SUB 4.500%/EUSA5+330BP 14-21.02.25 17 800 000.00 14 002 192.00 0.24EUR RAIFFEISEN BANK INTL AG-SUB 5.163%/VAR 13-18.06.24 11 200 000.00 9 076 816.00 0.16EUR ROYAL BK OF SCOTLAND GP PLC-REG-S-SUB 3.625/VAR 14-25.03.24 18 755 000.00 19 651 489.00 0.34EUR SNS REAAL GROEP-SUB *DEFAULT* 6.258%/3M EURIBOR+229BP 07-PRP 1 000 000.00 0.10 0.00EUR UBS AG-REG-S-SUB 4.750%/VAR 14-12.02.26 1 485 000.00 1 651 542.75 0.03EUR UNIPOLSAI SPA-SUB 5.750%/VAR 14-PRP 13 590 000.00 14 002 320.60 0.24Total EUR 215 867 718.59 3.75
GBP
GBP ARGON CAP PLC FOR RBS-SUB 8.162%/3M LIBOR+233BP 07-PRP 1 940 000.00 2 279 274.21 0.04GBP BELFIUS FINANCING CO-SUB 5.875%/3M LIBOR+70BP 07-09.02.17 12 000 000.00 16 337 793.30 0.28GBP CREDIT AGRICOLE SA-REG-S-SUB 5.136%/3M LIBOR+157.5BP 06-PRP 1 250 000.00 1 754 256.73 0.03GBP KONINKLIJKE KPN NV-REG-S-SUB 6.875%/VAR 13-14.03.73 2 390 000.00 3 556 478.02 0.06GBP LAFARGE SA VAR 09-30.05.17 4 500 000.00 7 182 450.55 0.13GBP THOMAS COOK GROUP PLC 7.750%/RATING LINKED 10-22.06.17 3 080 000.00 4 552 080.75 0.08Total GBP 35 662 333.56 0.62
USD
USD BPCE SA-SUB 10Y CMT+30BP 04-PRP 10 253 000.00 7 923 640.60 0.14USD LBG CAPITAL NO1 PLC-REG-S SUB-8.000%/VAR 09-PRP 13 650 000.00 13 831 618.72 0.24USD ROYAL BANK OF SC PLC-SUB 7.64000%/3M LIBOR+232BP 07-PRP 1 900 000.00 1 937 150.84 0.03Total USD 23 692 410.16 0.41
Total Medium term notes, floating rate 276 548 508.67 4.80
Bonds, fixed rate
CHF
CHF MATTERHORN MOBILE SA-REG-S 6.75000% 12-15.05.19 4 355 000.00 4 369 001.28 0.07CHF SUNRISE COMMUNICATIONS HLDGS SA-REG-S 2.12500% 15-31.03.22 15 100 000.00 14 229 092.84 0.25Total CHF 18 598 094.12 0.32
EUR
EUR ABENGOA FINANCE SAU-REG-S 6.00000% 14-31.03.21 6 110 000.00 5 719 571.00 0.10EUR AGROKOR DD-REG-S 9.87500% 12-01.05.19 6 090 000.00 6 559 721.70 0.11EUR ALMIRALL SA-REG-S 4.62500% 14-01.04.21 5 630 000.00 5 991 727.50 0.10EUR ALTICE FINANCING SA-REG-S 6.50000% 13-15.01.22 9 030 000.00 9 774 342.90 0.17EUR ALTICE SA-REG-S 6.25000% 15-15.02.25 17 165 000.00 17 163 798.45 0.30EUR ALTICE SA-REG-S 7.25000% 14-15.05.22 40 590 000.00 42 302 492.10 0.73EUR AURIS LUXEMBOURG II SARL-REG-S 8.00000% 14-15.01.23 11 130 000.00 12 017 283.60 0.21EUR BHARTI AIRTEL INTL NETHERLANDS BV-REG-S 3.37500% 14-20.05.21 6 680 000.00 7 231 166.80 0.13EUR BILBAO LUXEMBOURG SA-144A (PIK) 10.50000% 13-01.12.18 900 000.00 949 500.00 0.02EUR CAMPOFRIO FOOD GROUP SA-REG-S 8.25000% 09-31.10.16 2 000 000.00 2 040 060.00 0.04EUR CEGEDIM SA 7.00000% 10-27.07.15 1 150 000.00 1 165 950.50 0.02EUR CEMEX SAB DE CV-REG-S 4.75000% 14-11.01.22 7 229 000.00 7 375 098.09 0.13EUR CERBA EUROPEAN LAB-REG-S 7.00000% 13-01.02.20 10 630 000.00 11 242 075.40 0.20EUR CERBERUS NIGHTINGALE 1 SARL-REG-S 8.25000% 15-01.02.20 14 335 000.00 14 885 177.30 0.26EUR CHESAPEAKE ENERGY CORP 6.25000% 06-15.01.17 3 620 000.00 3 855 300.00 0.07EUR CIRSA FUNDING LUXEMBOURG SA-REG-S 8.75000% 10-15.05.18 9 000 000.00 9 235 710.00 0.16EUR CMC RAVENNA-REG-S 7.50000% 14-01.08.21 22 340 000.00 21 429 645.00 0.37EUR CROWN EUROPEAN HOLDINGS SA-REG-S 4.00000% 14-15.07.22 21 400 000.00 23 136 182.00 0.40EUR DEUTSCHE RASTSTATTEN GRUP IV GMBH-REG-S 6.75000% 13-30.12.20 5 910 000.00 6 385 873.20 0.11EUR DOMETIC GROUP AB-REG-S (PIK) 9.50000% 14-26.06.19 4 250 000.00 4 300 532.50 0.08EUR EMPARK FUNDING SA-REG-S 6.75000% 13-15.12.19 16 980 000.00 18 624 173.40 0.32EUR FAURECIA-REG-S 3.12500% 15-15.06.22 7 560 000.00 7 612 920.00 0.13EUR GALAPAGOS SA-REG-S 5.37500% 14-15.06.21 4 180 000.00 4 292 567.40 0.07EUR GAZ CAPITAL SA-REG-S LPN 5.13600% 06-22.03.17 3 240 000.00 3 256 750.80 0.06EUR GAZPROM NEFT OAO VIA GPN CAP-REG-S LPN 2.93300% 13-26.04.18 14 200 000.00 13 052 924.00 0.23EUR GCS HOLDCO FINANCE I SA-REG-S 6.50000% 13-15.11.18 3 744 000.00 3 929 889.60 0.07EUR GEO DEBT FINANCE SCA-REG-S 7.50000% 13-01.08.18 3 140 000.00 3 004 257.80 0.05EUR GIE PSA TRESORERIE 6.00000% 03-19.09.33 10 101 000.00 12 769 886.22 0.22
Description Quantity/ Valuation in EUR as a % Nominal Unrealized gain of net (loss) on Futures/ assets Options/Forward Exchange Contracts/ Swaps (Note 1)

58 The notes are an integral part of the fi nancial statements.
UBS (Lux) Bond Fund – Euro High Yield (EUR)Annual Report as of 31 March 2015
Description Quantity/ Valuation in EUR as a % Nominal Unrealized gain of net (loss) on Futures/ assets Options/Forward Exchange Contracts/ Swaps (Note 1)
EUR GRUPO ANTOLIN DUTCH BV-REG-S 4.75000% 14-01.04.21 4 615 000.00 4 727 606.00 0.08EUR GRUPO ISOLUX CORSAN FINANCE BV-REG-S 6.62500%14-15.04.21 14 290 000.00 12 530 186.50 0.22EUR HUNTSMAN INTERNATIONAL LLC-REG-S 4.25000% 15-01.04.25 19 470 000.00 19 221 757.50 0.33EUR HYDRA DUTCH HOLDINGS-REG-S 8.00000% 15-15.04.19 13 031 000.00 13 114 789.33 0.23EUR IMS HEALTH INC-REG-S 4.12500% 15-01.04.23 9 165 000.00 9 187 912.50 0.16EUR INFOR US INC-REG-S 5.75000% 15-15.05.22 19 920 000.00 19 969 800.00 0.35EUR INTRALOT CAPITAL LUXEMBOURG SA-REG-S 6.00000% 14-15.05.21 10 166 000.00 9 037 777.32 0.16EUR JARDEN CORP-REG-S 3.75000% 14-01.10.21 9 640 000.00 10 279 710.40 0.18EUR KERNEOS TECH GROUP SAS-REG-S 5.75000 14-01.03.21 10 990 000.00 11 659 181.10 0.20EUR LA FINANCIERE ATALIAN SA-REG-S 7.25000% 13-15.01.20 4 460 000.00 4 835 978.00 0.08EUR LABCO SAS-REG-S 8.50000% 11-15.01.18 10 505 000.00 10 981 086.60 0.19EUR LABEYRIE FINE FOODS SAS-REG-S 5.62500% 14-15.03.21 4 615 000.00 4 896 191.95 0.09EUR LBG CAPITAL NO.2 PLC-SUB 8.87500% 09-07.02.20 4 320 000.00 4 859 308.80 0.08EUR MERLIN ENTERTAINMENTS PLC-REG-S 2.75000% 15-15.03.22 6 115 000.00 6 149 060.55 0.11EUR METSA BOARD CORP-REG-S 4.00000% 14-13.03.19 4 990 000.00 5 408 361.60 0.09EUR NOVO BANCO SA 2.62500% 14-08.05.17 19 300 000.00 18 656 538.00 0.32EUR NUMERICABLE GROUP SA-REG-S 5.62500% 14-15.05.24 21 650 000.00 22 800 481.00 0.40EUR NUMERICABLE GROUP SA-REG-S 5.37500% 14-15.05.22 23 280 000.00 24 325 504.80 0.42EUR OBRASCON HUARTE LAIN SA-REG-S 4.75000% 14-15.03.22 8 280 000.00 7 762 914.00 0.14EUR OBRASCON HUARTE LAIN SA-REG-S 5.50000% 15-15.03.23 7 635 000.00 7 264 320.75 0.13EUR ONEX WIZARD ACQUISITION CO II SCA-REG-S 7.75000% 15-15.02.23 18 970 000.00 20 001 019.50 0.35EUR ONTEX GROUP N.V-REG-S 4.75000% 14-15.11.21 2 255 000.00 2 426 222.15 0.04EUR PAPREC HOLDING-REG-S 5.25000% 15-01.04.22 2 340 000.00 2 402 992.80 0.04EUR PAPREC HOLDING-REG-S-SUB 7.37500% 15-01.04.23 3 490 000.00 3 609 741.90 0.06EUR PATERNOSTER HOLDING III GMBH-REG-S 8.50000% 15-15.02.23 3 060 000.00 3 082 980.60 0.05EUR PETROBRAS GLOBAL FINANCE BV 2.75000% 14-15.01.18 25 800 000.00 23 248 380.00 0.40EUR PETROBRAS GLOBAL FINANCE BV 3.75000% 14-14.01.21 11 280 000.00 9 903 952.80 0.17EUR PHOENIX PIB DUTCH FINANCE BV-REG-S 3.62500% 14-30.07.21 5 435 000.00 5 793 492.60 0.10EUR PLAY FINANCE 2 SA-REG-S 6.50000% 14-01.08.19 4 850 000.00 5 132 221.50 0.09EUR PLAY FINANCE 2 SA-REG-S 5.25000% 15-01.02.19 5 385 000.00 5 600 938.50 0.10EUR POLISH TELEVISION HOLD BV-REG-S (PIK) 11.00000% 13-15.01.21 6 740 000.00 8 077 081.20 0.14EUR PORTUGAL TELECOM INTL FINANCE BV 4.37500% 05-24.03.17 7 350 000.00 7 439 155.50 0.13EUR R&R ICE CREAM LTD-REG-S 4.75000% 14-15.05.20 4 250 000.00 4 349 620.00 0.08EUR RHINO BONDCO S.P.A-REG-S 7.25000% 13-15.11.20 8 470 000.00 9 025 039.10 0.16EUR ROYAL BANK OF SCOTLAND PLC-SUB 5.50000% 04-29.11.49 25 991 000.00 25 980 603.60 0.45EUR RZD CAP PLC/RUSSIAN RAILWAYS REG-S 4.60000% 14-06.03.23 4 500 000.00 3 905 685.00 0.07EUR RZD CAPITAL PLC-REG-S LPN 3.37440% 13-20.05.21 15 900 000.00 13 438 680.00 0.23EUR SAPPI PAPIER HOLDING AG-REG-S 3.37500% 15-01.04.22 5 385 000.00 5 322 318.60 0.09EUR SCHAEFFLER FINANCE BV-REG-S 2.50000% 15-15.05.20 7 790 000.00 7 760 865.40 0.14EUR SCHAEFFLER HOLDING FINANCE-REG-S (PIK) 5.75000% 14-15.11.21 11 310 000.00 12 214 573.80 0.21EUR SGD GROUP SAS-REG-S 5.62500% 14-15.05.19 5 990 000.00 6 113 034.60 0.11EUR SMURFIT KAPPA AQUISITION-REG-S 3.25000% 14-01.06.21 27 390 000.00 29 025 730.80 0.50EUR SMURFIT KAPPA AQUISITION-REG-S 2.75000% 15-01.02.25 11 410 000.00 11 641 508.90 0.20EUR SNAI SPA-REG-S 7.62500% 13-15.06.18 5 350 000.00 5 582 511.00 0.10EUR SPCM SA-REG-S 5.50000% 12-15.06.20 4 770 000.00 5 068 554.30 0.09EUR TA MANUFACTURING LTD-REG-S 3.62500% 15-15.04.23 7 490 000.00 7 561 454.60 0.13EUR TELEMAR NORTE LESTE SA-REG-S 5.12500% 10-15.12.17 3 635 000.00 3 679 892.25 0.06EUR TUI AG-REG-S 4.50000% 14-01.10.19 5 040 000.00 5 333 479.20 0.09EUR TVN FINANCE CORPORATION III AB-REG-S 7.37500% 13-15.12.20 7 550 000.00 8 412 059.00 0.15EUR UNICREDIT SPA-REG-S-SUB 6.95000% 12-31.10.22 26 070 000.00 32 149 784.70 0.56EUR UNITYMEDIA KABELBW GMBH-REG-S 3.75000% 15-15.01.27 54 855 000.00 53 793 007.20 0.93EUR UNITYMEDIA NRW/HESSEN-REG-S 6.25000% 13-15.01.29 4 730 000.00 5 325 554.30 0.09EUR UNITYMEDIA NRW/HESSEN-REG-S 4.00000% 14-15.01.25 21 260 000.00 22 129 534.00 0.38EUR UNITYMEDIA NRW/HESSEN-REG-S 3.50000% 15-15.01.27 8 890 000.00 8 896 667.50 0.15EUR UT2 FUNDING PLC-SUB 5.32100% 06-30.06.16 4 329 000.00 4 404 757.50 0.08EUR VWR FUNDING INC-REG-S 4.62500% 15-15.04.22 36 900 000.00 36 366 057.00 0.63EUR WIND ACQUISITION FINANCE SA-REG-S 7.00000% 14-23.04.21 48 890 000.00 52 052 205.20 0.90EUR WIND ACQUISITION FINANCE SA-REG-S 4.00000% 14-15.07.20 38 920 000.00 39 209 175.60 0.68EUR ZIGGO BOND FINANCE BV-REG-S 4.62500% 15-15.01.25 7 450 000.00 7 715 890.50 0.13Total EUR 1 030 149 466.66 17.88
GBP
GBP 1ST CREDIT HOLDINGS 11.00000% 13-10.06.20 7 020 000.00 10 668 911.59 0.18GBP AA BOND CO LTD-REG-S 5.50000% 15-31.07.22 16 650 000.00 23 251 630.20 0.40GBP AA PIK CO LTD-REG-S 9.50000% 13-07.11.19 13 505 000.00 9 542 295.43 0.17GBP BOPARAN FINANCE PLC-REG-S 5.50000% 14-15.07.21 7 160 000.00 8 750 434.73 0.15GBP BRAKES CAPITAL-REG-S 7.12500% 13-15.12.18 10 450 000.00 14 669 630.66 0.25GBP GALAXY BIDCO LTD-REG-S 6.37500% 13-15.11.20 1 650 000.00 2 290 486.05 0.04GBP GALAXY FINCO LTD-REG-S 7.87500% 13-15.11.21 14 275 000.00 19 423 722.55 0.34GBP GRAINGER PLC-REG-S 5.00000% 13-16.12.20 8 270 000.00 11 797 744.87 0.20GBP KELDA FINANCE NO 3 PLC-REG-S 5.75000% 13-17.02.20 7 130 000.00 10 370 824.26 0.18GBP MATALAN FINANCE PLC-REG-S 6.87500% 14-01.06.19 11 120 000.00 15 468 150.53 0.27GBP MATALAN FINANCE PLC-REG-S 7.87500% 14-01.06.20 11 456 000.00 15 937 116.95 0.28GBP MEIF RENEWABLE ENERGY UK PLC-REG-S 6.75000% 15-01.02.20 5 870 000.00 8 357 178.52 0.14GBP PENSION INSURANCE CORP PLC-REG-S-SUB 6.50000% 14-03.07.24 10 000 000.00 14 311 464.62 0.25GBP PETROBRAS GLOBAL FINANCE BV 5.37500% 12-01.10.29 2 000 000.00 2 268 907.59 0.04GBP TESCO PROPERTY FINANCE 3 PLC 5.74400% 10-13.04.40 2 300 000.00 3 215 938.34 0.06GBP TWINKLE PIZZA HOLDINGS PLC-REG-S 8.62500% 14-01.08.22 6 755 000.00 9 876 540.22 0.17GBP TWINKLE PIZZA PLC-REG-S-SUB 6.62500% 14-01.08.21 6 745 000.00 9 798 522.41 0.17GBP UNICREDIT INTL BK LUX SA 8.59250% 08-PRP 2 890 000.00 4 388 072.81 0.08GBP VIRGIN MEDIA SECURED FINANCE PLC-REG-S 4.87500% 15-15.01.27 12 950 000.00 17 727 144.31 0.31GBP VOUGEOT BIDCO PLC-REG-S 7.87500% 13-15.07.20 4 560 000.00 6 620 004.19 0.11GBP VOYAGE CARE BONDCO PLC-REG-S 6.50000% 13-01.08.18 8 355 000.00 11 873 156.24 0.21Total GBP 230 607 877.07 4.00
USD
USD PERSTORP HOLDING AB-144A-SUB 11.00000% 12-15.08.17 7 000 000.00 6 762 104.28 0.12USD RBS CAPITAL TRUST B 6.80000% 02-PRP 14 700 000.00 13 848 522.35 0.24Total USD 20 610 626.63 0.36
Total Bonds, fixed rate 1 299 966 064.48 22.56

The notes are an integral part of the fi nancial statements. 59
UBS (Lux) Bond Fund – Euro High Yield (EUR)Annual Report as of 31 March 2015
Bonds, floating rate
EUR
EUR ACCOR SA-REG-S-SUB 4.125%/VAR 14-PRP 13 000 000.00 13 474 370.00 0.23EUR ARKEMA SA-REG-S-SUB 4.750%/VAR 14-PRP 18 900 000.00 20 093 157.00 0.35EUR BANCA INTESA SPA-SUBS 8.04700%3M EURIBOR+410BP 08-PRP 13 000 000.00 14 867 450.00 0.26EUR BANCO BILBALO VIZCAYA ARGENT-REG-S-SUB 7.000%/VAR 14-PRP 15 800 000.00 16 254 250.00 0.28EUR BANCO BILBALO VIZCAYA ARGENT-SUB-REG-S 6.750%/VAR 15-PRP 9 800 000.00 10 045 392.00 0.17EUR BANCO POPULAR ESPAN-SUB 5.702%/3M EURIBOR+360BP 09-22.12.19 2 000 000.00 1 989 940.00 0.03EUR BANCO SANTANDER SA-REG-S-SUB 6.250%/VAR 14-PRP 12 900 000.00 12 993 009.00 0.23EUR BPCE SA-SUB 4.750%/3M EURIBOR+135BP 06-PRP 11 850 000.00 11 909 250.00 0.21EUR CAIXA SABADELL PREFERENTES SAU-SUB 3M EURIBOR+195BP 06-PRP 8 550 000.00 7 096 500.00 0.12EUR CREDIT AGRICOLE SA REG-S-SUB 6.500%/VAR 14-PRP 4 970 000.00 5 222 724.50 0.09EUR CREDIT LOGEMENT SA-SUB 4.60400%/3M EURIBOR+115BP 06-PRP 13 300 000.00 11 362 988.00 0.20EUR CREDIT SUISSE-REG-S-SUB 5.750%/EUSA5+400BP 13-18.09.25 4 220 000.00 4 882 371.20 0.08EUR DANSKE BANK AS-REG-S-SUB 5.750%/VAR 14-PRP 7 960 000.00 8 196 810.00 0.14EUR DEUTSCHE ANNINGTON FIN BV-REG-S-SUB 4.625%/VAR 14-08.04.74 18 500 000.00 19 867 520.00 0.34EUR DEUTSCHE ANNINGTON FIN BV-REG-S-SUB 4.000%/VAR 14-PRP 8 700 000.00 9 174 498.00 0.16EUR DEUTSCHE POSTBANK-SUB 5.983%/3M EURIBOR+207BP 07-PRP 7 700 000.00 8 166 158.00 0.14EUR ELM BV-REG-S-SUB 2.600%/6M EURIBOR+305BP 15-PRP 5 130 000.00 5 168 628.90 0.09EUR ENEL SPA-REG-S-SUB 5.000%/VAR 14-15.01.75 13 160 000.00 14 394 144.80 0.25EUR ENEL SPA-SUB 6.500%/VAR 13-10.01.74 22 340 000.00 25 214 934.60 0.44EUR GAS NATURAL FENOSA FINANCE BV-REG-S-SUB 4.12500% 14-30.11.49 15 300 000.00 16 261 146.00 0.28EUR GRAND CITY PROPERTIES SA-144A-SUB 3.750%/VAR 15-PRP 3 800 000.00 3 762 714.40 0.07EUR GROUPAMA SA-REG-S-SUB 6.375%/3M EURIBOR+577BP 14-PRP 40 700 000.00 43 815 585.00 0.76EUR GROUPE BPCE 12.50000%/3M LIBOR+1313BP 09-PRP 7 693 000.00 10 675 576.10 0.19EUR HSBC HOLDINGS PLC-144A-REG-S-SUB 5.25000%/VAR 14-PRP 6 500 000.00 6 738 875.00 0.12EUR HT1 FUNDING GMBH-SUB 6.35200%/12M EURIBOR+200BP 06-PRP 4 002 000.00 4 074 836.40 0.07EUR HYDRA DUTCH HOLDINGS-REG-S 3M EURIBOR+550BP 14-15.04.19 10 944 000.00 9 948 424.32 0.17EUR HYPO REAL ES INTL-SUB 5.86400%/3M EURIBOR+213 BP 07-31.12.49 3 500 000.00 3 115 385.00 0.05EUR INTESA SANPAOLO VITA SPA-REG-S-SUB 4.750%/VAR 14-PRP 8 800 000.00 9 529 432.00 0.17EUR KONINKLIJKE KPN NV-REG-S-SUB 6.125%/VAR 13-PRP 15 610 000.00 17 146 492.30 0.30EUR LA MONDIALE SAM-REG-S-SUB 5.050%/VAR 14-PRP 370 000.00 413 001.40 0.01EUR LAFARGE SA-REG-S 5.000%/RATING LINKED 10-13.04.18 1 350 000.00 1 528 969.50 0.03EUR LLOYDS BANKING GROUP PLC-REG-S-SUB 6.375%/VAR 14-PRP 5 551 000.00 5 916 144.78 0.10EUR NATIXIS-SUB 6.307%/3M EURIBOR+268P 07-PRP 2 750 000.00 3 016 392.50 0.05EUR PFLEID FIN BV *DEFAULT*-SUB 7.12500%/3M EURIBOR+423BP 07-PRP 4 000 000.00 80 000.00 0.00EUR RBS CAP TRUST C-SUB 4.243%/3M EURIBOR+169BP 05-PRP 5 075 000.00 5 075 000.00 0.09EUR REPSOL INTERNATIONAL FINANCE BV-SUB-REG-S 3.875%/VAR 15-PRP 33 890 000.00 33 830 692.50 0.59EUR REPSOL INTERNATIONAL FINANC-REG-S-SUB 4.500%/VAR 15-25.03.75 34 480 000.00 34 290 015.20 0.59EUR REXAM PLC-SUB 6.75000%/VAR 07-29.06.67 8 450 000.00 8 661 503.50 0.15EUR RHINO BONDCO S.P.A-REG-S 3M EURIBOR+550BP 13-15.12.19 3 310 000.00 3 290 901.30 0.06EUR ROYAL BANK OF SCOT GP PLC 7.09160%/3M EURIBOR+233BP 07-PRP 7 350 000.00 7 973 206.50 0.14EUR SOCIETE GENERALE-REG-S-SUB 6.750%/VAR 14-PRP 12 140 000.00 12 598 042.20 0.22EUR SOCIETE GENERALE-SUB 9.375%/3M EURIBOR+890.1BP 09-31.12.99 6 800 000.00 8 515 776.00 0.15EUR SRLEV NV VAR 9.000%/12M EURIBOR+616.5BP 11-15.04.41 8 374 000.00 11 371 054.60 0.20EUR TDC A/S-REG-S-SUB 3.500%/VAR 15-26.02.3015 15 430 000.00 15 494 651.70 0.27EUR TELEFONICA EUROPE BV-REG-S-SUB 6.500%/VAR 13-PRP 5 800 000.00 6 515 140.00 0.11EUR TELEFONICA EUROPE BV-REG-S-SUB 7.625%/VAR 13-PRP 13 200 000.00 16 171 056.00 0.28EUR TELEFONICA EUROPE BV-REG-S-SUB 5.000%/VAR 14-PRP 16 700 000.00 18 066 895.00 0.31EUR TELEFONICA EUROPE BV-REG-S-SUB 5.875%/VAR 14-PRP 19 200 000.00 22 067 520.00 0.38EUR TELEFONICA EUROPE BV-REG-S-SUB 4.200%/VAR 14-PRP 18 000 000.00 18 981 180.00 0.33EUR UBS CAPITAL JERSEY LTD 7.15200%/3M EURIBOR+345BP 07-PRP 1 400 000.00 1 578 724.00 0.03EUR UBS GROUP AG-REG-S-SUB 5.750%/VAR 15-PRP 9 145 000.00 9 567 041.75 0.17EUR UNICREDIT LUX FINANCE SA-SUB 8.125%/3M EURIBOR+665BP 09-PRP 18 662 000.00 21 810 839.26 0.38EUR UNICREDITO ITALIANO SPA-SUB 9.375%/FLR 10-PRP 25 331 000.00 29 790 269.24 0.52EUR VOLVO TREASURY AB-REG-S-SUB 4.200%/VAR 14-10.06.75 8 990 000.00 9 282 984.10 0.16EUR VOLVO TREASURY AB-REG-S-SUB 4.850%/VAR 14-10.03.78 14 940 000.00 15 783 512.40 0.27EUR WIENERBERGER AG-SUB 6.500%/VAR 14-PRP 8 835 000.00 9 162 336.75 0.16Total EUR 676 275 412.70 11.74
GBP
GBP ABN AMRO BANK NV-SUB 5.00000%/3M LIBOR+148BP 06-PRP 4 221 000.00 5 913 680.74 0.10GBP ASSICURAZIONI GENERALI-SUB 6.41600%/3M LIBOR+220BP 07-PRP 8 650 000.00 12 776 839.94 0.22GBP BANK OF SCOTLAND 7.281%/VAR 01-PRP 5 627 000.00 9 294 464.55 0.16GBP BANK OF SCOTLAND-REG-S-SUB 7.754%/VAR 00-PRP 2 160 000.00 3 493 136.31 0.06GBP CARE UK HEALTH&SOCIAL CARE-REG-S 3M LIBOR+500BP 14-15.07.19 11 920 000.00 15 539 023.93 0.27GBP CARE UK HEALTH&SOCIAL CARE-REG-S 3M LIBOR+750BP 14-15.01.20 6 760 000.00 8 549 558.93 0.15GBP COVENTRY BUILDING SOCIETY-REG-S-SUB 6.375% 14-PRP 5 850 000.00 7 939 931.19 0.14GBP CREDIT AGRICOLE SA-SUB 7.58900%/3M LIBOR+355BP-PRP 7 300 000.00 11 312 097.33 0.20GBP CREDIT AGRICOLE SA-SUB 8.12500%/3M LIBOR+646BP 09-PRP 6 400 000.00 10 152 586.73 0.18GBP ENEL SPA-REG-S-SUB 7.750%/VAR 13-10.09.75 2 237 000.00 3 486 898.75 0.06GBP ENEL SPA-SUB 6.625%/VAR 14-15.09.76 2 890 000.00 4 319 085.99 0.07GBP GENERALI FINANCE BV 6.21400%/3M LIBOR+208BP 06-PRP 1 750 000.00 2 479 253.22 0.04GBP HBOS CAPITAL FUNDING LP-SUB 6.46100%/VAR 01-PRP 8 395 000.00 12 454 486.98 0.22GBP LLOYDS BANKING GROUP PLC-REG-S-SUB 7.000%/VAR 14-PRP 4 100 000.00 5 801 168.91 0.10GBP ORANGE SA-REG-S-SUB 5.875%/VAR 14-PRP 3 710 000.00 5 491 598.14 0.09GBP SCOTTISH WIDOWS PLC -SUB 5.12500%/3M LIBOR+163BP 05-PRP 4 014 000.00 5 576 067.13 0.10Total GBP 124 579 878.77 2.16
USD
USD SKANDINAVISKA ENSKILDA BANKEN-REG-S-SUB 5.750%/VAR 14-PRP 9 970 000.00 9 380 897.39 0.16USD SOCIETE GENERALE SA-SUB-144A 7.875%/VAR 13-PRP 5 800 000.00 5 575 884.54 0.10USD UBS GROUP AG-REG-S-SUB 7.125%/VAR 15-PRP 11 070 000.00 10 789 539.39 0.19USD UBS GROUP AG-REG-S-SUB 7.000%/VAR 15-PRP 14 275 000.00 13 804 749.07 0.24USD UNICREDIT SPA-REG-S-SUB 8.000%/VAR 14-PRP 5 100 000.00 4 880 899.44 0.08Total USD 44 431 969.83 0.77
Total Bonds, floating rate 845 287 261.30 14.67
Description Quantity/ Valuation in EUR as a % Nominal Unrealized gain of net (loss) on Futures/ assets Options/Forward Exchange Contracts/ Swaps (Note 1)

60 The notes are an integral part of the fi nancial statements.
UBS (Lux) Bond Fund – Euro High Yield (EUR)Annual Report as of 31 March 2015
Description Quantity/ Valuation in EUR as a % Nominal Unrealized gain of net (loss) on Futures/ assets Options/Forward Exchange Contracts/ Swaps (Note 1)
Other bonds, floating rate
GBP
GBP SOCIETE GENERALE-SUB 8.875%/3M LIBOR+340BP 08-PRP 11 534 000.00 18 081 163.14 0.31Total GBP 18 081 163.14 0.31
Total Other bonds, floating rate 18 081 163.14 0.31
Total Transferable securities and money market instruments listed on an official stock exchange 4 996 650 519.42 86.72
Transferable securities and money market instruments traded on another regulated market
Mortgage Backed Securities, floating rate
USD
USD ALADDIN CDO I LTD-REG-S *DEFAULT* 3M LIBOR+750BP 06-31.10.16 1 700 000.00 0.01 0.00USD COMM 2014-TWC MTG TRUST-144A-SUB 1M LIBOR+225BP 14-13.02.32 18 950 000.00 17 629 128.53 0.30USD COMMERCIAL MTGE PASS-THR-144A-SUB 1M LIBOR+375BP 13-08.06.30 5 318 125.00 4 955 180.30 0.09Total USD 22 584 308.84 0.39
Total Mortgage Backed Securities, floating rate 22 584 308.84 0.39
Notes, fixed rate
EUR
EUR AXALTA COATING SYSTEMS US/DUTCH-REG-S 5.75000% 13-01.02.21 4 140 000.00 4 374 572.40 0.08EUR GATES GLOBAL LLC/CO-REG-S 5.75000% 14-15.07.22 4 316 000.00 3 991 350.48 0.07EUR INFOR US INC 10.00000% 12-01.04.19 8 090 000.00 8 797 875.00 0.15EUR PLAY TOPCO SA-REG-S (PIK) 7.75000% 14-28.02.20 8 040 000.00 8 290 767.60 0.14Total EUR 25 454 565.48 0.44
GBP
GBP VIRGIN MEDIA SECURED FINANCE PLC-REG-S 6.00000% 13-15.04.21 13 984 000.00 18 229 982.97 0.32Total GBP 18 229 982.97 0.32
USD
USD ALTICE SA-144A 7.62500% 15-15.02.25 9 445 000.00 8 810 716.36 0.15USD AMERICAN AXLE & MANUFACTURING INC 6.62500% 12-15.10.22 2 930 000.00 2 925 907.82 0.05USD ANTERO RESOURCES CORP 5.37500% 14-01.11.21 2 450 000.00 2 212 756.05 0.04USD BEVERAGE PACKAGING HOLDING II-144A 5.62500% 13-15.12.16 9 850 000.00 9 205 714.62 0.16USD BIOMET INC-SUB 6.50000% 13-01.10.20 11 646 000.00 11 385 754.19 0.20USD CHRYSLER GROUP LLC/CG CO-ISSUER 8.00000% 11-15.06.19 9 280 000.00 9 061 824.95 0.16USD CHRYSLER GROUP LLC/CG CO-ISSUER INC 8.25000% 11-15.06.21 6 800 000.00 7 022 297.96 0.12USD DUFRY FINANCE SCA-144A 5.50000% 12-15.10.20 4 375 000.00 4 249 013.03 0.07USD EDP FINANCE BV-REG-S 5.25000% 14-14.01.21 4 890 000.00 4 945 365.36 0.09USD GENERAL MOTORS FINANCIAL CO INC 4.25000% 14-15.05.23 8 320 000.00 8 025 313.97 0.14USD MECCANICA HOLDINGS USA INC-144A 6.25000% 09-15.07.19 2 000 000.00 2 071 694.60 0.04USD OWENS-BROCKWAY GLASS CONTAINER INC-144A 5.00000% 14-15.01.22 2 750 000.00 2 608 275.14 0.04USD PINNACLE MERGER SUB INC-144A 9.50000% 13-01.10.23 3 809 000.00 3 936 675.98 0.07USD SABINE PASS LIQUEFACTION LLC STEP-UP/DOWN 14-01.02.21 8 310 000.00 7 788 187.71 0.13Total USD 84 249 497.74 1.46
Total Notes, fixed rate 127 934 046.19 2.22
Notes, floating rate
USD
USD SOCIETE GENERALE-REG-S-SUB 6.000%VAR 14-PRP 4 000 000.00 3 533 519.55 0.06Total USD 3 533 519.55 0.06
Total Notes, floating rate 3 533 519.55 0.06
Medium term notes, fixed rate
EUR
EUR TVN FINANCE CORPORATION III AB-REG-S 7.87500% 10-15.11.18 5 044 000.00 5 257 361.20 0.09Total EUR 5 257 361.20 0.09
Total Medium term notes, fixed rate 5 257 361.20 0.09
Bonds, fixed rate
EUR
EUR LGE HOLDCO VI BV-REG-S 7.12500% 14-15.05.24 27 040 000.00 30 637 131.20 0.53EUR SNAI SPA-REG-S-SUB 12.00000% 13-15.06.18 1 150 000.00 1 225 382.50 0.02Total EUR 31 862 513.70 0.55
GBP
GBP CABOT FINANCIAL LUXEMBOURG SA-REG-S 6.50000% 14-01.04.21 6 420 000.00 8 343 349.45 0.14GBP FINDUS BONDCO SA-REG-S 9.50000% 13-01.07.18 1 600 000.00 2 340 036.42 0.04GBP VIRGIN MEDIA SECURED FINANCE PLC-REG-S 6.25000% 14-28.03.29 3 400 000.00 5 061 680.58 0.09Total GBP 15 745 066.45 0.27
USD
USD CONTINENTAL AIRLINES INC-144A 6.12500% 12-29.04.18 3 620 000.00 3 555 959.03 0.06USD SPCM SA-144A 6.00000% 13-15.01.22 6 100 000.00 5 878 491.62 0.11Total USD 9 434 450.65 0.17
Total Bonds, fixed rate 57 042 030.80 0.99

The notes are an integral part of the fi nancial statements. 61
UBS (Lux) Bond Fund – Euro High Yield (EUR)Annual Report as of 31 March 2015
Bonds, floating rate
USD
USD CREDIT AGRICOLE SA-REG-S-SUB 8.125%/VAR 13-19.09.33 6 450 000.00 6 823 847.77 0.12USD HSBC HOLDINGS PLC-SUB 6.375%/VAR 15-PRP 3 750 000.00 3 570 181.56 0.06Total USD 10 394 029.33 0.18
Total Bonds, floating rate 10 394 029.33 0.18
Total Transferable securities and money market instruments traded on another regulated market 226 745 295.91 3.93
Recently issued transferable securities and money market instruments
Notes, fixed rate
USD
USD AECOM TECHNOLOGY CORP-144A 5.87500% 14-15.10.24 9 675 000.00 9 458 798.88 0.17USD WR GRACE & CO-CONN-144A 5.62500% 14-01.10.24 15 000 000.00 14 909 217.88 0.26Total USD 24 368 016.76 0.43
Total Notes, fixed rate 24 368 016.76 0.43
Total Recently issued transferable securities and money market instruments 24 368 016.76 0.43
Total investments in securities 5 247 763 832.09 91.08
Derivative instruments
Derivative instruments not listed on an official stock exchange and not traded on another regulated market
Credit default swaps*
EUR JPMORGAN/PPCGA CREDIT DEFAULT SWAPS PAYER 5.00000% 15-20.03.20 -2 000 000.00 506 465.24 0.01EUR JPMORGAN/HTOGA CREDIT DEFAULT SWAPS PAYER 5.00000% 15-20.06.20 -5 000 000.00 154 989.61 0.00EUR JPMORGAN/HTOGA CREDIT DEFAULT SWAPS PAYER 5.00000% 15-20.06.20 -2 000 000.00 61 995.84 0.00EUR MS/NORSKE SKOGINDUSTRIER CREDIT DEFAULT SWAPS REC 5.00000% 14-20.06.15 5 000 000.00 -21 583.61 0.00EUR MS/NORSKE SKOGINDUSTRIER CREDIT DEFAULT SWAPS REC 5.00000% 14-20.06.15 5 000 000.00 -21 583.61 0.00EUR MORGAN STANLEY/NSINO CREDIT DEFAULT SWAPS REC 5.00000% 14-20.06.15 5 000 000.00 -21 583.61 0.00EUR JPM/OIBRBZ CREDIT DEFAULT SWAPS REC 5.00000% 14-20.09.19 8 000 000.00 146 863.02 0.00EUR JPMORGAN/UCGIM CREDIT DEFAULT SWAPS REC 1.00000% 14-20.12.19 10 000 000.00 -498 957.44 -0.01USD JPMORGAN/CMBX.NA.BB.6 CDI REC 5.00000% 13-11.05.63 15 000 000.00 223 503.26 0.00EUR MORGAN STANLEY/NSINO CREDIT DEFAULT SWAPS REC 5.00000% 14-20.09.15 7 000 000.00 -215 215.16 0.00EUR JPMORGAN/NSINO CREDIT DEFAULT SWAPS REC 5.00000% 14-20.06.15 2 000 000.00 -61 490.04 0.00Total Credit default swaps 253 403.50 0.00
Total Derivative instruments not listed on an official stock exchange and not traded on another regulated market 253 403.50 0.00
Total Derivative instruments 253 403.50 0.00
* Positive nominal: the subfund is “Receiver”, negative nominal: the subfund is “Payer”.
Forward Foreign Exchange contracts
Forward Foreign Exchange contracts (Purchase/Sale)
CHF 19 956 800.00 EUR 18 610 341.77 2.4.2015 520 462.79 0.01USD 2 213 477 100.00 EUR 1 956 071 750.18 2.4.2015 104 893 892.28 1.82CNH 1 294 214 700.00 EUR 181 547 343.17 2.4.2015 12 641 943.77 0.22HKD 1 756 922 700.00 EUR 200 182 154.41 2.4.2015 10 814 606.28 0.19SGD 490 942 900.00 EUR 318 364 092.65 2.4.2015 14 883 916.58 0.26GBP 32 788 000.00 EUR 44 483 698.49 2.4.2015 836 400.21 0.02GBP 340 500.00 EUR 463 652.00 2.4.2015 6 992.55 0.00EUR 2 304 453.66 HKD 20 237 500.00 2.4.2015 -125 958.87 0.00CHF 124 000.00 EUR 116 099.76 2.4.2015 2 767.98 0.00SGD 5 817 200.00 EUR 3 813 187.13 2.4.2015 135 480.46 0.00CNH 9 313 800.00 EUR 1 320 118.82 2.4.2015 77 361.97 0.00GBP 204 500.00 EUR 280 614.42 2.4.2015 2 048.76 0.00CHF 314 300.00 EUR 292 894.40 2.4.2015 8 396.98 0.00CHF 619 700.00 EUR 582 110.23 2.4.2015 11 940.90 0.00EUR 3 314 447.39 SGD 5 021 000.00 2.4.2015 -93 766.18 0.00GBP 1 128 600.00 EUR 1 556 210.99 2.4.2015 3 758.00 0.00CHF 1 470 700.00 EUR 1 378 313.05 2.4.2015 31 515.89 0.00EUR 3 270 409.36 HKD 27 589 000.00 2.4.2015 -42 877.92 0.00CHF 1 913 300.00 EUR 1 787 967.08 2.4.2015 46 143.02 0.00GBP 422 100.00 EUR 587 631.75 2.4.2015 -4 198.37 0.00CHF 910 700.00 EUR 850 921.89 2.4.2015 22 084.99 0.00EUR 9 538 917.20 CNH 63 620 600.00 2.4.2015 -6 978.82 0.00EUR 3 136 487.24 HKD 25 798 100.00 2.4.2015 38 277.21 0.00CHF 363 400.00 EUR 341 208.48 2.4.2015 7 150.69 0.00EUR 854 949 605.16 GBP 611 165 000.00 20.4.2015 10 463 701.02 0.18EUR 28 406 878.09 CHF 30 270 000.00 20.4.2015 -622 975.46 -0.01EUR 422 518 403.08 USD 447 875 000.00 20.4.2015 5 594 559.95 0.10AUD 429 830 000.00 EUR 309 804 580.15 20.4.2015 -4 426 951.67 -0.08CAD 99 165 800.00 EUR 73 424 874.59 20.4.2015 -549 471.58 -0.01CHF 293 600.00 EUR 277 038.63 2.4.2015 4 409.51 0.00
Description Quantity/ Valuation in EUR as a % Nominal Unrealized gain of net (loss) on Futures/ assets Options/Forward Exchange Contracts/ Swaps (Note 1)

62 The notes are an integral part of the fi nancial statements.
UBS (Lux) Bond Fund – Euro High Yield (EUR)Annual Report as of 31 March 2015
EUR 1 939 374.96 CAD 2 613 300.00 20.4.2015 18 901.46 0.00EUR 15 917 053.73 USD 16 850 000.00 20.4.2015 231 501.38 0.00CHF 274 700.00 EUR 257 934.03 2.4.2015 5 396.36 0.00CHF 1 055 300.00 EUR 991 609.89 2.4.2015 20 012.12 0.00EUR 5 544 377.90 AUD 7 729 700.00 20.4.2015 52 724.33 0.00EUR 3 452 981.39 CNH 22 895 000.00 2.4.2015 17 721.60 0.00EUR 4 167 589.73 SGD 6 132 800.00 2.4.2015 4 695.45 0.00CHF 878 900.00 EUR 828 866.31 2.4.2015 13 656.75 0.00EUR 3 698 882.88 HKD 30 591 400.00 2.4.2015 25 023.86 0.00CHF 720 500.00 EUR 683 374.32 2.4.2015 7 304.78 0.00EUR 6 128 687.10 HKD 50 576 500.00 2.4.2015 54 727.41 0.00CHF 310 400.00 EUR 294 684.48 2.4.2015 2 868.32 0.00EUR 1 456 541.66 CAD 1 977 500.00 20.4.2015 3 307.69 0.00CHF 2 147 000.00 EUR 2 033 579.16 2.4.2015 24 558.29 0.00CHF 380 000.00 EUR 363 886.03 2.4.2015 386.08 0.00GBP 186 100.00 EUR 253 615.14 2.4.2015 3 615.26 0.00CHF 871 300.00 EUR 828 781.83 2.4.2015 6 455.78 0.00USD 33 451 600.00 EUR 30 522 256.91 2.4.2015 624 484.24 0.01EUR 4 763 943.99 CNH 32 461 300.00 2.4.2015 -106 682.73 0.00CHF 32 604 600.00 EUR 31 133 480.77 7.5.2015 153 389.99 0.00EUR 31 102 890.25 CHF 32 604 600.00 2.4.2015 -152 232.33 0.00EUR 2 043 033 915.26 USD 2 246 928 700.00 2.4.2015 -49 078 468.35 -0.85USD 2 246 928 700.00 EUR 2 042 116 652.46 7.5.2015 48 974 348.07 0.85CNH 1 184 551 600.00 EUR 172 529 290.10 7.5.2015 4 337 717.54 0.08HKD 1 602 130 200.00 EUR 187 743 765.82 7.5.2015 4 551 251.50 0.08SGD 485 606 300.00 EUR 322 940 945.67 7.5.2015 6 227 970.50 0.11EUR 47 588 535.26 GBP 35 069 800.00 2.4.2015 -885 503.94 -0.02GBP 35 069 800.00 EUR 47 557 429.96 7.5.2015 881 192.53 0.02EUR 173 286 462.45 CNH 1 184 551 600.00 2.4.2015 -4 448 522.75 -0.08EUR 187 838 415.81 HKD 1 602 130 200.00 2.4.2015 -4 568 616.33 -0.08EUR 323 306 458.06 SGD 485 606 300.00 2.4.2015 -6 319 110.91 -0.11HKD 20 713 600.00 EUR 2 446 093.73 7.5.2015 40 047.58 0.00CHF 876 500.00 EUR 834 894.69 7.5.2015 6 181.18 0.00CHF 928 900.00 EUR 889 923.15 7.5.2015 1 434.95 0.00CHF 557 600.00 EUR 533 220.62 7.5.2015 1 843.73 0.00CHF 724 900.00 EUR 694 832.51 7.5.2015 770.34 0.00Total Forward Foreign Exchange contracts (Purchase/Sale) 155 908 984.65 2.71
Cash at banks, deposits on demand and deposit accounts and other liquid assets 343 546 513.01 5.96Other assets and liabilities 14 264 460.44 0.25
Total net assets 5 761 737 193.69 100.00
Description Quantity/ Valuation in EUR as a % Nominal Unrealized gain of net (loss) on Futures/ assets Options/Forward Exchange Contracts/ Swaps (Note 1)

The notes are an integral part of the fi nancial statements. 63
UBS (Lux) Bond Fund – Full Cycle Asian Bond (USD)Annual Report as of 31 March 2015
UBS (Lux) Bond Fund – Full Cycle Asian Bond (USD)
Three-year comparison
ISIN 31.3.2015 31.3.2014 31.3.2013Net assets in USD 371 780 995.99 391 927 960.95 839 969 573.46Class (EUR hedged) F-acc1 LU0464251627Units outstanding 46 231.3610 97 983.9790 -Net asset value per unit in EUR 133.61 123.63 -Issue and redemption price per unit in EUR2 133.61 123.63 -Class (EUR hedged) N-acc LU0464250819Units outstanding 8 650.4140 8 964.5110 14 513.6010Net asset value per unit in EUR 116.71 109.37 109.83Issue and redemption price per unit in EUR2 116.71 109.37 109.83Class (EUR hedged) P-acc LU0464250652Units outstanding 382 670.7690 575 808.4190 1 194 718.0970Net asset value per unit in EUR 131.28 122.72 122.93Issue and redemption price per unit in EUR2 131.28 122.72 122.93Class (EUR hedged) P-dist LU0464250496Units outstanding 166 037.8080 221 399.6620 571 760.6920Net asset value per unit in EUR 110.82 107.53 111.88Issue and redemption price per unit in EUR2 110.82 107.53 111.88Class (SGD hedged) F-acc3 LU0964819261Units outstanding 38 529.0000 55 736.0000 -Net asset value per unit in SGD 113.06 104.50 -Issue and redemption price per unit in SGD2 113.06 104.50 -Class (SGD hedged) P-acc LU0464247518Units outstanding 141 969.7180 139 410.6920 251 234.6760Net asset value per unit in SGD 126.23 117.87 117.88Issue and redemption price per unit in SGD2 126.23 117.87 117.88Class (SGD hedged) P-mdist LU0464247435Units outstanding 284 161.1670 231 227.5170 536 490.2190Net asset value per unit in SGD 98.57 97.12 102.66Issue and redemption price per unit in SGD2 98.57 97.12 102.66Class F-acc LU0464245496Units outstanding 511 979.5670 319 799.0000 691 146.3170Net asset value per unit in USD 134.99 124.90 123.40Issue and redemption price per unit in USD2 134.99 124.90 123.40Class I-A1-acc LU0464245819Units outstanding 111 343.8340 4 433.4280 9 663.4280Net asset value per unit in USD 119.03 110.47 109.44Issue and redemption price per unit in USD2 119.03 110.47 109.44Class I-X-acc LU0464246890Units outstanding 162 103.2540 37 472.3340 808.7420Net asset value per unit in USD 134.72 124.18 122.19Issue and redemption price per unit in USD2 134.72 124.18 122.19Class I-X-dist4 LU0464246627 Units outstanding 146 338.8700 - -Net asset value per unit in USD 101.44 - -Issue and redemption price per unit in USD2 101.44 - -Class K-1-acc5 LU0464244929Units outstanding - 0.2000 2.5000Net asset value per unit in USD - 6 299 601.65 6 256 046.50Issue and redemption price per unit in USD2 - 6 299 601.65 6 256 046.50Class P-acc LU0464244333Units outstanding 693 985.1120 903 183.6450 1 835 170.3510Net asset value per unit in USD 131.23 122.85 122.75Issue and redemption price per unit in USD2 131.23 122.85 122.75Class P-mdist LU0464244259Units outstanding 441 416.1520 522 186.0900 1 669 127.9980Net asset value per unit in USD 98.68 97.33 102.79Issue and redemption price per unit in USD2 98.68 97.33 102.79
1 First NAV: 10.7.20132 See note 13 First NAV: 7.10.20134 First NAV: 17.2.20155 The unit class K-1-acc was in circulation until 31.12.2014.

64 The notes are an integral part of the fi nancial statements.
UBS (Lux) Bond Fund – Full Cycle Asian Bond (USD)Annual Report as of 31 March 2015
Performance
Currency 2014/2015 2013/2014 2012/2013Class (EUR hedged) F-acc EUR 8.1% - -Class (EUR hedged) N-acc EUR 6.7% -0.4% 8.8%Class (EUR hedged) P-acc EUR 7.0% -0.2% 9.1%Class (EUR hedged) P-dist EUR 7.0% -0.2% 9.1%Class (SGD hedged) F-acc SGD 8.2% - -Class (SGD hedged) P-acc SGD 7.1% 0.0% 9.3%Class (SGD hedged) P-mdist SGD 7.1% 0.0% 9.3%Class F-acc USD 8.1% 1.2% 10.1%Class I-A1-acc USD 7.7% 0.9% 9.7%Class I-X-acc USD 8.5% 1.6% 10.4%Class I-X-dist1 USD - - -Class K-1-acc USD - 0.7% 10.1%Class P-acc USD 6.8% 0.1% 9.4%Class P-mdist USD 6.8% 0.1% 9.4%
Historical performance is no indicator of current or future performance.The performance data does not take account of any commissions and costs charged when subscribing and redeeming units.The performance data were not audited.The subfund does not have a benchmark.
1 Due to the recent launch, there are no data for the calculation of the performance.

The notes are an integral part of the fi nancial statements. 65
UBS (Lux) Bond Fund – Full Cycle Asian Bond (USD)Annual Report as of 31 March 2015
Report of the Portfolio Manager
The Asian USD credit market performed strongly over the reporting year from 1 April 2014 to 31 March 2015, driven by the significant rally in US Treasuries and run-ning yield. Whilst US Treasury yields trended down over the year, credit spreads in contrast ended largely unchanged. Spreads tightened early, supported by expectations of continued easy monetary policy globally. They widened, however, in the second half of the report-ing year, given the spillover effect of an increase in risk aversion in global markets on the back of the sharp fall in oil prices. In addition, negative corporate news flow around certain Chinese property companies was also negative. Markets were able to stage a strong recovery late in the reporting period on the back of an improve-ment in investor sentiment, buoyed by policy easing in several Asian countries. As a result, credit spreads ended largely unchanged over the reporting year.
The subfund posted a positive return in the reporting year given the underlying market movements as described. In terms of sector allocation, the subfund increased exposure to high yield around October. The subfund adopted a defensive interest rate duration stance over most of the reporting year.
Structure of the Securities Portfolio
Geographical Breakdown as a % of net assetsBritish Virgin Islands 24.07Cayman Islands 14.95Hong Kong 9.41Singapore 8.79Indonesia 7.04South Korea 6.68Philippines 5.47Malaysia 4.51United States 3.82India 3.00Sri Lanka 1.68Netherlands 1.47China 1.30Australia 1.00United Kingdom 0.73Bermuda 0.60Pakistan 0.55Vietnam 0.14Total 95.21
Economic Breakdown as a % of net assetsFinance & holding companies 34.71Banks & credit institutions 15.21Countries & central governments 11.55Real Estate 9.02Petroleum 4.77Building industry & materials 4.22Miscellaneous unclassified companies 3.67Mining, coal & steel 2.26Energy & water supply 1.93Miscellaneous services 1.82Internet, software & IT services 1.71Retail trade, department stores 1.01Tobacco & alcohol 0.76Food & soft drinks 0.75Rubber & tyres 0.64Electronics & semiconductors 0.60Traffic & transportation 0.58Total 95.21

66 The notes are an integral part of the fi nancial statements.
UBS (Lux) Bond Fund – Full Cycle Asian Bond (USD)Annual Report as of 31 March 2015
Statement of Net Assets USDAssets 31.3.2015Investments in securities, cost 351 833 027.72Investments in securities, unrealized appreciation (depreciation) 2 149 034.11Total investments in securities (Note 1) 353 982 061.83Cash at banks, deposits on demand and deposit accounts 20 346 206.90Other liquid assets (Margins) 28 592.50Receivable on securities sales (Note 1) 10 137 696.00Receivable on subscriptions 579 435.03Interest receivable on securities 3 976 451.85Unrealized gain (loss) on financial futures (Note 1) 65 093.75Unrealized gain (loss) on forward foreign exchange contracts (Note 1) -2 979 854.35Unrealized gain (loss) on swaps (Note 1) 324 287.33Total Assets 386 459 970.84
LiabilitiesPayable on securities purchases (Note 1) -13 962 517.31Payable on redemptions -505 050.72Provisions for flat fee (Note 2) -177 820.23Provisions for taxe d’abonnement (Note 3) -33 586.59Total provisions -211 406.82Total Liabilities -14 678 974.85
Net assets at the end of the financial year 371 780 995.99
Statement of Operations USDIncome 1.4.2014-31.3.2015Interest on liquid assets 2 038.88Interest on securities 17 719 592.00Interest received on swaps (Note 1) 166 944.43Income on securities lending (Note 14) 328 191.42Total income 18 216 766.73
ExpensesInterest paid on swaps (Note 1) -123 888.88Cost on securities lending (Note 14) -131 276.56Flat fee (Note 2) -4 660 283.43Taxe d’abonnement (Note 3) -148 377.51Interest on cash and bank overdraft -333.29Total expenses -5 064 159.67
Net income (loss) on investments 13 152 607.06
Realized gain (loss) (Note 1)Realized gain (loss) on market-priced securities without options 12 510 021.43Realized gain (loss) on options -612 926.84Realized gain (loss) on financial futures -625 876.14Realized gain (loss) on forward foreign exchange contracts -25 925 726.60Realized gain (loss) on swaps -286 199.54Realized result on subscriptions/redemptions (Note 5) 252 869.28Total realized gain (loss) on investments -14 687 838.41Realized gain (loss) on foreign exchange -150 834.27Total realized gain (loss) -14 838 672.68
Net realized gain (loss) of the financial year -1 686 065.62
Changes in unrealized appreciation (depreciation) (Note 1)Unrealized appreciation (depreciation) on market-priced securities without options 946 597.15Unrealized appreciation (depreciation) on financial futures -390 036.33Unrealized appreciation (depreciation) on forward foreign exchange contracts -4 068 266.96Unrealized appreciation (depreciation) on swaps 324 287.33Total changes in unrealized appreciation (depreciation) -3 187 418.81
Net increase (decrease) in net assets as a result of operations -4 873 484.43

The notes are an integral part of the fi nancial statements. 67
UBS (Lux) Bond Fund – Full Cycle Asian Bond (USD)Annual Report as of 31 March 2015
Statement of Changes in Net Assets USD 1.4.2014-31.3.2015Net assets at the beginning of the financial year 391 927 960.95Subscriptions 178 470 202.54Redemptions -188 952 478.05Total net subscriptions (redemptions) -10 482 275.51Dividend paid -4 791 205.02Net income (loss) on investments 13 152 607.06Total realized gain (loss) -14 838 672.68Total changes in unrealized appreciation (depreciation) -3 187 418.81Net increase (decrease) in net assets as a result of operations -4 873 484.43Net assets at the end of the financial year 371 780 995.99
Development of the outstanding units
1.4.2014-31.3.2015Class (EUR hedged) F-accNumber of units outstanding at the beginning of the financial year 97 983.9790Number of units issued 0.0000Number of units redeemed -51 752.6180Number of units outstanding at the end of the financial year 46 231.3610Class (EUR hedged) N-accNumber of units outstanding at the beginning of the financial year 8 964.5110Number of units issued 4 177.4820Number of units redeemed -4 491.5790Number of units outstanding at the end of the financial year 8 650.4140Class (EUR hedged) P-accNumber of units outstanding at the beginning of the financial year 575 808.4190Number of units issued 91 233.4310Number of units redeemed -284 371.0810Number of units outstanding at the end of the financial year 382 670.7690Class (EUR hedged) P-distNumber of units outstanding at the beginning of the financial year 221 399.6620Number of units issued 20 990.9570Number of units redeemed -76 352.8110Number of units outstanding at the end of the financial year 166 037.8080Class (SGD hedged) F-accNumber of units outstanding at the beginning of the financial year 55 736.0000Number of units issued 9 605.0000Number of units redeemed -26 812.0000Number of units outstanding at the end of the financial year 38 529.0000Class (SGD hedged) P-accNumber of units outstanding at the beginning of the financial year 139 410.6920Number of units issued 44 423.9670Number of units redeemed -41 864.9410Number of units outstanding at the end of the financial year 141 969.7180Class (SGD hedged) P-mdistNumber of units outstanding at the beginning of the financial year 231 227.5170Number of units issued 155 767.5580Number of units redeemed -102 833.9080Number of units outstanding at the end of the financial year 284 161.1670Class F-accNumber of units outstanding at the beginning of the financial year 319 799.0000Number of units issued 334 184.4640Number of units redeemed -142 003.8970Number of units outstanding at the end of the financial year 511 979.5670Class I-A1-accNumber of units outstanding at the beginning of the financial year 4 433.4280Number of units issued 146 497.5010Number of units redeemed -39 587.0950Number of units outstanding at the end of the financial year 111 343.8340Class I-X-accNumber of units outstanding at the beginning of the financial year 37 472.3340Number of units issued 224 295.8720Number of units redeemed -99 664.9520Number of units outstanding at the end of the financial year 162 103.2540Class I-X-distNumber of units outstanding at the beginning of the financial year 0.0000Number of units issued 152 838.8700Number of units redeemed -6 500.0000Number of units outstanding at the end of the financial year 146 338.8700

68 The notes are an integral part of the fi nancial statements.
UBS (Lux) Bond Fund – Full Cycle Asian Bond (USD)Annual Report as of 31 March 2015
Class K-1-accNumber of units outstanding at the beginning of the financial year 0.2000Number of units issued 0.0000Number of units redeemed -0.2000Number of units outstanding at the end of the financial year 0.0000Class P-accNumber of units outstanding at the beginning of the financial year 903 183.6450Number of units issued 156 700.7510Number of units redeemed -365 899.2840Number of units outstanding at the end of the financial year 693 985.1120Class P-mdistNumber of units outstanding at the beginning of the financial year 522 186.0900Number of units issued 166 465.7040Number of units redeemed -247 235.6420Number of units outstanding at the end of the financial year 441 416.1520
Annual Distribution
UBS (Lux) Bond Fund Ex-Date Pay-Date Currency Amount per unit– Full Cycle Asian Bond (USD)
(EUR hedged) P-dist 2.6.2014 5.6.2014 EUR 4.04
Monthly Distribution
UBS (Lux) Bond Fund Ex-Date Pay-Date Currency Amount per unit– Full Cycle Asian Bond (USD)
(SGD hedged) P-mdist 15.4.2014 22.4.2014 SGD 0.45– Full Cycle Asian Bond (USD)
(SGD hedged) P-mdist 15.5.2014 20.5.2014 SGD 0.45– Full Cycle Asian Bond (USD)
(SGD hedged) P-mdist 16.6.2014 19.6.2014 SGD 0.45– Full Cycle Asian Bond (USD)
(SGD hedged) P-mdist 15.7.2014 18.7.2014 SGD 0.45– Full Cycle Asian Bond (USD)
(SGD hedged) P-mdist 18.8.2014 21.8.2014 SGD 0.45– Full Cycle Asian Bond (USD)
(SGD hedged) P-mdist 15.9.2014 18.9.2014 SGD 0.45– Full Cycle Asian Bond (USD)
(SGD hedged) P-mdist 15.10.2014 20.10.2014 SGD 0.45– Full Cycle Asian Bond (USD)
(SGD hedged) P-mdist 17.11.2014 20.11.2014 SGD 0.40– Full Cycle Asian Bond (USD)
(SGD hedged) P-mdist 15.12.2014 18.12.2014 SGD 0.40– Full Cycle Asian Bond (USD)
(SGD hedged) P-mdist 15.1.2015 20.1.2015 SGD 0.44– Full Cycle Asian Bond (USD)
(SGD hedged) P-mdist 18.2.2015 25.2.2015 SGD 0.44– Full Cycle Asian Bond (USD)
(SGD hedged) P-mdist 16.3.2015 19.3.2015 SGD 0.44– Full Cycle Asian Bond (USD)
P-mdist 15.4.2014 22.4.2014 USD 0.45– Full Cycle Asian Bond (USD)
P-mdist 15.5.2014 20.5.2014 USD 0.45– Full Cycle Asian Bond (USD)
P-mdist 16.6.2014 19.6.2014 USD 0.45– Full Cycle Asian Bond (USD)
P-mdist 15.7.2014 18.7.2014 USD 0.45– Full Cycle Asian Bond (USD)
P-mdist 18.8.2014 21.8.2014 USD 0.45– Full Cycle Asian Bond (USD)
P-mdist 15.9.2014 18.9.2014 USD 0.45– Full Cycle Asian Bond (USD)
P-mdist 15.10.2014 20.10.2014 USD 0.45– Full Cycle Asian Bond (USD)
P-mdist 17.11.2014 20.11.2014 USD 0.40– Full Cycle Asian Bond (USD)
P-mdist 15.12.2014 18.12.2014 USD 0.40– Full Cycle Asian Bond (USD)
P-mdist 15.1.2015 20.1.2015 USD 0.40– Full Cycle Asian Bond (USD)
P-mdist 18.2.2015 25.2.2015 USD 0.40– Full Cycle Asian Bond (USD)
P-mdist 16.3.2015 19.3.2015 USD 0.40

The notes are an integral part of the fi nancial statements. 69
UBS (Lux) Bond Fund – Full Cycle Asian Bond (USD)Annual Report as of 31 March 2015
Statement of Investments in Securities and other Net Assets as of 31 March 2015
Description Quantity/ Valuation in USD as a % Nominal Unrealized gain of net (loss) on Futures/ assets Options/Forward Exchange Contracts/ Swaps (Note 1)
Transferable securities and money market instruments listed on an official stock exchange
Notes, fixed rate
USD
USD AGILE PROPERTY HOLDINGS LTD-REG-S 8.87500% 10-28.04.17 1 000 000.00 983 530.00 0.26USD ALAM SYNERGY PTE LTD-REG-S 6.95000% 13-27.03.20 1 300 000.00 1 245 738.00 0.34USD ALIBABA GROUP HOLDING LTD-REG-S 4.50000% 14-28.11.34 3 650 000.00 3 703 071.00 1.00USD CAIFU HOLDINGS LTD-REG-S 8.75000% 13-24.01.20 5 500 000.00 5 002 140.00 1.35USD CHINA OVERSEAS FINANCE CY LTD 4.87500% 12-15.02.17 1 500 000.00 1 566 480.00 0.42USD CHINA SCE PROPERTY HOLDINGS LTD-REG-S 11.50000% 12-14.11.17 1 000 000.00 967 190.00 0.26USD CHINA SHANSHUI CEMENT GROUP LTD-REG-S 10.50000% 12-27.04.17 1 000 000.00 1 053 750.00 0.28USD CNOOC FINANCE 2012 LTD-REG-S 3.87500% 12-02.05.22 9 400 000.00 9 790 758.00 2.63USD CNPC GENERAL CAPITAL LTD-REG-S 3.40000% 13-16.04.23 8 600 000.00 8 637 582.00 2.32USD DOUBLE ROSY LTD-REG-S 3.62500% 14-18.11.19 6 000 000.00 6 019 380.00 1.62USD GAJAH TUNGGAL TBK PT-REG-S 7.75000% 13-06.02.18 2 500 000.00 2 396 425.00 0.64USD GOLDEN EAGLE RETAIL GROUP-REG-S 4.62500% 13-21.05.23 4 400 000.00 3 740 660.00 1.01USD GREENKO DUTCH BV-REG-S 8.00000% 14-01.08.19 1 000 000.00 943 540.00 0.25USD HYUNDAI CAPITAL SERVICES INC-REG-S 2.62500% 15-29.09.20 4 300 000.00 4 310 535.00 1.16USD INDONESIA, REPUBLIC OF-REG-S 7.75000% 08-17.01.38 2 000 000.00 2 737 500.00 0.74USD INDONESIA, REPUBLIC OF-REG-S 4.87500% 11-05.05.21 1 000 000.00 1 088 330.00 0.29USD INDONESIA, REPUBLIC OF-REG-S 5.25000% 12-17.01.42 1 700 000.00 1 787 176.00 0.48USD INDUSTRIAL COMMERCIAL BANK CHINA-REG-S 2.75000% 12-12.09.17 2 000 000.00 2 031 800.00 0.55USD KOREA DEVELOPMENT BANK 3.87500% 11-04.05.17 5 000 000.00 5 235 300.00 1.41USD KOREA DEVELOPMENT BANK 3.50000% 12-22.08.17 4 000 000.00 4 175 040.00 1.12USD KOREA HYDRO & NUCLEAR POWER CO-REG-S 3.00000% 12-19.09.22 3 000 000.00 3 057 990.00 0.82USD MIE HOLDINGS CORP-REG-S 7.50000% 14-25.04.19 4 500 000.00 2 658 150.00 0.71USD ONGC VIDESH LTD-REG-S 3.75000% 13-07.05.23 2 000 000.00 1 991 740.00 0.54USD PERTAMINA PT-REG-S 4.30000% 13-20.05.23 8 700 000.00 8 732 625.00 2.35USD PERTAMINA PT-REG-S 5.62500% 13-20.05.43 2 000 000.00 1 941 600.00 0.52USD PHBS LTD 6.62500% 10-PRP 2 500 000.00 2 547 050.00 0.69USD PHILIPPINES, REPUBLIC OF 5.50000% 11-30.03.26 7 000 000.00 8 581 580.00 2.31USD RELIANCE HOLDINGS USA INC-REG-S 5.40000% 12-14.02.22 5 200 000.00 5 693 220.00 1.53USD SINOPEC CAPITAL 2013 LTD-REG-S 1.87500% 13-24.04.18 11 700 000.00 11 606 166.00 3.12USD SRI LANKA, DEMOCRATIC REP OF-REG-S 6.25000% 10-04.10.20 1 000 000.00 1 033 930.00 0.28USD STATS CHIPPAC LTD-REG-S 4.50000% 13-20.03.18 2 250 000.00 2 238 322.50 0.60USD STUDIO CITY FINANCE-REG-S 8.50000% 12-01.12.20 2 000 000.00 2 046 380.00 0.55USD VEDANTA RESOURCES PLC-REG-S 8.25000% 11-07.06.21 3 000 000.00 2 714 250.00 0.73USD YINGDE GASES INVESTMENT LTD-REG-S 7.25000% 14-28.02.20 1 710 000.00 1 363 177.80 0.37Total USD 123 622 106.30 33.25
Total Notes, fixed rate 123 622 106.30 33.25
Notes, floating rate
USD
USD HUTCHISON WHAMPOA INTL-REG-S-SUB 6.000%/VAR 10-PRP 3 000 000.00 3 062 550.00 0.82Total USD 3 062 550.00 0.82
Total Notes, floating rate 3 062 550.00 0.82
Medium term notes, fixed rate
USD
USD BANK OF CHINA LTD-REG-S-SUB 5.00000% 14-13.11.24 2 650 000.00 2 791 642.50 0.75USD BOC AVIATION PTE LTD-REG-S 3.00000% 15-30.03.20 2 200 000.00 2 197 206.00 0.59USD CHARMING LIGHT INVESTMENTS LTD-REG-S 3.75000% 14-03.09.19 8 130 000.00 8 248 291.50 2.22USD CITIC PACIFIC LTD-REG-S 6.87500% 12-21.01.18 6 000 000.00 6 655 500.00 1.79USD CNPC GENERAL CAPITAL LTD-REG-S 2.70000% 14-25.11.19 2 000 000.00 2 011 562.00 0.54USD EASTERN CREATION II INVESTMENT HOLDINGS 2.62500% 14-20.11.17 4 450 000.00 4 482 663.00 1.21USD FAR EAST HORIZON LTD-REG-S 4.62500% 14-06.03.17 1 350 000.00 1 380 330.45 0.37USD HUARONG FINANCE II CO LTD-REG-S 5.50000% 15-16.01.25 4 700 000.00 4 986 089.00 1.34USD INDIAN OIL CORP LTD-REG-S 5.75000% 13-01.08.23 2 500 000.00 2 797 875.00 0.75USD KOREA EXCHANGE BANK-REG-S 2.00000% 13-02.04.18 6 000 000.00 5 987 580.00 1.61USD NWD MTN LTD-REG-S 5.25000% 14-26.02.21 3 000 000.00 3 186 207.00 0.86USD OTTAWA HOLDINGS PTE LTD-REG-S 5.87500% 13-16.05.18 1 000 000.00 828 680.00 0.23USD SAN MIGUEL CORP-REG-S 4.87500% 13-26.04.23 3 000 000.00 2 813 250.00 0.76USD TEMASEK FINANCIAL-REG-S 3.37500% 12-23.07.42 5 450 000.00 5 178 045.00 1.39USD TENCENT HOLDINDS LTD-REG-S 3.37500% 14-02.05.19 4 000 000.00 4 136 480.00 1.11Total USD 57 681 401.45 15.52
Total Medium term notes, fixed rate 57 681 401.45 15.52
Medium term notes, floating rate
USD
USD CHINA CONS BK ASIA CORP LTD-REG-S-SUB 4.250%/VAR 14-20.08.24 2 000 000.00 2 048 666.00 0.55USD MALAYAN BANKING-REG-S-SUB 3.250%/H15T5Y+260BP 12-20.09.22 4 000 000.00 4 030 600.00 1.08USD OVERSEA-CHINESE BKNG CORP-REG-S-SUB 3.150%/VAR 12-11.03.23 6 000 000.00 6 118 260.00 1.65USD OVERSEA-CHINESE BKNG CORP-REG-S-SUB 4.000%/VAR 14-15.10.24 4 400 000.00 4 585 944.00 1.23USD UNITED OVERSEAS BANK LTD-REG-S-SUB 2.875%/VAR 12-17.10.22 4 000 000.00 4 068 880.00 1.10USD UNITED OVERSEAS BANK LTD-REG-S-SUB 3.75%/VAR 14-19.09.24 4 000 000.00 4 133 320.00 1.11USD WING HANG BANK LTD-SUB 6.00000%/3M LIBOR+185BP 07-PRP 5 800 000.00 6 112 214.00 1.64Total USD 31 097 884.00 8.36
Total Medium term notes, floating rate 31 097 884.00 8.36

70 The notes are an integral part of the fi nancial statements.
UBS (Lux) Bond Fund – Full Cycle Asian Bond (USD)Annual Report as of 31 March 2015
Bonds, fixed rate
USD
USD ABJA INVESTMENT CO PTE LTD-REG-S 5.95000% 14-31.07.24 2 000 000.00 2 077 660.00 0.56USD BAOSTEEL FINANCING 2015 PTY LTD-REG-S 3.87500% 15-28.01.20 3 600 000.00 3 700 116.00 0.99USD BEIJING CAPITAL POLARIS INVEST CO-REG-S 2.87500% 15-01.04.18 6 600 000.00 6 616 170.00 1.78USD BHARTI AIRTEL INTL NETHERLANDS BV-REG-S 5.35000% 14-20.05.24 2 000 000.00 2 197 120.00 0.59USD CHINA AOYUAN PROPERTY GROUP LTD-REG-S 11.25000% 14-17.01.19 3 250 000.00 3 080 675.00 0.83USD CHINA GREAT WALL-REG-S 2.50000% 14-17.09.17 2 819 000.00 2 828 677.63 0.76USD CHINA OVERSEAS FINANCE CAYMAN II-REG-S 5.50000% 10-10.11.20 2 000 000.00 2 186 260.00 0.59USD CHINA OVERSEAS FINANCE-REG-S 3.95000% 12-15.11.22 5 500 000.00 5 485 480.00 1.48USD COUNTRY GARDEN HOLDINGS CO LTD-REG-S 7.25000% 13-04.04.21 3 000 000.00 2 977 470.00 0.80USD COUNTRY GARDEN HOLDINGS CO LTD-REG-S 7.50000% 15-09.03.20 1 700 000.00 1 702 125.00 0.46USD FIRST GEN CORP-REG-S 6.50000% 13-09.10.23 1 000 000.00 1 057 100.00 0.28USD FRANSHION BRILLIANT LTD-REG-S 5.75000% 14-19.03.19 1 850 000.00 1 961 647.50 0.53USD FUTURE LAND DEV HLDGS LTD-REG-S 10.25000% 14-21.07.19 3 550 000.00 3 445 168.50 0.93USD HERO ASIA INVESTMENT LTD-REG-S 2.87500% 14-03.10.17 4 500 000.00 4 508 127.00 1.21USD HUARONG FINANCE CO LTD-REG-S 4.00000% 14-17.07.19 6 650 000.00 6 816 050.50 1.83USD JSW STEEL LTD-REG-S 4.75000% 14-12.11.19 3 750 000.00 3 616 725.00 0.97USD KWG PROPERTY HOLDING LTD-REG-S 8.97500% 14-14.01.19 3 000 000.00 2 910 000.00 0.78USD KWG PROPERTY HOLDING LTD-REG-S 8.25000% 14-05.08.19 2 850 000.00 2 728 476.00 0.73USD PACNET LTD-REG-S 9.00000% 13-12.12.18 2 000 000.00 2 227 780.00 0.60USD PAKISTAN, ISLAMIC REPUBLIC OF-REG-S 7.25000% 14-15.04.19 2 000 000.00 2 058 760.00 0.55USD PAKUWON PRIMA PTE LTD-REG-S 7.12500% 14-02.07.19 810 000.00 807 998.49 0.22USD PHILIPPINES, REPUBLIC OF 3.95000% 15-20.01.40 6 438 000.00 6 828 271.56 1.84USD SHIMAO PROPERTY HOLDINGS LIMITED-REG-S 8.37500% 15-10.02.22 3 750 000.00 3 796 875.00 1.02USD SRI LANKA, DEMOCRATIC REP OF-REG-S 5.12500% 14-11.04.19 3 090 000.00 3 077 454.60 0.83USD SRILANKAN AIRLINES LTD-REG-S 5.30000% 14-27.06.19 2 200 000.00 2 153 140.00 0.58USD VIETNAM, SOCIALIST REPUBLIC-REG-S 4.80000% 14-19.11.24 500 000.00 519 000.00 0.14USD WHEELOCK FINANCE LTD-REG-S 2.75000% 14-02.07.17 4 700 000.00 4 718 048.00 1.27USD YUZHOU PROPERTIES CO LTD-REG-S 8.62500% 14-24.01.19 3 000 000.00 2 846 460.00 0.77USD ZHEJIANG ENERGY GRP HONG KONG LTD-REG-S 2.30000% 14-30.09.17 5 200 000.00 5 170 100.00 1.39Total USD 94 098 935.78 25.31
Total Bonds, fixed rate 94 098 935.78 25.31
Bonds, floating rate
USD
USD PETRON CORP-REG-S-SUB 7.500%/VAR 13-PRP 1 000 000.00 1 049 300.00 0.28USD PUBLIC BANK BHD-SUB 6.840%/3M LIBOR+230BP 06-22.08.36 4 100 000.00 4 162 082.20 1.12USD SUN HUNG KAI PROPERTIES-REG-S 3.375/VAR 14-25.02.24 4 300 000.00 4 385 062.60 1.18Total USD 9 596 444.80 2.58
Total Bonds, floating rate 9 596 444.80 2.58
Treasury notes, fixed rate
USD
USD AMERICA, UNITED STATES OF 1.75000% 15-28.02.22 8 500 000.00 8 523 902.00 2.29Total USD 8 523 902.00 2.29
Total Treasury notes, fixed rate 8 523 902.00 2.29
Total Transferable securities and money market instruments listed on an official stock exchange 327 683 224.33 88.13
Transferable securities and money market instruments traded on another regulated market
Bonds, fixed rate
USD
USD 1MDB GLOBAL INV-REG-S 4.40000% 13-09.03.23 9 500 000.00 8 586 005.00 2.31USD CNOOC FINANCE 2013 LTD 3.00000% 13-09.05.23 4 000 000.00 3 889 080.00 1.05USD INDO ENERGY FINANCE II BV-REG-S 6.37500% 13-24.01.23 3 500 000.00 2 310 000.00 0.62USD INDONESIA, REPUBLIC OF-REG-S 6.62500% 07-17.02.37 5 500 000.00 6 689 375.00 1.80USD LODHA DEVELOPERS INTL LTD-REG-S 12.00000% 15-13.03.20 1 750 000.00 1 718 027.50 0.46USD THE EXPORT-IMPORT BANK OF KOREA 2.87500% 13-17.09.18 2 000 000.00 2 066 540.00 0.56Total USD 25 259 027.50 6.80
Total Bonds, fixed rate 25 259 027.50 6.80
Bonds, floating rate
USD
USD ICICI BANK LTD-REG-S-SUB 6.375%/6M LIBOR+228BP 07-30.04.22 1 000 000.00 1 039 810.00 0.28Total USD 1 039 810.00 0.28
Total Bonds, floating rate 1 039 810.00 0.28
Total Transferable securities and money market instruments traded on another regulated market 26 298 837.50 7.08
Total investments in securities 353 982 061.83 95.21
Description Quantity/ Valuation in USD as a % Nominal Unrealized gain of net (loss) on Futures/ assets Options/Forward Exchange Contracts/ Swaps (Note 1)

The notes are an integral part of the fi nancial statements. 71
UBS (Lux) Bond Fund – Full Cycle Asian Bond (USD)Annual Report as of 31 March 2015
Derivative instruments
Derivative instruments listed on an official stock exchange
Financial Futures on bonds
USD US ULTRA LONG BOND (CBT) FUTURE 19.06.15 21.00 65 093.75 0.01Total Financial Futures on bonds 65 093.75 0.01
Total Derivative instruments listed on an official stock exchange 65 093.75 0.01
Derivative instruments not listed on an official stock exchange and not traded on another regulated market
Credit default swaps*
USD JPMORGAN/MALAYS CREDIT DEFAULT SWAPS PAYER 1.00000% 14-20.06.20 -10 000 000.00 149 326.44 0.04USD JPMORGAN/THAIGOV CREDIT DEFAULT SWAPS PAYER 1.00000% 15-20.06.20 -20 000 000.00 70 828.89 0.02USD JPMORGAN/CHINAGOV CREDIT DEFAULT SWAPS REC 1.00000% 15-20.06.20 20 000 000.00 104 132.00 0.03Total Credit default swaps 324 287.33 0.09
Total Derivative instruments not listed on an official stock exchange and not traded on another regulated market 324 287.33 0.09
Total Derivative instruments 389 381.08 0.10
Forward Foreign Exchange contracts
Forward Foreign Exchange contracts (Purchase/Sale)
EUR 76 023 800.00 USD 84 590 161.78 16.4.2015 -2 924 901.90 -0.78SGD 50 007 400.00 USD 36 512 812.28 16.4.2015 -68 421.89 -0.02USD 960 889.44 EUR 884 000.00 16.4.2015 11 290.90 0.00USD 347 297.15 SGD 479 600.00 16.4.2015 -2 225.71 0.00USD 409 054.47 SGD 568 400.00 16.4.2015 -5 184.05 0.00USD 460 217.93 EUR 419 500.00 16.4.2015 9 588.30 0.00Total Forward Foreign Exchange contracts (Purchase/Sale) -2 979 854.35 -0.80
Cash at banks, deposits on demand and deposit accounts and other liquid assets 20 374 799.40 5.48Other assets and liabilities 14 608.03 0.01
Total net assets 371 780 995.99 100.00
* Positive nominal: the subfund is “Receiver”, negative nominal: the subfund is “Payer”.
Description Quantity/ Valuation in USD as a % Nominal Unrealized gain of net (loss) on Futures/ assets Options/Forward Exchange Contracts/ Swaps (Note 1)

72 The notes are an integral part of the fi nancial statements.
UBS (Lux) Bond Fund – GBPAnnual Report as of 31 March 2015
UBS (Lux) Bond Fund – GBP
Three-year comparison
ISIN 31.3.2015 31.3.2014 31.3.2013Net assets in GBP 62 684 140.77 74 405 212.75 103 860 962.77Class F-acc1 LU0415169761Units outstanding 17 261.6510 24 359.0400 -Net asset value per unit in GBP 227.18 200.07 -Issue and redemption price per unit in GBP2 227.18 200.07 -Class I-A2-acc3 LU0415170777Units outstanding - 47 500.0000 47 500.0000Net asset value per unit in GBP - 116.34 117.12Issue and redemption price per unit in GBP2 - 116.34 117.12Class P-acc LU0035346187Units outstanding 189 272.3570 235 546.3020 361 936.0638Net asset value per unit in GBP 225.06 199.40 201.82Issue and redemption price per unit in GBP2 225.06 199.40 201.82Class P-dist LU0035345882Units outstanding 232 822.7730 267 296.7910 378 968.9655Net asset value per unit in GBP 69.43 63.74 66.63Issue and redemption price per unit in GBP2 69.43 63.74 66.63
1 First NAV: 6.9.20132 See note 13 For the period from 11.5.2011 to 16.2.15 the unit class I-A2-acc was in circulation
Performance
Currency 2014/2015 2013/2014 2012/2013Class F-acc GBP 13.6% - -Class I-A2-acc GBP - -0.7% 9.2%Class P-acc GBP 12.9% -1.2% 8.6%Class P-dist GBP 12.9% -1.2% 8.6%
Historical performance is no indicator of current or future performance.The performance data does not take account of any commissions and costs charged when subscribing and redeeming units.The performance data were not audited.The subfund does not have a benchmark.

The notes are an integral part of the fi nancial statements. 73
UBS (Lux) Bond Fund – GBPAnnual Report as of 31 March 2015
Report of the Portfolio Manager
During the reporting year, from 1 April 2014 to 31 March 2015, interest rates decreased substantially mainly at longer maturities. Yields on two-year maturities decreased from 0.68% to 0.42%, yields on 10-year maturities from 2.73% to 1.58% and yields on 30-year maturities from 3.50% to 2.33%. During this year, the Bank of England kept its official interest rate at 0.5% and its purchases of UK government bonds stable at GBP 375 billion.
The subfund posted a strong performance due to decreasing yields and favorable strategy decisions. We run a short duration at the beginning of the reporting year and lengthened duration later, which had a slightly negative impact on performance. Securities selection and sector allocation added to performance. There were no downgrades below investment grade during the reporting year.
Structure of the Securities Portfolio
Geographical Breakdown as a % of net assetsUnited Kingdom 44.39United States 11.87France 11.68Netherlands 6.69Supranationals 5.66Australia 3.04Germany 2.88Belgium 2.62Jersey 1.51Cayman Islands 1.13Spain 1.10Sweden 1.01Japan 0.82Ireland 0.75Norway 0.71Singapore 0.57Switzerland 0.55Mexico 0.36Total 97.34
Economic Breakdown as a % of net assetsBanks & credit institutions 30.14Finance & holding companies 17.26Energy & water supply 10.00Mortgage & funding institutions 6.14Public, non-profit institutions 5.75Supranational organisations 5.66Traffic & transportation 3.78Miscellaneous unclassified companies 2.81Telecommunications 2.78Retail trade, department stores 2.12Pharmaceuticals, cosmetics & medical products 1.80Insurance 1.43Real Estate 1.30Countries & central governments 1.25Petroleum 0.72Graphic design, publishing & media 0.62Electrical devices & components 0.61Vehicles 0.53Electronics & semiconductors 0.52Miscellaneous services 0.51Tobacco & alcohol 0.50Investment funds 0.42Precious metals & stones 0.35Aerospace industry 0.34Total 97.34

74 The notes are an integral part of the fi nancial statements.
UBS (Lux) Bond Fund – GBPAnnual Report as of 31 March 2015
Statement of Net Assets GBPAssets 31.3.2015Investments in securities, cost 55 967 246.91Investments in securities, unrealized appreciation (depreciation) 5 050 871.37Total investments in securities (Note 1) 61 018 118.28Cash at banks, deposits on demand and deposit accounts 549 416.67Other liquid assets (Margins) 10 680.00Receivable on subscriptions 726 570.93Interest receivable on securities 1 130 862.51Interest receivable on liquid assets 81.37Unrealized gain (loss) on financial futures (Note 1) 8 220.00Total Assets 63 443 949.76
LiabilitiesPayable on securities purchases (Note 1) -689 761.66Payable on redemptions -38 841.51Provisions for flat fee (Note 2) -23 762.43Provisions for taxe d’abonnement (Note 3) -7 443.39Total provisions -31 205.82Total Liabilities -759 808.99
Net assets at the end of the financial year 62 684 140.77
Statement of Operations GBPIncome 1.4.2014-31.3.2015Interest on liquid assets 1 563.26Interest on securities 2 919 980.39Income on securities lending (Note 14) 30 233.82Total income 2 951 777.47
ExpensesCost on securities lending (Note 14) -12 093.53Flat fee (Note 2) -563 431.51Taxe d’abonnement (Note 3) -30 120.49Total expenses -605 645.53
Net income (loss) on investments 2 346 131.94
Realized gain (loss) (Note 1)Realized gain (loss) on market-priced securities without options 845 568.58Realized gain (loss) on financial futures -149 009.50Realized result on subscriptions/redemptions (Note 5) 39 485.01Total realized gain (loss) on investments 736 044.09Total realized gain (loss) 736 044.09
Net realized gain (loss) of the financial year 3 082 176.03
Changes in unrealized appreciation (depreciation) (Note 1)Unrealized appreciation (depreciation) on market-priced securities without options 4 858 354.21Unrealized appreciation (depreciation) on financial futures 33 660.00Total changes in unrealized appreciation (depreciation) 4 892 014.21
Net increase (decrease) in net assets as a result of operations 7 974 190.24

The notes are an integral part of the fi nancial statements. 75
UBS (Lux) Bond Fund – GBPAnnual Report as of 31 March 2015
Statement of Changes in Net Assets GBP 1.4.2014-31.3.2015Net assets at the beginning of the financial year 74 405 212.75Subscriptions 10 300 694.32Redemptions -29 404 814.44Total net subscriptions (redemptions) -19 104 120.12Dividend paid -591 142.10Net income (loss) on investments 2 346 131.94Total realized gain (loss) 736 044.09Total changes in unrealized appreciation (depreciation) 4 892 014.21Net increase (decrease) in net assets as a result of operations 7 974 190.24Net assets at the end of the financial year 62 684 140.77
Development of the outstanding units
1.4.2014-31.3.2015Class F-accNumber of units outstanding at the beginning of the financial year 24 359.0400Number of units issued 13 732.2850Number of units redeemed -20 829.6740Number of units outstanding at the end of the financial year 17 261.6510Class I-A2-accNumber of units outstanding at the beginning of the financial year 47 500.0000Number of units issued 145.0000Number of units redeemed -47 645.0000Number of units outstanding at the end of the financial year 0.0000Class P-accNumber of units outstanding at the beginning of the financial year 235 546.3020Number of units issued 30 210.3200Number of units redeemed -76 484.2650Number of units outstanding at the end of the financial year 189 272.3570Class P-distNumber of units outstanding at the beginning of the financial year 267 296.7910Number of units issued 12 129.6040Number of units redeemed -46 603.6220Number of units outstanding at the end of the financial year 232 822.7730
Annual Distribution
UBS (Lux) Bond Fund Ex-Date Pay-Date Currency Amount per unit– GBP P-dist 2.6.2014 5.6.2014 GBP 2.26

76 The notes are an integral part of the fi nancial statements.
UBS (Lux) Bond Fund – GBPAnnual Report as of 31 March 2015
Statement of Investments in Securities and other Net Assets as of 31 March 2015
Description Quantity/ Valuation in GBP as a % Nominal Unrealized gain of net (loss) on Futures/ assets Options/Forward Exchange Contracts/ Swaps (Note 1)
Transferable securities and money market instruments listed on an official stock exchange
Asset Backed Securities, fixed rate
GBP
GBP BL SUPERSTORES FINANCE PLC 4.48200% 06-04.10.25 950 000.00 916 032.12 1.46Total GBP 916 032.12 1.46
Total Asset Backed Securities, fixed rate 916 032.12 1.46
Mortgage Backed Securities, fixed rate
GBP
GBP MEADOWHALL FINANCE PLC 4.98600% 06-12.01.32 645 000.00 677 297.71 1.08Total GBP 677 297.71 1.08
Total Mortgage Backed Securities, fixed rate 677 297.71 1.08
Notes, fixed rate
GBP
GBP AMERICA MOVIL SAB DE CV 4.37500% 12-07.08.41 200 000.00 223 132.00 0.36GBP BRITISH TELECOMMUNICATIONS PLC 5.75000% 99-07.12.28 50 000.00 63 697.00 0.10GBP BROADGATE FINANCING PLC 4.82100% 05-05.07.33 500 000.00 628 345.00 1.00GBP EUROPEAN INVESTMENT BANK 5.62500% 00-07.06.32 700 000.00 1 041 775.00 1.66GBP LONDON & QUADRANT HOUSING TRUST 5.50000% 10-27.01.40 300 000.00 412 914.00 0.66GBP SEGRO PLC 6.75000% 00-23.02.24 250 000.00 326 750.00 0.52GBP STANDARD CHARTERED BANK PLC-SUB 7.75000% 08-03.04.18 500 000.00 579 090.00 0.93GBP UNITE USAF II PLC 3.37400% 13-30.06.23 250 000.00 261 727.50 0.42GBP WESSEX WATER SERVICES FINANCE LTD 5.37500% 05-10.03.28 300 000.00 377 700.00 0.60Total GBP 3 915 130.50 6.25
Total Notes, fixed rate 3 915 130.50 6.25
Medium term notes, fixed rate
GBP
GBP ABBEY NATIONAL TREASURY SERV PLC 4.12500% 10-14.09.17 600 000.00 642 126.00 1.02GBP ABBEY NATIONAL TREASURY SERVICES-REG-S 5.75000% 11-02.03.26 600 000.00 806 034.00 1.29GBP ABN AMRO BANK NV 4.87500% 12-16.01.19 300 000.00 336 975.00 0.54GBP AFFINITY SUTTON CM PLC 5.98100% 08-17.09.38 200 000.00 290 368.00 0.46GBP ANGLIAN WATER SERVICES FINANCING PLC 4.50000% 12-05.10.27 300 000.00 349 062.00 0.56GBP BANK NEDERLANDSE GEMEENTEN NV 5.20000% 99-07.12.28 600 000.00 804 684.00 1.28GBP BANK OF AMERICA CORP 7.75000% 08-30.04.18 400 000.00 472 488.00 0.75GBP BANK OF AMERICA CORP 6.12500% 09-15.09.21 200 000.00 244 158.00 0.39GBP BARCLAYS BANK PLC 5.75000% 09-17.08.21 600 000.00 727 998.00 1.16GBP BARCLAYS BANK PLC-REG-S 4.25000% 12-12.01.22 200 000.00 231 114.00 0.37GBP BAT INTERNATIONAL FINANCE PLC 6.00000% 09-24.11.34 200 000.00 278 904.00 0.44GBP BELGIUM, KINGDOM OF 5.00000% 03-24.04.18 700 000.00 783 202.00 1.25GBP BHP BILLITON FINANCE LTD 3.25000% 12-25.09.24 400 000.00 421 940.00 0.67GBP BHP BILLITON FINANCE LTD 4.30000% 12-25.09.42 300 000.00 339 183.00 0.54GBP BMW (UK) CAPITAL PLC 5.00000% 09-02.10.17 300 000.00 329 289.00 0.53GBP BNP PARIBAS 3.50000% 11-07.12.16 413 000.00 429 334.15 0.68GBP CAISSE D’AMORTIS DE LA DETTE SOCIALE 3.75000% 11-15.10.18 500 000.00 545 320.00 0.87GBP CENTRICA PLC 7.00000% 08-19.09.33 400 000.00 578 552.00 0.92GBP CENTRICA PLC-REG-S 6.37500% 09-10.03.22 300 000.00 373 236.00 0.60GBP CITIGROUP INC 5.15000% 03-21.05.26 400 000.00 485 620.00 0.77GBP COMMONWEALTH BANK OF AUSTRALIA 3.00000% 12-04.09.26 400 000.00 431 956.00 0.69GBP COMMUNITY FINANCE CO 1 PLC 5.01700% 11-31.07.34 200 000.00 261 778.00 0.42GBP COVENTRY BUILDING SOCIETY 6.00000% 09-16.10.19 600 000.00 708 438.00 1.13GBP E.ON INTERNATIONAL FINANCE BV 6.37500% 02-07.06.32 300 000.00 412 059.00 0.66GBP EAST JAPAN RAILWAY CO 4.87500% 06-14.06.34 400 000.00 511 980.00 0.82GBP ELECTRICITE DE FRANCE 6.12500% 09-02.06.34 300 000.00 405 558.00 0.65GBP ELECTRICITE DE FRANCE 5.50000% 11-17.10.41 600 000.00 777 978.00 1.24GBP ELECTRICITE DE FRANCE 5.87500% 01-18.07.31 700 000.00 924 245.00 1.47GBP ELECTRICITE DE FRANCE 6.87500% 08-12.12.22 300 000.00 400 683.00 0.64GBP EUROPEAN INVESTMENT BANK 5.00000% 99-15.04.39 600 000.00 889 350.00 1.42GBP EUROPEAN INVESTMENT BANK 4.12500% 09-07.12.17 500 000.00 543 535.00 0.87GBP EUROPEAN INVESTMENT BANK 3.87500% 12-08.06.37 450 000.00 568 404.00 0.91GBP EUROPEAN INVESTMENT BANK 1.37500% 13-15.01.18 500 000.00 507 180.00 0.81GBP FCE BANK PLC-REG-S 4.82500% 12-15.02.17 400 000.00 424 112.00 0.68GBP GATWICK FUNDING LTD 5.75000% 12-23.01.37 200 000.00 263 330.00 0.42GBP GDF SUEZ 5.00000% 10-01.10.60 250 000.00 329 635.00 0.53GBP GDF SUEZ 6.12500% 09-11.02.21 400 000.00 493 068.00 0.79GBP GE CAPITAL UK FUNDING 5.12500% 06-24.05.23 200 000.00 239 198.00 0.38GBP GENERAL ELECTRIC CAPITAL CORP 5.50000% 98-07.06.21 300 000.00 357 036.00 0.57GBP GENERAL ELECTRIC CAPITAL CORP 6.44000% 00-15.11.22 1 000 000.00 291 212.20 0.46GBP GENERAL ELECTRIC CAPITAL CORP-SUB 4.87500% 05-18.09.37 700 000.00 826 036.40 1.32GBP GOLDMAN SACHS GROUP INC 6.12500% 02-14.02.17 500 000.00 544 055.00 0.87GBP HEATHROW FUNDING LTD 5.87500% 11-13.05.41 500 000.00 685 160.00 1.09GBP HSBC HOLDINGS PLC 6.50000% 09-20.05.24 500 000.00 655 690.00 1.05GBP HSBC HOLDINGS PLC-SUB 7.00000% 08-07.04.38 400 000.00 557 284.00 0.89GBP ING BANK NV 5.37500% 11-15.04.21 300 000.00 356 178.00 0.57GBP KREDITANSTALT FUER WIEDERAUFBAU 5.00000% 01-09.06.36 400 000.00 584 232.00 0.93GBP LLOYDS BANK PLC 6.50000% 10-17.09.40 400 000.00 606 008.00 0.97GBP LLOYDS BANK PLC 7.50000% 09-15.04.24 200 000.00 279 228.00 0.45GBP METROPOLITAN LIFE GLOBAL FUNDING-REG-S 3.50000% 12-30.09.26 500 000.00 550 355.00 0.88GBP MORGAN STANLEY 5.75000% 07-14.02.17 600 000.00 649 596.00 1.04GBP MOTABILITY OPERATIONS GROUP PLC 6.62500% 09-10.12.19 400 000.00 489 348.00 0.78GBP NATIONAL AUSTRALIA BANK LTD 3.00000% 12-04.09.26 400 000.00 433 284.00 0.69GBP NATIONWIDE BUILDING SOCIETY-REG-S 5.62500% 11-28.01.26 500 000.00 668 195.00 1.07GBP NATIXIS 5.87500% 00-24.02.20 700 000.00 832 286.00 1.33GBP NETWORK RAIL MTN FINANCE PLC 4.75000% 04-29.11.35 200 000.00 277 494.00 0.44

The notes are an integral part of the fi nancial statements. 77
UBS (Lux) Bond Fund – GBPAnnual Report as of 31 March 2015
GBP NOMURA EUROPE FINANCE NV 5.50000% 10-23.03.17 500 000.00 541 085.00 0.86GBP NORTHERN ROCK ASSET 6.37500% 99-02.12.19 300 000.00 355 641.00 0.57GBP RABOBANK NEDERLAND NV 4.62500% 11-13.01.21 700 000.00 799 323.00 1.28GBP RABOBANK NEDERLAND NV 5.25000% 11-23.05.41 200 000.00 265 624.00 0.42GBP RESEAU FERRE DE FRANCE SA-REG-S 5.50000% 98-01.12.21 200 000.00 247 372.00 0.39GBP RESEAU FERRE DE FRANCE SA-REG-S 5.25000% 99-07.12.28 800 000.00 1 066 320.00 1.70GBP RIO TINTO FINANCE PLC 4.00000% 12-11.12.29 200 000.00 218 132.00 0.35GBP ROLLS-ROYCE HOLDINGS PLC 7.37500% 00-14.06.16 200 000.00 215 336.00 0.34GBP ROYAL BANK OF SCOTLAND NV 6.37500% 00-07.12.28 500 000.00 672 795.00 1.07GBP ROYAL BANK OF SCOTLAND PLC 6.62500% 08-17.09.18 400 000.00 467 136.00 0.75GBP SCENTRE GROUP TRUST 1-REG-S 3.87500% 14-16.07.26 250 000.00 277 640.00 0.44GBP SIEMENS FINANCIERINGSMAATSCHAPPIJ-REG-S 2.75000% 12-10.09.25 300 000.00 310 716.00 0.50GBP SMITHKLINE BEECHAM CAPITAL PLC 5.25000% 01-19.12.33 400 000.00 523 872.00 0.84GBP SOUTHERN WATER SERVICES (FINANCE) LTD 6.19200% 03-31.03.29 200 000.00 270 028.00 0.43GBP SOUTHERN WATER SERVICES (FINANCE) LTD 5.00000% 05-31.03.21 200 000.00 229 606.00 0.37GBP STATOIL ASA 6.87500% 09-11.03.31 300 000.00 447 843.00 0.71GBP SVENSKA HANDELSBANKEN AB-REG-S 4.00000% 12-18.01.19 300 000.00 329 064.00 0.51GBP TELEFONICA EMISIONES SAU 5.44500% 10-08.10.29 200 000.00 245 342.00 0.39GBP TELFONICA EMISIONES S.A. 5.37500% 06-02.02.18 400 000.00 441 124.00 0.70GBP TEMASEK FINANCIAL (I) LTD 4.62500% 10-26.07.22 300 000.00 356 112.00 0.57GBP THAMES WATER UTILITIES CAYMAN FINANCE 4.62500% 12-04.06.46 400 000.00 476 680.00 0.76GBP THFC FUNDING NO 2 PLC 6.35000% 09-08.07.39 300 000.00 444 177.00 0.71GBP TOTAL CAPITAL SA 4.25000% 09-08.12.17 500 000.00 541 240.00 0.86GBP TRANSPORT FOR LONDON 3.87500% 12-23.07.42 500 000.00 594 665.00 0.95GBP TRANSPORT FOR LONDON 2.25000% 12-09.08.22 700 000.00 719 887.00 1.15GBP UBS AG LONDON BRANCH 6.62500% 08-11.04.18 300 000.00 347 280.00 0.55GBP VATTENFALL AB 6.87500% 09-15.04.39 200 000.00 304 022.00 0.48GBP YORKSHIRE BUILDING SOCIETY 4.75000% 11-12.04.18 500 000.00 553 520.00 0.88GBP YORKSHIRE WATER SERVICES FINANCE PLC 6.37500% 09-19.08.39 200 000.00 294 242.00 0.47Total GBP 40 760 575.75 65.02
Total Medium term notes, fixed rate 40 760 575.75 65.02
Medium term notes, floating rate
GBP
GBP ANHEUSER-BUSCH INBEV SA 9.750%/RATING LINKED 09-30.07.24 200 000.00 314 274.00 0.50GBP ELECTRICITE DE FRANCE SA-REG-S-SUB 6.000%/VAR 13-PRP 300 000.00 327 750.00 0.52GBP HEATHROW FUNDING-REG-S 5.250%/12M LIBOR+400BP 08-15.02.25 200 000.00 236 364.00 0.38GBP HSBC HOLDINGS PLC-SUB 6.37500%/3M LIBOR+130BP 07-18.10.22 700 000.00 765 352.00 1.22Total GBP 1 643 740.00 2.62
Total Medium term notes, floating rate 1 643 740.00 2.62
Bonds, fixed rate
GBP
GBP ALLIANZ FINANCE II BV 4.50000% 13-13.03.43 300 000.00 369 846.00 0.59GBP BRITISH TELECOMMUNICATIONS PLC 8.62500% 94-26.03.20 300 000.00 391 695.00 0.62GBP CANARY WHARF FINANCE II PLC 6.45500% 00-22.10.33 700 000.00 262 626.00 0.42GBP CIRCLE ANGLIA SOCIAL HOUSING PLC 7.25000% 08-12.11.38 200 000.00 320 046.00 0.51GBP COMCAST CORP 5.50000% 10-23.11.29 300 000.00 388 533.00 0.62GBP EAST FINANCE PLC 5.48600% 12-15.06.42 200 000.00 264 802.00 0.42GBP EMH TREASURY PLC 4.50000% 14-29.01.44 200 000.00 236 982.00 0.38GBP FMS WERTMANAGEMENT-REG-S 1.12500% 14-07.12.16 700 000.00 704 620.00 1.12GBP FMS WERTMANAGEMENT-REG-S 1.87500% 14-07.12.18 500 000.00 515 140.00 0.82GBP FRESHWATER FINANCE PLC 4.55600% 06-03.04.36 200 000.00 232 274.00 0.37GBP GENFINANCE II PLC 6.06400% 09-21.12.39 200 000.00 282 454.00 0.45GBP HSBC HOLDINGS PLC-SUB 6.75000% 08-11.09.28 400 000.00 518 032.00 0.83GBP LCR FINANCE PLC-REG-S 4.50000% 99-07.12.28 600 000.00 770 130.00 1.23GBP LCR FINANCE PLC-REG-S 4.50000% 99-07.12.38 200 000.00 272 480.00 0.43GBP LLOYDS BANK PLC 6.00000% 11-08.02.29 700 000.00 997 738.00 1.59GBP NATIONAL GRID CO PLC 5.87500% 99-02.02.24 300 000.00 385 092.00 0.61GBP NOTTING HILL HOUSING TRUST-REG-S 3.75000% 12-20.12.32 200 000.00 213 022.00 0.34GBP PFIZER INC 6.50000% 09-03.06.38 400 000.00 604 844.00 0.97GBP PRUDENTIAL CORP PLC 6.87500% 98-20.01.23 400 000.00 525 516.00 0.84GBP ROYAL BANK OF SCOTLAND PLC-REG-S 5.12500% 12-13.01.24 300 000.00 373 092.00 0.60GBP SNCB HOLDING SA 9.37500% 95-21.02.20 400 000.00 543 985.60 0.87GBP SOUTHERN ELECTRIC POWER DISTRIBUTION 5.50000% 01-07.06.32 250 000.00 325 657.50 0.52GBP SOUTHERN WATER SERVICES (FINANCE) LTD 4.50000% 06-31.03.52 200 000.00 236 446.00 0.38GBP VERIZON WIRELESS CAPITAL LLC 8.87500% 08-18.12.18 300 000.00 377 621.10 0.60GBP WAL-MART STORES INC 5.25000% 04-28.09.35 500 000.00 674 785.00 1.08GBP WAL-MART STORES INC 4.87500% 06-19.01.39 500 000.00 651 230.00 1.04GBP WELLCOME TRUST FINANCE PLC 4.62500% 06-25.07.36 400 000.00 526 528.00 0.84GBP YORKSHIRE ELECTRICITY DISTRIBUTION PLC 5.12500% 05-04.05.35 400 000.00 500 672.00 0.80Total GBP 12 465 889.20 19.89
Total Bonds, fixed rate 12 465 889.20 19.89
Bonds, floating rate
GBP
GBP GENERAL ELECTRIC-REG-S-SUB 6.500%/3M LIBOR+200BP 07-15.09.67 300 000.00 324 522.00 0.52GBP STANDARD CHARTERED BANK-SUB 8.10300%/VAR 01-PRP 300 000.00 314 931.00 0.50Total GBP 639 453.00 1.02
Total Bonds, floating rate 639 453.00 1.02
Total Transferable securities and money market instruments listed on an official stock exchange 61 018 118.28 97.34
Total investments in securities 61 018 118.28 97.34
Description Quantity/ Valuation in GBP as a % Nominal Unrealized gain of net (loss) on Futures/ assets Options/Forward Exchange Contracts/ Swaps (Note 1)

78 The notes are an integral part of the fi nancial statements.
UBS (Lux) Bond Fund – GBPAnnual Report as of 31 March 2015
Derivative instruments
Derivative instruments listed on an official stock exchange
Financial Futures on bonds
GBP SHORT GILT FUTURE 26.06.15 30.00 8 220.00 0.01Total Financial Futures on bonds 8 220.00 0.01
Total Derivative instruments listed on an official stock exchange 8 220.00 0.01
Total Derivative instruments 8 220.00 0.01
Cash at banks, deposits on demand and deposit accounts and other liquid assets 560 096.67 0.90Other assets and liabilities 1 097 705.82 1.75
Total net assets 62 684 140.77 100.00
Description Quantity/ Valuation in GBP as a % Nominal Unrealized gain of net (loss) on Futures/ assets Options/Forward Exchange Contracts/ Swaps (Note 1)

The notes are an integral part of the fi nancial statements. 79
UBS (Lux) Bond Fund – Global (CHF)Annual Report as of 31 March 2015
UBS (Lux) Bond Fund – Global (CHF)
Three-year comparison
ISIN 31.3.2015 31.3.2014 31.3.2013Net assets in CHF 221 083 272.77 222 416 962.74 199 818 633.47Class (EUR hedged) P-acc LU0487186396Units outstanding 66 479.1160 296 862.7220 138 373.0590Net asset value per unit in EUR 120.40 112.11 110.99Issue and redemption price per unit in EUR1 120.40 112.11 110.99Class (EUR hedged) P-dist LU0487186123Units outstanding 21 967.9460 25 183.5440 50 705.9860Net asset value per unit in EUR 114.09 107.34 107.66Issue and redemption price per unit in EUR1 114.09 107.34 107.66Class (JPY hedged) P-acc2 LU0817644254Units outstanding 89 563.9780 79 054.9890 -Net asset value per unit in JPY 10 972.00 10 235.00 -Issue and redemption price per unit in JPY1 10 972.00 10 235.00 -Class (JPY hedged) P-dist2 LU0817644841Units outstanding 2 905.3620 2 413.6040 -Net asset value per unit in JPY 10 924.00 10 232.00 -Issue and redemption price per unit in JPY1 10 924.00 10 232.00 -Class I-B-acc LU0415185379Units outstanding 169 452.7240 60 224.4320 51 514.9500Net asset value per unit in CHF 122.98 114.04 111.94Issue and redemption price per unit in CHF1 122.98 114.04 111.94Class P-acc LU0071006638Units outstanding 72 357.4350 77 477.5420 94 479.2188Net asset value per unit in CHF 797.16 747.49 741.98Issue and redemption price per unit in CHF1 797.16 747.49 741.98Class P-dist LU0071005408Units outstanding 92 024.9080 108 577.9680 138 441.6281Net asset value per unit in CHF 497.64 471.41 474.11Issue and redemption price per unit in CHF1 497.64 471.41 474.11Class U-X-acc LU0415185700Units outstanding 6 247.0000 4 821.0000 2 923.0000Net asset value per unit in CHF 12 420.10 11 509.76 11 290.04Issue and redemption price per unit in CHF1 12 420.10 11 509.76 11 290.04
1 See note 12 First NAV: 13.11.2013
Performance
Currency 2014/2015 2013/2014 2012/2013Class (EUR hedged) P-acc EUR 7.4% 1.0% 4.1%Class (EUR hedged) P-dist EUR 7.4% 1.0% 4.1%Class (JPY hedged) P-acc JPY 7.2% - -Class (JPY hedged) P-dist JPY 7.3% - -Class I-B-acc CHF 7.8% 1.9% 5.0%Class P-acc CHF 6.6% 0.7% 3.8%Class P-dist CHF 6.6% 0.7% 3.8%Class U-X-acc CHF 7.9% 1.9% 5.0%
Historical performance is no indicator of current or future performance.The performance data does not take account of any commissions and costs charged when subscribing and redeeming units.The performance data were not audited.The subfund does not have a benchmark.

80 The notes are an integral part of the fi nancial statements.
UBS (Lux) Bond Fund – Global (CHF)Annual Report as of 31 March 2015
Report of the Portfolio Manager
In the reporting year, from 1 April 2014 to 31 March 2015, policymaker action was again a focus of the markets, against a background of moderate global growth, low inflation and heightened currency market volatility. Much of the period saw a continuation of the appreciation of the US Dollar driven by an apparently ever growing divergence in the monetary policy stance between the US Federal Reserve and, increasingly, the rest of the developed world. An increasing number of central banks turned to providing additional stimulus measures and the ECB finally actioned its long-awaited QE sovereign bond purchase program; the collapse of oil prices in the second half of the period saw prices fall to below 50% of their peak and applied additional pressure to stubbornly low global inflation.
In the reporting year, the subfund gained value. Dura-tion strategy and spread management both contributed positively whilst currency allocation was negative. We are currently running a short duration strategy. We favor USD, SEK and JPY while we are cautious on EUR and CAD.
Structure of the Securities Portfolio
Geographical Breakdown as a % of net assetsUnited States 32.17Japan 11.09United Kingdom 8.40Italy 8.29France 5.25New Zealand 3.65Ireland 3.40Spain 3.34Netherlands 2.86Australia 2.69Germany 2.68Belgium 2.42Supranationals 1.68Cayman Islands 1.20British Virgin Islands 1.07Norway 0.97Denmark 0.82Luxembourg 0.65Iceland 0.61Sweden 0.57Jersey 0.39South Korea 0.36Turkey 0.34Indonesia 0.34Colombia 0.30Brazil 0.29Malaysia 0.27Curacao 0.26Mexico 0.24Croatia 0.16Total 96.76
Economic Breakdown as a % of net assetsCountries & central governments 77.13Banks & credit institutions 7.05Finance & holding companies 3.52Mortgage & funding institutions 1.75Supranational organisations 1.68Investment funds 1.29Telecommunications 0.85Miscellaneous unclassified companies 0.76Public, non-profit institutions 0.49Petroleum 0.44Real Estate 0.44Building industry & materials 0.29Pharmaceuticals, cosmetics & medical products 0.26Chemicals 0.18Packaging industry 0.17Miscellaneous services 0.16Food & soft drinks 0.16Insurance 0.14Total 96.76

The notes are an integral part of the fi nancial statements. 81
UBS (Lux) Bond Fund – Global (CHF)Annual Report as of 31 March 2015
Statement of Net Assets CHFAssets 31.3.2015Investments in securities, cost 214 019 273.78Investments in securities, unrealized appreciation (depreciation) -97 497.79Total investments in securities (Note 1) 213 921 775.99Cash at banks, deposits on demand and deposit accounts 6 283 115.45Other liquid assets (Margins) 416 343.92Receivable on securities sales (Note 1) 116 056.27Receivable on subscriptions 50 771.50Interest receivable on securities 1 462 039.52Interest receivable on liquid assets 301.02Unrealized gain (loss) on financial futures (Note 1) -235 995.06Unrealized gain (loss) on forward foreign exchange contracts (Note 1) -508 552.59Total Assets 221 505 856.02
LiabilitiesPayable on securities purchases (Note 1) -115 598.96Payable on redemptions -227 020.06Provisions for flat fee (Note 2) -62 171.51Provisions for taxe d’abonnement (Note 3) -17 792.72Total provisions -79 964.23Total Liabilities -422 583.25
Net assets at the end of the financial year 221 083 272.77
Statement of Operations CHFIncome 1.4.2014-31.3.2015Interest on liquid assets 10 629.69Interest on securities 5 267 447.70Income on securities lending (Note 14) 135 462.89Other income 37 384.67Total income 5 450 924.95
ExpensesCost on securities lending (Note 14) -54 185.15Flat fee (Note 2) -1 587 005.06Taxe d’abonnement (Note 3) -74 057.18Interest on cash and bank overdraft -1 025.68Total expenses -1 716 273.07
Net income (loss) on investments 3 734 651.88
Realized gain (loss) (Note 1)Realized gain (loss) on market-priced securities without options 5 967 761.47Realized gain (loss) on financial futures -1 038 755.37Realized gain (loss) on forward foreign exchange contracts 1 798 560.77Realized result on subscriptions/redemptions (Note 5) 261 692.11Total realized gain (loss) on investments 6 989 258.98Realized gain (loss) on foreign exchange 262 545.23Total realized gain (loss) 7 251 804.21
Net realized gain (loss) of the financial year 10 986 456.09
Changes in unrealized appreciation (depreciation) (Note 1)Unrealized appreciation (depreciation) on market-priced securities without options 2 736 226.52Unrealized appreciation (depreciation) on financial futures -240 419.00Unrealized appreciation (depreciation) on forward foreign exchange contracts -1 123 969.43Total changes in unrealized appreciation (depreciation) 1 371 838.09
Net increase (decrease) in net assets as a result of operations 12 358 294.18

82 The notes are an integral part of the fi nancial statements.
UBS (Lux) Bond Fund – Global (CHF)Annual Report as of 31 March 2015
Statement of Changes in Net Assets CHF 1.4.2014-31.3.2015Net assets at the beginning of the financial year 222 416 962.74Subscriptions 117 436 233.55Redemptions -130 583 006.79Total net subscriptions (redemptions) -13 146 773.24Dividend paid -545 210.91Net income (loss) on investments 3 734 651.88Total realized gain (loss) 7 251 804.21Total changes in unrealized appreciation (depreciation) 1 371 838.09Net increase (decrease) in net assets as a result of operations 12 358 294.18Net assets at the end of the financial year 221 083 272.77
Development of the outstanding units
1.4.2014-31.3.2015Class (EUR hedged) P-accNumber of units outstanding at the beginning of the financial year 296 862.7220Number of units issued 472 527.0860Number of units redeemed -702 910.6920Number of units outstanding at the end of the financial year 66 479.1160Class (EUR hedged) P-distNumber of units outstanding at the beginning of the financial year 25 183.5440Number of units issued 2 273.6810Number of units redeemed -5 489.2790Number of units outstanding at the end of the financial year 21 967.9460Class (JPY hedged) P-accNumber of units outstanding at the beginning of the financial year 79 054.9890Number of units issued 19 018.4940Number of units redeemed -8 509.5050Number of units outstanding at the end of the financial year 89 563.9780Class (JPY hedged) P-distNumber of units outstanding at the beginning of the financial year 2 413.6040Number of units issued 850.0560Number of units redeemed -358.2980Number of units outstanding at the end of the financial year 2 905.3620Class I-B-accNumber of units outstanding at the beginning of the financial year 60 224.4320Number of units issued 109 228.2920Number of units redeemed 0.0000Number of units outstanding at the end of the financial year 169 452.7240Class P-accNumber of units outstanding at the beginning of the financial year 77 477.5420Number of units issued 21 727.5360Number of units redeemed -26 847.6430Number of units outstanding at the end of the financial year 72 357.4350Class P-distNumber of units outstanding at the beginning of the financial year 108 577.9680Number of units issued 5 864.4120Number of units redeemed -22 417.4720Number of units outstanding at the end of the financial year 92 024.9080Class U-X-accNumber of units outstanding at the beginning of the financial year 4 821.0000Number of units issued 1 426.0000Number of units redeemed 0.0000Number of units outstanding at the end of the financial year 6 247.0000
Annual Distribution
UBS (Lux) Bond Fund Ex-Date Pay-Date Currency Amount per unit– Global (CHF) (EUR hedged) P-dist 2.6.2014 5.6.2014 EUR 1.11– Global (CHF) (JPY hedged) P-dist 2.6.2014 5.6.2014 JPY 49.00– Global (CHF) P-dist 2.6.2014 5.6.2014 CHF 4.85
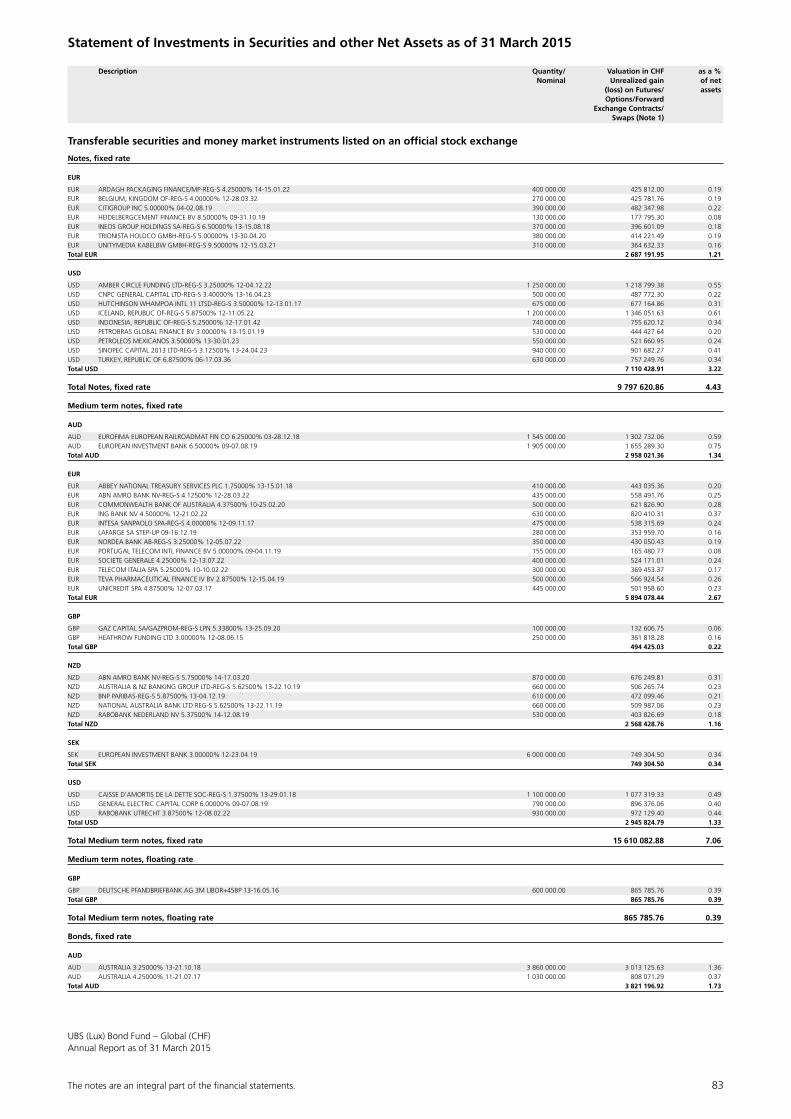
The notes are an integral part of the fi nancial statements. 83
UBS (Lux) Bond Fund – Global (CHF)Annual Report as of 31 March 2015
Statement of Investments in Securities and other Net Assets as of 31 March 2015
Description Quantity/ Valuation in CHF as a % Nominal Unrealized gain of net (loss) on Futures/ assets Options/Forward Exchange Contracts/ Swaps (Note 1)
Transferable securities and money market instruments listed on an official stock exchange
Notes, fixed rate
EUR
EUR ARDAGH PACKAGING FINANCE/MP-REG-S 4.25000% 14-15.01.22 400 000.00 425 812.00 0.19EUR BELGIUM, KINGDOM OF-REG-S 4.00000% 12-28.03.32 270 000.00 425 781.76 0.19EUR CITIGROUP INC 5.00000% 04-02.08.19 390 000.00 482 347.98 0.22EUR HEIDELBERGCEMENT FINANCE BV 8.50000% 09-31.10.19 130 000.00 177 795.30 0.08EUR INEOS GROUP HOLDINGS SA-REG-S 6.50000% 13-15.08.18 370 000.00 396 601.09 0.18EUR TRIONISTA HOLDCO GMBH-REG-S 5.00000% 13-30.04.20 380 000.00 414 221.49 0.19EUR UNITYMEDIA KABELBW GMBH-REG-S 9.50000% 12-15.03.21 310 000.00 364 632.33 0.16Total EUR 2 687 191.95 1.21
USD
USD AMBER CIRCLE FUNDING LTD-REG-S 3.25000% 12-04.12.22 1 250 000.00 1 218 799.38 0.55USD CNPC GENERAL CAPITAL LTD-REG-S 3.40000% 13-16.04.23 500 000.00 487 772.30 0.22USD HUTCHINSON WHAMPOA INTL 11 LTSD-REG-S 3.50000% 12-13.01.17 675 000.00 677 164.86 0.31USD ICELAND, REPUBLIC OF-REG-S 5.87500% 12-11.05.22 1 200 000.00 1 346 051.63 0.61USD INDONESIA, REPUBLIC OF-REG-S 5.25000% 12-17.01.42 740 000.00 755 620.12 0.34USD PETROBRAS GLOBAL FINANCE BV 3.00000% 13-15.01.19 530 000.00 444 427.64 0.20USD PETROLEOS MEXICANOS 3.50000% 13-30.01.23 550 000.00 521 660.95 0.24USD SINOPEC CAPITAL 2013 LTD-REG-S 3.12500% 13-24.04.23 940 000.00 901 682.27 0.41USD TURKEY, REPUBLIC OF 6.87500% 06-17.03.36 630 000.00 757 249.76 0.34Total USD 7 110 428.91 3.22
Total Notes, fixed rate 9 797 620.86 4.43
Medium term notes, fixed rate
AUD
AUD EUROFIMA EUROPEAN RAILROADMAT FIN CO 6.25000% 03-28.12.18 1 545 000.00 1 302 732.06 0.59AUD EUROPEAN INVESTMENT BANK 6.50000% 09-07.08.19 1 905 000.00 1 655 289.30 0.75Total AUD 2 958 021.36 1.34
EUR
EUR ABBEY NATIONAL TREASURY SERVICES PLC 1.75000% 13-15.01.18 410 000.00 443 035.36 0.20EUR ABN AMRO BANK NV-REG-S 4.12500% 12-28.03.22 435 000.00 558 491.76 0.25EUR COMMONWEALTH BANK OF AUSTRALIA 4.37500% 10-25.02.20 500 000.00 621 826.90 0.28EUR ING BANK NV 4.50000% 12-21.02.22 630 000.00 820 410.31 0.37EUR INTESA SANPAOLO SPA-REG-S 4.00000% 12-09.11.17 475 000.00 538 315.69 0.24EUR LAFARGE SA STEP-UP 09-16.12.19 280 000.00 353 959.70 0.16EUR NORDEA BANK AB-REG-S 3.25000% 12-05.07.22 350 000.00 430 050.43 0.19EUR PORTUGAL TELECOM INTL FINANCE BV 5.00000% 09-04.11.19 155 000.00 165 480.77 0.08EUR SOCIETE GENERALE 4.25000% 12-13.07.22 400 000.00 524 171.01 0.24EUR TELECOM ITALIA SPA 5.25000% 10-10.02.22 300 000.00 369 453.37 0.17EUR TEVA PHARMACEUTICAL FINANCE IV BV 2.87500% 12-15.04.19 500 000.00 566 924.54 0.26EUR UNICREDIT SPA 4.87500% 12-07.03.17 445 000.00 501 958.60 0.23Total EUR 5 894 078.44 2.67
GBP
GBP GAZ CAPITAL SA/GAZPROM-REG-S LPN 5.33800% 13-25.09.20 100 000.00 132 606.75 0.06GBP HEATHROW FUNDING LTD 3.00000% 12-08.06.15 250 000.00 361 818.28 0.16Total GBP 494 425.03 0.22
NZD
NZD ABN AMRO BANK NV-REG-S 5.75000% 14-17.03.20 870 000.00 676 249.81 0.31NZD AUSTRALIA & NZ BANKING GROUP LTD-REG-S 5.62500% 13-22.10.19 660 000.00 506 265.74 0.23NZD BNP PARIBAS-REG-S 5.87500% 13-04.12.19 610 000.00 472 099.46 0.21NZD NATIONAL AUSTRALIA BANK LTD REG-S 5.62500% 13-22.11.19 660 000.00 509 987.06 0.23NZD RABOBANK NEDERLAND NV 5.37500% 14-12.08.19 530 000.00 403 826.69 0.18Total NZD 2 568 428.76 1.16
SEK
SEK EUROPEAN INVESTMENT BANK 3.00000% 12-23.04.19 6 000 000.00 749 304.50 0.34Total SEK 749 304.50 0.34
USD
USD CAISSE D’AMORTIS DE LA DETTE SOC-REG-S 1.37500% 13-29.01.18 1 100 000.00 1 077 319.33 0.49USD GENERAL ELECTRIC CAPITAL CORP 6.00000% 09-07.08.19 790 000.00 896 376.06 0.40USD RABOBANK UTRECHT 3.87500% 12-08.02.22 930 000.00 972 129.40 0.44Total USD 2 945 824.79 1.33
Total Medium term notes, fixed rate 15 610 082.88 7.06
Medium term notes, floating rate
GBP
GBP DEUTSCHE PFANDBRIEFBANK AG 3M LIBOR+45BP 13-16.05.16 600 000.00 865 785.76 0.39Total GBP 865 785.76 0.39
Total Medium term notes, floating rate 865 785.76 0.39
Bonds, fixed rate
AUD
AUD AUSTRALIA 3.25000% 13-21.10.18 3 860 000.00 3 013 125.63 1.36AUD AUSTRALIA 4.25000% 11-21.07.17 1 030 000.00 808 071.29 0.37Total AUD 3 821 196.92 1.73

84 The notes are an integral part of the fi nancial statements.
UBS (Lux) Bond Fund – Global (CHF)Annual Report as of 31 March 2015
DKK
DKK DENMARK, KINGDOM OF 4.00000% 05-15.11.17 9 480 000.00 1 473 585.54 0.67DKK DENMARK, KINGDOM OF 4.50000% 08-15.11.39 1 300 000.00 343 100.97 0.15Total DKK 1 816 686.51 0.82
EUR
EUR AGROKOR DD-REG-S 9.87500% 12-01.05.19 314 000.00 352 821.82 0.16EUR BELGIUM, KINGDOM OF 3.75000% 10-28.09.20 1 220 000.00 1 534 146.04 0.69EUR BELGIUM, KINGDOM OF 4.25000% 11-28.09.21 2 240 000.00 2 967 393.98 1.34EUR BELGIUM, KINGDOM OF-144A-REG-S 3.00000% 14-22.06.34 300 000.00 432 219.20 0.20EUR CMC RAVENNA-REG-S 7.50000% 14-01.08.21 290 000.00 290 193.36 0.13EUR CROWN EUROPEAN HOLDINGS SA-REG-S 4.00000% 14-15.07.22 340 000.00 383 455.09 0.17EUR DIRECTV HOLDINGS LLC/FINANCING CO INC 2.75000% 13-19.05.23 300 000.00 346 845.66 0.16EUR FRANCE, REPUBLIC OF-OAT 2.75000% 12-25.10.27 3 420 000.00 4 475 811.12 2.02EUR FRANCE, REPUBLIC OF-OAT-REG-S 3.25000% 12-25.05.45 1 629 000.00 2 637 281.45 1.19EUR GCS HOLDCO FINANCE I SA-REG-S 6.50000% 13-15.11.18 330 000.00 361 340.07 0.16EUR GERMANY, REPUBLIC OF 4.75000% 03-04.07.34 1 160 000.00 2 160 496.78 0.98EUR GERMANY, REPUBLIC OF 2.50000% 12-04.07.44 329 000.00 520 985.15 0.24EUR HEATHROW FUNDING LTD 4.37500% 12-25.01.17 440 000.00 492 118.79 0.22EUR IRELAND, REPUBLIC OF-REG-S 3.90000% 13-20.03.23 2 080 000.00 2 737 970.33 1.24EUR IRELAND, REPUBLIC OF-REG-S 0.80000% 15-15.03.22 2 670 000.00 2 856 862.16 1.29EUR IRELAND, REPUBLIC OF-REG-S 2.00000% 15-18.02.45 1 260 000.00 1 506 173.26 0.68EUR ITALY, REPUBLIC OF BTP 4.50000% 13-01.05.23 4 045 000.00 5 333 423.75 2.41EUR ITALY, REPUBLIC OF-BTP 4.00000% 05-01.02.37 1 750 000.00 2 479 473.35 1.12EUR ITALY, REPUBLIC OF-BTP 5.00000% 11-01.03.22 3 270 000.00 4 346 362.87 1.97EUR ITALY, REPUBLIC OF-BTP 4.75000% 13-01.09.44 535 000.00 889 247.47 0.40EUR ITALY, REPUBLIC OF-BTP 1.35000% 15-15.04.22 3 040 000.00 3 261 319.30 1.48EUR KERNEOS TECH GROUP SAS-REG-S 5.75000 14-01.03.21 330 000.00 365 209.42 0.17EUR NETHERLANDS, KINGDOM OF THE 5.50000% 98-15.01.28 755 000.00 1 285 233.97 0.58EUR NETHERLANDS, KINGDOM OF THE 3.25000% 11-15.07.21 500 000.00 626 714.18 0.28EUR NETHERLANDS, KINGDOM OF THE 2.75000% 14-15.01.47 121 000.00 199 699.50 0.09EUR SPAIN GOVERNMENT BOND-144A-REG-S 2.75000% 14-31.10.24 4 563 000.00 5 431 888.83 2.46EUR SPAIN, KINGDOM OF-144A 5.15000% 13-31.10.28 395 000.00 593 993.18 0.27EUR SPAIN, KINGDOM OF-144A-REG-S 5.15000% 13-31.10.44 770 000.00 1 367 132.16 0.62EUR WIND ACQUISITION FINANCE SA-REG-S 4.00000% 14-15.07.20 290 000.00 304 768.83 0.14Total EUR 50 540 581.07 22.86
GBP
GBP UNITED KINGDOM OF GREAT BRITAIN & N IRL 4.25000% 06-07.12.27 2 160 000.00 3 985 149.36 1.80GBP UNITED KINGDOM OF GREAT BRITAIN & N IRL 4.50000% 07-07.12.42 690 000.00 1 446 097.98 0.65GBP UNITED KINGDOM OF GREAT BRITAIN & N IRL 2.00000% 10-22.01.16 690 000.00 1 007 990.48 0.46GBP UNITED KINGDOM OF GREAT BRITAIN & N IRL 3.75000% 11-07.09.21 885 000.00 1 472 337.57 0.67GBP UNITED KINGDOM OF GREAT BRITAIN & N IRL 1.00000% 12-07.09.17 500 000.00 728 733.65 0.33GBP UNITED KINGDOM OF GREAT BRITAIN & N IRL 1.75000% 12-07.09.22 815 000.00 1 203 700.31 0.54GBP UNITED KINGDOM OF GREAT BRITAIN & N IRL 2.25000% 13-07.09.23 520 000.00 792 823.00 0.36GBP UNITED KINGDOM OF GREAT BRITAIN & N IRL 3.25000% 12-22.01.44 1 160 000.00 2 000 594.50 0.91GBP UNITED KINGDOM OF GREAT BRITAIN & N IRL 1.25000% 13-22.07.18 200 000.00 292 661.40 0.13GBP UNITED KINGDOM TREASURY GILT 3.75000% 10-07.09.20 730 000.00 1 196 787.13 0.54GBP UNITED KINGDOM TREASURY GILT 1.75000% 13-22.07.19 1 382 000.00 2 053 575.62 0.93Total GBP 16 180 451.00 7.32
JPY
JPY JAPAN 0.40000% 13-20.03.18 484 350 000.00 3 961 897.81 1.79JPY JAPAN 0.70000% 12-20.12.22 154 300 000.00 1 293 745.81 0.59JPY JAPAN 1.10000% 03-20.03.33 556 000 000.00 4 586 119.56 2.07JPY JAPAN 1.20000% 14-20.12.34 244 750 000.00 2 010 173.02 0.91JPY JAPAN 1.50000% 12-20.06.32 195 000 000.00 1 721 014.09 0.78JPY JAPAN 1.50000% 13-20.03.33 440 000 000.00 3 863 464.26 1.75JPY JAPAN 1.70000% 03-20.06.33 422 000 000.00 3 811 247.94 1.72JPY JAPAN 1.70000% 14-20.09.44 157 700 000.00 1 382 677.55 0.63JPY JAPAN 1.80000% 13-20.03.43 209 800 000.00 1 882 900.26 0.85Total JPY 24 513 240.30 11.09
NZD
NZD NEW ZEALAND 3.00000% 13-15.04.20 9 496 000.00 6 862 242.00 3.10NZD NEW ZEALAND 6.00000% 13-15.05.21 810 000.00 659 262.24 0.30Total NZD 7 521 504.24 3.40
USD
USD AGENCE FRANCAISE DE DEVELOPPEMENT-REG-S 1.62500% 12-04.10.17 1 050 000.00 1 035 948.28 0.47USD BESTGAIN REAL ESTATE LTD-REG-S 2.62500% 13-13.03.18 1 010 000.00 966 081.98 0.44USD BRAZIL, FEDERATIVE REPUBLIC OF 7.12500% 06-20.01.37 550 000.00 631 709.24 0.28USD CHINA OVERSEAS FINANCE CAYMAN-REG-S 4.25000% 14-08.05.19 760 000.00 766 491.60 0.35USD COLOMBIA, REPUBLIC OF 6.12500% 09-18.01.41 580 000.00 667 574.49 0.30USD GAZ CAPITAL SA (GAZPROM)-REG-S LPN 7.28800% 07-16.08.37 250 000.00 236 147.31 0.11USD KOMMUNALBANKEN A/S-REG-S 2.12500% 14-15.03.19 2 150 000.00 2 149 085.26 0.97USD PETRONAS CAPITAL LTD-REG-S 5.25000% 09-12.08.19 550 000.00 598 096.42 0.27Total USD 7 051 134.58 3.19
Total Bonds, fixed rate 111 444 794.62 50.41
Bonds, floating rate
EUR
EUR HSBC HOLDINGS PLC-144A-REG-S-SUB 5.25000%/VAR 14-PRP 250 000.00 270 378.24 0.12EUR ROYAL BANK OF SCOT GP PLC 7.09160%/3M EURIBOR+233BP 07-PRP 150 000.00 169 744.07 0.08EUR SOCIETE GENERALE-REG-S-SUB 6.750%/VAR 14-PRP 270 000.00 292 284.52 0.13Total EUR 732 406.83 0.33
GBP
GBP ASSICURAZIONI GENERALI-SUB 6.41600%/3M LIBOR+220BP 07-PRP 200 000.00 308 173.30 0.14Total GBP 308 173.30 0.14
Description Quantity/ Valuation in CHF as a % Nominal Unrealized gain of net (loss) on Futures/ assets Options/Forward Exchange Contracts/ Swaps (Note 1)
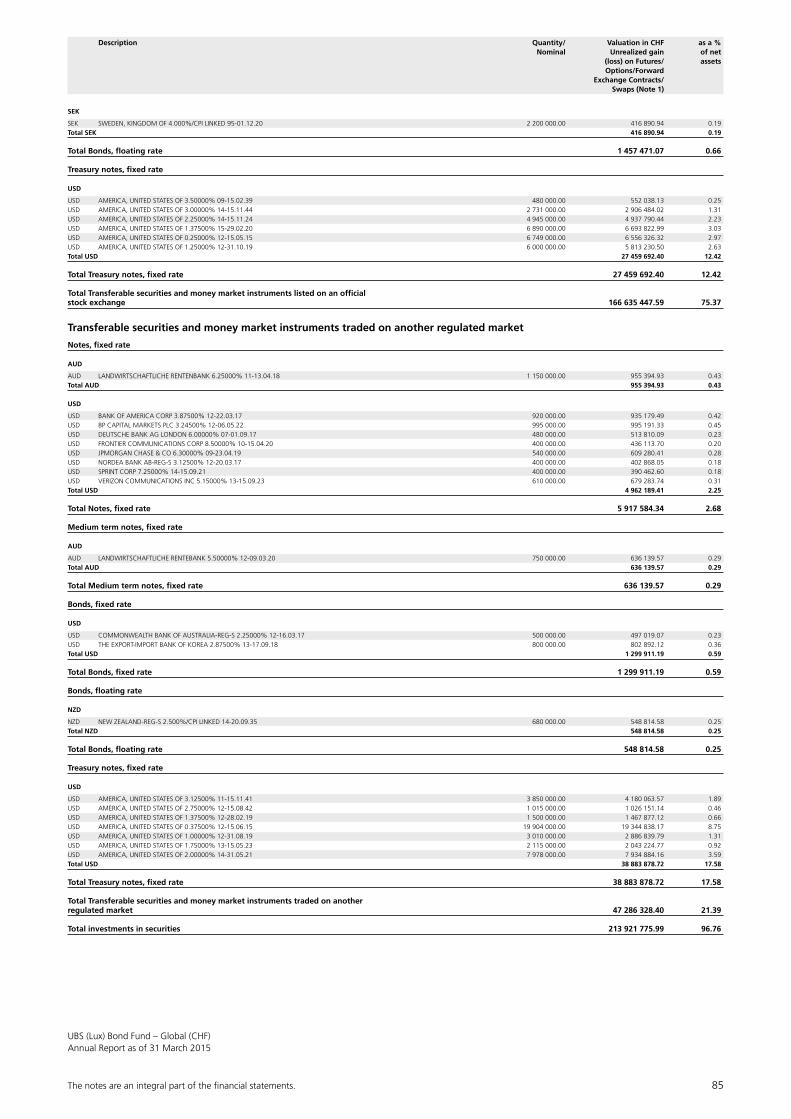
The notes are an integral part of the fi nancial statements. 85
UBS (Lux) Bond Fund – Global (CHF)Annual Report as of 31 March 2015
SEK
SEK SWEDEN, KINGDOM OF 4.000%/CPI LINKED 95-01.12.20 2 200 000.00 416 890.94 0.19Total SEK 416 890.94 0.19
Total Bonds, floating rate 1 457 471.07 0.66
Treasury notes, fixed rate
USD
USD AMERICA, UNITED STATES OF 3.50000% 09-15.02.39 480 000.00 552 038.13 0.25USD AMERICA, UNITED STATES OF 3.00000% 14-15.11.44 2 731 000.00 2 906 484.02 1.31USD AMERICA, UNITED STATES OF 2.25000% 14-15.11.24 4 945 000.00 4 937 790.44 2.23USD AMERICA, UNITED STATES OF 1.37500% 15-29.02.20 6 890 000.00 6 693 822.99 3.03USD AMERICA, UNITED STATES OF 0.25000% 12-15.05.15 6 749 000.00 6 556 326.32 2.97USD AMERICA, UNITED STATES OF 1.25000% 12-31.10.19 6 000 000.00 5 813 230.50 2.63Total USD 27 459 692.40 12.42
Total Treasury notes, fixed rate 27 459 692.40 12.42
Total Transferable securities and money market instruments listed on an official stock exchange 166 635 447.59 75.37
Transferable securities and money market instruments traded on another regulated market
Notes, fixed rate
AUD
AUD LANDWIRTSCHAFTLICHE RENTENBANK 6.25000% 11-13.04.18 1 150 000.00 955 394.93 0.43Total AUD 955 394.93 0.43
USD
USD BANK OF AMERICA CORP 3.87500% 12-22.03.17 920 000.00 935 179.49 0.42USD BP CAPITAL MARKETS PLC 3.24500% 12-06.05.22 995 000.00 995 191.33 0.45USD DEUTSCHE BANK AG LONDON 6.00000% 07-01.09.17 480 000.00 513 810.09 0.23USD FRONTIER COMMUNICATIONS CORP 8.50000% 10-15.04.20 400 000.00 436 113.70 0.20USD JPMORGAN CHASE & CO 6.30000% 09-23.04.19 540 000.00 609 280.41 0.28USD NORDEA BANK AB-REG-S 3.12500% 12-20.03.17 400 000.00 402 868.05 0.18USD SPRINT CORP 7.25000% 14-15.09.21 400 000.00 390 462.60 0.18USD VERIZON COMMUNICATIONS INC 5.15000% 13-15.09.23 610 000.00 679 283.74 0.31Total USD 4 962 189.41 2.25
Total Notes, fixed rate 5 917 584.34 2.68
Medium term notes, fixed rate
AUD
AUD LANDWIRTSCHAFTLICHE RENTEBANK 5.50000% 12-09.03.20 750 000.00 636 139.57 0.29Total AUD 636 139.57 0.29
Total Medium term notes, fixed rate 636 139.57 0.29
Bonds, fixed rate
USD
USD COMMONWEALTH BANK OF AUSTRALIA-REG-S 2.25000% 12-16.03.17 500 000.00 497 019.07 0.23USD THE EXPORT-IMPORT BANK OF KOREA 2.87500% 13-17.09.18 800 000.00 802 892.12 0.36Total USD 1 299 911.19 0.59
Total Bonds, fixed rate 1 299 911.19 0.59
Bonds, floating rate
NZD
NZD NEW ZEALAND-REG-S 2.500%/CPI LINKED 14-20.09.35 680 000.00 548 814.58 0.25Total NZD 548 814.58 0.25
Total Bonds, floating rate 548 814.58 0.25
Treasury notes, fixed rate
USD
USD AMERICA, UNITED STATES OF 3.12500% 11-15.11.41 3 850 000.00 4 180 063.57 1.89USD AMERICA, UNITED STATES OF 2.75000% 12-15.08.42 1 015 000.00 1 026 151.14 0.46USD AMERICA, UNITED STATES OF 1.37500% 12-28.02.19 1 500 000.00 1 467 877.12 0.66USD AMERICA, UNITED STATES OF 0.37500% 12-15.06.15 19 904 000.00 19 344 838.17 8.75USD AMERICA, UNITED STATES OF 1.00000% 12-31.08.19 3 010 000.00 2 886 839.79 1.31USD AMERICA, UNITED STATES OF 1.75000% 13-15.05.23 2 115 000.00 2 043 224.77 0.92USD AMERICA, UNITED STATES OF 2.00000% 14-31.05.21 7 978 000.00 7 934 884.16 3.59Total USD 38 883 878.72 17.58
Total Treasury notes, fixed rate 38 883 878.72 17.58
Total Transferable securities and money market instruments traded on another regulated market 47 286 328.40 21.39
Total investments in securities 213 921 775.99 96.76
Description Quantity/ Valuation in CHF as a % Nominal Unrealized gain of net (loss) on Futures/ assets Options/Forward Exchange Contracts/ Swaps (Note 1)
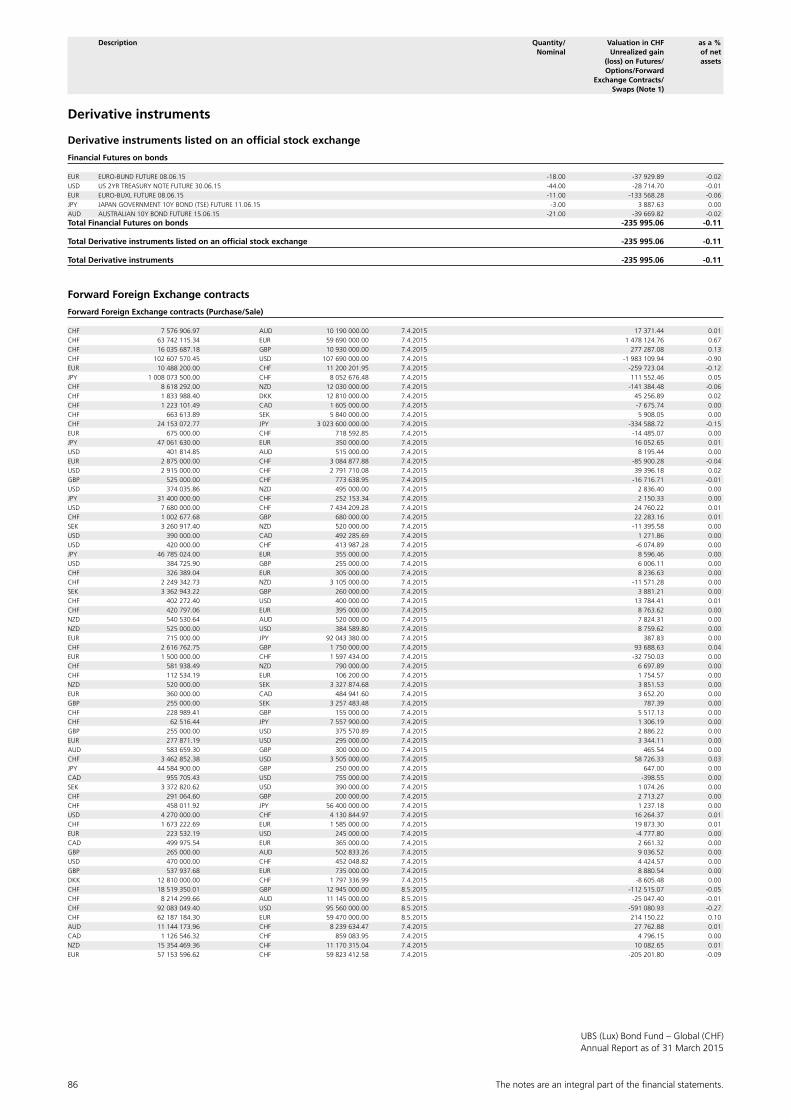
86 The notes are an integral part of the fi nancial statements.
UBS (Lux) Bond Fund – Global (CHF)Annual Report as of 31 March 2015
Derivative instruments
Derivative instruments listed on an official stock exchange
Financial Futures on bonds
EUR EURO-BUND FUTURE 08.06.15 -18.00 -37 929.89 -0.02USD US 2YR TREASURY NOTE FUTURE 30.06.15 -44.00 -28 714.70 -0.01EUR EURO-BUXL FUTURE 08.06.15 -11.00 -133 568.28 -0.06JPY JAPAN GOVERNMENT 10Y BOND (TSE) FUTURE 11.06.15 -3.00 3 887.63 0.00AUD AUSTRALIAN 10Y BOND FUTURE 15.06.15 -21.00 -39 669.82 -0.02Total Financial Futures on bonds -235 995.06 -0.11
Total Derivative instruments listed on an official stock exchange -235 995.06 -0.11
Total Derivative instruments -235 995.06 -0.11
Forward Foreign Exchange contracts
Forward Foreign Exchange contracts (Purchase/Sale)
CHF 7 576 906.97 AUD 10 190 000.00 7.4.2015 17 371.44 0.01CHF 63 742 115.34 EUR 59 690 000.00 7.4.2015 1 478 124.76 0.67CHF 16 035 687.18 GBP 10 930 000.00 7.4.2015 277 287.08 0.13CHF 102 607 570.45 USD 107 690 000.00 7.4.2015 -1 983 109.94 -0.90EUR 10 488 200.00 CHF 11 200 201.95 7.4.2015 -259 723.04 -0.12JPY 1 008 073 500.00 CHF 8 052 676.48 7.4.2015 111 552.46 0.05CHF 8 618 292.00 NZD 12 030 000.00 7.4.2015 -141 384.48 -0.06CHF 1 833 988.40 DKK 12 810 000.00 7.4.2015 45 256.89 0.02CHF 1 223 101.49 CAD 1 605 000.00 7.4.2015 -7 675.74 0.00CHF 663 613.89 SEK 5 840 000.00 7.4.2015 5 908.05 0.00CHF 24 153 072.77 JPY 3 023 600 000.00 7.4.2015 -334 588.72 -0.15EUR 675 000.00 CHF 718 592.85 7.4.2015 -14 485.07 0.00JPY 47 061 630.00 EUR 350 000.00 7.4.2015 16 052.65 0.01USD 401 814.85 AUD 515 000.00 7.4.2015 8 195.44 0.00EUR 2 875 000.00 CHF 3 084 877.88 7.4.2015 -85 900.28 -0.04USD 2 915 000.00 CHF 2 791 710.08 7.4.2015 39 396.18 0.02GBP 525 000.00 CHF 773 638.95 7.4.2015 -16 716.71 -0.01USD 374 035.86 NZD 495 000.00 7.4.2015 2 836.40 0.00JPY 31 400 000.00 CHF 252 153.34 7.4.2015 2 150.33 0.00USD 7 680 000.00 CHF 7 434 209.28 7.4.2015 24 760.22 0.01CHF 1 002 677.68 GBP 680 000.00 7.4.2015 22 283.16 0.01SEK 3 260 917.40 NZD 520 000.00 7.4.2015 -11 395.58 0.00USD 390 000.00 CAD 492 285.69 7.4.2015 1 271.86 0.00USD 420 000.00 CHF 413 987.28 7.4.2015 -6 074.89 0.00JPY 46 785 024.00 EUR 355 000.00 7.4.2015 8 596.46 0.00USD 384 725.90 GBP 255 000.00 7.4.2015 6 006.11 0.00CHF 326 389.04 EUR 305 000.00 7.4.2015 8 236.63 0.00CHF 2 249 342.73 NZD 3 105 000.00 7.4.2015 -11 571.28 0.00SEK 3 362 943.22 GBP 260 000.00 7.4.2015 3 881.21 0.00CHF 402 272.40 USD 400 000.00 7.4.2015 13 784.41 0.01CHF 420 797.06 EUR 395 000.00 7.4.2015 8 763.62 0.00NZD 540 530.64 AUD 520 000.00 7.4.2015 7 824.31 0.00NZD 525 000.00 USD 384 589.80 7.4.2015 8 759.62 0.00EUR 715 000.00 JPY 92 043 380.00 7.4.2015 387.83 0.00CHF 2 616 762.75 GBP 1 750 000.00 7.4.2015 93 688.63 0.04EUR 1 500 000.00 CHF 1 597 434.00 7.4.2015 -32 750.03 0.00CHF 581 938.49 NZD 790 000.00 7.4.2015 6 697.89 0.00CHF 112 534.19 EUR 106 200.00 7.4.2015 1 754.57 0.00NZD 520 000.00 SEK 3 327 874.68 7.4.2015 3 851.53 0.00EUR 360 000.00 CAD 484 941.60 7.4.2015 3 652.20 0.00GBP 255 000.00 SEK 3 257 483.48 7.4.2015 787.39 0.00CHF 228 989.41 GBP 155 000.00 7.4.2015 5 517.13 0.00CHF 62 516.44 JPY 7 557 900.00 7.4.2015 1 306.19 0.00GBP 255 000.00 USD 375 570.89 7.4.2015 2 886.22 0.00EUR 277 871.19 USD 295 000.00 7.4.2015 3 344.11 0.00AUD 583 659.30 GBP 300 000.00 7.4.2015 465.54 0.00CHF 3 462 852.38 USD 3 505 000.00 7.4.2015 58 726.33 0.03JPY 44 584 900.00 GBP 250 000.00 7.4.2015 647.00 0.00CAD 955 705.43 USD 755 000.00 7.4.2015 -398.55 0.00SEK 3 372 820.62 USD 390 000.00 7.4.2015 1 074.26 0.00CHF 291 064.60 GBP 200 000.00 7.4.2015 2 713.27 0.00CHF 458 011.92 JPY 56 400 000.00 7.4.2015 1 237.18 0.00USD 4 270 000.00 CHF 4 130 844.97 7.4.2015 16 264.37 0.01CHF 1 673 222.69 EUR 1 585 000.00 7.4.2015 19 873.30 0.01EUR 223 532.19 USD 245 000.00 7.4.2015 -4 777.80 0.00CAD 499 975.54 EUR 365 000.00 7.4.2015 2 661.32 0.00GBP 265 000.00 AUD 502 833.26 7.4.2015 9 036.52 0.00USD 470 000.00 CHF 452 048.82 7.4.2015 4 424.57 0.00GBP 537 937.68 EUR 735 000.00 7.4.2015 8 880.54 0.00DKK 12 810 000.00 CHF 1 797 336.99 7.4.2015 -8 605.48 0.00CHF 18 519 350.01 GBP 12 945 000.00 8.5.2015 -112 515.07 -0.05CHF 8 214 299.66 AUD 11 145 000.00 8.5.2015 -25 047.40 -0.01CHF 92 083 049.40 USD 95 560 000.00 8.5.2015 -591 080.93 -0.27CHF 62 187 184.30 EUR 59 470 000.00 8.5.2015 214 150.22 0.10AUD 11 144 173.96 CHF 8 239 634.47 7.4.2015 27 762.88 0.01CAD 1 126 546.32 CHF 859 083.95 7.4.2015 4 796.15 0.00NZD 15 354 469.36 CHF 11 170 315.04 7.4.2015 10 082.65 0.01EUR 57 153 596.62 CHF 59 823 412.58 7.4.2015 -205 201.80 -0.09
Description Quantity/ Valuation in CHF as a % Nominal Unrealized gain of net (loss) on Futures/ assets Options/Forward Exchange Contracts/ Swaps (Note 1)

The notes are an integral part of the fi nancial statements. 87
UBS (Lux) Bond Fund – Global (CHF)Annual Report as of 31 March 2015
SEK 2 428 676.92 CHF 273 252.28 7.4.2015 267.41 0.00USD 96 734 584.08 CHF 93 344 133.64 7.4.2015 606 427.84 0.27GBP 12 942 062.32 CHF 18 544 318.72 7.4.2015 114 985.60 0.05JPY 3 002 211 826.00 CHF 24 218 026.12 7.4.2015 96 415.91 0.04CHF 10 866 974.37 EUR 10 382 000.00 7.4.2015 37 275.09 0.02EUR 10 382 000.00 CHF 10 856 353.58 8.5.2015 -37 385.36 -0.02JPY 992 362 400.00 CHF 7 997 182.67 8.5.2015 32 279.48 0.02CHF 1 796 635.45 DKK 12 810 000.00 8.5.2015 8 378.88 0.00CHF 24 194 731.20 JPY 3 002 300 000.00 8.5.2015 -97 658.58 -0.04CHF 11 121 795.41 NZD 15 355 000.00 8.5.2015 -4 375.28 0.00CHF 860 167.30 CAD 1 130 000.00 8.5.2015 -4 727.88 0.00CHF 273 142.93 SEK 2 430 000.00 8.5.2015 -270.47 0.00CHF 8 070 887.18 JPY 1 000 515 600.00 7.4.2015 -32 131.52 -0.01Total Forward Foreign Exchange contracts (Purchase/Sale) -508 552.59 -0.23
Cash at banks, deposits on demand and deposit accounts and other liquid assets 6 699 459.37 3.03Other assets and liabilities 1 206 585.06 0.55
Total net assets 221 083 272.77 100.00
Description Quantity/ Valuation in CHF as a % Nominal Unrealized gain of net (loss) on Futures/ assets Options/Forward Exchange Contracts/ Swaps (Note 1)

88 The notes are an integral part of the fi nancial statements.
UBS (Lux) Bond Fund – USDAnnual Report as of 31 March 2015
UBS (Lux) Bond Fund – USD
Three-year comparison
ISIN 31.3.2015 31.3.2014 31.3.2013Net assets in USD 163 935 319.82 200 695 594.00 248 629 435.25Class F-acc1 LU0415176030Units outstanding 57 772.2250 81 465.2890 -Net asset value per unit in USD 303.86 291.11 -Issue and redemption price per unit in USD2 303.86 291.11 -Class P-acc LU0035346773Units outstanding 396 250.2890 476 916.5660 682 175.4180Net asset value per unit in USD 300.74 289.85 288.06Issue and redemption price per unit in USD2 300.74 289.85 288.06Class P-dist LU0035346344Units outstanding 252 450.7120 363 017.8320 476 556.8239Net asset value per unit in USD 107.79 106.73 109.38Issue and redemption price per unit in USD2 107.79 106.73 109.38
1 First NAV: 10.7.20132 See note 1
Performance
Currency 2014/2015 2013/2014 2012/2013Class F-acc USD 4.4% - -Class P-acc USD 3.8% 0.6% 3.9%Class P-dist USD 3.8% 0.6% 3.9%
Historical performance is no indicator of current or future performance.The performance data does not take account of any commissions and costs charged when subscribing and redeeming units.The performance data were not audited.The subfund does not have a benchmark.

The notes are an integral part of the fi nancial statements. 89
UBS (Lux) Bond Fund – USDAnnual Report as of 31 March 2015
Report of the Portfolio Manager
US capital market interest rates dropped slightly in the reporting year from 1 April 2014 to 31 March 2015. The fall was unexpected and results from the surpris-ingly weaker recovery of the US economy. The yield on ten-year US Treasuries fell from a high of 2.8% to below 2%. Despite the extremely loose monetary policy of the key central banks, credit risk premiums rose slightly.
The subfund provided a positive return thanks to lower risk-free interest rates. Duration, i.e. the weighted aver-age maturity of the subfund, was predominantly at an average of -0.3 years. The subfund benefited from sector allocation and, above all, from stock picking (mainly in financials).
Structure of the Securities Portfolio
Geographical Breakdown as a % of net assetsUnited States 39.52Supranationals 12.41France 5.94United Kingdom 5.27Netherlands 5.10Germany 4.73Canada 4.40South Korea 3.87Luxembourg 3.16Sweden 2.03British Virgin Islands 1.80Cayman Islands 1.48Japan 1.30Italy 1.05Norway 1.04Qatar 1.04Saudiarabia 0.98Belgium 0.97Australia 0.94Singapore 0.92Chile 0.65Hong Kong 0.18Total 98.78
Economic Breakdown as a % of net assetsBanks & credit institutions 28.53Finance & holding companies 21.05Supranational organisations 12.41Mortgage & funding institutions 8.46Energy & water supply 4.48Computer hardware & network equipment providers 4.45Countries & central governments 3.66Petroleum 3.16Cantons, federal states 2.51Internet, software & IT services 2.44Food & soft drinks 1.83Tobacco & alcohol 1.43Chemicals 0.92Pharmaceuticals, cosmetics & medical products 0.85Traffic & transportation 0.61Miscellaneous unclassified companies 0.49Aerospace industry 0.48Miscellaneous trading companies 0.44Miscellaneous services 0.27Insurance 0.19Lodging, catering & leisure 0.12Total 98.78

90 The notes are an integral part of the fi nancial statements.
UBS (Lux) Bond Fund – USDAnnual Report as of 31 March 2015
Statement of Net Assets USDAssets 31.3.2015Investments in securities, cost 154 746 638.99Investments in securities, unrealized appreciation (depreciation) 7 194 168.78Total investments in securities (Note 1) 161 940 807.77Cash at banks, deposits on demand and deposit accounts 405 498.30Other liquid assets (Margins) 433 290.84Receivable on subscriptions 129 897.21Interest receivable on securities 1 580 008.42Unrealized gain (loss) on financial futures (Note 1) -233 391.66Unrealized gain (loss) on swaps (Note 1) -16 285.51Total Assets 164 239 825.37
LiabilitiesPayable on redemptions -225 377.39Provisions for flat fee (Note 2) -60 391.67Provisions for taxe d’abonnement (Note 3) -18 736.49Total provisions -79 128.16Total Liabilities -304 505.55
Net assets at the end of the financial year 163 935 319.82
Statement of Operations USDIncome 1.4.2014-31.3.2015Interest on securities 6 216 578.83Income on securities lending (Note 14) 86 179.76Total income 6 302 758.59
ExpensesInterest paid on swaps (Note 1) -78 576.39Cost on securities lending (Note 14) -34 471.90Flat fee (Note 2) -1 510 854.75Taxe d’abonnement (Note 3) -79 708.59Interest on cash and bank overdraft -45.46Total expenses -1 703 657.09
Net income (loss) on investments 4 599 101.50
Realized gain (loss) (Note 1)Realized gain (loss) on market-priced securities without options 2 060 805.02Realized gain (loss) on options -26 656.00Realized gain (loss) on financial futures -1 049 120.30Realized result on subscriptions/redemptions (Note 5) 7 587.07Total realized gain (loss) on investments 992 615.79Total realized gain (loss) 992 615.79
Net realized gain (loss) of the financial year 5 591 717.29
Changes in unrealized appreciation (depreciation) (Note 1)Unrealized appreciation (depreciation) on market-priced securities without options 1 692 812.82Unrealized appreciation (depreciation) on financial futures -577 015.10Unrealized appreciation (depreciation) on swaps 60 371.73Total changes in unrealized appreciation (depreciation) 1 176 169.45
Net increase (decrease) in net assets as a result of operations 6 767 886.74

The notes are an integral part of the fi nancial statements. 91
UBS (Lux) Bond Fund – USDAnnual Report as of 31 March 2015
Statement of Changes in Net Assets USD 1.4.2014-31.3.2015Net assets at the beginning of the financial year 200 695 594.00Subscriptions 21 317 504.80Redemptions -63 823 187.01Total net subscriptions (redemptions) -42 505 682.21Dividend paid -1 022 478.71Net income (loss) on investments 4 599 101.50Total realized gain (loss) 992 615.79Total changes in unrealized appreciation (depreciation) 1 176 169.45Net increase (decrease) in net assets as a result of operations 6 767 886.74Net assets at the end of the financial year 163 935 319.82
Development of the outstanding units
1.4.2014-31.3.2015Class F-accNumber of units outstanding at the beginning of the financial year 81 465.2890Number of units issued 10 880.2200Number of units redeemed -34 573.2840Number of units outstanding at the end of the financial year 57 772.2250Class P-accNumber of units outstanding at the beginning of the financial year 476 916.5660Number of units issued 58 459.4710Number of units redeemed -139 125.7480Number of units outstanding at the end of the financial year 396 250.2890Class P-distNumber of units outstanding at the beginning of the financial year 363 017.8320Number of units issued 7 320.0000Number of units redeemed -117 887.1200Number of units outstanding at the end of the financial year 252 450.7120
Annual Distribution
UBS (Lux) Bond Fund Ex-Date Pay-Date Currency Amount per unit– USD P-dist 2.6.2014 5.6.2014 USD 2.87

92 The notes are an integral part of the fi nancial statements.
UBS (Lux) Bond Fund – USDAnnual Report as of 31 March 2015
Statement of Investments in Securities and other Net Assets as of 31 March 2015
Description Quantity/ Valuation in USD as a % Nominal Unrealized gain of net (loss) on Futures/ assets Options/Forward Exchange Contracts/ Swaps (Note 1)
Transferable securities and money market instruments listed on an official stock exchange
Notes, fixed rate
USD
USD ABN AMRO BANK NV-REG-S 1.37500% 13-22.01.16 2 000 000.00 2 008 780.00 1.23USD ALIBABA GROUP HOLDING LTD-REG-S 2.50000% 14-28.11.19 450 000.00 448 798.50 0.27USD APPLE INC 2.40000% 13-03.05.23 900 000.00 888 948.90 0.54USD APPLE INC 3.45000% 14-06.05.24 1 000 000.00 1 061 349.00 0.65USD APPLE INC 3.85000% 13-04.05.43 1 000 000.00 1 015 793.00 0.62USD ASIAN DEVELOPMENT BANK 1.87500% 11-23.10.18 1 450 000.00 1 483 909.70 0.91USD BARCLAYS BANK PLC 5.00000% 09-22.09.16 1 100 000.00 1 162 561.40 0.71USD CHILE, REPUBLIC OF 3.25000% 11-14.09.21 1 000 000.00 1 068 750.00 0.65USD CNOOC FINANCE 2012 LTD-REG-S 3.87500% 12-02.05.22 1 200 000.00 1 249 884.00 0.76USD CORPORACION ANDINA DE FOMENTO 4.37500% 12-15.06.22 1 500 000.00 1 637 998.50 1.00USD ELECTRICITE DE FRANCE-REG-S 6.50000% 09-26.01.19 2 650 000.00 3 099 323.40 1.89USD EXPORT-IMPORT BANK OF KOREA 1.25000% 12-20.11.15 1 000 000.00 1 002 910.00 0.61USD EXXON MOBIL CORP 3.17600% 14-15.03.24 1 800 000.00 1 894 662.00 1.16USD FREDDIE MAC 6.25000% 02-15.07.32 1 550 000.00 2 299 451.35 1.40USD FREDDIE MAC 6.75000% 00-15.03.31 1 500 000.00 2 289 813.00 1.40USD GDF SUEZ-REG-S 1.62500% 12-10.10.17 1 500 000.00 1 509 420.00 0.92USD GOOGLE INC 3.37500% 14-25.02.24 1 200 000.00 1 273 909.20 0.78USD IBM CORP 1.62500% 13-15.05.20 1 500 000.00 1 479 873.00 0.90USD INTERNATIONAL BUSINESS MACHINES CORP 1.87500% 12-01.08.22 3 000 000.00 2 854 059.00 1.74USD KOREA DEVELOPMENT BANK 4.00000% 11-09.09.16 1 500 000.00 1 559 760.00 0.95USD KOREA GAS CORPORATION-REG-S 2.25000% 12-25.07.17 1 100 000.00 1 113 453.00 0.68USD KREDITANSTALT FUER WIEDERAUFBAU 1.25000% 12-15.02.17 2 500 000.00 2 526 277.50 1.54USD LLOYDS BANK PLC-REG-S 5.80000% 10-13.01.20 1 500 000.00 1 745 821.50 1.06USD LOMBARDY, REGION OF 5.80400% 02-25.10.32 1 500 000.00 1 719 829.50 1.05USD MITSUBISHI CORP-REG-S 2.87500% 13-18.07.18 700 000.00 722 848.00 0.44USD PETROBRAS GLOBAL FINANCE BV 5.87500% 07-01.03.18 500 000.00 478 750.00 0.29USD QATAR, STATE OF-REG-S 5.25000% 09-20.01.20 1 500 000.00 1 702 500.00 1.04USD QNB FINANCE LTD-REG-S 2.75000% 13-31.10.18 1 250 000.00 1 271 012.50 0.78USD RECKITT BENCKISER TREAS SERV-REG-S 3.62500% 13-21.09.23 750 000.00 794 021.25 0.48USD SB CAPITAL SA FOR SBERBANK-REG-S LPN 4.95000% 12-07.02.17 1 200 000.00 1 165 500.00 0.71USD SHELL INTERNATIONAL FINANCE BV 2.25000% 12-06.01.23 1 400 000.00 1 369 716.60 0.84USD STATOIL ASA 5.25000% 09-15.04.19 1 500 000.00 1 705 443.00 1.04USD UBS AG/STAMFORD CT-SUB 7.37500% 97-15.06.17 2 900 000.00 3 246 500.70 1.98Total USD 50 851 627.50 31.02
Total Notes, fixed rate 50 851 627.50 31.02
Medium term notes, fixed rate
USD
USD ADCB FINANCE CAYMAN LTD-REG-S 2.50000% 13-06.03.18 700 000.00 704 375.00 0.43USD AIA GROUP LTD-REG-S 3.20000% 15-11.03.25 300 000.00 302 733.00 0.18USD ASIAN DEVELOPMENT BANK 2.12500% 14-24.11.21 800 000.00 815 721.60 0.50USD BELGIUM, KINGDOM OF-REG-S 2.87500% 14-18.09.24 1 500 000.00 1 586 010.00 0.97USD BP CAPITAL MARKETS PLC-REG-S 1.62500% 12-17.08.17 1 500 000.00 1 505 415.00 0.92USD DBS BANK LTD 2.37500% 10-14.09.15 1 500 000.00 1 511 535.00 0.92USD GENERAL ELECTRIC CAPITAL CORP 6.75000% 02-15.03.32 3 800 000.00 5 255 966.20 3.21USD HYPOTHEKENBANK FRANKFURT INTL 5.12500% 06-21.01.16 3 921 000.00 4 019 730.78 2.45USD MORGAN STANLEY 6.62500% 08-01.04.18 1 500 000.00 1 706 028.00 1.04USD NESTLE HOLDINGS INC-REG-S 2.12500% 14-14.01.20 1 500 000.00 1 523 610.00 0.93USD RABOBANK NEDERLAND NV 2.25000% 12-31.07.15 1 000 000.00 1 006 020.00 0.61Total USD 19 937 144.58 12.16
Total Medium term notes, fixed rate 19 937 144.58 12.16
Bonds, fixed rate
USD
USD AFRICAN DEVELOPMENT BANK 7.37500% 93-06.04.23 2 000 000.00 2 709 680.00 1.65USD ASSOCIATE CORP OF N.AMERICA 6.95000% 98-01.11.18 1 800 000.00 2 096 289.00 1.28USD BANK NEDERLANDSE GEMEENTEN NV-REG-S 2.62500% 14-28.04.21 2 000 000.00 2 090 640.00 1.28USD CNOOC FINANCE 2013 LTD 1.75000% 13-09.05.18 450 000.00 448 063.20 0.27USD EUROPEAN INVESTMENT BANK 2.12500% 14-15.10.21 1 000 000.00 1 023 645.00 0.62USD EUROPEAN INVESTMENT BANK 1.87500% 12-15.10.19 4 000 000.00 4 079 400.00 2.49USD EXPORT DEVELOPMENT CANADA 1.50000% 13-03.10.18 1 500 000.00 1 516 254.00 0.93USD EXPORT-IMPORT BANK OF KOREA 4.12500% 10-09.09.15 1 000 000.00 1 014 220.00 0.62USD FANNIE MAE 2.62500% 14-06.09.24 2 000 000.00 2 072 180.00 1.26USD INTER-AMERICAN DEVELOPMENT BANK 2.12500% 13-09.11.20 2 000 000.00 2 057 022.00 1.25USD INTER-AMRICAN DEVELPMENT BANK 1.37500% 13-15.07.20 1 600 000.00 1 587 281.60 0.97USD INTL BK FOR RECONSTR & DEVT WORLD BANK 7.62500% 93-19.01.23 3 150 000.00 4 438 035.00 2.71USD INTL BK FOR RECONSTR & DEVT WORLD BANK 2.50000% 14-25.11.24 500 000.00 517 654.00 0.32USD JOHNSON & JOHNSON 2.45000% 14-05.12.21 1 000 000.00 1 039 880.00 0.63USD KREDITANSTALT FUER WIEDERAUFBAU 4.87500% 09-17.06.19 3 250 000.00 3 714 412.00 2.27USD LINDE AG 1.50000% 13-18.04.18 1 500 000.00 1 508 850.00 0.92USD NOVARTIS CAPITAL CORP 4.40000% 14-06.05.44 1 000 000.00 1 151 706.00 0.70USD NTT FINANCE CORP 1.50000% 12-25.07.17 1 400 000.00 1 403 696.00 0.86USD QUEBEC, PROVINCE OF 9.00000% 86-01.04.16 700 000.00 755 944.00 0.46USD ROYAL BANK OF CANADA 2.20000% 14-23.09.19 2 000 000.00 2 036 598.00 1.24USD SAUDI ELECTRICITY CO-REG-S 4.21100% 12-03.04.22 1 500 000.00 1 612 725.00 0.98Total USD 38 874 174.80 23.71
Total Bonds, fixed rate 38 874 174.80 23.71
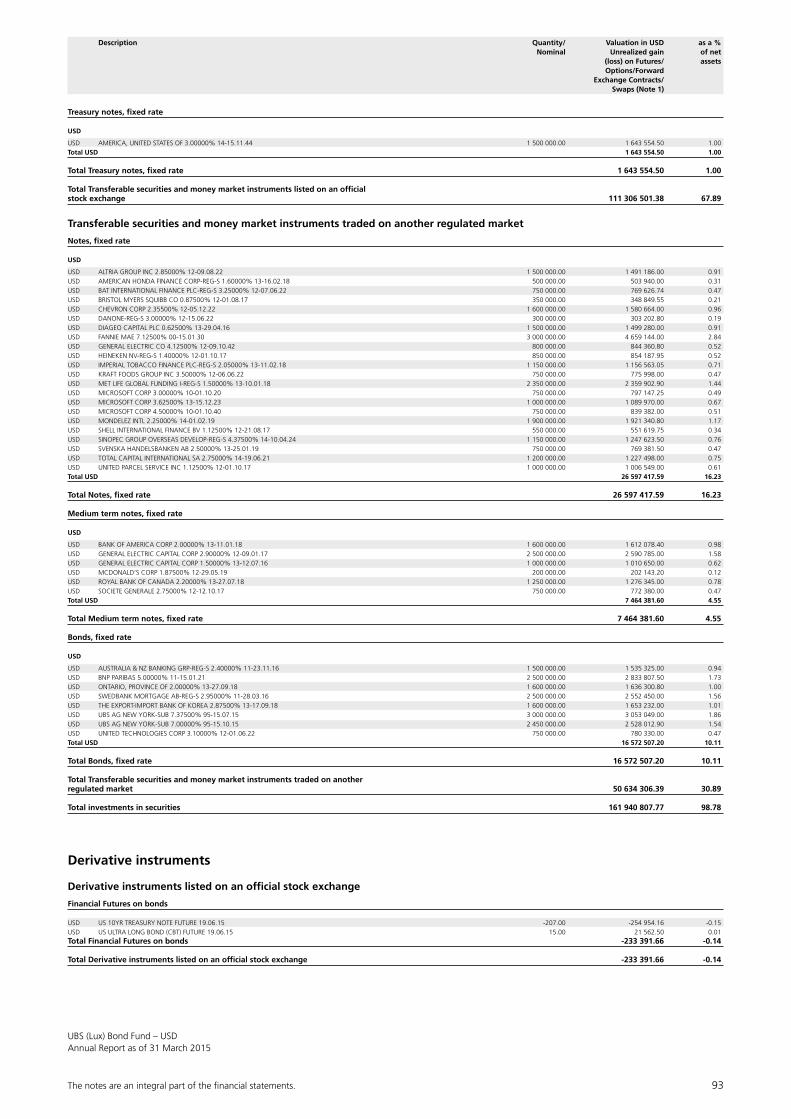
The notes are an integral part of the fi nancial statements. 93
UBS (Lux) Bond Fund – USDAnnual Report as of 31 March 2015
Treasury notes, fixed rate
USD
USD AMERICA, UNITED STATES OF 3.00000% 14-15.11.44 1 500 000.00 1 643 554.50 1.00Total USD 1 643 554.50 1.00
Total Treasury notes, fixed rate 1 643 554.50 1.00
Total Transferable securities and money market instruments listed on an official stock exchange 111 306 501.38 67.89
Transferable securities and money market instruments traded on another regulated market
Notes, fixed rate
USD
USD ALTRIA GROUP INC 2.85000% 12-09.08.22 1 500 000.00 1 491 186.00 0.91USD AMERICAN HONDA FINANCE CORP-REG-S 1.60000% 13-16.02.18 500 000.00 503 940.00 0.31USD BAT INTERNATIONAL FINANCE PLC-REG-S 3.25000% 12-07.06.22 750 000.00 769 626.74 0.47USD BRISTOL MYERS SQUIBB CO 0.87500% 12-01.08.17 350 000.00 348 849.55 0.21USD CHEVRON CORP 2.35500% 12-05.12.22 1 600 000.00 1 580 664.00 0.96USD DANONE-REG-S 3.00000% 12-15.06.22 300 000.00 303 202.80 0.19USD DIAGEO CAPITAL PLC 0.62500% 13-29.04.16 1 500 000.00 1 499 280.00 0.91USD FANNIE MAE 7.12500% 00-15.01.30 3 000 000.00 4 659 144.00 2.84USD GENERAL ELECTRIC CO 4.12500% 12-09.10.42 800 000.00 844 360.80 0.52USD HEINEKEN NV-REG-S 1.40000% 12-01.10.17 850 000.00 854 187.95 0.52USD IMPERIAL TOBACCO FINANCE PLC-REG-S 2.05000% 13-11.02.18 1 150 000.00 1 156 563.05 0.71USD KRAFT FOODS GROUP INC 3.50000% 12-06.06.22 750 000.00 775 998.00 0.47USD MET LIFE GLOBAL FUNDING I-REG-S 1.50000% 13-10.01.18 2 350 000.00 2 359 902.90 1.44USD MICROSOFT CORP 3.00000% 10-01.10.20 750 000.00 797 147.25 0.49USD MICROSOFT CORP 3.62500% 13-15.12.23 1 000 000.00 1 089 970.00 0.67USD MICROSOFT CORP 4.50000% 10-01.10.40 750 000.00 839 382.00 0.51USD MONDELEZ INTL 2.25000% 14-01.02.19 1 900 000.00 1 921 340.80 1.17USD SHELL INTERNATIONAL FINANCE BV 1.12500% 12-21.08.17 550 000.00 551 619.75 0.34USD SINOPEC GROUP OVERSEAS DEVELOP-REG-S 4.37500% 14-10.04.24 1 150 000.00 1 247 623.50 0.76USD SVENSKA HANDELSBANKEN AB 2.50000% 13-25.01.19 750 000.00 769 381.50 0.47USD TOTAL CAPITAL INTERNATIONAL SA 2.75000% 14-19.06.21 1 200 000.00 1 227 498.00 0.75USD UNITED PARCEL SERVICE INC 1.12500% 12-01.10.17 1 000 000.00 1 006 549.00 0.61Total USD 26 597 417.59 16.23
Total Notes, fixed rate 26 597 417.59 16.23
Medium term notes, fixed rate
USD
USD BANK OF AMERICA CORP 2.00000% 13-11.01.18 1 600 000.00 1 612 078.40 0.98USD GENERAL ELECTRIC CAPITAL CORP 2.90000% 12-09.01.17 2 500 000.00 2 590 785.00 1.58USD GENERAL ELECTRIC CAPITAL CORP 1.50000% 13-12.07.16 1 000 000.00 1 010 650.00 0.62USD MCDONALD’S CORP 1.87500% 12-29.05.19 200 000.00 202 143.20 0.12USD ROYAL BANK OF CANADA 2.20000% 13-27.07.18 1 250 000.00 1 276 345.00 0.78USD SOCIETE GENERALE 2.75000% 12-12.10.17 750 000.00 772 380.00 0.47Total USD 7 464 381.60 4.55
Total Medium term notes, fixed rate 7 464 381.60 4.55
Bonds, fixed rate
USD
USD AUSTRALIA & NZ BANKING GRP-REG-S 2.40000% 11-23.11.16 1 500 000.00 1 535 325.00 0.94USD BNP PARIBAS 5.00000% 11-15.01.21 2 500 000.00 2 833 807.50 1.73USD ONTARIO, PROVINCE OF 2.00000% 13-27.09.18 1 600 000.00 1 636 300.80 1.00USD SWEDBANK MORTGAGE AB-REG-S 2.95000% 11-28.03.16 2 500 000.00 2 552 450.00 1.56USD THE EXPORT-IMPORT BANK OF KOREA 2.87500% 13-17.09.18 1 600 000.00 1 653 232.00 1.01USD UBS AG NEW YORK-SUB 7.37500% 95-15.07.15 3 000 000.00 3 053 049.00 1.86USD UBS AG NEW YORK-SUB 7.00000% 95-15.10.15 2 450 000.00 2 528 012.90 1.54USD UNITED TECHNOLOGIES CORP 3.10000% 12-01.06.22 750 000.00 780 330.00 0.47Total USD 16 572 507.20 10.11
Total Bonds, fixed rate 16 572 507.20 10.11
Total Transferable securities and money market instruments traded on another regulated market 50 634 306.39 30.89
Total investments in securities 161 940 807.77 98.78
Derivative instruments
Derivative instruments listed on an official stock exchange
Financial Futures on bonds
USD US 10YR TREASURY NOTE FUTURE 19.06.15 -207.00 -254 954.16 -0.15USD US ULTRA LONG BOND (CBT) FUTURE 19.06.15 15.00 21 562.50 0.01Total Financial Futures on bonds -233 391.66 -0.14
Total Derivative instruments listed on an official stock exchange -233 391.66 -0.14
Description Quantity/ Valuation in USD as a % Nominal Unrealized gain of net (loss) on Futures/ assets Options/Forward Exchange Contracts/ Swaps (Note 1)

94 The notes are an integral part of the fi nancial statements.
UBS (Lux) Bond Fund – USDAnnual Report as of 31 March 2015
Description Quantity/ Valuation in USD as a % Nominal Unrealized gain of net (loss) on Futures/ assets Options/Forward Exchange Contracts/ Swaps (Note 1)
Derivative instruments not listed on an official stock exchange and not traded on another regulated market
Credit default swaps*
USD JPM/SWISS BANK CORP NY CREDIT DEFAULT SWAPS PAYER 1.00000% 10-20.06.15 -7 750 000.00 -16 285.51 -0.01Total Credit default swaps -16 285.51 -0.01
Total Derivative instruments not listed on an official stock exchange and not traded on another regulated market -16 285.51 -0.01
Total Derivative instruments -249 677.17 -0.15
Cash at banks, deposits on demand and deposit accounts and other liquid assets 838 789.14 0.51Other assets and liabilities 1 405 400.08 0.86
Total net assets 163 935 319.82 100.00
* Positive nominal: the subfund is “Receiver”, negative nominal: the subfund is “Payer”.

The notes are an integral part of the fi nancial statements. 95
UBS (Lux) Bond FundAnnual Report as of 31 March 2015
Note 1 – Summary of significant accountingpolicies
The financial statements have been prepared in accor-dance with the generally accepted accounting principles for investment funds in Luxembourg. The significant accounting policies are summarised as follows:
a) Calculation of the net asset valueThe net asset value and the issue and redemption price per unit of any subfund or of any unit class are expressed in the currency of account of the subfund or of the unit class concerned and are calculated every business day by dividing the overall net assets of the subfund attributable to each unit class by the number of units in circulation in the respective unit class of this subfund.
In this context, “business day” refers to normal bank business days in Luxembourg (i.e. each day on which the banks are open during normal business hours) with the exception of individual non-statutory rest days in Luxembourg and days on which exchanges in the main countries in which the subfund invests are closed or 50% or more subfund investments cannot be adequately valued.
The percentage of the net asset value attributable to each unit class of a subfund changes each time units are issued or redeemed. It is determined by the ratio of the units in circulation in each unit class to the total number of units in circulation in the subfund, taking into account the fees charged to that unit class. The net asset value attributable to the unit class concerned is increased or reduced by the amount received or paid out.
If the total subscriptions or redemptions of all the unit classes of a subfund on a single trading day come to a net capital inflow or outflow, the net asset value of the subfund may be increased or reduced accordingly. The maximum adjustment amounts to 2% of the net asset value. Estimated transaction costs and tax charges that may be incurred by the subfund as well as the esti-mated bid/offer spread of the assets in which the fund invests may be taken into account. The adjustment leads to an increase in net asset value if the net movements result in a rise in the number of units in the subfund con-cerned. It results in a reduction of net asset value if the net movements bring about a fall in the number of units. The Board of Directors can set a threshold value for each subfund. This may consist in the net movement on a trading day in relation to the net fund assets or to an absolute amount in the currency of the subfund
concerned. The net asset value would be adjusted only if this threshold were to be exceeded on a trading day.
b) Valuation principles – Liquid funds – whether in the form of cash, bank deposits, bills of exchange and sight securities and receivables, prepaid expenses, cash dividends and declared or accrued interest that has not yet been received – are valued at their full value unless it is unlikely that this value will be fully paid or received, in which case their value is determined by taking into consideration a deduction that seems appropriate in order to portray their true value.
– Securities, derivatives and other investments listed on a stock exchange are valued at the last-known market prices. If these securities, derivatives or other investments are listed on several stock exchanges, the latest available price on the stock exchange that repre-sents the major market for these investments will apply.
In the case of securities, derivatives and other investments infrequently traded on a stock exchange and for which a secondary market among securities traders exists with pricing in line with the market, the Management Company may value these securities, derivatives and other investments based on these prices. Securities, derivatives and other investments not listed on a stock exchange but which are traded on another regulated market which operates regularly and is recognised and open to the public are valued at the last available price on this market.
– Securities and other investments that are not listed on a stock exchange or traded on another regulated market, and for which no appropriate price can be obtained, are valued by the Management Company according to other principles chosen by it in good faith on the basis of the likely sales prices.
– Derivatives not listed at a stock exchange (OTC deriva-tives) are valued on the basis of independent pricing sources. In case only one independent pricing source of a derivative is available, the plausibility of the valu-ation obtained will be verified by means of calculation methods recognised by the Management Company based on the market value of the underlying instru-ment from which the derivative originates.
– Units of other undertakings for collective investment in transferable securities (UCITS) and/or undertakings for collective investment (UCI) are valued at their last-known net asset value.
– Money market instruments not traded on a stock exchange or on another regulated market open to the public will be valued on the basis of the relevant curves. The valuation based on the curve is with reference to
Notes to the Financial Statements

96 The notes are an integral part of the fi nancial statements.
UBS (Lux) Bond FundAnnual Report as of 31 March 2015
the two components of interest rate and credit spread. The following principles are applied in this process: for each money market instrument, the interest rates nearest the residual maturity are interpolated. The interest rate calculated in this way is converted into a market price by adding a credit spread that reflects the underlying borrower. This credit spread is adjusted if there is a significant change in the credit rating of the borrower.
Interest income earned by subfunds between the order date concerned and the valuation date concerned is included in the valuation of the assets of the subfund concerned. The asset value per share on a given valuation date therefore includes projected interest earnings.
– Securities, money market instruments, derivatives and other investments denominated in a currency other than the reference currency of the relevant subfund and not hedged by foreign-exchange transactions, are valued at the middle-market rate of exchange ( midway between the bid and offer rate) known in Luxembourg or, if not available, on the most representative market for this currency.
– Fixed-term deposits and fiduciary investments are val-ued at their nominal value plus accumulated interest.
– The value of swaps is calculated by an external ser-vice provider and a second independent valuation is provided by another external service provider. The cal-culation is based on the net present value of all cash flows, both inflows and outflows. In some specific cases, internal calculations (based on models and mar-ket data made available from Bloomberg), and/or bro-ker statement valuations may be used. The valuation methods depend on the respective security and are determined pursuant to the Global Valuation Policy.
The Management Company is authorised to apply other generally recognised and auditable valuation criteria in good faith in order to achieve an appropriate valuation of the net asset value if, due to extraordinary circum-stances, a valuation in accordance with the aforemen-tioned regulations proves to be unfeasible or inaccurate.
In extraordinary circumstances, additional valuations can be carried out over the course of the day. These new val-uations will then be authoritative for subsequent issues and redemptions of units.
c) Valuation of forward foreign exchange contractsThe unrealized gain (loss) of outstanding forward foreign exchange contracts is valued on the basis of the forward exchange rates prevailing at valuation date.
d) Valuation of financial futures contractsFinancial futures contracts are valued based on the lat-est available published price applicable on the valuation date. Realized gains and losses and the changes in unre-alized gains and losses are recorded in the statement of operations. The realized gains and losses are calculated in accordance with the FIFO method, i.e. the first con-tracts acquired are regarded as the first to be sold.
e) Net realized profit (loss) on the sales of securitiesThe realized profits or losses on the sales of securities are calculated on the basis of the average cost of the securities sold.
f) Conversion of foreign currenciesBank accounts, other net assets and the valuation of the investments in securities denominated in currencies other than the reference currency of the different subfunds are converted at the mid closing spot rates on the valuation date. Income and expenses denominated in currencies other than the currency of the different subfunds are converted at the mid closing spot rates at payment date. Profit or loss on foreign exchange is included in the statement of operations.
The cost of the securities denominated in currencies other than the reference currency of the different subfunds is converted at the mid closing spot rate on the day of acquisition.
g) Accounting of securities’ portfolio transactionsThe securities’ portfolio transactions are accounted for the bank business day following the transaction date.
h) SwapsThe fund may enter into interest rate swap contracts, forward rate agreements on interest rates swaptions and credit default swaps, if they are executed with first-class financial institutions that specialize in transactions of this kind.
Changes in unrealized profits and losses are reflected in the statement of operations under “Unrealized appreciation (depreciation) on swaps”.
Gains or losses on swaps incurred when closed-out or matured are recorded as “Realized gain (loss) on swaps” in the statement of operations.
i) Consolidated financial statementsThe consolidated financial statements of the fund are established in EUR. The various items of the consolidated statement of net assets and the consolidated statement of operations as at 31 March 2015 of the fund are equal to the sum of the corresponding items in the financial statements of each subfund converted into EUR at the closing exchange rates.
The following exchange rates were used for the conversion of the consolidated financial statements as of 31 March 2015:
Exchange rates
EUR 1 = AUD 1.405851
EUR 1 = CAD 1.360221
EUR 1 = CHF 1.043176
EUR 1 = GBP 0.723476
EUR 1 = USD 1.074000

The notes are an integral part of the fi nancial statements. 97
UBS (Lux) Bond FundAnnual Report as of 31 March 2015
j) “Mortgage-backed securities”The fund, in accordance with its investment policies, may invest in mortgage-backed securities. A mortgage-backed security is a participation in a pool of residential mortgages which is consolidated into the form of securi-ties. The principal and interest payments on the underly-ing mortgages are passed through to the holders of the mortgage-backed security of which the principle reduces the cost basis of the security. The payment of principal and interest may be guaranteed by quasigovernmental agencies of the United States. A gain or loss is calcu-lated on each paydown associated with each payment of principal. This gain or loss has been included in Net real-ized gain or loss on sales of securities in the statement of operations. In addition, prepayments of the underlying mortgages may shorten the life of the security, thereby affecting the fund’s expected yield.
For “Mortgage-backed securities”, if the factor to be applied to the nominal of the security is greater than one at the valuation date, then the nominal shown in the financial statements is adjusted to reflect this factor. In the other cases the nominal shown reflects the effect of a factor equal to one.
k) Receivable on securities sales,Payable on securities purchasesThe account “Receivable on securities sales” can also include receivables from foreign currency transactions. The account “Payable on securities purchases” can also include payables from foreign currency transactions.
l) Income recognitionDividends, net of withholding taxes, are recognized as income on the date upon which the relevant securities are first listed as “ex-dividend”. Interest income is accrued on a daily basis.
Note 2 – Flat fee
The fund pays for each of the subfunds/unit classes a monthly flat fee calculated on the average net asset value of the subfunds/unit classes as shown in the table below:
UBS (Lux) Bond Fund – AUDUBS (Lux) Bond Fund – CADUBS (Lux) Bond Fund – CHFUBS (Lux) Bond Fund – EURUBS (Lux) Bond Fund – GBPUBS (Lux) Bond Fund – USD
Maximum Flat fee
Unit classes with “P” in their name 0.900%
Unit classes with “N” in their name 1.000% 1.600% for the subfund UBS (Lux) Bond Fund – EUR
Unit classes with “K-1” in their name 0.550%
Unit classes with “F” in their name 0.340% 0.250% for the subfund UBS (Lux) Bond Fund – CHF
Unit classes with “Q” in their name 0.500%
Maximum Flat fee
Unit classes with “I-A1” in their name 0.460%
Unit classes with “I-A2” in their name 0.400% 0.340% for the subfund UBS (Lux) Bond Fund – CHF
Unit classes with “I-A3” in their name 0.340% 0.250% for the subfund UBS (Lux) Bond Fund – CHF
Unit classes with “I-B” in their name 0.065%
Unit classes with “I-X” in their name 0.000%
Unit classes with “U-X” in their name 0.000%
1 Max. 1.600% / Eff. 1.200%
UBS (Lux) Bond Fund – Convert Europe (EUR)
Maximum Flat fee
Unit classes with “P” in their name 1.800%
Unit classes with “N” in their name 2.100%
Unit classes with “K-1” in their name 1.020%
Unit classes with “F” in their name 0.400%
Unit classes with “Q” in their name 0.900%
Unit classes with “I-A1” in their name 0.500%
Unit classes with “I-A2” in their name 0.460%
Unit classes with “I-A3” in their name 0.400%
Unit classes with “I-B” in their name 0.065%
Unit classes with “I-X” in their name 0.000%
Unit classes with “U-X” in their name 0.000%
UBS (Lux) Bond Fund – Euro High Yield (EUR)
Maximum Flat fee
Unit classes with “P” in their name 1.260%
Unit classes with “N” in their name 1.750%
Unit classes with “K-1” in their name 0.700%
Unit classes with “F” in their name 0.520%
Unit classes with “Q” in their name 0.720%
Unit classes with “I-A1” in their name 0.620%
Unit classes with “I-A2” in their name 0.580%
Unit classes with “I-A3” in their name 0.520%
Unit classes with “I-B” in their name 0.065%
Unit classes with “I-X” in their name 0.000%
Unit classes with “U-X” in their name 0.000%
UBS (Lux) Bond Fund – Global (CHF)
Maximum Flat fee
Unit classes with “P” in their name 1.140%
Unit classes with “N” in their name 1.600%
Unit classes with “K-1” in their name 0.600%
Unit classes with “F” in their name 0.320%
Unit classes with “Q” in their name 0.600%
Unit classes with “I-A1” in their name 0.510%
Unit classes with “I-A2” in their name 0.380%
Unit classes with “I-A3” in their name 0.320%
Unit classes with “I-B” in their name 0.065%
Unit classes with “I-X” in their name 0.000%
Unit classes with “U-X” in their name 0.000%1

98 The notes are an integral part of the fi nancial statements.
UBS (Lux) Bond FundAnnual Report as of 31 March 2015
UBS (Lux) Bond Fund – Full Cycle Asian Bond (USD)
Maximum Flat fee
Unit classes with “P” in their name 1.500%
Unit classes with “N” in their name 1.750%
Unit classes with “K-1” in their name 0.900%
Unit classes with “F” in their name 0.520%
Unit classes with “Q” in their name 0.800%
Unit classes with “I-A1” in their name 0.680%
Unit classes with “I-A2” in their name 0.620%
Unit classes with “I-A3” in their name 0.520%
Unit classes with “I-B” in their name 0.115%
Unit classes with “I-X” in their name 0.000%
Unit classes with “U-X” in their name 0.000%
1 Only for the unit class F-Acc Max. 0.520% / Eff. 0.370%
Out of the above monthly flat fee, the fund will bear all costs incurred in connection with the administration, port-folio management and safekeeping of the fund’s assets and fund sales, such as: – annual fees and expenses for approving and supervis-ing the fund in Luxembourg and abroad;
– other fees charged by the supervisory authorities; – printing of the regulations, prospectuses and the annual and semi-annual reports;
– production of the KIID or the corresponding docu-ments for the fund’s sales countries;
– price publications and publication of notices to inves-tors;
– fees incurred in connection with the listing of the fundand sales within Luxembourg and abroad;
– commission and expenses of the Custodian Bank for the safekeeping of the fund’s assets, dealing with payments and other duties, as required under the Luxembourg Law of 17 December 2010;
– fees and other expenses for the payment of dividends to investors and
– auditor’s fees.
Out of the management commission, fees are paid to distributors and asset managers of the fund.
The Custodian Bank, administrative agent and Management Company are nevertheless entitled to be reimbursed the costs of non-routine arrangements made by them in the interests of the investors; otherwise such expenses will be charged direct to the fund.
For purposes of general comparability with fee rules of different fund providers that do not have a flat fee, the term “maximum management fee” is set at 80% of the flat fee.
The fund will also bear all transaction expenses arising in connection with the administration of the fund assets (brokerage commission in line with the market, fees, fis-cal charges, etc.).
All taxes levied on the income and assets of the fund, particularly the payment of the taxe d’abonnement, will also be borne by the fund.
All costs which can be allocated accurately to individual subfunds or unit classes are charged to these subfunds or unit classes. If costs pertain to several or all subfunds/ unit classes, these costs will be charged to the subfunds/ unit classes concerned in proportion to their relative net asset values.
In the subfunds that may invest in other UCI or UCITS under the terms of their investment policies, fees may be incurred both at the level of the subfund as well as at the level of the relevant target fund. The upper limit for management fees of target funds in which the assets of the subfunds are invested amounts to a maximum of 3%, taking into account any trail fees.
In the case of investments in units of funds managed directly or indirectly by the Management Company itself or another company related to it by common management or control, or by a substantial direct or indi-rect holding of the Management Company, or by a sub-stantial direct or indirect holding of any other company of the same group of companies, the subfund’s holding in the target fund may not be charged with any of the target fund’s issue or redemption commissions.
Details on the ongoing charges of the fund can be found in the KIID.
Note 3 – Taxe d’abonnement
In accordance with the law and the regulations currently in force, the fund is subject to a subscription tax at the annual rate of 0.05%, reduced taxe d’abonnement amounting to 0.01% p.a. is due for certain unit classes, payable quar-terly and calculated on the basis of the net assets of the fund at the end of each quarter.
The taxe d’abonnement is waived for that part of the net assets invested in units or shares of other undertakings for collective investment that have already paid the taxe d’abonnement in accordance with the statutory provisions of Luxembourg law.
Note 4 – Related party transactions
The volume of securities and money-market transactions (except options) undertaken via a broker that is an affiliate of the Management Company, the Portfolio Manager or the Board of Directors for the period from 1 April 2014 to 31 March 2015 for the following subfunds licensed for sale in Hong Kong is:
1

The notes are an integral part of the fi nancial statements. 99
UBS (Lux) Bond FundAnnual Report as of 31 March 2015
UBS (Lux) Bond Fund Volume of transactions As a percentage in other Securities of the total of (except options) with security related parties transactions
– Euro High Yield (EUR) 302 355 258.31 3.85%
– Full Cycle Asian Bond (USD) 35 317 625.04 3.45%
UBS (Lux) Bond Fund Commissions on As a percentage transactions in other of the total of Securities (except options) Commissions with related parties
– Euro High Yield (EUR) 0.00 0.00%
– Full Cycle Asian Bond (USD) 0.00 0.00%
For the conversion of “Volume of transactions in other Securities (except options) with related parties“ into subfund currency, the exchange rates of the financial statements as of 31 March 2015 were used.
According to normal Market practice, no commissions have been charged to the fund on transactions on other securities (except options) with related parties.
Such transactions were entered in the ordinary course of business and on normal commercial terms.
Note 5 – Realized result on subscriptions/redemptions
The average fees (brokerage commission, stock exchange fees/duties, etc.) incurred by the subfund in connection with the related transactions may be charged to the inves-tor on a net asset value basis. This income is in favour of the subfund and mentioned in the statement of opera-tions as ”Realized result on subscriptions/redemptions”.
Note 6 – Income distribution
In accordance with Article 10 of the Management Regulations, once the annual accounts are closed the Management Company will decide whether and to what extent distributions are to be paid out by each subfund. The payment of distributions must not result in the net assets of the fund falling below the minimum amount for fund assets laid down by law of 2010. If distributions are made, payment will be effected within four months of the end of the financial year.
The details of the distributions are unaudited.
The Board of Directors is authorized to pay interim dividends and to suspend the payment of distributions.
An income equalisation amount will be calculated so that the distribution corresponds to the actual income entitlement.
Note 7 – Soft commission arrangements
During the period from 1 April 2014 until 31 March 2015, no ”soft commission arrangements” were entered into on behalf of UBS (Lux) Bond Fund and “soft commis-sions“ amount to nil.
Note 8 – Commitments on Financial Futures and Swaps
Commitments on Financial Futures and Swaps per subfund and respective currency as of 31 March 2015 can be summarised as follows:
a) Financial Futures
UBS (Lux) Bond Fund Financial Futures Financial Futures on bonds on bonds (purchased) (sold)
– AUD 23 748 819.63 AUD 29 288 997.40 AUD
– EUR 12 371 040.00 EUR 34 226 320.00 EUR
– Full Cycle Asian Bond (USD) 3 567 375.00 USD - USD
– GBP 3 124 500.00 GBP - GBP
– Global (CHF) - CHF 20 013 128.72 CHF
– USD 2 548 125.00 USD 26 683 593.75 USD
b) Swaps
UBS (Lux) Bond Fund Credit-Default Credit-Default -Swaps -Swaps (purchased) (sold)
– Euro High Yield (EUR) 56 312 985.78 EUR 8 262 799.30 EUR
– Full Cycle Asian Bond (USD) 20 104 132.00 USD 29 770 678.00 USD
– USD - USD 7 763 917.45 USD
UBS (Lux) Bond Fund Swaps and forward Swaps and forward swaps on interest swaps on interest rates (purchased) rates (sold)
– CHF 84 500 000.00 CHF 11 500 000.00 CHF
Note 9 – Total Expense Ratio (TER)
This ratio was calculated in accordance with the SwissFunds and Asset Management Association (SFAMA)“Guidelines on the calculation and disclosure of the TER and PTR” in the current version and expresses the sum of all costs and commissions charged on an ongoing basis to the net assets (operating expenses) taken retrospec-tively as a percentage of the net assets.
TER for the last 12 months:
UBS (Lux) Bond Fund Total Expense Ratio (TER)
– AUD F-acc 0.35%
– AUD I-A1-acc 0.47%
– AUD I-X-acc 0.01%
– AUD N-acc 1.05%
– AUD P-acc 0.95%
– AUD P-dist 0.95%
– AUD Q-acc 0.56%

100 The notes are an integral part of the fi nancial statements.
UBS (Lux) Bond FundAnnual Report as of 31 March 2015
UBS (Lux) Bond Fund Total Expense Ratio (TER)
– CAD F-acc 0.35%
– CAD P-acc 0.95%
– CAD P-dist 0.95%
– CAD Q-acc 0.56%
– CAD Q-dist 0.55%
– CHF F-acc 0.26%
– CHF F-dist 0.26%
– CHF I-A1-acc 0.47%
– CHF N-acc 1.05%
– CHF P-acc 0.95%
– CHF P-dist 0.95%
– Convert Europe (EUR) (CHF hedged) P-acc 1.85%
– Convert Europe (EUR) F-acc 0.41%
– Convert Europe (EUR) I-A1-acc 0.51%
– Convert Europe (EUR) I-A1-dist 0.51%
– Convert Europe (EUR) I-X-acc 0.01%
– Convert Europe (EUR) I-X-dist 0.01%
– Convert Europe (EUR) K-1-acc 1.07%
– Convert Europe (EUR) P-acc 1.85%
– Convert Europe (EUR) P-dist 1.87%
– Convert Europe (EUR) Q-acc 0.95%
– EUR F-acc 0.35%
– EUR F-dist 0.35%
– EUR N-acc 1.25%
– EUR P-acc 0.95%
– EUR P-dist 0.95%
– EUR Q-acc 0.55%
– Euro High Yield (EUR) (AUD hedged) P-mdist 1.31%
– Euro High Yield (EUR) (CAD hedged) P-mdist 1.31%
– Euro High Yield (EUR) (CHF hedged) P-acc 1.32%
– Euro High Yield (EUR) (GBP hedged) P-mdist 1.31%
– Euro High Yield (EUR) (HKD hedged) P-mdist 1.31%
– Euro High Yield (EUR) (RMB hedged) K-1-mdist 0.75%
– Euro High Yield (EUR) (RMB hedged) P-mdist 1.31%
– Euro High Yield (EUR) (SGD hedged) P-mdist 1.31%
– Euro High Yield (EUR) (USD hedged) K-1-acc 0.76%
– Euro High Yield (EUR) (USD hedged) P-acc 1.31%
– Euro High Yield (EUR) (USD hedged) P-mdist 1.31%
– Euro High Yield (EUR) F-acc 0.53%
– Euro High Yield (EUR) I-A1-acc 0.63%
– Euro High Yield (EUR) I-B-acc 0.07%
– Euro High Yield (EUR) I-B-mdist 0.07%
– Euro High Yield (EUR) I-X-acc 0.02%
– Euro High Yield (EUR) K-1-acc 0.75%
– Euro High Yield (EUR) N-dist 1.80%
– Euro High Yield (EUR) P-6%-mdist 1.34%
– Euro High Yield (EUR) P-acc 1.31%
– Euro High Yield (EUR) P-dist 1.31%
– Euro High Yield (EUR) P-mdist 1.31%
– Euro High Yield (EUR) Q-acc 0.77%
– Full Cycle Asian Bond (USD) (EUR hedged) F-acc 0.53%
– Full Cycle Asian Bond (USD) (EUR hedged) N-acc 1.79%
– Full Cycle Asian Bond (USD) (EUR hedged) P-acc 1.55%
– Full Cycle Asian Bond (USD) (EUR hedged) P-dist 1.55%
– Full Cycle Asian Bond (USD) (SGD hedged) F-acc 0.53%
– Full Cycle Asian Bond (USD) (SGD hedged) P-acc 1.55%
– Full Cycle Asian Bond (USD) (SGD hedged) P-mdist 1.55%
– Full Cycle Asian Bond (USD) F-acc 0.38%
UBS (Lux) Bond Fund Total Expense Ratio (TER)
– Full Cycle Asian Bond (USD) I-A1-acc 0.68%
– Full Cycle Asian Bond (USD) I-X-acc 0.01%
– Full Cycle Asian Bond (USD) I-X-dist 0.01%
– Full Cycle Asian Bond (USD) P-acc 1.55%
– Full Cycle Asian Bond (USD) P-mdist 1.55%
– GBP F-acc 0.35%
– GBP P-acc 0.95%
– GBP P-dist 0.95%
– Global (CHF) (EUR hedged) P-acc 1.18%
– Global (CHF) (EUR hedged) P-dist 1.19%
– Global (CHF) (JPY hedged) P-acc 1.19%
– Global (CHF) (JPY hedged) P-dist 1.19%
– Global (CHF) I-B-acc 0.08%
– Global (CHF) P-acc 1.19%
– Global (CHF) P-dist 1.19%
– Global (CHF) U-X-acc 0.01%
– USD F-acc 0.35%
– USD P-acc 0.95%
– USD P-dist 0.95%
The TER for classes of units which were active less than a 12 month period are annualised.
Transaction costs and any other costs incurred in connec-tion with currency hedging are not included in the TER.
Note 10 – Portfolio Turnover Rate (PTR)
This ratio was calculated in accordance with the Swiss Funds and Asset Management Association (SFAMA) “Guidelines on the calculation and disclosure of the TER and PTR” in the current version. The PTR is considered an indicator of the relevance of the additional costs incurred when buying and selling investments. It shows how many security transactions occurred as a result of voluntary investment shifts in relation to the average net assets. Transactions that resulted from uncontrollable subscrip-tions and redemptions are not included in this rate.
PTR:
UBS (Lux) Bond Fund Portfolio Turnover Rate (PTR)
– AUD 16.54%
– CAD 35.32%
– CHF -2.24%
– Convert Europe (EUR) 27.41%
– EUR 21.02%
– Euro High Yield (EUR) -0.89%
– Full Cycle Asian Bond (USD) 176.60%
– GBP -10.00%
– Global (CHF) 212.47%
– USD -4.90%

The notes are an integral part of the fi nancial statements. 101
UBS (Lux) Bond FundAnnual Report as of 31 March 2015
Note 11 – Transaction costs
Transaction costs include brokerage fees, stamp duty, local taxes and other foreign charges if incurred during the period. Transaction fees are included in the cost of securities purchased and sold.
For the financial year ended on 31 March 2015, the fund incurred transaction costs relating to purchase or sale of investments in securities and similar transactions as follows:
UBS (Lux) Bond Fund Transaction costs
– AUD 49 040.00 AUD
– CAD - CAD
– CHF - CHF
– Convert Europe (EUR) 129.73 EUR
– EUR 11 897.90 EUR
– Euro High Yield (EUR) - EUR
– Full Cycle Asian Bond (USD) 27 874.80 USD
– GBP 619.50 GBP
– Global (CHF) 2 673.27 CHF
– USD 8 114.20 USD
Not all transaction costs are separately identifiable. For fixed income investments, forward currency contracts and other derivative contracts, transaction costs will be included in the purchase and sale price of the investment. Whilst not separately identifiable these transaction costs will be captured within the performance of each Fund.
Note 12 – Securities priced by the Board of Directors at zero or closed to zero
Based on a proposal by the UBS Global Valuation Committee, the Board of Directors has decided to value the following securities at/or close to zero:
ISIN Securities
XS0310904155 SNS REAAL GROEP-SUB *DEFAULT* 6.258%/3M EURIBOR+229BP 07-PRP
USG47709AB95 ALADDIN CDO I LTD-REG-S *DEFAULT* 3M LIBOR+750BP 06-31.10.16
DE000A0N0N07 ARCANDOR AG *DEFAULT* 8.87500% 08-11.07.13
Note 13 – Applicable law, place of performance and authoritative language
The Luxembourg District Court is the place of perfor-mance for all legal disputes between the unitholders, the Management Company and the Custodian Bank. Luxembourg law applies. However, in matters concern-ing the claims of investors from other countries, the Management Company and/or the Custodian Bank can elect to make themselves and the fund subject to the jurisdiction of the countries in which the fund units were bought and sold.
The German version of these financial statements is theauthoritative version and only this version was audited from the auditor. However, in the case of units sold to investors from the other countries in which fund units can be bought and sold, the Management Company and the Custodian Bank may recognize approved translations (i.e. approved by the Management Company and the Custodian Bank) into the languages concerned as bind-ing upon themselves and the fund.

102 The notes are an integral part of the fi nancial statements.
UBS (Lux) Bond FundAnnual Report as of 31 March 2015
Note 14 – OTC Derivatives and Securities Lending
If the Fund enters into OTC transactions, it may be exposed to risks related to the creditworthiness of the OTC counterparties: when the Fund enters into futures contracts, options and swap transactions or uses other derivative techniques it is subject to the risk that an OTC counterparty may not meet (or can not meet) its obligations under a specific or multiple contracts. Counterparty risk can be reduced by depositing a security. If the Fund is owed a security pursuant to an applicable agreement, such security shall be held in custody by the Custodian bank/Custodian in favour of the Fund. Bankruptcy and insolvency events or other credit events with the OTC counterparty, the Custodian Bank or within their subcustodian /correspondent bank network may result in the rights or recognition of the Fund in connection with the security to be delayed, restricted or even eliminated, which would force the Fund to fulfil its obligations in the framework of the OTC transaction, in spite of any security that had previously been made available to cover any such obligation.
The Fund may lend portions of its securities portfolio to third parties. In general, lendings may only be effected via recognized clearing houses such as Clearstream International or Euroclear, or through the intermediary of prime financial institutions that specialise in such activities and in the modus specified by them. Securities lend-ing income and costs are shown separately in the Statement of Operations. Collateral is received in relation to securities lent. Collateral is composed of high quality securities in an amount typically at least equal to the market value of the securities loaned.
UBS (Luxembourg) S.A. acts as securities lending agent.
OTC-Derivatives*
SubfundCounterparty Market value Collateral
UBS (Lux) Bond Fund – CHF
UBS AG -963 175.28 CHF 0.00 CHF
Zuercher Kantonalbank -1 354 777.23 CHF 0.00 CHF
UBS (Lux) Bond Fund – Convert Europe (EUR)
UBS AG -203 291.05 EUR 0.00 EUR
UBS (Lux) Bond Fund – Euro High Yield (EUR)
JP Morgan 533 369.49 EUR 0.00 EUR
Morgan Stanley -279 965.99 EUR 0.00 EUR
UBS AG 155 908 984.65 EUR 0.00 EUR
UBS (Lux) Bond Fund – Full Cycle Asian Bond (USD)
JP Morgan 324 287.33 USD 0.00 USD
UBS AG -2 979 854.35 USD 0.00 USD
UBS (Lux) Bond Fund – Global (CHF)
UBS AG -508 552.59 CHF 0.00 CHF
UBS (Lux) Bond Fund – USD
JP Morgan -16 285.51 USD 0.00 USD
* Derivatives traded on an official exchange are not included in this table as they are gauranteed by a clearing house. In the event of a counterparty default the clearing house assumes the risk of loss.
Securities Lending
Counterparty Exposure fromSecurities Lending as of 31 March 2015
Collateral Breakdown (Weight in %) as of 31 March 2015
UBS (Lux) Bond Fund Market value of securities lent Collateral (UBS AG) Equities Bonds Cash
– CAD 162 421 030.90 CAD 170 675 211.23CAD 62.76 37.24 0.00– CHF 18 289 575.00 CHF 19 219 044.84 CHF 62.76 37.24 0.00– Convert Europe (EUR) 32 511 746.00 EUR 34 163 981.63 EUR 62.76 37.24 0.00– EUR 179 355 935.91 EUR 188 470 742.22 EUR 62.76 37.24 0.00– Euro High Yield (EUR) 1 110 517 020.21 EUR 1 166 953 109.13 EUR 62.76 37.24 0.00– Full Cycle Asian Bond (USD) 63 391 214.85 USD 66 612 734.35 USD 62.76 37.24 0.00– GBP 11 538 935.60 GBP 12 125 340.30 GBP 62.76 37.24 0.00– Global (CHF) 98 524 186.95 CHF 103 531 151.88 CHF 62.76 37.24 0.00– USD 41 856 975.94 USD 43 984 132.91 USD 62.76 37.24 0.00

UBS (Lux) Bond FundAnnual Report as of 31 March 2015
103
Global Exposure (unaudited)
Risk managementRisk management in accordance with the commitment approach and the value-at-risk approach is applied pursuant to the applicable laws and regulatory provisions.
LeverageLeverage is defined pursuant to the applicable CESR directives as the total of the notional values of the derivatives used by the respective subfund. According to this definition, leverage may result in artificially increased leverage amounts, as some derivatives that can be used for hedging purposes may be included in the calculation. Conse-quently, this information does not necessarily reflect the precise actual leverage risk that the investor is exposed to.
UBS (Lux) Bond Fund Global risk calculation method
– AUD Commitment approach
– CAD Commitment approach
– CHF Commitment approach
– Convert Europe (EUR) Commitment approach
– EUR Commitment approach
– Euro High Yield (EUR) Commitment approach
– Full Cycle Asian Bond (USD) Commitment approach
– GBP Commitment approach
– Global (CHF) Commitment approach
– USD Commitment approach

UBS (Lux) Bond FundAnnual Report as of 31 March 2015
104
Securities Lending (unaudited)
UBS (Lux) Bond Fund UBS (Lux) Bond Fund – AUD
UBS (Lux) Bond Fund – CAD
UBS (Lux) Bond Fund – CHF
UBS (Lux) Bond Fund – Convert Europe (EUR)
UBS (Lux) Bond Fund – EUR
By Country:– Australia 1.53 1.53 1.53 1.53– Belgium 0.71 0.71 0.71 0.71– British Virgin Islands 0.02 0.02 0.02 0.02– Cayman Islands 0.20 0.20 0.20 0.20– China 2.93 2.93 2.93 2.93– Denmark 0.61 0.61 0.61 0.61– Germany 10.59 10.59 10.59 10.59– Finland 0.06 0.06 0.06 0.06– France 6.61 6.61 6.61 6.61– United Kingdom - GB 2.85 2.85 2.85 2.85– Hong Kong 0.35 0.35 0.35 0.35– Japan 15.30 15.30 15.30 15.30– Canada 3.90 3.90 3.90 3.90– Luxembourg 0.25 0.25 0.25 0.25– New Zealand 0.49 0.49 0.49 0.49– Netherlands 2.65 2.65 2.65 2.65– Norway 0.57 0.57 0.57 0.57– Austria 0.14 0.14 0.14 0.14– Sweden 0.98 0.98 0.98 0.98– Switzerland 9.29 9.29 9.29 9.29– Singapore 0.87 0.87 0.87 0.87– South Korea 0.01 0.01 0.01 0.01– Supranationals 0.89 0.89 0.89 0.89– United States 38.20 38.20 38.20 38.20
by Credit Rating:
– Rating > AA- 78.40 78.40 78.40 78.40
– Rating <=AA- 21.60 21.60 21.60 21.60
– without Rating 0.00 0.00 0.00 0.00
Securities Lending
Assets and Revenues / Ratios
Average Invested Assets (1) 381 882 119.67 AUD 211 421 492.98 CAD 564 862 112.68 CHF 665 063 364.65 EUR 457 371 127.41 EUR
Average SecuritiesLent (2) 0.00 AUD 135 205 263.54 CAD 42 059 671.76 CHF 44 209 982.44 EUR 177 884 031.09 EUR
Average Collateralreceived (3) 0.00 AUD 155 292 274.20 CAD 46 073 992.23 CHF 51 465 198.53 EUR 198 416 730.90 EUR
Average CollateralRatio (3)/(2) 0.00% 114.86% 109.54% 116.41% 111.54%
Average Securities LendingRatio (2)/(1) 0.00% 63.95% 7.45% 6.65% 38.89%
Securities Lendingrevenues 0.00 AUD 119 604.11 CAD 40 461.92 CHF 399 552.83 EUR 193 465.26 EUR
Securities Lendingoperational Costs/Fees 0.00 AUD 47 841.64 CAD 16 184.77 CHF 159 821.12 EUR 77 386.10 EUR
Securities LendingRevenues 0.00 AUD 71 762.47 CAD 24 277.15 CHF 239 731.71 EUR 116 079.16 EUR

UBS (Lux) Bond FundAnnual Report as of 31 March 2015
105
Securities Lending (unaudited)
UBS (Lux) Bond Fund UBS (Lux) Bond Fund – Euro High Yield (EUR)
UBS (Lux) Bond Fund – Full Cycle Asian Bond (USD)
UBS (Lux) Bond Fund – GBP
UBS (Lux) Bond Fund – Global (CHF)
UBS (Lux) Bond Fund – USD
By Country:– Australia 1.53 1.53 1.53 1.53 1.53– Belgium 0.71 0.71 0.71 0.71 0.71 – British Virgin Islands 0.02 0.02 0.02 0.02 0.02 – Cayman Islands 0.20 0.20 0.20 0.20 0.20 – China 2.93 2.93 2.93 2.93 2.93 – Denmark 0.61 0.61 0.61 0.61 0.61 – Germany 10.59 10.59 10.59 10.59 10.59 – Finland 0.06 0.06 0.06 0.06 0.06 – France 6.61 6.61 6.61 6.61 6.61 – United Kingdom - GB 2.85 2.85 2.85 2.85 2.85 – Hong Kong 0.35 0.35 0.35 0.35 0.35 – Japan 15.30 15.30 15.30 15.30 15.30– Canada 3.90 3.90 3.90 3.90 3.90 – Luxembourg 0.25 0.25 0.25 0.25 0.25 – New Zealand 0.49 0.49 0.49 0.49 0.49 – Netherlands 2.65 2.65 2.65 2.65 2.65 – Norway 0.57 0.57 0.57 0.57 0.57 – Austria 0.14 0.14 0.14 0.14 0.14 – Sweden 0.98 0.98 0.98 0.98 0.98 – Switzerland 9.29 9.29 9.29 9.29 9.29 – Singapore 0.87 0.87 0.87 0.87 0.87 – South Korea 0.01 0.01 0.01 0.01 0.01 – Supranationals 0.89 0.89 0.89 0.89 0.89 – United States 38.20 38.20 38.20 38.20 38.20
by Credit Rating:
– Rating > AA- 78.40 78.40 78.40 78.40 78.40
– Rating <=AA- 21.60 21.60 21.60 21.60 21.60
– without Rating 0.00 0.00 0.00 0.00 0.00
Securities Lending
Assets and Revenues / Ratios
Average Invested Assets (1) 4 783 155 847.44 EUR 369 784 376.49 USD 66 421 544.96 GBP 219 626 951.92 CHF 180 406 427.08 USD
Average SecuritiesLent (2) 1 121 482 079.00 EUR 90 680 519.32 USD 14 602 611.89 GBP 100 097 866.17 CHF 37 018 582.77 USD
Average Collateralreceived (3) 1 257 008 522.43 EUR 98 233 603.41 USD
16 101 104.45 GBP 111 686 903.62 CHF 39 781 688.13 USD
Average CollateralRatio (3)/(2) 112.08% 108.33% 110.26% 111.58% 107.46%
Average Securities LendingRatio (2)/(1) 23.45%
24.52% 21.98%
45.58% 20.52%
Securities Lendingrevenues 4 469 117.57 EUR 328 191.42 USD 30 233.82 GBP 135 462.89 CHF 86 179.76 USD
Securities Lendingoperational Costs/Fees 1 787 646.92 EUR 131 276.56 USD 12 093.53 GBP 54 185.15 CHF 34 471.90 USD
Securities LendingRevenues 2 681 470.65 EUR 196 914.86 USD 18 140.29 GBP 81 277.74 CHF 51 707.86 USD

ab © U
BS 2
015.
The
key
sym
bol a
nd U
BS a
re a
mon
g th
e re
gist
ered
and
unr
egis
tere
d tr
adem
arks
of
UBS
. All
right
s re
serv
ed.
Als
o av
aila
ble
in G
erm
an. 8
0208
E-15
01