annual report 2014 - dart mining nl · 2017-05-26 · 4 operations review in the financial year to...
TRANSCRIPT
Annual Report 2014

2
Contents
Board Chairman, Non-Executive Director Bruce J Paterson LLB, MAICDNon-Executive Director Rob A Hogarth FCANon-Executive Director John W Cottle PhD, FAusIMM, (CPGeo).
ManagementCommercial Manager/Acting CEO John W Cornelius SAFin, MAICD, MAusIMM, PESACFO/Company Secretary John M Nethersole CA Manager, Unicorn PFS Project Colin J Seaborn PhD, FAusIMM, MAICDManager, Geology and Environment Dean G Turnbull M.AIGManager, Exploration Rod Boucher PhD, AIG (RPGeo), MAusIMM, GSA, AAPGCorryong, Regional Support Manager Natalie Purden
Dart Mining – Strategic Advisory PanelStrategic Adviser- Geology David Royle FAusIMM, (CPGeo), FSEGStrategic Adviser -Environment and Biodiversity Sarah Lawley PhD, MAusIMM, MARPIs, MAIPStrategic Adviser- Metallurgy Colin J Seaborn PhD, FAusIMM, MAICD
ContactACN 119 904 880Dart Mining N LRegistered Office Foster Nicholson Jones Level 6, 406 Collins Street, Melbourne. Vic 3000Principal Office Lower Ground Floor, 395 Collins Street, Melbourne. Vic 3000 Telephone +61 3 96202029 Email [email protected] Website www.dartmining.com.auRegional Office; Corryong PO Box 141 Corryong Vic 3707 Telephone +61 2 60762336Lawyers: Foster Nicholson JonesAuditors: MSI Ragg WeirBankers: Bendigo Bank, ANZ BankListing: Australian Securities Exchange LimitedASX Code: DTMShare Registry: Link Market Services, Melbourne Contact www.linkmarketservices.com.au Telephone 13 554 474 Fax 02 9287 0303
Cover image. Molybdenite in quartz stockwork veins, 582.2 m drill hole DUNDD005 – Unicorn Deposit
03 Chairmans’s Report04 Operations Review Core activities 04 Research & Development 07 Deposit development 07 Unicorn Pre-feasibility Study and Beyond 07 Unicorn Project Timeline 08 Unicorn Project 10 Metallurgy 10 Environment 10 Community 10 Molybdenum Market 10 Pre-feasibility 10 Environment 12 Health and Safety 12 Exploration 12 EL4726/EL5194/EL5058 –
Regional Exploration North East Victoria 13 Gentle Annie 13 Copper Quarry Prospect 14 Onslow Reef Prospect 14 EL 4724 Regional Exploration 15
North East Victoria Fairley’s Prospect 15 Nerrina Prospect 17 Corporate 17 About Molybdenum 17 Competent Persons Statement 1819 Financial Report
FiguresFigure 1 Location Plan of Dart Mining Exploration Licences NE. Victoria 5
Figure 2 Key Prospect Location Plan with mineralisation corridors 6
Figure 3 Gentle Annie magnetic anomaly and soil geochemistry sample results 13
Figure 4 Copper Quarry contoured copper soil geochemistry (based on handheld XRF) with point highs (Cu ppm) and with local geology mapping overlay. 14
Figure 5 Schematic cross section of the Copper Quarry Prospect 14
Figure 6 Colour coded arsenic in soil (by handheld Olympus XRF) at Onslow Reef and nearby Onslow South historic workings over colour digital elevation model. 15
Figure 7 Fairley’s Prospect soil grid extension showing arsenic values (ppm) around previous central prospect soil grid that was the focus of previous drilling by Dart Mining in 2008 (EL4724). 16

3
Chairman’s Report
I also wish to express my sincere gratitude to you the Shareholders and Owners of the Company for your solid support for, and patience with, my Board of Directors and Management through this period of major change up to the end of the financial year, and beyond to the time of writing. I want to clearly re-iterate to you and the broader share market that the current Board has resolved, in view of the many corporate and commercially sensitive matters being dealt with during the PFS, that Non-Executive Directors will not hold shares in the Company until at least completion of the PFS. This approach to Director’s financial remuneration maximises the ideal of ‘steel-proofing’ the independence, integrity and performance of Directors in the sole interest of Dart, its forward progress, and future corporate performance.
To other stakeholders, I thank you on behalf of Shareholders for your cooperation and support.To summarise the aforementioned change(s), your Company:• Has re-focused all its activities
on its founding assets in NE Victoria;
• Divided these activities into Deposit Development (Unicorn Project), and Regional Exploration streams; and further sub-divided Regional Exploration into:
> Smaller scale, short duration to production, near surface (e.g. Gold) prospects; and
> Larger scale, longer development, porphyry and base metal exploration,
• Created a comprehensive strategic plan and budget to guide all the above;
• Created a strong Risk Management Plan to comprehensively manage corporate, technical, personal, and Company-wide personnel OH&S risk;
• Recommenced the stalled PFS;
• Appointed a metallurgical experienced PFS Project Manager;
• Appointed an Environment/EES Strategic advisor;
• Appointed a globally experienced, especially porphyry copper and base metal, Exploration Strategic advisor;
• Upgraded EES flora, fauna and aquatic surveys, and commissioned the spring survey, rendering your Company ‘EES ready’;
• Received a $1.1M further Research and Development (R&D) Grant;
• Raised over $1M from sophisticated investors, including from a new substantial shareholder; and
• Resolved the metallurgical challenges that had previously threatened the Unicorn Project.
I believe your Company is now on track towards a successful future. I look forward to providing further updates on PFS and exploration progress at the Annual General Meeting in Albury on 20 November 2014.
Thank you again.
Yours Sincerely
Bruce Paterson Chairman
26 September, 2014
Dear Shareholders
While all the information gathered and analyses completed in the first half of the 2014 financial year, to December, 2013, contributed solidly to your Company’s knowledge base, the conclusions drawn on the outcomes to that time are now consigned to history.
Jumping ahead 9 months from then to September 2014, Dart announced the Game Changing Turnaround of the Unicorn Project. The extraction of saleable copper and molybdenum products both from Oxide material and Sulphides from across all sulphide zones, means the twin metallurgical challenges that previously threatened the Unicorn Project have now been overcome.
This focused metallurgical work and its positive outcomes vindicates and provides solid final foundation for your Directors’ decision to recommence the Unicorn Pre-Feasibility Study (PFS), announced on 30 July 2014, and brings into full play the Company’s $10 million Strategic Plan schedule and budget, adopted and announced on 24 March 2014.
Since the change of the Company’s Board in February 2014, your current Directors, Company employees and consultants have been extraordinarily busy and intensely involved in turning the Company’s fortunes around. I sincerely thank them all on your behalf, and particularly, their achievement of this impressive outcome in just a few months. In particular, I must make mention of the tireless efforts and strong leadership of our Acting CEO,
John Cornelius, as well as the dedication and commitment of our CFO/Company Secretary, John Nethersole.
Manager Geology & Environment, Dean Turnbull continues to provide leadership for the hard working Corryong based Unicorn regional exploration team. This team has been expanded with addition of Corryong region field people who have undergone risk, first aid, environment, safety and technical training in preparation for a Unicorn focused drilling campaign and upgraded regional exploration effort.
Your Board and Acting CEO have also demonstrated their preparedness and capacity for identifying, engaging and managing appropriately qualified and experienced people to complement the already strong Dart Management team with an overviewing and guiding Strategic Advisory Panel (see below).
I also wish to sincerely thank on your behalf, the local Corryong community for their sincere engagement and face-to-face discussions with the Board across the range of aspects and issues specific to the Unicorn Project. I can assure you and the local community that this mode of open and transparent engagement and discussion will continue as the Unicorn Project proceeds to potential production.

4
Operations ReviewIn the financial year to 30 June 2014 and to the date of this report (26 September 2014) Dart Mining NL (Dart) has not just turned the corner, but it has turned a full 180° back to ‘full steam ahead’:
• Towards further enhancement of a successful Pre-Feasibility Study (PFS) and potential Unicorn production;
• Re-focussing all efforts back on its founding assets in North Eastern (NE) Victoria, incorporating a detailed examination of all aspects of Dart’s activities including:
> corporate, and financial, disclosure;
> exploration, geology, metallurgy, environment and tenements; and
> personnel, policy, practice and risk.
• Generating and implementing a $10M Strategic Plan, budget and schedule;
• Strengthening the already strong new Board and Management with appointment of a Strategic Advisory Panel covering Metallurgy and PFS Project Management, the Environment and Exploration Geology;
• Successfully addressing and reversing the twin metallurgical challenges that had previously threatened the Unicorn Project;
• Revising PFS-level mine planning for Whittle mine planning calculations of annual tonnes and grade according to the newly defined and technically positive metallurgical process parameters and flowsheet for both Oxide and deposit-wide Sulphide saleable metal;
• Rendering the Unicorn Project EES ready, with commissioning of Spring Flora, Fauna, and Aquatic surveying and monitoring;
• Creating and instituting an exceedingly strong Risk Management Plan across the entire Company’s operations;
• Raising $1.1M from R&D grants and $1.1M from sophisticated investors, including a new substantial (~12%) shareholder; and now
• Believing, given all the above, that it is better placed to endeavour to meet conditions precedent to the 2nd $4.7M tranche of Orion Resource Partners (Aus) Pty Ltd funding by the due date of 31 October 2014.
It has been a year of great change for the Company, culminating as of the date of this report in the game changing turnaround of the Unicorn Project and the Company, due to the reversal of the twin metallurgical challenges that had previously threatened the Unicorn Project.
While the Company’s share price in the first half of the financial year was more than disappointing, the new Board and Management since commencement of the second half, has ‘held its nerve’ in a mining investment marketplace and climate, less than conducive to investment in base and precious metals exploration and development companies, while the Board worked hard
on reversing the Company’s fortunes which has taken time. Technical work such as field sampling, surveying, and metallurgical test work must be carried out in exacting sequence with meticulous control and results analysis, recording and documentation. Not only does this consume considerable time, effort and funds, it necessarily means that reliable and regulatory complying results are not publicly available for some time to enable an associated news release to be made.
In managing the preceding timing issues, the new Board and Management are acutely aware of their responsibilities regarding good governance and Continuous Disclosure to keep shareholders, the market, and communities local to the Company’s operations, fully and promptly informed of all material corporate and operations
activities and outcomes, as and when they become firm and available for publication.
Due to the complete turnaround in the fortunes of the Company during the year, the following operations review ‘cuts to the chase’ and describes the activities and achievements regarding the various projects and endeavours of the Company in terms of, current status of progress, and future potential, as of the date (26 September, 2014) of this report.
As another change, Dart has appointed a Strategic Advisory Panel to augment and complement the strong new Board and management in the areas of Metallurgy, Environment and Exploration. This panel of experts in their particular fields will provide guidance and supervision variously both up and down the line from Board to field operations activity.
Core activitiesCore activities of the Company include:• Exploration;• Deposit Development
(Unicorn);• Research and
Development (R&D); and• Environment
These activities are all focused in the area of the Company’s founding assets in North Eastern (NE) Victoria, comprising exploration licences (EL’s) and the many prospects and potential deposit developments the Company has identified. Figure 1, depicts the location of Dart’s EL’s.
Location of the major prospects and deposits upon which Dart
is currently working are shown in Figure 2, together with the main structural mineralisation corridors along which these prospect and deposits tend to align.
In March 2014 Dart generated and announced (24 March 2014) a comprehensive $10M Strategic Plan, schedule and budget, for the entirety of its operations to 30 June 2015. Together with minor internal timing and budgeting updates and adjustments this plan is and will be used for ongoing measurement of activities performance against schedule and budget.

5
Figure 1. Location Plan of Dart Mining Exploration Licences NE. Victoria

6
Operations Review
Figure 2. Key Prospect Location Plan with mineralisation corridors

7
Research & Development (R&D)To date the Company has not widely highlighted its ongoing (since IPO inception) Research & Development (R&D) efforts towards the facilitation and attendant efficiency of potential discovery of Henderson/Climax type porphyry copper and molybdenum deposits within its founding tenement base in Victoria, and ultimately more widely throughout the Lachlan Fold Belt in Australia.
This has been an ongoing ‘development-in-progress’ process with the initial generation and gradual, incremental, and continuing development of a Company proprietary model named the Unicorn Henderson/Climax Model (UHCM) by a continually iterative process of: informing the model with information available to date; experimentally applying the model; and analysing the results or outcomes of this experiment, followed by iterating the preceding process as new or further information becomes available.
To date this R&D, the UHCM, and continually interactive approach has assisted the Company greatly in facilitating the efficiency with which the Company, has been able to identify and follow up potential porphyry copper, and other targets within its NE Victoria region of operation. While methodologies employed are conventional, significant R&D around the hybrid nature of Unicorn Mo/Cu/Ag/Zn mineralisation was required to resolve the metallurgical intricacies.
Deposit developmentUnicorn Pre-feasibility Study and BeyondThe table on pages 8-9 provides a summary outline of both past and prospective achievements regarding the Unicorn Project and its development journey towards potential ultimate production.
Understandably the items mentioned are in summary form and indicative only of the major effort and detail which has been, or will be, enacted and performed.
Manager Geology and Environment, Dean Turnbull reviewing geological setting at Unicorn with Dart Board members.

DART MINING UNICORN PROJECT TIMELINE
31/8/12 18/11/13 – 1/02/14 1/08/14 2015 2016 2018
SCOPING STUDY 2
± 40% COST/ACCURACY
• Public Meeting/Media Release
• Plan Native Title, Flora & Fauna Surveys
• 203Mt @ 596 MoEq ppm1
• Whittle Pit Optimisations
• Scoping metal Recoveries
• Scoping Capex and Opex
• See Infrastructure
• See Infrastructure
• Equity Raisings
• Initial $15M Capital Construction
• Scoping Project Capex
• Capex $304M, Opex $9.01/t
Conceptual - What if ...
REVISED SCOPING STUDY
• Community Engagement/Media Release
• Monitoring continued
• Revised Schedule Plan and Budget
• Revised Schedule Plan and Budget
• Recovery from Oxide & 'Clean' Cu Conc.
• Integrated Process Development
• Option Study Planning
• Water Option design re�nement
• Schedule & Budget for Options studies
• Revised Schedule and Budget
• Review Schedule and Budget
• $1.1M R&D, $1.1M raising
Conceptual - What about ...
INITIAL PRE-FEASIBILITY STUDY
• Public Meeting/Media Release
• Referral EES studies, Environmental monitoring
• Detailed Resource Drillout Plan
• Detailed Mine Design Planned
• Recovery from Oxide & 'Clean' Cu Conc.
• Detailed Plant Design to be initiated
• PFS Level Complete
• PFS Level Complete
• PFS Level Complete
• $4.5M Orion. $1M R&D funding
• Capex -$392M, Opex $6.96/t.
Refinement± 25% COST/ACCURACY ± 30% COST/ACCURACY
PRE-FEASIBILITYOPTIONS
Studies Refinements
15 MONTHS 3 6 MONTHS 4 6 -12 MONTHS 4 2-3 QTR 154 24 MONTHS
± 25% COST/ACCURACY
• Community Engagement/Media Release
• EES Spring Flora and Fauna Aquatic Surveys
• Drillout & Update Resource Estimate
• PFS Mine Design detail
• Draft Process Flowsheet detailed
• PFS Process Flowsheet Design
• Option Studies
• Waterline Option PFS level design
• Options integrating Metallurgy, Water
• PFS Level Design -Buildings, Roads, etc.
• Capital and Operating Cost estimates
• $4.7M Orion 2nd Tranche, Equity raises
1 Molybdenum ppm Equivalents | 2 Initial PFS: assumed 'Stoppers' and Re�nements | 3 Including Decision Not to Proceed - Intimated at and in AGM Release | 4 Including Decision to Proceed
MINING
TAILINGS
WATER
ENVIRONMENT
COMMUNITY
RESOURCE
METALLURGY
FUNDING
ECONOMICS
PROCESSING
INFRASTRUCTURE
POWER
DEVELOPMENT & CONSTRUCTION
FEASIBILITY STUDY
Major IssueNot Finalised to StageFinalised to Stage
• Scoping Project Capex
8

DART MINING UNICORN PROJECT TIMELINE
31/8/12 18/11/13 – 1/02/14 1/08/14 2015 2016 2018
SCOPING STUDY 2
± 40% COST/ACCURACY
• Public Meeting/Media Release
• Plan Native Title, Flora & Fauna Surveys
• 203Mt @ 596 MoEq ppm1
• Whittle Pit Optimisations
• Scoping metal Recoveries
• Scoping Capex and Opex
• See Infrastructure
• See Infrastructure
• Equity Raisings
• Initial $15M Capital Construction
• Scoping Project Capex
• Capex $304M, Opex $9.01/t
Conceptual - What if ...
REVISED SCOPING STUDY
• Community Engagement/Media Release
• Monitoring continued
• Revised Schedule Plan and Budget
• Revised Schedule Plan and Budget
• Recovery from Oxide & 'Clean' Cu Conc.
• Integrated Process Development
• Option Study Planning
• Water Option design re�nement
• Schedule & Budget for Options studies
• Revised Schedule and Budget
• Review Schedule and Budget
• $1.1M R&D, $1.1M raising
Conceptual - What about ...
INITIAL PRE-FEASIBILITY STUDY
• Public Meeting/Media Release
• Referral EES studies, Environmental monitoring
• Detailed Resource Drillout Plan
• Detailed Mine Design Planned
• Recovery from Oxide & 'Clean' Cu Conc.
• Detailed Plant Design to be initiated
• PFS Level Complete
• PFS Level Complete
• PFS Level Complete
• $4.5M Orion. $1M R&D funding
• Capex -$392M, Opex $6.96/t.
Refinement± 25% COST/ACCURACY ± 30% COST/ACCURACY
PRE-FEASIBILITYOPTIONS
Studies Refinements
15 MONTHS 3 6 MONTHS 4 6 -12 MONTHS 4 2-3 QTR 154 24 MONTHS
± 25% COST/ACCURACY
• Community Engagement/Media Release
• EES Spring Flora and Fauna Aquatic Surveys
• Drillout & Update Resource Estimate
• PFS Mine Design detail
• Draft Process Flowsheet detailed
• PFS Process Flowsheet Design
• Option Studies
• Waterline Option PFS level design
• Options integrating Metallurgy, Water
• PFS Level Design -Buildings, Roads, etc.
• Capital and Operating Cost estimates
• $4.7M Orion 2nd Tranche, Equity raises
1 Molybdenum ppm Equivalents | 2 Initial PFS: assumed 'Stoppers' and Re�nements | 3 Including Decision Not to Proceed - Intimated at and in AGM Release | 4 Including Decision to Proceed
MINING
TAILINGS
WATER
ENVIRONMENT
COMMUNITY
RESOURCE
METALLURGY
FUNDING
ECONOMICS
PROCESSING
INFRASTRUCTURE
POWER
DEVELOPMENT & CONSTRUCTION
FEASIBILITY STUDY
Major IssueNot Finalised to StageFinalised to Stage
• Scoping Project Capex
9

10
Operations ReviewUnicorn Project MetallurgyProgress on the Unicorn PFS early in the financial year gave way on 18 November 2013 to a virtual ‘shelving’ of the Project due principally to perceived metallurgical impediments, namely, zinc contamination of copper concentrates preventing production of a saleable copper concentrate product. The then Board announced its decision to ‘moderate progress’ of the Unicorn prefeasibility study and the accompanying environment approvals process. The decision reflected a determination that certain metallurgical issues required resolution before committing to further major expenditure on a full scale Environmental Effects Statement incorporating associated flora, fauna and aquatic field surveys and studies.
The primary issues were metallurgical and comprised:
• low molybdenum and copper recovery from the Oxide zone;
• zinc mineralisation within portions of the resource preventing production of a clean saleable copper concentrate; and
• further, the molybdenum price had fallen considerably since the time of the Scoping Study, and remained weak in the months leading up to November 2013.
The current Board since February 2014, initiated a comprehensive review of Unicorn PFS studies and implemented a disciplined, technically and commercially focused programme of testing and study within each of the key project areas.
This discipline and focus has resulted in a turnaround in the Unicorn Project and accordingly Dart’s prospects with the re-ignition of the Unicorn Project PFS back to the positive direction, based on resolution of the metallurgical issues.
Intensifying the petrological and mineralogical studies by a specifically experienced consultant, currently engaged in identical work for an operating mine, led to results and outcomes that were effectively summarised as showing no reason why a ‘clean’ (of zinc) copper concentrate of saleable specifications could not be produced.
This outcome led to systematic metallurgy tests and trial work embracing conventional metallurgical techniques, with exacting methodical application of extraction and recovery tests to the oxide zone and all geological sulphide mineralisation domains, producing results that demonstrate:• extraction of saleable
concentrates of both copper and molybdenum is achievable from sulphides across the deposit without the zinc contamination impediment previously observed; and
• metal recovery into saleable products from the Oxide zone is also achievable.
These results – replicated by two independent laboratories (in the case of the sulphides) – were achieved using a number of commercially proven extraction processes previously used variously at the Hellyer silver/lead/zinc mine in Tasmania and other mines thoughtout the Lachlan Fold Belt in Australia. Furthermore, as they are conventional processes, this greatly reduces both the technical and commercial risk of the Project.
While the metallurgical processes identified are conventional processes, considerable investigative research and development has gone into their development due to the hybrid (Henderson/Climax) and multi-metallic (Mo/Cu/Ag/Zn) nature of the Unicorn Porphyry Deposit, in order to match its special characteristics.
An indicative draft process flowsheet has now been developed covering all the Unicorn project’s mineralisation zones. This will now be used as a guide in the ongoing development of the ultimate process flowsheet detail and design as a key element of the PFS, expected to be completed early in 2015.
All the above metallurgical test work investigations, analysis, and turnaround has been achieved under the supervision of consultant metallurgist, Dr. Colin Seaborn. Colin now has also been appointed PFS Project Manager for the duration of the ongoing PFS enhancing study work.

11
EnvironmentIn September 2013 the Victorian Minister for Planning confirmed the requirement for an Environmental Effects Statement (EES) on the Unicorn Project. Planning for, and implementing baseline environmental surveys and data collection has continued, with now more than a year of data collection and analysis. Monitoring has now been expanded and is continuing with the commencement of spring flora, fauna and aquatic surveys.
CommunityCommunity engagement and consultation is integral to facilitating the planning and approvals process for the Unicorn Project. Dart’s strategy includes information exchange with the local communities of Corryong, Biggara, Thowgla and Khancoban. An active reinvigoration of community engagement can now commence with the provision of updates as information becomes available on further project design such as:• key project infrastructure
including the process plant, and tailings storage;
• water access/storage and usage; and
• management of the Bull Paddock Creek catchment area, including water management.
Molybdenum MarketThe molybdenum market price has again fallen away to circa USD11.50 per pound after rising to US14.50 earlier this year.
Forward projections of demand in the context of development of catalysts, low sulphur diesel fuel and high strength molybdenum content thin steels see demand growth exceeding 60 thousand tonnes per annum (~25%) post 2016 with attendant stronger pricing.
Dart Mining have initiated discussions with the molybdenum market and potential Dart metal product buyers.
Pre-feasibilityAt the end of the financial year, and subsequently up to the time of writing (26 September, 2014), all components of the Unicorn Project were approaching PFS completion levels:• A Scoping level Metallurgical
Process Flowsheet has been built, with PFS level detail and design work ongoing;
• A re-estimation mine scheduling of the resource block model (by Whittle optimisation) has been completed to produce indicative annual potential production tonnes and grade, but accounting now for:
> the availability of the Oxide zone as ‘ore’;
> the newly defined metallurgical process saleable concentrate parameters and recoveries across the deposit;
Servicing Thowgla Valley weather station
• The tailings storage facility design is complete to PFS level detail but will be subject to ongoing refinement and enhancement;
• Water storage is complete to PFS level detail but has been further developed with the consideration and investigation of ongoing enhancment options; and
• Dr Colin Seabom has been appointed Manager Unicorn PFS for the ongoing PFS enhancing study work.

12
EnvironmentAs can be seen from the accompanying picture on this page, the Corryong region including the Indi, Biggara and Thowgla Valleys, provides an environment of which Dart is keenly aware and protective.
With any planned on-the-ground action, the environment always comes first with the environmental screening of all areas of intended activity on cultural, flora, fauna, and aquatic bases. When clearing of vegetation is necessary for exploration access, size and ecologically equivalent land offsets are purchased and secured for conservation.
Dart strives for full maintenance of the environment and
conducts its field operations in an environmentally sustainable manner. All staff are trained in maintenance of the environment and all operations areas are rehabilitated subsequent to exploration.
The Company has appointed Dr Sarah Lawley as Strategic Advisor, Environment and Biodiversity to provide expertise, direction, supervision and advice in the Company’s ongoing environmental work.
Health and SafetyThe personal safety of all staff is paramount and the occupational health and safety (OH&S) of all personnel and their workplaces are maintained at the highest levels. As an example Company personnel have undergone accredited
advanced driver training and all field personnel have undergone appropriate and accredited four wheel drive (4WD) training courses.
Total days since lost time due to incident or injury is 883 days as at 26 September 2014.
ExplorationDart is currently subdividing its regional exploration into two streams:• Smaller scale, short duration
to production prospects (e.g. Gold); and
• Larger scale, porphyry copper and other base metal prospects and targets.
To assist with continuation and acceleration of this twin stream regional exploration work, Dart has appointed David Royle as Strategic Advisor, Geology. David has vast global experience in exploration, particularly in porphyry copper deposits and their surrounding systems.
With the focus of activity at the Unicorn Project during the period diverted from on ground geology and drilling, the field team focused on regional exploration. Work included prospect scale soil sampling traverses and geological mapping across geochemical, magnetic and/or topographic features in NE Victoria.
Operations Review
Collecting weather and atmospheric data
13
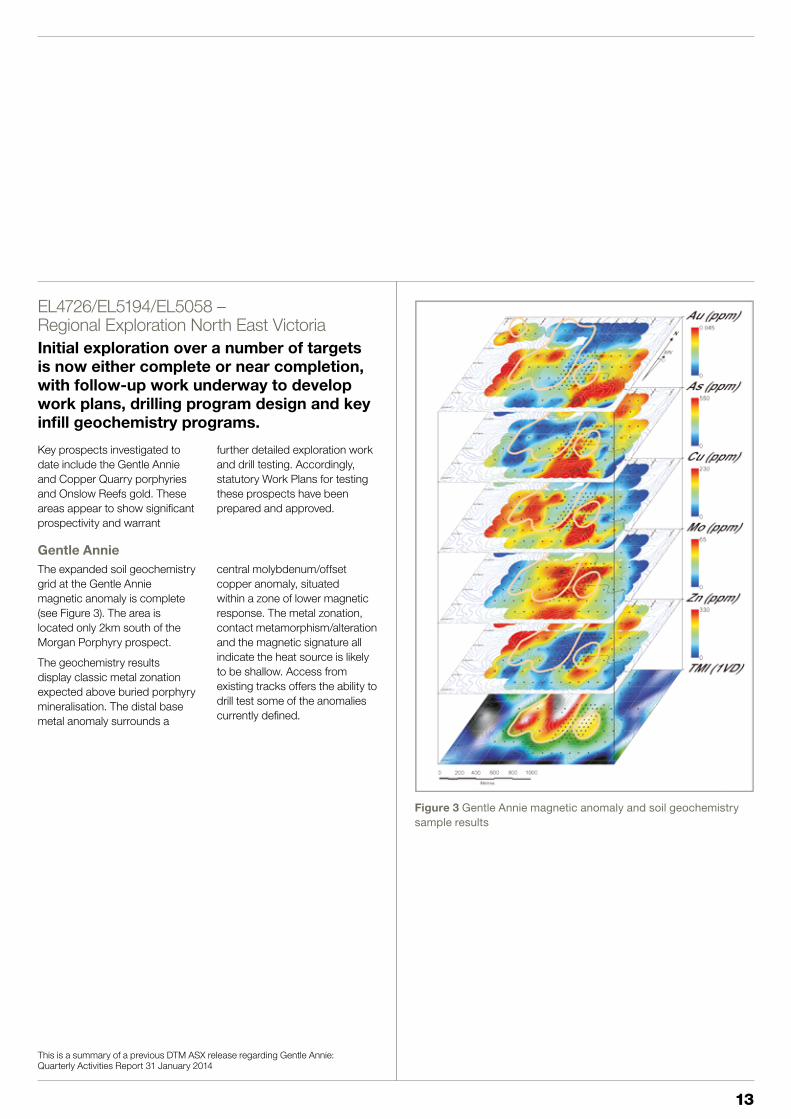
Figure 3 Gentle Annie magnetic anomaly and soil geochemistry sample results
EL4726/EL5194/EL5058 – Regional Exploration North East Victoria Initial exploration over a number of targets is now either complete or near completion, with follow-up work underway to develop work plans, drilling program design and key infill geochemistry programs.
Key prospects investigated to date include the Gentle Annie and Copper Quarry porphyries and Onslow Reefs gold. These areas appear to show significant prospectivity and warrant
further detailed exploration work and drill testing. Accordingly, statutory Work Plans for testing these prospects have been prepared and approved.
Gentle Annie The expanded soil geochemistry grid at the Gentle Annie magnetic anomaly is complete (see Figure 3). The area is located only 2km south of the Morgan Porphyry prospect.
The geochemistry results display classic metal zonation expected above buried porphyry mineralisation. The distal base metal anomaly surrounds a
central molybdenum/offset copper anomaly, situated within a zone of lower magnetic response. The metal zonation, contact metamorphism/alteration and the magnetic signature all indicate the heat source is likely to be shallow. Access from existing tracks offers the ability to drill test some of the anomalies currently defined.
This is a summary of a previous DTM ASX release regarding Gentle Annie: Quarterly Activities Report 31 January 2014

14
Operations ReviewCopper Quarry Prospect The Copper Quarry prospect, near Corryong, shows highly anomalous copper over 400m from soil sampling. Variable composition of cross-cutting igneous rocks at surface suggest a complex intrusive history. A soil grid has been completed over the greater Copper Quarry area based on a nominal 50m x 50m grid with infill based on a 25m grid over the most anomalous area.
Further specific soil samples were collected adjacent to and within dykes to test for
associated copper mineralisation (Figure 4).
Alteration, pyritic mineralisation, sets of quartz veins and various dykes at the surface support the hypothesis of a mineralised porphyry below the sedimentary roof pendant (Figure 5). Two drill holes are planned to test for alteration changes with depth and to allow for downhole geophysics or deeper drilling if successful. The two steep holes will be sited near the centre of the mineralisation at surface, from an existing access track.
Onslow Reef Prospect The historic Onslow Reef workings occur as a small isolated cluster 8km south of Unicorn and shows narrow quartz-sulphide style lodes with true width between 0.7 and 1.5m where mapped in the main adit level.
The aim of exploration within this area is to target extensions of the known lode and additional parallel/intersecting mineralised fault zones containing high grade pods of gold mineralisation.
During the period a soil grid has been established and specific areas targeted for tight infill sampling. Sample results for both gold and arsenic have shown the potential for larger scale mineralisation to exist at Onslow with an open gold and arsenic soil anomaly currently over 200m in strike length.
The plan in Figure 6 illustrates two main mineralisation trends (East-West and North-South) defined by soil arsenic (As) values and isolated historic workings. Ongoing soil sampling is enlarging the grid to search for additional lodes.
Figure 5. Schematic cross section of the Copper Quarry Prospect (not to scale)
Figure 4. Copper Quarry contoured copper soil geochemistry (based on handheld XRF) with point highs (Cu ppm) and with local geology mapping overlay.

15
EL 4724 Regional Exploration North East Victoria
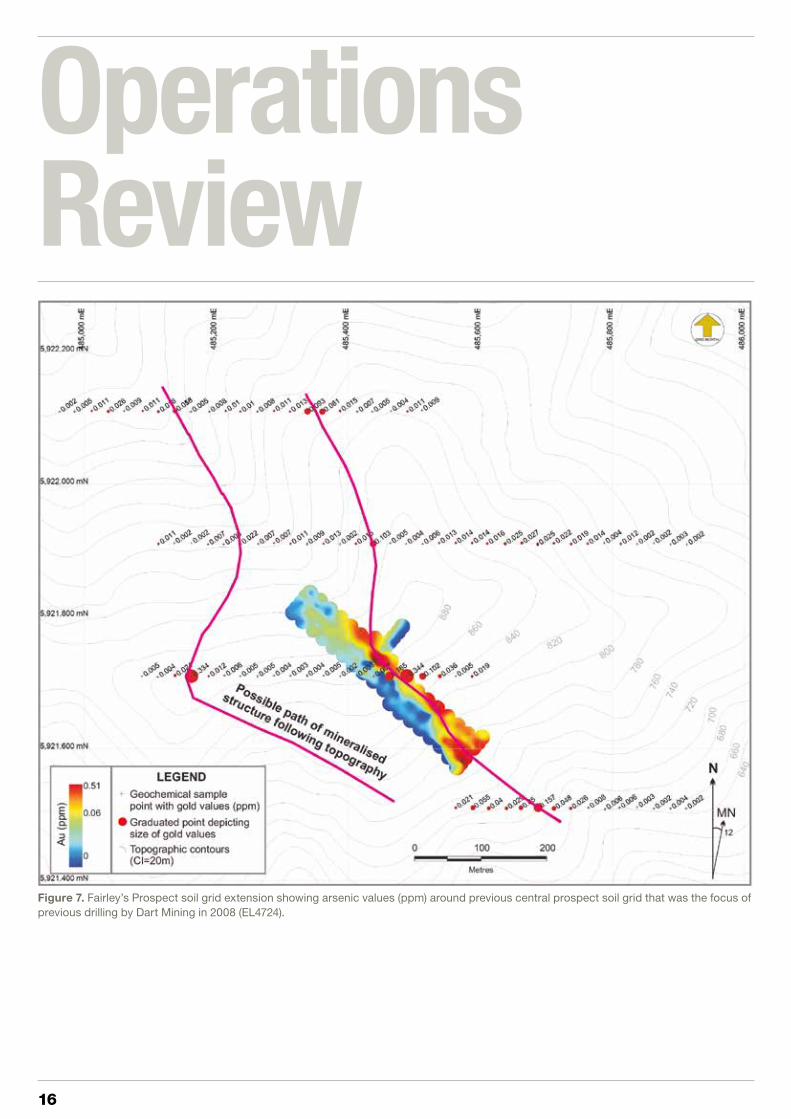
Fairley’s Prospect Dart was the first to recognise a disseminated style of gold mineralisation within the historic Buckland Goldfield. Initial exploration, including drilling by Dart, uncovered broad, low grade intersections, however, new mapping and a reinterpretation of the stratigraphic setting has opened the potential of the prospect. During the period, geochemical soil sampling tested for possible extensions and parallel lines of gold mineralisation to that already tested through
drilling in 2008. Four additional widely spaced soil lines were completed.
Results from the recent soil geochemistry program show the Fairley’s Prospect now appears to be part of a far larger mineralised set of splay and parallel shears hosting disseminated gold and sulphides, Figure 7. The potential of the prospect will be further evaluated and drill targets defined if warranted, with early success during the soil grid work showing very encouraging results.
TENEMENT STATUS REPORT AS AT JUNE 30 2014
Tenement Name Area (Graticules)
Interest Location
EL4724 Buckland 2 82 100% NE Victoria
EL4726 Dart 1,2 680 100% NE Victoria
EL5058 Cudgewa 413 100% NE Victoria
EL5194 Mt. Alfred 95 100% NE Victoria
EL8190 Koonenberry 3 99 100% NW NSW
EL5467 McCormacks 92 100% NE Victoria
EL5468 Upper Murray 198 100% NE Victoria
All tenements remain in good standing at 30 June 2014.
Notes 1: The Unicorn Project area is subject to a contingent 2% NSR Royalty agreement with BCKP Limited (Orion Resource Partners) dated 29 April 2013.
2: Areas subject to a 1.5% Founders NSR Royalty Agreement. 3: Being Relinquished
Figure 6. Colour coded arsenic in soil (by handheld Olympus XRF) at Onslow Reef and nearby Onslow South historic workings over colour digital elevation model.
16
Operations Review
Figure 7. Fairley’s Prospect soil grid extension showing arsenic values (ppm) around previous central prospect soil grid that was the focus of previous drilling by Dart Mining in 2008 (EL4724).

17
Nerrina ProspectDrilling of 6 RC holes by Dart Mining revealed multiple, sub-horizontal mineralised quartz shoots at Nerrina north of Ballarat in central Victoria. The shoots are interpreted to occupy a large cross sectional area over significant strike lengths and provide the potential for large tonnages of mineralised quartz. Drilling intersected deeper historic workings than previously recorded, mapped or expected and indicates that
there is a more significant mining and production history than has previously been appreciated or documented. The best gold intercept from the programme was from DMSRC005 of 12m @ 2.89 AU g/t including 2m @ 15.24 AU g/t. Following Dart Mining’s refocus to exploration and development on its founding assets in North East (NE) Victoria, Dart Mining did not proceed further with Nerrina.
Information in this Section headed - Exploration is a summary of previous DTM ASX Releases Copper Quarry, Gentle Annie and Fairleys - 29 January 2014, Onslow Releases including Quarterly Activities Report - 31 January 2014, Gentle Annie, Copper Quarry, and Fairley’s and Quarterly Activities Report - 30 April 2014, regarding Onslow.
CorporateThe Company underwent significant Board and Management changes during the Financial Year, but with the game changing turnaround of the Unicorn Project and the Company’s fortunes, the end of Financial Year came with signs of renewed corporate purpose and shareholder hope.
The share price reversed its downward direction and had turned upwards by over 100% (from its lows) at the time of writing (26 September 2014).
Prior to the end of the Financial Year the Company received a further $1.1M in grant funding from AusIndustry.
Subsequent to the end of the year a further $1.1 million was raised via a share issue to
sophisticated investors, one of whom became a substantial (~12%) shareholder.
Dart continues to need to raise funds, particularly to fund continuing development activities on its newly invigorated Unicorn Project, and looks forward to a successful outcome in October 2014 regarding the Orion Resource Partners second tranche funding of $4.7 million.
About MolybdenumMolybdenum is a metal with unique characteristics which are important for modern high-tech applications as well as conventional usage. Its primary use is as an essential metal in the manufacture of steel as it adds strength, hardness, toughness and resistance to corrosion.
Molybdenum also has a range of chemical uses including acting as a catalyst to remove impurities, notably sulphur, during crude oil production. Molybdenum is also used in the paint and plastics industries.
World demand for molybdenum is growing at 4% to 6% per annum and new uses for molybdenum continue to be discovered. A recent example is the development by two Australian scientists of a new two-dimensional material using molybdenum oxide that they believe could revolutionise the electronics market by facilitating thinner, faster and lighter gadgets.
This continues molybdenum’s diversification into areas and uses in addition to its traditional use in steel production.
The use of molybdenum is also growing in the renewable energy sector, where it is used in the manufacture of solar panels and, potentially, as an electrode plate for the separation of hydrogen and oxygen to produce hydrogen energy. Molybdenum is also used in nano-technologies to make electrical goods smaller.

18
Operations ReviewCompetent Persons StatementThe information in this report that relates to metallurgical results is based on information compiled by Dr. Colin Seaborn PhD, FAusIMM, MAICD, a Competent Person who is a Member of The Australasian Institute of Mining and Metallurgy. Dr. Seaborn is the Principal of SOS Initiatives Pty Ltd. Dr. Seaborn has sufficient experience that is relevant to the style of mineralisation and type of deposits under consideration and to the activity being undertaken to qualify as a competent person as defined in the 2012 Edition of the “Australasian Code for Reporting of Exploration Results, Mineral Resources and Ore Reserves”. Dr. Seaborn consents to the inclusion in the report of the matters based on his information in the form and context in which it appears.
The information in this report that relates to Exploration Results for regional exploration is based on information compiled by Dr Rodney Boucher B.App.Sc. (Geol) Hons PhD. M. AIG R.P. Geo., M. AusIMM, a Competent Person who is a Member of the Australian Institute of Geoscientists and The Australasian Institute of Mining and Metallurgy. Dr. Boucher is a consultant to Dart Mining and full time employee of Linex Pty Ltd. Dr. Boucher has sufficient experience that is relevant to the style of mineralisation and type of deposits under consideration and to the activity being undertaken to qualify as a Competent Person as defined in the 2012 Edition of the “Australasian Code for Reporting of Exploration Results, Mineral Resources and Ore Reserves”. Dr. Boucher consents to the inclusion in the report of the matters based on his information in the form and context in which it appears.

19Dart Mining NL
Financial Report
Table of ContentsDirectors’ Report 20
Corporate Governance Statement 33
Auditors Independence Declaration 34
Consolidated Statement of Comprehensive Income 35
Consolidated Statement of Financial Position 36
Consolidated Statement of Changes in Equity 37
Consolidated Statement of Cash Flows 38
Notes to the Consolidated Financial Statements 39
Directors’ Declaration 70
Auditor’s Report 71
ASX Additional Information 73

20 Dart Mining NL
ReportDirectors’ Report
The Directors of Dart Mining NL submit their report for the year ended 30 June 2014 and to the date of this report.
Operating and Financial Review
Group overviewDart Mining NL (Dart) was established in May 2006 with a mandate to explore and develop base metals and gold properties in north-east Victoria and southern New South Wales. The current Board has refocused on the mandated corporate objectives.
Following the 2013 Annual General meeting, concerns were expressed by many shareholders at the direction the then Board had embarked upon with activity away from the Company’s core foundation. The foundation was North Eastern Victorian exploration, including development of the Unicorn Project and pursuit through the geological modelling and research of the region’s porphyry occurrences.
Shareholder concerns led to a change of Board in February 2014 and most importantly, since February, the current Dart Board has re-focused its attention to exploration, development and operations activities on its core foundation assets in the North-east particularly on addressing the previously announced metallurgical and technical issues at the Unicorn Project
Exploration review
Unicorn Project Progress on the Unicorn Pre-feasibility Study (PFS) early in the financial year gave way in November 2013 to a virtual ‘shelving’ of the Unicorn Project due principally to perceived metallurgical impediments and zinc contamination of copper concentrate preventing production of a saleable copper concentrate product. While major commitments to spring 2013 flora, fauna and aquatic surveys were cancelled some work on Unicorn petrology continued through to February 2014.
On taking office the current Board initiated a comprehensive review of Unicorn PFS studies and implemented a disciplined technical and commercial focused programme of testing and study within each of the key project components.
At the end of the financial year the Unicorn Project was still in the mid stages of the PFS with the new metallurgical process design nearing completion but not yet finalised and other ongoing studies continuing to inform and enhance the overall project.
In conjunction with continuing development of the metallurgical process design, further refinement and enhancement studies of other associated project PFS aspects, Mining, Environment, Geotechnical, Water, Tailings and Infrastructure continued.
As announced to the ASX on 11 September 2014 our disciplined focus has resulted in a turnaround in the Unicorn Project and Dart’s prospects with the re-ignition of the Unicorn Project PFS back to positive territory based on resolution of the metallurgical issues. Systematic metallurgy tests and trial work embracing conventional methodologies, with exacting methodical application of tests to all geological mineralised domains and composite samples made up of samples from all of those domains, has produced results that extraction of saleable concentrates of both copper and molybdenum can be achieved.
These results – replicated by two independent laboratories – were achieved using a variation of commercially proven extraction processes previously used at the Hellyer copper mine in Tasmania and as they are conventional processes, this greatly reduces both technical and commercial risk.
As a result of these trials an indicative flow chart is now being developed which will cover all the project’s mineralised zones.
Potential recoveries from these four processes will form a key element of the PFS that is expected to be completed early in 2015.
In September 2013 the Victorian Minister for Planning confirmed the requirement for an Environmental Effects Statement (EES) on the Unicorn Project. Planning for, and collection of, supporting base line environmental surveys and monitoring has continued now with more than a year of data collection and analysis. Monitoring has now been expanded and is continuing and the spring flora, fauna and aquatic surveys are being planned.
Community engagement and consultation is integral to facilitate the planning and approvals process for the Unicorn Project. Dart’s strategy includes information exchange with the local communities of Corryong, Biggara and Thowgla. An active reinvigoration of community engagement can now commence with the provision of updates as information becomes available on project design; key project infrastructure such as the process plant, water and tailings storage; water use and management of the Bull Paddock Creek catchment above the Thowgla Valley.

21Dart Mining NL
ReportDirectors’ Report
Regional exploration Regional exploration activity included prospect scale soil sampling traverses and geological mapping across known geochemical, magnetic and/or topographic features in NE Victoria.
Initial exploration over a number of targets is now either complete or near completion with work plans developed and approved for drilling and infill geochemistry programs. Key prospects investigated to date include the Gentle Annie porphyry, Copper Quarry and Onslow Reef prospects. These areas appear to show significant prospectivity and warrant further detailed exploration work and drill testing in the coming months.
Dart’s regional exploration strategy is loosely divided into two main streams comprising: smaller scale, short duration to production gold targets and large scale porphyry copper and other base metal targets.
Research and developmentThe Company continued its Research and Development (R&D) programme during the financial year, collecting relevant information, including it in the Polygonal Vortex Model (PVM), Hybrid Unicorn Henderson Climax geological model then testing and experimenting with the predictive capacity of the still developing Model to generate porphyry copper and molybdenum targets of the Henderson/Climax type within the region of Dart’s exploration assets. Work is ongoing in this important and strategic arm to the Company’s exploration strategy within NE Victoria, and ultimately throughout the Lachlan Fold Belt in Australia
Gentle Annie ProspectThe expanded soil geochemistry grid at the Gentle Annie magnetic anomaly is complete. The area is located only some 500m south of the Morgan Porphyry prospect. The metal zonation appears to display classic zonation about a buried intrusive centre or centres. The distal base metal anomaly surrounds a central molybdenum / offset copper anomaly, situated within a zone of lower magnetic response. The metal zonation, contact metamorphism/alteration and the magnetic signature all indicate the heat source is likely to be shallow. Access off existing tracks offer the ability to drill test some of the anomalies currently defined.
Copper Quarry Prospect The Copper Quarry Prospect near Corryong shows highly anomalous copper over 400m from soil sampling with variable composition and cross- cutting igneous rocks at surface suggesting a complex intrusive history. A soil grid has been completed over the greater copper quarry area based on a nominal 50m x 50m grid with infill based on a 25m grid over the most anomalous area. Further specific soil samples were collected adjacent to and within dykes to test for associated copper mineralisation. An economically viable target requires a quick transition into mineralised porphyry below the sedimentary roof pendant.
Onslow Reef ProspectThe historic Onslow Reef workings occur as a small isolated cluster within 8km south of Unicorn and shows narrow quartz-sulphide style lodes with true width between 0.7 and 1.5m where mapped in the main adit level. The aim of exploration within this area is to target extensions of the known lode and additional parallel/intersecting mineralised fault zones containing high grade pods of gold mineralisation. During the period a soil grid has been established and specific areas targeted for tight infill sampling. Sample results for both gold and arsenic have shown the potential for larger scale mineralisation to exist at Onslow with an open gold and arsenic soil anomaly currently over 200m in strike length.
Fairley’s Prospect Dart Mining was the first to recognise a disseminated style of gold mineralisation within the historic Buckland Goldfield. Initial exploration including drilling by Dart uncovered broad, low grade intersections, however, new mapping and a reinterpretation of the stratigraphic setting has opened the potential of the prospect. During the financial year, geochemical soil sampling tested for possible extensions and parallel lines of gold mineralisation to that already tested through drilling in 2008. Four additional widely spaced soil lines were completed. Results from the recent soil geochemistry program show the Fairley’s prospect now appears to be part of a far larger mineralised set of splay and parallel shears hosting disseminated gold and sulphides. The potential of the prospect will be further evaluated and drill targets defined if warranted, with early success during the soil grid work showing very encouraging results.
RelinquishmentsThe Koonenberry (EL8190 (NSW)) Prospect is being relinquished and an option held over the Nerrina Prospect (EL4169 (Vic)) – held by New Ballarat Consolidated Pty. Ltd.) was not exercised during the financial year.

22 Dart Mining NL
ReportDirectors’ Report
Financial overview
Operating results for the yearThe loss for the consolidated entity after income tax was $1,060,846 (2013: $55,567 restated profit). This result is consistent with expectations of costs associated with the exploration and development programmes budgeted and undertaken that reflect:
• costs associated with managing the exploration program; • reduced activity on research and development exploration
expenditure associated with the Polygonal Vortex Model; and• corporate overheads associated with statutory and regulatory
requirements as a consequence of being listed on the Australian Securities Exchange.
Review of financial positionAt the end of the financial year, a proportion of the funds raised in prior financial years were held by the Group as cash investments for use in future financial periods. The Group strives to maximise the return on these funds for exploration purposes by investing surplus funds and minimising expenditure on corporate overheads.
Cash flowsThe cash flows of the Group consist primarily of payments to suppliers and employees used in advancing the Unicorn Project, together with payments both for exploration activities on tenements held by the Group and the maintenance of the corporate head office. Primarily, head office manages existing projects as well as costs involved in investigating new exploration opportunities.
Capital raising and capital structureDuring the year under review, the Group raised $NIL (net of capital raising costs) through the issue of NIL ordinary shares (2013: $2,117,542; 26,153,722 ordinary shares).
Information on DirectorsThe names and details of the Company’s Directors in office during the financial year and until the date of this report are as follows. Directors were in office for this entire period unless otherwise stated.
Names, qualifications, experience and special responsibilities
Bruce J Paterson Chairman
Appointed 7 February 2014Bruce has a law degree from Melbourne University and extensive commercial, legal, public company director and company secretarial experience relating primarily to ASX listed companies and their subsidiaries in Australia and internationally. He had 16 years broad experience at the international gold miner, Newcrest Mining Limited, acting as Commercial Manager - International and before that Company Secretary. Bruce has since spent the past 18 years providing management, commercial, legal and company secretarial advice, together with Non-executive Director services, to a range of public companies, both ASX listed and unlisted, in the mineral resources, energy and innovative technology sectors. These services were spread to corporate operations located in more than 20 countries. His expertise and experience has led to assignments to negotiate major “State” agreements with foreign governments, joint ventures, mineral property purchases and disposals, land access agreements, royalty agreements, option agreements and operating agreements both within Australia and offshore.
Bruce has been appointed Chairman of the Remuneration and Nomination Committee and a member of both the Audit and Risk Management Committee and the Technical Committee.
Bruce is a member of the Australian Institute of Company Directors.
Other current directorships of listed companies None.
Former directorships of listed companies in the last three years None.

23Dart Mining NL
ReportDirectors’ Report
Robert A Hogarth Non-executive Director
Appointed 7 February 2014Rob Hogarth, who has an economics degree from Sydney University and is a Fellow of the Institute of Chartered Accountants in Australia, built his mining industry expertise during a 37 year career with KPMG where he was the leader of its Energy and Natural Resources and Major Projects Advisory Practices and lead partner for many of the firm’s listed mining clients. Since retiring from KPMG in 2009 he has become a director of AMC Consultants, Pegnel Resources and Federation Training. He sits on a number of audit committees including the Victorian Environment Protection Authority; Manningham City Council; Sustainability Victoria and the Taxi Services Commission.
Rob has been appointed both Chairman of the Audit and Risk Management Committee and a member of the Remuneration and Nomination Committee.
Other current directorships of listed companies None.
Former directorships of listed companies in last three years None.
Dr John W Cottle Non-executive Director
Appointed 20 May 2014John has over 40 years experience in the exploration and mining resource industries both in Australia and internationally. He brings extensive knowledge and experience in large and small scale projects and regional exploration to the Company. This experience has been applied in disciplines encompassing geology, resource and reserve estimation, selective mining, geo-metallurgy and valuation. John received his PhD. in Economic Geology and Geostatistics in 1976. In roles such as Managing Director, CEO and COO, he has managed corporations, implemented strategic development and conducted corporate and equity financing.
John has been appointed Chairman of the Technical Committee.
Other current directorships of listed companies None.
Former directorships of listed companies in last three years None.
Christopher J Bain Chris Bain is a geologist and mineral economist. He resigned as a Non-executive Director of the Company on 18 February 2014.
Lindsay J WardLindsay Ward was the Managing Director and Chief Executive Officer until his resignation from the Company on 24 December 2013.
Dean G Turnbull Dean Turnbull is a geologist. He resigned as an Executive Director of the Company on 20 May 2014. Dean retains his management role of Manager – Geology and Environment.
Stephen G Poke Stephen Poke owns and manages a drilling company. He resigned as a Non-executive Director of the Company on 7 February 2014.
Richard G Udovenya Richard Udovenya is a lawyer. He resigned as a Non-executive Director of the Company on 7 February 2014.
Andrew Draffin Company Secretary
Andrew Draffin is a Chartered Accountant. He resigned as a Company Secretary on 20 May 2014.
John M Nethersole CFO and Company Secretary
Appointed 20 May 2014
John joined Dart on 28 April 2014 and was appointed Company Secretary and CFO on 20 May 2014. He holds a Bachelor of Business Studies degree and is a member of the Institute of Chartered Accountants in Australia. John has more than 30 years experience in accounting and finance in a broad range of industries including 17 years in resource related entities. He has previously held the role of company secretary and Chief Financial Officer for several publicly listed companies.
24 Dart Mining NL
ReportDirectors’ Report
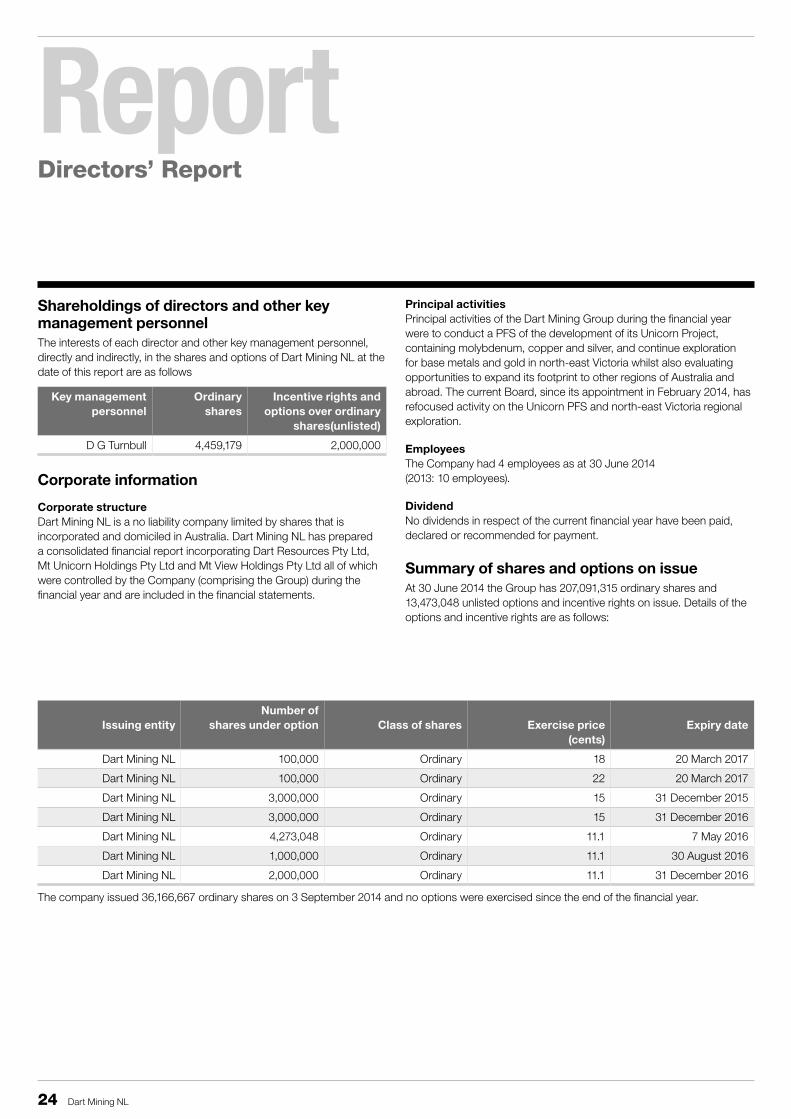
Shareholdings of directors and other key management personnelThe interests of each director and other key management personnel, directly and indirectly, in the shares and options of Dart Mining NL at the date of this report are as follows
Key management personnel
Ordinary shares
Incentive rights and options over ordinary
shares(unlisted)
D G Turnbull 4,459,179 2,000,000
Corporate information
Corporate structureDart Mining NL is a no liability company limited by shares that is incorporated and domiciled in Australia. Dart Mining NL has prepared a consolidated financial report incorporating Dart Resources Pty Ltd, Mt Unicorn Holdings Pty Ltd and Mt View Holdings Pty Ltd all of which were controlled by the Company (comprising the Group) during the financial year and are included in the financial statements.
Principal activitiesPrincipal activities of the Dart Mining Group during the financial year were to conduct a PFS of the development of its Unicorn Project, containing molybdenum, copper and silver, and continue exploration for base metals and gold in north-east Victoria whilst also evaluating opportunities to expand its footprint to other regions of Australia and abroad. The current Board, since its appointment in February 2014, has refocused activity on the Unicorn PFS and north-east Victoria regional exploration.
EmployeesThe Company had 4 employees as at 30 June 2014 (2013: 10 employees).
DividendNo dividends in respect of the current financial year have been paid, declared or recommended for payment.
Summary of shares and options on issue At 30 June 2014 the Group has 207,091,315 ordinary shares and 13,473,048 unlisted options and incentive rights on issue. Details of the options and incentive rights are as follows:
Issuing entity
Number of shares under option
Class of shares
Exercise price
(cents)
Expiry date
Dart Mining NL 100,000 Ordinary 18 20 March 2017
Dart Mining NL 100,000 Ordinary 22 20 March 2017
Dart Mining NL 3,000,000 Ordinary 15 31 December 2015
Dart Mining NL 3,000,000 Ordinary 15 31 December 2016
Dart Mining NL 4,273,048 Ordinary 11.1 7 May 2016
Dart Mining NL 1,000,000 Ordinary 11.1 30 August 2016
Dart Mining NL 2,000,000 Ordinary 11.1 31 December 2016
The company issued 36,166,667 ordinary shares on 3 September 2014 and no options were exercised since the end of the financial year.

25Dart Mining NL
ReportDirectors’ Report
During the financial year, the following incentive rights were granted to a KMP (formerly an Executive Director) of the Company:
Key management personnel
Issuing entity Number of incentive rights granted
D G Turnbull Dart Mining NL 2,000,000
During the financial year, the following options were granted to Arrowhead Business and Investment Decisions LLC in recognition for work undertaken by assisting the Company to achieve a Royalty Agreement as announced on 12 March 2013:
Grantee Issuing entity Number of incentive rights granted
Arrowhead Business and Investment Decisions LLC
Dart Mining NL 1,000,000
Significant changes in state of affairsThere were no significant changes in the state of affairs of the Group during the financial year.
Significant events after balance dateOn 3 September 2014 the Company raised $1,085,000 from a placement of 36,166,667 fully paid ordinary shares to investors. Other than the capital raising there has been no matter or circumstance since 30 June 2014 which has significantly affected or may significantly affect the operations of the consolidated entity, the results of those operations or the state of affairs of the consolidated entity in subsequent financial years.
Future developments, prospects and business strategiesThe Board of Directors intends to continue with the exploration of the Group’s tenements and focus on the Unicorn Project. Further details of the Group’s prospects are included in the Exploration Report.
As the Group is listed on the Australian Securities Exchange, it is subject to the continuous disclosure requirements of the ASX Listing Rules which require immediate disclosure to the market of information that is likely to have a material effect on the price or value of Dart Mining NL’s securities.
The Board of Directors believe they have been compliant with the continuous disclosure requirements throughout the reporting period and to the date of this report.
Environmental regulationThe economic entity holds participating interests in a number of exploration tenements. The various authorities granting such tenements require the tenement holder to comply with the terms of the grant of the tenement and all directions given to it under those terms of the tenement. There have been no known breaches of the tenement conditions and no such breaches have been notified by any government agencies during either the year ended 30 June 2014 or at the date of this report.
Directors and committee meetingsThe Board of Directors established the Audit and Risk Management Committee on 9 May 2007. The charter for the Audit and Risk Management Committee was adopted on 12 July 2007 (revised 17 June 2014). The members of the Committee consist of Robert Hogarth (Chairman) and Bruce Paterson. Chris Bain, Stephen Poke and Dean Turnbull resigned from the Committee during the year.
The Board of Directors established the Remuneration and Nomination Committee on 5 December 2012. The charter for the Remuneration and Nomination Committee was adopted on 19 February 2013 (revised on 17 June 2014). The members of the Committee consist of Bruce Paterson (Chairman) and Robert Hogarth both of whom are Non-executive Directors. Richard Udovenya, Stephen Poke and Chris Bain resigned from the Committee during the year.
The Board of Directors established the Technical Committee on 18 February 2014. The charter for the Technical Committee was adopted on 17 June 2014. The members of the Committee consist of John Cottle (Chairman) and Bruce Paterson. Chris Bain and Dean Turnbull resigned from the Committee during the year.
26 Dart Mining NL
ReportDirectors’ Report
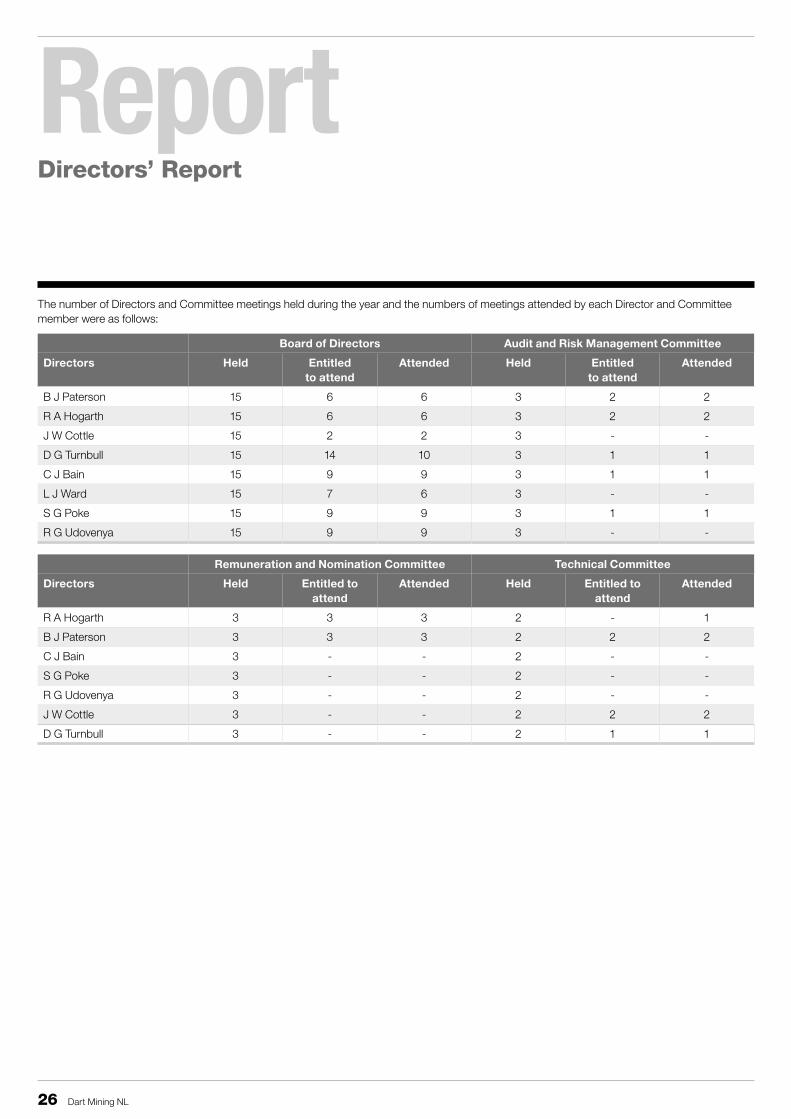
The number of Directors and Committee meetings held during the year and the numbers of meetings attended by each Director and Committee member were as follows:
Board of Directors Audit and Risk Management Committee
Directors Held Entitled to attend
Attended Held Entitled to attend
Attended
B J Paterson 15 6 6 3 2 2
R A Hogarth 15 6 6 3 2 2
J W Cottle 15 2 2 3 - -
D G Turnbull 15 14 10 3 1 1
C J Bain 15 9 9 3 1 1
L J Ward 15 7 6 3 - -
S G Poke 15 9 9 3 1 1
R G Udovenya 15 9 9 3 - -
Remuneration and Nomination Committee Technical Committee
Directors Held Entitled to attend
Attended Held Entitled to attend
Attended
R A Hogarth 3 3 3 2 - 1
B J Paterson 3 3 3 2 2 2
C J Bain 3 - - 2 - -
S G Poke 3 - - 2 - -
R G Udovenya 3 - - 2 - -
J W Cottle 3 - - 2 2 2
D G Turnbull 3 - - 2 1 1
27Dart Mining NL
ReportDirectors’ Report
Indemnification and insurance of directors and officers The Company has entered into Deeds of Indemnity with the Directors and Officers of the Company, indemnifying them against certain liabilities and costs to the extent permitted by law.
The Company has also agreed to pay a premium in respect of a contract insuring the directors and officers of the Company. Full details of the cover and premium are not disclosed as the insurance policy prohibits the disclosure.
Proceedings on behalf of the CompanyNo persons have applied for leave of a Court to bring proceedings on behalf of the Company or intervene in any proceedings to which the Company is a party for the purpose of taking responsibility on behalf of the Company for all or any part of those proceedings. The Company was not a party to any such proceedings during the year.
Non-audit servicesThe directors are satisfied that the provision of non-audit services during the year by the auditor (or by another person or firm on the auditor’s behalf) is compatible with the general standards of independence for auditors imposed by the Corporations Act 2001.
Auditor independence declarationThe auditor’s independence declaration for the year ended 30 June 2014 has been received and is included in this report.
Remuneration Report - AuditedThis remuneration report, which forms part of the Directors’ report, sets out information about the remuneration of the Group’s directors and other key management personnel for the financial year ended 30 June 2014. The prescribed details for each person covered by this report are detailed below.
Details of Directors and other Key Management PersonnelDirectors and other key management personnel of the Group during and since the end of the financial year are as follows:
DirectorsC J Bain (resigned 18 February 2014) L J Ward (resigned 24 December 2013) S G Poke (resigned 7 February 2014) R G Udovenya (resigned 7 February 2014) B J Paterson (appointed 7 February 2014) R A Hogarth (appointed 7 February 2014) J W Cottle (appointed 20 May 2014)
Other Key Management PersonnelD G Turnbull (resigned as a director 20 May 2014; remains as a KMP) A J Draffin (resigned 20 May 2014) J M Nethersole (appointed 28 April 2014) J W Cornelius (appointed 7 February 2014) J Eltham Project Director-AJE Project Development Consultancy Pty Ltd (by agreement 4 February 2013; retired 31 August 2014).
Remuneration philosophyThe Board of Directors of Dart Mining NL is responsible for determining and reviewing compensation arrangements for the Directors, the Managing Director and other key management personnel after consideration is given to the recommendations of the Company’s Remuneration and Nomination Committee. The Remuneration and Nomination Committee’s policy is to ensure that a remuneration package properly reflects the person’s duties and responsibilities, with the overall objective of ensuring maximum stakeholder benefit from the retention of a high quality Board and executive team. The Board of the Company reviews and adopts or amend the recommendations of the Remuneration and Nomination Committee as proposed. The officers of the Company are given the opportunity to receive their base emolument in a variety of forms, including cash, fringe benefits such as motor vehicles and incentive rights. It is intended that the manner of payment chosen will be optimal for the recipient without creating undue cost to the Group.
To assist in achieving these objectives, the Board’s objective is to link the nature and amount of Directors and other key management personnel emoluments to the Company’s financial and operational performance. It is the Board’s policy that employment contracts are entered into with all senior executives. At the date of this report, executive remuneration is set at levels approved by the Board. The Board has implemented these guaranteed levels of remuneration which are not dependent on performance in order to ensure the Group’s ability to retain quality personnel.
Employment Agreements are entered into with Executive Directors and specified executives.

28 Dart Mining NL
ReportDirectors’ Report
The Group’s earnings and movements in shareholders’ wealth for the last 6 financial years to 30 June 2014 is detailed in the following table:
30 June 2014 30 June 2013 30 June 2012 30 June 2011 30 June 2010 30 June 2009
Revenue $2,167,529 $4,612,093 $80,135 $42,893 $16,679 $106,379
Net profit/( loss) after tax ($1,060,846) $55,567 ($2,968,386) ($526,388) ($844,916) ($1,146,803)
Share price at start of year (cents) 7 10 6 11 8 18
Share price at end of year (cents) 1.6 7 10 6 11 8
Dividends - - - - - -
Basic earnings per share (cents) (0.51) 0.03 (1.98) (0.51) (1.32) (2.62)
Diluted earnings per share (cents) (0.51) 0.03 (1.98) (0.51) (1.32) (2.62)
Remuneration structureIn accordance with best practice corporate governance, the structure of non-executive and executive director remuneration is separate and distinct.
Non-executive director remunerationObjectiveThe Board seeks to set aggregate remuneration at a level which provides the Company with the ability to attract and retain directors of the highest calibre at a cost that is acceptable to shareholders.
StructureThe Constitution and the ASX Listing Rules specify that the aggregate remuneration of Non-executive Directors shall be determined from time to time by a general meeting of the Company’s shareholders. An amount not exceeding the sum determined is then divided between the directors as agreed whilst maintaining a surplus amount that can be attributed to additional Non-executive Directors should they be appointed at any time. The latest determination was sought and granted at the Company’s AGM on 2 October 2012 whereby shareholders approved an aggregate remuneration of $475,000 per year: an increase from the previous aggregate remuneration amount of $200,000 per year which was set with the adoption of the Company’s constitution on 22 June 2006.
The amount of aggregate remuneration sought to be approved by shareholders and the manner in which it is apportioned amongst directors is reviewed annually. The Board considers advice from external consultants as well as the fees paid to Non-executive Directors of comparable companies when undertaking the annual review process.
Each Non-executive Director receives a fee for being a Director of the Group. Directors who are called upon to perform extra services beyond the Director’s ordinary duties or who are members of Board Committees may be paid additional fees for those services.
The remuneration of Non-executive Directors for the financial year ended 30 June 2014 is detailed in this report.
The Board encourages its directors to align their interests with the Company by owning equity. The Board has resolved that in view of Company and commercially sensitive aspects being dealt with during the PFS that Non-executive Directors will not hold shares in the Company until at least completion of the Study.
Senior executive remunerationObjectiveThe Board aims to reward Executives with a level and mix of remuneration commensurate with their position and responsibilities within the Company and so as to:
• reward Executives for Company, business unit and individual performance against targets set by reference to appropriate benchmarks;
• align the interests of Executives with those of shareholders;• link reward with the strategic goals and performance of the Company;
and• ensure total remuneration is competitive by market standards.
StructureIn determining the level and make-up of executive remuneration, the Board obtained independent advice from external consultants on market levels of remuneration for comparable executive roles. It is the Board’s policy that employment contracts are entered into with all senior executives.

29Dart Mining NL
ReportDirectors’ Report
Service contractsService contracts were entered into with Executive Directors and Specified Executives.
Interim Chief Executive Officer and Commercial ManagerThe terms of an employment agreement with the interim CEO, John Cornelius, issued on 1 July 2014 include inter alia:
• A fixed remuneration package of $262,800 per annum, together with reimbursement of all business related expenses including motor vehicle expenses reimbursed at the rate designated by the Australian Taxation Office;
• Performance bonus target which is based on specific performance criteria related to the Group’s capacity to complete the Unicorn Project PFS; and
• The agreement can be terminated by 3 months notice being given by either party. On termination, unvested STI awards are forfeited.
Dean G TurnbullThe terms of an employment agreement with Dean Turnbull include inter alia:
• A remuneration package of $181,639 per annum, with annual reviews, together with reimbursement of all business related expenses including motor vehicle running and maintenance expenses plus statutory annual leave entitlements;
• A restraint on Dean undertaking additional part-time consulting or provision of other services which may conflict with the activities of Dart without the approval of the Chairman which may not be unreasonably withheld. This restraint continues for 12 months after cessation of engagement with the Company;
• The agreement can be terminated by either party upon 3 months notice being given; and
• A bonus may be paid to Dean at the sole discretion of the Board which is based on certain performance criteria being exceeded for any pre-determined period.
Other Key Management PersonnelAll other KMP have rolling contracts with standard termination provisions as follows:
Notice period
Payment in lieu of notice
Treatment of STI on termination
Resignation 1 - 3 months 1 - 3 months Unvested awards forfeited
Termination for cause
1 month 1 month Unvested awards forfeited. Clawback of deferred STI payments at the Board’s discretion
Termination in cases of disablement, redundancy or notice without cause
3 months 3 months Clawback of deferred STI payments at the Board’s discretion
Payments applicable to outgoing executivesLindsay Ward resigned from his part-time position of Managing Director and CEO on 24 December 2013. Payments made as a result of Lindsay’s resignation are as follows:
• $112,240 termination payment in lieu of notice;• $8,463 annual leave entitlements;• $17,000 payment of expenses in respect of motor vehicle finance
repayments, repairs and maintenance, fuel, service and telephone.
Andrew DraffinDuring the year the Company remunerated Draffin Walker Pty Ltd, a firm of Chartered Accountants of which Andrew Draffin is a director, for secretarial, accounting and corporate compliance services. Fees received for the year under review were $56,934.
30 Dart Mining NL
ReportDirectors’ Report
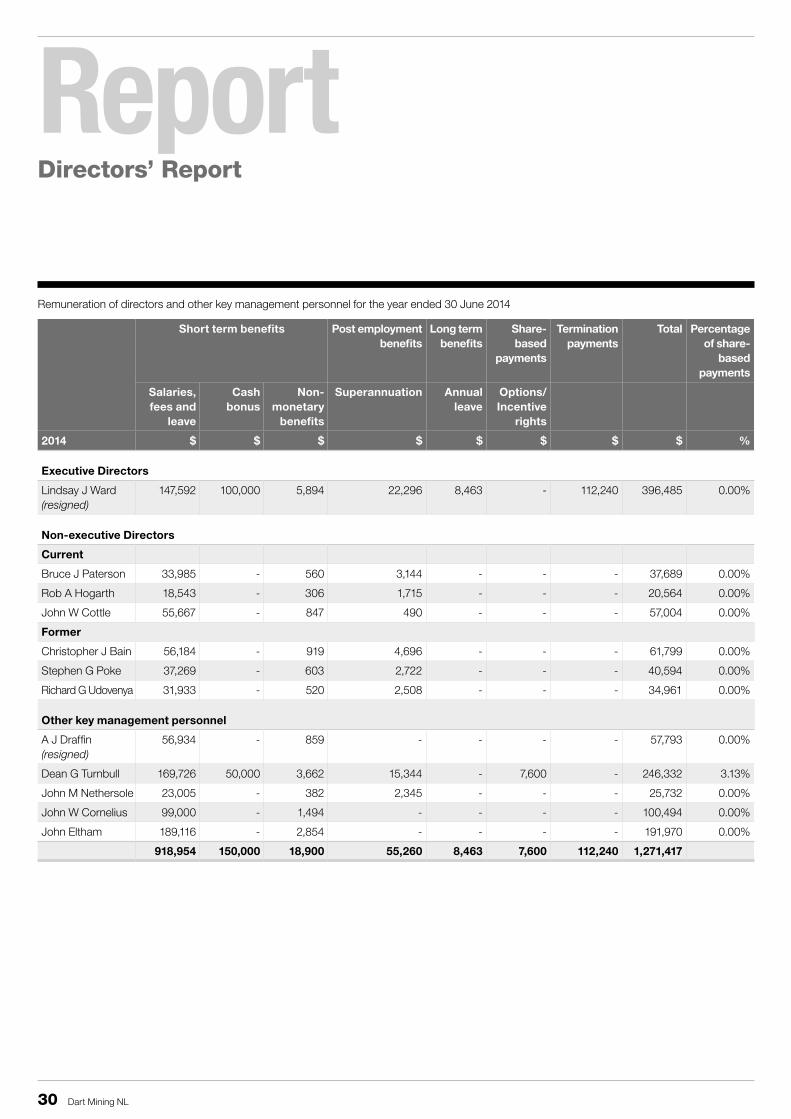
Remuneration of directors and other key management personnel for the year ended 30 June 2014
Short term benefits Post employment benefits
Long term benefits
Share-based
payments
Termination payments
Total Percentage of share-
based payments
Salaries, fees and
leave
Cash bonus
Non-monetary
benefits
Superannuation Annual leave
Options/Incentive
rights
2014 $ $ $ $ $ $ $ $ %
Executive Directors
Lindsay J Ward (resigned)
147,592 100,000 5,894 22,296 8,463 - 112,240 396,485 0.00%
Non-executive Directors
Current
Bruce J Paterson 33,985 - 560 3,144 - - - 37,689 0.00%
Rob A Hogarth 18,543 - 306 1,715 - - - 20,564 0.00%
John W Cottle 55,667 - 847 490 - - - 57,004 0.00%
Former
Christopher J Bain 56,184 - 919 4,696 - - - 61,799 0.00%
Stephen G Poke 37,269 - 603 2,722 - - - 40,594 0.00%
Richard G Udovenya 31,933 - 520 2,508 - - - 34,961 0.00%
Other key management personnel
A J Draffin (resigned)
56,934 - 859 - - - - 57,793 0.00%
Dean G Turnbull 169,726 50,000 3,662 15,344 - 7,600 - 246,332 3.13%
John M Nethersole 23,005 - 382 2,345 - - - 25,732 0.00%
John W Cornelius 99,000 - 1,494 - - - - 100,494 0.00%
John Eltham 189,116 - 2,854 - - - - 191,970 0.00%
918,954 150,000 18,900 55,260 8,463 7,600 112,240 1,271,417

31Dart Mining NL
ReportDirectors’ Report
Short term benefits Post employment benefits
Long term benefits
Share-based
payments
Termination payments
Total Percentage of share-
based payments
Salaries, fees and
leave
Cash bonus
Non-monetary
benefits
Superannuation Annual leave
Options/Incentive
rights
2013 $ $ $ $ $ $ $ $ %
Executive Directors
Lindsay J Ward 230,672 100,000 7,846 29,761 334 184,000 - 552,613 33.78%
Dean G Turnbull 164,266 50,000 3,640 14,618 23,876 - - 256,400 0.00%
Non-executive Directors
Christopher J Bain 78,692 - 2,669 6,750 - 99,900 - 188,011 53.90%
Stephen G Poke 50,538 - 2,226 4,154 - 99,900 - 156,818 64.62%
Richard G Udovenya 49,000 - 2,203 4,050 - 99,900 - 155,153 65.32%
Other key management personnel
A Draffin 44,175 - 636 - - - - 44,811 0.00%
J Eltham 123,570 - 1,780 - - - - 125,350 0.00%
740,913 150,000 21,000 59,333 24,210 483,700 - 1,479,156
BonusesCash bonuses totalling $150,000 were granted to Executive Directors during the financial year ended 30 June 2014 (2013: $150,000).
Employee options 2,000,000 incentive rights were issued to a Director during the year.
At the end of the financial year, the following share-based payment arrangements were in existence:
Grantee Number Grant date Expiry date Exercise price (cents)
Fair value at grant date
(cents)
Vesting date
C J Bain 1,000,000 5 Nov 2012 31 Dec 2015 15 4.600 5 Nov 2012
C J Bain 1,000,000 5 Nov 2012 31 Dec 2016 15 5.390 5 Nov 2012
S G Poke 1,000,000 5 Nov 2012 31 Dec 2015 15 4.600 5 Nov 2012
S G Poke 1,000,000 5 Nov 2012 31 Dec 2016 15 5.390 5 Nov 2012
R G Udovenya 1,000,000 5 Nov 2012 31 Dec 2015 15 4.600 5 Nov 2012
R G Udovenya 1,000,000 5 Nov 2012 31 Dec 2016 15 5.390 5 Nov 2012
D G Turnbull 2,000,000 21 May 2014 31 Dec 2016 11 0.380 21 May 2014
These options and incentive rights are not quoted, not transferrable and may be exercised at any time after vesting date.
4,000,000 remuneration options lapsed during the financial year.

32 Dart Mining NL
ReportDirectors’ Report
The following table summarises the value of remuneration options and incentive rights granted, exercised or lapsed during the year:
Value of incentive rights granted
Value of options exercised
Value of options lapsed at lapse date
$ $ $
D G Turnbull 7,600 - 1,000
C J Bain - - 1,000
S G Poke - - 1,000
R G Udovenya - - 1,000
This directors’ report is signed in accordance with a resolution of directors made pursuant to s.298(2) of the Corporations Act 2001.
Bruce J Paterson Chairman
John W Cottle Director
Robert A Hogarth Director
Melbourne 23 September 2014

33Dart Mining NL
ReportCorporate Governance Statement
The Board of Directors of Dart Mining NL (the Company) is responsible for establishing the corporate governance framework of the Group having regard to the ASX Corporate Governance Council (CGC) published guidelines as well as its corporate governance principles and recommendations. The Board guides and monitors the business and affairs of the Company on behalf of the shareholders by whom they are elected and to whom they are accountable.
The Company’s corporate governance statement for 2014 is located on the Company’s website at www.dartmining.com.au - Our Company –Corporate Governance.

34 Dart Mining NL
DeclarationAuditor’s Independence Declaration

35Dart Mining NL
FinancialsConsolidated Statement of Comprehensive IncomeFor the financial year ended 30 June 2014
Consolidated Group
2014Restated
2013
Note $ $
Continuing operations
Revenue 4 2,167,529 4,612,093
Consultancy fees (275,725) -
Professional fees (133,678) -
Share based payments (43,600) (377,758)
Employee benefits expense (685,997) (400,857)
Exploration costs written-off (1,022,549) (582,362)
Research and development expense (798,585) (2,570,396)
Depreciation and amortisation expense (173) (348)
Other expenses (48,614) (10,391)
Office expenses (37,981) (9,412)
Administrative expenses (174,939) (572,994)
Travel related expenses (6,534) (32,008)
Expenses (3,228,375) (4,556,526)
Profit/(loss) before income tax expense 5 (1,060,846) 55,567
Income tax expense 6 - -
Profit/(loss) for the year (1,060,846) 55,567
Other comprehensive income
Items that will not be reclassified to profit or loss - -
Items that may be reclassified subsequently to profit or loss - -
Other comprehensive income for the year - -
Total comprehensive income for the year - -
Attributable to:
Net profit/(loss) attributable to
Members of the parent entity (1,060,846) 55,567
Non-controlling interests - -
Total comprehensive income (1,060,846) 55,567
Earnings per share
From continuing and discontinued operations
Basic earnings per share (cents) 9 (0.51) 0.03
Diluted earnings per share (cents) 9 (0.51) 0.03
The accompanying notes form part of these financial statements

36 Dart Mining NL
FinancialsConsolidated Statement of Financial PositionAs at 30 June 2014
Consolidated
30 June 2014Restated
30 June 2013Restated
1 July 2012
Note $ $ $
ASSETS
Current assets
Cash and cash equivalents 10 3,583,741 5,747,831 3,482,337
Trade and other receivables 11 95,264 171,507 139,975
Other assets 15 25,343 28,319 28,986
Total current assets 3,704,348 5,947,657 3,651,298
Non-current assets
Property, plant and equipment 13 19,526 50,610 83,801
Other non-current assets 15 99,840 87,711 86,328
Deferred exploration and evaluation costs 14 7,030,130 6,143,028 5,884,905
Total non-current assets 7,149,496 6,281,349 6,055,034
TOTAL ASSETS 10,853,844 12,229,006 9,706,332
LIABILITIES
Current liabilities
Trade and other payables 16 241,661 608,003 544,064
Provisions 17 38,793 30,367 21,109
Total current liabilities 280,454 638,370 565,173
TOTAL LIABILITIES 280,454 638,370 565,173
NET ASSETS 10,573,390 11,590,636 9,141,159
EQUITY
Issued capital 18 17,310,599 17,310,599 15,193,057
Reserves 27 371,698 336,448 60,080
Retained earnings (7,108,907) (6,056,411) (6,111,978)
TOTAL EQUITY 10,573,390 11,590,636 9,141,159
The accompanying notes form part of these financial statements

37Dart Mining NL
FinancialsConsolidated Statement of Changes in EquityFor the financial year ended 30 June 2014
Ordinary share capital
Option reserve Accumulated losses
Total
Consolidated $ $ $ $
Balance at 1 July 2012 restated 15,193,057 60,080 (6,111,978) 9,141,159
Comprehensive income
Profit for the year - - 55,567 55,567
Other comprehensive income for the year - - - -
Total comprehensive income for the year - - 55,567 55,567
Transactions with owners, in their capacity as owners, and other transfers
Options and performance rights issued - 697,823 - 697,823
Options exercised - (230,620) - (230,620)
Shares issued during the year 2,279,988 - - 2,279,988
Capital raising costs (162,446) - - (162,446)
Fair value adjustments for options issued - (190,835) - (190,835)
Total transactions with owners and other transfers
2,117,542 276,368 - 2,393,910
Balance at 30 June 2013 restated 17,310,599 336,448 (6,056,411) 11,590,636
Balance at 1 July 2013 restated 17,310,599 336,448 (6,056,411) 11,590,636
Comprehensive income
Profit/(loss) for the year - - (1,060,846) (1,060,846)
Other comprehensive income for the year - - - -
Total comprehensive income for the year - - (1,060,846) (1,060,846)
Transactions with owners, in their capacity as owners, and other transfers
Options and performance rights issued - 43,600 - 43,600
Fair value of lapsed options transferred - (8,350) 8,350 -
Total transactions with owners and other transfers
- 35,250 8,350 43,600
Balance at 30 June 2014 17,310,599 371,698 (7,108,907) 10,573,390
The accompanying notes form part of these financial statements

38 Dart Mining NL
FinancialsConsolidated Statement of Cash FlowsFor the year ended 30 June 2014
Consolidated
2014 Restated 2013
Note $ $
Cash flows from operating activities
Sale of royalty interest - 4,500,000
Research and development grant received 2,033,411 -
Interest received 155,838 95,301
Payments to suppliers and employees (2,024,196) (3,566,117)
Net cash provided by/(used in) operating activities 22a 165,053 1,029,184
Cash flows from investing activities
Payments for exploration costs (2,276,321) (645,242)
Purchase of property, plant and equipment (4,741) (5,369)
Payments for investments (37,500) -
Cash amounts used as security deposits (10,581) -
Net cash provided by/(used) in investing activities (2,329,143) (650,611)
Cash flows from financing activities
Proceeds from issue of ordinary shares - 2,049,368
Payment of share issue costs - (162,447)
Net cash provided by/(used in) financing activities - 1,886,921
Net increase/(decrease) in cash held (2,164,090) 2,265,494
Cash and cash equivalent at the beginning of the financial year 5,747,831 3,482,337
Cash and cash equivalent at the end of the financial year 10 3,583,741 5,747,831
The accompanying notes form part of these financial statements

Financials
39Dart Mining NL
Notes to the Consolidated Financial StatementsFor the financial year ended 30 June 2014
Note 1 Corporate information
The consolidated financial statements of Dart Mining NL and its subsidiaries (collectively, the Group) for the year ended 30 June 2014 were authorised for issue in accordance with a resolution of the Directors on 23 September 2014.
Dart Mining NL (the Company or the parent) is a for profit company limited by shares incorporated in Australia whose shares are publicly
traded on the Australian Stock Exchange.
The nature of the operations and principal activities of the Group are described in the Directors’ Report. Information on the Group’s structure is provided in Note 12. Information on other related party relationships is provided in Note 25.
Note 2 Summary of significant accounting policies
Basis of preparationThese financial statements are general-purpose financial statements which have been prepared in accordance with the Australian Accounting Standards, Australian Accounting Interpretations, other authoritative pronouncements of the Australian Accounting Standards Board and the Corporations Act 2001
Australian Accounting Standards set out accounting policies that the Australian Accounting Standards Board has concluded would result in financial statements containing relevant and reliable information about transactions, events and conditions. Compliance with Australian Accounting Standards ensures that the financial statements and notes also comply with International Financial Reporting Standards (IFRS) as issued by the International Accounting Standards Board. Material accounting policies adopted in the preparation of the financial statements are presented below and have been consistently applied unless stated otherwise.
Except for cash flow information, the financial statements have been prepared on an accrual basis and are based on historical costs, modified where applicable by the measurement at fair value of selected non-current assets, financial assets and financial liabilities.
Changes in accounting policyEffective 1 June 2013, the Group has amended its accounting policy for the treatment of research and development costs whereby such costs are now expensed as incurred in accordance with AASB 138 – Intangible Assets. This amendment to the accounting policy has had a significant effect on the financial performance of the Group because it previously deferred exploration related research and development expenditures in the period it was incurred. The Group has transferred at the beginning of the comparative period research and development costs carried forward to accumulated losses as a result of the change in accounting policy.
The research and development expenditure is now expensed as incurred directly in the Statement of Comprehensive Income. The Directors believe that this method of accounting for research and development expenditure provides more relevant information about the Company’s operations. The cumulative impacts of this change are shown below.
Consolidated Consolidated Consolidated
30 June 2014 30 June 2013Periods prior to
1 July 2012
$ $ $
Statement of financial position
(Decrease) in trade and other receivables (876,733) (876,733) -
(Decrease) in deferred exploration & evaluation costs (4,518,691) (4,518,691) (1,948,295)
(Increase) in accumulated losses (5,395,424) (5,395,424) (1,948,295)
Statement of comprehensive income
(Decrease) in revenue - (876,733) -
Increase in expenses - (2,570,396) (1,948,295)
Change in EPS (cents) - (1.30) Not applicable
Statement of cash flows
(Increase) decrease in payments to suppliers - (2,570,396) (1,948,295)
(Increase) decrease in payments for exploration costs - 2,570,396 1,948,295

Financials
40 Dart Mining NL
Notes to the Consolidated Financial StatementsFor the financial year ended 30 June 2014
(a) Principles of consolidationThe consolidated financial statements incorporate the assets, liabilities and results of entities controlled by Dart Mining NL at the end of the reporting period. A controlled entity is any entity over which Dart Mining NL has the ability and right to govern the financial and operating policies so as to obtain benefits from the entity’s activities.
The result of subsidiaries acquired or disposed of during the year are included in the consolidated statement of comprehensive income from the effective date of acquisition or up to the effective date of disposal, as appropriate. A list of controlled entities is contained in Note 12 to the financial statements.
In preparing the consolidated financial statements, all intra-group balances and transactions between entities in the consolidated group have been eliminated in full.
(b) Income tax The income tax expense (income) for the year comprises current income tax expense (income) and deferred tax expense/ (income).
Current income tax expense charged to profit or loss is the tax payable on taxable income. (Current tax liabilities)/assets are measured at the amounts expected to be paid to/ (recovered from) the relevant taxation authority.
Deferred income tax expense reflects movements in deferred tax assets and deferred tax liability balances during the year and unused tax losses.
Current and deferred income tax expense/ (income) is charged or credited outside profit or loss when the tax relates to items that are recognised outside profit or loss.
Except for business combinations, no deferred income tax is recognised from the initial recognition of an asset or liability, where there is no effect on accounting or taxable profit or loss.
Deferred tax assets and liabilities are calculated at the tax rates that are expected to apply to the period when the asset is realised or the liability is settled. Their measurement also reflects the manner in which management expects to recover or settle the carrying amount of the related asset or liability. With respect to non-depreciable items of property, plant and equipment measured at fair value and items of investment property measured at fair value, the related deferred tax liability or deferred tax asset is measured on the basis that the carrying amount of the asset will be recovered entirely through sale.
Deferred tax assets relating to temporary differences and unused tax losses are recognised only to the extent that it is probable that future taxable profit will be available against which the benefits of the deferred tax asset can be utilised.
Where temporary differences exist in relation to investments in subsidiaries, branches, associates and joint ventures, deferred tax assets and liabilities are not recognised where the timing of the reversal of the temporary difference can be controlled and it is not probable that the reversal will occur in the foreseeable future.
Current tax assets and liabilities are offset where a legally enforceable right of set-off exists and it is intended that net settlement or simultaneous realisation and settlement of the respective asset and liability will occur. Deferred tax assets and liabilities are offset where : (a) a legally enforceable right of offset exists; and (b) the deferred tax assets and liabilities relate to income taxes levied by the same taxation authority on either the same taxable entity or different taxable entities where it is intended that net settlement or simultaneous realisation and settlement of the respective asset and liability will occur in future periods in which significant amounts of deferred tax assets or liabilities are expected to be recovered or settled.
(c) Property, plant and equipmenti) AcquisitionItems of property, plant and equipment are initially recorded at cost net of GST and depreciated as outlined below.
ii) Depreciation of property, plant and equipment Property, plant and equipment are depreciated on a straight line basis at rates based upon the expected useful lives of these assets. The useful lives of these assets are detailed in Note 13 to the financial statements.
iii) DisposalThe gain or loss arising on disposal or retirement of property, plant or equipment is determined as the difference between the sales proceeds and the carrying amount of the asset and is recognised in profit and loss.
iv) Subsequent measurementProperty, plant and equipment are subsequently measured at amortised cost. Amortised cost is calculated as the amount at which the asset is measured at initial recognition less any depreciation or impairment.
(d) Deferred exploration and evaluation In accordance with AASB 6 Exploration For and Evaluation of Mineral Resources, exploration and evaluation expenditure incurred is accumulated in respect of each identifiable area of interest. Other than Research and Development costs (see Note 2 (e)) these costs are only carried forward to the extent that they are expected to be recouped through the successful development of the area or where activities in the area have not yet reached a stage which permits reasonable assessment of the existence of economically recoverable reserves.

Financials
41Dart Mining NL
Notes to the Consolidated Financial StatementsFor the financial year ended 30 June 2014
Accumulated costs in relation to an abandoned area are written off in full against operating results in the year in which the decision to abandon the area is made.
When production commences, the accumulated costs for the relevant area of interest are amortised over the life of the area according to the rate of depletion of the economically recoverable reserves.
A regular review is undertaken of each area of interest to determine the appropriateness of continuing to carry forward costs in relation to that area of interest.
Costs of site restoration are provided over the life of the facility from when exploration commences and are included in the costs of that stage. Site restoration costs include the dismantling and removal of mining plant, equipment and building structures, waste removal and rehabilitation of the site in accordance with the clauses of the mining permits. Such costs are determined using estimates of future costs, current legal requirements and technology on an undiscounted basis.
Any changes in the estimates for the costs are accounted for on a prospective basis. In determining the costs of site restoration there is uncertainty regarding the nature and extent of the restoration due to community expectations and future legislation. Accordingly the costs are determined on the basis that restoration will be completed within one year of abandoning a site.
(e) Research and development costsResearch costs relating to the development of exploration models are expensed as incurred.
This is a change in accounting policy from 1 June 2013 as previously research costs had been carried forward as deferred exploration and evaluation expenditure. The impact of this change is a $1,948,295 reduction in assets and increase in accumulated losses. The reason for the change is the new policy better reflects the nature of this expenditure and better matches the recognition of related Government Grants (see Note 2(s)).
(f) Financial instruments
Initial recognition and measurementFinancial assets and financial liabilities are recognised when the entity becomes a party to the contractual provisions to the instrument. For financial assets, this is equivalent to the date that the Company commits itself to either the purchase or sale of the asset (i.e. trade date accounting is adopted).
Financial instruments are initially measured at fair value plus transaction costs except where the instrument is classified at fair value through profit or loss in which case transaction costs are expensed to profit or loss immediately.
Classification and subsequent measurementFinancial instruments are subsequently measured at fair value, amortised cost using either the effective interest method or cost
Amortised cost is calculated as the amount at which the financial assets or financial liability is measured at initial recognition less principal repayments, any reduction for impairment and adjusted for any cumulative amortisation of the difference between that initial amount and the maturity amount calculated using the effective interest method.
Fair value is determined based on current bid prices for all quoted investments. Valuation techniques are applied to determine the fair value for all unlisted securities, including recent arm’s length transactions, by reference to similar instruments and option pricing models.
The effective interest method is used to allocate interest income or interest expense over the relevant period and is equivalent to the rate that discounts estimated future cash payments or receipts (including fees, transaction costs and other premiums or discounts) over the expected life (or when this cannot be reliably predicted, the contractual term) of the financial instrument to the net carrying amount of the financial asset or financial liability. Revisions to expected future net cash flows will necessitate an adjustment to the carrying amount with a consequential recognition of an income or expense item in profit or loss.
The Group does not designate any interests in subsidiaries, associates or joint venture entities as being subject to the requirements of accounting standards specifically applicable to financial instruments.
(i) Loans and receivables Loans and receivables are non-derivative financial assets
with fixed or determinable payments that are not quoted in an active market and are subsequently measured at amortised cost. Gains or losses are recognised in profit or loss through the amortisation process and when the financial asset is de-recognised.
(ii) Held-to-maturity investments Held-to-maturity investments are non-derivative financial assets
that have fixed maturities and fixed or determinable payments, and it is the Group’s intention to hold these investments to maturity. They are subsequently measured at amortised cost. Gains or losses are recognised in profit or loss through the amortisation process and when the financial asset is de-recognised.
(iii) Financial liabilities Non-derivative financial liabilities other than financial guarantees
are subsequently measured at amortised cost. Gains or losses are recognised in profit or loss through the amortisation process and when the financial asset is de-recognised.

Financials
42 Dart Mining NL
Notes to the Consolidated Financial StatementsFor the financial year ended 30 June 2014
ImpairmentAt the end of each reporting period the Group assesses whether there is objective evidence that a financial asset has been impaired. A financial asset (or a group of financial assets) is deemed to be impaired if, and only if, there is objective evidence of impairment as a result of one or more events (a “loss event”) having occurred, which has an impact on the estimated future cash flows of the financial asset(s).
In the case of available-for-sale financial assets, a significant or prolonged decline in the market value of the instrument is considered to constitute a loss event. Impairment losses are recognised in profit or loss immediately. Also, any cumulative decline in fair value previously recognised in other comprehensive income is reclassified to profit or loss at this point.
In the case of financial assets carried at amortised cost, loss events may include: indications that the debtors or a group of debtors are experiencing significant financial difficulty, default or delinquency in interest or principal payments; indications that they will enter bankruptcy or other financial reorganisation; and changes in arrears or economic conditions that correlate with defaults.
For financial assets carried at amortised cost (including loans and receivables), a separate allowance account is used to reduce the carrying amount of financial assets impaired by credit losses. After having taken all possible measures of recovery, if management establishes that the carrying amount cannot be recovered by any means, at that point the written-off amounts are charged to the allowance account or the carrying amount of impaired financial assets is reduced directly if no impairment amount was previously recognised in the allowance account.
When the terms of financial assets that would otherwise have been past due or impaired have been renegotiated, the Group recognises the impairment for such financial assets by taking into account the original terms as if the terms have not been renegotiated so that the loss events that have occurred are duly considered.
De-recognitionFinancial assets are de-recognised when the contractual rights to receipt of cash flows expire or the asset is transferred to another party whereby the entity no longer has any significant continuing involvement in the risks and benefits associated with the asset. Financial liabilities are de-recognised when the related obligations are discharged, cancelled or have expired. The difference between the carrying amount of the financial liability extinguished or transferred to another party and the fair value of consideration paid, including the transfer of non-cash assets or liabilities assumed, is recognised in the statement of comprehensive income or profit or loss.
(g) Impairment of assetsAt the end of each reporting period, the Group assesses whether there is any indication that an asset may be impaired. The assessment will include the consideration of external and internal sources of information including dividends received from subsidiaries, associates or jointly controlled entities deemed to be out of pre-acquisition profits. If such an indication exists, an impairment test is carried out on the asset by comparing the recoverable amount of the asset, being the higher of the asset’s fair value less costs to sell and value in use, to the asset’s carrying amount. Any excess of the asset’s carrying amount over its recoverable amount is recognised immediately in profit or loss, unless the asset is carried at a revalued amount in accordance with another Standard (e.g. in accordance with the revaluation model in AASB 116: Property, Plant and Equipment). Any impairment loss of a revalued asset is treated as a revaluation decrease in accordance with that other Standard.
Where it is not possible to estimate the recoverable amount of an individual asset, the Group estimates the recoverable amount of the cash-generating unit to which the asset belongs.
Impairment testing is performed annually for goodwill, intangible assets with indefinite lives and intangible assets not yet available for use.
(h) LeasesLeases are classified at their inception as either operating or finance leases based on the economic substance of the agreement so as to reflect the risks and benefits incidental to ownership.
Operating LeasesThe minimum lease payments of operating leases, where the lesser effectively retains substantially all of the risks and benefits of ownership of the leased item, are recognised as an expense on a straight line basis. Contingent rentals are recognised as an expense in the financial year in which they are incurred.
Finance LeasesLeases which effectively transfer substantially the entire risks and benefits incidental to ownership of the leased item to the Group are capitalised at the present value of the minimum lease payments and disclosed as property, plant and equipment under lease. A lease liability of equal value is also recognised. The consolidated entity has no finance leases as at 30 June 2014.
(i) Employee benefitsProvision is made for the Group’s liability for employee benefits arising from services rendered by employees to the end of the reporting period. Employee benefits that are expected to be settled within one year have been measured at the amounts expected to be paid when the liability is settled.

Financials
43Dart Mining NL
Notes to the Consolidated Financial StatementsFor the financial year ended 30 June 2014
Employee benefits payable later than one year have been measured at the present value of the estimated future cash outflows to be made for those benefits. In determining the liability, consideration is given to employee wage increases and the probability that the employee may satisfy any vesting requirements. These cash flows are discounted using market yields on national government bonds with terms to maturity that match the expected timing of cash flows attributable to employee benefits.
(j) ProvisionsProvisions are recognised when the group has a legal or constructive obligation, as a result of past events, for which it is probable that an outflow of economic benefits will result and that outflow can be reliably measured.
(k) Cash and cash equivalentsCash and cash equivalents include cash on hand, deposits available on demand with banks, other short-term highly liquid investments with original maturities of 3 months or less and bank overdrafts. Bank overdrafts are reported within short-term borrowings in current liabilities in the statement of financial position.
(l) Issued capitalIssued and paid up capital is recognised at the fair value of the consideration received by the Company.
Transaction costs on the issue of equity instrumentsTransaction costs arising on the issue of equity instruments are recognised directly in equity as a reduction of the proceeds of the equity instrument to which the costs relate. Transaction costs are costs that are incurred directly in connection with the issue of those equity instruments and which would not have been incurred had those instruments not been issued.
(m) Share-based paymentsThe Group measures the cost of equity-settled transactions with employees and consultants by reference to the fair value of the equity instruments at the date at which they are granted. The fair value is determined by using the Black-Scholes model, using the assumptions detailed in Note 23.
(i) The fair value determined at the grant date of the equity settled share based payment is expensed on a straight-line basis over the vesting period, based on the directors’ estimate of shares that will eventually vest.
(ii) Equity-settled share based payment transactions with other parties are measured at the fair value of the goods and services received, except where the fair value cannot be estimated reliably, in which these are measured at the fair value of the equity instruments granted at the date the entity obtains the goods or the counterparty renders the service.
(n) Going concern basisThe Group is involved in the exploration and evaluation of mineral tenements and as such expects to be cash absorbing until these tenements demonstrate that they contain economically recoverable reserves.
As at 30 June 2014, the Group had a surplus of current assets over current liabilities of $3,423,894 (2013: $5,309,287) including cash reserves of $3,583,741 (2013: $5,747,831).
The balance of these cash reserves broadly is within the Group’s planned minimum expenditure budget including exploration activities for the 12 months to 31 August 2015 based on the minimum spend required in order to maintain the Group’s existing tenements. The Group is currently undertaking a Pre-feasibility Study on the Unicorn Project under a $9.9 million strategic plan. Additional funding will be required to complete the work outlined in the strategic plan.
For the year ended 30 June 2014, the Group reported net cash inflows/ (outflows) from operations and investing activities of $165,053 (2013:$1,029,184) and ($2,329,143) (2013: ($650,611)) respectively. These cash outflows were offset by net cash inflows from financing activities of $NIL (2013: $1,886,921) resulting in total cash inflows/ (outflows) for the year of ($2,164,090) (2013: $2,265,494).
Notwithstanding the above, the financial statements have been prepared on a going concern basis which contemplates the continuity of normal business activities and the realisation of assets and settlement of liabilities in the ordinary course of business.
The ability of the Group to continue as a going concern for the twelve months from the date of this report is dependent on its ability to control its overhead costs and exploration expenditures. The Group also has the ability potentially to generate additional funds from activities including:
• the potential receipt of the $4.7 million discretionary second tranche of funding from Orion Finance Group (refer Note 14);
• other future equity or debt fund raisings;• the potential farm-out of participating interests in the Group’s
tenements; and• successful development of existing tenements.
Having carefully assessed the likelihood of securing additional funding or entering into farm-out arrangements including the funds raised subsequent to the balance date and the Group’s ability to effectively manage their expenditures and cash flows from operations, the directors believe that the Group will continue to operate as a going concern for the foreseeable future and therefore it is appropriate to prepare the financial statements on a going concern basis.
Financials
44 Dart Mining NL
Notes to the Consolidated Financial StatementsFor the financial year ended 30 June 2014
(o) Revenue and other incomeRevenue is measured at the fair value of the consideration received or receivable after taking into account any trade discounts and volume rebates allowed. When the inflow of consideration is deferred it is treated as the provision of financing and is discounted at a rate of interest that is generally accepted in the market for similar arrangements. The difference between the amount initially recognised and the amount ultimately received is interest revenue.
Interest revenue is recognised using the effective interest method.
All revenue is stated net of the amount of goods and services tax.
(p) Trade and other receivablesTrade and other receivables include amounts due from customers for goods sold and services performed in the ordinary course of business. Receivables expected to be collected within 12 months of the end of the reporting period are classified as current assets. All other receivables are classified as non-current assets.
Trade and other receivables are initially recognised at fair value and subsequently measured at amortised cost using the effective interest method, less any provision for impairment. Refer to Note 2(f) for further discussion on the determination of impairment losses.
(q) Trade and other payablesTrade and other payables represent the liabilities for goods and services received by the entity that remain unpaid at the end of the reporting period. The balance is recognised as a current liability with the amounts normally paid within 30 days of recognition of the liability.
(r) Goods and services tax (GST)Revenues, expenses and assets are recognised net of the amount of GST, except where the amount of GST incurred is not recoverable from the Australian Taxation Office (ATO).
Receivables and payables are stated inclusive of the amount of GST receivable or payable. The net amount of GST recoverable from, or payable to, the ATO is included with other receivables or payables in the statement of financial position.
Cash flows are presented on a gross basis. The GST components of cash flows arising from investing or financing activities which are recoverable from, or payable to, the ATO are presented as operating cash flows included in receipts from customers or payments to suppliers.
(s) Government grantsGovernment grants are recognised at fair value where there is reasonable assurance that the grant will be received and all grant conditions will be met. Grants relating to expense items are recognised as income on the date of receipt of the grant. Grants relating to assets are credited to deferred income at fair value and are credited to income over the expected useful life of the asset on a straight-line basis.
(t) Comparative figuresWhen required by Accounting Standards, comparative figures have been adjusted to conform to changes in presentation for the current financial year.
Where the Group retrospectively applies an accounting policy, makes a retrospective restatement or reclassifies items in its financial statements, an additional (third) statement of financial position as at the beginning of the preceding period in addition to the minimum comparative financial statement is presented.
(u) Critical accounting judgements and sources of estimationsIn applying the Group’s accounting policies, management is required to make judgements, estimates and assumptions about the carrying values of assets and liabilities. These estimates and assumptions are made based on past experience and other factors that are considered relevant. Actual results may differ from these estimates. All estimates and underlying assumptions are reviewed on an ongoing basis. Revisions to accounting estimates are recognised in the period in which the estimate is revised if the revision affects both current and future periods.
The following describes critical judgements that management has made in the process of applying the Group’s accounting policies and that have the most significant effect on the amounts recognised in the financial statements:
Impairment of deferred exploration costsThe Group’s accounting policy for exploration expenditure results in some items being capitalised for an area of interest where it is considered likely to be recoverable in the future or where the activities have not reached a stage which permits a reasonable assessment of the existence of reserves. Management is required to make certain estimates and assumptions as to future events and circumstances which may change as new information becomes available. If a judgement is made that recovery of a capitalised expenditure is unlikely, the relevant amount will be written off to the income statement.
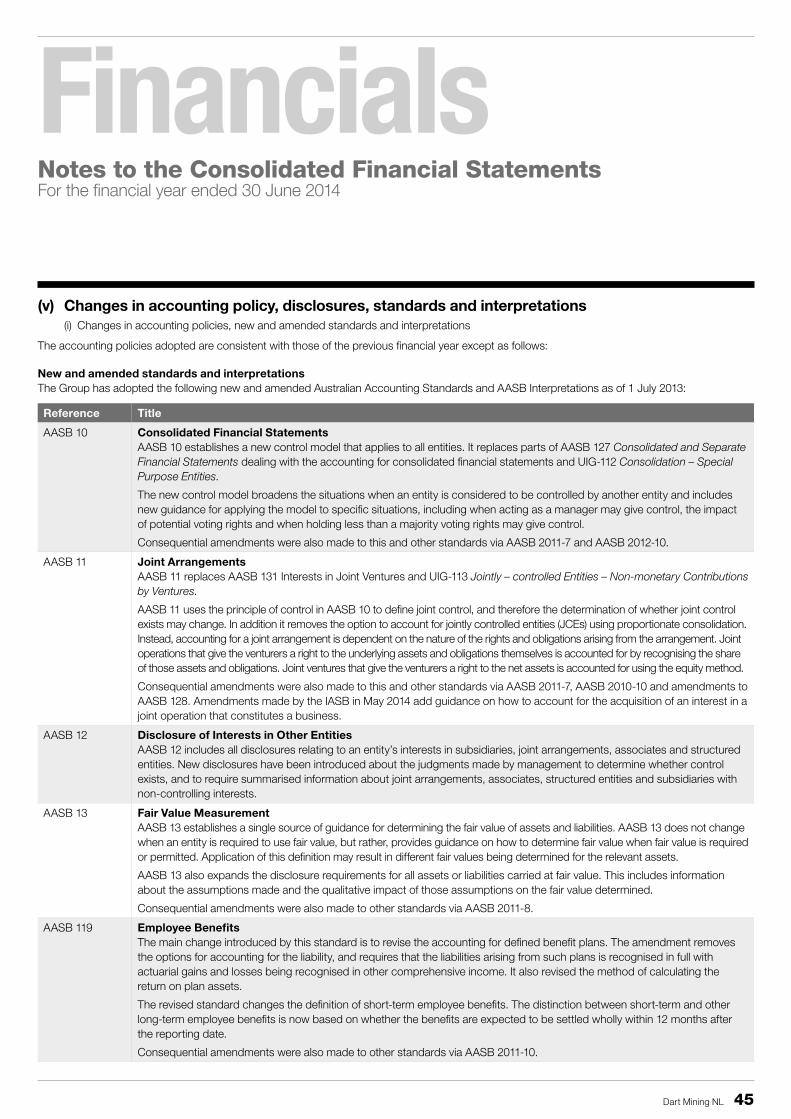
Financials
45Dart Mining NL
Notes to the Consolidated Financial StatementsFor the financial year ended 30 June 2014
(v) Changes in accounting policy, disclosures, standards and interpretations(i) Changes in accounting policies, new and amended standards and interpretations
The accounting policies adopted are consistent with those of the previous financial year except as follows:
New and amended standards and interpretationsThe Group has adopted the following new and amended Australian Accounting Standards and AASB Interpretations as of 1 July 2013:
Reference Title
AASB 10 Consolidated Financial StatementsAASB 10 establishes a new control model that applies to all entities. It replaces parts of AASB 127 Consolidated and Separate Financial Statements dealing with the accounting for consolidated financial statements and UIG-112 Consolidation – Special Purpose Entities.
The new control model broadens the situations when an entity is considered to be controlled by another entity and includes new guidance for applying the model to specific situations, including when acting as a manager may give control, the impact of potential voting rights and when holding less than a majority voting rights may give control.
Consequential amendments were also made to this and other standards via AASB 2011-7 and AASB 2012-10.
AASB 11 Joint ArrangementsAASB 11 replaces AASB 131 Interests in Joint Ventures and UIG-113 Jointly – controlled Entities – Non-monetary Contributions by Ventures.
AASB 11 uses the principle of control in AASB 10 to define joint control, and therefore the determination of whether joint control exists may change. In addition it removes the option to account for jointly controlled entities (JCEs) using proportionate consolidation. Instead, accounting for a joint arrangement is dependent on the nature of the rights and obligations arising from the arrangement. Joint operations that give the venturers a right to the underlying assets and obligations themselves is accounted for by recognising the share of those assets and obligations. Joint ventures that give the venturers a right to the net assets is accounted for using the equity method.
Consequential amendments were also made to this and other standards via AASB 2011-7, AASB 2010-10 and amendments to AASB 128. Amendments made by the IASB in May 2014 add guidance on how to account for the acquisition of an interest in a joint operation that constitutes a business.
AASB 12 Disclosure of Interests in Other EntitiesAASB 12 includes all disclosures relating to an entity’s interests in subsidiaries, joint arrangements, associates and structured entities. New disclosures have been introduced about the judgments made by management to determine whether control exists, and to require summarised information about joint arrangements, associates, structured entities and subsidiaries with non-controlling interests.
AASB 13 Fair Value MeasurementAASB 13 establishes a single source of guidance for determining the fair value of assets and liabilities. AASB 13 does not change when an entity is required to use fair value, but rather, provides guidance on how to determine fair value when fair value is required or permitted. Application of this definition may result in different fair values being determined for the relevant assets.
AASB 13 also expands the disclosure requirements for all assets or liabilities carried at fair value. This includes information about the assumptions made and the qualitative impact of those assumptions on the fair value determined.
Consequential amendments were also made to other standards via AASB 2011-8.
AASB 119 Employee BenefitsThe main change introduced by this standard is to revise the accounting for defined benefit plans. The amendment removes the options for accounting for the liability, and requires that the liabilities arising from such plans is recognised in full with actuarial gains and losses being recognised in other comprehensive income. It also revised the method of calculating the return on plan assets.
The revised standard changes the definition of short-term employee benefits. The distinction between short-term and other long-term employee benefits is now based on whether the benefits are expected to be settled wholly within 12 months after the reporting date.
Consequential amendments were also made to other standards via AASB 2011-10.

Financials
46 Dart Mining NL
Notes to the Consolidated Financial StatementsFor the financial year ended 30 June 2014
Reference Title
Interpretation 20 Stripping Costs in the Production Phase of a Surface MineThis interpretation applies to stripping costs incurred during the production phase of a surface mine. Production stripping costs are to be capitalised as part of an asset. If an entity can demonstrate that it is probable future economic benefits will be realised, the costs can be reliably measured and the entity can identify the component of an ore body for which access has been improved. This asset is to be called the “stripping activity asset”.
The stripping activity asset shall be depreciated or amortised on a systematic basis, over the expected useful life of the identified component of the ore body that becomes more accessible as a result of the stripping activity. The units of production method shall be applied unless another method is more appropriate.
Consequential amendments were also made to other standards via AASB 2011-12.
AASB 2012-2 Amendments to Australian Accounting Standards - Disclosures - Offsetting Financial Assets and Financial LiabilitiesAASB 2012-2 principally amends AASB 7 Financial Instruments: Disclosures to require disclosure of the effect or potential effect of netting arrangements, including rights of set-off associated with the entity’s recognised financial assets and recognised financial liabilities, on the entity’s financial position, when all the offsetting criteria of AASB 132 are not met.
AASB 2012-5 Amendments to Australian Accounting Standards arising from Annual Improvements 2009-2011 CycleAASB 2012-5 makes amendments resulting from the 2009-2011 Annual Improvements Cycle. The standard addresses a range of improvements, including the following: • Repeat application of AASB 1 is permitted (AASB 1) • Clarification of the comparative information requirements when an entity provides a third balance sheet
(AASB 101 Presentation of Financial Statements)
AASB 2012-9 Amendment to AASB 1048 arising from the withdrawal of Australian Interpretation 1039AASB 2012-9 amends AASB 1048 Interpretation of Standards to evidence the withdrawal of Australian Interpretation 1039 Substantive Enactment of Major Tax Bills in Australia.
The adoption of the standards or interpretations do not impact the annual consolidated financial statements of the Group or the interim condensed consolidated financial statements of the Group.
The AASB has issued a number of new and amended Accounting Standards and Interpretations that have mandatory application dates for future reporting periods, some of which are relevant to the Group. The Group has decided not to early adopt any of the new and amended pronouncements. The Group’s assessment of the new and amended pronouncements that are relevant to the Group but applicable in future reporting periods is set out below:
Reference Title Summary Application date of standard
Application date for group
AASB 2012-3 Amendments to Australian Accounting Standards – Offsetting Financial Assets and Financial Liabilities
AASB 2012-3 adds application guidance to AASB 132 Financial Instruments: Presentation to address inconsistencies identified in applying some of the offsetting criteria of AASB 132, including clarifying the meaning of “currently has a legally enforceable right of set-off” and that some gross settlement systems may be considered equivalent to net settlement.
1 January 2014 1 July 2014
Interpretation 21 Levies This Interpretation confirms that a liability to pay a levy is only recognised when the activity that triggers the payment occurs. Applying the going concern assumption does not create a constructive obligation.
1 January 2014 1 July 2014

Financials
47Dart Mining NL
Notes to the Consolidated Financial StatementsFor the financial year ended 30 June 2014
Reference Title Summary Application date of standard
Application date for group
AASB 9 Financial Instruments AASB 9 includes requirements for the classification and measurement of financial assets. It was further amended by AASB 2010-7 to reflect amendments to the accounting for financial liabilities.
These requirements improve and simplify the approach for classification and measurement of financial assets compared with the requirements of AASB 139. The main changes are described below.
a. Financial assets that are debt instruments will be classified based on (1) the objective of the entity’s business model for managing the financial assets; (2) the characteristics of the contractual cash flows.
b. Allows an irrevocable election on initial recognition to present gains and losses on investments in equity instruments that are not held for trading in other comprehensive income. Dividends in respect of these investments that are a return on investment can be recognised in profit or loss and there is no impairment or recycling on disposal of the instrument.
c. Financial assets can be designated and measured at fair value through profit or loss at initial recognition if doing so eliminates or significantly reduces a measurement or recognition inconsistency that would arise from measuring assets or liabilities, or recognising the gains and losses on them, on different bases.
d. Where the fair value option is used for financial liabilities the change in fair value is to be accounted for as follows:
• The change attributable to changes in credit risk are presented in other comprehensive income (OCI)
• The remaining change is presented in profit or loss
If this approach creates or enlarges an accounting mismatch in the profit or loss, the effect of the changes in credit risk are also presented in profit or loss.
Consequential amendments were also made to other standards as a result of AASB 9, introduced by AASB 2009-11 and superseded by AASB 2010-7 and 2010-10.
The AASB issued a revised version of AASB 9 (AASB 2013-9) during December 2013. The revised standard incorporates three primary changes:1. New hedge accounting requirements including changes to
hedge effectiveness testing, treatment of hedging costs, risk components that can be hedged and disclosures
2. Entities may elect to apply only the accounting for gains and losses from own credit risk without applying the other requirements of AASB 9 at the same time
3. In February 2014, the IASB tentatively decided that the mandatory effective date for AASB 9 will be 1 January 2018
1 January 2018 1 July 2018

Financials
48 Dart Mining NL
Notes to the Consolidated Financial StatementsFor the financial year ended 30 June 2014
Reference Title Summary Application date of standard
Application date for group
AASB 2013-3 Amendments to AASB 136 – Recoverable Amount Disclosures for Non-Financial Assets
AASB 2013-3 amends the disclosure requirements in AASB 136 Impairment of Assets. The amendments include the requirement to disclose additional information about the fair value measurement when the recoverable amount of impaired assets is based on fair value less costs of disposal.
1 January 2014 1 July 2014
AASB 2013-4 Amendments to Australian Accounting Standards – Novation of Derivatives and Continuation of Hedge Accounting [AASB 139]
AASB 2013-4 amends AASB 139 to permit the continuation of hedge accounting in specified circumstances where a derivative, which has been designated as a hedging instrument, is novated from one counterparty to a central counterparty as a consequence of laws or regulations.
1 January 2014 1 July 2014
Annual Improvements 2010–2012 Cycle
Annual Improvements to IFRSs 2010–2012 Cycle
This standard sets out amendments to International Financial Reporting Standards (IFRS) and the related bases for conclusions and guidance made during the International Accounting Standards Board’s Annual Improvements process. These amendments have not yet been adopted by the AASB.
The following items are addressed by this standard:
• IFRS 2 - Clarifies the definition of ‘vesting conditions’ and ‘market condition’ and introduces the definition of ‘performance condition’ and ‘service condition’.
• IFRS 3 - Clarifies the classification requirements for contingent consideration in a business combination by removing all references to IAS 37.
• IFRS 8 - Requires entities to disclose factors used to identify the entity’s reportable segments when operating segments have been aggregated. An entity is also required to provide a reconciliation of total reportable segments’ asset to the entity’s total assets.
• IAS 16 & IAS 38 - Clarifies that the determination of accumulated depreciation does not depend on the selection of the valuation technique and that it is calculated as the difference between the gross and net carrying amounts.
• IAS 24 - Defines a management entity providing KMP services as a related party of the reporting entity. The amendments added an exemption from the detailed disclosure requirements in paragraph 17 of IAS 24 for KMP services provided by a management entity. Payments made to a management entity in respect of KMP services should be separately disclosed.
1 July 2014 1 July 2014

Financials
49Dart Mining NL
Notes to the Consolidated Financial StatementsFor the financial year ended 30 June 2014
Reference Title Summary Application date of standard
Application date for group
Annual Improvements 2011–2013 Cycle
Annual Improvements to IFRSs 2011–2013 Cycle
This standard sets out amendments to International Financial Reporting Standards (IFRS) and the related bases for conclusions and guidance made during the International Accounting Standards Board’s Annual Improvements process. These amendments have not yet been adopted by the AASB.
The following items are addressed by this standard:
• IFRS 13 - Clarifies that the portfolio exception in paragraph 52 of IFRS 13 applies to all contracts within the scope of IAS 39 or IFRS 9, regardless of whether they meet the definitions of financial assets or financial liabilities as defined in IAS 32.
• IAS 40 - Clarifies that judgment is needed to determine whether an acquisition of investment property is solely the acquisition of an investment property or whether it is the acquisition of a group of assets or a business combination in the scope of IFRS 3 that includes an investment property. That judgment is based on guidance in IFRS 3.
1 July 2014 1 July 2014
AASB 1031 Materiality The revised AASB 1031 is an interim standard that cross-references to other Standards and the Framework (issued December 2013) that contain guidance on materiality.
AASB 1031 will be withdrawn when references to AASB 1031 in all Standards and Interpretations have been removed.
1 January 2014 1 July 2014
AASB 2013-9 Amendments to Australian Accounting Standards – Conceptual Framework, Materiality and Financial Instruments
The Standard contains three main parts and makes amendments to a number of Standards and Interpretations.
Part A of AASB 2013-9 makes consequential amendments arising from the issuance of AASB CF 2013-1.
Part B makes amendments to particular Australian Accounting Standards to delete references to AASB 1031 and also makes minor editorial amendments to various other standards.
Part C makes amendments to a number of Australian Accounting Standards, including incorporating Chapter 6 Hedge Accounting into AASB 9 Financial Instruments.
20 December 2013
1 January 2014
1 January 2015
1 July 2014
1 July 2014
1 July 2015
IFRS 14 Interim standard on regulatory deferral accounts
This interim standard provides first-time adopters of IFRS with relief from de-recognising rate-regulated assets and liabilities until a comprehensive project on accounting for such assets and liabilities is completed by the IASB. It is intended to encourage rate-regulated entities to adopt IFRS while bridging the gap with entities that already apply IFRS, but do not recognise regulatory deferral accounts.
1 January 2016 1 July 2016

Financials
50 Dart Mining NL
Notes to the Consolidated Financial StatementsFor the financial year ended 30 June 2014
Reference Title Summary Application date of standard
Application date for group
Amendments to IAS 16 and IAS 38
Clarification of Acceptable Methods of Depreciation and Amortisation (Amendments to IAS 16 and IAS 38)
IAS 16 and IAS 38 both establish the principle for the basis of depreciation and amortisation as being the expected pattern of consumption of the future economic benefits of an asset.
The IASB has clarified that the use of revenue-based methods to calculate the depreciation of an asset is not appropriate because revenue generated by an activity that includes the use of an asset generally reflects factors other than the consumption of the economic benefits embodied in the asset.
The IASB also clarified that revenue is generally presumed to be an inappropriate basis for measuring the consumption of the economic benefits embodied in an intangible asset. This presumption, however, can be rebutted in certain limited circumstances.
1 January 2016 1 July 2016
IFRS 15 Revenue from Contracts with Customers
IFRS 15 establishes principles for reporting useful information to users of financial statements about the nature, amount, timing and uncertainty of revenue and cash flows arising from an entity’s contracts with customers.
IFRS 15 supersedes:(a) IAS 11 Construction Contracts(b) IAS 18 Revenue(c) IFRIC 13 Customer Loyalty Programmes(d) IFRIC 15 Agreements for the Construction of Real Estate(e) IFRIC 18 Transfers of Assets from Customers(f) SIC-31 Revenue—Barter Transactions Involving Advertising
Services
The core principle of IFRS 15 is that an entity recognises revenue to depict the transfer of promised goods or services to customers in an amount that reflects the consideration to which the entity expects to be entitled in exchange for those goods or services. An entity recognises revenue in accordance with that core principle by applying the following steps:(a) Step 1: Identify the contract(s) with a customer(b) Step 2: Identify the performance obligations in the contract(c) Step 3: Determine the transaction price(d) Step 4: Allocate the transaction price to the performance
obligations in the contract(e) Step 5: Recognise revenue when (or as) the entity satisfies a
performance obligation
Early application of this standard is permitted.
1 January 2017 1 July 2017
The amendments issued but not yet effective from the Annual Improvements Projects to the above mentioned standards will have no impact on the accounting policies, financial position or performance of the Group.

Financials
51Dart Mining NL
Notes to the Consolidated Financial StatementsFor the financial year ended 30 June 2014
Consolidated
2014 Restated 2013
$ $
Note 3 Parent information
Statement of Financial Position
Assets
Current assets 3,704,321 5,971,661
Non-current assets 7,138,696 6,281,347
Total assets 10,843,017 12,253,008
Liabilities
Current liabilities 280,654 652,049
Total liabilities 280,654 652,049
Net assets 10,562,363 11,600,959
Equity
Issued capital 17,310,599 17,310,599
Reserves 371,698 336,448
Retained earnings (7,119,934) (6,046,088)
Total equity 10,562,363 11,600,959
Statement of Profit or Loss and Other Comprehensive Income
Total profit/(loss) (1,082,743) 65,807
Total comprehensive income (loss) (1,082,743) 65,807
Note 4 Revenue and other income
Revenue from continuing operations
Sales revenue
– Sale of royalty interest - 4,500,000
– Research and development grant 2,033,958 -
2,033,958 4,500,000
Other revenue
– Interest received 133,321 111,992
– Other revenue 250 101
133,571 112,093
2,167,529 4,612,093

Financials
52 Dart Mining NL
Notes to the Consolidated Financial StatementsFor the financial year ended 30 June 2014
Consolidated
2014 Restated 2013
$ $
Note 5 Profit/(loss) for the year
Profit/(loss) before income tax from operations include the following expenses
Exploration expenses written off 1,022,549 582,362
Research and development costs 798,585 2,570,396
Share- based payments 43,600 377,568
Depreciation 173 348
Note 6 Tax expense
(a) The prima facie tax on profit from ordinary activities before income tax is reconciled to the income tax expense
Profit/(loss) from continuing operations (1,060,846) 55,567
Income tax expense (benefit) calculated at 30% (318,254) 16,670
Effect of non-deductible expenses 571,561 1,072,788
Effect of deductible temporary differences (366,678) (592,838)
Effect of unused tax losses and tax offsets not recognised as deferred tax assets 113,371 -
Utilisation of tax losses brought forward - (496,620)
Income tax expense - -
(b) Tax losses not brought to account
Tax losses brought forward 1,625,774 3,169,404
Current year tax losses 113,371 -
Utilisation of tax losses brought forward - (496,620)
(De-recognition)/recognition of tax losses – prior years - (1,047,010)
Tax losses carried forward 1,739,145 1,625,774

Financials
53Dart Mining NL
Notes to the Consolidated Financial StatementsFor the financial year ended 30 June 2014
Consolidated
2014 2013
$ $
Note 7 Key management personnel compensation
Total remunerations paid to KMP of the Company and the Group during the year are as follows :
Short-term employee benefits 1,087,854 911,913
Post-employment benefits 55,260 59,333
Share-based payments 7,600 483,700
Long-term employee benefits 8,463 24,210
Termination payments 112,240 -
Total KMP compensation 1,271,417 1,479,156
KMP options and rights holdingsThere were no listed options over ordinary shares held during the financial year by KMP of the Group (2013 : NIL)
The number of unlisted options and incentive rights over ordinary shares held during the financial year by each KMP of the Group is as follows :
Balance at beginning of year
Incentive rights granted as
remuneration during the year
Incentive rights exercised, lapsed
or excluded during the year
Net other changes1
Balance at end of year
2014
D G Turnbull 1,000,000 2,000,000 (1,000,000) - 2,000,000
C J Bain 3,000,000 - (1,000,000) (2,000,000) -
S G Poke 3,000,000 - (1,000,000) (2,000,000) -
R G Udovenya 3,000,000 - (1,000,000) (2,000,000) -
10,000,000 2,000,000 (4,000,000) (6,000,000) 2,000,000
2013
L J Ward - 2,000,000 (2,000,000) - -
D G Turnbull 1,000,000 - - - 1,000,000
C J Bain 1,000,000 2,000,000 - - 3,000,000
S G Poke 1,000,000 2,000,000 - - 3,000,000
R G Udovenya 1,000,000 2,000,000 - - 3,000,000
4,000,000 8,000,000 (2,000,000) - 10,000,000

Financials
54 Dart Mining NL
Notes to the Consolidated Financial StatementsFor the financial year ended 30 June 2014
Note 7 Key management personnel compensation (continued)
KMP shareholdingsThe number of ordinary shares held by each KMP of the Group or their nominees during the financial year is as follows :
Balance at beginning of year
Shares acquired through exercise
of options and incentive rights
Shares disposed Net other change1 Balance at end of year
2014
L J Ward 2,000,000 - - (2,000,000) -
D G Turnbull 4,459,179 - - - 4,459,179
C J Bain 1,853,332 - - (1,853,332) -
S G Poke 2,903,749 - - (2,903,749) -
R G Udovenya 423,955 - - (423,955) -
11,640,215 - - (7,181,036) 4,459,179
2013
L J Ward 2,000,000 2,000,000 (2,000,000) - 2,000,000
D G Turnbull 4,822,500 - (363,321) - 4,459,179
C J Bain 1,853,332 - - - 1,853,332
S G Poke 2,903,749 - - - 2,903,749
R G Udovenya 423,955 - - - 423,955
12,003,536 2,000,000 (2,363,321) - 11,640,215
1 Net other changes represents reductions to Directors’ options or shareholdings on their resignations.
Note 8 Auditor’s remuneration
Consolidated
2014 2013
$ $
Amounts received or due and receivable by MSI Ragg Weir for:
Audit or review of the financial statements of the Group 27,500 25,800

Financials
55Dart Mining NL
Notes to the Consolidated Financial StatementsFor the financial year ended 30 June 2014
Consolidated
2014 2013
$ $
Note 9 Earnings per share
(a) Reconciliation of earnings to profit and loss
Net profit/(loss) for the year (1,060,846) 55,567
Earnings/(loss) used to calculate basic EPS (1,060,846) 55,567
(b) Weighted average number of ordinary shares outstanding during the year used in the calculation of basic EPS 207,091,315 193,001,042
Basic earnings per share (0.51) 0.03
Diluted earnings per share (0.51) 0.03
Diluted earnings per share is calculated after classifying all options on issue remaining unconverted at 30 June 2014 as potential ordinary shares. At 30 June 2014, the Company had on issue 13,473,048 options and incentive rights over unissued capital and had incurred a net loss. Unlisted options are not considered dilutive and have not been included in the calculations of diluted earnings per share.
Note 10 Cash and cash equivalent
Cash at bank and on hand 38,717 962,931
Short-term deposits 3,545,024 4,784,900
3,583,741 5,747,831
Note 11 Trade and other receivables
Accrued interest – other persons/corporations 11,620 33,589
Security deposits - 1,549
GST receivable 47,388 131,238
Withholding tax receivable - 547
Others 36,256 4,584
95,264 171,507
No receivable amounts were past due or impaired at 30 June 2014 (2013 : NIL)
Credit riskThe Group has no significant concentration of credit risk with respect to any single counter party or group of counter parties other than those receivables specifically provided for and mentioned within Note 11. The class of assets described as Trade and Other Receivables is considered to be the main source of credit risk related to the Group.

Financials
56 Dart Mining NL
Notes to the Consolidated Financial StatementsFor the financial year ended 30 June 2014
Note 12 Controlled entities
Country of incorporation
Percentage owned (%)
2014 2013
Dart Resources Pty Ltd Australia 100% 100%
Mt Unicorn Holdings Pty Ltd Australia 100% 100%
Mt View Holdings Pty Ltd Australia 100% 100%
For each of the controlled entities that the place of business is the same as the place of incorporation. The activities of these entities are not material to the Group.
There are no significant restrictions on the Group’s or its controlled entities ability to access or use the assets and settle the liabilities of the Group nor are there restrictions on ownership changes to these entities.
Note 13 Property, plant and equipment
Consolidated
2014 2013
$ $
Plant and equipment
At cost 152,129 150,283
Accumulated depreciation (136,410) (115,697)
15,719 34,586
Computer equipment & software
At cost 121,610 118,715
Accumulated depreciation (117,803) (104,007)
3,807 14,708
Motor vehicles
At cost 100,811 100,811
Accumulated depreciation (100,811) (99,495)
- 1,316
Total property, plant and equipment 19,526 50,610

Financials
57Dart Mining NL
Notes to the Consolidated Financial StatementsFor the financial year ended 30 June 2014
Note 13 Property, plant and equipment (continued)
Plant & equipment Computer equipment &
software
Motor vehicles Total
Consolidated $ $ $ $
Balance at 1 July 2012 52,315 26,395 5,091 83,801
Additions 5,369 - - 5,369
Depreciation expense - (348) - (348)
Depreciation expense capitalised (23,098) (11,339) (3,775) (38,212)
Balance at 30 June 2013 34,586 14,708 1,316 50,610
Balance at 1 July 2013 34,586 14,708 1,316 50,610
Additions 1,846 2,895 - 4,741
Depreciation expense - (173) - (173)
Depreciation expense capitalised (20,713) (13,623) (1,316) (35,652)
Balance at 30 June 2014 15,719 3,807 - 19,526
The following useful lives are used in the calculation of depreciation:
Plant and equipment 3 – 6 years
Computer equipment & software 3 – 4 years
Motor vehicles 4 – 5 years
Note 14 Deferred exploration and evaluation
Consolidated
2014 Restated 2013
$ $
Balance at beginning of financial year 6,143,028 5,884,905
Current year expenditure capitalised 1,909,651 840,485
Exploration costs written-off (1,022,549) (582,362)
Balance at end of financial year 7,030,130 6,143,028

Financials
58 Dart Mining NL
Notes to the Consolidated Financial StatementsFor the financial year ended 30 June 2014
Note 14 Deferred exploration and evaluation (continued)
Ultimate recovery of deferred exploration and evaluation costs is dependent upon the success of Pre-feasibility Studies, exploration and evaluation or sale or farm-out of the exploration interests. A percentage of the CEO’s salary and associated costs are capitalised in line with the Company’s policy for capitalising costs directly relating to pre-feasibility and exploration. Namely, the Company has four cost centres, Corporate, Pre-feasibility, Research and Development and Exploration. Where identifiable, costs associated with the Pre-feasibility and Exploration cost centres are capitalised. These costs are annually reviewed for impairment and a charge is made direct to the Income Statement of the Company when an impairment is identified. An impairment of $1,022,549 (2013: $582,362) was brought to account for the financial year for costs associated with the Nerrina and Koonenberry Projects. The Company still intends to continue activity on the remaining tenements under its control.
Orion Resource Partners (Aus) Pty Ltd (Orion) (previously RK Mine Finance) purchased a 2% Net Smelter Return Royalty (NSR) in the Unicorn Project. The purchase arrangements impose a range of conditions on the Project.
Orion has agreed to purchase a further 1% NSR for $4 million (plus subscribe for shares in the Company at a subscription price of $700,000) in the Unicorn Project subsequent to certain conditions precedent being satisfied by 31 October 2014 including:
• Orion being satisfied in its absolute discretion, acting reasonably, with the technical progress on the Project as evidenced by completion of Pre-feasibility type technical studies on the tailings facility and metallurgy;
• confirmation from the Victorian Minister for Planning that the Project will not require an Environmental Effects Statement or the Project otherwise being ready to commence the Environmental Effects Statement process;
• confirmation that the Company has appointed a person with substantial experience in the mining sector together with appropriate mining project implementation credentials to the Company’s executive management team or Board to the satisfaction of Orion;
• the original 1.5% NSR founders royalty* owned by three of the Company’s founders be bought out at a mutually agreed valuation or otherwise be addressed in a manner satisfactory to Orion and the Company; and
• the Company submitting a detailed budget to the satisfaction of Orion as to the use of funds from the second tranche investment. * The Company has agreed to the payment of a royalty being 1.5% in aggregate of the value of any gold or other metals or valuable minerals produced and sold from the
tenements (EL4724 and EL 4726), and any flow on tenements, less any reasonable transport, refining or realisation costs necessarily incurred in the sale of the above product.

Financials
59Dart Mining NL
Notes to the Consolidated Financial StatementsFor the financial year ended 30 June 2014
Consolidated
2014 2013
$ $
Note 15 Other assets
CURRENT
Prepayments 25,343 28,319
25,343 28,319
NON-CURRENT
Bond security for exploration tenement licences 74,340 62,211
Bond security for company credit cards 25,500 25,500
99,840 87,711
Note 16 Trade and other payables
CURRENT
Trade payables 134,238 531,033
Sundry payables 107,423 76,970
241,661 608,003
Terms and conditions relating to the above financial instruments:
(i) Trade creditors are non-interest bearing and are usually settled on 30 day terms. (ii) Other creditors are non-interest bearing and have an average term of 30 days.
Note 17 Provisions
CURRENT
Short term employee benefits
Opening balance 30,367 21,109
Additional provisions 33,062 38,419
Amounts used 24,636 29,161
Closing balance 38,793 30,367

Financials
60 Dart Mining NL
Notes to the Consolidated Financial StatementsFor the financial year ended 30 June 2014
Note 18 Issued capital
Consolidated
2014 2013
$ $
207,091,315 fully paid ordinary shares (2013 : 207,091,315) 17,310,599 17,310,599
Ordinary shares
2014 2013
Consolidated No $ No $
Balance at the beginning of the financial year 207,091,315 17,310,599 180,937,593 15,193,057
Shares issued during the year - - 26,153,722 2,279,988
Less transaction costs arising from issue of shares - - - (162,446)
Balance at end of financial year 207,091,315 17,310,599 207,091,315 17,310,599
Terms and conditions of contributed equity
Ordinary sharesOrdinary shares have the right to receive dividends as declared and, in the event of winding up of the Company, to participate in the proceeds from the sale of all surplus assets in proportion to the number of and amounts paid up on shares held. Ordinary shares entitle their holder to one vote, either in person or by proxy, at a meeting of the Company.
The issued capital of the Company quoted on the ASX comprises 207,091,315 ordinary shares (2013: 207,091,315).
Share optionsDuring the financial year, the Company issued the following share options :
Securities Expiry date Number Exercise price (cents)
Escrow period
Unlisted 30 August 2016 1,000,000 11.1 -
Unlisted 31 December 2016 2,000,000 11.1 -
At the end of the financial year, there were 13,473,048 (2013: 18,823,048) unlisted options on issue
Securities Expiry date Number Exercise price (cents)
Escrow period
Unlisted 20 March 2017 100,000 18 -
Unlisted 20 March 2017 100,000 22 -
Unlisted 31 December 2015 3,000,000 15 -
Unlisted 31 December 2016 3,000,000 15 -
Unlisted 7 May 2016 4,273,048 11.1 -
Unlisted 30 August 2016 1,000,000 11.1 -
Unlisted 31 December 2016 2,000,000 11.1 -

Financials
61Dart Mining NL
Notes to the Consolidated Financial StatementsFor the financial year ended 30 June 2014
Note 19 Expenditure commitments
Exploration expenditureUnder the terms of the exploration tenement licences, the Group has a commitment to meet a minimum expenditure requirement in order to keep its rights current. The minimum expenditure requirement is not recognised as a liability in the Statement of Financial Position of the Group as the Group may relinquish its rights to a particular tenement thereby removing the requirement to meet the minimum expenditure requirement.
Consolidated
2014 2013
$ $
Not longer than 1 year 1,118,400 256,500
Between 1 and 5 years 1,212,990 256,500
Longer than 5 years - 1,359,450
2,331,390 1,872,450
Operating leases
The Group has commercial leases on property. These leases have an average life of between one and two years with renewal options in the property leases. There are no restrictions upon the lessee by entering into these leases.
Future minimum lease payments payable under non-cancellable operating leases as at the balance date are as follows:
Not longer than 1 year 15,687 2,872
Between 1 and 5 years 2,902 -
18,589 2,872
Note 20 Contingent liabilities and contingent assets
No contingent assets existed at the reporting date. Contingent liabilities at this date comprised:
(i) under tenement licence conditions in Victoria the Group is required to rehabilitate each licence area to its original state subsequent to any exploration work. Rehabilitation costs are estimated not to exceed $60,000.
(ii) the research and development grants received of $2,570,396 by the Company may be subject to review by AusIndustry and subsequent claw back of funds should there be a determination of non-conforming claims.
Note 21 Operating segments
The Group’s activities consist of base metal and gold exploration currently in one geographic region of north-east Victoria. There are no other significant classes of business, either singularly or in aggregate. Internal monthly management reports are provided to the Group’s Directors that consolidate operations in one segment. Therefore the Group’s activities are classed as one business segment and as a result operating and financial information are not separately disclosed in this note.

Financials
62 Dart Mining NL
Notes to the Consolidated Financial StatementsFor the financial year ended 30 June 2014
Note 22 Cash-flow information
Consolidated
2014 Restated 2013
$ $
a) Reconciliation of cash flow from operations with profit after income tax
Profit/(loss) after income tax (1,060,846) 55,567
Non cash flows in profit/(loss)
Depreciation 173 348
Share-based payments 43,600 377,568
Exploration cost written off 1,022,549 582,362
Loss on disposal of investment 37,500 -
Changes in assets and liabilities
(Increase)/Decrease in receivables 50,600 (31,532)
(Increase)/Decrease in other assets 2,978 667
Increase/(Decrease) in trade payables and accruals 72,618 34,946
Increase/(Decrease) in provisions (4,119) 9,258
Cash flow from operations 165,053 1,029,184
b) Reconciliation of cash
Cash balance comprises:
Cash on hand and at call 38,717 962,931
Term deposits 3,545,024 4,784,900
3,583,741 5,747,831
c) Financing facility The Group has no available finance facilities at balance date.
d) Non-cash financing and investing activities There were no non-cash financing or investing activities during the financial year.

Financials
63Dart Mining NL
Notes to the Consolidated Financial StatementsFor the financial year ended 30 June 2014
Note 23 Share-based payments
The aggregate share-based payments for the financial year are set out below:
Consolidated
2014 2013
$ $
Details of share-based payments
Fair value of incentive rights granted to Executive Director 7,600 -
Fair value of incentive rights granted to Managing Director - 184,000
Fair value of incentive rights granted to employees - 36,540
Fair value of incentive rights or options granted to Non-executive Directors - 299,700
Fair value of granted options capitalised and classified as exploration cost - (129,420)
Fair value of options granted as share based payments 36,000 177,583
Fair value adjustment to options issued in prior years - (190,836)
Expense arising from share-based payments 43,600 377,567
Executive optionsShare-based payment options held at the end of the reporting year were as follows:
Grant date Grantee Number Vesting date Expiry date Exercise price (cents)
Fair value at grant date
(cents)
5 Nov 2012 C J Bain 1,000,000 5 Nov 2012 31 Dec 2015 15 4.60
5 Nov 2012 S G Poke 1,000,000 5 Nov 2012 31 Dec 2015 15 4.60
5 Nov 2012 R G Udovenya 1,000,000 5 Nov 2012 31 Dec 2015 15 4.60
5 Nov 2012 C J Bain 1,000,000 5 Nov 2012 31 Dec 2016 15 5.39
5 Nov 2012 S G Poke 1,000,000 5 Nov 2012 31 Dec 2016 15 5.39
5 Nov 2012 R G Udovenya 1,000,000 5 Nov 2012 31 Dec 2016 15 5.39
21 May 2014 D G Turnbull 2,000,000 21 May 2014 31 Dec 2016 11.1 0.38
Third party options
Grant date Number Vesting date Expiry date Exercise price (cents)
Fair value at grant date
(cents)
20 Mar 2012 100,000 20 Mar 2012 20 Mar 2017 18 4.50
20 Mar 2012 100,000 20 Mar 2012 20 Mar 2017 22 3.63
7 May 2013 4,273,048 7 May 2013 7 May 2016 11.1 4.49
30 August 2013 1,000,000 30 Aug 2013 30 Aug 2016 11.1 3.60

Financials
64 Dart Mining NL
Notes to the Consolidated Financial StatementsFor the financial year ended 30 June 2014
Note 23 Share-based payments (continued)
The total fair value of the unexercised share options and incentive rights granted during the financial year was $43,600. Options were priced using a Black-Scholes model. Where relevant, the expected life used in the model has been adjusted based on management’s best estimate for the effects of non-transferability, exercise restrictions. Expected volatility is based on the historical share price volatility of the Company over the reporting period.
Consolidated
2014 2013
$ $
Share price at grant date 3.9 - 8 cents 8.5 – 10 cents
Exercise price 11 - 11.1 cents 11.1 – 15 cents
Expected volatility 53.19 – 79.15% 79.1 – 81.6%
Option life 3 years 3 – 5 years
Dividend yield Nil Nil
Risk-free interest rate 2.52 – 2.75% 2.75 – 3.25%
Weighted average remaining contractual lifeShare options outstanding at 30 June 2014 had a weighted average contractual life of 750 days (2013 : 682 days)
Movements in share-based payments options
2014 2013
Number Weighted average exercise price
(cents)
Number Weighted average exercise price
(cents)
Balance at beginning of year 18,823,048 8,550,000
Granted with an exercise price of 11.1 cents 1,000,000 11.1 -
Incentive rights granted with an exercise price of 11 cents
2,000,000 11.1 -
Granted with an exercise price of 0.92 cents - 2,000,000 0.92
Granted with an exercise price of 0.84 cents - 555,000 0.84
Granted with an exercise price of 11.1 cents - 4,273,084 11.1
Granted with an exercise price of 15 cents - 6,000,000 15
Exercised at 0.92 cents - (2,000,000) 0.92
Exercised at 0.84 cents - (555,000) 0.84
Expired (8,350,000) -
Balance at end of year 13,473,048 18,823,048
Exercisable at end of year 13,473,048 18,823,048

Financials
65Dart Mining NL
Notes to the Consolidated Financial StatementsFor the financial year ended 30 June 2014
Note 24 Events after the reporting periodDart completed on 3 September 2014, a share placement of 36,166,679 fully paid shares raising $1.085 million.
Two other significant announcements have been made to the ASX by Dart: (i) 11 September 2014; new studies on metallurgical matters resolved zinc separation issues and with conventional processes saleable concentrates are achievable from all zones within the Unicorn Project; and (ii) 15 September 2014; commitment to a spring survey of flora, fauna and acquatic habitats in order to advance an Environmental Effects Statement in respect to the Unicorn Project. No other matters or circumstances have arisen since the end of the financial year that have significantly affected or may have a significant effect on the financial operations of the Group, the financial performance of those operations or the financial position of the Group in the subsequent financial year.
Note 25 Related party transactions
The Group’s related parties are as follows :
Key Management PersonnelAny person(s) having authority and responsibility for planning, directing and controlling the activities of the entity, directly or indirectly, including any Director (executive or otherwise) of the entity are considered Key Management Personnel.
Other related partiesOther related parties include entities controlled by the ultimate parent entity and entities over which key management personnel have joint control.
Transactions with related partiesTransactions with related parties are on normal commercial terms and conditions no more favourable than those available to other parties unless otherwise stated.
The following transactions occurred with related parties
Consolidated
2014 2013
$ $
Director related entities
Professional fees paid to Cotlco Pty Ltd, of which J Cottle is a member 50,374 -
Professional fees paid to TFO Nominees Pty Ltd, of which J Cornelius is a consultant 99,000 -
Professional fees paid to AJE Projects Development Consultancy Pty Ltd, of which J Eltham is a member
189,116 123,750
Professional fees paid to Pritchard ResourcesLaw International, of which R G Udovenya is a member
35,625 27,102
Directors fees paid to Pritchard ResourcesLaw International, of which R G Udovenya is a member 34,441 53,050
Consultancy fees paid to North East Geological Contractors Pty Ltd, a company in which D G Turnbull is a director and shareholder
27,000 27,000
Professional fees paid to Draffin Walker Pty Ltd, a company in which A Draffin is a director and shareholder
56,934 44,175
Drilling services paid to Edrill Pty Ltd, a company in which S G Poke is a part owner - 1,003,290
Amount due to related parties at end of year
AJE Project Development Consultancy Pty Ltd 13,411 -
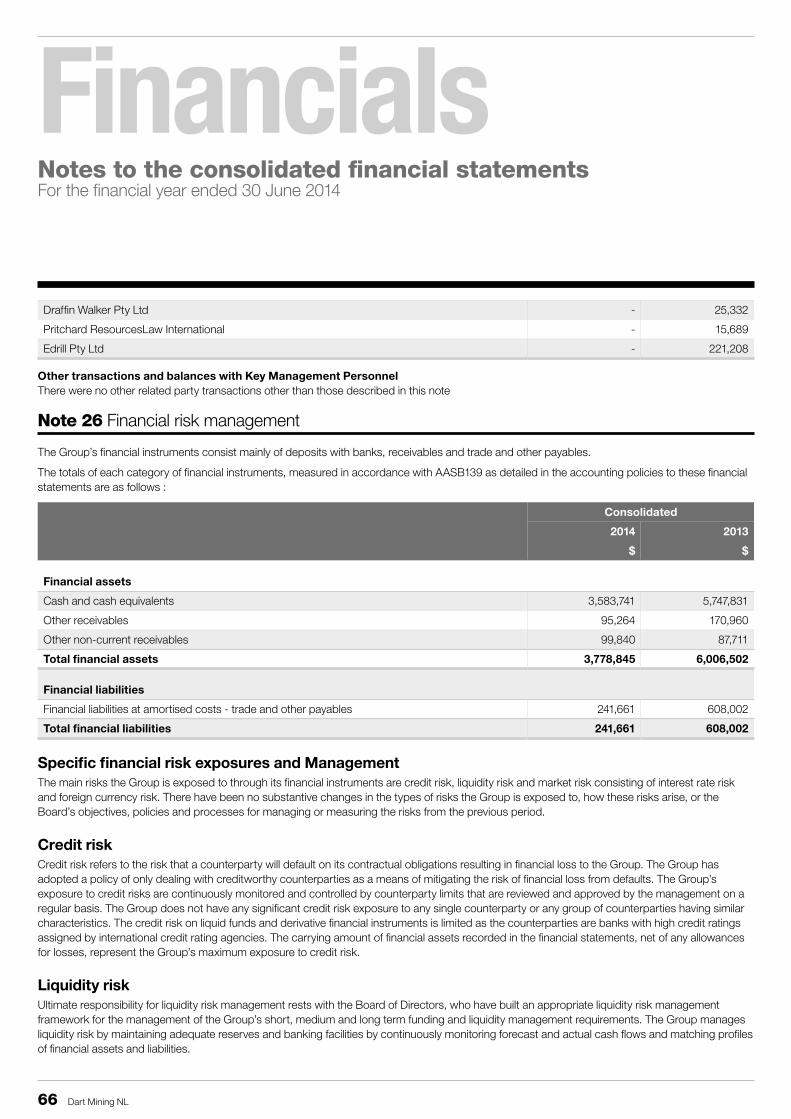
Financials
66 Dart Mining NL
Notes to the consolidated financial statementsFor the financial year ended 30 June 2014
Draffin Walker Pty Ltd - 25,332
Pritchard ResourcesLaw International - 15,689
Edrill Pty Ltd - 221,208
Other transactions and balances with Key Management PersonnelThere were no other related party transactions other than those described in this note
Note 26 Financial risk management
The Group’s financial instruments consist mainly of deposits with banks, receivables and trade and other payables.
The totals of each category of financial instruments, measured in accordance with AASB139 as detailed in the accounting policies to these financial statements are as follows :
Consolidated
2014 2013
$ $
Financial assets
Cash and cash equivalents 3,583,741 5,747,831
Other receivables 95,264 170,960
Other non-current receivables 99,840 87,711
Total financial assets 3,778,845 6,006,502
Financial liabilities
Financial liabilities at amortised costs - trade and other payables 241,661 608,002
Total financial liabilities 241,661 608,002
Specific financial risk exposures and ManagementThe main risks the Group is exposed to through its financial instruments are credit risk, liquidity risk and market risk consisting of interest rate risk and foreign currency risk. There have been no substantive changes in the types of risks the Group is exposed to, how these risks arise, or the Board’s objectives, policies and processes for managing or measuring the risks from the previous period.
Credit riskCredit risk refers to the risk that a counterparty will default on its contractual obligations resulting in financial loss to the Group. The Group has adopted a policy of only dealing with creditworthy counterparties as a means of mitigating the risk of financial loss from defaults. The Group’s exposure to credit risks are continuously monitored and controlled by counterparty limits that are reviewed and approved by the management on a regular basis. The Group does not have any significant credit risk exposure to any single counterparty or any group of counterparties having similar characteristics. The credit risk on liquid funds and derivative financial instruments is limited as the counterparties are banks with high credit ratings assigned by international credit rating agencies. The carrying amount of financial assets recorded in the financial statements, net of any allowances for losses, represent the Group’s maximum exposure to credit risk.
Liquidity riskUltimate responsibility for liquidity risk management rests with the Board of Directors, who have built an appropriate liquidity risk management framework for the management of the Group’s short, medium and long term funding and liquidity management requirements. The Group manages liquidity risk by maintaining adequate reserves and banking facilities by continuously monitoring forecast and actual cash flows and matching profiles of financial assets and liabilities.

Financials
67Dart Mining NL
Notes to the Consolidated Financial StatementsFor the financial year ended 30 June 2014
Note 26 Financial risk management (continued)
The following table details the Group’s remaining contractual maturity for its financial liabilities and financial assets
Within 1 year 1 to 5 years Over 5 years Total
2014 2013 2014 2013 2014 2013 2014 2013
Consolidated
Financial liabilities due for payment
Trade and other payable 241,661 608,002 - - - - 241,661 608,002
Total contractual outflows
241,661 608,002 - - - - 241,661 608,002
Financial assets cash flow realisable
Cash and cash equivalents 3,583,741 5,747,831 - - - - 3,583,741 5,747,831
Loans and other receivables - - 99,840 87,711 - - 99,840 87,711
Held to maturity investments - - - - - - - -
Other non-interest bearing receivables
95,264 171,507 - - - - 95,264 171,507
Total anticipated inflows 3,679,005 5,919,338 99,840 87,711 - - 3,778,845 6,007,049
Net (outflow)/inflow on financial instruments
3,437,344 5,311,336 99,840 87,711 - - 3,537,184 5,399,047
Market riskInterest rate risk The Group’s exposure to market risk primarily consist of financial risks associated with changes in interest rates as detailed below. As the level of risk is low, the Group does not use any derivatives to hedge its exposure. Market risks are managed through cash flow forecasts and sensitivity analysis on a regular basis.
The Group is exposed to interest rate risks as it holds funds at both fixed and variable interest rates. The risk is managed through the use of cash flow forecasts supplemented by sensitivity analysis.
The Group currently holds no amounts of borrowed funds.
Interest rate sensitivity analysis A sensitivity analysis have been determined based on the exposure to interest rates at reporting date with the stipulated change taking place at the beginning of the financial year and held constant throughout the reporting period. A 50 basis point increase or decrease is used when reporting interest rate risk internally to key management personnel and represents management’s assessment of the possible change in interest rates.
Consolidated
Profit Equity
$ $
Year ended 30 June 2014
+/- 0.5% in interest rates 17,919 17,919
Year ended 30 June 2013
+/- 0.5% in interest rates 29,178 29,178
There have been no changes in any methods or assumptions used to prepare the above analysis from the previous year.

Financials
68 Dart Mining NL
Notes to the Consolidated Financial StatementsFor the financial year ended 30 June 2014
Note 26 Financial risk management (continued)
Fair valueThe Directors consider that the carrying amounts of financial assets and financial liabilities recorded at cost less any accumulated impairments in the financial statements approximates their fair values.
The fair values of financial assets and financial liabilities are determined as follows:
• Holdings in unlisted shares are measured at cost less any impairments. The directors consider that no other measure could be used reliably;• Other financial assets and financial liabilities are determined in accordance with generally accepted pricing models.
Fair value estimationThe fair value of financial assets and financial liabilities are presented in the following table and can be compared to their carrying amounts as presented in the Statement of Financial Position. Fair value is the amount at which an asset could be exchanged, or a liability settled between knowledgeable, willing parties in an arm’s length transaction.
Fair values derived may be based on information that is estimated or subject to judgment, where changes in assumptions may have a material impact on the amounts estimated. Areas of judgment and the assumptions have been detailed below. Where possible, valuation information used to calculate fair value is extracted from the market, with more reliable information available from markets that are actively traded. In this regard, fair values for listed securities are obtained from quoted market bid prices. Where securities are unlisted and no market quotes are available, fair value is obtained using discounted cash flow analysis and other valuation techniques commonly used by market participants.
Differences between fair values and carrying amounts of financial instruments with fixed interest rates are due to the change in discount rates being applied by the market since their initial recognition by the Group. Most of these instruments, which are carried at amortised cost (i.e. term receivables, held-to-maturity assets), are to be held until maturity and therefore the fair value figures calculated bear little relevance to the Group.
2014 2013
Carrying amount Fair value Carrying amount Fair value
Financial assets
Cash and cash equivalents 3,583,741 3,583,741 5,747,831 5,747,831
Loans and other receivables 99,840 99,840 87,711 87,711
Other non-interest bearing receivables 95,264 95,264 171,507 171,507
Total financial assets 3,778,845 3,778,845 6,007,049 6,007,049
Financial liabilities
Trade and other payables 241,661 241,661 608,003 608,003
Total financial liabilities 241,661 241,661 608,003 608,003
The fair values disclosed in the above table have been determined based on the following methodologies:
Cash and cash equivalents, trade and other receivables and trade and other payables are short-term instruments in nature whose carrying amount is equivalent to fair value. Trade and other payables excludes amounts provided for annual leave, which is outside the scope of AASB 139.
Financial Instruments Measured at Fair ValueThe financial instruments recognised at fair value in the Statement of Financial position have been analysed and classified using a fair value hierarchy reflecting the significance of the inputs used in making the measurements. The fair value hierarchy consists of the following levels:
- quoted prices in active markets for identical assets or liabilities (Level 1)- inputs other than quoted prices included within Level 1 that are observable for the asset or liability, either directly (as prices) or indirectly (derived
from prices) (Level 2); and- inputs for the asset or liability that are not based on observable market data (unobservable inputs) (Level 3).

Financials
69Dart Mining NL
Notes to the Consolidated Financial StatementsFor the financial year ended 30 June 2014
Note 26 Financial risk management (continued)
Level 1 Level 2 Level 3 Total
Consolidated $ $ $ $
2014
Financial assets
Cash and cash equivalents
Cash on hand and fixed interest deposits - 3,583,741 - 3,583,741
2013
Financial assets
Cash and cash equivalents
Cash on hand and fixed interest deposits - 5,747,831 - 5,747,831
Note 27 Reserves
Equity - settled benefits reserveThe equity-settled benefits reserve is used to recognise the fair value options issued to Directors, employees and third parties.
Consolidated
2014 2013
$ $
Balance at beginning of financial year 336,448 60,080
1,000,000 options granted at a fair value of 3.60 cents per option 36,000 -
2,000,000 incentive rights granted at a fair value of 0.38 cents per right to an Executive Director on 21 May 2014
7,600 -
3,000,000 options granted at a fair value of 4.60 cents per option to Non-executive Directors on 5 November 2012
- 138,000
3,000,000 options granted at a fair value of 5.39 cents per option to Non-executive Directors on 5 November 2012
- 161,700
4,273,048 options granted at a fair value of 3.92 cents per option - 167,503
Share-based payments reclassified (8,350)
Fair value adjustments for options on issue - (190,835)
Balance at end of financial year 371,698 336,448
Note 28 Company details
Registered office of the Company :c/- the offices of Foster Nicholson Jones, Level 6, 406 Collins Street, Melbourne
Principal place of business :Lower ground floor, 395 Collins Street, Melbourne
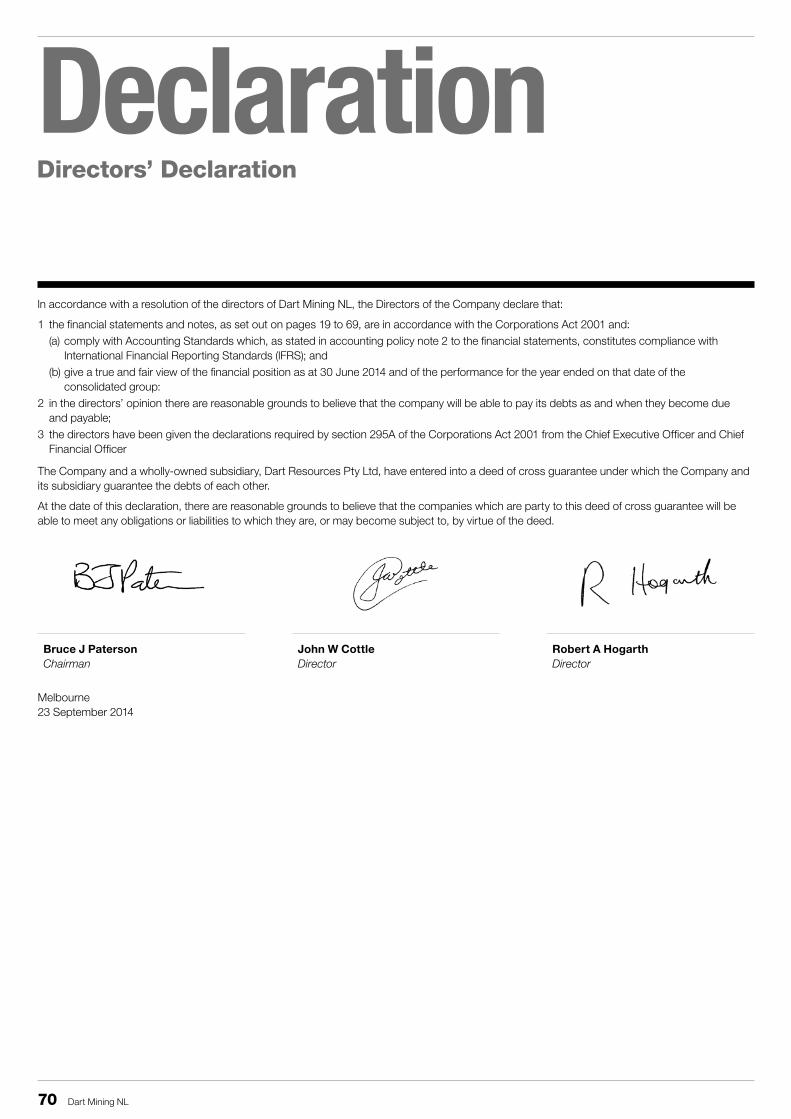
70 Dart Mining NL
DeclarationDirectors’ Declaration
ln accordance with a resolution of the directors of Dart Mining NL, the Directors of the Company declare that:
1 the financial statements and notes, as set out on pages 19 to 69, are in accordance with the Corporations Act 2001 and: (a) comply with Accounting Standards which, as stated in accounting policy note 2 to the financial statements, constitutes compliance with
International Financial Reporting Standards (lFRS); and (b) give a true and fair view of the financial position as at 30 June 2014 and of the performance for the year ended on that date of the
consolidated group:2 in the directors’ opinion there are reasonable grounds to believe that the company will be able to pay its debts as and when they become due
and payable;3 the directors have been given the declarations required by section 295A of the Corporations Act 2001 from the Chief Executive Officer and Chief
Financial Officer
The Company and a wholly-owned subsidiary, Dart Resources Pty Ltd, have entered into a deed of cross guarantee under which the Company and its subsidiary guarantee the debts of each other.
At the date of this declaration, there are reasonable grounds to believe that the companies which are party to this deed of cross guarantee will be able to meet any obligations or liabilities to which they are, or may become subject to, by virtue of the deed.
Bruce J Paterson Chairman
John W Cottle Director
Robert A Hogarth Director
Melbourne 23 September 2014

71Dart Mining NL
AuditAuditor’s Report

72 Dart Mining NL
AuditAuditor’s Report

73Dart Mining NL
AdditionalASX Additional Information
Additional information required by the Australian Securities Exchange Ltd Listing Rules and not disclosed elsewhere in this report is as follows. The information is current as at 5 September 2014.
Twenty largest shareholders
Rank Name of holder No. of ordinary shares held
Issued Capital
%
1 Kelvin Park Pty Ltd 29,333,334 12.06
2 Mr Russell Simpson & Mrs Elizabeth Simpson & Ms Meredith Simpson 15,670,331 6.44
3 J P Morgan Nominees Australia Limited 8,701,814 3.58
4 Mr Russell Mclarty Simpson & Mrs Elizabeth Vernon Simpson & Ms Meredith Hilary Simpson 7,668,307 3.15
5 Citicorp Nominees Pty Limited 6,757,862 2.78
6 W & E Maas Holdings Pty Limited 6,045,000 2.49
7 Specialised Alloys Services Pty Ltd 5,750,600 2.36
8 Mr Philip Alan Kenneth Naylor & Mrs Andrea Naylor 4,500,000 1.85
9 North East Geological Contractors Pty Ltd 4,459,179 1.83
10 J Barlow Consultants Pty Ltd 3,666,666 1.51
11 Mr Paul Dominic Ferguson 3,582,391 1.47
12 B Hochwimmer & Associates Pty Ltd 3,250,483 1.34
13 Strath Dee Pty Ltd 3,200,000 1.32
14 Finook Pty Ltd 2,755,747 1.13
15 Mr Errol Giuseppe Robertson 2,301,692 0.95
16 Granite Hills (Victoria) Pty Ltd 2,181,546 0.90
17 Mr Andrew Matthew Cameron & Mrs Gweneth Marsh Cameron & Mrs Fiona Crichton Barclay 1,844,555 0.76
18 R D Boyd Pty Ltd 1,781,719 0.73
19 Mrs Meredith Hilary Lyons 1,757,025 0.72
20 Mr Robert Charles Seawright 1,500,000 0.62
20 Mr Michael Andrew Pajmon 1,500,000 0.62
Total 118,208,251 48.59
Shares on issueOrdinary fully paid shares 243,257,982
Substantial ShareholdersSubstantial shareholders as advised to the Company are set out below:
Name No. of Ordinary Shares
Percentage of Issued Capital
Kelvin Park Pty Ltd 29,333,334 12.06
R Simpson, E Simpson and M Simpson 23,338,638 9.59

74 Dart Mining NL
AdditionalASX Additional Information
Distribution of member holdings
Ordinary shares
Size of holding No of holders No of shares
1 – 1,000 51 8,679
1,001 – 5,000 94 364,497
5,001 – 10,000 250 2,176,242
10,001 – 100,000 726 29,235,825
100,001 and over 294 211,471,739
Total Holders 1,415 243,257,982
The number of security investors holding less than a marketable parcel of securities is 518 with a combined total of 4,215,447 securities.
Voting RightsAll shares carry one vote per share without restriction.
Tenement schedule
Tenement number Licensed holder Name & region of subject of licence
EL 4724 Dart Mining NL Buckland, North-east Victoria including Fairleys prospect
EL 4726 Dart Mining NL Dart, North-east Victoria including Mountain View, Elliot, Morgan and Unicorn prospects
EL 5467 Dart Mining NL McCormack’s, North-east Victoria.
EL 5468 Dart Mining NL Upper Murray, North-east Victoria.
EL 5058 Dart Mining NL Cudgewa and Koetong, North-east Victoria abutting Dart EL
EL 5194 Dart Mining NL Mt. Alfred, North-east Victoria abutting Dart EL
EL 5559 Dart Mining NL Mountain View, North-east Victoria

