annual report 2013 - 2014 · contents page workcover wa annual report 2013/14 ... of western...
TRANSCRIPT

Annual Report 2013 - 2014

Introduction | WorkCover WA 2013/14 Annual Report
2
Introduction 3About this report 3About us 4Year in review 6
Section 1: Agency in Focus 11Chairman and CEO report 12Agency brief 13 Leadership 14People 20Enabling Legislation 21Governance 22Performance Management Framework 28
Section 2: Scheme Performance 33Claim numbers 34Claim trends 34Frequency rates 35Scheme payments 2013/14 36Average recommended premium rates 36Scheme payments and premium income 37Settlements 38
Section 3: Report on Operations 39Service 1: Scheme Regulation 40Service 2: Scheme Services 51Report against 2013/14 Strategic Initiatives 63
Section 4: Opportunities and Challenges 69Opportunity and accessibility 70Agency challenges 76IT initiatives 76
Section 5: Disclosures and Legal Compliance 77Report on funds management 78Other financial disclosures 80Ministerial directives 81Governance disclosures 81Board and committee remuneration 84Legal compliance 87Government policy requirements 89
Section 6: Key Performance Indicators 91Additional Key Performance Indicator Information 92Key Performance Indicators 94Summary of Key Performance Indicators 95Key Performance Indicators of Effectiveness 96Key Performance Indicators of Efficiency 101
Section 7: Financial Statements and Notes 109Financial Statements 110Independent Audit Opinion 110Notes to the Financial Statements 114
Contents Page
WorkCover WA Annual Report 2013/14© WorkCover WA, Government of Western Australia 2014ISSN 1839 - 1281 ISSN 1839 - 129X

3
Introduction | WorkCover WA 2013/14 Annual Report
Chris WhiteActing Chief Executive OfficerWorkCover WA
21 August 2014
Statement of compliance
In accordance with section 63 of the Financial Management Act 2006, we hereby submit for your information and presentation to Parliament the report of the WorkCover Western Australia Authority for the financial year ended 30 June 2014.
The Annual Report has been prepared in accordance with the provisions of the Financial Management Act 2006, and where applicable, a statement acknowledging the incorporation within the Report of any special reporting requirements imposed upon WorkCover Western Australia Authority by any other written law.
Greg JoyceChaimanWorkCover WA
21 August 2014
To the Honourable Michael Mischin MLCMinister for Commerce
About this report
Welcome to our 2013/14 Annual ReportThis report delivers a comprehensive analysis of our oversight and regulation of Western Australia’s workers’ compensation and injury management scheme over the past year. An introduction to WorkCover WA (the Agency) and our year in review begins on page 6. For a more comprehensive analysis of aspects of the year refer to section(s):
1. Agency in Focus » p. 112. Scheme Performance » p. 333. Report on Operations p. » 394. Opportunities and Challenges » p. 695. Disclosures and Legal Compliance » p. 776. Key Performance Indicators » p. 917. Financial Statements and Notes » p. 109
This report was developed in line with the Public Sector Commission’s Western Australian Public Sector Annual Reporting Framework for the 2013–2014 Reporting Year and the Department of Treasury’s Model Annual Report for Net Cost of Service Statutory Authorities. In compliance with these guidelines costs were minimised for production and printing. As printed copies of each annual report are limited, this report is also published on the Agency’s website www.workcover.wa.gov.au in the ‘Resources’ section. It adheres to State Government requirements for accessibility and readability, and can be viewed in PDF format as a whole or in sections. Alternative formats are available on request.
This publication may be copied in whole or part, with acknowledgement of WorkCover WA.

4
Introduction | WorkCover WA 2013/14 Annual Report
About usOur profileWorkCover WA is the government agency responsible for overseeing the workers’ compensation and injury management scheme in Western Australia.
This includes monitoring compliance with the Workers’ Compensation and Injury Management Act 1981 (the Act) and informing and educating workers, employers and other stakeholders about workers’ compensation and injury management, as well as providing an independent dispute resolution system.
Our purposeTo lead a contemporary, healthy and integrated workers’ compensation scheme that is fair, accessible and cost-effective for all participants through:
• providing advice and guidance on workers’ compensation and injury management
• active, responsive and transparent management of the scheme • focused information, education and compliance activities • fair and timely dispute resolution• a strong customer service focus.
Our strategic directionThe Agency’s Strategic Plan 2012-2015 (see page 31) defines four strategic goals that direct the delivery of WorkCover WA’s purpose:
1. Goal 1: Strategic scheme management Maintain the integrity and stability of the scheme
2. Goal 2: Stakeholder confidence and engagement Promote stakeholder confidence and engagement in the sustainability of the scheme
3. Goal 3: Regulatory compliance Ensure compliance with the regulatory requirements of the scheme
4. Goal 4: Organisational excellence Ensure WorkCover WA has the right culture, people, systems and processes to deliver high quality outcomes
Our vision is for a workers’ compensation and injury management scheme that works for all.
““

5
Introduction | WorkCover WA 2013/14 Annual Report
Customer Service• We are clear about what we will deliver• We consider our customers and their needs• We take responsibility for delivering effective and
appropriate services
Innovation• We are proactive, positive, flexible and act
strategically• We recognise that change is constant and that it
can bring opportunity• We build on opportunities
Respect• We embrace diversity and individual differences• We seek to understand and recognise peoples’
interests and rights• We are fair and prompt in our actions and dealings
with others
Integrity• We are trustworthy and accountable• We act in a consistent and impartial manner• We are transparent in our decision making
Collaboration• We work as a team• We value the contribution of others• We embrace a culture of open communication
Our values Our stakeholdersStakeholders in the workers’ compensation scheme include every worker and employer who employs workers (including contractors and subcontractors), as well as the health and service providers they utilise in a workers’ compensation and injury management context.
WorkCover WA is committed to working collaboratively with
all participants in the workers’ compensation scheme. During
2013/14 an extensive consultation process was undertaken
as part of the review of the Workers’ Compensation and
Injury Management Act 1981. We plan to continue to work
with stakeholders in the development of a new workers’
compensation statute.
Chris WhiteA/Chief Executive Officer WorkCover WA
“
“

6
Introduction | WorkCover WA 2013/14 Annual Report
Year in reviewYear in numbers
14,329 Enquiries
into expired policies, cancellations, new businesses and new owner checks
422 Investigations
into complaints, enquiries and reporting
70Prosecutions
completed against non-compliant employers
3,996 Registrations
of memoranda of agreement for the finalisation of workers’ compensation claims via settlement
1,899 Conciliations
completed
422 Arbitrations
completed
14,693 Publications
mailed to workers, employers, health providers and service providers
256,529 Visits
to the WorkCover WA website
23,289 Calls
for advice and assistance handled by the Advice and Assistance Unit
2,266 Hours
of staff training completed
7
Introduction | WorkCover WA 2013/14 Annual Report
Year in briefWorkCover WA has an important role in ensuring the Western Australian workers’ compensation and injury management scheme operates fairly and efficiently for all stakeholders, from injured workers to employers, insurers, health professionals and legal representatives.
As detailed in Section 1: Agency in Focus, WorkCover WA’s contribution to Government Goal 3, ‘Results-Based Service Delivery’ is achieved through the delivery of two services: regulation of scheme participants for compliance with legislative requirements; and the provision of effective and equitable dispute resolution and other services to scheme participants. The Agency’s delivery of these services are analysed in Section 3: Report on Operations. WorkCover WA’s success in delivering these services is measured against key performance indicators (KPIs) outlined in Section 6: Key Performance Indicators.
The overall workers’ compensation environment in the State remained healthy in 2013/14. Section 2: Scheme Performance analyses the WA workers’ compensation and injury management scheme, using the most recent data available. It reflects a stable picture in regards to the number and cost of claims.
A focus in this year’s report is the WorkCover WA Strategic Plan 2012–2015. The four key goals of the Strategic Plan (page 31) refocused the Agency’s approach to strategic scheme management, stakeholder engagement, regulatory compliance and organisational excellence. In 2013/14, 5 initiatives were delivered against this plan. The Agency’s successful delivery of these strategic initiatives is described in detail in Section 3: Report on Operations.
Internally, the Agency remained committed to the health and wellbeing of its staff through a variety of developmental and occupational safety and health related initiatives, as outlined in Section 4: Opportunities and Challenges. The Agency’s compliance with State Government policies and its financial performance and activities for 2013/14 are disclosed in Section 5: Disclosures and Legal Compliance and Section 7: Financial Statements and Notes respectively.
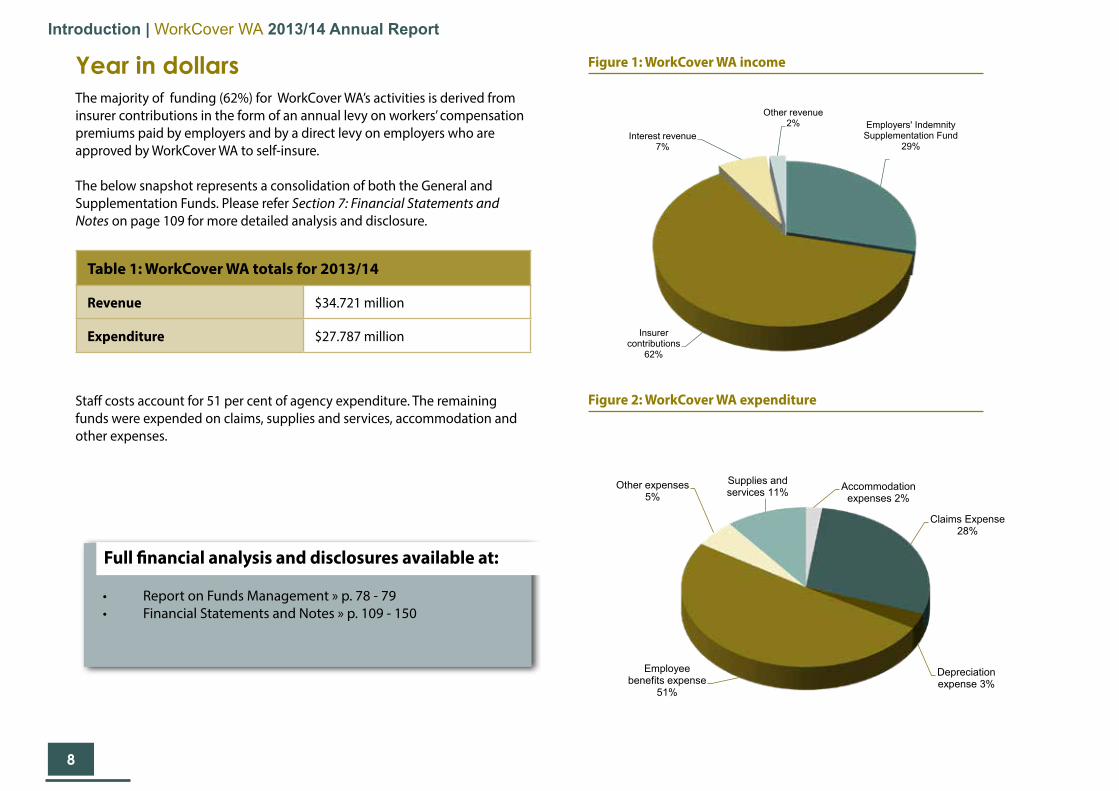
Figure 1: WorkCover WA income
Figure 2: WorkCover WA expenditure
Employers' Indemnity Supplementation Fund
29%
Insurer contributions
62%
Interest revenue7%
Other revenue2%
8
Introduction | WorkCover WA 2013/14 Annual Report
Year in dollarsThe majority of funding (62%) for WorkCover WA’s activities is derived from insurer contributions in the form of an annual levy on workers’ compensation premiums paid by employers and by a direct levy on employers who are approved by WorkCover WA to self-insure.
The below snapshot represents a consolidation of both the General and Supplementation Funds. Please refer Section 7: Financial Statements and Notes on page 109 for more detailed analysis and disclosure.
Table 1: WorkCover WA totals for 2013/14
Revenue $34.721 million
Expenditure $27.787 million
Staff costs account for 51 per cent of agency expenditure. The remaining funds were expended on claims, supplies and services, accommodation and other expenses.
•
• Report on Funds Management » p. 78 - 79• Financial Statements and Notes » p. 109 - 150
Full financial analysis and disclosures available at:
Accommodation expenses 2%
Claims Expense28%
Depreciation expense 3%
Employee benefits expense
51%
Other expenses 5%
Supplies and services 11%

9
Introduction | WorkCover WA 2013/14 Annual Report
Year scorecard2013/14 performance snapshotThe outcomes of WorkCover WA’s activities and services are measured by KPIs comprised of effectiveness and efficiency indicators. The 2013/14 scorecard provides a snapshot view of our performance for the year.
Full explanations on all measures, analysed against previous years and set targets, are located on the page(s) referenced beside each indicator in table 2 and 3.
Table 4 provides a summary of the delivery of our 2013/14 Strategic Initiatives.
Table 2: Indicators of effectiveness snapshot
# Description 2013/14 Target/Result Reference
1.1 Number of non-compliance events identified as a result of a claim on the General Account
p. 96
1.2 Proportion of conciliations completed within 8 weeks of the date the application for conciliation was accepted
p. 98
1.3Average number of days to resolve a dispute
p. 99
Table 3: Indicators of efficiency snapshot
# Description 2013/14 Target/Result Reference
1.1Average cost per employer compliance activity
p. 102
1.2 Average cost per approved and monitored service provider
p. 103
1.3 Average cost per client contact to provide information and advice
p. 104
2.1 Average cost to complete a conciliation
p. 106
2.2Average cost to complete an arbitration
p. 107
2.3 Average cost to process a Memorandum of Agreement
p. 108
Target
Result
8
4
Target
Result
97.0%
96.8%
Target
Result
126
190
Target
Result
$271
$198
Target
Result
$3,284
$3,047
Target
Result
$105
$120
Target
Result
$2,895
$2,268
Target
Result
$11,658
$11,153
Target
Result
$428
$389
10
Introduction | WorkCover WA 2013/14 Annual Report
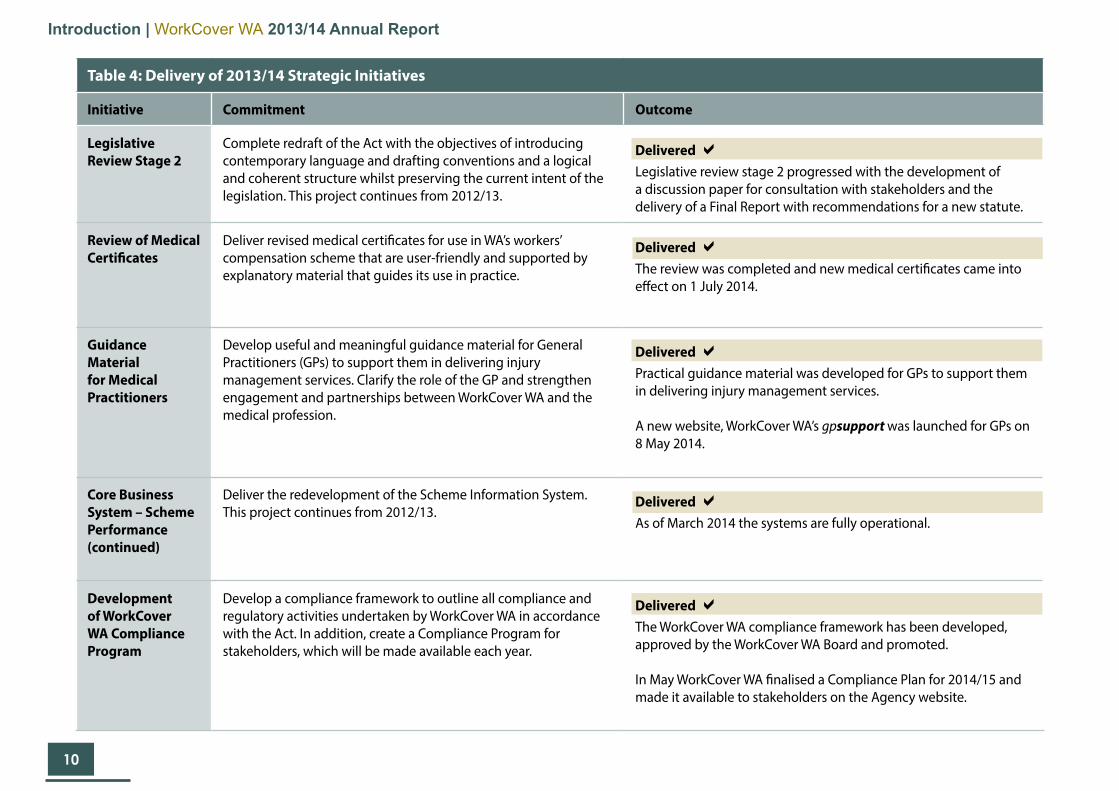
Table 4: Delivery of 2013/14 Strategic Initiatives
Initiative Commitment Outcome
Legislative Review Stage 2
Complete redraft of the Act with the objectives of introducing contemporary language and drafting conventions and a logical and coherent structure whilst preserving the current intent of the legislation. This project continues from 2012/13.
Delivered aLegislative review stage 2 progressed with the development of a discussion paper for consultation with stakeholders and the delivery of a Final Report with recommendations for a new statute.
Review of Medical Certificates
Deliver revised medical certificates for use in WA’s workers’ compensation scheme that are user-friendly and supported by explanatory material that guides its use in practice.
Delivered aThe review was completed and new medical certificates came into effect on 1 July 2014.
Guidance Material for Medical Practitioners
Develop useful and meaningful guidance material for General Practitioners (GPs) to support them in delivering injury management services. Clarify the role of the GP and strengthen engagement and partnerships between WorkCover WA and the medical profession.
Delivered aPractical guidance material was developed for GPs to support them in delivering injury management services.
A new website, WorkCover WA’s gpsupport was launched for GPs on 8 May 2014.
Core Business System – Scheme Performance (continued)
Deliver the redevelopment of the Scheme Information System. This project continues from 2012/13.
Delivered aAs of March 2014 the systems are fully operational.
Development of WorkCover WA Compliance Program
Develop a compliance framework to outline all compliance and regulatory activities undertaken by WorkCover WA in accordance with the Act. In addition, create a Compliance Program for stakeholders, which will be made available each year.
Delivered aThe WorkCover WA compliance framework has been developed, approved by the WorkCover WA Board and promoted.
In May WorkCover WA finalised a Compliance Plan for 2014/15 and made it available to stakeholders on the Agency website.

11
Chairman and CEO report | 12Agency brief | 13Leadership | 14People | 20Enabling legislation | 21Governance | 22Performance Management Framework | 28
Section 1: Agency in Focus

12
Agency in Focus | WorkCover WA 2013/14 Annual Report
WorkCover WA strives to ensure Western Australian workers and employers have access to a strong and sustainable workers’ compensation scheme. During 2013/14 the scheme continued to deliver fair compensation benefits and return to work support for injured workers at an affordable cost for employers.
The scheme is in good health with premium rates being maintained at historically low levels while there have been no changes to the entitlements of injured workers. Western Australia has the lowest standardised average premium rate across the states and territories. Helping injured workers to return to work is a key goal of the scheme and it is pleasing to report Western Australia again achieved a return to work rate better than the national average. We acknowledge the contribution of all stakeholders in supporting injured workers to return to suitable work as soon as possible to optimise recovery. WorkCover WA closely monitors the performance of all aspects of the scheme and provides timely information to scheme participants to drive continuous improvement.
As an organisation WorkCover WA is guided by the strategic goals and themes set out in our 2012-2015 Strategic Plan. This Annual Report highlights the success of the Agency in delivering on its goals and commitments. A significant achievement this year has been the implementation of new
Chairman and CEO reportcertificates of capacity as part of a focus on promoting the health benefits of work. The certificates, completed by general practitioners (GPs), are a fundamental tool in the management of every workers’ compensation claim. In addition to significantly improving the clarity of the certificates, guidance material was developed to support GPs in delivering injury management services. The new certificates and guidance materials were developed through effective collaboration with medical practitioners, insurers, workplace rehabilitation providers, employers and unions.
Over the course of 2013/14 we strived to maintain a high level of engagement with stakeholders as part of our long-term review of workers’ compensation legislation. In September 2013 we released a discussion document outlining proposals for a complete rewrite of the Workers’ Compensation and Injury Management Act 1981 (the Act). After comprehensive consultation with all our stakeholders a final report was presented to the Minister for Commerce in June 2014 containing detailed recommendations for a new statute. We thank those who participated in this process for their valuable and constructive contributions. Our commitment to meaningful and transparent consultation with stakeholders will continue as we embark upon the next phase of the review – drafting the new statute.
Another innovation launched in 2013/14 was the WorkCover WA compliance framework which is designed to help employers and service providers comply with their workers’ compensation and injury management responsibilities. The framework details our risk-based approach to compliance activities; the strategies used to detect instances of non-compliance; and the three strategies used to encourage compliance - education, engagement and enforcement. WorkCover WA has also published its first Compliance Plan. The Plan outlines the areas of regulatory focus and specific activities to be undertaken by the Regulatory Services Division during the 2014/15 financial year. Stakeholders now know what to expect and when, so they can plan for these activities and potential contact with WorkCover WA staff. The compliance framework and 2014-15 plan will underpin a renewed focus on compliance in the coming years.
» Greg Joyce, Chairman WorkCover WA (left); and » Chris White, Acting Chief Executive Officer WorkCover WA (right).

13
Agency in Focus | WorkCover WA 2013/14 Annual Report
A challenge for the year has been the need to deal effectively with an increase in the number of disputes within the scheme. A significant increase in the number of dispute applications and the closure of a number of complex long-term cases have resulted in an increase in the time taken to resolve disputes that proceed to arbitration. The rise in matters referred for arbitration has required the reallocation of resources to this area through the recruitment of additional in-house and sessional arbitrators. In particular, our staff have responded well to the increased demand for conciliation and arbitration services. We undertake to continue to closely monitor outcomes to ensure employers and injured workers have access to fair, timely and cost-effective services to support resolution of workers’ compensation disputes.
This year saw the completion of a three year program to replace WorkCover WA’s core information technology systems. WorkCover WA now has a modern, flexible technology platform for collecting and managing data to support our regulatory and dispute resolution services. The delivery of this large scale program on time and under budget is a credit to all involved.The WorkCover WA Board has provided strong leadership and governance oversight for our Agency. This year saw the reappointment of a number of members and the departure of Ms Linda Morich and Mr Ian Williams after five and three years of service respectively. We would like to thank Ms Morich and Mr Williams for their contribution to ensuring the effectiveness of WorkCover WA as an organisation and the sustainability of the scheme. In their place, we welcome new members Mr Steve Burns and Mr Owen Whittle.
The achievements outlined in this report would not have been possible without the dedicated commitment of WorkCover WA staff. We sincerely thank everyone for their hard work over the year in providing a valuable service to our community.
WorkCover WA looks forward to 2014/15 and remains confident we, along with our stakeholders, will continue to deliver a workers’ compensation scheme that works for all Western Australians.
Agency briefWorkers’ compensation and injury management: the Western Australian contextThe WA workers’ compensation and injury management scheme is designed to ensure workers suffering a work-related injury or illness are compensated for lost wages, medical expenses and associated costs while they are unable to work. Under the scheme, work-related injuries are actively managed to enable an injured worker’s prompt and safe return to work.
The WA scheme is based on a ‘no-fault’ principle. This means an injured worker does not need to establish their employer was at fault or negligent to make a claim.
The scheme in WA is privately underwritten, with insurance coverage provided by approved incorporated insurance offices. Employers are obliged by the Act to maintain current workers’ compensation insurance coverage for all their workers. WorkCover WA provides advice and assistance to employers to help them understand and comply with their legislative obligations, including who to cover.
A range of other related issues are also covered under the WA workers’ compensation and injury management scheme. These include compensation related to noise-induced hearing loss, assessment of permanent impairment, and finalising claims through settlement or common law proceedings.
Chairman and CEO report cont...
Refer to the Scheme Performance section from page 33 for an analysis of the workers’ compensation environment in the Western Australian context using the most recent data available.

14
Agency in Focus | WorkCover WA 2013/14 Annual Report
LeadershipAgency overview
Responsible Minister The Hon Michael Mischin MLC, Minister for Commerce.
Agency funding Funding for WorkCover WA’s activities is provided via an annual levy on workers’ compensation insurers and by a direct levy on employers who are approved by WorkCover WA to self-insure.
Administration The day-to-day administration of WorkCover WA is delegated by the WorkCover WA Board to the Chief Executive Officer who directs the Agency’s operations.
Organisational structure WorkCover WA comprises of four Divisions as outlined in the following organisational structure diagram and divisional descriptions.
Organisational structure
WorkCover WA’s Corporate Executive team
Conciliation and Arbitration
Services
Corporate Resources
Division
Legislation and Scheme Information
Regulatory Services Division
Audit
• Provision of dispute resolution services
• Registration of agreements
• Processing of applications
• Financial and budget management
• Facilities, asset and procurement management
• Records management
• Information and communications technology and systems
• Human resource services
• Workforce development
• Legislation• Scheme
Information
• Performance monitoring
• Investigation and enforcement
• Standards and accreditation
• Complaints management
• Customer assistance and advice
• Communications and education
MINISTER FOR COMMERCE
WorkCover WA Board
Chief Executive Officer
Executive Services

15
Agency in Focus | WorkCover WA 2013/14 Annual Report
Divisions and directionCorporate ExecutiveWorkCover WA is led by a Corporate Executive team which compromises of the Chief Executive Officer, divisional heads, the Registrar Arbitration and the Chief Finance Officer. The Corporate Executive is responsible for developing, monitoring and reporting the Agency’s overall corporate direction, budgeting, planning and monitoring of operational performance outcomes.
Conciliation and Arbitration ServicesThe Conciliation and Arbitration Services Division are responsible for the resolution of disputes in the WA workers’ compensation and injury management scheme. It comprises of conciliation (leads to final and appropriate agreements between parties in relation to disputes) and arbitration (enables disputes unresolved by conciliation to be determined according to their substantial merits with as little formality and technicality as possible).
Corporate ResourcesThe Corporate Resources Division ensures staff, financial, technical, information and physical resources are available to support the Agency’s operations and delivery of outputs.
Legislation and Scheme InformationThe Legislation and Scheme Information Division maintains scheme viability and effectiveness through:
• policy and legislation development• research and evaluation of scheme performance• collection, quality assurance and analysis of data from approved insurers
and self-insurers to assist compliance activities and set premium rates.
The Division has a strategic focus on activities that assist the Board and Government to effectively manage the workers’ compensation system.
Regulatory ServicesThe Regulatory Services Division maintains strong working relationships with key stakeholders and ensures parties operating within the workers’ compensation and injury management scheme comply with their statutory and administrative obligations by:
• educating, engaging and informing staff and stakeholders• providing advice and assistance• monitoring scheme participants’ compliance with the Act and other
standards through annual reviews, audits and self-assessments• applying compliance tools including letters of caution, infringement
notices and formal prosecution.
General Manager Regulatory Services, Harley White (left); A/General Manager Corporate Resources, Ron de Blank; A/Chief Executive Officer, Chris White; A/General Manager Conciliation and Arbitration Services, Ross Paparone; Chief Finance Officer, John Hull; Registrar, Shane Melville (right).

16
Agency in Focus | WorkCover WA 2013/14 Annual Report
WorkCover WA Board The WorkCover Western Australia Authority (the Board) is responsible for governance of the Agency; the provision of independent advice to the Minister; and the approval of certain service providers. Constituted under section 94(1) of the Act, the Board is authorised to use and operate under the trading name ‘WorkCover WA’.
The Chief Executive Officer, who is a member of the Board, directs the operations and day-to-day administration of WorkCover WA through the implementation of the Board’s strategic direction. The Chief Executive Officer and all other staff of WorkCover WA are employed under the provisions of the Public Sector Management Act 1994.
Table 5: Board Meeting Attendance
Member Number of meetings eligible to attend
Number of meetings attended
Greg Joyce (Chairman) 11 11
Brian Bradley 11 7
Linda Morich 3 0
Karin Lee 11 11
Ian Williams 1 1
Victoria Wilmot 11 10
Owen Whittle 5 5
Steven Burns 8 8
Chris White 11 11
Chairman appointed by the Governor on the recommendation of the Minister
Greg Joyce has been a member and Chair of WorkCover WA’s Board since 1 May 2005. Greg was reappointed for a further three year term from 4 January 2014. Mr Joyce was the Director General of the Department of Housing and Works from July 2001 until his retirement in January 2005. Mr Joyce is
currently a Member of the Liquor Commission of Western Australia, has a law degree from the University of Western Australia and is qualified to practise as a barrister and solicitor in Western Australia.
Member Chief Executive Officer of WorkCover WA
Michelle Reynolds was appointed as the Chief Executive Officer of WorkCover WA on 22 September 2009 after acting in the role from 25 December 2008. Ms Reynolds has more than 28 years experience in the Western Australian public sector, the past 13 years in senior executive roles.
*During 2013/14 Chris White, WorkCover WA’s General Manager of Legislation and Scheme Information, was Acting Chief Executive Officer of WorkCover WA whilst Ms Reynolds was seconded to the Department of the Premier and Cabinet.

17
Agency in Focus | WorkCover WA 2013/14 Annual Report
17
Member Chief Executive Officer of the Department of the Public Service of the State principally assisting the Minister charged with the administration of the Occupational Safety and Health Act 1984
Brian Bradley, PSM is the Director General of the Department of Commerce. He served as Chairman of the former Workers’ Compensation and Rehabilitation Commission from 2000 to 2005, and was the Western
Australian member of the Australian Safety and Compensation Council from 2005 to April 2009. Mr Bradley is currently the Deputy Chair of the Western Australian Commission for Occupational Safety and Health, Western Australian member of Safe Work Australia and a member of the Legal Aid Commission.
Member Experienced in employers’ interests
Karin Lee was appointed a member of the WorkCover WA Board on 22 February 2011, and was reappointed for a further three year term from 4 January 2014. Ms Lee is the Manager Safety and Risk Services at the WA Chamber of Commerce and Industry and has over 15 years of experience in the area of workers’ compensation. Ms Lee has previously worked at Allianz
Insurance and WorkCover QLD, and as a solicitor in personal injury litigation matters. Ms Lee is a member of the WA Commission for Occupational Safety and Health.
Member Experienced in accounting and financial management
Victoria Wilmot was appointed to WorkCover WA’s Board on 4 January 2005, and was reappointed for a further three year term from 4 January 2014. She is the Deputy Director Financial Services at the University of Western Australia. Ms Wilmot is a member of the
Institute of Chartered Accountants (CA) in Australia, a Fellow of the Financial Services Institute of Australasia and a member of the Board of the University Credit Society Ltd.
MemberExperienced in insurance matters
Steven Burns was appointed a member of the WorkCover WA Board on 1 October 2013, for a three year term ending 30 September 2016. Mr Burns is a member of QBE Australia’s national workers’ compensation leadership team. Mr Burns joined the insurance industry in 1993 and has held general management and product management responsibility in Tasmania, Northern Territory, Western Australia, ACT and New Zealand.
*Mr Burns replaced Ian Williams as the nominee member experienced in insurance matters on 1 October 2013. Mr Williams was appointed a member of the WorkCover WA Board on 1 August 2010, for a term ending 31 July 2013. Mr Willams held senior management positions in Western Australia, Victoria and New South Wales during his 30 year insurance career.
Member Experienced in workers’ interests
Owen Whittle was appointed to the WorkCover WA Board for a term expiring on 29 December 2014. Mr Whittle is the Assistant Secretary of UnionsWA where he leads its occupational health and safety work and is a member of the National ACTU Occupational Health and Safety Committee.
*Mr Whittle replaced Linda Morich as the nominee member experienced in workers’ interests on 4 January 2014. Ms Morich was appointed a member of the WorkCover WA Board on 30 December 2008 and is the Occupational Health and Safety Officer at the Maritime Union of Australia.
18
Agency in Focus | WorkCover WA 2013/14 Annual Report
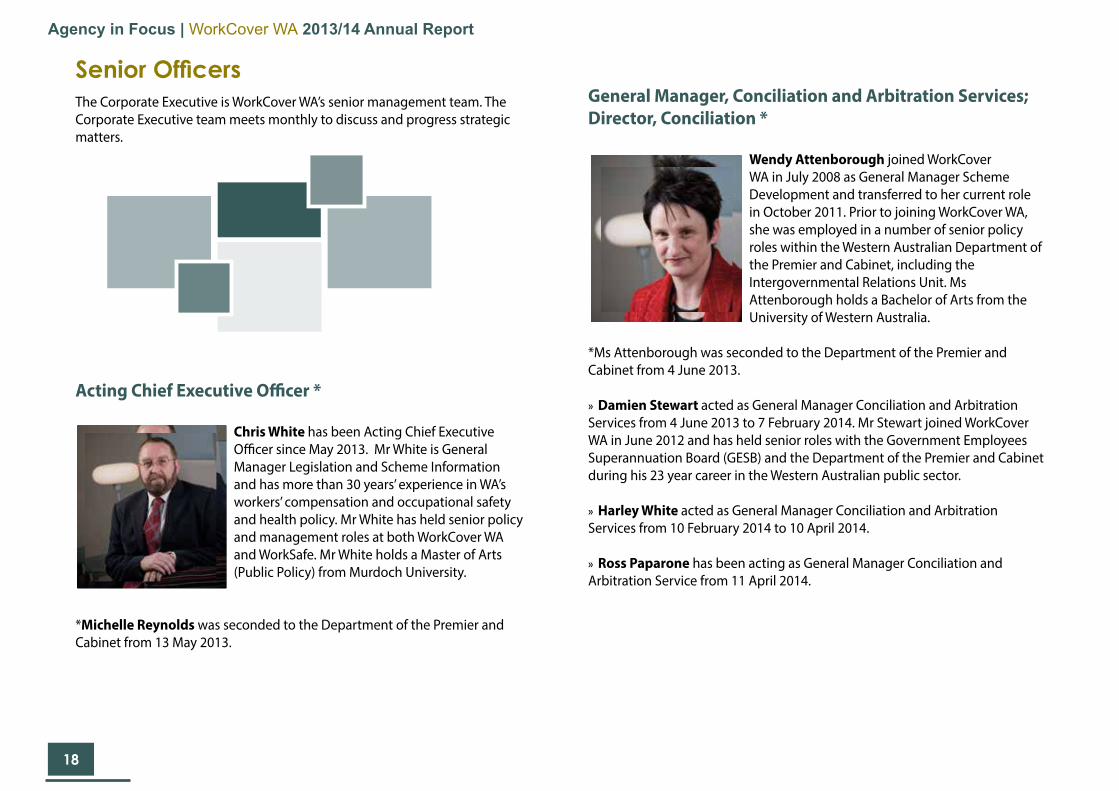
General Manager, Conciliation and Arbitration Services; Director, Conciliation *
Wendy Attenborough joined WorkCover WA in July 2008 as General Manager Scheme Development and transferred to her current role in October 2011. Prior to joining WorkCover WA, she was employed in a number of senior policy roles within the Western Australian Department of the Premier and Cabinet, including the Intergovernmental Relations Unit. Ms Attenborough holds a Bachelor of Arts from the University of Western Australia.
*Ms Attenborough was seconded to the Department of the Premier and Cabinet from 4 June 2013.
» Damien Stewart acted as General Manager Conciliation and Arbitration Services from 4 June 2013 to 7 February 2014. Mr Stewart joined WorkCover WA in June 2012 and has held senior roles with the Government Employees Superannuation Board (GESB) and the Department of the Premier and Cabinet during his 23 year career in the Western Australian public sector.
» Harley White acted as General Manager Conciliation and Arbitration Services from 10 February 2014 to 10 April 2014.
» Ross Paparone has been acting as General Manager Conciliation and Arbitration Service from 11 April 2014.
Senior Officers The Corporate Executive is WorkCover WA’s senior management team. The Corporate Executive team meets monthly to discuss and progress strategic matters.
Acting Chief Executive Officer *
Chris White has been Acting Chief Executive Officer since May 2013. Mr White is General Manager Legislation and Scheme Information and has more than 30 years’ experience in WA’s workers’ compensation and occupational safety and health policy. Mr White has held senior policy and management roles at both WorkCover WA and WorkSafe. Mr White holds a Master of Arts (Public Policy) from Murdoch University.
*Michelle Reynolds was seconded to the Department of the Premier and Cabinet from 13 May 2013.

19
Agency in Focus | WorkCover WA 2013/14 Annual Report
Registrar, Arbitration
Shane Melville was appointed as Registrar, Arbitration, in December 2011 and previously held the position of Director, Dispute Resolution Directorate. Mr Melville commenced at WorkCover WA as an Arbitrator in the Dispute Resolution Directorate in November 2005. He holds the degrees of Bachelor of Jurisprudence and Bachelor of Laws from the University of Western Australia, accreditation from the Institute of Arbitrators and Mediators Australia and has more than 25 years of experience as a legal practitioner in workers’ compensation litigation.
Chief Finance Officer
John Hull commenced with WorkCover WA as the Chief Finance Officer in July 2010. He has extensive public sector experience and has undertaken senior finance, compliance and corporate management roles across a range of agencies within the public sector including the Department of Treasury and Finance and the Office of the Auditor General. Mr Hull is a CPA and has a Bachelor of Business Degree in Finance and Accounting.
General Manager, Corporate Resources
Jeff McDonough joined WorkCover WA in October 2007 as General Manager Corporate Resources. Prior to joining WorkCover WA, Mr McDonough worked for a number of years in the TAFE sector. He has extensive experience in human resources management, organisational development and quality assurance, and holds a Diploma in Management Studies.
Mr McDonough retired from the WA public service on 24 January 2014.
» Ron de Blank commenced at WorkCover WA as acting General Manager, Corporate Resources in May 2014. Mr de Blank is seconded from the Department of the Premier and Cabinet and brings significant senior experience working in the Western Australian public sector and as a management consultant in areas including labour relations, human resource management and strategic policy. He holds a Bachelor of Economics with Honours from the University of Western Australia.
General Manager, Regulatory Services
Harley White is General Manager, Regulatory Services. He has been employed in workers’ compensation and related fields since 1994, and has held positions in a number of areas within WorkCover WA including dispute resolution, policy and legislation, and regulation. He is a career public sector employee, having joined the sector in 1978 and holds a Diploma in Legal Studies.
» Kelly Riddle acted as General Manager, Regulatory Services from 10 February 2014 to 22 July 2014.

Agency in Focus | WorkCover WA 2013/14 Annual Report
Workforce policies WorkCover WA’s workforce policies are outlined on page 70 under ‘Opportunity and accessibility’ in Section 4: Opportunities and Challenges, and the entries disclosed under ‘Legal compliance’ on page 87 in Section 5: Disclosures and Legal Compliance.
Figure 4: Staff by division
27%
25%16%
27%
5%
Regulatory Services
Conciliation and Arbitration
Legislation and Scheme Information
Corporate Resources
Executive Services
27%
25%16%
27%
5%
Regulatory Services
Conciliation and Arbitration
Legislation and Scheme Information
Corporate Resources
Executive Services
77%
10%
8%
4% 1%
Sales
Full-time permanent
Full-time contract
Part-time measured on an FTE basis
Staff on secondment
Staff on traineeship
20
77%
10%
8%4% 1%
Sales
Full-time permanent
Full-time contract
Part-time measured on an FTE basis
Staff on secondment
Staff on traineeship
PeopleWorkforce profile The following figures summarise the Agency’s 2013/14 workforce profile. WorkCover WA’s complete FTE profile is disclosed on page 80 under ‘Employment and industrial relations’ in Section 5: Disclosures and Legal Compliance.
Figure 3: Staff by FTE
WorkCover WA staff.

21
Agency in Focus | WorkCover WA 2013/14 Annual Report
Key legislation impacting on WorkCover WA’s activities
• A New Tax System (Fringe Benefits Reporting) Act 1999 (Commonwealth) • A New Tax System (Goods and Services Tax) Act 1999 (Commonwealth)• Auditor General Act 2006 • Corruption and Crime Commission Act 2003 • Disability Services Act 1993 • Electoral Act 1907 • Electronic Transactions Act 2011 • Equal Opportunity Act 1984 • Financial Management Act 2006 • Freedom of Information Act 1992 • Industrial Relations Act 1979 • Minimum Conditions of Employment Act 1993 • Occupational Safety and Health Act 1984 • Occupiers’ Liability Act 1985 • Public and Bank Holidays Act 1972 • Public Interest Disclosure Act 2003 • Public Sector Management Act 1994 • Public Sector Management (Redeployment and Redundancy) Regulations
1994 • Salaries and Allowances Act 1975 • Superannuation Guarantee (Administration) Act 1992 (Commonwealth) • State Supply Commission Act 1991 • State Records Act 2000
Enabling legislation The WorkCover Western Australia Authority is constituted under section 94 of the Act. WorkCover WA’s functions and powers are detailed in sections 100 and 101 of the Act. The objectives and constitution of the Conciliation and Arbitration Services are contained within sections 177, 181 and 182ZO of the Act.
Legislation administered In the performance of its functions, WorkCover WA administers the following legislation:
• Workers’ Compensation and Injury Management Act 1981 • Employers’ Indemnity Supplementation Fund Act 1980 • Workers’ Compensation and Injury Management (Acts of Terrorism) Act 2001 • Workers’ Compensation (Common Law Proceedings) Act 2004 • Waterfront Workers’ (Compensation for Asbestos Related Diseases) Act 1986 • Employers’ Indemnity Policies (Premium Rates) Act 1990
Subsidiary legislation
• Workers’ Compensation and Injury Management Regulations 1982 • Workers’ Compensation Code of Practice (Injury Management) 2005 • Workers’ Compensation and Injury Management (Scales of Fees) Regulations
1998 • Workers’ Compensation (Legal Practitioners and Registered Agents) Costs
Determination 2014 • Workers’ Compensation and Rehabilitation (Acts of Terrorism) (Final Day)
Regulations 2002 • WorkCover Western Australia Guides for the Evaluation of Permanent
Impairment – Third Edition• Workers’ Compensation and Injury Management Conciliation Rules 2011• Workers’ Compensation and Injury Management Arbitration Rules 2011
22
Agency in Focus | WorkCover WA 2013/14 Annual Report
Other legislation impacting on WorkCover WA’s activities
• Competition Policy Reform (WA) Act 1996 • Constitution Act 1889 • Constitution Acts Amendment Act 1899 • Coroners’ Act 1996 • Criminal Code Act Compilation Act 1913 • Defence Act 1903 (Commonwealth)• Evidence Act 1906 • Interpretation Act 1984 • State Administrative Tribunal Act 2004 • Statutory Corporations (Liability of Directors) Act 1996
Governance
Delegation of authorityTo contribute to the effectiveness of the WorkCover WA Board and to meet specific legislative responsibilities, an Audit Committee, Costs Committee and Medical Committee are established to provide objective administration and management of certain elements of the WA workers’ compensation and injury management scheme. Governance issues for the committees are included as a standing item at Board meetings.
As part of their governance practices these committees have:
• formal documented terms of reference/standing orders• an appointed Chairman who is also a Board member• committee members with the expertise most relevant to dealing with the
issues• a mechanism for regular feedback to the Board• transparency on committee activities• appropriate administrative support.
A/CEO, Chris White, leads a discussion at a monthly Corporate Executive meeting.

23
Agency in Focus | WorkCover WA 2013/14 Annual Report
Audit CommitteeThe Audit Committee provides independent assurance and assistance to the Board on WorkCover WA’s risk, control and compliance framework, and its external accountability responsibilities.
Refer to page 82 under ‘Governance disclosures’ in Section 5: Disclosures and Legal Compliance for full disclosures on this committee.
Costs CommitteeThe Costs Committee is an independent committee established under section 269 of the Act reporting directly to the Minister of Commerce. It is empowered to make, amend or revoke a determination fixing maximum costs for legal services and registered agent services in relation to conciliation and arbitration.
Refer to page 82 under ‘Governance disclosures’ in Section 5: Disclosures and Legal Compliance for full disclosures on this committee.
Medical CommitteeThe Medical Committee is an advisory committee established under section 100A of the Act to primarily provide guidance on permanent impairment assessment but also other matters of a medical nature within the Western Australian workers’ compensation scheme.
Refer to page 83 under ‘Governance disclosures’ in Section 5: Disclosures and Legal Compliance for full disclosures on this committee.
Workplace consultationEmergency Planning CommitteeThe Emergency Planning Committee (EPC) meets quarterly and is responsible for identifying events which could produce emergency situations. The Committee, in conjunction with the Emergency Control Organisation (ECO), prepares and reviews emergency plans, and appropriate emergency response procedures.
During 2013/14 the ECO as directed by the EPC, conducted two evacuation tests, documented all procedures for duress alarms and updated WorkCover WA’s desktop emergency response guide booklet to include difficult client procedures.
Equity and Diversity CommitteeThe Equity and Diversity Committee (EEO) meets quarterly to contribute to the development and monitoring of policies relating to equal employment opportunity, disability and indigenous issues, and associated action plans, and is chaired by a member of the Corporate Executive. This includes the development of initiatives to raise staff awareness and understanding of equity and diversity; matters affecting people with disabilities; and employment strategies supporting diversity at WorkCover WA.
In 2013/14, the EEO:
• developed a new Reconciliation Action Plan (RAP) • published articles providing information to all staff on the Disability
Access and Inclusion Plan and the RAP• raised awareness of staff on broad cultural awareness and sensitivities
through the development of an information sheet made available to all new and existing staff
• reviewed and ensured our premises and internal and external infrastructure are accessible to all people with disability
• ensured all new WorkCover WA forms comply with accessibility guidelines• supported employment of contractors with a disability to undertake
maintenance of the grounds at WorkCover WA.

24
Agency in Focus | WorkCover WA 2013/14 Annual Report
IT Steering CommitteeThe IT Steering Committee governs investment in, and the use of, information systems, communications and technology on behalf of WorkCover WA. The committee ensures WorkCover WA achieves the greatest affordable benefit from information technology, manages information according to legislation and complies with government policies.
In 2013/14 the IT Steering Committee:
• presented a business case to the Board in October 2013 recommending the replacement of the external website. This was approved on 17 October 2013
• approved access to selected social media tools for all Agency staff, with appropriate monitoring and reporting
• approved retirement of the outbound facsimile service from the Dispute Case Management System (DCMS).
At the April 2014 meeting of the Steering Committee it was agreed matters normally dealt with by the Steering Committee would be reported quarterly to the Corporate Executive. IT Steering Committee meetings have been suspended until further notice.
Joint Consultative CommitteeComprising the WorkCover WA elected union delegates, the CEO, and senior management representatives, the Joint Consultative Committee (JCC) convenes quarterly, or as required, to ensure consultation occurs between staff and management on major issues affecting the working conditions of employees.
In 2013/14 the JCC made recommendations regarding the implementation of the Public Sector Commission’s Employee Perception Survey, training for staff on the prevention of workplace bullying and the ‘Christmas closedown’. The JCC also provided feedback on a review of a range of corporate policies and procedures.
Occupational Safety and Health CommitteeThe Occupational Safety and Health (OSH) Committee facilitates consultation and cooperation between WorkCover WA and its employees by examining issues affecting the health and wellbeing of staff, and developing and implementing measures to prevent workplace accidents and injuries. The committee makes recommendations to both the Agency and its employees regarding the establishment, maintenance and monitoring of programs, measures and procedures in the workplace relating to the safety and health of all employees.
The OSH Committee is chaired by a member of the Corporate Executive and for the reporting period comprised the General Manager Conciliation and Arbitration Services, the Coordinator Workforce Development, the Administration Officer Business Services, and three elected employee representatives. The committee meets on a quarterly basis to address OSH issues, and review hazards and incident reports.
In 2013/14, the OSH Committee was involved with the following initiatives:
• review and ongoing implementation of the 2013/15 OSH Management Plan
• review of the OSH Policy and Procedures• production of intranet articles alerting staff to workplace health risks• review and updating of agency Workplace Inspection Forms• completion of risk assessments of all external stairs and access ways
including the installation of nonslip surfacing and hand rails on external staircases.
25
Agency in Focus | WorkCover WA 2013/14 Annual Report
KPI Performance Reporting CommitteeThe KPI Performance Reporting Committee reviews and manages the Agency Outcome Based Management (OBM) structure. The objectives of the committee are to comply with relevant government directives, guidelines and legislation; as well as develop, implement and monitor organisational performance outcomes.
Members (consisting of Corporate Executive members and relevant staff) meet as required. The committee met six times in 2013/14. The KPI Performance Reporting Committee has enabled the clear integration of the Agency’s KPIs with other key processes so discussions around KPIs are viewed as assisting, rather than adding, to the existing reporting framework.
Risk Management Review GroupThe Risk Management Review Group (RMRG) oversees WorkCover WA’s risk management processes and is responsible for maintaining the Agency’s risk management framework. The RMRG meets quarterly to:
• monitor and track risks• monitor, track and report the progress of risk treatment action plans• encourage and promote greater awareness and understanding of risk
throughout all levels of the Agency• provide guidance on risk management.
During 2013/14 the RMRG ensured a consistent process is used to consider and record risks for all projects, as well as keeping the risk register accurate and up-to-date.
Communications policiesWorkCover WA has a number of policies which govern internal communications with staff and external communications with stakeholders. These policies are supported by WorkCover WA’s Freedom of Information Policy, Records Management Policy and the Code of Conduct, to ensure the Agency is complying with relevant legislation whilst maintaining proactive, transparent and responsive internal and external communications. Every policy is reviewed by a WorkCover WA Board and/or Corporate Executive member periodically for adequacy, currency and effectiveness.
Governance Policy: Official CommunicationThis policy governs the flow of information between members of the WorkCover WA Board, Board Committees and stakeholders, as well as the dissemination of information from the WorkCover WA CEO to Agency employees.
Communications occur for a variety of reasons, including:
• informing or involving internal and external stakeholders• responding to the media, lobbyists, or other requests for information,
compliance or reporting• to promote or represent WorkCover WA.
This policy establishes:
• who should communicate with whom, and when (including authorisation to make public comment on behalf of WorkCover WA)
• the extent of what should be communicated• confidentiality considerations.

26
Agency in Focus | WorkCover WA 2013/14 Annual Report
Customer First Feedback Policy and ProceduresFeedback from customers is the most immediate and effective way an agency can analyse public perception of its performance. A customer feedback system forms part of an agency’s commitment to continuously improve services to customers and the community.
WorkCover WA’s Customer First Feedback System complies with the Australian Standard on Complaints Handling (AS 10002-2006) and the Public Sector Commission Circular 2009-27: Complaints Handling. It provides customers with an avenue to deliver positive or negative feedback about the Agency’s services, decisions, procedures, policies and facilities.
This feedback mechanism increases WorkCover WA’s understanding of customer needs and expectations and identifies opportunities for organisational improvements. Customer feedback is reported regularly to the Agency’s Corporate Executive for discussion and trend identification.
Customer feedback is recorded either verbally (in person or by telephone) or in writing (by Customer First Feedback Form, email, website, letter, fax or ministerial). Verbal feedback must be responded to within five working days, and written feedback must be responded to within 10 working days. More complex complaints are expected to be resolved within 30 working days.
2013/14 outcomes from the WorkCover WA Customer First Feedback System are available on page 61.
External Data Release PolicyAs WorkCover WA receives requests for aggregate and unit level data from external parties on a regular basis, this policy governs the supply of data to government agencies, researchers, stakeholders and the general public. The policy protects the Agency’s intellectual property and data confidentiality, and ensures the terms and conditions for the use of the supplied data are clearly outlined in written agreements.
Restriction of Communications when dealing with Unreasonable Customer Behaviour Policy Open communication with stakeholders and the general public is part of WorkCover WA’s Values and Code of Conduct. However, customers may be excluded from contact with WorkCover WA staff where their behaviour is deemed unreasonable. This policy provides WorkCover WA staff with guidance on managing customers who have displayed unreasonable behaviour in the course of personal, telephone or written communications.
In compliance with the WA Ombudsmen’s guidelines for ‘Managing Unreasonable Complainant Conduct’, unreasonable behaviour is categorised as follows:
• habitual or obsessive complainants• rude, angry and harassing complainants• aggressive complainants.
In May 2014 the Policy was reviewed and updated to reflect current information.
Disclosure of Personal Information PolicyThis policy ensures all personal information concerning WorkCover WA staff remains strictly confidential unless the staff member in question has given written consent for its disclosure.

27
Agency in Focus | WorkCover WA 2013/14 Annual Report
Risk Management policies Risk Management FrameworkWorkCover WA’s approach to risk is based on the principle every staff member has a role to play in risk management and mitigation. Policies informing staff of all risk and occupational safety and health responsibilities are embedded in business activities and consolidated through training initiatives. These procedures ensure the Agency manages risks in accordance with the Australian New Zealand standard AS/NZS ISO 31000:2009.
WorkCover WA’s risk management framework includes:
• an Audit Committee (see ‘Governance disclosures’ in Section 5: Disclosures and Legal Compliance) charged with the responsibility of providing assurance to the Board on WorkCover WA’s risks and controls
• an Audit Services Manager with the responsibility of advising the Agency on risk management
• a Risk Management Policy and Risk Management Guidelines• a Risk Management Review Group (see ‘Workplace consultation: Risk
Management Review Group’ on page 25) which provides ongoing assurance to the Corporate Executive risks are being addressed in a timely and appropriate manner
• a risk register that is monitored and maintained regularly.
Risk Management Policy and GuidelinesThe Agency’s Risk Management Policy and Risk Management Guidelines cover all aspects of the active management of existing risks, as well as outlining the processes involved with the identification, recording and management of new risks. The policies and procedures are applied on an ongoing basis, ensuring the Agency’s risk management activities are reported bi-annually to the Audit Committee.
Other policies and proceduresThe Agency’s other policies and procedures involving risk management include:
• Occupational Safety and Health Procedures• an Occupational Safety and Health Policy• an Occupational Safety and Health Risk and Legal Register.
Risk management audit strategies Risk management is a key business process for effective planning and decision making. WorkCover WA aims to develop organisational wide capabilities in risk management to ensure consistent, efficient and effective assessment of risk in the achievement of strategic objectives.
The Agency evaluates its risks through risk review workshops, the Risk Management Review Group’s monitoring of risk and mitigation strategies, and further oversight by the Agency’s Audit Committee and the WorkCover WA Board.
To ensure the Agency’s risk management strategy and framework is contemporary and aligns with whole of government requirements as well as agency objectives, periodic audits and reviews are undertaken.
The risk management function at WorkCover was last audited in November 2012. The Agency is currently conducting an in house review of its risk management approach to evaluate if improvements are necessary.
28
Agency in Focus | WorkCover WA 2013/14 Annual Report
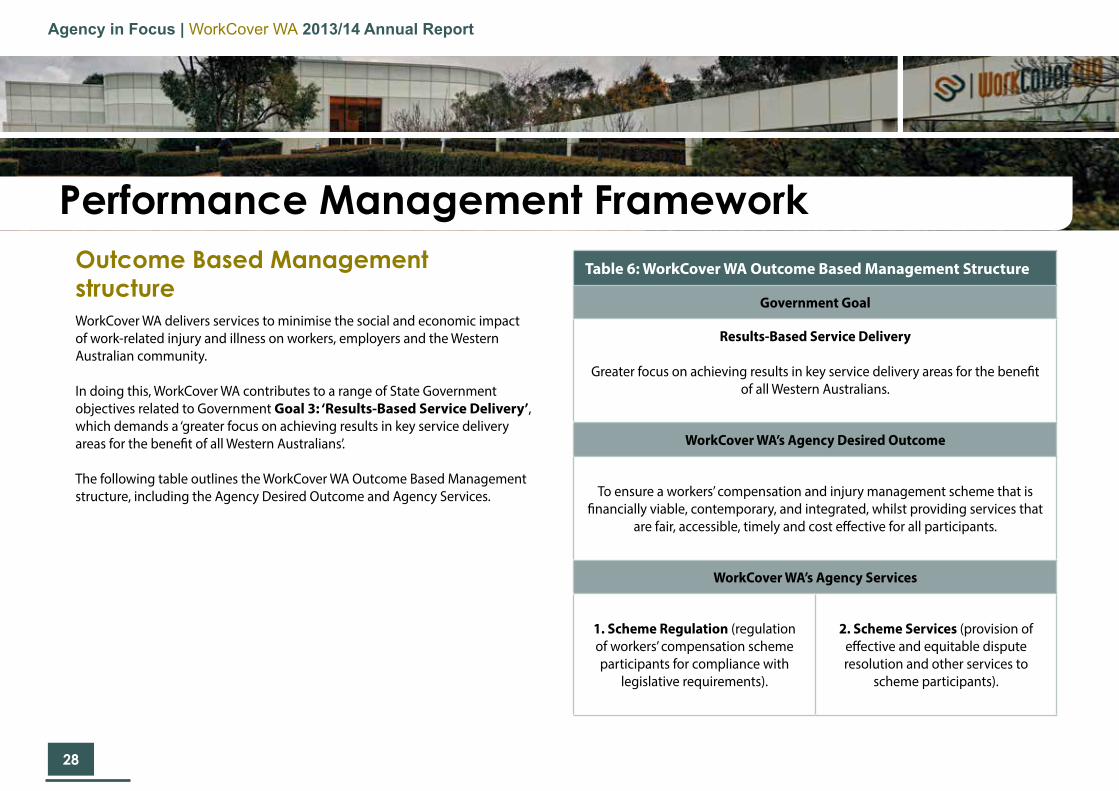
Outcome Based Management structure WorkCover WA delivers services to minimise the social and economic impact of work-related injury and illness on workers, employers and the Western Australian community.
In doing this, WorkCover WA contributes to a range of State Government objectives related to Government Goal 3: ‘Results-Based Service Delivery’, which demands a ‘greater focus on achieving results in key service delivery areas for the benefit of all Western Australians’.
The following table outlines the WorkCover WA Outcome Based Management structure, including the Agency Desired Outcome and Agency Services.
Performance Management FrameworkTable 6: WorkCover WA Outcome Based Management Structure
Government Goal
Results-Based Service Delivery
Greater focus on achieving results in key service delivery areas for the benefit of all Western Australians.
WorkCover WA’s Agency Desired Outcome
To ensure a workers’ compensation and injury management scheme that is financially viable, contemporary, and integrated, whilst providing services that
are fair, accessible, timely and cost effective for all participants.
WorkCover WA’s Agency Services
1. Scheme Regulation (regulation of workers’ compensation scheme participants for compliance with
legislative requirements).
2. Scheme Services (provision of effective and equitable dispute resolution and other services to
scheme participants).

29
Agency in Focus | WorkCover WA 2013/14 Annual Report
Other government goalsWorkCover WA also contributes to the following State Government goals:
• Goal 2 – Financial and economic responsibility Through its work in maintaining a cost/benefit balance as part of managing a viable workers’ compensation system.
• Goal 4 – Stronger focus on the regions Through an ongoing program of providing information, education and services to employers and injured workers in regional areas.
• Goal 5 – Social and environmental responsibility By ensuring the workers’ compensation system is managed in a socially responsible manner for the long-term benefit of the State.
Shared responsibilities with other agenciesWorkCover WA did not share any responsibilities under the Act with other agencies in 2013/14.
Manager IT, Galina Louw and Technical Project Leader, Dennis Reincastle are committed to WorkCover WA’s Performance Management Framework.
30
Agency in Focus | WorkCover WA 2013/14 Annual Report
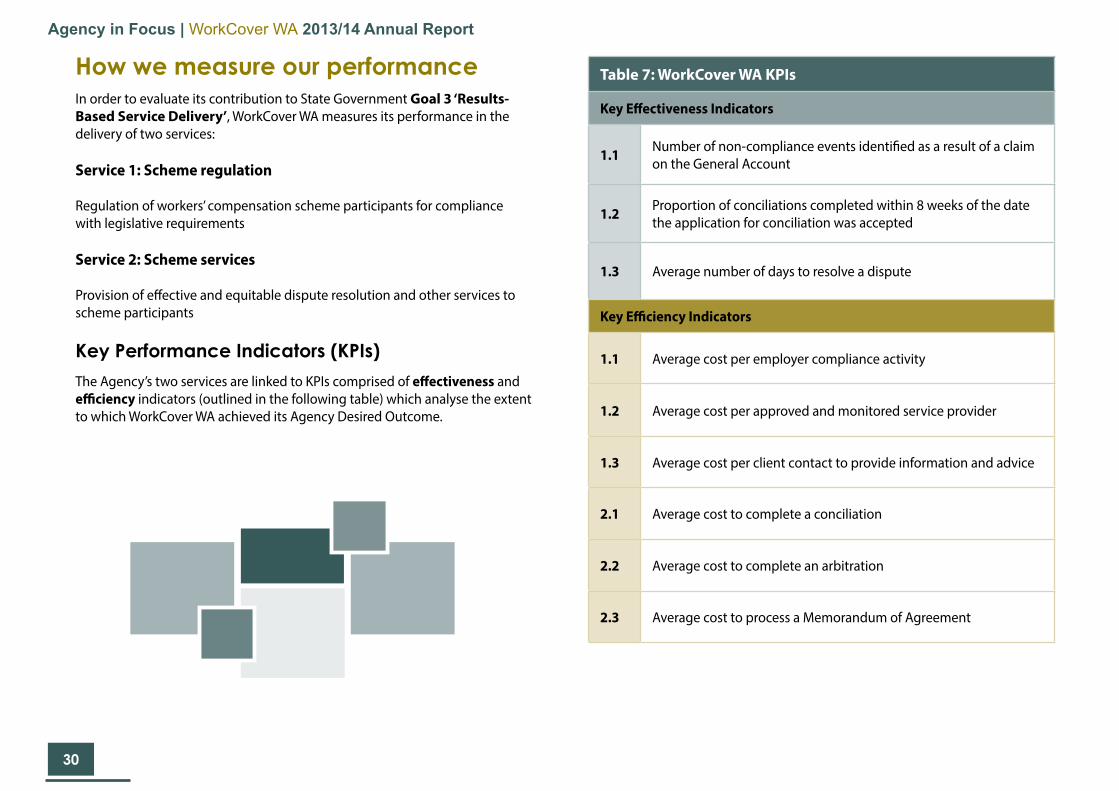
How we measure our performance In order to evaluate its contribution to State Government Goal 3 ‘Results-Based Service Delivery’, WorkCover WA measures its performance in the delivery of two services:
Service 1: Scheme regulation
Regulation of workers’ compensation scheme participants for compliance with legislative requirements
Service 2: Scheme services
Provision of effective and equitable dispute resolution and other services to scheme participants
Key Performance Indicators (KPIs)The Agency’s two services are linked to KPIs comprised of effectiveness and efficiency indicators (outlined in the following table) which analyse the extent to which WorkCover WA achieved its Agency Desired Outcome.
Table 7: WorkCover WA KPIs
Key Effectiveness Indicators
1.1 Number of non-compliance events identified as a result of a claim on the General Account
1.2 Proportion of conciliations completed within 8 weeks of the date the application for conciliation was accepted
1.3 Average number of days to resolve a dispute
Key Efficiency Indicators
1.1 Average cost per employer compliance activity
1.2 Average cost per approved and monitored service provider
1.3 Average cost per client contact to provide information and advice
2.1 Average cost to complete a conciliation
2.2 Average cost to complete an arbitration
2.3 Average cost to process a Memorandum of Agreement

31
Agency in Focus | WorkCover WA 2013/14 Annual Report
WorkCover WA’s operations are aligned to a strategic plan developed in response to key challenges, such as maintaining scheme viability in times of economic volatility, as well as implementing and consolidating the changes emerging from the Legislative Review project.
The Strategic Plan 2012–2015 recognises and reflects the Agency’s increasing maturity as an organisation, and the significant gains that have been made to improve systems and develop an effective, motivated workforce. It emphasises the shift from an internal focus to an external one, enabling the Agency to give greater attention to the needs of scheme participants (view our Strategic Plan at http://bit.ly/1tDV6cH).
Strategic goals and initiatives The Agency’s Strategic Plan 2012–2015 outlines four strategic goals that frame WorkCover WA’s initiatives and ensures projects relate to the Agency’s Purpose, and, ultimately, the Agency Desired Outcome.
The four strategic goals are:
1. Strategic scheme management2. Stakeholder confidence and engagement3. Regulatory compliance4. Organisational excellence
Within each year of the Strategic Plan, WorkCover WA outlines Strategic Initiatives to be developed or completed within that financial year. These initiatives are aligned with, and contribute to, one or more of the four strategic goals.
To view the Agency’s performance against the 2013/14 Strategic Initiatives turn to page 63.
Strategic Plan 2012-2015
WorkCover WA’s front entrance at 2 Bedbrook Place, Shenton Park.
32
Agency in Focus | WorkCover WA 2013/14 Annual Report
Outlook for the future WorkCover WA’s Strategic Initiatives for 2014/15, and their alignment with the Agency’s four strategic goals, are outlined in the following table.
Table 8: 2014/15 Strategic Initiatives
Goals Strategic Initiative
1,2Legislative Review Stage 2 (continued)
Continuing from 2013/14, this project involves a complete redraft of the Workers’ Compensation and Injury Management Act 1981 with the objectives of introducing contemporary language and drafting conventions, and a logical and coherent structure, whilst preserving the current intent of the legislation. Identified policy issues will also be addressed during the review.
2,3 Guidance Material for Medical Practitioners (continued)
This project will develop useful guidance material for GPs to support them in delivering injury management services. It will clarify the role of the GP and strengthen engagement and partnerships between WorkCover WA and the medical profession.
4Implementation of organisational and technological reforms
This project involves the implementation of an electronic document management system across the Agency.
WorkCover WA’s building.

3333
Claim numbers | 34Claim trends | 34Frequency rates | 35Scheme payments 2013/14 | 36Average recommended premium rates | 36Scheme payments and premium income | 37Settlements | 38
Section 2: Scheme Performance

34
Scheme Performance | WorkCover WA 2013/14 Annual Report
Claim trendsWhile the total number of claims lodged in the WA workers’ compensation scheme increased between 2009/10 and 2011/12 there was a three per cent decrease in 2012/13. The number of long duration claims (claims with 60 or more days/shifts lost time) has increased over the last five years, whereas claims with shorter duration and no lost time decreased.
Figure 6: Claim trends
Claim numbersImportant: Due to the nature of the processes involved in the capture, verification and analysis of claims data, information relating to time lost as a result of workers’ compensation claims is only available one year retrospectively. Therefore, some information from 2013/14 was unavailable at the time of publishing this report and we have reported on information from 2012/13.
In 2012/13, 37,396 claims were lodged. Of these, 49 per cent involved at least one day or shift off work (claims with lost time). Of all lost time claims lodged in 2012/13, 30 per cent of claims had 60 or more days or shifts lost (long duration claims).
Further information on scheme performance is available from the WorkCover WA website at:
http://bit.ly/Ze9YBW
Figure 5: Claim numbers
No lost time claims18,963 51%
12,875 34%
5,558 15%
Lost time claims 18,433 49%
Total number of 1-59 days/shifts lost claimsTotal number of long duration claims (60+ days/shifts lost)
39,426 36,593 37,706 38,721 37,396
21,880 20,113 20,168 20,450 18,963
13,516 12,573 13,128 13,365 12,875
4,030 3,907 4,410 4,906 5,558
0
10,000
20,000
30,000
40,000
50,000
2008/09 2009/10 2010/11 2011/12 2012/13
Num
ber o
f cla
ims
Lodgement year
Total number of workers compensation claims lodged
Total number of no lost time claims lodged
Total number of 1-59 days/shifts lost claims
Total number of long duration claims (60+ days/shifts lost)

35
Scheme Performance | WorkCover WA 2013/14 Annual Report
Frequency ratesThe number of lost time claims per million hours worked (frequency rate) decreased by six per cent between 2010/11 and 2012/13. Similar to trends for the number of claims lodged, the frequency rate of longer duration claims increased.
Figure 7: Frequency rates
9.7 9.0 9.3 8.9 8.7
7.5 6.9 6.9 6.5
6.1
2.2 2.1 2.3 2.4 2.6
0.0
2.0
4.0
6.0
8.0
10.0
12.0
2008/09 2009/10 2010/11 2011/12 2012/13
Cla
ims
per m
illio
n ho
urs
wor
ked
Lodgement year
Frequency rate of lost time claims (at least one day/shift lost)
Frequency rate of 1-59 days/shifts lost claims
Frequency rate of long duration claims (60 or more days/shifts lost)
Frequency of lost time claims by industryIn 2012/13 the industries with the highest lost time claim frequencies were manufacturing, arts and recreation services, health care and social assistance and construction.
Figure 8: Frequency of lost time claims by industry
15.1
13.6
13.0
12.8
12.6
11.6
10.1
9.2
8.9
8.7
7.6
7.4
6.1
6.0
5.8
5.3
3.2
2.4
1.8
1.1
0 2 4 6 8 10 12 14 16
ManufacturingArts and recreation services
Health care and social assistanceConstruction
Transport, postal and warehousingAgriculture, forestry and fishing
Wholesale tradeEducation and training
Accommodation and food servicesAll industry average
Public administration and safetyRetail trade
MiningRental, hiring and real estate services
Other servicesElectricity, gas, water and waste services
Administrative and support servicesInformation media and telecommunications
Professional, scientific and technical servicesFinancial and insurance services
Frequency rate
9.7 9.0 9.3 8.9 8.7
7.5 6.9 6.9 6.5
6.1
2.2 2.1 2.3 2.4 2.6
0.0
2.0
4.0
6.0
8.0
10.0
12.0
2008/09 2009/10 2010/11 2011/12 2012/13
Cla
ims
per m
illio
n ho
urs
wor
ked
Lodgement year
Frequency rate of lost time claims (at least one day/shift lost)
Frequency rate of 1-59 days/shifts lost claims
Frequency rate of long duration claims (60 or more days/shifts lost)

36
Scheme Performance | WorkCover WA 2013/14 Annual Report
Scheme payments 2013/14During 2013/14, 67 per cent of scheme payments were paid directly to workers in the form of income payment and common law and lump sum payments, while 23 per cent of payments were made for treatment services such as medical, allied health and vocational rehabilitation services. 10 per cent of payments were related to legal and other services.
Figure 9: Scheme payments 2013/14
352.5
256.8
208.3
95.6
50
100
150
200
250
300
350
400
0 0 0 0
$ M
illio
ns 39%
28%
23%
10%
Income payment
Common law and lumpsum payments
Treatment servicepayments
Legal and other servicepayments
28%
23%
10%Income payment
Common law and lump sum payments
Treatment service payments
Legal and other service payments
352.5
256.8
208.3
95.6
50
100
150
200
250
300
350
400
0 0 0 0
$ M
illio
ns 39%
28%
23%
10%
Income payment
Common law and lumpsum payments
Treatment servicepayments
Legal and other servicepayments
28%
23%
10%Income payment
Common law and lump sum payments
Treatment service payments
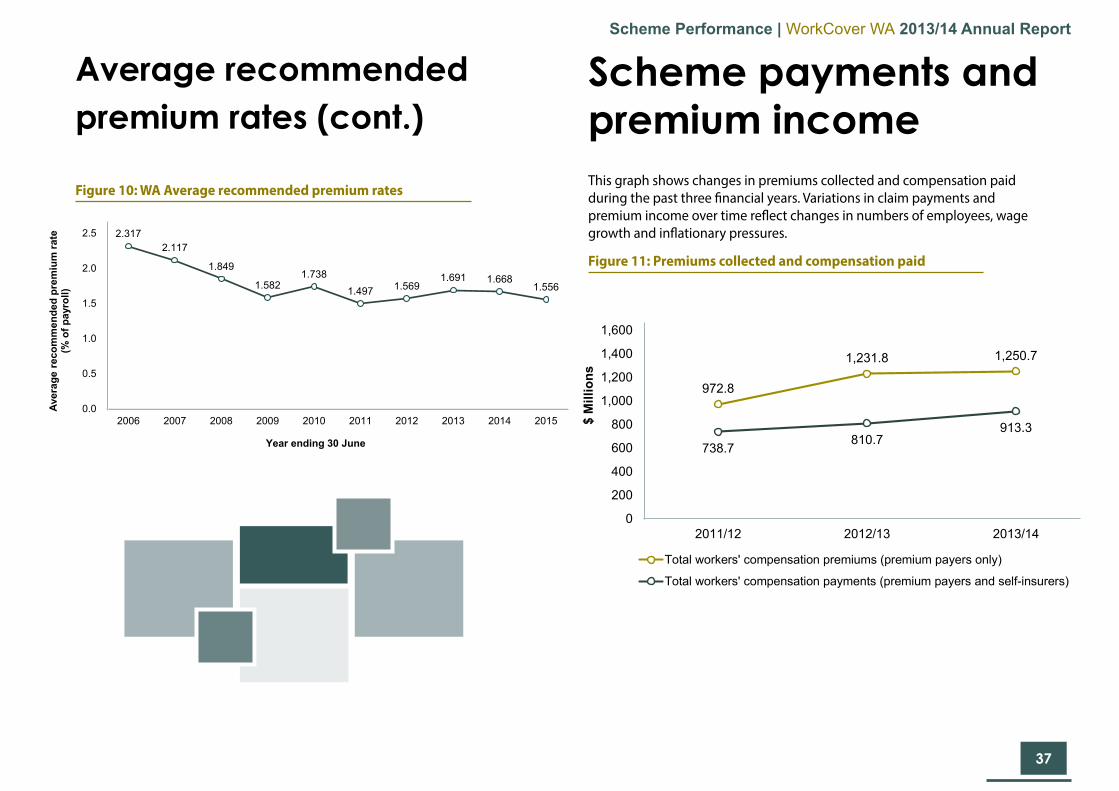
Legal and other service payments Each year, WorkCover WA publishes recommended premium rates for workers’ compensation insurance for each industry. The average recommended premium rate for 2014/15 represents a decrease of 6.7 per cent on the previous rate, down from 1.668 per cent of total wages to 1.556 per cent of total wages.
The decrease in 2014/15 is largely driven by:
• wages growth in excess of wage inflation in Western Australia• a decrease in the claim numbers for 2012/13 and in the half year to
31 December 2013• an increase in the average claim size • a decrease in claim management expenses
However, the premium rate decrease is partially offset by costs associated with longer duration claims.
The average recommended premium rate has reduced by 33 per cent since 2005/06. High wages, growth, improved safety performance and strong rates of return for insurers over the last 10 years were the main drivers of these reductions.
Average recommended premium rates
352.5
256.8
208.3
95.6
50
100
150
200
250
300
350
400
0 0 0 0
$ M
illio
ns 39%
28%
23%
10%
Income payment
Common law and lumpsum payments
Treatment servicepayments
Legal and other servicepayments
28%
23%
10%Income payment
Common law and lump sum payments
Treatment service payments
Legal and other service payments
352.5
256.8
208.3
95.6
50
100
150
200
250
300
350
400
0 0 0 0
$ M
illio
ns 39%
28%
23%
10%
Income payment
Common law and lumpsum payments
Treatment servicepayments
Legal and other servicepayments
28%
23%
10%Income payment
Common law and lump sum payments
Treatment service payments
Legal and other service payments
37
Scheme Performance | WorkCover WA 2013/14 Annual Report
Figure 10: WA Average recommended premium rates
Average recommended premium rates (cont.)
Scheme payments and premium incomeThis graph shows changes in premiums collected and compensation paid during the past three financial years. Variations in claim payments and premium income over time reflect changes in numbers of employees, wage growth and inflationary pressures.
Figure 11: Premiums collected and compensation paid
972.8
1,231.8 1,250.7
738.7 810.7913.3
0
200
400
600
800
1,000
1,200
1,400
1,600
2011/12 2012/13 2013/14
$ M
illio
ns
Total workers' compensation premiums (premium payers only)
Total workers' compensation payments (premium payers and self-insurers)
2.3172.117
1.849
1.5821.738
1.497 1.5691.691 1.668
1.556
0.0
0.5
1.0
1.5
2.0
2.5
2006 2007 2008 2009 2010 2011 2012 2013 2014 2015
Aver
age
reco
mm
ende
d pr
emiu
m ra
te
(% o
f pay
roll)
Year ending 30 June
972.8
1,231.8 1,250.7
738.7 810.7913.3
0
200
400
600
800
1,000
1,200
1,400
1,600
2011/12 2012/13 2013/14
$ M
illio
ns
Total workers' compensation premiums (premium payers only)
Total workers' compensation payments (premium payers and self-insurers)
38
Scheme Performance | WorkCover WA 2013/14 Annual Report
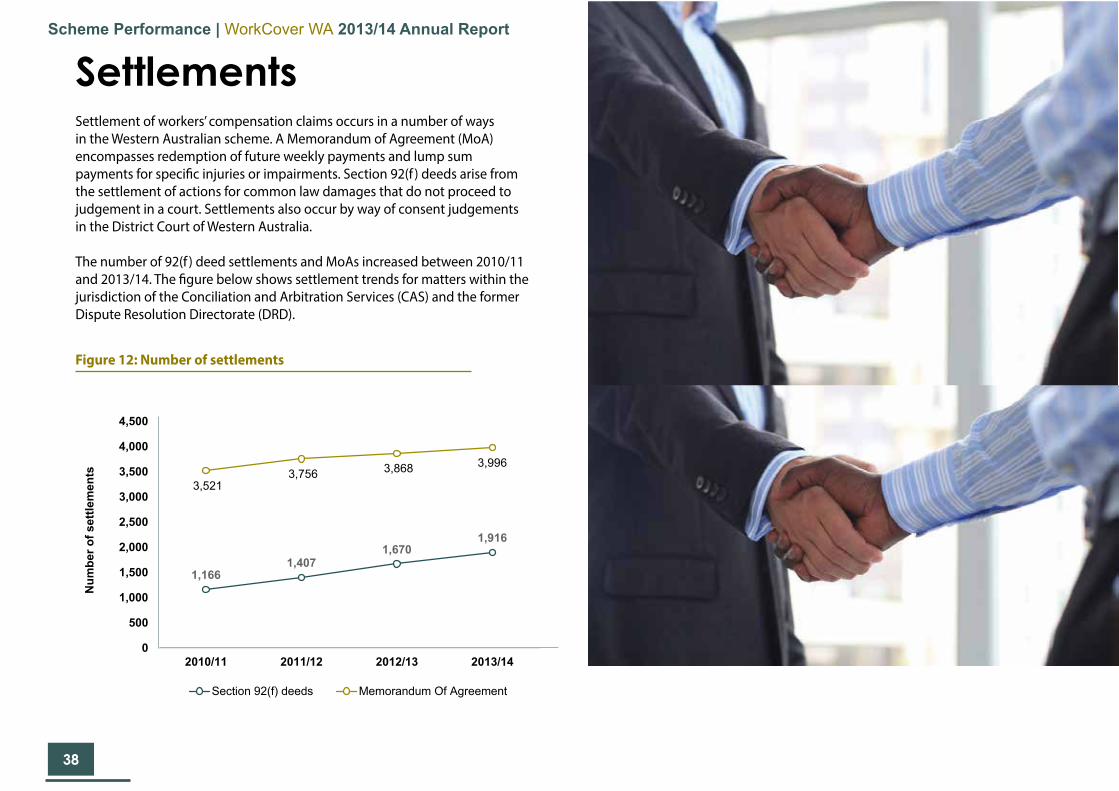
SettlementsSettlement of workers’ compensation claims occurs in a number of ways in the Western Australian scheme. A Memorandum of Agreement (MoA) encompasses redemption of future weekly payments and lump sum payments for specific injuries or impairments. Section 92(f ) deeds arise from the settlement of actions for common law damages that do not proceed to judgement in a court. Settlements also occur by way of consent judgements in the District Court of Western Australia.
The number of 92(f ) deed settlements and MoAs increased between 2010/11 and 2013/14. The figure below shows settlement trends for matters within the jurisdiction of the Conciliation and Arbitration Services (CAS) and the former Dispute Resolution Directorate (DRD).
Figure 12: Number of settlements
1,1661,407
1,6701,916
3,521 3,756 3,868 3,996
0
500
1,000
1,500
2,000
2,500
3,000
3,500
4,000
4,500
2010/11 2011/12 2012/13 2013/14
Num
ber o
f set
tlem
ents
Section 92(f) deeds Memorandum Of Agreement

393939
Service 1: Scheme Regulation | 40 » Regulating service providers | 40 » Regulating employers | 44 » Acting on noise-induced hearing loss | 47 » Improving scheme performance | 47 » Progressing legislative reform | 49Service 2: Scheme Services | 51 » Resolving disputes | 51 » Education and information | 54 » Training and seminars | 59 » Consultation and engagement with stakeholders | 60 » Handling complaints | 61 » Collaborations | 61Report against 2013/14 Strategic Initiatives | 63
Section 3: Report on Operations

40
Report on Operations | WorkCover WA 2013/14 Annual Report
Regulating service providers
This scheme service contributes to, and is aligned with:
Government Goal(s) WorkCover WA Strategic Goal
3 – Results-Based Service Delivery
5 – Social and environmental responsibility
3 – Regulatory compliance
The Agency continued to approve and monitor service providers in 2013/14 to ensure compliance with workers’ compensation legislation and the delivery of appropriate standards of service. The monitored service providers consist of approved insurers and self-insurers, workplace rehabilitation providers (WRPs), registered agents, audiometric officers and audiologists, and approved medical specialists (AMS).
Regulatory activities regarding service providers in 2013/14 included:
• approval, monitoring and renewal of service providers (table 9)• annual reviews of approved insurers and self-insurers• audits of service provider performance including WRPs quality assurance
checks based on Agency data and other intelligence• investigation of complaints against service providers (table 10)• provision of assistance and guidance to all stakeholders, including service
providers and employers• provision of training and workshops to service providers and other groups• peer review of service providers.
Table 9: Approval of service providers
Type of service provider
Approvals in 2012/13
Approvals in 2013/14
Total at 30 June 2014
Approved insurers 0 1 9
Approved self-insurers 0 1 27
Approved workplace rehabilitation providers 30 6 35
Registered agents 221 219 200
Approved medical specialists 7 16 235
Approved audiometric officers, audiologists and audiometrists
109 87 572
Total approvals 367 330 1078
Service 1: Scheme RegulationRegulation of scheme participants for compliance with legislative requirements

41
Report on Operations | WorkCover WA 2013/14 Annual Report
Complaints handling Wherever possible complainants are encouraged to resolve complaints directly with the party(s) involved. If WorkCover WA intervention is required, complainants are requested to complete a form to capture relevant information to help resolve the matter. If a complaint is substantiated the service provider may be directed to take appropriate remedial action which may involve training and/or being required to amend internal policies and procedures.
Table 10: Complaints against service providers
Type of service provider
2011/12 2012/13 2013/14
Approved insurers 11 17 4
Approved self-insurers 1 1 1
Approved workplace rehabilitation providers 4 7 1
Registered agents 6 6 1
Approved medical specialists 2 1 0
Approved audiometric officers, audiologists and audiometrists
2 0 0
Total complaints 26 32 7
Insurers and self-insurers Insurer monitoringThe 2012/13 annual review of approved insurers assessed performance against a number of selected performance and financial indicators to help determine whether insurers are meeting their statutory workers’ compensation obligations. The report focussed on:
• financial management and viability• material and financial resources• claims management• data management and reporting• complaints• standards of service.
All approved insurers met their legislative obligations under the Workers’ Compensation and Injury Management Act 1981 (the Act) and their minimum capital requirements. Some issues regarding the timeliness of new and renewed policy data, injury management documentation, policies and procedures and the rates of pended claims were raised in follow-up discussions with individual approved insurers. Performance in these areas has been monitored and will be reported on as part of the 2013/14 Annual Review.
Insurer complaints There were four complaints against approved insurers this financial year, compared with 17 complaints in 2012/13. One complaint against a self-insurer was received in 2012/13 and none reported in 2013/14.
The significant reduction in complaints is believed to be a reflection of parties seeking to resolve matters through insurers’ and self-insurers’ Internal Dispute Resolution Programs (IDRP) or WorkCover WA’s Conciliation and Arbitration Services.
Complaints are dealt with in accordance with WorkCover WA’s established procedure for complaints against a scheme participant which includes encouraging parties to resolve matters through insurers’/self-insurers’ IDRP. In 2013/14 only one complaint against an approved insurer was substantiated.

42
Report on Operations | WorkCover WA 2013/14 Annual Report
Workplace rehabilitation providers Audit framework WorkCover WA has an audit framework for WRPs based on the Service Provision and Service Description Standards implemented for WRPs in December 2011.
Throughout 2013/2014 WorkCover WA completed nine audits in accordance with the number of audits planned for the year.
Workplace rehabilitation provider complaints There was one complaint against a WRP in 2013/14, an improvement when compared to seven complaints in the previous financial year.
The complaint was substantiated and dealt with in accordance to the complaints framework.
Registered agentsAudit frameworkRegistered agents are persons who are not legal practitioners who are approved to represent parties in proceedings in the Conciliation and Arbitration Services. Most registered agents are employees of insurers, self-insurers, law firms or representative organisations. There are a small number of independent registered agents.
A formal audit program for independent registered agents was conducted in 2012. During 2013/14 WorkCover WA’s Standards and Monitoring Branch assessed and monitored the compliance of independent registered agents with legislative and regulatory requirements through regular activities including assessments of annual applications for registration and complaint investigation.
The planned 2013/14 audit was postponed whilst compliance resources undertook investigations relating to a series of complaints into an independent registered agent. The next audit will now occur in 2014/15.
Registered agent complaintsWorkCover WA received three complaints against an independent registered agent in early June 2013. The complaints were investigated during the first and second quarters of 2013/14 in accordance with WorkCover WA’s established procedure for complaints against a scheme participant.
The investigations revealed breaches of the Workers’ Compensation and Injury Management Regulations 1982 had occurred. As a consequence of the findings of this and previous investigations WorkCover WA cancelled the independent registered agent’s registration. The independent registered agent subsequently appealed this decision in the State Administrative Tribunal. The Tribunal concluded WorkCover WA’s decision was appropriate and upheld the cancellation.
Approved audiometric officers Under the Noise Induced Hearing Loss Compensation Legislation Approved Procedures, audiometric officers (AAO) are approved to conduct baseline hearing tests once specified criteria are met. This includes the successful completion of an audiometric officer course and online training. WorkCover WA requires AAOs to submit test results via the online database.
Following approval, each AAO is required to conduct at least 12 baseline hearing tests per year. If an AAO’s approval status has lapsed by more than two years the full audiometric officer course and online training must be undertaken. These criteria provide a regulatory framework designed to maintain standards and ensure tests are conducted in a competent and professional manner.
No complaints were recorded against AAOs in 2013/14.
43
Report on Operations | WorkCover WA 2013/14 Annual Report
Non-compliance
During the Approved Medical Specialist Peer Review project two AMS were identified as submitting reports not in accordance with the WorkCover WA Guides for the Evaluation of Permanent Impairment, Third Edition and the American Medical Association’s Guides to the Evaluation of Permanent Impairment, Fifth Edition (AMA 5). WorkCover WA wrote to the AMS identified to inform the medical practitioners of the errors contained in their permanent impairment reports.
Approved medical specialists Under section 146 of the Act, AMS are designated to assess a worker’s degree of permanent whole of person impairment.
To monitor AMS reports for compliance and consistency, WorkCover WA completed the final two phases of an Approved Medical Specialist Peer Review project in January 2014. During these phases, a number of permanent impairment reports were selected per quarter, the reports submitted were a combination of random selection and targeted peer review. The findings from the project identified education and training opportunities for AMS and also improved communication with the AMS community through implementation of a newsletter and provision of case studies for informal peer review evenings.
Following the successful conclusion of the project, the Agency has elected to proceed with the peer review process on an ongoing basis.
In 2013/14, the Agency also revised the criteria for designation as an AMS, to preclude designation of medical practitioners who have current notations, conditions or reprimands for disciplinary purposes recorded against their registration. The proposed change to the criteria was reviewed at the Medical Committee meeting on 6 February 2014, and endorsed by the WorkCover WA Board at the meeting on 20 February 2014. The amended criteria were published in the Government Gazette of 29 April 2014.

44
Report on Operations | WorkCover WA 2013/14 Annual Report
Regulating employers WorkCover WA understands the integrity and success of the workers’ compensation scheme is reliant on employers complying with their legislative and associated workers’ compensation and injury management responsibilities. Table 11 below outlines the outcomes of the Agency’s 2013/14 annual compliance activities aimed at monitoring employer compliance with, and knowledge of, their legislative obligations. The compliance activities are based on WorkCover WA’s compliance framework which specifies the engagement, education and enforcement options using a risk based approach.
Table 11: 2013/14 compliance outcomes
Compliance activity Total number
Compliance investigations 422
Letters of caution sent to employers 61
Prosecutions completed 70
Enquiries into lapsed/expired policies 8,984
Enquiries into policy cancellations 3,676
Return to work 2
Australian Business Register (data matching) 1,667
This scheme service contributes to, and is aligned with:
Government Goal(s) WorkCover WA Strategic Goal
3 – Results-Based Service Delivery &
(4 – Stronger focus on the regions)
3 – Regulatory compliance
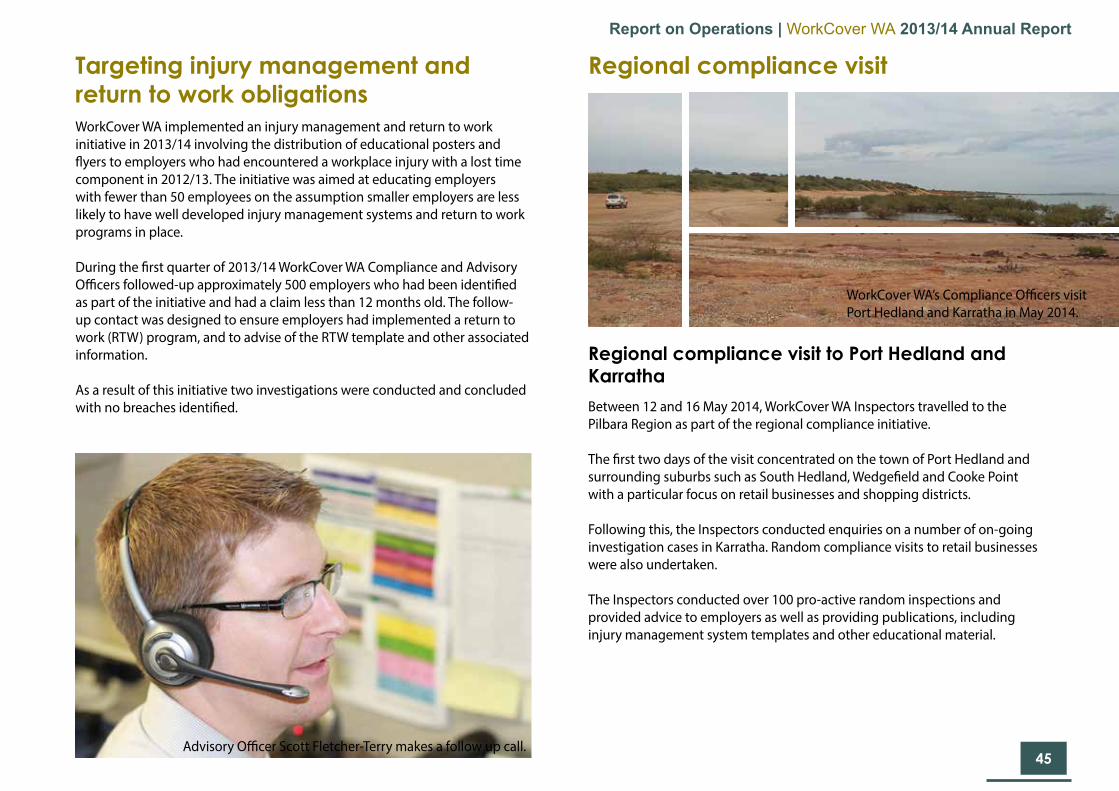
45
Report on Operations | WorkCover WA 2013/14 Annual Report
Targeting injury management and return to work obligationsWorkCover WA implemented an injury management and return to work initiative in 2013/14 involving the distribution of educational posters and flyers to employers who had encountered a workplace injury with a lost time component in 2012/13. The initiative was aimed at educating employers with fewer than 50 employees on the assumption smaller employers are less likely to have well developed injury management systems and return to work programs in place.
During the first quarter of 2013/14 WorkCover WA Compliance and Advisory Officers followed-up approximately 500 employers who had been identified as part of the initiative and had a claim less than 12 months old. The follow-up contact was designed to ensure employers had implemented a return to work (RTW) program, and to advise of the RTW template and other associated information.
As a result of this initiative two investigations were conducted and concluded with no breaches identified.
Regional compliance visit
Regional compliance visit to Port Hedland and KarrathaBetween 12 and 16 May 2014, WorkCover WA Inspectors travelled to the Pilbara Region as part of the regional compliance initiative.
The first two days of the visit concentrated on the town of Port Hedland and surrounding suburbs such as South Hedland, Wedgefield and Cooke Point with a particular focus on retail businesses and shopping districts.
Following this, the Inspectors conducted enquiries on a number of on-going investigation cases in Karratha. Random compliance visits to retail businesses were also undertaken.
The Inspectors conducted over 100 pro-active random inspections and provided advice to employers as well as providing publications, including injury management system templates and other educational material.
WorkCover WA’s Compliance Officers visit Port Hedland and Karratha in May 2014.
Advisory Officer Scott Fletcher-Terry makes a follow up call.

46
Report on Operations | WorkCover WA 2013/14 Annual Report
Albany 2014During the week of 13 to 17 January 2014, two WorkCover WA Inspectors visited the Albany region and surrounding towns. Random and targeted inspections were conducted focusing on the cafe and restaurant industry due to a high rate of non-compliance having previously been identified.
The Inspectors performed 100 inspections, providing employers with information packs containing injury management templates. Meetings were held with local insurance brokers to discuss concerns in the area and distribute educational materials. A meeting was also held with a representative from the Plantagenet Shire Council to discuss the requirement for contractors to hold policies for their workers.
During the compliance visit:
• 100 random and targeted inspections were completed• 31 matters were identified as requiring further investigation• a current investigation was closed following a site visit conducted at a
residential property in King River• a witness statement was taken from an injured worker in Mt Barker in
relation to an open investigation• a meeting was held with the Plantagenet Shire Council Human Resources
Manager regarding the requirement for contractors to hold policies for their workers
• meetings were held with four insurance brokers in central Albany.
Example outcomes from these inspections are outlined in the following case study.
Case Study 1Example outcome 1 The Inspectors held a meeting with the manager of a major insurance broker in the area. She had previously worked for an insurer for seven years in the 1990s and had a solid working knowledge of employer obligations. During the meeting she indicated her building and construction industry clients did not fully understand the provisions of the Act relating to the requirement for a principal employer to hold a policy to cover any contractors and/or sub-contractors performing work for their trade or business. Educational material was left with the broker to distribute to her clients.
Example outcome 2
Prior to undertaking travel to the Albany region, a complaint was made by a worker alleging their Albany based employer had not made weekly workers’ compensation payment on their usual pay day contrary to the requirements of the Act. An Inspector attended the worker’s Albany residence to obtain a witness statement and collect documents, including bank statements.
The documents showed although some payments were received late due to public holidays, there were two payments which were not made on the employee’s usual pay day. The employer was provided an opportunity to respond and advised the delayed payment was due to cash flow problems. The employer further stated he had arranged for the insurer to make advance payments and the matter had been rectified. The employer was issued with a letter of caution.

47
Report on Operations | WorkCover WA 2013/14 Annual Report
Acting on noise-induced hearing loss
This scheme service contributes to, and is aligned with:
Government Goal(s) WorkCover WA Strategic Goal
3 – Results-Based Service Delivery &
(5 – Social and environmental responsibility)
3 – Regulatory compliance
In 2013/14, WorkCover WA continued to offer advice and guidance to workers and employers across the State with regards to noise-induced hearing loss (NIHL) related tests and claims. Table 12 below outlines the Agency’s activities involving the monitoring and management of NIHL claims.
Table 12: Involvement in noise-induced hearing loss
NIHL activity/outcome Total number
Workers identified with potential NIHL claims 800
Full audiological assessments arranged 275
Otorhinolaryngology (ear, nose and throat) assessments of occupational hearing loss arranged 149
Successful claims for work-related gradual onset NIHL 122
First election claims (10 per cent permanent hearing loss) 118
Subsequent election claims (additional 5 per cent permanent hearing loss) 4
Improving scheme performance
This scheme service contributes to, and is aligned with:
Government Goal(s) WorkCover WA Strategic Goal
3 – Results-Based Service &
(2 – Financial and economic responsibility,
5 – Social and environmental responsibility)
1 – Strategic scheme management
In accordance with the Act, WorkCover WA continued to actively manage the workers’ compensation and injury management scheme during the financial year to ensure stakeholders have access to a viable, equitable and robust system. This included the calculation and gazettal of variations to entitlement limits, and to other workers’ compensation amounts, for the financial year commencing 1 July 2014; as well as the indexation of medical and allied health fees, effective 1 November 2013. Other activities are outlined over the following pages.
WorkCover WA’s noise-induced hearing loss officers, Rhonda Doyle (left) and William Rogers.

48
Report on Operations | WorkCover WA 2013/14 Annual Report
Medical Assessment PanelsThe Medical Assessment Panel (MAP) project commenced last financial year with the aim to deliver a MAP register containing a broader representation of required specialties. The secondary purpose was to confirm the details of all practitioners currently listed on the register.
The role of a MAP is to resolve conflicts of medical opinion between a doctor engaged by the worker and a doctor engaged and paid for by the employer concerning the nature, or the extent of an injury, or a worker’s capacity for work. The determination of a MAP is final and binding on all parties and on any court or tribunal.
The MAP project was completed in March 2014. Following completion of this project WorkCover WA added eight new specialists to the MAP Register, with the appointment of all newly-recruited MAP Register participants formally approved by the Minister for Commerce. This outcome has improved WorkCover WA’s ability to convene MAPs in a timely manner.
Implementation of infringement notices In 2014 the Agency increased enforcement options with the commencement of the use of infringement notices and associated modified penalties. Infringement notices are now incorporated as part of an ongoing compliance strategy, seeking continual improvements to existing prosecution and enforcement options to ensure compliance with the Act. Infringement notices provide an additional option between a letter of caution and formal prosecution proceedings which in turn will result in a larger enforcement footprint for the Agency.
The strategy to implement infringement notices followed a review of outstanding investigation cases. Many of the reviewed cases were deemed suitable to be dealt with by way of an infringement, rather than by formal prosecution.
The power to issue infringement notices provides immediate punitive effect in regard to non-compliance without the delay and costs of court proceedings. The Agency’s Enforcement Criteria Checklist has been amended to include infringement notices and ensure ongoing objective guidance when selecting the appropriate compliance option.
National Insurer Data Specification Between 2010 and 2012 WorkCover WA collaborated with the Insurance Council of Australia and workers’ compensation regulators in the privately underwritten jurisdictions of Tasmania, the Australian Capital Territory and the Northern Territory to develop a common specification for workers’ compensation data supplied by insurers and self-insurers. The new National Insurer Data Specification (NIDS) was agreed in 2012 and specifies data items, formats and validation rules. NIDS is closely based on the Western Australian Q1 specification but also includes data items specific to the individual jurisdictions while allowing for a common data extraction and supply process for insurers.

49
Report on Operations | WorkCover WA 2013/14 Annual Report
WorkCover WA decided late in 2012 to implement the NIDS in Western Australia from January 2014. A project was commenced in February 2013 to have all insurers and self-insurers operating within the WA scheme convert to the new standard, and to rewrite WorkCover WA’s data processing systems to accommodate the new standard. The implementation deadline set was 1 March 2014.
While some insurers and self-insurers did not meet the original deadline, all were providing data in accordance with the NIDS by the end of 2013/14.
New industry classes for recommended premium rates WorkCover WA is working with stakeholders to transition from premium rating classifications (PRC) based on the Australian and New Zealand Standard Industry Classification (ANZSIC) 1993 to classifications based on the ANZSIC 2006 standard. In 2013/14 collection of data to support the conversion of the rates by the Actuary commenced.
Insurers were requested to provide policy data coded to both ANZSIC 1993 and ANZSIC 2006 from the 2012/13 reporting year. While not all insurers were able to supply the relevant data, it is anticipated the missing data for that reporting year will be provided with the 2013/14 policy data.
While it is hoped recommended premium rates based on ANZSIC 2006 for 2016/17 will be prepared in March 2016, this will depend on the completeness and quality of data provided by insurers and advice from the scheme actuary following a review of data for the 2012/13 and 2013/14 reporting years. In the interim, WorkCover WA is continuing to monitor insurers’ implementation of dual-coded policies and liaise with the scheme actuary.
Progressing legislative reform
Presumptive workers’ compensation legislation for firefightersOn 13 November 2013 the Workers’ Compensation and Injury Management Amendment Act 2013 implemented new presumptive workers’ compensation laws for the benefit of career firefighters who contract any one of 12 specified cancers whilst performing firefighting duties.
The legislation provides for a rebuttable presumption in favour of firefighters and shifts the burden of proof regarding the cause of the cancer from the cancer sufferer to their employer or the employer’s insurer. This ensures the cancer is considered an occupational disease and is therefore compensable, unless proven otherwise.
The legislative amendments were in response to various scientific studies which indicate an increased risk to career firefighters of contracting certain cancers from their accumulated exposure to carcinogens in the course of fighting structural and chemical fires.
This scheme service contributes to, and is aligned with:
Government Goal(s) WorkCover WA Strategic Goal
3 – Results-Based Service Delivery &
(2 – Financial and economic responsibility,
5 – Social and environmental responsibility)
1 – Strategic scheme management
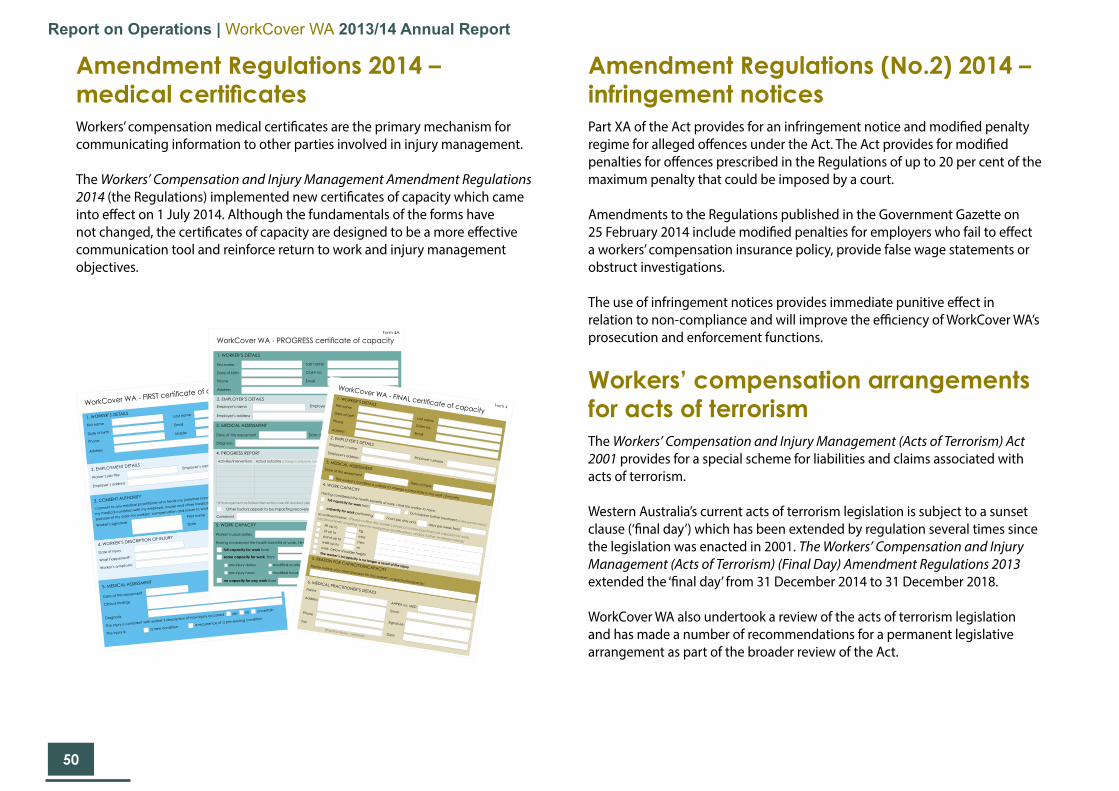
50
Report on Operations | WorkCover WA 2013/14 Annual Report
Amendment Regulations 2014 – medical certificates Workers’ compensation medical certificates are the primary mechanism for communicating information to other parties involved in injury management.
The Workers’ Compensation and Injury Management Amendment Regulations 2014 (the Regulations) implemented new certificates of capacity which came into effect on 1 July 2014. Although the fundamentals of the forms have not changed, the certificates of capacity are designed to be a more effective communication tool and reinforce return to work and injury management objectives.
Amendment Regulations (No.2) 2014 – infringement noticesPart XA of the Act provides for an infringement notice and modified penalty regime for alleged offences under the Act. The Act provides for modified penalties for offences prescribed in the Regulations of up to 20 per cent of the maximum penalty that could be imposed by a court.
Amendments to the Regulations published in the Government Gazette on 25 February 2014 include modified penalties for employers who fail to effect a workers’ compensation insurance policy, provide false wage statements or obstruct investigations.
The use of infringement notices provides immediate punitive effect in relation to non-compliance and will improve the efficiency of WorkCover WA’s prosecution and enforcement functions.
Workers’ compensation arrangements for acts of terrorism The Workers’ Compensation and Injury Management (Acts of Terrorism) Act 2001 provides for a special scheme for liabilities and claims associated with acts of terrorism.
Western Australia’s current acts of terrorism legislation is subject to a sunset clause (‘final day’) which has been extended by regulation several times since the legislation was enacted in 2001. The Workers’ Compensation and Injury Management (Acts of Terrorism) (Final Day) Amendment Regulations 2013 extended the ‘final day’ from 31 December 2014 to 31 December 2018.
WorkCover WA also undertook a review of the acts of terrorism legislation and has made a number of recommendations for a permanent legislative arrangement as part of the broader review of the Act.
Form 3
WorkCover WA - FIRST certificate of capacity
1. Worker’s Details
First name
Date of birth
Phone
address
Last name
Mobile
2. employment Details
Worker’s job title
Employer’s address
Employer’s name
Worker’s signature Print name
Date
4. Worker’s Description oF injury
Date of injury
What happened?
Worker’s symptoms
3. consent authority
I consent to any medical practitioner who treats me (whether named on this certificate or not) to discuss
my medical condition with my employer, insurer and other medical or allied health professionals for the
purpose of my claim for workers’ compensation and return to work options.
5. meDical assessment
Date of this assessment
Clinical findings
Diagnosis
The injury is consistent with worker’s description of how injury occurred yes no uncertain
The injury is: a new condition a recurrence of a pre-existing condition
Form 4A
WorkCover WA - PROGRESS certificate of capacity
1. Worker’s DetAils
First name
Date of birth
Phone
Address
Claim no.
2. employer’s DetAilsEmployer’s name
Employer’s address
Employer’s phone
4. proGress report
Activities/interventions Actual outcome (change in symptoms, function, activity and work participation) still required?*
yes Noyes Noyes Noyes Noyes Noyes No
3. meDicAl AssessmeNt
Date of this assessment Date of injury
Diagnosis
5. Work cApAcity
Worker’s usual duties
Having considered the health benefits of work, I find this worker to have:
full capacity for work from but requires further treatment
some capacity for work, from to performing:
pre-injury duties modified or alternative duties workplace modifications
pre-injury hours modified hours of hrs/day days/wk
no capacity for any work from to (outline clinical reason on next page)
*(If management activities/interventions are still required, please also list them in Section 6 ‘Injury Management Plan’)
Other factors appear to be impacting recovery and return to work
comment
Last name
Form 4
WorkCover WA - FINAL certificate of capacity
1. Worker’s DetailsFirst nameDate of birth
Phone
address
Claim no.Email
2. employer’s DetailsEmployer’s nameEmployer’s address Employer’s phone3. meDical assessmentDate of this assessment Date of injury
The worker’s condition is unlikely to change substantially in the next 12 months
4. Work capacity
Having considered the health benefits of work, I find this worker to have:
full capacity for work from but requires further treatment (outline specifics below)
capacity for work performing hours per day and days per week from
as outlined below: (Please outline the worker’s physical and/or psychosocial capacity for work,
functional limits, ongoing need for workplace modifications, and/or further treatment needs)
lift up to kg sit up to mins stand up to mins walk up to m work below shoulder height The worker’s incapacity is no longer a result of the injury
Last name
5. reason For capacity/incapacityPlease outline your clinical reason for the worker’s capacity/incapacity:6. meDical practitioner’s Details
Name
address
Phone
Fax
Signature
Date
aHpra no. meD
(Practice stamp – optional)
51
Report on Operations | WorkCover WA 2013/14 Annual Report
Resolving disputes
WorkCover WA’s Conciliation and Arbitration Services (CAS) provide a fair and cost effective system for the resolution of disputes that:
• is timely• is accessible, approachable and professional• minimises costs to parties to disputes• in the case of conciliation, leads to final and appropriate agreements
between parties in relation to disputes • in the case of arbitration, enables disputes not resolved by conciliation to
be determined according to their substantial merits with as little formality and technicality as practicable.
In addition to providing conciliation services the Conciliation Service is responsible for the finalisation of workers’ compensation claims via settlements (i.e. registration of memoranda of agreement and common law settlement deeds) and the processing of documents submitted in relation to common law proceedings. The Conciliation Service registered 3,996 memoranda of agreement in 2013/14.
General CAS initiatives in 2013/14 included:
• development of standard operating procedures to document over 110 technical and administrative processes overseen and administered by CAS staff
• review and re-design of all external facing forms to ensure they were fit for purpose and professionally presented
• review and re-design of the key Guide to Resolving Disputes publication• establishment of an electronic database of previous decisions to assist
work undertaken by conciliation officers and arbitrators• engagement of arbitrators on a sessional basis to assist in dealing with
disputes in a timely manner.
Service 2: Scheme ServicesProvision of effective and equitable dispute resolution and other services to scheme participants
This scheme service contributes to, and is aligned with:
Government Goal(s) WorkCover WA Strategic Goal
3 – Results-Based Service Delivery &
(2 – Financial and economic responsibility)
4 – Organisational excellence
The Conciliation Service registered 3,996 memoranda of agreement in 2013/14

52
Report on Operations | WorkCover WA 2013/14 Annual Report
Separation of conciliation and arbitration functions
The objective of the Conciliation Service is to provide a time constrained service to assist parties to resolve their dispute within eight weeks. The focus of the Arbitration Service is resolving disputes according to their substantial merits. The following figures illustrate WorkCover WA’s achievement of these objectives. In Figure 14, KPI effectiveness indicator 1.2 relates to Conciliation Services and 1.3 to Conciliation and Arbitration Services.
Figure 13: 2013/14 CAS application and cases
Figure 14: 2013/14 KPI effectiveness indicators related to CAS
# Description 2013/14 Target/Result Reference
1.2 Proportion of conciliations completed within 8 weeks of the date the application for conciliation was accepted
p. 98
1.3 Average number of days to resolve a dispute p. 99
1,945 1,899
463 422
Conciliation applicationsaccepted
Conciliation casescompleted
Arbitration applicationsaccepted
Arbitration casescompleted
Target
Result
97
96.8%
Target
Result
126
190
Arbitration at WorkCover WA.
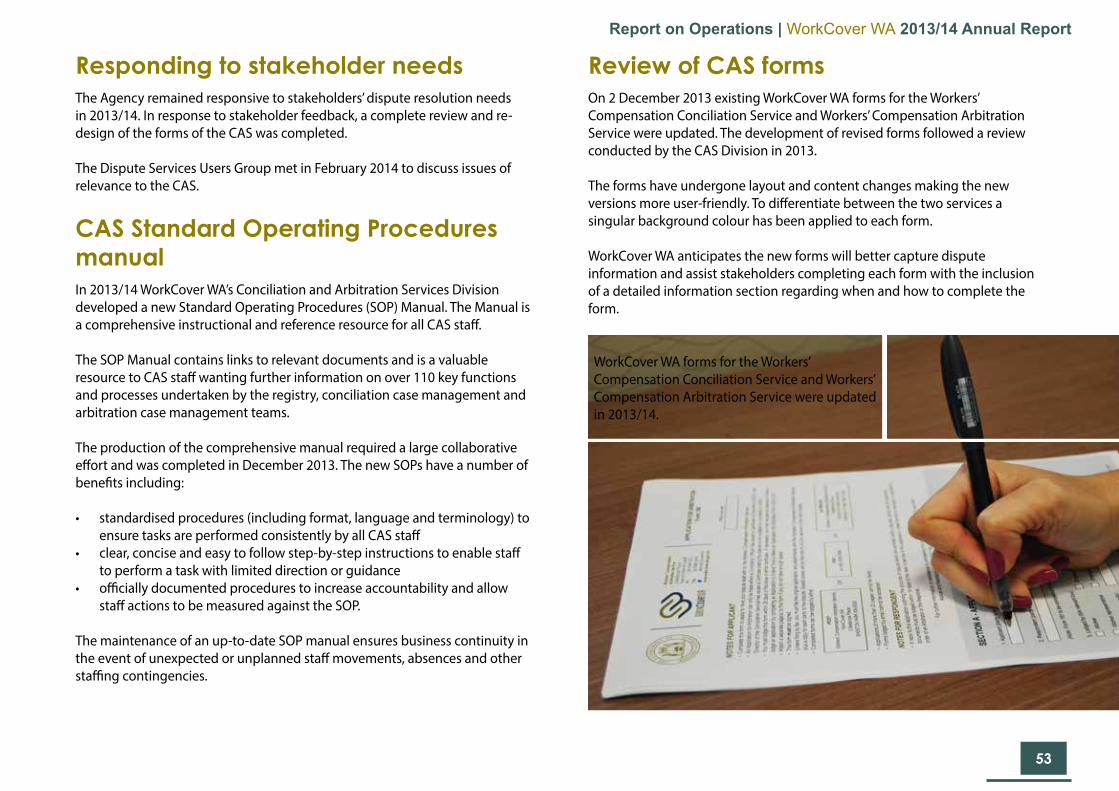
53
Report on Operations | WorkCover WA 2013/14 Annual Report
Responding to stakeholder needsThe Agency remained responsive to stakeholders’ dispute resolution needs in 2013/14. In response to stakeholder feedback, a complete review and re-design of the forms of the CAS was completed.
The Dispute Services Users Group met in February 2014 to discuss issues of relevance to the CAS.
CAS Standard Operating Procedures manualIn 2013/14 WorkCover WA’s Conciliation and Arbitration Services Division developed a new Standard Operating Procedures (SOP) Manual. The Manual is a comprehensive instructional and reference resource for all CAS staff.
The SOP Manual contains links to relevant documents and is a valuable resource to CAS staff wanting further information on over 110 key functions and processes undertaken by the registry, conciliation case management and arbitration case management teams.
The production of the comprehensive manual required a large collaborative effort and was completed in December 2013. The new SOPs have a number of benefits including:
• standardised procedures (including format, language and terminology) to ensure tasks are performed consistently by all CAS staff
• clear, concise and easy to follow step-by-step instructions to enable staff to perform a task with limited direction or guidance
• officially documented procedures to increase accountability and allow staff actions to be measured against the SOP.
The maintenance of an up-to-date SOP manual ensures business continuity in the event of unexpected or unplanned staff movements, absences and other staffing contingencies.
Review of CAS formsOn 2 December 2013 existing WorkCover WA forms for the Workers’ Compensation Conciliation Service and Workers’ Compensation Arbitration Service were updated. The development of revised forms followed a review conducted by the CAS Division in 2013.
The forms have undergone layout and content changes making the new versions more user-friendly. To differentiate between the two services a singular background colour has been applied to each form.
WorkCover WA anticipates the new forms will better capture dispute information and assist stakeholders completing each form with the inclusion of a detailed information section regarding when and how to complete the form.
WorkCover WA forms for the Workers’ Compensation Conciliation Service and Workers’ Compensation Arbitration Service were updated in 2013/14.

54
Report on Operations | WorkCover WA 2013/14 Annual Report
Review of Guide to Dispute publicationWorkCover WA’s What happens if there is a dispute? brochure, introduced in 2011, was reviewed in 2014. Following the review minor amendments were made to the content in the existing brochure, and the decision made to create two new guides.
The new guides, Guide to the Workers’ Compensation Conciliation Service and Guide to the Workers’ Compensation Arbitration Service, provide specific information relevant to each service.
Along with the review of the dispute resolution publications, relevant content on the WorkCover WA website was also revised.
The project was completed in June 2014. It is intended the changes to the guides will provide stakeholders with more relevant and thorough information on workers’ compensation dispute resolution in Western Australia.
Publication of appeal decisionsThe decisions of arbitrators are appealable to the District Court of Western Australia. Following District Court approval in January 2014, changes were made to the WorkCover WA website to provide ready access to these decisions.
Education and information
The Agency offers education, advice and assistance to all workers’ compensation scheme participants and the community via a number of methods and resources. The provision of education and information is a vital WorkCover WA service aimed at establishing and increasing stakeholders’ knowledge of rights and responsibilities in regards to workers’ compensation and injury management.
This scheme service contributes to, and is aligned with:
Government Goal(s) WorkCover WA Strategic Goal
3 – Results-Based Service Delivery &
(4 – Stronger focus on the regions)
2 – Stakeholder confidence and engagement
WorkCover WA’s training room.

55
Report on Operations | WorkCover WA 2013/14 Annual Report
Injury Management: A Guide for Employers
A technical note on Contractors and Workers’ Compensation
A Guide to Noise Induced Hearing Loss
What happens if there is a dispute?
Insurance Brokers’ Code of Practice
WorkCover WA publications can be downloaded from the ‘Resources’ section on the WorkCover WA website.
www.workcover.wa.gov.au
Web
Web
Web
Web
Web
10%
3%
2%
16%
4%
1%
PublicationsFigure 15: Publication numbers
Publications mailed
Publications downloaded from website
WorkCover WA has a variety of publications to provide workers, employers, insurance brokers and other scheme participants with relevant and comprehensive sources of information. In 2013/14, these publications continued to be promoted and utilised across the State by stakeholders and the general public. Workers’ Compensation and Injury Management: A Guide for Workers was again the most requested publication by mail, recording 60 per cent of all publications ordered. In contrast, Injury Management: A Guide for Employers was the most downloaded publication, recording 42 per cent of all downloads. This indicates the different distribution methods required for workers and employers.
A full statistical breakdown for all publications in 2013/14 are outlined below:
Figure 16: 2013/14 publications by delivery method
Workers’ Compensation and Injury Management: A Guide for Workers
Workers’ Compensation and Injury Management: A Guide for Employers
14, 693
13, 260
Web
Web
60% 11%
7%
6%
14%
13%
9%
14%

56
Report on Operations | WorkCover WA 2013/14 Annual Report
New visitor42%
Returning visitor58%
SALESWebsiteThe Agency maintained an informative internet presence throughout 2013/14, presenting information about WorkCover WA’s services and expertise, and stakeholders’ rights and responsibilities in an accessible, accurate and user-friendly manner. This included the distribution of 29 latest news articles to over 850 WorkCover WA website subscribers.
Other internet outcomes for 2013/14 are outlined below.
DownloadsThere have been a total of 65,980, unique downloads of publications, forms, reports and other information in 2013/14.
Other than publications, key download highlights include:
Workers’ Compensation Claim Forms 8,092
Form 100 – Application for Conciliation 2,257
Variations to the Prescribed Amount 2012–13 7,873
Recommended Premium Rates 2012–13 6,254
Legislative Review Discussion Paper 1,085
Figure 17: Site visits
Figure 18: Direct Traffic Source
27%
13%
60%
0%
Direct traffic Referral traffic Search traffic Social
27%
13%60%
0%
Direct traffic Referral traffic Search traffic Social
Unique visits109,053
Visits256,529
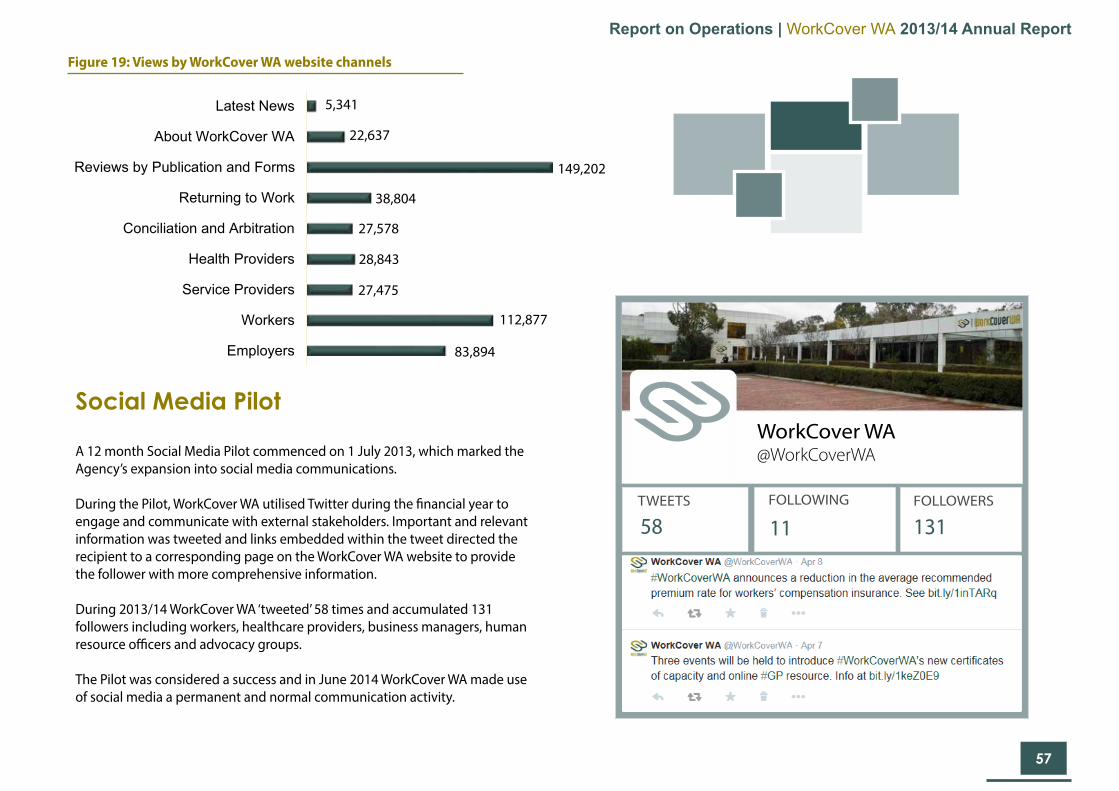
57
Report on Operations | WorkCover WA 2013/14 Annual Report
Employers
Workers
Service Providers
Health Providers
Conciliation and Arbitration
Returning to Work
Reviews by Publication and Forms
About WorkCover WA
Latest News 5,341
22,637
149,202
38,804
27,578
28,843
27,475
112,877
83,894
Figure 19: Views by WorkCover WA website channels
Social Media Pilot
A 12 month Social Media Pilot commenced on 1 July 2013, which marked the Agency’s expansion into social media communications.
During the Pilot, WorkCover WA utilised Twitter during the financial year to engage and communicate with external stakeholders. Important and relevant information was tweeted and links embedded within the tweet directed the recipient to a corresponding page on the WorkCover WA website to provide the follower with more comprehensive information.
During 2013/14 WorkCover WA ‘tweeted’ 58 times and accumulated 131 followers including workers, healthcare providers, business managers, human resource officers and advocacy groups.
The Pilot was considered a success and in June 2014 WorkCover WA made use of social media a permanent and normal communication activity.
58TWEETS
11FOLLOWING FOLLOWERS
131
WorkCover WA@WorkCoverWA
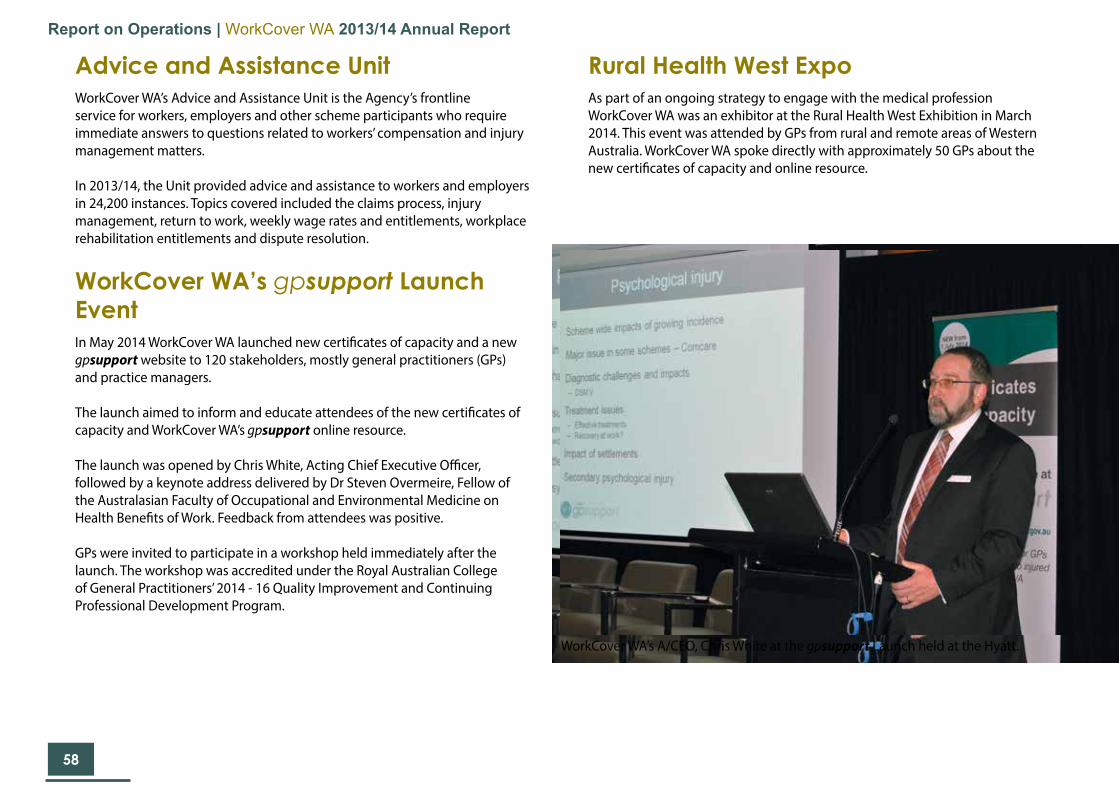
58
Report on Operations | WorkCover WA 2013/14 Annual Report
Advice and Assistance UnitWorkCover WA’s Advice and Assistance Unit is the Agency’s frontline service for workers, employers and other scheme participants who require immediate answers to questions related to workers’ compensation and injury management matters.
In 2013/14, the Unit provided advice and assistance to workers and employers in 24,200 instances. Topics covered included the claims process, injury management, return to work, weekly wage rates and entitlements, workplace rehabilitation entitlements and dispute resolution.
WorkCover WA’s gpsupport Launch Event In May 2014 WorkCover WA launched new certificates of capacity and a new gpsupport website to 120 stakeholders, mostly general practitioners (GPs) and practice managers.
The launch aimed to inform and educate attendees of the new certificates of capacity and WorkCover WA’s gpsupport online resource.
The launch was opened by Chris White, Acting Chief Executive Officer, followed by a keynote address delivered by Dr Steven Overmeire, Fellow of the Australasian Faculty of Occupational and Environmental Medicine on Health Benefits of Work. Feedback from attendees was positive.
GPs were invited to participate in a workshop held immediately after the launch. The workshop was accredited under the Royal Australian College of General Practitioners’ 2014 - 16 Quality Improvement and Continuing Professional Development Program.
Rural Health West ExpoAs part of an ongoing strategy to engage with the medical profession WorkCover WA was an exhibitor at the Rural Health West Exhibition in March 2014. This event was attended by GPs from rural and remote areas of Western Australia. WorkCover WA spoke directly with approximately 50 GPs about the new certificates of capacity and online resource.
WorkCover WA’s A/CEO, Chris White at the gpsupport Launch held at the Hyatt.

59
Report on Operations | WorkCover WA 2013/14 Annual Report
Approved Medical Specialist Peer ReviewWorkCover WA hosts Approved Medical Specialist Peer Review evenings in conjunction with the Australasian Faculty of Occupational and Environmental Medicine (AFOEM) each year. The events aim to educate AMS and AFOEM members on permanent impairment issues, as identified through WorkCover WA’s peer review; provides for informal discussions on relevant case studies; and offers medical stakeholders an opportunity to network and liaise with relevant professionals.
In 2013/14 the Agency held two Approved Medical Specialist Peer Review evenings, with a total of 94 attendees.
Presentations on requestWorkCover WA frequently delivers a range of tailored external presentations to various stakeholders upon request. During 2013/14 the Agency delivered eight presentations to employers, health providers, workers and service providers regarding the operation of the WA workers’ compensation and injury management scheme.
Training and seminars
Welcome to WorkCover WA seminarsWelcome to WorkCover WA seminars are regular events in the Agency’s calendar. Providing an introductory overview of WorkCover WA and its role within the workers’ compensation and injury management scheme, the seminar offers scheme participants an opportunity to discuss individual queries and concerns with experienced divisional heads.
WorkCover WA conducted four seminars in 2013/14 informing and educating a total of 221 stakeholders about the overall scheme.
Insurance Brokers’ Breakfast Seminar An Insurance Brokers’ Breakfast Seminar was held in May 2014. Providing insurance brokers with knowledge of WorkCover WA’s role and the WA workers’ compensation and injury management scheme, this annual seminar encourages insurance brokers to utilise their increased understanding of the scheme to provide a better service to their clients.
Delivered by WorkCover WA Divisional General Managers and Dallas Booth, Chief Executive Officer of the National Insurance Brokers’ Association, the 2014 seminar was presented to 140 insurance brokers. Feedback from attendees was positive and the event afforded attendees the opportunity to engage with the Agency’s General Managers about issues particular to them.
The seminars are accredited for professional development by the National Insurance Brokers’ Association.
During 2013/14 the Agency delivered a range of educational and information events in the form of seminars, information sessions and presentations. The activities engaged and educated scheme participants and the general public on relevant issues surrounding workers’ compensation and injury management. The activities also promoted collaboration and mutual respect between stakeholder groups by providing insight into the various elements of the scheme.
General Manager Regulatory Services, Harley White presenting at a Welcome to WorkCover WA Seminar.
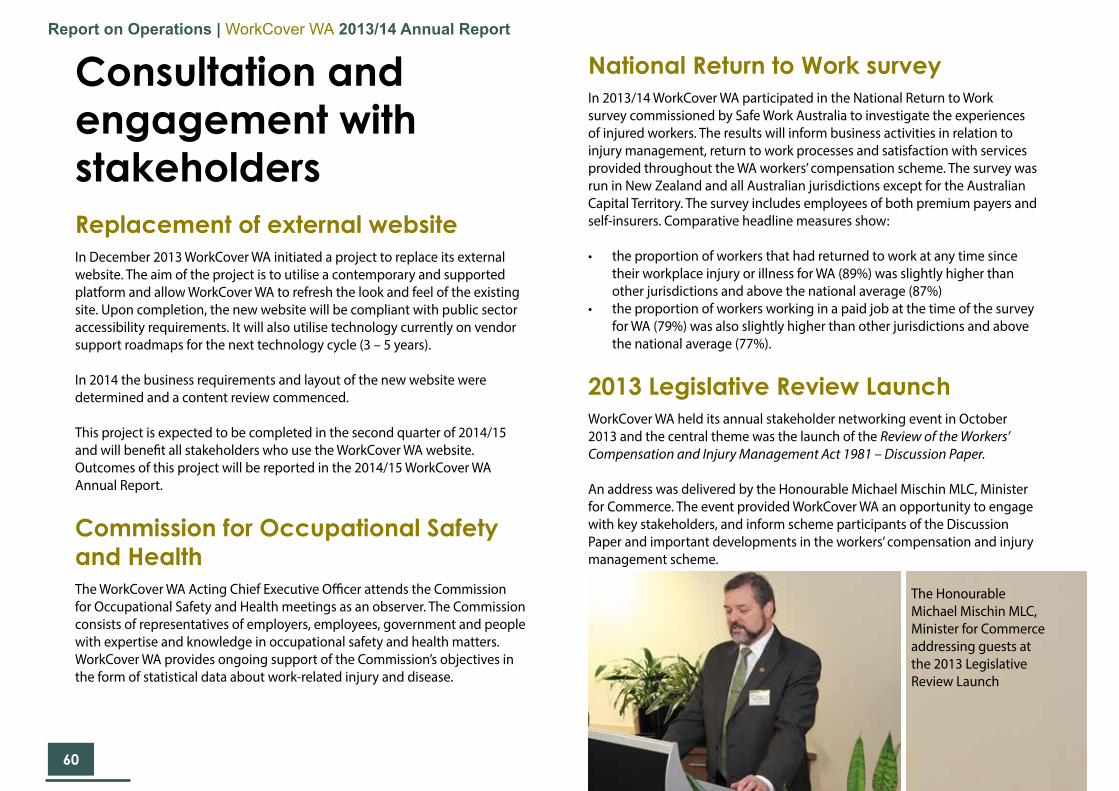
60
Report on Operations | WorkCover WA 2013/14 Annual Report
Consultation and engagement with stakeholders Replacement of external websiteIn December 2013 WorkCover WA initiated a project to replace its external website. The aim of the project is to utilise a contemporary and supported platform and allow WorkCover WA to refresh the look and feel of the existing site. Upon completion, the new website will be compliant with public sector accessibility requirements. It will also utilise technology currently on vendor support roadmaps for the next technology cycle (3 – 5 years).
In 2014 the business requirements and layout of the new website were determined and a content review commenced.
This project is expected to be completed in the second quarter of 2014/15 and will benefit all stakeholders who use the WorkCover WA website. Outcomes of this project will be reported in the 2014/15 WorkCover WA Annual Report.
Commission for Occupational Safety and HealthThe WorkCover WA Acting Chief Executive Officer attends the Commission for Occupational Safety and Health meetings as an observer. The Commission consists of representatives of employers, employees, government and people with expertise and knowledge in occupational safety and health matters. WorkCover WA provides ongoing support of the Commission’s objectives in the form of statistical data about work-related injury and disease.
National Return to Work survey In 2013/14 WorkCover WA participated in the National Return to Work survey commissioned by Safe Work Australia to investigate the experiences of injured workers. The results will inform business activities in relation to injury management, return to work processes and satisfaction with services provided throughout the WA workers’ compensation scheme. The survey was run in New Zealand and all Australian jurisdictions except for the Australian Capital Territory. The survey includes employees of both premium payers and self-insurers. Comparative headline measures show:
• the proportion of workers that had returned to work at any time since their workplace injury or illness for WA (89%) was slightly higher than other jurisdictions and above the national average (87%)
• the proportion of workers working in a paid job at the time of the survey for WA (79%) was also slightly higher than other jurisdictions and above the national average (77%).
2013 Legislative Review LaunchWorkCover WA held its annual stakeholder networking event in October 2013 and the central theme was the launch of the Review of the Workers’ Compensation and Injury Management Act 1981 – Discussion Paper.
An address was delivered by the Honourable Michael Mischin MLC, Minister for Commerce. The event provided WorkCover WA an opportunity to engage with key stakeholders, and inform scheme participants of the Discussion Paper and important developments in the workers’ compensation and injury management scheme.
The Honourable Michael Mischin MLC, Minister for Commerce addressing guests at the 2013 Legislative Review Launch

61
Report on Operations | WorkCover WA 2013/14 Annual Report
Handling complaints WorkCover WA’s Customer First Feedback System provides customers with an opportunity to deliver positive or negative feedback about the Agency’s services, decisions, procedures, policies and facilities. See page 26 for a full description on WorkCover WA’s commitment to customer feedback.
2013/14 outcomes are:
Compliments 13
Complaints 15
Suggestions 12
All customer feedback was responded to within the agreed deadlines of five working days for verbal feedback and 10 working days for written feedback. Since 2012/13 the total number of complaints, compliments and suggestions increased by 42 per cent. This increase is seen as positive as it indicates that more people are using the Customer First Feedback System.
Collaborations The Agency is involved in a number of collaborative initiatives contributing to the effective management of the workers’ compensation and injury management scheme, and aimed at ensuring stakeholders are educated and informed about their rights and responsibilities under the Act.
Public Sector Safety and Injury Management Steering CommitteeWorkCover WA is a member of the Public Sector Safety and Injury Management Steering Committee, which consists of representatives from the Department of Commerce’s WorkSafe and Office of the Director General divisions, RiskCover, Public Sector Commission and UnionsWA.
Australian Business RegisterWorkCover WA obtains data from the Australian Business Register in relation to new business entities that have registered for GST and/or have a turnover of greater than $75,000 – both of which indicate an intention to employ. This information is then matched against WorkCover WA data, providing the Agency with a source of intelligence regarding employers who may not be appropriately covered by a policy of insurance. This program continues to work well ensuring new business owners are informed of their obligations.
In 2013/14 the data matching program identified 5,632 new business entities which met the criteria indicating the potential employment of workers after start up. WorkCover WA wrote to each of these businesses to inform them of their obligations to obtain appropriate cover with insurance for workers’ compensation. 1,726 of these businesses were identified for further follow up by WorkCover WA’s Regulatory Services Division to verify their obligations had been met.
Customer feedback was responded to within the agreed deadlines

62
Report on Operations | WorkCover WA 2013/14 Annual Report
Industrial Foundation for Accident PreventionWorkCover WA’s cooperative partnership with the not-for-profit Industrial Foundation for Accident Prevention (IFAP) continued in 2013/14 with the provision of free information sessions to injured workers. IFAP is a registered training organisation providing education and information to injured workers about the workers’ compensation, injury management and return to work process.
In the past year, 14 free IFAP seminars were delivered to a total of 117 injured workers. Three seminars were delivered in regional Western Australia (Bunbury, Geraldton and Kalgoorlie).
Personal Injury Education FoundationWorkCover WA is a member of the Personal Injury Education Foundation (PIEF) and continued to support programs developed by PIEF, including return to work and case management training for people working within the personal injury industry (such as case managers and employer representatives).
WorkSafe WAWorkCover WA shares relevant data with WorkSafe WA to facilitate analysis of workers’ compensation data from a prevention perspective. This initiative is outlined under ‘Targeting injury management and return to work obligations’ in Section 3 on page 45.
ThinkSafe Small Business Program WorkCover WA maintained its involvement in WorkSafe’s ThinkSafe Small Business Program with a contribution of $250,000. The Agency identified potential employers who would benefit from the ThinkSafe Small Business Program, using information gathered during compliance-related activities.
In order to promote the prevention of accidents and injuries in Western Australian workplaces, the Program introduced small businesses to:
• hazard identification and risk reduction• safety and health policies• safe work systems• good injury management practice.
Delivered through on-site safety assessments and group information seminars for businesses employing less than 30 workers, the Program provided essential information regarding workers’ compensation and injury management obligations directly to employers.
During on-site assessments, consultants review the adequacy and effectiveness of a business’ injury management system (IMS) and return to work programs. Recommendations are made to employers who do not have appropriate systems and programs in place. The Program also includes a follow-up visit 12 months after the initial consultation.
Outcomes for 2013/14* are as follows:
Individual business consultations conducted 476
Follow-up visits conducted 80
Businesses advised by WorkCover WA of the availability of the ThinkSafe Small Business Program
22*
*up until November 2013 when WorkCover WA was advised funding for the program had been exhausted.

63
Report on Operations | WorkCover WA 2013/14 Annual Report
Report against 2013/14 Strategic Initiatives
Following the release of the Discussion Paper WorkCover WA actively consulted with representative and interest groups to discuss particular issues and alternative options in more detail. WorkCover WA participated in 25 meetings and workshops and provided daily assistance to stakeholders preparing submissions on technical and process issues.
On 26 June 2014 the Review of the Workers’ Compensation and Injury Management Act 1981: Final Report was publicly released by WorkCover WA and tabled in the Legislative Council by the Minister for Commerce. The final report recommends the drafting of a new statute and includes 171 specific recommendations. The Government will consider the drafting of a bill to implement the report’s recommendations following a short period of consultation closing 31 July 2014.
Outcome Key points
Delivered
• Legislative Review Stage 2 progressed with the development of a discussion paper for consultation with stakeholders and the delivery of a Final Report with recommendations for a new statute.
• Through consultation with stakeholders, the Legislative Review also contributes to Strategic Goal 2: Stakeholder confidence and engagement.
In 2012/13 WorkCover WA committed a number of resources towards the achievement of Strategic Initiatives aligned with the Strategic Plan 2012–2015. The Agency’s performance against these initiatives this financial year is detailed in the following section. As per the Agency’s Performance Management Framework, the following projects relate to State Government objectives embedded within Goal 3: ‘Results-Based Service Delivery’ and the achievement of WorkCover WA’s Agency Desired Outcome as outlined on page 28 of this report.
Initiative 1: Legislative Review Stage 2The following initiative is aligned with
WorkCover WA Strategic Goal
1 – Strategic scheme management & 2 – Stakeholder confidence and engagement
In 2013/14, WorkCover WA progressed the second phase of the review of the Act which is focussed on recommendations for a new workers’ compensation statute. The review addresses:
• outstanding proposals from the Workers’ Compensation and Injury Management Act 1981– Legislative Review 2009
• identified technical and process issues with the current legislation• the need to enhance readability and consistency in the legislation
including contemporary language and drafting conventions.
In September 2013 WorkCover WA released the Review of the Workers’ Compensation and Injury Management Act 1981: Discussion Paper to facilitate consultation with scheme stakeholders. The closing date for submissions was 7 February 2014.
The Discussion Paper was based on WorkCover WA’s internal review of the legislation which took into account stakeholder issues raised over many years including those identified but not progressed in the Legislative Review 2009. WorkCover WA received 66 submissions.

64
Report on Operations | WorkCover WA 2013/14 Annual Report
Initiative 2: Review of Medical CertificatesThe Review of medical certificates is one of two strategic projects directed towards increasing the engagement and support of GPs delivering services to injured workers in Western Australia.
WorkCover WA undertook a review of workers’ compensation medical certificates in 2013/14 following stakeholder feedback on the effectiveness of the existing certificates in communicating critical information about a workers’ injury and return to work. Feedback included comments the design and layout was congested and the language used on the certificates reinforced avoidance of activity, rather than a focus on work capacity.
Key objectives
• Redevelop the medical certificates to be user friendly, better promote workers’ capacity to stay in or return to work; trigger early identification and management of psychosocial factors that may risk timely recovery and return to work; and meet legislative requirements
• Provide guidance, clarify expectations about information required to be completed on the form
• Support GPs in fulfilling their role in injury management.
In the latter half of 2013 WorkCover WA progressed the revision of the medical certificates through an injury management technical group and developed new certificates of capacity. The technical group comprised of representatives from the:
• Australian Medical Association (WA) (Council of General Practice)• Royal Australasian College of Physicians (WA)• Australasian Faculty of Occupational and Environmental Medicine (WA)• Law Society of Western Australia• Chamber of Commerce and Industry (WA)• UnionsWA• Insurance Council of Australia (WA)• Insurance Commission of Western Australia (RiskCover)
Regulatory amendments to effect the changes to the medical certificates were progressed in the first half of 2014. The new certificates of capacity were launched at a stakeholder event on 8 May 2014, followed by a GP workshop and two webinars to promote the changes and WorkCover WA’s new online website for GPs, gpsupport. The new medical certificates came into effect on 1 July 2014.
The following initiative is aligned with
WorkCover WA Strategic Goal
2 – Stakeholder confidence and engagement & 3 – Regulatory compliance
Outcome Key points
DeliveredThe review was completed and new medical certificates came into effect on 1 July 2014.
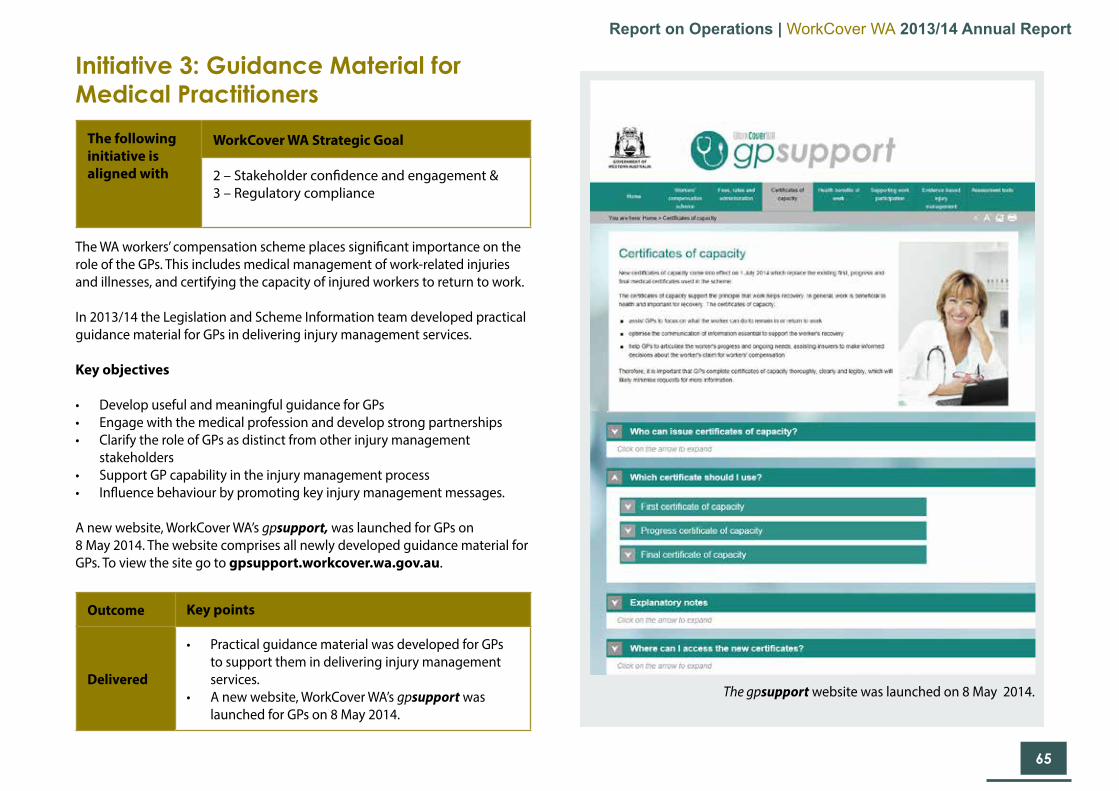
65
Report on Operations | WorkCover WA 2013/14 Annual Report
Initiative 3: Guidance Material for Medical Practitioners
The WA workers’ compensation scheme places significant importance on the role of the GPs. This includes medical management of work-related injuries and illnesses, and certifying the capacity of injured workers to return to work.
In 2013/14 the Legislation and Scheme Information team developed practical guidance material for GPs in delivering injury management services.
Key objectives
• Develop useful and meaningful guidance for GPs • Engage with the medical profession and develop strong partnerships• Clarify the role of GPs as distinct from other injury management
stakeholders• Support GP capability in the injury management process• Influence behaviour by promoting key injury management messages.
A new website, WorkCover WA’s gpsupport, was launched for GPs on 8 May 2014. The website comprises all newly developed guidance material for GPs. To view the site go to gpsupport.workcover.wa.gov.au.
The following initiative is aligned with
WorkCover WA Strategic Goal
2 – Stakeholder confidence and engagement & 3 – Regulatory compliance
Outcome Key points
Delivered
• Practical guidance material was developed for GPs to support them in delivering injury management services.
• A new website, WorkCover WA’s gpsupport was launched for GPs on 8 May 2014.
The gpsupport website was launched on 8 May 2014.

66
Report on Operations | WorkCover WA 2013/14 Annual Report
Initiative 4: Core Business System – Scheme Performance (continued)
The final stage of the redevelopment of the Scheme Information System involved both the adoption of the National Insurer Data Specification (NIDS) by WorkCover WA, insurers and self-insurers, and the replacement of WorkCover WA’s legacy internal data processing systems.
Due to delays in insurer and self-insurer implementation of the NIDS in other jurisdictions, the full implementation and testing of replacement internal systems could not be completed by the original deadline of 1 February 2014.
The deadline was revised to 1 March 2014, and once NIDS data submissions commenced on that date it was possible to fully test the replacement processing systems. By 30 June 2014 the new system is fully operational, successfully processing NIDS data, and has been moved into ‘maintenance’ mode.
The following initiative is aligned with
WorkCover WA Strategic Goal
1 – Strategic scheme management, 2 – Stakeholder confidence and engagement & 4 – Organisational excellence
Outcome Key points
Delivered
• Redeveloped processing systems delivered for final acceptance testing early-February 2014, accepted mid-February 2014 as ready for production use.
• First ‘production’ NIDS submission (from ALCOA World Alumina – Australia Ltd) successfully received and processed on 4 March 2014.
• All insurers and self insurers providing data in accordance with the NIDS by the end of 2013/14.

67
Report on Operations | WorkCover WA 2013/14 Annual Report
Initiative 5: Development of WorkCover WA Compliance Program
The Regulatory Compliance Framework was developed in 2013/14 to outline and inform stakeholders about the various compliance and regulatory activities undertaken by WorkCover WA in accordance with the Act.
The aim of the Framework is to inform key stakeholders of the Agency’s regulatory functions.
As a part of the initiative WorkCover WA developed and published the Framework, detailing WorkCover WA’s risk based approach to compliance activities and the strategies used to detect and address non-compliance by our stakeholders. The Framework included a poster for employers and service providers which highlights the three strategies employed by WorkCover WA to gain compliance.
Key objectives:
• Inform stakeholders about WorkCover WA’s approach to obtaining compliance and to detail the key activities undertaken
• Improve stakeholder engagement by providing informational and promotional material to complement the advertising of activities WorkCover WA intends to undertake in the forthcoming year.
In May 2014 WorkCover WA finalised and published a Compliance Plan for 2014/15. The Plan will allow stakeholders to prepare for intended contact, allocate resources and organise required material. The Plan will be reviewed and updated on the Agency website each year.
The following initiative is aligned with
WorkCover WA Strategic Goal
2 – Stakeholder confidence and engagement & 3 – Regulatory compliance
Outcome Key points
Delivered
• In May WorkCover WA finalised a Compliance Plan for 2014/15 and made it available to stakeholders on the Agency website.
• The Plan will be reviewed and updated on the Agency website each year.
WorkCover WA is committed to the principles ofProcedural FairnessEquity Transparency
Compliance Framework
For more information call 1300 794 744 or
visit www.workcover.wa.gov.au
Relevance
Strong working relationshipsSocial Media Industry GroupsCommitteesa
a aa
Engage
Suspension or cancellation of approval
Letter of cautionInfringement notices
Formal prosecutiona
a
Self-Assessments
Renewal Process
Annual Reviews
Prosecution details published on website
SeminarsEvents
WorkCover WA website
Advice and Assistance Line
a a
a a
a aa
a
a
Enforce
Auditsa
Educatea
Employers - Are you compliant?Do you have a current Workers’ Compensation Policy for your full time, part-time and/or casual workers, including trainees or apprentices?
Do you have a current Workers’ Compensation Policy for any contractors/sub-contractors?
Service Providers - Are you compliant?
aaaaa
aaaaa
Do you have an Injury Management System in place?
Do you have a compliant return to work program (applicable only if you have an injured worker)?
Are your required insurances and registrations up to date?
If you submit data, is it accurate and timely? (Penalties may apply)
Do you charge in accordance with permitted rates and fees?
Have you informed WorkCover WA of any changes that may affect your registration?
Are you aware of your compliance obligations?
Do you have a current Workers’ Compensation Certificate of Currency available to present onsite during an inspection?
WorkCover WA’s Compliance Framework poster.

68
Report on Operations | WorkCover WA 2013/14 Annual Report
Case Study 2: Engagement with GPs and certification practices“Indeed, the key to improving sickness certification practices is for health professionals to be clear about the positive relationship between work and health.” – Professor Sir Mansel Aylward
The challenge
GPs play a critical role in injured workers’ recovery and return to work. Certificates are GPs’ primary tool for communicating information that directs injury management outcomes. Certification practices suggested GPs were generally unaware of injury management evidence based principles, in particular the positive relationship between work and health. The challenge was to assist GPs to integrate these injury management principles into practice.
Who we engaged and what we did
Adopting a highly consultative approach with the medical profession and industry, WorkCover WA developed the new ‘certificates of capacity’ and online resources for GPs, gpsupport. The new forms are clearer and make better provision for GPs to communicate information about the worker’s capacity for work and injury management. WorkCover WA’s gpsupport hosts all scheme-related, best practice information for GPs in one location, offering a platform for future educational initiatives. In partnership with industry, WorkCover WA delivered workshops and webinars accredited by the Royal Australian College of General Practitioners, the first step in an ongoing commitment to support GPs in practice.
The results so far
The feedback received from GPs and industry has been encouraging. Most GPs believe the certificates are a better communication tool and the online resources will assist them in practice. Since its launch in May 2014, WorkCover WA’s gpsupport has already had 6,000 hits. Through the engagement process, WorkCover WA learned GPs want to know how to better manage patients with workers’ compensation injuries. 94 per cent of webinar participants indicated the activity was entirely relevant. GPs appreciated the ‘Health Benefits of Work’ message, and valued the employer and insurer perspectives. These initiatives are part of WorkCover WA’s broader commitment to support the industry to deliver best practice in injury management.
Stakeholders attending the gpsupport workshop at the launch.

Section 4: Opportunities and Challenges
Opportunity and accessibility | 70 » Workforce Development | 70 » Equality and inclusion | 73 » Traineeship program | 73 » Safety, health and wellbeing | 74
Agency challenges | 76IT initiatives | 76
69

70
Opportunities and Challenges | WorkCover WA 2013/14 Annual Report
Courses conducted in-house included Emergency Evacuation Planning, First Aid, Job Application and Interview Techniques, and Manager Competency. During this financial year 64 staff attended in-house courses.
The total hours of general staff training in 2013/14 are as follows:
Manager Competency Program The Manager Competency Program involves the delivery of a series of targeted internal and external training sessions for managers and nominated aspiring managers. The Program aims to enhance workplace competency and capability of managers by providing them with the requisite knowledge and skills.
During 2013/14, seven training sessions were delivered involving a total of 35 participants. Training programs are repeated periodically to cater for the appointment of new managers.
Feedback from participants continues to be positive, indicating the Program is meeting its intended outcomes. A formal measure of the Program was undertaken through the August 2013 and February 2014 Performance Development Agreement (PDA) system in which staff were invited to provide feedback on their supervising officer’s performance over the past year.
Employee developmentWorkCover WA’s employee development process is facilitated through our PDA system.
Following an employee development review undertaken in 2012/13 WorkCover WA made amendments to the PDA survey in February 2014 to provide a broader measure of the effectiveness of the employee development process.
Workforce Development
Staff training In 2013/14 a total of 71 WorkCover WA staff attended external learning and development training courses. The courses covered areas including professional development, the principles of management, leadership, information technology, technical skills and occupational safety and health.
The following initiatives are aligned with, and contribute to:
WorkCover WA Strategic Goal
4 – Organisational excellence
Training hours in total 2,266
Training hours per employee 16
Opportunity and accessibility

71
Opportunities and Challenges | WorkCover WA 2013/14 Annual Report
In 2013/14 the following improvements to the PDA system were implemented:
• performance measures against specific job competencies were included in August 2013
• succession planning was incorporated in the process in February 2014.
Attraction and retention
Graduate ProgramThe Graduate Program advances graduate career opportunities in an exciting, supportive and diverse environment. The Graduate Program ties into the WorkCover WA Workforce Plan by developing future management and leadership capabilities.
There were no graduates engaged in 2013/14 with the next intake of graduates planned for 2014/15.
New attraction and recruitment methodologies In 2013/14 WorkCover WA implemented new attraction and recruitment methodologies with a view to enhancing the Agency’s ability to identify the most suitable and available candidates for appointment.
Alternate attraction and recruitment methodologies included as part of WorkCover WA’s ongoing employment strategies include:
• engaging with former employees• developing a dedicated careers page on the WorkCover WA website• utilising recruitment agencies to source candidates and employees• networking via contacts at events• professional association membership to assist the Agency to source
candidates and employees.
The utilisation of recruitment agencies has proven to be a successful strategy with a number of Agency staff competently filling vacant positions, one of which has been appointed as a permanent WorkCover WA employee.
In addition, useful contacts have been made at events and two staff have been appointed as a result of this strategy.
Due to the recent implementation of these strategies, their effectiveness will be further monitored and measured from 2014/15.
Succession management reviewIn 2013/14 a number of new initiatives were incorporated into WorkCover WA’s Succession Planning Framework and included as a key focus of the PDA system. A review of the succession planning process in April 2014 was undertaken to identify whether key objectives were met and further improvements were required. Initiatives implemented through the succession planning project in 2013/14 included:
• the integration of the competency framework in succession management• the continued identification of critical positions and gaps• the development and delivery of succession management training• the integration of succession planning in the employee development
process• the implementation of additional succession planning strategies
including project mentoring, higher duties acting reviews, and the Corporate Executive annual succession planning meeting.
Further review of the success of these strategies, including the continuing review of critical positions within the Agency, will be conducted in 2014/15.
72
Opportunities and Challenges | WorkCover WA 2013/14 Annual Report
Careers page
The development of a WorkCover WA careers page was a focus of the Corporate Resources Division in 2013/14. The key project objective was to enhance the existing information on the WorkCover WA website through a dedicated careers page.
An internal working group was established in August 2013 to assist the Agency to identify ways to market and sell the benefits of employment at WorkCover WA. The working group included representatives from Communications & Education, Human Resources and Information Technology branches as well as selected staff who had recently commenced at WorkCover WA.
In March 2014 a revised careers page was published. The page provides job seekers with a comprehensive overview of the Agency, as well as information on employment opportunities, what the Agency offers employees, salary provisions and the Agency’s commitment to diversity.
Innovation Framework developmentThe Public Sector Commission (PSC) advised “the State Government has made a commitment to innovation within the public sector to enhance cost savings, service delivery and agency performance.”
Further, the PSC stated, “in the context of the current public sector cost saving challenges and corrective measures, and the Public Sector Commissioner’s commitment to innovation in the sector, ‘Innovation’ has replaced ‘Reducing the regulatory burden on business and the community’ as a sector wide initiative for the 2013/14 reporting period.”
In 2013/14 WorkCover WA developed an Innovation Framework. This will ensure the Agency contributes effectively to the achievement of the State Government’s and Public Sector Commissioner’s commitments. The Innovation Framework will facilitate the generation of ideas and guide their development and implementation, consistent with Agency goals and governance requirements.
The next stage of this project, which is to examine options to operationalise the Innovation Framework across the Agency, has commenced. It is intended the implementation of the Framework will lead to improved efficiency and effectiveness of service delivery by the Agency.
Workplace consultation
Induction materials review and approved recommendations In May 2013 a small project team comprising of both recent and longer-serving staff members worked on a review of the current online induction program in order to facilitate content and structural changes to the program.
All approved recommendations from the review were implemented to develop a revised online induction program in 2013/14. The recommendations were aimed at ensuring the induction process for new employees is of a high standard and user-friendly. In addition to changes to the online induction program, other changes to the induction process include:
• new employees are to commence the online induction on their first day• to aid the new online induction process, all managers and supervisors
receive appropriate training to assist them to understand the importance of their role in providing a positive induction experience for new staff members
• the Manager’s Induction checklist has been amended to include tasks which promote ongoing support for new employees
• the Agency’s Human Resources branch will ensure new employees are exposed to in-person induction methods to compliment the online induction module
The following initiatives are aligned with, and contribute to:
WorkCover WA Strategic Goal
4 – Organisational excellence
73
Opportunities and Challenges | WorkCover WA 2013/14 Annual Report
• all work stations, email accounts, and access to networks and the building are in place prior to a new employee’s start date
• a formal ‘buddy system’ has been implemented for new employees• the Human Resources branch meets with each new employee after
having completed the online induction module and induction feedback survey to obtain in-person feedback on their induction experience.
Equality and inclusion
Disability Access and Inclusion Plan In May 2013 a new Disability Access and Inclusion Plan (DAIP) was developed and approved by the Disability Services Commission. It was implemented on 1 July 2013 by the WorkCover WA Equity & Diversity Committee.
The DAIP outlines how WorkCover WA contributes to an accessible and inclusive community for people with disabilities, as well as their families and carers. This includes ensuring people with disabilities have the same opportunities as other people to:
• access WorkCover WA services and events• access the building and facilities• receive information in a format enabling them to access information
readily• receive a high-level quality of service from our staff• make complaints• participate in any public consultation• obtain and maintain employment with WorkCover WA.
During the year WorkCover WA utilised both the website and intranet to promote its commitment to the DAIP to people with disabilities, staff and contractors.
Traineeship programPrimarily targeted at youth under the age of 25, WorkCover WA’s Traineeship Program also contains an emphasis on engaging with young Aboriginal and Torres Strait Islander Australians.
In 2013/14 WorkCover WA trialled differing methods to identify suitable Aboriginal trainees, including engagement with the Wirrapanda Foundation and the Western Australian Football League. Through this process one Aboriginal trainee was appointed.
Once engaged at WorkCover WA, trainees are required to complete a Certificate III in Government while undertaking a range of work placements across the Agency. This arrangement provides trainees with skills and experience to enable them to be ‘job ready’ for future employment opportunities.
In 2013/14 two trainees completed the program; one of whom was successful in gaining ongoing employment in the public sector.
Reconciliation Action PlanIn May 2014 WorkCover WA developed a new Reconciliation Action Plan (RAP).
The RAP aims to raise awareness about the culture and values of Aboriginal and Torres Strait Islander Australians and was approved by Reconciliation Australia in June 2014. Promotion of significant cultural events and days such as National Reconciliation Week; publication of intranet articles focusing on issues affecting Aboriginal and Torres Strait Islander Australians; and cultural awareness training for staff were all progressed as part of the RAP in 2013/14.
The RAP is also intended to instigate strategies to promote employment and development opportunities for indigenous Australians.
The following initiatives all fall under the banner of the Equal Employment Opportunity Plan. All initiatives are aligned with, and contribute to:
WorkCover WA Strategic Goal
4 – Organisational excellence

74
Opportunities and Challenges | WorkCover WA 2013/14 Annual Report
Safety, health and wellbeing
Occupational Safety and Health Management Plan
The WorkCover WA Board and Corporate Executive are committed to ensuring all employees are able to perform their duties in a safe working environment. A report on occupational safety and health (OSH) matters is referred to the Corporate Executive on a quarterly basis. The Chief Executive Officer tables the OSH updates at the WorkCover WA Board on a quarterly basis.
The OSH Committee facilitates consultation and cooperation between WorkCover WA and its employees by collaboratively examining issues affecting the health and wellbeing of staff, and developing and implementing measures to prevent workplace accidents and injuries. The Committee’s members and activities are outlined in detail on page 24 under ‘Workplace consultation’ in Section 1: Agency in focus.
In accordance with the Occupational Safety and Health Act 1984 (OSH Act 1984), the Occupational Safety and Health Regulations 1996, the Public Sector Occupational Safety and Health Code of Practice 2007 and the WorkSafe Plan 2010, WorkCover WA’s Occupational Safety and Health (OSH) Management Plan ensures the Agency maintains a systematic and consistent approach to OSH management. As such, documented OSH requirements, management processes and other OSH-related activities all contribute to improving and maintaining proactive OSH outcomes.
Management of workplace injuries and rehabilitation solutions, including return to work plans, are undertaken in accordance with the provisions of the Workers’ Compensation and Injury Management Act 1981 (the Act).
The following initiatives are aligned with, and contribute to:
WorkCover WA Strategic Goal
4 – Organisational excellence
During 2013/14, initiatives implemented from the OSH Management Plan included:
• publication on the intranet of Safe Work information on health hazards relevant to WorkCover WA
• review of the online OSH training for all employees and managers to ensure compliance with WA Acts, Regulations, Guidance Notes and Codes of Practice
• review of OSH legislation to ensure information retained in the OSH Risk and Legal Register is current
• review of the agency OSH policies and procedures.
WorkCover WA is also committed to supporting and contributing to the health and wellbeing of its employees through the Health and Wellness Program which in 2013/14 offered:
• healthy heart checks• skin cancer screening checks• flu vaccinations• fitness classes• massages• blood donations• lunch and learn sessions on wellness topics• support for the HBF Run for a Reason.
WorkCover WA participated in the 2014 HBF Run for a Reason.

75
Opportunities and Challenges | WorkCover WA 2013/14 Annual Report
Each year the OSH and injury management policies, practices and initiatives are regularly promoted throughout the organisation via intranet articles, posters and signage, and a range of staff training opportunities. In this way the programs delivered in 2013/14 have all contributed to heightened staff awareness regarding both OSH responsibilities and health issues, creating a safer and healthier working environment for WorkCover WA employees.
Occupational Safety and Health Audit Action PlanThe Occupational Safety and Health Audit Action Plan devised a timeline to address recommendations from the 2013 external audit of WorkCover WA’s OSH Management System using the WorkSafe recognised assessment tool.
90 per cent of the recommended actions derived from the 2013 audit were completed last financial year. The remaining 10 per cent of the recommended actions scheduled for 2013/14 have been implemented.
The implementation of the recommended actions has strengthened WorkCover WA’s OSH Management System, as well as the general approach to managing health and safety across the Agency.
Under the OSH Audit Action Plan in 2012/13, WorkCover WA’s OSH Management System received a Gold Certificate of Achievement after being audited against the WorkSafe Plan assessment tool.
Gold accreditation was awarded as a result of WorkCover WA’s OSH Management System being more than 75 per cent compliant against each of the WorkSafe Plan elements: Management Commitment, Planning, Consultation, Hazard Management and Training. The system was monitored in 2013/14 to ensure the gold accreditation standard is maintained. The next audit is due in 2015.
Occupational safety and health representatives The OSH Committee comprises elected employer and OSH representatives. It is constituted to examine issues affecting the health and wellbeing of staff, and to advise management on strategies to prevent workplace accidents and injuries. For more information refer to the OSH Committee on page 24, under Workplace consultation’ in Section 1: Agency in Focus.
The representatives have functions in addition to their normal ‘work duties’ including monitoring discrete work areas on a monthly basis. These functions are articulated in the OSH Act 1984 and remain unchanged from 2012/13.
In 2013/14 the OSH representatives initiated a review of sedentary work practices. The review was completed in May 2014 and new initiatives progressed in June 2014. The outcome of this review will be reported in the 2014/15 Annual Report.
Health and wellness - PSC Employee Perceptions SurveyIn April 2014 WorkCover WA staff participated in the Public Sector Commission’s (PSC) Employee Perceptions Survey.
The survey will allow WorkCover WA to collect employees’ views regarding behaviours in the Agency and if they are consistent with good human resource and ethical practice, and equity and diversity principles.
The PSC will provide WorkCover WA with results of the survey and provide aggregated agency level data and comparisons with the average public sector outcomes.
The survey results will contribute towards WorkCover WA’s decision making affecting staff.

76
Opportunities and Challenges | WorkCover WA 2013/14 Annual Report
Agency challenges Electronic Document and Records Management SystemOne of the key recommendations of the IT Strategic Plan 2012-2015 was the implementation of an Electronic Document Management System (EDRMS).
Using a phased approach initially focused on replacing the existing legacy Records Management System, the EDRMS Phase 1 Project commenced in March 2013. The initial phase focused on implementing TRIM within the Records area to manage hard-copy records. Once the platform and core components are bedded down, TRIM will be implemented across the rest of the Agency. TRIM was successfully implemented in Records and went live in December 2013. To align with the introduction of TRIM WorkCover WA also implemented a new Retention and Disposal Schedule, approved by the State Records Office.
In February 2014, the Board approved the EDRMS Whole of Agency Project, which will progress the implementation of TRIM to all business areas by June 2015.
IT initiatives IT Strategic PlanSupporting WorkCover WA’s strategic planning process, the IT Strategic Plan 2012-2015 defines the IT strategies to ensure the Agency is appropriately supported by technology.
A significant project implemented as part of the IT Strategic Plan in 2013/14 was a new Scheme Information System (SIMS), which was successfully completed. The SIMS System is the last in a three year Core Business System Replacement program to replace WorkCover WA’s legacy technology with modern, web-based systems.
The IT Strategic Plan now moves into an ‘agile’ model, incorporating ongoing development and maintenance of existing systems, rather than deferring expenditure to the end of a system’s lifecycle. Proposed projects over the next three years include EDRMS Whole of Agency (2014/15), Desktop and Laptop Replacement (2015/16) and Infrastructure Replacement (2015/16).
Financial Management Information System UpgradeWorkCover WA’s Information Technology team with assistance from a third-party vendor replaced the hardware utilised by the Agency’s Financial Management Information System (FMIS) with new hardware and migrated to a Microsoft platform. The new hardware is now consistent with all of WorkCover WA’s architecture and will improve supportability of the FMIS system. This project was successfully completed in November 2013.
Mobility pilotDuring 2013/14, 10 Windows tablets were provided to WorkCover WA Corporate Executive and Senior Managers to help reduce the cost of printing and increase work flexibility and efficiency. Objectives of the pilot were achieved and the tablets have replaced the use of paper in Corporate Executive meetings and other Committee meetings.
Firewall replacementIn May 2014, the IT team replaced WorkCover WA’s firewall hardware with new firewall technology providing better security measures to protect WorkCover WA’s network from external threats.

7777
Report on funds management | 78Other financial disclosures | 80Ministerial directives | 81Governance disclosures | 81Board and committee remuneration | 84Legal compliance | 87Government policy requirements | 89
Section 5: Disclosures and Legal Compliance

78
Disclosures and Legal Compliance | WorkCover WA 2013/14 Annual Report
Uninsured claims managementThe Workers’ Compensation and Injury Management Trust Account is maintained in accordance with section 110 of the Workers’ Compensation and Injury Management Act 1981 (the Act). WorkCover WA seeks to optimise returns and security of funds invested for the benefit of the dependants of deceased workers.
Section 218 of the Act empowers an arbitrator to order compensation to be paid in trust to WorkCover WA when it cannot immediately be paid to a person under a legal disability or the dependants of a deceased worker. These funds are invested in accordance with Treasurer’s guidelines.
Investment strategies employed provided an average yield for the year of 3.20 per cent for all trust accounts.
Uninsured claims managementWorkCover WA manages specific funds to provide a source of compensation for workers of uninsured employers, pursuant to section 174 of the Act. Funds paid to workers from the General Account are recovered from uninsured employers by WorkCover WA.
As part of its operations, the compliance activity establishes an employer’s insurance status to ensure monies released from the General Account are in accordance with the provisions of the Act. This year, the compliance activity investigated 23 potential claims on the General Account pursuant to section 174, compared with 25 last year. There were four new claims this year and 26 continuing claims from previous financial years. The cost of new claims was $158,352.73 and ongoing claims amounted to $1,457,956.06.
At 30 June 2014, the total outstanding debt from uninsured employers was approximately $1,616,308.79. Recovery action against these employers is ongoing.
Report on funds managementThe Employers’ Indemnity Supplementation Fund was established under the provisions of the Employers’ Indemnity Supplementation Fund Act 1980 and exists to guard against the collapse of an insurer.
The Employers’ Indemnity Supplementation Fund also pays claims under the Waterfront Workers’ (Compensation for Asbestos Related Disease) Act 1986 and the Workers’ Compensation and Injury Management (Acts of Terrorism) Act 2001.
Payments for claims under the Waterfront Workers’ (Compensation for Asbestos Related Disease) Act 1986 for 2013/14 were nil. Since its inception (February 1987), a total of $2,800,507 has been paid.
Payments for claims under the Workers’ Compensation and Injury Management (Acts of Terrorism) Act 2001 for 2013/14 were nil. The Acts of Terrorism came into effect in 2001, but the first claim payment was not received until December 2005.
Debts and investmentsTable 13: Claim payments and receipts for insurers
Item HIH Insurance ($)
National Employers’ Mutual General Insurance
Co. ($)
Value of outstanding claims in Western Australia
1,250,848 153,989
Received from liquidators in 2013/14
9,992,639 Nil
Claim payments for 2013/14 377,128 420,359
Claim payments since liquidation commenced
75,565,197 6,453,477
Employer’s indemnity supplementation fund

79
Disclosures and Legal Compliance | WorkCover WA 2013/14 Annual Report
At 30 June 2014, there were 95 outstanding debtors resulting from fines and penalties awarded under section 170 of the Act, with debts outstanding of $547,795. In 2013/14, the weighted average rate of return on General Account investments was 3.77 per cent.
Table 14: Actual results vs budget results
Item 2013/14 Target
$000
2013/14 Actual
$000
Variation $000
Total Revenue(sourced from Statement of Comprehensive Income)
22,058 34,721 12,663 (a)
Total Expenses(sourced from Statement of Comprehensive Income)
21,538 27,787 6,249 (b)
Total Equity(sourced from Statement of Financial Position)
73,516 77,862 4,346 (c)
Net increase/(decrease) in cash held(sourced from Statement of Cash Flows)
1,799 8,846 7,047 (d)
Item 2013/14 Target
2013/14 Actual
Variation
Approved full-time equivalent (FTE) staff level
137.44 134.20 3.24
a) Greater than anticipated revenue was the result of additional recoveries in the Supplementation Fund, due to the liquidation of HIH Insurance.
b) The variance is the result of an increase in claims expense, due to an increase in the actuarial assessed claims liability for the Uninsured and Employer’s Indemnity Supplementation Fund.
c) The variation is a result of a combination of factors including increased cash reserves from higher than expected HIH Insurance liquidation recoveries for the Supplementation Fund, higher than expected cash surplus from operational savings, and the capitalisation of intangible assets. This was offset by an increase in claims expense as noted above.
d) The variance is due to increased cash receipts resulting from higher than expected HIH Insurance liquidation recoveries for the Supplementation Fund and a higher than expected cash surplus from operational savings.
Further explanations are also contained in Note 34 ‘Explanatory statement’ to the financial statements.
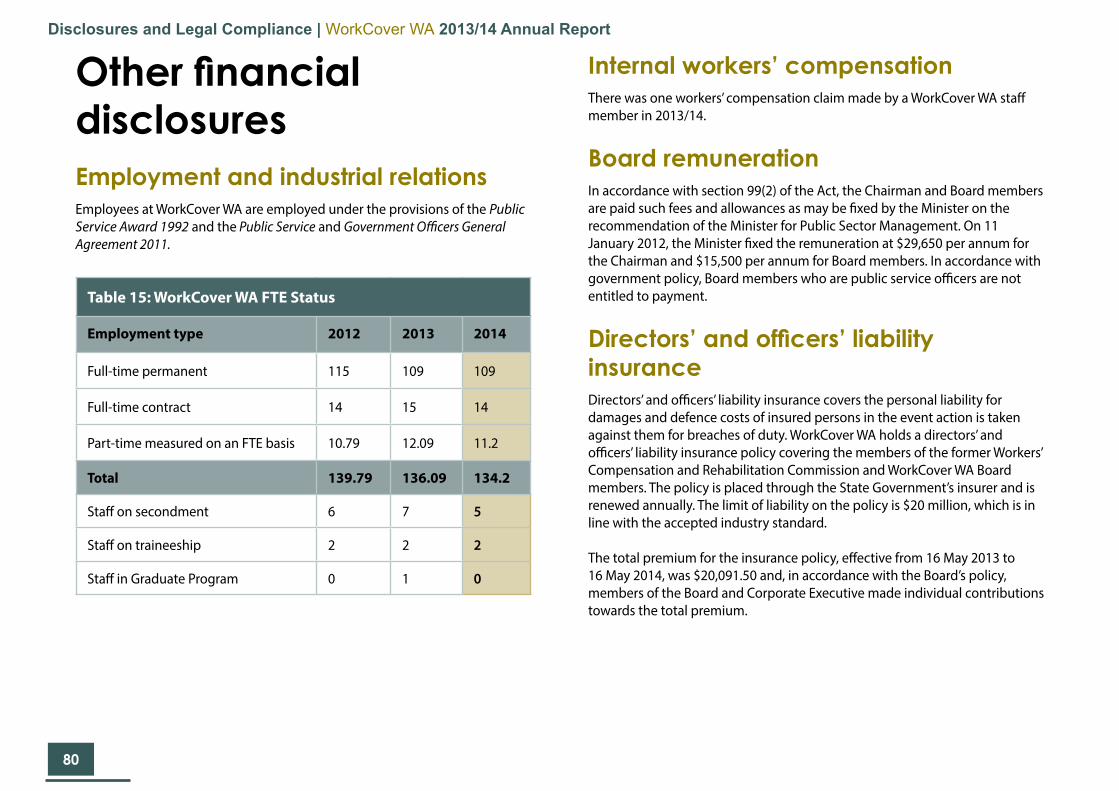
80
Disclosures and Legal Compliance | WorkCover WA 2013/14 Annual Report
Other financial disclosures Employment and industrial relations Employees at WorkCover WA are employed under the provisions of the Public Service Award 1992 and the Public Service and Government Officers General Agreement 2011.
Table 15: WorkCover WA FTE Status
Employment type 2012 2013 2014
Full-time permanent 115 109 109
Full-time contract 14 15 14
Part-time measured on an FTE basis 10.79 12.09 11.2
Total 139.79 136.09 134.2
Staff on secondment 6 7 5
Staff on traineeship 2 2 2
Staff in Graduate Program 0 1 0
Internal workers’ compensationThere was one workers’ compensation claim made by a WorkCover WA staff member in 2013/14.
Board remuneration In accordance with section 99(2) of the Act, the Chairman and Board members are paid such fees and allowances as may be fixed by the Minister on the recommendation of the Minister for Public Sector Management. On 11 January 2012, the Minister fixed the remuneration at $29,650 per annum for the Chairman and $15,500 per annum for Board members. In accordance with government policy, Board members who are public service officers are not entitled to payment.
Directors’ and officers’ liability insurance Directors’ and officers’ liability insurance covers the personal liability for damages and defence costs of insured persons in the event action is taken against them for breaches of duty. WorkCover WA holds a directors’ and officers’ liability insurance policy covering the members of the former Workers’ Compensation and Rehabilitation Commission and WorkCover WA Board members. The policy is placed through the State Government’s insurer and is renewed annually. The limit of liability on the policy is $20 million, which is in line with the accepted industry standard.
The total premium for the insurance policy, effective from 16 May 2013 to 16 May 2014, was $20,091.50 and, in accordance with the Board’s policy, members of the Board and Corporate Executive made individual contributions towards the total premium.
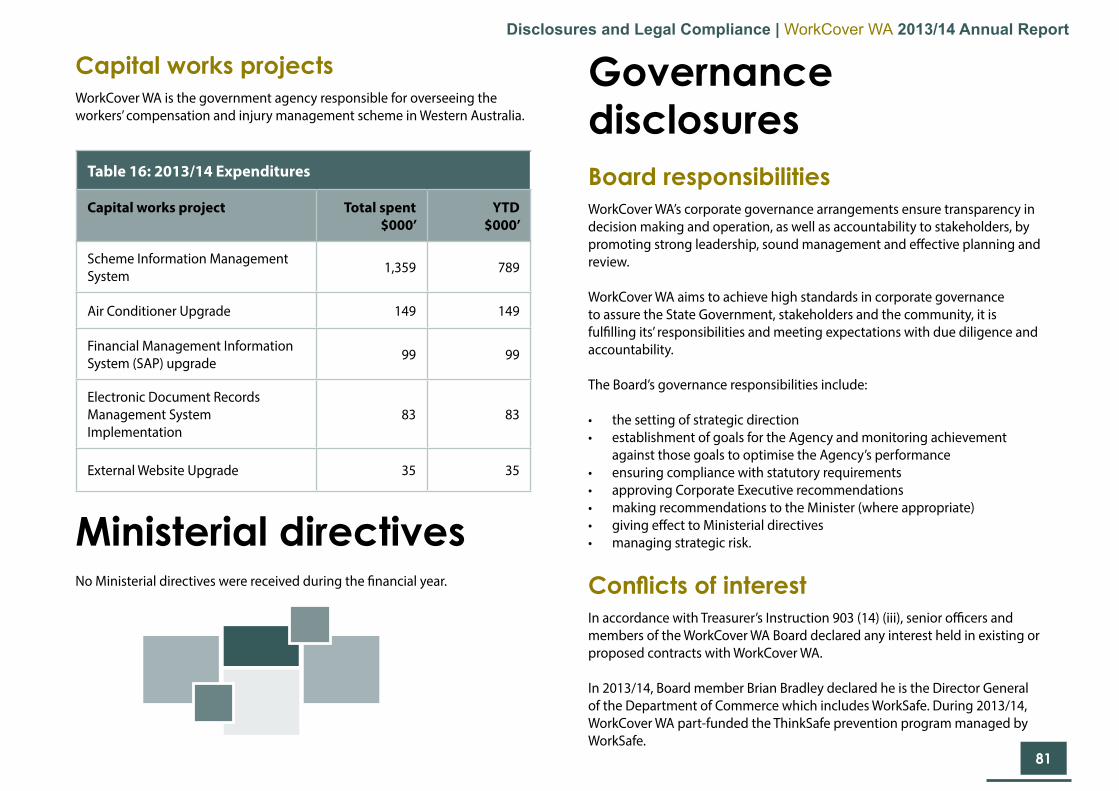
81
Disclosures and Legal Compliance | WorkCover WA 2013/14 Annual Report
Table 16: 2013/14 Expenditures
Capital works project Total spent $000’
YTD $000’
Scheme Information Management System 1,359 789
Air Conditioner Upgrade 149 149
Financial Management Information System (SAP) upgrade 99 99
Electronic Document Records Management System Implementation
83 83
External Website Upgrade 35 35
Ministerial directives No Ministerial directives were received during the financial year.
Governance disclosures Board responsibilitiesWorkCover WA’s corporate governance arrangements ensure transparency in decision making and operation, as well as accountability to stakeholders, by promoting strong leadership, sound management and effective planning and review.
WorkCover WA aims to achieve high standards in corporate governance to assure the State Government, stakeholders and the community, it is fulfilling its’ responsibilities and meeting expectations with due diligence and accountability.
The Board’s governance responsibilities include:
• the setting of strategic direction• establishment of goals for the Agency and monitoring achievement
against those goals to optimise the Agency’s performance• ensuring compliance with statutory requirements• approving Corporate Executive recommendations• making recommendations to the Minister (where appropriate)• giving effect to Ministerial directives• managing strategic risk.
Conflicts of interest In accordance with Treasurer’s Instruction 903 (14) (iii), senior officers and members of the WorkCover WA Board declared any interest held in existing or proposed contracts with WorkCover WA.
In 2013/14, Board member Brian Bradley declared he is the Director General of the Department of Commerce which includes WorkSafe. During 2013/14, WorkCover WA part-funded the ThinkSafe prevention program managed by WorkSafe.
Capital works projects WorkCover WA is the government agency responsible for overseeing the workers’ compensation and injury management scheme in Western Australia.

82
Disclosures and Legal Compliance | WorkCover WA 2013/14 Annual Report
Board member Karin Lee is the Manager Safety and Risk Services at the WA Chamber of Commerce and Industry. In 2013/14, Ms Lee declared her employer has a tender contract to deliver services under the ThinkSafe program, and she is listed as a consultant/supervisor of consultants under this arrangement.
Board Member Steven Burns is the Manager Underwritten States of QBE Insurance (Australia) Ltd. Mr Burns declared an employment with a licensed insurer, QBE Australia Pty Ltd.
Committees Audit Committee The Audit Committee provides independent assurance and assistance to the Board on WorkCover WA’s risk, control and compliance framework and its external accountability responsibilities. The committee reviews strategic and annual internal audit plans, monitors the progress of audit recommendations, and provides stewardship by promoting discussion with internal and external auditors to ensure effective systems and policies are in place. In 2013/14, two external and nine internal audits took place.
Table 17: Audit Committee attendance
Audit Committee Member No. of meetings eligible to attend
No. of meetings attended
Victoria Wilmot (Chair) 5 5
Greg Joyce 5 5
Brian Bradley 5 4
Costs CommitteeThe Costs Committee is an independent committee established under section 269 of the Act, reporting directly to the Minister of Commerce. The committee is empowered under section 271 of the Act to make, amend or revoke a determination fixing maximum costs for legal services and registered agent services provided in WorkCover WA’s Conciliation and Arbitration Services.
The Costs Committee met in September 2013 to consider a review of the Costs Determination. In October 2013 the Committee circulated a discussion paper to key stakeholders with proposals to amend part of the scale of costs.
The proposals were considered and the Costs Committee amended the Costs Determination. The Workers’ Compensation (Legal Practitioners and Registered Agents) Costs Determination 2014 came into effect on 28 February 2014.
Table 18: Costs Committee attendance
Costs Committee Member No. of meetings eligible to attend
No. of meetings attended
Chris White (A/Chair) 1 1
Karin Lee 1 1
Marcus Cocker 1 1
David Bruns 1 1

83
Disclosures and Legal Compliance | WorkCover WA 2013/14 Annual Report
Medical CommitteeThe Medical Committee is an advisory committee established under section 100A of the Act. The Committee provides guidance on matters of a medical nature within the Western Australian workers’ compensation scheme and advises the Board on medical matters, such as:
• the WorkCover WA Guides for the Evaluation of Permanent Impairment• the criteria for designation and monitoring of Approved Medical
Specialists (AMS) providing impairment assessments• the role of AMS within the scheme.
In 2013/14, the Medical Committee endorsed 16 applicants for designation as an AMS. The applicants were subsequently added to the AMS register.
The Committee also provided advice on several key WorkCover WA initiatives and offered opinions on the Legislative Review, as well as the review of medical certificates and guidance material for General Practitioners.
Table 19: Medical Committee attendance
Medical Committee Member
No. of meetings eligible to attend
No. of meetings attended
Chris White (A/Chair) 3 3
Dr Marcus Adonis 3 3
Dr Heather Campbell 3 3
Dr Alan Home 3 3
Barrie Slinger 1 0
Dr Neil Ozanne 3 3
David Colvin 3 2
Paul Taylor 2 2
Industrial Diseases Medical Panel The Industrial Diseases Medical Panel (IDMP) was established to determine prescribed questions in relation to asbestos-related diseases. All claims for compensation in relation to pneumoconiosis, mesothelioma, lung cancer and diffuse pleural fibrosis are referred to the IDMP for determination as to whether:
• the worker is or was suffering from the prescribed diseases.• the worker’s degree of permanent whole person impairment.
The IDMP comprises of physicians who specialise in diseases of the chest or occupational diseases. IDMPs operate independently. WorkCover WA provides administrative support and funding.
In 2013/14, the panel convened on 29 occasions and made 48 determinations.
Table 20: Industrial Diseases Medical Panel Members
2013/14 Industrial Diseases Medical Panel Chairman (Rotating)
Members
Dr E Gabbay Dr D Bucens
Dr M K Tandon Dr M Musk
Dr K C Wan Dr A Tribe*
Dr Q Summers Dr P Psaila-Savona
Dr J Wrobel
*membership concluded in September 2013

84
Disclosures and Legal Compliance | WorkCover WA 2013/14 Annual Report
Table 21: Number of IDMP applications
Applications 2010/11 2011/12 2012/13 2013/14
New 38 42 38 42
Reviewed 6 7 2 11
Total 44 49 4 53
Table 22: Number of diseases determination
Disease 2010/11 2011/12 2012/13 2013/14
Pneumoconiosis 9 12 12 18
Pneumoconiosis & Diffuse Pleural Fibrosis N/A 5 3 4
Pneumoconiosis & Lung Cancer 0 1 0 0
Diffuse Pleural Fibrosis N/A 1 2 5
Mesothelioma 21 20 13 12
Lung Cancer 5 5 6 9
Sub total 35 44 36 48
Determinations where disease not present or disease present but a 0% level of impairment
9 5 4 5
Total 44 49 40 53
Table 23: Costs Committee Remuneration
Position/ member name
Name Type of remuneration
Period of membership
Gross/actual remuneration
Presiding Member
Chris White
Per meeting Acting N/A
Member Karin Lee
Per meeting 01/07/11-01/05/14
$270
Member Marcus Cocker
Per meeting 01/03/09 - 01/10/16
$370
Member David Bruns
Per meeting 01/08/09 - 01/10-16
$370
Total $1,010
Costs Committee Remuneration
Board and committee remuneration

85
Disclosures and Legal Compliance | WorkCover WA 2013/14 Annual Report
WorkCover WA Board Remuneration
Table 24: WorkCover WA Board Remuneration
Position/ member name
Name Type of remuneration
Period of membership Gross/actual remuneration
Chairman Greg Joyce Annual 04/01/14 - 03/01/17 $29,650.00
Member Chris White (**Michelle Reynolds on secondment to DPC)
N/A – Public Service Virtue of office N/A
Member Brian Bradley N/A – Public Service Virtue of office N/A
Member Karin Lee Annual 04/01/14 - 03/01/17 $15,500.00
Member Owen Whittle Annual 04/01/2014 - 29/12/14 $0 (Mr Whittle elected not to receive sitting fees)
Member Steven Burns Annual 01/10/13 - 30/09/16 $11,625.03
Member Victoria Wilmot Annual 04/01/14 - 03/01/17 $15,500.00
Total $72,275.03

86
Disclosures and Legal Compliance | WorkCover WA 2013/14 Annual Report
Medical Committee Remuneration
Table 25: Medical Committee Remuneration
Position/ member name
Name Type of remuneration
Period of membership
Gross/actual remuneration
Chair Chris White (**Michelle Reynolds on secondment to DPC)
N/A – Public Service Virtue of office N/A
Member Dr Marcus Adonis Per meeting 15/10/2011-14/10/2014
$1,110
Member Dr Heather Campbell Per meeting 15/10/2011-14/10/2014
$1,110
Member Dr Alan Home Per meeting 15/10/2011-14/10/2014
$1,110
Member Dr Neil Ozanne Per meeting 15/10/2011-14/10/2014
$1,110
Member David Colvin Per meeting 15/10/2011-14/10/2014
$740
Member Paul Taylor Per meeting 5/2/2014 - 14/10/2014
$740
Member Barrie Slinger Per meeting 15/10/2011- 9/10/2013
$0
Total $76,150
87
Disclosures and Legal Compliance | WorkCover WA 2013/14 Annual Report
Legal compliance Public Sector standards and ethical codesWorkCover WA has policies, procedures and guidelines in place to ensure Agency obligations are met with respect to the Public Sector Standards (Human Resource Management), the WA Public Sector Code of Ethics, and the WorkCover WA Code of Conduct.
These policies and supporting guidelines are available to all staff via the WorkCover WA intranet, the online induction and the online training system. To support knowledge of these Standards and Codes, training on accountable and ethical decision-making in the Western Australian Public Sector continued to be delivered to new staff via the online induction system in 2013/14.
Public Sector Code of EthicsThere were no claims lodged in 2013/14 relating to the Public Sector Code of Ethics.
WorkCover WA Code of Conduct In 2013/14, the WorkCover WA Code of Conduct was reviewed, and minor amendments made to reflect current public sector and Agency policy.
There were no claims lodged in 2013/14 relating to the WorkCover WA Code of Conduct.
Public Sector Commissioner’s Instruction Employment StandardThere were no breaches of standard claims against the Employment Standard in 2013/14.
Grievance Resolution StandardThere were no breaches of standard claims against the Grievance Resolution Standard in 2013/14.
Disability Access and Inclusion PlanThe Agency’s Disability Access and Inclusion Plan is outlined on page 73 in Section 4: Opportunities and Challenges.
Recordkeeping PlanUnder the State Records Act 2000 every government organisation is required to have a Recordkeeping Plan (RKP). The RKP is to provide an accurate reflection of the recordkeeping program within the organisation and must be complied with by the organisation and its officers. Under Part 3, Division 4 of the State Records Act 2000, the organisation must review its RKP every five years or when there is any significant change to the organisation’s functions.
WorkCover WA demonstrates compliance with the RKP by providing evidence in the four key areas identified over the page.
88
Disclosures and Legal Compliance | WorkCover WA 2013/14 Annual Report
3. The efficiency and effectiveness of the organisation’s recordkeeping training program is reviewed from time to time
The online Records Management training module within the Agency’s induction program has been reviewed and was updated in September 2013. Training initiatives and materials are reviewed regularly to ensure information provided to WorkCover WA staff meets requirements and complies with relevant legislation and standards. It is envisaged the induction training relating to Records will again be revised when the EDRMS Whole-of-agency Project has been completed as recordkeeping processes and procedures will change for all staff.
4. The organisation’s induction program addresses employee roles and responsibilities in regard to their compliance with the organisation’s recordkeeping
Records management is a mandatory component of the WorkCover WA induction program.
Recordkeeping information, policies and procedures are also available on the intranet for staff use. The effectiveness of the induction program in addressing employee roles and responsibilities is regularly reviewed to ensure compliance with the Recordkeeping Plan and the State Records Act 2000.
Report against WorkCover WA Recordkeeping Plan
1. The efficiency and effectiveness of the organisation’s recordkeeping systems is evaluated no less than once every five years
WorkCover WA’s RKP was due for review in 2014, but the State Records Commission has formally granted WorkCover WA an extension to June 2015. Significant changes in recordkeeping processes and procedures for all staff will be introduced as part of the EDRMS Whole-of-agency Project, therefore the RKP will be updated as part of that Project in line with the implementation of the resulting changes in practice.
WorkCover WA has fully revised and updated its Business Classification Scheme (BCS) as well as the Retention and Disposal (R&D) schedule. The R&D was approved by the State Records Office in November 2013 and both the new BCS and the new R&D have been implemented in TRIM. This provides improved accuracy and efficiency in classification, retention and disposal of records.
2. The organisation conducts a recordkeeping training program
At WorkCover WA, recordkeeping training is compulsory for all staff and associated statistics are reported quarterly to the Corporate Executive.
99 per cent of WorkCover WA staff have completed the recordkeeping training.

89
Disclosures and Legal Compliance | WorkCover WA 2013/14 Annual Report
AdvertisingSection 175ZE of the Electoral Act 1907 requires the publication of the details of certain classes of expenditure in an agency’s annual report. Expenditure during 2013/14 included advertising for job vacancies, notification to employers for compliance matters, promotion of WorkCover WA industry related events and monitoring of WorkCover WA social media.
Below is a statement of expenditure for the 2013/14 financial year.
Table 26: 2013/14 Advertising Expenditure
Type Organisation 2013/14 Expenditure ($)
Advertising agencies
AdCorp Australia Limited The West Australian Cambridge Group Pty Ltd
2,069 125 1,144
Direct mail organisations
Quickmail 6,370
Market research organisations
e-CBD Pty Ltd 3,894
Media advertising organisations
- Nil
Polling organisations
- Nil
Total $13,602
Government policy requirements Substantive equalityWorkCover WA’s compliance with Public Sector Standards and Ethical Codes is detailed under ‘Opportunity and accessibility’ in Section 4: Opportunities and Challenges from page 70 of this report.
Occupational safety, health and injury management WorkCover WA’s Occupational Safety, Health and Injury Management policies are detailed under ‘Opportunity and accessibility’ in Section 4: Opportunities and Challenges from page 74 of this report.
OSH and injury management performance WorkCover WA’s OSH and injury management data for this reporting period is disclosed over the page in table 27. Comparative data has been included where possible.

90
Disclosures and Legal Compliance | WorkCover WA 2013/14 Annual Report
Table 27: 2013/14 OSH performance data
OSH indicator 2010/11 2011/12 2012/13 Actual
2013/14 Target
2013/14 Actual
Number of fatalities
0 0 0 0 0
Lost-time injury/disease incidence rate *
0.67% 0 0 0 0.75%
Lost-time injury/disease severity rate
0 0 0 0 0
% injured workers returned to work within 13 weeks
- 100% N/A** 100% 100%
% injured workers returned to work within 26 weeks
- 100% N/A** 100% 100%
% managers trained in occupational safety, health and injury management responsibilities
82% 92% 92% 100% 92%
OSH training for staffAll staff are required to undertake the WorkCover WA online OSH training module. The module comprises a number of sections, including:
• legislative framework and requirements• WorkCover WA OSH Management System• supervisor responsibilities• OSH resources• Hazard and Incident Management System.
Completion rates are monitored by Human Resources and reported to the Corporate Executive on a quarterly basis.
*The lost-time injury/disease incidence rate is the number of lost-time injuries/diseases where one day/shift or more was lost in the financial year per 100 employees.
** Not applicable – no claims were recorded in 2013/14

Section 6: Key Performance Indicators
Additional Key Performance Indicator Information | 92 » Certification of KPIs | 92 » Detailed information in support of KPIs | 92 » Changes to Outcomes Based Management Structure | 93Key Performance Indicators | 94 » Summary of Key Performance Indicators | 95 » Key Performance Indicators of Effectiveness | 96 » Key Performance Indicators of Efficiency | 101
9191

92
Key Performance Indicators | WorkCover WA 2013/14 Annual Report
Additional Key Performance Indicator InformationCertification of KPIsWe hereby certify the key performance indicators are based on proper records, are relevant and appropriate for assisting users to assess WorkCover WA’s performance, and fairly represent the performance of WorkCover WA for the financial year ended 30 June 2014.
Greg Joyce Chairman WorkCover WA 21 August 2014
Chris White Acting Chief Executive Officer WorkCover WA 21 August 2014
Detailed information in support of Key Performance IndicatorsGovernment Goals provide the high level basis of the Government’s intentions to improve the quality of life for all Western Australians, with the needs of Western Australians living in the regions a major priority.
The most recent goals were introduced in 2009 to better reflect current Government priorities. Broad high-level government goals are supported by strategic (whole of Government) outcome statements and at departmental level by more agency specific desired outcomes. Agency level desired outcomes clarify the contributions agencies are expected to make towards achieving government policies and priorities, and must be linked to the government goals.
Agencies deliver services to achieve these desired outcomes which ultimately contribute to meeting the Government goals. This linkage creates a hierarchy in which the purpose of each service provided by an agency can be traced to a Government goal.
WorkCover WA contributes to Government Goal 3, ‘Results-Based Service Delivery’ by delivering services aimed at minimising the social and economic impact of work-related injury and disease on workers, employers and the Western Australian community.
WorkCover WA’s purpose is to lead a contemporary, healthy and integrated workers’ compensation scheme that is fair, accessible and cost effective for all participants, through:
• providing advice and guidance on workers’ compensation and injury management
• active, responsive and transparent management of the scheme• focused information, education and compliance activities• fair and timely dispute resolution• a strong customer service focus.

93
Key Performance Indicators | WorkCover WA 2013/14 Annual Report
Detailed information in support of Key Performance Indicators (cont.)WorkCover WA strives to achieve its outcome through the effective administration of the Workers’ Compensation and Injury Management Act 1981 (the Act), the provision of quality policy advice to Government, and excellent stakeholder relationships.
Our Agency Desired Outcome linking to this goal relates directly to our vision and purpose and is: “To ensure a workers’ compensation and injury management scheme that is financially viable, contemporary and integrated whilst providing services that are fair, accessible, timely and cost effective for all participants”.
The Agency Services provided to ensure WorkCover WA achieves its desired outcome are:
• Scheme Regulation (regulation of workers’ compensation scheme participants for compliance with legislative requirements); and
• Scheme Services (provision of effective and equitable dispute resolution and other services to scheme participants).
The following table shows the WorkCover WA Outcome Based Management (OBM) Structure including the Agency Desired Outcome and Agency Services.
Table 28: WorkCover WA’s links to Government Goals through its Agency Desired Outcome and Services
Government Goal
Results-Based Service Delivery
Greater focus on achieving results in key service delivery areas for the benefit of all Western Australians.
WorkCover WA’s Agency Desired Outcome
To ensure a workers’ compensation and injury management scheme that is financially viable, contemporary, and integrated, whilst providing services that
are fair, accessible, timely and cost effective for all participants.
WorkCover WA’s Agency Services
1. Scheme Regulation (regulation of workers’ compensation scheme participants for compliance with
legislative requirements).
2. Scheme Services (provision of effective and equitable dispute resolution and other services to
scheme participants).
Changes to the Outcomes Based Management Structure (OBM) in 2013/14WorkCover WA has not made any changes to its Outcomes Based Management Structure (OBM) and Key Performance Indicators (KPIs) in 2013/14. The last changes were made in 2012 and discussed in the Agency’s 2012/13 Annual Report.

94
Key Performance Indicators | WorkCover WA 2013/14 Annual Report
Key Performance IndicatorsTable 29: WorkCover WA’s key performance indicators and their relationship with the Agency’s Outcome Based Management Structure
Agency Desired Outcome
To ensure a workers’ compensation and injury management scheme that is financially viable, contemporary, and integrated whilst providing services that are fair, accessible, timely and cost effective for all participants.
Effectiveness Indicators
1.1 The number of non-compliance events identified as a result of a claim on the General Account
1.2 The proportion of conciliations completed within 8 weeks of the date the application for conciliation was accepted
1.3 The average number of days to resolve dispute
Agency Services
1. Scheme Regulation (regulation of workers’ compensation scheme participants for compliance with legislative requirements)
2. Scheme Services (provision of effective and equitable dispute resolution and other services to scheme participants)
Efficiency Indicators
1.1 Average cost per employer compliance activity
1.2 Average cost per approved and monitored service provider
1.3 Average cost per client contact to provide information and advice
2.1 Average cost to complete a conciliation
2.2 Average cost to complete an arbitration
2.3 Average cost to process a Memorandum of Agreement

95
Key Performance Indicators | WorkCover WA 2013/14 Annual Report
Table 30: Key Performance Indicators of Effectiveness
# Indicator 2010/11 Actual
2011/12 Actual
2012/13 Actual
2013/14 Actual
2013/14 Target
1.1 The number of non-compliance events identified as a result of a claim on the General Account
6 5 3 4 8
1.2 The proportion of conciliations completed within 8 weeks of the date the application for conciliation was accepted
96.7% 97.8% 96.8% 97.0%
1.3 The average number of days to resolve a dispute 152 190 126
Table 31: Key Performance Indicators of Effeciency
# Indicator 2010/11 Actual
2011/12 Actual
2012/13 Actual
2013/14 Actual
2013/14 Target
1.1 The number of non-compliance events identified as a result of a claim on the General Account
$281 $235 $265 $198 $271
1.2 Average cost per approved and monitored service provider $2,942 $3,087 $2,871 $3,047 $3,284
1.3 Average cost per client contact to provide information and advice $126 $133 $120 $120 $105
2.1 Average cost to complete a conciliation $2,412 $2,579 $2,268 $2,895
2.2 Average cost to complete an arbitration $13,803 $13,014 $11,153 $11,658
2.3 Average cost to process a Memorandum of Agreement $381 $373 $389 $428
Summary of Key Performance Indicators

96
Key Performance Indicators | WorkCover WA 2013/14 Annual Report
Note: The present KPI costing model was first introduced for the 2011-12 reporting year. To ensure the model remains current a review of cost mapping and associated activities was undertaken across the agency in April 2013. The review identified changes to the mapping of activities within the Conciliation and Arbitration Services Division which took effect from 1 July 2013.
To ensure the comparative figures for previous years provide an accurate representation, the figures for all Conciliation and Arbitration efficiency KPIs have been recast using the revised costing model. Only KPIs 2.1 and 2.3 showed significant variances across both years. KPI 2.2 showed a very minor variance of less than 1% for both years. Further details of changes to the cost allocation are provided under the heading ‘Allocation of Agency Costs’.
Key Performance Indicators of EffectivenessAgency level government desired outcomes should reflect the purpose of the agency. WorkCover WA’s Agency Desired Outcome is “To ensure a workers’ compensation and injury management scheme that is financially viable, contemporary, and integrated whilst providing services that are fair, accessible, timely and cost effective for all participants.”
WorkCover WA must measure its success in achieving its’ outcome through effectiveness indicators. Effectiveness indicators provide information on the extent to which agency level Government desired outcomes have been achieved, or contributed to, through the delivery of services.
The effectiveness indicators chosen by WorkCover WA provide information in relation to workers’ compensation compliance activities and timeframes for managing conciliation and arbitration processes.
These indicators relate directly to the two services provided by WorkCover WA, i.e. Scheme Regulation and Scheme Services.
The commentary below explains the rationale behind each effectiveness indicator and how it measures success in achieving our outcome.
Indicator 1.1
Number of non-compliance events identified as a result of a claim on the General Account
2010/11 Actual
2011/12 Actual
2013/13 Actual
2013/14 Actual
2013/14 Target
6 5 3 4 8
» Description
Effectiveness indicator 1.1 was first introduced in 2009/10 and shows the number of non-compliance events identified as a result of a claim on the General Account, measuring the impact of employers who fail to maintain workers’ compensation insurance policies.
A non-compliance event is defined as “an occupational safety and health incident to a worker or workers of an uninsured employer, which has a financial impact on WorkCover WA’s General Account by way of an uninsured claim payment”. Given the long tail for claims relating to workplace incidents involving asbestos and industrial disease, these are excluded from the definition of an ‘event’. For example, the four main diseases associated with the inhalation of asbestos fibres (i.e. asbestosis, mesothelioma, asbestos-related lung cancer and diffuse pleural fibrosis) generally take many years, if not decades, to develop after a worker has been exposed to asbestos. The inclusion of uninsured employers for these types of work-related disease as an event would not reflect the current level of uninsured employers.
To determine the target for this indicator, an adopted figure based upon an analysis of previous years’ figures of two uninsured claims payments per 10,000 insured claims has been set as the standard. The total number of insured claims for 2013/14 is estimated to be approximately 40,000; therefore, a performance target of eight events has been set.

97
Key Performance Indicators | WorkCover WA 2013/14 Annual Report
The continued low number of uninsured claims (equal to or less than eight) indicates WorkCover WA is meeting its obligations in ensuring that all employers have adequate workers’ compensation coverage for their employees.
This information is derived from two of the agency information systems. The information in relation to claim numbers is reported from the Q1 database which captures details of all claims as reported by approved insurers and self-insurers.
The data in relation to uninsured claim payments is derived from the Agency Financial Management Information System (FMIS) which reports the commencement of any payments made from the General Account. As FMIS reports all payments made in respect to claims against the General Account, this information is further analysed to exclude those matters where payments are for administration costs only e.g. investigation or legal costs. The reported figure relates to payments made to a worker or service provider only. This reflects those matters where there was a legitimate entitlement to the payment of workers’ compensation benefits.
» Analysis
In 2013/14 there were four new claims against the General Account. This is 50 per cent less than the set target of eight accepted by the WorkCover WA Board and a slight increase of one (25 per cent) on the number of claims for 2012/13.
The target for this KPI is based on an approved methodology of two claims per 10,000 insured claims. Insured claims are still in the vicinity of 40,000 per annum and therefore the target of eight or less is being maintained. The continued low number of claims on the General Account can be attributed in part to the focus placed on WorkCover WA’s compliance activities and the consistent application of providing stakeholder information and education to ensure employers have adequate workers’ compensation for their employees.
The following graph shows the trend over the past four years.
Figure 20: New claims on the General Account
0123456789
2010/11 2011/12 2012/13 2013/14 2013/14Target
New claims on the GeneralAccount 6 5 3 4 8
New claims on the General Account
0123456789
2010/11 2011/12 2012/13 2013/14 2013/14Target
New claims on the GeneralAccount 6 5 3 4 8
New claims on the General Account
New claims on the General Account
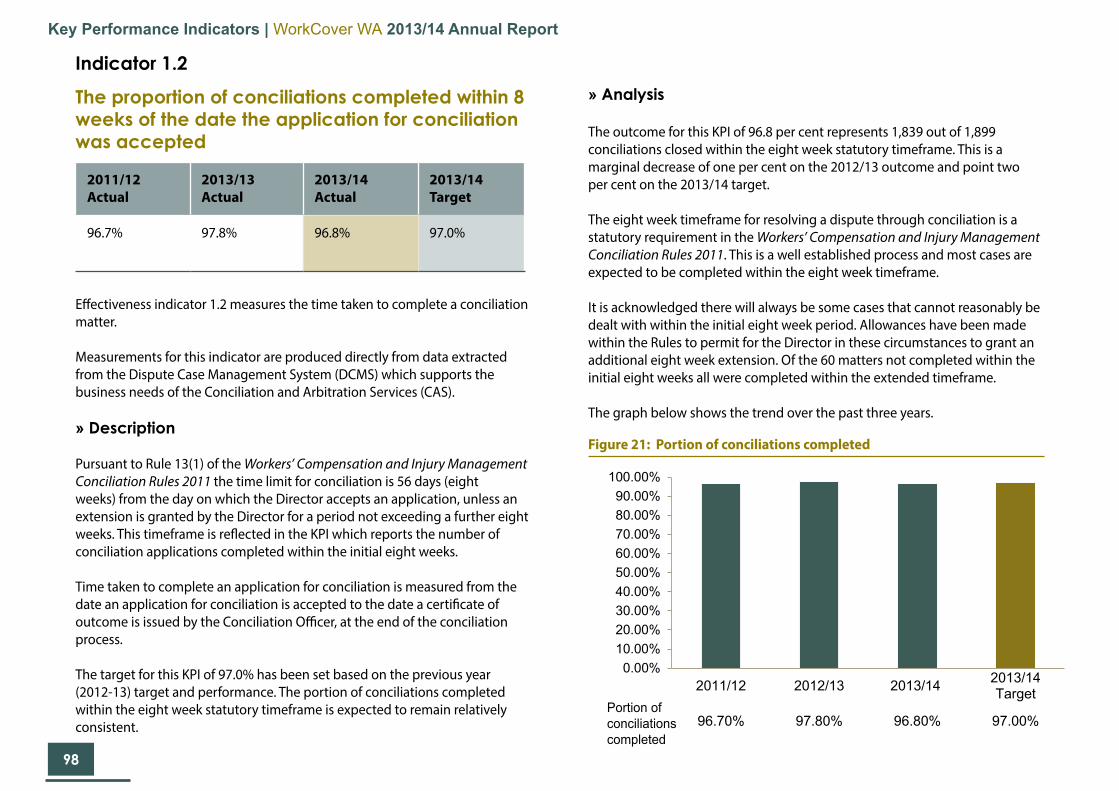
98
Key Performance Indicators | WorkCover WA 2013/14 Annual Report
Indicator 1.2
The proportion of conciliations completed within 8 weeks of the date the application for conciliation was accepted
Effectiveness indicator 1.2 measures the time taken to complete a conciliation matter.
Measurements for this indicator are produced directly from data extracted from the Dispute Case Management System (DCMS) which supports the business needs of the Conciliation and Arbitration Services (CAS).
» Description
Pursuant to Rule 13(1) of the Workers’ Compensation and Injury Management Conciliation Rules 2011 the time limit for conciliation is 56 days (eight weeks) from the day on which the Director accepts an application, unless an extension is granted by the Director for a period not exceeding a further eight weeks. This timeframe is reflected in the KPI which reports the number of conciliation applications completed within the initial eight weeks.
Time taken to complete an application for conciliation is measured from the date an application for conciliation is accepted to the date a certificate of outcome is issued by the Conciliation Officer, at the end of the conciliation process.
The target for this KPI of 97.0% has been set based on the previous year (2012-13) target and performance. The portion of conciliations completed within the eight week statutory timeframe is expected to remain relatively consistent.
2011/12 Actual
2013/13 Actual
2013/14 Actual
2013/14 Target
96.7% 97.8% 96.8% 97.0%
» Analysis
The outcome for this KPI of 96.8 per cent represents 1,839 out of 1,899 conciliations closed within the eight week statutory timeframe. This is a marginal decrease of one per cent on the 2012/13 outcome and point two per cent on the 2013/14 target.
The eight week timeframe for resolving a dispute through conciliation is a statutory requirement in the Workers’ Compensation and Injury Management Conciliation Rules 2011. This is a well established process and most cases are expected to be completed within the eight week timeframe.
It is acknowledged there will always be some cases that cannot reasonably be dealt with within the initial eight week period. Allowances have been made within the Rules to permit for the Director in these circumstances to grant an additional eight week extension. Of the 60 matters not completed within the initial eight weeks all were completed within the extended timeframe.
The graph below shows the trend over the past three years.
Figure 21: Portion of conciliations completed
0.00%10.00%20.00%30.00%40.00%50.00%60.00%70.00%80.00%90.00%
100.00%
2011/12 2012/13 2013/14 2013/14Target
Portion of conciliationscompleted 96.70% 97.80% 96.80% 97.00%
Portion of conciliations completed
0.00%10.00%20.00%30.00%40.00%50.00%60.00%70.00%80.00%90.00%
100.00%
2011/12 2012/13 2013/14 2013/14Target
Portion of conciliationscompleted 96.70% 97.80% 96.80% 97.00%
Portion of conciliations completed
Portion of conciliations completed
99
Key Performance Indicators | WorkCover WA 2013/14 Annual Report
Indicator 1.3
The average number of days to resolve a dispute
» Description
This KPI reports the time taken to resolve a dispute and is consistent with Part XI, Section 177 of the Act, which states:
The main objectives of the Conciliation and Arbitration functions are to:
Provide a fair and cost effective system for the resolution of disputes under the Act that
a) is timely; b) is accessible, approachable and professional; c) minimises costs to parties to disputes; d) in the case of conciliation, leads to final and appropriate agreements between parties in relation to disputes; and e) in the case of arbitration, enables disputes not resolved by conciliation to be determined according to their substantial merits with as little formality and technicality as practicable.
This KPI measures the average number of days to resolve disputes. It specifically measures the time taken to resolve disputes which proceed from conciliation to arbitration and measures the total time taken from the lodgement of an application for conciliation through to when final orders for an arbitration decision are issued or the arbitration matter has been otherwise finalised.
2011/12 Actual
2013/13 Actual
2013/14 Actual
2013/14 Target
N/A 152 190 126
The time period measured includes the number of days between acceptance and finalisation of a conciliation application, added to the number of days between the acceptance and finalisation of an arbitration application. It does not include the statutory period (28 days) allowed for an applicant to decide whether or not to make an arbitration application once a conciliation has finalised.
This KPI provides an average overall timeframe within which matters are resolved. The target is an average of 126 days.
Comparative data from previous years for KPI 1.3 cannot be provided beyond 2012/13 due to the considerable differences in the previous and new dispute resolution systems. Whilst the new arrangements commenced in December 2011, figures for the seven month period of 2011/12 are not a true comparison as the total possible timeframe is artificially shortened to the seven month period.
The target has been set based on performance for 2012/13 with some considerations being given to the increased available resource for 2013/14.
» Analysis
The average number of days to resolve a dispute for 2013/14 is 190 days. This is a 51 per cent increase on the projected target and a 25 per cent increase on the average number of days taken in 2012/13.
This indicator is designed to give members of the public an indication of the time taken on average to resolve a dispute.
A number of factors including the ongoing increase in the number of cases proceeding to arbitration; complex long term cases that affect the average measure; and previous difficulties in recruiting to vacant arbitration positions contributing to less manageable caseloads for existing staff have all contributed to the performance of this indicator.

100
Key Performance Indicators | WorkCover WA 2013/14 Annual Report
The number of applications proceeding to arbitration increased from 416 in 2012/13 to 463 in the current year (an increase of 11 per cent) and the number of cases completed from 295 in 2012/13 to 422 in 2013/14 (an increase of 43 per cent). A number of recently closed long term matters, some of which involved progressing in other jurisdictions or having significant medical impacts, have notably skewed the average measure.
Whilst there will always be the issue of complex matters, WorkCover WA has taken a number of steps to address the increased workload such as the appointment of additional arbitrators, the recent commissioning of an additional arbitration room and the creation of a new position to facilitate the allocation process. All of these initiatives are now in place and have contributed to the significant increase in the number of cases completed for the year. It is expected going forward that the considerable reduction in the backlog as well as the increase in resources will have a positive effect on the average time to resolve a dispute.
As explained above, this KPI is only in its second full year and limited data has been available on which to base initial targets. As more data is becoming available increasingly realistic estimates based on emerging trends can be used to predict outcomes for future years. Consideration is currently being given to changing the measure for this indicator to a median value rather than an average to lessen the slant of long term complex cases on the overall outcome.
Figure 22: Number of days to resolve a dispute
020406080
100120140160180200
2012/13 2013/14 2013/14 TargetNumber of days to resolve a
dispute 152 190 126
Number of days to resolve a dispute
020406080
100120140160180200
2012/13 2013/14 2013/14 TargetNumber of days to resolve a
dispute 152 190 126
Number of days to resolve a dispute
Number of days to resolve a dispute
The graph below shows the performance over the past two years.
101
Key Performance Indicators | WorkCover WA 2013/14 Annual Report
Efficiency indicators relate services to the level of resource inputs required to deliver them. The efficiency indicators for WorkCover WA are focused on financial resources and provide a per unit cost.
There are three efficiency indicators chosen for each of the two services, Scheme Regulation and Scheme Services. These indicators measure the overall costs of delivering the core services for regulation of scheme participants and conciliation and arbitration services.
Allocation of Agency costsTo ensure accurate allocations of costs to the KPIs across the Agency, a review of all agency costs was undertaken in the later part of 2012/13 with particular attention given to how duties were allocated to positions across the Operations Branch within the relatively new Conciliation and Arbitration Services (CAS). The review identified considerable work for common law and section 92f deeds that had not previously been accounted for separately. The percentage breakdown for both of these areas has been calculated and evenly allocated back over the three CAS KPIs. Previous years measures for all CAS KPIs have been recast for comparative purposes.
Budget figures used in the costing model for 2013/14 are consistent with the approved budget.
» Overheads
WorkCover WA uses a cost allocation model to determine overheads and to allocate costs across the agency’s divisions and six efficiency KPIs.
Direct costs for each activity are allocated to individual cost centres within the relevant business units in the first instance. Indirect costs (overheads) that can easily be attributed to Full Time Equivalent (FTE) positions, such as payroll tax, superannuation, workers compensation, employee entitlements etc are allocated across all agency cost centres on an FTE basis. Other overheads, such as rates, water, electricity, depreciation of buildings etc have been allocated according to the floor space specifically allocated to an area.
In order to account for all agency costs, expenditure from cost centres that are not attributed directly to a KPI is allocated across all KPIs on an FTE basis.
» Exempted expenditure
Certain expenditure and revenue in relation to the payment and subsequent recovery of workers’ compensation claims are not incorporated into the KPI calculation data. This is due to the nature of these transactions and the fact that WorkCover WA has no control over the number or amount of claims lodged in accordance with the Act, which if included, would unduly skew key KPI data (For 2013/14 this represents 29% of the total expenditure).
The increase in exempted expenditure as a percentage of total expenditure is due to the Actuarial valuation of claims liabilities in both the Supplementation and General Funds. This has resulted in a significant increase in the claims expense incurred to account for the claims liability provision.
Service 1. Scheme Regulation (regulation of Workers’ Compensation Scheme participants for compliance with legislative requirements)
As part of its responsibilities in administering the Act, WorkCover WA has responsibility to ensure the efficient and effective operation of the workers’ compensation scheme by monitoring compliance of employers, insurers and others participating in or affected by the scheme.
The KPIs listed on the following page measure the costs of providing these activities.
Key Performance Indicators of Efficiency

102
Key Performance Indicators | WorkCover WA 2013/14 Annual Report
2010/11 Actual
2011/12 Actual
2013/13 Actual
2013/14 Actual
2013/14 Target
$281 $235 $265 $198 $271
Indicator 1.1
Average cost per employer compliance activity
» Description
Under the Act, WorkCover WA has responsibility for ensuring that every employer obtains from an approved insurance office, and keeps current, a policy of insurance for the full amount of any liability to pay compensation under the Act to any worker employed section 160(1). Employers have other obligations relating to insurer notifications, section 57A (2), and regular payments to injured workers, section 57A (7).
The Act has 34 penalty provisions relating to employers’ obligations. Upon notification of a possible breach, an investigation/prosecution may result.
Each employer compliance activity is recorded by team members directly into the purpose built Regulatory Services Management System (RSMS) which was commissioned on 1 December 2012. The total number of employer compliance activities for 2013/14 has been extracted directly from this system.
This indicator demonstrates the average cost per employer compliance activity and is measured by dividing the full costs of the Compliance Section plus one third of the Regulatory Services Executive and the determined WorkCover WA overhead allocation by the total number of employer compliance activities.
» Analysis
The average cost per employer compliance activity for 2013/14 was $198. This is a reduction on the previous year’s outcome of $265 by 25 per cent and a further reduction on the expected target of $271 by 27 per cent.
This is mostly due to targeted activity aimed at reducing the number of outstanding expired policy cases which has significantly increased the number of compliance activities recorded for the year.
This is in addition to a reduction in the costs of providing this service due to vacancies within the Division has had an impact on this KPI.
The graph below shows the cost trend over the past four years.
Figure 23: Cost per employer compliance activity
$-
$50
$100
$150
$200
$250
$300
2010/11 2011/12 2012/13 2013/14 2013/14Target
Cost per activity $281 $235 $265 $198 $271
Cost per employer compliance activity
$-
$50
$100
$150
$200
$250
$300
2010/11 2011/12 2012/13 2013/14 2013/14Target
Cost per activity $281 $235 $265 $198 $271
Cost per employer compliance activity
Cost per employer compliance activity

103
Key Performance Indicators | WorkCover WA 2013/14 Annual Report
Indicator 1.2
Average cost per approved and monitored service provider
2010/11 Actual
2011/12 Actual
2013/13 Actual
2013/14 Actual
2013/14 Target
$2,942 $3,087 $2,871 $3,047 $3,284
» Description
WorkCover WA is responsible for reviewing the performance of approved participants in the workers’ compensation scheme, and whether performance standards prescribed by legislation or developed by WorkCover WA are being met.
Service providers’ performance is monitored against established standards which can include performance criteria relating to legislative compliance, codes of conduct, codes of practice and guidelines.
Through its standards and monitoring activities, WorkCover WA approves and/or monitors the performance of the following service providers: insurers, self-insurers, workplace rehabilitation providers, approved medical specialists, audiologists/ audiometric officers and registered agents.
This indicator demonstrates the average cost per approved and monitored service provider and is measured by dividing the full costs of the Standards and Monitoring Section plus one third of the Regulatory Services Executive and the determined WorkCover WA overhead allocation by the total number of approved and monitored service providers.
All information relevant to the approved and monitored service providers is captured in the RSMS as the single data source. Reports to provide the data for this indicator are produced directly from the RSMS which has been built to support business needs in the Regulatory Services Division (RS).
The total cost of monitoring services operational activity for the reference period is provided by the Cost Allocation Model.
The target for this indicator was determined by dividing the approved budget for these activities (including allocated overheads) by the estimated total number of approved and monitored service providers. The estimated number of approved and monitored service providers for the period was set as 1,131. This is based on previous years and projected figures for the first quarter of 2013/14.
The number of service providers used to measure this KPI for 2013/14 is the number registered as at 30 June 2014.
» Analysis
The average cost per approved and monitored service provider for 2013/14 was $3,047. This is 7.2 per cent below the expected target of $3,284 and an increase of 6.1 per cent on the 2012/13 figure of $2,871.
The overall reduction in the total service provider numbers (predominantly Audiometric Officers) together with long term vacancies in the area has affected the outcome of this KPI. There have not been any regulatory or legislative initiatives to generate this trend nor has the reduction in numbers adversely affected service delivery in this area.
Whilst the average cost of providing this service has increased marginally on the previous year and not realised the expected 2013/14 target the cost of providing this service has not changed significantly over time.
The graph on the following page shows the cost trend over the past four years.

104
Key Performance Indicators | WorkCover WA 2013/14 Annual Report
Figure 24: Average cost per approved and monitored service provider Indicator 1.3
Average cost per client contact to provide information and advice
2010/11 Actual
2011/12 Actual
2013/13 Actual
2013/14 Actual
2013/14 Target
$126 $133 $120 $120 $105
» Description
WorkCover WA has responsibility under the Act to promote awareness and disseminate information about the workers’ compensation scheme [s100 (h)].
This indicator demonstrates the average cost of providing information and advice in relation to all aspects of the scheme.
All written advice notifications and verbal consultations are captured in the Regulatory Services Management System (RSMS). This includes all in-person enquiries, appointments, and written enquiries. Inward telephone calls made to the Agency Advisory Line (1300 794 744) are captured by the NEC phone system. The total number of matters conducted is then extracted directly from the respective systems and compiled into a monthly activity report. Other enquiries such as Ministerial correspondence is recorded in the Ministerial tracking system and included in this monthly activity report.
The target for this indicator was determined by dividing the approved budget for this activity (including allocated overheads) by the estimated total number of written advice notifications prepared and verbal consultations conducted for the year.
$-
$500
$1,000
$1,500
$2,000
$2,500
$3,000
$3,500
2010/11 2011/12 2012/13 2013/14 2013/14Target
Cost per service provider $2,942 $3,087 $2,871 $3,047 $3,284
Average cost per approved and monitored service provider
$-
$500
$1,000
$1,500
$2,000
$2,500
$3,000
$3,500
2010/11 2011/12 2012/13 2013/14 13/14Target
Cost per service provider $2,942 $3,087 $2,871 $3,047 $3,284
Average cost per approved and monitored service provider
Average cost per approved and monitored service provider

105
Key Performance Indicators | WorkCover WA 2013/14 Annual Report
» Analysis
The average cost per client contact to provide information and advice for 2013/14 was $120. This is equal to the 2012/13 outcome and a 14.3 per cent increase on the estimated target of $105.
The Advice and Assistance Unit responds to almost 25,000 requests per annum. The estimated number of responses used to determine the 2013/14 target was calculated by applying a 5 per cent increase on the prior year in line with previous trends however this was not realised. This along with an increase in the overall cost of providing this service for 2013/14, mostly due to backfill arrangements for long term paid leave, has affected the outcome of this KPI.
The graph below shows the cost trend over the past four years.
Service 2: Scheme Services (provision of effective and equitable dispute resolution and other services to scheme participants)During 2011 WorkCover WA made significant amendments to the Act. These amendments establish new conciliation and arbitration services within WorkCover WA, which began operation on 1 December 2011.
Activity is only reported for the period since 1 December 2011, when the new dispute resolution services began operation.
Due to the significant differences between the old and new dispute resolution systems it is not possible to provide comparative data for previous years beyond 2011/12 for the following two KPIs 2.1 and 2.2.
Whilst the process for completing Memoranda of Agreement is consistent with that used in previous years, the significant changes to the dispute resolution system and changes in the cost allocation model within which it sits does not lend itself to providing comparisons with previous years beyond 2011/12 for indicator 2.3.
The present KPI costing model was first introduced for the 2011/12 reporting year. To ensure the model remains current a review of cost mapping and associated activities was undertaken across the agency in April 2013. The review identified changes to the mapping of activities within the Conciliation and Arbitration Services Division which took effect from 1 July 2013.
To ensure the comparative figures for previous years provide an accurate representation the figures for all Conciliation and Arbitration efficiency KPIs have been recast using the revised costing model. Only KPIs 2.1 and 2.3 showed significant variances across both years. KPI 2.2 showed a very minor variance of less than 1% for both years. Further details of changes to the cost allocation are provided under the heading ‘Allocation of Agency Costs’.
$-
$20
$40
$60
$80
$100
$120
$140
2010/11 2011/12 2012/13 2013/14 2013/14Target
Cost per activity $126 $133 $120 $120 $105
Average cost per client contact to provideinformation and advice
$-
$20
$40
$60
$80
$100
$120
$140
2010/11 2011/12 2012/13 2013/14 2013/14Target
Cost per activity $126 $133 $120 $120 $105
Average cost per client contact to provideinformation and advice
Figure 25: Average cost per client contact to provide information and advice
$-
$20
$40
$60
$80
$100
$120
$140
2010/11 2011/12 2012/13 2013/14 2013/14Target
Cost per activity $126 $133 $120 $120 $105
Average cost per client contact to provideinformation and advice

106
Key Performance Indicators | WorkCover WA 2013/14 Annual Report
Indicator 2.1
Average cost to complete a conciliation
» Description
This KPI measures the average cost to complete a conciliation application. It is measured by dividing the full costs of providing the conciliation process, including the determined WorkCover WA overhead allocation, by the total number of conciliations completed.
All applications for conciliation are recorded in the Dispute Case Management System (DCMS) as are dates completed. ‘Completed’ is measured as the date that a Conciliation Officer records a Certificate of Outcome at the end of a conciliation process. A report showing the number of cases completed is produced directly from the DCMS.
The target denominator for indicator 2.1 for 2013/14 was set based on the actual number of conciliations completed for 2012/13.
The provision of comparative data from previous years for KPI 2.1 cannot be provided beyond 2011/12 due to the considerable differences in the previous and new dispute resolution systems.
Due to changes in the mapping of costs in the Cost Allocation Model introduced from 1 July 2013 all previous year’s measures for this KPI have been recast.
2011/12 Actual
2013/13 Actual
2013/14 Actual
2013/14 Target
$2,412 $2,579 $2,268 $2,895
» Analysis
The average cost to complete a conciliation for 2013/14 was $2,268. This is 21.7 per cent lower than the projected target of $2,895 and a 12.1 per cent reduction on the 2012/13 result of $2,579.
The number of conciliations completed for the period is significantly (19.4 per cent) higher than what was expected. Costs of providing this service are showing a 6.5 per cent reduction compared to the target due to realignment of resources within the Conciliation and Arbitration Services Division during the year.
The graph below shows the cost trend over the past three years.
Figure 26: Average cost to complete a conciliation
$-
$500
$1,000
$1,500
$2,000
$2,500
$3,000
$3,500
2011/12 2012/13 2013/14 2013/14Target
Cost per completedconciliation $2,412 $2,579 $2,268 $2,895
Average cost to complete a conciliation
$-
$500
$1,000
$1,500
$2,000
$2,500
$3,000
$3,500
2011/12 2012/13 2013/14 2013/14Target
Cost per completedconciliation $2,412 $2,579 $2,268 $2,895
Average cost to complete a conciliation
Average cost to complete a conciliation

107
Key Performance Indicators | WorkCover WA 2013/14 Annual Report
Indicator 2.2
Average cost to complete an arbitration
» Description
This KPI measures the average cost to complete an arbitration application. It is measured by dividing the full costs of providing the arbitration process, including the determined WorkCover WA overhead allocation, by the total number of arbitrations completed.
All arbitration applications are recorded in the DCMS, as are dates the matters are finalised. ‘Finalised’ can mean that a matter is discontinued or that finalising orders are issued by an Arbitrator.
The target denominator for indicator 2.2 for 2013/14 was set based on the 2012/13 actual figure of 312 and a trend of increased activity over quarters three and four of 2012/13.
The provision of comparative data from previous years for KPI 2.2 cannot be provided beyond 2011/12 due to the considerable differences in the previous and new dispute resolution systems.
Due to changes in the mapping of costs in the Cost Allocation Model introduced from 1 July 2013 all previous year’s measures for this KPI have been recast.
2011/12 Actual
2013/13 Actual
2013/14 Actual
2013/14 Target
$13,803 $13,014 $11,153 $11,658
» Analysis
The average cost to complete an arbitration for 2013/14 was $11,153. This is 4.3 per cent lower than the target of $11,658 and a reduction of 14.3 per cent on the cost in 2012/13 of $13,014.
The variance to target is predominantly attributed to the significant increase in the number of arbitration cases completed for the year however this is also offset by the engagement of sessional arbitrators throughout the year to assist with the increased workload; and the appointment to two new positions within the area in the later part of the year. The target number of arbitration cases completed figure of 372 was based on the number of arbitration cases completed for 2012/13 and emerging trends over the second half of the year. The actual number of arbitration cases completed was 422 a further 13.4 per cent increase on the predicted figure.
The 14.3 per cent reduction in the cost per arbitration from the previous year is directly attributed to the increase in the number of arbitration cases completed. This is a significant achievement considering the difficulties in recruiting to arbitrator positions and the impacts of notably increased case loads on the existing resources.
The graph below shows the cost trend over the past three years.
Figure 27: Average cost to complete an arbitration
$-
$2,000
$4,000
$6,000
$8,000
$10,000
$12,000
$14,000
$16,000
2011/12 2012/13 2013/14 2013/14Target
Cost per completed arbitration $13,803 $13,014 $11,153 $11,658
Average cost to complete an arbitration
$-
$2,000
$4,000
$6,000
$8,000
$10,000
$12,000
$14,000
$16,000
2011/12 2012/13 2013/14 13/14Target
Cost per completed arbitration $13,803 $13,014 $11,153 $11,658
Average cost to complete an arbitration
Average cost to complete and arbitration

108
Key Performance Indicators | WorkCover WA 2013/14 Annual Report
Indicator 2.3
Average cost to process a Memorandum of Agreement
» Description
Subject to the provisions of section 76 of the Act, WorkCover WA is responsible for registering Memoranda of Agreement (MoAs), where parties agree to settle a claim in the workers’ compensation scheme, either through redemption of weekly entitlements and medical expenses, and/or through an assessment of a worker’s impairment.
Registering MoAs involves an assessment of the accuracy of the documentation provided by the parties, as well as of compliance with the Act.
Each MoA registered is recorded in the Memoranda of Agreements database which is part of the DCMS. The number of MoAs registered within the reference period is then extracted directly from this system via the MoA Registered Report.
The denominator used to derive the target for this KPI was set based on the 2012/13 actual number of MoAs processed of 3,868.
The processing of MoAs has been undertaken in previous years. However, due to significant changes in the dispute resolution system on 1 December 2011, and changes in the cost allocation model it is not feasible to provide comparisons with previous years beyond 2011/12 for this indicator.
Due to changes in the mapping of costs in the Cost Allocation Model introduced from 1 July 2013 all previous year’s measures for this KPI have been recast.
2011/12 Actual
2013/13 Actual
2013/14 Actual
2013/14 Target
$381 $373 $389 $428
» Analysis
The average cost to process a MoA for 2013/14 was $389. This is a 10 per cent reduction on the expected target and a 4.3 per cent increase on the previous year.
The target number of MOAs processed for 2013/14 was 3,868 the same as the number processed in 2012/13. The actual number of MoAs registered for the period was 3,996 which is a 3.3 per cent increase on the previous year and the target. The 6.0 per cent reduction in costs of providing this service is directly attributed to the realignment of activities within the Operations support branch of the Conciliation and Arbitration Services division.
The graph below shows the cost trend over the past two years.
Figure 28: Average cost to complete a Memorandum of Agreement (MoA)
$- $50
$100 $150 $200 $250 $300 $350 $400 $450
2011/12 2012/13 2013/14 2013/14Target
Cost per completed MoA $381 $373 $389 $428
Average cost to complete a Memorandum of Agreement (MoA)
$- $50
$100 $150 $200 $250 $300 $350 $400 $450
2011/12 2012/13 2013/14 2013/14Target
Cost per completed MoA $381 $373 $389 $428
Average cost to complete a Memorandum of Agreement (MoA)
Average cost to complete a MoA

109
Section 7: Financial Statements and Notes
Financial Statements |110 » Independent Audit Opinion | 110 » Statement of Comprehensive Income | 112 » Statement of Financial Position | 112 » Statement of Changes in Equity | 113 » Statement of Cash Flows | 113
Notes to the Financial Statements |114
109

110
Financial Statements and Notes | WorkCover WA 2013/14 Annual Report
Financial StatementsCertification of Financial Statements
The accompanying financial statements of WorkCover Western Australia Authority have been prepared in compliance with the provisions of the Financial Management Act 2006 from proper accounts and records to present fairly the financial transactions for the financial year ended 30 June 2014 and the financial position as at 30 June 2014.
At the date of signing we are not aware of any circumstances which would render the particulars included in the financial statements misleading or inaccurate.
Auditor General
Page 1 of 3
7th Floor Albert Facey House 469 Wellington Street Perth MAIL TO: Perth BC PO Box 8489 Perth WA 6849 TEL: 08 6557 7500 FAX: 08 6557 7600
INDEPENDENT AUDITOR’S REPORT To the Parliament of Western Australia WORKCOVER WESTERN AUSTRALIA AUTHORITY Report on the Financial Statements I have audited the accounts and financial statements of the WorkCover Western Australia Authority. The financial statements comprise the Statement of Financial Position as at 30 June 2014, the Statement of Comprehensive Income, Statement of Changes in Equity and Statement of Cash Flows for the year then ended, and Notes comprising a summary of significant accounting policies and other explanatory information. Authority’s Responsibility for the Financial Statements The Authority is responsible for keeping proper accounts, and the preparation and fair presentation of the financial statements in accordance with Australian Accounting Standards and the Treasurer’s Instructions, and for such internal control as the Authority determines is necessary to enable the preparation of financial statements that are free from material misstatement, whether due to fraud or error. Auditor’s Responsibility As required by the Auditor General Act 2006, my responsibility is to express an opinion on the financial statements based on my audit. The audit was conducted in accordance with Australian Auditing Standards. Those Standards require compliance with relevant ethical requirements relating to audit engagements and that the audit be planned and performed to obtain reasonable assurance about whether the financial statements are free from material misstatement. An audit involves performing procedures to obtain audit evidence about the amounts and disclosures in the financial statements. The procedures selected depend on the auditor’s judgement, including the assessment of the risks of material misstatement of the financial statements, whether due to fraud or error. In making those risk assessments, the auditor considers internal control relevant to the Authority’s preparation and fair presentation of the financial statements in order to design audit procedures that are appropriate in the circumstances. An audit also includes evaluating the appropriateness of the accounting policies used and the reasonableness of accounting estimates made by the Authority, as well as evaluating the overall presentation of the financial statements. I believe that the audit evidence obtained is sufficient and appropriate to provide a basis for my audit opinion. Opinion In my opinion, the financial statements are based on proper accounts and present fairly, in all material respects, the financial position of the WorkCover Western Australia Authority at 30 June 2014 and its financial performance and cash flows for the year then ended. They are in accordance with Australian Accounting Standards and the Treasurer’s Instructions.
Greg JoyceChairman
WorkCover Western Australia Authority
21 August 2014
Chris WhiteActing Chief Executive Officer
WorkCover Western Australia Authority
21 August 2014
John HullChief Finance Officer
WorkCover Western Australia Authority
21 August 2014
Independent Audit Opinion

111
Financial Statements and Notes | WorkCover WA 2013/14 Annual Report
Page 2 of 3
Report on Controls I have audited the controls exercised by the WorkCover Western Australia Authority during the year ended 30 June 2014. Controls exercised by the WorkCover Western Australia Authority are those policies and procedures established by the Authority to ensure that the receipt, expenditure and investment of money, the acquisition and disposal of property, and the incurring of liabilities have been in accordance with legislative provisions. Authority’s Responsibility for Controls The Authority is responsible for maintaining an adequate system of internal control to ensure that the receipt, expenditure and investment of money, the acquisition and disposal of public and other property, and the incurring of liabilities are in accordance with the Financial Management Act 2006 and the Treasurer’s Instructions, and other relevant written law. Auditor’s Responsibility As required by the Auditor General Act 2006, my responsibility is to express an opinion on the controls exercised by the WorkCover Western Australia Authority based on my audit conducted in accordance with Australian Auditing and Assurance Standards. An audit involves performing procedures to obtain audit evidence about the adequacy of controls to ensure that the Authority complies with the legislative provisions. The procedures selected depend on the auditor’s judgement and include an evaluation of the design and implementation of relevant controls. I believe that the audit evidence obtained is sufficient and appropriate to provide a basis for my audit opinion. Opinion In my opinion, the controls exercised by the WorkCover Western Australia Authority are sufficiently adequate to provide reasonable assurance that the receipt, expenditure and investment of money, the acquisition and disposal of property, and the incurring of liabilities have been in accordance with legislative provisions during the year ended 30 June 2014. Report on the Key Performance Indicators I have audited the key performance indicators of the WorkCover Western Australia Authority for the year ended 30 June 2014. The key performance indicators are the key effectiveness indicators and the key efficiency indicators that provide information on outcome achievement and service provision. Authority’s Responsibility for the Key Performance Indicators The Authority is responsible for the preparation and fair presentation of the key performance indicators in accordance with the Financial Management Act 2006 and the Treasurer’s Instructions and for such controls as the Authority determines necessary to ensure that the key performance indicators fairly represent indicated performance. Auditor’s Responsibility As required by the Auditor General Act 2006, my responsibility is to express an opinion on the key performance indicators based on my audit conducted in accordance with Australian Auditing and Assurance Standards.
Page 3 of 3
An audit involves performing procedures to obtain audit evidence about the key performance indicators. The procedures selected depend on the auditor’s judgement, including the assessment of the risks of material misstatement of the key performance indicators. In making these risk assessments the auditor considers internal control relevant to the Authority’s preparation and fair presentation of the key performance indicators in order to design audit procedures that are appropriate in the circumstances. An audit also includes evaluating the relevance and appropriateness of the key performance indicators for measuring the extent of outcome achievement and service provision. I believe that the audit evidence obtained is sufficient and appropriate to provide a basis for my audit opinion. Opinion In my opinion, the key performance indicators of the WorkCover Western Australia Authority are relevant and appropriate to assist users to assess the Authority’s performance and fairly represent indicated performance for the year ended 30 June 2014. Independence In conducting this audit, I have complied with the independence requirements of the Auditor General Act 2006 and Australian Auditing and Assurance Standards, and other relevant ethical requirements. Matters Relating to the Electronic Publication of the Audited Financial Statements and Key Performance Indicators This auditor’s report relates to the financial statements and key performance indicators of the WorkCover Western Australia Authority for the year ended 30 June 2014 included on the Authority’s website. The Authority’s management is responsible for the integrity of the Authority’s website. This audit does not provide assurance on the integrity of the Authority’s website. The auditor’s report refers only to the financial statements and key performance indicators described above. It does not provide an opinion on any other information which may have been hyperlinked to/from these financial statements or key performance indicators. If users of the financial statements and key performance indicators are concerned with the inherent risks arising from publication on a website, they are advised to refer to the hard copy of the audited financial statements and key performance indicators to confirm the information contained in this website version of the financial statements and key performance indicators.
GLEN CLARKE DEPUTY AUDITOR GENERAL Delegate of the Auditor General for Western Australia Perth, Western Australia 22 August 2014

112
Financial Statements and Notes | WorkCover WA 2013/14 Annual Report
Statement of Comprehensive IncomeFor the year ended 30 June 2014
Note 2014 2013$000 $000
IncomeRevenueInsurer contributions 21,509 21,278 Interest revenue 7 2,427 2,702 Other revenue 8 780 914 Employers' Indemnity Supplementation Fund 9 10,005 264
Total Revenue 34,721 25,158
GainsDecrease in claims liability 27,30 - 1,924
Total Gains - 1,924
Total Income 34,721 27,082
ExpensesExpenses Employee benefits expense 12 14,052 13,631 Supplies and services 13 2,908 2,986 Depreciation and amortisation expense 14 884 838 Accommodation expenses 15 587 581 Claims expense 10 7,840 1,479 Loss on disposal of non-current assets 11 30 14 Other expenses 16 1,486 1,650
Total Expenses 27,787 21,179
Profit before grants and subsidies from State Government 6,934 5,903 Services received free of charge 17 230 170
Profit for the period 7,164 6,073
Other Comprehensive IncomeItems not reclassified subsequently to profit or lossRemeasurements of defined benefit liability 27 (267) 148 Changes in asset revaluation surplus 28 190 947
Total other comprehensive income (77) 1,095
Total Comprehensive Income For The Period 7,087 7,168
See also note 43 ‘Schedule of Income and Expenses by Service’.
The Statement of Comprehensive Income should be read in conjunction with the accompanying notes.
Statement of Financial PositionFor the year ended 30 June 2014
Note 2014 2013
Assets $000 $000
Current Assets
Cash and cash equivalents 18 8,917 9,762
Restricted cash and cash equivalents 19 72,607 62,916
Receivables 20 1,233 1,080
Other financial assets 21 9,908 5,337
Total Current Assets 92,665 79,095
Non-Current Assets
Property, plant, equipment & vehicles 22 23,506 24,033
Intangible assets 24 3,173 2,151
Total Non-Current Assets 26,679 26,184
Total Assets 119,344 105,279
LiabilitiesCurrent Liabilities
Payables 26 863 814
Provisions 27 6,303 5,366
Total Current Liabilities 7,166 6,180
Non-Current Liabilities
Provisions 27 34,316 28,324
Total Non-Current Liabilities 34,316 28,324
Total Liabilities 41,482 34,504
Net Assets 77,862 70,775
Equity 28
Reserves 20,165 19,975
Retained earnings 57,697 50,800
Total Equity 77,862 70,775
The Statement of Financial Position should be read in conjunction with the accompanying notes.

113
Financial Statements and Notes | WorkCover WA 2013/14 Annual Report
Statement of Changes in EquityFor the year ended 30 June 2014
Note Reserves Retained earnings
Totalequity
$000 $000 $000
Balance at 1 July 2012 28 19,028 44,579 63,607
Surplus - 6,073 6,073
Other comprehensive income 947 148 1,095
Total comprehensive income for the period 947 6,221 7,168
Balance at 30 June 2013 19,975 50,800 70,775
Balance at 1 July 2013 19,975 50,800 70,775
Surplus - 7,164 7,164
Other comprehensive income 190 (267) (77)
Total comprehensive income for the period 190 6,897 7,087
Balance at 30 June 2014 20,165 57,697 77,862
The Statement of Changes in Equity should be read in conjunction with the accompanying notes.
Statement of Cash FlowsFor the year ended 30 June 2014
Note 2014 2013
$000 $000
Cash Flows From Operating ActivitiesReceipts
Supplementation Fund receipts 10,005 264
Insurer contributions 21,509 21,279
Provision of services 10 9
Interest received 2,444 2,867
GST receipts on sales 74 68
GST receipts from taxation authority 417 493
Other receipts 536 526
Payments
Workers' Compensation claim payments (798) (1,096)
Employee benefits (14,831) (14,674)
Supplies and services (2,991) (3,000)
Accommodation (618) (591)
GST payments on purchases (501) (561)
Other payments (620) (838)
Net cash provided by operating activities 29 14,636 4,746
Cash Flows From Investing ActivitiesReceipts
Proceeds from sale of non-current physical assets 11 53 83
Payments
Purchase of non-current physical assets (1,272) (1,596)
Purchase of investments 21 (4,571) (2,068)
Net cash used in investing activities (5,790) (3,581)
Net increase in cash and cash equivalents 8,846 1,165
Cash and cash equivalents at the beginning of the period 72,678 71,513
Cash and cash equivalents at the end of the period 29 81,524 72,678
The Statement of Cash Flows should be read in conjunction with the accompanying notes.
114
Financial Statements and Notes | WorkCover WA 2013/14 Annual ReportNotes to the Financial Statements for the year ended 30 June 2014
Notes to the Financial Statements1. Australian Accounting StandardsGeneral
The Authority’s financial statements for the year ended 30 June 2014 have been prepared in accordance with Australian Accounting Standards. The term ‘Australian Accounting Standards’ includes Standards and Interpretations issued by the Australian Accounting Standards Board (AASB).
The Authority has adopted any applicable new and revised Australian Accounting Standards from their operative dates.
Early adoption of standards
The Authority cannot early adopt an Australian Accounting Standard unless specifically permitted by TI 1101 Application of Australian Accounting Standards and Other Pronouncements. There has been no early adoption of Australian Accounting Standards that have been issued or amended (but not operative) by the Authority for the annual reporting period ended 30 June 2014.
2. Summary of significant accounting policies
(a) General statement
The Authority is a not-for-profit reporting entity that prepares general purpose financial statements in accordance with Australian Accounting Standards, the Framework, Statements of Accounting Concepts and other authoritative pronouncements of the AASB as applied by the Treasurer’s instructions. Several of these are modified by the Treasurer’s instructions to vary application, disclosure, format and wording.
The Financial Management Act 2006 and the Treasurer’s instructions impose legislative provisions that govern the preparation of financial statements and take precedence over Australian Accounting Standards, the Framework, Statements of Accounting Concepts and other authoritative pronouncements of the AASB.
Where modification is required and has had a material or significant financial effect upon the reported results, details of that modification and the resulting financial effect are disclosed in the notes to the financial statements.

115
Financial Statements and Notes | WorkCover WA 2013/14 Annual ReportNotes to the Financial Statements for the year ended 30 June 2014
(b) Basis of preparation
The financial statements have been prepared on the accrual basis of accounting using the historical cost convention, except for land and buildings which have been measured at fair value.
The accounting policies adopted in the preparation of the financial statements have been consistently applied throughout all periods presented unless otherwise stated.
The financial statements are presented in Australian dollars and all values are rounded to the nearest thousand dollars ($’000).
Note 4 ‘Judgements made by management in applying accounting policies’ discloses judgements that have been made in the process of applying the Authority’s accounting policies resulting in the most significant effect on amounts recognised in the financial statements.
Note 5 ‘Key sources of estimation uncertainty’ discloses key assumptions made concerning the future, and other key sources of estimation uncertainty at the end of the reporting period, that have a significant risk of causing a material adjustment to the carrying amounts of assets and liabilities within the next financial year.
(c) Reporting entity
The reporting entity comprises WorkCover Western Australia Authority.
The financial statements represent transactions of the Workers’ Compensation and Injury Management General Account established under Section 106 of the Workers’ Compensation and Injury Management Act 1981, and the Supplementation Fund established under Section 5 of the Employers’ Indemnity Supplementation Fund Act 1980.
Trust Accounts under Section 110 of the Workers’ Compensation and Injury Management Act 1981 are administered independently of the General Account and Supplementation Fund. See note 38 ‘Workers’ Compensation & Injury Management Trust Account’ for transactions relating to the Trust Account.
(d) Income
» Revenue recognition
Revenue is recognised and measured at the fair value of consideration received or receivable. Revenue is recognised for the major business activities as follows:
Insurer contributions and supplementation fund leviesRevenue is recognised when the amount becomes due and payable.
Provision of servicesRevenue is recognised on delivery of the service to the client or by reference to the stage of completion of the transaction.
Grants, donations, gifts and other non-reciprocal contributionsRevenue is recognised at fair value when the Authority obtains control over the assets comprising the contributions, usually when cash is received.
Other non-reciprocal contributions that are not contributions by owners are recognised at their fair value. Contributions of services are only recognised when a fair value can be reliably determined and the services would be purchased if not donated.
Recoveries from uninsured employersRevenue is recognised on receipt of the recovered monies.
InterestRevenue is recognised as the interest accrues.

116
Financial Statements and Notes | WorkCover WA 2013/14 Annual ReportNotes to the Financial Statements for the year ended 30 June 2014
» Gains
Realised and unrealised gains are usually recognised on a net basis. These include gains arising on the disposal of non-current assets and some revaluations of non-current assets.
The effect of an Actuarial assessed decrease in the outstanding claims liability is included in the Statement of Comprehensive Income as a Gain. Refer to Provisions – Employers’ Indemnity Supplementation Fund and General Account.
(e) Property, plant and equipment and vehicles
» Capitalisation/expensing of assets
Items of property, plant and equipment and vehicles costing $5,000 or more are recognised as assets and the cost of utilising assets is expensed (depreciated) over their useful lives. Items of property, plant and equipment and vehicles costing less than $5,000 are immediately expensed direct to the Statement of Comprehensive Income (other than where they form part of a group of similar items which are significant in total).
» Initial recognition and measurement
Property, plant and equipment and vehicles are initially recognised at cost.
For items of property, plant and equipment and vehicles acquired at no cost or for nominal cost, the cost is the fair value at the date of acquisition.
» Subsequent measurement
Subsequent to initial recognition as an asset, the revaluation model is used for the measurement of land and buildings and historical cost for all other property, plant and equipment. Land and buildings are carried at fair value less accumulated depreciation (buildings only) and accumulated impairment losses. All other items of property, plant and equipment are stated at historical cost less accumulated depreciation and accumulated impairment losses.
Where market-based evidence is available, the fair value of land and buildings is determined on the basis of current market values determined by reference to recent market transactions. When buildings are revalued by reference to recent market transactions, the accumulated depreciation is eliminated against the gross carrying amount of the asset and the net amount restated to the revalued amount.
In the absence of market-based evidence, fair value of land and buildings is determined on the basis of existing use. This normally applies where buildings are specialised or where land use is restricted. Fair value for existing use buildings is determined by reference to the cost of replacing the remaining future economic benefits embodied in the asset, i.e. the depreciated replacement cost. Where the fair value of buildings is determined on the depreciated replacement cost basis, the gross carrying amount and the accumulated depreciation are restated proportionately.
Land and buildings are independently valued annually by the Western Australian Land Information Authority (Valuation Services) and recognised annually to ensure that the carrying amount does not differ materially from the asset’s fair value at the end of the reporting period.
The most significant assumptions and judgements in estimating fair value are made in assessing whether to apply the existing use basis to assets and in determining estimated economic life. Professional judgment by the valuer is required where the evidence does not provide a clear distinction between market type assets and existing use assets.
» Derecognition
Upon disposal or derecognition of an item of property, plant and equipment, any revaluation surplus relating to that asset is retained in the asset revaluation surplus.
» Asset revaluation surplus
The asset revaluation surplus is used to record increments and decrements on the revaluation of non-current assets as described in note 22 ‘Property, plant, equipment and vehicles’.

117
Financial Statements and Notes | WorkCover WA 2013/14 Annual ReportNotes to the Financial Statements for the year ended 30 June 2014
Amortisation for intangible assets with finite useful lives is calculated for the period of the expected benefit (estimated useful life which is reviewed annually) on the straight line basis. All intangible assets controlled by the Authority have a finite useful life and zero residual value.
The expected useful lives for each class of intangible asset are:
» Licences
Licences have a finite useful life and are carried at cost less accumulated amortisation and accumulated impairment losses.
» Computer software
Software that is an integral part of the related hardware is recognised as property, plant and equipment. Software that is not an integral part of the related hardware is recognised as an intangible asset. Software costing less than $5,000 is expensed in the year of acquisition.
(g) Impairment of assets
Property, plant and equipment are tested for any indication of impairment at the end of each reporting period. Where there is an indication of impairment, the recoverable amount is estimated. Where the recoverable amount is less than the carrying amount, the asset is considered impaired and is written down to the recoverable amount and an impairment loss is recognised. Where an asset measured at cost is written down to recoverable amount, an impairment loss is recognised in profit or loss. Where a previously revalued asset is written down to recoverable amount, the loss is recognised as a revaluation decrement in other comprehensive income. As the Authority is a not-for-profit entity, unless a specialised asset has been identified as a surplus asset, the recoverable amount is the higher of an asset’s fair value less costs to sell and depreciated replacement cost.
Licences up to 10 yearsSoftware (a) 3 to 10 years
(a) Software that is not integral to the operation of any related hardware
» Depreciation
All non-current assets having a limited useful life are systematically depreciated over their estimated useful lives in a manner that reflects the consumption of their future economic benefits.
Depreciation is calculated using the straight line method, using rates that are reviewed annually. Estimated useful lives for each class of depreciable asset are:
Buildings 25 yearsPlant and equipment 5 to 15 years
Information technology - Hardware 3 to 5 yearsInformation technology - Software (a) 3 to 10 yearsMotor vehicles 6 to 7 years
(a) Software that is integral to the operation of related hardware
Land is not depreciated.
(f) Intangible assets
» Capitalisation/expensing of assets
Acquisitions of intangible assets costing $5,000 or more and internally generated intangible assets costing $50,000 or more are capitalised. The cost of utilising the assets is expensed (amortised) over their useful lives. Costs incurred below these thresholds are immediately expensed directly to the Statement of Comprehensive Income.
Intangible assets are initially recognised at cost. For assets acquired at no cost or for nominal cost, the cost is their fair value at the date of acquisition.
The cost model is applied for subsequent measurement requiring the asset to be carried at cost less any accumulated amortisation and accumulated impairment losses.
118
Financial Statements and Notes | WorkCover WA 2013/14 Annual ReportNotes to the Financial Statements for the year ended 30 June 2014
The risk of impairment is generally limited to circumstances where an asset’s depreciation is materially understated, where the replacement cost is falling or where there is a significant change in useful life. Each relevant class of assets is reviewed annually to verify that the accumulated depreciation/amortisation reflects the level of consumption or expiration of asset’s future economic benefits and to evaluate any impairment risk from falling replacement costs.
Intangible assets with an indefinite useful life and intangible assets not yet available for use are tested for impairment at the end of each reporting period irrespective of whether there is any indication of impairment.
The recoverable amount of assets identified as surplus assets is the higher of fair value less costs to sell and the present value of future cash flows expected to be derived from the asset. Surplus assets carried at fair value have no risk of material impairment where fair value is determined by reference to market-based evidence. Surplus assets at cost are tested for indications of impairment at the end of each reporting period.
(h) Leases
The Authority has not entered into any finance lease arrangements.
The Authority has not entered into any operating lease arrangements.
(i) Financial instruments
In addition to cash, the Authority has three categories of financial instrument:
• loans and receivables; • held-to-maturity investments (term deposits); and • financial liabilities measured at amortised cost.
These financial instruments have been disaggregated in the following classes:
Financial Assets• Cash and cash equivalents• Restricted cash and cash equivalents• Receivables• Term deposits
Financial Liabilities• Payables
Initial recognition and measurement of financial instruments is at fair value which normally equates to the transaction cost or the face value. Subsequent measurement is at amortised cost using the effective interest method.
The fair value of short-term receivables and payables is the transaction cost or the face value because there is no interest rate applicable and subsequent measurement is not required as the effect of discounting is not material.
(j) Cash and cash equivalents
For the purpose of the Statement of Cash Flows, cash and cash equivalent (and restricted cash and cash equivalent) assets comprise cash on hand and short-term deposits with original maturities of three months or less that are readily convertible to a known amount of cash and which are subject to insignificant risk of changes in value.
(k) Accrued Salaries
Accrued salaries (refer to note 26 ‘Payables’) represent the amount due to staff but unpaid at the end of the financial year. Accrued salaries are settled within a fortnight of the financial year end. The Authority considers the carrying amount of accrued salaries to be equivalent to its fair value.
(l) Receivables
Receivables are recognised at original invoice amount less an allowance for any uncollectible amounts (i.e. impairment). The collectability of receivables is reviewed on an ongoing basis and any receivables identified as uncollectible are written-off against the allowance account. The allowance for uncollectible amounts (doubtful debts) is raised when there is objective evidence that the Authority will not be able to collect the debts. The carrying amount is equivalent to fair value as it is due for settlement within 30 days.

119
Financial Statements and Notes | WorkCover WA 2013/14 Annual ReportNotes to the Financial Statements for the year ended 30 June 2014
(m) Investments and other financial assets
The Authority classifies its investments into the following categories: financial assets at fair value through profit or loss, loans and receivables, held-to-maturity investments, and available-for-sale financial assets. The classification depends on the purpose for which the investments were acquired. Management determines the classification of its investments at initial recognition and re-evaluates this designation at each balance sheet date. Investments not at fair value are initially recognised at cost being the fair value of consideration given, including directly attributable transaction costs.
Loans and receivables and held-to-maturity investments, such as commercial bills, are subsequently measured at amortised cost using the effective interest method. Amortised cost is calculated by taking into account any discount or premium on acquisition, over the period to maturity. For investments carried at amortised cost, gains and losses are recognised in the Statement of Comprehensive Income when the investments are derecognised or impaired, as well as through the amortisation process.
The Authority assesses at each balance date whether there is objective evidence that a financial asset or group of financial assets is impaired.
(n) Payables
Payables are recognised at the amounts payable when the Authority becomes obliged to make future payments as a result of a purchase of assets or services. The carrying amount is equivalent to fair value, as settlement is generally within 30 days.
(o) Provisions
Provisions are liabilities of uncertain timing or amount and are recognised where there is a present legal or constructive obligation as a result of a past event and when the outflow of resources embodying economic benefits is probable and a reliable estimate can be made of the amount of the obligation. Provisions are reviewed at the end of each reporting period.
» Provisions - employee benefits
All annual leave and long service leave provisions are in respect of employees’ services up to the end of the reporting period.
Annual leaveAnnual leave is not expected to be settled wholly within 12 months after the end of the reporting period and is therefore considered to be ‘other long term employee benefits’. The annual leave liability is recognised and measured at the present value of amounts expected to be paid when the liabilities are settled using the remuneration rate expected to apply at the time of settlement.
When assessing expected future payments consideration is given to expected future wage and salary levels including non-salary components such as employer superannuation contributions, as well as the experience of employee departures and periods of service. The expected future payments are discounted using market yields at the end of the reporting period on national government bonds with terms to maturity that match, as closely as possible, the estimated future cash outflows.
The provision for annual leave is classified as a current liability as the Authority does not have an unconditional right to defer settlement of the liability for at least 12 months after the end of the reporting period.
Long service leaveLong service leave is not expected to be settled wholly within 12 months after the end of the reporting period is recognised and measured at the present value of amounts expected to be paid when the liabilities are settled using the remuneration rate expected to apply at the time of settlement.
When assessing expected future payments consideration is given to expected future wage and salary levels including non-salary components such as employer superannuation contributions, as well as the experience of employee departures and periods of service. The expected future payments are discounted using market yields at the end of the reporting period on national government bonds with terms to maturity that match, as closely as possible, the estimated future cash outflows.

120
Financial Statements and Notes | WorkCover WA 2013/14 Annual ReportNotes to the Financial Statements for the year ended 30 June 2014
Unconditional long service leave provisions are classified as current liabilities as the Authority does not have an unconditional right to defer settlement of the liability for at least 12 months after the end of the reporting period. Pre- conditional and conditional long service leave provisions are classified as non-current liabilities because the Authority has an unconditional right to defer the settlement of the liability until the employee has completed the requisite years of service.
SuperannuationThe Government Employees Superannuation Board (GESB) and other funds providers administer public sector superannuation arrangements in Western Australia in accordance with legislative requirements. Eligibility criteria for membership in particular schemes for public sector employees vary according to commencement and implementation dates.
Eligible employees contribute to the Pension Scheme, a defined benefit pension scheme closed to new members since 1987, or to the Gold State Superannuation Scheme (GSS), a defined benefit lump sum scheme closed to new members since 1995.
Employees commencing employment prior to 16 April 2007 who were not members of either the Pension Scheme or the GSS became non-contributory members of the West State Superannuation Scheme (WSS). Employees commencing employment on or after 16 April 2007 became members of the GESB Super Scheme (GESBS). From 30 March 2012, existing members of the WSS or GESBS and new employees became able to choose their preferred superannuation fund provider. The Authority makes contributions to GESB or other funds providers on behalf of employees in compliance with the Commonwealth Government’s Superannuation Guarantee (Administration) Act 1992. Contributions to these accumulation schemes extinguish the Authority’s liability for superannuation charges in respect of employees who are not members of the Pension Scheme or GSS.
The GSS is a defined benefit scheme for the purposes of employees and whole-of-government reporting. However, it is a defined contribution plan for agency purposes because the concurrent contributions (defined contributions) made by the Authority to GESB extinguishes the agency’s obligations to the related superannuation liability.
The Pension Scheme and the pre-transfer benefit for employees who transferred to the GSS Scheme are defined benefit schemes. These benefits are wholly unfunded and the liabilities for future payments are provided at the end of the reporting period. The liabilities under these schemes have been calculated separately for each scheme annually by PricewaterhouseCoopers Actuaries using the projected unit credit method.
The expected future payments are discounted to present value using market yields at the end of the reporting period on national government bonds with terms to maturity that match, as closely as possible, the estimated future cash outflows.
» Provisions - other
Employment on-costsEmployment on-costs, including workers’ compensation insurance and payroll tax, are not employee benefits and are recognised separately as liabilities and expenses when the employment to which they relate has occurred. Employment on-costs are included as part of ‘Other expenses’ and are not included as part of the Authority’s ‘Employee benefits expense’. The related liability is included in ‘Employment on-costs provision’.
» Provisions – Employers’ Indemnity Supplementation Fund and General Account
Liability for future claimsThe liability for outstanding claims is measured as the central estimate of the present value of expected future payments against claims incurred at the reporting date, with an additional risk margin to allow for the inherent uncertainty in the central estimate. The expected future payments include those in relation to claims reported but not yet paid, claims incurred but not reported (IBNR), claims incurred but not enough reported (IBNER) and anticipated claims handling costs.
Claims handling costs include costs that can be associated directly with individual claims, such as legal and other professional fees, and costs that can only be indirectly associated with individual claims such as claims administration costs. The expected future payments are discounted to present value using a risk free rate.

121
Financial Statements and Notes | WorkCover WA 2013/14 Annual ReportNotes to the Financial Statements for the year ended 30 June 2014
The effect of an Actuarial assessed increase in the outstanding claims liability or changes in the discount rate are included in the Statement of Comprehensive Income under workers compensation claims. The effect of an Actuarial assessed decrease in the outstanding claims liability is included in the Statement of Comprehensive Income under Gains.
(p) Superannuation expense
Superannuation expense is recognised in the Statement of Comprehensive Income in profit or loss for defined contribution plans, including the concurrent payment of employer contributions to the GSS scheme, as and when the contributions fall due.
For defined benefit plans (the Pension Scheme and the pre-transfer component of the GSS), changes in the defined benefit obligation are recognised in the Statement of Comprehensive Income either in profit or loss, or, other comprehensive income as follows:
Profit or loss:• current service cost;• past service cost; and• interest cost.
other comprehensive income:• actuarial gains and losses.
(q) Comparative figures
Comparative figures are, where appropriate, reclassified to be comparable with the figures presented in the current financial year.
(r) Assets and services received free of charge or for nominal cost
Assets or services received free of charge or for nominal cost, that the Authority would otherwise purchase if not donated, are recognised as income at the fair value of the assets or services where they can be reliably measured. A corresponding expense is recognised for services received. Receipts of assets are recognised in the Statement of Financial Position.
Assets or services received from other State Government agencies are separately disclosed under Income from State Government in the Statement of Comprehensive Income.
(s) Provision for uninsured claims pursuant to Section 174
Provision is made to meet payments required under Section 174 of the Workers’ Compensation and Injury Management Act 1981 where Conciliation and Arbitration Services has made an order and the worker has not received the compensation due from the General Account at the end of the reporting period.
3. Segment information
In accordance with AASB 8 and TI 1101, the Authority has provided summary information at note 43 for each of the Authority’s services inclusive of the General and Supplementation Fund.

122
Financial Statements and Notes | WorkCover WA 2013/14 Annual ReportNotes to the Financial Statements for the year ended 30 June 2014
4. Judgements made by management in applying accounting policies
The preparation of financial statements requires management to make judgements about the application of accounting policies that have a significant effect on the amounts recognised in the financial statements. The Authority evaluates these judgements regularly.
The judgements that have been made in the process of applying accounting policies that have the most significant effect on the amounts recognised in the financial report include:
I. The Authority uses the services of an actuary for the purpose of determining the liability for workers’ compensation claims for asbestos and non-asbestos claims for the General Account and Supplementation Fund.
II. The Authority has adopted a policy of obtaining actuarial assessment of employee entitlements.
5. Key sources of estimation uncertainty
Key estimates and assumptions concerning the future are based on historical experience and various other factors that have a significant risk of causing a material adjustment to the carrying amount of assets and liabilities within the next financial year.
Long Service LeaveSeveral estimations and assumptions used in calculating the Authority’s long service leave provision include expected future salary rates, discount rates, employee retention rates and expected future payments. Changes in these estimations and assumptions may impact on the carrying amount of the long service leave provision.
Defined benefit superannuation plansIn determining the Authority’s ultimate cost of its defined superannuation plans, actuarial assumptions are required to be made. The principal actuarial assumptions used are disclosed in note 27 ‘Provisions’.
Assessment of Supplementation Fund and General Account future claims liabilityThe Authority’s risk in relation to outstanding claims liability arising from future claims liability in respect to the Supplementation Fund and General Account has been determined by actuarial assessment. The principal actuarial assumptions used are disclosed in note 27 ‘Provisions’.

123
Financial Statements and Notes | WorkCover WA 2013/14 Annual ReportNotes to the Financial Statements for the year ended 30 June 2014
AASB 13 Fair Value Measurement
This Standard defines fair value, sets out a framework for measuring fair value and requires additional disclosures for fair value measurements for assets and liabilities measured at fair value. There is no financial impact.
AASB 119 Employee Benefits
This Standard supersedes AASB 119 (October 2010), making changes to the recognition, presentation and disclosure requirements.
The Authority assessed employee leave patterns to determine whether annual leave is a short-term or other long-term employee benefit. The resultant discounting of annual leave liabilities that were previously measured at the undiscounted amounts is not material.
AASB 1048 Interpretation of Standards
This Standard supersedes AASB 1048 (June 2012), enabling references to the Interpretations in all other Standards to be updated by reissuing the service Standard. There is no financial impact.
AASB 2011-8 Amendments to Australian Accounting Standards arising from AASB 13 [AASB 1, 2, 3, 4, 5, 7, 9, 2009-11, 2010-7, 101, 102, 108, 110, 116, 117, 118, 119, 120, 121, 128, 131, 132, 133, 134, 136, 138, 139, 140, 141, 1004, 1023 & 1038 and Int 2, 4, 12, 13, 14, 17, 19, 131 & 132]
This Standard replaces the existing definition and fair value guidance in other Australian Accounting Standards and Interpretations as the result of issuing AASB 13 in September 2011. There is no financial impact.
AASB 2011-10 Amendments to Australian Accounting Standards arising from AASB 119 (September 2011) [AASB 1, 8, 101, 124, 134, 1049 & 2011-8 and Int 14]
This Standard makes amendments to other Australian Accounting Standards and Interpretations as a result of issuing AASB 119 in September 2011. The resultant discounting of annual leave liabilities that were previously measured at the undiscounted amounts is not material.
AASB 2012-2 Amendments to Australian Accounting Standards – Disclosures – Offsetting Financial Assets and Financial Liabilities [AASB 7 & 132]
This Standard amends the required disclosures in AASB 7 to include information that will enable users of an entity’s financial statements to evaluate the effect or potential effect of netting arrangements, including rights of set-off associated with the entity’s recognised financial assets and recognised financial liabilities, on the entity’s financial position. There is no financial impact.
6. Disclosure of changes in accounting policy and estimates
Initial application of an Australian Accounting Standard
The Authority has applied the following Australian Accounting Standards effective for annual reporting periods beginning on or after 1 July 2013 that impacted on the Authority.

124
Financial Statements and Notes | WorkCover WA 2013/14 Annual ReportNotes to the Financial Statements for the year ended 30 June 2014
AASB 2012-5 Amendments to Australian Accounting Standards arising from Annual Improvements 2009-11 Cycle [AASB 1, 101, 116, 132 & 134 and Int 2]
This Standard makes amendments to the Australian Accounting Standards and Interpretations as a consequence of the annual improvements process. There is no financial impact.
AASB 2012-6 Amendments to Australian Accounting Standards – Mandatory Effective Date of AASB 9 and Transition Disclosures [AASB 9, 2009-11, 2010-7, 2011-7 & 2011-8]
This Standard amends the mandatory effective date of AASB 9 Financial Instruments to 1 January 2015 (instead of 1 January 2013). Further amendments are also made to numerous consequential amendments arising from AASB 9 that will now apply from 1 January 2015. There is no financial impact.
AASB 2012-9 Amendment to AASB 1048 arising from the Withdrawal of Australian Int 1039
The withdrawal of Int 1039 Substantive Enactment of Major Tax Bills in Australia has no financial impact for the Authority during the reporting period and at balance date. Measurement of tax assets and liabilities continues to be measured in accordance with enacted or substantively enacted tax law pursuant to AASB 112.46-47.
AASB 2012-10 Amendments to Australian Accounting Standards – Transition Guidance and Other Amendments [AASB 1, 5, 7, 8, 10, 11, 12, 13, 101, 102, 108, 112, 118, 119, 127, 128, 132, 133, 134, 137, 1023, 1038, 1039, 1049 & 2011-7 and Int 12]
The Standard introduces a number of editorial alterations and amends the mandatory application date of Standards for not for profit entities accounting for interests in other entities. There is no financial impact.
AASB 2013-9 Amendments to Australian Accounting Standards – Conceptual Framework, Materiality and Financial Instruments.
Part A of this omnibus Standard makes amendments to other Standards arising from revisions to the Australian Accounting Conceptual Framework for periods ending on or after 20 December 2013. Other Parts of this Standard become operative in later periods. There is no financial impact for Part A of the Standard.
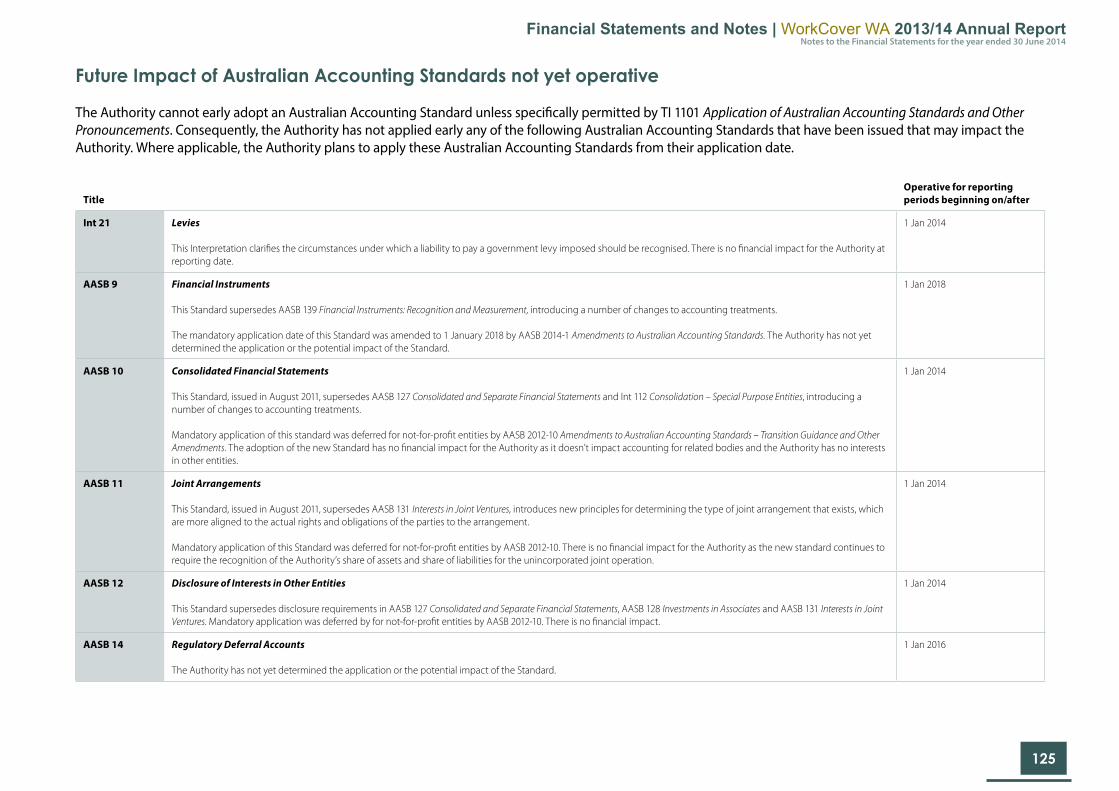
125
Financial Statements and Notes | WorkCover WA 2013/14 Annual ReportNotes to the Financial Statements for the year ended 30 June 2014
Future Impact of Australian Accounting Standards not yet operative
The Authority cannot early adopt an Australian Accounting Standard unless specifically permitted by TI 1101 Application of Australian Accounting Standards and Other Pronouncements. Consequently, the Authority has not applied early any of the following Australian Accounting Standards that have been issued that may impact the Authority. Where applicable, the Authority plans to apply these Australian Accounting Standards from their application date.
TitleOperative for reporting periods beginning on/after
Int 21 Levies
This Interpretation clarifies the circumstances under which a liability to pay a government levy imposed should be recognised. There is no financial impact for the Authority at reporting date.
1 Jan 2014
AASB 9 Financial Instruments
This Standard supersedes AASB 139 Financial Instruments: Recognition and Measurement, introducing a number of changes to accounting treatments.
The mandatory application date of this Standard was amended to 1 January 2018 by AASB 2014-1 Amendments to Australian Accounting Standards. The Authority has not yet determined the application or the potential impact of the Standard.
1 Jan 2018
AASB 10 Consolidated Financial Statements
This Standard, issued in August 2011, supersedes AASB 127 Consolidated and Separate Financial Statements and Int 112 Consolidation – Special Purpose Entities, introducing a number of changes to accounting treatments.
Mandatory application of this standard was deferred for not-for-profit entities by AASB 2012-10 Amendments to Australian Accounting Standards – Transition Guidance and Other Amendments. The adoption of the new Standard has no financial impact for the Authority as it doesn’t impact accounting for related bodies and the Authority has no interests in other entities.
1 Jan 2014
AASB 11 Joint Arrangements
This Standard, issued in August 2011, supersedes AASB 131 Interests in Joint Ventures, introduces new principles for determining the type of joint arrangement that exists, which are more aligned to the actual rights and obligations of the parties to the arrangement.
Mandatory application of this Standard was deferred for not-for-profit entities by AASB 2012-10. There is no financial impact for the Authority as the new standard continues to require the recognition of the Authority’s share of assets and share of liabilities for the unincorporated joint operation.
1 Jan 2014
AASB 12 Disclosure of Interests in Other Entities
This Standard supersedes disclosure requirements in AASB 127 Consolidated and Separate Financial Statements, AASB 128 Investments in Associates and AASB 131 Interests in Joint Ventures. Mandatory application was deferred by for not-for-profit entities by AASB 2012-10. There is no financial impact.
1 Jan 2014
AASB 14 Regulatory Deferral Accounts
The Authority has not yet determined the application or the potential impact of the Standard.
1 Jan 2016

126
Financial Statements and Notes | WorkCover WA 2013/14 Annual ReportNotes to the Financial Statements for the year ended 30 June 2014
TitleOperative for reporting periods beginning on/after
AASB 127 Separate Financial Statements
This Standard, issued in August 2011, supersedes AASB 127 Consolidated and Separate Financial Statements, removing the consolidation requirements of the earlier standard whilst retaining accounting and disclosure requirements for the preparation of separate financial statements. Mandatory application was deferred by one year for not-for-profit entities by AASB 2012-10. There is no financial impact.
1 Jan 2014
AASB 128 Investments in Associates and Joint Ventures
This Standard supersedes AASB 128 Investments in Associates, introducing a number of clarifications for the accounting treatments of changed ownership interest.
Mandatory application was deferred for not-for-profit entities by AASB 2012-10. The adoption of the new Standard has no financial impact for the Authority as it does not hold investments in associates and the accounting treatments for joint operations is consistent with current practice.
1 Jan 2014
AASB 1031 Materiality
This Standard supersedes AASB 1031 (February 2010), removing Australian guidance on materiality that is not available in IFRSs and refers to other Australian pronouncements that contain guidance on materiality. There is no financial impact.
1 Jan 2014
AASB 1055 Budgetary Reporting
This Standard requires specific budgetary disclosures in the financial statements of not-for-profit entities within the General Government Sector. The Authority will be required to disclose additional budgetary information and explanations of major variances between actual and budgeted amounts, though there is no financial impact.
1 Jul 2014
AASB 2009-11 Amendments to Australian Accounting Standards arising from AASB 9 [AASB 1, 3, 4, 5, 7, 101, 102, 108, 112, 118, 121, 127, 128, 131, 132, 136, 139, 1023 & 1038 and Int 10 & 12]
[modified by AASB 2010-7]
1 Jan 2015
AASB 2010-7 Amendments to Australian Accounting Standards arising from AASB 9 (December 2010) [AASB 1, 3, 4, 5, 7, 101, 102, 108, 112, 118, 120, 121, 127, 128, 131, 132, 136, 137, 139, 1023 & 1038 and Int 2, 5, 10, 12, 19 & 127]
This Standard makes consequential amendments to other Australian Accounting Standards and Interpretations as a result of issuing AASB 9 in December 2010.
AASB 2012-6 amended the mandatory application date of this Standard to 1 January 2015. The Authority has not yet determined the application or the potential impact of the Standard.
1 Jan 2015
AASB 2011-7 Amendments to Australian Accounting Standards arising from the Consolidation and Joint Arrangements Standards [AASB 1, 2, 3, 5, 7, 101, 107, 112, 118, 121, 124, 132, 133, 136, 138, 139, 1023 & 1038 and Int 5, 9, 16 & 17]
This Standard gives effect to consequential changes arising from the issue of AASB 10, AASB 11, AASB 127 Separate Financial Statements and AASB 128 Investments in Associates and Joint Ventures. For not-for-profit entities it applies to annual reporting period beginning on or after 1 January 2014. The Authority has not yet determined the application or the potential impact of the Standard.
1 Jan 2013
AASB 2012-3 Amendments to Australian Accounting Standards – Offsetting Financial Assets and Financial Liabilities [AASB 132]
This Standard adds application guidance to AASB 132 to address inconsistencies identified in applying some of the offsetting criteria, including clarifying the meaning of “currently has a legally enforceable right of set-off” and that some gross settlement systems may be considered equivalent to net settlement.
The Authority does not routinely hold financial assets and financial liabilities that it intends to settle on a net basis, therefore there is no financial impact.
1 Jan 2013

127
Financial Statements and Notes | WorkCover WA 2013/14 Annual ReportNotes to the Financial Statements for the year ended 30 June 2014
TitleOperative for reporting periods beginning on/after
AASB 2013-3 Amendments to AASB 136 – Recoverable Amount Disclosures for Non- Financial Assets.
This Standard introduces editorial and disclosure changes. There is no financial impact.
1 Jan 2014
AASB 2013-4 Amendments to Australian Accounting Standards – Novation of Derivatives and Continuation of Hedge Accounting [AASB 139]
This Standard permits the continuation of hedge accounting in circumstances where a derivative, which has been designated as a hedging instrument, is novated from one counterparty to a central counterparty as a consequence of laws or regulations. The Authority does not routinely enter into derivatives or hedges, therefore there is no financial impact.
1 Jan 2014
AASB 2013-8 Amendments to Australian Accounting Standards – Australian Implementation Guidance for Not-for-Profit Entities – Control and Structured Entities [AASB 10, 12 & 1049].
The amendments, issued in October 2013, provide significant guidance in determining whether a not-for-profit entity controls another entity when financial returns are not key attribute of the investor’s relationship. The Standard has no financial impact in its own right, rather the impact results from the adoption of the amended AASB 10.
1 Jan 2014
AASB 2013-9 Amendments to Australian Accounting Standards – Conceptual Framework, Materiality and Financial Instruments.
This omnibus Standard makes amendments to other Standards arising from the deletion of references to AASB 1031 in other Standards for periods beginning on or after 1 January 2014 (Part B), and, defers the application of AASB 9 to 1 January 2017 (Part C). The application date of AASB 9 was subsequently deferred to 1 January 2018 by AASB 2014-1. The Authority has not yet determined the application or the potential impact of AASB 9, otherwise there is no financial impact for Part B.
1 Jan 20141 Jan 2017
AASB 2014-1 Amendments to Australian Accounting Standards
The Authority has not yet determined the application or the potential impact of the Standard.
1 Jul 20141 Jan 20151 Jan 2016 1 Jan 2018

128
Financial Statements and Notes | WorkCover WA 2013/14 Annual ReportNotes to the Financial Statements for the year ended 30 June 2014
7. Interest revenue2014 2013
$000 $000
General Account 577 576
Employers' Indemnity Supplementation Account (see note 30) 1,850 2,126
2,427 2,702
8. Other revenueGeneral Account
Recoveries from uninsured employers 61 397
Other (a) 719 517
780 914
(a) Other is mainly comprised of fines, avoided premiums and contribution from Executive Vehicle Scheme.
9. Employers' Indemnity Supplementation Fund
Surcharge (i) 12 87
Recovery (ii) 9,993 177
10,005 264
(i) Represents funds collected from the Supplementation Fund Levy.(ii) Dividends received from the liquidation of HIH, CIC and FAI Insurance.
10. Claims ExpenseWorkers' compensation claims - Employers' Indemnity Supplementation Fund (see note 27 & 30)
5,469 1,135
Uninsured claims - General Fund (see note 27) 2,371 344
7,840 1,479
11. Net gain/(loss) on disposal of non-current assets
2014 2013
$000 $000
Proceeds from Disposal of Non-Current Assets
Vehicles 53 83
53 83
Costs of Disposal of Non-Current Assets
Equipment (9) (8)
IT Hardware (16) -
Vehicles (58) (89)
(83) (97)
Net loss (30) (14)
12. Employee benefits expense
Wages and salaries (a) 12,644 12,169
Superannuation - defined contribution plans (b) 1,209 1,178
Superannuation - defined benefit plans (see note 27 'Provisions') 199 284
14,052 13,631
(a) Includes the value of the fringe benefit to the employee plus the fringe benefits tax component and leave entitlements, including the superannuation contribution component.
(b) Defined contribution plans include West State, Gold State and GESB Super Scheme (contributions paid).
Employment on-costs such as workers’ compensation insurance are included at note 16 ‘Other expenses’. The employment on-costs liability is included at note 27 ‘Provisions’.

129
Financial Statements and Notes | WorkCover WA 2013/14 Annual ReportNotes to the Financial Statements for the year ended 30 June 2014
13. Supplies and services2014 2013
$000 $000
Communications 146 170
Consultants and contractors 1,848 1,375
Consumables 658 643
Insurance 39 557
Training 143 170
Travel 21 30
Other 53 41
2,908 2,986
14. Depreciation and amortisation expense
Depreciation
Plant, equipment and vehicles 191 217
Buildings 332 393
Total depreciation 523 610
Amortisation
Intangible assets 361 228
Total amortisation 361 228
Total depreciation and amortisation 884 838
16. Other expenses General Account
Joint initiative with WorkSafe 253 252
Employment on-costs (a) 725 868
Seminars 10 -
Doubtful debts expense 60 84
Sitting fees 82 96
Staff wellness programs 60 79
Audit Fees 194 174
Administration fee paid to Insurance Commission of WA for Uninsured General Fund Claims
33 44
Finance Cost - 1
Other 25 42
Employers' Indemnity Supplementation Fund (see note 30)
Administration fee paid to Insurance Commission of WA 44 10
1,486 1,650
(a) Includes worker's compensation insurance, payroll tax and other employment on-costs. The on-costs liability associated with the recognition of annual and long service leave liability is included at note 27 'Provisions'. Superannuation contributions accrued as part of the provision for leave are employee benefits and are not included in employment on-costs.
15. Accommodation expenses2014 2013
$000 $000
Outgoings 192 142
Repairs and maintenance 190 219
Other 205 220
587 581
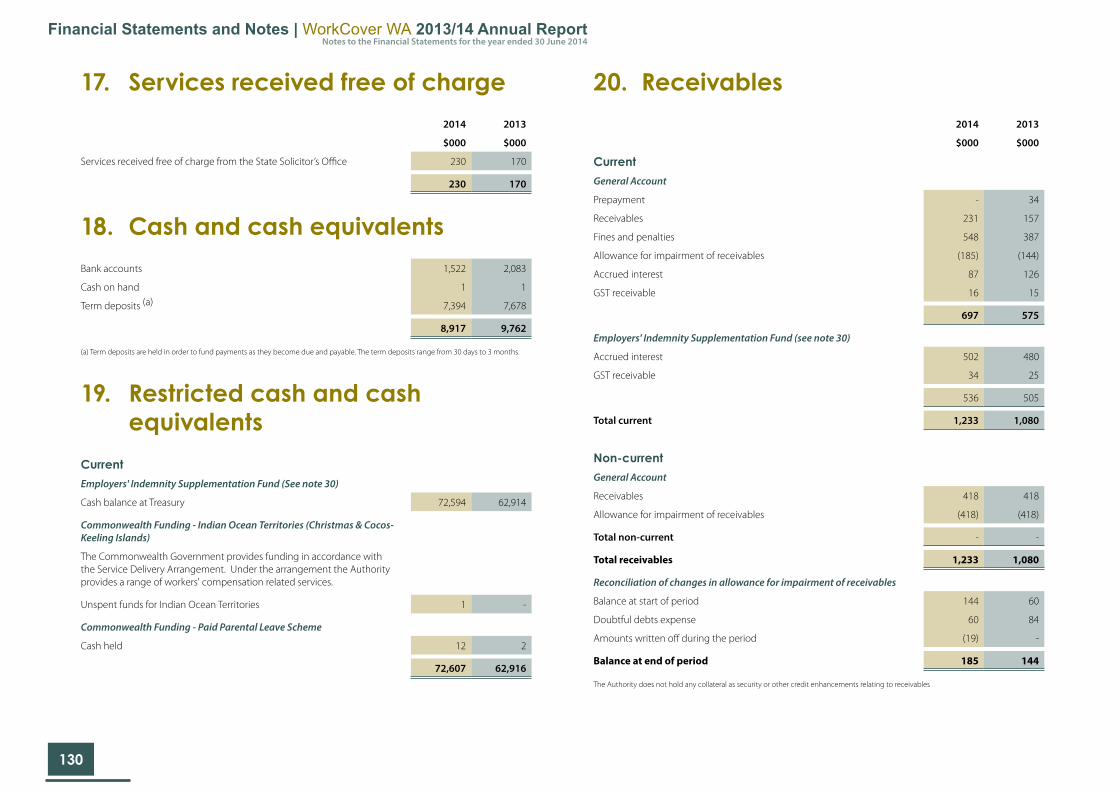
130
Financial Statements and Notes | WorkCover WA 2013/14 Annual ReportNotes to the Financial Statements for the year ended 30 June 2014
17. Services received free of charge2014 2013
$000 $000
Services received free of charge from the State Solicitor’s Office 230 170
230 170
18. Cash and cash equivalentsBank accounts 1,522 2,083
Cash on hand 1 1
Term deposits (a) 7,394 7,678
8,917 9,762
(a) Term deposits are held in order to fund payments as they become due and payable. The term deposits range from 30 days to 3 months.
19. Restricted cash and cash equivalents
CurrentEmployers' Indemnity Supplementation Fund (See note 30)
Cash balance at Treasury 72,594 62,914
Commonwealth Funding - Indian Ocean Territories (Christmas & Cocos-Keeling Islands)
The Commonwealth Government provides funding in accordance with the Service Delivery Arrangement. Under the arrangement the Authority provides a range of workers' compensation related services.
Unspent funds for Indian Ocean Territories 1 -
Commonwealth Funding - Paid Parental Leave Scheme
Cash held 12 2
72,607 62,916
20. Receivables 2014 2013
$000 $000
CurrentGeneral Account
Prepayment - 34
Receivables 231 157
Fines and penalties 548 387
Allowance for impairment of receivables (185) (144)
Accrued interest 87 126
GST receivable 16 15
697 575
Employers' Indemnity Supplementation Fund (see note 30)
Accrued interest 502 480
GST receivable 34 25
536 505
Total current 1,233 1,080
Non-currentGeneral Account
Receivables 418 418
Allowance for impairment of receivables (418) (418)
Total non-current - -
Total receivables 1,233 1,080
Reconciliation of changes in allowance for impairment of receivables
Balance at start of period 144 60
Doubtful debts expense 60 84
Amounts written off during the period (19) -
Balance at end of period 185 144
The Authority does not hold any collateral as security or other credit enhancements relating to receivables

131
Financial Statements and Notes | WorkCover WA 2013/14 Annual ReportNotes to the Financial Statements for the year ended 30 June 2014
21. Other financial assets2014 2013
$000 $000
CurrentAt Cost:
Term deposits (a) 9,908 5,337
9,908 5,337
(a) The term deposits range from 90 days to 365 days.
22. Property, plant, equipment and vehicles
Land
At fair value (a) 15,700 16,500
15,700 16,500
Buildings
At fair value (a) 6,100 6,500
Accumulated depreciation - -
6,100 6,500
Plant, equipment & vehicles
At cost 2,533 1,216
Accumulated depreciation (827) (734)
1,706 482
Work in Progress
At cost - 551
- 551
23,506 24,033
(a) Land and buildings were revalued as at 30 June 2014 by the Western Australian Land Information Authority. The property was inspected on 17 May 2014. The fair value of all land and buildings have been determined by reference to recent market transactions.
ReconciliationsReconciliations of carrying amounts of property, plant, equipment and vehicles at the beginning and end of the reporting period are set out in the table below.
Land BuildingsWork in
Progress
Plant, equipment
and vehicles Total
$000 $000 $000 $000 $000
2014
Carrying amount at start of period 16,500 6,500 551 482 24,033
Additions - - - 409 409
Transfers (a) - (1,058) (551) 1,089 (520)
Disposals - - - (83) (83)
Revaluation Increments / (Decrements)
(800) 990 - - 190
Depreciation - (332) - (191) (523)
Carrying amount at end of period 15,700 6,100 - 1,706 23,506
Land BuildingsWork in
Progress
Plant, equipment
and vehicles Total
$000 $000 $000 $000 $000
2013
Carrying amount at start of period 14,900 7,400 447 597 23,344
Additions - - 1,398 199 1,597
Transfers (a) - 147 (1,294) - (1,147)
Disposals - - - (97) (97)
Revaluation Increments / (Decrements)
1,600 (653) - - 947
Depreciation - (393) - (217) (610)
Carrying amount at end of period 16,500 6,500 551 482 24,033
(a) Transfers represent the completion of intangible asset projects previously recognised in Work in Progress. In addition, 1.058 million of fitouts were reclassified from buildings to plant, equipment and vehicles.
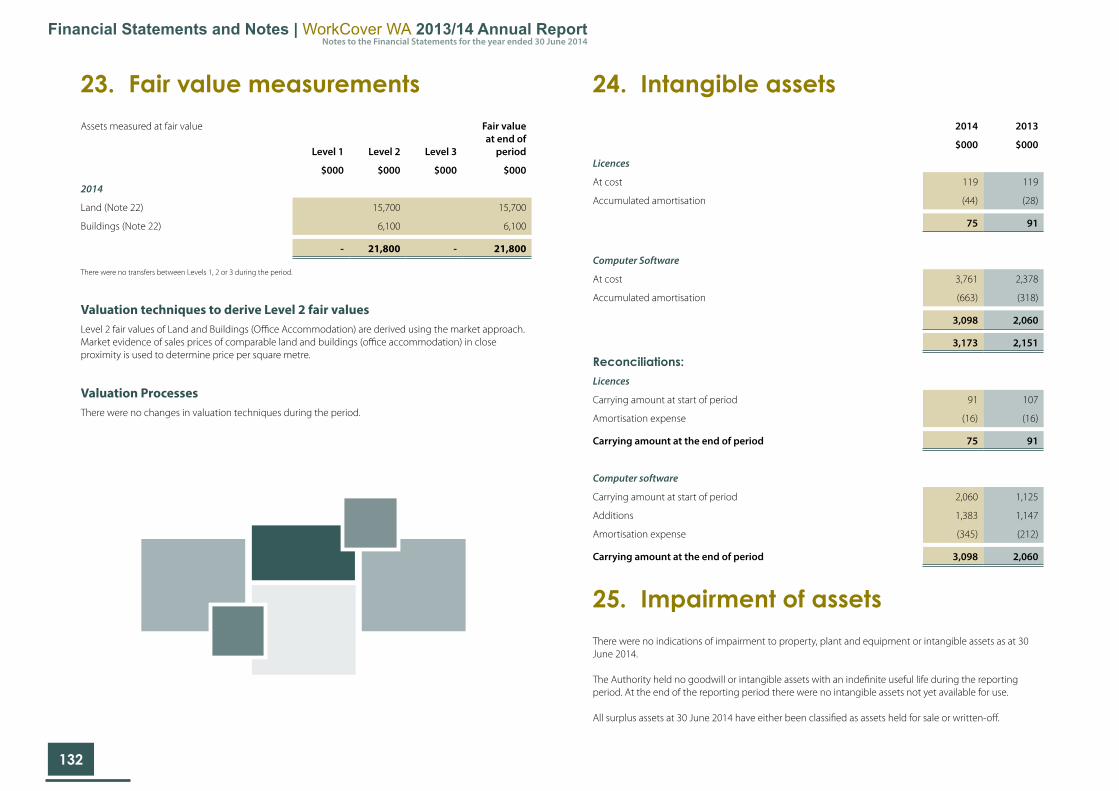
132
Financial Statements and Notes | WorkCover WA 2013/14 Annual ReportNotes to the Financial Statements for the year ended 30 June 2014
24. Intangible assets 2014 2013
$000 $000
Licences
At cost 119 119
Accumulated amortisation (44) (28)
75 91
Computer Software
At cost 3,761 2,378
Accumulated amortisation (663) (318)
3,098 2,060
3,173 2,151
Reconciliations:Licences
Carrying amount at start of period 91 107
Amortisation expense (16) (16)
Carrying amount at the end of period 75 91
Computer software
Carrying amount at start of period 2,060 1,125
Additions 1,383 1,147
Amortisation expense (345) (212)
Carrying amount at the end of period 3,098 2,060
25. Impairment of assetsThere were no indications of impairment to property, plant and equipment or intangible assets as at 30 June 2014.
The Authority held no goodwill or intangible assets with an indefinite useful life during the reporting period. At the end of the reporting period there were no intangible assets not yet available for use.
All surplus assets at 30 June 2014 have either been classified as assets held for sale or written-off.
23. Fair value measurementsAssets measured at fair value
Level 1 Level 2 Level 3
Fair value at end of
period
$000 $000 $000 $000
2014
Land (Note 22) 15,700 15,700
Buildings (Note 22) 6,100 6,100
- 21,800 - 21,800
There were no transfers between Levels 1, 2 or 3 during the period.
Valuation techniques to derive Level 2 fair valuesLevel 2 fair values of Land and Buildings (Office Accommodation) are derived using the market approach. Market evidence of sales prices of comparable land and buildings (office accommodation) in close proximity is used to determine price per square metre.
Valuation ProcessesThere were no changes in valuation techniques during the period.

133
Financial Statements and Notes | WorkCover WA 2013/14 Annual ReportNotes to the Financial Statements for the year ended 30 June 2014
26. Payables2014 2013
$000 $000
CurrentGeneral Account
Trade payables 75 93
Accrued expenses 260 250
Accrued salaries 379 356
Other payables 27 115
Employers' Indemnity Supplementation Fund (see note 30)
Claim payments 122 -
863 814
27. Provisions2014 2013
$000 $000
CurrentGeneral AccountEmployee benefits provision
Annual leave (a) 573 657
Long service leave (b) 2,001 1,837
Superannuation (d) 483 330
3,057 2,824
Uninsured Workers (e) 1,189 1,030
1,189 1,030
Other provisions
Employment on-costs (c) 153 148
153 148
Employers' Indemnity Supplementation Fund (see note 30)
Liability for estimated future claim payments 1,904 1,364
1,904 1,364
Total current provisions 6,303 5,366
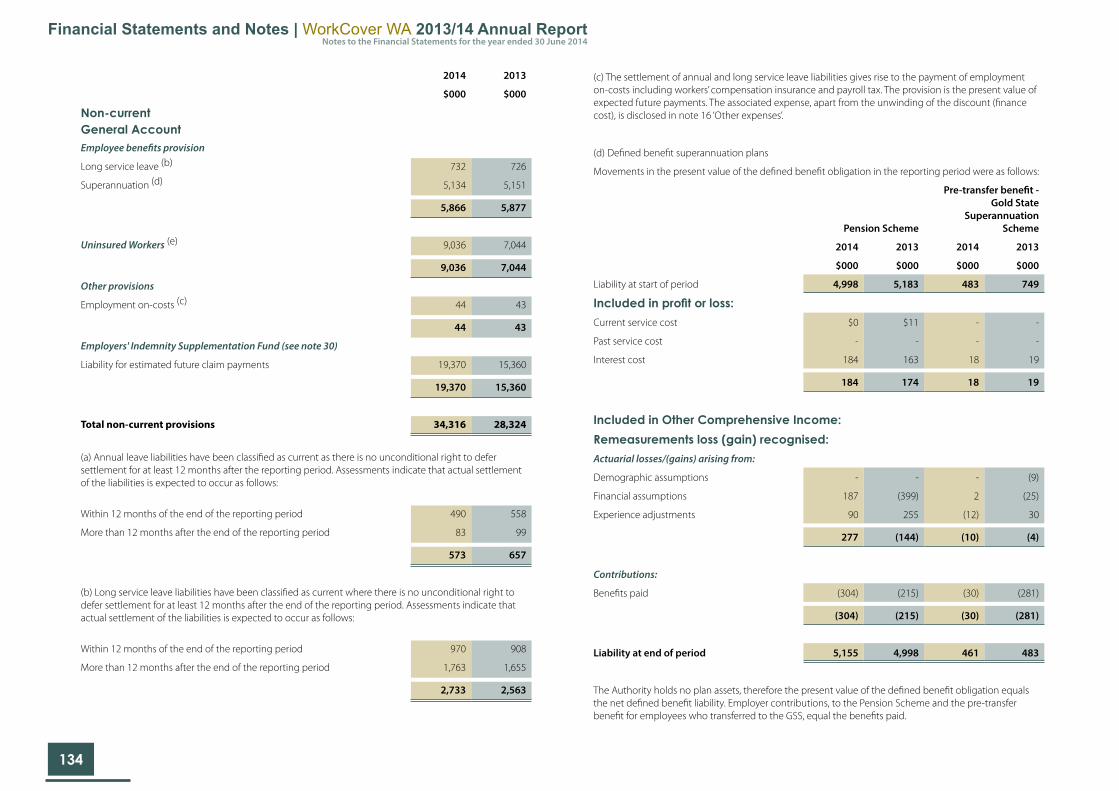
134
Financial Statements and Notes | WorkCover WA 2013/14 Annual ReportNotes to the Financial Statements for the year ended 30 June 2014
2014 2013
$000 $000
Non-currentGeneral AccountEmployee benefits provision
Long service leave (b) 732 726
Superannuation (d) 5,134 5,151
5,866 5,877
Uninsured Workers (e) 9,036 7,044
9,036 7,044
Other provisions
Employment on-costs (c) 44 43
44 43
Employers' Indemnity Supplementation Fund (see note 30)
Liability for estimated future claim payments 19,370 15,360
19,370 15,360
Total non-current provisions 34,316 28,324
(a) Annual leave liabilities have been classified as current as there is no unconditional right to defer settlement for at least 12 months after the reporting period. Assessments indicate that actual settlement of the liabilities is expected to occur as follows:
Within 12 months of the end of the reporting period 490 558
More than 12 months after the end of the reporting period 83 99
573 657
(b) Long service leave liabilities have been classified as current where there is no unconditional right to defer settlement for at least 12 months after the end of the reporting period. Assessments indicate that actual settlement of the liabilities is expected to occur as follows:
Within 12 months of the end of the reporting period 970 908
More than 12 months after the end of the reporting period 1,763 1,655
2,733 2,563
(c) The settlement of annual and long service leave liabilities gives rise to the payment of employment on-costs including workers’ compensation insurance and payroll tax. The provision is the present value of expected future payments. The associated expense, apart from the unwinding of the discount (finance cost), is disclosed in note 16 ‘Other expenses’.
(d) Defined benefit superannuation plans
Movements in the present value of the defined benefit obligation in the reporting period were as follows:
Pension Scheme
Pre-transfer benefit - Gold State
Superannuation Scheme
2014 2013 2014 2013
$000 $000 $000 $000
Liability at start of period 4,998 5,183 483 749
Included in profit or loss:Current service cost $0 $11 - -
Past service cost - - - -
Interest cost 184 163 18 19
184 174 18 19
Included in Other Comprehensive Income:Remeasurements loss (gain) recognised:Actuarial losses/(gains) arising from:
Demographic assumptions - - - (9)
Financial assumptions 187 (399) 2 (25)
Experience adjustments 90 255 (12) 30
277 (144) (10) (4)
Contributions:
Benefits paid (304) (215) (30) (281)
(304) (215) (30) (281)
Liability at end of period 5,155 4,998 461 483
The Authority holds no plan assets, therefore the present value of the defined benefit obligation equals the net defined benefit liability. Employer contributions, to the Pension Scheme and the pre-transfer benefit for employees who transferred to the GSS, equal the benefits paid.

135
Financial Statements and Notes | WorkCover WA 2013/14 Annual ReportNotes to the Financial Statements for the year ended 30 June 2014
The principal actuarial assumptions used (expressed as weighted averages) were as follows:
Pension Scheme
Pre-transferbenefit - Gold State
Superannuation Scheme
2014 2013 2014 2013
Discount rate 3.50% 3.80% 3.50% 3.80%
Pension increases 2.50% 2.50%
Future salary increases N/A N/A 4.1% for the first 4 years
and 4.5% thereafter
4.50%
Average longevity at retirement age (65) for current pensioners (years)
Male 22.80 22.60 N/A N/A
Female 25.40 25.20 N/A N/A
Average longevity at retirement age (65) for current employees (years)
Male 22.80 22.60 N/A N/A
Female 25.40 25.20 N/A N/A
At 30 June 2014, the weighted average duration of the defined benefit obligation was 13 years for Pension Scheme (2013:13 years) and 6 years for Gold State Superannuation Scheme (2013: 5 years).
The Pension Scheme and the pre-transfer benefit for the GSS expose the Authority to actuarial risks, such as salary risk, longevity risk and interest rate risk. The sensitivity analyses below have been determined based on reasonably possible changes of the respective assumptions occurring at the end of the reporting period, holding all other assumptions constant.
Defined Benefit Obligation
Pension Scheme
Pre-transferbenefit - Gold State
Superannuation Scheme
2014 2013 2014 2013
Increase Decrease Increase Decrease
$000 $000 $000 $000
Discount rate (1% movement) (583) 719 (27) 30
Future salary growth (1% movement) N/A N/A 27 (25)
Pension increases (1% movement) 719 (593) N/A N/A
Future longevity (1 year movement) 235 (200) N/A N/A
Employer funding arrangements for the defined benefit plans The Pension Scheme and the pre-transfer benefit for the GSS in respect of individual plan participants are settled by the Authority on their retirement. Funding requirements are based on invoices provided to the Authority by GESB that represent the cost of benefits paid to members during the reporting period.
Employer contributions of $286k are expected to be paid to the Pension Scheme for the subsequent annual reporting period.
Employer contributions of $304k are expected to be paid to the Gold State Superannuation Scheme for the subsequent annual reporting period.
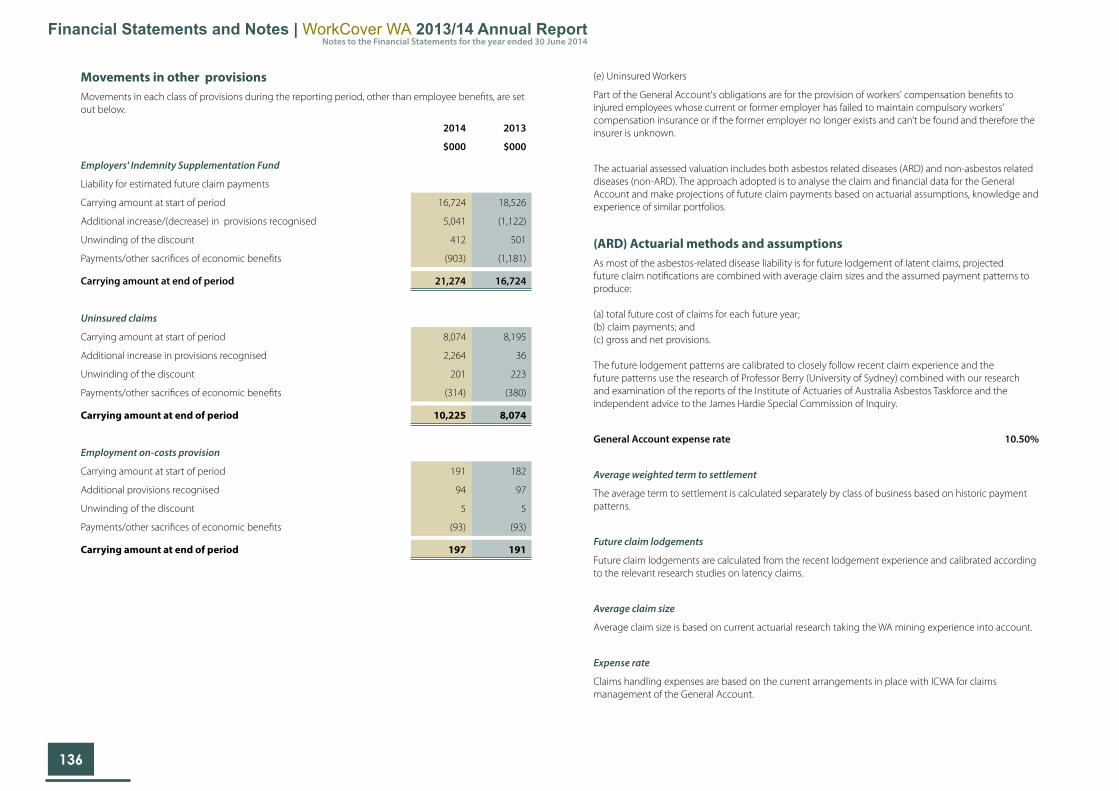
136
Financial Statements and Notes | WorkCover WA 2013/14 Annual ReportNotes to the Financial Statements for the year ended 30 June 2014
Movements in other provisionsMovements in each class of provisions during the reporting period, other than employee benefits, are set out below.
2014 2013
$000 $000
Employers' Indemnity Supplementation Fund
Liability for estimated future claim payments
Carrying amount at start of period 16,724 18,526
Additional increase/(decrease) in provisions recognised 5,041 (1,122)
Unwinding of the discount 412 501
Payments/other sacrifices of economic benefits (903) (1,181)
Carrying amount at end of period 21,274 16,724
Uninsured claims
Carrying amount at start of period 8,074 8,195
Additional increase in provisions recognised 2,264 36
Unwinding of the discount 201 223
Payments/other sacrifices of economic benefits (314) (380)
Carrying amount at end of period 10,225 8,074
Employment on-costs provision
Carrying amount at start of period 191 182
Additional provisions recognised 94 97
Unwinding of the discount 5 5
Payments/other sacrifices of economic benefits (93) (93)
Carrying amount at end of period 197 191
(e) Uninsured Workers
Part of the General Account's obligations are for the provision of workers' compensation benefits to injured employees whose current or former employer has failed to maintain compulsory workers’ compensation insurance or if the former employer no longer exists and can’t be found and therefore the insurer is unknown.
The actuarial assessed valuation includes both asbestos related diseases (ARD) and non-asbestos related diseases (non-ARD). The approach adopted is to analyse the claim and financial data for the General Account and make projections of future claim payments based on actuarial assumptions, knowledge and experience of similar portfolios.
(ARD) Actuarial methods and assumptionsAs most of the asbestos-related disease liability is for future lodgement of latent claims, projected future claim notifications are combined with average claim sizes and the assumed payment patterns to produce:
(a) total future cost of claims for each future year;(b) claim payments; and(c) gross and net provisions.
The future lodgement patterns are calibrated to closely follow recent claim experience and the future patterns use the research of Professor Berry (University of Sydney) combined with our research and examination of the reports of the Institute of Actuaries of Australia Asbestos Taskforce and the independent advice to the James Hardie Special Commission of Inquiry.
General Account expense rate 10.50%
Average weighted term to settlement
The average term to settlement is calculated separately by class of business based on historic payment patterns.
Future claim lodgements
Future claim lodgements are calculated from the recent lodgement experience and calibrated according to the relevant research studies on latency claims.
Average claim size
Average claim size is based on current actuarial research taking the WA mining experience into account.
Expense rate
Claims handling expenses are based on the current arrangements in place with ICWA for claims management of the General Account.

137
Financial Statements and Notes | WorkCover WA 2013/14 Annual ReportNotes to the Financial Statements for the year ended 30 June 2014
Inflation and Discount Rates
Next 12 Months % PA Later % PA
Inflation Rates
Normal 4.50% 4.50%
Superimposed: 2.00% 2.00%
Discount Rates 2.47% 2.62% to 4.53%
Discount rates
Discount rates are derived as the one-year forward rates implied by the Commonwealth Government yield curve as at the balance date.
Inflation rates
Economic inflation assumptions have been set by reference to current economic indicators.
Superimposed inflation
Superimposed inflation being the real increase after adjusting for normal inflation, usually due to non-economic effects e.g changes in legislation, court settlement precedents. The superimposed inflation rates assumed considered both the portfolio’s own real cost increases and industry superimposed inflation trends.
In addition to the above assumptions the following allowances have been made for the act changes promulgated on 1 October 2011:
The following increases in the average claim size for the removal of age limits.
· 15% increase for claimants aged under 65 year olds and · 75% increase for claimants aged over 65. Note that the average claim size of claimants aged over 65
is capped at a maximum equal to those aged under 65 years old. Therefore the actual increase to the base average claim size is 46%.
· 70% of ARD claims will be lodged as common law claims, with an average claim size 406% greater than the statutory average claim size.
· allowed for a 22% increase in the number of claims lodged due to behavioural change and the availability of common law access for the General Account.
4.97% increase in the ARD average claim size to allow for common law claims made by employed contractors.
(Non-ARD) Actuarial methods and assumptionsClaims estimates for the workers’ compensation business are derived from an analysis of several different actuarial models. Ultimate number of claims incurred are projected based on past reporting patterns. Payments experience is analysed based on average paid per claim incurred, average paid per claim finalised, projected case estimates and Bornheutter Ferguson. Historic case estimates development is also used to form a model of future payments. The resulting projected payments from these models are analysed along with benchmarks for average claim size and ratio to case estimates and other statistics, in order to determine the final estimate of outstanding claims.
Claims inflation is built into the resulting projected payments, to allow for both general economic inflation and superimposed inflation detected in the modelling of payment experience. Superimposed inflation arises from non-economic factors such as developments of legal precedent and changes in claimant behaviour.
Projected payments are discounted to allow for the time value of money.
General Account expense rate 10.50%
Average weighted term to settlement
The average term to settlement is calculated separately by class of business based on historic payment patterns.
Future claim reports (IBNR)
Future claim reports are analysed using the ratio of late reported claims to reported claims over future development periods.
Average claim size
Average claim size is a benchmark being the outcome of the accident year blend of actuarial methods described above.
Expense rate
Claims handling expenses were calculated by analysis of General Account actual expenses from the Statement of Comprehensive Income over the last 12 months.

138
Financial Statements and Notes | WorkCover WA 2013/14 Annual ReportNotes to the Financial Statements for the year ended 30 June 2014
Discount rates
Discount rates are derived as the one-year forward rates implied by the Commonwealth Government yield curve as at the balance date.
Inflation rates
Economic inflation assumptions have been set by reference to current economic indicators.
Superimposed inflation
Superimposed inflation being the real increase after adjusting for normal inflation, usually due to non-economic effects e.g. changes in legislation, court settlement precedents. The superimposed inflation rates assumed considered both the portfolio’s own real cost increases and industry superimposed inflation trends.
Sufficiency Margin
The inherent uncertainty in the estimated claim liability means that there is a range of possible outcomes. An analysis of the variation of the expected results lead to adoption of a 30% co-efficient of variation and the lognormal distribution. This distribution is then used to calculate the risk margin required to increase the level of sufficiency of the central estimate from 50% to 75%.
In addition to the above assumptions we have included the following prospective allowances for claims incurred from 1 October 2011 due to the 2011 Amendment Act:
· 1.81% increase in the non-ARD average claim size for the removal of age limits. · 5% of non-ARD claims will be lodged as common law claims, with an average claim size $0.5
million. This year we have applied to 5% only to claims lodged in the past year or future claims reported. A claimant has to elect to pursue common law damages or apply for an extension within 12 months of a claim being lodged. Therefore no claims lodged prior to 30 June 2013 are eligible to pursue common law damages anymore. The average claim size from the December 2011 report is indexed by two years wage inflation and superimposed inflation.
· 3.09% increase in the non-ARD average claim size to allow for common law claims made by employed contractors.
Inflation and Discount Rates
Next 12 Months % PA Later % PA
Inflation Rates
Normal 4.50% 4.50%
Superimposed:
PPCI 2.50% 2.50%
PPCF 2.50% 2.50%
Discount Rates 2.47% 2.62% to 5.03%
28. EquityThe Western Australian Government holds the equity interest in the Authority on behalf of the community. Equity represents the residual interest in the net assets of the Authority. The asset revaluation surplus represents that portion of equity resulting from the revaluation of non-current assets.
2014 2013
$000 $000
ReservesAsset revaluation surplus
Balance at start of period 19,975 19,028
Net revaluation increments/(decrements):
Land (800) 1,600
Buildings 990 (653)
Balance at end of period 20,165 19,975
Retained earningsBalance at start of period 50,800 44,579
Result for the period 6,897 6,221
Balance at end of period 57,697 50,800
Total equity at end of period 77,862 70,775
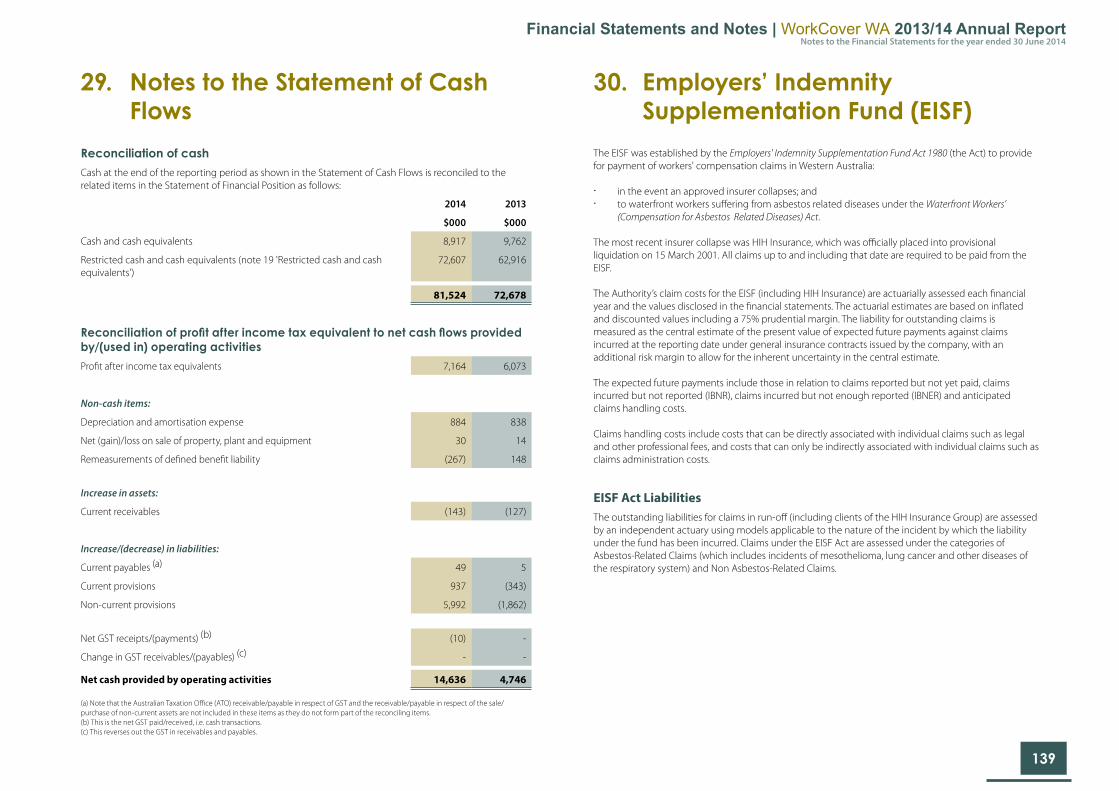
139
Financial Statements and Notes | WorkCover WA 2013/14 Annual ReportNotes to the Financial Statements for the year ended 30 June 2014
29. Notes to the Statement of Cash Flows
Reconciliation of cashCash at the end of the reporting period as shown in the Statement of Cash Flows is reconciled to the related items in the Statement of Financial Position as follows:
2014 2013
$000 $000
Cash and cash equivalents 8,917 9,762
Restricted cash and cash equivalents (note 19 'Restricted cash and cash equivalents')
72,607 62,916
81,524 72,678
Reconciliation of profit after income tax equivalent to net cash flows provided by/(used in) operating activitiesProfit after income tax equivalents 7,164 6,073
Non-cash items:
Depreciation and amortisation expense 884 838
Net (gain)/loss on sale of property, plant and equipment 30 14
Remeasurements of defined benefit liability (267) 148
Increase in assets:
Current receivables (143) (127)
Increase/(decrease) in liabilities:
Current payables (a) 49 5
Current provisions 937 (343)
Non-current provisions 5,992 (1,862)
Net GST receipts/(payments) (b) (10) -
Change in GST receivables/(payables) (c) - -
Net cash provided by operating activities 14,636 4,746
(a) Note that the Australian Taxation Office (ATO) receivable/payable in respect of GST and the receivable/payable in respect of the sale/purchase of non-current assets are not included in these items as they do not form part of the reconciling items.(b) This is the net GST paid/received, i.e. cash transactions.(c) This reverses out the GST in receivables and payables.
30. Employers’ Indemnity Supplementation Fund (EISF)
The EISF was established by the Employers' Indemnity Supplementation Fund Act 1980 (the Act) to provide for payment of workers' compensation claims in Western Australia:
· in the event an approved insurer collapses; and · to waterfront workers suffering from asbestos related diseases under the Waterfront Workers’
(Compensation for Asbestos Related Diseases) Act.
The most recent insurer collapse was HIH Insurance, which was officially placed into provisional liquidation on 15 March 2001. All claims up to and including that date are required to be paid from the EISF.
The Authority’s claim costs for the EISF (including HIH Insurance) are actuarially assessed each financial year and the values disclosed in the financial statements. The actuarial estimates are based on inflated and discounted values including a 75% prudential margin. The liability for outstanding claims is measured as the central estimate of the present value of expected future payments against claims incurred at the reporting date under general insurance contracts issued by the company, with an additional risk margin to allow for the inherent uncertainty in the central estimate.
The expected future payments include those in relation to claims reported but not yet paid, claims incurred but not reported (IBNR), claims incurred but not enough reported (IBNER) and anticipated claims handling costs.
Claims handling costs include costs that can be directly associated with individual claims such as legal and other professional fees, and costs that can only be indirectly associated with individual claims such as claims administration costs.
EISF Act LiabilitiesThe outstanding liabilities for claims in run-off (including clients of the HIH Insurance Group) are assessed by an independent actuary using models applicable to the nature of the incident by which the liability under the fund has been incurred. Claims under the EISF Act are assessed under the categories of Asbestos-Related Claims (which includes incidents of mesothelioma, lung cancer and other diseases of the respiratory system) and Non Asbestos-Related Claims.
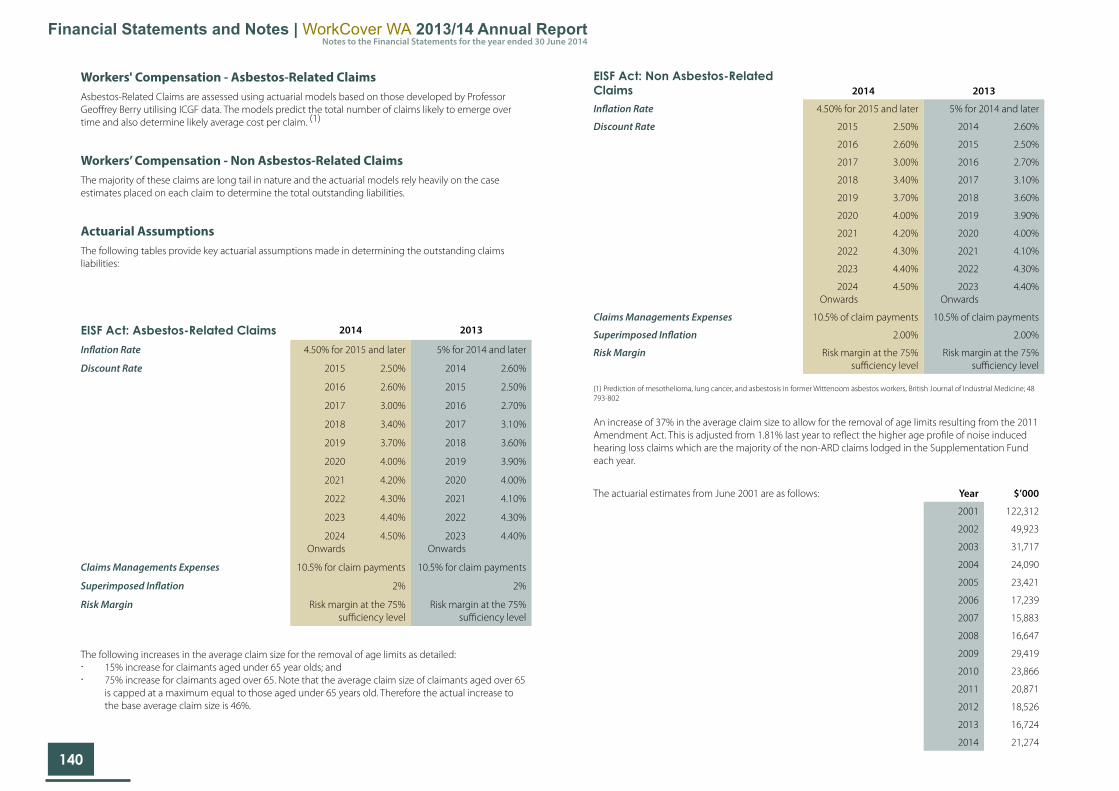
140
Financial Statements and Notes | WorkCover WA 2013/14 Annual ReportNotes to the Financial Statements for the year ended 30 June 2014
EISF Act: Asbestos-Related Claims 2014 2013
Inflation Rate 4.50% for 2015 and later 5% for 2014 and later
Discount Rate 2015 2.50% 2014 2.60%
2016 2.60% 2015 2.50%
2017 3.00% 2016 2.70%
2018 3.40% 2017 3.10%
2019 3.70% 2018 3.60%
2020 4.00% 2019 3.90%
2021 4.20% 2020 4.00%
2022 4.30% 2021 4.10%
2023 4.40% 2022 4.30%
2024 Onwards
4.50% 2023 Onwards
4.40%
Claims Managements Expenses 10.5% for claim payments 10.5% for claim payments
Superimposed Inflation 2% 2%
Risk Margin Risk margin at the 75% sufficiency level
Risk margin at the 75% sufficiency level
The following increases in the average claim size for the removal of age limits as detailed: · 15% increase for claimants aged under 65 year olds; and · 75% increase for claimants aged over 65. Note that the average claim size of claimants aged over 65
is capped at a maximum equal to those aged under 65 years old. Therefore the actual increase to the base average claim size is 46%.
EISF Act: Non Asbestos-Related Claims 2014 2013
Inflation Rate 4.50% for 2015 and later 5% for 2014 and later
Discount Rate 2015 2.50% 2014 2.60%
2016 2.60% 2015 2.50%
2017 3.00% 2016 2.70%
2018 3.40% 2017 3.10%
2019 3.70% 2018 3.60%
2020 4.00% 2019 3.90%
2021 4.20% 2020 4.00%
2022 4.30% 2021 4.10%
2023 4.40% 2022 4.30%
2024 Onwards
4.50% 2023 Onwards
4.40%
Claims Managements Expenses 10.5% of claim payments 10.5% of claim payments
Superimposed Inflation 2.00% 2.00%
Risk Margin Risk margin at the 75% sufficiency level
Risk margin at the 75% sufficiency level
(1) Prediction of mesothelioma, lung cancer, and asbestosis in former Wittenoom asbestos workers, British Journal of Industrial Medicine; 48 793-802
An increase of 37% in the average claim size to allow for the removal of age limits resulting from the 2011 Amendment Act. This is adjusted from 1.81% last year to reflect the higher age profile of noise induced hearing loss claims which are the majority of the non-ARD claims lodged in the Supplementation Fund each year.
The actuarial estimates from June 2001 are as follows: Year $’000
2001 122,312
2002 49,923
2003 31,717
2004 24,090
2005 23,421
2006 17,239
2007 15,883
2008 16,647
2009 29,419
2010 23,866
2011 20,871
2012 18,526
2013 16,724
2014 21,274
Workers' Compensation - Asbestos-Related ClaimsAsbestos-Related Claims are assessed using actuarial models based on those developed by Professor Geoffrey Berry utilising ICGF data. The models predict the total number of claims likely to emerge over time and also determine likely average cost per claim. (1)
Workers’ Compensation - Non Asbestos-Related ClaimsThe majority of these claims are long tail in nature and the actuarial models rely heavily on the case estimates placed on each claim to determine the total outstanding liabilities.
Actuarial AssumptionsThe following tables provide key actuarial assumptions made in determining the outstanding claims liabilities:

141
Financial Statements and Notes | WorkCover WA 2013/14 Annual ReportNotes to the Financial Statements for the year ended 30 June 2014
The actuarial estimates from 2001 to 2005 provide for current known asbestos related claims.
From 2005 the actuarial assessment makes allowance for current known asbestos related claims and for claims incurred but not reported claims. Prior to 2007 the estimates did not include provision for Non-HIH liabilities.
In accordance with Accounting Standard AASB 1023 General Insurance Contracts the outstanding claims liability at 30 June 2014 was assessed at $21.274 million and a provision for this amount has been included in the financial statements (see note 27).
The actuary’s assessment of outstanding claims liability does not recognise that money may be recovered from HIH’s liquidator.
For the purpose of addressing the outstanding claims liability, a surcharge was imposed on employers’ insurance policies on previous years. From the 25 June 2008 the surcharge was discontinued. The revenue collected previously from the surcharge will be used to pay this liability.
31. Commitments 2014 2013
$000 $000
Other expenditure commitmentsOther expenditure commitments for IT consultants contracted for at the end of the reporting period but not recognised as liabilities, are payable as follows:
Within 1 year 175 -
175 -
32. Contingent liabilities and contingent assets
2014 2013
$000 $000
Contingent LiabilitiesThere were no contingent liabilities in existence at 30 June 2014 and up to the date of this report.
- 72
- 72
Contingent AssetsThere were no contingent assets in existence at 30 June 2014 and up to the date of this report.
- 36
- 36
33. Events occurring after the end of the reporting period
There were no known events occurring after the end of the reporting period and up to the date of this report.

142
Financial Statements and Notes | WorkCover WA 2013/14 Annual ReportNotes to the Financial Statements for the year ended 30 June 2014
Other RevenueThe increase reflects higher than expected fines and penalties issued to businesses for failing to have adequate Workers Compensation Insurance.
Employers' Indemnity Supplementation FundThe variance represents unbudgeted liquidated recoveries received from the Administrator of HIH.
Employee benefits expensesThe variance mainly reflects a number of vacant positions that remained unfilled at various stages throughout the year.
Supplies and ServicesThe variance is mainly due to an increase in disputed workers compensation claims, resulting in additional costs associated with sessional arbitrators. Supplies and Services also included unbudgeted resources received free of charge from the State Solicitor’s Office.
Claims expenseThe variance is due to an increase in the actuarial assessed claims liability for the Uninsured and Employer's Indemnity Supplementation Fund.
Accommodation expenseThe variance is due to additional building repair and maintenance expenditure provided for under the Asset Replacement and Building Maintenance (ARBM) Program.
Significant variances between actual results for 2014 and 20132014 2013
$000 $000 $000
Income
General Fund Contributions 21,509 21,278 231
Interest Revenue 2,427 2,702 (275)
Employers' Indemnity Supplementation Fund 10,005 264 9,741
Decrease in claims liability - 1,924 (1,924)
Expenses
Employee benefits expense 14,052 13,631 421
Claims Expense 7,840 1,479 6,361
General Fund ContributionsThe contributions received from Insurers and Self-insurers increased in line with the annual increase in WorkCover WA's operating budget.
Interest RevenueThe decrease reflects lower than expected returns from a reduction in interest rates over the last 12 months.
Employers' Indemnity Supplementation FundThe increase reflects a substantial increase in recoveries received from the Administrator of HIH, as the liquidation draws to a close.
Decrease in claims liabilityThe Actuarial assessment of future expected claims liabilities have increased in the 2014 valuation (refer to claims expense).
Employee Benefits ExpenseThe variance is due to wage growth of 4.25% combined with the payout for two employees who accepted voluntary redundancy.
Claims ExpenseThe increase reflects an actuarially assessed increase in the Supplementation Fund and Uninsured claims liabilities.
2014 2014
Actual Estimate Variance
$000 $000 $000
Income
Other Revenue 780 179 601
Employers' Indemnity Supplementation Fund 10,005 - 10,005
Expenses
Employee Benefits expenses 14,052 15,145 (1,093)
Supplies and services 2,908 2,611 297
Claims expense 7,840 1,900 5,940
Accommodation expenses 587 350 237
34. Explanatory statementSignificant variations between estimates and actual results for income and expense as presented in the financial statement titled ‘Statement of Comprehensive Income’ are shown below: Significant variations are considered to be those greater than 10% or $200,000.
Significant variances between estimate and actual for 2014

143
Financial Statements and Notes | WorkCover WA 2013/14 Annual ReportNotes to the Financial Statements for the year ended 30 June 2014
35. Financial instruments
(a) Financial risk management objectives and policies
Financial instruments held by the Authority are cash and cash equivalents, restricted cash and cash equivalents, receivables, held-to-maturity investments and payables. The Authority has limited exposure to financial risks. The Authority’s overall risk management program focuses on managing the risks identified below.
Credit riskCredit risk arises when there is the possibility of the Authority’s receivables defaulting on their contractual obligations resulting in financial loss to the Authority. The maximum exposure to credit risk at the end of the reporting period in relation to each class of recognised financial assets is the gross carrying amount of those assets inclusive of any provisions for impairment as shown in the table at note 35(c) ‘Financial instruments disclosures’ and note 20 ‘Receivables’.
The Authority has policies in place to ensure that sales of products and services are made to customers with an appropriate credit history. In addition, receivable balances are monitored on an ongoing basis with the result that the Authority’s exposure to bad debts is minimal. At the end of the reporting period there were no significant concentrations of credit risk.
Liquidity riskLiquidity risk arises when the Authority is unable to meet its financial obligations as they fall due. The Au-thority is exposed to liquidity risk through its trading in the normal course of business. The Authority has appropriate procedures to manage cash flows by monitoring forecast cash flows to ensure that sufficient funds are available to meet its commitments.
Market riskMarket risk is the risk that changes in market prices such as foreign exchange rates and interest rates will affect the Authority’s income or the value of its holdings of financial instruments. The Authority does not trade in foreign currency and is not materially exposed to other price risks. Other than as detailed in the interest rate sensitivity analysis table at note 35(c), the Authority is not exposed to any further interest rate risk.
2014 2013
$000 $000
Financial Assets
Cash and cash equivalents 8,917 9,762
Restricted cash 72,607 62,916
Receivables (i) 1,183 1,006
Held-to-maturity investments 9,908 5,337
Financial Liabilities
Payables 863 814
(i) The amount of receivables excludes GST recoverable from the ATO (statutory receivable).
(b) Categories of financial instruments
The carrying amounts of each of the following categories of financial assets and financial liabilities at the end of the reporting period are:

144
Financial Statements and Notes | WorkCover WA 2013/14 Annual ReportNotes to the Financial Statements for the year ended 30 June 2014
(c) Financial instrument disclosures
Credit riskThe following table discloses the Authority’s maximum exposure to credit risk, interest rate exposures and the ageing analysis of financial assets. The Authority’s maximum exposure to credit risk at the end of the reporting period is the carrying amount of financial assets as shown below. The table discloses the ageing of financial assets that are past due but not impaired and impaired financial assets. The table is based on information provided to senior management of the Authority.
The Authority does not hold any collateral as security or other credit enhancement relating to the financial assets it holds.
Aged analysis of financial assets
2014 Carrying AmountNot past due and
not impaired
Past Due But Not Impaired Impaired Financial AssetsUp To 1 Month 1 to 3 Months 3 to 6 Months 6 to 12 Months More than 1 Year
Financial Assets $000 $000 $000 $000 $000 $000 $000 $000
Cash and cash equivalents 8,917 8,917 - - - - - -
Restricted cash 72,607 72,607 - - - - - -
Receivables (a) 1,183 818 50 125 12 100 78 -
Other financial assets 9,908 9,908 - - - - - -
92,615 92,250 50 125 12 100 78 -
2013Financial Assets
Cash and cash equivalents 9,762 9,762 - - - - - -
Restricted cash 62,916 62,916 - - - - - -
Receivables (a) 1,006 767 69 71 13 47 39 -
Other financial assets 5,337 5,337 - - - - - -
79,021 78,782 69 71 13 47 39 -
(a) The amount of Receivables excludes GST recoverable from the ATO (statutory receivable).

145
Financial Statements and Notes | WorkCover WA 2013/14 Annual ReportNotes to the Financial Statements for the year ended 30 June 2014
Liquidity Risk and interest rate exposureThe following table details the Authority’s interest rate exposure and the contractual maturity analysis of financial assets and liabilities. The maturity analysis section includes interest and principal cash flows. The interest rate exposure section analyses only the carrying amounts of each item.
Interest rate exposure and maturity analysis for financial assets and financial liabilities
Interest Rate Exposure Maturity Dates
2014
Weighted Average Effective
Interest RateCarrying Amount
Variable Interest Rate
Fixed Interest Rate Maturity
Less than 1 Year
Non Interest Bearing
Nominal Amount
Up to 1 Month 1 to 3 Months 3 to 6 Months
6 to 12 Months
More than 1 Year
Financial Assets % $000 $000 $000 $000 $000 $000 $000 $000 $000 $000
Cash and cash equivalents 3.18 8,917 878 8,038 1 8,917 3,023 5,894 - - -
Restricted cash 2.82 72,607 72,607 - - 72,607 72,607 - - - -
Receivables (a) - 1,183 - - 1,183 1,183 868 125 12 100 78
Other financial assets 3.64 9,908 - 9,908 - 9,908 - - 9,908 - -
92,615 73,485 17,946 1,184 92,615 76,498 6,019 9,920 100 78
Financial Liabilities
Payables - 863 - - 863 863 863 - - - -
863 - - 863 863 863 - - - -
2013Financial Assets % $000 $000 $000 $000 $000 $000 $000 $000 $000 $000
Cash and cash equivalents 3.95 9,762 1,887 7,874 1 9,762 5,233 4,529 - - -
Restricted cash 3.39 62,916 62,916 - - 62,916 62,916 - - - -
Receivables (a) - 1,006 - - 1,006 1,006 836 71 13 47 39
Other financial assets 4.10 5,337 - 5,337 - 5,337 - - 5,337 - -
79,021 64,803 13,211 1,007 79,021 68,985 4,600 5,350 47 39
Financial Liabilities
Payables - 814 - - 814 814 814 - - - -
814 - - 814 814 814 - - - -
(a) The amount of Receivables excludes GST recoverable from the ATO (statutory receivable).

146
Financial Statements and Notes | WorkCover WA 2013/14 Annual ReportNotes to the Financial Statements for the year ended 30 June 2014
Interest rate sensitivity analysisThe following table represents a summary of the interest rate sensitivity of the Authority’s financial assets and liabilities at the end of the reporting period on the surplus for the period and equity for a 1% change in interest rates. It is assumed that the change in interest rates is held constant throughout the reporting period.
Carrying amount -100 basis points +100 basis points
2014 Surplus Equity Surplus Equity
Financial Assets $000 $000 $000 $000 $000
Cash and cash equivalents 1,523 (15) (15) 15 15
Restricted cash and cash equivalents 72,607 (726) (726) 726 726
Total Increase/(Decrease) (741) (741) 741 741
Carrying amount -100 basis points +100 basis points
2013 Surplus Equity Surplus Equity
Financial Assets $000 $000 $000 $000 $000
Cash and cash equivalents 2,084 (21) (21) 21 21
Restricted cash and cash equivalents 62,916 (629) (629) 629 629
Total Increase/(Decrease) (650) (650) 650 650
Fair valueAll financial assets and liabilities recognised in the Statement of Financial Position, whether they are carried at cost or fair value, are recognised at amounts that represent a reasonable approximation of fair value unless otherwise stated in the applicable notes.

147
Financial Statements and Notes | WorkCover WA 2013/14 Annual ReportNotes to the Financial Statements for the year ended 30 June 2014
36. Remuneration of members of the accountable authority and senior officers
Remuneration of members of the accountable authorityThe number of members of the accountable authority, whose total fees, salaries, superannuation, non-monetary benefits and other benefits for the financial year, fall within the following bands are:
2014 2013
$
0 - 10,000 2 1
10,001 - 20,000 3 4
30,001 - 40,000 1 1
$000 $000
Base remuneration and superannuation 86 100
The total remuneration of members of the accountable authority 86 100
The total remuneration includes the superannuation expense incurred by the Authority in respect of members of the accountable authority.
No members of the Accountable Authority are members of the Pension Scheme.
Remuneration of senior officersThe number of senior officers, other than senior officers reported as members of the Accountable Authority, whose total fees, salaries, superannuation, non-monetary benefits and other benefits for the financial year, fall within the following bands are:
2014 2013
$
20,001 - 30,000 1 -
60,001 - 70,000 - 1
70,001 - 80,000 1 -
90,001 - 100,000 - 1
110,001 - 120,000 1 1
130,001 - 140.000 1 -
150,001 - 160,000 - 1
160,001 - 170,000 1 1
170,001 - 180,000 1 -
180,001 - 190,000 - 1
210,001 - 220,000 - 1
230,001 - 240,000 1 -
$000 $000
Base remuneration and superannuation 951 996
Annual leave and long service leave accruals (46) (21)
Other benefits 7 25
The total remuneration of senior officers 912 1,000
(a) Four senior officers resided in these remuneration bands due to part-year occupancy and total remuneration being below $160,000.
The superannuation included here represents the superannuation expense incurred by the Authority in respect of senior officers other than senior officers reported as members of the accountable authority.
No senior officers are members of the Pension Scheme.
(a)

148
Financial Statements and Notes | WorkCover WA 2013/14 Annual ReportNotes to the Financial Statements for the year ended 30 June 2014
37. Remuneration of auditorRemuneration payable to the Auditor General for the reporting period is as follows:
2014 2013
$000 $000
Auditing the accounts, financial statements and key performance indicators 82 80
82 80
38. Workers’ Compensation & Injury Management Trust Account
The purpose of the Trust Fund is to hold funds paid into the custody of the Authority pursuant to Section 110 of the Workers’ Compensation and Injury Management Act 1981. These funds are not consolidated as they are funds that are administered on behalf of dependants of deceased workers.
Income
Amounts paid to the custody of the Authority 281 364
Interest on investments 33 42
314 406
Expenditure
Payments by the Authority 299 234
Administration fee 12 11
311 245
Surplus/(Deficit) 3 161
Balance July 1 1,083 922
Balance June 30 1,086 1,083
Balance of funds held represents:
Cash and cash equivalents 1,086 1,083
1,086 1,083
39. Supplementary financial information
Potential Claims Recoveries Written OffIn relation to the General Account, WorkCover may have a statutory obligation to pay a workers’ compensation claim. For uninsured claims where the employer has not maintained a workers’ compensation insurance policy, or the employer is not able to be identified or located or an employer is in breach of the insurance contract, WorkCover seeks to recover the costs of the claims from the employer.
Potential recoveries receivable are assessed with regard to the ability of the debtors to meet their obligation. These recoveries have not been recognised as income because the amount to be recovered could not be reliably measured and consequently the write-off of these debts have not been charged as an expense in the Statement of Comprehensive Income. The General Account Uninsured debt write-offs outlined below are net of recoveries received from employers.
In accordance with Section 48(2) of the Financial Management Act 2006, potential recoveries were written off from the following fund:
2014 2013
$000 $000
Write-Offs
General account uninsured claims 33 -
Fines and penalties 19 -
52 -
2014 2013
Number of individual recovery write-offs with values between:
$ 0 - 100,000 7 -
2014 2013
$000 $000
Losses Through Theft, Defaults And Other Causes
Losses of public money and public and other property through theft, default and other causes
- -
Amount recovered - -
- -
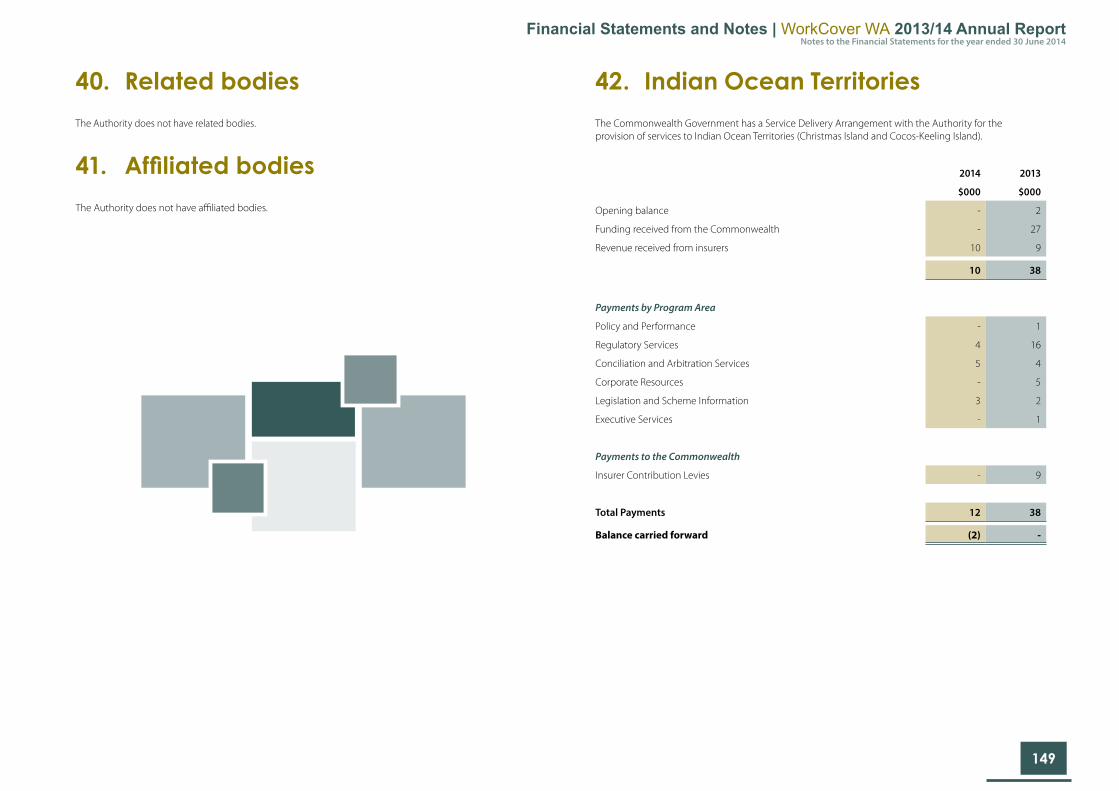
149
Financial Statements and Notes | WorkCover WA 2013/14 Annual ReportNotes to the Financial Statements for the year ended 30 June 2014
40. Related bodiesThe Authority does not have related bodies.
41. Affiliated bodiesThe Authority does not have affiliated bodies.
42. Indian Ocean TerritoriesThe Commonwealth Government has a Service Delivery Arrangement with the Authority for the provision of services to Indian Ocean Territories (Christmas Island and Cocos-Keeling Island).
2014 2013
$000 $000
Opening balance - 2
Funding received from the Commonwealth - 27
Revenue received from insurers 10 9
10 38
Payments by Program Area
Policy and Performance - 1
Regulatory Services 4 16
Conciliation and Arbitration Services 5 4
Corporate Resources - 5
Legislation and Scheme Information 3 2
Executive Services - 1
Payments to the Commonwealth
Insurer Contribution Levies - 9
Total Payments 12 38
Balance carried forward (2) -

150
Financial Statements and Notes | WorkCover WA 2013/14 Annual ReportNotes to the Financial Statements for the year ended 30 June 2014
43. Schedule of income and expenses by serviceScheme
RegulationScheme Services
Grand Total
2014 2013 2014 2013 2014 2013
Income $000 $000 $000 $000 $000 $000
Insurer contributions 10,075 10,425 11,434 10,853 21,509 21,278
Interest revenue 1,137 1,324 1,290 1,378 2,427 2,702
Other revenue 365 447 415 467 780 914
Employers' Indemnity Supplementation Fund 4,687 129 5,318 135 10,005 264
Decrease in claims liability - 943 - 981 - 1,924
Total Income 16,264 13,268 18,457 13,814 34,721 27,082
Expenses
Employee benefits expense 6,582 6,678 7,470 6,953 14,052 13,631
Supplies and services 1,362 1,462 1,546 1,524 2,908 2,986
Depreciation and amortisation expense 414 411 470 427 884 838
Accomodation expenses 275 285 312 296 587 581
Claims expense 3,672 723 4,168 756 7,840 1,479
Loss on disposal of non current assets 14 7 16 7 30 14
Other expenses 696 808 790 842 1,486 1,650
Total Expenses 13,015 10,374 14,772 10,805 27,787 21,179
Profit before grants and subsidies from State Government 3,249 2,894 3,685 3,009 6,934 5,903
Services received free of charges 108 83 122 87 230 170
Profit for the period 3,357 2,977 3,807 3,096 7,164 6,073

Annual Report 2013 2014
