annual report 2012 - astra industrial annual report 12...... salman faris al faris, ghiath muneer...
TRANSCRIPT
1
Annual Report 2012

Contact Us: P.O. Box 1560, Riyadh 11441Kingdom of Saudi ArabiaTel: + 966 11 475 2001Fax: + 966 11 475 [email protected]
3
01 Astra Industries Page 4-5
02 Board of Directors Page 6-7
03 Chairman’s Message Page 8-9
04 Group President’s Report Page 10-13
05 Tabuk Pharmaceutical Manufacturing Co. Page 16-17
06 Astra Industrial Complex Co., Ltd. (Astrachem) Page 20-23
07 Astra Polymer Compounding Co. Page 26-27
08 International Building Systems Factory Co. Page 30-33
09 Al Tanmiya Steel Industries Page 36-37
10 Audited Financial Statements Page 40-65

4
Astra Industries
Established in 2006, Astra Industries is one of the leading industrial investment companies in the Kingdom of Saudi Arabia. We are composed of various industrial subsidiaries, each committed to deliver sustainable growth and long-term stakeholder value.
To fulfill this vision, Astra Industries has focused on laying the foundations for sustainable growth by creating a robust and effective new system to integrate its operational and financial management as well as processes. This has enabled Astra Industries to deliver the highest quality products and superior industrial output, ensuring continued strength and competitiveness in the local and regional market.
Astra Industries continues to vigorously pursue its expansion strategy in key industrial sectors, especially in pharmaceuticals and steel manufacturing. This is consistent with our long-term vision to become a premier industrial investment company in the region through value-added products and services.
To leverage our strength in the local market and our business momentum, we have diversified our product offering and expanded our presence to more markets in the Middle East, North Africa, Europe and Asia. Exports to these markets now account for 30% of total sales, a proud achievement which has enabled us to actively participate in helping sustain our national prosperity by helping to diversify the local economy, creating jobs and boosting exports.
Astra Industries and all our subsidiaries continue to earn the trust and confidence of our local and regional partners, thanks to the strategic focus and vision of our team, and the passion and commitment of our management.
4
55
6
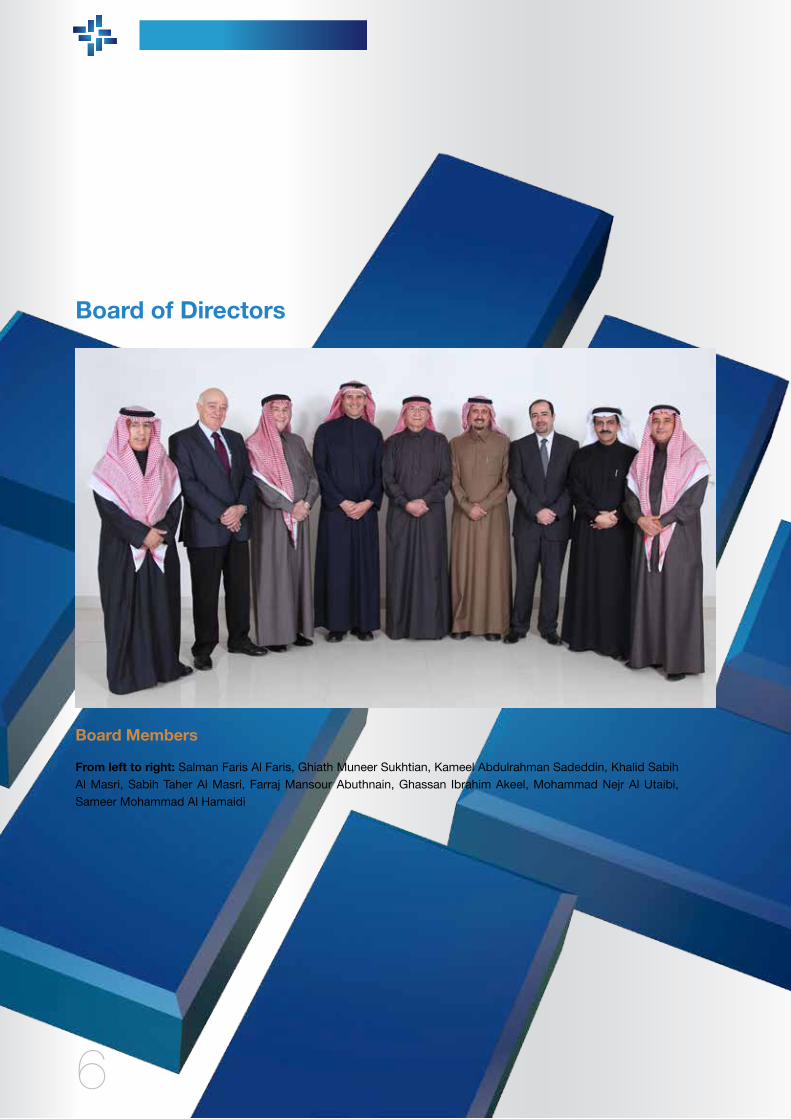
Board of Directors
Board Members
From left to right: Salman Faris Al Faris, Ghiath Muneer Sukhtian, Kameel Abdulrahman Sadeddin, Khalid Sabih Al Masri, Sabih Taher Al Masri, Farraj Mansour Abuthnain, Ghassan Ibrahim Akeel, Mohammad Nejr Al Utaibi, Sameer Mohammad Al Hamaidi
6

7
Sabih Taher Al MasriChairman of the BoardMember of the Nominations & Remunerations Committee
Kameel AbdulrahmanSadeddinMember of the BoardMember of Performance &Investment Committee
Mohammad Nejr Al UtaibiMember of the BoardMember of Performance &Investment Committee
Ghassan Ibraheem AkeelMember of the BoardMember of Performance &Investment CommitteeChairman of Audit Committee
Farraj Mansour AbuthnainMember of the BoardMember of Performance &Investment Committee
Khaled Sabih Al MasriDeputy Chairman of the BoardChairman of Performance &Investment Committee
Ghiath Muneer SukhtianMember of the Board
Sameer MohammadAl HamaidiMember of the BoardMember of Audit CommitteeMember of Nominations &Remunerations Committee
Selman Faris Al FarisMember of the BoardMember of Audit CommitteeChairman of the Nomination & Remunerations Committee
7
88
Chairman’s Message Dear Shareholders,
On behalf of the board of directors, I am delighted to presentthe annual report of Astra Industries for calendar year 2012.This year, Astra Industries achieved phenomenal growth despite a very challenging and volatile business environment in the Middle East, heightened competition in the chemicalssector and expenditures associated with the completion of the new Tanmiya Steel mill in Iraq.
In addition to the completion of Tanmiya steel mill the group continued to pursue its expansion strategy by putting the final touches on our new Tabuk Pharmaceutical manufacturing plant in Dammam and the international building factory system in Jubail. These expansion moves have boosted capacity and enabled us to meet growing demand for our products. We have also deployed new systems and practices which integrated and strengthened the operational and business infrastructure of our various subsidiaries.
Sabih Taher Al MasriChairman of the Board

99
In conjunction with continued investment in physical assets, the Group is also investing heavily in our human capital, specifically on team members and professionals with the potential to transform our ability to grow and compete. To boost productivity, we also nurtured a professional work environment consistent with a world class organization which can compete in the modern world. This was accompanied by the adoption of a new SAP ERP system across all our subsidiaries, revolutionizing the way we work together as a group and optimizing our performance and business agility.
As part of our strategic goals, we also remain strongly and passionately committed to our vital role in shaping the communities we serve. This includes our belief in the importance of implementing a clear Saudization strategy and providing opportunities for women to participate in society in a way which is consistent with our culture and
values. We also actively supported various programs and initiatives in the community aimed at benefiting the needy.
Our impressive achievements in 2012 allowed us to consolidate our gains and build our strength in the Middle East and North African markets. These solid foundations will no doubt continue to drive our momentum and help us achieve stable growth and performance in the road ahead.
On behalf of the board of directors, I would like to thank all our employees and our management team for their dedication, as well as our partners in the private and government sector for their ongoing support, and all our shareholders for their trust and confidence in our vision.

10
GroupPresident’s Report
Dear Shareholders,
I am very pleased to present a summary of our most important developments and achievements during the year. Astra Industries’ business volume and performance picked up significantly during 2013 with record sales of SR 1.5 billion compared to SR 1.4 billion in 2011, an increase of SR 114 million or 8 percent. Meanwhile, we achieved net profits of SR 243 million versus SR 248 million in 2011, down SR 5.5 million or 2 percent, while share price was at SR 3.27 per share versus SR 3.35 in 2011.
Overall, strong growth in the specialty chemicals sector drove revenue growth while our overall profitability experienced downward pressure from leaner profit margins in the specialist chemicals sector and from rising pre-operating expenses at the new Al Tanmiya Steel Industries in Iraq which is nearing the startup phase.
Khalid Al GwaizGroup President

11
In keeping with our business expansion plans, in 2012 we continued building capacity with the completion of the new Tabuk Pharmaceutical manufacturing company plant in Dammam for medical injections and other products. This facility will allow the company to meet rising market demand and expand its product portfolio. Al Tanmiya Steel’s new steel mill in Basra, Iraq has reached full implementation and is awaiting electricity connection to commence commissioning. International Building Systems Factory (IBSF) continued to implement new processes and install additional machinery to boost capacity at its new factory in Jubail and meet rising demand from customers in the Eastern Province and neighboring Gulf countries. Also during the year, Astra Polymers started commercial production at its facility in Petro Rabigh on the Red Sea. The new facility joins three other Astra Polymers facilities in Dammam, Dubai and Turkey to handle growing market demand in the Western Province as well as export markets in Europe and Africa.
Astra Industries has also invested in its internal infrastructure, rolling out a group-wide state-of-the-art SAP ERP (Enterprise Resource Planning) system. With the rollout of the main system infrastructure, for the first time, Astra Industries and its various subsidiaries in the Kingdom and abroad are now integrated under one system, consolidating resource and production planning, sales, business processes and finance. A robust high-capacity network for round-the-clock data storage and exchange was also implemented, along with a data center outside Riyadh, to ensure uninterrupted business operations during emergencies and natural disasters. At the same time, we have been working to finalize and implement new work policies and procedures across the group to strengthen our internal organization and meet client requirements. New guidelines now clearly identify individual duties and responsibilities and spell out administration and financial authority for every subsidiary. This improves work flow, reduces mistakes and raises productivity. We also revised our human resource
policies including compensation and benefits. The new system was based on extensive research, analysis and market surveys. This has helped us formulate new ways to improve the ability of Astra Industries to attract and retain the best human talent and ensure sustainability and growth. As part of our commitment to society, Astra Industries continues to enhance its Saudization drive in terms of quality and numbers. Our aim is to exceed regulatory requirements and ensure that Saudis are attracted, developed, retained and play active roles across various levels of the organization, managerial and otherwise.
As a testament to our success in this initiative: two of our Astra Industries subsidiaries have achieved Platinum status under the Ministry of Labor ratings, while the rest of the group have achieved Green status with a comfortable margin.
We also set up a ladies section to promote female employment within the group and allow them to actively participate in the national economy. Our corporate social responsibility (CSR) activities include support for programs and initiatives aimed at alleviating the suffering of the needy including low-income families, children and the handicapped, as well as provide them with opportunities to build a better life. In addition, social awareness activities such as drug control and breast cancer awareness have also received Astra Industries funding as part of our CSR drive.
Lastly, I wish to express my sincere appreciation to all the staff of Astra Industries for their hard work and outstanding performance. This has made a tremendous difference in our growth and success. I also wish to thank our customers, suppliers and service providers for their valued patronage and support. Finally, I would like to thank all the members of our board and our shareholders for their continued trust and confidence.
12
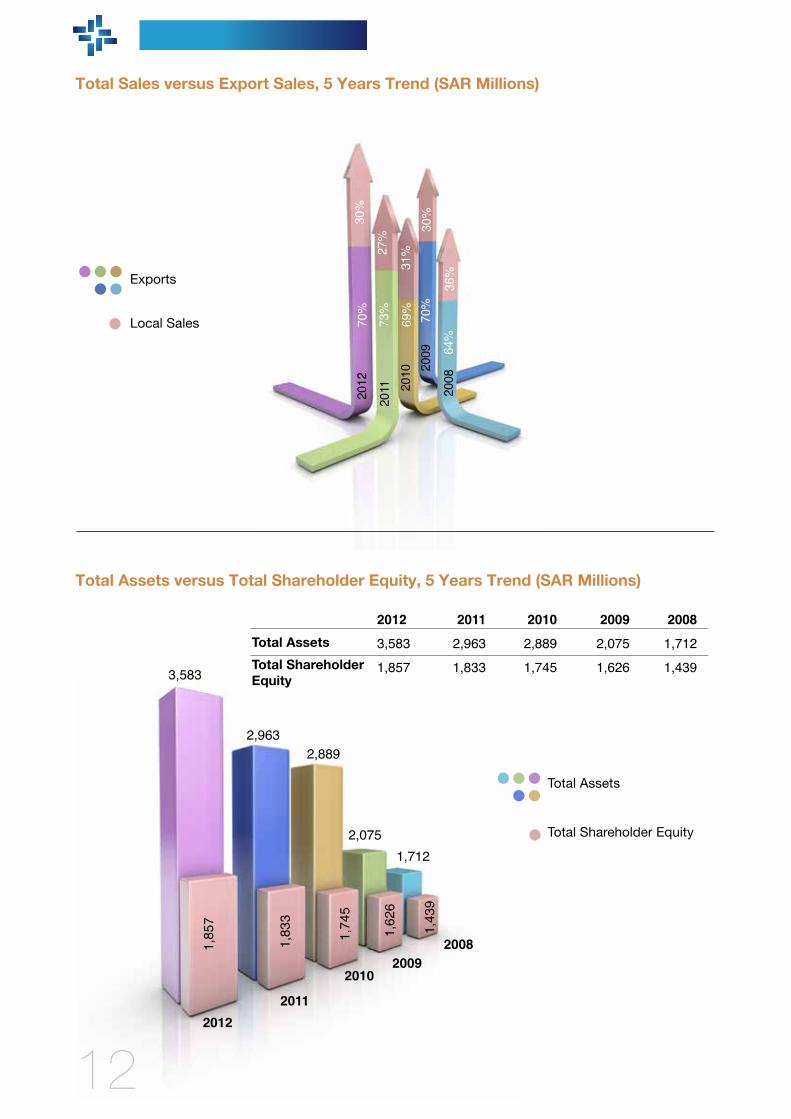
Total Sales versus Export Sales, 5 Years Trend (SAR Millions)
69%
2010
31%
70%
2012
30%
64%
2008
30%
36%
70%
2009
73%
2011
27%
Total Assets20123,583
1,857
20112,963
1,833
20102,889
1,745
20092,075
1,626
20081,712
1,439
Total Assets versus Total Shareholder Equity, 5 Years Trend (SAR Millions)
Local Sales
Exports
1,85
7
1,83
3
1,74
5
1,62
6
1,43
9
20122011
20102009
2008
3,583
2,9632,889
2,0751,712
12
Total Shareholder Equity
Total Assets
Total Shareholder Equity

13
Segmental Revenue and Net Profit Distribution for 2012 (SAR Millions)
SalesNet Profit
27%
5%
71%
-3%20%
43%
37%
2012
PharmaceuticalsPharmaceuticals Steel IndustriesSteel & Energy IndustriesSpecialty ChemicalsSpecialty Chemicals Holding Company
Net Profit 2012
Sales for 2012(Million in SR)
172
656
65
547
13
293
-7ـــــ
Specialty Chemicals
Holding Company
Pharmaceuticals Steel Industries
991
1,0421,121
243
248259
204
186
Net Profit and Revenue, 5 Years Trend (SAR Millions)
Net Profit
Sales
1,382
1,496
Net Profit
Sales
2011
2012
2010
2009
2008
2012243
1,496
2011248
1,382
2010259
1,121
2009204
1,042
2008186
991


15

16
Tabuk Pharmaceutical Manufacturing Co.
Tabuk Pharmaceutical Manufacturing Company was established in Tabuk, Saudi Arabia in 1994. It is engaged mainly in developing, manufacturing, marketing and distributing branded generic pharmaceuticals and licensed products in the Kingdom and abroad.
The company manufactures a wide range of medical products in various formats from pills and ointments to syrups, suppositories and injections. Today, Tabuk Pharmaceutical is the second largest pharmaceutical manufacturing company in the Kingdom.
The company produces a wide selection of high-quality generic drugs under its own brand names. It also manufactures major international brand names under license from global companies. Tabuk Pharmaceutical has built a formidable portfolio of brands in the Kingdom, the Middle East and North Africa, thanks to its strong reputation for high quality and its local and regional marketing and distribution network.
16

1717


20
Astra Industrial Complex Co., Ltd. (Astrachem)
Astrachem is an integrated producer and supplier of high-quality products for the agricultural sector including agrochemicals, fertilizers and pesticides.
During the year, Astrachem continued to strengthen its position in the local and regional market, adding 10 new products to our portfolio including Timasol, a new line of microgranular fertilizers. In addition, we are launching 15 more products in 2013 featuring all-new formulations. Astrachem is also poised to enter new categories such as animal feedstuff in the later part of 2013.
Meanwhile, Astrachem has been increasing its focus on the fast-evolving Saudi agricultural sector in order to meet growing local demand. We have also consolidated our regional strength with new products and a stronger regional sales and distribution network. Despite prevailing political uncertainty in some of the markets we serve, these have not slowed our commitment and resolve to continue serving the growing needs of our customers.
20

2121

2222
23
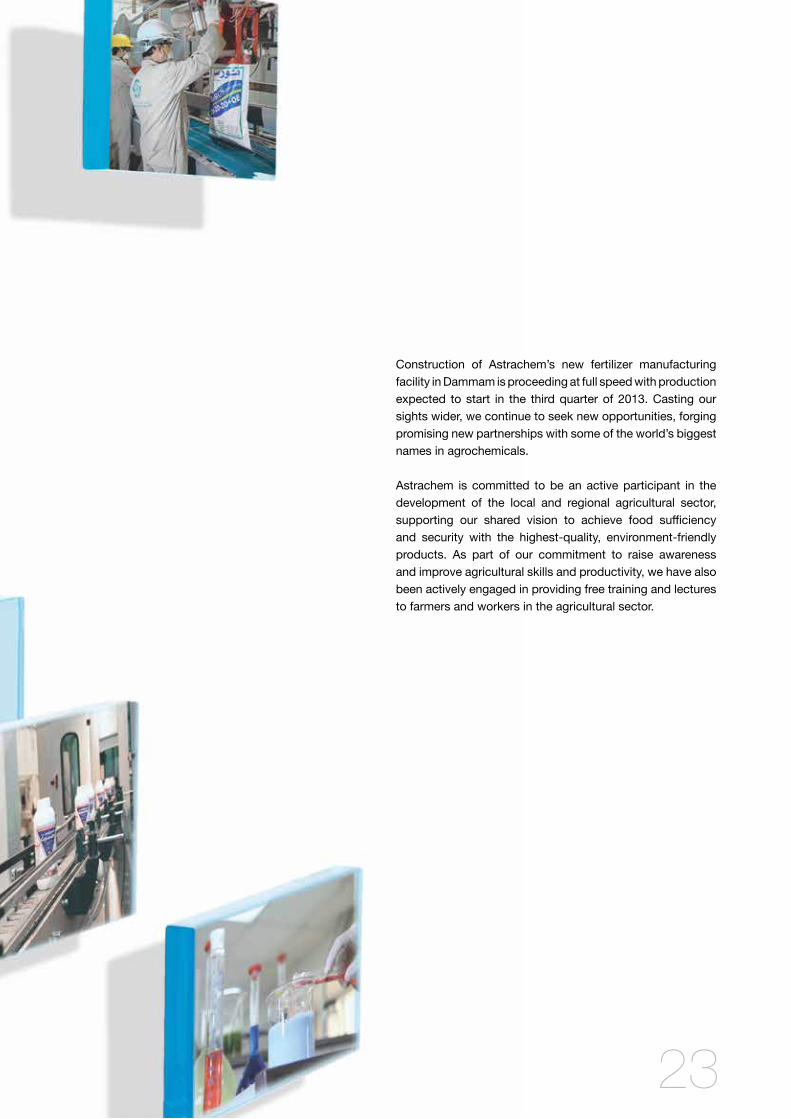
Construction of Astrachem’s new fertilizer manufacturing facility in Dammam is proceeding at full speed with production expected to start in the third quarter of 2013. Casting our sights wider, we continue to seek new opportunities, forging promising new partnerships with some of the world’s biggest names in agrochemicals.
Astrachem is committed to be an active participant in the development of the local and regional agricultural sector, supporting our shared vision to achieve food sufficiency and security with the highest-quality, environment-friendly products. As part of our commitment to raise awareness and improve agricultural skills and productivity, we have also been actively engaged in providing free training and lectures to farmers and workers in the agricultural sector.


26
Astra Polymer Compounding Co.
Astra Polymers was established in 1993 to produce polymers, plastic colorants and additives for the plastics and petrochemicals industry. The company is a leading producer of dust-free additives and custom-made thermo-plastic compounds tailored to customer specifications such as color, flexibility, solidity and resistance to sunlight.
Astra Polymers is also one of the leading producers of high quality colorants and plastic additives in the Middle East, manufactured to the exact specifications and the special requirements of customers. The company provides essential raw materials for manufacturers engaged in all stages of polymer production, from main producers to intermediate and end-product manufacturers.
Astra Polymers is proud of its enduring partnerships. Our client list now includes SABIC, Broug, BASF, as well as many leading companies in the Middle East and North Africa. Astra Polymers also exports to many countries in Asia, Africa and Europe with production facilities in Saudi Arabia (Dammam and Rabigh), the United Arab Emirates and Turkey.
26

2727 27


30
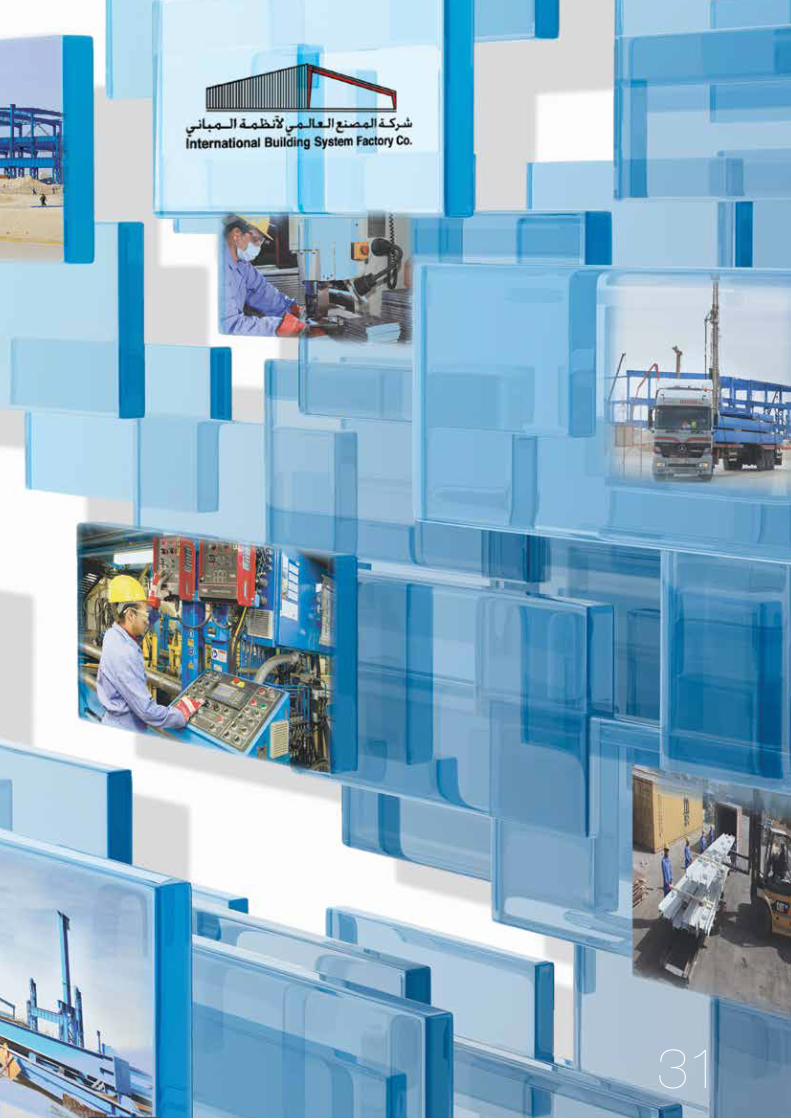
International Building Systems Factory Co.
IBSF is a limited liability company established in the Kingdom in 1993. We operate mainly in Saudi Arabia with a paid up capital of SR 40 million. The company’s main activities include designing, manufacturing and erecting pre-engineered steel buildings and steel structures for high-rise buildings, aircraft hangars, oil and gas companies, the petrochemical industry, as well as heavy industries such as steel, cement, power generation and desalination plants.
IBSF is also a producer of sandwich boards and panels for industrial buildings. The company has introduced a wide range of building accessories including energy-efficient flooring systems, mezzanines, decorative walls, canopies, crane systems, cladding and fascias. The company also produces a wide range of doors, windows, ventilators and related accessories. IBSF’s manufacturing facilities are located in Riyadh and Jubail.
IBSF markets its products in the Kingdom and the GCC, and has a full-fledged marketing and sales network serving these countries. The company is also fully capable of operating in other countries and has undertaken projects in Algeria, Iraq, Jordan and some Asian countries.
In addition, IBSF caters to clients who require value-added building and construction services including installation and supervision, project management and technical consultancy for steel structure design and engineering.
30
3131

3232

33
IBSF is committed to the highest technical and quality standards. We are certified to ISO (2001:9000) and ISO (2004:14000) standards, reflected in every stage of our production process. Our Quality Control department includes a team of highly qualified and fully certified inspectors and engineers. They observe the most stringent quality control procedures consistent with the latest codes for pre-engineered steel buildings from such panels as the American Institute of Steel Construction and others. IBSF is also committed to the latest AWS (American Welding Society) standards.
IBSF consists of a dedicated team of highly experienced professionals who are passionate about quality and timely delivery. They are a team totally committed to safety in our factories and at all our worksites in the Kingdom and beyond.
33

شركة أسرتا للطاقةAstra Energy

36
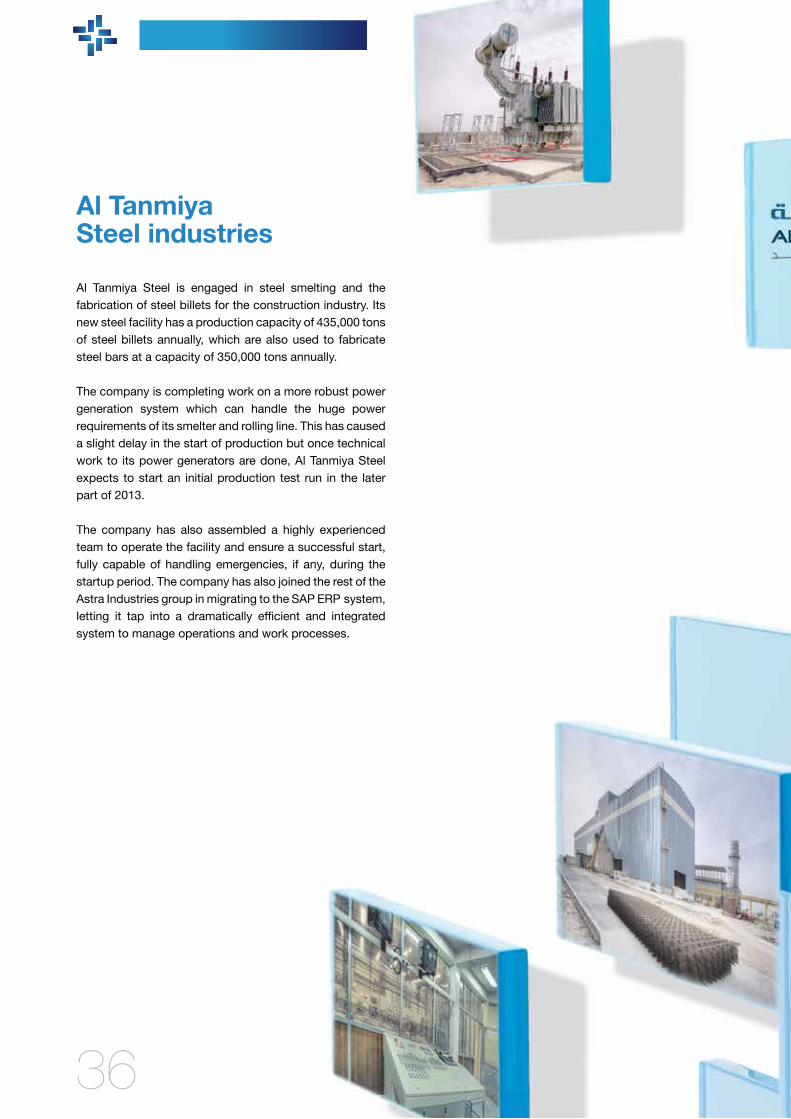
Al TanmiyaSteel industries
Al Tanmiya Steel is engaged in steel smelting and the fabrication of steel billets for the construction industry. Its new steel facility has a production capacity of 435,000 tons of steel billets annually, which are also used to fabricate steel bars at a capacity of 350,000 tons annually.
The company is completing work on a more robust power generation system which can handle the huge power requirements of its smelter and rolling line. This has caused a slight delay in the start of production but once technical work to its power generators are done, Al Tanmiya Steel expects to start an initial production test run in the later part of 2013.
The company has also assembled a highly experienced team to operate the facility and ensure a successful start, fully capable of handling emergencies, if any, during the startup period. The company has also joined the rest of the Astra Industries group in migrating to the SAP ERP system, letting it tap into a dramatically efficient and integrated system to manage operations and work processes.
36

3737

ASTRA INDUSTRIAL GROUP COMPANY(A Saudi Joint Stock Company)
CONSOLIDATED FINANCIAL STATEMENTS FORTHE YEAR ENDED DECEMBER 31, 2012 ANDINDEPENDENT AUDITORS’ REPORT

C o n t e n t s : Pages
Independent Auditors’ Report 40
Consolidated Balance Sheet 41
Consolidated Income Statement 43
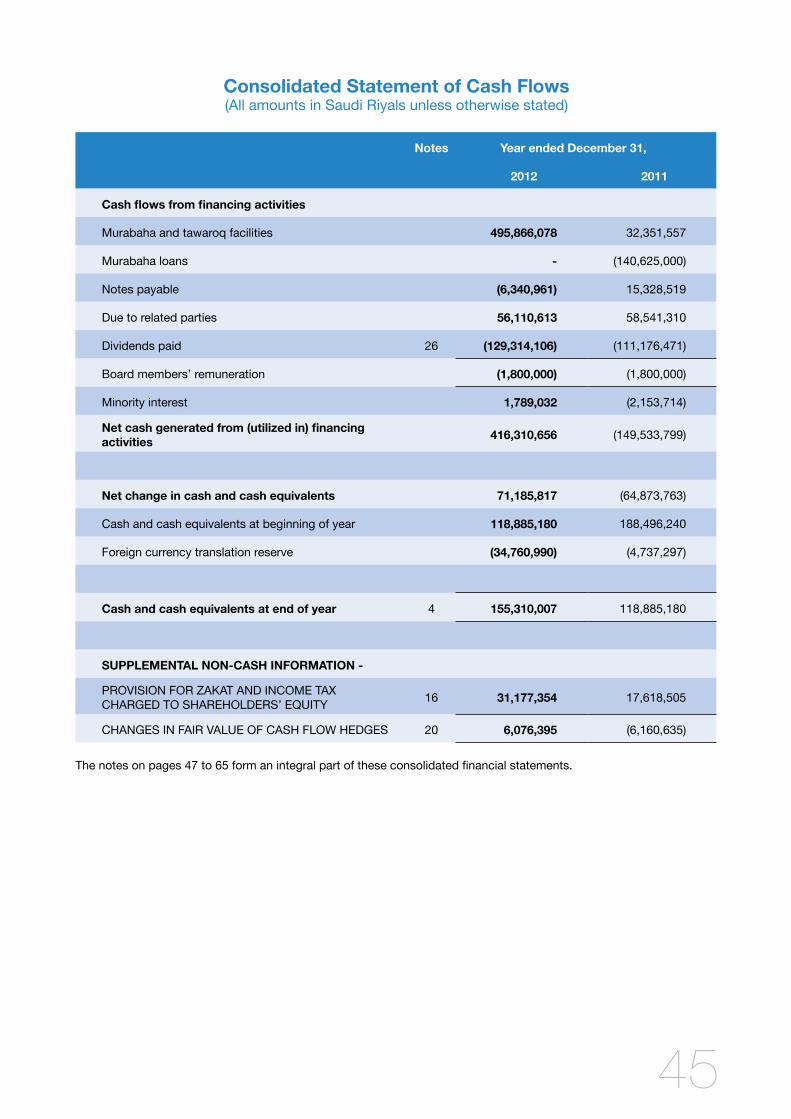
Consolidated Statement of Cash Flows 44
Consolidated Statement of Changes in Shareholders’ Equity 46
Notes to the Consolidated Financial Statements 47

40

41
Consolidated Balance Sheet(All amounts in Saudi Riyals unless otherwise stated)
As at December 31,
Assets Notes 2012 2011
Current assets
Cash and cash equivalents 4 155,310,007 118,885,180
Murabaha investments 407,681,759 459,106,759
Accounts receivable, net 5 771,670,748 579,173,855
Due from related parties 9 45,889,308 42,845,677
Inventories, net 6 816,463,270 552,280,893
Prepayments and other assets 7 177,723,323 89,013,364
2,374,738,415 1,841,305,728
Non-current assets
Investment in unconsolidated subsidiaries and as-sociates 8 1,996,201 1,590,634
Property, plant and equipment, net 10 1,159,913,122 1,072,319,694
Goodwill 11 44,054,811 44,054,811
Intangible assets, net 12 2,080,059 3,077,155
1,208,044,193 1,121,042,294
Total assets 3,582,782,608 2,962,348,022
Liabilities
Current liabilities
Murabaha and tawaroq facilities 13 1,016,524,253 520,658,175
Notes payable 14 17,582,644 23,923,605
Accounts payable 149,303,400 103,546,603
Due to related parties 9 2,768,687 10,967,063
Accrued and other liabilities 15 158,560,316 158,206,712
Provision for zakat and income tax 16 30,532,513 35,290,938
1,375,271,813 852,593,096
Non-current liabilities
Due to related parties 9 286,136,136 218,783,516
End of service benefits 17 64,196,557 57,852,070
Total liabilities 1,725,604,506 1,129,228,682
As at December 31,

42
Assets Notes 2012 2011
Equity
Shareholders of the Company:
Share capital 1,18 741,176,470 741,176,470
Statutory reserve 19 406,568,677 406,568,677
Retained earnings 738,034,366 658,047,024
Foreign currency translation reserve (43,366,363) (8,605,373)
Changes in fair value of cash flow hedges 20 (84,240) (6,160,635)
Total shareholders’ equity 1,842,328,910 1,791,026,163
Minority interest 14,849,192 42,093,177
Total equity 1,857,178,102 1,833,119,340
Total liabilities and equity 3,582,782,608 2,962,348,022
Contingencies and commitments 27
The notes on pages 47 to 65 form an integral part of these consolidated financial statements.
Consolidated Balance Sheet(All amounts in Saudi Riyals unless otherwise stated)

43
Consolidated Income Statement(All amounts in Saudi Riyals unless otherwise stated)
Year ended December 31,
Notes 2012 2011
Revenues 1,496,329,255 1,381,988,548
Cost of revenues (878,403,274) (832,207,589)
Gross profit 617,925,981 549,780,959
Operating expenses
Selling and marketing 21 (236,632,868) (224,711,591)
General and administrative 22 (185,702,491) (123,971,249)
Research and development (10,369,541) (14,316,158)
Income from main operations 185,221,081 186,781,961
Other income (expenses)
Share in net income (loss) of unconsolidated subsid-iaries and associates 8 405,567 (87,128)
Financial charges 13 (21,094,297) (16,253,650)
Other, net 23 49,105,208 61,428,885
Income from continuing operations before minority interest 213,637,559 231,870,068
Minority interest 29,033,019 16,257,926
Net income for the year 242,670,578 248,127,994
Earnings per share: 24
Income from main operations 2.50 2.52
Net income for the year 3.27 3.35
The notes on pages 47 to 65 form an integral part of these consolidated financial statements.

44
Consolidated Statement of Cash Flows(All amounts in Saudi Riyals unless otherwise stated)
Notes Year ended December 31,
2012 2011
Cash flows from operating activities
Net income for the year 242,670,578 248,127,994
Adjustments for non-cash items
Depreciation 10 39,835,373 27,806,008
Amortization 12 714,376 635,687
Share in net (income) loss of unconsolidated subsidiaries and associates 8 (405,567) 87,128
Loss applicable to minority interest (29,033,019) (16,257,926)
Changes in working capital
Accounts receivable, net (192,496,893) (74,875,258)
Inventories, net (264,182,377) (136,472,365)
Due from related parties - 592,912
Prepayments and other current assets (88,709,959) (21,898,518)
Accounts payable 45,756,797 6,612,800
Accrued and other current liabilities 6,038,226 2,391,208
Due to related parties - 10,423,246
Zakat and income tax paid 16 (35,935,779) (31,831,897)
End of service benefits, net 6,344,487 7,990,935
Net cash (utilized in) generated from operating activities (269,403,757) 23,331,954
Cash flows from investing activities
Murabaha investments 51,425,000 292,574,480
Investment in unconsolidated subsidiaries and associates - (1,768,815)
Purchases of property, plant and equipment 10 (184,076,197) (269,163,892)
Proceeds from disposal of property, plant and equipment, net 56,647,395 42,487,433
Intangible assets 282,720 (2,801,124)
Net cash (utilized in) generated from investing activities (75,721,082) 61,328,082
45
Notes Year ended December 31,
2012 2011
Cash flows from financing activities
Murabaha and tawaroq facilities 495,866,078 32,351,557
Murabaha loans - (140,625,000)
Notes payable (6,340,961) 15,328,519
Due to related parties 56,110,613 58,541,310
Dividends paid 26 (129,314,106) (111,176,471)
Board members’ remuneration (1,800,000) (1,800,000)
Minority interest 1,789,032 (2,153,714)
Net cash generated from (utilized in) financing activities 416,310,656 (149,533,799)
Net change in cash and cash equivalents 71,185,817 (64,873,763)
Cash and cash equivalents at beginning of year 118,885,180 188,496,240
Foreign currency translation reserve (34,760,990) (4,737,297)
Cash and cash equivalents at end of year 4 155,310,007 118,885,180
SUPPLEMENTAL NON-CASH INFORMATION -
PROvISION FOR ZAKAT AND INCOME TAx CHARGED TO SHAREHOLDERS’ EQUITY 16 31,177,354 17,618,505
CHANGES IN FAIR vALUE OF CASH FLOW HEDGES 20 6,076,395 (6,160,635)
The notes on pages 47 to 65 form an integral part of these consolidated financial statements.
Consolidated Statement of Cash Flows(All amounts in Saudi Riyals unless otherwise stated)

46
Con
solid
ated
Sta
tem
ent o
f Cha
nges
in S
hare
hold
ers’
Equ
ity(A
ll am
ount
s in
Sau
di R
iyal
s un
less
oth
erw
ise
stat
ed)
Not
esSh
are
capi
tal
Stat
utor
y
rese
rve
Ret
aine
d
earn
ings
Fore
ign
curr
ency
tr
ansl
atio
n re
serv
eC
hang
es in
fair
valu
e of
ca
sh fl
ow h
edge
sTo
tal
Janu
ary
1, 2
012
741,
176,
470
406,
568,
677
658,
047,
024
(8,6
05,3
73)
(6,1
60,6
35)
1,79
1,02
6,16
3
Net
inco
me
for t
he y
ear
--
242,
670,
578
--
242,
670,
578
Divi
dend
s26
--
(129
,705
,882
)-
-(1
29,7
05,8
82)
Boar
d m
embe
rs’ r
emun
erat
ion
--
(1,8
00,0
00)
--
(1,8
00,0
00)
Cur
renc
y tra
nsla
tion
diffe
renc
e of
con
solid
ated
sub
sidi
arie
s-
--
(34,
760,
990)
-(3
4,76
0,99
0)
Cha
nges
in fa
ir va
lue
of c
ash
flow
hed
ges
20-
--
-6,
076,
395
6,07
6,39
5
Zaka
t and
inco
me
tax
16-
-(3
1,17
7,35
4)-
-(3
1,17
7,35
4)
Dec
embe
r 31,
201
274
1,17
6,47
040
6,56
8,67
773
8,03
4,36
6(4
3,36
6,36
3)(8
4,24
0)1,
842,
328,
910
Janu
ary
1, 2
011
741,
176,
470
406,
568,
677
540,
514,
006
(3,8
68,0
76)
-1,
684,
391,
077
Net
inco
me
for t
he y
ear
--
248,
127,
994
--
248,
127,
994
Divi
dend
s26
--
(111
,176
,471
)-
-(1
11,1
76,4
71)
Boar
d m
embe
rs’ r
emun
erat
ion
--
(1,8
00,0
00)
--
(1,8
00,0
00)
Cur
renc
y tra
nsla
tion
diffe
renc
e of
con
solid
ated
sub
sidi
arie
s-
--
(4,7
37,2
97)
-(4
,737
,297
)
Cha
nges
in fa
ir va
lue
of c
ash
flow
hed
ges
20-
--
-(6
,160
,635
)(6
,160
,635
)
Zaka
t and
inco
me
tax
16-
-(1
7,61
8,50
5)-
-(1
7,61
8,50
5)
Dec
embe
r 31,
201
174
1,17
6,47
040
6,56
8,67
765
8,04
7,02
4(8
,605
,373
)(6
,160
,635
)1,
791,
026,
163
The
note
s on
pag
es 4
7 to
65
form
an
inte
gral
par
t of t
hese
con
solid
ated
fina
ncia
l sta
tem
ents
.

47
Notes to the consolidated financial statements for the year ended December 31, 2012(All amounts in Saudi Riyals unless otherwise stated)
1) General information
Astra Industrial Group Company (the “Company”) and its subsidiaries (collectively the “Group”) consist of the Company and its various Saudi Arabian and foreign subsidiaries listed below. The Company’s main objectives include establishment, management, operating and investment in industrial entities (subject to obtaining the Saudi Arabian General Investment Authority (“SAGIA”) approval for each project to be established).
The Company is a Saudi Joint Stock Company licensed under foreign investment license No. 030114989-01 issued in Riyadh by SAGIA and operating under commercial registration No. 1010069607 issued in Riyadh on 9 Muharram 1409H (August 22, 1988). The registered address of the Company is P.O. Box 1560, Riyadh 11441, Kingdom of Saudi Arabia. The shares of Astra Industrial Group Company were listed on the Saudi Stock Market (“Tadawul”) on 17 Shabaan 1429H (August 18, 2008) through subscription of 30% of the Company’s shares by the public.
The accompanying consolidated financial statements include the accounts of the Company and its following subsidiaries, operating under individual commercial registrations:
Effective ownership %at December 31, 2012
Name of Subsidiary Country ofincorporation Direct Indirect
Ø Tabuk Pharmaceutical Manufacturing Company (“TPMC”). This company has the following subsidiaries: Saudi Arabia 95 5
- Tabuk Pharmaceutical Research Company Jordan 100 -
- Tabuk Pharmaceutical Company Limited Sudan 80 -
- Al Bareq Pharmaceutical Manufacturing Factory Company Limited* Saudi Arabia 95 -
Ø Astra Polymer Compounding Company Limited (“Polymer”). This company has the following fully owned subsidiary: Saudi Arabia 95 5
- Constab Middle East Polimer A.S. (“CMEP”) Turkey 100 -
Ø International Building Systems Factory Company Limited (“IBSF”) Saudi Arabia 95 5
Ø Astra Industrial Complex Co. Ltd. for Fertilizer and Agrochemicals (“AstraChem”). This company has the following foreign subsidiaries:
Saudi Arabia 95 5
- AstraChem Saudia Algeria 100 -
- AstraChem Morocco Morocco 100 -
- Aggis International Limited British virginIslands 100 -
- AstraChem Turkey Turkey 100 -
- Astrachem Syria Syria 100 -
- Astrachem Tashqand Uzbekistan 100 -
- Astra Industrial Complex Co. Ltd. for Fertilizer and Agrochemicals, Jordan Jordan 50 -
- Astra Nova, Turkey Turkey 67 -
Ø Al-Tanmiya Company for Steel Manufacturing. This company has the following fully owned subsidiary: Jordan 51 -
- Al Inma’a Company Iraq 51 -
Ø Astra Energy LLC Jordan 76 -
Ø Astra Mining Company Limited Saudi Arabia 60 -
*The remaining 5% interest in this company is owned by Astra Industrial Group Company.
The principal activities of the subsidiaries are as follows:

48
· Production, marketing and distribution of medicine and pharmaceutical products.· Production of polymer compounds, plastic additives, color concentrates and other plastic products.· Metal based construction of industrial buildings and building frames.· Production of compounded fertilizers and agriculture pesticides and the wholesale and retail trading of
fertilizers, forages and insecticides. Also, execution of agricultural contracting projects.· Production of steel pallets and rebar and generation of the required power of such activity.· Exploration of all ores and minerals in all regions of the Kingdom of Saudi Arabia except for those land and
marine areas beyond the scope of application of the mining investment law specified in Article No. 8 of the law.
2) Summary of significant accounting policies
The principal accounting policies applied in the preparation of these consolidated financial statements are set out below. These policies have been consistently applied to all periods presented, unless otherwise stated.
2.1 Basis of preparation
The accompanying consolidated financial statements have been prepared under the historical cost convention on the accrual basis of accounting, as modified by the revaluation of derivatives financial instruments to fair value, and in compliance with accounting standards promulgated by Saudi Organization for Certified Public Accountants (“SOCPA”).
2.2 Critical accounting estimates and judgments
The preparation of consolidated financial statements in conformity with generally accepted accounting principles requires the use of certain critical estimates and assumptions that affect the reported amounts of assets and liabilities and disclosure of contingent assets and liabilities at the reporting date and the reported amounts of revenues and expenses during the reporting period. Estimates and judgments are continually evaluated and are based on historical experience and other factors, including expectations of future events that are believed to be reasonable under the circumstances. The Group makes estimates and assumptions concerning the future. The resulting accounting estimates will, by definition, seldom equal the related actual results.
2.3 Investments
(a) Subsidiaries
Subsidiaries are entities over which the Group has the power to govern the financial and operating policies to obtain economic benefit generally accompanying a shareholding of more than one half of the voting rights. The existence and effect of potential voting rights that are currently exercisable or convertible are considered when assessing whether the Group controls another entity. Subsidiaries are consolidated from the date on which control is transferred to the Group. They are de-consolidated from the date that control ceases.
Investments in subsidiaries which are not considered as material to the consolidated financial statements are accounted for using the equity method of accounting.
The purchase method of accounting is used to account for the acquisition of subsidiaries. The cost of an acquisition is measured as the fair value of the assets given or liabilities incurred or assumed at the date of acquisition, plus costs directly attributable to the acquisition. The excess of the cost of acquisition over the fair value of the Group’s share of the identifiable net assets acquired is recorded as goodwill. Goodwill is tested annually for impairment and carried at cost, net of impairment losses, if any.
Inter-company transactions, balances and unrealized gains on transactions between Group companies are eliminated. Unrealized losses are also eliminated. Accounting policies of subsidiaries have been changed where necessary to ensure consistency with the policies adopted by the Group.
(b) Associates
Associates are entities over which the Group has significant influence, but not control, generally accompanying a shareholding of between 20% and 50% of the voting rights. Investments in associates are accounted for using the

49
equity method of accounting and are initially recognized at cost.
The Group’s share of its associates’ post-acquisition income or losses is recognized in the consolidated income statement and its share of post-acquisition movements in reserves is recognized in reserves. The cumulative post-acquisition movements are adjusted against the carrying amount of the investment. When the Group’s share of losses in an associate equals or exceeds its interest in the associate, including any other unsecured receivables, the Group does not recognize further losses, unless it has incurred obligations or made payments on behalf of the associate.
Unrealized gains on transactions between the Group and its associates are eliminated to the extent of the Group’s interest in the associates.
2.4 SEGMENT REPORTING
(a) Business segment
A business segment is a group of assets, operations or entities:
(i) Engaged in revenue producing activities;(ii) Results of its operations are continuously analyzed by management in order to make decisions related to
resource allocation and performance assessment; and(iii) Financial information is separately available.
(b) Geographical segment
A geographical segment is a group of assets, operations or entities engaged in revenue producing activities within a particular economic environment that are subject to risks and returns different from those operating in other economic environments.
2.5 FOREIGN CURRENCY TRANSLATION
(a) Reporting currency
These consolidated financial statements are presented in Saudi Riyals (“SR”) which is the reporting currency of the Company.
(b) Transactions and balances
Foreign currency transactions are translated into Saudi Riyals using the exchange rates prevailing at the dates of the transactions. Foreign exchange gains and losses resulting from the settlement of such transactions and from the translation at the year-end exchange rates of monetary assets and liabilities denominated in foreign currencies are recognized in the consolidated income statement.
(c) Group companies
The results and financial position of foreign subsidiaries and associates having reporting currencies other than Saudi Riyals are translated into Saudi Riyals as follows:
(i) assets and liabilities for each balance sheet presented are translated at the closing exchange rate at the date of that balance sheet;
(ii) income and expenses for each income statement are translated at average exchange rates; and(iii) components of the equity accounts are translated at the exchange rates in effect at the dates the related
items originated. Cumulative adjustments resulting from the translations of the financial statements of foreign subsidiaries and
associates into Saudi Riyals, if material, are reported as a separate component of equity.
Dividends received from an associate or a subsidiary are translated at the exchange rate in effect at the transaction date and related currency translation differences are realized in the consolidated income statement.
When an investment in a foreign subsidiary and an associate is partially disposed off or sold, currency translation differences that were recorded in equity are recognized in the consolidated income statement as part of gain or loss on disposal or sale.
2.6 Cash and cash equivalents
Cash and cash equivalents include cash in hand and with banks and other short-term highly liquid investments with maturities of three months or less from the purchase date.

50
2.7 Murabaha investments
Murabaha investments are short-term highly liquid investments with original maturities of three months or more but not more than one year from the purchase date. Commission income is recognized on an accrual basis using agreed commission rates.
2.8 Accounts receivable
Accounts receivable are carried at original invoice amount less provision for doubtful debts. A provision against doubtful debts is established when there is objective evidence that the Group will not be able to collect all amounts due according to the original terms of the receivables. Such provisions are charged to the consolidated income statement, and reported under “Selling and marketing expenses”. When account receivable is uncollectible, it is written-off against the provision for doubtful debts. Any subsequent recoveries of amounts previously written-off are credited against “Selling and marketing expenses” in the consolidated income statement.
2.9 Accrued revenue
Accrued revenue represents revenue earned but not yet billed at year-end. Such amounts will be billed in the subsequent period. These balances are currently included under accounts receivable.
2.10 Inventories
Inventories are carried at the lower of cost or net realizable value. Cost is determined using the weighted average method. The cost of finished products include the cost of raw materials, labor and production overheads.
Net realizable value is the estimated selling price in the ordinary course of business, less the costs of completion and selling expenses.
2.11 Property, plant and equipment
Property, plant and equipment are carried at cost less accumulated depreciation except projects under construction which is carried at cost. Land is not depreciated. Depreciation is charged to the consolidated income statement, using the straight-line method to allocate the costs of the related assets over the following estimated useful lives:
Number of Years
Buildings 10 - 33
Leasehold improvements 4 - 10
Machinery and equipment 5 - 12.5
Furniture, fixtures and office equipment 3 - 10
vehicles 4
Computer software 4
Gains and losses on disposals are determined by comparing proceeds with carrying amount and are included in the consolidated income statement.
Maintenance and normal repairs which do not materially extend the estimated useful life of an asset are charged to the consolidated income statement, as and when incurred. Major renewals and improvements, if any, are capitalized and the assets so replaced are retired.
2.12 Impairment of non-current assets
Non-current assets are reviewed for impairment whenever events or changes in circumstances indicate that the carrying amount may not be recoverable. An impairment loss is recognized for the amount by which the carrying amount of the asset exceeds its recoverable amount which is the higher of an asset’s fair value less cost to sell and value in use. For the purpose of assessing impairment, assets are grouped at lowest levels for which there are separately identifiable cash flows (cash-generating units). Non-current assets other than intangible assets that suffered impairment are reviewed for possible reversal of impairment at each reporting date. Where an impairment loss subsequently reverses, the carrying amount of the asset or cash-generating unit is increased to the revised

51
estimate of its recoverable amount, but the increased carrying amount should not exceed the carrying amount that would have been determined, had no impairment loss been recognized for the assets or cash-generating unit in prior years. A reversal of an impairment loss is recognized as income immediately in the consolidated income statement. Impairment losses recognized on intangible assets are not reversible.
2.13 Intangible assets
Intangible assets, apart from goodwill, represent registration and license fees and are amortized on a straight-line method over a period of 5 years.
2.14 Borrowings
Borrowings are recognized at the proceeds received, net of transaction costs incurred, if any. Borrowing costs that are directly attributable to the acquisition, construction or production of qualifying assets are capitalized as part of those assets. Other borrowing costs are charged to the consolidated income statement.
2.15 End of service benefits
End of service benefits required by Saudi Labor Law are accrued by the Group and its Saudi subsidiaries and charged to the consolidated income statement. The liability is calculated; at the current value of the vested benefits to which the employee is entitled, should the employee leave at the consolidated balance sheet date. Termination payments are based on employees’ final salaries and allowances and their cumulative years of service, as stated in the laws of Saudi Arabia.
The foreign subsidiaries provide indemnity plans for employee end of service and other benefits as required under the laws of their respective countries of domicile. There are no funded or unfunded benefit plans established by the foreign subsidiaries.
2.16 Accounts payable and accruals
Liabilities are recognized for amounts to be paid for goods and services received, whether or not billed to the Group.
2.17 Zakat and taxes
In accordance with the regulations of the Department of Zakat and Income Tax (“DZIT”), the Group is subject to zakat attributable to the Saudi shareholders and to income tax attributable to the foreign shareholders. Provisions for zakat and income tax are charged to the equity accounts of the Saudi and the foreign shareholders, respectively. Additional amounts payable, if any, at the finalization of final assessments are accounted for when such amounts are determined. For subsidiaries outside the Kingdom of Saudi Arabia, provision for income tax is computed in accordance with tax regulations as applicable in the respective countries, if required, and charged to the consolidated income statement.
Deferred income taxes are recognized on all major temporary differences between financial income and taxable income during the year in which such differences arise, and are adjusted when related temporary differences are reversed. Deferred income tax assets on carry forward losses are recognized to the extent that it is probable that future taxable income will be available against which such carry-forward tax losses can be utilized. Deferred income taxes are determined using tax rates which have been enacted by the consolidated balance sheet date and are expected to apply when the related deferred income tax asset is realized or the deferred income tax liability is settled. Deferred income taxes arising out of such temporary differences were not significant and, accordingly, were not recorded as of December 31, 2012 and 2011.
The Group and its Saudi Arabian subsidiaries withhold taxes on certain transactions with non-resident parties in the Kingdom of Saudi Arabia as required under Saudi Arabian Income Tax Law.
2.18 Derivative financial instruments
The Group uses forward contracts to hedge its risks of foreign currency fluctuations associated with operational activities and are recognized at fair value. All financial derivatives are carried as assets when the fair value is positive, and as liabilities when the fair value is negative.
52
Usually, fair values of forward contracts are being obtained with reference to current market prices, if such market prices are not available, fair values are determined at other forecast bases, as appropriate.
When using derivative financial instruments to hedge risks of cash flows related to certain obligations or expected transactions, gains or losses arising from financial instruments that qualify for hedge accounting are directly taken to shareholders’ equity. The ineffective portion of an effective hedge is taken to the consolidated statement of income and any gains/losses generated at recognition of financial instrument values, are being recognized.
If the hedging instrument expires and hedged transactions are still probable to occur, gains and losses are retained in the shareholders’ equity, and recognized in accordance with the policy above, if such transaction is not probable, accumulated gains/losses - which is already recognized in shareholders’ equity - are taken to the consolidated statement of income.
2.19 Provisions
Provisions are recognized when; the Group has a present legal or constructive obligation as a result of a past event; it is probable that an outflow of resources will be required to settle the obligation; and the amount can be reliably estimated.
2.20 Revenue recognition
Revenues are recognized upon delivery of products and customer acceptance, if any, or on the performance of services. Revenues are shown net of trade or quantity discounts, if any, and after eliminating sales within the Group. Royalty income is recognized on an accrual basis in accordance with the substance of agreements.
Contract revenues are recognized using the percentage of completion method. The percentage of completion is determined by comparison of contract cost incurred to date with the total estimated cost for the contract. Changes in cost estimates and losses on uncompleted contracts, if any, are recognized in the period they are determined. When it is probable that the total contract costs will exceed the total contract revenues, the expected loss is recognized immediately. Costs and estimated earnings in excess of billing, if any, are included in the current assets. However, billing in excess of costs incurred and estimated earnings, if any, are included in current liabilities.
2.21 Selling, marketing, general and administrative expenses
Selling, marketing, general and administrative expenses include direct and indirect costs not specifically part of production costs as required under generally accepted accounting principles. Allocations between selling, marketing and general and administrative expenses and cost of revenues, when required, are made on a consistent basis.
2.22 Research and development costs
Research and development costs are charged to the consolidated income statement in the period in which they are incurred.
2.23 Operating leases
Rental expenses under operating leases are charged to the consolidated income statement over the period of the respective lease.
2.24 Dividends
Dividends are recorded in the consolidated financial statements in the period in which they are approved by the shareholders of the Company.
2.25 Reclassification
Following reclassification has been made in the comparative 2011 interim consolidated financial statements to conform with 2012 presentation:

53
(i) For proper presentation, medical samples amounting to SR 4.53 million for the year ended December 31, 2011 have been reclassified as part of cost of revenues from selling and marketing expenses.
(ii) Also, for proper presentation, certain balances included in non-current liabilities and end of service benefits at December 31, 2011 amounting to SR 5.99 million and SR 1.3 million, respectively, were reclassified as part of accrued and other current liabilities.
3) Financial instruments and risk management
The Group’s activities expose it to a variety of financial risks: market risk (including currency risk, fair value and cash flows interest rate risks and price risk), credit risk and liquidity risk. The Group’s overall risk management program focuses on the unpredictability of financial markets and seeks to minimize potential adverse effects on the Group’s financial performance.
Risk management is carried out by senior management. The most important types of risks are summarized below.
Financial instruments carried on the consolidated balance sheet include cash and cash equivalents, Murabaha investments, accounts receivable, investments in unconsolidated subsidiaries and associates, murabaha and tawaroq facilities, notes payable and accounts payable. The particular recognition methods adopted are disclosed in the individual policy statements associated with each item.
Financial asset and liability is offset and net amounts reported in the consolidated financial statements, when the Company has a legally enforceable right to set off the recognized amounts and intends either to settle on a net basis, or to realize the asset and liability simultaneously.
3.1 Currency risk
Currency risk is the risk that the value of a financial instrument will fluctuate due to changes in foreign exchange rates. The Group’s transactions are principally in Saudi Riyals, US dollars, Turkish Lyra, Euro, UAE Dirham, Jordanian Dinar and Sudanese Pound.
The Group operates internationally and is exposed to foreign exchange risk arising from various currency exposures. The Group also has investments in foreign subsidiaries and associates, whose net assets are exposed to currency translation risk. Currently, such exposures are mainly related to exchange rate movements between Saudi Riyals against Sudanese Pound, Turkish Lyra, Jordanian Dinar and other. Such exposures are recorded as a separate component of shareholders’ equity in the accompanying consolidated financial statements.
3.2 Fair value and cash flows interest rate risks
Fair value and cash flow interest rate risks are the exposures to various risks associated with the effect of fluctuations in the prevailing interest rates on the Group’s financial positions and cash flows. The Group’s interest rate risks arise mainly from its murabaha investments and murabaha and tawaroq facilities which are at floating rate of interest and are subject to repricing on a regular basis.
3.3 Price risk
The risk that the value of a financial instrument will fluctuate as a result of changes in market prices, whether those changes are caused by factors specific to the individual instrument or its issuer or factors affecting all instruments traded in the market. The Group is currently not exposed to price risk.
3.4 Credit risk
Credit risk is the risk that one party to a financial instrument will fail to discharge an obligation and cause the other party to incur a financial loss. Cash is placed with banks with sound credit ratings. Accounts receivable are carried net of provision for doubtful debts.

54
3.5 Liquidity risK
Liquidity risk is the risk that an enterprise will encounter difficulty in raising funds to meet commitments associated with financial instruments. Liquidity risk may result from an inability to sell a financial asset quickly at an amount close to its fair value. Liquidity risk is managed by monitoring on a regular basis that sufficient funds are available through committed credit facilities to meet any future commitments.
3.6 Fair value
Fair value is the amount for which an asset could be exchanged, or a liability settled between knowledgeable willing parties in an arm’s length transaction. As the Group’s financial instruments are compiled under the historical cost convention except for revaluation of derivatives financial at fair value, differences can arise between the book values and fair value estimates. Management believes that the fair values of the Group’s financial assets and liabilities are not materially different from their carrying values.
4) Cash and cash equivalents
2012 2011
Cash at banks 151,278,174 116,052,038
Cash in hand 4,031,833 2,833,142
155,310,007 118,885,180

55
5) Accounts receivable, net
2012 2011
Accounts receivable - trade 760,159,573 570,471,915
Accrued revenue 39,263,106 29,132,763
799,422,679 599,604,678
Less: Provision for doubtful debts (27,751,931) (20,430,823)
771,670,748 579,173,855
6) Inventories, net
2012 2011
Raw and packing materials 527,229,294 367,889,860
Finished goods 220,563,631 103,945,254
Work in process 32,468,031 33,691,499
Goods in transit 13,958,428 39,673,407
Spare parts and consumables (not held for sale) 49,189,589 24,877,855
843,408,973 570,077,875
Less: Provision for obsolete and slow moving inventories (26,945,703) (17,796,982)
816,463,270 552,280,893
7) Prepayments and other current assets
2012 2011
Advances to suppliers 106,307,679 34,398,638
Prepaid expenses 37,754,925 23,516,041
Employees’ receivables 16,855,506 13,643,241
Refundable deposits and insurance claims 4,890,346 7,329,967
Accrued murabaha income 2,867,716 2,120,497
Other 9,047,151 8,004,980
177,723,323 89,013,364

56
8) Investment in unconsolidated subsidiaries and associates
Ownership interest
2012 2011
Unconsolidated subsidiaries:
Tabuk Poland Limited - Poland 100% 100%
Tabugen France - France 100% 100%
Tabuk Czech s.r.o - Czech Republic 100% 100%
Associates:
Mastra Agricultural Company - Egypt 49% 49%
Astra Agricultural Company Ltd. - Republic of Yemen 49% 49%
Movement of the Group’s share in unconsolidated subsidiaries and associates is as follows:
2012 2011
January 1 1,590,634 9,095,196
Additions - 134,889
Disposals / transfers - (7,552,323)
Share in net income (loss), net 405,567 (87,128)
December 31 1,996,201 1,590,634
9) Related party transactions and balances
During the years 2012 and 2011, the Company and its subsidiaries transacted with various related parties. Terms of those billings and charges are similar to commercial transactions with external parties. Following are the details of the major transactions with related parties during the years ended December 31:
2012 2011
Sales 18,223,627 14,170,552
Purchases 6,852,580 12,196,524
Finance commission 11,939,921 8,505,341

57
Due from related parties comprises of the following as of December 31:
2012 2011
Al-Kendi Factory - Algeria 25,076,479 24,693,789
United Pharmaceutical Manufacturing Company 9,131,510 9,124,810
Astra Agricultural Company Ltd. - Republic of Yemen 5,466,005 3,344,566
Munir Sukhtian Group - Jordan 3,435,939 1,583,541
Societe Tabuk Algeri (E.U.R.L) 1,570,410 1,570,410
Other 1,208,965 2,528,561
45,889,308 42,845,677
Due to related parties comprises of the following as of December 31:
2012 2011
Current:
Nour Communications Company 436,365 2,725,590
Dr. Bahaa Al Din Abdlhamid - 4,316,740
Arab Supply and Trading Company - 1,455,113
Other 2,332,322 2,469,620
2,768,687 10,967,063
Non-current:
Al Maseera International Company 244,886,136 181,283,516
Mr. Ali Shamara 41,250,000 37,500,000
286,136,136 218,783,516
Non-current amounts above represent long term loans from the minority shareholders in Al-Tanmiya Company for Steel Manufacturing and Astra Energy Company (subsidiaries), to finance the construction of the steel factory and a power station. These balances are not scheduled for repayment during next twelve month.

58
10)
Prop
erty
, pla
nt a
nd e
quip
men
t, ne
t
Land
Build
ings
Leas
ehol
d im
prov
emen
ts
Mac
hine
ry
and
equi
pmen
t
Furn
iture
, fix
ture
s an
d offi
ce
equi
pmen
t
Vehi
cles
Com
pute
r so
ftwar
e
Proj
ects
un
der
cons
truc
tion
Tota
l
Cos
t
Janu
ary
1, 2
012
12,9
08,6
9315
7,08
2,13
19,
662,
293
309,
694,
351
39,4
73,8
9127
,474
,374
-76
8,22
4,02
61,
324,
519,
759
Addi
tions
-19
,036
,425
693,
317
42,5
59,9
275,
817,
857
6,48
8,69
616
,685
,973
92,7
94,0
0218
4,07
6,19
7
Disp
osal
s/ tr
ansf
ers
-(3
83,9
13)
(87,
983)
(13,
915,
221)
(641
,230
)(4
,928
,034
)-
(42,
743,
869)
(62,
700,
250)
Dec
embe
r 31,
201
212
,908
,693
175,
734,
643
10,2
67,6
2733
8,33
9,05
744
,650
,518
29,0
35,0
3616
,685
,973
818,
274,
159
1,44
5,89
5,70
6
Accu
mul
ated
de
prec
iatio
n
Janu
ary
1, 2
012
-51
,255
,056
3,80
4,77
515
7,01
2,26
724
,488
,723
15,6
39,2
44-
-25
2,20
0,06
5
Cha
rge
for t
he y
ear
-5,
330,
988
1,27
6,97
420
,988
,744
4,52
3,47
14,
153,
045
3,56
2,15
1-
39,8
35,3
73
Disp
osal
s-
(371
,728
)-
(3,3
08,9
65)
(622
,085
)(1
,750
,076
)-
-(6
,052
,854
)
Dec
embe
r 31,
201
2-
56,2
14,3
165,
081,
749
174,
692,
046
28,3
90,1
0918
,042
,213
3,56
2,15
1-
285,
982,
584
Net
boo
k va
lue
Dec
embe
r 31,
201
212
,908
,693
119,
520,
327
5,18
5,87
816
3,64
7,01
116
,260
,409
10,9
92,8
2313
,123
,822
818,
274,
159
1,15
9,91
3,12
2
Dec
embe
r 31,
201
112
,908
,693
105,
827,
075
5,85
7,51
815
2,68
2,08
414
,985
,168
11,8
35,1
30-
768,
224,
026
1,07
2,31
9,69
4
So
me
of th
e bu
ildin
gs a
nd p
lant
faci
litie
s of
the
Com
pany
’s su
bsid
iarie
s ar
e co
nstru
cted
on
land
leas
ed u
nder
var
ious
ope
ratin
g le
ase
agre
emen
ts a
t nom
inal
ann
ual r
ent u
nder
re
new
able
ope
ratin
g le
ases
.
Pr
oper
ty, p
lant
and
equ
ipm
ent a
lso
incl
ude
an a
mou
nt e
qual
to S
audi
Riy
als
39.5
milli
on (2
001:
27.
6 m
illion
) ela
ted
to c
omm
issi
on o
n lo
ans
whi
ch w
as c
apita
lized
as
part
of
prop
erty
, pl
ant
and
equi
pmen
t co
st in
acc
orda
nce
with
the
acc
ount
ing
stan
dard
s ap
plic
able
in t
he K
ingd
om o
f Sa
udi A
rabi
a.
Th
e G
roup
is in
the
proc
ess
of e
xpan
ding
and
est
ablis
hing
new
pro
duct
ion
faci
litie
s. P
roje
cts
unde
r con
stru
ctio
n at
Dec
embe
r 31,
201
2 pr
inci
pally
repr
esen
t cos
ts in
curre
d on
se
vera
l exp
ansi
on a
nd n
ew p
roje
cts.
59
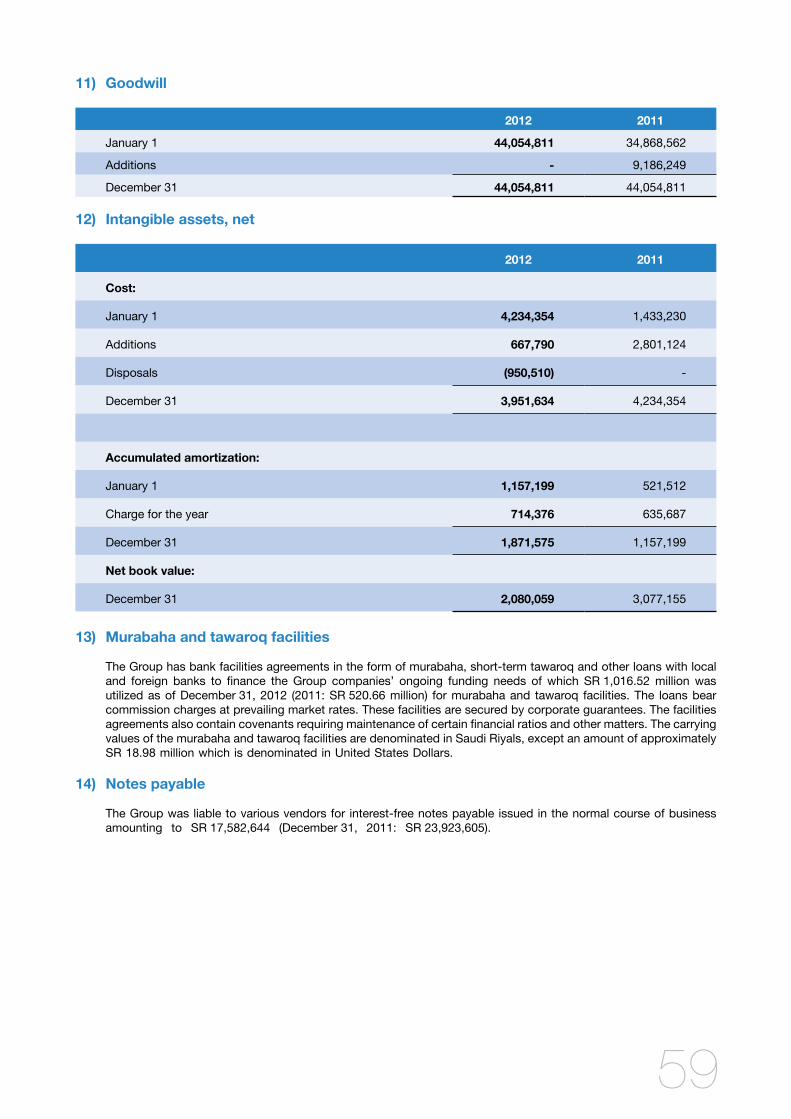
11) Goodwill
2012 2011
January 1 44,054,811 34,868,562
Additions - 9,186,249
December 31 44,054,811 44,054,811
12) Intangible assets, net
2012 2011
Cost:
January 1 4,234,354 1,433,230
Additions 667,790 2,801,124
Disposals (950,510) -
December 31 3,951,634 4,234,354
Accumulated amortization:
January 1 1,157,199 521,512
Charge for the year 714,376 635,687
December 31 1,871,575 1,157,199
Net book value:
December 31 2,080,059 3,077,155
13) Murabaha and tawaroq facilities
The Group has bank facilities agreements in the form of murabaha, short-term tawaroq and other loans with local and foreign banks to finance the Group companies’ ongoing funding needs of which SR 1,016.52 million was utilized as of December 31, 2012 (2011: SR 520.66 million) for murabaha and tawaroq facilities. The loans bear commission charges at prevailing market rates. These facilities are secured by corporate guarantees. The facilities agreements also contain covenants requiring maintenance of certain financial ratios and other matters. The carrying values of the murabaha and tawaroq facilities are denominated in Saudi Riyals, except an amount of approximately SR 18.98 million which is denominated in United States Dollars.
14) Notes payable
The Group was liable to various vendors for interest-free notes payable issued in the normal course of business amounting to SR 17,582,644 (December 31, 2011: SR 23,923,605).
60
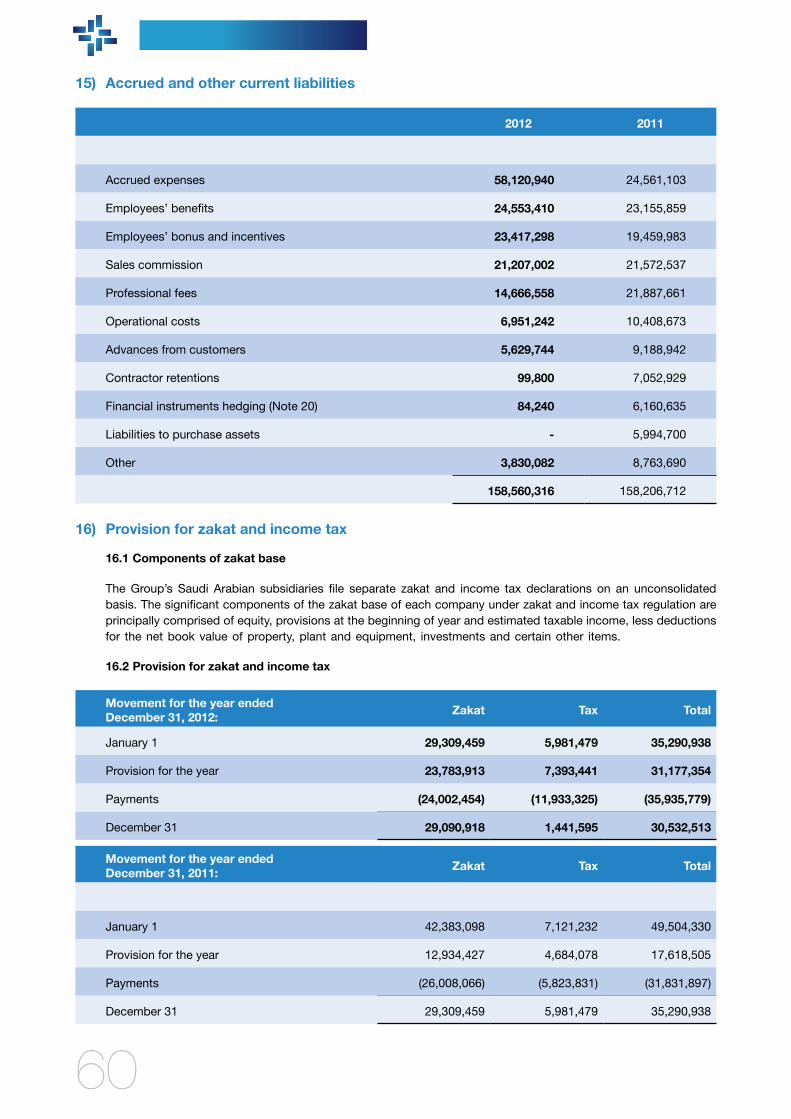
15) Accrued and other current liabilities
2012 2011
Accrued expenses 58,120,940 24,561,103
Employees’ benefits 24,553,410 23,155,859
Employees’ bonus and incentives 23,417,298 19,459,983
Sales commission 21,207,002 21,572,537
Professional fees 14,666,558 21,887,661
Operational costs 6,951,242 10,408,673
Advances from customers 5,629,744 9,188,942
Contractor retentions 99,800 7,052,929
Financial instruments hedging (Note 20) 84,240 6,160,635
Liabilities to purchase assets - 5,994,700
Other 3,830,082 8,763,690
158,560,316 158,206,712
16) Provision for zakat and income tax
16.1 Components of zakat base
The Group’s Saudi Arabian subsidiaries file separate zakat and income tax declarations on an unconsolidated basis. The significant components of the zakat base of each company under zakat and income tax regulation are principally comprised of equity, provisions at the beginning of year and estimated taxable income, less deductions for the net book value of property, plant and equipment, investments and certain other items.
16.2 Provision for zakat and income tax
Movement for the year ended December 31, 2012: Zakat Tax Total
January 1 29,309,459 5,981,479 35,290,938
Provision for the year 23,783,913 7,393,441 31,177,354
Payments (24,002,454) (11,933,325) (35,935,779)
December 31 29,090,918 1,441,595 30,532,513
Movement for the year ended December 31, 2011: Zakat Tax Total
January 1 42,383,098 7,121,232 49,504,330
Provision for the year 12,934,427 4,684,078 17,618,505
Payments (26,008,066) (5,823,831) (31,831,897)
December 31 29,309,459 5,981,479 35,290,938

61
16.3 Status of final assessmentS
The Company and its subsidiaries filed zakat/income tax returns for the years through December 31, 2011. The following are the final zakat and income tax assessments of the Company and its subsidiaries that have been agreed with the DZIT as at December 31, 2012:
Name of subsidiary/companyFinal zakat/ income
tax assessments up to
Astra Industrial Group Company 2004
Tabuk Pharmaceutical Manufacturing Company 2002
ASTRA Polymer Compounding Company Limited 2002
International Building Systems Factory Company Limited 2002
Astra Industrial Complex Ltd. for Fertilizers and Agrochemicals 2005
Astra Mining Company Limited Not yet issued
Al Bareq Pharmaceutical Manufacturing Factory Company Not yet issued
17) End of service benefits
2012 2011
January 1 57,852,070 51,160,192
Provisions 10,946,800 13,516,960
Payments (4,602,313) (6,825,082)
December 31 64,196,557 57,852,070
18) Share capital
The share capital of the Company as at December 31 was comprised of 74,117,647 shares stated at SR 10 per share owned as follows:
Shareholders Shareholding
2012 2011
Saudi founding shareholders 58.89% 58.89%
Non-Saudi founding shareholders 11.11% 11.11%
Public 30.00% 30.00%
100.00% 100.00%
19) Statutory reserve
In accordance with the Regulations for Companies in Saudi Arabia and the Company’s By-laws, the Company has established a statutory reserve by the appropriation of 10% of net income until the reserve equals at least 50% of the share capital. This reserve is not available for dividend distribution.

62
20) Derivative financial instruments
The fair value of derivative financial instruments (foreign exchange forward contract) together with the contract amounts is as follows:
Notional amount Negative fair value
December 31, 2012 2,722,390 (84,240)
December 31, 2011 61,845,113 (6,160,635)
21) Selling and marketing expenses
2012 2011
Employees’ salaries, bonus and other benefits 119,660,171 114,267,482
Marketing, advertising and promotions 57,042,014 47,484,006
Distribution charges 12,627,045 17,348,028
Travel and transportation 9,506,282 6,707,733
Provision for doubtful debts 8,232,169 5,478,337
Rent 6,477,675 5,569,409
Expired and damaged inventory 3,126,269 3,026,266
Registration 2,514,774 8,186,135
Depreciation 2,835,193 3,076,498
Utilities 1,723,134 1,944,029
Other 12,888,142 11,623,668
236,632,868 224,711,591
22) General and administrative expenses
2012 2011
Employees’ salaries, bonus and other benefits 100,400,540 80,419,064
Professional fees 29,432,948 10,449,593
Travel and transportation 18,053,406 9,042,072
Rent 6,642,400 3,512,818
Depreciation 6,289,833 6,278,127
Utilities 4,490,911 2,007,701
Maintenance 2,956,243 2,261,586
Communications and office expenses 2,231,596 1,590,497
Amortization 375,711 313,583
Other 14,828,903 8,096,208
185,702,491 123,971,249

63
23) Other income, net
2012 2011
Toll manufacturing fee 28,940,554 33,478,413
Income on Murabaha investments 11,865,816 15,335,666
Investment income 5,343,241 -
Royalty income 3,217,811 2,297,099
Sale of scraped items 1,939,477 2,348,766
Foreign exchange (loss) gain (8,436,954) 2,685,212
Other, net 6,235,263 5,283,729
49,105,208 61,428,885
24) Earnings per share
Earnings per share for the years ended December 31, 2012 and 2011 have been computed by dividing the income from main operations and net income for each year by weighted average number of shares outstanding during such years.
25) Segment information
The Group operates principally in the following major business segments:
(i) Pharmaceuticals; (ii) Specialty Chemicals; (iii) Steel Industries; and (iv) Holding Company and other

64
Selected financial information as at December 31, 2012 and 2011 and for the years then ended summarized by the above business segments was as follows:
2012 Pharmaceuticals Specialty Chemicals
Power and Steel
Industries
Holding Company and other
Total
Sales and projects revenue:
-Local 438,483,133 370,954,354 231,925,858 - 1,041,363,345
-Export 217,461,935 175,879,653 61,624,322 - 454,965,910
-Total 655,945,068 546,834,007 293,550,180 - 1,496,329,255
Gross profit 407,318,177 147,621,270 62,986,534 - 617,925,981
Income (loss) from main operations 149,500,068 67,953,018 (8,358,834) (23,873,171) 185,221,081
Income (loss) from continuing operations before minority interest
172,147,061 60,465,598 (8,052,036) (10,923,064) 213,637,559
Depreciation 14,841,388 13,279,299 6,799,877 4,914,809 39,835,373
Amortization 375,711 338,665 - - 714,376
Property, plant and equipment, net 180,991,036 156,130,008 805,013,893 17,778,185 1,159,913,122
Capital expenditures 41,435,956 77,139,332 47,434,314 18,066,595 184,076,197
2011 Pharmaceuticals Specialty Chemicals
Power and Steel
Industries
Holding Company and other
Total
Sales and projects revenue:
-Local 350,076,156 359,454,184 295,540,729 - 1,005,071,069
-Export 194,867,439 160,774,465 21,275,575 - 376,917,479
-Total 544,943,595 520,228,649 316,816,304 - 1,381,988,548
Gross profit 327,085,393 161,122,270 61,573,296 - 549,780,959
Income (loss) from main operations 97,973,321 91,055,787 16,061,355 (18,308,502) 186,781,961
Income (loss) from continuing operations before minority interest
133,837,262 79,414,583 18,831,066 (212,843) 231,870,068
Depreciation 10,287,744 9,699,829 6,726,083 1,092,352 27,806,008
Amortization 313,583 322,104 - - 635,687
Property, plant and equipment, net 166,792,958 123,301,476 765,502,963 16,722,297 1,072,319,694
Capital expenditures 65,124,023 94,969,914 99,527,161 9,542,794 269,163,892

65
The Group’s operations are conducted principally in Saudi Arabia, in addition to Iraq and other countries. Selected financial information as of December 31 and for the years then ended summarized by geographic area, was as follows:
2012 Saudi Arabia Iraq Other countries Total
Property, plant and equipment 385,820,303 718,194,196 55,898,623 1,159,913,122
2011
Property, plant and equipment 321,803,492 698,282,869 52,233,333 1,072,319,694
More than 70% of the Group’s export sales are in the Middle East and North African (MENA) region.
Property, plant and equipment in Iraq is owned by the Group through its two subsidiaries, Al Inma’a Company and Astra Energy LLC., in which it holds 51% and 76% interest.
26) Dividends
The General Assembly of the shareholders approved in its meeting held on 7 Rajab 1433H (corresponding to May 28, 2012) the Company’s Board of Directors’ recommendation to distribute cash dividends amounting to SR 129,705,882 for the year ended December 31, 2011 being SR 1.75 for each outstanding share.
27) Contingencies and commitments
At December 31, 2012, the Group had contingent liabilities arising in the normal course of business, in respect of letters of guarantee, amounting to SR 115,559,342 (2011: SR 145,723,440) and letters of credit amounting to SR 64,039,485 (2011: SR 109,531,037).
The Group in the normal course of business has entered into arrangements with suppliers for the purchase of machines and equipment and other services. The capital commitments at December 31, 2012 are amounting to SR 52.46 million (2011: SR 53.1 million).

66
Addresses
شركة أسرتا للطاقةAstra Energy
P.O.Box 1560 Riyadh 11441 Kingdom of Saudi Arabia Tel: +966 11 475 2002 Fax: +966 11 475 2001 [email protected]
P.O.Box 54061 Riyadh 11514 Kingdom of Saudi ArabiaTel : +966 11 477 2346 / 473 1130Fax: +966 11 478 [email protected]
P.O.Box 1737 Riyadh 11441 Kingdom of Saudi Arabia Tel: +966 11 256 0004 Fax: +966 11 [email protected] www.ibsf.com
P.O.Box 28170 Riyadh 11437 Kingdom of Saudi Arabia Tel: +966 11 4774946 Fax: +966 11 4778268 [email protected]
Shmiesani, Abu Hamid Al Ghazali St.Amman, Jordan.Tel: +962 6 569 2976, +962 656 79190Fax: +962 6 560 [email protected]
P.O.Box 30740 AlKhobar 31952Kingdom of Saudi Arabia Tel: +966 3 812 1232 Fax: +966 3 812 [email protected]


P.O.Box 1560 Riyadh, 11441 Kingdom of Saudi Arabia
Tel: +966 11 475 2002 Fax: +966 11 475 2001