annual report 2012-13 - public transport authority · your annual report in this report, the pta...
TRANSCRIPT

Annual Report 2012-13
Looking to the future

To the Hon. Troy Buswell MLA Minister for Transport
In accordance with Section 63 of the Financial Management Act 2006, I submit for your information and presentation to Parliament the Annual Report of the Public Transport Authority of Western Australia for the year ended 30 June 2013. The Annual Report has been prepared in accordance with the provisions of the Financial Management Act 2006.
Reece Waldock Chief Executive Officer

Contents
Letter to Minister
Overview
Introduction 2
Corporate Plan 2
Leadership overview 5
The numbers 9
PTA highlights 9
Service and financial achievements 10
Our Network 13
Network maps 14
Our Network – metro 24
Looking ahead 33
Spotlight: Transforming the CBD 36
Our Network – regional (Transwa) 38
Looking ahead 41
Our Network – regional (RTBS) 42
Looking ahead 43
Our Network – orange school buses
44
Customers and the community 47
Customer satisfaction 48
Spotlight: We’re listening to you 52
Safety and security 53
Access to services 57
Disability access 58
The environment 60
Communicating with our customers 61
Looking ahead 62
Fares and other revenue 63
Transperth zone map 64
Fares and other revenue – metro 65
Spotlight: SmartRider is a winner 66
Fares and other revenue – regional 70
About PTA 73
Our workforce 74
Spotlight: Ten years of transits 78
Property assets 79
Organisational structure 80
Executive profiles 81
Glossary of terms 86
Governance and compliance 87
Governance and compliance 88
Compliance statements 94
Key Performance Indicators 95
Financial statements 120
1

Introduction
The Public Transport Authority of Western Australia (PTA) is responsible for the operation of all bus, train and ferry public transport services in the greater metropolitan area under the Transperth brand. It also operates public transport services in regional centres, operates road coach and rail passenger services to regional areas under the Transwa brand, and administers and manages School Bus Services (SBS).
In addition to operating these transport services, the PTA is responsible for designing, building and maintaining public transport infrastructure and for protecting the long-term viability of Western Australia’s rail corridor and railway infrastructure.
The PTA delivers public transport services seven days a week and in some cases up to 24 hours a day.
As at June 30 2013, the PTA had 1538 employees spread across the metropolitan area, from Nowergup in the north to Mandurah in the south and Midland in the east, as well as in major regional centres such as Albany, Bunbury, Esperance, Geraldton and Kalgoorlie. The PTA also provides a substantial amount of its services and works projects using contractors and therefore has significant contract management functions.
Corporate Plan
VisionTo be recognised as a leader in providing world-class public transport services and solutions.
PurposeTo provide safe, customer-focussed, integrated and efficient transport services.
Values• Safety – We are committed to safety and
protecting your future.
• Respect – We value and respect our customers, suppliers and each other.
• Recognition – We recognise each other for achievement, initiative and innovation.
• Integrity – We are honest and ethical.
• Sustainability – We consider the long-term impact of everything we do – economic, social and environmental.
2 Public Transport Authority Annual Report 2012-13

Key Result AreasThe PTA has identified five Key Result Areas (KRAs) to ensure the organisation is focussed on realising its Vision. Each KRA contains goals to guide the prioritisation, development and implementation of strategies to achieve our KRAs.
• The PTA will improve system and service resilience through the strategic management of all critical assets.
• The PTA will secure a workforce with the right capabilities and attitudes.
• The PTA will provide public transport services that meet community demand and customer expectations.
• The PTA will make strategic and timely decisions through the use of integrated information and knowledge management systems.
• The PTA will apply communication strategies to improve patronage and increase customer satisfaction.
Customer Service CharterThe PTA is a customer service-oriented organisation, responsible for the delivery of efficient and sustainable passenger transport services to the public. It operates under the following Customer Service Charter:
• The PTA is committed to providing a quality passenger transport service to the public.
• Our bus, train and ferry staff and contractors are focussed on delivering safe and reliable services.
• Our staff and contractors will treat customers in a respectful and professional manner.
• Our buses, trains, ferries and facilities will be clean and well presented.
• Current information about all PTA services will be available from customer service staff, brochures, timetables, our call centres and our website.
• The PTA will plan and review passenger transport services in consultation with the community to get the best results.
• The PTA will plan and provide transport systems that respect the environment and improve sustainability.
To help us improve our services we maintain an InfoLine for feedback, 13 62 13, and our websites, www.pta.wa.gov.au, www.transperth.wa.gov.au or www.transwa.wa.gov.au for specific PTA business.
3

Your Annual Report
In this report, the PTA fulfils its reporting obligation by identifying the relevant strategic outcomes and its contribution to them in 2012-13 through:
• operational reports which show the effectiveness and efficiency of our transport services (9-86).
• compliance reports (87-94).
• audited key performance indicators report (95-119).
• audited financial report (120-164).
This year, to convey relevant information more clearly and concisely, we have adopted a new structure. Previous reports had been divided into the PTA’s departmental units rather than looking at the organisation as a whole. This year’s report presents seven major aspects of the PTA as seen by our passengers and the wider general public. Our Network offers key details of the PTA’s extensive network including patronage, fleet and maintenance and upgrades; Customers and the community focusses on our ongoing commitment to customer service and community engagement; Fares and other revenue looks at our overall income and expenditure; About PTA discusses the PTA workforce and property assets; and Governance and compliance, Key Performance Indicators and Financial statements finish off the mandatory reporting requirements.
Within various sections of the report, which is themed Looking to the future, we have included Spotlights, highlighting outstanding achievements or interesting case studies.
We have also included QR (Quick Response) codes in some sections to provide access to further information (supporting videos, documentation and websites) for readers with the appropriate smartphone app.
Measuring effectiveness and efficiencyTo honour the Government’s vision for Western Australia, the PTA has targeted two outcomes:
1. An accessible, reliable and safe public transport system.
2. Protection of the long-term functionality of the rail corridor and railway infrastructure.
Indicators of success in achieving the first of these outcomes are based on patronage and service provision, accessibility, reliability, customer satisfaction, safety and cost efficiency.
For the second outcome, success results from quality management of the railway corridor and residual issues of the rail freight network, which was leased to private sector operators in 2000.
4 Public Transport Authority Annual Report 2012-13

Perth has one of Australia’s most efficient and integrated transport systems. However, we face some unique challenges including vast urban sprawl and the nation’s fastest growing population. On the public transport front, the PTA has continued to plan for this growth and follow through on the priorities that have contributed to our system being recognised as the finest in the country.
Like every growing city, good public transport is essential to creating a socially and economically viable community by connecting people and places while reducing our carbon footprint. Significant works on key projects including Perth City Link in the CBD and the Joondalup Line extension to Butler are focussed on increasing the capacity of the current system.
In addition to these milestones and contributing to the PTA’s wonderful track record of achievement, works to provide passenger transport services that are accessible to everyone have also been undertaken.
Planning for a new railway station, bus interchange and 2000-bay Park ‘n’ Ride facility at Aubin Grove has started, and a long-running program to upgrade a number of stations – including better disability compliance and enhanced security through improved lighting and CCTV – continues.
The PTA leads through innovation by delivering these transformational projects and I am exceedingly proud of this.
Though Transperth’s overall satisfaction rating reflected some punctuality issues due to congestion and track works, 82.3 per cent of passengers were pleased with the services provided.
The latest addition to inner-city transport, the Green CAT service, connects Leederville with the Esplanade Busport and is yet another measure of how we are planning for our growing population.
Integration is the key when planning public transport for Perth. The system today operates on multi-mode ticketing and fare integration, which results in a simple fare structure and easy transfers between trains, buses and ferries.
Looking ahead, we are embarking on a whole new world of passenger movement using the same principles, via rapid transit services such as light rail and bus rapid transit. The final version of the Public Transport in Perth to 2031 plan is expected to outline a strategy to increase capacity and efficiency of the current network and further expand it, as well as implementing a rapid transit system.
By turning these short and long-term strategic transport plans into reality, the PTA and its portfolio partners – the Department of Transport and Main Roads WA – will continue to meet the community’s high expectations and build a world-class integrated transport network.
Reece Waldock CEO Public Transport Authority
CEO’s overview
5

In the world of commercial reality, the measure of how good you are is quite simple: what are your sales like? How many (of whatever it is you’re selling) were you able to shift; how does this compare with the past few years; and what does it look like for the next couple of years?
On this basis, the PTA is doing well.
We’re in the people-moving business, and in 2012-13 we moved more people than ever before. Total boardings on Transperth, the metro-area operation which does the bulk of our business and is therefore our most widely-recognised brand, were within a whisker of 150 million (149,697,303 to be precise), 3.9 per cent higher than 2011-12.
Rail travel represents an increasing proportion of this total. In the PTA’s first full year of operation (2003-04) rail patronage was 31.1m (and the total system was 90.6m); in the latest year it was 65.7m. In other words, rail patronage has more than doubled (up 111.25 per cent) over a period when system-wide total boardings have increased by a bit more than 65 per cent. In fact, it has increased by more than 600 per cent since the system was electrified and expanded in the early 1990s.
Urban passenger rail patronage across Australia’s major cities has been growing at a substantial rate for some years. In Perth, about 45 per cent of public transport trips are by rail, compared with 10 per cent in 1990.
We know that there is still latent demand in Perth’s northern and southern suburbs, and we know that demand overall will continue to increase. The scenario was central to a major multi-modal study, a draft of which was released for public comment late in 2011 by the
State Government. Public Transport for Perth in 2031 (the final copy is yet to be released) envisages that public transport use in Perth will double over the next 20 years.
Such is the way of modern public transport. A well-designed system will rely on direct, mass rapid transport to do the heavy lifting, and support it with a comprehensive feeder network. This is a concept which suits a linear city like Perth, where the combination of low population density and high car dependence results in one of the world’s most challenging environments for public transport.
Our take-up of public transport is increasing because it must. Traffic congestion – and all the socio-economic and environmental issues that go with it – is becoming a major problem all over the world. In Perth, this has been exacerbated by the extraordinary population growth we have seen over the past 5-6 years. While there are many exciting and transformational projects on our books and in the pipeline – some of which are discussed in this annual report – they are all a product of the increasing population and the increasing reliance on public transport.
This is the challenge that we face – to grow and change with the times... to stay ahead of the game without sacrificing performance standards, reliability or customer service.
Managing Director’s overview
6 Public Transport Authority Annual Report 2012-13

Thanks to the quality of our people, the quality of our service remains high despite the pressure generated by the explosion of numbers. Transperth leads the country in compliance with disability accessibility provisions and has been officially and independently recognised as having Australia’s best rail public transport system.
In successive polls (2011 and 2013) Canstar – a well-respected national industry pollster – looked at urban rail in Sydney, Melbourne, Brisbane, Adelaide and Perth on the basis of Overall Satisfaction, Reliability and Performance, Comfort, Timetable/Scheduling, Signage and Announcements, and Safety. Both times Transperth was rated significantly higher than any other system.
Canstar’s bouquet is consistent with the findings of Transperth’s Passenger Satisfaction Monitor, a comprehensive, independently-run tracking research program which has been running for 23 years. The PSM puts the percentage of passengers who are satisfied with Transperth overall in the low to mid-80s.
We are well placed to continue successfully meeting the challenges of the remarkable patronage growth.
We are in the middle of a major upgrade of our bus network – in 2011 the Government announced a five-year increase in Transperth’s annual bus service kilometres (a measure of the distance for which timetabled bus travel is funded) of 15.2 million – a massive 28.5 per cent. This was supported by a 19.8 per cent increase (also over five years) in the size of the bus fleet. Meanwhile, on top of the physical expansion and upgrading of our rail network, we are about to get 22 new three-car trains – deliveries start in the first half of 2013-14 and continue through until the end of 2016, with the intent of having deliveries of a new series of trains (yet to be ordered) start straight after that.
It’s a scenario which enables us to look to the future with confidence.
Mark Burgess Managing Director, Public Transport Authority
7

8 Public Transport Authority Annual Report 2012-13

WINNER Canstar Award for Best Urban Rail System
The numbers
$850 million of project work managed by the Major Projects unit
More than
42 million views on the Transperth website
61 million bus service kilometres delivered in the metro area
82.3% Transperth passenger satisfaction
92% Transwa passenger satisfaction
SmartRider made up
70% of fares
150 million metro boardings
1,538 employees
1,215 new parking bays constructed
25,064 training hours completed by PTA staff
Overview
The numbers
Our Network
Customers and the community
Fares and other revenue
About PTA
Governance and compliance
Key Performance Indicators
Financial statements
9

The numbers – Service and financial achievements During the financial year 2012-13, the PTA delivered public transport services to the people of Western Australia worth $1152.4 million. The graphs below shows how these funds were spent across each service. Refer to the individual sections of Review of Performance by mode for further details on expenditure by services. Total revenue and funding received during the year amounted to $912.2 million.
$50.0
$15.7
$117.7 $424.7
$428.0
$116.2
$69.9
$108.2 $140.8
$268.9
$245.4
$319.2
$212.4
$45.8
$654.0
Expenditure by service – $ million
Transperth Train Operations – 38% Transperth Metropolitan Bus and
Ferry Operations – 37% Regional School Bus Services – 10% Rail Corridor and Residual Freight
Issues – 10% Country Passenger Rail and Road
Coach Services – 4% Regional Bus Operations – 1%
Expenditure by type – $ million
Bus, ferry and regional bus operators – 28%
Supplies, services and energy – 24% Depreciation and amortisation – 21% Employee benefits expense – 12% School bus operators – 9% Finance costs – 6%
Income sources – $ million
State – 72% User charges and fees – 23% Other Income – 5%
10 Public Transport Authority Annual Report 2012-13

11

12 Public Transport Authority Annual Report 2012-13

Our Network
1,045 Transperth train services on an average weekday
14,871 Transperth bus trips on an average weekday
2.5 million regional town bus boardings in 2012-13
144 Transwa road coach services per week
29,153 regional and special education students carried per school day
Overview
The numbers
Our Network
Customers and the community
Fares and other revenue
About PTA
Governance and compliance
Key Performance Indicators
Financial statements
13

Our Network – network maps
14 Public Transport Authority Annual Report 2012-13

15

16 Public Transport Authority Annual Report 2012-13

17

18 Public Transport Authority Annual Report 2012-13

19

20 Public Transport Authority Annual Report 2012-13
Shire of Serpentine-Jarrahdale
Shire of Serpentine-Jarrahdale
Shire of Serpentine-JarrahdaleTow
n of Kw
inana
City of Armadale
City of ArmadaleShire of Serpentine-Jarrahdale
Shire of Serpentine-Jarrahdale
Shire of Murray
City of ArmadaleShire of Serpentine-Jarrahdale
BedfordaleRecreation Lake
MagenupLake
252
253
252
253
252
253
251 252253
253
251
252
253
251
253
251
Lookout
Netball
Tennis
Tennis
Jarrahdale Oval
Tennis
Tennis
BriggsPark
EquestrianArena
DavidButterfield Equestrian Ground
EquestrianArena
Serpentine Cemetery
Jarrahdale Cemetery
KeysbrookStation
Bella CummingReserve
FloraAnd Fauna Reserve
Beenyup BrookReserve
JandakotRegional Park
Mandejal BrookReserve
ForestGreen
Wungong RegionalPark
SerpentineNational Park
OscarBrunsReserve
CasuarinaNature Reserve
MundongNature Reserve
Paul Robinson Park
Spencer Reserve
LambkinReserve
Brickwood Reserve
CardupNature Reserve
SunraysPark
MundijongRailway Park
Whitby Falls Hostel
Byford CHC
BakerHall
SerpentineJarrahdale
Comm Centre
Wandi Comm Hall
HopelandComm Centre
SerpentineCWA Hall
JARRAHDALE
WELLARD
MARDELLA
OAKFORD
MUNDIJONG
BYFORD
BEDFORDALE
WANDI
WHITBY
KEYSBROOK
HILBERT
CARDUP
SERPENTINE
KARRAKUP
BANJUP
OLDBURY
HOPELAND
CASUARINA
BALDIVIS
FORRESTDALE
DARLING DOWNS
WUNGONG
SES
Karnet MinistryOf JusticePrison Farm
PoliceStation
ByfordSt Aidan Anglican
Church
ByfordFree
Reformed Church
Byford UnitingChurch
Jarrahdale St PaulAnglicanChurch
ByfordBaptist Church
KeysbrookBuddhist SocietyOf WA Retreat
Serpentine St KevinCatholic Church
SerpentineSt Stephen AnglicanChurch
MundijongUniting Church
Place of Worship
Mundijong LibrarySerpentineJarrahdale
ShireOffice
Mardella Hall
Department OfEnvironment AndConservation
Information
Bedfordale Hall
FS
FS
FS
FS
FS
FS
Byford Brickworks
Trotting
Horse
Horse
Horse
Horse
Trotting
Trotting
CarOrMotorcycle
BMX
Horse
Horse
Horse
Horse
BMX
Horse
Horse
Horse
Horse
Horse
Horse
Horse
K
WaterwayFarm
Studio
Clem KentishRecreationCentre
Foothills Polocrosse Club &Serpentine Horse
& Pony Club
Tennis
ByfordLawn Bowls
SerpentineGolf Clubhouse
JarrahdaleTennis ClubGooralong Park
Sou t
h W
e st e
r n H
wy
Sout
h W
este
r n H
wy
Albany Hwy
South
Western
Hwy
Tonk
in H
wy
Thomas Rd
Mundijong Rd
Coyle Rd
Wrig
ht R
d
Kar
gotic
h R
d
Rowley Rd
Hop
kins
on R
d
Richardson St
Jarrahdale Rd
King
Rd
Karnup Rd
Net
tleto
n R
d
Turner Rd
Springfield Rd
Kingsbury Dr
Admiral Rd
Sold
iers
Rd
Nettlet
on Rd
King
Rd
Kingsbury D
r
Nic
hols
on R
d
Hop
kins
on R
d
Rap id s
Rd
Thomas Rd
Karnup Rd
Anketell Rd
Orton Rd
Cas
uarin
a R
d
Rowley Rd
Orton Rd
Watkins Rd
Karg
otic
h R
d
Mundijong Rd
Lowlands Rd
Hop
kins
on R
d
Mortimer Rd
Sold
iers
Rd
Rowley Rd
Karnup Rd
Orton Rd
Pate
rson
St
Eleventh Rd
Karg
o ti c
h R
d
Wrig
ht R
d
CampsiteCampsite
C
entre R d
Adm
ir al R
d S
outh
Sel
kirk
Rd
Kittys Gorge Trk
Ro
bins
woo
d Folw
Water
Rd
Spencer Rd
Spe
ncer
Rd
Hayali Lodge
WhitbyFalls Coach
House Centre
MillbrookWinery
JarrahdaleHolidayCarriages
Ye OldeSerpentineInne Tavern
Leonda Reception/function Centre
JarrahdaleTavern
SerpentineRetreatCentre
ByfordTavern
Coffey
Rd
Devon Ct
Polla
rd
Crss
Mou
nt E
den
L ane
Vort illa Ct
Hol
mes
Rd
Ballawarra Av
Ada
ms
St
Jackson Rd
Mer
riwee
Lane
Abernethy Rd
Tige
reye
Av
Peac
h W
ay
Foster Way
Brock w ell Pl
Efficient Way
Dm
ietrief f R
d
Kar
dan
Bvd
Punrak
Rd
Empire Rose Ct
Bly theswoo
d Av
Yoorda
C l
Mckenna Dr
Atkins St
Wilaring St
Harwood Pass
Plaimar Rmbl
Brown St
Woile
Way
Wund i W
a y
Tranby Av
Ber nborough
Way
Bodem
a n R
d
Dia
ma n
tina
Bvd
She
ehan
Way
Pure
Steel Lan
e
Hu ghes
Rd
Veterans Dr
Portw
ine Av
Caraw
ay Av
Mintb erry G
dns
V ermi l io n
Bvd
Les lie Rd
Bunya Grn
Burgess Dr
Siri
us W
ayC
omic
Court Cct
Gadd Av
Goodman Dr
Rap ids
Rd
Kow
in C
t
Jubb Rd
Blair Rd
Pen
iche
Rd
Bla
ir R
d
Bu n do ran
Ap p
Honeyde w Bend
Dag
o stin
o R
d
Dar
b y W
ay
Roman Rd
Chr
ysom
ou S
t
Duckpond Rd
Mon
sign
or Av
Marr St
Leipold Rd
Hal
liday
Rd
Gloaming Way
Hug
gins
Rd
Pad
ra
Turn
Cal
negg
ia D
r
P
ony Pl
Tonkin St
Gua
va Link
Letterkenny Way
Rub
ery
Way
Hay
R
d
Cr a
nbou
rne
Way
Hof
fman
Way
Mill
ard
Wa y
Wes
tcot
t Rd
Nic
hols
on R
d
Nor
th R
d
Mele Mews
Wiroo Way
Miro Lane
Malek Dr
Marlee St
South Cr
Cum
min
g R
d
Dou
gall
St
Wandi Dr
Coron ation Rd
Old
Dai
ry Ct
Wilk
inso
n R
d
Jandu St
Stracham Way
North Cr
Sanda
lwoo
d Av
Mad
er R
d
Allanson Dr
Brig
gs R
d
Clo
on C
t
Wod
alla
Pde
He l
en C
r
War
ringt
on R
d
Craghill Way
Dowell Lane
Sunr
ays
St
Oak
Way
Dai
ry Li
nk
Meadowbrook Rtt
Limpet Way
Livesey St
Turquoise Rd
Redcu
rrant
St
Vickers Pass
Toffe
e La
ne
Abernethy Rd
Larsen Rd
Bat
ty R
d
Hun
t R
d
Cou
sens
St
Tonkin St
Beacham Rd
Ninka Lane
Spearmint Dr
Meyrick Link
Admiral Rd
Hilb
ert R
d
Marble Rd
Colesbrook Dr
Pyburne L ink
Pomera Dr
Shelley St
Butter Gum Cl
Valli Link
Summerfield Rd
Allwood Av
Tayl
or R
d
Macey Lane
Cath eri ne
St
J ac a
randa Av
Gho
st Gum Hts
Leslie St
George St
L efr oy S
t
North Rd
Beenyup Rd
Talla
gand
ra C
t
Wellard St
Stanley Rd
Walters Rd
Adon
is St
Vanc
e Rd
Park Rd
Bevis
Ct
But
cher
Rd
Cur
o S
t
Uren Way
Brady Rd
Craig St
Gob
by R
d
Clondyke Dr
Powd erba
rk C
l
C yprian Pl
Mas
ters
Rd
Jersey Rd
Rud
all
St
Sta
ff S
t
M icha el St
Old Haul
Road No.
3
Hibbertia C
t
Rustic Pl
Elliott Rd
Miyak Ct
Wallangarra Dr
Norman Rd
Blytheswood
Rd
Komiza
Ct
Senior Ct
Rob
inso
n S
t
Free
man
Rd
Clifton St
Mar
y S
t
Am
y S
t
Ma re e
Cl
Enf ie ld E
lb
Ora
na P
l
Harico
t L ane
Har
t Rd
Tayl
or R
d
Gaffin
Rd
Mead St
Castle Rd
Bird
Rd
Gib
lett
St
Wo lf e
Rd
Mcgurk Ct
Middleton Cl
Isma Ct
Waterside Pass
Dalray Ct
Learmouth
Turn
Evelyn St
An gus
Cl
Fairb airn Rd
Jamieson Rise
Barip Pl
Wallace StWhitby St
Richardson St
Cockram St
Rig
oll C
t
Absolon St
Bren Cl
Char les
St
Banks
i a R
d
Bilya Av
Ballagar Rd
Buck
land
Rd
Cardup Siding Rd
Hovea Ct
Jessie St
Daisy Rd
Bambee Ct
Kin
near
Trl
Makin Ct
Wilk
inso
n C
t
Lupi
no S
t
Dav
ey Rd
Tulloch Way
Buckle Ct
Bullock Dr
Peth ick Cl
Ste
vens
on P
l
Wun
gon g
Sout
h Rd
Redcliffe Rd
Ha w
k W
ay
Will
iam
St
Byford Dr
Del
ta Ct
Jone
s C
t
Scrivener Rd
Lion el St
Lin ton S
t
Clara S t
Wol fe
Rd
Culham
Vsta
Finch Mews
Walja Bend
Bar
jadd
a S
t
Parker Pl
Alic
e R
d
Karbro Dr
Wung ong
South
Rd
Kunz ea
Rise
Leys Rise
Pollard Crss West
Wun gong Cl
Mcneil Gr
Silverpan Way
Utley Rd
Newbold Rd
Mathews Cl
Rich ard son
St
Butc
her S
t
Pruden Rd
Anst
ey St
Sparkman Rd
Max w
e ll St
Si
lich
Ct
Karbro Dr
Bateman St
Hefro
n G
l de
Crossing View
Barratt Pl
Bur
rell
St
Cavanagh Cl
C h
ippe
r C
l
Old Haul Road No. 1
Friesian Cl
Corrigan Rise
Jilli
jilli
Cl
Bo t
ica
Cl
Bru
ns D
r
Freckleton
Ct
Knoop
Dr
Hetherington Cl
Gre
enhi
ll G
r
Cow
en S
t
Lydon Rd
Boomerang Rd
Lowlands Rd
Hillview Cl
Pinebrook Rd
Holmes Cl
Rho
des
Pl
Long
ridge
St
Robinson R
d
Scar
pvie
w D
r
Henderson West Rd
G odwit Rtt
Par
sons
Rd
Cross Rd
Eileen Av
Lewis Rd
Coleman C
l
Charolais Ct
College Ct
Tunn
ey R
d
Egerton Dr
Ditt
on R
d
Munro St
Simmental Pl
Bishop Rd
Mason Ct
Punrak Rd
Jolley Rd
Gooralong Rd
Stef
anel
li C
l
White Gum Rise
Cas
uarin
a R
d
Bas
kerv
ille
Rd
Old
Admira
l Lane
Wils
on S
t
Gull St
Balmoral Rd
Keenan St
Bra dsh aw
Rd
M yara Rd
Millb roo k Cl
Frayne Pl
Wattle Rd
Shale Rd
Livin
gstone Rd
Lang Rd
Gallagher
Way
Transit Rd
Par
r y R
d
Limous in
Pl
Bangap Pl
Wills P l
Lord Fury Ct
Dowell Cl
Reilly Rd
Chatfield Rd
Meado w
s W
ay
Lambert Lane
Tiara Ct
Gurners Lane
Gladstone Dr
Bushlark Cl
Kentucky Dr West
Man
ning
Rd
Bate Rd
Wal
ker
Rd
Lakeman
Pl
L aw
renc
e W
ay
Randell Rd
Stevens Rd
Eurythmic RdSaddle Lane
Evening Peal Ct
Gordon Rd
Binshaw Av
Northerly
Lane
Mitchell St
Littl e
Pl
F rem
nells
Vale
Gossage Rd
Lavery Dr
Firns
Rd
Rowley Rd
Bullara Rmbl
M arsh Ct
Pev
eret
t Lan
e
Sha
nley
Rd
Dirk Rd
Moore St
Ric
e R
d
Gan
gem
i Rd
Wes
tcot
t Rd
Fisher Rd
Keirnan St
Gibson Top
Shine Rd
Phar L ap
Dr
Echoveld Cl
Wal
ker
Rd
Nor
th
Fiel
dvie
w C
h
Ling
don
Lane
All u
m W
ay
Scott Rd
Galvin Rd
Hella Kipper Dr
Rain Lover Ct
Atk
ins
Rd
Wedgetail Dr
S wam p
Gum
Rd
Stockmans Cl
Kellet
Dr
Kar
nup
Cre
ek R
d
Leaver Way
Abernethy Rd
Arnold Rd
Boomerang Rd
Lyster Rd
Kiln Rd
Tuar
t R
d
Coogly Rd
Gull Rd
Dol
ey R
d
Manjedal R
d
Bishop Rd
Wal
ker R
d
Phi l lips Rd
Lowlands Rd
Boomerang Rd
Jarrah Rd
Feast Rd
Bade
n Rd
Henderson Rd
Rowe Rd
Araucaria B
v d
Moo
nsto
ne R
d
Portnoo Lane
Ale
xand
er R
d
Selkirk Rd
Bena
l la C
r
Plaistowe Bvd
Fawcett
Rd
Reed Rd
Hal
fpen
ny A
v
Cra
ddon
Rd
Woo
land
ra D
r
Evans Way
Ol d Ch
estn
ut La
ne
Dea
rden
Rd
Pri mrose
Loop
L int on S
t N
ort h
W
idji Way
Kandimak Bvd
Hal
l Rd
Hal
l R
d
Edw
ard Cr
Hop
elan
d R
d
Qui
bero
n Li
nk
Springfield Rd
Vla
sich
Rd
De
Hae
r Rd
Rai
ls C
r
F ore st Av
Skipt a
r Gr
Lightbody Rd
Marri Park Dr
Warburton Ct
Mal
arke
y R
d
Kar
gotic
h R
d
Geo
rge
St
Bla
ckbe
rry Rm
bl
Cura
co a Way
D'vitale Loop
Pira Loop
Irong
uard
Rd
Ki n
g Ja
rrah Cir
Falls Rd
Barraberry Way
Fielder Rd
Ray Cl
Old Bric
kwo
rks
Rd
Che
stnu
t R
d
Cad
u ce us Way
Jarra hgl en Rise
Holstein Ct
Marg
inata P de
Day Rd
Day R
d
Bullich Rtt
Dalley
St
Byford Me adows D
r
Gordin
W ay
Lampiter Dr
John Cr
Otw
ay P l
Kar
li Li
nk
Col
es S
t
Sco
vell
Cr
Medulla Rd
Harris
Pl
Wat
tle R
d
Coulterh and Cir
Coral Vine
Loop
Spears Dr
Ha rdey
Rd
Gad
dara
Cnr
Ballak
Pl
Aquanita Rise
Mckay
Dr
Alg
eri L
ink
Millars
Rd
Ada
mso
n S
t
Barg
e Dr
Mill
St
Rob
ert s
on R
d
Hic
ks S
t
Racy Prince Ct
Bournbrook Av
Thre
e Kanga
roos
Way
Foxton Dr
Foxto
n Dr
Wal
ton
St
Madeira Turn
That
cher
Rd
Baigup Loop
Sca
rp R
d
Mard
ja
Loop
Coun try
Dr
Berringar Elb
Macleod Cl
Lazenby Dr
Ren
aud
Way
Gin
gera
le
Cir
Sundew Lane
Cunningham Dr
Win
dm
ill Av
How
itzer
Tu
rn
Lore
nz W
ay
Peters Way
Adm
i ra l R
d S
o uth
Baldwin Rd
Salmon Bark Rd
BedfordaleChild Care
Centre
ByfordChild CareCentre
ByfordComm Kindy
Byford PS
Jarrahdale PS
John Calvin Sch- Byford
Marri Grove PS
Mundijong PS
Serpentine-JarrahdaleGram Sch
Serpentine PS
TAFE ChallengerIT -
Mundijong
Southern HillsChrist Coll
Bita
lli B
e nd
Truman Prom
Mead St
Mead St
Joh a
nsen
Rd
Baystone St
Aldred Turn
Ethereal Rd
Arc
her S
t
Durling Rd
Koo
nart
Pas
s
Han
rett y
Rd
Rodgers Cl
Bat
tam
s W
ay
Cril
lin W
ay
Dai
mpr
e W
ay
Bickel Lane
Hutchinson Bvd
Mclach
lan Turn
Banker St San
sim
eon
Bvd
Tonkin Hwy
Tonk
in H
wy
Henderson Rd
Carn
elia
n Lin
k
Ta nz anite Rd
Burto Cl
Atw
ell R
d
Ran
gevi
ew Lo
op
Partridge Bend
Gal
ilee
Cl
Sparkman Rd
Jarrah Rd
Granfell Way
Turner St
Hardey
Rd
Fa rm View
Malua Lane
C hicory Wa
y
Kola Bend
Skipton St
Newhaven Pde
Indigo Pwy
Rigby Lane
Anderson Rd
Mak
ybe
Bvd
Ken
tish
Rd
Bet
t Rd
Lang
St
Woo
nda
Way
Rowe Rd
Rob
ert s
o n R
d
Nel
son
St
Howard St
Aven
turin
e W
ay
Perret t Rd
Jasmin
Prom
Sarsp ar il la Rmbl
Poseidon Rd
Wal
ton Cr
Siford W
ay
Sedd
on La
ne
Rimfire St
Ke ntuc ky D
r
Magazine Link
Arm adan Ct
Sladden St
Nig
htm
arch
Grn
Unwi
n Li
nk
Law Rd
Rec
reat
ion
Rd
Ken
tish
Rd
Koolba
rd i Loop
Olsen Gdns
Smi th
St
Scott Rd
Henderson Rd
Fisher Rd
Upt on
Cl
Al ford R
d
Rob
ert s
on R
d
Kane
Way
Kar
a ngi Cir
Peridot Pwy
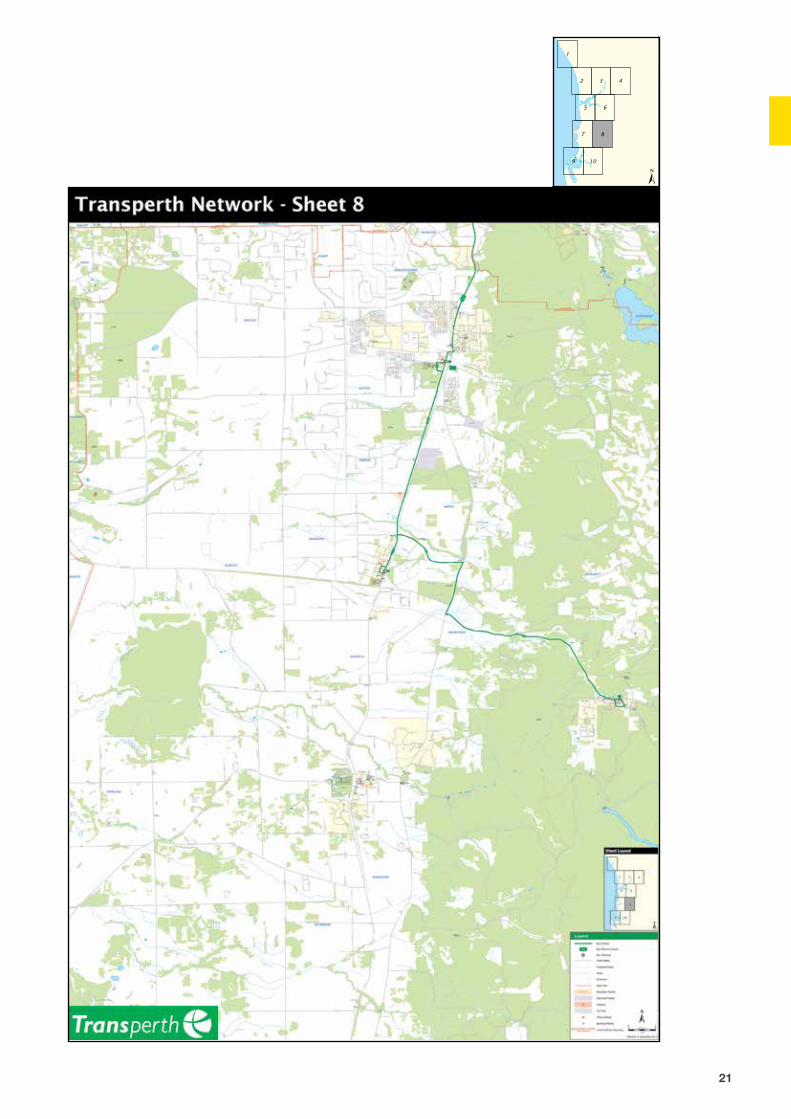
Transperth Network - Sheet 8
1
9
8
42
7
5 6
3
10
Sheet Layout
Legend
Effective 11 November 2012
Bus Route Numbers
Bus Terminus
Bus Routes
1:20,000
Hospital
Sporting Facility
Local Authority Boundary
Industrial Facility
Education Facility
Car Park
Police Station
Cycleway
Walk Trail
252
Mundijong PS
0 1Kilometres
Town of Kwinana
Shire of Serpentine-Jarrahdale
Public Road
Track
Proposed Road
21

22 Public Transport Authority Annual Report 2012-13

23

Transperth is the brand and operating name of the public transport system in the greater metropolitan area of Perth. It consists of a bus network, a fully-electrified urban train system and a ferry service. It is managed by the Transperth branch of the Transperth System, Regional and School Bus Services (TRSBS) division and covers key functions such as system planning, bus service delivery, passenger information services, ticketing and bus fleet procurement.
Transperth bus and ferry services are provided under commercial contract arrangements; train services are provided by the PTA’s Transperth Train Operations (TTO) division under an internal service level agreement.
Passenger information is provided through Transperth InfoCentres, the Transperth InfoLine service and the Transperth website. All InfoCentres and the InfoLine service are operated under contract by Serco.
Key achievements
• Transperth continued with the implementation of a five-year bus service expansion program which began in 2011-12.
– New routes to Byford West, Pinjarra, South Yunderup and North Yunderup.
– Significant improvement to Shepperton Road-Albany Highway services between Perth and Westfield Carousel, and to Great Eastern Highway services between Perth and Redcliffe.
– Additional peak-period trips and more consistent headways on Alexander Drive and Beaufort Street.
– Additional peak-period trips to Curtin University and UWA.
– Extensions of route 517 to Thornlie Station and route 518 to Cockburn Central.
– Additional peak trips and more consistent headways on Flinders Street, plus doubled Saturday frequency.
– Additional peak trips and more consistent headways on route 60, plus doubled Sunday frequency.
– Increased frequency, better peak, off-peak, after-hours and weekend services on route 371.
– Improvements to Joondalup Line feeder bus services.
– Investment in routes across the network to improve reliability and legibility.
• Upgraded the railcar simulator, used to train new drivers and an important tool in on-going training and driver performance reviews.
• Implemented operational changes to facilitate Perth City Link project work to sink the Fremantle Line.
• Started a new contract with MSS Security for Revenue Protection Officers.
• Concluded an 18-month trial of 4am weekend train services, after which they were withdrawn because of low patronage.
• Extended the ferry’s evening operating hours with the introduction of 12 additional services on an average weekday during summer.
• Upgraded CCTV server hardware.
• Completed radio narrowbanding.
• Upgraded the Ellipse Enterprise Resource Planning System.
Our Network – metro
24 Public Transport Authority Annual Report 2012-13

Fleet
TTO runs an electrified suburban train system with more than 1045 services on an average week day, and more than 6640 weekly services.
The system covers 173.1km of track with 70 stations on five lines, and a fleet of 234 railcars which can be coupled in configurations of two, three, four or six-car trains. The train network consists of the Joondalup Line (33.2km), the Fremantle Line (19km), the Midland Line (16km), the Armadale/Thornlie Line (30.5km, and a 3km spur line to Thornlie), and the Mandurah Line (71.4km).
Transperth’s fleet of 1305 buses was made up of 758 diesel and 547 CNG buses as at June 30. The fleet includes 243 buses (18.6 per cent), which conform to the Euro5 emissions standard and 499 (38.2 per cent) which conform to Euro4. The 197 (15.1 per cent) new Volvo
buses that have been delivered so far meet the Euro5EEV (enhanced environmentally-friendly vehicle) standard.
The Volvo contract will deliver 792 new diesel buses over an eight year period.
Transperth is also trialling a Volvo diesel-electric hybrid bus, which is operating as part of the Perth CAT fleet.
The Transperth bus system operated 295 standard timetabled bus routes and 323 school routes in 2012-13. On a typical weekday this involved operating 14,548 standard and 323 school service trips. Accessible buses are always used on 164 of the standard routes. A bus service frequency of 15 minutes or better is provided all day on most major corridors, with higher frequencies in peak periods.
The bus service expansion program added 2.69 million service kilometres during the year to deliver a total of 60.781m kilometres, up 4.6 per cent from 58.091m in 2011-12 (itself an increase of 8.5 per cent from 53.551m in 2010-11). With the legal capacity of CNG buses (which make up 41.9 per cent of the fleet) increased from November 2011, the total capacity of the bus fleet increased a further 8.1 per cent to 4708.3 million passenger place kilometres, following a 16.5 per cent increase in 2011-12.
25

Bus operations are divided into geographic contract areas which are periodically subject to competitive tender. Last year, the contract areas of Kalamunda, Belmont and Fremantle-Cockburn were re-tendered as two separate contracts (Kalamunda and Fremantle) with the new contracts coming into force on October 7 2012. This reduced the number of contracts from 12 to 11. At balance date, three contractors operated Transperth bus services:
Path Transit: Kalamunda, Morley
Swan Transit: Canning, Claremont, Marmion, Midland (including Midland Shuttle), and Southern River
Veolia Transdev (previously Southern Coast Transit): Fremantle-Cockburn (including Fremantle CAT), Joondalup (including Joondalup CAT), Rockingham-Mandurah, and the Perth CAT contract
Two Transperth ferries (MV Phillip Pendal and MV Shelley Taylor-Smith) operate between the city (Barrack Street) and South Perth (Mends Street). The ferry service is operated under contract by Captain Cook Cruises. An extended summer (September-April) timetable was introduced on December 16 to increase the number of services on an average weekday from 80 to 92. The winter (May-August) timetable remained unchanged with 60 services on an average weekday.
In an Australian first, Transperth took delivery of a Volvo B5RH parallel (diesel-electric) hybrid bus during the year, and launched a 12-month trial on the CAT routes.
26 Public Transport Authority Annual Report 2012-13

Network patronage
Patronage on the Transperth system continued to increase in 2012-13, though the rate of growth was marginally lower. Patronage is reported in four categories:
Fare-paying boardings – cash and paid SmartRider boardings plus special event boardings
Cash, and SmartRider initial boardings – fare-paying boardings plus free travel on SmartRider
Total initial boardings – cash and SmartRider initial boardings plus free travel on FTZ (free transit zone) services and on CAT (central area transit) services in Perth, Fremantle and Joondalup and on the Midland Shuttle service
Total boardings – total initial boardings plus transfer boardings
Free travel on SmartRider refers to travel by WA seniors, aged and disability pensioners and (from May 1) carers, from 9am to 3.30pm on weekdays and all day on weekends and public holidays; all-day free travel by veterans and PTA current and some retired staff; and train travel within the FTZ (available only to SmartRider users).
In 2012-13, total boardings, the most widely-quoted figure, rose 3.9 per cent to 149.7 million following an increase of six per cent in 2011-12. Fare-paying boardings rose 4.1 per cent (up seven per cent previously), cash and SmartRider initial boardings rose 4.2 per cent (6.9 per cent), and total initial boardings increased 3.7 per cent (5.1 per cent).
Transperth: Patronage (millions)
2008-09
2009-10
2010-11
2011-12
2012-13
Fare-paying boardingsCash and SmartRider initial boardingsTotal initial boardingsTotal boardings
0 30 60 90 120 150
76.46777.60591.456128.784
74.10378.85293.043131.629
75.92980.81796.051135.975
81.26286.393100.991144.130
84.59790.007104.713149.697
27

BusesPatronage on Transperth’s bus services continued to increase, but at a slower rate. Total boardings rose 3.6 per cent to 83.543m, compared with increases of 5.2 per cent in 2011-12, 2.5 per cent in 2010-11, and 1.6 per cent in 2009-10.
Transperth Buses Patronage (millions)
2008-09
2009-10
2010-11
2011-12
2012-13
Fare-paying boardingsCash and SmartRider initial boardingsTotal boardings
0 20 40 60 80 100
41.25741.96373.550
39.14842.23574.756
39.42242.59076.636
42.36045.70380.626
43.94547.48983.543
Fare-paying boardings rose 3.7 per cent (up 7.5 per cent in 2011-12) and cash and SmartRider initial boardings were up 3.9 per cent (7.3 per cent). Boardings on special event services increased 7.3 per cent to 147,657.
Total boardings by contract area were:
Canning: 8.430m, up 3.1 per cent, Claremont: 4.536m, up 2.3 per cent, Fremantle-Cockburn: 9.911m, up 2.4 per cent, Joondalup: 7.15m, up 6.2 per cent, Kalamunda: 7.969m, up 2.7 per cent, Marmion: 7.749m, up 7.9 per cent, Midland: 2.415m, up 4.9 per cent, Morley: 11.175m, up 4.3 per cent, Rockingham: 6.234m, up 3.1 per cent, Southern River: 3.822m, up 0.9 per cent.
Free travel by seniors, aged or disability pensioners and carers continued to be a winner, accounting for 8.404m total boardings in 2012-13, up 3.6 per cent from 8.108m in 2011-12. At 5.713m total boardings (5.473m in 2011-12), bus travel accounted for slightly more than two-thirds of the total. There were 2.662m (previously 2.606m) of these free boardings on trains and a small number on the ferry.
28 Public Transport Authority Annual Report 2012-13

In part, this growth reflected the continuing increase in bus service kilometres. In 2012-13, the most significant recipients of the extra kilometres were Joondalup and Marmion, with increases of 15.4 per cent and 9.8 per cent respectively. Not surprisingly, these two areas had easily the biggest patronage increases.
However, road congestion, particularly in peak periods, and the lack of significant bus priority measures on major roads in Perth continue to impact service reliability and may affect future patronage growth.
TrainsAs was the case with buses, train patronage increased for the tenth year in succession – total boardings increased 4.2 per cent to 65.689m, compared with increases of 7.1 per cent in 2011-12, 4.4 per cent in 2010-11, and three per cent in 2009-10.
Transperth Trains Patronage (millions)
2008-09
2009-10
2010-11
2011-12
2012-13
Fare-paying boardingsCash and SmartRider initial boardingsTotal boardings
0 10 20 30 40 50 60 70 80
34.81535.24354.750
34.64236.28456.409
36.18237.88458.868
38.58440.35563.030
40.33742.60365.689
The line-by-line figures were:
Armadale/Thornlie Line: 9.668m, up 4.8 per centFremantle Line: 8.866m, up 2.2 per centJoondalup Line: 17.45m, up 4.5 per centMandurah Line: 21.150m, up 4.2 per centMidland Line: 6.689m, up 0.9 per cent
Fare-paying boardings rose 4.5 per cent (up 6.6 per cent in 2011-12), as did cash and SmartRider initial boardings (previously 6.5 per cent).
FerriesThe ferry service represents a very small proportion of Transperth system patronage (less than 0.5 per cent). Tourism makes up about half the ferry’s business, so random fluctuations in tourist traffic for reasons over which we have no control, can have a significant impact on ferry patronage.
Transperth Ferries Patronage (millions)
2008-09
2009-10
2010-11
2011-12
2012-13
Fare-paying boardingsCash and SmartRider initial boardingsTotal boardings
0.0 0.1 0.2 0.3 0.4 0.5 0.6
0.3940.3990.484
0.3120.3330.464
0.3240.3420.471
0.3170.3350.474
0.3140.3330.465
In 2012-13, total boardings on the ferry fell 1.9 per cent to 465,000. Cash and SmartRider initial boardings fell 0.6 per cent and fare-paying boardings fell by 0.8 per cent. This was despite an extension of the summer timetable operating hours, adding 12 services on an average weekday.
29

Capacity
The total (passenger carrying) capacity of the Transperth bus, train and ferry system is calculated by multiplying the average capacity of the fleet by the number of service kilometres provided. It is referred to as passenger place kilometres.
Total capacity has increased substantially in recent years, reflecting the expansion initially of the rail network and more recently the bus network. At 12,382.9m passenger place kilometres (a 7.2 per cent increase on 2011-12), this year’s figure chalked up a major milestone – up 50.2 per cent since 2007-08, when the Mandurah Line was opened.
Transperth: Passenger place kilometres (millions)
2008-09 2009-10 2010-11 2011-12 2012-13
10,138.410,579.9
9,337.0
11,552.212,382.9
0
3,000
6,000
9,000
12,000
15,000
In 2012-13, the total capacity of our train network rose 6.6 per cent to 7669.3m, reflecting a similar increase in service kilometres operated (to 15.956m) and unchanged average capacity.
On the bus side, there was another significant increase in service kilometres – up 8.1 per cent in 2012-13 (following 2011-12’s 16.5 per cent increase). As well as continued growth in the number of vehicles in the fleet, the increase was helped by Main Roads WA’s decision in November 2011 to authorise Transperth to carry additional passengers on its CNG buses.
Compared with the previous limit of 59, 12.3-metre CNG buses now carry 76 passengers, and 11.2-metre buses 65. Consequently the average capacity of the bus fleet increased 3.5 per cent to 77.463 passengers (following an increase of 7.3 per cent in 2011-12).
Reliability
Buses Transperth buses aim never to leave a terminus or travel through a mid-way timing point early, and for 85 per cent of services to arrive within four minutes of the scheduled time. Reliability is monitored through a random sample of about one per cent of trips in each bus contract area, using the GPS Reporter function in SmartRider which provides an precise assessment. The one per cent sample is substantial given that there are more than 14,500 bus trips on a typical weekday.
In the past couple of years, bus OTR has been affected by road works and diversions associated with a number of major projects, which have also exacerbated the effect of increasing traffic congestion. As a result, bus OTR was 75.1 per cent in 2012-13 (79.1 per cent in 2011-12). Hopefully, the fact that the June 2013 monthly figure was back up to 78.3 per cent suggests we have turned the corner. The projects which had the most severe impact on bus service reliability during the year were works on Great Eastern Highway, Perth City Link, Elizabeth Quay, Beaufort Street, William Street, Fiona Stanley Hospital, Perth Arena, and the freeway extensions.
GPS Reporter helps identify under-performing routes which, after a careful review, can be re-scheduled to ensure a more reliable service.
30 Public Transport Authority Annual Report 2012-13

Trains The service reliability (or on-time running – OTR) of Transperth trains is precisely measured through our train control system. The target is for 95 per cent of services to arrive within four minutes of the scheduled time. In 2012-13, 93 per cent of train services met this target, continuing a four-year slide. The decline can be attributed to several factors – a high level of track work and disruptions, weather conditions which resulted in slower running, and high passenger numbers which caused delays at stations.
Transperth: Service reliability by mode – Proportion of services meeting on-time targets
2008-09
2009-10
2010-11
2011-12
2012-13
BusTrainFerry
0% 20% 40% 60% 80% 100%
84.5%94.7%98.4%
85.5%95.9%98.4%
85.1%95.7%99.2%
79.1%94.6%96.7%
75.1%93.0%84.7%
Ferries Our ferry’s OTR (also measured by SmartRider GPS facility) target is for 98 per cent of services to arrive within three minutes of the scheduled time. While the ferry is usually a very reliable performer, in 2012-13, only 84.7 per cent of services met the target (96.7 per cent in 2011-12). The main factor behind the big drop was ferries having to give way to barges engaged in Elizabeth Quay works.
Maintenance
The Network and Infrastructure Division (N&I) is responsible for the management and maintenance of the urban passenger rail network, the delivery of part of the asset investment program, and the delivery of information technology services to the PTA.
N&I has a service level agreement with TTO which details its responsibility for the provision and maintenance of the infrastructure required to operate train services reliably, efficiently and safely.
Most of the division’s resources are allocated to maintenance, both planned and breakdown. Routine maintenance is planned carefully to ensure the infrastructure is safe and highly reliable. This ensures that our passengers continue to enjoy a safe and dependable service. The division also deploys its resources to ensure a rapid response to any breakdowns to minimise delays and customer impact.
31
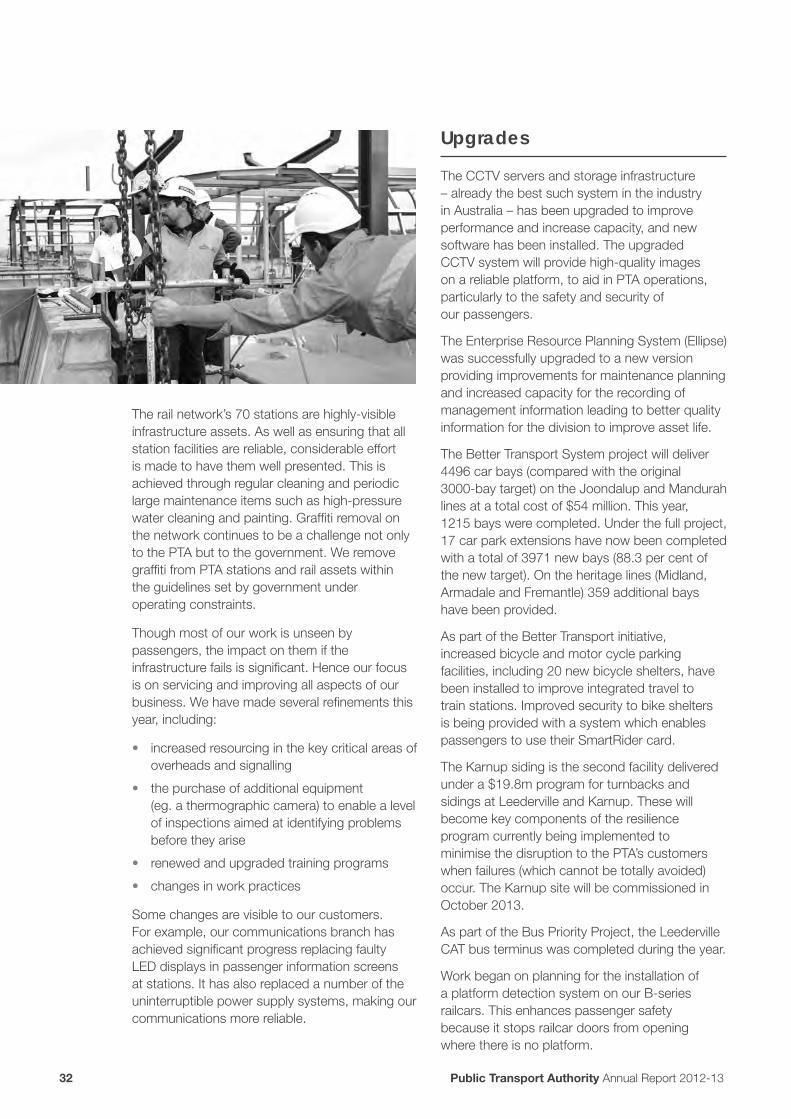
The rail network’s 70 stations are highly-visible infrastructure assets. As well as ensuring that all station facilities are reliable, considerable effort is made to have them well presented. This is achieved through regular cleaning and periodic large maintenance items such as high-pressure water cleaning and painting. Graffiti removal on the network continues to be a challenge not only to the PTA but to the government. We remove graffiti from PTA stations and rail assets within the guidelines set by government under operating constraints.
Though most of our work is unseen by passengers, the impact on them if the infrastructure fails is significant. Hence our focus is on servicing and improving all aspects of our business. We have made several refinements this year, including:
• increased resourcing in the key critical areas of overheads and signalling
• the purchase of additional equipment (eg. a thermographic camera) to enable a level of inspections aimed at identifying problems before they arise
• renewed and upgraded training programs
• changes in work practices
Some changes are visible to our customers. For example, our communications branch has achieved significant progress replacing faulty LED displays in passenger information screens at stations. It has also replaced a number of the uninterruptible power supply systems, making our communications more reliable.
Upgrades
The CCTV servers and storage infrastructure – already the best such system in the industry in Australia – has been upgraded to improve performance and increase capacity, and new software has been installed. The upgraded CCTV system will provide high-quality images on a reliable platform, to aid in PTA operations, particularly to the safety and security of our passengers.
The Enterprise Resource Planning System (Ellipse) was successfully upgraded to a new version providing improvements for maintenance planning and increased capacity for the recording of management information leading to better quality information for the division to improve asset life.
The Better Transport System project will deliver 4496 car bays (compared with the original 3000-bay target) on the Joondalup and Mandurah lines at a total cost of $54 million. This year, 1215 bays were completed. Under the full project, 17 car park extensions have now been completed with a total of 3971 new bays (88.3 per cent of the new target). On the heritage lines (Midland, Armadale and Fremantle) 359 additional bays have been provided.
As part of the Better Transport initiative, increased bicycle and motor cycle parking facilities, including 20 new bicycle shelters, have been installed to improve integrated travel to train stations. Improved security to bike shelters is being provided with a system which enables passengers to use their SmartRider card.
The Karnup siding is the second facility delivered under a $19.8m program for turnbacks and sidings at Leederville and Karnup. These will become key components of the resilience program currently being implemented to minimise the disruption to the PTA’s customers when failures (which cannot be totally avoided) occur. The Karnup site will be commissioned in October 2013.
As part of the Bus Priority Project, the Leederville CAT bus terminus was completed during the year.
Work began on planning for the installation of a platform detection system on our B-series railcars. This enhances passenger safety because it stops railcar doors from opening where there is no platform.
32 Public Transport Authority Annual Report 2012-13

LookingAhead
On the passenger front, Transperth will:
• introduce a new timetable in July 2013 for the restored Fremantle-Midland service following the sinking of the Fremantle Line as part of the Perth City Link project
• complete detailed operational schedules for the extension of the Joondalup Line to Butler Station
• significantly upgrade services by introducing an additional 1.4 million bus service kilometres (annualised), of which 800,000km will be implemented during the year. Improvements have been prioritised as follows:
– services which cannot pick up additional passengers due to overloading
– key transport corridors providing access between key primary and secondary centres to help achieve the planned land use outcomes proposed by the Department of Planning in Directions 2031
– new urban areas developing on the fringes of the metropolitan area
As patronage continues to grow, it is important that there are strategic long-term plans in place to increase the capacity of the system. Key N&I actions include:
• ongoing enhancement of the asset management system to continually improve the performance of existing assets
• refinement of investment plans to meet the rapidly-increasing demands
• upgrading the current ATP (automatic train protection system) with new technology to provide for significantly reduced headways (i.e. schedule trains closer together to provide more services per hour) to increase system capacity
• restructuring maintenance teams to enable a quicker response to faults
As well as operational arms such as Transperth, Transwa and N&I, there are two divisions of the PTA which are specifically in the “Looking Ahead” business – IPLS (Infrastructure Planning and Land Services) and MPU (the Major Projects Unit). In general terms, IPLS has the vision and does the planning, after which MPU turns the vision into reality by doing the building.
Infrastructure Planning and Land Services
IPLS provides engineering expertise for the planning and design of all rail projects, and technical support for the civil and track maintenance of our assets. This includes:
• preparation of concepts and design of railway alignments in response to planning initiatives
• development of feasibility studies and technical reports for future projects
• ensuring that new works comply with rail safety legislation and design standards
• receipt and processing of incoming plans and designs
• providing the PTA with a CAD (computer-aided design) service
In the year under review, IPLS produced a PDP for the new Perth Stadium transport infrastructure; completed detailed designs for various modifications to the existing network – specifically, crossovers at Armadale, Gosnells and Karnup, and work at the Claisebrook rail yard; and provided technical support to the Departments of Transport (east-west rail and port link) and Planning (Midland freight line realignment), Main Roads WA (Esperance Port access corridor, Lloyd Street underpass, Third and Seventh Avenue bridges) and the City of Mandurah (Mandurah Station footbridge).
Work continues on track and civil design for the new Perth Stadium Station as well as PDPs for:
• Airport Rail Link
• Aubin Grove Station
• Butler-to-Yanchep rail extension
33

The budget is $46.5m, of which about $5.2m will be spent in 2013-14. Works to be undertaken include:
• engagement of consultants to undertake concept definition and prepare tender documentation
• call public tenders for a design and construct form of contract
Major Projects Unit
Through 2012-13, MPU managed more than $850 million of project work. The value of projects going forward in 2013-14 together with the value of future projects outlined below is more than $1.35 billion.
Extension of the Joondalup Line to Butler
The $241 million Butler project is on track for completion, with the start of operations from the new station in 2014. This year, the civil and bridge works were completed and work started on the track, overhead wiring, traction power supply and station building. In 2013-14, the remaining infrastructure works at Nowergup Depot, additional servicing facilities at Mandurah Depot and Butler Station will be completed and commissioned, with $66.9m budgeted to complete the project.
new Perth Stadium (Transport)
The planning for the public transport services and infrastructure required to support the operation of the new Perth Stadium at Burswood was undertaken in 2012. In doing so, the PTA worked closely with the Department of Sport and Recreation (DSR) and the Office of Strategic Projects (OSP). The PDP (Project Definition Plan) for the transport infrastructure was submitted to government in November 2012 and approved the following month. The Government has budgeted $358.6m ($298m unescalated) for the transport infrastructure. Expenditure on planning
Aubin Grove Station
Planning for possible future stations on the Mandurah Line was included in the Master Plan approved by Government in 2002. In August 2012, the Government approved funding of an $80m plan to build a new station at Aubin Grove with parking for up to 2000 cars, including a $23m allocation for two three-car train sets.
In 2013-14, we expect to spend $16 million finalising the PDP, acquiring the land and developing designs to enable tenders to be called in early 2014. Construction will start later in the year with completion due by end-2016.
Edgewater multi-storey car park
The Government has committed to a multi-storey facility at Edgewater Station with capacity for approximately 1000 cars. Construction is due to start in 2014, with completion in 2017.
34 Public Transport Authority Annual Report 2012-13

in 2012-13 was $4.6m. The expected cost of further planning and the start of forward works to relocate essential services and undertake ground improvement in 2013-14 is $60.8m.
Main Roads WA will work as a contract manager for the PTA to deliver several key elements, including the new Swan River pedestrian bridge and adjustments to existing freeway and highway and bridge infrastructure at Victoria Park Drive, Graham Farmer Freeway and Great Eastern Highway.
Key activities in 2013-14 will be:
• continuation of forward works including relocation of a Western Power 132kV underground cable and ground improvements to part of the future track alignment – ground improvements will involve surcharging to overcome poor ground conditions
• continuation of geotechnical and environmental investigations
• finalise design and start construction of the first span of the modified structure of Victoria Park Drive to provide a new alignment for the construction of a new single track for the Armadale Line
• tenders for the design and construction of the modifications to Victoria Park Drive road and bridge and connections to the Graham Farmer Freeway and modifications to the intersection of Victoria Park Drive and Great Eastern Highway
• continuation of design and start of procurement for changes to the infrastructure of the State Tennis Centre
• continue to prepare concept design and tender documentation for construction of the Swan River pedestrian bridge
35

Spotlight: Transforming the CBD
Perth City Link
The transport component of the Perth City Link project is the first stage in connecting the CBD and Northbridge, which will enable the revitalisation of the whole precinct. It is laying the foundations, literally, for the most significant urban renewal in our capital’s history. The PTA will deliver the PCL transport project in two stages: the $360m rail project (2011-2014) and the $249m bus project (2014-2016).
To realise the PCL vision, we will:
• sink the Fremantle Line between William Street and Lake/King Streets
• upgrade Perth Station and ensure platform capacity for future growth
• improve the link between Perth Station and Perth Underground with a pedestrian underpass
• replace WSBS (Wellington Street Bus Station) with a new underground facility
The $609m total budget is being funded by three tiers of government – State ($336m), Commonwealth ($236m, rail project only) and local (City of Perth $37m). The project is mid-way to completion, with the rail component (being undertaken through an alliance between the PTA, John Holland and GHD) in its final stages and the bus project tender process underway.
PCL Rail Project
This marks the PTA’s first experience in delivering a major infrastructure project through an alliance form of contract. PCLRA (Perth City Link Rail Alliance) was formed in March 2011 (the PTA started forward works in 2010).
In 2012-13, PCLRA achieved the following milestones:
• completion of the rail tunnel beneath Barrack Street and the structural support work under the city of Perth Child Care Centre
• completion and opening of Platform 8 including the reinstatement of the Fremantle-Midland through-service
• completion of the new Fremantle Line tunnel, including installation of solid conductor rail
• breakthrough of the pedestrian underpass into Perth Underground
• preparation for two five-day central station shutdowns, with associated impact on train services, to connect the new tunnel
PCL Bus Project
Public tenders to establish an Alliance to design and build the new underground bus station were called in January 2013. From the initial five responses, two proponents were short-listed – the City Busport Alliance (Brookfield Multiplex and BG&E) and the Translink Alliance (John Holland and Aurecon). At balance date, the proponents were undertaking design development and costing during the Alliance Development stage. Final proposals are due in late August, evaluation and selection of the preferred proponent in September, and award of the contract in October 2013.
The new bus station will have advanced passenger arrival, waiting and information systems and will feature a dynamic bus stand allocation system to maximise the use of the space. This requires the operation of a real-time tracking system (RTTS) throughout the entire bus fleet. The RTTS is part of the control system which will accurately assess the location of every bus, including its arrival at the new station.
36 Public Transport Authority Annual Report 2012-13

37

Our Network – regional (Transwa)
Transwa is the brand and operating name for the road and rail public transport system serving regional centres in the southern half of Western Australia. Its purpose is to provide a customer-focussed, safe and cost-effective public transport service to regional WA.
Transwa monitors its performance against a range of non-financial and financial indicators such as customer satisfaction, OTR and cost per passenger kilometre.
Fleet
The train fleet consists of 14 railcars – seven Prospector, two AvonLink (also used to provide MerredinLink services) and five Australind railcars. We run four distinct services.
• The Prospector runs 18 services a week – return trips between Perth (the East Perth terminal) and Kalgoorlie daily, and two on Mondays and Fridays.
• The Australind runs 28 services a week – two daily return services between Bunbury and Perth.
• The AvonLink runs 10 services a week – an early-morning weekday (except public holidays) service from Northam to Midland, returning early each evening.
• The MerredinLink runs six services a week – an all-stops return service between Perth (the East Perth terminal) and Merredin on Mondays, Wednesdays and Fridays (except public holidays).
In 2012-13 we employed 21 railcar drivers based at East Perth and Bunbury. Australind onboard services are provided by Bunbury-based Transwa staff; a contractor provides onboard services on the Prospector, AvonLink and MerredinLink.
The road coach fleet consists of 22 five-star vehicles, operating 144 services a week. We employ 34 road coach operators.
38 Public Transport Authority Annual Report 2012-13
Patronage
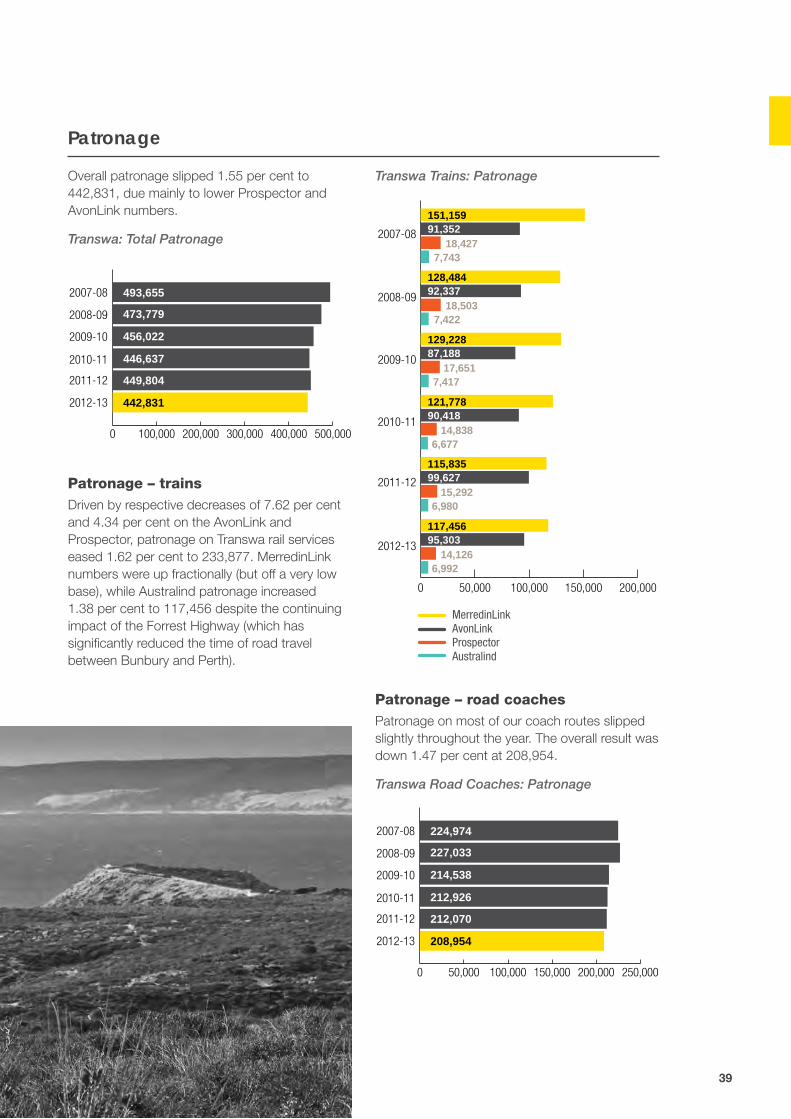
Overall patronage slipped 1.55 per cent to 442,831, due mainly to lower Prospector and AvonLink numbers.
Transwa: Total Patronage
2008-09
2007-08
2009-10
2010-11
2011-12
2012-13
0 100,000 200,000 300,000 400,000 500,000
493,655
473,779
456,022
446,637
449,804
442,831
Patronage – trainsDriven by respective decreases of 7.62 per cent and 4.34 per cent on the AvonLink and Prospector, patronage on Transwa rail services eased 1.62 per cent to 233,877. MerredinLink numbers were up fractionally (but off a very low base), while Australind patronage increased 1.38 per cent to 117,456 despite the continuing impact of the Forrest Highway (which has significantly reduced the time of road travel between Bunbury and Perth).
Transwa Trains: Patronage
0 50,000 100,000 150,000 200,000
2008-09
2007-08
2009-10
2010-11
2011-12
2012-13
MerredinLinkAvonLinkProspectorAustralind
91,35218,427
7,743
151,159
92,33718,503
7,422
128,484
87,18817,651
7,417
129,228
90,41814,838
6,677
121,778
99,62715,292
6,980
115,835
95,30314,126
6,992
117,456
Patronage – road coachesPatronage on most of our coach routes slipped slightly throughout the year. The overall result was down 1.47 per cent at 208,954.
Transwa Road Coaches: Patronage
2008-09
2007-08
2009-10
2010-11
2011-12
2012-13
0 50,000 100,000 150,000 200,000 250,000
224,974
227,033
214,538
212,926
212,070
208,954
39

Reliability
The 2012-13 OTR targets were:
• Prospector – 90 per cent of services to arrive within 15 minutes of schedule
• Australind – 90 per cent (10 min)
• AvonLink – 95 per cent (10 min)
• MerredinLink – 95 per cent (10 min)
• Road coaches – 95 per cent (10 min)
Transwa: OTR Performance
0% 20% 40% 60% 80% 100%
Prospector
RoadCoaches
AvonLink
MerredinLink
Australind
2007-082008-092009-10
2010-112011-122012-13
95%95%
97%98%97%97%
99%99%
98%98%99%99%
83%84%
87%92%94%94%
82%83%
95%95%89%94%
77%42% 95%
72%75%77%77%
The completion of Brookfield Rail’s rolling program of track upgrade work resulted in a significant improvement to the Australind’s OTR, which ended the year at 94 per cent, up from 2011-12’s 89 per cent.
The performance of the other trains was good – the AvonLink remained very strong at 99 per cent while the MerredinLink was 94 per cent and the Prospector 77 per cent.
The road coaches maintained a high level of reliability, with 97 per cent of services arriving within the time parameter, continuing a long record of meeting or bettering performance targets.
Significantly, the ongoing review of Transwa bus stop locations (including refreshment facilities) over all services during the year improved the running times for these services.
Maintenance
The Prospector’s maintenance program continued with completion of bogie refurbishment. Engines and transmissions have now been overhauled on all the Prospector railcars, with the AvonLink engines and transmissions being overhauled in mid-2013.
The fifth phase of the road coach PMP (preventative maintenance program) is in progress. This is focussing largely on the vehicles’ cooling systems, electrical, much of the steering and suspension components that were beginning to age over time. The PMP has been operating since 2009 and is designed to run until 2014-15. It ensures that our road fleet continues to operate safely and reliably and maintains a high level of comfort for customers. The program includes replacing vital components at certain milestones and carrying out rebuilds of major assemblies such as engines and transmissions before reliability issues arise.
40 Public Transport Authority Annual Report 2012-13

Upgrades
In the year under review, we completed an upgrade of the road coach depot at East Perth. This has provided defined work areas for the cleaning, fuelling and mechanical repairs of our road fleet.
The exterior paintwork and trimmings on our coaches was upgraded, with the paintwork extensively refurbished and the front roo bars straightened and refurbished. All exterior door hinges were assessed and replaced as necessary. The stone guards were removed and repainted. All of the safety handrails were removed and powder-coated again in safety yellow.
New seats with individual entertainment system monitors for each passenger were fitted to the Prospector railcars during the year, and seating and interior decor has been upgraded on the AvonLink railcars.
Interior upgrading of the Prospector railcars is planned for the second half of 2013.
The last of the new seats were fitted into the Australind railcars to improve comfort for passengers and to improve the overall appearance of the train.
LookingAhead
In 2011-12, a business case was prepared to secure funding to replace the existing passenger booking system with a more functional and modern system, in keeping with customer expectations. A tender sought interest in supplying an existing system to meet Transwa requirements, including the capability to provide a mobile ticketing service and allow account bookings to be made via the web. The replacement booking system is expected to be finalised in 2013-14.
41

Our Network – regional (RTBS)
Through the Regional Town Bus Services (RTBS) branch of TRSBS, the PTA manages bus services in 14 major regional towns in rural WA, and seven inter-town regional bus services – four in the Pilbara and one each in the Gascoyne, Goldfields and Mid West regions.
Fleet
This year, the RTBS fleet stayed at 151 vehicles with the total number of PTA-owned buses increasing from 115 to 130 and the number of low-floor accessible buses increasing from 67 to 99.
Patronage
Total RTBS boardings increased by 2.7 per cent to 2.492 million. Fare-paying boardings increased 2.5 per cent to 2.125m.
On intra-town bus services, total boardings rose 2.8 per cent to 2.484m while fare-paying boardings increased 2.5 per cent to 2.116m. On inter-town services, boardings (total and fare-paying) decreased 4.8 per cent to 8,193.
Intra-Town 2008/09 2009/10 2010/11 2011/12 2012/13
Total Boardings (millions) 2.355 2.466 2.411 2.417 2.484
Fare Paying Boardings (millions)
2.082 2.083 2.017 2.064 2.116
Inter-Town 2008/09 2009/10 2010/11 2011/12 2012/13
Total/FP Boardings 8,081 6,368 6,532 8,610 8,193
42 Public Transport Authority Annual Report 2012-13

Upgrades
The new bus depot at Bunbury was completed.
Bunbury and Geraldton town bus services were renumbered with unique route numbers to facilitate the incorporation of regional services into the Transperth Information Centre’s database (IPTIS) and to allow the development of a regional services Journey Planner (currently being tested). This is currently being extended to all the branch’s school services.
The fleet replacement program continued, based around rolling out former Transperth low-floor (accessible) buses to regional areas, with a view to reducing the average age of regional buses and increasing the percentage of low-floor vehicles. This includes sufficient low-floor and air conditioned vehicles to operate timetabled town bus services. The program ensures that the regional bus fleet meets Federal disability access standards, and that passenger comfort continues to improve.
The rollout of the Trans branding continued with the launch of TransManjimup in May 2013. This program has been very effective in lifting the profile of public transport in regional WA. As 2012-13 ended, TransAlbany was about to launch, and Narrogin will be the next town to receive the upgrade.
Service audits of contractors conducted in Albany, Busselton, Bunbury, Carnarvon, Collie, Dunsborough, Esperance, Karratha, Kalgoorlie, Manjimup and Narrogin were carried out. These aim to assess service effectiveness and the accuracy of record-keeping for patronage, occupational safety and other operational data.
On the back of the successful initiative in Geraldton, the TransBunbury and TransAlbany fleets are being fitted with CCTV, duress alarms and two-way radio communications to enhance safety and security.
LookingAhead
Work is progressing on the introduction of a new TransRegional website, improving web-based and contact centre service for regional passengers.
All Regional Town Service timetables will be standardised in colour and format. The implementation of a standard format will provide uniformity and a readily identifiable timetable suite for all Regional Town Services.
Major service reviews scheduled for 2013-14 include:
• Review of Albany bus services, with a view to increasing service frequency on well-patronised routes and coordinating services for better connections.
• Service improvements for Karratha, with a view to coordinating services for better connections and the installation of bus stops throughout the town.
• Review of Bunbury bus services to ensure the new service developments are being utilised.
• Service improvements in Narrogin including the installation of 80 bus stops.
• Service improvements in Manjimup and Collie including the installation of bus stops.
• Community consultation sessions in Kalgoorlie and Port Hedland.
43
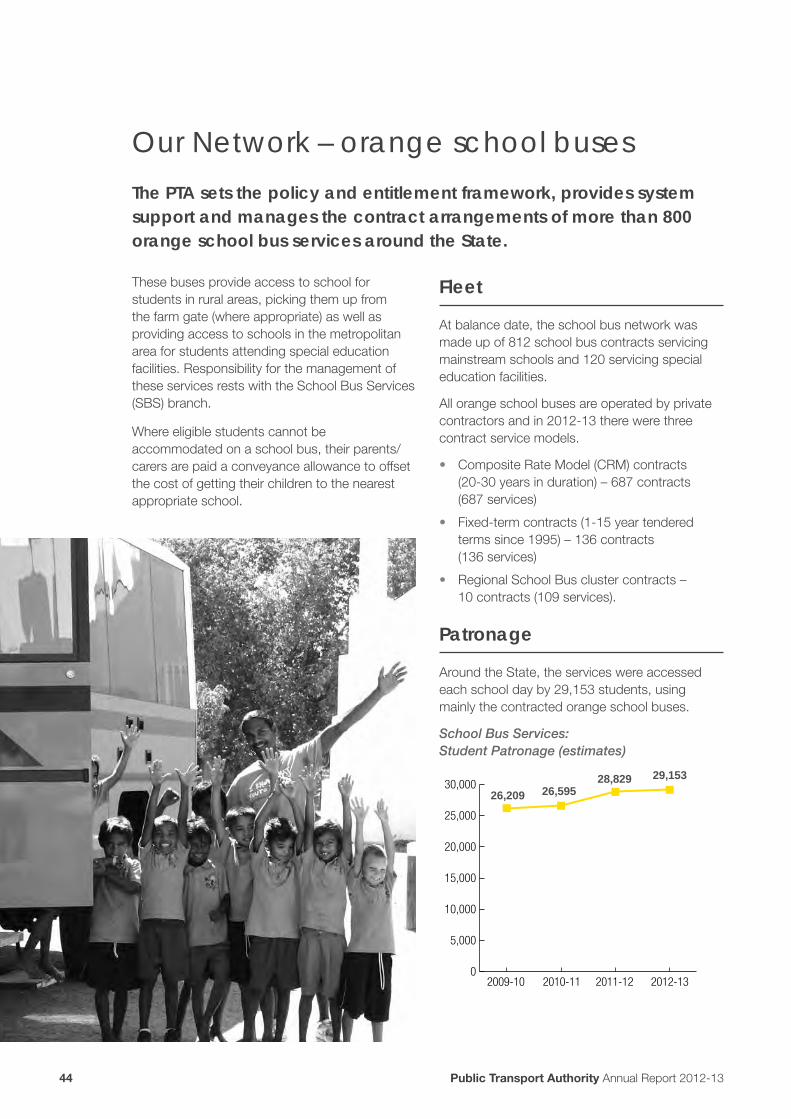
Our Network – orange school buses
The PTA sets the policy and entitlement framework, provides system support and manages the contract arrangements of more than 800 orange school bus services around the State.
These buses provide access to school for students in rural areas, picking them up from the farm gate (where appropriate) as well as providing access to schools in the metropolitan area for students attending special education facilities. Responsibility for the management of these services rests with the School Bus Services (SBS) branch.
Where eligible students cannot be accommodated on a school bus, their parents/carers are paid a conveyance allowance to offset the cost of getting their children to the nearest appropriate school.
Fleet
At balance date, the school bus network was made up of 812 school bus contracts servicing mainstream schools and 120 servicing special education facilities.
All orange school buses are operated by private contractors and in 2012-13 there were three contract service models.
• Composite Rate Model (CRM) contracts (20-30 years in duration) – 687 contracts (687 services)
• Fixed-term contracts (1-15 year tendered terms since 1995) – 136 contracts (136 services)
• Regional School Bus cluster contracts – 10 contracts (109 services).
Patronage
Around the State, the services were accessed each school day by 29,153 students, using mainly the contracted orange school buses.
School Bus Services: Student Patronage (estimates)
2009-10 2010-11 2011-12 2012-13
26,59528,829
26,209
29,153
0
5,000
10,000
15,000
20,000
25,000
30,000
44 Public Transport Authority Annual Report 2012-13

The 2012-13 student data snapshot shows a 1.1 per cent increase on the previous year, in the number of eligible students receiving school bus transport assistance.
In the specific operational regions the number of 2012-13 student travellers compared to 2011-12 varied as follows:
Region Students % Variance
Gascoyne 133 -3.6
Goldfields Esperance 1,336 -4.1
Great Southern 3,345 6.0
Kimberley 1,240 10.7
Metropolitan 5,328 4.6
Mid West 1,545 -3.7
Peel 2,974 -7.0
Pilbara 409 15.9
South West 7,840 5.1
Wheatbelt 5,003 -5.8
Total 29,153
Capacity
Around the State, our services covered an average of 164,795km each school day, totalling 31.5 million contract service kilometres for the year.
School Bus Services: Average Daily Service Kilometres (thousands)
2009-10 2010-11 2011-12 2012-13
155.5162.7
149.9164.8
0
20
40
60
80
100
120
140
160
180
The 2012-13 daily average service kilometre data across all the operational regions was up 1.3 per cent on the previous year.
In the specific operational regions the 2012-13 service kilometre data compared to 2011-12 varied as follows:
RegionAverage Daily
Kilometres % Variance
Gascoyne 519 0.9
Goldfields Esperance 9,598 -1.3
Great Southern 19,382 2.2
Kimberley 5,336 5.2
Metropolitan 26,333 6.3
Mid West 11,445 -1.2
Peel 11,239 -6.8
Pilbara 2,652 -0.3
South West 29,849 4.1
Wheatbelt 48,441 -0.6
Total 164,794
Reliability
The service reliability measure covers rural mainstream services and education support school buses in the metropolitan area, and is based upon arrival less than 10 minutes before school starts and departure less than 10 minutes after school finishes.
School Bus Services: Service Reliability
2009-10 2010-11 2011-12 2012-13
99.3% 99%97.3% 99.8%
0%
20%
40%
60%
80%
100%
45

46 Public Transport Authority Annual Report 2012-13
Customers and the community
84.7% of Perth properties are within 500m of a Transperth service
99% of Transperth bus and train customers feel safe during the day
560 television screens installed in new Prospector railcar seats
34 diesel, low-floor buses transferred to regional towns
650 bus stops upgraded to disability standard
Overview
The numbers
Our Network
Customers and the community
Fares and other revenue
About PTA
Governance and compliance
Key Performance Indicators
Financial statements
47

Customers and the community – customer satisfaction Transperth
An independent market research firm commissioned by Transperth carries out the annual Passenger Satisfaction Monitor (PSM) to determine passenger sentiment about various aspects of Transperth and Transwa services. The survey, which has been running for 20 years, conducts detailed face-to-face interviews with more than 4500 regular public transport users, covering all modes, all lines and all the main demographics.
Transperth: Level of overall customer satisfaction
85.8% 84.4%85.4% 85.5% 82.3%
0%
20%
40%
60%
80%
100%
20102009 2011 2012 2013
Overall satisfaction with the quality of service offered by the Transperth system (bus, train and ferry – calculated as the weighted average across all modes) fell 3.2 points to 82.3 per cent in 2013.
Satisfaction with bus and train services declined by 2.4 points and 5.6 points respectively; ferry satisfaction was up 1.1 points.
Transperth Trains: Level of overall customer satisfaction
20102009 2011 2012 2013
93%88%89% 89%
84%
0%
20%
40%
60%
80%
100%
Among peak-time train passengers, 80 per cent expressed satisfaction (down from 86 per cent in 2012); off-peak, it was 88 (92) per cent.
The main reasons for dissatisfaction among peak-time passengers were “too crowded” and “no seating.” The significant increase in patronage (up 4.2 per cent, on top of 2011-12’s 7.1 per cent increase) contributed to this. In order to satisfy this increasing demand, the PTA will bring into service 22 new three-car trains between 2013-14 and 2016-17.
48 Public Transport Authority Annual Report 2012-13

Bus satisfaction was down only marginally from 2011’s equal five-year high.
Transperth Buses Level of overall customer satisfaction
20102009 2011 2012 2013
81% 82%83% 83% 81%
0%
20%
40%
60%
80%
100%
In a year in which bus OTR was significantly impacted by road and major project works, punctuality was the most important bus characteristic.
As was the case in 2012, “cost of fares” was rated as the most important train service characteristic.
Service characteristic Importance rating %Satisfaction
(dissatisfaction) rating %
2012 2013 2012 2013
Cost of fares 72 72 58 (13) 52 (16)
Punctuality 67 69 93 (3) 93 (3)
Speed of the trip 61 63 94 (2) 92 (2)
Availability of seats 60 62 71 (21) 72 (18)
Cleanliness on board 67 57 92 (3) 90 (2)
Service frequency weekdays 48 57 83 (7) 82 (8)
Service frequency peak times 52 54 76 (14) 74 (16)
Time waiting for a connecting bus 38 36 68 (18) 68 (16)
Service characteristic Importance rating %Satisfaction
(dissatisfaction) rating %
2012 2013 2012 2013
Punctuality 68 72 81 (8) 82 (9)
Cost of fares 66 71 64 (9) 58 (13)
Shelter provided at the bus stop 60 61 74 (17) 74 (18)
Service frequency weekdays 56 58 71 (17) 68 (19)
Speed of the trip 51 54 92 (3) 92 (3)
Cleanliness on board 57 52 94 (1) 93 (2)
Availability of seats 50 51 90 (6) 92 (5)
Service frequency peak times 49 43 76 (15) 73 (19)
49

The ferry continued to enjoy a very high level of satisfaction.
Transperth Ferries: Level of overall customer satisfaction
20102009 2011 2012 2013
96% 96% 96% 96%95%
0%
20%
40%
60%
80%
100%
The cost of the fare and cleanliness on board were deemed the key service characteristics. A sudden jump in the rating of punctuality followed an out-of-character drop in OTR, reflecting the fact that our ferries must give way to barges engaged in Elizabeth Quay work.
Service characteristic Importance rating %Satisfaction
(dissatisfaction) rating %
2012 2013 2012 2013
Cost of the fare 79 78 83 (3) 78 (2)
Cleanliness on board 69 76 99 (0) 100 (0)
Punctuality 56 66 99 (1) 91 (1)
Service frequency weekdays 64 60 69 (16) 70 (13)
Speed of the trip 60 58 99 (0) 97 (1)
Availability of seats 55 53 100 (0) 87 (13)
Shelter at the jetty 57 48 84 (8) 74 (18)
Access to ticket purchase facilities 45 43 76 (12) 83 (17)
50 Public Transport Authority Annual Report 2012-13

Transwa
Customer satisfaction with the Transwa (train and road coach) system equalled a four-year high at 92 per cent.
Transwa: Customer Satisfaction
2008-09
2007-08
2009-10
2010-11
2011-12
2012-13
0% 20% 40% 60% 80% 100%
88%
92%
92%
90%
90%
90%
The satisfaction level of Prospector passengers jumped significantly to 93 per cent, reflecting the installation of a new entertainment system, and the Australind remained high at 93 per cent. Ratings for both the MerredinLink and the Avonlink dropped marginally.
Transwa Trains: Customer Satisfaction
0% 20% 40% 60% 80% 100%
2008-09
2007-08
2009-10
2010-11
2011-12
2012-13
ProspectorAustralindAvonLink & MerredinLink*AvonLink*MerredinLink
86%
87%89%
96%
90%92%
96%
84%93%
94%
75%96%
86%93%87%90%
93%93%84%88%
*Before 2011-12 AvonLink and MerredinLink results were combined
Transwa’s road coaches also enjoy consistently high customer approval ratings, and 2013’s 93 per cent is the highest in recent years.
Transwa Road Coaches: Customer Satisfaction
2008-09
2007-08
2009-10
2010-11
2011-12
2012-13
0% 20% 40% 60% 80% 100%
88%
90%
93%
89%
90%
91%
51

Spotlight: We’re listening to you
The PTA’s commitment to excellent customer service relies heavily on the feedback of passengers and the public.
Transperth’s Call Centre is operated under contract by Serco.
The Call Centre, which also operates the PTA’s switchboard, is staffed right through service operating hours – from 5am to midnight during the week and longer over the weekends, making a total of about 139 hours a week.
It has 76 people on its staff and, through the main part of a normal weekday, there will be 26 people on duty.
It handles general inquiries as well as InfoLine, PTA Feedback and SmartRider queries. The numbers are daunting: Over the course of a year it handles more than 1.18 million telephone calls, hundreds of thousands of emails and sends out about 350,000 SmartRider forms.
On an average day it handles about 3500 telephone calls alone (not including PTA switchboard calls). The one-day record, set on Australia Day about five years ago, is more than 11,000 calls.
The vast majority of contacts (phone and email) involve providing straightforward service advice. A small percentage call for further information and are directed through for handling by the appropriate PTA officer. These are referred to as PTA Feedbacks.
PTA feedback
In 2012-13, the PTA received 22,524 inquires from customers and from members of the public which became PTA Feedbacks. This was an increase of 14.5 per cent from 2011-12 (19,664). The number of substantiated complaints was up 22.9 per cent from 2011-12 (11,528) and the number of commendations increased 0.8 per cent (1448).
Customer feedback
Members of the public can contact the PTA in various ways. Website feedback forms are available on the Transperth, PTA and Transwa sites. Customers can also call the InfoLine number on 13 62 13, email their comment, or write a letter. All methods of contact are listed on the websites and in the Yellow Pages.
Once a contact is made, the Call Centre member will either resolve the issue or generate a PTA Feedback for referral to a PTA officer for response.
In 2012-13, 31 per cent of PTA Feedbacks were answered within two days and a further 50 per cent within the first seven days.
Response times
19% 31%
50%
0-2 days – 5187 3-7 days – 8398 +7 days – 3153
6%6% 64%
24%
Substantiated complaints – 14,170
Unsubstantiated complaints – 5203
Commendations – 1460
General feedback – 1454
52 Public Transport Authority Annual Report 2012-13

Customers and the community – safety and security
The welfare of our passengers – and our own people – is an absolute priority for the PTA and we do everything we can to make sure our system is as safe as possible. As part of this commitment to safety, we are required to report specific rail safety incidents to an independent regulator (the Office of Rail Safety). These “notifiable occurrences” are discussed later in this report.
We also have a range of initiatives to enhance system safety for our customers.
During the year, we implemented recommendations from a Curtin-Monash Accident Research Centre (C-MARC) study aimed at reducing the number of level crossing incidents.
We conducted a major facelift of the Dorothy Street pedestrian crossing in Gosnells:
• Upgraded all of the signage and delineation at the crossing to make it clearer
• Widened the crossing on the perway
• Painted high-visibility yellow line-markings through the entire crossing
We also acted to address a big increase in the number of slip-trip-fall incidents. (Most such incidents involved passengers losing their balance while running or walking on a moving escalator and included mobility issues and/or were alcohol-related.) We monitor statistics on a daily basis, N&I supervisors conduct monthly station inspections, we maintain our lifts and escalators to original specifications, certify plant to Australian standards, provide (through TTO) customer service for people with disabilities, ensure that lighting on accessible pathways is compliant with DSAPT requirements, and have improved proactive warning signage at escalators.
We work hard to be proactive in promoting safe behaviour around our system. As well as clear signage and posters, we run various community education sessions through the Transperth Information and Event Services, particularly the Get on Board and Give Way to Buses programs.
We specifically target at-risk youth with the award-winning Right Track and Stay Off the Tracks programs, which include a big social media presence, and we have continued with the successful series of school visits by a high-impact speaker, Jonathon Beninca, who lost an arm and a leg in a train accident in NSW several years ago.
This emphasis on safety also extends to our contracting partners.
Safety audits and monitoring of Transperth bus contractors continued in line with standard AS 4801-OSH Management Systems. Each depot was audited at least once with other documented site visits occurring throughout the year. These regular audits and inspections have generated improved safety management systems and safety focus, and our contractors’ Lost Time Injury (LTI) rate continues to be well below the industry standard.
• Swan Transit is certified to AS4801, and certified as compliant with ISO 14001 Environmental Management Systems, both being valid to February 2015. In 2012-13, the LTI frequency rate was 10.0 and the LTI incident rate 1.9.
• Path Transit, which has achieved the WorkSafe Platinum Award, is certified to AS4801 and certified as compliant with ISO 14001 Environmental Management Systems, both being valid to August 2015. In 2012-13, the LTI frequency rate was 9.88 and the LTI incident rate 2.0.
53

• Veolia Transdev (formerly Southern Coast Transit), which has achieved the WorkSafe Platinum Award, is certified to AS4801 and certified as compliant with ISO 14001 Environmental Management Systems, both being valid to January 2014. In 2012-13, the LTI frequency rate was 5.71 and the LTI incident rate 0.08.
In 2012-13, our SBS branch completed the following programs to promote safety on our contracted school bus services.
• Introduced the Safety Management System (SMS) comprising a Safety Management Plan, Driver’s Operating Guide and an Emergency Plan. It included an example of a compliant policy, guidelines and forms to enable contractors and drivers at all levels of experience to implement safe systems of work.
The plan was rolled out over a series of workshops in the various regions. In addition to the presentation, the contractors were provided with a hard copy version of the three manuals that comprise the SMS. New contracts with SBS require compliance with the SMS which forms part of the key performance indicators for the contract. SBS staff undertaking audits on school bus contracts attended an accredited audit training course which was developed specifically for SBS.
• Following an eight-week trial, ministerial approval was given for the installation of safety devices on new school buses. To activate the device, the driver must walk to the rear of the bus, thus ensuring that no children are left on the vehicle.
• Engine fire suppression systems were retro-fitted on all existing education support buses which carry children with special needs. All new buses are required to be fitted with these systems.
Passenger movements on the ferry service were improved by the modification of the gangplank system to eliminate the gap between the ferry and the jetty. An internal door arrangement was added to ensure that disembarking passengers wait until the ferry had been securely berthed.
Detailed independent technical investigations and subsequent reviews were carried out in the wake of fires on Mercedes OC500 CNG buses late 2012 and early 2013. These involved experts from Mercedes Benz, local fire investigation specialists and engineering consultants from Australia and overseas. A number of improvements and modifications were identified and, as at June 30, had been completed on all the gas buses or were undergoing field trials.
These included a significantly upgraded fire suppression system; a different engine coolant and changes to coolant hoses and components; reconfigured insulation material; a weekly inspection regime; driver cab-mounted battery isolation switches; cab-mounted CNG isolation controls; redesigned exhaust system and heat shielding; and routing and condition reports of engine bay wiring.
Mercedes Benz and the PTA are continuing to negotiate the terms on which a scope of works can be developed and implemented to carry out any further items identified as requiring rectification.
During the year under review, the gas leak detection system for Transperth’s CNG workshop facilities was commissioned to ensure that maintenance of CNG buses was carried out in a safe environment. The system includes gas detection sensors, alarm systems, extraction fans and the infrastructure to support the maintenance of these units including safe access ladder systems and roof-top walkways.
Commissioning of spray paint booths to ensure that spray painting was carried out by contractors in a safe environment was also completed during the year.
54 Public Transport Authority Annual Report 2012-13

Customer safety and security
The PSM assesses customer perceptions of security and personal safety during the day and at night, both waiting for and aboard the (bus, train or ferry) service. Virtually all passengers feel safe on our system (aboard or waiting) during the day.
Transperth: Passenger safety – Proportion of respondents who generally feel safe on-board during the day
2009
2010
2011
2012
2013
BusTrainFerry
0% 20% 40% 60% 80% 100%
98.0%98.0%99.0%
98.0%98.0%99.0%
99.0%98.0%100.0%
99.0%99.0%99.0%
99.0%99.0%97.0%
The 2013 PSM asked train users: How safe do you generally feel from personal interference or threat from other passengers? The following graph shows the proportion of respondents who always or usually feel safe at specified times and locations.
Transperth Trains: Customer perception of safety
0% 20% 40% 60% 80% 100%
2009
2010
2011
2012
2013
On-board (day)On-board (night)At station/interchange (day)At station/interchange (night)
98.0%76.0%
66.0%97.0%
98.0%75.0%
70.0%98.0%
98.0%76.0%
72.0%99.0%
99.0%72.0%
68.0%98.0%
99.0%78.0%
69.0%98.0%
89%
55

In 2013 there was a significant increase in the proportion of passengers who feel safe on board at night – an 8.3 per cent jump to 78 per cent. There was also a small (1.5 per cent) increase in the proportion of users who felt safe at the station or interchange at night.
The PTA is committed to ensuring that all passengers feel safe at all times on the train network. To help achieve this aim, all our railcars have CCTV, and digitised CCTV footage from all train stations is monitored at the new CMR, a state-of-the-art facility which is manned 24 hours a day, seven days a week. We have about 400 security personnel including well-trained and well-equipped transit and revenue protection officers who man stations, ride trains and operate mobile patrols.
The same question (How safe do you generally feel from personal interference or threat from other passengers?) was asked of bus passengers, with similar results, also improvements on 2012.
Transperth Buses: Customer perception of safety
0% 20% 40% 60% 80% 100%
On-board (day)On-board (night)At station/interchange (day)At station/interchange (night)
98.0%82.0%
68.0%97.0%
98.0%79.0%
70.0%96.0%
99.0%82.0%
73.0%97.0%
99.0%79.0%
72.0%97.0%
99.0%81.0%
73.0%97.0%
2009
2010
2011
2012
2013
Transperth also has extensive bus security measures in place, including CCTV, duress alarms and two-way radio on buses, station-based security and mobile patrols which shadow key routes. CCTV footage from all bus stations is also monitored live in the CMR on a 24/7 basis.
The same question was asked of ferry passengers. Results were high across the board, though there was a significant drop in the proportion of users who felt safe at night at the jetty.
Transperth Ferries: Customer perception of safety
0% 20% 40% 60% 80% 100%
On-board (day)On-board (night)At station/interchange (day)At station/interchange (night)
99.0%97.0%
97.0%99.0%
99.0%94.0%
88.0%99.0%
100.0%89.0%
86.0%100.0%
99.0%97.0%
96.0%99.0%
97.0%92.0%
87.0%98.0%
2009
2010
2011
2012
2013
A CCTV camera system operates on both our ferries. It is continuously monitored to ensure passenger safety and, when operations have ceased, the security of the vessels.
56 Public Transport Authority Annual Report 2012-13

Customers and the community – access to services
To provide an accurate estimate of how convenient it is for people in the wider Perth area to get to public transport, we have developed the following measure. It determines the proportion of PSAs (property street addresses) in the PPTA (Perth public transport area) within walking distance (500m) of a Transperth stop or station providing an acceptable service level (ASL). An ASL is defined as a 20-minute or better service in the peak-flow direction during the peak, and at least an hourly service through the core of the day.
Transperth uses GPS (global positioning system) data to determine the exact location of all bus stops and train stations. Access to these facilities is measured against other spatial and scheduling data – in this case PSAs and service timetables.
As is usually the case, the measure showed a further slight improvement.
Access to public transport – Proportion of Property Street Addresses in the Perth Public Transport Area within 500m of a Transperth stop providing an acceptable level of service
20102009 2011 2012 2013
81.1% 82.9% 83.8% 84.7%84.6%
0%
20%
40%
60%
80%
100%
This was achieved in the face of an increase in the total number of PSAs in the PPTA (up from 906,184 in 2012, to 915,252). Since 2009, the number of PSAs within walking distance of an ASL stop has increased by 13.7 per cent, from 681,989 to 775,253.
57
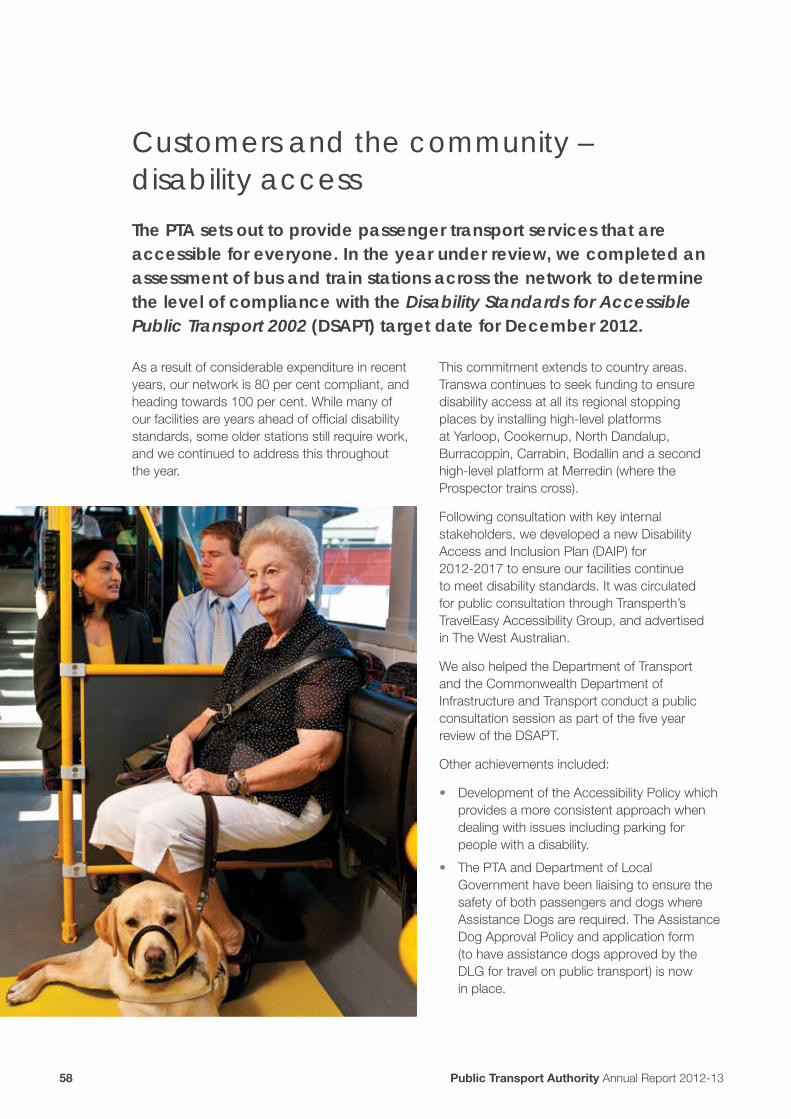
Customers and the community – disability access
The PTA sets out to provide passenger transport services that are accessible for everyone. In the year under review, we completed an assessment of bus and train stations across the network to determine the level of compliance with the Disability Standards for Accessible Public Transport 2002 (DSAPT) target date for December 2012.
As a result of considerable expenditure in recent years, our network is 80 per cent compliant, and heading towards 100 per cent. While many of our facilities are years ahead of official disability standards, some older stations still require work, and we continued to address this throughout the year.
This commitment extends to country areas. Transwa continues to seek funding to ensure disability access at all its regional stopping places by installing high-level platforms at Yarloop, Cookernup, North Dandalup, Burracoppin, Carrabin, Bodallin and a second high-level platform at Merredin (where the Prospector trains cross).
Following consultation with key internal stakeholders, we developed a new Disability Access and Inclusion Plan (DAIP) for 2012-2017 to ensure our facilities continue to meet disability standards. It was circulated for public consultation through Transperth’s TravelEasy Accessibility Group, and advertised in The West Australian.
We also helped the Department of Transport and the Commonwealth Department of Infrastructure and Transport conduct a public consultation session as part of the five year review of the DSAPT.
Other achievements included:
• Development of the Accessibility Policy which provides a more consistent approach when dealing with issues including parking for people with a disability.
• The PTA and Department of Local Government have been liaising to ensure the safety of both passengers and dogs where Assistance Dogs are required. The Assistance Dog Approval Policy and application form (to have assistance dogs approved by the DLG for travel on public transport) is now in place.
58 Public Transport Authority Annual Report 2012-13

• Continued implementation of a 12-year program to replace the existing fleet with low-floor, accessible buses with the purchase of 117 new vehicles under the agreement with Volvo. At balance date, Transperth operated 1076 accessible buses in a total fleet of 1305 (82.4 per cent) compared with 995 (79.9 per cent of 1246) previously. We use these whenever possible so that, off-peak, most buses are accessible.
• During the year, 34 diesel low-floor buses were transferred to regional towns.
• Though the Mends Street jetty in South Perth was already accessible for people in wheelchairs, the existing ramps were further improved. Planning is in progress for a new jetty to meet all accessibility standards and provide improved facilities. The Barrack Street jetty already meets the standard.
• Continued recognition of companion cards, which allow travel with a person with a permanent disability at no additional cost. Further, carers who hold a Carers Health Care Card and receive the Commonwealth Carer Payment can now travel free between 9am and 3.30pm on weekdays and all day on weekends and public holidays.
• Developing and managing an accessibility group via TravelEasy as a mechanism to disseminate disability-specific updates to relevant organisations.
• Completing upgrades at Meltham and Mt Lawley stations. The full platform area was resurfaced and the lighting, handrails and signage upgraded for people with disabilities. The gap between the platform and train carriage was minimised and significant work done to the pedestrian access gates at the southern end of Meltham Station. Upgrades of Queens Park, Beckenham and Maddington stations were started.
• Upgrading 650 bus stops to DSAPT requirements under the Government’s Bus Stop Accessibility Works Program. Upgrades typically involve construction of a concrete passenger boarding area, tactile ground surface indicators and connection to the existing local footpath network. Since January 2010, more than 2100 stops have been upgraded.
• Delivering 37 in-class presentations and station tour experiences through the school-based Get On Board program for Education Support students. The program continues to work with disability organisations to deliver information and training at both the staff and client level. Train-the-trainer sessions have been delivered to provide the skills and knowledge necessary to take clients on the Transperth network and teach them how to become safe and confident travellers.
• The PTA was part of an Accessibility Consultation group chaired by the Department of Sports and Recreation for the new Perth Stadium.
59

Customers and the community – the environment
The PTA is very conscious of the impact our operations have on the environment. Perth’s rail system now operates close to 24 hours per day, seven days a week. In addition, most of our maintenance must be carried out while trains are not operating, which is in the early hours of the morning. We are very aware of the potential impact our activities on surrounding residents and have in place detailed processes and practices to minimise noise.
We regularly review the PA systems at stations to ensure that, while patrons are able to clearly hear the messages, the noise “spill” into neighbouring residential areas is kept to a minimum.
Combining an asset replacement schedule with a noise amelioration plan, we have installed swing-nose points – which have lower levels of operational noise – on the Armadale Line.
IPLS’ Environment Branch provides environmental support to the whole organisation. Key services include:
• Coordination of environmental approvals
• Environmental input into PDPs
• Response to noise and vibration complaints regarding passenger and freight trains
• Management of any contaminated sites and asbestos-containing buildings
In the period under review, the branch coordinated environmental studies for the whole of the new Perth Stadium project and successfully secured State and Commonwealth environmental approvals; completed contamination investigations and remediation at the Kewdale freight terminal (T1 site) and Forrestfield (Site C), gaining DEC classification to allow industrial-commercial development in each case; and managed the handover to LandCorp of the site and contamination responsibility for the Batavia Coast Marina Stage 2.
Asbestos was removed from the Public Transport Centre in East Perth and a site in Narrogin; rehabilitation was undertaken at the
Warnbro Station vegetation preservation area, Stakehill Sump and Paganoni Swamp; and contamination investigations, remediation or monitoring was carried out at:
• Bencubbin rail yard
• Leighton – former marshalling yard
• Merredin – former service station
• Mosman Park – Beehive Montessori School site and future lease area
• East Perth rail coach depot
• Collie Roundhouse
• Hester – former timber treatment site
At balance date, we were awaiting DEC clearance after completing contamination investigations on a site at Bluff Point, in Geraldton; and had nearly completed contamination investigations at a former service station site in Gosnells, with remediation to start in 2013-14.
SustainabilityThe PTA works hard to maximise sustainability during the development and planning of transport services. This philosophy, which often involves working with external parties, embraces concepts such as transit-oriented developments (TODs), integrated infrastructure for pedestrians and cyclists; and the protection and restoration of local air, water, soils, flora and fauna.
During the year we continued to implement the PTA water efficiency management plan (including using recycled water and reverse osmosis to wash railcars) and the Energy Efficiency Opportunities Program (including an energy assessment of the Public Transport Centre and the TTO offices).
We also reviewed and updated the online greenhouse gas savings calculator, which uses travel information (including the car size and distance travelled) to calculate a passenger’s greenhouse gas savings, and submitted our Greenhouse and Energy Report to the Department of Climate Change.
60 Public Transport Authority Annual Report 2012-13

Customers and the community – communicating with our customers
In 2012-13, the Transperth Information and Event Services team successfully undertook a wide range of initiatives:
• Continued with the popular I Give Two Hoots campaign launched in 2009-10 to improve courtesy among passengers. The campaign is designed to highlight behaviour that passengers find irritating, such as playing loud music, not moving away from train doors and trying to board a train when passengers are still trying to alight.
• Continued to roll out new ticketing InfoCubes to provide passengers on the train system with improved ticketing information.
• Communicated the new free travel entitlements for WA Carers.
• Launched a campaign designed to raise awareness of the extended summer ferry timetable.
• Rolled out a new campaign entitled Give Way to Buses, in partnership with Department of Transport. This campaign is designed to highlight the requirement of motorists to give way to buses pulling out from bus stops.
• Improved signage at a number of stations as part of a system-wide upgrade. The new signage improves visibility of key components
of infrastructure, such as lifts, to make them easier to identify for those who need to use them.
• Continued to provide service disruption information to passengers across all modes of public transport. There was a significant increase in the number of disruptions due to work on the Perth City Link and Butler Station projects as well as infrastructure maintenance.
• Delivered service change information to passengers following the continued roll out of additional bus service kilometres.
• Continued to deliver Get on Board presentations to a broad range of community groups.
• Rolled out the first Video FAQs (frequently-asked questions) on the Transperth-dedicated YouTube channel. They answer some of the common queries about how public transport works in Perth.
• Continued to work with major event organisers to ensure the provision of special events and promote integrated ticketing.
TravelEasy is Transperth’s free email update service.
Registration is through the Transperth website and is a fast and simple process. TravelEasy allows users to personalise their account to receive up-to-date public transport information.
Users can select the services about which they want to receive information. These services include bus routes, train lines and events such as AFL and concerts.
TravelEasy is used by the Transperth Information and Event Services team to inform users about service changes or disruptions (planned as well as unplanned) and information related to upcoming events.
Currently there are 124,561 people registered to receive TravelEasy updates.
61
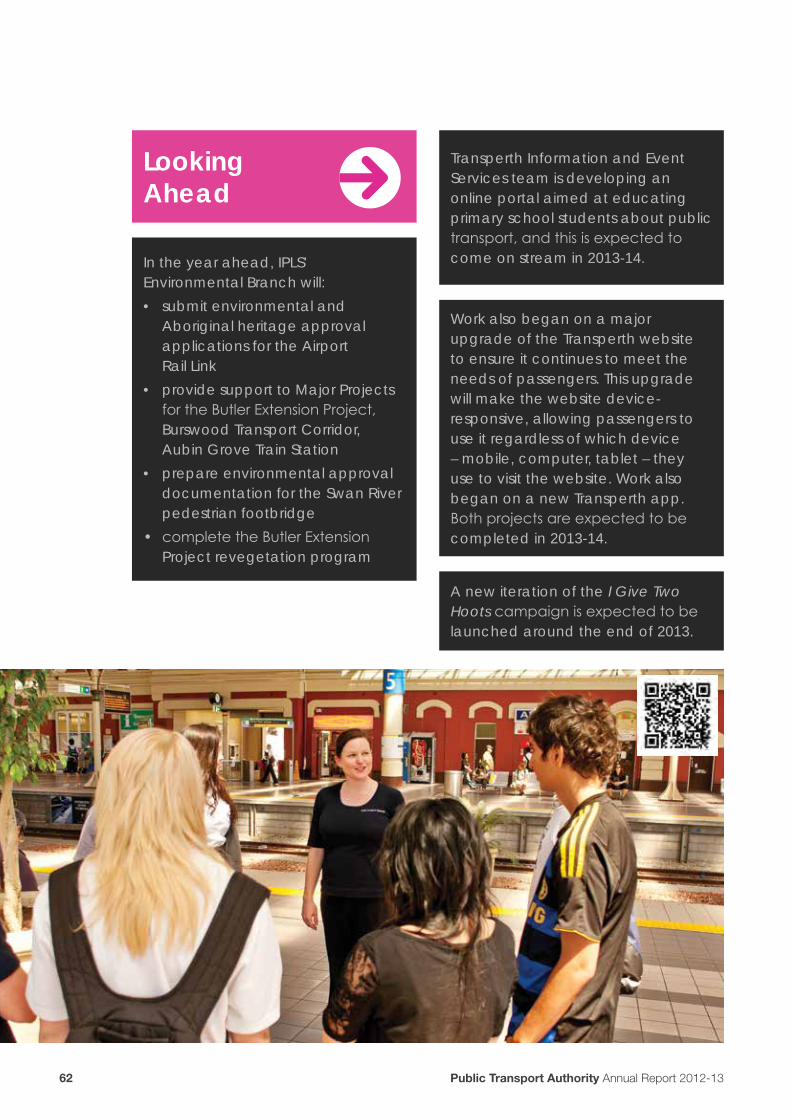
LookingAhead
In the year ahead, IPLS’ Environmental Branch will:
• submit environmental and Aboriginal heritage approval applications for the Airport Rail Link
• provide support to Major Projects for the Butler Extension Project, Burswood Transport Corridor, Aubin Grove Train Station
• prepare environmental approval documentation for the Swan River pedestrian footbridge
• complete the Butler Extension Project revegetation program
A new iteration of the I Give Two Hoots campaign is expected to be launched around the end of 2013.
Work also began on a major upgrade of the Transperth website to ensure it continues to meet the needs of passengers. This upgrade will make the website device-responsive, allowing passengers to use it regardless of which device – mobile, computer, tablet – they use to visit the website. Work also began on a new Transperth app. Both projects are expected to be completed in 2013-14.
Transperth Information and Event Services team is developing an online portal aimed at educating primary school students about public transport, and this is expected to come on stream in 2013-14.
62 Public Transport Authority Annual Report 2012-13

Fares and other revenue
$214.5 million Transperth total revenue
$12.88 million Transwa total revenue
96% SmartRider satisfaction for train users
98% SmartRider satisfaction for bus users
100% SmartRider satisfaction for ferry users
Overview
The numbers
Our Network
Customers and the community
Fares and other revenue
About PTA
Governance and compliance
Key Performance Indicators
Financial statements
63

64 Public Transport Authority Annual Report 2012-13

Transperth operates a common fare structure which applies across the whole of its integrated bus, train and ferry network.
Fares are based on a zone system delineated by nine concentric bands – the inner zone has an 8km radius; zones two and three, 9km; and zones four to nine, 10km. A short-distance fare is available for trips of up to 3.2km (two sections). Students up to year 12 pay a flat fare (50c) for all travel during the school year except on weekends and during the Christmas holidays. In addition, there are capped-price multi-trip daily tickets for individuals (DayRider) and groups (FamilyRider).
Passengers can transfer between services and modes without extra charge within two hours of starting their journey on trips covering up to four zones, and within three hours on longer trips. The transfer facility is not available on the two-section fare.
Discounts on the standard cash fares are provided through Transperth’s SmartRider system and are based on the method used to reload or top up the card. A 25 per cent discount is available to users choosing Autoload (direct debit or credit card); all other methods (eg. BPay, add-value machines, on-board bus/ferry, and at retail sales outlets and InfoCentres) qualify for a 15 per cent discount.
The facilities provided for passengers who choose to pay cash for their travel are electronic ticket-issuing machines (ETIMs) on all buses and ferries, and ticket-vending machines (TVMs) at all train stations and ferry jetties. SmartRider users tag on and tag off at smartcard processors on buses and ferries and at train stations.
Fares and other revenue – metro
65

Spotlight: SmartRider is a winner
Since the 2007 introduction of SmartRider – still the only fully-functional electronic ticketing system in Australia – the PTA has had access to a wealth of information on passenger travel behaviour that was previously unavailable.
Information on passenger origins, destinations, travel times and ticket types has enriched performance evaluation and eliminates the reliance on customer surveys and platform station counts to determine passenger characteristics.
The volume and precision of SmartRider information enable us to assess market segments to determine who our customers are, and to differentiate between leisure and commuter travel.
Tag-on information enables boarding times to be analysed to determine the peak volumes of demand to assist station and platform design and provide for supporting transport services.
Through simulation modelling, the information also provides the ability to estimate passenger journey time, including wait times and onboard journey time, to determine station and line demand, and to quantify the performance outcome from a customer focus.
SmartRider has therefore fundamentally changed the way in which we can assess and plan public transport services. Demand analysis based on SmartRider information enables the PTA to plan effectively and efficiently to ensure that demand is correctly managed, sufficient platform and service capacity is provided and the railway is best utilised to meet customer demand.
66 Public Transport Authority Annual Report 2012-13

Fare structure
Transperth Cash Fares Schedule 2012-13
Standard Concession OtherCash SmartRider –
cost per journeyCash SmartRider –
cost per journey15%
discount25%
discount15%
discount25%
discount2 Sections $1.90 $1.62 $1.43 $0.80 $0.68 $0.601 Zone $2.70 $2.30 $2.03 $1.10 $0.94 $0.832 Zones $4.00 $3.40 $3.00 $1.60 $1.36 $1.203 Zones $4.90 $4.17 $3.68 $2.00 $1.70 $1.504 Zones $5.80 $4.93 $4.35 $2.30 $1.96 $1.735 Zones $7.10 $6.04 $5.33 $2.80 $2.38 $2.106 Zones $8.10 $6.89 $6.08 $3.20 $2.72 $2.407 Zones $9.40 $7.99 $7.05 $3.80 $3.23 $2.858 Zones $10.20 $8.67 $7.65 $4.10 $3.49 $3.089 Zones $11.00 $9.35 $8.25 $4.40 $3.74 $3.30DayRider $11.00 $4.40 $3.30 $3.30FamilyRider $11.00Student (a) $0.5024 Hour SmartRider (b) $4.70Unrestricted half-yearly (c) $92.70Unrestricted monthly (c) $15.50
(a) Available only as a SmartRider. It is valid for any travel on Transperth services from Monday to Friday from the first to the last gazetted school day of the year; during mid-year school term holidays; and on public holidays that fall on a weekday during the school year. It is not valid on Saturdays and Sundays.
(b) Sold only to welfare agencies to be issued to their clients.
(c) Available only to persons receiving the disability support pension and employed in a supported employment setting. Persons receiving the disability support pension but not employed in a supported employment setting may apply for this ticket if they satisfied specified criteria.
Our highly-successful SmartRider electronic ticketing system continued to grow at the expense of cash tickets. SmartRider accounted for 70 per cent of all fare-paying boardings in 2012-13 – this was an increase of two percentage points, all of which came from cash transactions (28 per cent). Special-event boardings were unchanged at two per cent. (Full patronage details are outlined in the Our Network section of the annual report.)
Excluding special-event boardings, standard-fare passengers accounted for 54 per cent of cash and SmartRider boardings (previously 52 per cent), concession passengers were 32 per cent (35 per cent) and 50c-fare students were 11 per cent (10 per cent), while FamilyRider accounted for a steady three per cent.
Free travel on Transperth services includes SmartRider-based free travel on all modes by seniors, aged or disability pensioners and carers, free travel on passes (manually recorded on bus and ferry but not recorded on train) and travel within the FTZ and on CAT services.
Transfers made by SmartRider users accounted for 75 per cent of total transfers compared with 73 per cent in 2011-12.
The 2013 PSM showed very high levels of satisfaction among SmartRider users: 98 per cent of bus passengers (97 per cent in 2012), 96 per cent of train passengers (96 per cent) and 100 per cent of ferry passengers (94 per cent) said they were happy with the system.
67

Revenue and expenditure
In 2012-13, the average total cost (i.e. including capital charges) of providing Transperth services increased by 4.6 per cent to $0.569 per passenger kilometre. Total system cost rose 8.8 per cent while passenger kilometres were up 4.1 per cent.
Transperth: Total cost per passenger kilometre
0%
15%
30%
45%
60%
2008-09 2009-10 2010-11 2011-12 2012-13
$0.526
$0.534$0.533
$0.544$0.569
This figure is based on an average passenger trip length which is calculated using SmartRider data (extrapolated to include cash and free travel).
Total and operating costs increased across all modes.
On our buses, total costs rose 8.7 per cent to $419.024m, operating costs rose 9.7 per cent to $358.674m and annual capital charges (interest and depreciation) rose 2.8 per cent to $60.350m. The increase in operating cost was due to the application of price indexation arrangements applicable under the contracts and the continued roll-out of the bus service improvement program which saw an extra 2.69m service kilometres during the year.
Train total costs rose nine per cent to $428.025m though capital charges fell 0.4 per cent to $153.322m. Train operating costs include transfer expenses (infrastructure maintenance and corporate overheads). In 2012-13, total operating costs were up 15 per cent at $274.703m – direct costs increased 5.8 per cent to $179.189m and transfer expenses increased 37 per cent to $95.514m.
The increase in direct operating costs was due mainly to higher energy costs resulting from the introduction of the carbon tax and service changes to accommodate Perth City Link work, which added one million service kilometres.
The total cost of operating the ferry service rose 4.7 per cent and the operating cost by 5.2 per cent.
Transperth: System expenditure ($ millions)
$0
$200
$400
$600
$800
$1,000
2008-09 2009-10 2010-11 2011-12 2012-13
$691.172
$499.108
$731.790
$523.948
$667.886
$479.941
$779.186
$566.474
$847.882
$634.130
Total expenditure Operating expenditure
Total expenditure on Transperth services rose 8.8 per cent to $847.882 million. Operating expenditure (excluding capital charges) rose 11.9 per cent to $634.130m and capital charges (interest and depreciation) went up 0.5 per cent to $213.752m.
68 Public Transport Authority Annual Report 2012-13

Transperth: System revenue ($ millions)
$0
$50
$100
$150
$200
$250
2008-09 2009-10 2010-11 2011-12 2012-13
$155.659 $169.494
$152.216
$191.739
$176.059
$155.854$141.735$135.262
$214.546
$194.006
Total revenue Fare revenue
Transperth revenue continued to increase. Total revenue (fares plus income from parking, advertising, rent, etc) increased 11.9 per cent to $214.546m. Fare revenue was up 10.2 per cent to $194.006m.
As well as money from cash and SmartRider boardings, fare revenue includes full or part funding for CAT services, contributions for the provision of specific bus services, revenue from joint ticketing for special events (where the public transport fare is included in the price of the event ticket), Commonwealth funding for concession travel by interstate seniors and income from the sale of SmartRider cards.
A new fare schedule, effective from July 1 2012, provided an overall weighted average increase in fares of 6.5 per cent, with standard fares rising by an average of 5.2 per cent and concession fares (which are set at 40 per cent of standard fares) an average 10.2 per cent. The student fare remained at 50c.
The rising trend in fare revenue continued, fuelled by the increase in bus and train fare-paying boardings as well as higher fares. In 2012-13, fare revenue on bus was up 8.7 per cent to $79.855m, on train up 11.3 per cent to $111.913m, and on ferry up 5.4 per cent to $0.500m. The increase in ferry fare revenue despite the fall in fare-paying boardings was due to the increase in two-section fares for both standard and concession passengers.
69

Fares and other revenue – regional
Transwa
Revenue and expenditureThe average cost per coach passenger kilometre went up 4.55 per cent to $0.23, while the rail equivalent went up 15 per cent to $0.46.
Transwa: Average cost per passenger kilometre
$0.00 $0.1O $0.20 $0.30 $0.40 $0.50
2008-09
2007-08
2009-10
2010-11
2011-12
2012-13
$0.19$0.44
$0.24$0.41
$0.20$0.44
$0.22
$0.22
$0.23
$0.43
$0.46
$0.40
Road Coaches Rail
Fare revenue was up slightly at $11.25 million, due mainly to a fare increase in July 2012 and increased passenger numbers on the Australind. At the same time, expenditure was higher than in 2011-12 – up 7.42 per cent to $49.96m.
Transwa: Revenue (millions)
$0 $2 $4 $6 $8 $10 $12
2008-09
2007-08
2009-10
2010-11
2011-12
2012-13
$10.38
$10.14
$10.26
$10.41
$11.22
$11.25
70 Public Transport Authority Annual Report 2012-13

Transwa: Revenue (millions) by service
AvonLink
Australind
MerredinLink
Prospector
Road
$0.00 $1.00 $2.00 $3.00 $4.00
$4.00$5.00
$2.29$1.96$2.10$2.00$1.95$2.05
$3.45$3.45$3.38$3.63$4.27$4.11
$4.40$4.49$4.53$4.57$4.76$4.84
$0.15$0.15$0.15$0.13$0.14$0.13
$0.09$0.09$0.10$0.09$0.11$0.12
2007-08 2008-09 2009-102010-11 2011-12 2012-13
Transwa: Expenditure (millions)
$0 $10 $20 $30 $40 $50 $60
2008-09
2007-08
2009-10
2010-11
2011-12
2012-13
$49.00
$49.24
$45.79
$46.22
$46.51
$49.96
Regional Town Bus Services
Cost of the serviceThe cost of operating regional town bus services in 2012-13 was down 7.5 per cent at $16m. The cost of intra-town services decreased 8.5 per cent to $15m but the cost of inter-town services increased 7.4 per cent to $979,493.
71

72 Public Transport Authority Annual Report 2012-13

About PTA
14.2% culturally diverse workforce
$15 million rental from leased properties
4,871 job applications received for 210 positions offered
12 employees recognised for 40+ years service
70% of the workforce is employed in operational areas
Overview
The numbers
Our Network
Customers and the community
Fares and other revenue
About PTA
Governance and compliance
Key Performance Indicators
Financial statements
73

About PTA – our workforce
POD (the People and Organisational Development division) works collaboratively with the other PTA divisions to design and implement initiatives to effectively attract, support, develop, manage and retain our people to achieve the PTA’s current and future goals.
POD consists of four branches:
• Learning and Development
• Human Resource Services (HR Consultancy, Recruitment and Establishment, Personnel and Payroll)
• Human Resource Strategy
• Labour Relations
Key Achievements and people matrix
Total number of employees
Percentage Gender split as at 30.06.13
Number of applications received in FY 2012/13
210/4871 – Out of 4871 applications received, 210 were offered positions, including offers to appointment pool
Occupational groupings as percentage of workforce
70% are employed in operations which involves looking after the day to day processes of delivering a public transport system
20% are employed in infrastructure which relates to the construction and maintenance of tracks, signals, stations and other facilities which allow trains to run
10% support the service delivery in the areas of policy development and implementation, safety, contracts, communication and other corporate areas.
20%
10%70%
0 400 800 1200 1600
1479
1538 – 14.2% of who are culturally diverse
June 30 2012
June 30 2013
23%females
77%males
74 Public Transport Authority Annual Report 2012-13

Strategic People Management
The activities of our Human Resource Services and Human Resource Strategy branches can be grouped together under the common heading of Strategic People Management. The KRA for Strategic People Management is: Secure a workforce with the right capabilities and attitudes to realise our vision.
The PTA is committed to providing safe, customer-focussed, integrated and efficient transport services to the people of Western Australia. To achieve this, and to realise our vision of being recognised as a world leader in the provision of these essential transport services, we must secure a workforce with the right capabilities and attitudes. Accordingly, we implement a range of strategies to attract, develop and retain the right people in the right jobs, so as to maintain the high standards of service delivered each year.
We conduct a regular Employee Opinion Poll (EOP) to gauge employee opinion and measure our performance as an employer. In the most recent poll, conducted in March 2012, most respondents reported feeling positive about working at the PTA. Further analysis of the results identified priority areas for improvement. These areas become priorities of
the onePTA program. In 2012-13 the focus of onePTA has been on enhancing management and leadership capability and increasing employee involvement.
The PTA promotes and supports a positive work environment for its people and seeks to motivate them to give their best. We recognise the importance of providing a great place to work, good leadership, recognition for achievement and effort, and supporting development in engaging and retaining employees. Improved employee engagement, motivation and commitment result in greater employee loyalty and increased productivity. To this end, the onePTA program promotes a united vision and purpose for PTA employees and supports a strong culture of safety, respect, recognition, integrity and sustainability.
Workforce planning and development continue to be a key focus. Workforce planning and analysis provide a strategic framework to identify future workforce needs and the challenges we face in attracting and retaining a workforce with the right skills and attitudes. In this context the PTA develops strategies to attract and recruit new employees and develop the capabilities of the existing workforce.
75

The PTA Graduate Program is an important vehicle to attract and retain high-calibre employees for eventual appointment to key leadership roles in the PTA. It started in 2002 and has provided a pool of talented employees. It will be maintained as a key strategy in a competitive employment market. Last year we introduced a complementary Undergraduate Program to provide people who seek vacation work at the PTA, a structure through which they might enter the Graduate Program. The program performed well last year and continues in 2013 with a focus on attracting engineering students to the PTA.
The PTA maintains a strong commitment to continuously review our processes in accordance with public sector standards in human resource management to sustain a high standard of merit, equity and probity. As part of our continuous improvement strategy, reviews of some key policies and procedures have been undertaken with subsequent guidance and support to our managers and staff to ensure an approach that is fully aligned to the PTA values.
Learning and Development
The PTA has a dedicated Learning and Development team to help identify the development needs and source, design and deliver training and development opportunities for individuals, teams and occupational groups. The services provided by the L&D team expanded during the year, with an overall increase in training hours and the amount of training per-capita.
The PTA uses technology to provide flexible delivery models to achieve learning and development goals. This is particularly effective among operational employees. Technologies include e-learning, videos and other multimedia options such as video conferencing, online discussion groups and the PTA intranet.
The PTA is a Registered Training Organisation (RTO) capable of delivering accredited training in accordance with the Australian Quality Training Framework (AQTF). The RTO offers the following qualifications:
CPP30411 – Certificate III in Security Operations
TLI20410 – Certificate II in Transport and Logistics (Rail Operations)
TLI30410 – Certificate III in Transport and Logistics (Rail Operations)
TLI40410 – Certificate IV in Transport and Logistics (Rail Operations)
TLI42211 – Certificate IV in Rail Network Control
The PTA works with the Office of Rail Safety to ensure all minimum standards are met. The RTO delivers training to ensure the quality and safety of PTA’s delivered services, and will expand the scope of courses delivered to further this end.
76 Public Transport Authority Annual Report 2012-13

Labour Relations
The remuneration and employment conditions for PTA employees are governed by industrial instruments registered in the Western Australian Industrial Relations Commission.
The Labour Relations branch has continued to undertake a key role in dispute resolution, policy development, enterprise bargaining and the provision of strategic advice to operational managers in relation to work reform initiatives.
Diversity
The PTA’s Workforce and Diversity Plan 2012-2016 (WDP), builds on the achievements and experiences of our previous Equity and Diversity Management Plan 2010-2012. In 2012, the PTA consolidated its diversity strategies into a single plan, building a solid connection with business success. The WDP sets out targets consistent with core business goals and in line with the Western Australian Equal Opportunity Act 1984 and other relevant legislation.
The PTA is an equal opportunity employer committed to achieving greater workforce diversity. We strive to create and foster a supportive work environment where all individuals can realise their full potential. We recognise that managing diversity is an ongoing process that will have a positive effect on organisational culture and performance.
The strengthening of the labour market and evident skills shortages across the State require an open approach in the way we attract, develop and retain our workforce. Considering untapped sources of potential employees will enhance the performance of the PTA and the ability to meet our core business needs in a changing business landscape.
Diversifying the workforce will also ensure we match the demographics of the diverse Australian community and are able to provide better services to our customers.
Health and lifestyle
The PTA has a new health and wellbeing program which is shifting its focus from activities to results. The program provides useful metrics and offers new initiatives consistent with the philosophical shift.
The focus of the program will shift from catering for people in the maintenance phase (ie people already engaged in activity to maintain their health) to those in the contemplation phase. It will encourage individuals to partake in the program and have an active interest in their own health and wellbeing.
To demonstrate the value of the program, there will be a stronger emphasis on return on investment. The program will work with key stakeholders to apply targeted intervention strategies in key areas of concern or in areas identified as higher risk.
77

Service milestones
A number of our people achieved significant service milestones in 2012-2013. Awards recognising 40 and 50 years of service went to the following.
Collins, Maxwell Railway Operations Coord Mgr 50 Year award in Nov-2012
Crisp, Paul Suburban Operations Coordinator 40 Year award in Oct-2012
Francis, Dexter Train Controller 40 Year award in Oct-2012
Kelly, Stanley Railcar Driver Claisebrook 40 Year award in Oct-2012
Rodrick, Vincent Prosecutor’s Assistant 40 Year award in Oct-2012
Taylor, Ian Road Coach Operator East Perth 40 Year award in Oct-2012
Barton, Michael Driver Trainer Claisebrook 40 Year award in Nov-2012
Thomas, James Driver Trainer Claisebrook 40 Year award in Nov-2012
Steedman, Jeffrey Business Manager 40 Year award in Dec-2012
Lewis, Valentine Safety System Analyst 40 Year award in Feb-2013
Rakich, Philip Manager, Corporate Issues 40 Year award in Mar-2013
Italiano, Pat General Manager TTO 40 Year award in Mar-2013
Spotlight: Ten years of transits
It’s been ten years since the introduction of our transit officers.
Originally called transit guards, the role was established in late 2002 to provide a stronger safety presence on train services – especially at night. They were also tasked with countering fare evasion, providing customer information, and helping people with special needs.
The new approach to train security was launched in September 2002. The milestone was marked in late 2012 when a group of the initial transit guard intake celebrated their 10 years of service with the PTA.
In the years since their inception, the team has significantly stepped up the level of security professionalism on our train services, to the extent where we are now the envy of many other transport operators.
Unlike previous security services, the transit guards were given the power of arrest and were employed directly by PTA (WAGR at the time).
A major recruitment drive was undertaken in early 2002. Almost 1200 people applied. Numbers were stepped up again in 2007 to reflect the expansion of the train network that came about with the introduction on the Mandurah Line.
The initial team was made up of 115 transit guards including 12 supervisors. The numbers jumped to 150 in November that year as more recruits completed their 12-week specialised training course. Currently we have about 240 TOs (including managers, supervisors and trainers) with a new school set to start early in the new financial year. These officers are the key element of a total presence of more than 400 security personnel across the Transperth network.
78 Public Transport Authority Annual Report 2012-13

About PTA – property assets
• The safety of disused lines was addressed with programmed maintenance.
• Rental from leased properties amounted to $15m.
• Utility-type services to Kewdale Terminal were completed.
• Land in Kewdale and Forrestfield was provided for the Gateway Project, saving a considerable amount.
• Support was provided in relation to land matters for ongoing PTA projects.
• Management of the Rail Freight Corridor and the relationship with the network lessee continues.
• Land management policies were developed.
79

About PTA – organisational structure
Managing Director
Public Transport AuthorityChief Executive Officer
Executive Officer toManaging Director
Manager Corporate
Issues
Manager Investigations
Corporate Solicitor
Finance and
Contracts
Network and Infrastructure
Infrastructure Planning and Land Services
Major Projects
Unit
Transperth System,
Regional and School Bus Services
Transperth Train
Operations
People and Organisational Development
Safety and Strategic
Development
Corporate Communications
Executive board members
80 Public Transport Authority Annual Report 2012-13

About PTA – executive profiles
Reece Waldock Chief Executive Officer
Reece has 27 years experience in strategic management with particular expertise in organisational reform. He held a number of senior executive roles within the Department of Commerce and Trade and Department of Transport from the early 1990s through to the end of 2000. Prior to his career with the WA public sector, Reece held a number of senior management roles with BHP.
In December 2000, following the sale of the rail freight business of the Western Australian Government Railways Commission, Reece acted in the position of Commissioner of Railways. With the creation of the PTA on July 1, 2003 Reece was appointed as the inaugural CEO and oversaw the integration of all state-wide public transport services, together with a major construction program which included the Mandurah Railway.
In May 2010 the State Government integrated WA’s three key transport agencies and Reece was appointed to head the Transport portfolio, consisting of the Department of Transport, Main Roads WA and the PTA. This has heralded a new direction for the portfolio of single point accountability, a whole of portfolio approach and ensuring we get the transport system right.
Mark Burgess Managing Director
Mark has gained extensive logistic, transport and people management skills through 21 years in the Army and 16 years in senior public transport management roles.
He joined the PTA at its formation after six years when Transperth was within the Department of Transport and the Department for Planning and Infrastructure.
As PTA’s Managing Director, Mark is responsible for the day to day operations of the PTA. Prior to moving to this position three years ago, Mark was Executive Director of the Transperth system – that is Perth’s integrated bus, train and ferry system – for 12 years.
81

Pat Italiano General Manager Transperth Train Operations
Pat has been General Manager of Transperth Train Operations and a member of the PTA executive board since 2004.
In a 40-year career in public transport, Pat has acquired considerable expertise in business and strategic management, risk management, contract negotiations and audit. He has been on the operational side of Transperth’s urban passenger rail network since 2004.
Pat has direct line responsibility for all customer service personnel, train controllers, train drivers, service planners, depot staff, rollingstock procurement and maintenance (diesel and electric), and security personnel.
He is committed to the delivery of urban passenger rail services to the highest of customer service standards and to ensuring the successful integration and delivery of expansions to the urban passenger rail network.
Professionally, Pat is a qualified accountant, with a Bachelor of Business majoring in accounting and economics, a post-graduate Diploma in Accounting, and is a member of CPA Australia.
Kim Stone General Manager Network and Infrastructure
Kim joined the PTA in August 2004 as the General Manager of Transwa after a two year secondment in the Department for Planning and Infrastructure. He had previously been director of Coastal and Facilities Management in the Department of Transport for four years.
Kim has worked in both the State and Federal Government arenas in addition to a number of roles in the private sector, including running his own management consulting business. His background is in engineering and management.
In September 2009, Kim moved to the Network and Infrastructure Division as the General Manager and his responsibilities include the management and maintenance of the PTA railway network infrastructure, including controlling access by third parties under the Railways (Access) Act 1998 and ensuring the provision of Information Technology services to support PTA’s operations.
82 Public Transport Authority Annual Report 2012-13

Tim Woolerson General Manager Transwa
Twenty-one years in the military has provided Tim with extensive logistics and management skills along with an Associate Diploma in Engineering Maintenance. Tim commenced work at the PTA eight years ago as the Transperth Fleet Manager after six years in the private sector working in the vehicle fleet management field.
As general manager of Transwa, Tim is responsible for the delivery of a customer-focussed, safe and cost-effective transport services through the regional train and road coach network and for the maintenance of infrastructure and management of contracts associated with these services.
Martin White Executive Director Transperth System, Regional and School Bus Services
Martin joined the PTA in 2006. He was formerly General Manager of the Eastern Goldfields Transport Board (trading as TransGoldfields). Martin has 23 years’ experience in public transport, having previously worked in both the Department of Transport and the Department for Planning and Infrastructure. He is a qualified accountant and has a post-graduate qualification in management.
He is responsible for managing, coordinating and marketing the Transperth system, comprising commercial bus contractors, a commercial ferry contractor and the urban passenger rail services. His role is also responsible for the management of Regional Town Bus Services and School Bus Services throughout Western Australia.
Kevin Kirk Executive Director Finance and Contracts
Kevin has more than 36 years’ experience in public service and has held senior roles in Main Roads WA and the Department of Transport. He holds a Bachelor of Business (Accounting) degree and is a CPA and a fellow of the Institute of Public Accountants. His professional interest is in the areas of financial management, business performance and procurement.
Kevin is PTA’s Chief Finance Officer, responsible for maintaining PTA’s financial management and procurement systems and processes.
83

David Browne Executive Director Safety and Strategic Development
David joined PTA predecessor WAGRC in December 2002 as a Policy Officer and has a Master of Transport Studies degree (UWA) as well as qualifications in policy and management. Before joining the PTA, David spent 20 years in the aviation industry including 15 years in the RAAF where he worked in a number of areas including strategic airspace management policy and planning.
His role includes making the link between high-level policy and operations within the agency, managing a number of key projects, and driving strategic change in safety, policy development and business management.
Brian Appleby Executive Director People and Organisational Development
Brian brings to the organisation more than 30 years’ experience in Labour Relations, human resource management, workforce services and learning and development. After beginning his career in the private sector, Brian has undertaken a range of roles as an operative, operational manager and director in key public sector agencies and central government departments. He holds a post-graduate qualification in Industrial Relations and is a former Australian Army Reserve officer. He is a board member of the Logistics Training Council and a member of the Australasian Railways Workforce Development Committee.
Along with his responsibility for strategic people management, Brian oversees the delivery of functional human resource services for the PTA’s people. He commenced his appointment in February 2008.
Ross Hamilton Executive Director Major Projects
Ross has worked for Westrail and the PTA for 26 years in various roles including Construction, Planning Land Rationalisation and Maintenance. With the inception of the PTA he worked as the Manager Track and Civil Infrastructure and then took over the construction of the Mandurah railway through the critical commissioning phase for the commencement of services in December 2007.
Ross is responsible for the delivery of major projects for the PTA and is currently working on the Perth City Link project and the extension to the Northern Suburbs Railway from Clarkson to Butler.
84 Public Transport Authority Annual Report 2012-13

Peter Martinovich Executive Director Infrastructure Planning and Land Services
Peter began his railway career with WAGR as a junior clerk in 1964 and graduated as an engineer in Westrail’s Civil Engineering branch in 1974. He returned to this branch after a two-year secondment with the Australian Railways Research and Development Organisation in Melbourne in the early 80s. In 1987, he was appointed Maintenance Engineer in the Civil Branch. After serving in the position of Planning Engineer Northern Suburbs Railway, Peter rose to the position of Principal Engineer Planning and Permanent Way before transferring to the Department of Transport in 1995.
He became Manager, Transit Planning with the Department of Transport in 1995, and set up and led the team which developed the South West Metropolitan Railway and Northern Suburbs Extension Master Plans. He was appointed Deputy Project Director of New MetroRail in 2003. After completion of the NMR Project in 2007, he was appointed Director of Railway and Infrastructure Planning within the PTA’s Network and Infrastructure Division.
In 2009, he was appointed Executive Director of the newly-formed Infrastructure Planning and Land Services Division.
David Hynes Manager Corporate Communications
David brought a wealth of communications experience to the PTA (then WAGRC) when he joined the organisation in 2003 and has been a significant contributor to its communications activities, especially media relations, since then. Immediately prior to his appointment he had been working as a government media adviser to a senior Cabinet Minister.
He had previously worked as a freelance journalist, writing for a range of national and international publications, and ran his own public relations consultancy, providing high-level strategic advice to a big number of clients. This followed a 20-year career at WA Newspapers working on the Daily News, Weekend News and Countryman, culminating in a three-year stint as Business and Finance Editor of The West Australian.
85

About PTA – glossary of terms
AM Asset Management
AMP Asset Management Plan
ASL Acceptable Service Level
CAT Central Area Transit
CMR Central Monitoring Room
CNG Compressed Natural Gas
CRM Composite Rate Model
CCTV Closed-circuit television
DAIP Disability Access and Inclusion Plan
DSAPT Disability Standards for Accessible Public Transport
EEV Enhanced Environmentally-friendly Vehicle
FTZ Free Transit Zone
GPS Global Positioning System
HSE Health, Safety and Environment
IPLS Infrastructure Planning and Land Services
LTI Lost-Time Injury
N&I Network and Infrastructure (PTA division)
NMR New MetroRail (former PTA division)
OMI Office of Multicultural Interests
ORS Office of Rail Safety
OSH Occupational Safety and Health
OTR On-time running
PCL Perth City Link
PDP Project Definition Plan
PMP Prevention Maintenance Program
PPTA Perth Public Transport Area
PSA Property Street Addresses
PSM Passenger Satisfaction Monitor
PTA Public Transport Authority of Western Australia
RTBS Regional Town Bus Services
SBS School Bus Services (PTA branch)
TOD Transit Oriented Development
TRIS Transperth Route Information System
TTO Transperth Train Operations (PTA division)
UWA University of Western Australia
WAGRC Western Australian Government Railways Commission (PTA predecessor)
Acceptable Service Level (ASL)
Is defined as an hourly service during the day with at least three trips, IE at 20-minute intervals, in the peak flow direction in the morning and afternoon peaks.
Category A Incident causing serious injury, death, or significant damage.
Category B Incident that may have the potential to cause a serious accident.
Circle Route
A high-frequency bus service connecting major shopping centres, universities, schools and colleges.
Fare-paying boardings
Covers only those people, standard fare or concession, who pay (either by tagging on or by the purchase of a cash ticket) as they enter the system.
Initial boardings
Fare-paying boardings, plus free travel on passes, free travel on CAT services in Perth, Fremantle and Joondalup and free travel on services within the Perth FTZ.
Passenger place kilometres
The average seat capacity multiplied by the kilometres travelled while in service.
Service kilometres
The kilometres travelled while in service.
Total boardings
Fare-paying boardings, plus free travel on passes, free travel on CAT services in Perth, Fremantle and Joondalup and free travel on services within the Perth FTZ, plus transfers between services.
86 Public Transport Authority Annual Report 2012-13

Governance and compliance
KPIs 88
Safety and Strategy Directorate 90
Notifiable occurrences 90
Health and Safety 90
HSE management system 91
Rail safety accreditation 91
Reporting systems 91
Injury management 92
Health assessment standards 92
Drug and alcohol testing 92
Risk management 92
Record-keeping 93
Pricing policy 2012-13 93
Compliance statements 94
Statement of Compliance with Public Sector Standards 94
Statement of Compliance with relevant written law 94
Overview
The numbers
Our Network
Customers and the community
Fares and other revenue
About PTA
Governance and compliance
Key Performance Indicators
Financial statements
87

Governance and compliance – KPIs
Key performance Indicators are an integral part of managing outcomes in areas that have been identified as being critical to our business. The following is a summary of our success in delivering agreed outcomes in accordance with the 2011-2015 PTA Strategic Plan including other regulatory requirements.
KPIs Measures TargetLevel of
achievement Status Ref
Safety incidents per million passenger decrease
Notifiable occurrences CAT ‘A’ per million passenger boardings
0.23 100%
Notifiable occurrences CAT ‘A’ per million train kilometres
0.88 100%
Notifiable occurrences CAT ‘B’ per million passenger boardings
7.20 84% See notifiable occurrences
page 90
Notifiable occurrences CAT ‘B’ per million train kilometres
27.20 93% See notifiable occurrences
page 90
Pass service inspections (school bus)
99.5% 99.9%
Obligations under the lease are adhered to
Lease breaches 0 100%
Five-year independent audit
0 0
Key
On Target We are achieving our goals Desired results not achieved – taking action
88 Public Transport Authority Annual Report 2012-13

KPIs Measures 2010-11 2011-12 2012-13 TargetLevel of
achievement Status Ref
Occupational Safety & Health
Lost-time injury/disease (LTI/D incident rate)
7.70 6.95 5.88
Zero (0) or 10%
improvement on the
previous three (3)
years
25% improvement from 2010-11
See note #1
Lost time injury severity rate
N/A 24 23.86
Zero (0) or 10%
improvement on the
previous three (3)
years
N/A See note #2
% of injured workers returned to work within (i) 13 weeks and (ii) 26 weeks
N/A56
12.510.22
Greater than or equal to 80% return to
work within 26 weeks
10.22% See note #3
% of managers trained in OSH and injury-management responsibilities
14% 45% 76%Greater than or equal to
80%76%
See note #4
Number of fatalities (employees/ contractors)
0 1 0 0 100%
Key
On Target We are achieving our goals Desired results not achieved – taking action
Please note :
Ref #1 – The majority of the lost time injuries involves PTA’s Transit Officers who are carrying their duties in the front line and are subject to unforseen hazards when interacting with members of the public.
Ref #2 – Modest improvement from 2011-2012 to 2012-2013 Financial Years.
Ref #3 – The results were the contributing factors of the severity of the injuries being suffered.
Ref #4 – The result is a notable achievement in one year however this is an ongoing program to ensure that all managers receive the training in the next three years.
89
Governance and compliance – SSDGuided by internal needs, whole-of-government directions, and trends in public transport, the Safety and Strategy Directorate provides strategic leadership and support for the PTA in corporate policy, health and safety (including workers’ compensation and injury management), the environment, records services and the business management system.
Notifiable occurrences
Under the Rail Safety Act (2010), specific railway safety incidents must be reported to the ORS (Office of Rail Safety). These notifiable occurrences are defined in the Rail Safety Regulations (2011) as Category A (death, serious injury, or significant damage) or Category B (incidents that may have the potential to cause a serious accident). They do not cover non-rail operations. The benchmark performance targets for Category A and Category B incidents are calculated and normalised using estimates of passenger boardings and train kilometres travelled.
There were 12 Category A incidents in 2012-13, three fewer than in 2011-12. Excluding incidents beyond the PTA’s control (such as those considered to be suicides or attempted suicides), there were five such incidents (previously nine). No adverse trends were identified.
The number of Category B incidents increased 17 per cent to 526. There were a number of contributing factors:
• Incidents in the Slip-Trip-Fall category increased by 67 per cent. (Measures to address this are discussed elsewhere in this report.)
• Train collisions with objects illegally placed on the track (vandalism) or with stray animals increased by 33 per cent. In this case, the corrective action involved cleaning the rail reserve (ongoing hazard treatment, frequent inspections and debris removal), seasonal grass cutting and vegetation pruning to maintain line of sight, and frequent monitoring and inspection of construction sites on or near the railway.
Health and Safety
The provision of a healthy and safe workplace is the prime responsibility of management at all levels, as part of our commitment to making public transport an attractive and sustainable choice for connecting people and places in Western Australia.
The PTA has established a formal mechanism for consultation with employees on occupational safety and health matters through the establishment of safety and health committees. These committees include management and employees who consult and cooperate to develop and implement measures to ensure the safety and health of all our employees and customers.
The Health, Safety and Environment (HSE) committee procedure details the relevant processes.
Our worker’s compensation and injury management policy demonstrates the PTA’s commitment to comply with the Workers’ Compensation and Injury Management Act 1981 (WA) and the WorkCover’s guidelines for injury management. Return-to-work plans are developed in consultation with the injured worker, the medical practitioner, the supervisor and our injury management team for everyone who returns to the workplace after a work-related injury.
As well as satisfying state legislative requirements, the return-to-work plan provides early intervention to support employees with rehabilitation processes, and prioritised treatment plans to help employees get back to work.
90 Public Transport Authority Annual Report 2012-13
HSE management system
The Safety and Strategy Directorate continued to monitor and review the HSE system through a comprehensive audit program to ensure that all aspects – from local hazard control measures to the overarching organisational strategy – are working effectively to identify areas for continuous improvement. Identified corrective actions are tracked and regularly monitored through our STAR Reporting System.
Improved access to safety procedures has been achieved with the introduction of a HSE tab of the intranet home page, providing quick access to procedures and links.
The PTA’s safety management system extends to our direct contractor stakeholders. We ensure that our contractors understand the PTA’s safety management requirements and reinforce the overall commitment to safety.
Rail safety accreditation
The Western Australian Government Railways (trading as Westrail) was granted accreditation as a railway owner and operator on December 17 1999 following the introduction of the Rail Safety Act 1998 and compliance with AS4292.1: 1005. This requirement was amended in June 2004 following the enactment of new legislation and the creation of the Public Transport Authority on July 1 2004. The original accreditation date was retained.
Following the revision and publication of AS4292.1:1998, the Director Rail Safety issued an amended Notice of Accreditation No. 2 dated January 5 2006, directing railway owners and operators to have an accredited rail safety management system compliant with AS4292.1: 2006. A special condition of accreditation was added to allow PTA until May 31 2006 to identify the gaps in the current accredited Rail Safety Management System and the new requirements of AS4292.1: 2006 and to implement those changes by end-2006. The PTA accreditation was amended on January 5 2006, retaining the original accreditation date.
The Rail Safety Act 1998 was amended and decreed as the Rail Safety Act 2010 with the rail safety management system elements of AS4292.1: 2006 embodied into the Rail Safety Regulations 2011 as Schedule 1. Consequently the PTA rail safety management system policies and procedures were reviewed to ensure compliance with the revised requirements.
On May 31 2013, the Director Rail Safety issued a revised Notice of Accreditation, bringing the format into line with national rail safety regulatory requirements due to take effect from January 1 2014.
Reporting systems
The STAR Reporting System enables the efficient reporting, storage and analysis of hazards, near-misses, incidents, injuries and Workers’ Compensation claim data.
The PTA’s rail safety reporting system (IFRS) enables the reporting and storage of rail-related incidents, particularly Notifiable Occurrences. This system is compliant with national reporting requirements defined in the Rail Safety Regulations 2011 and ONS-1 (WA) 2008 and is updated as required.
The information collated by PTA’s reporting systems is used to identify trends which may indicate where corrective actions and other improvements may be required. A report consisting of lead and lag indicators for the organisation as a whole, as well as individual divisions, is tabled at a quarterly meeting of the Executive HSE Management Committee. Summaries of the key outcomes of this report are regularly communicated through the PTA intranet.
A recent improvement to the report is the introduction of an Action Register for Investigation Outcomes. The register lists actions against specific managers and includes deadlines for completion, thereby monitoring performance against corporate KPI’s. Further improvement to this divisional reporting process has continued throughout the year with new reporting parameters including traffic infringements and security incidents being reported and analysed for trends.
91

Injury management
The first three months of the financial year saw the Injury Management Team finalising the recommendations coming from the KPMG audit, released in February 2012.
In November 2012 the Office of the Auditor General conducted an audit on the Management of Injured Workers in the Public Sector. Eight agencies were audited, including the PTA. The audit was welcomed by the Injury Management Team as a way to ensure that best practice was being undertaken, maintained and, where possible, improved.
The key findings of the audit indicated that the Injury Management Team has established an effective approach to the management of our injured workers and is continuing to seek ways to improve.
While our key indicators show that there has been an increase in the number of longer-term claims, due to the nature of the injuries and our ageing workforce, the Injury Management Team continues to help our injured workers in a timely, cost-efficient and effective manner.
Health assessment standards
As part of ongoing improvement the updated National Health Assessment Standards were adopted in January to ensure an up-to-date understanding of the impact of certain health conditions regarding safe working.
Drug and alcohol testing
The PTA has a zero tolerance to the use of drugs or alcohol in the workplace. It is a recognised occupational health and safety issue because of the impairment effects which can compromise the individual employee’s ability to work safely.
More than 2000 alcohol and other drug tests where conducted during the year as part of our blanket and random testing. Four contractors returned positive alcohol results and one employee returned a result positive for drugs.
All the people concerned have undertaken a counselling program and have attended regular random testing for the six months following the positive result.
One employee tested positive to drugs during a scheduled health assessment.
Risk management
The PTA is committed to ensure that a proactive approach is adopted in managing and controlling risk at all levels. We are focussed on delivering our Strategic Plan’s Vision – To be recognised as a leader in providing world-class public transport services and solutions – and Purpose – To provide safe, customer-focussed, integrated and efficient transport services.
Our success in achieving this is closely aligned to the effectiveness of the management framework. The Executive is committed to ensuring that risk management is embedded in the organisation, by endorsing the development of appropriate culture, processes and structures.
The PTA is focussed on ensuring that risk is managed to a level deemed As Low As Reasonably Practicable (ALARP). Effective risk management is evidenced when strategic, operational and project risks are identified, assessed and treated, and opportunities are recognised and capitalised upon.
The Strategic Risk Management Group (SRMG) identifies, assesses and monitors the top strategic risks of the PTA and devises strategies to further mitigate risks. The Divisional Risk Coordinator Group (DRCG) then formalises appropriate actions at divisional level and the SRMG reviews the implementation of the strategies.
The DRCG also oversees the PTA’s risk management system (RiskBase), practices and procedures to ensure effectiveness of risk identification and management, and compliance to internal policies and guidelines, and external legislative and regulatory requirements. Quarterly risk reports identifying any significant risk trends are tabled at Executive meetings.
92 Public Transport Authority Annual Report 2012-13

Updates from the PTA’s risk management portfolio include:
• Outcomes from the KPMG audit of the our Risk Management Framework have been addressed with improvements being implemented in the areas of raising risk awareness, communications, accountability and reporting
• The risk management policy and guidelines were reviewed and enhanced to ensure compliance and alignment to the international risk management standard
• The provision of a risk education program formulated by Learning and Development delivered customised training modules to PTA staff to further enhance the organisation’s maturity and capability in risk management
• Ongoing structured bi-monthly DRCG and quarterly SRMG meetings were held.
Record-keeping
In accordance with State Records Commission requirements, the PTA has revised both the Functional Retention and Disposal Schedule and the Recordkeeping Plan. The agency has also continued with the disposal of records in accordance with State Records Office requirements, and provided Disaster Recovery training for Records Services staff.
In accordance with the requirements of State Records Commission Standard 6 – Outsourcing, the PTA has started a pilot project to retrieve contractor records from the Perth City Link Rail Alliance. The information thus provided will be used to develop more robust retrieval procedures.
Other records management milestones achieved in the year under review include:
• 14,041 incoming correspondence documents scanned and registered
• 8023 files created
• 1816 archive boxes created
• 1395 files destroyed
• 681 Ministerials created
• 84 barcode audits completed (work areas, compactus units and other storage areas)
• 16 new Work Instructions developed
Recordkeeping at the PTA continues to improve and the agency is well on the way towards compliance with the State Records Act 2000 and the policies, procedures and guidelines of the State Records Commission.
Pricing policy 2012-13
Government continued to maintain public transport fares at an affordable level. Transperth fares were increased by the projected rate of increase in CPI of 2.8 per cent plus 1.5 percentage points to allow for the recovery of the carbon tax. In accordance with government policy, concession fares were set at 40 per cent of standard fares and the student fare was left unchanged at 50 cents. Transperth fares are rounded to the nearest 10 cents.
Transwa fares are established by Government to ensure affordability for regional West Australians. For the 2012-13 financial year, Transwa fare increases were restricted to 2.8 per cent inline with the projected rate of increase in CPI, though the increase in Prospector fares was offset by a 2.29 per cent reduction resulting from the phased abolition of a fare loading previously applied to this service. Transwa fares are rounded to the nearest 5 cents.
Transperth fare information is provided at www.transperth.wa.gov.au.
Transwa fare information is provided at www.transwa.wa.gov.au.
93

Compliance statements
Statement of Compliance with Public Sector Standards
The PTA’s human resource management policies and practices are subject to ongoing review and, in accordance with section 31 (1) of the Public Sector Management Act, comply fully with the Public Sector standards in Human Resource Management.
Statement of Compliance with relevant written law
Enabling LegislationThe PTA is established under the Public Transport Authority Act 2003, an Act to establish a State agency responsible for providing public passenger transport services anywhere in the State and performing functions under other Acts, including the Rail Freight System Act 2000 and the Government Railways Act 1904 as well as the construction of railways under various railway enabling Acts. Currently the Minister responsible for the PTA is the Minister for Transport.
Legislation impacting on the PTA’s ActivitiesIn the performance of its functions, the PTA complies with all relevant written laws of Western Australia and, where required, reports on an annual basis in accordance with the following key legislation:
Financial Management Act 2006; Electoral Act 1907; Equal Opportunity Act 1984; State Superannuation Act 2000; Heritage of Western Australia Act 1990; Freedom of Information Act 1992; State Supply Commission Act 1991; Public Sector Management Act 1994; Disability Services Act 1993 (Cth); Rail Safety Act 2010; Railways (Access) Act 1998; State Trading Concerns Act 1916; Occupational Safety & Health Act 1984; Environmental Protection Act 1986; Contaminated Sites Act 2003; Auditor General Act 2006; State Records Act 2000; Salaries and Allowances Act 1975; and Public Interest Disclosure Act 2003.
Other various Agreements/Acts and written laws impact on the PTA’s activities from time to time.
In the financial administration of the PTA, we have complied with the requirements of the Financial Management Act 2006. We have also complied with every other relevant written law and exercised controls to provide reasonable assurance that the receipt and expenditure of moneys, the acquisition and disposal of public property and the incurring of liabilities have been in accordance with legislative provisions.
At the date of signing we are not aware of any circumstances which would render the particulars included in this statement misleading or inaccurate.
Reece Waldock Kevin KirkAccountable Authority Chief Finance Officer10 September 2013 10 September 2013
94 Public Transport Authority Annual Report 2012-13

Key Performance Indicators
Financial Targets: Actuals compared to budget targets 96
Summary of Key Performance Indicators: Actual compared to budget targets 97
Electoral Act 1907 – Section 175ZE 100
Explanation of Major Capital Expenditure Variations 2012-13 101
Independent audit opinion 102
Audited Key Performance Indicators 104
Certificate of Key Performance Indicators 104
Key Performance Indicators 104
Measuring Performance 105
Overview
The numbers
Our Network
Customers and the community
Fares and other revenue
About PTA
Governance and compliance
Key Performance Indicators
Financial statements
95

Key Performance Indicators – Financial Targets: Actuals compared to budget targetsThe following table provides a comparison of the financial targets and outcomes against criteria included in the Resource Agreement between the Chief Executive Officer, Minister for Transport and the Treasurer.
2012-13 Target
$000
2012-13 Actual
$000
Variation
$000
Total cost of services 1,151,698 1,152,368 (670) Note 1
Net cost of services 914,482 894,147 20,335 Note 2
Total Equity 4,737,210 4,787,181 ( 49,971) Note 3
Net increase/(decrease) in cash held (2,600) (14,171) (11,571) Note 4
Number of FTE’s
Number of FTE’s
Number of FTE’s
Approved full time equivalent 1,521 1,482 39 Note 5
Notes:
(1) Total Cost of Services The minor increase is due to reduced borrowing costs offset by increased expenditures on external works and various cost pressures.
(2) Net Cost of Services The variation is primarily due to increased revenue.
(3) Total Equity The variation is mainly due to an increase in non-current assets due largely to a transfer of assets from Main Roads WA and a decrease in accumulated depreciation.
(4) Net Decrease in Cash Held The net decrease is mainly due to the expenditure from cash contributed for the Perth City Link project ($24.8 million) offset by increased provisions for contaminated sites and workers’ compensation.
(5) Approved Full Time Equivalent. The variation to the approved FTE staff level is mainly due to lower than anticipated recruitment of Transit Officers. Train security was maintained by use of contracted security services.
96 Public Transport Authority Annual Report 2012-13

Key Performance Indicators – Summary of Key Performance Indicators: Actual compared to budget targets
2012-13 Target 2012-13 Actual Variation
Outcome: Accessible, Reliable and Safe Public Transport System
Key Effectiveness Indicators
Use of public transport – passengers per service kilometre:
• metropolitan bus services 1.38 1.37 -0.01
• metropolitan train services 4.41 4.12 -0.29
• metropolitan ferry services 13.82 12.74 -1.08
• regional bus services 0.833 0.815 -0.018
• country passenger rail services 0.238 0.236 -0.002
• country passenger road coach services 0.067 0.065 -0.002
Accessible Public Transport:
The proportion of street addresses within the Perth Public Transport Area which are within 500 metres of a Transperth stop providing an acceptable level of service 85.00% 84.70% -0.30%
Metropolitan and regional passenger services reliability:
• bus services within four minutes of scheduled time 82.00% 75.07% -6.93%
• train arriving within four minutes of scheduled time 95.00% 92.97% -2.03%
• ferries arriving within three minutes of scheduled time (a) 98.00% 84.73% -13.27%
Country passenger rail and road coach services reliability:
• Prospector arriving within 15 minutes of scheduled time (b) 90% 77% -13.00%
• Australind arriving within 10 minutes of scheduled time 90% 94% 4.00%
• MerredinLink arriving within 10 minutes of scheduled time 95% 94% -1.00%
• AvonLink arriving within 10 minutes of scheduled time 95% 99% 4.00%
• Road Coaches arriving within 10 minutes of scheduled time 95% 97% 2.00%
97

2012-13 Target 2012-13 Actual Variation
Regional school bus services reliability:
• drop off no less than 10 minutes before the school starts and pick up within 10 minutes of school ending 97% 99.8% 2.8%
Level of overall customer satisfaction – customer satisfaction index:
• metropolitan bus services 81% 81% 0.00%
• metropolitan train services 90% 84% -6.00%
• metropolitan ferry services 98% 96% -2.00%
• country passenger rail and road coach services 92% 92% 0.00%
Customer perception of safety – independent external surveys:
• train station – daytime 96% 98% 2.00%
• on-board train – daytime 97% 99% 2.00%
• train station – night-time 69% 69% 0.00%
• on-board train – night-time 75% 78% 3.00%
• bus station – daytime 96% 97% 1.00%
• on-board bus – daytime 98% 99% 1.00%
• bus station – night-time 70% 73% 3.00%
• on-board bus – night-time 82% 81% -1.00%
Level of notifiable safety occurrences – notifiable occurrences:
• Category A: occurrences per million passenger boardings 0.23 0.18 -0.05
• Category A: occurrences per million train kilometres 0.88 0.68 -0.20
• Category B: occurrences per million passenger boardings (c) 7.20 7.98 0.78
• Category B: occurrences per million train kilometres (c) 27.20 29.73 2.53
• Regional school bus services: notifiable occurrences (accidents) reported each school year (d) 13 27 14
98 Public Transport Authority Annual Report 2012-13

2012-13 Target 2012-13 Actual Variation
Outcome: Protection of the long term functionality of the rail corridor and railway infrastructure:
• Number of lease breaches Nil Nil Nil
Key Efficiency Indicators
Service 1: Metropolitan and Regional Passenger Services
Average cost per passenger kilometre
• Transperth bus operations $0.89 $0.90 $0.01
• Transperth train operations $0.44 $0.42 -$0.02
• Transperth ferry operations $1.19 $1.30 $0.11
Average cost per 1,000 place kilometres
• Regional bus services $76.54 $74.49 -$2.05
Total passenger place kilometres (millions)
• Regional bus services 210.247 211.040 0.793
Service 2: Country Passenger Rail and Road Coach Services
Average cost per passenger kilometre
• Transwa rail $0.46 $0.46 $0.00
• Transwa road coaches $0.23 $0.23 $0.00
Service 3: Regional School Bus Services
Average cost per contracted kilometre: School bus services $3.60 $3.62 $0.02
Service 4: Rail Corridor and Residual Freight Issues
Total cost of managing the rail freight corridor and residual freight issues $117,663,000 $117,749,000 $86,000
Note: For more explanations on the variation, please refer to the section Audited Key Performance Indicators.
a) The on time running result of Transperth Ferry in 2012-13 was 13.54% below target mainly due to ferries having to give way to barges involved in Elizabeth Quay works.
b) The Prospector on time running result was 14.36% below target as a result of speed restrictions, delays due to increased traffic and disruptions in services due to track repairs, signal failures and train crossing.
c) Category ‘B’ incidents per million passenger boardings and per million train kilometres were 10.82% and 9.31% above the targets.
d) Regional school bus services notifiable occurrences were 107.69% above target; 70% of the accident cases occurred through no fault of the school bus driver. No fatalities have been recorded.
99

Electoral Act 1907 – Section 175ZE
In compliance with section 175ZE of the Electoral Act 1907, the Public Transport Authority of Western Australia is required to report on expenditure incurred during the financial year in relation to advertising agencies, market research organisations, polling organisations, direct mail organisations and media advertising organisations.
The details of the report are as follows:
2012-13
$
Expenditure with Advertising Agencies:Definition Pty Ltd 339,410
Cooch Creative 210,880
ADCORP Marketing Communication 93,855
key2creative 91,485
Exposure Print and Design 43,857
Radiowest Broadcasters 28,285
Cineads Australia Pty Ltd 22,200
Bishop Media 19,620
Design Co-operative Limited 13,177
ICON Illustrations 11,021
Equilibrium Interactive Pty Ltd 8,648
Mills Wilson 6,720
Graduate Careers Australia 6,375
Countrywide Publications 5,273
Concept Media 5,000
Scott Shorter Pty Ltd 4,400
Australia’s South West 2,980
Australia’s Golden Outback 1,991
915,177
Expenditure with Market Research Agencies:Painted Dog Research 256,879
Expenditure with Polling Agencies: Nil
Expenditure with Direct Mail Agencies: Nil
Expenditure with Media Advertising Agencies:Mitchell & Partners Australia 91,883
Gramercy Park Consulting 13,313
Metropolitan Redevelopment 7,020
Siamese Pty Ltd 2,567
114,783
Total Expenditure 1,286,839
100 Public Transport Authority Annual Report 2012-13

Explanation of Major Capital Expenditure Variations 2012-13
(a) Budgeted estimates and actual results for 2012-13
Budget $000
Actual $000
Variation $000 Comments
Extension of Northern Suburbs Railway to Butler 92,674 64,474 28,200 Project scheduling Grain Freight Re-sleepering Project 81,236 56,019 25,217 Project scheduling Perth City Link 173,804 177,100 (3,296) Project scheduling Business Support Upgrades 7,073 6,147 926 Project scheduling Maddington Station Upgrade 2,555 3,166 (611) Project scheduling
Aubin Grove Station - 378 (378)New project approved post 2012-13 Budget Paper
Power Supply Continuity Program - 801 (801) Project scheduling Warnbro Bus Rail Interchange 3,266 3,948 (682) Project scheduling Bus Priority Projects 7,626 7,837 (211) Project scheduling Bus Acquisition Program for Additional Bus Kilometre Services 9,648 9,330 318 Project scheduling Goongoongup Rail Bridge - 937 (937) Project scheduling Bus Replacement Program 25,790 26,526 (736) Project scheduling Escalator and Lift Upgrade 3,105 2,637 468 Project scheduling
new Perth Stadium Transport Project - 5,436 (5,436)New project approved post 2012-13 Budget Paper
Network & Infrastructure Maintenance Depot 1,050 2,157 (1,107) Project scheduling Disability Access for Intermediate Minor Stations & Track Works 8,757 10,940 (2,183) Project scheduling Purchase of 22 Railcars 41,624 71,660 (30,036) Project scheduling Others 89,452 67,464 21,988 Project scheduling
Grand Total 547,660 516,957 30,703
(b) Major Works in progress and completed
Description of Work
2012-13 Estimated Total Cost
$000
Estimated Cost to
Complete $000
Total Cost of Project
Actual $000
Expected Year of
Completion
Perth City Link 609,269 288,009 321,260 2015-16 Bus Replacement Program 431,369 363,309 68,060 2020-21 Purchase of 22 Railcars 163,948 75,601 88,347 2016-17 Extension of Northern Suburbs Railway to Butler 240,730 240,730 - 2014-15 Grain Freight Re-sleepering Project 171,420 58,272 113,148 2013-14 Bus Acquisition Program for Additional Bus Kilometre Services 87,958 69,741 18,217 2017-18 Better Transport System (3000 parking bays) 52,349 - 52,349 2012-13 Disability Access for Intermediate Minor Stations & Track Works 33,304 14,718 18,586 2016-17 Bus Priority Projects 25,590 11,565 14,025 2015-16
101

Independent audit opinionIndependent Auditor’s ReportTo the Parliament of Western Australia
Public Transport Authority of Western AustraliaReport on the Financial Statements
I have audited the accounts and financial statements of the Public Transport Authority of Western Australia.
The financial statements comprise the Statement of Financial Position as at 30 June 2013, the Statement of Comprehensive Income, Statement of Changes in Equity and Statement of Cash Flows for the year then ended, and Notes comprising a summary of significant accounting policies and other explanatory information.
Chief Executive Officer’s Responsibility for the Financial Statements The Chief Executive Officer is responsible for keeping proper accounts, and the preparation and fair presentation of the financial statements in accordance with Australian Accounting Standards and the Treasurer’s Instructions, and for such internal control as the Chief Executive Officer determines is necessary to enable the preparation of financial statements that are free from material misstatement, whether due to fraud or error.
Auditor’s Responsibility As required by the Auditor General Act 2006, my responsibility is to express an opinion on the financial statements based on my audit. The audit was conducted in accordance with Australian Auditing Standards. Those Standards require compliance with relevant ethical requirements relating to audit engagements and that the audit be planned and performed to obtain reasonable assurance about whether the financial statements are free from material misstatement.
An audit involves performing procedures to obtain audit evidence about the amounts and disclosures in the financial statements. The procedures selected depend on the auditor’s judgement, including the assessment of the risks of material misstatement of the financial statements, whether due to fraud or error. In making those risk assessments, the auditor considers internal control relevant to the Authority’s preparation and fair presentation of the financial statements in order to design audit procedures that are appropriate in the circumstances. An audit also includes evaluating the appropriateness of the
accounting policies used and the reasonableness of accounting estimates made by the Chief Executive Officer, as well as evaluating the overall presentation of the financial statements.
I believe that the audit evidence obtained is sufficient and appropriate to provide a basis for my audit opinion.
Opinion In my opinion, the financial statements are based on proper accounts and present fairly, in all material respects, the financial position of the Public Transport Authority of Western Australia at 30 June 2013 and its financial performance and cash flows for the year then ended. They are in accordance with Australian Accounting Standards and the Treasurer’s Instructions.
Report on Controls
I have audited the controls exercised by the Public Transport Authority of Western Australia during the year ended 30 June 2013.
Controls exercised by the Public Transport Authority of Western Australia are those policies and procedures established by the Chief Executive Officer to ensure that the receipt, expenditure and investment of money, the acquisition and disposal of property, and the incurring of liabilities have been in accordance with legislative provisions.
Chief Executive Officer’s Responsibility for Controls The Chief Executive Officer is responsible for maintaining an adequate system of internal control to ensure that the receipt, expenditure and investment of money, the acquisition and disposal of public and other property, and the incurring of liabilities are in accordance with the Financial Management Act 2006 and the Treasurer’s Instructions, and other relevant written law.
Auditor’s Responsibility As required by the Auditor General Act 2006, my responsibility is to express an opinion on the controls exercised by the Public Transport Authority of Western Australia based on my audit conducted in accordance with Australian Auditing and Assurance Standards.
Auditor General
102 Public Transport Authority Annual Report 2012-13

An audit involves performing procedures to obtain audit evidence about the adequacy of controls to ensure that the Authority complies with the legislative provisions. The procedures selected depend on the auditor’s judgement and include an evaluation of the design and implementation of relevant controls.
I believe that the audit evidence obtained is sufficient and appropriate to provide a basis for my audit opinion.
Opinion In my opinion, the controls exercised by the Public Transport Authority of Western Australia are sufficiently adequate to provide reasonable assurance that the receipt, expenditure and investment of money, the acquisition and disposal of property, and the incurring of liabilities have been in accordance with legislative provisions during the year ended 30 June 2013.
Report on the Key Performance Indicators
I have audited the key performance indicators of the Public Transport Authority of Western Australia for the year ended 30 June 2013.
The key performance indicators are the key effectiveness indicators and the key efficiency indicators that provide information on outcome achievement and service provision.
Chief Executive Officer’s Responsibility for the Key Performance Indicators The Chief Executive Officer is responsible for the preparation and fair presentation of the key performance indicators in accordance with the Financial Management Act 2006 and the Treasurer’s Instructions and for such controls as the Chief Executive Officer determines necessary to ensure that the key performance indicators fairly represent indicated performance.
Auditor’s Responsibility As required by the Auditor General Act 2006, my responsibility is to express an opinion on the key performance indicators based on my audit conducted in accordance with Australian Auditing and Assurance Standards.
An audit involves performing procedures to obtain audit evidence about the key performance indicators. The procedures selected depend on the auditor’s judgement, including the assessment of the risks of material misstatement of the key performance indicators. In making these risk assessments the auditor considers internal control relevant to the Chief Executive Officer’s preparation and fair presentation of the key performance indicators
in order to design audit procedures that are appropriate in the circumstances. An audit also includes evaluating the relevance and appropriateness of the key performance indicators for measuring the extent of outcome achievement and service provision.
I believe that the audit evidence obtained is sufficient and appropriate to provide a basis for my audit opinion.
Opinion In my opinion, the key performance indicators of the Public Transport Authority of Western Australia are relevant and appropriate to assist users to assess the Authority’s performance and fairly represent indicated performance for the year ended 30 June 2013.
Independence
In conducting this audit, I have complied with the independence requirements of the Auditor General Act 2006 and Australian Auditing and Assurance Standards, and other relevant ethical requirements.
Matters Relating to the Electronic Publication of the Audited Financial Statements and Key Performance Indicators
This auditor’s report relates to the financial statements and key performance indicators of the Public Transport Authority of Western Australia for the year ended 30 June 2013 included on the Authority’s website. The Authority’s management is responsible for the integrity of the Authority’s website. This audit does not provide assurance on the integrity of the Authority’s website. The auditor’s report refers only to the financial statements and key performance indicators described above. It does not provide an opinion on any other information which may have been hyperlinked to/from these financial statements or key performance indicators. If users of the financial statements and key performance indicators are concerned with the inherent risks arising from publication on a website, they are advised to refer to the hard copy of the audited financial statements and key performance indicators to confirm the information contained in this website version of the financial statements and key performance indicators.
Colin Murphy Auditor General For Western Australia Perth, Western Australia 19 September 2013
103

Audited Key Performance Indicators
Certification of Key Performance Indicators
For the year ended 30 June 2013I hereby certify that the key performance indicators are based on proper records, are relevant and appropriate for assisting users to assess the Public Transport Authority’s performance, and fairly represent the performance of the Public Transport Authority of Western Australia for the financial year ended 30 June 2013.
Reece Waldock Accountable Authority 10 September 2013
Key Performance Indicators
Relationship to Government Strategic GoalThe following table depicts the relationship between the Government’s Goals and the outcomes and services that the PTA provides in order to achieve those goals.
Government Strategic Goal PTA Outcomes PTA Services
Results-Based Service Delivery:
Greater focus on achieving results in key service delivery areas for the benefit of all Western Australians
Accessible, reliable and safe public transport system
1. Metropolitan and Regional Passenger Services
2. Country Passenger Rail and Road Coach Services
3. Regional School Bus Services
Protection of the long term functionality of the rail corridor and railway infrastructure
4. Rail Corridor and Residual Freight Issues Management
Note: The key performance indicators and the variances are calculated based on original source data and the results are reported with rounding to the nearest appropriate decimals.
104 Public Transport Authority Annual Report 2012-13

Measuring Performance
Outcome 1: Accessible, reliable and safe public transport system
Effectiveness indicatorsThe PTA’s effectiveness in providing an accessible, reliable and safe public transport system is measured using the following key effectiveness indicators for:
1. Use of public transport
2. Accessible public transport
3. Service reliability
4. Level of overall customer satisfaction
5. Customer perception of safety
6. Level of notifiable safety incidents.
1. Use of Public Transport
The use of public transport is measured by comparing the annual number of passengers carried with the number of service kilometres. Service kilometres are kilometres operated on scheduled passenger services and exclude “non-productive running” i.e. travelling to or from the depot to commence a service trip or re-positioning to commence another service trip.
The measure indicates the extent to which services provided, as represented by the number of kilometres operated, are being utilised. An increasing trend in the indicator will generally signify that patronage is rising at a rate greater than the rate of increase in service kilometres operated and represents an improvement in effectiveness as well as an increase in the use of public transport.
This effectiveness indicator is applied to each mode of public transport. The indicator is based on total boardings on Transperth services and includes fare-paying boardings plus free travel and transfers. Transfers are boardings which occur either between services within the same mode or between modes during the specified ticket transfer time.
Transperth Bus Services
0.0 0.3 0.6 0.9 1.2 1.5
2009-10
2010-11
2011-12
2012-13
Target2012-13
1.38
1.37
1.39
1.43
1.43
Passengers per service kilometre
Passengers per service kilometre on Transperth bus was marginally (0.97 per cent) below the 2011-12 result and 0.40 per cent below the 2012-13 target.
Total boardings reached 83.543 million in 2012-13 compared to 80.626 million in 2011-12 and the target of 82.807 million, an increase of 3.62 per cent over 2011-12 and 0.89 per cent above the target.
The introduction of new bus services increased service kilometres to 60.781 million kilometres, 4.63 per cent (2.690 million) above the 2011-12 result of 58.091 million and 0.94 per cent above the 2012-13 target of 60.213 million.
Transperth Train Services
0 1 2 3 4 5
2009-10
2010-11
2011-12
2012-13
Target2012-13
4.41
4.12
4.21
4.11
4.15
Passengers per service kilometre
Passengers per service kilometre on Transperth train was 2.25 per cent below the 2011-12 result and 6.64 per cent below the target.
105

Total boardings reached 65.689 million in 2012-13, 4.22 per cent above the 2011-12 result of 63.030 million and 0.39 per cent below the 2012-13 target of 65.944 million. The increased boardings are due to the increase in population and the benefits of Public Transport over other transport modes.
Train service kilometres reached 15.956 million kilometres compared to 14.965 million in 2011-12, an increase of 6.62 per cent over 2011-12 and 6.65 per cent above the target as a result of strengthened services on weekdays, weekends and during main special events with additional 3-car, 4-car and 6-car trains being used for longer periods.
Regional Town Bus Services
Intra-town services operate within rural town boundaries, while inter-town services run between regional centres.
a. Intra-Town Services
0.0 0.2 0.4 0.6 0.8 1.0 1.2
2009-10
2010-11
2011-12
2012-13
Target2012-13
0.979
0.944
0.962
0.990
1.004
Passengers per service kilometre
Passengers per service kilometre reached 0.944, 1.91 per cent below the 2011-12 result of 0.962 and 3.61 per cent below the target of 0.979 in 2012-13.
This was mainly due to a 4.78 per cent increase in service kilometres to 2.632 million kilometres from 2.512 million in 2011-12 and a 2.78 per cent increase in total patronage to 2.484 million from 2.417 million in 2011-12.
b. Inter-Town Services
0.000 0.005 0.010 0.015 0.020
2009-10
2010-11
2011-12
2012-13
Target2012-13
0.019
0.0193
0.019
0.016
0.018
Passengers per service kilometre
Passengers per service kilometre reached 0.0193, 1.57 per cent above the 2011-12 result and 1.80 per cent above the target in 2012-13.
This was mainly due to a 6.32 per cent decrease in service kilometres to 0.424 million kilometres from 0.453 million kilometres in 2011-12 and a 4.84 per cent decrease in total patronage to 8,193 from 8,610 in 2011-12 as a result of the termination of the Greyhound road coach service between Perth and Broome in March 2013.
Transperth Ferry Services
0 3 6 9 12 15
2009-10
2010-11
2011-12
2012-13
Target2012-13
13.82
12.74
13.68
13.64
13.43
Passengers per service kilometre
Passengers per service kilometre reached 12.74, 6.85 per cent below the 2011-12 result of 13.68 and 7.80 per cent below the target of 13.82.
This was mainly due to a 1.94 per cent decrease in total boardings to 464,542 from 473,728 in 2011-12 and a 5.28 per cent increase in annual service kilometres to 36,457 from 34,630 kilometres in 2011-12 as a result of the introduction of extra services trips in December 2012.
106 Public Transport Authority Annual Report 2012-13
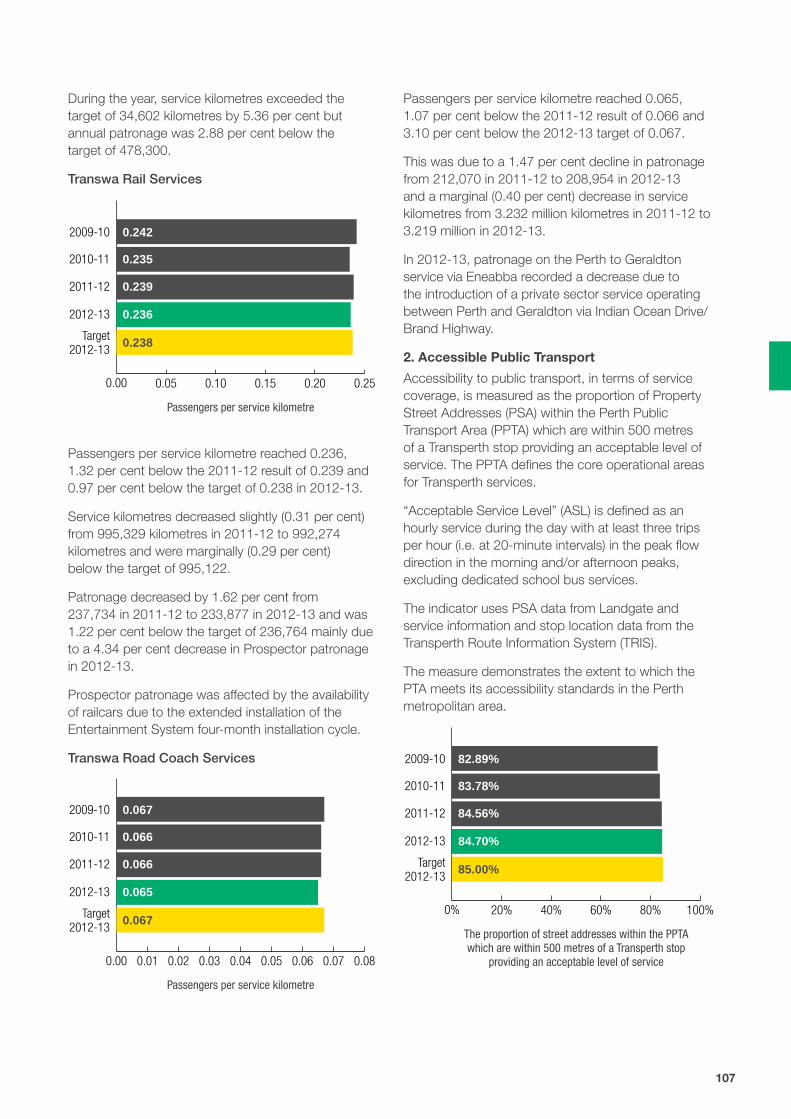
During the year, service kilometres exceeded the target of 34,602 kilometres by 5.36 per cent but annual patronage was 2.88 per cent below the target of 478,300.
Transwa Rail Services
0.00 0.05 0.10 0.15 0.20 0.25
2009-10
2010-11
2011-12
2012-13
Target2012-13
0.238
0.236
0.239
0.235
0.242
Passengers per service kilometre
Passengers per service kilometre reached 0.236, 1.32 per cent below the 2011-12 result of 0.239 and 0.97 per cent below the target of 0.238 in 2012-13.
Service kilometres decreased slightly (0.31 per cent) from 995,329 kilometres in 2011-12 to 992,274 kilometres and were marginally (0.29 per cent) below the target of 995,122.
Patronage decreased by 1.62 per cent from 237,734 in 2011-12 to 233,877 in 2012-13 and was 1.22 per cent below the target of 236,764 mainly due to a 4.34 per cent decrease in Prospector patronage in 2012-13.
Prospector patronage was affected by the availability of railcars due to the extended installation of the Entertainment System four-month installation cycle.
Transwa Road Coach Services
0.00 0.01 0.02 0.03 0.04 0.05 0.06 0.07 0.08
2009-10
2010-11
2011-12
2012-13
Target2012-13
0.067
0.065
0.066
0.066
0.067
Passengers per service kilometre
Passengers per service kilometre reached 0.065, 1.07 per cent below the 2011-12 result of 0.066 and 3.10 per cent below the 2012-13 target of 0.067.
This was due to a 1.47 per cent decline in patronage from 212,070 in 2011-12 to 208,954 in 2012-13 and a marginal (0.40 per cent) decrease in service kilometres from 3.232 million kilometres in 2011-12 to 3.219 million in 2012-13.
In 2012-13, patronage on the Perth to Geraldton service via Eneabba recorded a decrease due to the introduction of a private sector service operating between Perth and Geraldton via Indian Ocean Drive/Brand Highway.
2. Accessible Public Transport
Accessibility to public transport, in terms of service coverage, is measured as the proportion of Property Street Addresses (PSA) within the Perth Public Transport Area (PPTA) which are within 500 metres of a Transperth stop providing an acceptable level of service. The PPTA defines the core operational areas for Transperth services.
“Acceptable Service Level” (ASL) is defined as an hourly service during the day with at least three trips per hour (i.e. at 20-minute intervals) in the peak flow direction in the morning and/or afternoon peaks, excluding dedicated school bus services.
The indicator uses PSA data from Landgate and service information and stop location data from the Transperth Route Information System (TRIS).
The measure demonstrates the extent to which the PTA meets its accessibility standards in the Perth metropolitan area.
0% 20% 40% 60% 80% 100%
2009-10
2010-11
2011-12
2012-13
Target2012-13
85.00%
84.70%
84.56%
83.78%
82.89%
The proportion of street addresses within the PPTAwhich are within 500 metres of a Transperth stop
providing an acceptable level of service
107

Accessibility to public transport increased by 0.17 per cent from 2011-12 but was 0.35 per cent below the target. In 2012-13, the number of PSAs within the PPTA increased by 1 per cent to 915,252 from 906,184 in 2011-12. The number of PSAs within 500 metres of an ASL stop also increased by 1.17 per cent to 775,253 from 766,276 in 2011-12. The 2012-13 result indicates that a very high proportion of PSAs in Perth, 775,253 out of 915,252 (84.70 per cent) have ready access to an acceptable level of public transport services.
3. Service Reliability
According to an independent survey which measured customer satisfaction, service reliability is regarded as one of the most significant characteristics of a quality service. Service reliability is essentially a combination of two main factors, punctuality and consistency.
Services are considered to be punctual if they arrive within a defined period of time after the scheduled arrival time. This parameter is referred to as “On Time Running” (OTR).
Operation ‘OTR’ parameter
Metropolitan and Regional Passenger Services
Transperth Trains 4 minutes
Transperth Buses 4 minutes
Transperth Ferries 3 minutes
Country Passenger Rail and Road Coach Services
Transwa Rail
Prospector 15 minutes
Australind 10 minutes
AvonLink 10 minutes
MerredinLink 10 minutes
Road Coaches 10 minutes
Regional School Bus Services
Drop off no less than 10 minutes before school starts and pick up within 10 minutes of school ending
The ‘OTR’ measure demonstrates the extent to which the PTA meets its service reliability standards.
Transperth Train Services
0% 20% 40% 60% 80% 100%
2009-10
2010-11
2011-12
2012-13
Target2012-13
95.00%
92.97%
94.59%
95.71%
95.90%
Percentage of services arriving within‘on-time arrival’ parameter
The ‘OTR’ of Transperth Trains in 2012-13 reached 92.97 per cent, 1.71 per cent below the previous year’s result and 2.14 per cent below the 2012-13 target.
This was mainly due to a 4.22 per cent increase in passenger boardings resulting in long dwell times at stations, mechanical issues with both A and B series railcars and bad weather which resulted in slippery track conditions and trains travelling at a reduced speed.
Transperth Bus Services
0% 20% 40% 60% 80% 100%
2009-10
2010-11
2011-12
2012-13
Target2012-13
82.00%
75.07%
79.08%
85.13%
85.54%
Percentage of services arriving within‘on-time arrival’ parameter
The ‘OTR’ of Transperth Bus in 2012-13 reached 75.07 per cent, 5.06 per cent below the 2011-12 result and 8.45 per cent below the target mainly due to congestion caused by works on the Great Eastern Highway, Perth City Link, Elizabeth Quay, Beaufort Street, William Street, Perth Arena, Fiona Stanley Hospital and freeway extensions.
108 Public Transport Authority Annual Report 2012-13

Transperth Ferry Services
0% 20% 40% 60% 80% 100%
2009-10
2010-11
2011-12
2012-13
Target2012-13
98.00%
84.73%
96.67%
99.19%
98.39%
Percentage of services arriving within‘on-time arrival’ parameter
The ‘OTR’ of Transperth ferry in 2012-13 reached 84.73 per cent, 12.35 per cent below the 2011-12 result of 96.67 per cent and 13.54 per cent below the target of 98 per cent mainly due to ferries having to give way to barges involved in Elizabeth Quay works. Of the 131 trips checked during 2012-13, 111 trips have met the target.
Transwa Rail Services
Indicators of the ‘OTR’ performance for Transwa rail services are reported separately for each service.
a. Prospector
0% 20% 40% 60% 80% 100%
2009-10
2010-11
2011-12
2012-13
Target2012-13
90%
77%
77%
75%
72%
Percentage of services arriving within‘on-time arrival’ parameter
The ‘OTR’ of the Prospector reached 77 per cent in 2012-13, same as the 2011-12 result and 14.36 per cent below the 2012-13 target of 90 per cent mainly due to daily speed restrictions associated with the Brookfield re-railing program, delays and disruptions in services resulting from crossings, track works and late running by other rail users.
b. Australind
0% 20% 40% 60% 80% 100%
2009-10
2010-11
2011-12
2012-13
Target2012-13
90%
94%
89%
95%
95%
Percentage of services arriving within‘on-time arrival’ parameter
The ‘OTR’ of the Australind in 2012-13 reached 94 per cent, 5.44 per cent above the 2011-12 result and 3.95 per cent above the target. The improvement in the ‘OTR’ performance was due to services returning to normal operation as a result of the completion of track works.
c. AvonLink
0% 20% 40% 60% 80% 100%
2009-10
2010-11
2011-12
2012-13
Target2012-13
95%
99%
99%
98%
98%
Percentage of services arriving within‘on-time arrival’ parameter
The ‘OTR’ of the AvonLink in 2012-13 remained high at 99 per cent, same as the 2011-12 result and 4.43 per cent above the target of 95 per cent in 2012-13 due to limited numbers of rail crossings between Northam and Midland. Even though there is dual gauge in operation between Northam and Midland, crossings may still occur.
109
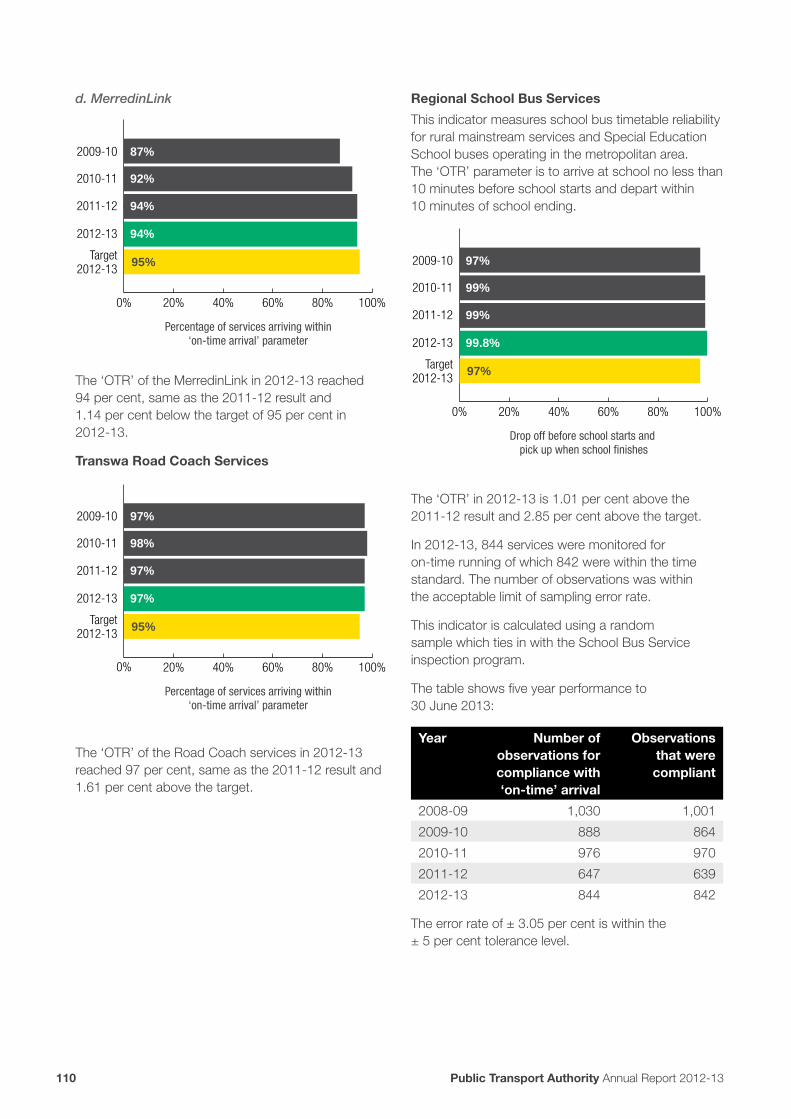
d. MerredinLink
0% 20% 40% 60% 80% 100%
2009-10
2010-11
2011-12
2012-13
Target2012-13
95%
94%
94%
92%
87%
Percentage of services arriving within‘on-time arrival’ parameter
The ‘OTR’ of the MerredinLink in 2012-13 reached 94 per cent, same as the 2011-12 result and 1.14 per cent below the target of 95 per cent in 2012-13.
Transwa Road Coach Services
0% 20% 40% 60% 80% 100%
2009-10
2010-11
2011-12
2012-13
Target2012-13
95%
97%
97%
98%
97%
Percentage of services arriving within‘on-time arrival’ parameter
The ‘OTR’ of the Road Coach services in 2012-13 reached 97 per cent, same as the 2011-12 result and 1.61 per cent above the target.
Regional School Bus Services
This indicator measures school bus timetable reliability for rural mainstream services and Special Education School buses operating in the metropolitan area. The ‘OTR’ parameter is to arrive at school no less than 10 minutes before school starts and depart within 10 minutes of school ending.
0% 20% 40% 60% 80% 100%
2009-10
2010-11
2011-12
2012-13
Target2012-13
97%
99.8%
99%
99%
97%
Drop off before school starts and pick up when school finishes
The ‘OTR’ in 2012-13 is 1.01 per cent above the 2011-12 result and 2.85 per cent above the target.
In 2012-13, 844 services were monitored for on-time running of which 842 were within the time standard. The number of observations was within the acceptable limit of sampling error rate.
This indicator is calculated using a random sample which ties in with the School Bus Service inspection program.
The table shows five year performance to 30 June 2013:
Year Number of observations for compliance with ‘on-time’ arrival
Observations that were compliant
2008-09 1,030 1,001
2009-10 888 864
2010-11 976 970
2011-12 647 639
2012-13 844 842
The error rate of ± 3.05 per cent is within the ± 5 per cent tolerance level.
110 Public Transport Authority Annual Report 2012-13

4. Level of Overall Customer Satisfaction
The proportion of patrons who expressed overall satisfaction with their public transport service level, measures the public perception of Transperth’s performance in providing a high-quality and attractive public transport service.
The measure for Transperth services is derived from an extensive annual survey conducted by independent pollsters. The survey, known as the ‘Passenger Satisfaction Monitor’ (PSM), provides an objective, unbiased view over time of patrons’ overall satisfaction with the system, e.g. safety, on-time running, courtesy of staff, service frequency and station amenities. The information is used by Transperth to develop strategies for improving service performance and infrastructure.
The pollsters interview a large sample of passengers in lengthy face-to-face surveys. Interviewers are assigned to various services and transit station locations over a four week period covering the working week and weekend.
Transperth Train Services
For the train PSM, a total of 1,001 train patrons were surveyed. The overall sample comprised of:
• Adults aged 18 years or over resident within the Perth metropolitan area;
• Current users of Transperth train services (excluding school students); and
• Patrons who travel on trains at least once per fortnight.
The sample error estimate was within ± 3 – 4 per cent and represents score differences required to reach the 95 per cent confidence level.
0% 20% 40% 60% 80% 100%
2009-10
2010-11
2011-12
2012-13
Target2012-13
90%
84%
89%
88%
93%
Percentage of respondents either ‘Very satisfied’ or ‘Satisfied’
Overall satisfaction decreased by 5.62 per cent from 2011-12 and was 6.67 per cent below the target.
The results were driven largely by a 6 per cent decrease in overall satisfaction of peak-time travellers (from 86 per cent in 2011-12 to 80 per cent in 2012-13) resulting from the 4.22 per cent increase in patronage and heavy peak time demand.
The expressed levels of dissatisfaction increased from 4 per cent in 2011-12 to 7 per cent in 2012-13.
The main reasons for dissatisfaction related to crowding issues, seat availability in peak times, insufficient railcars and infrequent off-peak services on weekdays and weekends.
Transperth Bus Services
For the Transperth bus PSM, a total of 3,056 bus patrons were surveyed. The overall sample comprised of:
• Adults aged 18 years or over resident within the Perth Bus Contract region;
• Current users of Transperth bus services (excluding school students); and
• Patrons who travel on bus at least once per fortnight.
The sample error estimate was within ± 2 – 3 per cent and represents score differences required to reach the 95 per cent confidence level.
0% 20% 40% 60% 80% 100%
2009-10
2010-11
2011-12
2012-13
Target2012-13
81%
81%
83%
82%
81%
Percentage of respondents either ‘Very satisfied’ or ‘Satisfied’
Overall satisfaction reached 81 per cent, same as the target in 2012-13 and 2.41 per cent below the 2011-12 result mainly due to a 3.62 per cent (2.9 million) increase in patronage.
In 2012-13, Marmion, Circle Routes and all CAT services recorded significantly higher satisfaction levels ranging from 88 per cent to 96 per cent.
111

Levels of dissatisfaction decreased from 10 per cent in 2011-12 to 9 per cent in 2012-13. The 2012-13 results remained steady and are consistent with those of the past five years. Significantly higher dissatisfaction levels were recorded for Midland and Morley. Midland has recorded significantly higher dissatisfaction and lower satisfaction compared to other regions in 2012-13.
The most frequent reasons for dissatisfaction with the Bus system in 2012-13 were issues relating to service frequency, punctuality, insufficient off-peak and weekend services and limited connection of buses and trains.
Transperth Ferry Services
For the Transperth ferry PSM, a total of 200 ferry patrons were surveyed. The overall sample comprised of:
• Adults aged 18 years or over resident within the Perth metropolitan area, (i.e. Patrons who were users of Transperth Ferry services and used it more than once a fortnight for Perth residents);
• Patrons who were users of Transperth Ferry services whilst visiting Perth; and
• School students were excluded from the sample.
The sample error estimate was within ± 10 per cent and represents score differences required to reach the 95 per cent confidence level.
0% 20% 40% 60% 80% 100%
2009-10
2010-11
2011-12
2012-13
Target2012-13
98%
96%
95%
96%
96%
Percentage of respondents either ‘Very satisfied’ or ‘Satisfied’
Customer satisfaction with the overall level of Transperth ferry services remained very high at 96 per cent, 1.05 per cent above the 2011-12 result and 2.04 per cent below the target.
In 2012-13, zero per cent of the respondents indicated that they were dissatisfied at the overall service level, thus maintaining the long-term trend of minimal or zero dissatisfaction with Transperth ferry services. The proportion of users who were ‘very satisfied’ with the Transperth ferry services was 69 per cent in 2012-13 compared to 75 per cent in 2011-12.
The key factors affecting the level of satisfaction were cost of fares, cleanliness on board, punctuality, service frequency on weekdays, speed of the trip, personal safety and seat availability.
Transwa Train and Road Coach Services
An independent passenger satisfaction survey is undertaken annually for each service: Australind, Prospector, AvonLink, MerredinLink and Road Coaches.
In 2012-13 a total of 1,272 country services patrons were surveyed via a self-completion questionnaire.
The sample error estimate was within ± 3 – 5 per cent and represents score differences required to reach the 95 per cent confidence level.
0% 20% 40% 60% 80% 100%
2009-10
2010-11
2011-12
2012-13
Target2012-13
92%
92%
90%
90%
90%
Percentage of respondents either ‘Very satisfied’ or ‘Satisfied’
Overall satisfaction reached 92 per cent, same as the 2012-13 target and was 2.22 per cent above the 2011-12 result mainly due to a 8.14 per cent increase in overall satisfaction with the Prospector services (from 86 per cent in 2011-12 to 93 per cent in 2012-13 mainly due to the upgrade of the seats and Entertainment System).
AvonLink recorded a 3.45 per cent decrease in overall satisfaction. However, overall services in 2012-13 recorded a higher level of satisfaction compared to that of the past three years.
112 Public Transport Authority Annual Report 2012-13
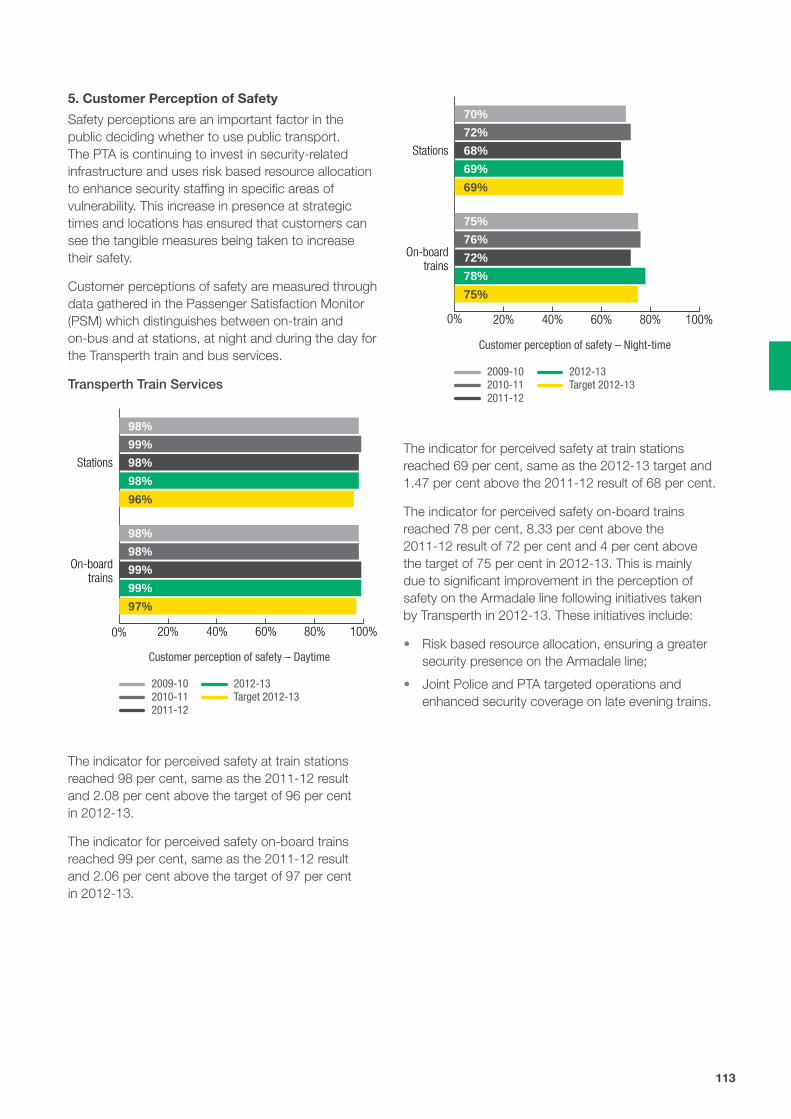
5. Customer Perception of Safety
Safety perceptions are an important factor in the public deciding whether to use public transport. The PTA is continuing to invest in security-related infrastructure and uses risk based resource allocation to enhance security staffing in specific areas of vulnerability. This increase in presence at strategic times and locations has ensured that customers can see the tangible measures being taken to increase their safety.
Customer perceptions of safety are measured through data gathered in the Passenger Satisfaction Monitor (PSM) which distinguishes between on-train and on-bus and at stations, at night and during the day for the Transperth train and bus services.
Transperth Train Services
0% 20% 40% 60% 80% 100%
Stations
On-boardtrains
96%
98%
98%
99%98%
97%
99%
99%
98%98%
Customer perception of safety – Daytime
2009-102010-112011-12
2012-13Target 2012-13
The indicator for perceived safety at train stations reached 98 per cent, same as the 2011-12 result and 2.08 per cent above the target of 96 per cent in 2012-13.
The indicator for perceived safety on-board trains reached 99 per cent, same as the 2011-12 result and 2.06 per cent above the target of 97 per cent in 2012-13.
0% 20% 40% 60% 80% 100%
Stations
On-boardtrains
69%
69%
68%
72%70%
75%
78%
72%
76%75%
Customer perception of safety – Night-time
2009-102010-112011-12
2012-13Target 2012-13
The indicator for perceived safety at train stations reached 69 per cent, same as the 2012-13 target and 1.47 per cent above the 2011-12 result of 68 per cent.
The indicator for perceived safety on-board trains reached 78 per cent, 8.33 per cent above the 2011-12 result of 72 per cent and 4 per cent above the target of 75 per cent in 2012-13. This is mainly due to significant improvement in the perception of safety on the Armadale line following initiatives taken by Transperth in 2012-13. These initiatives include:
• Risk based resource allocation, ensuring a greater security presence on the Armadale line;
• Joint Police and PTA targeted operations and enhanced security coverage on late evening trains.
113

Transperth Bus Services
0% 20% 40% 60% 80% 100%
At busstations/
interchanges
On-boardbuses
96%
97%
97%
97%96%
98%
99%
99%
99%98%
Customer perception of safety – Daytime
2009-102010-112011-12
2012-13Target 2012-13
The indicator for perceived safety at bus stations reached 97 per cent, same as the 2011-12 result and 1.04 per cent above the 2012-13 target of 96 per cent.
The indicator for perceived safety on-board reached 99 per cent, same as the 2011-12 result and 1.02 per cent above the 2012-13 target of 98 per cent.
0% 20% 40% 60% 80% 100%
At busstations/
interchanges
On-boardbuses
70%
73%
72%
73%70%
82%
81%
79%
82%79%
Customer perception of safety – Night-time
2009-102010-112011-12
2012-13Target 2012-13
The indicator for perceived safety at bus stations reached 73 per cent, 1.39 per cent above the 2011-12 result of 72 per cent and 4.29 per cent above the 2012-13 target of 70 per cent.
The indicator for perceived safety on-board buses reached 81 per cent, 2.53 per cent above the 2011-12 result of 79 per cent and 1.22 per cent below the 2012-13 target of 82 per cent.
6. Level of Notifiable Occurrences
Rail Safety
Railway safety incidents are recorded and notified to the Office of Rail Safety. These incidents are termed ‘notifiable occurrences’ and are defined in the Rail Safety Regulations 2011 as Category ‘A’ (serious injury, death or significant damage) or Category ‘B’ (incidents that may have the potential to cause a serious accident). Notifiable occurrences reporting is a legislated requirement under the Rail Safety Act 2010 for the accredited owner and operator of a rail system and form part of the PTA’s safety management system. These arrangements do not cover bus operations.
The performance measure for Category ‘A’ and ‘B’ occurrences is expressed as the number of occurrences per million passenger boardings and per million train kilometres. A low rate of incidents indicates that sound safety procedures and risk management procedures/controls exist and are operating effectively throughout the rail system.
The benchmark values for Category ‘A’ and Category ‘B’ incidents are calculated on the projected estimations of the number of future passenger boardings and train kilometres.
0.0 0.2 0.4 0.6 0.8 1.0
Category Aoccurencesper millionpassengerboardings
Category Aoccurencesper million
trainkilometres
0.23
0.18
0.24
0.190.23
0.88
0.68
0.90
0.690.86
Notifiable occurrences – Rail safety
2009-102010-112011-12
2012-13Target 2012-13
The indicator for Category ‘A’ incidents per million passenger boardings reached 0.18, 23.22 per cent below the 2011-12 result of 0.24 and 20.86 per cent below the target of 0.23 in 2012-13.
114 Public Transport Authority Annual Report 2012-13

The indicator for Category ‘A’ occurrences per million train kilometres reached 0.68, 24.94 per cent below the 2011-12 result of 0.90 and 22.92 per cent below the 2012-13 target of 0.88.
The KPIs were calculated based on 12 Category ‘A’ incidents, total train kilometres of 17.691 million and 65.923 million boardings in 2012-13.
Category ‘A’ occurrences, which includes suicides, decreased by 20 per cent from 15 in 2011-12 to 12 in 2012-13.
However, when excluding suicides and attempted suicides, there were 5 Category ‘A’ occurrences compared to 9 in 2011-12.
0 5 10 15 20 25 30 35
Category Boccurencesper millionpassengerboardings
Category Boccurencesper million
trainkilometres
7.20
7.98
7.11
6.638.19
27.20
29.73
27.11
24.6930.74
Notifiable occurrences – Rail safety
2009-102010-112011-12
2012-13Target 2012-13
The indicator for Category ‘B’ incidents per million passenger boardings reached 7.98, 12.18 per cent above the 2011-12 result of 7.11 and 10.82 per cent above the target of 7.20 in 2012-13. There were 526 Category ‘B’ occurrences in 2012-13 compared to 450 in 2011-12, an increase of 16.89 per cent mainly due to a 4.20 per cent increase in boardings.
The indicator for Category ‘B’ occurrences per million train kilometres reached 29.73, 9.67 per cent above the 2011-12 result of 27.11 and 9.31 per cent above the 2012-13 target of 27.20 per cent.
Effective Safety Management Systems controls are in place and ongoing reviews undertaken to minimise the incidents.
Regional School Bus Services Safety
Accidents attributable to all causes are notified to the PTA. The measure for the notifiable occurrences is expressed as the number of accidents (major and minor) reported during the school year.
A low number of occurrences indicate that effective safety management procedures and controls exist and are being adhered to by school bus contractors and drivers throughout the regional school bus fleet.
0 5 10 15 20 25 30
2009-10
2010-11
2011-12
2012-13
Target2012-13
13
27
22
19
17
School bus services notifiable occurrences(accidents) reported each school year
The indicator reached 27, 22.73 per cent above the 2011-12 result of 22 and 107.69 per cent above the target of 13 in 2012-13.
Overall, there were 27 ‘on-road’ school bus accidents in 2012-13, comprising of 4 major and 23 minor accidents. Approximately 70 per cent of the accident cases occurred through no fault of the school bus driver. No fatalities have been recorded although one accident causing significant injuries to a student was recorded. The student concerned has since returned to school and his recovery is making progress well ahead of schedule.
Of the 27 accidents, 16 occurred in the country area and 11 in metropolitan Perth. School Bus Services continues to campaign and educate school bus contractors and drivers about the relative risks associated with accidents and measures such as the requirement for all contractors to have in place Safety Management Plans are effective means of improving and maintaining safety standards.
In 2012-13, School Bus Services organised a series of workshops designed for school bus contractors and drivers across 35 localities in Western Australia and aimed at reinforcing the importance of safety management. Approximately 1,230 school bus contractors and drivers attended the workshops across the various localities, representing a participation rate in excess of 94 per cent.
115

Efficiency indicatorsThe PTA’s effectiveness in providing a cost efficient public transport system is measured using the following key efficiency indicators:
1. Average cost per passenger kilometre
2. Average cost per 1,000 place kilometres
3. Total passenger place kilometres (millions)
4. Average cost per contracted kilometres
1. Average Cost per Passenger Kilometre
This indicator measures the cost efficiency of providing passenger services, expressed as the cost of carrying one passenger one kilometre.
Transperth
Passenger kilometres are calculated by multiplying the number of total boardings by the average trip length.
The indicator measures the cost efficiency of the services, i.e. the trend in the cost of carrying one passenger over one kilometre. A declining trend indicates that the resources used to provide the services are being utilised in a cost efficient manner.
Transperth Train Services
$0.00 $0.10 $0.20 $0.30 $0.40 $0.50
2009-10
2010-11
2011-12
2012-13
Target2012-13
$0.44
$0.42
$0.40
$0.40
$0.41
Transperth Train OperationsAverage cost per passenger kilometre
The indicator reached $0.42, 4.25 per cent above the 2011-12 result of $0.40 and 5.03 per cent below the target of $0.44.
Cost of the services increased by 8.95 per cent to $428.025 million from $392.857 million in 2011-12 but was 5.49 per cent below the target of $452.872 million. The increased costs were mainly due to a 4.22 per cent increase in boardings and a 6.62 per cent increase in service kilometres.
Passenger kilometres also increased by 4.51 per cent to 1,024 million in 2012-13 from 980 million in 2011-12 but was marginally (0.17 per cent) below the target of 1,026 million in 2012-13.
Transperth Bus Services
$0.00 $0.20 $0.40 $0.60 $0.80 $1.00
2009-10
2010-11
2011-12
2012-13
Target2012-13
$0.89
$0.90
$0.85
$0.83
$0.76
Transperth Bus OperationsAverage cost per passenger kilometre
The indicator reached $0.90, 5.40 per cent above the 2011-12 result of $0.85 and 1.14 per cent above the target of $0.89 in 2012-13.
Cost of the services increased by 8.69 per cent to $419.024 million from $385.533 million in 2011-12 and was 2.26 per cent above the target of $409.762 million. This was mainly due to a 3.62 per cent increase in passengers and a 4.63 per cent increase in bus service kilometres resulting in increased bus maintenance and operating costs.
Passenger kilometres also increased by 3.12 per cent to 465.493 million from 451.404 million in 2011-12 and was marginally (0.74 per cent) above the target of 462.063 million in 2012-13.
Transperth Ferry Services
$0.00 $0.30 $0.60 $0.90 $1.20 $1.50
2009-10
2010-11
2011-12
2012-13
Target2012-13
$1.19
$1.30
$1.22
$1.15
$1.22
Transperth Ferry OperationsAverage cost per passenger kilometre
116 Public Transport Authority Annual Report 2012-13

The indicator reached $1.30, 6.76 per cent above the 2011-12 result of $1.22 and 9.23 per cent above the target of $1.19 in 2012-13.
Cost of the services increased by 4.68 per cent to $0.833 million from $0.796 million in 2011-12 and was 6.29 per cent above the target of $0.784 million in 2012-13. The increase in costs is mainly due to a 5.28 per cent increase in service kilometres following the introduction of extra services trips in December 2012.
Passenger kilometres decreased by 1.94 per cent to 641,067 from 653,744 in 2011-12 and was 2.87 per cent below the target of 660,000.
Transwa Rail Services
$0.00 $0.10 $0.20 $0.30 $0.40 $0.50
2009-10
2010-11
2011-12
2012-13
Target2012-13
$0.46
$0.46
$0.40
$0.43
$0.44
Transwa RailAverage cost per passenger kilometre
The indicator reached $0.46, same as the 2012-13 target and 13.77 per cent above the 2011-12 result of $0.40.
This was mainly due to a 10.22 per cent increase in total expenses to $34.184 million from $31.013 million in 2011-12 and a 3.12 per cent decrease in passenger kilometres from 76.756 million in 2011-12 to 74.364 million in 2012-13.
The reduction in passenger kilometres is largely driven by a 4.34 per cent decrease in Prospector patronage. In 2012-13, total Rail service kilometres decreased marginally (0.31 per cent) to 0.992 million kilometres from 0.995 million in 2011-12.
Transwa Road Coach Services
$0.00 $0.05 $0.10 $0.15 $0.20 $0.25
2009-10
2010-11
2011-12
2012-13
Target2012-13
$0.23
$0.232
$0.22
$0.22
$0.20
Transwa Road CoachesAverage cost per passenger kilometre
The indicator reached $0.232, 5.18 per cent above the 2011-12 result of $0.22 and marginally (0.70 per cent) above the target in 2012-13.
This was mainly due to a 2.04 per cent increase in total expenses to $14.960 million from $14.660 million in 2011-12 and a 2.98 per cent decrease in passenger kilometres from 66.574 million in 2011-12 to 64.592 million in 2012-13 driven mainly by a 1.47 per cent decrease in patronage and a marginal (0.40 per cent) decrease in service kilometres.
2. Average Cost per 1000 Place Kilometres
This indicator measures the cost efficiency of providing the service per 1,000 place kilometres and it is calculated for each mode by dividing total cost by place kilometres and multiplying by 1,000. Place kilometres are calculated by multiplying the average fleet capacity by the service kilometres.
Regional Bus Services
Intra-Town and Inter-Town Services
$0 $20 $40 $60 $80 $100
2009-10
2010-11
2011-12
2012-13
Target2012-13
$76.54
$74.49
$85.95
$80.91
$80.09
Regional Town Bus ServicesIntra and Inter-town services
Average cost per 1,000 place kilometres
117

The indicator reached $74.49, 13.34 per cent below the 2011-12 result of $85.95 and 2.69 per cent below the target of $76.54 in 2012-13.
This was mainly due to a 7.77 per cent decrease in total costs from $17.045 million in 2011-12 to $15.720 million in 2012-13 and a 6.43 per cent increase in total passenger place kilometres from 198.298 million in 2011-12 to 211.040 million in 2012-13 (largely due to a 3.09 per cent increase in service kilometres from 2.965 million kilometres in 2011-12 to 3.057 million in 2012-13 and increases in average bus fleet capacity following fleet changes in Bunbury, Busselton, Port Hedland, Geraldton and Broome).
3. Total Passenger Place Kilometres (millions)
This indicator measures the total number of passengers that can be carried for the service kilometres.
It is calculated for each mode of transport by multiplying the average fleet capacity by the service kilometres and this represents the capacity provided on each mode.
The service kilometres for most intra-town services are calculated using the Transperth Route Information System (TRIS).
Regional Bus Services
Intra-Town and Inter-Town Services
0 50 100 150 200 250
2009-10
2010-11
2011-12
2012-13
Target2012-13
210.2
211.0
198.3
190.9
190.5
Intra-town and Inter-town Bus ServicesTotal passenger place kilometres (millions)
The indicator reached 211.0, 6.43 per cent above the 2011-12 result of 198.3 and 0.38 per cent above the target of 210.2 in 2012-13.
This was mainly due to a 3.09 per cent increase in service kilometres from 2.965 million kilometres in 2011-12 to 3.057 million in 2012-13 and increases in average bus fleet capacity following changes introduced in 2012-13 to bus fleet in Bunbury, Busselton, Port Hedland, Geraldton and Broome.
4. Average Cost per Contracted Kilometres
Regional School Bus Services
The cost of administering school bus services on a kilometre basis is calculated by dividing the total cost of school bus contracts and operating expenses by the total contracted kilometres.
$0.00 $1.00 $2.00 $3.00 $4.00
2009-10
2010-11
2011-12
2012-13
Target2012-13
$3.60
$3.62
$3.63
$3.39
$3.27
Regional School Bus ServicesAverage cost per contracted kilometre
The indicator reached $3.62, 0.29 per cent below the 2011-12 result of $3.63 and 0.67 per cent above the 2012-13 target of $3.60.
During the year, total costs increased by 5.97 per cent to $114.074 million from $107.652 million in 2011-12 mainly due to the increased costs associated with the increase in student number.
Contract kilometres also increased by 6.28 per cent to 31.476 million kilometres from 29.617 million in 2011-12.
118 Public Transport Authority Annual Report 2012-13

Outcome 2: Protection of the long-term functionality of the rail corridor and railway infrastructure
Effectiveness IndicatorThe most significant issue for this outcome is the management of the long-term lease of the rail freight infrastructure to Brookfield Rail Pty Ltd.
Brookfield Rail manages and operates the rail freight infrastructure under the terms of the Railway Infrastructure Lease. Under the Lease, Brookfield Rail is the ‘accredited owner’ of the infrastructure as defined in the Rail Safety Act 1998.
Under the terms and conditions of the Railway Infrastructure Lease, an independent inspection of the railway infrastructure is carried out every five years. The last independent inspection was completed in June 2010.
The results of this inspection did not indicate any cause for concern and confirmed that the rail corridor and infrastructure was being satisfactorily maintained.
Cost EfficiencyThe cost efficiency for the management of the long-term lease of the rail freight infrastructure to Brookfield Rail is monitored using the total cost of managing the rail corridor and residual freight issues.
$0 $30,000 $60,000 $90,000 $120,000
2009-10
2010-11
2011-12
2012-13
Target2012-13
$117,663
$117,749
$112,713
$100,346
$29,681
Cost of managing rail corridor and residualfreight issues management ($’000s)
The cost of managing the rail corridor and residual freight issues in 2012-13 was 4.47 per cent above the 2011-12 result and marginally (0.07 per cent) above the target.
This was mainly due to increases in external works and depreciation costs.
The significant increase in 2010-11 was the result of a revaluation of the freight network which increased the depreciation costs by $76 million.
119

Certification of Financial Statements 121
Statement of Comprehensive Income 122
Statement of Financial Position 123
Statement of Changes in Equity 124
Statement of Cash Flows 125
Notes to the Financial Statements 126
1 Australian Accounting Standards 126
2 Summary of significant accounting policies 126
3 Judgements made by management in applying accounting policies 133
4 Key sources of estimation uncertainty 133
5 Disclosure of changes in accounting policy and estimates 134
6 Employee benefits expense 139
7 Supplies and services 139
8 Depreciation and amortisation expense 139
9 Finance costs 139
10 Grants and subsidies expense 140
11 Other expenses 140
12 User charges and fees 140
13 Operating lease revenue 140
14 Commonwealth grants and contributions 141
15 Interest revenue 141
16 Other revenue 141
17 Net gain/(loss) on disposal of non-current assets 141
18 Income from State Government 142
19 Restricted cash and cash equivalents 142
20 Inventories 143
21 Receivables 143
22 Amounts receivable for services (Holding Account) 143
23 Infrastructure, property, plant, equipment and vehicles 144
24 Intangible assets 147
25 Non-current assets classified as held for sale 147
26 Impairment of assets 147
27 Payables 148
28 Borrowings 148
29 Provisions 148
30 Other current liabilities 150
31 Deferred income – operating leases 150
32 Equity 150
33 Notes to the Statement of Cash Flows 151
34 Commitments 152
35 Contingent liabilities and contingent assets 153
36 Remuneration of members of the accountable authority and senior officers 153
37 Financial instruments 154
38 Supplementary financial information 159
39 Events occurring after the end of the reporting period 160
40 Explanatory statement 160
41 Schedule of income and expenses by service 162
42 Remuneration of auditor 164
43 Act of Grace payments 164
Financial StatementsFor the year ended 30 June 2013
120 Public Transport Authority Annual Report 2012-13

Certification of Financial StatementsFor the year ended 30 June 2013
The accompanying financial statements of the Public Transport Authority of Western Australia have been prepared in compliance with the provisions of the Financial Management Act 2006 from proper accounts and records to present fairly the financial transactions for the financial year ended 30 June 2013 and the financial position as at 30 June 2013.
At the date of signing we are not aware of any circumstances which would render the particulars included in the financial statements misleading or inaccurate.
R Waldock K Kirk Accountable Authority Chief Finance Officer 10 September 2013 10 September 2013
Overview
The numbers
Our Network
Customers and the community
Fares and other revenue
About PTA
Governance and compliance
Key Performance Indicators
Financial statements
121

Statement of Comprehensive IncomeFor the year ended 30 June 2013
Note2013 $000
2012 $000
Cost of ServicesExpenses Employee benefits expense 6 140,790 135,193
Supplies and services 7 217,361 197,149
Depreciation and amortisation expense 8 245,404 245,646
Finance costs 9 69,877 67,672
Grants and subsidies 10 427,440 384,157
Energy and fuel 31,176 25,236
Loss on disposal of non-current assets 17 0 816
Other expenses 11 20,320 20,818
Total cost of services 1,152,368 1,076,687
IncomeRevenueUser charges and fees 12 212,442 192,003
Operating lease revenue 13 5,466 5,466
Commonwealth grants and contributions 14 526 466
Interest revenue 15 2,380 3,125
Gain on disposal of non-current assets 17 77 0
Other revenue 16 37,330 32,164
Total revenue 258,221 233,224
Total income other than income from State Government 258,221 233,224
Net Cost of Services 894,147 843,463
Income from State Government 18
Operating subsidy contributions 646,521 776,189
Services received free of charge 619 455
Royalties for Regions Fund 3,297 3,007
Contribution – other government agencies 3,529 1,437
Total income from State Government 653,966 781,088
(Deficit)/surplus for the period (240,181) (62,375)
Other Comprehensive IncomeChanges in asset revaluation surplus 32 (2,624) 19,184
Total other comprehensive income (2,624) 19,184
Total comprehensive income for the period (242,805) (43,191)
Refer to note 41 ‘Schedule of income and expenses by service’. The Statement of Comprehensive Income should be read in conjunction with the accompanying notes.
122 Public Transport Authority Annual Report 2012-13
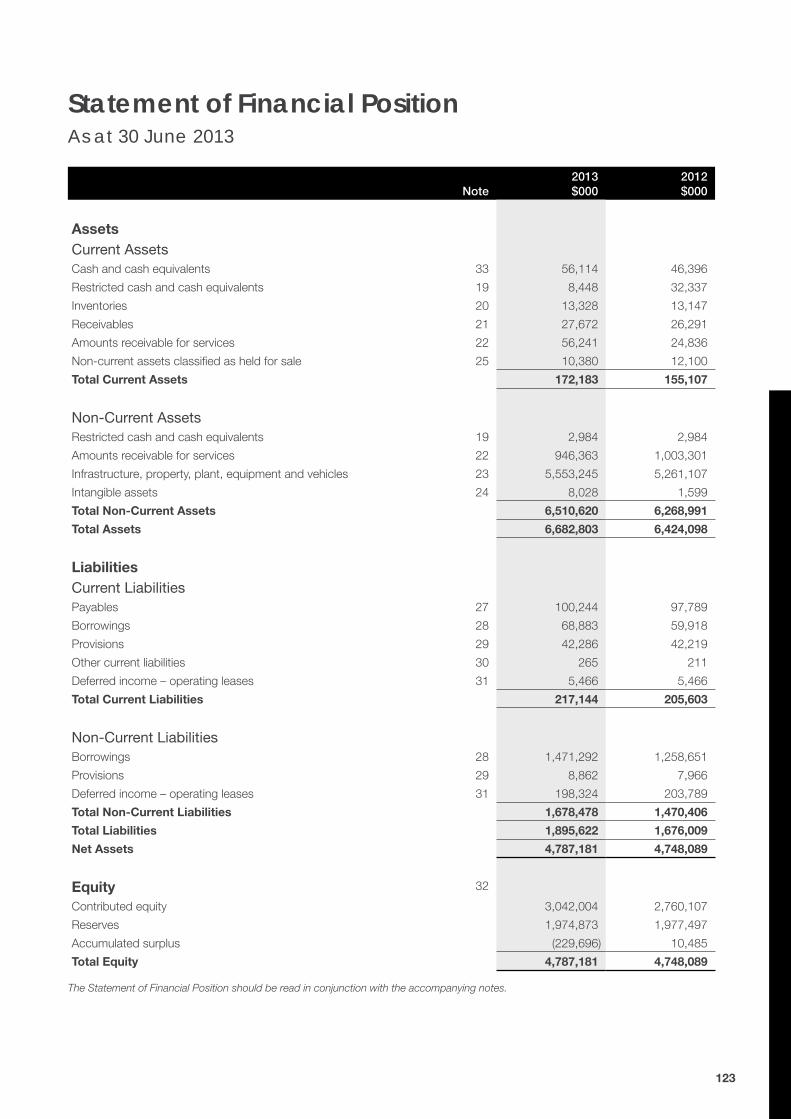
Statement of Financial PositionAs at 30 June 2013
Note2013 $000
2012 $000
Assets
Current Assets
Cash and cash equivalents 33 56,114 46,396
Restricted cash and cash equivalents 19 8,448 32,337
Inventories 20 13,328 13,147
Receivables 21 27,672 26,291
Amounts receivable for services 22 56,241 24,836
Non-current assets classified as held for sale 25 10,380 12,100
Total Current Assets 172,183 155,107
Non-Current Assets
Restricted cash and cash equivalents 19 2,984 2,984
Amounts receivable for services 22 946,363 1,003,301
Infrastructure, property, plant, equipment and vehicles 23 5,553,245 5,261,107
Intangible assets 24 8,028 1,599
Total Non-Current Assets 6,510,620 6,268,991
Total Assets 6,682,803 6,424,098
Liabilities
Current Liabilities Payables 27 100,244 97,789
Borrowings 28 68,883 59,918
Provisions 29 42,286 42,219
Other current liabilities 30 265 211
Deferred income – operating leases 31 5,466 5,466
Total Current Liabilities 217,144 205,603
Non-Current Liabilities Borrowings 28 1,471,292 1,258,651
Provisions 29 8,862 7,966
Deferred income – operating leases 31 198,324 203,789
Total Non-Current Liabilities 1,678,478 1,470,406
Total Liabilities 1,895,622 1,676,009
Net Assets 4,787,181 4,748,089
Equity 32
Contributed equity 3,042,004 2,760,107
Reserves 1,974,873 1,977,497
Accumulated surplus (229,696) 10,485
Total Equity 4,787,181 4,748,089
The Statement of Financial Position should be read in conjunction with the accompanying notes.
123

Statement of Changes in EquityFor the year ended 30 June 2013
Note
Contributed equity
$000Reserves
$000
Accumulated surplus/(deficit)
$000Total equity
$000
Balance at 1 July 2011 32 2,557,005 1,958,313 72,860 4,588,178
Surplus/(deficit) 0 0 (62,375) (62,375)
Other comprehensive income 0 19,184 0 19,184
Total comprehensive income for the period 0 19,184 (62,375) (43,191)
Transactions with owners in their capacity as owners:
Capital appropriations 201,813 0 0 201,813
Transfer of net assets from other agencies 1,539 0 0 1,539
Distributions to owners (250) 0 0 (250)
Total 203,102 0 0 203,102
Balance at 30 June 2012 2,760,107 1,977,497 10,485 4,748,089
Balance at 1 July 2012 2,760,107 1,977,497 10,485 4,748,089
Surplus/(deficit) 0 0 (240,181) (240,181)
Other comprehensive income 0 (2,624) 0 (2,624)
Total comprehensive income for the period 0 (2,624) (240,181) (242,805)
Transactions with owners in their capacity as owners:
Capital appropriations 245,964 0 0 245,964
New Perth Stadium account 4,621 0 0 4,621
Other contributions by owners 2,600 0 0 2,600
Transfer of net assets from other agencies 31,962 0 0 31,962
Distributions to owners (3,250) 0 0 (3,250)
Total 281,897 0 0 281,897
Balance at 30 June 2013 3,042,004 1,974,873 (229,696) 4,787,181
The Statement of Changes in Equity should be read in conjunction with the accompanying notes.
124 Public Transport Authority Annual Report 2012-13

Statement of Cash FlowsFor the year ended 30 June 2013
Note2013 $000
2012 $000
Cash Flows from State Government
Operating subsidy contributions 646,521 611,324
Capital appropriation – other government agencies 2,600 490
Capital appropriations 245,964 201,813
New Perth Stadium account 4,621 0
Royalties for Regions Fund 3,297 3,007
Holding account drawdown 25,533 39,958
Net cash provided by State Government 928,536 856,592
Utilised as follows:
Cash Flows from Operating Activities
Payments
Employee benefits (135,127) (137,233)
Supplies and services (246,027) (227,222)
Finance costs (70,422) (67,639)
Grants and subsidies (427,489) (380,767)
Receipts paid into consolidated account (3,500) (3,052)
GST payments on purchases (117,147) (94,981)
Other payments (17,127) (10,781)
Receipts
User charges and fees: Transwa 11,001 11,917
User charges and fees: Transperth train operations and buses 214,734 197,699
Commonwealth grants and contributions 526 466
Interest received 2,651 2,686
GST receipts on sales 25,021 22,225
GST receipts from taxation authority 89,246 71,345
Other receipts 27,004 14,369
Net cash used in operating activities 33 (646,656) (600,968)
Cash Flows from Investing Activities
Payments
Purchase of non-current physical assets (518,764) (352,408)
Receipts
Proceeds from sale of non-current physical assets 1,107 292
Net cash used in investing activities (517,657) (352,116)
Cash Flows from Financing Activities
Payments
Repayment of borrowings (69,490) (79,667)
Other repayments (365) (365)
Receipts
Proceeds from borrowings 291,461 163,394
Net cash provided by financing activities 221,606 83,362
Net (decrease)/increase in cash and cash equivalents (14,171) (13,130)
Cash and cash equivalents at the beginning of the period 81,717 94,847
Cash and Cash Equivalents at the end of the period 33 67,546 81,717
The Statement of Cash Flows should be read in conjunction with the accompanying notes. 125

1. Australian Accounting Standards
GeneralThe Public Transport Authority of Western Australia’s (PTA) financial statements for the year ended 30 June 2013 have been prepared in accordance with Australian Accounting Standards. The term ‘Australian Accounting Standards’ includes Standards and Interpretations issued by the Australian Accounting Standards Board (AASB).
The PTA has adopted any applicable new and revised Australian Accounting Standards from their operative dates.
Early adoption of standardsThe PTA cannot early adopt an Australian Accounting Standard unless specifically permitted by TI 1101 Application of Australian Accounting Standards and Other Pronouncements. There has been no early adoption of Australian Accounting Standards that have been issued or amended (but not operative) by the PTA for the annual reporting period ended 30 June 2013.
2. Summary of significant accounting policies
a) General statementThe PTA is a not-for-profit reporting entity that prepares general purpose financial statements in accordance with Australian Accounting Standards, the Framework, Statements of Accounting Concepts and other authoritative pronouncements of the AASB as applied by the Treasurer’s Instructions. Several of these are modified by the Treasurer’s Instructions to vary application, disclosure, format and wording.
The Financial Management Act 2006 and the Treasurer’s Instructions impose legislative provisions that govern the preparation of financial statements and take precedence over Australian Accounting Standards, the Framework, Statements of Accounting Concepts and other authoritative pronouncements of the AASB.
Where modification is required and has had a material or significant financial effect upon the reported results, details of that modification and the resulting financial effect are disclosed in the notes to the financial statements.
b) Basis of preparationThe financial statements have been prepared on the accrual basis of accounting using the historical cost convention, except for land, buildings, rollingstock, vessels, buses and infrastructure which have been measured at fair value.
The accounting policies adopted in the preparation of the financial statements have been consistently applied throughout all periods presented unless otherwise stated.
The financial statements are presented in Australian dollars and all values are rounded to the nearest thousand dollars ($’000).
Note 3 ‘Judgements made by management in applying accounting policies’ discloses judgements that have been made in the process of applying the PTA’s accounting policies resulting in the most significant effect on amounts recognised in the financial statements.
Note 4 ‘Key sources of estimation uncertainty’ discloses key assumptions made concerning the future, and other key sources of estimation uncertainty at the end of the reporting period, that have a significant risk of causing a material adjustment to the carrying amounts of assets and liabilities within the next financial year.
c) Reporting entityThe PTA is the reporting entity and there are no other related or affiliated bodies.
d) Contributed equityAASB Interpretation 1038 Contributions by Owners made to Wholly-Owned Public Sector Entities requires transfers in the nature of equity contributions, other than as a result of a restructure of administrative arrangements, to be designated by the Government (the owner) as contributions by owners (at the time of, or prior to transfer) before such transfers can be recognised as equity contributions. Capital appropriations have been designated as contributions by owners by TI 955 Contributions by Owners made to Wholly-Owned Public Sector Entities and have been credited directly to Contributed Equity.
Notes to the Financial StatementsFor the year ended 30 June 2013
126 Public Transport Authority Annual Report 2012-13

The transfers of net assets to/from other agencies, other than as a result of a restructure of administrative arrangements, are designated as contributions by owners where the transfers are non-discretionary and non-reciprocal.
e) IncomeRevenue recognitionRevenue is recognised and measured at the fair value of consideration received or receivable. Revenue is recognised for the major business activities as follows:
Sale of goodsRevenue is recognised from the sale of goods and disposal of other assets when the significant risks and rewards of ownership control transfer to the purchaser and can be measured reliably.
Provision of servicesRevenue is recognised by reference to the stage of completion of the transaction.
InterestRevenue is recognised as the interest accrues.
Lease incomeLease income from deferred operating leases is recognised as income on a straight-line basis over the term of the lease. (See note 13 ‘Operating lease revenue’ and note 31 ‘Deferred income – operating leases’).
Operating subsidy contributionsOperating subsidy contributions are recognised as revenues at fair value in the period in which the PTA gains control of the appropriated funds. The PTA gains control of appropriated funds at the time those funds are deposited to the bank account or credited to the ‘Amounts receivable for services’ (holding account) held at Treasury. (See note 18 ‘Income from State Government’).
Grants, donations, gifts and other non-reciprocal contributionsRevenue is recognised at fair value when the PTA obtains control over the assets comprising the contributions, usually when cash is received.
Other non-reciprocal contributions that are not contributions by owners are recognised at their fair value. Contributions of services are only recognised when a fair value can be reliably determined and the services would be purchased if not donated.
Royalties for Regions funds are recognised as revenue at fair value in the period in which the PTA obtains control over the funds. The PTA obtains control of the funds at the time the funds are deposited into the PTA’s bank account.
InfringementsInfringements are recognised at the time payment is received. Outstanding infringements are not recognised as debts, as the future economic benefits are minimal and cannot be reliably measured at the end of the reporting period.
GainsRealised and unrealised gains are usually recognised on a net basis. These include gains arising on the disposal of non current assets and some revaluations of non-current assets.
f) Borrowing costsAll borrowing costs are recognised as expenses in the period in which they are incurred. (See note 3 ‘Judgements made by management in applying accounting policies’).
g) Infrastructure, property, plant and equipment and vehicles
Capitalisation/expensing of assetsItems of infrastructure, property, plant and equipment and vehicles costing $5,000 or more are recognised as assets and the cost of utilising assets is expensed (depreciated) over their useful lives. Items of infrastructure, property, plant and equipment and vehicles costing less than $5,000 are immediately expensed direct to the Statement of Comprehensive Income (other than where they form part of a group of similar items which are significant in total).
Initial recognition and measurementInfrastructure, property, plant and equipment and vehicles are initially recognised at cost.
For items of infrastructure, property, plant and equipment and vehicles acquired at no cost or for nominal cost, the cost is their fair value at the date of acquisition.
Subsequent measurementSubsequent to initial recognition as an asset, the revaluation model is used for the measurement of land, buildings, urban rail system and bus infrastructure, rollingstock, vessels and buses and the historical cost for plant and equipment and motor vehicles. Land is carried at fair value less accumulated impairment losses.
127

Buildings, urban rail system, freight network infrastructure and bus infrastructure are carried at fair value less accumulated depreciation and accumulated impairment losses. Plant and equipment and motor vehicles are stated at historical cost less accumulated depreciation and accumulated impairment losses.
Where market-based evidence is available, the fair value of land and buildings is determined on the basis of current market buying values determined by reference to recent market transactions. When buildings are revalued by reference to recent market transactions, the accumulated depreciation is eliminated against the gross carrying amount of the asset and the net amount restated to the revalued amount.
In the absence of market-based evidence, the fair value of land and buildings is determined on the basis of existing use. This normally applies where buildings are specialised or where land use is restricted. Fair value for existing use assets is determined by reference to the cost of replacing the remaining future economic benefits embodied in the asset, i.e. the depreciated replacement cost. Where the fair value of buildings is determined on the depreciated replacement cost basis, the gross carrying amount and the accumulated depreciation are restated proportionately.
The revaluation of land controlled by the PTA including metropolitan and regional corridor land, not subject to commercial lease, is provided independently on an annual basis by the Western Australian Land Information Authority (Valuation Services) and recognised annually to ensure that the carrying amount does not differ materially from the asset’s fair value at the end of reporting period.
Land and buildings which are commercially leased are independently valued at fair value based on the capitalised value of current leases. Independent valuations are obtained annually.
Buildings, bus infrastructure, rollingstock, vessels and buses have been revalued at fair value using depreciated replacement cost by independent valuers, engineering and management professionals. Valuations are obtained every 3 to 5 years. The fair value is based on depreciated replacement cost as the assets are specialised and no market-based evidence of value is available.
Urban rail system infrastructure and freight network infrastructure are revalued, at least once every five years, to its fair value based on depreciated replacement cost, as the assets are specialised and no market-based evidence of value is available.
When infrastructure is revalued, the accumulated depreciation is restated proportionately with the change in the gross carrying amount of the asset so that the carrying amount of the asset after revaluation equals its revalued amount.
Construction in progress is recognised at cost.
The most significant assumptions in estimating fair value are made in assessing whether to apply the existing use basis to assets and in determining estimated useful life. Professional judgement by the valuer is required where the evidence does not provide a clear distinction between market type assets and existing use assets.
DerecognitionUpon disposal or derecognition of an item of property, plant and equipment, infrastructure and vehicles, any revaluation surplus relating to that asset is retained in the asset revaluation surplus.
Asset revaluation surplusThe asset revaluation surplus is used to record increments and decrements on the revaluation of non-current assets as described in note 23 ‘Infrastructure, property, plant, equipment and vehicles’.
DepreciationAll non-current assets having a limited useful life are systematically depreciated over their estimated useful lives in a manner which reflects the consumption of their future economic benefits.
Depreciation is calculated using the straight-line method, using rates which are reviewed annually. Estimated useful lives for each class of depreciable asset are:
Class of Asset Useful Life
Buildings 10 to 50 years
Rollingstock 10 to 45 years
Infrastructure 10 to 75 years
Plant and equipment 5 to 40 years
Buses 10 to 45 years
Motor vehicles 5 to 10 years
Vessels 4 to 20 years
Office equipment 3 to 5 years
Assets under construction are not depreciated until they are available for use.
Land is not depreciated.
128 Public Transport Authority Annual Report 2012-13

h) Intangible assetsCapitalisation/Expensing of assetsAcquisitions of intangible assets costing $5,000 or more and internally generated intangible assets costing $5,000 or more are capitalised. The cost of utilising the assets is expensed (amortised) over their useful lives. Costs incurred below these thresholds are immediately expensed directly to the Statement of Comprehensive Income.
Intangible assets are initially recognised at cost. For assets acquired at no cost or for nominal cost, the cost is their fair value at the date of acquisition.
The cost model is applied for subsequent measurement requiring the asset to be carried at cost less any accumulated amortisation and accumulated impairment losses.
Amortisation for intangible assets with finite useful lives is calculated for the period of the expected benefit (estimated useful life which is reviewed annually) on the straight-line basis. All intangible assets controlled by the PTA have a finite useful life and zero residual value.
The expected useful lives for each class of intangible asset are:
Class of Intangible asset Useful Life
Software* 2 to 5 years
Website costs 3 to 5 years
Licences 15 years
* Software that is not integral to the operation of any related hardware.
Computer softwareSoftware that is an integral part of the related hardware is recognised as property, plant and equipment. Software that is not an integral part of the related hardware is recognised as an intangible asset. Software costing less than $5,000 is expensed in the year of acquisition.
Website costsWebsite costs are charged as expenses when they are incurred unless they relate to the acquisition or development of an asset when they may be capitalised or amortised. Generally, costs in relation to feasibility studies during the planning phase of a website, and ongoing costs of maintenance during the operating phase are expensed. Costs incurred in building or enhancing a website, to the extent that they represent probable future economic benefits that can be reliably measured, are capitalised.
LicencesLicences have a finite useful life and are carried at cost less accumulated amortisation and accumulated impairment losses.
i) Impairment of assetsProperty, plant and equipment, infrastructure, vehicles and intangible assets are tested for any indication of impairment at the end of each reporting period. Where there is an indication of impairment, the recoverable amount is estimated. Where the recoverable amount is less than the carrying amount, the asset is considered impaired and is written down to the recoverable amount and an impairment loss is recognised. Where an asset measured at cost is written down to recoverable amount, an impairment loss is recognised in profit or loss. Where a previously revalued asset is written down to recoverable amount, the loss is recognised as a revaluation decrement in other comprehensive income. As the PTA is a not-for-profit entity, unless an asset has been identified as a surplus asset, the recoverable amount is the higher of an asset’s fair value less costs to sell and depreciated replacement cost.
The risk of impairment is generally limited to circumstances where an asset’s depreciation is materially understated, where the replacement cost is falling or where there is a significant change in useful life. Each relevant class of assets is reviewed annually to verify that the accumulated depreciation/amortisation reflects the level of consumption or expiration of asset’s future economic benefits and to evaluate any impairment risk from falling replacement costs.
Intangible assets with an indefinite useful life and intangible assets not yet available for use are tested for impairment at the end of each reporting period irrespective of whether there is any indication of impairment.
The recoverable amount of assets identified as surplus assets is the higher of fair value less costs to sell and the present value of future cash flows expected to be derived from the asset. Surplus assets carried at fair value have no risk of material impairment where fair value is determined by reference to market-based evidence. Where fair value is determined by reference to the depreciated replacement cost, surplus assets are at risk of impairment and the recoverable amount is measured. Surplus assets at cost are tested for indications of impairments at the end of each reporting period.
129

j) Non-current assets (or disposal groups) classified as held for sale
Non-current assets (or disposal groups) held for sale are recognised at the lower of carrying amount and fair value less costs to sell, and are disclosed separately from other assets in the Statement of Financial Position. Assets classified as held for sale are not depreciated or amortised.
k) LeasesThe PTA has entered into a number of operating lease arrangements where the lessor effectively retains materially all of the risks and benefits incidental to ownership of the items held under the operating leases. Operating leases are expensed on a straight line basis over the term of the lease as this represents the pattern of benefits derived from the leased properties.
l) Deferred income operating leasesThe sale of the Westrail Freight Business on 17 December 2000 included an operating lease of the freight network infrastructure for 49 years between the Western Australian Government Railways Commission (WAGR) – now Public Transport Authority of Western Australia (PTA) and Westnet Rail Pty Ltd – now Brookfield Rail Pty Ltd. The lease rentals were fully prepaid on 17 December 2000, and credited to deferred income-operating leases. 133 grain receival sites were leased for a 99 year period in two tranches in 2003 and 2004. The rental for sites was prepaid and credited to deferred income-operating leases. (See note 2(e)).
m) Financial instrumentsIn addition to cash and cash equivalents, the PTA has two categories of financial instruments:
• Loans and receivables; and
• Financial liabilities measured at amortised cost.
Financial instruments have been disaggregated into the following classes:
• Financial Assets
– Cash and cash equivalents – Restricted cash and cash equivalents – Receivables – Amounts receivable for services
• Financial Liabilities
– Payables – Other current liabilities – Western Australian Treasury
Corporation (WATC) loans – Commonwealth loans
Initial recognition and measurement of financial instruments is at fair value which normally equates to the transaction cost or the face value. Subsequent measurement is at amortised cost using the effective interest method.
The fair value of short-term receivables and payables is the transaction cost or the face value because there is no interest rate applicable and subsequent measurement is not required as the effect of discounting is not material.
n) Cash and cash equivalentsFor the purpose of the Statement of Cash Flows, cash and cash equivalents (and restricted cash and cash equivalents) assets comprise of cash on hand.
o) Accrued salariesAccrued salaries (refer to note 27 ‘Payables’) represent the amount due to staff but unpaid at the end of the financial year. Accrued salaries are settled within a fortnight of the financial year end. The PTA considers the carrying amount of accrued salaries to be equivalent to its fair value.
p) Amounts receivable for services (Holding account)
The PTA received income from the State Government partly in cash and partly as an asset (holding account receivable) until 2011-12. From 2012-13, the PTA no longer receives funding into holding account receivable. The accrued amount appropriated is accessible on the emergence of the cash funding requirement to cover leave entitlements and asset replacement.
q) InventoriesInventories are measured at the lower of cost and net realisable value. Costs are assigned by the method most appropriate to each particular class of inventory. Inventory recorded using the inventory control system is valued at the weighted average cost and the remainder is valued on a first in first out basis.
Inventories not held for resale are measured at cost unless they are no longer required, in which case they are measured at net realisable value.
r) ReceivablesReceivables are recognised at original invoice amount less an allowance for any uncollectible amounts (i.e. impairment).
The collectability of receivables is reviewed on an ongoing basis and any receivables identified as uncollectible are written off against the allowance account. The allowance for uncollectible amounts (doubtful debts) is raised when there is objective
130 Public Transport Authority Annual Report 2012-13

evidence that the PTA will not be able to collect the debts. The carrying amount is equivalent to fair value as they are generally settled within 30 days.
s) PayablesPayables are recognised at the amounts payable when the PTA becomes obliged to make future payments as a result of a purchase of assets or services. The carrying amount is equivalent to fair value, as settlement is generally 30 days.
t) BorrowingsAll loans payable are initially recognised at fair value, being the net proceeds received. Subsequent measurement is at amortised cost using the effective interest rate method.
u) ProvisionsProvisions are liabilities of uncertain timing or amount and are recognised where there is a present legal or constructive obligation as a result of a past event and when the outflow of resources embodying economic benefits is probable and a reliable estimate can be made of the amount of the obligation. Provisions are reviewed at the end of each reporting period.
(i) Provisions – employee benefits All annual leave and long service leave provisions are in respect of employees’ services up to the end of the reporting period.
Annual leaveThe liability for annual leave that is expected to be settled within 12 months after the end of the reporting period is recognised and measured at the undiscounted amounts expected to be paid when the liability is settled.
Annual leave that is not expected to be settled within 12 months after the end of the reporting period is recognised and measured at the present value of amounts expected to be paid when the liabilities are settled using the remuneration rate expected to apply at the time of settlement.
When assessing expected future payments consideration is given to expected future wage and salary levels including non-salary components such as employer superannuation contributions, as well as the experience of employee departures and periods of service. The expected future payments are discounted using market yields at the end of the reporting period on national government bonds with terms to maturity that match, as closely as possible, the estimated future cash outflows.
The provision for annual leave is classified as a current liability as the PTA does not have an unconditional right to defer settlement of the liability for at least 12 months after the end of the reporting period.
Long service leaveThe liability for long service leave is recognised at the face value of each employee’s long service leave entitlement based on remuneration rates current as at the end of the reporting period, adjusted for the employee’s age factor. This method is referred to as the shorthand method.
An actuarial assessment of long service leave undertaken by PriceWaterhouseCoopers Actuaries at 30 June 2013 determined that the liability measured using the short hand measurement technique above was not materially different from the liability determined using the present value of expected future payments. This calculation is consistent with the PTA’s experience of employee retention and leave taken.
Unconditional long service leave provisions are classified as current liabilities as the PTA does not have an unconditional right to defer the settlement of the liability for at least 12 months after the end of the reporting period. Pre-conditional and conditional long service leave provisions are classified as non-current liabilities because the PTA has an unconditional right to defer the settlement of the liability until the employee has completed the requisite years of service.
Sick leaveLiabilities for sick leave are recognised when it is probable that sick leave paid in the future will be greater than the entitlement that will accrue in the future.
Past history indicates that on average, sick leave taken each reporting period is less than the entitlement accrued. This is expected to continue in future periods. Accordingly, it is unlikely that existing accumulated entitlements will be used by employees and no liability for unused sick leave entitlements is recognised. As sick leave is non-vesting, an expense is recognised in the Statement of Comprehensive Income for this leave as it is taken.
Deferred leaveThe provision for deferred leave relates to Public Service employees who have entered into an agreement to self-fund an additional 12 months leave in the fifth year of the agreement.
131

The provision recognises the value of salary set aside for employees to be used in the fifth year. This liability is measured on the same basis as annual leave. Deferred leave is reported as a current provision as employees can leave the scheme at their discretion at any time.
Purchased leaveThe provision for purchased leave relates to Public Service employees who have entered into an agreement to self-fund up to an additional eight weeks leave per calendar year. The provision recognises the value of salary set aside for employees and is measured at the nominal amounts expected to be paid when the liabilities are settled.
SuperannuationThe Government Employees Superannuation Board (GESB) and other fund providers administer public sector superannuation arrangements in Western Australia in accordance with legislative requirements. Eligibility criteria for membership in particular schemes for public sector employees vary according to commencement and implementation dates.
Eligible employees contribute to the Pension Scheme, a defined benefit pension scheme closed to new members since 1987, or the Gold State Superannuation Scheme (GSS), a defined benefit lump sum scheme closed to new members since 1995.
Employees commencing employment prior to 16 April 2007 who were not members of either the Pension Scheme or the GSS became non-contributory members of the West State Superannuation Scheme (WSS). Employees commencing employment on or after 16 April 2007 became members of the GESB Super Scheme (GESBS). From 30 March 2012, existing members of the WSS or GESBS and new employees have been able to choose their preferred superannuation fund provider. The PTA makes contributions to GESB or other fund providers on behalf of employees in compliance with the Commonwealth Government’s Superannuation Guarantee (Administration) Act 1992. Contributions to these accumulation schemes extinguish the PTA’s liability for superannuation charges in respect of employees who are not members of the Pension Scheme or GSS.
The GSS is a defined benefit scheme for the purposes of employees and whole-of-government reporting. However, it is a defined contribution
plan for agency purposes because the concurrent contributions (defined contributions) made by the PTA to GESB extinguishes the agency’s obligations to the related superannuation liability.
The PTA has no liabilities under the Pension Scheme or the GSS. The liabilities for the unfunded Pension Scheme and the unfunded GSS transfer benefits attributable to members who transferred from the Pension Scheme, are assumed by the Treasurer. All other GSS obligations are funded by concurrent contributions made by the PTA to the GESB.
The GESB makes all benefit payments in respect of the Pension Scheme and GSS, and is recouped from the Treasurer for the employer’s share.
(ii) Provisions – otherEmployment on-costsEmployment on-costs, including payroll tax and workers’ compensation insurance, are not employee benefits and are recognised separately as liabilities and expenses when the employment to which they relate has occurred. Employment on-costs are included as part of ‘Other expenses’ and are not included as part of the PTA’s ‘Employee benefits expense’. The related liability is included in ‘Employment on-costs provision’.
Public liability Provision is made for all outstanding public liability claims before 1 July 2005 worth less than $1 million. The amount of the provision is the estimated outstanding value of the claims at the end of the reporting period.
Workers’ compensationProvision is made for all outstanding claims from periods before 1 July 1997 and any previous years fund contribution assessments based on claims experience and performance adjustment from RiskCover. The amount of the provision is the estimated outstanding value of claims plus any actuarial assessments of the previous years adjusted fund contribution at the end of the reporting period.
Contaminated sitesProvision is recognised for the sites that are classified as contaminated – remediation required or possibly contaminated – investigation required, and where the PTA has a liability in respect of investigation or remediation expenses. Estimates are based on the present value of expected future cash outflows.
132 Public Transport Authority Annual Report 2012-13

v) Superannuation expenseThe superannuation expense in the Statement of Comprehensive Income comprises employer contributions paid to the GSS (concurrent contributions), WSS, and the GESBS and other superannuation funds.
w) Assets and services received free of charge or for nominal cost
Assets or services received free of charge (except those designated as contribution from owners) or for nominal cost are recognised as income at the fair value of the assets and/or the fair value of those services that can be reliably measured and the PTA would otherwise pay for. A corresponding expense is recognised for services received. Receipts of assets are recognised in the Statement of Financial Position.
Assets or services received from another State Government agency (except those designated as contribution from owners) are separately disclosed under Income from State Government in the Statement of Comprehensive Income.
x) Comparative figuresComparative figures are, where appropriate, reclassified to be comparable with the figures presented in the current financial year.
y) Foreign currency translation Transactions denominated in a foreign currency are translated at the rates in existence at the dates of the transactions.
3. Judgements made by management in applying accounting policies
The preparation of financial statements requires management to make judgements about the application of accounting policies that have a significant effect on the amounts recognised in the financial statements. The PTA evaluates these judgements regularly.
Borrowing CostsThe PTA has made a determination to expense all borrowing costs associated with the construction of capital projects as allowed by the alternative accounting treatment under AASB 123 Borrowing Costs.
4. Key sources of estimation uncertainty
Key estimates and assumptions concerning the future are based on historical experience and various other factors that have a significant risk of causing a material adjustment to the carrying amount of assets and liabilities within the next financial year.
Long Service LeaveThe PTA undertook an actuarial assessment of its long service leave provision and is using employees’ age based factors for discounting its expected future payments between valuations. These factors incorporate a series of assumptions such as demographics, salary inflation, and market yields on commonwealth government bonds. Fluctuations in any of the assumptions used to calculate these factors may impact the provision for annual and long service leave.
Estimating useful life of key assetsThe useful lives are estimated having regard to such factors as asset maintenance, rate of technical and commercial obsolescence, and asset usage. The useful lives of key assets are reviewed annually.
Depreciated replacement cost of railway infrastructure assetsThe Building Cost Index from the Department of Finance has been applied in a model developed by the PTA for measuring the current replacement cost of the urban railway infrastructure.
The remaining useful life of the freight network infrastructure assets has been assessed by experienced independent engineering and valuation professionals based on a review of information pertaining to age, history, site assessment observation and condition. The PTA has assumed no residual value on life expired freight network infrastructure assets.
Workers’ Compensation provisionThe Workers’ Compensation Deposit Contributions are initially calculated on estimates of wages, prior year claims and budgeted investment income and are then adjusted on the actual outcomes of these factors for the period of cover. Workers’ Compensation Contributions are adjusted three years after the close of the period of cover and the PTA has made a provision based upon the RiskCover performance adjustment. The performance adjustment outcome for a year is influenced by the actual experience for a year being different to what was expected when the Deposit Fund Contribution was set. Differences can arise when the actual outcome is different from that originally projected, specifically in relation to number of claims received, cost of the claims, reinsurance costs and investment returns.
Contaminated sites provisionThe contaminated sites provision was based on estimates made by management for investigation or remediation expenses of contaminated or suspected contaminated sites.
133

5. Disclosure of changes in accounting policy and estimates
Initial application of an Australian Accounting StandardThe PTA has applied the following Australian Accounting Standards effective for annual reporting periods beginning on or after 1 July 2012 that impacted on the PTA.
AASB 2011-9 Amendments to Australian Accounting Standards – Presentation of Items of Other Comprehensive Income [AASB 1, 5, 7, 101, 112, 120, 121, 132, 133, 134, 1039 & 1049]
This Standard requires to group items presented in other comprehensive income on the basis of whether they are potentially reclassifiable to profit or loss subsequently (reclassification adjustments). There is no financial impact.
Future impact of Australian Accounting Standards not yet operativeThe PTA cannot early adopt an Australian Accounting Standard unless specifically permitted by TI 1101 Application of Australian Accounting Standards and Other Pronouncements. Consequently, the PTA has not applied early any of the following Australian Accounting Standards that have been issued that may impact the PTA. Where applicable, the PTA plans to apply these Australian Accounting Standards from their application date.
AASB 9 Financial Instruments
This Standard supersedes AASB 139 Financial Instruments: Recognition and Measurement, introducing a number of changes to accounting treatments.
AASB 2012-6 Amendments to Australian Accounting Standards – Mandatory Effective Date of AASB 9 and Transition Disclosures amended the mandatory application date of this Standard to 1 January 2015. The PTA has not yet determined the application or the potential impact of the Standard.
The Standard is required to be applied to annual reporting periods beginning on or after 1 January 2015.
AASB 10 Consolidated Financial Statements
This Standard supersedes AASB 127 Consolidated and Separate Financial Statements and Int 112 Consolidation – Special Purpose Entities, introducing a number of changes to accounting treatments.
Mandatory application of this Standard was deferred by one year for not-for-profit entities by AASB 2012-10 Amendments to Australian Accounting Standards – Transition Guidance and Other Amendments. The PTA has not yet determined the application or the potential impact of the Standard.
The Standard is required to be applied to annual reporting periods beginning on or after 1 January 2014.
AASB 11 Joint Arrangements
This Standard supersedes AASB 131 Interests in Joint Ventures, introducing a number of changes to accounting treatments.
Mandatory application of this Standard was deferred by one year for not-for-profit entities by AASB 2012-10. The PTA has not yet determined the application or the potential impact of the Standard.
The Standard is required to be applied to annual reporting periods beginning on or after 1 January 2014.
134 Public Transport Authority Annual Report 2012-13

AASB 12 Disclosure of Interests in Other Entities
This Standard supersedes disclosure requirements under AASB 127 Consolidated and Separate Financial Statements, AASB 131 Interests in Joint Ventures.
Mandatory application of this Standard was deferred by one year for not-for-profit entities by AASB 2012-10. The PTA has not yet determined the application or the potential impact of the Standard.
The Standard is required to be applied to annual reporting periods beginning on or after 1 January 2014.
AASB 13 Fair Value Measurement
This Standard defines fair value, sets out a framework for measuring fair value and requires additional disclosures about fair value measurements. There is no financial impact.
The Standard is required to be applied to annual reporting periods beginning on or after 1 January 2013.
AASB 119 Employee Benefits
This Standard supersedes AASB 119 (October 2010), making changes to the recognition, presentation and disclosure requirements.
The PTA does not have any defined benefit plans, and therefore the financial impact will be limited to the effect of discounting annual leave and long service leave liabilities that were previously measured at the discounted amounts.
The Standard is required to be applied to annual reporting periods beginning on or after 1 January 2013.
AASB 127 Separate Financial Statements
This Standard supersedes AASB 127 Consolidated and Separate Financial Statements, introducing a number of changes to accounting treatments.
Mandatory application of this Standard was deferred by one year for not-for-profit entities by AASB 2012-10. The PTA has not yet determined the application or the potential impact of the Standard.
The Standard is required to be applied to annual reporting periods beginning on or after 1 January 2014.
AASB 128 Investments in Associates and Joint Ventures
This Standard supersedes AASB 128 Investments in Associates, introducing a number of changes to accounting treatments.
Mandatory application of this Standard was deferred by one year for not-for-profit entities by AASB 2012-10. The PTA has not yet determined the application or the potential impact of the Standard.
The Standard is required to be applied to annual reporting periods beginning on or after 1 January 2014.
AASB 1053 Application of Tiers of Australian Accounting Standards
This Standard establishes a differential financial reporting framework consisting of two tiers of reporting requirements for preparing general purpose financial statements. There is no financial impact.
The Standard is required to be applied to annual reporting periods beginning on or after 1 July 2013.
135
AASB 1055 Budgetary Reporting
This Standard specifies the nature of budgetary disclosures, the circumstances in which they are to be included in the general purpose financial statements of not-for-profit entities within the General Government Sector (GGS). The PTA will be required to disclose additional budgetary information and explanations of major variances between actual and budgeted amounts, though there is no financial impact.
The Standard is required to be applied to annual reporting periods beginning on or after 1 July 2014.
AASB 2010-2 Amendments to Australian Accounting Standards arising from Reduced Disclosure Requirements [AASB 1, 2, 3, 5, 7, 8, 101, 102, 107, 108, 110, 111, 112, 116, 117, 119, 121, 123, 124, 127, 128, 131, 133, 134, 136, 137, 138, 140, 141, 1050 & 1052 and Int 2, 4, 5, 15, 17, 127, 129 & 1052]
This Standard makes amendments to Australian Accounting Standards and Interpretations to introduce reduced disclosure requirements for certain types of entities. There is no financial impact.
The Standard is required to be applied to annual reporting periods beginning on or after 1 July 2013.
AASB 2010-7 Amendments to Australian Accounting Standards arising from AASB 9 (December 2010) [AASB 1, 3, 4, 5, 7, 101, 102, 108, 112, 118, 120, 121, 127, 128, 131, 132, 136, 137, 139, 1023 & 1038 and Int 2, 5, 10, 12, 19 & 127]
This Standard makes consequential amendments to other Australian Accounting Standards and Interpretations as a result of issuing AASB 9 in December 2010.
AASB 2012-6 amended the mandatory application date of this Standard to 1 January 2015. The PTA has not yet determined the application or the potential impact of the Standard.
The Standard is required to be applied to annual reporting periods beginning on or after 1 January 2015.
AASB 2011-2 Amendments to Australian Accounting Standards arising from the Trans-Tasman Convergence Project – Reduced Disclosure Requirements [AASB 101 & 1054]
This Standard removes disclosure requirements from other Standards and incorporates them in a single Standard to achieve convergence between Australian and New Zealand Accounting Standards for reduced disclosure reporting. There is no financial impact.
The Standard is required to be applied to annual reporting periods beginning on or after 1 July 2013.
AASB 2011-6 Amendments to Australian Accounting Standards – Extending Relief from Consolidation, the Equity Method and Proportionate Consolidation – Reduced Disclosure Requirements [AASB 127, 128 & 131]
This Standard extends the relief from consolidation, the equity method and proportionate consolidation by removing the requirement for the consolidated financial statements prepared by the ultimate or any intermediate parent entity to be IFRS compliant, provided that the parent entity, investor or venturer and the ultimate or intermediate parent entity comply with Australian Accounting Standards or Australian Accounting Standards – Reduced Disclosure Requirements. There is no financial impact.
The Standard is required to be applied to annual reporting periods beginning on or after 1 July 2013.
136 Public Transport Authority Annual Report 2012-13

AASB 2011-7 Amendments to Australian Accounting Standards arising from the Consolidation and Joint Arrangements Standards [AASB 1, 2, 3, 5, 7, 101, 107, 112, 118, 121, 124, 132, 133, 136, 138, 139, 1023 & 1038 and Int 5, 9, 16 & 17]
This Standard gives effect to consequential changes arising from the issuance of AASB 10, AASB 11, AASB 127 Separate Financial Statements and AASB 128 Investments in Associates and Joint Ventures. For not-for-profit entities it applies to annual reporting periods beginning on or after 1 January 2014. The PTA has not yet determined the application or the potential impact of the Standard.
The Standard is required to be applied to annual reporting periods beginning on or after 1 January 2013.
AASB 2011-8 Amendments to Australian Accounting Standards arising from AASB 13 [AASB 1, 2, 3, 4, 5, 7, 101, 102, 108, 110, 116, 117, 118, 119, 120, 121, 128, 131, 132, 133, 134, 136, 138, 139, 140, 141, 1004, 1023 & 1038 and Int 2, 4, 12, 13, 14, 17, 19, 131 & 132]
This Standard replaces the existing definition and fair value guidance in other Australian Accounting Standards and Interpretations as the result of issuing AASB 13 in September 2011. There is no financial impact.
The Standard is required to be applied to annual reporting periods beginning on or after 1 January 2013.
AASB 2011-10 Amendments to Australian Accounting Standards arising from AASB 119 (September 2011) [AASB 1, 8, 101, 124, 134, 1049 & 2011-8 and Int 14]
This Standard makes amendments to other Australian Accounting Standards and Interpretations as a result of issuing AASB 119 in September 2011. There is no financial impact.
The Standard is required to be applied to annual reporting periods beginning on or after 1 January 2013.
AASB 2011-11 Amendments to AASB 119 (September 2011) arising from Reduced Disclosure Requirements
This Standard gives effect to Australian Accounting Standards – Reduced Disclosure Requirements for AASB 119 (September 2011). There is no financial impact.
The Standard is required to be applied to annual reporting periods beginning on or after 1 July 2013.
AASB 2012-1 Amendments to Australian Accounting Standards – Fair Value Measurement – Reduced Disclosure Requirements [AASB 3, 7, 13, 140 & 141]
This Standard establishes and amends reduced disclosure requirements for additional and amended disclosures arising from AASB 13 and the consequential amendments implemented through AASB 2011-8. There is no financial impact.
The Standard is required to be applied to annual reporting periods beginning on or after 1 July 2013.
AASB 2012-2 Amendments to Australian Accounting Standards – Disclosures – Offsetting Financial Assets and Financial Liabilities [AASB 7 & 132]
This Standard amends the required disclosures in AASB 7 to include information that will enable users of an entity’s financial statements to evaluate the effect or potential effect of netting arrangements, including rights of set-off associated with the entity’s recognised financial assets and recognised financial liabilities, on the entity’s financial position. There is no financial impact.
The Standard is required to be applied to annual reporting periods beginning on or after 1 January 2013.
137

AASB 2012-3 Amendments to Australian Accounting Standards – Offsetting Financial Assets and Financial Liabilities [AASB 132]
This Standard adds application guidance to AASB 132 to address inconsistencies identified in applying some of the offsetting criteria, including clarifying the meaning of “currently has a legally enforceable right of set-off” and that some gross settlement systems may be considered equivalent to net settlement. There is no financial impact.
The Standard is required to be applied to annual reporting periods beginning on or after 1 January 2014.
AASB 2012-5 Amendments to Australian Accounting Standards arising from Annual Improvements 2009-11 Cycle [AASB 1, 101, 116, 132 & 134 and Int 2]
This Standard makes amendments to the Australian Accounting Standards and Interpretations as a consequence of the annual improvements process. There is no financial impact.
The Standard is required to be applied to annual reporting periods beginning on or after 1 January 2013.
AASB 2012-6 Amendments to Australian Accounting Standards – Mandatory Effective Date of AASB 9 and Transition Disclosures [AASB 9, 2009-11, 2010-7, 2011-7 & 2011-8]
This Standard amends the mandatory effective date of AASB 9 Financial Instruments to 1 January 2015. Further amendments are also made to consequential amendments arising from AASB 9 that will now apply from 1 January 2015 and to consequential amendments arising out of the Standards that will still apply from 1 January 2013. There is no financial impact.
The Standard is required to be applied to annual reporting periods beginning on or after 1 January 2013.
AASB 2012-7 Amendments to Australian Accounting Standards arising from Reduced Disclosure Requirements [AASB 7, 12, 101 & 127]
This Standard adds to or amends the Australian Accounting Standards to provide further information regarding the differential reporting framework and the two tiers of reporting requirements for preparing general financial statements. There is no financial impact.
The Standard is required to be applied to annual reporting periods beginning on or after 1 July 2013.
AASB 2012-10 Amendments to Australian Accounting Standards – Transition Guidance and Other Amendments [AASB 1, 5, 7, 8, 10, 11, 12, 13, 101, 102, 108, 112, 118, 119, 127, 128, 132, 133, 134, 137, 1023, 1038, 1039, 1049 & 2011-7 and Int 12]
This Standard makes amendments to AASB 10 and related Standards to revise the transition guidance relevant to the initial application of those Standards, and to clarify the circumstances in which adjustments to an entity’s previous accounting for its involvement with other entities are required and the timing of such adjustments.
The Standard was issued in December 2012. The PTA has not yet determined the application or the potential impact of the Standard.
The Standard is required to be applied to annual reporting periods beginning on or after 1 January 2013.
AASB 2012-11 Amendments to Australian Accounting Standards – Reduced Disclosure Requirements and Other Amendments [AASB 1, 2, 8, 10, 107, 128, 133, 134 & 2011-4]
This Standard makes various editorial corrections to Australian Accounting Standards – Reduced Disclosure Requirements (Tier 2). These corrections ensure that the Standards reflect decisions of the AASB regarding the Tier 2 requirements.
This Standard also extends the relief from consolidation and the equity method (in the new Consolidation and Joint Arrangements Standards) to entities complying with Australian Accounting Standards – Reduced Disclosure Requirements. There is no financial impact.
The Standard is required to be applied to annual reporting periods beginning on or after 1 July 2013.
138 Public Transport Authority Annual Report 2012-13
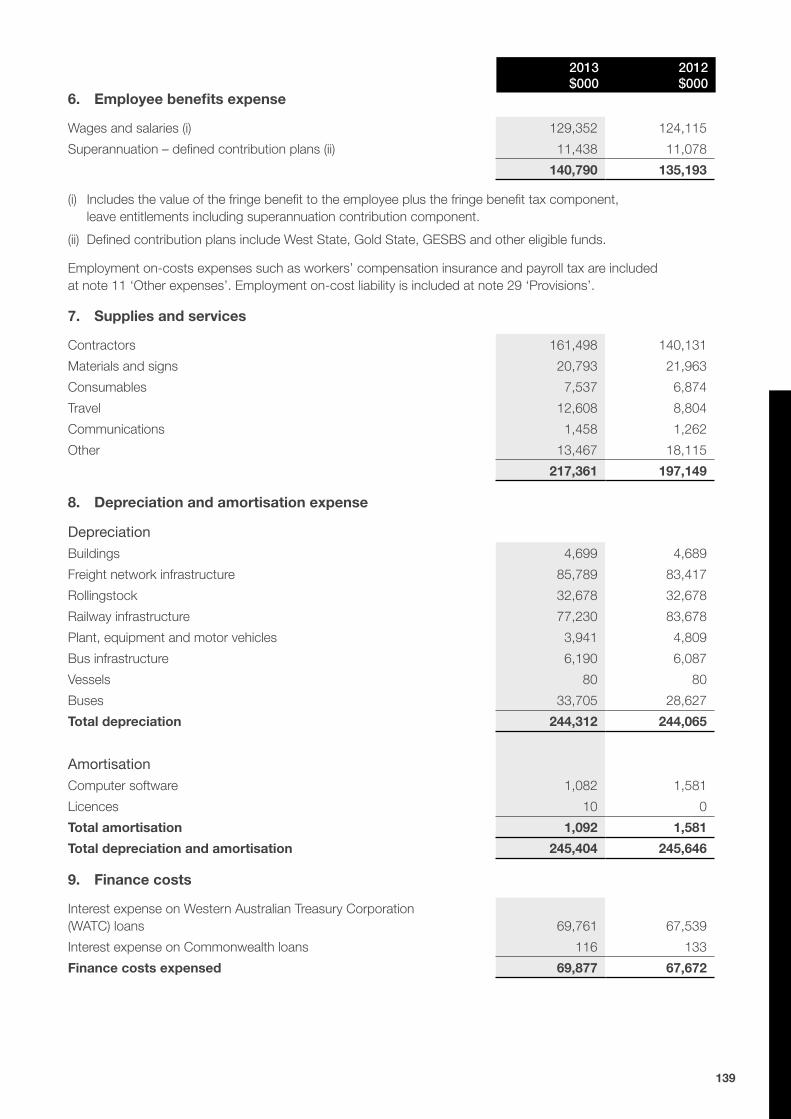
6. Employee benefits expense
Wages and salaries (i) 129,352 124,115
Superannuation – defined contribution plans (ii) 11,438 11,078
140,790 135,193
(i) Includes the value of the fringe benefit to the employee plus the fringe benefit tax component, leave entitlements including superannuation contribution component.
(ii) Defined contribution plans include West State, Gold State, GESBS and other eligible funds.
Employment on-costs expenses such as workers’ compensation insurance and payroll tax are included at note 11 ‘Other expenses’. Employment on-cost liability is included at note 29 ‘Provisions’.
7. Supplies and services
Contractors 161,498 140,131
Materials and signs 20,793 21,963
Consumables 7,537 6,874
Travel 12,608 8,804
Communications 1,458 1,262
Other 13,467 18,115
217,361 197,149
8. Depreciation and amortisation expense
DepreciationBuildings 4,699 4,689
Freight network infrastructure 85,789 83,417
Rollingstock 32,678 32,678
Railway infrastructure 77,230 83,678
Plant, equipment and motor vehicles 3,941 4,809
Bus infrastructure 6,190 6,087
Vessels 80 80
Buses 33,705 28,627
Total depreciation 244,312 244,065
AmortisationComputer software 1,082 1,581
Licences 10 0
Total amortisation 1,092 1,581
Total depreciation and amortisation 245,404 245,646
9. Finance costs
Interest expense on Western Australian Treasury Corporation (WATC) loans 69,761 67,539
Interest expense on Commonwealth loans 116 133
Finance costs expensed 69,877 67,672
2013 $000
2012 $000
139

10. Grants and subsidies expense
Bus operators 303,892 259,445
School bus services 108,200 103,062
Regional bus services 14,563 14,932
Rail corridor and freight issues management 0 3,325
Ferry services 763 728
Grants to local government 22 1,165
Grants to other government agencies 0 1,500
427,440 384,157
11. Other expenses
Employment on-costs (i) 295 187
Payroll tax 7,502 7,505
Workers’ compensation 7,942 9,301
Doubtful debts expense 285 148
Notional charges for services provided by government agencies 619 455
Audit fees 177 170
Payment of infringements to consolidated account 3,500 3,052
20,320 20,818
(i) Includes workers’ compensation insurance and payroll tax relating to annual and long service leave. The on-costs liabilities associated with the recognition of annual and long service leave liabilities are included at note 29 ‘Provisions’. Superannuation contributions accrued as part of the provision for leave are employee benefits and are not included in employment on-costs.
12. User charges and fees
Transperth system revenue 196,367 176,039
School bus services revenue 4,831 4,747
Country passenger operations revenue 11,244 11,217
212,442 192,003
13. Operating lease revenue
Rental income from freight network infrastructure (i) 5,383 5,383
Rental income from grain receival sites (ii) 83 83
5,466 5,466
(i) The sale of the Westrail Freight Business on 17 December 2000 included an operating lease of the freight network infrastructure for 49 years between the Western Australian Government Railways Commission (WAGR) – now Public Transport Authority of Western Australia (PTA) and Westnet Rail Pty Ltd – now Brookfield Rail Pty Ltd. The lease rentals were fully prepaid on 17 December 2000, and credited to deferred operating lease revenue.
(ii) A 99 year operating lease for 118 grain receival sites was entered into with Co-operative Bulk Handling (CBH) in 2003. Rental income for 99 years of $7.45 million was received in full at the commencement of the lease, and is accounted for as revenue over the 99 year lease period, with the prepaid portion shown as deferred income. (See note 31 ‘Deferred income – operating leases’).
A further 99 year operating lease for 15 grain receival sites was entered into with CBH in 2004. Rental income for 99 years of $775,000 was received in full at the commencement of the lease, and is accounted for as revenue over the 99 year lease period, with the prepaid portion shown as deferred income. (See note 31 ‘Deferred income – operating leases’).
2013 $000
2012 $000
140 Public Transport Authority Annual Report 2012-13

14. Commonwealth grants and contributions
Chamber of Commerce and Industry 17 11
National Partnership Agreement – concessions for pensioners and seniors card holders 509 455
526 466
15. Interest revenue
Interest revenue 2,380 3,125
Interest revenue is received quarterly from Department of Treasury calculated on the daily balance held on the interest bearing bank account.
16. Other revenue
Rents and leases 14,763 12,906
External works 5,751 2,909
Advertising income 5,952 4,823
Infringements 3,567 3,280
Parking 2,463 2,340
SmartRider card sales 1,291 1,194
Cost savings from commonwealth project 0 1,089
Miscellaneous 3,543 3,623
37,330 32,164
17. Net gain/(loss) on disposal of non-current assets
Proceeds from disposal of non-current assetsLand 0 1,685
Buses 1,114 43
Other 27 0
Net costs of disposal of non-current assetsLand 0 (1,685)
Buses (1,049) (416)
Other (15) (443)
Net gain/(loss) 77 (816)
2013 $000
2012 $000
141

18. Income from State Government
Appropriation received during the period:
Operating subsidy contributions (i) 646,521 776,189
Services received free of charge from other State government agencies during the period:
Landgate 595 450
Department of Finance 13 0
Main Roads WA 11 0
Building Management and Works 0 5
619 455
Royalties for Regions Fund:
Regional Community Services Account (ii) 3,297 3,007
3,297 3,007
Contribution – other government agencies
Department of Finance – funding for the new Perth Stadium 3,529 947
Department of Transport – funding for CAT bus replacement and new CAT depot 0 163
Department of Transport – funding for the Central Northern Corridor LRT project 0 327
3,529 1,437
653,966 781,088
(i) Operating subsidy contributions fund the net cost of services delivered except depreciation expense.
(ii) This is a sub-fund within the over-arching ‘Royalties for Regions Fund’. The recurrent funds are committed to projects and programs in WA regional areas.
19. Restricted cash and cash equivalents
CurrentCapital Grant from the City of Perth (i) 0 28,239
Royalties for Regions Fund (ii) 279 (585)
Parental Leave 13 1
Commonwealth Funds – Eastern Goldfield Railway project 1,089 1,089
Funding segregated for specific projects 7,067 3,593
8,448 32,337
Non-CurrentAccrued salaries suspense account (iii) 2,984 2,984
2,984 2,984
(i) Funds held for the construction of the Perth City Link project.
(ii) Unspent funds are committed to projects and programs in WA regional areas.
(iii) Funds held in suspense account used only for the purpose of meeting the 27th pay in a financial year that occurs every 11 years.
2013 $000
2012 $000
142 Public Transport Authority Annual Report 2012-13

20. Inventories
CurrentInventories not held for resale:
Maintenance spares – at cost 13,328 13,147
13,328 13,147
21. Receivables
CurrentReceivables 4,379 5,612
Allowance for impairment of receivables (290) (154)
Accrued revenue 8,964 7,951
GST receivable 12,976 10,487
Other receivables – external works 231 668
26,260 24,564
Prepayments 1,412 1,727
Total receivables 27,672 26,291
Reconciliation of changes in the allowance for impairment of receivables:
Balance at start of period 154 12
Doubtful debts expense 285 148
Amount written off during the period (85) 0
Amount recovered during the period (64) (6)
Balance at end of period 290 154
22. Amounts receivable for services (Holding Account)
Current 56,241 24,836
Non-current 946,363 1,003,301
1,002,604 1,028,137
Represents the non-cash component of operating subsidy contributions. It is restricted in that it can only be used for asset replacement or payment of leave liability.
2013 $000
2012 $000
143

23.
Infr
astr
uctu
re, p
rop
erty
, pla
nt, e
qui
pm
ent
and
veh
icle
s
20
1320
1320
1320
1320
1220
1220
1220
12
Co
st A
t Fa
ir V
alue
A
ccum
ulat
ed
dep
reci
atio
n C
arry
ing
am
oun
t as
at
30 J
une
2013
Co
st A
t Fa
ir V
alue
A
ccum
ulat
ed
dep
reci
atio
n C
arry
ing
am
oun
t as
at
30 J
une
2012
$00
0 $
000
$00
0 $
000
$00
0 $
000
$00
0 $
000
Ow
ned
Ass
ets:
Land
(i)
036
0,83
30
360,
833
036
1,22
20
361,
222
Bui
ldin
gs (i
i)0
211,
026
103,
185
107,
841
021
1,02
698
,486
112,
540
Frei
ght n
etw
ork
infra
stru
ctur
e (ii
i)(vi
)0
5,15
3,41
53,
962,
906
1,19
0,50
90
5,12
1,80
73,
877,
117
1,24
4,69
0
Rol
lings
tock
(ii)
01,
023,
824
435,
223
588,
601
01,
023,
824
402,
545
621,
279
Rai
lway
infra
stru
ctur
e (iv
)0
2,96
8,44
591
7,80
52,
050,
640
02,
949,
634
840,
575
2,10
9,05
9
Pla
nt, e
quip
men
t and
mot
or
vehi
cles
39,9
400
21,4
8418
,456
35,1
210
17,7
9317
,328
Bus
infra
stru
ctur
e (ii
)0
239,
446
114,
129
125,
317
023
5,51
610
7,94
012
7,57
6
Vess
els
(ii)
03,
200
1,93
11,
269
03,
200
1,85
11,
349
Bus
es (i
i)0
746,
661
372,
058
374,
603
071
3,85
836
4,79
634
9,06
2
Con
stru
ctio
n in
pro
gres
s (v
)73
5,17
60
073
5,17
631
7,00
20
031
7,00
2
Tota
l77
5,11
610
,706
,850
5,92
8,72
15,
553,
245
352,
123
10,6
20,0
875,
711,
103
5,26
1,10
7
144 Public Transport Authority Annual Report 2012-13

(i) Land controlled by the PTA has been revalued as at 1 July 2012 by Landgate (Valuation Services) and Burgess Rawson. The valuations were performed during the year ended 30 June 2013 and recognised at 30 June 2013. The fair value was determined by reference to market values. See note 2(g).
To ensure the valuations provided by Valuation Services were compliant at 30 June 2013 with the fair value requirements under AASB 116, Valuation Services provided the Department of Treasury with information that tracked the general movement in the market value of land and in building construction costs from 1 July 2012 (the date of valuation) to 30 June 2013. Department of Treasury reviewed the information and determined that the valuations provided by Valuation Services (as at 1 July 2012) were compliant with fair value requirements for 30 June 2013 reporting without further adjustment by reference to market values based on existing use.
Land and buildings which are commercially leased were independently valued on the capitalised value of current lease by Burgess Rawson. The valuations were performed during the year ended 30 June 2013 and recognised at 30 June 2013.
(ii) Buildings, rollingstock, bus infrastructure, vessels and buses were last revalued on 30 June 2010 by independent valuers, engineering and management professionals at depreciated replacement cost which represents the fair value of the assets.
(iii) Freight network infrastructure was revalued on 30 June 2010 at depreciated replacement cost which represents the fair value of the assets. A model was developed using independent third party audited information, engineering and independent valuers.
(iv) Railway infrastructure was revalued on 30 June 2012. Railway infrastructure has been revalued by PTA’s management professionals and third party vendors. The methodology adopted has been depreciated replacement cost with a modern equivalent asset capable of delivering the same service potential. This represents the fair value of the assets.
(v) Construction in progress is valued at cost.
(vi) The PTA entered into a finance lease with Karara Mining Limited and Gindalbie Metals Limited during the year. The lease is over a railway line from Tilley to Karara which was constructed by Karara for its exclusive use over the period of the lease term of 49 years. While legal ownership is vested in PTA, beneficial ownership and the asset will be transferred to PTA upon the expiry of the lease.
145

Rec
onci
liatio
ns o
f the
car
ryin
g am
ount
s of
infra
stru
ctur
e, p
rope
rty,
pla
nt, e
quip
men
t and
veh
icle
s at
the
begi
nnin
g an
d en
d of
the
repo
rtin
g pe
riod
are
set o
ut in
the
tabl
e be
low
.
2013
Car
ryin
g
amo
unt
at s
tart
o
f p
erio
d$0
00A
dd
itio
ns$0
00Tr
ansf
ers
(vii)
$000
Rev
alua
tion
Incr
emen
ts$0
00D
isp
osa
ls$0
00D
epre
ciat
ion
$000
Car
ryin
g
amo
unt
at
end
of
per
iod
$000
Ow
ned
Ass
ets:
Land
361,
222
160
355
(904
)0
036
0,83
3
Bui
ldin
gs11
2,54
00
00
0(4
,699
)10
7,84
1
Frei
ght n
etw
ork
infra
stru
ctur
e1,
244,
690
031
,608
00
(85,
789)
1,19
0,50
9
Rol
lings
tock
621,
279
00
00
(32,
678)
588,
601
Rai
lway
infra
stru
ctur
e2,
109,
059
2,17
216
,639
00
(77,
230)
2,05
0,64
0
Pla
nt, e
quip
men
t and
mot
or v
ehic
les
17,3
284,
583
501
0(1
5)(3
,941
)18
,456
Bus
infra
stru
ctur
e12
7,57
688
93,
042
00
(6,1
90)
125,
317
Vess
els
1,34
90
00
0(8
0)1,
269
Bus
es34
9,06
22,
737
57,5
580
(1,0
49)
(33,
705)
374,
603
Con
stru
ctio
n in
pro
gres
s31
7,00
250
2,36
0(8
4,18
6)0
00
735,
176
Tota
l5,
261,
107
512,
901
25,5
17(9
04)
(1,0
64)
(244
,312
)5,
553,
245
(vii)
On
the
30th
Jun
e 20
13, t
he P
TA re
cogn
ised
tran
sfer
red
asse
ts fr
om M
ain
Roa
ds W
A fo
r la
nd a
t Wan
nero
o ($
355,
000)
and
rai
l cor
ridor
and
leve
l cro
ssin
gs
alon
g th
e Fr
eigh
t Net
wor
k ($
31,6
08,0
00) a
nd tr
ansf
erre
d as
sets
to M
ain
Roa
ds W
A fo
r pr
iorit
y bu
s la
nes
alon
g th
e G
reat
Eas
tern
Hig
hway
from
Koo
yong
Roa
d to
Ton
kin
Hig
hway
($3,
250,
000)
.
2012
Car
ryin
g
amo
unt
at s
tart
o
f p
erio
d$0
00A
dd
itio
ns$0
00Tr
ansf
ers
$000
Rev
alua
tion
Incr
emen
ts$0
00D
isp
osa
ls$0
00D
epre
ciat
ion
$000
Car
ryin
g
amo
unt
at
end
of
per
iod
$000
Ow
ned
Ass
ets:
Land
350,
737
04,
529
5,95
60
036
1,22
2
Bui
ldin
gs11
3,49
232
33,
414
00
(4,6
89)
112,
540
Frei
ght n
etw
ork
infra
stru
ctur
e1,
290,
996
037
,111
00
(83,
417)
1,24
4,69
0
Rol
lings
tock
653,
957
00
00
(32,
678)
621,
279
Rai
lway
infra
stru
ctur
e2,
131,
920
755
45,1
8915
,328
(455
)(8
3,67
8)2,
109,
059
Pla
nt, e
quip
men
t and
mot
or v
ehic
les
24,1
542,
046
(4,0
55)
0(8
)(4
,809
)17
,328
Bus
infra
stru
ctur
e13
0,57
914
62,
938
00
(6,0
87)
127,
576
Vess
els
1,42
90
00
0(8
0)1,
349
Bus
es31
8,45
60
59,6
290
(396
)(2
8,62
7)34
9,06
2
Con
stru
ctio
n in
pro
gres
s12
1,36
825
7,13
0(6
1,49
6)0
00
317,
002
Tota
l5,
137,
088
260,
400
87,2
5921
,284
(859
)(2
44,0
65)
5,26
1,10
7
146 Public Transport Authority Annual Report 2012-13

24. Intangible assets
Software – at cost 11,474 8,559
Accumulated amortisation (7,676) (6,960)
3,798 1,599
Licences – at cost 4,240 0
Accumulated amortisation (10) 0
4,230 0
8,028 1,599
Reconciliations:
SoftwareCarrying amount at start of period 1,599 3,014
Additions and transfers in 3,281 166
Amortisation expense and disposal (1,082) (1,581)
Carrying amount at end of period 3,798 1,599
LicencesAdditions 4,240 0
Amortisation expense (10) 0
Carrying amount at end of period 4,230 0
25. Non-current assets classified as held for sale
Freehold landOpening balance 12,100 15,885
Revaluation (1,720) (2,100)
Assets sold 0 (1,685)
Closing balance 10,380 12,100
The PTA holds land surplus to its operational requirements. Various properties have been identified as land for future sales. The PTA anticipates that all the freehold land in the closing balance will be disposed of in accordance with the Government’s asset disposal policy in the next reporting period. See also note 2(j) Non-current assets (or disposal groups) classified as held for sale.
26. Impairment of assets
There were no indications of impairment to property, plant and equipment, vehicles, infrastructure or intangible assets at 30 June 2013.
The PTA held no goodwill or intangible assets with an indefinite useful life during the reporting period. At the end of the reporting period there were no intangible assets not yet available for use.
All surplus assets at 30 June 2013 have either been classified as assets held for sale or written-off.
2013 $000
2012 $000
147

27. Payables
CurrentTrade payables 5,381 9,553
Accrued operational expenses 73,909 68,630
Accrued salaries 6,227 4,634
Accrued interest 12,880 13,426
Other payables 1,847 1,546
100,244 97,789
28. Borrowings
CurrentWestern Australian Treasury Corporation loans 68,533 59,553
Commonwealth loans 350 365
68,883 59,918
Non-CurrentWestern Australian Treasury Corporation loans (i) 1,470,041 1,257,049
Commonwealth loans 1,251 1,602
1,471,292 1,258,651
(i) The non-current amount includes an amount that will be due and payable during the year 2013-14 which will be refinanced rather than repaid and therefore is not recognised as current borrowings.
29. Provisions
CurrentEmployee benefits provision
Annual leave (i) 14,078 13,198
Long service leave (ii) 14,668 12,543
Deferred salary scheme (iv) 36 103
28,782 25,844
Other provisions
Public liability provision 40 710
Workers’ compensation 7,925 9,586
Contaminated sites 2,729 3,555
Employment on-costs (iii) 2,810 2,524
13,504 16,375
42,286 42,219
Non-CurrentEmployee benefits provision
Long service leave (ii) 6,593 6,462
6,593 6,462
Other provisions
Contaminated sites 1,605 850
Employment on-costs (iii) 664 654
2,269 1,504
8,862 7,966
2013 $000
2012 $000
148 Public Transport Authority Annual Report 2012-13

(i) Annual leave liabilities have been classified as current as there is no unconditional right to defer settlement for at least 12 months after the end of the reporting period. Assessments indicate that actual settlement of liabilities is expected to occur as follows:
Within 12 months of the end of the reporting period 10,501 9,872
More than 12 months after the end of the reporting period 3,577 3,326
14,078 13,198
(ii) Long service leave liabilities have been classified as current where there is no unconditional right to defer settlement for at least 12 months after the end of the reporting period. Assessments indicate that actual settlement of the liabilities is expected to occur as follows:
Within 12 months of the end of the reporting period 2,469 2,240
More than 12 months after the end of the reporting period 18,792 16,765
21,261 19,005
(iii) The settlement of annual and long service leave liabilities gives rise to the payment of employment on-costs including payroll tax and workers’ compensation insurance. The provision is the present value of expected future payments.
The associated expense is disclosed in note 11 ‘Other expenses’.
(iv) Deferred salary scheme liabilities have been classified as current where there is no unconditional right to defer settlement for at least 12 months after the end of the reporting period. Actual settlement of the liabilities is expected to occur as follows:
Within 12 months of the end of the reporting period 36 103
More than 12 months after the end of the reporting period 0 0
36 103
Movements in other provisionsMovements in each class of provisions during the period, other than employee benefits, are set out below:
Public liability provision
Carrying amount at start of period 710 141
Additional provisions recognised (416) 576
Payments/other sacrifices of economic benefit (254) (7)
Carrying amount at end of period 40 710
Workers’ compensation provisions
Carrying amount at start of period 9,586 5,546
Additional provisions recognised 7,942 9,301
Payments/other sacrifices of economic benefit (9,603) (5,261)
Carrying amount at end of period 7,925 9,586
Employment on-cost provision
Carrying amount at start of period 3,178 2,949
Additional provisions recognised 1,652 1,636
Payments/other sacrifices of economic benefit (1,356) (1,407)
Carrying amount at end of period 3,474 3,178
2013 $000
2012 $000
149

Contaminated sites provision
Carrying amount at start of period 4,405 5,054
Additional provisions recognised 4,041 2,173
Payments/other sacrifices of economic benefit (4,112) (2,822)
Carrying amount at end of period 4,334 4,405
Provision has been established to cover for the costs related to 54 contaminated and suspected contaminated sites.
30. Other current liabilities
Contractors’ deposits 64 80
Payments held in suspense 188 130
Parental leave 13 1
265 211
31. Deferred income – operating leases
CurrentFreight network infrastructure prepaid operating lease 5,383 5,383
Co-operative Bulk Handling 99 year lease 83 83
5,466 5,466
Non-CurrentFreight network infrastructure prepaid operating lease 191,088 196,470
Co-operative Bulk Handling 99 year lease 7,236 7,319
198,324 203,789
203,790 209,255
32. Equity
The Government holds the equity interest in the PTA on behalf of the community. Equity represents the residual interest in the net assets of the PTA. The asset revaluation surplus represents that portion of equity resulting from the revaluation of the non-current assets.
Contributed equityBalance at start of period 2,760,107 2,557,005
Contributions by owners
Capital appropriations 245,964 201,813
New Perth Stadium account 4,621 0
Other contributions by owners
Department of Transport 2,600 0
Transfer of net assets from other agencies
Main Roads WA 31,962 1,539
Total contributions by owners 285,147 203,352
2013 $000
2012 $000
150 Public Transport Authority Annual Report 2012-13

Distributions to owners
Transfer of net assets to other agencies
Main Roads WA (3,250) (250)
Total distributions to owners (3,250) (250)
Balance at end of period 3,042,004 2,760,107
Reserves
Asset revaluation surplus
Balance at start of period 1,977,497 1,958,313
Net revaluation increments/(decrements):
Land (2,624) 3,856
Rail infrastructure 0 15,328
Balance at end of period 1,974,873 1,977,497
Accumulated surplus
Balance at start of period 10,485 72,860
Result for the period (240,181) (62,375)
Balance at end of period (229,696) 10,485
Total Equity at end of period 4,787,181 4,748,089
33. Notes to the Statement of Cash Flows
Reconciliation of cash and cash equivalentsCash and cash equivalents at the end of the financial year as shown in the Statement of Cash Flows is reconciled to the related items in the Statement of Financial Position as follows:
Cash and cash equivalents 56,114 46,396
Restricted cash and cash equivalents (refer to note 19) 11,432 35,321
67,546 81,717
Financing facilitiesThe PTA has a short-term liquidity facility of $200 million (2011-12: $200 million) with the WATC.
Amounts drawn from this facility at June 30 0 0
2013 $000
2012 $000
151

Reconciliation of net cost of services to net cash flows used in operating activities
Net cost of services (894,147) (843,463)
Non cash items:
Depreciation and amortisation expense 245,404 245,646
(Gain)/loss on sale of property, plant and equipment (77) 816
Services received free of charge 619 455
Write-off of assets 2,655 0
(Increase)/decrease in assets:
Current receivables 1,108 (2,194)
Current inventories (181) (301)
Increase/(decrease) in liabilities:
Current payables 4,900 678
Current provisions 67 6,951
Other current liabilities 54 (1,043)
Non-current provisions 896 (496)
Non-current deferred operating lease revenue (5,465) (5,466)
Change in GST receivables/payments (2,489) (2,551)
Net cash used in operating activities (646,656) (600,968)
34. Commitments
The commitments below are inclusive of GST.
Capital expenditure commitments:Capital expenditure commitments, being contracted capital expenditure additional to the amounts reported in the financial statements, are payable as follows:
Within one year 258,019 352,729
Later than one year and not later than five years 476,014 452,388
Later than five years 54,220 275,752
788,253 1,080,869
Non-cancellable operating lease commitments:Vehicle lease commitments for minimum lease payments are payable as follows:
Within one year 810 686
Later than one year and not later than five years 772 460
1,582 1,146
Other expenditure commitments: Other expenditure commitments contracted for at the end of the reporting period but not recognised as liabilities, are payable as follows:
Within one year 619,483 531,819
Later than one year and not later than five years 2,126,104 1,715,861
Later than five years 2,468,855 2,089,025
5,214,442 4,336,705
2013 $000
2012 $000
152 Public Transport Authority Annual Report 2012-13

35. Contingent liabilities and contingent assets
Contingent liabilitiesThe following contingent liabilities are additional to the liabilities included in the financial statements:
Litigation in progressA third party has an ongoing (commenced in February 2012) Supreme Court action against the PTA relating to a claim to provide a Railway Crossing pursuant to Section 102 of the Public Works Act. The PTA has denied all liability and is defending the action. It is not possible to estimate the amount of any eventual payments in relation to this claim at balance sheet date.
Contaminated SitesUnder the Contaminated Sites Act 2003, the PTA is required to report known and suspected contaminated sites to the Department of Environment and Conservation (DEC). In accordance with the Act, DEC classifies these sites on the basis of the risk to human health, the environment and environmental values. Where sites are classified as contaminated – remediation required or possibly contaminated – investigation required, the PTA may have a liability in respect of investigation or remediation expenses.
During the year the PTA reported one additional suspected contaminated site to DEC. This has yet to be classified. The PTA is unable to assess the likely outcome of the classification process, and accordingly, it is not practicable to estimate the potential financial effect or to identify the uncertainties relating to the amount or timing of any outflows. Whilst there is no possibility of reimbursement of any future expenses that may be incurred in the remediation of these sites, the PTA may apply for funding from the Contaminated Sites Management Account to undertake further investigative work or to meet remediation costs that may be required.
36. Remuneration of members of the accountable authority and senior officers
Remuneration of members of the accountable authorityThe number of members of the accountable authority, whose total of fees, salaries, superannuation, non-monetary benefits and other benefits for the financial year, fall within the following bands are:
$ 2013 2012
0 – 10,000 1 1
2013 $000
2012$000
The total remuneration of members of the accountable authority 0 0
The total remuneration includes the superannuation expense incurred by the PTA in respect of the member of the accountable authority.
The accountable authority of the PTA is the Director General – Transport who oversees the agencies Main Roads WA, the Department of Transport and the PTA from 3 May 2010. The Director General’s remuneration is paid by the Department of Transport. The day-to-day operations of the PTA are overseen by the Managing Director whose remuneration is reported under the remuneration of senior officers.
153

Remuneration of senior officers The number of senior officers, other than senior officers reported as members of the accountable authority, whose total fees, salaries, superannuation, non-monetary benefits and other benefits for the financial year fall within the following bands are:
$ 2013 2012
130,001 – 140,000 1 0
160,001 – 170,000 1 0
170,001 – 180,000 0 1
180,001 – 190,000 1 1
190,001 – 200,000 0 3
200,001 – 210,000 3 4
210,001 – 220,000 4 1
230,001 – 240,000 0 1
240,001 – 250,000 1 0
280,001 – 290,000 0 1
310,001 – 320,000 1 0
12 12
2013$000
2012$000
Base remuneration and superannuation 2,135 2,173
Annual leave and long service leave accruals 298 266
Other benefits 93 55
The total remuneration of senior officers 2,526 2,494
The total remuneration includes the superannuation expense incurred by the PTA in respect of senior officers other than the senior officer reported as the member of the accountable authority.
37. Financial instruments
a) Financial risk management objectives and policiesFinancial instruments held by the PTA are cash and cash equivalents, restricted cash and cash equivalents, WATC borrowings, finance leases, receivables and payables. The PTA has limited exposure to financial risks. The PTA’s overall risk management program focuses on managing the risks identified below.
Credit riskCredit risk arises when there is the possibility of the PTA’s receivables defaulting on their contractual obligations resulting in financial loss to the PTA.
The maximum exposure to credit risk at the end of the reporting period in relation to each class of recognised financial assets is the gross carrying amount of those assets inclusive of any allowance for impairment as shown in the table at note 37 ‘Financial instruments’ and note 21 ‘Receivables’.
Credit risk associated with the PTA’s financial assets is minimal because the main receivable is the amounts receivable for services (holding account). For receivables other than government, the PTA trades only with recognised, creditworthy third parties. The PTA has policies in place to ensure that sales of products and services are made to customers with an appropriate credit history. In addition, receivable balances are monitored on an ongoing basis with the result that the PTA’s exposure to bad debts is minimal. At the end of the reporting period there were no significant concentrations of credit risk.
154 Public Transport Authority Annual Report 2012-13
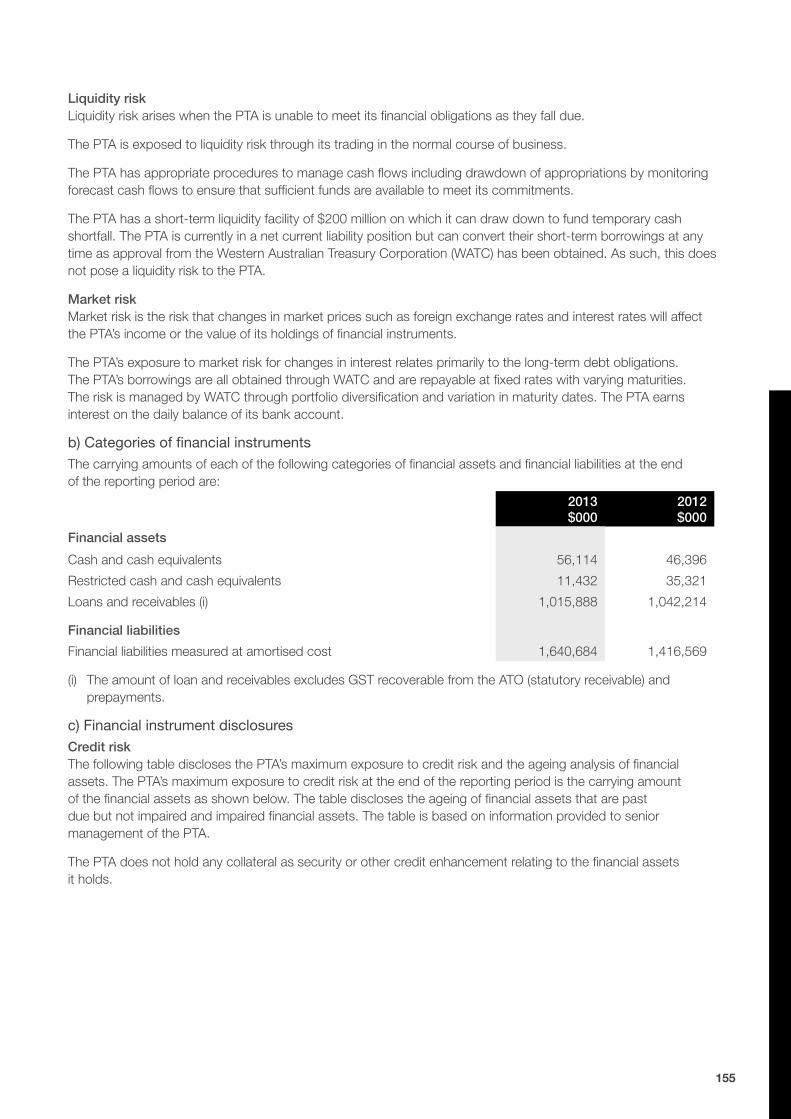
Liquidity riskLiquidity risk arises when the PTA is unable to meet its financial obligations as they fall due.
The PTA is exposed to liquidity risk through its trading in the normal course of business.
The PTA has appropriate procedures to manage cash flows including drawdown of appropriations by monitoring forecast cash flows to ensure that sufficient funds are available to meet its commitments.
The PTA has a short-term liquidity facility of $200 million on which it can draw down to fund temporary cash shortfall. The PTA is currently in a net current liability position but can convert their short-term borrowings at any time as approval from the Western Australian Treasury Corporation (WATC) has been obtained. As such, this does not pose a liquidity risk to the PTA.
Market riskMarket risk is the risk that changes in market prices such as foreign exchange rates and interest rates will affect the PTA’s income or the value of its holdings of financial instruments.
The PTA’s exposure to market risk for changes in interest relates primarily to the long-term debt obligations. The PTA’s borrowings are all obtained through WATC and are repayable at fixed rates with varying maturities. The risk is managed by WATC through portfolio diversification and variation in maturity dates. The PTA earns interest on the daily balance of its bank account.
b) Categories of financial instrumentsThe carrying amounts of each of the following categories of financial assets and financial liabilities at the end of the reporting period are:
2013 $000
2012 $000
Financial assets
Cash and cash equivalents 56,114 46,396
Restricted cash and cash equivalents 11,432 35,321
Loans and receivables (i) 1,015,888 1,042,214
Financial liabilities
Financial liabilities measured at amortised cost 1,640,684 1,416,569
(i) The amount of loan and receivables excludes GST recoverable from the ATO (statutory receivable) and prepayments.
c) Financial instrument disclosuresCredit risk The following table discloses the PTA’s maximum exposure to credit risk and the ageing analysis of financial assets. The PTA’s maximum exposure to credit risk at the end of the reporting period is the carrying amount of the financial assets as shown below. The table discloses the ageing of financial assets that are past due but not impaired and impaired financial assets. The table is based on information provided to senior management of the PTA.
The PTA does not hold any collateral as security or other credit enhancement relating to the financial assets it holds.
155

Aged analysis of financial assets
Past due but not impaired
Note
Carrying Amount
$000
Not past due
and not impaired
$000
Up to 1 month
$000
1 to 3 months
$000
3 months to 1 year
$000
1 to 5 years$000
More than 5 years$000
Impaired financial
assets$000
2013
Cash and cash equivalents 33 56,114 56,114 0 0 0 0 0 0
Restricted cash and cash equivalents 19 11,432 11,432 0 0 0 0 0 0
Receivables (i) 21 13,284 9,345 2,087 1,667 0 0 0 185
Amounts receivable for services 22 1,002,604 1,002,604 0 0 0 0 0 0
1,083,434 1,079,495 2,087 1,667 0 0 0 185
2012
Cash and cash equivalents 33 46,396 46,396 0 0 0 0 0 0
Restricted cash and cash equivalents 19 35,321 35,321 0 0 0 0 0 0
Receivables (i) 21 14,077 12,656 474 309 484 0 0 154
Amounts receivable for services 22 1,028,137 1,028,137 0 0 0 0 0 0
1,123,931 1,122,510 474 309 484 0 0 154
(i) The amount of receivables excludes GST recoverable from the ATO (statutory receivable) and prepayments.
156 Public Transport Authority Annual Report 2012-13
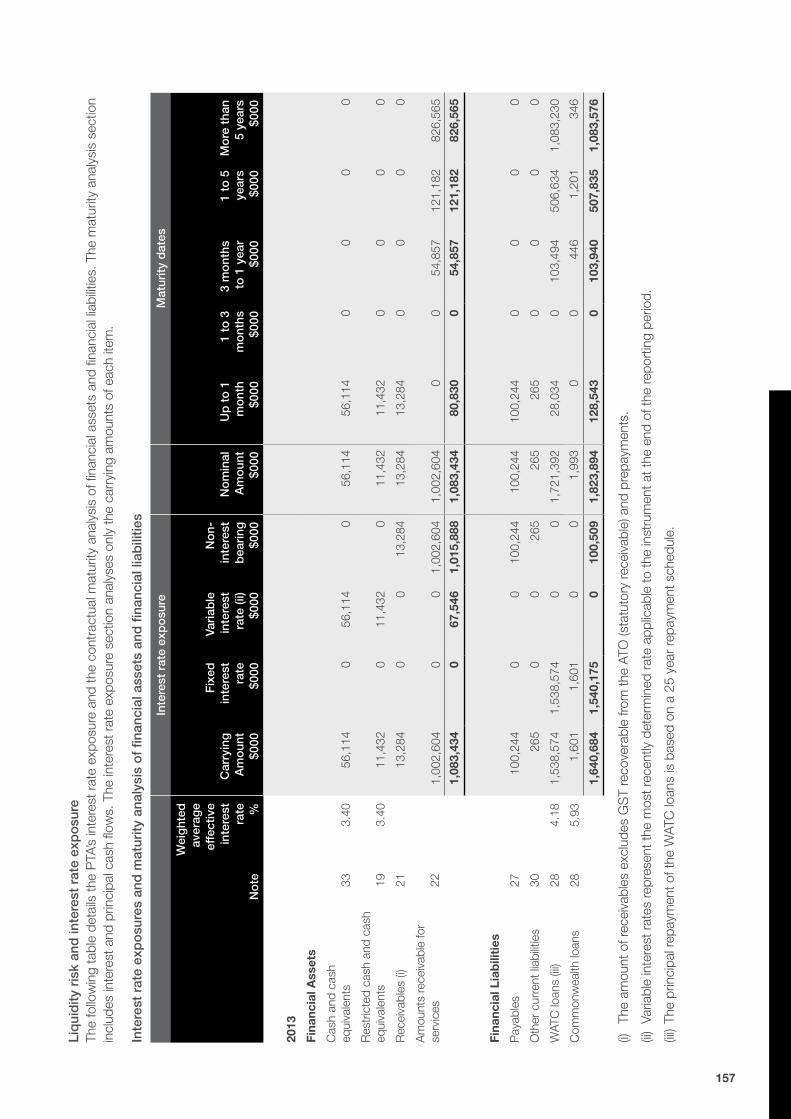
Liq
uid
ity r
isk
and
inte
rest
rat
e ex
po
sure
The
follo
win
g ta
ble
deta
ils th
e P
TA’s
inte
rest
rat
e ex
posu
re a
nd th
e co
ntra
ctua
l mat
urity
ana
lysi
s of
fina
ncia
l ass
ets
and
finan
cial
liab
ilitie
s. T
he m
atur
ity a
naly
sis
sect
ion
incl
udes
inte
rest
and
prin
cipa
l cas
h flo
ws.
The
inte
rest
rat
e ex
posu
re s
ectio
n an
alys
es o
nly
the
carr
ying
am
ount
s of
eac
h ite
m.
Inte
rest
rat
e ex
po
sure
s an
d m
atur
ity a
naly
sis
of
finan
cial
ass
ets
and
fina
ncia
l lia
bili
ties
Inte
rest
rat
e ex
po
sure
Mat
urity
dat
es
No
te
Wei
ght
ed
aver
age
effe
ctiv
e in
tere
st
rate %
Car
ryin
g
Am
oun
t$0
00
Fix
ed
inte
rest
ra
te$0
00
Vari
able
in
tere
st
rate
(ii)
$000
No
n-
inte
rest
b
eari
ng$0
00
No
min
al
Am
oun
t$0
00
Up
to
1
mo
nth
$000
1 to
3
mo
nths
$000
3 m
ont
hs
to 1
yea
r$0
00
1 t
o 5
ye
ars
$000
Mo
re t
han
5 ye
ars
$000
2013
Fina
ncia
l Ass
ets
Cas
h an
d ca
sh
equi
vale
nts
333.
4056
,114
056
,114
056
,114
56,1
140
00
0
Res
tric
ted
cash
and
cas
h eq
uiva
lent
s19
3.40
11,4
320
11,4
320
11,4
3211
,432
00
00
Rec
eiva
bles
(i)
2113
,284
00
13,2
8413
,284
13,2
840
00
0
Am
ount
s re
ceiv
able
for
serv
ices
221,
002,
604
00
1,00
2,60
41,
002,
604
00
54,8
5712
1,18
282
6,56
5
1,08
3,43
40
67,5
461,
015,
888
1,08
3,43
480
,830
054
,857
121,
182
826,
565
Fina
ncia
l Lia
bili
ties
Pay
able
s27
100,
244
00
100,
244
100,
244
100,
244
00
00
Oth
er c
urre
nt li
abilit
ies
3026
50
026
526
526
50
00
0
WAT
C lo
ans
(iii)
284.
181,
538,
574
1,53
8,57
40
01,
721,
392
28,0
340
103,
494
506,
634
1,08
3,23
0
Com
mon
wea
lth lo
ans
285.
931,
601
1,60
10
01,
993
00
446
1,20
134
6
1,64
0,68
41,
540,
175
010
0,50
91,
823,
894
128,
543
010
3,94
050
7,83
51,
083,
576
(i)
The
amou
nt o
f rec
eiva
bles
exc
lude
s G
ST
reco
vera
ble
from
the
ATO
(sta
tuto
ry re
ceiv
able
) and
pre
paym
ents
.
(ii)
Varia
ble
inte
rest
rat
es re
pres
ent t
he m
ost r
ecen
tly d
eter
min
ed r
ate
appl
icab
le to
the
inst
rum
ent a
t the
end
of t
he re
port
ing
perio
d.
(iii)
The
prin
cipa
l rep
aym
ent o
f the
WAT
C lo
ans
is b
ased
on
a 25
yea
r re
paym
ent s
ched
ule.
157
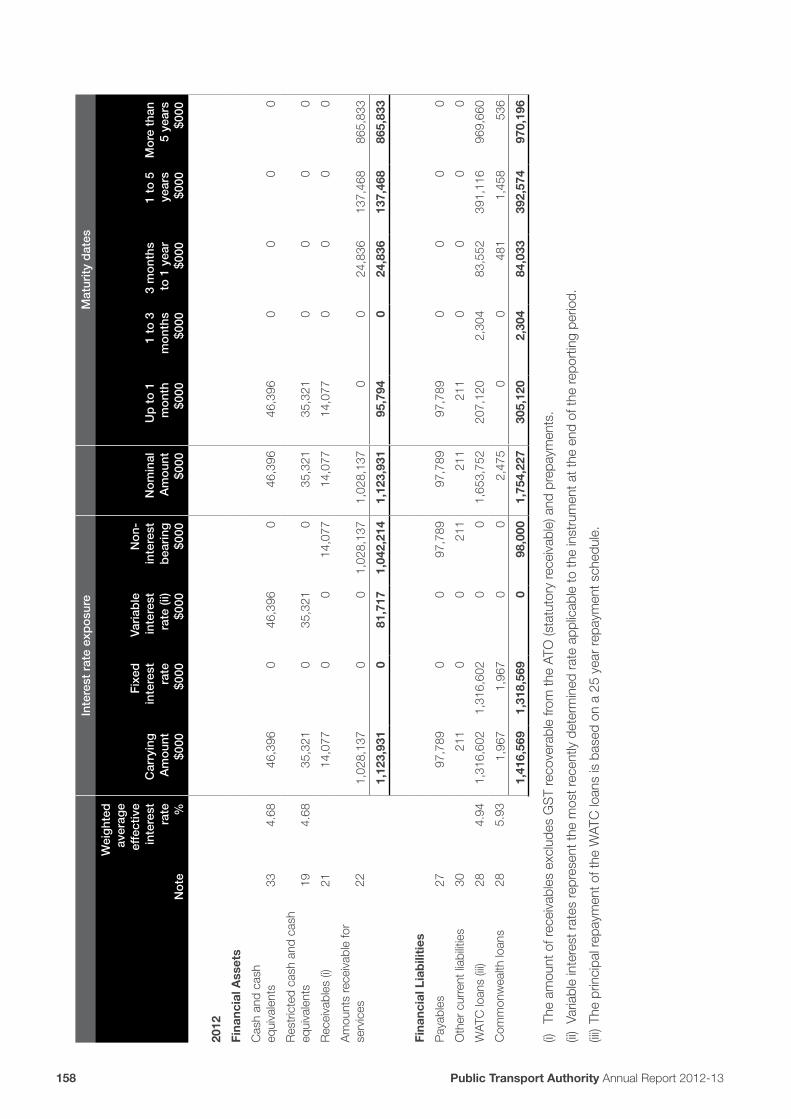
Inte
rest
rat
e ex
po
sure
Mat
urity
dat
es
No
te
Wei
ght
ed
aver
age
effe
ctiv
e in
tere
st
rate %
Car
ryin
g
Am
oun
t$0
00
Fix
ed
inte
rest
ra
te$0
00
Vari
able
in
tere
st
rate
(ii)
$000
No
n-
inte
rest
b
eari
ng$0
00
No
min
al
Am
oun
t$0
00
Up
to
1
mo
nth
$000
1 to
3
mo
nths
$000
3 m
ont
hs
to 1
yea
r$0
00
1 t
o 5
ye
ars
$000
Mo
re t
han
5 ye
ars
$000
2012
Fina
ncia
l Ass
ets
Cas
h an
d ca
sh
equi
vale
nts
334.
6846
,396
046
,396
046
,396
46,3
960
00
0
Res
tric
ted
cash
and
cas
h eq
uiva
lent
s19
4.68
35,3
210
35,3
210
35,3
2135
,321
00
00
Rec
eiva
bles
(i)
2114
,077
00
14,0
7714
,077
14,0
770
00
0
Am
ount
s re
ceiv
able
for
serv
ices
221,
028,
137
00
1,02
8,13
71,
028,
137
00
24,8
3613
7,46
886
5,83
3
1,12
3,93
10
81,7
171,
042,
214
1,12
3,93
195
,794
024
,836
137,
468
865,
833
Fina
ncia
l Lia
bili
ties
Pay
able
s27
97,7
890
097
,789
97,7
8997
,789
00
00
Oth
er c
urre
nt li
abilit
ies
3021
10
021
121
121
10
00
0
WAT
C lo
ans
(iii)
284.
941,
316,
602
1,31
6,60
20
01,
653,
752
207,
120
2,30
483
,552
391,
116
969,
660
Com
mon
wea
lth lo
ans
285.
931,
967
1,96
70
02,
475
00
481
1,45
853
6
1,41
6,56
91,
318,
569
098
,000
1,75
4,22
730
5,12
02,
304
84,0
3339
2,57
497
0,19
6
(i)
The
amou
nt o
f rec
eiva
bles
exc
lude
s G
ST
reco
vera
ble
from
the
ATO
(sta
tuto
ry re
ceiv
able
) and
pre
paym
ents
.
(ii)
Varia
ble
inte
rest
rat
es re
pres
ent t
he m
ost r
ecen
tly d
eter
min
ed r
ate
appl
icab
le to
the
inst
rum
ent a
t the
end
of t
he re
port
ing
perio
d.
(iii)
The
prin
cipa
l rep
aym
ent o
f the
WAT
C lo
ans
is b
ased
on
a 25
yea
r re
paym
ent s
ched
ule.
158 Public Transport Authority Annual Report 2012-13
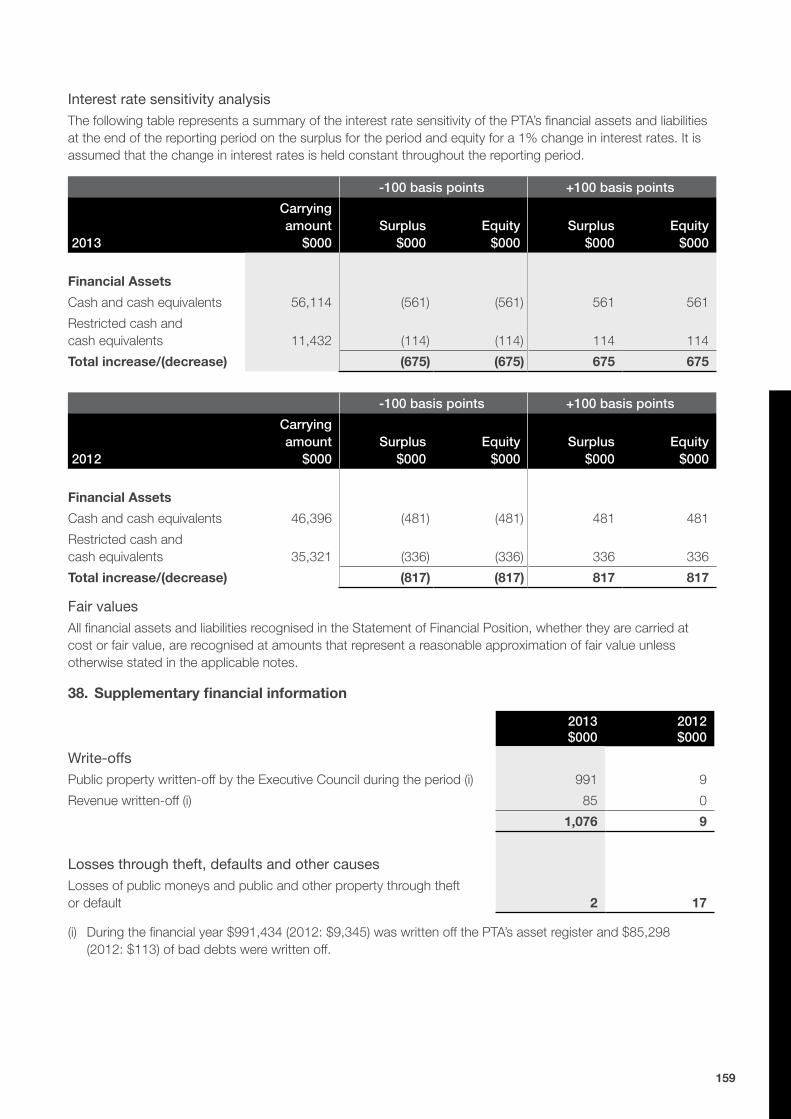
Interest rate sensitivity analysisThe following table represents a summary of the interest rate sensitivity of the PTA’s financial assets and liabilities at the end of the reporting period on the surplus for the period and equity for a 1% change in interest rates. It is assumed that the change in interest rates is held constant throughout the reporting period.
-100 basis points +100 basis points
2013
Carrying amount
$000Surplus
$000Equity
$000Surplus
$000Equity
$000
Financial Assets
Cash and cash equivalents 56,114 (561) (561) 561 561
Restricted cash and cash equivalents 11,432 (114) (114) 114 114
Total increase/(decrease) (675) (675) 675 675
-100 basis points +100 basis points
2012
Carrying amount
$000Surplus
$000Equity
$000Surplus
$000Equity
$000
Financial Assets
Cash and cash equivalents 46,396 (481) (481) 481 481
Restricted cash and cash equivalents 35,321 (336) (336) 336 336
Total increase/(decrease) (817) (817) 817 817
Fair valuesAll financial assets and liabilities recognised in the Statement of Financial Position, whether they are carried at cost or fair value, are recognised at amounts that represent a reasonable approximation of fair value unless otherwise stated in the applicable notes.
38. Supplementary financial information
2013 $000
2012 $000
Write-offsPublic property written-off by the Executive Council during the period (i) 991 9
Revenue written-off (i) 85 0
1,076 9
Losses through theft, defaults and other causes Losses of public moneys and public and other property through theft or default 2 17
(i) During the financial year $991,434 (2012: $9,345) was written off the PTA’s asset register and $85,298 (2012: $113) of bad debts were written off.
159

39. Events occurring after the end of the reporting period
The PTA has not identified any material events after the end of the reporting period that would require adjustment or disclosure to be made.
40. Explanatory statement
Significant variations between estimates and actual results for 2013 and between the actual results for 2012 and 2013 are shown below. Significant variations are considered to be those greater than 10% or $5 million.
a) Significant variances between estimated and actual result for 2013
2013 Estimate
$000
2013Actual
$000Variance
$000
User charges and fees 200,228 212,442 12,214
Grants and subsidies expenses 415,341 427,440 (12,099)
Supplies and services 205,598 217,361 (11,763)
Depreciation and amortisation 254,953 245,404 9,549
Finance costs 94,809 69,877 24,932
User charges and feesIncreased user charges and fees mainly due to patronage.
Grants and subsidies expensesIncreased grants and subsidies expenses mainly due to increased bus service kilometres for the Transperth Bus Network.
Supplies and services• Increased costs of providing services funded by external parties;
• Forward planning and design works for future projects;
• Increased mesothelioma cost.
Depreciation and amortisation Decreased depreciation costs of $9.5 million resulting from deferral of the asset investment program.
Finance costsDecreased interest cost mainly due to deferral of the asset investment program and lower interest rate.
b) Significant variances between actual results for 2012 and 2013
2013 Actual
$000
2012Actual
$000Variance
$000
Income
User charges and fees 212,442 192,003 20,439
Other revenue 37,330 32,164 5,166
Expenses
Employee benefits expense 140,790 135,193 (5,597)
Grants and subsidies expense 427,440 384,157 (43,283)
Supplies and services 217,361 197,149 (20,212)
Energy and fuel 31,176 25,236 (5,940)
160 Public Transport Authority Annual Report 2012-13

User charges and feesIncreased user charges and fees mainly due to patronage and fare increase.
Other revenueIncreased revenue from services funded by external parties and income from leased properties and advertising.
Employee benefits expenseIncreased employee benefits expense mainly due to salary and wages increment based on the Enterprise Bargaining Agreements.
Grants and subsidies expenseIncreased grants and subsidies expense mainly due to increased:
• Bus service kilometres for the Transperth Bus Network;
• Labour and fuel costs for the Transperth and School bus operators;
• Bus contract cost escalation.
Supplies and servicesIncreased supplies and services expense mainly due to:
• Forward planning and design works for future projects;
• Increased maintenance of railcars;
• Increased security on rail and buses;
• Increased contaminated sites provision;
• Increased mesothelioma cost.
Energy and fuel Increased energy costs mainly due to additional train services and increased electricity tariffs.
161

41.
Sch
edul
e o
f in
com
e an
d e
xpen
ses
by
serv
ice
Met
rop
olit
an a
nd R
egio
nal
Pas
seng
er S
ervi
ces
Co
untr
y P
asse
nger
Rai
l an
d R
oad
Co
ach
Ser
vice
sR
egio
nal S
cho
ol
Bus
Ser
vice
sR
ail C
orr
ido
r an
d
Res
idua
l Fre
ight
Issu
esTo
tal
2013
$000
2012
$000
2013
$000
2012
$000
2013
$000
2012
$000
2013
$000
2012
$000
2013
$000
2012
$000
Cos
t of
Ser
vice
sE
xpen
ses
Em
ploy
ee b
enefi
ts e
xpen
ses
114,
495
112,
952
13,7
8612
,607
4,10
73,
543
8,40
26,
091
140,
790
135,
193
Sup
plie
s an
d S
ervi
ces
176,
590
164,
909
24,1
1622
,184
1,87
91,
393
14,7
768,
663
217,
361
197,
149
Dep
reci
atio
n an
d am
ortis
atio
n ex
pens
e15
0,71
115
3,00
34,
172
4,40
91,
311
1,07
789
,210
87,1
5724
5,40
424
5,64
6
Fina
nce
cost
s64
,026
59,5
613,
063
3,41
50
02,
788
4,69
669
,877
67,6
72
Gra
nts
and
subs
idie
s31
9,24
027
6,66
30
010
8,20
010
3,07
90
4,41
542
7,44
038
4,15
7
Ene
rgy
and
fuel
26,3
8221
,474
3,43
72,
624
024
1,35
71,
114
31,1
7625
,236
Loss
on
disp
osal
of n
on-
curr
ent a
sset
s0
816
00
00
00
081
6
Oth
er e
xpen
ses
16,9
9018
,501
1,39
01,
268
724
472
1,21
657
720
,320
20,8
18
Tota
l co
st o
f se
rvic
es86
8,43
480
7,87
949
,964
46,5
0711
6,22
110
9,58
811
7,74
911
2,71
31,
152,
368
1,07
6,68
7
Inco
me
Use
r ch
arge
s an
d fe
es19
6,36
717
6,03
911
,244
11,2
174,
831
4,74
70
021
2,44
219
2,00
3
Ope
ratin
g le
ase
reve
nue
00
00
00
5,46
65,
466
5,46
65,
466
Com
mon
wea
lth g
rant
s an
d co
ntrib
utio
ns44
336
466
910
017
1152
646
6
Inte
rest
reve
nue
00
00
00
2,38
03,
125
2,38
03,
125
Gai
n on
dis
posa
l of n
on-
curr
ent a
sset
s65
00
00
012
077
0
Oth
er re
venu
e24
,656
20,7
701,
574
180
011
,100
11,3
7637
,330
32,1
64
Tota
l inc
om
e o
ther
th
an in
com
e fr
om
S
tate
Go
vern
men
t22
1,53
119
7,17
312
,884
11,3
264,
831
4,74
718
,975
19,9
7825
8,22
123
3,22
4
Net
Cos
t of
Ser
vice
s64
6,90
361
0,70
637
,080
35,1
8111
1,39
010
4,84
198
,774
92,7
3589
4,14
784
3,46
3
162 Public Transport Authority Annual Report 2012-13

Met
rop
olit
an a
nd R
egio
nal
Pas
seng
er S
ervi
ces
Co
untr
y P
asse
nger
Rai
l an
d R
oad
Co
ach
Ser
vice
sR
egio
nal S
cho
ol
Bus
Ser
vice
sR
ail C
orr
ido
r an
d
Res
idua
l Fre
ight
Issu
esTo
tal
2013
$000
2012
$000
2013
$000
2012
$000
2013
$000
2012
$000
2013
$000
2012
$000
2013
$000
2012
$000
Inco
me
from
Sta
te
Gov
ernm
ent
Ope
ratin
g su
bsid
y co
ntrib
utio
ns49
5,15
963
4,98
133
,080
38,8
6310
7,65
110
2,14
610
,631
199
646,
521
776,
189
Ser
vice
s re
ceiv
ed fr
ee
of c
harg
e0
00
00
061
945
561
945
5
Roy
altie
s fo
r R
egio
ns0
09
73,
288
3,00
00
03,
297
3,00
7
Con
trib
utio
ns –
Oth
er
Gov
ernm
ent A
genc
ies
3,52
91,
437
00
00
00
3,52
91,
437
Tota
l inc
om
e fr
om
S
tate
Go
vern
men
t49
8,68
863
6,41
833
,089
38,8
7011
0,93
910
5,14
611
,250
654
653,
966
781,
088
Sur
plu
s/(d
efici
t) f
or
the
per
iod
(148
,215
)25
,712
(3,9
91)
3,68
9(4
51)
305
(87,
524)
(92,
081)
(240
,181
)(6
2,37
5)
The
Sch
edul
e of
Inco
me
and
Exp
ense
s by
Ser
vice
sho
uld
be re
ad in
con
junc
tion
with
the
acco
mpa
nyin
g no
tes.
163

42. Remuneration of auditor
Remuneration paid or payable to the Auditor General in respect of the audit for the current financial year is as follows:
Auditing the accounts, financial statements and key performance indicators 160 166
43. Act of Grace payments
Eight Act of Grace payments made pursuant to authorisations given under Section 80(1) of the Financial Management Act 2006. (2012: NIL payment) 50 0
2013 $000
2012 $000
164 Public Transport Authority Annual Report 2012-13


Public Transport Centre West Parade Perth, WA 6000
PO Box 8125 Perth Business Centre Perth, WA 6849
[email protected] Telephone (08) 9326 2000
www.pta.wa.gov.au