annual report 2011 - lonza
TRANSCRIPT

Annual Report 2011Activities
—
Financial ReportRemuneration ReportCorporate Governance

In 2011, Lonza completed a number of major strate-gic initiatives that established the company as the clear global leader in Microbial Control and Custom Manufacturing, two attractive sectors in the life- science markets. Lonza delivered underlying growth in sales and EBITDA, despite significant external chal-lenges – for example, the foreign exchange impact of CHF 84 million due to the strong Swiss franc, higher and more volatile raw material prices especially in Life Science Ingredients, and the effect of an FDA warning letter on our Hopkinton, MA (USA), site (CHF 15 million).
– Before acquisition: revenues at CHF 2 505 million (2010: 2 680 million), up by 5.6 % in constant exchange rates. EBIT of CHF 292 million (2010: CHF 374 million), up 0.5 % in constant currencies
– CHF 84 million negative exchange rate impact on EBIT
– Solid EBITDA margins before acquisition of 22.3 % (24.0 % in 2010)
– Capital expenditure in ongoing strategic growth projects was reduced substantially to CHF 267 million (CHF 300 million in 2010) after acquisition
– With the fully debt-financed acquisition of Arch, gearing came up to 112 % by the end of 2011 (46 % at the end of 2010)
– The Board of Directors is proposing a cash dividend of CHF 2.15 per share
Lonza Key Facts and Figures
Annual Report 2011Activities
—
Financial ReportRemuneration ReportCorporate Governance
Key figures Lonzamillion CHF
2011before Arch acquisition
2011after Arch
acquisition
2010
Sales 2 505 2 692 2 680EBITDA 559 537 643EBIT 292 261 374Core 1 EBIT 306 326 387Profit for the period 190 154 284Core 1 profit for the period 216 225 299Free cash flow before acquisitions 171 127 362Capital expenditure 256 267 300Net debt 1 111 2 647 1 108Net debt-equity ratio 0.46 1.12 0.46Total equity 2 403 2 356 2 387
1 In the core results for the items: result from operating activities (EBIT), profit for the period and earnings per share, the im-pact of amortization of acquisition- related intangible assets, impairment and reversal of impairment of assets, results from asso-ciates and other special charges / income from restructuring / acquisition is elimi-nated (see reconciliation of IFRS results to core results on pages 182 / 183).
Full-year Results in a Snapshot

Share informationCHF
2011before Arch acquisition
2011after Arch
acquisition
2010
Basic earnings per share 3.68 2.98 5.55 Diluted earnings per share 3.67 2.97 5.53Dividend payout ratio % 58 72 39 Core 1 basic earnings per share 4.19 4.36 5.84Core 1 diluted earnings per share 4.17 4.34 5.81Ordinary dividend declared per share 2.15 2.15 2.15
Profitability%
2011before Arch acquisition
2011after Arch
acquisition
2010
EBITDA 22.3 19.9 24.0EBIT 11.7 9.7 14.0Core 1 EBIT 12.2 12.1 14.4RONOA 9.0 6.9 10.8
Share price high
81.70
Janu
ary
Febr
uary
Mar
ch
April
May
June
July
Augu
st
Sept
embe
r
Octo
ber
Nove
mbe
r
Dece
mbe
r
90
80
70
60
50
40
Share Price Development 2011
1
2
34
5
6
1 Full-year 2010 results
2 Lonza Annual General Meeting (AGM)
3 First-quarter business update
4 Dividend payment
5 Half-year 2011 results
6 Third-quarter business update
Share price at year end
55.50Share price low
46.89
1 In the core results for the items: result from operating activities (EBIT), profit for the period and earnings per share, the im-pact of amortization of acquisition- related intangible assets, impairment and reversal of impairment of assets, results from asso-ciates and other special charges / income from restructuring / acquisition is elimi-nated (see reconciliation of IFRS results to core results on pages 182 / 183).

2007
2008
*200
9
2010
2011
EBIT and Profit for the Periodmillion CHF
2007
2008
2009
2010
2011
Sales Progressionmillion CHF
2 505
2 937
2 690
2 680
2 870
2 692
Sales by Operating Segmentsmillion CHF
697Life Science Ingredients
486Microbial Control
202Bioscience
10Corporate
Custom Manufacturing
1 297
441
328
301
408
380
279
374
284
EBIT Profit for the period Gain on the sale of the remaining stake in Polynt S.p.A.
* Before special charges
After acquisition
Before acquisition
292
190
261
154
91
After acquisition
Befo
re a
cqui
sitio
n

Annual Report 2011Lonza is a leading supplier to the pharmaceutical,
healthcare and life-science industry. Since 2011, Lonza has been market leader in
the area of Microbial Control. Our products and services span customers’ needs from
research to final product manufacturing. Lonza is headquartered in Basel, Switzerland,
and is listed on the SIX Swiss Exchange. Since October 2011, we have had a secondary listing
on the SGX Singapore Exchange.

2 Lonza Annual Report 2011
2
Lonza Quality Assurance Photo Reportage
Quality is a term – unlike safety, for example – which is not always clear and well-defined, but often open to different interpretations, in particular in the production of chemicals, drugs and biotechnology products. If you find a fault or a fracture in a porcelain object, the quality aspect is plain for all to see. In drug manufac-turing, things are different. The quality of such prod-ucts is not immediately evident. Quality deficiencies only become evident through use, in other words in the efficacy achieved. This is a field in which the quality as-
pect is especially critical. It is not surprising, therefore, that more and more quality criteria have been added for certain drug products over the last few decades.
The photo reportage running through this Annual Re-port uses the example of pharmaceutical products at the Visp (CH) site to illustrate the different quality aspects which are a top priority in the manufacture of drugs for our customers. Picture no. 1 of the photo reportage is on the title page.
Control and review of production parameters are key for a successful product delivered on time and in the quality required by the customer. Electronic or
handwritten documentation is essential for Lonza and the customer.
Lonz
a Qu
ality
Ass
uran
ce

3Lonza Annual Report 2011
Lonza Annual Report 2011
Activities
Introduction 5 Foreword from the Chairman
of the Board of Directors 10 Lonza Highlights 2011
A New Sector 15 New Microbial Control Sector
Is the World Leader with Exciting Growth Prospects
21 Integration: Becoming One Team 25 Lonza at the Olympics: New
Metal-Free Wood Preservative Used on Pedestrian Bridge
Company Overview 30 Company Profile 32 Seven Markets
Financial Report
Remuneration Report
Corporate Governance
73
185
207
Innovation on Many Fronts 35 Lonza Helps Biopharma Customers
Bring Their Products to Market Faster 39 The 4D-Nucleofector™ System:
Pushing the Limits of Transfection 43 A Regenerative Medicine Partnership
Business and Functions 48 Life Science Ingredients 50 Microbial Control 52 Custom Manufacturing 54 Bioscience 58 Environment, Health and Safety 66 Lonza Global Map 68 Lonza’s Trademarks

4
3
Sample preparation is one of the most challenging procedures. Compliance with standard operating procedures
ensures results of consistent quality.
Lonz
a Qu
ality
Ass
uran
ce

5Lonza Annual Report 2011
Once again, you have the Lonza Annual Report in your hands. But before I speak about Lonza, I would like to say a word of thanks to you, to express my gratitude for the fact that you hold Lonza shares! They are a token of your trust in our company, of the interest and appreciation you show, also in uncertain times, in some cases over many years. The Board of Directors, Management Committee and employees know that this places the onus of responsibility on us. Rest assured: We take it very seriously.
This year’s Annual Report from Lonza is more compact than in recent years. It is intended to give a clear and comprehensive picture of all that Lonza has achieved in the past year, and show you where we stand, both strategically and financially. In 2011 Lonza again earned praise from various quarters for the transparency of its reporting. Wherever we see an opportunity, we try to raise the level even further, one step at time.
This year, we are placing a particular emphasis on the presentation of our new business sector: Lonza Microbial Control. The acquisition of Arch for around CHF 1.4 billion was one of the striking events of 2011. It was carried out in a most professional and efficient way: We announced our intention in July; by 20 October 2011 all the legal formalities had been completed, and on the same day the new management team was put in place. Since then, the integration has proceeded according to plan. Through this acquisition, we have become the world’s leading supplier of solutions for the control of unwanted microbes. This is an exciting business sector with great potential in both mature and new markets. Thanks to Lonza’s expertise in the relevant fields, it is well positioned to exploit the areas
Dear Shareholders

6 Lonza Annual Report 2011
of development, particularly at a time when the regulatory environment is becoming increasingly strict. Through genuine innovations and its global presence, Lonza aims to ensure that the sector becomes a cornerstone of the Group.
Needless to say, this acquisition was not the only step we took to consolidate and expand the basis of our business. Notable projects included: – In Visp (CH), the building of additional capacity for cytotoxic active ingredients for
pharmaceuticals and a new production plant for crop protection intermediates. – In the USA, we extended the infrastructure in Hopkinton, MA, the cell therapy
capacities in Walkersville, MD, and inaugurated the Innovation Center for Microbial Control in Alpharetta, GA.
– In Singapore, the mammalian cell culture facility came on stream, while the cell therapy facility is scheduled to be completed in 2012.
– In China, we invested in the L-carnitine plant in Nansha and the production facility for pyromellitic dianhydride in Nanjing.
The last two examples show one thing: Lonza takes Asia seriously. This is further underlined by the secondary listing in Singapore. We are the first Swiss and only the second European company to be listed on the Singapore Exchange! This direct presence in one of the most important financial centers on this vast continent will open up new opportunities in the medium term.
This all goes to show how Lonza is striving, step by step, to balance out its traditionally strong position in Switzerland. There are certain realities we have to accept: The Swiss franc has gotten strong within an extremely short period of time which ultimately also let the Swiss National Bank to set a minimum exchange rate for the Swiss franc. Productivity gains of up to 25 % to offset the strong Swiss franc cannot be achieved at the same pace as the movements in exchange rates, even more so when your company was working efficiently in the first place which has been the dilemma of the entire Swiss industry. Also, the level of cost for labor, energy, and certain raw materials in Switzerland is still high. The question how and what we can manufacture competitively in Visp will always be on the agenda. We greatly respect and appreciate the way our employees and their representatives have accepted this and are making a constructive contribution to the search for a pragmatic and effective entrepreneurial response. Accompanying this strategic drive to maintain the competitiveness of our Swiss plants, we have to redouble our efforts to strengthen our positions in the growth markets. As you know, reshaping the company step by step is nothing new in Lonza’s history. As in the past, the solutions will be responsible ones, based on sound judgement.
Regarding the underlying business, we were able to improve both sales and EBITDA – at least when measured at constant exchange rates – with high capacity utilization in most business segments. Custom Manufacturing benefited from sustained demand for out-sourcing from pharma and biotech customers. This was particularly the case in Biological Manufacturing, where capacity utilization was over 85 % – not including the new plant in

7Lonza Annual Report 2011
Singapore! New contracts were signed in all business areas, reflected in a solid improve-ment in the project pipeline. In Asia, we took further steps to expand our market presence, including the relocation of our Life Science Ingredients division to Beijing (CN). This sector faces a serious challenge in the niacin segment, which is subject to increasing competition and pressure on margins: Lonza is determined to find smart solutions and take vigorous action to defend its leading position. From the third quarter on, the Microbial Control busi-ness experienced a slowdown in the so-called mature markets, but this was partly offset by new products and the opening up of new markets. The Bioscience sector suffered under the budget limitations of many customers, both large and small, but strengthened its posi-tion in some of its business fields.
Lonza has initiated various strategic steps in recent years. These were substantially shaped by CEO Stefan Borgas, to whom we wish to express our gratitude. However, the results achieved in recent years have not measured up to expectations, the 2011 result included. External factors beyond our control certainly played their part. But the fact is: the outcome is still unsatisfactory, and Lonza has to do better. That is why the Board of Directors has decided to initiate a change of CEO, a move that was announced on 25 January 2012. This decision is not the outward sign of a fundamental new orientation of the business activities: Lonza is in a strong position, both strategically and financially. From now on, “Focus and Delivery” must be the motto that guides our company, our teams and our work.
The Board of Directors has adjusted the expectations to the extent that it “put back the clock” in January. The 2011 result is the starting point. There is nothing we can do to change that. But from now on realistic and solid growth is our goal. This will be possible in 2012 thanks to the acquisition of Arch. As you know, the deal was not financed by way of an increase in capital, but with capital borrowed on favorable terms. The EPS, which is of particular interest to you as a shareholder, will benefit significantly from this growth.
As I have already mentioned, Focus and Delivery is the motto guiding our management teams across the world. Of course, the Board also has to play its part. A pointer in this di-rection is given by the two candidatures for seats on the Board, which you will find on the agenda for the Annual General Meeting. Margot Scheltema and Jörg Reinhardt bring experi-ence and expertise which will be invaluable for our company: on the one hand, experience in industry and management; on the other – more vital than ever – specialized knowledge in the areas of audit and compliance.
There are good reasons why Corporate Social Responsibility is a fact of life in the busi-ness world of today. One way Lonza recognizes this is through membership of the UN Global Compact. The UN principles are not just something written on paper that we pay lip service to, but part of day-to-day life at Lonza, involving all our locations. Safety at work is the number-one priority. It is heartening to report that, after good progress in previous years, we were able to keep the accident rate in 2011 at a low level; it is currently 1.7 per million hours worked (lost-time injuries frequency rate).

8 Lonza Annual Report 2011
The 2012 business year will not be an easy ride. Many of the countries in which we operate are not in the best of shape. However, the current year – starting from the result Lonza achieved in 2011 – will have to bring overall growth in both sales and income. This will be possible in the Microbial Control sector thanks to the acquisition of Arch. Synergies from that acquisition and improvements in productivity, particularly in Switzerland, will contribute to the growth. The Group is in good shape. The project pipeline is growing in all sectors, and further growth projects are lined up: antibody drug conjugates, cell therapy and biosimilars, to name but a few. Capital expenditure, including maintenance, is forecast to be below CHF 400 million in 2012. The free cash flow generated will enable Lonza to reduce its net debt. The course is set for an improved performance in 2012!
I started by thanking our shareholders. Now I also wish to thank our customers, who rely on our services and spur us on to give of our best. Finally, last but by no means least, I want to express heartfelt thanks to all our employees. They are the ones who do the work. Their com-mitment and skills are the basis for our success. Without them, we could achieve nothing.
With best regards
Rolf SoironChairman of the Board of Directors

9
4
The sampling of our raw materials is a vital starting point for a high-quality product. Manufacturing under GMP
conditions requires rigorous control of raw material quality.
Lonz
a Qu
ality
Ass
uran
ce

10 Lonza Annual Report 2011
Lonza Highlights 2011
Operational Highlights
New agrochemical plant in Visp (CH), running at high capacity utilizations
—Start-up of the new L-carnitine plant
in Nansha (CN)—
Start-up of the new production plant for pyromellitic dianhydride in Nanjing (CN)
—Opening of the Innovation and Technology
Center in Alpharetta, GA (USA)—
Successful start of investment in additional capacity for cytotoxic active pharmaceutical
ingredients in Visp —
Very successful year for the business unit Biological Manufacturing
with a capacity utilization of above 85 % —
Start-up of the large-scale mammalian facility in Singapore
—Completion of equipment additions and
infrastructure changes in Hopkinton, MA (USA)—
Strategic alliance with Mesoblast (Australia) for clinical and long-term commercial production of Mesoblast’s off-the-shelf
(allogeneic) adult stem cell products
Secondary Listing in Singapore
In October, Lonza’s shares made their trading debut on the Singapore stock exchange.
Lonza is the first SIX-listed company to have a secondary listing, by way of an introduction,
on the Singapore Exchange (SGX-ST). The listing will help enhance our profile in the region
and offers options for accessing capital.
Employees by Regionin %
34.6 %Americas
16.5 %Asia
48.9 %EMEA
(Europe, Middle East, Africa)

11Lonza Annual Report 2011
Lonza Highlights 2011
Awards
Best Ingredient Award at the in-cosmetics Asia for ReGEniStem™ Red Rice, a sustainable anti-aging active, derived from a meristematic
culture of Himalayan red rice, which finds application in skin care products
—2011 Frost & Sullivan Asia Pacific
Green Excellence Award for Lonza Biologics Tuas, Singapore
—2011 Excellence in EHS management by
Nanjing Chemical Industry Park for the Lonza site in Nanjing (CN)
Arch Acquisition
With the completion of the Arch acquisition in October, Lonza became the global
leader in microbial control, providing innovative, chemistry-based and related solutions
to destroy or selectively inhibit the growth of harmful microorganisms.
The Arch business has been combined with Lonza’s existing Microbial Control
business to create the new Lonza Microbial Control sector.
Employees by Division
2 212Life Science Ingredients
3 047Microbial Control
1 017Bioscience
505Corporate Functions
Custom Manufacturing
4 220
11 001Total

12 Lonza Annual Report 2011
Microbial testing and environmental monitoring are part of the quality-related requirements that ensure
the potency and safety of drugs for patients.

13Lonza Annual Report 2011 13
5
Microbial testing and environmental monitoring are part of the quality-related requirements that ensure
the potency and safety of drugs for patients.
Lonz
a Qu
ality
Ass
uran
ce

14
6
The maintenance and qualification of increasingly complicated and sophisticated instruments always fall within the scope
of regulatory and customer inspections.
Lonza Quality Assurance

15Lonza Annual Report 2011
New Microbial Control Sector Is the World Leader with Exciting Growth Prospects
The acquisition of Arch Chemical Inc. gives Lonza Micro-bial Control a well-balanced set of business-to-business and business-to-consumer products and applications, combined with a broad geographic footprint.
Lonza has a new business sector: Lonza Microbial Control. This fourth business sector was created on 20 October 2011 when Lonza acquired Arch Chemi-cals, Inc., a global leader in the control of unwanted microbes, with annual revenues of about USD 1.3 bil-lion. On day one of its creation, it became the world leader in Microbial Control Solutions, with a global market of USD 10 billion. Together with the former Lonza Microbial Control business unit, which prior to the acquisition had been part of the Life Science In-gredients sector, our new Microbial Control sector had 2010 pro-forma sales of approximately USD 1.6 billion, comprising more than 40 % of overall Group sales.
Our new sector is led by Chief Operating Officer Jeanne Thoma, who previously served as head of the Lonza Microbial Control businesses and is now a member of Lonza’s Management Committee. With approximately 3 000 employees and 26 major man-ufacturing and R&D locations worldwide, the new Microbial Control sector offers compelling competi-tive advantages, including:
– The broadest portfolio of approved, active micro-bial ingredients and formulations in the world
– Market-leading positions in water treatment, wood protection, health and hygiene applications
– Excellent growth opportunities in materials protection and personal care products, and
– A strong presence in fast-growing markets such as China, India, Brazil and South Africa.
Moreover, having a significant portion of its sales in North America, the sector provides a currency hedge against the strong Swiss franc. With the integration of Arch well underway, the sector is on track to achieve an estimated USD 50 million in cost-saving syner-gies by year-end 2013 and incremental sales of at least USD 40 million by the third year. The sector is expected to be EPS accretive in year one and EVA positive in year two, generating sustainable advan-tages for our shareholders.

16 Lonza Annual Report 2011
New Microbial Control Sector Is the World Leader with Exciting Growth Prospects
Water TreatmentIn an interesting synergy, even before the Arch ac-quisition, Lonza provided halogenated hydantoins to Arch as ingredients in some pool and spa prod-ucts. Our Water Treatment business (including the world renowned HTH™ family of pool treatments) is the world’s largest supplier of swimming pool and spa treatment products. In addition, we offer treat-ment chemicals, formulations, feeder systems and support services for the treatment of potable and drinking water, surface waters and water used in papermaking, industrial cooling and other industrial applications.
One of our exciting growth stories in water treatment is Lonza Microbial Control’s oil and gas production treatment business. It is growing rapidly as we serve customers engaged in shale gas and oil extraction and other exciting new forms of energy production. We provide biocides, corrosion inhibitors, surfac-tants, and other products used to prevent corrosion and the growth of bacteria and biofilms in production wells, pipelines and other energy equipment. In late 2011, we launched the Dantogard™ 2000 biodegrad-able, environmentally responsible biocidal solution for preserving and protecting water used in shale gas hydraulic fracturing – a “green” solution that helps protect human health, drinking water quality, and the environment.
Hygiene & PreservationLonza Microbial Control is the leader in registered for-mulations for the hygiene and preservation markets, where our products are used in hard surface disin-fectants, sanitizers and cleaning products; in the in-stitutional healthcare markets, hotel and restaurants markets, in health care applications such as gauze bandages and topical wound treatments; in cleaning and sanitizing applications for Pharmaceutical Clean Room manufacturing and in food hygiene treatments such as beverage bottle sanitizing and the post-har-vest cleansing of fruits, vegetables and poultry.
Personal CareWith a strong biotechnology platform and many certi-fied organic products which distinguish us from com-petitors, the expanded Lonza Personal Care business is a comprehensive solutions provider to global per-sonal care and cosmetic companies. Our portfolio includes biotechnological actives, delivery systems, natural and traditional preservatives, botanicals, an-tidandruff agents and functional ingredients. Our zinc Omadine® biocide, for example, is the most popular antidandruff shampoo active in the world, and it is enjoying strong demand growth in China and India.
Wood TreatmentThe Lonza wood treatment businesses is a world leader in providing advanced, formulated products and support services to our customers. Our products make wood resistant to termites, fungi, mold, fire and moisture. Key wood brands and treatments have earned “green building” awards and certifications worldwide for their sustainability and other environ-mental advantages.

17Lonza Annual Report 2011
Materials ProtectionThis business unit is an innovative leader in antimi-crobial control technologies for use in paints, coat-ings and other building products, adhesives and sealants, marine antifouling hull paints and aquacul-ture nets, polymer emulsions, metalworking fluids, textiles and plastics. As an example, the biocidal ac-tives and formulated products that we supply to the building products market deter the growth of mold and mildew on painted surfaces, wallboard, ceiling tiles and related building materials, helping protect human health and safety.
Supplementing the offerings above, our oleochemi-cal derivatives business is a high quality supplier of key additives, primarily emulsifiers, for use in foods, plastics, textiles, metalworking, water treatment, oil-field and personal care products.
All in all, Lonza Microbial Control provides a well-balanced range of business-to-business and busi-ness-to-consumer products and applications. With our broader geographic footprint, abundant cross-selling opportunities, and a commitment to signifi-cant R&D investments, this exciting new sector will generate profitable global growth by bringing life-enhancing microbial control solutions to customers and consumers.
With its acquisition of Arch Chemicals, Lonza became the world’s largest supplier of swimming pool and spa sanitizers and related treatment products, such as the world-famous HTH® brand of chemicals.
Net sales (USD thousands)
New product sales as % of net sales
700 000
600 000
500 000
400 000
300 000
200 000
100 000
USD
2007
2008
2009
2010
2011
35 %
30 %
25 %
20 %
15 %
10 %
5 %
0 %
Water Treatment New Product Sales as % of Net Sales

18 Lonza Annual Report 2011
7
Lonz
a Qu
ality
Ass
uran
ce

19
Packaging and labeling of our products also ensure their integrity and quality. Lonza invests significant time and resources in testing
the stability of active pharmaceutical ingredients.

20
8
In early-phase projects with many manual operations, written procedures, training and knowledge of the equipment are
essential to obtaining a high-quality product.
Lonz
a Qu
ality
Ass
uran
ce

21Lonza Annual Report 2011
Integration: Becoming One Team In October 2011, we completed the acquisition of Arch Chemicals, which represented our largest acquisition ever and created the global leader in Microbial Control solutions.
From a business perspective, the acquisition strengthens our global footprint, adding infrastruc-ture in the fast-growing markets of South America, South Africa and Asia, which will accelerate our growth in these markets. The combined business also gives us the broadest portfolio of registered microbial control actives and formulations in the world. The Microbial Control business with over 3 000 people, provides a strong business pillar for Lonza.
From a personnel perspective, we were looking forward to integrating our new colleagues from the beginning. Like most global organizations, the team is quite diverse. However, the first thing we realized was how much we had in common. Still, we made no assumptions that this would be an easy process. So we developed a strategy which included the Global Human Resources team, Corporate Communica-tions, the business and opinion leaders, as well as external consultants.
We are still at an early stage of the integration pro-cess but have enjoyed some initial successes. Our focus throughout the process is summarized in the following six points:
1. Showing Up Lonza’s top management visits sites and offices to be acquired
Right after announcing the offer to buy Arch, the se-nior management from Lonza visited all of the larger sites (with 20 employees and more). These personal visits, which included opportunities for Arch employ-ees to pose questions and share their concerns, gave the employees a voice in the process. In addition, this enabled the teams to learn the rationale behind Lonza’s acquisition decision. It was important for ev-eryone to understand that this is a story about growth, not consolidation. In four weeks, Lonza management hosted more than 25 “town hall meetings” throughout the world, reaching two-thirds of the new colleagues!
2. Setting Priorities Defining clear and consistent targets
From the first meeting, the targets of the deal and its priorities were explained. The first priority of the integration was to keep our eye on the business, with the target of not losing a single customer. To do this we focused on stabilizing the organization and there-fore the business. Once the business is stabilized, we can begin to optimize it. In order to settle the teams, the new organization was rolled out quickly. We an-nounced the new sector team on day one. The next level of management was announced six weeks later.
Parallel to the integration, we began the detailed task of identifying immediate cost savings, primarily from overlapping corporate functions.

22 Lonza Annual Report 2011
Business synergies are the next step. Our goal is to achieve USD 40 million in additional sales from cross-selling synergies within the first three years.
Also within the next three years, we will start to ben-efit from our broad innovation pipeline, optimizing both companies’ R&D and innovation capabilities and activities to create a strong, forward-looking portfolio of products, technologies and services.
Integration: Becoming One Team
3. Clear Roles & Responsibilities Early positioning of a dedicated integration team
Two weeks after Lonza announced its plans to ac-quire Arch, the integration team was defined. The team comprises five senior managers from both organizations. It was important to all of us that we had an open, shared approach from the start. The integration team was expanded to include experts from corporate functions including: Finance, Human Resources, Information Technologies (IT), Commu-nications, Regulatory and Supply Chain. Especially important in phase one is that the integration team serves as a bridgehead for all internal and external questions and drives the transformational process. The team is focused on drawing the best elements from both companies.
4. Open, Continuous Communication Sharing information and ideas as soon as possible
In keeping with Lonza’s culture, we approached the integration process with a commitment to open, frequent and clear communication. One step in this process was the issue of weekly updates, via broad-cast e-mails, intranet messages and other methods, about integration timelines, synergy goals, plan-ning processes and decisions made. This included clear information regarding headcount reductions planned at the former Arch corporate headquarters. The commercial teams have also provided regular updates to other critical groups – namely our cus-tomers and suppliers!
2 000More than 25 town hall
meetings were held around the world, reaching around
2000 new employees.

23Lonza Annual Report 2011
5. Day-One Activities Taking the first step together
On day one, when the acquisition deal was officially closed, all new employees received detailed informa-tion which was communicated via e-mail, the Lonza intranet and in “town hall meetings”. These meetings took place at every Microbial Control site (former Arch and Lonza Microbial Control sites). The presentations were given by teams which included people from both legacy organizations. Proceedings began with videotaped messages from the CEO and the newly positioned COO of Microbial Control. The presenta-tions also highlighted the scope and resources of our new business and gave important information about Lonza’s systems and businesses. That day we also issued letters to our customers and suppliers, as-suring them of our dedication to ensuring a smooth transition for all of our stakeholders.
6. Demonstrating Cultural Awareness Identifying, accepting and managing differences
According to expert opinion, one of the key reasons that integrations fail is the lack of cultural fit. We saw cultural fit as one of the strengths in favor of the acquisition. Our two organizations had important overlaps in culture with regard to the focus on safety, innovation and customers. However, we did not as-sume that all aspects of our organizations would be the same. The integration plan therefore includes a strategy for cultural integration.
We are very excited about the progress that we have made to date and look forward, over the next few years, to a successful conclusion to the integration processes.
The early achievements are the result of much hard work and enthusiastic support from all of our col-leagues. Lonza management is very thankful to them for all of their support and commitment.

24
9
Quality assurance is no easy task. The parameters of cost and time have to be
balanced with quality requirements.
Lonza Quality Assurance

25Lonza Annual Report 2011
Lonza at the Olympics: New Metal-Free Wood Preservative Used on Pedestrian Bridge
Many visitors to the 2012 Olympic Games in London will pass over a wood-clad pedestrian bridge that uses in-novative wood preservative Tanalith® M. This is akin to a gold-medal triumph for Arch Timber Protection (UK), a Lonza company.
The development of this breakthrough wood preser-vative was in many ways similar to Lonza’s process of developing innovative pharmaceutical ingredients for life-saving medicines. In the case of the wood treatment industry, however, the “patients” are the spruce, larch, pine and western red cedar woods on which new treatments have to be tested in real-world environments.
Now a part of the Lonza Microbial Control business sector, Arch Timber Protection and its sister business-es recently introduced a cutting-edge new product family – metal-free wood preservatives that not only provide effective protection against wood decay and insect attack, but also leave the treated timber with a longer-lasting, bright and clear natural appearance. In Europe, the formulation of this new Tanalith® M preservative, for which a patent application is pend-ing, includes the high-performance triazole products that have traditionally been used in Arch’s world-renowned Tanalith® E preservatives, along with an insecticide and a unique conditioning agent to ensure superior protection against weathering.
Tanalith® M has been fully tested in laboratories and – more importantly – in rigorous field-test pro-grams required by British and European regulations. In these stringent tests, Tanalised® Clear pressure-treated timber (the term coined to describe timber treated with Tanalith® M) exceeded regulatory re-quirements for exterior, above-ground and uncoated wood applications, offering a service life of 30 years’ protection for cladding and cedar shingles and 15 years for decking, playground equipment and gar-den buildings.
In North America, the Wolman® AG preservative sys-tem for wood treatment is another member of this specially formulated, metal-free preservative fam-ily. Wood treated with this preservative is known as Wolmanized® EraWood™ pressure-treated lumber. Listed as an environmentally preferable product in the widely respected GreenSpec® directory, this lumber is used for decking, molding and trim, among other applications.

26 Lonza Annual Report 2011
Lonza at the Olympics: New Metal-Free Wood Preservative Used on Pedestrian Bridge
12 00012 000 meters of FSC-certified
Siberian larch cladding louvers and 200 meters of special
laminated larch sections for the Olympic bridge.

27Lonza Annual Report 2011
The most impressive outcome from the field testing was the weathering performance of the treated tim-ber. Tanalith® M preservative has an innovative active surface conditioner that helps to protect the surface of the wood and improve its weathering characteris-tics. Consequently, the treated timber stays clearer and brighter for a long time. It slowly softens to a sun-bleached appearance, particularly in cladding, and, in the longer term to a pale gray appearance. In short, Tanalised® Clear pressure-treated timber now enables architects to confidently specify timber for its natural beauty and color, a design breakthrough enabled by our revolutionary new product.
In addition to Arch’s own rigorous field testing, inde-pendent experts such as EcoBuild, a testing center for eco-efficient, innovative, and durable wood-based materials hosted by SP Technical Research Institute in Sweden, conducted their own field tests, beginning back in 2009. A recent report by EcoBuild stated: “A remarkable observation is that the rings treated with Tanalised® Clear product more or less retain their original appearance, and do not have the typical grayish color of untreated, thermally treated or CCA-treated (CCA: chromated copper arsenate) wood after two years’ exposure.”
Further testing was conducted by MPA Eberswalde, which concluded that: “… after twelve months, un-treated larch, spruce and pine all showed very bad stains, but the test product (Tanalith® M), on the con-trary, provided perfect or almost perfect protection for the entire period of eighteen months. This is re-markable, as the vertical set-up, with unprotected board ends, represents a worst-case simulation.”
Tanalith® M also offers special aesthetic benefits when used with cedar shingles. Traditional preser-vative treatments for cedar can leave the product quite dark in color, but the new treatment, when used in roofing and cladding applications such as for the Olympic bridge, allows the natural coloration to appear. In addition to these benefits, when col-ored stains have been added to the treated timber, the natural coloration of the substrate gives a truer, brighter result to the final coating.
In response to strong customer interest, Arch Timber Protection recently converted its high-pressure treat-ment facilities in Preston, England, and now offers the timber trade the alternative of Tanalised® Clear pressure-treated wood. One of the first major proj-ects completed at the Preston center was the treat-ment of 12 000 meters of FSC-certified Siberian larch cladding louvers and 200 meters of special laminated larch sections for the Olympic bridge. The pedestrian bridge has a span of 55 meters and will connect the car and bus park with the underpass that leads into the Olympic Park.

28
After the release is granted, the logistics and warehouse employees make sure that the right product and the corresponding certificates
are shipped to the customer under the correct conditions.

29Lonza Annual Report 2011
10Lonza Quality Assurance

30 Lonza Annual Report 2011
Company ProfileLonza is a global company serving the needs of the life-science industry. From 1897 to the present day, the com-pany has had an enterprising character, adapting its offerings and services to the needs of customers and to changing technologies.
Over a century ago, Lonza began as a small Swiss electricity company, making a few chemicals on the banks of the river Lonza in the Valais region of the Swiss Alps. Now, more than 110 years later, Lonza is a leading supplier to the pharmaceutical, healthcare, and life-science industries. Throughout our history, we have maintained a strong culture of performance, results, and dependability that is valued by all of our diverse customers.
Organized Around CustomersTo provide optimal support for our customers, we are organized in businesses and markets that focus on specific sets of customers and their exact needs. We operate as four divisions and serve the following sev-en markets: BioResearch, Pharma&Biotech, Nutrition, MicrobialControl, Agriculture, MaterialsScience and PersonalCare. Our customers are located across the globe. To ensure the close connection necessary to serve their needs to best effect, we have production and R&D activities at 45 major sites around the world.
Products and Services for Our CustomerOur strategy is to target the life-science industry with two fundamental technologies: chemistry and biotechnology. Using these two technologies, we offer both products and custom manufacturing services to the pharmaceutical, biotech, and life-science industries.
In our Life Science Ingredients division, we offer products used in nutrition and in selected indus-trial markets. In these businesses, we produce the ingredients that make our customers’ products ef-fective. Our customers are manufacturers of con-sumer and health products, distributors, formula-tors, and service companies. Our ingredients range from nutritional ingredients that support improved health to complex chemical intermediates for the agricultural industry.
Our Microbial Control division is the world leader, pro-viding innovative, chemistry-based and related solu-tions to destroy or selectively inhibit the growth of harmful microorganisms. Our activities encompass the areas of water treatment, personal care, health and hygiene, industrial preservation, materials pro-tection, and wood treatment. Our product range in-cludes swimming pool and spa treatment chemicals, active biocides for hospital disinfectants as well as metal-free wood preservatives.

31Lonza Annual Report 2011
In our Custom Manufacturing division, we are a part-ner to our pharmaceutical and biopharmaceutical customers for their manufacturing needs. Using a variety of technologies, we make the ingredients that are ultimately used in many critical drugs, treating patients in areas such as cardiovascular diseases, cancer, neurological and infectious diseases. Our product capabilities include both small and large mol-ecules, resulting from technology processes such as advanced chemical synthesis, peptide synthesis, microbial fermentation and mammalian cell culture.
In our Bioscience division, we make the tools that life-science customers use to discover, develop, make and test therapeutics. Our customers are worldwide, in pharmaceutical and biotechnology companies, as well as in academic and government research orga-nizations. Our products range from cell culture and molecular biology tools for life-science research to media used in the production of therapeutics and tests for microbial detection. We also offer custom manufacturing services to cell therapy companies.
Life Science Ingredients
Nutrition Ingredients
Performance Intermediates
Microbial Control
Hygiene & Preservation
Water Treatment
Materials Protection
Personal Care
Wood Treatment
Custom Manufacturing
Chemical Manufacturing
Biological Manufacturing
Development Services
Bioscience
Therapeutic Cell Solutions
Testing Solutions
Research Solutions
37Other
Americas
1 248
374Switzerland
Europe
676Sales Third-party by Geographical Location of Customersmillion CHF
357Asia

32 Lonza Annual Report 2011
Seven Markets To be close to our customers
and to meet the requirements of our broad customer base,
our brand communication is focused on the major markets we serve. This way, we address
the specific market needs by presenting innovative solutions
for each market.
With innovations in life-science technology, devel-opment and manufacturing platforms, Lonza is well positioned to meet the latest demands in the phar-maceutical and biotechnology markets. We continue to seize strategic opportunities allowing for targeted growth and change with the market. We are commit-ted to emerging and established customers alike, mitigating their risks and taking them to the next level of success. Lonza’s expertise in mammalian and microbial fermentation, advanced chemical and peptide synthesis, as well as modern cellular and gene therapies, allows customers to bring their prod-ucts to market faster and more efficiently.
Pharma&Biotech
Many innovative agrochemical companies through-out the world rely on Lonza’s highly complex, ISO-certified custom manufacturing services for their modern herbicides, insecticides, and fungicides. The continuous expansion of our core technologies is the basis for our success in ISO custom manufacturing. Together with our key customers, we continually expand our technical offerings, steadily reinventing ourselves in the process. Furthermore, Lonza has an outstanding reputation in the agrochemical industry for manufacturing active ingredients and complex in-termediates. Lonza leads the world in the production of Meta™ metaldehyde and is dedicated to the high-est standards in human, animal and environmental safety in regard to application in the field.
Agriculture
A long-time industry leader, Lonza’s Microbial Control business provides innovative antimicrobial formula-tions, finished products, regulatory, analytical and microbiological expertise, and a full range of support services around the world. Lonza is the world leader in microbial control, providing innovative, chemical and related solutions for destroying or selectively inhibiting the growth of harmful microorganisms. Lonza’s offerings include active ingredients, pre-servatives and formulated products for the following areas: hygiene, oil and gas, water treatment, wood treatment, industrial preservation, polymers, metal powder, and metal protection, providing sustainable solutions for healthy homes and workplaces.
MicrobialControl

33Lonza Annual Report 2011
Lonza provides the BioResearch market with the tools life-science researchers use to develop and test therapeutics, from basic research through to final product release. Our products and services range from cell culture and discovery technologies for research to quality control tests and software for ensuring product quality. We deliver physiologically relevant cell biology solutions, biomarker discovery services, technologies for understanding compound action and complete solutions for rapid microbiologi-cal testing. We serve research customers in pharma-ceutical, biopharmaceutical, biotechnology and per-sonal care companies worldwide, as well as academic and government research institutions.
BioResearch
Lonza produces high-quality, branded nutritional ingredients for both human and animal applications. Many years of experience, as well as extensive marketing and regulatory support, make Lonza a preferred supplier to the industry. The world’s larg-est manufacturer of vitamin B3, Lonza offers this vitamin in the form of niacin as well as niacinamide. Lonza’s L-carnitine products include Carnipure™ for human nutrition and Carniking™, Carnifeed™, and Carnichrome™ for animal nutrition. ResistAid™ is an immune support ingredient for human nutrition that contains polyphenols, while LaraFeed™ is a prebiotic used in feed products. DHAid™ is a purely vegetarian source of omega-3 fatty acids, which is made from naturally occurring microalgae.
Nutrition
MaterialsScience unifies Lonza’s entire materials and services business, including the High Performance Materials (HPM), Materials Protection, and Perfor-mance Intermediates segments valued by many different key industries. Our HPM business serves the materials science market, including high-tech industries such as aerospace, electronics, telecom-munications, and coatings. At Lonza, the Materials Protection segment provides solutions by enhanc-ing the properties of plastics and powdered metals. The Performance Intermediates product portfolio consists of hydrocyanic acid (HCN), diketene de-rivatives, and basic chemicals that are key starting materials and intermediates in many sophisticated applications such as dyestuffs, optical brighteners, and adhesives.
MaterialsScience
Lonza offers unique solutions to meet a wide range of personal care development needs, from innovation to formulation and preservation. Utilizing the latest advances in biotechnology, Lonza interacts with manufacturers of personal care products to realize the full potential of product lines, create new formula-tions, and expand product claims. Our breakthroughs include customer-friendly preservatives permitted by ECOCERT, NATRUE and The Soil Association for use in certified organic cosmetics, and Laracare™, an aqueous extract of the larch tree, which reduces the appearance of fine lines and wrinkles. Other products include surfactants, natural emulsifiers and active ingredients used in sunscreens and nutricosmetics.
PersonalCare

34 Lonza Annual Report 2011
11
A lecture on avoidance of human error is given. The positive feedback from employees shows that quality
influences day-to-day work at Lonza on all levels.
Lonz
a Qu
ality
Ass
uran
ce

35Lonza Annual Report 2011
Lonza Helps Biopharma Customers Bring Their Products to Market Faster
The healthcare industry is under tremendous pressure to reduce product development costs and shorten the time to clinical trials. Lonza’s One-Step Cell Line Construc-tion Program uses science and technology to support our customers by addressing both challenges.
In fact, Lonza’s creation of the One-Step Cell Line Construction Program has reduced the cell line con-struction timelines to just 19 weeks. That is a dra-matic improvement, offering enormous benefits to our customers. It’s worth explaining just how we achieved this breakthrough.
The One-Step Cell Line Construction Program is based on Lonza’s GS Gene Expression System™ (GS: glutamine synthetase), which has been used successfully by more than 100 pharmaceutical and biotechnology companies worldwide to achieve rapid development of high-yielding and stable mammalian cell lines. Together with the newly intro-duced cell culture medium and feed platform known as “Version 8”, the GS Gene Expression System™ achieves product yields up to 10 g / L. Nine thera-peutics that use the GS Gene Expression System™ have been approved, including Zenapax® (Roche), Synagis® (Medimmune) and Solaris® (Alexion).
To help the pharmaceutical industry improve effi-ciency and increase the likelihood of a successful outcome to clinical trials, Lonza is continuously up-grading the GS Gene Expression System™. Recent improvements focused on three areas:
1. Shortening cell line construction timelines; 2. Improving the quantity and quality of product
produced; and 3. Increasing supply chain security by enabling GS
licensees to manufacture products in the same geographical region as their patient populations.
These improvements have enabled Lonza to reduce cell line construction timelines to just 19 weeks, compared with earlier construction programs of 105 weeks.

36 Lonza Annual Report 2011
How did we reduce this time frame so dramatically? The engineering of a cell line to produce a desired therapeutic protein for initial clinical trials is the first stage in developing a drug manufacturing process. Historically, this has always been the longest single part of the process. That’s why we focused on reduc-ing the time required for cell line engineering, and, by so doing, significantly shortened the time to produce cGMP (current good manufacturing practice) prod-ucts suitable for clinical trials. Initial improvements were achieved through two critical steps:
– First, chemically defined media (non-protein containing and animal-component-free) were used throughout the manufacturing process. This resulted in a streamlined purification pro-cess and simplified regulatory filings.
– Second, further efficiencies were achieved through the use of Lonza’s capillary-aided cloning method, in which very small droplets of culture fluid containing single cells are deposited on a microtiter plate for further analysis.
The combination of these improvements enabled Lonza to offer a 40-week cell line construction pro-cess and provide cGMP material for clinical trials in approximately 18 months.
Three years ago, we initiated a project with the ob-jective of cutting this development time in half. The 40-week process that we targeted consisted of two stages: generation of uncloned cell lines, followed by the generation of cloned cell lines from the un-cloned ones. The project aimed to combine these two processes into a single step, giving rise to the new One-Step Cell Line Construction Program.
To accomplish this, Lonza utilized a fluorescence-activated cell sorter (FACS) and invested in state-of-the-art automated imaging technology. This combi-nation enabled early detection of clonal cell lines and miniaturization of some cell culture steps. Lonza was amongst the first in the bioprocessing field to use 96-well shaking plate technology. The resulting process enabled Lonza to generate cell lines in 19 weeks and provide cGMP products within 13 months of start-ing the project. Dozens of commercial projects have used this faster one-step approach.
The One-Step Cell Line Construction Program has been further automated through the incorporation of two new dedicated robots. This required a major investment in the R&D cell culture facilities in Slough (UK). For our customers, it means many more cell lines can be progressed and screened during a cell line construction program, without affecting the time it takes for them to reach the clinical stage. This novel development service for advancing more cell lines through to the predictive screening stages of the pro-gram ensures the greatest chance for our customers to have the product they need when they are ready to enter the clinical phase.
Lonza Helps Biopharma Customers Bring Their Products to Market Faster

37Lonza Annual Report 2011
19 weeks
105 week CLC
40 week CLC
19 week CLC
GMP materia
l
GMP materia
l
GMP materia
l
Classic two stepTra
ditional
Rapid one step
0
6
12
18
24
30
Months
Graphic illustration of DNA double helix. Timeline illustrates the effect of shortening One-Step Cell Line Construction Program to 19 weeks over traditional method.
DNA seq. optimization and rep.
Cell line construction (CLC)
Cell line stability studies
MCB
Process development and pilot / GMP manufacture
DNA Sequence to Clinical SupplyEffect of shortening cell line construction

38 Lonza Annual Report 2011
Since the One Step-Cell Line Construction Program became available, numerous cell lines have been created for the production of recombinant proteins. Products manufactured using the One-Step Cell Line Construction Program are currently in early-phase clinical trials or at the preclinical stage of develop-ment. Customers for this program extend from the range of large pharma to small biotech companies.
The One-Step Cell Line Construction Program allows our customers to obtain the first cGMP product suit-able for early clinical trials in less than 13 months
– saving more than six months compared with tradi-tional cell line construction technologies. In addition, we leverage our process development experience and expertise to successfully scale up the manu-facturing process from early clinical supply to full commercial-scale production, with a high probability of success. Our enhanced development programs are not just relevant in the early stages: they form a robust foundation for the full development path of each customer’s drug candidates. The reliability of the GS Gene Expression System™ as a consistent means of rapidly generating highly productive cell lines reduces product costs and time to market.
Graphic illustration of a monoclonal antibody bound to a protein on the cell membrane.

39Lonza Annual Report 2011
The 4D-Nucleofector™ System: Pushing the Limits of Transfection
Lonza’s recent improvements to its Nucleofector™ Gene Transfection Technology offer customers heightened po-tential for developing breakthrough treatments for dis-eases such as Alzheimer’s and biotherapies designed to instruct an individual patient’s unique immune system to fight cancers.
Among other benefits, the improved Nucleofector™ Technology provides greater flexibility and speed by enabling researchers to use different vessels and formats in which cells can be transfected. The new HT Nucleofector™ Device can process thousands of samples in a matter of minutes, allowing high-throughput experimentation in a diverse range of applications. Another new feature is the ability to transfect cells while they are growing adherently on a matrix – a breakthrough that is especially valuable in the field of neurobiology.
All living organisms are composed of cells, the small-est units capable of living independently. Some life-forms are composed of singular cells, while others, like our own bodies, encompass trillions of individual cells. There are hundreds of different cell types with very distinct properties and functions in the human body. They are the building blocks that underlie the whole complexity of the human body, allowing us to eat, think, walk, drive cars – or read and process information like this. This is why cells are at the center of biomedical research seeking to understand the functions of tissues, organs, and finally the entire human body, both normal and diseased.
The genes present in every cell may be compared to software instructing them how to execute certain routines. Genes affect both the cell’s function and fate. So understanding the role individual genes play and how they interact is at the heart of biomedical research. Inserting genetic information such as DNA, RNA, siRNA and other molecules into living cells – a process called transfection – is a widely used tech-nology. For example, it is essential in exploring the functions and interactions of genes and cells, and has already helped to explain an enormous number of mechanisms involved in disease progression. Transfection helps investigate the mode of action of drugs being developed for the treatment of various diseases, such as neurodegenerative disorders or cancer. Moreover, genetic elements such as certain types of RNA can be inserted into human cells to en-gineer specific responses, e.g. in biotechnology, ba-sic and pharmaceutical research, and gene therapy.

40 Lonza Annual Report 2011
Lonza’s Nucleofector™ Technology has been well recognized by the market for years as a technique for specifically addressing cell types that are hard to transfect using other methods, such as primary cells derived from human tissues. Among the unique advantages of Nucleofection™ is its success in de-livering diverse biomolecules into essentially every human cell type studied so far. In recent years, thou-sands of independent scientific publications have proven the suitability as well as the unique benefits of this powerful technology.
Compared with earlier technologies, Nucleofection™ ensures high survival rates and functionality in cells, providing researchers with a tool for studying iso-lated cells that exhibit behavior more similar to their normal functions in their natural environment, the human body. In particular, genes can be delivered directly into the cell’s nucleus, where genes are actually read by the cell’s molecular machinery. Al-though viruses can be used to deliver genes inserted into their genomes, the generation of these tools is still quite complex, and in many cases can change the natural behavior of the affected cell. In addition, genetically modified viruses made to target human cells pose a significant safety risk, both for the re-searcher handling them in the lab and for patients in therapeutic applications. Nucleofection™ offers a safer way to perform genetic research and proceed to clinical application.
The new 4D-Nucleofector™ System offers our cus-tomers even more unique capabilities. The device al-lows greater flexibility and speed, with different ves-sels and formats in which cells can be transfected.
One new feature is the ability to transfect cells while they are growing adherently on a matrix. This is espe-cially important for researching cell properties, since cells need to be attached to a substrate, as in the body, in order to survive and maintain their biological functions. This novel feature allows even tissue slic-es or complex networks composed of different cell types to be addressed in conditions more closely re-sembling the in vivo situation. One medical research area specifically benefitting from this capability is neurobiology. Neuronal cells are difficult to maintain in culture, and transfecting them has always been a challenge. “The newly developed Nucleofector™ concept now allows efficient transfection of these cells, while maintaining their growth environment and functionality,” said Dr. Herbert Müller-Hartmann, Head of R&D in Discovery Technologies at Lonza Bioscience. “This application will support ongoing efforts to develop treatments for neurodegenerative diseases such as Alzheimer’s.”
The 4D-Nucleofector™ System: Pushing the Limits of Transfection

41Lonza Annual Report 2011
Highly Efficient Genetic Modification in Neurons
Picture: Rat hypothalamus neurons
Transfection efficiency
Viability
Future applications of Nucleofector™ Technology may include therapeutically relevant gene transfer, thus supporting cell-based regenerative medicine with potential applications in immunotherapy. If a cancer patient’s own immune cells can be modified, they could be guided to initiate a specific immune response, killing cancer cells while leaving normal cells unaffected. Cancer immunotherapy has the potential to become a standard treatment in oncol-ogy, and could replace today’s standard, still largely non-specific chemotherapies. The new-generation Nucleofector™ Platform could be an ideal technology for the support of novel, personalized biotherapy treatments, offering greater specificity and fewer adverse reactions.
Mouse cortex neurons
Rat hippocampal n
eurons
100
80
60
40
20
0
Rat corte
x neurons
%
60 %Efficiency

42
12
Lonz
a Qu
ality
Ass
uran
ce
Production of biopharmaceuticals places great demands on safety, contamination prevention, processes,
equipment qualification and validation.

Lonza Annual Report 2011 43
A Regenerative Medicine Partnership
In 2011, Mesoblast and Lonza announced a strategic al-liance for the clinical and long-term commercial produc-tion of Mesoblast’s off-the-shelf (allogeneic) adult stem cell products. Mesoblast’s CEO, Silviu Itescu, and Lonza’s Global Head of Therapeutic Cell Solutions, David Smith, offer their insights.
What are the fields of application for Mesoblast’s stem cell products?
—Silviu Itescu: At this point in time, our focus is on a number of clini-cal application areas. We are most advanced in the cardiovascular and orthopedic fields. In the cardiovascular field we focus on congestive heart failure, heart at-tacks and chronic angina. In the orthopedic space we focus on bone repair. Additionally, we are moving forward with an intrave-nous formulation that could be used to target a number of sys-temic diseases including inflam-mation and immune conditions and in particular diabetes.
You mentioned a lot of interesting applications. Are there even more applications expected over the next couple of years?
—Silviu Itescu: Absolutely, I men-tioned the areas which are in the latest stage of clinical develop-ment. In addition, through our partnership with our distributor Teva Pharmaceuticals, we are also focusing on some broad new areas in neurological diseases, in-cluding Parkinson’s disease, mul-tiple sclerosis, and stroke. These are areas of major medical need where existing therapies are either inefficient or insufficient to provide appropriate improve-ments in clinical outcomes. So, we anticipate that our stem cells are going to have a major impact in the way these degenerative diseases will be treated over the next five or ten years.
And what about the outsourcing trend in the cell therapy industry?
—Silviu Itescu: There are two very different approaches to regenera-tive medicine stem cell therapy. One is a sort of personalized medicine and the other is a more industrialized, scalable approach. To be able to deliver these kinds of therapies, you need to be a real leader in manufacturing capabil-ity, in scalability and in technol-ogy trends. We made an impor-tant strategic decision to partner with Lonza because we think that Lonza is the best in the field in terms of its ability to industrialize the manufacturing process.
David Smith: I would add that the biggest trend we see is to-ward the industrialization of cell therapies. Over the years, most patients have been treated with

Lonza Annual Report 201144
cell therapies at university hos-pitals. At the same time, Lonza has industrialized the manufac-ture of mesenchymal stem cells. Using these methods developed by Lonza, Mesoblast can manu-facture sufficient quantities of cells to treat these diseases, at a much lower cost than before. In this way, stem cells can become a standard treatment for these larger indications.
Silviu Itescu: What this change in manufacturing approach means is that you can now produce cell-based products with significant lot sizes, appropriately tested within the parameters that regu-lators have already established for other therapies.
Coming back to the collaboration between Mesoblast and Lonza: How does this concept work exactly?
—David Smith: This is a true col-laboration. We were able to write a contract that allows both par-ties to benefit. Together we can move the scaled manufacturing process forward to meet the projected therapeutic market demands.
Silviu Itescu: That’s right. Each company has its own particular strength, I would say. Mesoblast is particularly strong in the sci-ence behind its proprietary stem cell technology and the ability to innovate manufacturing through science. Lonza brings the much broader know-how and technical capabilities from a biologics and cell therapy perspective. And of course, Mesoblast’s further strength is at the level of trans-lational medicine in clinical trials.
David Smith: Absolutely. Meso-blast’s expertise is much broad-er in translational medicine. And Lonza is much stronger in cGMP production and navigating the regulatory aspects of manufac-turing. One of the things really unique about Mesoblast’s ap-
proach is how they approach manufacturing in their partner-ship. I think the market recog-nizes this unique aspect and re-wards it with a fair company value.
Silviu Itescu: Mesoblast is the leading stem-cell company in the world and our manufacturing strategy is a key to this success. The first reason for this is the fact that we have positive results in late-phase clinical trials and we are advancing to phase-three studies. Secondly, we bring to the table two of the largest and most creative pharmaceutical companies – Cephalon and Teva
– that will facilitate our ability to penetrate major global markets. And third is the amount of cash we have on-hand to deploy for clinical programs and manufacturing of
A Regenerative Medicine Partnership
—The partnership with
Lonza further allows Mesoblast to underpin it’s growth.
—
Silviu Itescu

Lonza Annual Report 2011 45
our products, something to which the market has paid attention. The partnership with Lonza further allows Mesoblast to underpin its growth.
How important was the Singapore location of Lonza’s cell therapy facility for Australia-based Mesoblast?
—Silviu Itescu: Mesoblast is a global regenerative medicine company. The major markets for us in the mid term are going to be the USA, Europe, Japan and Asia. And of course we see the emerging markets of China, India, and Southeast Asia as a clear growth opportunity. We see Me-soblast – even though we are a US-centric company – also as an Asia-Pacific story. From Australia we are in a very interesting posi-tion to take strategic advantage of the strength of the USA and
the emerging strength of Asia. Our base in Singapore simplifies our ability to target US, European and Asian markets. This location was a major driver for us in enter-ing this alliance. I have to take my hat off to Lonza for having seen the importance of establishing a major manufacturing hub in Singapore several years ago.
David Smith: Our cell therapy fa-cility in Singapore leverages the relationship Lonza has already established with the Singapore government, along with Lonza’s existing engineering and start-up expertise at the Tuas bioproduc-tion site.
To what extent does this alliance differ from previous strategic partnerships Lonza has previously entered in the cell therapy field?
—
David Smith: In the cell therapy field this is unique. Because the Singapore plant is the first large-scale facility for cell therapy, we were able to set the standard and write a unique agreement creating a partnership of mutual benefit.
To come back to the start of the discussion: What role does the field of adult stem cells play for Lonza? And what is the benefit resulting for Lonza from this alliance?
—David Smith: Over the last ten years, Lonza has been building core expertise and technology around production of allogeneic stem cells – basically in indus-trializing stem cell production. Mesoblast is a perfect partner because they are well capitalized, well accepted in the market, very strong in clinical development and have great partnerships. We can be more successful, with bet-ter growth, by working together, rather than individually.
David Smith
—We can be more successful,
with better growth, by working together, rather
than individually. —

46 Lonza Annual Report 2011
13
Lonz
a Qu
ality
Ass
uran
ce

47Lonza Annual Report 2011
Changeover in multipurpose plants is a challenging task that requires accuracy, knowledge,
training and quality-related planning.

48 Lonza Annual Report 2011
Life Science Ingredients(Excluding Microbial Control 2010 and 2011)
Life Science Ingredients experienced a high capacity utilization. Results were negatively influenced by the strong Swiss franc, volatile raw material prices and competitive pressure in certain areas.
In 2011, we streamlined our Life Science Ingredients project pipeline, concentrating on the most advanced and promising product candidates.
Nutrition Ingredients generated high volumes in 2011, as demand for nicotinates (vitamin B3 for food, feed and pharmaceutical applications) grew accord-ing to expectations, despite a slight softening affect-ing feed-grade products in the second half.
– Nicotinates (vitamin B3) Based on strong over-all market demand, feed and food volume sales were buoyant; however, pharma-grade volumes were slightly weaker. Overall, vitamin B3 prices were maintained at the target level, though this was lower than last year. Increasing raw material prices and a strong currency effect had a negative influence on margins.
– Carniking™ feed-grade L-carnitine 2011 sales of the Carniking™ product portfolio to the animal feed industry continued to be strong in terms of volume. The first deliveries of Carniking™ products from our new production facility in Nansha (CN) were well received by the customers.
Life Science Ingredients million CHF
2011 Change
in %
ChangeCER1
in %
2010
Sales 697 (1.4) 9.3 707
Change due to Volume and prices 66Currency translation (76)Scope of consolidation 0
Result from operating activities (EBIT) 40 (57.0) (22.6) 93Margin in % 5.7 13.2Margin in % at CER 1 9.3
EBITDA 104 (32.5) (10.4) 154Margin in % 14.9 21.8Margin in % at CER 1 17.9
1 Change from current to prior year, based on constant exchange rates (CER).

49Lonza Annual Report 2011
– Meta™ metaldehyde is a specific active ingredient, acting as a molluscicide, used for slug and snail control in agriculture and the home and garden markets. Sales were behind plan in 2011 because of unfavorable weather conditions in most parts of Europe, leading to a low slug population and re-duced sales of metaldehyde in the key markets of the EU. The long-term perspective for the Meta™ metaldehyde business is promising thanks to the positive listing of metaldehyde in Annex 1 (EU reg-istration of active substances) and Lonza’s strate-gic decision to move up the value chain, creating our own formulated product range.
Work on the construction of a new niacinamide (vi-tamin B3) plant in Nansha is going according to plan.
Performance Intermediates saw good demand for its products, resulting in high capacity utilization.
– The High Performance Materials business enjoyed strong demand in the electronics, aerospace and construction industries. Customer demand for our Primaset™ cyanate esters and our Lonzacure™ products continued to be strong. The new PMDA (pyromellitic dianhydride) production plant in Nan-jing (CN) is up and running. We improved the effi-ciency of our alkylation plant in Visp (CH) in response to increased demand for ortho-alkylated anilines for the polymer and crop protection industries.
– Underlying demand for diketene derivatives was strong all year. Our primary focus for these products continues to be the European markets. Acetic acid prices peaked in the second and third quarters, but have since dropped to normal levels. The strong Swiss franc continued to put pressure on our margins. Asset utilization remained high.
– HCN derivatives sales were also strong due to robust demand in Europe and the Far East. Asset utilization remained high, although margins suf-fered under the strong Swiss franc.
– Underlying demand for agrochemical actives and ISO-regulated custom manufacturing enjoyed a significant increase. We started up our new pro-duction plant for a plant protection intermediate in Visp in mid-year. Plant utilization was high through to the year-end and on into 2012. We continued to grow our project portfolio for agrochemical actives and ISO-regulated intermediates.
The Life Science Ingredients headquarters has moved to Beijing (CN) to further strengthen its Asian footprint.

50 Lonza Annual Report 2011
Microbial Control
Lonza completed the acquisition of Arch Chemicals on 20 October 2011. The Arch business has been com-bined with Lonza’s existing Microbial Control business to create the new Lonza Microbial Control sector.
The integration of Arch has moved forward following the closure of the deal. The integration team and busi-ness leadership team were announced at the close. The teams have confirmed the following targets, an-nounced at the time of the acquisition: – Sustainable savings of $50 million in cost
synergies to be delivered by the end of 2013 – $85 million in one-time integration costs over
two years – Increased sales of $40 million up to December
2014 through cross-selling of the combined portfolio
During the next 18 to 24 months, Lonza Microbial Control’s innovation efforts will be focused on devel-oping new formulations from the combined portfolio.
2011 Results The combined Microbial Control business performed at the expected levels. The business enjoyed a strong first quarter across all markets and sectors. However, the faltering economic environment, espe-cially in the USA and EU, had an impact on demand in the third and fourth quarter. This slowdown in the established markets was partially offset by sales of new products and sales in new markets.
As with Lonza overall, the Microbial Control business faced a number of strong headwinds in 2011. Impact from foreign exchange rates and volatility in the raw material markets continued throughout the year. The increase in raw material prices was partially offset
Microbial Control million CHF
2011 Change
in %
Change1 CER
in %
2010
Sales 486 55.3 80.8 313
Change due to Volume and prices 66Currency translation (80)Scope of consolidation 187
Result from operating activities (EBIT) (8) (121.1) (115.8) 38Margin in % (1.6) 12.1Margin in % at CER 1 (1.1)
EBITDA 14 (73.1) (63.5) 52Margin in % 2.9 16.6Margin in % at CER 1 3.4
1 Change from current to prior year, based on constant exchange rates (CER).

51Lonza Annual Report 2011
by price increases. The business also experienced strong competitive pressure in the EU and Asia, particularly in the water, hygiene and preservation markets. The natural and nuclear disaster in Japan also had an impact.
Other business highlights for the Microbial Control business during 2011 include: – The opening of a new oil and gas lab in
Houston, TX (USA), emphasizing our long-term commitment to this market
– The opening of the Alpharetta, GA (USA), Innovation and Technology Center, which will focus on the innovative new formulations needed to achieve our longer-term targets
– The Suzhou plant (CN) was awarded Best Supplier Award for 2011 by a major customer
– Receipt of the InCosmetics Asia award for Regenistem™ Red Rice products
Lonza Microbial Control is based on five key business units: – Hygiene & Preservation – Water Treatment – Materials Protection – Personal Care – Wood Treatment
The Hygiene & Preservation business offers solu-tions for environmental hygiene, including household and commercial, healthcare, pharmaceutical, veteri-nary, agriculture, food protection, wipes and hand care. Lonza offers the largest portfolio of efficacious, registered formulations for these markets.
Lonza’s Water Treatment business includes rec-reational water treatment products sold directly to consumers for use in pools and spas, including the industry’s leading brand, HTH™. The business also provides products to treat surface water, municipal water, beverages, cooling water, pulp and paper pro-cessing, and for other industrial applications. Two of the main growth areas in this segment are potable water, and oil and gas.
The Materials Protection business unit offers prod-ucts and services for industrial preservatives, mold control, water repellants, fire retardants, textiles and colorants. The business offers solutions for paint and coatings, marine antifouling, polymer emulsions, metalworking fluids, plastics, textiles and construc-tion materials.
Wood Treatment provides microbial control prod-ucts for pressure-treated wood and anti-sapstains. The portfolio includes the well-respected brands Wolman® E, Lumbrella® and Chemonite® .
The Personal Care business offers a unique portfolio of products that leverages the full range of technolo-gies in the Lonza portfolio, from chemical to biological solutions, creating a broad offering of solutions for our customers in the areas of anti-dandruff, personal cleansing and cosmetic preservatives, including py-rithiones (Omadine®), Glydant™, agarose and PHMB (Vantocil® / Cosmocil®).
Regulatory At Lonza we view the global regulatory agencies as our partners. We see their focus on con-tinuous improvement through better regulation as providing increased opportunities for more sustain-able microbial control solutions.
Regulators provide our customers with peace of mind, and through registration we ensure the efficacy of our active ingredients and formulated products.
We will continue to support the efforts of the global agencies, world health organizations and trade asso-ciations to promote the advancement of the microbial control industry.
Innovation The Lonza Microbial Control innova-tion pipeline will leverage our knowledge across the life-science businesses, and our relationships with universities and other innovators to develop new so-lutions, including active ingredients, formulated prod-ucts, delivery systems, detection and diagnostics.

52 Lonza Annual Report 2011
Custom Manufacturing
Driven by the continuing outsourcing trend in 2011, Lonza Custom Manufacturing experienced increas-ing demand across all three business units.
Chemical Manufacturing In 2011, Lonza’s “Total Life Cycle Management” – offering development and man-ufacturing services, from early product development through the post-patent generic stage – continued to strengthen our product pipeline to over 330 projects across all clinical phases and to deliver capacity utili-zation of over 80 %. Another important factor in building our pipeline is our leadership in new differentiating technologies – cytotoxics, antibody drug conjugates (ADC), highly active pharmaceutical ingredients (HAPI) and our microreactor technology (flow chemistry).
Lonza Chemical Manufacturing continued to implement its strategy for growth, adding capacity and investing in facilities to support new technology platforms. All of these major investment projects were initiated in response to customer demand and are on schedule: – In Nansha (CN), the first two expansion phases
of the large-scale multipurpose cGMP API (active pharmaceutical ingredients) plant continued to be utilized for multiple customer projects. Demand for this capacity increased in the first half of 2011 following FDA approval of the site.
– Also in Nansha, a new cGMP kilo lab and an additional small-scale manufacturing train were successfully brought on stream in the second half of 2011.
– In Visp (CH), five additional HAPI labs with the capability to handle cytotoxic substances are now fully operational.
– Investment in additional cytotoxic API manufacturing capacity at the Visp site has started successfully.
Custom Manufacturingmillion CHF
2011 Change
in %
Change1 CER
in %
2010
Sales 1 297 (10.2) 0.8 1 445
Change due to Volume and prices 12Currency translation (160)Scope of consolidation 0
Result from operating activities (EBIT) 228 (9.9) 7.9 253Margin in % 17.6 17.5Margin in % at CER 1 18.8
EBITDA 393 (7.7) 7.0 426Margin in % 30.3 29.5Margin in % at CER 1 31.3
1 Change from current to prior year, based on constant exchange rates (CER).

53Lonza Annual Report 2011
Biological Manufacturing Lonza’s Biological Manu-facturing business unit had a very successful year, with multiple new products and production cam-paigns increasing mid- and large-scale asset utiliza-tion to above 85 %. Business also benefitted from high batch success rates, above the industry average. In 2011, we were also able to increase our current product pipeline to more than 300 active projects. This was the result of numerous marketing initiatives as well as portfolio additions across our mammalian and microbial services and manufacturing offerings.
The business unit made further progress with the ex-ecution of its planned expansion projects, with a num-ber of important milestones being reached in 2011: – The large-scale mammalian facility in
Singapore began operations with engineering and validation batches for multiple customers, achieving a start-up utilization above 70 %.
– The expansion of development labs and manufacturing capacities in Slough (UK) facility started in the first half of 2011.
– Equipment additions and infrastructure changes in Hopkinton, MA (USA), were completed and all manufacturing lines and development laboratories are fully operational.
– Harmonization programs in all mid- and large-scale mammalian manufacturing facilities now allow us to provide tailor-made capacity offerings from multiple sites.
In September 2011, the Hopkinton site received an FDA warning letter related to aspects of analytical methods for one product (Ontak™). These issues have been addressed and the site is preparing for the FDA re-approval audit in February 2012.
Development Services The Development Services business unit continued to experience strong cus-tomer demand. This was driven by interest in our AggreSolve™ technology, our highly potent cell lines (strategic collaboration with BioWa, Potelligent®) and the new media and feed systems that we now offer (sourced from Lonza Bioscience).
In 2011, Lonza’s technologies and expertise en-abled new yield records to be set. The new GS Gene Expression System™ Version 8 medium and feed platform achieved yields of up to 10 g/l and the Singapore large-scale manufacturing site was able to harvest final product at 4.6 g/l.
Lonza introduced a customized program (Light Path™) providing streamlined process development, cell line development and custom material supply, from discovery to early clinical development.
Lonza’s leading position in the microbial biopharma-ceuticals market has been strengthened by continu-ous efforts to improve our XS Microbial Expression™ platform, the new pDNA production platform, and the new fast-track program for strain development and clinical material supply.
Lonza began expanding its Development Services platform in Singapore to meet increasing customer demand in the region.

54 Lonza Annual Report 2011
Bioscience
The sales increase at constant exchange rates (CER) in Lonza Bioscience was mainly due to strongly in-creased Cell Therapy sales. A lower level of academic research spending in the USA and southern Europe was only partially offset by stronger growth devel-opment in Asia-Pacific, where sales increased by more than 20 % in Swiss francs. Margins were slightly lower than 2010, mainly because of the impact of the overall business mix and pre-investments in fu-ture business. Measures taken to offset this margin pressure included operational excellence projects and delayed hiring.
Lonza’s Bioscience division is focused on becom-ing the leading supplier to the regenerative health industry, with an emphasis on cell and viral therapy. This follows a strategic review that took place in the first quarter of 2011.
Therapeutic Cell Solutions sales increased signifi-cantly from 2010 due to higher cell / viral therapy sales. Media sales grew well in the USA and Asia, but declined in the EU. Profits from Therapeutic Cell Solutions were higher than in 2010, but were con-strained by short-notice cancelations and delays in the production of clinical products.
A significant manufacturing contract was signed with Mesoblast (Australia) for its most advanced allogeneic pharmaceutical project (cardiovascular, phase III) and an orthopedic project (phase II). Clinical production for Mesoblast is due to start at Lonza in Singapore and Walkersville, MD (USA), in 2012.
Biosciencemillion CHF
2011 Change
in %
Change1 CER
in %
2010
Sales 202 (4.3) 11.8 211
Change due to Volume and prices 24Currency translation (33)Scope of consolidation 0
Result from operating activities (EBIT) 13 (7.1) 0.0 14Margin in % 6.4 6.6Margin in % at CER 1 5.9
EBITDA 28 7.7 19.2 26Margin in % 13.9 12.3Margin in % at CER 1 13.1
1 Change from current to prior year, based on constant exchange rates (CER).

55Lonza Annual Report 2011
Cell therapy continues to attract growing interest from both pharma and biotech companies. This is reflected in an increased number of pipeline projects, with pro-cess development also running at very high capacity.
To meet increased demand for viral manufacturing, we are expanding capacity at our facility in Houston, TX (USA). This will come on line in the first half of 2012 as anticipated. The new viral therapy sterile filling line in Houston was validated and became operational in the third quarter of 2011.
Testing Solutions sales increased by over 5 % in lo-cal currencies in the EU and USA, and at a double-digit rate in Asia.
A slowdown of endotoxin sales was observed in the fourth quarter of 2011 because of destocking by ma-jor pharmaceutical customers. Sales of the MODA™ real-time, point-of-testing, environmental monitoring system grew more slowly than anticipated owing to stringent CAPEX restrictions, mainly from pharma-ceutical customers. This led to resources being refo-cused on cell/viral therapy production, the division’s most important strategic segment.
The launch of the microCompass™ II platform (micro-biology testing) has been postponed until the first half of 2012. Hardware development is still delayed by our partner. Assay developments are on track and first applications are being tested by lead customers.
Research Solutions revenue declined slightly in 2011. In Europe, sales grew nicely in local currencies due to higher bulk agarose (chromatography) and transfection, cell biology and cell assay sales. How-ever, sales growth was constrained by a clear slow-down in academic and research spending in southern Europe in the second half of the reporting year.
Sales in the USA were slightly below 2010 levels, mainly due to the late release of federal funding and conservative spending by US academic and govern-ment institutions.
56 Lonza Annual Report 2011
14
Lonz
a Qu
ality
Ass
uran
ce

57
Once the analytical test methods have been developed, validated and approved in the quality control laboratories,
the results are needed for official batch release.

58 Lonza Annual Report 2011
20112010
2009
2008
2007
2006
2005 Occupational Accidentsper 1 000 000 hours worked (LTIFR)
Goals The good result of 1.7 in the reporting year is in line with the safety performance goal of 1.0 LTIFR by 2015. Lonza is progressing toward its goals by systematic application of high safety standards and sustained motivation of all employees worldwide. The environmental goals will be reviewed in 2012 in light of the impact of the acquisition of Arch Chemicals in late 2011.
Safety 1
per 1 million hours worked
Basis
2000
Status end
2006
Goal
2010
Status end
2011
Goal
2015
LTIFR 2 Frequency of accidents 9.5 3.1 2.0 1.7 1.0
LTISR 3 Severity of accidents 1 460 556 330 157 250
Environment 1 Basis
2000
Status end
2006
Goal
2010
Status end
2011
Goal
2015
CO2 emissions 4 in 1 000 metric tons 930 418 400 337 360
VOC emissions 5 in metric tons 759 576 300 639 270
Air impurities 6 in metric tons 1 485 1 180 900 1 051 810
1 Includes all active non-legacy Arch production and R&D sites as well as headquarters in the referenced years.
2 Lost-time injury frequency rate: number of accidents per 1 million hours worked
3 Lost-time injury severity rate: number of hours lost through accidents per 1 million hours worked
4 Carbon dioxide (fossil- as well as non-fossil-based)5 Volatile organic compounds6 Air impurities comprise VOC, nitrogen oxides (NOx), sulphur
dioxide (SO2) and particulate matter7 Intensity: Consumption of a resource or emission of a pollutant
in relation to the production of one metric ton of finished goods
IndicatorsIn 2011, the intensity indicators were adversely affected by a 13 % decrease in finished goods pro-duction, while overall plant operation did not change proportionally.
Intensities 2011 7 Change on2010
Energy intensity 25.3 GJ/t + 9.6 %Industrial water intensity 15.7 m3/t + 10 %CO2 intensity 1 073 kg/t – 2.0 %Air impurity intensity 3.3 kg/t + 20 %Hazardous waste intensity 225 kg/t + 9.1 %
The accident frequency rate in 2011 was 1.7 accidents per 1 million hours worked, 10 % up on the previous year. Although not as successful as in 2010, Lonza is on track to meet its ambitious medium-term goal of 1.0 in 2015. Continued strict adherence to existing safety guidelines, the correspond-ing training, and the incorporation of the is-sue in the personal goals of each co-worker are key. Since 2005 Lonza improved its safety performance by a factor of 3.4.
5.8
1.7

59Lonza Annual Report 2011
Environment, Health and SafetyWe are committed to delivering a safe and healthy work-ing environment, and safe, risk-assessed processes and products, making sustainable use of natural resources, continuously improving the Environment, Health and Safety (EHS) performance, and being recognized as a reliable and sustainable partner by our stakeholders.
As leading supplier to our life-science partners, we actively manage EHS as an integral part of our busi-ness in order to prevent harm to people and damage to the environment and property. Lonza commits substantial financial and human resources to EHS activities. At the end of the reporting year, a total of 213 people, 2.5 % of our 8 500 employees, worked in the EHS field, including the regulatory department. EHS cost reporting was centralized and redefined in 2010 and we are now able to compare numbers for the first time in a consistent manner. The EHS area was not exempt from the operational efficiency measures adopted by the Group and we are proud to contribute with a decrease of – 2.2 % on the previous year, recording total EHS operational costs of CHF 53 million. At the same time, we were able to keep up with ambitious EHS challenges and maintain our level of performance. Capital expenditure on SHE was CHF 56 million, equivalent to 1.7 % of sales and 22 % of the Group’s total investment in fixed assets. The capital projects with the largest EHS expenditure in 2011 were cytotoxics production (Visp, CH), air emissions handling (Braine, BE), and the cell therapy
expansion (Singapore). We expect significant contri-butions towards increasing EHS performance in the areas of air impurities and safety at work.
A central element in the Lonza EHS management sys-tem is systematic and regular performance auditing of all research and production sites. Auditors with many years of experience in the chemical industry ensure that the sites have an appropriate EHS orga-nization in place, and compliance with standards is enforced throughout the Group. EHS performance audits provide a comprehensive review of safety, security, hygiene, environmental protection and resources management. Conducting regular audits allows us to assess the level of EHS performance at the group locations. In addition, audits provide valu-able EHS information to both local and corporate management. This type of monitoring and control activity makes it possible to target local site support and contributes to the management cycle of con-tinual improvement. The audit intervals are specific to each site and take into account the size of the company and its strategic importance, risk poten-tial, changes in organization and the sensitivity of its neighborhood. In 2011, sixteen comprehensive EHS system, performance and support audits were conducted. A full cycle of audits, which includes all Lonza facilities at least once, typically takes three to four years. Summarizing the 2011 auditing experi-
At the end of October 2011, Arch Chemicals, a US-based company active in the microbial control business, with more than 40 facilities and 2 500 employees worldwide, was acquired by Lonza. Data for the present EHS annual report 2011 do not include any Arch activi-ties and are thus comparable with previous years.

60 Lonza Annual Report 2011
800
600
400
2000
– 15.3 %
2005
2006
2007
2008
2009
2010
2011
ence, we feel reassured that Lonza companies are safe and in good shape. Most of the deviations from accepted standards tend to center on the areas of good housekeeping, change management, and the level of acceptance of personal responsibility for safety at work.
As a lead indicator for safety performance, we fol-low the trend in lost-time occupational accidents at all production, research and development, and headquarter sites. Accident frequency significantly decreased over the past few years, showing the sustained effect of our efforts in safety awareness training, installation of safety coaches, setting yearly safety-related incentive targets, and other site-specific programs to enhance safety at work. Accident frequency in 2011 was 1.7 per million hours worked, a slight rise compared with the previous year.
We will continue to pursue our goal of 1.0 by 2015, which we are confident of achieving through the planned group-wide initiatives.
Stakeholders are continually increasing the demands they place on industry to operate in a sustainable way and to pay special attention to energy efficiency and climate-related questions. Providing informa-tion about our progress is of greater value than ever before. We demonstrate our commitment as a re-sponsible corporate citizen in a number of ways: by publishing EHS performance data on our corporate website, in the context of our membership of the UN Global Compact; by reporting climate-relevant information in the framework of the Carbon Disclo-sure Project; and by responding openly to numerous stakeholder queries. We are aware that being good is never good enough, so we try harder.
Environment, Health and Safety
Total output of carbon dioxide in 2011 was 337 000 metric tons, 15.3 % down on the previous year (the fossil-based fraction decreased by 22 %). Fossil fuel substitu-tion and energy efficiency measures are the main contributors, in addition to the economic slowdown and the biannual maintenance shutdown in Visp. CO2 gener-ated by the incineration of fossil fuels was 41 % of total CO2 emissions in 2011. Carbon dioxide equivalents from other greenhouse gases amounted to 16 % of direct CO2 emis-sions and are not reflected in the graph.
CO2 Emissionsin 1 000 metric tons
CO2 (fossil fuels)
CO2 (non-fossil)
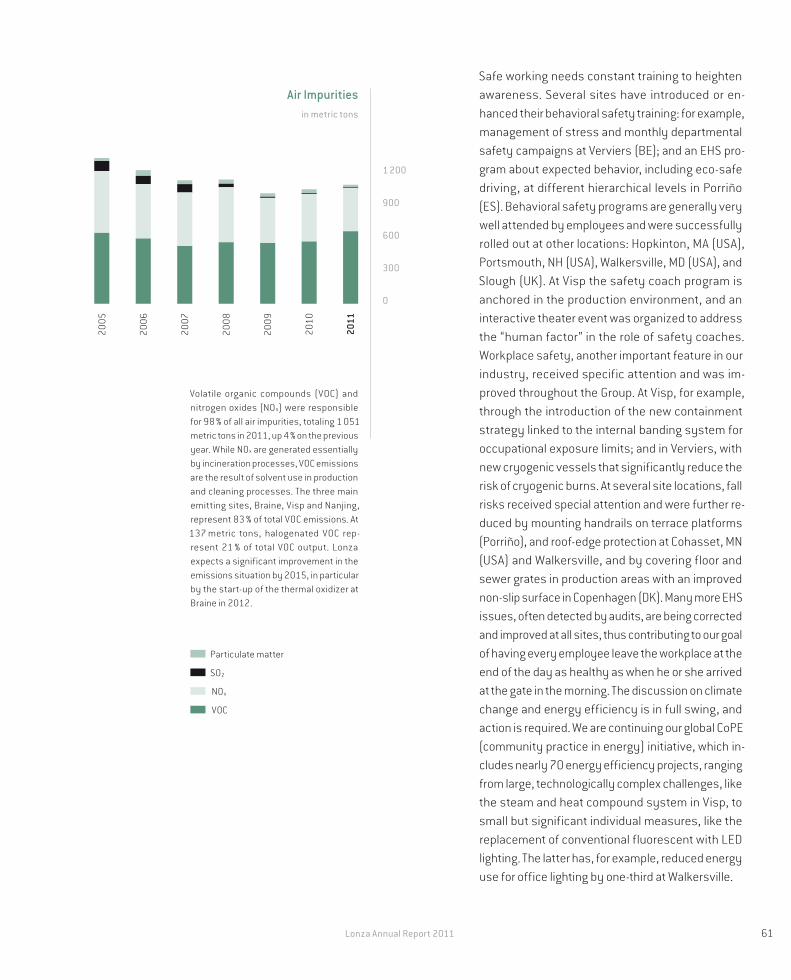
61Lonza Annual Report 2011
1 200
900
600
300
0
2005
2006
2007
2008
2009
2010
2011
Volatile organic compounds (VOC) and nitrogen oxides (NOx) were responsible for 98 % of all air impurities, totaling 1 051 metric tons in 2011, up 4 % on the previous year. While NOx are generated essentially by incineration processes, VOC emissions are the result of solvent use in production and cleaning processes. The three main emitting sites, Braine, Visp and Nanjing, represent 83 % of total VOC emissions. At 137 metric tons, halogenated VOC rep-resent 21 % of total VOC output. Lonza expects a significant improvement in the emissions situation by 2015, in particular by the start-up of the thermal oxidizer at Braine in 2012.
Safe working needs constant training to heighten awareness. Several sites have introduced or en-hanced their behavioral safety training: for example, management of stress and monthly departmental safety campaigns at Verviers (BE); and an EHS pro-gram about expected behavior, including eco-safe driving, at different hierarchical levels in Porriño (ES). Behavioral safety programs are generally very well attended by employees and were successfully rolled out at other locations: Hopkinton, MA (USA), Portsmouth, NH (USA), Walkersville, MD (USA), and Slough (UK). At Visp the safety coach program is anchored in the production environment, and an interactive theater event was organized to address the “human factor” in the role of safety coaches. Workplace safety, another important feature in our industry, received specific attention and was im-proved throughout the Group. At Visp, for example, through the introduction of the new containment strategy linked to the internal banding system for occupational exposure limits; and in Verviers, with new cryogenic vessels that significantly reduce the risk of cryogenic burns. At several site locations, fall risks received special attention and were further re-duced by mounting handrails on terrace platforms (Porriño), and roof-edge protection at Cohasset, MN (USA) and Walkersville, and by covering floor and sewer grates in production areas with an improved non-slip surface in Copenhagen (DK). Many more EHS issues, often detected by audits, are being corrected and improved at all sites, thus contributing to our goal of having every employee leave the workplace at the end of the day as healthy as when he or she arrived at the gate in the morning. The discussion on climate change and energy efficiency is in full swing, and action is required. We are continuing our global CoPE (community practice in energy) initiative, which in-cludes nearly 70 energy efficiency projects, ranging from large, technologically complex challenges, like the steam and heat compound system in Visp, to small but significant individual measures, like the replacement of conventional fluorescent with LED lighting. The latter has, for example, reduced energy use for office lighting by one-third at Walkersville.
Air Impuritiesin metric tons
Particulate matter
SO2
NOx
VOC

62 Lonza Annual Report 2011
175
140
105
70
35
0
2005
2006
2007
2008
2009
2010
2011
The total quantity of waste produced by Lonza in 2011 was 137 000 metric tons (– 7.6 %), of which 71 000 metric tons consisted of special (hazardous) wastes and 66 000 metric tons of non-hazardous wastes or inert materials. Lonza has a spe-cialized waste disposal concept at all its sites, dedicated to the principle of avoid-ance, recycling and environmentally sound disposal. The categorization into special (hazardous) waste and non-hazardous waste conforms at all sites to the appli-cable national legislation.
In the reporting year 84 % of hazardous waste materials were incinerated or exter-nally recycled, and 16 % went to secured landfills, while hazardous waste genera-tion in total fell by 5.8 %. All companies in-volved in the transportation, processing and final disposal of wastes are known to Lonza. Waste treatment is a matter of trust. The selection of the vendors is based on quality and EHS criteria as well as on eco-nomic factors. As a matter of principle, they are reputable firms which comply with all legal requirements.
Environment, Health and Safety
16 %Landfill
External recycling
7 %
Incineration
77 %
– 7.6 %
Final Destination of Special Waste 2011
Waste Categoriesin 1 000 metric tons
Non-hazardous waste
Hazardous waste

63Lonza Annual Report 2011
12 000
9 000
6 000
3 000
0
7 958
2005
2006
2007
2008
2009
2010
2011
The total energy requirement in the year under review was 7 958 terajoules (2 200 GWh), 5.4 % down on the previous year. The main energy sources used by Lonza in 2011 were: utilization of waste (33 %), electricity (33 %) and natural gas (29 %). Liquid fossil fuels accounted for 3 % of the overall energy consumption. Energy from renewable sources accounted for 7 % of the electrical energy consumed.
Improvements to process and emission control equipment, such as measures to reduce the level of active pharmaceutical ingredients in the outfall of the waste water treatment plant in Visp, the start-up of a new scrubber for efficient odor elimination in Kourim (CZ), and completion of the thermal oxidizer project to handle solvent air emissions at Braine (BE), led to a decrease in emissions to the environment, or will do so in the near future.
Energyin terajoules
Self-generated
Liquid fuels
Natural gas
Steam
Net electricity
Several Lonza companies received awards and were recognized by third-party stakeholders:
Tuas, Singapore2011 Annual Workplace Safety and Health
Performance Award2011 Frost & Sullivan Asia Pacific Green
Excellence Award—
Nanjing (CN)2011 Excellence in EHS management from
Nanjing Chemical Industry Park—
Williamsport (US)2011 Recognition of Safety Performance by
the Metal Powder Producers Association
EHS integration of the Arch Chemicals company will be a major challenge in 2012. We will review our abso-lute medium-term EHS goals, reflecting the new com-pany’s size and manufacturing processes. Lonza will strengthen its EHS performance by rolling out Vision ‘Zero’ – zero injuries, zero process incidents, zero dis-tribution incidents, and zero environmental incidents.

64
Even minor changes to the equipment are first documented and then reviewed by the quality units before
they are approved and implemented.

65Lonza Annual Report 2011
15
Lonz
a Qu
ality
Ass
uran
ce
Even minor changes to the equipment are first documented and then reviewed by the quality units before
they are approved and implemented.

66 Lonza Annual Report 2011
USAAllendale, NJ Alpharetta, GABrandenburg, KYCharleston, TNCohasset, MNConley, GAHopkinton, MAHouston, TX
BrazilIgarassuSalto
ArgentinaBuenos Aires
Mapleton, ILPortsmouth, NHRochester, NYRockland, MESouth Plainfield, NJWalkersville, MDWayne, PAWilliamsport, PA
Lonza Global Map
106 Like our customers,
we have a global reach, with representatives on every
continent. Lonza operates 106 sites in 33 countries,
providing production, research and development (R&D),
and sales services to customers worldwide.
This world map shows every Lonza production and R&D site with 15 employees or more. The main pro-duction and R&D locations with more than 100 em-ployees are highlighted with a bigger dot. Lonza also has a sophisticated network of sales offices around the world where Lonza representatives are close to our customers, understand their needs and speak their language.
Production
R&D
R&D and Production

67Lonza Annual Report 2011
South Africa Kempton ParkPort Elizabeth
SingaporeTuas
ChinaGuangzhouNanjingNanshaSuzhou
Belgium Braine-l’AlleudVerviers
Czech RepublicKourim
FranceAmboiseSaint-Beauzire
GermanyCologne
IrelandSwords
SpainPorriño
SwitzerlandBasel (HQ)Visp
IndiaHyderabad
JapanTokyo
New ZealandAuckland
United KingdomBlackleyCastlefordHuddersfieldSlough
Basel

68 Lonza Annual Report 2011
Lonza’s Trademarks This is not a complete listing of all trademarks owned by Lonza, but rather those trademarks currently being used in connection with active sales products.
Lonza Trademarks4D-Nucleofector
96-Well Shuttle
—
Accugene
Acrawax
Aldo
Aldosperse
Amphoterge
Axcela
—
Barchlor
Bardac
Bardap
Barlene
Barlox
Barquat
Bio-Surf
Biowhittaker
Bulletkit
—
Carboquat
Carbosan
Carboserve
Carboshield
Carnichrome
Carnifeed
Carniking
Carnipass
Carnipure
Carsoquat
Cellsep
Cells on Demand
Ceramid
CLB-Transfection
Clonetics
CHO-1
—
D-Nucleofector
Dantobrom
Dantochlor
Dantocol
Dantogard
Dantosperse
DHAid
—
EasyAccess
EBM
EGM
Epibase
Equinox
—
Fastlane
FBM
FGM
Flashgel
Flowplate
FMB
—
Gadlizo
Gamozo
Gatlezo
Geogard
Geogard Ultra
Glycacil
Glychlor
Glyco
Glycolube
Glycomul
Glyconol
Glycoserve
Glycosperse
Glycostat
Glydant
Glydant Plus
GS Gene Expression System
—
Hifect
Hyamine
—
Immunostat
Immunotuning
Incert
Isocil
—
KBM
KGM
Kinetic-QCL
—
LaraCare
LaraFeed
Long Ranger
Lonza
Lonzabac
Lonzacure
Lonzagard
Lonzaine
Lonzamon
Lonzaserve
Lonzastab
Lonzest
Lore
Lucetta
—
M Moda
Maxfp
Maxgfp
MBM
Meta
Meta The Molluscicide
MEBM
MEGM
MGM
microCompass
MODA
MODA-EM
MODA-FDC
MODA-VIP
More Science. Less Paper.
Mycoalert
Mytoxygen
—
Natrulon
Niamax
Nodesensor
Nucleocuvette
Nucleofection
Nukleofektion

69Lonza Annual Report 2011
Nucleofector
Nusieve
—
Pager
Pdelight
Pegosperse
Phenocide
Pklight
Poietics
Polyaldo
Powercho
Ppilight
Primaset
Prosieve
Pylopass
Pyrogent
Pyrogene
Pyrosense
Pyrosperse
Pyrotec
—
QCL-1000
Q Meta Quality
—
Reliant
Reselute
ResistAid
—
Seaag
Seaplaque
Seaprep
Seapure
Simax
Singel
Singlequots
Spectradyne
Spinbind
—
Therapeak
Toxilight
Tri-Dye
Tripole
Truband
Twin Chain
Unamine
Unihib
Uniquat
—
Vialight
Vinylube
—
Winkqcl
—
Xiren
X-Vivo
Xl-1000
Xpressnow
XS Technologies
Xtreme
Arch TrademarksAB
Accudose
Action 5
Active Cleaning
Active Clear
Algae-X
Algae Free
Algaebloc
Algaebomb
Algaetrine
Algi-Cure
Algimycin
Algi-Plus
Ama HTH Empilo
Ambol
Antiblu
Antiborer
Applied Biochemists
Aqua Plan
Aqua Sense
Aqua Silk
Aqua-Prep
Aquachlor
Aquaframe
Aquapool
Aquashade
Aquashadow
Aquatrac
Aqua Enhancers
Arch
Archcoatings
Autofeed
Autofix
Auto-Treater
Awaken
—
b-Gel
Bahia
Balyos
Bacti-Klear
Baq Out
Baqua
Baqua Brite
Baqua Burst
Baqua Check
Baqua Clean
Baqua Floc
Baqua Shock
Baqua Spa
Baqua Start
Baqua-Acid
Baquacare
Baquacheck
Baquacil
Baquaflock
Baquaguard
Baquapil
Baquaplus
Baquashock
Baquastart
Baquatop
Baquazul
Being
Biocyde
Biodynes
Biolumen
Biovert
Black Algaetrine
Black Out
Blackal Choc
Blackwatch
Blue Bayou
Blue Dolphin
Blue Tech
Bois Plein Air
Brilliance
Brite Stix
Bug-Out
—
Carefree
Carral
CCH
Cedartone
Cedartone Classic
Cedartone Plus
Cedartone Wood
Celcure
Cell Saver
Cellon
Chemonite
Chrome King
Citrabright
Claris
Clarmax
Clean Shock
Clear 4 Weeks
Clear Blue
Clear Guard
Clearcare
Clearcare Expert
Clearigate
Clo-Rotec
Comchlor
Computreat
Constant Chlor
Cosmocil
600Lonza has approximately
600 trademarks and over 4 500 active filings
worldwide.

70 Lonza Annual Report 2011
Creol
Cutrine
Cycl’eau
—
Defend
Delcide
Densil
Dermaflux
Detex PS
Diffusol
Dirty Duck
Dissolve
Down & Out
Dricon
Drifix
Drop-Vac
Drytec
Duration
—
E T
Easiflo
Easyclic
Ecoboard
Ecodeck
Ecohive
Ecoseal
Ecowood
Endure
Enblu
Enbora
End-Seal
Enhance
Ensele
Enviromark
Esscents
Express Check
Extra
E-Z Drum
Eyepro
—
Fencedec
Fi-Buoy
Fi-Chem
Fi-Clor
Fi-Gard
Filter Fresh
Fipac
Fire Away
Fitab
Flamtard
Flocmax
Framecoat
Frameguard
Frameseal
Fresch-Clor
Frexus
FRX
—
Garantor
Gigatab
GLB
Gold-n-Clear
Granufast
Granules
Granulong
Green Science
—
Harpoon
Harvester
Hcl Advantage
Hickson
Hickson Antiblu
Hickson Antiborer
Hickson Decor
Hickson Timbercare
Hi-Fix
Homecare
Hose Master
HTH
HTH Advanced
HTH Algicida
HTH Blue Magic
HTH Clear Blu
HTH Controller
HTH Lifestyle
HTH On-Call
HTH Pop Up Pool
HTH Quick Test
HTH Scientific
HTH Super Shock
HTH Ultra
HTHcare
Hydro-Floc
Hydromide
Hypocal
—
Imersol
Immutan
Indoor Wood
Info-Treater
Instant Clear
—
Kiwideck
—
L3
Leisure Time
Leisure Time Boost
Leisure Time Citrabright
Leisure Time Control
Leisure Time Free
Les Essentiels HTH
Les Experts HTH
Life Club HTH
Lumbrella
Luxveil
—
Magi’clic
Marina
Marine Biochemists
Maxfloc
Maxitab
Maxi-Clear
Maxi-Tabs
Metabiotics
Metal King
Metal Master
Mikrokill
Minitab
Mismavi
Multifruit
Natural Clear
Natural Select
Navigate
Navitrol
NCX
NCX-Blue
Neutral Clean
Non Com
Norclor
Nordesclor
Nutri-Sorb
—
Omacide
Omadine
Outdoor
Oxiclor
Oxy-Brite
—
Pace
Pace Agropec
Party Blue
Peptamide
Perfect PH
PH Magic
PH-Plus
PHdown
PHup
Phycomycin
Phytonutridyne
Phytopurics
Phytoterra
Pink Cure
Plug ‘n Go
Plumbcare
Pod
Poly-A
Poly-CD
Poly-Chill
Poly-G
Poly-G Hqee
Poly-L
Poly-Q
Poly-Solv
Poly-T
Pond Cycle Science
Pool Assist

71Lonza Annual Report 2011
Pool Breeze
Pool Care
Poolife
Pooltrine
Power Blast
Powerclean
Predec
Prefen
Prevent Plus
Pro Chlor
Promexal
Prosynergen
Proxel
Pulsar
Purista
Purjavel
Pyrolith
—
Quantum Biochemical
Qwik Dip
—
Rapid Shock
Rapid Water Pro
Rapidfloc
Reflect
Regenistem
Regularfloc
Removit
Rendezvous
Renew
Reputain
Reputex
Reserve & Renew
Resist
Resistol
Restol
RestoreS.M.A.R.T.
Richer, Deeper, Wetter…
Robarb
—
Salt-Boost
Salt Solutions by Ultima
Sanikit
Saniklar
Sayerlack
Scav-OX
Scum Digester
Scumshield
Septictrine
Sequa-Sol
Shock
Shock-It
Shocktrine
Shore-Klear
Shoreklear-Plus
Shoxidizer
Silky Scents
Sillbor
Simple Spa Care
Silver King
Sock It
Soft Soak
Soft Spa
Soundwood
Spa Lustre
Spa Selections
Spa Specialties
Sparkle-It
Splashes
Stain-Tamer
Stocktrine
Strike-Out
Suds-X
Super Algi-Gon
Super Blue
Super Noxtane
Super Shock
Super Shock & Design
Super Sock It
Supersystem
Swamp to Swim
Swimmer’s Choice
Swimtrine
Synaptodyne
—
Tan
Tana
Tanacoat
Tanadapta
Tanadeck
Tanalised
Tanalith
Tanaltith
Tanamine
Tanapile
Tanapost
Tanatone
Tanlised
Tanalised Ecoseal
Tanalised Ecowood
Tanalised Enseal
Tanalith
Tanalog
Tanamine
Tantrim
Tempo
Tile Buster
Timbercare
TLC
Treat Water-4L
Triadine
Tri-Tabs
Turbo Blue
Turbo Illusion
Turbo XP
Turboblu Clarifier
Turboshock
Ultima
Ultima Nix
Ultima Platinum Plus
Ultra Brite Stix
Ultra Clear
Ultra Drastic
Ultra Durastix
Ultra Quick Swim
Unifloc
—
Vac Sol
Vac Vac
Vac / Vac
Vacsele
Vacsol
Vacsolizada
Vactrol
Vac-Vac
Vag’
Vanquis
Vanquish
Vantoc
Vantocil
Vantropol
Velvet Touch
Velvet Touch
Vestoply
Vestos
Viscup
—
Wayhib
Waterchemist
Weed-Trine
Week-Easi
Wolman
Wolman CCA
Wolman E
Wolman Natural Select
Wolmanac
Wolmanizada
Wolmanized
Wolmanized Erawood
Wolmanized Natural Select
Wolmanized Yard Guard
Wood Works Outdoors
—
Xtrawood
Yardguard
Yello Free
Yellowrid
Yellowtrine
—
Zefyr
Zinc Omadine
Zoe
Zymbiozome

73Lonza Annual Report 2011
Financial Statements of Lonza Group Ltd 168 Balance Sheet – Lonza Group Ltd 170 Income Statement – Lonza Group Ltd 171 Notes to the Financial Statements –
Lonza Group Ltd 173 Proposal of the Board of Directors 174 Report of the Statutory Auditor
Supplementary Financial Information 176 Investor Information 180 Statement of Value Added 181 Free Cash Flow 182 Core Results
Activities
Financial Report
Consolidated Financial Statements 74 Consolidated Balance Sheet 76 Consolidated Income Statement 77 Consolidated Statement of
Comprehensive Income 78 Consolidated Cash Flow Statement 80 Consolidated Statement of Changes
in Equity 81 Notes to the Consolidated Financial
Statements 166 Report of the Statutory Auditor
Remuneration Report
Corporate Governance
5
185
207
Lonza Annual Report 2011

74 Lonza Annual Report 2011
Consolidated Balance Sheet
Assets 1
million CHF
2 Note2011 2010
Fixed assetsProperty, plant and equipment 6 5313 4 874 Accumulated depreciation and accumulated impairment losses 6
(2 612) 2 701
(2 404) 2 470
Intangible assets 7 930 244 Goodwill 7 1 132 410 Other non-current assets 122 49 Deferred tax assets 22 167 103 Investments in associates / joint ventures 8 14 19 Other investments 6 6 Long-term loans and advances 14 56 43 Total fixed assets 5 128 3 344
Current assetsInventories 9 830 552Value adjustments 9 (57) 773 (57) 495 Trade receivables, net 10 695 488 Current tax receivables 41 32 Other receivables, prepaid expenses and accrued income 11 185 170 Short-term advances 14 2 923 1 691 Cash and cash equivalents 12, 14 196 248 Total current assets 1 892 1 434
Total assets 7 020 4 778
1 At 31 December2 See the accompanying notes to the consolidated financial statements

75Lonza Annual Report 2011
Total equity and liabilities 1 million CHF 2 Note
2011 2010
EquityShare capital 53 53 Share premium 310 311 Treasury shares (110) (44)Retained earnings and reserves 2 104 2 067 Total equity attributable to equity holders of the parent see page 80 2 357 2 387 Non-controlling interest (1) 0 Total equity 2 356 2 387
LiabilitiesDeferred tax liabilities 22 711 321 Long-term provisions 13 51 19 Employee benefit liability 197 43 Other long-term liability 30 60 Long-term debt 14 2 725 850 Total long-term liabilities and provisions 3 714 1 293 Other short-term liabilities 15 452 351 Current tax payables 28 38Trade payables 16 294 159 Short-term debt: Due to bank and other financial institutions 14 176 550 Total current liabilities and deferred items 950 1 098 Total liabilities 4 664 2 391
Total equity and liabilities 7 020 4 778
1 At 31 December2 See the accompanying notes to the consolidated financial statements

76 Lonza Annual Report 2011
Consolidated Income Statement
million CHF
1 Note2011 2010
Sales (see segment information) 32 2 692 2 680 Cost of goods sold (1 992) (1 969)Gross profit 700 711
Marketing and distribution (160) (155)Research and development 23 (94) (99)Administration and general overheads (205) (152)Other operating income 20 42 100 Other operating expenses 20 (22) (31)Result from operating activities (EBIT) 261 374 Financial income 21.1 18 6 Financial expenses 21.2 (91) (49)Net financing costs (73) (43)Share of profit / (loss) of associates / joint ventures 21.3 (13) (1)Profit before income taxes 175 330
Income taxes 22 (21) (46)Profit for the period 154 284
Attributable to:Equity holders of the parent 154 291 Non-controlling interest 0 (7)Profit for the period 154 284
CHF CHFBasic earnings per share 27 2.98 5.55Diluted earnings per share 27 2.97 5.53
1 See the accompanying notes to the consolidated financial statements

77Lonza Annual Report 2011
Consolidated Statement of Comprehensive Income
million CHF2011 2010
Profit for the period 154 284 Exchange differences on translating foreign operations
(14)
(230)
Cash flow hedges:Gains / (losses) arising during the year (2) 3Reclassification adjustments for (gains) / losses included in profit or loss
9 7 5 8
Income tax relating to components of other comprehensive income 0 7 Other comprehensive income for the period, net of tax (7) (215)Total comprehensive income for the period 147 69
Total comprehensive income attributable to:Equity holders of the parent 148 76 Non-controlling interest (1) (7)Total comprehensive income for the period 147 69

78 Lonza Annual Report 2011
Consolidated Cash Flow Statement
million CHF
1 Note2011 2010
Profit for the period 154 284 Adjustments for non-cash items:
– Income taxes 22 21 46 – Net financing costs 21 73 43 – Share of (profit) / loss of associates / joint ventures 21.3 13 1 – Depreciation of property, plant and equipment
(excl. impairment) 6 248 246 – Amortization of intangibles 7 28 27 – Reversal of impairment 0 (4)– (Decrease) / increase of provisions (4) (27)– (Decrease) / increase of employee benefit liability 0 (1)– (Gain) / loss on disposal of property, plant
and equipment (1) (17)– Reversal amortization of other liabilities / assets (12) (3)– Share-based payments 5 7
Income taxes paid (33) (43)Interest paid (44) (29)Cash flow before change in net working capital 448 530
(Increase) / decrease inventories (26) 45 (Increase) / decrease trade receivables (97) (7)Increase / (decrease) trade payables 43 (44)(Increase) / decrease other net working capital (46) 23 Increase / (decrease) of other payables net (101) (45)Net cash (used for) / provided by operating activities 221 502
Purchase of property, plant and equipment 6 (248) (285)Purchase of intangible assets 7 (19) (15)Proceeds from sale of tangible and intangible assets 7 26 Acquisition of subsidiaries, net of cash acquired 3.1, 3.2, 3.3 (918) (26)Purchase of unconsolidated investments 0 (5)Proceeds from unconsolidated investments 0 2Purchase of other assets (5) (47) Proceeds from sale of other assets 9 12 Decrease in loans and advances 1 2Increase in loans and advances (24) (28) Interest received 4 5 Dividends received 0 1Net cash (used for) / provided by investing activities (1 193) (358)
1 See the accompanying notes to the consolidated financial statements

79Lonza Annual Report 2011
(Consolidated Cash Flow Statement continued)
Net cash (used for) / provided by investing activities (1 193) (358) Repayment of straight bond 0 (300)Issue of straight bonds 376 397 Issue of syndicated loan 491 0 Repayment of syndicated loan (500) 0 Raising of acquisition bridge financing 1 185 0 Repayment of acquisition bridge financing (381) 0 Proceeds from / (repayment of) borrowings (62) 15 Acquisition of non-controlling interests 4 0 (57)Increase in other liabilities 1 0 Decrease in other liabilities (3) (3)Dividends paid (111) (92)Purchase of treasury shares (77) (4)Sale of treasury shares 4 14 Net cash (used for) / provided by financing activities 923 (30)
Effect of currency translation on cash (3) (6)
Net (decrease) / increase in cash and cash equivalents (52) 108 Cash and cash equivalents at 1 January 248 140 Cash and cash equivalents at 31 December 196 248
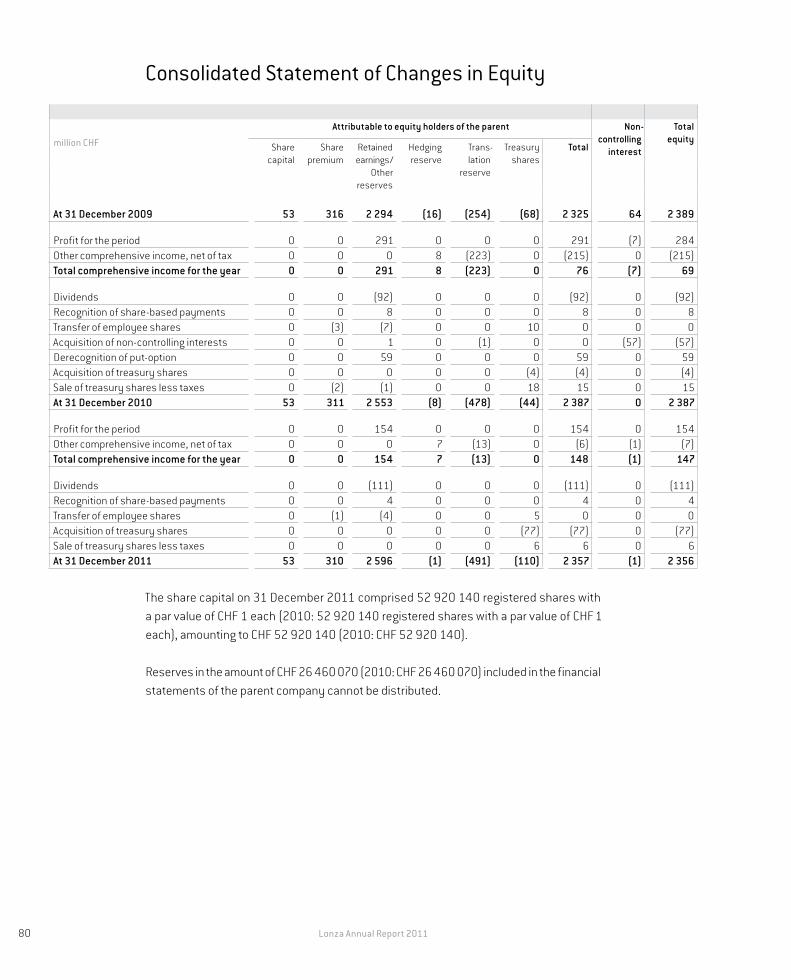
80 Lonza Annual Report 2011
Consolidated Statement of Changes in Equity
million CHF
Attributable to equity holders of the parent Non- controlling
interest
Total equity
Share capital
Share premium
Retainedearnings /
Other reserves
Hedging reserve
Trans- lation
reserve
Treasury shares
Total
At 31 December 2009 53 316 2 294 (16) (254) (68) 2 325 64 2 389
Profit for the period 0 0 291 0 0 0 291 (7) 284 Other comprehensive income, net of tax 0 0 0 8 (223) 0 (215) 0 (215)Total comprehensive income for the year 0 0 291 8 (223) 0 76 (7) 69
Dividends 0 0 (92) 0 0 0 (92) 0 (92)Recognition of share-based payments 0 0 8 0 0 0 8 0 8 Transfer of employee shares 0 (3) (7) 0 0 10 0 0 0 Acquisition of non-controlling interests 0 0 1 0 (1) 0 0 (57) (57)Derecognition of put-option 0 0 59 0 0 0 59 0 59 Acquisition of treasury shares 0 0 0 0 0 (4) (4) 0 (4)Sale of treasury shares less taxes 0 (2) (1) 0 0 18 15 0 15 At 31 December 2010 53 311 2 553 (8) (478) (44) 2 387 0 2 387
Profit for the period 0 0 154 0 0 0 154 0 154 Other comprehensive income, net of tax 0 0 0 7 (13) 0 (6) (1) (7)Total comprehensive income for the year 0 0 154 7 (13) 0 148 (1) 147
Dividends 0 0 (111) 0 0 0 (111) 0 (111)Recognition of share-based payments 0 0 4 0 0 0 4 0 4 Transfer of employee shares 0 (1) (4) 0 0 5 0 0 0 Acquisition of treasury shares 0 0 0 0 0 (77) (77) 0 (77)Sale of treasury shares less taxes 0 0 0 0 0 6 6 0 6 At 31 December 2011 53 310 2 596 (1) (491) (110) 2 357 (1) 2 356
The share capital on 31 December 2011 comprised 52 920 140 registered shares with a par value of CHF 1 each (2010: 52 920 140 registered shares with a par value of CHF 1 each), amounting to CHF 52 920 140 (2010: CHF 52 920 140). Reserves in the amount of CHF 26 460 070 (2010: CHF 26 460 070) included in the financial statements of the parent company cannot be distributed.

81Lonza Annual Report 2011
Notes to the Consolidated Financial Statements
Accounting PrinciplesBasis of preparation The consolidated financial statements for 2011 and 2010 are re-ported in Swiss francs (CHF) and are based on the annual accounts of the individual sub-sidiaries at 31 December which have been drawn up according to uniform Group accounting principles. The consolidated accounts are prepared in accordance with the International Financial Reporting Standards (IFRS) and with Swiss law. They are prepared on the histori-cal cost basis, except that derivative financial instruments and short-term financial assets available for sale are stated at their fair value.
Changes in accounting policies The following new and revised standards and interpreta-tions have been issued, being effective for the reporting year 2011: – Amendment to IAS 32 – Financial instruments: Presentation – Classification
of rights issues – IFRIC 19 – Extinguishing financial liabilities with equity instruments – IAS 24 revised – Related party disclosures – Amendment to IFRIC 14 – Prepayments of a minimum funding requirement – Improvements to IFRS (issued in May 2010)
With the exception of additional disclosures, the new and revised standards and interpreta-tions had no material impact on the consolidated financial statements for the year 2011. As a result of the acquisition of Arch Chemicals Inc. some of the financial statement posi-tions have changed significantly compared to the previous financial year. Therefore, the comparability of the consolidated balance sheet positions as of the end of 2011 and 2010 as well as the consolidated income statement 2011 and 2010 is limited.
The Arch business has been combined with Lonza’s existing Microbial Control business to create the new Lonza Microbial Control sector. All tables in the notes to the consolidated financial statements containing segment information such as note 32 Segment informa-tion have been changed to reflect the additional sector and prior year information has been restated accordingly.
The following new and revised standards and interpretations have been issued, but are not yet effective. They have not been applied early in these consolidated financial state-ments. Their impact on the consolidated financial statements of Lonza has not yet been systematically analyzed. The expected effects as disclosed below reflect a first assess-ment by Group management.
1

82 Lonza Annual Report 2011
Standard / InterpretationEffective date Planned application
by Lonza
Amendment to IAS 12 – Recovery of underlying assets * 1 January 2012 Reporting year 2012Amendment to IFRS 7 – Transfers of financial assets * 1 July 2011 Reporting year 2012Amendment to IAS 1 – Presentation of items of other comprehensive income * 1 July 2012 Reporting year 2013Amendment to IAS 19 – Employee benefits *** 1 January 2013 Reporting year 2013IAS 27 revised – Separate financial statements * 1 January 2013 Reporting year 2013IAS 28 revised – Investments in associates and joint ventures * 1 January 2013 Reporting year 2013Amendment to IFRS 7 – Disclosures – Offsetting financial assets and financial liabilities * 1 January 2013 Reporting year 2013IFRS 10 – Consolidated financial statements * 1 January 2013 Reporting year 2013IFRS 11 – Joint arrangements * 1 January 2013 Reporting year 2013IFRS 12 – Disclosure of interests in other entities * 1 January 2013 Reporting year 2013IFRS 13 – Fair value measurement * 1 January 2013 Reporting year 2013
Amendment to IAS 32 – Offsetting financial as-sets and financial liabilities * 1 January 2014 Reporting year 2014IFRS 9 – Financial instruments ** 1 January 2015 Reporting year 2015
Group management expects that from the changes in accounting standards outlined above, the following amendments to IAS 19 will have the most significant impact on the consoli-dated financial statements: – The option to defer the recognition of actuarial gains and losses from defined benefit
plans (corridor method), as currently applied by Lonza, will be eliminated. Lonza will retrospectively adopt the standard for the reporting year 2013. The expected pre-tax impact on retained earnings and the liability related to pension and other post-employment benefit plans as of 1 January 2012 is approximately equal to the amount of “Unrecognized actuarial gains and losses” as of 31 December 2011 disclosed in note 24.
– The concept of including the expected return on plan assets at an estimated rate of return would be replaced by calculating interest on the net of the defined benefit obligation and plan assets using the discount rate that is used to discount the defined benefit obligation. As a result of the current underfunded status of Lonza’s defined benefit plans (see note 24) the post-tax income would have been negatively impacted had Lonza early applied the standard in 2011.
* No or no significant impact is expected on the consolidated financial statements.** The impacts on the consolidated financial statements cannot yet be determined with sufficient reliability.*** The final assessment on the impact on the consolidated financial statements is not yet completed.

83Lonza Annual Report 2011
Principles of consolidation The consolidated financial statements represent the accounts for the year ended 31 December of Lonza Group Ltd, its subsidiaries and the group’s interest in associates and jointly controlled entities.
Subsidiaries acquired during the year are included in the consolidated accounts from the date of acquisition, while any subsidiaries sold are excluded from the accounts from the date of sale. Changes in ownership interests in subsidiaries are accounted for as equity transactions if they occur after control has already been obtained and if they do not result in a loss of control. The full consolidation method is used, whereby the assets, liabilities, income and expenses are incorporated in full, irrespective of the extent of any non-control-ling interest. Payables, receivables, income and expenses between Lonza-consolidated companies are eliminated. Inter-company profits included in year-end inventories of goods produced within Lonza are eliminated. Transactions between subsidiaries are concluded under market conditions. Unrealized gains on transactions between subsidiaries are elimi-nated. Unrealized losses are also eliminated unless the transaction provides evidence of an impairment of the asset transferred. Associates and interests in joint ventures are valued in the consolidated financial statements using the equity method of accounting. Under this method, the investment is initially recorded at cost, and is increased or decreased by the proportionate share of the associate’s profits or losses and other comprehensive income after the date of acquisition, adjusted for any impairment in the interest in the associate and depreciation of fair market value increments / decrements recognized at that time. Dividends paid during the year reduce the carrying value of the investments. The significant subsidiaries included in the financial statements are shown in note 2.
Definition of subsidiary and associates A subsidiary is an enterprise controlled by Lonza Group Ltd. Control exists when the company has the power, directly or indirectly, to govern the financial and operating policies of an enterprise so as to obtain benefits from its activities.
An associate is an enterprise in which the Group has the ability to exercise significant influ-ence, but not control, over the financial and operating policies. The consolidated financial statements include the Group’s share of the total recognized gains and losses of associ-ates on an equity-accounted basis, from the date that significant influence commences until the date it ceases.
Revenue recognition Sales are recognized when the significant risks and rewards of ownership of the assets have been transferred to a third party and are reported net of sales taxes and rebates. Provisions for rebates to customers are recognized in the same period that the related sales are recorded. Revenue from termination fees is recorded in the income statement in the period in which the termination occurs. The POC (percentage of completion) method is applied for development projects as well as defined long-term contracts in the Custom Manufacturing segment, which have the economic substance of a construction contract. The stage of completion of a contract is determined on the basis of the estimated total contract costs. Revenue from the sale of rights is recognized upon transfer of rights or on an accrual basis, depending on whether the transaction in substance

84 Lonza Annual Report 2011
is a sale or a licensing arrangement. Interest income is recognized on a time-proportion basis using the effective interest method. Dividend income is recognized when the right to receive payment is established.
Foreign currencies Items included in the financial statements of each of the Group’s enti-ties are measured using the currency of the primary economic environment in which the entity operates (“the functional currency”). The consolidated financial statements are presented in Swiss francs (CHF) which is the Group’s presentation currency. For consolida-tion purposes the balance sheet of foreign consolidated companies is translated to CHF with the rate on the balance sheet date. Income, expenses and cash flows of the foreign consolidated companies are translated into CHF using the monthly average exchange rates during the year (unless this average is not a reasonable approximation of the cumulative effect of the rates prevailing on the transaction dates, in which case income and expenses are translated at the dates of the transactions). Exchange rate differences arising from the different exchange rates applied in balance sheets and income statements are recognized in other comprehensive income.
In the individual company’s financial statements, transactions in foreign currencies are translated at the foreign exchange rate applicable at the date of the transaction. Monetary assets and liabilities denominated in foreign currencies at the balance sheet date are trans-lated at the foreign exchange rate ruling at that date. All resulting foreign exchange gains and losses are recognized in the individual company’s profit or loss statement, except when they arise on monetary items that form a part of the Group’s net investment in a foreign entity. In such case the gains and losses are recognized in other comprehensive income.
Derivative financial instruments and hedging Derivative financial instruments are initially recognized in the balance sheet at their fair value. The method of recognizing the resulting gain or loss is dependent on whether the derivative contract is designed to hedge a specific risk and qualifies for hedge accounting. On the date a derivative contract is entered into, the Group designates derivatives which qualify as hedges for accounting purposes as either a hedge of the fair value of a recognized asset, liability or firm commitment (fair value hedge), a hedge of a forecasted transaction (cash flow hedge) or a hedge of a net investment in a foreign entity. Changes in the fair value of derivatives which are fair value hedges are recognized in the income statement, along with any changes in the fair value of the hedged asset or liability that is attributable to the hedged risk. Changes in the fair value of deriva-tives in cash flow hedges that are highly effective are recognized in other comprehensive income. The gain or loss relating to the ineffective portion is recognized immediately in the income statement. Where the forecasted transaction results in the recognition of an asset or liability, the gains and losses previously included in other comprehensive income are included in the initial measurement of the asset or liability. Otherwise, amounts recorded in other comprehensive income are transferred to the income statement and classified as revenue or expense in the same period in which the forecasted transaction affects the income statement.

85Lonza Annual Report 2011
Certain derivative instruments, while providing effective economic hedges under the Group’s policies, do not qualify for hedge accounting. Changes in the fair value of any de-rivative instruments that do not qualify for hedge accounting are recognized immediately in the income statement.
When a hedging instrument expires or is sold, or when a hedge no longer meets the criteria for hedge accounting, any cumulative gain or loss existing in other comprehensive income at that time remains in equity and is recognized in the income statement, when the com-mitted or forecasted transaction is ultimately recognized in the income statement.
However, if a forecasted or committed transaction is no longer expected to occur, the cu-mulative gain or loss that was recognized in other comprehensive income is immediately transferred to the income statement.
The purpose of hedge accounting is to match the impact of the hedged item and the hedging instrument in the income statement. To qualify for hedge accounting, the hedging relation-ship must meet several strict conditions with respect to documentation, probability of occurrence, hedge effectiveness and reliability of measurement. At the inception of the transaction, the Group documents the relationship between hedging instruments and hedged items, as well as its risk management objective and strategy for undertaking vari-ous hedge transactions.
This process includes linking all derivatives designated as hedges to specific assets and liabilities or to specific firm commitments or forecasted transactions. The Group also docu-ments its assessment, both at the hedge inception and on an ongoing basis, as to whether the derivatives that are used in hedging transactions are highly effective in offsetting changes in fair values or cash flows of hedged items.
The fair value of derivatives (forward exchange contract, FX swaps, commodity swaps and interest rate swaps) is estimated by discounting the difference between the contractual forward price and the current forward price for the residual maturity of the contract us-ing a credit-adjusted risk free rate. Current forward prices are provided by banks or other financial service provider.
Property, plant and equipment Property, plant and equipment is stated at cost less ac-cumulated depreciation and accumulated impairment losses. The assets are depreciated on a component basis over their estimated useful lives, which vary from 10 to 50 years for buildings and structures, and 5 to 16 years for production facilities, machinery, plant, equipment and vehicles. Fixed assets are depreciated using the straight-line method over their estimated useful lives.
Subsequent expenditure incurred to replace a component of an item of property, plant and equipment that is accounted for separately, including major inspection and overhaul expen-diture, is capitalized. Other subsequent expenditure is capitalized only when it increases

86 Lonza Annual Report 2011
the future economic benefits embodied in the item of property, plant and equipment. Bor-rowing costs incurred with respect to qualifying assets are capitalized and included in the carrying value of the assets. All other expenditure is recognized in the income statement as an expense as incurred. The residual values and the useful life of items of property, plant and equipment are reviewed and adjusted, if appropriate, at each balance sheet date.
Lease Financial leases, which effectively constitute assets purchased with long-term financing, are carried as fixed assets at their purchase price and are written off over their estimated useful lives if the leased assets are transferred to the lessee at the end of the lease term. If there is no reasonable certainty that the lessee will obtain ownership by the end of the lease term, the asset is fully depreciated over the shorter of the lease term and its useful life. The corresponding liabilities are included in long-term and short-term debt. The finance lease gives rise to a depreciation expense for depreciable assets as well as a finance expense for each accounting period. For the purpose of classifying a lease of land and buildings, lease of the land and of the buildings are evaluated separately. Lease pay-ments under an operating lease are recognized as an expense in the income statement on a straight-line basis over the lease term.
Intangible assets Purchased intangible assets with a finite useful life are stated at cost less accumulated amortization and accumulated impairment losses. Intangibles include software, licenses, patents, trademarks and similar rights granted by third parties, capital-ized product development costs and capitalized computer software development costs. Costs associated with internally developed or maintained computer software programs are recognized as an expense as incurred. Costs that are directly associated with the production of identifiable and unique software products controlled by the Group, and that will probably generate future economic benefits exceeding costs beyond one year, are recognized as intangible assets. Those direct costs include the software development employee costs and an appropriate portion of relevant overheads. Intangible assets are amortized using the straight-line method over their estimated useful lives, which is the lower of the legal dura-tion and the economic useful life. Useful lives vary from 3 to 5 years for software, 5 to 30 years for patents, trademarks and similar rights and 4 to 16 years for development costs. All intangible assets in Lonza have finite useful lives, except for trademarks acquired in 2011 through the Arch business combination and 2007 through the Cambrex business combination. We consider that these trademarks have an indefinite useful life as they are well established in the respective markets and have a history of strong performance. The Group intends and has the ability to maintain these trademarks for the forseeable future.
Goodwill and business combinations Business combinations are accounted for using the acquisition method. The consideration transferred in a business combination is measured at fair value at the date of acquisition and includes the cash paid plus the fair value at the date of exchange of assets, liabilities incurred or assumed and equity instruments issued by the Group. The fair value of the consideration transferred also includes contingent consideration arrangements at fair value. Directly attributable acquisition-related costs are expensed in the current period and reported within administration and general overhead expenses. At

87Lonza Annual Report 2011
the date of acquisition, the Group recognizes the identifiable assets acquired, the liabilities assumed and any non-controlling interest in the acquired business. The identifiable assets acquired and the liabilities assumed are initially recognized at fair value. Where the Group does not acquire 100 % ownership of the acquired business, non-controlling interests are recorded as the proportion of the fair value of the acquired net assets attributable to the non-controlling interest. Goodwill is recorded as the surplus of the consideration transferred over the Group’s interest in the fair value of the acquired net assets. Any goodwill and fair value adjustments are recorded as assets / liabilities of the acquired business in the func-tional currency of that business. When the initial accounting for a business combination is incomplete at the end of a reporting period, provisional amounts are used. During the measurement period, the provisional amounts are retrospectively adjusted and additional assets and liabilities may be recognized to reflect new information obtained about the facts and circumstances that existed at the acquisition date which, had they been known, would have affected the measurement of the amounts recognized at that date. The measurement period does not exceed twelve months from the date of acquisition. Goodwill is not amor-tized, but is tested annually for impairment. Goodwill may also arise upon investments in associates, being the surplus of the cost of investment over the Group’s share of the fair value of the net identifiable assets.
Such goodwill is recorded within investments in associates. Changes in ownership inter-ests in subsidiaries are accounted for as equity transactions if they occur after control has already been obtained and if they do not result in a loss of control.
Inventories Inventories are reported at the lower of cost (purchase price or production cost) or market value (net realizable value). In determining net realizable value, any costs of completion and selling costs are deducted from the realizable value. The cost of invento-ries is calculated using the weighted average method. Prorated production overheads are included in the valuation of inventories. Adjustments are made for inventories with a lower market value or which are slow moving. Unsalable inventory is fully written off. Costs include all expenditures related directly to specific projects and an allocation of fixed and variable overheads incurred in the Group’s contract activities based on normal operating capacity.
Receivables Trade receivables are recognized at the original invoice amount less allow-ances made for doubtful accounts. An allowance is recorded for the difference between the carrying amount and the recoverable amount where there is objective evidence that the Group will not be able to collect all amounts due. A reconciliation of changes in the al-lowance accounts for credit losses is provided.
Financial assets Loans and advances and other financial assets are non-derivative finan-cial assets with fixed or determinable payments that are not quoted in an active market. They arise when the Group provides money, goods or services directly to a debtor with no intention of trading the receivable. They are classified as short-term with maturities not longer than 12 months and as long-term with maturities greater than 12 months after the balance sheet date. Loans and advances are carried at amortized costs using the effective

88 Lonza Annual Report 2011
interest method. Realized and unrealized gains and losses are recorded in the income state-ment in the period in which they arise. The Group derecognizes a financial asset when the contractual rights to the cash flows from the asset expire, or it transfers the rights to receive the contractual cash flows in a transaction in which substantially all the risk and rewards of ownership of the financial asset are transferred. Any interest in such transferred financial assets that is created or retained by the Group is recognized as a separate asset or liability.
Cash and cash equivalents Cash includes cash in hand, in postal and bank accounts, as well as short-term deposits and highly liquid funds which have an original maturity of less than three months.
Impairment Assets that are subject to amortization and depreciation are reviewed for im-pairment whenever events or changes in circumstances indicate that the carrying amount may not be recoverable. Goodwill and intangible assets with indefinite useful lives are tested for impairment annually, and whenever there is an indication that the assets may be impaired. An impairment loss is recognized for the amount by which the asset’s carrying amount exceeds its recoverable amount. The recoverable amount is the higher of an asset’s fair value less costs to sell and value in use. For the purposes of assessing impairment, assets are grouped at the lowest levels for which there are separately identifiable cash flows (cash generating units).
Calculation of recoverable amount – In assessing value in use, the estimated future cash flows are discounted to their present value using a pre-tax discount rate that reflects cur-rent market assessments of the time value of money and the risks specific to the asset.
Reversal of impairment – An impairment loss is reversed if the subsequent increase in recoverable amount can be related objectively to an event occurring after the impairment loss was recognized. An impairment loss in respect of goodwill is not reversed. In respect of other assets, an impairment loss is reversed if there has been a change in the estimates used to determine the recoverable amount. An impairment loss is reversed only to the extent that the asset’s carrying amount does not exceed the carrying amount that would have been determined, net of depreciation or amortization, if no impairment loss had been recognized.
Discontinued operations and non-current assets held for sale A discontinued operation is a component of the Group’s business that represents a separate major line of business or geographical area of operations or is a subsidiary acquired exclusively with a view to resale. Reclassification as a discontinued operation occurs upon disposal or when the operation meets the criteria to be classified as held for sale, if earlier.
A disposal group is a group of assets that are to be disposed of as a group in a single transaction, together with the liabilities directly associated with those assets that will be transferred in the transaction. The assets and liabilities in a disposal group are reclassified as held for sale if their carrying amount will be recovered principally through a sale rather than through continuing use. The disposal group must be available for sale in its present

89Lonza Annual Report 2011
condition and the sale must be highly probable. Immediately before classification as held for sale, the measurement of all assets and liabilities in a disposal group is updated in accordance with applicable accounting policies. Then, on initial classification as held for sale, disposal groups are recognized at the lower of carrying value and fair value less the cost of disposal. Impairment losses on initial classification as held for sale are included in the income statement.
Deferred taxes Tax expense is calculated using the balance sheet liability method. Ad-ditional deferred taxes are provided wherever temporary differences exist between the tax base of an asset or liability and its carrying amount in the consolidated accounts for the year.
Deferred tax assets and liabilities are recognized for the future tax consequences attribut-able to differences between the financial statement carrying amounts of existing assets and liabilities and their respective tax bases and operating loss and tax credit carry-forwards.
Deferred tax assets and liabilities are measured using substantially enacted tax rates in the respective jurisdictions in which Lonza operates that are expected to apply to taxable income in the years in which those temporary differences are expected to be recovered or settled. In assessing the recoverability of deferred tax assets, management considers whether it is probable that some portion or all of the deferred tax assets will not be realized. For transactions and other events recognized directly in other comprehensive income or in equity, any related tax effect is recognized in other comprehensive income or in equity.
Retirement benefits Most of Lonza’s subsidiaries operate their own pension plans. Gener-ally, they are funded by employees’ and employer’s contributions. The net asset or liability recognized in the balance sheet is the present value of the defined benefit obligation at the balance sheet date less the fair value of plan assets, together with adjustments for unrecognized actuarial gains or losses and past service gains and costs. A policy has been established whereby actuarial valuations are performed on a yearly basis. Actuarial gains and losses are recognized over a period not exceeding the expected remaining working lives of the participating employees if the accumulated gains and losses exceed the corridor of 10 % of the greater of plan assets and projected defined benefit obligation.
Termination benefits Termination benefits are payable when employment is terminated before the normal retirement date, or whenever an employee accepts voluntary redun-dancy in exchange for these benefits. The Group recognizes termination benefits when it is demonstrably committed to either: terminating the employment of current employees according to a detailed formal plan without possibility of withdrawal; or providing termina-tion benefits as a result of an offer made to encourage voluntary redundancy.
Employee benefit liability Employee benefit liabilities as stated in the consolidated bal-ance sheet include retirement benefits, other post-employment benefits (medical plans) as well as other long-term employee related liabilities, such as long-term vacation accounts.

90 Lonza Annual Report 2011
Provisions A provision is recognized in the balance sheet when (i) the Group has a legal or constructive obligation as a result of a past event, (ii) it is probable that an outflow of economic benefits will be required to settle the obligation and (iii) a reliable estimate of the amount of the obligation can be made. If the effect is material, provisions are determined by discounting the expected future cash flows at a pre-tax rate that reflects current market assessments of the time value of money and the risks specific to the liability.
A provision for restructuring is recognized when the Group has approved a detailed and formal restructuring plan, and the restructuring has either commenced or has been an-nounced publicly. Future operating costs are not provided for.
Provisions for environmental liabilities are made when there is a legal or constructive ob-ligation for the Group which will result in an outflow of economic resources. Provisions are made for remedial work, where there is an obligation to remedy environmental damage, as well as for containment work where required by environmental regulations.
Debt Debt instruments are initially recorded at cost, which is the proceeds received net of transaction costs. They are subsequently stated at amortized cost; any difference be-tween the net proceeds and the redemption value is recognized in the income statement over the period of the debt instrument using the effective interest method. Debt acquired as part of a business combination is initially recognized at its fair value.
Share capital Ordinary shares are classified as equity. Incremental costs directly at-tributable to the issue of new shares or options are shown in equity as a deduction, net of tax, from the proceeds. Where any Group company purchases Lonza Group Ltd’s equity share capital (treasury shares), the consideration paid, including any directly attributable incremental costs (net of income taxes), is deducted from equity attributable to the Group’s equity holders until the shares are cancelled, reissued or disposed of.
Dividend Dividend distribution to Lonza’s shareholders is recognized as a liability in the Group’s financial statements in the period in which the dividends are approved by the Lonza shareholders.
Share-based compensation The Group operates an equity-settled, share-based com-pensation plan. The fair value of the employee services received in exchange for the grant of shares and other share-based compensations is recognized as an expense. The total amount to be expensed over the vesting period is determined by reference to the fair value of the shares granted. At each balance sheet date, the entity revises its estimates of the number of shares that are expected to become exercisable. It recognizes the impact of the revision of original estimates, if any, in the income statement, and a corresponding adjustment to equity over the remaining vesting period.

91Lonza Annual Report 2011
Research and development Research and development costs are charged against income as incurred. Development costs are only capitalized when the related products meet the recognition criteria of an internally generated intangible asset, which mainly require the technical feasibility of completing the intangible asset, the probability of future economic benefits, the reliable measurement of costs and the ability and intention of the Group to use or sell the intangible asset. Fixed assets (buildings, machinery, plant, equipment) used for research purposes are valued similarly to other fixed assets. Such assets are capitalized and depreciated over their estimated useful lives. Expenses for research and development include associated wages and salaries, material costs, depreciation on fixed assets, as well as overhead costs.
Other operating income and other operating expenses Other operating income and other operating expenses include items not assignable to other functions of the consolidated income statement. They mainly include gains and losses from the disposal of intangible assets, property, plant and equipment and other non-current assets, income and expenses from the release and recognition of provisions, income and expense related to restructur-ing, gains and losses from currency-related operating derivative instruments as well as exchange rate gains and losses.
Net financing costs Net financing costs comprise interest payable on borrowings cal-culated using the effective interest method, the finance charge for finance leases, divi-dend income, foreign exchange gains and losses arising on financial assets and liabilities, gains and losses on hedging instruments that are recognized in the income statement and gain / losses of sale of financial assets. Interest income / expense is recognized in the income statement as it accrues, taking into account the effective yield of the asset or liability or an applicable floating rate. Dividend income is recognized in the income state-ment on the date that the dividend is declared.
Interest income and expense include the amortization of any discount or premium or other differences between the initial carrying amount of an interest-bearing instrument and its amount at maturity calculated on an effective interest rate basis.
Segment reporting IFRS 8 requires segment disclosure based on the components of the entity that management monitors in making decisions about operating matters. Such components (operating segments) are identified on the basis of internal reports that the entity’s chief operating decision maker (CODM) reviews regularly in allocating resources to segments and in assessing their performance. Lonza’s operating segments represent business sectors that offer different products and services.

92 Lonza Annual Report 2011
Principal Subsidiaries 1
In 2011, Lonza acquired Arch Chemicals Inc. to create the world’s leading Microbial Con-trol business. In 2010, Lonza entered the viral-based manufacturing market by acquiring Vivante GMP Solutions, Inc. (Houston, USA) and strengthened the Rapid Testing Solutions platform of its Bioscience division by acquiring MODA Technology Partners (Wayne, USA). The principal subsidiaries and joint ventures are shown on the following pages.
Lonza Companies Town / Country Purpose Currency 2 1 Share Capitalin 000
Holding direct
%
Holding indirect
%
Lonza Australia Pty Ltd Mt. Waverly, AU AUD 90 100 %Algonomics NV Gent, BE EUR 374 100 %Lonza Braine SA Braine-l’Alleud, BE EUR 40 000 100 %Lonza Verviers Sprl Verviers, BE EUR 19 100 %Lonza AG Visp, CH CHF 60 000 100 %Lonza Sales AG Basel, CH CHF 2 000 100 %Lonza Swiss Licences AG Basel, CH CHF 100 100 %Lonza BioPharma AG Visp, CH CHF 550 100 %Lonza Bioproducts AG Basel, CH CHF 100 100 %Lonza Engineering AG Basel, CH CHF 2 000 70 %TL Biopharmaceutical Ltd Visp, CH CHF 1 000 50 %
Lonza Finance Limited St. Helier, Jersey, GB
USD CHF
16335 100 %
Lonza Biotec sro Kour im, CZ CZK 282 100 100 %Lonza Guangzhou Ltd Guangzhou, CN USD 12 000 100 %Lonza Guangzhou Nansha Ltd Guangzhou, CN USD 135 500 100 %Lonza (China) Investments Co. Ltd Guangzhou, CN USD 75 500 100 %Lonza Guangzhou Research and Development Center Ltd Guangzhou, CN USD 4 100 100 %Lonza Liyang Chemical Company Ltd Liyang, CN USD 3 000 100 %Lonza Nanjing Ltd Nanjing, CN USD 14 000 100 %Lonza Group GmbH Waldshut-Tiengen, DE EUR 25 100 %Gewerbepark Hochrhein GmbH Waldshut-Tiengen, DE EUR 10 400 100 %Lonza Cologne GmbH Cologne, DE EUR 1 502 100 %Lonza Copenhagen ApS Vallensbaek Strand, DK DKK 150 100 %Lonza Biologics Porriño, S.L. Porriño, ES EUR 10 296 100 %Lonza Ibérica S.A.U. Barcelona, ES EUR 60 100 %Lonza Bioscience Sàrl Paris, FR EUR 8 849 100 %Lonza France Sàrl Levallois-Perret, FR EUR 132 100 %Lonza Biologics plc Slough, GB GBP 14 500 100 %Lonza Wokingham Limited Wokingham, GB GBP 1 100 %Lonza Group UK Limited Slough, GB GBP 17 000 100 %Lonza India Private Ltd Mumbai, IN INR 23 459 100 %Lonza Milano S.r.l. Treviglio, IT EUR 52 100 %Lonza Japan Ltd Tokyo, JP JPY 200 000 100 %Lonza Mexico S. de R.L. de C.V. Mexico City, MX MXN 3 100 %Lonza Europe BV Breda, NL EUR 19 100 %Lonza Benelux BV Breda, NL EUR 112 100 %OOO Lonza Rus Moscow, RU RUB 10 100 %
2
1 All companies belonging to Lonza Group are non-listed entities

93Lonza Annual Report 2011
Lonza Biologics Tuas Pte Ltd Singapore, SG
USDSGD
25 000172 000 100 %
Lonza Bioscience Singapore Pte Ltd Singapore, SG USD 1 100 %Lonza Holding Singapore Pte Ltd Singapore, SG USD 100 000 100 %Lonza Microbial Control Asia Pacific Pte Ltd Singapore, SG SGD 183 100 %Lonza America Inc. Allendale, US USD 8 100 %Lonza Inc. Allendale, US USD 697 100 %Lonza Biologics Inc. Portsmouth, US USD 1 100 %Lonza Walkersville Inc. Walkersville, US USD 1 100 %Lonza Rockland Inc. Rockland, US USD 1 100 %Lonza Houston Inc. Houston, US USD 1 100 %
Legacy Arch Companies Town / Country Purpose Currency 2 3 Share Capitalin 000
Holding direct
%
Holding indirect
%
Arch Chemicals, Inc. Norwalk, US USD 1 3 100 %Arch UK Biocides Limited Castleford, GB GBP 1 644 100 %Arch Quimica Brasil Ltda. Salto, BR BRL 30 388 100 %Hickson Limited Castleford, GB GBP 108 161 100 %Arch Water Products South Africa (Proprietary) Limited Kempton Park, SA ZAR 100 100 %Arch Treatment Technologies, Inc. Atlanta, US USD 4 100 %Arch Wood Protection, Inc. Atlanta, US USD 1 4 100 %Arch Chemicals (China) Co., Ltd Suzhou, CN CNY 5 100 %Arch Water Products France S.A.S. Amboise, FR EUR 460 100 %Arch Personal Care Products, L.P. South Plainfield, US USD 6 100 %Arch Chemicals Japan, Inc. Tokyo, JP JPY 4 100 %Arch Wood Protection (NZ) Limited Auckland, NZ NZD 6 100 100 %Arch Wood Protection (Aust) Pty Limited Trentham, AU AUD 4 100 %Arch Chemicals Limited Castleford, GB GPB 1 000 100 %Arch Wood Protection Canada Corp. Mississauga, CA CAD 4 100 %Arch Chemicals BV Swords, IE EUR 281 100 %
Research & Development
Production
Sales Office
Service / Financing
2 Abbreviation of currencies in accordance with ISO standards3 Rounded4 No par value or not provided by law5 No shares issued; capital is registered6 Limited partnership

94 Lonza Annual Report 2011
Business CombinationAcquisition of Arch Chemicals Inc.On 10 July 2011, Lonza entered into a merger agreement with Arch Chemicals Inc. (“Arch”) pursuant to which Lonza made a successful tender offer to purchase all of the shares of Arch for USD 47.20 per share in cash. As a result, Lonza acquired 100 % of the shares for a total cash consideration of USD 1.2 billion and Arch became a wholly owned subsidiary of the Group, effective 20 October 2011.
Arch is a global Biocides company and provides innovative, chemistry-based and related solutions to destroy or selectively inhibit the growth of harmful microorganisms. Arch is concentrated in the areas of water treatment, personal care, health and hygiene, industrial preservation and protection, and wood treatment. Arch operates in two segments: Biocides Products and Performance Products. Together with its subsidiaries, Arch has approximately 3 000 employees and manufacturing and customer-support facilities in North and South America, Europe, Asia, Australia and Africa.
The Arch business has been combined with Lonza’s existing Microbial Control business to create the new Lonza Microbial Control sector.
From 20 October 2011 to 31 December 2011, the acquired business contributed sales of CHF 187 million and a result from operating activities of CHF – 15 million to the Group. If the acquisition had occurred on 1 January 2011, Group sales in 2011 would have been CHF 3 759 million (+ CHF 1 067 million) and the Group result from operating activities CHF 319 million (+ CHF 58 million). These amounts were calculated using the Group’s accounting policies and by adjusting the results of the subsidiary to reflect the additional amortization and depreciation that would have been charged if the fair value adjustments to intangible assets and property, plant and equipment had applied from January 2011.
Net assets acquired and goodwill are shown as follows:
million CHF
Total purchase consideration 1 085Fair value of net assets acquired (388)Goodwill 697
The goodwill includes expected synergies from the acquisition, the labor force and intan-gible assets that could not be recognized separately. None of the goodwill recognized is expected to be deductible for income tax purposes. The acquisition has been accounted for using the acquisition method.
3
3.1

95Lonza Annual Report 2011
The following amounts of assets and liabilities acquired have been included in the financial statements:
million CHF
1 Assets and liabilities included at
acquisition date
Property, plant and equipment 227Intangible assets (customer relations, technologies, trademarks) 669Other non-current assets 32Investment in associates / joint ventures 2Deferred tax assets 34Inventories 242Trade receivables 141Other receivables, prepaid expenses and accrued income 40Tax receivables 12Cash and cash equivalents 167Total assets 1 566
Deferred tax liabilities (353)Long-term provisions (34)Other long-term liabilities and employee benefit obligations (233)Long-term debt (147)Other short-term liabilities (130)Taxes payable (1)Short-term debt (190)Trade payables (90)Total liabilities (1 178)
Fair value of net assets acquired 388Goodwill 697Cost of the business combination 1 085
Purchase consideration settled in cash 1 085Cash and cash equivalents of subsidiary acquired (167)Cash outflow on acquisition 918
The fair value of the trade receivables amounts to CHF 141 million. The gross amount of trade receivables is CHF 146 million. The fair value includes a deduction of CHF 5 million for trade receivables for which it is expected that the full contractual amounts cannot be collected.
Transaction costs of CHF 7 million have been expensed and are included in “Administration and general overheads”.
1 The fair values have been determined on a provisional basis.

96 Lonza Annual Report 2011
Acquisition of MODA Technology PartnersEffective 18 May 2010, Lonza Group acquired 100 % of the shares of MODA Technology Partners (“MODA”) for a cash consideration of CHF 24 million. MODA provides a mobile data acquisition platform that enables quality assurance and quality control organizations in the life-science industry to automate their regulated manufacturing processes, including environmental monitoring (EM), utility testing, and product testing. MODA is headquar-tered in Wayne, PA (USA), with authorized resellers and technology integration partners throughout North America. Lonza will integrate this company into its Bioscience segment.
From 18 May 2010 to 31 December 2010, the acquired business contributed sales of CHF 2.5 million and a result from operating activities of CHF – 0.3 million to the Group. If the acquisition had occurred on 1 January 2010, Group sales 2010 would have been CHF 2 681 million (CHF + 1 million) and the Group result from operating activities CHF 373 million (CHF – 0.4 million). These amounts were calculated using the Group’s accounting policies and by adjusting the results of the subsidiary to reflect the additional amortiza-tion that would have been charged if the fair value adjustments to intangible assets had applied from January 2010.
Net assets acquired and goodwill are shown as follows:
million CHF
Total purchase consideration 24.3Fair value of net assets acquired (3.9)Goodwill 20.4
The goodwill includes expected synergies from the acquisition, the labor force and intan-gible assets that could not be recognized separately. None of the goodwill recognized is expected to be deductible for income tax purposes. The acquisition has been accounted for using the acquisition method.
3.2

97Lonza Annual Report 2011
The following amounts of assets and liabilities acquired have been included in the financial statements:
million CHFAssets and
liabilities included at acquisition date
Intangible assets (technology, trademark) 6.1Trade receivables, net 0.6Other receivables, prepaid expenses and accrued income 0.1Other short-term liabilities (0.4)Deferred tax liabilities (2.5)Fair value of net assets acquired 3.9Goodwill 20.4Cost of the business combination 24.3
Purchase consideration settled in cash 24.3Cash and cash equivalents of subsidiary acquired 0.0Cash outflow on acquisition 24.3
Acquisition of Vivante GMP Solutions Inc.Effective 27 August 2010, Lonza Group acquired 100 % of the shares of Vivante GMP Solu-tions, Inc. (“Vivante”). The acquisition advances Lonza’s strategy to broaden its biologics custom service offering for the growing viral vaccine and gene therapy markets. Based in Houston, Texas, Vivante is a custom manufacturing organization dedicated to producing GMP viral-based therapeutics. The company’s viral-vaccine production services will be enhanced by Lonza’s established expertise in expression technologies and large-scale manufacturing platforms. Additionally, Vivante’s experience with pre-clinical through late-stage supply of viral-vector-based products will complement Lonza’s growing cellular and gene therapy process development and manufacturing capabilities. Lonza will integrate this company into its Bioscience segment.
The total purchase consideration was CHF 2.2 million, of which CHF 1.2 million was paid in cash and CHF 1 million arises from a contingent consideration arrangement. The pay-ment from this arrangement is based on the achievement of two separate performance milestones. A liability of CHF 1 million was recognized at the acquisition date, based on management’s best estimate of the expected cash outflow from the arrangement. As at 31 December 2010, the amount recognized for this arrangement was unchanged, based on the most recent management estimates. Vivante’s identified net liabilities were CHF 0.6 million, resulting in a goodwill of CHF 2.8 million.
3.3

98 Lonza Annual Report 2011
From 27 August 2010 to 31 December 2010, the acquired business contributed sales of CHF 1 million and a result from operating activities of CHF – 0.8 million to the Group. If the acquisition had occurred on 1 January 2010, Group sales would have been CHF 2 681 million (CHF + 1.5 million) and the Group result from operating activities CHF 373 million (CHF – 0.9 million). These amounts have been calculated using the Group’s accounting policies and by adjusting the results of the subsidiary to reflect the additional depreciation and amortization that would have been charged if the fair value adjustments to property, plant and equipment and intangible assets had applied from January 2010.
Acquisition of Non-controlling InterestsOn 15 February 2006, Lonza Group and Singapore’s Bio*One Capital announced the creation of a joint venture company, Lonza Biologics Tuas Pte Ltd, to build a large-scale mammalian cell culture facility in Singapore for the manufacture of commercial biopharmaceuticals. On 27 August 2008, Lonza acquired a further 20 % of the share capital, increasing its stake to 70 % and giving it full control of Lonza Biologics Tuas Pte Ltd. In 2008 Lonza granted to Bio*One a put option to sell its non-controlling interests of 30 % at a predetermined price. The present value of the future cash outflows from a potential exercise of the put option of CHF 60 million was recognized as a credit in financial liability and a debit to equity. In addition Bio*One granted Lonza a call option to acquire the non-controlling interests at a predetermined price.
On 15 December 2010, Lonza exercised its call option to acquire 30 % of the share capital of Lonza Biologics Tuas Pte Ltd from Bio*One Capital for CHF 57 million in cash, increasing its stake to 100 %. The group recognized a decrease in non-controlling interests of CHF 57 million. The acquisition of non-controlling interests resulted in the derecognition of the put-option Lonza granted to Bio*One Capital by derecognizing the financial liability related to the put-option against equity.
Restructuring and ImpairmentThe re-engineering project launched in 2009 resulted in charges to the consolidated income statement 2009 of CHF 141 million for impairments (CHF 83 million), write-down of invento-ries (CHF 22 million), restructuring costs (CHF 25 million) and environmental costs (CHF 11 million). In 2010, impairment losses of CHF 4 million for the Walkersville plant (Bioscience) and restructuring provisions of CHF 5 million, mainly related to the Conshohocken plant (Customer Manufacturing), were reversed; these are disclosed as “Other operating income”. Restructuring provisions were increased by CHF 9 million (Life Science Ingredients: CHF 6 million and Corporate: CHF 3 million) for which the related expenses are disclosed within
“Administration and general overheads”. The environmental provision of CHF 7 million for the Visp plant was reversed (Life Science Ingredients) and is reported as a deduction in
“Research and development” costs.
4
5

99Lonza Annual Report 2011
Property, Plant and Equipment
2011million CHF
Land Buildings and structures
Production facilities
Construction in progress
Total
CostAt 1 January 48 1 333 2 955 538 4 874Additions 1 0 6 241 248Disposals (3) (14) (26) (1) (44)Acquisition of subsidiaries 16 36 128 47 227Transfers / reclassification 0 129 325 (454) 0Currency translation differences 0 6 20 (18) 8At 31 December 62 1 490 3 408 353 5 313
Accumulated depreciation and impairmentAt 1 January (1) (590) (1 813) 0 (2 404)Depreciation charge 0 (50) (198) 0 (248)Disposals 0 13 25 0 38Currency translation differences 0 0 2 0 (2)At 31 December (1) (627) (1 984) 0 (2 612)Net carrying amount 31 December 61 863 1 424 353 2 701
Insurance value 31 December 0 1 371 4 602 159 6 132
2010million CHF
Land Buildings and structures
Production facilities
Construction in progress
Total
CostAt 1 January 56 1 362 3 031 556 5 005Additions 2 0 4 279 285Disposals (4) (32) (134) (1) (171)Acquisition of subsidiaries 0 0 1 0 1Transfers / reclassification 0 56 196 (252) 0Currency translation differences (6) (53) (143) (44) (246)At 31 December 48 1 333 2 955 538 4 874
Accumulated depreciation and impairmentAt 1 January (3) (587) (1 825) 0 (2 415)Depreciation charge 0 (48) (198) 0 (246)Disposals 1 29 131 0 161Reversal of impairment losses 0 4 0 0 4Currency translation differences 1 12 79 0 92At 31 December (1) (590) (1 813) 0 (2 404)Net carrying amount 31 December 47 743 1 142 538 2 470
Insurance value 31 December 0 1 166 3 494 56 4 716
In 2010, impairment losses of CHF 4 million recognized in 2009 for the Walkersville plant (Bioscience) were reversed, as a result of an improved market environment.
6
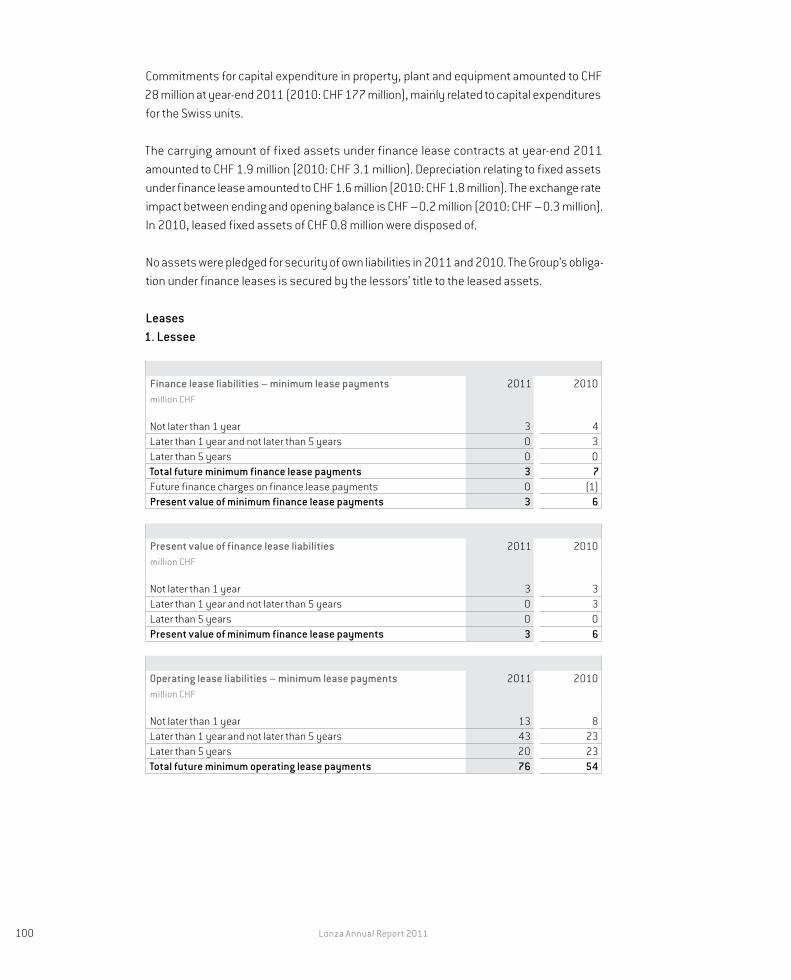
100 Lonza Annual Report 2011
Commitments for capital expenditure in property, plant and equipment amounted to CHF 28 million at year-end 2011 (2010: CHF 177 million), mainly related to capital expenditures for the Swiss units.
The carrying amount of fixed assets under finance lease contracts at year-end 2011 amounted to CHF 1.9 million (2010: CHF 3.1 million). Depreciation relating to fixed assets under finance lease amounted to CHF 1.6 million (2010: CHF 1.8 million). The exchange rate impact between ending and opening balance is CHF – 0.2 million (2010: CHF – 0.3 million). In 2010, leased fixed assets of CHF 0.8 million were disposed of.
No assets were pledged for security of own liabilities in 2011 and 2010. The Group’s obliga-tion under finance leases is secured by the lessors’ title to the leased assets.
Leases1. Lessee
Finance lease liabilities – minimum lease paymentsmillion CHF
2011 2010
Not later than 1 year 3 4 Later than 1 year and not later than 5 years 0 3 Later than 5 years 0 0 Total future minimum finance lease payments 3 7 Future finance charges on finance lease payments 0 (1) Present value of minimum finance lease payments 3 6
Present value of finance lease liabilitiesmillion CHF
2011 2010
Not later than 1 year 3 3 Later than 1 year and not later than 5 years 0 3 Later than 5 years 0 0 Present value of minimum finance lease payments 3 6
Operating lease liabilities – minimum lease paymentsmillion CHF
2011 2010
Not later than 1 year 13 8 Later than 1 year and not later than 5 years 43 23 Later than 5 years 20 23 Total future minimum operating lease payments 76 54

101Lonza Annual Report 2011
The finance lease agreements in 2011 and 2010 are related to buildings and production facilities in the USA expiring in 2012 and are based on an interest rate of 8.7 %. All leases are on a fixed repayment basis and no arrangements have been entered into for contingent rental payments. The fair value of the Group’s lease obligations approximates to their car-rying amount. The Group’s obligation under finance leases is secured by the lessors’ title to the leased assets.
Lonza leases a number of buildings, warehouses, factory and office facilities, vehicles, as well as land under operating leases. The leases for buildings, warehouses, factory and office facilities and vehicles run for periods between one and twelve years and for the land up to five years, all with an option to renew the lease after that date. None of the leases includes contingent rentals.
During the year ended 31 December 2011, CHF 11.4 million (2010: CHF 9.1 million) was recognized as an expense in the consolidated income statement in respect of operating leases, of which none was due to sublease payments.
The land and building elements of a lease of land and buildings were considered separately for the purpose of lease classification as outlined in IAS 17.
2. LessorThere is an operating lease for which Lonza acts as lessor. This lease falls within the scope of IAS 17 and IFRIC 4 guidance. It consists primarily of a biopharmaceutical manufacturing facility in Visp. The future minimum lease payments under non-cancelable operating leases are zero, because the lease payments are pre-financed by the customer.

102 Lonza Annual Report 2011
Intangible Assets and GoodwillCost and Accumulated Amortization and Impairment
2011million CHF
Goodwill Patents, trademarks,
client relationship
Computer software
Development cost
Construction in progress
Total
CostAt 1 January 417 293 75 13 8 806Additions 0 10 7 0 2 19Disposals 0 0 (2) 0 0 (2)Acquisition of subsidiaries 697 596 3 70 0 1 366Transfers / reclassification 0 0 0 7 (7) 0Currency translation differences 25 24 0 3 0 52At 31 December 1 139 923 83 93 3 2 241
Accumulated amortization and impairmentAt 1 January (7) (86) (52) (7) 0 (152)Amortization 0 (16) (10) (2) 0 (28)Disposals 0 0 2 0 0 2Transfers / reclassification 0 0 0 0 0 0Currency translation differences 0 0 0 (1) 0 (1)At 31 December (7) (102) (60) (10) 0 (179)Net carrying amount 31 December 1 132 821 23 83 3 2 062
2010million CHF
Goodwill Patents, trademarks,
client relationship
Computer software
Development cost
Construction in progress
Total
CostAt 1 January 453 318 61 15 6 853Additions 0 1 11 0 3 15Disposals 0 (1) (1) 0 0 (2)Acquisition of subsidiaries 23 6 0 0 0 29Transfers / reclassification 0 (6) 6 0 0 0Currency translation differences (59) (25) (2) (2) (1) (89)At 31 December 417 293 75 13 8 806
Accumulated amortization and impairmentAt 1 January (8) (72) (47) (6) 0 (133)Amortization 0 (14) (11) (2) 0 (27)Disposals 0 1 1 0 0 2Transfers / reclassification 0 (6) 6 0 0 0Currency translation differences 1 5 (1) 1 0 6At 31 December (7) (86) (52) (7) 0 (152)Net carrying amount 31 December 410 207 23 6 8 654
7
7.1

103Lonza Annual Report 2011
Intangible assets include software purchased from third parties, related software imple-mentation costs, as well as patents, trade marks, client relationships acquired and devel-opment costs. Their amortization is included in the line item “Administration and general overheads” of the consolidated income statement. Construction in progress includes capi-talized development costs of the Bioscience segment.
Patents, trade marks and client relationships include intangible assets with indefinite useful lives of CHF 369 million (2010: CHF 25.5 million).
Impairment Tests for Cash-generating Units Containing Goodwill and Intangible Assets with Indefinite Useful Life
The following units show carrying amounts of goodwill (at year-end exchange rates):
million CHF2011 2010
Lonza Biologics (Biopharmaceuticals business) 26 25Lonza Guangzhou (Nicotinates business) 4 4Lonza Inc. Microbial Control (Biocidal Quats business) 8 8Lonza Braine SA (Peptide business) 35 36Lonza Bioscience 333 337Arch (Microbial Control business) 726 0Total carrying amounts of goodwill 1 132 410
The following units show carrying amounts of intangible assets (trademarks) with indefinite useful life (at year-end exchange rates):
million CHF2011 2010
Lonza Bioscience 25 25Arch (Microbial Control business) 344 0Total carrying amounts of intangible assets with indefinite useful life 369 25
The change in the carrying amounts of goodwill and intangible assets with indefinite use-ful life between 2011 and the previous year results primarily from the acquisition of Arch, acquired on 20 October 2011, representing the Microbial Control business.
7.2

104 Lonza Annual Report 2011
The recoverable amount of the above cash-generating units is based on the value-in-use calculation. The cash flow projections include the actual operating results and a five-year business plan approved by management. These cash flow projections are based on the yearly business strategy review and exclude any future cash inflows and outflows expected to arise from growth potential of future capital expenditures.
The key assumptions and the approach to determining the recovery value of the cash-generating units are based on the following:
The Biopharmaceutical business is primarily located in the United States as well as in Great Britain. Sales are based on existing contracts and planned utilization of equipment based on customer demand over the five-year period. Prices are as per contracts realized and are assumed to stay at current levels. Cost developments are based on individual assumptions per cost element. Personnel costs are assumed to increase on average by 4.4 % p.a. and the other expenses by 3.6 % p.a. The cash flow projections beyond the five-year period are based on a zero growth rate. A pre-tax discount rate of 7.5 % (2010: 8.6 %) has been used in discounting the projected cash flows. Management believes that any reasonably possible change in the key assumptions on which the recoverable amount is based would not cause the carrying amount to exceed its recoverable amount.
The Nicotinates (vitamin B3) business plan relates to the site in Guangzhou in China. The cash flow projections are based on a strong decrease in gross margin in 2012 and a slight decrease in 2013, due to an expected decrease in selling price, and thereafter an unchanged margin until 2016. According to the strategy review for the nicotinates market, sales volume will be assumed to grow by 2.0 % p.a. The cash flow projections beyond the five-year period are extrapolated using a zero growth rate due to limitation of capacity. The cash flows are discounted at a pre-tax discount rate of 12.5 % (2010: 10.6 %). Management believes that any reasonably possible change in any of these key assumptions would not cause the carrying amount to exceed the recoverable amount of this business.
The Biocidal Quats business is located in the United States. The cash flow projections are based on constant expected gross margins during the five-year planning period, with a 3.0 % p.a. increase in sales. Selling price changes are assumed to offset changes in raw material prices. Overhead costs are anticipated to grow in line with sales from 2012 – 2016. No major regulatory changes will have an unfavorable impact on the volumes. Management believes this to be a fair and reasonable assumption. The cash flow projections beyond the five-year period are extrapolated using a zero growth rate. The cash flows are discounted at a pre-tax discount rate of 10.0 % (2010: 10.0 %). Management believes that any reasonably possible change in any of these key assumptions would not cause the carrying amount to exceed the recoverable amount of this business.

105Lonza Annual Report 2011
The Peptides business represents the cash-generating unit of Lonza Braine SA, Belgium, including Lonza Sales Ltd, Switzerland. Sales are projected on the current portfolio of pep-tides, with production costs varying in line with sales increase. From 2012 until 2016, sales are assumed to grow on average by 8.6 % p.a. Fixed costs are planned to be reduced by 2.2 % in 2012, kept constant for the following two years and increased by 5.0 % in 2015. The cash flow projections beyond the five-year period are extrapolated using a zero growth rate (2010: 0 %). The cash flows are discounted at a pre-tax discount rate of 9.8 % (2010: 8.7 %), resulting in a recoverable amount exceeding the carrying amount by CHF 26 million. If sales grew at a 1.0 %-point-lower yearly growth rate over the five-year period, or if the pre-tax discount rate were 1.6 % points higher, the recoverable amount would agree with the carrying amount.
The Bioscience business includes the Cambrex Corporation, acquired on 6 February 2007, the amaxa business, acquired on 2 July 2008, which was integrated into the Cell Discovery business, as well as MODA Technology Partners and Vivante GMP Solutions, acquired on 18 May 2010 and 27 August 2010 respectively. MODA Technology Partners was integrated in the Testing Solutions business and Vivante GMP Solutions in the Cell Therapy business. Therefore, the impairment analysis is based on the combined cash-generating unit of the Bioscience segment. The cash flow projections from 2012 – 2016 are based on a 11.9 % average sales growth with growing EBIT margin, as the Bioscience segment is operating in growing markets and economic recovery continues on a low level. The cash flow projections beyond the five-year period are extrapolated using a 0.5 % growth rate (2010: 0.5 %), which is in line with the current business strategy review. The cash flows are discounted at a pre-tax discount rate of 7.8 % (2010: 7.6 %) what results in a recoverable amount exceeding the carrying amount. If sales grew at a 0.9 %-point-lower yearly average growth rate over the five-year period, or if the pre-tax discount rate were 1.6 % points higher, the recoverable amount would agree with the carrying amount.
The Microbial Control Business includes Arch Chemicals, acquired on 20 October 2011. The impairment analysis is based on the combined cash-generating unit comprising all Arch subsidiaries. The cash flow projections from 2012 – 2016 are based on the target 2012 and on a 2 % growth rate in sales and overhead for the following four years. The operating margins are kept constant over the planning period. The cash flow projections beyond the five-year period are extrapolated using a zero growth rate. The cash flows are discounted at a pre-tax discount rate of 7.9 %. Management believes that any reasonably possible change in any of these key assumptions would not cause the carrying amount to exceed the recoverable amount of this business.

106 Lonza Annual Report 2011
Investments in Associates and Joint VenturesAssociatesLonza holds a 31 % stake in Aravis Ventures I, L.P., an international venture capital fund under Cayman Islands jurisdiction focusing on early-stage companies in biotechnology and drug development industry sectors. The total capital commitment of Lonza in Aravis Ventures is USD 18.2 million of which USD 17.9 million (2010: USD 17.7 million) was drawn up until 31 December 2011. The investment in Aravis Venture I, L.P. is accounted for using the equity method.
In Lonza’s 2011 financial statements, the investment in the associate relating to Aravis Ventures I, L.P. amounted to CHF 11.4 million (2010: CHF 19.0 million). The net capital con-tribution to Aravis Venture was CHF 0.3 million in 2011 (2010: CHF 0.8 million). An equity loss of CHF 4.9 million in 2011 (2010: equity income of CHF 4.0 million) and a currency loss of CHF 2.9 million (2010: currency gain of CHF 1 million) were disclosed.
In addition, Lonza holds a 33 % stake in Hemel Emprenye Sanayi de Ticaret A.S. (Turkey), acquired through the Arch business combination. The investment as of 31 December 2011 amounts to CHF 0.6 million. No equity income or loss was recognized in Lonza’s financial statements 2011.
Joint VenturesTL Biopharmaceutical LtdOn 14 May 2009, the Biotechnology company TL Biopharmaceutical Ltd, a joint venture between Lonza and Teva, was established to develop, manufacture and market a portfolio of biosimilars. Through this joint venture, Lonza and Teva will bring together highly comple-mentary capabilities to reach a leading position in the emerging biosimilars market. The company received a capital injection of CHF 0.5 million from both parties. Lonza recognized its interest in the joint venture using the equity method. In 2009, the original investment in TL Biopharmaceutical Ltd was entirely offset by an equity loss of CHF 0.5 million.
In 2011 an equity loss of CHF 8.8 million (2010: CHF 4.8 million) was recognized. The equity loss is recognized as value adjustment to the loan, as the loan partially has the substance of an equity contribution. As of 31 December 2011, Lonza financed the joint venture with a loan of CHF 66.4 million (2010: CHF 44.5 million) nominal value, of which CHF 9.9 million is subordinated.
The sales of goods and services from Lonza to TL Biopharmaceutical Ltd in 2011 amounted to CHF 34.6 million (2010: CHF 25 million).
8
8.1
8.2

107Lonza Annual Report 2011
The following aggregate amounts were disclosed for Lonza’s interest in TL Biopharmaceutical Ltd:
million CHF2011 2010
Current assets 0.3 0.1Fixed assets 72.2 46.5Current liabilities 19.6 7.2Long-term liabilities 66.5 44.3Revenues 0.0 0.0Profit / (loss) (8.8) (4.5)
According to the joint venture agreement as of January 2009, each party agreed on minimum contributions (as a subscription for company securities or as a loan) for the following years:2012: USD 68 million2013: USD 84 million
Proteccion de Madera LtdaThrough the business combination with Arch, Lonza acquired a 50 % stake in Proteccion de Madera Ltda (Chile). The investment as of 31 December 2011 amounts to CHF 1.6 million. An equity income of CHF 0.15 million was recognized in Lonza’s financial statements 2011.
Inventories
million CHF %
2011 %
2010
Raw materials 21 164 18 89 Work in progress 7 56 10 48 Finished goods 56 434 51 252 Other 16 119 21 106 Total 100 773 100 495
By operating segmentsmillion CHF %
2011 %
2010
Custom Manufacturing 38 289 55 270 Life Science Ingredients 21 164 28 141 Microbial Control 35 273 8 41 Bioscience 6 47 9 43 Total 100 773 100 495
The reported inventories are net of a total value adjustment amounting to CHF 57 million (2010: CHF 57 million).
9

108 Lonza Annual Report 2011
The movement of inventory value adjustments is shown as follows:
Inventory write-downsmillion CHF
Raw materials
Work in progress
and finished goods
Other Total
At 1 January 2011 10 19 28 57 Increase 26 52 4 82 Reversal / Utilization of write-downs (27) (52) (3) (82)Currency translation differences 0 0 0 0 At 31 December 2011 9 19 29 57
The cost of inventories recognized as expenses during the period and included in “Cost of goods sold” amounted to CHF 1 840 million (2010: CHF 1 795 million).
Development contracts In the Custom Manufacturing segment, the percentage of comple-tion method was applied to accounting for development contracts as well as a long-term manufacturing contract with the economic substance of a construction contract. The stage of completion is estimated on the basis of costs incurred, compared with total forecasted costs. This accounting method is applied only to customer contracts with defined payment and delivery dates. Contract costs are usually recognized as an expense in the income statement in the accounting periods in which the work is performed. An expected excess over total contract revenue for the contract is recognized as an expense as soon as it is apparent that total contract costs may exceed total contract revenue.
million CHF2011 2010
Contract revenue recognized as revenue in the period 66 36
– Contract costs incurred 23 22 – Recognized profits less recognized losses 20 11
Contract costs incurred plus recognized profits less recognized losses 43 33 Less progress billings (9) (10)Total net amount due from / (to) customers 34 23
Gross amount due from customers for contract work 34 23Gross amount due to customers for contract work 0 0
Advances received 8 33Retentions held by customers for contract work 0 0

109Lonza Annual Report 2011
Trade Receivables
million CHF2011 2010
Receivables from customers 697 490 Allowances for credit losses (2) (2)Total 695 488
The credit risk is diversified due to the large number of entities comprising the Lonza cus-tomer base and the dispersion across many different industries and regions. Management has a credit policy in place and the exposure to credit risk is monitored on an ongoing basis. At 31 December 2011, there were no significant concentrations of credit risk. The maximum exposure to credit risk is equal to the carrying amounts.
Ageing of trade receivablesmillion CHF
2011 2010
Not past due 601 401Past due 1 – 30 days 69 47Past due 31 – 120 days 12 30Past due more than 120 days 13 10Total 695 488
Reconciliation of changes in allowance accounts for credit lossesmillion CHF
2011 2010
Balance at the beginning of the year 2 6 Write-offs (1) (4)Increase in provision for credit losses 2 2 Decrease in provision for credit losses (1) (2)Translation differences 0 0 Balance at the end of the year 2 2
In general, Lonza does not require collateral in respect of trade and other receivables, but uses credit insurance for country risk where appropriate.
10

110 Lonza Annual Report 2011
Other Receivables, Prepaid Expenses and Accrued Income
million CHF2011 2010
Other receivables 99 98 Prepaid taxes and social security payments 7 7 Prepaid expenses and accrued income 79 65 Total 185 170
“Other receivables” include accruals and receivables for taxes (other than income taxes), the positive fair values of derivative financial instruments and short-term financial assets available for sale (see note 31).
Cash and Cash Equivalents
million CHF2011 2010
Cash 186 237 Time deposits 10 11 Total 196 248
Provisions
Long-term provisions million CHF
Environ-mental
Restruc- turing
Other Total
At 1 January 2011 14 1 4 19Increase 0 0 0 0Used (1) 0 0 (1)Reversed 0 0 (1) (1)Acquisition of subsidiaries 33 0 1 34Reclassification (to short-term provisions) (1) (1) 0 (2)Currency translation differences 2 0 0 2At 31 December 2011 47 0 4 51
Short-term provisions (see note 15)million CHF
Environ-mental
Restruc- turing
Other Total
At 1 January 2011 2 3 1 6Increase 0 1 0 1Used 0 (2) 0 (2)Reversed (1) (1) 0 (2)Acquisition of subsidiaries 1 2 0 3Reclassification (from long-term provisions) 1 1 0 2Currency translation differences 0 (1) 0 (1)At 31 December 2011 3 3 1 7
11
12
13

111Lonza Annual Report 2011
Environmental The long-term environmental provision reflects the future expenses for environmental protection for the plants in Waldshut (Germany), in Visp (Switzerland), Lonza Inc. (USA) as well as for the various Arch plants and is expected to be utilized within 10 years. The provision for Arch includes environmental risks for existing as well as divested plants. Long-term environmental provisions were used for Lonza Inc. (USA) (CHF 1 million) and short-term provisions for the Visp plant were reversed (CHF 1 million).
Restructuring In 2011, restructuring provisions of CHF 2 million related to the re-engi-neering project launched in 2009 were used. Minor restructuring activities in a variety of locations in Lonza Group led to an increase of CHF 1 million. The increase in provisions (CHF 2 million) as a result of the acquisition of subsidiaries reflects restructuring activities of Arch independent of the merger with Lonza.
Other Other long-term provisions are mainly associated with asset retirement obligations of Lonza Biologics Tuas PTE Ltd. (CHF 2 million) and Arch (CHF 1 million). Provisions for develop-ment costs at Gewerbepark Hochrhein GmbH (CHF 1 million) were reversed.
Net Debt The net debt comprises:
Long-term debtmillion CHF
2011 2010
Straight bond (2009 – 2013) 299 298 Straight bond (2010 – 2016) 398 397 Straight bond (2011 – 2015) 238 0 Straight bond (2011 – 2018) 138 0 Syndicated loan (2011 – 2016) 491 0 Arch acquisition bridge financing 861 0
Due to banks and others:– Banks 14 16 – Other 286 300 136 152
Leasing 0 3 Total long-term debt 2 725 850
Straight bond (2009 – 2013) On 28 April 2009, a bond was issued with the following terms: Amount: CHF 300 million, due 27 May 2013. Interest: 3.75 % p.a. payable on 27 May. The net proceeds of the bond amount to CHF 297.0 million per 27 May 2009 after considering upfront fees of CHF 3.770 million and an agio of CHF 0.750 million.
Straight bond (2010 – 2016) On 2 June 2010, a bond was issued with the following terms: Amount CHF 400 million, due 2 June 2016; interest 3.00 % p.a., payable on 2 June, for the first time on 2 June 2011. The net proceeds of the bond amount to CHF 396.9 million as of 2 June 2010 after considering up-front fees of CHF 5.970 million and an agio of CHF 2.884 million.
14

112 Lonza Annual Report 2011
The Syndicated loan of CHF 500 million, which became due for repayment in December 2011, was refinanced by signing a new syndicated loan with a consortium of banks based on the following terms: Credit facility of CHF 700 million, of which CHF 500 million was used as of 31 December 2011, due 9 September 2016, at floating interest rates (libor + margin, depending on margin grid). Lonza hedged the interest rate until 13 February 2012. The net proceeds of the syndicated loan amount to CHF 490.9 million after considering up-front fees of CHF 9.1 million.
Acquisition bridge financing The acquisition of Arch is completely debt-financed. A consor-tium of banks committed credit facilities of USD 1 550 million to Lonza, of which USD 1 375 million was raised in October 2011 to acquire the Arch shares and prepay part of the debt. The facilities are at floating interest rates (libor + margin, depending on margin grid). The first facility would have been originally repayable in June 2012 (USD 450 million) and the other facilities are repayable in March 2013 (USD 500 million) and October 2014 (USD 425 million). USD 412 million of the facility due in 2012 (USD 450 million) was repaid in December 2011 and refinanced by the issuance of two straight bonds on the following terms: – CHF 240 million, due 7 December 2015. Interest: 2.25 % p.a., payable on
7 December, for the first time on 7 December 2012. The net proceeds of the bond amount to CHF 238.1 million per 7 December 2011, after considering up-front fees of CHF 3.001 million and an agio of CHF 1.131 million.
– CHF 140 million, due 7 December 2018. Interest: 3.125 % p.a., payable on 7 December, for the first time on 7 December 2012. The net proceeds of the bond amount to CHF 138.2 million per 7 December 2011, after considering upfront fees of CHF 2.615 million and an agio of CHF 0.780 million.
The syndicated loan as well as the acquisition bridge financing agreements contain a fi-nancial covenant which is based on net debt / EBITDA ratio. The Group is in compliance with the covenant.
Short-term debt million CHF
2011 2010
Due to banks and other financial institutions 127 45 Arch acquisition bridge financing 36 0 Others 10 3 Leasing 3 3
Long-term debt due within one year– Syndicated loan (2006 – 2011) 0 499
Total short-term debt 176 550
Total debt
2 901 1 400

113Lonza Annual Report 2011
Loans and advances (floating interest rates) and cashmillion CHF
2011 2010
Long-term loans and advances (56) (43)Short-term loans and advances (2) (1)Cash and cash equivalents (196) (248)Total loans and advances / cash and cash equivalents (254) (292)
Net debt
2 647 1 108
Loans and advances increased in 2011 compared with the prior year, mainly due to the loan granted to the TL Biopharmaceutical Ltd joint venture.
Breakdown of total debt by currenciesmillion CHF
2011 2010Average interest
rates %
%
Average interest
rates %
%
CHF 2.91 54 1 580 3.19 85 1 199 CNY 6.50 1 19 4.37 1 16 EUR 0.00 0 0 1.45 0 1 USD 2.63 45 1 296 2.15 13 175 Other 0.90 0 6 0.90 1 9 Total 100 2 901 100 1 400
Breakdown of loans and advances by currenciesmillion CHF
2011 2010Average interest
rates %
%
Average interest
rates %
%
CHF 1.00 2 1 0.00 0 0 GBP 1.00 2 1 1.05 2 1 USD 1.80 96 56 1.95 98 43 Total 100 58 100 44
Interest rates are floating rates.

114 Lonza Annual Report 2011
Other Short-term Liabilities
million CHF2011 2010
Short-term provisions (see note 13) 7 6 Accrued liabilities and other payables 273 201 Other interest-free liabilities 152 128 Accrued interest payables 20 16 Total 452 351
“Accrued liabilities and other payables” include accruals and deferred income, such as down-payments from customers and the negative fair values of derivative financial instru-ments (see note 31). In “Other interest-free liabilities”, payments received from customer funding are included. The increase in “Other interest-free liabilities” is due to the increase of personnel related liabilities for severance payments and accruals for salaries and vacation.
Trade Payables
million CHF2011 2010
Payables to third parties 294 159 Total 294 159
“Payables to third parties” principally comprise amounts outstanding for trade purchases and ongoing costs. The carrying amount of trade payables approximates to their fair value.
Contingent LiabilitiesNo contingent liabilities exist for 2011 and 2010.
Material and Energy Costs
million CHF2011 2010
Material costs 914 855 Energy costs 85 87 Total 999 942
15
16
17
18

115Lonza Annual Report 2011
Personnel Expenses
million CHF2011 2010
Wages and salaries 654 644 Pensions (IAS 19) 26 23 Other social security contributions 123 130 Other personnel expenses 52 26 Total personnel cost 855 823
Other Operating Income and Expenses“Other operating income” and “Other operating expenses” include items not assignable to the other functions of the consolidated income statement.
Major elements of “Other operating income” in 2011 include: compensation from local authorities for the relocation of the Lyiang (CN) plant, exchange rate gains, amortization of customer-funded assets and reversal of provisions. “Other operating expenses” in 2011 comprise mainly exchange rate losses and increase of provisions.
Major elements of “Other operating income” in 2010 include: milestone payments received from Genentech, the gain on sale of the Conshohocken (Riverside) plant, exchange rate gains, amortization of customer-funded assets and reversal of provisions. “Other operat-ing expenses” in 2010 comprise mainly exchange rate losses and increase of provisions.
Financial ResultInterest and Other Financial Income
million CHF2011 2010
Interest income 4 5 Other financial income 14 1 Total 18 6
19
20
21
21.1

116 Lonza Annual Report 2011
Interest and Other Financial Expenses
million CHF2011 2010
Interest expenses (49) (40)Other financial expenses (42) (9)Total (91) (49)
In 2011, “Other financial expenses” include financing cost as well as currency differences and the cost for the secondary listing of Lonza’s shares on the Singapore stock exchange.
“Other financial expenses” in 2010 are primarily composed of financing costs and currency differences.
“Other financial income” includes mainly currency differences.
Income from Investments, Associates and Joint Ventures
million CHF2011 2010
Share of (loss) / profit of associates / joint ventures (13) (1)Other investment income / (loss) 0 0 Total (13) (1)
“Share of (loss) / profit of associates / joint ventures” in 2011 comprises a loss of CHF 4.9 mil-lion (2010: income of CHF 4.0 million) from Aravis Ventures I, L.P., and a loss of CHF 8.8 million (2010: CHF 4.8 million) from the TL Biopharmaceutical Ltd joint venture.
TaxesIncome Taxes
Major components of tax expensesmillion CHF
2011 2010
Current taxes (26) (32)Deferred tax expense relating to the origination and reversal of temporary differences 5 (15)Deferred tax (expense) / income resulting from tax rate changes 0 1 Total (21) (46)
Lonza Group Ltd and the operating company Lonza Ltd are domiciled in Switzerland. The maxi-mum rate of all income taxes on companies domiciled in Switzerland is 8 % (2010: 8 %) for holding companies and 23 % for operating companies (2010: 23 %).
21.2
21.3
22
22.1

117Lonza Annual Report 2011
Since the Group operates across the world, it is subject to income taxes in many different tax jurisdictions. Lonza calculates the average tax rate as a weighted average of the rates apply-ing in the tax jurisdictions in which it operates. The average tax rate for 2011 is 21 % (2010: 21 %). The effective tax rate for 2011 is 12 % (2010: 14 %). The change of the tax rate reflects the capitalization of tax incentives in Europe as deferred tax assets, other tax-free income in Asia, Europe and Switzerland, and the first time recognition of deferred tax assets on tax losses in the USA based on a reassessment in relation with the acquisition of Arch Chemicals Inc. (CHF 29 million).
Reconciliation of tax expensemillion CHF
2011 2010
Profit before income taxes 175 330
Tax at the domestic rates applicable to the profits earned in the country concerned (2011: 21 % / 2010: 21 % ) 37 68Expenses that are not deductible for tax purposes 2 4 Tax-free earnings (19) (27) Deferred tax benefit from tax rate changes 0 (1) Under- / (overprovided) in prior years 0 (1)Not recognized potential deferred tax assets of current year 3 2Other 1 (2) 1 Total 21 46
Deferred tax expenses (charged) / credited directly to equity 0 0 Current tax expenses (charged) / credited directly to equity 0 7
Capital taxes of CHF 11 million (2010: CHF 10 million) are contained in “Administration and general overheads”.
Components of deferred income tax balancesmillion CHF
Assets2011
Liabilities Assets
1 2010Liabilities
Short-term operating provisions 23 124 2 12 Long-term operating provisions / Employee benefit liability 176 225 46 106 Intangible assets 2 285 1 18 Inventory 19 56 1 24 Property, plant and equipment 2 182 2 172 Other assets 18 0 13 0 Tax loss carry-forwards 88 0 49 0 Netting of deferred tax assets and deferred tax liabilities (IAS 12.74b) (161) (161) (11) (11)Total 167 711 103 321
1 The table has changed in 2011 and 2010 information was adjusted accordingly

118 Lonza Annual Report 2011
The components of deferred income tax balances are included in the following cap-tions in the balance sheet:
million CHF2011 2010
Deferred tax assets 167 103 Deferred tax liabilities (711) (321)Net deferred tax liability (544) (218) Less deferred tax (assets) / liabilities net opening balance 218 202 (Increase) / decrease in deferred tax liabilities, net (326) (16) Currency translation differences 12 (1) Acquisition of subsidiaries 319 3 Movements of deferred tax assets / (liabilities) charged to equity 0 0 (Expense) / income recognized in income statement 5 (14)
Unrecognized tax losses: expirymillion CHF
2011 2010
Within 1 year 1 10 Between 2 to 5 years 20 7 After 5 years 264 84 Unlimited 77 108 Total 362 209
In assessing whether it is probable that future taxable profit will be available against which the Group can utilize the potential benefit of tax loss carry-forwards, management consid-ers a portion of such benefits to be recoverable on the basis of the current situation of the company and the future economic benefits outlined in specific business plans for each relevant subsidiary.
Disclosure of Tax Effects to each Component of Other Comprehensive Income
million CHF2011 2010
Before-tax amount
Tax (expense) benefit
Net-of-tax amount
Before-tax amount
Tax (expense) benefit
Net-of-tax amount
Exchange differences on translating foreign operations (14) 0 (14) (230) 7 (223)Cash flow hedges 7 0 7 8 0 8 Other comprehensive income (7) 0 (7) (222) 7 (215)
22.2

119Lonza Annual Report 2011
Research and Development Research and development costs include all primary costs directly related to this function, as well as internal services and imputed depreciation. These costs are incurred for: – Development of new products and services – Improvement of existing products and services – Development of new production processes – Improvement of existing production processes – Cost for patents – Purchase price for product and process know-how
as far as it has not been capitalized
The research and development costs amounted to CHF 171 million (2010: CHF 141 million) and represent the full range of R&D activity. However, the consolidated income statement discloses research and development costs of only CHF 94 million (2010: CHF 99 million), because of costs absorbed in “Cost of goods sold” by R&D products and services sold.
Pension Benefits Defined benefit pension plans Lonza sponsors pension plans set up according to the regulations of the countries in which it operates. For pension accounting purposes, these plans are considered as defined benefit plans. During 2011, actuarial valuations were performed for all significant defined benefit plans using the Projected Unit Credit Valuation Method. The principal assumptions, expressed as a weighted average for Lonza, are the result of the underlying national economic conditions of the respective countries.
Actuarial assumptions %
2011 2010
Discount rate 3.4 2.9Expected return on plan assets at 1 January 4.2 4.5Future salary increases 2.1 2.1Future pension increases 0.5 0.2
Assumptions regarding future mortality are based on published statistics and mortality tables. The average life expectancy of an individual retiring at age 65 is 18 for males and 21 for females.
The overall expected long-term rate of return on assets is 4.2 % (2010: 4.5 %). The expected long-term rate of return is based on the portfolio as a whole and not on the sum of the returns on individual asset categories. The return is based exclusively on historical returns, without adjustments.
23
24

120 Lonza Annual Report 2011
The funded status of the defined benefit pension plans and the related net position in the balance sheet is as follows:
million CHF2011 2010
Present value of unfunded obligations 19 16Present value of funded obligations 2 375 1 592Total present value of obligations 2 394 1 608Fair value of plan assets (2 001) (1 409)Funded status (surplus) / deficit 393 199Unrecognized actuarial gains / (losses) (350) (257)Unrecognized past service gains / (costs) 32 39Limitation on recognition of assets 1 0Net liability / (asset) recognized in the balance sheet 76 (19)
Assets of CHF 62 million 1 (2010: CHF 33 million) and liabilities of CHF 138 million (2010: CHF 14 million) are included in the financial statements.
Plan assets consist of the following:
million CHF2011 2010
Equity securities 845 290Bonds 265 404Property occupied by the Group 0 0Property 77 121Cash 814 594Company’s own ordinary shares 0 0Total fair value of plan assets 2 001 1 409
Movement in the defined benefit obligationsmillion CHF
2011 2010
Opening defined benefit obligation at 1 January 1 608 1 538Interest cost 53 56Current service cost (employer) 39 35Contributions by plan participants 16 17Benefits (paid) / deposited, net (133) (73)Acquisition of subsidiaries 765 0Curtailments and settlements 0 (38)Actuarial (gains) / losses on obligation 0 104Impact of exchange rate changes 46 (32)Adjustment 0 1Closing defined benefit obligation at 31 December 2 394 1 608
1 Included in “Other non-current assets”

121Lonza Annual Report 2011
Movement in plan assetsmillion CHF
2011 2010
Opening fair value of plan assets at 1 January 1 409 1 408Expected return on plan assets 69 64Contributions by the employer 121 47Contributions by plan participants 16 17Benefits (paid) / deposited, net (133) (73)Acquisition of subsidiaries 585 0Curtailments and settlements 0 (34)Actuarial gains / (losses) on plan assets (101) 2Impact of exchange rate changes 35 (23)Adjustment 0 1Closing fair value of plan assets at 31 December 2 001 1 409
The net periodic pension costs for Lonza’s significant benefit plans consist of the following:
million CHF2011 2010
Current service cost (employer) 39 35 Interest cost 53 56 Expected return on plan assets (69) (64)Actuarial (gains) / losses recognized in current year 9 5 Past service cost / (gain) (6) (7)Effect of curtailments and settlements 0 (2)Total recognized pension costs 26 23
Pension costs are recognized in personnel expenses (see note 19) and allocated to the individual functions of the consolidated financial income statement.
Actual return on plan assetsmillion CHF
2011 2010
Expected return on plan assets 69 64 Actuarial gains / (losses) on plan assets (101) 2 Actual return on plan assets (32) 66

122 Lonza Annual Report 2011
Historical informationmillion CHF
2011 2010 2009 2008 2007
Present value of defined benefit obligation 2 394 1 608 1 538 1 443 1 450Fair value of plan assets (2 001) (1 409) (1 408) (1 301) (1 450)(Surplus) / deficit 393 199 130 142 0
Experience adjustments on defined benefit obligation (gains) / losses (44) 11 (18)Experience adjustments on plan assets gains / (losses) (101) 2 47
The Group expects to pay CHF 116 million in contributions to defined benefit plans in 2012.
Other post-retirement benefits Lonza’s post employment benefits other than pensions are not funded. They consist mainly of post-retirement healthcare benefits in the USA, which are provided under a defined benefit plan.
The principal assumptions are as follows:
Actuarial assumptions %
2011 2010
Discount rate 4.59 5.20Medical-cost trend rate 8.16 8.00
Assumed healthcare-cost trend rates have a significant effect on the amounts recognized in profit and loss. A one-percentage-point change in assumed healthcare-cost trend rates would have the following effects:
%
1 %-point increase
1 %-point decrease
Effect on the aggregate service and interest cost 2.8 – 2.3Effect on defined benefit obligation 1.8 – 1.7
The funded status of the post-retirement benefit plans is as follows:
million CHF2011 2010
Present value of unfunded benefit obligations 57 37 Unrecognized actuarial gains / (losses) (7) (4)Unrecognized prior service cost 0 0 Liability recognized in the balance sheet 50 33

123Lonza Annual Report 2011
Movement in the defined benefit obligationsmillion CHF
2011 2010
Opening defined benefit obligation at 1 January 37 33Interest cost 2 2 Current service cost (employer) 0 0 Contributions by plan participants 1 1 Benefits (paid) / deposited, net (3) (3)Actuarial (gains) / losses on obligation 3 9 Acquisition of subsidiaries 16 0 Impact of exchange rate changes 1 (4)Adjustment 0 (1)Closing defined benefit obligation at 31 December 57 37
Movement in the liability recognized in the balance sheetmillion CHF
2011 2010
Liability as of 1 January 33 37Expenses recognized in income statement 2 2 Benefits (paid) / deposited, net (2) (2)Acquisition of subsidiaries 16 0 Impact of exchange rate changes 1 (3)Adjustment 0 (1)Liability as of 31 December 50 33
Net periodic costs for the post-retirement benefit plans are the following:
million CHF2011 2010
Current service cost (employer) 0 0Interest cost 2 2Actuarial (gains) / losses recognized in current year 0 0 Past service cost 0 0Adjustment 0 1Total post-retirement cost 2 3
These expenses are recognized in personnel expenses (see note 19).
Historical information of other post-retirement benefitsmillion CHF
2011 2010 2009 2008 2007
Present value of defined benefit obligation 57 37 33 31 34 Experience adjustments on defined benefit obligation (gains) / losses (2) 3 0

124 Lonza Annual Report 2011
Share-based Payments Equity-settled share option scheme
Employee Share Purchase Plan (ESPP) In keeping with our vision and culture, Lonza has continuously encouraged employee participation in the company through stock owner-ship. In 2005, the former Employee Share Purchase Plan was updated. Under the new plan, ESPP Plus, the employees have the opportunity – but not the obligation – to acquire Lonza shares in multiples of three at a price reduction of 30 %. The shares purchased in this manner remain blocked for three years. After this blocking period, participants are entirely free to do as they wish with the shares. If participants keep their shares for a further two years in a blocked deposit, they will then – after this holding period is over – receive one additional free share for every three shares purchased. Due to cost-saving measures, the reissue of the share purchase plan was interrupted in 2009, but resumed in 2010.
The minimum conditions to participate in the ESPP Plus were in:2006: ranging from 9 shares to 270 shares2007: ranging from 6 shares to 195 shares2008: ranging from 3 shares to 162 shares2010: ranging from 6 shares to 177 shares2011: ranging from 6 shares to 198 shares
The ESPP is not part of an incentive program. The plan is intended as a long-term share-savings scheme to provide employees with an incentive to strengthen teamwork and personal commitment.
Details of share purchase plans Purchased Ratio Granted share awards
Plan expiry date
Price at grant date
CHF
ESPP 2006 64 266 3:1 21 422 15 05 2011 87.90ESPP 2007 52 293 3:1 17 431 15 05 2012 120.29ESPP 2008 51 000 3:1 17 000 15 05 2013 138.54 ESPP 2010 71 865 3:1 23 955 30 05 2015 76.81ESPP 2011 74 526 3:1 24 842 30 05 2016 75.76
25

125Lonza Annual Report 2011
Development of share purchase plans 2011
Share awards outstanding 01 01 2011
Share awards granted
during 2011
Share awards forfeited
during 2011
Shares vested
during 2011
Share awards lapsed
during 2011
Share awards outstanding 31 12 2011
ESPP 2006 19 493 0 0 (15 462) (4 031) 0ESPP 2007 16 154 0 0 (22) 0 16 132ESPP 2008 15 492 0 0 (27) 0 15 465ESPP 2010 23 914 0 0 (35) 0 23 879ESPP 2011 0 24 842 0 0 0 24 842Total shares 75 053 24 842 0 (15 546) (4 031) 80 318
Development of share purchase plans 2010
Share awards outstanding 01 01 2010
Share awards granted
during 2010
Share awards forfeited
during 2010
Shares vested
during 2010
Share awards lapsed
during 2010
Share awards outstanding 31 12 2010
ESPP 2005 22 393 0 0 (15 382) (7 011) 0ESPP 2006 19 882 0 0 (389) 0 19 493ESPP 2007 16 543 0 0 (389) 0 16 154ESPP 2008 15 985 0 0 (493) 0 15 492ESPP 2010 0 23 955 0 (41) 0 23 914Total shares 74 803 23 955 0 (16 694) (7 011) 75 053
The estimated fair value of the share awards granted in 2011 was CHF 60.61 (2010: CHF 61.45). The weighted average share price of the vested shares in 2011 was CHF 88.01 (2010: CHF 77.13). The outstanding share awards at 31 December 2011 had a weighted average share price of CHF 97.10 (2010: CHF 101.79) and a remaining weighted average contractual life of 33 months (2010: 28 months).
The fair values were calculated using the market price at grant date. The discount on the purchase price of shares is expensed at the moment the employees acquire Lonza shares. The fair value of the free shares is expensed on a straight-line basis over the vesting period, based on estimates of shares that will eventually vest. The expected volatility was 20 % in 2011 (2010: 20 %). The expected dividend was not incorporated in the calculation of fair value.
Fair value at grant date CHF
ESPP 2006 1 318 096ESPP 2006 discount 1 694 694ESPP 2007 1 467 742ESPP 2007 discount 1 887 097ESPP 2008 1 648 626ESPP 2008 discount 2 119 662ESPP 2010 1 471 987ESPP 2010 discount 1 655 985ESPP 2011 1 505 624ESPP 2011 discount 1 693 827
A total of 66 509 treasury shares with a par value of CHF 1 each (31 December 2010: 61 055 shares) is reserved for the share purchase plans.

126 Lonza Annual Report 2011
Long-Term Incentive Plan (LTIP) In 2007, 2008, 2009, 2010 and 2011, the Board of Di-rectors of Lonza Group Ltd implemented a Long-Term Incentive Plan (LTIP) for a selected segment of the Group’s employees. The LTIP is a stock bonus plan, replacing the former option plans. The LTIP has been designed to align the interests of key employees with those of Lonza’s shareholders, to promote a team-based performance culture throughout the organization, and to align remuneration with the creation of shareholder value. The general idea of the LTIP is that selected key employees are awarded the right to receive a number of registered shares of Lonza in the future, provided that certain service- and performance-related conditions are achieved. Depending on the level of the job category, the entitlement is between 10 % and 200 % of the annual base salary. For the CEO the entitlement is 200 % based on the full share value, for Management Committee members it is 150 %. The maximum number of shares to be granted is capped at the start of the plan. Under no condition can the incentive exceed the set percentage, even if the performance exceeds the set targets. Individual investment in Lonza shares is a mandatory prerequisite for participation in the plan.
The central feature of the plan is that key employees will only receive title and ownership of the shares after a three-year vesting period and only if the conditions of vesting are fully or partially met. The conditions of vesting of the shares are as follows:
The vesting of up to 50 % of the awarded share entitlement is based on the total shareholder return (TSR 1) achieved during the three fiscal years of Lonza before the end of the vesting period compared with a peer group. For the share entitlements granted under the LTIP 2008 to 2010, the peer group consisted of MSCI Chemicals, DSM, UCB, Crucell, Genentech / Roche, BMS, MSCI Healthcare, Rhodia, Cambrex, Dr Reddy’s, Biocon, Nicholas Piramal, Clariant, Sigma Aldrich, Invitrogen, Millipore, and Thermo Fisher Scientific. For the share entitle-ments granted under the LTIP 2011, the peer group was adapted to the new stock index classification and now consists of MSCI Chemicals, MSCI Health, and SPI. This change in the peer group was also recommended by the external compensation consultant (Kepler As-sociates) due to the experience that some companies diversified their business or merged during the relevant vesting period of the LTIP. In such cases the company may no longer be relevant as a peer group. The TSR target is fully reached in the event that Lonza outperforms the peer group on an annualized basis by 9 % (LTIP 2008, 2009, 2010: 5 %) on average over three years. At this TSR level, all shares vest. Higher TSR than this threshold does not lead to higher payouts. If the TSR target is not fully reached, the percentage of the vested shares from the share entitlement will be reduced linearly, down to the minimum target of TSR relative to the peer group. The minimum target is to achieve the same annualized TSR development as the index of the peer group. If this minimum target is met, then 25 % of the shares will vest. If the minimum target is not met, no shares in this section will vest.
1 TSR measures growth in share price with dividends reinvested. This measure is based on an external market view of the company’s success.

127Lonza Annual Report 2011
For shares initially granted up to and including 2009, the vesting of up to 50 % of the remaining awarded share entitlement is based on the average annual earnings per share (EPS) of Lonza achieved during the three fiscal years of Lonza before the end of the vesting period. The EPS target is reached if Lonza increases its EPS within the vesting period by 50 %. If the EPS target is not fully reached, the percentage of the vested shares, from the share entitlement will be reduced linearly, down to the minimum target of EPS. The minimum target is to hold EPS on the level at the beginning of the fixed period. If this minimum target is met, then 25 % of the shares will vest. If the minimum target is not met, no shares in this section will vest.
From 2010 onwards, the vesting of up to 50 % of the remaining awarded share entitle-ment is based on the average annual Group Economic Value Added (EVA 1) growth of Lonza achieved during the three fiscal years of Lonza before the end of the vesting period. The EVA target for share entitlements awarded in 2011 is reached if Lonza increases its EVA within the vesting period from CHF 15.9 million up to CHF 114.4 million (for share entitle-ments awarded in 2010: from CHF 34.25 million up to CHF 137.0 million). If the EVA target is not fully reached, the percentage of the vested shares from the share entitlement will be reduced linearly, down to the minimum target of EVA. The minimum target is to hold EVA at the level of the beginning of the fixed period. If this minimum target is met, then 25 % of the shares will vest. If the minimum target is not met, no shares in this section will vest.
If TRS and EPS / EVA minimum targets are not met, the share entitlement expires uncon-ditionally.
For the LTIP 2008 no payout was made in January 2011 and for the LTIP 2009 no payout will be made in January 2012.
The following table shows historical data on vesting conditions for LTIP share awards in the years 2008 – 2011, information used in calculating the fair value of the LTIP grants, and the number of shares vesting following the target attainment in the respective year.
Details of long-term incentive plans
Grant date Share price
CHF
Granted share awards
TSR EPS growth / EVA level targets
Vesting date
LTIP 2008 01 02 2008 137.60 85 011 5 % 50 % 31 01 2011LTIP 2009 01 02 2009 106.10 121 356 5 % 50 % 31 01 2012LTIP 2010 01 02 2010 75.65 147 711 5 % 137.0 mn 31 01 2013 LTIP 2011 01 02 2011 74.35 152 077 9 % 114.4 mn 31 01 2014
1 EVA or Economic Value Added is an estimate of true “economic” profit, or the amount by which earnings exceed or fall short of the required minimum rate of return that shareholders and lenders could get by investing in other securities of comparable risk. The EVA is calculated as follows: Net operating profit after taxes minus cost of capital of net operating assets.

128 Lonza Annual Report 2011
Conditions of vesting 2011 Minimum Maximum Target Probability
TSR 25 % 100 % 9 % 50.00 % EVA 25 % 100 % 114.4 mn 50.00 % Turnover of employees 3.00 %
Conditions of vesting 2010 Minimum Maximum Target Probability
TSR 25 % 100 % 5 % 50.00 % EVA 25 % 100 % 137 mn 50.00 % Turnover of employees 0.00 %
Conditions of vesting 2009 Minimum Maximum Target Probability
TSR 25 % 100 % 5 % 50.00 % EPS 25 % 100 % 50 % 45.40 % Turnover of employees 3.00 %
Conditions of vesting 2008 Minimum Maximum Target Probability
TSR 25 % 100 % 5 % 50.00 % EPS 25 % 100 % 50 % 100.00 % Turnover of employees 3.00 %
Vesting conditions Market price
CHF
Granted share
awards
Fair value TSR
Fair value of share awards at grant date
CHF
Expected vesting EPS
Probability minimum
targets
Volatility employees
Total probability
Total cost at grant date
CHF
LTIP 2008 137.60 85 011 50 % 5 848 757 100.00 % 100 % 3 % 97.00 % 5 673 294LTIP 2009 106.10 121 356 50 % 6 437 936 45.40 % 100 % 3 % 44.04 % 2 835 138
Vesting conditions Market price
CHF
Granted share
awards
Fair value TSR
Expected vesting EVA
Fair value of share awards at grant date
CHF
Probability minimum
targets
Volatility employees
Tota probability
Total cost at grant date
CHF
LTIP 2010 TSR 75.65 73 855 50 % 2 793 565 100 % n.a. 100.00 % 2 793 565LTIP 2010 EVA 75.65 73 856 50 % 2 793 603 100 % 0 % 100.00 % 2 793 603LTIP 2011 TSR 74.35 76 038 50 % 2 826 713 100 % 3 % 97 % 2 741 911LTIP 2011 EVA 74.35 76 039 50 % 2 826 750 100 % 3 % 97 % 2 741 947

129Lonza Annual Report 2011
Development of long-term incentive plan 2011
Share awards outstanding 01 01 2011
Share awards granted
during 2011
Share awards forfeited
during 2011
Shares vested
during 2011
Share awards lapsed
during 2011
Share awards outstanding 31 12 2011
LTIP 2008 84 417 0 0 0 (84 417) 0LTIP 2009 121 356 0 0 0 0 121 356LTIP 2010 147 711 0 0 0 0 147 711LTIP 2011 0 152 077 0 0 0 152 077Total shares 353 484 152 077 0 0 (84 417) 421 144
Development of long-term incentive plan 2010
Share awards outstanding 01 01 2010
Share awards granted
during 2010
Share awards forfeited
during 2010
Shares vested
during 2010
Share awards lapsed
during 2010
Share awards outstanding 31 12 2010
LTIP 2007 80 100 0 0 (28 076) (52 024) 0LTIP 2008 84 417 0 0 0 0 84 417LTIP 2009 121 356 0 0 0 0 121 356LTIP 2010 0 147 711 0 0 0 147 711Total shares 285 873 147 711 0 (28 076) (52 024) 353 484
The estimated fair value of the share awards granted in 2011 was CHF 37.18 (2010: CHF 37.82). No share awards were vested in 2011. The weighted average share price of the vested shares in 2010 was CHF 77.10. The outstanding share awards at 31 December 2011 had a weighted average share price of CHF 41.98 (2010: CHF 50.45) and a remaining weighted average contractual life of 15 months (2010: 15 months).
The costs were calculated using the market price at grant date, including probabilities as per conditions of vesting. The amounts for shares are expensed on a straight-line basis over the vesting period, based on estimates of shares that will eventually vest. The expected dividend was not incorporated in the calculation of fair value.
In January 2010, the Nomination and Compensation Committee reviewed the interpreta-tion of the conditions for minimum vesting under the LTIP 2007, 2008 and 2009. It was not stated precisely if both the minimum targets for the TSR section of the LTIP and the EPS section of the LTIP needed to be met for any vesting at all to occur in either of the two sections of the LTIP. The Nomination and Compensation Committee clarified that attainment of the minimum target in one of the two sections was sufficient for vesting to begin in the respective section, irrespective of target attainment in the other section. That is, the two sections based on TSR and EPS targets are independent. This clarification resulted in a fair value adjustment of CHF 3 304 536 for the LTIP 2007 and none for the LTIP 2008 and 2009. These costs were fully expensed in 2010.

130 Lonza Annual Report 2011
Fair value at grant date CHF
LTIP 2008 5 848 757LTIP 2009 6 437 936LTIP 2010 5 587 168LTIP 2011 5 653 463
Long-Term Incentive Plan for members of the Management Committee named “Bridge the Gap (MC shares)” The LTIP plan did not provide any payouts for the Management Com-mittee until 2009. Therefore, a three-year “Bridge the Gap” plan was also launched in 2006. This plan provides share grants for the Management Committee. Individual investment in Lonza shares is a mandatory prerequisite for participation in the plan. The share awards were granted from January 2006 until January 2008 and will vest over a one- to three-year period (title and ownership of the shares will only be received after the respective vesting periods). The MC shares are subject to a restriction period. During the restriction period, a MC member may not sell, pledge or grant any other rights to any third party with respect to the MC shares. Shares will become unconditional after lapse of the restriction period. New entrants have a pro-rata share entitlement with a partially shortened restriction period.
Non-vested shares Grant date Share price Granted share awards
Vesting date
MC shares 2008 31 01 2008 137.60 5 155 31 01 2011MC shares 2009 31 07 2009 105.90 472 31 07 2012MC shares 2010 01 04 2010 85.95 1 242 31 01 2011
Development of long-term incentive plan for Management Committee 2011
Share awards outstanding 01 01 2011
Share awards granted
during 2011
Share awards forfeited
during 2011
Shares vested
during 2011
Share awards lapsed
during 2011
Share awards outstanding 31 12 2011
MC shares 2008 5 155 0 0 (5 154) (1) 0MC shares 2009 472 0 0 0 0 472MC shares 2010 1 242 0 0 (1 242) 0 0Total non-vested shares 6 869 0 0 (6 396) (1) 472
Development of long-term incentive plan for Management Committee 2010
Share awards outstanding 01 01 2010
Share awards granted
during 2010
Share awards forfeited
during 2010
Shares vested
during 2010
Share awards lapsed
during 2010
Share awards outstanding 31 12 2010
MC shares 2007 5 921 0 0 (5 920) (1) 0MC shares 2008 7 733 0 0 (2 578) 0 5 155MC shares 2009 472 0 0 0 0 472MC shares 2010 0 2 484 0 (1 242) 0 1 242Total non-vested shares 14 126 2 484 0 (9 740) (1) 6 869

131Lonza Annual Report 2011
No share awards were granted in 2011. The estimated fair value of the share awards granted in 2010 was CHF 85.95. The weighted average share price of the vested shares in 2011 was CHF 127.57 (2010: CHF 118.92). The outstanding share awards at 31 December 2011 had a weighted average share price of CHF 105.90 (2010: CHF 126.08) and a remaining weighted average contractual life of 7 months (2010: 2 months).
The fair value was calculated using the market price at grant date. The amounts for shares were expensed on a straight-line basis over the vesting period, based on estimates of shares that will eventually vest. The expected volatility was 0 % (2010: 0 %). The expected dividend was not incorporated in the calculation of fair value.
Fair value at grant date CHF
MC shares 2008 1 418 794 MC shares 2009 49 985MC shares 2010 213 500
Other share plans In recognition of the extraordinary efforts by employees to ensure suc-cessful integration of new businesses, the Lonza Management Committee has decided to provide a one-time award of Lonza shares if certain service-related conditions are achieved. The employees will only receive title and ownership of the shares after a minimum one-year vesting period and only if the conditions of vesting are fully or partially met. In addition, in recognition of extraordinary efforts on the part of employees for successful completion of projects or successful settlements, the Lonza Management Committee has the ability to provide a one-time award of Lonza shares.
Non-vested shares Grant date Share price Granted share awards
Vesting date
Arch Acquisition Team 21 10 2011 56.40 9 576 21 10 2011Other awards 2011 20 01 2011 69.95 458 20 01 2011Other awards 2008 01 09 2008 156.70 479 01 09 2011
Development of the other share plans 2011 Share awards outstanding 01 01 2011
Share awards granted
during 2011
Share awards forfeited
during 2011
Shares vested
during 2011
Share awards lapsed
during 2011
Share awards outstanding 31 12 2011
Arch Acquisition Team 0 9 576 0 (9 576) 0 0Other awards 2011 0 458 0 (458) 0 0Other awards 2008 0 479 0 (479) 0 0Total non-vested shares 0 10 513 0 (10 513) 0 0

132 Lonza Annual Report 2011
The estimated fair value of the share awards granted in 2011 was CHF 61.56. The weighted average share price of the vested shares in 2011 was CHF 61.56. No share awards were outstanding at 31 December 2011.
The fair value was calculated using the market price at grant date. The amounts for shares are expensed on a straight-line basis over the vesting period, based on estimates of shares that will eventually vest. The expected volatility was 0 % in 2011. The expected dividend was not incorporated in the calculation of fair value.
Fair value at grant date CHF
Arch Acquisition Team 540 086Other awards 2011 32 037Other awards 2008 75 059
A total of 161 634 treasury shares (2010: 381 648) with a par value of CHF 1 each are reserved for the long-term incentive and other share plans.
Compensation for Board of Directors The compensation system for the Board of Direc-tors allows the members to choose either a payment in shares or a combination of cash and shares, whereby the cash portion cannot exceed 40 %. Shares granted are valued at the market price at grant date, based on the average of the last five business days of each quarter, with a discount of 20 %. They are blocked for a period of three years and are eligible for a dividend. Access to these shares is only available in the fourth or later years.

133Lonza Annual Report 2011
Development of compensation for Board of Directors 2011
Grant date Total number of shares
Share price
CHF
Fair values of shares
1 Cash
CHF
Total
CHF
Blocked until
31 03 2011 5 334 77.12 411 358 150 000 561 358 31 03 201430 06 2011 6 845 62.34 426 717 230 000 656 717 30 06 201430 09 2011 8 118 55.78 452 822 180 000 632 822 30 09 201431 12 2011 7 198 54.80 394 450 245 000 639 450 31 12 2014
Total 27 495 61.30 1 685 347 805 000 2 490 347
The amount of CHF 2 490 347 was recognized as an expense in the year 2011.
Development of compensation for Board of Directors 2010
Grant date Total number of shares
Share price
CHF
Fair values of shares
1 Cash
CHF
Total
CHF
Blocked until
31 03 2010 4 781 86.02 411 262 150 000 561 262 31 03 201330 06 2010 5 494 75.22 413 259 150 000 563 259 30 06 201330 09 2010 4 899 84.36 413 280 150 000 563 280 30 09 201331 12 2010 5 404 76.46 413 190 150 000 563 190 31 12 2013
Total 20 578 80.23 1 650 991 600 000 2 250 991
The amount of CHF 2 250 991 was recognized as an expense in the year 2010.
Development of compensation for Board of Directors 2009
Grant date Total number of shares
Share price
CHF
Fair values of shares
1 Cash
CHF
Total
CHF
Blocked until
31 03 2009 3 922 113.42 444 833 175 000 619 833 31 03 201230 06 2009 4 282 106.70 456 889 175 000 631 889 30 06 201230 09 2009 4 073 112.20 456 990 175 000 631 990 30 09 201231 12 2009 6 295 72.26 454 877 175 000 629 877 31 12 2012
Total 18 572 97.65 1 813 589 700 000 2 513 589
The amount of CHF 2 513 589 was recognized as an expense in the year 2009.
Development of compensation for Board of Directors 2008
Grant date Total number of shares
Share price
CHF
Fair values of shares
1 Cash
CHF
Total
CHF
Blocked until
31 03 2008 3 060 129.45 396 117 145 000 541 117 31 03 201130 06 2008 3 174 140.66 446 455 175 000 621 455 30 06 201130 09 2008 3 172 140.57 445 888 175 000 620 888 30 09 201131 12 2008 4 579 97.14 444 804 175 000 619 804 31 12 2011
Total 13 985 123.94 1 733 264 670 000 2 403 264
The amount of CHF 2 403 264 was recognized as an expense in the year 2008.
1 Excluding social security and withholding tax

134 Lonza Annual Report 2011
Other share-based payments A consulting agreement was signed by Lonza Ltd in 2010. The agreement allows the consultant to choose either a payment in shares or a combina-tion of cash and shares, whereby the cash portion cannot exceed 40 %. Shares granted are valued at the market price at grant date, based on the average of the last five business days of each quarter, with a discount of 20 %. They are blocked for a period of three years and are eligible for a dividend. Access to these shares is only available in the fourth and later years.
Development of compensation for consulting agreement 2011
Grant date Total number of shares
Share price
CHF
Fair values of shares
1 Cash
CHF
Total
CHF
Blocked until
31 03 2011 571 77.12 44 036 25 000 69 036 31 03 201430 06 2011 707 62.34 44 074 25 000 69 074 30 06 201430 09 2011 790 55.78 44 066 25 000 69 066 30 09 201431 12 2011 804 54.80 44 059 25 000 69 059 31 12 2014
Total 2 872 61.36 176 235 100 000 276 235
The amount of CHF 276 235 was recognized as an expense in the year 2011.
Development of compensation for consulting agreement 2010
Grant date Total number of shares
Share price
CHF
Fair values of shares
1 Cash
CHF
Total
CHF
Blocked until
31 03 2010 514 86.02 44 214 25 000 69 214 31 03 201330 06 2010 588 75.22 44 229 25 000 69 229 30 06 201330 09 2010 524 84.36 44 205 25 000 69 205 30 09 201331 12 2010 579 76.46 44 270 25 000 69 270 31 12 2013
Total 2 205 80.23 176 918 100 000 276 918
The amount of CHF 276 918 was recognized as an expense in the year 2010.
Recognition in the Consolidated Financial Statements The equity-settled share-based payments had an impact on the 2011 “Profit before income taxes” amounting to an expense of CHF 4.5 million (2010: CHF 8.9 million).
1 Excluding social security and withholding tax

135Lonza Annual Report 2011
Changes in Shares and Share Capital Movements
Number of shares31 12 2011 Change
in year31 12 2010 Change
in year31 12 2009
Total number of shares 52 920 140 0 52 920 140 0 52 920 140
Treasury sharesShares reserved for share option plan (LOSOP) 0 0 0 (148 349) 148 349Shares reserved for share purchase plan (ESPP) 66 509 5 454 61 055 7 261 53 794Shares reserved for long-term incentive plan (LTIP) 161 634 (6 396) 168 030 (37 816) 205 846Free shares 1 079 201 865 583 213 618 (64 751) 278 369Total treasury shares 1 307 344 864 641 442 703 (243 655) 686 358
Total shares ranking for dividend at 31 December 51 612 796 (864 641) 52 477 437 243 655 52 233 782
Transferred shares between January and date of dividend payment of following year n.a.
(965 796)
177 116
Total shares ranking for dividend at date of dividend payment n.a.
51 511 641
52 410 898
Share capital movementsShare capital CHF 52 920 140 0 52 920 140 0 52 920 140
Translation reserve The translation reserve of the consolidated statement of changes in equity comprises all foreign exchange differences arising from the translation of the financial statements of foreign entities including the impact on translating monetary items that form a net investment in a foreign operation.
Hedging reserve The hedging reserve comprises the effective portion of the cumulative net change in the fair value of cash flow hedging instruments where the hedged transac-tion has not yet occurred at the balance sheet date.
Dividend A dividend per share of CHF 2.15 (2010: CHF 2.15) is proposed after the balance sheet date.
Conditional capital The share capital of Lonza Group Ltd may be increased through the issuance of a maximum of 5 029 860 fully paid-in registered shares with a par value CHF 1 each up to a maximum aggregate amount of CHF 5 029 860.
26
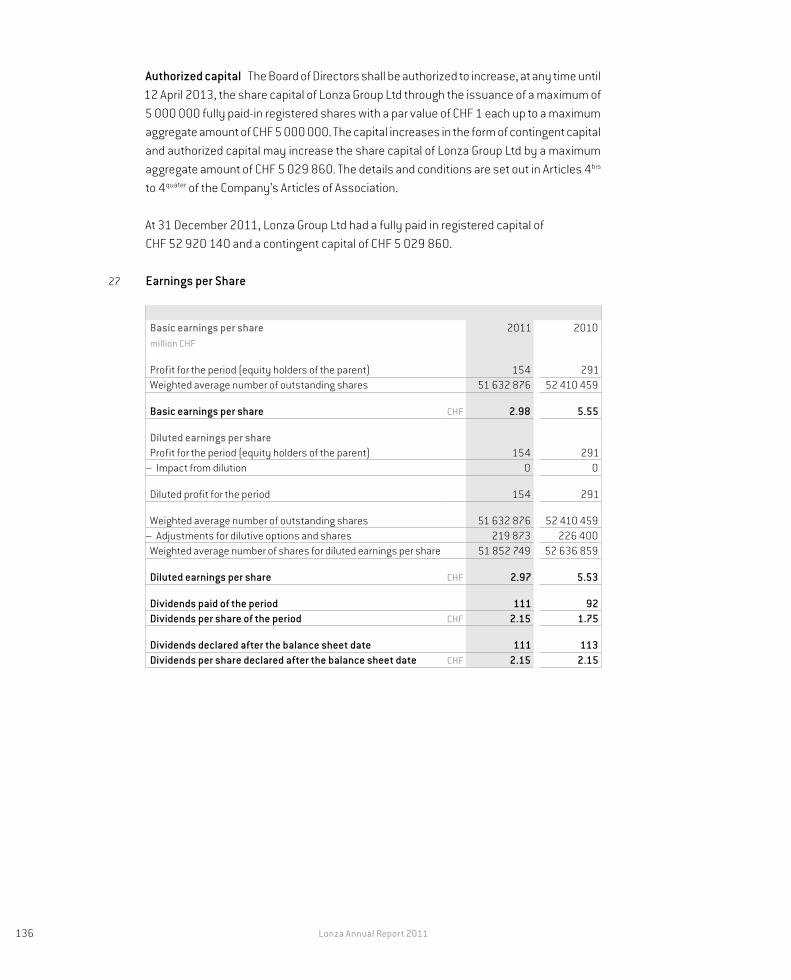
136 Lonza Annual Report 2011
Authorized capital The Board of Directors shall be authorized to increase, at any time until 12 April 2013, the share capital of Lonza Group Ltd through the issuance of a maximum of 5 000 000 fully paid-in registered shares with a par value of CHF 1 each up to a maximum aggregate amount of CHF 5 000 000. The capital increases in the form of contingent capital and authorized capital may increase the share capital of Lonza Group Ltd by a maximum aggregate amount of CHF 5 029 860. The details and conditions are set out in Articles 4bis to 4quater of the Company’s Articles of Association.
At 31 December 2011, Lonza Group Ltd had a fully paid in registered capital of CHF 52 920 140 and a contingent capital of CHF 5 029 860.
Earnings per Share
Basic earnings per sharemillion CHF
2011 2010
Profit for the period (equity holders of the parent) 154 291Weighted average number of outstanding shares 51 632 876 52 410 459
Basic earnings per share CHF 2.98 5.55
Diluted earnings per shareProfit for the period (equity holders of the parent) 154 291
– Impact from dilution 0 0
Diluted profit for the period 154 291
Weighted average number of outstanding shares 51 632 876 52 410 459– Adjustments for dilutive options and shares 219 873 226 400
Weighted average number of shares for diluted earnings per share 51 852 749 52 636 859
Diluted earnings per share CHF 2.97 5.53
Dividends paid of the period 111 92Dividends per share of the period CHF 2.15 1.75
Dividends declared after the balance sheet date 111 113Dividends per share declared after the balance sheet date CHF 2.15 2.15
27

137Lonza Annual Report 2011
Related PartiesIdentity of related parties The Group has a related-party relationship with associates, joint ventures (see note 8) as well as with the Board of Directors and the members of the Management Committee.
Transactions with Key Management PersonnelBoard of Directors In 2011, payments to acting members of the Board of Directors of Lonza Group Ltd totaled CHF 2.652 million 1 (2010: CHF 2.503 million 1), 63.56 % (2010: 65.96 %) of which was received in the form of shares. The compensation system for Board members allows them to choose either a payment in shares or a combination of cash and shares. Shares granted are rated at the relevant market price at grant date. Free access to these shares is only available in the fourth and later years.
Members of the Board of Directors and their immediate relatives control 112 574 or 0.21 % (2010: 0.17 %) of the voting shares of Lonza Group Ltd. None of the directors owns shares in the Group’s subsidiaries or associates.
Management Committee compensation None of the acting members of the Manage-ment Committee gave up his or her function in the year under review, two new members joined the Management Committee. The acting members of the Management Committee received, for their contributions and time served in 2011, CHF 5.440 million 1 (2010: CHF 5.195 million 1) in cash and additional benefits and 73 107 shares (2010: 62 923 shares), equivalent to a value of CHF 3.004 million (2010: CHF 2.500 million).
The compensation for the Board of Directors and the Management Committee was as follows:
million CHF2011 2010
Short-term benefits 1 4.832 4.569Post-employment benefits 2 0.390 0.375Other benefits 1.072 0.727Severance payments 0.113 0.376Share- / option-based payments 4.689 4.151Total 11.096 10.198
The remuneration is included in “Personnel expenses”, see note 19. For detailed informa-tion, please refer to Note 33.
In 2011 Lonza granted a loan of CHF 1.19 million to a member of the Management Committee, for which Lonza charges floating interest rates at market conditions.
28
1 Including incentive payout in March of the following year 2 Including contribution for social security and pension fund

138 Lonza Annual Report 2011
Accounting Estimates and JudgmentsKey Assumptions and Sources of Estimation Uncertainty
Use of estimates The preparation of the financial statements and related disclosures in conformity with International Financial Reporting Standards requires management to make estimates and assumptions that affect the reported amounts of assets and liabilities, and disclosure of contingent assets and liabilities at the date of the financial statements and revenues and expenses during the period reported. Actual results could differ from those estimates. Estimates are used in accounting for allowances for uncollectible receivables, inventory obsolescence, depreciation, employee benefits, taxes, restructuring provisions and contingencies. Estimates and assumptions are reviewed periodically and the effects of revisions are reflected in the financial statements in the period they are determined to be necessary.
The key assumptions about the future key sources of estimation uncertainty that entail a significant risk of causing a material adjustment to the carrying value of assets and li-abilities within the next financial year are described below.
Environmental provisions Lonza is exposed to environmental liabilities and risks relating to its past operations, principally in respect of provisions for remediation costs, which at 31 December 2011 amounted to CHF 50 million (2010: CHF 16 million), as disclosed in note 13. Provisions for non-recurring remediation costs are made when there is a legal or constructive obligation and the cost can be reliably estimated. It is difficult to estimate any future action required by Lonza to correct the effects on the environment of prior disposal or release of chemical substances by Lonza or other parties, and the associated costs, pursu-ant to environmental laws and regulations. The material components of the environmental provisions consist of costs to fully clean and refurbish contaminated sites and to treat and contain contamination at sites. The Group’s future remediation expenses are affected by a number of uncertainties which include, but are not limited to, the method and extent of remediation and the percentage of material attributable to Lonza at the remediation sites, relative to that attributable to other parties. The Group permanently monitors the various sites identified as at risk for environmental exposures.
Lonza believes that its provisions are adequate, based upon currently available informa-tion; however, given the inherent difficulties in estimating liabilities in this area, there is no guarantee that additional costs will not be incurred beyond the amounts provided. Due to the uncertainty both of the amount and timing of future expenses, the provisions provided for environmental remediation costs could be affected in future periods.
Income taxes At 31 December 2011, deferred tax assets of CHF 167 million (2010: CHF 103 million), current tax receivables of CHF 41 million (2010: CHF 32 million), deferred tax liabilities of CHF 711 million (2010: CHF 321 million) and current tax payables of CHF 28 million (2010: CHF 38 million) were disclosed in the consolidated balance sheet. Signifi-cant estimates are required in determining the current and deferred assets and liabilities
29

139Lonza Annual Report 2011
for income taxes. Some of these estimates are based on interpretations of existing tax laws or regulations. Management believes that the estimates are reasonable and that the recognized liabilities for income tax-related uncertainties are adequate. Various internal and external factors may have favorable or unfavorable effects on the income tax assets and liabilities. These factors include, but are not limited to, changes in tax laws, regulations and / or rates, changing interpretations of existing tax laws or regulations and changes in overall levels of pre-tax earnings. Such changes that arise could affect the assets and li-abilities recognized in the balance sheet in future periods.
Pensions Many of the Group’s employees participate in post-employment plans. The cal-culations of the recognized assets and liabilities from such plans are based upon statistical and actuarial calculations. In particular, the present value of the defined benefit obligation is influenced by assumptions, on discount rates used to arrive at the present value of future pension liabilities, and assumptions on future increases in salaries and benefits. Further-more, the Group’s independent actuaries use statistically based assumptions, covering areas such as future withdrawals of participants from the plan and estimates of life expectancy. At 31 December 2011, the present value of the Group’s defined benefit obligation is CHF 2 375 million (2010: CHF 1 592 million) for funded plans and CHF 19 million (2010: CHF 16 million) for unfunded plans. The plan assets at fair value amount to CHF 2 001 million (2010: CHF 1 409 million), resulting, compared with the present value of the pension obligation, in a funded status deficit of CHF 393 million (2010: CHF 199 million) (see note 24).
The actuarial assumptions used may differ materially from actual results due to changes in market and economic conditions, higher or lower withdrawal rates or longer or shorter life spans of participants and other changes in the factors being assessed. These differ-ences could affect the assets or liabilities recognized in the balance sheet in future periods.
Impairment test of property, plant and equipment, intangible assets and goodwill The Group has carrying values with regard to property, plant and equipment of CHF 2 701 million (2010: CHF 2 470 million), goodwill of CHF 1 132 million (2010: CHF 410 million) and intan-gible assets of CHF 930 million (2010: CHF 244 million) (see notes 6 and 7). The intangible assets include trademarks acquired through a business combination with a carrying value of CHF 369 million (2010: CHF 25 million) which have an indefinite useful life and are not systematically amortized. All of these assets are reviewed annually for impairment. To assess if any impairment exists, estimates are made of the future cash flows expected to result from the use of the asset and its possible disposal. Actual outcomes could vary significantly from such estimates of discounted future cash flows. Factors such as changes in the planned use of buildings, machinery or equipment, or closure of facilities, the pres-ence or absence of competition, technical obsolescence or lower than anticipated sales for products with capitalized rights could result in shortened useful lives or impairment. The impairment calculation as explained in note 7 is sensitive to the discount rate used for the discounted cash flow model as well as the expected future cash-inflows and the growth rate used for extrapolation purposes. The key assumptions used to determine the recoverable amount for the different cash generating units are further explained in note 7.

140 Lonza Annual Report 2011
Business combinations Where the Group enters into a business combination, the con-sideration transferred has to be allocated to the identifiable assets acquired, the liabilities assumed and any non-controlling interest in the acquired business, with any residual recorded as goodwill. The process of assessing fair values requires in particular manage-ment involvement and judgment in the recognition and measurement of the following items: – Intellectual property such as patents, licenses, trademarks, customer relations
and similar rights – Contingencies such as legal and environmental matters – Contingent consideration arrangements – The recoverability of any accumulated tax losses previously incurred by the
acquired company
In all cases, management makes an assessment based on the underlying economic sub-stance of the items in order to fairly present these items.
Critical accounting judgments in applying the Group’s accounting policies In the process of applying the Group’s accounting policies, management has made the following judgments that have the most significant effect on the amounts recognized in the financial statements (apart from those involving estimations, which are dealt with above).
Revenue recognition The Group has recognized revenue for sales of goods during 2011 to customers who have the right to rescind the sale if the goods do not meet the agreed quality. The Group believes that, based on past experiences with similar transactions, the quality delivered will be accepted. Therefore it is appropriate to recognize revenue on these transactions during 2011. Moreover, the Group has various contract agreements which include upfront and milestone payments over a period of several years. Revenue is rec-ognized only when, according to Management’s judgments, risks and rewards have been transferred to the customer. For certain transactions, recognition of revenue is based on the performance of the conditions agreed in particular contracts, the verification of which requires evaluation and judgments by management.
Events after the Balance Sheet DateOn 25 January 2012, the Group announced a change in the Chief Executive Officer position, and that during the transition the Chairman will co-ordinate the Management Commit-tee.The Board of Directors author ized the consolidated financial statements for issue on 24 February 2012.
30

141Lonza Annual Report 2011
Financial Risk ManagementOverall Risk Management PolicyLonza is exposed in particular to credit and liquidity risk as well as to risks from movements in foreign currency exchange rates, interest rates and market prices that affect its assets, liabilities, and forecasted transactions.
Lonza’s overall risk management policy aims to limit these risks through operational and finance activities. The Board of Directors has overall responsibility for the establishment and oversight of Lonza’s risk management framework. Financial risk management is carried out by a central treasury department (Group Treasury). Group Treasury is responsible for implementing the policy, and identifies, evaluates and hedges financial risks in close cooperation with Lonza’s business units. Group Treasury also has the sole responsibility for carrying out foreign exchange transactions and executing financial derivative transactions with third parties.
Lonza’s risk management policies are established to identify and analyze the risks faced by Lonza, to set appropriate risk limits and controls, and to monitor risks and adherence to limits. Risk management policies and systems are reviewed regularly to reflect changes in market conditions and Lonza’s activities.
Lonza Audit Committee oversees how management monitors compliance with Lonza’s risk management policies and procedures and reviews the adequacy of the risk manage-ment framework in relation to the risks faced by Lonza. Lonza Audit Committee is assisted in its oversight role by Internal Audit. Internal Audit undertakes both regular and ad hoc reviews of risk management controls and procedures, the results of which are reported to the Audit Committee.
Credit RiskCredit risk is the risk of financial loss to Lonza if a customer or counterparty to a financial instrument fails to meet its contractual obligations, and mainly arises from Lonza’s receiv-ables from customers.
Accounts ReceivablesLonza’s exposure to credit risk is influenced mainly by the individual characteristics of each customer. Risk control assesses the credit quality of the customer, taking into account its financial position, past experience and other factors. In monitoring customer credit risk, customers are grouped according to their credit characteristics, including geographic loca-tion, industry, and existence of previous financial difficulties.
Purchase limits are established for each customer, which represents the maximum open amount without requiring approval from the Audit Committee; these limits are reviewed regularly. For customers domiciled in specific countries with high risk, Lonza has credit risk insurances covering the maximum exposure.
31
31.1
31.2

142 Lonza Annual Report 2011
The maximum credit risk is equal to the carrying amount of the respective assets. There are no commitments that could increase this exposure to more than the carrying amounts. In general, Lonza does not require collateral in respect of trade and other receivables, but uses credit insurance for country risk where appropriate.
Lonza establishes an allowance for impairment that represents its estimate of incurred losses in respect of trade and other receivables. The allowance is based only on the specific loss component that relates to individually significant exposures. There is no collective impairment recognized.
Financial Instruments and Cash DepositsCredit risk from balances with banks and financial institutions is managed by the Group’s treasury department in accordance with the Group’s treasury policy. The credit rating of Lonza Group’s counterparties must be at least: – Standard & Poor’s: A – Moody’s: A1
Counterparty credit ratings are reviewed regularly.
The carrying amount of financial assets represents the maximum credit exposure. The maximum exposure to credit risk at the reporting date was as follows:
million CHF
2011 2010
Financial assets – available for saleOther investments – available for sale – carried at cost 6 6Short-term financial assets – available for sale – at fair value 1 26 33Total financial assets – available for sale 32 39
Loans and receivablesTrade receivables, net 695 488Other receivables and accrued income 69 43Short-term advances 2 1Long-term loans and advances 56 43Cash and cash equivalents 196 248Total loans and receivables 1 018 823
Financial assets at fair value through profit or loss – held for tradingCurrency-related instruments 4 22Total financial assets at fair value through profit or loss – held for trading 4 22
Total 1 054 884
1 Included in “Other receivables” (see note 11)

143Lonza Annual Report 2011
Liquidity RiskLiquidity risk is the risk that Lonza will not be able to meet its financial obligations as they fall due. Lonza’s approach to managing liquidity is to ensure that it will always have suf-ficient liquidity to meet its liabilities when due, under both normal and stressed conditions, without incurring unacceptable losses or risking damage to Lonza’s reputation. Group Treasury maintains flexibility in funding also using bilateral credit lines. Lonza concludes the following lines of credit: – Committed credit lines of CHF 382 million. Lines are committed for up to two years – Uncommitted credit lines of CHF 319 million with a maturity of one year
The table below analyzes the Group’s financial liabilities and net-settled derivative financial liabilities in relevant maturity groupings, based on the remaining period at the balance sheet date to the contractual maturity date. The amounts disclosed in the table are the contractual undiscounted cash flows. Balances due within 12 months are equal to their carrying balances, as the impact of discounting is not significant.
31 December 2011million CHF
Carrying amount
Contractual cash flows
Less than 1 year
Between 1 and 2 years
Between 2 and 5 years
Over 5 years
Financial liabilitiesStraight bond (2009 – 2013) 299 322 11 311 0 0Straight bond (2010 – 2016) 398 460 12 12 436 0Straight bond (2011 – 2015) 238 262 5 5 252 0Straight bond (2011 – 2018) 138 171 4 4 13 150Syndicated loan (2011 – 2016) 491 550 10 10 530 0Arch acquisition bridge financing 897 974 71 490 413 0Due to banks and financial institutions 141 160 51 24 85 0Due to others 296 370 19 9 26 316Leasing 3 3 3 0 0 0Total debt 2 901 3 272 186 865 1 755 466Trade payables 294 294 294 0 0 0Other short-term liabilities 407 407 407 0 0 0Total financial liabilities 3 602 3 973 887 865 1 755 466
31 December 2010million CHF
Carrying amount
Contractual cash flows
Less than 1 year
Between 1 and 2 years
Between 2 and 5 years
Over 5 years
Financial liabilitiesStraight bond (2009 – 2013) 298 333 11 11 311 0Straight bond (2010 – 2016) 397 472 12 12 36 412Syndicated loan (2006 – 2011) 499 515 515 0 0 0Due to banks 61 63 46 17 0 0Due to others 139 193 3 3 9 178Leasing 6 7 4 3 0 0Total debt 1 400 1 583 591 46 356 590Trade payables 159 159 159 0 0 0Other short-term liabilities 307 307 307 0 0 0Total financial liabilities 1 866 2 049 1 057 46 356 590
31.3

144 Lonza Annual Report 2011
Market RiskMarket risk is the risk that changes in market prices will affect Lonza’s income or the value of its holdings of financial instruments. Lonza is exposed to market risk from changes in currency exchange and interest rates and commodities. The objective of market risk man-agement is to manage and control market risk exposures within acceptable parameters, while optimizing the return on risk. Lonza has established a treasury policy of which the objective is to reduce the volatility relating to these exposures. Lonza enters into various derivative transactions based on Lonza’s treasury policy that establishes guidelines in areas such as counterparty exposure and hedging practices. Counterparties to agree-ments are major international financial institutions with at least single-A rating. Positions are monitored using techniques such as market value and sensitivity analyses. All such transactions are carried out within the guidelines set by the Audit Committee.
Foreign exchange risk Lonza is exposed to foreign exchange risk on sales, purchases and borrowings that are denominated in a currency other than the respective functional currencies of Group entities. The currencies in which these transactions are primarily de-nominated are USD, EUR, GBP, SGD and BRL.
In managing its exposure regarding the fluctuation in foreign currency exchange rates, Lonza has entered into a variety of currency swaps, foreign exchange contracts and op-tions. These agreements generally include the exchange of one currency against another currency at a future date. To hedge currency risk, forward contracts are designated as cash flow hedges. Lonza adopts a policy of hedging 100 % of the committed contractual exposure. The hedging of the planned contractual exposure depends on Lonza’s view of the market.
The table below shows the impact on post-tax profit and equity, if at 31 December a currency had strengthened (+) or weakened (–) versus the Swiss franc with all other variables held constant as a result of the currency exposures outlined in the tables below:
Currencymillion CHF
Sensitivity Post-tax profit Equity
2011 2010 2011 2010+ – + – + – + –
USD + / – 10 % 4.8 (4.8) 7.1 (7.1) 0.3 (0.3) 0.1 (0.1)EUR + / – 5 % 1.2 (1.2) 0.1 (0.1) 0.1 (0.1) 0.0 0.0GBP + / – 10 % (0.2) 0.2 0.5 (0.5) 0.0 0.0 0.0 0.0JPY + / – 5 % 0.0 0.0 (0.2) 0.2 0.0 0.0 0.0 0.0BRL + / – 10 % 1.8 (1.8) 0.0 0.0 0.0 0.0 0.0 0.0
31.4

145Lonza Annual Report 2011
Lonza’s exposure to foreign currency risk was as follows, based on notional amounts:
31 December 2011million CHF
USD GBP EUR CHF JPY BRL SGD CZK Other Total
Other investments 0 0 0 0 0 0 0 0 0 0Long-term loans and advances 53 0 0 0 0 0 0 0 2 55Trade receivables, net 208 28 79 1 0 23 0 0 6 345Other receivables, prepaid expenses and accrued income 7 11 11 0 0 0 2 0 0 31Short-term advances 0 0 0 0 0 0 0 0 0 0Cash and cash equivalents 35 1 24 0 0 7 1 0 5 73Long-term debt 1 (22) 0 (2) 0 0 0 0 0 0 (24)Other long-term liabilities 0 0 0 0 0 (1) (2) 0 0 (3)Other short-term liabilities (92) (46) (34) (11) 0 (4) (2) 0 0 (189)Trade payables (13) (2) (25) 0 0 (4) (9) 0 0 (53)Short-term debt 1 (14) 0 0 0 0 0 0 0 0 (14)Gross balance sheet exposure 162 (8) 53 (10) 0 21 (10) 0 13 221
Currency-related instruments (106) 6 (26) 0 0 0 0 0 0 (126)
Net exposure 56 (2) 27 (10) 0 21 (10) 0 13 95
31 December 2010million CHF
USD GBP EUR CHF JPY BRL SGD CZK Other Total
Other investments 0 0 0 0 0 0 0 0 0 0Long-term loans and advances 40 0 0 0 0 0 0 0 0 40Trade receivables, net 115 26 57 1 0 0 0 0 1 200Other receivables, prepaid expenses and accrued income 1 0 3 0 0 0 0 1 2 7Short-term advances 1 0 0 0 0 0 0 0 0 1Cash and cash equivalents 59 3 5 0 0 0 0 0 0 67Long-term debt (16) 0 0 0 0 0 0 0 0 (16)Other long-term liabilities 0 0 0 0 0 0 0 0 (2) (2)Other short-term liabilities (25) (22) (27) 0 (3) 0 0 (2) (5) (84)Trade payables (10) (1) (13) 0 (2) 0 0 0 (8) (34)Short-term debt (16) 0 0 0 0 0 0 0 0 (16)Gross balance sheet exposure 149 6 25 1 (5) 0 0 (1) (12) 163
Estimated forecast purchases (41) 0 0 0 0 0 0 0 0 (41)Currency-related instruments (25) 0 (24) 0 1 0 2 12 0 (34)
Net exposure 83 6 1 1 (4) 0 2 11 (12) 88
1 The acquisition bridge financing was raised in USD by Lonza Swiss Finance Ltd, which granted a USD loan of the same amount to Lonza America Inc. As a result, there is no foreign currency exposure in the consolidated income statement associated to the acquisition bridge financing.

146 Lonza Annual Report 2011
The following exchange rates were applied during the year:
Balance sheet year-end rates 2011 2010
EU Euro 1.2163 1.2511USA Dollar 0.9416 0.9369Great Britain Pound sterling 1.4517 1.4489Singapore Singapore dollar 0.7243 0.7309China Renminbi 0.1496 0.1421
Income statement year-average rates 2011 2010
EU Euro 1.2329 1.3824USA Dollar 0.8866 1.0427Great Britain Pound sterling 1.4213 1.6105Singapore Singapore dollar 0.7047 0.7647China Renminbi 0.1372 0.1540
Interest rate risk Lonza’s interest rate risk arises from long-term borrowings. Borrowings issued at variable rates expose Lonza to cash flow interest rate risk. Lonza’s policy is to manage interest cost using a mix of fixed and variable rate debt. Group policy is to maintain at least 50 % of its borrowings in fixed-rate instruments. In order to manage this mix in a cost-efficient manner, Lonza enters into interest rate swaps to exchange, at specified in-tervals, the difference between fixed and variable interest amounts calculated by reference to a corresponding notional principal amount. Lonza adopts a policy of having one-third of the debt on a short-term basis and two-thirds of the debt on a long-term basis. The mix between floating and fixed rates depends on the market view of Lonza.
Lonza’s exposure to interest risk was as follows, based on significant carrying amounts outlined in note 14:
Borrowings denominated in: million CHF
Total debt Debt at fixed interest rates Interest risk exposure
2011 2010 2011 2010 2011 2010
CHF 1 580 1 199 1 564 1 193 16 6USD 1 296 175 234 0 1 062 175

147Lonza Annual Report 2011
The table below shows the impact on post-tax profit and equity, if at 31 December interest rates had been 100 basis points higher (+) or lower (–) with all other variables held constant:
Borrowings denominated in: million CHF
Sensitivity Post-tax profit 1 Equity
2011 2010 2011 2010+ – + – + – + –
CHF + / – 1 % 0.0 0.0 0.0 0.0 0.0 0.0 (12.2) 12.2USD + / – 1 % (9.1) 9.1 (1.5) 1.5 0.0 0.0 0.0 0.0
Commodity price risk Lonza needs LPG as raw material for a cracker in Visp. Butane, naphtha or propane can be used as feedstock for the cracker. The raw material ultimately used depends on its availability and specifications. The annual demand is approximately 110 000 metric tons. In order to minimize the risk of higher raw material prices, Lonza hedges the butane price risk via swaps. At 31 December 2011, if the Butane price had weakened / strengthened by 10 % , with all other variables held constant, there would have been no impact on equity (2010: CHF 0.7 million lower / higher).
Overview of Derivative Financial InstrumentsThe following table shows the contract or underlying principal amounts and fair values of derivative financial instruments by type of contract at 31 December 2011 and 2010. Con-tract or underlying principal amounts indicate the volume of business outstanding at the balance sheet date and do not represent amounts at risk. The fair values are determined by using the difference of the prices fixed in the outstanding derivative contracts from the actual market conditions which would have been applied at the year-end if we had to recover these trades.
Financial instruments at fair value through profit or loss – held for trading million CHF
2011 2010 2011 2010 2011 2010 2011 2010
Contract or underlying principal amount
Positive fair values Negative fair values Total net fair values
Currency-related instruments– Forward foreign exchange rate contracts 92 15 2 1 (1) 0 1 1 – Currency swaps 581 502 2 20 (15) (3) (13) 17 – FX Options 0 45 0 1 0 0 0 1
Total currency-related instruments 673 562 4 22 (16) (3) (12) 19
Interest-related instruments– Interest rate swaps 528 0 0 0 (3) 0 (3) 0 – Cross currency interest rate swaps 380 0 0 0 (18) 0 (18) 0
Total interest-related instruments 908 0 0 0 (21) 0 (21) 0
Total financial instruments at fair value through profit or loss – held for trading
1 581 562 4 22
(37) (3)
(33) 19
31.5
1 Impact on post-tax profit from CHF borrowings is not disclosed as it is not material

148 Lonza Annual Report 2011
Financial instruments effective for hedge-accounting purposesmillion CHF
2011 2010 2011 2010 2011 2010 2011 2010
Contract or underlying principal amount
Positive fair values Negative fair values Total net fair values
Currency-related instruments– US dollar cash deposit 0 41 0 0 0 (1) 0 (1)– Forward foreign exchange rate contracts 143 23 0 1 (3) 0 (3) 1
Total currency-related instruments 143 64 0 1 (3) (1) (3) 0
Interest-related instruments– Interest rate swaps 0 500 0 0 0 (12) 0 (12)
Total interest-related instruments 0 500 0 0 0 (12) 0 (12)
Commodity-related instruments– Butane swap 10 7 0 1 0 0 0 1 – Naphtha swap 18 7 0 2 0 0 0 2
Total commodity-related instruments 28 14 0 3 0 0 0 3
Total financial instruments effective for hedge-accounting purposes
171
578 0 4 (3) (13) (3) (9)
Financial instruments by currency Forward foreign exchange rate contracts and currency swapsmillion CHF
2011 2010
USD 638 498 GBP 29 17 EUR 111 67 CZK 29 34 JPY 1 2 DKK 6 6 SGD 2 2 Total 816 626 Commodity swap 28 14 Interest rate swap 528 500 Cross currency interest rate swap 380 0Total financial instruments 1 752 1 140
Positive fair values of derivatives are included in the balance sheet caption “Other receiv-ables, prepaid expenses and accrued income”. Negative fair values of derivatives are in-cluded in the balance sheet caption “Other short-term liabilities”.
The following hedges were included: – Cash flow hedges on highly probable payments in foreign currency – Cash flow hedges on highly probable payments for raw materials (butane) – Fair value hedges on firm commitments for raw materials (naphtha)

149Lonza Annual Report 2011
Financial Instruments Carried at Fair ValueThe Group applied the following hierarchy for determining and disclosing the fair value of financial instruments by valuation technique: – Level 1: quoted (unadjusted) prices in active markets for identical assets or liabilities – Level 2: inputs other than quoted prices included within level 1 that are observable
for the asset or liability, either directly or indirectly. – Level 3: inputs for the asset or liability that are not based on observable market data
(unobservable inputs).
2011 2010million CHF Level 1 Level 2 Level 3 Total fair
valueLevel 1 Level 2 Level 3 Total fair
value
AssetsDerivative financial instruments 0 4 0 4 0 26 0 26Short-term financial assets 26 0 0 26 33 0 0 33LiabilitiesDerivative financial instruments 0 (40) 0 (40) 0 (15) 0 (15)Net assets and liabilities measured at fair value 26 (36) 0 (10) 33 11 0 44
In 2011, there were no transfers between Level 1 and Level 2 fair value measurements, and no transfers into and out of Level 3 fair value measurements.
Carrying Amounts and Fair Values of Financial Instruments by CategoryThe carrying values less impairment provision of trade receivables and payables are as-sumed to approximate to their fair values due to the short-term nature of trade receivables. The fair value of financial liabilities for disclosure purposes is estimated by discounting the future contractual cash flows at the current market interest rate that is available to the Group for similar financial instruments.
The fair value of interest rate swaps is calculated as the present value of the estimated future cash flows. The fair value of forward foreign exchange contracts is determined using quoted forward exchange rates at the balance sheet date.
31.6
31.7

150 Lonza Annual Report 2011
The table below shows the carrying amounts and fair values of financial instruments by category.
Carrying amounts and fair values of financial instruments by categorymillion CHF
31 12 2011 31 12 2010 31 12 2011 31 12 2010
Carrying amount Fair value
Financial assets – available for saleOther investments – available for sale – carried at cost 6 6 6 6Short-term financial assets – available for sale – at fair value 1 26 33 26 33Total financial assets – available for sale 32 39 32 39
Loans and receivablesTrade receivables, net 695 488 695 488Other receivables and accrued income 69 43 69 43Short-term advances 2 1 2 1Long-term loans and advances 56 43 56 43Cash and cash equivalents 196 248 196 248Total loans and receivables 1 018 823 1 018 823
Financial assets at fair value through profit or loss – held for tradingCurrency-related instruments 4 22 4 22Total financial assets at fair value through profit or loss – held for trading 4 22 4 22
Financial liabilities at amortized costLong-term debt 2 725 850 2 764 880Other short-term liabilities 391 304 391 304Trade payables 294 159 294 159Short-term debt 176 550 176 550Total financial liabilities at amortized cost 3 586 1 863 3 625 1 893
Financial liabilities at fair value through profit or loss – held for tradingCurrency-related instruments 16 3 16 3Interest-related instruments 21 0 21 0Total financial liabilities at fair value through profit or loss – held for trading 37 3 37 3
1 Included in “Other receivables” (see note 11)

151Lonza Annual Report 2011
Capital ManagementThe Board’s policy is to maintain a strong capital base so as to maintain investor, creditor and market confidence and to sustain future development of the business. The Board of Directors monitors both the demographic spread of shareholders, as well as the return on capital and the level of dividends to ordinary shareholders.
At present, employees hold one percent of ordinary shares, or just under three percent, assuming that all outstanding share awards vest.
The Board seeks to maintain a balance between the higher returns that might be possible with higher levels of borrowings and the advantages and security afforded by a sound capital position. Lonza’s target is to achieve a return on shareholders’ equity of between 10 % and 15 %; in 2011, the return was 6.9 % (2010: 11.7 %). In comparison, the weighted average interest expense on interest-bearing borrowings (excluding liabilities with imputed interest) was 2.8 % (2010: 3.2 %).
From time to time, Lonza purchases its own shares on the market; the timing of these purchases depends on market prices. Primarily, the shares are intended to be used for Lonza’s share programs. Lonza does not have a defined share buy-back plan 1.
Neither Lonza Group Ltd nor any of its subsidiaries are subject to externally imposed capital requirements.
Segment Information General InformationAccording to the requirements of the standard IFRS 8 “Operating Segments”, Lonza identi-fied the following four operating segments: – Custom Manufacturing – Life Science Ingredients – Microbial Control – Bioscience
which are described as follows:
31.8
32
32.1
1 On 27 January 2011, Lonza announced the purchase of up to one million Lonza shares within a period of one year.

152 Lonza Annual Report 2011
The Custom Manufacturing segment is the partner to pharmaceutical and biopharmaceuti-cal customers for their manufacturing needs. Using a variety of technologies, ingredients are manufactured for ultimate use in many critical drugs, treating patients in areas such as cardiovascular diseases, cancer, neurological and infectious diseases. Its product capabilities include both small and large molecules, resulting from technology processes such as chemical synthesis, peptide synthesis, biotransformation, microbial fermenta-tion and mammalian cell culture.
The Life Science Ingredients segment offers products used in nutrition and in selected industrial markets. The customers of this business segment are manufacturers of con-sumer and health products, distributors, formulators and service companies. The in-gredients range from nutritional ingredients to complex chemical intermediates for the agricultural industry.
The Microbial Control segment formed by the acquisition of Arch Chemicals will provide customers with complete solutions for their microbial control needs. Microbial control deals with hygiene and preservation, water treatment, materials protection, personal care and wood treatment.
The Bioscience segment offers tools that life-science customers use to discover, develop, make and test therapeutics. Its customers are worldwide pharmaceutical and biotechnol-ogy companies, as well as academic and government research organizations. Bioscience’s products range from cell culture and molecular biology tools for life-science research, to media used in the production of therapeutics and tests for microbial detection.
Corporate includes mainly corporate functions such as finance and accounting, legal, communication, information technology and human resources.
Information about Reportable Segments In the following table, revenues and profit or loss are disclosed by the four reportable seg-ments and corporate, which includes the costs of the corporate functions, including elimina-tions, and adds up to the Group total. Lonza does not allocate financing costs, income and expenses from associates and joint ventures as well as taxes to the reportable segments. The information disclosed by operating segments is the same as reported monthly to the management committee.
32.2

153Lonza Annual Report 2011
Year ended 31 December 2011million CHF
Custom Manu-
facturing
Life Science
Ingre dients
Microbial Control
Bioscience Total operating
segments
Corporate / Eliminations
Group total
Sales third-party 1 297 697 486 202 2 682 10 2 692 Inter-segment sales 1 52 65 12 11 140 (140) 0 Total sales 1 349 762 498 213 2 822 (130) 2 692 Result from operating activities (EBIT) 228 40 (8) 13 273 (12) 261
– Percentage return on sales % 17.6 5.7 (1.6) 6.4 10.2 n.a. 9.7
Financial income 18 Financial expenses (91)Net financing costs (73)Share of profit / (loss) of associates / joint ventures (13)Profit before income taxes 175 Income taxes (21)Profit for the period 154
Included in result from operating activities (EBIT):
– Other operating income 15 18 3 2 38 4 42 – Other operating expenses (9) (2) (5) (2) (18) (4) (22)– Research and development 118 24 11 15 168 3 171 – Depreciation and amortization 165 65 22 15 267 9 276
Total assets 2 852 1 035 2 692 780 7 359 (339) 7 020 Total liabilities 1 433 878 1 304 519 4 134 530 4 664 Total equity 1 419 157 1 388 261 3 225 (869) 2 356 Net financial (assets) / liabilities 620 739 657 414 2 430 881 3 311 Net capital invested 2 2 039 896 2 045 675 5 655 12 5 667
Return on net capital invested (RONOA) 3 % 12.2 4.6 1.3 4.3 7.3 n.a. 6.9
Included in total reportable segment assets:Total property, plant and equipment 1 448 720 350 153 2 671 30 2 701
– Additions to property, plant and equipment 86 92 21 44 243 5 248
– Additions to property, plant and equipment from acquisitions 0 0 227 0 227 0 227
Total goodwill and intangible assets 139 8 1 432 468 2 047 15 2 062 – Additions to intangible assets 1 4 1 6 12 7 19 – Additions to goodwill and
intangible assets from acquisitions 0 0 1 366 0 1 366 0 1 366 Investments in associates / joint ventures 0 0 2 0 2 12 14
– Additions to investment in associates / joint ventures 0 0 0 0 0 0 0
– Additions to investment in associates / joint ventures from acquisitions 0 0 2 0 2 0 2
Headcount 4 220 2 212 3 047 1 017 10 496 505 11 001 Average headcount 4 144 2 193 1 767 1 002 9 106 535 9 641
1 Inter-segment sales were based on prevailing market prices.2 Net capital invested comprises all operating assets and goodwill less
operating liabilities.3 Calculated at historical monthly average rates based on net capital
invested excluding goodwill.

154 Lonza Annual Report 2011
Year ended 31 December 2010million CHF
Custom Manu-
facturing
*Life Science
Ingre dients
*Microbial Control
Bioscience Total operating
segments
Corporate / Eliminations
Group total
Sales third-party 1 445 707 313 211 2 676 4 2 680 Inter-segment sales 1 35 146 11 11 203 (203) 0 Total sales 1 480 853 324 222 2 879 (199) 2 680 Result from operating activities (EBIT) 253 93 38 14 398 (24) 374
– Percentage return on sales % 17.5 13.2 12.1 6.6 14.9 n.a. 14.0
Financial income 6 Financial expenses (49)Net financing costs (43)Share of profit / (loss) of associates / joint ventures (1)Profit before income taxes 330 Income taxes (46)Profit for the period 284
Included in result from operating activities (EBIT):
– Other operating income 77 16 1 6 100 0 100 – Other operating expenses (10) (10) (5) (2) (27) (4) (31)– Research and development 87 25 10 15 137 4 141 – Depreciation and amortization 173 61 14 16 264 9 273 – Reversal of impairment 0 0 0 4 4 0 4 – Restructuring (expenses) / income 5 (6) 0 0 (1) (3) (4) – Environmental (expenses) / income 0 7 0 0 7 0 7
Total assets 2 816 965 437 744 4 962 (184) 4 778 Total liabilities 1 445 796 296 459 2 996 (605) 2 391 Total equity 1 371 169 141 285 1 966 421 2 387 Net financial (assets) / liabilities 654 657 37 357 1 705 (404) 1 301 Net capital invested 2 2 025 826 178 642 3 671 17 3 688
Return on net capital invested (RONOA) 3 % 12.1 11.3 19.2 4.2 11.6 n.a. 10.8
Included in total reportable segment assets:Total property, plant and equipment 1 532 683 108 114 2 437 33 2 470
– Additions to property, plant and equipment 128 114 12 28 282 3 285
– Additions to property, plant and equipment from acquisitions 0 0 0 1 1 0 1
Total goodwill and intangible assets 144 5 14 477 640 14 654 – Additions to intangible assets 1 0 1 5 7 8 15 – Additions to goodwill and
intangible assets from acquisitions 0 0 0 29 29 0 29 Investments in associates / joint ventures 0 0 0 0 0 19 19
– Additions to investment in associates / joint ventures 0 0 0 0 0 1 1
Headcount 4 069 2 174 485 987 7 715 565 8 280 Average headcount 4 096 2 255 462 967 7 780 553 8 333
1 Inter-segment sales were based on prevailing market prices.2 Net capital invested comprises all operating assets and goodwill less
operating liabilities.3 Calculated at historical monthly average rates based on net capital
invested excluding goodwill.* Due to the introduction of “Microbial Control” as a new business segment in 2011,
the disclosure of the segment information in 2010 was restated, accordingly.

155Lonza Annual Report 2011
Measurement of Operating Segment Profit or LossThe accounting principles applied to the operating segments are based on the same ac-counting principles used for the consolidated financial statements. Lonza evaluates the performance of its operating segments on the basis of the result from operating activities (EBIT). Inter-segment sales and transfers are based on prevailing market prices.
Geographical Information
Year ended 31 December 2011million CHF
Revenue from external customers (Sales)
Non-current assets
Property, plant and
equipment
Intangible assets
Goodwill Other non-current
assets
Total
Switzerland 374 1 007 47 15 39 1 108Spain 16 151 0 0 7 158Czech Republic 5 110 0 0 0 110Belgium 22 64 1 86 0 151United Kingdom 151 61 1 17 0 79Germany 150 13 45 71 0 129France 136 1 3 11 0 15Rest of Europe 196 7 2 23 0 32Europe 1 050 1 414 99 223 46 1 782
United States 1 141 689 770 900 60 2 419Rest of North America 60 0 0 0 0 0North America 1 201 689 770 900 60 2 419
Latin America 47 14 0 0 4 18
Singapore 29 302 60 0 4 366China 110 268 1 4 8 281Japan 83 1 0 0 0 1India 75 4 0 3 0 7Rest of Asia 60 0 0 0 0 0Asia 357 575 61 7 12 655
Other countries 37 9 0 2 0 11
Total 2 692 2 701 930 1 132 122 4 885
32.3
32.4

156 Lonza Annual Report 2011
Year ended 31 December 2010million CHF
Revenue from external customers (Sales)
Non-current assets
Property, plant and
equipment
Intangible assets
Goodwill Other non-current
assets
Total
Switzerland 339 1 023 45 15 25 1 108Spain 29 179 1 0 8 188Czech Republic 5 132 0 0 0 132Belgium 25 64 1 88 0 153United Kingdom 147 46 1 17 0 64Germany 194 17 49 73 0 139France 170 0 1 11 0 12Rest of Europe 283 2 3 24 0 29Europe 1 192 1 463 101 228 33 1 825
United States 1 019 521 80 173 3 777Rest of North America 31 0 0 0 0 0North America 1 050 521 80 173 3 777
Latin America 42 0 0 0 0 0
Singapore 42 281 61 0 4 346China 109 203 1 4 8 216Japan 93 0 1 0 1 2India 85 2 0 3 0 5Rest of Asia 45 0 0 0 0 0Asia 374 486 63 7 13 569
Other countries 22 0 0 2 0 2
Total 2 680 2 470 244 410 49 3 173
Information about Major Customers In 2011, Lonza’s largest customer accounts for 8.5 % and the second, third, fourth and fifth largest ones for 6.5 %, 4.8 %, 3.7 % and 3.6 % in relation to sales. No other customer accounts for 3.0 % or more of Lonza’s sales. All of the five largest customers relate to the Custom Manufacturing segment, except for the second largest which relates to Life Sci-ence Ingredients.
In 2010, Lonza’s largest customer accounts for 7.0 % and the second, third and fourth largest ones for 5.8 %, 5.4 % and 4.6 % in relation to sales. No other customer accounts for 4.0 % or more of Lonza’s sales. All of the four largest customers relate to the Custom Manufacturing segment, except for the second largest which relates to Life Science Ingredients.
32.5

157Lonza Annual Report 2011
Disclosures on Board and Management CompensationMethod of Determining Compensation and the Shareholding ProgramsThe overall structure of compensation for the Management Committee originally implemented in 2006 remained largely unchanged again in 2011. Base salary targets levels around the average for the market as described below, with the potential for executives to earn above-average compensation through a combination of attractive short- and long-term incentive programs, but only if the Group outperforms its financial targets. These incentive plans are designed to align the Management Committee’s objectives with the interests of our share-holders. The total compensation (base salary, variable elements and fringe benefits) of the members of the Management Committee is benchmarked annually against the relevant industry.The comparison data reflect the compensation of the Senior Management and the members of the Management Committee in Switzerland and the northeast coast of the USA in the pharma and chemical industry and general industry in multinational organizations of a size comparable with Lonza. The reference data represent a direct market comparison in terms of the samples and the functions of the analyzed manager positions. At least two benchmark providers (in the year 2011: Towers Watson and Mercer) are used to draw the comparisons.
In 2011 the Board of Directors decided to reappraise the total compensation package of the Senior Management (including the members of the Management Committee) in a more detailed way. This analysis was conducted by a specialized external consultant (Kepler As-sociates in March 2011) on the basis of the same benchmark data as in 2006 (see above). It found that the Senior Management total compensation package was below the median of the relevant comparison market. For the management Committee Kepler Associates bench-marked the compensation against Swiss-listed companies of a similar size (peer group of 18 companies) and international sector comparators (peer group of 37 companies of the pharma and chemical industry). This survey showed that the remuneration of the members of the Management Committee is between median and lower quartile (50 percentile and 25 percentile of the benchmark). As a consequence, the Nomination and Compensation Commit-tee decided to readjust successively the compensation plans for the Management Commit-tee. In a first step, an extension of the Short-Term Incentive Plan (E-STIP) was implemented.
The members of the Management Committee receive an annual base salary in cash. In addition, they are eligible for an annual incentive, the Short-Term Incentive (STIP), the Extended Short-Term Incentive Plan (E-STIP) and the Long-Term Incentive for Senior Man-agement and Key Employees (LTIP).
For the Management Committee, the STIP puts a weight of at least 80 % on the financial target of Economic Value Added (EVA) of the Group. A weight of at most 20 % is put on individual qualitative targets, linked to the delivery of strategic milestones. (An exception, described in last year’s report concerned the STIP 2010, which put a higher weight on the individual targets. In 2011, the STIP again puts a weight of at least 80 % on the EVA target). For the members of the Management Committee the overall STIP amount is targeted as a percentage of base salary ranging from 50 % to 70 %, and the overall payout depends on the achievement of the goals against the targets. The incentive is paid in cash.
33
33.1

158 Lonza Annual Report 2011
The Extended Short-Term Incentive (E-STIP) was introduced because of the need to establish even more long-term orientation of the incentive system as well as with the aim of increas-ing the retention power of the compensation system. Senior Management as well as the members of the Management Committee are included in this plan. The value of the plan is strongly dependent on Lonza’s and the executive’s past as well as future performance. Specifically, first an amount equal to half of the STIP 2011 (which depends on financial and individual goals) is awarded to each member of the Management Committee in the form of restricted share units entitlements. Second, these restricted share units are subject to three-year vesting conditions. The grant of the restricted share units under the E-STIP 2011 will take place on 31 March 2012, at which date the number of restricted share units will be determined based on the closing stock price on that date. During the three-years vesting period, theses restricted share units do not qualify for dividends and voting rights and no dispositions are allowed.
The LTIP is a stock bonus plan. The plan establishes targets for Total Shareholder Return (TSR) to exceed an index of industry peers by 9 % per year on average over three years. The second target is Economic Value Added (EVA) to increase up to CHF 114.4 million over the same three-year period. If targets are met, shares are granted. The maximum number of shares to be granted is capped at the start of the plan. The grant amount is calculated as a percentage of base salary and can range from 150 % to 200 % of base salary. Individual investment in Lonza shares is a mandatory prerequisite for participation in the plan. Be-sides the members of the Management Committee, the upper management, as well as specialists and experts, are also included in this program and therefore in the company’s mid-term and long-term goals.
The LTIP did not provide any compensation for the Management Committee until 2009, there-fore a three-year “Bridge the Gap” plan was also launched in 2006. This plan provides share grants for the Management Committee. Individual investment in Lonza shares is a mandatory prerequisite for participation in the plan. The share awards were granted from January 2006 until January 2008 and will vest over a one- to three-year period (title and ownership of the shares will only be received after the respective vesting period). The MC shares are subject to a restriction period. During the restriction period, an MC member may not sell, pledge or grant any other rights to any third party with respect to the MC shares. Shares will become unconditional after lapse of the restriction period. New entrants have a pro-rata share entitle-ment with partially shortened restriction period. This plan was terminated in 2010.
Members of the Management Committee receive customary additional benefits such as a company car, health insurance and in some cases contributions to children’s education.

159Lonza Annual Report 2011
Board of Directors The members of the Board of Directors received a compensation package with a base amount and additional compensation for chairing one of the Board committees. The decision regarding the remuneration of the Board of Directors was taken by the Board of Directors in April 2011. The overall structure and level of compensation of the Board of Director has not changed since 2005. The high portion of the shares aligns significantly with the share price development. Our aim is to pay the members of the Board of Directors at the industry market average, drawing on data from studies on Swiss Leader Index (SLI) companies. In 2011, payments to acting members of the Board of Directors of Lonza Group Ltd totaled CHF 2.652 million 1 (2010: CHF 2.503 million 1), 63.56 % (2010: 65.96 %) of which was distributed in the form of shares. The compensation system for the Board of Directors allows the members to choose either a payment in shares or a combination of cash and shares, whereby the cash portion cannot exceed 40 %. Shares granted are valued at the market price at grant date, based on the average of the last five business days of each quarter, with a discount of 20 %. They are blocked for a period of three years and are eligible for a dividend. Directors are reimbursed for travel and other related expenses associated with the performance of their services for Lonza. Therefore, all the amounts given for the Board of Directors below refer to fixed pay.
Board of Directors’ compensation
2011 2010
2 Cash payment
CHF
Number of shares
3 Value of shares
CHF
Total
CHF
2 Cash payment
CHF
Number of shares
3 Value of shares
CHF
Total
CHF
Rolf SoironChairman of the Board 194 350 5 806 356 288 550 638 204 145 4 442 356 401 560 546
Richard SykesVice-Chairman of the Board 116 875 4 898 306 885 423 760 100 000 4 672 374 864 474 864
Patrick AebischerMember of the Board 117 222 3 448 211 592 328 814 123 956 2 656 213 078 337 034
Jean-Daniel GerberMember of the Board 88 332 2 777 159 514 247 846
Julia HigginsMember of the Board 192 500 3 207 196 797 389 297 192 500 2 452 196 743 389 243
Gerhard MayrMember of the Board 120 763 3 332 207 155 327 918 86 992 3 258 261 364 348 356
Peter WildenMember of the Board 136 161 4 027 247 116 383 277 144 218 3 098 248 541 392 759
Total 966 203 27 495 1 685 347 2 651 550 851 811 20 578 1 650 991 2 502 802
1 Including social security and withholding tax2 All compensation amounts given in the Remuneration Report (both for the Board of Directors and the Manage-
ment Committee) refer to gross payments, including social security and with-holding tax, except where stated otherwise. The accrual principle is applied.
3 The fair values were calculated using the market price at grant date, see note 25 in the Lonza Financial Report 2011.

160 Lonza Annual Report 2011
In 2011, no member of the Board of Directors gave up his or her function, one new member was elected at the Annual General Meeting (2010: one member gave up his function, and no new member joined the Board of Directors). In 2011, there were 7 members on the Board (2010: 6 members). The average number of Board members during the year was 6.75 full-time equivalents (2010: 6.25 full-time equivalents).
Management Committee No member of the Management Committee gave up his or her function in the year under review. The acting members of the Management Committee received, for their contributions and time served in 2011, CHF 5.440 million 1 (2010: CHF 5.195 million 1) in cash and additional benefits, and 73 107 conditional LTIP shares (2010: 62 923 shares) and a number of restricted share units (the exact number will be determined in March 2012), equivalent to a value of CHF 3.004 million (2010: CHF 2.500 million). The restricted share units of the E-STIP and the conditional shares of the LTIP are subject to vesting conditions of three years. The vesting of the LTIP shares is linked to performance conditions and the value at maturity will be higher, lower or even zero. The ratio of fixed compensation to the performance-related components of compensation was 114.0 % (2010: 123.6 %)
Management Committee’s compensationmillion CHF
2011 2010
Base salary 2 3.197 2.861Incentive 3 0.942 1.156Post-employment benefits 4 0.374 0.349Other benefits 5 0.814 0.453Severance payments 6 0.113 0.376Share- / option-based payments
Value of E-STIP restricted share units (number of share units 2011: will be determined in March 2012; 2010: n / a; ) 0.421 0.0Value of LTIP Bridge the Gap Shares (number of shares 2011: 0; 2010: 2 484) 0.0 0.214Value of LTIP shares 7 (number of shares 2011:73 107; 2010: 60 439) 2.583 2.286Total 8.444 7.695Ratio of fixed compensation to the performance-related components of compensation 114.0 % 123.6 %
1 Including social security and incentive paid in March of the following year2 2010: 6 members, CEO included; 2011: 7 members, CEO included3 Incentive (STIP) of the reporting year, paid in March of the following year4 Social security and pension fund5 Company car, health insurance and tuition. The table shows the fair value of these benefits. In 2011 two mem-
bers of the MC moved to Asia and the USA. Therefore, the costs for insurances, tuition and housing (in case of international assignments) are higher than in the year before. Furthermore, two new members joined the MC.
6 This table discloses the actual amounts paid for the years 2010 and 2011. The severance agreements are discussed in the remuneration report.
7 The fair values were calculated using the market price at grant date according to IFRS 2, see note 25 in the Lonza Financial Report 2011 and the more detailed comments further below. In particular, the fair values are not actual payouts made, but provide information about the expected value of the shares. It is possible that, given the performance conditions on the shares, the eventual value is higher or lower (or even zero).

161Lonza Annual Report 2011
The employment agreements of the members of the Management Committee provide for notice periods between 12 and 18 months, except in one case where the notice period is 60 days.
In case of termination by the company without cause or due to the disability of a member of the Management Committee other than the CEO (who was terminated in January 2012, see page 194 of the remuneration report) or of resignation by the relevant member of the Management Committee for good reason (such as reduction of remuneration or demotion), such member of the Management Committee is entitled to a payment corresponding to a maximum of 18 months’ base salary, and outplacement support and additional health insurance until a new employment is found, under the condition that the relevant member of the Management Committee executes a release in favor of the company.
In case of termination by the company without cause, the CEO and the Head of Human Resources (and the Nomination and Compensation Committee as regards E-STIP shares) may, at their discretion, decide the immediate vesting of the LTIP and E-STIP shares.
In case of termination due to the disability, death or retirement of a member of the Manage-ment Committee, the E-STIP and ESPP shares vest immediately. As far as the LTIP shares are concerned, a termination of the employment agreement due to disability or death results in 50 % of the shares being forfeited and the remaining 50 % shares vesting immediately.
Other than with respect to the CEO (see remuneration report page 194), the applicable notice periods are in principle extended to 18 months if the company terminates the employment of a member of the Management Committee as a result of a change of control, or if a member of the Management Committee resigns for good reasons (such as reduction of remunera-tion or demotion) in such a context. All the shares attributed to the relevant member of the Management Committee as part of the E-STIP, LTIP and ESPP vest immediately in such a case. In addition, the relevant member of the Management Committee may be entitled to receive, under certain conditions: a cash amount equal to 100 % of the STIP compensation during the notice period, a cash amount equal to 100 % of the LTIP compensation during the notice period; and an outplacement support up to an amount of CHF 50 000.
The highest compensation of a member of the Management Committee in 2011 was paid to Stefan Borgas. Mr. Borgas received CHF 1 283 884 (2010: CHF 1 634 593) paid in cash and additional benefits and 24 220 conditional LTIP shares based on the performance of 2011 (2010: 23 569) equivalent to a fair value of CHF 900 500 (2010: 891 380). The conditional shares of the LTIP are subject to vesting conditions of three years. The vest-ing of these shares is linked to performance conditions and the value at maturity will be higher, lower or even zero. The ratio of fixed compensation to the performance-related components of the compensation was 118.3 % (2010: 85.3 %).

162 Lonza Annual Report 2011
Compensation of the highest-paid individual (Stefan Borgas)million CHF
2011 2010
Base salary 0.917 0.898Incentive 1 0.100 0.472Post-employment benefits 2 0.113 0.106Other benefits 3 0.153 0.159Severance payments 4 0.0 0.0Share- / option-based payments
Value of E-STIP share units 0.0 0.0Value of LTIP Bridge the Gap Shares 0.0 0.0Value of LTIP shares 5 (number of shares 2011: 24 220; 2010: 23 569) 0.901 0.891Total 2.184 2.526Ratio of fixed compensation to the performance-related components of compensation 118.3 % 85.3 %
In 2011, there were 7 members (2010: 6 members) on the Management Committee. The average number of Management Committee members during the year was 6.1 full-time equivalents (2010: 5.4 full-time equivalents).
On 25 January 2012, the company announced the termination of Stefan Borgas’ role as CEO of the Group. The financial consequences of the termination of Mr. Borgas’ employment with the company are set forth in the remuneration report on page 194.
In 2010 one severance payment was made to a member of the Management Committee, who gave up her function. In 2011, as no member left the Management Committee, no new severance payment was made to a member of the Management Committee. In 2011, no member of the Board of Directors and no member of the Management Committee gave up their function.
Conflict of interest No member of the Board of Directors benefits materially from any contract between a Lonza company and a third party.
1 Incentive (STIP) of the reporting year, paid in March of the following year2 Social security and pension fund3 Company car, health insurance and tuition. The table shows the fair value of these benefits.4 This table discloses the actual amount paid for the year 2010 and 2011. The severance agreements are discussed
in the remuneration report.5 The fair values were calculated using the market price at grant date according to IFRS 2, see note 25 in the Lonza
Financial Report 2011 and the more detailed comments further below. In particular, the fair values are not actual payouts made, but provide information about the expected value of the shares. It is possible that, given the performance conditions on the shares, the eventual value is higher or lower (or even zero).

163Lonza Annual Report 2011
Compensation for Former Members of Governing BodiesCompensation of CHF 0.113 million was paid to a former member of the governing bodies (2010: 0.479 millions); this was contained in the personnel expenses 2010.
Share AllotmentIn the reporting year 2011, the members of the Board of Directors received shares as part of their total remuneration. There were no further share allotments, except as stated in note 33.1 of this report. In note 33.1, the allotment of the LTIP shares for the Management Committee is included. These shares are only granted if the targets are met. As described in note 33.1, this plan did not provide any income before 2009.
Share OwnershipBased on information available to Lonza Group Ltd, the members of the Board of Directors and parties closely associated with them 1 held, as of 31 December 2011, a total of 112 574 (2010: 85 799) registered shares in Lonza Group Ltd and controlled 0.21 % (2010: 0.17 %) of the share capital. None of the directors owns shares in the Group’s subsidiaries or associates.
The members of the Management Committee and parties closely associated with them 1 held 71 950 (2010: 64 841) registered shares in Lonza Group Ltd as per 31 December 2011.
Share ownership of Board of Directors and Management Committee as of 31 December:
Board of DirectorsLonza shares (numbers)
2011 2010 Management CommitteeLonza shares (numbers)
2011 2010
Rolf Soiron 36 339 30 992 Stefan Borgas 35 402 36 548
Richard Sykes 22 240 16 170 Uwe Böhlke 5 084 3 719
Jean-Daniel Gerber 2 031 Toralf Haag 11 213 10 493
Julia Higgins 12 726 9 774 Stephan Kutzer 10 000 8 987
Gerhard Mayr 14 655 11 175 Jeanne Thoma 4 091
Peter Wilden 15 974 12 260 Lukas Utiger 6 037 5 094
Patrick Aebischer 8 609 5 428 Harry Boot 123
33.2
33.3
33.4
1 Spouse, children below age 18, any legal entities that they own or otherwise control, or any legal or natural person who is acting as their fiduciary.

164 Lonza Annual Report 2011
Additional RemunerationDuring the year under review, none of the members of the Board of Directors or the Man-agement Committee, or parties closely linked to such persons, billed honoraria or other remunerations to Lonza Group Ltd or any subsidiaries for additional services performed.
Loans Granted by Governing BodiesIn 2011, the CEO, Stefan Borgas, was granted a loan of CHF 1 730 000 in total. The interest rate was set according to market conditions at the time of the grant and repayment upon termination of employment. The out-payment was in March 2011 and in early 2012. This loan will fully offset against payments due to Mr Stefan Borgas according to the separation agreement with the company (2010: the members of the Management Committee did not receive any credits or loans).
After Closing EventThe employment agreement of Stefan Borgas has been terminated in January 2012. The conditions about his leave are described on page 194 of the remuneration report.
Risk Management ProcessThe risk management review, now an established procedure, was conducted in the second half of the reporting year.
The process of identifying and evaluating the risks involved the following steps: – Identification and description of possible operational risks, carried out by
the risk management officers in the business units and corporate functions – Valuation of risks in terms of probability of occurrence and likely
impact should they occur – Development and initiation of measures for risk reduction (reducing the
probability or impact), including assignment of responsibilities for implementation – Verification and consolidation of results by the risk management
officers at Group level – Creation of a Group risk map, providing an overview of the most significant
risks and a basis for detailed discussion and analysis.
At their meeting in December, the Management Committee and Board of Directors have been informed about the results of the risk management process and the findings have been approved. The risk management process, which has been conducted for several years, ensures a common basis of understanding between operational management and the Board of Directors in regard to the existing risks and the measures to be adopted.
33.6
33.7
34

165Lonza Annual Report 2011
For an innovative company, which is a technology leader in a number of fields, effective risk management is a key issue. Changes in personnel in the strategic business fields, operations involving critical chemicals, highly potent compounds, complex information systems and rapid technological advances, as well as the dynamic nature of the relevant markets, demand a critical assessment of the attendant risks on an ongoing basis.
This risk comprehension not only corresponds to our ethical principles, but is also clearly expected from us, particularly by our worldwide customers in the Custom Manufacturing area. The protection of employees, production facilities, raw material supplies, distribution channels and information systems from imminent negative influences and the preparation of alternative production capacity in case of unforeseen events are prerequisites for the selection of Lonza as a partner.
Financial Risk Management is disclosed in note 31.

166 Lonza Annual Report 2011
Report of the Statutory Auditoron the Consolidated Financial Statements to the Annual General Meeting of Lonza Group Ltd, Basel
As statutory auditor, we have audited the accompanying consolidated financial statements of Lonza Group Ltd, which comprise the balance sheet, income statement, statement of comprehensive income, cash flow statement, statement of changes in equity and notes on pages 74 to 165 for the year ended 31 December 2011.
Board of Directors’ ResponsibilityThe board of directors is responsible for the preparation and fair presentation of the con-solidated financial statements in accordance with International Financial Reporting Stan-dards (IFRS) and the requirements of Swiss law. This responsibility includes designing, implementing and maintaining an internal control system relevant to the preparation and fair presentation of consolidated financial statements that are free from material mis-statement, whether due to fraud or error. The board of directors is further responsible for selecting and applying appropriate accounting policies and making accounting estimates that are reasonable in the circumstances.
Auditor’s ResponsibilityOur responsibility is to express an opinion on these consolidated financial statements based on our audit. We conducted our audit in accordance with Swiss law, Swiss Auditing Standards and International Standards on Auditing. Those standards require that we plan and perform the audit to obtain reasonable assurance whether the consolidated financial statements are free from material misstatement.
An audit involves performing procedures to obtain audit evidence about the amounts and disclosures in the consolidated financial statements. The procedures selected depend on the auditor’s judgment, including the assessment of the risks of material misstatement of the consolidated financial statements, whether due to fraud or error. In making those risk assessments, the auditor considers the internal control system relevant to the entity’s preparation and fair presentation of the consolidated financial statements in order to de-sign audit procedures that are appropriate in the circumstances, but not for the purpose of expressing an opinion on the effectiveness of the entity’s internal control system. An audit also includes evaluating the appropriateness of the accounting policies used and the reasonableness of accounting estimates made, as well as evaluating the overall presenta-tion of the consolidated financial statements. We believe that the audit evidence we have obtained is sufficient and appropriate to provide a basis for our audit opinion.
OpinionIn our opinion, the consolidated financial statements for the year ended 31 December 2011 give a true and fair view of the financial position, the results of operations and the cash flows in accordance with International Financial Reporting Standards (IFRS) and comply with Swiss law.

167Lonza Annual Report 2011
Report on Other Legal RequirementsWe confirm that we meet the legal requirements on licensing according to the Auditor Over-sight Act (AOA) and independence (article 728 CO and article 11 AOA) and that there are no circumstances incompatible with our independence.
In accordance with article 728a paragraph 1 item 3 CO and Swiss Auditing Standard 890, we confirm that an internal control system exists, which has been designed for the preparation of consolidated financial statements according to the instructions of the board of directors.
We recommend that the consolidated financial statements submitted to you be approved.
KPMG AG
Regula Wallimann Norbert StrubLicensed Audit Expert Licensed Audit Expert
Auditor in Charge
Zurich, 24 February 2012

168 Lonza Annual Report 2011
Balance Sheet – Lonza Group Ltd
Assets 1
CHF2011 2010
Fixed assetsProperty, plant and equipment 1 128 908 1 486 936Investments 1 717 063 573 1 422 961 446Long-term loans to subsidiaries and associates 1 179 039 769 1 082 509 817Total fixed assets 2 897 232 250 2 506 958 199
Current assets
Receivables:– From third parties 129 800 33 403– From subsidiaries and associates 16 225 550 11 769 002
Prepaid expenses:– Third parties 18 307 638 30 542 765– Subsidiaries and associates 3 434 719 3 005 606
Short-term advances:– Third parties 1 190 000 0– Subsidiaries and associates 192 484 255 238 088 222
Marketable securities:– Own shares 72 557 592 33 180 590
Cash 5 287 165 230 749Total current assets 304 334 841 481 850 337Total assets 3 201 567 091 2 988 808 536
1 At 31 December

169Lonza Annual Report 2011
Liabilities and shareholders’ equity 1
CHF2011 2010
Shareholders’ equityShare capital 52 920 140 52 920 140
Legal reserve: – General legal reserve 26 460 070 25 225 000– Reserve from capital contribution 839 727 980 202 551 480– Reserve for own shares 110 550 603 44 491 517
Available earnings brought forward 783 334 935 1 524 326 393Profit for the year 97 106 559 74 229 225Total shareholders’ equity 1 910 100 287 1 923 743 755
LiabilitiesLong-term liabilitiesLong-term debt:
– Due to third parties 900 000 000 400 000 000
Long-term provisions: – Due to third parties 495 837 574 445
Total long-term liabilities 900 495 837 400 574 445
Current liabilitiesPayables and other liabilities:
– Due to third parties 816 309 706 482– Due to subsidiaries and associates 22 405 143 482
Accrued expenses: – Due to third parties 44 691 187 32 494 859– Due to subsidiaries and associates 1 316 700 317 010
Short-term provisions: – Due to third parties 0 108 444
Short-term debt: – Due to third parties 5 600 000 500 000 000– Due to subsidiaries and associates 338 524 366 130 720 059
Total current liabilities 390 970 967 664 490 336Total liabilities 1 291 466 804 1 065 064 781Total liabilities and shareholders’ equity 3 201 567 091 2 988 808 536Shareholders’ equity as a percentage of total assets % 59.7 64.4
1 At 31 December

170 Lonza Annual Report 2011
Income Statement – Lonza Group Ltd
CHF2011 2010
IncomeIncome from investments 152 945 781 135 741 562Interest income 24 924 693 31 182 763Other financial income 10 407 891 7 397 661Other income 1 993 258 1 077 963Total income 190 271 623 175 399 949
ExpensesPersonnel expenses 9 006 106 9 159 060Other administrative expenses 5 288 324 5 355 760Interest expenses 28 456 357 24 508 512Other financial expenses 46 366 428 43 650 783Taxes 2 064 592 1 876 538Other expenses 1 474 563 1 434 719Write-offs on property, plant and equipment 508 694 434 895Write-offs on loans 0 14 750 457Total expenses 93 165 064 101 170 724
Profit for the year 97 106 559 74 229 225

171Lonza Annual Report 2011
Notes to the Financial Statements – Lonza Group Ltd
Contingent LiabilitiesAt 31 December 2011, indemnity liabilities, guarantees and pledges in favor of third par-ties totaled CHF 1 732 592 318 (31 December 2010: CHF 437 204 027). The company is a member of the Lonza Group value-added-tax group in Switzerland and is thereby jointly and severally liable to the federal tax authorities for value-added-tax debts of that group.
Liabilities to Personnel Welfare Institutions31 December 2011: CHF 92 539 (31 December 2010: CHF 142 088).
InvestmentsSee list of principal subsidiaries, page 92 and 93.
Major shareholders in accordance with Art. 663c of the Swiss Code of ObligationsSee 1.2 Principal Shareholders in Corporate Governance, page 210.
Disclosures on Board and Management Compensation in Accordance with Art. 663b bis and Art. 663c para. 3 of the Swiss Code of ObligationsSee note 33 in Consolidated Financial Statements, page 157.
Information about the Risk Assessment Process in Accordance with Art. 663b para. 12 COLonza Group Ltd is fully integrated into the Group-wide risk management process of Lonza Group. The specific risks arising from the type and scope of Lonza Group Ltd’s business activi-ties are covered in the Group-wide risk management process. A detailed description of the risk management process can be found in note 34 of the Consolidated Financial Statements, page 164.
Own SharesAt 31 December 2011, Lonza Group Ltd held 1 307 344 of its registered shares with a par value of CHF 1 each (31 December 2010: 442 703), resulting in a reserve for own shares of CHF 110 550 603 (31 December 2010: CHF 44 491 517).
In 2011, Lonza Group Ltd acquired 1 000 000 registered shares at an average market value of CHF 77.29. In order to satisfy the exercise of the different share and option plans in 2011, Lonza Group Ltd delivered 135 359 registered shares at an average market value of CHF 72.35. A total of 228 143 of the registered shares with a par value of CHF 1 each (31 December 2010: 442 703) are reserved for the different share and option plans. There-fore 1 079 201 of the registered shares have no special restriction. At 31 December 2011, the total number of registered shares not entitled to a dividend was 1 307 344, with a par value of CHF 1 each (2010: 442 703).
1
2
3
4
5
6
7

172 Lonza Annual Report 2011
Share CapitalContingent capital: The share capital of Lonza Group Ltd may be increased through the issuance of a maximum of 5 029 860 fully paid-in registered shares with a par value of CHF 1 each up to a maximum aggregate amount of CHF 5 029 860. Authorized capital: The Board of Directors shall be authorized to increase, at any time until April 12 2013, the share capital of the Lonza Group Ltd through the issuance of a maximum of 5 000 000 fully paid in registered shares with a par value of CHF 1 each up to a maximum aggregate amount of CHF 5 000 000. The capital increases in the form of contingent capital and authorized capital may increase the share capital of Lonza Group Ltd by a maximum aggregate amount of CHF 5 029 860. The details and conditions are set out in Articles 4bis to 4quater of the Company’s Articles of Association.
At 31 December 2011, Lonza Group Ltd had a fully paid-in registered capital of CHF 52 920 140 and a contingent capital of CHF 5 029 860.
Amount in Reserve from Capital ContributionIn the context of the Corporate Taxation Reform II in Switzerland, the capital contribution principle was implemented with effect from 1 January 2011. The reserves from capital contribution established from 1 January 1997 to 31 December 2010 which qualify for the capital contribution principle of CHF 839 727 980 were finally approved by the Swiss Federal Tax Authority on 6 December 2011. The amount of CHF 747 926 528 was reclassified from Available earnings brought forward to Reserve from capital contribution as per 31 December 2011 to reflect the approved amount as Reserve from capital contribution.
Long- / Short-term DebtsIn February 2007, Lonza Group Ltd used the available syndicated loan facility in order to finance the acquisition of the Biopharma and Bioscience businesses from Cambrex. The facility was set up in December 2006 in an amount of CHF 500 million, with a maturity of five years and floating interest rates. In October 2011, Lonza Group Ltd replaced this facility. The new facility was set up in an amount of CHF 700 million, with a maturity of five years and floating interest rates.
In June 2010, Lonza Group Ltd issued a 3 % bond of CHF 400 million at an issue price of 100.721 %, with maturity date 2 June 2016.
Additional NotesExchange gains / losses Other financial expenses in 2011 include net exchange rate losses of CHF 12 492 586 (2010: CHF 38 320 731).
Own shares Other financial expenses in 2011 includes a depreciation for own shares of CHF 26 682 084 (2010: Other financial income CHF 6 646 071).
Long-term loans to subsidiaries and associates Lonza Group Ltd signed subordination agreements of CHF 48 million (2010: CHF 54 million).
8
9
10
11

173Lonza Annual Report 2011
Proposal of the Board of Directors concerning the appropriation of available earnings
CHF2011 2010
Available earnings brought forward 783 334 934 1 524 326 393 Profit for the year 97 106 559 74 229 225 Available earnings at the disposal of the Annual General Meeting 880 441 493 1 598 555 618
Increase in general legal reserve in 2010 0 (1 235 070)Available earnings carry-forward 880 441 493 1 597 320 548
Increase reserve for own shares in the 2011 business year ( 66 059 086)Increase in general legal reserve qualified as reserve from capital contribution in the 2011 business year ( 747 926 528)Available earnings brought forward after creation of reserve for own shares 783 334 934
CHF2011 2010
General legal reserve qualified as reserve from capital contribution 91 801 452 202 551 480 Earnings brought forward qualified for reserve from capital contribution 747 926 528 0 Reserve from capital contribution 1 839 727 980 202 551 480
Payment of a dividend in 2011 of CHF 2.15 (2010: CHF 2.15) per share on the share capital eligible for dividend of CHF 51 612 796 (2010: CHF 51 511 641) (110 967 511) (110 750 028) Available reserve from capital contribution carry-forward 728 760 469 91 801 452
If the Annual General Meeting approves the above proposal from the Board of Directors, the dividend of CHF 2.15 per registered share, net of withholding tax (as per Article 5 Abs 1bis VStG), will be paid as of 12 April 2012 at the offices designated in the publication organ of the company and in selected daily newspapers.
Basel, 24 February 2012
Rolf Soiron Toralf HaagChairman of the Board Chief Financial Officer
1 Refer to note 9

174 Lonza Annual Report 2011
Report of the Statutory Auditoron the Financial Statements to the Annual General Meeting of Lonza Group Ltd, Basel
As statutory auditor, we have audited the accompanying financial statements of Lonza Group Ltd, which comprise the balance sheet, income statement and notes on pages 168 to 173 for the year ended 31 December 2011.
Board of Directors’ ResponsibilityThe board of directors is responsible for the preparation of the financial statements in ac-cordance with the requirements of Swiss law and the company’s articles of incorporation. This responsibility includes designing, implementing and maintaining an internal control system relevant to the preparation of financial statements that are free from material mis-statement, whether due to fraud or error. The board of directors is further responsible for selecting and applying appropriate accounting policies and making accounting estimates that are reasonable in the circumstances.
Auditor’s ResponsibilityOur responsibility is to express an opinion on these financial statements based on our audit. We conducted our audit in accordance with Swiss law and Swiss Auditing Standards. Those standards require that we plan and perform the audit to obtain reasonable assurance whether the financial statements are free from material misstatement.
An audit involves performing procedures to obtain audit evidence about the amounts and disclosures in the financial statements. The procedures selected depend on the auditor’s judgment, including the assessment of the risks of material misstatement of the financial statements, whether due to fraud or error. In making those risk assessments, the auditor considers the internal control system relevant to the entity’s preparation of the financial statements in order to design audit procedures that are appropriate in the circumstances, but not for the purpose of expressing an opinion on the effectiveness of the entity’s internal control system. An audit also includes evaluating the appropriateness of the accounting policies used and the reasonableness of accounting estimates made, as well as evaluating the overall presentation of the financial statements. We believe that the audit evidence we have obtained is sufficient and appropriate to provide a basis for our audit opinion.
OpinionIn our opinion, the financial statements for the year ended 31 December 2011 comply with Swiss law and the company’s articles of incorporation.

175Lonza Annual Report 2011
Report on Other Legal RequirementsWe confirm that we meet the legal requirements on licensing according to the Auditor Over-sight Act (AOA) and independence (article 728 CO and article 11 AOA) and that there are no circumstances incompatible with our independence.
In accordance with article 728a paragraph 1 item 3 CO and Swiss Auditing Standard 890, we confirm that an internal control system exists, which has been designed for the preparation of financial statements according to the instructions of the board of directors.
We further confirm that the proposed appropriation of available earnings complies with Swiss law and the company’s articles of incorporation.
We recommend that the financial statements submitted to you be approved.
KPMG AG
Regula Wallimann Norbert StrubLicensed Audit Expert Licensed Audit Expert
Auditor in Charge
Zurich, 24 February 2012

176 Lonza Annual Report 2011
Investor Information
Lonza Group Ltd shares are listed on the SIX Swiss Exchange and were included in the Swiss Market Index (SMI) until September 2011. As of 19 September 2011, Lonza changed from the SMI to the Swiss Leader Index (SLI). Since 21 October 2011, Lonza has a secondary listing on the SGX Singapore Exchange. The nominal value of the Lonza Group Ltd share is CHF 1. Lonza Group shares closed at the end of 2011 at a price of CHF 55.50, which represents a decrease of 26.0 % in 2011.
The most significant news releases, other than results publications, during the course of 2011 were the following: – 5 January: Lonza Selects IDBS to Optimize Bioprocess Execution & Knowledge
Management – 27 January: Lonza Starts Share Purchase Program – 2 March: Lonza Introduces New Branding – 15 March: Lonza Signs Commercial Manufacturing Deal with Enobia for Orphan
Drug Candidate – 17 March: Lonza Signs Development and Manufacturing Agreement with Emerging
Biotech Company Athera – 29 March: Lonza to invest £16 million to expand its Slough facility – 11 April: Lonza and Roche enter into MycoTOOL® distribution agreement for rapid
mycoplasma testing solutions – 12 April: Annual General Meeting of Lonza Group Ltd – 19 April: Lonza and ORGANOBALANCE Enter Global License Agreement to Develop
and Market Unique Probiotic, Lactobacillus anti-H. pylori – 12 May: Lonza to Expand Cytotoxic Manufacturing to Serve Growing Oncology
API Market – 18 May: Lonza to expand viral production capacity; Construction of new cGMP
clean room will support large-scale viral vaccine, gene therapy projects – 7 June: Lonza to expand in Singapore to meet increasing demand for biopharma
development services from preclinical to commercial – 16 June: Lonza to refinance revolving credit facility – 30 June: Temporary 43 hour work week instituted to ensure long-term strengthening
of Visp site – 11 July: Lonza to acquire Arch Chemicals to create the world’s leading Microbial
Control business – 15 July: Lonza commences tender offer to acquire all of the outstanding shares of
Arch Chemicals, Inc. for USD 47.20 per share – 19 July: Lonza signs manufacturing deal with IMMUNE Pharmaceuticals for
Bertilimumab (iCo-008) – 10 August: Lonza to invest in long-term growing Meta™ metaldehyde business – 11 August: Lonza extends tender offer for all outstanding shares of Arch Chemicals
common stock to 12 September 2011

177Lonza Annual Report 2011
– 19 August: Lonza to appoint Jeanne Thoma as future COO of the Microbial Control sector – 24 August: Lonza, JFC Technologies and Novoset LLC announce a strategic
collaboration to advance high performance materials offerings – 1 September: Lonza celebrates 40 years as leading producer of vitamin B3 – 2 September: Oxford BioTherapeutics licenses Lonza’s GS Gene Expression System™ – 12 September: Lonza extends tender offer for all outstanding shares of Arch Chemicals
common stock to 30 September 2011 – 15 September: Lonza enters manufacturing agreement with Pasteuria Bioscience
for production of a novel bio-nematicide – 16 September: Lonza Group Ltd plans secondary listing on the Main Board of the
Singapore Stock Exchange – 26 September (Switzerland) / 27 September (Australia): Mesoblast and Lonza
establish strategic global manufacturing alliance – 29 September: Lonza receives antitrust clearance in France – 30 September: Lonza extends tender offer for all outstanding shares of Arch
Chemicals common stock to 14 October 2011 – 11 October: Lonza announces key partnership with Lipogen for phosphatidylserine;
Bolstering nutrition ingredient portfolio and cognitive health offering – 17 October: Lonza completes tender offer for Arch Chemicals; announces subsequent
offering period – 20 October: Lonza completes acquisition of Arch Chemicals – 20 October: Lonza to make trading debut on the Singapore Exchange – 25 October: Lonza enters development and manufacturing agreement with Genmab
A / S for a novel antibody drug conjugate (ADC), HuMax-TF™ – 15 November: Lonza Prices CHF 350 Million Dual Tranche Straight Bonds – 18 November: Change in Visp Site Management – 8 December: Lonza Signs Applied Protein Services Agreement with ImmuneMed for
Immunogenicity Risk Assessment and Deimmunization of Novel Protein – 15 December: Lonza to Expand Early Phase Manufacturing Capacity to Serve Small
Molecules Market
For a comprehensive review of the media releases issued during 2011, refer towww.lonza.com

178 Lonza Annual Report 2011
Lonza Group Ltd 2011 share price development versus the Swiss Leader Index and the Swiss Market Index, rebased
Janu
ary
Febr
uary
Mar
ch
April
May
June
July
Augu
st
Sept
embe
r
Octo
ber
Nove
mbe
r
Dece
mbe
r
80
70
60
50
40
Lonza SLI rebased SMI rebased
The changes in shareholdings that Lonza Group Ltd has announced since the beginning of 2011 can be viewed at www.lonza.com/en/about-lonza/investor-relations/investor-information/major-shareholders-and-changes-in-disclosed-shareholdings.aspx
The free float in Lonza Group Ltd registered shares reached 97.53 % at the year-end and the average daily trade volume was 326 387 shares in 2011.

179Lonza Annual Report 2011
Registered sharesCHF
2011 2010
Number of shares issued 52 920 140 52 920 140Number of shares ranking for dividend 1 51 612 796 52 477 437Par value per share CHF 1 1
Net income (equity holders of the parent) million CHF 154 291
Diluted net income 2 million CHF 154 291
Ratios per security 2 2011 2010
Weighted average number of shares 51 632 876 52 410 459Diluted weighted average number of shares 51 852 749 52 636 859Basic earnings per share CHF 2.98 5.55Diluted earnings per share CHF 2.97 5.53
Historical overview:
Ten-year overview of major highlightsmillion CHF
2011 2010 2009 2008 2007 2006 2005 2004 2003 2002
Sales 2 692 2 680 2 690 2 937 2 870 2 914 2 521 2 182 2 242 2 536Result from operating activities (EBIT) 261 374 239 441 408 344 297 212 139 302
Net capital invested 5 667 3 688 3 900 3 768 3 277 2 608 2 786 2 574 2 473 2 430Return on net capital invested (RONOA) % 6.9 10.8 6.7 13.8 14.1 12.4 11.0 8.4 12.2 16.8
Headcount 11 001 8 280 8 386 8 462 6 929 6 146 4 992 5 664 5 938 6 216
1 See note 262 See note 27
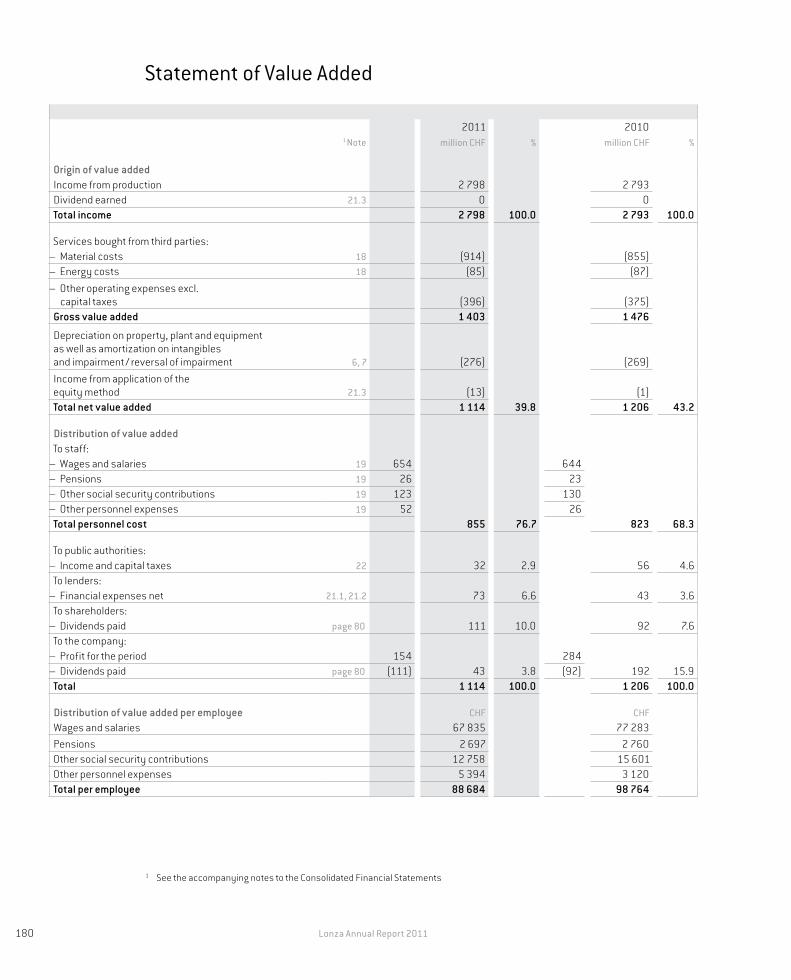
180 Lonza Annual Report 2011
Statement of Value Added
1 Note2011
million CHF %2010
million CHF %
Origin of value addedIncome from production 2 798 2 793 Dividend earned 21.3 0 0 Total income 2 798 100.0 2 793 100.0
Services bought from third parties: – Material costs 18 (914) (855)– Energy costs 18 (85) (87)– Other operating expenses excl.
capital taxes (396) (375)Gross value added 1 403 1 476
Depreciation on property, plant and equipment as well as amortization on intangibles and impairment / reversal of impairment 6, 7 (276)
(269)Income from application of the equity method 21.3 (13) (1)Total net value added 1 114 39.8 1 206 43.2
Distribution of value addedTo staff:
– Wages and salaries 19 654 644 – Pensions 19 26 23 – Other social security contributions 19 123 130 – Other personnel expenses 19 52 26
Total personnel cost 855 76.7 823 68.3
To public authorities: – Income and capital taxes 22 32 2.9 56 4.6
To lenders: – Financial expenses net 21.1, 21.2 73 6.6 43 3.6
To shareholders: – Dividends paid page 80 111 10.0 92 7.6
To the company: – Profit for the period 154 284 – Dividends paid page 80 (111) 43 3.8 (92) 192 15.9
Total 1 114 100.0 1 206 100.0
Distribution of value added per employee CHF CHFWages and salaries 67 835 77 283 Pensions 2 697 2 760 Other social security contributions 12 758 15 601 Other personnel expenses 5 394 3 120 Total per employee 88 684 98 764
1 See the accompanying notes to the Consolidated Financial Statements

181Lonza Annual Report 2011
Free Cash Flow
The following is a summary of the free cash flow, using Lonza’s definition. It includes earnings before interest, taxes and depreciation (EBITDA) and subtracts / adds the in-crease / decrease of operating net working capital, subtracts capital expenditures, ac-quisitions and adds disposal of fixed assets and subsidiaries as well as changes in other long-term operating assets / liabilities. This key measure is the same as reported monthly to the Management Committee.
million CHF2011 2010
EBITDA 537 643Change of operating net working capital (88) 47Capital expenditures in tangible and intangible assets (267) (300)Disposal of tangible assets 6 9Change of other assets and liabilities (61) (37)Free cash flow before acquisition 127 362Acquisition of subsidiaries (918) (26)Free cash flow (791) 336

182 Lonza Annual Report 2011
Core Results
Reconciliation of IFRS results to core results 2011million CHF
IFRS results Amortization of intangible assets
from acquisition
Impact of Arch integration
costs
Results associates
1 Core
results
Sales (see segment information) 2 692 0 0 0 2 692 Cost of goods sold (1 992) 18 12 0 (1 962)Gross profit 700 18 12 0 730 Marketing and distribution (160) 0 0 0 (160)Research and development (94) 0 0 0 (94)Administration and general overheads (205) 0 35 0 (170)Other operating income 42 0 0 0 42 Other operating expenses (22) 0 0 0 (22)Result from operating activities (EBIT) 261 18 47 0 326 Financial income 18 0 0 0 18 Financial expenses (91) 0 0 0 (91)Other investment income / (loss) 0 0 0 0 0 Net financing costs (73) 0 0 0 (73)Share of profit / (loss) of associates / joint ventures (13) 0 0 16 3 Profit before income taxes 175 18 47 16 256 Income taxes 2 (21) (2) (6) (2) (31)Profit for the period 154 16 41 14 225 Non-controlling interests 0 0 0 0 0 Equity holders of the parent 154 16 41 14 225
Number of Basic Shares, weighted 5 1632 876 51 632 876Number of Diluted Shares, weighted 5 1852 749 51 852 749Basic earnings per share 2.98 4.36Diluted earnings per share 2.97 4.34
1 In the core results for the items: “Result from operating activities (EBIT)”, “Profit for the period” and “Earnings per share”, the impact of amortization of acquisition-related intangible assets, impairment and reversal of impairment of assets, results from associates and other special charges / income from restructuring / acquisition is eliminated.
2 Tax impact calculated based on average Group tax rate

183Lonza Annual Report 2011
Reconciliation of IFRS results to core results 2010million CHF
IFRS results Amortization of intangible assets from
acquisition
Reversal of Impairments
Restructuring costs /income
Results associates
1 Core
results
Sales (see segment information) 2 680 0 0 0 0 2 680 Cost of goods sold (1 969) 17 0 0 0 (1 952)Gross profit 711 17 0 0 0 728 Marketing and distribution (155) 0 0 0 0 (155)Research and development (99) 0 0 (7) 0 (106)Administration and general overheads (152) 0 0 9 0 (143)Other operating income 100 0 (4) (5) 0 91 Other operating expenses (31) 0 0 3 0 (28)Result from operating activities (EBIT) 374 17 (4) 0 0 387 Financial income 6 0 0 0 0 6 Financial expenses (49) 0 0 0 0 (49)Other investment income / (loss) 0 0 0 0 0 0 Net financing costs (43) 0 0 0 0 (43)Share of profit / (loss) of associates / joint ventures (1) 0 0 0 5 4
Profit before income taxes 330 17 (4) 0 5 348 Income taxes 2 (46) (2) 0 0 (1) (49)Profit for the period 284 15 (4) 0 4 299 Non-controlling interests 7 0 0 0 0 7 Equity holders of the parent 291 15 (4) 0 4 306
Number of Basic Shares, weighted 52 410 459 52 410 459Number of Diluted Shares, weighted 52 636 859 52 636 859Basic earnings per share 5.55 5.84Diluted earnings per share 5.53 5.81
1 In the core results for the items: “Result from operating activities (EBIT)”, “Profit for the period” and “Earnings per share”, the impact of amortization of acquisition-related intangible assets, impairment and reversal of impairment of assets, results from associates and other special charges / income from restructuring / acquisition is eliminated.
2 Tax impact calculated based on average Group tax rate

185Lonza Annual Report 2011
Activities
Financial Report
Remuneration Report
186 Structure of the Report 186 Compensation Philosophy 187 Architecture of the Pay-setting Process 188 Compensation of the Board of Directors 191 Compensation of the Management Committee 202 Other Share Plans 203 Share Ownership for the Board of Directors
and Management Committee 204 Employee Share Purchase Plan (ESPP)
Corporate Governance
5
73
207
Lonza Annual Report 2011
This Remuneration Report has been included to provide an overview of Lonza’s compensation programs.
In addition to a description of the compensation programs, it includes the compensation levels of the Board
of Directors and the Management Committee. Some information from Notes 25, 28 and 33 of the Financial
Report is repeated here.

186 Lonza Annual Report 2011
Structure of the Report
This remuneration report begins with a general discussion of the compensation philosophy at Lonza, outlining the major elements of compensation for all employees. The remainder of the remuneration report then focuses on the compensation of the Board of Directors and the Management Committee. First, the architecture of the pay-setting process is described. Second, the report turns to the compensation of the Board of Directors. Third, the report dis-cusses the compensation of the Management Committee. At the end of the report, additional information on special share awards and the Employee Share Purchase Plan (ESPP) is given.
Compensation Philosophy
Lonza’s compensation philosophy is designed to serve two goals: to enable Lonza to be-come the employer of choice in our industry, and to motivate and reward employees based on the company’s long-term financial success. Our culture is performance-oriented, with rewards based on the achievement of specific goals. All employees have the opportunity to profit from Lonza’s financial success.
With regard to executive compensation, Lonza’s philosophy is to compensate at an aver-age level in base pay, combined with a variable component to encourage performance, but also with a defined upper limit. By putting a significant amount of total compensation
“at risk” the company encourages its executives to take actions and make decisions with consideration for both short- and long-term performance, and in line with strategic objec-tives. By putting a defined upper limit in place in combination with long-term programs, the company discourages short-term actions that risk the health and financial stability of the company in the long term.
Base pay The base pay of Lonza employees and senior management is established by assessing the scope of the individual’s job within the context of the relevant market, as well as personal experience, skills, abilities and ongoing performance. The base pay is comparable with the average level for a similar position in the industry. Potential increases in base pay are evaluated on an annual basis and are based on the market situation along with the individual’s performance.
Benefits Benefit programs are defined regionally to meet local regulations and to take into consideration the competitive situation. These programs are designed to offer benefits similar to the relevant market. The benefit packages are reviewed on a yearly basis.
Variable compensation and other programs Variable compensation and other programs are designed to provide employees with the opportunity to participate in the company’s overall success and earn total compensation that is in line with the industry. The Employee Share Purchase Plan is a share-savings plan open to all employees. The Incentive Programs

187Lonza Annual Report 2011
are performance-oriented. The guiding principle for these plans is to motivate and reward employees on the company’s long-term financial success as well as on the individuals’ performance of specific goals. The incentive programs include a Short-Term Incentive Plan (STIP), a Long-Term Incentive Plan (LTIP), and share plans for recognizing extraordinary achievements (e.g. strategic projects). More details on the workings of the STIP and LTIP are provided in the discussion of the compensation of the Management Committee below.
Architecture of the Pay-setting Process
The compensation policy is set by the Board of Directors. In order to ensure effective gov-ernance, the Board tasks the Nomination and Compensation Committee with preparing the decision-making. Specifically, the meetings of the Nomination and Compensation Com-mittee relevant to compensation matters take place regularly, typically in January, April, July, October, and December. In the October meeting, the overall compensation strategy is reviewed. In the December meeting, the conceptual designs of the Short-Term Incen-tive Plan (STIP), the Long-Term Incentive Plan (LTIP), and the Employee Stock Purchase Program (ESPP) are discussed. This allows for a periodic review of the compensation and share-ownership programs. In general, the details of the STIP for the coming year are fixed. In the January meeting of the Nomination and Compensation Committee, the specific list of names of participants in the LTIP is drawn up, the STIP results for the company are re-viewed, the achievement levels for the prior year for the Management Committee LTIP are established, and the compensation targets for the new year are finalized. The objectives of CEO and Management Committee members for the current year are also fixed. The April meeting of the Nomination and Compensation Committee reviews the total compensation and the base salaries of the CEO and the members of the Management Committee, as well as the compensation of the Board of Directors.
The Nomination and Compensation Committee also meets at other times throughout the year to discuss other topics the Board of Directors has delegated to it. After each meeting, the Nomination and Compensation Committee informs the Board of Directors and, where necessary, submits proposals for decision by the Board of Directors. The Board of Direc-tors makes the ultimate decisions on all matters related to the pay of the Board of Direc-tors and the Management Committee. The payment-relevant materials for the Nomination and Compensation meetings are provided by the Head of Global Human Resources and the Head of Compensation and Benefits. The Head of Global Human Resources attends all the relevant meetings, the Head of Compensation and Benefits those concerning the Management Committee’s compensation, or when required. Both individuals are there to advise the Nomination and Compensation Committee, but do not have a vote. Management Committee members generally attend Board of Directors meetings, but do not have a vote.

188 Lonza Annual Report 2011
An external advisor (Kepler Associates) was consulted by Lonza with respect to the struc-turing of the compensation and share-ownership programs. This advisor has no additional mandates at Lonza.
During the year under review, none of the members of the Board of Directors or the Man-agement Committee or parties closely linked to such persons billed honoraria or other remunerations to Lonza Group Ltd or any subsidiaries for additional services performed.
The remuneration report is subject to an advisory shareholder vote on the occasion of the Annual General Meeting.
Compensation of the Board of Directors
The members of the Board of Directors received a compensation package with a base amount and additional compensation for chairing one of the Board committees. The decision regarding the remuneration of the Board of Directors was taken by the Board of Directors in April 2011. The overall structure and level of compensation of the Board of Directors has not changed since 2005. The high portion of the shares aligns it significantly with the share price develop-ment. Our aim is to pay the members of the Board of Directors at the industry market average, drawing on data from studies on Swiss Leader Index (SLI) companies. In 2011, payments to acting members of the Board of Directors of Lonza Group Ltd totaled CHF 2.652 million 1 (2010: CHF 2.503 million 1), 63.56 % (2010: 65.96 %) of which was distributed in the form of shares. The compensation system for the Board of Directors allows the members to choose either a payment in shares or a combination of cash and shares, whereby the cash portion cannot exceed 40 %. Shares granted are valued at the market price at grant date, based on the average of the last five business days of each quarter, with a discount of 20 %. They are blocked for a period of three years and are eligible for a dividend. Access to these shares is only available in the fourth or later years. Directors are reimbursed for travel and other related expenses associated with the performance of their services for Lonza. Directors do not receive variable compensation. Therefore, all the amounts given for the Board of Direc-tors below refer to fixed pay.
1 Including social security and withholding tax

189Lonza Annual Report 2011
Board of Directors’ compensation
2011 2010
1 Cash payment
CHF
Number of shares
2 Value of shares
CHF
Total
CHF
1 Cash payment
CHF
Number of shares
2 Value of shares
CHF
Total
CHF
Rolf SoironChairman of the Board 194 350 5 806 356 288 550 638 204 145 4 442 356 401 560 546
Richard SykesVice-Chairman of the Board 116 875 4 898 306 885 423 760 100 000 4 672 374 864 474 864
Patrick AebischerMember of the Board 117 222 3 448 211 592 328 814 123 956 2 656 213 078 337 034
Jean-Daniel GerberMember of the Board 88 332 2 777 159 514 247 846
Julia HigginsMember of the Board 192 500 3 207 196 797 389 297 192 500 2 452 196 743 389 243
Gerhard MayrMember of the Board 120 763 3 332 207 155 327 918 86 992 3 258 261 364 348 356
Peter WildenMember of the Board 136 161 4 027 247 116 383 277 144 218 3 098 248 541 392 759
Total 966 203 27 495 1 685 347 2 651 550 851 811 20 578 1 650 991 2 502 802
In 2011 no member of the Board of Directors gave up his or her function, one new member was elected at the Annual General Meeting (2010: one member gave up his function, and no new member joined the Board of Directors). In 2011, there were 7 members on the Board (2010: 6 members). The average number of Board members during the year was 6.75 full-time equivalents (2010: 6.25 full-time equivalents)
The members of the Board of Directors did not receive any credits or loans in 2011 (2010: ditto).
Regarding conflicts of interest, note that no member of the Board of Directors benefits materially from any contract between a Lonza company and a third party.
1 All compensation amounts given in this Remuneration Report (both for the Board of Directors and the Manage-ment Committee) refer to gross payments, including social security and withholding tax, except where stated otherwise. The accrual principle is applied.
2 The fair values were calculated using the market price at grant date, see note 25 in the Lonza Financial Report 2011.

190 Lonza Annual Report 2011
Development of compensation
Development of compensation for Board of Directors 2011
Grant date Total number of shares
Share price
CHF
Fair values of shares
1 Cash
CHF
Total
CHF
Blocked until
31 03 2011 5 334 77.12 411 358 150 000 561 358 31 03 201430 06 2011 6 845 62.34 426 717 230 000 656 717 30 06 201430 09 2011 8 118 55.78 452 822 180 000 632 822 30 09 201431 12 2011 7 198 54.80 394 450 245 000 639 450 31 12 2014
Total 27 495 61.30 1 685 347 805 000 2 490 347
The amount of CHF 2 490 347 was recognized as an expense in the year 2011.
Development of compensation for Board of Directors 2010
Grant date Total number of shares
Share price
CHF
Fair values of shares
1 Cash
CHF
Total
CHF
Blocked until
31 03 2010 4 781 86.02 411 262 150 000 561 262 31 03 201330 06 2010 5 494 75.22 413 259 150 000 563 259 30 06 201330 09 2010 4 899 84.36 413 280 150 000 563 280 30 09 201331 12 2010 5 404 76.46 413 190 150 000 563 190 31 12 2013
Total 20 578 80.23 1 650 991 600 000 2 250 991
The amount of CHF 2 250 991 was recognized as an expense in the year 2010.
Development of compensation for Board of Directors 2009
Grant date Total number of shares
Share price
CHF
Fair values of shares
1 Cash
CHF
Total
CHF
Blocked until
31 03 2009 3 922 113.42 444 833 175 000 619 833 31 03 201230 06 2009 4 282 106.70 456 889 175 000 631 889 30 06 201230 09 2009 4 073 112.20 456 990 175 000 631 990 30 09 201231 12 2009 6 295 72.26 454 877 175 000 629 877 31 12 2012
Total 18 572 97.65 1 813 589 700 000 2 513 589
The amount of CHF 2 513 589 was recognized as an expense in the year 2009.
Development of compensation for Board of Directors 2008
Grant date Total number of shares
Share price
CHF
Fair values of shares
1 Cash
CHF
Total
CHF
Blocked until
31 03 2008 3 060 129.45 396 117 145 000 541 117 31 03 201130 06 2008 3 174 140.66 446 455 175 000 621 455 30 06 201130 09 2008 3 172 140.57 445 888 175 000 620 888 30 09 201131 12 2008 4 579 97.14 444 804 175 000 619 804 31 12 2011
Total 13 985 123. 94 1 733 264 670 000 2 403 264
The amount of CHF 2 403 264 was recognized as an expense in the year 2008.
1 Excluding social security and withholding tax

191Lonza Annual Report 2011
Compensation of the Management Committee
Method of determining compensation and the shareholding programs The overall struc-ture of compensation for the Management Committee originally implemented in 2006 remained largely unchanged again in 2011. Base salary targets levels around the average for the market as described below, with the potential for executives to earn above-average compensation through a combination of attractive short- and long-term incentive programs, but only if the Group outperforms its financial targets. These incentive plans are designed to align the Management Committee’s objectives with the interests of our shareholders. The total compensation (base salary, variable elements and fringe benefits) of the members of the Management Committee is benchmarked annually against the relevant industry. The comparison data reflect the compensation of the Senior Management and members of the Management Committee in Switzerland and the northeast coast of the USA in the pharma and chemical industry and general industry in multinational organizations of a size com-parable with Lonza. The reference data represent a direct market comparison in terms of the samples and the functions of the analyzed manager positions. At least two benchmark providers (in the year 2011: Towers Watson and Mercer) are used to draw the comparisons.
In 2011 the Board of Directors decided to reappraise the total compensation package of the Senior Management (including the members of the Management Committee) in a more detailed way. This analysis was conducted by a specialized external consultant (Kepler Associates in March 2011) on the basis of the same benchmark data as in 2006 (see above). It found that the Senior Management total compensation package was below the median of the relevant comparison market. For the Management Committee Kepler Associates benchmarked the compensation against Swiss-listed companies of a similar size (peer group of 18 companies) and international sector comparators (peer group of 37 companies of the pharma and chemical industry).This survey showed that the remunera-tion of the members of the Management Committee is between median and lower quartile (50 percentile and 25 percentile of the benchmark). As a consequence, the Nomination and Compensation Committee decided to readjust successively the compensation plans for the Management Committee. In a first step, an extension of the Short-Term Incentive Plan (E-STIP) was implemented.
Overview of Management Committee compensation The members of the Management Committee receive an annual base salary in cash. In addition, they are eligible for an annual incentive, the Short-Term Incentive Plan (STIP), the Extended Short-Term Incentive Plan (E-STIP) and the Long-Term Incentive Plan for Senior Management and Key Employees (LTIP). These plans set certain performance targets. A formula that takes into account the achievement level determines how much is paid out, without further discretion by the Board. The mechanics of these plans, as well as the targets and their levels, are discussed further below. All equity-based pay is performance-related (except the Bridge the Gap Program, which was implemented in 2006 and terminated in 2010).

192 Lonza Annual Report 2011
Management Committee’s compensationmillion CHF
2011 2010
Base salary 1 3.197 2.861Incentive 2 0.942 1.156Post-employment benefits 3 0.374 0.349Other benefits 4 0.814 0.453Severance payments 5 0.113 0.376Share- / option-based payments
Value of E-STIP restricted share units (2011: will be determined in March 2012: number of share units 2010: n/a) 0.421 0.0Value of LTIP Bridge the Gap shares (number of shares 2011: 0; 2010: 2 484) 0.0 0.214Value of conditional LTIP shares 6 (number of shares 2011: 73 107; 2010: 60 439) 2.583 2.286Total 8.444 7.695Ratio of fixed compensation to the performance-related components of compensation 114.0 % 123.6 %
In 2011, there were 7 members (2010: 6 members) on the Management Committee. The average number of Management Committee members during the year was 6.1 full-time equivalents (2010: 5.4 full-time equivalents).
The acting members of the Management Committee received, for their contributions and time served in 2011, CHF 5.440 million 7 (2010: CHF 5.195 million 7) in cash and additional benefits, 73 107 conditional LTIP shares (2010: 62 923 shares) and a number of restricted share units (the exact number will be determined in March 2012; no such restricted share units were granted in 2010), equivalent to a value of CHF 3.004 million (2010: CHF 2.500 million). The restricted share units of the E-STIP and the conditional shares of the LTIP have a three-year vesting period. The vesting of the LTIP shares is linked to performance conditions and the value at maturity will be higher, lower or even zero. The ratio of fixed compensation to the performance-related components of compensation was 114.0 % (2010: 123.6 %).
1 2010: 6 members, CEO included; 2011: 7 members, CEO included2 Incentive (STIP) of the reporting year, paid in March of the following year3 Social security and pension fund4 Company car, health insurance and tuition. The table shows the fair value of these benefits. In 2011 two members of
the MC moved to Asia and the USA respectively. Therefore, the costs for insurances, tuition and housing (in the case of international assignments) are higher than in the year before. Furthermore, two new members joined the MC.
5 This table discloses the actual amounts paid for the years 2010 and 2011. The severance agreements are discussed in the text.
6 The fair values were calculated using the market price at grant date according to IFRS 2, see note 25 in the Lonza Financial Report 2011 and the more detailed comments further below. In particular, the fair values are not actual payouts made, but provide information about the expected value of the shares. It is possible that, given the performance conditions placed on the shares, the eventual value will be higher or lower (or even zero).
7 Including post-employment benefits and incentive paid in March of the following year

193Lonza Annual Report 2011
The employment agreements of the members of the Management Committee provide for notice periods of between 12 and 18 months, except in one case where the notice period is 60 days.
In case of termination by the company without cause or due to the disability of a member of the Management Committee other than the CEO (who was terminated in January 2012), or of resignation by the relevant member of the Management Committee for good reason (such as reduction of remuneration or demotion), such member of the Management Com-mittee is entitled to a payment corresponding to a maximum of 18 months’ base salary, outplacement support and additional health insurance until a new employment is found, under the condition that the relevant member of the Management Committee executes a release in favor of the company.
In case of termination by the company without cause, the CEO and the Head of Human Resources (and the Nomination and Compensation Committee as regards E-STIP shares) may, at their discretion, decide the immediate vesting of the LTIP and E-STIP shares.
In case of termination due to the disability, death or retirement of a member of the Manage-ment Committee, the E-STIP and ESPP shares vest immediately. As far as the LTIP shares are concerned, termination of the employment agreement due to disability or death results in 50 % of the shares being forfeited and the remaining 50 % shares vesting immediately.
Other than with respect to the CEO (see below), the applicable notice periods are in prin-ciple extended to 18 months if the company terminates the employment of a member of the Management Committee as a result of a change of control, or if a member of the Management Committee resigns for good reasons (such as reduction of remuneration or demotion) in such a context. All the shares attributed to the relevant member of the Management Committee as part of the E-STIP, LTIP and ESPP vest immediately in such a case. In addition, the relevant member of the Management Committee may be entitled to receive, under certain conditions: a cash amount equal to 100 % of the STIP compensation during the notice period; a cash amount equal to 100 % of the LTIP compensation during the notice period; and outplacement support up to an amount of CHF 50 000.
In 2010, one severance payment was made to a member of the Management Committee. This payment amounted to CHF 376 433 (corresponding to 30.8 % of the yearly compen-sation of this Management Committee member) and included the purchase of consulting services valued at CHF 133 467. In 2011, as no member left the Management Committee, no new severance payment was made to a member of the Management Committee. The table above shows the payments for the purchase of consulting services, valued at CHF 113 062, that were made to the individual who had left the Management Committee the previous year.

194 Lonza Annual Report 2011
The highest compensation of a member of the Management Committee in 2011 was paid to Stefan Borgas. Mr. Borgas received CHF 1 283 884 (2010: CHF 1 634 593) paid in cash and additional benefits and 24 220 conditional LTIP shares based on the performance in 2010 (2010: 23 569), equivalent to a fair value of CHF 900 500 (2010: CHF 891 380). The conditional shares of the LTIP have a three-year vesting period. The vesting of the LTIP shares is linked to performance conditions and the value at maturity will be higher, lower or even zero. The ratio of fixed compensation to the performance-related compo-nents of compensation was 118.3 % (2010: 85.3 %).
The employment agreement of Stefan Borgas was terminated in January 2012, with effect on 31 May 2012. Until then, Stefan Borgas will receive his base salary and STIP at target (pro rata temporis) and other contractual benefits. In addition, he will be paid severance equal to two years’ base salary, STIP at target and an outplacement contribution of CHF 50 000. His STIP for 2011 was set at CHF 100 000 and he is to keep the shares that were granted to him under the company’s Long-Term Incentive plan for 2010 and 2011, as well as ESPP shares (no bonus shares).
Compensation of the highest-paid individual (Stefan Borgas)million CHF
2011 2010
Base salary 0.917 0.898Incentive 1 0.100 0.472Post-employment benefits 2 0.113 0.106Other benefits 3 0.153 0.159Severance payments 4 0.0 0.0Share- / option-based payments
Value of E-STIP restricted share units 0.0 0.0Value of LTIP Bridge the Gap shares 0.0 0.0Value of conditional LTIP shares 5 (number of shares 2011: 24 220; 2010: 23 569) 0.901 0.891Total 2.184 2.526Ratio of fixed compensation to the performance-related components of compensation 118.3 % 85.3 %
1 Incentive (STIP) of the reporting year, paid in March of the following year 2 Social security and pension fund3 Company car, health insurance and tuition. The table shows the fair value of these benefits.4 This table discloses the actual amounts paid for the years 2010 and 2011. The severance agreements are
discussed in the text.5 The fair values were calculated using the market price at grant date according to IFRS 2, see note 25 in the Lonza
Financial Report 2011 and the more detailed comments further below. In particular, the fair values are not actual payouts made, but provide information about the expected value of the shares. It is possible that, given the performance conditions placed on the shares, the eventual value will be higher or lower (or even zero).

195Lonza Annual Report 2011
In 2011, the CEO, Stefan Borgas, was granted a loan of CHF 1 730 000 in total. The interest rate was set according to market conditions at the time of granting and repayment is set upon termination of employment. The payment was in March 2011 and in early 2012. This loan will be fully offset against payments due to Mr. Borgas according to the separation agreement (2010: the members of the Management Committee did not receive any credits or loans).
After Closing EventThe employment agreement of Stefan Borgas was terminated in January 2012. The condi-tions of his leaving are described on page 194.
Details of Management Committee CompensationThis subsection describes the workings of the Short-Term Incentive Plan (STIP), the Extended Short-Term Incentive Plan (E-STIP) and the Long-Term Incentive Plan (LTIP).
Short-Term Incentive Plan (STIP) In 2005, the Board of Directors of Lonza Group Ltd implemented the current Short-Term Incentive Plan (STIP) for the majority of the Group’s employees, including the Management Committee. This program provides the potential for an annual incentive based on the performance and job category of the individual, and the financial performance of their business sector and / or the Group. The targeted incentive amount is stated as a percentage of the base salary and varies by level up to a maximum of 70 % for the chief executive officer. In this plan, every individual is assigned specific yearly financial and personal goals in writing. The weight of the financial goals (which are measured at the Group and Sector levels) increases with the level of the employee, up to 80 % of the total potential incentive. The personal goals are generally linked to strategic projects that Lonza must deliver in the year in order to build its growth for the future. Each goal is assessed for achievement at the end of the year. The assessment varies between a rating of “not achieved” (with a factor of zero) to a rating of “over-achieved” (with a maximum factor of 2.5 for financial goals and 1.5 for individual goals). The maximum annual total incentive level is, therefore, capped at 2.3 (= 80 % × 2.5 + 20 % × 1.5) times the potential incentive amount. The incentive is paid in cash during the first half of the following year. About 90 % of our employees participated in one of our short-term plans, either in the STIP or in a local bonus program.
For members of the Management Committee, the STIP puts a weight of at least 80 % on the financial target of Economic Value Added (EVA) of the Group. A weight of at most 20 % is put on individual qualitative targets, linked to the delivery of strategic milestones. (An exception, described in last year’s report, concerned the STIP 2010, which put a higher weight on the individual targets. In 2011, the STIP again put a weight of at least 80 % on the EVA target.) The goals are set on a yearly basis. The individual targets of the members of the Management Committee are also aligned with the strategic targets and the overall success of the company. In general, the CEO had two individual targets; one was linked to the improvement of the customer-related “promoter score” (an internal, quantitative and objective measure of how customers rate Lonza as a supplier) and the other one to the implementation of the strategy. For the members of the Management Committee, the

196 Lonza Annual Report 2011
overall STIP amount, is targeted as a percentage of base salary ranging from 50 % to 70 %, and the overall payout depends on the achievement of the goals against the targets. The incentive is paid in cash. The average actual target attainment for the Management Com-mittee (CEO excluded) led to a payout factor of 72.9 % (2010: 118.5 %). For the CEO, the STIP payment was regulated in a special separation agreement. The payout was CHF 100 000.
Extended Short-Term Incentive Plan (E-STIP) Based on the benchmark analysis for 2011 and recognizing the need to establish even more long-term orientation of the incentive sys-tem as well as the aim of increasing the retention power of the compensation system, the Board of Directors of Lonza Group Ltd implemented in 2011 an Extended Short-Term Incen-tive Plan (E-STIP) for senior managers, including the Management Committee members. The value of the plan is strongly dependent on Lonza’s and the executive’s past as well as future performance (see on page 191). Specifically, first, an amount equal to half of the STIP 2011 (which depends on financial and individual goals as described above) is awarded to each Management Committee member in the form of restricted share units entitlements. Second, these restricted share units are subject to a three-year vesting condition. The grant of the restricted share units under the E-STIP 2011 will take place on 31 March 2012, at which date the number of restricted share units will be determined based on the closing stock price of that date. During the three-year vesting period, these restricted share units do not qualify for dividends and voting rights and no dispositions are allowed.
Long-Term Incentive Plan (LTIP) In 2007, 2008, 2009, 2010 and 2011, the Board of Directors of Lonza Group Ltd implemented a Long-Term Incentive Plan (LTIP) for a selected segment of the Group’s employees. The LTIP is a stock bonus plan, replacing the former option plans. The LTIP has been designed to align the interests of key employees with those of Lonza’s shareholders, to promote a team-based performance culture throughout the organization, and to align remuneration with the creation of shareholder value. The general idea of the LTIP is that selected key employees are awarded the right to receive a number of registered shares of Lonza in the future, provided that certain service- and performance-related conditions are achieved. Depending on the level of the job category, the entitlement is between 10 % and 200 % of the annual base salary. For the CEO, the entitlement is 200 % based on the full share value, for Management Committee members it is 150 %. The maximum number of shares to be granted is capped at the start of the plan. Under no condition can the incentive exceed the set percentage, even if the performance exceeds the set targets. Individual investment in Lonza shares is a mandatory prerequisite for participation in the plan.
The central feature of the plan is that key employees will only receive title and ownership of the shares after a three-year vesting period and only if the conditions of vesting are fully or partially met. The conditions of vesting of the shares are as follows:

197Lonza Annual Report 2011
The vesting of up to 50 % of the awarded share entitlement is based on the total share-holder return (TSR 1) achieved during the three fiscal years of Lonza before the end of the vesting period compared with a peer group consisting in MSCI Chemicals, DSM, UCB, Crucell, Genentech/Roche, BMS, MSCI Healthcare, Rhodia, Cambrex, Dr Reddy’s, Biocon, Nicholas Piramal, Clariant, Sigma Aldrich, Invitrogen, Millipore, Thermo Fisher Scientific for the share entitlements granted under the LTIP 2008, 2009 and 2010. For the share entitlements granted under the LTIP 2011, the peer group was adapted to the new stock index classification and now consists of MSCI Chemicals, MSCI Health, SPI. This change of the peer group was also recommended by the external compensation consultant (Ke-pler Associates) due to the experience that some companies diversified their business or merged during the relevant vesting period of the LTIP. In such cases the company may no longer be relevant as a member of the peer group. The TSR target is fully reached in the event that Lonza outperforms the average of the peer group on an annualized basis by 9 % (LTIP 2008, 2009, 2010: 5 %) on average over three years. At this TSR level, all shares vest. Higher TSR than this threshold does not lead to higher payouts. If the TSR target is not fully reached, the percentage of the vested shares from the share entitlement will be reduced linearly, down to the minimum target of TSR relative to the peer group. The minimum target is to achieve the same annualized TSR development as the index of the peer group. If this minimum target is met, then 25 % of the shares will vest. If the minimum target is not met, no shares in this section will vest.
For shares initially granted up to and including 2009, the vesting of up to 50 % of the remaining awarded share entitlement is based on the average annual earnings per share (EPS) of Lonza achieved during the three fiscal years of Lonza before the end of the vesting period. The EPS target is reached if Lonza increases its EPS within the vesting period by 50 %. If the EPS target is not fully reached, the percentage of the vested shares from the share entitlement will be reduced linearly, down to the minimum target of EPS. The minimum target is to hold EPS on the level at the beginning of the fixed period. If this minimum target is met, then 25 % of the shares will vest. If the minimum target is not met, no shares in this section will vest.
From 2010 onwards, the vesting of up to 50 % of the remaining awarded share entitle-ment is based on the average annual Group Economic Value Added (EVA 2) growth of Lonza achieved during the three fiscal years of Lonza before the end of the vesting period. The EVA target for share entitlements awarded in 2011 is reached if Lonza increases its EVA within the vesting period from CHF 15.9 million up to CHF 114.4 million (for share entitle-ments awarded in 2010: from CHF 34.25 million up to CHF 137.0 million). If the EVA target is not fully reached, the percentage of the vested shares from the share entitlement will be reduced linearly, down to the minimum target of EVA. The minimum target is to hold EVA
1 TSR measures growth in share price with dividends reinvested. This measure is based on an external market view of the company’s success.
2 EVA or Economic Value Added is an estimate of true “economic” profit, or the amount by which earnings exceed or fall short of the required minimum rate of return that shareholders and lenders could get by investing in other securities of comparable risk. The EVA is calculated as follows: Net operating profit after taxes minus cost of capital of net operating assets.

198 Lonza Annual Report 2011
at the level of the beginning of the fixed period. If this minimum target is met, then 25 % of the shares will vest. If the minimum target is not met, no shares in this section will vest.
If TSR and EPS/ EVA minimum targets are not met, the share entitlement expires uncon-ditionally.
For the LTIP 2008, no payout was made in January 2011 and for the LTIP 2009 no payout will be made in January 2012.
The following table shows historical data on vesting conditions for LTIP share awards in the years 2008 – 2011, information used in calculating the fair value of the LTIP grants, and the number of shares vesting following the target attainment in the respective year.
Details of long-term incentive plans
Grant date Share price CHF
Granted share awards
TSR EPS growth / EVA level targets
Vesting date
LTIP 2008 01 02 2008 137.60 85 011 5 % 50 % 31 01 2011LTIP 2009 01 02 2009 106.10 121 356 5 % 50 % 31 01 2012LTIP 2010 01 02 2010 75.65 147 711 5 % 137.0 mn 31 01 2013 LTIP 2011 01 02 2011 74.35 152 077 9 % 114.4 mn 31 01 2014
Conditions of vesting 2011 Minimum Maximum Target Probability
TSR 25 % 100 % 9 % 50.00 %EVA 25 % 100 % 114.4 mn 50.00 %Turnover of employees 3.00 %
Conditions of vesting 2010 Minimum Maximum Target Probability
TSR 25 % 100 % 5 % 50.00 %EVA 25 % 100 % 137 mn 50.00 %Turnover of employees 0.00 %
Conditions of vesting 2009 Minimum Maximum Target Probability
TSR 25 % 100 % 5 % 50.00 %EPS 25 % 100 % 50 % 45.40 %Turnover of employees 3.00 %
Conditions of vesting 2008 Minimum Maximum Target Probability
TSR 25 % 100 % 5 % 50.00 %EPS 25 % 100 % 50 % 100.00 %Turnover of employees 3.00 %

199Lonza Annual Report 2011
Vesting conditions Market price
CHF
Granted shares
Fair value TSR
Fair value of share awards at grant date
CHF
Expected vesting EPS
Probability min. targets
Volatility employees
Total probability
Total cost at grant date
CHF
LTIP 2008 137.60 85 011 50 % 5 848 757 100.00 % 100 % 3 % 97.00 % 5 673 294 LTIP 2009 106.10 121 356 50 % 6 437 936 45.40 % 100 % 3 % 44.04 % 2 835 138
Vesting conditions Market price
CHF
Granted share
awards
Fair value TSR
Expected vesting EVA
Fair value of share awards at grant date
CHF
Probability min. targets
Volatility employees
Total probability
Total cost at grant date
CHF
LTIP 2010 TSR 75.65 73 855 50 % 2 793 565 100 % n.a. 100.00 % 2 793 565LTIP 2010 EVA 75.65 73 856 50 % 2 793 603 100 % 0 % 100.00 % 2 793 603LTIP 2011 TSR 74.35 76 038 50 % 2 826 713 100 % 3 % 97.00 % 2 741 911LTIP 2011 EVA 74.35 76 039 50 % 2 826 750 100 % 3 % 97.00 % 2 741 947
Development of long-term incentive plan 2011
Share awards outstanding 01 01 2011
Share awards granted
during 2011
Share awards forfeited
during 2011
Share vested
during 2011
Share awards lapsed
during 2011
Share awards outstanding 31 12 2011
LTIP 2008 84 417 0 0 0 (84 417) 0 LTIP 2009 121 356 0 0 0 0 121 356 LTIP 2010 147 711 0 0 0 0 147 711LTIP 2011 0 152 077 0 0 0 152 077Total shares 353 484 152 077 0 0 (84 417) 421 144
Development of long-term incentive plan 2010
Share awards outstanding 01 01 2010
Share awards granted
during 2010
Share awards forfeited
during 2010
Share vested
during 2010
Share awards lapsed
during 2010
Share awards outstanding 31 12 2010
LTIP 2007 80 100 0 0 (28 076) (52 024) 0LTIP 2008 84 417 0 0 0 0 84 417 LTIP 2009 121 356 0 0 0 0 121 356 LTIP 2010 0 147 711 0 0 0 147 711Total shares 285 873 147 711 0 (28 076) (52 024) 353 484
The estimated fair value of the share awards granted in 2011 was CHF 37.18 (2010: CHF 37.82). No share awards vested in 2011. The weighted average share price of the vested shares in 2010 was CHF 77.10. The outstanding share awards at 31 December 2011 had a weighted average share price of CHF 41.98 (2010: CHF 50.45) and a remaining weighted average contractual life of 15 months (2010: 15 months).
The costs were calculated using the market price at grant date, including probabilities as per conditions of vesting. The amounts for shares are expensed on a straight-line basis over the vesting period, based on estimates of shares that will eventually vest. The expected dividend was not incorporated in the calculation of fair value.

200 Lonza Annual Report 2011
In January 2010, the Nomination and Compensation Committee reviewed the interpreta-tion of the conditions for minimum vesting under the LTIP 2007, 2008 and 2009. It was not stated precisely that both the minimum targets for the TSR section of the LTIP and the EPS section of the LTIP needed to be met for any vesting at all to occur in either of the two sections of the LTIP. The Nomination and Compensation Committee clarified that attain-ment of the minimum target in one of the two sections was sufficient for vesting to begin in the respective section, irrespective of target attainment in the other section. That is, the two sections based on TSR and EPS target are independent. This clarification resulted in a fair value adjustment of CHF 3 304 536 for the LTIP 2007 and none for the LTIP 2008 and 2009. These costs were fully expensed in 2010.
Fair value at grant date CHF
LTIP 2008 5 848 757 LTIP 2009 6 437 936LTIP 2010 5 587 168LTIP 2011 5 653 463
Long-Term Incentive Plan for Members of the Management Committee named “Bridge the Gap (MC shares)” The LTIP plan did not provide any payouts for the Management Committee until 2009. Therefore, a three-year “Bridge the Gap” plan was also launched in 2006. This plan provides share grants for the Management Committee. Individual in-vestment in Lonza shares is a mandatory prerequisite for participation in the plan. The share awards were granted from January 2006 until January 2008 and will vest over a one- to three-year period (title and ownership of the shares will only be received after the respective vesting periods). The MC shares are subject to a restriction period. During the restriction period, an MC member may not sell, pledge or grant any other rights to any third party with respect to the MC shares. Shares will become unconditional after lapse of the restriction period. New entrants have a pro-rata share entitlement with a partially shortened restriction period.
MC shares Grant date Share price Granted share awards
Vesting date
MC shares 2008 31 01 2008 137.60 5 155 31 01 2011 MC shares 2009 31 07 2009 105.90 472 31 07 2012MC shares 2010 01 04 2010 85.95 1 242 31 01 2011

201Lonza Annual Report 2011
Development of long-term incentive plan for Management Committee 2011
Share awards outstanding 01 01 2011
Share awards granted
during 2011
Share awards forfeited
during 2011
Shares vested
during 2011
Share awards lapsed
during 2011
Share awards outstanding 31 12 2011
MC shares 2008 5 155 0 0 (5 154) (1) 0MC shares 2009 472 0 0 0 0 472MC shares 2010 1 242 0 0 (1 242) 0 0Total non-vested shares 6 869 0 0 (6 396) (1) 472
Development of long-term incentive plan for Management Committee 2010
Share awards outstanding 01 01 2010
Share awards granted
during 2010
Share awards forfeited
during 2010
Shares vested
during 2010
Share awards lapsed
during 2010
Share awards outstanding 31 12 2010
MC shares 2007 5 921 0 0 (5 920) (1) 0MC shares 2008 7 733 0 0 (2 578) 0 5 155MC shares 2009 472 0 0 0 0 472MC shares 2010 0 2 484 0 (1 242) 0 1 242Total non-vested shares 14 126 2 484 0 (9 740) (1) 6 869
No share awards were granted in 2011. The estimated fair value of the share awards granted in 2010 was CHF 85.95. The weighted average share price of the vested shares in 2011 was CHF 127.57 (2010: CHF 118.92). The outstanding share awards at 31 De-cember 2011 had a weighted average share price of CHF 105.90 (2010: CHF 126.08) and a remaining weighted average contractual life of 7 months (2010: 2 months).
The fair value was calculated using the market price at grant date. The amounts for shares are expensed on a straight-line basis over the vesting period, based on estimates of shares that will eventually vest. The expected turnover was 0 % (2010: 0 %). The expected dividend was not incorporated in the calculation of fair value.
Fair value at grant date CHF
MC shares 2008 1 418 794 MC shares 2009 49 985MC shares 2010 213 500

202 Lonza Annual Report 2011
Other Share Plans
The following plans do not presently include Management Committee members, but are reported here for completeness. In recognition of the extraordinary efforts by employees to ensure successful integration of new businesses, the Lonza Management Committee has decided to provide a one-time award of Lonza shares if certain service-related conditions are achieved. The employees will only receive title and ownership of the shares after a mini-mum one-year vesting period and only if the conditions of vesting are fully or partially met.In addition, in recognition of extraordinary efforts on the part of employees for successful completion of projects or successful settlements, the Lonza Management Committee has the ability to provide a one-time award of Lonza shares.
Non-vested shares Grant date Share price Granted share awards
Vesting date
Arch Acquisition Team 21 10 2011 56.40 9 576 21 10 2011Other awards 2011 20 01 2011 69.95 458 20 01 2011Other awards 2008 01 09 2008 156.70 479 01 09 2011
Development of the other share plans 2011
Share awards outstanding 01 01 2011
Share awards granted
during 2011
Share awards forfeited
during 2011
Shares vested
during 2011
Share awards lapsed
during 2011
Share awards outstanding 31 12 2011
Arch Acquisition Team 0 9 576 0 (9 576) 0 0Other awards 2011 0 458 0 (458) 0 0Other awards 2008 0 479 0 ( 479) 0 0Total non-vested shares 0 10 513 0 (10 513) 0 0
The estimated fair value of the share awards granted in 2011 was CHF 61.56. The weighted average share price of the vested shares in 2011 was CHF 61.56. No share awards were outstanding at 31 December 2011.
The fair value was calculated using the market price at grant date. The amounts for shares are expensed on a straight-line basis over the vesting period, based on estimates of shares that will eventually vest. The expected turnover was 0 % in 2011. The expected dividend was not incorporated in the calculation of fair value.
Fair value at grant date CHF
Arch Acquisition Team 540 086Other awards 2010 32 037Other awards 2008 75 059
A total of 161 634 treasury shares (2010: 381 648) with a par value of CHF 1 each are reserved for the long-term incentive and other share plans.

203Lonza Annual Report 2011
Share Ownership for the Board of Directors and Management CommitteeBased on information available to Lonza Group Ltd, the members of the Board of Directors and parties closely associated with them 1 held, as of 31 December 2011, 112 574 (2010: 85 799) registered shares in Lonza Group Ltd and controlled 0.21 % (2010: 0.17 %) of the share capital. None of the directors owns shares in the Group’s subsidiaries or associates.
The members of the Management Committee and parties closely associated with them 1 held 71 950 (2010: 64 841) registered shares in Lonza Group Ltd as of 31 December 2011.
Share ownership of acting members of the Board of Directors and Management Committee as of 31 December:
Board of DirectorsLonza shares (numbers)
2011 2010 Management CommitteeLonza shares (numbers)
2011 2010
Rolf Soiron 36 339 30 992 Stefan Borgas 35 402 36 548
Richard Sykes 22 240 16 170 Uwe Böhlke 5 084 3 719
Jean-Daniel Gerber 2 031 Toralf Haag 11 213 10 493
Julia Higgins 12 726 9 774 Stephan Kutzer 10 000 8 987
Gerhard Mayr 14 655 11 175 Jeanne Thoma 4 091
Peter Wilden 15 974 12 260 Lukas Utiger 6 037 5 094
Patrick Aebischer 8 609 5 428 Harry Boot 123
1 Spouse, children below 18, any legal entities that they own or otherwise control, or any legal or natural person who is acting as their fiduciary.

204 Lonza Annual Report 2011
Employee Share Purchase Plan (ESPP)
In keeping with our vision and culture, Lonza has continuously encouraged employee participation in the company through stock ownership. In 2005, the former Employee Share Purchase Plan was updated. Under the new plan, ESPP Plus, the employees have the opportunity – but not the obligation – to acquire Lonza shares in multiples of three at a price reduction of 30 %. The shares purchased in this manner remain blocked for three years. After this blocking period, participants are entirely free to do as they wish with the shares. If participants keep their shares for a further two years in a blocked deposit, they will then – after this holding period is over – receive one additional free share for every three shares purchased. Due to cost-saving measures, the reissue of the share purchase plan was interrupted in 2009, but resumed in 2010.
The minimum conditions to participate in the ESPP Plus were in:2006: ranging from 9 shares to 270 shares2007: ranging from 6 shares to 195 shares2008: ranging from 3 shares to 162 shares2010: ranging from 6 shares to 177 shares2011: ranging from 6 shares to 198 shares
The ESPP is not part of an incentive program. The plan is intended as a long-term share-savings scheme to provide employees with an incentive to strengthen team work and personal commitment.
Details of share purchase plans
Purchased Ratio Granted share awards
Plan expiry date
Price at grant date
CHF
ESPP 2006 64 266 3:1 21 422 15 05 2011 87.90ESPP 2007 52 293 3:1 17 431 15 05 2012 120.29 ESPP 2008 51 000 3:1 17 000 15 05 2013 138.54ESPP 2010 71 865 3:1 23 955 30 05 2015 76.81ESPP 2011 74 526 3:1 24 842 30 05 2016 75.76
Development of share purchase plans 2011
Share awards outstanding 01 01 2011
Share awards granted
during 2011
Share awards forfeited
during 2011
Shares vested
during 2011
Share awards lapsed
during 2011
Share awards outstanding 31 12 2011
ESPP 2006 19 493 0 0 (15 462) (4 031) 0ESPP 2007 16 154 0 0 (22) 0 16 132ESPP 2008 15 492 0 0 (27) 0 15 465ESPP 2010 23 914 0 0 (35) 0 23 879ESPP 2011 0 24 842 0 0 0 24 842Total shares 75 053 24 842 0 (15 546) (4 031) 80 318

205Lonza Annual Report 2011
Development of share purchase plans 2010
Share awards outstanding 01 01 2010
Share awards granted
during 2010
Share awards forfeited
during 2010
Shares vested
during 2010
Share awards lapsed
during 2010
Share awards outstanding 31 12 2010
ESPP 2005 22 393 0 0 (15 382) (7 011) 0ESPP 2006 19 882 0 0 (389) 0 19 493ESPP 2007 16 543 0 0 (389) 0 16 154ESPP 2008 15 985 0 0 (493) 0 15 492ESPP 2010 0 23 955 0 (41) 0 23 914Total shares 74 803 23 955 0 (16 694) (7 011) 75 053
The estimated fair value of the share awards granted in 2011 was CHF 60.61 (2010: CHF 61.45). The weighted average share price of the vested shares in 2011 was CHF 88.01 (2010: CHF 77.13). The outstanding share awards at 31 December 2011 had a weighted average share price of CHF 97.10 (2010: CHF 101.79) and a remaining weighted average contractual life of 33 months (2010: 28 months).
The fair values were calculated using the market price at grant date. The discount on the purchase price of shares is expensed at the moment the employees acquire Lonza shares. The fair value of the free shares is expensed on a straight-line basis over the vesting period, based on estimates of shares that will eventually vest. The expected volatility was 20 % in 2011 (2010: 20 %). The expected dividend was not incorporated in the calculation of fair value.
Fair value at grant date CHF
ESPP 2006 1 318 096ESPP 2006 discount 1 694 694ESPP 2007 1 467 742ESPP 2007 discount 1 887 097ESPP 2008 1 648 626ESPP 2008 discount 2 119 662ESPP 2010 1 471 987ESPP 2010 discount 1 655 985ESPP 2011 1 505 624ESPP 2011 discount 1 693 827
A total of 66 509 treasury shares with a par value of CHF 1 each (31 December 2010: 61 055 shares) is reserved for the share purchase plans.

207Lonza Annual Report 2011
Activities
Financial Report
Remuneration Report
Corporate Governance
208 Group Structure and Shareholders 211 Capital Structure 214 Board of Directors 227 Management Committee 235 Compensation, Shareholdings and Loans 235 Shareholders’ Participation Rights 236 Changes of Control and Defense Measures 237 Auditors 238 Information and Key Reporting Dates
5
73
185
Lonza Annual Report 2011

208 Lonza Annual Report 2011
Group Structure and Shareholders
Lonza Group Ltd, a holding company under Swiss law, is fully committed to good corporate governance. As an internationally active company, Lonza complies with the local rules and regulations of all countries in which it does business. Lonza’s corporate governance is measured against the SIX Swiss Exchange’s “Directive on Information relating to Cor-porate Governance” (Corporate Governance Directive, DCG). The principles and rules of Lonza Group Ltd are laid down in the Company’s Articles of Association 1, the Regulations Governing Internal Organization and Board Committees, including their Charters 2, and the Code of Conduct 3. The Board of Directors reviews these principles and rules regularly in the light of prevailing best practices, as the “Swiss Code of Best Practice” issued by the Swiss Business Federation. In March 2009, Lonza Group Ltd joined the United Nations Global Compact, a strategic policy initiative for businesses 4. In 2010, as a consequence of the decision taken on 18 December 2009 by the Sanction Commission of SIX Exchange Regu-lation 5, the internal instructions and procedures that should ensure compliance with the stock exchange rules and regulations were thoroughly analyzed together with an external consultant and any flaws detected were corrected by adapting directives and procedures.
Detailed information on governance matters is also displayed on the company’s website: www.lonza.com/about-lonza/investor-relations/corporate-governance.aspx
Operational Group StructureLonza is one of the world’s leading suppliers to the pharmaceutical, healthcare and life-science industries. Its products and services span customers’ needs, from research to final product manufacture. It is the global leader in the production and support of active pharmaceutical ingredients, both chemically and biotechnologically. Biopharmaceuticals are one of the key growth drivers of the pharmaceutical and biotechnology industries. Lonza has strong capabilities in large and small molecules, peptides, amino acids and niche bioproducts which play an important role in the development of novel medicines and healthcare products. Lonza is also the world leader in microbial control providing innova-tive, chemistry-based and related solutions to destroy or selectively inhibit the growth of harmful microorganisms. Its activities encompass the areas of water treatment, personal care, health and hygiene, industrial preservation, materials protection, and wood treatment. In addition, Lonza is a leader in cell-based research, endotoxin detection and cell therapy manufacturing. Furthermore, the company is a leading provider of value-added chemical and biotech ingredients to the nutrition and agro markets.
1
1.1
1 www.lonza.com/article-of-association2 www.lonza.com/bylaws 3 www.lonza.com/about-lonza/investor-relations/corporate-governance.aspx4 www.unglobalcompact.org5 www.six-exchange-regulation.com/enforcement/sanction_decisions/adhoc_publicity_en.html

209Lonza Annual Report 2011
Lonza is headquartered in Basel, Switzerland. Its activities are organized in four divisions. The divisions function as profit centers and bear full responsibility for their respective business activities. A detailed description of Lonza’s worldwide activities is available on the Group’s website: www.lonza.com/en/about-lonza/company-profile/organization/business-structure.aspx
Holding company, principal subsidiaries and affiliates Lonza owns, directly or indirectly, all companies worldwide belonging to its Group, except Lonza Engineering AG (70 %) and TL Biopharmaceutical Ltd (50 %).
Principal subsidiaries 1 In 2011, Lonza acquired Arch Chemicals, Inc., a company with more than 70 affiliates, and integrated it in the new Microbial Control business sector, thereby creating the world’s leading microbial control business. The new division will provide custom-ers with complete solutions for their microbial control needs and will be perfectly positioned to offer a complementary range of products and activities to a broader range of customers in both established and emerging markets. The principal subsidiaries are shown on pages 92 and 93 of the Lonza Financial Report 2011.
Organizational Structure
Life Science Ingredients BioscienceCustom Manufacturing
External Audit Lonza Audit Services
Microbial Control
Management Committee
Board of Directors
1 All companies belonging to Lonza Group are non-listed entities.

210 Lonza Annual Report 2011
Principal ShareholdersThe following table outlines the identities of those Lonza Group Ltd shareholders and their respective shareholdings with more than 3 % of voting rights (according to information received from these shareholders):
Principal ShareholdersNumber of shares at CHF 1 par value
31 12 2011 %
31 12 2010 %
Manning & Napier Advisors, Inc., Fairport (USA) 7 006 770 13.24 2 545 279 4.81Franklin Resources, Inc., Fort Lauderdale (USA) 5 267 936 9.95 5 267 936 9.95Affiliated Managing Group, Inc., Prides Crossing (USA) 1 912 949 3.61 n.a. n.a.Bank of New York Mellon, New York (USA) 1 737 479 3.28 n.a. n.a.BlackRock, Inc., New York (USA) 1 588 649 3.00 1 592 590 3.01Grupo Plafin SA, Barcelona (ES) n.a. n.a. 4 120 364 7.79FMR LLC, Boston (USA) n.a. n.a. 2 673 056 5.05The Capital Group Companies, Inc., Los Angeles (USA) n.a. n.a. 2 512 994 4.75
Lonza Group Ltd knows of no other shareholder(s) that owned more than 3 % of the total share capital of Lonza Group Ltd as of 31 December 2011. To the best knowledge of Lonza Group Ltd, the above-mentioned shareholders are not linked by any shareholders’ agree-ment or similar arrangement with respect to their shareholdings in Lonza Group Ltd or the exercise of shareholders’ rights. The company’s 2011 reports in accordance with Art. 20 SESTA (Federal Act on Stock Exchange and Securities Trading) are published on the SIX Swiss Exchange Ltd disclosure platform 1 and on the company’s website 2.
Cross-shareholdingsLonza Group Ltd has not entered into any cross-shareholdings.
1.2
1.3
1 www.six-exchange-regulation.com/publications/published_notifications/major_shareholders_en.html2 www.lonza.com/about-lonza/investor-relations/investor-information/major-shareholders-and-changes-in-
disclosed-shareholdings.aspx

211Lonza Annual Report 2011
Capital Structure
Share CapitalThe share capital of Lonza Group Ltd as of 31 December 2011 was CHF 52 920 140, fully paid-in and divided into 52 920 140 registered shares with a par value of CHF 1 each.
Shareholder StructureShareholders
%
1 2011Shares
%Shareholders
%
1 2010Shares
%
Switzerland 90.77 26.64 91.62 20.14United Kingdom 0.77 29.36 0.75 26.75Spain 0.42 0.04 0.45 7.81USA 2.07 7.94 1.95 8.12Others 5.96 3.12 5.22 5.73Shares in transit 30.43 30.61Treasury shares without voting rights 0.01 2.47 0.01 0.84Total 100.00 100.00 100.00 100.00Total number of shares 52 920 140 52 920 140
Share Register 1 2011 1 2010
Registered shareholders 18 328 17 366Registered shares 36 815 534 36 722 975
Share distribution: 1 – 100 6 756 6 845 101 – 1 000 10 100 9 224 1 001 – 50 000 1 418 1 108 50 001 – 100 000 27 161 100 001 – 1 000 000 21 23 over 1 000 000 6 5Total registered shareholders 18 238 17 366
Authorized and Conditional CapitalAs of 31 December 2011 Lonza Group Ltd had conditional capital of CHF 5 029 860 and authorized capital of CHF 5 000 000 at its disposal. This conditional /authorized capital was created by the Annual General Meetings held respectively on 11 April 2005 and 12 April 2011. The details and conditions are set out in Articles 4bis to 4quater of the Company’s Articles of Association 2.
2
2.1
2.2
1 As of 31 December2 www.lonza.com/article-of-association

212 Lonza Annual Report 2011
Changes in CapitalShare Capital and Registered Shares
1 2011 1 2010 1 2009
Share capital in CHF 52 920 140 52 920 140 52 920 140Registered shares 52 920 140 52 920 140 52 920 140Par value in CHF / share 1 1 1
Changes in Lonza Group Ltd Capital and Reserves
CHF
Financial year2011
Financial year2010
Financial year2009
Share capital 52 920 140 52 920 140 52 920 140General legal reserve 26 460 070 25 225 000 227 776 480Reserve from capital contribution 839 727 980 202 551 480 0Reserve for own shares 110 550 603 44 491 517 68 061 133Available earnings brought forward 783 334 935 1 524 326 393 1 495 985 580 Total capital and reserves 1 812 993 728 1 849 514 530 1 844 743 333Net income for the year 97 196 559 74 229 225 96 490 269
For additional information, please refer to the consolidated statement of shareholders’ equity on page 80 in the Lonza Financial Report 2011.
Shares and Participation CertificatesLonza Group Ltd registered shares, with a par value of CHF 1 each, are listed / traded on the SIX Swiss Exchange (SIX) and on the Singapore Exchange Securities Trading Limited (SGX-ST). In Switzerland they are included in the SIX SMI mid Index (SMIM).
Lonza Group Ltd has not issued any participation certificates (non-voting shares).
Security number: (i) SIX: 001384101 (valor), ISIN CH0013841017, stock symbol: LONN VX (Telekurs); (ii) SGX-ST stock code: O6Z
On 31 December 2011, Lonza had a market capitalization of CHF 2 937 million (2010: CHF 3 966 million).
Bonus CertificatesLonza Group Ltd has not issued any non-voting equity security (Genussscheine, bonus certificates).
2.3
2.3.1
2.3.2
2.4
2.5
1 As of 31 December

213Lonza Annual Report 2011
Limitations on Transferability and Nominee RegistrationsPurchasers of registered shares declaring that they have acquired these shares in their own name and for their own account will be entered without limitation as shareholders with voting rights in the share register. Persons who do not declare to have acquired the respective shares in their own name and for their own account are considered “nominees” and will be entered with voting rights in the share register up to a maximum of 2 % of the share capital, unless the actually entitled persons are revealed. The details are set out in Article 6 of the Company’s Articles of Association 1.
Bonds and OptionsBonds In April 2009, Lonza Swiss Finance Ltd, Basel, Switzerland, raised a CHF 300 million 3.75 % bond due 2013 and in November 2011 CHF 380 million (CHF 240 million at 2.25 % due in 2015 and CHF 140 million at 3.125 % due in 2018) and in 2010 Lonza Group Ltd, Basel, Switzerland, raised a CHF 400 million 3.00 % bond due 2016.
Options The members of the Board of Directors and the members of the Management Committee have no longer any rights to outstanding options.
2.6
2.7
1 www.lonza.com/article-of-association

214 Lonza Annual Report 2011
Board of Directors
Members of the Board of Directors The Board of Directors is made up of non-executive members and comprises three Swiss and four non-Swiss members.
The members of the Board of Directors as of 1 January 2012 were as follows:
Name Nationality Year of birth Position held Year of initial appointment
Expiration of current term of office
Rolf Soiron Swiss 1945Chairman of the Board of Directors and Member of the Nomination and Compensation Committee 2005 2012
Sir Richard Sykes British 1942
Vice-Chairman of the Board of Directors and Chairman of the Nomination and Compensation Committee 2003 2012
Patrick Aebischer Swiss 1954Member of the Board of Directors and Member of the Innovation and Technology Committee 2008 2012
Jean-Daniel Gerber Swiss 1946Member of the Board of Directors and Member of the Audit and Compliance Committee 2011 2012
Dame Julia Higgins British 1942Member of the Board of Directors and Chairwoman of the Innovation and Technology Committee 2006 2012
Gerhard Mayr Austrian 1946Member of the Board of Directors and Member of the Audit and Compliance Committee 2006 2012
Peter Wilden German 1957Member of the Board of Directors and Chairman of the Audit and Compliance Committee 2004 2012
With the exception of Dame Julia Higgins, all other members of the Board of Directors will stand for re-election for a further term of one year.
3
3.1

215Lonza Annual Report 2011
Activities and Functions of the Members of the Board of Directors
Rolf Soiron Holds a PhD in history from the University of Basel and a PMD from the Harvard Business School.
Chairman of the Board of Directors of Lonza Group Ltd, Basel (since April 2005)
Current activities and functions: – Member of the Council of the Foundation of the Graduate Institute
of International and Development Studies, Geneva (since 2010) – Member of the Council of the International Committee of the Red
Cross, Geneva (since 2010) and Member of the International Committee of the Red Cross, Geneva (since 2009)
– Chairman of the Foundation Council of Avenir Suisse (since 2009) – Member of the Board of economiesuisse (since 2009) – Chairman of the Board of Directors of Holcim Ltd, Jona (since 2003)
and member of the Board (since 1994) – Member of the Board of Directors of Jungbunzlauer Group, Basel
(since 1993)
Former activities and functions:
– Chairman of the Board of Directors of Nobel Biocare Holding Ltd, Zurich
(2003 – 2010)
– Chairman of the Basel University Council (1995 – 2005)
– Managing Director of Jungbunzlauer Group, Basel (2001 – 2003)
– CEO of Jungbunzlauer Group, Basel (1993 – 2001)
– Sandoz Group – COO and Head of Pharma in Basel (1992 – 1993),
Group Vice-President Agribusiness USA in New York (1988 – 1992)
– Protek Group (orthopedic implants) President and CEO in Berne (1983 – 1987)
– Sandoz Group – various functions in Human Resources, Finance and
Corporate in Basel (1972 – 1983)
3.2
Rolf Soiron

216 Lonza Annual Report 2011
Sir Richard Sykes holds a number of degrees and awards from Institu-tions both in the UK and overseas. He is a Fellow of the Royal Society and Academy of Medical Sciences, and an Honorary Fellow of the Royal Academy of Engineering, Royal Society of Chemistry, Royal Pharma-ceutical Society, Royal College of Pathologists and the Royal College of Physicians. He is also President of the R and D Society, a position he has held since 2002. He is president of the Institute for Employment Studies (IES) and President of the Medical and Dental Students’ Association. He is a Fellow of Imperial College London and the Imperial College School of Medicine, King’s College London and Honorary Fellow of the Universities of Wales and Central Lancashire. Sir Richard received a Knighthood in the 1994 New Year’s Honours list for services to the pharmaceutical industry. He was awarded Honorary Citizenship of Singapore in 2004 for his contribution to the development of the country’s biomedical sciences industry. He has over 30 years’ experience within the biotechnology and pharmaceutical industries field.
Vice-Chairman of the Board of Directors of Lonza Group Ltd, Basel (since April 2005), Member of the Board of Directors of Lonza Group Ltd, Basel (since April 2003)
Current activities and functions: – Chairman of Imperial College Healthcare NHS Trust (since 2012) – Chairman of the Royal Institution of Great Britain (since 2010) – Chairman of the UK Stem Cell Foundation (since 2004) – Chairman of CRAC, the Careers and Research Advisory Council
(since 2008) – Chairman of Toumaz UK Ltd, Oxford, UK (since 2005); Circassia UK,
Oxford, UK (since 2007); Omnicyte Ltd, London (since 2006) – Sits on the advisory boards of Siemens Holdings plc and
the Virgin Group (since 2010) – Chairman of the International Advisory Board, A*Star Biomedical
Research Council, Singapore (since 2002) – Board member of EDBI (since 2004)
Former activities and functions:
– Senior Independent Director and non executive Chairman of ENRC plc, London
(2007 – 2011)
– Chairman of NHS London (2008 – 2010)
– Rector of Imperial College, London from (2000 – 2008)
– Non executive director of Rio Tinto plc, London (1997 – 2007) and senior
independent director (2004 – 2007).
– Chief Executive and Chairman of Glaxo Wellcome plc, London (1995 – 2000)
and then Chairman of GlaxoSmithkline plc, Middlesex, UK (until 2002)
Sir Richard Sykes

217Lonza Annual Report 2011
Patrick Aebischer Holds a doctorate in medicine from the University of Geneva. Has received numerous honors, including the Robert Bing Prize of the Swiss Academy of Medicine and the Pfizer Foundation Prize for Clinical Neurosciences.
Member of the Board of Directors of Lonza Group Ltd, Basel (since March 2008)
Current activities and functions: – Member of the Board of Directors of Nestlé Health Science SA
(since 2011) – President of the Swiss Federal Institute of Technology (EPFL),
Lausanne (since 2000) – Professor of Neurosciences, Swiss Federal Institute of Technology
(EPFL), Lausanne (since 2000) – Fellow of the American Institute for Medical and Biological
Engineering (since 2000) – Fellow of the Swiss Academy of Medical Sciences (since 1998)
Former activities and functions:
– Founder of three biotechnology companies
Patrick Aebischer

218 Lonza Annual Report 2011
Jean-Daniel Gerber
Jean-Daniel Gerber Holds a lic. rer. pol in economics from the University of Bern. Awarded an honorary doctorate by the Faculty of Economics and Social Sciences of the University of Bern.
Member of the Board of Directors of Lonza Group Ltd, Basel (since April 2011)
Former activities and functions:
– Director of the State Secretariat for Economic Affairs (SECO) with the title of
State Secretary (2004 – 2011)
– Director of the Federal Office for Migration (then Federal Office for
Refugees) in the Federal Department of Justice and Police (1997 – 2004)
– Executive Director at the World Bank (1993 – 1997) and Dean of the
Executive Directors of the World Bank Group (1996 – 19 97)
– Chief of Section for Developing Countries in the former Federal Office
for Foreign Economic Affairs (1991 – 1992)

219Lonza Annual Report 2011
Dame Julia Higgins Holds a B.A. Honours in Physics and a D. Phil. from the Department of Physical Chemistry at the University of Oxford. Fellow and member of a number of scientific institutions in the UK and over-seas, e.g. Royal Society, Royal Academy of Engineering, Royal Society of Chemistry and the American Chemical Society. Honored with the DBE (Dame Commander of the Order of the British Empire).
Member of the Board of Directors of Lonza Group Ltd, Basel (since March 2006)
Current activities and functions: – Chairwoman of the Advisory Committee for Mathematics Education
(since 2008) – Trustee of the Daphne Jackson Memorial Fellowships (since 1994) – Professor of Polymer Science, Imperial College London, Department
of Chemical Engineering and Chemical Technology (since 1989); Emeritus and Senior Research Investigator (from 2007)
Former activities and functions:
– Trustee of The National Gallery (2001 – 2010)
– President of the Association for Science Education (2007 – 2008)
– Principal of the Faculty of Engineering, Imperial College, London
(2006 – 2007)
– Chairwoman of the Engineering and Physical Sciences Research Council
(2003 – 2007)
– Foreign Secretary and Vice-President of The Royal Society (2001 – 2006)
Dame Julia Higgins

220 Lonza Annual Report 2011
Gerhard Mayr Holds a Masters Degree in Chemical Engineering from the Swiss Federal Institute of Technology (ETH), Zurich, and a Master of Business Administration from Stanford University.
Member of the Board of Directors of Lonza Group Ltd, Basel (since March 2006)
Current activities and functions: – Member of the Board of UCB SA, Brussels (since 2005) – Member of the Board of Project Hope, USA (since 2002) – Member of the Board of the Vienna Science, Research and
Technology Foundation (since 2002) – Member of the circle of patrons of INSEAD Business School
(since 2000)
Former activities and functions:
– Member of the Board of Alcon, Inc., Hüneberg (2007 – 2010)
– Member of the Board of OMV AG, Vienna (2002 – 2009)
– Member of the Board of Bank Austria AG, Vienna (1998 – 2006)
– Executive Vice-President of Eli Lilly & Company with responsibility
for global pharmaceutical operations (1999 – 2004)
– Member of the US-Egypt President’s Council (1999 – 2004)
– Member of the Board of the European Federation of the
Pharmaceutical Industry (1995 – 1997 and 2000 – 2002)
– President of Eli Lilly Intercontinental (1997 – 1999)
– President of Eli Lilly International (1993 – 1997)
– Joined Eli Lilly in 1972 as Sales Representative
Gerhard Mayr

221Lonza Annual Report 2011
Peter Wilden Holds a degree in business administration and informa-tion technology, as well as a PhD in business administration from the University of Kiel.
Member of the Board of Directors of Lonza Group Ltd, Basel (since March 2004)
Current activities and functions: – Executive Vice-President Finance and Chief Financial Officer of
Ferring Pharmaceuticals in Lausanne, Switzerland (since 2000) – Member of various scientific research organizations in Germany,
the United States and the Netherlands
Former activities and functions:
– Member of the Board of Trace Biotech AG, Braunschweig, Germany
(1999 – 2002)
– Held various managerial positions in the Ferring Group (1991 – 2000)
– Consultant for Mak Data System, Kiel, Germany, and the Krupp network
(1988 – 1991)
– Management Assistant with Krupp MaK Maschinenbau GmbH, Kiel, Germany
(1986 – 1988)
– Scientific Assistant of the Kiel Institute of World Economics (1983 – 1986)
Peter Wilden

222 Lonza Annual Report 2011
Elections and Terms of OfficeEach member of the Board of Directors is individually elected by the Annual General Meeting for a term of one year. Re-election is possible with a maximum incumbency of nine years and an age limit of 70. The Board constitutes itself and elects from amongst its members the Chairman, the Vice-Chairman and the Board Committees.
Internal Organizational Structure In accordance with the law and the Articles of Association 1, the Board of Directors is the supreme management body of the Group. It consists of the Chairman, the Vice-Chairman and the other members. In accordance with the Articles of Association 1, the number of members must be at least three.
The members of the Board of Directors sat on the following committees in 2011:
Audit and Compliance
Committee
Nomination and Compensation
Committee
Innovation and Technology
Committee
Rolf Soiron Member Sir Richard Sykes Chairman Patrick Aebischer Member Jean-Daniel Gerber Member Dame Julia Higgins Chairwoman Gerhard Mayr Member Peter Wilden Chairman
3.3
3.4
1 www.lonza.com/article-of-association

223Lonza Annual Report 2011
Audit and Compliance Committee The Audit and Compliance Committee meets and consults regularly with the Management Committee, the Lonza Audit Services and the independent auditors to review the scope and results of their work and their performance according to the Audit and Compliance Committee Charter. Internal and external auditors have full and free access to the Audit and Compliance Committee. The Audit and Compliance Committee reviews the systems of internal control and financial reporting, and compliance with laws and regulations. The Audit and Compliance Committee also oversees the Lonza Audit Services. The Audit and Compliance Committee is fully empowered to decide the tasks assigned to it and it regularly informs the Board of Directors on all matters discussed and decided in its meetings.
Nomination and Compensation Committee The Nomination and Compensation Com-mittee is entrusted, for example, with the review and recommendation of compensation policies and programs (e.g. incentive compensation and equity plans), the Chairman’s and the CEO’s compensation based on their performance, as well as the compensation of the members of the Management Committee and key executives. This Committee also makes an assessment to ensure that the area of Nomination and Compensation is in com-pliance with the standards set forth in the associated Charter. Further, the Nomination and Compensation Committee is continuously evaluating potential members for the Board of Directors. With regard to the tasks assigned to it, the Nomination and Compensation Com-mittee regularly informs the Board of Directors on all matters discussed in its meetings and submits proposals for decision by the Board in accordance with the Nomination and Compensation Committee Charter.
Innovation and Technology Committee The main tasks of the Innovation and Technology Committee are to support the LIFT (Lonza Innovation for Future Technology) Initiative, to monitor potential technology breakthroughs, to support management in driving innovation projects and to provide and facilitate contacts, e.g. with academia and research institutions. With regard to the tasks assigned to it, the Innovation and Technology Committee regularly informs the Board of Directors on all matters discussed and decided in its meetings.
In 2011, the members of the Board of Directors spent their annual learning day in Singapore on the topic of “Lonza’s presence in Asia”.

224 Lonza Annual Report 2011
Attendance and main topics Detailed information on attendance and main topics at Board and Committee meetings in 2011 is provided in the following table:
Board of Directors Audit and Compliance Committee
Nomination and Compensation Committee
Innovation and Technology Committee
Number of meetings 8 1 5 6 2 4 3
Overall attendance 93 % 100 % 100 % 100 %
Main topics
Discussions on Secondary Listing at SGX-ST
Review of 2011 audit findings, financial results and 2012 budget
Monitoring of compensation and incentive structure
Monitoring of trends in research and development
Discussions on Arch Chemicals, Inc. acquisition; M&A review
Review of internal audit reports
Review of short-term incentive objectives and calculation basis
Review of developments in LIFT (Lonza Innovation for Future Technology)
Discussions on site profitability improvements
Review of quarterly and half-year results/outlooks
Reassessment of the long-term incentive program
Support of the innovation process
Review of quarterly and half-year results 2011 and planning 2012
Review of VAT situation and transfer pricing
Review of succession plans and talent development program
Providing and facilitating scientific contacts
In 2011, an ad-hoc committee of the Board of Directors (R. Soiron, R. Sykes and P. Wilden) held four meetings (one as a telephone conference) to discuss and provide support for the acquisition of Arch Chemicals, Inc. In addition, members of the Board of Directors supported the Management Committee through regular individual contacts.
1 Three as telephone conferences and five full-day meetings (all with members of the Management Committee attending)2 One as telephone conference3 At one meeting with the presence of an external consultant

225Lonza Annual Report 2011
Areas of ResponsibilityThe Board of Directors is responsible for the tasks assigned to it according to (i) Article 18 of the Company’s Articles of Association 1 and (ii) the Regulations Governing Internal Or-ganization and Board Committees 2. The Board of Directors defines the strategic direction and is responsible for the ultimate management of Lonza as well as the supervision of the persons entrusted with Group management, especially with regard to compliance with the law, the Articles of Association 1, the regulations and the directives, and it is obliged and entitled to issue the necessary instructions. In compliance with the law and the Articles of Association 1 of Lonza Group Ltd, the Board of Directors has – with the exception of non-delegable and inalienable duties – delegated the management of the company to the Management Committee.
Organizational structures and control instruments The Board of Directors continues to commit itself to maintaining the highest standards of integrity and transparency in its gov-ernance of Lonza. On an annual basis, the Board undertakes a self-assessment process and also participates in an assessment by the Management Committee. The aim is to achieve continuous improvement in the functioning of the Board. The Regulations Governing Inter-nal Organization and Board Committees 2 set out in detail the powers and responsibilities of the Board of Directors, its Committees and the Management Committee. The standing Board Committees in the areas of audit / compliance, nomination / compensation and in-novation / technology provide modern corporate governance guidance and support to the Board of Directors. The Code of Conduct 3 expresses Lonza’s core principles and values in professional business behavior, and provides assistance in recognizing, understanding and complying with the laws and ethical standards that govern Lonza’s business activities.
Broad supervisory and reviewing powers are held by the Board of Directors, which is directly supported by the Lonza Audit Services. The Regulations Governing Internal Or-ganization and Board Committees 2 confer on the CEO the duty to inform the Management Committee and – together with the Chairman – the Board of Directors on the business activities and all important business transactions, including risk issues. The Board of Directors meets periodically with the Management Committee or its subcommittees for business updates and decisions to be taken.
3.5
1 www.lonza.com/article-of-association2 www.lonza.com/bylaws3 www.lonza.com/about-lonza/investor-relations/corporate-governance.aspx

226 Lonza Annual Report 2011
Information and Control InstrumentsLonza has a system of internal financial and accounting policies, procedures and controls to provide a reasonable assurance, given the inherent limitations of all internal control systems, at appropriate cost, that transactions are executed in accordance with company authorization, that they are properly recorded and reported in the financial statements, and that assets are properly safeguarded. Lonza Audit Services comprise 6.5 experts who oversee the finance, operational and process activities of the Group with a risk-based audit program. They continually evaluate the adequacy and effectiveness of the system of internal accounting policies, procedures and controls, and take appropriate action to correct deficiencies as they are identified. In 2011, they delivered 66 internal audit reports to the Audit and Compliance Committee.
In addition to the documents required to pass resolutions, the Board of Directors receives the following reports at its regular meetings: – Reports on the sales and earnings performance of the company, with the relevant
market information in the same period since the beginning of the year, structured by divisions / business sectors, with the main sales areas and key product groups
– Reports on the cash flows, debt and debt-equity ratio, plus other relevant key figures for the Group
– Qualitative assessments of the divisions / business sectors and major subsidiaries – Audit reports prepared by the internal and external auditors – Analysis of the shareholder structure – Annual overview of the Group’s key staff benefit schemes, including pension funds – In cases involving extraordinary events of considerable commercial relevance, the
Board of Directors receives direct, immediate information. – Reports encompassing the subject of risk assessment are submitted at least
once per year; they are designed to provide the Board with a consistent, Group-wide perspective of key risks according to specific criteria.
3.6

227Lonza Annual Report 2011
Management Committee
The Management Committee is appointed by the Board of Directors of Lonza Group Ltd. It performs the duties assigned to it by the Board of Directors, either under the terms of the Regulations Governing Internal Organization and Board Committees 1 or additional tasks as delegated. It is responsible for leading Lonza and for developing and implementing the Lonza policy and strategy after approval by the Board of Directors. It supports and coordinates the activities of the divisions and corporate functions. The Management Committee is also responsible for leadership development and succession planning. In March 2011, Harry Boot was appointed COO Life Science Ingredients division and member of the Management Committee, and in October 2011 Jeanne Thoma was appointed COO Microbial Control divi-sion and member of the Management Committee.
Members of the Management CommitteeAt 1 January 2012, the Management Committee consisted of seven active members.
Name Nationality Year of birth Current function
Stefan Borgas German 1964
Chief Executive Officer (since June 2004* / COO Life Sciences Ingredients division (ad interim since June 2010 until March 2011)
Uwe H. Böhlke German 1964Chief Officer Human Resources / Corporate Services
Harry Boot Dutch 1967COO Life Science Ingredients division (as from March 2011)
Toralf Haag German 1966 Chief Financial Officer
Stephan Kutzer American 1965 COO Custom Manufacturing division
Jeanne Thoma American 1959COO Microbial Control division (as from October 2011)
Lukas Utiger Swiss 1963 COO Bioscience division
4
4.1
1 www.lonza.com/article-of-association* Change of CEO was announced in January 2012

228 Lonza Annual Report 2011
Activities and Functions of the Members of the Management Committee
Stefan Borgas Holds a degree in business administration from the University of Saarbruecken and a lic. oec. HSG degree (MBA) from the University of St. Gallen
Chief Executive Officer (since June 2004*); since June 2010 until March 2011 also ad interim COO Life Science Ingredients division
Former activities and functions:
– Worked in various functions for the BASF Group (1990 – May 2004)
Group Vice-President, Regional Business Unit Fine Chemicals North America,
BASF Corp. (2003 – May 2004) / Group Vice-President, Regional Business
Unit Fine Chemicals Europe, Africa, Middle East, BASF AG, Ludwigshafen
(2001 – 2003) / Director Strategic Marketing Animal Nutrition, Fine Chemicals
Division, BASF AG, Ludwigshafen (1998 – 2001) / Group Logistics Manager,
Engineering Plastics, BASF Corp. (1995 – 1998)
4.2
Stefan Borgas
* Change of CEO was announced in January 2012

229Lonza Annual Report 2011
Uwe H. Böhlke Holds a degree and a PhD in mechanical engineering as well as a degree in economics from RWTH Aachen University
Member of the Management Committee (since January 2007)
Functions within Lonza: – Chief Officer Human Resources / Corporate Services
(since November 2009) – COO Custom Manufacturing / Head of the business sector –
Exclusive Synthesis (January 2007 – October 2009)
Former activities and functions:
– Held various positions at SCHOTT AG, Mainz (1996 – 2006):
Executive Vice-President of the global business unit “Home Tech”
(2003 – 2006) / Vice-President Global “Research and Development”
(1998 – 2003) / Additional global assignment “Intellectual Properties”
(2001 – 2003) / Vice-President “Corporate Engineering and Special
Machines” (1996 – 1998)
– Worked in various functions for Fraunhofer-Gesellschaft, Munich;
Institute of Production Technology, Aachen (1990 – 1996):
Chief engineer and member of Institute Management (1994 – 1996) /
Consultant in Technology and Innovation Management (1990 – 1994)
Uwe H. Böhlke

230 Lonza Annual Report 2011
Harry Boot Holds a masters degree in mechanical engineering from the Technical University of Delft, Holland
Member of the Management Committee (since March 2011)
Functions within Lonza: – COO Life Science Ingredients division (since March 2011)
Former activities and functions:
– Chief Commercial Officer of Bluestar / Blackstone, Beijing
(2009 – February 2011)
– Chief Commercial Officer Europe, Middle East & Africa at
GE Consumer & Industrial (C&I), Budapest (2007 – 2009)
– Held various positions at GE Plastics (GEP) in Shanghai, Stockholm and
Bergen op Zoom:
Polymers Director Pacific and GE Industrial Growth Leader Pacific
(2006 – 2007) / Marketing Director Pacific (2005 – 2007) / Marketing
Director Europe ( 2002 – 2005) / European Commercial Director
(2000 – 2002) / Global & Pan European Sales Leader (1998 – 2000)
Harry Boot

231Lonza Annual Report 2011
Toralf Haag Holds a degree in business administration from the Uni-
versity of Augsburg and a PhD from the University of Kiel
Member of the Management Committee and Chief Financial Officer
(since August 2005)
Former activities and functions:
– Chief Financial Officer and Member of the Management Board at Norddeutsche
Affinerie AG, Hamburg (2002 – 2005)
– CEO (President) Stamping & Frame Division of The Budd Company Detroit,
a subsidiary of ThyssenKrupp Automotive (2000 – 2001)
– Director Finance, M&A and Corporate Development, The Budd Company
Detroit (1997 – 1999)
– Assistant to the CEO of Thyssen Handelsunion AG, Düsseldorf (1994 – 1996)
Toralf Haag

232 Lonza Annual Report 2011
Stephan Kutzer Holds a PhD in chemical engineering from the Technical University of Munich
Member of the Management Committee (since July 2005)
Functions within Lonza: – COO Custom Manufacturing division (since November 2009) – COO Custom Manufacturing / Head of the business sector –
Biopharmaceuticals (June 2005 – October 2009) – Head of Performance Chemicals (2003 – 2005) – Site manager of Lonza Bayport, TX, facilities (November
1999 – 2002) – Assistant production manager in Lonza Guangzhou Ltd, Guangzhou,
China (July – September 1999) – Joined Lonza in 1996 as assistant production manager at Visp and
became production manager nicotinates in 1998.
Stephan Kutzer

233Lonza Annual Report 2011
Jeanne Thoma Holds a Bachelor of Science from Montclair State Uni-versity and a Master in Business Administration (MBA) from Fairleigh Dickinson University
Member of the Management Committee (since October 2011)
Functions within Lonza: – COO Microbial Control division (since October 2011) – Head of the Microbial Control business unit
(June 2007 – October 2011) – Member of the Management Committee
(August 2005 – June 2007) – Joined Lonza as Head of Global Human Resources
(December 2004)
Former activities and functions:
– Held various positions with BASF Corporation (1990 – August 2004)
in Sales, Marketing and Logistics.
– Worked as a Sales and Marketing Consultant to Fortune 500 companies
(1985 – 1989)
Jeanne Thoma

234 Lonza Annual Report 2011
Lukas Utiger Holds a PhD in chemical engineering from Imperial College, London
Member of the Management Committee (since August 2001)
Functions within Lonza: – COO Bioscience division (since June 2010) – COO Life Science Ingredients division (August 2006 – May 2010) – Head of the Exclusive Synthesis business sector
(August 2001 – December 2006) – Head of Research and Development for Exclusive Synthesis
(October 2000 – July 2001) – Joined Lonza as R&D chemist in 1992 and became R&D group
leader for fine chemicals in 1998
– Acquired his business experience at ICI Chemicals & Polymers Division
in Runcorn (1988 – 1992)
Management ContractsLonza Group Ltd and its subsidiaries have not entered into management contracts with third parties.
4.3
Lukas Utiger

235Lonza Annual Report 2011
Compensation, Shareholdings and Loans
Details of Board and Management compensation are contained in the Consolidated Financial Statements (page 157, note 33) and in the Remuneration Report (page 185).
Shareholders’ Participation Rights
Voting-rights Restrictions and RepresentationOnly persons with valid entries in the share register are recognized as shareholders or usufructuaries. A shareholder may only be represented at the Annual General Meeting by a legal representative or – by way of written proxy – by another shareholder entitled to vote, the appointed representative of the corporate body, the independent proxy or an as-signee of proxy votes for deposited shares. Persons who do not declare to have acquired their shares in their own name and for their own account are considered “nominees” and will be only entered with voting rights in the share register up to a maximum of 2 % of the share capital, unless the actually entitled persons are revealed. The details are set out in Article 6 of the Company’s Articles of Association 1.
Each share has the right to one vote.
The shares held by Lonza Group Ltd are not entitled to vote at the Annual General Meeting and bear no dividend.
Lonza may use an electronic voting system for all the resolutions to be taken at its Annual General Meetings.
Statutory QuoraExcept as otherwise stipulated by law, an absolute majority of the votes represented at the Annual General Meeting is required for resolutions and elections.
For certain important matters such as a change of the company purpose and domicile, the dissolution of the company without liquidation, and matters relating to capital changes, Article 704 of the Swiss Code of Obligations provides for a two-thirds majority of votes cast, representing an absolute majority of nominal values of shares represented.
5
6
6.1
6.2
1 wwww.lonza.com/article-of-association

236 Lonza Annual Report 2011
Convocation of Shareholders’ MeetingsOrdinary Shareholders’ Meetings are called in accordance with the law and the Company’s Articles of Association 1. Extraordinary Shareholders’ Meetings must be called upon resolu-tion of a Shareholders’ Meeting or if demanded by one or more shareholders representing at least 5 % of the share capital.
Lonza posts the invitations to shareholders at least 20 working days before the Annual General Meeting and publishes it on its website as well as in the Swiss Official Gazette of Commerce and several newspapers.
AgendaOne or more shareholders representing together shares with a par value of CHF 100 000 may request an item to be included in the agenda of a Shareholders’ Meeting. The request to include an item must be submitted in writing at least 40 days before the meeting, stat-ing the item to be included and the motions.
Entry in the Share RegisterPurchasers of Lonza Group Ltd shares may submit a request to be entered, without limi-tation, as shareholders with voting rights in the share register, provided they expressly declare that they have acquired these shares in their own name and on their own account. Special rules exist for persons who do not expressly declare in the entry application that they hold the shares on their own account (nominees).
There are no special statutory rules in the Company’s Articles of Association 1 concerning a deadline for entry in the share register. The share register will this year be closed on 23 March 2012 at 5 pm.
Changes of Control and Defense Measures
Duty to Make an OfferAn offer to acquire all shares must be made in accordance with Art. 32 SESTA (Federal Act on Stock Exchange and Securities Trading) if the threshold of 33 1/3 of the voting rights is exceeded. No special opting-out or opting-up dispositions are contained in the Company’s Articles of Association 1.
Clauses on Changes of ControlThe employment agreements / pension plans of the Management Committee Members contain certain clauses on changes of control, which are outlined in the Remuneration Report (page 185 ss).
6.3
6.4
6.5
7
7.1
7.2
1 www.lonza.com/article-of-association

237Lonza Annual Report 2011
Auditors
Duration of the Mandate and Term of Office of the Auditor in ChargeSince 1999, KPMG Ltd, Badenerstrasse 172, 8026 Zurich 4, Switzerland, has held the mandate as the external statutory auditors of Lonza Group Ltd and the Group.
The auditing company is elected for a term of one year.
Regula Wallimann from KPMG Ltd has been the auditor in charge since 8 April 2009.
The Board of Directors proposes that KPMG Ltd be re-elected as statutory and Group audi-tors for the business year 2012.
Head of Lonza Audit Services is Emilio Rubio, Basel (Switzerland).
Auditing HonorariumLonza Group paid KPMG Ltd CHF 4.212 million (2010: CHF 2.048 million) for professional services rendered in connection with the audit of the Group’s annual financial statements and other audit-related activities.
Additional HonorariumKPMG Ltd received a total fee of CHF 0.125 million (2010: CHF 0.01 million) for other ser-vices rendered to Lonza.
Supervisory and Control Instruments vis-à-vis the AuditorsThe Audit and Compliance Committee is responsible for evaluating the external auditors on behalf of the Board of Directors. In the reporting year, there were two joint meetings with the representatives of the external auditors. The Audit and Compliance Committee reviews Lonza’s financial reporting process on behalf of the Board of Directors. Manage-ment is responsible for the financial statements and the reporting process, including the system of internal controls. The Audit and Compliance Committee is also responsible for overseeing the conduct of the activities by Lonza management and the external auditors.
The independent statutory auditor, KPMG Ltd, is responsible for expressing an opinion on the accounting records and the financial statements prepared in accordance with Swiss law and the Company’s Articles of Association 1. KPMG Ltd is also responsible for expressing an opinion on the consolidated financial statements (balance sheet, income statement, state-ment of comprehensive income, cash flow statement, statement of changes in equity and notes) prepared in accordance with the International Financial Reporting Standards (IFRS), issued by the International Accounting Standards Board (IASB), and Swiss law.
8
8.1
8.2
8.3
8.4
1 www.lonza.com/article-of-association

238 Lonza Annual Report 2011
Information and Key Reporting Dates
Lonza pursues a proactive and professional communication policy. Lonza Group Ltd publishes price-sensitive information in accordance with the obligation to disclose price-sensitive facts as required by the SIX Swiss Exchange.
Corporate Communications reports directly to the Chief Executive Officer, while Investor Rela-tions reports to the Chief Financial Officer. On basic matters of general corporate policy, Corpo-rate Communications receives its directives from the Management Committee.
Lonza Group Ltd provides shareholders entered in the share register (on request only) with an annual report as well as with the half-year and full-year results. These reports are also available on the company’s website www.lonza.com. The website is regularly updated and provides relevant information such as share price development, news releases and presentations. It also contains an electronic version of the Annual Report 2011 .
Media conferences and analyst meetings take place at the Company’s headquarters or by conference call. Lonza manages an annual program of investor meetings.
Investors, potential investors, as well as financial analysts, are also welcomed at the Company’s headquarters in Basel.
Anticipated Key Reporting DatesThe list of all corporate events of special interest is subject to change during the year as dates are adjusted and added.
Annual General Meeting for the 2011 financial year3 April 2012, 10.30 amCongress Center Basel, MCH Swiss Exhibition (Basel) Ltd
Half-year Report 2012, analysts’ meeting25 July 2012
Full-year Report 2012, analysts’ meetingJanuary 2013
Annual General Meeting for the 2012 financial year9 April 2013Congress Center Basel, MCH Swiss Exhibition (Basel) Ltd
Dividend Transfer to BanksAs a rule, Lonza Group pays the dividend to its shareholders on the fifth business day fol-lowing the Annual General Meeting.
9

This publication is accessible online at www.lonza.com and is
also available in German. The English version prevails. In this
report, “Lonza” and “the Group” refer to the whole group of
Lonza companies, “Lonza Group Ltd” refers to Lonza Holding.
Lonza is listed on the SIX Swiss Exchange, with a secondary
listing on the Singapore Exchange Securities Trading Limited
(“SGX-ST”). Lonza is not subject to the SGX-ST’s continuing
listing requirements. Lonza is subject to the listing rules of
the SIX Swiss Exchange. By publishing this Annual Report,
Lonza fulfills its obligations under the SIX Swiss Exchange
as well as its obligation towards SGX-ST.
Publication details
Production Corporate Communications, Lonza Group Ltd,
Basel, Switzerland | All rights reserved
Editorial completion: February 2011 | Design: Lonza
Photography Thomas Andenmatten, Brig, Switzerland |
Chris Burke, Ann Harbor (MI), USA | C. Kurt Holter,
Frederick (MD), USA | Many Lonza employees have
contributed other pictures.
Lithography Birkhäuser+GBC AG, Reinach, Switzerland
Print Veenman+, Rotterdam, The Netherlands
Forward-looking statements
Forward-looking statements contained herein are qualified
in their entirety as there are certain factors that could cause
results to differ materially from those anticipated. Investors
are cautioned that all forward-looking statements involve
risks and uncertainties. In addition to those discussed above,
factors that could cause actual results to differ materially
include: the timing and strength of new product offerings;
pricing strategies of competitors; the company’s ability to
continue to receive adequate products from its vendors on
acceptable terms, or at all, and to continue to obtain suffi-
cient financing to meet its liquidity needs; and changes in
the political, social and regulatory framework in which the
company operates, or in economic or technological trends
or conditions, including currency fluctuations, inflation and
consumer confidence, on a global, regional or national basis.

15
1
16
At the table, Erich Truffer, logistics employee, shipping department, checking and labeling pallets with the necessary shipment and customer labels. On the vehicle, Benjamin Summermatter, logistics employee, shipping department, receiving the packed and labeled pallets from the conveyor system. Carsten Meininghaus, former Head of QA Visp Custom Manufacturing: Training in the auditorium. Daniela Grand, QA manager: visual check through the inspection glass. Urs Abgottspon, operator, connecting a water hose. Janick Haene, laboratory assistant, changing the sample plate of an HPLC chromatograph. Technical adjustment of a Lonza microreactor. Matthias Schnydrig, logistics employee, technical goods reception, taking delivery of a consignment for inspection.
Marie-Madlen Amstutz, Operator: temperature control while sterilizing the sampling system at the main fermenter. Stefan Walker, shift worker, at the control panel of a centrifuge. Benjamin Burk, biology lab assistant at QC BioPharma Microbiology: aseptic preparation of an active pharmaceutical ingredient for contamination control. Heinz Locher, logistics assistant: sampling of raw materials at the reception control. Deborah Venetz, biology lab assistant at QC BioPharma Microbiology: membrane filtration of an active pharmaceutical ingredient for contamination control. QC BioPharma Microbiology: identification of microorganisms on the genomic level. Andreas Hänni, operator: packaging and labeling of products. Andreas Hänni, operator: monitoring activities. Deborah Venetz, biology lab assistant at QC BioPharma Microbiology, flaming forceps tips for aseptic transfer of membranes onto growing media.
2
3
4
5
6
7
8
9
10
11
12
13
14
Pictures for Photo Reportage: Thomas Andenmatten, Brig, Switzerland

Legal Domicile
Basel, Switzerland
Global Headquarters
Lonza Group Ltd
Muenchensteinerstrasse 38
4002 Basel, Switzerland
Tel +41 61 316 81 11
Fax +41 61 316 91 11
www.lonza.com
Anticipated Key Reporting Dates
Annual General Meeting
for the financial year 2011
3 April 2012, 10.30 am
Congress Center Basel
MCH Swiss Exhibition (Basel) Ltd
Half-year Report 2012: 25 July 2012
Full-year Report 2012: January 2013
Annual General Meeting
for the financial year 2012
9 April 2013
Congress Center Basel
MCH Swiss Exhibition (Basel) Ltd
Dividend Transfer to Banks
As a rule, Lonza Group Ltd pays the dividend
to its shareholders on the fifth business
day following the Annual General Meeting.
Listing and Security Information
Stock Exchange Listing / Trading
SIX Swiss Exchange, SGX Singapore Exchange
Common Stock Symbols
Bloomberg LONN:VX
Reuters LONN.VX
Telekurs LONN
Security Number
Valor 001384101
ISIN CH0013841017
Contacts per Market
BioResearch: [email protected]
Pharma&Biotech: [email protected]
Nutrition: [email protected]
MicrobialControl: Europe: [email protected]
USA: [email protected]
Agriculture: [email protected]
MaterialsScience: [email protected]
PersonalCare: [email protected]
Contacts
For publications and further
information please contact:
Lonza Group Ltd
Muenchensteinerstrasse 38
4002 Basel, Switzerland
www.lonza.com
Investor Relations
Tel +41 61 316 85 40
Fax +41 61 316 95 40
Media / Corporate Communications
Tel +41 61 316 87 98
Fax +41 61 316 97 98
Share Register
c/o SIX SAG AG
P.O. Box
4601 Olten, Switzerland
Tel +41 62 311 61 33
Fax +41 62 311 61 93
The Lonza Annual Report 2011 is printed on
non-chlorine-bleached, FSC-certified paper.

1
16
The quality manager optimizes quality-oriented processes in line with the goal of continuous
improvement. Ensuring quality standards is not just a matter for the Quality Units. Everyone is
responsible for product quality in his or her field.
Lonz
a Qu
ality
Ass
uran
ce
Lonz
a Qu
ality
Ass
uran
ce