annual report 2011 - 12 - tata · pdf filethe embedded product design division ... product...
TRANSCRIPT

Annual Report 2011 - 12

Industries Served
engineeringengineering creativity ... creativity ... in every aspectin every aspect engineering creativity ... in every aspect
AutomotiveAerospace Broadcast
Communication Consumer Electronics
Media and Entertainment
FMCG
Semiconductor
Defence and Homeland Security
Healthcare

Your Company has performed well in its chosen business areas in FY 11-12, reporting a 30% growth in total income and 73% growth in PBT as compared to FY 10-11.
This was supported by the performance of all units across geographies and business segments, in an uncertain business environment that was affected by the unfortunate natural disasters in Japan and Thailand and economic uncertainties in Europe.
The Embedded Product Design Division delivered a complete Smart-phone design and prototype based on the latest Android platform for a leading OEM. This project encompassed the integrated design capabilities of Tata Elxsi, covering hardware, system software and innovative applications based on advanced sensors. The Industrial Design division worked jointly to support industrial design of the phone.
Among other projects, the Industrial Design Division also supported the design of a low-cost diagnostic device for affordable healthcare in emerging countries, and packaging design for the Danone range of dairy products in India.
While Visual Computing Labs (VCL) delivered major projects for animation and visual effects for Hollywood and Bollywood feature films this year, it made exciting forays into high-end photorealistic content development and visualization of campuses for corporate and virtual cars for advertising. It also worked with some leading international game developers for game art development.
The Systems Integration Division successfully completed a landmark project for Mazagon Dock Limited, with the turnkey implementation of a state-of-the-art virtual reality facility for ship design.
The Professional Services group inked a strategic deal with Lenovo as their Authorised Service Partner for India for their entire range of products.
The external environment continues to be volatile even as we move into FY 12-13. However, your company looks forward to continuing on its path of growth, building on the experience of dealing with difficult market conditions from the last year and earlier.
As a technology-led design company, we continue to leverage our mature design processes, technology, creative skills, and the talent base developed over the years to deliver value to our customers.
We will also continue to invest in skill development and take appropriate measures in retaining, developing, and attracting the best talent required to deliver higher value to our customers. We also believe that our ongoing investments in R&D and technology development, as well as exploration of new and adjacent markets will help de-risk any downturns in specific industries and markets, and lay the foundation for future business.
Your Company’s Board of Directors has recommended a final dividend of Rs. 7 per share, maintaining consistent dividends and returns to our shareholders.
S Ramadorai
Dear Shareholder,
Message from the Chairman

Financial Highlights
542.9Total income ( ` Crs)
34.6Profit after tax ( ` Crs)
11.11Earnings per share ( ` )
61.65Book value per share ( ` )
7.0Dividend per share ( ` )

Annual Report 2011 - 12
Contents
04 Embedded Product Design
05 Industrial Design
06 Visual Computing Labs
07 Systems Integration
08 Board of Directors/Statutory Committees
09 Notice of AGM
13 Directors' Report
19 Compliance Report on Corporate Governance
27 Management Discussion & Analysis Statement
31 Auditors' Report
34 Balance Sheet
35 Statement of Profit and Loss
36 Cash Flow Statement
37 Notes Forming Part of the Financial Statements
57 Auditors’ Report on the Consolidated Financial Statement
58 Consolidated Balance Sheet
59 Consolidated Statement of Profit and Loss
60 Consolidated Cash Flow Statement
61 Notes Forming Part of the Consolidated Financial Statements
82 Statement Pursuant to Sec 212/ Significant Three Year Highlights

04
Business Units
The Embedded Product Design division provides technology consulting, new product development, system integration, and testing services for leading product companies, service providers, and aspiring start-ups. This is backed by an in-depth understanding of technology, a large multi-disciplinary product development team, and mature processes and systems.
It also creates and licenses intellectual property and software components, helping customers create product differentiation and reduce development costs and time-to-market.
It offers solutions across a diverse range of industries including broadcast, industrial and consumer products, transportation, energy, medical technology, and wireless communications and convergence.
Embedded Product Design

Industrial Design
The Industrial Design division helps customers develop winning brands and products, by using design as a strategic tool for business success. Its expertise extends across research & strategy, branding & graphic design, product design, packaging design, UI design, retail design & signage, transportation design, design engineering, and manufacturing support.
An in-depth understanding of consumers and rapidly changing market dynamics, backed by a multi-disciplinary design team, enables it to service a broad spectrum of industries. This includes Automotive, Communications, Consumer products, Healthcare, and Retail.
It has supported the launch of multiple brands and products across the world. It has won several international awards and patents for design and innovation.
Annual Report 2011 - 12
05

06
Visual Computing Labs (VCL) is an award-winning digital production studio providing Animation, Visual Effects (VFX), and 3D stereoscopic content for feature films, episodic television, and advertising. It hosts world-class studios in Los Angeles and India and has a creative team that includes Academy Award® winning and BAFTA nominated professionals.
VCL also offers custom content development for visualization and product marketing, and is a leading developer of mobile, online, and console games.
Visual Computing Labs
Business Units
Recent awards include a Golden Lotus and a Silver Lotus at the 56th National awards for exemplary Animation and Visual Effects in feature films, the 2010-11 INFOCOM-ASSOCHAM EME AWARDS, FICCI BAF Awards 2010, and the 10th Indian Telly Awards 2010.

Systems Integration
Annual Report 2011 - 12
07
Systems Integration division implements and integrates complete systems and solutions for High-Performance Computing, CAD/CAM/CAE, Broadcast, Virtual Reality, Storage, and Disaster Recovery.
It addresses the broadcast, manufacturing, government, defence, and education sectors, with an expert team of integration specialists and support engineers located across a wide network of offices. This is backed by strategic partnerships with best-in-class software and technology providers.
The Professional Services Group (PSG) under SI extends maintenance and support services for data mining, facilities management, network management, and storage consultancy and management, in India and overseas.

08
Mr. S Ramadorai Chairman
Mr. P McGoldrick
Mr. P G Mankad
Dr. R Natarajan
Mrs. S Gopinath
Mr. Madhukar Dev Managing Director
Audit Committee
Mrs. S Gopinath Chairperson
Mr. S Ramadorai
Dr. R Natarajan
Investor Grievance Committee
Mr. P G Mankad Chairman
Dr. R Natarajan
Mr. G Vaidyanathan Company Secretary
Registrars & Share Transfer Agents
TSR Darashaw Limited 6-10, Haji Moosa Patrawala Ind. Estate 20, Dr. E. Moses Road, Mahalaxmi Mumbai - 400 011
Auditors
Deloitte Haskins & Sells Chartered Accountants
Registered & Corporate Office
ITPB Road Whitefield Bangalore 560 048 India
Statutory Committees (Pursuant to the Listing Agreement with the Stock Exchanges)
Board of Directors(as on 7th May, 2012)

9
NOTICENotice is hereby given that the TWENTY THIRD ANNUAL GENERAL MEETING of TATA ELXSI LIMITED will be held at Devraj Urs
Bhavan, (behind Dr. Ambedkar Bhavan), 16 D, Millers Tank Bed Area, Vasanthanagar, Bangalore 560052 on Tuesday 24th July 2012 at
12.30 p.m. to transact the following business:
1. To receive and adopt the Audited Profi t and Loss Account for the year ended March 31, 2012 and the Balance Sheet as at that date
together with the Cash Flow Statement and the reports of the Directors and Auditors thereon.
2. To declare dividend for the year ended 31st March 2012.
3. To appoint a Director in place of Mr. S. Ramadorai who retires by rotation and is eligible for reappointment.
4. To appoint a Director in place of Dr. R. Natarajan who retires by rotation and is eligible for reappointment
5. To appoint auditors to hold offi ce from the conclusion of this Annual General Meeting upto the conclusion of the next Annual
General Meeting and to fi x their remuneration.
Special Business
6. To consider and, if thought fi t, to pass with or without modifi cation the following resolution as an Ordinary Resolution:
“RESOLVED THAT Mrs. Shyamala Gopinath who was appointed as an Additional Director of the Company, with eff ect from
18th August, 2011, who holds offi ce up to this Annual General Meeting, pursuant to the provisions of Section 260 of the Companies
Act, 1956 (“the Act”) and is eligible for re-appointment and in respect of whom the Company has received a notice in writing from
a member u/s 257 of the Act, proposing her candidature to the offi ce of Directorship of the Company, be and is hereby appointed
as Director of the Company whose terms of offi ce will be determined by retirement by rotation”.
7. To consider and, if thought fi t, to pass with or without modifi cation, the following resolution as a Special Resolution:
“RESOLVED that pursuant to the Provisions of Section 309 and other applicable provisions, if any, of the Companies Act, 1956 (“the
Act”), a sum not exceeding 1% per annum of the net profi ts of the Company calculated in accordance with the provisions of Sections
198, 349, and 350 of the Act, be and is hereby approved for payment to and distribution amongst the Directors of the Company,
or some, or any of them (other than the Managing Director and Whole-time Directors, if any) in such amounts or proportions and
in such a manner and in all respects as may be directed by the Board of Directors of the Company and that such payments and
distribution shall be made in respect of the profi ts of the Company for each year of the period of fi ve years, commencing from
1st April 2011”.
By Order of the Board
For Tata Elxsi Limited
G Vaidyanathan
Company Secretary
Mumbai, May 07, 2012
Registered Offi ce:
ITPB Road, Whitefi eld,
Bangalore 560 048.

Twenty Third Annual Report 2011 - 12
10
NOTES:
a) The relevant details of the persons seeking re-appointment/appointment as Director under Item Nos. 3, 4, and 6 above, pursuant
to Clause 49 of the Listing Agreement entered into with the Stock Exchanges is annexed hereto.
b) A MEMBER ENTITLED TO ATTEND AND VOTE IS ENTITLED TO APPOINT A PROXY TO ATTEND AND VOTE INSTEAD OF HIMSELF AND
THE PROXY NEED NOT BE A MEMBER.
c) Members desirous of getting any information in respect of Accounts of the Company are requested to send their queries in
writing to the Company at the Registered Offi ce, so as to reach at least 7 days before the date of the Meeting, so that the required
information can be made available at the Meeting.
d) Members / Proxies attending the Meeting are requested to bring their copy of the Annual Report for reference at the Meeting as
also the Attendance Slip duly fi lled in for attending the Meeting.
e) Register of Members and Transfer Books of the Company will be closed from 17th July, 2012 to 24th July, 2012 (both dates inclusive)
for the purpose of determining the shareholders entitled to the payment of Dividend declared at the Annual General Meeting on
24th July, 2012 for the year ended March 31, 2012.
Dividend on shares, when declared, will be paid only to those members whose names are registered as such in the Register of
Members of the Company, after giving eff ect to valid share transfers in physical form lodged with the Company, on or before 16th
July, 2012 and to the Benefi cial Holders as per the Benefi ciary List as on 16th July, 2012 provided by the NSDL and CDSL.
f) Members holding shares in electronic form may please note that as per the regulations of National Securities Depository Ltd (NSDL)
and Central Depository Services (India) Ltd. (CDSL), the Company is obliged to print the bank details on the dividend warrants as
furnished by these Depositories to the Company and the Company cannot entertain any request for deletion / change of bank
details already printed on dividend warrants as per information received from the concerned Depositories. In this regard, Members
should contact their Depository Participant (DP) and furnish particulars of any changes desired by them.
g) Members who have not received their dividend paid by the Company in respect of earlier years, are requested to check
with the Company’s Registrars & Transfer Agents i.e. M/s. TSR Darashaw Ltd., 6-10 Haji Moosa Patrawala Industrial Estate,
20, Dr. E. Moses Road, Mahalaxmi, Mumbai 400 011. Members are requested to note that in terms of Section 205C of
the Companies Act, 1956 any dividend unpaid / unclaimed for a period of 7 years from the date these fi rst became due
for payment, is to be transferred to the Central Government to the credit of the Investor Education & Protection Fund.
Thereafter, no claim shall be entertained by the company in respect of the dividend transferred to the Fund.
Members who have not yet encashed their dividends for the fi nancial year ended 31st March 2005 onwards are being
individually intimated and are requested to make their claims to the Company’s Registrars & Transfer Agents accordingly,
without delay. It may be noted that the unclaimed dividend for the fi nancial year ended 31st March 2005 and 31st March
2006 are due for transfer to the Investor Education & Protection Fund on 27th August, 2012 and 2nd September, 2013
respectively.
h) In support of the “Green Intitiative”, Members are requested to register their email address with the Company for receipt
of Notices, Annual Report etc., electronically. The email may be sent to [email protected] quoting their
Folio No./DP, or Client ID, as the case may be.

11
ANNEXURE TO NOTICEEXPLANATORY STATEMENT PURSUANT TO SECTION 173(2) OF THE COMPANIES ACT, 1956
The following Explanatory Statement, pursuant to Section 173 (2) of the Companies Act, 1956, (‘the Act’) sets out all material facts relating
to the business mentioned at Item Nos. 6 & 7 of the accompanying Notice:
Item No. 6
The Board of Directors, on the recommendation of the Nomination committee, had appointed Mrs. Shyamala Gopinath as an Additional
Director of your Company, with eff ect from 18th August, 2011, pursuant to the provisions of Section 260 of the Companies Act, 1956
and Article 151 of the Articles of Association of the Company. Accordingly, in terms of the said Article and Section, Mrs. Gopinath holds
offi ce upto the date of this Annual General Meeting and being eligible, is proposed to be appointed at this Annual General Meeting as a
Director liable to retire by rotation.
Mrs. Gopinath, aged 63 years, is a Master of Commerce and a Certifi ed Associate of Indian Institute of Bankers. Mrs. Gopinath has more
than 39 years experience in fi nancial sector policy formulation in diff erent capacities at the Reserve Bank of India. She retired as Deputy
Governor of Reserve Bank of India. She has vast experience in guiding and infl uencing the national policies, in the diverse areas of
fi nancial sector regulation and supervision, development and regulation of fi nancial markets, capital account management, management
of government borrowings, forex reserves management, RBI accounts and payment and settlement systems. During 2001-03, she has
worked as Senior Financial sector Expert in the then Monetary Aff airs and Exchange Department of the IMF (Financial Institutions
Division). She was also a member of Financial Sector Assessment Program (FSAP) missions to Tanzania and Nigeria and foreign exchange
and reserve management to Turkey and Kosovo. In 2009, she represented India at the G20 as the Central Bank Deputy. She was the sole
representative of the Reserve Bank at the Uruguay Round/WTO negotiations earlier in her career.
Mrs. Gopinath is also in the Board of Indian Oil Corporation Ltd., Gas Authority of (India) Limited, and National Stock Exchange Ltd.
Your Board considers that in view of the experience and expertise possessed by Mrs. Gopinath , it would be in the interest of your
Company to appoint Mrs. Gopinath as a Director on the Board of your Company.
Notice and deposit as required under Section 257 of the Companies Act, 1956 has been received from a member proposing the
candidature of Mrs. S. Gopinath as a Director of your Company.
None of the Directors, except Mrs. S. Gopinath, is concerned or interested in Item No. 6 of the Notice.
Item No. 7
In view of the valuable services being rendered by the Directors to the Company and the increased responsibilities they are required to
shoulder, the members had at the Seventeenth Annual General Meeting held on 28th July, 2006, approved payment of commission, not
exceeding 1% per annum of the net profi ts of the Company, calculated in accordance to the provisions of the Companies Act, 1956, to
the Non-Executive Directors of the Company for a period of fi ve years commencing from 1st April 2006, to be distributed amongst some
or all of the Directors, in accordance with the directions given by the Board.
Consequent to the expiry of the said period of fi ve years on 31st March 2011, it is proposed to extend payment of such commission by
another fi ve years commencing from 1st April 2011.
All the Non-Executive Directors of the Company may be deemed to be concerned or interested in the resolution under item no. 7 of the
notice, to the extent of the remuneration that may be received by them.
By Order of the Board
For TATA ELXSI LIMITED
G Vaidyanathan
Company Secretary
Mumbai, May 07, 2012
Registered Offi ce:
ITPB Road, Whitefi eld,
Bangalore 560 048.
Twenty Third Annual Report 2011 - 12
12
ANNEXURE
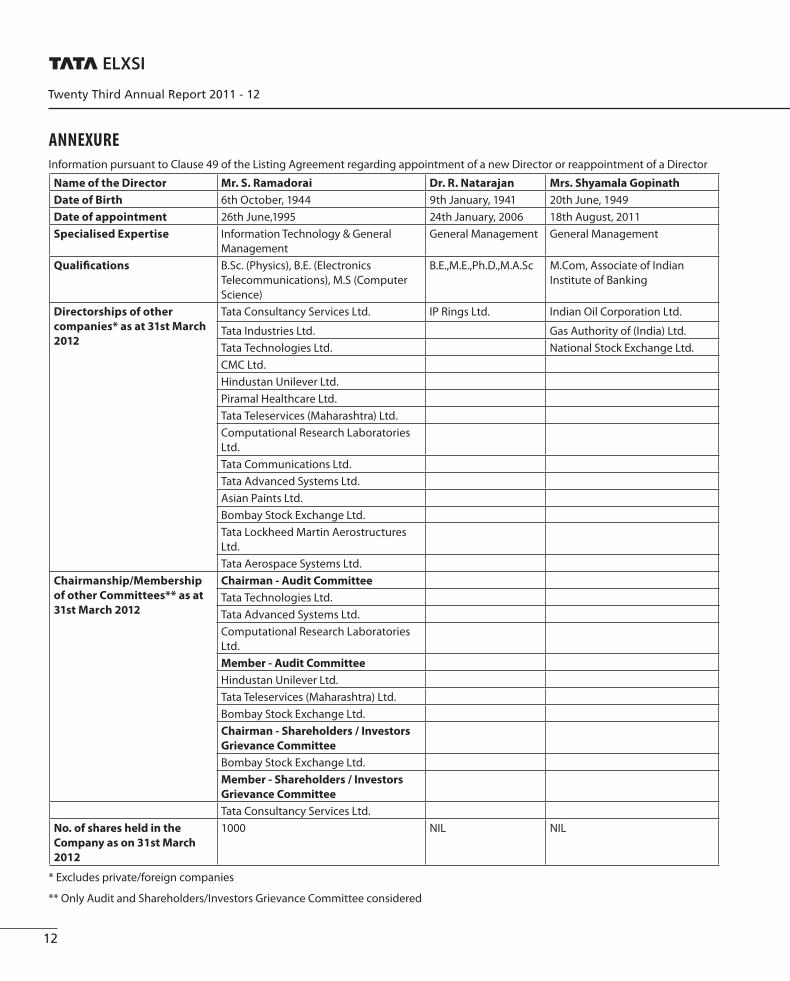
Information pursuant to Clause 49 of the Listing Agreement regarding appointment of a new Director or reappointment of a Director
Name of the Director Mr. S. Ramadorai Dr. R. Natarajan Mrs. Shyamala Gopinath
Date of Birth 6th October, 1944 9th January, 1941 20th June, 1949
Date of appointment 26th June,1995 24th January, 2006 18th August, 2011
Specialised Expertise Information Technology & General
Management
General Management General Management
Qualifi cations B.Sc. (Physics), B.E. (Electronics
Telecommunications), M.S (Computer
Science)
B.E.,M.E.,Ph.D.,M.A.Sc M.Com, Associate of Indian
Institute of Banking
Directorships of other
companies* as at 31st March
2012
Tata Consultancy Services Ltd. IP Rings Ltd. Indian Oil Corporation Ltd.
Tata Industries Ltd. Gas Authority of (India) Ltd.
Tata Technologies Ltd. National Stock Exchange Ltd.
CMC Ltd.
Hindustan Unilever Ltd.
Piramal Healthcare Ltd.
Tata Teleservices (Maharashtra) Ltd.
Computational Research Laboratories
Ltd.
Tata Communications Ltd.
Tata Advanced Systems Ltd.
Asian Paints Ltd.
Bombay Stock Exchange Ltd.
Tata Lockheed Martin Aerostructures
Ltd.
Tata Aerospace Systems Ltd.
Chairmanship/Membership
of other Committees** as at
31st March 2012
Chairman - Audit Committee
Tata Technologies Ltd.
Tata Advanced Systems Ltd.
Computational Research Laboratories
Ltd.
Member - Audit Committee
Hindustan Unilever Ltd.
Tata Teleservices (Maharashtra) Ltd.
Bombay Stock Exchange Ltd.
Chairman - Shareholders / Investors
Grievance Committee
Bombay Stock Exchange Ltd.
Member - Shareholders / Investors
Grievance Committee
Tata Consultancy Services Ltd.
No. of shares held in the
Company as on 31st March
2012
1000 NIL NIL
* Excludes private/foreign companies
** Only Audit and Shareholders/Investors Grievance Committee considered

13
DIRECTORS’ REPORT TO THE MEMBERS
1. Your Directors present the Twenty-Third Annual Report, together with the Audited Statements of Accounts of your Company for the
year ended March 31, 2012.
2. Financial Highlights:
During the fi nancial year 2011-12, the operations of your Company resulted in the following:
(` Crores)
Unconsolidated Consolidated
2011-12 2010-11 2011-12 2010-11
Sales and Service 514.46 411.01 538.71 415.91
Other income 6.12 3.86 4.20 3.86
Total Income 520.58 414.87 542.91 419.77
Profi t before fi nancial expenses and depreciation 73.20 50.20 78.21 51.05
Less : Financial expenses 2.33 1.88 2.33 1.88
Depreciation 20.52 17.20 20.52 17.20
Profi t for the year 50.35 31.12 55.36 31.97
Less : Provision for Income tax 16.40 (0.61) 16.65 (0.55)
Share of loss from associate Company - - 4.12 -
Profi t after tax 33.95 31.73 34.59 32.52
Add: Profi t brought forward 107.47 105.99 109.40 107.13
Balance available for appropriation which has been
appropriated as under:
141.42 137.72 143.98 139.65
Proposed dividend. 21.80 21.80 21.80 21.80
Dividend tax thereon net of reversal thereof. 3.54 3.45 3.54 3.45
Transfer to General Reserve 5.00 5.00 5.00 5.00
Balance of profi t carried to Balance Sheet 111.08 107.47 113.64 109.40
Total appropriations 141.42 137.72 143.98 139.65
3. Dividend:
Your Directors recommend for your approval a dividend of 70% (` 7.00 per share) [previous year 70% (` 7.00 per share)] for the year
ended 31st March 2012, involving an outgo of ` 21.80 crores (previous year ` 21.80 crores). Additionally, dividend distribution tax
will involve an outlay of ` 3.54 crores (previous year ` 3.45 crores), involving a payout ratio of 73%.
4. Review of Operations:
The total income (consolidated) during the year under review was ` 542.91 crores, as against ` 419.77 crores in the previous year,
registering an overall increase of 30%. NASSCOM, the premier trade body for Indian IT-ITES industry, had projected a growth of 16%
from exports for IT and ITES fi rms in FY 2012 and your Company grew more than the industry average, supported strongly by volume
growth, and partly by rupee depreciation. The Profi t after tax was ` 34.59 crores, as against ` 32.52 crores in the previous year.
NASSCOM has forecasted that exports from India’s information technology sector will grow more slowly for the fi nancial year ending
March 31, 2013 and has forecasted a guidance of 11-14% for the likely growth in FY 2013. Your Company is well prepared to continue
the growth momentum, despite the volatile environment, leveraging its niche portfolio and global presence.
More details are set out in the attached Management Discussion and Analysis Statement.
A business-wise analysis of your Company’s two main segments viz. Software Development & Services, and Systems Integration &
Support follows hereunder:
Software Development & Services:
The businesses constituting this segment are Embedded Product Design, Industrial Design, and Visual Computing Labs. Business
in this segment registered an increase of 27% to ` 454.25 crores during FY12 from ` 358.20 crores in FY11. The segment’s profi t
increased from ` 36.81 crores to ` 55.69 crores, mainly on account of increased business volume.

Twenty Third Annual Report 2011 - 12
14
DIRECTORS’ REPORT TO THE MEMBERS (Contd.)
Embedded Product Design:
The Embedded Product Design division provides technology consulting, new product development, system integration, and testing
services for the broadcast, industrial and consumer electronics, transportation, wireless communications, and convergence industries.
It also creates and licenses intellectual property and software components, helping customers create product diff erentiation, and
reduce development costs and time-to-market.
Apart from the recessionary trends in Europe, the outlook for Japan is still weak, and has potential implications for business from the
semiconductor, consumer electronics, and automotive industries. Your company is taking adequate steps to overcome these risks,
by focusing on key customers in these geographies, to ensure revenue protection and diversifying into new geographies.
Your Company is incubating a medical electronics practice by leveraging its existing medical device customer base from the
industrial design division and embedded systems expertise of the Embedded Product Design division.
Medical device engineering and R&D services is expected to grow steadily over the next few years. Your Company plans to target
and grow services for this industry, in order to address the growing demand for medical devices from emerging markets and
convergence of medical products with communications and information technology.
Industrial Design:
The Industrial Design division helps customers develop winning brands and products by using design as a strategic tool for business
success. Its expertise extends across consumer insight, branding, product design, packaging design, transportation design, visual
design, design engineering, and manufacturing support.
This division has worked with prestigious FMCG brands in packaging design. It has developed award-winning designs in the food,
beverage, personal and home care segments, for leading brands in India and Overseas.
Apart from executing several projects for interior and exterior styling of vehicles, it has also developed cutting edge products for the
consumer electronics and healthcare industry.
Visual Computing Labs:
Visual Computing Labs off ers Animation, Visual Eff ects (VFX), and 3D stereoscopic content for feature fi lms, episodic television
and advertising. It also off ers custom content development for visualization and product marketing, and is a leading provider of
engineering and animation services for mobile, online and console games.
During the year, your Company continued its eff orts to provide strong sales thrust from the overseas VFX studio, that was set up at
Santa Monica near Hollywood, and to improve collaboration with Indian operations.
Your Company entered into a Joint Venture Agreement with M/s A Squared Entertainment, LLC, USA (A2E) on September 30, 2011
to create, develop, and distribute original brands, including animated entertainment, digital gaming, and originally designed
consumer products. The new Company, M/s A Squared Elxsi Entertainment (A2E2), LLC, has been incorporated at Delaware, USA.
During the year, A2E2 completed its fi rst IP “Martha & Friends”, an animated series featuring a 10-year old Martha Stewart. Your
Company contributed signifi cantly to the development of this IP. Other forthcoming projects of the joint venture include “Secret
Millionaire’s Club”, an animated series featuring billionaire Warren Buff ett.
During the year, the Joint Venture has incurred signifi cant eff orts, because of projects under development and expects to monetize
those brands / IPs developed in the next fi scal year.
Both partners of the JV - Tata Elxsi and A2E, will be assigned equity capital in the new company. Allocation of units to the two partners
is pending completion of all due formalities associated with the allocation of units. Therefore, your Company for the purpose of
consolidation for this fi scal year is taking only its share of loss in A2E2.
Systems Integration & Support:
During the year, the segment turnover and profi t were ` 84.45 crores and ` 8.40 crores respectively, compared to `57.71 crores and
` 6.77 crores respectively during 2010-11.
This business has improved its turnover signifi cantly by 46%, while focusing on a solutions centric approach that includes more of
software and services to better protect margins.

15
DIRECTORS’ REPORT TO THE MEMBERS (Contd.)5. Finance:
Interest cost was ` 2.33 crores as against ` 1.88 crores in the previous year. Borrowings as at the year end was ` 34.16 crores,
compared to ` 25.43 crores in the previous year.
6. Directors:
Mr. S. Ramadorai and Dr. R. Natarajan retire by rotation and being eligible, off er themselves for reappointment.
Mrs. Shyamala Gopinath, who has been appointed as an Additional Director with eff ect from 18th August 2011, holds offi ce up to the
conclusion of the ensuing Annual General Meeting. The Company has received a notice from a member u/s 257 of the Companies
Act, 1956 proposing Mrs. S. Gopinath to the offi ce of Directorship whose terms of offi ce will be determined by retirement by rotation.
In accordance with the Guidelines on Composition of Board adopted by your Company’s Board of Directors, Mr. H.H. Malgham
stepped down from your Company’s Board eff ective 23rd July 2011 on attaining the maximum age permissible for Directors
under the guidelines. Mr. Malgham was the Chairman of the Audit and Remuneration Committees. He was also the member of the
Executive and Investors Grievance Committees. The Directors place on record their appreciation for the valuable contribution made
by him during his tenure in the Board and diff erent Committees of the Board.
7. Directors Responsibility Statement:
Pursuant to Section 217(2AA) of the Companies Act, 1956, your Directors, based on the representations received from the Operating
Management, confi rm that -
(i) in the preparation of the annual accounts, the applicable accounting standards have been followed and that there are no
material departures;
(ii) they have, in the selection of the accounting policies, consulted the Statutory Auditors and have applied them consistently and
made judgments and estimates that are reasonable and prudent so as to give a true and fair view of the state of aff airs of the
Company at the end of the fi nancial year and of the profi t of the Company for that year;
(iii) they have taken proper and suffi cient care, to the best of their knowledge and ability, for the maintenance of adequate
accounting records, in accordance with the provisions of the Companies Act, 1956, for safeguarding the assets of the Company
and for preventing and detecting fraud and other irregularities;
(iv) they have prepared the annual accounts on a going concern basis.
8. Personnel:
Your company recognizes the critical importance of its human capital. Capacity addition through the induction of fresh engineers
and lateral hires are driven by the annual business planning exercise. Capacity addition is continuously monitored and changed
depending on business demand. Your company takes signifi cant initiatives to increase effi ciency through training, leadership
development, and other measures.
9. Disclosure of Particulars:
Information required under Section 217(2A) of the Companies Act, 1956 and the Rules made there under, is provided in Annexure-B
forming part of the Report. In terms of Section 219(1) (b) (iv) of the Act, the Report and Accounts are being sent to the Shareholders,
excluding the aforesaid Annexure. Any Shareholders interested in obtaining a copy of the same may write to the Company Secretary.
10. Subsidiary Company, Statement under Section 212 of the Companies Act, 1956 and Consolidated Financial Statements:
The Company’s wholly owned subsidiary, Tata Elxsi (Singapore) Pte. Ltd. recorded a turnover of ` 26.54 crores and Profi ts before Tax
of ` 2.82 crores during the year 2011-12, as against the previous year’s turnover of ` 4.90 crores and Profi t before tax of ` 0.85 crores.
The Board of Directors of your Company has given their consent for not attaching to its Balance Sheet, the documents relating to its
subsidiary specifi ed in Section 212 (1) of the Companies Act, 1956 in terms of the General Circular no. 2/2011 of the MCA.
In terms of the said circular, a statement in one page containing specifi ed fi nancial details of the subsidiary Company, is to be
included in the consolidated annual fi nancial statements of the parent Company. The annual accounts of the subsidiary and the
related detailed information will be made available to the holding and subsidiary Companies investors seeking such information at
any point of time. The annual accounts of the subsidiary will also be kept available for inspection by any investor at the head offi ce
of the parent and subsidiary Company respectively.

Twenty Third Annual Report 2011 - 12
16
As required pursuant to the Accounting Standards of the Institute of Chartered Accountants of India and the Listing Agreement with
the Stock Exchanges, the stand-alone annual accounts of your Company, along with the consolidated fi nancial statements of your
Company and the subsidiary Company made up to 31st March 2012, are also presented.
11. Corporate Governance:
Pursuant to Clause 49 of the Listing Agreement, the Corporate Governance Report, the Management Discussion & Analysis Statement,
and the Auditors’ Certifi cate regarding Compliance of Conditions of Corporate Governance are part of this Annual Report.
12. Voluntary Delisting of Company’s Equity Shares
During the year under review your Company applied for voluntary delisting of its equity shares from Bangalore Stock Exchange and
Delhi Stock Exchange in terms of the SEBI (Delisting of Securities) Regulation, 2009. The Bangalore Stock Exchange, vide its letter
no. 03/2011/476 dated 15th November, 2011, delisted the Company’s Equity shares from their stock exchange with eff ect from
15th November, 2011. The delisting of Company’s equity Shares from Delhi Stock Exchange is yet to happen. The Company’s equity
shares continue to be listed with Bombay Stock Exchange (BSE) & National Stock Exchange (NSE) and are being actively traded in
these exchanges.
13. Acknowledgements:
The Directors wish to thank the Company’s employees, customers, partners, suppliers, and above all, its shareholders and investors
for their continued support and co-operation.
On behalf of the Board of Directors
S. RAMADORAI
Chairman
Mumbai, May 07, 2012

17
ANNEXURE “A” TO DIRECTOR’S REPORTParticulars pursuant to Section 217 (1)(e) of the Companies Act, 1956 read with Companies (Disclosure of Particulars in the Report of
Board of Directors) Rules, 1988
1. Conservation of Energy
Your Company is in a knowledge intensive industry, and does not operate industrial machinery, production facilities, or other such
energy intensive operations. However, as a responsible corporate citizen, it continues to pursue and adopt appropriate energy
conservation measures.
Energy conservation programs adopted by your Company are:
(i) Continuous education and awareness programs among all employees on energy conservation measures that can be adopted
at individual levels, to help conserve power and energy.
(ii) Continuous monitoring of energy consumption. This covers optimization of space utilization, using technology to monitor
and control power consumption of air conditioning and other related equipment, use of energy effi cient light bulbs, using
technology for switching off computer monitors, motion sensors for lighting controls, etc.
(iii) Initiatives such as provision of company mass transport and car pooling for employees commuting to work.
(iv) Rain-water harvesting and using recycled water for gardening.
(v) Regular reviews of energy requirements and consumption patterns, with action plans on eff ective utilization of power, during
peak and non-peak seasons, including purchase/use of energy saving devices based on techno-commercial evaluation.
Your Company will continue to monitor and control overall energy expenses, in relation to the growth in the scale of operations.
2. Technology Absorption
a. Research & Development
Your company’s key services are directed towards software and electronic system development for industries such as wireless,
multimedia, automotive, networking, consumer electronics, and broadcast. Your Company devotes a certain portion of its human
capital in developing expertise in emerging technologies, through technology partnerships, subscription and active participation in
technology forums, trade shows, technology training, and in-house R&D projects. These help in enabling new technology familiarity
for the engineering teams, as part of the continuous training and human resource development.
b. Benefi ts derived out of the above R&D
Internal IP programs facilitate your Company to train and enable expertise development in a larger pool of people, than those
directly engaged with customers on specifi c projects. This allows the Company to scale its delivery capability and capacity in a
short period of time, and also showcase technology and engineering capability, relevant to customer needs, without violating
confi dentiality of work being executed for customers in the same area.
Further, certain programs are focused on creating Intellectual Property (IP), which have the potential to be commercialized and
generate licensing revenue streams.
Your Company leveraged its R&D expertise, especially in the broadband wireless technology area e.g. WiMax, LTE and Multimedia
(audio & video codec’s) and developed advanced reference designs and software as part of R&D projects. During the year, your
Company developed a ready-to-deploy Android-based Hybrid Set Top Box and such R&D initiatives resulted in bringing out
innovative product solutions to address the market requirement. Some of the reference designs/ IPs have been successfully licensed
to some customers, enabling revenues from licensing and additional revenues from related services in helping these customers
integrate and customize the design to suit their specifi cations.
Future plan of action
During the year, your Company invested 3.1% of revenue in developing intellectual properties, through in-house R&D projects. Your
Company intends to continue investment in technology IP development, especially those related to wireless and multimedia. It aims
to grow revenues through IP licensing and related services to licensees for adaption and integration of the licensed technology to
suit their specifi cations.
Twenty Third Annual Report 2011 - 12
18
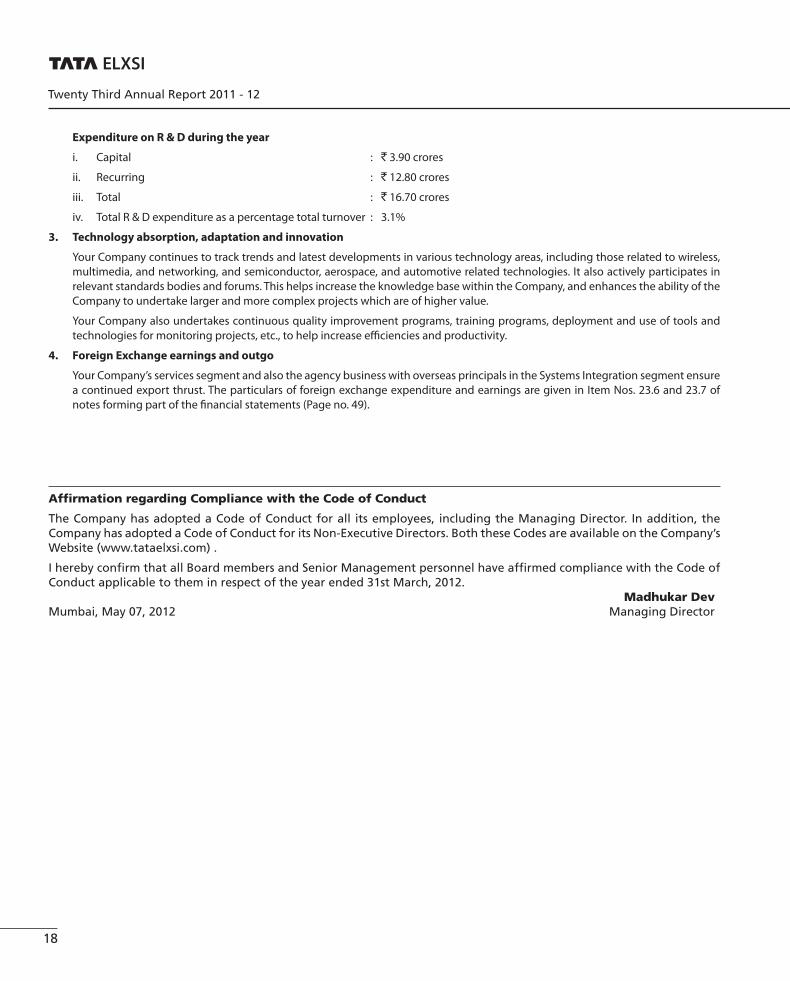
Expenditure on R & D during the year
i. Capital : ` 3.90 crores
ii. Recurring : ` 12.80 crores
iii. Total : ` 16.70 crores
iv. Total R & D expenditure as a percentage total turnover : 3.1%
3. Technology absorption, adaptation and innovation
Your Company continues to track trends and latest developments in various technology areas, including those related to wireless,
multimedia, and networking, and semiconductor, aerospace, and automotive related technologies. It also actively participates in
relevant standards bodies and forums. This helps increase the knowledge base within the Company, and enhances the ability of the
Company to undertake larger and more complex projects which are of higher value.
Your Company also undertakes continuous quality improvement programs, training programs, deployment and use of tools and
technologies for monitoring projects, etc., to help increase effi ciencies and productivity.
4. Foreign Exchange earnings and outgo
Your Company’s services segment and also the agency business with overseas principals in the Systems Integration segment ensure
a continued export thrust. The particulars of foreign exchange expenditure and earnings are given in Item Nos. 23.6 and 23.7 of
notes forming part of the fi nancial statements (Page no. 49).
Affi rmation regarding Compliance with the Code of Conduct
The Company has adopted a Code of Conduct for all its employees, including the Managing Director. In addition, the Company has adopted a Code of Conduct for its Non-Executive Directors. Both these Codes are available on the Company’s Website (www.tataelxsi.com) .
I hereby confi rm that all Board members and Senior Management personnel have affi rmed compliance with the Code of Conduct applicable to them in respect of the year ended 31st March, 2012. Madhukar DevMumbai, May 07, 2012 Managing Director
19
Mandatory Requirements:
1. A brief statement on the Company’s philosophy on code of governance. Your Company believes in conducting its aff airs with the
highest levels of integrity, with proper authorisations, accountability and transparency. The business operations of your Company
are conducted not to benefi t any particular interest group but for the benefi t of all stakeholders.
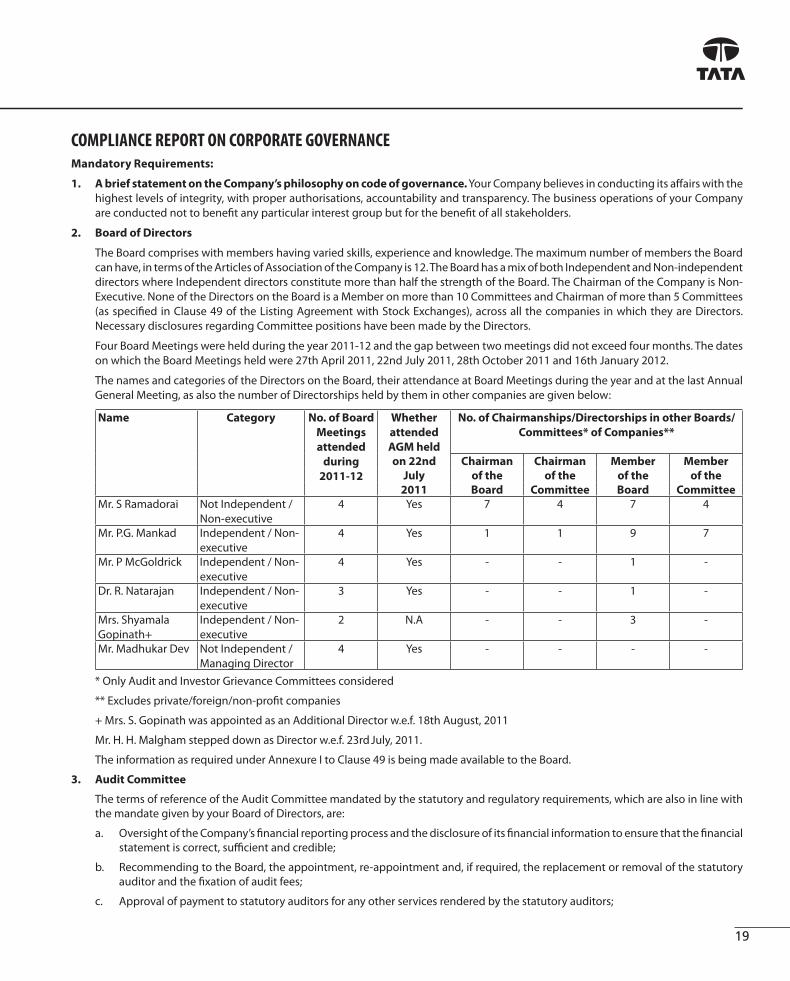
2. Board of Directors
The Board comprises with members having varied skills, experience and knowledge. The maximum number of members the Board
can have, in terms of the Articles of Association of the Company is 12. The Board has a mix of both Independent and Non-independent
directors where Independent directors constitute more than half the strength of the Board. The Chairman of the Company is Non-
Executive. None of the Directors on the Board is a Member on more than 10 Committees and Chairman of more than 5 Committees
(as specifi ed in Clause 49 of the Listing Agreement with Stock Exchanges), across all the companies in which they are Directors.
Necessary disclosures regarding Committee positions have been made by the Directors.
Four Board Meetings were held during the year 2011-12 and the gap between two meetings did not exceed four months. The dates
on which the Board Meetings held were 27th April 2011, 22nd July 2011, 28th October 2011 and 16th January 2012.
The names and categories of the Directors on the Board, their attendance at Board Meetings during the year and at the last Annual
General Meeting, as also the number of Directorships held by them in other companies are given below:
Name Category No. of Board
Meetings
attended
during
2011-12
Whether
attended
AGM held
No. of Chairmanships/Directorships in other Boards/
Committees* of Companies**
on 22nd Chairman Chairman Member Member
July of the of the of the of the
2011 Board Committee Board Committee
Mr. S Ramadorai Not Independent /
Non-executive
4 Yes 7 4 7 4
Mr. P.G. Mankad Independent / Non-
executive
4 Yes 1 1 9 7
Mr. P McGoldrick Independent / Non-
executive
4 Yes - - 1 -
Dr. R. Natarajan Independent / Non-
executive
3 Yes - - 1 -
Mrs. Shyamala
Gopinath+
Independent / Non-
executive
2 N.A - - 3 -
Mr. Madhukar Dev Not Independent /
Managing Director
4 Yes - - - -
* Only Audit and Investor Grievance Committees considered
** Excludes private/foreign/non-profi t companies
+ Mrs. S. Gopinath was appointed as an Additional Director w.e.f. 18th August, 2011
Mr. H. H. Malgham stepped down as Director w.e.f. 23rd July, 2011.
The information as required under Annexure I to Clause 49 is being made available to the Board.
3. Audit Committee
The terms of reference of the Audit Committee mandated by the statutory and regulatory requirements, which are also in line with
the mandate given by your Board of Directors, are:
a. Oversight of the Company’s fi nancial reporting process and the disclosure of its fi nancial information to ensure that the fi nancial
statement is correct, suffi cient and credible;
b. Recommending to the Board, the appointment, re-appointment and, if required, the replacement or removal of the statutory
auditor and the fi xation of audit fees;
c. Approval of payment to statutory auditors for any other services rendered by the statutory auditors;
COMPLIANCE REPORT ON CORPORATE GOVERNANCE

Twenty Third Annual Report 2011 - 12
20
d. Reviewing, with the management, the annual fi nancial statements before submission to the Board for approval, with particular
reference to:
i. Matters required to be included in the Director’s Responsibility Statement to be included in the Board’s Report in terms of clause (2AA) of section 217 of the Companies Act, 1956;
ii. Changes, if any, in accounting policies and practices and reasons for the same;
iii. Major accounting entries involving estimates based on the exercise of judgment by management;
iv Signifi cant adjustments made in the fi nancial statements arising out of audit fi ndings;
v. Compliance with listing and other legal requirements relating to fi nancial statements;
vi. Disclosure of any related party transactions; and
vii. Qualifi cations in the draft audit report;
e. Reviewing, with the management, the quarterly fi nancial statements before submission to the Board for approval;
f. Reviewing, with the management, performance of statutory and internal auditors, adequacy of the internal control systems;
g. Reviewing the adequacy of internal audit function, if any, including the structure of the internal audit department, staffi ng and seniority of the offi cial heading the department, reporting structure, coverage, and frequency of internal audit;
h. Discussion with internal auditors, any signifi cant fi ndings and follow up there on;
i. Reviewing the fi ndings of any internal investigations by the internal auditors into matters where there is suspected fraud or irregularity, or a failure of internal control systems of a material nature and reporting the matter to the Board;
j. Discussion with statutory auditors before the audit commences, about the nature and scope of audit, as well as post-audit discussion to ascertain any area of concern;
k. To look into the reasons for substantial defaults in the payment to the depositors, debenture holders, shareholders (in case of non payment of declared dividends), and creditors;
l. To review the functioning of the Whistle Blower mechanism;
m. Carrying out any other function, as is mentioned in the terms of reference of the Audit Committee.
The Audit Committee reviewed the reports of the internal auditors, the reports of the statutory auditors arising out of the quarterly, half-yearly, and annual audit of the accounts; considered signifi cant fi nancial issues aff ecting the Company and held discussions with the internal and statutory auditors and the Company Management during the year.
Six Audit Committee Meetings were held during the year 2011-12. The dates on which the Audit Committee Meetings were held were 27th April 2011, 21st July 2011, 22nd July 2011, 28th October 2011, 16th January 2012, and 8th March 2012. Due to pre-commitment Dr. Natarajan did not attend the meeting held on 27th April, 2011. The Board co-opted Mr. P. McGoldrick to attend the 27th April, 2011 meeting, in order to have requisite quorum in terms of the listing agreement.
The composition, names of the members, chairperson, particulars of the Meetings, and attendance of the members during the
year are as follows:
Sl.No. Names of Members Category No. of Meetings attended during the year 2011-12
1 Mrs. Shyamala Gopinath*Chairperson
Independent/Non-executive 3
2 Mr. S Ramadorai Not Independent / Non-executive 4
3 Dr. R. Natarajan Independent / Non-executive 54 Mr. Patrick McGoldrick Independent / Non-executive 15 Mr. H.H. Malgham**
(Chairman up to 22nd July, 2011)Independent / Non-executive 3
* Mrs. Shyamala Gopinath was appointed as the Chairperson and Member of the Audit Committee w.e.f. 18th August 2011.
** Mr. H H Malgham stepped down from the Committee w.e.f. 23rd July, 2011.
Mr. H.H. Malgham, the then Chairman of the Audit Committee, was present at the 22nd AGM held on 22nd July, 2011.
COMPLIANCE REPORT ON CORPORATE GOVERNANCE (Contd.)
21
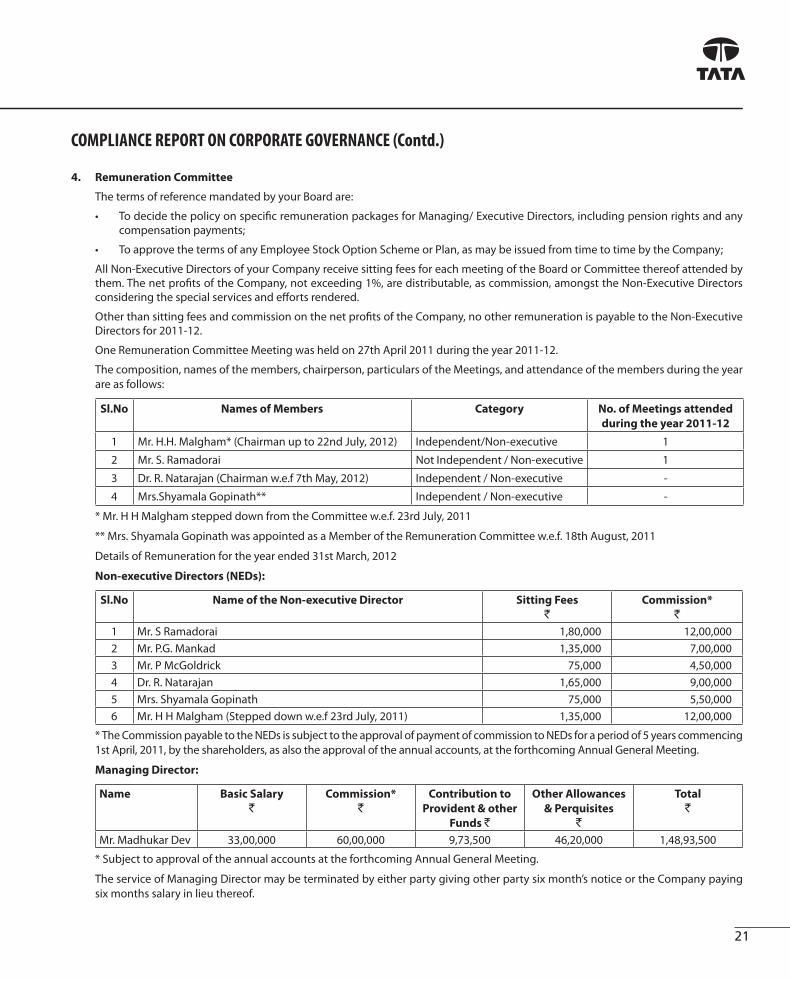
4. Remuneration Committee
The terms of reference mandated by your Board are:
• To decide the policy on specifi c remuneration packages for Managing/ Executive Directors, including pension rights and any compensation payments;
• To approve the terms of any Employee Stock Option Scheme or Plan, as may be issued from time to time by the Company;
All Non-Executive Directors of your Company receive sitting fees for each meeting of the Board or Committee thereof attended by them. The net profi ts of the Company, not exceeding 1%, are distributable, as commission, amongst the Non-Executive Directors considering the special services and eff orts rendered.
Other than sitting fees and commission on the net profi ts of the Company, no other remuneration is payable to the Non-Executive Directors for 2011-12.
One Remuneration Committee Meeting was held on 27th April 2011 during the year 2011-12.
The composition, names of the members, chairperson, particulars of the Meetings, and attendance of the members during the year
are as follows:
Sl.No Names of Members Category No. of Meetings attended
during the year 2011-12
1 Mr. H.H. Malgham* (Chairman up to 22nd July, 2012) Independent/Non-executive 1
2 Mr. S. Ramadorai Not Independent / Non-executive 1
3 Dr. R. Natarajan (Chairman w.e.f 7th May, 2012) Independent / Non-executive -
4 Mrs.Shyamala Gopinath** Independent / Non-executive -
* Mr. H H Malgham stepped down from the Committee w.e.f. 23rd July, 2011
** Mrs. Shyamala Gopinath was appointed as a Member of the Remuneration Committee w.e.f. 18th August, 2011
Details of Remuneration for the year ended 31st March, 2012
Non-executive Directors (NEDs):
Sl.No Name of the Non-executive Director Sitting Fees
`Commission*
`1 Mr. S Ramadorai 1,80,000 12,00,000
2 Mr. P.G. Mankad 1,35,000 7,00,000
3 Mr. P McGoldrick 75,000 4,50,000
4 Dr. R. Natarajan 1,65,000 9,00,000
5 Mrs. Shyamala Gopinath 75,000 5,50,000
6 Mr. H H Malgham (Stepped down w.e.f 23rd July, 2011) 1,35,000 12,00,000
* The Commission payable to the NEDs is subject to the approval of payment of commission to NEDs for a period of 5 years commencing
1st April, 2011, by the shareholders, as also the approval of the annual accounts, at the forthcoming Annual General Meeting.
Managing Director:
Name Basic Salary
`Commission*
`Contribution to
Provident & other
Funds `
Other Allowances
& Perquisites
`
Total
`
Mr. Madhukar Dev 33,00,000 60,00,000 9,73,500 46,20,000 1,48,93,500
* Subject to approval of the annual accounts at the forthcoming Annual General Meeting.
The service of Managing Director may be terminated by either party giving other party six month’s notice or the Company paying
six months salary in lieu thereof.
COMPLIANCE REPORT ON CORPORATE GOVERNANCE (Contd.)

Twenty Third Annual Report 2011 - 12
22
5. Shareholders / Investors Grievances Committee
The terms of reference mandated by your Board, which is also in line with the statutory and regulatory requirements, are:
• Redressing of Shareholders and Investors complaints;
• To ensure expeditious share transfers;
• To review status of legal cases involving the investors where the Company has been made a party.
Three Investor Grievance Committee Meetings were held during the year 2011-12. The dates on which the Investor Grievance
Committee Meetings held were 27th April 2011, 22nd July 2011, and 16th January 2012.
The composition, names of the members, chairperson, particulars of the Meetings and attendance of the members during the year
are as follows:
Sl.No. Names of Members Category No. of Meetings attended during the year 2011-12
1 Mr. P.G. Mankad, Chairman Independent / Non-executive 3
2 Mr. H H Malgham* Independent / Non-executive 2
3 Dr. R. Natarajan** Independent / Non-executive 1
* Mr. H H Malgham stepped down from the Committee w.e.f. 23rd July, 2011
** Dr. R. Natarajan was nominated as a Member of the Committee w.e.f 18th August, 2011
Name, designation & address of the Compliance Offi cer:
Mr. G. Vaidyanathan
Company Secretary
Tata Elxsi Ltd.,
ITPB Road, Whitefi eld, Bangalore – 560 048.
Phone : +91-80-22979316
Fax : +91-80-28411474
E-mail : [email protected]
Details of complaints received and redressed during 2011-12 :
Opening Balance Received during the year Resolved during the year Closing Balance
- 16 13 3
Complaints/correspondence are usually dealt with within 10 days of receipt and are completely resolved, except in cases where
litigation is involved.
Share transfer lodgements are processed within 20 days and returned, except in cases where litigation is involved.
The following persons can also be contacted in case of investor grievances:
a. Ms. Mary Alles (email:[email protected]);
Phone: +91-080-22979789; Fax: +91-080-22979770
b. TSR Darashaw Ltd. (email: [email protected]);
Phone: +91-022-66568484; Fax: +91-022-66568494
COMPLIANCE REPORT ON CORPORATE GOVERNANCE (Contd.)

23
6. General Body Meetings
Particulars about the last three Annual General Meetings (AGM’s) of the Company are:
Sl.No AGM Particulars Date Venue Time
1 22nd AGM in respect of the year 2010-11 22nd July, 2011 Good Shepherd Auditorium 25, Museum
Road, opp. St. Joseph P.U College Bangalore
12.00 p.m.
2 21st AGM in respect of the year 2009-10 26th July, 2010 Dr. B.R Ambedkar Bhavan, Millers Road,
Vasanth Nagar, Bangalore
11.30 a.m.
3 20th AGM in respect of the year 2008-09 7th September, 2009 St. John’s Auditorium, Koramangala,
Bangalore
11.00 a.m.
No item of business, which required the members’ approval through postal ballot, was transacted during 2011-12.
As required under clause 49(G) (i) of the listing agreement, particulars of the Directors seeking appointment/reappointment are
given in the Annexure to the Notice.
7. Disclosures
• There are no materially signifi cant related party transactions during the year that have potential confl ict with the interests of
the Company at large;
• There has been no non-compliance or penalties, or strictures imposed on your Company by any of the Stock Exchanges or SEBI,
or any statutory authority on any matter related to capital markets during the last three years;
• Your Company has adopted a Whistle Blower Policy which is permanently posted on the Company’s intranet. All issues raised
under the Whistle Blower Policy are directly reported to the Chairman/Chairperson of the Company’s Audit Committee and no
personnel have been denied access to the Audit Committee.
• The Company has complied with all the mandatory requirements and most of the non-mandatory requirements specifi ed in
the revised Clause 49 of the Listing Agreement.
8. Means of Communication
• Your Company uses several modes for communicating with its external stakeholders, such as announcements and press
releases in newspapers, circular letters and other reports to the members, posting information on its Website (www.tataelxsi.
com), intimation to the Stock Exchanges, responding to analyst’s queries etc.
• Your Company’s quarterly results are disseminated through all the modes mentioned above. Financial Express (English daily)
and Sanjevani (vernacular daily) are usually the papers in which the quarterly results are published.
• Your Company’s Management Discussion & Analysis of the Business for the year ended 31st March, 2012 forms a part of this
Annual Report and is given under the Section so captioned.
9. General Shareholders Information
Sl.No Salient Items of Interest Particulars
i. AGM Date, Time, and Venue Tuesday, 24th July, 2012 at Devraj Urs Bhavan, (behind Dr. Ambedkar
Bhavan), 16D, Millers Tank Bed Area, Vasanthanagar, Bangalore 560052 at
12.30 p.m.
ii. Financial Calendar 7th May, 2012 – Q4 & FY12 Results
24th July, 2012 – Q1 Results & AGM
Oct, 2012 – Q2 Results
Jan, 2013 – Q3 Results
iii. Date of Book Closure 17th July, 2012 to 24th July, 2012 (both days inclusive)
iv. Dividend Payment Date On and after 25th July, 2012
COMPLIANCE REPORT ON CORPORATE GOVERNANCE (Contd.)

Twenty Third Annual Report 2011 - 12
24
v. Listing on Stock Exchanges Bombay Stock Exchange Limited
Phiroze Jeejeebhoy Towers, Dalal Street,
Mumbai-400 001, India
Tel. : +91-22-22721234
Fax : +91-22-22722041
The National Stock Exchange of India Limited
Exchange Plaza Plot No.C/1,
G Block Bandra-Kurla Complex Bandra (East) Mumbai–400 051, India
Tel. : +91-22-26598100
Fax : +91-22-26598237
The Delhi Stock Exchange Association Limited (Applied for Delisting)
DSE House, 3/1 ASAF Ali Road,
New Delhi-110 002, India
Tel. : +91-11-46470000
Fax: +91-11-46470053
vi. Stock Code Bombay Stock Exchange Ltd.: 500408
National Stock Exchange Ltd.: TATAELXSI
vii. Registrar & Share Transfer Agents TSR Darashaw Limited,
6-10, Haji Moosa Patrawala Ind. Estate, 20, Dr. E. Moses Road, Mahalaxmi,
Mumbai - 400 011
viii. Share Transfer System Shares lodged in physical form with the Company / its Registrars & Share
Transfer Agents are processed and returned, duly transferred within 20
days normally, except in cases where litigation is involved.
In respect of shares held in dematerialized mode, the transfer takes place
instantaneously between the transferor, transferee, and the Depository
Participant through electronic debit/credit of the accounts involved.
ix. Dematerialisation of shares and liquidity 2,93,83,933 shares were held in dematerialized mode, as at March 31, 2012.
The Company’s equity shares are actively traded on BSE and NSE.
x. Outstanding GDRs / ADRs / Warrants or
any convertible instruments, conversion
date and likely impact on equity
There are no outstanding instruments and hence there will be no dilution
of the equity.
xi. Plant Locations Your Company’s software development centers are located at the following
addresses:
a. ITPB Road, Whitefi eld, Bangalore – 560 048;
b. Brigade Tech Park, Block-B 134/1, 134/2, Pattandur Agrahara Village,
Whitefi eld Road, K.R. Puram, Bangalore – 560 066;
c. 171/2, Phase-2, Maruthi Industrial Estate, ITPB Road, Whitefi eld,
Bangalore – 560 066;
d. Neyyar, Plot No. 23-28, Technopark Campus, Kariyavattom,
Trivandrum – 695 581;
e. “Gayatri” Technopark,1st fl oor, Kariyavattom, Trivandrum – 695 581;
f. “Leela Infopark” 5th Floor, Plot No.2, Technopark Campus,
Trivandrum – 695 581;
g. Alpha – 1&2 Building, GIGA Space, IT Park, 198/1B, Viman Nagar,
Pune - 411 014;
h. Boston House, Suren Road, Andheri(East), Mumbai – 400 093;
i. 4th Floor, IITM Research Park, Kanagam Road, Taramani,
Chennai – 600 113;
xii. Address for correspondence ITPB Road, Whitefi eld, Bangalore – 560 048
COMPLIANCE REPORT ON CORPORATE GOVERNANCE (Contd.)

25
Market Price Data: High/Low during each month of 2011-12 on the following exchanges:
BSE NSE
Month High
`Low
`Vol (No. of
shares)
High
`Low
`Vol (No. of
shares)
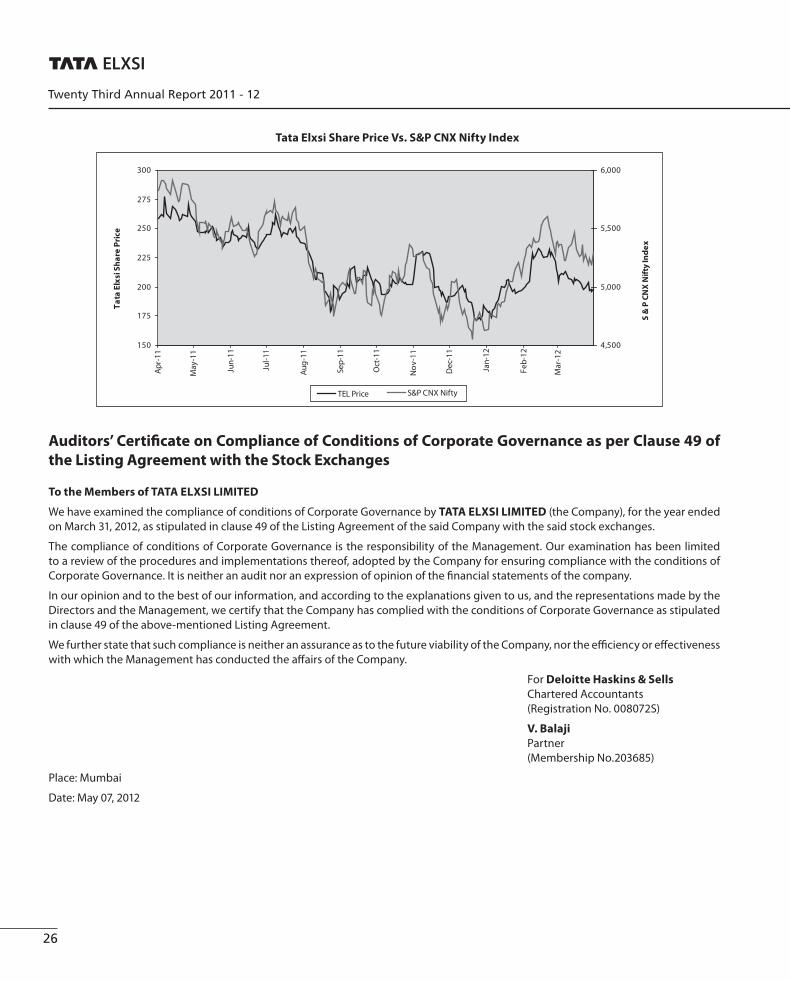
April 2011 281.35 254.60 17,43,417 281.35 251.10 38,75,570
May 2011 261.40 232.25 4,61,775 261.35 232.00 11,04,897
June 2011 257.20 229.10 4,01,422 256.50 229.05 12,26,554
July 2011 264.00 234.00 5,81,495 263.90 234.80 15,47,560
August 2011 239.60 171.80 3,65,454 239.75 169.95 8,59,122
September 2011 222.00 191.90 4,82,559 222.35 191.50 11,01,665
October 2011 230.60 191.00 6,70,839 231.00 191.00 14,08,575
November 2011 236.00 184.70 4,62,867 236.40 182.10 9,16,735
December 2011 208.40 167.10 2,63,832 208.90 165.10 6,37,967
January 2012 211.50 172.90 6,19,657 211.45 172.80 13,29,874
February 2012 238.75 199.55 9,78,912 238.90 198.50 19,88,870
March 2012 221.40 193.10 3,61,872 221.75 191.20 11,06,470
Distribution of Shareholding as on March 31, 2012
Range of Shares No. of Shareholders % of Shareholders No. of Shares held % of Shareholding
1 - 500 53,452 95.70 70,03,680 22.49
501 – 1000 1,640 2.92 13,23,586 4.25
1001- 2000 616 1.10 9,39,186 3.02
2001 – 3000 193 0.34 4,95,609 1.59
3001 – 4000 85 0.15 3,13,053 1.01
4001 – 5000 56 0.10 2,66,070 0.85
5001 – 10000 97 0.17 7,11,124 2.28
Over 10,000 87 0.15 2,00,85,912 64.51
Total 56,226 100.00 3,11,38,220 100.00
Categories of Shareholding as on March 31, 2012
Category No. of Shareholders No. of Shares held % of Shareholding
Individuals 54,798 1,36,46,707 43.83
NRI’s 490 1,71,840 0.55
Companies 735 19,29,443 6.20
Tata Group 4 1,40,47,632 45.11
Mutual Funds, FI’s, FII’s 12 11,72,582 3.76
Clearing Member/Clearing House 187 1,70,016 0.55
Total 56,226 3,11,38,220 100.00
COMPLIANCE REPORT ON CORPORATE GOVERNANCE (Contd.)
Twenty Third Annual Report 2011 - 12
26
Auditors’ Certifi cate on Compliance of Conditions of Corporate Governance as per Clause 49 of
the Listing Agreement with the Stock Exchanges
To the Members of TATA ELXSI LIMITED
We have examined the compliance of conditions of Corporate Governance by TATA ELXSI LIMITED (the Company), for the year ended
on March 31, 2012, as stipulated in clause 49 of the Listing Agreement of the said Company with the said stock exchanges.
The compliance of conditions of Corporate Governance is the responsibility of the Management. Our examination has been limited
to a review of the procedures and implementations thereof, adopted by the Company for ensuring compliance with the conditions of
Corporate Governance. It is neither an audit nor an expression of opinion of the fi nancial statements of the company.
In our opinion and to the best of our information, and according to the explanations given to us, and the representations made by the
Directors and the Management, we certify that the Company has complied with the conditions of Corporate Governance as stipulated
in clause 49 of the above-mentioned Listing Agreement.
We further state that such compliance is neither an assurance as to the future viability of the Company, nor the effi ciency or eff ectiveness
with which the Management has conducted the aff airs of the Company.
For Deloitte Haskins & Sells
Chartered Accountants
(Registration No. 008072S)
V. Balaji
Partner
(Membership No.203685)
Place: Mumbai
Date: May 07, 2012
Tata Elxsi Share Price Vs. S&P CNX Nifty Index
150
175
200
225
250
275
300
Ap
r-1
1
Ma
y-1
1
Jun
-11
Jul-
11
Au
g-1
1
Sep
-11
Oct
-11
No
v-1
1
De
c-1
1
Jan
-12
Fe
b-1
2
Ma
r-1
2
Ta
ta E
lxsi
Sh
are
Pri
ce
4,500
5,000
5,500
6,000
S &
P C
NX
Nif
ty In
de
x
TEL Price S&P CNX Nifty

27
MANAGEMENT DISCUSSION & ANALYSIS (MDA) STATEMENT FOR THE YEAR ENDED 31ST MARCH, 2012
1. Business Analysis
Your Company’s operations are broadly broken up into two business segments i.e. Software Development & Services and Systems
Integration & Support.
Software Development and Services:
This business segment registered an increase of 27% from ` 358.20 crores during FY11 to ` 454.25 crores in FY12. The profi t of this
segment registered an increase of 51% from ` 36.81 crores during FY11 to ` 55.69 crores in FY12. This was due to increased volume
growth and improved margins.
This business segment is broken up into three distinct business groups:
Embedded Product Design:
The Embedded Product Design division provides technology consulting, new product development, system integration and testing
services for leading product companies, service providers, and aspiring start-ups. This is backed by an in-depth understanding of
technology, a large multi-disciplinary product development team, and mature processes and systems.
It also creates and licenses intellectual property and software components, helping customers create product diff erentiation and
reduce development costs and time-to-market.
It off ers solutions across a diverse range of industries including broadcast, consumer electronics, convergence, medical devices,
transportation, and wireless communications.
To take advantage of the emerging embedded systems engineering market opportunity, your Company is focusing on building
vertical centric capabilities in segments with high growth potential. This is also expected to help drive large share of business from
key customers in these segments.
Your Company derives revenues from Japan for its embedded product design services, especially in the consumer electronics,
telecom and automotive electronics segments. Despite the compounding eff ects of Tsunami, fl oods in Thailand and weak overseas
recovery, your Company has managed to show moderate volume growth from Japan during the year and is working to continue the
same growth momentum in the next year.
A brief overview of the key industry segments addressed is detailed below:
Broadcast and Consumer Electronics:
Tata Elxsi provides turn-key product engineering services for the broadcast and consumer electronics markets. These include
“full-life cycle” embedded product design services including hardware, software, and enclosure design of various products in the
broadcast and consumer electronics industry. These “full-life cycle” services play continues to make your Company the preferred
service provider for leading broadcast and consumer electronics OEMs.
This division works with leading product companies developing digital television products, set-top boxes, e-book readers, tablets,
media players, digital still, and video cameras. Your Company works with leading product companies to successfully develop and
deploy these products in various geographies in compliance with diff erent standards and service provider requirements.
The broadcast digitization mandate within various countries creates increased demand for development and deployment of set-top
boxes. There is also increased adoption of mobile internet devices such as tablets and Over-the-top (OTT) content from the internet
on TV. This requires specifi c engineering and development for both OEMs and operators, and your Company is positioned well to
capitalize the continuing growth from these segments.
Your Company continues to engage with broadcast service providers across the world in the development of value-added
applications that enhance the consumer experience of their services, and helping them reduce development and testing costs
associated with service deployment.
Communications:
Tata Elxsi works with wire-line & wireless communications product companies for product engineering. Your Company is among the
leading third-party software IP providers for 3GPP LTE and Mobile WiMAX standards, for both commercial and special applications
such as public safety and defence.

Twenty Third Annual Report 2011 - 12
28
The telecom market is migrating to the latest technologies for broadband wireless access, especially for LTE (Long Term Evolution)
standards. While WiMax continues to be deployed in certain parts of the world, most operators are now adopting LTE as the preferred
standard for broadband wireless.
Your Company has continued to invest in developing software IPR for LTE during the year. This resulted in new customer wins and
licensing deals with telecom equipment vendors.
During the year, your Company saw its customers showcasing their LTE solutions, based on our IPR, in leading industry events such
as the Femto World Congress in London and Mobile World Congress in Barcelona. Your Company also demonstrated its IP and
solutions through direct participation in these leading industry events.
Transportation:
Your Company off ers electronics, software development, and full system services for automotive industry. Focus areas in automotive
electronics include Powertrain, Body Electronics, Safety, Driver Assistance, and In-vehicle Infotainment. Your Company also provides
software based on the AUTOSAR standards and the multimedia components for in-car entertainment. Our partnerships with GENIVI,
AUTOSAR, and Artop enable us to support customers in developing solutions for next-generation automotive electronics.
The industry is witnessing an increasing demand for more fuel-effi cient vehicles, convergence, and networked connectivity within
vehicles. Due to the demand for such increased functionality, there is an increasing relevance of embedded systems in vehicles and
your Company is well poised to take advantage of this addressable opportunity.
Due to regulatory pressure for stringent emission and safer transport from various governments across the world, the demand for
intelligent electronics is expected to increase substantially. Tata Elxsi is engaging with leading OEMs and systems suppliers in the
development of next-generation hybrid engine technologies, active, and passive safety systems in the vehicle.
Industrial Design:
The Industrial Design division helps customers develop winning brands and products by using design as a strategic tool for business
success. Its expertise extends across consumer insight, branding, product design, packaging design, transportation design, visual
design, design engineering, and manufacturing support.
An in-depth understanding of consumers and rapidly changing market dynamics, backed by a multi-disciplinary design team,
enables it to service a broad spectrum of industries. This includes automotive, communications, consumer products, healthcare,
and retail.
It has supported the launch of leading brands and products across the world. It has won several international awards and patents for
design and innovation.
During the year, the division has worked on some challenging projects that have enabled it to create a better business advantage
for its customers through design. It helped develop a low cost x-ray machine for emerging markets, for a leading healthcare player,
integrating key constraints posed by the product environment and cost. For one of the world’s leading consumer durables company,
it has worked on the complete development of a luxury promotional bus that was deployed to showcase the new range of products.
After successfully executing the signage system design for Bangalore Metro, the division has also executed the signage design for
one of India’s leading airports.
Visual Computing Labs
Visual Computing Labs is an award-winning digital production studio providing Animation, Visual Eff ects (VFX), and 3D stereoscopic
content for feature fi lms, episodic television and television, commercials. It hosts world-class studios in Los Angeles and India and
has a creative team that includes national and international award winning professionals.
It also off ers custom content development for visualization and product marketing, and is a leading provider of engineering and
animation services for mobile, online and console games.
VCL is seeing more traction overseas and your Company continues to execute projects for major Hollywood studios and smaller
independent fi lm producers. During the year, your Company executed key master service agreements with leading game developers
and publishers. During the year, VCL division was felicitated with two awards at the prestigious FICCI Frames BAF AWARDS – 2012.
VCL won the Best Animated Ad Film for Samsung Wave II Game TVC (TV Commercials) and the “Special Jury Award” in the VFX
in a Commercial category for Panasonic ‘Econavi’ AC TVC at FICCI BAF AWARDS 2012. VCL’s projects were also nominated at the
International Animation Awards 2011, Anifest India 2011, and CGTantra Community Awards 2011.
MANAGEMENT DISCUSSION & ANALYSIS (MDA) STATEMENT FOR THE YEAR ENDED 31ST MARCH, 2012 (contd.)

29
During the year, your Company entered into a Joint Venture Agreement with M/s A Squared Entertainment LLC, USA to create,
develop and distribute original brands targeted at children entertainment. The Joint Venture refl ects the company’s eff orts to
expand its business beyond its traditional work-for-hire model and enhance its participation across the value chain.
Systems Integration and Support
This business segment registered an increase of 46 % from ` 57.71 crores during FY11 to ` 84.45 crores in FY12. The profi t of this
segment registered an increase of 24 % from ` 6.77 crores during FY11 to ` 8.40 crores in FY12.
This segment comprises of the Systems Integration, Customer Support, and Professional Services Group businesses.
The Systems Integration division implements and integrates complete systems and solutions for High-Performance Computing,
CAD/CAM/CAE, Broadcast, Virtual Reality, Storage and Disaster Recovery. It addresses the broadcast, manufacturing, government,
defense, and education sectors, with an expert team of integration specialists and support engineers, located across a wide network
of offi ces. This is backed by strategic partnerships with best-in-class software and technology providers.
The Professional Services group off ers storage, network, and infrastructure management services for the Indian and overseas
markets.
During the year, the Professional Services group won a Pan-India support contract, from one of the world’s leading personal
computing companies, and expects to fully operationalize this over the next fi nancial year.
2. Internal Controls systems and their adequacy:
Your Company has put in place adequate internal control systems, commensurate to the size and scale of its operations. The Company
has ensured a two-level Audit System with in-house Internal Auditors conducting regular and periodic audits of specifi c processes
and controls, and a quarterly audit of internal controls in diff erent areas of operation by an external fi rm, Ernst & Young. Signifi cant
observations made by the in-house and external internal auditors are presented to the Audit Committee for their recommendations.
The status of the implementation of the observation and recommendations are also presented to the Audit Committee periodically.
The Company has implemented a new ERP package, which helps in the integrations of all functionalities of the Organisation,
streamlining of business process and also ensures that the integrity of data is protected.
3. Financial Analysis:
The following are relevant fi nancial performance details, on consolidated basis, with respect to the operational performance of the
Company:
Salient Consolidated Financial Data Expenditure Analysis Relating to Profi t & Loss Account Percentage to Income
2011-12 2010-11 Change over
previous year %
2011-12 2010-11
` crores ` crores % %
Sales and services 538.71 415.91 29.53 99.23 99.08
Other income 4.20 3.86 8.81 0.77 0.92
Total Revenues 542.91 419.77 29.34 100.00 100.00
Cost of sales 71.72 53.66 33.66 13.21 12.78
Personnel expenses 278.07 216.71 28.31 51.22 51.63
Financial expenses 2.33 1.88 23.94 0.43 0.45
Depreciation/ Amortisation 20.52 17.20 19.30 3.78 4.10
Other expenses 114.91 98.35 16.84 21.17 23.43
Total Expenditure 487.55 387.80 25.72 89.80 92.38
Profi t before tax for the year 55.36 31.97 73.16 10.20 7.62
Tax 16.65 (0.55) - 3.07 (0.13)
Profi t after tax for the year 38.71 32.52 19.03 7.13 7.75
Share of loss from associated Company 4.12 - - 0.76 -
Net profi t for the year 34.59 32.52 6.37 6.37 7.75
MANAGEMENT DISCUSSION & ANALYSIS (MDA) STATEMENT FOR THE YEAR ENDED 31ST MARCH, 2012 (contd.)
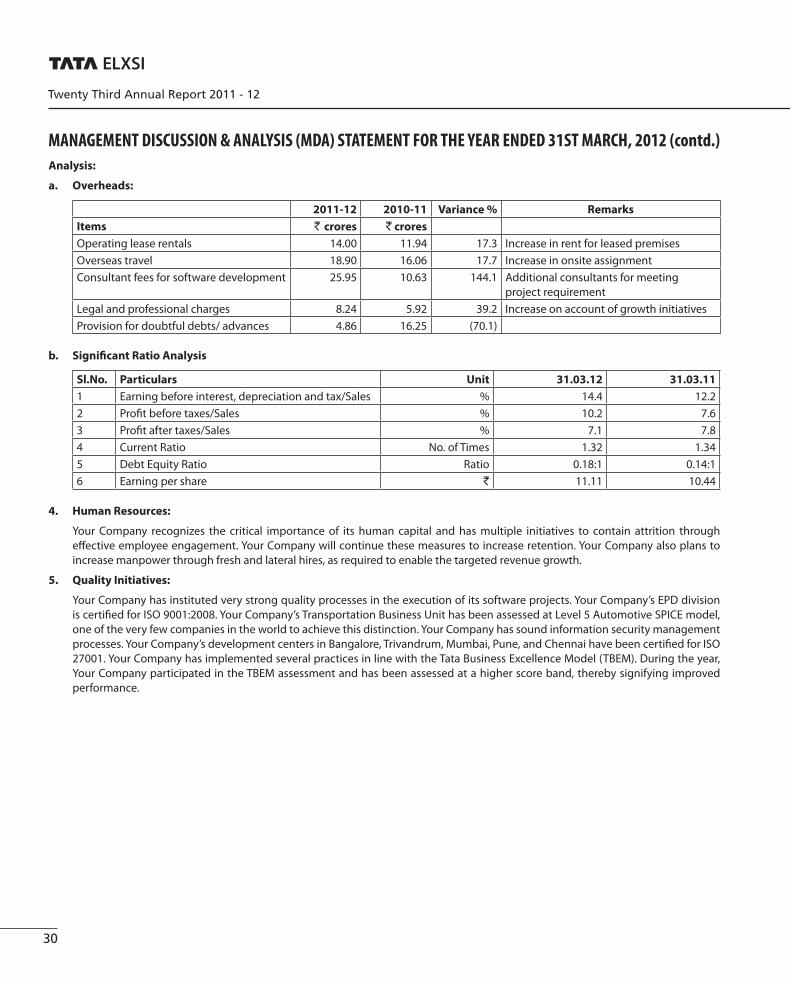
Twenty Third Annual Report 2011 - 12
30
Analysis:
a. Overheads:
2011-12 2010-11 Variance % Remarks
Items ` crores ` crores
Operating lease rentals 14.00 11.94 17.3 Increase in rent for leased premises
Overseas travel 18.90 16.06 17.7 Increase in onsite assignment
Consultant fees for software development 25.95 10.63 144.1 Additional consultants for meeting
project requirement
Legal and professional charges 8.24 5.92 39.2 Increase on account of growth initiatives
Provision for doubtful debts/ advances 4.86 16.25 (70.1)
b. Signifi cant Ratio Analysis
Sl.No. Particulars Unit 31.03.12 31.03.11
1 Earning before interest, depreciation and tax/Sales % 14.4 12.2
2 Profi t before taxes/Sales % 10.2 7.6
3 Profi t after taxes/Sales % 7.1 7.8
4 Current Ratio No. of Times 1.32 1.34
5 Debt Equity Ratio Ratio 0.18:1 0.14:1
6 Earning per share ` 11.11 10.44
4. Human Resources:
Your Company recognizes the critical importance of its human capital and has multiple initiatives to contain attrition through
eff ective employee engagement. Your Company will continue these measures to increase retention. Your Company also plans to
increase manpower through fresh and lateral hires, as required to enable the targeted revenue growth.
5. Quality Initiatives:
Your Company has instituted very strong quality processes in the execution of its software projects. Your Company’s EPD division
is certifi ed for ISO 9001:2008. Your Company’s Transportation Business Unit has been assessed at Level 5 Automotive SPICE model,
one of the very few companies in the world to achieve this distinction. Your Company has sound information security management
processes. Your Company’s development centers in Bangalore, Trivandrum, Mumbai, Pune, and Chennai have been certifi ed for ISO
27001. Your Company has implemented several practices in line with the Tata Business Excellence Model (TBEM). During the year,
Your Company participated in the TBEM assessment and has been assessed at a higher score band, thereby signifying improved
performance.
MANAGEMENT DISCUSSION & ANALYSIS (MDA) STATEMENT FOR THE YEAR ENDED 31ST MARCH, 2012 (contd.)

31
Auditors’ Report
TO THE MEMBERS OF TATA ELXSI LIMITED
1. We have audited the attached Balance Sheet of TATA ELXSI LIMITED (“the Company”) as at March 31, 2012, the Statement of Profi t
and Loss and the Cash Flow Statement of the Company for the year ended on that date, both annexed thereto. These fi nancial
statements are the responsibility of the Company’s Management. Our responsibility is to express an opinion on these fi nancial
statements based on our audit.
2. We conducted our audit in accordance with the auditing standards generally accepted in India. Those Standards require that we plan
and perform the audit to obtain reasonable assurance about whether the fi nancial statements are free of material misstatements.
An audit includes examining, on a test basis, evidence supporting the amounts and the disclosures in the fi nancial statements. An
audit also includes assessing the accounting principles used and the signifi cant estimates made by the Management, as well as
evaluating the overall fi nancial statement presentation. We believe that our audit provides a reasonable basis for our opinion.
3. As required by the Companies (Auditor’s Report) Order, 2003 (CARO) issued by the Central Government in terms of Section 227(4A)
of the Companies Act, 1956, we give in the Annexure a statement on the matters specifi ed in paragraphs 4 and 5 of the said Order.
4. Further to our comments in the Annexure referred to in paragraph 3 above, we report that:
(i) we have obtained all the information and explanations which to the best of our knowledge and belief were necessary for the
purposes of our audit;
(ii) in our opinion, proper books of account as required by law have been kept by the Company so far as it appears from our
examination of those books;
(iii) the Balance Sheet, the Statement of Profi t and Loss and the Cash Flow Statement dealt with by this report are in agreement
with the books of account;
(iv) in our opinion, the Balance Sheet, the Statement of Profi t and Loss and the Cash Flow Statement dealt with by this report are
in compliance with the Accounting Standards referred to in Section 211(3C) of the Companies Act, 1956;
(v) in our opinion and to the best of our information and according to the explanations given to us, the said accounts give the
information required by the Companies Act, 1956 in the manner so required and give a true and fair view in conformity with
the accounting principles generally accepted in India:
(a) in the case of the Balance Sheet, of the state of aff airs of the Company as at March 31, 2012;
(b) in the case of the Statement of Profi t and Loss, of the profi t of the Company for the year ended on that date; and
(c) in the case of the Cash Flow Statement, of the cash fl ows of the Company for the year ended on that date.
5. On the basis of the written representations received from the Directors as on March 31, 2012 taken on record by the Board of
Directors, we report that none of the Directors is disqualifi ed as on March 31, 2012 from being appointed as a director in terms of
Section 274(1)(g) of the Companies Act, 1956.
For DELOITTE HASKINS & SELLS
Chartered Accountants
(Firm Registration No. 008072S)
V. Balaji
Partner
(Membership No. 203685)
Place: Mumbai
Date: May 07, 2012

Twenty Third Annual Report 2011 - 12
32
(Referred to in paragraph 3 of our report of even date)
(i) Having regard to the nature of the Company’s business/activities/results, clauses iii (b) to (d), (f) & (g), v, vi, viii, xii, xiii, xiv, xvi, xix and
xx of CARO are not applicable.
(ii) In respect of its fi xed assets:
(a) The Company has maintained proper records showing full particulars, including quantitative details and situation of the fi xed
assets.
(b) The fi xed assets were physically verifi ed during the year by the Management in accordance with a regular programme of
verifi cation which, in our opinion, provides for physical verifi cation of all the fi xed assets at reasonable intervals. According to
the information and explanation given to us, no material discrepancies were noticed on such verifi cation.
(c) The fi xed assets disposed off during the year, in our opinion, do not constitute a substantial part of the fi xed assets of the
Company and such disposal has, in our opinion, not aff ected the going concern status of the Company.
(iii) In respect of its inventory:
(a) As explained to us, the inventories were physically verifi ed during the year by the Management at reasonable intervals.
(b) In our opinion and according to the information and explanation given to us, the procedures of physical verifi cation of
inventories followed by the Management were reasonable and adequate in relation to the size of the Company and the nature
of its business.
(c) In our opinion and according to the information and explanations given to us, the Company has maintained proper records of
its inventories and no material discrepancies were noticed on physical verifi cation.
(iv) The Company has neither granted nor taken any loans, secured or unsecured, to/from companies, fi rms or other parties listed in the
Register maintained under Section 301 of the Companies Act, 1956.
(v) In our opinion and according to the information and explanations given to us, having regard to the explanations that some of
the items purchased are of special nature and suitable alternative sources are not readily available for obtaining comparable
quotations, there is an adequate internal control system commensurate with the size of the Company and the nature of its business
with regard to purchase of inventory and fi xed assets and the sale of goods and services. During the course of our audit, we have
not observed any major weakness in such internal control system.
(vi) In our opinion, the Company has an adequate internal audit system commensurate with the size and the nature of its business.
(vii) According to the information and explanations given to us in respect of statutory dues:
(a) The Company has generally been regular in depositing undisputed dues, including Provident Fund, Investor Education and
Protection Fund, Employees’ State Insurance, Income-tax, Sales Tax, Wealth Tax, Service Tax, Custom Duty, Excise Duty, Cess
and other material statutory dues applicable to it with the appropriate authorities.
(b) There were no undisputed amounts payable in respect of Provident Fund, Investor Education and Protection Fund, Employees’
State Insurance, Income-tax, Sales Tax, Wealth Tax, Service Tax, Custom Duty, Excise Duty, Cess and other material statutory
dues in arrears as at March 31, 2012 for a period of more than six months from the date they became payable.
(c) Details of dues of Income-tax, Sales Tax, Wealth Tax, Service Tax, Custom Duty, Excise Duty and Cess which have not been
deposited as on March 31, 2012 on account of disputes are given below:
Statute Nature of
Dues
Forum where Dispute is
pending
Period to which the amount
relates
Amount involved
(Rs. in lakhs)
Sales Tax Act Sales Tax Commissioner of Sales Tax,
Appeals
Financial Year 2003-04 0.11
Wealth Tax Act Wealth Tax Commissioner of Wealth Tax,
Appeals
Financial Years 1993-94 to 1998-99 25.89
Income Tax Act Income Tax Commissioner of Income Tax,
Appeals
Financial year 2004-05 87.68
ANNEXURE TO THE AUDITORS’ REPORT

33
Statute Nature of
Dues
Forum where Dispute is
pending
Period to which the amount
relates
Amount involved
(Rs. in lakhs)
Income Tax Act Income Tax Commissioner of Income Tax,
Appeals
Financial Year 2005-06 5.40
Income Tax Act Income Tax Commissioner of Income Tax,
Appeals
Financial Year 2006-07 27.13
Income Tax Act Income Tax Deputy Commissioner of
Income Tax
Financial Year 2007-08 274.41
Income Tax Act Income Tax Deputy Commissioner of
Income Tax
Financial Year 2008-09 34.66
Income Tax Act Income Tax Deputy Commissioner of
Income Tax
Financial Year 2009-10 22.46
Income Tax Act Income Tax Deputy Commissioner of
Income Tax
Financial Year 2010-11 17.67
(viii) The Company does not have accumulated losses at the end of the fi nancial year and has not incurred cash loss during the fi nancial
year and the immediately preceding fi nancial year.
(ix) In our opinion and according to the information and explanations given to us, the Company has not defaulted in the repayment of
dues to banks and fi nancial institutions. The Company has not issued any debentures.
(x) In our opinion and according to the information and explanations given to us, the terms and conditions of the guarantees given by
the Company for loans taken by others from banks and fi nancial institutions are not prima facie prejudicial to the interests of the
Company.
(xi) In our opinion and according to the information and explanations given to us and on an overall examination of the Balance Sheet,
we report that funds raised on short-term basis have not been used during the year for long- term investment.
(xii) The Company has not made any preferential allotment of shares to parties and companies covered in the Register maintained
under section 301 of the Act.
(xiii) To the best of our knowledge and according to the information and explanations given to us, no fraud on or by the Company has
been noticed or reported during the year.
For DELOITTE HASKINS & SELLS
Chartered Accountants
(Firm Registration No. 008072S)
V. Balaji
Partner
(Membership No. 203685)
Place: Mumbai
Date: May 07, 2012

Twenty Third Annual Report 2011 - 12
34
Balance Sheet as at 31 March, 2012 Rs. lakhs
Note As at As at31 March, 2012 31 March, 2011
EQUITY AND LIABILITIES
Shareholders' funds
Share capital 3 3,113.82 3,113.82 Reserves and surplus 4 15,793.48 14,932.14
18,907.30 18,045.96 Non Current liabilities
Long-term provisions 5 688.74 686.35 Deferred tax liabilities (Net) 24.7 372.00 150.00
1,060.74 836.35 Current liabilities
Short-term borrowings 6 3,415.60 2,543.16 Trade payables 7 4,777.67 3,997.22 Other current liabilities 8 2,223.65 1,866.52 Short-term provisions 9 2,601.27 2,551.89
13,018.19 10,958.79 Total 32,986.23 29,841.10
ASSETS
Non current assets
Fixed assets 10 Tangible assets 7,672.32 7,271.11 Intangible assets 2,315.12 1,805.04 Capital work-in progress 105.97 419.61 Intangible assets under development 940.15 763.92
11,033.56 10,259.68 Non-current Investments 11 28.67 28.67 Long-term loans and advances 12 5,054.43 4,989.53
16,116.66 15,277.88 Current assets
Inventories 13 2.13 57.11 Trade receivables 14 12,354.11 10,414.63 Cash and cash equivalents 15 2,355.09 2,022.25 Short-term loans and advances 16 1,033.02 1,147.47 Other current assets 17 1,125.22 921.76
16,869.57 14,563.22 Total 32,986.23 29,841.10
Corporate information and signifi cant accounting policies 1 & 2See the accompanying notes forming part of the fi nancial statements
In terms of our report attached For and on behalf of the Board of Directors
For Deloitte Haskins & SellsChartered Accountants S. Ramadorai Chairman Shyamala Gopinath DirectorV. Balaji Madhukar Dev Managing DirectorPartner Sudha Madhavan Chief Financial Offi cer G. Vaidyanathan Company Secretary
Mumbai, May 07, 2012 Mumbai, May 07, 2012

35
In terms of our report attached For and on behalf of the Board of Directors
For Deloitte Haskins & SellsChartered Accountants S. Ramadorai Chairman Shyamala Gopinath DirectorV. Balaji Madhukar Dev Managing DirectorPartner Sudha Madhavan Chief Financial Offi cer G. Vaidyanathan Company Secretary
Mumbai, May 07, 2012 Mumbai, May 07, 2012
Statement of Profi t and Loss for the year ended 31 March, 2012Rs. lakhs
Note For the year ended
31 March, 2012
For the year ended
31 March, 2011
REVENUE
Revenue from operations 18 51,445.84 41,101.16
Other income 19 612.46 386.34
Total 52,058.30 41,487.50
EXPENSES
Purchases 20 5,010.58 5,026.32
Changes in inventories of stock-in-trade 20A 54.98 (50.87)
Employee benefi ts expenses 21 27,807.29 21,670.28
Finance costs 232.63 188.26
Depreciation/ amortisation expense 10 2,051.92 1,720.47
Other expenses 22 11,866.34 9,821.09
Total 47,023.74 38,375.55
Profi t before tax for the year 5,034.56 3,111.95
Tax Expense
i) Current tax (1,290.62) (1,096.00)
ii) MAT credit entitlement - 786.00
iii) Overseas tax of prior years (127.38) -
iv) Net current tax expense (1,418.00) (310.00)
v) Deferred tax (222.00) 371.50
Total (1,640.00) 61.50
Net Profi t for the year 3,394.56 3,173.45
Earnings per equity share of Rs.10/- each
Basic and diluted 10.90 10.19
Corporate information and signifi cant accounting policies 1 & 2
See the accompanying notes forming part of the fi nancial statements

Twenty Third Annual Report 2011 - 12
36
Cash Flow Statement for the year ended 31 March, 2012 Rs. lakhs
For the year ended For the year ended31 March, 2012 31 March, 2011
A. Cash fl ows from operating activitiesNet Profi t before tax 5,034.56 3,111.95 Adjustment for:
Depreciation and amortisation 2,051.92 1,720.47 Interest income (3.25) (33.41) Dividend received from subsidiary (191.96) - Finance costs 232.63 188.26 Provision for diminution in value of investment 411.75 - Provision for doubtful debts/advances 486.25 1,625.00 Liabilities / provisions no longer required, written back (25.44) (65.04) Loss/(Profi t) on sale of assets 33.14 1.22 Unrealised exchange loss/(gains) 162.71 67.88
Operating profi t before working capital changes 8,192.31 6,616.33 Changes in working capital:
Adjustments for (increase) / decrease in operating assets: Deposits as Margin Money or Security against commitments (7.20) - Inventories 54.98 (50.87) Trade receivables (2,223.49) (152.31) Short-term loans and advances 146.68 (13.29) Long-term loans and advances 1.74 (60.76) Other current assets (203.46) 152.44 Adjustments for increase / (decrease) in operating liabilities: Trade payables 667.48 1,239.78 Other current liabilities 308.88 539.77 Short-term provisions 49.44 (51.14) Long-term provisions 2.39 (19.83)
Cash generated from operations 6,989.75 8,200.12 Income tax paid (1,373.66) (1,027.10)
Net cash fl ow from / (used in) operating activities 5,616.09 7,173.02 B. Cash fl ows from investing activities
Purchase of fi xed assets/ capital advances (2,873.06) (2,908.40)Proceeds of sale of fi xed assets 54.85 7.44 Dividend received from subsidiary 191.96 - Share application money in A Squared Elxsi Entertainment LLC, USA (518.30) - Interest received 3.25 33.41 Net cash fl ow from / (used in) investing activities (3,141.30) (2,867.55)
C. Cash fl ows from fi nancing activitiesShort term borrowings availed/ (re-paid) (net) 443.46 (853.77)Interest paid (232.63) (188.26)Dividend paid (2,176.59) (2,164.71)Tax on dividend paid (353.60) (362.02)Net cash fl ow from / (used in) fi nancing activities (2,319.36) (3,568.76)Net increase/(decrease) in cash and cash equivalents 155.43 736.71 Cash and cash equivalents as at beginning of the year 2,022.25 1,343.02 Exchange gain/(loss) on restatement of foreign currency cash and cash equivalents 170.21 (57.48)Cash and cash equivalents as at end of the year 2,347.89 2,022.25
Reconciliation of cash and cash equivalents with the Balance Sheet:Cash and cash equivalents as per Balance Sheet (Refer Note 15) 2,355.09 2,022.25 Less: Bank balances not considered as Cash and cash equivalents
as defi ned in AS 3 Cash Flow Statements 7.20 - Cash and cash equivalents at the end of the year comprises: 2,347.89 2,022.25 (a) Cash on hand 1.05 0.90 (b) Cheques on hand 89.45 15.91 (c) Balances with banks
i) in current accounts 1,806.82 1,353.38 ii) in EEFC accounts 211.66 416.24 iii) in earmarked accounts-Unpaid dividend accounts 238.91 235.82
2,347.89 2,022.25
Corporate information and signifi cant accounting policiesSee the accompanying notes forming part of the fi nancial statements 1&2
In terms of our report attached For and on behalf of the Board of Directors
For Deloitte Haskins & SellsChartered Accountants S. Ramadorai Chairman Shyamala Gopinath DirectorV. Balaji Madhukar Dev Managing DirectorPartner Sudha Madhavan Chief Financial Offi cer G. Vaidyanathan Company Secretary
Mumbai, May 07, 2012 Mumbai, May 07, 2012
37
Notes forming part of the fi nancial statements1 Corporate information
Tata Elxsi Limited was incorporated in 1989. The Company provides product design and engineering services to the consumer
electronics, communications & transportation industries and systems integration and support services for enterprise customers. It
also provides digital content creation for media and entertainment industry.
The company is headquartered in Bangalore, and operates through delivery centers in Bangalore, Chennai, Coimbatore, Pune,
Mumbai and Tiruvananthapuram.
Its sales operations are located in multiple cities in India, and in multiple international locations including Dubai, France, Germany,
Japan, UK and USA.
2 Signifi cant Accounting Policies
2.1 Basis of accounting and preparation of fi nancial statements
The fi nancial statements of the Company have been prepared in accordance with the Generally Accepted Accounting Principles in
India (Indian GAAP) to comply with the Accounting Standards notifi ed under the Companies (Accounting Standards) Rules, 2006 (as
amended) and the relevant provisions of the Companies Act, 1956. The fi nancial statements have been prepared on accrual basis
under the historical cost convention . The accounting policies adopted in the preparation of the fi nancial statements are consistent
with those followed in the previous year.
2.2 Use of estimates
The preparation of the fi nancial statements in conformity with Indian GAAP requires the Management to make estimates and
assumptions considered in the reported amounts of assets and liabilities (including contingent liabilities) and the reported income
and expenses during the year. The Management believes that the estimates used in preparation of the fi nancial statements are
prudent and reasonable. Future results could diff er due to these estimates and the diff erences between the actual results and the
estimates are recognised in the periods in which the results are known / materialised.
2.3 Inventories
Components and spares are valued at lower of cost and net realizable value. Cost is determined on the basis of specifi c identifi cation
method.
Computer systems and software, components and spares intended for customer support are written off over the eff ective life of the
systems maintained, as estimated by Management.
2.4 Cash and cash equivalents (for purposes of Cash Flow Statement)
Cash comprises cash on hand and demand deposits with banks. Cash equivalents are short-term balances (with an original maturity
of three months or less from the date of acquisition), highly liquid investments that are readily convertible into known amounts of
cash and which are subject to insignifi cant risk of changes in value.
2.5 Cash fl ow statement
Cash fl ows are reported using the indirect method, whereby profi t / (loss) before extraordinary items and tax is adjusted for the
eff ects of transactions of non-cash nature and any deferrals or accruals of past or future cash receipts or payments. The cash fl ows
from operating, investing and fi nancing activities of the Company are segregated based on the available information.
2.6 Depreciation and amortisation
Depreciation has been provided on the straight-line method as per the rates prescribed in Schedule XIV to the Companies Act, 1956
except in respect of the following categories of assets, in whose case the life of the assets has been assessed as under:
Leasehold land is amortised over the duration of the lease
Assets costing less than Rs.5,000 each are fully depreciated in the year of capitalisation
Intangible assets are amortised over their estimated useful life as follows:
In-house Technical Know-How – 3 years.
The estimated useful life of the intangible assets and the amortisation period are reviewed at the end of each fi nancial year and the
amortisation method is revised to refl ect the changed pattern.

Twenty Third Annual Report 2011 - 12
38
2.7 Revenue recognition
Sale of goods
Income from sales of goods is recognised upon passage of risks and rewards of ownership to the goods, which generally coincide
with the despatch. Sales exclude taxes and levies.
Income from services
a) Income from services is recognized upon rendering of the services. Income from maintenance contracts relating to the year is
recognized when the contracts are entered into on a time proportionate basis.The income excludes taxes and levies.
b) Revenue from software development on fi xed price, fi xed time frame contracts is recognised as per the proportionate
completion method. On time and materials contracts, revenue is recognised as the related services are rendered.
c) In respect of orders procured, for which sales are eff ected directly to the customers by the vendors, the Company accounts only
for the commission, installation and other charges to which it is entitled.
2.8 Other income
Interest income is accounted on accrual basis. Dividend income is accounted for when the right to receive it is established.
2.9 Tangible fi xed assets
Fixed assets are carried at cost less accumulated depreciation and impairment losses, if any. The cost of fi xed assets includes interest
on borrowings attributable to acquisition of qualifying fi xed assets up to the date the asset is ready for its intended use and other
incidental expenses incurred up to that date. Subsequent expenditure relating to fi xed assets is capitalised only if such expenditure
results in an increase in the future benefi ts from such asset beyond its previously assessed standard of performance.
Fixed assets retired from active use and held for sale are stated at the lower of their net book value and net realisable value and are
disclosed separately in the Balance Sheet.
Capital work-in-progress:
Projects under which assets are not ready for their intended use and other capital work-in-progress are carried at cost, comprising
direct cost, related incidental expenses and attributable interest.
2.10 Intangible Assets.
Intangible assets are carried at cost less accumulated amortisation and impairment losses, if any. The cost of an intangible asset
comprises its purchase price, including any import duties and other taxes (other than those subsequently recoverable from the
taxing authorities), and any directly attributable expenditure on making the asset ready for its intended use and net of any trade
discounts and rebates. Subsequent expenditure on an intangible asset after its purchase / completion is recognised as an expense
when incurred unless it is probable that such expenditure will enable the asset to generate future economic benefi ts in excess of its
originally assessed standards of performance and such expenditure can be measured and attributed to the asset reliably, in which
case such expenditure is added to the cost of the asset.
Refer note 2.18 for accounting for research and development expenses.
2.11 Foreign currency transactions and translations
Initial recognition
Transactions in foreign currencies entered into by the Company and its integral foreign operations are accounted at the exchange
rates prevailing on the date of the transaction or at rates that closely approximate the rate at the date of the transaction.
Measurement of foreign currency monetary items at the Balance Sheet date
Foreign currency monetary items (other than derivative contracts) of the Company and its net investment in non-integral foreign
operations outstanding at the Balance Sheet date are restated at the year-end rates.
In the case of integral operations, assets and liabilities (other than non-monetary items), are translated at the exchange rate prevailing
on the Balance Sheet date. Non-monetary items are carried at historical cost. Revenue and expenses are translated at the average
exchange rates prevailing during the year. Exchange diff erences arising out of these translations are charged to the Statement of
Profi t and Loss.
Notes forming part of the fi nancial statements

39
Notes forming part of the fi nancial statements
Accounting of forward contracts
Premium / discount on forward exchange contracts, which are not intended for trading or speculation purposes, are
amortised over the period of the contracts if such contracts relate to monetary items as at the Balance Sheet date.
Refer Note 2.22 for accounting for forward exchange contracts relating to fi rm commitments and highly probable forecast
transactions.
2.12 Investments
Long-term investments (excluding investment properties), are carried individually at cost less provision for diminution, other than
temporary, in the value of such investments. Current investments are carried individually, at the lower of cost and fair value. Cost of
investments include acquisition charges such as brokerage, fees and duties.
2.13 Employee benefi ts
Employee benefi ts include contribution to provident fund, superannuation fund, gratuity fund and compensated absences.
Defi ned contribution plans
The Company’s contribution to provident fund and superannuation fund are considered as defi ned contribution plans and are
charged as an expense as they fall due based on the amount of contribution required to be made.
Defi ned benefi t plans
For defi ned benefi t plans in the form of gratuity fund, the cost of providing benefi ts is determined using the Projected Unit Credit
method, with actuarial valuations being carried out at each Balance Sheet date. Actuarial gains and losses are recognised in the
Statement of Profi t and Loss in the period in which they occur. Past service cost is recognised immediately to the extent that the
benefi ts are already vested and otherwise is amortised on a straight-line basis over the average period until the benefi ts become
vested. The retirement benefi t obligation recognised in the Balance Sheet represents the present value of the defi ned benefi t
obligation as adjusted for unrecognised past service cost, as reduced by the fair value of scheme assets. Any asset resulting from this
calculation is limited to past service cost, plus the present value of available refunds and reductions in future contributions to the
schemes.
Short-term employee benefi ts
The undiscounted amount of short-term employee benefi ts expected to be paid in exchange for the services rendered by
employees are recognised during the year when the employees render the service. These benefi ts include performance incentive
and compensated absences which are expected to occur within twelve months after the end of the period in which the employee
renders the related service. The cost of such compensated absences is accounted as under :
(a) in case of accumulated compensated absences, when employees render the services that increase their entitlement of future
compensated absences; and
(b) in case of non-accumulating compensated absences, when the absences occur.
Long-term employee benefi ts
Compensated absences which are not expected to occur within twelve months after the end of the period in which the employee
renders the related service are recognised as a liability at the present value of the defi ned benefi t obligation as at the Balance Sheet
date less the fair value of the plan assets out of which the obligations are expected to be settled.
2.14 Segment reporting
The Company identifi es primary segments based on the dominant source, nature of risks and returns and the internal organisation
and management structure. The operating segments are the segments for which separate fi nancial information is available and for
which operating profi t/loss amounts are evaluated regularly by the executive Management in deciding how to allocate resources
and in assessing performance.
The accounting policies adopted for segment reporting are in line with the accounting policies of the Company. Segment revenue,
segment expenses, segment assets and segment liabilities have been identifi ed to segments on the basis of their relationship to the
operating activities of the segment.

Twenty Third Annual Report 2011 - 12
40
Notes forming part of the fi nancial statements
Inter-segment revenue is accounted on the basis of transactions which are primarily determined based on market / fair value factors.
Revenue, expenses, assets and liabilities which relate to the Company as a whole and are not allocable to segments on reasonable
basis have been included under “unallocated revenue / expenses / assets / liabilities”.
2.15 Leases
Assets leased by the Company in its capacity as lessee where substantially all the risks and rewards of ownership vest in the Company
are classifi ed as fi nance leases. Such leases are capitalised at the inception of the lease at the lower of the fair value and the present
value of the minimum lease payments and a liability is created for an equivalent amount. Each lease rental paid is allocated between
the liability and the interest cost so as to obtain a constant periodic rate of interest on the outstanding liability for each year.
Lease arrangements where the risks and rewards incidental to ownership of an asset substantially vest with the lessor are recognised
as operating leases. Lease rentals under operating leases are recognised in the Statement of Profi t and Loss on a straight-line basis.
2.16 Earnings per share
Basic earnings per share is computed by dividing the profi t / (loss) after tax (including the post - tax eff ect of extraordinary items,
if any) by the weighted average number of equity shares outstanding during the year. Diluted earnings per share is computed by
dividing the profi t / (loss) after tax (including the post tax eff ect of extraordinary items, if any) as adjusted for dividend, interest and
other charges to expense or income relating to the dilutive potential equity shares, by the weighted average number of equity
shares considered for deriving basic earnings per share and the weighted average number of equity shares which could have
been issued on the conversion of all dilutive potential equity shares. Potential equity shares are deemed to be dilutive only if their
conversion to equity shares would decrease the net profi t per share from continuing ordinary operations. Potential dilutive equity
shares are deemed to be converted as at the beginning of the period, unless they have been issued at a later date. The dilutive
potential equity shares are adjusted for the proceeds receivable had the shares been actually issued at fair value (i.e. average market
value of the outstanding shares). Dilutive potential equity shares are determined independently for each period presented. The
number of equity shares and potentially dilutive equity shares are adjusted for share splits / reverse share splits and bonus shares,
as appropriate.
2.17 Taxes on income
Current tax is the amount of tax payable on the taxable income for the year as determined in accordance with the provisions of the
Income Tax Act, 1961 and Foreign Tax laws.
Minimum Alternate Tax (MAT) paid in accordance with the tax laws, which gives future economic benefi ts in the form of adjustment
to future income tax liability, is considered as an asset if there is convincing evidence that the Company will pay normal income tax.
Accordingly, MAT is recognised as an asset in the Balance Sheet when it is probable that future economic benefi t associated with it
will fl ow to the Company.
Deferred tax is recognised on timing diff erences, being the diff erences between the taxable income and the accounting income
that originate in one period and are capable of reversal in one or more subsequent periods. Deferred tax is measured using the tax
rates and the tax laws enacted or substantively enacted as at the reporting date. Deferred tax liabilities are recognised for all timing
diff erences. Deferred tax assets in respect of unabsorbed depreciation and carry forward of losses are recognised only if there is
virtual certainty that there will be suffi cient future taxable income available to realise such assets. Deferred tax assets are recognised
for timing diff erences of other items only to the extent that reasonable certainty exists that suffi cient future taxable income will be
available against which these can be realised. Deferred tax assets and liabilities are off set if such items relate to taxes on income
levied by the same governing tax laws and the Company has a legally enforceable right for such set off . Deferred tax assets are
reviewed at each Balance Sheet date for their realisability.
Current and deferred tax relating to items in equity are recognised in equity and not in the Statement of Profi t and Loss.
2.18 Research and development expenses
Revenue expenditure pertaining to research is charged to the Statement of Profi t and Loss. Development costs of products are
also charged to the Statement of Profi t and Loss unless a product’s technological feasibility has been established, in which case
such expenditure is capitalised. The amount capitalised comprises expenditure that can be directly attributed or allocated on a
reasonable and consistent basis to creating, producing and making the asset ready for its intended use. Fixed assets utilised for
research and development are capitalised and depreciated in accordance with the policies stated for Tangible Fixed Assets and
41
Notes forming part of the fi nancial statements
Intangible Assets.
2.19 Impairment of assets
The carrying values of assets / cash generating units at each Balance Sheet date are reviewed for impairment. If any indication of
impairment exists, the recoverable amount of such assets is estimated and impairment is recognised, if the carrying amount of these
assets exceeds their recoverable amount. The recoverable amount is the greater of the net selling price and their value in use. Value
in use is arrived at by discounting the future cash fl ows to their present value based on an appropriate discount factor. When there
is indication that an impairment loss recognised for an asset in earlier accounting periods no longer exists or may have decreased,
such reversal of impairment loss is recognised in the Statement of Profi t and Loss, except in case of revalued assets.
2.20 Provisions and contingencies
A provision is recognised when the Company has a present obligation as a result of past events and it is probable that an outfl ow
of resources will be required to settle the obligation in respect of which a reliable estimate can be made. Provisions (excluding
retirement benefi ts) are not discounted to their present value and are determined based on the best estimate required to settle
the obligation at the Balance Sheet date. These are reviewed at each Balance Sheet date and adjusted to refl ect the current best
estimates. Contingent liabilities are disclosed in the Notes.
2.21 Provision for warranty
As per the terms of the contracts, the Company provides post-contract services / warranty support to some of its customers.
The Company accounts for the post-contract support / provision for warranty on the basis of the information available with the
Management duly taking into account the current and past technical estimates.
2.22 Derivative contracts
The Company enters into derivative contracts in the nature of foreign currency options, forward contracts with an intention to
hedge its existing assets and liabilities, fi rm commitments and highly probable transactions. Derivative contracts which are closely
linked to the existing assets and liabilities are accounted as per the policy stated for Foreign Currency Transactions and Translations.
All other derivative contracts are marked-to-market and losses are recognised in the Statement of Profi t and Loss. Gains arising on
the same are not recognised, until realised, on grounds of prudence.
2.23 Insurance claims / Claims with ECGC
Insurance claims and claims with ECGC are accounted for on the basis of claims admitted / expected to be admitted and to the
extent that there is no uncertainty in receiving the claims.

Twenty Third Annual Report 2011 - 12
42
Notes forming part of the fi nancial statements Rs. lakhs
As at As at31 March, 2012 31 March, 2011
3 SHARE CAPITAL
Authorised :35,000,000 equity shares of Rs. 10/- each with voting rights 3,500.00 3,500.00 Issued :
31,165,620 equity shares of Rs. 10/- each with voting rights 3,116.56 3,116.56 Subscribed and fully paid up :
31,138,220 equity shares of Rs.10/-each, with voting rights 3,113.82 3,113.82 Total 3,113.82 3,113.82
Reconciliation of the number of shares and amount outstanding at the beginning and at the end of the reporting period:
Equity shares with voting rights Opening Balance Closing Balance
Year ended 31 March, 2012
- Number of shares 31,138,220 31,138,220
- Amount in Rs. Lakhs 3,113.82 3,113.82
Year ended 31 March, 2011
- Number of shares 31,138,220 31,138,220
- Amount in Rs. Lakhs 3,113.82 3,113.82
Details of shares held by each shareholder holding more than 5% shares:
As at 31 March, 2012 As at 31 March, 2011
Class of shares / Name of share holder Number of
shares held
% of holding
in that class of
shares
Number of
shares held
% of holding
in that class of
shares
Equity shares with voting rights
Tata Sons Limited 13,147,632 42.22% 13,147,632 42.22%
Life Insurance Corporation of India 2,023,599 6.50% 2,193,990 7.05%
The Company has only one class of Equity Share, having a par value of Rs.10/-. Each holder of equity share is entitled to one vote per
share. In the event of liquidation of the Company, the holders of the equity shares will be entitled to receive any of the remaining assets
of the company, after distribution of all preferential amounts. However, as on date no such preferential amounts exists. The distribution
will be in proportion to number of equity shares held by the shareholders.
4 RESERVES AND SURPLUS
Capital reserve: Subsidy received from Kerala State Government 25.00 25.00 General reserve: Opening balance 4,159.82 3,659.82 Add: Transferred from surplus in Statement of Profi t and Loss 500.00 500.00
4,659.82 4,159.82 Surplus in Statement of Profi t and Loss Opening balance 10,747.32 10,598.73 Add: Net Profi t for the year 3,394.56 3,173.45 Balance available for appropriation 14,141.88 13,772.18 Less: - Dividend proposed to be distributed to Equity Shareholders (Rs. 7/-
per share) (previous year: Rs. 7/- per share)
2,179.68 2,179.68
- Dividend tax net of reversal thereof 353.54 345.18 - Transfer to general reserve 500.00 500.00 Closing balance 11,108.66 10,747.32 Total 15,793.48 14,932.14
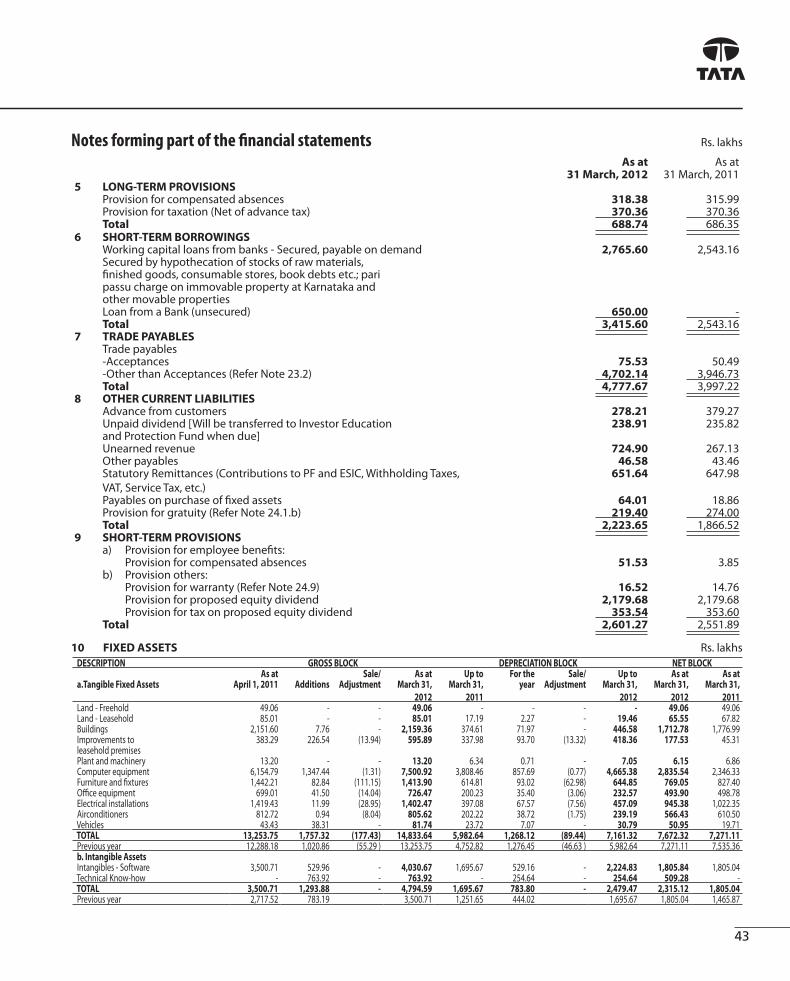
43
10 FIXED ASSETS Rs. lakhs
DESCRIPTION GROSS BLOCK DEPRECIATION BLOCK NET BLOCK As at Sale/ As at Up to For the Sale/ Up to As at As at
a.Tangible Fixed Assets April 1, 2011 Additions Adjustment March 31,
2012
March 31,
2011
year Adjustment March 31,
2012
March 31,
2012
March 31,
2011 Land - Freehold 49.06 - - 49.06 - - - - 49.06 49.06 Land - Leasehold 85.01 - - 85.01 17.19 2.27 - 19.46 65.55 67.82 Buildings 2,151.60 7.76 - 2,159.36 374.61 71.97 - 446.58 1,712.78 1,776.99 Improvements to 383.29 226.54 (13.94) 595.89 337.98 93.70 (13.32) 418.36 177.53 45.31 leasehold premises Plant and machinery 13.20 - - 13.20 6.34 0.71 - 7.05 6.15 6.86 Computer equipment 6,154.79 1,347.44 (1.31) 7,500.92 3,808.46 857.69 (0.77) 4,665.38 2,835.54 2,346.33 Furniture and fi xtures 1,442.21 82.84 (111.15) 1,413.90 614.81 93.02 (62.98) 644.85 769.05 827.40 Offi ce equipment 699.01 41.50 (14.04) 726.47 200.23 35.40 (3.06) 232.57 493.90 498.78 Electrical installations 1,419.43 11.99 (28.95) 1,402.47 397.08 67.57 (7.56) 457.09 945.38 1,022.35 Airconditioners 812.72 0.94 (8.04) 805.62 202.22 38.72 (1.75) 239.19 566.43 610.50 Vehicles 43.43 38.31 - 81.74 23.72 7.07 - 30.79 50.95 19.71 TOTAL 13,253.75 1,757.32 (177.43) 14,833.64 5,982.64 1,268.12 (89.44) 7,161.32 7,672.32 7,271.11 Previous year 12,288.18 1,020.86 (55.29 ) 13,253.75 4,752.82 1,276.45 (46.63 ) 5,982.64 7,271.11 7,535.36 b. Intangible Assets Intangibles - Software 3,500.71 529.96 - 4,030.67 1,695.67 529.16 - 2,224.83 1,805.84 1,805.04 Technical Know-how - 763.92 - 763.92 - 254.64 - 254.64 509.28 - TOTAL 3,500.71 1,293.88 - 4,794.59 1,695.67 783.80 - 2,479.47 2,315.12 1,805.04 Previous year 2,717.52 783.19 3,500.71 1,251.65 444.02 1,695.67 1,805.04 1,465.87
As at As at31 March, 2012 31 March, 2011
5 LONG-TERM PROVISIONSProvision for compensated absences 318.38 315.99 Provision for taxation (Net of advance tax) 370.36 370.36 Total 688.74 686.35
6 SHORT-TERM BORROWINGSWorking capital loans from banks - Secured, payable on demand 2,765.60 2,543.16 Secured by hypothecation of stocks of raw materials, fi nished goods, consumable stores, book debts etc.; paripassu charge on immovable property at Karnataka and other movable propertiesLoan from a Bank (unsecured) 650.00 - Total 3,415.60 2,543.16
7 TRADE PAYABLESTrade payables-Acceptances 75.53 50.49 -Other than Acceptances (Refer Note 23.2) 4,702.14 3,946.73 Total 4,777.67 3,997.22
8 OTHER CURRENT LIABILITIESAdvance from customers 278.21 379.27 Unpaid dividend [Will be transferred to Investor Education 238.91 235.82 and Protection Fund when due]Unearned revenue 724.90 267.13 Other payables 46.58 43.46 Statutory Remittances (Contributions to PF and ESIC, Withholding Taxes,
VAT, Service Tax, etc.)
651.64 647.98
Payables on purchase of fi xed assets 64.01 18.86 Provision for gratuity (Refer Note 24.1.b) 219.40 274.00 Total 2,223.65 1,866.52
9 SHORT-TERM PROVISIONSa) Provision for employee benefi ts:
Provision for compensated absences 51.53 3.85 b) Provision others:
Provision for warranty (Refer Note 24.9) 16.52 14.76 Provision for proposed equity dividend 2,179.68 2,179.68 Provision for tax on proposed equity dividend 353.54 353.60
Total 2,601.27 2,551.89
Notes forming part of the fi nancial statements Rs. lakhs

Twenty Third Annual Report 2011 - 12
44
Notes forming part of the fi nancial statementsRs. lakhs
As at As at 31 March, 2012 31 March, 2011
11 NON-CURRENT INVESTMENTSLong Term, Trade - Investment (at cost) in 100,000 fully paid equity shares (Unquoted) of Tata Elxsi (Singapore) Pte Ltd - a wholly owned subsidiary 28.67 28.67 Total 28.67 28.67
12 LONG-TERM LOANS AND ADVANCES(Unsecured, considered good)Capital Advances 4.43 - Deposits 1,268.65 1,270.39 Tax deducted at source/Advance tax paid (Net of
provision for tax )
1,494.05 1,112.39
MAT credit entitlement Opening balance 2,606.75 1,820.75 Availed / (Utilized) during the year (426.00) 2,180.75 786.00 2,606.75 Share Application money in A Squared Elxsi
Entertainment LLC, USA (Refer Note 24.4.c ) 518.30 Less: Provision for diminution in value 411.75 106.55 - Total 5,054.43 4,989.53
13 INVENTORIES (lower of cost or net realisable value) Components and spares - for trading 2.13 57.11 Total 2.13 57.11
14 TRADE RECEIVABLES (UNSECURED) a) Trade receivables outstanding for a period
exceeding six months from the date they were
due for payment Considered good 308.35 1,825.74 Considered doubtful 1,787.93 2,501.70
2,096.28 4,327.44 Less: Provision for doubtful trade receivables 1,787.93 2,501.70
308.35 1,825.74 b) Other Trade Receivables (Considered good) 12,045.76 8,588.89Total 12,354.11 10,414.63
15 CASH AND CASH EQUIVALENTS
Cash on hand 1.05 0.90
Cheques on hand 89.45 15.91
Balances with banks
i) in current accounts 1,806.82 1,353.38
ii) in EEFC accounts 211.66 416.24
iii) in earmarked accounts
- Unpaid dividend accounts 238.91 235.82
- Balances held as margin money or security against
commitments 7.20 -
2,264.59 2,005.44
Total 2,355.09 2,022.25
Of the above, the balances that meet the defi nition
of Cash and cash equivalents as per AS 3 Cash Flow
Statements is
2,347.89 2,022.25

45
Notes forming part of the fi nancial statementsRs. lakhs
As at As at
31 March, 2012 31 March, 2011
16 SHORT-TERM LOANS AND ADVANCES
(Unsecured and considered good)
a) Loans and advances to employees 142.95 185.23
b) Prepaid Expenses 255.72 204.32
c) Claims Receivable 329.12 140.80
d) Advance to suppliers 293.61 609.01
e) Deposits 11.62 8.11
Total 1,033.02 1,147.47
17 OTHER CURRENT ASSETS
Unbilled revenue 1,125.22 921.76
Total 1,125.22 921.76
For the year
ended
31 March, 2012
For the year
ended
31 March, 201118 REVENUE FROM OPERATIONS
Sale of traded goods (Refer note (i) below) 2,880.67 2,820.63 Rendering of services (Refer note (ii) below) 48,565.17 38,280.53 Total 51,445.84 41,101.16 (i) Sale of traded goods include sales of computers, networking and storage systems.(ii) Rendering of services comprises: (a) Product Design 42,269.11 33,813.68 (b) Graphics Animation and Gaming 3,156.37 2,006.17 (c) System Integration and Support 3,139.69 2,460.68
48,565.17 38,280.53 19 OTHER INCOME
Interest from:- Banks 3.25 29.97 - Others - 3.44
Dividend income from long term investment - Subsidiary 191.96 - Net gain on foreign currency transactions and translation 380.87 281.57 Miscellaneous income 36.38 71.36 Total 612.46 386.34
20 PURCHASES Purchase of traded goods 2,252.13 2,259.22 Spares, consumables and others 2,758.45 2,767.10 Total 5,010.58 5,026.32
20A CHANGES IN INVENTORIES OF STOCK-IN-TRADEInventories at the end of the year:Stock-in-trade 2.13 57.11 Inventories at the beginning of the year:Stock-in-trade 57.11 6.24 Net (increase) / decrease 54.98 (50.87)
21 EMPLOYEE BENEFITS EXPENSESalaries 26,208.88 20,404.06 Contribution to provident and other funds 809.62 671.79 Staff welfare expenses 788.79 594.43 Total 27,807.29 21,670.28

Twenty Third Annual Report 2011 - 12
46
Notes forming part of the fi nancial statementsRs. lakhs
For the year
ended
31 March, 2012
For the year
ended
31 March, 2011
22 OTHER EXPENSES
Operating lease rentals (Refer Note 24.5) 1,399.87 1193.81
Rates and taxes 102.07 105.82
Power and fuel 737.39 642.14
Repairs and maintenance : Building 159.50 22.19
: Plant and machinery 265.47 262.16
: Others 234.64 199.20
Telephone, datalink, courier and postage 659.14 554.50
Inland travel and conveyance 719.99 703.86
Overseas travel 1,890.04 1,605.80
Advertisement and sales promotion expenses 310.20 302.23
Commission on sales 73.38 59.74
Hire charges 65.62 86.68
Printing and stationery 86.04 99.48
Motor vehicle expenses 292.08 172.80
Recruitment 106.01 66.50
Training 161.22 128.29
Consultant fees for software development 2,595.17 1,062.68
Legal and professional charges 824.87 591.50
Secretarial charges 5.85 10.60
Insurance 100.56 114.96
Loss on sale of assets (net) 33.14 1.22
Bank and other charges 47.00 42.77
Commission to non-executive directors 50.00 30.00
Auditors’ remuneration (Refer Note (i) below) 35.25 21.82
Bad debts/advances written off 1,200.02
Less: Amount transferred from provision for doubtful debts 1,200.02 - -
Provision for doubtful debts/ advances 486.25 1,625.00
Provision for diminution in value of investment 411.75 -
Provision for warranty (net) (Refer Note 24.9) 1.76 14.76
General expenses 12.08 100.58
Total 11,866.34 9,821.09
Note (i): Payments to the auditors comprises:
As auditors - statutory audit 29.25 18.00
Company law matters 0.75 0.75
Reimbursement of expenses 1.40 1.03
Service Tax 3.85 2.04
Total 35.25 21.82

47
Notes forming part of the fi nancial statements
Rs. lakhs
As at 31 March,
2012
As at 31 March,
2011
23.1 Contingent liabilities and commitments (to the extent not provided for)
(i) Contingent liabilities
(a) Claims against the Company not acknowledged as debt
1. Disputed demands for Income Tax aggregates . 1,038.12 1,040.69
2. Disputed demands for Wealth Tax aggregates. 25.89 25.89
3. Disputed amount of Sales Tax aggregates. 656.83 656.83
4. Service tax matters. 842.26 193.61
5. Amount not recognised as debts. 292.44 -
(b) Guarantees- Guarantees given to a Housing Finance Company for housing loans
availed by employees during their employment with the company
104.96 122.87
(c) Guarantee given to a bank for a loan to be secured by A Squared Elxsi Entertainment
LLC, USA(A2E2)
1,594.50 -
(d) Loan drawn by A2E2 against the above guarantee 1,024.38 -
(ii) Capital Commitments :
Estimated amount of contracts remaining to be executed on capital account and not
provided for :
Tangible assets 198.30 215.10
Intangible assets 141.50 37.51
23.2 Disclosures required under Section 22 of the Micro, Small and Medium Enterprises
Development Act, 2006
(i) Principal amount remaining unpaid to any supplier as at the end of the accounting year 3.39 1.87
(ii) Interest due thereon remaining unpaid to any supplier as at the end of the accounting
year
1.71 1.03
(iii) The amount of interest paid along with the amounts of the payment made to the
supplier beyond the appointed day 1.03 -
(iv) The amount of interest due and payable for the year 1.71
(v) The amount of interest accrued and remaining unpaid at the end of the accounting year 1.71 1.03
(vi) The amount of further interest due and payable even in the succeeding year, until
such date when the interest dues as above are actually paid
- -
Dues to Micro and Small Enterprises have been determined to the extent such parties have been identifi ed on the basis of
information collected by the Management. This has been relied upon by the auditors.

Twenty Third Annual Report 2011 - 12
48
Notes forming part of the fi nancial statements
23.3 Disclosure as per Clause 32 of the Listing Agreements with the Stock Exchanges
Loans and advances in the nature of loans given to subsidiaries, associates and others and investment in shares of the Company by
such parties:
Rs. lakhs
Name of the party Relationship Amount outstanding
as at 31 March, 2012
Maximum balance
outstanding during the
year
Tata Elxsi (Singapore)Pte Ltd Subsidiary
Investments 28.67 28.67
(28.67) (28.67)
A Squared Elxsi Entertainment LLC, USA [Refer Note
24.4.c)
Proposed subsidiary 1,024.38
(Nil)
1,024.38
(Nil)
Note: Figures in bracket relate to the previous year.
23.4 Details on derivatives instruments and unhedged foreign currency exposures
I. The following derivative positions are open as at 31 March, 2012. These transactions have been undertaken to act as economic
hedges for the Company’s exposures to various risks in foreign exchange markets and may / may not qualify or be designated
as hedging instruments. The accounting for these transactions is stated in Notes 2.11 and 2.22
(a) Forward exchange contracts and options [being derivative instruments], which are not intended for trading or speculative
purposes but for hedge purposes to establish the amount of reporting currency required or available at the settlement date of
certain payables and receivables.
(i) Outstanding forward exchange contracts entered into by the Company as on 31 March, 2012
Currency Amount Buy / Sell Amount
USD 16 lakhs Sell Rs. 826.08 lakhs
(Nil) (Nil)
GBP 5 lakhs Sell Rs. 394.95 lakhs
(Nil) (Nil)
JPY 200 lakhs Sell Rs.134.90 lakhs
(Nil) (Nil)
EURO 1 lakh Sell Rs. 66 lakhs
(Nil) (Nil)
Note: Figures in brackets relate to the previous year
(ii) Outstanding option contracts entered into by the Company as on 31 March, 2012
Currency Amount Buy / Sell Amount
JPY - - -
(1200 lakhs) Sell (Sell@ Rs. 659.40 lakhs)
USD - - -
( 15 lakhs) Sell (Sell@ Rs. 673.50 lakhs)
EURO - - -
( 7.5 lakhs) Sell (Sell@ Rs. 469.13 lakhs)
GBP - - -
( 5.0 lakhs) Sell (Sell@ Rs. 384.40 lakhs)
Note: Figures in brackets relate to the previous year

49
Notes forming part of the fi nancial statements
II. The year-end foreign currency exposures that have not been hedged by a derivative instrument or otherwise are given
below:
As at 31 March, 2012 As at 31 March, 2011
Receivable
in foreign currency
lakhs
Receivable
Rs. lakhs
Receivable
in foreign currency
lakhs
Receivable
Rs. lakhs
Euro 15.68 1,072.10 Euro 3.04 192.31
GBP 34.56 2,826.96 GBP 29.27 2,102.03
USD 63.77 3,266.16 USD 92.76 4,148.25
JPY 2,898.51 1,809.41 JPY 1,348.82 729.99
ZAR 7.23 55.18 ZAR 5.03 33.30
KRW 20.46 0.91 KRW 20.44 0.82
Amount payable in foreign currency on account of purchase of goods and services
As at 31 March, 2012 As at 31 March, 2011
Payable
in foreign currency
lakhs
Payable
Rs. lakhs
Payable
in foreign currency
lakhs
Payable
Rs. lakhs
Euro 0.56 38.25 Euro 1.61 101.87
GBP 0.29 23.42 GBP 0.80 57.59
USD 20.66 1,058.20 USD 7.25 323.84
JPY 2.98 1.86 - - -
ZAR 0.05 0.35 - - -
Rs.lakhs23.5 Value of imports calculated on CIF basis : For the year ended
31 March, 2012
For the year ended
31 March, 2011Computer systems, peripherals, software etc., 1,864.63 1,487.46 Capital goods 905.97 495.51
2,770.60 1,982.97
23.6 Expenditure in foreign currency:
Overseas Offi ce expenses 8,561.48 7,054.08 Foreign Travel 1,269.77 1,023.69 Other expenditure 592.88 660.69
10,424.13 8,738.46
23.7 Earnings in foreign currency:
Service Income 40,058.80 31,203.59 Sale to domestic customer in foreign currency 355.37 965.53 Sales and Support 414.52 15.79 Dividend 191.96 -
41,020.65 32,184.91
24.1 Employee benefi t plans
24.1.a Defi ned contribution plans
The Company makes Provident Fund and Superannuation Fund contributions to defi ned contribution plans for qualifying
employees. Under the Schemes, the Company is required to contribute a specifi ed percentage of the payroll costs to fund
the benefi ts. The Company recognised Rs. 471.93 lakhs (Year ended 31 March, 2011 Rs. 415.99 lakhs) for Provident Fund
contributions and Rs.197.99 lakhs (Year ended 31 March, 2011 Rs. 150.95 lakhs) for Superannuation Fund contributions in the
Statement of Profi t and Loss. The contributions payable to these plans by the Company are at rates specifi ed in the rules of the
schemes.

Twenty Third Annual Report 2011 - 12
50
Notes forming part of the fi nancial statements
24.1.b Defi ned benefi t plans
The Company off ers gratuity to its employees under defi ned benefi t plans
The following table sets out the funded status of the defi ned benefi t schemes and the amount recognised in the fi nancial
statements:
Rs. lakhs
Particulars Year ended
31 March, 2012
Year ended
31 March, 2011
Components of employer expense
Current service cost 118.06 115.13
Interest cost 44.21 46.95
Expected return on plan assets (22.29) (25.73)
Curtailment cost / (credit) - -
Settlement cost / (credit) - -
Past service cost - -
Actuarial losses/(gains) (12.56) (31.34)
Total expense recognised in the Statement of Profi t and Loss 127.42 105.01
Actual contribution and benefi t payments for year
Actual benefi t payments 70.00 86.04
Actual contributions 182.02 160.00
Net asset / (liability) recognised in the Balance Sheet
Present value of defi ned benefi t obligation (664.89) (552.64)
Fair value of plan assets 445.49 278.64
Funded status [Surplus / (Defi cit)] - -
Unrecognised past service costs - -
Net asset / (liability) recognised in the Balance Sheet (219.40) (274.00)
Change in defi ned benefi t obligations (DBO) during the year
Present value of DBO at beginning of the year 552.64 533.67
Current service cost 118.06 115.13
Interest cost 44.21 46.95
Curtailment cost / (credit) - -
Settlement cost / (credit) - -
Plan amendments - -
Acquisitions - -
Actuarial (gains) / losses 19.98 (57.07)
Past service cost - -
Benefi ts paid (70.00) (86.04)
Present value of DBO at the end of the year 664.89 552.64
Change in fair value of assets during the year
Plan assets at beginning of the year 278.64 204.68
Acquisition adjustment - -
Expected return on plan assets 22.29 25.73

51
Rs. lakhs
Particulars Year ended
31 March, 2012
Year ended
31 March, 2011
Actual company contributions 182.02 160.00
Actuarial gain / (loss) 32.54 (25.73)
Benefi ts paid (70.00) (86.04)
Plan assets at the end of the year 445.49 278.64
Actual return on plan assets 54.83 25.73
Planned asset are insurer managed funds (Life Insurance Corporation of India) Category
of such assets is not disclosed as such information is not available from the insurer who
manages the funds.
LIC- Mortality (1994-96)Table
21-30 years 10%
31-40 years 5%
41-50 years 3%
51 & above -2%
Particulars Year ended
31 March, 2012
Year ended
31 March, 2011
Actuarial assumptions:
Discount rate 8.50% 8.00%
Expected return on plan assets 8.60% 8.00%
Salary escalation 5.00% 5.00%
Attrition 10% if <5 yrs ;else 8% 10% if <5 yrs ;else 8%
Estimates of amount of contribution in the immediate next year (Rs. lakhs) 167.98 163.61
24.2 Experience adjustments
Rs. lakhs
Gratuity 2011-12 2010- 11 2009-10 2008-09 2007-08
Present value of DBO 664.89 (552.64) (533.67) (467.06) (410.69)
Fair value of plan assets 445.49 278.64 204.68 179.86 142.13
Funded status [Surplus / (Defi cit)] (219.40) (274.00) (328.99) (287.20) (268.56)
Experience (gain) / loss adjustments
on plan liabilities
42.82 (57.07) (5.23) (53.12) 2.22
Experience gain / (loss) adjustments
on plan assets
32.54 (25.73) 0.96 (2.20) (0.38)
Notes forming part of the fi nancial statements

Twenty Third Annual Report 2011 - 12
52
Notes forming part of the fi nancial statements
Particulars For the year ended
31 March, 2012
For the year ended
31 March, 2011
Actuarial assumptions for long-term compensated absences
Discount rate 8.50% 8.00%
Expected return on plan assets 8.60% 8.00%
Salary escalation 5.00% 5.00%
Attrition 10% if <5 yrs ;else 8% 10% if <5 yrs ;else 8%
24.3 Segment information
The Company has identifi ed business segments as its primary segment and geographic segments as its secondary segment.
Business segments are primarily System Integration & Support and Software Development & Services. Revenues and expenses
directly attributable to segments are reported under each reportable segment. All other expenses which are not attributable or
allocable to segments have been disclosed as unallocable expenses. Assets and liabilities that are directly attributable or allocable
to segments are disclosed under each reportable segment. All other assets and liabilities are disclosed as unallocable. Fixed assets
that are used interchangeably amongst segments are not allocated to primary and secondary segments. Geographical revenues are
allocated based on the location of the customer. Geographic segments of the Company are India, Europe, US, Japan and Others
Rs. lakhs
Particulars For the year ended 31 March, 2012
Business segments
TotalSystem
Integration &
Support
Software
Development &
Services
Revenue 6,020.36 45,425.48 51,445.84
(5,281.31) (35,819.85) (41,101.16)
Segment result 558.15 5,569.28 6,127.43
(591.44) (3,680.68) (4,272.12)
Unallocable expenses (net) 232.63
(188.26)
Operating income 5,894.80
(4,083.86)
Other expenses (net) 860.24
(971.91)
Profi t before taxes 5,034.56
(3,111.95)
Tax expense 1,640.00
(-61.50)
Net profi t for the year 3,394.56
(3,173.45)
Segment asset include all assets relating to the segment and consist principally of fi xed assets, receivables, other current assets and
non-current assets.
Segment liabilities include all liabilities relating to the segment and consist principally of trade payables on other operating liabilities.

53
Notes forming part of the fi nancial statements
Rs. lakhsParticulars For the year ended 31 March, 2012
Business segments
TotalSystem
Integration & Support
Software Development &
Services
Segment assets 5,470.99 11,335.00 16,805.99
(2,567.69) (13,161.15) (15,728.84)Unallocable assets 14,686.20
(14,112.26)Total assets 31,492.19
(29,841.10)Segment liabilities 2,064.31 3,433.38 5,497.69
(1,427.40) (1,976.54) (3,403.94)Unallocable liabilities 4,423.29
(8,241.20)Total liabilities 9,920.98
(11,645.14)
Other informationCapital expenditure (unallocable) 3,051.20
(1,804.05)Depreciation and amortisation (unallocable) 2,051.92
(1,720.47)Provision for doubtful debts 486.25
(1,625.00)Provision in diminution in value of investment 411.75
(-)
The geographic segments individually contributing 10 percent or more of the Company’s revenues and segment assets are shown
separately:
Rs. lakhs
Geographic Segment RevenuesFor the year ended
31 March, 2012
Segment assetsas at
31 March, 2012
Capital expenditure incurred as at
31 March, 2012
India 11,421.99 13,672.32 2,201.29
(9,897.57) (12,993.77) (1,534.03)US 15,711.57 3,798.48 768.26
(13,059.10) (3,062.08) (266.93)Europe 17,713.27 4,193.46 26.32
(11,706.57) (3,352.73) (0.42)Japan 5,224.12 1,499.86 55.33
(5,009.53) (114.59) (2.67)Others 1,374.89 223.55 -
(1,428.39) (1,151.14) - Total 51,445.84 23,387.67 3,051.20
(41,101.16) (20,674.31) (1,804.05)
Note: Figures in bracket relates to the previous year
Segment revenue in India comprises revenue from System Integration and software development and services. Segment revenue
outside India predominantly comprises revenue from software development and services. Segment assets include all assets relating
to the segment and consist principally of Fixed assets, Receivables, Inventory, Other Current and Non-Current Assets. Assets located
outside India primarily relate to Trade Receivables.

Twenty Third Annual Report 2011 - 12
54
Notes forming part of the fi nancial statements
24.4 Related party transactions
24.4.a Details of related parties:
Description of relationship Names of related parties
Company with Signifi cant Infl uence Tata Sons Ltd.
Subsidiary Tata Elxsi (Singapore) Pte ltd.
Entity on which the Company has signifi cant infl uence A Squared Elxsi Entertainment LLC, USA
Key Management Personnel (KMP) Mr. Madhukar Dev- Managing Director
Note: Related parties have been identifi ed by the Management.
24.4.b Details of related party transactions during the year ended 31 March, 2012 and balances outstanding as at 31 March,
2012:
Rs. lakhs
Particulars Company with
Signifi cant
Infl uence
Subsidiaries Entity on which
the Company
has signifi cant
infl uence
KMP Total
Rendering of services 229.00 473.78 702.78 (Nil) (Nil) (Nil)
Reimbursement of expenses 27.46 27.46 (4.99) (Nil) (4.99)
Dividend received 191.96 191.96 (Nil) (Nil)
Receiving of services- Brand fee and other
Services 147.55 147.55 (131.63) (131.63)
Managerial remuneration and commission 148.94 148.94 (130.85) (130.85)
Guarantees and collaterals 1,024.38 1024.38 (Nil) (Nil)
Share application money 518.30 518.30 (Nil) (Nil)
Balances outstanding at the end of the yeari) Trade receivables 27.46 27.46
(2.19) (2.19)ii) Trade payable 129.58 60.00 189.58
(113.44) (50.00) (163.44)
Note: Figures in bracket relates to the previous year
24.4.c Investment in A Squared Elxsi Entertainment LLC, USA
The Company has entered into a Joint Venture Agreement with A Squared Entertainment LLC, USA (“A2”) for carrying on business
in the fi eld of animated content development, development of related characters/intellectual property, and licensing thereof
to merchandising companies, pursuant to which A Squared Elxsi Entertainment LLC, USA (“A2E2”) has been incorporated to
carry on the activities of the joint venture. The Company has remitted USD 1,000,001 as Share Application Money to A2E2,
against which shares are yet to be allotted as at March 31, 2012. The JV Partner, A2 is in the process of completing its obligation
under the agreement, on completion of which and issuance of equity to both the parties, A2E2 will become a subsidiary of the
Company.

55
Rs. lakhs
24.5 Particulars For the year ended
31 March, 2012
For the year ended
31 March, 2011
Details of leasing arrangements
The Company has entered into operating lease arrangements for certain facilities
and offi ce premises. Some of these leases are non-cancellable and are for a period of
one to three years and may be renewed based on mutual agreement of the parties.
These lease agreements provide for an increase in the lease payments by up to 5 %
every year.
Future minimum lease payments :
not later than one year 198.35 289.94
later than one year and not later than fi ve years 90.03 159.40
later than fi ve years Nil Nil
Lease payments recognised in the Statement of Profi t and Loss 1,399.87 1,193.81
24.6 Particulars
Earnings per share
Basic
Net profi t for the year from continuing operations attributable to the equity
shareholders (Rs. lakhs)
3,394.56 3,173.45
Weighted average number of equity shares 31,138,220 31,138,220
Par value per share (Rs.) 10.00 10.00
Earnings per share - Basic and diluted (Rs.) 10.90 10.19
24.7 Particulars
Deferred tax (liability) / asset
Tax eff ect of items constituting deferred tax liability
On diff erence between book balance and tax balance of fi xed assets (1,305.18) (1198.98)
Tax eff ect of items constituting deferred tax liability (1,305.18) (1,198.98)
Tax eff ect of items constituting deferred tax assets
Disallowances under Section 40(a)(i), 43B of the Income Tax Act, 1961, etc. 933.18 1048.98
Tax eff ect of items constituting deferred tax assets 933.18 1,048.98
Net deferred tax (liability) / asset (372.00) (150.00)
Notes forming part of the fi nancial statements

Twenty Third Annual Report 2011 - 12
56
Notes forming part of the fi nancial statements
Rs. lakhs
24.8 Particulars For the year ended
31 March, 2012
For the year ended
31 March, 2011
Details of expenditure recognised as employee benefi t expenses and other
expenses in note 21 and 22 respectively are net of the following expenses
that have been capitalised as part of intangible assets/intangible assets under
development.
a) Employee benefi t expenses 743.77 558.26
b) Other expenses 165.15 205.45
908.92 763.71
24.9 Details of provisions
The Company has made provision for various contractual obligations and disputed liabilities based on its assessment of the amount
it estimates to incur to meet such obligations, details of which are given below:
Rs. lakhs
Particulars As at 1 April, 2011 Additions Utilisation Reversal
(withdrawn as no
longer required)
As at 31 March,
2012
Provision for
warranty
14.76 12.54 10.78 (Nil) 16.52
(Nil) (14.76) (Nil) (Nil) (14.76)
Note: - Figures in brackets relate to the previous year.
Of the above, the following amounts are expected to be incurred within a year: Rs. lakhs
Particulars As at 31 March, 2012 As at 31 March, 2011
Provision for warranty 16.52 14.76
25 The Revised Schedule VI has become eff ective from 1 April, 2011 for the preparation of fi nancial statements. This has signifi cantly
impacted the disclosure and presentation made in the fi nancial statements. Previous year’s fi gures have been regrouped / reclassifi ed
wherever necessary to correspond with the current year’s classifi cation / disclosure.
For and on behalf of the Board of Directors
S. Ramadorai Chairman Shyamala Gopinath Director Madhukar Dev Managing Director Sudha Madhavan Chief Financial Offi cer G. Vaidyanathan Company Secretary
Mumbai, May 07, 2012

57
AUDITORS’ REPORT
TO THE MEMBERS OF TATA ELXSI LIMITED
1. We have audited the attached Consolidated Balance Sheet of TATA ELXSI LIMITED (“the Company”) and its subsidiary (the
Company and its subsidiary constitute “the Group”) as at March 31, 2012, the Consolidated Statement of Profi t and Loss and the
Consolidated Cash Flow Statement of the Group for the year ended on that date, both annexed thereto. The Consolidated Financial
Statements include investments in associates accounted on the equity method in accordance with Accounting Standard 23
(Accounting for Investments in Associates in Consolidated Financial Statements). These fi nancial statements are the responsibility
of the Company’s Management and have been prepared on the basis of the separate fi nancial statements and other information
regarding components. Our responsibility is to express an opinion on these Consolidated Financial Statements based on our audit.
2. We conducted our audit in accordance with the auditing standards generally accepted in India. Those Standards require that we plan
and perform the audit to obtain reasonable assurance about whether the fi nancial statements are free of material misstatements.
An audit includes examining, on a test basis, evidence supporting the amounts and the disclosures in the fi nancial statements. An
audit also includes assessing the accounting principles used and the signifi cant estimates made by the Management, as well as
evaluating the overall fi nancial statement presentation. We believe that our audit provides a reasonable basis for our opinion.
3. We report that the Consolidated Financial Statements have been prepared by the Company in accordance with the requirements
of Accounting Standard 21 (Consolidated Financial Statements) and Accounting Standard 23 (Accounting for Investments in
Associates in Consolidated Financial Statements) as notifi ed under the Companies (Accounting Standards) Rules, 2006.
4. Based on our audit, and to the best of our information and according to the explanations given to us, in our opinion, the Consolidated
Financial Statements give a true and fair view in conformity with the accounting principles generally accepted in India:
(i) in the case of the Consolidated Balance Sheet, of the state of aff airs of the Group as at March 31, 2012;
(ii) in the case of the Consolidated Statement of Profi t and Loss, of the profi t of the Group for the year ended on that date; and
(iii) in the case of the Consolidated Cash Flow Statement, of the cash fl ows of the Group for the year ended on that date.
For DELOITTE HASKINS & SELLS
Chartered Accountants
(Firm Registration No. 008072S)
V. Balaji
Partner
(Membership No. 203685)
Place: Mumbai
Date: May 07, 2012

Twenty Third Annual Report 2011 - 12
58
Consolidated Balance Sheet as at 31 March, 2012 Rs. lakhs
As at As at
Note 31 March, 2012 31 March, 2011
EQUITY AND LIABILITIES
Shareholders’ funds
Share capital 3 3,113.82 3,113.82
Reserves and surplus 4 16,084.14 15,122.89
19,197.96 18,236.71
Non Current liabilities
Long-term provisions 5 688.74 686.35
Deferred tax liabilities (Net) 23.6 372.00 150.00
1,060.74 836.35
Current liabilities
Short-term borrowings 6 3,415.60 2,543.16
Trade payables 7 4,969.02 4,102.94
Other current liabilities 8 2,217.20 1,896.48
Short-term provisions 9 2,601.27 2,551.89
13,203.09 11,094.47
Total 33,461.79 30,167.53
ASSETS
Non current assets
Fixed assets 10
Tangible assets 7,672.32 7,271.11
Intangible assets 2,315.12 1,805.04
Capital work-in-progress 105.97 419.61
Intangible assets under development 940.15 763.92
11,033.56 10,259.68
Long-term loans and advances 11 5,025.17 4,980.07
16,058.73 15,239.75
Current assets
Inventories 12 2.13 57.11
Trade receivables 13 12,565.54 10,721.92
Cash and cash equivalents 14 2,671.74 2,079.59
Short-term loans and advances 15 1,038.43 1,147.40
Other current assets 16 1,125.22 921.76
17,403.06 14,927.78
Total 33,461.79 30,167.53
Corporate information and signifi cant accounting policies 1 & 2
See the accompanying notes forming part of the fi nancial statements
In terms of our report attached For and on behalf of the Board of Directors
For Deloitte Haskins & SellsChartered Accountants S. Ramadorai Chairman Shyamala Gopinath DirectorV. Balaji Madhukar Dev Managing DirectorPartner Sudha Madhavan Chief Financial Offi cer G. Vaidyanathan Company Secretary
Mumbai, May 07, 2012 Mumbai, May 07, 2012

59
Consolidated Statement of Profi t and Loss for the year ended 31 March, 2012 Rs. lakhs
Note
For the
year ended
31 March, 2012
For the
year ended
31 March, 2011
REVENUE
Revenue from operations 17 53,870.74 41,591.12
Other income 18 420.50 386.34
Total 54,291.24 41,977.46
EXPENSES
Purchases 19 7,117.34 5,417.14
Changes in inventories of stock-in-trade 19A 54.98 (50.87)
Employee benefi ts expenses 20 27,807.29 21,670.28
Finance costs 232.63 188.26
Depreciation/ amortisation expense 10 2,051.92 1,720.47
Other expenses 21 11,491.00 9,834.96
Total 48,755.16 38,780.24
Profi t before tax for the year 5,536.08 3,197.22
Tax Expense
i) Current tax (1,316.20) (1,103.05)
ii) MAT credit entitlement - 786.00
iii) Overseas tax of prior years (127.38) -
iv) Net current tax expense (1,443.58) (317.05)
v) Deferred tax (222.00) 371.50
vi) Total (1,665.58) 54.45
Profi t after tax for the year 3,870.50 3,251.67
Share of loss from an Associate Company 411.75 -
Net Profi t for the year 3,458.75 3,251.67
Earnings per equity share of Rs.10/- each
Basic and diluted 11.11 10.44
Corporate information and signifi cant accounting policies 1 & 2
See the accompanying notes forming part of the fi nancial statements
In terms of our report attached For and on behalf of the Board of Directors
For Deloitte Haskins & SellsChartered Accountants S. Ramadorai Chairman Shyamala Gopinath DirectorV. Balaji Madhukar Dev Managing DirectorPartner Sudha Madhavan Chief Financial Offi cer G. Vaidyanathan Company Secretary
Mumbai, May 07, 2012 Mumbai, May 07, 2012

Twenty Third Annual Report 2011 - 12
60
Consolidated Cash Flow Statement for the year ended 31 March, 2012 Rs. lakhs
For theyear ended
31 March, 2012
For theyear ended
31 March, 2011A. Cash fl ows from operating activities
Net Profi t before tax 5,536.08 3,197.22 Adjustment for:
Depreciation and amortisation 2,051.92 1,720.47 Interest income (3.25) (33.41) Finance costs 232.63 188.26 Provision for doubtful debts/advances 486.25 1,625.00 Liabilities / provisions no longer required, written back (25.44) (65.04) Loss/(Profi t) on sale of assets 33.14 1.22 Unrealised exchange loss/(gains) 162.71 67.88
Operating profi t before working capital changes 8,474.04 6,701.60 Changes in working capital: Adjustments for (increase) / decrease in operating assets: Deposits as Margin Money or Security against commitments (7.20) - Inventories 54.98 (50.87) Trade receivables (2,127.63) 591.90 Short-term loans and advances 141.20 (9.51) Long-term loans and advances 0.74 (60.76) Other current assets (203.46) 152.44 Adjustments for increase / (decrease) in operating liabilities: Trade payables 788.82 322.87 Other current liabilities 272.48 605.05 Short-term provisions 49.44 (51.14) Long-term provisions 2.39 (19.83)
Cash generated from operations 7,445.80 8,181.75 Income tax paid (1,378.44) (1,036.87)
Net cash fl ow from / (used in) from operating activities 6,067.36 7,144.88
B. Cash fl ows from investing activitiesPurchase of fi xed assets/ capital advances (2,873.06) (2,908.40)Proceeds of sale of fi xed assets 54.85 7.44 Share application money in A Squared Elxsi Entertainment LLC, USA (518.30) - Interest received 3.25 33.41 Net cash fl ow from / (used in) investing activities (3,333.26) (2,867.55)
C. Cash fl ows from fi nancing activitiesShort term borrowings availed/(re-paid) (net) 443.46 (853.77)Interest paid (232.63) (188.26)Dividend paid (2,176.59) (2,164.71)Tax on dividend paid (353.60) (362.02)Net cash fl ow from / (used in) fi nancing activities (2,319.36) (3,568.76)Net increase/(decrease) in cash and cash equivalents 414.74 708.57 Cash and cash equivalents as at beginning of the year 2,079.59 1,428.50 Exchange gain/(loss) on restatement of foreign currency cash and cash equivalents 170.21 (57.48)Cash and cash equivalents as at end of the year 2,664.54 2,079.59 Reconciliation of cash and cash equivalents with the Balance Sheet:
Cash and cash equivalents as per Balance Sheet (Refer Note 14) 2,671.74 2,079.59
Less: Bank balances not considered as Cash and cash equivalents
as defi ned in AS 3 Cash Flow Statements 7.20 - Cash and cash equivalents at the end of the year comprises: 2,664.54 2,079.59 (a) Cash on hand 1.05 0.90 (b) Cheques on hand 89.45 15.91 (c) Balances with banks
i) in current accounts 2123.47 1,410.72 ii) in EEFC accounts 211.66 416.24 iii) in earmarked accounts -Unpaid dividends account 238.91 235.82
2,664.54 2,079.59
Corporate information and signifi cant accounting policies 1 & 2 See the accompanying notes forming part of the fi nancial statements
In terms of our report attached For and on behalf of the Board of Directors
For Deloitte Haskins & SellsChartered Accountants S. Ramadorai Chairman Shyamala Gopinath DirectorV. Balaji Madhukar Dev Managing DirectorPartner Sudha Madhavan Chief Financial Offi cer G. Vaidyanathan Company Secretary
Mumbai, May 07, 2012 Mumbai, May 07, 2012

61
Notes forming part of the consolidated fi nancial statements
1 Corporate information
Tata Elxsi Limited was incorporated in 1989. The Company provides product design and engineering services to the consumer
electronics, communications, and transportation industries and systems integration and support services for enterprise customers.
It also provides digital content creation for media and entertainment industry.
The company is headquartered in Bangalore, and operates through delivery centers in Bangalore, Chennai, Coimbatore, Pune,
Mumbai, and Tiruvananthapuram.
Its sales operations are located in multiple cities in India, and in multiple international locations including Dubai, France, Germany,
Japan, UK, and USA.
2 Signifi cant Accounting Policies
2.1 Basis of accounting and preparation of fi nancial statements
The condensed consolidated fi nancial statements of Tata Elxsi Limited and its subsidiary are prepared under the historical cost
convention on the accrual basis of accounting and comply with the accounting standards applicable in India.
Following Companies are considered in the consolidated fi nancial statements:
Name of the Entity Country of Incorporation % of share holding
Tata Elxsi (Singapore) Pte Ltd Singapore 100%
Principles of consolidation
The fi nancial statements of the subsidiary company used in the consolidation are drawn up to the same reporting date as of the
Company.
The consolidated fi nancial statements have been prepared on the following basis:
The fi nancial statements of the Company and its subsidiary company have been combined on a line-by-line basis by adding
together like items of assets, liabilities, income, and expenses. Inter-company balances and transactions and unrealised profi ts or
losses have been fully eliminated.
Minority interest is not computed as it is a wholly owned subsidiary.
The Company has entered into a Joint Venture Agreement with A Squared Entertainment Inc LLC, USA (“A2”) for carrying on
business in the fi eld of animated content development, development of related characters/intellectual property, and licensing
thereof to merchandising companies, pursuant to which A Squared Elxsi Entertainment LLC, USA (“A2E2”) has been incorporated to
carry on the activities of the Joint Venture. The Company has remitted USD 1,000,001 as Share Application Money to A2E2, against
which shares are yet to be allotted as at 31 March, 2012. The JV Partner, A2 is in the process of completing its obligation under the
agreement, on completion of which and issuance of equity to both the parties, A2E2 will become a subsidiary of the Company. As
at 31st March, 2012, for the purpose of presenting the consolidated results, A2E2 has been considered as an associate.
2.2 Use of estimates
The preparation of the fi nancial statements in conformity with Indian GAAP requires the Management to make estimates and
assumptions considered in the reported amounts of assets and liabilities (including contingent liabilities) and the reported income
and expenses during the year. The Management believes that the estimates used in preparation of the fi nancial statements are
prudent and reasonable. Future results could diff er due to these estimates and the diff erences between the actual results and the
estimates are recognised in the periods in which the results are known / materialised.
2.3 Inventories
Components and spares are valued at lower of cost and net realizable value. Cost is determined on the basis of specifi c identifi cation
method.
Computer systems and software, components and spares intended for customer support are written off over the eff ective life of
the systems maintained, as estimated by Management.

Twenty Third Annual Report 2011 - 12
62
Notes forming part of the consolidated fi nancial statements
2.4 Cash and cash equivalents (for purposes of Cash Flow Statement)
Cash comprises cash on hand and demand deposits with banks. Cash equivalents are short-term balances (with an original
maturity of three months or less from the date of acquisition), highly liquid investments that are readily convertible into known
amounts of cash and which are subject to insignifi cant risk of changes in value.
2.5 Cash fl ow statement
Cash fl ows are reported using the indirect method, whereby profi t / (loss) before extraordinary items and tax is adjusted for the
eff ects of transactions of non-cash nature and any deferrals or accruals of past or future cash receipts or payments. The cash fl ows
from operating, investing, and fi nancing activities of the Company are segregated based on the available information.
2.6 Depreciation and amortisation
Depreciation has been provided on the straight-line method as per the rates prescribed in Schedule XIV to the Companies Act,
1956, except in respect of the following categories of assets, in whose case the life of the assets has been assessed as under:
Leasehold land is amortised over the duration of the lease
Assets costing less than Rs. 5,000 each are fully depreciated in the year of capitalisation
Intangible assets are amortised over their estimated useful life as follows:
In-house Technical Know-How – 3 years.
The estimated useful life of the intangible assets and the amortisation period are reviewed at the end of each fi nancial year and the
amortisation method is revised to refl ect the changed pattern.
2.7 Revenue recognition
Sale of goods
Income from sales of goods is recognised upon passage of risks and rewards of ownership to the goods, which generally coincide
with the despatch. Sales exclude taxes and levies
Income from services
a) Income from services is recognized upon rendering of the services. Income from maintenance contracts relating to the year is
recognized when the contracts are entered into on a time proportionate basis.
b) Revenue from software development on fi xed price, fi xed time frame contracts is recognised as per the proportionate
completion method. On time and materials contracts, revenue is recognised as the related services are rendered.
c) In respect of orders procured, for which sales are eff ected directly to the customers by the vendors, the Company accounts only
for the commission, installation and other charges to which it is entitled.
2.8 Other income
Interest income is accounted on accrual basis. Dividend income is accounted for when the right to receive it is established.
2.9 Tangible fi xed assets
Fixed assets, are carried at cost less accumulated depreciation and impairment losses, if any. The cost of fi xed assets includes
interest on borrowings attributable to acquisition of qualifying fi xed assets up to the date the asset is ready for its intended use
and other incidental expenses incurred up to that date. Subsequent expenditure relating to fi xed assets is capitalised only if such
expenditure results in an increase in the future benefi ts from such asset beyond its previously assessed standard of performance.
Fixed assets retired from active use and held for sale are stated at the lower of their net book value and net realisable value and are
disclosed separately in the Balance Sheet.
Capital work-in-progress:
Projects under which assets are not ready for their intended use and other capital work-in-progress are carried at cost, comprising
direct cost, related incidental expenses and attributable interest.
2.10 Intangible assets.
Intangible assets are carried at cost less accumulated amortisation and impairment losses, if any. The cost of an intangible asset
comprises its purchase price, including any import duties, and other taxes (other than those subsequently recoverable from the

63
Notes forming part of the consolidated fi nancial statements
taxing authorities), and any directly attributable expenditure on making the asset ready for its intended use and net of any trade
discounts and rebates. Subsequent expenditure on an intangible asset after its purchase / completion is recognised as an expense
when incurred unless it is probable that such expenditure will enable the asset to generate future economic benefi ts in excess
of its originally assessed standards of performance and such expenditure can be measured and attributed to the asset reliably, in
which case such expenditure is added to the cost of the asset.
Refer Note 2.16 for accounting for Research and Development Expenses.
2.11 Foreign currency transactions and translations
Initial recognition
Transactions in foreign currencies entered into by the Company and its integral foreign operations are accounted at the exchange
rates prevailing on the date of the transaction or at rates that closely approximate the rate at the date of the transaction.
Measurement of foreign currency monetary items at the Balance Sheet date
Foreign currency monetary items (other than derivative contracts) of the Company and its net investment in non-integral foreign
operations outstanding at the Balance Sheet date are restated at the year-end rates.
In the case of integral operations, assets and liabilities (other than non-monetary items), are translated at the exchange rate
prevailing on the Balance Sheet date. Non-monetary items are carried at historical cost. Revenue and expenses are translated at
the average exchange rates prevailing during the year. Exchange diff erences arising out of these translations are charged to the
Statement of Profi t and Loss.
Treatment of exchange diff erences
Exchange diff erences arising on settlement / restatement of short-term foreign currency monetary assets and liabilities of the
Company and its integral foreign operations are recognised as income or expense in the Statement of Profi t and Loss. The exchange
diff erences on restatement / settlement of loans to non-integral foreign operations that are considered as net investment in such
operations are accumulated in a “Foreign currency translation reserve” until disposal / recovery of the net investment.
Accounting of forward contracts
Premium / discount on forward exchange contracts, which are not intended for trading or speculation purposes, are
amortised over the period of the contracts if such contracts relate to monetary items as at the Balance Sheet date.
Refer Notes 2.20 for accounting for forward exchange contracts relating to fi rm commitments and highly probable forecast
transactions.
Employee benefi ts
Employee benefi ts include contribution to provident fund, superannuation fund, gratuity fund and compensated absences.
Defi ned contribution plans
The Company’s contribution to provident fund and superannuation fund are considered as defi ned contribution plans and are
charged as an expense as they fall due based on the amount of contribution required to be made.
Defi ned benefi t plans
For defi ned benefi t plans in the form of gratuity fund, the cost of providing benefi ts is determined using the Projected Unit Credit
method, with actuarial valuations being carried out at each Balance Sheet date. Actuarial gains and losses are recognised in the
Statement of Profi t and Loss in the period in which they occur. Past service cost is recognised immediately to the extent that the
benefi ts are already vested and otherwise is amortised on a straight-line basis over the average period until the benefi ts become
vested. The retirement benefi t obligation recognised in the Balance Sheet represents the present value of the defi ned benefi t
obligation as adjusted for unrecognised past service cost, as reduced by the fair value of scheme assets. Any asset resulting from
this calculation is limited to past service cost, plus the present value of available refunds and reductions in future contributions to
the schemes.
Short-term employee benefi ts
The undiscounted amount of short-term employee benefi ts expected to be paid in exchange for the services rendered by
employees are recognised during the year when the employees render the service. These benefi ts include performance incentive
and compensated absences which are expected to occur within twelve months after the end of the period in which the employee
renders the related service. The cost of such compensated absences is accounted as under :

Twenty Third Annual Report 2011 - 12
64
(a) in case of accumulated compensated absences, when employees render the services that increase their entitlement of
future compensated absences; and
(b) in case of non-accumulating compensated absences, when the absences occur.
Long-term employee benefi ts
Compensated absences which are not expected to occur within twelve months after the end of the period in which the employee
renders the related service are recognised as a liability at the present value of the defi ned benefi t obligation as at the Balance Sheet
date less the fair value of the plan assets out of which the obligations are expected to be settled.
2.12 Segment reporting
The Company identifi es primary segments based on the dominant source, nature of risks and returns and the internal organisation
and management structure. The operating segments are the segments for which separate fi nancial information is available and for
which operating profi t/loss amounts are evaluated regularly by the executive Management in deciding how to allocate resources
and in assessing performance.
The accounting policies adopted for segment reporting are in line with the accounting policies of the Company. Segment revenue,
segment expenses, segment assets and segment liabilities have been identifi ed to segments on the basis of their relationship to
the operating activities of the segment.
Inter-segment revenue is accounted on the basis of transactions which are primarily determined based on market / fair value
factors.
Revenue, expenses, assets and liabilities which relate to the Company as a whole and are not allocable to segments on reasonable
basis have been included under “unallocated revenue / expenses / assets / liabilities.
2.13 Leases
Assets leased by the Company in its capacity as lessee where substantially all the risks and rewards of ownership vest in the
Company are classifi ed as fi nance leases. Such leases are capitalised at the inception of the lease at the lower of the fair value and
the present value of the minimum lease payments and a liability is created for an equivalent amount. Each lease rental paid is
allocated between the liability and the interest cost so as to obtain a constant periodic rate of interest on the outstanding liability
for each year.
Lease arrangements where the risks and rewards incidental to ownership of an asset substantially vest with the lessor are recognised
as operating leases. Lease rentals under operating leases are recognised in the Statement of Profi t and Loss on a straight-line basis.
2.14 Earnings per share
Basic earnings per share is computed by dividing the profi t / (loss) after tax (including the post tax eff ect of extraordinary items,
if any) by the weighted average number of equity shares outstanding during the year. Diluted earnings per share is computed by
dividing the profi t / (loss) after tax (including the post tax eff ect of extraordinary items, if any) as adjusted for dividend, interest and
other charges to expense or income relating to the dilutive potential equity shares, by the weighted average number of equity
shares considered for deriving basic earnings per share and the weighted average number of equity shares which could have
been issued on the conversion of all dilutive potential equity shares. Potential equity shares are deemed to be dilutive only if their
conversion to equity shares would decrease the net profi t per share from continuing ordinary operations. Potential dilutive equity
shares are deemed to be converted as at the beginning of the period, unless they have been issued at a later date. The dilutive
potential equity shares are adjusted for the proceeds receivable had the shares been actually issued at fair value (i.e. average
market value of the outstanding shares). Dilutive potential equity shares are determined independently for each period presented.
The number of equity shares and potentially dilutive equity shares are adjusted for share splits / reverse share splits and bonus
shares, as appropriate.
2.15 Taxes on income
Current tax is the amount of tax payable on the taxable income for the year as determined in accordance with the provisions of the
Income Tax Act, 1961 and Foreign tax laws.
Minimum Alternate Tax (MAT) paid in accordance with the tax laws, which gives future economic benefi ts in the form of adjustment
to future income tax liability, is considered as an asset if there is convincing evidence that the Company will pay normal income tax.
Accordingly, MAT is recognised as an asset in the Balance Sheet when it is probable that future economic benefi t associated with
it will fl ow to the Company.
Notes forming part of the consolidated fi nancial statements

65
Notes forming part of the consolidated fi nancial statements
Deferred tax is recognised on timing diff erences, being the diff erences between the taxable income and the accounting income
that originate in one period and are capable of reversal in one or more subsequent periods. Deferred tax is measured using the
tax rates and the tax laws enacted or substantively enacted as at the reporting date. Deferred tax liabilities are recognised for all
timing diff erences. Deferred tax assets in respect of unabsorbed depreciation and carry forward of losses are recognised only if
there is virtual certainty that there will be suffi cient future taxable income available to realise such assets. Deferred tax assets are
recognised for timing diff erences of other items only to the extent that reasonable certainty exists that suffi cient future taxable
income will be available against which these can be realised. Deferred tax assets and liabilities are off set if such items relate to taxes
on income levied by the same governing tax laws and the Company has a legally enforceable right for such set off . Deferred tax
assets are reviewed at each Balance Sheet date for their realisability.
Current and deferred tax relating to items in equity are recognised in equity and not in the Statement of Profi t and Loss.
2.16 Research and development expenses
Revenue expenditure pertaining to research is charged to the Statement of Profi t and Loss. Development costs of products are
also charged to the Statement of Profi t and Loss unless a product’s technological feasibility has been established, in which case
such expenditure is capitalised. The amount capitalised comprises expenditure that can be directly attributed or allocated on a
reasonable and consistent basis to creating, producing and making the asset ready for its intended use. Fixed assets utilised for
research and development are capitalised and depreciated in accordance with the policies stated for Tangible Fixed Assets and
Intangible Assets.
2.17 Impairment of assets
The carrying values of assets / cash generating units at each Balance Sheet date are reviewed for impairment. If any indication of
impairment exists, the recoverable amount of such assets is estimated and impairment is recognised, if the carrying amount of
these assets exceeds their recoverable amount. The recoverable amount is the greater of the net selling price and their value in
use. Value in use is arrived at by discounting the future cash fl ows to their present value based on an appropriate discount factor.
When there is indication that an impairment loss recognised for an asset in earlier accounting periods no longer exists or may have
decreased, such reversal of impairment loss is recognised in the Statement of Profi t and Loss, except in case of revalued assets.
2.18 Provisions and contingencies
A provision is recognised when the Company has a present obligation as a result of past events and it is probable that an outfl ow
of resources will be required to settle the obligation in respect of which a reliable estimate can be made. Provisions (excluding
retirement benefi ts) are not discounted to their present value and are determined based on the best estimate required to settle
the obligation at the Balance Sheet date. These are reviewed at each Balance Sheet date and adjusted to refl ect the current best
estimates. Contingent liabilities are disclosed in the Notes.
2.19 Provision for warranty
As per the terms of the contracts, the Company provides post-contract services / warranty support to some of its customers.
The Company accounts for the post-contract support / provision for warranty on the basis of the information available with the
Management duly taking into account the current and past technical estimates.
2.20 Derivative contracts
The Company enters into derivative contracts in the nature of foreign currency options, forward contracts with an intention to
hedge its existing assets and liabilities, fi rm commitments and highly probable transactions. Derivative contracts which are closely
linked to the existing assets and liabilities are accounted as per the policy stated for Foreign Currency Transactions and Translations.
All other derivative contracts are marked-to-market and losses are recognised in the Statement of Profi t and Loss. Gains arising on
the same are not recognised, until realised, on grounds of prudence.
2.21 Insurance claims / Claims with ECGC
Insurance claims and claims with ECGC are accounted for on the basis of claims admitted / expected to be admitted and to the
extent that there is no uncertainty in receiving the claims.

Twenty Third Annual Report 2011 - 12
66
Notes forming part of the consolidated fi nancial statements
Rs. lakhs
As at As at
31 March, 2012 31 March, 2011
3 SHARE CAPITAL
Authorised :
35,000,000 equity shares of Rs. 10/- each with voting rights 3,500.00 3,500.00
Issued :
31,165,620 equity shares of Rs. 10/- each with voting rights 3,116.56 3,116.56
Subscribed and fully paid up :
31,138,220 equity shares of Rs.10/-each, with voting rights 3,113.82 3,113.82
Total 3,113.82 3,113.82
Reconciliation of the number of shares and amount outstanding at the beginning and at the end of the reporting period:
Equity shares with voting rights Opening
Balance
Closing
Balance
Year ended 31 March, 2012
- Number of shares 31,138,220 31,138,220
- Amount in Rs. Lakhs 3,113.82 3,113.82
Year ended 31 March, 2011
- Number of shares 31,138,220 31,138,220
- Amount in Rs. Lakhs 3,113.82 3,113.82
Details of shares held by each shareholder holding more than 5% shares:
As at 31 March, 2012 As at 31 March, 2011
Class of shares / Name of share holder Number of
shares held
% of holding
in that class of
shares
Number of
shares held
% of holding
in that class of
shares
Equity shares with voting rights
Tata Sons Limited 13,147,632 42.22% 13,147,632 42.22%
Life Insurance Corporation of India 2,023,599 6.50% 2,193,990 7.05%
The Company has only one class of Equity Share, having a par value of Rs.10/-. Each holder of equity share is entitled to one vote per
share. In the event of liquidation of the Company, the holders of the equity shares will be entitled to receive any of the remaining
assets of the company, after distribution of all preferential amount. However, as on date no such preferential amounts exists. The
distribution will be in proportion to number of equity shares held by the shareholders.

67
Notes forming part of the consolidated fi nancial statements
Rs. lakhs
As at
31 March, 2012
As at
31 March, 2011
4 RESERVES AND SURPLUS
Capital reserve:
Subsidy received from Kerala State Government 25.00 25.00
General reserve:
Opening balance 4,159.82 3,659.82
Add: Transferred from surplus in Statement of Profi t and Loss 500.00 500.00
4,659.82 4,159.82
Foreign exchange translation reserve 34.46 (1.26)
Surplus in Statement of Profi t and Loss
Opening balance 10,939.33 10,712.52
Add: Net Profi t for the year 3,458.75 3,251.67
Balance available for appropriation 14,398.08 13,964.19
Less:
- Dividend Proposed to be distributed to Equity
Shareholders (Rs.7/- per share) (previous year Rs.7/- per
share)
2,179.68 2,179.68
- Dividend tax net of reversal thereof 353.54 345.18
- Transfer to general reserve 500.00 500.00
Closing balance 11,364.86 10,939.33
Total 16,084.14 15,122.89
5 LONG-TERM PROVISIONS
Provision for compensated absences 318.38 315.99
Provision for taxation (Net of advance tax) 370.36 370.36
Total 688.74 686.35
6 SHORT TERM BORROWINGS
Working capital loans from banks - Secured, payable on demand 2,765.60 2,543.16
Secured by hypothecation of stocks of raw materials,
fi nished goods, consumable stores, book debts etc.; pari
passu charge on immovable property at Karnataka and
other movable properties
Loan from a Bank (unsecured) 650.00 -
Total 3,415.60 2,543.16
7 TRADE PAYABLES
Trade payables
-Acceptances 75.53 50.49
-Other than Acceptances (Refer Note 22.2) 4,893.49 4,052.45
Total 4,969.02 4,102.94

Twenty Third Annual Report 2011 - 12
68
Rs. lakhs
As at
31 March, 2012
As at
31 March, 2011
8 OTHER CURRENT LIABILITIES
Advance from customers 278.21 409.23
Unpaid dividend [Will be transferred to Investor Education
and Protection Fund when due]
238.91 235.82
Unearned revenue 724.90 267.13
Other Payables 46.58 43.46
Statutory Remittances (Contributions to PF and ESIC, Withholding
Taxes, VAT, Service Tax, etc.)
645.19 647.98
Payables on purchase of fi xed assets 64.01 18.86
Provision for gratuity (Refer Note 23.1.b) 219.40 274.00
Total 2,217.20 1,896.48
9 SHORT-TERM PROVISIONS
a) Provision for employee benefi ts:
Provision for compensated absences 51.53 3.85
b) Provision others:
Provision for warranty (Refer Note 23.8) 16.52 14.76
Provision for proposed equity dividend 2,179.68 2,179.68
Provision for tax on proposed dividend 353.54 353.60
Total 2,601.27 2,551.89
10 FIXED ASSETS Rs. lakhs
DESCRIPTION GROSS BLOCK DEPRECIATION BLOCK NET BLOCK
As at Sale/ As at Up to For the Sale/ Up to As at As at
a.Tangible Fixed Assets April 1, 2011 Additions Adjustment March 31,
2012
March 31,
2011
year Adjustment March 31,
2012
March 31,
2012
March 31,
2011
Land - Freehold 49.06 - - 49.06 - - - - 49.06 49.06
Land - Leasehold 85.01 - - 85.01 17.19 2.27 - 19.46 65.55 67.82
Buildings 2,151.60 7.76 - 2,159.36 374.61 71.97 - 446.58 1,712.78 1,776.99
Improvements to 383.29 226.54 (13.94) 595.89 337.98 93.70 (13.32) 418.36 177.53 45.31
leasehold premises
Plant and machinery 13.20 - - 13.20 6.34 0.71 - 7.05 6.15 6.86
Computer equipment 6,154.79 1,347.44 (1.31) 7,500.92 3,808.46 857.69 (0.77) 4,665.38 2,835.54 2,346.33
Furniture and fi xtures 1,442.21 82.84 (111.15) 1,413.90 614.81 93.02 (62.98) 644.85 769.05 827.40
Offi ce equipment 699.01 41.50 (14.04) 726.47 200.23 35.40 (3.06) 232.57 493.90 498.78
Electrical installations 1,419.43 11.99 (28.95) 1,402.47 397.08 67.57 (7.56) 457.09 945.38 1,022.35
Airconditioners 812.72 0.94 (8.04) 805.62 202.22 38.72 (1.75) 239.19 566.43 610.50
Vehicles 43.43 38.31 - 81.74 23.72 7.07 - 30.79 50.95 19.71
TOTAL 13,253.75 1,757.32 (177.43) 14,833.64 5,982.64 1,268.12 (89.44) 7,161.32 7,672.32 7,271.11
Previous year 12,288.18 1,020.86 (55.29 ) 13,253.75 4,752.82 1,276.45 (46.63 ) 5,982.64 7,271.11 7,535.36
b. Intangible Assets
Intangibles - Software 3,500.71 529.96 - 4,030.67 1,695.67 529.16 - 2,224.83 1,805.84 1,805.04
Technical Know-how - 763.92 - 763.92 - 254.64 - 254.64 509.28 -
TOTAL 3,500.71 1,293.88 - 4,794.59 1,695.67 783.80 - 2,479.47 2,315.12 1,805.04
Previous year 2,717.52 783.19 3,500.71 1,251.65 444.02 1,695.67 1,805.04 1,465.87
Notes forming part of the consolidated fi nancial statements

69
Notes forming part of the consolidated fi nancial statements
Rs. lakhs
As at
31 March, 2012
As at
31 March, 2011
11 LONG-TERM LOANS AND ADVANCES
(Unsecured, considered good)
Capital Advances 4.43 -
Deposits 1,268.65 1,269.39
Tax deducted at source/Advance tax paid (Net of provision
for tax )
1,464.79 1,103.93
MAT credit entitlement
Opening balance 2,606.75 1,820.75
Availed / (Utilized) during the year (426.00) 2,180.75 786.00 2,606.75
Share Application money in A Squared Elxsi Entertainment
LLC, USA (Refer Note 24) 518.30
-
Less: Provision for diminution in value 411.75 106.55 -
Total 5,025.17 4,980.07
12 INVENTORIES
(lower of cost or net realisable value)
Components and spares - for trading 2.13 57.11
Total 2.13 57.11
13 TRADE RECEIVABLES (Unsecured)
a) Trade receivables outstanding for a period exceeding six
months from the date they were due for payment
Considered good 439.98 1,825.74
Considered doubtful 1,787.93 2,501.70
2,227.91 4,327.44
Less: Provision for doubtful trade receivables 1,787.93 2,501.70
439.98 1,825.74
b) Other trade Receivables (Considered good) 12,125.56 8,896.18
Total 12,565.54 10,721.92
14 CASH AND CASH EQUIVALENTS
Cash on hand 1.05 0.90
Cheques on hand 89.45 15.91
Balances with banks
i) in current accounts 2,123.47 1,410.72
ii) in EEFC accounts 211.66 416.24
iii) in earmarked accounts
- Unpaid dividend accounts 238.91 235.82
- Balances held as margin money or security against
commitments 7.20 -
2,581.24 2,062.78
Total 2,671.74 2,079.59
Of the above, the balances that meet the defi nition of Cash
and cash equivalents as per AS 3 Cash Flow Statements is
2,664.54 2,079.59

Twenty Third Annual Report 2011 - 12
70
Notes forming part of the consolidated fi nancial statements
Rs. lakhs
As at
31 March, 2012
As at
31 March, 2011
15 SHORT-TERM LOANS AND ADVANCES
(Unsecured and considered good)
a) Loans and advances to employees 142.95 185.23
b) Prepaid Expenses 256.44 205.59
c) Claims Receivable 329.12 140.81
d) Advance to suppliers 298.30 606.66
e) Deposits 11.62 9.11
Total 1,038.43 1,147.40
16 OTHER CURRENT ASSETS
Unbilled revenue 1,125.22 921.76
Total 1,125.22 921.76
Rs. lakhs
For the year
ended
31 March, 2012
For the year
ended
31 March, 2011
17 REVENUE FROM OPERATIONS
Sale of traded goods (Refer note (i) below) 5,305.57 3,310.59
Rendering of services (Refer note (ii) below) 48,565.17 38,280.53
Total 53,870.74 41,591.12
(i) Sale of traded goods include sales of computers,
networking and storage systems.
(ii) Rendering of services comprises:
(a) Product Design 42,269.11 33,813.68
(b) Graphics Animation and Gaming 3,156.37 2,006.17
(c) System Integration and Support 3,139.69 2,460.68
48,565.17 38,280.53
18 OTHER INCOME
Interest from:
- banks 3.25 29.97
- others - 3.44
Net gain on foreign currency transactions and translation 380.87 281.57
Miscellaneous income 36.38 71.36
Total 420.50 386.34
19 PURCHASES
Purchase of traded goods 4,358.89 2,259.22
Spares, consumables and others 2,758.45 3,157.92
Total 7,117.34 5,417.14
19A CHANGES IN INVENTORIES OF STOCK-IN-TRADE
Inventories at the end of the year:
Stock-in-trade 2.13 57.11
Inventories at the beginning of the year:
Stock-in-trade 57.11 6.24
Net (increase) / decrease 54.98 (50.87)

71
Notes forming part of the consolidated fi nancial statements
Rs. lakhs
For the year
ended
31 March, 2012
For the year
ended
31 March, 2011
20 EMPLOYEE BENEFITS EXPENSE
Salaries 26,208.88 20,404.06
Contribution to provident and other funds 809.62 671.79
Staff welfare expenses 788.79 594.43
Total 27,807.29 21,670.28
21 OTHER EXPENSES
Operating lease rentals (Refer Note23.4) 1,399.87 1193.81
Rates and taxes 102.07 106.35
Power and fuel 737.39 642.14
Repairs and maintenance : Building 159.50 22.19
: Plant and machinery 265.47 262.16
: Others 234.64 199.20
Telephone, datalink, courier and postage 659.25 554.50
Inland travel and conveyance 719.99 703.86
Overseas travel 1,890.04 1,605.80
Advertisement and sales promotion expenses 310.20 302.23
Commission on sales 73.38 59.74
Hire charges 65.62 86.68
Printing and stationery 86.04 99.48
Motor vehicle expenses 292.08 172.80
Recruitment 106.01 66.50
Training 161.22 128.29
Consultant fees for software development 2,595.17 1,062.68
Legal and professional charges 834.41 599.30
Secretarial charges 5.85 10.60
Insurance 101.22 114.96
Loss on sale of assets (net) 33.14 1.22
Bank and other charges 70.75 46.63
Commission to non-executive directors 50.00 30.00
Auditors’ remuneration (Refer Note (i) below) 37.56 23.50
Bad debts/advances written off 1,200.02
Less: Amount transferred from provision for doubtful debts 1,200.02 - -
Provision for doubtful debts/ advances 486.25 1,625.00
Provision for warranty (net) (Refer Note 23.8) 1.76 14.76
General expenses 12.12 100.58
Total 11,491.00 9,834.96
Note (i): Payments to the auditors comprises:
As auditors - statutory audit 31.56 19.68
Company law matters 0.75 0.75
Reimbursement of expenses 1.40 1.03
Service Tax 3.85 2.04
Total 37.56 23.50

Twenty Third Annual Report 2011 - 12
72
Notes forming part of the consolidated fi nancial statements
Rs. lakhs
As at
31 March, 2012
As at
31 March, 2011
22.1 Contingent liabilities and commitments (to the extent not provided for)
(i) Contingent liabilities
(a) Claims against the Company not acknowledged as debt
1. Disputed demands for Income tax aggregates 1,038.12 1,040.69
2. Disputed demands for Wealth tax aggregates 25.89 25.89
3. Disputed amount of Sales tax aggregates 656.83 656.83
4. Service tax matters 842.26 193.61
5. Amount not recognised as debts 292.44 -
(b) Guarantees : Guarantees given to Housing Finance Company for housing loans availed
by employees during their employment with the company
104.96 122.87
(c) Guarantee given to a bank for loan to be secured by A squared Elxsi Entertainment LLC,
USA(A2E2)
1,594.50 -
(d) Loan drawn by A2E2 against the above guarantee 1,024.38 -
(ii) Capital Commitments :
(a) Estimated amount of contracts remaining to be executed on capital account and not
provided for
Tangible assets 198.30 215.10
Intangible assets 141.50 37.51
22.2 Disclosures required under Section 22 of the Micro, Small and Medium Enterprises Development Act, 2006
Particulars
(i) Principal amount remaining unpaid to any supplier as at the end of the accounting year 3.39 1.87
(ii) Interest due thereon remaining unpaid to any supplier as at the end of the accounting
year
1.71 1.03
(iii) The amount of interest paid along with the amounts of the payment made to the
supplier beyond the appointed day
1.03
(iv) The amount of interest due and payable for the year 1.71
(v) The amount of interest accrued and remaining unpaid at the end of the accounting
year
1.71 1.03
(vi) The amount of further interest due and payable even in the succeeding year, until such
date when the interest dues as above are actually paid
- -
Dues to Micro and Small Enterprises have been determined to the extent such parties have been identifi ed on the basis of
information collected by the Management. This has been relied upon by the auditors.

73
Notes forming part of the consolidated fi nancial statements
22.3 Disclosure as per Clause 32 of the Listing Agreements with the Stock Exchanges
Loans and advances in the nature of loans given to subsidiaries, associates and others and investment in shares of the Company
by such parties:
Rs. lakhs
Name of the party Relationship Amount outstanding as at
31 March, 2012
Maximum balance
outstanding during the year
A Squared Elxsi Entertainment
LLC, USA (Refer Note 24.4.c)
Proposed Subsidiary
1,024.38 1,024.38
(Nil) (Nil)
Note: Figures in bracket relate to the previous year.
22.4 Details on derivatives instruments and unhedged foreign currency exposures
I. The following derivative positions are open as at 31 March, 2012. These transactions have been undertaken to act as economic
hedges for the Company’s exposures to various risks in foreign exchange markets and may / may not qualify or be designated
as hedging instruments. The accounting for these transactions is stated in Notes 2.11 and 2.20
(a) Forward exchange contracts and options [being derivative instruments], which are not intended for trading or speculative
purposes but for hedge purposes to establish the amount of reporting currency required or available at the settlement date of
certain payables and receivables.
(i) Outstanding forward exchange contracts entered into by the Company as on 31 March, 2012
Currency Amount Buy / Sell Amount
USD 16 lakhs Sell Rs. 826.08 lakhs
(Nil) (Nil)
GBP 5 lakhs Sell Rs. 394.95 lakhs
(Nil) (Nil)
JPY 200 lakhs Sell Rs. 134.90 lakhs
(Nil) (Nil)
EURO 1 lakh Sell Rs. 66 lakhs
(Nil) (Nil)
Note: Figures in brackets relate to the previous year
(ii) Outstanding option contracts entered into by the Company as on 31 March, 2012
Currency Amount Buy / Sell Amount
JPY - - -
(1200 lakhs) Sell (Sell@ Rs. 659.40 lakhs)
USD - - -
( 15 lakhs) Sell (Sell@ Rs. 673.50 lakhs)
EURO - - -
( 7.5 lakhs) Sell (Sell@ Rs. 469.13 lakhs)
GBP - - -
( 5.0 lakhs) Sell (Sell@ Rs. 384.40 lakhs)
Note: Figures in brackets relate to the previous year

Twenty Third Annual Report 2011 - 12
74
Notes forming part of the consolidated fi nancial statements
(iii). The year-end foreign currency exposures that have not been hedged by a derivative instrument or otherwise are given below:
As at 31 March, 2012 As at 31 March, 2011
Receivable
in foreign currency
lakhs
Receivable
Rs. lakhs
Receivable
in foreign currency
lakhs
Receivable
Rs. lakhs
Euro 15.68 1,072.10 Euro 3.04 192.31
GBP 34.56 2,826.96 GBP 29.27 2,102.03
USD 68.43 3,505.04 USD 100.87 4,511.04
JPY 2,898.51 1,809.41 JPY 1,348.80 729.99
ZAR 7.23 55.18 ZAR 5.03 33.30
KRW 20.46 0.91 KRW 20.44 0.82
(iv). Amount payable in foreign currency on account of purchase of goods and services
As at 31 March, 2012 As at 31 March, 2011
Payable Payable
in foreign currency
lakhs
Payable
Rs. lakhs
in foreign currency
lakhs
Payable
Rs. lakhs
Euro 0.56 38.25 Euro 1.61 101.87
GBP 0.29 23.42 GBP 0.80 57.59
USD 25.36 1,298.93 USD 7.25 323.84
JPY 2.98 1.86 - - -
ZAR 0.05 0.35 - - -
23.1 Employee benefi t plans
23.1.a Defi ned contribution plans
The Company makes Provident Fund and Superannuation Fund contributions to defi ned contribution plans for qualifying employees.
Under the Schemes, the Company is required to contribute a specifi ed percentage of the payroll costs to fund the benefi ts. The
Company recognised Rs. 471.93 lakhs (Year ended 31 March, 2011 Rs.415.99 lakhs) for Provident Fund contributions and Rs. 197.99
lakhs (Year ended 31 March, 2011 Rs. 150.95 lakhs) for Superannuation Fund contributions in the Statement of Profi t and Loss. The
contributions payable to these plans by the Company are at rates specifi ed in the rules of the schemes.
23.1.b Defi ned benefi t plans
The Company off ers gratuity to its employees under defi ned benefi t plans.
The following table sets out the funded status of the defi ned benefi t schemes and the amount recognised in the fi nancial statements:
Rs. lakhs
Particulars Year ended 31
March, 2012
Year ended 31
March, 2011
Components of employer expense
Current service cost 118.06 115.13
Interest cost 44.21 46.95
Expected return on plan assets (22.29) (25.73)
Curtailment cost / (credit) - -
Settlement cost / (credit) - -

75
Notes forming part of the consolidated fi nancial statements
Rs. lakhs
Particulars Year ended
31 March, 2012
Year ended
31 March, 2011
Past service cost - -
Actuarial losses/(gains) (12.56) (31.34)
Total expense recognised in the Statement of Profi t and Loss 127.42 105.85
Actual contribution and benefi t payments for year
Actual benefi t payments 70.00 86.04
Actual contributions 182.02 160.00
Net asset / (liability) recognised in the Balance Sheet
Present value of defi ned benefi t obligation (664.89) (552.64)
Fair value of plan assets 445.49 278.64
Funded status [Surplus / (Defi cit)] - -
Unrecognised past service costs - -
Net asset / (liability) recognised in the Balance Sheet (219.40) (274.00)
Change in defi ned benefi t obligations (DBO) during the year
Present value of DBO at beginning of the year 552.64 533.67
Current service cost 118.06 115.13
Interest cost 44.21 46.95
Curtailment cost / (credit) - -
Settlement cost / (credit) - -
Plan amendments - -
Acquisitions - -
Actuarial (gains) / losses 19.98 (57.07)
Past service cost - -
Benefi ts paid (70.00) (86.04)
Present value of DBO at the end of the year 664.89 552.64
Change in fair value of assets during the year
Plan assets at beginning of the year 278.64 204.68
Acquisition adjustment - -
Expected return on plan assets 22.29 25.73
Actual company contributions 182.02 160.00
Actuarial gain / (loss) 32.54 (25.73)
Benefi ts paid (70.00) (86.04)
Plan assets at the end of the year 445.49 278.64
Actual return on plan assets 54.83 25.73
Planned asset are insurer managed funds (Life Insurance Corporation of India)
Category of such assets is not disclosed as such information is not available from the
insurer who manages the funds.
LIC- Mortality (1994-96)Table
21-30 years 10%
31-40 years 5%
41-50 years 3%
51 & above -2%

Twenty Third Annual Report 2011 - 12
76
Particulars Year ended
31 March, 2012
Year ended
31 March, 2011
Actuarial assumptions:
Discount rate 8.50% 8.00%
Expected return on plan assets 8.60% 8.00%
Salary escalation 5.00% 5.00%
Attrition 10% if <5 yrs ;else 8% 10% if <5 yrs ;else 8%
Estimate of amount of contribution in the immediate next year (Rs. lakhs) 167.98 163.61
Experience adjustments
Rs. lakhs
Gratuity 2011-12 2010- 11 2009-10 2008-09 2007-08
Present value of DBO 664.89 (552.64) (533.67) (467.06) (410.69)
Fair value of plan assets 445.49 278.64 204.68 179.86 142.13
Funded status [Surplus / (Defi cit)] (219.40) (274.00) (328.99) (287.20) (268.56)
Experience (gain) / loss adjustments
on plan liabilities
42.82 (57.07) (5.23) (53.12) 2.22
Experience gain / (loss) adjustments
on plan assets
32.54 (25.73) 0.96 (2.20) (0.38)
Particulars For the year ended
31 March, 2012
For the year ended
31 March, 2011
Actuarial assumptions for long-term compensated absences
Discount rate 8.50% 8.00%
Expected return on plan assets 8.60% 8.00%
Salary escalation 5.00% 5.00%
Attrition 10% if <5 yrs; else 8% 10% if <5 yrs; else 8%
23.2 Segment information
The Company has identifi ed business segments as its primary segment and geographic segments as its secondary segment.
Business segments are primarily System integration & support and Software Development & Services. Revenues and expenses
directly attributable to segments are reported under each reportable segment. All other expenses which are not attributable or
allocable to segments have been disclosed as unallocable expenses. Assets and liabilities that are directly attributable or allocable
to segments are disclosed under each reportable segment. All other assets and liabilities are disclosed as unallocable. Fixed assets
that are used interchangeably amongst segments are not allocated to primary and secondary segments. Geographical revenues are
allocated based on the location of the customer. Geographic segments of the Company are India, Europe, US, Japan and Others.
Notes forming part of the consolidated fi nancial statements
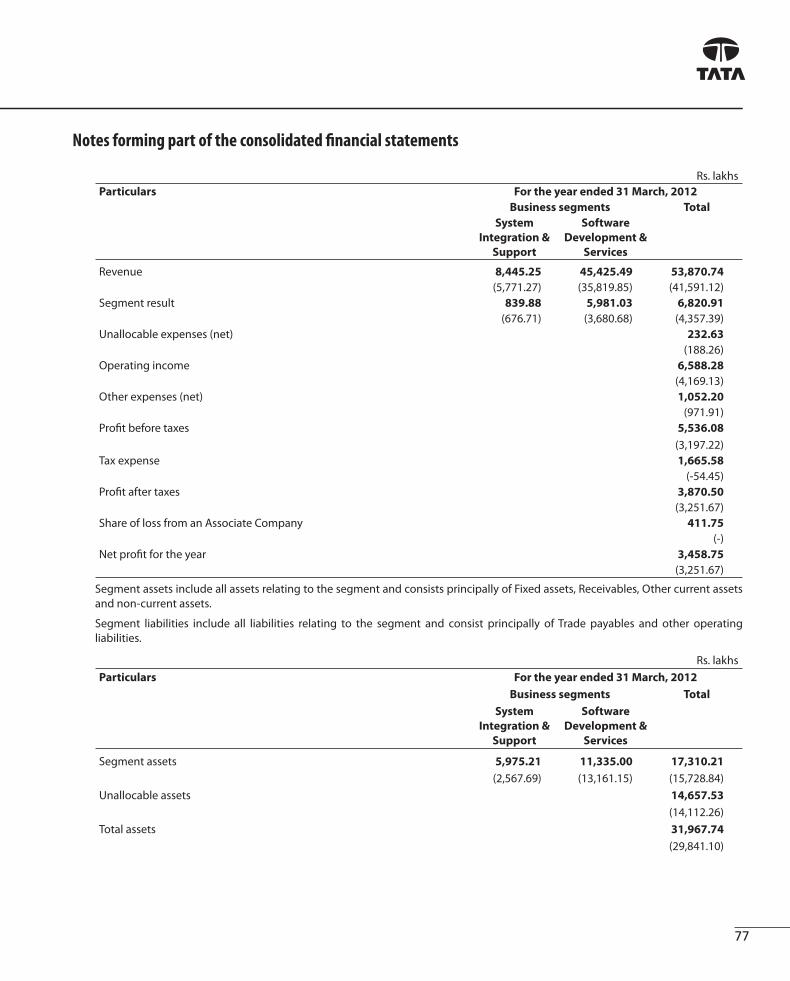
77
Notes forming part of the consolidated fi nancial statements
Rs. lakhs
Particulars For the year ended 31 March, 2012
Business segments Total
System
Integration &
Support
Software
Development &
Services
Revenue 8,445.25 45,425.49 53,870.74
(5,771.27) (35,819.85) (41,591.12)
Segment result 839.88 5,981.03 6,820.91
(676.71) (3,680.68) (4,357.39)
Unallocable expenses (net) 232.63
(188.26)
Operating income 6,588.28
(4,169.13)
Other expenses (net) 1,052.20
(971.91)
Profi t before taxes 5,536.08
(3,197.22)
Tax expense 1,665.58
(-54.45)
Profi t after taxes 3,870.50
(3,251.67)
Share of loss from an Associate Company 411.75
(-)
Net profi t for the year 3,458.75
(3,251.67)
Segment assets include all assets relating to the segment and consists principally of Fixed assets, Receivables, Other current assets
and non-current assets.
Segment liabilities include all liabilities relating to the segment and consist principally of Trade payables and other operating
liabilities.
Rs. lakhs
Particulars For the year ended 31 March, 2012
Business segments Total
System
Integration &
Support
Software
Development &
Services
Segment assets 5,975.21 11,335.00 17,310.21
(2,567.69) (13,161.15) (15,728.84)
Unallocable assets 14,657.53
(14,112.26)
Total assets 31,967.74
(29,841.10)

Twenty Third Annual Report 2011 - 12
78
Notes forming part of the consolidated fi nancial statements
Rs. lakhs
Particulars For the year ended 31 March, 2012
Business segments Total
System
Integration &
Support
Software
Development &
Services
Segment liabilities 2,249.22 3,433.38 5,682.60
(1,563.09) (1,976.54) (3,539.63)
Unallocable liabilities 4,423.27
(8,241.19)
Total liabilities 10,105.87
(11,780.82)
Other information
Capital expenditure (unallocable) 3,051.20
(1,804.05)
Depreciation and amortisation (unallocable) 2,051.92
(1,720.47)
Provision for doubtful debts 486.25
(1,625.00)
Provision for diminution in value of investment 411.75
(-)
The geographic segments individually contributing 10 percent or more of the Company’s revenues and segment assets are shown
separately:
Rs. lakhsGeographic Segment Revenues
For the year
ended
31 March, 2012
Segment assets
as at
31 March, 2012
Capital
expenditure
incurred as at
31 March, 2012
India 13,846.89 14,107.30 2,201.29
(10,387.53) (13,609.90) (1,534.03)US 15,711.57 3,798.48 768.26
(13,059.10) (3,062.08) (266.93)Europe 17,713.27 4,193.46 26.32
(11,706.57) (3,352.73) (0.42)Japan 5,224.12 1,499.86 55.33
(5,009.53) (114.59) (2.67)Others 1,374.89 - -
(1,428.39) (842.31) -
Total 53,870.74 23,599.10 3,051.20
(41,591.12) (20,981.60) (1,804.05)
Note: Figures in bracket relates to the previous year
Segment revenue in India comprises revenue from System Integration and software development and services. Segment revenue
outside India predominantly comprises revenue from software development and services. Segment assets include all assets relating
to the segment and consist principally of Fixed assets, Receivables, Inventory, Other Current and Non-Current Assets. Assets located
outside India primarily relate to Trade Receivables.

79
Notes forming part of the consolidated fi nancial statements
23.3 Related party transactions
23.3.a Details of related parties:
Description of relationship Names of related parties
Company with Signifi cant Infl uence Tata Sons Ltd
Key Management Personnel (KMP) Mr. Madhukar Dev- Managing Director
Note: Related parties have been identifi ed by the Management.
Details of related party transactions during the year ended 31 March, 2012 and balances outstanding as at 31 March, 2012:
Rs. lakhs23.3.b Pariculars Company with
Signifi cant
Infl uence
KMP Total
Receiving of services- Brand fee and other Services 147.55 147.55 (131.63) (131.63)
Managerial remuneration and commission 148.94 148.94 (130.85) (130.85)
Guarantees and collateralsBalances outstanding at the end of the yearTrade payable 129.58 60.00 189.58
(113.44) (50.00) (163.44)
Note: Figures in bracket relates to the previous year
Rs. lakhs23.4 Particulars For the year
ended
31 March, 2012
For the year
ended
31 March, 2011Details of leasing arrangementsThe Company has entered into operating lease arrangements for certain facilities and
offi ce premises. Some of these leases are non-cancellable and are for a period of one to
three years and may be renewed based on mutual agreement of the parties. These lease
agreements provide for an increase in the lease payments by up to 5 % every year.Future minimum lease payments not later than one year 198.35 289.94 later than one year and not later than fi ve years 90.03 159.40 later than fi ve years Nil Nil Lease payments recognised in the Statement of Profi t and Loss 1,399.87 1,193.81
23.5 Particulars For the year
ended
31 March, 2012
For the year
ended
31 March, 2011Earnings per shareBasicNet profi t / (loss) for the year from continuing operations attributable to the equity
shareholders (Rs. lakhs)
3,458.75 3,251.67
Weighted average number of equity shares 31,138,220 31,138,220 Par value per share (Rs.) 10.00 10.00 Earnings per share - Basic and diluted (Rs.) 11.11 10.44

Twenty Third Annual Report 2011 - 12
80
Notes forming part of the consolidated fi nancial statements
Rs. lakhs
23.6 Particulars As at
31 March, 2012
As at
31 March, 2011
Deferred tax (liability) / asset
Tax eff ect of items constituting deferred tax liability
On diff erence between book balance and tax balance of fi xed assets (1,305.18) (1,198.98)
Tax eff ect of items constituting deferred tax liability (1,305.18) (1,198.98)
Tax eff ect of items constituting deferred tax assets
Disallowances under Section 40(a)(i), 43B of the Income Tax Act, 1961, etc. 933.18 1,048.98
Mumbai, May 7, 2012
Tax eff ect of items constituting deferred tax assets 933.18 1,048.98
Net deferred tax (liability) / asset (372.00) (150.00)
Rs. lakhs
23.7 Particulars For the year
ended
31 March, 2012
For the year
ended
31 March, 2011
Details of research and development expenditure recognised as employee benefi t expenses
and other expenses in note 20 and 21 respectively are net of the following expenses that
have been capitalised as part of intangible assets/intangible assets under development.
a) Employee benefi t expenses 743.77 558.26
b) Other expenses 165.15 205.45
Total 908.92 763.71
23.8 Details of provisions
The Company has made provision for various contractual obligations and disputed liabilities based on its assessment of the amount
it estimates to incur to meet such obligations, details of which are given below:
Rs. lakhs
Particulars As at
1 April, 2011
Additions Utilisation Reversal
(withdrawn
as no longer
required)
As at
31 March, 2012
Provision for warranty 14.76 12.54 10.78 (Nil) 16.52
(Nil) (14.76) (Nil) (Nil) (14.76)
Note: - Figures in brackets relate to the previous year.
Of the above, the following amounts are expected to be incurred within a year:
Rs.lakhs
Particulars As at
31 March, 2012
As at
31 March, 2011
Provision for warranty 16.52 14.76
24 Investment in A Squared Elxsi Entertainment LLC, USA
The Company has entered into a Joint Venture Agreement with A Squared Entertainment LLC, USA (“A2”) for carrying on business
in the fi eld of animated content development, development of related characters/intellectual property and licensing thereof to
merchandising companies, pursuant to which A Squared Elxsi Entertainment LLC, USA (“A2E2”) has been incorporated to carry on the

81
Notes forming part of the consolidated fi nancial statements
activities of the Joint Venture. The Company has remitted USD 1,000,001 as Share Application Money to A2E2 against which shares
are yet to be allotted as at March 31, 2012. The JV Partner, A2 is in the process of completing its obligation under the agreement, on
completion of which and issuance of equity to both the parties, A2E2 will become a subsidiary of the Company. As at 31 March, 2012,
for the purpose of presenting the consolidated results, A2E2 has been considered as an associate.
25 Summary of Information relating to subsidiary is as follows
Subsidiary Tata Elxsi (Singapore) Pte Ltd
2011-12 2010-11
Exchange rate as at March 31,2012 Rs. 51.22 Rs. 44.72
Rs. lakhs
Issued and Subscribed share capital 28.67 28.67
Reserves 290.66 190.75
Loans - -
Total assets 475.56 326.43
Total liabilities 475.56 326.43
Investments Long-term - -
Current - -
Total - -
Turnover 2653.98 489.96
Profi t/(Loss) before taxation Rs. Lakhs 281.76 85.26
Provision for taxation 25.58 7.05
Profi t/(Loss) after taxation 256.18 78.21
Dividend paid 191.96 -
26 The Revised Schedule VI has become eff ective from 1 April, 2011 for the preparation of fi nancial statements. This has signifi cantly
impacted the disclosure and presentation made in the fi nancial statements. Previous year’s fi gures have been regrouped / reclassifi ed
wherever necessary to correspond with the current year’s classifi cation / disclosure.
For and on behalf of the Board of Directors
S. Ramadorai Chairman Shyamala Gopinath Director Madhukar Dev Managing Director Sudha Madhavan Chief Financial Offi cer G. Vaidyanathan Company Secretary
Mumbai, May 07, 2012

Twenty Third Annual Report 2011 - 12
82
Twenty Third Annual Report 2011 - 12
82
Rs. lakhs
Subsidiary Year Exchange rate as at March 31 Rs./USD
Issued and Subscribedshare capital
Reserves Loans Total assets
Total liabilities
Investments Turnover Profi t/(Loss) before taxation
Provision for taxation
Profi t/(Loss) after taxation
Dividend
Long-term
Current Total
Tata Elxsi (Singapore) Pte. Ltd
2011-12
2010-11
51.22
44.72
28.67
28.67
290.66
190.75
-
-
475.56
326.43
475.56
326.43
-
-
-
-
-
-
2653.98
489.96
281.76
85.26
25.58
7.05
256.18
78.21
191.96
-
Statement pursuant to Section 212 of the Companies Act, 1956
Signifi cant 3 year highlights (Consolidated)
3 Years Profi t and Loss Account Rs. lakhs
31.03.2012 31.03.2011 31.03.2010
INCOME
Sales and services 53,870.74 41,591.12 38,817.25
Other Income 420.50 386.34 94.94
Total 54,291.24 41,977.46 38,912.19
EXPENDITURE
Cost of sales 7,172.32 5,381.03 4,864.06
Personnel expenses 27,807.29 21,670.28 20,031.89
Administrative and selling expenses 11,491.00 9,834.96 7,122.58
Financial expenses 232.63 188.26 173.88
Depreciation 2,051.92 1,720.47 1,658.26
Total 48,755.16 38,780.24 33,850.67
Profi t before Tax for the year 5,536.08 3,197.22 5,061.52
Provision for Tax (1,665.58) 54.45 179.81
Profi t after Tax 3,870.50 3,251.67 4,881.71
Share of loss from an Associate Company 411.75 - -
Net Profi t for the year 3,458.75 3,251.67 4,881.71
Signifi cant Ratio Analysis
S. No. Particulars Unit 31.03.2012 31.03.2011 31.03.2010
1 Earnings before interest, depreciation and tax/Sales % 14.40 12.16 17.72
2 Profi t before taxes/Sales % 10.20 7.62 13.01
3 Profi t after taxes/Sales % 7.13 7.75 12.55
4 Current Ratio No. of Times 1.78 1.75 2.71
5 Debt Equity Ratio % 17.79 13.95 19.40
6 Earnings per share Rs. 11.11 10.44 15.68
7 Dividend per share Rs. 7.00 7.00 7.00
8 Book Value share Rs. 61.65 58.57 56.24
9 Return on Net Worth % 18.02 17.83 27.88
10 Return on Capital Employed % 15.30 15.65 23.35

Industries Served
engineering creativity ... in every aspect engineeringengineering creativity ... creativity ... in every aspectin every aspect
Broadcast
Defence and Homeland Security
FMCG
Semiconductor
Aerospace
ConsumerElectronics
Media andEntertainment
Healthcare
Automotive
Communication

ITPB Road Whitefield Bangalore 560 048 India
Tel +91 80 2297 9123 Fax +91 80 2841 1474 e-mail [email protected]
www.tataelxsi.com