annual report 2010/11 - parliament of nsw
TRANSCRIPT

Annual Report 2010/11


Ausgrid – Annual Report 2010/11 3
ContentsAbout this report 4
Ausgrid 5
Chairman and Managing Director’s report 9
Key results 11
Strategic achievements, challenges and targets 12
Operational excellence 15
Marketplace 19
Community 23
Environment 27
Workplace 31
Finance report 34
Directors’ report 35
Consolidated financial report 39
Directors’ declaration 95
Independent auditor’s report 96
Statutory information 98
Independent assurance statement 122
Glossary 125
Index 127

4
The organisation that operates the electricity network across
the Central Coast, the Hunter and much of Sydney was renamed
Ausgrid in March, after the sale of the EnergyAustralia retail
assets. A program to roll out the new brand across buildings,
trucks and uniforms began and will continue over the next 18
months. The sale included an agreement to transition all retail
services over 2-3 years, including billing operations
for customers.
Launching a new brand
Ausgrid was known as EnergyAustralia
up until 2 March 2011 and comprised an
electricity network and retail business. In
March, the EnergyAustralia retail brand,
customer and wholesale contracts were
sold to TRUenergy. The electricity network
business is now called Ausgrid.
This report refers to Ausgrid throughout, and
outlines the performance of the organisation
over the period, including its operations as
both EnergyAustralia and Ausgrid. It does not
cover TRUenergy’s use of the EnergyAustralia
brand between 1 March and 30 June 2011.
The contents of this report are guided by:
The State Owned Corporations Act (1989)
The Annual Report Statutory Bodies Act
(1984)
The Global Reporting Initiative (GRI)
Sustainability Reporting Guidelines
Version 3.0 and Electric Utility Sector
Supplement; and
The Energy Supply Association of Australia
(esaa) Sustainable Practice Framework.
Report layout
This report is separated into three main
sections representing the material issues of
EnergyAustralia and Ausgrid’s key interest groups:
1. Performance highlights – a written
account of EnergyAustralia and Ausgrid’s
operations and performance based on
its corporate scorecard areas including
workplace, community, marketplace,
operational excellence, finance
and environment.
2. Consolidated financial report – the
company’s financial statements for the
2010/11 financial year.
3. Statutory information – the information
the company is legally obliged to disclose.
A glossary and index are included on
pages 125–128.
Ausgrid’s Sustainability Indicators
Supplement provides a full account of the
organisation’s performance in meeting
the core indicators identified in the Global
Reporting Initiative (GRI) Sustainability
Reporting Guidelines version 3.0 and Electric
Utility Sector Supplement; and the Energy
Supply Association of Australia Sustainable
Practice Framework. The supplement is
available at www.ausgrid.com.au.
Together with the 2010/11 Annual Report,
this sustainability supplement provides a full
account of Ausgrid’s financial and organisational
performance during the reporting period.
Assurance
The consolidated financial report has been
audited by the Audit Office of NSW and the
Independent Auditor’s report can be found
on page 96. The non-financial content of this
report has also been externally audited by Net
Balance to the AA1000 Assurance Standard
2008 and a detailed assurance statement is on
pages 122–124.
Feedback
Ausgrid encourages your feedback on this
report. Any feedback can be provided to:
[email protected] or via
Twitter and Facebook, or
GPO Box 4009, Sydney NSW 2001.
About this reportAusgrid’s 2010/11 Annual Report documents the operating, financial and sustainability performance for the period 1 July 2010 to 30 June 2011.

Ausgrid – Annual Report 2010/11 5
Ausgrid’s distribution network covers
22,275 square kilometres from Waterfall in
Sydney’s south to Auburn in western Sydney
and the upper Hunter Valley in the north.
Ausgrid supplies electricity to more than
1.6 million customers in Sydney, the Central
Coast and the Hunter Region in New South
Wales (NSW). Its electricity network powers
large and small businesses, as well as major
industry including mining, shipping, tourism,
manufacturing and agriculture.
Up until 1 March 2011, the organisation was
also a retailer of electricity and gas to more
than 1.54 million homes and businesses
in New South Wales, the Australian
Capital Territory (ACT), Victoria (VIC) and
Queensland (Qld).
Purpose and vision
Ausgrid re-examined its purpose and vision
following the sale of its retail assets. Its
vision is to be a world leader in distributing
electricity and providing energy services
by being:
Australia’s safest network and cause zero
harm to its employees and the public
Australia’s most efficient and respected
energy services provider
Australia’s most reliable network and a
leader in smart grid technology
A culture of innovation and sustainability.
This vision will be achieved through Ausgrid’s
company values of:
Safe and reliable
Future focussed
Efficient; and
Caring.
Ausgrid’s operations are guided by a
number of important policies and codes,
including a Code of Conduct, Safety Policy,
Environmental Code of Conduct and Policy
and Statement of Ethics.
The organisation publishes a Statement of
Corporate Intent, outlining its strategies, risks
and operational and commercial objectives.
A document called Supply and Demand:
Investment in the Electricity Network is also
published and outlines planned investments in
Ausgrid’s electricity network.
Additional information on average household
electricity use, solar panel installations,
streetlight repair times, graffiti clean ups and
network upgrades are also published on its
website according to local government areas.
Network map
Ausgrid

6
Ausgrid
Organisation structure
Board
Internal AuditOffice of the
Managing Director*
Distribution,
Operations and
Reliability
Responsible
for planning,
designing, building
and maintaining
the 11kV and low
voltage network,
along with
new customer
connections,
security, claims
management,
logistics and fleet
management.
Transmission and
System Operations
Responsible for
the development,
design,
construction,
commissioning and
maintenance of
our high-voltage
network as well as
making investment
decisions and
prioritising the
delivery of our
capital works
program and the
daily operation of
our network.
System Planning
and Regulation
Responsible
for long-term
planning of major
projects, including
maintenance,
managing all
regulatory and
pricing issues,
managing
major customer
connections
and metering.
Finance and
Corporate
Responsible for
managing the
organisation’s
finances,
information
technology and
property portfolio.
Shared Services
Responsible for
servicing the
Ausgrid network
customer and retail
billing, contact
centre operations,
geospatial
information,
metering data
services, responding
to customer
complaints and
revenue collection.
This division also
provides services
for TRUenergy.
Distribution Operations and
Reliability
Transmission and System Operations
System Planning and Regulation
Finance and Corporate
Shared Services
Human Resources
Human Resources
Responsible for
recruitment,
development,
mentoring
and coaching,
performance
management,
payroll services,
health and safety
framework,
workplace
relations
and workers
compensation.
Managing Director
* The Office of the MD includes Secretariat, Legal, Energy Services & Corporate Communications. Operational functions commenced transition
from Shared Services to the new Energy Services business from April until July 2011.

Ausgrid – Annual Report 2010/11 7
A performance dashboard, Our Scorecard
2010/11 is published and is available on the
Ausgrid website, www.ausgrid.com.au.
Principal activities and governance
Ausgrid is a NSW State Owned Corporation
established under the Energy Services
Corporations Act 1995 and the State Owned
Corporations Act 1989. Ausgrid’s main activities
are the safe ownership and management of
its electricity network. Prior to March 2011,
activities also included the retailing of electricity
and gas in the national market.
The business is regulated by a large number
of statutory and legislative requirements
including OH&S, environmental, trade
practices, industrial, consumer protection
and information laws, the National Electricity
and Gas Law Rules, the NSW Electricity Supply
Act 1995, and a NSW Distribution Network
Service Provider licence.
Ausgrid ensures compliance with these laws
and regulations through its internal codes
and policies by a common control framework.
It comprises plans, policies, procedures,
delegations, instruction and training, audit
and risk management.
Internal control and compliance is
monitored by the Board of Directors. Ausgrid
has robust risk management policies and
processes, including a strong internal audit
function and emergency management
system. Maintaining ethical behaviour is
core to effective corporate governance and
Ausgrid has a Business Ethics Committee, a
Statement of Ethics and a Business Guideline
for its suppliers.
Ausgrid delivers its business activities through
six business divisions, Internal Audit and
the Office of the Managing Director, which
includes Corporate Secretary, Legal and
Corporate Communications.
Ausgrid’s Shareholding Ministers are the
NSW Treasurer and the Minister for Finance.
The Shareholding Ministers appoint the
Ausgrid Board. The Directors’ Report section
(see page 35) includes a description of the
Board functions and structure, the members
of the Board and the Executive.
Scale
In 2010/11, Ausgrid’s network supplied
more than 30,691 GWh of electricity to over
1.6 million network customers. It had 5,941
full-time equivalent employees and net
profit after tax of $325.9 million (excluding
the sale of the retail assets). Total company
assets were $11.27 billion with shareholders
equity of $1.93 billion.
Ausgrid’s distribution network includes:
A subtransmission system of 33kV, 66kV
and 132kV assets
A high-voltage distribution system of 5kV
and 11kV assets
A low-voltage distribution system of 240V
and 415V assets.
These assets are referred to throughout the
report as “the network”. Ausgrid’s network
customers are therefore customers who are
connected to this network of assets.
Stakeholder engagement
Ausgrid has a range of stakeholders who, as
individuals or as a group, could potentially be
affected by its operations or could affect its
ability to provide services to its customers.
Ausgrid is committed to engaging with
stakeholders on key issues to help achieve
best outcomes. These stakeholders include
but are not limited to:
Employees
Network customers
Energy retailers
Shareholders
Local communities
Partners and suppliers
Government and regulators
Industry associations.
A more comprehensive list of stakeholders
and how Ausgrid engages with them is
available on Ausgrid’s website
www.ausgrid.com.au.
Key issues
Ausgrid is committed to consulting with
stakeholders and identifying key issues to address
and report against. The issues raised included:
Keeping employees and the community safe
Providing a safe and reliable electricity
supply for customers
Promoting energy efficiency to help
customers reduce their energy use and
costs and greenhouse emissions
Protecting and preserving the environment
Supporting local communities and minimising
adverse impacts from its operations
Ensuring responsible procurement
and maintaining high standards of
ethical behaviour
Developing employees; and
Delivering shareholder value.
Ausgrid’s RoleCustomers
Step-downtransformer
Step-uptransformer
local substation
HV transmission lines
Power Station
Generation Transmission (132kV and below)
Distribution Consumption

8
Ausgrid – Annual Report 2010/11 9
Business changes
This year there was a significant change to
our business when Ausgrid’s retail assets
were sold on 1 March 2011 as part of the
NSW Government’s re-structuring of the
industry. The EnergyAustralia brand formed
part of the assets sold to TRUenergy and
the new Ausgrid brand was launched for the
network business. Ausgrid will provide retail
business services to TRUenergy for up to
three years under the Transition
Services Agreement.
Safety
The safety of the public and our workers
remains our highest priority. It is also our
main focus for improvement. While there
was an increase in the number of safety
procedures, including safety inspections and
hazard alerts over this reporting period, our
overall safety performance declined.
The number of staff injuries increased over
the period and the organisation’s lost time
injury frequency rate was outside our targets.
As a Board and Executive Team we have spent
a great deal of time this year considering
our safety performance and improving our
safety culture is a clear priority. We are
confident that a new behavioural change
and safety leadership program, improved risk
identification and management, and
greater communication will lead to a
safer workplace.
Replacing and renewing the network
Ausgrid is now delivering one of the country’s
largest infrastructure programs to replace
and renew our electricity network. About half
of our large zone substations were built in the
1960s and 1970s and we are now replacing
and upgrading much of this infrastructure.
At the end of the 2010/11 year, our program
had delivered seven zone substations,
installed more than 900km of high and low
voltage cable and commissioned 473 local
distribution substations. Our staff and our
alliance partners are to be commended for
their commitment to this work.
Supporting customers
The cost of investment in the electricity
network is one of the reasons why electricity
prices have increased quite rapidly over the
past two years. While the work is essential
to keep our network safe and reliable, we
have also taken steps to reduce the impact
on household budgets. Ausgrid continued
to roll out time-of-use or smart meters to
its customers to help them control their
electricity use and costs. There are now more
than 380,000 households and businesses on
network time-of-use billing in our network
area. We have also continued to provide
customers with advice and programs to use
energy more efficiently to help them manage
their bills.
Tradesmen and women are important
decision-makers on energy consumption
equipment and they are now able to learn
more about better energy management at
our new energy efficiency centre. The centre
is also open to schools and the public to learn
more about energy efficiency.
We also continue to advocate broad changes
to the rules governing demand management
for the industry to help reduce the need
for electrical infrastructure and return
greater savings to customers. We support
the Australian Energy Market Commission’s
review into these rules.
Financial performance and efficiency
Ausgrid delivered a strong financial result
for the year with Earnings Before Interest
and Tax (EBIT) of $984 million, excluding the
sale of our retail business. Total distributions
to government after the sale were $1,734
million. The organisation continues to
maintain a strong balance sheet with
gearing at approximately 78 percent.
During the reporting period, we have
also delivered a number of productivity
improvements to ensure that our operations
are being conducted as efficiently as possible.
Underlying operational expenditure has been
reduced by $67 million, contributing to a
$110 million reduction over the full five-year
regulatory period.
A further $800 million in savings are being
targeted from the capital program 2009-14,
without compromising the reliability of the
electricity network.
Smart grid technology
Ausgrid has continued to implement new
smart grid technology and is leading the
Commonwealth Government’s three-year
$100 million Smart Grid, Smart City program.
These smart grid initiatives will provide
network operators and households with more
real-time information, improved reliability,
and better control over electricity use and
costs. Over time, these technologies will
enable customers to reduce peak demands
and hence their bills. Reducing energy
consumed at peak times will also allow us to
reduce the costs of providing the networks of
the future.
Reliability
Ausgrid’s reliability performance of an
average 99 minutes per customer is within
targets. The result was influenced by the
extreme weather in some regions, as well
as the need to take significant parts of
the network out of service to allow new
equipment to be commissioned. Taking into
account these factors, the result is consistent
with a strong trend of improving reliability
on our network. This trend will continue as
our capital program progresses.
Supporting staff
We are proud that Ausgrid continued to be
one of the state’s largest single employers of
apprentices over the past 12 months. This is
a valuable investment in our future frontline
workforce. Our crews will now learn their
trade in a new purpose-built learning centre,
which opened this year in Sydney, and will
serve as an important vocational training and
community facility for many years to come.
This has been a demanding year for Ausgrid
staff. The results we have delivered are a
credit to their efforts throughout the year.
We would like to thank all our customers,
staff and fellow directors for
their commitment.
Chairman and Managing Director’s reportAusgrid’s vision is to be a world leader in distributing electricity and providing energy services. The strategies we pursue to achieve this vision focus on delivering innovative, efficient and safe energy solutions to the public, our customers and retailers.

10
Ausgrid delivered nearly $1,578 million in capital
investment in 2010/11, including seven new major zone
substations. More than 445,500 maintenance tasks were
completed on the electricity network throughout the year.
Performance highlights

Ausgrid – Annual Report 2010/11 11
Key results Customer minutes without supply
Average: 98 (Average performance per year, calculated since 2006/07)
Notifiable environmental incidents Average: 14.2 (Average incidents per year, calculated since 2006/07)
07
/08
100
06
/07
102
08
/09
1090
9/1
0
79
10
/11
99
07
/08
11
06
/07
17
08
/09
12
09
/10
16
10
/11
15
Employees Average: 5,640 (Average number of employees per year,
calculated since 2006/07)
Capital expenditure ($ millions)Average: 1,185 (Average performance per year, calculated since 2006/07)
07
/08
5,389
06
/07
5,185
08
/09
5,649
09
/10
5,908
10
/11
6,067
07
/08
951
06
/07
7840
8/0
9
1,291
09
/10
1,319
10
/11
1,578
Lost time injury frequency rate (per million hours worked)Average: 3.9 (Average performance per year, calculated since 2006/07)
Net profit after tax ($ millions)Average: 286 (Average performance per year, calculated since 2006/07)
07
/08
3.9
06
/07
2.9
08
/09
4.1
09
/10
4.2*
10
/11
4.4
07
/08
268**
06
/07
259*
08
/09
231
09
/10
345
10
/11
326***
* The 2006/07 and 2007/08 results included the impact of the EA - IPR partnership** Adjusted for accounting policy change*** This excludes the sale of retail business for $1,247.9 million
* See p.103 for explanation of increase

12
Strategic achievements, challenges and targets
Operational excellence Marketplace Community
2010/11 ObjectivesDeliver almost $1.6 billion in system
and non-system capital investment
Deliver 95% or more of the
sub-transmission and distribution
maintenance program
Increase level of business continuity
Implement smart grid program including
the Smart Grid, Smart City program.
Performance in 2010/11Delivered nearly $1,578 million in
system and non-system projects
Completed more than 445,500 or
98.2% of planned maintenance tasks
Reached 96.1% level of business
continuity preparedness
Implemented Smart Grid, Smart City
program and met deployment targets
for smart grid roll out.
ChallengesDelivering a large number of network
projects, while achieving internal
efficiency targets
It becomes more challenging
to maintain a reliable supply of
electricity for customers when new
electricity infrastructure is
being commissioned.
Testing and implementing new smart
grid technology that has not been
deployed before.
2011/12 ObjectivesDeliver 90% or more of the capital
works program
Deliver 95% or more of the
maintenance program
Continue to lead the deployment of
smart grid technology
Develop new demand
management strategy.
2010/11 ObjectivesAchieve System Average Interruption
Duration Index (SAIDI) less than
102 minutes
Achieve System Average Interruption
Frequency Index (SAIFI) less than
1.2 outages
Grow and maintain customer
numbers to 1.46 million or more
Maintain customer service and
support levels to greater than 95%.
Performance in 2010/11Reached average reliability levels
of 98.59 minutes and 1.08 outages
per customer
Achieved customer satisfaction of
93% to end of February 2011
Reached 1.54 million retail customer
accounts at the end of February 2011
More than 4.3 million bills were
issued to retail customers to the end
of February 2011.
ChallengesDelivering new energy services to
customers to help manage household
energy use
Continuing to improve reliability to
meet community and government
expectations while keeping electricity
prices as low as possible
Meet our obligations to the new
owner of the retail business.
2011/12 ObjectivesMeet reliability standards for CBD,
urban and rural categories
Deliver the energy services strategy
Prepare for the 2014-19
regulatory submission
Deliver services under the
Transitional Services Agreement.
2010/11 ObjectivesKeep the community safe from the
dangers of electrical equipment
Raise awareness of electrical safety
Support the community where we work
Keep the community informed of work
around the network and services.
Performance in 2010/11Met and consulted with the local
community on 100 separate
major projects
Supported over 300 community
groups through financial grants
Completed 118,686 bushfire patrols
around bushfire prone areas
Ran 13 public electrical safety
awareness campaigns
Five members of the public were
injured after coming into contact with
the electricity network. There was one
public fatality as a result of contact
with the electricity network.
ChallengesRespecting the views of local
communities while delivering one of
the largest capital works programs in
the country
Keeping the public safe from electrical
infrastructure 24 hours a day
Maintaining support for the local
community at an acceptable cost.
2011/12 ObjectivesImproving the way Ausgrid engages
with the local community
Keep the public safe near electrical
infrastructure
Continue support for the local
community where we work.

Ausgrid – Annual Report 2010/11 13
Environment Workplace Financial
2010/11 ObjectivesDeliver 95% or greater targets from
the environmental action plans
Demonstrate leadership in
energy efficiency services and
demand management
Deliver operational work without
environmental incidents.
Performance in 2010/1198% of activities targeted in the
Environmental Improvement Plan
were completed
Met 100% of greenhouse and energy
efficiency obligations to the end of
February 2011
129 environmental investigations
undertaken with 15 notifiable to
environmental regulators.
ChallengesDelivering an increasing capital
works program while minimising
environmental incidents or impacts
Achieving changes to the regulatory
structure to encourage greater
demand management opportunities
Reducing energy, water and waste
from our operations.
2011/12 ObjectivesDevelop demand management strategy
Reduce notifiable
environmental incidents
Deliver 95% or more of targets from
environmental action plans.
2010/11 ObjectivesTo keep our staff safe and free
from injury
Achieve a Lost Time Injury Frequency
target of less than three
Complete the Learning Centre
Employ and train new apprentices.
Performance in 2010/11There were 3,238 safety inspections
and 546 hazard alerts issued and 236
near miss reports
There were 1,148 safety incidents
and 311 medically treated injuries
contributing to a Lost Time Injury
Frequency Rate of 4.4
The new Ausgrid Learning Centre at
Silverwater was opened in May 2011
153 new apprentices employed,
taking apprentice training numbers to
590 at the end of June 2011.
ChallengesProtecting a less experienced
workforce, completing a larger
number of jobs
Communicating new safety measures
to ensure risks are properly managed
Ensuring the workforce is delivering
outcomes in the most efficient and
reliable manner.
2011/12 ObjectivesImprove safety performance and
safety culture
Develop skills and knowledge
of workforce
Increase indigenous employment in
the workforce from 0.9%.
2010/11 ObjectivesAchieve underlying earnings
before interest and tax (EBIT) of
$770 million
Achieve return on assets (ROA) of 7.3%
Meet regulatory outcomes
No significant breach of
compliance obligations.
Performance in 2010/11Achieved EBIT (excluding the profit
on the sale of the retail assets)
of $984 million
Achieved a ROA of 9.1%
Reduced underlying operational
expenditure by 8.4% or $67 million
Delivered 94% productivity measures
No significant breaches of
compliance obligations
Successfully completed the sale of
the EnergyAustralia retail assets in
March 2011.
ChallengesDeliver operational and capital
efficiencies while achieving all
outcomes of the capital program
Supporting the NSW Government
on the next stage of its industry
reform while delivering a record
capital program.
2011/12 ObjectivesAchieve outcomes of procurement
strategy
Achieve operational expenditure
efficiency targets
Achieve underlying EBIT and ROA.

Work continued on the Balgowlah North Zone Substation and
the installation of 132kV cables to connect it to a major point in
Warringah. Construction of the building was completed in August
2010 allowing the electrical fit out to begin. Work also continued
on the installation of five kilometres of 11kV cables to take power
from the substation to the local distribution network. The new
substation will replace the existing Balgowlah Zone Substation
that was built in 1955.
Balgowlah North zone substation
14

Ausgrid – Annual Report 2010/11 15
Determining network investment
2010/11 was the second year of a five-year
network investment program that is set out
in a regulatory submission to the Australian
Energy Regulator (AER), the national
regulator for electricity distribution and
transmission networks.
The AER determines the revenue required for
these essential upgrades which makes sure
the electricity network delivers a safe and
reliable supply of electricity.
In 2009, the AER approved Ausgrid’s proposal
to invest $8 billion in the electricity network
over the five years to 2014. It also allowed
$630 million in expenditure to support the
electricity network – known as non-system
capital expenditure.
The main driver behind this program is to
upgrade or renew infrastructure that is
due for replacement. About 45 percent of
Ausgrid’s major substations were built in
the 1960s and 1970s, while an additional 25
percent were built in the 1950s. This major
infrastructure generally has a life of 40 or
50 years and it is now time for much of it to
be replaced.
The capital program is also driven by the
need to meet reliability standards set by
the NSW Government. It is also catering
for future growth in electricity use and in
particular growing peak demand for power.
A new peak demand record of 6,072 MW for
the Ausgrid network was set on Thursday,
3 February 2011, a day on which the
maximum temperature across the network
was 38.1 degrees. It occurred during a week
of successive hot days driving the
use of air-conditioning in homes in the
Ausgrid network.
Network investment
Ausgrid invested about $1,376.4 million
in the electricity network during 2010/11.
Ausgrid releases a 12-month snapshot of
completed works and maintenance across
its electricity network to allow its customers
to see exactly where investment across the
electricity network is occurring.
Network investment included $558.9 million
on major substation projects, including
the development of high-voltage cables
connecting the substations to the network.
Network maintenance
Ausgrid carries out a comprehensive
maintenance program across the supply
area to ensure the network is capable of
delivering a safe and reliable energy supply
to homes and businesses. A combination of
age, performance and condition of electrical
assets is considered when determining
maintenance schedules along side the need
to replace assets.
Crews completed more than 445,500
maintenance tasks during 2010/11 across
the network.
More than $200 million in operational
expenditure funded this maintenance work,
which is in addition to Ausgrid’s capital
works program.
A range of technologies was used to identify
potential hazards prior to the bushfire
season, including vehicle and helicopter
patrols, thermal imaging of power lines, and
high-definition video images captured by
Ausgrid’s unmanned aerial vehicle.
Operational excellence
Maintenance tasks undertaken in 2010/11
Crews installed or replaced about
450distributors, the wires that
connect with distribution
substations, and
17,758 service wires across the network.
440kmof high-voltage cables to
connect and bring power into
commissioned substations
468km of below and above-ground
low-voltage cables to distribute
power from substations to the
street-level network, and
473 smaller distribution substations.
Ausgrid continued to deliver one of Australia’s largest infrastructure programs during 2010/11. This $8 billion network investment is driven by the need to replace older electrical equipment, meet increasing peak demand for power and reliability standards. It also includes the rollout of new smart grid technology to help make the electricity network more efficient.
Bushfire patrols
118,686
Other
36,495
Susbstation inspections
22,145
Pole inspections and treatments
133,837
Underground and overhead line inspections
134,383
Total: 445,546

16
Supporting the network
During 2010/11, Ausgrid invested $201.5
million in projects that supported
network operations.
This included key areas such as the purchase,
maintenance and upgrading of property,
information technology, telecommunications
and plant to help technicians maintain and
upgrade the electricity network.
Development of office and workspace at
the Wallsend, Muswellbrook, Maitland
and Merriwa depots and refurbishment
of administration buildings at Wallsend
continued throughout the reporting period.
On the Central Coast, a new major warehouse
at Somersby began operation in January. The
22,000m2 warehouse replaces two smaller
warehouses in Sydney and is needed to handle
an increase in material deliveries required for
Ausgrid’s capital works program.
Ausgrid spent $72 million on 244 IT projects
during 2010/11, including a SAP upgrade, a
new intranet, Contact Centre upgrade and the
completion of application and infrastructure
migrations to Ausgrid’s data centre. Significant
IT initiatives were also completed to meet
obligations under the sale of the retail assets.
Twenty-five elevated work platforms and five
crane borers were purchased to help support
network operations.
Ongoing major works
In 2010/11, 20 new zone substations went
from detailed design to construction phase,
while 50 projects were underway to replace
and upgrade equipment and facilities at zone
and subtransmission substations.
These works included replacement zone
substation projects for Top Ryde, Balgowlah
North, Bankstown, Rose Bay, Lake Munmorah,
Empire Bay, Tomago, Brandy Hill, Tomaree
Peninsula, Crows Nest and Gwawley Bay.
Major work to increase security of supply
in Sydney’s CBD included installation
of additional capacity at the City North
132/11kV substation.
Three major substations in Earlwood
(Canterbury), Marrickville and Kogarah are
being connected to Beaconsfield Bulk Supply
Point as part of a $214 million replacement
of the southern Sydney region’s underground
electricity supply. Work started on this project
in February 2011. It involves the installation
of 21 kilometres of double-circuit and seven
kilometres of single-circuit underground 132kV
cable. The route of the cables involves the
crossing of rivers, railway lines and major roads.
Work also continued on Ausgrid’s 132kV
and 66kV transmission system during the
reporting period.
During the year, technicians completed
the electrical fit-out of the new Ourimbah
subtransmission substation. The new
facility will allow for the retirement of the
existing Ourimbah substation, which has
been in service since 1959. Commissioning
of the new subtransmission substation
involved transfer of nine 33kV, 66kV and
132kV power lines supplying over 35,000
customers via the Long Jetty, Peats Ridge,
Gosford, Lisarow, and Wamberal
zone substations.
Ourimbah
subtransmission
substation

Ausgrid – Annual Report 2010/11 17
Milestones were reached in the $155 million
Botany Bay cable project, which involves
installation of new 132kV cables to connect
major substations in Kurnell and Bunnerong
(Matraville) via Botany Bay. The work will
improve power supply to about 61,000
homes and businesses in Sydney’s inner
suburbs and the CBD.
All land-based work for the 132kV cable
project was completed during 2010/11.
Electrical fit-out of Kurnell subtransmission
substation was completed during the year,
while preparations were in place to bury the
new cables into the Botany Bay seabed.
Construction of a 132kV power line connecting
the new Wamberal zone substation to the
Ourimbah subtransmission substation was
completed during the year, while transfer of
132kV, 66kV and 33kV services from the old
Ourimbah subtransmission substation to the
new facility also continued. (See story left).
Upgrading the Upper Hunter transmission
network from 33kV to 66kV also continued.
This included further progress on conversion of
the 48km Denman-Merriwa 33kV power line.
Work was completed on six new 132kV
power lines from Transgrid’s Bulk Supply
Point at Tomago, boosting capacity at key
points along Ausgrid’s 132kV Lower Hunter
transmission network.
Building a smarter electricity grid
Ausgrid continued to roll out new
technologies while this major replacement
and upgrade work was taking place.
New monitoring and communication
technology is transforming Ausgrid’s
network into a smarter system that will
make operations more reliable and provide
accurate information on performance and
condition of the network, particularly the low
voltage part.
As part of this transformation to a smart
grid, in 2010/11, 1,071 smart sensors were
commissioned in distribution substations
across local streets. These devices monitor
the power supply to homes and businesses. A
4G wireless communications network is being
built to transmit this information back to
Ausgrid’s control rooms.
This smart grid technology is also being rolled
out to support the Australian Government’s
Smart Grid, Smart City program. Australia’s
first commercial-scale smart grid is being
trialled under this project, which is being led
by Ausgrid. It began trialling electric vehicles
and the first offers for gas fuel cells and
battery storage units were sent to homes in
Newcastle during 2010/11.
Ausgrid has installed six smart switches. The
pulse closers have the ability to automatically
isolate, test and re-energise equipment on
Ausgrid’s overhead distribution network,
thus reducing the duration of unplanned
interruptions. More than 100 sites have been
identified and are being scheduled
for installation.
Seven major zone substations completed
Project Commissioning
Month
Port Botany substation Aug
Kurri Kurri substation Sep
Kurnell subtransmission substation
Oct
Bankstown substation Oct
Jesmond substation Dec
Ourimbah subtransmission substation
Feb
Royal North Shore Hospital zone substation’s 11kV feeders and switch gear
May
Completed replacement projects
07
/08
232
06
/07
217
08
/09
315
09
/10
655
10
/11
658

18
A number of underground and overhead cables in local shopping
areas are being replaced or relocated underground to make them
safer and reduce the chance of blackouts. Along King Street in
Newtown, 11kV cables located along shop awnings are being
replaced and installed underground, while existing underground
cables along Oxford Street, Paddington that are more than 50
years old are also being replaced. Small pillar boxes are also
installed to provide a more reliable access to customers’ premises
and safer restoration if a fault occurs.
Safe and reliable

Ausgrid – Annual Report 2010/11 19
On 1 March 2011, the retail customer and
wholesale contracts were sold to TRUenergy,
including the rights to the EnergyAustralia
brand. The remaining electricity network was
renamed Ausgrid and it continues to provide
a safe and reliable electricity supply to
customers connected to its network in Sydney,
the Central Coast and the Hunter Valley.
Therefore, the reporting period in Ausgrid’s
accounts for retail operations ended on 28
February 2011.
Network services for customers
In addition to providing a safe and reliable
electricity supply to homes and businesses
connected to its electricity network, Ausgrid
also provides its customers with 24-hour
emergency repairs and power restoration,
street lighting and household electrical repairs.
Government standards and customer
expectations help drive part of the network
investment program, including targeted
reliability work. The Design Reliability and
Performance licence conditions set out by the
Minister for Energy outline reliability targets.
These are categorised by different electricity
cables, or feeders, and whether they are
located in urban or rural areas.
Ausgrid also reports reliability across its
entire system via a normalised index covering
the average number of interruptions (SAIFI)
and the average time customers are without
electricity (SAIDI) during the year.
Ausgrid uses this data to invest in both the
subtransmission network and the local
distribution network to meet its safety
and reliability targets. That investment
is targeted in direct response to the
performance of power lines and other
equipment on the network.
Meeting customer expectations
Ausgrid crews completed a number of
targeted projects during 2010/11 to improve
reliability of supply for customers, and to
increase capacity at key connection points.
Analysis of power line performance coupled
with customer feedback helps field staff
to target reliability investigations and
improvement projects across the network.
A total of 121 11kV feeders were inspected
under this program during 2010/11.
Related projects involved replacement of bare
overhead mains with covered conductor or
undergrounding short sections of overhead
power line from substations to the distribution
network to improve performance. Locations
where this work was successfully completed
included zone substations at Bass Hill, Sefton
and Pennant Hills.
Extensive work was carried out to improve
capacity on the 11kV network delivering
electricity to homes and businesses.
Upgrade work was completed on power
lines from zone substations at Gwawley Bay,
Drummoyne, and East Charmhaven.
Work also continued to replace older-style
aluminium cables throughout parts of the
electricity network including Caringbah,
Marsfield and Auburn. The newer
underground cables are more reliable and
connect with small above ground pillar
boxes that allow quick and more efficient
restoration of power during outages.
Customer service standards
The NSW Government Customer Service
Standards require a minimum level of service
to customers in metropolitan and non-
metropolitan areas. If customers experience
outages that are longer or more frequent than
the standards allow, they may be entitled to
compensation. During 2010/11, 1,425 customers
who were not provided with the level of supply
required by the Customer Service Standards
received a total of $114,000 in compensation.
Compensation can also be paid on a
case-by-case basis on other occasions
when there may be an interruption to the
electricity supply. This can include damage
to a customer’s installation or electrical
appliances or food spoilage. Over $1.9 million
was provided to customers in 2010/11 in
additional compensation payments.
Marketplace
Frequency of interruptions per customer (SAIFI)
Streetlight repair times
Average days to repair streetlights
For 10 years, the name EnergyAustralia represented both the electricity network serving parts of Sydney, Central Coast and the Hunter, as well as an electricity retail business.
07
/08
3.4
06
/07
2.4
2.2
08
/09
11.60
9/1
0
5.9
10
/11
07
/08
06
/07
08
/09
09
/10
10
/11
1.15
1.16
1.31
1.05
1.08

20
Public lighting
Streetlights are managed on behalf of 41
councils and other customers throughout
Ausgrid’s network. It had 251,298 streetlight
connections at the end of 2010/11 and 15,475
energy efficient streetlights were installed
throughout the year. More than 75,880
streetlights or 31 percent across the Ausgrid
network now have energy-efficient globes.
Ausgrid systematically replaces globes to
reduce faults before they occur and reduce
maintenance costs. Crews responded to 15,251
streetlight faults – 460 were underground
faults, and 14,791 were overhead problems.
The average response time for repair of
overhead faults was 2.2 days.
Energylight provides external floodlighting
to customers on a rental basis for safety
and security purposes. This floodlighting is
connected directly to the Ausgrid electricity
network and 3,050 services were provided to
customers in 2010/11.
EnergyFix
During 2010/11, Ausgrid provided 18,042
EnergyFix services to customers. EnergyFix
is one of the largest networks of qualified
electrical specialists in Australia. It’s
available 24 hours a day, seven days a week.
This service includes the provision of safety
services for electrical wiring.
It also provides hot water installations and
general electrical contracting, such as the
installation of new appliances, and electrical
repairs and maintenance.
Working with suppliers
Ausgrid continued to implement the Supply
Chain Management Module of the NSW
Government’s Sustainability Advantage
program. In 2010/11, 24 percent of office
supplies expenditure was for products with
recycled content.
Providing retail services – EnergyAustralia
The reporting period for EnergyAustralia
(Ausgrid) retail operations includes activity
from 1 July 2010 to 28 February 2011 when
it offered electricity and gas products
to residential and business customers
throughout NSW, VIC and the ACT and
electricity for QLD customers.
Prior to 1 March 2011, the retail business
provided customers with competitive prices
for their electricity and gas products, billing
services and call centre services. Ausgrid
(since March under a Transition Services
Agreement), now provides customer services,
including billing and call centre services.
EnergyAustralia had 1.54 million retail
electricity and gas customers prior to the sale
of the retail assets, compared to 1.47 million
at the end of 2009/10. The increase reflected
the growth in gas connections and electricity
connections outside the network area in
NSW, VIC and Qld. In the commercial and
industrial sector EnergyAustralia had sales of 7.1
TWh of energy.
Ausgrid’s Energy Efficiency Centre
was relocated from Homebush
to its new Learning Centre at
Silverwater. The centre is a
show case for energy efficiency
technology and education and is
available to the general public,
school groups and technical or
trade groups.
New Energy
Efficiency Centre

Ausgrid – Annual Report 2010/11 21
EnergyAustralia electricity customers in NSW
could choose either a two-tier domestic rate or
a time-of-use rate, called Powersmart. There
were 231,127 customers on Powersmart rates
to the end of February 2011.
A range of accredited GreenPower products
were provided to 54,012 customers at
28 February 2011 by the EnergyAustralia
retail business. Customers chose to have
10 percent, 25 percent, 50 percent or 100
percent of the electricity they used matched
with electricity from renewable sources and
delivered to the national electricity grid.
Metering and billing
The sale of its retail assets has not affected
Ausgrid’s meter reading process which it
provides for all retailers in its network area.
Ausgrid completed more than 6.97 million
electricity meter reads in 2010/11. More
than 4.3 million bills were issued to retail
customers to the end of February 2011.
Supporting customers
Electricity prices have been a topic of
community concern, so a range of payment
options were available for customers
experiencing difficulty paying their electricity
bills, as well as tools to help reduce their
energy use and bills. These options were
targeted at providing both short term and
long term support.
Customers having difficulty paying their bills
chose from a number of options to help them
manage. Throughout the shortened reporting
period, 235,281 payment extensions were
granted, providing customers with more time
to pay their bills. Alternatively, customers
could choose an instalment plan. There were
38,996 instalment plans approved during this
period. These customers had their bills broken
into manageable portions to be paid over a
period of time. In the reporting period, 8,569
new customers chose to pay their bills using
EnergyAustralia’s regular payment option,
totalling 45,580 customers who chose to pay
this way. About 21,200 chose to pay their bills
via Centrepay.
EnergyAssist is EnergyAustralia’s hardship
prevention program designed to support
customers experiencing long-term financial
difficulty. Staff have been trained to recognise
these customers and offer the program where
deemed appropriate. EnergyAssist customers
are provided with payment extensions,
budgeting assistance and energy efficiency
advice. About 2,925 customers joined the
program in the shortened reporting time,
compared to about 3,400 in 2009/10.
In addition to paper reminder notices,
EnergyAustralia issued more than 135,742
SMS reminders to customers in the period
to 28 February 2011. About 32 percent of
customers who received a reminder sent
to their mobile phone in 2010/11 made a
payment towards their bill within seven days
of receiving it.
Customers who were disconnected for
non-payment were assisted by Contact Centre
staff and through referrals to the EnergyAssist
program, where appropriate. For the period
from 1 July 2010 to 28 February 2011,
disconnections for non-payment (electricity
and gas) was 2.3 for every 1,000 customers.
There were 3,567 EnergyAustralia customers
disconnected from the electricity network
for non-payment in the adjusted reporting
period, compared to 6,819 the full
year before.
Customer satisfaction
Monthly surveys of customers who had
recently called EnergyAustralia’s Contact
Centre during the adjusted reporting period
showed 93 percent of customers were
extremely satisfied, very satisfied or satisfied
with the level of service they received,
compared with a target of 95 percent. Surveys
of customers who had recently called the
Contact Centre also highlighted that 88.8
percent advised their concern was resolved
on the first call against a target of 90 percent.
The result showed an increase in performance
compared with the score of 86 percent the
previous year.
Contact Centre performance
Under a Transition Services Agreement, calls
for EnergyAustralia retail operations, as
well as Ausgrid’s network operations were
answered by a combined Contact Centre in
2010/11. More than 3.14 million calls were
received, almost a 12 percent increase on
2009/10. Of these, approximately 1.86 million
were retail-related calls during the shortened
reporting period.
Number of Customers on Time of Use Billing (retail)
07
/08
143,512
06
/07
111,251
08
/09
181,329
09
/10
215,620
10
/11
231,127

22
In 2010/11, Ausgrid launched its Annual Electrical Safety Survey
to better educate the community on electrical safety. More than
1,353 residents across the electricity network participated in the
online survey. Human error was revealed as the major cause of
electric shocks followed by faulty appliances and faulty wiring.
The results of the survey will be used to advance the Public
Electrical Safety Awareness Plan.
Public safety survey

Ausgrid – Annual Report 2010/11 23
Public safety
The electricity network operates 24 hours a
day and contains live electrical equipment.
Ausgrid invests in security measures and
electrical safety campaigns to keep the
community safe and educate the public on
the dangers of live electricity.
In 2010/11, there were five incidents that
resulted in members of the public receiving
an injury after coming into contact with the
electricity network. This included incidents
when tradespeople did not take adequate
steps when working around powerlines
and other occasions when members of the
public allegedly attempted illegal entry into
electrical facilities. On 31 October 2010,
a member of the public was killed while
attempting to climb a power pole.
Security
Unfortunately, members of the public are
continuing to place themselves at risk of injury
and death by attempting theft and vandalism
of electrical infrastructure. In 2010/11, there
were 86 incidents of theft at Ausgrid depots
and substations, costing $194,000. This was a
substantial increase from the previous year,
more than $100,000. The international price of
copper and scrap metal is a substantial driver
for illegal entry and theft.
In 2010/11, Ausgrid invested more than
$3.3 million to secure electrical equipment
to keep the community safe and protect
essential infrastructure, including a program
to install perimeter fencing and ongoing
distribution substation security upgrades.
Regular security patrols and inspections of
electrical equipment were also carried out to
help deter and detect these sorts of incidents.
Public awareness
Each year, Ausgrid delivers a range of
campaigns to help educate the public
about how to stay safe around electricity.
These campaigns are based on research on
public attitudes, analysis of past incidents
and potential risks. There were 13 separate
public campaigns delivered in 2010/11
under the $1.98 million electrical safety
awareness program.
Electrical safety campaigns included
overhead power line awareness and
Electricity Safety Week. These were primarily
aimed at school children, tradespeople and
homeowners. Major campaigns included
Christmas light safety, Dial Before You Dig
and storm safety. Ausgrid took part in joint
initiatives with Endeavour Energy and
Essential Energy providing electricity safety
resources for primary schools. In 2010/11
Ausgrid ran almost 6,000 electrical safety
messages in print and on radio across the
electricity distribution network area.
Dial Before You Dig
Striking underground electricity cables can
endanger the lives of anyone who comes
into contact with them and could potentially
blackout thousands of homes and businesses.
Dial Before You Dig (DBYD) is a non-profit,
free, referral service designed to give residents,
plumbers, builders and other trades people,
information on the location of underground
assets to prevent damage to pipes and
underground cables. In 2010/11, Ausgrid
received and processed 92,737 DBYD referrals.
Graffiti
Ausgrid makes every effort to keep its
electrical infrastructure clean and free from
graffiti vandalism. In 2010/11, it invested
more than $1.1 million to clean up graffiti,
about $500,000 more than last financial
year. Specially trained graffiti crews cleaned
all 3,276 reported incidents of graffiti,
about 23 percent more than last financial
year. Ausgrid also delivered 188,000 safety
notices to residents and businesses urging
the community to report graffiti. Safety
messages were delivered to about 376,000
residences living within 1km of identified zone
substations in 2011.
Community
Graffiti – number of clean ups
Electric shocks on private premises
There were
363reported electric shocks on
private premises in 2010/11
compared to
344in 2009/2010.
Ausgrid has an obligation to support the community that it serves by keeping them safe from the dangers of electricity, respecting their local neighbourhoods and making every effort to consult and communicate about upgrades and services.
08
/09
2,107
09
/10
2,658
10
/11
3,276

24
Bushfire prevention
Ausgrid conducts additional aerial and
land-based patrols of overhead power lines
in bushfire prone areas of its network, to
help reduce the risk of bushfire. Any high-
risk defects identified on our network are
corrected on a prioritised basis. In 2010/11,
around 118,000 poles and overhead wires
were inspected in bushfire prone areas, as
part of our targeted bushfire safety program.
Ausgrid works closely with stakeholders such
as the Rural Fire Service, local councils and
community groups to help reduce the risk of
bushfire damage to our assets. This includes
significant hazard reduction activities,
such as the removal of vegetation along
transmission line corridors and access ways.
There were more than 280 radio and 15 print
advertisements to remind those property
owners with private electricity infrastructure
on their land of their legal obligations.
EMF
Ausgrid operates and builds its electricity
network and smart grid electricity network in
line with national health standards to protect
the public. Electric and Magnetic Fields
(EMF) are present in the natural environment
and wherever electricity or electrical
equipment is used. Ausgrid policy works
to minimise public exposure to EMF from
electrical infrastructure. In 2010/11 Ausgrid
received and responded to 199 customer and
community enquiries about EMF.
Corporate responsibility
In 2010/11, Ausgrid maintained
its platinum ranking in Corporate
Responsibility Index benchmarking with
an overall score of 96 percent. In its first
year participating in benchmarking against
the Dow Jones Sustainability Index (DJSI),
Ausgrid received a score of 65 percent,
placing it in the top quarter for electricity
companies world-wide. Ausgrid scored 100
percent in biodiversity and
scorecards/measurement systems.
Community investment and partnerships
The State Owned Corporations Act sets
out financial and social objectives for a
government-owned energy corporation,
such as Ausgrid. It also states that state
owned corporations must operate in a
socially responsible manner toward the
community within which it operates.
Ausgrid supports a diverse number of
community, sporting, artistic and education
organisations to help meet those aims.
That support is aligned to company values
including safety, energy efficiency and
building the skills base of the energy industry.
Voluntary contributions to the community are
measured using the London Benchmarking
In 2010/11, Ausgrid started work
replacing 132 kV cables along a 21km
route between a bulk supply point in
Beaconsfield and zone substations in
Kogarah, Rockdale and Canterbury.
More than 8,000 homes and businesses
along the cable route received
newsletters with information about the
project. A series of community displays
were also held across Sydney’s south to
inform the community and seek feedback
on the project plans. Ausgrid planners
also worked closely with local road
authorities to minimise the impact on
traffic and the environment.
Respecting the
community

Ausgrid – Annual Report 2010/11 25
Group (LBG) framework. This is the
international standard for valuing corporate
community investment. The LBG measured
Ausgrid’s contribution to the community
at more than $2.5 million for 2010/11,
compared to more than $2.2 million
in 2009/10. For the full list of Ausgrid
partnerships see page 108.
Ausgrid’s Community Care program awards
small grants to organisations where staff
are active volunteers. Electrical fit-outs
are also offered to community buildings or
facilities where staff volunteer. This work is
carried out by apprentices and helps build
their skill base in becoming electrically
qualified workers.
In 2010/11, over 670 grants were provided
to more than 300 community organisations
totalling over $200,000 and 10 electrical
fit-outs were completed.
Employees participated in fundraising
for Movember in 2010, which raised over
$125,000 towards men’s health. As part of
Movember, about 1,600 staff undertook a
free confidential health check at 18 locations
across the network.
In 2010/11, more than 1,200 staff contributed
about $191,000 to 18 charities through the
Ausgrid Employee Payroll Giving Program,
including the Cancer Council NSW, Ausgrid
Employees’ Children’s Appeal and the Westpac
Rescue Helicopter Service. Employees also
donated more than $55,000 to the Queensland
Floods Appeal, dollar-matched by Ausgrid to a
total of over $110,000.
Ausgrid supported 31 organisations through its
partnership program (refer to full list on page
108). A key focus of Ausgrid’s partnership
program is energy efficiency.
Ausgrid undertook energy audits of 39 surf
life saving clubs from Sydney’s Northern
Beaches to the Hunter region. Activities at
Ausgrid’s Zoo Month at Taronga Zoo also
focused on energy efficiency actions for
households.
As part of fostering educational pathways
for careers in the energy industry, Ausgrid
also supported the Science and Engineering
Challenge education program in Sydney,
Central Coast and Hunter regions.
Ausgrid funds a Chair of Power Engineering
at the University of Sydney, a Chair of
Intelligent Networks at Newcastle University
and Chair of Electrical Power Economics at
the University of New South Wales. These
partnerships aim to foster skills development,
research, innovation and investment within
the energy industry.
Respecting the community
To minimise the impact on local streets,
homes and businesses, Ausgrid works closely
with the community. Planners consult with
the community and local councils during the
planning and construction stages of major
infrastructure work. In 2010/11, Ausgrid
consulted with the local communities on
more than 100 major projects, including
meeting key local and state government
representatives, residents, chambers of
commerce and local businesses. Community
displays were also held to seek input on
project planning and newsletters were
distributed to keep the public updated of
construction progress. In 2010/11, Ausgrid
also responded to questions and comments
from the public via its Facebook and Twitter
pages. Ausgrid provided local 1800 telephone
information lines to allow community
members to quickly access the project team
to seek information or raise issues whenever
they occur.
Noise
Ausgrid works to minimise the impact on
customer’s power supply, local traffic,
businesses and residents. Noise and vibration
can however occur during construction work
and during the operation of electrical assets.
Noise mitigation options are investigated
during the assessment phase of both major
and minor projects. Ausgrid guidelines
reflect regulations set by the NSW Office of
the Environment and Heritage (OEH). Ten
construction noise complaints about night
works were received in 2010/11.
07
/08
$2,148,987
08
/09
$2,086,963
09
/10
$2,246,718
10
/11
$2,513,410
07
/08
$116,762
08
/09
$161,145
09
/10
$181,001
10
/11
$191,000
Payroll giving
Voluntary community contributions*
* London Benchmarking Group
Australia/New Zealand data

26
In 2010/11 Ausgrid recycled 47,943 tonnes of vegetation,
522 tonnes of steel and 228 tonnes of electricity meters.
A trial was run at Ausgrid’s Homebush Depot during the
reporting period to help reduce the amount of waste being sent
to landfill. The trial involved the use of dedicated recycling bins
and more visible signage to further improve waste recycling.
Reducing waste

Ausgrid – Annual Report 2010/11 27
This section reports the environmental
performance of both parts of the business.
However, some key indicators from the retail
side of the operations are only reported up
until the end of February 2011.
Environmental management
Ausgrid’s environmental management team
prioritises projects, training and management
strategies as part of an Environmental
Improvement Plan. This plan is endorsed
by the Environmental Steering Committee.
During the reporting period, 98 percent of
the plan was completed.
Ausgrid investigated 129 environmental
incidents that were reported to it during
2010/11. Not all these reports related to
its operations. Of these, 15 were notifiable
incidents and were reported to the NSW
Office of the Environment and Heritage or the
Department of Planning and Infrastructure.
The majority of incidents related to noise or
sediment from projects to replace, upgrade
or maintain the electricity network. Other
incidents involved the impacts on threatened
species, heritage items and land or water
contamination. The number of notifiable
environmental incidents have not increased
significantly in the past four years. This is
despite the large increase in work on the
electricity network.
Energy use
Under the National Greenhouse Energy
Reporting framework, businesses that consume
more than 350TJ of energy or over 87.5kt
of greenhouse gas emissions are required
to submit a report. Ausgrid has prepared
a report for 2010/11, including how much
energy it consumed, generated and lost from
its electricity network and the greenhouse gas
emissions generated from its operations.
The EnergyAustralia retail business complied
with all its greenhouse obligations in 2010.
This included the NSW and ACT Greenhouse
Gas Abatement Schemes, NSW Energy
Savings Scheme, Commonwealth Renewable
Energy Target, Queensland Gas Scheme and
the Victorian Energy Efficiency Target.
Under the NSW Greenhouse Gas Abatement
Scheme, the retail business delivered
3.19 million tonnes of greenhouse gas savings
associated with electricity use in the year
until the end of February 2011. This saving
includes a forecast component.
The retail business surrendered 1.24 million
large scale generation certificates in February
2011 as part of its obligations under the
Commonwealth Renewable Energy Target.
Renewable energy
The retail business bought renewable energy
and owned a small portfolio of renewable
generators including the 600 kW Kooragang
Wind Turbine and 407 kW Singleton Solar
Farm. These purchases and the small
portfolio helped support EnergyAustralia’s
accredited GreenPower products.
The GreenPower program is externally audited
on a calendar year. During 2010, 347,870
renewable energy certificates were surrendered
to support these GreenPower products.
Waste
Ausgrid conducted a review into its waste and
recycling services in 2009/10 with the results
helping to guide new practices, policies and
projects in this reporting period. An improved
recycling system has reduced waste going to
landfill at the Homebush Depot, while new
excavation, trenching and backfill practices
on an underground cable project in the
Newcastle suburb of Jesmond was expected
to eliminate the need to send approximately
3,600 tonnes of soil to landfill.
Ausgrid produces waste from its day-to-day
maintenance operations, such as tree
trimming, streetlight lamp replacements,
power pole replacements, and the use of
lubricants and insulating material, such as oil.
EnvironmentAusgrid carries out its operations in line with laws and regulations set by local, state and federal governments. Additional projects are undertaken to improve the energy efficiency of its operations and reduce the production of waste.
Number of Aboriginal groups consulted with
07
/08
55
06
/07
18
08
/09
84
09
/10
96
10
/11
85
07
/08
06
/07
18
08
/09
09
/10
10
/11
6,190
5,435
4,181
4,484
4,423
Environmental training
Number of employees
and contractors trained

28
The increasing number of large electrical
infrastructure projects also produce waste.
Ausgrid attempts to reduce the production
of this waste during the construction and
maintenance process, as well as reusing or
recycling remaining material.
Electricity transformers contain oil to assist
in the safe operation of electrical equipment.
Historically, transformer oil contained
PCB (polychlorinated biphenyl), a known
hazardous substance. In 1989, Ausgrid began
a program to remove PCBs from its network,
in line with the Environmentally Hazardous
Chemicals Act 1985. All known pure PCBs
have been removed from the network.
In 2010/11, 444,444 litres of
PCB-contaminated oil and 1,054 tonnes of
PCB-contaminated equipment were removed
from the network and sent to a licensed facility
for recovery.
Impact of vehicles
Upgrading and maintaining the electricity
network often requires staff and materials to
travel large distances across the distribution
area. Vehicle and fuel use creates a
challenge when attempting to reduce the
impact of its operations on the environment.
Ausgrid’s hybrid vehicles increased from
13 in 2009/10 to 45 during the reporting
period. There are also 20 electric-only
vehicles in use. Nineteen of those cars are
part of the Smart Grid, Smart City project,
jointly funded by the Federal Government.
Demand management
Ausgrid investigates demand management
options for all network constraints where
the cost of the proposed supply-side
augmentation project is more than
$1 million. It undertook 18 demand
management screening tests during the
reporting period. Three more detailed
demand management investigations were
completed, and it was concluded that all
were cost effective demand management
solutions. These activities are detailed on
page 113. In 2010/11 Ausgrid:
Completed implementation of power
factor correction programs in the
Willoughby and Greenacre Park areas.
Entered into a network support
agreement with the owner of a
co-generation site in North Sydney
from November 2010 to March 2011.
This provided the equivalent of 2.3MVA
of demand reduction during summer
peak demand periods.
Installed a 500kVA temporary generator
in summer 2010/11 to provide network
support during peak demand periods. This
enabled the deferral of 11kV cable works
in the North West Pennant Hills area.
Customers
Ausgrid offers a number of services and
programs to help customers reduce their
energy use, including an online energy
reporting tool called Webgraphs. There were
2,903 companies using this service for energy
management in 2010/11, including 848 schools.
More than 6,500 down lights were replaced
with more efficient lights in hairdressing salons
under a program that finished in December
2010. There were 245 lighting upgrades
completed, saving an estimated 508 tonnes of
greenhouse gas emissions each year.
Ausgrid also provides a number of
educational materials on energy efficiency,
including booklets on winter heating,
swimming pool efficiency, summer cooling,
hot water and an energy usage guide.
An average residential customer used
about 6,600 kilowatt hours at the end of the
reporting period. In April 2011, Ausgrid began
listing information on its website showing the
Some outages are caused by environmental
factors such as trees or animals coming into
contact with powerlines. Unfortunately, this
can also cause injuries to native animals such as
flying foxes and possums. To help rescue, care
and re-release these protected species, two
workers from Ausgrid’s environmental services
team have become trained NSW Wildlife
Information Rescue and Education Service
(WIRES) volunteers. This means that they are
now licensed to rehabilitate and release sick,
injured or orphaned animals.
Working with WIRES

Ausgrid – Annual Report 2010/11 29
Ausgrid’s motor fleet improvements
In 2010/11, Ausgrid’s motor
vehicle fleet used
4.78 megalitres of unleaded petrol,
5.34 megalitres of diesel and
0.19 megalitres of LPG.
Ausgrid replaced
225 leased passenger vehicles and
reduced the comparative CO2
emissions by 15%.
181 light commercial vehicles were
replaced and the new vehicles
delivered a 10% reduction in CO2
emissions when compared to
those replaced.
Re-using water
Stormwater is now being captured
from Ausgrid’s Homebush Depot
and re-used on local playing fields.
The run-off is collected from two
buildings via stormwater pipes,
and filtered through a pollutant
trap before flowing into a 100,000
litre storage tank built under the
local park.
average amount of electricity used by local
government area.
This new service was designed to encourage
more discussion on energy use and how to use
electricity more efficiently.
Solar buyback
Energy distributors in NSW are tasked with
the operation of the NSW Government’s solar
bonus scheme. Eligible customers under the
scheme are paid either 60 or 20 cents for every
kilowatt hour they export to the electricity
grid from their roof top solar panels.
EnergyAustralia paid an additional six cents
per kilowatt hour.
Members of the public can now also go to
Ausgrid’s website to see the number, location
and generation capacity of rooftop solar
panels connected to its electricity network.
There were 46,365 customers with solar
panels connected to Ausgrid’s electricity
network at the end of the reporting period.
There were an additional 7,007 customers
waiting to have solar panels connected
to the network. When all systems are
connected, the generation capacity of all
renewable energy generators was expected
to be 110 MW.
Our operations
Ausgrid purchased 28,342 gigawatt hours
of accredited GreenPower during the
2010 calendar year to match the energy
consumption for all its offices, depots and
training centres.
Work across the electricity network is planned
to minimise its impact on local ecology.
Where there is an impact, additional work is
sometimes carried out to help compensate,
repair or improve biodiversity of an area.
A 12 metre tree was removed at a depot
in Chatswood in Sydney’s north for safety
reasons. Four nest boxes were placed in an
adjacent tree to help provide a safe place for
local native species to nest. The tree hollows
that were removed were donated to the
Australian Reptile Park and to local council to
provide tree hollows for other native species.
Similar steps were taken around projects
at Rathmines in the Lower Hunter and
Wamberal on the Central Coast. More than
130 nest boxes have now been installed
in these areas. An audit of 42 nest boxes
near Tomago produced evidence of recent
habitation by native species.
Ausgrid crews changed scheduled work at
a site near Galston in Sydney’s north-west
to help protect a rare plant species, Epacris
purpurascens, and tunnelling underneath the
Cooks River in Sydney’s south was relocated to
protect the roots of iconic Port Jackson figs.
Crews had to disturb plants on a large median
strip near Belrose on Sydney’s Northern
Beaches to lay a new 33kV underground cable.
After the work was complete 1,742 shrubs and
11,510 grasses were replanted.
Ausgrid’s new Learning Centre was opened
in May 2011 (see page 30), incorporating
the latest energy and water-efficient
design. The main building incorporates a
tri-generation plant which comprises a
125kVa combined heat and power unit and
a 95kW absorption chiller. It also helps to
heat and cool the building. Geothermal
bores help to remove waste heat from
water for the air-conditioning plant while
a hollow-core slab thermal mass system
maintains building temperature more evenly.
A 260 panel, 51 kilowatt photovoltaic system
has been installed on the roof and rainwater
is collected in a 147,000 litre rainwater tank.
The centre also includes 10 electric-vehicle
charging stations.
An Energy Efficiency Centre is also located
at the building to help the general public
learn about electricity. It aims to give them
practical advice to understand how much
energy they use, what appliances are energy
efficient, and how to reduce their energy use
without affecting their lifestyle. (see page 18)
Heritage
Ausgrid consulted with local Aboriginal
Land Councils on seven of its larger projects
throughout the reporting period, including
the Denman 66kV powerline and Mitchell
Line subtransmission substation.
A building containing a small distribution
substation in Annandale turned 100 years
old in 2010. Its detailed federation freestyle
façade has been retained. It originally operated
as a zone substation and is still an excellent
example of early electricity infrastructure.
Special information panels were placed on
the external wall of the new Kogarah Zone
Substation in Sydney’s south to celebrate early
use of the site as a silent movie theatre, boxing
ring and World War II navy ammunition store.

30
The new Ausgrid Learning Centre at Silverwater officially opened on 17 May
for Sydney-based apprentices. The purpose-built training facility includes
a pole yard for heights training, jointing pits for cable jointers, electrical
mechanics workshops and a substation simulator. These allow apprentices
to hone their skills in different simulated electrical environments. The $75
million project was jointly funded by Ausgrid and the Federal Government
through the Commonwealth Education Investment Fund. It also includes an
energy efficiency centre for school students and other public groups to learn
more about how to use energy wisely.
A new Learning Centre

Ausgrid – Annual Report 2010/11 31
The large-scale replacement and renewal of
the electricity network continued to be the
focus throughout 2010/11. After the sale
of the EnergyAustralia retail business, staff
in that area continued to be employed by
Ausgrid, but started providing services to the
new owners of the retail business under a
Transitional Services Agreement.
The workforce
A total of 440 employees joined Ausgrid in
2010/2011, compared to 471 who joined the
year before. Approximately half of those new
starters were employed in technical positions.
At the same time, 83 employees retired from
Ausgrid, compared to 44 the year before.
The total workforce was 5,941 full time
equivalents with an actual head count of
6,067 at the end of the reporting period.
The average workforce tenure at Ausgrid over
the last five years has remained at 12.6 years.
About 837 employees are aged between
55 and 65 years of age, and a further 116
staff are older than 65 years of age.
Apprenticeship training
A total of 153 apprentices joined Ausgrid
in 2010/11. The new recruits, aged 16 to 50
years, will complete a four-year apprenticeship
and undertake training in Sydney, Newcastle
and Muswellbrook. At the end of the reporting
period, Ausgrid was one of the largest
employers of apprentices in NSW.
Graduate, cadet and trainee programs
A total of 22 engineering graduates, three
commercial graduates, five cadets and 12
trainees started their careers at Ausgrid in
the reporting period. A two-year rotational
job program is offered to graduates with a
choice of 50 job-rotation positions to gain
experience and knowledge. Traineeships are
a four-year part-time program offering the
chance to study for an Advanced Diploma
in Electricity Supply Industry at TAFE while
gaining work experience.
Safety performance
The electricity industry around the world is
acknowledged as a hazardous industry and
so Ausgrid ranks safety as its highest priority.
During the reporting period, there was an
increase in the number of safety activities,
including safety inspections and hazard alerts.
There was also an increase in the number
of reported safety incidents and near-miss
incidents after a deliberate and high-profile
campaign to encourage staff reporting.
Ausgrid also continued to report the total
number of safety injuries. This step was taken
to create greater transparency and better
safety awareness.
However, overall safety performance of the
workforce declined during the reporting
period. The number of medically treated
injuries increased as did the safety indicator
used across the industry known as Lost Time
Injury Frequency Rate (LTIFR). The rate
is determined by the number of lost time
injuries and illnesses for each million hours
worked. At the end of the reporting period
the LTIFR was 4.4 per employee against a
target of less than three.
There were three serious reportable safety
incidents involving employees working
around the electricity network in 2010/11.
This included an employee who was seriously
injured in Newcastle when his leg became
entangled in a winder, resulting in extensive
lacerations and amputation. The worker has
since returned to work.
Workers compensation
There were 408 workers compensation claims
during the reporting period with expenditure
on all open claims of more than $3.7 million.
This compares to 336 new claims in the last
period and a total on all open claims of
$2.7 million.
WorkplaceImproving workplace safety remains the highest priority at Ausgrid. There was also an increased focus on improving staff engagement, performance management and delivering quality training to build the skills base of the technical workforce.
Lost Time Injury Severity Rate (LTISR)
Medical Treatment Injury Frequency Rate (MTIFR)
07
/08
45.6
06
/07
33.8
08
/09
52.4
09
/10
63.9*
10
/11
49.2
07
/08
26.2
06
/07
27.7
08
/09
24.5
09
/10
25.91
0/1
1
26.3
* See p.103 for explanation of increase

32
Safety improvements
A number of programs are underway for the
2011/12 year to improve safety performance.
A common safety management system called
Be Safe is being developed. The objective of
Be Safe is to have a single, outcome-driven
system for managing health and safety across
Ausgrid. This system consists of policies and
procedures to help provide a safe workplace
for employees, contractors, consultants and
visitors to worksites.
A safety video competition was launched to
encourage participation in safety initiatives.
A new OHS incident reporting form was also
launched in March 2011.
A new drug and alcohol program began in
2010/11. The phased rollout of the program
included 268 drug and alcohol awareness
sessions that more than 5,100 staff attended.
Developing people
There was a strong focus on developing skills
to assist staff in their careers. Succession
planning, a Talent Program, mentoring,
coaching and additional training was
provided. Underpinning this has been a
workforce planning program to help ensure
Ausgrid has the right mix of people and skills
to deliver its capital works plan.
The reporting of performance recognition
began in 2010/11 as did an annual
company-wide staff awards program. New
performance recovery and discipline policies
were also implemented in 2010/11 as well as
awareness sessions for 253 managers.
E-learning is proving to be a cost-effective
alternative to consistently train staff across
the business. This year new modules were
released – 117 staff completed online
induction, 119 staff accessed the working
with equity and respect module, and the
target for the business continuity awareness
online session reached 75 percent for
affected staff.
The results from a staff engagement survey
held in 2010 were used to help improve
communication via team briefs, the
management of change in the workplace
and addressing staff performance. A similar
survey will be held in March 2012 to measure
the success of these programs.
Diversity
Ausgrid is committed to providing equal
opportunity employment and promoting
the principles of equity and respect in the
workplace. Training is provided for all new
employees and the principles of equity and
respect continue to be promoted through the
Code of Conduct.
Each year field staff are selected to represent Ausgrid
at the Electrical Field Safety Days, where teams from
other energy businesses compete in a variety of events
designed to test their safety skills. At the 2011 event,
the Ausgrid team gained five first places, three second
and two third places.
Safety field days

Ausgrid – Annual Report 2010/11 33
The Code was reviewed to reflect the new
Ausgrid brand and values and re-issued to all
staff in March 2011.
Ausgrid’s Equity and Diversity Strategy reflects
a commitment to increasing employment
in the workforce by 2015. Currently, 55
employees have identified themselves as
indigenous through their membership of the
Ausgrid Indigenous Steering Committee.
Ausgrid’s Women @ Work Network was
launched in 2010/11 and there are 382
members. It aims to empower and support
women in the workplace to reach their full
potential. Fifteen activities were held in
Sydney and Newcastle.
Indigenous programs
Ausgrid’s Aboriginal and Torres Strait
Islander Pre-Apprenticeship Program began
in 2005. Ninety-two indigenous apprentices
have completed the program and 41 have
joined Ausgrid since it began. Of these, 35 are
still employed, an 85 percent retention rate
for pre-apprenticeship graduates.
In 2010, 28 participants completed the
program, 11 were offered apprenticeships and
began work at Ausgrid in January 2011.
Ausgrid was a finalist for the 2010
Diversity @ Work Award – Employment
and Inclusion of Indigenous Australians
and joint winner of the 2010 Business/
Higher Education Round Table Award for
Best Vocational Education and Industry
Collaboration, shared with TAFE Sydney
Institute - Petersham College.
Workplace relations
Ausgrid has a two-year enterprise agreement
covering the employment conditions of 5,554
staff. This agreement was renegotiated in
March 2011.
A Memorandum of Understanding with the
Electrical Trades Union (ETU) remained in
operation during 2010/11. That agreement
deals with workforce issues surrounding
Ausgrid’s expanding capital works program.
This includes the need for external contract
resources for overflow work in street
lighting, routine pole replacements, aerial
bundled cables (ABC), and fire-stopping.
An additional alliance was introduced
this year.
This is in addition to prior agreements with
two alliance partners which provide extra
resources to deliver projects on the high-
voltage and subtransmission network.
Employee support programs
Ausgrid offers all employees parental leave,
flexibility in balancing work and family
responsibilities and encouragement to return
to work following parental leave. A part-time
work procedure enables negotiation for
part-time and job-sharing arrangements,
while a redeployment procedure provides
redeployment as the first consideration for
employees whose positions are excess to
requirements.
Two employee assistance programs
provide confidential counselling services
to all employees and their immediate
families, including specific counselling for
employees exposed to trauma or critical
incidents. Other support includes a manager
advisory hotline service, Energy Industries
Superannuation Scheme information sessions,
an active staff club and a retired employees’
staff club.
Health and well-being
Ausgrid again offered free gym membership
and combined seasonal flu and H1N1 vaccines
in 2010/11 to promote ongoing staff health
and well-being. The Dust Diseases Board’s
Lung Bus offered all current and previous
Ausgrid staff free lung testing, starting in
June 2011 and continuing until November.
Age distribution of employees
21.6% 45 – <55
13.8% 55 – <65
1.9% 65+
35 – <4526.4%
25 – <3524.9%
<2511.3%
Employee facts 2010/11
12.6Average years length
of employee service
153Apprentices joined Ausgrid
3Serious reportable employee
safety incidents
55Indigenous employees

34
Finance report
2010/11
result
2010/11
SCI*
2010/11
plan
variation to
plan
2009/10
result
Operating revenue ($m) 4,070 2,408 4,662 (592) 3,980
EBIT ($m)** 984 770.8 854.5 129.5 913
EBITDA ($m)** 1,391.7 1,157.8 1,241.5 150.2 1,246
Net profit after tax($m)** 325.9 155.9 220.1 105.8 345
Dividend ($m) 175.08 109.1 154 21.08 250
Other payments ($m) 1,370.0 - - 1,370.0 -
Total distributions to Government ($m) 1,734 175.9 248.9 1,485.1 386
Return on equity (%) 17.2 8.8 11.7 5.5 19
Capital expenditure ($m) 1,578 1,595 1,595 17 1,319
* The Statement of Corporate Intent (SCI) targets do not include the retail business, the 2010/11 results should be compared with the plan, which include
combination of the retail and network business. ** For comparison, the sale from the retail business of $1,247.9 million has been excluded from the
10/11 results.
Financial results
Financial highlights
Ausgrid achieved Earnings Before Interest
and Tax (EBIT) of $2,231.9m and includes
profit on sale from the retail assets of
$1,247.9m. Excluding this, EBIT was $984
million from total revenues of $4.07 billion.
EBIT in 2010/11 was $71 million higher
than last year’s reported result (see table
above). The network business performed
well, reflecting favourable energy volume
variances and favourable demand/
capacity variances offset by unfavourable
price variances. At the date of sale, the
retail business was well ahead of target,
which represented the strong operational
performance of the business driven by higher
gross margins and lower operational costs.
Return on shareholders’ funds
Total company assets were $11.27 billion at
30 June 2011 and the return on these assets
was 9.1 per cent. Shareholders’ equity
increased during 2010/11 to $1.93 billion due
to the increased earnings. Ausgrid achieved a
17.2 per cent return on equity which was better
than the Statement of Corporate Intent target
of 8.8 per cent. Total earnings provided a net
profit after tax of $1,573.8 million or
$325.9 million, excluding the sale of the retail
business. Ausgrid’s distributions to the NSW
Government were $364 million from a dividend
of $175 million and income tax expense of
$189 million. Total distributions to government
were $1,734 million including $1,370 million
arising from the sale of the retail business on
1 March 2011. Excluding the sale of retail,
distributions were $115 million higher
than plan.
Productivity savings and efficiencies
During the reporting period, both operating
and capital cost reduction savings were
targeted to ensure Ausgrid’s operations were
being conducted as efficiently as possible.
Total Ausgrid funded capital expenditure
of $1,578 million was $17 million less than
target, reflecting efficiencies in major
projects, including the replacement of
33kV cables at Lindfield and Belmore Park,
Balgowlah, Hurstville North and Tomago
zone substations.
Underlying operational expenditure was
reduced by $67 million partly through
reductions in corporate overheads. Over the
five year regulatory period, $800 million
savings in capital costs are being targeted.

Ausgrid – Annual Report 2010/11 35
Governance at Ausgrid
Ausgrid is a State Owned Corporation
established under the Energy Services
Corporations Act 1995 and the State
Owned Corporations Act 1989. It is subject
to a significant number of statutory and
subordinate legislative requirements.
The Board has overall responsibility for
corporate governance at Ausgrid. The
governance framework establishes the
approach of the organisation to various
economic, environmental and social
practices. However, governance is not just
a matter for the Board and it is important
that a good governance culture is fostered
throughout the organisation. In determining
the governance practices the Board has
taken into consideration the Australian
Securities Exchange (ASX) Corporate
Governance Council, Principles of Good
Corporate Governance and Best Practice
Recommendations and other relevant best
practice guides.
The Board has a formal Charter which sets
out its role and key responsibilities among
other things. The Charter was reviewed and
updated during the year. The Board has
adopted the organisation’s Code of Conduct
as its model of behaviour.
Ausgrid’s operational performance is
monitored at Board and Sub-Committee
meetings. Reports to the Board include
monthly reports on the financial and
operational performance of the business (via
the Managing Director’s report), approval of
large capital investment projects or awarding
of contracts, business operational and risk
management reports.
Beyond the matters reserved for its decision,
the Board has delegated all remaining
authority to the Managing Director. The
Managing Director is accountable to the
Board for the authority that has been
delegated and for the performance of the
business. The businesses objectives and
performance targets are established each
year in the Statement of Corporate Intent,
business plans and Network Management
Plans. Other plans available at www.ausgrid.
com.au establish the objectives and targets
for electrical safety, community education
and bushfire risk management. Ausgrid’s
strategic plan to 2014 incorporates the
key strategic themes of safety, reliability,
innovation, managing costs, driving process
improvement and performance management,
building foundations for the future and
sustainable growth.
The Board undertakes a formal process to
review the performance of the Managing
Director and Executive team. The evaluation
is based on pre-agreed criteria which
incorporates an independent assessment of
organisational and business performance.
A copy of the Board and Sub-Committee
Charters are available on Ausgrid’s website,
www.ausgrid.com.au.
A Board performance review was
completed in September 2010. The review
recommendations were considered by the
Board and a number of those have been
implemented including the formation of a
Nomination committee and additional non-
executive director sessions.
Directors’ report
A - Indicates number of meetings held during the period the Director was entitled to attend/a member of the Sub-Committee
B - Indicates the number of meetings attended by the Director during the period
* - Attended meeting as an invitee
Michael Lambert’s appointment ceased on 31 August 2010. Peter Dodd was appointed 6 September 2010. Where the number of attendances exceeds the number of meetings held,
the attendee was not a member of the Sub-Committee for the entire period and attended some meetings as a guest. Sub-Committee membership changed on 1 January 2011.
Scheduled A B A B A B A B A B
J Conde, AO 14 14 2 5 4 8 3 3 - 6
G Maltabarow 14 14 * 5 5 8 8 3 3 8 8
P Akopiantz 14 13 3 3 8 7 3 2 - 3
P Jeans 14 13 3 4 4 6 3 3 8 8
M Lambert 1 1 1 1 - - - - 1 1
R Mifsud 14 14 5 5 4 5 - - 8 7
P Dodd 13 11 2 2 - 1 - - 4 4
Capital Investment
& Economic
Regulation
Sub-Committee
Human Resources
Sub-Committee
Retail & Energy
Services Sub-
Committee
Audit & Risk
Sub-Committee
Board of Directors
Meeting

36
Directors’ report
John Conde AO
BSc, BE (Hons), MBA
Chairman
A non-executive director since November 1997.
Chairman of the Nomination Sub-Committee
and member of the Audit & Risk and Human
Resources Sub-Committees. Chairman of Sydney
Symphony Limited, Whitehaven Coal Limited,
BUPA Australia Health Pty Ltd, Homebush Motor
Racing Authority Advisory Board, Downtown
Utilities, Australian Olympic Committee (NSW)
Fundraising Committee, Ausgrid Pty Limited and
Events NSW. President of the Commonwealth
Remuneration Tribunal and the Dermatology
Research Foundation – University of Sydney.
Director of DEXUS Property Group.
George Maltabarow
BE, BEc
Managing Director
An executive director since May 2005. A
member of the Capital Investment & Economic
Regulation, Human Resources and Retail &
Energy Services Sub-Committees. An attendee
at the Audit & Risk Sub-Committee. Director
of Ausgrid Pty Limited, the Energy Networks
Association of Australia and the Energy Supply
Association of Australia. President of the
Council of Electrical & Information Engineering
Foundation of the University of Sydney and
Member of the CSIRO Energy and Transport
Sector Advisory Council.
Patricia Akopiantz
BA, MBA
A non-executive director since March 2006.
Chairman of the Human Resources Sub-
Committee and member of the Retail & Energy
Services and Nomination Sub-Committees.
Director of AXA APH, National Mutual Life
Association and National Mutual Funds
Management until 31 March 2011. Director
of AMP from 31 March 2011 and NSW
Library Foundation.
Peter Dodd
PhD, MSc MCom, BCom, Dip Ed
A non-executive director since September
2010. Chairman of the Audit & Risk Sub-
Committee and member of the Nomination
and Capital Investment & Economic
Regulation Sub-Committees. A director of
Collgar Wind Farm Pty Ltd, CWF Holdings Pty
Ltd, Macquarie Uni Property Investment Co
Pty Ltd, North American Energy Partners, The
Centre of Independent Studies, Macquarie
Graduate School of Management Pty Ltd,
MUH Operations Pty Ltd, Investa Listed
Funds Management Limited. Deputy Vice
Chancellor and Chief Operating Officer of
Macquarie University.
Paul Jeans
BE
A non-executive director since March 2000.
Chairman of the Capital Investment &
Economic Regulation Sub-Committee and
member of the Human Resources and Retail &
Energy Services Sub-Committees. Chairman of
Newcastle Port Corporation.
Rebecca Mifsud
BA, LLB
A non-executive director since October 2009.
Chairman of the Retail & Energy Services
Sub-Committee and member of the Capital
Investment & Economic Regulation and Audit
& Risk Sub-Committees.
The Board
In accordance with the State Owned Corporations Act 1989, up to seven directors can be appointed by the Shareholders including a director
nominated by Unions NSW. The Board currently has six members. In August 2010 Mr Michael Lambert’s term expired. The vacancy was filled by
Dr Peter Dodd on 6 September 2010. The remuneration of non-executive directors is determined by the shareholders and paid for by Ausgrid. The
directors holding office at 30 June 2011 were:

Ausgrid – Annual Report 2010/11 37
Board responsibilities and meetings
The responsibilities of the Board include:
Approving the business plan and reports
to the shareholders on progress against
the business plan
Considering and determining the strategic
direction of the organisation
Monitoring reports on issues including the
safety of the workforce, environmental
performance and issues, compliance,
financial performance and risk management
Appointing, evaluating and remunerating
the Managing Director and Executive and
Ensuring that assets are effectively utilised
to achieve the desired outcomes for the
shareholders, customers and the community.
The Board meets as often as necessary to fulfil
its functions. Senior managers attend Board
meetings by invitation to discuss matters for
approval, provide updates on significant issues,
for example: safety incidents or to discuss
strategic issues. The non-executive directors
meet regularly in the absence of the Managing
Director and other management.
During the course of its work, the Board is able
to obtain independent advice as required. The
Board reviews its performance regularly.
Board Sub-Committees
The Board has established Sub-Committees
to assist it in monitoring the performance
of the business including the management
of risk, compliance and the core business
operations of Ausgrid. Arising from a Board
review undertaken, the Board established a
Nomination Sub-Committee. Information on
each Sub-Committee appears below.
Audit & Risk
The Sub-Committee assists the Board
in assuring the integrity of the statutory
and regulatory financial statements and
the operation of the internal control,
business risk and compliance frameworks
in the organisation. A new Charter for
the Sub-Committee was approved in
February 2011. The main changes related
to the responsibilities for monitoring of Risk
Management activities.
Activities during the year
The Sub-Committee completed all activities
under its Charter including:
Approval of Internal Audit plans,
monitoring the performance of Internal
Audit and progress with implementing
internal audit recommendations
Endorsement of the statutory and
regulatory financial statements prior to
Board approval
Reviewing business continuity plans,
IT back-up and application forward
remediation program, insurance coverage
Monitoring the outcome of investigations
into alleged corrupt conduct
Endorsing changes to the presentation of
the monthly financial report to the
Board, and
Reviewing the action plans in place for
major risks.
Retail & Energy Services
This Sub-Committee was previously
known as the Retail Performance & Risk
Management Sub-Committee. In February
2011 the Charter for the Sub-Committee
was substantially changed in line with the
proposed sale of retail assets to TRUenergy.
This Sub-Committee assists the Board of
Directors in fulfilling its responsibilities in
relation to the monitoring of service delivery
obligations under internal and external service
agreements, monitoring activities required
to transition the retail operations to its new
owners; and review of the development of new
energy products and services.
Activities during the year
The Sub-Committee completed all activities
under its Charter including:
Monitoring activity associated with the NSW
Government’s Energy Reform Strategy
Reviewing the monthly performance
reports associated with the provision of
services to TRUenergy and residual retail
risks retained by Ausgrid, and
Reviewing the development of the energy
services strategy.
Human Resources
This Sub-Committee assists the Board in
its oversight of the Human Resources &
safety management systems and practices
including succession & workforce planning,
remuneration and the safety governance
framework and its operation. The Charter
for the Sub-Committee was reviewed and
updated in February 2011.
Activities during the year
The Sub-Committee completed all activities
under its Charter including:
Overseeing the implementation of an
enhanced safety reporting framework
focussing on lead and lag indicators
including improved incident and near
miss reporting
Monitoring the implementation of the
succession planning and learning and
development frameworks
Monitoring the progress with workforce
planning activities to ensure that the
organisation has identified and is taking
action to manage risks associated with
any skills and capability gaps arising from
the significant capital program
Reviewing the development of the
framework to measure productivity
offsets that underpin wage increases, and
Considering the recommended changes to
remuneration for the Executive team and
their performance prior to Board approval.
Capital Investment & Economic Regulation
The Sub-Committee assists the Board in
its oversight of the planning and delivery
of the capital program, the economic
impacts of the regulatory framework on
business performance and the approach to
maintenance and utilisation of major assets.
The Charter for the Sub-Committee was
reviewed and updated in February 2011.
Activities during the year
The Sub-Committee completed all activities
under its Charter including:
Endorsed the capital budget, significant
investments and regularly reviewed
progress with the capital program
Reviewed strategy associated with the
rollout of the transmission and distribution
automation programs and the proposed
funding arrangements for the programs
Considered the strategy for CBD to 2017
and the key projects underway to ensure
licence compliance
Reviewed the distribution licence
compliance report, and
Reviewed pricing strategies for the
distribution business.
Nomination
This Sub-Committee was formed in 2011.
The role of the Nomination Sub-Committee
is to assist the Board of Directors in fulfilling
its responsibilities in relation to identifying,
evaluating and recommending candidates
for appointment as non-executive directors;
and performance evaluation and effective
operation of the Board, including its
Sub-Committees and individual directors.
Activities during the year
The Sub-Committee did not meet in 2010/11.

38
Managing Director
George Maltabarow BE,
BEc
Distribution Operations
& Reliability
Executive General
Manager - John Eisenhuth
BE, GradDipMgmt
Human Resources
Executive General
Manager - Maree Slater
BA(Hons), MA, MBA, Dip
Ind. Law & IR, Dip Ed
Transmission & System
Operations
Executive General
Manager - Trevor
Armstrong BE
Shared Services
Executive General
Manager - Mike Bailey
Ausgrid’s leadership team
Internal control
Ausgrid has in place effective internal control
processes monitored by its Board of Directors,
and administered by management and staff to
deliver corporate objectives and ensure that
laws and regulations, codes and policies are
being complied with, and financial reporting
is accurate. Ausgrid has a strong internal
audit function that provides independent
assessments of the effective design and
operation of this internal control framework
and the management of key business risks.
Risk management
Ausgrid has in place a robust business
risk management policy and process for
embedding risk management practices into
the organisation’s culture and actions. The
policy is consistent with the Australian/New
Zealand Standard on risk management
(AS/NZS ISO 31000:2009). A formal strategic
risk management assessment is conducted
annually as part of the corporate planning
process. For 2010/11, 21 key strategic risks
were identified, assessed, mitigated and
reported to the Board. Operational risk
assessments are completed annually for
each business area which establish the key
business risks to be managed and action
plans to address gaps. Ausgrid’s emergency
procedures for managing incidents such as
fires, storms, natural disasters or anything
else that may affect the electricity network
or critical business processes are defined in
its Incident Management System available to
all staff. Ausgrid’s response to emergencies
centres around three priorities – safety for
both people and property, the environment
and restoring the network. Ausgrid has a
comprehensive insurance program in place
and reviews the adequacy of its insurance
limit annually. This includes a review of
participating insurers’ financial position.
Ethics
Maintaining ethical behaviour is core to
effective corporate governance. This requires
leading by example and building a culture of
performance aligned to integrity and Ausgrid’s
performance behaviours of collaboration,
accountability, reliability, safety, commerciality,
innovation and leadership. Ausgrid is
committed to maintaining high standards of
accountability and ethics. Ausgrid’s Business
Ethics Committee comprises senior divisional
management representatives who oversee
the implementation and effectiveness of
appropriate ethical programs. Ausgrid’s
leadership has accepted responsibility
to promote its corporate values, create
commitment to these values and generate
improved performance within the organisation.
There have been no cases referred to Ausgrid’s
Business Ethics Committee by either Ausgrid
employees or contractors in 2010/11.
Employees can also call the St James Ethics
Centre helpline on 1800 672 303 if they do not
wish to raise an issue with Ausgrid’s Business
Ethics Committee.
Finance & Corporate
Executive General
Manager - Craig
James B-Fin Admin,
DipFinServices
System Planning &
Regulation
Executive General
Manager - Peter Birk
BSc Elec Eng, MBA
Corporate Secretary
Lisa Maffina BBus,
GradDipMgmt
Legal Branch
General Counsel -
Susan Bailey BA, LLM
Chief Internal
Auditor
Noel Kean BBus,
DipComm
Energy Services
Executive General
Manager - Jane Mills
BComm

Ausgrid – Annual Report 2010/11 39
Ausgrid (formerly known as EnergyAustralia Group)
Consolidated Financial ReportFor the year ended 30 June 2011
Page Contents
Page Notes to the financial statements
40 Statements of Comprehensive Income
41 Statements of Financial Position
42 Statements of Changes in Equity
46 Statements of Cash Flows
47 Notes to the Financial Statements
95 Directors’ Declaration
96 Independent Auditor‘s Report
47 1 Significant accounting policies
56 2 Revenue
57 3 Expenses
58 4 Gain/(Loss) on disposal
58 5 Income tax expense
59 6 Cash and cash equivalents
59 7 Trade and other receivables
60 8 Other financial assets
60 9 Inventories
60 10 Other current assets
61 11 Property, plant and equipment
62 12 Intangible assets
63 13 Current tax liabilities
63 14 Deferred tax assets and liabilities
64 15 Trade and other payables
65 16 Borrowings
67 17 Provisions
67 18 Other financial liabilities
68 19 Capital and reserves
69 20 Financial instruments
82 21 Related parties – key management personnel disclosures
83 22 Related parties – non-key management personnel disclosures
83 23 Remuneration of auditor
84 24 Contingent liabilities and contingent assets
84 25 Capital and other commitments
85 26 Operating leases
86 27 Consolidated entities
86 28 Reconciliation of cash flows from operating activities
87 29 Employee benefits
87 30 Superannuation
93 31 Discontinued Operation
94 32 External consultants
94 33 Events after the statement of financial position date

40
Ausgrid and controlled entities
Statements of Comprehensive IncomeFor the year ended 30 June 2011
Consolidated Entity Ausgrid
Note
2011 2010 2011 2010
$M $M $M $M
Continuing Operations
Revenue 2 2 635.6 1 997.9 2 635.6 1 997.9
Expenses, excluding finance costs and fair value
movements in financial instruments 3(a) (1 862.3) (1 499.6) (1 862.4) (1 499.6)
Finance costs 3(b) (469.7) (431.7) (469.7) (431.7)
Gain / (Loss) on disposal 4 ( 3.6) ( 6.9) ( 3.6) ( 6.9)
Profit before income tax and financial instrument fair value movements 300.0 59.7 299.9 59.7
Income tax expense on profit before financial
instrument fair value movements 5 124.2 10.1 124.2 10.1
Profit before financial instrument fair value movements 175.8 49.6 175.7 49.6
Fair value movements in financial instruments 3(c) (0.7) 0.9 (0.7) 0.9
Income tax expense / (credit) on financial
instrument fair value movements 5 (0.2) 0.3 (0.2) 0.3
Profit after tax from continuing operations 175.3 50.2 175.2 50.2
Profit after tax from discontinuing operations 31 1 398.5 294.8 1 398.5 294.8
Profit for the year 1 573.8 345.0 1 573.7 345.0
Other Comprehensive Income
Net increase/(decrease) in revaluation reserve 25.2 4.3 25.2 4.3
Net increase/(decrease) in hedging reserve 30.6 (2.6) 30.6 (2.6)
Superannuation actuarial gains/(losses) 30 8.3 (33.4) 8.3 (33.4)
Income tax expense/(credit) on other
comprehensive income 5 18.3 (8.8) 18.3 (8.8)
Other comprehensive income for the year, net of
income tax 45.8 ( 22.9) 45.8 (22.9)
Total comprehensive income for the year 1 619.6 322.1 1 619.5 322.1
Profit attributable to:
Owners of the Corporation 1 573.8 345.0 1 573.7 345.0
Non-controlling interest - - - -
Profit for the year 1 573.8 345.0 1 573.7 345.0
Total comprehensive income attributable to:
Owners of the Corporation 1 619.6 322.1 1 619.5 322.1
Non-controlling interest - - - -
Total comprehensive income for the year 1 619.6 322.1 1 619.5 322.1
The above statements of comprehensive income should be read in conjunction with the accompanying notes.

Ausgrid – Annual Report 2010/11 41
As at 30 June 2011
Note
2011 2010 2011 2010
$M $M $M $M
Current assets
Cash and cash equivalents 6 99.4 156.6 99.4 156.6
Trade and other receivables 7 538.4 688.0 538.4 688.1
Other financial assets - including derivatives 8 76.1 43.8 76.1 43.8
Inventories 9 31.6 34.7 31.6 34.7
Other current assets 10 66.3 133.4 66.3 133.4
Total current assets 811.8 1 056.5 811.8 1 056.6
Non-current assets
Other financial assets - including derivatives 8 7.0 54.0 7.0 54.0
Property, plant and equipment 11 9 949.7 8 715.5 9 949.7 8 715.5
Intangible assets 12 269.1 255.6 269.1 255.6
Deferred tax assets 14 232.8 255.9 232.8 255.9
Total non-current assets 10 458.6 9 281.0 10 458.6 9 281.0
Total assets 11 270.4 10 337.5 11 270.4 10 337.6
Current liabilities
Trade and other payables 15 570.4 620.8 570.4 620.8
Borrowings 16 168.9 286.0 168.9 286.0
Other financial liabilities - including derivatives 18 77.1 26.4 77.1 26.4
Deferred revenue 37.4 65.9 37.4 65.9
Employee benefits 29 426.6 428.4 426.6 428.4
Provisions 17 288.9 306.9 288.9 306.9
Deposits 2.7 24.8 2.7 24.8
Current tax liabilities 13 164.3 40.2 164.3 40.2
Deferred government grants 6.7 1.0 6.7 1.0
Total current liabilities 1 743.0 1 800.4 1 743.0 1 800.4
Non-current liabilities
Borrowings 16 6 622.9 5 549.1 6 622.9 5 549.1
Other financial liabilities - including derivatives 18 7.9 92.1 7.9 92.1
Employee benefits 29 196.0 221.5 196.0 221.5
Provisions 17 45.3 47.4 45.3 47.4
Deposits 9.5 1.8 9.5 1.8
Deferred tax liabilities 14 639.9 714.9 639.9 714.9
Deferred government grants 76.3 55.2 76.3 55.2
Total non-current liabilities 7 597.8 6 682.0 7 597.8 6 682.0
Total liabilities 9 340.8 8 482.4 9 340.8 8 482.4
Net assets 1 929.6 1 855.1 1 929.6 1 855.2
Equity
Parent entity interest
Contributed equity and share capital 402.1 402.1 402.1 402.1
Reserves 998.5 961.5 998.5 961.5
Retained earnings 529.3 491.8 529.0 491.6
Total parent entity interest 1 929.9 1 855.4 1 929.6 1 855.2
Non-controlling interest in controlled entity ( 0.3) ( 0.3) - -
Total equity 1 929.6 1 855.1 1 929.6 1 855.2
The above statements of financial position should be read in conjunction with the accompanying notes.
Ausgrid and controlled entities
Statements of Financial Position
AusgridConsolidated Entity

42
Ausgrid and controlled entities
Statements of Changes in EquityFor the year ended 30 June 2011
Contributed
equity
and share
capital
Hedging
reserve
Non-
controlling
interest
Revaluation
reserveTotal
Retained
earningsTotal equity
Consolidated Entity Note $M $M $M $M $M $M $M
Balance at 1 July 2010 402.1 983.0 (21.5) 491.8 1 855.4 (0.3) 1 855.1
Comprehensive income for the year
Profit for the year - - - 1 573.8 1 573.8 - 1 573.8
Other comprehensive income
Net increase/(decrease) in
revaluation reserve, net of tax
5,19 - 18.5 - - 18.5 - 18.5
Net increase/(decrease) in hedging
reserve, net of tax
5,19 - - 21.5 - 21.5 - 21.5
Transfers to and from reserves/
retained profits
- ( 3.0) - 3.0 - - -
Superannuation actuarial gains/
(losses), net of tax
5,19 - - - 5.8 5.8 - 5.8
Total other comprehensive income
for the year - 15.5 21.5 8.8 45.8 - 45.8
Total comprehensive income for
the year - 15.5 21.5 1 582.6 1 619.6 - 1 619.6
Transactions with owners, recorded directly in equity
Dividends and other payments
to shareholders
19
- - - (1 545.1) (1 545.1) - (1 545.1)
Total transactions with owners - - - (1 545.1) (1 545.1) - (1 545.1)
Balance at 30 June 2011 402.1 998.5 0.0 529.3 1 929.9 (0.3) 1 929.6
The above statements of changes in equity should be read in conjunction with the accompanying notes.

Ausgrid – Annual Report 2010/11 43
Ausgrid and controlled entities
Statements of Changes in Equity
Contributed
equity and
share capital
Hedging
reserve
Revaluation
reserveTotal equity
Retained
earnings
Ausgrid Note $M $M $M $M $M
Balance at 1 July 2010 402.1 983.0 (21.5) 491.6 1 855.2
Comprehensive income for the year
Profit for the year - - - 1 573.7 1 573.7
Other comprehensive income
Net increase/(decrease) in revaluation reserve, net of tax 5,19 - 18.5 - - 18.5
Net increase/(decrease) in hedging reserve, net of tax 5,19 - - 21.5 - 21.5
Transfers to and from reserves/retained profits - (3.0) - 3.0 -
Superannuation actuarial gains/(losses), net of tax 5,19 - - - 5.8 5.8
Total other comprehensive income for the year - 15.5 21.5 8.8 45.8
Total comprehensive income for the year - 15.5 21.5 1 582.5 1 619.5
Transactions with owners, recorded directly in equity
Dividends and other payments to shareholders 19 - - - (1 545.1) (1 545.1)
Total transactions with owners - - - (1 545.1) (1 545.1)
Balance at 30 June 2011 402.1 998.5 0.0 529.0 1 929.6
The above statements of changes in equity should be read in conjunction with the accompanying notes.
For the year ended 30 June 2011

44
Ausgrid and controlled entities
Statements of Changes in EquityFor the year ended 30 June 2010
Contributed
equity
and share
capital
Hedging
reserve
Non-
controlling
interest
Revaluation
reserveTotal
Retained
earningsTotal equity
Consolidated Entity Note $M $M $M $M $M $M $M
Balance at 1 July 2009 402.1 978.4 (19.7) 422.7 1 783.5 (0.3) 1 783.2
Comprehensive income for the year
Profit for the year - - - 345.0 345.0 - 345.0
Other comprehensive income
Net increase/(decrease) in
revaluation reserve, net of tax 5,19 - 2.3 - - 2.3 - 2.3
Net increase/(decrease) in hedging
reserve, net of tax 5,19 - - (1.8) - (1.8) - ( 1.8)
Transfers to and from reserves/
retained profits - 2.3 - (2.3) - - -
Superannuation actuarial gains/
(losses), net of tax 5,19 - - - (23.4) (23.4) - (23.4)
Total other comprehensive income
for the year - 4.6 (1.8) (25.7) (22.9) - (22.9)
Total comprehensive income for
the year - 4.6 (1.8) 319.3 322.1 - 322.1
Transactions with owners, recorded
directly in equity
Dividends and other payments to
shareholders 19 - - - (250.2) (250.2) - (250.2)
Total transactions with owners - - - (250.2) (250.2) - (250.2)
Balance at 30 June 2010 402.1 983.0 (21.5) 491.8 1 855.4 (0.3) 1 855.1
The above statements of changes in equity should be read in conjunction with the accompanying notes.

Ausgrid – Annual Report 2010/11 45
Ausgrid and controlled entities
Statements of Changes in Equity
Contributed
equity and
share capital
Hedging
reserve
Revaluation
reserveTotal equity
Retained
earnings
Ausgrid Note $M $M $M $M $M
Balance at 1 July 2009 402.1 978.4 (19.7) 422.5 1 783.3
Comprehensive income for the year
Profit for the year - - - 345.0 345.0
Other comprehensive income
Net increase/(decrease) in revaluation reserve, net of tax 5,19 - 2.3 - - 2.3
Net increase/(decrease) in hedging reserve, net of tax 5,19 - - (1.8) - (1.8)
Transfers to and from reserves/retained profits - 2.3 - (2.3) -
Superannuation actuarial gains/(losses), net of tax 5,19 - - - (23.4) (23.4)
Total other comprehensive income for the year - 4.6 (1.8) (25.7) (22.9)
Total comprehensive income for the year - 4.6 (1.8) 319.3 322.1
Transactions with owners, recorded directly in equity
Dividends and other payments to shareholders 19 - - - (250.2) (250.2)
Total transactions with owners - - - (250.2) (250.2)
Balance at 30 June 2010 402.1 983.0 (21.5) 491.6 1 855.2
The above statements of changes in equity should be read in conjunction with the accompanying notes.
For the year ended 30 June 2010

46
2011 2010
Ausgrid and controlled entities
Statements of Cash Flows
Note $M $M
Cash flows from operating activities
Receipts from customers 3 775.6 4 173.9
Payments to suppliers and employees (2 450.5) (2 998.6)
Cash generated from operations 1,325.1 1,175.3
Interest received 4.8 1.5
Interest paid (445.6) (330.9)
Income tax equivalent paid (134.6) (120.8)
Net cash from operating activities 28 749.7 725.1
Cash flows from investing activities
Proceeds from sale of investments (discontinuing operations) 1 441.4 -
Proceeds from sale of property, plant and equipment 4.7 3.9
Payments for property, plant and equipment and intangible assets (1 577.8) (1 318.7)
Net cash used in investing activities (131.7) (1 314.8)
Cash flows from financing activities
Proceeds from borrowings 945.0 999.3
Dividend and other payments to shareholders (1 620.2) (173.0)
Net cash from financing activities (675.2) 826.3
Net increase/(decrease) in cash and cash equivalents (57.2) 236.6
Cash and cash equivalents at 1 July 6 156.6 (80.0)
Cash and cash equivalents at 30 June 6 99.4 156.6
The above statements of cash flows should be read in conjunction with the accompanying notes.
For the year ended 30 June 2011
The Statements of Cash Flows and their Notes apply to both Ausgrid and the Consolidated Entity.

Ausgrid – Annual Report 2010/11 47
Ausgrid (formerly known as EnergyAustralia)
is a NSW statutory state owned corporation
(for-profit) established on 1 March 1996
by the Energy Services Corporations Act
1995 and the Energy Services Corporations
Amendment (Change of Name) Regulation
2011. The consolidated financial report
of the Corporation for the year ended 30
June 2011 comprises the Corporation and
its subsidiaries (together referred to as the
“consolidated entity”) and the consolidated
entity’s interest in jointly controlled entities.
On 14 December 2010, the NSW Government
announced the successful outcome of the first
tranche of transactions in the State’s energy
reform process. The Government reached
agreement to sell the electricity retailing
operations of EnergyAustralia and two
Marulan development sites to TRUenergy.
The transactions were completed on 1 March
2011. On 2 March 2011, the name change to
Ausgrid was gazetted.
The financial report was authorised for issue
by the Directors on 14 September 2011.
(a) Statement of compliance
The financial report is a general purpose
financial report which has been prepared
in accordance with Australian Accounting
Standards (AASBs) (including the Australian
Accounting Interpretations) adopted by the
Australian Accounting Standards Board,
the requirements of the Public Finance
and Audit Act 1983, the Public Finance and
Audit Regulation 2010, and the State Owned
Corporations Act 1989. Australian Accounting
Standards include Australian equivalents
to International Financial Reporting
Standards (IFRSs). The financial reports of
the consolidated entity and the Corporation
also comply with IFRSs and interpretations
adopted by the International Accounting
Standards Board.
(b) Basis of preparation
The financial report is presented in
Australian dollars.
The financial report is prepared on the
historical cost basis, except that the following
assets and liabilities are stated at their fair
value: derivative financial instruments,
financial instruments held for trading, financial
instruments classified as available-for-sale
and items of property, plant and equipment.
The Corporation is exempt from Clause 9
of the Public Finance and Audit Regulation
2005. The amounts shown in the accounts
have been rounded to the nearest tenth of a
million dollars, unless otherwise stated.
Use of estimates and judgements
The preparation of a financial report
requires management to make judgements,
estimates and assumptions that affect the
application of policies and reported amounts
of assets and liabilities, income and expenses.
The estimates and associated assumptions
are based on historical experience and
various other factors that are believed to
be reasonable under the circumstances, the
results of which form the basis of making the
judgements about carrying values of assets
and liabilities that are not readily apparent
from other sources. Actual results may differ
from these estimates. These accounting
policies have been consistently applied by
each entity in the consolidated entity.
The estimates and underlying assumptions
are reviewed on an ongoing basis. Revisions
to accounting estimates are recognised in
the period in which the estimate is revised, if
the revision affects only that period or in the
period of the revision and future periods if the
revision affects both current and future periods.
Judgements made by management in the
application of AASBs that have significant
effect on the financial report and estimates
with a significant risk of material adjustment
in the next year are discussed in Note 1(w)
and various respective notes.
Unless otherwise indicated, the accounting
policies set out below have been applied
consistently to all periods presented in the
consolidated financial report. The accounting
policies have been applied consistently by
consolidated entities.
Certain comparative amounts have been
reclassified to conform with the current
year’s presentation (see Statement of
Comprehensive Income and Notes 2, 3 and
5). This has resulted from the sale of Ausgrid’s
electricity retailing operation on 1 March
2011 (see Note 31).
Certain new and revised accounting
standards and the Australian Accounting
Interpretations have been published that
are not mandatory for the 30 June 2011
reporting period. The Ausgrid Group has
elected not to apply these new standards
and interpretations to the annual reporting
period beginning 1 July 2010 (see Note 1(z)).
(c) Basis of consolidation
(i) Subsidiaries
Subsidiaries are entities controlled by
the Corporation. Control exists when
the Corporation has the power, directly
or indirectly, to govern the financial and
operating policies of an entity so as to obtain
benefits from its activities. In assessing
control, potential voting rights that presently
are exercisable or convertible are taken
into account. The financial statements of
subsidiaries are included in the consolidated
financial statements from the date that control
commences until the date that control ceases.
(ii) Transactions eliminated on consolidation
Intragroup balances and any unrealised
gains and losses or income and expenses arising
from Intragroup transactions are eliminated in
preparing the consolidated financial statements.
(d) Income tax
Ausgrid and its controlled entities (“the
Group”) are exempt from federal income
tax under the Income Tax Assessment Acts.
However, the Group is subject to the National
Tax Equivalent Regime which is based on the
Income Tax Assessment Acts. Tax equivalents
are payable to the Office of State Revenue.
Income tax on the profit or loss for the
year comprises current and deferred tax.
Income tax is recognised in the Statement of
Comprehensive Income except to the extent
that it relates to items recognised directly in
equity, in which case it is recognised in equity.
Current tax is the expected tax payable on
the taxable income for the year, using tax
rates enacted or substantively enacted at
the statement of financial position date, and
any adjustment to tax payable in respect of
previous years.
Deferred tax is provided using the statement
of financial position liability method, providing
for temporary differences between the carrying
amounts of assets and liabilities for financial
reporting purposes and the amounts used for
taxation purposes. The following temporary
differences are not provided for: initial
recognition of goodwill, the initial recognition
of assets or liabilities that affect neither
accounting nor taxable profit, nor differences
relating to investments in subsidiaries to the
extent that they will probably not reverse in
the foreseeable future. The amount of deferred
tax provided is based on the expected manner
of realisation or settlement of the carrying
amount of assets and liabilities, using tax
rates enacted or substantively enacted at the
statement of financial position date.
For the year ended 30 June 2011
Ausgrid and controlled entities
Notes to the financial statements1 SIGNIFICANT ACCOUNTING POLICIES

48
A deferred tax asset is recognised only to the
extent that it is probable that future taxable
profits will be available against which the asset
can be utilised. Deferred tax assets are reduced
to the extent that it is no longer probable that
the related tax benefit will be realised.
Additional income taxes that arise from the
distribution of dividends and other payments
are recognised at the same time as the liability
to pay the related dividend or payment.
Tax consolidation
The Corporation and its wholly-owned
Australian resident entities have formed a
tax-consolidated group with effect from 1
July 2003 and are therefore taxed as a single
entity from that date. The head entity within
the tax-consolidated group is Ausgrid.
Current tax expense/income, deferred tax
liabilities and deferred tax assets arising from
temporary differences of the members of
the tax-consolidated group are recognised
in the separate financial statements of the
members of the tax-consolidated group using
the ‘group allocation’ approach by reference
to the carrying amounts of assets and
liabilities in the separate financial statements
of each entity and the tax values applying
under tax consolidation.
Any current tax liabilities (or assets) and
deferred tax assets arising from unused tax
losses of the subsidiaries is assumed by the
head entity in the tax-consolidated group
and are recognised as amounts payable
(receivable) to (from) other entities in the
tax-consolidated group in conjunction with
any tax funding arrangement amounts
(refer below).
The Corporation recognises deferred tax
assets arising from unused tax losses of the
tax-consolidated group to the extent that
it is probable that future taxable profits of
the tax-consolidated group will be available
against which the asset can be utilised.
Any subsequent period adjustments to
deferred tax assets arising from unused tax
losses as a result of revised assessments of
the probability of recoverability is recognised
by the head entity only.
The head entity, in conjunction with other
members of the tax-consolidated group,
has entered into a tax funding arrangement
which sets out the funding obligations of
members of the tax-consolidated group in
respect of tax amounts. The tax funding
arrangements require payments to/from
the head entity equal to the current tax
liability (asset) assumed by the head entity
and any tax-loss deferred tax asset assumed
by the head entity, resulting in the head
entity recognising an inter-entity receivable
(payable) equal in amount to the tax liability
(asset) assumed. The inter-entity receivable
(payable) is at call.
Contributions to fund the current tax
liabilities are payable as per the tax funding
arrangement and reflect the timing of the
head entity’s obligation to make payments
for tax liabilities to the relevant tax authorities.
(e) Cash and cash equivalents
Cash and cash equivalents comprise cash
balances and call deposits. Bank overdraft
and short term accommodation from
NSW Treasury Corporation (T-Corp) form an
integral part of the consolidated entity’s
cash management.
(f) Revenue recognition
Revenue
(i) Sale of energy and services rendered
The Group recognises revenue involving the
rendering of electricity supply services in
the Statement of Comprehensive Income
using a percentage stage of completion
methodology for customers on fixed term
contracts. The stage of completion is assessed
by reference to how the proportion that
costs incurred to date bear to the estimated
total costs over the life of the service
transaction. No revenue is recognised if
there are significant uncertainties regarding
recovery of the consideration due, or the
costs incurred or to be incurred can not be
measured reliably.
(ii) Rental income
Rental income from properties leased
under property leases is recognised in the
Statement of Comprehensive Income on a
straight line basis over the term of the lease.
Lease incentives granted are recognised as an
integral part of the total rental income.
(iii) Government grants
Government grants are recognised in the
Statement of Financial Position initially as
deferred income when they are received and
the consolidated entity complies with the
conditions attaching to them.
Grants that compensate the consolidated
entity for the cost of an asset are recognised
in the Statement of Comprehensive Income
as revenue on a systematic basis over the
useful life of the asset.
Grants that compensate the consolidated
entity for expenses incurred are recognised as
revenue in the Statement of Comprehensive
Income in the same period in which the
expenses are incurred.
(iv) Contributions for capital works
This represents sums contributed by
customers and developers, mainly towards
the capital cost of electricity connections.
Cash and non-cash capital contributions
have been reported in order to comply with
Australian Accounting Interpretation 18
Transfers of Assets from Customers.
Cash capital contributions are initially
recorded as liabilities. Once the network
asset is completed or modified as outlined in
the terms of the contract, the contribution
amount is transferred to revenue, and the
asset is recognised at fair value.
Contributions of non-current assets are
recognised as revenue and an asset when
the Ausgrid Group gains control of the
asset. The fair value of contributed assets is
recognised at the date at which control is
gained.
(v) Social programs
Pensioner rebates are funded by the NSW
Government. However the Government, at
reporting date, has not reimbursed all of
the rebates for the year ended 30 June 2010
and as at 28 February 2011. An income
accrual has been recognised for rebates not
yet reimbursed. As at 1 March 2011, the
pensioner rebate revenue and obligation was
transferred to TRUenergy.
For the year ended 30 June 2011
Ausgrid and controlled entities
Notes to the financial statements

Ausgrid – Annual Report 2010/11 49
(g) Inventories
Inventories are stated at the lower of cost
and net realisable value. Cost is determined
using the average purchase price of each
item. In the case of manufactured stock
for internal use, costs include direct
labour, materials and a portion of variable
overhead which is allocated on the basis
of labour hours. Net realisable value is the
estimated selling price in the ordinary course
of business, less the estimated costs of
completion and selling expenses.
(h) Property, plant and equipment
(i) Owned assets
System assets
System assets are stated at fair value less
accumulated depreciation and impairment
losses. This is in accordance with NSW Treasury
Accounting Policy Valuation of Physical
Non-Current Assets at Fair Value [TPP07-1].
Fair value is best represented as current
market price, however where this cannot be
observed, an asset’s fair value is measured at
depreciated replacement cost in accordance
with AASB 116 Property, Plant and Equipment.
The Policy Guidelines for the Valuation of
Network Assets of Electricity Network Business
(December 1995) were developed by industry
regulators and NSW Treasury and issued as a
NSW Treasury technical paper. The guidelines
developed Optimised Depreciated
Replacement Cost (ODRC) as the method
of valuing network assets for the electricity
transmission and distribution industries.
A revaluation of the network system
assets was undertaken and booked during
2005/06. All network assets were revalued
at ODRC. The valuations used were based
on the revaluation method applied in the
NSW Treasury Report for Ausgrid on the NSW
Electricity Supply Industry ODRC Valuation of
Distribution Assets (March 2003) and Sinclair
Knight Merz (SKM) report ODRC Valuation of
Transmission Assets (30 June 2004). The ODRC
values were indexed through to 30 June 2005
using the Australian Bureau of Statistics CPI
figures for Sydney. Ausgrid’s policy has been
to revalue system assets on an ODRC basis
every five years.
The net carrying value of system assets
has been reviewed at each balance sheet
date since 2005/06 on a “cash generating
unit” basis using a discounted cash flow
calculation. Ausgrid has not applied the
“frequency of revaluation” requirements as
defined under TPP07-01. The net carrying
amount of system assets does not differ
materially to the discounted cash flow value.
This approach is in full compliance with
Australian Accounting Standards.
Non-system land and buildings
Non-system land and buildings are valued
at fair value of the asset. Non-system land
and buildings were revalued during 2010/11
to reflect fair value in accordance with AASB
116 and the NSW Treasury Accounting Policy
Valuation of Physical Non-Current Assets at
Fair Value [TPP07-1]. Independent valuers,
Preston Rowe Paterson NSW Pty Limited
(PRP) were engaged to value these assets.
The 2010/11 valuations were assessed at
fair value based upon existing use which was
provided by PRP.
Other property, plant and equipment
Other property, plant and equipment assets
are recorded initially at cost in the Statement
of Financial Position and are depreciated
as outlined in Note 1(h)(v) (deemed to be
fair value in accordance with NSW Treasury
Accounting Policy Valuation of Physical Non-
Current Assets at Fair Value [TPP07-1] as there
is no material difference between the two).
(ii) Revaluations
Revaluation increments are credited directly to
the asset revaluation reserve, except that, to the
extent that an increment reverses a revaluation
decrement in respect of that asset previously
recognised as an expense in net profit or loss, the
increment is recognised immediately as revenue
in net profit or loss. Revaluation decrements are
recognised immediately as expenses in net profit
or loss, except that, to the extent that a credit
balance exists in the asset revaluation reserve
in respect of the same asset, they are debited
directly to the asset revaluation reserve.
Gains and losses on disposal of revalued
assets are included in the Statement of
Comprehensive Income for the year.
Any related revaluation increments in the
asset revaluation reserve upon disposal are
transferred to Retained Earnings.
(iii) Capitalisation policy
Non-system assets purchased below $500
are expensed as acquired. All cost of assets
constructed by the Ausgrid Group (system
assets) are capitalised. This includes the
cost of materials, direct labour, the initial
estimate, where relevant, of the costs of
dismantling and removing the items and
restoring the site on which they are located,
and a proportion of overhead is allocated on
the basis of labour hours.
(iv) Subsequent costs
The consolidated entity recognises in the
carrying amount of an item of property, plant
and equipment the cost of replacing part of
such an item when that cost is incurred if it is
probable that the future economic benefits
embodied with the item will flow to the
consolidated entity and the cost of the item
can be measured reliably. All other costs are
recognised in the Statement of Comprehensive
Income as an expense as incurred.
(v) Depreciation
Where parts of an item of property, plant and
equipment have different useful lives, they
are accounted for as separate components of
property, plant and equipment.
Depreciation is charged to the Statement of
Comprehensive Income on a straight-line
basis over the estimated useful lives of
each part of an item of property, plant and
equipment. Land is not depreciated.
The estimated useful lives in the current and
comparative periods are as follows:
buildings 40 years
system assets 4 – 70 years
plant and equipment 3 – 25 years
System assets with 70-year useful lives relate
to the City South Cable Tunnel and City West
Cable Tunnel respectively.
The residual value, if significant, is
reassessed annually.
(i) Intangible assets
Intangible assets that are acquired externally
or internally generated by the consolidated
entity are stated at cost less accumulated
amortisation and impairment losses (see
Note 1(j)).

50
Subsequent expenditure on capitalised
intangible assets is capitalised only when it
increases the future economic benefits embodied
in the specific asset to which it relates. All other
expenditure is expensed as incurred.
Amortisation is charged to the Statement of
Comprehensive Income on a straight-line basis
over the estimated useful lives of intangible
assets unless such lives are indefinite.
Intangible assets with an indefinite useful
life are systematically tested for impairment
at each statement of financial position
date. Other intangible assets are amortised
from the date they are available for use.
Easements are not amortised as they are
granted for an unlimited time. The estimated
useful lives in the current and comparative
periods are as follows:
computer software 4 years
customer acquisitions 1 month – 3 years
(j) Impairment
(i) Financial assets (including receivables)
A financial asset not carried at fair value
through profit or loss is assessed at each
reporting date to determine whether there
is objective evidence that it is impaired.
A financial asset is impaired if objective
evidence indicates that a loss event has
occurred after the initial recognition of the
asset, and that the loss event had a negative
effect on the estimated future cash flows of
that asset that can be estimated reliably.
An impairment loss in respect of a financial
asset measured at amortised cost is calculated
as the difference between its carrying amount
and the present value of the estimated future
cash flows discounted at the asset’s original
effective interest rate. Losses are recognised
in profit or loss and reflected in an allowance
account against receivables. Interest on the
impaired asset continues to be recognised
through the unwinding of discount. When
a subsequent event causes the amount of
impairment loss to decrease, the decrease in
impairment loss in reversed through profit
or loss.
Significant receivables are individually assessed
for impairment. Impairment testing of
significant receivables that are not assessed
as impaired individually is performed by
placing them into portfolios of significant
receivables with similar risk profiles and
undertaking a collective assessment of
impairment. Non-significant receivables
are not individually assessed. Instead,
impairment testing is performed by placing
non-significant receivables in portfolios
of similar risk profiles, based on objective
evidence from historical experience adjusted
for any effects of conditions existing at each
balance date.
Impairment losses on available-for-sale
investment securities are recognised by
transferring the cumulative loss that has
been recognised in other comprehensive
income, and presented in the fair value
reserve in equity, to profit or loss.
The cumulative loss that is removed from
other comprehensive income and recognised
in profit or loss is the difference between
the acquisition cost, net of any principal
repayment and amortisation, and the current
fair value, less any impairment loss previously
recognised in profit or loss. Changes in
impairment provisions attributable to time
value are reflected as a component of
interest income.
If, in a subsequent period, the fair value
of an impaired available-for-sale debt
security increases and the increase can be
related objectively to an event occurring
after the impairment loss was recognised
in profit or loss, then the impairment loss is
reversed, with the amount of the reversal
recognised in profit or loss. However, any
subsequent recovery in the fair value of an
impaired available-for-sale equity security is
recognised in other comprehensive income.
(ii) Non-financial assets
The carrying amounts of the consolidated
entity’s assets, other than inventories,
derivatives and deferred tax assets are
reviewed at each Statement of Financial
Position date to determine whether there
is any indication of impairment. If any such
indication exists, the asset’s recoverable
amount is estimated.
For assets that have an indefinite useful
life and intangible assets that are not yet
available for use, the recoverable amount
is estimated at each Statement of Financial
Position date.
The recoverable amount of an asset or cash
generating unit is the greater of their fair
value less costs to sell and value in use.
In assessing value in use, the estimated
future cash flows are discounted to their
present value using a pre-tax discount rate
that reflects current market assessments of
the time value of money and the risks specific
to the asset. For an asset that does not
generate largely independent cash inflows,
the recoverable amount is determined for the
cash-generating unit to which the
asset belongs.
An impairment loss is recognised whenever
the carrying amount of an asset or its
cash-generating unit exceeds its recoverable
amount. Impairment losses are recognised
in the Statement of Comprehensive Income,
unless an asset has previously been
revalued, in which case the impairment loss
is recognised as a reversal to the extent of
that previous revaluation with any excess
recognised through profit or loss.
Impairment losses recognised in respect of
cash-generating units are allocated first to
reduce the carrying amount of any goodwill
(if any) allocated to cash-generating units
(group of units) and then, to reduce the
carrying amount of the other assets in the
unit (group of units) on a pro rata basis.
(k) Trade and other payables
These amounts represent liabilities for goods
and services provided to the Ausgrid Group
prior to the end of the financial year and which
are unpaid. The amounts are unsecured and
are usually paid within 30 days of recognition.
Subsequent to initial recognition of these
liabilities at fair value, they are measured at
amortised cost using the effective interest
rate method.
(l) Financial instruments
The Ausgrid’s accounting policies for financial
instruments are set out below.
(i) Foreign exchange contracts
The Ausgrid Group enters into foreign
exchange contracts for anticipated purchase
For the year ended 30 June 2011
Ausgrid and controlled entities
Notes to the financial statements

Ausgrid – Annual Report 2010/11 51
commitments for the supply of parts and
equipment which are denominated in foreign
currencies. Where the instruments are
not designated to hedging relationships,
movements in the fair value of these
instruments are recognised in the Statement
of Comprehensive Income.
(ii) Loans and receivables
Receivables assets are initially accounted for
at fair value plus any directly attributable
transaction costs and subsequently measured
at amortised cost using the effective interest
method, less any impairment losses.
The Ausgrid Group’s primary objective in
the management of its investments and
borrowings is to optimise economic returns
for given risk levels. These risk levels have
been defined in terms of the modified
duration of the respective portfolios
managed and have been set relative to
appropriate benchmarks.
In order that the Ausgrid Group’s portfolios
are aligned with these benchmarks, financial
securities of varying maturities are sold
(issued) by T-Corp on Ausgrid’s behalf. These
securities comprise the core debt portfolio.
These are initially recognised at fair value,
net of transaction costs incurred and then
are subsequently measured at amortised costs.
The difference between the face value and the
capital value of these debt securities is amortised
over the life of the specific instrument. Interest
associated with these instruments is brought
to account on an accrual basis.
T-Corp utilises financial instruments to
manage the modified duration of the Ausgrid
Group’s debt portfolios. The gains and
losses on derivatives are recognised in the
Statement of Comprehensive Income.
Loan debt shown as a current liability is
nominally due for repayment within twelve
months. However, due to the availability of
roll-over facilities and the liquidity of the
underlying debt instruments, the Ausgrid
Group may not necessarily need to repay
these loans within twelve months.
(iii) Energy derivatives
The Ausgrid Group was a participant in the
wholesale energy market. Market volatility
was managed by entering into commodity
based contracts (swaps and options) as cash
flow hedges against movements in spot prices.
Energy trading activities were conducted in
accordance with Board approved policies.
Under the Group’s energy risk management
policies, derivatives that do not qualify
for hedge accounting were required to be
accounted for as trading instruments.
Energy derivative instruments were stated
at fair value and were revalued against
observed market data. Movements in the
unrealised fair value of all designated
hedges (to the extent they were effective)
were written to a revaluation reserve within
Equity and recognised in the Statement of
Comprehensive Income only when realised.
Similar movements in the unrealised and
realised fair value of all other instruments
were recognised within the Statement of
Comprehensive Income.
The fair value of energy derivatives designated
as hedges was classified as a non-current
asset or non-current liability when the
maturity of the derivative was more than
twelve months and as a current asset or
current liability when the remaining maturity
of the hedge relationship was less than twelve
months from reporting date. The fair value of
all other energy derivatives was classified as a
current asset or current liability as they were
deemed to be held for trading, as they did not
qualify for hedge accounting.
Non-novated energy derivatives
For any energy derivative contracts that are
not novated in the Retail sale, a back to back
arrangement is created for each contract
that transfers the energy price risk back to
Ausgrid. Derivative assets and liabilities
for non-novated contracts are continued
to recognise in the Statement of Financial
Position, with an offsetting asset and liability.
(iv) Available-for-sale financial assets
Available-for-sale financial assets are
non-derivative financial assets that are
designated as available-for-sale and that
are not classified in any of the previous
categories. The Ausgrid Group’s investments
in equity securities and certain debt
securities are classified as available-for-
sale financial assets. Subsequent to initial
recognition, they are measured at fair value
and changes therein, other than impairment
losses, and foreign currency differences on
available-for-sale equity instruments, are
recognised in other comprehensive income
and presented within equity in the fair value
reserve. When an investment is derecognised,
the cumulative gain or loss in equity is
transferred to profit or loss.
(v) Derecognition of financial instruments
The Group derecognises a financial asset
only when the contractual rights to the
cash flows from the asset expire, or when it
transfers the financial asset and substantially
all the risks and rewards of ownership of the
asset to another entity. If the Group retains
substantially all the risks and rewards of
ownership of a transferred financial asset, the
Group continues to recognise the financial
asset and the associated liability.
The Group derecognises a financial liability
when, and only when, the Group’s obligation
specified in the contract is discharged,
cancelled or expires.
(m) Employee benefits
All liabilities for employee benefits that are
expected to be paid for services provided by
employees to balance date are fully provided
for in the financial report.
Liabilities for employee benefits for wages,
salaries, annual leave, sick leave and long
service leave that are expected to be settled
within twelve months of the reporting date
represent present obligations resulting from
employees’ services provided to reporting
date, are calculated at undiscounted amounts
based on remuneration wage and salary rates
that the consolidated entity expects to pay as
at reporting date including related on-costs,
such as workers compensation, insurance and
payroll tax.
The liability for long service leave is
recognised in the provision for employee
benefits and measured as the present value
of expected future payments to be made in
respect of services provided by employees
up to the reporting date using the projected
unit credit method. Consideration is given

52
to expected future wage and salary levels,
experience of employees’ departures and
periods of service.
Expected future payments (over twelve
months) are discounted using market yields
at the reporting date on national government
bonds with terms to maturity and currency
that match, as closely as possible, the
estimated future cash outflows.
(n) Superannuation
In 1996/97 the Ausgrid Group contributed
to three defined benefits schemes, namely
the State Authorities Superannuation
Scheme (SASS), the State Authorities
Non-Contributory Superannuation Scheme
(SANCS) and the State Superannuation
Scheme (SSS). On 1 July 1997 the bulk
of employees’ benefits was transferred
from these superannuation schemes to
three divisions of the Energy Industries
Superannuation Scheme (EISS) as follows
(one employee remains as the member of
both SASS and SANCS as at 30 June 2011):
SASS - Division B
SANCS - Division C
SSS - Division D
The consolidated entity’s net obligation in
respect of defined benefit plans is calculated
separately for each plan by estimating the
amount of future benefit that employees have
earned in return for their service in the current
and prior periods; that benefit is discounted to
determine its present value, and the fair value
of any plan assets is deducted.
The discount rate is the yield at the statement
of financial position date on government
bonds that have maturity dates approximating
to the terms of the consolidated entity’s
obligations. The calculation is performed by
a qualified actuary using the projected unit
credit method.
All actuarial gains and losses as at 1 July 2004,
the date of transition to Australian
equivalents to IFRSs, were recognised.
Where the calculation results in a benefit to
the consolidated entity, the recognised asset
is limited to the net total of any unrecognised
actuarial losses and past service costs and
the present value of any future refunds from
the plan or reductions in future contributions
to the plan.
Past service cost is the increase in the present
value of the defined benefit obligation for
employee services in prior periods, resulting
in the current period from the introduction
of, or changes to, post-employment benefits
or other long-term employee benefits. Past
service costs may either be positive (where
benefits are introduced or improved) or
negative (where existing benefits are reduced).
The Ausgrid Group has determined that
detailed disclosure of the defined benefit
schemes (for one member) of SASS, SANCS,
SSS will not materially influence the users
of the financial report and therefore has not
been disclosed in detail.
The Group has classified the defined benefits
schemes wholly as non-current liability to
reflect the appropriate timing of the obligation.
(o) Provisions
A provision is recognised in the Statement
of Financial Position when the consolidated
entity has a present legal or constructive
obligation as a result of a past event, and
it is probable that an outflow of economic
benefits will be required to settle the
obligation. If the effect is material, provisions
are determined by discounting the expected
future cash flows at a pre-tax rate that
reflects current market assessments of the
time value of money and, where appropriate,
the risks specific to the liability.
(i) Workers’ compensation insurance
The Ausgrid Group is a self-insurer through
its insurance provision for workers’
compensation and meets all liabilities under
the Workers’ Compensation legislation in
NSW and other States. The liabilities cover
claims incurred but not yet reported and the
anticipated fund management fees in respect
of the management of those claims.
During 2010/11, a consulting actuary,
David A. Zaman, undertook the annual
investigation of the Ausgrid Group’s
estimated liability for workers’ compensation
as at 30 June 2011. The liability is measured
as the present value of future payments at
30 June 2011 and was estimated to be $15.3
million (2010: $15.5 million). This includes
the liability for dust related diseases which is
estimated at $5.7 million (2010: $6.1 million).
(ii) Dividends and other payments
Provision is made for the amount of any
dividend and other payments determined
by the Directors on or before the end of the
financial year but not distributed at balance
date. The dividend has regard to the annual
performance agreement (Statement of
Corporate Intent) with NSW Treasury.
The dividend is calculated according with
TPP09-6 Financial Distribution Policy for
Government Businesses. The dividend payable
of $175.1 million (2010: $250.2 million)
is calculated based on profit adjusted for
certain non-cash items.
Pursuant to Section 59B(2) of the Public
Finance and Audit Act 1983, Ausgrid has made
a payment of $1,370.0 million on 11 March
2011 to the NSW Government against the
retail sale proceeds received from TRUenergy
on 1 March 2011 (see Note 19).
(iii) Other
Provision for site remediation
A provision for site remediation was created
in 2001/02 to cover all asbestos remediation
costs to be incurred during subsequent
years. An additional provision to cover all
contaminated land remediation costs to be
incurred in subsequent years was made
in 2009/10.
The provision as at 30 June 2011 was
estimated to be $10.6 million (2010: $11.8
million). The provision is the best estimate of
the present value of the expenditure required
to settle the obligation at the reporting
date, based on current legal requirements
and technology. Future costs are reviewed
annually and any changes are reflected in the
present value of the provision at the end of
the reporting period.
Provision for removal and disposal of
equipment (restoration provision)
A provision for removal and disposal of system
equipment was created in 2004/05 to cover
future end of life removal costs where there is
a legislative obligation to perform this.
For the year ended 30 June 2011
Ausgrid and controlled entities
Notes to the financial statements

Ausgrid – Annual Report 2010/11 53
The provision as at 30 June 2011 was
estimated to be $26.1 million (2010: $24.9
million). The provision is the best estimate
of the present value of the expenditure
required to settle the restoration obligation
at the reporting date, based on current legal
requirements and technology.
Future restoration costs are reviewed
annually and any changes are reflected in the
present value of the restoration provision at
the end of the reporting period.
The amount of the provision for future
restoration costs is capitalised and is
depreciated in accordance with the policy
set out in Note 1(h)(v). The unwinding of
the effect of discounting on the provision is
recognised as a finance cost.
Provision for costs relating to the
Retail Sale
A provision for costs relating to the Retail
Sale was created in 2010/11 to cover
expected future costs incurred during
subsequent years. The provision as at 30 June
2011 was estimated to be $71.1 million.
Other provisions
Other provisions also include a provision for
costs relating to decommissioning assets of $6.3
million. This provision was created in 2010/11 to
cover the expected future costs associated with
decommissioning Ausgrid’s assets.
(p) Deferred revenue
Deferred revenue is recognised for revenue
from electricity supply contracts and
customer prepayments for external,
recoverable and contestable works carried
out by Ausgrid at reporting date. The revenue
is deferred pending completion of the works
and services.
In previous years, deferred revenue ensured
costs associated with extreme events over a
contract’s life were matched with recognition
of the revenue for the contract. This related
deferred revenue was derecognised upon the
sale of the retail operations as at 1 March 2011.
(q) Deposits
Deposits represent liabilities for customer
and contractors’ deposits which can be
refunded at any time after the end of
the financial year and unclaimed monies
which are held up to 6 years before being
transferred to the Office of State Revenue.
The amount which can be refunded in the
succeeding financial year and at any time is
shown as current and the remainder of the
liability as non-current. Deposits relating
to customer deposits were transferred to
TRUenergy as at 1 March 2011.
(r) Share capital
Ausgrid (formerly known as EnergyAustralia)
was corporatised on 1 March 1996 with
issued capital of two $1 shares.
Ausgrid’s shareholding Ministers are the
Treasurer and the Minister for Finance. The $2
share capital is included in Contributed Equity
in the Statement of Financial Position.
Ausgrid attributes the distribution to
members only on consolidated operating
profit as in agreement with the Statement of
Corporate Intent.
(s) Financing costs
Finance costs are recognised as expenses
in the period in which they are incurred
and include:
Interest expenses calculated using the
effective interest method as described
in AASB 139 Financial Instruments:
Recognition and Measurement, e.g. interest
on overdrafts and short-term and long-
term borrowings, including amounts paid
or received on interest rate swaps, and
amortisation of discounts or premiums
relating to borrowings;
amortisation of ancillary costs incurred
in connection with the arrangement of
borrowings; and
a government loan guarantee fee assessed
by NSW Treasury.
Finance costs are expensed as incurred in the
Statement of Comprehensive Income unless
they relate to qualifying assets, in which case
they are capitalised as part of the cost of
those assets in accordance with AASB 123
Borrowing Costs. Qualifying assets are assets
that take a substantial period of time to get
ready for their intended use. The Corporation
considers this to be 12 months or more.
Capitalisation of borrowing costs is
undertaken where a direct relationship can
be established between the borrowings
and the relevant projects giving rise to
qualifying assets. Typically, these are projects
whose expected total project expenditure is
approximately $10 million or greater.
The amount of borrowing costs capitalised
during the year was $10.6 million (2010: $1.2
million), and the capitalisation rate used to
determine this amount was at a weighted
average interest rate of 7.9% (2010: 8.1%).
(t) Leases as lessee and as lessor
Payments made under operating leases
are recognised in the Statement of
Comprehensive Income on a straight-line
basis over the term of the lease. Lease
incentives received are recognised in the
Statement of Comprehensive Income as an
integral part of the total lease expense and
spread over the lease term.
The Ausgrid Group has not entered into any
finance leases as at reporting date. Leases
in terms of which the consolidated entity
assumes substantially all the risks and
rewards of ownership are classified as
finance leases.
The Ausgrid Group does have material leases
of land with a term exceeding 50 years.
The title of these leases has been retained
and the aggregate fair value of the leased
assets is negligible.
The Ausgrid Group leases out its properties,
including premises, land and communications
towers, under operating lease agreements
at market rentals, predominantly on a fixed
term basis.
Rentals received from the tenants during
the year are recognised as income in the
Statement of Comprehensive Income
and the costs of repairs and maintenance
incurred on these properties for the year are
recognised as an expense in the Statement of
Comprehensive Income.
(u) Greenhouse legislation
Under various legislation described below,
the Corporation is required to surrender
certificates in 2011/12 to acquit obligations

54
as at 31 December 2011 placed on it by
the various Commonwealth and States’
greenhouse schemes. The obligations
relate to the retail business of the former
EnergyAustralia and ceased after the
electricity sales transaction on 1 March 2011.
Commonwealth
All certificates acquired under the following
scheme are accounted for as an asset at
the lower of cost or net realisable value.
The surrender of these certificates is
recognised in the underlying purchase
commitment as an element of electricity
purchase costs.
The Renewable Energy (Electricity) Act
2000 (as amended) imposed on electricity
retailers, the obligation to ‘surrender’
sufficient certificates each year to meet the
Commonwealth Government’s Renewable
Energy Target (RET) for the quantity of
electricity generated from renewable
sources. The Act imposed an obligation on
the Ausgrid Group (up to 31 December 2010)
to procure Renewable Energy Certificates
(RECs) and surrender them and to lodge an
annual liability statement to the Office of
the Renewable Energy Regulator (ORER) in
discharge of the Ausgrid Group’s renewable
energy obligations under the RET Scheme.
From 1 January 2011, the RET scheme is
split into Small-scale Renewable Energy
Scheme (SRES) and Large-scale Renewable
Energy Target (LRET) requiring the surrender
respectively of Small-scale Technology
Certificates (STCs) and Large-scale
Generation Certificates (LGCs).
Australian Capital Territory
The Electricity (Greenhouse Gas Emissions) Act
2004 (ACT) imposed on electricity retailers in
ACT the obligation to ‘surrender’ sufficient
certificates each year to satisfy the ACT
Government’s strategy to reduce greenhouse
gas per capita emissions from electricity use.
This imposed an obligation upon the Ausgrid
Group (up to 28 February 2011) to purchase
and surrender Greenhouse Gas Abatement
Certificates (GACs), and to lodge an annual
greenhouse benchmark statement with the
Independent Competition and Regulatory
Commission (ICRC) in discharge of the
Ausgrid Group’s greenhouse gas emission
reduction obligations in the ACT.
New South Wales
The Electricity Supply Act 1995 No.94 imposed
an obligation on electricity retailers in
NSW to comply with the Greenhouse Gas
Abatement Scheme and the Energy Savings
Scheme. These obligations require the
Ausgrid Group to acquire and surrender
sufficient NSW Greenhouse Gas Abatement
Certificates (NGACs) and Energy Savings
certificates (ESCs), and to lodge an annual
greenhouse benchmark statement with the
Independent Pricing and Regulatory Tribunal
(IPART) for each scheme in discharge of the
Ausgrid Group’s greenhouse gas emission
reduction obligations.
Queensland
The Electricity Act 1994 (Qld) imposed
on electricity retailers, the obligation
to ‘surrender’ sufficient Gas Electricity
Certificates (GECs) each year in line with
the Queensland Government’s strategy of
encouraging the greater use of natural gas
to generate electricity. The 15% target for
electricity generated by natural gas also
encourages the development of new gas
sources and infrastructure in Queensland as
well as reduces greenhouse gas emissions
from the Queensland electricity sector. This
imposed an obligation on the Ausgrid Group
(up to 28 February 2011) to purchase GECs
and surrender them and to lodge an annual
self-assessment report to the Department of
Mines and Energy (DME) in discharge of the
Ausgrid Group’s obligations under
the scheme.
Victoria
The Victorian Energy Efficiency Target Act
2007 aims to encourage the uptake of
energy efficient technology. It imposes on
retailers who sell electricity or gas to 5,000
or more residential customers in Victoria,
the obligation to ‘surrender’ sufficient
Victorian Energy Efficiency Certificates
(VEECs) each year in order to meet the
Victorian Government’s mandated efficiency
target for that year. The Ausgrid Group was
thus obligated (up to 28 February 2011) to
purchase VEECs and surrender them to the
Essential Services Commission in discharge
of the Ausgrid Group’s obligations under the
VEET Scheme.
(v) Goods and services tax
Revenues, expenses and assets are recognised
net of the amount of Goods and Services
Tax (GST), except where the amount of GST
incurred is not recoverable from the taxation
authority. In these circumstances, the GST is
recognised as part of the cost of acquisition
of the asset or as part of the expense.
Receivables and payables are stated with
the amount of GST included. The net amount
of GST recoverable from, or payable to, the
taxation authority is included as a current
asset or liability in the Statement of
Financial Position.
Cash flows are included in the Statement
of Cash Flows on a gross basis. The GST
components of cash flows arising from investing
and financing activities which are recoverable
from, or payable to, the taxation authority are
classified as operating cash flows.
(w) Accounting estimates and judgements
Investment properties
The consolidated entity leases out a portion
of its properties. These properties are in
excess of current usage requirements and
are held for future use as owner occupied
properties. Therefore these properties
fall outside the definition of investment
properties and are treated as leases of
property, plant and equipment.
Asset definition
Ausgrid’s view is that the distribution network
as a whole should be considered to be a
“single asset” for the purposes of revaluation.
This is because all components within the
network must work together in order to
reliably supply electricity. Further, due to
the specialised nature of Ausgrid’s network,
components cannot be readily sold to third
parties for different uses.
(x) Assets and liabilities held for sale.
Immediately before classification as held
for sale, the measurement of the assets
(and all assets and liabilities in a disposal
For the year ended 30 June 2011
Ausgrid and controlled entities
Notes to the financial statements

Ausgrid – Annual Report 2010/11 55
group) is brought up-to-date in accordance
with applicable accounting standards. Then,
on initial classification as held for sale,
non-current assets and disposal groups are
recognised at the lower of carrying amount
and fair value less costs to sell.
Impairment losses on initial classification
as held for sale are included in profit or loss,
even when there is a revaluation. The same
applies to gains and losses on subsequent re-
measurement.
(y) Discontinued operation
A discontinued operation is a component of the
Group’s business that represents a separate
major line of business or geographical area
of operations that has been disposed of or is
held for sale or distribution, or is a subsidiary
acquired exclusively with a view to resale (see
Note 31).
Classification as a discontinued operation
occurs upon disposal or when the operation
meets the criteria to be classified as held
for sale, if earlier. When an operation is
classified as a discontinued operation, the
comparative statement of comprehensive
income is re-presented as if the operation
has been discontinued from the start of the
comparative year.
(z) New and revised accounting standards
and Australian Accounting Interpretations
Various new and revised accounting standards
and Australian Accounting Interpretations
have been published that are not mandatory
for the 30 June 2011 reporting period.
The Group’s assessment of the impact of new
standards and interpretations which may have
an impact and which have not been early
adopted is set out below.
i. AASB 9 Financial Instruments and
AASB 2010-7 Amendments to Australian
Accounting Standards arising from AASB 9
(December 2010) [AASBs 1, 3, 4, 5, 7, 101,
102, 108, 112, 118, 120, 121, 127, 128,
131, 132, 136, 137, 139, 1023 & 1038] and
Interpretations [2, 5, 10, 12, 19 & 127]
ii. AASB 9 (Revised) and AASB 2010-7 are
applicable to annual reporting periods
beginning on or after 1 January 2013.
The Group has not elected to adopt this
standard early. The Group will apply
these standards in the 2013/14 financial
statements.
iii. AASB 2010-4 Further Amendments to
Australian Accounting Standards arising from
the Annual Improvements Project [AASBs 1, 7,
101 & 134] and Interpretation [13]
iv. AASB 2010-4 is applicable to annual
reporting periods beginning on or after 1
January 2011. The Group has not elected
to adopt this standard early. The Group
will apply this standard in the 2011/12
financial statements.
v. AASB 13 Fair Value Measurement and
AASB 2011-8 Amendments to Australian
Accounting Standards arising from AASB
13 [AASB 1, 2, 3, 4, 5, 7, 9, 2009-11,
2010-7, 101, 102, 108, 110, 116, 117, 118,
119, 120, 121, 128, 131, 132, 133, 134,
136, 138, 139, 140, 141, 1004, 1023 & 1038
and Interpretations 2, 4, 12, 13, 14, 17, 19,
131 & 132]
vi. AASB 13 and AASB 2011-8 are applicable
to annual reporting periods beginning on
or after 1 January 2013. The Group has
not elected to adopt this standard early.
The Group will apply these standards in
the 2013/14 financial statements.
All other new standards and
interpretations have no impact on the
Group and will not affect the Group’s
financial statements.

56
For the year ended 30 June 2011
Ausgrid and controlled entities
Notes to the financial statements
2 REVENUE
2011 2010 2011 2010
$M $M $M $M
Network use of system income 2 301.6 1 811.7 2 301.6 1 811.7
Public lighting system charge 47.3 29.9 47.3 29.9
Capital contributions(1) 54.5 47.8 54.5 47.8
Recoverable works 13.4 14.0 13.4 14.0
Interest Income 4.4 1.1 4.4 1.1
Transitional services agreement 63.4 - 63.4 -
Other 151.0 93.4 151.0 93.4
2 635.6 1 997.9 2 635.6 1 997.9 (1) Capital Contributions
Gross capital contributions 11.3 8.2 11.3 8.2
Contribution of assets 42.2 38.6 42.2 38.6
Government grants 1.0 1.0 1.0 1.0
54.5 47.8 54.5 47.8
Consolidated Entity Ausgrid

Ausgrid – Annual Report 2010/11 57
Consolidated Entity Ausgrid3 EXPENSES
2011 2010 2011 2010
$M $M $M $M
(a) Expenses, excluding finance costs and fair value
movements in financial instruments
Distribution of energy, including financial instrument fair
value movements 1 862.3 1 499.6 1 862.4 1 499.6
These expenses include the following:
Depreciation
Buildings 21.5 10.3 21.5 10.3
System assets 260.9 235.6 260.9 235.6
Plant and equipment 50.9 37.3 50.9 37.3
Total depreciation 333.3 283.2 333.3 283.2
Amortisation
Intangible - computer software 41.3 39.4 41.3 39.4
Bad debts and impairment of trade receivables (1.5) 1.0 (1.5) 1.0
Total superannuation expense recognised
in profit for the year 19.1 24.8 19.1 24.8
Other employee benefits expense 387.1 390.6 387.1 390.6
Maintenance expenses
(i) Employee related maintenance expenses included in
employee benefits expense 137.9 148.6 137.9 148.6
(ii) Contracted labour and other (non- employee
related) expenses 140.7 137.0 140.7 137.0
278.6 285.6 278.6 285.6
(b) Finance costs
Interest and finance charges paid/payable 468.4 430.1 468.4 430.1
Unwinding of discount on provisions 1.3 1.6 1.3 1.6
Finance costs recognised in the Statement of
Comprehensive Income 469.7 431.7 469.7 431.7
(c) Fair Value movements in financial instruments
Net foreign exchange gain/(loss) (0.7) 0.9 (0.7) 0.9
Gain/(loss) arising on derivatives in fair value hedge (22.8) 15.4 (22.8) 15.4
Gain/(loss) arising on derivatives in supply commitment in fair
value hedge 22.8 (15.4) 22.8 (15.4)
(0.7) 0.9 (0.7) 0.9

58
For the year ended 30 June 2011
Ausgrid and controlled entities
Notes to the financial statements
4 GAIN / (LOSS) ON DISPOSAL
2011 2010 2011 2010
$M $M $M $M
Loss on disposal of property, plant and equipment
Proceeds from disposal 5.3 4.1 5.3 4.1
Less: Written down value of assets disposed (8.9) (11.0) (8.9) (11.0)
(3.6) (6.9) (3.6) (6.9)
5 INCOME TAX EXPENSE
Recognised in the Statement of Comprehensive Income
Current tax expense
Current year 260.8 127.3 260.8 127.3
Adjustments for prior years (2.1) (0.3) (2.1) (0.3)
258.7 127.0 258.7 127.0
Deferred tax expense
Origination and reversal of temporary differences (70.2) 9.3 (70.2) 9.3
Benefit of tax losses recognised - - - -
(70.2) 9.3 (70.2) 9.3
Total income tax expense in Statement of
Comprehensive Income 188.5 136.3 188.5 136.3
Attributable to:
Continuing operations 124.0 10.4 124.0 10.4
Discontinuing operations 64.5 125.9 64.5 125.9
188.5 136.3 188.5 136.3
Numerical reconciliation between tax expense and pre-tax net profit
Profit before tax 1 762.3 481.3 1 762.2 481.3
Income tax using the domestic corporation tax rate of 30% (2010: 30%) 528.7 144.4 528.7 144.4
Increase in income tax expense due to:
Other deductible expenses 9.7 (1.9) 9.7 (1.9)
Investment allowance (2.1) (5.9) (2.1) (5.9)
Under / (over) provided in prior years (2.1) (0.3) (2.1) (0.3)
Non assessable capital gain on proceeds of Retail sale (345.7) - (345.7) -
Income tax expense on pre-tax net profit 188.5 136.3 188.5 136.3
Attributable to:
Continuing operations 124.0 10.4 124.0 10.4
Discontinuing operations 64.5 125.9 64.5 125.9
188.5 136.3 188.5 136.3
Deferred tax recognised in other comprehensive income
Unfunded Superannuation 2.5 (10.0) 2.5 (10.0)
Relating to revaluation of property, plant and equipment 6.6 2.0 6.6 2.0
Relating to revaluation of hedge derivatives 9.2 (0.8) 9.2 (0.8)
18.3 (8.8) 18.3 (8.8)
Consolidated Entity Ausgrid

Ausgrid – Annual Report 2010/11 59
Consolidated Entity Ausgrid6 CASH AND CASH EQUIVALENTS
2011 2010 2011 2010
$M $M $M $M
Cash on hand 0.1 0.1 0.1 0.1
Bank balances 9.6 2.6 9.6 2.6
Money market securities and deposits 89.7 153.9 89.7 153.9
Cash and cash equivalents in the statement of cash flows 99.4 156.6 99.4 156.6
7 TRADE AND OTHER RECEIVABLES
Trade receivables 465.3 312.7 465.3 312.7
Less: impairment of trade receivables (4.8) (18.5) (4.8) (18.5)
460.5 294.2 460.5 294.2
Prepayments 28.4 20.2 28.4 20.2
Receivables due from controlled entities - - - 0.1
488.9 314.4 488.9 314.5
Accrued sales of energy 49.5 378.2 49.5 378.2
Less: impairment of accrued sales of energy - (4.6) - (4.6)
538.4 688.0 538.4 688.1
The movement in the impairment of trade receivables is detailed below:
Opening Balance at 1 July (18.5) (12.8) (18.5) (12.8)
- additional provisions (3.6) (8.5) (3.6) (8.5)
- amounts used 0.1 0.1 0.1 0.1
- amounts reversed 17.2 2.7 17.2 2.7
Closing Balance at 30 June (4.8) (18.5) (4.8) (18.5)
The movement in the impairment of accrued sales of energy is detailed below:
Opening Balance at 1 July (4.6) (3.8) (4.6) (3.8)
- additional provisions -# (0.8) -# (0.8)
- amounts reversed 4.6 4.6
Closing Balance at 30 June - (4.6) - (4.6)
#Amount reduced to zero as a result of rounding to nearest $0.1 million (see Note 1(b)).

60
For the year ended 30 June 2011
Ausgrid and controlled entities
Notes to the financial statements
2011 2010 2011 2010
$M $M $M $M
Current
Energy derivatives-undesignated 76.1 43.8 76.1 43.8
76.1 43.8 76.1 43.8
Non-current
Energy derivatives 6.9 44.6 6.9 44.6
Other financial assets 0.1 9.4 0.1 9.4
7.0 54.0 7.0 54.0
9 INVENTORIES
Stores and materials
- at cost 31.6 33.9 31.6 33.9
- at net realisable value - 0.8 - 0.8
31.6 34.7 31.6 34.7
10 OTHER CURRENT ASSETS
Deferred costs – WIP on recoverable works 38.4 37.9 38.4 37.9
Greenhouse certificates
- at cost 27.9 84.2 27.9 84.2
- at net realisable value - 18.1 - 18.1
Less: impairment of greenhouse certificates - at net
realisable value - (6.8) - (6.8)
66.3 133.4 66.3 133.4
The movement in the impairment of greenhouse certificates is detailed below:
Opening balance at 1 July (6.8) (26.1) (6.8) (26.1)
-amounts reversed (on surrender) - 30.2 - 30.2
-provision net movement 6.8 (10.9) 6.8 (10.9)
Closing balance at 30 June - (6.8) - (6.8)
Consolidated Entity Ausgrid
8 OTHER FINANCIAL ASSETS - INCLUDING DERIVATIVES
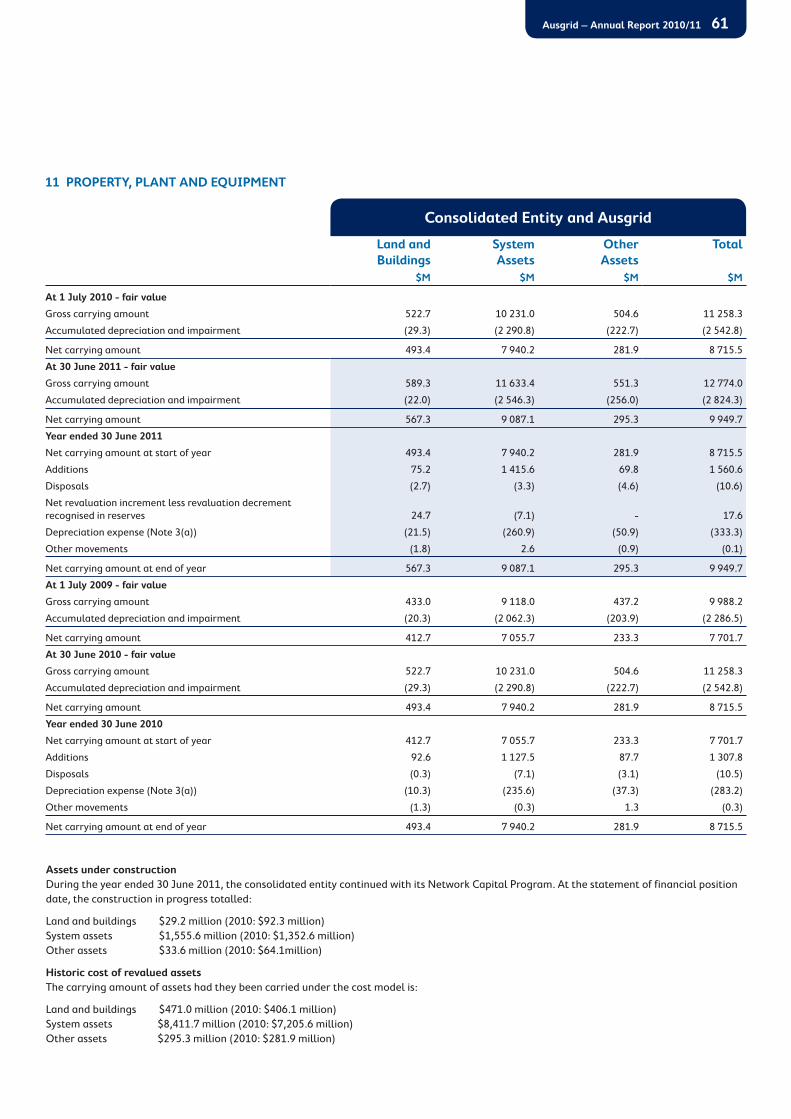
Ausgrid – Annual Report 2010/11 61
Consolidated Entity and Ausgrid
Land and
Buildings
System
Assets
Other
Assets
Total
$M $M $M $M
At 1 July 2010 - fair value
Gross carrying amount 522.7 10 231.0 504.6 11 258.3
Accumulated depreciation and impairment (29.3) (2 290.8) (222.7) (2 542.8)
Net carrying amount 493.4 7 940.2 281.9 8 715.5
At 30 June 2011 - fair value
Gross carrying amount 589.3 11 633.4 551.3 12 774.0
Accumulated depreciation and impairment (22.0) (2 546.3) (256.0) (2 824.3)
Net carrying amount 567.3 9 087.1 295.3 9 949.7
Year ended 30 June 2011
Net carrying amount at start of year 493.4 7 940.2 281.9 8 715.5
Additions 75.2 1 415.6 69.8 1 560.6
Disposals (2.7) (3.3) (4.6) (10.6)
Net revaluation increment less revaluation decrement
recognised in reserves 24.7 (7.1) - 17.6
Depreciation expense (Note 3(a)) (21.5) (260.9) (50.9) (333.3)
Other movements (1.8) 2.6 (0.9) (0.1)
Net carrying amount at end of year 567.3 9 087.1 295.3 9 949.7
At 1 July 2009 - fair value
Gross carrying amount 433.0 9 118.0 437.2 9 988.2
Accumulated depreciation and impairment (20.3) (2 062.3) (203.9) (2 286.5)
Net carrying amount 412.7 7 055.7 233.3 7 701.7
At 30 June 2010 - fair value
Gross carrying amount 522.7 10 231.0 504.6 11 258.3
Accumulated depreciation and impairment (29.3) (2 290.8) (222.7) (2 542.8)
Net carrying amount 493.4 7 940.2 281.9 8 715.5
Year ended 30 June 2010
Net carrying amount at start of year 412.7 7 055.7 233.3 7 701.7
Additions 92.6 1 127.5 87.7 1 307.8
Disposals (0.3) (7.1) (3.1) (10.5)
Depreciation expense (Note 3(a)) (10.3) (235.6) (37.3) (283.2)
Other movements (1.3) (0.3) 1.3 (0.3)
Net carrying amount at end of year 493.4 7 940.2 281.9 8 715.5
Assets under construction
During the year ended 30 June 2011, the consolidated entity continued with its Network Capital Program. At the statement of financial position
date, the construction in progress totalled:
Land and buildings $29.2 million (2010: $92.3 million)
System assets $1,555.6 million (2010: $1,352.6 million)
Other assets $33.6 million (2010: $64.1million)
Historic cost of revalued assets
The carrying amount of assets had they been carried under the cost model is:
Land and buildings $471.0 million (2010: $406.1 million)
System assets $8,411.7 million (2010: $7,205.6 million)
Other assets $295.3 million (2010: $281.9 million)
11 PROPERTY, PLANT AND EQUIPMENT

62
For the year ended 30 June 2011
Ausgrid and controlled entities
Notes to the financial statements
Consolidated Entity and Ausgrid12 INTANGIBLE ASSETS
Land and
Buildings
Computer
Software
Customer
Acquisitions
Other Total
$M $M $M $M $M
At 1 July 2010
At cost 90.3 440.2 17.9 10.0 558.4
Accumulated amortisation and impairment - (284.9) (17.9) - (302.8)
Net carrying amount 90.3 155.3 - 10.0 255.6
At 30 June 2011
At cost 94.2 405.8 - 10.0 510.0
Accumulated amortisation and impairment - (238.9) - (2.0) (240.9)
Net carrying amount 94.2 166.9 - 8.0 269.1
Year ended 30 June 2011
Net carrying amount at start of year 90.3 155.3 - 10.0 255.6
Acquisitions 3.9 82.9 - - 86.8
Disposals - (2.1) - - (2.1)
Amortisation (Note 3(a)) - (39.3) - (2.0) (41.3)
Impairment loss - (30.0) - - (30.0)
Other movement - 0.1 - - 0.1
Net carrying amount at end of year 94.2 166.9 - 8.0 269.1
At 1 July 2009
At cost 87.0 443.8 9.0 - 539.8
Accumulated amortisation and impairment - (293.6) (7.9) - (301.5)
Net carrying amount 87.0 150.2 1.1 - 238.3
At 30 June 2010
At cost 90.3 440.2 17.9 10.0 558.4
Accumulated amortisation and impairment - (284.9) (17.9) - (302.8)
Net carrying amount 90.3 155.3 - 10.0 255.6
Year ended 30 June 2010
Net carrying amount at start of year 87.0 150.2 1.1 - 238.3
Acquisitions 3.3 44.6 18.5 10.0 76.4
Disposals - (0.4) - - (0.4)
Amortisation (Note 3(a)) - (39.4) (19.6) - (59.0)
Other movement - 0.3 - - 0.3
Net carrying amount at end of year 90.3 155.3 - 10.0 255.6

Ausgrid – Annual Report 2010/11 63
12 INTANGIBLE ASSETS continued
Impairment loss
During the year ended 30 June 2011, a majority of the Group’s retail business was sold, this caused the Group to assess the recoverable amount
of the related remaining assets. The recoverable amount of the cash generating unit was estimated based on its value in use, over the term of
the transitional services agreement. Based on the assessment at 30 June 2011 the carrying value was determined to be $30.0m higher than its
recoverable amount and an impairment loss was recognised. The estimate of value in use was determined using a discount rate of 8.4%.
Assets under construction
During the year ended 30 June 2011, the consolidated entity continued with its Capital Program. At the statement of financial position date, the
construction in progress totalled:
Computer software $61.1 million (2010: $65.3 million)
13 CURRENT TAX LIABILITIES
The current tax liability for the consolidated entity and the corporation of $164.3 million (2010: $40.2 million) represent the amount of income
taxes payable in respect of current and prior periods.
In accordance with the tax consolidation legislation, Ausgrid as the head entity of the Australian tax-consolidated group has assumed the
current tax liability initially recognised by the members in the tax consolidation group.
NetLiabilitiesAssets14 DEFERRED TAX ASSETS AND LIABILITIES
Recognised deferred tax assets and liabilities
2011 2010 2011 2010 2011 2010
$M $M $M $M $M $M
Deferred tax assets and liabilities are attributable to the following:
Consolidated Entity
Property, plant and equipment - - 607.3 644.7 607.3 644.7
Intangible assets - - 10.6 5.0 10.6 5.0
Hedge derivatives - - - (8.4) - (8.4)
Employee benefits (121.7) (119.4) - - (121.7) (119.4)
Deferred government grants (16.6) (16.9) - - (16.6) (16.9)
Provisions (41.8) (56.5) - - (41.8) (56.5)
Other items (52.7) (63.1) 22.0 73.6 (30.7) 10.5
Tax (assets) / liabilities (232.8) (255.9) 639.9 714.9 407.1 459.0
Set off of tax - - - - - -
Net tax (assets) / liabilities (232.8) (255.9) 639.9 714.9 407.1 459.0
Ausgrid
Property, plant and equipment - - 607.3 644.7 607.3 644.7
Intangible assets - - 10.6 5.0 10.6 5.0
Hedge derivatives - - - (8.4) - (8.4)
Employee benefits (121.7) (119.4) - - (121.7) (119.4)
Deferred government grants (16.6) (16.9) - - (16.6) (16.9)
Provisions (41.8) (56.5) - - (41.8) (56.5)
Other items (52.7) (63.1) 22.0 73.6 (30.7) 10.5
Tax (assets) / liabilities (232.8) (255.9) 639.9 714.9 407.1 459.0
Set off of tax - - - - - -
Net tax (assets) / liabilities (232.8) (255.9) 639.9 714.9 407.1 459.0
The deductible temporary differences and tax losses do not expire under current tax legislation.

64
For the year ended 30 June 2011
Ausgrid and controlled entities
Notes to the financial statements
Consolidated Entity Ausgrid
Movement in temporary differences
during the year
Balance
1 July 10
Recognised
in income
Recognised
in equity
Balance
30 June 11
Balance
1 July 10
Recognised
in income
Recognised
in equity
Balance
30 June 11
$M $M $M $M $M $M $M $M
Property, plant and equipment 644.7 (44.0) 6.6 607.3 644.7 (44.0) 6.6 607.3
Intangible assets 5.0 5.6 - 10.6 5.0 5.6 - 10.6
Hedge derivatives (8.4) (0.8) 9.2 - (8.4) (0.8) 9.2 -
Employee benefits (119.4) (2.3) - (121.7) (119.4) (2.3) - (121.7)
Deferred government grants (16.9) 0.3 - (16.6) (16.9) 0.3 - (16.6)
Provisions (56.5) 14.7 - (41.8) (56.5) 14.7 - (41.8)
Other items 10.5 (43.7) 2.5 (30.7) 10.5 (43.7) 2.5 (30.7)
459.0 (70.2) 18.3 407.1 459.0 (70.2) 18.3 407.1
Balance
1 July 09
Recognised
in income
Recognised
in equity
Balance
30 June 10
Balance
1 July 09
Recognised
in income
Recognised
in equity
Balance
30 June 10
$M $M $M $M $M $M $M $M
Property, plant and equipment 633.9 8.8 2.0 644.7 633.9 8.8 2.0 644.7
Intangible assets 6.2 (1.2) - 5.0 6.2 (1.2) - 5.0
Hedge derivatives (3.9) (3.7) (0.8) (8.4) (3.9) (3.7) (0.8) (8.4)
Employee benefits (118.4) (1.0) - (119.4) (118.4) (1.0) - (119.4)
Deferred government grants (9.6) (7.3) - (16.9) (9.6) (7.3) - (16.9)
Provisions (52.6) (3.9) - (56.5) (52.6) (3.9) - (56.5)
Other items 2.9 17.6 (10.0) 10.5 2.9 17.6 (10.0) 10.5
458.5 9.3 (8.8) 459.0 458.5 9.3 (8.8) 459.0
2011 2010 2011 2010
$M $M $M $M
Other trade payables and accrued expenses 570.4 620.8 570.4 620.8
570.4 620.8 570.4 620.8
Consolidated Entity Ausgrid
14 DEFERRED TAX ASSETS AND LIABILITIES continued
15 TRADE AND OTHER PAYABLES

Ausgrid – Annual Report 2010/11 65
This note provides information about the contractual terms of
the consolidated entity’s interest-bearing loans and borrowings.
For more information about the consolidated entity’s exposure
to interest rate and foreign currency risks, see Note 20.
2011 2010 2011 2010
$M $M $M $M
Current liabilities
Current portion of loans 168.9 286.0 168.9 286.0
Non-current liabilities
Non-current portion of loans 6 622.9 5 549.1 6 622.9 5 549.1
Financing facilities
The Corporation has access to the following lines of credit:
Total facilities available
Bank overdraft(2) 2.0 2.0 2.0 2.0
T-Corp short term accommodation 450.0 450.0 450.0 450.0
T-Corp loans 7 400.0 6 300.0 7 400.0 6 300.0
Inscribed stock(3) - 3.2 - 3.2
7 852.0 6 755.2 7 852.0 6 755.2
Facilities utilised at reporting date
Bank overdraft(4), (5) - - - -
T-Corp short term accommodation(5)
- - - -
T-Corp loans(5) 6 791.8 5 831.9 6 791.8 5 831.9
Inscribed stock(5) - 3.2 - 3.2
6 791.8 5 835.1 6 791.8 5 835.1
Facilities not utilised at reporting date
Bank overdraft 2.0 2.0 2.0 2.0
T-Corp short term accommodation 450.0 450.0 450.0 450.0
T-Corp loans 608.2 468.1 608.2 468.1
Inscribed stock - - - -
1 060.2 920.1 1 060.2 920.1
(2) Represents the bank overdraft limit in relation to any debit balances of the daily bank statements. (3) All inscribed stock was extinguished on 31 October 2010. (4) The bank statement balance at reporting date was $11.6 million credit (2010: $2.4 million credit).
2011 2010 2011 2010
% % % %
(5)Effective interest rates:
Bank overdraft 4.5 4.2 4.5 4.2
T-Corp short term accommodation 4.9 4.7 4.9 4.7
T-Corp loans 5.7 5.9 5.7 5.9
Inscribed stock - 7.0 - 7.0
Consolidated Entity
Consolidated Entity
Ausgrid
Ausgrid
16 BORROWINGS

66
For the year ended 30 June 2011
Ausgrid and controlled entities
Notes to the financial statements16 BORROWINGS continued
Financing arrangements
Bank overdrafts
Interest on bank overdrafts is charged at prevailing market rates plus an additional 5.0% on any balance in excess of the approved overdraft on
the Group Limit Facility of $2 million.
The total bank overdraft of the consolidated entity is secured by a charge over the consolidated entity’s assets. The bank overdrafts are payable
on demand and are subject to annual review.
T-Corp short term accommodation
Ausgrid has approval from the Public Authorities (Financial Arrangements) Act 1987 (“PAFA Act”) to obtain a $450 million short term
accommodation (Come-and-Go facility) from T-Corp.
Interest on T-Corp short term accommodation is charged at prevailing market rates.
T-Corp loans
Ausgrid has approval from the “PAFA Act” to obtain $7,400 million (2010: $6,300 million) loan funds from T-Corp.
The loans amount in current liabilities includes the portion of the consolidated entity’s T-Corp loans payable within one year of $168.9 million
(2010: $284.6 million).
The non-current T-Corp loans are payable on or before 15 April 2039, with maturity dates ranging between 2 and 28 years from reporting date.
All T-Corp debt is fully payable on maturity with the majority being fixed rate loans.
Inscribed stock
Ausgrid had borrowings by the issue of inscribed stock to private individuals, companies and various government bodies. There have been no new
debt issues for this type of borrowing since 1980.
All outstanding borrowings were fully repaid by 31 October 2010.

Ausgrid – Annual Report 2010/11 67
2011 2010 2011 2010
% % % %
Current
Energy derivatives-undesignated 76.1 6.3 76.1 6.3
Energy derivatives-designated - 19.8 - 19.8
Forward exchange contracts 1.0 0.3 1.0 0.3
77.1 26.4 77.1 26.4
Non-current
Energy derivatives - 60.8 - 60.8
Supply contract commitment 6.9 29.7 6.9 29.7
Other financial liabilities (Note 20(d)) 1.0 1.6 1.0 1.6
7.9 92.1 7.9 92.1
Consolidated Entity
Consolidated Entity and Ausgrid
Ausgrid
17 PROVISIONS
Insurance Dividends
& Other
Payments
Other Total
$M $M $M $M
Balance at 1 July 2010 17.5 250.2 86.6 354.3
Provisions made during the year 5.3 1 545.1 81.1 1 631.5
Provisions used during the year (5.5) (1 620.2) (25.9) (1 651.6)
Balance at 30 June 2011 17.3 175.1 141.8 334.2
Non-current 14.7 - 30.6 45.3
Current 2.6 175.1 111.2 288.9
17.3 175.1 141.8 334.2
Note: See Note 1(o) for commentary on provisions.
18 OTHER FINANCIAL LIABILITIES - INCLUDING DERIVATIVES

68
For the year ended 30 June 2011
Ausgrid and controlled entities
Notes to the financial statements19 CAPITAL AND RESERVES
Contributed equity and share capital
The number of shares on issue (fully paid) at 30 June 2011 are 2 (2010: 2).
The holders of ordinary shares are entitled to receive dividends as declared from time to time and are entitled to one vote per share at meetings
of the Corporation.
Revaluation reserve
The revaluation reserve relates to fair value movements in property and records movements in the fair value of available-for-sale financial assets.
Hedging reserve
The hedging reserve is used to record the unrealised gains or losses of effective cash flow hedges. The unrealised gains or losses of all other
energy derivatives are recognised in profit and loss.
The hedging reserve also comprises the effective portion of the cumulative net change in the fair value of cash flow hedging instruments related
to hedged transactions that have not yet occurred.
Dividends and other payments to shareholders
Dividends and other payments to shareholders recognised in the current year by the Corporation are:
Other payments to shareholders
A payment was made to shareholders for the current year of $1,370,036,000 and related to the retail sale proceeds received from TRUenergy on
1 March 2011 [see Note 1(o)(ii)].
Total Amount
$M
Date of
payment
2011
Payment 2011 1 370.0 11 March 2011
Interim 2011 85.1 29 July 2011
Final 2011 90.0 30 November 2011
Total amount 1 545.1
2010
Interim 2010 125.1 30 July 2010
Final 2010 125.1 30 November 2010
Total amount 250.2
Consolidated Entity and Ausgrid

Ausgrid – Annual Report 2010/11 69
20 FINANCIAL INSTRUMENTS
Financial instruments apply to both Ausgrid and the consolidated entity.
Details of the significant accounting policies and methods adopted, including the criteria for recognition, the basis of measurement and the basis
on which income and expenses are recognised, in respect of each class of financial asset, financial liability and equity instrument are disclosed in
Note 1 to the financial statements.
Exposure to credit, interest rate, energy price, foreign currency and liquidity risks arises in the normal course of the consolidated entity’s business.
Derivative financial instruments are used to trade and hedge exposure to fluctuations in foreign exchange rates, interest rates and energy prices.
(a) Foreign exchange risk
The consolidated entity is exposed to foreign currency risk in respect of purchases of capital equipment that are denominated in a currency other
than the AUD.
The consolidated entity hedges all foreign exchange exposures that exceed $A 500,000 in value.
The consolidated entity uses forward exchange contracts to hedge its foreign currency risk.
There are no other significant assets or liabilities denominated in currencies other than AUD.
The consolidated entity classifies its forward exchange contracts that are not designated to hedging relationships and states them at fair value.
The net fair value of forward exchange contracts used as hedges of forecasted transactions at 30 June 2011 was -$1.0 million (2010: -$0.3
million), comprising assets of $4.4 million (2010: $9.3 million) and liabilities of $5.4 million (2010: $9.6 million) that were recognised in fair
value derivatives.
Recognised assets and liabilities
Changes in the fair value of forward exchange contracts that economically hedge monetary liabilities in foreign currencies and for which no
hedge accounting is applied are recognised in the Statement of Comprehensive Income. There were nil forward exchange contracts designated as
economic hedges at 30 June 2011 (2010: nil).
(b) Interest rate risk
Interest rate risk is managed using futures instruments and interest rate swaps. All derivatives are managed through T-Corp in accordance with
Board policies for the purpose of managing interest rate exposures associated with external debt raised.
The consolidated entity adopts a policy of ensuring that its debt portfolio is managed within a risk framework including specified limits. In order
to do this, interest rate futures and swap instruments denominated in AUD are used.
There were no swaps outstanding at balance date (2010: nil).

70
For the year ended 30 June 2011
Ausgrid and controlled entities
Notes to the financial statements
2011 2010 2011 2010
$M $M $M $M
Total loans 6 791.8 5 835.1 6 791.8 5 835.1
Less: cash and cash equivalents (99.4) (156.6) (99.4) (156.6)
Net debt 6 692.4 5 678.5 6 692.4 5 678.5
Total equity 1 937.1 1 855.1 1 937.1 1 855.2
Total capital 8 629.5 7 533.6 8 629.5 7 533.7
Gearing ratio 77.6% 75.4% 77.6% 75.4%
Consolidated Entity Ausgrid
20 FINANCIAL INSTRUMENTS continued
Effective interest rates and repricing analysis
In respect of income-earning financial assets and interest-bearing financial liabilities, the table in Note 20(h) indicates their effective interest
rates at the statement of financial position date and the periods in which they reprice or mature (whichever is earlierThe holders of ordinary
shares are entitled to receive dividends as declared from time to time and are entitled to one vote per share at meetings of the Corporation.
Capital risk management
Consistent with NSW Treasury Accounting Policy Capital Structure Policy for Government Businesses [TPP02-7] which is a component of the NSW
Government’s Commercial Policy Framework, the consolidated entity’s objectives are to determine an appropriate capital structure to enable an
appropriate return on equity and efficient investment decisions to be made on a commercial basis.
Under the policy, both an appropriate capital structure and a minimum-to-maximum capital structure range are determined whilst considering
the following criteria:
provision of an acceptable stream of dividends;
maintenance of an appropriate investment grade rating, taking into account industry and entity specific factors;
ability to meet key debt service criteria, based on industry benchmarks;
capacity to finance the approved capital expenditure program through internally generated cash flows and debt, with consideration of the
current phase of the investment cycle; and
provision of sufficient flexibility for relevant contingencies.
The minimum-to maximum capital structure ‘range’ is an acceptable variation (indicated by gearing ratios) around the consolidated entity’s
capital structure. The consolidated entity monitors this on the basis of gearing levels and ratios. This ratio is calculated as net debt divided
by total capital. Net debt is calculated as total loans and T-Corp short term accommodation less cash and cash equivalents. Total capital is
calculated as ‘equity’ as shown in the Statement of Financial Position plus net debt.
The consolidated entity’s agreed capital structure and range is reviewed every year as part of the SCI “Statement of Corporate Intent” process.
The purpose of such a review is to confirm whether or not the current capital structure and range continue to be appropriate and, if not, to
negotiate revised arrangements between the Board and Shareholders.

Ausgrid – Annual Report 2010/11 71
(c) Energy price risk
Up to 28 February 2011, the former EnergyAustralia Group maintained two broad energy derivative portfolios – a Trading Portfolio and a
Hedge Portfolio.
The Trading Portfolio did not hedge an underlying cashflow exposure, and had only contained trading instruments. Segregated trading contracts
held within the Trading Portfolio were marked to market with both realised and unrealised gains and losses recognised in the Statement of
Comprehensive Income immediately. The terms of these contracts were generally for no more than 5 years.
The Hedge Portfolio did have an underlying cashflow exposure, and the former EnergyAustralia Group entered into hedging contracts in this
portfolio to hedge against movements in spot prices in the National Electricity Market (NEM) for anticipated purchase commitments of energy.
The former EnergyAustralia Group used a combination of swap and option contracts transacted with generators and other market participants in
its hedging strategy. The terms of these contracts were generally for no more than 5 years, but some longer term contracts had been transacted
to strategically manage the former EnergyAustralia Group’s long term position structure. As these contracts were hedging anticipated future
purchases, any realised gains and losses on the contracts were recognised in the measurement of the underlying purchase commitment as an
element of electricity purchase costs.
While the derivative contracts within the Hedge Portfolio were true economic hedges, and most of these contracts were effective cashflow
hedges within the strictures of AASB 139 Financial Instruments: Recognition and Measurement, some contracts had been treated as trading
instruments. Movements in the unrealised and realised fair value of these trading instruments within the Hedge Portfolio were recognised within
the Statement of Comprehensive Income. Movements in the unrealised fair value of all designated hedges were written to a revaluation reserve
within Equity (to the extent that they were effective) and recognised in the Statement of Comprehensive Income only when the underlying hedge
cashflow was also recognised in the Statement of Comprehensive Income.
Certain hedge transactions were de-designated from time to time as part of the management of the energy contract portfolio and related load
risks in line with AASB 139 recognition criteria. Of the contracts that we had previously undesignated, the practice had been to hold the previous
fair value prevalent in the previous reporting period (i.e. the month end prior to de-designation) in equity, and to record in the Statement of
Comprehensive Income any subsequent changes in fair value. However when the contract in question enters into or is in the contract period, that
amount that was held in equity was evenly released to the Statement of Comprehensive Income until its maturity.
As part of the retail sale transaction on 1 March 2011, the Corporation transferred its open energy trading contracts to the purchaser,
TRUenergy. A number of energy trading contracts were unable to be novated to TRUenergy and are recorded in the balance sheet as at
30 June 2011. Non-novated contracts held in Ausgrid’s name are matched to an equal and opposite position with TRUenergy pending their
novation or expiration. Ausgrid does not derive any benefit associated with cash flow but still bears residual legal risks until the contract is
novated or expires
Hedge Accounting
2011 2010 2011 2010
$M $M $M $M
Cash flow hedges
The effective portion of the gains/(losses) on cash flow hedges
recognised in the cashflow hedge reserve (57.6) (2.6) (57.6) (2.6)
Note : All cashflow hedges were effective.
Consolidated Entity Ausgrid

72
For the year ended 30 June 2011
Ausgrid and controlled entities
Notes to the financial statements
The net fair value of foreign exchange contracts is calculated by reference to the current spot and forward market currency exchange rates.
(vi) Deposits
Customer deposits represent liabilities for customer and contractors’ deposits which can be refunded at any time after the end of the financial
year. The net fair value is the carrying value.
2011 2010
Loans and borrowings 4.8% - 5.7% 4.6 % - 5.6 %
20 FINANCIAL INSTRUMENTS continued
Net fair values of financial assets and liabilities
Valuation techniques and assumptions applied for the purposes of measuring fair value
The fair values of financial assets and financial liabilities are determined as follows.
The fair values of financial assets and financial liabilities with standard terms and conditions and traded on active liquid markets are determined
with reference to quoted market prices.
The fair values of other financial assets and financial liabilities (excluding energy derivatives) are determined in accordance with generally
accepted pricing models based on discounted cash flow analysis using prices from observable current market transactions and dealer quotes for
similar instruments.
(i) Electricity derivatives
Fair value of electricity derivatives was calculated either using readily observed market sources or internally adjusted market prices.
The forward curve against which electricity derivatives are revalued is constructed from readily observed market sources. The inputs for this
curve are sourced from a combination of available brokers’ screens on the Reuters electronic news service as well as closing Sydney Futures
Exchange prices.
For those electricity derivatives, where directly appropriate market price valuations were not available, the net fair value for such contracts
had been calculated based on internally adjusted market price estimates for similar products or reasonable extrapolation of the last observed
relative reference prices. Certain other more exotic contracts involving term structures, conditions and strike prices for which there were no
observable market prices had been valued based on entity specific inputs using models that were also used in risk management. In all of these
cases, estimated future cashflows resulting from the valuation exercise were discounted to derive the relative net fair values as at balance date.
The discount rates used were sourced from a zero coupon yield curve constructed by an independent content provider.
(ii) Interest-bearing loans and borrowings
Fair value is calculated based on discounted expected future principal and interest cash flows.
(iii) Trade and other receivables / payables
For receivables / payables with a remaining life of less than one year, the notional amount is deemed to reflect the fair value.
(iv) Interest rates used for determining fair value
The entity uses the government yield curve as at 30 June 2011 plus an adequate constant credit spread to discount financial instruments.
The interest rates used are as follows:
(v) Foreign exchange contracts
Consolidated Entity
and Ausgrid

Ausgrid – Annual Report 2010/11 73
The carrying amounts and net fair values of financial assets and liabilities at balance date are:
Financial instruments
2011 2011 2010 2010
Carrying
Amount
$M
Net Fair
Value
$M
Carrying
Amount
$M
Net Fair
Value
$M
Financial assets
Cash and cash equivalents (Note 6) 99.4 99.4 156.6 156.6
Trade and other receivables (Note 7) 538.4 538.4 688.0 688.0
Energy derivatives (Note 8) 83.0 83.0 88.4 88.4
Other financial assets (Note 8) 0.1 0.1 9.4 9.4
720.9 720.9 942.4 942.4
Financial liabilities
Loans (Note 16) 6 791.8 6 958.4 5 835.1 6 033.2
Trade and other payables (Note 15) 570.4 570.4 620.8 620.8
Deposits 12.2 12.2 26.6 26.6
Deferred government grants 83.0 83.0 56.2 56.2
Energy derivatives (Note 18) 76.1 76.1 86.9 86.9
Forward exchange contracts (Note 18) 1.0 1.0 0.3 0.3
Supply contract commitment (Note 18) 6.9 6.9 29.7 29.7
Other financial liabilities (Note 18) 1.0 1.0 1.6 1.6
7 542.4 7 709.0 6 657.2 6 855.3
Financial instruments
2011 2011 2010 2010
Carrying
Amount
$M
Net Fair
Value
$M
Carrying
Amount
$M
Net Fair
Value
$M
Financial assets
Cash and cash equivalents (Note 6) 99.4 99.4 156.6 156.6
Trade and other receivables (Note 7) 538.4 538.4 688.1 688.1
Energy derivatives (Note 8) 83.0 83.0 88.4 88.4
Other financial assets (Note 8) 0.1 0.1 9.4 9.4
720.9 720.9 942.5 942.5
Financial liabilities
Loans (Note 16) 6 791.8 6 958.4 5 835.1 6 033.2
Trade and other payables (Note 15) 570.4 570.4 620.8 620.8
Deposits 12.2 12.2 26.6 26.6
Deferred government grants 83.0 83.0 56.2 56.2
Energy derivatives (Note 18) 76.1 76.1 86.9 86.9
Forward exchange contracts (Note 18) 1.0 1.0 0.3 0.3
Supply contract commitment (Note 18) 6.9 6.9 29.7 29.7
Other financial liabilities (Note 18) 1.0 1.0 1.6 1.6
7 542.4 7 709.0 6 657.2 6 855.3
Consolidated Entity
Ausgrid

74
For the year ended 30 June 2011
Ausgrid and controlled entities
Notes to the financial statements20 FINANCIAL INSTRUMENTS continued
(e) Fair value measurements recognised in the statement of financial position
The following table provides an analysis of financial instruments that are measured subsequent to initial recognition at fair value, grouped into
Levels 1 to 3 based on the degree to which the fair value is observable.
Level 1 - fair value measurements are those derived from quoted prices (unadjusted) in active markets for identical assets or liabilities.
Level 2 - fair value measurements are those derived from inputs other than quoted prices included within Level 1 that are observable for the
asset or liability, either directly (i.e. as prices) or indirectly (i.e. derived from prices).
Level 3 - fair value measurements are those derived from valuation techniques that include inputs for the asset or liability that are not based
on observable market data (unobservable input)
Consolidated Entity
Level 1
$M
Level 2
$M
Level 3
$M
Total
$M
Financial assets at fair value through profit or loss
Energy derivatives – designated and undesignated - 64.8 18.2 83.0
- 64.8 18.2 83.0
Financial liabilities at fair value through profit or loss
Energy derivatives – designated and undesignated - (64.8) (11.3) (76.1)
Supply contract commitment - - (6.9) (6.9)
Forward exchange contracts - (1.0) - (1.0)
- (65.8) (18.2) (84.0)
Ausgrid
Financial assets at fair value through profit or loss
Energy derivatives – designated and undesignated - 64.8 18.2 83.0
- 64.8 18.2 83.0
Financial liabilities at fair value through profit or loss
Energy derivatives – designated and undesignated - (64.8) (11.3) (76.1)
Supply contract commitment - - (6.9) (6.9)
Forward exchange contracts - (1.0) - (1.0)
- (65.8) (18.2) (84.0)
2011

Ausgrid – Annual Report 2010/11 75
Consolidated Entity
Level 1
$M
Level 2
$M
Level 3
$M
Total
$M
Financial assets at fair value through profit or loss
Energy derivatives – designated and undesignated - 32.7 55.8 88.5
- 32.7 55.8 88.5
Financial liabilities at fair value through profit or loss
Energy derivatives – designated and undesignated - (86.9) - (86.9)
Supply contract commitment - - (29.7) (29.7)
Forward exchange contracts - (10.0) - (10.0)
- (96.9) (29.7) (126.6)
Ausgrid
Financial assets at fair value through profit or loss
Energy derivatives – designated and undesignated - 32.7 55.8 88.5
- 32.7 55.8 88.5
Financial liabilities at fair value through profit or loss
Energy derivatives – designated and undesignated - (86.9) - (86.9)
Supply contract commitment - - (29.7) (29.7)
Forward exchange contracts - (10.0) - (10.0)
- (96.9) (29.7) (126.6)
2010

76
For the year ended 30 June 2011
Ausgrid and controlled entities
Notes to the financial statements
Reconciliation of Level 3 fair value measurements of
financial instruments
Fair value through
profit or loss
Fair value through
profit or loss
Energy
derivatives
$M
Total
$M
Energy
derivatives
$M
Supply contract
commitment
$M
Total
$M
Consolidated Entity
Balance at 1 July 2010 55.8 55.8 - (29.7) (29.7)
Total gains or losses:
- in profit or loss (37.6) (37.6) (11.3) 22.8 11.5
- in other comprehensive Income - - - - -
New contracts during the Period - - - - -
Contracts expired during the period - - - - -
Transfers into level 3 - - - - -
Transfers out of level 3 - - - - -
Balance at 30 June 2011 18.2 18.2 (11.3) (6.9) (18.2)
Total gains or losses for the year included in profit or loss for
assets held at 30 June 2011 (37.6) (37.6) (11.3) 22.8 11.5
Ausgrid
Balance at 1 July 2010 55.8 55.8 - (29.7) (29.7)
Total gains or losses:
- in profit or loss (37.6) (37.6) (11.3) 22.8 11.5
- in other comprehensive income - - - - -
New contracts during the period - - - - -
Contracts expired during the period - - - - -
Transfers into level 3 - - - - -
Transfers out of level 3 - - - - -
Balance at 30 June 2011 18.2 18.2 (11.3) (6.9) (18.2)
Total gains or losses for the year included in profit or loss for
assets held at 30 June 2011(6) (37.6) (37.6) (11.3) 22.8 11.5
(6) Gains or losses reported in the profit or loss are presented separately in Note 3(c).
Financial assets Financial liabilities20 FINANCIAL INSTRUMENTS continued

Ausgrid – Annual Report 2010/11 77
Reconciliation of Level 3 fair value measurements of
financial instruments
Fair value through
profit or loss
Fair value through
profit or loss
Energy
derivatives
$M
Total
$M
Energy
derivatives
$M
Supply contract
commitment
$M
Total
$M
Consolidated Entity
Balance at 1 July 2009 28.9 28.9 - (14.3) (14.3)
Total gains or losses:
- in profit or loss 26.9 26.9 - (15.4) (15.4)
- in other comprehensive Income - - - - -
New contracts during the Period - - - - -
Contracts expired during the period - - - - -
Transfers into level 3 - - - - -
Transfers out of level 3 - - - - -
Balance at 30 June 2010 55.8 55.8 (29.7) (29.7)
Total gains or losses for the year included in profit or loss for
assets held at 30 June 2010 26.9 26.9 - (15.4) (15.4)
Ausgrid
Balance at 1 July 2009 28.9 28.9 - (14.3) (14.3)
Total gains or losses:
- in profit or loss 26.9 26.9 - (15.4) (15.4)
- in other comprehensive income - - - - -
New contracts during the period - - - - -
Contracts expired during the period - - - - -
Transfers into level 3 - - - - -
Transfers out of level 3 - - - - -
Balance at 30 June 2010 55.8 55.8 - (29.7) (29.7)
Total gains or losses for the year included in profit or loss for
assets held at 30 June 2010 (6) 26.9 26.9 - (15.4) (15.4)
(6) Gains or losses reported in the profit or loss are presented separately in Note 3(c).
Financial assets Financial liabilities

78
For the year ended 30 June 2011
Ausgrid and controlled entities
Notes to the financial statements
Reflected in
profit or loss
Reflected in other
comprehensive income
Favourable
change
$M
Unfavourable
change
$M
Favourable
change
$M
Unfavourable
change
$M
Energy derivatives - - - -
Supply contract commitments - - - -
Reflected in
profit or loss
Reflected in other
comprehensive income
Favourable
change
$M
Unfavourable
change
$M
Favourable
change
$M
Unfavourable
change
$M
Energy derivatives 8.3 (8.3) - -
Supply contract commitments - - - -
As at 30 June 2011
As at 30 June 2010
Level 3 sensitivity disclosures shown above exclude the impact of any contracts which are offset by a fair value hedge arrangement.
Given that all Ausgrid’s electricity derivatives have equal and offsetting positions, there will be no impact on the Profit or Loss Statement if any
underlying assumptions are changed.
(f) Sensitivity analysis
In managing interest rate, foreign currency and energy price risks, the consolidated entity aims to reduce the impact of short-term fluctuations
on the consolidated entity’s earnings. Over the longer-term, however, permanent changes in interest rates would have an impact on
consolidated earnings.
The Ausgrid Group does not account for any fixed rate financial assets and liabilities at fair value through profit or loss, and the Group does
not designate interest rate derivatives as hedging instruments under a fair value hedge accounting model. The Group has minimal variable
rate financial liabilities at year end and it is estimated that a change in interest rates by one percentage point at reporting date would have no
material impact on the consolidated entity’s profit before tax (2010: nil). There would be no effect on equity.
It is estimated that a change at reporting date by ten percentage points in the value of the AUD against other foreign currencies would not have
a material impact on the consolidated entity’s profit nor value of equity.
From 1 March, 2011, there is no longer any energy price risk except for the sole retained customer for which the Group has entered into a Fair
Value Hedge arrangement. The 10% sensitivity test will yield a nil value as there is no open position in the Derivatives book.
The following tables show the sensitivity of level 3 fair values to reasonably possible alternative assumptions as at 30 June 2011 and
30 June 2010 respectively:
20 FINANCIAL INSTRUMENTS continued

Ausgrid – Annual Report 2010/11 79
(g) Credit risk exposures
The credit risk on trade and other receivables, and accrued sales of energy of the Ausgrid Group that have been recognised in the Statement of
Financial Position, is generally the carrying amount, net of any impairment provisions.
Up to 28 February 2011, the Group minimised concentrations of credit risk by undertaking transactions with a large number of customers and
was not materially exposed to any individual customer. The Group’s policy required customers to pay in accordance with agreed payment terms.
The payment terms were generally 14 days, the minority of customers that requested longer terms were required to negotiate the arrangement
with management and an extended terms premium was applied.
From 1 March 2011, the Group’s policy requires customers to pay in accordance with agreed payment terms. The payment terms are generally
15-30 days.
All credit and recovery risks associated with trade receivables have been provided for in the Statement of Financial Position.
The credit risk of accrued sales of energy (up to 28 February 2011) was less than 6 months offset by a 1-2% impairment provision for revenue
recoverability. All credit and recovery risk associated with accrued sales have been provided for in the Statement of Financial Position.
The ageing of trade receivables past due but not impaired at 30 June 2011 is detailed below:
Interest rate swaps are subject to credit risk in relation to the relevant counter-parties, which are principally large banks. The credit risk on swap
contracts is limited to the net amount to be received from counter-parties on contracts that are favourable to the Ausgrid Group. As at 30 June
2011 the Ausgrid Group did not have any swap positions (2010: nil).
Exposure to fluctuations in the wholesale price of energy is managed by entering into derivative transactions with approved counter-parties for
the purpose of hedging the purchase cost of energy. By entering into these arrangements the Ausgrid Group is exposed to credit related losses
in the event of non-performance by counter-parties to these derivative instruments. These derivative contracts are transacted within the terms
of the International Swaps and Derivatives Association documentation framework and include mitigating netting provisions. The Ausgrid Group
does not hold collateral from any derivative counter-party (2010: nil) at reporting date.
The Ausgrid Group’s credit risk is minimised as it transacts predominantly with other Government owned corporations in the energy industry.
Where the counter-party is a non-Government owned corporation its creditworthiness is established in accordance with the Ausgrid Group’s risk
management policies.
At balance date the maximum credit exposure resulting from energy derivatives, excluding realised gains and losses not yet settled, amounted
to $80.9 million (2010: $53.2 million). 92.7% of this exposure was attributable to three counterparties (2010: 86.0% was attributable to the
top three counterparties). These derivatives comprise the residual element of a larger portfolio of contracts that have been sold to, and are
effectively held for TRUenergy pending their formal novation.
2011 2010 2011 2010
$M $M $M $M
Less than 3 months overdue 10.5 34.6 10.5 34.6
3 months to 6 months overdue 0.8 1.8 0.8 1.8
Later than 6 months overdue 4.3 5.0 4.3 5.0
15.6 41.4 15.6 41.4
Consolidated Entity Ausgrid

80
For the year ended 30 June 2011
Ausgrid and controlled entities
Notes to the financial statements
(h) Liquidity risk
The Ausgrid Group’s liquidity risks are managed with the availability of readily accessible standby facilities and other funding arrangements and
by investing surplus funds in marketable securities and deposits (see Notes 1(e), 6 and 16).
The contractual maturity of the Group’s fixed and floating rate financial liabilities and derivatives are shown in the following table.
Consolidated Entity and Ausgrid
As at 30 June 2011 As at 30 June 2010
Weighted
average
effective
interest rate
Total 1 year
or less
1-5
years
More than
5 years
Weighted
average
effective
interest rate
Total 1 year
or less
1-5
years
More than
5 years
% $M $M $M $M % $M $M $M $M
Derivative financial liabilities
Energy derivatives - (76.1) (76.1) - - - (86.9) (26.1) (60.8) -
Supply contract commitment - (6.9) - - (6.9) - (29.7) - - (29.7)
Forward exchange contracts - (1.0) (1.0) - - - (0.3) (0.2) (0.1) -
Derivative financial assets
Energy derivatives - 83.0 76.1 - 6.9 - 88.4 43.9 14.8 29.7
Non derivative financial liabilities
AUD fixed rate loans 5.8 (10 190.9) (455.6) (2 993.2) (6 742.1) 5.9 (8 343.1) (594.0) (3 017.6) (4 731.5)
AUD floating rate loans 5.1 (101.4) (101.4) - - 4.7 (152.4) (152.4) - -
Trade and other payables - (570.4) (570.4) - - - (620.8) (620.8) - -
Non derivative financial assets
Cash and cash equivalents 4.7 99.4 99.4 - - 4.4 156.6 156.6 - -
Note: The amounts disclosed above for loans are the contractual undiscounted cash flows and therefore will not reconcile to the Statement of Financial
Position. These disclosed contractually committed cash flows will not differ from the timing and the amounts expected to be incurred for these liabilities.
20 FINANCIAL INSTRUMENTS continued

Ausgrid – Annual Report 2010/11 81
The following tables include the undiscounted contractual net cash inflows and outflows on derivative liabilities that settle on a net basis and the
undiscounted gross inflows and outflows on those derivatives that require gross settlement. When the amount payable or receivable is not fixed,
the amount disclosed has been determined by reference to the projected prices as illustrated by the forward curves at the end of each reporting
period. Energy derivatives, pending their novation, are subject to pass through provisions in the Purchase and Sale Agreement with TRUenergy,
and consequently all cashflows are offset either against contra cashflows with either the original counterparty or TRUenergy.
Derivative financial liabilities
Carrying
amount
$M
Total contractual
cashflows
$M
1 year
or less
$M
1-5
years
$M
More than
5 years
$M
Net settled:
energy derivatives (76.1) (265.0) (69.1) (188.9) (7.0)
cashflows available under offset arrangements with TRUenergy 76.1 265.0 69.1 188.9 7.0
- - - - -
Gross settled:
foreign exchange contracts 5.4 5.5 5.5 - -
Derivative financial liabilities
Carrying
amount
$M
Total contractual
cashflows
$M
1 year
or less
$M
1-5
years
$M
More than
5 years
$M
Net settled:
energy derivatives 86.9 93.2 38.0 53.7 1.5
Gross settled:
foreign exchange contracts 9.6 10.0 4.5 5.5 -
Note: The above amounts disclosed are the contractual undiscounted cash flows and therefore will not reconcile to the Statement of Financial Position.
As at 30 June 2011
As at 30 June 2010

82
For the year ended 30 June 2011
Ausgrid and controlled entities
Notes to the financial statements21 RELATED PARTIES - KEY MANAGEMENT PERSONNEL DISCLOSURES
The following were key management personnel of the consolidated entity at any time during the reporting period and unless otherwise indicated
were key management personnel for the entire period.
Directors
Mr J Conde AO (Chairman)
Mr G Maltabarow (Managing Director)
Ms P Akopiantz (term concluded 31 August 2011)
Mr P Jeans
Mr M Lambert (term concluded 31 August 2010)
Ms R Mifsud
Dr P Dodd (appointed 6 September 2010)
Executives
Mr C James (Executive General Manager - Finance and Corporate)
Mr J Eisenhuth (Executive General Manager - Distribution Operations and Reliability)
Mr G Lilliss (Executive General Manager - Engineering Transmission and Technology) [ceased employment effective 19 November 2010]
Mr T Armstrong (Executive General Manager - Transmission and System Operations) [appointment effective 20 November 2010] (previously
Executive General Manager – System Planning and Regulation 1 July 201 0 – 19 November 2010)
Mr P Birk (Acting Executive General Manager – System Planning and Regulation) [from 8 April 2011 to 30 June 2011; appointed 22 August 2011]
Mr D Anderson (Executive General Manager - Shared Services) [ceased employment effective 18 March 2011]
Mr M Bailey (Executive General Manager - Shared Services) [appointment effective 21 March 2011] (previously Executive General Manager – Retail
1 July 2010 – 18 March 2011)
Ms J Mills (Executive General Manager - Energy Services) [appointment effective 21 March 2011]
Ms M Slater (Executive General Manager - Human Resources)
Ms L Maffina (Corporate Secretary)
Transactions with key management personnel
In addition to their salaries, the consolidated entity also provides post employment benefits to Directors and executive officers (see Notes 1(m)
and 1(n)).
The key management personnel compensation included in “employee benefits expense” (see Note 3(a)) are as follows:
2011$M
2010$M
2011$M
2010$M
Short-term employee benefits 6.4 5.8 6.4 5.8
Long-term benefits 2.1 1.6 2.1 1.6
Post-employment benefits 0.9 0.4 0.9 0.4
Termination benefits 0.6 - 0.6 -
AusgridConsolidated Entity
Other transactions
During the financial year, Ausgrid entered into the following transaction with its Director-related entity:
Ausgrid paid $483,356 (2010: $552,025) to the Sydney Symphony Orchestra in accordance with a sponsorship agreement. Mr Conde is
Chairman of the Sydney Symphony Orchestra.
In the case of this transaction, the Director concerned took no part in the transaction for either the Corporation or the Director-related entity.
The Directors of Ausgrid are also Directors of other companies which may have had transactions with Ausgrid during the financial year. With
respect to any such transaction, no Director has declared that he/she has control or significant influence on the financial and/or operating
policies of those companies in their dealings with Ausgrid.
From time to time, Directors of the Corporation or its controlled entities, or their Director-related entities, may purchase goods from the
consolidated entity. These purchases are on the same terms and conditions as those entered into by other consolidated entity employees or
customers and are trivial or domestic in nature.
All transactions are conducted on an arm’s length basis in the normal course of business and on commercial terms and conditions.

Ausgrid – Annual Report 2010/11 83
22 RELATED PARTIES – NON-KEY MANAGEMENT PERSONNEL DISCLOSURES Identity of related parties
The consolidated entity has a related party relationship with its subsidiaries (see Note 27) and with its Directors and executive officers
(see Note 21).
Other related party transactions
(i) Subsidiaries
During the year ended 30 June 2011, Ausgrid provided funding to the controlled entities to enable them to meet their commitments but did not
receive any repayments from them. It is expected that this funding will continue in 2011/12. Loans outstanding between Ausgrid and its controlled
entities have no fixed date of repayment and are non-interest bearing. There were no loans (net) to subsidiaries at 30 June 2011 (2010: nil).
(ii) Other transactions
During the financial year, Ausgrid entered into a number of services for nil consideration with all controlled entities within the Group. These
services have been categorised as follows:
- accounting services
- supply and rental of premises
- inter-company funding
- information technology services
- administrative and other services
No services were provided to Ausgrid by any of the controlled entities.
Ausgrid has also provided the necessary cash facilities for each of the controlled entities, with respect to external transactions which were not
settled by the controlled entity.
23 REMUNERATION OF AUDITOR
2011$M
2010$M
2011$M
2010$M
Amounts paid and payable to the Audit Office of NSW for:
Audit of Financial Report 0.4 0.4 0.4 0.4
Australian Financial Services Licence Audit -# -# -# -#
0.4 0.4 0.4 0.4
#Amount reduced to zero as a result of rounding to nearest $0.1 million (see Note 1(b)).
AusgridConsolidated Entity

84
2011$M
2010$M
2011$M
2010$M
Contingent liabilities
Guarantees issued by financial institutions(7) - - - -
Bank guarantees provided in the normal course of business,
in lieu of retention and security deposits -# -# -# -#
Guarantees provided to regulatory and statutory authorities 58.8 286.2 58.8 286.2
58.8 286.2 58.8 286.2
Contingent assets
Potential recoveries from gross workers compensation
claim payments 2.2 1.9 2.2 1.9
#Amount reduced to zero as a result of rounding to nearest $0.1 million (see Note 1(b)). (7)The Ausgrid Group has fully indemnified the issuing financial institutions in the unlikely event these guarantees are called on.
AusgridConsolidated Entity
For the year ended 30 June 2011
Ausgrid and controlled entities
Notes to the financial statements
2011$M
2010$M
2011$M
2010$M
(a) Capital commitments
Commitments for the acquisition of system assets, plant
and equipment contracted for at the reporting date but not
recognised as liabilities, payable:
Within twelve months 496.1 393.5 496.1 393.5
Twelve months or longer and not longer than five years 8.3 16.0 8.3 16.0
Total (including GST) 504.4 409.5 504.4 409.5
GST credits 45.9 37.2 45.9 37.2
(b) Other commitments
Commitments in relation to operating expenditure
contracted for at the reporting date but not recognised as
liabilities, payable:
Within twelve months 31.4 29.2 31.4 29.2
Twelve months or longer and not longer than five years 27.5 8.2 27.5 8.2
Longer than five years - - - -
Total (including GST) 58.9 37.4 58.9 37.4
GST credits 5.4 3.4 5.4 3.4
AusgridConsolidated Entity
Ausgrid has contractual commitments to purchase power and GHG certificates based on future volumes to be supplied over a period of
time varying from 1 to 13 years. Negotiations to novate these contracts are continuing and pending their novation, Ausgrid has offsetting
commitments from TRUenergy.
25 CAPITAL AND OTHER COMMITMENTS
24 CONTINGENT LIABILITIES AND CONTINGENT ASSETS

Ausgrid – Annual Report 2010/11 85
26 OPERATING LEASES
Leases as lessee
2011$M
2010$M
2011$M
2010$M
Non-cancellable operating leases are payable as follows:
Within twelve months 29.5 25.4 29.5 25.4
Twelve months or longer and not longer than five years 40.1 32.3 40.1 32.3
Longer than five years 111.2 110.8 111.2 110.8
Total (including GST) 180.8 168.5 180.8 168.5
GST credits 16.4 15.3 16.4 15.3
AusgridConsolidated Entity
Ausgrid leases various premises under operating leases including depot and office facilities, and a number of offices at interstate locations.
The Corporation also has a long term operating lease arrangement in place for a Zone Substation installation at Strathfield which expires in
2065. Lease payments under these leases are subject to annual, bi-annual or three yearly reviews to reflect market rentals. The majority of these
operating leases which are in place for the purpose of securing tenure to Ausgrid’s Network Infrastructure Assets, are long term (generally for
periods in excess of 25 years and up to 99 years) and are for a nominal or “peppercorn” consideration. None of the Corporation’s operating leases
include contingent rentals. There have been no properties sublet by the Corporation.
Ausgrid leases its passenger fleet and some light commercial fleet under operating leases. The majority of the fleet leases are fully maintained
leases and typically run for a period of 3 or 4 years dependant on business requirements.
Ausgrid leases personal computers under operating leases. All personal computer leases are for a period of 3 years.
During the year ended 30 June 2011, $28.8 million (2010: $25.4 million) was recognised as an expense in the
Statement of Comprehensive Income in respect of operating leases.
Leases as lessor
2011$M
2010$M
2011$M
2010$M
The consolidated entity leases out its properties, including
premises, land and communications towers, under operating
lease agreements at market rentals, predominantly on a fixed
term basis. The future minimum lease payments under
non-cancellable leases are as follows:
Within twelve months 4.7 6.7 4.7 6.7
Twelve months or longer and not longer than five years 9.6 8.2 9.6 8.2
Longer than five years(8) 8.7 10.5 8.7 10.5
Total (including GST) 23.0 25.4 23.0 25.4
GST debits 2.1 2.3 2.1 2.3
During the year ended 30 June 2011, $7.1 million (2010: $7.4 million) was recognised as rental income in the Statement of Comprehensive
Income and $0.8 million (2010: $0.8 million) in respect of repairs and maintenance was recognised as an expense in the Statement of
Comprehensive Income relating to these properties.
(8) The leases greater than 5 years are mainly leases with no fixed term contract and are expected to continue for an indefinite period. A period of 10 years
has been disclosed in the Note.
AusgridConsolidated Entity

86
For the year ended 30 June 2011
Ausgrid and controlled entities
Notes to the financial statements
2011
$M
2010
$M
2011
$M
2010
$M
Profit for the year from continuing operations 1 573.8 345.0 1 573.7 345.0
Add / (less) non-cash items:
Depreciation and amortisation 419.8 342.2 419.8 342.2
Amortisation of unrealised capital (debt) 15.1 13.4 15.1 13.4
Amortisation of deferred government grants (1.0) (0.9) (1.0) (0.9)
Impairment of assets (25.1) (12.9) (25.1) (12.9)
Loss on disposal of property, plant and equipment 3.6 6.8 3.6 6.8
Gain on sale of retail business (1 247.9) - (1 247.9) -
Gain on reversal of asset revaluation 8.7 - 8.7 -
(Profit) on disposal of other non-current assets (0.2) (1.4) (0.2) (1.4)
(Profit)/loss on close out liability contracts (3.3) 3.8 (3.3) 3.8
Decrease in fair value of financial instruments (9.9) 13.7 (9.9) 13.7
Changes in assets and liabilities:
(Increase) in accrued sales of energy 328.7 (67.1) 328.7 (67.1)
(Increase) in other accrued income (152.6) (64.3) (152.6) (64.3)
(Increase) in operating related inventories 3.1 (4.0) 3.1 (4.0)
(Increase) in deferred tax assets 23.1 (19.3) 23.1 (19.3)
(Increase) in prepaid operating expenditure 75.0 (7.0) 75.0 (7.0)
Increase/(decrease) in accrued operating expenditure (295.1) 94.5 (295.1) 94.5
Increase/(decrease) in provision for income taxes payable 124.1 6.2 124.1 6.2
Increase/(decrease) in deferred tax liabilities (75.0) 19.8 (75.0) 19.8
Increase in other provisions 27.7 52.3 27.7 52.3
Increase in deferred revenue (28.5) 4.0 (28.5) 4.0
Increase/(decrease) in customer security deposits (14.4) 0.3 (14.4) 0.3
Net cash from operating activities 749.7 725.1 749.7 725.1
27 CONSOLIDATED ENTITIES
2011%
2010%
Parent entity
Ausgrid(9)
Subsidiaries
Ausgrid Pty Ltd (9) Australia 100 100
Downtown Utilities Pty Ltd Australia 70 70
(9) On 2 March 2011, EnergyAustralia changed its name to Ausgrid (see Note 1).
Ausgrid
Ownership interest
Consolidated Entity
Country of incorporation
28 RECONCILIATION OF CASH FLOWS FROM OPERATING ACTIVITIES

Ausgrid – Annual Report 2010/11 87
29 EMPLOYEE BENEFITS
2011$M
2010$M
2011$M
2010$M
Aggregate liability for employee benefits, including on-costs:
Short term benefits 146.6 166.1 146.6 166.1
Long term benefits 299.3 279.6 299.3 279.6
Post employment benefits 176.7 204.2 176.7 204.2
622.6 649.9 622.6 649.9
Current 426.6 428.4 426.6 428.4
Non-current 196.0 221.5 196.0 221.5
622.6 649.9 622.6 649.9
AusgridConsolidated Entity
The current provision for employee benefits includes $257.9 million (2010: $240.2 million) of long service leave entitlements accrued but not
expected to be taken within 12 months. Balances are the same for both the Group and Ausgrid.
30 SUPERANNUATION
Superannuation benefits apply to both Ausgrid and the consolidated entity. All references are to the April 2007 version of AASB 119
Employee Benefits.
Accounting policy [AASB 119 – paragraph 120A(a)]
Actuarial gains and losses are recognised immediately in other comprehensive income in the year in which they occur.
General description of the type of plan
The Energy Industries Superannuation Scheme:
Division B
Division C
Division D
These Divisions are all defined benefit schemes – at least a component of the final benefit is derived from a multiple of member salary and years
of membership.
All the Divisions are closed to new members.

88
For the year ended 30 June 2011
Ausgrid and controlled entities
Notes to the financial statements
$M $M
Reconciliation of the present value of the defined benefit obligation
Present value of partly funded defined benefit obligations at beginning of the year 801.6 701.8
Current service cost 21.9 25.9
Interest cost 45.3 40.6
Contributions by Fund participants 9.1 9.2
Actuarial (gains)/losses 10.3 53.5
Benefits paid (43.7) (29.4)
Present value of partly funded defined benefit obligations at end of the year 844.5 801.6
Reconciliation of the fair value of Fund assets
Fair value of Fund assets at beginning of the year 597.6 524.6
Expected return on Fund assets 48.1 41.7
Actuarial gains/(losses) 18.6 20.1
Employer contributions 38.3 31.4
Contribution by Fund participants 9.1 9.2
Benefits paid (43.7) (29.4)
Fair value of Fund assets at end of the year 668.0 597.6
Reconciliation of the assets and liabilities recognised in the statement of financial position
Present value of partly funded defined benefit obligations at end of the year 844.5 801.6
Fair value of Fund assets at end of the year (668.0) (597.6)
Net liability/(asset) recognised in the statement of financial position at end of the year 176.5 204.0
Expense recognised in the statement of comprehensive income
Components recognised in the statement of comprehensive income:
Current service cost 21.9 25.9
Interest cost 45.3 40.6
Expected return on Fund assets (net of expenses) (48.1) (41.7)
Expense/(income) recognised 19.1 24.8
Amounts recognised in the statement of comprehensive income
Actuarial (gains)/losses (8.3) 33.4
Cumulative amount recognised in the statement of comprehensive income
Actuarial (gains)/losses 193.4 201.7
2011 201030 SUPERANNUATION continued

Ausgrid – Annual Report 2010/11 89
Fund assets
The percentage invested in each asset class at the statement of financial position date (latest available):
Fair value of Fund assets
All Scheme assets are invested by the Trustees at arm’s length through independent managers.
Expected rate of return on assets
The expected return on assets assumption is determined by weighting the expected long-term return for each asset class by the target allocation
of assets to each class. The returns used for each class are net of investment tax and investment fees.
Actual return on Fund assets
Valuation method and principal actuarial assumptions at the statement of financial position date
(a) Valuation method
The Projected Unit Credit (PUC) valuation method was used to determine the present value of the defined benefit obligations and the related
current service costs. This method sees each period of service as giving rise to an additional unit of benefit entitlement and measures each unit
separately to build up the final obligation.
(b) Economic assumptions
$M $M
Listed equities 63.5% -
Private equity 1.7% -
Semi-liquids and absolute return (growth) 15.9% -
Fixed Income 13.4% -
Property 2.4% 2.5%
Cash 3.1% 5.7%
Australian equities - 36.4%
Overseas equities - 32.3%
Australian fixed interest securities - 14.6%
Australian inflation-linked bonds - 3.8%
Other - 4.7%
2011 2010
$M $M
Actual return on Fund assets 66.6 59.5
2011 2010
$M $M
Salary increase rate (excluding promotional increases) 4.0%pa 4.0%pa
Rate of CPI increase 2.5%pa 2.5%pa
Expected rate of return on assets 8.10% 8.10%
Discount rate 5.28% 5.17%
2011 2010

90
Additional
promotional
salary increase rate
%
Age nearest birthday
Death Total &
Permanent
Disability
Retirement Resignation
Males
30 4 3 - 120 3.0
40 5 3 - 108 0.1
50 9 8 - 63 -
60 24 10 1,880 - -
Females
30 2 3 - 262 2.5
40 3 5 - 157 1.6
50 6 30 - 105 1.1
60 15 - 900 - -
For the year ended 30 June 2011
Ausgrid and controlled entities
Notes to the financial statements
(c) Demographic assumptions
The demographic assumptions at 30 June 2011 are those used in the 2009 triennial actuarial valuation. A selection of the most financially
significant assumptions is shown below:
(i) Contributors - the number of contributors expected in any one year (out of 10,000 members), at the ages shown, to leave the fund as a result
of death, disability, resignation, retirement and redundancy. Promotional salary increase rates are also shown.
(ii) Commutation - the proportion of members assumed to commute their pension to lump sum in any one year.
(iii) Pensioner Mortality – assumed mortality rates for pensioners (separately for normal retirement/spouses and invalidity).
Number of members expected in any one year, out of 10,000
members at the age shown, to leave the fund as a result of:
Retirement pensioners and
spouses and widowsInvalidity pensions
Age Males Females Males Females
55 0.0014 0.0013 0.0063 0.0065
65 0.0044 0.0040 0.0091 0.0093
75 0.0188 0.0103 0.0446 0.0226
85 0.0761 0.0638 0.1089 0.0867
Proportion of pension commuted
Retirement Breakdown
Age 0.10 0.15
Later of commencement or age 55 Widow Widower
55 .2000 .2000
65 .5380 .5800
75 .4825 .5160
85 .3928 .3728
30 SUPERANNUATION continued

Ausgrid – Annual Report 2010/11 91
(b) Contribution recommendations
Recommended contribution rates for the entity are:
Division B = 1.9 x member contributions
Division C = 2.5% x salaries
Division D = 1.64 x member contributions
Plus additional contributions of $13,857,000 pa
(c) Funding method
The method used to determine the employer contribution recommendations in the 2009 triennial actual review was the
Aggregate Funding method. The method adopted affects the timing of the cost to the employer.
Under the Aggregate Funding method, the employer contribution rate is determined so that sufficient assets will be available to meet benefit
payments to existing members, taking into account the current value of assets and future contributions.
Age Males Females
55 0.03433 0.02590
65 0.03033 0.02511
75 0.02417 0.02294
85 0.01664 0.01719
Improvement rates
(for years 2009 – 2014)
20072010 20082011 2009
$M $M $M $M $M
Historical information
Present value of defined benefit obligation 844.5 801.6 701.8 669.1 671.8
Fair value of Fund assets (668.0) (597.6) (524.6) (640.9) (702.4)
Deficit/(Surplus) in Fund 176.5 204.0 177.2 28.2 (30.6)
Experience adjustments – Fund liabilities 10.3 53.5 (7.8) (55.7) 37.3
Experience adjustments – Fund assets (18.6) 20.1 (160.2) (111.4) 54.5
Expected contributions
Expected employer contributions to be paid in the next reporting period 30.6 34.2
Funding arrangements for employer contributions
(a) Surplus/deficit
The following is a summary of the 30 June 2011 financial position of
the Fund calculated in accordance with AAS 25 “Financial Reporting by Superannuation Plans”.
Accrued benefits 721.4 669.6
Net market value of Fund assets (668.0) (597.6)
Net (surplus)/deficit 53.4 72.0
(iv) Pensioner Mortality Improvements – per annum assume rates of mortality improvement for pensioners.

92
For the year ended 30 June 2011
Ausgrid and controlled entities
Notes to the financial statements30 SUPERANNUATION continued (d) Economic assumptions
The economic assumptions adopted for the 2009 actuarial review of the Fund were:
Weighted-Average Assumptions
Expected rate of return on Scheme assets 7.0%pa
Expected salary increase rate 4.0%pa
Expected rate of CPI increase 2.5%pa
Nature of asset/liability
If a surplus exists in the employer’s interest in the Fund, the employer may be able to take advantage of it in the form of a reduction in the
required contribution rate, depending on the advice of the Fund’s actuary.
Where a deficiency exists, the employer is responsible for any difference between the employer’s share of Fund assets and the defined
benefit obligation.

Ausgrid – Annual Report 2010/11 93
31 DISCONTINUED OPERATION
On 14 December 2010 the NSW Government announced that the Victorian-based electricity retailer TRUenergy was the successful purchaser
of the Group’s retail business and two Marulan development sites. The disposal was completed on 1 March 2011. The operation was not a
discontinued operation or classified as held for sale as at 30 June 2010. The comparative Statement of Comprehensive Income has been
re-presented to show the discontinued operation separately from continuing operations.
Cash flow information related to discontinued operations has not been disclosed due to books and records not being kept to distinguish between
the Retail and Network business separately in prior years and up to the date of sale. Significant assumptions would have to be made to separate
the financial information if these disclosures were to be presented that, in management’s view, would not reflect a true and fair position of the
discontinued operations cash flow position.
The profit from discontinued operation of $1 398.5 million (2010: profit of $294.8 million) is attributable entirely to the owners of the Corporation.
* Tax neutrality has been granted by the Australian Taxation Office.
Results of discontinued operation $M $M
Revenue
Sale and delivery of energy 1 409.6 1 952.6
Community service obligations refunds from Government 24.6 30.1
1 434.2 1 982.6
Expenses (1 229.7) (1 548.2)
Profit before income tax and financial instrument fair value movements 204.5 434.4
Income tax expense on profit before financial instrument fair value movements (61.3) (130.3)
Profit before financial instrument fair value movements 143.2 304.1
Fair value movements in financial instruments 10.6 (13.7)
Income tax (expense)/credit on financial instrument fair value movements (3.2) 4.4
Results from operating activities, net of tax 150.6 294.8
Net gain on sale of discontinued operation 1 247.9 -
Income tax on net gain on sale of discontinued operation* - -
Profit for the year 1 398.5 294.8
2011 2010
Effect of disposal on the financial position of the Group $M
Property, plant and equipment 4.4
Inventories 1.0
Trade and other receivables 708.0
Other current assets 82.2
Other financial assets 68.5
Trade and other payables (584.3)
Deposits (20.1)
Other financial liabilities (200.1)
Net assets/(liabilities) attributable to discontinued operations 59.6
2011

94
For the year ended 30 June 2011
Ausgrid and controlled entities
Notes to the financial statements
Sale on Retail Business $M
Net gain on sale of discontinued operation 1 247.9
Less: transaction related costs (88.6)
Net result on sale 1 159.3
2011
32 EXTERNAL CONSULTANTS The total amount paid to or accrued for consultants during the year ended 30 June 2011 was $0.6 million (2010: $0.9 million).
33 EVENTS AFTER THE STATEMENT OF FINANCIAL POSITION DATE Effective on 1 September 2011, the gas participant ID will be transferred from Ausgrid to TRUenergy. The retained gas customers and
contracts will be novated at that date resulting in a decrease of current assets matched against a decrease of current liabilities in Ausgrid’s
financial statements.
END OF AUDITED FINANCIAL STATEMENTS
31 DISCONTINUED OPERATION continued

Ausgrid – Annual Report 2010/11 95
For the year ended 30 June 2011
Ausgrid and controlled entities
Directors’ Declaration

96

Ausgrid – Annual Report 2010/11 97

98
Statutory InformationAccess to Information/statement of affairs 99
Annual report costs 102
Consultancies 102
Consumer response 102
Electronic services delivery 103
Employment equity 103
Events affecting the 2009/10 report 105
Executive remuneration 105
Exemptions from the reporting provisions 106
List of annual reporting exemptions 108
Funds granted under Ausgrid’s Community Investment and Partnerships Program 108
Heritage Act requirements 110
Judicial decisions 110
Legislative changes in 2010/11 110
Memberships 112
Ministry reporting requirements - demand management 112
Ministry reporting requirements - standard for provision of services 117
Multicultural policies and services program 118
Occupational health and safety 118
Overseas visit statistics 118
Property disposal 120
Publications 120
Research and development 120
Waste reduction and purchasing policy 121

Ausgrid – Annual Report 2010/11 99
Access to information – Government Information (Public Access) Act
The Government Information (Public Access) Act 2009 (NSW) replaced the Freedom of Information Act 1989 from 1 July 2010. The aim of the
legislation is to promote openness, accountability and transparency. Ausgrid is committed to proactively providing information to the public
and the Ausgrid website has undergone significant investment to provide a continuous and easy-to-use source of up-to-date key statistics and
information of interest to the public in compliance with Clause 7 (3) of the GIPA Act.
Members of the public can access the following ‘open access’ information (as per section 18 and clause 5 of the GIPA Act): current publication
guide, parliamentary documents, policy documents, disclosure log of access applications, contract register, record of open – access information
not made publicly available because of an overriding public interest against disclosure, code of conduct, information about major assets sales
and purchases (www.ausgrid.com.au/Common/About-us).
Requests for access to information can be formally or informally submitted (the GIPA Act does not require reporting of informal requests).
Formal access applications must be made in writing supplying all details required and should be accompanied with the $30 application fee.
Application forms are available on Ausgrid’s website and may be lodged in person or posted to the GIPA Coordinator.
The GIPA Coordinator is available during business hours of 8am to 5pm or a meeting can be arranged by prior appointment. Contact details for
the GIPA Coordinator are:
GIPA Coordinator OR post to:
Ausgrid Building GIPA Coordinator
570 George Street, Sydney Ausgrid
Telephone: (02) 9269 2941 GPO Box 4009
Facsimile: (02) 9264 2982 Sydney NSW 2001

100
The statistical data relating to access applications during the financial year 2010/2011 is provided in the tables below with 3 FOI applications
being carried over from the previous financial year. The change from the FOI Act to the GIPA Act has not significantly impacted the number of
access applications received. In 2010/11, 28 new applications were received with two carried forward to 2011/12. There were no internal or
external review applications during the financial year 2010/11.
The following table shows how applications received under Government Information (Public Access) Act 2009 (NSW) for 2010/11 have been
dealt with.
Access
granted in
full
Access
granted in
part
Access
refused in
full
Information
not held
Information
already
available
Refuse to
deal with
application
Refuse to
confirm/
deny whether
information is
held
Application
withdrawn
Media 2 1
Members of Parliament 3 1
Private sector business 1 1
Not for profit organisations or
community groups
Members of the public (application
by legal representative) 6 3 1
Members of the public (other) 6 4
* More than one decision can be made in respect of a particular access application. If so, a recording must be made in relation to each such decision. This
also applies to Table B.
Table A: Number of applications by type of applicant and outcome*
Access
granted in
full
Access
granted in
part
Access
refused in
full
Information
not held
Information
already
available
Refuse to
deal with
application
Refuse to
confirm/
deny whether
information is
held
Application
withdrawn
Personal information applications* 0 0 0 0 0 0 0 0
Access applications (other than
personal information applications) 18 9 0 1 0 0 0 1
Access applications that are partly
personal information applications
and partly other 0 0 0 0 0 0 0 0
* A personal information application is an access application for personal information (as defined in clause 4 of Schedule 4 to the Act) about the applicant
(the applicant being an individual).
Table B: Number of applications by type of application and outcome
Reason for invalidity No of applications
Application does not comply with formal requirements (section 41 of the Act) 0
Application is for excluded information of the agency (section 43 of the Act) 0
Application contravenes restraint order (section 110 of the Act) 0
Total number of invalid applications received 0
Invalid applications that subsequently became valid applications 0
* A personal information application is an access application for personal information (as defined in clause 4 of Schedule 4 to the Act) about the applicant
(the applicant being an individual).
Table C: Invalid applications
Statutory Information

Ausgrid – Annual Report 2010/11 101
Number of times
consideration used*
Overriding secrecy laws 0
Cabinet information 0
Executive Council information 0
Contempt 0
Legal professional privilege 0
Excluded information 0
Documents affecting law enforcement and public safety 0
Transport safety 0
Adoption 0
Care and protection of children 0
Ministerial code of conduct 0
Aboriginal and environmental heritage 0
* More than one public interest consideration may apply in relation to a particular access application and, if so, each such consideration is to be recorded
(but only once per application). This also applies in relation to Table E.
Number of occasions when
application not successful
Responsible and effective government 0
Law enforcement and security 0
Individual rights, judicial processes and natural justice 6
Business interests of agencies and other persons 7
Environment, culture, economy and general matters 0
Secrecy provisions 0
Exempt documents under interstate Freedom of Information legislation 0
Table D: Conclusive presumption of overriding public interest against disclosure: matters listed in Schedule 1 to Act
Table E: Other public interest considerations against disclosure: matters listed in table to section 14 of Act
Number of applications
Decided within the statutory timeframe (20 days plus any extensions) 28
Decided after 35 days (by agreement with applicant) 1
Not decided within time (deemed refusal) 0
Total 29
Table F: Timeliness
Decision varied Decision upheld Total
Internal review 0 0 0
Review by Information Commissioner* 0 0 0
Internal review following recommendation under section 93 of Act 0 0 0
Review by ADT 0 0 0
Total 0 0 0
* The Information Commissioner does not have the authority to vary decisions, but can make recommendations to the original decision-maker. The data in
this case indicates that a recommendation to vary or uphold the original decision has been made by the Information Commissioner.
Table G: Number of applications reviewed under Part 5 of the Act (by type of review and outcome)

102
Number of applications
for review
Applications by access applicants 0
Applications by persons to whom information the subject of access application relates (see section 54 of the Act) 0
Table H: Applications for review under Part 5 of the Act (by type of applicant)
Annual report costs
The total external cost for the productions of this Annual Report was approximately $22,300 excluding GST. Printed copies of the 2010/11 report
are not available as Ausgrid works to minimise its impact on the environment. However, it is available at Ausgrid’s website www.ausgrid.com.au.
Ausgrid’s sustainability component of the Annual Report includes the growing body of issues covered to be in accordance with the Global Reporting
Initiative and esaa Sustainability Practice Framework guidelines. This increases the cost of production.
Type of Consultancy Cost
Finance & Accounting $ 296,660
Management Services $ 260,029
Engineering $ 25,000
Total $ 581,689
Consultancy
Consumer response
EnergyAssist
From 1 July 2010 to 28 February 2011, a total of 2,925 customers joined EnergyAustralia’s EnergyAssist program. Of the EnergyAssist customer
base: 62 per cent have established a Centrepay payment arrangement, 695 successfully completed the program during the year and 2,374 were
exited from EnergyAssist for various reasons including due to not maintaining contact with EnergyAustralia or due to non-payment.
Customer Relations
The customer relations complaints team is the referral point for escalated retail disputes raised within EnergyAustralia or via the Energy and
Water Ombudsman NSW (EWON). In March 2011, EnergyAustralia’s customers and wholesale contracts were sold to TRUenergy, including the
EnergyAustralia brand. For the July 2010 to February 2011 period, EWON received about 1,900 complaints related to the combined retail and
distribution EnergyAustralia business. Since 1 March 2011, only EWON distribution-related complaints apply to the remaining Ausgrid business
and these totalled about 180 from Ausgrid’s 1.6 million network customers.
Contact Centre
The Contact Centre handled more than 3.14 million calls during 2010/11. This represents an increase of more than 310,000 calls from 2009/10
(2.83 million). Customer Service Representatives handled more than 2.17 million calls, with the remainder completed via various automatic
options. The majority of calls related to customer account enquiries, customers moving premises and solar electricity as a result of changes to the
scheme to the end of February. Following a challenging high bill season, mainly due to price rises, planning and resourcing became the primary
focus of the Contact Centre in the second half of 2010/11 to restore performance. Now the primary focus is to ensure that Transition Services
Agreement’s key performance indicators are delivered and that the high standard of performance in the Contact Centre is maintained.
Customer Council
The Customer Council is a two-way communication forum involving diverse stakeholder and community groups, including the Council of Social
Service NSW, Ethnic Community Council, Country Women’s Association, Council on the Ageing (COTA) Over 50’s, and the Nature Conservation
Council. The EnergyAustralia retail and network combined Customer Council met three times up to 28 February 2011. After the sale of its retail
assets, Ausgrid conducted an additional Network Customer Council meeting in May 2011. The council convenes to discuss, review and improve a
range of matters including products, services and dispute resolution.
Consultancies
Statutory Information

Ausgrid – Annual Report 2010/11 103
Electronic services delivery
Ausgrid website
The aim of Ausgrid’s website (www.ausgrid.com.au) is to provide customers with a relevant, convenient and personalised on-line service by
providing relevant information on energy-related areas, including products, education, safety and efficiency
ensuring products and price changes are readily available and easy to find
ensuring key network, safety, community and corporate documents are readily accessible.
During the year a project was undertaken to separate and remove all retail related information from the Ausgrid website following the sale of the
retail assets.
Employment equity
Ausgrid is committed to the provision of equal employment opportunity (EEO) and promoting the principles of equity and respect in the
workplace. These principles are outlined in Ausgrid’s Code of Conduct under the value of Respect for our People, Community and Environment.
These principles contribute to a workplace of co-operation, trust and support for Ausgrid’s people who are free from prejudice, harassment,
victimisation and bullying; and respecting diversity by treating others equally, irrespective of their gender, marital status, race, religion, age or
sexual preference. The principles are promoted through:
the Code of Conduct and provision of Equity and Respect training as a component of Ausgrid’s orientation program for all new employees,
refresher Equity and Respect training sessions conducted, as required, and
reviewing Ausgrid’s values, behaviours and ethics as part of Ausgrid’s Frontline and Senior Leadership programs.
An e-learning package has been developed to provide online Working with Equity and Respect training, to make it available to employees at all times.
There were five cases of equal employment opportunity grievances in 2010/11 which were dealt with in line with the Equal Employment Opportunity
policy’s grievance procedure. Ausgrid had no incidents of complaints involving indigenous people during 2010/11, consistent with 2009/10.
In 2010/11 Ausgrid maintained a sound base of equity and diversity policies including merit appointment, part-time work and parental leave.
Ausgrid also continued its Working with Equity and Respect training to communicate the EEO and Discrimination and Harassment Prevention
Policy. Ausgrid’s Equity and Diversity Strategy resulted in proactive merit-based programs such as the Aboriginal and Torres Strait Island Pre-
Apprenticeship Program. Refer to the Workplace section (see page 31).
Ausgrid Indigenous Steering Committee
Ausgrid’s Indigenous Steering Committee meets approximately every quarter and is made up of Indigenous Ausgrid employees who work together with
Ausgrid’s Indigenous Program Co-ordinators and Department of Education, Employment and Workplace Relations (DEEWR) representatives.
The Committee aims to:
support participants joining Ausgrid after the Pre-Apprenticeship Program;
consider indigenous policy and programs at Ausgrid;
communicate and share information in a safe and culturally appropriate environment and;
identify opportunities for group development.
In 2010/11, the Indigenous Steering Committee had 55 members and held six meetings.
Women @ Work
Ausgrid’s Women @ Work Network aims to empower and support women in the workplace to reach their full potential. There are 382 members
in the Women @ Work network. In FY10/11, the Women @ Work program ran the following events:
15 Emazon “Stand Your Ground” and “Mind Mechanics” talks and workshops in Sydney and Newcastle.
6 International Women’s day Breakfasts in Newcastle, Muswellbrook, Sydney, Homebush, Zetland and Tuggerah.
International Conference for Women Engineers and Scientists - eight delegates were selected in June 2011 and will attend the conference in
July 2011.
WELL - Workplace English Language and Literacy
In 2010 applications were submitted to the Department of Education, Employment & Workplace Relations (DEEWR) for funds for two Workplace
English Language and Literacy (WELL) programs to support apprentices with the foundation skills associated with their first year of training. It
was envisaged that a major focus of training would be on the underpinning numeracy and maths related to their TAFE units.
Key features include:
Simultaneous delivery to targeted participants of both programs that support cross-cultural relationships and prevent the stigmatising of the
indigenous apprentices.
Provision of a large TAFE teaching team at each session ensures all individual needs are met and groups can be subdivided according to
specific requirements.

104
Government
Benchmark /
Target
Trends in the Representation of EEO Groups
Percentage of Total Staff
2009 2010 2011
Women 50.0% 14.2% 14.4% 14.0%
Aboriginal people and Torres Strait Islanders 2.6% 1.5% 2.0% 1.4%
People whose first language was not English 19.0% 15.1% 15.9% 16.1%
People with a disability N/A 4.4% 4.1% 3.3%
People with a disability requiring work-related adjustment 1.5% 0.8% 0.7% 0.6%
EEO Group
EEO Group
Government
Benchmark /
Target
Trends in the Distribution of EEO Groups
2009 2010 2011
Women 100 101 100 101
Aboriginal people and Torres Strait Islanders 100 64 55 68
People whose first language was not English 100 106 102 105
People with a disability 100 101 101 104
People with a disability requiring work-related adjustment 100 106 108 105
Source: NSW DPC 2010/11 Workforce Profile (v2011.09.01)
Note 1. A Distribution Index of 100 indicates that the centre of the distribution of the EEO group across salary levels is equivalent to that of other staff. Values less than 100 mean that
the EEO group tends to be more concentrated at lower salary levels than is the case for other staff. The more pronounced this tendency is, the lower the index will be. In some cases the
index may be more than 100, indicating that the EEO group is less concentrated at lower salary levels.
Note 2. The Distribution Index is not calculated where EEO group or non-EEO group numbers are less than 20.
The use of maths teachers from the Indigenous Pre-Apprenticeship Program means there is valuable background knowledge of participants
and their learning issues.
All maths teachers on the program (from Ultimo and Petersham Foundation Studies sections) have extensive experience supporting electrical
trade delivery at TAFE.
An electrical trade teacher is included in the support team when required to provide the relevant contexts for training.
Ausgrid trainers support each group session and the TAFE team liaises with them at all times about individual apprentices.
Ausgrid trainers have participated in some of the learning sessions and gained benefit from access to refresher maths knowledge e.g. scientific
calculator, transpositions etc
Regular meetings are held with Ausgrid trainers, Ausgrid HR officers and the TAFE teaching team to review delivery and address any issues.
Support of Electrical Trade teachers at Ultimo means that the TAFE teaching team has ready access to apprentice progress and issues in their
TAFE learning environment.
Outcomes
41 apprentices in total accessed the support sessions on at least one occasion. There was a core group of 20-25 who accessed the training
each week.
Statutory Information

Ausgrid – Annual Report 2010/11 105
Name Position RemunerationAt Risk
Performance PaymentStatement of performance
G Maltabarow Managing Director $725,000 $157,688
Was in the role for the full reporting year. Majority
of scorecard targets met or exceeded; achieved
operating cost savings; improved reliability and
achieved capital works program savings. Led the
successful Smart Grid, Smart City consortium.
J EisenhuthExecutive General Manager -
Distribution Operations and Reliability$416,120 $91,546
Was in the role for the full reporting year. Delivered
improved distribution system reliability, major
maintenance and capital works programs.
C JamesExecutive General Manager -
Finance and Corporate$407,200 $94,674
Was in the role for the full reporting year. Achieved
strong financial results, delivered retail asset sale
project and development of the Learning Centre.
M BaileyExecutive General Manager -
Shared Services$390,000 $90,675
Appointed to this position in March 2011 (previously
held the position of EGM Retail). Delivered strong
retail profitability and leadership of retail service
transition to the private sector.
T ArmstrongExecutive General Manager -
Transmission & System Operations$380,000 $82,659
Appointed to this position in November 2010
(previously EGM System Planning & Regulation).
Delivered regulatory outcomes, transmission
system capital programs, improved reliability and
changes to electrical safety rules.
M SlaterExecutive General Manager -
Human Resources$356,900 $80,303
Was in the role for the full reporting year.
Delivered improvements to safety governance,
organisational development programs, improved
engagement and curriculum for Learning Centre.
L Maffina Corporate Secretary $265,000 $60,950
Was in the role for the full reporting year.
Delivered improved governance framework,
ongoing compliance reporting and retail asset sale
activities.
Notes - Executive Remuneration
1. The position of Executive General Manager System Planning & Regulation was held by Trevor Armstrong until 19 November 2010. Peter Birk was appointed Executive General
Manager System Planning & Regulation, effective 22 August 2011.
2. Mike Bailey was appointed to the position of Executive General Manager Shared Services, effective 21 March 2011. The position was previously held by Don Anderson who ceased
employment, effective 18 March 2011. Mike Bailey was previously in the role of Executive General Manager Retail.
3. Geoff Lilliss held the position of Executive General Manager Engineering Transmission & Technology until 19 November 2010. Trevor Armstrong was appointed to this position,
effective 20 November 2010 and the division was renamed Transmission & System Operations.
4. A new position of Executive General Manager Energy Services was created in March 2011 and Jane Mills was appointed to that position, effective 21 March 2011. Operational
functions commenced transition from Shared Services to the new Energy Services business from April until July 2011.
Executive Remuneration
Executive remuneration
Events affecting the 2009/10 report
The lost time injury frequency rate for 2009/10 was reported as 3.5. However, further days were lost after the 2009/10 Annual Report was printed
as a result of injuries incurred in the 2009/10 reporting period. This has meant the lost time injury frequency rate has been revised to be 4.2 for
the 2009/10 reporting period.
At the close of 2009/10, the lost time injury severity rate (LTISR) result was reported as 50.4 and was based on 575 days being lost to injuries
occurring between July 2009 to June 2010. During 20010/11, a further 155 days were lost by employees injured in 2009/10, resulting in 730 days
being lost for that period. As a result, the 2009/10 LTISR increased from 50.4 to 63.9 to reflect this.

106
Exemptions from the reporting provisions
A list of financial and annual reporting exemptions for agencies in competition.
Annual reporting exemptions
Budgets
detailed budget for the year reported on s.7(1)(a)(iii) ARSBA
outline budget for next year s.7(1)(a)(iii) ARSBA
particulars of material adjustments to detailed budget for the year reported on c7 ARSBR
Report of Operations s.7(1)(a)(iv) ARSBA
Summary Review of Operations
narrative summary of significant operations
selected financial and other quantitative information associated with the
administration of programs or operations
Schedule 1 ARSBR Exemption subject to a condition.
The condition is that comments
and information relating to the
“summary review of operations”
are to be disclosed in a
summarised form.
Management & Activities
nature & range of activities
measures & indicators of performance
internal & external performance reviews
benefits from management & strategy reviews
management improvement plans & achievements
major problems & issues
major works in progress, cost to date, estimated dates of completion & cost overruns
reasons for significant delays etc. to major works or programs
Schedule 1 ARSBR Exemption subject to a condition.
The condition is that comments
and information relating to
“management & activities” are to
be disclosed in a summarised form.
Research & Development
completed research including resources allocated
continuing research and development activities, including resources allocated
unless that information could adversely affect operations
Schedule 1 ARSBR
Human Resources
number of employees by category & comparison to prior three years
exceptional movements in employee wages, salaries or allowances
personnel policies & practices
industrial relations policies & practices
Schedule 1 ARSBR
Consultants
for each engagement costing greater than $50,000
- name of consultant
- title of project
- actual cost
for each engagement costing less than $50,000
- total number of engagements
- total cost
if applicable, a statement that no consultants were engaged
Schedule 1 ARSBR Exemption subject to a condition.
The condition is that the total
amount spent on consultants is to
be disclosed along with a summary
of the main purposes of the
engagements.
#ARSBA - Annual Reports (Statutory Bodies) Act 1984
ARSBR - Annual Reports (Statutory Bodies) Regulation 2010
Statutory requirementsAct / regulation
references#Comments
Statutory Information

Ausgrid – Annual Report 2010/11 107
Annual reporting exemptions
Land Disposal
list of properties disposed of during the year other than by public auction or tender
that had a value of more than $5 million, including the name of person acquiring the
property and the proceeds from the disposal of the property.
details of family or business connections between the purchaser & the person
responsible for approving the disposal
statement giving reasons for the disposal
purpose/s for which proceeds were used
statement indicating that access to the documents relating to the disposal can be
obtained under Government Information (Public Access) Act
Schedule 1 ARSBR
Consumer Response
extent & main features of complaints
services improved / changed in response to complaints / suggestions
Schedule 1 ARSBR Exemption subject to a condition.
The condition is that comments
and information relating to
“consumer response” are to be
disclosed in a summarised form.
Payment of accounts
performance in paying accounts, including action to improve payment performance
Schedule 1 ARSBR Statutory SOCs are not subject to
the payment of accounts provisions
in c13 of the Public Finance and
Audit Regulation 2010.
Time for Payment of Accounts
reasons for late payments
interest paid due to late payments
Schedule 1 ARSBR As above
Report on Risk Management & Insurance Activities Schedule 1 ARSBR Exemption subject to a condition.
The condition is that the comments
and information are to be
disclosed in a summarised form.
Disclosure of Controlled Entities
details of names, objectives, operations, activities of controlled entities and measures
of performance
Schedule 1 ARSBR Exemption subject to a condition.
The condition is that the names of
the controlled entities are to be
disclosed along with a summarised
disclosure of the controlled
entities’ objectives, operations
and activities and measures of
performance.
Investment Performance cl. 12 ARSBR
Liability Management Performance cl. 13 ARSBR
#ARSBA - Annual Reports (Statutory Bodies) Act 1984
ARSBR - Annual Reports (Statutory Bodies) Regulation 2010
Statutory requirementsAct / regulation
references#Comments

108
Annual reporting requirements
Payment of accounts
performance in paying accounts, including action to improve
payment performanceSchedule 1 ARSBR
Statutory SOCs are not subject to the
payment of accounts provisions in
c13 of the Public Finance and Audit
Regulation 2010n.
Time for Payment of Accounts
reasons for late payments
interest paid due to late payments Schedule 1 ARSBR As above
# ARSBA - Annual Reports (Statutory Bodies) Act 1984
ARSBR - Annual Reports (Statutory Bodies) Regulation 2010
Statutory requirements Regulation references# Comments
Funds granted under Ausgrid’s Community Investment and Partnerships Program
Ausgrid has a responsibility to support the communities in which it operates and to assist in their development and growth. Ausgrid supported a
range of organisations through its $4.3 million Community Investment and Partnerships program that includes Sponsorships, Employee Payroll
Giving, University Chair Partnerships and the extensive Community Care program in 2010/11. Refer to the Community section (see page 24-25).
Name of recipient organisation Program area as per budget
e.g. Partnerships, Community
Care Program, Payroll Giving
Purpose Remuneration Target
group
Community Care Program Beneficiaries
Annual reporting requirements
NSW Rural Fire Service Community Program Partnership Emergency Services Community
Movember Foundation Community Program Health Community
Environmental Organisations (eg WIRES) Community Program Environment Community
Social Welfare Organisations (eg Meals on Wheels) Community Program Social Welfare Community
Emergency Services Organisations (eg Surf Life Saving Clubs) Community Program Emergency Services Community
Education Organisations (eg School Parents & Friends Groups) Community Program Education & Youth Community
Health Organisations (eg MS Australia) Community Program Health Community
Payroll Giving Program Beneficiaries*
EA Employees' Children's Appeal (EA Dollar Matches $50,000) Payroll Giving Program Health Community
Alzheimer's Australia Payroll Giving Program Health Community
DebRA Australia Payroll Giving Program Health Community
Fred Hollows Foundation Payroll Giving Program Health Community
NSW Cancer Council Payroll Giving Program Health Community
House with no Steps Payroll Giving Program Social Welfare Community
Hunter Westpac Rescue Helicopter Service Payroll Giving Program Emergency Services Community
National Heart Foundation Payroll Giving Program Health Community
* EnergyAustralia dollar matched $50,000 to the EA Employees’ Children’s Appeal. All other Payroll Giving Charities receive contributions from employees. # ARSBA - Annual Reports (Statutory Bodies) Act 1984
ARSBR - Annual Reports (Statutory Bodies) Regulation 2010
Community group recipients
List of annual reporting exemptions
For agencies not in competition.
Statutory Information

Ausgrid – Annual Report 2010/11 109
Name of recipient organisation Program area as per budget
e.g. Partnerships, Community
Care Program, Payroll Giving
Purpose Remuneration Target
group
Community Care Program Beneficiaries
Payroll Giving Program Beneficiaries* continued
Life Saver Rescue Helicopter - Southern Region SLS Payroll Giving Program Emergency Services Community
National Breast Cancer Foundation Payroll Giving Program Health Community
Ovarian Cancer Australia Payroll Giving Program Health Community
Odyssey House Payroll Giving Program Social Welfare Community
Police Citizens Youth Clubs of NSW Payroll Giving Program Youth Community
RSCPA NSW - Operation Wags Payroll Giving Program Animal Welfare Community
The Smith Family Payroll Giving Program Social Welfare Community
Sids & Kids Hunter Region Payroll Giving Program Health Community
Taronga Foundation Payroll Giving Program Conservation Community
Youth off the Streets Payroll Giving Program Youth Community
Partnership Beneficiaries
Ausgrid Bright Future Awards (Hunter & Central Coast schools) Sponsorship Education & Innovation Students
Electrical Energy Society Australia Sponsorship Education & Innovation Industry
Engineers Australia Sydney and Newcastle Divisions Sponsorship Education & Innovation Industry
Hunter Business Chamber Sponsorship Education & Innovation Industry
Hunter, Sydney and South Western Sydney Institutes (TAFE) Sponsorship Education & Innovation Students
National Breast Cancer Foundation Sponsorship Education & Innovation Community
NSW Premier’s Teachers Scholarship Sponsorship Education & Innovation Students
Science and Engineering Challenge Sponsorship Education & Innovation Students
The University of Sydney Chair in Power Engineering Sponsorship Education & Innovation Industry
The University of New South Wales Chair in Electrical Power Economics Sponsorship Education & Innovation Industry
The University of Newcastle Chair of Intelligent Electricity Networks Sponsorship Education & Innovation Industry
Sydney Olympic Park Authority Sponsorship Education & Innovation Students
Central Coast Mariners Football Club Sponsorship Community & Safety Community
City of Sydney’s “Our Christmas” celebrations Sponsorship Community & Safety Community
Newcastle Knights Rugby League Football Club Sponsorship Community & Safety Community
Starstruck Sponsorship Community & Safety Community
Sydney Symphony Orchestra Sponsorship Community & Safety Community
Westpac Rescue Helicopter Service (Hunter) Sponsorship Community & Safety Community
Vision Australia Christmas Sponsorship Community & Safety Community
Green Globe Awards Sponsorship Energy Efficiency & Sustainability Industry
Surf Life Saving (Northern Beaches, Central & Hunter Branches) Sponsorship Energy Efficiency & Sustainability Community
Sydney Theatre Company Sponsorship Energy Efficiency & Sustainability Community
Taronga Zoo Sponsorship Energy Efficiency & Sustainability Community
City of Sydney Sustainability Awards Sponsorship Energy Efficiency & Sustainability Industry
Hunter Valley Research Foundation Sponsorship Research Industry
* EnergyAustralia dollar matched $50,000 to the EA Employees’ Children’s Appeal. All other Payroll Giving Charities receive contributions from employees. # ARSBA - Annual Reports (Statutory Bodies) Act 1984
ARSBR - Annual Reports (Statutory Bodies) Regulation 2010
Community group recipients

110
Heritage Act requirements
Ausgrid’s Heritage and Conservation Register includes 12 properties of State significance and 193 properties of local significance. Refer to the
Environment section (p27).
Judicial decisions
Rosebanner Pty Ltd v EnergyAustralia [2011] NSWCA 28 and Rosebanner Pty Ltd v EnergyAustralia (No. 2) [2011] NSWCA 150.
In February 2011, the NSW Court of Appeal upheld a decision in EnergyAustralia’s (as it then was) favour by the Supreme Court of NSW in
2009. It had been alleged that the presence of infrastructure on the claimants’ property was a trespass and that a contract had been formed
to remove this within a stated period and then breached. The Court of Appeal found there was no trespass and that no contract as alleged was
established. EnergyAustralia was also awarded indemnity costs.
Legislative changes in 2010/11
As a NSW Statutory State Owned Corporation and NSW Energy Services Corporation, Ausgrid is generally subject to most of the statutory and
other legal requirements as other businesses. Ausgrid operates in the National Electricity Market (NEM) as both a distribution and transmission
network service provider (DNSP and TNSP). Up until 1 March 2011 Ausgrid also operated as an electricity retailer and gas retailer in the national
electricity and gas markets under the name of EnergyAustralia. From 1 March 2011, EnergyAustralia’s name changed to Ausgrid when its retail
assets were sold to TRUenergy Pty Ltd. The following lists the main legislative and other regulatory changes which have been made during the
last financial year which particularly impact upon Ausgrid as an energy services corporation.
Australian Consumer Law
The Australian Consumer Law commenced in two phases during the year:
1. The Trade Practices Amendment (Australian Consumer Law) Act (No.1) 2010 introduced provisions relating to unfair contract terms (in consumer
contracts) with effect from 1 July 2010. Those reforms void unfair terms in standard form consumer contracts that are entered into on or after
1 July 2010, and the unfair terms of existing standard form consumer contracts that are renewed or varied on or after 1 July 2010.
2. The Trade Practices Amendment (Australian Consumer Law) Act (No.2) 2010 renamed the Trade Practices Act 1974 (Cth) the Competition and
Consumer Act 2010 (Cth) and consolidated and reformed the consumer protection provisions of the Trade Practices Act and the State and
Territory Fair Trading Acts with effect from 1 January 2011.
The Australian Consumer Law (ACL) forms Schedule 2 of the Competition and Consumer Act 2010 effective from 1 January 2011 and introduces a
number of new provisions including:
(a) a new system of statutory consumer guarantees;
(b) the new regime prohibiting unfair contract terms in standard form consumer contracts; and
(c) additional investigative and enforcement powers for the Australian Competition and Consumer Commission.
National Work Health & Safety
All Australian States and Territories will introduce uniform legislation to commence in January 2012. New South Wales has already passed
its Work Health and Safety Act 2011, which will commence on 1 January 2012. New South Wales has also enacted amendments to the current
Occupational Health and Safety Act 2000. Those amendments, which commenced on 7 June 2011, change the nature of the primary duty under the
Act, which used to be unqualified but is now the duty to ensure, so far as is reasonably practicable, the health and safety of people at work and
people affected by workplace activities. This provision is also the central feature of the new Work Health and Safety Act. A model National Work
Health and Safety Regulation has been released for public comment but has not been finalised and no Australian jurisdiction has formulated its
own regulations.
National Energy Markets
Ausgrid is subject to the National Electricity Law (NEL) and National Electricity Rules (NERs) which regulate the National Electricity Market. There
were a number of changes to the NEL and NERs during the year. The following are those which particularly impact upon Ausgrid’s operations.
1. National Electricity Amendment (Payments under Feed-in Schemes and Climate Change Funds) Rule 2010. This Rule commenced on 1
July 2010 and implemented a cost recovery mechanism to enable DNSPs to recover payments they make under jurisdictional schemes such as
feed-in tariff schemes and climate change funds as part of their annual pricing proposal.
2. National Electricity Amendment (DNSP recovery of transmission-related charges) Rule 2011. This Rule commenced on 24 March 2011
and clarified and confirmed the ability of DNSPs to recover charges related to the transmission of energy to and between its network and the
networks of other TNSPs and DNSPs.
3. National Electricity Amendment (Provision of Metering Data Services and Clarification of Existing Metrology Requirements) Rule 2010.
This Rule commenced on 16 December 2010 and 20 January 2011 and provides for the responsibility for meter data provider services in the
NEM to be transferred from the Australian Energy Market Operator to the Responsible Person under the Rules so that the responsible person
will have end to end responsibility for metering arrangements. The exception to this arrangement will be where a TNSP is the Responsible
Person in which case AEMO will be responsible for the provision of metering data services. New arrangements for complex connection points
will require AEMO to identify connection points with ‘special site or technology related conditions’ and the relevant responsible party is to
ensure that they accommodate these conditions. The rule also made a number of general clarifications and changes to metering in the NEM.
Statutory Information

Ausgrid – Annual Report 2010/11 111
4. The National Electricity Amendment (Ministerial Smart Meter Roll Out Determinations) Transitional Rule 2010 was made by the South
Australian Minister for Energy on 19 December 2010. This rule commenced on 1 January 2011 (as Part ZF of Chapter 11 of the National
Electricity Rules) to support the National Electricity (South Australia) (Smart Meters) Amendment Act 2009. This rule makes certain technical
provisions relating to the Ministerial Smart Meter Roll Out Determination including that DNSPs are to be exclusively responsible for meter
provision and meter data services for the period of a mandated roll-out in a jurisdiction.
5. The National Energy Retail Law (South Australia) Act 2011 was passed by the South Australian Parliament as the lead legislator in March
2011. This legislation will establish the National Energy Customer Framework (NECF) as a national framework:
(a) for the supply of electricity and transfer of gas to customers including the connection arrangements applying to such customers; and
(b) for the relationship between the distributors and retailers of such customers.
NSW and each participating jurisdiction must now implement legislation to apply the NECF in its jurisdiction. 1 July 2012 is the target date
for implementation in all jurisdictions. The NECF will not entirely displace NSW energy legislation or general consumer protection and NSW
energy laws will continue to supplement key aspects of the NECF.
New South Wales
The following lists the legislative changes in New South Wales which have been made during the last financial year and particularly impact
upon Ausgrid.
1. The Government Information (Public Access) Act 2009 (NSW) (the GIPA Act) commenced on 1 July 2010 and replaced the Freedom
of Information Act 1989 (NSW). The GIPA Act introduced reforms to make more information available as well as to make the process for
obtaining government information more transparent and prescriptive. The GIPA Act imposes new obligations upon Ausgrid to proactively
publish certain information held by Ausgrid. In particular, Ausgrid is required to publish on its website information about contracts entered
into with the private sector with a value of $150,000 or more.
2. The Energy Legislation Amendment (Infrastructure Protection) Act 2009 (NSW) commenced on 1 July 2010. The Act amends the Electricity
Supply Act 1995 (NSW) and introduces new licence conditions for distribution network service providers. The key amendments include:
(a) network operators (including Ausgrid) are required to belong to the Dial Before You Dig Scheme;
(b) network operators are required to respond to Dial Before You Dig inquiries by providing information on the location and type of
underground electricity powerlines in the vicinity of proposed excavation work;
(c) statutory indemnity for Dial Before You Dig when it provides information in accordance with the new requirements;
(d) making it mandatory for individuals undertaking excavation works to notify network operators if any damage is caused to the
electricity network;
(e) granting the court the power to order payment of costs incurred by the network operator in preventing or mitigating damage to electricity
networks. The court may also award compensation to a network operator for loss or damage resulting from certain offences committed under
the Electricity Supply Act 1995 (NSW); and
(f) granting network operators the ability to serve notice on any person the network operator believes is about to carry out work that will
damage the network operator’s assets, such notices may include a provision requiring that the proposed works be modified or stopped.
The Act also strengthens the maximum penalties that apply under s65 of the Electricity Supply Act 1995 (NSW) increasing the maximum fine
for individuals from $11,000 to $22,000 and the maximum fine for corporations from $220,000 to $440,000.
3. The Electricity Supply (General) Amendment (Infrastructure Protection) Regulation 2010 amends the Electricity Supply (General)
Regulation 2001 to prescribe elements of the ‘Dial before You Dig Scheme’ (which commenced on 1 July 2010). The Regulation specifies that
Dial Before You Dig (as the designated information provider under the ‘Dial Before You Dig Scheme’) must be contacted for, and its members
must provide information about, the location and type of underground electricity powerlines for certain proposed excavation work. Relevant
individuals who receive such information must have regard to that information in carrying out the work. The Regulation also sets out the
method by which Ausgrid must be notified of any damage caused by excavation work to underground power lines.
4. The Environmental Planning and Assessment Amendment (Part 3A Repeal) Act 2011 (Repeal Act) was assented to on 27 June 2011, but
has yet to be proclaimed. Part 3A was introduced to the Environmental Planning and Assessment Act 1979 as a new regime for assessing major
projects (being projects of State or regional significance where it was considered the Minister for Planning ought to be the consent authority).
When the Repeal Act is proclaimed, Part 3A of the Environmental Planning and Assessment Act 1979 will be amended by removing Part 3A
entirely and replaced with a new regime where:
(a) State Significant Infrastructure (being development for such things as electricity transmission and distribution networks, railways, roads,
pipelines, water supply, ports, sewerage, public parks and reserves and the like that are declared to be State Significant Development) will
be assessed by requirements prescribed by the Department of Planning and Infrastructure and local planning instruments will not apply.
The Minister for Planning will usually be the consent authority for this type of development. The planning and assessment regime for State
Significant Infrastructure is substantially the same as it was in Part 3A; and

112
(b) State Significant Development (being development of State or regional significance that is declared to be State Significant
Development). While the Minister for Planning may be the consent authority for this type of development, it is understood that the
Minister is likely to delegate the consent role to independent planning commissions. Local planning instruments will apply to the
assessment of State Significant Development.
Transitional provisions apply under the Repeal Act. Where an application for development was lodged under Part 3A and the
Department of Planning and Infrastructure has issued the planning and assessment requirements for that development before the
proclamation of the Repeal Act, that development will continue to be assessed under Part 3A.
5. The NSW Solar Bonus Schemes was amended in October 2010 and subsequently closed to new applicants from 29 April 2011. The Electricity
Supply Amendment (Solar Bonus Scheme) Act 2010 (NSW) commenced on 28 October 2010 and varied the rate of the solar bonus from $0.60 per
kilowatt hour to $0.20 per kilowatt hour. The Act and supporting regulations also set criteria for certain customers to be eligible to continue
to receive the higher bonus rate. The Solar Bonus Scheme was closed to new applicants (from 29 April 2011) by the Minister for Energy on 29
June 2011 by notification published on 1 July 2011. The Electricity Supply (General Amendment (Solar Bonus Savings) Regulation 2011 amends
the Electricity Supply (General) Regulation 2001 as a consequence of the closure of the solar bonus scheme to new customers and saves the
rights of certain customers to receive credits under the scheme for electricity generated by complying generators.
Memberships
As the distribution network provider to Australia’s largest city, Ausgrid understands the important role knowledge sharing plays in an essential
service industry. As a result Ausgrid maintained a number of key memberships at an organisation level in 2010/11 including:
Energy Supply Association of Australia
Energy Networks Association
Energy Retailers Association of Australia (to 28 February 2011)
Asset Management Council
Australian Power Institute
Dial Before You Dig NSW/ACT
Committee for Economic Development of Australia
Business Council of Australia
Engineers Australia
Green Building Council Of Australia
CIGRE (Australia); and
Geospatial Information & Technology Association (GITA).
Ausgrid also participated in:
Working group participation associated with ‘AEMO National SMART Metering Program’
‘Device Language Message Specification (DLMS) User Association’
ENA Demand Management and Embedded Generation Committee
Office of Environment & Heritage (previously DECCW) Climate Change and Infrastructure Adaptation Panel; and
Electricity Industry Safety Steering Committee.
Ministry reporting requirements - Demand Management
Efficient and effective consideration of Demand Management (DM) is an important part of delivering cost-effective network services to
customers and satisfying licence and legislative requirements. Ausgrid’s DM process has been developed and implemented as an integral part of
the Investment Governance Process to improve the effectiveness and efficiency of DM investigations.
Ausgrid’s DM process also enables it to meet its obligations regarding the investigation of demand management alternatives under the NSW
Electricity Supply Act, 1995 and the conditions of its Distribution Network Service Provider Licence. In developing this process Ausgrid has
considered the requirements embodied in the revised “Demand Management for Electricity Distributors: NSW Code of Practice (September 2004)”
as published by the then Department of Energy, Utilities and Sustainability, which provides guidance on the interpretation of the legislative
requirements. The DM process is also designed to meet the requirements relating to DM in the National Electricity Rules.
Emerging constraints on the supply system are identified through the planning process, and published in the Annual Electricity System
Development Review (AESDR) on the Ausgrid website. Ausgrid maintains a DM Register of Interested Parties, who are notified of the publication
of the AESDR as well as the release of DM public consultation papers and any other related reports.
Each constraint is assessed to determine whether it is reasonable to expect that DM might prove to be cost effective. Emerging constraints that
are expected to have a network augmentation solution with a capital cost of less than $1 million are not normally considered material and DM
investigations are not normally pursued for these constraints.
Statutory Information

Ausgrid – Annual Report 2010/11 113
All material constraints identified are subjected to a DM Screening Test, which is the first step in the demand management process. It consists of
an analysis of the drivers behind the emerging constraint, determination of the extent to which demand is driving investment and the demand
management requirement. This requirement is described as the approximate size, cost per kVA and nature (time of day, seasonality, etc) of the
demand management options that would be required to defer the proposed investment for at least one year. The test report provides the basis
for a decision regarding whether it would be reasonable to expect that it would be cost effective to avoid or postpone the expansion of the
network by implementing DM strategies. Once determined that DM is likely to be cost effective, a formal DM Investigation follows.
Based on the DM requirements identified in the screening test, the DM Investigation identifies possible DM options that might exist in the study
area. It determines the approximate amount of DM available and the likely cost (to Ausgrid) of each of the identified options. Options are
identified based on existing knowledge, field visits, public consultation seeking proposals from interested parties, and through discussions with
specific customers. The public consultation is focussed on identifying potential options and uncovering information that is already known (by
others) but otherwise unavailable to Ausgrid. The information is analysed using a standard approach that compares the net present value of
costs for the DM alternative to the net present value of the deferral of the network expansion option. The DM Investigation report identifies and
describes any feasible DM options to be considered for development alongside network augmentation options.
If a feasible DM option is determined to be the most economical solution, it is developed into a DM Project Proposal. This consists of a business
case and implementation plan that outlines clear deliverables in terms of demand reduction, timing and cost. Once authorised, a DM project is
implemented.
The DM Implementation strategy may include a range of implementation options including RFPs (requests for proposal), standard offers,
marketing programs and direct customer negotiations depending on the DM options being implemented. The process and methodologies used
are described in detail in Ausgrid’s “Demand Management Guidelines”. A summary of this process is provided in various public documents and on
Ausgrid’s website.
Over the past 12 months Ausgrid has undertaken the following DM activities:
Addressing network capacity constraints
18 DM Screening Tests have been completed, of which four led to opportunities for further investigation.
Three detailed DM investigations were completed, all of which indicated cost effective DM options for development and implementation.
Two new DM projects were authorised for implementation.
EnergyAustralia/Ausgrid completed implementation of power factor correction programs in the Willoughby and Greenacre Park areas. These
targeted programs raise customer awareness about the potential savings on their energy bills, in addition to offering them cost effective
solutions to improve their power factor. This achieves the dual benefit of peak demand reductions on our network while also reducing energy
costs for our customers.
We entered into a network support agreement with a gas cogeneration site in North Sydney.
We continued to operate an embedded generator project at Wollombi (1MW), and initiated a new generator project at North West
Pennant Hills.
Network capacitors have been approved at one substation location to provide reactive power support which will reduce demand on upstream
network elements.
Demand Management Innovation Allowance (DMIA)
Two Demand Management Innovation Allowance (DMIA) projects are currently underway – a trial of Reliability Improvements of Large
Embedded Generators, and an investigation into Dynamic Load Control of Small Hot Water Cylinders. A third project was approved for the
Development & Design of a CBD Embedded Generator Connection Trial.
Metering and tariffs
Controlled load tariffs continue to be used to manage hot water load into off-peak periods.
Price signalling of energy costs is reflected through what is known as inclining block tariffs to domestic and business customers with induction
disc meters. The block differential for 2011/12 is set at 54 percent for the network component of domestic customers’ tariffs. In concert with
this, the retail differential creates an overall differential of 41 percent between the first and second block of domestics tariffs (GST included).
This provides a strong signal to reduce energy consumption.
More than 380,000 Ausgrid customers now have a Time of Use (ToU) capable interval meter in their home or business. These meters measure
how much electricity is used over half-hour intervals, compared to the standard meters that measure electricity use over a three-month period.
Around 3,300 AMI meters, which are interval meters with additional ‘smart’ features, are now in use in residences across Ausgrid.
The learnings from this process are assisting development of the Smart Metering Infrastructure (SMI) business case.
EnergySave 2010/11 – program summary
The EnergySave program helps customers better understand and manage their energy usage, environmental impact and bills. The 2010/11
EnergySave program focused on providing assistance to low-income residential customers, small businesses and school students.

114
Efficient downlights for small businesses
Launched at the end of 2009, the Hairdressers Downlight Replacement program offered more than 2,000 hairdressing salons across Ausgrid’s
network area the chance to get a better understanding of their energy use and replace energy guzzling downlights for free. Some 300 customers
registered for the program, with more than 250 upgrades completed by the end of December 2010 and over 6,500 downlights replaced. This
equates to more than $91,000 in customer bill savings and 498 tonnes of greenhouse gas emissions each year.
Educational materials and products
Our Energy Usage Guide and range of energy-saving booklets are updated annually to reflect price rises, new technologies and changes to
government assistance programs. Booklets include Winter Heating, Summer Cooling, Swimming Pool Efficiency, and Hot Water. The Energy
Usage Guide is also available in 10 languages to assist customers from different ethnic backgrounds.
For the second year in a row the EnergySave team produced A Guide to Affordable Energy Efficient Appliances in partnership with Choice
Magazine. The booklet is used by consumer advocacy groups in helping low income customers make energy-wise appliance choices and for the
first year, has been made available to all customers via the Ausgrid website.
Amy’s Energy Saving website
Originally developed as a hard-copy education kit for students in Kindergarten through to Year 2, Amy’s Energy Saving kit went live on the
internet in December 2010. The site includes an online story book, games and activities that children can do at home. Work commenced with the
Department of Education and Training in February 2011 to promote the use of this tool to over 500 primary schools in Ausgrid’s network area.
197 schools are using the hard copy kits and 4,283 people have visited the website.
Energy Efficiency Centre events
A range of topical energy efficiency seminars and events were held at the previous Energy Efficiency Centre in Homebush; attracting key
stakeholders, businesses, advisors and members of the public.
Three major public events were held this financial year prior to the closing of the original Centre in September 2010. These events included
“The Sixth Wave – how to survive in a resource limited world” with Dr James Bradfield Moody. The final public event at the Centre was on
“Green Marketing” and featured Ben Peacock from the Republic of Everyone, Murray Hogarth, Senior Adviser to the Total Environment Centre’s
Green Capital Program and Fiona Grant from the Australian Competition and Consumer Commission. The Energy Efficiency Centre was also open
to members of the public as part of Sustainable House Day 2010.
Appliance Assist
To continue EnergySave’s support for customers experiencing hardship, a new program titled ‘Appliance Assist’ was created. Appliance Assist is
an online ordering service for No-Interest Loan schemes. It provides new, energy efficient refrigerators and washing machines at up to 50% off
the Recommended Retail Price. The discount includes an Ausgrid rebate of $100 per appliance.
Ausgrid partnered with Appliances Online to build the password-protected ordering system and has commenced marketing the program to
No Interest Loan Schemes.
Smart Home Family and blog
The successful family chosen to live in the Smart Home and test the latest energy and water solutions was announced in July 2010. The Smart
Home Family blog was launched at this time, with the family moving into the home shortly after. Since the blog was launched more than 22,000
people have visited the site. There are opportunities for visitors to participate by posting comments and connecting to the Smart Home Family via
Twitter, Facebook and Youtube. More than 25 tours of the home have been conducted for key stakeholder groups.
Newington Public School Case Study
Following a visit by the Managing Director, Newington Public School was offered an energy audit with a view to uncovering the reason for its poor
solar Photovoltaic export. Ausgrid has since replaced the school’s existing five solar inverters with eight new units and installed a new SMA Sunny
web portal which allows the school to view its electricity generation online. A case study has been produced to encourage other schools
to investigate.
High School Power Mate Lite Kit
EnergySave has created a program targeting high schools within the Ausgrid network area. The program encourages high school students to
check the energy use of appliances at home or school using Ausgrid’s ‘Find your Energy Guzzler’ kits available from school libraries. The kits
consist of an Ausgrid-branded Power Mate Lite and an A5 booklet that provides students with information on energy efficiency activities. These
encourage them to learn about where their household and school energy goes. Following advice from the Department of Education, the kit will
be introduced into 142 high school libraries within the Ausgrid network area during school term three in 2011.
Statutory Information

Ausgrid – Annual Report 2010/11 115
Project Description of Demand Management
Project Implemented
Peak Demand
Reduction
(kVA)
CO2 Reduction
(Tonnes Per
Year and
Expected
Duration)
PV of Costs
of Demand
Management
Project
PV of Total of
Capital Expenditure
Deferment
plus Operating
Expenditure Savings
Individual large projects
Greenacre Park Area
Stage 2 - Power Factor
Correction
A power factor correction program facilitating
the installation of equipment at up to 38 large
customers’ premises where power factor is
low. Customers are offered discounted prices
through bulk buying and project facilitation.
The target capacity of installations is 3.5MVAr
resulting in peak demand reduction of 1.3 MVA.
Demand reduction capability will persist for
duration of deferral (1 year). 3,500 kVAr
223 tonnes/yr
for 10 years $114,536 $2,565,000
North West Pennant
Hills generators
0.4 MVA to 1MVA of diesel generation has
been installed in North West Pennant Hills for
summer 2010/11 through to summer 2014/15.
It is capable of operating in parallel with the
network and can be called at any time from
the network control room. Demand reduction
capability will persist for duration of deferral
(5 years). 1,000 kVA Not applicable $1,252,525 $1,600,000
Network capacitors at
Peakhurst STS
Installation of reactive support within
the network 80,000 kVar
5,088 tonnes/yr
for 10 years $3,389,924 Not applicable(1)
Sub-totals 1,000kVA +
83,500kVar
5,311 tonnes/yr
for 10 years $4,756,985 $4,165,000
Individual large projects
Totals 1,000kVA +
83,500kVar
5,311 tonnes/yr
for 10 years $4,756,985 $4,165,000
(1) To reduce load at risk and ensure power factor complies with National Electricity Rules requirements.
Demand Management Projects Implemented During 2010/2011

116
Description of Potential Demand Management Project Investigated Cost of
Investigations
Maitland 33/11kV
Zone Substation
A constraint was identified for investigation. The screening test concluded that DM was likely to be cost
effective in this case. However the subsequent investigation concluded that DM was not a viable option in
this case. $48,705
St Ives Zone
Substation Upgrade
A constraint was identified for investigation. The screening test was completed and concluded that DM
would not be cost effective option to enable deferral of the supply side project in this instance. $52,390
Epping 11kV
Zone Development
A constraint was identified for investigation. The screening test & subsequent investigation concluded that
DM was likely to be cost effective in this case. Development of a DM project was initiated, however this was
cancelled due to lack of interest from the relevant customer(s). $67,824
Morisset Zone
11kV Development
A constraint was identified for investigation. The screening test was completed and concluded that DM
would not be a cost effective option to enable deferral of the supply side project in this instance. $495
Breakfast Point
Development
A constraint was identified for investigation. The screening test was completed and concluded that DM
would not be a cost effective option to enable deferral of the supply side project in this instance. $1,225
Zetland South
Zone Development
A constraint was identified for investigation. The screening test was completed and concluded that DM
would not be a cost effective option to enable deferral of the supply side project in this instance. $1,537
Balgowlah North
Zone Development
A constraint was identified for investigation. The screening test was completed and concluded that DM
would not be a cost effective option to enable deferral of the supply side project in this instance. $2,793
Lidcombe to Flemington
11kV Load Transfer
A constraint was identified for investigation. The screening test was completed and concluded that DM
would not be a cost effective option to enable deferral of the supply side project in this instance. $1,611
Sydney Olympic Park Authority
New Zone Substation
A constraint was identified for investigation. The screening test was completed and concluded that DM
would not be a cost effective option to enable deferral of the supply side project in this instance. $35,711
Medowie
Zone Substation
A constraint was identified for investigation. The screening test was completed and concluded that DM
would not be a cost effective option to enable deferral of the supply side project in this instance. $14,997
Campsie & Enfield
Zones Load Area
A constraint was identified for investigation. The screening test was completed and concluded that DM
would not be a cost effective option to enable deferral of the supply side project in this instance. $2,939
Oxford St Low Voltage
Development
A constraint was identified for investigation. The screening test was completed and concluded that DM
would not be a cost effective option to enable deferral of the supply side project in this instance. $2,991
Inner Metropolitan
Reactive Support
A constraint was identified for investigation. The screening test was completed and concluded that DM
would not be a cost effective option to enable deferral of the supply side project in this instance. $3,423
East Maitland
Zone Substation
A constraint was identified for investigation. The screening test was completed and concluded that DM
would not be a cost effective option to enable deferral of the supply side project in this instance. $66,835
Avoca Zone
11kV Development
A constraint was identified for investigation. The screening test was completed and concluded that DM
would not be a cost effective option to enable deferral of the supply side project in this instance. $2,626
Turramurra North
Zone Development
A constraint was identified for investigation. The screening test was completed and concluded that DM
would not be a cost effective option to enable deferral of the supply side project in this instance. $861
Peats Ridge
Pa 3 & 4
A constraint was identified for investigation. The screening test was completed and concluded that DM
would not be a cost effective option to enable deferral of the supply side project in this instance. $29,058
Charmhaven
Zone development - Stage 1
A constraint was identified for investigation. The screening test was completed and concluded that DM
would not be a cost effective option to enable deferral of the supply side project in this instance. $9,486
Description of Potential Demand Management Project Under Investigation PV of Costs of
Investigations
Maitland
33kV Feeder 30028 A constraint was identified for investigation. This investigation is in progress. $1,550
Milperra Zone
Substation Uprating A constraint was identified for investigation. This investigation is in progress. $3,361
Nelson Bay (Anna Bay) STS A constraint was identified for investigation. This investigation is in progress. $3,415
Demand Management Investigations concluded in 2010/2011
Demand Management Investigations in progress 2010/2011
Statutory Information

Ausgrid – Annual Report 2010/11 117
Ministry reporting requirements-standard for provision of services
Ausgrid has produced a Standard Customer Supply Contract and Standard Customer Connection Contract that outlines the standard of customer
service and electricity supply that customers can expect from Ausgrid. Under its licence, Ausgrid reports to the Independent Pricing and
Regulatory Tribunal (IPART) on network standards of service or statistics, including:
telephone services for faults and difficulties
timely provision of services
timely notice of planned interruptions to supply
repair of faulty street lights
complaints.
Telephone services for faults and difficulties
The Licence Holder’s telephone number for reporting network faults and difficulties Tel 131 388
Calls made to this service during 2010/11 397,334
Calls dropped out or were abandoned 44,950
Calls to this service answered by an operator within 30 seconds 205,987
Timely provision of services
Number of connections provided by the Licence Holder for existing and new premises where the Licence Holder undertook work 2317
Of the connections provided, the number not provided on or before the agreed date 7
The compensation paid in relation to these $1,260
Timely notice of planned interruptions
Number of planned interruptions to supply in 2010/11 3226
Number of occasions the Licence Holder did not provide at least two business days’ notice to the affected customers about the interruption
to their supply 108
Number of occasions the Licence Holder interrupted the customer’s supply of electricity for longer than the time indicated in the relevant
supply interruptions notice 15
Value of compensation paid in relation to these $2,500
Repair of faulty street lights
Number of reported street light faults during 2010/11, excluding multiple reports for the same fault 15,251
Occasions the Licence Holder failed to complete the repairs of faulty street lighting on or before the date agreed between the Licence
Holder and any eligible customer 10
Average number of days to repair faulty street lights 2.2 days
Value of compensation paid to customers $165
Complaints
Complaints the Licence Holder received during 2010/11 from small retail customers in relation to distribution network service matters 1,529
1. Ausgrid has an automated power outage management system (POMS) that provides recorded messages about known outages based on the location of
the outage. If a customer calls from a location that has a known outage, they will be advised by automated message of the incident and the restoration
time. The customer then terminates the call, consistent with the intent of the system. These calls are not classified as abandoned. Customers requiring
additional information, wishing to report safety concerns or about an incident unknown to Ausgrid are encouraged to remain on the line, and the call is
routed to an experienced customer service representative.
2. The figures for total reported street light faults does not include multiple reports of the same fault. However, it is indicative of the volume of notifications
received and the number of visits to a public lighting asset to ensure public safety.
3. This figure also includes faults that did not result in loss of illumination. Compensation is paid due to loss of illumination as per Ausgrid’s Standard Form
Customer Connection Contract.
Provision of Services
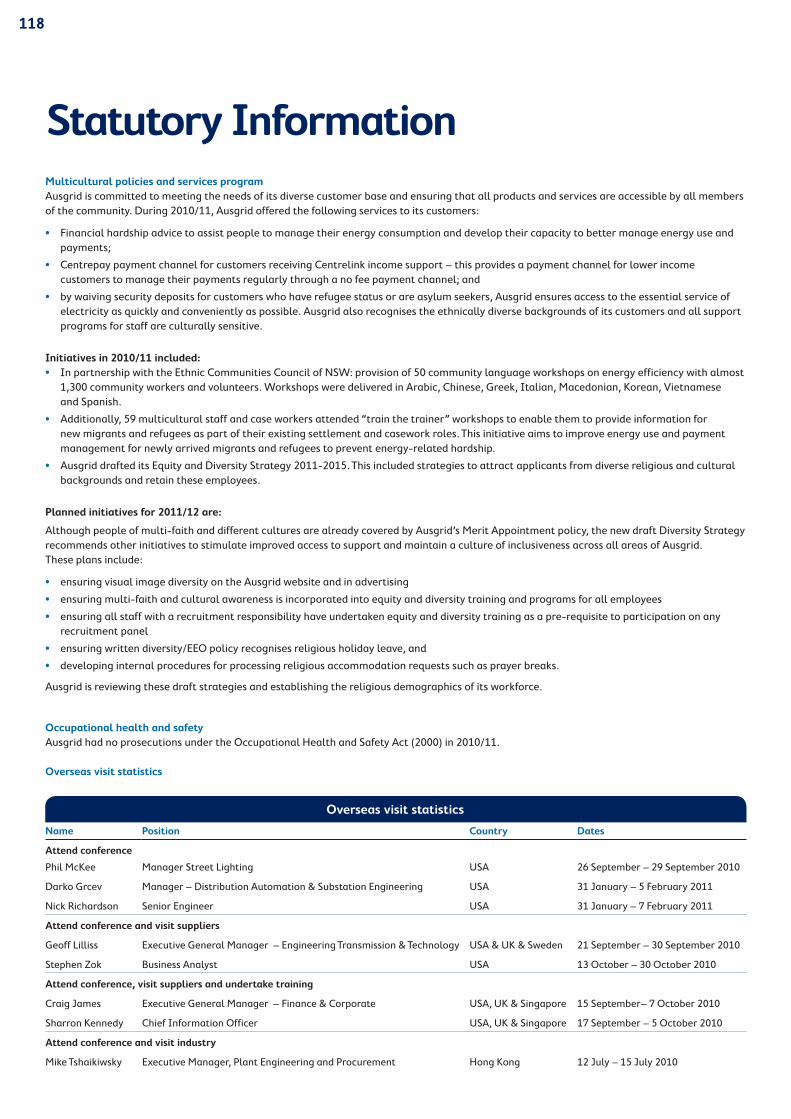
118
Name Position Country Dates
Attend conference
Phil McKee Manager Street Lighting USA 26 September – 29 September 2010
Darko Grcev Manager – Distribution Automation & Substation Engineering USA 31 January – 5 February 2011
Nick Richardson Senior Engineer USA 31 January – 7 February 2011
Attend conference and visit suppliers
Geoff Lilliss Executive General Manager – Engineering Transmission & Technology USA & UK & Sweden 21 September – 30 September 2010
Stephen Zok Business Analyst USA 13 October – 30 October 2010
Attend conference, visit suppliers and undertake training
Craig James Executive General Manager – Finance & Corporate USA, UK & Singapore 15 September– 7 October 2010
Sharron Kennedy Chief Information Officer USA, UK & Singapore 17 September – 5 October 2010
Attend conference and visit industry
Mike Tshaikiwsky Executive Manager, Plant Engineering and Procurement Hong Kong 12 July – 15 July 2010
Overseas visit statistics
Occupational health and safety
Ausgrid had no prosecutions under the Occupational Health and Safety Act (2000) in 2010/11.
Overseas visit statistics
Multicultural policies and services program
Ausgrid is committed to meeting the needs of its diverse customer base and ensuring that all products and services are accessible by all members
of the community. During 2010/11, Ausgrid offered the following services to its customers:
Financial hardship advice to assist people to manage their energy consumption and develop their capacity to better manage energy use and
payments;
Centrepay payment channel for customers receiving Centrelink income support – this provides a payment channel for lower income
customers to manage their payments regularly through a no fee payment channel; and
by waiving security deposits for customers who have refugee status or are asylum seekers, Ausgrid ensures access to the essential service of
electricity as quickly and conveniently as possible. Ausgrid also recognises the ethnically diverse backgrounds of its customers and all support
programs for staff are culturally sensitive.
Initiatives in 2010/11 included:
In partnership with the Ethnic Communities Council of NSW: provision of 50 community language workshops on energy efficiency with almost
1,300 community workers and volunteers. Workshops were delivered in Arabic, Chinese, Greek, Italian, Macedonian, Korean, Vietnamese
and Spanish.
Additionally, 59 multicultural staff and case workers attended “train the trainer” workshops to enable them to provide information for
new migrants and refugees as part of their existing settlement and casework roles. This initiative aims to improve energy use and payment
management for newly arrived migrants and refugees to prevent energy-related hardship.
Ausgrid drafted its Equity and Diversity Strategy 2011-2015. This included strategies to attract applicants from diverse religious and cultural
backgrounds and retain these employees.
Planned initiatives for 2011/12 are:
Although people of multi-faith and different cultures are already covered by Ausgrid’s Merit Appointment policy, the new draft Diversity Strategy
recommends other initiatives to stimulate improved access to support and maintain a culture of inclusiveness across all areas of Ausgrid.
These plans include:
ensuring visual image diversity on the Ausgrid website and in advertising
ensuring multi-faith and cultural awareness is incorporated into equity and diversity training and programs for all employees
ensuring all staff with a recruitment responsibility have undertaken equity and diversity training as a pre-requisite to participation on any
recruitment panel
ensuring written diversity/EEO policy recognises religious holiday leave, and
developing internal procedures for processing religious accommodation requests such as prayer breaks.
Ausgrid is reviewing these draft strategies and establishing the religious demographics of its workforce.
Statutory Information
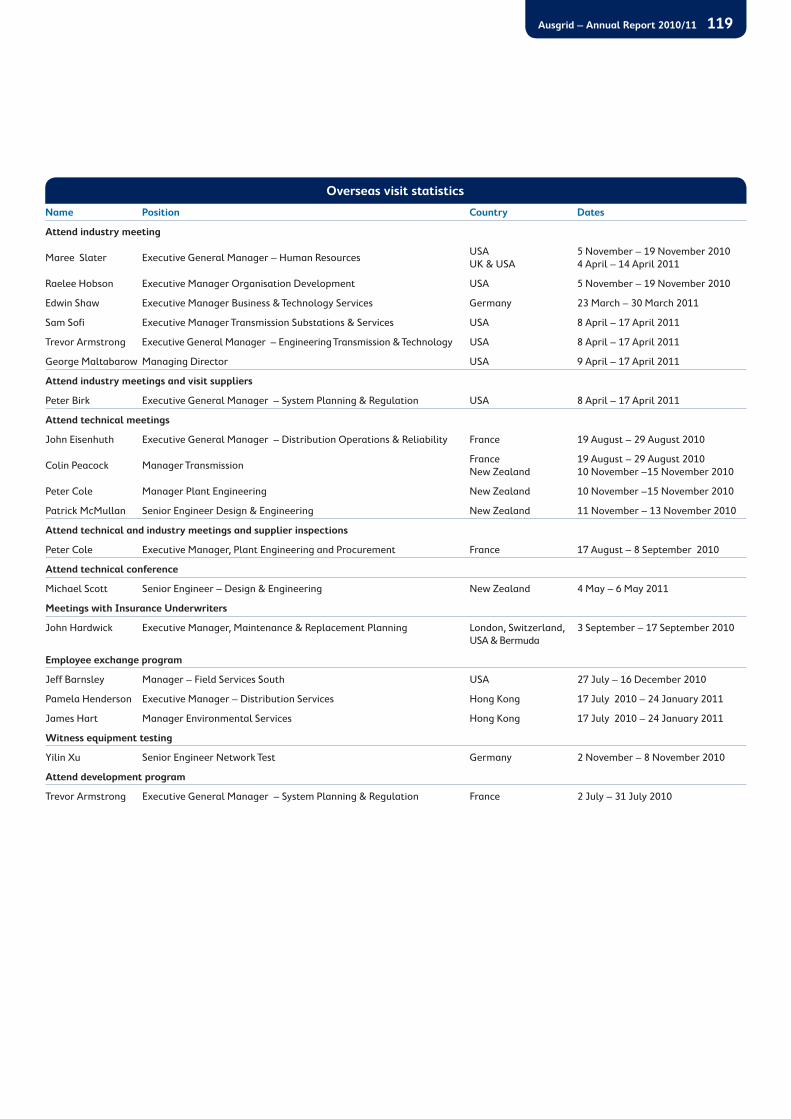
Ausgrid – Annual Report 2010/11 119
Name Position Country Dates
Attend industry meeting
Maree Slater Executive General Manager – Human Resources USA
UK & USA
5 November – 19 November 2010
4 April – 14 April 2011
Raelee Hobson Executive Manager Organisation Development USA 5 November – 19 November 2010
Edwin Shaw Executive Manager Business & Technology Services Germany 23 March – 30 March 2011
Sam Sofi Executive Manager Transmission Substations & Services USA 8 April – 17 April 2011
Trevor Armstrong Executive General Manager – Engineering Transmission & Technology USA 8 April – 17 April 2011
George Maltabarow Managing Director USA 9 April – 17 April 2011
Attend industry meetings and visit suppliers
Peter Birk Executive General Manager – System Planning & Regulation USA 8 April – 17 April 2011
Attend technical meetings
John Eisenhuth Executive General Manager – Distribution Operations & Reliability France 19 August – 29 August 2010
Colin Peacock Manager Transmission France
New Zealand
19 August – 29 August 2010
10 November –15 November 2010
Peter Cole Manager Plant Engineering New Zealand 10 November –15 November 2010
Patrick McMullan Senior Engineer Design & Engineering New Zealand 11 November – 13 November 2010
Attend technical and industry meetings and supplier inspections
Peter Cole Executive Manager, Plant Engineering and Procurement France 17 August – 8 September 2010
Attend technical conference
Michael Scott Senior Engineer – Design & Engineering New Zealand 4 May – 6 May 2011
Meetings with Insurance Underwriters
John Hardwick Executive Manager, Maintenance & Replacement Planning London, Switzerland,
USA & Bermuda
3 September – 17 September 2010
Employee exchange program
Jeff Barnsley Manager – Field Services South USA 27 July – 16 December 2010
Pamela Henderson Executive Manager – Distribution Services Hong Kong 17 July 2010 – 24 January 2011
James Hart Manager Environmental Services Hong Kong 17 July 2010 – 24 January 2011
Witness equipment testing
Yilin Xu Senior Engineer Network Test Germany 2 November – 8 November 2010
Attend development program
Trevor Armstrong Executive General Manager – System Planning & Regulation France 2 July – 31 July 2010
Overseas visit statistics

120
Property disposal
Ausgrid disposed of five properties in 2010/11 that were surplus to its needs. A former substation property at Balgowlah was sold, together
with the disposal of a small vacant portion of Revesby Zone Substation site to the Transport Infrastructure Development Corporation. Three
properties at Marulan were sold as part of the retail sale. The total value of $6,539,182 from the sales has been taken up in this year’s financial
statements and placed in general revenue.
Ausgrid is not aware of any family connection or business association between any party who acquired the properties and any member of Ausgrid
who approved the sale or were involved in the sale process. Application for access to documents concerning details of properties disposed of may
be made in accordance with the Government Information (Public Access) Act 2009 (NSW).
Publications
Ausgrid publishes an extensive range of publications to assist in keeping its customers, the community and potential employees informed. These
publications are typically free of charge and are generally available at Ausgrid Customer Service Centres or by calling 13 15 35. Information on
Ausgrid and its services is also available at www.ausgrid.com.au. Examples include:
Fact sheets and brochures
Switch on to safety (WireAlert)
Information on electro-magnetic fields (EMF)
EnergySave related documents
Apprenticeship program brochure
Electrical engineering cadetship, graduate and traineeship program brochures
Aboriginal & Torres Strait Islander Pre-Apprenticeship Program brochure
Dial Before You Dig – How to Read Plans and Working Near Cables
Unplugged newsletter - Testing Certification Australia.
Policies and guidelines
Ausgrid’s Business Ethics Statement
Code of Conduct
Environmental Code of Conduct
Equal employment opportunity and discrimination and harassment prevention policy
“Our Scorecard” 2010/11
PeopleSafe policy.
Reports
Statement of Corporate Intent
Investing in Future Generations
Network Performance Report
Research and development
Ausgrid continues to support innovation and research for emerging energy technologies. It works closely with major equipment suppliers to
introduce new solutions for its electricity network and maintains close links with universities and other research institutions. Ausgrid is a member
of the Australian Strategic Technology Program which fosters collaborative research into energy technologies across a number of projects and
institutions. Ausgrid is a participant in the Centre for Transformer Performance Management at Monash University, CIGRE (International Council
on Large Electric Systems), CEATI International, and the Australian Power Institute. Ausgrid supports research at the University of Technology
Queensland, and sponsors a Chair of Power Engineering at Sydney University among other research involvements.
The challenge of moving electricity grids towards a low-carbon environment requires a smarter grid and acquiring new technology requires
significant research. Centres of Excellence in Intelligent Electricity Networks (CIEN) with nodes at the Universities of Newcastle and Sydney have
been established through an Ausgrid investment of up to $10 million over five years.
This year, CIEN welcomed Professor David J Hill, as the new Ausgrid Chair at the University of Sydney and also Professor Joe Dong, who
completed his commitments in Hong Kong to commence as the Ausgrid Chair at the University of Newcastle. The vision is to curb peak demand.
CIEN is committed to connecting researchers with creative power engineers and our major global technology partners to share the vision and
capability to build a premier Ausgrid centre of innovation for smart grids.
The approach is to use the Smart Grid, Smart City project as a building block to create a global research chain in which major global technology
partners would have the capability to contribute to Ausgrid in applied research and development, through research programs that focus on
reliability and the impact of large scale renewable energy schemes, activities to improve the network and to benefit Australia’s national wealth.
Statutory Information

Ausgrid – Annual Report 2010/11 121
Waste Reduction and Purchasing Policy
EnergyAustralia took part in the NSW Government Waste Reduction and Purchasing Policy (WRAPP) initiative since 2001 as part of its
commitment to reduce the amount of waste going to landfill. This commitment is designed to promote ecologically sustainable development by
reducing the consumption of natural resources, recycling materials where possible, purchasing products with a recycled content, and reusing
materials wherever practicable.
Now as Ausgrid, it continues to use its resources wisely and wherever possible establishes work practices that encourage minimising, reusing and
recycling of waste generated at its offices, depots and worksites. Examples of the initiatives undertaken throughout 2010/11 include:
Reducing the generation of waste (waste avoidance and minimisation)
To the end of February 2011, EnergyAustralia had around 24,886 customers signed up to the BPAY View service, which allowed customers to
receive and view invoices online through internet banking. This means a saving of at least 99,544 A4 sheets or 199 reams of paper a year.
Resource recovery (waste reuse and recycling)
Recycling facilities were maintained in depots and offices for materials, for paper, cardboard, cans, bottles and plastics. Additional recycling
streams were set up for timber, vegetation, streetlight fittings and hard plastics at the Homebush Depot to improve Ausgrid’s
recycling systems
The Homebush worm farm reduced food scraps going into general waste. Approximately 49 litres of worm tea has been collected from the
worm farm and used as a fertiliser
The mobile phone recycling program sent 132 phones for recycling
1,717 printer and toner cartridges were recycled through Cartridge Rescue on 2010/11
96 per cent (535 of 557 tonnes) of paper and cardboard recycled
47,965 tonnes of vegetation clippings were produced with – 99.95 percent reused as mulch
*1,418 tonnes of copper-based and aluminium-based cables returned to warehouse
*228 tonnes of kilowatt house meters returned to warehouse
*21 tonnes of miscellaneous street light fittings returned to warehouse
*101 tonnes of switches and insulators returned to warehouse
*411 tonnes of steel returned to the warehouse.
* Sold to scrap metal companies who recover and recycle where applicable.
Use of recycled material (purchase of recycled-content materials)
91.3% (40,850 of 44,752 reams) of A4 paper was purchased with recycled content.
Other office items purchased with recycled content include binders, inserts, correction tape, notebooks, envelopes, pencils, pens, highlighters,
markers, staplers, cartridges, sticky notes, in-trays, storage boxes, waste bins, biodegradable plates and cutlery, filing cabinets, toilet paper
and kitchen towels.
24% of total spend on stationery was on products with recycled content.

122

Ausgrid – Annual Report 2010/11 123

124

Ausgrid – Annual Report 2010/11 125
Glossary
V volt A volt is the unit of potential or electrical pressure
W watt A measurement of the power present when a current of one ampere fl ows under a potential of one volt
kW kilowatt One kW = 1000 watts
KWh kilowatt hour The standard unit of energy which represents the consumption of electrical energy at the rate of one kilowatt for one hour
kV kilovolt One kV = 1000 volts
kVA kilovolt ampere A unit of apparent power in an alternating current circuit equal to 1000 volt amperes
kVAr kilovolt ampere reactive
A measure of the reactive component of power demand. Reactive power is consumed by inductive loads. Capacitors are commonly installed at customer sites to reduce reactive power demand on the electricity network
Kt kilotonne 1 Kt=1,000 tonnes
MVA megavolt ampere A unit of apparent power in an alternating current circuit equal to one million volt amperes (A unit commonly used when expressing the rating of a large power transformer)
MW megawatt One MW = 1000 kW or one million watts
MWh megawatt hour One MWh = 1000 kilowatt hours
GWh gigawatt hour One GWh = 1000 megawatt hours or one million kilowatt hours
Gg gigagram One Gg = 1 kilotonne
GJ gigajoule One gigajoule = 1000 megajoules. A joule is the basic unit of energy used in the gas industry equal to the work done when a current of one ampere is passed through a resistance of one ohm for one second
TJ terajoule 10 to the power of 12 joules
STS Subtransmission system Consists of 33 kV, 66 kV and 132 kV assets
HV high voltage Consists of 5 kV, 11 kV and 22 kV distribution assets
LV low voltage Consists of 240V and 415V distribution assets
TWh Terrawatt hour 1TWh= 1,000,000,000 kW/h
ACT Australian Capital Territory
AEIFRS Australian Equivalents to the International Financial Reporting Standards
AER Australian Energy Regulator
ARSBA Annual Reports (Statutory Bodies) Act 1984
ARSBR Annual Reports (Statutory Bodies) Regulation 2005
CALD Culturally and linguistically diverse
CBD Central Business District
CentrePay A free direct bill-paying service for Centrelink entitlement recipients whereby the customer has an amount deducted each week toward their bill
CO2e Carbon dioxide equivalent
CRI Corporate Responsibility Index
DIY Do it yourself
DM Demand Management
EBIT Earnings Before Interest and Tax
Electricity
Other

126
EEO Equal employment opportunity
EMF Electric and magnetic fi elds
Energy consortium The Energy Consortium brings together leading industry peers to collaborate on unique sector specific human capital management best practices and insights. Each participating organisation provides metric data on workforce and business issues. This data is used to create benchmarks and conduct analyses to identify industry trends and relationships as well as critical areas of opportunity and challenge in the workforce.
esaa Energy Supply Association of Australia
EWON Electricity and Water Ombudsman NSW
FTE Full-time equivalent
GIS Gas insulated switchgear
GIS Geographical Information System
GGAS Greenhouse Gas Abatement Scheme
GREENPOWER GreenPower is a national accreditation program that sets stringent environmental and reporting standards for renewable energy products offered by electricity suppliers to households and businesses across Australia
GRI Global Reporting Initiative
GST Goods and services tax
IPART Independent Pricing and Regulatory Tribunal
LBG London Benchmarking Group
LED Light emitting diode – an energy effi cient method of lighting
LTIFR Lost Time Injury Frequency Rate
LTISR Lost Time Injury Severity Rate, calculated as total days of lost time injury per million hours worked
MTIFR Medical Treatment Injury Frequency Rate
Network The network is the system of assets which enables electricity to be transported to customers. EnergyAustralia’s network includes both transmission (high voltage) and distribution (lower voltage) assets
NGACs NSW Greenhouse Gas Abatement Certifi cates
NSW New South Wales, the Australian state
OH&S Occupational Health and Safety
PINC Platform for Intelligent Network Communications
Retail Refers to the process of selling electricity to the consumer. The Retail business purchases electricity in the National Electricity Market and sells it to consumers.
Return on assets Net income divided by total company assets, provides an indication of how profi table the organisation is
PCB Polychlorinated biphenyls
RPO Regular payment option
SAIDI System Average Interruption Duration Index
SAIFI System Average Interruption Frequency Index
SCI Statement of corporate intent
TAFE Technical and Further Education Commission, NSW based vocational education and training provider
Time-of-use Time-of-use Electricity pricing based on the time at which the electricity is used. This type of pricing requires a special meter
Other (continued)

Ausgrid – Annual Report 2010/11 127
Index
Index Page Index Page
A smarter network 17
Aboriginal groups-consultation 33
About this report 4
Access to information/statement
of affairs 99
Age distribution of employees 33
Annual report costs 102
Apprenticeship training 30, 31
Audit & Risk Sub-Committee 37
Ausgrid 6
Board 35-37
Brand 4
Bushfire prevention 24
Capital expenditure 11
Capital Investment &
Economic Regulation Sub-Committee 37
Chairman & Managing Director’s report 9
Community 23
Community investment
and partnerships 24, 108
Completed replacement projects 17
Consolidated Financial Report 39
Consultancies 102
Consumer response 102
Contact centre performance 21
Corporate responsibility 24
Customer assistance programs 21
Customer complaints 102
Customer disconnections 21
Customer satisfaction 21
Demand management 28
Determining network investment 15
Developing people 32
Dial Before You Dig 23
Directors’ report 35, 36
Diversity 32
Education programs 27, 31-33, 103
Electronic services delivery 103
EMF 24
Employee support programs 33
Employment equity 104
Energy efficiency 20, 30
EnergyFix 20
EnergyFix services 23
Environment 27
Environmental incidents 11
Events affecting the 2009/10 report 105
Executive remuneration 105
Exemptions from the reporting provisions 106
Finance report 34
Financial highlights 34
Fleet 28-29
Community investments 24, 108
Governance 7, 35
Graduate, cadet and trainee programs 31
Graffiti clean-ups 23
Greenhouse obligations 27
Health and well-being 33
Heritage 29, 110
Human Resources Sub-Committee 37
Indigenous programs 33
Internal control 38
Judicial decisions 110

Index Page Index Page
Key results 11
Leadership team 38
Learning Centre 30
Legislative changes in 2010/11 110
Lost time injury frequency rate 11
Lost time injury severity rate 31
Maintenance tasks undertaken 15
Major substations completed 16-17
Marketplace 19
Medical treatment injury frequency rate 31
Memberships 112
Metering & billing 21
Ministry reporting requirements
demand management 112
Ministry reporting requirements
standard for provision of services 117
Multicultural policies and
services program 118
Network investment 15
Network maintenance 15
Network map 5
Network reliability 11, 19
Noise 25
Occupational health and safety 31-33, 118
Ongoing major works 16
Operational excellence 15
Organisation structure 6
Overseas visit statistics 118
Payment options 21
Payroll giving 25
Property disposal 120
Public awareness 23
Public safety 23
Publications 120
Recycling 26
Reliability performance 19
Renewable energy 27
Research and development 120
Retail & Energy Services Sub-Committee 37
Return on shareholders’ funds 34
Safety improvements 32
Safety performance 31
SAIDI-System average interruption
duration index (customer minutes without supply) 11, 19
SAIFI-System average interruption
frequency index 19
Security 23
Smart Grid, Smart City 17
Smart sensors 17
Solar buy-back 29
Strategic achievements, challenges
and targets 12
Streetlighting 19-20
Supporting the network 16
Time-of-Use billing 21
Voluntary community contributions 25
Waste 27
Workers compensation 31
Workforce 11, 31-33
Working with suppliers 20
Workplace 31
Workplace relations 33
Ausgrid – Annual Report 2010/11 129
Annual Report2010/2011
Head Office
570 George Street Sydney NSW 2000
Telephone 13 15 35
Facsimile 02 9269 2830
Postal Address
GPO Box 4009 Sydney NSW 2001
Ausgrid offices are open between 8.30am and 5.00pm Monday to Friday
Emergency services are available 24 hours a day Telephone 13 13 88
Internet address: www.ausgrid.com.au