annual report 2010 - foskor reports/annual report 2010.pdf · sulphuric acid, phosphoric acid ......
TRANSCRIPT

Annual Report 2010
determined delivery of value

Fosk
or A
nnua
l Rep
ort 2
010
3
AbOut FOskOR 1
Vision, mission, values and strategic goals 1
Company profile 1
Highlights of the year 2
Five-year review 3
Board of Directors 6
Executive management 8
Chairman’s statement 10
Chief Executive Officer’s review 14
FINANCIAL AND OPERAtIONAL REVIEW 18
Group financial performance 19
Operational review 24
Foskor Phalaborwa: Mining Division 24
Foskor Richards Bay: Acid Division 27
Review of mineral resources and ore reserves 28
CORPORAtE gOVERNANCE 34
Introduction 34
Board and Board sub-committees 35
Enterprise Wide Risk Management 40
Internal control and internal audit 42
Mine site rehabilitation and closure 45
sustAINAbILIty REPORt 48
Introduction 48
Corporate social investment 49
Social performance indicators 54
Economic empowerment 60
Environment 64
FINANCIAL stAtEmENts 68
Directors’ declaration 70
Independent auditors’ report 71
Directors’ report 72
Principal statements 75
Notes to the financial statements 80
OthER INFORmAtION 135
Directorships held in other companies 135
Company Secretarial notice 136
Glossary 137
Administration 141
CONTENTS

Fosk
or A
nnua
l Rep
ort 2
010
1
AbOuT FOSkOr
Resolved• as per our competitive advantage;Responsibly• handled and followed through with impeccable execution;
Respectfully• considered, advised and delivered; and Rewarded• generously and consistently.
Vision Foskor is internationally respected for competing with determination in the profitable and responsible beneficiation of phosphates to the sustained benefit of all stakeholders.
mission Foskor continues to earn the respect of stakeholders by competing internationally in the beneficiation of phosphates. We take pride in our heritage of creating value through profits.
Values Any undertakings with the Foskor family will be:
Foskor is a proudly South African producer of phosphates and phosphoric acid with international exposure. Foskor unlocks shareholder value through the profitable, responsible and sustainable beneficiation of phosphate rock into either phosphoric acid or phosphate-based granular fertilisers sold globally.
Meet and exceed production targets;•Reduce costs per ton of output;•Manage operational risks; •
Grow through product and market diversification;•Maintain its world-class safety record; and•Maintain its employer of choice status.•
strategic goals In 2010/11 Foskor aspires to:
table 1: Foskor at a glance
OperationsPermanent
staff headcount 1
Achievements Certifications
Phalaborwa Mining 1,133
• DEKRAFiveShieldsaward
• 0.32DIFR• 2.2millioninjury-free
hours
• ISO9001–QualityManagement
• ISO14001–EnvironmentalManagement
• OHSAS18001–OccupationalHealth and Safety Management
• SANS16001–HIV/AIDSManagement
Richards bay
Acid and Fertiliser
602
• DEKRAFiveShieldsaward
• 0.28DIFR• 1.4millioninjury-free
hours• Awarded:Employerof
the Year 2008/09; Above and Beyond Award for service excellence; and Premium Award, by the Zululand Chamber of Commerce and Industry
• ISO9001–QualityManagement
• ISO14001–EnvironmentalManagement
• OHSAS18001–OccupationalHealth and Safety Management
• SANS16001–HIV/AIDSManagement
total workforce
Group1,735
1 As at 31 March 2010. Numbers of contract/temporary workers vary according to operational needs.
COMPANY PROFILE
Foskor is the only vertically integrated phosphate producer in South Africa. From phosphate-bearing ores, the operations in Phalaborwa mine and process phosphate rock concentrate, which is crucial for stimulating and raising crop yields. The Richards Bay plant manufactures sulphuric acid, phosphoric acid and phosphate-based granular fertilisers (MAP and DAP) by using phosphate rock as a raw material.
About 84% of Phalaborwa’s phosphate rock concentrate is railed to Richards Bay and the rest is sold externally. The Acid Division exports phosphoric acid to India, Japan, Bangladesh, the Netherlands, Mexico and Dubai. Phosphoric acid has agricultural, industrial, medical and retail applications. Products made from phosphoric acid include catalysts, rustproofing materials, chemical reagents, latex, dental cements, tooth whiteners, toothpaste, disinfectants, food supplements, carbonated beverages, waxes, polishes and animal feeds, among others.

Fosk
or A
nnua
l Rep
ort 2
010
2
• Revenue of R3.5 billion – despite sharp pull-back in demand
• Operating profit of R345 million – better than the expected
break-even
• Foskor entered into new export markets
• BEE announcement was made in July 2009
• Foskor attained three new mining licences
• Pyroxenite Expansion Projects on time and within budget
• Zero fatalities
• Foskor retained its ISO, OHSAS and SANS certifications
HigHligHTS OF THE yEAr

Fosk
or A
nnua
l Rep
ort 2
010
3
2010 2009 2008 2007 2006R’m R’m R’m R’m R’m
Group statement of financial position
Non-current assets 3,182 2,110 2,397 1,875 1,819 Current assets 1,613 2,561 3,264 2,427 1,558 Total assets 4,795 4,671 5,661 4,302 3,377
Non-current liabilities 816 666 554 721 401 Current liabilities 497 849 2,462 553 500 Total liabilities 1,313 1,515 3,016 1,274 901
Net assets 3,482 3,156 2,645 3,028 2,476
Group statement of comprehensive income
Revenue 3,465 10,159 3,869 2,950 2,574
Operating profit 345 2,747 1,102 351 5
Earnings before interest and tax (EBIT) (7) 2,750 1,100 351 5Net finance income 28 199 (18) 187 28 Net foreign exchange profits/(losses) 28 (294) (44) 19 12
Profit/(Loss) before tax from continuing operations 49 2,656 1,038 558 45 Income tax expense (107) (793) (258) 23 (1)Profit/(Loss) after tax from continuing operations (58) 1,863 780 581 44 Profit/(Loss) after tax from discontinued operations - 56 60 - - Total group profit/(loss] (58) 1,919 840 581 44
Group cash flow statement
Cash flows from operations 986 1,085 994 451 132 Capital expenditure 824 489 360 150 104 Free cash inflow 155 631 640 219 58
Total assets revenue
Revenue and total assets
2006 2007 2008 2009 2010
12,000
10,000
8,000
6,000
4,000
2,000
–
r’m
Free cash inflow/(outflow)
r’mFree cash flows
800
600
400
200
–2006 2007 2008 2009 2010
FivE-yEAr rEviEw
Total group profit/(loss)
Profit/(Loss) after tax
2006 2007 2008 2009 2010
2,500
2,000
1,500
1,000
500
–
-500
r’m

Fosk
or A
nnua
l Rep
ort 2
010
4
2010 2009 2008 2007 2006
Key drivers
Average exchange rate R/US$ 7.84 8.71 7.09 7.02 6.37 P2O5 CFR sales price ($/ton) 583 1,505 607 462 440 P2O5 CFR sales price (R/ton) 4,567 13,112 4,337 3,275 2,806 Sulphur FOB purchase price ($/ton) 40 499 104 58 65 Sulphur CFR purchase price ($/ton) 68 540 175 83 85 Sulphur CFR purchase price (R/ton) 604 4,401 1,263 606 573 Ammonia CFR purchase price ($/ton) 310 704 324 341 320 Rock FOB sales price ($/ton) 110 188 72 58 59 Rock FOB sales price (R/ton) 897 1,737 513 404 376 Granular FOB sales price ($/ton) 416 1,076 544 307 283 Granular FOB sales price (R/ton) 3,260 9,375 3,855 2,154 1,801 P2O5 - Production volume (‘000 tons) 622 659 692 529 626 P2O5 - Sales volume (‘000 tons) 459 565 557 498 581 Granular - Production volume (‘000 tons) 307 163 261 137 190 Granular - Sales volume (‘000 tons) 292 149 261 164 177 Rock - Production volume (‘000 tons) 2,190 2,415 2,382 2,670 2,528 Rock - Sales volume (‘000 tons) 2,243 2,529 2,911 2,520 2,606
2,190
’000 tons2,900
2,700
2,500
2,300
2,100
1,900
rock – Production volume (’000 tons)
2,528
2,670
2,382
2,415
Phosphate Rock Production Volume
2006 2007 2008 2009 2010
190
307
137
261
163
granular - Production volume (’000 tons)
350300250200150100
50-
’000 tons granular Production Volume
2006 2007 2008 2009 2010
750
700
650
600
550
500
’000 tons P2O5 Production Volume
626
622
529
692
659
2006 2007 2008 2009 2010
P205 – Production volume (’000 tons)
650
550
450
350
250
150
50
$/ton
Sulphur CFr purchase price ($/ton)
sulphur CFR Purchase Price ($/ton)
83175
540
6885
2006 2007 2008 2009 2010
210
180
150
120
90
60
30
$/ton
rock FOb sales price ($/ton)
188
11059 58 72
Rock FOb sales Price
2006 2007 2008 2009 2010
1,600
1,200
800
400
-
$/ton
P205 CFr sales price ($/ton)
P2O5 CFR sales Price
583440 462 607
1,505
2006 2007 2008 2009 2010
granular FOb sales price ($/ton)
1,200
800
400
-
$/ton granular FOb sales Price
416283 307
544
1,076
2006 2007 2008 2009 2010
Average exchange rate r/uS$
9.00
8.00
7.00
6.00
5.00
r/$
7.84
6.377.02
7.09
8.71
Average Exchange Rate
2006 2007 2008 2009 2010

Fosk
or A
nnua
l Rep
ort 2
010
5
2010 2009 2008 2007 2006
Trends
ProfitabilityOperating income to revenue (%) 9.96 27.03 28.47 11.90 0.19Pre-tax margin (%) 1.41 26.14 26.83 18.91 1.75
Asset managementReturn on assets (%) (1.21) 41.09 14.84 13.50 1.30Return on equity (%) (1.67) 60.81 31.75 19.18 1.78
Solvency and liquidityCurrent ratio (times) 3.25 3.02 1.33 4.39 3.12 Debt to equity ratio (%) 0.00 0.00 0.00 0.00 0.00
ProductivityNumber of employees at year end 1 1,753 1,723 1,805 1,799 1,783 Average revenue per employee (R’000) 1,977 5,896 2,143 1,640 1,444 P205 - Production volume (‘000 tons) 622 659 692 529 626 Granular - Production volume (‘000 tons) 307 163 261 137 190 Rock - Production volume (‘000 tons) 2,190 2,415 2,382 2,670 2,528
Major cost items (R’million)Staff costs 1 604 526 446 362 401 Repairs and maintenance 376 376 294 297 258 Depreciation 172 163 123 109 96 Capex 825 489 360 150 104
1 Zirconia excluded from 2009
Operating income to revenue (%)
30.00%
20.00%
10.00%
0.00%2006 2007 2008 2009 2010
Operating income to revenue (%)
0.19%
11.90%
28.47% 27.03%
9.96%
Current ratio (times)
2006 2007 2008 2009 2010
Current ratio
5.00
4.00
3.00
2.00
1.00
0.00
4.39
3.02
1.33
3.12 3.25
return on equity (%)
Return on equity (%)
80.00%
60.00%
40.00%
20.00%
0.00%
-20.00%
1.78%19.18%
31.75%
60.81%
2006 2007 2008 2009 2010
-1.67%
Average revenue per employee (r’000)
Revenue per employee
1,4441,640
2,143
5,896
7,000
6,000
5,000
4,000
3,000
2,000
1,000
r’000
2006 2007 2008 2009 2010
1,977

Fosk
or A
nnua
l Rep
ort 2
010
6
bOArd OF dirECTOrS
1. Mr MG Qhena 3 (Age 44) BCompt (Hons), CA (SA), SEP, Adv Tax Cert non-executive director and Chairman Mr Qhena is a non-executive director and the Chairman of
the company. He is also the Chief Executive Officer (CEO) of the Industrial Development Corporation of South Africa (IDC), Foskor’s parent company.
2. Mr Ma Pitse 1 2 3 (Age 55) BCompt (Hons), MBL, CA (SA) executive director and President/Chief executive Officer Mr Pitse is an executive director and is currently the President
and Chief Executive Officer (CEO) of Foskor. Prior to joining the Foskor group in June 2003, he was the CEO of Prilla 2000 (Pty) Ltd, a South African textile manufacturer, from January 2002 to June 2003, where he continues to hold the position of Chairman. Before that, he worked for the IDC as the Head of the Finance Department and was responsible for the IDC’s internal financial reporting and planning function.
Mr Pitse was the elected President of the Fertiliser Society of South Africa (FSSA) from 2005 to 2007 and currently serves as the elected Vice President of the FSSA. He serves as the Vice President, representing South Africa, of the International Fertiliser Association (IFA). He also serves as the President of the Africa Forum of IFA.
3. Mr A VellAyAn 3 4 (Age 57) BCom, Ind Admin, MBS non-executive director Mr Vellayan is a non-executive director of Foskor. He is
the Executive Chairman of the Murugappa group, and the Chairman of Coromandel International Ltd (CIL) and EID- Parry (India) Ltd. CIL has a 14% shareholding in Foskor. Mr Vellayan is also Co-chairman of the Fertiliser Association of India and serves on the Board of the Indian Overseas Bank.
4. Mr G VAn Wyk 1 3 (Age 50) BCom (Hons), MCom, MBL, AMP (INSEAD) non-executive director Mr van Wyk is a non-executive director of Foskor and is
currently the Chief Risk Officer at the IDC, with responsibility for the overall risk management function within the IDC. Mr van Wyk is also responsible for ensuring compliance with environmental, health and safety requirements, and for management of the restructuring of investments and the valuation of assets financed. Prior to this appointment in 2004, he was the Executive Vice President at the IDC, responsible for the new economy sector corporate finance division. From 1995 to 1999 he served as the Chief Economist of the Research and Information Department at the IDC.
5. Ms ss nGoMA 1 (Age 34) BCom (Hons), CA (SA) non-executive director Ms Ngoma is a non-executive director of Foskor and is
currently the Head of the Internal Audit Department at the IDC, with responsibility for developing and implementing the internal audit strategy for the IDC. From 2003 to 2006 Ms Ngoma served as the Senior Account Manager in the metals business unit of the IDC.
1. 2. 3. 4. 5.

Fosk
or A
nnua
l Rep
ort 2
010
7
6. Ms JM Modise 3 (Age 47) BCom, MDP, SEP, MBL Non-executive director Ms Modise is a non-executive director of the company. She
is currently a member of the executive of the IDC. Prior to this, Ms Modise served as the Human Resources Director and Executive at various organisations, including Hewlett Packard South Africa, SAP Africa, Mutual & Federal and most recently Sappi Southern Africa. Ms Modise was also involved in management consulting and property investment.
7. dr ds Phaho 2 (Age 42) BSc (Hons), MSc, PhD independent non-executive director Dr Phaho is an independent non-executive director of the
company and is currently the CEO of the Tshumisano Trust, a Department of Science and Technology agency dedicated to improving the competitiveness and innovation capacity of small and medium enterprises in key manufacturing sectors of the economy.
Dr Phaho is responsible for the overall management and strategic direction of the Tshumisano Trust. Before joining the Department of Science and Technology, Dr Phaho was a Research Group Leader at Sasol Technology (until June 2004). He serves on the Board of Pikitup (Pty) Ltd as a non-executive director and is the Chair of Council for the Vaal University of Technology.
8. Mr F Madavo 2 (Age 50) BSc (Hons) Chem Eng, MSc, IEDP Independent non-executive director Mr Madavo is an independent non-executive director of
Foskor and is currently employed at the Public Investment Corporation (PIC) Ltd as the Portfolio Manager in Resources. The PIC is an investment management company, wholly owned by the government of South Africa, and manages a diversified portfolio of assets. Mr Madavo is responsible for all equity research and investments made by the PIC in listed resource companies.
Prior to joining the PIC, Mr Madavo was the Vice President of Metals and Mining at Citigroup, and was primarily responsible for equity research on platinum companies listed on the JSE. He has worked for a number of companies in South Africa and abroad.
9. Mr M BooI 1 (Age 48) BCompt (Hons), CA (SA), CIMA Independent non-executive director Mr Booi is an independent non-executive director of Foskor
and is currently a director of Ernst & Young, one of the Big Four global accounting firms. Mr Booi was previously the CEO of the audit firm Gobodo Inc (2000–2003) and has also worked as an Investment Executive at an investment company, Amabubesi (2003–2006).
For a list of directorships held by Foskor directors in other companies, refer to page 135 of this report.
1 Board Audit and Risk Committee member2 Board Technical Committee member3 Board Human Resources Committee member4 Non-resident
6. 7. 8. 9.

Fosk
or A
nnua
l Rep
ort 2
010
8
ExECuTivE mANAgEmENT
1. 2. 3. 4. 5.
1. Mr MA Pitse (Age 55) BCompt (Hons), MBL, CA (SA) executive director and President/Chief executive Officer Mr Pitse has been the President and Chief Executive Officer
(CEO) of Foskor since 2003. He provides strategic leadership to the company and ensures the implementation of corporate strategies, policies and procedures for the group. His key roles include managing the Foskor group, meeting the Board’s goals and strategic objectives and liaising on behalf of Foskor.
2. Mr tJ KOeKeMOer (Age 59) BCom (Hons), CA (SA), AEP Chief Financial Officer Mr Koekemoer has been the Chief Financial Officer of Foskor
since 2002 and is responsible for developing and implementing financial strategies, policies and procedures in the reporting responsibilities of the group. His role includes ensuring compliance with IFRS and statutory requirements. In addition, he is in charge of providing strategic recommendations and guidance to senior management on all financial matters. His primary responsibilities include the management of budget processes, tax, risk and the treasury.
3. Mr JW HOrn (Age 39) BEng, Pr Eng, MSAIIE, BB&A (Hons), MBA Vice President: Mining Mr Horn is the Vice President responsible for ensuring the
sustainable and profitable management of the Phalaborwa operations. He has held an executive management position for the past 8 years, since he joined Foskor in January 1994.
He is responsible for the development and implementation of operational strategies, policies and procedures for the mining and beneficiation operations and the completion of the strategic Pyroxenite Expansion Project (PEP).
Mr Horn is also a director of Foskor Zirconia (Pty) Ltd, the Chairman of the Foskor Environmental Rehabilitation Trust and a trustee of the Foskor Social Responsibility Trust.
4. Mr JWT PoTgieTer (Age 52) NHD Chem Eng (Hons), MBA Vice President: Acid Mr Potgieter has been the Vice President of the Acid Division
since 2007 and is responsible for managing the sulphuric, phosphoric and granulation operations at the Richards Bay plant and ensuring continued operations and optimal profitability. He is also responsible for the coordinated development and implementation of operational strategies, policies and procedures, and managing performance of the production, technical services, SHREQ, human resources, procurement, and finance functions at the Richards Bay plant.
5. Mr KM Cele (Age 38) BCom (Hons), IEP (INSEAD) Vice President: Procurement and logistics Mr Cele is the Vice President of Procurement and Logistics
and is responsible for Foskor’s procurement of both strategic materials and operations’ requirements. He has been with Foskor since December 1999. He is mainly responsible for effectively developing and implementing procurement and

Fosk
or A
nnua
l Rep
ort 2
010
9
6. 7. 8. 9.
logistics strategies, managing on- and off-shore logistics, and negotiating price and other procurement agreements. Mr Cele creates and maintains strategic procurement and logistics business alliances. He is also responsible for enhancing and driving transformation through BEE procurement and enterprise development.
6. Ms Xs LuthuLi (Age 36) BSocSci, PDP, IEP (INSEAD) Vice President: human Capital Ms Luthuli has been the Vice President of Human Capital since
November 2006. She is responsible for Foskor’s recruitment, strategic talent management, training, employee relations and remuneration. She oversees various human capital projects, including organisational development and change management.
7. Mr MP Mosweu (Age 47) NHD Elec Eng, GCC, MAP, MBA Vice President: strategy and New Business Development Mr Mosweu has been the Vice President of Strategy and New
Business Development since February 2009. He is responsible for developing and overseeing the implementation of Foskor’s growth strategy. He manages strategic business development projects, identifies new opportunities for the group and advises on the advancement of the business. He has more than 22 years of experience in engineering, project management, new business development and strategic formulation and implementation in various industries.
8. Mr SMS SibiSi (Age 45) BA LLB, AMP (INSEAD) Vice President: Corporate Affairs Mr Sibisi has been the Vice President of Corporate Affairs since
April 2009, and is responsible for the legal and compliance, risk management, corporate communications, company secretariat and stakeholder relations functions at Foskor. Before joining Foskor he was the General Counsel at the IDC for four years, responsible for the legal, international finance and investment monitoring departments.
9. Mr G SkhoSAnA (Age 53) BCom, MDP, ASMP Vice President: Marketing and Sales Mr Skhosana has been the Vice President of Marketing and
Sales at Foskor since 2004 and has the task of establishing and maintaining strategic business alliances, and developing and implementing the marketing and sales strategy. He sets targets for both local sales and exports. He has more than 25 years’ experience in sales and marketing of consumer goods and more than 6 years’ experience in sales and marketing of phosphates and other fertiliser products.

Fosk
or A
nnua
l Rep
ort 2
010
10
Fosk
or A
nnua
l Rep
ort 2
010
10
‘these are the times that try men’s souls.’ (thomas Paine)

Fosk
or A
nnua
l Rep
ort 2
010
11
CHAIRMAN’S STATEMENT
The 2009 year was largely characterised by consolidation in the banking sector, stimulus packages, policy interventions, market corrections and price normalisation. This was in response to the financial crisis triggered in September 2008. After a deep global recession, economic growth is ticking up moderately as the effects of stimulus packages from governments begin to be felt. Policy interventions are progressively supporting demand, such that systemic risk is waning and investors’ insecurities and fears are being allayed.
thE FINANCIAL CRIsIs
The global liquidity crunch was precipitated by banks funding loan portfolios for financial innovations such as securitised loans and off-balance sheet vehicles through the capital and money markets. When creative equity capital leveraging in a multitude of ways spread from the USA to other territories, an unsustainable investment boom resulted. The fragility of the global financial system and the extent of the interconnectivity of other financial systems to the USA’s was totally unpredicted. The resulting systemic risk was also totally unforeseen by market participants and regulators. Furthermore, the absence of an authority regulating all aspects of the global financial system meant that the watchdogs lacked sufficient information to piece the risk factors together.
As the crisis intensified, trade finance evaporated into thin air and the associated costs escalated dramatically because
of growing liquidity pressures in mature markets. As a result of rising country and counterparty risks, trading partners’ indebtedness and insurance claims accelerated. Finance houses also demanded additional guarantees from importers. This led to short-term exposures drying up rapidly while banks and other financial institutions deleveraged.
Both Dubai World’s recent plea for a six-month debt standstill to its creditors and Greece and Mexico’s credit downgrades prove that the crisis overhang is still sorely felt. Policy makers in both developed and emerging markets have stepped in to protect country balance of payments and to curtail further credit erosion. Towards the end of 2009, developing economies regained safe haven status as risk aversion dropped and stock markets rebounded. The resulting strengthening of capital inflows attributable to relatively high interest rate differentials saw emerging markets’ exchange rates appreciate against the US dollar to pre-crisis levels, while prior stock market losses recovered gradually.
The unprecedented global recession has certainly altered the financial landscape in the short to medium term. To counter the effects of the crisis and prohibit a recurrence, authorities have to strengthen financial regulation to reduce excessive risk-taking by financial intermediaries by either imposing higher capital requirements or limiting risky lending. Furthermore, risk management strategies such as capital controls and reserve accumulation should be directed at reducing financial volatilities. Also, all market participants (both lenders and borrowers) need to become more risk averse and financially literate.
Mr MG Qhena Chairman (Non-executive director)

Fosk
or A
nnua
l Rep
ort 2
010
12
sOuth AFRICA
As in most emerging markets, carry trade exerted upward pressure on the real effective exchange rate and the rand appreciated against the weakening dollar. A strong rand coupled with weak commodity prices meant that many local resource producers lost external competiveness at a time when demand remained constrained.
With the resource and manufacturing sectors struggling, among others, tomaintain and create jobs, South Africa’s economicgrowth contracted for three consecutive quarters since 2008, notably being the first recession in 17 years. Domestic output measured -2.8% in the second quarter of 2009 at an annualised rate.
COmmODItIEs
Prior to 2000, commodity trade was mainly focused on traded and industrial metals. Between 2003 and 2008, non-energy commodity prices doubled, while fuel and other energy commodities rose by as much as 170%. These price pressures resulted from strong country growth, especially in China, coupled with supply-side shortfalls. Grain prices soared as inventory stockpiles diminished in favour of biofuels, given arable land shortages. Excess demand saw commodities peaking in the third quarter of 2008, before plummeting towards the end of 2008 and into 2009. As such the US dollar price of agricultural goods retreated by about 30% in 2009 from previous levels. Phosphate-based fertilisers followed suit with similar price contractions over the past year.
With regard to mining, cost saving measures and cutbacks in demand fuelled the downturn in the commodities cycle. The bottomlinesofmanymineswere further impactedbyprojectcancellations due to financing limitations, tight scrap markets and industrial action. Moreover, many South African mines, including Foskor’s, face declining ore grades, and environmental and land rehabilitation, as well as water and electricity price pressures.
The global economy
The main drag on global growth comes from high-income countries such as those in the Organisation for Economic Co-operation and Development (OECD), Japan and also the USA.
‘The global economic crisis affected developing countries first and foremost through a sharp slowdown in global industrial activity due to a sudden cut in investment programs, consumer durable demand, and a widespread effort to reduce inventories in the face of uncertain conditions. Falling export demand, commodity prices and capital flows exacerbated and extended the downturn. Overall, growth in developing countries declined to an estimated 1.2% in 2009, down from 5.6% in 2008.
Among developing country regions, economies in Europe and Central Asia were hit hardest by the crisis, with gross domestic product (GDP) contracting by 6.2%. The main causes were lower oil prices in Russia and difficulties in funding large current account deficits in a risk adverse environment.
Growth in the East Asia and Pacific region (particularly China) as well as in South Asia (particularly India) has been resilient, buoyed by a massive fiscal stimulus package in China and by India’s skilful macroeconomic management. Between 2008 and 2009, growth in the East Asia and Pacific region is estimated to have eased by only 1.2 percentage points to 6.8%, while South Asian growth has remained stable at 5.7%. GDP growth in China slowed from 9% in 2008 to 8.4% in 2009.’(Source: World Bank: Global Economic Prospects: Crisis, Finance and Growth 2010).
The above signifies a definitive shift away from the previous powers (America and Europe) to Asia and the Pacific Region. It also reiterates our view, that Foskor is correctly positioned to optimise the growth opportunities that India presents. Foskor remains mindful of China’s dominant market position in the fertiliser industry and takes cognisance of the detrimental impact that China’s expansion and trade policies have on the prices of fertilisers around the world.

Fosk
or A
nnua
l Rep
ort 2
010
13
FOskOR
2009 proved to be a particularly testing year for Foskor. The challenges brought about by weak demand and prices and also rand appreciation were exacerbated by productivity hurdles. The focus on various operational matters detracted from production targets throughout the year. I am however pleased that despite all the difficulties encountered, Foskor’s Austerity Measures Task Force successfully implemented cost saving initiatives. Foskor therefore generated operational profit of R345 million, better than the break-even position that was initially anticipated.
In July 2009, the Manyoro Consortium, the Ba-Phalaborwa and uMhlathuze communities, and employees of Foskor and Foskor Zirconia were named as the company’s black economic empowerment (BEE) partners. The after tax loss is largely attributable to the costs associated with this transaction (labelled share-based payment expense in the financial statements).
Foskor has accessed a facility from the Industrial Development Corporation of R1 billion, to ensure that it continues with the expansion and resource protection plan required to meet the project’sfuturedemand.
thE INItIAL PubLIC OFFERINg
During the period under review, initial public offering (IPO) activities remained subdued around the globe. The only deals worth mentioning by size and value happened in China, Brazil and India. Foskor’s Board postponed listing on the securities exchange until market direction becomes clearer. We trust that future investors will prefer better returns yielded by improved market conditions and sound economic fundamentals. A listing date will be published as soon as the Board is convinced that complete confidence and market recovery have returned to the domestic economy.
OutlOOk
The current rebound in the economy is likely to continue albeit moderately. However, hindsight will determine what impact the withdrawal of stimulus packages in 2010 will have on the global economy and which policy interventions were effective. The return of private sector confidence is cautiously anticipated, the onset of which will hopefully revive positive consumer sentiment. It is likely that the negative wealth effects brought about by the crash, and exacerbated by rising unemployment and mounting household indebtedness, will dampen consumer demand for some time to come. The anticipated falling food prices will stimulate the demand for both animal feed and grains and, as such, the need for fertiliser.
Foskor’s management is going to great lengths to improve efficiencies and is implementing productivity enhancing growth strategies. These strategies involve simultaneously addressing underlying structural problems such as poor controls, lack of staff discipline and narrowing the skills gap, while complying with regulatory and corporate governance requirements.
From an economic perspective, trading conditions in 2010 are likely to remain tough, with lack of clarity in the European Union on the extent of debt from some of the countries. I trust that Foskor will resolve many of its capacity problems speedily and that it is correctly positioned to take advantage of the expected upswing in demand and prices. I expect Foskor’s production in the forthcoming year to surpass the production targets on time and within budget. As always, I remain indebted to the Board for their loyalty and support. Together, we will steer Foskor through another trying period and yield positive outcomes.

Fosk
or A
nnua
l Rep
ort 2
010
14
‘most of the important things in the world have been accomplished by people who have kept on trying when there seemed to be no hope at all.’ (Dale Carnegie)
Fosk
or A
nnua
l Rep
ort 2
010
14

Fosk
or A
nnua
l Rep
ort 2
010
15
CHIEF ExECUTIVE OFFICER’S REVIEW
Operating in an already saturated market, Foskor’s mettle, both as a profit-making entity and as a family, was tried and tested in every possible way during the 2009/10 financial year (FY2010). The financial crisis peaked towards the end of 2008 and drove commodity prices to 2003 levels. Market dynamics led to continuous rand strengthening against the US dollar, and the deepening global recession saw demand pull back significantly. The impact of these harsh market conditions on the company was exacerbated by capacity problems that ultimately led to unmet production targets.
We were aware of the hardening trading conditions at the start of the financial year, and although we were prepared to face the worst we still remained optimistic that the recession would be short-lived and that profits would normalise quickly. We hoped to break even (worst case scenario) or generate pre-2008 profits (best case scenario under normal market conditions). In the end, our output was somewhere in between, with operating profit recording R345 million.
We are very excited about the opening of the new mine at the Phalaborwa operation. Mining in the South Pyroxenite pit has become a necessity as the existing stockpiles are almost depleted. The North Pyroxenite pit is becoming too deep and yields lower grade phosphate ores with varying mineralogy.
These lower grade ores frustrate production technologies, especially those at Extension 8, causing incessant breakdowns and pushing maintenance and output costs to uncompetitive levels.
We are pleased that the phosphate ores that are now being mined, at the South Pyroxenite pit, are of a superior quality; the better ore grades have almost succeeded in eliminating the equipment failures that were previously experienced. With a new phosphate ore reserve of at least 70 years and better functioning machinery, I am certain that in 2010/11 output will quickly be ramped back up to the normal level of 2.5 million tons of phosphate rock concentrate, reaching the target of 3 million tons by 2013/14.
Foskor’s productivity in the year under review was negatively impacted by numerous factors, some beyond our control. Delays in attaining three new mining licences caused a shortfall in production of phosphate rock concentrate at the mine in Phalaborwa; and the first blast at the South Pyroxenite mine only took place on 22 September 2009, much later than anticipated.
The concurrence of capacity constraints and contractions in demand sounds contradictory, but Foskor was in an exceptionally fortunate position where end product sales were maintained throughout FY2010. The Foskor marketing team delivered on its promise to diversify into new markets. The market diversification
Mr MA PitsePresident/Chief Executive Officer (Executive director)

Fosk
or A
nnua
l Rep
ort 2
010
16
Bay Division received a R1.1 million rebate from the Chemical IndustriesEducationandTrainingAuthorityforon-the-jobskillsdevelopment.
I wish to emphasise how proud I am of Foskor Richards Bay’s progress on becoming environmentally friendly. The plant expended substantial amounts on reducing sulphur emissions and eradicating foul odours released into the atmosphere. The Acid Division also made a concerted effort to cut groundwater pollution by improving storm water systems. To conserve water, a potable-water surge tank, due for completion by June 2010, is under construction. Alternative uses and disposal options for gypsum and other by-products are being sought. The plant’s conservation strategy strives to preserve the environment and have minimal impact on the surrounding marine and aquatic life. In addition, the division is augmenting the municipal supply of electricity to the plant by generating power from its waste steam. Foskor’s Acid Division has certainly come a long way from the days when environmentalists sought its closure.
In Phalaborwa, the R1.2 billion Pyroxenite Expansion Project(PEP) is on track and within budget. PEP1a was the development of the new South Pyroxenite opencast mine and its associated infrastructure. PEP1b refers to the installation of a primary gyratory crusher and an overland conveyor system needed to move ore from the new mine to the existing plant. PEP2 is the de-bottlenecking of the existing Extension 8 plant, meaning the addition of crushing and milling capacity, with expected completion in March 2011. Phalaborwa’s Mining Division’s environmental projects includeworkdoneontheSelati tailingsdamandnewengineering designs for the water management systems.
In July 2009 Foskor announced that the Manyoro Consortium, the Ba-Phalaborwa and uMhlathuze communities, and Foskor staff, together with Foskor Zirconia’s employees, will be the new black economic empowerment (BEE) equity partners of the Industrial Development Corporation, CIL and Sun International (a company that is based in India and is an agent of Foskor).
strategy reduced the company’s dependency on India, bringing phosphoric acid sales to India to 43% of total sales, compared to 66% a year ago. For the review period, Foskor exported phosphoric acid to Bangladesh, Indonesia, Japan, Europe, Dubai and Mexico. Led by Mr G Skhosana, the team aims to increase sales outside India, to 30% by 2013 as it pursues new customers in North America and elsewhere for the additional planned output.
Foskor’s phosphoric acid inventories at the Richards Bay acid plant remained low. The Acid Division was plagued by problems over the past year, such as the fire in the sulphur storage shed that halted production for two days. We were deeply moved by the assistance and support that the company received from the Richards Bay business and local communities, the media and also the municipality. Through their dedicated efforts and quick reactions, the fire was successfully extinguished with minimal environmental damage and no fatalities. I extend my heartfelt gratitude to these parties.
The ageing acid plant requires more maintenance and more frequent and intensive shutdowns. The smooth running of this plant also requires technical and engineering expertise and experienced managers. The skills gap in South Africa is well documented and needs no further elaboration on my part. To address these shortages, Foskor entered into a technical assistance agreement (TAA) with our Indian partner, Coromandel International Ltd (CIL). The TAA will endeavour to raise and improve Foskor’s technical, safety, procurement, capital expenditure, research, technological and recruitment capabilities. This contract has been extended to March 2012 to allow adequate skills transfer and returns on human capital investment. We have also recruited four engineers from India through CIL to strengthen the supervisory function and to curb overspending and downtime on repairs.
I am delighted that Foskor Phalaborwa attained accreditation for offering training in metallurgy, technical fitting and turning, and mineral excavation. For the period under review, the Richards

Fosk
or A
nnua
l Rep
ort 2
010
17
Foskor encourages agrarian reform and develops emerging farmers through Mion (Pty) Ltd’s farmer assistance centres in KwaZulu-Natal.Emergingfarmersareadvisedonandtrainedin land cultivation techniques. The centres promote agricultural enhancement practices and serve as distribution points for fertiliser and basic farming tools. Foskor holds the view that we have a moral obligation to combat hunger and help alleviate poverty in Southern Africa. By offering assistance to Mion, FoskorhelpsimprovefoodsecurityinKwaZulu-Natal.
OutLOOk
I am upbeat about the prospects that 2010 brings. Greater clarity and market direction are coming to the fore. Although the direction that the rand will take remains anybody’s guess, commodity prices seem to have bottomed out and are gaining momentum at the same time that demand is reviving. As the after-effects of the financial crisis wear off and access to finance returns, farmers around the globe are growing their businesses. Moreseedsarebeingplanted–spurredonbythedemandfornutrients, food, feed and biofuel.
Foskor’s distribution networks are growing through the market diversification strategy. A new department, the Strategy and New Business Development Division, has been created to focus on product diversification through both acquisitive and organic growth. In time, the combination of the product and market diversification strategies will balance the company’s portfolio, steady sales volumes and protect cash flow during economic downturns.
Foskor’s competitive advantage in the domestic market lies in the fact that we are the only vertically integrated phosphate producer in South Africa. Sasol Nitro closed its plant in Phalaborwa in October 2009 and Omnia has signalled its intention to stop producing phosphates in the near future. The South Pyroxenite pit guarantees ore reserves for the next 70 years and positions the company to adequately supply the shortfall in the domestic market. Foskor will continually upgrade its granulation capacity,
while growing its supply chain and distribution networks. The company remains committed to implementing financial and managerial discipline, while raising output and containing input costs.
To ensure Foskor’s survival through the trying times, an Austerity Measures Task Force was formed to monitor and curtail excessive and unnecessary spending across all the functions. The Procurement and Logistics Division played a critical role in this regard and successfully managed to contain price increments. On average, annual price increases were maintained below 7%. The Procurement and Logistics Division also successfully updated and streamlined its supplier database, giving preferential treatment to vendors meeting the specified BEE criteria.
As always, we are deeply indebted to our Board for their stewardship and loyalty through the tough times. We believe that we are correctly positioned for growth; and now that the capacity constraints have been dealt with, we are adequately geared to take advantage of the economic upturn. Both the Mining Division and the Acid Division are certain that FY2011 is the year in which they will meet and possibly exceed production targets. The implementation of the various growth strategies combined with a workforce that is determined to deliver will secure Foskor’s future and protect its bottom line for forthcoming generations.

Fosk
or A
nnua
l Rep
ort 2
010
1818
Fosk
or A
nnua
l Rep
ort 2
010
FiNANCiAl ANd OPErATiONAl rEviEw

Fosk
or A
nnua
l Rep
ort 2
010
19
Earnings 31 Mar % 31 Mar
Earnings (r’m) 2010 change 2009
Revenue 3,465 -66% 10,159Gross profit 1,278 -67% 3,874Operating profit 345 -87% 2,747Net finance income 28 -87% 199Net foreign exchange profits/(losses) 28 109% (294) (Loss)/Profit after tax from continuing operations (58) -103% 1,863Profit after tax from discontinued operations - -100% 56 Earnings per share - Continuing operations (rands) (6.39) -103% 211.24
Factors posing major risks to Foskor’s financial performance are: • Exchangeratevolatility;• Commodityprice ;• Maximisingproductionoutputtoincreasecostefficiency;• Completingcapitalexpenditureprojectsontimeandwithin
budget;and• Attracting,developingandretainingskilledstaffwithscarce
and/orcriticalskills.
OutlOOk Thefinancialobjectivesfortheyear2010/11(FY2011)include:• Completionof thePyroxeniteExpansionProject (PEP), and
increasingproductioncapacity;
Group financial performance
• Financing of capital expenditure by means of long-termfundingfacilitiessecuredduringFY2010;and
• Addedfocusonstrategiccostmanagement.
Revenue Thegroup’srevenueinMarch2009wasR10,159billionandthisdecreasedby66%asatMarch2010toR3,465billion,primarilydue to the fall in commodity prices as a result of the globaleconomicrecession.Onaverage,sellingpricesofthecompany’sproductsdecreasedby54%duringtheperiodunderreview.
Thesellingpricesforphosphoricacid,granularfertilisersandphosphaterockasat31March2009wereUS$1,505CostandFreight (CFR) inclusive, US$ 1,076 Free on Board (FOB), and US$188 (FOB),per tonrespectively.During thepastfinancialyearthepricesdecreasedsignificantlythroughoutthefirstthree
Foskor’s main challenge is to maximise the differential between raw material costs and selling prices, while containing operational costs in the process of raising output and improving product quality.

Fosk
or A
nnua
l Rep
ort 2
010
20
Selling prices 31 Mar % 31 Mar(annual averages) 2010 change 2009
P2O5 CFR price ($/ton) 583 -61% 1,505Granular FOB price ($/ton) 416 -61% 1,076Rock FOB price ($/ton) 110 -41% 188
Raw materialsRaw materials 31 Mar % 31 Mar(annual averages) 2010 change 2009
Sulphur FOB price ($/ton) 40 -92% 499Sulphur CFR price ($/ton) 68 -87% 540Ammonia CFR price ($/ton) 310 -56% 704
The commodity price boom in 2008 fuelled the cost of raw material imports (see table above), hence the inflated average input costs as at 31 March 2009. The recent financial crisis and ensuing global recession pushed commodity prices to 2003 levels. Restricted access to financing and poor liquidity globally saw demand pull back and stockpiles build. During the year under review, on average, the CFR cost per ton for sulphur reduced by 87% from US$ 540 to US$ 68, and for ammonia the CFR cost per ton reduced by 56% from US$ 704 to US$ 310. Operating profit Operating profit as at 31 March 2009 was R2.7 billion, dropping by 87% to R345 million in March 2010. The decrease is attributable to the reduced selling prices and the exchange rate. Distribution costs decreased by 27% year-on-year due to lower phosphate rock volumes railed to Richards Bay compared to the previous year. For the period under review, the revenue from copper amounted to R151 million, compared to R112 million in March 2009. Foskor’s copper reserves are now completely depleted.
Finance income and costs Net finance income as at 31 March 2010 was R28 million, down 86% from R199 million in March 2009. This was as a result of a reduction in cash balances due to the repayment of the shareholder loan (R1.4 billion) in FY2009 and the payment of a
consecutive quarters, and the annual average selling prices of the aforementioned commodities as at 31 March 2010 had dropped to US$ 583 (CFR), US$ 416 (FOB), and US$ 110 (FOB), per ton respectively. The decrease in revenue was exacerbated by the strengthening of the South African rand (ZAR) against the US dollar. As Foskor is a net exporter, any appreciation in the rand adversely affects the company’s results.

Fosk
or A
nnua
l Rep
ort 2
010
21
dividend of R1.3 billion to shareholders towards the end of the previous financial year.
Foreign exchange profits or losses Quarterly rand/US dollar 31 Mar % 31 Marexchange rates 2010 change 2009
June 8.46 9% 7.77September 7.79 0% 7.78December 7.49 -25% 9.93March 7.50 -24% 9.93
Year – Average 7.81 -12% 8.85
The net foreign exchange profit for the year ended March 2010 was R28 million, compared to a loss of R294 million as at March 2009. The loss in the previous year resulted from the weakening of the rand and the high costs of imported raw materials (especially sulphur and ammonia). For the financial year ended 31 March 2010, the exchange rate strengthened by 25% in the third quarter and by a further 24% in the fourth quarter compared to the corresponding period in the previous year. The profit in FY2010 is as a result of hedging the bill of lading exchange rate by means of forward contracts, so as to protect revenues.
Taxation Foskor earned insufficient taxable income to be liable for income tax in the year ended March 2010. The tax charge in the income statement results from changes in deferred tax balances. In the year under review, the South African Revenue Service (SARS) appealed against the Income Tax Court’s 2008 decision to exclude the F100 ore stockpiles from trading stock. The matter was heard in the Appellate Division of the Supreme Court, where the court found in favour of SARS; the F100 stockpiles were to be included as trading stock, giving rise to a tax charge of R60.6 million. The S89quat interest of R51.2 million would be waived, however. The net tax cost to Foskor of this judgment is calculated as being R2.4 million and the net interest cost as at 31 March 2010 amounted to R5.3 million.
Net profit after taxNet profit/(loss) after tax decreased year-on-year by 103% to a R58 million loss as at 31 March 2010, primarily as a result of the reasons discussed above.
Earnings per shareEarnings per share decreased by 103% to R6.39 negative as a result of the lower profit results compared to the previous year. The weighted average number of shares was 9,157,647 (2009: 9,157,647).
StatEmENt of fiNaNcial poSitioN
Statement of financial 31 mar % 31 Marposition (R’m) 2010 change 2009
assetsProperty, plant and equipment 2,933 50% 1,956Inventory 753 12% 675Trade and other receivables 341 -77% 1,497Derivative financial instruments 1 -92% 12Cash and cash equivalents 518 41% 366
liabilitiesTrade and other payables 418 -34% 629
property, plant and equipmentThe net book value of property, plant and equipment increased by 50% year-on-year as a result of capital expenditure of R824 million and an impairment reversal of R323 million as at 31 March 2010. R507 million was spent on the PEP during FY2010 and the remainder on other capital projects needed to sustain the business at both operations. The impairment loss of R600 million contributed to the lower balance in 2009.
impairmentIn FY2009, the Acid Division was assessed for impairment as a result of the fall in phosphoric acid prices and the negative

Fosk
or A
nnua
l Rep
ort 2
010
22
economic outlook as at March 2009. An impairment loss of R600 million was recorded in the income statement. For the year under review, the impairment assessment concluded that the operation need no longer be fully impaired; as such R323 million was reversed from the prior year’s impairment loss of R600 million.
Inventory Inventory increased by 12% year-on-year to R753 million, due to marginally higher stock levels and higher costs per ton of finished goods compared to the previous year.
Trade and other receivables Trade and other receivables decreased by 77% year-on-year to R341 million primarily owing to reduced selling prices and tighter cash collection procedures in FY2010.
Cash and cash equivalents Cash and cash equivalents increased by 41% year-on-year to R518 million. The cash balance as at 31 March 2009 was lower as a result of the R1.3 billion dividend payment close to the year-end.
Trade and other payablesTrade payables decreased by 34% year-on-year to R418 million, due to lower raw material costs as at 31 March 2010 for commodities such as sulphur and ammonia.
Cash flow
31 Mar % 31 Mar
Cash flows (R’m) 2010 change 2009
Net cash inflows from operating activities 986 -9% 1,085
Net cash outflows for investing activities (831) 83% (454)
Net cash outflows for financing activities (3) -100% (1,545)
Free cash flows 155 -75% 631
Cash flows from operating activities decreased by 9% year-on-year to a R986 million inflow as at 31 March 2010, as a result of the reduction in profits and set off by a decrease in working capital of R837 million.
Cash flows for investing activities increased by 83% year-on-year to an outflow of R831 million in March 2010 due to the increased capital expenditure for the expansion projects.
Cash flows for financing activities decreased from R1.5 billion to R3 million outflow in March 2010. In the previous year (FY2009) the R1.5 billion outflow was primarily owing to the repayment of the shareholder loan of R1.45 billion and the buy-back of the class ‘B’ shares for R92 million.
FundingDuring the period under review, Foskor secured R1 billion in long-term funding from its parent company, the Industrial Development Corporation Ltd (IDC), to finance the expansion projects. The funding is on a commercial terms basis and repayable from April 2012. A short-term committed facility was also secured from the commercial banks. As at the year-end these facilities had not yet been utilised.
Mine closure cost provisionThe scheduled mine closure cost has increased from R335 million as at March 2009 to R362 million, as a result of the inclusion of the new South Pyroxenite pit mine. The liability in the balance sheet has been valued at R214 million, which has increased from R207 million in the previous year due to the inclusion of the new mine and changes in the inflation and risk-free rate assumptions.
The unscheduled mine closure cost has increased by R53 million as a result of the new mine. As at March 2009 the unscheduled closure cost was R420 million. The assets in the Environmental Rehabilitation Trust have increased from R69 million to R85 million. An R8 million cash investment by the company and growth in the investments have been recorded.

Fosk
or A
nnua
l Rep
ort 2
010
23
www.foskor.co.za
Phase 1 of Foskor’s strategic pyroxenite expansion project (PEP) is successfully underway, potentially raising phosphate rock concentrate production to 2,65-million tons a year, up 150 000 t/y on current production and effectively extending the mine life by at least 50 years.
We remain committed to our strategic growth programme. As such, an expected commissioning of PEP Phase 2 is to follow in 2011, increasing capacity to a further 200 000 t/y.
Foskor is the only vertically integrated producer of phosphate rock, phosphoric acid and granular fertiliser in South Africa. The Group‘s core activities focus on the mining and beneficiation of phosphate rock and subsequent production of phosphoric acid and phosphate-based fertilisers.
Focused on growth - for the benefit of all
stakeholders.
PEP Phase 1 successfully underway, on time and
within budget.
Focused on growth –for the benefit of all
stakeholders.
PEP Phase 1 successfullyunder way, on time and
within budget
Phase 1 of Foskor’s strategic pyroxenite expansion project (PEP) is successfully under way, potentially raising phosphate rock concentrate production to 2.65 million tons a year and effectively extending the mine life by at least 50 years.
We remain committed to our strategic growth programme. As such, an expected commissioning of PEP Phase 2 is to follow in 2011, increasing capacity by a further 200,000 tons a year.
Foskor is the only vertically integrated producer of phosphate rock, phosphoric acid and granular fertilisers in South Africa. The group‘s core activities focus on the mining and beneficiation of phosphate rock and subsequent production of phosphoric acid and phosphate-based fertilisers.
www.foskor.co.za Fosk
or A
nnua
l Rep
ort 2
010
23

Fosk
or A
nnua
l Rep
ort 2
010
24
OPERATIONAL REVIEW
PMC
Crusher
East
Crusher North
Crusher
North
Pyroxenite
New Crusher
PEP Phase 1B
Waste
South
Pyroxenite
PEP Phase
1A
New Primary
Stockpiles
PEP Phase
1B
High Verm
Stockpile
New Overland
Conveyor
PEP Phase
1B
INtRODuCtION
The operations focused primarily on infrastructure development in the year under review. A brief synopsis of output per division follows, with a description of the operating divisions’ capital expenditure.
FOskOR PhALAbORWA: mININg DIVIsION
Figure 1: Overview map of the Phalaborwa operations

Fosk
or A
nnua
l Rep
ort 2
010
25
Flotation C,D Bank
Crushing
Stockpiling
Milling
Slurry pumps
Sasol
Nitro Domestic sales Exports
Drill & blast
Load & haul
South
Pyroxenite
pit
North
Pyroxenite
pit
Conceptual production model
Crushing
Stockpiling
Milling Tolling at PMC
Drying & dispatch
Flotation F Bank
Flotation E Bank
Flotation Extension 8
Drill & blast
Load & haul
Crushing
Stockpiling
Milling
Milling Loesche
82BPL
Crushing
Stockpiling
Fosk
or A
nnua
l Rep
ort 2
010
25
Figure 2: Conceptual production model: Phalaborwa operations

Fosk
or A
nnua
l Rep
ort 2
010
26
Capital expenditure on the Pyroxenite Expansion Project(PEP) was the core focus of infrastructure development at Phalaborwa. The PEP was split into two separate phases –known respectively as PEP1 and PEP2. Improved throughput and sustainable production necessitated the R1.2 billion allocation totheexpansionproject.
Founded in 1951, Foskor’s Mining Division in Phalaborwa mines phosphate rock (foskorite and pyroxenite), from which Foskor’s Acid Division in Richards Bay produces phosphoric acid and phosphate-based granular fertilisers for local and international markets. The opencast mine in Phalaborwa, in South Africa’s Limpopo Province, has the capacity to yield 2.6 million tons per annum of phosphate rock concentrate from processing 35 million tons of ore per annum. Once crushed, milled, concentrated and dried, most of the phosphate rock concentrate is railed to Foskor’s processing plant in Richards Bay, 800 km away on the country’s east coast.
Commissioned in 1953, Foskor has traditionally mined foskorite and pyroxenite in a 60:40 ratio. With the body of foskorite ore nearing depletion, Foskor appointed Bateman Africa to
PEP Project Engineer, mr A Nienaber (front row left), and his team
undertake a feasibility study for the construction of a new mine to increase its pyroxenite processing, as well as remedial measures to enhance throughput on its Extension 8 processing plant.
PEP Phase 1With the most recent extension to the mine’s beneficiation capacity being Extension 8 in 1999, PEP Phase 1 represents the ninth extension to the Foskor mine. Approved by the Foskor Board in September 2007, Phase 1 involves the construction of a new opencast mine for the mining of pyroxenite ore (PEP1a), together with the installation of a new primary gyratory crusher and an overland conveyor system to move the ore from the new mine to the existing processing plant five kilometres away (PEP1b). This new source guarantees ore reserves for at least the next 70 years. Establishing the new mine in the South Pyroxenite area was done to replace depleting foskorite above ground and to process pyroxenite ore being mined, which will enable Foskor to maintain its existing phosphate rock concentrate output. The R542 million project was successfully completed in June 2010, on time and within budget.
PEP Phase 2Phase 2 focuses on de-bottlenecking the existing Extension 8 plant to improve its throughput rate, in order to meet its original design capacity. The PEP2 was approved by Foskor’s Board in September 2008 and is due for completion in March 2011 at an estimated loss of R475 million.
When Extension 8 was conceptualised in the late 1990s, a dry milling process was selected over the wet (ball and rod) milling process used elsewhere at Foskor. The advantage of the dry milling process was that ore could be reduced from greater than 125 mm to less than 0.5 mm in one processing step – with obvious economic and environmental benefits. However, due to a combination of process design and equipment underperformance, the Extension 8 plant has never performed at design capacity for any extended period. Various process modifications have been attempted to rectify the performance and reliability shortcomings but none have been totally successful to date.

Fosk
or A
nnua
l Rep
ort 2
010
27
Extension 8
Foskor has to de-bottleneck the Extension 8 plant by adding a separate, parallel tertiary crushing circuit to crush the ore from 125 mm down to about 16 mm. A wet milling section (as used elsewhere in the Foskor plant) has been added, to reduce the ore particle sizes further, from 16 mm to smaller than 0.5 mm. After wet milling, the ore is reintroduced to the Extension 8 process at the flotation conditioners, together with the dry circuit ore. The combination of the two streams ensures that the flotation plant is fully utilised and that Extension 8 is able to perform at design output levels.
Progress As at the end of March 2010, Phase 1a was completed and Phase 1b was 91% complete, with only one month’s delay. At the same time, Phase 2 was two months ahead of schedule and already 71% complete. Both phases are within budget – a significant achievement, given the complexity of both contracts. The implementation approval for Phase 1 came at the height of the economic boom in South Africa, which meant that staff and technical consultants were in short supply and the project had to be managed in-house. Despite the challenges of managing such a large project internally, the project has been very successful.
Foskor richards Bay: acid division
Foskor’s Acid Division in Richards Bay has invested considerable resources in addressing legacy issues and correcting the perception that it is an environmentally hazardous operation. Two start-up scrubbers were designed and constructed at a cost of R36.5 million, to reduce emissions and discomfort to personnel at the sulphuric acid plants. These were commissioned in May 2009 and May 2010 respectively. All emissions from the plant are now routed through an alkali scrubbing medium, before being vented into the atmosphere.
The Acid Division committed R158 million to discharging gypsum, a by-product, into the sea in a manner that is not harmful to the aquatic and marine life. A pipeline and pumping system from the port were constructed to substitute industrial effluent from uMhlathuze Water with sea water, so that the gypsum can dissolve odourlessly and more quickly. Alternative uses for gypsum are being sought; it is possible that gypsum could be used to build wall panels for houses in the region.
A further outlay was made to upgrade the roads and storm water systems built in 1976, and a truck-stop with 18-truck capacity was added. The new storm water drainage systems will drastically reduce groundwater pollution, increase the lifespan of the roads carrying heavy traffic, make the roads safer for the public and simplify storm water drainage maintenance procedures.
A 4.95 megalitre potable-water surge tank, due for completion in the second half of 2010, will reduce the risk of pressure surges and control the intake of municipal water. More efficient water usage from Foskor will be an added benefit to the surrounding community, which will hopefully face fewer water interruptions.
It is not surprising that Foskor Richards Bay was named Employer of the Year 2008/09 by the Zululand Chamber of Commerce and Industry in August 2009. The Chamber also honoured Foskor with an Above and Beyond Award for ‘Best service excellence’ and a Premium Award as the top performing company in that region.

Fosk
or A
nnua
l Rep
ort 2
010
28
Act (No. 28 of 2002), related to minerals and reserves. Submissions were made for four new mining rights, three of which have already been granted with the fourth in the process of being reviewed. Two submissions were made for the conversion of old order used rights to new mining rights.
The Palabora Igneous Complex, situated south of the town of Phalaborwa in the Limpopo Province, comprises 14 distinct rock types, each with a specific mineral composition, as illustrated in Figure 3. It is a semi-vertical volcanic pipe, roughly kidney-shaped and measuring between 1.5 and 3.5 km in width and 6.5kminlength.Thecomplexconsistsofthreeconjoinedlobes–namelytheNorthPyroxenite,LoolekopandSouthPyroxeniteareas.
Apatite is the only phosphate-bearing mineral in the igneous complex. Although it is sometimes present in only very small amounts, it is never completely absent and often figures as an abundant mineral constituent in the pyroxenite and foskorite rock types. Copper and magnetite are present in the Loolekop lobe and are exclusively associated with foskorite and carbonatite rock types.
As a result of exploration drilling, higher concentrations of apatite mineralisation, expressed as a percentage of P2O5, were found in the Loolekop foskorite and pyroxenite rock types, as well as in the pyroxenite rock types of the north-west corner of the North Pyroxenite lobe and the South Pyroxenite lobe. Four mining areas are currently operating in the Palabora Igneous Complex. Palabora Mining Company (PMC) operates an underground copper mine in the central portion of the complex, as well as a vermiculite mine in the southern portion of the complex. Foskor operates two phosphate rock mining operations, one situated in the North Pyroxenite area and another in the South Pyroxenite area.
Foskor (Pty) Ltd has submitted all applications as required in terms of the Mineral and Petroleum Resources Development
Figure 3: the geology of the Palabora Igneous Complex
REVIEW OF MINERAL RESOURCES AND ORE RESERVES

Fosk
or A
nnua
l Rep
ort 2
010
29
The mining rights already granted are:• New Mining Right – South Pyroxenite (LP30/5/ 1 /2/2/09 MR);• New Mining Right – North Pyroxenite Extension
(LP30/5/1 /2/2/03 MR); and• New Mining Right – Stripping Area (LP30/5/1 /2/2/22 MR).
Mining right applications submitted and under review are:• North Pyroxenite – North-west Corner (LP30/5/2/2/126 MR).
Application for conversion of old order used rights to new mining rights submitted and under review are:• Old Order Used Right – North Pyroxenite (LP30/5/1 /2/2/124
CMR); and• Conversion of remainder of all existing Stockpiles
(LP 30/5/1 /2/2/125).
Management is confident that the outstanding applications will be finalised and approved by the Department of Mineral Resources in due course.
GeoloGical exploration
From 1950 onwards, numerous drill campaigns have been performed on the phosphate deposits, with the most recent drilling completed in 2006. A total of 100,544 metres were drilled to demarcate mineral resources in the North and South Pyroxenite pits. Drilling was also performed in PMC’s active tailings dam to evaluate possible mineral resources.
Samples acquired from the defined drill holes were assessed at Foskor’s chemical laboratory. Foskor is not currently undertaking any new exploration projects.
resource estimation
Geostatistical analysis of the drilling information was used to build 3-dimensional geological block models showing phosphate mineral distribution. The block models for the two mining areas and the tailings dam were validated by correlating the original drill-hole assay results with the estimated values determined by the geostatistical methods.
Mineral resources were classified as either measured, indicated or inferred, based on drill-hole densities, kriging efficiency parameters and the cumulative knowledge and experience of Foskor’s geologists and independent external consultants.
Mineral resources and reserves
The mineral resources and reserves were classified according to the South African Mineral Resource Committee (SAMREC) Code. SAMREC defines a mineral resource as: ‘a concentration or occurrence of material of economic interest in or on the earth’s crust in such form, quality and quantity that there are reasonable and realistic prospects for eventual economic extraction’.
In terms of the Code, ‘the location, quantity, grade, continuity and other geological characteristics of a mineral resource are known, or estimated from specific geological evidence, sampling and knowledge interpreted from an appropriately constrained and portrayed geological model. Mineral resources are subdivided, and must be so reported, in order of increasing confidence in respect of geo-scientific evidence, into inferred, indicated or measured categories’.
To elaborate, a mineral reserve is the economically mineable material derived from either a measured or an indicated mineral source. It includes diluted and contaminated materials and allows for mining losses. At minimum, an appropriate assessment for a project should be a pre-feasibility study. Alternatively, a Life of Mine Plan – detailing considerations; modifications; realistically assumed mining; and all other modifying factors such as the metallurgical, economic, marketing, legal, environmental, social and governmental impacts – should be drawn up.
The cut-off feed grade to economically produce a saleable phosphate rock concentrate was calculated using methods originally made famous by leading mathematician and mining consultant Kenneth Lane. The cut-off grade currently used for the North and South mineral reserves is 5.5% P2O5, with material with a grade of between 4% and 5.5% P2O5 classified as marginal ore.

Fosk
or A
nnua
l Rep
ort 2
010
30North Pyroxenite pit – old mine
North PyroxeNite dePosit
Foskor commenced mining phosphate-bearing ore from the North Pyroxenite deposit, situated in the north-western part of the Palabora Igneous Complex, in 1966. From 1961 to 1977, almost 150 drill holes or 24,377 metres were drilled. Between 1980 and 1984, an additional 55 holes were drilled around the existing pit, adding a further 23,200 metres.
The lithological (rock classification) information from these holes was interpreted to build a resource mineralisation model. On this basis, the mineral resources were estimated and categorised as either measured, indicated or inferred. Optimisation of the pit was designed using the Whittle pit method (i.e. the global open-pit mine planning system used to maximise net present values, and to balance schedules, blends and stockpiles). The North Pyroxenite mineral reserves were estimated with modifying factors at 432.7 million metric tons as at 31 March 2010.

Fosk
or A
nnua
l Rep
ort 2
010
31
South Pyroxenite dePoSit
Drilling in the South Pyroxenite area began in the late 1950s and continued into the 1960s. In the 1990s an infill drilling programme was terminated prematurely, due to financial considerations, but was completed during 2005/06. In total, 143 drill holes or 49,584 metres were drilled. Bulk and trench sampling was also done in the South Pyroxenite area.
The geological and resource models for the South Pyroxenite area were based on the exploration campaigns. The geological contacts were interpreted from the drilling data. Ordinary kriging was used to estimate the P2O5 block model values, which were finally validated through comparisons against the original drill hole data.
Mineral resources in the South Pyroxenite area were audited by Snowden Mining Industry Consulting in 2008. As at 31 March 2010, the reserves were estimated at 997 million metric tons.
Central area: PMC aCtive tailings daM
Phosphate-rich tailings have been deposited in the PMC active tailings dam since the late 1970s. Foskor owns the rights to the apatite in the tailings even though the dam is located on PMC’s premises. A resource of approximately 297 million metric tons with an in situ (i.e. prior to processing) grade of 6.6% P2O5 was delineated through drilling and sampling during the 1990s.
The data collected during exploration was evaluated for geostatistical application. An oriented block model was then created and ordinary kriging was applied to estimate the grade distribution throughout the dam. The resources were categorised as either measured, indicated or inferred.
In 2003 a feasibility study (carried out with assistance from Snowden Mining Industry Consultants and Rio Tinto Technical Services) to reclaim the tailings revealed that the planned capital and operating costs would exceed actual benefits. The project was aborted and PMC’s use of the tailings dam continued.
South Pyroxenite pit – new mine
Tailings waste disposal dam

Fosk
or A
nnua
l Rep
ort 2
010
32
StockpileS
The carbonatite intrusion in the centre of the igneous complex is surrounded by apatite-bearing foskorite and pyroxene pegmatoid rock types. PMC used to mine and stockpile the foskorite and pyroxene pegmatoid rock as a by-product of mining the copper-bearing carbonatite ore. PMC selectively mined and stockpiled ore according to the Extension 100F Agreement between Foskor and PMC. The agreement gave PMC the right to process ore with a less than an agreed P2O5 grade, and to retain every mineral except phosphate.
The rights to the ore mined by PMC were determined by conventional grade control practices by PMC and monitored by Foskor. PMC commenced mining in 1965, and in 2002 the opencast mine reached its maximum planned depth of 750 metres, after which PMC developed an underground mine in the same ore body below the opencast mine. The foskorite and apatite-rich pegmatoid mined by PMC containing more than 6% P2O5 was stockpiled as foskorite stockpiles for Foskor. The remainder of these stockpiles have been mined and processed during the year under review.
Stockpiles

Fosk
or A
nnua
l Rep
ort 2
010
33
Palabora PhosPhate & vermiculite tailings
Currently, PMC operates an opencast mine in the South Pyroxenite area, which produces vermiculite concentrate from the plant. PMC transports the high P2O5 tailings from this plant to a stockpile close to Foskor’s East Crusher. Foskor has reclaimed high phosphate tailings from this stockpile since 2006.
resPonsible Persons
The estimated mineral resources and reserves reported here were reviewed and endorsed by the following competent persons:• Mr H Coetzee, BSc (Geology), 23 years’ experience, Mine
Geologist;• Ms N Mzamo, BSc (Hons) (Geology), 10 years’ experience in
mining geology, registered with SACNASP as professional natural scientist, Superintendent Mine Services;
• Mr C Terblanche, BSc (Mining), BCom, MBA, 12 years’ mining experience, Senior Mine Engineer; and
• Mr N Richardson, NHD (Mine Survey), Government Mine Surveyor Certificate of Competence, Chief Surveyor.
Snowden Consulting was appointed to act as competent person in the validation of the original report compiled in 2009.
Table 2: Proved mineral resources as at 31 March 2010
Mineral resources as at 31 March 2010
Geological area Resource category
Reserves (million
tons)% P2O5 % Cu
North Pyroxenite pit
Measured 677.0 7.21 -
Indicated 509.0 7.07 -
Inferred 296.0 6.77 -
South Pyroxenite pit
Measured 2,273.0 6.70 -
Indicated 1,148.0 6.30 -
Inferred 1,491.0 6.26 -
PMC active tailings dam
Measured 238.3 6.70 -
Indicated 48.8 6.60 -
Inferred 9.9 6.40 -
Stockpiles
Measured - - -
Area 6 11.00 4.35 0.19
Area 2 0.50 6.90 0.05
Table 3: Proved and probable mineral reserves, as at 31 March 2010
Mineral reserves as at 31 March 2010
Geological area Resource category
Reserves (million
tons)% P2O5 % Cu
North Pyroxenite pitProved 433.0 7.04 -
Probable 98.0 6.56 -
South Pyroxenite pitProved 997.0 6.91 -
Probable 64.3 6.56 -

Fosk
or A
nnua
l Rep
ort 2
010
3434
Fosk
or A
nnua
l Rep
ort 2
010
COrPOrATE gOvErNANCE
Introduction
The release of the King III report, effective 1 March 2010, is a milestone in the evolution of corporate governance in South Africa. King III brings significant opportunities for organisations that embrace the principles of discipline, transparency, independence, accountability, responsibility, fairness and social responsibility. Foskor (Pty) Ltd strives to uphold King III‘s corporate governance standards. For the year under review Foskor complied materially with the King Code’s governance principles. Foskor’s operations and policies are aligned stringently to the recommended corporate governance framework.
Photo: Van Rhyssen Dam, Phalaborwa (Foskor site)

Fosk
or A
nnua
l Rep
ort 2
010
35
BOARD AND BOARD SUB-COMMITTEES
The Board of Directors is responsible to shareholders for the performance of the company. Its role includes the establishment, review and monitoring of strategic objectives. The Board approves major acquisitions, disposals and capital expenditure, while overseeing the group’s systems of internal control, governance and risk management.
Foskor has a unitary Board to achieve the desired level of objectivity and independence in Board deliberations and decision-making.
All directors have unlimited access to the advice and services offered by the company secretariat, responsible for compliance with Board procedures.
The following sub-committees assist the Board to discharge its duties:• Board Human Resources Committee (BHRC);• Board Technical Committee (BTC); and• Board Audit and Risk Committee (BARC).
The Board retains full and effective control of the company by monitoring executive management’s implementation of policies and strategies. The Board sets targets and measures the company’s performance at regular intervals. Brief biographical details of the Board members are provided on pages 6 and 7.
Table 4: Board meetings attendance record
Name 19/06 01/09 20/10* 25/11 04/02** 25/03 Total
Mr MG Qhena (Chairman) ✓ ✓ ✓ ✓ ✓ ✓ 6
Mr MA Pitse – CEO ✓ ✓ ✓ ✓ ✓ ✓ 6
Mr A Vellayan 1 ✓1 ✗ ✗ ✓ ✓1 ✓1 4
Mr G van Wyk ✓ ✓ ✓ ✓ ✓ ✓ 6
Dr DS Phaho ✓ ✓ ✓ ✓ ✓ ✓ 6
Mr F Madavo ✓ ✗ ✓ ✓ ✓ ✓ 5
Ms JM Modise ✓ ✓ ✓ ✗ ✓ ✓ 5
Ms SS Ngoma ✓ ✓ ✓ ✓ ✓ ✓ 6
Mr M Booi ✓ ✓ ✓ ✓ ✗ ✓ 5
Mr XGS Sithole 2 ✓ – – – – – 1
✓ Attended✗ Apologies
* Special Board meeting** Board strategy session
1 Attendance by proxy2 Resigned 22 June 2009

Fosk
or A
nnua
l Rep
ort 2
010
36
Foskor’s Executive Committee (Exco) executes plans drawn from the strategic direction and advice afforded to them by the Board. The executives are responsible for the day-to-day running of the operations, enforcing fiscal and managerial discipline,
overseeing controls and delivering the Board’s mandates. The brief biographies on pages 8 and 9 present the credentials of the Exco members.
The execuTive commiTTee
Figure 4: Foskor management organogram
Audit & Risk Committee
board of Directors
President/Chief Executive Officer (CEO)
human Resources Committee
technical Committee
VP: Acid
VP: mining
FgAs (Internal
Audit)
Chief Financial
Officer
VP: marketing
& sales
VP: Procurement & Logistics
VP: human Capital
VP: strategy & New bus
Devt
VP: Corporate
Affairs
Company secretary

Fosk
or A
nnua
l Rep
ort 2
010
37
Board Human resources committee
The Board Human Resources Committee (BHRC) is governed by a Charter, which constitutes the BHRC as a sub-committee of Foskor’s Board. Committee members are all also governing Board members; the BHRC comprises four non-executive directors and Foskor’s CEO. The Chair of the BHRC is appointed by Foskor’s governing Board, and may not also be the Chair of Foskor’s Board. The group executive responsible for human resources attends by invitation. The BHRC may, in consultation with the Chairman of Foskor’s Board of Directors and the Company Secretary, obtain external or other independent professional advice when deemed necessary.
The BHRC Chairperson may also invite auditors or any member of the Board of Directors to attend meetings of the BHRC. Foskor’s Board has the power to remove any BHRC members and to fill such vacancies when appropriate.
The BHRC meets at least four times per annum. The Company Secretary is the BHRC’s secretary who serves notice of every meeting, confirming the venue, time, date and agenda at least five working days prior to a meeting. Minutes taken at each
meeting are circulated to Foskor’s Board two weeks prior to a Board meeting. The BHRC Chairperson presents its findings and recommendations to Foskor’s Board for ratification or approval.
The BHRC’s responsibilities include the following:• Reviewing and debating submissions to the Foskor Board on
the general remuneration policy and proposed adjustments thereto;
• Approving the remuneration packages and incentives of the executive management team, including those of the CEO;
• Considering matters of staff composition and transformation, identifying skills, and analysing and addressing gaps in terms of gender, age, seniority and ethnicity;
• Considering succession planning for the CEO and subordinates;
• Monitoring compliance with the company’s code of ethics;• Reviewing human capital matters;• Monitoring compliance with employment equity and other
relevant legislation; and• Revising human resources policies when deemed
necessary.
table 5: board human Resources Committee meetings attendance record
Name 19/06 01/09 25/11 04/02* 25/03 total
Ms JM Modise (Chairperson) ✓ ✓ ✗ ✓ ✓ 4
MrMAPitse–CEO ✓ ✓ ✓ ✓ ✓ 5
MrMGQhena ✓ ✓ ✓ ✓ ✓ 5
Mr G van Wyk ✓ ✓ ✓ ✓ ✓ 5
Mr A Vellayan 1 ✓1 ✗ ✓ ✗ ✓1 3
✓ Attended✗ Apologies
* Special BHRC meeting1 Attendance by proxy

Fosk
or A
nnua
l Rep
ort 2
010
38
Board Technical commiTTee
Table 6: Board Technical committee’s meeting attendance record
name 01/06 07/08 02/11 03/03 Total
Dr DS Phaho (Chairman) ✓ ✓ ✓ ✓ 4
Mr MA Pitse – CEO ✓ ✓ ✓ ✓ 4
Mr F Madavo ✓ ✓1 ✓ ✓ 4
Mr XGS Sithole 2 ✓ - - - 1
✓ Attended 1 Telephone link✗ Apologies 2 Resigned 22 June 2009
Foskor’s Board established the Board Technical Committee (BTC) as a sub-committee to assist the Board in its fiduciary duties, specifically in the areas where specialised technical skills are required: for example, operations management; safety, health and environment (SHE) management; and capital project evaluations. The BTC considers complex operational and technical aspects of the business, and reviews capital projects
from inception to completion. Furthermore, it evaluates new strategic expansion projects and ensures compliance with world-class SHE management principles.
The BTC comprises three non-executive directors and Foskor’s CEO. They are supported by the Vice Presidents of the operations and the Vice President of the Strategy and New Business Development Division.
Board audit and risk Committee
table 7: Board audit and risk Committee’s meeting attendance record
name 08/05 09/06 09/09 10/11 16/03 total
Mr M Booi (Chairman) ✓ ✓ ✓ ✓ ✓ 5
Mr MA Pitse – CEO ✓ ✓ ✓ ✓ ✓ 5
Ms SS Ngoma ✓ ✓ ✓ ✓ ✓ 5
Mr G van Wyk ✓ ✓ ✓ ✓ ✓ 5
✓ Attended

Fosk
or A
nnua
l Rep
ort 2
010
39
The Board Audit and Risk Committee (BARC) assists the Board with the company’s accounting, auditing, internal control and financial reporting practices. The BARC comprises three non-executive directors and Foskor’s CEO. The Chief Financial Officer, the group Internal Audit Manager and representatives from the external auditors, nominated executives and members of management attend meetings by invitation.
The BARC is authorised by the Board to access any internal audit reports and financial statements and can instruct either Foskor’s management or the auditors to conduct an investigation if deemed necessary. The auditors have unrestricted access to the BARC, which meets at least once every quarter. The BARC is guided by the BARC Charter.
For the period under review, the committee executed its accounting, auditing, internal control and financial reporting duties as mandated.
These duties include:• Evaluating financial functions, internal controls and risk
management; • Reviewing the Audit Plan from the external auditors;• Revising, with management, accounting and operational
controls, • Discussing correspondence on compliance from regulatory
authorities;• Assessing the duties and responsibilities of the Board of
Directors of Foskor and its subsidiaries;• Examining the adequacy and overall effectiveness of the
group’s system of internal control and the implementation thereof;
• Evaluating the risk profile of the group;• Appraising the effectiveness of the internal audit function,
internal accounting control systems, and financial management, as well as the group’s IT controls;
• Reviewing matters relating to potential conflicts of interest or breaches of corporate ethics;
• Checking the accounting policies adopted and the adequacy of disclosures by the group in terms of Generally Accepted
Accounting Principles and the International Financial Reporting Standards (IFRS);
• Deliberating on the impact of new legislation on Foskor’s affairs;
• Evaluating transactions entered into by the group that effect changes to the control structure of the company and its subsidiaries;
• Investigating reports on major defalcations as well as irregularities and incidents of fraud;
• Examining enterprise wide risk management issues;• Considering the appropriateness and achievability of budget
targets and forecasts; • Monitoring compliance with the Companies Act, all other
applicable legislation and the Code of Corporate Practices and Conduct;
• Ensuring compliance with statutes, internal policies and procedures; and
• Vetting controls, record keeping, audit processes and overall financial management.
Management reviewed the annual financial statements with the BARC and the external auditors. The quality and appropriateness of the accounting policies were fully discussed with the external auditors. As stated in the Directors’ report (pages 72 to 74), the BARC considers the annual financial statements of Foskor (Pty) Ltd and its subsidiaries to fairly present, in all material respects, the financial position of the group as of 31 March 2010, and their financial performance and cash flows for the year then ended.

Fosk
or A
nnua
l Rep
ort 2
010
40
ENTERPRISEWIDERISKMANAGEMENT
Understanding key risks and developing appropriate responses to these risks is essential to Foskor’s success. Foskor is exposed to a variety of risks and uncertainties, which may have a financial or reputational impact on the group and which may also impact on the achievement of social, economic and environmental objectives. Foskor’s risk management strategy is at the core of the organisation. Risks and opportunities are identified during risk assessments and are reviewed by various committees to ensure a coordinated approach to risk mitigation strategies.
Foskor’s risk philosophy is conservative and serves to protect the interests of stakeholders. The company’s risk profiling methodology ascertains threats to achieving business objectives. The methodology aligns risk tolerance in the organisation to risk appetite parameters for each division or strategic business unit.
The process of risk management, including the system of internal control, is the responsibility of the Board of Directors. Management is accountable to the Board, for designing, implementing and monitoring the process of risk management, and integrating risk management into the day-to-day activities of the organisation. Specific attention is given to Foskor’s key business risks, which are of strategic importance to the organisation and are regularly reviewed by the Executive Committee (Exco), the CEO and the Board.
These processes are geared to promoting staff safety while delivering a world-class product. The risk management strategy protects stakeholders by safeguarding investments and the company’s assets. Foskor continues to align itself with the recommendations of King III and the Institute of Risk Management South Africa’s Codes of Practice.
Foskor has adopted an Enterprise Wide Risk Management (EWRM) framework, which is continually evolving and is supported by the same set of risk-based operating standards that underpin the risk management policy. The policy details the risk identification and assessment processes, risk responses

Fosk
or A
nnua
l Rep
ort 2
010
41
and risk assurance activities. The EWRM standards and processes relate to the governance of risk management and management’s responsibility. The EWRM standards establish the rules and instructions for enterprise wide risks that require common treatment across all operations and business units. Foskor has a business continuity management procedure and plan in place that identifies and evaluates risks to its resources and operations, maintains prevention procedures and mitigates the effects of unforeseen losses. The processes of continuity and recovery are regularly audited, tested and updated.
The business continuity management programme covers:• Emergency responses, crisis management and business
recovery protocols, dealing with notification procedures and interfaces for certain defined events;
• Training requirements; and• Testing the administration of plans, including auditing plans
and procedures once developed.
Foskor’s risks (these include strategic, commercial, operational, compliance and financial risks) have been identified, assessed and uploaded onto the Cura risk management database. The process of assessing risks and ensuring that there are controls and action plans in place to mitigate the risks is an ongoing one.
Among the key risks facing the group are:• Increased competitor supply of P2O5 at lower prices:
Foskor’s products are sold globally and face intense international competition from other phosphate producers. The group mitigates this risk by entering into long-term supply agreements with major customers.
• Reliance on distribution networks: The company is dependent on Transnet Freight Rail (TFR) to provide rail services between Phalaborwa and Richards Bay. Disruptions to rail services, and any ad hoc price increments on the part of TFR, may adversely affect Foskor’s business, prospects or financial position. The group continually engages TFR on wagon availability and service delivery. Alternative export routes through Maputo are also being considered.
• Exchange rate volatilities: Foskor’s revenue is derived substantially from export sales denominated in US dollars. Foskor is therefore directly exposed to the unpredictable financial markets and currency movements. The group uses derivative financial instruments (mainly forward exchange contracts and zero-cost collar option contracts) to hedge against certain risk exposures.

Fosk
or A
nnua
l Rep
ort 2
010
42
INTERNAL CONTROL AND INTERNAL AUDIT
Management is responsible for controlling Foskor’s operations in a manner that provides the Board of Directors reasonable assurance that:• Data and information published is accurate, reliable and
made available in a timely fashion;• The actions of directors, executives and employees are
in compliance with Foskor’s policies, standards, plans and procedures, as well as with all relevant laws and regulations;
• Foskor’s resources (including its people, systems, data or information bases, and customer goodwill) are adequately protected;
• Resources are acquired economically and employed profitably;
• The quality of business processes is enhanced, and continuous improvement efforts are ongoing; and
• Foskor’s plans, goals and objectives are achieved.
In terms of company policy, Foskor’s management must:• Identify and evaluate the potential exposures to loss relating
to the operations;• Specify and establish policies, plans and operating standards,
and procedures, systems and other disciplines, to be used to minimise, mitigate and/or limit the risks associated with the exposures identified;
• Establish practical control processes that require and encourage directors, executives and employees to carry out their duties and responsibilities; and
• Maintain effective controls and continually improve these processes.
In accordance with the International Standards for the Professional Practice of Internal Auditing, it is Foskor’s policy to maintain a centralised and independent internal auditing function, named Foskor Group Audit Services (FGAS).
FGAS offers independent, objective assurance and consulting services designed to add value and improve Foskor’s operations. The internal audit department assists Foskor in accomplishing its objectives by bringing a systematic, disciplined approach to evaluating and improving the effectiveness of risk management, control and governance. FGAS has the responsibility of informing and advising management and the Board Audit and Risk Committee (BARC) with regard to deficiencies or other substantive issues noted in the course of its activities. Internal audit assures the BARC that all identified risks that may impact on the achievement of the business objectives are effectively managed. FGAS helps the BARC and management personnel to exercise their responsibilities by providing analyses, appraisals, recommendations, counsel and information concerning the activities reviewed.
FGAS reports to the BARC. The BARC, on behalf of the Foskor Board, determines FGAS’s mandate. The group’s Internal Audit Manager has full and independent access to the CEO and the BARC and attends Exco meetings by invitation. The BARC warrants that the internal audit function is subjected to an independent quality review at least once every three years. The BARC can appoint, remove or replace the group’s Internal Audit Manager at any time deemed appropriate.
FGAS has unrestricted access to all records, properties, functions and personnel necessary for effectively performing its duties. All the divisions of Foskor and its subsidiaries, associates and joint ventures, with their consent, may be subjected to periodic audits by FGAS. In performing its functions, FGAS does not engage in any activities that could reasonably be construed as compromising its independence and objectivity. FGAS has complete auditing independence and is not restricted by operational or executive management; furthermore, the Board does not place any restrictions on the scope of the audits, although the BARC may provide strategic direction. Either the

Fosk
or A
nnua
l Rep
ort 2
010
43
BARC or the CEO may request FGAS to carry out special reviews or audits as deemed necessary.
The scope of FGAS includes, but is not limited to, the following: • Developing and implementing a flexible annual Audit Plan
with set deliverables;• Maintaining professional auditing staff with sufficient
knowledge, skills, experience and professional certifications to meet the Charter requirements;
• Evaluating and assessing the significant merging or consolidating of functions;
• Reviewing services, operations and control processes coincident with the development, implementation and expansion of business units;
• Informing the BARC of emerging trends and successful practices in internal auditing;
• Assisting in the investigation of suspected fraud within the organisation and notifying management, the BARC, the Fraud Prevention and Ethics Committee, and the internal Audit and Risk Committee of the outcomes; and
• Considering the scope of work of the external auditors and regulators, for optimal auditing coverage in the organisation.
Internal audit pursues a risk-based approach to planning, assesses the needs and expectations of its key stakeholders, and assures that its reporting meets the approval of management and the BARC.
The BARC:• Acts as the Risk Management Steering Committee;• Reviews and evaluates the most significant risks that the
company faces in the ordinary course of business;• Working with management and other relevant personnel,
assists in dealing with day-to-day risks and issues;• Monitors and highlights the various possible impacts of HIV/
AIDS;• Monitors and advises on management’s residual risk; and• Appropriately addresses misconduct by management.
The group believes that, as at 31 March 2010, Foskor’s system of internal control satisfied all criteria necessary for effective internal control.
Fraud prevention and ethics
Management is accountable for detecting fraud, theft and other irregularities.
Fraud and related crime prevention techniques fall into three disciplines:
• operational control: addresses the operations’ risk exposures and encompasses financial and audit controls, personnel selection and monitoring techniques;
• physical security: deals largely with regulating visitors, restricting access to sensitive areas, and removing firearms, drugs and other harmful objects; and
• system security: monitors the improper usage of computer systems and e-mail facilities, and focuses on password control, authorisations, logging off, encryptions and message authentication.
In the first instance, controls should focus on prevention rather than detection, emphasising in all at Foskor an understanding and awareness of the following:
• The ethical values and code of conduct of the organisation;
• The importance of personally contributing to crime prevention;
• Foskor’s business practices, systems and manual or automated controls; and
• Knowledge of the different types of crime that can occur and how to detect them.
Foskor expects its employees to conduct business with the highest levels of professionalism, integrity and excellence aligned to the organisation’s values. This culture is embedded in the company’s reporting and quality testing systems. The Fraud Prevention and Ethics Committee investigates unethical conduct, driving transparency in Foskor.

Fosk
or A
nnua
l Rep
ort 2
010
44
Whistle-bloWing
The organisation is committed to the highest standards of openness and accountability. Foskor recognises that employees, suppliers, business partners, local communities and other stakeholders prefer associating with ethical organisations. The whistle-blowing policy serves to build employee, supplier and business partner loyalty. The policy identifies and eliminates unethical practices, and provides a confidential means of conveying information through existing communication channels. The policy encourages and enables staff to raise concerns within Foskor rather than overlooking a problem or resorting to the use of inappropriate communication channels.
Where information indicating serious malpractice or wrongdoing is discovered, it can be disclosed without fear of reprisal.
In line with the Protected Disclosures Act (No. 26 of 2000) Foskor:• Strives to create a culture that facilitates the responsible
disclosure by employees of information relating to criminal and other irregular conduct in the workplace;
• Sets clear guidelines for disclosing such information;• Protects against reprisals as a result of such
disclosure; and • Promotes the elimination of criminal and other irregular
conduct within the company.
The objectives of Section 2 of the Protected Disclosures Act are: • To protect from occupational detriment those employees who
make disclosures;• To provide remedies for occupational detriment suffered on
account of having made a protected disclosure; and• To provide employees with procedures to responsibly disclose
information on improprieties.
Supplier blackliSting
Employees and suppliers are obliged to report suspicions of fraud, corruption, theft or other unethical and/or illegal behaviour within Foskor. These types of allegations are investigated by FGAS.
The Vice President (VP) of the Procurement and Logistics Division, in consultation with the Corporate Affairs Division, may obtain an external legal opinion before deciding to terminate a vendor relationship. The VP of Procurement and Logistics, or a person designated by the VP, is responsible for maintaining a database of all blacklisted suppliers.
Any employee who is found guilty of unethical conduct or who resigns prior to a disciplinary hearing is thereafter barred from servicing Foskor as a vendor.

Fosk
or A
nnua
l Rep
ort 2
010
45
MINE SITE REHABILITATION AND CLOSURE
An environmental assessment was performed at the end of March 2010 by Golder Associates Africa, an internationally recognised and respected company.
Foskor provides for environmental rehabilitation based on a two-tier strategy: scheduled end-of-mine closure is provided for by deposits into and growth of the special purpose Section 37A Environmental Rehabilitation Trust; while unscheduled or premature mine closure is provided for by means of bank guarantees for the difference. Based on a Mine Rehabilitation and Closure Cost Assessment performed in March 2010 by Golder Associates Africa, the contingent liability has been recognised for the issuing of guarantees to the Department of Mineral Resources (DMR) in terms of Regulation 54(2) of the Regulations promulgated in terms of the Minerals and Petroleum Resources Development Act (No. 28 of 2002). The estimated present value for the total scheduled rehabilitation liability increased from R207 million in the previous year to R214 million in the year under review, after taking into account the following assumptions (refer to Note 17 to the annual financial statements):
Table 8: Scheduled rehabilitation assumptions
Cost of closing the mine R362 million
Estimated escalation p.a. 6.16%
Discount period 20 years
Risk-free rate government bonds (closure costs discounted to present value) 8.97%
The environmental rehabilitation liability of R214 million, considered together with the value of the Environmental Rehabilitation Trust amounting to R85 million, results in an unfunded portion of the liability of R129 million (refer to Notes 8 and 17 to the annual financial statements). The estimated unscheduled rehabilitation liability amounts to R473 million.
Table 9: Unscheduled rehabilitation net shortfall
Net shortfall at this stage R’m
Recommended mine closure cost R473 million
Assets held in Environmental Rehabilitation Trust R85 million
Net shortfall after realising assets held in Environmental Rehabilitation Trust R388 million
A contingent liability has been recognised for the issuing of guarantees to the DMR as follows (refer to Note 30 to the annual financial statements):
Table 10: Guarantees issued for mine rehabilitation
Guarantee issue date R’m
July 2007 R100 million
March 2009 R115 million
March 2010 R150 million
Guarantees obtained to date R365 million

Fosk
or A
nnua
l Rep
ort 2
010
46
A commitment has been made to the DMR with respect to the phased-in delivery of guarantees for premature mine closure provision.
Foskor EnvironmEntal rEhabilitation trust (Phalaborwa minE)
Details of contributions to the Environmental Rehabilitation Trust are as follows (refer to Note 17.1 to the annual financial statements):
table 11: Contributions to the Environmental rehabilitation trust
Date r’000
Before June 2000 13,767
June 2004 3,000
March 2006 8,000
March 2007 10,000
March 2009 8,000
March 2010 8,000
Contributions to date r50,767
The current market value of the assets in the Environmental Rehabilitation Trust is circa R85 million, which is regarded as adequate at this point when considering the remaining life of the Phalaborwa mine.

Fosk
or A
nnua
l Rep
ort 2
010
47
R68 million upgrade of process and storm
water drainage and road rehabilitation.
Investing in benefits for all stakeholders.
In 2008, Foskor’s Acid Division in Richards Bay undertook a comprehensive survey regarding the condition and suitability of systems serving current and future needs.
A project to upgrade the infrastructure and the design of new sub-soil drains and improved storm water systems dealing better with maintenance challenges on-site followed with construction work commencing in June 2009 and expected to be complete during the first quarter of 2011.
The project includes a truck-stop facility where up to 18 road trucks waiting to be loaded with fertiliser and acid can park.
This investment benefits all stakeholders by virtue of:reduced impact of groundwater pollution;• improved maintenance of storm water systems;• increased lifespan of roads carrying heavy traffic; and• improved road safety for the general public.•
www.foskor.co.za Fosk
or A
nnua
l Rep
ort 2
010
47

Fosk
or A
nnua
l Rep
ort 2
010
4848
Fosk
or A
nnua
l Rep
ort 2
010
SuSTAiNAbiliTy rEPOrT
Introduction
Despite financial pressures as a result of the credit crisis that severely damaged economies and company balance sheets, in the year under review Foskor remained devoted to its corporate social investment initiatives. Foskor is a value-creating enterprise that is privileged to contribute meaningfully to the communities in its areas of operation.
When it comes to community projects, Foskor chooses initiatives that should enable local people to earn and to transfer skills after the company’s initial outlay has been made. By emphasising education, sports, health, and arts and culture programmes in its community projects, Foskor believes that it is nurturing untapped potential and grooming a future talent pool. Foskor’s continued focus on the communities in the vicinity of its operations proves that the company values the association of its brand with goodwill, reputation, quality of governance and strategic direction.
Foskor’s sustainability strategy is founded on the principles of self-sufficiency and constant returns on investment. Foskor recognises that the value added by its people is its core competency and that the company’s success depends on the talent drawn from all its stakeholders – including employees, shareholders, customers, advisors and suppliers. Embracing a business approach that creates long-term shareholder value through managing risks and making the most of economic, social and environmental opportunities, Foskor balances the company’s portfolio, steadies sales volumes and protects cash flows.
Photo: Foskor site, Phalaborwa

Fosk
or A
nnua
l Rep
ort 2
010
49
CORPORATE SOCIAL INVESTMENT
Case study 1
audit on social Responsibility systems: 99% scoreaudit on Corporate Governance systems: 97% score
‘Foskor’s SHREQ department deserves special mention as it is obvious that they walk the extra mile to incorporate risk control beyond the traditional SHEQ systems. The management team and supervisors maintain excellent control, with meetings conducted in a well disciplined way.’
(Dr Gustav W Pistorius, Pr Eng, BSc, BEng [Mech–Ind], MBL, APRM, DTech – Technical Advisor to the Limpopo Department of Health and Social Development).
Foskor’s social and economic development initiatives are aligned with the company’s overall growth strategy and accord with the government’s priorities. Foskor invests in community projects that are both mutually beneficial and sustainable. In the year under review Foskor endowed R36 million to projects advancing education and skills, health, arts and culture, and sport in underprivileged neighbourhoods.
Table 12: Foskor’s corporate social investment expenditure (2005/06–2009/10)
Financial year 2009/10 2008/09 2007/08 2006/07 2005/06
Corporate social investment expenditure (rand values) 1,033,299 1,121,740 559,125 296,157 205,640
learners at Foskor Primary School proudly hold up the new name

Fosk
or A
nnua
l Rep
ort 2
010
50
Foskor sponsors the University of Zululand’s Science Centre to ensure that Zululand’s communities have access to world-class science and technology apparatus. In collaboration with the Zululand Sustainable Development Forum, Foskor sponsors a Winter School for Grade 12 learners. The company also makes a grader available to local schools over weekends so that they can level sports fields or playgrounds, and repair pathways for pedestrians.
Foskor embraces the Dinaledi Maths and Science project, having adopted four schools: two in Limpopo Province and two in KwaZulu-Natal. The Dinaledi project enhances maths and science tutoring in secondary schools in preparation for tertiary studies. Dinaledi schools are earmarked to become centres of excellence and training for both educators and learners hoping to pursue careers in the maths and science fields.The refurbished Foskor Primary school grounds
Foskor Primary learners excited about the new school
Education and skills dEvElopmEnt
Foskor accommodates three schools on its premises at no cost. These are the Kingfisher Private School and Moshate Hotel School (Phalaborwa); and the Ntambanana Crèche (Richards Bay). Foskor is reconstructing the Ntambanana Community Centre in Richards Bay as a lodge for widows, orphans and other vulnerable persons. This community centre will be equipped with training facilities for business start-ups and will offer assistance to entrepreneurs.
Foskor is encouraging early childhood development training at a pre-school in Phalaborwa by partnering with the national Department of Basic Education in granting teaching aids and development programmes to educators in the region. Foskor also adopted the former Stanbury Primary School and renamed it Foskor Primary School in November 2009.

Fosk
or A
nnua
l Rep
ort 2
010
51
Foskor funds two media centres. The Richards Bay Media Centre was founded in partnership with the Zululand Chamber of Business Foundation and the Department of Education. This centre provides administrative support services such as faxing, photocopying, printing, risography (high-speed digital printing), document binding and laminating to 46 schools. Foskor gives both educators and learners access to data and information by stocking the library with relevant and up-to-date textbooks. At the Phalaborwa Media Centre in Namakgale, Foskor rents equipment and pays for the upkeep of the facility that serves as a resource centre for 75 schools.
Community health and well-being
Foskor actively participates in the communities where it operates and is visibly a socially responsible corporate citizen. Foskor provides the following premises in support of various charities:• Phelang: HIV/AIDS programme. From Phelang, the Foskor
nursing sister distributes free condoms and nutritional
supplements to the Ba-Phalaborwa community. The sister also offers counselling and training to home-based care-givers in need of a support group.
• Foskor Community Centre: business centre in Namakgale. Founded about 20 years ago, the centre currently houses seven small, medium and micro enterprises (SMMEs), including catering concerns, a vehicle spares shop, hairdressers, and sewing, upholstery and tailoring businesses. The anchor tenant is the Department of Roads and Transport. Foskor subsidises the SMMEs’ rentals so that they can render affordable vital services to the Ba-Phalaborwa residents.
• Huis Maroela: shelter for abused women. Foskor leases a four-bedroom house at R1 per annum to the Women’s Federation in Phalaborwa.
• Enseleni: safe house for the indigent. In Richards Bay, Foskor has partnered with Business Against Crime to provide a safe house for destitute victims of crime.
Foskor supports the business Against Crime initiative in the richards bay community
Foskor Community Centre, Namakgale

Fosk
or A
nnua
l Rep
ort 2
010
52
The race is on: F21 runners The Foskor museum, Phalaborwa
Heritage (cultural dress-up) day
Sport
Foskor hosts various sports days, the proceeds of which go to charities. In both Phalaborwa and Richards Bay a 21-km fun run, named the F21 Half Marathon, is held annually. For the period under review, Foskor raised R300,000 from its Golf Days, and this money will be donated to local charities. In cooperation with the Department of Sports and Recreation, Foskor plans to build a sports field in Emabhuyeni (near Richards Bay) to encourage soccer and rugby in the township.
ArtS And culture
The Foskor family takes great pride in its corporate culture, which is celebrated by means of numerous events such the Long Service Awards, Heritage (cultural dress-up) Day, Football Friday and staff team builds, among others. The Foskor Museum in Phalaborwa is an invaluable archive that tracks Foskor’s development over time. It houses Foskor memorabilia and is popular with local children and tourists to the area alike.

Fosk
or A
nnua
l Rep
ort 2
010
53
• ‘Congratulations to the Foskor Richards Bay team ona very successful annual audit on ISO 9001, ISO 14001,OHSAS18001,SANS16001,andtheDEKRAShieldaudit.Foskor was also successfully audited on CorporateGovernance Systems and Corporate Social InvestmentSystemsduringtheweekof12October.Foskorhasonceagain proven itself as a responsible corporate citizen.Foskorites proudly practise what they preach and arecommittedpeoplewhoacceptconstructivecriticism.’
• ‘WethankFoskorforthehospitality,openness,seriousnessand for the positive manner in which business isconducted.Wealsohadfunduringtheaudit.Wesawalotofgoodthingshappeningatthecompany–thecontinuousimprovementisamazing.’
• ‘Foskorhasamatureauditingprogramme inplacethatis well entrenched. Foskor’s continuous improvementeffortscommandacuteattentiontodetail fromauditorslookingtoaddvalue.’
Ivan Pleaner (ISO 18001) – Lead Auditor
• ‘Weareveryimpressedwiththewaytheclinicismanaged.Therecordkeepingisexcellent.TheextentofintegrationbetweenFoskorandClinixismostimpressive.Theclinicis operated as an integral part of Foskor. Surely everyFoskoritefeelssafeinClinix’shands.’
• ‘ThehumanelementintheHIV/AIDSprogrammeisvisibleandcorrectlyfocused.We’lldefinitelylearnfromyou.WithafewminoradjustmentsintheriskassessmentsFoskorwillhaveatrulyphenomenalprogramme.’
Lorna Pretorius (AMS 16001)
• ‘An excellent job is done with respect to operation andcontrol. Waste management, pollution control, and the
induction video are excellent. I love thenewwaste yard–congratulationsonthisachievement.Wearealsoveryimpressedwiththelevelofenvironmentalreporting.’
Ciranne Bates (ISO 14001)
• ‘ThiswillsurelyberecordedasahighlightinFoskor’shistory.’
• ‘BothFoskorandClinixretainedtheirFiveShieldDEKRAratingsin2009.’
I Pleaner, L Pretorius & C BatesDEKRA auditors
Case study 2
Foskor is seCond south aFriCan Company with dekra Gold
Foskor flies its dEkrA flag

Fosk
or A
nnua
l Rep
ort 2
010
54
SOCIAL PERFORMANCE INDICATORS
OccupatiOnal health and safety
Safety is Foskor’s number one priority. To minimise on-duty injuries, Foskor follows global best practice by adhering to the management systems of the International Organization for Standardization (ISO). In 2009/10 Foskor became the second South African company to be awarded gold status – DEKRA Five Shields – at the Safety, Health, Environmental and Risk Management Conference held at Sun City (April 2010).
DEKRA is an international safety and quality ratings agency dealing with technology, the environment, training, monitoring and mobility certifications. With its roots in France and Germany, the two largest European markets, it offers high-level safety, health, environment and quality (SHEQ) reporting services around the world to multinationals, industrial organisations and SMMEs.
Between April 2009 and January 2010, Foskor reported eight disabling injuries. The disabling injury frequency rates (DIFR), calculated as the number of disabling injuries per million hours worked, were 0.32 and 0.28 for the Mining and Acid Divisions respectively. The average of 0.30 is a marked improvement on last year’s average of 0.465 primarily due to the concerted efforts of Foskor’s Safety Task Force guided by Mr JW Horn (Vice President: Mining). Foskor had zero fatalities in the year under review.
The Acid Division’s safety awareness programme promotes safety training with pamphlets, banners and clear messaging posted on the site. The management team do regular walkabouts to encourage safe working practices. Workers know that they have the right to refuse to work should they feel unsafe or that a required task will compromise their health or well-being.
In 2009, Foskor retained its ISO 14001 (Environmental Management), ISO 9001 (Quality Management), OHSAS 18001 (Occupational Health and Safety Management) and SANS 16001 (HIV/AIDS Management) certifications. Foskor must now also comply with the SANS 451: 2008 standard for Spirometry – the procedure to be followed for the generation of acceptable and

Fosk
or A
nnua
l Rep
ort 2
010
55
repeatable spirograms for the purpose of occupational and medical surveillance of respiratory (lung) function in humans. SANS 451 covers the performance requirements and calibration of the instruments used, as well as hygiene and infection control. Foskor conducted its first spirogram audit in 2009.
Foskor hosted a Safety Awareness Day on 15 April 2009 at the Foskor Community Centre in Namakgale, Phalaborwa. The message that safety is everyone’s responsibility was communicated through all channels to employees. Guest speakers and artists participating in the programme used passionate and effective presentations, speeches and performances to drive home the message about the importance of workplace safety. The staff showed support for the safety campaign by wearing safety hats and dedicated a moment of silence to those who had lost their lives since the inception of Foskor almost 60 years ago. The Department of Mineral Resources announced that 98.3% of the 2,283 safety pledges signed on Safety Awareness Day were contributed by Foskorites and the remainder by contractors. At the Awareness Day function, Foskor’s President/CEO, Mr MA Pitse, complimented the Safety Task Force members on their commitment to maintaining and exceeding global best practice.
HealtH
The Mining Division in Phalaborwa was the first South African operation to receive certification by the South African National Standards (SANS) Bureau for its progressive HIV/AIDS programme, in 2008. SANS 16001, derived from the ISO, is the national best practice benchmark for workplace HIV/AIDS programmes. The Acid Division in Richards Bay attained its certification for the first time in November 2008 and has since successfully retained it.
The SANS 16001: 2007 processes are relatively new to most mines. The following five-step programme is entailed:
• Assessing the risk of HIV against the company’s needs – this entails rating the available HIV services and systems and measuring their efficacy;
Award-winning Clinix on Foskor’s premises
• Planning and developing a customised intervention based on the assessment, setting targets, objectives and success criteria, and then allocating responsibility and resources to effect the interventions required;
• Implementing customised solutions to manage the identified risks, targets, objectives and success criteria;
• Monitoring the monthly and quarterly statistics and the project plan in terms of achieving the targets and objectives; and
• Evaluating the implemented interventions for efficacy, outcomes, achievement of success criteria and return on investment, as well as compliance with SANS 16001.

Fosk
or A
nnua
l Rep
ort 2
010
56
required by the Employment Equity Act. Employment equity forums at both operations ensure that appropriate plans are developed, executed, monitored and communicated to employees. The group experiences challenges in attracting suitably qualified women in the mining discipline, and thus makes attracting women to work in the group’s core business a focal point.
The Mining Division established a Women in Mining forum to:
• Evaluate, promote, support and encourage the women’s forum initiatives;
• Vet and implement these initiatives;
Situationalanalysis
Actuarial or prevalence
surveys
Pre- and post- kAbP surveys
development of Hiv/AidS Committee
development of Hiv/AidS policy and
procedures
development of project plan, targets
and objectives
Project management, mentorship and
coaching
information system
Hiv counselling and
testing
referral into disease management programme
Psychological support (employee assistance
programmes / employee well-being)
information, education and communication for behaviour change and risk reduction
across business functions
2. Planning
3. Implementation
hIV/AIDs management system auditsANs 16001
bEst PRACtICE
4. monitoring
5. Evaluation
1. Assessment
Human capital development
employment equityFoskor is committed to transforming itself into a fully representative company and regards meeting the requirements of the Employment Equity Act (No. 55 of 1998) as a business imperative. Foskor has formally implemented programmes to develop and promote staff in designated groups, such as expatriate skills transfer programmes, mentoring programmes and graduate recruitment and development programmes.
Foskor successfully complies with the Department of Labour’s recommendations and submits employment equity reports as
The process followed by Foskor – as the first South African company to comply – can be diagrammatically represented as follows:
Figure 5: Diagrammatic representation of the sANs 16001: 2007 compliance process

Fosk
or A
nnua
l Rep
ort 2
010
57
• Monitor and evaluate trends and recommend changes to procedures;
• Disseminate information on matters relating to women in mining; and
• Strengthen networking with relevant stakeholders.
Employment relationsInteractions governing the relationship between Foskor and its staff remained stable over the period under review. Ongoing consultations, to gauge areas of conflict, allow for joint problem solving and have resulted in the following:
• Substantive negotiations around conditions of employment were successfully concluded with the three recognised trade unions, namely, Solidarity, NUM and CEPPWAWU. Employees in the bargaining unit will receive an effective increase of 12.3% on basic wages;
• The resolution of pending matters culminated in a job evaluation settlement being signed between management, NUM and Solidarity in Phalaborwa. Negotiations for this agreement commenced in 2003; and
• A memorandum of understanding was entered into between Foskor (Pty) Ltd, Foskor Zirconia (Pty) Ltd and NUM to govern the working relationship between the parties.
Employee benefitsFoskor aspires to provide affordable, effective and sustainable health care, as well as death or disability benefits, to all employees and their dependants. Foskor retains a healthy workforce by offering staff access to well managed medical care and insurance. Employees have freedom of choice with regard to the medical aid service provider and the level of health care cover. The company subsidises a portion of medical aid contributions. Death and disability benefits from a reputable provider cover own death; permanent or temporary disability; and the death of a spouse or partner of an employee. Foskor also offers staff funeral cover and mortgage protection through a recognised financial services provider.
learnerships – advancing women in mining
It is compulsory that all permanent employees be members of the company’s retirement fund, which is registered with the Financial Services Board and the South African Revenue Service. Foskor contributes monthly to the fund on behalf of the employees, and individuals can choose the percentage contribution that they wish to invest.
Employee well-beingFoskor remains devoted to the welfare of its employees. The company’s employee assistance programmes offer free professional services, to enhance the quality of life and to help staff improve performance and productivity.
The Foskor employee assistance programmes focus on:• HIV/AIDS and other illnesses;• Disabilities;• Addiction (alcohol and other substances, gambling etc.);• Stress management;• Trauma and bereavement counselling;• Financial life skills management; and• Case work dealing with family matters.

Fosk
or A
nnua
l Rep
ort 2
010
58
Empowering women across all operations
HIV/AIDS ravages communities throughout Africa. Foskor acknowledges the seriousness of the pandemic and offers support to employees and their families to manage the disease. The interventions conducted during the period under review include the following:• Focusing on prevention against infection through ongoing
training and awareness sessions;• Voluntary counselling and testing;• Provision of nutrition supplements; and• Provision of antiretroviral treatment to infected employees.
During the period under review, both Foskor operations retained the SANS 16001 certification for the HIV/AIDS management system.
Human resources development In the year under review Foskor embarked on a talent management project, using cutting edge methodologies and techniques to benchmark and position the company’s most critical and influential people. The company has a strong succession pipeline, cultivates talent and has measures in place to retain and transfer skills.
The Human Capital Division commits to the following:• Further aligning the talent management strategy to the
business strategy and goals;• Convincing talent to stay in the organisation;• Sharing accountability with stakeholders;• Narrowing the gap between talent supply and demand;• Enriching performance management and leadership; • Fully understanding the talent supply management
process; and• Maintaining Foskor’s status as employer of choice.
The Human Capital Division focuses on building competencies and enhancing the leadership capabilities needed to achieve business excellence, while building skills pipelines for the future. When recruiting, the division considers both employment equity criteria and succession management needs.
The Human Capital Division coordinates a range of development programmes to equip employees with the skills necessary to compete successfully in a demanding and challenging environment. These programmes are in the following areas:• Portable skills;• Bursaries and study assistance;• Graduates-in-training;• Learnerships and mentorships; and• Technical assistance.

Fosk
or A
nnua
l Rep
ort 2
010
59
women in the manufacturing plant: Acid division
Succession management makes provision for the smooth continuation of functions performed by staff in critical positions. The Human Capital Division sets the criteria for development plans aligned to Foskor’s strategy. Foskor keeps a watchful eye on staff movements in the financial, technical and engineering fields and tries to minimise the impact on the company of labour turnover. An outgoing executive may be shadowed by a successor for up to 18 months to facilitate a smooth handover.
All training and development is based on thorough needs analysis, taking cognisance of the business strategy. As part of the company’s initiative to develop expertise, a National Certificate:ChemicalOperations,anNQFLevel2qualificationthat is accredited by the Chemical Industries Education and Training Authority, is offered in-house. A total of 25 employees were trained during the period under review. Foskor’s artisan and chemical operations learnership programme had 62 learners. To retain artisan competence in the group, the company embarked on an aggressive artisan competency assessment drive, through which all artisans were assessed and re-trained where necessary.
Foskor offers bursaries to school-leavers interested in mining and chemical engineering related disciplines, such as engineering, geology, metallurgy and chemical engineering. Foskor has a learning culture that complements education and competency with study aid, for the mutual benefit of both the individual and the organisation. For the period under review, 48 employees received study assistance.
Foskor currently has nine participants in the three-year Graduate-in-Training Programme. This programme bridges the gap between academic theory and the practical working environment. Every graduate-in-training has a mentor, who facilitates training and development, pinpoints opportunities and develops leadership.
Foskor also offered adult basic education and training to 93 learners for the period reviewed.
Foskor, in partnership with external faculties such as Mopani FET College, runs a talent management programme to develop competencies. A similar partnership exists in Richards Bay, with the Joint Training Committee forming part of Zululand’s Chamber of Commerce and Industry.
To enhance management’s performance, participation in a senior management development programme at any of South Africa’s leading higher education institutions is encouraged.
Foskor emphasises formal leadership development initiatives, mentorship programmes and talent review sessions involving senior managers. Building and retaining a pool of current and future leaders is a priority for Foskor, and interventions to this effect, such as executive coaching and comprehensive talent reviews, are ongoing.

Fosk
or A
nnua
l Rep
ort 2
010
60
The Department of Mineral Resources awarded Foskor three new mining licences in September 2009 and approved the company’s economic impact assessments and environmental management plans for the Pyroxenite Expansion Project. Foskor is still in the process of converting its old order mining rights into new order rights in terms of the Minerals and Petroleum Resources Development Act (No. 28 of 2002). The new mine, the South Pyroxenite pit, has been operational since September 2009.
LocaL Economic DEvELopmEnt
Local Economic Development (LED) is a government-driven economic growth initiative that encourages locals to pool resources with municipalities and alleviate poverty. LED was designed to seek growth and employment creation opportunities. By definition, a successful LED programme is one that is aligned to national policy, strategy and guidelines. It provides direct and hands-on support to provincial and local government structures and outlines the management of the LED Fund used to offer technical support to nodal economic development planners. LED is also a useful tool for coordinating and monitoring donor programmes and for building capacity processes.
An Integrated Development Plan (IDP) is a process whereby municipalities prepare five-year strategic plans, reviewed annually, in consultation with communities and other stakeholders. These plans strive to promote integration by balancing social, economic and ecological pillars of sustainability without compromising the government’s institutional capacity.
The Ba-Phalaborwa Municipality and Foskor have agreed on five projects valued at R26.5 million over the next four years, as per the 2009/10 IDP. These are:• Paving the streets and installing additional storm water
drains;• Rehabilitating streets in Phalaborwa; • Rehabilitating landfill sites in Namakgale, Lulekani and
Phalaborwa;• Upgrading the sports precinct in Lulekani; and• Creating a Bollanoto infrastructure development hub.
The existing tarred streets in Phalaborwa are in a grim state and in urgent need of fixing. The streets in the central business district and industrial sites accommodate high traffic volumes running to different routes and local hubs. The road rehabilitation project will form a network of reliable, safe streets. It is part of the Expanded Public Works Programme, the main beneficiary of which is the Ba-Phalaborwa community.
ECONOMIC EMPOWERMENT
Foskor sponsors street rehabilitation in Phalaborwa

Fosk
or A
nnua
l Rep
ort 2
010
61
As part of the LED strategy for the greater Phalaborwa area, projects that will enhance tourism and the lives of people in the area were sought. Vacant land in Phalaborwa – adjacent to Hendrick van Eck Avenue and currently covered in foliage – was marked as ideal for the development of tourist attractions. Foskor plans to convert this land into a pedestrian boulevard. This Bollanoto infrastructure development hub has also been dubbed ‘the jewel of wildlife tourism’ by the local municipality.
EmpowEring communitiEs
Foskor believes in uplifting impoverished communities by providing the means to be self-sufficient. At the Ntambanana Centre (Richards Bay), Foskor provides widows with tools and seeds to cultivate their own gardens. Together with the Department of Arts and Culture, Foskor is involved in supporting the teaching of beading to rural women. The company also endows traditional leaders with a development fund to drive innovative ideas within the community.
In a quest to reduce gypsum disposal, Foskor joined forces with Rapid Building Systems from Australia. The Rapidwall Project, estimated at R145 million, uses phospho-gypsum to
manufacture prefabricated wall panels for use in houses. The project is currently in the feasibility stage and a demonstration house was erected in Richards Bay in April 2010. After rigorous testing and upon approval from the authorities, a panel manufacturing plant will be set up in Richards Bay. The plant will provide approximately 90 permanent jobs and consume about 104,000 tons of gypsum, currently considered waste, per annum.
gypsum demonstration house being erected
SmmEs supported by Foskor: catering services
SmmEs supported by Foskor: laundromat

Fosk
or A
nnua
l Rep
ort 2
010
62
BEE ProcurEmEnt
In 2009 the Procurement and Logistics Division focused on promoting transformation and wealth creation through preferential black economic empowerment (BEE) spending. The department made dedicated efforts to update its database with current supplier contact details, capturing changes to business profiles and verifying compliance documentation.
During 2009, supplier evaluation was reinstated at the Acid Division in Richards Bay and adjustments were made to the processes used at the Mining Division in Phalaborwa. The revised systems serve to identify duplication of tenders by the same supplier across different divisions and simplify the procedure of listing BEE compliant vendors.
Systems were put in place to ensure an improvement in preferential procurement and BEE spending. The Acid Division achieved a 60% BEE procurement spend and the Mining Division 32%. Plans to improve BEE spending in Phalaborwa are under way. On average, the group achieved 45% BEE spend, up from 44% in 2008/09.
Foskor entered into an agreement with South African International Business Linkages (SAIBL). In terms of the agreement Foskor offers procurement opportunities to black owned entities that SAIBL will empower. Foskor and SAIBL fund 40% each of the total cost of interventions and the benefited entity contributes 20%. Foskor allocated R1 million to this project in 2009/10. Ten SMMEs benefited from this initiative of which five were in Phalaborwa and the balance from Richards Bay.
The Acid Division donated two computers to the Zululand Chamber of Commerce and Industry to be used by emerging suppliers to access the tanarawa system for web opportunities tendering. The Acid Division facilitated computer training for potential suppliers in partnership with the National Youth Development Agency.
Foskor attained its first BEE rating from Emex at level 5 and was ranked an 80% BEE contributor. The company plans to achieve level 4 in the next verification with the following elements identified for improvement: preferential procurement, enterprise development and socio-economic development/corporate social investment.

Fosk
or A
nnua
l Rep
ort 2
010
63
Table 13: B-BBEE spending (1 April 2009 – 31 March 2010)
B-BBEE contribution Group Mining Division Acid Division
Level 1 10,137,526 8,193,435 1,944,092
Level 2 89,233,789 48,180,394 41,053,396
Level 3 73,333,195 40,814,020 32,519,174
Level 4 170,722,350 98,306,944 72,415,406
Level 5 190,458,141 176,451,971 14,006,170
Level 6 130,814,630 91,383,048 39,431,582
Level 7 17,663,704 10,022,137 7,641,567
Level 8 34,481,723 20,774,715 13,707,008
Total on B-BBEE compliant suppliers 716,845,059 494,126,664 222,718,395
Total B-BBEE spending 716,845,059 494,126,664 222,718,395
45% 40.1% 60%
Non-compliant suppliers 884,781,171.43 738,781,094.88 146,000,076.55
Total spending 1,601,626,230.42 1,232,907,758.65 368,718,471.77

Fosk
or A
nnua
l Rep
ort 2
010
64
Foskor’s gives feedback on its environmental performance at a quarterly Environmental Forum with stakeholders from the industry, local and national government bodies, residents and other interested and affected parties. Foskor’s environmental teams are also represented at the following forums:• The Richards Bay Clean Air Association; • The uMhlathuze Pipeline Forum, relating to the management
of effluent quality and volumes discharged at sea;• Transnet’s Environmental Forum Meeting in accordance with
the Environmental Management Plan for Port Operations; • The uMhlathuze Emergency Planning Forum;• The Olifant River Water Catchment Forum; and• The Kruger National Park Environmental Management
Forum.
Water consumption and conservation
The Mining Division in Phalaborwa used annual Water Week to raise stakeholder awareness of Foskor’s role in protecting water sources in the Kruger National Park.
Water management project
In September 2009, Foskor staff in Richards Bay joined KwaZulu-Natal Wildlife and the Department of Environmental Affairs and Tourism in cleaning the beaches and the Casuarina section of the harbour.
The Acid Division in Richards Bay sources potable and clarified water from the uMhlathuze Municipality and is contractually bound to consume no more than 393,802 kilolitres of potable water per month. Approximately 10 megalitres of water are
used throughout the plant per day. The Richards Bay plant is authorised to use an average of 13.5 megalitres capped at 17.6 megalitres of clarified water per day. The clarified water is mainly used for manufacturing phosphoric acid. Daily monitoring and reporting of water use ensures stringent control.
A storm water dam south of Foskor’s boundary in Richards Bay collects the majority of the storm water that leaves the site. The storm water recovered from the site is returned to the phosphoric acid and granulation plants via pipelines, for reuse. The majority of roads and storm water systems in Richards Bay have served the plant since 1976. A R68 million storm water drainage and road rehabilitation upgrade process, started in 2008, addresses on-site challenges and simplifies maintenance.
Foskor reuses and recycles water from within the site and from other industries wherever practically possible; for example:• For a number of years now, industrial effluent pumped out
to sea has been used as a slurry medium for gypsum, thus lowering the intake of raw water. Foskor uses sea water for slurry to lower toxicity levels by as much as four times;
ENVIRONMENT
Foskor protects the water resources in the communities where it operates

Fosk
or A
nnua
l Rep
ort 2
010
65
• Recycled effluent water from the Hillside smelter is used; and
• A filter system was installed for producing potable water, resulting in significant cost saving.
Protection of Plant and animal sPecies
Foskor protects indigenous plants. Service contracts regulate the control of alien plant species in and around the Foskor sites as well as in the area immediately surrounding the old gypsum dump site in Richards Bay.
In Phalaborwa, to protect both human and animal life, Foskor is embarking on marking about 1,000 cattle in the vicinity with reflectors so that they can be easily seen on the road at night.
Foskor donated R800,000 to the Resuscitation Programme to encourage Limpopo’s residents to preserve the environment and to reduce global warming by growing indigenous trees in residential areas. Approximately 100 new jobs can potentially be created in collaboration with the government’s Expanded Public Works Programme. Foskor resuscitates the environment in its vicinity that was previously damaged by irresponsible human
upgraded storm water drainage system in richards bay
behaviour, conflict between conservation and development goals or unsustainable biodiversity, or as a result of firewood used as an alternative energy source.
Air quAlity
The Acid Division monitors and measures emissions as is required by various environmental acts and regulations as well as permits and licences issued to Foskor. Monitoring reduces or eliminates environmental risks such as water and air pollution. Ad hoc monitoring is conducted when the need arises, when requested by regulators and also as a result of complaints received from interest groups.
The Environmental Forum monitors the emission of the following hazardous substances:• Dust; • Ambient fluoride;• P2O5; • Sulphur dioxide;• Hydrogen sulphide; • Particulates (PM10 and PM2.5); and • Ammonia.
The Acid Division risks emitting sulphur dioxide in excess of permit requirements when the sulphuric acid plants are started up. To avoid excessive emissions and discomfort to both personnel and the surrounding public, plant start-ups are limited to favourable weather conditions and certain times of the day. Foskor invested R36.5 million to design and construct two start-up scrubbers to cut and re-route emissions from the plant through an alkali scrubbing medium before venting them into the atmosphere.
Foskor installed five ambient Airpointer sulphur dioxide (SO2) monitors worth R1.9 million. The Airpointer is a complex real-time analyser that uses SO2 ultraviolet fluorescent technology to measure the SO2 levels in the atmosphere, taking account of the prevailing wind direction given the proximity of the

Fosk
or A
nnua
l Rep
ort 2
010
66
community and surrounding industries. The unit is currently linked to the distributed control system and emits a warning signal when SO2 levels are excessive.
EnErgy EfficiEncy
The Acid Division’s electricity is supplied directly from Scorpio substation, operated by the City of uMhlathuze. The station consists of two incoming feeders running in parallel, each with a capacity of 22.8 MVA. The predetermined maximum demand that the Acid Division is allowed to draw from this supply is 27 MVA. The Acid Division also utilises a 26 MVA ‘cogeneration’
onsite steam turbine generator, which is powered by heat from excess steam and is set to augment the municipal supply of electricity to the plant. Foskor currently generates between 6 MVA and 8 MVA using its waste steam.
Waste disposal
Over the years, Foskor has undertaken various efficient waste disposal initiatives and now successfully recycles the following on-site: • Paper i.e. ordinary typing paper, newspapers, magazines and
telephone directories;• Non-ferrous metals;• Ferrous metals including stainless steel;• Polystyrene;• Melamine;• Wood;• Conveyor belting (rubber); and• All types of plastic (PET, HDPE, PVC etc.).
A new sorting yard or radiation waste and bunker facility, for improved bulk handling of hazardous waste, has reduced the disposal of construction, demolition and hazardous waste by 15% compared to the previous reporting year. This has prevented contamination, aided the recovery of materials for reuse in the plant, and recycled both acidic filter cake and sandblasting grids.
ConClusion
Foskor recognises that sustainable development links opportunity with responsibility. Sustainable development raises competitiveness and allows for more informed production, taking damage to the environment into consideration. Socially responsible behaviour spreads economic wealth equitably and brings a better quality of life to those affected by the operation’s daily activities. Foskor acknowledges that there is always room for improvement. Using the Global Reporting Initiative as a basis, the company’s sustainability performance can be measured by a few key performance indicators, as presented in Table 14.

Fosk
or A
nnua
l Rep
ort 2
010
67
Table 14: Five-year comparison (2006–2010) of Foskor’s key sustainability performance indicators, as at 31 March of financial year
Key performance indicator March 2010 March 2009 March 2008 March 2007 March 2006
Finance (rand values)
Corporate donations 7,762,932 1,628,963 1,441,539 882,490 390,158
Materials handling
Energy consumption (MWh) – Mining 446,007 460,017 472,462 498,483 472,440
Energy consumption (MW) – Acid 116,989 150,108 177,533 150,148 170,535
Total water usage (kilolitres) – Mining 5,484 5,503 6,103 7,249 9,521
Total water usage (kilolitres) – Acid 8,735,046 7,298,874 6,366,500 6,266,350 7,762,421
Employment
Average employee age 42.48 42.82 42.87 43.11 42.98
Average wage settlement 12.3% 10.4% 5.9% 5.5% 6.5%
Disabling injury frequency rate (DIFR) 0.30 0.22 0.44 0.73 1.25
Average ratio of men’s to women’s salaries 1:1.10 1:1.17 1:1.18 1:1.20 1:1.14
Number of in-house training programmes 39 40 38 36 35
Number of participants in learnership programmes 62 63 35 42 23
Number of graduates-in-training 9 10 4 0 0
Controls/compliance
Number of dismissals 8 12 11 7 16
Number of fraud cases/thefts reported 1 4 2 1 3
Number of disciplinary hearings 80 58 68 40 72
Number of grievances submitted 1 1 8 7 1
Number of cases referred to the CCMA 12 11 5 14 39
Corporate social investment
Number of communities supported 3 9 5 3 2
Number of community projects invested in 65 88 29 21 9
Number of SMMEs supported 7 10 0 0 0
Employment
Total workforce – Group 1,753 1,723 1,805 1,799 1,783
Total workforce – Mining 1,133 1,118 1,233 1,196 1,198
Total workforce – Acid 620 605 572 603 585
Hours worked – Mining 5,254,410 4,515,629 4,091,809 4,011,446 3,957,680
Hours worked – Acid 2,120,047 1,989,331 2,004,332 2,251,264 1,583,111
DIFR – Mining (target<1) 0.32 0.09 0.15 0.25 0.20
DIFR – Acid (target<1) 0.28 0.70 0.70 0.80 1.01

Fosk
or A
nnua
l Rep
ort 2
010
6868
Fosk
or A
nnua
l Rep
ort 2
010
Financial statements

Fosk
or A
nnua
l Rep
ort 2
010
69
cOntents
Directors’ Declaration 70
inDepenDent auDitors’ report 71
Directors’ report 72
Group anD company statements oF Financial position 75
Group anD company statements oF comprehensive income 76
Group anD company statements oF chanGes in equity 77
Group anD company cash Flow statements 79
notes to the Financial statements 80
1 Summary of significant accounting policies 80
2 Critical accounting policies and judgements 92
3 Property, plant and equipment 94
4 Intangible assets 97
5 Investments in subsidiaries 98
6 Investment in joint venture 98
7 Investment in associate 99
8 Financial investments 99
9 Inventory and ore stockpile 100
10 Trade and other receivables 101
11 Derivative financial instruments 101
12 Deferred taxation 102
13 Discontinued operations 103
14 Share capital 103
15 Share-based payment reserve 103
16 Finance lease liability 106
17 Environmental rehabilitation liability 107
18 Post-employment obligations 108
19 Trade and other payables 112
20 Provisions 112
21 Operating profit 113
22 Net finance income 114
23 Net foreign exchange profits/(losses) 114
24 Taxation 115
25 Earnings per share 116
26 Cash generated from operations 118
27 Borrowing facilities 119
28 Commitments 120
29 Financial instruments 121
30 Guarantees and contingent liabilities 127
31 Segmental reporting 128
32 Related party transactions 131

Fosk
or A
nnua
l Rep
ort 2
010
70
DIRECTORS’ DEClARATION
To the members of Foskor (Pty) LtdThe directors are responsible for the preparation and fair presentation of the group and company annual financial statements, comprising the statements of financial position as at 31 March 2010, and the statements of comprehensive income, changes in equity and cash flow for the year then ended, and the notes to the financial statements, which include a summary of significant accounting policies and other explanatory notes, and the directors’ report, in accordance with International Financial Reporting Standards and in the manner required by the Companies Act of South Africa.
The directors’ responsibility includes: designing, implementing and maintaining internal control relevant to the preparation and fair presentation of these financial statements that are free from material misstatement, whether due to fraud or error; selecting and applying appropriate accounting policies; and making accounting estimates that are reasonable in the circumstances.
The directors’ responsibility also includes maintaining adequate accounting records and an effective system of risk management as well as preparation of the supplementary schedules included in these financial statements.
The directors have made an assessment of the group’s and company’s ability to continue as a going concern and have no reason to believe that the business will not be a going concern in the year ahead.
The independent auditors are responsible for expressing an opinion on whether the group and company annual financial statements are fairly presented in accordance with the applicable financial reporting framework.
Approval of the annual financial statements The group and company annual financial statements, as identified in the first paragraph, were approved by the Board of Directors on 25 June 2010 and are signed on its behalf by:
Mr MA Pitse Mr MG Qhena President/Chief Executive Officer Chairman 25 June 2010 25 June 2010
CertifiCAte by CoMPAny SeCretAry Foskor (Pty) Ltd has complied with all statutory and regulatory requirements in accordance with the Companies Act of South Africa, 1973 as amended. I hereby confirm that, for the year ended 31 March 2010, the company has lodged with the Registrar of Companies all such returns as are required of a private company in terms of this Act and that all such returns are, to the best of my knowledge and belief, true, correct and up to date.
------------------------------- Ms AUS KhanyileCompany Secretary 25 June 2010
Directors’ responsibility and approval of the group and company annual financial statements for the year ended 31 march 2010

Fosk
or A
nnua
l Rep
ort 2
010
71
INDEPENDENT AuDITORS’ REPORT
To the members of Foskor (Pty) Ltd We have audited the annual financial statements and group annual financial statements of Foskor (Pty) Ltd, which comprise the directors’ report, the statements of financial position and the consolidated statements of financial position as at 31 March 2010, the statements of comprehensive income and the consolidated statements of comprehensive income, the statements of changes in equity and the consolidated statement of changes in equity, the cash flow statements and the consolidated cash flow statements for the year then ended, and a summary of significant accounting policies and other explanatory notes, as set out on pages 72 to 134.
Directors’ responsibility for the financial statements The company’s directors are responsible for the preparation and fair presentation of these financial statements in accordance with International Financial Reporting Standards (IFRS) and in the manner required by the Companies Act of South Africa. This responsibility includes: designing, implementing and maintaining internal control relevant to the preparation and fair presentation of financial statements that are free from material misstatement, whether due to fraud or error; selecting and applying appropriate accounting policies; and making accounting estimates that are reasonable in the circumstances.
Auditors’ responsibility Our responsibility is to express an opinion on these financial statements based on our audit. We conducted our audit in accordance with International Standards on Auditing. Those standards require that we comply with ethical requirements and plan and perform the audit to obtain reasonable assurance that the financial statements are free from material misstatement.
An audit involves performing procedures to obtain evidence about the amounts and disclosures in the financial statements. The procedures selected depend on the auditor’s judgment, including the assessment of the risks of material misstatement
of the financial statements, whether due to fraud or error. In making those risk assessments, the auditor considers internal control relevant to the entity’s preparation and fair presentation of the financial statements in order to design audit procedures that are appropriate in the circumstances, but not for the purpose of expressing an opinion on the effectiveness of the entity’s internal control. An audit also includes evaluating the appropriateness of accounting policies used and the reasonableness of accounting estimates made by management, as well as evaluating the overall presentation of the financial statements.
We believe that the audit evidence that we have obtained is sufficient and appropriate to provide a basis for our audit opinion.
Opinion In our opinion, the financial statements present fairly, in all material respects, the financial position of the company and of the group as of 31 March 2010, and their financial performance and their cash flows for the year then ended in accordance with International Financial Reporting Standards and in the manner required by the Companies Act of South Africa.
PricewaterhouseCoopers Inc Ngubane & Co. IncDirector: TD Shango Director: DS MsomiRegistered Auditor Registered AuditorSunninghill Durban
4 August 2010 4 August 2010

Fosk
or A
nnua
l Rep
ort 2
010
72
DIRECTORS’ REPORT
Nature of busiNess
Foskor’s core business is the beneficiation of phosphate rock at the Mining Division in Phalaborwa and the manufacture and supply of internal standard merchant grade phosphoric acid and related granular fertiliser products at the Acid Division in Richards Bay. Approximately 89% of the phosphate rock concentrate is railed to Richards Bay for processing into phosphoric acid, which is then used as a raw material in the production of granular fertiliser. About 74% of the phosphoric acid produced is exported to Europe and Asia and the balance is converted into granular which is mainly sold to the local market.
Further information on Foskor’s business activities is provided in the CEO’s review (pages 14 to 17).
eNviroNmeNtal respoNsibilities
Management continually assesses and monitors the various environmental threats to the group. Foskor’s environmental provision strategy prescribes the use of a special purpose vehicle (Section 37A, Environmental Rehabilitation Trust) for scheduled mine closures, and bank guarantees for unscheduled or premature mine closure, as per Department of Mineral Resources (DMR) regulations. The environmental impact of emissions and other hazardous materials at the Richards Bay plant is closely monitored. A significant portion of the capital expenditure at the division is dedicated to minimising harmful effects on the environment, such as groundwater contamination.
fiNaNcial results
The group achieved a turnover from continuing operations of R3.5 billion, representing a decline of 66% compared to the R10.2 billion of the previous year. Net profit after tax decreased by 103%, from R1.9 billion for the year ended 31 March 2009 to a R58 million loss. The group has a positive cash balance of R518 million (2009: R366 million). A detailed report on the group’s financial performance is contained on pages 18 to 22.
GeNeral review of operatioNs
As at 31 March 2010, Foskor produced 2.2 million tons (FY2009: 2.4 million tons) of phosphate rock concentrate; 622,000 tons
(FY2009: 659,000 tons) of phosphoric acid; and 307,000 tons (FY2009: 163,000 tons) of granular fertiliser (MAP/DAP). A detailed operational review of the Phalaborwa and Richards Bay divisions is contained in the report on pages 24 to 27.
Accounting policies, restAtements And reclAssificAtions
The group has adopted all of the new and revised standards and interpretations issued by the International Accounting Standards Board (IASB) and the International Financial Reporting Interpretations Committee (IFRIC) of the IASB that are relevant to its operations and effective for accounting periods beginning on or after 1 January 2009. strAtegicAlly importAnt investments
investment in coromandel international ltdCoromandel International Ltd (CIL) is a customer of Foskor and a multinational group with interests in the manufacturing of merchant grade phosphoric acid. Foskor owns 1.72% of CIL share capital; the value of the investment as at 31 March 2010 was R122 million, as compared to R42 million as at 31 March 2009.
foskor Zirconia (pty) ltd Foskor currently owns 49% of Foskor Zirconia (Pty) Ltd. Foskor Zirconia is a producer of electro-fused zirconia for export. This is a raw material used in the production of monoclinic or calcia-stabilised zirconia, mainly used in the steel casting, refractory and abrasive industries. The remaining 51% of Foskor Zirconia is owned by Carborundum Universal Ltd (a multinational company based in India and part of the Murugappa group).
subsidiaries Details of subsidiaries of the company are set out in Note 5 of the annual financial statements.
dividends
There were no dividends declared by the Board in the financial year under review. For the previous year (ended 31 March 2009), the Board declared a special dividend of 141.96 cents per share amounting to R1.3 billion. Dividends were received from CIL
the directors have pleasure in presenting the annual financial statements of the Foskor group for the year ended 31 march 2010

Fosk
or A
nnua
l Rep
ort 2
010
73
of R3.9 million (FY2009: R4.3 million) during the year under review.
Insurance rIsk management
The group’s philosophy is to manage its risks in order to protect its assets and earnings against unacceptable financial loss and to avoid legal liabilities. In this regard, possible catastrophic type risks are insured at a relatively advantageous cost with satisfactory cover, while non-catastrophic type risks are self-insured. The management of risk is further supported by the group’s health and safety programmes, and maintenance of the ISO 9001 (quality) and ISO 14001 (environmental) standards.
The policy loss limit is restricted to R2 billion per site, with sub-limits for each cover and a R30 million aggregate deductible on the policy for fire, explosion, machinery breakdown and loss of profits. Risk surveys and assessments are integral to the group’s risk management policy and are performed as part of the integrated group risk management system. Risks identified during these surveys are eliminated, reduced or transferred to the insurers.
share capItal
The authorised and issued share capital as at 31 March 2010 was 9,157,647 ordinary shares of R1 each.
Foskor’s shareholding is as follows:• 85% held by the Industrial Development Corporation of South
Africa Ltd (IDC); • 11.82% held by CFL Mauritius Ltd (a Mauritius-based
company); • 2.18% held by Coromandel International Ltd (CIL – based in
India); and • 1% held by Sun International FZE (a company based in
India).
There were no changes in the shareholding during the year under review. The directors are authorised, until the next Annual General Meeting, to issue unissued ordinary shares.
Broad-Based Black economic empowerment ownership transaction
In July 2009 Foskor announced that the Manyoro Consortium, the Ba-Phalaborwa and uMhlathuze communities, and Foskor staff, together with Foskor Zirconia’s employees, would be the black economic empowerment (BEE) partners who would acquire 26% of Foskor from Foskor’s parent company, the IDC. At 31 March 2010, the BEE transaction had not yet been finalised. puBlic Finance management act
Foskor was granted full exemption by the Minister of Finance for compliance with the Public Finance Management Act (No. 1 of 1999, as amended by Act No. 2 of 1999) until 31 October 2011. It is likely that the exemption will be renewed.
resolutions
The following special resolutions were passed during the financial year ended 31 March 2010: • To enter into a broad-based BEE transaction for the sale and
transfer of 26% of Foskor’s equity;• To establish Community Trusts and the Employee Share
Ownership Plan and implement all matters in relation to the operation of the Trusts; and
• To provide financial assistance in terms of Section 38(1) of the Companies Act by Foskor in the context of the BEE transaction.
loans By and to the Foskor group
During the year under review, Foskor obtained a long-term funding facility from the IDC amounting to R1 billion for the Pyroxenite Expansion Project, and a committed short-term facility of R200 million from the commercial banks. As at year end these facilities had not yet been utilised.
material commitments, lease payments and contingencies
The group’s head office in Midrand leases a building and accounts for the lease as an operating lease. The lease commenced on 1 September 2008 for a period of three years. The operating

Fosk
or A
nnua
l Rep
ort 2
010
74
lease payments escalate by 8% per annum. The Acid Division leases a pipeline from the uMhlathuze Water Board (Richards Bay Municipality) to discharge effluent. The lease has been accounted for as a finance lease. The remaining period of the lease is 16 years.
Capital expenditure of R925 million has been approved for the next financial year.
The company appealed to the Income Tax Court for a resolution of the revised 1999 income tax assessment. In that assessment, the F100 mining ore stockpiles were included as trading stock, and gave rise to a potential additional tax charge of R60.6 million and S89quat interest of R51.2 million. The first hearing was held in 2008 and in December of that year the presiding judge ruled in favour of Foskor. The South African Revenue Service (SARS) appealed against the decision in 2009 and the matter was heard in the Appellate Division of the Supreme Court in March 2010. The judgment from the Supreme Court was received in April 2010 where the court found in favour of SARS in respect of the inclusion of the ore stockpiles as trading stock in the 1999 assessment, but ordered that the S89quat interest be waived. Although Foskor is obliged to settle the outstanding assessment and interest since the date of this assessment, the company is entitled to refunds of this tax in subsequent years as and when the income tax returns of the subsequent years are assessed. The net tax cost to Foskor of this judgment is calculated as being R2.4 million, and the net interest cost as at 31 March 2010 amounted to R5.3 million.
GoinG concern
The directors believe that Foskor has sufficient resources and expected cash flows to continue operating as a going concern.
Post-balance sheet events
There have been no facts or circumstances of a material nature that have occurred between the accounting year end and the date of this report that require adjustment or disclosure in the annual financial statements.
Changes to the Board
Biographical details of directors currently serving on the Board are provided on pages 6 and 7 of this report. There were no appointments during the year under review. Mr XGS Sithole resigned from the Board on 22 June 2009; he was also a member of the Board Technical Committee.
serviCe ContraCts with direCtors and exeCutive management
The Chief Executive Officer (CEO) and the executive management of Foskor have signed contracts of employment with the company. There are no service contracts between the company and any of its non-executive directors having a notice period exceeding one month, or providing for compensation and benefits in excess of one month’s salary.
direCtors’ interests
The non-executive directors have no interests in the company. The CEO, by virtue of the all-employee share scheme, will be awarded units in the Employee Share Ownership Trust.
independent auditors
PricewaterhouseCoopers Inc and Ngubane & Co. Inc will continue in office in accordance with Section 270(2) of the Companies Act of South Africa.

Fosk
or A
nnua
l Rep
ort 2
010
75
GROUP COMPANYNotes 2010 2009 2010 2009
R’000 R’000 R’000 R’000ASSETSProperty, plant and equipment 3 2,932,647 1,956,217 2,931,929 1,955,547 Intangible assets 4 1,756 1,801 1,756 1,801 Investments in subsidiaries 5 - - 104,007 104,007 Loans to subsidiaries 5 - - 13,654 12,270 Investment in joint venture 6 25 25 25 25 Investment in associate 7 29,742 30,052 26,006 26,006 Financial investments 8 217,458 121,560 207,458 111,560 Non-current assets 3,181,628 2,109,655 3,284,835 2,211,216 Inventory 9.1 752,817 674,802 752,817 674,802 Ore stockpile short-term 9.2 - 11,412 - 11,412 Trade and other receivables 10 341,232 1,496,695 335,209 1,492,338 Derivative financial instruments 11 1,314 12,201 1,314 12,201 Cash and cash equivalents 517,542 365,829 515,380 364,495 Total current assets 1,612,905 2,560,939 1,604,720 2,555,248 Total assets 4,794,533 4,670,594 4,889,555 4,766,464
EQUITY AND LIABILITIESShare capital 14 9,158 9,158 9,158 9,158 Share premium 14 132,013 132,013 132,013 132,013 Retained earnings 2,945,264 3,003,782 2,818,356 2,876,971 Share-based payment reserve 15.1 303,914 - 303,914 - Fair value reserve 91,306 10,643 91,306 10,643 Shareholders' equity 3,481,655 3,155,596 3,354,747 3,028,785 Finance lease liability 16 22,092 24,902 22,092 24,902 Environmental rehabilitation liability 17 244,094 238,623 244,094 238,623 Employee share-based payment liability 15.2 23,460 - 23,460 -Loans from subsidiaries 5 - - 222,801 222,890 Post-employment obligations 18 83,700 68,543 83,700 68,543 Deferred taxation 12 442,769 333,640 442,937 333,640 Non-current liabilities 816,115 665,708 1,039,084 888,598 Trade and other payables 19 417,796 629,446 416,740 629,174 Current tax liability 7,429 108,028 7,539 108,091 Finance lease liability 16 2,810 3,061 2,810 3,061 Derivative financial instruments 11 245 25,906 245 25,906 Provisions 20 68,483 82,849 68,390 82,849 Current liabilities 496,763 849,290 495,724 849,081 Total equity and liabilities 4,794,533 4,670,594 4,889,555 4,766,464
Group and company statements of financial positionas at 31 March 2010

Fosk
or A
nnua
l Rep
ort 2
010
76
GROUP COMPANYNotes 2010 2009 2010 2009
R’000 R’000 R’000 R’000Revenue 3,465,001 10,159,464 3,464,477 10,159,013 Cost of sales (2,187,230) (6,285,337) (2,184,874) (6,285,157)Gross profit 1,277,771 3,874,127 1,279,603 3,873,856 Other operating income 44,449 24,177 48,737 29,786 Administrative expenses (306,187) (228,844) (311,229) (227,969)Distribution costs (671,069) (922,928) (671,069) (932,551)Operating profit 21 344,964 2,746,532 346,042 2,743,122 Investment income 3,932 - 3,932 53,602 Share-based payment expense 15.3 (327,374) - (327,374) -Transaction fees 15.4 (27,731) - (27,731) - (Loss)/Profit from associate 7 (310) 4,046 - - Earnings before interest and tax (6,519) 2,750,578 (5,131) 2,796,724Finance income 22 76,038 223,875 74,690 222,833 Finance costs 22 (48,250) (24,870) (48,250) (24,870)Net foreign exchange profits/(losses) 23 27,273 (293,667) 27,253 (293,719)Profit before taxation 48,542 2,655,916 48,562 2,700,968 Taxation 24 (107,060) (792,801) (107,177) (791,654)(Loss)/Profit for the year from continuing operations (58,518) 1,863,115 (58,615) 1,909,314
Discontinued operations Profit for the year from discontinued operations 13 - 55,813 - 52,177 (Loss)/Profit for the year (58,518) 1,918,928 (58,615) 1,961,491 Fair value gain/(loss) 8.1 80,663 (15,646) 80,663 (15,646)Other comprehensive income/(loss) for the year 80,663 (15,646) 80,663 (15,646)Total comprehensive income for the year 22,145 1,903,282 22,048 1,945,845
Earnings/(Loss) per share for profit attributable to the equity holders of the company during the year (expressed in rands)Basic earnings/(loss) per share (rands)From continuing operations 25 (6.39) 211.24 (6.40) 216.48 From discontinued operations - 6.33 - 5.92
(6.39) 217.57 (6.40) 222.40 Diluted earnings/(loss) per share (rands)From continuing operations 25 (6.39) 211.24 (6.40) 216.48 From discontinued operations - 6.33 - 5.92
(6.39) 217.57 (6.40) 222.40
Group and company statements of comprehensive incomefor the year ended 31 March 2010

Fosk
or A
nnua
l Rep
ort 2
010
77
GROUP Notes Share Share Retained Share-based Fair value Totalcapital premium earnings payment reserve
reserveR'000 R'000 R'000 R'000 R'000 R'000
Balance at 1 April 2008 31,484 13,800 2,384,854 188,024 26,289 2,644,451 Profit for the year - - 1,918,928 - - 1,918,928 Other comprehensive incomeFair value loss - - - - (15,646) (15,646)Total comprehensive income - - 1,918,928 - (15,646) 1,903,282
Transactions with owners Increase in share capital 1,174 131,892 - - - 133,066 Transfer to share capital - - - (188,024) - (188,024)Buy-back of class 'B' shares (23,500) (13,679) - - - (37,179)Dividend paid - - (1,300,000) - - (1,300,000)Total transactions with owners (22,326) 118,213 (1,300,000) (188,024) - (1,392,137)
Balance at 31 March 2009 9,158 132,013 3,003,782 - 10,643 3,155,596 Profit for the year - - (58,518) - - (58,518) Share based payment reserve - - - 303,914 - 303,914Other comprehensive incomeFair value gain - - - - 80,663 80,663 Total comprehensive income - - (58,518) 303,914 80,663 326,059 Balance at 31 March 2010 9,158 132,013 2,945,264 303,914 91,306 3,481,655
Group and company statements of changes in equityfor the year ended 31 March 2010

Fosk
or A
nnua
l Rep
ort 2
010
78
Group and company statements of changes in equityfor the year ended 31 March 2010
company notes share share retained share-based Fair value totalcapital premium earnings payment reserve
reserveR'000 R'000 R'000 R'000 R'000 R'000
Balance at 1 april 2008 31,484 13,800 2,215,480 188,024 26,289 2,475,077 Profit for the year - - 1,961,491 - - 1,961,491 other comprehensive incomeFair value loss - - - - (15,646) (15,646)total comprehensive income - - 1,961,491 - (15,646) 1,945,845
transactions with owners Increase in share capital 1,174 131,892 - - - 133,066 Transfer to share capital - - - (188,024) - (188,024)Buy-back of class 'B' shares (23,500) (13,679) - - - (37,179)Dividend paid - - (1,300,000) - - (1,300,000)total transactions with owners (22,326) 118,213 (1,300,000) (188,024) - (1,392,137)
Balance at 31 march 2009 9,158 132,013 2,876,971 - 10,643 3,028,785 Profit for the year - - (58,615) - - (58,615) Share-based payment reserve - - - 303,914 - 303,914other comprehensive incomeFair value gain - - - - 80,663 80,663 total comprehensive income - - (58,615) 303,914 80,663 325,962Balance at 31 march 2010 9,158 132,013 2,818,356 303,914 91,306 3,354,747

Fosk
or A
nnua
l Rep
ort 2
010
79
GROUP COMPANYNotes 2010 2009 2010 2009
R’000 R’000 R’000 R’000Cash flows from operating activities Cash generated from operations 26 1,032,568 3,038,011 1,034,314 3,030,621 Interest received 54,208 219,468 52,860 218,364 Interest paid (28,308) (13,464) (28,308) (13,464)Dividends received 3,932 - 3,932 53,602 Dividend paid - (1,300,000) - (1,300,000)Realised foreign exchange profits/(losses) 27,273 (246,671) 27,253 (244,053)Taxes paid (103,876) (612,829) (103,778) (611,200)Net cash from operating activities 985,797 1,084,515 986,273 1,133,870
Cash flows from investing activities Additions to property, plant and equipment 3 (824,071) (487,242) (823,902) (487,242)Acquisition of software 4 (1,063) (2,042) (1,063) (2,042)Proceeds on disposal of property, plant and equipment 2,112 13,385 2,112 13,402
Contribution to pension fund 18 - (14,000) - (14,000)Sale of share in subsidiary - 53,602 - 53,602 Acquisition of financial investment held in the Environmental Rehabilitation Trust 17 (8,000) (8,000) (8,000) (8,000)
Acquisition of investment held in the Foskor Social Responsibility Trust 8 - (10,000) - -
Net cash used in investing activities (831,022) (454,297) (830,853) (444,280)
Cash flows from financing activitiesRepayment of shareholder loan - (1,450,000) - (1,450,000)Repayment of loans from subsidiaries - - (1,473) (57,658)Repayment of finance lease liability (3,062) (3,073) (3,062) (3,073)Buy-back of class 'B' shares - (92,179) - (92,179)Net cash used in financing activities (3,062) (1,545,252) (4,535) (1,602,910)
Net increase/(decrease) in cash and cash equivalents 151,713 (915,034) 150,885 (913,320)
Cash and cash equivalents at the beginning of the year 365,829 1,280,863 364,495 1,277,815
Cash and cash equivalents at the end of the year 517,542 365,829 515,380 364,495
Group and company cash flow statementsfor the year ended 31 March 2010

Fosk
or A
nnua
l Rep
ort 2
010
80
Notes to the financial statements for the year ended 31 March 2010
PrinciPal accounting Policies
The principal accounting policies applied in the preparation of these consolidated financial statements are set out below. These policies have been consistently applied to all the years presented, unless otherwise stated.
1. summary of significant accounting policies
1.1 Basis of preparation
The consolidated financial statements of the Foskor group have been prepared in accordance with the International Financial Reporting Standards (IFRS or IFRSs) historical cost convention, as modified by the revaluation of available-for-sale investment securities, and financial assets and liabilities at fair value through profit or loss.
The preparation of financial statements in conformity with IFRS requires the use of certain accounting estimates and assumptions that affect the reported amounts of assets and liabilities and disclosure of contingent assets and liabilities at the date of the financial statements, and the reported amounts of revenue and expenses during the reporting period based on management’s best knowledge of current events and actions. Actual results may ultimately differ from these estimates.
1.1.1 standards, amendments and international Financial reporting interpretations committee (iFric) interpretations effective in the current year.
•AmendmentstoiFrs 7, Financial instruments: Disclosures: improving Disclosures about Financial instruments (effective from 1 January 2009). The amendment increases the disclosure requirements about fair value measurement and reinforces existing principles for disclosure about liquidity risk. The amendment introduces a three-level hierarchy for fair value measurement disclosure and requires some specific quantitative disclosures for financial instruments in the lowest level in
the hierarchy. In addition, the amendment clarifies and enhances existing requirements for the disclosure of liquidity risk, primarily requiring a separate liquidity risk analysis for derivative and non-derivative financial liabilities.
•Amendments to IFRIC 9, Reassessment of Embedded Derivatives and IAS 39, Financial Instruments: Recognition and Measurement (effective from 1 July 2008). The amendments clarify that if a financial asset is reclassified out of the ‘at fair value through profit or loss’ category it must be assessed for embedded derivatives at the date of reclassification. In addition, a contract that includes an embedded derivative that cannot be separately measured, is prohibited from being reclassified out of the ‘at fair value through profit or loss’ category.
•AC 504: IAS 19(AC 116) The Limit on a Defined Benefit Asset, Minimum Funding Requirements and their Interaction in the South African Pension Fund Environment
1.1.2 Standards, amendments and interpretations to existing standards not yet effective and also not early adopted by the group
• IAS 24 (Revised), Related Party Disclosures (effective for financial periods beginning on/after 1 January 2011). The revision simplifies the disclosure requirements for government-related entities and clarifies the definition of a related party.

Fosk
or A
nnua
l Rep
ort 2
010
81
• IAS 27 (Revised), Consolidated and Separate Financial Statements (effective for financial periods beginning on/after 1 July 2009). IAS 27 (Revised) requires the effects of all transactions with non-controlling interests to be recorded in equity if there is no change in control. Such transactions will no longer result in goodwill or gains and losses. The standard also specifies the accounting method when control is lost. Any remaining interest in the entity is re-measured to fair value and a gain or loss is recognised in profit or loss.
• IAS 32 (Amendment), Financial Instruments: Presentation – Classification of Rights Issues (effective for financial periods beginning on/after 1 February 2010). The amendment addresses the accounting for rights issues (rights, options or warrants) that are denominated in a currency other than the functional currency of the issuer. Previously such rights issues were accounted for as derivative liabilities. The amendment requires that, provided certain conditions are met, such rights issues be classified as equity regardless of the currency in which the exercise price is denominated.
• IAS 39 (Amendment), Financial Instruments: Recognition and Measurement – Eligible Hedged Items (effective for financial periods beginning on/after 1 July 2009). The amendment clarifies how the existing principles underlying hedge accounting should be applied in the designation of: a one-sided risk in a hedged item; and inflation in a financial hedged item.
• IFRS 1 (Revised), First-time Adoption of International Financial Reporting Standards (effective for financial periods beginning on/after 1 July 2009). IFRS 1 has been amended many times since it was first issued, to accommodate first-time adoption requirements resulting from new or amended IFRSs. As a result the text became increasingly complex.
IFRS 1 has been restructured to make it easier to understand, and to allow it to accommodate more easily any future changes that might be necessary.
• IFRS 1 (Amendment), First-time Adoption of International Financial Reporting Standards and IAS 27 (Amendment): Consolidated and Separate Financial Statements – Cost of an Investment in a Subsidiary, Jointly Controlled Entity or Associate (effective for financial periods beginning on/after 1 July 2009). When an entity adopts IFRSs for the first time, an exemption is added to IFRS 1 that will allow investments in subsidiaries, jointly controlled entities and associates to be measured at cost in accordance with IAS 27 or deemed cost (being the fair value determined in accordance with IAS 39 at the date of transition; or the previous Generally Accepted Accounting Principles carrying amount). Dividends received from subsidiaries, jointly controlled entities and associates will be recognised in profit and loss in the separate financial statements when the entities’ right to receive dividends is established (i.e. there is no longer a need to distinguish between dividends declared from pre-acquisition and post-acquisition profits). IAS 36, Impairment of Assets was consequentially amended to include the following additional impairment indicators: the carrying amount of the investment in a subsidiary, jointly controlled entity or associate, in the separate financial statements exceeds the carrying amount of the investee’s net assets in the consolidated financial statements; and the dividend exceeds the total comprehensive income of the subsidiary, jointly controlled entity or associate in the period the dividend is declared.
• IFRS 1 (Amendment), First-time Adoption of International Financial Reporting Standards – Additional Exemptions for First-time Adopters (effective for financial periods

Fosk
or A
nnua
l Rep
ort 2
010
82
beginning on/after 1 January 2010). The amendments address the retrospective application of IFRSs to particular situations (including: the use of deemed cost for oil and gas assets; determination of whether an arrangement contains a lease; and decommissioning liabilities included in the cost of property, plant and equipment) and are aimed at ensuring that entities applying IFRSs will not face undue cost or effort in the transition process.
• IFRS 1 (Amendment), First-time Adoption of International Financial Reporting Standards – Limited Exemptions from Comparative IFRS 7 Disclosures for First-time Adopters (effective for financial periods beginning on/after 1 July 2010). The additional amendment relieves first-time adopters of IFRSs from presenting comparative information for new three-level classification disclosures required by the March 2009 amendments to IFRS 7, Financial Instruments: Disclosures. It thereby ensures that first-time adopters benefit from the same transition provisions that amendments to IFRS 7 provide to current IFRS preparers.
• IFRS 2 (Amendment), Share-based Payments – Group Cash-settled Share-based Payment Transactions (effective for financial periods beginning on/after 1 January 2010). The amendment clarifies that an entity that receives goods or services in a share-based payment arrangement must account for those goods or services irrespective of which entity in the group settles the transaction, and irrespective of whether the transaction is settled in shares or cash. The amendment provides guidance on how to account for group share-based payment schemes in entities’ separate financial statements. The amendment incorporates guidance previously included in IFRIC 8, Scope of IFRS 2, and IFRIC 11, IFRS 2 – Group and Treasury Share Transactions. As a result, the IASB has withdrawn IFRIC 8 and IFRIC 11.
• IFRS 3 (Revised), Business Combinations (effective for financial periods beginning on/after 1 July 2009). The new standard continues to apply the acquisition method to business combinations, with some significant changes. For example, all payments to purchase a business are to be recorded at fair value at the acquisition date, with some contingent payments subsequently re-measured at fair value through income. Goodwill may be calculated based on the parent company’s share of net assets or it may include goodwill related to the minority interest. All transaction costs will be expensed.
• IFRS 9, Financial Instruments (effective for financial periods beginning on/after 1 January 2013). IFRS 9 addresses classification and measurement of financial assets. It uses a single approach to determine whether a financial asset is measured at amortised cost or at fair value. The approach in IFRS 9 is based on how an entity manages its financial instruments (its business model) and the contractual cash flow characteristics of the financial assets. The standard requires a single impairment method to be used, replacing the numerous impairment methods in IAS 39 that arose from the different classification categories. The standard also removes the requirement to separate embedded derivatives from financial asset hosts.
• IFRIC 14 (Amendment), The Limit on a Defined Benefit Asset, Minimum Funding Requirements and their Interaction – Prepayment of Minimum Funding Requirements (effective for financial periods beginning on/after 1 January 2011). This amendment applies in the limited circumstances where an entity is subject to minimum funding requirements and makes an early payment of contributions to cover those requirements. The amendment permits such an entity to treat the benefit of such an early payment as an asset.

Fosk
or A
nnua
l Rep
ort 2
010
83
• IFRIC 17, Distributions of Non-cash Assets to Owners (effective for financial periods beginning on/after 1 July 2009). This interpretation claries that: (1) A dividend payable should be recognised when the dividend is appropriately authorised and is no longer at the discretion of the entity; (2) An entity should measure the dividend payable at the fair value of the net assets to be distributed; and (3) An entity should recognise the difference between the dividend paid and the carrying amount of the net assets distributed in profit and loss. The interpretation also requires an entity to provide additional disclosure if the net assets being held for distribution to owners meet the definition of a discontinued operation. The interpretation does not apply to common control transactions.
• IFRIC 19, Extinguishing Financial Liabilities with Equity Instruments (effective for financial periods beginning on/after 1 July 2010). This interpretation provides guidance on how to account for the extinguishment of a financial liability by the issue of equity instruments. It clarifies the accounting when an entity renegotiates the terms of its debt with the result that the liability is extinguished through the debtor issuing its own equity instruments to the creditor. A gain or loss is recognised in the profit and loss account based on the fair value of the equity instruments compared to the carrying amount of the debt.
• Improvements to International Financial Reporting Standards (IFRSs) is a collection of amendments to the IFRS. These amendments are the result of conclusions that the International Accounting Standards Board has reached on proposals made in its annual improvements project.
• Improvements to IFRSs 2008: IFRS 5 Non-current Assets Held for Sale and Discontinued Operations – Plan to sell the controlling
interest in a subsidiary (effective for financial periods beginning on/after 1 July 2009). This improvement clarifies that assets and liabilities of a subsidiary should be classified as held for sale if the parent company is committed to a plan involving loss of control of the subsidiary, regardless of whether the entity will retain a non-controlling interest after the sale.
• Improvements to IFRSs 2009 This contains 15 amendments to 12 standards.
1.2 Consolidation
1.2.1 Investments in subsidiaries Subsidiaries – which are those entities (including special purpose entities, or SPEs) in which the group has an interest of more than one half of the voting rights or otherwise has power to govern the financial and operating policies – are consolidated. The group annual financial statements incorporate the assets, liabilities and results of the operations of the company and all of its subsidiaries. Subsidiaries are fully consolidated from the date on which control is transferred to the group. They are de-consolidated from the date that control ceases.
The purchase method of accounting is used to account for the acquisition of subsidiaries by the group. The cost of an acquisition is measured as the fair value of the assets given, equity instruments issued and liabilities incurred or assumed at the date of exchange, plus costs directly attributable to the acquisition. The assets, liabilities and contingent liabilities acquired are assessed and included in the balance sheet at their estimated fair value to the group. If the cost of acquisition is higher than the net assets acquired, any difference between the net asset value and the cost of acquisition of a subsidiary is treated in accordance with the group’s accounting policy for goodwill. If the cost of acquisition is less than the fair value of the net assets of the subsidiary acquired, the difference is recognised directly in the statement of comprehensive income.

Fosk
or A
nnua
l Rep
ort 2
010
84
Inter-company transactions, balances and unrealised profits on transactions between group companies are eliminated; unrealised losses are also eliminated but considered an impairment indicator of the asset transferred. The accounting policies of subsidiaries are consistent with the policies adopted by the group.
In the company’s stand-alone accounts, subsidiaries are recorded at cost less accumulated impairment.
1.2.2 Investments in joint ventures The group’s interest in jointly controlled entities is accounted for by the equity method of accounting. Under this method, the investment in the jointly controlled entity is initially recognised at cost. For subsequent measurement, the company’s share of the post-acquisition profits or losses of joint ventures is recognised in the statement of comprehensive income, and its share of post-acquisition movements in reserves is recognised in equity. The cumulative post-acquisition movements are adjusted against the carrying amount of the investment. In the company’s stand-alone accounts, joint ventures are recorded at cost.
At each balance sheet date the group assesses whether there is any indication of impairment.
Unrealised profits on transactions between the group and its joint ventures are eliminated to the extent of the group’s interest in the joint venture. Unrealised losses are also eliminated unless the transaction provides evidence of an impairment of the asset transferred. The accounting policies of joint ventures are consistent with the policies adopted by the group.
1.2.3 Investments in associates Associates are all entities over which the group has significant influence but not control, generally accompanying a shareholding of between 20% and 50% of the voting rights. Investments in associates are accounted for using the equity method of
accounting and are initially recognised at cost. The group’s investment in associates includes goodwill identified on acquisition, net of any accumulated impairment loss.
The group’s share of its associates’ post-acquisition profits and losses is recognised in the statement of comprehensive income, and its share of post-acquisition movements in reserves is recognised in reserves. The cumulative post-acquisition movements are adjusted for against the carrying amount of the investment. When the group’s share of losses in an associate equals or exceeds its interest in the associate, including any other unsecured receivables, the group does not recognise further losses, unless it has incurred obligations or made payments on behalf of the associate.
Unrealised profits on transactions between the group and associates are eliminated to the extent of the group’s interest in the associates. Unrealised losses are also eliminated unless the transaction provides evidence of an impairment of the asset transferred. The accounting policies of associates are consistent with the policies adopted by the group.
Dilution profits and losses arising in investments in associates are recognised in the statement of comprehensive income.
1.3 Segmental reporting
Operating segments are reported in a manner consistent with the internal reporting provided to the chief operating decision-maker. The chief operating decision-maker, who is responsible for allocating resources, assessing performance of the resources and assessing performance of the operating segments, has been identified as the Executive Committee.
1.4 Property, plant and equipment
Property, plant and equipment includes land, mine properties, capital work in progress, office and plant buildings, heavy plant and machinery, equipment, and

Fosk
or A
nnua
l Rep
ort 2
010
85
vehicles, as well as certain essential plant spares that are held to minimise delays arising from plant breakdowns. All property, plant and equipment is stated at historical cost less accumulated depreciation and accumulated impairment. Historical cost includes expenditure that is directly attributable to the acquisition of the items. Land and capital work in progress is stated at cost less accumulated impairment.
Direct costs incurred on major projects during the period of development or construction are capitalised. Subsequent costs are included in the asset’s carrying amount or recognised as a separate asset, as appropriate, only when it is probable that future economic benefits associated with the item will flow to the group and the cost of the item can be measured reliably. The carrying amount of the replaced part is de-recognised. All other repairs and maintenance are charged to the statement of comprehensive income during the financial period in which they are incurred.
1.4.1 Depreciation
Land and capital work in progress Land and capital work in progress is stated at
cost and is not depreciated.
Property, plant and equipment Property, plant and equipment is depreciated on
the straight-line method to estimated residual values as follows:
Building and structures 30 – 50 years Vehicles 4 – 5 years Heavy plant and machinery 10 – 20 years Equipment 8 – 10 years Computer equipment 3 – 5 years Mining asset 10 – 20 years Factory equipment 4 – 5 years Capital insurance spares 10 – 20 years
1.4.2 Useful lives and residual values
The assets’ useful lives and residual values are reviewed, and adjusted if appropriate, at each
balance sheet date. Gains and losses on disposals are determined by comparing proceeds with carrying amount. These are included in the statement of comprehensive income.
1.4.3 Impairment
An asset’s carrying amount is written down immediately to its recoverable amount if the asset’s carrying amount is greater than its estimated recoverable amount (Note 1.6 below).
1.4.4 Capitalisation on borrowing costs
Interest costs on borrowings to finance the construction of property, plant and equipment that are considered to be ‘qualifying assets’ are capitalised during the period of time that is required to complete and prepare the asset for its intended use. Other borrowing costs are expensed.
1.5 Intangible assets
Goodwill
Goodwill represents the excess of the cost of an acquisition over the fair value of the group’s share of the net identifiable assets of the acquired subsidiary at the date of acquisition. Goodwill acquired in a business combination is initially measured at cost, being the excess of the cost of the business combination over the interest in the net fair value of the identifiable assets, liabilities and contingent liabilities.
Separately recognised goodwill is tested annually for impairment and is carried at cost less accumulated impairment losses. Impairment losses on goodwill are not reversed. Goodwill is allocated to cash-generating units for the purpose of impairment testing. The allocation is made to those cash-generating units or groups of cash-generating units that are expected to benefit from the business combination in which the goodwill arose.
Gains and losses on the disposal of an entity include the carrying amount of goodwill relating to the entity sold.

Fosk
or A
nnua
l Rep
ort 2
010
86
Computer software
Acquired computer software is capitalised on the basis of costs incurred to acquire and bring to use the specific software. These costs are amortised over their estimated useful lives of three years.
1.6 Impairment of assets
The carrying amounts of the group’s assets and cash generating units are reviewed at each balance sheet date, to determine whether there is any indication of impairment. If any such indication exists, the asset’s recoverable amount is determined. The recoverable amount is the higher of an asset’s fair value less costs to sell and value in use. For the purposes of assessing impairment, assets are grouped at the lowest levels for which there are separately identifiable cash flows (cash-generating units). Non-financial assets other than goodwill that suffered impairment are reviewed for possible reversal of the impairment at each reporting date.
An impairment loss is recognised whenever the carrying amount of an asset or its cash-generating unit exceeds its recoverable amount. Assets that are subject to amortisation are reviewed for impairment whenever events or changes in circumstances indicate that the carrying amount may not be recoverable.
Cash-generating units
A cash-generating unit is the smallest identifiable group of assets that generates cash inflows that are largely independent of the cash inflows from other assets or groups of assets. For an asset whose cash flow is largely dependent on that of other assets, the recoverable amount is determined for the cash-generating unit to which the asset belongs.
Impairment losses recognised in respect of cash-generating units are allocated first to reduce the net book value of any goodwill allocated to cash-generating units and then to reduce the net book value of the other assets in the unit on a pro rata basis. Impairment losses are recognised in the statement of comprehensive income.
Goodwill
Goodwill is allocated to cash-generating units for the purpose of impairment testing. The allocation is made to those cash-generating units or groups of cash-generating units that are expected to benefit from the business combination in which the goodwill arose. The recoverable amount for goodwill is assessed at each balance sheet date. Impairment losses relating to goodwill are not reversed.
Impairment reversals
An impairment loss is reversed only to the extent that the asset’s carrying amount does not exceed the carrying amount that would have been determined, net of depreciation or amortisation, if no impairment loss had been recognised.
1.7 Leases
The group is the lessee
Leases of property, plant and equipment where the group has substantially all the risks and rewards of ownership are classified as finance leases.
Assets held under finance lease agreements are capitalised. Such assets are depreciated in terms of the lease term relating to the relevant lease agreement, provided that such term of lease is shorter than the assets’ useful lives. Finance leases are capitalised at the inception of the lease at the lower of the fair value of the leased property and the present value of the minimum future lease payments. Lease finance charges are allocated to accounting periods over the duration of the leases by the effective rate method, which reflects the extent and cost of the lease finance utilised in each accounting period.
All other leases are treated as operating leases and the relevant rental incomes are recognised in income on a straight-line basis over the lease term. Where an arrangement with a supplier includes a component that has the substance of a lease, the lease component is separated from other payments and accounted for as a lease.

Fosk
or A
nnua
l Rep
ort 2
010
87
1.8 Inventories
Spares and consumables
Spares and consumable are valued at the lower of cost and net realisable value. Cost is determined using the weighted average method.
The cost of inventories comprises all costs of purchase and other costs incurred in bringing the inventories to the present location and condition. It excludes borrowing costs.
Obsolete, redundant and slow-moving items of spares and consumable stores are identified on a regular basis and written down to their net realisable value.
Net realisable value is the estimated selling price in the ordinary course of business, less the costs of completion and selling expenses.
Raw materials, work in progress and finished goods
Raw materials and finished goods consisting of phosphate rock, phosphoric acid, magnetite stock and other minerals are valued at the lower of cost of production and net realisable value.
Cost in respect of raw materials is determined on a first-in-first-out (FIFO) basis. Cost of production in respect of work in progress and finished goods is calculated on a standard cost basis, which approximates the actual cost and includes production overheads and is adjusted to net realisable value at year end when it is below cost. Production overheads are allocated on the basis of normal capacity.
Net realisable value is the estimated selling price in the ordinary course of business, less the costs of completion and selling expenses.
1.9 Trade and other receivables
Trade receivables are recognised initially at fair value and subsequently measured at amortised cost using the effective interest method, less provision for impairment. A provision for impairment of trade receivables is established when there is objective evidence that the group will not be able to collect all
amounts due according to the original terms of receivables. Significant financial difficulties of the debtor, probability that the debtor will enter bankruptcy or financial reorganisation, and default or delinquency in payments are considered indicators that the trade receivable is impaired. The amount of the provision is the difference between the asset’s carrying amount and the present value of estimated future cash flows, discounted at the original effective interest rate. The amount of the provision is recognised in the statement of comprehensive income.
The carrying amount of the asset is reduced through the use of an allowance account, and the amount of the loss is recognised in the statement of comprehensive income. When a trade receivable is uncollectible, it is written off against the allowance account for trade receivables. Subsequent recoveries of amounts previously written off are credited in the statement of comprehensive income.
1.10 Provisions
A provision is recognised when it is probable that the group has a present legal or constructive obligation as a result of past events resulting in an outflow of resources embodying economic benefits, and a reliable estimate of the obligation can be made. Provisions are not recognised for future operating losses. Where the effects of discounting are material, provisions are measured at their present values.
Provisions are measured at the present value of the expenditures expected to be required to settle the obligation using a pre-tax rate that reflects current market assessments of the time value of money and the risks specific to the obligation. The increase in the provision due to the passage of time is recognised as interest expense.
1.11 Pension obligation
The group operates a defined benefit and a defined contribution plan, the assets of which are held in separate trustee-administered funds. The schemes are generally funded through payments to insurance

Fosk
or A
nnua
l Rep
ort 2
010
88
companies or trustee-administered funds as determined by periodic actuarial valuations. A defined benefit plan is a pension plan that defines an amount of pension benefit to be provided, usually as a function of one or more factors such as age, years of service and compensation. A defined contribution plan is a pension plan under which the group pays fixed contributions into a separate entity (a fund) and under which the group will have no legal or constructive obligations to pay further contributions if the fund does not hold sufficient assets to pay all employees benefits relating to employee service in the current and previous periods.
The liability in respect of defined benefit pension plans is the present value of the defined benefit obligation at the balance sheet date minus the fair value of plan assets, together with adjustments for unrecognised actuarial gains/losses and past-service cost. The defined benefit obligation is calculated annually by independent actuaries using the projected unit credit method. The present value of the defined benefit obligation is determined by the estimated future cash outflows using interest rates of government securities that have terms to maturity approximating the terms of the related liability. Actuarial gains and losses arising from experience adjustments and the effects of changes in actuarial assumptions to the defined benefit plans are recognised fully in the statement of comprehensive income in the current year.
Past-service costs are recognised immediately in the statement of comprehensive income, unless the changes to pension plan are conditional on the employees remaining in service for a specified period of time (the vesting period). In this case, the past-service costs are amortised on a straight-line basis over the vesting period.
For defined contribution plans, the company pays contributions to publicly or privately administered pension insurance plans on a mandatory, contractual or voluntary basis. Once the contributions have been paid, the company has no further payment obligations. The regular contributions constitute net periodic costs
for the year in which they are due and as such are included in staff costs.
1.12 Other post-employment liability
The group provides post-employment health care benefits to its retirees who were employed by the company on or before 1 July 1995. The same benefits are provided to a specific group of employees employed before 1 July 1996. The entitlement to post-employment health care benefits is based on the employee remaining in service up to retirement age. The expected costs of these benefits are accrued over the period of employment, using the projected unit credit method. Valuations of these obligations are carried out annually by independent, qualified actuaries.
Actuarial gains and losses arising from previous adjustments and the effects of changes in actuarial assumptions to the defined benefit plans are recognised fully in the statement of comprehensive income as earned in the current year. Actuarial gains and losses arising from previous adjustments, changes in actuarial assumptions and amendments to pension plans are charged or credited to income over the average remaining service lives of the related employees.
1.13 Current and deferred taxation
The current income tax charge is calculated on the basis of the tax laws enacted or substantially enacted at the balance sheet date and in instances where companies in the group generate taxable income.
Deferred income tax and deferred capital gains tax are accounted for using the liability method for all temporary differences arising between the net book value of assets and liabilities in the financial statements and the corresponding tax bases. Deferred tax liabilities are recognised for all taxable temporary differences, and deferred tax assets are recognised to the extent that it is probable that future taxable profit will be available against which deductible temporary differences can be utilised.
Deferred tax assets and liabilities are not recognised if the temporary differences arise from goodwill or from

Fosk
or A
nnua
l Rep
ort 2
010
89
the initial recognition (other than in a business combination) of other assets and liabilities in a transaction that affects neither taxable income nor accounting income.
Deferred income tax is provided on temporary differences arising on investments in subsidiaries, except where the timing of the reversal of the temporary difference is controlled by the group and it is probable that the temporary difference will not reverse in the foreseeable future.
Deferred tax is charged or credited in the statement of comprehensive income, except where it relates to items credited or charged directly to equity, in which case the deferred tax is also recognised in equity.
1.14 Foreign currencies
Foreign currency translation
The group’s presentation currency is the same as its functional currency. The group’s presentation currency is South African rands (ZAR). The functional currency of the group’s operation is the currency of the primary economic environment in which each operation has its main activities.
Foreign currency transactions
Transactions in foreign currencies are translated into South African rands at the foreign exchange rate ruling at the date of the transaction.
Monetary assets and liabilities denominated in foreign currencies at the balance sheet date have been translated into South African rands at the rates ruling at that date.
Foreign exchange differences are recognised in the statement of comprehensive income.
1.15 Revenue
Revenue represents the gross income from sales of phosphate rock, phosphoric acid, granular fertiliser, zircon sand and other minerals. By-products, such as copper and magnetite stock, are included in revenue. Revenue is shown net of Value Added Tax (VAT), returns,
rebates and discounts and after eliminating sales within the group.
Sales between group companies are eliminated on consolidation. Revenue from the sales of goods is recognised when significant risks and rewards of the goods are transferred to the buyer. The group recognises revenue when the amount of revenue can be reliably measured, it is probable that future economic benefits will flow to the entity and specific criteria have been met for each of the group’s activities, as described below. The amount of revenue is not considered to be reliably measurable until all contingencies relating to the sale have been resolved. The group bases its estimates on historical results, taking into consideration the type of customer, the type of transaction and the specifics of each arrangement.
(a) Sale of goods
Sales of goods are recognised when a group entity has delivered products to the customer (depending on the International Commercial terms agreed to with the customer, i.e. Free on Board [FOB], Free on Rail [FOR] or Cost and Freight [CFR]), when the customer has full discretion over the channel and price to sell the products, and when there is no unfulfilled obligation that could affect the customer’s acceptance of the products. Delivery does not occur until the products have been shipped to the specified location, the risks of obsolescence and loss have been transferred to the customer, and the customer has accepted the products in accordance with the sales contract, or the acceptance provisions have lapsed, or the group has objective evidence that all criteria for acceptance have been satisfied.
(b) Interest income
Interest income is recognised on a time–proportion basis using the effective interest method. When a receivable is impaired, the group reduces the carrying amount to its recoverable amount, being the estimated future cash flow discounted at the original effective interest rate of the instrument, and continues unwinding the discount as interest income. Interest income on

Fosk
or A
nnua
l Rep
ort 2
010
90
impaired loans is recognised using the original effective interest rate.
(c) Royalty income
Royalty income is recognised on an accruals basis in accordance with the substance of the relevant agreements.
(d) Dividend income
Dividend income is recognised when the right to receive payments is established.
1.16 Financial instruments
Financial instruments consist mainly of borrowings, finance lease liabilities, listed and unlisted investments, cash and cash equivalents, derivative instruments, trade and other receivables, and trade and other payables. Derivative instruments consist of forward exchange contracts and option contracts. At inception the group classifies its financial assets into the following categories:
• Financial assets or financial liabilities at fair value through profit or loss – a financial asset is classified in this category if acquired principally for the purpose of selling in the short term. Derivatives are also categorised as held for trading unless they are designated as hedges. Assets in this category are classified as current assets.
None of the financial assets or liabilities are designated as at fair value through profit and loss.
• Loans and receivables – non-derivative assets with fixed or determinable payments that are not quoted in an active market other than those that the group intends to sell in the near future.
• Available-for-sale financial assets – non-derivative financial assets that are designated as available for sale or are not classified as:
– Loans and receivables;
– Held-to-maturity investments; or
– Financial assets at fair value through profit or loss.
The group assesses at the end of each reporting period whether there is objective evidence that an available-for-sale asset is impaired. In the case of equity investments, a significant or prolonged decline in fair value below the initial amount recognised for the asset are considered evidence that the asset is impaired. Should an impairment exist, any previous net upward revaluation in equity in respect of the asset is reversed first. Additional write-down below the initial amount recognised for the asset is recorded as an impairment loss in profit or loss.
Initial and subsequent measurement
• Financial assets or financial liabilities at fair value through profit or loss:
– Initial measurement is at fair value at trade date (excluding transaction costs); and
– Subsequent measurement is at fair value with gains or losses from fair value adjustments recognised in the statement of comprehensive income.
• Available-for-salefinancialassets:
– Initial measurement is at fair value at trade date (including transaction costs);
– Subsequent measurement is at fair value with gains or losses from fair value adjustments recognised in equity, except for impairment losses and foreign exchange gains and losses that are recognised in the statement of comprehensive income. The fair value adjustments previously recognised in equity are transferred to profit and loss upon de-recognition;
– Dividends accruing on available-for-sale financial instruments are recognised in profit and loss on right to receive dividends; and
– Interest on available-for-sale financial instruments is recognised in profit or loss using the effective interest method.

Fosk
or A
nnua
l Rep
ort 2
010
91
• Loansandreceivables:
– Initial measurement is at fair value net of transaction costs directly attributable to acquisition of funds;
– Subsequent measurement is at amortised cost, using the effective interest method; and
– Provision for impairment of loans and receivables is raised in line with accounting policy 1.10 (above) with write-off of irrecoverable amount approved by the Board of Directors.
Recognitionandde-recognition
Financial instruments are recognised when the company becomes party to the contractual provisions of the instruments.
Financial assets are de-recognised when the contractual rights to receive cash flows from the financial asset have expired or have been transferred and the group has transferred substantially all risks and rewards of ownership.
Financial liabilities are de-recognised when, and only when, they are extinguished, that is, when the obligation specified in the contract is either discharged, cancelled or expired.
1.17Environmentalobligations
Long-term environmental obligations are based on the group’s environmental management plans, in compliance with current environmental and regulatory requirements.
Full provision is made based on the net present value of the estimated cost of restoring the environmental disturbance that has occurred up to the balance sheet date, using a risk-free rate and risk-adjusted cash flows that reflect current market assessments and the risks specific to the provision. Increases due to additional environmental disturbances are capitalised and amortised over the remaining life of the mine.
Annual increases in the provision relating to change in the net present value of the provision and inflationary
increases are shown as part of finance costs in the statement of comprehensive income.
The estimated costs of rehabilitation are reviewed on a three-yearly basis or when events suggest that the costs may have changed, and adjusted as appropriate for changes in legislation, technology or other circumstances. Cost estimates are not reduced by the potential proceeds from the sale of assets, or from planned clean-up at closure, in view of the uncertainty of estimating the potential future proceeds. Changes in the expected costs are capitalised or reversed against the relevant asset.
Contributions are made to a dedicated Environmental Rehabilitation Trust Fund to fund the estimated cost of rehabilitation during and at the end of the life of the mine. The Environmental Rehabilitation Trust is consolidated into the group financial statements at each reporting date.
1.18 Dividends
Dividends payable are recorded in the group’s financial statements in the period in which they are approved by the group’s shareholders.
Dividends received are recorded when the right to receive them has been established.
1.19 Cash and cash equivalents
Cash and cash equivalents are defined as cash on hand, deposits held on call with banks, short-term liquid investments and original maturities of three months or less. Cash and cash equivalents are measured at amortised cost based on the relevant exchange rate at the balance sheet date.
1.20 Borrowings
Borrowings are recognised initially at fair value, net of transaction costs incurred. Borrowings are subsequently stated at amortised cost; any difference between the proceeds (net of transaction costs) and the redemption value is recognised in the statement of comprehensive income over the period of the borrowings using the effective interest method.

Fosk
or A
nnua
l Rep
ort 2
010
92
Borrowings are classified as current liabilities unless the group has an unconditional right to defer settlement of the liability for at least 12 months after the balance sheet date.
1.21 Fair value estimation
The fair value of financial instruments traded in active markets (such as trading and available-for-sale listed securities) is based on quoted market prices at the balance sheet date. The quoted market price used for financial assets held by the group is the current bid price.
The carrying values less impairment provision of trade receivables and payables are assumed to approximate their fair values. The fair value of financial liabilities for disclosure purposes is estimated by discounting the future contractual cash flows at the current market interest rate that is available to similar financial instruments trading in the market.
The fair value of forward exchange contracts is determined using quoted forward exchange rates at the balance sheet date.
1.22 Share-based payment transactions
The group operates an equity-settled share-based payment plan and a cash-settled share-based payment plan. The equity-settled payment plan was entered into with strategic business partners (SBPs) and special black groups (SBGs), under which the company will receive services (BEE credentials) as consideration for its own equity instruments. IFRS 2 requires that all equity-settled transactions be measured at the fair value of the goods and services at the date they are received. However, if the fair value of the goods or services cannot be measured reliably, the fair value shall be measured, indirectly, by reference to the fair value of the equity instruments granted. The fair value determined at grant date is recognised as an expense in the statement of comprehensive income and the corresponding credit is made to equity. The total amount expensed is determined by reference to the fair value of the equity instruments granted.
The cash-settled plan was entered into with the company’s employees, under which the company receives services from employees by incurring the liability to transfer cash to the employees for amounts that are based on the value of the company’s shares. The fair value of the transaction is measured using an option pricing model, taking into account all terms and conditions.
The services received by the company are recognised as they are received and the liability is measured at fair value. The fair value of the liability is re-measured at each reporting date and at the date of settlement. Any changes in the fair value are recognised in profit or loss for the period.
1.23 Earnings per share
Earnings/(loss) per share is calculated based on the net income/(loss) divided by the weighted average number of shares in issue during the year. A diluted earnings per share is presented when the inclusion of ordinary shares that may be issued in the future will have a dilutive effect on the earnings per share.
2. Critical accounting policies and judgements
Estimates and judgements are continually evaluated and are based on historical experience and other factors, including expectations of future events that are believed to be reasonable under the circumstances.
The group makes estimates and assumptions concerning the future. The resulting accounting estimates will, by definition, rarely equal the related actual results. The estimates and assumptions that have a significant risk of causing a material adjustment to the carrying amounts of assets and liabilities within the next financial year are outlined below.
(a) Income taxes
Significant judgement is required in determining the worldwide provision for income taxes. There are many transactions and calculations for which the ultimate tax determination is uncertain during the ordinary course of business. The group recognises liabilities for

Fosk
or A
nnua
l Rep
ort 2
010
93
anticipated tax audit issues based on estimates of whether additional taxes will be due. Where the final tax outcome of these matters is different from the amounts that were initially recorded, such differences will impact the income tax and deferred tax provisions in the period in which such determination is made.
(b) Fair value of financial instruments
The fair value of financial instruments that are not traded in an active market is determined by using valuation techniques. The group uses its judgement to make assumptions that are mainly based on market conditions existing at each balance sheet date.
(c) Post-employment obligations
Significant judgement and actuarial assumptions are required to determine the fair value of the post- employment obligations. More detail on these actuarial assumptions is provided in Note 18 to the financial statements.
(d) Environmental rehabilitation liability
In determining the environmental rehabilitation liability, an inflation rate of 6.16% (FY2009: 6%) was assumed to increase the rehabilitation liability for the next 20 years, and a rate of 8.97% (FY2009: 8.6%) to discount that amount to present value. The discount rate assumed of 8.97% is a risk-free rate, specifically the rate at which the R186 South African government bond was quoted at year end.
(e) Fair value of share-based payments
The fair value of equity instruments on grant date is determined based on a simulated company value, using the Geometric Brownian Motion model. The valuation technique applied to determine the simulated company value is part of the Monte Carlo simulation methodology. The market conditions relating to the growth in the market value of the Foskor shares have been taken into account in estimating the fair value of the equity instruments granted. The key assumptions used in the calculation are included in Note 15 of the financial statements.
(f) Impairment of assets
The group follows the guidance of IAS 36, Impairment of Assets to determine when an asset is impaired. This determination requires significant judgement. In making this judgement, the group evaluates the impairment indicators that could exist at year end, such as significant decreases in the selling prices of finished goods, significant decreases in sales volumes and changes in the international export regulatory environment.

Fosk
or A
nnua
l Rep
ort 2
010
94
notes to the financial statementsfor the year ended 31 March 2010
GROUP COMPANY2010 2009 2010 2009
R’000 R’000 R’000 R’0003 PROPERTY, PLANT AND EQUIPMENT
At costMining asset, land and buildings 688,502 630,676 687,872 629,957 Plant, equipment and vehicles 3,443,062 2,768,133 3,442,170 2,767,372 Capital work in progress 807,435 395,352 807,435 395,352 Aircraft 66,374 66,374 66,374 66,374 Total 5,005,373 3,860,535 5,003,851 3,859,055 Accumulated depreciationMining asset, land and buildings 256,984 235,242 256,829 235,043 Plant, equipment and vehicles 1,809,605 1,667,031 1,808,956 1,666,418 Aircraft 6,137 2,046 6,137 2,046 Total 2,072,726 1,904,319 2,071,922 1,903,508 Net book valueMining asset, land and buildings 431,518 395,644 431,043 394,914 Plant, equipment and vehicles 1,633,458 1,100,893 1,633,214 1,100,953 Capital work in progress 807,435 395,352 807,435 395,352 Aircraft 60,237 64,328 60,237 64,328 Net book value 2,932,647 1,956,217 2,931,929 1,955,547
Plant, equipment and vehicles includes the following lease where Foskor (Pty) Ltd is the lessee under a finance lease. The effluent pipeline is the only asset under finance lease (refer to Note 16).
Cost - Capitalised finance lease 41,567 41,567 41,567 41,567 Accumulated depreciation (11,950) (9,872) (11,950) (9,872)Net book value 29,617 31,695 29,617 31,695
Details of land and buildings are available for inspection at the registered office of the company.

Fosk
or A
nnua
l Rep
ort 2
010
95
Mining Plant, Capital asset, land equipment work in
and buildings and vehicles progress Aircraft TotalR'000 R'000 R'000 R'000 R'000
12 months ended 31 March 2010Movement in carrying value for the yearGroupOpening balance 395,644 1,100,893 395,352 64,328 1,956,217 Additions 54,043 357,946 412,082 - 824,071 Adjustment to the mining asset (refer to Note 17) 7,684 - - - 7,684 Depreciation (24,480) (143,979) - (4,091) (172,550)Impairment reversal - 323,000 - - 323,000 Disposals (1,374) (4,402) - - (5,776)Closing balance 431,518 1,633,458 807,434 60,237 2,932,647 CompanyOpening balance 394,914 1,100,953 395,352 64,328 1,955,547 Additions 53,874 357,946 412,082 - 823,902 Adjustment to the mining asset (refer to Note 17) 7,684 - - - 7,684 Depreciation (24,090) (144,282) - (4,091) (172,463)Impairment reversal - 323,000 - - 323,000 Disposals (1,340) (4,402) - - (5,742)Closing balance 431,043 1,633,215 807,434 60,237 2,931,929

Fosk
or A
nnua
l Rep
ort 2
010
96
Mining Plant, Capital asset, land equipment work in
and buildings and vehicles progress Aircraft TotalR'000 R'000 R'000 R'000 R'000
3 PROPERTY, PLANT AND EQUIPMENT (CONTINUED)
12 months ended 31 March 2009Movement in carrying value for the yearGroupOpening balance 382,281 1,535,931 330,205 - 2,248,417 Additions 39,695 316,026 65,147 66,374 487,242 Depreciation (20,695) (140,205) - (2,046) (162,946)Impairment charge - (600,000) - - (600,000)Disposals (5,637) (10,859) - - (16,496)Closing balance 395,644 1,100,893 395,352 64,328 1,956,217 CompanyOpening balance 381,708 1,535,708 330,205 - 2,247,621 Additions 39,695 316,026 65,147 66,374 487,242 Depreciation (20,695) (140,119) - (2,046) (162,860)Impairment charge - (600,000) - - (600,000)Disposals (5,794) (10,662) - - (16,456)Closing balance 394,914 1,100,953 395,352 64,328 1,955,547
The impairment reversal of R323 million for the year ended 31 March 2010 relates to a previous impairment to property, plant and equipment at the Richards Bay Acid Division. The operation was previously impaired in the year ended 31 March 2009 due to adverse market conditions. Management reviewed the indicators to determine whether the impairment still existed at year end and concluded that, with the increase in phosphoric acid prices and the plant operating at full capacity, R323 million of the R600 million impairment that had been made at 31 March 2009 should be reversed.
notes to the financial statementsfor the year ended 31 March 2010

Fosk
or A
nnua
l Rep
ort 2
010
97
GROUP COMPANY2010 2009 2010 2009
R’000 R’000 R’000 R’0004 INTANGIBLE ASSETS
At costComputer software 2,864 3,194 2,864 3,194 2,864 3,194 2,864 3,194 Accumulated amortisationComputer software 1,108 1,393 1,108 1,393 1,108 1,393 1,108 1,393 Net book value Computer software 1,756 1,801 1,756 1,801 Closing book value 1,756 1,801 1,756 1,801
Computer software
Total
R'000 R'00012 months ended 31 March 2010Movement in book valueGroup and CompanyOpening carrying amount 1,801 1,801 Additions 1,063 1,063 Amortisation (1,108) (1,108)Closing carrying amount 1,756 1,756
12 months ended 31 March 2009Movement in book value Group and CompanyOpening carrying amount 672 672 Additions 2,042 2,042 Amortisation (913) (913)Closing book value 1,801 1,801

Fosk
or A
nnua
l Rep
ort 2
010
98
Issued ordinary and preference
shares Shares at cost
R’000 Indebtedness
R’000Number Number % %
2010 2009 2010 2009 2010 2009 2010 20095 INVESTMENTS IN SUBSIDIARIES
Indian Ocean Fertilizer (Pty) Ltd 93,265 93,265 100% 100% 103,956 103,956 (218,501) (218,501)(South Africa) Inter Minerals Holdings AG - - - - 10 10 (10) (10)(Switzerland)Phosphate Shipping (Pty) Ltd 1,000 1,000 100% 100% 1 1 (4,290) (4,379)Loans from and shares in subsidiaries 103,967 103,967 (222,801) (222,890)
Phosfert Marine (Pty) Ltd 40,000 40,000 100% 100% 40 40 2,965 1,548 (South Africa)Phosphate Shipping (Pty) Ltd 1,000 1,000 100% 100% - - - - Foskor Social Responsibility Trust - - - - - - 10,000 10,000 IOF Property Trust (South Africa) - - - - - - 689 722 Loans to subsidiaries 40 40 13,654 12,270 Total shares at cost/Net loans owing 104,007 104,007 (209,147) (210,620)
The majority of subsidiaries have financial years ending 31 March and are consolidated to that date.
Loans to and from subsidiaries are interest-free with no repayment terms.
The shares in Indian Ocean Fertilizer (Pty) Ltd previously held by Inter Minerals South Africa (Pty) Ltd are now held directly by Foskor (Pty) Ltd.
Indicators for impairment were considered at 31 March 2010 and no impairment on these investments was deemed necessary.
GROUP COMPANY2010 2009 2010 2009
R’000 R’000 R’000 R’0006 INVESTMENT IN JOINT VENTURE
Foskor (Pty) Ltd has a 50% interest in a joint venture, Palfos Aviation (Pty) Ltd. The company's major asset, an aircraft, was sold in June 2004.Palfos Aviation (Pty) Ltd (South Africa)Carrying amount at the beginning of the year 25 25 25 25 Carrying amount at the end of the year 25 25 25 25
The investment consists of 12,500 shares of R2 each, being 50% of the authorised and issued share capital. As at year end the venture's assets comprised cash and cash equivalents of R25,000.
notes to the financial statementsfor the year ended 31 March 2010

Fosk
or A
nnua
l Rep
ort 2
010
99
GROUP COMPANY2010 2009 2010 2009
R’000 R’000 R’000 R’0007 INVESTMENT IN ASSOCIATE
At 1 April:Corporatisation of Foskor Zirconia (Pty) Ltd, wholly owned subsidiary 30,052 79,608 26,006 79,608
Sale of 51% share of Foskor Zirconia (Pty) Ltd on 1 August 2008 - (27,067) - (27,067)
Repayment of loan account by Foskor Zirconia (Pty) Ltd - (26,535) - (26,535)
Investment in associate 30,052 26,006 26,006 26,006 Share of associate (losses)/profits (310) 4,046 - - At 31 March 29,742 30,052 26,006 26,006
On 1 April 2008, Foskor Zirconia, which was previously a division of Foskor (Pty) Ltd, was corporatised into a wholly owned subsidiary, known as Foskor Zirconia (Pty) Ltd. The value of the assets less liabilities sold to the subsidiary was R79.6 million and a loan account was created in Foskor's balance sheet at 1 April 2008. On 1 August 2008, 51% of Foskor Zirconia (Pty) Ltd was sold to Carborundum Universal Ltd for R27.1 million and R26.5 million was financed by means of bank loans to settle the loan account between Foskor and Foskor Zirconia. Subsequently Foskor Zirconia (Pty) Ltd became an associate of the group.
GROUP COMPANY2010 2009 2010 2009
R’000 R’000 R’000 R’0008 FINANCIAL INVESTMENTS
8.1 Available-for-sale investments
Listed shares
Investment in Coromandel International Ltd 122,664 42,001 122,664 42,001 Opening balance 42,001 56,961 42,001 56,961 Fair value movements 80,663 (14,960) 80,663 (14,960)
The closing share price of the Coromandel International Ltd shares as at 31 March 2010 was Indian rupees 315.35 (2009: 90.60) and R51.11 (2009: R17.49)
Environmental Rehabilitation Trust investments - Available-for-saleinvestments (refer to Note 17) 75,998 34,445 75,998 34,445 Unit trusts 75,597 34,199 75,597 34,199 Sanlam shares 240 163 240 163 Old Mutual shares 161 83 161 83
The unit trust portfolio for these investments is invested in equity (22%), property (1%), international equity (9%), bonds (13%) and money market and cash (55%).
8.1.1

Fosk
or A
nnua
l Rep
ort 2
010
100
GROUP COMPANY2010 2009 2010 2009
R’000 R’000 R’000 R’0009 INVENTORY AND ORE STOCKPILE
9.1 Inventory Spares and consumables stores 249,429 232,010 249,429 232,010 Phosphate rock 91,940 90,439 91,940 90,439 Raw material 1 240,307 190,123 240,307 190,123 Finished goods 169,144 162,230 169,144 162,230 Work in progress 1,997 - 1,997 - Total 752,817 674,802 752,817 674,802 1 Includes magnetite stockpiles
There was no write-down of inventory as at 31 March 2010 and therefore no inventories are carried at net realisable value.
9.2 Ore stockpileThere were no ore stockpiles as at 31 March 2010 (2009: R11.4 million). The ore stockpile comprised ore containing phosphate and copper minerals still to be extracted, and was acquired in terms of an agreement with the Palabora Mining Company.
notes to the financial statementsfor the year ended 31 March 2010
GROUP COMPANY2010 2009 2010 2009
R’000 R’000 R’000 R’0008.2 Environmental Rehabilitation Trust investments - Other loans
and receivables (refer to Note 17)Cash deposits held by the Environmental Rehabilitation Trust (refer to Note 17)
8,796 35,112 8,796 35,112
Absa - 11,639 - 11,639 First National Bank 8,796 23,474 8,796 23,474 Total investments held in the Environmental Rehabilitation Trust 84,794 69,558 84,794 69,558
Cash receivable from Foskor (Pty) Ltd arising from dividends received on behalf of the Rehabilitation Trust is R41,876 (2009: R41,876).
Other loans and receivables - 2 - 2Richards Bay Fertiliser (Pty) Ltd - 2 - 2Foskor Social Responsibility Trust 10,000 10,000 - - Nedbank Call Account 10,000 10,000 - -
Total investments 217,458 121,560 207,458 111,560
8.2.1

Fosk
or A
nnua
l Rep
ort 2
010
101
GROUP COMPANY2010 2009 2010 2009
R’000 R’000 R’000 R’00010 TRADE AND OTHER RECEIVABLES
Gross trade receivables 240,110 885,538 234,655 881,681 Impairment provision for doubtful debts (5,068) (22,043) (5,024) (22,043)Net trade receivables 235,042 863,495 229,631 859,638 Employee loans 38 116 38 116 VAT receivable 44,705 518,853 44,173 518,413 Prepaid insurance 16,410 17,975 16,377 17,969 Interest receivable 1,069 20,054 1,069 20,054 Other receivables 2 43,968 76,202 43,921 76,148 Total 341,232 1,496,695 335,209 1,492,338 2 Other receivables as at 31 March 2010 mainly comprised sundry debtors of R28.5 million and payments made in advance for imports of R11.4 million.
GROUP COMPANY2010 2009 2010 2009
R’000 R’000 R’000 R’00011 DERIVATIVE FINANCIAL INSTRUMENTS
Assets 1,314 12,201 1,314 12,201 Forward foreign exchange contracts 1,314 12,201 1,314 12,201
Liabilities (245) (25,906) (245) (25,906)Forward foreign exchange contracts (245) - (245) - Derivative option contracts - (25,906) - (25,906)
Total 1,069 (13,705) 1,069 (13,705)
Trading derivatives are classified as current assets or liabilities. The remaining maturity of the instruments is less than 12 months. Gains and losses on these instruments are recognised in the statement of comprehensive income.

Fosk
or A
nnua
l Rep
ort 2
010
102
GROUP COMPANY2010 2009 2010 2009
R’000 R’000 R’000 R’00012 DEFERRED TAXATION
The gross movement on the deferred tax account is as follows:Beginning of the year (333,640) (263,679) (333,640) (263,679)Mining operations temporary differences - Other (932) 30,341 (932) 30,341 Mining operations temporary differences - Capex (23,414) (75,315) (23,414) (75,315)Non-mining operations temporary differences - Other (90,330) 150,048 (90,330) 150,048 Under-provision prior year 5,379 670 5,379 670 Tax loss utilised 168 (175,705) - (175,705)End of the year (442,769) (333,640) (442,937) (333,640)
The gross movement on the deferred tax account is as follows:
Deferred income tax assetFinance lease liability 6,972 7,830 6,972 7,830 Mark-to-market adjustment of forward exchange contracts - 7,254 - 7,254 Provisions 55,545 44,997 55,545 44,997 Mining rehabilitation liability 60,006 54,661 60,006 54,661 Income in advance 10,344 - 10,344 - Other 4,750 3,377 4,750 3,377 Tax losses utilised 168 - - -
137,785 118,119 137,617 118,119
Deferred income tax liabilityProperty, plant and equipment - Mining (338,135) (332,169) (338,135) (332,169)Property, plant and equipment - Other (191,581) (79,914) (191,581) (79,914)Property, plant and equipment - Leased (8,292) (8,875) (8,292) (8,875)Mark-to-market adjustment of forward exchange contracts (299) (3,669) (299) (3,669)Mining footprint (18,505) - (18,505) - Mining rehabilitation investment (23,742) (18,523) (23,742) (18,523)Ore stockpile - (2,995) - (2,995)Other - (5,614) - (5,614)
(580,554) (451,759) (580,554) (451,759)Net deferred income tax liability (442,769) (333,640) (442,937) (333,640)
Deferred tax on amounts charged to equity:No deferred tax has arisen on items charged to equity.
notes to the financial statementsfor the year ended 31 March 2010

Fosk
or A
nnua
l Rep
ort 2
010
103
13 DISCONTINUED OPERATIONSThe profits relating to Foskor Zirconia (while the assets were held for sale) and to the Sasol Nitro tolling agreement were included in discontinued operations. The tolling agreement ended on 1 April 2008.
Analysis of the result of discontinued operations, and the result recognised on the re-measurement of the assets or disposal group, is as follows:
GROUP COMPANY2010 2009 2010 2009
R’000 R’000 R’000 R’000Revenue - 182,789 - 131,342 Cost of sales - (110,807) - (75,046)Gross profit - 71,982 - 56,296
Expenses - (14,684) - (4,119)Profit before tax from discontinued operations - 57,298 - 52,177 Tax - (1,485) - - Profit for the year from discontinued operations - 55,813 - 52,177
GROUP AND COMPANYNumber
of shares Ordinary shares Share premium Total (thousands) R'000 R'000 R'000
14 SHARE CAPITALOrdinary share capital At 31 March 2009 9,158 9,158 132,013 141,171 Movements during the year - - - - At 31 March 2010 9,158 9,158 132,013 141,171
The total authorised share capital of ordinary shares is 9,157,647 (2009: 9,157,647) with a par value of R1 per share. All issued shares are fully paid.
15 SHARE-BASED PAYMENT RESERVE
15.1 Equity·settled share-based payment plan
Business assistance agreementIn the year ended March 2009, Foskor concluded its transaction with Coromandel International Ltd (CIL). Foskor had entered into a business assistance agreement (BAA) with CIL in February 2005, whereby CIL would render technical and business services to Foskor for a three-year period, which ended on 31 March 2008. In terms of the agreement CIL was issued ordinary shares (increasing CIL’s interest in Foskor to 14%) as well as class ‘B’ shares.
15.1.1

Fosk
or A
nnua
l Rep
ort 2
010
104
notes to the financial statementsfor the year ended 31 March 2010
Black economic empowerment transactionIn the current year, Foskor and the Industrial Development Corporation Ltd (IDC) entered into a black economic empowerment (BEE) transaction. In terms of the transaction the IDC sold a 15% interest in Foskor to strategic business partners (SBPs) and special black groups (SBGs) (collectively, the BEE partners), 5% to the communities where Foskor operates, and a 6% interest in Foskor to the Foskor Employee Share Ownership Plan (ESOP).
The transaction with the BEE partners and communities constitutes an equity-settled share-based payment plan and the transaction with the employees constitutes a cash-settled share-based payment plan (refer to Note 15.2).
Under the equity-settled share-based payment plan, the shares vest immediately at grant date. In determining the fair value of services received as consideration for equity instruments granted, measurement is referenced to the fair value of the equity instruments granted.
GROUP COMPANY2010 2009 2010 2009
R’000 R’000 R’000 R’000At the beginning of the year - 188,024 - 188,024Granted 303,914 - 303,914 -Exercised - (188,024) - (188,024)At the end of the year 303,914 - 303,914 -
Weighted average fair value assumptionsThe fair value of services received in return for equity instruments granted is measured by reference to the fair value of the equity instruments granted. The estimate of the fair value of the equity instruments granted is measured based on the Monte Carlo option pricing model.
The following weighted average assumptions were used in this option pricing model during the year:
GROUP AND COMPANY
2010Grant date 31 December 2009Initial company value (exercise price) R3,500,000,000Average share price at grant date R382.19Annualised expected volatility 43.19%Risk-free interest rate 8.54%Dividend yield 2.25%Strike price R655.68
The holders of the equity instruments are required to hold the instruments until 30 March 2018. Thereafter they will be able to acquire Foskor shares that can be retained or sold. The volatility indicator used in the calculation was based on the market prices of globally listed proxy companies that are in the same industry as Foskor, and the changes in their share prices over the past 10 years were used to determine the volatility in their share prices.
15.1.2

Fosk
or A
nnua
l Rep
ort 2
010
105
15.2 Cash-settled share-based payment planGROUP COMPANY
2010 2009 2010 2009R’000 R’000 R’000 R’000
Cash-settled share-based payment expense 23,460 - 23,460 -
The company entered into a cash-settled share-based payment plan with its employees. A total liability of R23 million was recorded and a corresponding debit was expensed in the statement of comprehensive income.The fair values were determined by reference to the fair value of the equity instruments granted using the Monte Carlo options pricing model. This model has been modified to take into account early exercise opportunities and expected employee exercise behaviour.
The following weighted average assumptions were input into the model:GROUP AND
COMPANY2010
Exercise price R3,500,000,000Average share price at grant date R382.19Annualised expected volatility 43.19%Risk-free interest rate- Five-year expected option lifetime 8.33%- Eight-year expected option lifetime 8.54%Expected dividend yield- Five-year expected option lifetime 2.11%- Eight-year expected option lifetime 2.25%Strike price- Five-year expected option lifetime R532.01- Eight-year expected option lifetime R617.45
The units in the Employee Share Ownership Trust will vest in three equal tranches from the third anniversary of the allocation date. The employees have the option to start selling their vested units from 30 March 2014 until 30 March 2018. The Employee Share Ownership Trust will be wound up on 30 March 2018, at which point any employees with remaining units will be given Foskor shares in exchange for their units.
The volatility indicator used in the calculation was based on the market prices of globally listed proxy companies that are in the same industry as Foskor, and the changes in their share prices over the past 10 years were used to determine the volatility in their share prices.

Fosk
or A
nnua
l Rep
ort 2
010
106
GROUP COMPANY2010 2009 2010 2009
R’000 R’000 R’000 R’00016 FINANCE LEASE LIABILITY
Finance lease liability - Minimum lease payments:Not later than one year 6,396 7,089 6,396 7,089 Later than one year and not later than five years 18,750 20,972 18,750 20,972 Later than five years 23,916 28,089 23,916 28,089
49,062 56,150 49,062 56,150 Future finance charges on finance lease (24,160) (28,187) (24,160) (28,187)
Present value of finance lease liability 24,902 27,963 24,902 27,963 Less current portion (2,810) (3,061) (2,810) (3,061)
Long-term portion of finance lease liability 22,092 24,902 22,092 24,902
Present value of finance lease liability is as follows:Not later than one year 2,810 3,061 2,810 3,061 Later than one year and not later than five years 7,761 8,727 7,761 8,727 Later than five years 14,331 16,175 14,331 16,175
24,902 27,963 24,902 27,963
The finance lease is between Foskor (Pty) Ltd and uMhlathuze Water Board for an effluent pipeline. The lease liability is effectively secured, as the rights to the leased asset revert to the lessor in the event of default. The lease is over a 20-year period with 16 years remaining as at 31 March 2010. Foskor has sole use of the effluent pipeline and pays for maintenance. The lease is at a fixed rate of 14.4% per annum.
notes to the financial statementsfor the year ended 31 March 2010
15.3 Total share-based payment expenseGROUP COMPANY
2010 2009 2010 2009R’000 R’000 R’000 R’000
Equity-settled share-based payment expense 303,914 - 303,914 -Cash-settled share-based payment expense 23,460 - 23,460 -Total share-based payment expense 327,374 - 327,374 -
15.4 Transaction feesThe transaction fees of R27.7 million comprise of legal and advisory fees incurred with respect to the BEE transaction.

Fosk
or A
nnua
l Rep
ort 2
010
107
17 ENVIRONMENTAL REHABILITATION LIABILITY
Foskor (Pty) Ltd continually contributes to the Environmental Rehabilitation Trust, to ensure that adequate funds are available to pay for mine closure and reclamation costs.
The Environmental Rehabilitation Trust is an irrevocable trust under the company’s control, is regarded as a Special Purpose Entity and is consolidated as part of Foskor (Pty) Ltd. This note compares the net present value of the rehabilitation liability to the assets held by the Trust.
GROUP COMPANY2010 2009 2010 2009
R’000 R’000 R’000 R’00017.1 Mining environmental rehabilitation liability
Balance at the beginning of the year 206,623 195,217 206,623 195,217 Unwinding of discount - 11,406 - 11,406 Adjustment to the liability (refer to Note 3) 7,684 - 7,684 - Balance at the end of the year 214,307 206,623 214,307 206,623 Environmental Rehabilitation Trust Balance at the beginning of the year 69,558 60,064 69,558 60,064 Fair valuation of investments 7,236 1,494 7,236 1,494 Investments held by the Trust (refer to Note 8) 76,794 61,558 76,794 61,558 Cash contribution made to the Trust 8,000 8,000 8,000 8,000 Total assets held by the Trust 84,794 69,558 84,794 69,558 Unfunded portion of rehabilitation liability 129,513 137,065 129,513 137,065
The financial assets held by the Trust are intended to fund the environmental rehabilitation liability of Foskor (Pty) Ltd and are not available for general purposes of the group. The objective of the Trust is to act as the financial provider for expenditure that its member, Foskor (Pty) Ltd, is likely to incur in order to comply with the statutory obligation with regard to environmental rehabilitation. The Trust is exempt from tax in accordance with Section 10(1)cP of the Income Tax Act (No. 58 of 1962).
The directors are aware of the estimated cost of rehabilitation and are satisfied that adequate provision is being made to meet this obligation. A contingent liability has been recognised for the issuing of guarantees to the Department of Mineral Resources (refer to Note 30.1).
17.2 Groundwater contamination - Richards Bay Foskor, in consultation with the Department of Water and Environmental Affairs (DWEA), continues to monitor the groundwater situation while solutions are being developed for approval by the DWEA for implementation. In the previous financial years ended 31 March 2008 and 31 March 2009, an amount of R5.3 million was spent on investigating the contamination plan to determine remedial solutions. In the current year ended 31 March 2010, R2.2 million was spent on this project. In the financial statements for the year ended 31 March 2010 an amount of R29.8 million has been accrued for the groundwater rehabilitation costs, as estimated by an independent external expert.
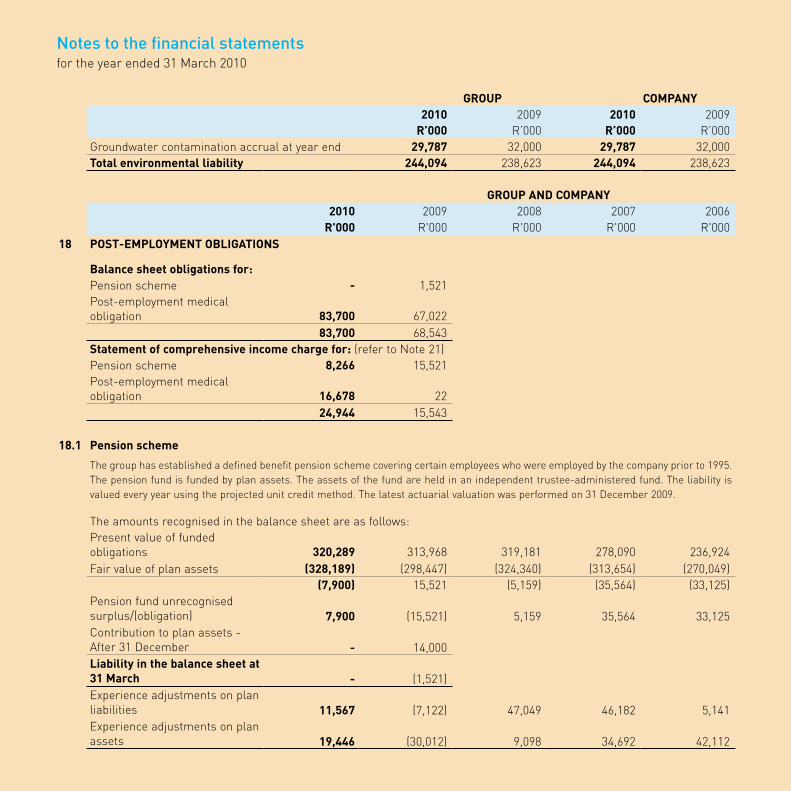
Fosk
or A
nnua
l Rep
ort 2
010
108
GROUP COMPANY2010 2009 2010 2009
R’000 R’000 R’000 R’000Groundwater contamination accrual at year end 29,787 32,000 29,787 32,000 Total environmental liability 244,094 238,623 244,094 238,623
GROUP AND COMPANY2010 2009 2008 2007 2006
R'000 R'000 R'000 R'000 R'00018 POST-EMPLOYMENT OBLIGATIONS
Balance sheet obligations for:Pension scheme - 1,521 Post-employment medical obligation 83,700 67,022
83,700 68,543 Statement of comprehensive income charge for: (refer to Note 21)Pension scheme 8,266 15,521 Post-employment medical obligation 16,678 22
24,944 15,543
18.1 Pension scheme
The group has established a defined benefit pension scheme covering certain employees who were employed by the company prior to 1995. The pension fund is funded by plan assets. The assets of the fund are held in an independent trustee-administered fund. The liability is valued every year using the projected unit credit method. The latest actuarial valuation was performed on 31 December 2009.
The amounts recognised in the balance sheet are as follows:Present value of funded obligations 320,289 313,968 319,181 278,090 236,924 Fair value of plan assets (328,189) (298,447) (324,340) (313,654) (270,049)
(7,900) 15,521 (5,159) (35,564) (33,125)Pension fund unrecognised surplus/(obligation) 7,900 (15,521) 5,159 35,564 33,125 Contribution to plan assets - After 31 December - 14,000 Liability in the balance sheet at 31 March - (1,521)Experience adjustments on plan liabilities 11,567 (7,122) 47,049 46,182 5,141 Experience adjustments on plan assets 19,446 (30,012) 9,098 34,692 42,112
notes to the financial statementsfor the year ended 31 March 2010

Fosk
or A
nnua
l Rep
ort 2
010
109
GROUP AND COMPANY2010 2009 2008 2007 2006
R'000 R'000 R'000 R'000 R'00018 POST-EMPLOYMENT OBLIGATIONS (CONTINUED)
The movement in the defined benefit obligation over the year is as follows:At 1 January 313,968 319,181 Current service cost 646 973 Interest cost 22,505 26,797 Actuarial losses/(gains) 11,567 (7,122)Benefits paid (28,397) (25,861)At 31 December 320,289 313,968
The movement in the fair value of plan assets over the year is as follows:At 1 January 298,447 324,340 Expected return on plan assets 22,764 29,602 Actuarial gains/(losses) 19,446 (30,012)Employer contributions 15,929 378 Benefits paid (28,397) (25,861)At 31 December 328,189 298,447
The amounts recognised in the statement of comprehensive income are as follows:Current service cost 646 973 Interest cost 22,505 26,797 Expected return on plan assets (22,764) (29,602)Effect of asset ceiling - (5,537)Actuarial losses recognised 7,879 22,890 Total, included in staff costs (refer to Note 21) 8,266 15,521
The actual return on plan assets was:Expected return on plan assets 22,764 29,602 Actuarial gains/(losses) on plan assets 19,446 (30,012)Actual return on plan assets 42,210 (410)
Plan assets are comprised as follows:Equity instruments 42.80% 40.00%Cash 27.00% 25.00%Debt instruments 10.40% 17.00%Other 19.80% 18.00%
100.00% 100.00%

Fosk
or A
nnua
l Rep
ort 2
010
110
GROUP AND COMPANY2010 2009 2008 2007 2006
R'000 R'000 R'000 R'000 R'00018 POST-EMPLOYMENT OBLIGATIONS (CONTINUED)
The principal actuarial assumptions used were as follows:- Discount rate 9.25% 7.50%- CPI inflation rate 5.75% 4.00%- Expected return on plan assets 7.50% 8.00%- Future salary increases 6.75% 4.00%- Future pension increases 4.89% 3.00%- Normal retirement age 60 60 - Pre-retirement mortality SA85-90 (light) SA85-90 (light) - Post-retirement mortality PA90-2 PA90-2
The sensitivity of the overall pension liability to changes in the weighted principal assumptions is: IMPACT ON OVERALL LIABILITY
Inflation rate (increase of 1%) 8% increase 8.86% increase Inflation rate (decrease of 1%) 7% decrease 9.28% decrease
The expected contributions to the post-employment pension scheme for the year ending 31 March 2011 are R431,460.
18.2 Post-employment medical obligation The group provides post-employment health care benefits to its retirees who were employed by the company on or before 1 July 1995. The same benefits are provided to a specific group of employees employed before 1 July 1996.
The group operates a post-employment medical obligation scheme, which is held in an independent trustee-administered fund. The liability is valued every year using the projected unit credit method. The latest actuarial valuation was performed on 31 December 2009.
In addition to the assumptions set out above, the principal actuarial assumptions for the medical obligation were:- Discount rate 9.25% 8.75%- General inflation rate 5.75% 5.25%- Medical inflation rate 7.25% 6.75%- Normal retirement age 60/65 60/65 - Pre-retirement mortality SA85-90 (light) SA85-90 (light) - Post-retirement mortality PA90-2 PA90-2
The amounts recognised in the balance sheet were determined as follows:Present value of unfunded obligations 83,700 67,022 67,000 68,234 201,739
Liability in the balance sheet 83,700 67,022 67,000 68,234 201,739
notes to the financial statementsfor the year ended 31 March 2010

Fosk
or A
nnua
l Rep
ort 2
010
111
GROUP AND COMPANY2010 2009 2008 2007 2006
R'000 R'000 R'000 R'000 R'00018 POST-EMPLOYMENT OBLIGATIONS (CONTINUED)
The movement in the defined benefit obligation over the year is as follows:
At 1 January 67,022 67,000 Current service cost 410 475 Interest cost 5,724 5,747 Actuarial losses 3,842 - Contributions paid (3,198) (6,200)Additional members not previously included 9,900 -
At 31 December 83,700 67,022
The amounts recognised in the statement of comprehensive income were as follows: Current service cost 410 475 Interest cost 5,724 5,747 Contributions paid (3,198) (6,200)Actuarial losses 3,842 - Additional members not previously included 9,900 -
Total, included in staff costs (refer to Note 21) 16,678 22
Change in past-service
liability
Change in service cost
plus interest cost
Inflation rate (increase of 1%) 12.9% increase 13.7% increase Inflation rate (decrease of 1%) 10.6% decrease 11.1% decrease
The expected contributions to post-employment medical plans for the year ending 31 March 2011 are R 3.4 million.

Fosk
or A
nnua
l Rep
ort 2
010
112
GROUP COMPANY2010 2009 2010 2009
R’000 R’000 R’000 R’00019 TRADE AND OTHER PAYABLES
Trade payables 115,809 384,088 114,762 383,846 Accruals 245,615 85,653 245,615 85,653 Leave 24,445 32,362 24,445 32,362 Sundry payables 1 20,549 115,965 20,540 115,935 BHP Billiton South Africa Ltd refund 2 11,378 11,378 11,378 11,378 Total 417,796 629,446 416,740 629,174 1 Sundry payables as at 31 March 2010 are composed mainly of R11.9 million VAT payable and R4.2 million provision for shortfall on the export storage tonnages.2 This amount relates to a refund due to BHP Billiton South Africa Ltd from a joint project between Foskor and BHP Billiton South Africa Ltd. The amount will be finalised following the completion of the Foskor tax assessments. The refund has no contractual repayment terms, and is unsecured and interest-free.
GROUP COMPANY2010 2009 2010 2009
R’000 R’000 R’000 R’00020 PROVISIONS
Bonus 57,859 78,416 57,766 78,416 Demurrage 3 10,624 4,433 10,624 4,433 Total 68,483 82,849 68,390 82,849 Movement in the provisionsOpening amount 82,849 77,059 82,849 77,059 Additional provisions 57,859 78,416 57,766 78,416 Utilised during period (72,225) (72,626) (72,225) (72,626)Closing amount 68,483 82,849 68,390 82,849 3 Demurrage is a penalty payable to a ship owner if the agreed loading time is not honoured.
notes to the financial statementsfor the year ended 31 March 2010

Fosk
or A
nnua
l Rep
ort 2
010
113
GROUP COMPANY2010 2009 2010 2009
R’000 R’000 R’000 R’00021 OPERATING PROFIT
Operating profit is arrived at before finance income, finance costs, and net foreign exchange gains after taking into account:IncomeReversal of impairment 323,000 - 323,000 - ExpenditureLoss on disposal of property, plant and equipment 3,659 3,071 3,629 3,054
Amortisation of intangible assets - Software 1,108 913 1,108 913 Auditors' remuneration 4,216 4,103 4,216 4,103 - Audit fee 2,451 1,685 2,451 1,685 - Other services 1,500 1,924 1,500 1,924 - Expenses 265 494 265 494 Depreciation 172,550 162,946 172,463 162,860 - Buildings 22,228 16,793 22,141 16,793 - Plant, equipment and vehicles 146,372 142,245 146,372 142,159 - Mining footprint 3,950 3,908 3,950 3,908 Impairment charge - 600,000 - 600,000 Operating lease charges 6,244 5,844 6,244 5,844 - Property rentals 1,423 1,304 1,423 1,304 - Equipment 4,821 4,540 4,821 4,540 Repairs and maintenance 375,950 375,505 375,950 375,505 Share-based payment expense 327,374 - 327,374 - Staff costs 603,985 525,538 603,985 525,538 - Salaries and wages 471,650 396,132 471,650 396,132 - Bonus 57,859 78,416 57,766 78,416 - Pension costs: Defined contribution plans 40,857 34,213 40,857 34,213 - Pension costs: Defined benefit plans (refer to
Note 18) 8,266 15,521 8,266 15,521
- Increase in post-employment medical liability 16,678 22 16,678 22 (refer to Note 18)
- Other staff costs 8,675 1,234 8,768 1,234

Fosk
or A
nnua
l Rep
ort 2
010
114
GROUP COMPANY2010 2009 2010 2009
R’000 R’000 R’000 R’00022 NET FINANCE INCOME
Interest expenses (48,250) (24,870) (48,250) (24,870) - Interest paid to banks (1,833) (8,601) (1,833) (8,601) - Interest paid on finance lease (4,027) (4,534) (4,027) (4,534) - Interest paid - Other (42,390) (11,735) (42,390) (11,735)Interest income 68,802 222,381 67,454 221,339 - Interest received from banks 54,208 178,519 52,860 177,477 - Interest received from customers - 23,808 - 23,808 - Interest received - Other 14,594 20,054 14,594 20,054 Environmental Rehabilitation Trust investment - Growth in investment 7,236 1,494 7,236 1,494 Total interest income 76,038 223,875 74,690 222,833 Net finance income 27,788 199,005 26,440 197,963
GROUP COMPANY2010 2009 2010 2009
R’000 R’000 R’000 R’00023 NET FOREIGN EXCHANGE PROFITS/(LOSSES)
Foreign transaction losses (165,472) (639,808) (165,472) (639,808) - Foreign exchange transaction losses (162,066) (613,902) (162,066) (613,902) - Derivative instruments (3,406) (25,906) (3,406) (25,906)
Foreign transaction profits 192,745 346,141 192,725 346,089 - Foreign exchange transaction profits 154,517 283,834 154,497 283,782 - Derivative instruments 38,228 62,307 38,228 62,307
Net foreign exchange profits/(losses) 27,273 (293,667) 27,253 (293,719)
notes to the financial statementsfor the year ended 31 March 2010

Fosk
or A
nnua
l Rep
ort 2
010
115
GROUP COMPANY2010 2009 2010 2009
R’000 R’000 R’000 R’00024 TAXATION
Composition - Including discontinued operations South African normal income tax
Normal tax 2,069 (703,340) 2,121 (702,193)- Current year (52) (703,343) - (702,193)- Adjustment previous year 2,121 3 2,121 - Secondary tax on companies - (19,500) - (19,500)Deferred tax (109,129) (69,961) (109,298) (69,961)- Current (114,508) (70,630) (114,677) (70,630)- Adjustment previous year 5,379 669 5,379 669
Total taxation as per income statement (107,060) (792,801) (107,177) (791,654)Discontinued operation - Foskor Zirconia (Pty) Ltd at 1 August 2008 - (1,485) - - Total tax charge (107,060) (794,286) (107,177) (791,654)
In the year under review, the South African Revenue Service (SARS) appealed against the Income Tax Court’s 2008 decision to exclude the F100 ore stockpiles from trading stock. The matter was heard in the Appellate Division of the Supreme Court, where the court found in favour of SARS; the F100 stockpiles were to be included as trading stock, giving rise to a tax charge of R60.6 million. The S89quat interest of R51.2 million would be waived, however. The net tax cost to Foskor of this judgment is calculated as being R2.4 million. The net interest cost as at 31 March 2010 amounted to R5.3 million.
Reconciliation of tax rateStandard tax rate 28.00% 28.00% 28.00% 28.00%Permanent differences 209.91% 1.14% 208.05% 0.61%Secondary tax on companies 0.00% 0.73% 0.00% 0.72%Tax on discontinued operations 0.00% 0.06% 0.00% 0.00%Prior year under-provision - Deferred tax -15.57% -0.03% -15.44% -0.02%Effective rate 222.34% 29.90% 220.61% 29.31%

Fosk
or A
nnua
l Rep
ort 2
010
116
GROUP COMPANY2010 2009 2010 2009
R’000 R’000 R’000 R’00025 EARNINGS PER SHARE25.1 Basic earnings/(loss) per share - Rands (6.39) 211.24 (6.40) 216.48
Basic earnings per share is calculated by dividing the profit/(loss) attributable to ordinary shareholders from continuing operations of R58,518,000 loss (2009: R1,863,115,000) for the group and R58,615,000 loss (2009: R1,909,314,000) for the company; by the weighted average number of ordinary shares in issue during the year of 9,157,647 (2009: 8,819,905).
25.2 Diluted earnings/(loss) per share - Rands (6.39) 211.24 (6.40) 216.48
Diluted earnings per share is calculated by adjusting the weighted average number of ordinary shares outstanding to assume conversion of all dilutive potential ordinary shares. The company has no dilutive potential ordinary shares.
Profit attributable to ordinary shareholders of the company - Continuing operations (58,518) 1,863,115 (58,615) 1,909,314
Profit used to determine diluted earnings per share (58,518) 1,863,115 (58,615) 1,909,314
Weighted average number of ordinary shares in issue 9,157,647 8,819,905 9,157,647 8,819,905
Weighted average number of ordinary shares for diluted earnings per share
9,157,647 8,819,905 9,157,647 8,819,905
notes to the financial statementsfor the year ended 31 March 2010

Fosk
or A
nnua
l Rep
ort 2
010
117
GROUP COMPANY2010 2009 2010 2009
R’000 R’000 R’000 R’00025.3 Headline earnings per share - Rands 8.64 233.04 8.62 233.04
Headline earnings per share is calculated on the basis of adjusted net earnings/(loss) attributable to ordinary shareholders of R79,080,000 (2009: R2,055,375,000) for the group and R78,913,000 (2009: R2,101,499,000) for the company; and 9,157,647 (2009: 8,819,905) shares being the weighted average number of ordinary shares in issue during the year.
Net profit/(loss) attributable to ordinary shareholders from continuing operations is reconciled to headline earnings as follows: (58,518) 1,863,115 (58,615) 1,909,314
Adjustments (amounts adjusted for tax):Share-based payment expense 235,709 - 235,709 - Depreciation on property, plant and equipment 124,236 117,321 124,173 117,259 Impairment reversal (217,056) - (217,056) - Inventory write-down - 40,708 - 40,708 Increase in post-employment medical liability and pension 10,913 1,111 10,913 1,111
Loss on disposal of property, plant and equipment 2,634 2,212 2,613 2,199
Provisions - 56,460 - 56,460 Amortisation of intangibles 798 657 798 657 Foreign exchange losses - 18,652 - 18,652 Foreign exchange profits (19,637) (44,861) (19,622) (44,861)
Total adjustments 137,598 192,260 137,528 192,185
Headline earnings/(loss) 79,080 2,055,375 78,913 2,101,499
25.4 Diluted headline earnings per share - Rands 8.64 233.04 8.62 238.72
Diluted headline earnings per share is calculated on the basis of adjusted earnings/(loss) attributable to ordinary shareholders of R79,080,000 (2009: R2,055,375,000) for the group and R78,913,000 (2009: R2,101,499,000) for the company; and R9,157,647 (2009: 8,819,905) shares being the diluted number of ordinary shares in issue during the year.

Fosk
or A
nnua
l Rep
ort 2
010
118
GROUP COMPANY2010 2009 2010 2009
R’000 R’000 R’000 R’00026 CASH GENERATED FROM OPERATIONS
Reconciliation of profit for the year:
Profit before taxation including discontinued operations 48,542 2,713,214 48,562 2,753,145
Adjustments for: - Depreciation 172,550 162,946 172,463 162,860 - Amortisation of intangible assets 1,108 913 1,108 913 - Loss on disposal of property 3,659 3,071 3,629 3,054 - Provisions - 78,416 - 78,416 - Growth in environmental rehabilitation (2,213) 32,807 (2,213) 32,807 - Post-employment obligation growth 15,157 17,064 15,157 17,064 - Decrease in ore stockpile 11,412 31,419 11,412 31,419 - Impairment (reversal)/charge (323,000) 600,000 (323,000) 600,000 - Share-based payment expense 327,374 - 327,374 - - Foreign exchange (profits)/losses on operating
activities (27,273) 296,339 (27,253) 293,719
- Net finance income (27,788) (199,066) (26,439) (197,963)- Investment income (3,932) - (3,932) (53,602)- Losses/(Income) from associate 310 (4,046) - -
Changes in working capital:Inventory (78,015) 244,944 (78,015) 244,944 Trade and other receivables 1,155,463 (552,536) 1,157,129 (551,746)Derivative financial assets (14,774) (36,479) (14,774) (36,479)Other financial assets at fair value - (49,665) - (49,665)Trade and other payables (211,646) (228,704) (212,434) (225,638)Provisions (14,366) (72,626) (14,459) (72,626)Total changes in working capital 836,662 (695,066) 837,447 (691,210)Cash generated from operations 1,032,568 3,038,011 1,034,314 3,030,621
notes to the financial statementsfor the year ended 31 March 2010

Fosk
or A
nnua
l Rep
ort 2
010
119
GROUP COMPANY2010 2009 2010 2009
R’000 R’000 R’000 R’00027 BORROWING FACILITIES
Rand-denominated facilitiesLong-term interest-bearing facilities:Total facility 1,000,000 - 1,000,000 - Utilised - - - - Available 1,000,000 - 1,000,000 -
The R1 billion is the long-term interest-bearing facility granted by the Industrial Development Corporation Ltd.
Short-term interest-bearing facilities:Total committed facility 200,000 400,000 200,000 400,000 Utilised - - - - Available 200,000 400,000 200,000 400,000
Guarantees:Total facility from banks 550,000 550,000 550,000 550,000 Utilised (390,471) (216,383) (390,471) (216,383)Available 159,529 333,617 159,529 333,617
Letters of credit:Total facility from banks 780,000 980,000 780,000 980,000 Utilised (51,959) (111,388) (51,959) (111,388)Available 728,041 868,612 728,041 868,612

Fosk
or A
nnua
l Rep
ort 2
010
120
GROUP COMPANY2010 2009 2010 2009
R’000 R’000 R’000 R’00028 COMMITMENTS
Capital commitmentsThe capital expenditure contracted for at the balance sheet date but not yet incurred is as follows:Property, plant and equipment 591,875 1,530,112 591,875 1,530,112 Total capital commitments 591,875 1,530,112 591,875 1,530,112
Operating lease commitmentsThe future minimum lease payments payable under non-cancellable leases are as follows:Payable not later than one year 1,752 2,122 1,752 2,122 Payable later than one year and not later than five years 755 2,507 755 2,507
2,507 4,629 2,507 4,629
The company leases photocopiers under various agreements, which terminate between 2008 and 2010. The lease for the head office premises in Midrand commenced on 1 September 2008 and expires at the end of August 2011.
notes to the financial statementsfor the year ended 31 March 2010

Fosk
or A
nnua
l Rep
ort 2
010
121
2010 2009R’000 R’000 R’000 R’000
Estimated fair Carrying Estimated fair Carrying value value value value
29 FINANCIAL INSTRUMENTSGroup
Financial assetsThe carrying amount and fair values of financial assets are as follows:Available-for-sale investments
Financial assets investments 198,662 198,662 76,446 76,446 Loans and receivables
Other loans and receivables 18,796 18,796 45,114 45,114 Trade and other receivables 264,608 264,608 959,751 959,751 Cash and cash equivalents 517,542 517,542 365,829 365,829
At fair value through profit and loss Derivative financial instruments 1,314 1,314 12,201 12,201 Total assets 1,000,922 1,000,922 1,459,341 1,459,341
LiabilitiesFinancial liabilities at amortised cost
Finance lease liability 24,902 24,902 27,963 27,963 Trade and other payables 377,251 377,251 597,084 597,084
At fair value through profit and lossDerivative financial instruments 245 245 25,906 25,906
Total liabilities 402,398 402,398 650,953 650,953
CompanyFinancial assetsThe carrying amount and fair values of financial assets are as follows:Available-for-sale investments
Financial assets investments 198,662 198,662 76,446 76,446 Loans and receivables
Other loans and receivables 8,796 8,796 35,114 35,114 Trade and other receivables 259,196 259,196 955,840 955,840 Cash and cash equivalents 515,380 515,380 364,495 364,495
At fair value through profit and lossDerivative financial instruments 1,314 1,314 12,201 12,201
Total assets 983,348 983,348 1,444,096 1,444,096
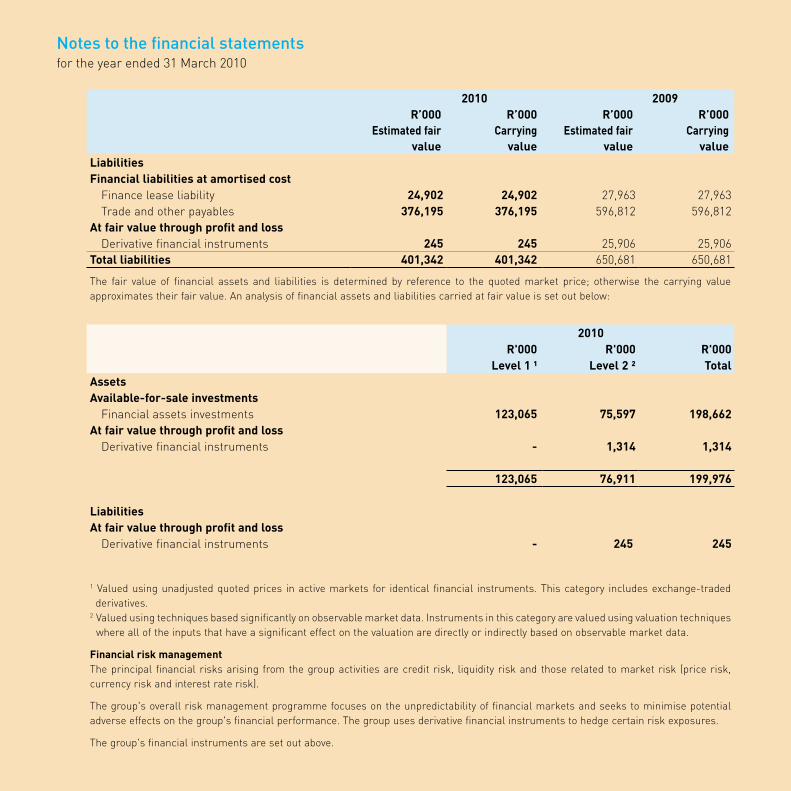
Fosk
or A
nnua
l Rep
ort 2
010
122
2010 2009R’000 R’000 R’000 R’000
Estimated fair Carrying Estimated fair Carrying value value value value
LiabilitiesFinancial liabilities at amortised cost
Finance lease liability 24,902 24,902 27,963 27,963 Trade and other payables 376,195 376,195 596,812 596,812
At fair value through profit and lossDerivative financial instruments 245 245 25,906 25,906
Total liabilities 401,342 401,342 650,681 650,681
The fair value of financial assets and liabilities is determined by reference to the quoted market price; otherwise the carrying value approximates their fair value. An analysis of financial assets and liabilities carried at fair value is set out below:
2010 R'000 R'000 R'000
Level 1 ¹ Level 2 ² Total AssetsAvailable-for-sale investments
Financial assets investments 123,065 75,597 198,662 At fair value through profit and loss
Derivative financial instruments - 1,314 1,314
123,065 76,911 199,976
LiabilitiesAt fair value through profit and loss
Derivative financial instruments - 245 245
1 Valued using unadjusted quoted prices in active markets for identical financial instruments. This category includes exchange-traded derivatives.
2 Valued using techniques based significantly on observable market data. Instruments in this category are valued using valuation techniques where all of the inputs that have a significant effect on the valuation are directly or indirectly based on observable market data.
Financial risk management The principal financial risks arising from the group activities are credit risk, liquidity risk and those related to market risk (price risk, currency risk and interest rate risk).
The group's overall risk management programme focuses on the unpredictability of financial markets and seeks to minimise potential adverse effects on the group's financial performance. The group uses derivative financial instruments to hedge certain risk exposures.
The group's financial instruments are set out above.
notes to the financial statementsfor the year ended 31 March 2010

Fosk
or A
nnua
l Rep
ort 2
010
123
29.1 Market risk management
29.1.1 Foreign currency risk managementThe group operates internationally and is exposed to foreign exchange risk arising from various currency exposures, primarily with respect to the US dollar.
Foreign exchange risk arises from future commercial transactions or recognised assets and liabilities that are denominated in a currency that is not the entity's functional currency. Approximately 67% of the foreign-denominated revenue transactions are covered by forward exchange contracts and zero-cost collar option contracts.
These contracts are entered into to cover firm foreign commitments not yet due and export earnings of which the proceeds are not yet receivable. The import of raw materials amounting to approximately a third of foreign-denominated revenue transactions is regarded as a natural hedge, which is considered sufficient to mitigate the remaining risk.
Details of the contracts are as follows:
GROUP COMPANY2010 2009 2010 2009
Forward exchange contractsDenominated in United States dollars (export notional amount) 8,500 11,000 8,500 11,000
Denominated in United States dollars (import notional amount) (5,300) - (5,300) -
Average exchange rate as per contract R7.46 R10.61 R7.46 R10.61
Derivative option contractsDenominated in United States dollars (notional amount) - 24,000 - 24,000
Average put contract exchange rate R/$ - R7.86 - R7.86Average call contract exchange rate R/$ - R8.49 - R8.49Spot rate at year end R/$ R7.34 R9.42 R7.34 R9.42
The following receivable and payable balances are exposed to exchange rate movements:
Receivables (less than one year)US$ denominated balances at year end - $'000 24,764 79,465 24,764 79,465 Rand equivalent balances at year end - R'000 181,817 748,560 181,817 748,560
Payables (less than one year)US$ denominated balances at year end - $'000 11,854 (31,927) 11,854 (31,927)Rand equivalent balances at year end - R'000 87,032 (300,752) 87,032 (300,752)

Fosk
or A
nnua
l Rep
ort 2
010
124
29.1.2
29.1.3
At 31 March 2010 if the rand had weakened by 10% against the US dollar with all other variables held constant, the profit before taxation for the group for the year would have been R9.5 million higher (2009: R44.8 million higher); conversely, if the rand had strengthened by 10% against the US dollar with all other variables held constant, the profit before taxation for the group would have been R9.5 million less (2009: R44.8 million less).
This sensitivity analysis considers the impact of a change in the rand vs US dollar exchange rate on the translation of US dollar denominated trade receivables and trade payables, as well as the fair value of open derivative contracts at year end.
Interest rate risk managementAs part of an ongoing restructuring of the borrowing mix and interest rate characteristics of borrowings, the group restructures funding of operating capital as appropriate. The group is exposed to cash flow interest rate risk mainly in respect of cash and cash equivalents that earn interest at a variable rate.
The group invests cash funds on call and in fixed short-term interest-bearing deposits. Interest on these deposits is linked to the prime interest rate. The group had no significant interest-bearing debt balances outstanding at year end. The sensitivity analysis below includes investments held in the Environmental Rehabilitation Trust that are sensitive to interest rate movements.
At 31 March 2010 if interest rates on financial instruments had been 1% lower with all other variables remaining constant, the pre-tax profit for the year would have been R5 million lower (2009: R4 million lower); conversely, if interest rates had been 1% higher with all other variables remaining constant, the pre-tax profit for the year would have been R5 million higher (2009: R4 million higher).
Price risk managementCommodity and share price riskChanges in copper, phosphoric acid and sulphur prices may have an adverse effect on current or future earnings.
The copper, phosphoric acid and sulphur markets are predominantly priced in US dollars, which further exposes the group to the risk that fluctuations in the SA rand/US dollar may also have an adverse effect on current or future earnings.
The risk of changes in the price of these commodities is hedged by entering into fixed contracts with customers and suppliers and derivative option contracts. As at 31 March 2010 and 31 March 2009, the group did not hold any commodity-based financial instruments.
The risk associated with listed equity investments is the change in equity prices resulting in changes in the fair values of the investments. Unit trusts and other investments (refer to Note 8) are actively managed by reputable fund managers and are held in conservative portfolios, which guarantees return of the capital amount invested.
GROUP COMPANY2010 2009 2010 2009
R’000 R’000 R’000 R’000Listed investmentsFair value at 31 March 2010 123,065 42,247 123,065 42,247
The equity investments are listed on the Bombay Stock Exchange in India and on the JSE in South Africa. A 5% decrease in a representative share index at the reporting date, with all other variables held constant, would have decreased equity by R6.2 million (2009: R2.1 million); conversely, a 5% increase in a representative share index at the reporting date, with all other variables held constant, would have increased equity by R6.2 million (2009: R2.1 million).
notes to the financial statementsfor the year ended 31 March 2010

Fosk
or A
nnua
l Rep
ort 2
010
125
29.2 Credit risk managementCredit risk arises from cash and cash equivalents, derivative financial instruments and outstanding receivables.
The group limits its investments and deposits to a maximum of R500 million per financial institution with AA+ rating by Fitch, and R200 million per financial institution with rating of AA-. Increase in such limits is subject to approval by the Board of Directors. Surplus funds available on transactional bank accounts are deposited in short-term high interest yielding investments.
The group manages credit risk on accounts receivable by fixing payment terms on open accounts and selling on letters of credit to foreign customers. Stringent credit assessments are employed before allowing credit sales with customers. At year end customers are assessed individually for impairment.
Recoverability for the outstanding amount can be analysed as follows:
GROUP COMPANY2010 2009 2010 2009
R’000 R’000 R’000 R’000Trade receivablesFully performing - Outstanding for less than 60 days 228,397 508,244 222,986 504,387 - Outstanding for more than 60 days but less than 120 days 1,579 282,316 1,622 282,316
Past due and impaired - Outstanding for more than 120 days 5,066 72,935 5,023 72,935
235,042 863,495 229,631 859,638
Major foreign debtors - Account balance Mangalore Chemicals and Fertilisers Ltd 24,313 - 24,313 - CFL Kakinada - 551,405 - 551,405 Coromandel International Ltd - 107,383 - 107,383 Gujarat State Fertilizers 90,544 38,290 90,544 38,290 Indian Farmers Fertiliser Cooperation Ltd - 12,509 - 12,509 Thermphos International BV 34,107 18,463 34,107 18,463
148,964 728,050 148,964 728,050
Cash and cash equivalents on hand 517,542 365,829 515,380 364,495
The group does not hold any collateral, nor has it pledged any financial assets as collateral for any of its obligations. No contracts that were past due have been renegotiated. Maximum exposure to credit risk is in the carrying amount of all financial assets subject to credit risk except for financial guarantees, for which the maximum exposure to credit risk is the maximum amount the group may be called on to deliver (refer to Note 30.1)

Fosk
or A
nnua
l Rep
ort 2
010
126
29.3 Liquidity risk managementPrudent liquidity risk management implies maintaining sufficient cash and marketable securities, the availability of funding through an adequate amount of committed credit facilities and the ability to close out market positions. Liquidity risk arises from existing obligations associated with the industry and the requirements to raise funds in order to meet these obligations.
The group manages liquidity by monitoring forecasted cash flows and ensuring that adequate unutilised borrowing facilities are available if necessary.
The group has no significant long-term interest-bearing debts.
Short-term obligations mainly include amounts payable to the trade creditors and derivative liability instruments. The derivative instrument obligations are hedged by underlying transactions. Current year’s trade payables can be analysed as follows:
GROUP COMPANY2010 2009 2010 2009
R’000 R’000 R’000 R’000Trade payables - Due in less than 60 days 99,944 103,894 98,897 103,652 - Due in more than 60 days but less than 120
days 2,077 - 2,077 -
- Due in more than 120 days 13,788 280,194 13,788 280,194 115,809 384,088 114,762 383,846
Other payables - Due in less than 60 days 266,164 202,568 266,155 202,568 - Raw material in transit due in more than 120
days - 30,898 - 30,898
BHP Billiton South Africa Ltd payable 11,378 11,378 11,378 11,378 Derivative liabilities - Derivative option contract - (25,906) - (25,906)Total 393,350 603,026 392,294 602,784
Maturity dates were spread evenly throughout the year ending 31 March 2010.
29.4 Capital risk managementThe group’s objectives when managing capital are to safeguard the group’s ability to continue as a going concern, in order to provide returns for shareholders and benefits for other stakeholders, and to maintain an optimal capital structure to reduce the cost of capital. The group's capital includes share capital and share premium. In order to maintain the capital structure, the group may issue new shares, adjust dividend amounts payable to shareholders, or return capital to shareholders.
GROUP COMPANY2010 2009 2010 2009
R’000 R’000 R’000 R’000Share capital 9,158 9,158 9,158 9,158 Share premium 132,013 132,013 132,013 132,013 Capital 141,171 141,171 141,171 141,171 There were no changes to the group's approach to capital management during the year. The company is not subject to externally imposed capital requirements.
notes to the financial statementsfor the year ended 31 March 2010
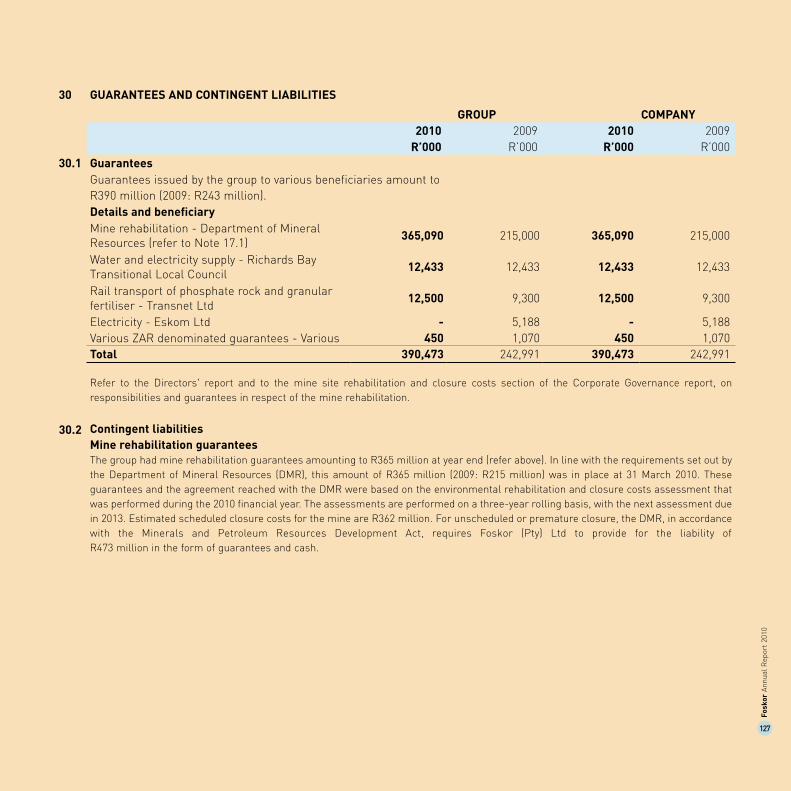
Fosk
or A
nnua
l Rep
ort 2
010
127
30 GUARANTEES AND CONTINGENT LIABILITIES
GROUP COMPANY2010 2009 2010 2009
R’000 R’000 R’000 R’00030.1 Guarantees
Guarantees issued by the group to various beneficiaries amount to R390 million (2009: R243 million).Details and beneficiaryMine rehabilitation - Department of Mineral Resources (refer to Note 17.1) 365,090 215,000 365,090 215,000
Water and electricity supply - Richards Bay Transitional Local Council 12,433 12,433 12,433 12,433
Rail transport of phosphate rock and granular fertiliser - Transnet Ltd 12,500 9,300 12,500 9,300
Electricity - Eskom Ltd - 5,188 - 5,188 Various ZAR denominated guarantees - Various 450 1,070 450 1,070 Total 390,473 242,991 390,473 242,991
30.2
Refer to the Directors' report and to the mine site rehabilitation and closure costs section of the Corporate Governance report, on responsibilities and guarantees in respect of the mine rehabilitation.
Contingent liabilitiesMine rehabilitation guaranteesThe group had mine rehabilitation guarantees amounting to R365 million at year end (refer above). In line with the requirements set out by the Department of Mineral Resources (DMR), this amount of R365 million (2009: R215 million) was in place at 31 March 2010. These guarantees and the agreement reached with the DMR were based on the environmental rehabilitation and closure costs assessment that was performed during the 2010 financial year. The assessments are performed on a three-year rolling basis, with the next assessment due in 2013. Estimated scheduled closure costs for the mine are R362 million. For unscheduled or premature closure, the DMR, in accordance with the Minerals and Petroleum Resources Development Act, requires Foskor (Pty) Ltd to provide for the liability of R473 million in the form of guarantees and cash.

Fosk
or A
nnua
l Rep
ort 2
010
128
31 SEGMENTAL REPORTING
Segment information Management has determined the operating segments based on the reports reviewed by the Executive Committee that are used to make strategic decisions.
The Executive Committee considers the business primarily from a product perspective. The products are segmented into phosphate rock and copper (Phalaborwa) and phosphoric acid and granular (Richards Bay).
Segment assets consist primarily of property, plant and equipment, intangible assets, inventories, prepaid tax, trade and other receivables and cash and cash equivalents.
Segment liabilities comprise non-current and current liabilities.
Capital expenditure comprises additions to property, plant and equipment (refer to Note 3) and intangible assets (refer to Note 4).
Phalaborwa Richards Bay TotalPhosphate Copper Phosphoric Granular *
rock acid 2010 2010 2010 2010 2010R'm R'm R'm R'm R'm
Total segment revenue 2,418 151 2,057 890 5,516 Inter-segment revenue (2,051) - - - (2,051)
Revenue from external customers 367 151 2,057 890 3,465
Earnings before interest and tax (EBIT) 659 151 (348) - 462
Depreciation and amortisation 89 - 84 - 173
Impairment reversal - - 323 - 323
Reportable segment assets 2,297 - 2,412 - 4,709
Capital expenditure for reportable segment non-current assets
677 - 147 - 824
Reportable segment liabilities 464 - 353 - 817
notes to the financial statementsfor the year ended 31 March 2010

Fosk
or A
nnua
l Rep
ort 2
010
129
31 SEGMENTAL REPORTING (CONTINUED) Phalaborwa Richards Bay Total
Phosphate Copper Phosphoric Granular *rock acid 2009 2009 2009 2009 2009R'm R'm R'm R'm R'm
Total segment revenue 4,836 112 7,962 1,198 14,108 Inter-segment revenue (3,949) - - - (3,949)
Revenue from external customers 887 112 7,962 1,198 10,159
Earnings before interest and tax (EBIT) 2,426 112 350 - 2,888
Depreciation and amortisation 73 - 90 - 163
Impairment charge - - (600) - (600)
Reportable segment assets 2,182 - 2,464 - 4,646
Capital expenditure for reportable segment non-current assets
334 - 155 - 489
Reportable segment liabilities 454 - 562 - 1,017
* Granular EBIT is combined with phosphoric acid EBIT.
31.1 Reconciliation of reportable segment revenues to profit before tax and discontinued operations is provided as follows:The Executive Committee assesses the performance of the operating segments based on a measure of adjusted earnings before interest and tax (EBIT). Segment EBIT equals segment revenue less segment expenses, which include costs of sales and other operating costs. This measurement basis excludes the effects of allocated corporate expenditure. Interest income and expenditure, as well as foreign exchange gains and losses, are not allocated to segments as this type of activity is driven by the central treasury function, which manages the cash position of the group.
The revenue from external parties reported to the Executive Committee is measured in a manner consistent with that of the statement of comprehensive income and there were no reconciling items. Sales of phosphate rock between operating segments (Phalaborwa and Richards Bay) are carried out at arm’s length.

Fosk
or A
nnua
l Rep
ort 2
010
130
31 SEGMENTAL REPORTING (CONTINUED) 2010 2009R’m R’m
Earnings before interest and tax (EBIT) 462 2,888 Corporate expenses (141) (141)Finance income 76 224 Finance costs (48) (25)Net foreign exchange profits/(losses) 27 (294)Share-based payment expense (327) -Equity accounted (losses)/profits - 4 Profit before tax and discontinued operations 49 2,656
31.2 Reportable segment assets are reconciled to total assets as follows:The amounts provided to the Executive Committee with respect to the total assets are measured in a manner consistent with that of the financial statements.
Deferred tax and derivative financial instruments held by the group are not considered to be segment assets but rather are managed by the central treasury function.
2010 2009R’m R’m
Segment assets for reportable segments 4,709 4,646 Unallocated:Derivative financial instruments 1 12 Other assets 85 12 Total assets per the balance sheet 4,795 4,670
31.3 Reportable segment liabilities are reconciled to total liabilities as follows:The amounts provided to the Executive Committee with respect to the total liabilities are measured in a manner consistent with that of the financial statements.
Deferred tax and derivative financial instruments are not considered to be segment assets but rather are managed by the central treasury function.
2010 2009R’m R’m
Segment liabilities for reportable segments 817 1,017
Unallocated:Deferred tax 443 334 Derivative financial instruments - 26 Corporate liabilities 53 138 Liabilities classified as held for sale - - Total liabilities per the balance sheet 1,313 1,515
notes to the financial statementsfor the year ended 31 March 2010

Fosk
or A
nnua
l Rep
ort 2
010
131
31.4 Geographical information 2010 2009R’m R’m
Geographical information - Revenues 1
India 1,488 6,656 South Africa 1,535 2,312 Europe 112 488 Far East 117 603 Unites States 121 10 Other 2 92 90 Total external revenues 3,465 10,159
1 Revenues are attributable to countries on the basis of customer location. 2 This includes revenue generated by sales to customers based in Dubai, Zambia and other countries.
The group does not have non-current assets in any country other than its country of domicile (South Africa).
Revenues of approximately R1.4 billion (2009: R6 billion) were derived from three external customers. These revenues are attributable to the Richards Bay segment.
32 RELATED PARTY TRANSACTIONSDirectors' emolumentsThe following table records the emoluments payable to the directors during the period:
32.1 Non-executive directors' remuneration
Directors' Directors' fees fees
2010 2009Rands
MG Qhena * 396,240 257,360 A Vellayan 33,060 105,360 G van Wyk * 195,480 180,420 DS Phaho 153,060 171,320 SS Ngoma * 177,480 136,500 F Madavo 109,300 153,280 JM Modise 132,110 191,520 XGS Sithole 1 33,060 148,220 M Booi 134,060 25,000 Total 1,363,850 1,368,980 1 Resigned on 22 June 2009 * All directors’ fees accrue directly to the Industrial Development Corporation Ltd and not to the director in his/her personal capacity.

Fosk
or A
nnua
l Rep
ort 2
010
132
32.2 Executive director's and executive members' remuneration Payments for Contributions
conversion to medical aid,Basic Termination to fixed term Performance pension, life Expenses
Rands salary benefit contracts bonuses * insurance & UIF allowances Total12 months ended 31 March 2010
MA Pitse ** 2,927,877 - - 1,647,725 414,240 1,200 4,991,042JW Horn 1,941,553 - - 939,196 29,454 24,192 2,934,395TJ Koekemoer 1,521,490 - - 870,214 331,801 15,717 2,739,222G Skhosana 1,809,254 - - 861,947 213,302 102,724 2,987,227KM Cele 1,584,463 - - 829,687 190,466 60,240 2,664,855XS Luthuli 1,547,416 - - 813,740 214,309 17,543 2,593,008JWT Potgieter 1,523,923 - - 830,596 322,305 15,256 2,692,080MP Mosweu 1,632,699 - - 694,268 209,208 56,515 2,592,690SMS Sibisi 1 1,500,703 - - 746,325 247,782 - 2,494,810Total 15,989,378 - - 8,233,698 2,172,867 293,387 26,689,330
Payments for Contributionsconversion to medical aid,
Basic Termination to fixed term Performance pension, life ExpensesRands salary benefit contracts bonuses * insurance & UIF allowances Total
12 months ended 31 March 2009
MA Pitse ** 2,146,071 - - 2,903,492 346,230 - 5,395,793JW Horn 1,519,919 - - 1,733,229 20,675 57,004 3,330,827TJ Koekemoer 1,150,347 - - 1,615,593 224,556 14,078 3,004,574G Skhosana 1,040,386 - - 1,601,006 149,367 94,059 2,884,818SMS Sibisi 1 - - - 2,181,084 - - 2,181,084J Vaidhyanathan 2 990,927 52,324 - - 117,558 - 1,160,809KM Cele 1,116,799 - - 1,540,986 138,429 41,774 2,837,988XS Luthuli 959,653 - - 1,504,723 116,131 17,273 2,597,780H Malhotra 3 277,924 40,343 - - 30,041 19,774 368,082JWT Potgieter 1,091,387 - - 1,582,661 235,461 21,040 2,930,549MP Mosweu 4 215,866 - - 233,249 29,272 - 478,387Total 10,509,279 92,667 - 14,896,023 1,407,720 265,002 27,170,6911 Appointed 1 April 2009 3 Resigned 6 July 20082 Retired 31 March 2009 4 Appointed 1 February 2009
* Represents amounts payable to executive members for achieving certain objectives that are aligned to the corporate objectives (targets). These objectives are approved by the Board at the beginning of each period. The amount paid is based on the financial, corporate and divisional performance.
** Executive director
notes to the financial statementsfor the year ended 31 March 2010

Fosk
or A
nnua
l Rep
ort 2
010
133
32 RELATED PARTY TRANSACTIONS (CONTINUED) The group is controlled by the Industrial Development Corporation Ltd (IDC), which owns 85% of the company's shares. The remaining shares are owned as follows: 14% by Coromandel International Ltd (this interest gives them significant influence), and 1% by Sun International FZE (both based in India).
The IDC is controlled by the South African government. Therefore the state and all entities controlled by the state are related parties as defined in IAS 24 (Related Party Disclosures).
The following transactions were carried out with related parties:
Nature of relationship Receiving of services
Purchase of goods
Share buy- back
Share-based payment
transaction
Total2010
R'000 R'000 R'000 R’000 R'000Shareholders
Industrial Development Corporation Ltd 1 42 - - 327,374 327,416 Coromandel International Ltd 3,686 765,354 - - 769,040 Sun International FZE 32,592 - - - 32,592
36,320 765,354 - 327,374 1,129,048State-owned enterprises
Eskom Ltd 127,161 - - - 127,161 Transnet Ltd 459,344 - - - 459,344 South African Airways (Pty) Ltd 2,183 - - - 2,183 Telkom Ltd 3,489 - - - 3,489 National Ports Authority 23,911 - - - 23,911 SA Post Office Ltd 85 - - - 85
616,173 - - - 616,173 Total related party transactions 652,493 765,354 - 327,374 1,745,221
1 A long-term borrowing facility of R1 billion was concluded with the IDC during the year (refer to Note 27).2 Foskor and the IDC have entered into a black economic empowerment (BEE) transaction (refer to Note 15).
2

Fosk
or A
nnua
l Rep
ort 2
010
134
Nature of relationship Receiving of services
Purchase of goods
Share buy- back
Share-based payment
transaction
Total2009
R'000 R'000 R'000 R’000 R'000Shareholders
Industrial Development Corporation Ltd 449 75,666 - - 76,115 Coromandel International Ltd 4,712 3,159,594 37,179 188,024 3,389,509Sun International FZE 97,534 - - - 97,534
102,695 3,235,260 37,179 188,024 3,563,158State-owned enterprises
Eskom Ltd 138,324 - - - 138,324 Transnet Ltd 424,522 - - - 424,522 South African Airways (Pty) Ltd 1,763 - - - 1,763 Telkom Ltd 1,216 - - - 1,216 SA Post Office Ltd 20 - - - 20
565,845 - - - 565,845 Total related party transactions 668,540 3,235,260 37,179 188,024 4,129,003
The directors of Foskor (Pty) Ltd have no interest in contracts.

Fosk
or A
nnua
l Rep
ort 2
010
135
OThER INFORMATION Directorships held in other companies
The list below is of other directorships held by the directors of the company during the previous five years.
Name Directorship Status
Mr MG Qhena Industrial Development Corporation of South Africa Ltd
Current
Findevco (Pty) Ltd Current
Acerinox SA (Pty) Ltd Current
Mr MA Pitse Prilla 2000 (Pty) Ltd Current
Foskor Zirconia (Pty) Ltd Current
Ms JM ModiseKaelo Property Investment (Pty) Ltd
Current
Polystry Tech (Pty) Ltd Current
Peopletree Holdings (Pty) LtdTerminated
Oct 2009
Dr DS Phaho Pikitup (Pty) Ltd Current
Vaal University of Technology Current
Mr G van Wyk I Burst Current
Crossley Current
SAFYR Current
Atlantis Forge (Pty) Ltd Terminated
Mr F Madavo –
Mr M Booi –
Name Directorship Status
Mr A Vellayan Murugappa Current
Coromandel International Limited Current
Godavari Fertilisers and Chemicals Ltd
Current
EID-Parry (India) Ltd Current
EXIM Bank Current
Kanoria Chemicals Current
Laserwords (Pty) Ltd Current
Nimita Solutions (Pty) Ltd Current
Parry Murray & Co. Ltd (UK) Current
Parry Murray & Co. Furnishings and Floor
Current
Coverings (India) (Pty) Ltd Current
Fertiliser Association of India Current
Cholamdandalam MS General Insurance Company Ltd
Current
Indfrag Ltd Current
Indian Potash Ltd Current
Tunisian Indian Fertilisers Current
Carborundum Universal Ltd Current
Parry American Inc (USA) Current
Indian Overseas Bank Current

Fosk
or A
nnua
l Rep
ort 2
010
136
NOTICE IS HEREBY GIVEN that the sixtieth Annual General Meeting of the members of the above company will be held at Foskor (Pty) Ltd, Riverview Office Park, Block G, Janadel Road, Midrand, on Friday 25 June 2010 at 13:00 for the following purposes:
1 To receive and consider the annual financial statements for the year ended 31 March 2010, including the directors’ report and the report of the auditors thereon;
2 To authorise the directors to fix the auditors’ remuneration for the past year;
3 To approve the directors’ fees;
4 To re-appoint the directors;
5 To re-appoint the auditors;
6 To declare a dividend; and
7 To transact any other business as may be transacted at the Annual General Meeting.
A member entitled to attend and vote at the meeting is entitled to appoint one or more proxies to attend and vote in his/her stead. A proxy need not be a member of the company.
Proxy forms should be forwarded to reach the registered office of the company not less than 48 hours before the time for the holding of the meeting.
BY ORDER OF THE BOARD
Ms AUS KhanyileCompany Secretary
Registered OfficeFoskor (Pty) LtdRiverview Office ParkBlock G, Janadel RoadMidrand
20 May 2010
COMPANy SECRETARIAl NOTICE Foskor (Pty) ltd (Registration number 1951/002918/07)

Fosk
or A
nnua
l Rep
ort 2
010
137
GlOSSARy
Abbreviation Meaning
AEP Advanced Executive ProgrammeAMP Advanced Management ProgrammeAMS AIDS Management SystemAPRM Advanced Planning and Risk ManagementASMP Advanced Sales Management ProgrammeAdv Tax Cert Certificate in Advanced TaxationBA LLB Bachelor of Arts with Bachelor of LawsBARC Board Audit and Risk Committee
BB&A Besigheids Bestuur & Admin (Honours in Management & Accounting)
B-BBEE Broad-based Black Economic Empowerment
BCom Bachelor of CommerceBCompt Bachelor of Accounting ScienceBEE Black Economic EmpowermentBEng Bachelor of EngineeringBHRC Board Human Resources CommitteeBSc Bachelor of ScienceBSocSci Bachelor of Social ScienceBTC Board Technical CommitteeBus Devt Business DevelopmentCapex Capital expenditureCA (SA) Chartered Accountant, South Africa
CCMA Commission for Conciliation, Mediation and Arbitration
CEO Chief Executive Officer
CEPPWAWU Chemical, Energy, Paper, Printing, Wood and Allied Workers Union
CFL Coromandel Fertilisers LtdCFR Cost and FreightChem Eng Chemical EngineeringCIL Coromandel International Ltd
Abbreviation Meaning
CIMA Chartered Institute of Management Accountants
CPI Consumer Price IndexCu CopperDAP Diammonium PhosphateDIFR Disabling Injury Frequency RateDip Bus Tax Diploma in Business TaxationDMR Department of Mineral Resources dti Department of Trade and IndustryDTech Doctor of TechnologyEBIT Earnings Before Interest and TaxEDP Executive Development ProgrammeElec Eng Electrical EngineeringEWRM Enterprise Wide Risk ManagementExco Executive CommitteeExt ExtensionFET Further Education and TrainingFGAS Foskor Group Audit ServicesFOB Free on BoardFOR Free on RailFY Financial or Fiscal YearGCC Government Certificate of CompetenceGDP Gross Domestic Product
HIV/AIDS Human Immunodeficiency Virus/Acquired Immune Deficiency Syndrome
H2SO4 Sulphuric AcidHDPE High Density PolyethyleneHons Honours degree
IASB International Accounting Standards Board
IDC Industrial Development Corporation of South Africa Ltd
IDP Integrated Development Plan

Fosk
or A
nnua
l Rep
ort 2
010
138
Abbreviation Meaning
IEP International Executive Programme
IEDP International Executive Development Programme
IFRIC International Financial Reporting Interpretations Committee
IFRS/s International Financial Reporting Standard/s
Inc IncorporatedInd Admin Industrial Administration
INSEADOriginally: Institut Européen d'Administration des Affaires – European Institute of Business Administration
ISO International Organization for Standardization
ISO 9001 International Organization for Standardization – Quality Management
ISO 14001International Organization for Standardization – Environmental Management
IT Information Technology
JSE Former Johannesburg Securities Exchange, now JSE
KABP Knowledge, Attitudes, Beliefs and Practices
King III Corporate Governance Codes of the King 3 report
km kilometre/sLED Local Economic DevelopmentLtd Limitedm million
MAP Management Advancement Programme
MAP Monoammonium PhosphateMar MarchMBA Master of Business AdministrationMBL Master of Business LeadershipMBS Master of Business Studies
Abbreviation Meaning
MCom Master of CommerceMDP Management Development ProgrammeMech–Ind Mechanical–Industrialmm millimetre/s
MSAIIE Masters: South Africa Institute for Industrial Engineering
MSc Master of ScienceMVA Megavolt AmpereMW Mega WattMWh Mega Watt hourNHD National Higher DiplomaNQF National Qualifications FrameworkNUM National Union of MineworkersOct October
OHSAS Occupational Health and Safety Assessment Series
OHSAS 18001Occupational Health and Safety Assessment Series – Occupational Health and Safety Management
p.a. per annum
P2O5
The term used in the phosphate industry to measure its phosphoric acid production volumes
PDP Personal Development ProgrammePEP1 Pyroxenite Expansion Project – Phase 1PEP2 Pyroxenite Expansion Project – Phase 2PET Polyethylene TerephthalatePhD Doctor of PhilosophyPIC Public Investment CorporationPMC Palabora Mining CompanyPM2.5 Particulate matter 2.5 micronsPM10 Particulate matter 10 micronsPr Eng Professional EngineerPty Proprietary

Fosk
or A
nnua
l Rep
ort 2
010
139
Abbreviation Meaning
PVC Polyvinyl ChlorideR Rand/sR’m Rand millionSA South Africa/n
SACNASP South African Council for Natural Scientific Professions
SANS South African National Standard/s
SANS 451 South African National Standard/s – Spirometry
SANS 16001 South African National Standard/s – HIV/AIDS
SARS South African Revenue ServiceSEP Senior Executive ProgrammeSMME Small, Medium and Micro EnterpriseSO2 Sulphur DioxideSHE Safety, Health and EnvironmentSHEQ Safety, Health, Environment and Quality
SHREQ Safety, Health, Risk, Environment and Quality
TFR Transnet Freight RailUK United KingdomUS United StatesUSA United States of AmericaUS$ American dollar/sVAT Value Added TaxVerm VermiculiteVP Vice PresidentZAR South African rand/s

Fosk
or A
nnua
l Rep
ort 2
010
140
Term Meaning
Black As defined in the dti Codes of Good Practice and amended in terms of the High Court ruling at June 2008
Carry trade A trade where you borrow and pay interest in order to buy something else that has higher interest
Current ratio Current assets to current liabilities ratioDebt to equity ratio Interest-bearing debt to equity ratioFree cash flows Net cash from operating activities less net cash in investing activitiesGoverning Board The committee of directors that governs the affairs of Foskor
Group Incorporates the operations in Phalaborwa, Richards Bay, Midrand, Phosphate Shipping and Phosphate Marine
Kriging A geostatistical approach to modellingMiddle management Functional managersOperating income to revenue Operating income expressed as a percentage of revenue
PA90-2 Mortality assumptions - standard tables and terms used by actuaries to value post-retirement liabilities based on international mortality rates
Pre-tax margin Profit before tax expressed as a percentage of revenueProfessional Technical experts and specialistsReturn on assets Profit after tax expressed as a percentage of total assetsReturn on equity Operating profit expressed as a percentage of shareholder equity and reserves
SA8590-2 Mortality assumptions - standard tables and terms used by actuaries to value post-retirement liabilities based on international mortality rates
Semi-skilled employees Technical and mechanical operators, drivers (heavy motor vehicles) and technical assistantsSenior management Group and divisional managersSkilled employees Artisans, technicians and production supervisors Top management Executives and general managersUnskilled labour Elementary occupations

Fosk
or A
nnua
l Rep
ort 2
010
141
ADMINISTRATION
DIRECTORS
ChairmanMr MG Qhena
Executive directorMr MA Pitse(President/Chief Executive Officer)
Non-executive directorsMr A VellayanMr G van WykMs SS NgomaMs JM ModiseDr DS Phaho (Independent)Mr F Madavo (Independent)Mr M Booi (Independent)
COMPANY SECRETARYMs AUS Khanyile
STAKEHOLDER RELATIONSMs BKM Smith
REGISTRATION NUMBERFoskor (Pty) Ltd1951/002918/07
AUDITORSPriceWaterhouseCoopers IncJohannesburg
Ngubane & Co. IncDurban
REGISTERED OFFICEFoskorRiverview Office Park, Block GJanadel Road, Midrand
PO Box 2494, Halfway House, 1685
Telephone: +27 11 347 0600Telefax: +27 11 347 0640Website: www.foskor.co.za
PHALABORWA27 Selati Road, PhalaborwaPO Box 1, Phalaborwa, 1390
Telephone: +27 15 789 2000Telefax: +27 15 789 2066
RICHARDS BAY21 John Ross Parkway, Richards BayPO Box 208, Richards Bay, 3900
Telephone: +27 35 902 3111Telefax: +27 35 797 3739

www.foskor.co.za
Foskor (pty) ltd — registered office
Riverview Office Park, Block G, Janadel Road, Midrand
PO Box 2494, halfway house, 1685
Tel: +27 11 347 0600
Fax: +27 11 347 0640
Registration Number: 1951/002918/07