annual report 2010-2011 - reliance mutual · pdf fileinvestment objective and performance...
TRANSCRIPT
BENCHMARK MUTUAL FUND ANNUAL REPORT
2010-2011

Trustees’ Report
For the Year ended March 31, 2011 Dear Unit holders, We have pleasure in presenting our Tenth Report and the audited financial statements of the Schemes of Benchmark Mutual Fund for the year ended March 31, 2011. CONSTITUTION Benchmark Mutual Fund (“the Fund”) has been sponsored by Niche Financial Services Pvt. Ltd. (“the Sponsor”) and was set up as a Trust under the Indian Trust Act, 1882 through Trust Deed dated February 14, 2001. The Fund has been registered with Securities and Exchange Board of India (“SEBI”) vide registration number MF/045/01/6 dated June 12, 2001. Benchmark Trustee Company Pvt. Ltd. (“the Trustee”) is sole Trustee of the Fund. In accordance with Securities and Exchange Board of India (Mutual Funds) Regulations, 1996, Benchmark Asset Management Company Pvt. Ltd. (BAMC) has been appointed as Asset Management Company (“the Investment Manager or AMC”) to the Fund vide Investment Management Agreement dated February 14, 2001. INVESTMENT PHILOSOPHY OF THE FUND The Fund uses indexing and quantitative approach to achieve Schemes’ investment objective. Unlike other Funds, the Fund does not try to beat the markets it tracks and does not seek temporary defensive positions when markets decline or appear over valued. The Fund does not make any judgments about the investment merit of a particular stock or a particular industry segment nor does it attempt to apply any economic, financial or market analysis. Indexing eliminates risks associated with active management with regard to over/underperformance vis-à-vis a benchmark. Also, the management fees and other operating expenses charged to the Schemes are one of the lowest in the Mutual Fund Industry in India. AWARD Nifty Benchmark Exchange Traded Scheme - Nifty BeES, a scheme of Benchmark Mutual Fund has been awarded Best Performing Mutual Fund of the Year in the Index Fund Category at the CNBC - TV18 - Crisil Mutual Fund of The Year Award 2010 by CRISIL Fund Services, CRISIL Limited. In total, 14 schemes were eligible for the award universe. Eligibility Criteria & Methodology Schemes present in all four quarterly CRISIL Mutual Fund Ranking were considered for the award. The award is based on consistency of the scheme’s performance in the four quarterly CRISIL Mutual Fund Rankings released during the calendar year 2010. The individual CRISIL Mutual Fund Ranking parameter scores averaged for the four quarters were further multiplied by the parameter weights as per the CRISIL Mutual Fund Ranking methodology to arrive at the final scores. A detailed methodology of the CRISIL Mutual Fund Ranking is available at www.crisil.com. Past performance is no guarantee of future results. Rankings and Award Source: CRISIL FundServices, CRISIL Ltd.
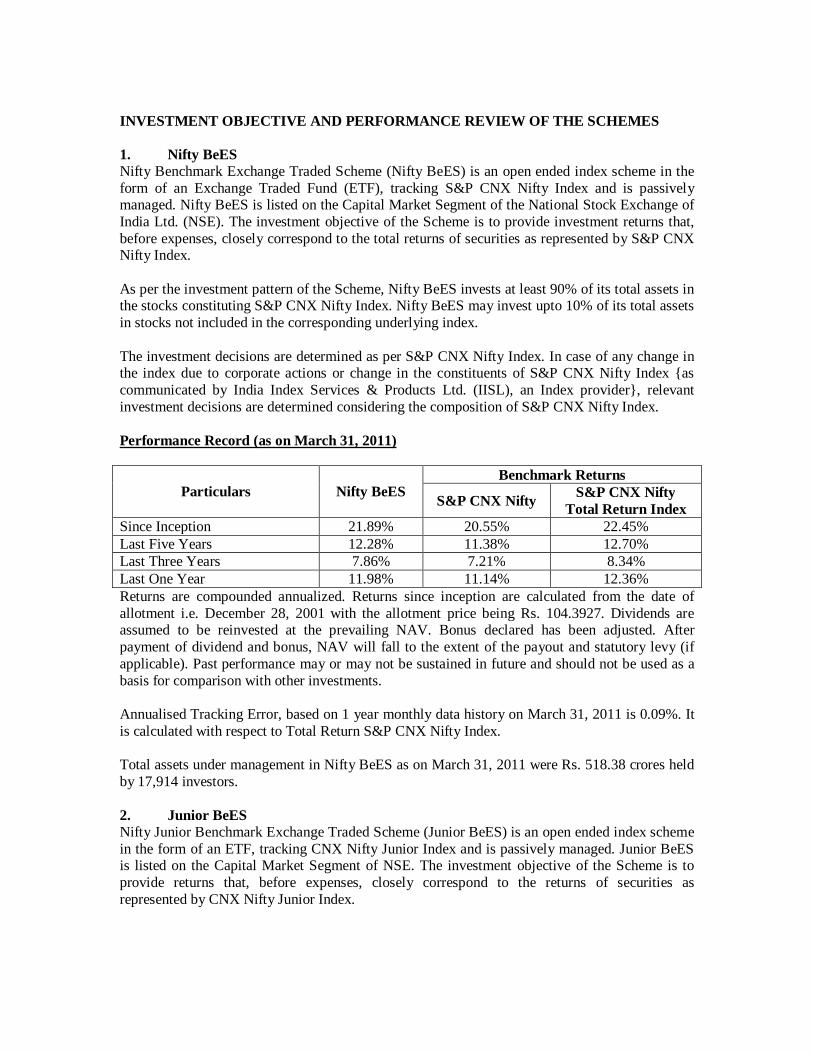
INVESTMENT OBJECTIVE AND PERFORMANCE REVIEW OF THE SCHEMES 1. Nifty BeES Nifty Benchmark Exchange Traded Scheme (Nifty BeES) is an open ended index scheme in the form of an Exchange Traded Fund (ETF), tracking S&P CNX Nifty Index and is passively managed. Nifty BeES is listed on the Capital Market Segment of the National Stock Exchange of India Ltd. (NSE). The investment objective of the Scheme is to provide investment returns that, before expenses, closely correspond to the total returns of securities as represented by S&P CNX Nifty Index. As per the investment pattern of the Scheme, Nifty BeES invests at least 90% of its total assets in the stocks constituting S&P CNX Nifty Index. Nifty BeES may invest upto 10% of its total assets in stocks not included in the corresponding underlying index. The investment decisions are determined as per S&P CNX Nifty Index. In case of any change in the index due to corporate actions or change in the constituents of S&P CNX Nifty Index {as communicated by India Index Services & Products Ltd. (IISL), an Index provider}, relevant investment decisions are determined considering the composition of S&P CNX Nifty Index. Performance Record (as on March 31, 2011)
Particulars
Nifty BeES
Benchmark Returns
S&P CNX Nifty S&P CNX Nifty Total Return Index
Since Inception 21.89% 20.55% 22.45% Last Five Years 12.28% 11.38% 12.70% Last Three Years 7.86% 7.21% 8.34% Last One Year 11.98% 11.14% 12.36% Returns are compounded annualized. Returns since inception are calculated from the date of allotment i.e. December 28, 2001 with the allotment price being Rs. 104.3927. Dividends are assumed to be reinvested at the prevailing NAV. Bonus declared has been adjusted. After payment of dividend and bonus, NAV will fall to the extent of the payout and statutory levy (if applicable). Past performance may or may not be sustained in future and should not be used as a basis for comparison with other investments. Annualised Tracking Error, based on 1 year monthly data history on March 31, 2011 is 0.09%. It is calculated with respect to Total Return S&P CNX Nifty Index. Total assets under management in Nifty BeES as on March 31, 2011 were Rs. 518.38 crores held by 17,914 investors. 2. Junior BeES Nifty Junior Benchmark Exchange Traded Scheme (Junior BeES) is an open ended index scheme in the form of an ETF, tracking CNX Nifty Junior Index and is passively managed. Junior BeES is listed on the Capital Market Segment of NSE. The investment objective of the Scheme is to provide returns that, before expenses, closely correspond to the returns of securities as represented by CNX Nifty Junior Index.

As per its investment pattern, Junior BeES invests at least 90% of its total assets in the stocks constituting CNX Nifty Junior Index. The Scheme may invest upto 10% of its total assets in stocks not included in the corresponding underlying index. The investment decisions are determined as per CNX Nifty Junior Index. In case of any change in the index due to corporate actions or change in the constituents of CNX Nifty Junior Index, by IISL, relevant investment decisions are determined considering the composition of CNX Nifty Junior Index. Performance Record (as on March 31, 2011)
Particulars
Junior BeES
Benchmark Returns
CNX Nifty Junior CNX Nifty Junior Total Return Index
Since Inception 29.38% 29.35% 31.23% Last Five Years 11.91% 11.95% 13.20% Last Three Years 12.13% 12.25% 13.46% Last One Year 4.79% 4.69% 5.78% Returns are compounded annualised. Returns since inception are calculated from the date of allotment i.e. February 21, 2003 with the allotment price being Rs. 142.7852. Dividends are assumed to be reinvested at the prevailing NAV. Bonus declared has been adjusted. After payment of dividend and consideration of bonus, NAV will fall to the extent of the payout and statutory levy (if applicable). Past performance may or may not be sustained in future and should not be used as a basis for comparison with other investments. Annualised Tracking Error, based on 1 year monthly data history on March 31, 2011 is 0.12%. It is calculated with respect to Total Return CNX Nifty Junior Index. Total assets under management as on March 31, 2011 were Rs. 106.35 crores held by 5,626 investors. 3. Liquid BeES Liquid Benchmark Exchange Traded Scheme (Liquid BeES) is an open ended liquid scheme in the form of an ETF listed on the Capital Market Segment of NSE. The investment objective of the Scheme is to enhance returns and minimize price risk by investing in a basket of call money, short-term government securities and money market instruments of short and medium maturities while maintaining the safety and liquidity. As per its investment pattern, Liquid BeES invests in Call Money, Short Term Government Securities, T-Bills, Repos, Debt Securities, Commercial Papers, Certificate of Deposits, Short Term Debentures and Floating Rate Notes. The Scheme will retain the flexibility to invest in the entire range of securities as per investment objective of the Scheme and as per the SEBI Regulations. Fitch Credit Rating Agency has assigned Credit Rating of AAAmmf(ind) to Liquid BeES. AAAmmf(ind) indicates the Scheme’s strong capacity to achieve its investment objective of preserving principal and providing shareholder liquidity through limiting credit, market and liquidity risk, relative to all other short term investments in India.
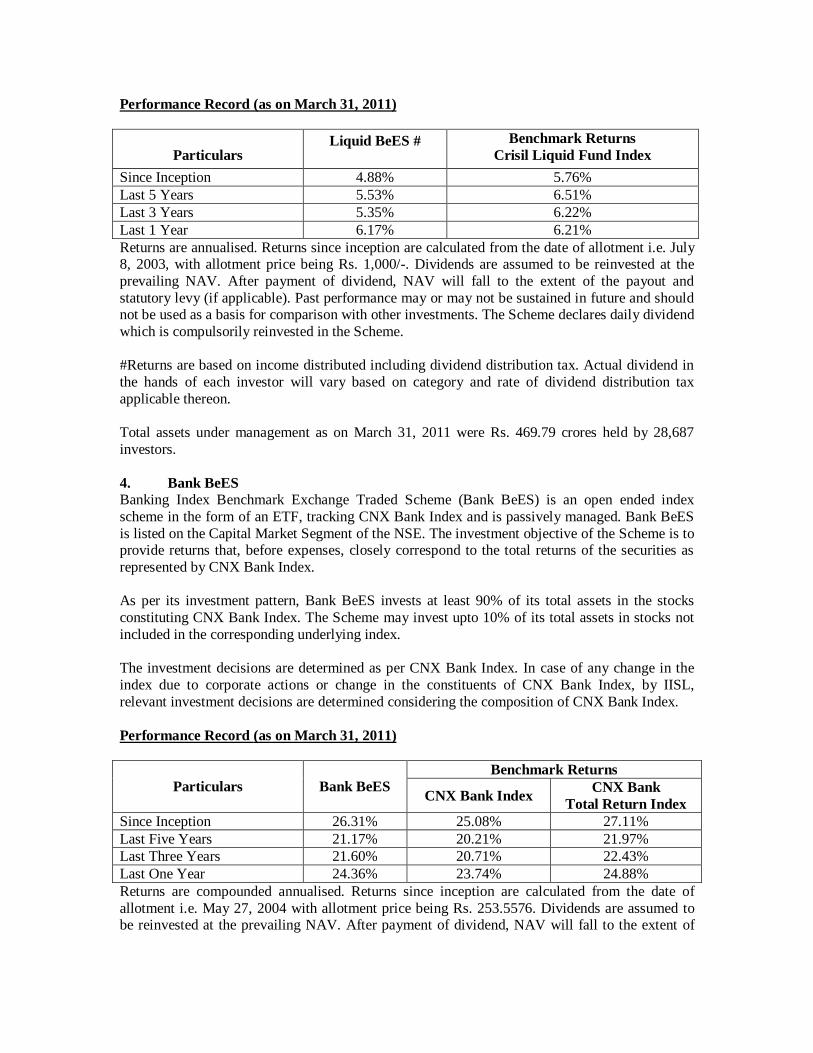
Performance Record (as on March 31, 2011)
Particulars
Liquid BeES #
Benchmark Returns Crisil Liquid Fund Index
Since Inception 4.88% 5.76% Last 5 Years 5.53% 6.51% Last 3 Years 5.35% 6.22% Last 1 Year 6.17% 6.21% Returns are annualised. Returns since inception are calculated from the date of allotment i.e. July 8, 2003, with allotment price being Rs. 1,000/-. Dividends are assumed to be reinvested at the prevailing NAV. After payment of dividend, NAV will fall to the extent of the payout and statutory levy (if applicable). Past performance may or may not be sustained in future and should not be used as a basis for comparison with other investments. The Scheme declares daily dividend which is compulsorily reinvested in the Scheme. #Returns are based on income distributed including dividend distribution tax. Actual dividend in the hands of each investor will vary based on category and rate of dividend distribution tax applicable thereon. Total assets under management as on March 31, 2011 were Rs. 469.79 crores held by 28,687 investors. 4. Bank BeES Banking Index Benchmark Exchange Traded Scheme (Bank BeES) is an open ended index scheme in the form of an ETF, tracking CNX Bank Index and is passively managed. Bank BeES is listed on the Capital Market Segment of the NSE. The investment objective of the Scheme is to provide returns that, before expenses, closely correspond to the total returns of the securities as represented by CNX Bank Index. As per its investment pattern, Bank BeES invests at least 90% of its total assets in the stocks constituting CNX Bank Index. The Scheme may invest upto 10% of its total assets in stocks not included in the corresponding underlying index. The investment decisions are determined as per CNX Bank Index. In case of any change in the index due to corporate actions or change in the constituents of CNX Bank Index, by IISL, relevant investment decisions are determined considering the composition of CNX Bank Index. Performance Record (as on March 31, 2011)
Particulars
Bank BeES
Benchmark Returns
CNX Bank Index CNX Bank Total Return Index
Since Inception 26.31% 25.08% 27.11% Last Five Years 21.17% 20.21% 21.97% Last Three Years 21.60% 20.71% 22.43% Last One Year 24.36% 23.74% 24.88% Returns are compounded annualised. Returns since inception are calculated from the date of allotment i.e. May 27, 2004 with allotment price being Rs. 253.5576. Dividends are assumed to be reinvested at the prevailing NAV. After payment of dividend, NAV will fall to the extent of
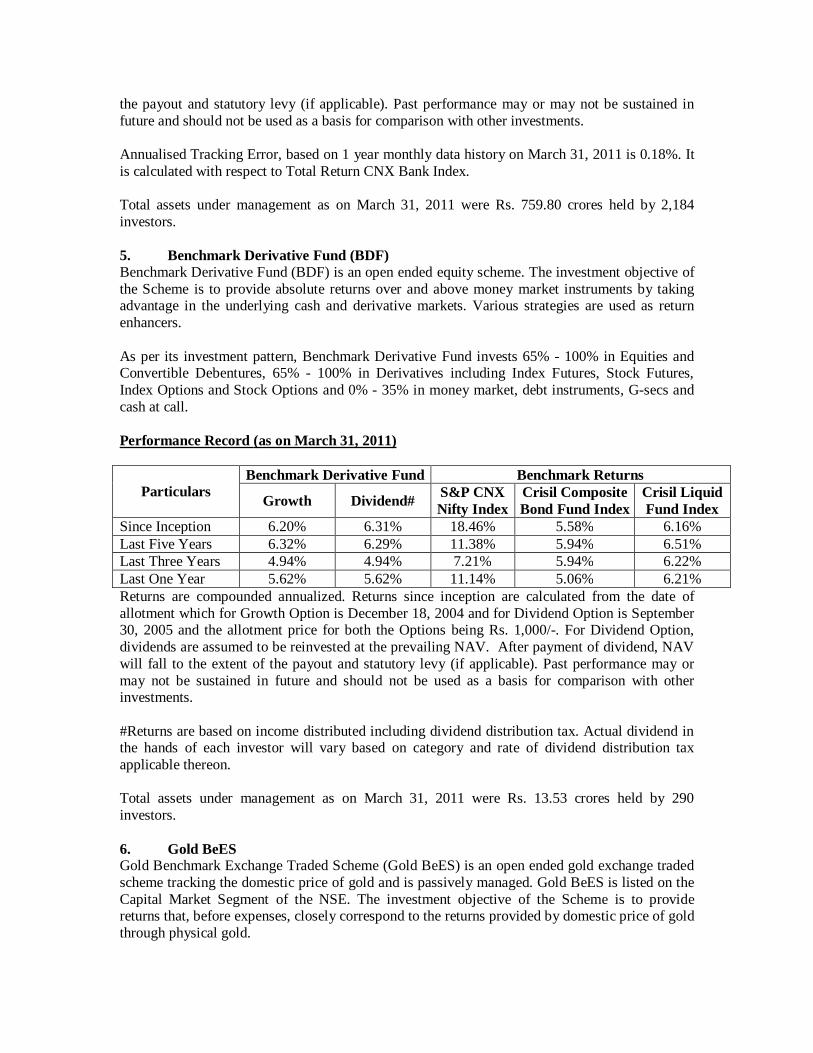
the payout and statutory levy (if applicable). Past performance may or may not be sustained in future and should not be used as a basis for comparison with other investments. Annualised Tracking Error, based on 1 year monthly data history on March 31, 2011 is 0.18%. It is calculated with respect to Total Return CNX Bank Index. Total assets under management as on March 31, 2011 were Rs. 759.80 crores held by 2,184 investors. 5. Benchmark Derivative Fund (BDF) Benchmark Derivative Fund (BDF) is an open ended equity scheme. The investment objective of the Scheme is to provide absolute returns over and above money market instruments by taking advantage in the underlying cash and derivative markets. Various strategies are used as return enhancers. As per its investment pattern, Benchmark Derivative Fund invests 65% - 100% in Equities and Convertible Debentures, 65% - 100% in Derivatives including Index Futures, Stock Futures, Index Options and Stock Options and 0% - 35% in money market, debt instruments, G-secs and cash at call. Performance Record (as on March 31, 2011)
Particulars
Benchmark Derivative Fund Benchmark Returns
Growth Dividend# S&P CNX Nifty Index
Crisil Composite Bond Fund Index
Crisil Liquid Fund Index
Since Inception 6.20% 6.31% 18.46% 5.58% 6.16% Last Five Years 6.32% 6.29% 11.38% 5.94% 6.51% Last Three Years 4.94% 4.94% 7.21% 5.94% 6.22% Last One Year 5.62% 5.62% 11.14% 5.06% 6.21% Returns are compounded annualized. Returns since inception are calculated from the date of allotment which for Growth Option is December 18, 2004 and for Dividend Option is September 30, 2005 and the allotment price for both the Options being Rs. 1,000/-. For Dividend Option, dividends are assumed to be reinvested at the prevailing NAV. After payment of dividend, NAV will fall to the extent of the payout and statutory levy (if applicable). Past performance may or may not be sustained in future and should not be used as a basis for comparison with other investments. #Returns are based on income distributed including dividend distribution tax. Actual dividend in the hands of each investor will vary based on category and rate of dividend distribution tax applicable thereon. Total assets under management as on March 31, 2011 were Rs. 13.53 crores held by 290 investors. 6. Gold BeES Gold Benchmark Exchange Traded Scheme (Gold BeES) is an open ended gold exchange traded scheme tracking the domestic price of gold and is passively managed. Gold BeES is listed on the Capital Market Segment of the NSE. The investment objective of the Scheme is to provide returns that, before expenses, closely correspond to the returns provided by domestic price of gold through physical gold.
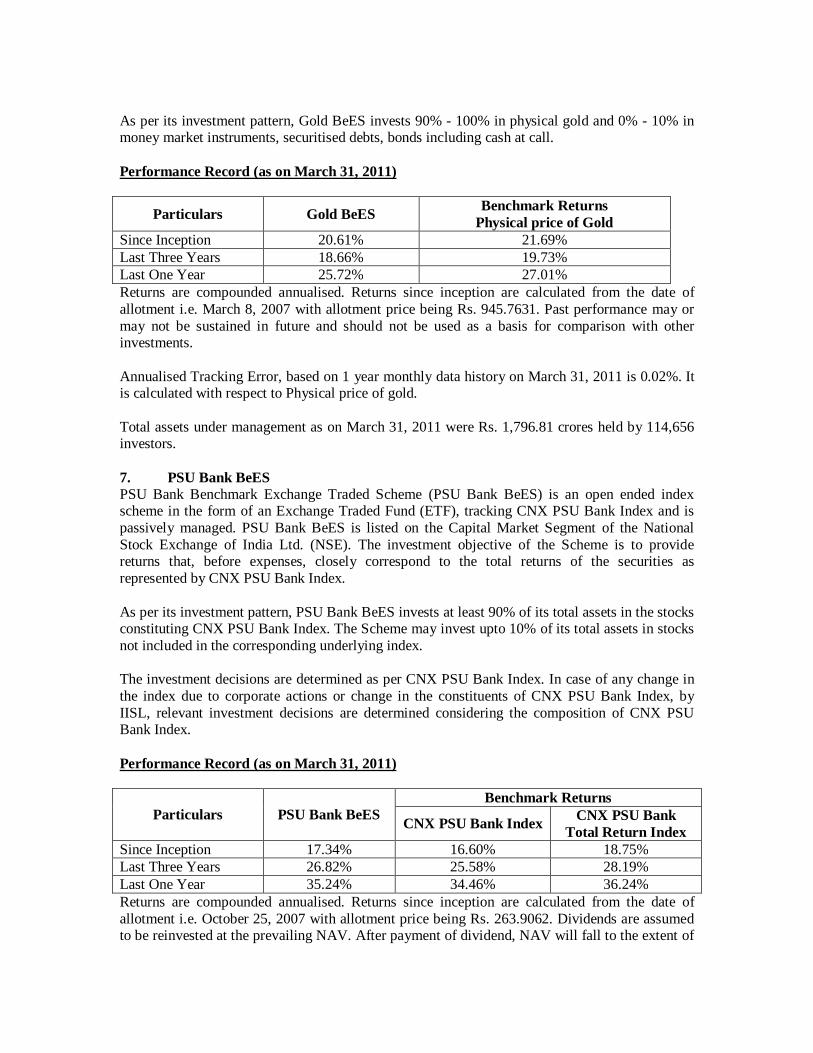
As per its investment pattern, Gold BeES invests 90% - 100% in physical gold and 0% - 10% in money market instruments, securitised debts, bonds including cash at call. Performance Record (as on March 31, 2011)
Particulars Gold BeES Benchmark Returns Physical price of Gold
Since Inception 20.61% 21.69% Last Three Years 18.66% 19.73% Last One Year 25.72% 27.01% Returns are compounded annualised. Returns since inception are calculated from the date of allotment i.e. March 8, 2007 with allotment price being Rs. 945.7631. Past performance may or may not be sustained in future and should not be used as a basis for comparison with other investments. Annualised Tracking Error, based on 1 year monthly data history on March 31, 2011 is 0.02%. It is calculated with respect to Physical price of gold. Total assets under management as on March 31, 2011 were Rs. 1,796.81 crores held by 114,656 investors. 7. PSU Bank BeES PSU Bank Benchmark Exchange Traded Scheme (PSU Bank BeES) is an open ended index scheme in the form of an Exchange Traded Fund (ETF), tracking CNX PSU Bank Index and is passively managed. PSU Bank BeES is listed on the Capital Market Segment of the National Stock Exchange of India Ltd. (NSE). The investment objective of the Scheme is to provide returns that, before expenses, closely correspond to the total returns of the securities as represented by CNX PSU Bank Index. As per its investment pattern, PSU Bank BeES invests at least 90% of its total assets in the stocks constituting CNX PSU Bank Index. The Scheme may invest upto 10% of its total assets in stocks not included in the corresponding underlying index. The investment decisions are determined as per CNX PSU Bank Index. In case of any change in the index due to corporate actions or change in the constituents of CNX PSU Bank Index, by IISL, relevant investment decisions are determined considering the composition of CNX PSU Bank Index. Performance Record (as on March 31, 2011)
Particulars
PSU Bank BeES
Benchmark Returns
CNX PSU Bank Index CNX PSU Bank Total Return Index
Since Inception 17.34% 16.60% 18.75% Last Three Years 26.82% 25.58% 28.19% Last One Year 35.24% 34.46% 36.24% Returns are compounded annualised. Returns since inception are calculated from the date of allotment i.e. October 25, 2007 with allotment price being Rs. 263.9062. Dividends are assumed to be reinvested at the prevailing NAV. After payment of dividend, NAV will fall to the extent of
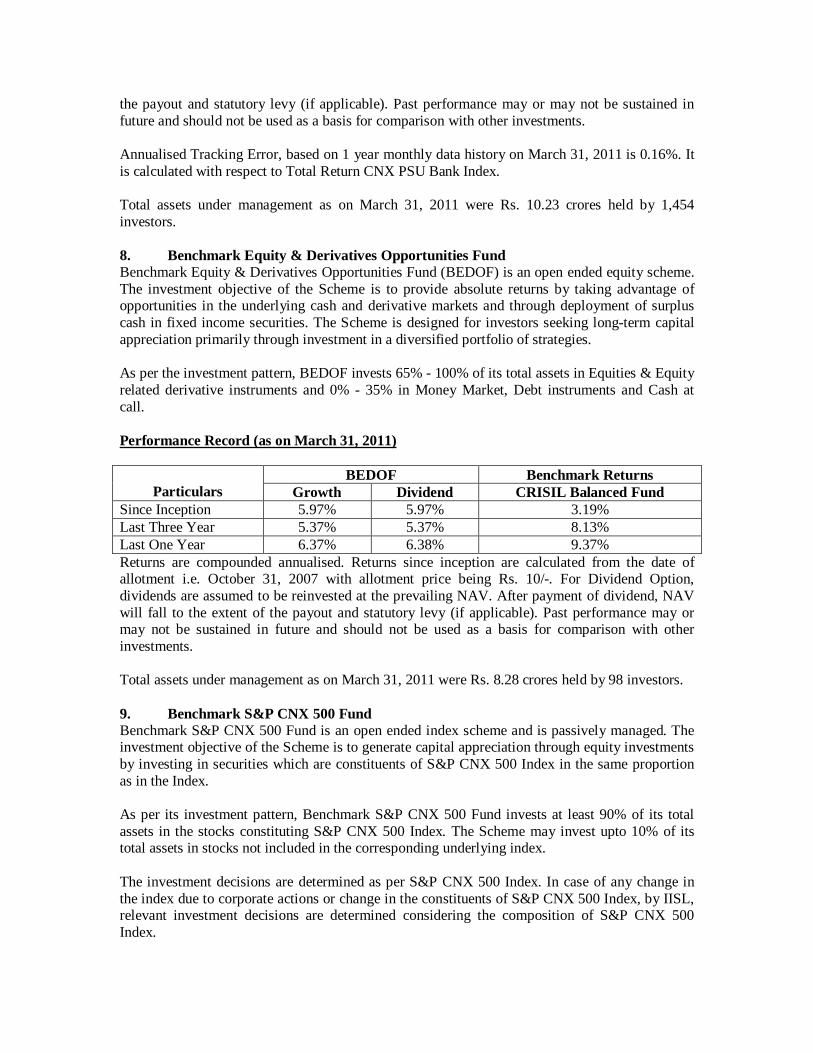
the payout and statutory levy (if applicable). Past performance may or may not be sustained in future and should not be used as a basis for comparison with other investments. Annualised Tracking Error, based on 1 year monthly data history on March 31, 2011 is 0.16%. It is calculated with respect to Total Return CNX PSU Bank Index. Total assets under management as on March 31, 2011 were Rs. 10.23 crores held by 1,454 investors. 8. Benchmark Equity & Derivatives Opportunities Fund Benchmark Equity & Derivatives Opportunities Fund (BEDOF) is an open ended equity scheme. The investment objective of the Scheme is to provide absolute returns by taking advantage of opportunities in the underlying cash and derivative markets and through deployment of surplus cash in fixed income securities. The Scheme is designed for investors seeking long-term capital appreciation primarily through investment in a diversified portfolio of strategies. As per the investment pattern, BEDOF invests 65% - 100% of its total assets in Equities & Equity related derivative instruments and 0% - 35% in Money Market, Debt instruments and Cash at call. Performance Record (as on March 31, 2011)
Particulars
BEDOF Benchmark Returns Growth Dividend CRISIL Balanced Fund
Since Inception 5.97% 5.97% 3.19% Last Three Year 5.37% 5.37% 8.13% Last One Year 6.37% 6.38% 9.37% Returns are compounded annualised. Returns since inception are calculated from the date of allotment i.e. October 31, 2007 with allotment price being Rs. 10/-. For Dividend Option, dividends are assumed to be reinvested at the prevailing NAV. After payment of dividend, NAV will fall to the extent of the payout and statutory levy (if applicable). Past performance may or may not be sustained in future and should not be used as a basis for comparison with other investments. Total assets under management as on March 31, 2011 were Rs. 8.28 crores held by 98 investors. 9. Benchmark S&P CNX 500 Fund Benchmark S&P CNX 500 Fund is an open ended index scheme and is passively managed. The investment objective of the Scheme is to generate capital appreciation through equity investments by investing in securities which are constituents of S&P CNX 500 Index in the same proportion as in the Index. As per its investment pattern, Benchmark S&P CNX 500 Fund invests at least 90% of its total assets in the stocks constituting S&P CNX 500 Index. The Scheme may invest upto 10% of its total assets in stocks not included in the corresponding underlying index. The investment decisions are determined as per S&P CNX 500 Index. In case of any change in the index due to corporate actions or change in the constituents of S&P CNX 500 Index, by IISL, relevant investment decisions are determined considering the composition of S&P CNX 500 Index.
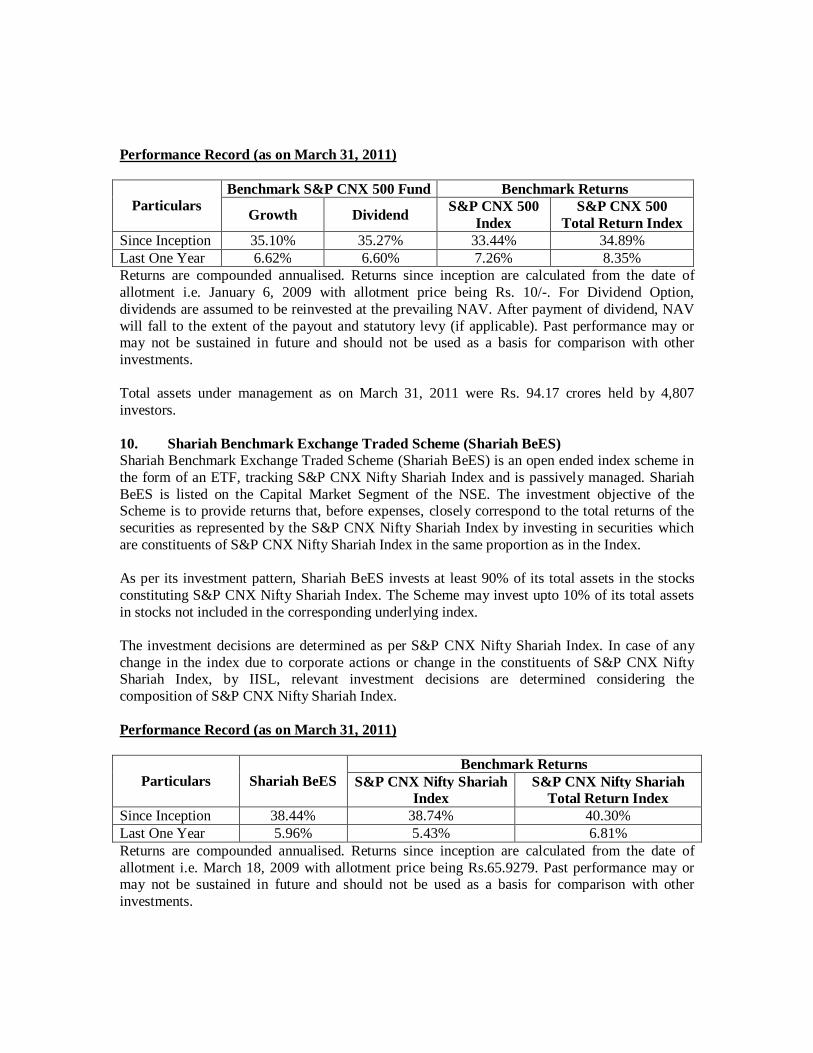
Performance Record (as on March 31, 2011)
Particulars
Benchmark S&P CNX 500 Fund Benchmark Returns
Growth Dividend S&P CNX 500 Index
S&P CNX 500 Total Return Index
Since Inception 35.10% 35.27% 33.44% 34.89% Last One Year 6.62% 6.60% 7.26% 8.35% Returns are compounded annualised. Returns since inception are calculated from the date of allotment i.e. January 6, 2009 with allotment price being Rs. 10/-. For Dividend Option, dividends are assumed to be reinvested at the prevailing NAV. After payment of dividend, NAV will fall to the extent of the payout and statutory levy (if applicable). Past performance may or may not be sustained in future and should not be used as a basis for comparison with other investments. Total assets under management as on March 31, 2011 were Rs. 94.17 crores held by 4,807 investors. 10. Shariah Benchmark Exchange Traded Scheme (Shariah BeES) Shariah Benchmark Exchange Traded Scheme (Shariah BeES) is an open ended index scheme in the form of an ETF, tracking S&P CNX Nifty Shariah Index and is passively managed. Shariah BeES is listed on the Capital Market Segment of the NSE. The investment objective of the Scheme is to provide returns that, before expenses, closely correspond to the total returns of the securities as represented by the S&P CNX Nifty Shariah Index by investing in securities which are constituents of S&P CNX Nifty Shariah Index in the same proportion as in the Index. As per its investment pattern, Shariah BeES invests at least 90% of its total assets in the stocks constituting S&P CNX Nifty Shariah Index. The Scheme may invest upto 10% of its total assets in stocks not included in the corresponding underlying index. The investment decisions are determined as per S&P CNX Nifty Shariah Index. In case of any change in the index due to corporate actions or change in the constituents of S&P CNX Nifty Shariah Index, by IISL, relevant investment decisions are determined considering the composition of S&P CNX Nifty Shariah Index. Performance Record (as on March 31, 2011)
Particulars
Shariah BeES
Benchmark Returns S&P CNX Nifty Shariah
Index S&P CNX Nifty Shariah
Total Return Index Since Inception 38.44% 38.74% 40.30% Last One Year 5.96% 5.43% 6.81% Returns are compounded annualised. Returns since inception are calculated from the date of allotment i.e. March 18, 2009 with allotment price being Rs.65.9279. Past performance may or may not be sustained in future and should not be used as a basis for comparison with other investments.
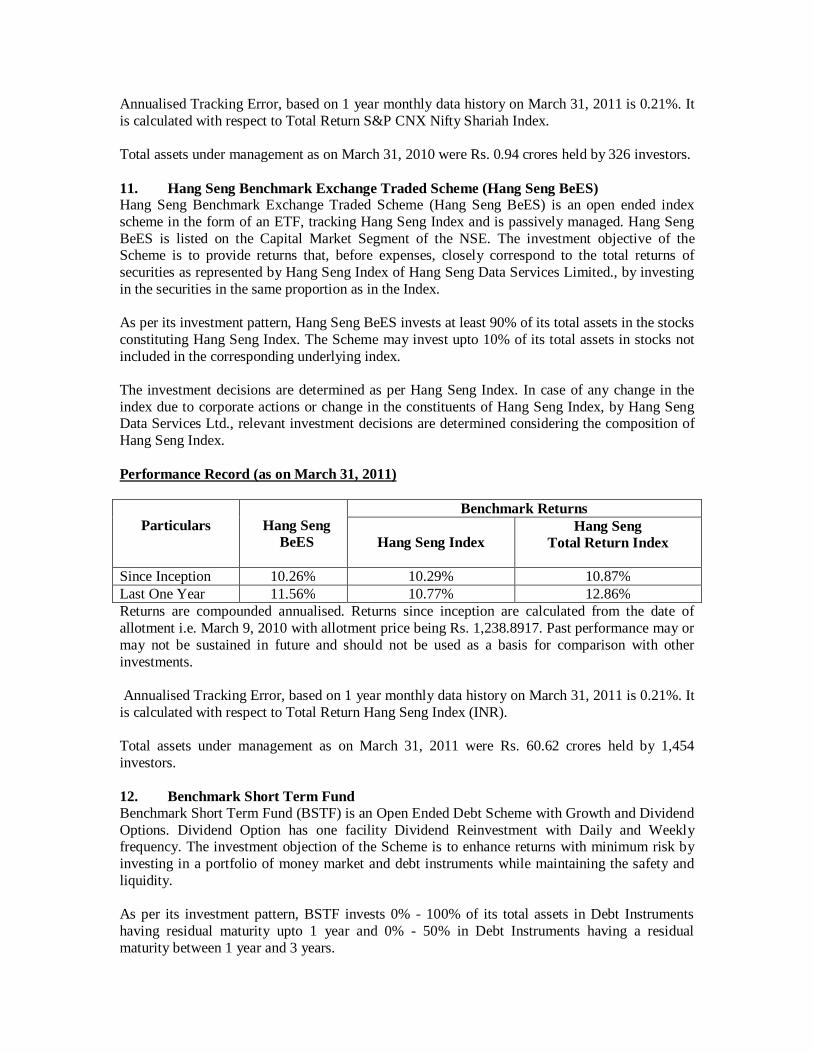
Annualised Tracking Error, based on 1 year monthly data history on March 31, 2011 is 0.21%. It is calculated with respect to Total Return S&P CNX Nifty Shariah Index. Total assets under management as on March 31, 2010 were Rs. 0.94 crores held by 326 investors. 11. Hang Seng Benchmark Exchange Traded Scheme (Hang Seng BeES) Hang Seng Benchmark Exchange Traded Scheme (Hang Seng BeES) is an open ended index scheme in the form of an ETF, tracking Hang Seng Index and is passively managed. Hang Seng BeES is listed on the Capital Market Segment of the NSE. The investment objective of the Scheme is to provide returns that, before expenses, closely correspond to the total returns of securities as represented by Hang Seng Index of Hang Seng Data Services Limited., by investing in the securities in the same proportion as in the Index. As per its investment pattern, Hang Seng BeES invests at least 90% of its total assets in the stocks constituting Hang Seng Index. The Scheme may invest upto 10% of its total assets in stocks not included in the corresponding underlying index. The investment decisions are determined as per Hang Seng Index. In case of any change in the index due to corporate actions or change in the constituents of Hang Seng Index, by Hang Seng Data Services Ltd., relevant investment decisions are determined considering the composition of Hang Seng Index. Performance Record (as on March 31, 2011)
Particulars
Hang Seng
BeES
Benchmark Returns
Hang Seng Index Hang Seng
Total Return Index
Since Inception 10.26% 10.29% 10.87% Last One Year 11.56% 10.77% 12.86% Returns are compounded annualised. Returns since inception are calculated from the date of allotment i.e. March 9, 2010 with allotment price being Rs. 1,238.8917. Past performance may or may not be sustained in future and should not be used as a basis for comparison with other investments. Annualised Tracking Error, based on 1 year monthly data history on March 31, 2011 is 0.21%. It is calculated with respect to Total Return Hang Seng Index (INR). Total assets under management as on March 31, 2011 were Rs. 60.62 crores held by 1,454 investors. 12. Benchmark Short Term Fund Benchmark Short Term Fund (BSTF) is an Open Ended Debt Scheme with Growth and Dividend Options. Dividend Option has one facility Dividend Reinvestment with Daily and Weekly frequency. The investment objection of the Scheme is to enhance returns with minimum risk by investing in a portfolio of money market and debt instruments while maintaining the safety and liquidity. As per its investment pattern, BSTF invests 0% - 100% of its total assets in Debt Instruments having residual maturity upto 1 year and 0% - 50% in Debt Instruments having a residual maturity between 1 year and 3 years.
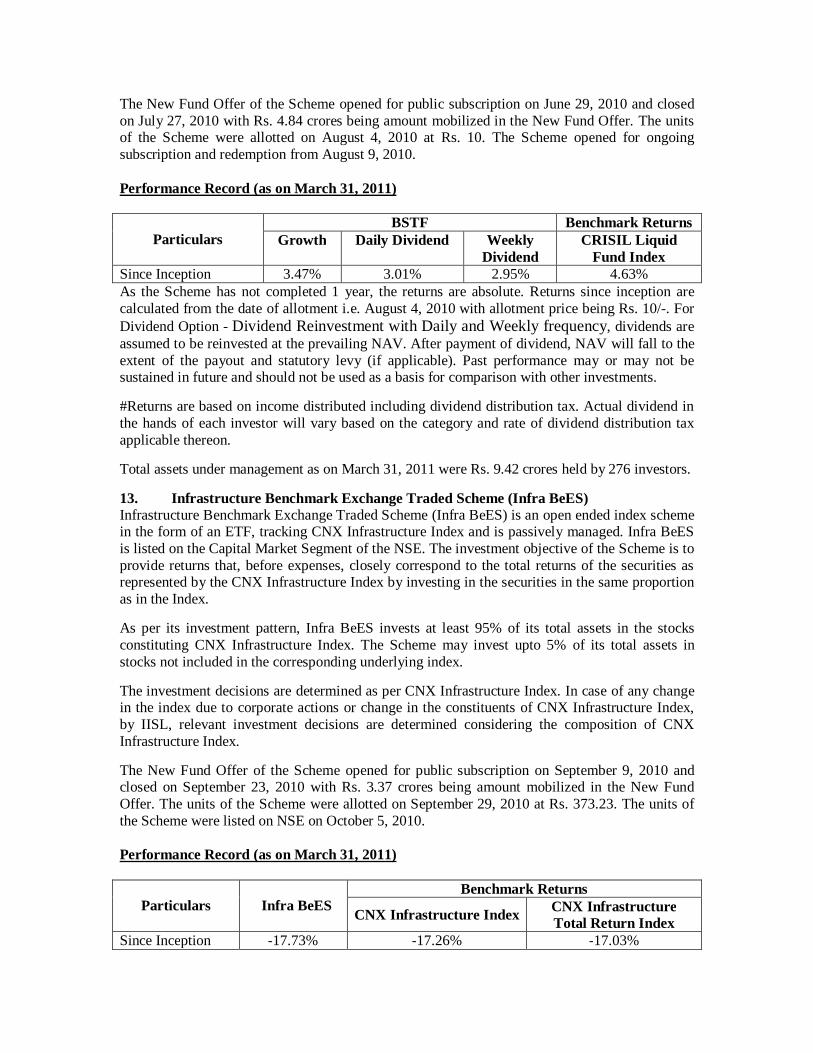
The New Fund Offer of the Scheme opened for public subscription on June 29, 2010 and closed on July 27, 2010 with Rs. 4.84 crores being amount mobilized in the New Fund Offer. The units of the Scheme were allotted on August 4, 2010 at Rs. 10. The Scheme opened for ongoing subscription and redemption from August 9, 2010. Performance Record (as on March 31, 2011)
Particulars
BSTF Benchmark Returns Growth Daily Dividend Weekly
Dividend CRISIL Liquid
Fund Index Since Inception 3.47% 3.01% 2.95% 4.63% As the Scheme has not completed 1 year, the returns are absolute. Returns since inception are calculated from the date of allotment i.e. August 4, 2010 with allotment price being Rs. 10/-. For Dividend Option - Dividend Reinvestment with Daily and Weekly frequency, dividends are assumed to be reinvested at the prevailing NAV. After payment of dividend, NAV will fall to the extent of the payout and statutory levy (if applicable). Past performance may or may not be sustained in future and should not be used as a basis for comparison with other investments. #Returns are based on income distributed including dividend distribution tax. Actual dividend in the hands of each investor will vary based on the category and rate of dividend distribution tax applicable thereon. Total assets under management as on March 31, 2011 were Rs. 9.42 crores held by 276 investors. 13. Infrastructure Benchmark Exchange Traded Scheme (Infra BeES) Infrastructure Benchmark Exchange Traded Scheme (Infra BeES) is an open ended index scheme in the form of an ETF, tracking CNX Infrastructure Index and is passively managed. Infra BeES is listed on the Capital Market Segment of the NSE. The investment objective of the Scheme is to provide returns that, before expenses, closely correspond to the total returns of the securities as represented by the CNX Infrastructure Index by investing in the securities in the same proportion as in the Index. As per its investment pattern, Infra BeES invests at least 95% of its total assets in the stocks constituting CNX Infrastructure Index. The Scheme may invest upto 5% of its total assets in stocks not included in the corresponding underlying index. The investment decisions are determined as per CNX Infrastructure Index. In case of any change in the index due to corporate actions or change in the constituents of CNX Infrastructure Index, by IISL, relevant investment decisions are determined considering the composition of CNX Infrastructure Index. The New Fund Offer of the Scheme opened for public subscription on September 9, 2010 and closed on September 23, 2010 with Rs. 3.37 crores being amount mobilized in the New Fund Offer. The units of the Scheme were allotted on September 29, 2010 at Rs. 373.23. The units of the Scheme were listed on NSE on October 5, 2010. Performance Record (as on March 31, 2011)
Particulars
Infra BeES
Benchmark Returns
CNX Infrastructure Index CNX Infrastructure Total Return Index
Since Inception -17.73% -17.26% -17.03%

Returns are absolute as the Scheme has not completed 1 year. Returns since inception are calculated from the date of allotment i.e. September 29, 2010. Past performance may or may not be sustained in future and should not be used as a basis for comparison with other investments. Annualised Tracking Error, based on 1 year monthly data history on March 31, 2011 is 0.13%. It is calculated with respect to Total Return CNX Infrastructure Index. Total assets under management as on March 31, 2011 were Rs. 33.77 crores held by 1,376 investors. TOTAL ASSETS UNDER MANAGEMENT As on March 31, 2011 total assets under management were Rs. 3,882.09 crores for all the Schemes. Dividend During the financial year 2010-11, the following dividends were declared:
Scheme Rate Record Date Benchmark Derivative Fund - Dividend Option Rs. 50.00 per unit 03-03-2011 Benchmark Equity & Derivatives Opportunities Fund - Dividend Option
Rs. 0.60 per unit 03-03-2011
Dividend, in the form of units, was declared and paid in Liquid BeES on a daily basis as per its Scheme Information Document. For Dividend Option of Benchmark Short Term Fund - Dividend Reinvestment with Daily and Weekly frequency, dividend was declared and paid on a daily and weekly frequency, respectively as per its Scheme Information Document. FUTURE OUTLOOK The Fund has filed Scheme Information Documents with SEBI for various Schemes including ETFs. The Fund would launch these Schemes once they are approved by SEBI. A Share Purchase Agreement dated March 15, 2011 was executed between Benchmark Trustee Company Pvt. Ltd (BTC)., shareholders of BTC, Benchmark Asset Management Company Private Limited (BAMC), shareholders of BAMC, Goldman Sachs Asset Management (India) Private Limited, Goldman Sachs Trustee Company (India) Private Limited and Goldman Sachs Asset Management L.P. for the following:
(i) Goldman Sachs Asset Management (India) Private Limited (GS AMC), asset management company of Goldman Sachs Mutual Fund (GSMF), will acquire the entire paid-up share capital (except for one equity share) of BAMC. One equity share would be acquired by Goldman Sachs Services Private Limited (GSSPL), another group company. Pursuant to such acquisition, the BAMC would effectively become a 100% subsidiary of GS AMC.
(ii) Goldman Sachs Trustee Company (India) Private Limited (GSTC), trustee of Goldman Sachs Mutual Fund, and GSSPL will acquire the entire paid-up share capital of Benchmark Trustee Company Pvt. Ltd. (BTC) resulting in it becoming wholly owned by Goldman Sachs group companies in India.
On account of the above transactions and subject to the provisions of SEBI (Mutual Fund), Regulations, 1996, Goldman Sachs Asset Management LP (GSAM), the sponsor of GSMF, would indirectly, through GS AMC, acquire ownership of approximately 100% of the total paid-up share capital of BAMC resulting in change in the controlling interest of BAMC and a change in the sponsor of Benchmark Mutual Fund from Niche Financial Services to GSAM. GSTC would take over the trusteeship of the Schemes of Benchmark Mutual Fund from BTC and GS AMC would take over the rights to manage the schemes from BAMC and become the investment manager of the schemes. The Schemes would become an integral part of GSMF. SEBI has pursuant to its letter no OW/20350/2011 dated June 27, 2011, given its no objection to the above transactions. STATUTORY DETAILS The price and redemption value of the units and income from them can go up as well as down with the fluctuation in the market value of its underlying investments. On written request, present and prospective Unitholder/investors can obtain a copy of the Trust Deed, the Annual Report and the text of the Schemes. Unitholders, if they so desire, may request the Annual Report of the AMC. Investor Complaints The details of investor complaints received by the Fund in financial year 2010 - 11 are enclosed as Annexure A. Voting Policy The Board of Directors of Benchmark Asset Management Company Pvt. Ltd. and Benchmark Trustee Company Pvt. Ltd., in their respective meetings have adopted a voting policy that, at present as a general policy, Benchmark Mutual Fund would abstain from voting on any matters with respect to companies in which its Schemes have invested. The voting policy adopted along with its rationale is mentioned below: “The objective of Benchmark Mutual Fund is to provide low cost, innovative products based on Passive and Quantitative Techniques. Based on this philosophy, Benchmark Mutual Fund has launched a number of Exchange Traded Funds (ETFs)/index funds which are based on various indices and gold. Benchmark Mutual Fund would be launching more ETFs/index funds based on indices. Benchmark Mutual Fund invests in the ETFs/index funds based on the index which is being tracked by the Scheme. These indices are developed, owned and maintained by independent index providers. The indices are maintained on a day to day basis by the index provider as per the policy laid down by the index provider and various parameters are used for inclusion and exclusion of stocks from the index. Benchmark Mutual Fund obtains a license for these indices and launches the schemes. These Schemes track the indices by investing in the stocks as per its weightage in such index. Benchmark Mutual Fund carries out rebalancing exercise based on the details of corporate actions, etc. received from the index providers. The Fund Manager does not play an active role in selection of the stocks for investment/disinvestment. The Fund Manager’s decisions are based solely on the notices of corporate actions received from the index providers. As Benchmark Mutual Fund has a passive philosophy towards investment and does not invest in a stock based on an active research, at present as a general policy, Benchmark Mutual Fund
would abstain from voting on any matters with respect to companies in which its Schemes have invested.” Based on the above voting policy, Benchmark Mutual Fund has abstained from voting on any matters with respect to companies in which its Schemes have invested. Details of voting in general meetings of listed company
A. Management Proposal
Date Type of Meeting (AGM / EGM)
Proposal
Management Recommendation
Vote (For / Against / Abstain)
Based on the Voting Policy, Benchmark Mutual Fund has abstained from voting on any matter.
B. Shareholder Proposal
Date Type of Meeting (AGM / EGM)
Proposal
Management Recommendation
Vote (For / Against / Abstain)
Based on the Voting Policy, Benchmark Mutual Fund has abstained from voting on any matter. LIABILITY AND RESPONSIBILITY OF TRUSTEE AND SPONSOR The main responsibility of the Trustee is to protect the interest of Unitholders and inter alia, ensure that the AMC functions in the interest of investors and in accordance with the Securities and Exchange Board of India (Mutual Funds) Regulations, 1996, the provisions of the Trust Deed, Statement of Additional Information (SAI) and Scheme Information Document (SID) of the Schemes. From the information provided to the Trustee and the reviews the Trustee has undertaken, the Trustee believes the AMC has operated in the interests of Unitholders. The Sponsor is not responsible or liable for any loss or shortfall resulting from the operation of the Schemes beyond the initial contribution of Rs. 1 lac made by it towards setting up of Benchmark Mutual Fund. ACKNOWLEDGEMENTS We would like to thank Securities and Exchange Board of India, National Stock Exchange of India Ltd., Service providers, Depositories, the investors, the AMC and its employees for their committed service. For and on behalf of the Board of Directors of Benchmark Trustee Company Pvt. Ltd. (Trustee to Benchmark Mutual Fund) Dr. S. A. Dave Chairman Place: Mumbai Date: June 29, 2011

Wit
hin
3
0 d
ays
30
-60
d
ays
60
-18
0
days
Beyon
d
18
0 d
ays
0-3
m
on
ths
3-6
m
on
ths
6-9
m
on
ths
9-1
2
mon
ths
I A
Non r
ecei
pt
of D
ivid
end o
n U
nits
01
10
00
00
00
0I
BIn
tere
st o
n d
elay
ed p
aym
ent
of
Div
iden
d0
00
00
00
00
00
I C
Non r
ecei
pt
of Red
emption
Proce
eds
01
00
00
01
00
0I
DIn
tere
st o
n d
elay
ed p
aym
ent
of
Red
emption
00
00
00
00
00
0II
AN
on r
ecei
pt
of Sta
tem
ent
of
Acc
ount/
Unit C
ertifica
te0
00
00
00
00
00
II B
Dis
crep
ancy
in S
tate
men
t of
Acc
ount
00
00
00
00
00
0II
CN
on r
ecei
pt
of Annual
Rep
ort
/Abri
dged
Sum
mar
y0
00
00
00
00
00
III
AW
rong s
witch
bet
wee
n S
chem
es0
00
00
00
00
00
III
BU
nau
thori
zed s
witch
bet
wee
n
Sch
emes
00
00
00
00
00
0II
I C
Dev
iation fro
m S
chem
e at
trib
ute
s0
00
00
00
00
00
III
DW
rong o
r ex
cess
char
ges
/load
00
00
00
00
00
0II
I E
Non u
pdat
ion o
f ch
anges
viz
. ad
dre
ss,
PAN
, ban
k det
ails
, nom
inat
ion,
etc
00
00
00
00
00
0IV
Oth
ers
05
40
10
00
00
0
Nam
e o
f th
e M
utu
al
Fu
nd
Ben
chm
ark
Mu
tual
Fu
nd
Tota
l N
um
ber
of
Foli
os
AN
NEX
UR
E -
A
*N
on
act
ion
ab
le m
ean
s th
e c
om
pla
int
that
are
in
com
ple
te /
ou
tsid
e t
he s
cop
e o
f th
e m
utu
al
fun
d
Com
pla
int
cod
eTyp
e o
f co
mp
lain
t#(a
) N
o.
of
com
pla
ints
p
en
din
g
at
the
beg
inn
ing
of
the
year
Act
ion
on
(a)
an
d (
b)
(b)
No o
f co
mp
lain
ts
rece
ived
d
uri
ng
th
e y
ear
Reso
lved
Non
A
ctio
nab
le*
Pen
din
g
17
91
48
Red
ress
al
of
Com
pla
ints
rece
ived
du
rin
g2
01
0-2
01
1
# i
ncl
ud
ing
ag
ain
st i
ts a
uth
ori
zed
pers
on
s/ d
istr
ibu
tors
/ e
mp
loyees.
etc
.

AUDITORS’ REPORT The Board of Directors, Benchmark Trustee Company Private Limited
We have audited the attached Balance Sheet as at March 31, 2011, the Revenue Account and the Cash
Flow Statement for the year ended on that date annexed thereto, of Nifty Benchmark Exchange
Traded Scheme (the Scheme), of Benchmark Mutual Fund. These financial statements are prepared in
accordance with SEBI (Mutual Fund) Regulations, 1996 (the Regulations) and are the responsibility
of the Management. Our responsibility is to express an opinion on these financial statements based on
our audit.
We conducted our audit in accordance with the standards on auditing issued by Institute of Chartered
Accountants of India. An audit includes examining on a test basis, evidence supporting the amounts
and disclosures in the financial statements. An audit also includes assessing the accounting principles
used and significant estimates made by the management, as well as evaluating the overall financial
statement presentation. We believe that our audit provides a reasonable basis for our opinion.
We report that:
1. We have obtained all information and explanations, which, to the best of our knowledge and
belief were necessary for the purpose of our audit.
2. The Balance Sheet, the Revenue Account and the Cash Flow Statement referred to above are
in agreement with the books of accounts of the Scheme.
3. The accounts have been prepared in accordance with the accounting policies adopted by the
trustees of the Fund and as specified in the Ninth Schedule to the Regulations.

4. In our opinion, valuation methods for Non Traded Securities, if any, adopted by the scheme
are fair and reasonable and are in accordance with the guidelines for valuation issued by
SEBI and approved by the Trustee.
5. Without qualifying our opinion, we draw attention to note no. 25 in Schedule H of the
financial statements whereby the management has not provided the Segment Reporting for
reasons mentioned therein.
6. In our opinion and to the best of our information and according to the explanations given to
us, the financial statements read with the accounting policies and notes to accounts attached
thereto, give the information required as per the Regulations and give a true & fair view in
accordance with the generally accepted accounting principles in India:
a. in the case of Balance Sheet, of the state of affairs of the scheme as at March 31,
2011;
b. in the case of Revenue Account, of the surplus of the scheme for the year ended on
that date; and
c. in the case of Cash Flow Statement, of the cash flows for the year ended on that date.
For N.M.RAIJI & CO. Chartered Accountants
Firm Reg. No:108296W
J. M. GANDHI Partner Membership No. 37924
Place: Mumbai Dated: June 29, 2011
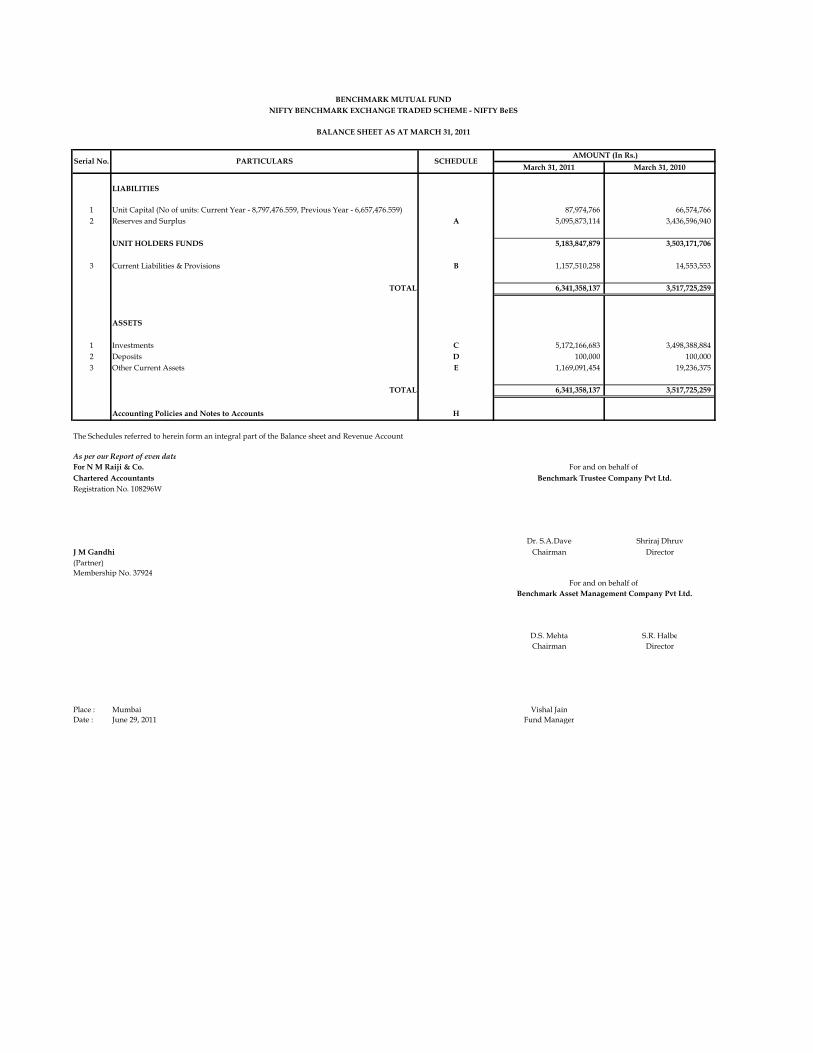
March 31, 2011 March 31, 2010
LIABILITIES
1 Unit Capital (No of units: Current Year - 8,797,476.559, Previous Year - 6,657,476.559) 87,974,766 66,574,766 2 Reserves and Surplus A 5,095,873,114 3,436,596,940
UNIT HOLDERS FUNDS 5,183,847,879 3,503,171,706
3 Current Liabilities & Provisions B 1,157,510,258 14,553,553
TOTAL 6,341,358,137 3,517,725,259
ASSETS
1 Investments C 5,172,166,683 3,498,388,884 2 Deposits D 100,000 100,000 3 Other Current Assets E 1,169,091,454 19,236,375
TOTAL 6,341,358,137 3,517,725,259
Accounting Policies and Notes to Accounts H
The Schedules referred to herein form an integral part of the Balance sheet and Revenue Account
As per our Report of even dateFor N M Raiji & Co.Chartered AccountantsRegistration No. 108296W
Dr. S.A.Dave Shriraj DhruvJ M Gandhi Chairman Director(Partner)Membership No. 37924
D.S. Mehta S.R. HalbeChairman Director
Place : Mumbai Vishal JainDate : June 29, 2011 Fund Manager
For and on behalf of
BENCHMARK MUTUAL FUND
BALANCE SHEET AS AT MARCH 31, 2011
SCHEDULESerial No. PARTICULARS AMOUNT (In Rs.)
NIFTY BENCHMARK EXCHANGE TRADED SCHEME - NIFTY BeES
For and on behalf of Benchmark Trustee Company Pvt Ltd.
Benchmark Asset Management Company Pvt Ltd.

March 31, 2011 March 31, 2010
1 INCOME AND GAINS1.1 Dividend 68,132,775 26,276,379 1.2 Other Income 2,062,407 - 1.3 Profit on sale / redemption of investments 950,713,269 834,872,803
(other than inter-scheme transfer/sale)1.4 Profit on Futures - 1,143,082 1.5 Net Change in unrealised appreciation on investments - 474,324,599
TOTAL 1,020,908,451 1,336,616,863
2 EXPENSES AND LOSSES2.1 Management & Operating Expenses F 25,354,650 15,058,665 2.2 Loss on sale/redemption of investments 188,317,952 78,518,350
(other than inter-scheme transfer/sale)2.3 Loss on Futures 1,085,445 2,885,398 2.4 Net Change in unrealised depreciation on investments 149,542,844 -
TOTAL 364,300,891 96,462,413
Surplus for the year 656,607,560 1,240,154,450
Add/(Less): Income Equalisation 686,336,097 640,589,759
1,492,486,501 1,549,737,250
Balance brought forward from Previous year 2,715,603,512 1,191,954,906
Surplus available for distribution 4,208,090,013 2,741,692,156
AppropriationIncome Distribution - 26,088,644
Balance Carried to the Balance Sheet 4,208,090,013 2,715,603,512
Accounting Policies and Notes to Accounts H
The Schedules referred to herein form an integral part of the Balance sheet and Revenue Account
As per our Report of even dateFor N M Raiji & Co.Chartered AccountantsRegistration No. 108296W
Dr. S.A.Dave Shriraj DhruvJ M Gandhi Chairman Director(Partner)Membership No. 37924
D.S. Mehta S.R. HalbeChairman Director
Place : Mumbai Vishal JainDate : June 29, 2011 Fund Manager
For and on behalf of
BENCHMARK MUTUAL FUNDNIFTY BENCHMARK EXCHANGE TRADED SCHEME - NIFTY BeES
REVENUE ACCOUNT FOR THE YEAR ENDED MARCH 31, 2011
SCHEDULEPARTICULARSSerial No. AMOUNT (In Rs.)
Benchmark Asset Management Company Pvt Ltd.
-
331,006,959
331,006,959
181,464,115
For and on behalf of Benchmark Trustee Company Pvt Ltd.
Add: Opening unrealised appreciation reserve
Less: Closing unrealised appreciation reserve

March 31, 2011 March 31, 2010
A. Cashflow from Operating ActivitiesSurplus/(Deficit) for the year 656,607,561 1,240,154,450 Change in unrealised Appreciation/(Depreciation) in the value of investments. 149,542,844 (474,324,599)
806,150,405 765,829,851
Adjustments for:-(Increase)/Decrease in Investments at Cost (1,823,320,643) (1,709,167,784) (Increase)/Decrease in Other Current Assets (1,143,510,431) 22,476,783 Increase/(Decrease) in Current Liabilities (4,258,845) 10,284,722 Net Cash Generated from/(used in) Operations (2,164,939,514) (910,576,428)
B. Cashflow from Financing ActivitiesIncrease/(Decrease) in Unit Capital 21,400,000 23,400,000 Increase/(Decrease) in Reserves 1,002,668,615 946,845,393 Adjustments for:-Increase/(Decrease) in Sundry Creditors for Units Redeemed by Investors 1,147,215,549 (24,215,671) (Increase)/Decrease in Sundry Debtors for Units Issued to Investors - Dividend paid during the Year/Period - (26,088,645)
Net Cash (used in)/Generated from Financing Activities 2,171,284,164 919,941,077
Net Increase/(Decrease) in Cash and Cash Equivalents (A+B) 6,344,650 9,364,650
Cash and Cash Equivalents as at the :-Beginning of the year 16,119,034 6,754,384 End of the year 22,463,684 16,119,034
Components of Cash and Cash EquivalentsBalances with Banks in Current Accounts 22,363,684 16,119,034 Deposits with Scheduled Banks 100,000 -
As per our attached report of even date
For N M Raiji & Co. Chartered Accountants Registration No. 108296W
J M Gandhi Dr. S.A. Dave Shriraj Dhruv(Partner) Chairman DirectorMembership No. 37924
D.S. Mehta S.R.HalbeChairman Director
Place: Mumbai Vishal JainDate: June 29, 2011 Fund Manager
NIFTY BENCHMARK EXCHANGE TRADED SCHEME - NIFTY BeES
CASH FLOW STATEMENT FOR THE YEAR ENDED MARCH 31, 2011
The above cash flow statement has been prepared under the indirect method setout in Accounting Standard (AS-3) issued by the Institute of Chartered Accountants of India.
For and on behalf of Benchmark Asset Management Company Pvt. Ltd.
For and on behalf of Benchmark Trustee Company Pvt Ltd.
March 31, 2011 March 31, 2010
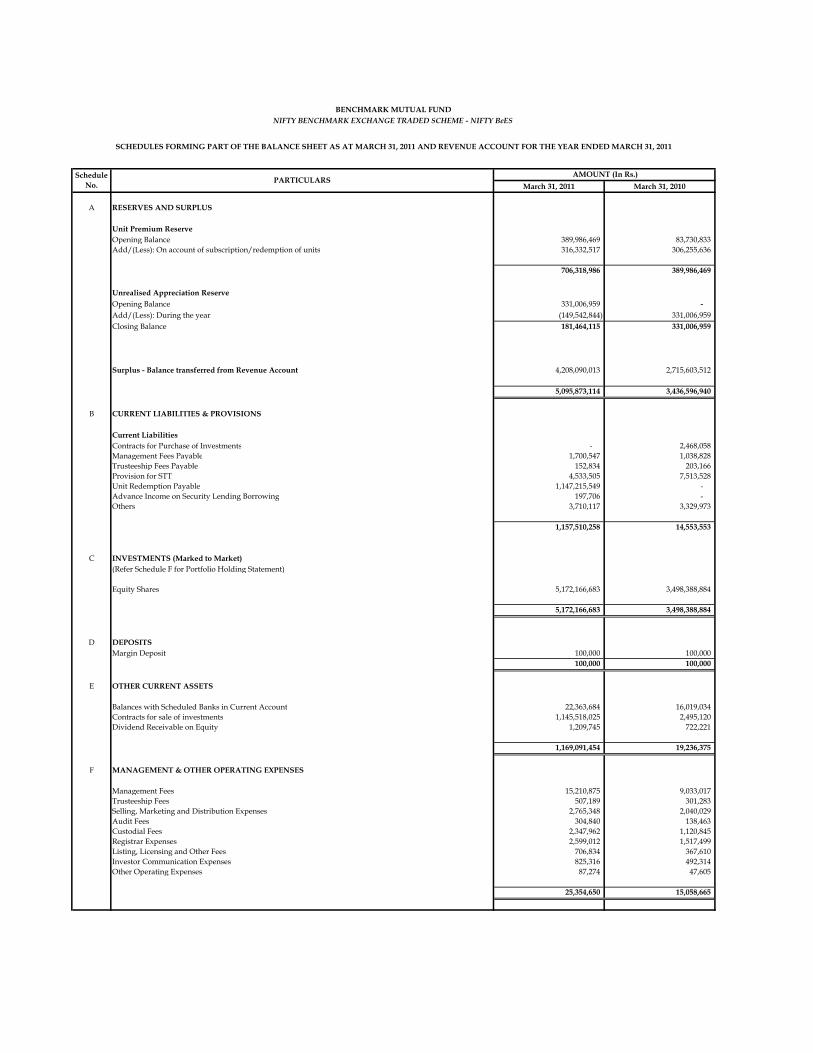
A RESERVES AND SURPLUS
Unit Premium ReserveOpening Balance 389,986,469 83,730,833 Add/(Less): On account of subscription/redemption of units 316,332,517 306,255,636
706,318,986 389,986,469
Unrealised Appreciation ReserveOpening Balance 331,006,959 - Add/(Less): During the year (149,542,844) 331,006,959 Closing Balance 181,464,115 331,006,959
Surplus - Balance transferred from Revenue Account 4,208,090,013 2,715,603,512
5,095,873,114 3,436,596,940
B CURRENT LIABILITIES & PROVISIONS
Current LiabilitiesContracts for Purchase of Investments - 2,468,058 Management Fees Payable 1,700,547 1,038,828 Trusteeship Fees Payable 152,834 203,166 Provision for STT 4,533,505 7,513,528 Unit Redemption Payable 1,147,215,549 - Advance Income on Security Lending Borrowing 197,706 - Others 3,710,117 3,329,973
1,157,510,258 14,553,553
C INVESTMENTS (Marked to Market)(Refer Schedule F for Portfolio Holding Statement)
Equity Shares 5,172,166,683 3,498,388,884
5,172,166,683 3,498,388,884
D DEPOSITSMargin Deposit 100,000 100,000
100,000 100,000
E OTHER CURRENT ASSETS
Balances with Scheduled Banks in Current Account 22,363,684 16,019,034 Contracts for sale of investments 1,145,518,025 2,495,120 Dividend Receivable on Equity 1,209,745 722,221
1,169,091,454 19,236,375
F MANAGEMENT & OTHER OPERATING EXPENSES
Management Fees 15,210,875 9,033,017 Trusteeship Fees 507,189 301,283 Selling, Marketing and Distribution Expenses 2,765,348 2,040,029 Audit Fees 304,840 138,463 Custodial Fees 2,347,962 1,120,845 Registrar Expenses 2,599,012 1,517,499 Listing, Licensing and Other Fees 706,834 367,610 Investor Communication Expenses 825,316 492,314 Other Operating Expenses 87,274 47,605
25,354,650 15,058,665
BENCHMARK MUTUAL FUNDNIFTY BENCHMARK EXCHANGE TRADED SCHEME - NIFTY BeES
Schedule No.
SCHEDULES FORMING PART OF THE BALANCE SHEET AS AT MARCH 31, 2011 AND REVENUE ACCOUNT FOR THE YEAR ENDED MARCH 31, 2011
PARTICULARS AMOUNT (In Rs.)
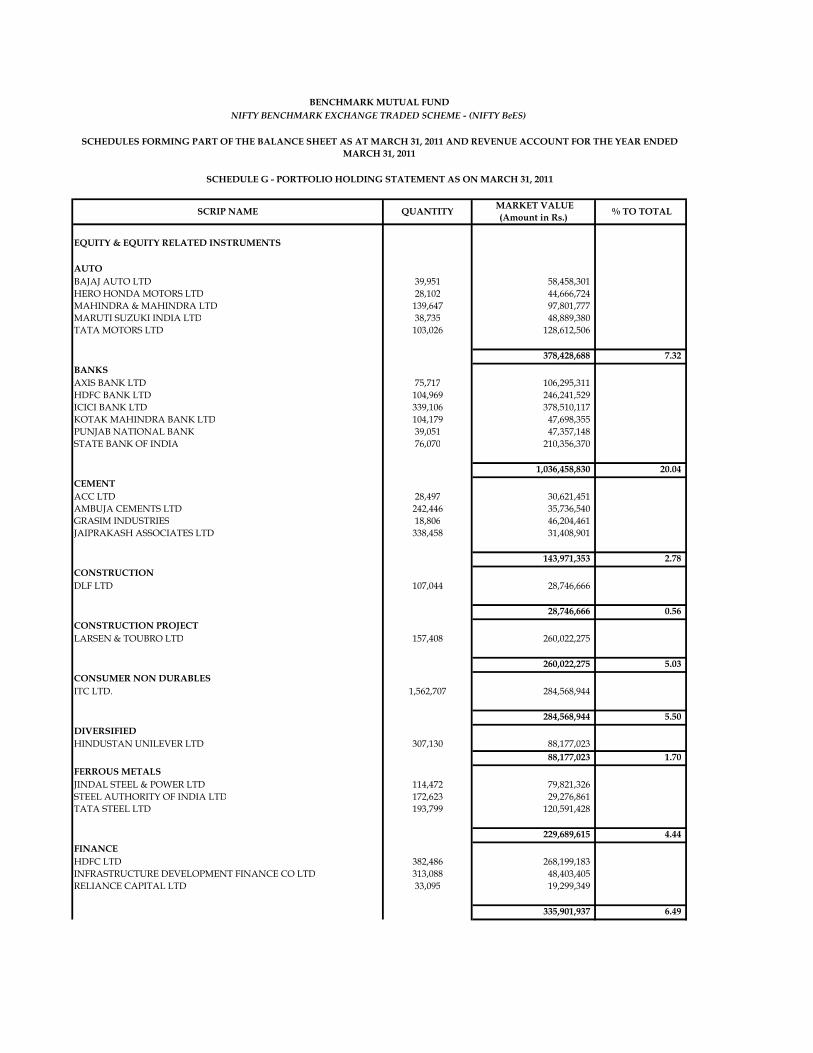
EQUITY & EQUITY RELATED INSTRUMENTS
AUTOBAJAJ AUTO LTD 39,951 58,458,301 HERO HONDA MOTORS LTD 28,102 44,666,724 MAHINDRA & MAHINDRA LTD 139,647 97,801,777 MARUTI SUZUKI INDIA LTD 38,735 48,889,380 TATA MOTORS LTD 103,026 128,612,506
378,428,688 7.32 BANKSAXIS BANK LTD 75,717 106,295,311 HDFC BANK LTD 104,969 246,241,529 ICICI BANK LTD 339,106 378,510,117 KOTAK MAHINDRA BANK LTD 104,179 47,698,355 PUNJAB NATIONAL BANK 39,051 47,357,148 STATE BANK OF INDIA 76,070 210,356,370
1,036,458,830 20.04 CEMENTACC LTD 28,497 30,621,451 AMBUJA CEMENTS LTD 242,446 35,736,540 GRASIM INDUSTRIES 18,806 46,204,461 JAIPRAKASH ASSOCIATES LTD 338,458 31,408,901
143,971,353 2.78 CONSTRUCTIONDLF LTD 107,044 28,746,666
28,746,666 0.56 CONSTRUCTION PROJECTLARSEN & TOUBRO LTD 157,408 260,022,275
260,022,275 5.03 CONSUMER NON DURABLESITC LTD. 1,562,707 284,568,944
284,568,944 5.50 DIVERSIFIEDHINDUSTAN UNILEVER LTD 307,130 88,177,023
88,177,023 1.70 FERROUS METALSJINDAL STEEL & POWER LTD 114,472 79,821,326 STEEL AUTHORITY OF INDIA LTD 172,623 29,276,861 TATA STEEL LTD 193,799 120,591,428
229,689,615 4.44 FINANCEHDFC LTD 382,486 268,199,183 INFRASTRUCTURE DEVELOPMENT FINANCE CO LTD 313,088 48,403,405 RELIANCE CAPITAL LTD 33,095 19,299,349
335,901,937 6.49
BENCHMARK MUTUAL FUNDNIFTY BENCHMARK EXCHANGE TRADED SCHEME - (NIFTY BeES)
SCHEDULES FORMING PART OF THE BALANCE SHEET AS AT MARCH 31, 2011 AND REVENUE ACCOUNT FOR THE YEAR ENDED MARCH 31, 2011
% TO TOTAL MARKET VALUE (Amount in Rs.) QUANTITYSCRIP NAME
SCHEDULE G - PORTFOLIO HOLDING STATEMENT AS ON MARCH 31, 2011

SCHEDULE G - PORTFOLIO HOLDING STATEMENT AS ON MARCH 31, 2011GASGAIL (INDIA) LTD 132,494 61,477,216
61,477,216 1.19 INDUSTRIAL CAPITAL GOODSBHARAT HEAVY ELECTRICALS LTD 46,526 95,966,854 SIEMENS LTD 44,388 39,108,047
135,074,901 2.61 MINERALS / MININGSESA GOA LTD 112,294 32,716,857
32,716,857 0.63
NON-FERROUS METALSHINDALCO INDUSTRIES LTD 378,736 79,212,634 STERLITE INDUSTRIES (INDIA) LTD 418,757 72,738,091
151,950,725 2.94 OILCAIRN INDIA LTD 128,094 44,954,589 OIL & NATURAL GAS CORPORATION LTD 397,383 115,757,668
160,712,257 3.11 PETROLEUM PRODUCTSBHARAT PETROLEUM CORPORATION LTD 38,166 23,351,867 RELIANCE INDUSTRIES LTD 499,240 523,752,683
547,104,550 10.58 PHARMACEUTICALSCIPLA LTD 149,486 48,082,172 DR REDDY'S LABORATORIES LTD 36,767 60,262,951 RANBAXY LABORATORIES LTD 44,918 20,015,460 SUN PHARMACEUTICAL INDUSTRIES LTD 110,652 48,963,510
177,324,093 3.43 POWERNTPC LTD 376,584 72,718,370 POWER GRID CORPORATION OF INDIA LTD 417,152 42,507,789 RELIANCE INFRASTRUCTURE LTD 41,123 28,372,814 RELIANCE POWER LTD 161,780 21,096,112 TATA POWER CO LTD 47,399 63,284,774
227,979,859 4.41 SOFTWAREHCL TECHNOLOGIES LTD 70,900 33,886,655 INFOSYS TECHNOLOGIES LTD 142,178 460,841,550 TATA CONSULTANCY SERVICES LTD 149,648 177,168,266 WIPRO LTD 149,290 71,689,058
743,585,529 14.38 TELECOM - SERVICESBHARTI AIRTEL LTD 355,994 127,232,256 RELIANCE COMMUNICATIONS LTD 195,477 21,043,099
148,275,355 2.87
TOTAL 5,172,166,683 100.00
Note : Cash and Cash Equivalents are not considered for the above purpose.

SCHEDULE G - PORTFOLIO HOLDING STATEMENT AS ON MARCH 31, 2011Disclosure for derivative positions as per SEBI Circular No. CIR/IMD/DF/11/2010 dated 18th August 2010A. Hedging Positions through Futures as on March 31, 2011
Underlying Long / ShortFutures Price when purchased
Current price of the contract
Margin maintained in Rs. Lakhs
NILTotal %age of existing assets hedged through futures : NIL
Total Number of contracts where futures were bought : NILTotal Number of contracts where futures were sold : NILGross Notional Value of contracts where futures were bought : NILGross Notional Value of contracts where futures were sold : NILNet Profit/Loss value on all contracts combined : NIL
B. Other than Hedging Positions through Futures as on March 31, 2011
Underlying Long / ShortFutures Price when purchased (Rs)
Current price of the contract (Rs)
Margin maintained (Rs. Lakhs)
NILTotal exposure due to futures (non hedging positions) as a %age of net assets : NIL
Total Number of contracts where futures were bought : 204Total Number of contracts where futures were sold : 204Gross Notional Value of contracts where futures were bought : Rs. 79,362,711.60Gross Notional Value of contracts where futures were sold : Rs. 78,337,887.00Net Profit/Loss value on all contracts combined : Rs. (1,024,824.60)
C. Hedging Positions through Put Options as on March 31, 2011
Underlying Number of Contracts
Option Price when purchased
Current Option Price
NIL
D. Other than Hedging Positions through Options as on March 31, 2011
Underlying Call / put Number of contracts Option Price when purchased
Current Price
NIL
E. Hedging Positions through swaps as on March 31, 2011 - NIL
Total Exposure through options as a %age of net assets : NILFor the half-year ended March 31, 2011 following details specified with regrd to non-hedging transactions through options which have already been exercised/expired :
Total Number of contracts entered into : NILGross National Value of contracts : NILNet Profit/Loss on all contracts (premium paid treated as loss) : NIL
For the half-year ended March 31, 2011 following details specified for hedging transactions through futures which have been squared off/expired:
For the half-year ended March 31, 2011 following details specified for non-hedging transactions through futures which have been squared off/expired:
Total % age of existing assets hedged through put options - NILFor the half-year ended March 31, 2011 following details specified for hedging transactions through options which have already been exercised/expired :
Total Number of contracts entered into : NILGross National value of contracts : NILNet Profit/Loss on all contracts (premium paid treated as loss) : NIL
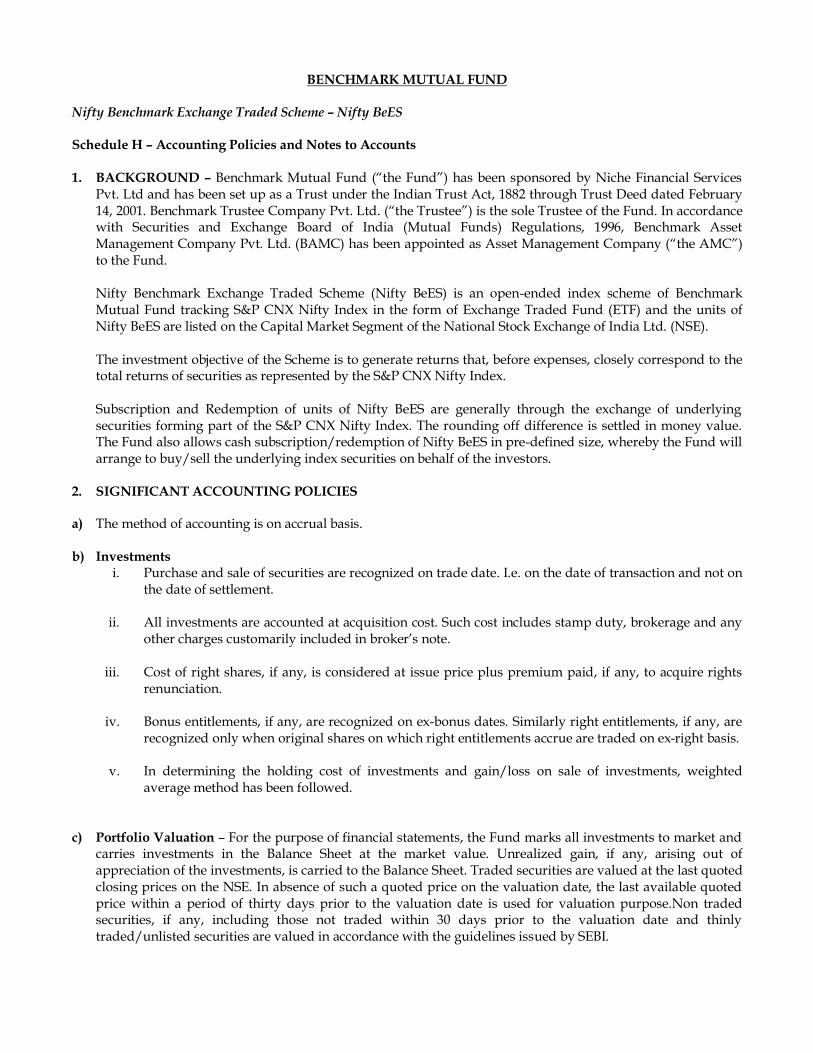
BENCHMARK MUTUAL FUND Nifty Benchmark Exchange Traded Scheme – Nifty BeES Schedule H – Accounting Policies and Notes to Accounts 1. BACKGROUND – Benchmark Mutual Fund (“the Fund”) has been sponsored by Niche Financial Services
Pvt. Ltd and has been set up as a Trust under the Indian Trust Act, 1882 through Trust Deed dated February 14, 2001. Benchmark Trustee Company Pvt. Ltd. (“the Trustee”) is the sole Trustee of the Fund. In accordance with Securities and Exchange Board of India (Mutual Funds) Regulations, 1996, Benchmark Asset Management Company Pvt. Ltd. (BAMC) has been appointed as Asset Management Company (“the AMC”) to the Fund.
Nifty Benchmark Exchange Traded Scheme (Nifty BeES) is an open-ended index scheme of Benchmark Mutual Fund tracking S&P CNX Nifty Index in the form of Exchange Traded Fund (ETF) and the units of Nifty BeES are listed on the Capital Market Segment of the National Stock Exchange of India Ltd. (NSE). The investment objective of the Scheme is to generate returns that, before expenses, closely correspond to the total returns of securities as represented by the S&P CNX Nifty Index. Subscription and Redemption of units of Nifty BeES are generally through the exchange of underlying securities forming part of the S&P CNX Nifty Index. The rounding off difference is settled in money value. The Fund also allows cash subscription/redemption of Nifty BeES in pre-defined size, whereby the Fund will arrange to buy/sell the underlying index securities on behalf of the investors.
2. SIGNIFICANT ACCOUNTING POLICIES a) The method of accounting is on accrual basis.
b) Investments
i. Purchase and sale of securities are recognized on trade date. I.e. on the date of transaction and not on the date of settlement.
ii. All investments are accounted at acquisition cost. Such cost includes stamp duty, brokerage and any
other charges customarily included in broker’s note.
iii. Cost of right shares, if any, is considered at issue price plus premium paid, if any, to acquire rights renunciation.
iv. Bonus entitlements, if any, are recognized on ex-bonus dates. Similarly right entitlements, if any, are
recognized only when original shares on which right entitlements accrue are traded on ex-right basis.
v. In determining the holding cost of investments and gain/loss on sale of investments, weighted average method has been followed.
c) Portfolio Valuation – For the purpose of financial statements, the Fund marks all investments to market and carries investments in the Balance Sheet at the market value. Unrealized gain, if any, arising out of appreciation of the investments, is carried to the Balance Sheet. Traded securities are valued at the last quoted closing prices on the NSE. In absence of such a quoted price on the valuation date, the last available quoted price within a period of thirty days prior to the valuation date is used for valuation purpose.Non traded securities, if any, including those not traded within 30 days prior to the valuation date and thinly traded/unlisted securities are valued in accordance with the guidelines issued by SEBI.

d) Income Recognition
a. Dividend income is accrued on ex-dividend date. b. Profit or loss on sale of investment is arrived at by applying weighted average cost on trade date.
c. Interest on fixed income investments are recognized on accrual basis.
d. Unrealized appreciation and changes thereon are recognized as gain/loss in the Revenue Account
and thereafter carried to the Balance Sheet as Unrealized Appreciation Reserve. e) Income Equalization
An appropriate portion of price of unit at the time of purchase and sale is transferred to Income Equalization Account. In arriving at the portion of the price to be transferred to Income Equalization Account, surplus/deficit (before considering unrealized appreciation) upto the date of transaction is taken into account. The net balance in Income Equalization Account is transferred to Revenue Account.
f) Unit Premium Reserve Unit Premium Reserve is debited or credited at the time of purchase or sale of units after taking into account the face value of units and Income Equalization. Balance in Unit Premium Reserve is not considered for distribution of dividend.
g) Entry / Exit Load The Fund does not charge any entry / exit load on subscription/redemption of units in the creation unit size. However in case no quotes are available on the NSE for five consecutive trading days, the exit load charged for redemption of units is upto 5% of NAV. Such load, if charged, at the time of repurchase of units, is offset against distribution and marketing expenses. Unutilized amount of load collected is carried to subsequent year unless the same is found excess by the Trustees / AMC. Such excess amount is credited to the Scheme. No entry load is charge, exit load in excess of 1% is credited to the scheme and load upto 1% is utilized for distribution and marketing expenses. As per the terms of the Offer Document, Depository and Custody Charges are recovered from the respective investor for transfer of shares on subscription and redemption and the same is utilized for payment of transaction charges to Depository Participant and Custodian on account of transfer of shares and hence do not form part of Revenue Account.
3. NOTES TO ACCOUNTS 1. Net Assets Value (NAV) is calculated after considering market/fair value of investments and after
providing for expenses on an estimated basis.
2. There are no underwriting obligations undertaken by the Scheme with respect to issue of securities of associate companies.
3. There is no contingent liability on underwriting commitment, partly paid equity shares or any other
uncalled liabilities. 4. All investments are marked to market and accordingly reflected in the Balance Sheet. The cost and
market value of investments are shown in Note no. 11. 5. The AMC has not dealt in any securities through brokers associated with the Sponsor. 6. Purchase of investments yet to be settled: Rs.Nil (Previous Year – Rs.2,468,058/-).

7. Sale of investments yet to be settled: Rs.1,145,518,025/- (Previous Year Rs.2,495,120/-).
8. Income and Expenses
Total income (including netprofit/(loss) on sale / redemptionof investments, profit on inter-scheme transfers and net change inunrealised appreciation /(depreciation) in value ofinvestments) 681,962,210 13.45% 1,255,213,115 41.66%Total expenditure (Annualrecurring expenses) 25,354,650 0.50% 15,058,665 0.50%
% of Average Net Assets
Aggregate Value (Rs.)
% of Average Net Assets
Average Daily Net Assets (Rs.) 5,071,891,163.31 3,012,827,977.11Year ended March 31, 2011 Year ended March 31, 2010
Aggregate Value (Rs.)
9. Aggregate Value of Purchase and Sale of Investments during the year
2010 - 11(Rs. In Lacs)
2009 - 10(Rs. In Lacs)
Daily Average Net Assets 50,718.91 30,128.28 Purchases 140,444.30 90,117.36 % to Daily Average Net Assets 276.91% 299.11%Sales 129,835.04 80,589.23 % to Daily Average Net Assets 255.99% 267.49%
10. Net Asset Value (Per Unit – in Rs.)
As at March 31, 2011
As at March 31, 2010
Face Value 10.00 10.00 Net Assets Value 589.2426 526.2011 Allotment NAV 104.3927 104.3927
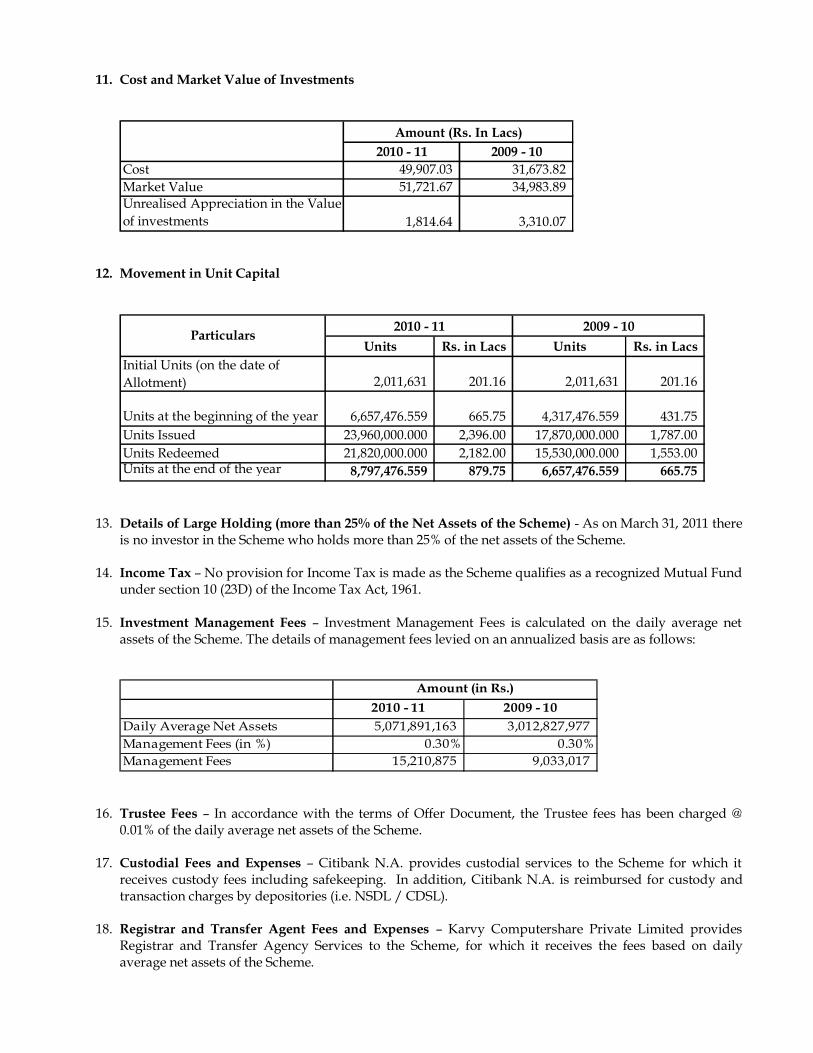
11. Cost and Market Value of Investments
2010 - 11 2009 - 10Cost 49,907.03 31,673.82 Market Value 51,721.67 34,983.89 Unrealised Appreciation in the Value of investments 1,814.64 3,310.07
Amount (Rs. In Lacs)
12. Movement in Unit Capital
Units Rs. in Lacs Units Rs. in LacsInitial Units (on the date of Allotment) 2,011,631 201.16 2,011,631 201.16
Units at the beginning of the year 6,657,476.559 665.75 4,317,476.559 431.75 Units Issued 23,960,000.000 2,396.00 17,870,000.000 1,787.00 Units Redeemed 21,820,000.000 2,182.00 15,530,000.000 1,553.00 Units at the end of the year 8,797,476.559 879.75 6,657,476.559 665.75
2010 - 11Particulars 2009 - 10
13. Details of Large Holding (more than 25% of the Net Assets of the Scheme) - As on March 31, 2011 there
is no investor in the Scheme who holds more than 25% of the net assets of the Scheme. 14. Income Tax – No provision for Income Tax is made as the Scheme qualifies as a recognized Mutual Fund
under section 10 (23D) of the Income Tax Act, 1961. 15. Investment Management Fees – Investment Management Fees is calculated on the daily average net
assets of the Scheme. The details of management fees levied on an annualized basis are as follows:
2010 - 11 2009 - 10Daily Average Net Assets 5,071,891,163 3,012,827,977 Management Fees (in %) 0.30% 0.30%Management Fees 15,210,875 9,033,017
Amount (in Rs.)
16. Trustee Fees – In accordance with the terms of Offer Document, the Trustee fees has been charged @
0.01% of the daily average net assets of the Scheme.
17. Custodial Fees and Expenses – Citibank N.A. provides custodial services to the Scheme for which it receives custody fees including safekeeping. In addition, Citibank N.A. is reimbursed for custody and transaction charges by depositories (i.e. NSDL / CDSL).
18. Registrar and Transfer Agent Fees and Expenses – Karvy Computershare Private Limited provides
Registrar and Transfer Agency Services to the Scheme, for which it receives the fees based on daily average net assets of the Scheme.

19. There are no investments made by Benchmark Trustee Company Pvt. Ltd. in the Scheme. Benchmark
Asset Management Company Pvt. Ltd. holds 776 units in the Scheme as at March 31, 2011.
20. The Scheme has made following investments in Group/Associate Companies.
NIFTY BeES BAJAJ AUTO LTD 1,548.58 584.58
Scheme Name Name of the Company
Aggregate investment during the year at cost (Rs. In Lacs)
Outstanding Investment as at March 31, 2011 at Market Value (Rs. In Lacs)
21. The Scheme has not made any investment in the issues lead managed by Associate Companies. 22. Details of transactions with associates in terms of Regulation 25 (8)
Brokerage paid to associates/related parties/group companies of Sponsor/AMC
Name of associate/related parties/group companies of
Sponsor/AMC
Nature of Association /
Nature of Relation
Period Covered (April 2010 to
March 2011 and April 2009 to March 2010)
Value of transaction ( in Rs. Cr. & % of total value of transaction of
the Fund )
Brokerage (Rs Cr & % of total
brokerage paid by the Fund)
Commission paid to associates/related parties/group companies of sponsor/AMCName of associate/related
parties/group companies of Sponsor/AMC
Nature of Association /
Nature of Relation
Period Covered (April 2010 to
March 2011 and April 2009 to March 2010)
Business Given ( in Rs. Cr. & %
of total business
received by the Fund )
Commission paid (Rs Cr & % of total
commssion paid by the Fund)
NIL
NIL
23. No brokerage, custodial fees or any other payment for services have been paid or is payable to any entity
in which the AMC or its major shareholders have a substantial interest.
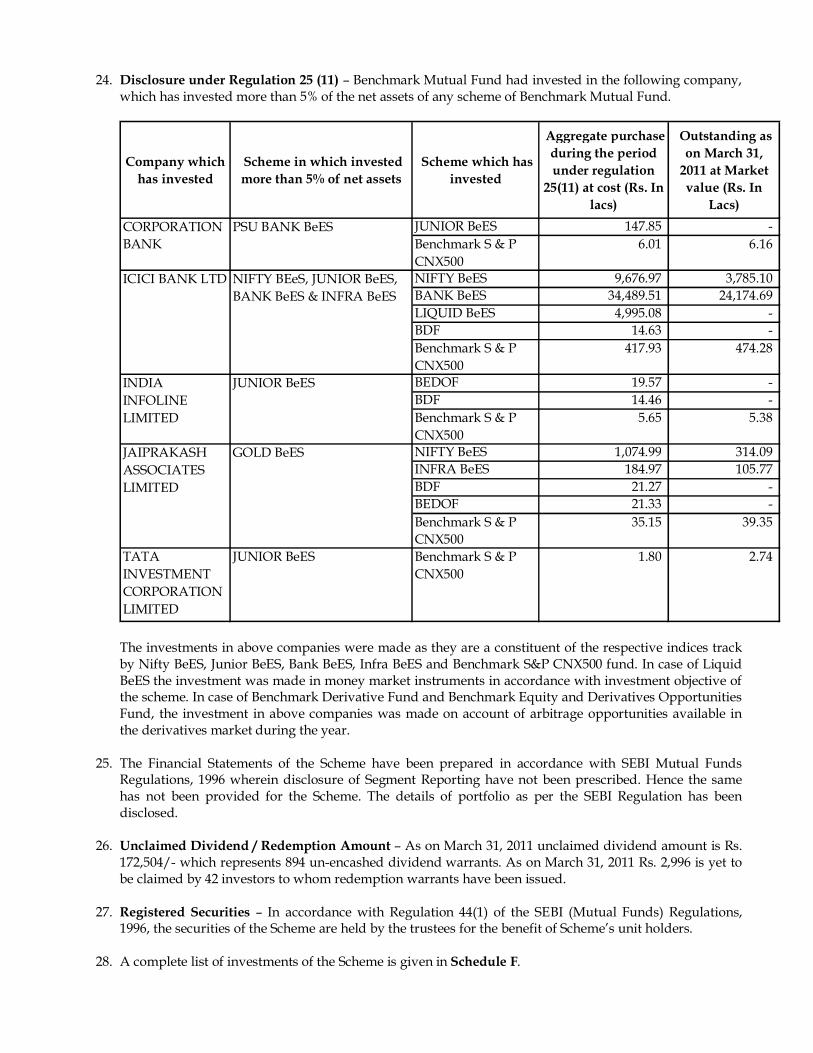
24. Disclosure under Regulation 25 (11) – Benchmark Mutual Fund had invested in the following company, which has invested more than 5% of the net assets of any scheme of Benchmark Mutual Fund.
Company which has invested
Scheme in which invested more than 5% of net assets
Scheme which has invested
Aggregate purchase during the period under regulation
25(11) at cost (Rs. In lacs)
Outstanding as on March 31,
2011 at Market value (Rs. In
Lacs)JUNIOR BeES 147.85 -Benchmark S & P CNX500
6.01 6.16
NIFTY BeES 9,676.97 3,785.10 BANK BeES 34,489.51 24,174.69 LIQUID BeES 4,995.08 -BDF 14.63 -Benchmark S & P CNX500
417.93 474.28
BEDOF 19.57 -BDF 14.46 -Benchmark S & P CNX500
5.65 5.38
NIFTY BeES 1,074.99 314.09 INFRA BeES 184.97 105.77 BDF 21.27 -BEDOF 21.33 -Benchmark S & P CNX500
35.15 39.35
TATA INVESTMENT CORPORATION LIMITED
JUNIOR BeES Benchmark S & P CNX500
1.80 2.74
INDIA INFOLINE LIMITED
JUNIOR BeES
JAIPRAKASH ASSOCIATES LIMITED
GOLD BeES
CORPORATION BANK
PSU BANK BeES
ICICI BANK LTD NIFTY BEeS, JUNIOR BeES, BANK BeES & INFRA BeES
The investments in above companies were made as they are a constituent of the respective indices track by Nifty BeES, Junior BeES, Bank BeES, Infra BeES and Benchmark S&P CNX500 fund. In case of Liquid BeES the investment was made in money market instruments in accordance with investment objective of the scheme. In case of Benchmark Derivative Fund and Benchmark Equity and Derivatives Opportunities Fund, the investment in above companies was made on account of arbitrage opportunities available in the derivatives market during the year.
25. The Financial Statements of the Scheme have been prepared in accordance with SEBI Mutual Funds Regulations, 1996 wherein disclosure of Segment Reporting have not been prescribed. Hence the same has not been provided for the Scheme. The details of portfolio as per the SEBI Regulation has been disclosed.
26. Unclaimed Dividend / Redemption Amount – As on March 31, 2011 unclaimed dividend amount is Rs.
172,504/- which represents 894 un-encashed dividend warrants. As on March 31, 2011 Rs. 2,996 is yet to be claimed by 42 investors to whom redemption warrants have been issued.
27. Registered Securities – In accordance with Regulation 44(1) of the SEBI (Mutual Funds) Regulations,
1996, the securities of the Scheme are held by the trustees for the benefit of Scheme’s unit holders.
28. A complete list of investments of the Scheme is given in Schedule F.

29. On March 15, 2011 Goldman Sachs Asset Management, L.P., through its subsidiaries Goldman Sachs
Asset Management (India) Private Limited (“GS AMC”) and Goldman Sachs Trustee Company (India) Private Limited (“GS Trustee”), executed a sale and purchase agreement relating to the acquisition of all the outstanding shares in Benchmark Asset Management Company Private Limited (“BAMC”) and Benchmark Trustee Company Private Limited (“BTC”) from Niche Financial Services Private Limited, the sponsor of Benchmark Mutual Fund (“Benchmark MF”), and the other shareholders of BAMC and BTC. The sale and purchase agreement contemplates that BAMC shall transfer the rights to manage the schemes of Benchmark MF to GS AMC and BTC shall transfer the schemes of Benchmark MF to GS Trustee as part of the transaction. This transaction has been approved by the regulator, Securities and Exchange Board of India (“SEBI”) on June 27, 2011.
30. The previous year figures have been regrouped/rearranged wherever necessary.
31. The audited results for the year ended March 31, 2011 have been approved by the Boards of Benchmark
Asset Management Company Pvt. Ltd (AMC) and Benchmark Trustee Company Pvt. Ltd (Trustee) at their meeting held on June 29, 2011 respectively.
NOTES:
1. On written request, present and prospective unit holders/investors can obtain a copy of the Trust Deed, the Annual Report, at a price if any, and the text of the Scheme.
2. On written request, the present and prospective unit holders/investors may request a copy of the Annual Report of the AMC.
3. On written request, the present and prospective unit holders/investors can inspect a full list of investments of the Scheme at the office of the AMC.
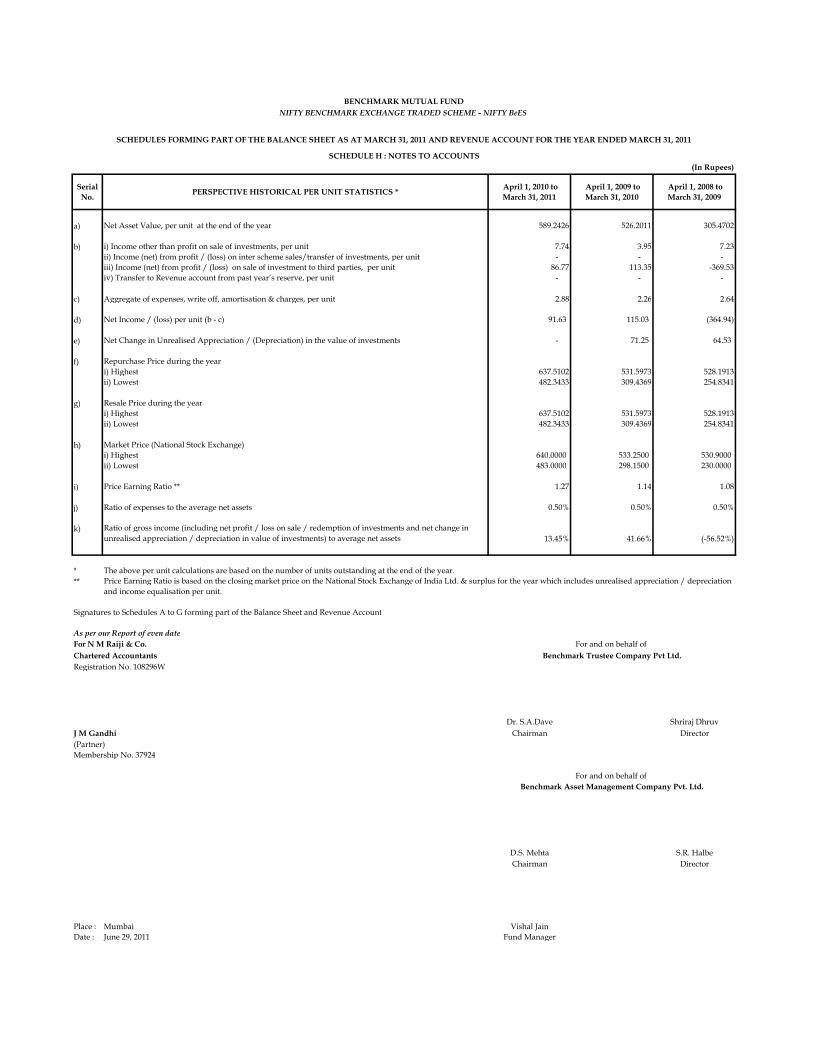
(In Rupees)
Serial No. PERSPECTIVE HISTORICAL PER UNIT STATISTICS * April 1, 2010 to
March 31, 2011 April 1, 2009 to March 31, 2010
April 1, 2008 to March 31, 2009
a) Net Asset Value, per unit at the end of the year 589.2426 526.2011 305.4702
b) i) Income other than profit on sale of investments, per unit 7.74 3.95 7.23ii) Income (net) from profit / (loss) on inter scheme sales/transfer of investments, per unit - - - iii) Income (net) from profit / (loss) on sale of investment to third parties, per unit 86.77 113.35 -369.53iv) Transfer to Revenue account from past year’s reserve, per unit - - -
c) Aggregate of expenses, write off, amortisation & charges, per unit 2.88 2.26 2.64
d) Net Income / (loss) per unit (b - c) 91.63 115.03 (364.94)
e) Net Change in Unrealised Appreciation / (Depreciation) in the value of investments - 71.25 64.53
f) Repurchase Price during the yeari) Highest 637.5102 531.5973 528.1913ii) Lowest 482.3433 309.4369 254.8341
g) Resale Price during the yeari) Highest 637.5102 531.5973 528.1913ii) Lowest 482.3433 309.4369 254.8341
h) Market Price (National Stock Exchange)i) Highest 640.0000 533.2500 530.9000 ii) Lowest 483.0000 298.1500 230.0000
i) Price Earning Ratio ** 1.27 1.14 1.08
j) Ratio of expenses to the average net assets 0.50% 0.50% 0.50%
k) Ratio of gross income (including net profit / loss on sale / redemption of investments and net change in unrealised appreciation / depreciation in value of investments) to average net assets 13.45% 41.66% (-56.52%)
***
Signatures to Schedules A to G forming part of the Balance Sheet and Revenue Account
As per our Report of even dateFor N M Raiji & Co.Chartered AccountantsRegistration No. 108296W
Dr. S.A.Dave Shriraj DhruvJ M Gandhi Chairman Director(Partner)Membership No. 37924
D.S. Mehta S.R. HalbeChairman Director
Place : Mumbai Vishal JainDate : June 29, 2011 Fund Manager
For and on behalf of Benchmark Asset Management Company Pvt. Ltd.
Price Earning Ratio is based on the closing market price on the National Stock Exchange of India Ltd. & surplus for the year which includes unrealised appreciation / depreciation and income equalisation per unit.
SCHEDULE H : NOTES TO ACCOUNTS
BENCHMARK MUTUAL FUNDNIFTY BENCHMARK EXCHANGE TRADED SCHEME - NIFTY BeES
SCHEDULES FORMING PART OF THE BALANCE SHEET AS AT MARCH 31, 2011 AND REVENUE ACCOUNT FOR THE YEAR ENDED MARCH 31, 2011
The above per unit calculations are based on the number of units outstanding at the end of the year.
For and on behalf of Benchmark Trustee Company Pvt Ltd.

AUDITORS’ REPORT The Board of Directors, Benchmark Trustee Company Private Limited
We have audited the attached Balance Sheet as at March 31, 2011, the Revenue Account and the Cash
Flow Statement for the year ended on that date annexed thereto, of Nifty Junior Benchmark Exchange
Traded Scheme (the Scheme), of Benchmark Mutual Fund. These financial statements are prepared in
accordance with SEBI (Mutual Fund) Regulations, 1996 (the Regulations) and are the responsibility
of the Management. Our responsibility is to express an opinion on these financial statements based on
our audit.
We conducted our audit in accordance with the standards on auditing issued by Institute of Chartered
Accountants of India. An audit includes examining on a test basis, evidence supporting the amounts
and disclosures in the financial statements. An audit also includes assessing the accounting principles
used and significant estimates made by the management, as well as evaluating the overall financial
statement presentation. We believe that our audit provides a reasonable basis for our opinion.
We report that:
1. We have obtained all information and explanations, which, to the best of our knowledge and
belief were necessary for the purpose of our audit.
2. The Balance Sheet, the Revenue Account and the Cash Flow Statement referred to above are in
agreement with the books of accounts of the Scheme.
3. The accounts have been prepared in accordance with the accounting policies adopted by the
trustees of the Fund and as specified in the Ninth Schedule to the Regulations.

4. In our opinion, valuation methods for Non Traded Securities, if any, adopted by the scheme are
fair and reasonable and are in accordance with the guidelines for valuation issued by SEBI and
approved by the Trustee.
5. Without qualifying our opinion, we draw attention to note no. 25 in Schedule G of the financial
statements whereby the management has not provided the Segment Reporting for reasons
mentioned therein.
6. In our opinion and to the best of our information and according to the explanations given to us,
the financial statements read with the accounting policies and notes to accounts attached thereto,
give the information required as per the Regulations and give a true & fair view in accordance
with the generally accepted accounting principles in India:
a. in the case of Balance Sheet, of the state of affairs of the scheme as at March 31, 2011;
b. in the case of Revenue Account, of the surplus of the scheme for the year ended on that date;
and
c. in the case of Cash Flow Statement, of the cash flows for the year ended on that date.
For N.M.RAIJI & CO. Chartered Accountants
Firm Reg. No:108296W
J. M. GANDHI Partner Membership No. 37924
Place: Mumbai Dated: June 29, 2011

March 31, 2011 March 31, 2010
LIABILITIES
1 Unit Capital (No of units: Current Year - 9,443,190, Previous Year - 9,075,190) 11,803,988 11,343,988 2 Reserves and Surplus A 1,051,707,792 964,029,927
UNIT HOLDERS FUNDS 1,063,511,780 975,373,915
3 Current Liabilities & Provisions B 135,060,792 4,246,719
TOTAL 1,198,572,572 979,620,634
ASSETS
1 Investments C 1,060,620,924 972,551,842 2 Other Current Assets D 137,951,648 7,068,792
TOTAL 1,198,572,572 979,620,634
Accounting Policies and Notes to Accounts G
The Schedules referred to herein form an integral part of the Balance sheet and Revenue Account
As per our Report of even dateFor N M Raiji & Co.Chartered AccountantsRegistration No. 108296W
Dr. S.A.Dave Shriraj DhruvJ M Gandhi Chairman Director(Partner)Membership No. 37924
D.S. Mehta S.R. HalbeChairman Director
Place : Mumbai Payal Wadhwa KaipunjalDate : June 29, 2011 Fund Manager
For and on behalf of Benchmark Trustee Company Pvt Ltd.
For and on behalf of Benchmark Asset Management Company Pvt Ltd.
BENCHMARK MUTUAL FUNDNIFTY JUNIOR BENCHMARK EXCHANGE TRADED SCHEME - JUNIOR BeES
BALANCE SHEET AS AT MARCH 31, 2011
SCHEDULESerial No. PARTICULARSAMOUNT (In Rs.)
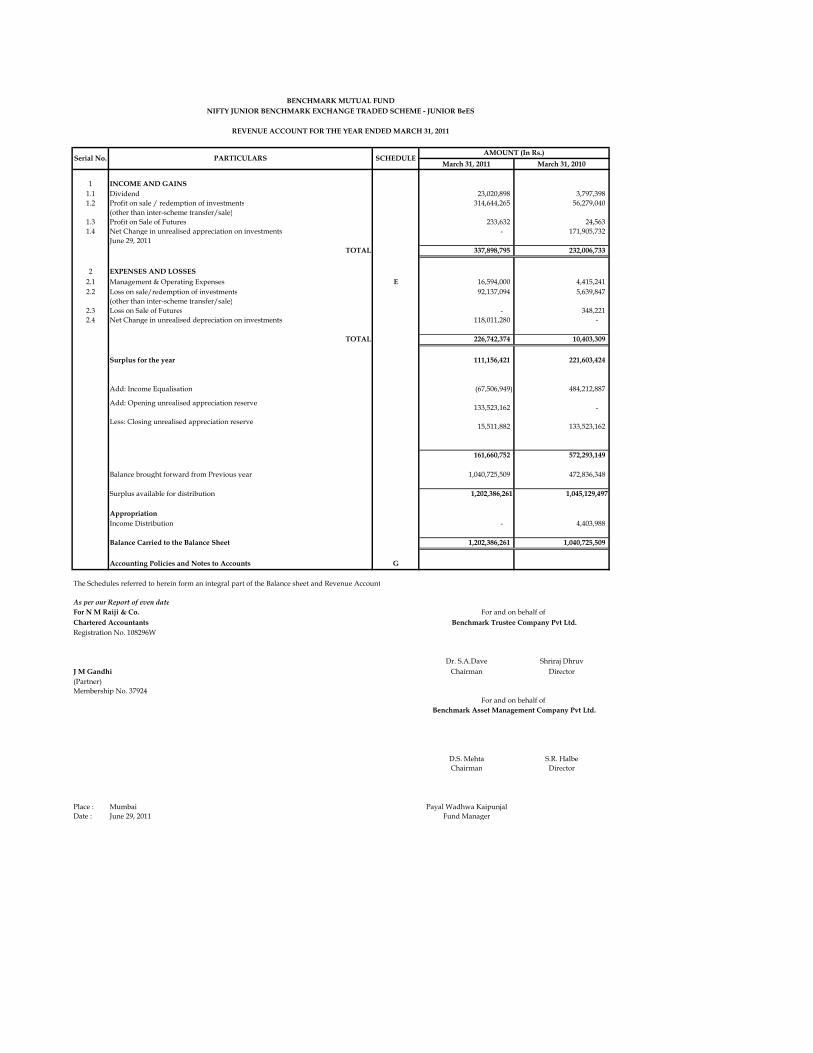
March 31, 2011 March 31, 2010
1 INCOME AND GAINS1.1 Dividend 23,020,898 3,797,398 1.2 Profit on sale / redemption of investments 314,644,265 56,279,040
(other than inter-scheme transfer/sale)1.3 Profit on Sale of Futures 233,632 24,563 1.4 Net Change in unrealised appreciation on investments - 171,905,732
June 29, 2011TOTAL 337,898,795 232,006,733
2 EXPENSES AND LOSSES2.1 Management & Operating Expenses E 16,594,000 4,415,241 2.2 Loss on sale/redemption of investments 92,137,094 5,639,847
(other than inter-scheme transfer/sale)2.3 Loss on Sale of Futures - 348,221 2.4 Net Change in unrealised depreciation on investments 118,011,280 -
TOTAL 226,742,374 10,403,309
Surplus for the year 111,156,421 221,603,424
Add: Income Equalisation (67,506,949) 484,212,887
161,660,752 572,293,149
Balance brought forward from Previous year 1,040,725,509 472,836,348
Surplus available for distribution 1,202,386,261 1,045,129,497
AppropriationIncome Distribution - 4,403,988
Balance Carried to the Balance Sheet 1,202,386,261 1,040,725,509
Accounting Policies and Notes to Accounts G
The Schedules referred to herein form an integral part of the Balance sheet and Revenue Account
As per our Report of even dateFor N M Raiji & Co.Chartered AccountantsRegistration No. 108296W
Dr. S.A.Dave Shriraj DhruvJ M Gandhi Chairman Director(Partner)Membership No. 37924
D.S. Mehta S.R. HalbeChairman Director
Place : Mumbai Payal Wadhwa KaipunjalDate : June 29, 2011 Fund Manager
BENCHMARK MUTUAL FUNDNIFTY JUNIOR BENCHMARK EXCHANGE TRADED SCHEME - JUNIOR BeES
For and on behalf of Benchmark Trustee Company Pvt Ltd.
For and on behalf of Benchmark Asset Management Company Pvt Ltd.
15,511,882
Add: Opening unrealised appreciation reserve
Less: Closing unrealised appreciation reserve 133,523,162
REVENUE ACCOUNT FOR THE YEAR ENDED MARCH 31, 2011
SCHEDULEPARTICULARSSerial No.AMOUNT (In Rs.)
- 133,523,162
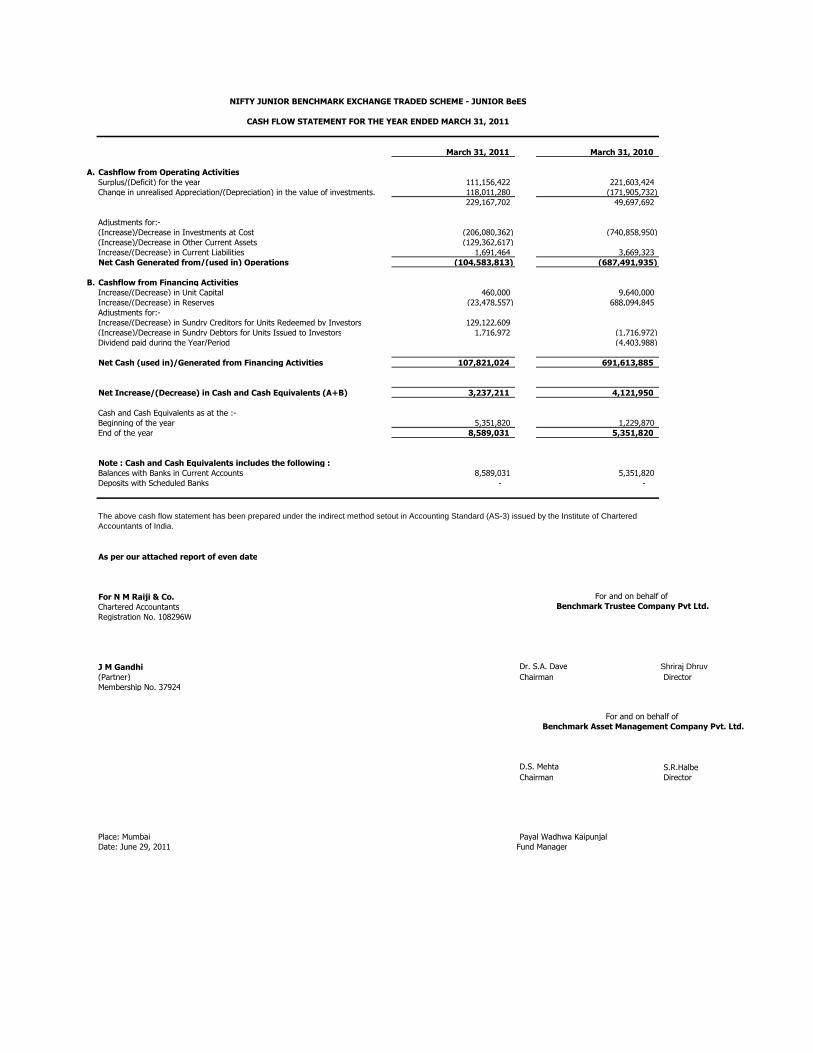
March 31, 2011 March 31, 2010
A. Cashflow from Operating ActivitiesSurplus/(Deficit) for the year 111,156,422 221,603,424 Change in unrealised Appreciation/(Depreciation) in the value of investments. 118,011,280 (171,905,732)
229,167,702 49,697,692
Adjustments for:-(Increase)/Decrease in Investments at Cost (206,080,362) (740,858,950) (Increase)/Decrease in Other Current Assets (129,362,617) Increase/(Decrease) in Current Liabilities 1,691,464 3,669,323 Net Cash Generated from/(used in) Operations (104,583,813) (687,491,935)
B. Cashflow from Financing ActivitiesIncrease/(Decrease) in Unit Capital 460,000 9,640,000 Increase/(Decrease) in Reserves (23,478,557) 688,094,845 Adjustments for:-Increase/(Decrease) in Sundry Creditors for Units Redeemed by Investors 129,122,609 (Increase)/Decrease in Sundry Debtors for Units Issued to Investors 1,716,972 (1,716,972) Dividend paid during the Year/Period (4,403,988)
Net Cash (used in)/Generated from Financing Activities 107,821,024 691,613,885
Net Increase/(Decrease) in Cash and Cash Equivalents (A+B) 3,237,211 4,121,950
Cash and Cash Equivalents as at the :-Beginning of the year 5,351,820 1,229,870 End of the year 8,589,031 5,351,820
Note : Cash and Cash Equivalents includes the following :Balances with Banks in Current Accounts 8,589,031 5,351,820 Deposits with Scheduled Banks - -
As per our attached report of even date
For N M Raiji & Co. Chartered Accountants Registration No. 108296W
J M Gandhi Dr. S.A. Dave Shriraj Dhruv(Partner) Chairman DirectorMembership No. 37924
D.S. Mehta S.R.HalbeChairman Director
Place: Mumbai Payal Wadhwa KaipunjalDate: June 29, 2011 Fund Manager
For and on behalf of Benchmark Asset Management Company Pvt. Ltd.
NIFTY JUNIOR BENCHMARK EXCHANGE TRADED SCHEME - JUNIOR BeES
CASH FLOW STATEMENT FOR THE YEAR ENDED MARCH 31, 2011
The above cash flow statement has been prepared under the indirect method setout in Accounting Standard (AS-3) issued by the Institute of Chartered Accountants of India.
For and on behalf of Benchmark Trustee Company Pvt Ltd.

March 31, 2011 March 31, 2010
A RESERVES AND SURPLUS
Unit Premium ReserveOpening Balance (210,218,744) (414,100,702) Add/(Less): On account of subscription/redemption of units 44,028,393 203,881,958
(166,190,351) (210,218,744)
Unrealised Appreciation ReserveOpening Balance 133,523,162 - Add/(Less): During the year (118,011,280) 133,523,162 Closing Balance 15,511,882 133,523,162
SurplusBalance transferred from Revenue Account 1,202,386,261 1,040,725,509
1,051,707,792 964,029,927
B CURRENT LIABILITIES & PROVISIONS
Current LiabilitiesManagement Fees Payable 461,820 363,152 Trusteeship Fees Payable 141,750 156,229 Contracts For Purchase of Equity - 1,713,832 Unit Redemption Payable 129,126,641 - Provision for STT 417,807 4,032 Others 4,912,774 2,009,474
135,060,792 4,246,719
C INVESTMENTS (Marked to Market)(Refer Schedule F for Portfolio Holding Statement)
Equity Shares 1,060,620,924 972,551,842
1,060,620,924 972,551,842
D OTHER CURRENT ASSETS
Contracts for Sale of Equity 129,100,089 - Balances with Scheduled Banks in Current Account 8,589,031 5,351,820 Unit Subcription Receivable - 1,716,972 Dividend receivable 262,528 -
137,951,648 7,068,792
E MANAGEMENT & OTHER OPERATING EXPENSES
Management Fees 8,293,914 2,205,272 Trusteeship Fees 830,009 220,997 Selling, Marketing and Distribution Expenses 4,897,356 999,829 Audit Fees 167,271 97,936 Custodial Fees 979,708 458,032 Registrar Expenses 843,817 217,648 Listing, Licensing and Other Fees 218,144 145,596 Investor Communication Expenses 331,379 63,617 Other Operating Expenses 32,402 6,314
16,594,000 4,415,241
Schedule No.
SCHEDULES FORMING PART OF THE BALANCE SHEET AS AT MARCH 31, 2011 AND REVENUE ACCOUNT FOR THE YEAR ENDED MARCH 31, 2011
PARTICULARSAMOUNT (In Rs.)
BENCHMARK MUTUAL FUNDNIFTY JUNIOR BENCHMARK EXCHANGE TRADED SCHEME - JUNIOR BeES
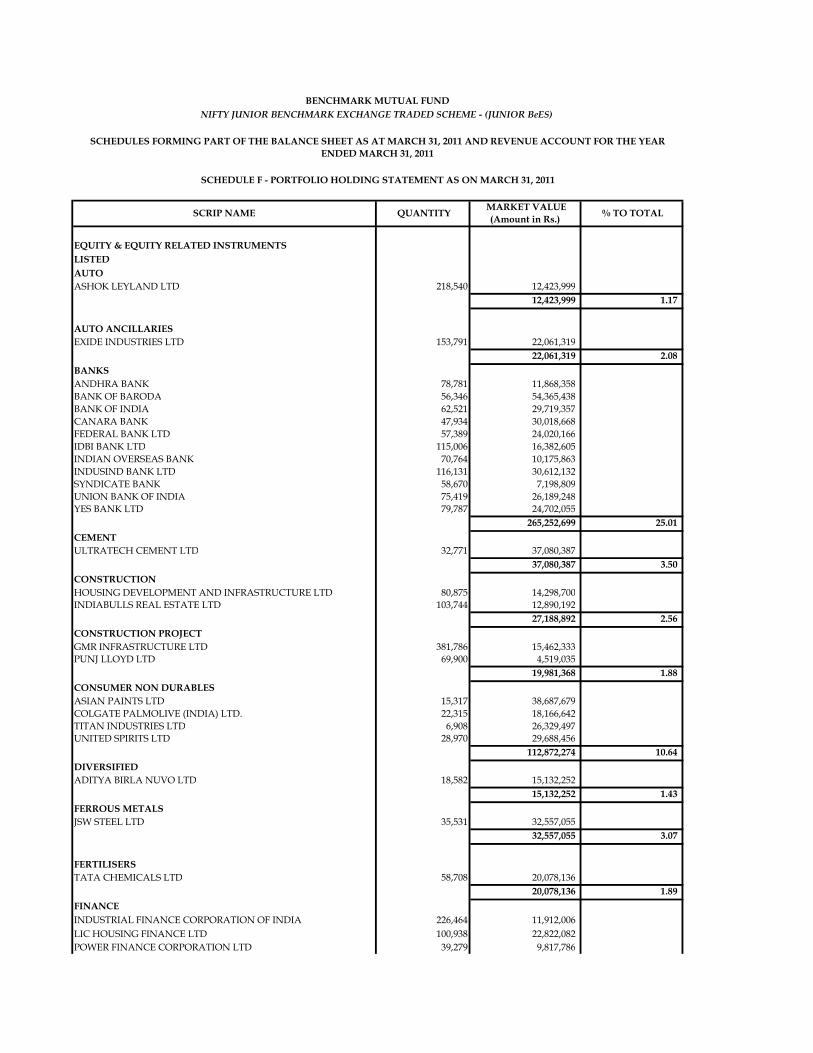
EQUITY & EQUITY RELATED INSTRUMENTSLISTEDAUTOASHOK LEYLAND LTD 218,540 12,423,999
12,423,999 1.17
AUTO ANCILLARIESEXIDE INDUSTRIES LTD 153,791 22,061,319
22,061,319 2.08 BANKSANDHRA BANK 78,781 11,868,358 BANK OF BARODA 56,346 54,365,438 BANK OF INDIA 62,521 29,719,357 CANARA BANK 47,934 30,018,668 FEDERAL BANK LTD 57,389 24,020,166 IDBI BANK LTD 115,006 16,382,605 INDIAN OVERSEAS BANK 70,764 10,175,863 INDUSIND BANK LTD 116,131 30,612,132 SYNDICATE BANK 58,670 7,198,809 UNION BANK OF INDIA 75,419 26,189,248 YES BANK LTD 79,787 24,702,055
265,252,699 25.01 CEMENTULTRATECH CEMENT LTD 32,771 37,080,387
37,080,387 3.50 CONSTRUCTIONHOUSING DEVELOPMENT AND INFRASTRUCTURE LTD 80,875 14,298,700 INDIABULLS REAL ESTATE LTD 103,744 12,890,192
27,188,892 2.56 CONSTRUCTION PROJECTGMR INFRASTRUCTURE LTD 381,786 15,462,333 PUNJ LLOYD LTD 69,900 4,519,035
19,981,368 1.88 CONSUMER NON DURABLESASIAN PAINTS LTD 15,317 38,687,679 COLGATE PALMOLIVE (INDIA) LTD. 22,315 18,166,642 TITAN INDUSTRIES LTD 6,908 26,329,497 UNITED SPIRITS LTD 28,970 29,688,456
112,872,274 10.64 DIVERSIFIEDADITYA BIRLA NUVO LTD 18,582 15,132,252
15,132,252 1.43 FERROUS METALSJSW STEEL LTD 35,531 32,557,055
32,557,055 3.07
FERTILISERSTATA CHEMICALS LTD 58,708 20,078,136
20,078,136 1.89 FINANCEINDUSTRIAL FINANCE CORPORATION OF INDIA 226,464 11,912,006 LIC HOUSING FINANCE LTD 100,938 22,822,082 POWER FINANCE CORPORATION LTD 39,279 9,817,786
BENCHMARK MUTUAL FUNDNIFTY JUNIOR BENCHMARK EXCHANGE TRADED SCHEME - (JUNIOR BeES)
SCHEDULES FORMING PART OF THE BALANCE SHEET AS AT MARCH 31, 2011 AND REVENUE ACCOUNT FOR THE YEAR ENDED MARCH 31, 2011
% TO TOTAL MARKET VALUE (Amount in Rs.) QUANTITY SCRIP NAME
SCHEDULE F - PORTFOLIO HOLDING STATEMENT AS ON MARCH 31, 2011

SCHEDULE F - PORTFOLIO HOLDING STATEMENT AS ON MARCH 31, 2011RURAL ELECTRIFICATION CORPORATION LTD 109,872 27,874,526 SHRIRAM TRANSPORT FINANCE COMPANY LTD 44,529 35,445,083
107,871,483 10.17 HOTELSINDIAN HOTELS CO LTD 169,054 14,200,536
14,200,536 1.34 INDUSTRIAL CAPITAL GOODSBHARAT ELECTRONICS LTD 6,468 10,887,584 CROMPTON GREAVES LTD 127,001 34,639,523
45,527,107 4.29 INDUSTRIAL PRODUCTSBHARAT FORGE LTD 45,167 15,686,499 CUMMINS INDIA LTD 32,517 22,693,614
38,380,113 3.62 MEDIA & ENTERTAINMENTZEE ENTERTAINMENT ENTERPRISES LTD 187,481 23,172,652
23,172,652 2.18 POWERTORRENT POWER LTD 56,696 14,219,357
14,219,357 1.34 PESTICIDESUNITED PHOSPHORUS LTD 113,628 16,981,705
16,981,705 1.60 PETROLEUM PRODUCTSHINDUSTAN PETROLEUM CORPORATION LTD 55,474 19,779,255
19,779,255 1.86 PHARMACEUTICALSBIOCON LTD 23,468 8,097,633 GLAXOSMITHKLINE PHARMACEUTICALS LTD 13,979 28,837,978 GLENMARK PHARMACEUTICALS LTD 46,825 13,284,253 LUPIN LTD 79,235 33,013,262
83,233,126 7.85 SOFTWAREMPHASIS LTD 24,507 10,176,531 ORACLE FINANCIAL SERVICES SOFTWARE LTD 5,526 10,978,504 PATNI COMPUTER SYSTEMS LTD 16,213 7,734,412 TECH MAHINDRA LTD 11,538 7,801,419
36,690,867 3.46 TRADINGADANI ENTERPRISES LTD 83,973 55,972,203
55,972,203 5.28 TRANSPORTATIONCONTAINER CORPORATION OF INDIA LTD 16,099 19,319,605 MUNDRA PORT AND SPECIAL ECONOMIC ZONE LTD 151,076 20,644,535
39,964,140 3.78
TOTAL 1,060,620,924 100.00
Note : Cash and Cash Equivalents are not considered for the above purpose.

SCHEDULE F - PORTFOLIO HOLDING STATEMENT AS ON MARCH 31, 2011Disclosure for derivative positions as per SEBI Circular No. CIR/IMD/DF/11/2010 dated 18th August 2010A. Hedging Positions through Futures as on March 31, 2011
Underlying Long / ShortFutures Price when purchased
Current price of the contract
Margin maintained in Rs. Lakhs
NILTotal %age of existing assets hedged through futures : NIL
Total Number of contracts where futures were bought : NILTotal Number of contracts where futures were sold : NILGross Notional Value of contracts where futures were bought : NILGross Notional Value of contracts where futures were sold : NILNet Profit/Loss value on all contracts combined : NIL
B. Other than Hedging Positions through Futures as on March 31, 2011
Underlying Long / ShortFutures Price when purchased (Rs)
Current price of the contract (Rs)
Margin maintained (Rs. Lakhs)
NILTotal exposure due to futures (non hedging positions) as a %age of net assets : NIL
Total Number of contracts where futures were bought : 30Total Number of contracts where futures were sold : 30Gross Notional Value of contracts where futures were bought : Rs. 8,628,528.65Gross Notional Value of contracts where futures were sold : Rs. 8,868,910.60Net Profit/Loss value on all contracts combined : Rs. 240,381.95
C. Hedging Positions through Put Options as on March 31, 2011
Underlying Number of Contracts Option Price when purchased Current Option Price
NIL
D. Other than Hedging Positions through Options as on March 31, 2011
Underlying Call / put Number of contracts Option Price when purchased
Current Price
NIL
E. Hedging Positions through swaps as on March 31, 2011 - NIL
For the half-year ended March 31, 2011 following details specified for hedging transactions through futures which have been squared off/expired:
For the half-year ended March 31, 2011 following details specified for non-hedging transactions through futures which have been squared off/expired:
Total % age of existing assets hedged through put options - NILFor the half-year ended March 31, 2011 following details specified for hedging transactions through options which have already been exercised/expired :
Total Number of contracts entered into : NILGross National value of contracts : NILNet Profit/Loss on all contracts (premium paid treated as loss) : NIL
Total Exposure through options as a %age of net assets : NILFor the half-year ended March 31, 2011 following details specified with regrd to non-hedging transactions through options which have already been exercised/expired :
Total Number of contracts entered into : NILGross National Value of contracts : NILNet Profit/Loss on all contracts (premium paid treated as loss) : NIL

BENCHMARK MUTUAL FUND Nifty Junior Benchmark Exchange Traded Scheme – Junior BeES Schedule G – Accounting Policies and Notes to Accounts 1. BACKGROUND – Benchmark Mutual Fund (“the Fund”) has been sponsored by Niche Financial Services
Pvt. Ltd and has been set up as a Trust under the Indian Trust Act, 1882 through Trust Deed dated February 14, 2001. Benchmark Trustee Company Pvt. Ltd. (“the Trustee”) is the sole Trustee of the Fund. In accordance with Securities and Exchange Board of India (Mutual Funds) Regulations, 1996, Benchmark Asset Management Company Pvt. Ltd. (BAMC) has been appointed as Asset Management Company (“the AMC”) to the Fund.
Nifty Junior Benchmark Exchange Traded Scheme (Junior BeES) is an open ended index scheme of Benchmark Mutual Fund, tracking CNX Nifty Junior Index, in the form of Exchange Traded Fund (ETF) and the units of Junior BeES are listed on the Capital Market Segment of the National Stock Exchange of India Ltd. (NSE). The investment objective of the Scheme is to generate returns that, before expenses, closely correspond to the total returns of securities as represented by the CNX Nifty Junior Index. Subscription and Redemption of units of Junior BeES are generally through the exchange of underlying securities forming part of the CNX Nifty Junior Index. The rounding off difference is settled in money value. The Fund also allows cash subscription/redemption of Junior BeES in pre-defined size, whereby the Fund will arrange to buy/sell the underlying index securities on behalf of the investors.
2. SIGNIFICANT ACCOUNTING POLICIES a) The method of accounting is on accrual basis.
b) Investments
i. Purchase and sale of securities are recognized on trade date. i.e. on the date of transaction and not on
the date of settlement.
ii. All investments are accounted at acquisition cost. Such cost includes stamp duty, brokerage and any other charges customarily included in broker’s note.
iii. Cost of right shares, if any, is considered at issue price plus premium paid, if any, to acquire rights
renunciation.
iv. Bonus entitlements, if any, are recognized on ex-bonus dates. Similarly right entitlements, if any, are recognized only when original shares on which right entitlements accrue are traded on ex-right basis.
v. In determining the holding cost of investments and gain/loss on sale of investments, weighted
average method has been followed.
c) Portfolio Valuation – For the purpose of financial statements, the Fund marks all investments to market and carries investments in the Balance Sheet at the Market Value. Unrealized Gain, if any, arising out of appreciation of the investments, is carried to the Balance Sheet. Traded securities are valued at the last quoted closing prices on the NSE, if such date is not preceding more than 30 days prior to the valuation date.Non traded securities, if any, including those not traded within 30 days prior to the valuation date and thinly traded/unlisted securities are valued in accordance with the guidelines issued by SEBI.
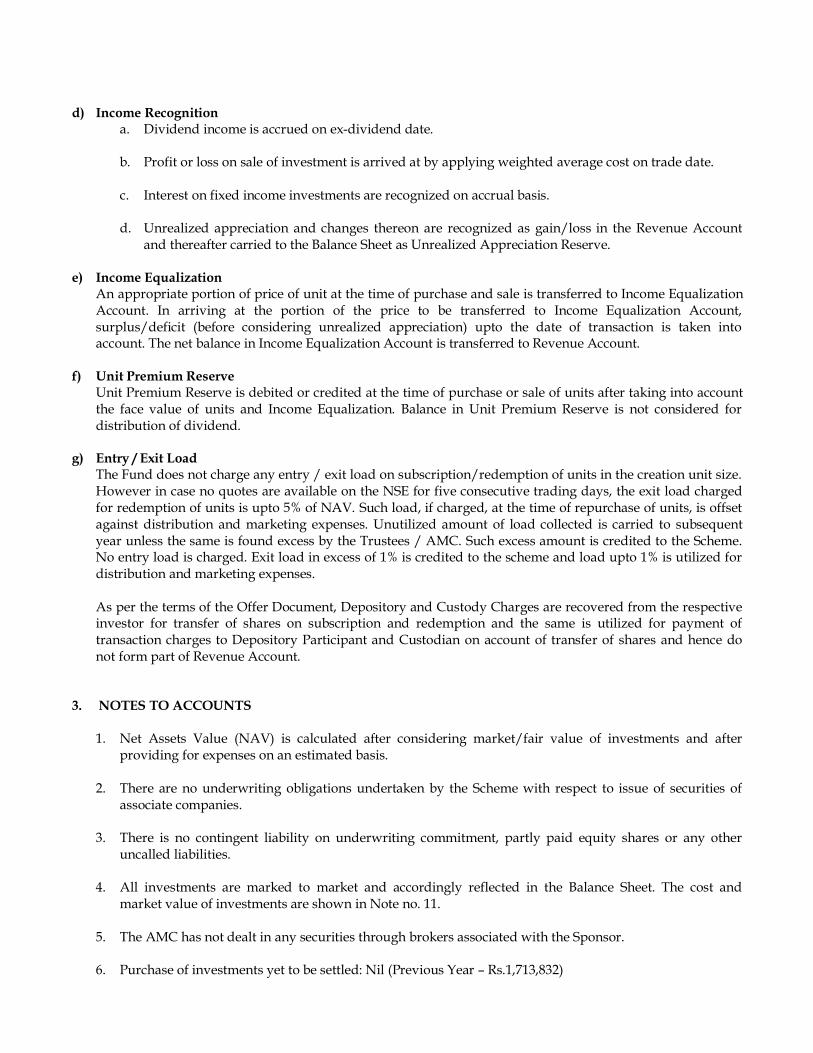
d) Income Recognition a. Dividend income is accrued on ex-dividend date. b. Profit or loss on sale of investment is arrived at by applying weighted average cost on trade date.
c. Interest on fixed income investments are recognized on accrual basis.
d. Unrealized appreciation and changes thereon are recognized as gain/loss in the Revenue Account
and thereafter carried to the Balance Sheet as Unrealized Appreciation Reserve. e) Income Equalization
An appropriate portion of price of unit at the time of purchase and sale is transferred to Income Equalization Account. In arriving at the portion of the price to be transferred to Income Equalization Account, surplus/deficit (before considering unrealized appreciation) upto the date of transaction is taken into account. The net balance in Income Equalization Account is transferred to Revenue Account.
f) Unit Premium Reserve Unit Premium Reserve is debited or credited at the time of purchase or sale of units after taking into account the face value of units and Income Equalization. Balance in Unit Premium Reserve is not considered for distribution of dividend.
g) Entry / Exit Load The Fund does not charge any entry / exit load on subscription/redemption of units in the creation unit size. However in case no quotes are available on the NSE for five consecutive trading days, the exit load charged for redemption of units is upto 5% of NAV. Such load, if charged, at the time of repurchase of units, is offset against distribution and marketing expenses. Unutilized amount of load collected is carried to subsequent year unless the same is found excess by the Trustees / AMC. Such excess amount is credited to the Scheme. No entry load is charged. Exit load in excess of 1% is credited to the scheme and load upto 1% is utilized for distribution and marketing expenses. As per the terms of the Offer Document, Depository and Custody Charges are recovered from the respective investor for transfer of shares on subscription and redemption and the same is utilized for payment of transaction charges to Depository Participant and Custodian on account of transfer of shares and hence do not form part of Revenue Account.
3. NOTES TO ACCOUNTS 1. Net Assets Value (NAV) is calculated after considering market/fair value of investments and after
providing for expenses on an estimated basis.
2. There are no underwriting obligations undertaken by the Scheme with respect to issue of securities of associate companies.
3. There is no contingent liability on underwriting commitment, partly paid equity shares or any other
uncalled liabilities. 4. All investments are marked to market and accordingly reflected in the Balance Sheet. The cost and
market value of investments are shown in Note no. 11. 5. The AMC has not dealt in any securities through brokers associated with the Sponsor. 6. Purchase of investments yet to be settled: Nil (Previous Year – Rs.1,713,832)
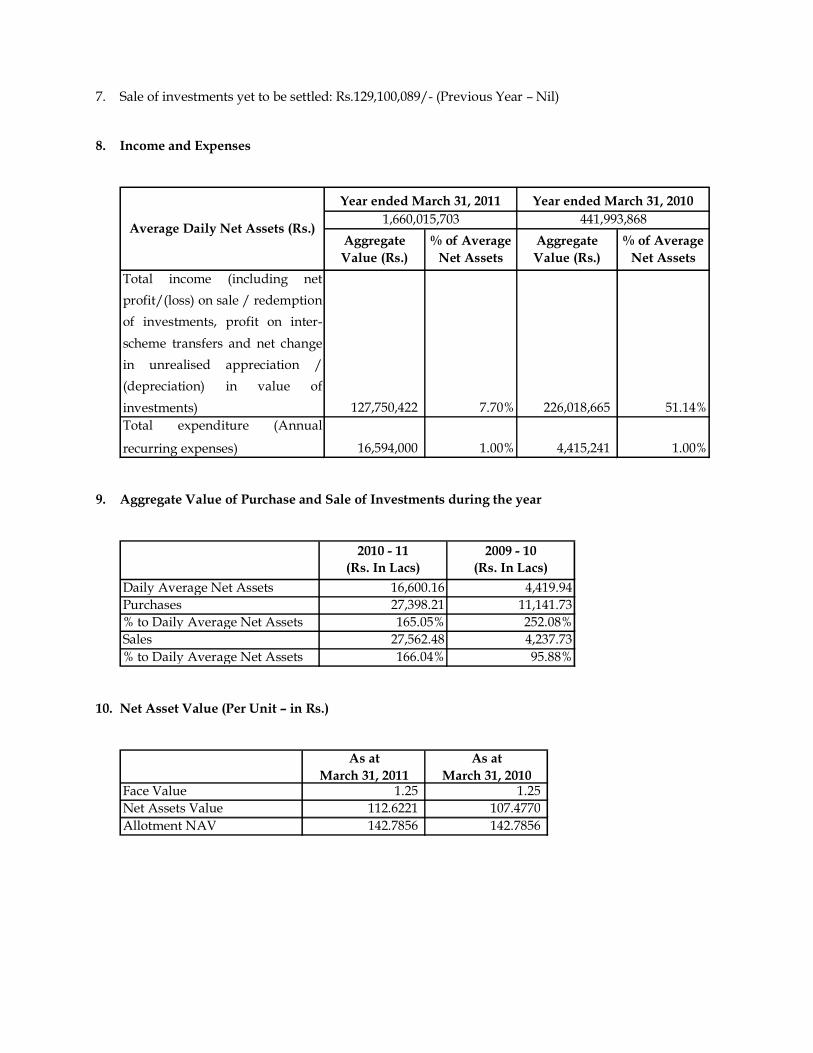
7. Sale of investments yet to be settled: Rs.129,100,089/- (Previous Year – Nil)
8. Income and Expenses
Total income (including netprofit/(loss) on sale / redemptionof investments, profit on inter-scheme transfers and net changein unrealised appreciation /(depreciation) in value ofinvestments) 127,750,422 7.70% 226,018,665 51.14%Total expenditure (Annual
recurring expenses) 16,594,000 1.00% 4,415,241 1.00%
% of Average Net Assets
Aggregate Value (Rs.)
% of Average Net Assets
Average Daily Net Assets (Rs.)1,660,015,703 441,993,868
Year ended March 31, 2011 Year ended March 31, 2010
Aggregate Value (Rs.)
9. Aggregate Value of Purchase and Sale of Investments during the year
2010 - 11(Rs. In Lacs)
2009 - 10(Rs. In Lacs)
Daily Average Net Assets 16,600.16 4,419.94Purchases 27,398.21 11,141.73% to Daily Average Net Assets 165.05% 252.08%Sales 27,562.48 4,237.73% to Daily Average Net Assets 166.04% 95.88%
10. Net Asset Value (Per Unit – in Rs.)
As at March 31, 2011
As at March 31, 2010
Face Value 1.25 1.25 Net Assets Value 112.6221 107.4770 Allotment NAV 142.7856 142.7856
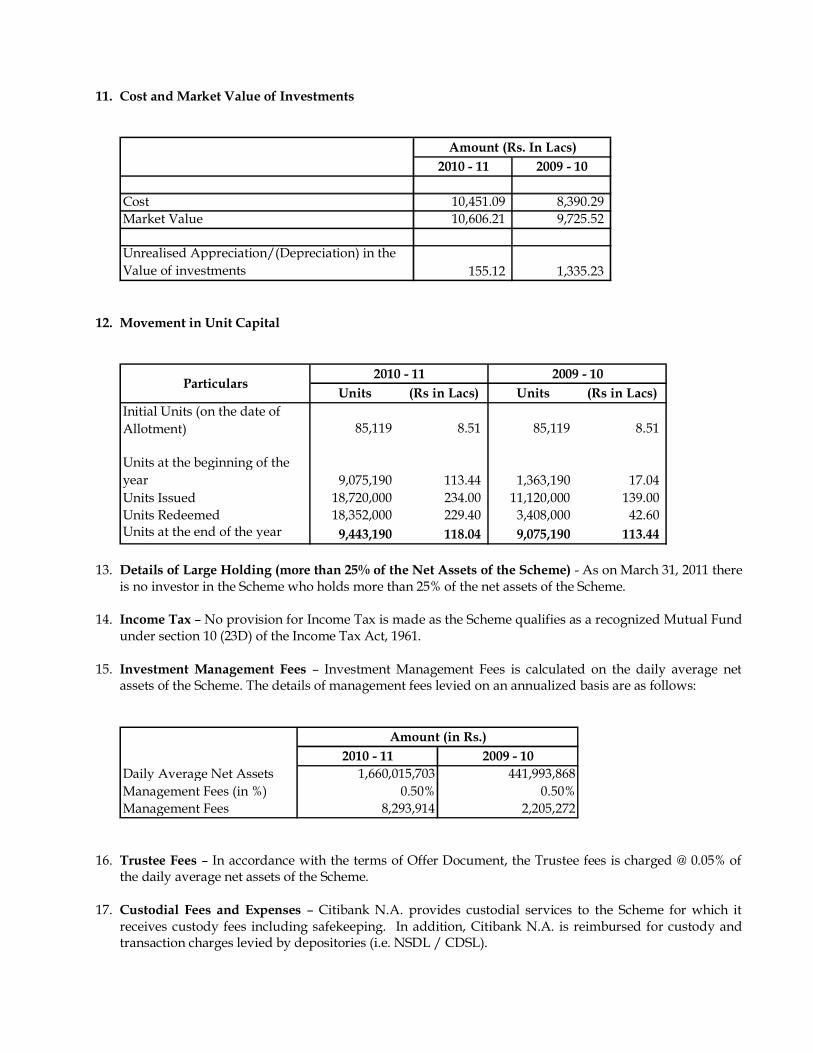
11. Cost and Market Value of Investments
2010 - 11 2009 - 10
Cost 10,451.09 8,390.29 Market Value 10,606.21 9,725.52
Unrealised Appreciation/(Depreciation) in the Value of investments 155.12 1,335.23
Amount (Rs. In Lacs)
12. Movement in Unit Capital
Units (Rs in Lacs) Units (Rs in Lacs)Initial Units (on the date of Allotment) 85,119 8.51 85,119 8.51
Units at the beginning of the year 9,075,190 113.44 1,363,190 17.04 Units Issued 18,720,000 234.00 11,120,000 139.00 Units Redeemed 18,352,000 229.40 3,408,000 42.60 Units at the end of the year 9,443,190 118.04 9,075,190 113.44
2010 - 11Particulars
2009 - 10
13. Details of Large Holding (more than 25% of the Net Assets of the Scheme) - As on March 31, 2011 there
is no investor in the Scheme who holds more than 25% of the net assets of the Scheme.
14. Income Tax – No provision for Income Tax is made as the Scheme qualifies as a recognized Mutual Fund under section 10 (23D) of the Income Tax Act, 1961.
15. Investment Management Fees – Investment Management Fees is calculated on the daily average net
assets of the Scheme. The details of management fees levied on an annualized basis are as follows:
2010 - 11 2009 - 10Daily Average Net Assets 1,660,015,703 441,993,868Management Fees (in %) 0.50% 0.50%Management Fees 8,293,914 2,205,272
Amount (in Rs.)
16. Trustee Fees – In accordance with the terms of Offer Document, the Trustee fees is charged @ 0.05% of
the daily average net assets of the Scheme.
17. Custodial Fees and Expenses – Citibank N.A. provides custodial services to the Scheme for which it receives custody fees including safekeeping. In addition, Citibank N.A. is reimbursed for custody and transaction charges levied by depositories (i.e. NSDL / CDSL).

18. Registrar and Transfer Agent Fees and Expenses – Karvy Computershare Private Limited provides Registrar and Transfer Agency Services to the Scheme, for which it receives the fees based on daily average net assets of the Scheme.
19. There are no investments made by Benchmark Trustee Company Pvt. Ltd. in the Scheme. Benchmark Asset Management Company Pvt. Ltd. holds 22,342 units in the Scheme as at March 31, 2011.
20. The Scheme has made following investments in any Group/Associate Companies.
JUNIOR BeES BAJAJ AUTO LTD 833.11 -
Scheme Name Name of the Company
Aggregate investment during the year at cost (Rs. In Lacs)
Outstanding Investment as at March 31, 2011 at Market Value (Rs. In Lacs)
21. The Scheme has not made any investment in the issues lead managed by Associate Companies. 22. Details of transactions with associates in terms of Regulation 25 (8)
Brokerage paid to associates/related parties/group companies of Sponsor/AMC
Name of associate/related parties/group companies of
Sponsor/AMC
Nature of Association /
Nature of Relation
Period Covered (April 2010 to
March 2011 and April 2009 to March 2010)
Value of transaction ( in Rs. Cr. & % of total value of transaction of
the Fund )
Brokerage (Rs Cr & % of total
brokerage paid by the Fund)
Commission paid to associates/related parties/group companies of sponsor/AMCName of associate/related
parties/group companies of Sponsor/AMC
Nature of Association /
Nature of Relation
Period Covered (April 2010 to
March 2011 and April 2009 to March 2010)
Business Given ( in Rs. Cr. & %
of total business
received by the Fund )
Commission paid (Rs Cr & % of total
commssion paid by the Fund)
NIL
NIL
23. No brokerage, custodial fees or any other payment for services have been paid or is payable to any entity
in which the AMC or its major shareholders have a substantial interest.
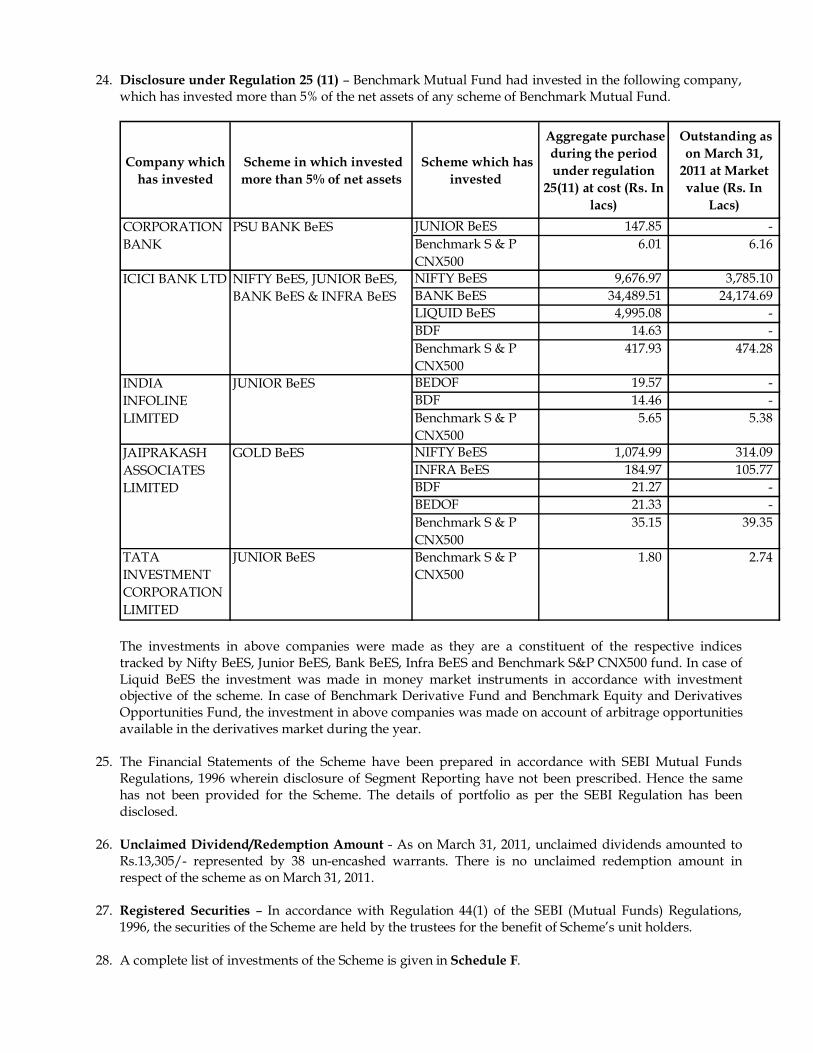
24. Disclosure under Regulation 25 (11) – Benchmark Mutual Fund had invested in the following company, which has invested more than 5% of the net assets of any scheme of Benchmark Mutual Fund.
Company which has invested
Scheme in which invested more than 5% of net assets
Scheme which has invested
Aggregate purchase during the period under regulation
25(11) at cost (Rs. In lacs)
Outstanding as on March 31,
2011 at Market value (Rs. In
Lacs)JUNIOR BeES 147.85 -Benchmark S & P CNX500
6.01 6.16
NIFTY BeES 9,676.97 3,785.10 BANK BeES 34,489.51 24,174.69 LIQUID BeES 4,995.08 -BDF 14.63 -Benchmark S & P CNX500
417.93 474.28
BEDOF 19.57 -BDF 14.46 -Benchmark S & P CNX500
5.65 5.38
NIFTY BeES 1,074.99 314.09 INFRA BeES 184.97 105.77 BDF 21.27 -BEDOF 21.33 -Benchmark S & P CNX500
35.15 39.35
TATA INVESTMENT CORPORATION LIMITED
JUNIOR BeES Benchmark S & P CNX500
1.80 2.74
INDIA INFOLINE LIMITED
JUNIOR BeES
JAIPRAKASH ASSOCIATES LIMITED
GOLD BeES
CORPORATION BANK
PSU BANK BeES
ICICI BANK LTD NIFTY BeES, JUNIOR BeES, BANK BeES & INFRA BeES
The investments in above companies were made as they are a constituent of the respective indices tracked by Nifty BeES, Junior BeES, Bank BeES, Infra BeES and Benchmark S&P CNX500 fund. In case of Liquid BeES the investment was made in money market instruments in accordance with investment objective of the scheme. In case of Benchmark Derivative Fund and Benchmark Equity and Derivatives Opportunities Fund, the investment in above companies was made on account of arbitrage opportunities available in the derivatives market during the year.
25. The Financial Statements of the Scheme have been prepared in accordance with SEBI Mutual Funds Regulations, 1996 wherein disclosure of Segment Reporting have not been prescribed. Hence the same has not been provided for the Scheme. The details of portfolio as per the SEBI Regulation has been disclosed.
26. Unclaimed Dividend/Redemption Amount - As on March 31, 2011, unclaimed dividends amounted to
Rs.13,305/- represented by 38 un-encashed warrants. There is no unclaimed redemption amount in respect of the scheme as on March 31, 2011.
27. Registered Securities – In accordance with Regulation 44(1) of the SEBI (Mutual Funds) Regulations,
1996, the securities of the Scheme are held by the trustees for the benefit of Scheme’s unit holders.
28. A complete list of investments of the Scheme is given in Schedule F.

29. On March 15, 2011 Goldman Sachs Asset Management, L.P., through its subsidiaries Goldman Sachs
Asset Management (India) Private Limited (“GS AMC”) and Goldman Sachs Trustee Company (India) Private Limited (“GS Trustee”), executed a sale and purchase agreement relating to the acquisition of all the outstanding shares in Benchmark Asset Management Company Private Limited (“BAMC”) and Benchmark Trustee Company Private Limited (“BTC”) from Niche Financial Services Private Limited, the sponsor of Benchmark Mutual Fund (“Benchmark MF”), and the other shareholders of BAMC and BTC. The sale and purchase agreement contemplates that BAMC shall transfer the rights to manage the schemes of Benchmark MF to GS AMC and BTC shall transfer the schemes of Benchmark MF to GS Trustee as part of the transaction. This transaction has been approved by the regulator, Securities and Exchange Board of India (“SEBI”) on June 27, 2011.
30. The previous year figures have been regrouped/rearranged wherever necessary.
31. The audited results for the year ended March 31, 2011 have been approved by the Boards of Benchmark
Asset Management Company Pvt. Ltd (AMC) and Benchmark Trustee Company Pvt. Ltd (Trustee) at their meeting held on June 29, 2011 respectively.
NOTES:
1. On written request, present and prospective unit holders/investors can obtain a copy of the Trust Deed, the Annual Report, at a price if any, and the text of the Scheme.
2. On written request, the present and prospective unit holders/investors may request a copy of the Annual Report of the AMC.
3. On written request, the present and prospective unit holders/investors can inspect a full list of investments of the Scheme at the office of the AMC.

(In Rupees)
Serial No. PERSPECTIVE HISTORICAL PER UNIT STATISTICS * April 1,2010 to
March 31, 2011 April 1,2009 to March 31, 2010
April 1,2008 to March 31, 2009
a) Net Asset Value, per unit at the end of the year 112.6221 107.4770 44.3369
b) i) Income other than profit on sale of investments, per unit 2.44 0.42 0.81ii) Income (net) from profit / (loss) on inter scheme sales/transfer of investments, per unit - - - iii) Income (net) from profit / (loss) on sale of investments to third parties, per unit 23.59 5.54 (21.14) iv) Transfer to Revenue account from past year’s reserve, per unit - - -
c) Aggregate of expenses, write off, amortisation & charges, per unit 1.76 0.49 0.56
d) Net Income / (loss) per unit (b - c) 24.27 5.48 (20.89)
e) Net Change in unrealised appreciation / (depreciation) in the value of investments -12.50 18.94 2.12
f) Repurchase Price during the yeari) Highest 135.5998 107.9554 95.6484ii) Lowest 101.4180 44.8588 36.8482
g) Resale Price during the yeari) Highest 135.5998 107.9554 95.6484ii) Lowest 101.4180 44.8588 36.8482
h) Market Price (National Stock Exchange)i) Highest 148.00 110.00 96.90 ii) Lowest 99.60 44.50 33.00
i) Price Earning Ratio ** 0.97 0.83 0.13
j) Ratio of expenses to the average net assets 1.00% 1.00% 1.00%
k) Ratio of gross income (including net profit / loss on sale / redemption of investments and net change in unrealised apreciation / depreciation in value of investments) to average net assets 14.80% 51.14% -32.34%
***
Signatures to Schedules A to G forming part of the Balance Sheet and Revenue Account
As per our Report of even dateFor N M Raiji & Co.Chartered AccountantsRegistration No. 108296W
Dr. S.A.Dave Shriraj DhruvJ M Gandhi Chairman Director(Partner)Membership No. 37924
D.S. Mehta S.R. HalbeChairman Director
Place : Mumbai Payal Wadhwa KaipunjalDate : June 29, 2011 Fund Manager
For and on behalf of Benchmark Trustee Company Pvt Ltd.
For and on behalf of Benchmark Asset Management Company Pvt Ltd.
BENCHMARK MUTUAL FUND
SCHEDULES FORMING PART OF THE BALANCE SHEET AS AT MARCH 31, 2011 AND REVENUE ACCOUNT FOR THE YEAR ENDED MARCH 31, 2011
The above per unit calculations are based on the number of units outstanding at the end of the year.Price Earning Ratio is based on the closing market price on the National Stock Exchange of India Ltd. & surplus for the year which includes unrealised appreciation / depreciation and income equalisation per unit.
SCHEDULE G : NOTES TO ACCOUNTS
NIFTY JUNIOR BENCHMARK EXCHANGE TRADED SCHEME - JUNIOR BeES

AUDITORS’ REPORT The Board of Directors, Benchmark Trustee Company Private Limited
We have audited the attached Balance Sheet as at March 31, 2011, the Revenue Account and the Cash
Flow Statement for the year ended on that date annexed thereto, of Liquid Benchmark Exchange
Traded Scheme (the Scheme), of Benchmark Mutual Fund. These financial statements are prepared in
accordance with SEBI (Mutual Fund) Regulations, 1996 (the Regulations) and are the responsibility
of the Management. Our responsibility is to express an opinion on these financial statements based on
our audit.
We conducted our audit in accordance with the standards on auditing issued by Institute of Chartered
Accountants of India. An audit includes examining on a test basis, evidence supporting the amounts
and disclosures in the financial statements. An audit also includes assessing the accounting principles
used and significant estimates made by the management, as well as evaluating the overall financial
statement presentation. We believe that our audit provides a reasonable basis for our opinion.
We report that:
1. We have obtained all information and explanations, which, to the best of our knowledge and
belief were necessary for the purpose of our audit.
2. The Balance Sheet, the Revenue Account and the Cash Flow Statement referred to above are in
agreement with the books of accounts of the Scheme.
3. The accounts have been prepared in accordance with the accounting policies adopted by the
trustees of the Fund and as specified in the Ninth Schedule to the Regulations.

4. In our opinion, valuation methods for Non Traded Securities, if any, adopted by the scheme are
fair and reasonable and are in accordance with the guidelines for valuation issued by SEBI and
approved by the Trustee.
5. Without qualifying our opinion, we draw attention to note no. 26 in Schedule H of the financial
statements whereby the management has not provided the Segment Reporting for reasons
mentioned therein.
6. In our opinion and to the best of our information and according to the explanations given to us,
the financial statements read with the accounting policies and notes to accounts attached thereto,
give the information required as per the Regulations and give a true & fair view in accordance
with the generally accepted accounting principles in India:
a. in the case of Balance Sheet, of the state of affairs of the scheme as at March 31, 2011;
b. in the case of Revenue Account, of the surplus of the scheme for the year ended on that date;
and
c. in the case of Cash Flow Statement, of the cash flows for the year ended on that date.
For N.M.RAIJI & CO. Chartered Accountants
Firm Reg. No:108296W
J. M. GANDHI Partner Membership No. 37924
Place: Mumbai Dated: June 29, 2011
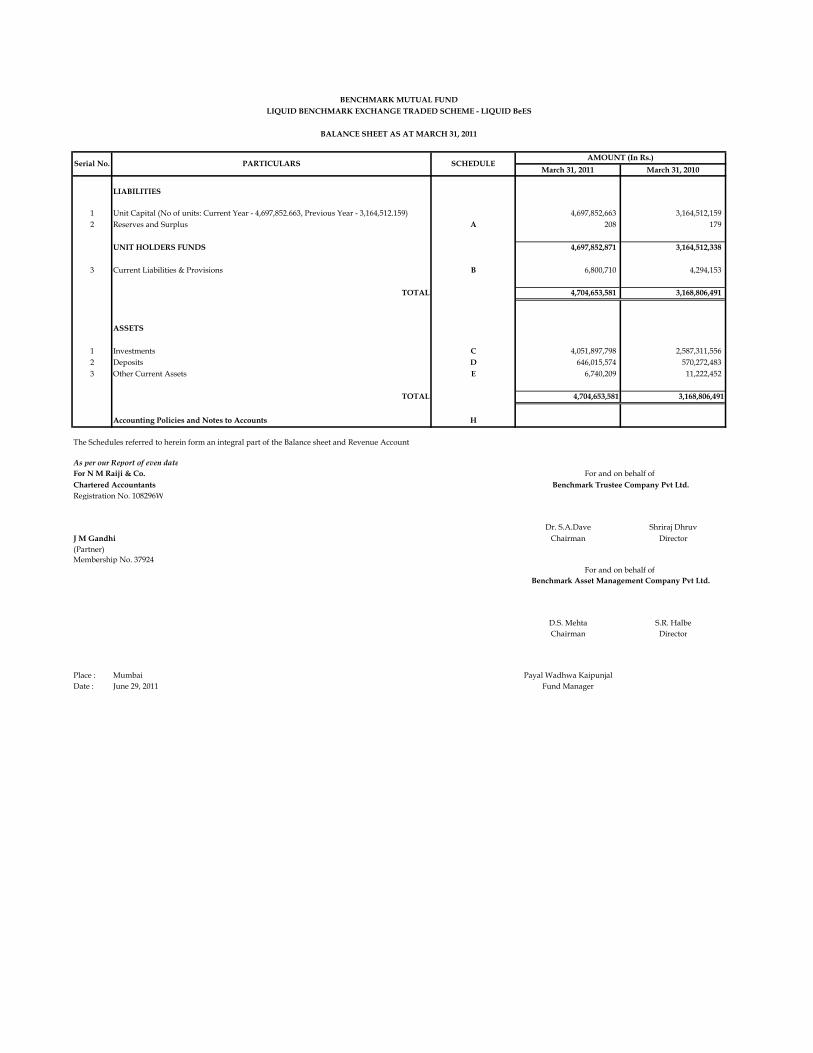
March 31, 2011 March 31, 2010
LIABILITIES
1 Unit Capital (No of units: Current Year - 4,697,852.663, Previous Year - 3,164,512.159) 4,697,852,663 3,164,512,159 2 Reserves and Surplus A 208 179
UNIT HOLDERS FUNDS 4,697,852,871 3,164,512,338
3 Current Liabilities & Provisions B 6,800,710 4,294,153
TOTAL 4,704,653,581 3,168,806,491
ASSETS
1 Investments C 4,051,897,798 2,587,311,556 2 Deposits D 646,015,574 570,272,483 3 Other Current Assets E 6,740,209 11,222,452
TOTAL 4,704,653,581 3,168,806,491
Accounting Policies and Notes to Accounts H
The Schedules referred to herein form an integral part of the Balance sheet and Revenue Account
As per our Report of even dateFor N M Raiji & Co.Chartered AccountantsRegistration No. 108296W
Dr. S.A.Dave Shriraj DhruvJ M Gandhi Chairman Director(Partner)Membership No. 37924
D.S. Mehta S.R. HalbeChairman Director
Place : Mumbai Payal Wadhwa KaipunjalDate : June 29, 2011 Fund Manager
For and on behalf of
For and on behalf of Benchmark Trustee Company Pvt Ltd.
Benchmark Asset Management Company Pvt Ltd.
BENCHMARK MUTUAL FUNDLIQUID BENCHMARK EXCHANGE TRADED SCHEME - LIQUID BeES
BALANCE SHEET AS AT MARCH 31, 2011
SCHEDULESerial No. PARTICULARSAMOUNT (In Rs.)
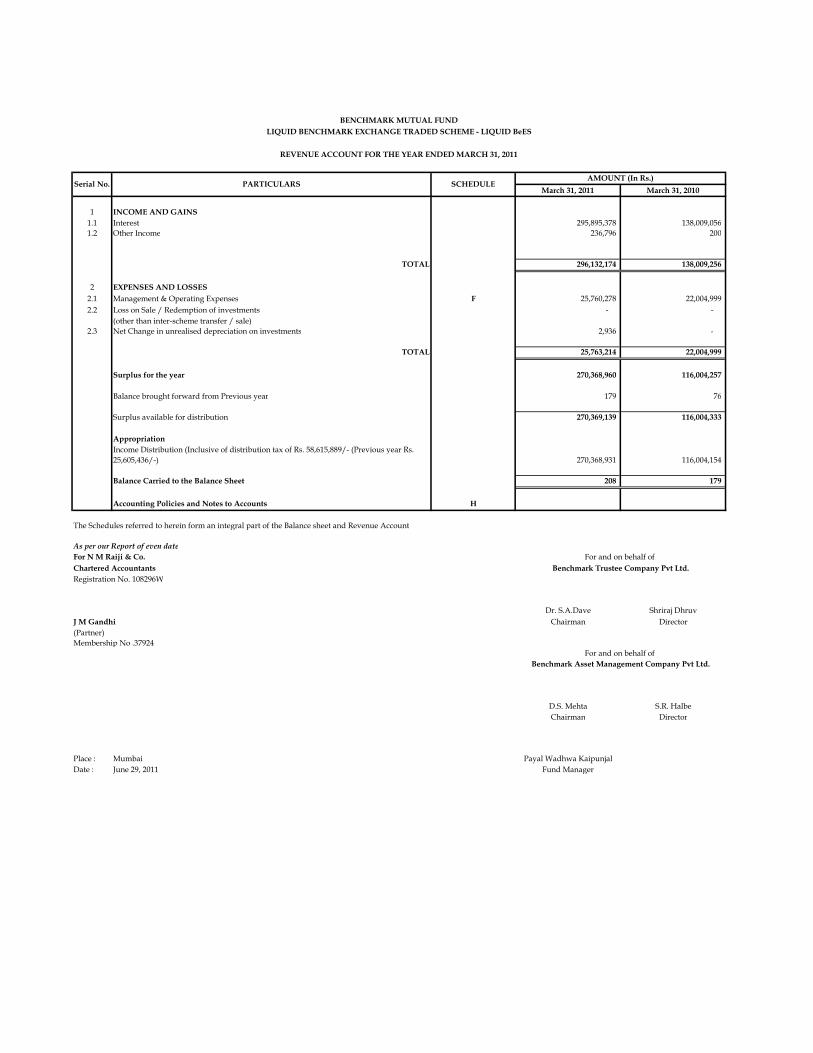
March 31, 2011 March 31, 2010
1 INCOME AND GAINS1.1 Interest 295,895,378 138,009,056 1.2 Other Income 236,796 200
TOTAL 296,132,174 138,009,256
2 EXPENSES AND LOSSES2.1 Management & Operating Expenses F 25,760,278 22,004,999 2.2 Loss on Sale / Redemption of investments - -
(other than inter-scheme transfer / sale)2.3 Net Change in unrealised depreciation on investments 2,936 -
TOTAL 25,763,214 22,004,999
Surplus for the year 270,368,960 116,004,257
Balance brought forward from Previous year 179 76
Surplus available for distribution 270,369,139 116,004,333
Appropriation
Balance Carried to the Balance Sheet 208 179
Accounting Policies and Notes to Accounts H
The Schedules referred to herein form an integral part of the Balance sheet and Revenue Account
As per our Report of even dateFor N M Raiji & Co.Chartered AccountantsRegistration No. 108296W
Dr. S.A.Dave Shriraj DhruvJ M Gandhi Chairman Director(Partner)Membership No .37924
D.S. Mehta S.R. HalbeChairman Director
Place : Mumbai Payal Wadhwa KaipunjalDate : June 29, 2011 Fund Manager
AMOUNT (In Rs.)
BENCHMARK MUTUAL FUNDLIQUID BENCHMARK EXCHANGE TRADED SCHEME - LIQUID BeES
REVENUE ACCOUNT FOR THE YEAR ENDED MARCH 31, 2011
SCHEDULEPARTICULARSSerial No.
270,368,931 116,004,154
Benchmark Asset Management Company Pvt Ltd.
For and on behalf of Benchmark Trustee Company Pvt Ltd.
Income Distribution (Inclusive of distribution tax of Rs. 58,615,889/- (Previous year Rs. 25,605,436/-)
For and on behalf of
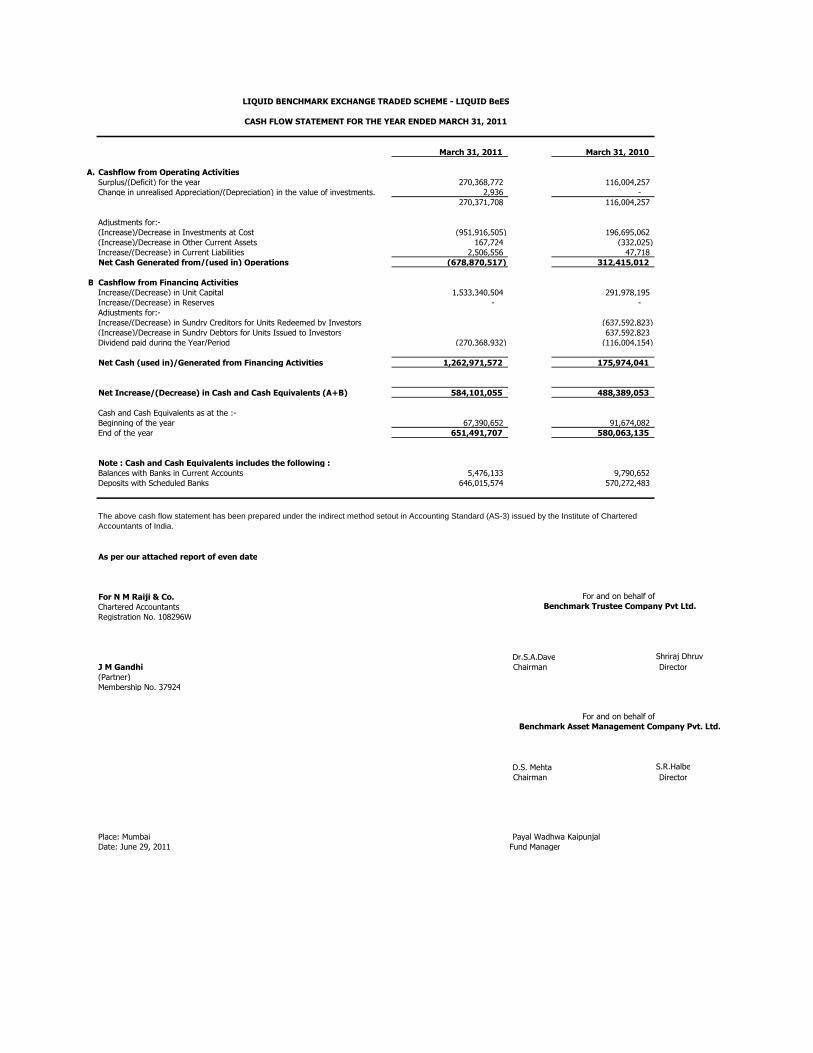
March 31, 2011 March 31, 2010
A. Cashflow from Operating ActivitiesSurplus/(Deficit) for the year 270,368,772 116,004,257 Change in unrealised Appreciation/(Depreciation) in the value of investments. 2,936 -
270,371,708 116,004,257
Adjustments for:-(Increase)/Decrease in Investments at Cost (951,916,505) 196,695,062 (Increase)/Decrease in Other Current Assets 167,724 (332,025) Increase/(Decrease) in Current Liabilities 2,506,556 47,718 Net Cash Generated from/(used in) Operations (678,870,517) 312,415,012
B Cashflow from Financing ActivitiesIncrease/(Decrease) in Unit Capital 1,533,340,504 291,978,195 Increase/(Decrease) in Reserves - - Adjustments for:-Increase/(Decrease) in Sundry Creditors for Units Redeemed by Investors (637,592,823) (Increase)/Decrease in Sundry Debtors for Units Issued to Investors 637,592,823 Dividend paid during the Year/Period (270,368,932) (116,004,154)
Net Cash (used in)/Generated from Financing Activities 1,262,971,572 175,974,041
Net Increase/(Decrease) in Cash and Cash Equivalents (A+B) 584,101,055 488,389,053
Cash and Cash Equivalents as at the :-Beginning of the year 67,390,652 91,674,082 End of the year 651,491,707 580,063,135
Note : Cash and Cash Equivalents includes the following :Balances with Banks in Current Accounts 5,476,133 9,790,652 Deposits with Scheduled Banks 646,015,574 570,272,483
As per our attached report of even date
For N M Raiji & Co. Chartered Accountants Registration No. 108296W
Dr.S.A.Dave Shriraj DhruvJ M Gandhi Chairman Director(Partner)Membership No. 37924
D.S. Mehta S.R.HalbeChairman Director
Place: Mumbai Payal Wadhwa KaipunjalDate: June 29, 2011 Fund Manager
The above cash flow statement has been prepared under the indirect method setout in Accounting Standard (AS-3) issued by the Institute of Chartered Accountants of India.
LIQUID BENCHMARK EXCHANGE TRADED SCHEME - LIQUID BeES
CASH FLOW STATEMENT FOR THE YEAR ENDED MARCH 31, 2011
Benchmark Asset Management Company Pvt. Ltd.
For and on behalf of Benchmark Trustee Company Pvt Ltd.
For and on behalf of
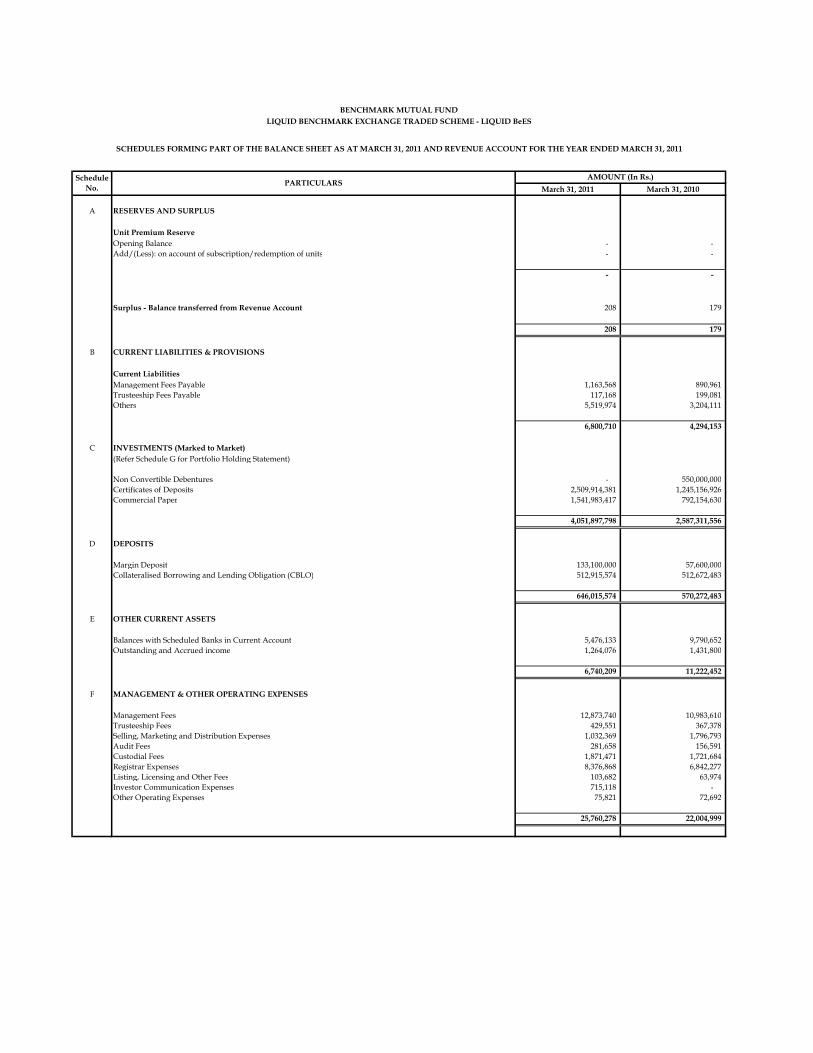
March 31, 2011 March 31, 2010
A RESERVES AND SURPLUS
Unit Premium ReserveOpening Balance - - Add/(Less): on account of subscription/redemption of units - -
- -
Surplus - Balance transferred from Revenue Account 208 179
208 179
B CURRENT LIABILITIES & PROVISIONS
Current LiabilitiesManagement Fees Payable 1,163,568 890,961 Trusteeship Fees Payable 117,168 199,081 Others 5,519,974 3,204,111
6,800,710 4,294,153
C INVESTMENTS (Marked to Market)(Refer Schedule G for Portfolio Holding Statement)
Non Convertible Debentures - 550,000,000 Certificates of Deposits 2,509,914,381 1,245,156,926 Commercial Paper 1,541,983,417 792,154,630
4,051,897,798 2,587,311,556
D DEPOSITS
Margin Deposit 133,100,000 57,600,000 Collateralised Borrowing and Lending Obligation (CBLO) 512,915,574 512,672,483
646,015,574 570,272,483
E OTHER CURRENT ASSETS
Balances with Scheduled Banks in Current Account 5,476,133 9,790,652 Outstanding and Accrued income 1,264,076 1,431,800
6,740,209 11,222,452
F MANAGEMENT & OTHER OPERATING EXPENSES
Management Fees 12,873,740 10,983,610 Trusteeship Fees 429,551 367,378 Selling, Marketing and Distribution Expenses 1,032,369 1,796,793 Audit Fees 281,658 156,591 Custodial Fees 1,871,471 1,721,684 Registrar Expenses 8,376,868 6,842,277 Listing, Licensing and Other Fees 103,682 63,974 Investor Communication Expenses 715,118 - Other Operating Expenses 75,821 72,692
25,760,278 22,004,999
PARTICULARS
SCHEDULES FORMING PART OF THE BALANCE SHEET AS AT MARCH 31, 2011 AND REVENUE ACCOUNT FOR THE YEAR ENDED MARCH 31, 2011
BENCHMARK MUTUAL FUNDLIQUID BENCHMARK EXCHANGE TRADED SCHEME - LIQUID BeES
AMOUNT (In Rs.)Schedule No.

DEBT INSTRUMENTS
CERTIFICATES OF DEPOSITSPunjab National Bank A1+ 2,500 249,742,185 6.16%Syndicate Bank PR1+ 2,500 249,532,428 6.16%Vijaya Bank A1+ 2,500 249,208,543 6.15%Bank Of Maharashtra PR1+ 2,500 248,824,028 6.14%Canara Bank P1+ 2,500 245,467,885 6.06%Punjab National Bank PR1+ 2,500 244,410,250 6.03%Axis Bank Ltd A1+ 2,400 235,357,603 5.81%Allahabad Bank A1+ 2,000 197,785,054 4.88%Yes Bank Ltd A1+ 2,000 197,131,808 4.87%Ing Vysya Bank P1+ 2,000 196,936,414 4.86%Uco Bank P1+ 2,000 195,518,183 4.83%
Total (A) 2,509,914,381 61.94%COMMERCIAL PAPERSTata Capital Ltd. A1+ 500 249,068,350 6.15%L&T Infrastructure Finance Ltd. PR1+ 500 248,182,228 6.13%Reliance Capital Ltd. A1+ 500 247,684,053 6.11%Kotak Mahindra Prime Ltd P1+ 420 209,651,942 5.17%Infrastructure Leasing And Financial Services Ltd. A1+ 400 196,970,662 4.86%Aditya Birla Finance Ltd A1+ 400 195,745,690 4.83%Religare Finvest Ltd A1+ 400 194,680,492 4.80%
Total (B) 1,541,983,417 38.06%
Grand Total (A+B) 4,051,897,798 100.00%
Note : Cash and Cash Equivalents are not considered for the above purpose.
BENCHMARK MUTUAL FUNDLIQUID BENCHMARK EXCHANGE TRADED SCHEME - LIQUID BeES
SCHEDULES FORMING PART OF THE BALANCE SHEET AS AT MARCH 31, 2011 AND REVENUE ACCOUNT FOR THE YEAR ENDED MARCH 31, 2011
% TO TOTAL
MARKET VALUE (Amount in Rs.) QUANTITYSCRIP NAME RATING
SCHEDULE G - PORTFOLIO HOLDING STATEMENT AS ON MARCH 31, 2011
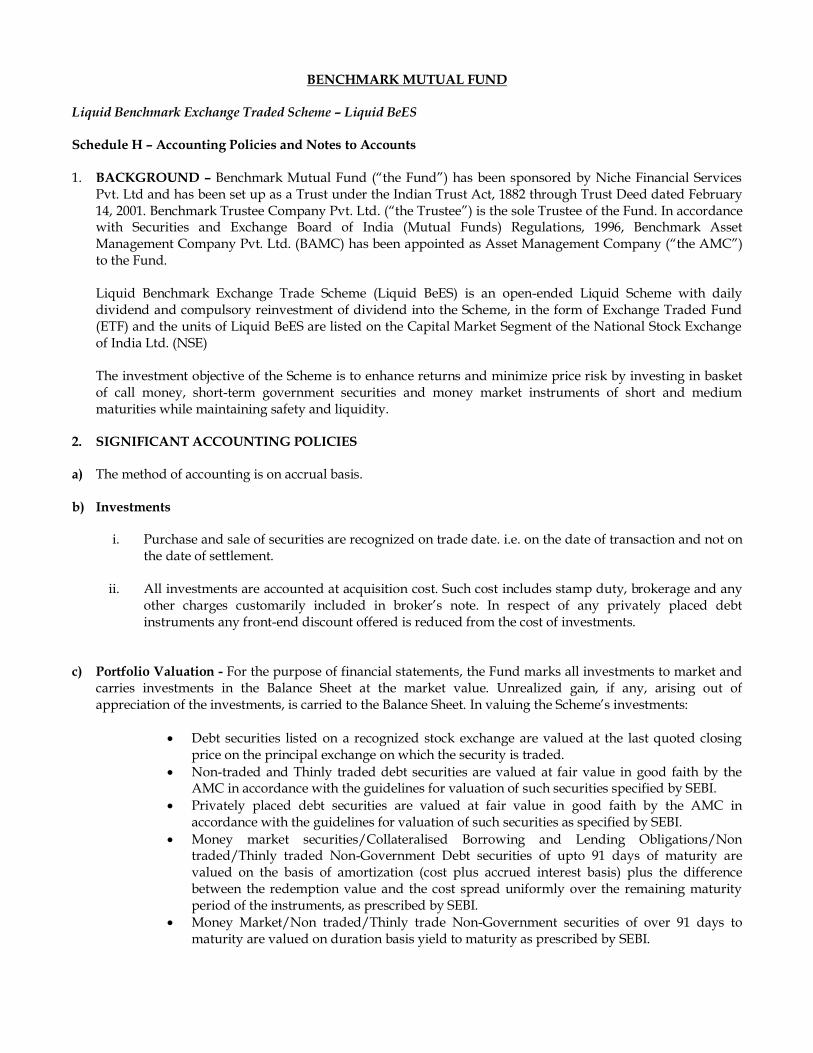
BENCHMARK MUTUAL FUND Liquid Benchmark Exchange Traded Scheme – Liquid BeES Schedule H – Accounting Policies and Notes to Accounts 1. BACKGROUND – Benchmark Mutual Fund (“the Fund”) has been sponsored by Niche Financial Services
Pvt. Ltd and has been set up as a Trust under the Indian Trust Act, 1882 through Trust Deed dated February 14, 2001. Benchmark Trustee Company Pvt. Ltd. (“the Trustee”) is the sole Trustee of the Fund. In accordance with Securities and Exchange Board of India (Mutual Funds) Regulations, 1996, Benchmark Asset Management Company Pvt. Ltd. (BAMC) has been appointed as Asset Management Company (“the AMC”) to the Fund.
Liquid Benchmark Exchange Trade Scheme (Liquid BeES) is an open-ended Liquid Scheme with daily dividend and compulsory reinvestment of dividend into the Scheme, in the form of Exchange Traded Fund (ETF) and the units of Liquid BeES are listed on the Capital Market Segment of the National Stock Exchange of India Ltd. (NSE) The investment objective of the Scheme is to enhance returns and minimize price risk by investing in basket of call money, short-term government securities and money market instruments of short and medium maturities while maintaining safety and liquidity.
2. SIGNIFICANT ACCOUNTING POLICIES a) The method of accounting is on accrual basis.
b) Investments
i. Purchase and sale of securities are recognized on trade date. i.e. on the date of transaction and not on the date of settlement.
ii. All investments are accounted at acquisition cost. Such cost includes stamp duty, brokerage and any
other charges customarily included in broker’s note. In respect of any privately placed debt instruments any front-end discount offered is reduced from the cost of investments.
c) Portfolio Valuation - For the purpose of financial statements, the Fund marks all investments to market and carries investments in the Balance Sheet at the market value. Unrealized gain, if any, arising out of appreciation of the investments, is carried to the Balance Sheet. In valuing the Scheme’s investments:
Debt securities listed on a recognized stock exchange are valued at the last quoted closing
price on the principal exchange on which the security is traded. Non-traded and Thinly traded debt securities are valued at fair value in good faith by the
AMC in accordance with the guidelines for valuation of such securities specified by SEBI. Privately placed debt securities are valued at fair value in good faith by the AMC in
accordance with the guidelines for valuation of such securities as specified by SEBI. Money market securities/Collateralised Borrowing and Lending Obligations/Non
traded/Thinly traded Non-Government Debt securities of upto 91 days of maturity are valued on the basis of amortization (cost plus accrued interest basis) plus the difference between the redemption value and the cost spread uniformly over the remaining maturity period of the instruments, as prescribed by SEBI.
Money Market/Non traded/Thinly trade Non-Government securities of over 91 days to maturity are valued on duration basis yield to maturity as prescribed by SEBI.
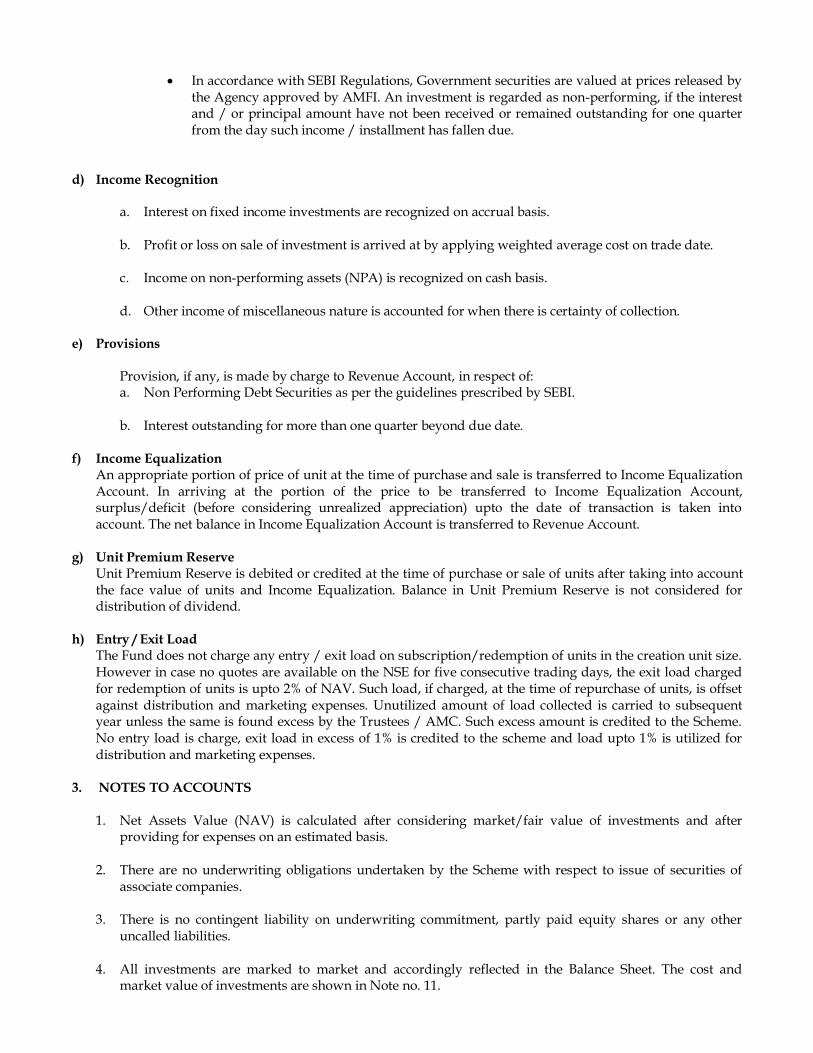
In accordance with SEBI Regulations, Government securities are valued at prices released by the Agency approved by AMFI. An investment is regarded as non-performing, if the interest and / or principal amount have not been received or remained outstanding for one quarter from the day such income / installment has fallen due.
d) Income Recognition
a. Interest on fixed income investments are recognized on accrual basis. b. Profit or loss on sale of investment is arrived at by applying weighted average cost on trade date.
c. Income on non-performing assets (NPA) is recognized on cash basis.
d. Other income of miscellaneous nature is accounted for when there is certainty of collection.
e) Provisions
Provision, if any, is made by charge to Revenue Account, in respect of: a. Non Performing Debt Securities as per the guidelines prescribed by SEBI.
b. Interest outstanding for more than one quarter beyond due date.
f) Income Equalization
An appropriate portion of price of unit at the time of purchase and sale is transferred to Income Equalization Account. In arriving at the portion of the price to be transferred to Income Equalization Account, surplus/deficit (before considering unrealized appreciation) upto the date of transaction is taken into account. The net balance in Income Equalization Account is transferred to Revenue Account.
g) Unit Premium Reserve Unit Premium Reserve is debited or credited at the time of purchase or sale of units after taking into account the face value of units and Income Equalization. Balance in Unit Premium Reserve is not considered for distribution of dividend.
h) Entry / Exit Load The Fund does not charge any entry / exit load on subscription/redemption of units in the creation unit size. However in case no quotes are available on the NSE for five consecutive trading days, the exit load charged for redemption of units is upto 2% of NAV. Such load, if charged, at the time of repurchase of units, is offset against distribution and marketing expenses. Unutilized amount of load collected is carried to subsequent year unless the same is found excess by the Trustees / AMC. Such excess amount is credited to the Scheme. No entry load is charge, exit load in excess of 1% is credited to the scheme and load upto 1% is utilized for distribution and marketing expenses.
3. NOTES TO ACCOUNTS 1. Net Assets Value (NAV) is calculated after considering market/fair value of investments and after
providing for expenses on an estimated basis. 2. There are no underwriting obligations undertaken by the Scheme with respect to issue of securities of
associate companies. 3. There is no contingent liability on underwriting commitment, partly paid equity shares or any other
uncalled liabilities. 4. All investments are marked to market and accordingly reflected in the Balance Sheet. The cost and
market value of investments are shown in Note no. 11.

5. The AMC has not dealt in any securities through brokers associated with the Sponsor. 6. Purchase of investments yet to be settled: NIL (Previous Year – NIL) 7. Sale of investments yet to be settled: NIL (Previous Year – NIL)
8. Income and Expense
Total income (including net profit/(loss) on sale / redemption of investments, profit on inter-scheme transfers and net change in unrealised appreciation / (depreciation) in value of investments) 296,129,238 6.89% 138,009,256 3.76%Total expenditure (Annual recurring expenses) 25,760,278 0.60% 22,004,999 0.60%
% of Average Net Assets
(annualised)
Aggregate Value (Rs.)
% of Average Net Assets
(annualised)
Average Daily Net Assets (Rs.)4,295,510,428.09 3,673,779,834.91
Year ended March 31, 2011 Year ended March 31, 2010
Aggregate Value (Rs.)
9. Aggregate Value of Purchase and Sale of Investments (including matured) during the year
Particulars2010 - 11
(Rs. In Lacs)2009 - 10
(Rs. In Lacs)Daily Average Net Assets 42,955.10 36,737.80 Purchases 511,914.72 903,148.69 % to Daily Average Net Assets 1191.74% 2458.36%Sales 495,954.95 800,014.07 % to Daily Average Net Assets 1154.59% 2177.63%
10. Net Asset Value (Per Unit – in Rs.)
As onMarch 31, 2011
As onMarch 31, 2010
Face Value 1,000.0000 1,000.0000 Net Assets Value 1,000.0000 1,000.0000

11. Cost and Market Value of Investments
2010 - 11 2009 - 10
Cost 40,519.01 25,873.12 Market Value 40,518.98 25,873.12
Unrealised Appreciation in the Value of investments (0.03) NIL
Amount (Rs. In Lacs)
12. Margin Deposits – Margin deposit consists of Rs. 1,200 Lacs in the form of Fixed Deposit and Rs.131 Lacs
in the form of Cash Margin.
13. Movement in Unit Capital
Units Rs in Lacs Units Rs in LacsInitial Units (on the date of Allotment) 89,650.000 896.50 89,650.000 896.50
Opening Units 3,164,512.159 31,645.12 2,872,533.960 28,725.34 Units Issued 14,548,044.621 145,480.45 10,978,611.983 109,786.12 Units Issued towards reinvestment of Dividend* 210,473.341 2,104.73 90,398.689 903.99 Units Redeemed 13,225,177.458 132,251.77 10,777,032.473 107,770.32
Units at the end of the year 4,697,852.663 46,978.53 3,164,512.159 31,645.12
* The Scheme declares daily dividend which is compulsorily reinvested in the Scheme.
2010 - 11Particulars
2009 - 10
14. Details of Large Holding (more than 25% of the Net Assets of the Scheme) - As on March 31, 2011 there is no investor in the Scheme who holds more than 25% of the net assets of the Scheme.
15. Income Tax – No provision for Income Tax is made as the Scheme qualifies as a recognized Mutual Fund
under section 10 (23D) of the Income Tax Act, 1961. 16. Investment Management Fees – Investment Management Fees is calculated on the daily average net
assets of the Scheme. The details of management fees levied on an annualized basis are as follows:
2010 - 11 2009 - 10Daily Average Net Assets 4,295,510,428 3,673,779,835Management Fees (in %) 0.30% 0.30%Management Fees 12,873,740 10,983,610
Amount (in Rs.)
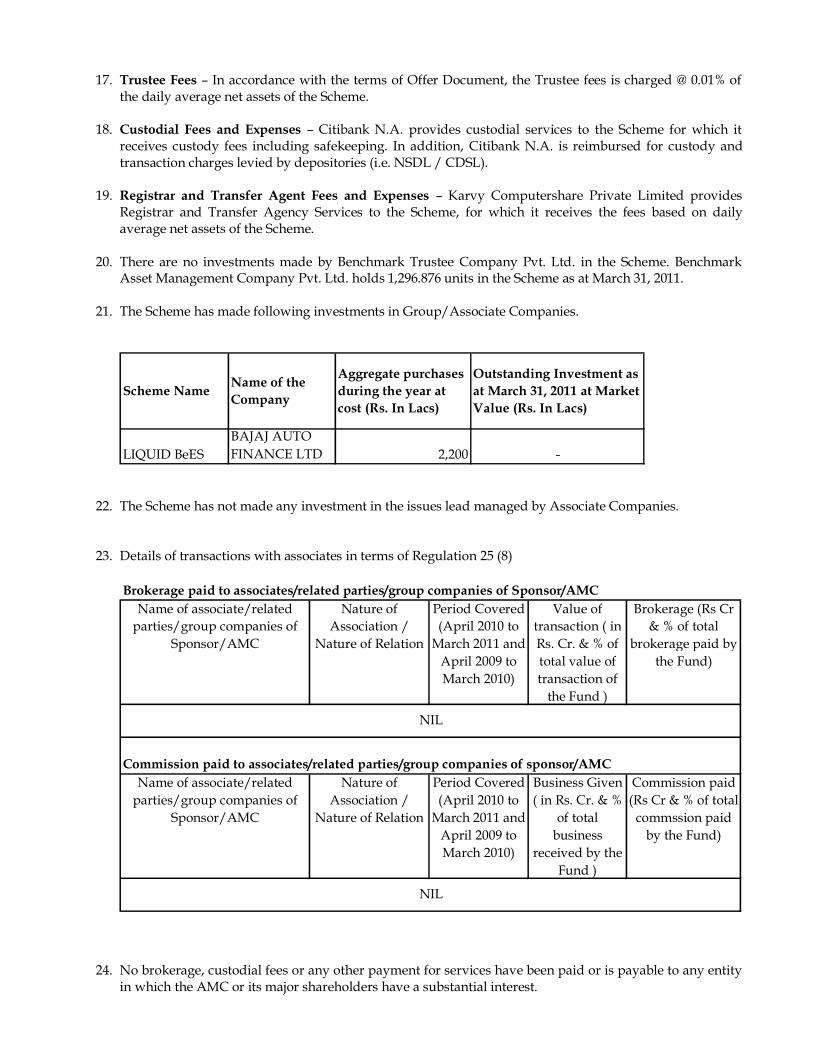
17. Trustee Fees – In accordance with the terms of Offer Document, the Trustee fees is charged @ 0.01% of the daily average net assets of the Scheme.
18. Custodial Fees and Expenses – Citibank N.A. provides custodial services to the Scheme for which it receives custody fees including safekeeping. In addition, Citibank N.A. is reimbursed for custody and transaction charges levied by depositories (i.e. NSDL / CDSL).
19. Registrar and Transfer Agent Fees and Expenses – Karvy Computershare Private Limited provides
Registrar and Transfer Agency Services to the Scheme, for which it receives the fees based on daily average net assets of the Scheme.
20. There are no investments made by Benchmark Trustee Company Pvt. Ltd. in the Scheme. Benchmark
Asset Management Company Pvt. Ltd. holds 1,296.876 units in the Scheme as at March 31, 2011.
21. The Scheme has made following investments in Group/Associate Companies.
LIQUID BeESBAJAJ AUTO FINANCE LTD 2,200 -
Scheme Name Name of the Company
Aggregate purchases during the year at cost (Rs. In Lacs)
Outstanding Investment as at March 31, 2011 at Market Value (Rs. In Lacs)
22. The Scheme has not made any investment in the issues lead managed by Associate Companies. 23. Details of transactions with associates in terms of Regulation 25 (8)
Brokerage paid to associates/related parties/group companies of Sponsor/AMC
Name of associate/related parties/group companies of
Sponsor/AMC
Nature of Association /
Nature of Relation
Period Covered (April 2010 to
March 2011 and April 2009 to March 2010)
Value of transaction ( in Rs. Cr. & % of total value of transaction of
the Fund )
Brokerage (Rs Cr & % of total
brokerage paid by the Fund)
Commission paid to associates/related parties/group companies of sponsor/AMCName of associate/related
parties/group companies of Sponsor/AMC
Nature of Association /
Nature of Relation
Period Covered (April 2010 to
March 2011 and April 2009 to March 2010)
Business Given ( in Rs. Cr. & %
of total business
received by the Fund )
Commission paid (Rs Cr & % of total
commssion paid by the Fund)
NIL
NIL
24. No brokerage, custodial fees or any other payment for services have been paid or is payable to any entity
in which the AMC or its major shareholders have a substantial interest.

25. Disclosure under Regulation 25 (11) – Benchmark Mutual Fund had invested in the following company,
which has invested more than 5% of the net assets of any scheme of Benchmark Mutual Fund.
Company which has invested
Scheme in which invested more than 5% of net assets
Scheme which has invested
Aggregate purchase during the period under regulation
25(11) at cost (Rs. In lacs)
Outstanding as on March 31,
2011 at Market value (Rs. In
Lacs)JUNIOR BeES 147.85 -Benchmark S & P CNX500
6.01 6.16
NIFTY BeES 9,676.97 3,785.10 BANK BeES 34,489.51 24,174.69 LIQUID BeES 4,995.08 -BDF 14.63 -Benchmark S & P CNX500
417.93 474.28
BEDOF 19.57 -BDF 14.46 -Benchmark S & P CNX500
5.65 5.38
NIFTY BeES 1,074.99 314.09 INFRA BeES 184.97 105.77 BDF 21.27 -BEDOF 21.33 -Benchmark S & P CNX500
35.15 39.35
TATA INVESTMENT CORPORATION LIMITED
JUNIOR BeES Benchmark S & P CNX500
1.80 2.74
INDIA INFOLINE LIMITED
JUNIOR BeES
JAIPRAKASH ASSOCIATES LIMITED
GOLD BeES
CORPORATION BANK
PSU BANK BeES
ICICI BANK LTD NIFTY BeES, JUNIOR BeES, BANK BeES & INFRA BeES
The investments in above companies were made as they are a constituent of the respective indices track by Nifty BeES, Junior BeES, Bank BeES, Infra BeES and Benchmark S&P CNX500 fund. In case of Liquid BeES the investment was made in money market instruments in accordance with investment objective of the scheme. In case of Benchmark Derivative Fund and Benchmark Equity and Derivatives Opportunities Fund, the investment in above companies was made on account of arbitrage opportunities available in the derivatives market during the year.
26. The Financial Statements of the Scheme have been prepared in accordance with SEBI Mutual Funds Regulations, 1996 wherein disclosure of Segment Reporting have not been prescribed. Hence the same has not been provided for the Scheme. The details of portfolio as per the SEBI Regulation has been disclosed.
27. Unclaimed Dividend/Redemption Amount – As on March 31, 2011 there is no unclaimed dividend /
redemption amount in the Scheme.
28. Registered Securities – In accordance with Regulation 44(1) of the SEBI (Mutual Funds) Regulations, 1996, the securities of the Scheme are held by the trustees for the benefit of Scheme’s unit holders.
29. A complete list of investments of the Scheme is given in Schedule G.
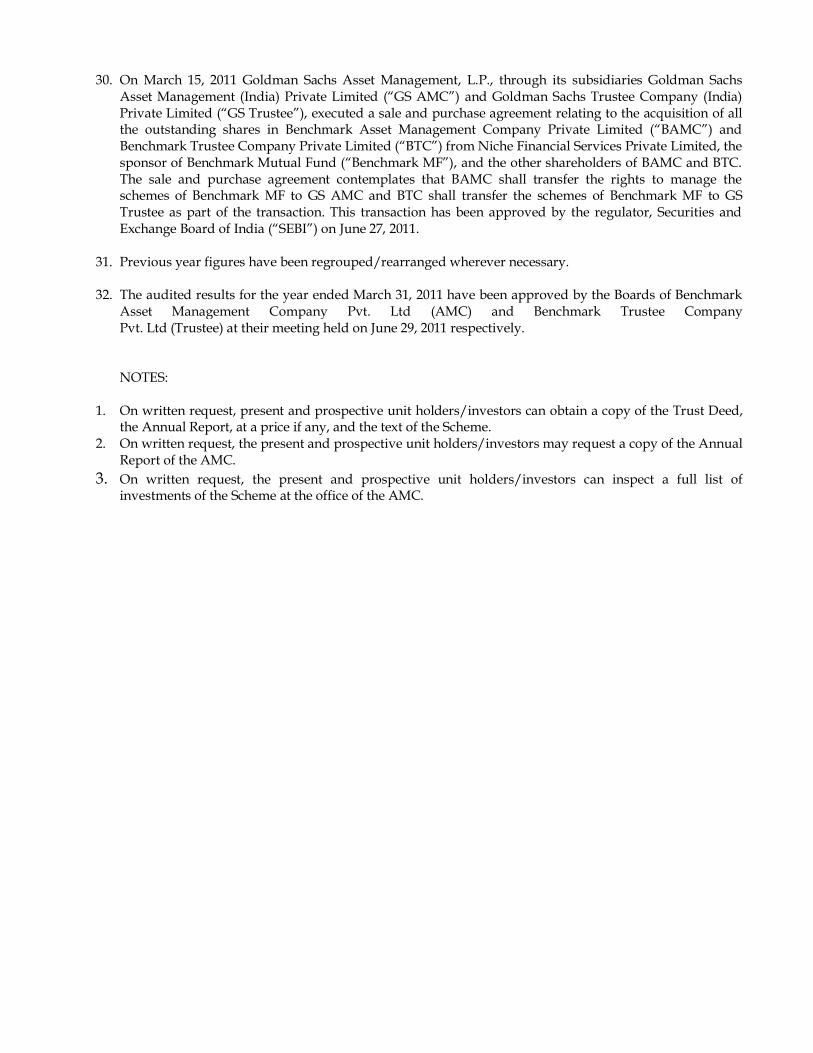
30. On March 15, 2011 Goldman Sachs Asset Management, L.P., through its subsidiaries Goldman Sachs Asset Management (India) Private Limited (“GS AMC”) and Goldman Sachs Trustee Company (India) Private Limited (“GS Trustee”), executed a sale and purchase agreement relating to the acquisition of all the outstanding shares in Benchmark Asset Management Company Private Limited (“BAMC”) and Benchmark Trustee Company Private Limited (“BTC”) from Niche Financial Services Private Limited, the sponsor of Benchmark Mutual Fund (“Benchmark MF”), and the other shareholders of BAMC and BTC. The sale and purchase agreement contemplates that BAMC shall transfer the rights to manage the schemes of Benchmark MF to GS AMC and BTC shall transfer the schemes of Benchmark MF to GS Trustee as part of the transaction. This transaction has been approved by the regulator, Securities and Exchange Board of India (“SEBI”) on June 27, 2011.
31. Previous year figures have been regrouped/rearranged wherever necessary.
32. The audited results for the year ended March 31, 2011 have been approved by the Boards of Benchmark
Asset Management Company Pvt. Ltd (AMC) and Benchmark Trustee Company Pvt. Ltd (Trustee) at their meeting held on June 29, 2011 respectively. NOTES:
1. On written request, present and prospective unit holders/investors can obtain a copy of the Trust Deed, the Annual Report, at a price if any, and the text of the Scheme.
2. On written request, the present and prospective unit holders/investors may request a copy of the Annual Report of the AMC.
3. On written request, the present and prospective unit holders/investors can inspect a full list of investments of the Scheme at the office of the AMC.

(In Rupees)
Serial No.
April 1,2010 to March 31, 2011
April 1,2009 to March 31, 2010
April 1,2008 to March 31, 2009
a) Net Asset Value, per unit at the end of the year 1,000.0000 1,000.0000 1,000.0000
b) i) Income other than profit on sale of investments, per unit 63.04 43.61 120.61 ii) Income (net) from profit / (loss) on inter scheme sales/transfer of investments, per unit - - - iii) Income (net) from profit / (loss) on sale of investment to third parties, per unit - - 0.14 iv) Transfer to Revenue account from past year’s reserve, per unit
c) Aggregate of expenses, write off, amortisation & charges, per unit 5.48 6.95 8.79
d) Net Income / (loss) per unit (b - c) 57.55 36.66 111.96
e) Net Change in unrealised appreciation / (depreciation) in the value of investments - - -
f) Repurchase Price during the yeari) Highest 1,000.0000 1,000.0000 1,000.0000 ii) Lowest 1,000.0000 1,000.0000 1,000.0000
g) Resale Price during the yeari) Highest 1,000.0000 1,000.0000 1,000.0000 ii) Lowest 1,000.0000 1,000.0000 1,000.0000
h) Market Price (National Stock Exchange)i) Highest 1,000.0100 1,149.8000 1,002.0000 ii) Lowest 991.0000 901.1000 851.1000
i) Price Earning Ratio ** 17.38 27.28 8.93
j) Ratio of expenses to the average net assets 0.60% 0.60% 0.60%
k)6.89% 3.76% 8.25%
***
Signatures to Schedules A to H forming part of the Balance Sheet and Revenue Account
As per our Report of even dateFor N M Raiji & Co.Chartered AccountantsRegistration No. 108296W
Dr. S.A.Dave Shriraj DhruvJ M Gandhi Chairman Director(Partner)Membership No. 37924
D.S. Mehta S.R. HalbeChairman Director
Place : Mumbai Payal Wadhwa KaipunjalDate : June 29, 2011 Fund Manager
Benchmark Asset Management Company Pvt Ltd.
SCHEDULE H - NOTES TO ACCOUNTS
The above per unit calculations are based on the number of units outstanding at the end of the year.Price Earning Ratio is based on the closing market price on the National Stock Exchange of India Ltd. & surplus for the year which includes unrealised appreciation / depreciation and Income Equalisation per unit.
For and on behalf of Benchmark Trustee Company Pvt Ltd.
For and on behalf of
BENCHMARK MUTUAL FUNDLIQUID BENCHMARK EXCHANGE TRADED SCHEME - LIQUID BeES
SCHEDULES FORMING PART OF THE BALANCE SHEET AS AT MARCH 31, 2011 AND REVENUE ACCOUNT FOR THE YEAR ENDED MARCH 31, 2011
Ratio of gross income (including net profit / loss on sale / redemption of investments and net change in unrealised apreciation / depreciation in value of investments) to average net assets
PERSPECTIVE HISTORICAL PER UNIT STATISTICS *
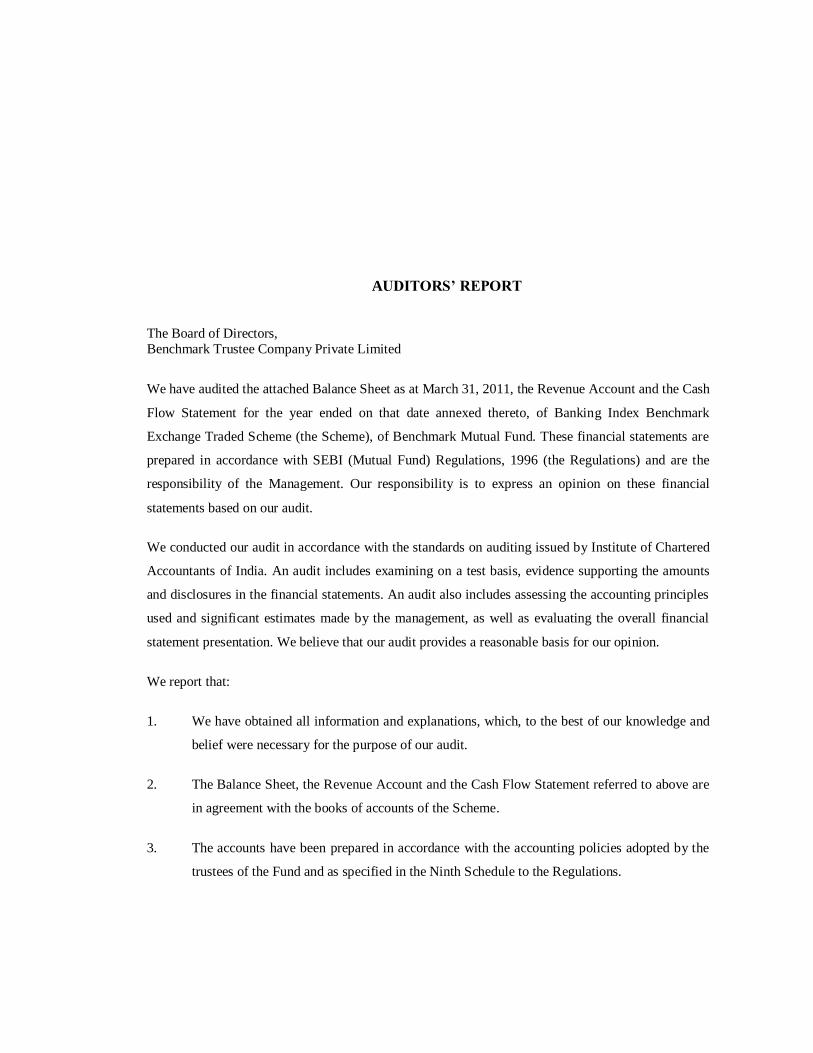
AUDITORS’ REPORT The Board of Directors, Benchmark Trustee Company Private Limited
We have audited the attached Balance Sheet as at March 31, 2011, the Revenue Account and the Cash
Flow Statement for the year ended on that date annexed thereto, of Banking Index Benchmark
Exchange Traded Scheme (the Scheme), of Benchmark Mutual Fund. These financial statements are
prepared in accordance with SEBI (Mutual Fund) Regulations, 1996 (the Regulations) and are the
responsibility of the Management. Our responsibility is to express an opinion on these financial
statements based on our audit.
We conducted our audit in accordance with the standards on auditing issued by Institute of Chartered
Accountants of India. An audit includes examining on a test basis, evidence supporting the amounts
and disclosures in the financial statements. An audit also includes assessing the accounting principles
used and significant estimates made by the management, as well as evaluating the overall financial
statement presentation. We believe that our audit provides a reasonable basis for our opinion.
We report that:
1. We have obtained all information and explanations, which, to the best of our knowledge and
belief were necessary for the purpose of our audit.
2. The Balance Sheet, the Revenue Account and the Cash Flow Statement referred to above are
in agreement with the books of accounts of the Scheme.
3. The accounts have been prepared in accordance with the accounting policies adopted by the
trustees of the Fund and as specified in the Ninth Schedule to the Regulations.

4. In our opinion, valuation methods for Non Traded Securities, if any, adopted by the scheme
are fair and reasonable and are in accordance with the guidelines for valuation issued by
SEBI and approved by the Trustee.
5. Without qualifying our opinion, we draw attention to note no. 25 in Schedule H of the
financial statements whereby the management has not provided the Segment Reporting for
reasons mentioned therein.
6. In our opinion and to the best of our information and according to the explanations given to
us, the financial statements read with the accounting policies and notes to accounts attached
thereto, give the information required as per the Regulations and give a true & fair view in
accordance with the generally accepted accounting principles in India:
a. in the case of Balance Sheet, of the state of affairs of the scheme as at March 31,
2011;
b. in the case of Revenue Account, of the surplus of the scheme for the year ended on
that date; and
c. in the case of Cash Flow Statement, of the cash flows for the year ended on that date.
For N.M.RAIJI & CO. Chartered Accountants
Firm Reg. No:108296W
J. M. GANDHI Partner Membership No. 37924
Place: Mumbai Dated: June 29, 2011

March 31, 2011 March 31, 2010
LIABILITIES
1 Unit Capital (No of units: Current Year - 6,467,474 , Previous Year - 317,474) 64,674,740 3,174,740 2 Reserves and Surplus A 7,533,346,412 296,737,679
UNIT HOLDERS FUNDS 7,598,021,152 299,912,419
3 Current Liabilities & Provisions B 124,707,119 6,694,273
TOTAL 7,722,728,271 306,606,692
ASSETS
1 Investments C 7,584,586,671 299,237,904 2 Deposits D 100,000 100,000 3 Other Current Assets E 138,041,600 7,268,788
TOTAL 7,722,728,271 306,606,692
Accounting Policies and Notes to Accounts H
The Schedules referred to herein form an integral part of the Balance sheet and Revenue Account
As per our Report of even dateFor N M Raiji & Co.Chartered AccountantsRegistration No. 108296W
J M Gandhi Dr. S.A.Dave Shriraj Dhruv(Partner) Chairman DirectorMembership No. 37924
D.S. Mehta S.R. HalbeChairman Director
Place : Mumbai Vishal JainDate : June 29, 2011 Fund Manager
Benchmark Asset Management Company Pvt Ltd.
BENCHMARK MUTUAL FUND
BALANCE SHEET AS AT MARCH 31, 2011
SCHEDULESerial. No. PARTICULARS
For and on behalf of Benchmark Trustee Company Pvt Ltd.
For and on behalf of
AMOUNT (In Rs.)
BANKING INDEX BENCHMARK EXCHANGE TRADED SCHEME - BANK BeES
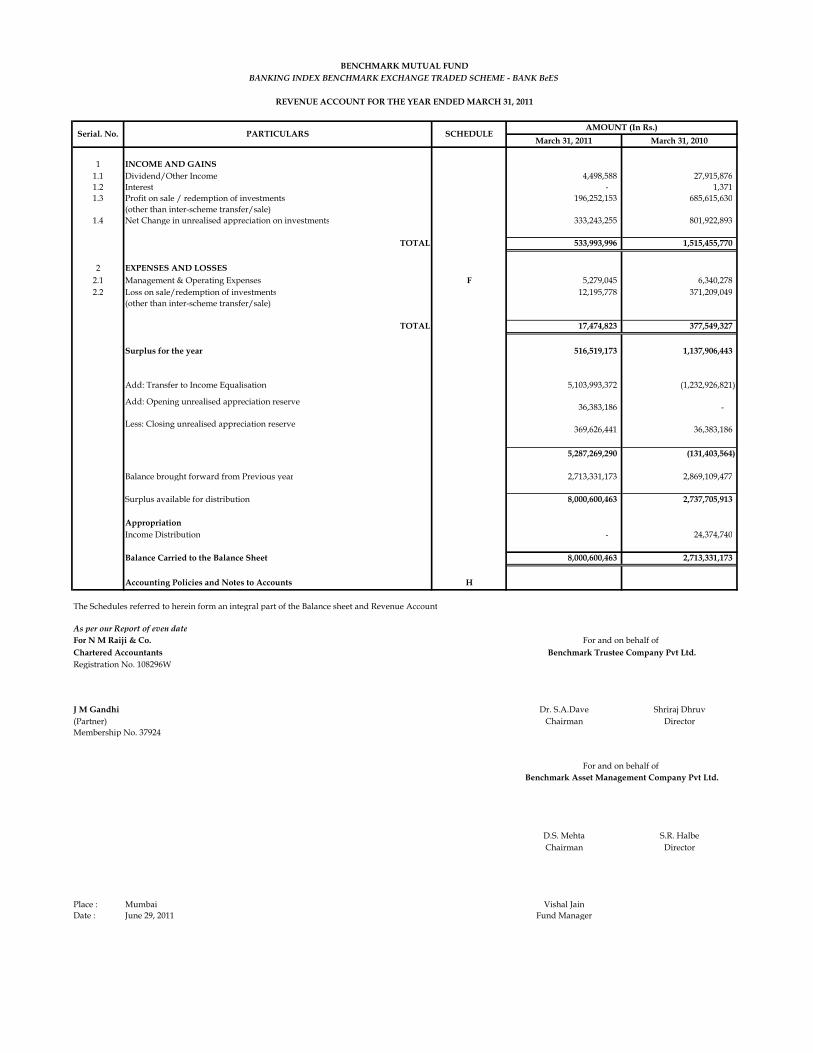
March 31, 2011 March 31, 2010
1 INCOME AND GAINS1.1 Dividend/Other Income 4,498,588 27,915,876 1.2 Interest - 1,371 1.3 Profit on sale / redemption of investments 196,252,153 685,615,630
(other than inter-scheme transfer/sale)1.4 Net Change in unrealised appreciation on investments 333,243,255 801,922,893
TOTAL 533,993,996 1,515,455,770
2 EXPENSES AND LOSSES2.1 Management & Operating Expenses F 5,279,045 6,340,278 2.2 Loss on sale/redemption of investments 12,195,778 371,209,049
(other than inter-scheme transfer/sale)
TOTAL 17,474,823 377,549,327
Surplus for the year 516,519,173 1,137,906,443
Add: Transfer to Income Equalisation 5,103,993,372 (1,232,926,821)
5,287,269,290 (131,403,564)
Balance brought forward from Previous year 2,713,331,173 2,869,109,477
Surplus available for distribution 8,000,600,463 2,737,705,913
AppropriationIncome Distribution - 24,374,740
Balance Carried to the Balance Sheet 8,000,600,463 2,713,331,173
Accounting Policies and Notes to Accounts H
The Schedules referred to herein form an integral part of the Balance sheet and Revenue Account
As per our Report of even dateFor N M Raiji & Co.Chartered AccountantsRegistration No. 108296W
J M Gandhi Dr. S.A.Dave Shriraj Dhruv(Partner) Chairman DirectorMembership No. 37924
D.S. Mehta S.R. HalbeChairman Director
Place : Mumbai Vishal JainDate : June 29, 2011 Fund Manager
AMOUNT (In Rs.)
BENCHMARK MUTUAL FUNDBANKING INDEX BENCHMARK EXCHANGE TRADED SCHEME - BANK BeES
REVENUE ACCOUNT FOR THE YEAR ENDED MARCH 31, 2011
Serial. No.
For and on behalf of Benchmark Trustee Company Pvt Ltd.
36,383,186
369,626,441
Add: Opening unrealised appreciation reserve
Less: Closing unrealised appreciation reserve
-
36,383,186
For and on behalf of Benchmark Asset Management Company Pvt Ltd.
SCHEDULEPARTICULARS

March 31, 2011 March 31, 2010
A. Cashflow from Operating ActivitiesSurplus/(Deficit) for the year 516,519,173 1,137,906,443 Change in unrealised Appreciation/(Depreciation) in the value of investments. (333,243,255) (801,922,893)
183,275,918 335,983,550
Adjustments for:-(Increase)/Decrease in Investments at Cost (6,952,105,512) 2,204,321,509 (Increase)/Decrease in Other Current Assets (106,080,540) Increase/(Decrease) in Current Liabilities 11,740,134 (3,104,258) Net Cash Generated from/(used in) Operations (6,863,170,000) 2,537,200,801
B. Cashflow from Financing ActivitiesIncrease/(Decrease) in Unit Capital 61,500,000 (38,000,000) Increase/(Decrease) in Reserves 6,720,089,561 (2,485,544,623) Adjustments for:-Increase/(Decrease) in Sundry Creditors for Units Redeemed by Investors 106,272,710 (Increase)/Decrease in Sundry Debtors for Units Issued to Investors (11,808,079) Dividend paid during the Year/Period - (24,374,740)
Net Cash (used in)/Generated from Financing Activities 6,876,054,192 (2,547,919,363)
Net Increase/(Decrease) in Cash and Cash Equivalents (A+B) 12,884,192 (10,718,562)
Cash and Cash Equivalents as at the :-Beginning of the year 7,368,788 18,087,350 End of the year 20,252,980 7,368,788
Components of Cash and Cash EquivalentsBalances with Banks in Current Accounts 20,152,980 7,268,788 Deposits with Scheduled Banks 100,000 100,000
As per our attached report of even date
For N M Raiji & Co. Chartered Accountants Registration No. 108296W
J M Gandhi Dr. S.A.Dave Shriraj Dhruv(Partner) Chairman DirectorMembership No. 37924
D.S.Mehta S.R. HalbeChairman Director
Place: Mumbai Vishal JainDate: June 29, 2011 Fund Manager
BANKING INDEX BENCHMARK EXCHANGE TRADED SCHEME - BANK BeES
CASH FLOW STATEMENT FOR THE YEAR ENDED MARCH 31, 2011
The above cash flow statement has been prepared under the indirect method setout in Accounting Standard (AS-3) issued by the Institute of Chartered Accountants of India.
Benchmark Asset Management Company Pvt. Ltd.
For and on behalf of Benchmark Trustee Company Pvt Ltd.
For and on behalf of
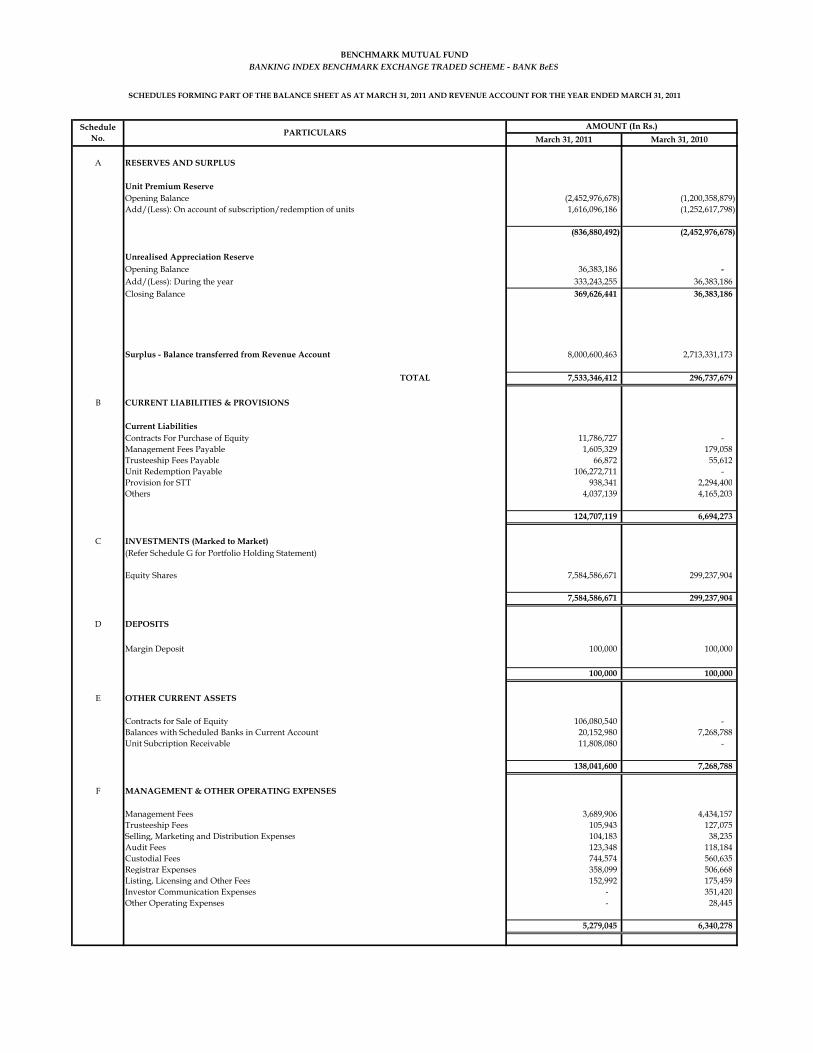
March 31, 2011 March 31, 2010
A RESERVES AND SURPLUS
Unit Premium ReserveOpening Balance (2,452,976,678) (1,200,358,879) Add/(Less): On account of subscription/redemption of units 1,616,096,186 (1,252,617,798)
(836,880,492) (2,452,976,678)
Unrealised Appreciation ReserveOpening Balance 36,383,186 - Add/(Less): During the year 333,243,255 36,383,186 Closing Balance 369,626,441 36,383,186
Surplus - Balance transferred from Revenue Account 8,000,600,463 2,713,331,173
TOTAL 7,533,346,412 296,737,679
B CURRENT LIABILITIES & PROVISIONS
Current LiabilitiesContracts For Purchase of Equity 11,786,727 - Management Fees Payable 1,605,329 179,058 Trusteeship Fees Payable 66,872 55,612 Unit Redemption Payable 106,272,711 - Provision for STT 938,341 2,294,400 Others 4,037,139 4,165,203
124,707,119 6,694,273
C INVESTMENTS (Marked to Market)(Refer Schedule G for Portfolio Holding Statement)
Equity Shares 7,584,586,671 299,237,904
7,584,586,671 299,237,904
D DEPOSITS
Margin Deposit 100,000 100,000
100,000 100,000
E OTHER CURRENT ASSETS
Contracts for Sale of Equity 106,080,540 - Balances with Scheduled Banks in Current Account 20,152,980 7,268,788 Unit Subcription Receivable 11,808,080 -
138,041,600 7,268,788
F MANAGEMENT & OTHER OPERATING EXPENSES
Management Fees 3,689,906 4,434,157 Trusteeship Fees 105,943 127,075 Selling, Marketing and Distribution Expenses 104,183 38,235 Audit Fees 123,348 118,184 Custodial Fees 744,574 560,635 Registrar Expenses 358,099 506,668 Listing, Licensing and Other Fees 152,992 175,459 Investor Communication Expenses - 351,420 Other Operating Expenses - 28,445
5,279,045 6,340,278
BANKING INDEX BENCHMARK EXCHANGE TRADED SCHEME - BANK BeES
Schedule No.
SCHEDULES FORMING PART OF THE BALANCE SHEET AS AT MARCH 31, 2011 AND REVENUE ACCOUNT FOR THE YEAR ENDED MARCH 31, 2011
PARTICULARSAMOUNT (In Rs.)
BENCHMARK MUTUAL FUND
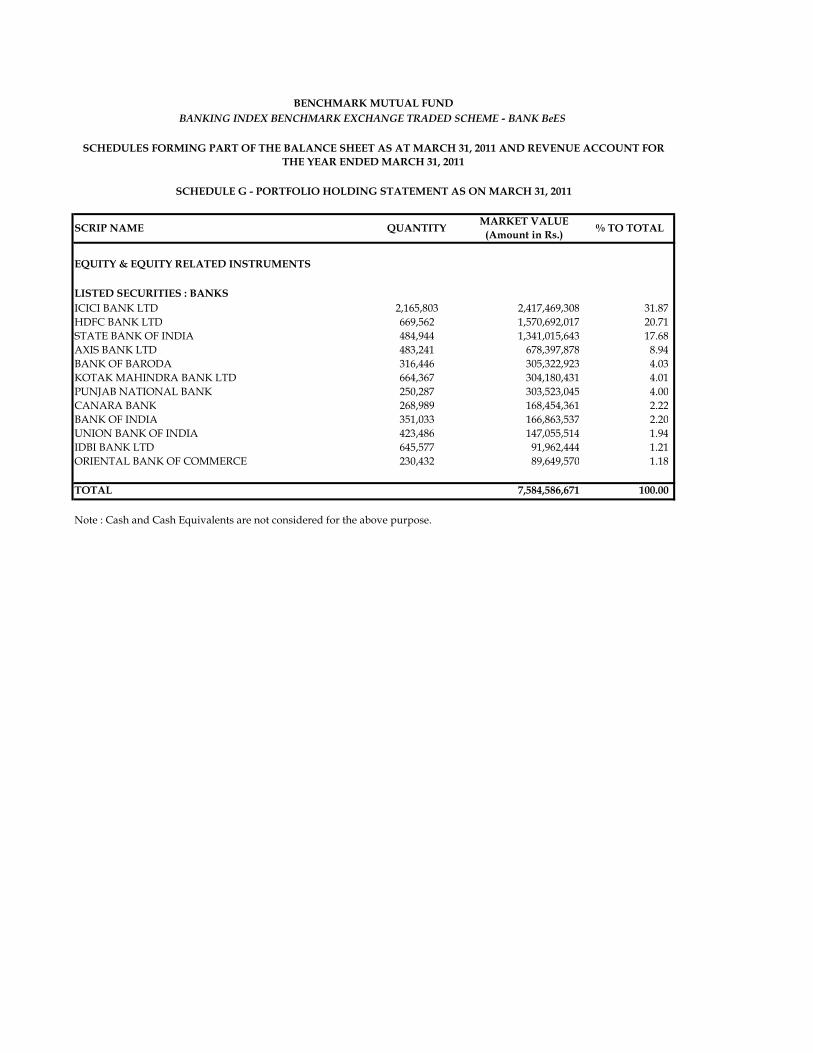
EQUITY & EQUITY RELATED INSTRUMENTS
LISTED SECURITIES : BANKSICICI BANK LTD 2,165,803 2,417,469,308 31.87 HDFC BANK LTD 669,562 1,570,692,017 20.71 STATE BANK OF INDIA 484,944 1,341,015,643 17.68 AXIS BANK LTD 483,241 678,397,878 8.94 BANK OF BARODA 316,446 305,322,923 4.03 KOTAK MAHINDRA BANK LTD 664,367 304,180,431 4.01 PUNJAB NATIONAL BANK 250,287 303,523,045 4.00 CANARA BANK 268,989 168,454,361 2.22 BANK OF INDIA 351,033 166,863,537 2.20 UNION BANK OF INDIA 423,486 147,055,514 1.94 IDBI BANK LTD 645,577 91,962,444 1.21 ORIENTAL BANK OF COMMERCE 230,432 89,649,570 1.18
TOTAL 7,584,586,671 100.00
Note : Cash and Cash Equivalents are not considered for the above purpose.
BENCHMARK MUTUAL FUNDBANKING INDEX BENCHMARK EXCHANGE TRADED SCHEME - BANK BeES
SCHEDULES FORMING PART OF THE BALANCE SHEET AS AT MARCH 31, 2011 AND REVENUE ACCOUNT FOR THE YEAR ENDED MARCH 31, 2011
% TO TOTALMARKET VALUE (Amount in Rs.)QUANTITYSCRIP NAME
SCHEDULE G - PORTFOLIO HOLDING STATEMENT AS ON MARCH 31, 2011
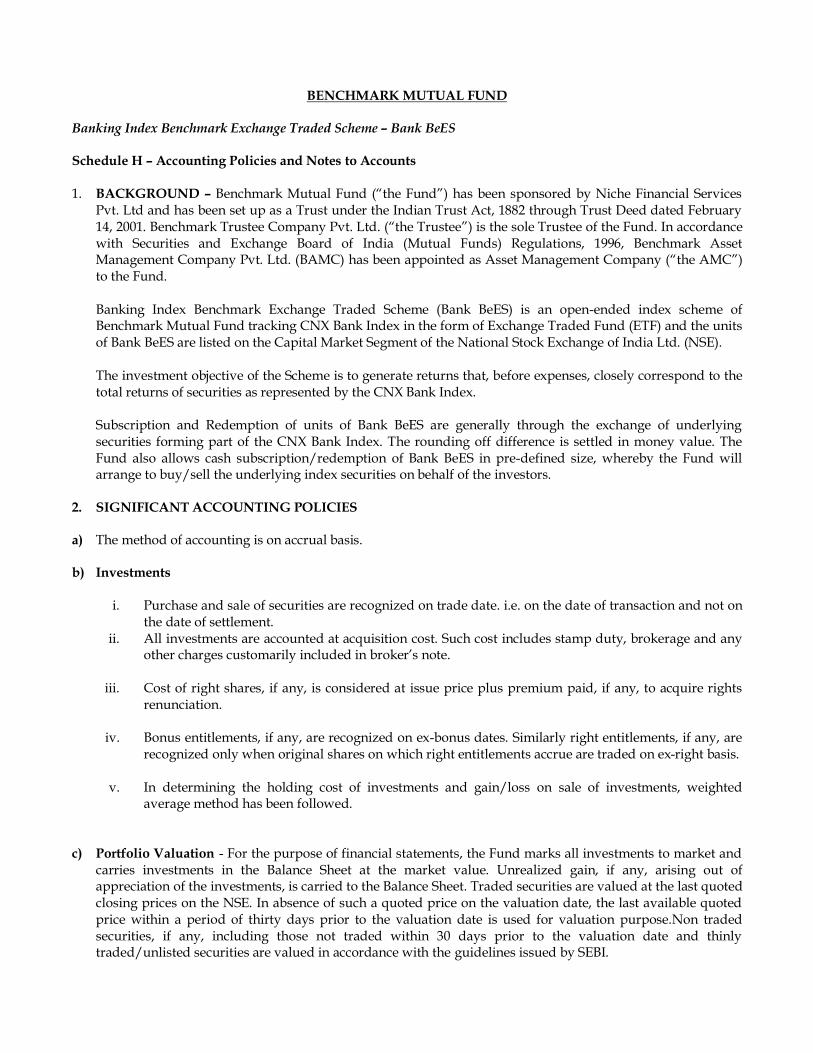
BENCHMARK MUTUAL FUND
Banking Index Benchmark Exchange Traded Scheme – Bank BeES Schedule H – Accounting Policies and Notes to Accounts 1. BACKGROUND – Benchmark Mutual Fund (“the Fund”) has been sponsored by Niche Financial Services
Pvt. Ltd and has been set up as a Trust under the Indian Trust Act, 1882 through Trust Deed dated February 14, 2001. Benchmark Trustee Company Pvt. Ltd. (“the Trustee”) is the sole Trustee of the Fund. In accordance with Securities and Exchange Board of India (Mutual Funds) Regulations, 1996, Benchmark Asset Management Company Pvt. Ltd. (BAMC) has been appointed as Asset Management Company (“the AMC”) to the Fund.
Banking Index Benchmark Exchange Traded Scheme (Bank BeES) is an open-ended index scheme of Benchmark Mutual Fund tracking CNX Bank Index in the form of Exchange Traded Fund (ETF) and the units of Bank BeES are listed on the Capital Market Segment of the National Stock Exchange of India Ltd. (NSE). The investment objective of the Scheme is to generate returns that, before expenses, closely correspond to the total returns of securities as represented by the CNX Bank Index. Subscription and Redemption of units of Bank BeES are generally through the exchange of underlying securities forming part of the CNX Bank Index. The rounding off difference is settled in money value. The Fund also allows cash subscription/redemption of Bank BeES in pre-defined size, whereby the Fund will arrange to buy/sell the underlying index securities on behalf of the investors.
2. SIGNIFICANT ACCOUNTING POLICIES a) The method of accounting is on accrual basis.
b) Investments
i. Purchase and sale of securities are recognized on trade date. i.e. on the date of transaction and not on
the date of settlement. ii. All investments are accounted at acquisition cost. Such cost includes stamp duty, brokerage and any
other charges customarily included in broker’s note.
iii. Cost of right shares, if any, is considered at issue price plus premium paid, if any, to acquire rights renunciation.
iv. Bonus entitlements, if any, are recognized on ex-bonus dates. Similarly right entitlements, if any, are
recognized only when original shares on which right entitlements accrue are traded on ex-right basis.
v. In determining the holding cost of investments and gain/loss on sale of investments, weighted average method has been followed.
c) Portfolio Valuation - For the purpose of financial statements, the Fund marks all investments to market and carries investments in the Balance Sheet at the market value. Unrealized gain, if any, arising out of appreciation of the investments, is carried to the Balance Sheet. Traded securities are valued at the last quoted closing prices on the NSE. In absence of such a quoted price on the valuation date, the last available quoted price within a period of thirty days prior to the valuation date is used for valuation purpose.Non traded securities, if any, including those not traded within 30 days prior to the valuation date and thinly traded/unlisted securities are valued in accordance with the guidelines issued by SEBI.

d) Income Recognition a. Dividend income is accrued on ex-dividend date. b. Profit or loss on sale of investment is arrived at by applying weighted average cost on trade date.
c. Interest on fixed income investments are recognized on accrual basis.
d. Unrealized gain/loss is recognized in Revenue Account. However, unrealized gain is excluded for
calculating distributable surplus and the same is carried to the Balance Sheet as Unrealized Appreciation Reserve.
e) Income Equalization
An appropriate portion of price of unit at the time of purchase and sale is transferred to Income Equalization Account. In arriving at the portion of the price to be transferred to Income Equalization Account, surplus/deficit (before considering unrealized appreciation) upto the date of transaction is taken into account. The net balance in Income Equalization Account is transferred to Revenue Account.
f) Unit Premium Reserve Unit Premium Reserve is debited or credited at the time of purchase or sale of units after taking into account the face value of units and Income Equalization. Balance in Unit Premium Reserve is not considered for distribution of dividend.
g) Entry / Exit Load The Fund does not charge any entry / exit load on subscription/redemption of units in the creation unit size. However in case no quotes are available on the NSE for five consecutive trading days, the exit load charged for redemption of units is upto 5% of NAV. Such load, if charged, at the time of repurchase of units, is offset against distribution and marketing expenses. Unutilized amount of load collected is carried to subsequent year unless the same is found excess by the Trustees / AMC. Such excess amount is credited to the Scheme. No entry load is charge, exit load in excess of 1% is credited to the scheme and load upto 1% is utilized for distribution and marketing expenses. As per the terms of the Offer Document, Depository and Custody Charges are recovered from the respective investor for transfer of shares on subscription and redemption and the same is utilized for payment of transaction charges to Depository Participant and Custodian on account of transfer of shares and hence do not form part of Revenue Account.
3. NOTES TO ACCOUNTS 1. Net Assets Value (NAV) is calculated after considering market/fair value of investments and after
providing for expenses on an estimated basis.
2. There are no underwriting obligations undertaken by the Scheme with respect to issue of securities of associate companies.
3. There is no contingent liability on underwriting commitment, partly paid equity shares or any other
uncalled liabilities. 4. All investments are marked to market and accordingly reflected in the Balance Sheet. The cost and
market value of investments are shown in Note no. 11. 5. The AMC has not dealt in any securities through brokers associated with the Sponsor. 6. Purchase of investments yet to be settled: 11,786,727/- (Previous Year - Nil)

7. Sale of investments yet to be settled: 106,080,540/- (Previous Year – Nil)
8. Income and Expenses
Total income (including net profit/(loss)
on sale / redemption of investments,
profit on inter-scheme transfers and net
change in unrealised appreciation /
(depreciation) in value of investments) 521,798,218 49.25% 1,144,246,722 90.05%Total expenditure (Annual recurringexpenses) 5,279,045 0.50% 6,340,278 0.50%
Aggregate Value (Rs.)
% of Average Net Assets
Aggregate Value (Rs.)
% of Average Net Assets
1,270,747,661Average Daily Net Assets (Rs.) Year ended March 31, 2010Year ended March 31, 2011
1,059,425,098
9. Aggregate Value of Purchase and Sale of Investments during the year
2010 - 11(Rs. In Lacs)
2009 - 10(Rs. In Lacs)
Daily Average Net Assets 10,594.25 12,707.48Purchases 108,923.12 27,761.62% to Daily Average Net Assets 1028.13% 218.47%Sales 41,242.63 52,948.90% to Daily Average Net Assets 389.29% 416.68%
10. Net Asset Value (Per Unit – in Rs.)
As on March 31, 2011
As on March 31, 2010
Face Value 10 10Net Asset Value 1,174.8051 944.6834Allotment NAV 253.5576 253.5576

11. Cost and Market Value of Investments
2009 - 10 2009 - 10
Cost 72,149.60 2,628.55 Market Value 75,845.87 2,992.38
Amount (Rs. In Lacs)
Unrealised Appreciation/(Depreciation) in the Value of investments 3,696.27 363.83
12. Movement in Unit Capital
Units (Rs in Lacs) Units (Rs in Lacs)Initial Units (on the date of Allotment) 177,474 17.75 177,474 17.75
Units at the beginning of the year 317,474 31.75 4,117,474 411.75 Units Issued 10,100,000 1,010.00 3,010,000 301.00 Units Redeemed 3,950,000 395.00 6,810,000 681.00 Units at the end of the year 6,467,474 646.75 317,474 31.75
2010 - 11Particulars
2009 - 10
13. Details of Large Holding (more than 25% of the Net Assets of the Scheme) - As on March 31, 2011, Scheme No. of Investors Percentage of holdingBank BeES 1 92.15%
14. Income Tax – No provision for Income Tax is made as the Scheme qualifies as a recognized Mutual Fund
under section 10 (23D) of the Income Tax Act, 1961. 15. Investment Management Fees – Investment Management Fees is calculated on the daily average net
assets of the Scheme. The details of management fees levied on an annualized basis are as follows:
2010 - 11 2009 - 10Daily Average Net Assets 1,059,425,098 1,270,747,661Management Fees (in %) 0.35% 0.35%Management Fees 3,689,906 4,434,157
Amount (in Rs.)
16. Trustee Fees – In accordance with the terms of Offer Document, the Trustee fees is charged @ 0.01% of
the daily average net assets of the Scheme.

17. Custodial Fees and Expenses – Citibank N.A. provides custodial services to the Scheme for which it receives custody fees including safekeeping. In addition, Citibank N.A. is reimbursed for custody and transaction charges levied by depositories (i.e. NSDL / CDSL).
18. Registrar and Transfer Agent Fees and Expenses – Karvy Computershare Private Limited provides
Registrar and Transfer Agency Services to the Scheme, for which it receives the fees based on daily average net assets of the Scheme.
19. There are no investments made by Benchmark Trustee Company Pvt. Ltd. in the Scheme. Benchmark
Asset Management Company Pvt. Ltd. holds 6,776 units in the Scheme as at March 31, 2011.
20. The Scheme has not made any investments in any Group/Associate Companies.
21. Details of transactions with associates in terms of Regulation 25 (8)
Brokerage paid to associates/related parties/group companies of Sponsor/AMCName of associate/related
parties/group companies of Sponsor/AMC
Nature of Association /
Nature of Relation
Period Covered (April 2010 to
March 2011 and April 2009 to March 2010)
Value of transaction ( in Rs. Cr. & % of total value of transaction of
the Fund )
Brokerage (Rs Cr & % of total
brokerage paid by the Fund)
Commission paid to associates/related parties/group companies of sponsor/AMCName of associate/related
parties/group companies of Sponsor/AMC
Nature of Association /
Nature of Relation
Period Covered (April 2010 to
March 2011 and April 2009 to March 2010)
Business Given ( in Rs. Cr. & %
of total business
received by the Fund )
Commission paid (Rs Cr & % of total
commssion paid by the Fund)
NIL
NIL
22. The Scheme has not made any investment in the issues lead managed by Associate Companies. 23. No brokerage, custodial fees or any other payment for services have been paid or is payable to any entity
in which the AMC or its major shareholders have a substantial interest.
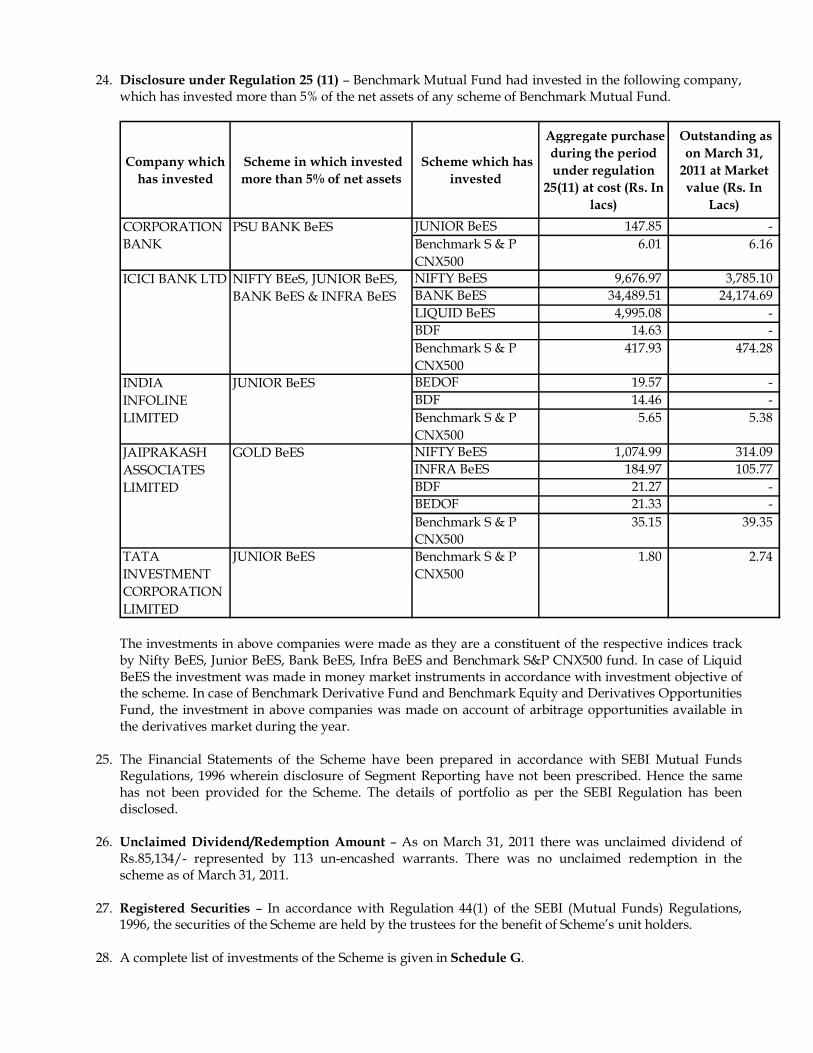
24. Disclosure under Regulation 25 (11) – Benchmark Mutual Fund had invested in the following company, which has invested more than 5% of the net assets of any scheme of Benchmark Mutual Fund.
Company which has invested
Scheme in which invested more than 5% of net assets
Scheme which has invested
Aggregate purchase during the period under regulation
25(11) at cost (Rs. In lacs)
Outstanding as on March 31,
2011 at Market value (Rs. In
Lacs)JUNIOR BeES 147.85 -Benchmark S & P CNX500
6.01 6.16
NIFTY BeES 9,676.97 3,785.10 BANK BeES 34,489.51 24,174.69 LIQUID BeES 4,995.08 -BDF 14.63 -Benchmark S & P CNX500
417.93 474.28
BEDOF 19.57 -BDF 14.46 -Benchmark S & P CNX500
5.65 5.38
NIFTY BeES 1,074.99 314.09 INFRA BeES 184.97 105.77 BDF 21.27 -BEDOF 21.33 -Benchmark S & P CNX500
35.15 39.35
TATA INVESTMENT CORPORATION LIMITED
JUNIOR BeES Benchmark S & P CNX500
1.80 2.74
INDIA INFOLINE LIMITED
JUNIOR BeES
JAIPRAKASH ASSOCIATES LIMITED
GOLD BeES
CORPORATION BANK
PSU BANK BeES
ICICI BANK LTD NIFTY BEeS, JUNIOR BeES, BANK BeES & INFRA BeES
The investments in above companies were made as they are a constituent of the respective indices track by Nifty BeES, Junior BeES, Bank BeES, Infra BeES and Benchmark S&P CNX500 fund. In case of Liquid BeES the investment was made in money market instruments in accordance with investment objective of the scheme. In case of Benchmark Derivative Fund and Benchmark Equity and Derivatives Opportunities Fund, the investment in above companies was made on account of arbitrage opportunities available in the derivatives market during the year.
25. The Financial Statements of the Scheme have been prepared in accordance with SEBI Mutual Funds Regulations, 1996 wherein disclosure of Segment Reporting have not been prescribed. Hence the same has not been provided for the Scheme. The details of portfolio as per the SEBI Regulation has been disclosed.
26. Unclaimed Dividend/Redemption Amount – As on March 31, 2011 there was unclaimed dividend of
Rs.85,134/- represented by 113 un-encashed warrants. There was no unclaimed redemption in the scheme as of March 31, 2011.
27. Registered Securities – In accordance with Regulation 44(1) of the SEBI (Mutual Funds) Regulations,
1996, the securities of the Scheme are held by the trustees for the benefit of Scheme’s unit holders.
28. A complete list of investments of the Scheme is given in Schedule G.

29. On March 15, 2011 Goldman Sachs Asset Management, L.P., through its subsidiaries Goldman Sachs Asset Management (India) Private Limited (“GS AMC”) and Goldman Sachs Trustee Company (India) Private Limited (“GS Trustee”), executed a sale and purchase agreement relating to the acquisition of all the outstanding shares in Benchmark Asset Management Company Private Limited (“BAMC”) and Benchmark Trustee Company Private Limited (“BTC”) from Niche Financial Services Private Limited, the sponsor of Benchmark Mutual Fund (“Benchmark MF”), and the other shareholders of BAMC and BTC. The sale and purchase agreement contemplates that BAMC shall transfer the rights to manage the schemes of Benchmark MF to GS AMC and BTC shall transfer the schemes of Benchmark MF to GS Trustee as part of the transaction. This transaction has been approved by the regulator, Securities and Exchange Board of India (“SEBI”) on June 27, 2011.
30. The previous year figures have been regrouped/rearranged wherever necessary.
31. The audited results for the year ended March 31, 2011 have been approved by the Boards of Benchmark
Asset Management Company Pvt. Ltd (AMC) and Benchmark Trustee Company Pvt. Ltd (Trustee) at their meeting held on June 29, 2011 respectively.
NOTES:
1. On written request, present and prospective unit holders/investors can obtain a copy of the Trust Deed, the Annual Report, at a price if any, and the text of the Scheme.
2. On written request, the present and prospective unit holders/investors may request a copy of the Annual Report of the AMC.
3. On written request, the present and prospective unit holders/investors can inspect a full list of investments of the Scheme at the office of the AMC.
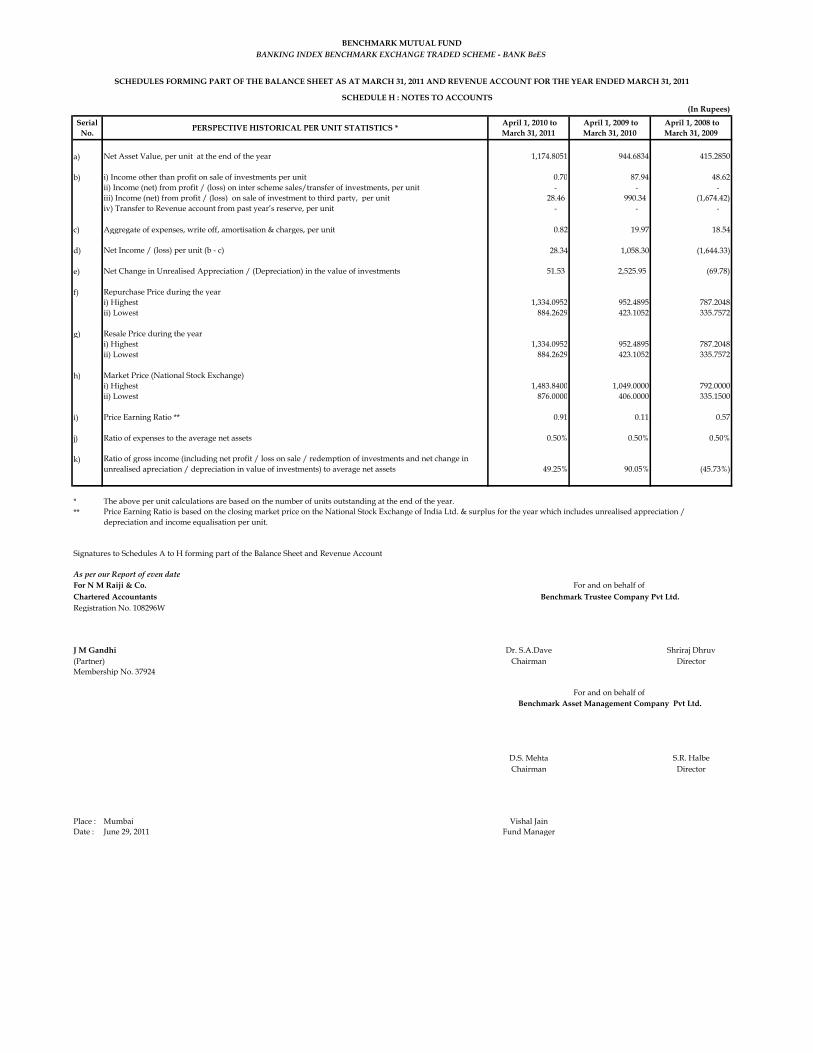
(In Rupees)
Serial No. PERSPECTIVE HISTORICAL PER UNIT STATISTICS * April 1, 2010 to
March 31, 2011 April 1, 2009 to March 31, 2010
April 1, 2008 to March 31, 2009
a) Net Asset Value, per unit at the end of the year 1,174.8051 944.6834 415.2850
b) i) Income other than profit on sale of investments per unit 0.70 87.94 48.62ii) Income (net) from profit / (loss) on inter scheme sales/transfer of investments, per unit - - - iii) Income (net) from profit / (loss) on sale of investment to third party, per unit 28.46 990.34 (1,674.42) iv) Transfer to Revenue account from past year’s reserve, per unit - - -
c) Aggregate of expenses, write off, amortisation & charges, per unit 0.82 19.97 18.54
d) Net Income / (loss) per unit (b - c) 28.34 1,058.30 (1,644.33)
e) Net Change in Unrealised Appreciation / (Depreciation) in the value of investments 51.53 2,525.95 (69.78)
f) Repurchase Price during the yeari) Highest 1,334.0952 952.4895 787.2048ii) Lowest 884.2629 423.1052 335.7572
g) Resale Price during the yeari) Highest 1,334.0952 952.4895 787.2048ii) Lowest 884.2629 423.1052 335.7572
h) Market Price (National Stock Exchange)i) Highest 1,483.8400 1,049.0000 792.0000ii) Lowest 876.0000 406.0000 335.1500
i) Price Earning Ratio ** 0.91 0.11 0.57
j) Ratio of expenses to the average net assets 0.50% 0.50% 0.50%
k) Ratio of gross income (including net profit / loss on sale / redemption of investments and net change in unrealised apreciation / depreciation in value of investments) to average net assets 49.25% 90.05% (45.73%)
***
Signatures to Schedules A to H forming part of the Balance Sheet and Revenue Account
As per our Report of even dateFor N M Raiji & Co.Chartered AccountantsRegistration No. 108296W
J M Gandhi Dr. S.A.Dave Shriraj Dhruv(Partner) Chairman DirectorMembership No. 37924
D.S. Mehta S.R. HalbeChairman Director
Place : Mumbai Vishal JainDate : June 29, 2011 Fund Manager
BANKING INDEX BENCHMARK EXCHANGE TRADED SCHEME - BANK BeESBENCHMARK MUTUAL FUND
For and on behalf of Benchmark Trustee Company Pvt Ltd.
For and on behalf of Benchmark Asset Management Company Pvt Ltd.
SCHEDULES FORMING PART OF THE BALANCE SHEET AS AT MARCH 31, 2011 AND REVENUE ACCOUNT FOR THE YEAR ENDED MARCH 31, 2011
The above per unit calculations are based on the number of units outstanding at the end of the year.Price Earning Ratio is based on the closing market price on the National Stock Exchange of India Ltd. & surplus for the year which includes unrealised appreciation / depreciation and income equalisation per unit.
SCHEDULE H : NOTES TO ACCOUNTS

AUDITORS’ REPORT The Board of Directors, Benchmark Trustee Company Private Limited
We have audited the attached Balance Sheet as at March 31, 2011, and the Revenue Account for the
year ended on that date, annexed thereto of Benchmark Derivative Fund (the scheme), of Benchmark
Mutual Fund. These financial statements are prepared in accordance with SEBI (Mutual Fund)
Regulations, 1996 (the Regulations) and are the responsibility of the Management. Our responsibility
is to express an opinion on these financial statements based on our audit.
We conducted our audit in accordance with the Standards on Auditing issued by Institute of Chartered
Accountants of India. An audit includes examining on a test basis, evidence supporting the amounts
and disclosures in the financial statements. An audit also includes assessing the accounting principles
used and significant estimates made by the management, as well as evaluating the overall financial
statement presentation. We believe that our audit provides a reasonable basis for our opinion.
We report that:
1. We have obtained all information and explanations, which, to the best of our knowledge and
belief were necessary for the purpose of our audit.
2. The Balance Sheet and the Revenue Account referred to above are in agreement with the
books of accounts of the Scheme.
3. The accounts have been prepared in accordance with the accounting policies adopted by the
trustees of the Fund and as specified in the Ninth Schedule to the Regulations.
4. In our opinion, valuation methods for Non Traded Securities, if any, adopted by the scheme
are fair and reasonable and are in accordance with the guidelines for valuation issued by
SEBI and approved by the Trustee.

5. Without qualifying our opinion, we draw attention to note no. 28 in Schedule H of the
financial statements whereby the management has not provided the Cash Flow Statement and
Segment Reporting for reasons mentioned therein.
6. In our opinion and to the best of our information and according to the explanations given to
us, the financial statements read with the accounting policies and notes to accounts attached
thereto, give the information required as per the Regulations and give a true & fair view in
accordance with the generally accepted accounting principles in India:
a. in the case of Balance Sheet, of the state of affairs of the scheme as at March 31,
2011; and
b. in the case of Revenue Account, of the surplus of the scheme for the year ended on
that date.
For N.M.RAIJI & CO. Chartered Accountants
Firm Reg. No:108296W
J. M. GANDHI Partner Membership No. 37924
Place: Mumbai Dated: June 29, 2011
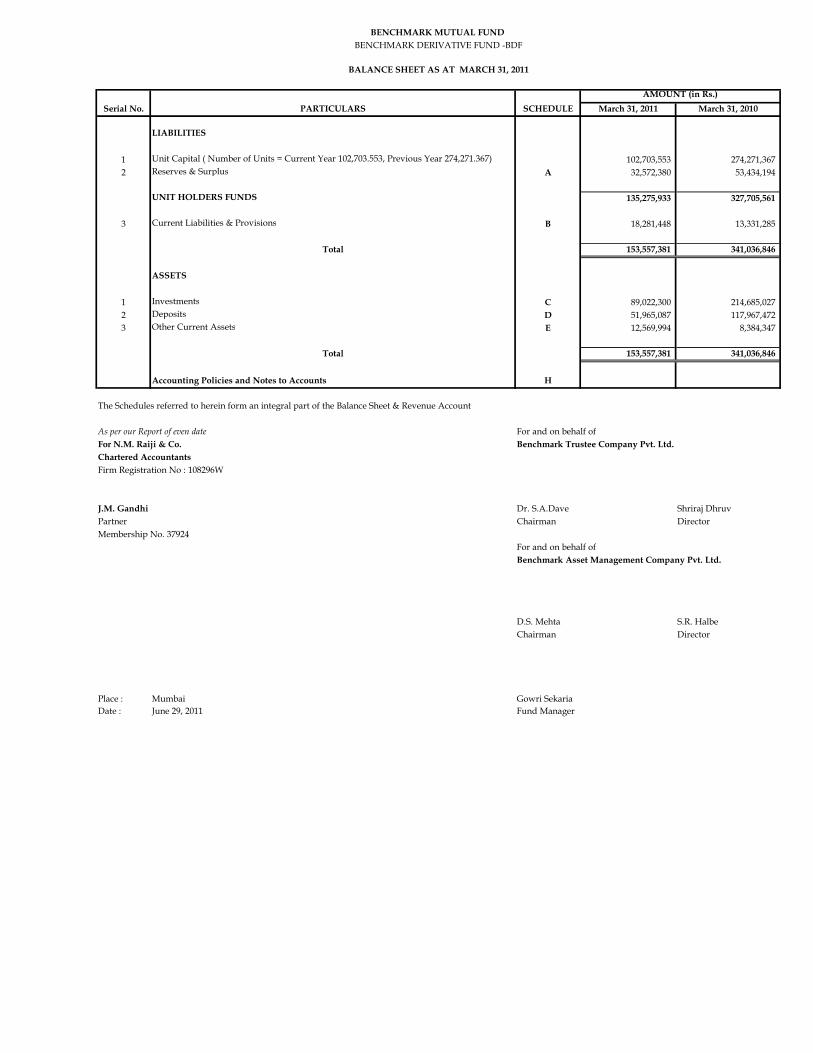
March 31, 2011 March 31, 2010
LIABILITIES
1 Unit Capital ( Number of Units = Current Year 102,703.553, Previous Year 274,271.367) 102,703,553 274,271,367 2 Reserves & Surplus A 32,572,380 53,434,194
UNIT HOLDERS FUNDS 135,275,933 327,705,561
3 Current Liabilities & Provisions B 18,281,448 13,331,285
Total 153,557,381 341,036,846
ASSETS
1 Investments C 89,022,300 214,685,027 2 Deposits D 51,965,087 117,967,472 3 Other Current Assets E 12,569,994 8,384,347
Total 153,557,381 341,036,846
Accounting Policies and Notes to Accounts H
The Schedules referred to herein form an integral part of the Balance Sheet & Revenue Account
As per our Report of even date For and on behalf ofFor N.M. Raiji & Co. Benchmark Trustee Company Pvt. Ltd.Chartered AccountantsFirm Registration No : 108296W
J.M. Gandhi Dr. S.A.Dave Shriraj DhruvPartner Chairman DirectorMembership No. 37924
For and on behalf of Benchmark Asset Management Company Pvt. Ltd.
D.S. Mehta S.R. HalbeChairman Director
Place : Mumbai Gowri SekariaDate : June 29, 2011 Fund Manager
BENCHMARK MUTUAL FUND BENCHMARK DERIVATIVE FUND -BDF
BALANCE SHEET AS AT MARCH 31, 2011
Serial No. PARTICULARS SCHEDULEAMOUNT (in Rs.)

March 31, 2011 March 31, 2010
1 INCOME AND GAINS 1.1 Dividend 1,547,310 1,138,603 1.2 Interest & Discount Income 4,369,718 3,659,139 1.3 Profit on sale/redemption of investments 34,310,836 110,497,147
(other than inter-scheme transfer/sale)1.4 Profit on sale/redemption of derivatives 9,288,966 - 1.5 Net change in unrealised appreciation/depreciation on Investments / Derviative postion
- 17,470,593 1.6 Other Income - 5,284
Total 49,516,830 132,770,766
2 EXPENSES AND LOSSES 2.1 Management & Operating expenses F 3,311,288 3,895,333 2.2 Loss on sale/redemption of investments 18,147,698 19,621,855
(other than inter-scheme transfer/sale) - 2.3 Loss on Derivatives 1,424,565 102,234,315 2.4
Net change in unrealised appreciation/depreciation on Investments / Derviative postion 15,148,863 -
Total 38,032,414 125,751,503
Surplus for the year 11,484,416 7,019,263 Add: Opening unrealised appreciation reserve 7,603,160 - Less: Closing unrealised appreciation reserve - (7,603,160) Add: Transfer to Income Equalisation (19,021,649) 15,886,492
65,927 15,302,595
Balance brought forward from previous year 69,501,043 60,435,341
Surplus available for distribution 69,566,970 75,737,936 AppropriationIncome Distribution 2,286,029 6,236,893 Balance carried to the Balance Sheet 67,280,941 69,501,043
Accounting Policies and Notes on Accounts H
The Schedules referred to herein form an integral part of the Balance Sheet & Revenue Account
As per our Report of even date For and on behalf ofFor N.M. Raiji & Co. Benchmark Trustee Company Pvt. Ltd.Chartered AccountantsFirm Registration No : 108296W
Dr. S.A.Dave Shriraj DhruvJ. M. Gandhi Chairman DirectorPartnerMembership No. 37924 For and on behalf of
Benchmark Asset Management Company Pvt. Ltd.
D.S. Mehta S.R. HalbeChairman Director
Place : Mumbai Gowri SekariaDate : June 29, 2011 Fund Manager
PARTICULARS
REVENUE ACCOUNT FOR THE YEAR ENDED MARCH 31, 2011
SCHEDULESerial No.AMOUNT (in Rs.)
BENCHMARK DERIVATIVE FUND - BDFBENCHMARK MUTUAL FUND
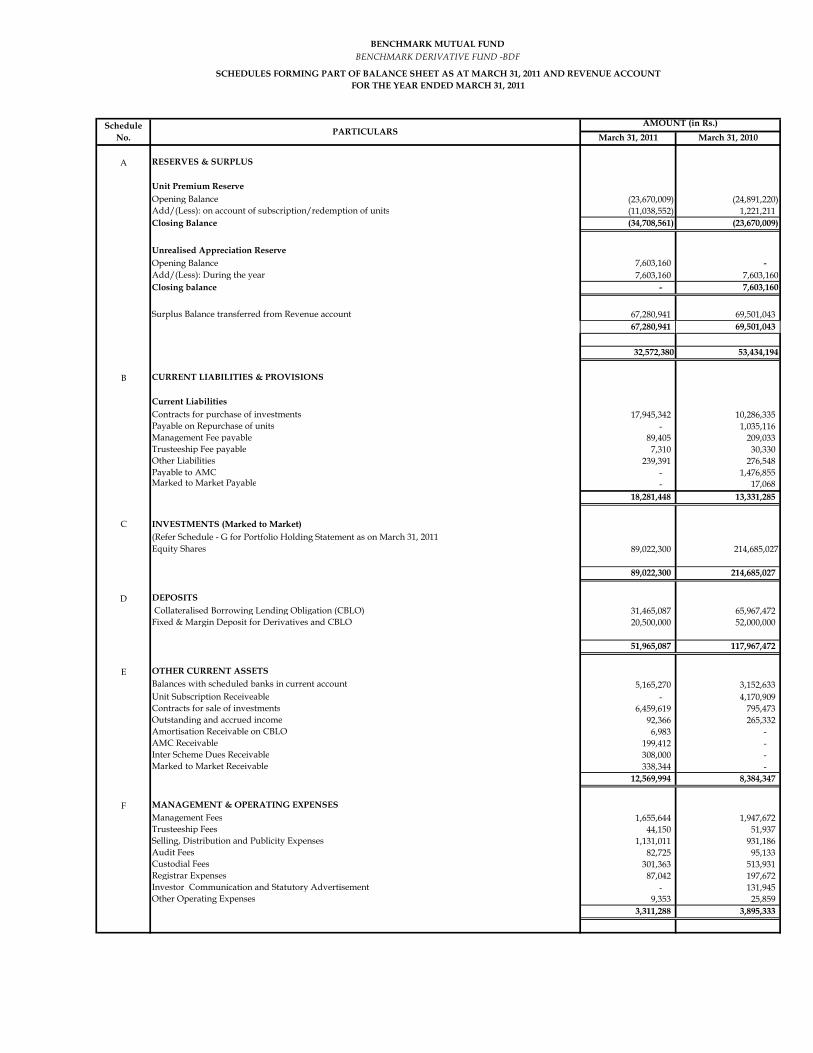
March 31, 2011 March 31, 2010
A RESERVES & SURPLUS
Unit Premium ReserveOpening Balance (23,670,009) (24,891,220) Add/(Less): on account of subscription/redemption of units (11,038,552) 1,221,211 Closing Balance (34,708,561) (23,670,009)
Unrealised Appreciation ReserveOpening Balance 7,603,160 - Add/(Less): During the year 7,603,160 7,603,160Closing balance - 7,603,160
Surplus Balance transferred from Revenue account 67,280,941 69,501,043 67,280,941 69,501,043
32,572,380 53,434,194
B CURRENT LIABILITIES & PROVISIONS
Current LiabilitiesContracts for purchase of investments 17,945,342 10,286,335 Payable on Repurchase of units - 1,035,116 Management Fee payable 89,405 209,033 Trusteeship Fee payable 7,310 30,330 Other Liabilities 239,391 276,548 Payable to AMC - 1,476,855 Marked to Market Payable - 17,068
18,281,448 13,331,285
C INVESTMENTS (Marked to Market)(Refer Schedule - G for Portfolio Holding Statement as on March 31, 2011Equity Shares 89,022,300 214,685,027
89,022,300 214,685,027
D DEPOSITS Collateralised Borrowing Lending Obligation (CBLO) 31,465,087 65,967,472 Fixed & Margin Deposit for Derivatives and CBLO 20,500,000 52,000,000
51,965,087 117,967,472
E OTHER CURRENT ASSETS Balances with scheduled banks in current account 5,165,270 3,152,633 Unit Subscription Receiveable - 4,170,909 Contracts for sale of investments 6,459,619 795,473 Outstanding and accrued income 92,366 265,332 Amortisation Receivable on CBLO 6,983 - AMC Receivable 199,412 - Inter Scheme Dues Receivable 308,000 - Marked to Market Receivable 338,344 -
12,569,994 8,384,347
F MANAGEMENT & OPERATING EXPENSES Management Fees 1,655,644 1,947,672 Trusteeship Fees 44,150 51,937 Selling, Distribution and Publicity Expenses 1,131,011 931,186 Audit Fees 82,725 95,133 Custodial Fees 301,363 513,931 Registrar Expenses 87,042 197,672 Investor Communication and Statutory Advertisement - 131,945 Other Operating Expenses 9,353 25,859
3,311,288 3,895,333
PARTICULARS
SCHEDULES FORMING PART OF BALANCE SHEET AS AT MARCH 31, 2011 AND REVENUE ACCOUNTFOR THE YEAR ENDED MARCH 31, 2011
BENCHMARK DERIVATIVE FUND -BDF
AMOUNT (in Rs.)Schedule No.
BENCHMARK MUTUAL FUND
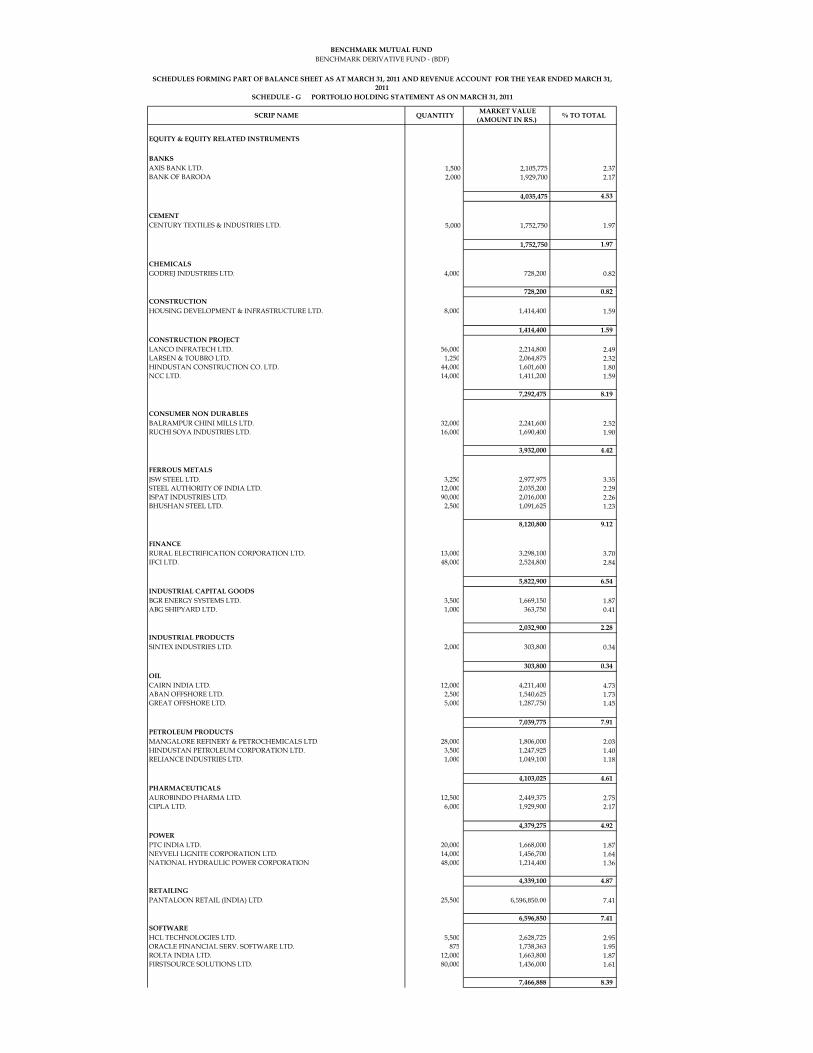
SCRIP NAME QUANTITY MARKET VALUE (AMOUNT IN RS.) % TO TOTAL
EQUITY & EQUITY RELATED INSTRUMENTS
BANKSAXIS BANK LTD. 1,500 2,105,775 2.37BANK OF BARODA 2,000 1,929,700 2.17
4,035,475 4.53
CEMENTCENTURY TEXTILES & INDUSTRIES LTD. 5,000 1,752,750 1.97
1,752,750 1.97
CHEMICALS GODREJ INDUSTRIES LTD. 4,000 728,200 0.82
728,200 0.82 CONSTRUCTIONHOUSING DEVELOPMENT & INFRASTRUCTURE LTD. 8,000 1,414,400 1.59
1,414,400 1.59 CONSTRUCTION PROJECTLANCO INFRATECH LTD. 56,000 2,214,800 2.49LARSEN & TOUBRO LTD. 1,250 2,064,875 2.32HINDUSTAN CONSTRUCTION CO. LTD. 44,000 1,601,600 1.80NCC LTD. 14,000 1,411,200 1.59
7,292,475 8.19
CONSUMER NON DURABLESBALRAMPUR CHINI MILLS LTD. 32,000 2,241,600 2.52RUCHI SOYA INDUSTRIES LTD. 16,000 1,690,400 1.90
3,932,000 4.42
FERROUS METALSJSW STEEL LTD. 3,250 2,977,975 3.35STEEL AUTHORITY OF INDIA LTD. 12,000 2,035,200 2.29ISPAT INDUSTRIES LTD. 90,000 2,016,000 2.26BHUSHAN STEEL LTD. 2,500 1,091,625 1.23
8,120,800 9.12
FINANCERURAL ELECTRIFICATION CORPORATION LTD. 13,000 3,298,100 3.70IFCI LTD. 48,000 2,524,800 2.84
5,822,900 6.54 INDUSTRIAL CAPITAL GOODSBGR ENERGY SYSTEMS LTD. 3,500 1,669,150 1.87ABG SHIPYARD LTD. 1,000 363,750 0.41
2,032,900 2.28 INDUSTRIAL PRODUCTSSINTEX INDUSTRIES LTD. 2,000 303,800 0.34
303,800 0.34 OILCAIRN INDIA LTD. 12,000 4,211,400 4.73ABAN OFFSHORE LTD. 2,500 1,540,625 1.73GREAT OFFSHORE LTD. 5,000 1,287,750 1.45
7,039,775 7.91 PETROLEUM PRODUCTSMANGALORE REFINERY & PETROCHEMICALS LTD. 28,000 1,806,000 2.03HINDUSTAN PETROLEUM CORPORATION LTD. 3,500 1,247,925 1.40RELIANCE INDUSTRIES LTD. 1,000 1,049,100 1.18
4,103,025 4.61 PHARMACEUTICALSAUROBINDO PHARMA LTD. 12,500 2,449,375 2.75CIPLA LTD. 6,000 1,929,900 2.17
4,379,275 4.92 POWER PTC INDIA LTD. 20,000 1,668,000 1.87NEYVELI LIGNITE CORPORATION LTD. 14,000 1,456,700 1.64NATIONAL HYDRAULIC POWER CORPORATION 48,000 1,214,400 1.36
4,339,100 4.87 RETAILINGPANTALOON RETAIL (INDIA) LTD. 25,500 6,596,850.00 7.41
6,596,850 7.41 SOFTWAREHCL TECHNOLOGIES LTD. 5,500 2,628,725 2.95ORACLE FINANCIAL SERV. SOFTWARE LTD. 875 1,738,363 1.95ROLTA INDIA LTD. 12,000 1,663,800 1.87FIRSTSOURCE SOLUTIONS LTD. 80,000 1,436,000 1.61
7,466,888 8.39
BENCHMARK MUTUAL FUND BENCHMARK DERIVATIVE FUND - (BDF)
SCHEDULES FORMING PART OF BALANCE SHEET AS AT MARCH 31, 2011 AND REVENUE ACCOUNT FOR THE YEAR ENDED MARCH 31, 2011
SCHEDULE - G PORTFOLIO HOLDING STATEMENT AS ON MARCH 31, 2011

SCHEDULE - G PORTFOLIO HOLDING STATEMENT AS ON MARCH 31, 2011TELECOM - SERVICESGTL LTD. 16,500 6,858,225 7.70TATA TELESERVICES (MAH) LTD. 162,000 2,770,200 3.11MAHANAGAR TELEPHONE NIGAM LTD. 60,000 2,721,000 3.06
12,349,425 13.87 TEXTILE PRODUCTSBOMBAY RAYON FASHIONS LTD. 8,000 2,064,000 2.32ALOK INDUSTRIES LTD. 90,000 1,993,500 2.24GRASIM INDUSTRIES LTD. 625 1,535,563 1.72
5,593,063 6.28 TRANSPORTATIONSHIPPING CORPORATION OF INDIA LTD. 16,000 1,719,200.00 1.93
1,719,200 1.93
TOTAL 89,022,300 100.00
Details of Derivative Positions outstanding as on March 31, 2011
Name of the Instrument Quantity * Market Value (Rs.) % to Net AssetsFUTURESGTL LTD (16,500) (6,895,350) N.A.PANTALOON RETAIL (INDIA) LTD. (25,500) (6,716,700) N.A.CAIRN INDIA LIMITED (12,000) (4,245,000) N.A.RURAL ELECTRIFICATION CORP LTD (13,000) (3,327,350) N.A.JSW STEEL LTD. (3,250) (3,003,000) N.A.TATA TELESERVICES (MAH) LIMITED (162,000) (2,794,500) N.A.MAHANAGAR TELEPHONE NIGAM LTD. (60,000) (2,754,000) N.A.HCL TECHNOLOGIES LTD. (5,500) (2,626,800) N.A.IFCI LTD (48,000) (2,551,200) N.A.AUROBINDO PHARMA LTD. (12,500) (2,453,750) N.A.BALRAMPUR CHINI MILLS LTD. (32,000) (2,252,800) N.A.LANCO INFRATECH LIMITED (56,000) (2,237,200) N.A.AXIS BANK LIMITED (1,500) (2,119,725) N.A.BOMBAY RAYON FASHIONS LTD. (8,000) (2,086,000) N.A.LARSEN & TOUBRO LTD. (1,250) (2,083,313) N.A.STEEL AUTHORITY OF INDIA LTD. (12,000) (2,052,000) N.A.ISPAT INDUSTRIES LTD (90,000) (2,025,000) N.A.ALOK INDUSTRIES LTD (90,000) (2,011,500) N.A.CIPLA LTD. (6,000) (1,946,100) N.A.BANK OF BARODA (2,000) (1,943,800) N.A.MANGALORE REFINERY & PETROCHEMICALS LTD. (28,000) (1,820,000) N.A.ORACLE FINANCIAL SERV SOFTWARE LTD (875) (1,749,956) N.A.CENTURY TEXTILES & INDUSTRIES LTD. (5,000) (1,749,250) N.A.SHIPPING CORPORATION OF INDIA LTD. (16,000) (1,736,000) N.A.RUCHI SOYA INDUSTRIES LIMITED (16,000) (1,704,000) N.A.BGR ENERGY SYSTEMS LIMITED (3,500) (1,685,425) N.A.PTC INDIA LIMITED (20,000) (1,685,000) N.A.ROLTA INDIA LTD. (12,000) (1,680,000) N.A.HINDUSTAN CONSTRUCTION CO. LTD. (44,000) (1,617,000) N.A.ABAN OFFSHORE LTD (2,500) (1,554,500) N.A.GRASIM INDUSTRIES LTD. (625) (1,549,188) N.A.NEYVELI LIGNITE CORPORATION LTD (14,000) (1,473,500) N.A.FIRSTSOURCE SOLUTIONS LIMITED (80,000) (1,452,000) N.A.NCC LTD. (14,000) (1,423,100) N.A.HOUSING DEVELOPMENT & INFRASTR LTD (8,000) (1,422,000) N.A.GREAT OFFSHORE LIMITED (5,000) (1,300,500) N.A.HINDUSTAN PETROLEUM CORPORATION LTD. (3,500) (1,248,800) N.A.NATIONAL HYDRAULIC POWER CORPORATION (48,000) (1,214,400) N.A.BHUSHAN STEEL LTD. (2,500) (1,101,750) N.A.RELIANCE INDUSTRIES LTD. (1,000) (1,056,800) N.A.GODREJ INDUSTRIES LTD. (4,000) (733,800) N.A.ABG SHIPYARD LTD (1,000) (364,450) N.A.SINTEX INDUSTRIES LTD. (2,000) (306,500) N.A.
TOTAL (988,500) (89,753,006)
* Negative Quantity indicates Sale Position.Note : Cash & Cash Equivalent are not considered for the above purpose

SCHEDULE - G PORTFOLIO HOLDING STATEMENT AS ON MARCH 31, 2011Disclosure for derivative positions as per SEBI Circular No. CIR/IMD/DF/11/2010 dated 18th August 2010
A. Hedging Positions through Futures as on March 31, 2011
Underlying Long / ShortFutures Price when purchased
Current price of the contract
Margin maintained in Rs. Lakhs
Aban Offshore Ltd Short 616.57 621.80 2.85 ABG Shipyard Ltd Short 364.70 364.45 0.58 Alok Industries Ltd Short 21.98 22.35 3.74 Aurobindo Pharma Ltd. Short 195.30 196.30 5.83 Axis Bank Limited Short 1,409.54 1,413.15 3.33 Balrampur Chini Mills Ltd. Short 70.48 70.40 3.53 Bank Of Baroda Short 967.96 971.90 3.03 BGR Energy Systems Limited Short 485.56 481.55 3.39 Bhushan Steel Ltd. Short 440.06 440.70 1.72 Bombay Rayon Fashions Ltd. Short 267.55 260.75 3.26 CAIRN INDIA LIMITED Short 354.47 353.75 6.62 Century Textiles & Industries Ltd. Short 349.42 349.85 3.13 Cipla Ltd. Short 322.32 324.35 3.04 Firstsource Solutions Limited Short 17.43 18.15 2.73 Godrej Industries Ltd. Short 185.29 183.45 1.21 Grasim Industries Ltd. Short 2,470.20 2,478.70 2.42 Great Offshore Limited Short 261.97 260.10 2.48 GTL Ltd Short 420.30 417.90 10.77 Hcl Technologies Ltd. Short 477.89 477.60 4.10 Hindustan Construction Co. Ltd. Short 36.99 36.75 2.82 Hindustan Petroleum Corporation Ltd. Short 356.79 356.80 1.95 Housing Development & Infrastr Ltd Short 169.63 177.75 2.92 IFCI Ltd Short 54.44 53.15 4.41 Ispat Industries Ltd Short 22.27 22.50 3.30 JSW Steel Ltd. Short 922.83 924.00 5.18 Lanco Infratech Limited Short 40.32 39.95 5.10 Larsen & Toubro Ltd. Short 1,671.70 1,666.65 3.25 Mahanagar Telephone Nigam Ltd. Short 45.90 45.90 4.93 Mangalore Refinery & Petrochemicals Ltd. Short 63.74 65.00 2.84 National Hydraulic Power Corporation Short 24.18 25.30 1.91 NCC Ltd. Short 101.24 101.65 2.45 Neyveli Lignite Corporation Ltd Short 106.65 105.25 2.50 Oracle Financial Serv Software Ltd Short 2,020.85 1,999.95 2.73 Pantaloon Retail (India) Ltd. Short 271.62 263.40 14.55 PTC India Limited Short 84.76 84.25 3.07 Reliance Industries Ltd. Short 1,045.14 1,056.80 1.65 Rolta India Ltd. Short 140.30 140.00 2.63 Ruchi Soya Industries Limited Short 106.85 106.50 2.95 Rural Electrification Corp Ltd Short 254.83 255.95 6.46 Shipping Corporation Of India Ltd. Short 109.71 108.50 2.71 Sintex Industries Ltd. Short 154.00 153.25 0.52 Steel Authority Of India Ltd. Short 169.66 171.00 3.20 Tata Teleservices (Mah) Limited Short 16.50 17.25 5.14
Total %age (gross exposure) of existing assets hedged through futures : 66.35%
Total Number of contracts where futures were bought : 7,044Total Number of contracts where futures were sold : 6,325Gross Notional Value of contracts where futures were bought : Rs. 1,871,362,349.86Gross Notional Value of contracts where futures were sold : Rs. 1,666,113,942.13Net Profit/Loss value on all contracts combined : Rs. 9,288,965.74
B. Other than Hedging Positions through Futures as on March 31, 2011
Underlying Long / ShortFutures Price when purchased (Rs)
Current price of the contract (Rs)
Margin maintained (Rs. Lakhs)
NILTotal exposure due to futures (non hedging positions) as a %age of net assets : NIL
Total Number of contracts where futures were bought : NILTotal Number of contracts where futures were sold : NILGross Notional Value of contracts where futures were bought : NILGross Notional Value of contracts where futures were sold : NILNet Profit/Loss value on all contracts combined : NIL
C. Hedging Positions through Put Options as on March 31, 2011
Underlying Number of Contracts
Option Price when purchased
Current Option Price
NIL
D. Other than Hedging Positions through Options as on March 31, 2011
Underlying Call / put Number of contracts Option Price when purchased
Current Price
NIL
E. Hedging Positions through swaps as on March 31, 2011 - NIL
For the month ended March 31, 2011 following details specified with regrd to non-hedging transactions through options which have already been exercised/expired :
Total Number of contracts entered into : NILGross National Value of contracts : NILNet Profit/Loss on all contracts (premium paid treated as loss) : NIL
For the month ended March 31, 2011 following details specified for hedging transactions through futures which have been squared off/expired:
For the month ended March 31, 2011 following details specified for non-hedging transactions through futures which have been squared off/expired:
Total % age of existing assets hedged through put options - NILFor the month ended March 31, 2011 following details specified for hedging transactions through options which have already been exercised/expired :
Total Number of contracts entered into : NILGross National value of contracts : NILNet Profit/Loss on all contracts (premium paid treated as loss) : NIL
Total Exposure through options as a %age of net assets : NIL
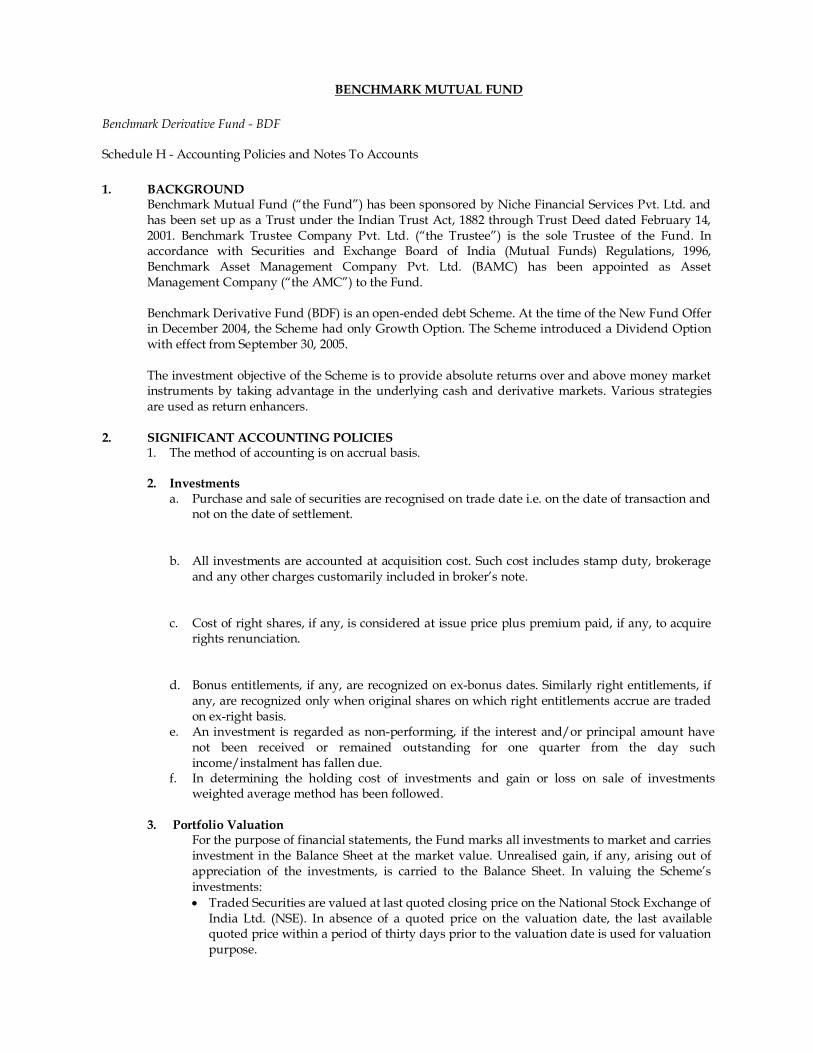
BENCHMARK MUTUAL FUND Benchmark Derivative Fund - BDF
Schedule H - Accounting Policies and Notes To Accounts 1. BACKGROUND
Benchmark Mutual Fund (“the Fund”) has been sponsored by Niche Financial Services Pvt. Ltd. and has been set up as a Trust under the Indian Trust Act, 1882 through Trust Deed dated February 14, 2001. Benchmark Trustee Company Pvt. Ltd. (“the Trustee”) is the sole Trustee of the Fund. In accordance with Securities and Exchange Board of India (Mutual Funds) Regulations, 1996, Benchmark Asset Management Company Pvt. Ltd. (BAMC) has been appointed as Asset Management Company (“the AMC”) to the Fund. Benchmark Derivative Fund (BDF) is an open-ended debt Scheme. At the time of the New Fund Offer in December 2004, the Scheme had only Growth Option. The Scheme introduced a Dividend Option with effect from September 30, 2005. The investment objective of the Scheme is to provide absolute returns over and above money market instruments by taking advantage in the underlying cash and derivative markets. Various strategies are used as return enhancers.
2. SIGNIFICANT ACCOUNTING POLICIES
1. The method of accounting is on accrual basis.
2. Investments a. Purchase and sale of securities are recognised on trade date i.e. on the date of transaction and
not on the date of settlement.
b. All investments are accounted at acquisition cost. Such cost includes stamp duty, brokerage and any other charges customarily included in broker’s note.
c. Cost of right shares, if any, is considered at issue price plus premium paid, if any, to acquire rights renunciation.
d. Bonus entitlements, if any, are recognized on ex-bonus dates. Similarly right entitlements, if any, are recognized only when original shares on which right entitlements accrue are traded on ex-right basis.
e. An investment is regarded as non-performing, if the interest and/or principal amount have not been received or remained outstanding for one quarter from the day such income/instalment has fallen due.
f. In determining the holding cost of investments and gain or loss on sale of investments weighted average method has been followed.
3. Portfolio Valuation
For the purpose of financial statements, the Fund marks all investments to market and carries investment in the Balance Sheet at the market value. Unrealised gain, if any, arising out of appreciation of the investments, is carried to the Balance Sheet. In valuing the Scheme’s investments: Traded Securities are valued at last quoted closing price on the National Stock Exchange of
India Ltd. (NSE). In absence of a quoted price on the valuation date, the last available quoted price within a period of thirty days prior to the valuation date is used for valuation purpose.
Debt securities, if any, listed on a recognised stock exchange are valued at the last quoted closing price on the principal exchange on which the security is traded. If no sale is reported at that date, debt securities are valued at fair value as determined in accordance with the valuation policy of the Fund.
Non-traded and Thinly-traded debt securities, if any, are valued at fair value in good faith by the AMC in accordance with the guidelines for valuation of such securities specified by SEBI.
Privately placed debt securities are valued at fair value in good faith by the AMC in accordance with the guidelines for valuation of such securities specified by SEBI.
Upto 1st August 2010 : Money market securities/Non traded/ Collateralised borrowing lending obligation /Thinly traded Non-Government Debt securities of up to182 days of maturity are valued on the basis of amortization (cost plus accrued interest basis) as prescribed by SEBI.
From 2nd August 2010 : Money market securities/Non traded/ Collateralised borrowing lending obligation /Thinly traded Non-Government Debt securities of up to 91 days of maturity are valued on the basis of amortization (cost plus accrued interest basis) as prescribed by SEBI.
Upto 1st August 2010 : Non-traded/Thinly traded Non-Government securities of over 182 days to maturity are valued on duration based yield to maturity as prescribed by SEBI.
From 2nd August 2010 :Non-traded/Thinly traded Non-Government securities of over 91 days to maturity are valued on duration based yield to maturity as prescribed by SEBI in accordance with SEBI Regulations, Government securities are valued at prices released by the Agency approved by AMFI.
4. Income Recognition
a. Dividend is accrued on ex-dividend date. b. Profit or loss on sale of investment is arrived at by applying weighted average cost on trade
date. c. Interest on fixed income investments is recognised on accrual basis. d. Income on non-performing assets (NPA), if any, is recognised on cash basis. e. Other income of miscellaneous nature is accounted for when there is certainty of collection. f. Unrealized gain/loss on investments and derivative position is recognized in Revenue
Account. However, unrealized gain is excluded for calculating distributable surplus and the same is carried to the Balance Sheet as Unrealized Appreciation Reserve.
5. Provisions
Provision, if any, is made by charge to Revenue Account, in respect of: a. Non Performing Debt Securities as per the Guidelines prescribed by SEBI. b. Interest Outstanding for more than one quarter beyond due date.
6. Income Equalisation
An appropriate portion of price of unit at the time of purchase and sale is transferred to or from Income Equalisation Account. In arriving at the portion of the price to be transferred to Income Equalisation Account, surplus/deficit (before considering unrealized appreciation) upto the date of transaction is taken into account. The net balance in Income Equalisation Account is transferred to the Revenue Account.
7. Unit Premium Reserve
Unit Premium Reserve is debited or credited at the time of purchase and sale of units after taking into account the face value of units and Income Equalisation. Balance in Unit Premium Reserve is not considered for distribution of Dividend
8. Entry/Exit Load
The load charged is utilized towards meeting distribution and marketing expenses viz. commission to agents and publicity expenses. Unutilized amount of load collected is carried to subsequent year unless the same is found excess by the Trustees/AMC. Such excess amount is
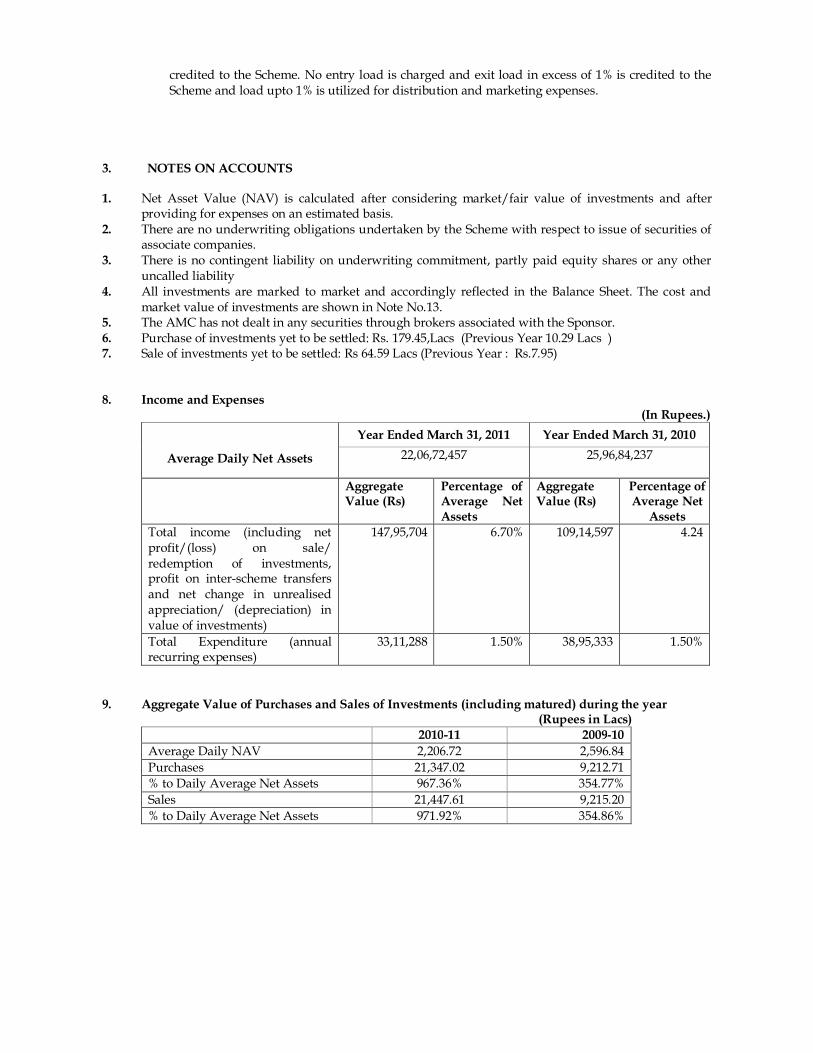
credited to the Scheme. No entry load is charged and exit load in excess of 1% is credited to the Scheme and load upto 1% is utilized for distribution and marketing expenses.
3. NOTES ON ACCOUNTS
1. Net Asset Value (NAV) is calculated after considering market/fair value of investments and after providing for expenses on an estimated basis.
2. There are no underwriting obligations undertaken by the Scheme with respect to issue of securities of associate companies.
3. There is no contingent liability on underwriting commitment, partly paid equity shares or any other uncalled liability
4. All investments are marked to market and accordingly reflected in the Balance Sheet. The cost and market value of investments are shown in Note No.13.
5. The AMC has not dealt in any securities through brokers associated with the Sponsor. 6. Purchase of investments yet to be settled: Rs. 179.45,Lacs (Previous Year 10.29 Lacs ) 7. Sale of investments yet to be settled: Rs 64.59 Lacs (Previous Year : Rs.7.95)
8. Income and Expenses (In Rupees.)
Average Daily Net Assets
Year Ended March 31, 2011 Year Ended March 31, 2010 22,06,72,457
25,96,84,237
Aggregate
Value (Rs) Percentage of Average Net Assets
Aggregate Value (Rs)
Percentage of Average Net
Assets Total income (including net profit/(loss) on sale/ redemption of investments, profit on inter-scheme transfers and net change in unrealised appreciation/ (depreciation) in value of investments)
147,95,704 6.70% 109,14,597 4.24
Total Expenditure (annual recurring expenses)
33,11,288 1.50% 38,95,333 1.50%
9. Aggregate Value of Purchases and Sales of Investments (including matured) during the year
(Rupees in Lacs) 2010-11 2009-10 Average Daily NAV 2,206.72 2,596.84 Purchases 21,347.02 9,212.71 % to Daily Average Net Assets 967.36% 354.77% Sales 21,447.61 9,215.20 % to Daily Average Net Assets 971.92% 354.86%
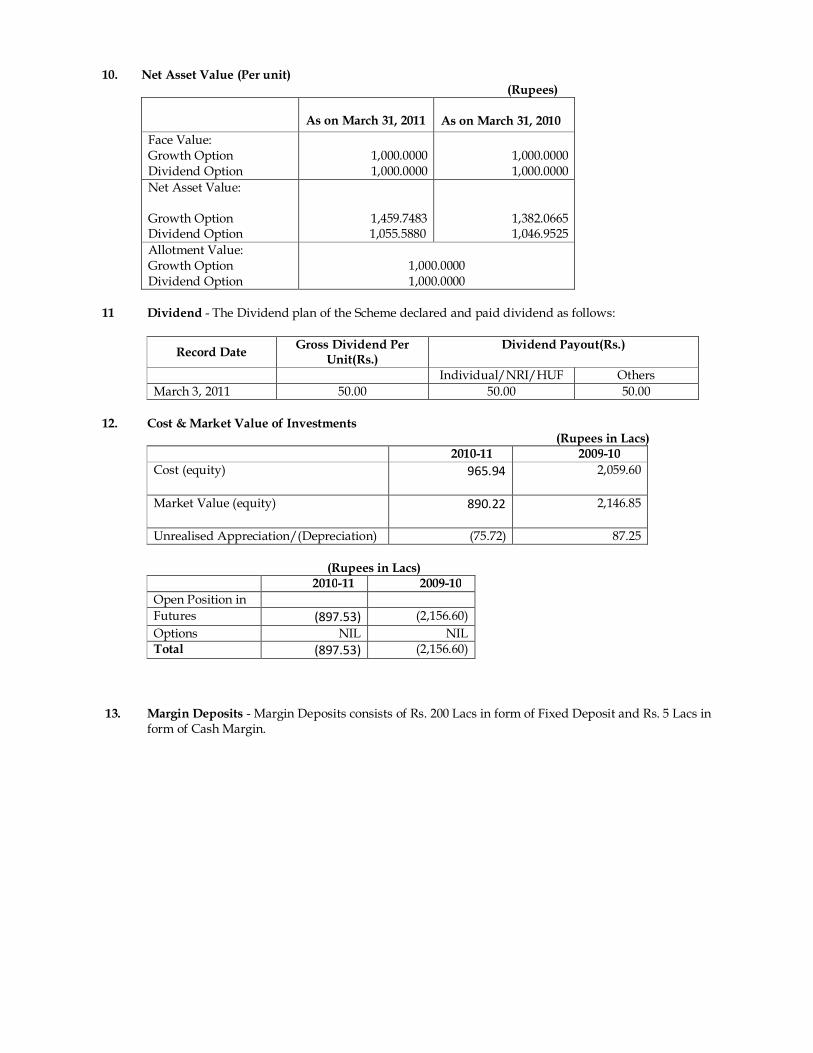
10. Net Asset Value (Per unit) (Rupees)
As on March 31, 2011
As on March 31, 2010
Face Value: Growth Option Dividend Option
1,000.0000 1,000.0000
1,000.0000 1,000.0000
Net Asset Value: Growth Option Dividend Option
1,459.7483 1,055.5880
1,382.0665 1,046.9525
Allotment Value: Growth Option Dividend Option
1,000.0000 1,000.0000
11 Dividend - The Dividend plan of the Scheme declared and paid dividend as follows:
Record Date Gross Dividend Per Unit(Rs.)
Dividend Payout(Rs.)
Individual/NRI/HUF Others March 3, 2011 50.00 50.00 50.00
12. Cost & Market Value of Investments (Rupees in Lacs)
2010-11 2009-10 Cost (equity) 965.94
2,059.60
Market Value (equity) 890.22
2,146.85
Unrealised Appreciation/(Depreciation) (75.72) 87.25
(Rupees in Lacs)
2010-11 2009-10 Open Position in Futures (897.53) (2,156.60) Options NIL NIL Total (897.53) (2,156.60)
13. Margin Deposits - Margin Deposits consists of Rs. 200 Lacs in form of Fixed Deposit and Rs. 5 Lacs in
form of Cash Margin.
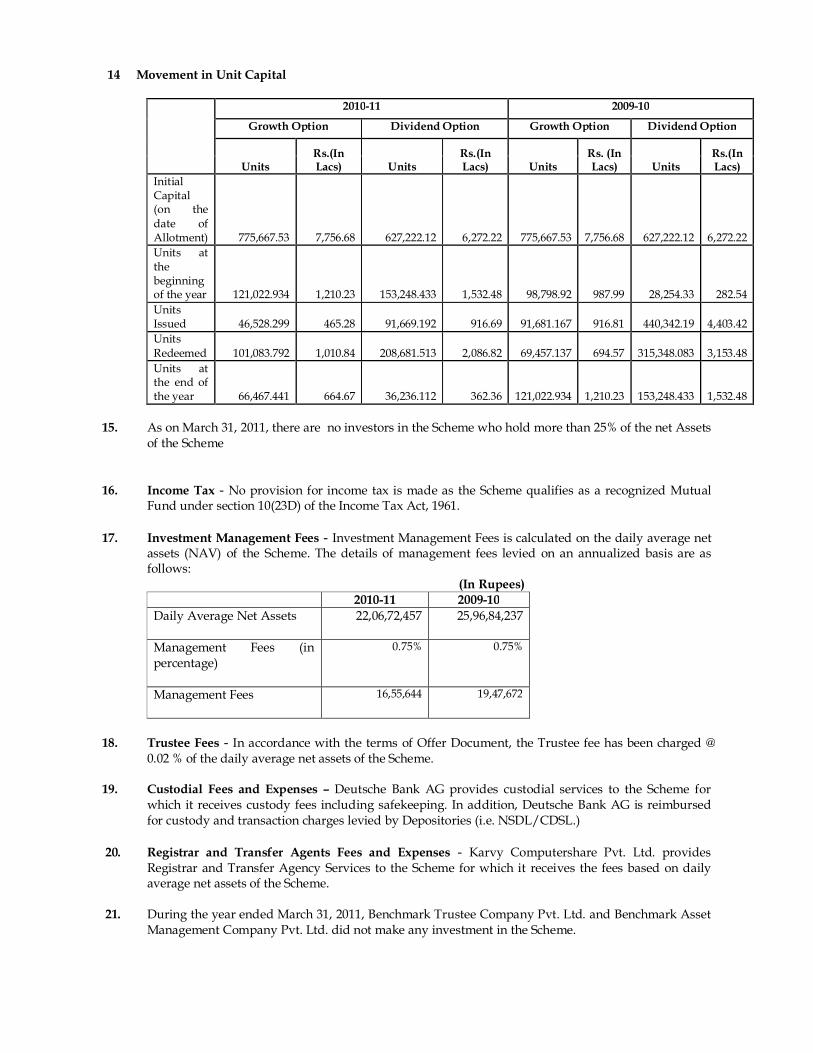
14 Movement in Unit Capital
2010-11 2009-10
Growth Option Dividend Option Growth Option Dividend Option
Units Rs.(In Lacs) Units
Rs.(In Lacs) Units
Rs. (In Lacs) Units
Rs.(In Lacs)
Initial Capital (on the date of Allotment) 775,667.53 7,756.68 627,222.12 6,272.22 775,667.53 7,756.68 627,222.12 6,272.22 Units at the beginning of the year 121,022.934 1,210.23 153,248.433 1,532.48 98,798.92 987.99 28,254.33 282.54 Units Issued 46,528.299 465.28 91,669.192 916.69 91,681.167 916.81 440,342.19 4,403.42 Units Redeemed 101,083.792 1,010.84 208,681.513 2,086.82 69,457.137 694.57 315,348.083 3,153.48 Units at the end of the year 66,467.441 664.67 36,236.112 362.36 121,022.934 1,210.23 153,248.433 1,532.48
15. As on March 31, 2011, there are no investors in the Scheme who hold more than 25% of the net Assets
of the Scheme
16. Income Tax - No provision for income tax is made as the Scheme qualifies as a recognized Mutual Fund under section 10(23D) of the Income Tax Act, 1961.
17. Investment Management Fees - Investment Management Fees is calculated on the daily average net
assets (NAV) of the Scheme. The details of management fees levied on an annualized basis are as follows:
(In Rupees) 2010-11 2009-10
Daily Average Net Assets
22,06,72,457
25,96,84,237
Management Fees (in percentage)
0.75% 0.75%
Management Fees
16,55,644
19,47,672
18. Trustee Fees - In accordance with the terms of Offer Document, the Trustee fee has been charged @
0.02 % of the daily average net assets of the Scheme. 19. Custodial Fees and Expenses – Deutsche Bank AG provides custodial services to the Scheme for
which it receives custody fees including safekeeping. In addition, Deutsche Bank AG is reimbursed for custody and transaction charges levied by Depositories (i.e. NSDL/CDSL.)
20. Registrar and Transfer Agents Fees and Expenses - Karvy Computershare Pvt. Ltd. provides Registrar and Transfer Agency Services to the Scheme for which it receives the fees based on daily average net assets of the Scheme.
21. During the year ended March 31, 2011, Benchmark Trustee Company Pvt. Ltd. and Benchmark Asset
Management Company Pvt. Ltd. did not make any investment in the Scheme.
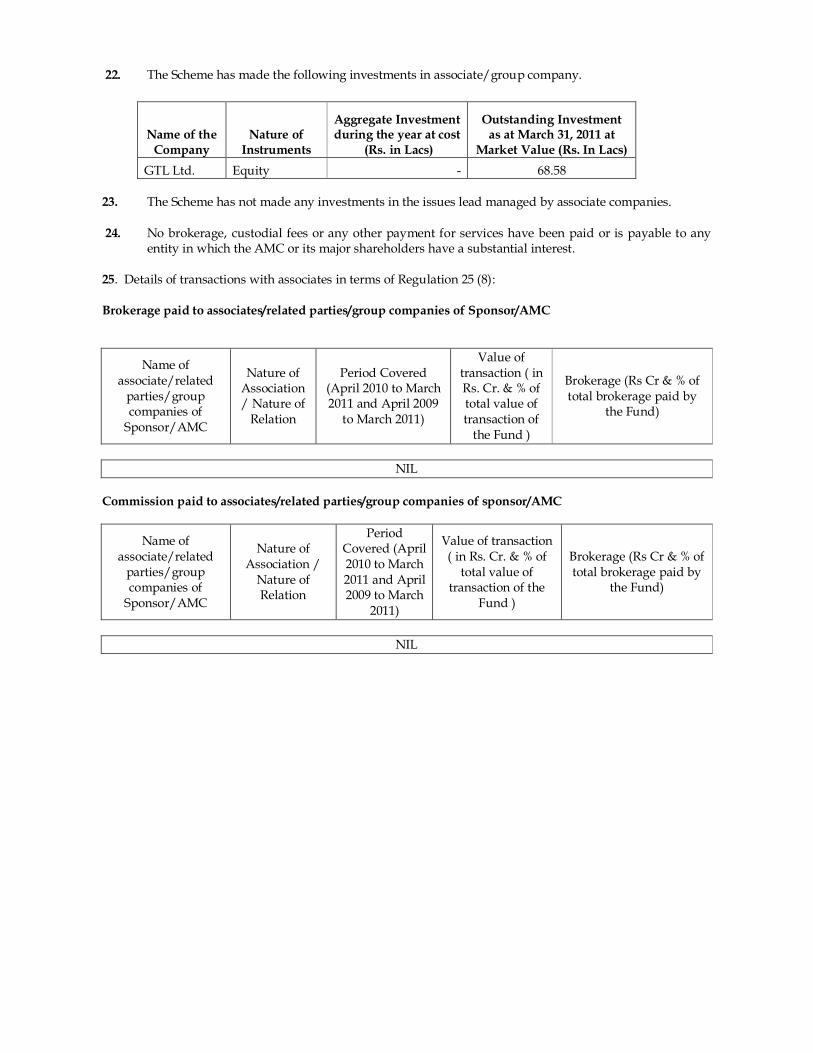
22. The Scheme has made the following investments in associate/group company.
Name of the Company
Nature of Instruments
Aggregate Investment during the year at cost
(Rs. in Lacs)
Outstanding Investment as at March 31, 2011 at
Market Value (Rs. In Lacs)
GTL Ltd. Equity - 68.58 23. The Scheme has not made any investments in the issues lead managed by associate companies. 24. No brokerage, custodial fees or any other payment for services have been paid or is payable to any
entity in which the AMC or its major shareholders have a substantial interest. 25. Details of transactions with associates in terms of Regulation 25 (8): Brokerage paid to associates/related parties/group companies of Sponsor/AMC
Name of associate/related
parties/group companies of
Sponsor/AMC
Nature of Association / Nature of
Relation
Period Covered (April 2010 to March 2011 and April 2009
to March 2011)
Value of transaction ( in Rs. Cr. & % of total value of transaction of
the Fund )
Brokerage (Rs Cr & % of total brokerage paid by
the Fund)
NIL
Commission paid to associates/related parties/group companies of sponsor/AMC
Name of associate/related
parties/group companies of
Sponsor/AMC
Nature of Association /
Nature of Relation
Period Covered (April 2010 to March 2011 and April 2009 to March
2011)
Value of transaction ( in Rs. Cr. & % of
total value of transaction of the
Fund )
Brokerage (Rs Cr & % of total brokerage paid by
the Fund)
NIL
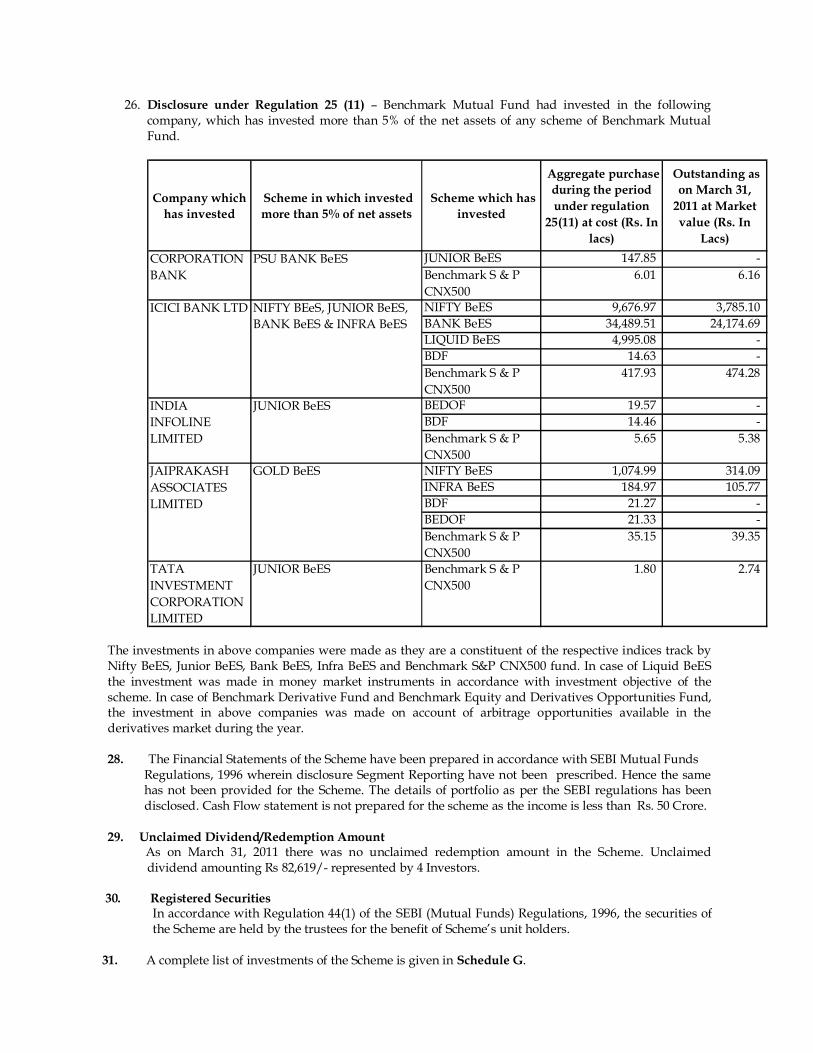
26. Disclosure under Regulation 25 (11) – Benchmark Mutual Fund had invested in the following company, which has invested more than 5% of the net assets of any scheme of Benchmark Mutual Fund.
Company which has invested
Scheme in which invested more than 5% of net assets
Scheme which has invested
Aggregate purchase during the period under regulation
25(11) at cost (Rs. In lacs)
Outstanding as on March 31,
2011 at Market value (Rs. In
Lacs)JUNIOR BeES 147.85 -Benchmark S & P CNX500
6.01 6.16
NIFTY BeES 9,676.97 3,785.10 BANK BeES 34,489.51 24,174.69 LIQUID BeES 4,995.08 -BDF 14.63 -Benchmark S & P CNX500
417.93 474.28
BEDOF 19.57 -BDF 14.46 -Benchmark S & P CNX500
5.65 5.38
NIFTY BeES 1,074.99 314.09 INFRA BeES 184.97 105.77 BDF 21.27 -BEDOF 21.33 -Benchmark S & P CNX500
35.15 39.35
TATA INVESTMENT CORPORATION LIMITED
JUNIOR BeES Benchmark S & P CNX500
1.80 2.74
INDIA INFOLINE LIMITED
JUNIOR BeES
JAIPRAKASH ASSOCIATES LIMITED
GOLD BeES
CORPORATION BANK
PSU BANK BeES
ICICI BANK LTD NIFTY BEeS, JUNIOR BeES, BANK BeES & INFRA BeES
The investments in above companies were made as they are a constituent of the respective indices track by Nifty BeES, Junior BeES, Bank BeES, Infra BeES and Benchmark S&P CNX500 fund. In case of Liquid BeES the investment was made in money market instruments in accordance with investment objective of the scheme. In case of Benchmark Derivative Fund and Benchmark Equity and Derivatives Opportunities Fund, the investment in above companies was made on account of arbitrage opportunities available in the derivatives market during the year.
28. The Financial Statements of the Scheme have been prepared in accordance with SEBI Mutual Funds
Regulations, 1996 wherein disclosure Segment Reporting have not been prescribed. Hence the same has not been provided for the Scheme. The details of portfolio as per the SEBI regulations has been disclosed. Cash Flow statement is not prepared for the scheme as the income is less than Rs. 50 Crore.
29. Unclaimed Dividend/Redemption Amount
As on March 31, 2011 there was no unclaimed redemption amount in the Scheme. Unclaimed dividend amounting Rs 82,619/- represented by 4 Investors.
30. Registered Securities
In accordance with Regulation 44(1) of the SEBI (Mutual Funds) Regulations, 1996, the securities of the Scheme are held by the trustees for the benefit of Scheme’s unit holders.
31. A complete list of investments of the Scheme is given in Schedule G.
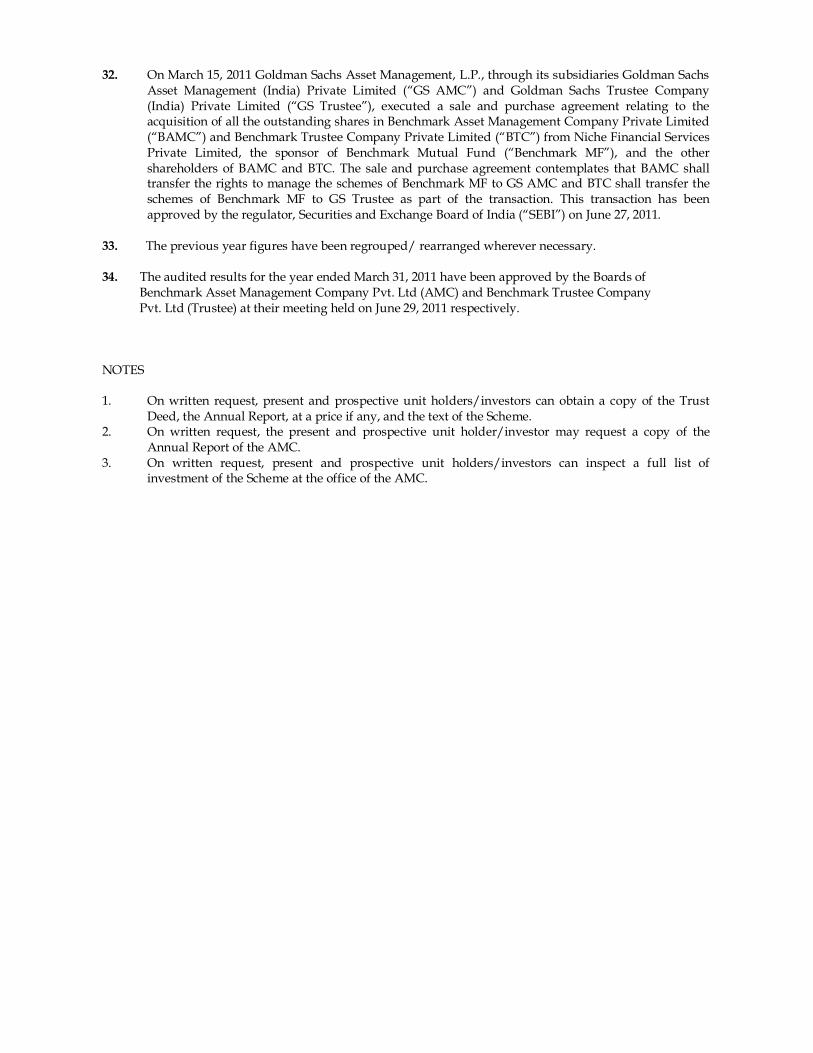
32. On March 15, 2011 Goldman Sachs Asset Management, L.P., through its subsidiaries Goldman Sachs Asset Management (India) Private Limited (“GS AMC”) and Goldman Sachs Trustee Company (India) Private Limited (“GS Trustee”), executed a sale and purchase agreement relating to the acquisition of all the outstanding shares in Benchmark Asset Management Company Private Limited (“BAMC”) and Benchmark Trustee Company Private Limited (“BTC”) from Niche Financial Services Private Limited, the sponsor of Benchmark Mutual Fund (“Benchmark MF”), and the other shareholders of BAMC and BTC. The sale and purchase agreement contemplates that BAMC shall transfer the rights to manage the schemes of Benchmark MF to GS AMC and BTC shall transfer the schemes of Benchmark MF to GS Trustee as part of the transaction. This transaction has been approved by the regulator, Securities and Exchange Board of India (“SEBI”) on June 27, 2011.
33. The previous year figures have been regrouped/ rearranged wherever necessary. 34. The audited results for the year ended March 31, 2011 have been approved by the Boards of Benchmark Asset Management Company Pvt. Ltd (AMC) and Benchmark Trustee Company Pvt. Ltd (Trustee) at their meeting held on June 29, 2011 respectively. NOTES 1. On written request, present and prospective unit holders/investors can obtain a copy of the Trust
Deed, the Annual Report, at a price if any, and the text of the Scheme. 2. On written request, the present and prospective unit holder/investor may request a copy of the
Annual Report of the AMC. 3. On written request, present and prospective unit holders/investors can inspect a full list of
investment of the Scheme at the office of the AMC.
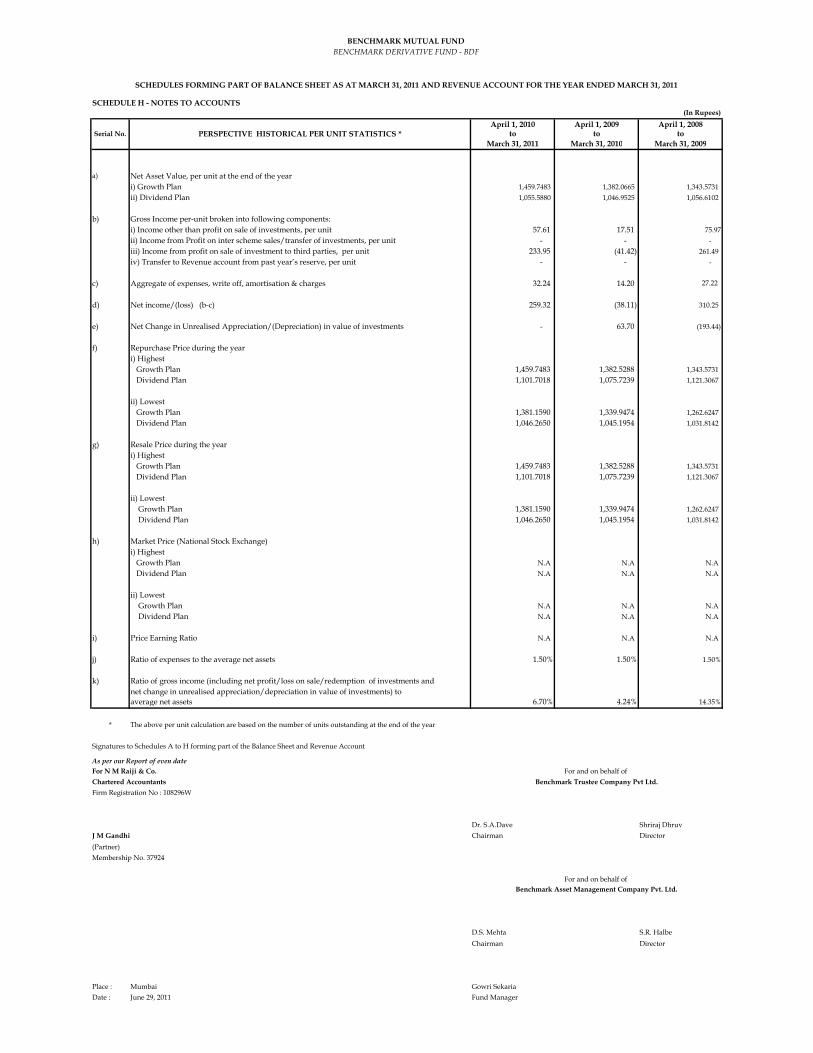
SCHEDULE H - NOTES TO ACCOUNTS(In Rupees)
April 1, 2010 April 1, 2009 April 1, 2008to to to
March 31, 2011 March 31, 2010 March 31, 2009
a) Net Asset Value, per unit at the end of the yeari) Growth Plan 1,459.7483 1,382.0665 1,343.5731 ii) Dividend Plan 1,055.5880 1,046.9525 1,056.6102
b) Gross Income per-unit broken into following components: i) Income other than profit on sale of investments, per unit 57.61 17.51 75.97
ii) Income from Profit on inter scheme sales/transfer of investments, per unit - - - iii) Income from profit on sale of investment to third parties, per unit 233.95 (41.42) 261.49 iv) Transfer to Revenue account from past year’s reserve, per unit - - -
c) Aggregate of expenses, write off, amortisation & charges 32.24 14.20 27.22
d) Net income/(loss) (b-c) 259.32 (38.11) 310.25
e) Net Change in Unrealised Appreciation/(Depreciation) in value of investments - 63.70 (193.44)
f) Repurchase Price during the yeari) Highest Growth Plan 1,459.7483 1,382.5288 1,343.5731 Dividend Plan 1,101.7018 1,075.7239 1,121.3067
ii) Lowest Growth Plan 1,381.1590 1,339.9474 1,262.6247 Dividend Plan 1,046.2650 1,045.1954 1,031.8142
g) Resale Price during the yeari) Highest Growth Plan 1,459.7483 1,382.5288 1,343.5731 Dividend Plan 1,101.7018 1,075.7239 1,121.3067
ii) Lowest Growth Plan 1,381.1590 1,339.9474 1,262.6247 Dividend Plan 1,046.2650 1,045.1954 1,031.8142
h) Market Price (National Stock Exchange)i) Highest Growth Plan N.A N.A N.A Dividend Plan N.A N.A N.A
ii) Lowest Growth Plan N.A N.A N.A Dividend Plan N.A N.A N.A
i) Price Earning Ratio N.A N.A N.A
j) Ratio of expenses to the average net assets 1.50% 1.50% 1.50%
k) Ratio of gross income (including net profit/loss on sale/redemption of investments andnet change in unrealised appreciation/depreciation in value of investments) toaverage net assets 6.70% 4.24% 14.35%
* The above per unit calculation are based on the number of units outstanding at the end of the year
Signatures to Schedules A to H forming part of the Balance Sheet and Revenue Account
As per our Report of even dateFor N M Raiji & Co.Chartered AccountantsFirm Registration No : 108296W
Dr. S.A.Dave Shriraj DhruvJ M Gandhi Chairman Director(Partner)Membership No. 37924
D.S. Mehta S.R. HalbeChairman Director
Place : Mumbai Gowri SekariaDate : June 29, 2011 Fund Manager
Benchmark Asset Management Company Pvt. Ltd.
Serial No. PERSPECTIVE HISTORICAL PER UNIT STATISTICS *
SCHEDULES FORMING PART OF BALANCE SHEET AS AT MARCH 31, 2011 AND REVENUE ACCOUNT FOR THE YEAR ENDED MARCH 31, 2011
BENCHMARK MUTUAL FUND
Benchmark Trustee Company Pvt Ltd.For and on behalf of
For and on behalf of
BENCHMARK DERIVATIVE FUND - BDF

AUDITORS’ REPORT The Board of Directors, Benchmark Trustee Company Private Limited
We have audited the attached Balance Sheet as at March 31, 2011, the Revenue Account and the Cash
Flow Statement for the year ended on that date annexed thereto, of Gold Benchmark Exchange
Traded Scheme (the Scheme), of Benchmark Mutual Fund. These financial statements are prepared in
accordance with SEBI (Mutual Fund) Regulations, 1996 (the Regulations) and are the responsibility
of the Management. Our responsibility is to express an opinion on these financial statements based on
our audit.
We conducted our audit in accordance with the standards on auditing issued by Institute of Chartered
Accountants of India. An audit includes examining on a test basis, evidence supporting the amounts
and disclosures in the financial statements. An audit also includes assessing the accounting principles
used and significant estimates made by the management, as well as evaluating the overall financial
statement presentation. We believe that our audit provides a reasonable basis for our opinion.
We report that:
1. We have obtained all information and explanations, which, to the best of our knowledge and
belief were necessary for the purpose of our audit.
2. The Balance Sheet, the Revenue Account and the Cash Flow Statement referred to above are
in agreement with the books of accounts of the Scheme.
3. The accounts have been prepared in accordance with the accounting policies adopted by the
trustees of the Fund and as specified in the Ninth Schedule to the Regulations.
4. In our opinion, valuation methods for Non Traded Securities, if any, adopted by the scheme
are fair and reasonable and are in accordance with the guidelines for valuation issued by
SEBI and approved by the Trustee.
5. Without qualifying our opinion, we draw attention to note no. 25 in Schedule G of the
financial statements whereby the management has not provided the Segment Reporting for
reasons mentioned therein.
6. In our opinion and to the best of our information and according to the explanations given to
us, the financial statements read with the accounting policies and notes to accounts attached
thereto, give the information required as per the Regulations and give a true & fair view in
accordance with the generally accepted accounting principles in India:
a. in the case of Balance Sheet, of the state of affairs of the scheme as at March 31,
2011;
b. in the case of Revenue Account, of the surplus of the scheme for the year ended on
that date; and
c. in the case of Cash Flow Statement, of the cash flows for the year ended on that date.
For N.M.RAIJI & CO. Chartered Accountants
Firm Reg. No:108296W
J. M. GANDHI Partner Membership No. 37924
Place: Mumbai Dated: June 29, 2011
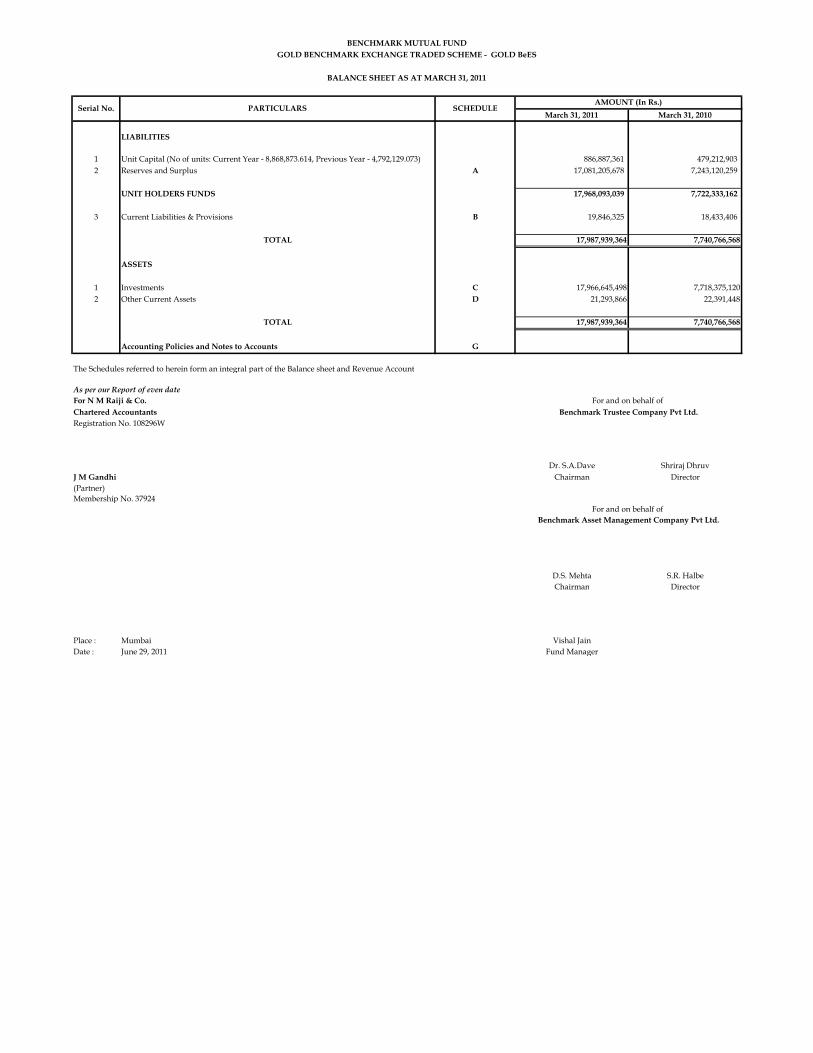
March 31, 2011 March 31, 2010
LIABILITIES
1 Unit Capital (No of units: Current Year - 8,868,873.614, Previous Year - 4,792,129.073) 886,887,361 479,212,903 2 Reserves and Surplus A 17,081,205,678 7,243,120,259
UNIT HOLDERS FUNDS 17,968,093,039 7,722,333,162
3 Current Liabilities & Provisions B 19,846,325 18,433,406
TOTAL 17,987,939,364 7,740,766,568
ASSETS
1 Investments C 17,966,645,498 7,718,375,1202 Other Current Assets D 21,293,866 22,391,448
TOTAL 17,987,939,364 7,740,766,568
Accounting Policies and Notes to Accounts G
The Schedules referred to herein form an integral part of the Balance sheet and Revenue Account
As per our Report of even dateFor N M Raiji & Co.Chartered AccountantsRegistration No. 108296W
Dr. S.A.Dave Shriraj DhruvJ M Gandhi Chairman Director(Partner)Membership No. 37924
D.S. Mehta S.R. HalbeChairman Director
Place : Mumbai Vishal JainDate : June 29, 2011 Fund Manager
For and on behalf of Benchmark Trustee Company Pvt Ltd.
For and on behalf of Benchmark Asset Management Company Pvt Ltd.
BENCHMARK MUTUAL FUNDGOLD BENCHMARK EXCHANGE TRADED SCHEME - GOLD BeES
BALANCE SHEET AS AT MARCH 31, 2011
SCHEDULESerial No. PARTICULARSAMOUNT (In Rs.)

March 31, 2011 March 31, 2010
1 INCOME AND GAINS1.1 Profit on sale / redemption of investments 195,417,168 70,185,192
(other than inter-scheme transfer/sale)1.2 Net Change in unrealised appreciation on investments 2,514,202,279 190,818,563 1.3 Other income - 11,794,751
TOTAL 2,709,619,447 272,798,506
2 EXPENSES AND LOSSES2.1 Management & Operating Expenses E 129,240,611 47,426,132 2.2 Loss on sale/redemption of investments - -
(other than inter-scheme transfer/sale)
TOTAL 129,240,611 47,426,132
Surplus for the year 2,580,378,836 225,372,374
Add: Income Equalisation (2,389,384,636) 919,912,679
(2,323,208,079) 954,466,490
Balance brought forward from Previous year 1,151,845,956 197,379,466
Surplus/(Deficit) available for distribution (1,171,362,123) 1,151,845,956
AppropriationIncome Distribution - -
Balance Carried to the Balance Sheet (1,171,362,123) 1,151,845,956
Accounting Policies and Notes to Accounts G
The Schedules referred to herein form an integral part of the Balance sheet and Revenue Account
As per our Report of even dateFor N M Raiji & Co.Chartered AccountantsRegistration No. 108296W
Dr. S.A.Dave Shriraj DhruvJ M Gandhi Chairman Director(Partner)Membership No. 37924
D.S. Mehta S.R. HalbeChairman Director
Place : Mumbai Vishal JainDate : June 29, 2011 Fund Manager
Benchmark Asset Management Company Pvt Ltd.For and on behalf of
For and on behalf of Benchmark Trustee Company Pvt Ltd.
BENCHMARK MUTUAL FUNDGOLD BENCHMARK EXCHANGE TRADED SCHEME - GOLD BeES
Less: Closing unrealised appreciation reserve
831,089,529
1,021,908,092
1,021,908,092
3,536,110,371
REVENUE ACCOUNT FOR THE YEAR ENDED MARCH 31, 2011
SCHEDULEPARTICULARSSerial No.AMOUNT (In Rs.)
Add: Opening unrealised appreciation reserve
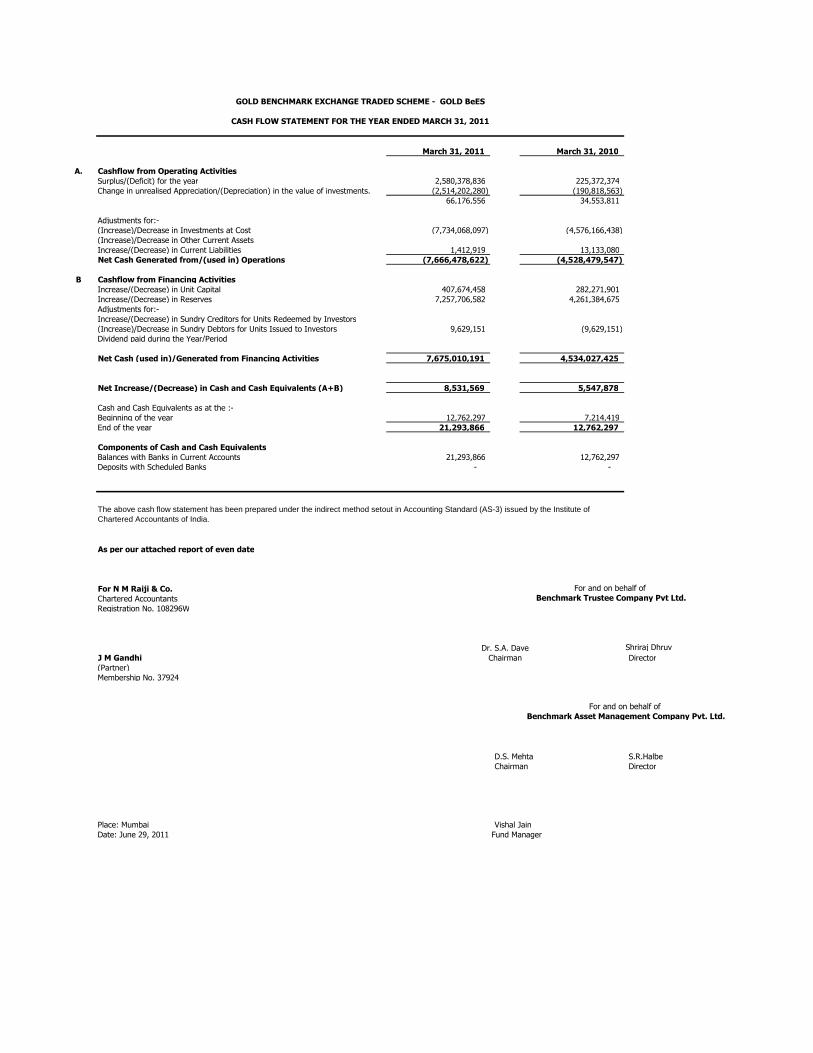
March 31, 2011 March 31, 2010
A. Cashflow from Operating ActivitiesSurplus/(Deficit) for the year 2,580,378,836 225,372,374 Change in unrealised Appreciation/(Depreciation) in the value of investments. (2,514,202,280) (190,818,563)
66,176,556 34,553,811
Adjustments for:-(Increase)/Decrease in Investments at Cost (7,734,068,097) (4,576,166,438) (Increase)/Decrease in Other Current AssetsIncrease/(Decrease) in Current Liabilities 1,412,919 13,133,080 Net Cash Generated from/(used in) Operations (7,666,478,622) (4,528,479,547)
B Cashflow from Financing ActivitiesIncrease/(Decrease) in Unit Capital 407,674,458 282,271,901 Increase/(Decrease) in Reserves 7,257,706,582 4,261,384,675 Adjustments for:-Increase/(Decrease) in Sundry Creditors for Units Redeemed by Investors(Increase)/Decrease in Sundry Debtors for Units Issued to Investors 9,629,151 (9,629,151) Dividend paid during the Year/Period
Net Cash (used in)/Generated from Financing Activities 7,675,010,191 4,534,027,425
Net Increase/(Decrease) in Cash and Cash Equivalents (A+B) 8,531,569 5,547,878
Cash and Cash Equivalents as at the :-Beginning of the year 12,762,297 7,214,419 End of the year 21,293,866 12,762,297
Components of Cash and Cash EquivalentsBalances with Banks in Current Accounts 21,293,866 12,762,297 Deposits with Scheduled Banks - -
As per our attached report of even date
For N M Raiji & Co. Chartered Accountants Registration No. 108296W
Dr. S.A. Dave Shriraj DhruvJ M Gandhi Chairman Director(Partner)Membership No. 37924
D.S. Mehta S.R.HalbeChairman Director
Place: Mumbai Vishal JainDate: June 29, 2011 Fund Manager
Benchmark Trustee Company Pvt Ltd.
For and on behalf of Benchmark Asset Management Company Pvt. Ltd.
GOLD BENCHMARK EXCHANGE TRADED SCHEME - GOLD BeES
CASH FLOW STATEMENT FOR THE YEAR ENDED MARCH 31, 2011
The above cash flow statement has been prepared under the indirect method setout in Accounting Standard (AS-3) issued by the Institute of Chartered Accountants of India.
For and on behalf of

March 31, 2011 March 31, 2010
A RESERVES AND SURPLUS
Unit Premium ReserveOpening Balance 5,069,366,211 1,727,894,214 Add/(Less): On account of subscription/redemption of units 9,647,091,219 3,341,471,997
14,716,457,430 5,069,366,211
Unrealised Appreciation ReserveOpening Balance 1,021,908,092 831,089,529 Add/(Less): During the year 2,514,202,279 190,818,563 Closing Balance 3,536,110,371 1,021,908,092
Surplus/(Deficit)Balance transferred from Revenue Account (1,171,362,123) 1,151,845,956
17,081,205,678 7,243,120,259
B CURRENT LIABILITIES & PROVISIONS
Current LiabilitiesContracts For Purchase of Gold - 9,890,439 Management Fees Payable 9,007,542 3,877,600 Trusteeship Fees Payable 420,039 309,578 Others 10,418,744 4,355,789
19,846,325 18,433,406
C INVESTMENTS (Marked to Market)(Refer Schedule F for Portfolio Holding Statement)
Gold 17,966,645,498 7,718,375,120
17,966,645,498 7,718,375,120
D OTHER CURRENT ASSETS
Balances with Scheduled Banks in Current Account 21,293,866 12,762,297 Unit Subcription Receivable - 9,629,151
21,293,866 22,391,448
E MANAGEMENT & OTHER OPERATING EXPENSES
Management Fees 77,544,392 18,819,050 Trusteeship Fees 1,292,406 474,252 Selling, Marketing and Distribution Expenses 4,049,812 4,200,850 Audit Fees 598,280 282,815 Custodial Fees 37,070,015 19,907,903 Registrar Expenses 6,626,273 2,551,061 Listing, Licensing and Other Fees 35,296 35,296 Investor Communication Expenses 1,813,533 826,354 Other Operating Expenses 210,604 328,551
129,240,611 47,426,132
BENCHMARK MUTUAL FUNDGOLD BENCHMARK EXCHANGE TRADED SCHEME - GOLD BeES
Schedule No.
SCHEDULES FORMING PART OF THE BALANCE SHEET AS AT MARCH 31, 2011 AND REVENUE ACCOUNT FOR THE YEAR ENDED MARCH 31, 2011
PARTICULARSAMOUNT (In Rs.)

GOLD (FINENESS 0.995, 1 KG GOLD BAR) 8,546 17,966,645,498 100.00
TOTAL 17,966,645,498 100.00
Note : Cash and Cash Equivalents are not considered for the above purpose.
BENCHMARK MUTUAL FUNDGOLD BENCHMARK EXCHANGE TRADED SCHEME - GOLD BeES
SCHEDULES FORMING PART OF THE BALANCE SHEET AS AT MARCH 31, 2011 AND REVENUE ACCOUNT FOR THE YEAR ENDED MARCH 31, 2011
% TO TOTAL
MARKET VALUE (Amount in Rs.)
QUANTITY (Kgs.)NAME OF THE SECURITY
SCHEDULE F - PORTFOLIO HOLDING STATEMENT AS ON MARCH 31, 2011

BENCHMARK MUTUAL FUND Gold Benchmark Exchange Traded Scheme – Gold BeES Schedule G – Accounting Policies and Notes to Accounts
1. BACKGROUND – Benchmark Mutual Fund (“the Fund”) has been sponsored by Niche Financial Services Pvt. Ltd and has been set up as a Trust under the Indian Trust Act, 1882 through Trust Deed dated February 14, 2001. Benchmark Trustee Company Pvt. Ltd. (“the Trustee”) is the sole Trustee of the Fund. In accordance with Securities and Exchange Board of India (Mutual Funds) Regulations, 1996, Benchmark Asset Management Company Pvt. Ltd. (BAMC) has been appointed as Asset Management Company (“the AMC”) to the Fund.
Gold BeES is an open ended gold exchange traded fund tracking domestic prices of gold through investments in physical gold, listed on the capital market segment of National Stock Exchange of India Ltd.
The investment objective of the Scheme is to provide returns that, before expenses, closely correspond to the returns provided by domestic price of gold through physical gold.
Subscription and Redemption of units of Gold BeES are generally through the exchange of physical gold of predefined quantity and purity. The rounding off difference is settled in money value.
2. SIGNIFICANT ACCOUNTING POLICIES a) The method of accounting is on accrual basis. b) Investments
i. Purchase and sale of physical gold and/or securities are recognized on trade date. i.e. on the date of
transaction and not on the date of settlement.
ii. All investments are accounted at acquisition cost. In case of physical gold, the same would include various levies like customs duty, stamp duty, Octroi, if applicable, and VAT (Value Added Tax). In case of securities, acquisition cost would include stamp duty, brokerage and any other charges customarily included in broker’s note.
iii. In determining the holding cost of investments and gain/loss on sale of investments, weighted
average method has been followed.
c) Portfolio Valuation – For the purpose of financial statements, the Fund marks all investments to market and carries investments in the Balance Sheet at the market value. The valuation of Gold portfolio is carried out as prescribed by SEBI, which is based on price of Gold quoted by London Bullion Market Association (LBMA). For the purpose of converting LBMA rate denoted in USD to INR, the exchange rate published by the Reserve Bank of India is considered. In addition, the value of gold includes customs duty, stamp duty, Octroi and VAT (Value Added Tax) as applicable. Unrealized Gain, if any, arising out of appreciation of the investments, is carried to the Balance Sheet. In valuing the Scheme’s investments:
Debt securities listed on a recognized stock exchange are valued at the last quoted closing
price on the principal exchange on which the security is traded. Non-traded and Thinly traded debt securities are valued at fair value in good faith by the
AMC in accordance with the guidelines for valuation of such securities specified by SEBI. Privately placed debt securities are valued at fair value in good faith by the AMC in
accordance with the guidelines for valuation of such securities as specified by SEBI. Money market securities/Collateralised Borrowing and Lending Obligations/Non
traded/Thinly traded Non-Government Debt securities of up to 182 days of maturity are valued on the basis of amortization (cost plus accrued interest basis) plus the difference
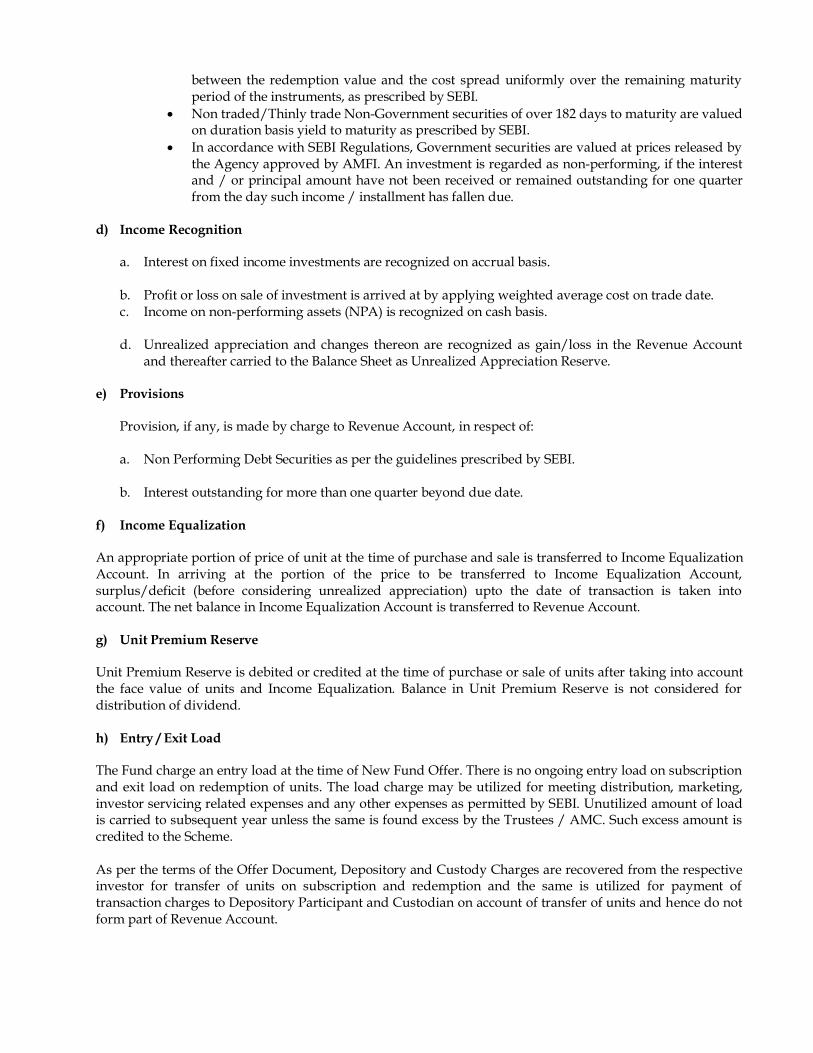
between the redemption value and the cost spread uniformly over the remaining maturity period of the instruments, as prescribed by SEBI.
Non traded/Thinly trade Non-Government securities of over 182 days to maturity are valued on duration basis yield to maturity as prescribed by SEBI.
In accordance with SEBI Regulations, Government securities are valued at prices released by the Agency approved by AMFI. An investment is regarded as non-performing, if the interest and / or principal amount have not been received or remained outstanding for one quarter from the day such income / installment has fallen due.
d) Income Recognition
a. Interest on fixed income investments are recognized on accrual basis. b. Profit or loss on sale of investment is arrived at by applying weighted average cost on trade date. c. Income on non-performing assets (NPA) is recognized on cash basis.
d. Unrealized appreciation and changes thereon are recognized as gain/loss in the Revenue Account
and thereafter carried to the Balance Sheet as Unrealized Appreciation Reserve.
e) Provisions
Provision, if any, is made by charge to Revenue Account, in respect of: a. Non Performing Debt Securities as per the guidelines prescribed by SEBI.
b. Interest outstanding for more than one quarter beyond due date.
f) Income Equalization An appropriate portion of price of unit at the time of purchase and sale is transferred to Income Equalization Account. In arriving at the portion of the price to be transferred to Income Equalization Account, surplus/deficit (before considering unrealized appreciation) upto the date of transaction is taken into account. The net balance in Income Equalization Account is transferred to Revenue Account. g) Unit Premium Reserve Unit Premium Reserve is debited or credited at the time of purchase or sale of units after taking into account the face value of units and Income Equalization. Balance in Unit Premium Reserve is not considered for distribution of dividend. h) Entry / Exit Load The Fund charge an entry load at the time of New Fund Offer. There is no ongoing entry load on subscription and exit load on redemption of units. The load charge may be utilized for meeting distribution, marketing, investor servicing related expenses and any other expenses as permitted by SEBI. Unutilized amount of load is carried to subsequent year unless the same is found excess by the Trustees / AMC. Such excess amount is credited to the Scheme. As per the terms of the Offer Document, Depository and Custody Charges are recovered from the respective investor for transfer of units on subscription and redemption and the same is utilized for payment of transaction charges to Depository Participant and Custodian on account of transfer of units and hence do not form part of Revenue Account.
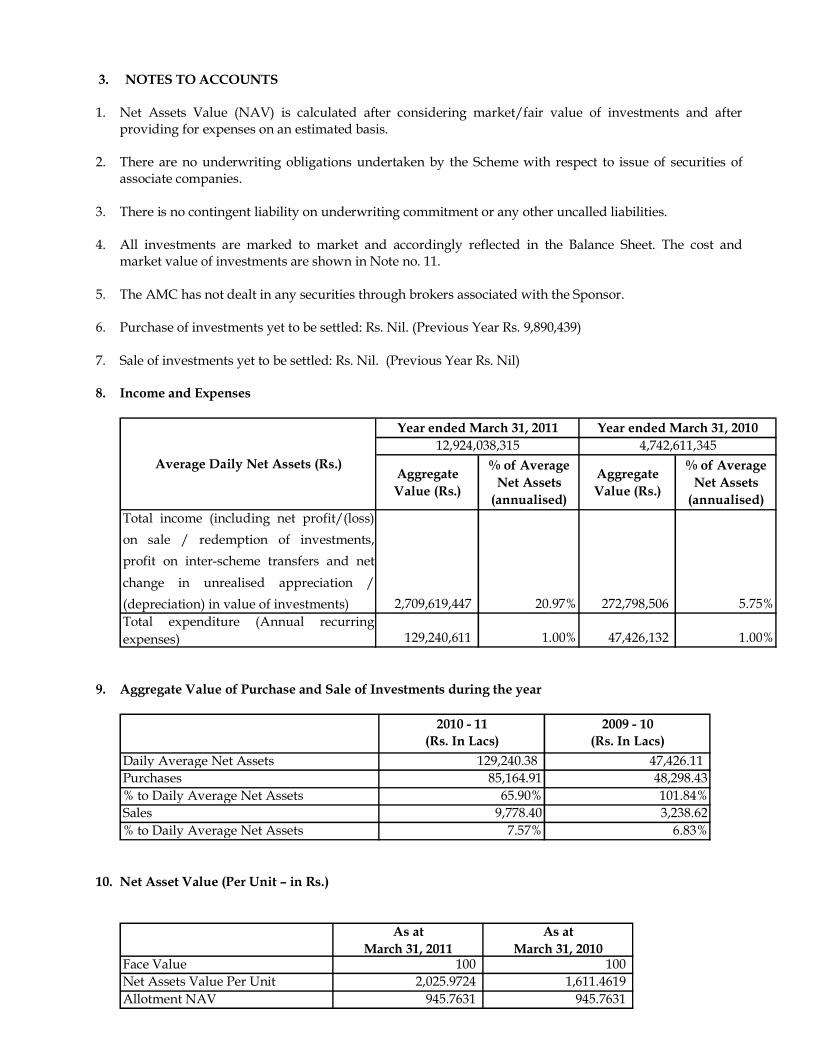
3. NOTES TO ACCOUNTS 1. Net Assets Value (NAV) is calculated after considering market/fair value of investments and after
providing for expenses on an estimated basis.
2. There are no underwriting obligations undertaken by the Scheme with respect to issue of securities of associate companies.
3. There is no contingent liability on underwriting commitment or any other uncalled liabilities. 4. All investments are marked to market and accordingly reflected in the Balance Sheet. The cost and
market value of investments are shown in Note no. 11. 5. The AMC has not dealt in any securities through brokers associated with the Sponsor.
6. Purchase of investments yet to be settled: Rs. Nil. (Previous Year Rs. 9,890,439) 7. Sale of investments yet to be settled: Rs. Nil. (Previous Year Rs. Nil) 8. Income and Expenses
Total income (including net profit/(loss)on sale / redemption of investments,profit on inter-scheme transfers and netchange in unrealised appreciation /(depreciation) in value of investments) 2,709,619,447 20.97% 272,798,506 5.75%Total expenditure (Annual recurringexpenses) 129,240,611 1.00% 47,426,132 1.00%
% of Average Net Assets
(annualised)
Average Daily Net Assets (Rs.)Aggregate Value (Rs.)
% of Average Net Assets
(annualised)
Aggregate Value (Rs.)
Year ended March 31, 2011 Year ended March 31, 201012,924,038,315 4,742,611,345
9. Aggregate Value of Purchase and Sale of Investments during the year
2010 - 11(Rs. In Lacs)
2009 - 10(Rs. In Lacs)
Daily Average Net Assets 129,240.38 47,426.11 Purchases 85,164.91 48,298.43% to Daily Average Net Assets 65.90% 101.84%Sales 9,778.40 3,238.62% to Daily Average Net Assets 7.57% 6.83%
10. Net Asset Value (Per Unit – in Rs.)
As at March 31, 2011
As at March 31, 2010
Face Value 100 100 Net Assets Value Per Unit 2,025.9724 1,611.4619 Allotment NAV 945.7631 945.7631

11. Cost and Market Value of Investments
Amount (Rs. In Lacs) Amount (Rs. In Lacs)2010 - 11 2009 - 10
Cost 144,305.35 66,964.67 Market Value 179,666.45 77,183.75
Unrealised Appreciation in the Value of investments 35,361.10 10,219.08 12. Movement in Unit Capital
Units Rs. in Lacs Units Rs. in LacsInitial Capital (on the date of allotment) 1,026,025.607 1,026.03 1,026,025.607 1,026.03
Unit at the beginning of the year 4,792,129.073 4,792.13 1,969,410.023 1,969.41 Units Issued 4,398,000.000 4,398.00 2,925,000.000 2,925.00 Units Redeemed 321,255.459 321.26 102,280.950 102.28
Units at the end of the year 8,868,873.614 8,868.87 4,792,129.073 4,792.13
Particulars2009 - 102010 - 11
13. Details of Large Holding (more than 25% of the Net Assets of the Scheme) - As on March 31, 2011 there is no investor in the Scheme who holds more than 25% of the net assets of the Scheme.
14. Income Tax – No provision for Income Tax is made as the Scheme qualifies as a recognized Mutual Fund
under section 10 (23D) of the Income Tax Act, 1961. 15. Investment Management Fees – Investment Management Fees is calculated on the daily average net
assets of the Scheme. The details of management fees levied on an annualized basis are as follows:
2010 - 11 2009 - 10Daily Average Net Assets 12,924,038,315 4,742,611,345Management Fees (in % ) 0.60% 0.40%Management Fees 77,544,392 18,819,050
Amount (in Rs.)
16. Trustee Fees – In accordance with the terms of Offer Document, the trustee fees is charged @ 0.01% of the daily average net assets of the Scheme.
17. Custodial Fees and Expenses – The Bank of Nova Scotia and Citibank N.A. provide custodial services to the Scheme for which they receive custody fees including safekeeping. In addition, they are also reimbursed for transaction charges.
18. Registrar and Transfer Agent Fees and Expenses – Karvy Computershare Private Limited provides
Registrar and Transfer Agency Services to the Scheme, for which it receives the fees based on daily average net assets of the Scheme.

19. There are no investments made by Benchmark Trustee Company Pvt. Ltd. and Benchmark Asset
Management Company Pvt. Ltd. in the Scheme during the year ended March 31, 2011.
20. The Scheme has not made any investments in Group/Associate Companies.
21. Details of transactions with associates in terms of Regulation 25 (8)
Brokerage paid to associates/related parties/group companies of Sponsor/AMCName of associate/related
parties/group companies of Sponsor/AMC
Nature of Association /
Nature of Relation
Period Covered (April 2010 to
March 2011 and April 2009 to March 2010)
Value of transaction ( in Rs. Cr. & % of total value of transaction of
the Fund )
Brokerage (Rs Cr & % of total
brokerage paid by the Fund)
Commission paid to associates/related parties/group companies of sponsor/AMCName of associate/related
parties/group companies of Sponsor/AMC
Nature of Association /
Nature of Relation
Period Covered (April 2010 to
March 2011 and April 2009 to March 2010)
Business Given ( in Rs. Cr. & %
of total business
received by the Fund )
Commission paid (Rs Cr & % of total
commssion paid by the Fund)
NIL
NIL
22. The Scheme has not made any investment in the issues lead managed by Associate Companies. 23. No brokerage, custodial fees or any other payment for services have been paid or is payable to any entity
in which the AMC or its major shareholders have a substantial interest.
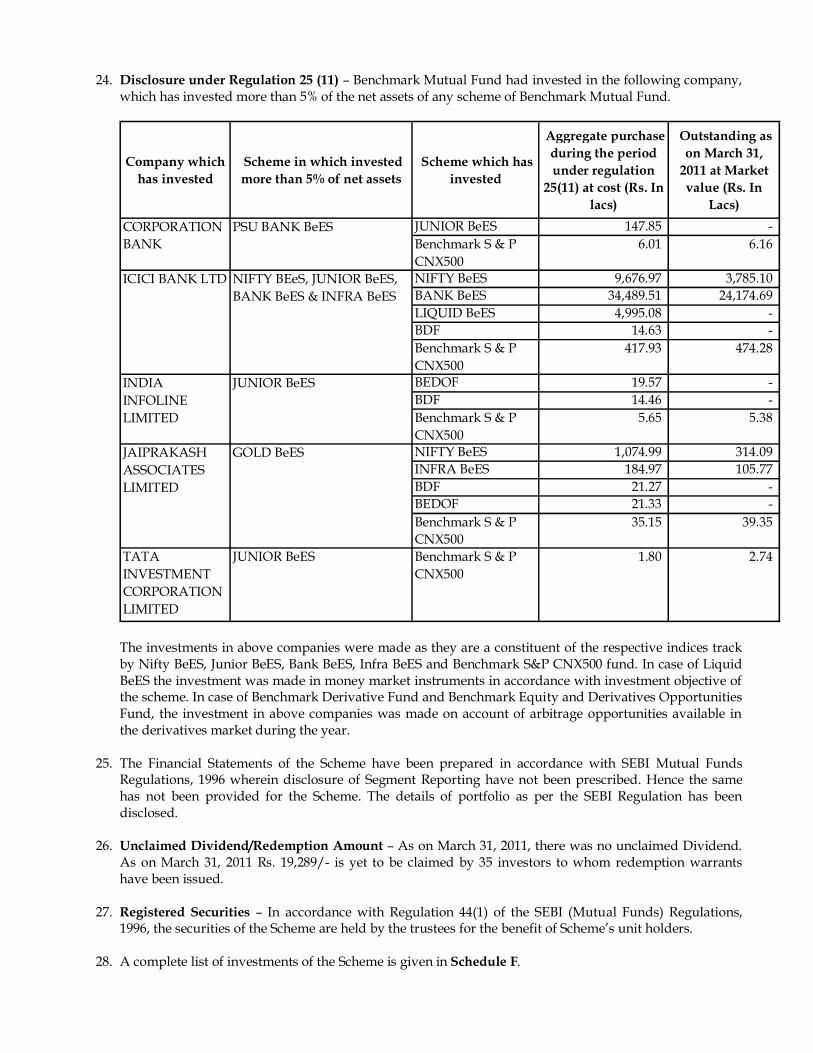
24. Disclosure under Regulation 25 (11) – Benchmark Mutual Fund had invested in the following company, which has invested more than 5% of the net assets of any scheme of Benchmark Mutual Fund.
Company which has invested
Scheme in which invested more than 5% of net assets
Scheme which has invested
Aggregate purchase during the period under regulation
25(11) at cost (Rs. In lacs)
Outstanding as on March 31,
2011 at Market value (Rs. In
Lacs)JUNIOR BeES 147.85 -Benchmark S & P CNX500
6.01 6.16
NIFTY BeES 9,676.97 3,785.10 BANK BeES 34,489.51 24,174.69 LIQUID BeES 4,995.08 -BDF 14.63 -Benchmark S & P CNX500
417.93 474.28
BEDOF 19.57 -BDF 14.46 -Benchmark S & P CNX500
5.65 5.38
NIFTY BeES 1,074.99 314.09 INFRA BeES 184.97 105.77 BDF 21.27 -BEDOF 21.33 -Benchmark S & P CNX500
35.15 39.35
TATA INVESTMENT CORPORATION LIMITED
JUNIOR BeES Benchmark S & P CNX500
1.80 2.74
INDIA INFOLINE LIMITED
JUNIOR BeES
JAIPRAKASH ASSOCIATES LIMITED
GOLD BeES
CORPORATION BANK
PSU BANK BeES
ICICI BANK LTD NIFTY BEeS, JUNIOR BeES, BANK BeES & INFRA BeES
The investments in above companies were made as they are a constituent of the respective indices track by Nifty BeES, Junior BeES, Bank BeES, Infra BeES and Benchmark S&P CNX500 fund. In case of Liquid BeES the investment was made in money market instruments in accordance with investment objective of the scheme. In case of Benchmark Derivative Fund and Benchmark Equity and Derivatives Opportunities Fund, the investment in above companies was made on account of arbitrage opportunities available in the derivatives market during the year.
25. The Financial Statements of the Scheme have been prepared in accordance with SEBI Mutual Funds
Regulations, 1996 wherein disclosure of Segment Reporting have not been prescribed. Hence the same has not been provided for the Scheme. The details of portfolio as per the SEBI Regulation has been disclosed.
26. Unclaimed Dividend/Redemption Amount – As on March 31, 2011, there was no unclaimed Dividend.
As on March 31, 2011 Rs. 19,289/- is yet to be claimed by 35 investors to whom redemption warrants have been issued.
27. Registered Securities – In accordance with Regulation 44(1) of the SEBI (Mutual Funds) Regulations,
1996, the securities of the Scheme are held by the trustees for the benefit of Scheme’s unit holders.
28. A complete list of investments of the Scheme is given in Schedule F.
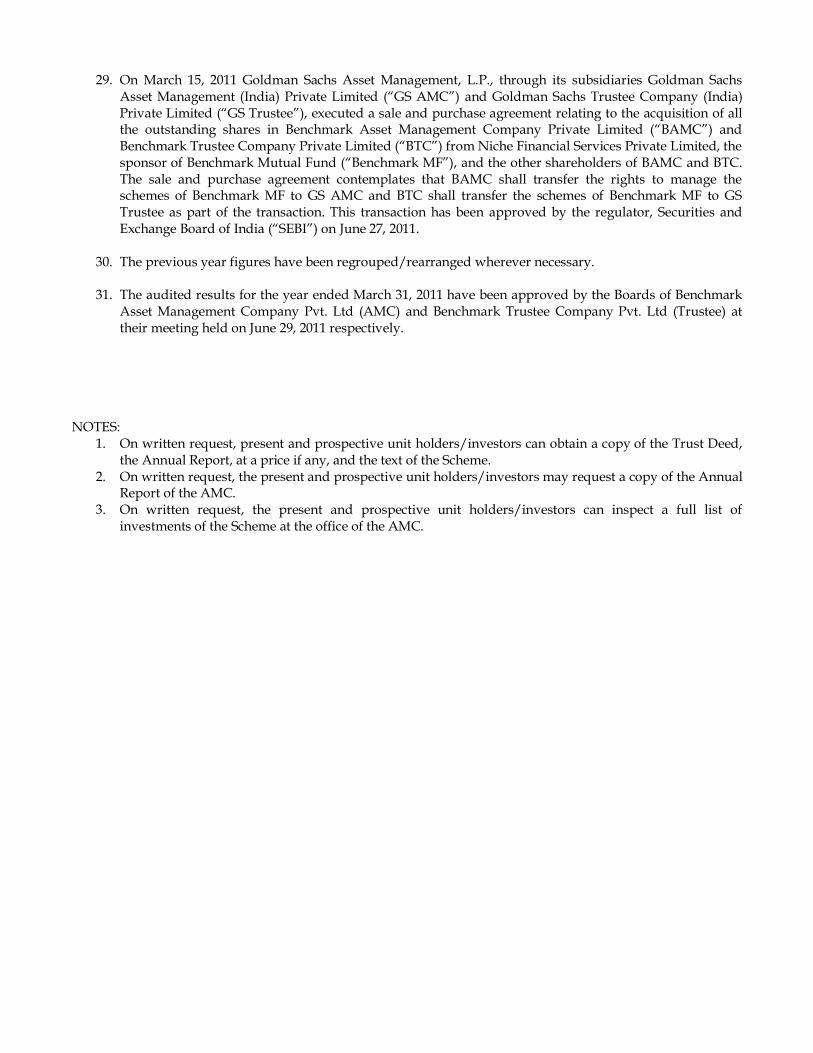
29. On March 15, 2011 Goldman Sachs Asset Management, L.P., through its subsidiaries Goldman Sachs Asset Management (India) Private Limited (“GS AMC”) and Goldman Sachs Trustee Company (India) Private Limited (“GS Trustee”), executed a sale and purchase agreement relating to the acquisition of all the outstanding shares in Benchmark Asset Management Company Private Limited (“BAMC”) and Benchmark Trustee Company Private Limited (“BTC”) from Niche Financial Services Private Limited, the sponsor of Benchmark Mutual Fund (“Benchmark MF”), and the other shareholders of BAMC and BTC. The sale and purchase agreement contemplates that BAMC shall transfer the rights to manage the schemes of Benchmark MF to GS AMC and BTC shall transfer the schemes of Benchmark MF to GS Trustee as part of the transaction. This transaction has been approved by the regulator, Securities and Exchange Board of India (“SEBI”) on June 27, 2011.
30. The previous year figures have been regrouped/rearranged wherever necessary.
31. The audited results for the year ended March 31, 2011 have been approved by the Boards of Benchmark
Asset Management Company Pvt. Ltd (AMC) and Benchmark Trustee Company Pvt. Ltd (Trustee) at their meeting held on June 29, 2011 respectively.
NOTES:
1. On written request, present and prospective unit holders/investors can obtain a copy of the Trust Deed, the Annual Report, at a price if any, and the text of the Scheme.
2. On written request, the present and prospective unit holders/investors may request a copy of the Annual Report of the AMC.
3. On written request, the present and prospective unit holders/investors can inspect a full list of investments of the Scheme at the office of the AMC.
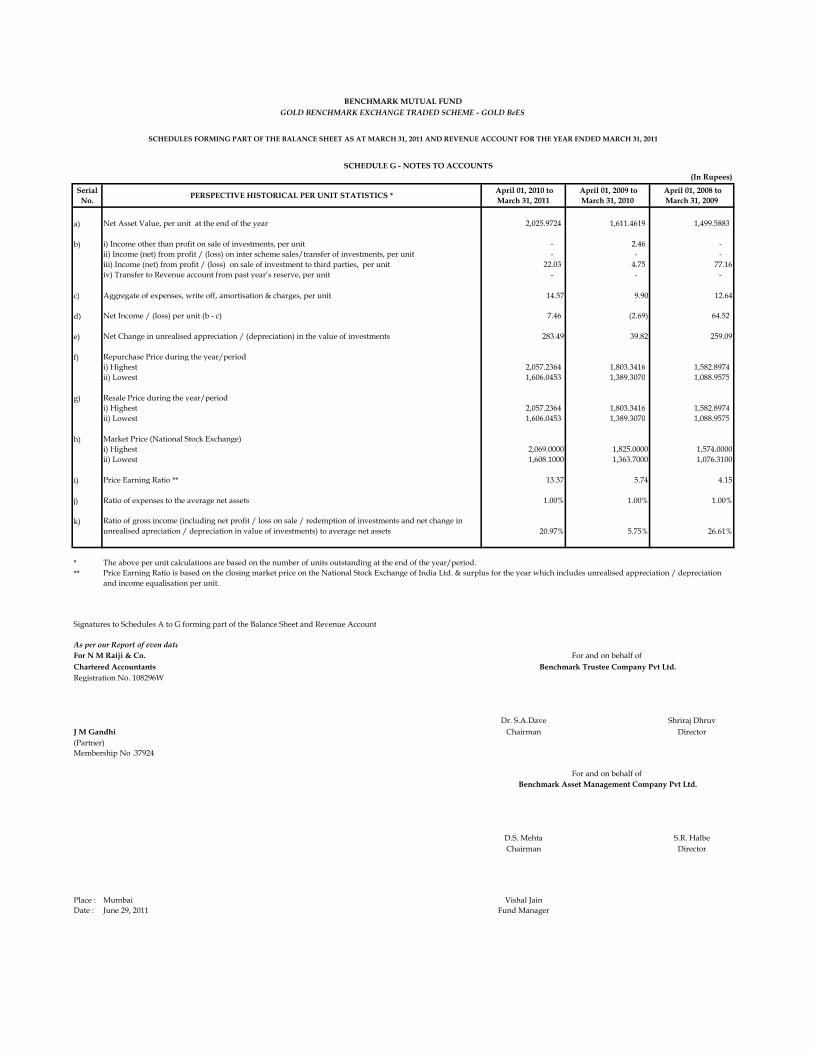
(In Rupees)
Serial No. PERSPECTIVE HISTORICAL PER UNIT STATISTICS * April 01, 2010 to
March 31, 2011 April 01, 2009 to March 31, 2010
April 01, 2008 to March 31, 2009
a) Net Asset Value, per unit at the end of the year 2,025.9724 1,611.4619 1,499.5883
b) i) Income other than profit on sale of investments, per unit - 2.46 - ii) Income (net) from profit / (loss) on inter scheme sales/transfer of investments, per unit - - - iii) Income (net) from profit / (loss) on sale of investment to third parties, per unit 22.03 4.75 77.16iv) Transfer to Revenue account from past year’s reserve, per unit - - -
c) Aggregate of expenses, write off, amortisation & charges, per unit 14.57 9.90 12.64
d) Net Income / (loss) per unit (b - c) 7.46 (2.69) 64.52
e) Net Change in unrealised appreciation / (depreciation) in the value of investments 283.49 39.82 259.09
f) Repurchase Price during the year/periodi) Highest 2,057.2364 1,803.3416 1,582.8974 ii) Lowest 1,606.0453 1,389.3070 1,088.9575
g) Resale Price during the year/periodi) Highest 2,057.2364 1,803.3416 1,582.8974 ii) Lowest 1,606.0453 1,389.3070 1,088.9575
h) Market Price (National Stock Exchange)i) Highest 2,069.0000 1,825.0000 1,574.0000ii) Lowest 1,608.1000 1,363.7000 1,076.3100
i) Price Earning Ratio ** 13.37 5.74 4.15
j) Ratio of expenses to the average net assets 1.00% 1.00% 1.00%
k) Ratio of gross income (including net profit / loss on sale / redemption of investments and net change in unrealised apreciation / depreciation in value of investments) to average net assets 20.97% 5.75% 26.61%
***
Signatures to Schedules A to G forming part of the Balance Sheet and Revenue Account
As per our Report of even dateFor N M Raiji & Co.Chartered AccountantsRegistration No. 108296W
Dr. S.A.Dave Shriraj DhruvJ M Gandhi Chairman Director(Partner)Membership No .37924
D.S. Mehta S.R. HalbeChairman Director
Place : Mumbai Vishal JainDate : June 29, 2011 Fund Manager
SCHEDULE G - NOTES TO ACCOUNTS
Benchmark Trustee Company Pvt Ltd.
For and on behalf of Benchmark Asset Management Company Pvt Ltd.
For and on behalf of
BENCHMARK MUTUAL FUND
SCHEDULES FORMING PART OF THE BALANCE SHEET AS AT MARCH 31, 2011 AND REVENUE ACCOUNT FOR THE YEAR ENDED MARCH 31, 2011
The above per unit calculations are based on the number of units outstanding at the end of the year/period.Price Earning Ratio is based on the closing market price on the National Stock Exchange of India Ltd. & surplus for the year which includes unrealised appreciation / depreciation and income equalisation per unit.
GOLD BENCHMARK EXCHANGE TRADED SCHEME - GOLD BeES

AUDITORS’ REPORT The Board of Directors, Benchmark Trustee Company Private Limited
We have audited the attached Balance Sheet as at March 31, 2011, the Revenue Account and the Cash
Flow Statement for the year ended on that date annexed thereto, of PSU Bank Benchmark Exchange
Traded Scheme (the Scheme), of Benchmark Mutual Fund. These financial statements are prepared in
accordance with SEBI (Mutual Fund) Regulations, 1996 (the Regulations) and are the responsibility
of the Management. Our responsibility is to express an opinion on these financial statements based on
our audit.
We conducted our audit in accordance with the standards on auditing issued by Institute of Chartered
Accountants of India. An audit includes examining on a test basis, evidence supporting the amounts
and disclosures in the financial statements. An audit also includes assessing the accounting principles
used and significant estimates made by the management, as well as evaluating the overall financial
statement presentation. We believe that our audit provides a reasonable basis for our opinion.
We report that:
1. We have obtained all information and explanations, which, to the best of our knowledge and
belief were necessary for the purpose of our audit.
2. The Balance Sheet, the Revenue Account and the Cash Flow Statement referred to above are in
agreement with the books of accounts of the Scheme.
3. The accounts have been prepared in accordance with the accounting policies adopted by the
trustees of the Fund and as specified in the Ninth Schedule to the Regulations.

4. In our opinion, valuation methods for Non Traded Securities, if any, adopted by the scheme are
fair and reasonable and are in accordance with the guidelines for valuation issued by SEBI and
approved by the Trustee.
5. Without qualifying our opinion, we draw attention to note no. 25 in Schedule G of the financial
statements whereby the management has not provided the Segment Reporting for reasons
mentioned therein.
6. In our opinion and to the best of our information and according to the explanations given to us,
the financial statements read with the accounting policies and notes to accounts attached thereto,
give the information required as per the Regulations and give a true & fair view in accordance
with the generally accepted accounting principles in India:
a. in the case of Balance Sheet, of the state of affairs of the scheme as at March 31, 2011;
b. in the case of Revenue Account, of the surplus of the scheme for the year ended on that date;
and
c. in the case of Cash Flow Statement, of the cash flows for the year ended on that date.
For N.M.RAIJI & CO. Chartered Accountants
Firm Reg. No:108296W
J. M. GANDHI Partner Membership No. 37924
Place: Mumbai Dated: June 29, 2011

March 31, 2011 March 31, 2010
LIABILITIES
1 Unit Capital (No of units: Current Year - 227,543, Previous Year - 237,543) 2,275,430 2,375,430 2 Reserves and Surplus A 100,001,869 76,575,498
UNIT HOLDERS FUNDS 102,277,299 78,950,928
3 Current Liabilities & Provisions B 1,062,214 1,086,666
TOTAL 103,339,513 80,037,594
ASSETS
1 Investments C 102,044,490 78,460,9892 Other Current Assets D 1,295,023 1,576,605
TOTAL 103,339,513 80,037,594
Accounting Policies and Notes to Accounts G
The Schedules referred to herein form an integral part of the Balance sheet and Revenue Account
As per our Report of even dateFor N M Raiji & Co.Chartered AccountantsRegistration No. 108296W
Dr. S.A.Dave Shriraj DhruvJ M Gandhi Chairman Director(Partner)Membership No. 37924
D.S. Mehta S.R. HalbeChairman Director
Place : Mumbai Payal Wadhwa KaipunjalDate : June 29, 2011 Fund Manager
BENCHMARK MUTUAL FUNDPSU BANK BENCHMARK EXCHANGE TRADED SCHEME - PSU Bank BeES
BALANCE SHEET AS AT MARCH 31, 2011
SCHEDULESerial No.
For and on behalf of Benchmark Trustee Company Pvt Ltd.
PARTICULARSAMOUNT (In Rs.)
For and on behalf of Benchmark Asset Management Company Pvt Ltd.

March 31, 2011 March 31, 2010
1 INCOME AND GAINS1.1 Dividend 1,117,328 3,255,936 1.2 Profit on sale / redemption of investments 10,918,904 60,337,269
(other than inter-scheme transfer/sale)1.3 Net Change in unrealised appreciation on investments 11,331,556 90,379,676
TOTAL 23,367,788 153,972,881
2 EXPENSES AND LOSSES2.1 Management & Operating Expenses E 605,418 1,140,788 2.2 Loss on sale/redemption of investments 156,745 32,080,611
(other than inter-scheme transfer/sale)
TOTAL 762,163 33,221,399
Surplus for the year 22,605,625 120,751,482
Add: Income Equalisation 14,209,163 9,485,663
25,483,233 129,384,864
Balance brought forward from Previous year (152,441,469) (281,121,075)
(Deficit) available for distribution (126,958,236) (151,736,211)
AppropriationIncome Distribution - 705,258
Balance Carried to the Balance Sheet (126,958,236) (152,441,469)
Accounting Policies and Notes to Accounts G
The Schedules referred to herein form an integral part of the Balance sheet and Revenue Account
As per our Report of even dateFor N M Raiji & Co.Chartered AccountantsRegistration No. 108296W
Dr. S.A.Dave Shriraj DhruvJ M Gandhi Chairman Director(Partner)Membership No. 37924
D.S. Mehta S.R. HalbeChairman Director
Place : Mumbai Payal Wadhwa KaipunjalDate : June 29, 2011 Fund Manager
Benchmark Asset Management Company Pvt Ltd.
Serial No.AMOUNT (In Rs.)
REVENUE ACCOUNT FOR THE YEAR ENDED MARCH 31, 2011
SCHEDULE
Less: Closing unrealised appreciation reserve
PARTICULARS
-
852,281
852,281
12,183,836
Benchmark Trustee Company Pvt Ltd.For and on behalf of
Add: Opening unrealised appreciation reserve
For and on behalf of
BENCHMARK MUTUAL FUNDPSU BANK BENCHMARK EXCHANGE TRADED SCHEME - PSU Bank BeES

March 31, 2011 March 31, 2010
A. Cashflow from Operating ActivitiesSurplus/(Deficit) for the year 22,605,625 120,751,482 Change in unrealised Appreciation/(Depreciation) in the value of investments. (11,331,556) (90,379,676)
11,274,069 30,371,806
Adjustments for:-(Increase)/Decrease in Investments at Cost (12,251,944) 150,732,516 (Increase)/Decrease in Other Current AssetsIncrease/(Decrease) in Current Liabilities (24,452) (526,030) Net Cash Generated from/(used in) Operations (1,002,327) 180,578,292
B. Cashflow from Financing ActivitiesIncrease/(Decrease) in Unit Capital (100,000) (6,500,000) Increase/(Decrease) in Reserves 820,745 (176,012,733) Adjustments for:-Increase/(Decrease) in Sundry Creditors for Units Redeemed by Investors(Increase)/Decrease in Sundry Debtors for Units Issued to InvestorsDividend paid during the Year/Period (705,258)
Net Cash (used in)/Generated from Financing Activities 720,745 (183,217,991)
Net Increase/(Decrease) in Cash and Cash Equivalents (A+B) (281,582) (2,639,699)
Cash and Cash Equivalents as at the :-Beginning of the year 1,576,605 4,216,304 End of the year 1,295,023 1,576,605
Components of Cash and Cash EquivalentsBalances with Banks in Current Accounts 1,295,023 1,576,605 Deposits with Scheduled Banks - -
As per our attached report of even date
For N M Raiji & Co. Chartered Accountants Registration No. 108296W
J M Gandhi Dr. S.A. Dave Shriraj Dhruv(Partner) Chairman DirectorMembership No. 37924
D.S. Mehta S.R. HalbeChairman Director
Place: Mumbai Payal Wadhwa KaipunjalDate: June 29, 2011 Fund Manager
PSU BANK BENCHMARK EXCHANGE TRADED SCHEME - PSU Bank BeES
CASH FLOW STATEMENT FOR THE YEAR ENDED MARCH 31, 2011
The above cash flow statement has been prepared under the indirect method setout in Accounting Standard (AS-3) issued by the Institute of Chartered Accountants of India.
Benchmark Asset Management Company Pvt. Ltd.
For and on behalf of Benchmark Trustee Company Pvt Ltd.
For and on behalf of

March 31, 2011 March 31, 2010
A RESERVES AND SURPLUS
Unit Premium ReserveOpening Balance 228,164,687 413,663,082 Add/(Less): On account of subscription/redemption of units (13,388,419) (185,498,395)
214,776,268 228,164,687
Unrealised Appreciation ReserveOpening Balance 852,281 - Add/(Less): During the year 11,331,556 852,281 Closing Balance 12,183,837 852,281
(Deficit) - Balance transferred from Revenue Account (126,958,236) (152,441,469)
100,001,869 76,575,498
B CURRENT LIABILITIES & PROVISIONS
Current LiabilitiesManagement Fees Payable 40,101 32,508 Trusteeship Fees Payable 2,311 5,846 Provision for STT - 8,138 Others 1,019,802 1,040,174
1,062,214 1,086,666
C INVESTMENTS (Marked to Market)(Refer Schedule F for Portfolio Holding Statement)
Equity Shares 102,044,490 78,460,989
102,044,490 78,460,989
D OTHER CURRENT ASSETS
Balances with Scheduled Banks in Current Account 1,295,023 1,576,605
1,295,023 1,576,605
E MANAGEMENT & OTHER OPERATING EXPENSES
Management Fees 400,295 757,817 Trusteeship Fees 8,205 15,319 Selling, Marketing and Distribution Expenses 15,848 - Audit Fees 82,725 100,119 Custodial Fees 56,795 106,155 Registrar Expenses 41,550 82,053 Listing, Licensing and Other Fees - 35,296 Investor Communication Expenses - 40,530 Other Operating Expenses - 3,499
605,418 1,140,788
BENCHMARK MUTUAL FUNDPSU BANK BENCHMARK EXCHANGE TRADED SCHEME - PSU Bank BeES
Schedule No.
SCHEDULES FORMING PART OF THE BALANCE SHEET AS AT MARCH 31, 2011 AND REVENUE ACCOUNT FOR THE YEAR ENDED MARCH 31, 2011
PARTICULARSAMOUNT (In Rs.)
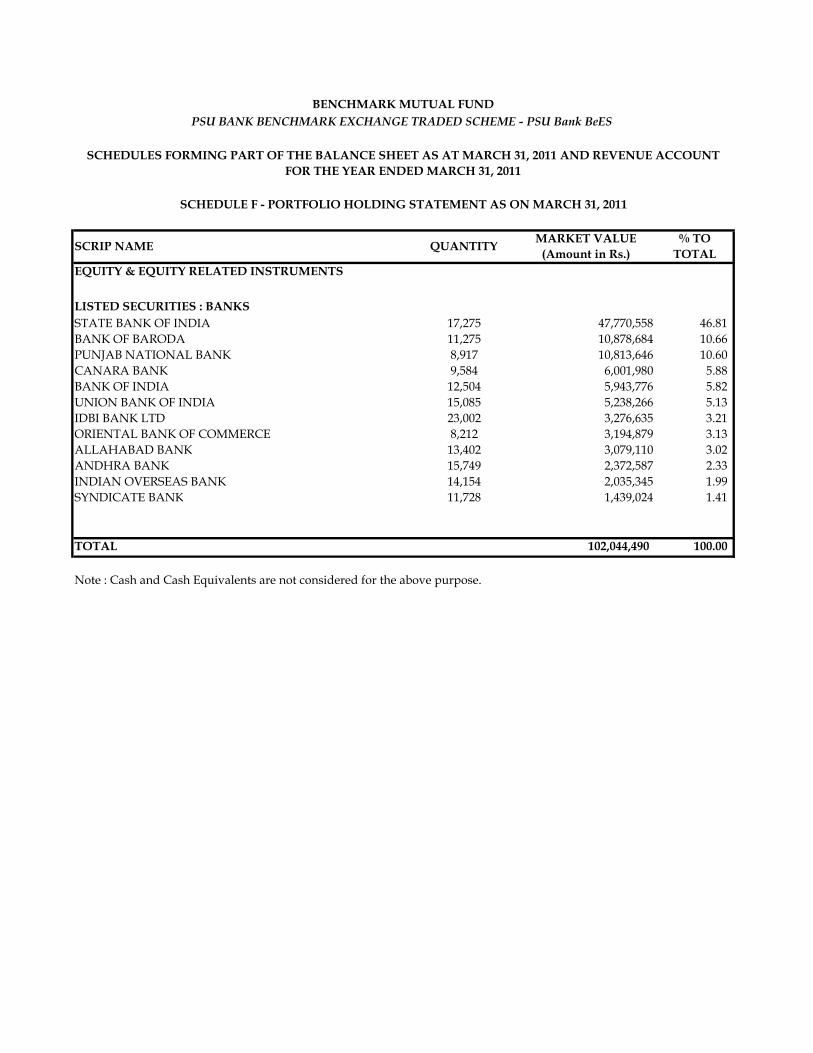
EQUITY & EQUITY RELATED INSTRUMENTS
LISTED SECURITIES : BANKSSTATE BANK OF INDIA 17,275 47,770,558 46.81 BANK OF BARODA 11,275 10,878,684 10.66 PUNJAB NATIONAL BANK 8,917 10,813,646 10.60 CANARA BANK 9,584 6,001,980 5.88 BANK OF INDIA 12,504 5,943,776 5.82 UNION BANK OF INDIA 15,085 5,238,266 5.13 IDBI BANK LTD 23,002 3,276,635 3.21 ORIENTAL BANK OF COMMERCE 8,212 3,194,879 3.13 ALLAHABAD BANK 13,402 3,079,110 3.02 ANDHRA BANK 15,749 2,372,587 2.33 INDIAN OVERSEAS BANK 14,154 2,035,345 1.99 SYNDICATE BANK 11,728 1,439,024 1.41
TOTAL 102,044,490 100.00
Note : Cash and Cash Equivalents are not considered for the above purpose.
BENCHMARK MUTUAL FUNDPSU BANK BENCHMARK EXCHANGE TRADED SCHEME - PSU Bank BeES
SCHEDULES FORMING PART OF THE BALANCE SHEET AS AT MARCH 31, 2011 AND REVENUE ACCOUNT FOR THE YEAR ENDED MARCH 31, 2011
% TO TOTAL
MARKET VALUE (Amount in Rs.)QUANTITYSCRIP NAME
SCHEDULE F - PORTFOLIO HOLDING STATEMENT AS ON MARCH 31, 2011
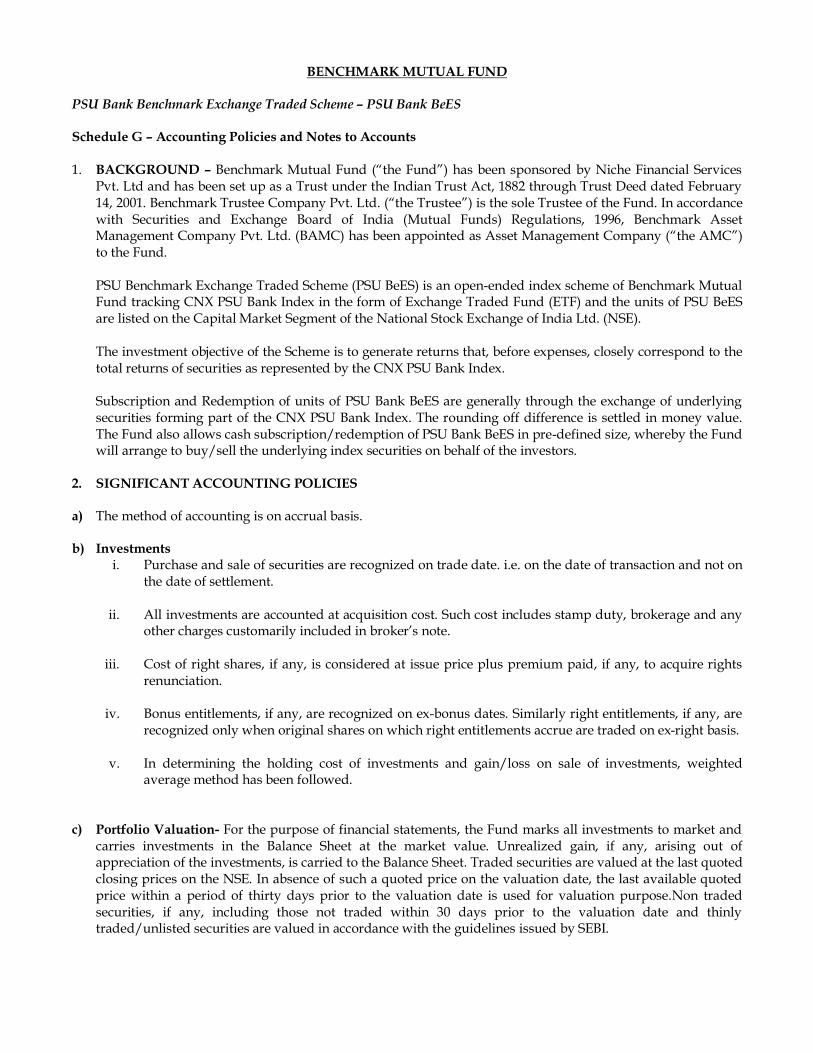
BENCHMARK MUTUAL FUND
PSU Bank Benchmark Exchange Traded Scheme – PSU Bank BeES Schedule G – Accounting Policies and Notes to Accounts 1. BACKGROUND – Benchmark Mutual Fund (“the Fund”) has been sponsored by Niche Financial Services
Pvt. Ltd and has been set up as a Trust under the Indian Trust Act, 1882 through Trust Deed dated February 14, 2001. Benchmark Trustee Company Pvt. Ltd. (“the Trustee”) is the sole Trustee of the Fund. In accordance with Securities and Exchange Board of India (Mutual Funds) Regulations, 1996, Benchmark Asset Management Company Pvt. Ltd. (BAMC) has been appointed as Asset Management Company (“the AMC”) to the Fund. PSU Benchmark Exchange Traded Scheme (PSU BeES) is an open-ended index scheme of Benchmark Mutual Fund tracking CNX PSU Bank Index in the form of Exchange Traded Fund (ETF) and the units of PSU BeES are listed on the Capital Market Segment of the National Stock Exchange of India Ltd. (NSE).
The investment objective of the Scheme is to generate returns that, before expenses, closely correspond to the total returns of securities as represented by the CNX PSU Bank Index. Subscription and Redemption of units of PSU Bank BeES are generally through the exchange of underlying securities forming part of the CNX PSU Bank Index. The rounding off difference is settled in money value. The Fund also allows cash subscription/redemption of PSU Bank BeES in pre-defined size, whereby the Fund will arrange to buy/sell the underlying index securities on behalf of the investors.
2. SIGNIFICANT ACCOUNTING POLICIES a) The method of accounting is on accrual basis.
b) Investments
i. Purchase and sale of securities are recognized on trade date. i.e. on the date of transaction and not on the date of settlement.
ii. All investments are accounted at acquisition cost. Such cost includes stamp duty, brokerage and any
other charges customarily included in broker’s note.
iii. Cost of right shares, if any, is considered at issue price plus premium paid, if any, to acquire rights renunciation.
iv. Bonus entitlements, if any, are recognized on ex-bonus dates. Similarly right entitlements, if any, are
recognized only when original shares on which right entitlements accrue are traded on ex-right basis.
v. In determining the holding cost of investments and gain/loss on sale of investments, weighted average method has been followed.
c) Portfolio Valuation- For the purpose of financial statements, the Fund marks all investments to market and carries investments in the Balance Sheet at the market value. Unrealized gain, if any, arising out of appreciation of the investments, is carried to the Balance Sheet. Traded securities are valued at the last quoted closing prices on the NSE. In absence of such a quoted price on the valuation date, the last available quoted price within a period of thirty days prior to the valuation date is used for valuation purpose.Non traded securities, if any, including those not traded within 30 days prior to the valuation date and thinly traded/unlisted securities are valued in accordance with the guidelines issued by SEBI.
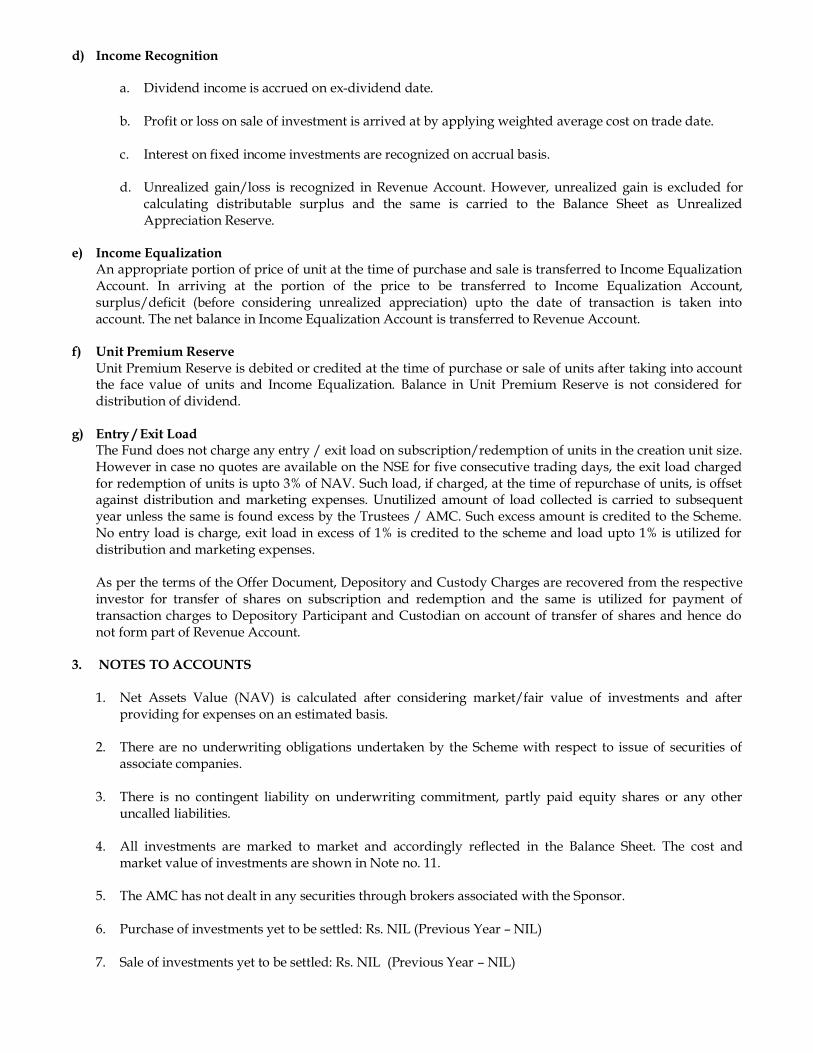
d) Income Recognition
a. Dividend income is accrued on ex-dividend date. b. Profit or loss on sale of investment is arrived at by applying weighted average cost on trade date.
c. Interest on fixed income investments are recognized on accrual basis.
d. Unrealized gain/loss is recognized in Revenue Account. However, unrealized gain is excluded for
calculating distributable surplus and the same is carried to the Balance Sheet as Unrealized Appreciation Reserve.
e) Income Equalization
An appropriate portion of price of unit at the time of purchase and sale is transferred to Income Equalization Account. In arriving at the portion of the price to be transferred to Income Equalization Account, surplus/deficit (before considering unrealized appreciation) upto the date of transaction is taken into account. The net balance in Income Equalization Account is transferred to Revenue Account.
f) Unit Premium Reserve Unit Premium Reserve is debited or credited at the time of purchase or sale of units after taking into account the face value of units and Income Equalization. Balance in Unit Premium Reserve is not considered for distribution of dividend.
g) Entry / Exit Load The Fund does not charge any entry / exit load on subscription/redemption of units in the creation unit size. However in case no quotes are available on the NSE for five consecutive trading days, the exit load charged for redemption of units is upto 3% of NAV. Such load, if charged, at the time of repurchase of units, is offset against distribution and marketing expenses. Unutilized amount of load collected is carried to subsequent year unless the same is found excess by the Trustees / AMC. Such excess amount is credited to the Scheme. No entry load is charge, exit load in excess of 1% is credited to the scheme and load upto 1% is utilized for distribution and marketing expenses. As per the terms of the Offer Document, Depository and Custody Charges are recovered from the respective investor for transfer of shares on subscription and redemption and the same is utilized for payment of transaction charges to Depository Participant and Custodian on account of transfer of shares and hence do not form part of Revenue Account.
3. NOTES TO ACCOUNTS 1. Net Assets Value (NAV) is calculated after considering market/fair value of investments and after
providing for expenses on an estimated basis.
2. There are no underwriting obligations undertaken by the Scheme with respect to issue of securities of associate companies.
3. There is no contingent liability on underwriting commitment, partly paid equity shares or any other
uncalled liabilities. 4. All investments are marked to market and accordingly reflected in the Balance Sheet. The cost and
market value of investments are shown in Note no. 11. 5. The AMC has not dealt in any securities through brokers associated with the Sponsor. 6. Purchase of investments yet to be settled: Rs. NIL (Previous Year – NIL) 7. Sale of investments yet to be settled: Rs. NIL (Previous Year – NIL)
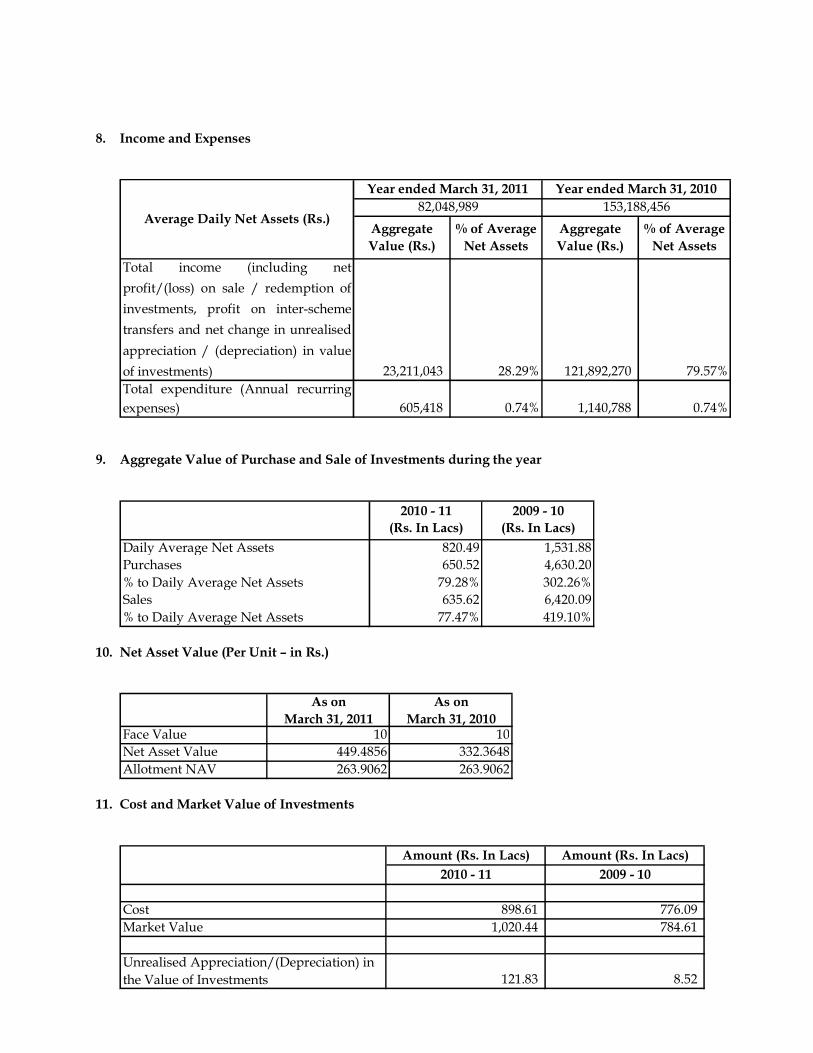
8. Income and Expenses
Total income (including netprofit/(loss) on sale / redemption ofinvestments, profit on inter-schemetransfers and net change in unrealisedappreciation / (depreciation) in valueof investments) 23,211,043 28.29% 121,892,270 79.57%Total expenditure (Annual recurringexpenses) 605,418 0.74% 1,140,788 0.74%
82,048,989 153,188,456% of Average
Net Assets
Average Daily Net Assets (Rs.)Aggregate Value (Rs.)
% of Average Net Assets
Aggregate Value (Rs.)
Year ended March 31, 2011 Year ended March 31, 2010
9. Aggregate Value of Purchase and Sale of Investments during the year
2010 - 11(Rs. In Lacs)
2009 - 10(Rs. In Lacs)
Daily Average Net Assets 820.49 1,531.88Purchases 650.52 4,630.20% to Daily Average Net Assets 79.28% 302.26%Sales 635.62 6,420.09% to Daily Average Net Assets 77.47% 419.10%
10. Net Asset Value (Per Unit – in Rs.)
As on
March 31, 2011As on
March 31, 2010Face Value 10 10Net Asset Value 449.4856 332.3648Allotment NAV 263.9062 263.9062
11. Cost and Market Value of Investments
Amount (Rs. In Lacs) Amount (Rs. In Lacs)2010 - 11 2009 - 10
Cost 898.61 776.09 Market Value 1,020.44 784.61
Unrealised Appreciation/(Depreciation) in the Value of Investments 121.83 8.52
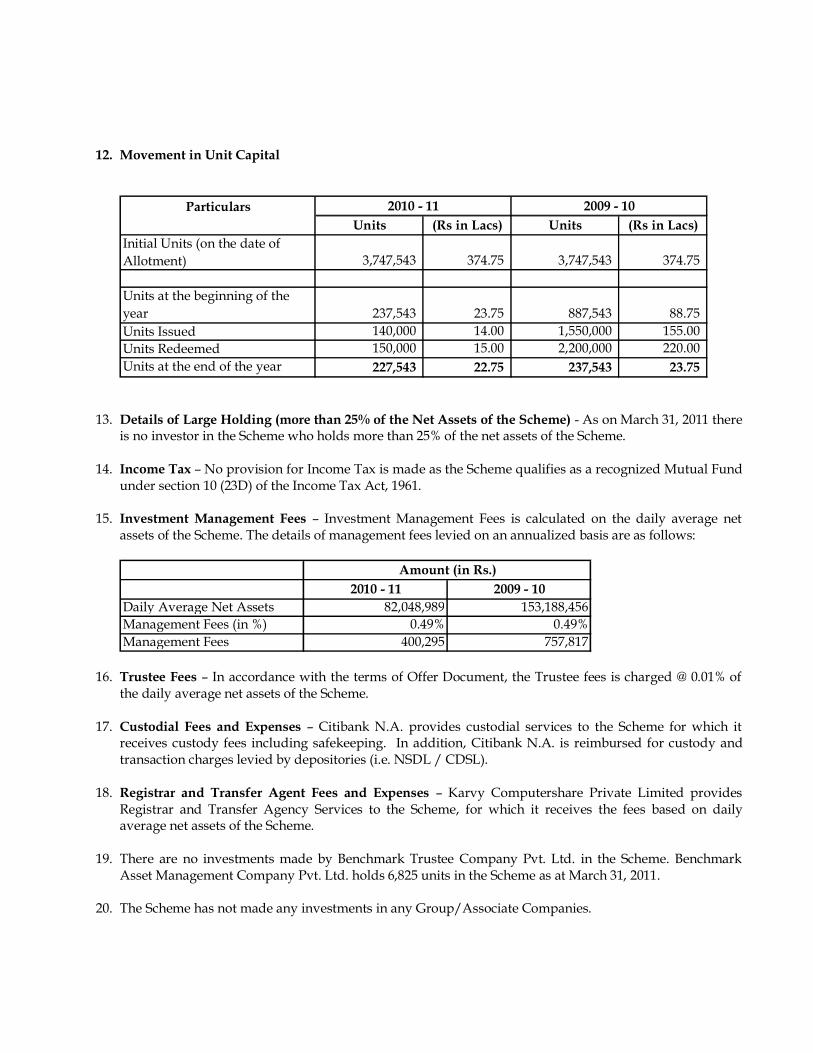
12. Movement in Unit Capital
ParticularsUnits (Rs in Lacs) Units (Rs in Lacs)
Initial Units (on the date of Allotment) 3,747,543 374.75 3,747,543 374.75
Units at the beginning of the year 237,543 23.75 887,543 88.75 Units Issued 140,000 14.00 1,550,000 155.00 Units Redeemed 150,000 15.00 2,200,000 220.00 Units at the end of the year 227,543 22.75 237,543 23.75
2009 - 102010 - 11
13. Details of Large Holding (more than 25% of the Net Assets of the Scheme) - As on March 31, 2011 there is no investor in the Scheme who holds more than 25% of the net assets of the Scheme.
14. Income Tax – No provision for Income Tax is made as the Scheme qualifies as a recognized Mutual Fund
under section 10 (23D) of the Income Tax Act, 1961. 15. Investment Management Fees – Investment Management Fees is calculated on the daily average net
assets of the Scheme. The details of management fees levied on an annualized basis are as follows:
2010 - 11 2009 - 10Daily Average Net Assets 82,048,989 153,188,456Management Fees (in %) 0.49% 0.49%Management Fees 400,295 757,817
Amount (in Rs.)
16. Trustee Fees – In accordance with the terms of Offer Document, the Trustee fees is charged @ 0.01% of the daily average net assets of the Scheme.
17. Custodial Fees and Expenses – Citibank N.A. provides custodial services to the Scheme for which it receives custody fees including safekeeping. In addition, Citibank N.A. is reimbursed for custody and transaction charges levied by depositories (i.e. NSDL / CDSL).
18. Registrar and Transfer Agent Fees and Expenses – Karvy Computershare Private Limited provides
Registrar and Transfer Agency Services to the Scheme, for which it receives the fees based on daily average net assets of the Scheme.
19. There are no investments made by Benchmark Trustee Company Pvt. Ltd. in the Scheme. Benchmark
Asset Management Company Pvt. Ltd. holds 6,825 units in the Scheme as at March 31, 2011.
20. The Scheme has not made any investments in any Group/Associate Companies.
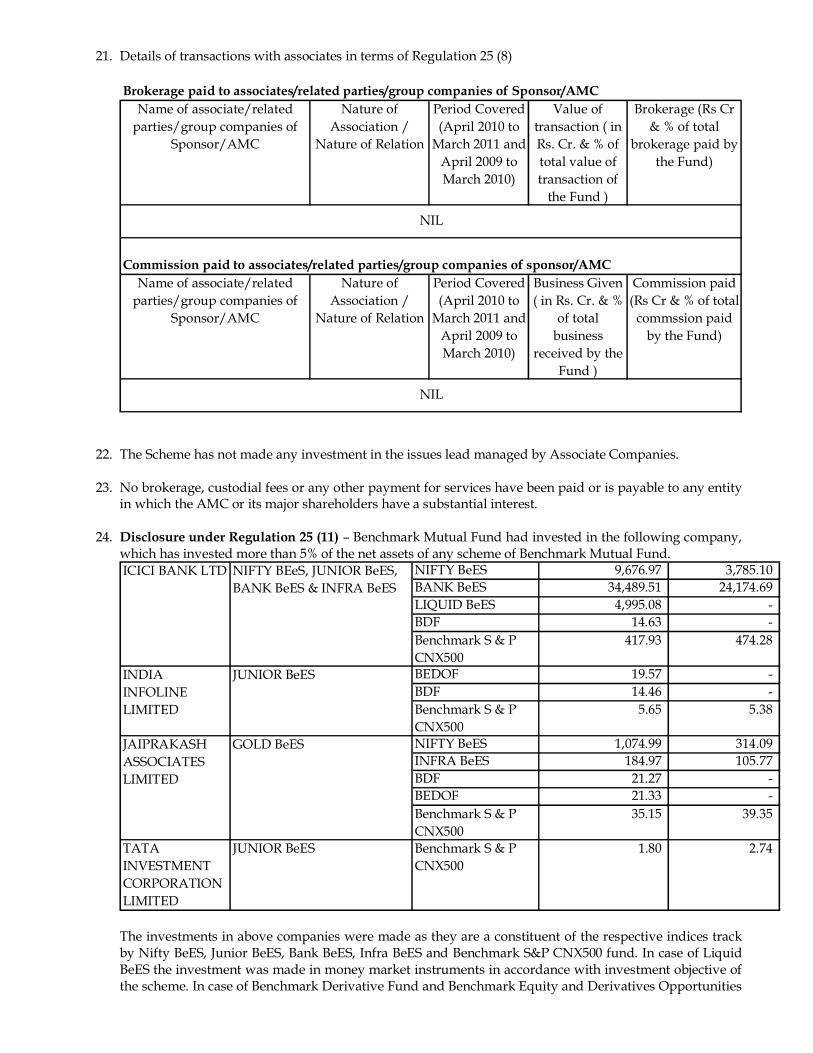
21. Details of transactions with associates in terms of Regulation 25 (8)
Brokerage paid to associates/related parties/group companies of Sponsor/AMCName of associate/related
parties/group companies of Sponsor/AMC
Nature of Association /
Nature of Relation
Period Covered (April 2010 to
March 2011 and April 2009 to March 2010)
Value of transaction ( in Rs. Cr. & % of total value of transaction of
the Fund )
Brokerage (Rs Cr & % of total
brokerage paid by the Fund)
Commission paid to associates/related parties/group companies of sponsor/AMCName of associate/related
parties/group companies of Sponsor/AMC
Nature of Association /
Nature of Relation
Period Covered (April 2010 to
March 2011 and April 2009 to March 2010)
Business Given ( in Rs. Cr. & %
of total business
received by the Fund )
Commission paid (Rs Cr & % of total
commssion paid by the Fund)
NIL
NIL
22. The Scheme has not made any investment in the issues lead managed by Associate Companies. 23. No brokerage, custodial fees or any other payment for services have been paid or is payable to any entity
in which the AMC or its major shareholders have a substantial interest. 24. Disclosure under Regulation 25 (11) – Benchmark Mutual Fund had invested in the following company,
which has invested more than 5% of the net assets of any scheme of Benchmark Mutual Fund. NIFTY BeES 9,676.97 3,785.10 BANK BeES 34,489.51 24,174.69 LIQUID BeES 4,995.08 -BDF 14.63 -Benchmark S & P CNX500
417.93 474.28
BEDOF 19.57 -BDF 14.46 -Benchmark S & P CNX500
5.65 5.38
NIFTY BeES 1,074.99 314.09 INFRA BeES 184.97 105.77 BDF 21.27 -BEDOF 21.33 -Benchmark S & P CNX500
35.15 39.35
TATA INVESTMENT CORPORATION LIMITED
JUNIOR BeES Benchmark S & P CNX500
1.80 2.74
INDIA INFOLINE LIMITED
JUNIOR BeES
JAIPRAKASH ASSOCIATES LIMITED
GOLD BeES
ICICI BANK LTD NIFTY BEeS, JUNIOR BeES, BANK BeES & INFRA BeES
The investments in above companies were made as they are a constituent of the respective indices track by Nifty BeES, Junior BeES, Bank BeES, Infra BeES and Benchmark S&P CNX500 fund. In case of Liquid BeES the investment was made in money market instruments in accordance with investment objective of the scheme. In case of Benchmark Derivative Fund and Benchmark Equity and Derivatives Opportunities

Fund, the investment in above companies was made on account of arbitrage opportunities available in the derivatives market during the year.
25. The Financial Statements of the Scheme have been prepared in accordance with SEBI Mutual Funds Regulations, 1996 wherein disclosures of Segment Reporting have not been prescribed. Hence the same has not been provided for the Scheme. The details of portfolio as per the SEBI Regulation has been disclosed.
26. Unclaimed Dividend/Redemption Amount – As on March 31, 2011 there is an unclaimed dividend of
Rs. 960/- represented by 9 Dividend Warrrants.There are no unclaimed redemptions as of March 31, 2011.
27. Registered Securities – In accordance with Regulation 44(1) of the SEBI (Mutual Funds) Regulations,
1996, the securities of the Scheme are held by the trustees for the benefit of Scheme’s unit holders.
28. A complete list of investments of the Scheme is given in Schedule F.
29. On March 15, 2011 Goldman Sachs Asset Management, L.P., through its subsidiaries Goldman Sachs Asset Management (India) Private Limited (“GS AMC”) and Goldman Sachs Trustee Company (India) Private Limited (“GS Trustee”), executed a sale and purchase agreement relating to the acquisition of all the outstanding shares in Benchmark Asset Management Company Private Limited (“BAMC”) and Benchmark Trustee Company Private Limited (“BTC”) from Niche Financial Services Private Limited, the sponsor of Benchmark Mutual Fund (“Benchmark MF”), and the other shareholders of BAMC and BTC. The sale and purchase agreement contemplates that BAMC shall transfer the rights to manage the schemes of Benchmark MF to GS AMC and BTC shall transfer the schemes of Benchmark MF to GS Trustee as part of the transaction. This transaction has been approved by the regulator, Securities and Exchange Board of India (“SEBI”) on June 27, 2011.
30. The previous year figures have been regrouped/rearranged wherever necessary.
31. The audited results for the year ended March 31, 2011 have been approved by the Boards of Benchmark
Asset Management Company Pvt. Ltd (AMC) and Benchmark Trustee Company Pvt. Ltd (Trustee) at their meeting held on June 29, 2011 respectively.
NOTES:
1. On written request, present and prospective unit holders/investors can obtain a copy of the Trust Deed, the Annual Report, at a price if any, and the text of the Scheme.
2. On written request, the present and prospective unit holders/investors may request a copy of the Annual Report of the AMC.
3. On written request, the present and prospective unit holders/investors can inspect a full list of investments of the Scheme at the office of the AMC.

(In Rupees)
Serial No.
April 01,2010 to March 31,2011
April 01,2009 to March 31,2010
April 01,2008 to March 31,2009
a) Net Asset Value, per unit at the end of the year 449.4856 332.3648 159.3359
b) i) Income other than profit on sale of investment, per unit 4.91 13.71 35.68ii) Income (net) from profit / (loss) on inter scheme sales/transfer of investment, per unit - - - iii) Income (net) from profit / (loss) on sale of investment to third party, per unit 47.30 118.95 -892.87iv) Transfer to Revenue account from past year’s reserve, per unit
c) Aggregate of Expenses, Write off, Amortisation & Charges, per unit 2.66 4.80 7.35
d) Net Income / (loss) per unit (b - c) 49.55 127.86 -864.54
e) Net Change in unrealised appreciation / (depreciation) in the value of investments 49.80 380.48 599.12
f) Repurchase Price during the yeari) Highest 543.9971 365.1563 257.7912ii) Lowest 330.5071 160.1703 132.1492
g) Resale Price during the yeari) Highest 543.9971 365.1563 257.7912ii) Lowest 330.5071 160.1703 132.1492
h) Market Price (The National Stock Exchange of India)i) Highest 590.0000 410.0000 270.0000 ii) Lowest 324.0000 145.1000 134.0000
i) Price Earning Ratio ** (0.88) (0.52) (0.50)
j) Ratio of expenses to the average net assets @ 0.74% 0.74% 0.75%
k)28.29% 79.57% (26.29%)
*
**@
Signatures to Schedules A to G forming part of the Balance Sheet and Revenue Account
As per our Report of even dateFor N M Raiji & Co.Chartered AccountantsRegistration No. 108296W
Dr. S.A.Dave Shriraj DhruvJ M Gandhi Chairman Director(Partner)Membership No .37924
D.S. Mehta S.R. HalbeChairman Director
Place : Mumbai Payal Wadhwa KaipunjalDate : June 29, 2011 Fund Manager
Ratio of gross income (including net profit / loss on sale / redemption of investments and net change in unrealised appreciation / (depreciation) in value of investments) to average net assets @
PERSPECTIVE HISTORICAL PER UNIT STATISTICS *
SCHEDULE G - NOTES TO ACCOUNTS
For and on behalf of Benchmark Trustee Company Pvt Ltd.
For and on behalf of Benchmark Asset Management Company Pvt Ltd.
BENCHMARK MUTUAL FUND
SCHEDULES FORMING PART OF THE BALANCE SHEET AS AT MARCH 31, 2011 AND REVENUE ACCOUNT FOR THE YEAR ENDED MARCH 31, 2011
The above per unit calculations are based on the number of units outstanding at the end of the year.Price Earning Ratio is based on the closing market price on the National Stock Exchange of India Ltd. & surplus for the year which includes unrealised appreciation / (depreciation) and income equalisation per unit.Annualised for the period ended March 31, 2008
PSU BANK BENCHMARK EXCHANGE TRADED SCHEME - PSU Bank BeES
AUDITORS’ REPORT The Board of Directors, Benchmark Trustee Company Private Limited
We have audited the attached Balance Sheet as at March 31, 2011, and the Revenue Account for the
year ended on that date, annexed thereto of Benchmark Equity & Derivative Opportunities Fund (the
scheme), of Benchmark Mutual Fund. These financial statements are prepared in accordance with
SEBI (Mutual Fund) Regulations, 1996 (the Regulations) and are the responsibility of the
Management. Our responsibility is to express an opinion on these financial statements based on our
audit.
We conducted our audit in accordance with the Standards on Auditing issued by Institute of Chartered
Accountants of India. An audit includes examining on a test basis, evidence supporting the amounts
and disclosures in the financial statements. An audit also includes assessing the accounting principles
used and significant estimates made by the management, as well as evaluating the overall financial
statement presentation. We believe that our audit provides a reasonable basis for our opinion.
We report that:
1. We have obtained all information and explanations, which, to the best of our knowledge and
belief were necessary for the purpose of our audit.
2. The Balance Sheet and the Revenue Account referred to above are in agreement with the
books of accounts of the Scheme.
3. The accounts have been prepared in accordance with the accounting policies adopted by the
trustees of the Fund and as specified in the Ninth Schedule to the Regulations.

4. In our opinion, valuation methods for Non Traded Securities, if any, adopted by the scheme
are fair and reasonable and are in accordance with the guidelines for valuation issued by
SEBI and approved by the Trustee.
5. Without qualifying our opinion, we draw attention to note no. 28 in Schedule H of the
financial statements whereby the management has not provided the Cash Flow Statement and
Segment Reporting for reasons mentioned therein.
6. In our opinion and to the best of our information and according to the explanations given to
us, the financial statements read with the accounting policies and notes to accounts attached
thereto, give the information required as per the Regulations and give a true & fair view in
accordance with the generally accepted accounting principles in India:
a. in the case of Balance Sheet, of the state of affairs of the scheme as at March 31,
2011; and
b. in the case of Revenue Account, of the surplus of the scheme for the year ended on
that date.
For N.M.RAIJI & CO. Chartered Accountants
Firm Reg. No:108296W
J. M. GANDHI Partner Membership No. 37924
Place: Mumbai Dated: June 29, 2011
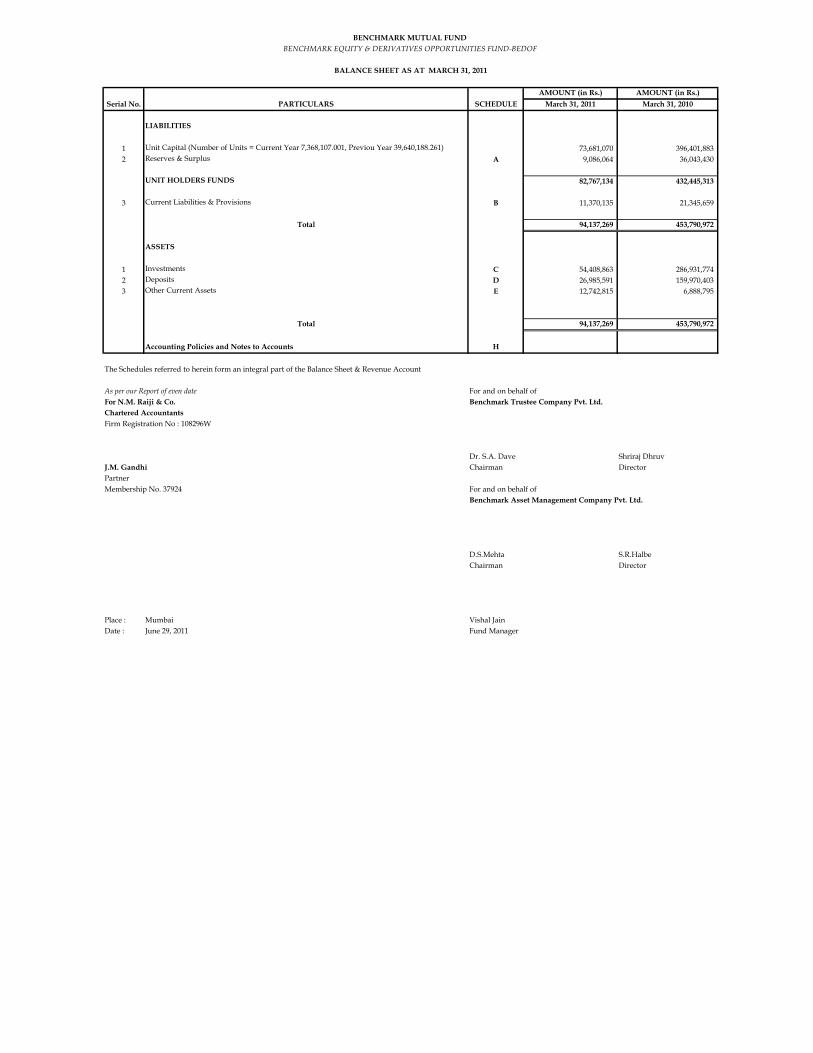
AMOUNT (in Rs.) AMOUNT (in Rs.)March 31, 2011 March 31, 2010
LIABILITIES
1 Unit Capital (Number of Units = Current Year 7,368,107.001, Previou Year 39,640,188.261) 73,681,070 396,401,883 2 Reserves & Surplus A 9,086,064 36,043,430
UNIT HOLDERS FUNDS 82,767,134 432,445,313
3 Current Liabilities & Provisions B 11,370,135 21,345,659
Total 94,137,269 453,790,972
ASSETS
1 Investments C 54,408,863 286,931,774 2 Deposits D 26,985,591 159,970,403 3 Other Current Assets E 12,742,815 6,888,795
Total 94,137,269 453,790,972
Accounting Policies and Notes to Accounts H 0
The Schedules referred to herein form an integral part of the Balance Sheet & Revenue Account
As per our Report of even date For and on behalf ofFor N.M. Raiji & Co. Benchmark Trustee Company Pvt. Ltd.Chartered AccountantsFirm Registration No : 108296W
Dr. S.A. Dave Shriraj DhruvJ.M. Gandhi Chairman DirectorPartnerMembership No. 37924 For and on behalf of
Benchmark Asset Management Company Pvt. Ltd.
D.S.Mehta S.R.HalbeChairman Director
Place : Mumbai Vishal JainDate : June 29, 2011 Fund Manager
Serial No. PARTICULARS SCHEDULE
BENCHMARK MUTUAL FUND BENCHMARK EQUITY & DERIVATIVES OPPORTUNITIES FUND-BEDOF
BALANCE SHEET AS AT MARCH 31, 2011
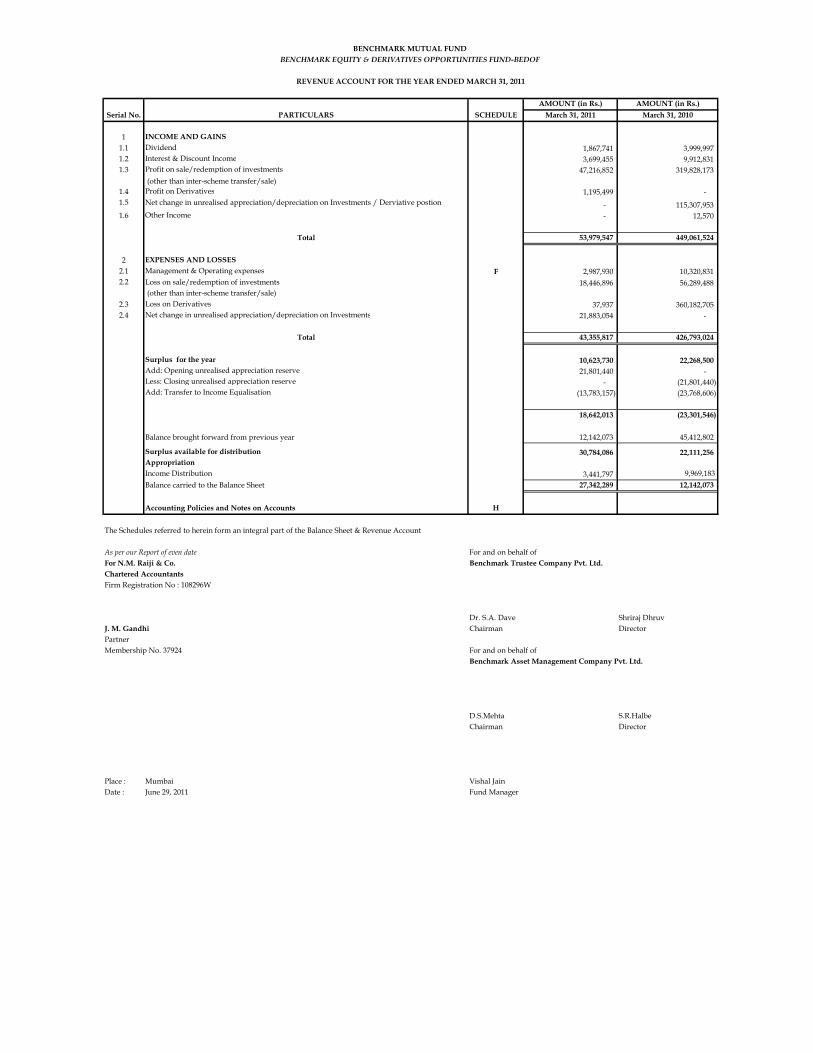
AMOUNT (in Rs.) AMOUNT (in Rs.)March 31, 2011 March 31, 2010
1 INCOME AND GAINS 1.1 Dividend 1,867,741 3,999,997 1.2 Interest & Discount Income 3,699,455 9,912,831 1.3 Profit on sale/redemption of investments 47,216,852 319,828,173
(other than inter-scheme transfer/sale)1.4 Profit on Derivatives 1,195,499 - 1.5 Net change in unrealised appreciation/depreciation on Investments / Derviative postion - 115,307,953 1.6 Other Income - 12,570
Total 53,979,547 449,061,524
2 EXPENSES AND LOSSES 2.1 Management & Operating expenses F 2,987,930 10,320,831 2.2 Loss on sale/redemption of investments 18,446,896 56,289,488
(other than inter-scheme transfer/sale)2.3 Loss on Derivatives 37,937 360,182,705 2.4 Net change in unrealised appreciation/depreciation on Investments 21,883,054 -
Total 43,355,817 426,793,024
Surplus for the year 10,623,730 22,268,500 Add: Opening unrealised appreciation reserve 21,801,440 - Less: Closing unrealised appreciation reserve - (21,801,440) Add: Transfer to Income Equalisation (13,783,157) (23,768,606)
18,642,013 (23,301,546)
Balance brought forward from previous year 12,142,073 45,412,802
Surplus available for distribution 30,784,086 22,111,256 AppropriationIncome Distribution 3,441,797 9,969,183 Balance carried to the Balance Sheet 27,342,289 12,142,073
Accounting Policies and Notes on Accounts H
The Schedules referred to herein form an integral part of the Balance Sheet & Revenue Account
As per our Report of even date For and on behalf ofFor N.M. Raiji & Co. Benchmark Trustee Company Pvt. Ltd.Chartered AccountantsFirm Registration No : 108296W
Dr. S.A. Dave Shriraj DhruvJ. M. Gandhi Chairman DirectorPartnerMembership No. 37924 For and on behalf of
Benchmark Asset Management Company Pvt. Ltd.
D.S.Mehta S.R.HalbeChairman Director
Place : Mumbai Vishal JainDate : June 29, 2011 Fund Manager
REVENUE ACCOUNT FOR THE YEAR ENDED MARCH 31, 2011
BENCHMARK MUTUAL FUND BENCHMARK EQUITY & DERIVATIVES OPPORTUNITIES FUND-BEDOF
PARTICULARSSerial No. SCHEDULE

AMOUNT (in Rs.) AMOUNT (in Rs.)March 31, 2011 March 31, 2010
A RESERVES & SURPLUS
Unit Premium ReserveOpening Balance 2,099,917 1,047,640
Add/(Less): on account of subscription/redemption of units (20,356,142) 1,052,277 Closing Balance -18,256,225 2,099,917
Unrealised Appreciation ReserveOpening Balance 21,801,440 - Add/(Less): During the year 21,801,440 21,801,440 Closing balance - 21,801,440
Surplus/(Deficit)Balance transferred from Revenue account 27,342,289 12,142,073
27,342,289 12,142,073
9,086,064 36,043,430
B CURRENT LIABILITIES & PROVISIONS
Current LiabilitiesContracts for purchase of investments 10,757,287 7,101,006 Payable on Repurchase of units - 10,341,549 Management Fee payable 36,190 201,135 Trusteeship Fee payable 2,163 29,708 Tax Payable - 205,076 Payable to AMC 354,764 2,803,106 Other Liabilities 219,731 267,882 Marked to Market Payable - 396,198
11,370,135 21,345,659
C INVESTMENTS (Marked to Market)(Refer Schedule - G for Portfolio Holding Statement as on March 31, 2011)Equity Shares 54,408,863 286,931,774
54,408,863 286,931,774
D DEPOSITS Collateralised borrowing lending obligation (CBLO) 12,985,591 57,470,403 Margin & Fixed Deposit for Derivatives and CBLO 14,000,000 102,500,000
- 26,985,591 159,970,403
E OTHER CURRENT ASSETS Balances with scheduled banks in current account 4,725,665 3,074,088 Unit Subscription Receiveable 10,000 170,033 Contracts for sale of investments 7,376,429 1,990,565 Outstanding and accrued income 243,940 1,654,109 Marked to Market Receivable 386,781 -
- 12,742,815 6,888,795
F MANAGEMENT & OPERATING EXPENSES Management Fees 995,986 3,440,309 Trusteeship Fees 19,919 68,804 Selling, Distribution and Publicity Expenses 1,087,271 4,323,669 Audit Fees 94,972 102,120 Custodial Fees 356,581 1,490,000 Registrar Expenses 354,294 541,924 Investor Communication and Statutory Advertisement 67,696 287,316 Other Operating Expenses 11,211 66,689
2,987,930 10,320,831
BENCHMARK MUTUAL FUND BENCHMARK EQUITY & DERIVATIVES OPPORTUNITIES FUND-BEDOF
SCHEDULES FORMING PART OF BALANCE SHEET AS AT MARCH 31, 2011 AND REVENUE ACCOUNT FOR THE YEAR ENDED MARCH 31, 2011
Schedule No. PARTICULARS
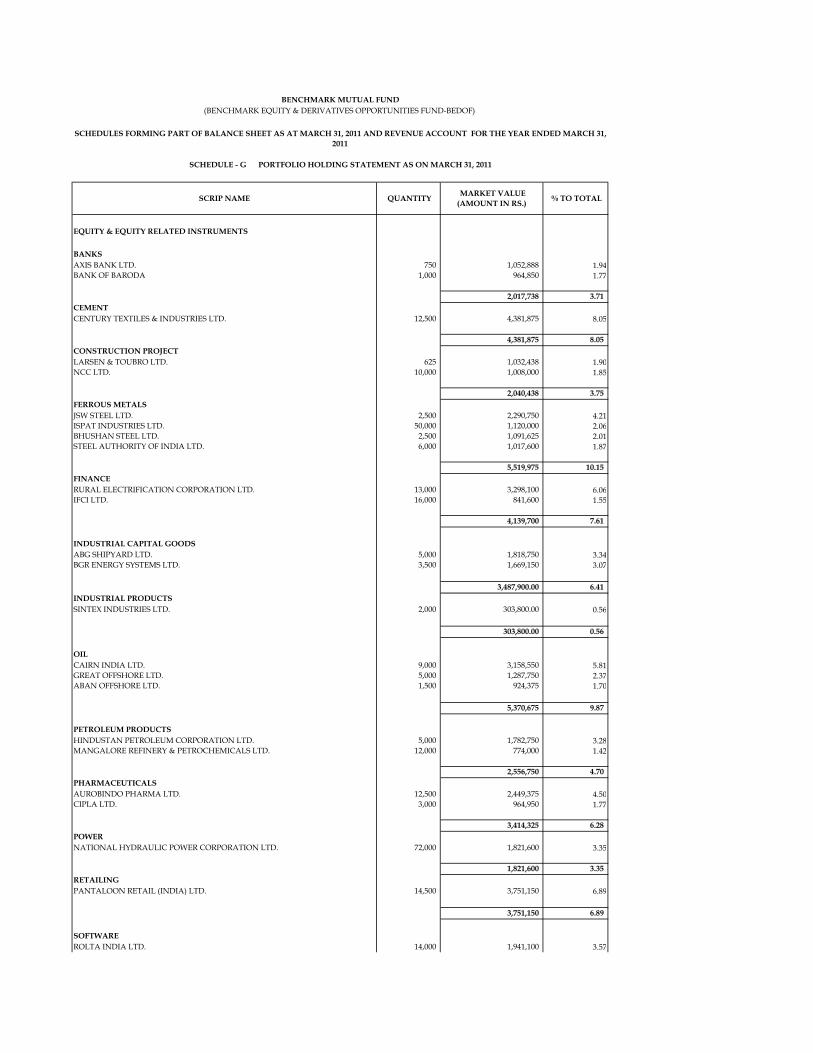
SCRIP NAME QUANTITY MARKET VALUE (AMOUNT IN RS.) % TO TOTAL
EQUITY & EQUITY RELATED INSTRUMENTS
BANKSAXIS BANK LTD. 750 1,052,888 1.94BANK OF BARODA 1,000 964,850 1.77
2,017,738 3.71 CEMENT CENTURY TEXTILES & INDUSTRIES LTD. 12,500 4,381,875 8.05
4,381,875 8.05 CONSTRUCTION PROJECTLARSEN & TOUBRO LTD. 625 1,032,438 1.90NCC LTD. 10,000 1,008,000 1.85
2,040,438 3.75 FERROUS METALSJSW STEEL LTD. 2,500 2,290,750 4.21ISPAT INDUSTRIES LTD. 50,000 1,120,000 2.06BHUSHAN STEEL LTD. 2,500 1,091,625 2.01STEEL AUTHORITY OF INDIA LTD. 6,000 1,017,600 1.87
5,519,975 10.15 FINANCERURAL ELECTRIFICATION CORPORATION LTD. 13,000 3,298,100 6.06IFCI LTD. 16,000 841,600 1.55
4,139,700 7.61
INDUSTRIAL CAPITAL GOODSABG SHIPYARD LTD. 5,000 1,818,750 3.34BGR ENERGY SYSTEMS LTD. 3,500 1,669,150 3.07
3,487,900.00 6.41 INDUSTRIAL PRODUCTSSINTEX INDUSTRIES LTD. 2,000 303,800.00 0.56
303,800.00 0.56
OILCAIRN INDIA LTD. 9,000 3,158,550 5.81GREAT OFFSHORE LTD. 5,000 1,287,750 2.37ABAN OFFSHORE LTD. 1,500 924,375 1.70
5,370,675 9.87
PETROLEUM PRODUCTSHINDUSTAN PETROLEUM CORPORATION LTD. 5,000 1,782,750 3.28MANGALORE REFINERY & PETROCHEMICALS LTD. 12,000 774,000 1.42
2,556,750 4.70 PHARMACEUTICALSAUROBINDO PHARMA LTD. 12,500 2,449,375 4.50CIPLA LTD. 3,000 964,950 1.77
3,414,325 6.28 POWER NATIONAL HYDRAULIC POWER CORPORATION LTD. 72,000 1,821,600 3.35
1,821,600 3.35 RETAILINGPANTALOON RETAIL (INDIA) LTD. 14,500 3,751,150 6.89
3,751,150 6.89
SOFTWAREROLTA INDIA LTD. 14,000 1,941,100 3.57
BENCHMARK MUTUAL FUND(BENCHMARK EQUITY & DERIVATIVES OPPORTUNITIES FUND-BEDOF)
SCHEDULES FORMING PART OF BALANCE SHEET AS AT MARCH 31, 2011 AND REVENUE ACCOUNT FOR THE YEAR ENDED MARCH 31, 2011
SCHEDULE - G PORTFOLIO HOLDING STATEMENT AS ON MARCH 31, 2011

SCHEDULE - G PORTFOLIO HOLDING STATEMENT AS ON MARCH 31, 2011
1,941,100.00 3.57
TELECOM - SERVICESGTL LTD. 20,000 8,313,000 15.28BHARTI AIRTEL LTD. 2,000 714,800 1.31
9,027,800 16.59
TEXTILE PRODUCTSALOK INDUSTRIES LTD. 90,000 1,993,500 3.66GRASIM INDUSTRIES LTD. 375 921,338 1.69
2,914,838 5.36
TRANSPORTATIONSHIPPING CORPORATION OF INDIA LTD. 16,000 1,719,200 3.16
1,719,200 3.16
TOTAL 54,408,863 100.00
Details of Derivative Positions outstanding as on March 31, 2011
Name of the Instrument Quantity * Market Value (Rs.) % to Net Assets
FUTURESGTL LTD (20,000) (8,358,000) N.A.CENTURY TEXTILES & INDUSTRIES LTD. (12,500) (4,373,125) N.A.PANTALOON RETAIL (INDIA) LTD. (14,500) (3,819,300) N.A.RURAL ELECTRIFICATION CORP LTD (13,000) (3,327,350) N.A.CAIRN INDIA LIMITED (9,000) (3,183,750) N.A.AUROBINDO PHARMA LTD. (12,500) (2,453,750) N.A.JSW STEEL LTD. (2,500) (2,310,000) N.A.ALOK INDUSTRIES LTD (90,000) (2,011,500) N.A.ROLTA INDIA LTD. (14,000) (1,960,000) N.A.ABG SHIPYARD LTD (5,000) (1,822,250) N.A.NATIONAL HYDRAULIC POWER CORPORATION LTD. (72,000) (1,821,600) N.A.HINDUSTAN PETROLEUM CORPORATION LTD. (5,000) (1,784,000) N.A.SHIPPING CORPORATION OF INDIA LTD. (16,000) (1,736,000) N.A.BGR ENERGY SYSTEMS LIMITED (3,500) (1,685,425) N.A.GREAT OFFSHORE LIMITED (5,000) (1,300,500) N.A.ISPAT INDUSTRIES LTD (50,000) (1,125,000) N.A.BHUSHAN STEEL LTD. (2,500) (1,101,750) N.A.AXIS BANK LIMITED (750) (1,059,863) N.A.LARSEN & TOUBRO LTD. (625) (1,041,656) N.A.STEEL AUTHORITY OF INDIA LTD. (6,000) (1,026,000) N.A.NCC LTD. (10,000) (1,016,500) N.A.CIPLA LTD. (3,000) (973,050) N.A.BANK OF BARODA (1,000) (971,900) N.A.ABAN OFFSHORE LTD (1,500) (932,700) N.A.GRASIM INDUSTRIES LTD. (375) (929,513) N.A.IFCI LTD (16,000) (850,400) N.A.MANGALORE REFINERY & PETROCHEMICALS LTD. (12,000) (780,000) N.A.BHARTI AIRTEL LTD. (2,000) (719,400) N.A.ALLAHABAD BANK (3,000) (687,150) N.A.YES BANK LTD. (2,000) (624,600) N.A.SINTEX INDUSTRIES LTD. (2,000) (306,500) N.A.HDFC BANK LTD. 250 589,175 N.A.UNION BANK OF INDIA 2,000 696,600 N.A.
TOTAL (405,000) (54,806,756)
* Negative Quantity indicates Sale Position.Note : Cash & Cash Equivalent are not considered for the above purpose
Disclosure for derivative positions as per SEBI Circular No. CIR/IMD/DF/11/2010 dated 18th August 2010
A. Hedging Positions through Futures as on March 31, 2011
Underlying Long / ShortFutures Price when purchased
Current price of the contract
Margin maintained in Rs. Lakhs
Aban Offshore Ltd Short 616.60 621.80 1.71ABG Shipyard Ltd Short 372.42 364.45 2.92Alok Industries Ltd Short 21.99 22.35 3.74Aurobindo Pharma Ltd. Short 195.54 196.30 5.83Axis Bank Limited Short 1,411.50 1,413.15 1.66Bank Of Baroda Short 949.11 971.90 1.52BGR Energy Systems Limited Short 487.17 481.55 3.39

SCHEDULE - G PORTFOLIO HOLDING STATEMENT AS ON MARCH 31, 2011Bharti Airtel Ltd. Short 356.25 359.70 1.12Bhushan Steel Ltd. Short 440.16 440.70 1.72CAIRN INDIA LIMITED Short 355.14 353.75 4.96Century Textiles & Industries Ltd. Short 348.52 349.85 7.82Cipla Ltd. Short 322.87 324.35 1.52Grasim Industries Ltd. Short 2,480.00 2,478.70 1.45Great Offshore Limited Short 259.88 260.10 2.48GTL Ltd Short 420.35 417.90 13.06Hindustan Petroleum Corporation Ltd. Short 353.75 356.80 2.79IFCI Ltd Short 54.58 53.15 1.47Ispat Industries Ltd Short 22.26 22.50 1.83JSW Steel Ltd. Short 922.72 924.00 3.99Larsen & Toubro Ltd. Short 1,678.72 1,666.65 1.62Mangalore Refinery & Petrochemicals Ltd. Short 63.57 65.00 1.22National Hydraulic Power Corporation Short 24.19 25.30 2.86NCC Ltd. Short 101.15 101.65 1.75Pantaloon Retail (India) Ltd. Short 271.62 263.40 8.27Rolta India Ltd. Short 140.19 140.00 3.07Rural Electrification Corp Ltd Short 254.90 255.95 6.46Shipping Corporation Of India Ltd. Short 109.68 108.50 2.71Sintex Industries Ltd. Short 154.00 153.25 0.52Steel Authority Of India Ltd. Short 169.78 171.00 1.60
Total %age (gross exposure) of existing assets hedged through futures : 66.19%
Total Number of contracts where futures were bought : 6,413Total Number of contracts where futures were sold : 5,364Gross Notional Value of contracts where futures were bought : Rs. 1,734,487,510.17Gross Notional Value of contracts where futures were sold : Rs. 1,450,677,912.71Net Profit/Loss value on all contracts combined : Rs. 1,489,745.43
B. Other than Hedging Positions through Futures as on March 31, 2011
Underlying Long / ShortFutures Price when purchased (Rs)
Current price of the contract (Rs)
Margin maintained (Rs. Lakhs)
Allahabad Bank Short 218.97 229.05 1.07HDFC Bank Ltd. Long 2,272.78 2,356.70 0.93Union Bank of India Long 339.73 348.30 1.10Yes Bank Ltd. Short 303.25 312.30 1.12
Total exposure (gross exposure) due to futures (non hedging positions) as a %age of net assets : 3.14%
Total Number of contracts where futures were bought : 520Total Number of contracts where futures were sold : 532Gross Notional Value of contracts where futures were bought : Rs. 159,628,931.32Gross Notional Value of contracts where futures were sold : Rs. 160,816,360.62Net Profit/Loss value on all contracts combined : Rs. 1,094,820.74
C. Hedging Positions through Put Options as on March 31, 2011
Underlying Number of Contracts
Option Price when purchased
Current Option Price
NIL
D. Other than Hedging Positions through Options as on March 31, 2011
Underlying Call / put Number of contracts Option Price when purchased Current Price
NIL
E. Hedging Positions through swaps as on March 31, 2011 - NIL
For the month ended March 31, 2011 following details specified with regrd to non-hedging transactions through options which have already been exercised/expired :
Total Number of contracts entered into : 82Gross National Value of contracts : Rs. 252,195.00Net Profit/Loss on all contracts (premium paid treated as loss) : Rs. (37,937.03)
For the month ended March 31, 2011 following details specified for hedging transactions through futures which have been squared off/expired:
For the month ended March 31, 2011 following details specified for non-hedging transactions through futures which have been squared off/expired:
Total % age of existing assets hedged through put options - NILFor the month ended March 31, 2011 following details specified for hedging transactions through options which have already been exercised/expired :
Total Number of contracts entered into : NILGross National value of contracts : NILNet Profit/Loss on all contracts (premium paid treated as loss) : NIL
Total Exposure through options as a %age of net assets : NIL
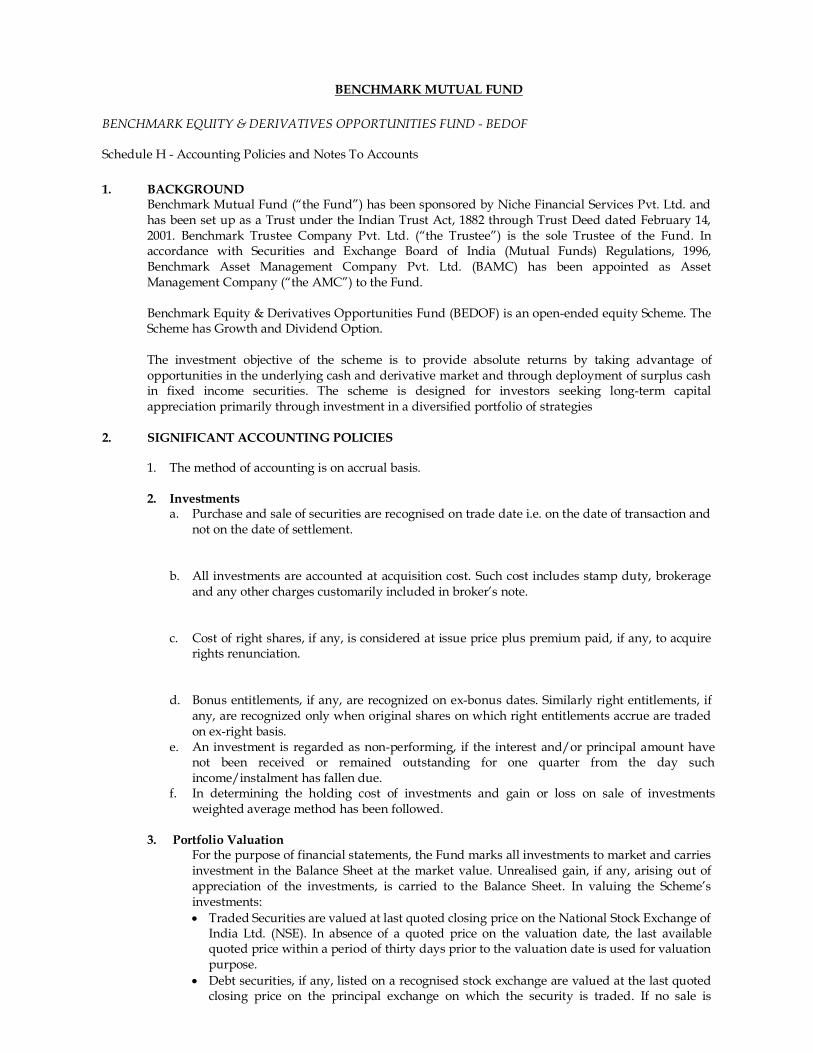
BENCHMARK MUTUAL FUND BENCHMARK EQUITY & DERIVATIVES OPPORTUNITIES FUND - BEDOF
Schedule H - Accounting Policies and Notes To Accounts 1. BACKGROUND
Benchmark Mutual Fund (“the Fund”) has been sponsored by Niche Financial Services Pvt. Ltd. and has been set up as a Trust under the Indian Trust Act, 1882 through Trust Deed dated February 14, 2001. Benchmark Trustee Company Pvt. Ltd. (“the Trustee”) is the sole Trustee of the Fund. In accordance with Securities and Exchange Board of India (Mutual Funds) Regulations, 1996, Benchmark Asset Management Company Pvt. Ltd. (BAMC) has been appointed as Asset Management Company (“the AMC”) to the Fund. Benchmark Equity & Derivatives Opportunities Fund (BEDOF) is an open-ended equity Scheme. The Scheme has Growth and Dividend Option. The investment objective of the scheme is to provide absolute returns by taking advantage of opportunities in the underlying cash and derivative market and through deployment of surplus cash in fixed income securities. The scheme is designed for investors seeking long-term capital appreciation primarily through investment in a diversified portfolio of strategies
2. SIGNIFICANT ACCOUNTING POLICIES
1. The method of accounting is on accrual basis.
2. Investments a. Purchase and sale of securities are recognised on trade date i.e. on the date of transaction and
not on the date of settlement.
b. All investments are accounted at acquisition cost. Such cost includes stamp duty, brokerage and any other charges customarily included in broker’s note.
c. Cost of right shares, if any, is considered at issue price plus premium paid, if any, to acquire rights renunciation.
d. Bonus entitlements, if any, are recognized on ex-bonus dates. Similarly right entitlements, if any, are recognized only when original shares on which right entitlements accrue are traded on ex-right basis.
e. An investment is regarded as non-performing, if the interest and/or principal amount have not been received or remained outstanding for one quarter from the day such income/instalment has fallen due.
f. In determining the holding cost of investments and gain or loss on sale of investments weighted average method has been followed.
3. Portfolio Valuation
For the purpose of financial statements, the Fund marks all investments to market and carries investment in the Balance Sheet at the market value. Unrealised gain, if any, arising out of appreciation of the investments, is carried to the Balance Sheet. In valuing the Scheme’s investments: Traded Securities are valued at last quoted closing price on the National Stock Exchange of
India Ltd. (NSE). In absence of a quoted price on the valuation date, the last available quoted price within a period of thirty days prior to the valuation date is used for valuation purpose.
Debt securities, if any, listed on a recognised stock exchange are valued at the last quoted closing price on the principal exchange on which the security is traded. If no sale is
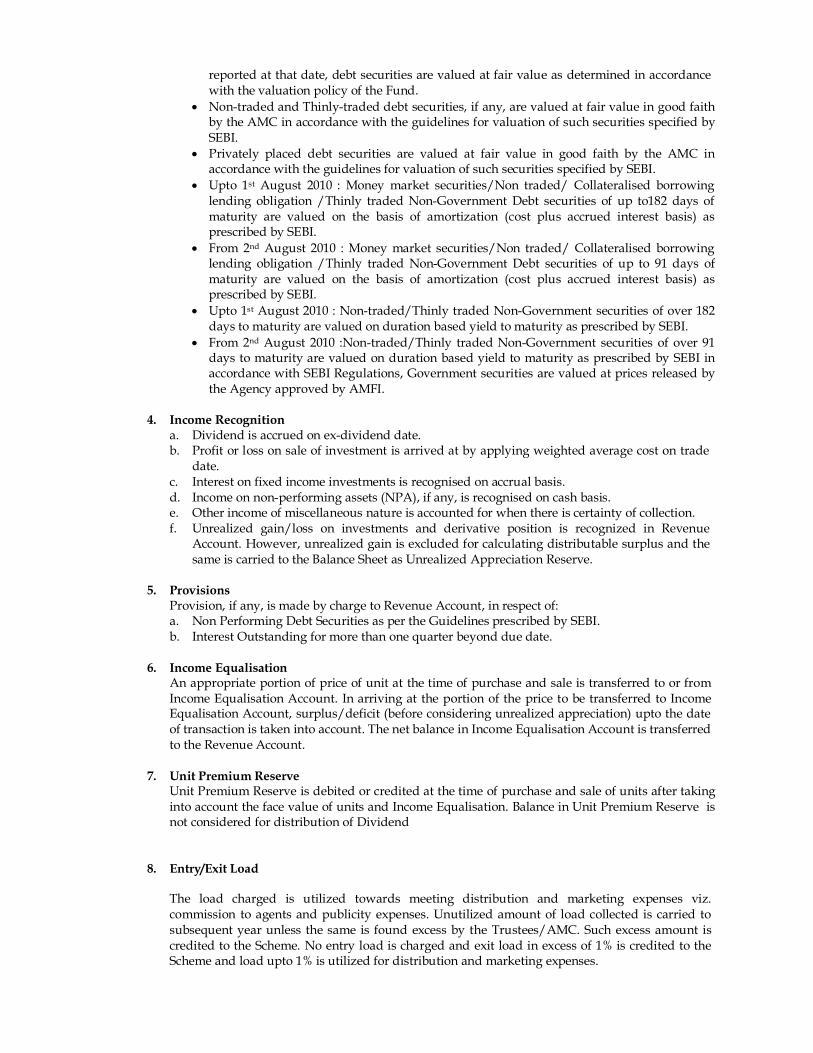
reported at that date, debt securities are valued at fair value as determined in accordance with the valuation policy of the Fund.
Non-traded and Thinly-traded debt securities, if any, are valued at fair value in good faith by the AMC in accordance with the guidelines for valuation of such securities specified by SEBI.
Privately placed debt securities are valued at fair value in good faith by the AMC in accordance with the guidelines for valuation of such securities specified by SEBI.
Upto 1st August 2010 : Money market securities/Non traded/ Collateralised borrowing lending obligation /Thinly traded Non-Government Debt securities of up to182 days of maturity are valued on the basis of amortization (cost plus accrued interest basis) as prescribed by SEBI.
From 2nd August 2010 : Money market securities/Non traded/ Collateralised borrowing lending obligation /Thinly traded Non-Government Debt securities of up to 91 days of maturity are valued on the basis of amortization (cost plus accrued interest basis) as prescribed by SEBI.
Upto 1st August 2010 : Non-traded/Thinly traded Non-Government securities of over 182 days to maturity are valued on duration based yield to maturity as prescribed by SEBI.
From 2nd August 2010 :Non-traded/Thinly traded Non-Government securities of over 91 days to maturity are valued on duration based yield to maturity as prescribed by SEBI in accordance with SEBI Regulations, Government securities are valued at prices released by the Agency approved by AMFI.
4. Income Recognition
a. Dividend is accrued on ex-dividend date. b. Profit or loss on sale of investment is arrived at by applying weighted average cost on trade
date. c. Interest on fixed income investments is recognised on accrual basis. d. Income on non-performing assets (NPA), if any, is recognised on cash basis. e. Other income of miscellaneous nature is accounted for when there is certainty of collection. f. Unrealized gain/loss on investments and derivative position is recognized in Revenue
Account. However, unrealized gain is excluded for calculating distributable surplus and the same is carried to the Balance Sheet as Unrealized Appreciation Reserve.
5. Provisions
Provision, if any, is made by charge to Revenue Account, in respect of: a. Non Performing Debt Securities as per the Guidelines prescribed by SEBI. b. Interest Outstanding for more than one quarter beyond due date.
6. Income Equalisation
An appropriate portion of price of unit at the time of purchase and sale is transferred to or from Income Equalisation Account. In arriving at the portion of the price to be transferred to Income Equalisation Account, surplus/deficit (before considering unrealized appreciation) upto the date of transaction is taken into account. The net balance in Income Equalisation Account is transferred to the Revenue Account.
7. Unit Premium Reserve
Unit Premium Reserve is debited or credited at the time of purchase and sale of units after taking into account the face value of units and Income Equalisation. Balance in Unit Premium Reserve is not considered for distribution of Dividend
8. Entry/Exit Load
The load charged is utilized towards meeting distribution and marketing expenses viz. commission to agents and publicity expenses. Unutilized amount of load collected is carried to subsequent year unless the same is found excess by the Trustees/AMC. Such excess amount is credited to the Scheme. No entry load is charged and exit load in excess of 1% is credited to the Scheme and load upto 1% is utilized for distribution and marketing expenses.
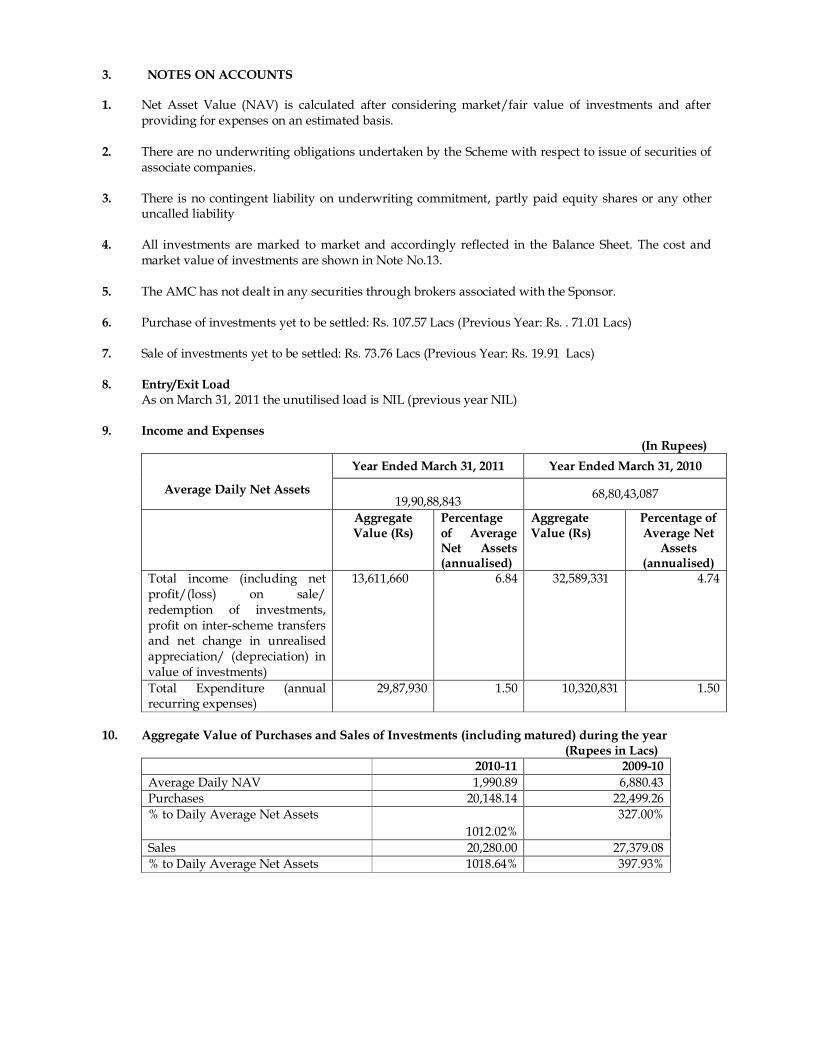
3. NOTES ON ACCOUNTS
1. Net Asset Value (NAV) is calculated after considering market/fair value of investments and after providing for expenses on an estimated basis.
2. There are no underwriting obligations undertaken by the Scheme with respect to issue of securities of associate companies.
3. There is no contingent liability on underwriting commitment, partly paid equity shares or any other uncalled liability
4. All investments are marked to market and accordingly reflected in the Balance Sheet. The cost and market value of investments are shown in Note No.13.
5. The AMC has not dealt in any securities through brokers associated with the Sponsor.
6. Purchase of investments yet to be settled: Rs. 107.57 Lacs (Previous Year: Rs. . 71.01 Lacs)
7. Sale of investments yet to be settled: Rs. 73.76 Lacs (Previous Year: Rs. 19.91 Lacs)
8. Entry/Exit Load As on March 31, 2011 the unutilised load is NIL (previous year NIL)
9. Income and Expenses
(In Rupees)
Average Daily Net Assets
Year Ended March 31, 2011 Year Ended March 31, 2010
19,90,88,843 68,80,43,087
Aggregate Value (Rs)
Percentage of Average Net Assets (annualised)
Aggregate Value (Rs)
Percentage of Average Net
Assets (annualised)
Total income (including net profit/(loss) on sale/ redemption of investments, profit on inter-scheme transfers and net change in unrealised appreciation/ (depreciation) in value of investments)
13,611,660
6.84
32,589,331
4.74
Total Expenditure (annual recurring expenses)
29,87,930 1.50 10,320,831 1.50
10. Aggregate Value of Purchases and Sales of Investments (including matured) during the year
(Rupees in Lacs) 2010-11 2009-10 Average Daily NAV 1,990.89 6,880.43 Purchases 20,148.14 22,499.26 % to Daily Average Net Assets
1012.02% 327.00%
Sales 20,280.00 27,379.08 % to Daily Average Net Assets 1018.64% 397.93%

11. Net Asset Value (Per unit) (Rupees)
As on March 31, 2011 As on March 31, 2010
Face Value: Growth Option Dividend Option
10.0000 10.0000
10.0000 10.0000
Net Asset Value: Growth Option Dividend Option
12.1911 10.8634
11.4607 10.7798
Allotment Value: Growth Option Dividend Option
10.0000 10.0000
12. Dividend - The Dividend plan of the Scheme declared and paid as follows:
Record Date Gross Dividend Per Unit(Rs.)
Dividend Payout(Rs.)
Individual/HUF Others March 3, 2011 0.60 0.60 0.60
13. Cost & Market Value of Investments
(Rupees in Lacs) 2010-11 2009-10
Cost (equity) 545.17
2,621.00
Market Value (equity) 544.09 2,869.32 Unrealised Appreciation / (Depreciation) (1.08) 248.32
(Rupees in Lacs)
2010-11 2009-10 Open Position in Futures (548.07) (2,882.37) Options NIL NIL Total (548.07) (2,882.37)
14. Margin Deposits - Margin Deposits consists of Rs. 5 Lacs as Cash deposit and Rs. 135 Lacs in form of Fixed Deposit
15. Movement in Unit Capital
2010-11 2009-10
Growth Option Dividend Option Growth Option Dividend Option
Units Rs.(In Lacs) Units Rs.(In Lacs) Units Rs.(In Lacs) Units
Rs.(In Lacs)
Initial Capital (on the date of Allotment) 24,093,143.48 2,409.31 103,479,244.54 10,347.92 24,093,143.48 2,409.31 103,479,244.54 10,347.92 Units at the beginning of the year 7,537,935.789 753.79 32,102,252.472 3,210.23 18,349,924.29
1,834.99
40,922,860.78
4,092.29
Units Issued 501,225.404 50.12 12,361.599 1.24 6,416,912.977 641.69 42,236,886.26 4,223.69 Units Redeemed 5,986,850.269 598.69 26,798,817.994 2,679.88 17,228,901.473 1,722.89 51,057,494.57 5,105.75 Units at the end of the year
2,052,310.924 205.23 5,315,796.077 531.58 7,537,935.789 753.79 32,102,252.47 3,210.23

16. As on March 31, 2011, there is no investor in the Scheme who hold more than 25% of the net Assets of
the Scheme 17. Income Tax - No provision for income tax is made as the Scheme qualifies as a recognized Mutual
Fund under section 10(23D) of the Income Tax Act, 1961. 18. Investment Management Fees - Investment Management Fees is calculated on the daily average net
assets (NAV) of the Scheme. The details of management fees levied on an annualized basis are as follows:
(In Rupees)
2010-11 2009-10 Daily Average Net Assets
19,90,88,843
68,80,43,087
Management Fees (in percentage) 0.50% 0.50% Management Fees 9,95,986 34,40,308
19. Trustee Fees - In accordance with the terms of Offer Document, the Trustee fee has been charged @ 0.01 % of the daily average net assets of the Scheme.
20. Custodial Fees and Expenses – Deutsche Bank AG provides custodial services to the Scheme for
which it receives custody fees including safekeeping. In addition, Deutsche Bank AG is reimbursed for custody and transaction charges levied by Depositories (i.e. NSDL/CDSL.)
21. Registrar and Transfer Agents Fees and Expenses - Karvy Computershare Pvt. Ltd. provides Registrar and Transfer Agency Services to the Scheme for which it receives the fees based on daily average net assets of the Scheme.
22. During the year ended March 31, 2011, Benchmark Trustee Company Pvt. Ltd. and Benchmark Asset
Management Company Pvt. Ltd. did not make any investment in the Scheme. 23. The Scheme has made the following investments in associate/group company.
Name of the Company Nature of Instruments
Aggregate purchases during
the year at cost (Rs. In Lacs)
Outstanding Investment as at March
31, 2011 at Market Value (Rs. In Lacs)
Bajaj Hindustan Ltd. Equity 0.34 - GTL Ltd. Equity - 83.13
24. The Scheme has not made any investments in the issues lead managed by associate companies. 25. No brokerage, custodial fees or any other payment for services have been paid or is payable to any
entity in which the AMC or its major shareholders have a substantial interest.
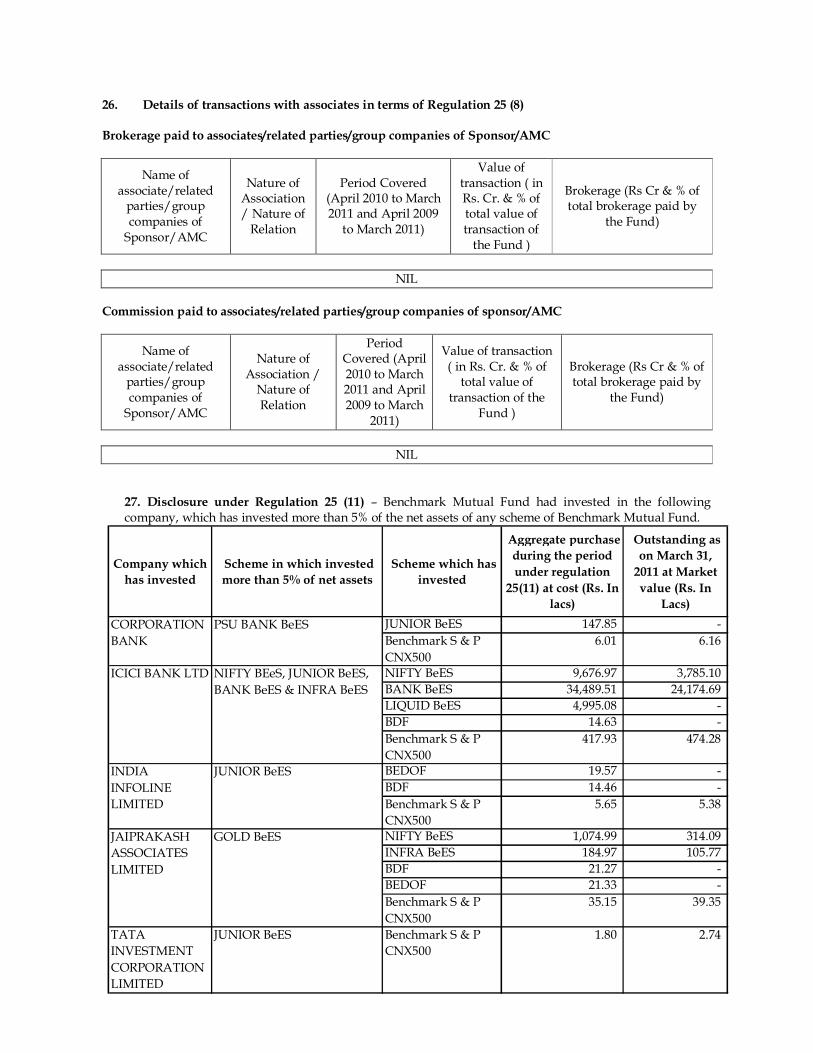
26. Details of transactions with associates in terms of Regulation 25 (8) Brokerage paid to associates/related parties/group companies of Sponsor/AMC
Name of associate/related
parties/group companies of
Sponsor/AMC
Nature of Association / Nature of
Relation
Period Covered (April 2010 to March 2011 and April 2009
to March 2011)
Value of transaction ( in Rs. Cr. & % of total value of transaction of
the Fund )
Brokerage (Rs Cr & % of total brokerage paid by
the Fund)
NIL
Commission paid to associates/related parties/group companies of sponsor/AMC
Name of associate/related
parties/group companies of
Sponsor/AMC
Nature of Association /
Nature of Relation
Period Covered (April 2010 to March 2011 and April 2009 to March
2011)
Value of transaction ( in Rs. Cr. & % of
total value of transaction of the
Fund )
Brokerage (Rs Cr & % of total brokerage paid by
the Fund)
NIL
27. Disclosure under Regulation 25 (11) – Benchmark Mutual Fund had invested in the following company, which has invested more than 5% of the net assets of any scheme of Benchmark Mutual Fund.
Company which has invested
Scheme in which invested more than 5% of net assets
Scheme which has invested
Aggregate purchase during the period under regulation
25(11) at cost (Rs. In lacs)
Outstanding as on March 31,
2011 at Market value (Rs. In
Lacs)JUNIOR BeES 147.85 -Benchmark S & P CNX500
6.01 6.16
NIFTY BeES 9,676.97 3,785.10 BANK BeES 34,489.51 24,174.69 LIQUID BeES 4,995.08 -BDF 14.63 -Benchmark S & P CNX500
417.93 474.28
BEDOF 19.57 -BDF 14.46 -Benchmark S & P CNX500
5.65 5.38
NIFTY BeES 1,074.99 314.09 INFRA BeES 184.97 105.77 BDF 21.27 -BEDOF 21.33 -Benchmark S & P CNX500
35.15 39.35
TATA INVESTMENT CORPORATION LIMITED
JUNIOR BeES Benchmark S & P CNX500
1.80 2.74
INDIA INFOLINE LIMITED
JUNIOR BeES
JAIPRAKASH ASSOCIATES LIMITED
GOLD BeES
CORPORATION BANK
PSU BANK BeES
ICICI BANK LTD NIFTY BEeS, JUNIOR BeES, BANK BeES & INFRA BeES

The investments in above companies were made as they are a constituent of the respective indices track by Nifty BeES, Junior BeES, Bank BeES, Infra BeES and Benchmark S&P CNX500 fund. In case of Liquid BeES the investment was made in money market instruments in accordance with investment objective of the scheme. In case of Benchmark Derivative Fund and Benchmark Equity and Derivatives Opportunities Fund, the investment in above companies was made on account of arbitrage opportunities available in the derivatives market during the year.
28. The Financial Statements of the Scheme have been prepared in accordance with SEBI Mutual Funds
Regulations, 1996 wherein disclosure of Segment Reporting has not been prescribed. Hence the same has not been provided for the Scheme. The details of portfolio as per the SEBI regulations have been disclosed. Cash Flow statement is not prepared for the scheme as the income is less than Rs. 50 Crore.
29. Unclaimed Dividend/Redemption Amount As on March 31, 2011 there was nil unclaimed redemption amount in the Scheme. Unclaimed
dividend amounted to Rs. 685,191/- represented by 8 investors. 30. Registered Securities
In accordance with Regulation 44(1) of the SEBI (Mutual Funds) Regulations, 1996, the securities of the Scheme are held by the trustees for the benefit of Scheme’s unit holders.
31. A complete list of investments of the Scheme is given in Schedule G. 32. On March 15, 2011 Goldman Sachs Asset Management, L.P., through its subsidiaries Goldman Sachs
Asset Management (India) Private Limited (“GS AMC”) and Goldman Sachs Trustee Company (India) Private Limited (“GS Trustee”), executed a sale and purchase agreement relating to the acquisition of all the outstanding shares in Benchmark Asset Management Company Private Limited (“BAMC”) and Benchmark Trustee Company Private Limited (“BTC”) from Niche Financial Services Private Limited, the sponsor of Benchmark Mutual Fund (“Benchmark MF”), and the other shareholders of BAMC and BTC. The sale and purchase agreement contemplates that BAMC shall transfer the rights to manage the schemes of Benchmark MF to GS AMC and BTC shall transfer the schemes of Benchmark MF to GS Trustee as part of the transaction. This transaction has been approved by the regulator, Securities and Exchange Board of India (“SEBI”) on June 27, 2011.
33. The previous period figures have been regrouped/ rearranged wherever necessary. 34. The audited results for the year ended March 31, 2011 have been approved by the Boards of
Benchmark Asset Management Company Pvt. Ltd (AMC) and Benchmark Trustee Company Pvt. Ltd (Trustee) at their meeting held on June 29, 2011 respectively.
NOTES:III 1. On written request, present and prospective unit holders/investors can obtain a copy of the Trust
Deed, the Annual Report, at a price if any, and the text of the Scheme. 2. On written request, the present and prospective unit holder/investor may request a copy of the
Annual Report of the AMC. 3. On written request, present and prospective unit holders/investors can inspect a full list of
investment of the Scheme at the office of the AMC.
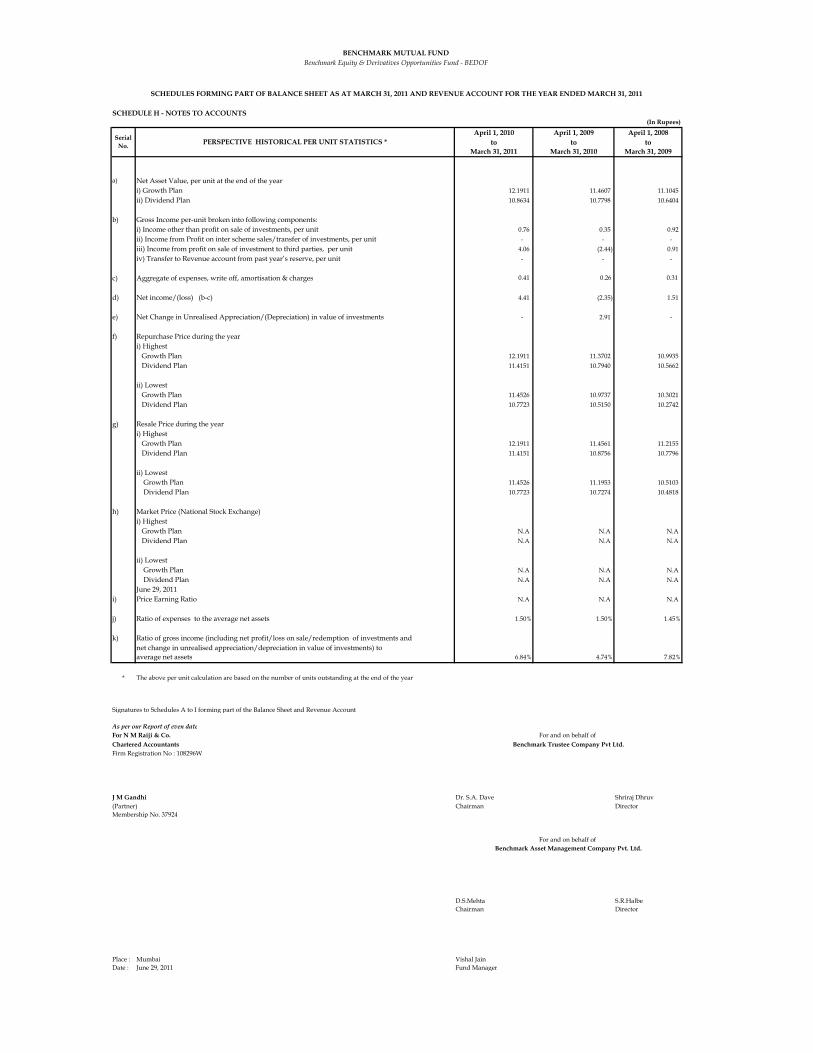
SCHEDULE H - NOTES TO ACCOUNTS(In Rupees)
April 1, 2010 April 1, 2009 April 1, 2008to to to
March 31, 2011 March 31, 2010 March 31, 2009
a) Net Asset Value, per unit at the end of the yeari) Growth Plan 12.1911 11.4607 11.1045 ii) Dividend Plan 10.8634 10.7798 10.6404
b) Gross Income per-unit broken into following components: i) Income other than profit on sale of investments, per unit 0.76 0.35 0.92
ii) Income from Profit on inter scheme sales/transfer of investments, per unit - - - iii) Income from profit on sale of investment to third parties, per unit 4.06 (2.44) 0.91 iv) Transfer to Revenue account from past year’s reserve, per unit - - -
c) Aggregate of expenses, write off, amortisation & charges 0.41 0.26 0.31
d) Net income/(loss) (b-c) 4.41 (2.35) 1.51
e) Net Change in Unrealised Appreciation/(Depreciation) in value of investments - 2.91 -
f) Repurchase Price during the yeari) Highest Growth Plan 12.1911 11.3702 10.9935 Dividend Plan 11.4151 10.7940 10.5662
ii) Lowest Growth Plan 11.4526 10.9737 10.3021 Dividend Plan 10.7723 10.5150 10.2742
g) Resale Price during the yeari) Highest Growth Plan 12.1911 11.4561 11.2155 Dividend Plan 11.4151 10.8756 10.7796
ii) Lowest Growth Plan 11.4526 11.1953 10.5103 Dividend Plan 10.7723 10.7274 10.4818
h) Market Price (National Stock Exchange)i) Highest Growth Plan N.A N.A N.A Dividend Plan N.A N.A N.A
ii) Lowest Growth Plan N.A N.A N.A Dividend Plan N.A N.A N.AJune 29, 2011
i) Price Earning Ratio N.A N.A N.A
j) Ratio of expenses to the average net assets 1.50% 1.50% 1.45%
k) Ratio of gross income (including net profit/loss on sale/redemption of investments andnet change in unrealised appreciation/depreciation in value of investments) toaverage net assets 6.84% 4.74% 7.82%
* The above per unit calculation are based on the number of units outstanding at the end of the year
Signatures to Schedules A to I forming part of the Balance Sheet and Revenue Account
As per our Report of even dateFor N M Raiji & Co.Chartered AccountantsFirm Registration No : 108296W
J M Gandhi Dr. S.A. Dave Shriraj Dhruv(Partner) Chairman DirectorMembership No. 37924
D.S.Mehta S.R.HalbeChairman Director
Place : Mumbai Vishal JainDate : June 29, 2011 Fund Manager
Benchmark Asset Management Company Pvt. Ltd.For and on behalf of
BENCHMARK MUTUAL FUND Benchmark Equity & Derivatives Opportunities Fund - BEDOF
SCHEDULES FORMING PART OF BALANCE SHEET AS AT MARCH 31, 2011 AND REVENUE ACCOUNT FOR THE YEAR ENDED MARCH 31, 2011
Serial No. PERSPECTIVE HISTORICAL PER UNIT STATISTICS *
For and on behalf of Benchmark Trustee Company Pvt Ltd.

AUDITORS’ REPORT The Board of Directors, Benchmark Trustee Company Private Limited
We have audited the attached Balance Sheet as at March 31, 2011, and the Revenue Account for the
year ended on that date, annexed thereto of Benchmark S&P CNX 500 Fund (the scheme), of
Benchmark Mutual Fund. These financial statements are prepared in accordance with SEBI (Mutual
Fund) Regulations, 1996 (the Regulations) and are the responsibility of the Management. Our
responsibility is to express an opinion on these financial statements based on our audit.
We conducted our audit in accordance with the Standards on Auditing issued by Institute of Chartered
Accountants of India. An audit includes examining on a test basis, evidence supporting the amounts
and disclosures in the financial statements. An audit also includes assessing the accounting principles
used and significant estimates made by the management, as well as evaluating the overall financial
statement presentation. We believe that our audit provides a reasonable basis for our opinion.
We report that:
1. We have obtained all information and explanations, which, to the best of our knowledge and
belief were necessary for the purpose of our audit.
2. The Balance Sheet and the Revenue Account referred to above are in agreement with the
books of accounts of the Scheme.
3. The accounts have been prepared in accordance with the accounting policies adopted by the
trustees of the Fund and as specified in the Ninth Schedule to the Regulations.
4. In our opinion, valuation methods for Non Traded Securities, if any, adopted by the scheme
are fair and reasonable and are in accordance with the guidelines for valuation issued by
SEBI and approved by the Trustee.

5. Without qualifying our opinion, we draw attention to note no. 27 in Schedule G of the
financial statements whereby the management has not provided the Cash Flow Statement and
Segment Reporting for reasons mentioned therein.
6. In our opinion and to the best of our information and according to the explanations given to
us, the financial statements read with the accounting policies and notes to accounts attached
thereto, give the information required as per the Regulations and give a true & fair view in
accordance with the generally accepted accounting principles in India:
a. in the case of Balance Sheet, of the state of affairs of the scheme as at March 31,
2011; and
b. in the case of Revenue Account, of the surplus of the scheme for the year ended on
that date.
For N.M.RAIJI & CO. Chartered Accountants
Firm Reg. No:108296W
J. M. GANDHI Partner Membership No. 37924
Place: Mumbai Dated: June 29, 2011
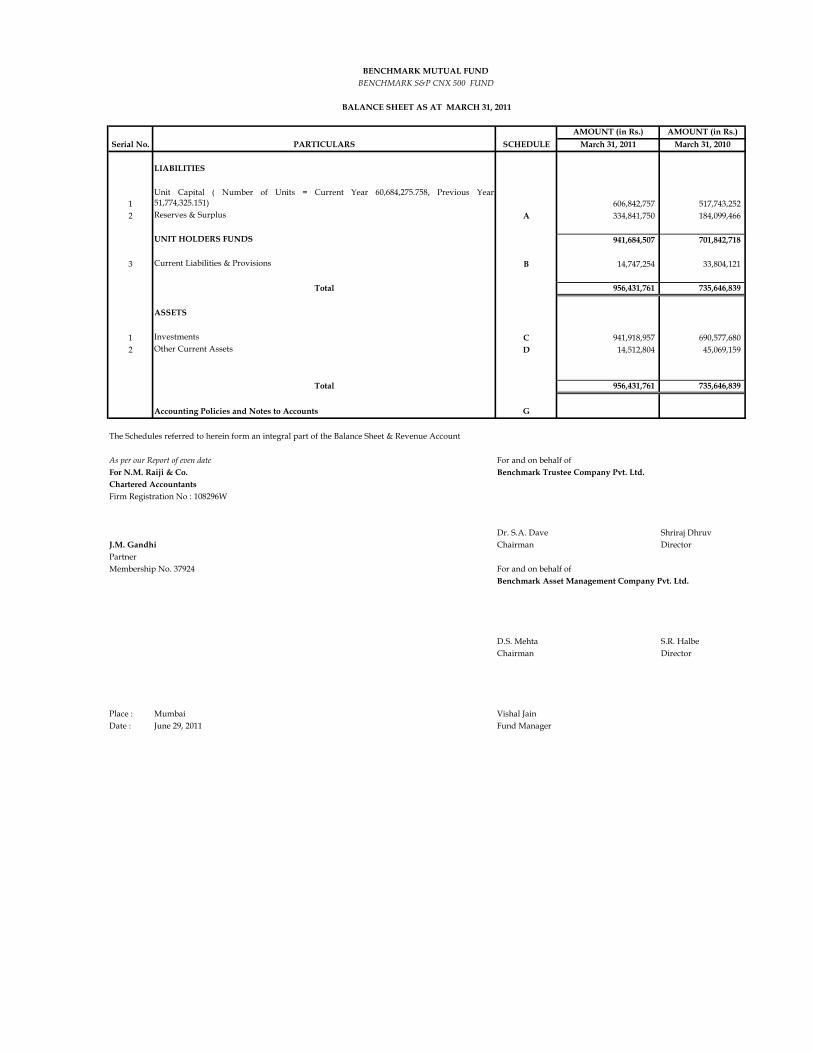
AMOUNT (in Rs.) AMOUNT (in Rs.)March 31, 2011 March 31, 2010
LIABILITIES
1Unit Capital ( Number of Units = Current Year 60,684,275.758, Previous Year51,774,325.151) 606,842,757 517,743,252
2 Reserves & Surplus A 334,841,750 184,099,466
UNIT HOLDERS FUNDS 941,684,507 701,842,718
3 Current Liabilities & Provisions B 14,747,254 33,804,121
Total 956,431,761 735,646,839
ASSETS
1 Investments C 941,918,957 690,577,680 2 Other Current Assets D 14,512,804 45,069,159
Total 956,431,761 735,646,839
Accounting Policies and Notes to Accounts G 0
The Schedules referred to herein form an integral part of the Balance Sheet & Revenue Account
As per our Report of even date For and on behalf ofFor N.M. Raiji & Co. Benchmark Trustee Company Pvt. Ltd.Chartered AccountantsFirm Registration No : 108296W
Dr. S.A. Dave Shriraj DhruvJ.M. Gandhi Chairman DirectorPartnerMembership No. 37924 For and on behalf of
Benchmark Asset Management Company Pvt. Ltd.
D.S. Mehta S.R. HalbeChairman Director
Place : Mumbai Vishal JainDate : June 29, 2011 Fund Manager
PARTICULARSSerial No.
BENCHMARK MUTUAL FUND
BALANCE SHEET AS AT MARCH 31, 2011
SCHEDULE
BENCHMARK S&P CNX 500 FUND

AMOUNT (in Rs.) AMOUNT (in Rs.)March 31, 2011 March 31, 2010
1 INCOME AND GAINS 1.1 Dividend 11,809,034 8,434,983 1.2 Profit on sale/redemption of investments 68,748,116 153,354,357
(other than inter-scheme transfer/sale)1.3 Profit on Futures - 116,571 1.4 Load Income 1,619,701 10,357,645 1.5 Net change in unrealised appreciation/depreciation on Investments / Derviative postion
16,630,980 23,681,730 1.6 Other Income 1,464 -
Total 98,809,295 195,945,286
2 EXPENSES AND LOSSES 2.1 Management & Operating expenses E 13,943,852 15,643,704 2.2 Loss on Derivatives 86,741 - 2.3 Loss on sale/redemption of investments 16,580,775 89,119,980
(other than inter-scheme transfer/sale) -
Total 30,611,368 104,763,684
Surplus for the year 68,197,927 91,181,602 Add: Opening unrealised appreciation reserve 25,015,505 1,333,775 Less: Closing unrealised appreciation reserve 41,646,485 (25,015,505) Add: Transfer to Income Equalisation 71,219,508 1,311,132,758
122,786,455 1,378,632,630
Balance brought forward from previous year 15,490,060 (837,295)
Surplus available for distribution 138,276,515 1,377,795,335 AppropriationIncome Distribution - 1,362,305,275 Balance carried to the Balance Sheet 138,276,515 15,490,060
Accounting Policies and Notes on Accounts G
The Schedules referred to herein form an integral part of the Balance Sheet & Revenue Account
As per our Report of even date For and on behalf ofFor N.M. Raiji & Co. Benchmark Trustee Company Pvt. Ltd.Chartered AccountantsFirm Registration No : 108296W
J. M. Gandhi Dr. S.A. Dave Shriraj DhruvPartner Chairman DirectorMembership No. 37924
For and on behalf of Benchmark Asset Management Company Pvt. Ltd.
D.S. Mehta S.R. HalbeChairman Director
Place : Mumbai Vishal JainDate : June 29, 2011 Fund Manager
SCHEDULE
BENCHMARK S&P CNX 500 FUND
REVENUE ACCOUNT FOR THE YEAR ENDED MARCH 31, 2011
PARTICULARSSerial No.
BENCHMARK MUTUAL FUND
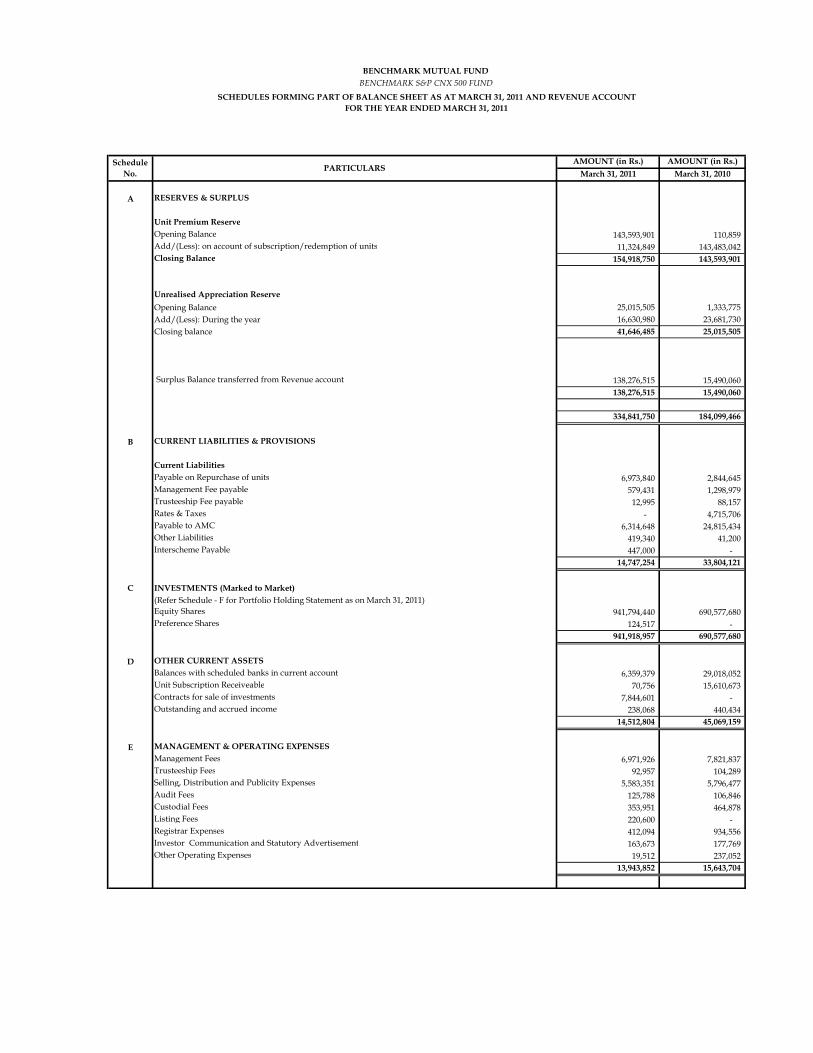
AMOUNT (in Rs.) AMOUNT (in Rs.)March 31, 2011 March 31, 2010
A RESERVES & SURPLUS
Unit Premium ReserveOpening Balance 143,593,901 110,859 Add/(Less): on account of subscription/redemption of units 11,324,849 143,483,042 Closing Balance 154,918,750 143,593,901
Unrealised Appreciation ReserveOpening Balance 25,015,505 1,333,775 Add/(Less): During the year 16,630,980 23,681,730 Closing balance 41,646,485 25,015,505
Surplus Balance transferred from Revenue account 138,276,515 15,490,060 138,276,515 15,490,060
334,841,750 184,099,466
B CURRENT LIABILITIES & PROVISIONS
Current LiabilitiesPayable on Repurchase of units 6,973,840 2,844,645 Management Fee payable 579,431 1,298,979 Trusteeship Fee payable 12,995 88,157 Rates & Taxes - 4,715,706 Payable to AMC 6,314,648 24,815,434 Other Liabilities 419,340 41,200 Interscheme Payable 447,000 -
14,747,254 33,804,121
C INVESTMENTS (Marked to Market)(Refer Schedule - F for Portfolio Holding Statement as on March 31, 2011)Equity Shares 941,794,440 690,577,680 Preference Shares 124,517 -
941,918,957 690,577,680
D OTHER CURRENT ASSETS Balances with scheduled banks in current account 6,359,379 29,018,052 Unit Subscription Receiveable 70,756 15,610,673 Contracts for sale of investments 7,844,601 - Outstanding and accrued income 238,068 440,434
14,512,804 45,069,159
E MANAGEMENT & OPERATING EXPENSES Management Fees 6,971,926 7,821,837 Trusteeship Fees 92,957 104,289 Selling, Distribution and Publicity Expenses 5,583,351 5,796,477 Audit Fees 125,788 106,846 Custodial Fees 353,951 464,878 Listing Fees 220,600 - Registrar Expenses 412,094 934,556 Investor Communication and Statutory Advertisement 163,673 177,769 Other Operating Expenses 19,512 237,052
13,943,852 15,643,704
Schedule No. PARTICULARS
BENCHMARK S&P CNX 500 FUND
SCHEDULES FORMING PART OF BALANCE SHEET AS AT MARCH 31, 2011 AND REVENUE ACCOUNTFOR THE YEAR ENDED MARCH 31, 2011
BENCHMARK MUTUAL FUND

SCRIP NAME QUANTITY MARKET VALUE (AMOUNT IN RS.) % TO TOTAL
EQUITY & EQUITY RELATED INSTRUMENTS
AUTOTata Motors Ltd. 12,901 16,104,963 1.71 Mahindra & Mahindra Ltd. 17,499 12,255,425 1.30 Bajaj Auto Ltd. 4,991 7,303,081 0.78 Maruti Suzuki India Ltd. 4,882 6,161,816 0.65 Hero Honda Motors Ltd. 3,522 5,598,043 0.59 Ashok Leyland Ltd. 24,065 1,368,095 0.15 Eicher Motors Ltd. 364 489,325 0.05 TVS Motor Company Ltd. 7,198 430,800 0.05 Escorts Ltd. 2,880 407,952 0.04
50,119,501 5.32 AUTO ANCILLARIESExide Industries Ltd. 16,940 2,430,043 0.26 Bosch Ltd. 334 2,240,639 0.24 Motherson Sumi Systems Ltd. 4,978 1,069,274 0.11 Amtek Auto Ltd. 5,384 811,100 0.09 Apollo Tyres Ltd. 11,196 778,682 0.08 MRF Ltd. 91 570,670 0.06 Amara Raja Batteries Ltd. 1,525 289,369 0.03 Kesoram Industries Ltd. 1,173 241,814 0.03 Asahi India Glass Ltd. 2,668 237,585 0.03 Sundaram Fasteners Ltd. 3,949 201,399 0.02 Amtek India Ltd. 2,234 182,853 0.02 Federal Mogal Goetze Ltd. 518 104,895 0.01 JK Tyre and Industries Ltd. 810 76,059 0.01 Automotive Axles Ltd. 163 67,678 0.01 Shanthi Gears Ltd. 1,700 63,410 0.01 Sona Koyo Steering Systems Ltd. 3,504 57,115 0.01 Banco Products India Ltd. 748 52,136 0.01 Rico Auto Industries Ltd. 2,514 39,344 0.00 Pricol Ltd. 2,154 35,003 0.00
-
9,549,067 1.01 BANKSICICI Bank Ltd. 42,491 47,428,454 5.04 HDFC Bank Ltd. 13,138 30,819,777 3.27 State Bank of India 9,513 26,306,299 2.79 Axis Bank Ltd. 9,482 13,311,306 1.41 Bank of Baroda 6,210 5,991,719 0.64 Kotak Mahindra Bank Ltd. 13,036 5,968,533 0.63 Punjab National Bank 4,910 5,954,357 0.63 Indusind Bank Ltd. 12,791 3,371,708 0.36 Canara Bank 5,277 3,304,721 0.35 Bank of India 6,886 3,273,260 0.35 Union Bank of India 8,308 2,884,953 0.31 Yes Bank Ltd. 8,785 2,719,836 0.29 Federal Bank Ltd. 6,318 2,644,399 0.28 IDBI Bank Ltd. 12,667 1,804,414 0.19 Oriental Bank of Commerce 4,522 1,759,284 0.19 Allahabad Bank 7,381 1,695,785 0.18
BENCHMARK MUTUAL FUNDBENCHMARK S&P CNX 500 FUND
SCHEDULES FORMING PART OF BALANCE SHEET AS AT MARCH 31, 2011 AND REVENUE ACCOUNT FOR THE PERIOD ENDED MARCH 31, 2011
SCHEDULE - F PORTFOLIO HOLDING STATEMENT AS ON MARCH 31, 2011
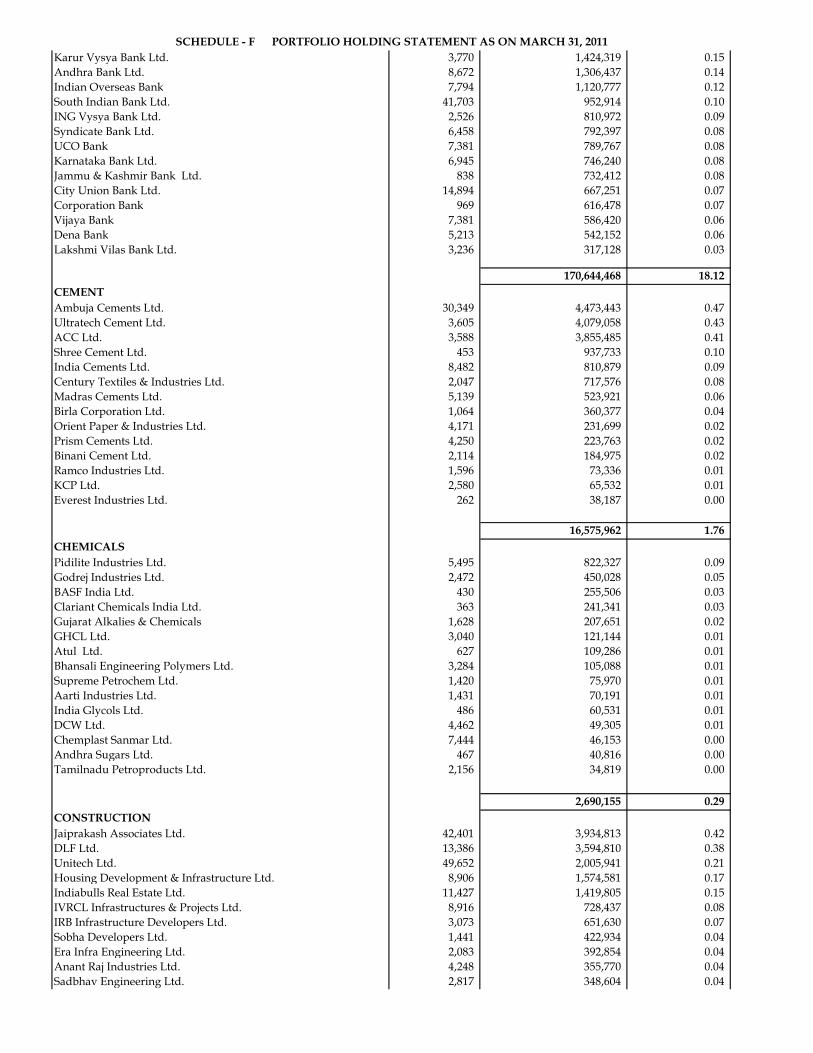
SCHEDULE - F PORTFOLIO HOLDING STATEMENT AS ON MARCH 31, 2011Karur Vysya Bank Ltd. 3,770 1,424,319 0.15 Andhra Bank Ltd. 8,672 1,306,437 0.14 Indian Overseas Bank 7,794 1,120,777 0.12 South Indian Bank Ltd. 41,703 952,914 0.10 ING Vysya Bank Ltd. 2,526 810,972 0.09 Syndicate Bank Ltd. 6,458 792,397 0.08 UCO Bank 7,381 789,767 0.08 Karnataka Bank Ltd. 6,945 746,240 0.08 Jammu & Kashmir Bank Ltd. 838 732,412 0.08 City Union Bank Ltd. 14,894 667,251 0.07 Corporation Bank 969 616,478 0.07 Vijaya Bank 7,381 586,420 0.06 Dena Bank 5,213 542,152 0.06 Lakshmi Vilas Bank Ltd. 3,236 317,128 0.03
170,644,468 18.12 CEMENT Ambuja Cements Ltd. 30,349 4,473,443 0.47 Ultratech Cement Ltd. 3,605 4,079,058 0.43 ACC Ltd. 3,588 3,855,485 0.41 Shree Cement Ltd. 453 937,733 0.10 India Cements Ltd. 8,482 810,879 0.09 Century Textiles & Industries Ltd. 2,047 717,576 0.08 Madras Cements Ltd. 5,139 523,921 0.06 Birla Corporation Ltd. 1,064 360,377 0.04 Orient Paper & Industries Ltd. 4,171 231,699 0.02 Prism Cements Ltd. 4,250 223,763 0.02 Binani Cement Ltd. 2,114 184,975 0.02 Ramco Industries Ltd. 1,596 73,336 0.01 KCP Ltd. 2,580 65,532 0.01 Everest Industries Ltd. 262 38,187 0.00
16,575,962 1.76 CHEMICALSPidilite Industries Ltd. 5,495 822,327 0.09 Godrej Industries Ltd. 2,472 450,028 0.05 BASF India Ltd. 430 255,506 0.03 Clariant Chemicals India Ltd. 363 241,341 0.03 Gujarat Alkalies & Chemicals 1,628 207,651 0.02 GHCL Ltd. 3,040 121,144 0.01 Atul Ltd. 627 109,286 0.01 Bhansali Engineering Polymers Ltd. 3,284 105,088 0.01 Supreme Petrochem Ltd. 1,420 75,970 0.01 Aarti Industries Ltd. 1,431 70,191 0.01 India Glycols Ltd. 486 60,531 0.01 DCW Ltd. 4,462 49,305 0.01 Chemplast Sanmar Ltd. 7,444 46,153 0.00 Andhra Sugars Ltd. 467 40,816 0.00 Tamilnadu Petroproducts Ltd. 2,156 34,819 0.00
2,690,155 0.29 CONSTRUCTIONJaiprakash Associates Ltd. 42,401 3,934,813 0.42 DLF Ltd. 13,386 3,594,810 0.38 Unitech Ltd. 49,652 2,005,941 0.21 Housing Development & Infrastructure Ltd. 8,906 1,574,581 0.17 Indiabulls Real Estate Ltd. 11,427 1,419,805 0.15 IVRCL Infrastructures & Projects Ltd. 8,916 728,437 0.08 IRB Infrastructure Developers Ltd. 3,073 651,630 0.07 Sobha Developers Ltd. 1,441 422,934 0.04 Era Infra Engineering Ltd. 2,083 392,854 0.04 Anant Raj Industries Ltd. 4,248 355,770 0.04 Sadbhav Engineering Ltd. 2,817 348,604 0.04

SCHEDULE - F PORTFOLIO HOLDING STATEMENT AS ON MARCH 31, 2011Phoenix Mills Ltd. 1,838 335,895 0.04 Mahindra Lifespace Developers Ltd. 744 286,775 0.03 Godrej Properties Ltd. 423 282,268 0.03 Peninsula Land Ltd. 4,653 275,690 0.03 Simplex Infrastrutcure Ltd. 834 274,011 0.03 Sunteck Realty Ltd. 810 237,168 0.03 Parsvnath Developers Ltd. 5,196 236,938 0.03 Oswal Chemicals & Fertilizers Ltd. 3,183 185,569 0.02 Patel Engineering Ltd. 1,187 166,180 0.02 Brigade Enterprises Ltd. 1,773 158,861 0.02 D B Realty Ltd. 1,195 141,488 0.02 HSIL Ltd. 981 130,130 0.01 Orbit Corporation Ltd. 2,280 123,804 0.01 Ackruti City Ltd. 474 107,314 0.01 Ansal Properties and Infrastructure Ltd. 2,825 105,938 0.01 Kajaria Ceramics Ltd. 1,334 100,517 0.01 Gammon Infrastructure Projects Ltd. 5,570 99,703 0.01 Omaxe Ltd. 702 96,244 0.01 Purvankara Projects Ltd. 798 86,344 0.01 Unity Infraprojects Ltd. 1,029 65,856 0.01 B.L.Kashyap & Sons Ltd. 2,212 51,208 0.01 D.S. Kulkarni Developers Ltd. 587 31,170 0.00
19,009,245 2.02 CONSTRUCTION PROJECTLarsen & Toubro Ltd. 19,718 32,572,164 3.46 GMR Infrastructure Ltd. 42,047 1,702,904 0.18 Voltas Ltd. 8,477 1,548,324 0.16 Lanco Infratech Ltd. 25,510 1,008,921 0.11 NCC Ltd. 7,571 763,157 0.08 Punj Lloyd Ltd. 7,772 502,460 0.05 Hindustan Construction Co. Ltd. 13,581 494,348 0.05 Gammon India Ltd. 3,203 379,716 0.04
38,971,993 4.14 CONSUMER DURABLESBlue Star Ltd. 1,987 738,071 0.08 Havells India Ltd. 1,770 656,139 0.07 Videocon Industries Ltd. 2,488 477,696 0.05 Tube Investments of India Ltd. 3,498 475,203 0.05 Whirlpool of India Ltd. 1,182 313,939 0.03 Bajaj Electricals Ltd. 1,293 303,209 0.03 Mirc Electronics Ltd. 2,134 45,134 0.00
3,009,391 0.32 CONSUMER NON DURABLESITC Ltd. 195,723 35,641,158 3.78 Hindustan Unilever Ltd. 38,465 11,043,302 1.17 Asian Paints Ltd. 1,687 4,261,025 0.45 United Spirits Ltd. 3,190 3,269,112 0.35 Titan Industries Ltd. 763 2,908,136 0.31 Colgate-Palmolive (India) Ltd. 2,459 2,001,872 0.21 Glaxosmithkline Consumer Healthcare Ltd. 882 1,981,104 0.21 Dabur India Ltd. 20,079 1,929,592 0.20 Aditya Birla Nuvo Ltd. 2,051 1,670,232 0.18 Tata Global Beverages Ltd. 14,782 1,444,941 0.15 Godrej Consumer Products Ltd. 3,889 1,421,430 0.15 Marico Ltd. 8,397 1,170,962 0.12 United Breweries Ltd. 2,216 1,063,791 0.11 Shree Renuka Sugars Ltd. 14,552 1,012,819 0.11 Britannia Industries Ltd. 2,162 805,345 0.09 E.I.D. Parry (India) Ltd. 3,459 739,188 0.08 Procter & Gamble Hygiene & Health Care Ltd. 352 635,395 0.07

SCHEDULE - F PORTFOLIO HOLDING STATEMENT AS ON MARCH 31, 2011Emami Ltd. 1,522 609,713 0.06 Rajesh Exports Ltd. 5,236 569,415 0.06 Kansai Nerolac Paints Ltd. 617 567,362 0.06 REI Agro Ltd. 20,727 564,811 0.06 Mcleod Russell India Ltd. 2,214 559,256 0.06 Ruchi Soya Industries Ltd. 4,921 519,904 0.06 Jubilant Foodworks Ltd. 885 477,148 0.05 Bata India Ltd. 1,149 449,489 0.05 Akzo Nobel India Ltd. 523 439,032 0.05 Balrampur Chini Mills Ltd. 6,021 421,771 0.04 Radico Khaitan Ltd. 3,078 400,910 0.04 Bajaj Hindustan Ltd. 5,525 392,828 0.04 Gitanjali Gems Ltd. 1,423 352,762 0.04 VIP Industries Ltd. 515 341,419 0.04 Triveni Engeering & Industries Ltd. 3,074 296,180 0.03 Tata Coffee Ltd. 296 284,693 0.03 Berger Paints India Ltd. 3,146 281,095 0.03 KS Oil Ltd. 8,044 259,821 0.03 Gillette India Ltd. 137 244,908 0.03 Zydus Wellness Ltd. 399 228,966 0.02 Godfrey Phillips India Ltd. 112 215,197 0.02 Navneet Publications (India) Ltd. 3,388 186,509 0.02 Karuturi Global Ltd. 15,629 165,667 0.02 Agro Tech Foods Ltd. 440 164,142 0.02 VST Industries Ltd. 199 126,355 0.01 Bannariamman Sugars Ltd. 193 112,191 0.01 DCM Shriram Consolidated Ltd. 2,678 107,656 0.01 Venkys India Ltd. 153 97,086 0.01 Century Plyboard India Ltd. 1,309 86,656 0.01 Jay Shree Tea & Industries Ltd. 483 76,145 0.01 Advanta India Ltd. 238 71,245 0.01 Carol Info Services Ltd. 479 68,473 0.01 Dhampur Sugar Mills Ltd. 980 58,457 0.01 Gujarat Ambuja Exports Ltd. 1,857 56,639 0.01 Shrenuj and Company Ltd. 1,047 54,758 0.01 Lakshmi Energy and Foods Ltd. 1,295 52,966 0.01 Heritage Foods India Ltd. 233 40,775 0.00 Sakthi Sugars Ltd. 906 33,839 0.00
83,035,641 8.82 ENGINEERING SERVICESEngineers India Ltd. 2,437 742,554 0.08 Dredging Corporation of India 224 77,414 0.01
819,968 0.09 FERROUS METALSTata Steel Ltd. 24,265 15,098,896 1.60 Jindal Steel & Power Ltd. 14,334 9,995,098 1.06 Steel Authority of India Ltd. 21,615 3,665,904 0.39 JSW Steel Ltd. 3,911 3,583,649 0.38 Jindal Saw Ltd. 5,505 1,126,598 0.12 Bhushan Steel Ltd. 2,331 1,017,831 0.11 Welspun Corp Ltd. 4,450 923,153 0.10 Ispat Industries Ltd. 29,422 659,053 0.07 Monnet Ispat and Energy Ltd. 1,186 609,545 0.06 Usha Martin Ltd. 6,992 399,243 0.04 Maharashtra Seamless Ltd. 1,190 387,940 0.04 JSL Stainless Ltd. 3,547 292,273 0.03 Uttam Galva Steels Ltd. 1,329 148,782 0.02 Tata Sponge Iron Ltd. 323 110,595 0.01 Tinplate Company of India Ltd. 1,468 94,613 0.01 PSL Ltd. 1,209 89,103 0.01 Surya Roshni Ltd. 735 70,046 0.01
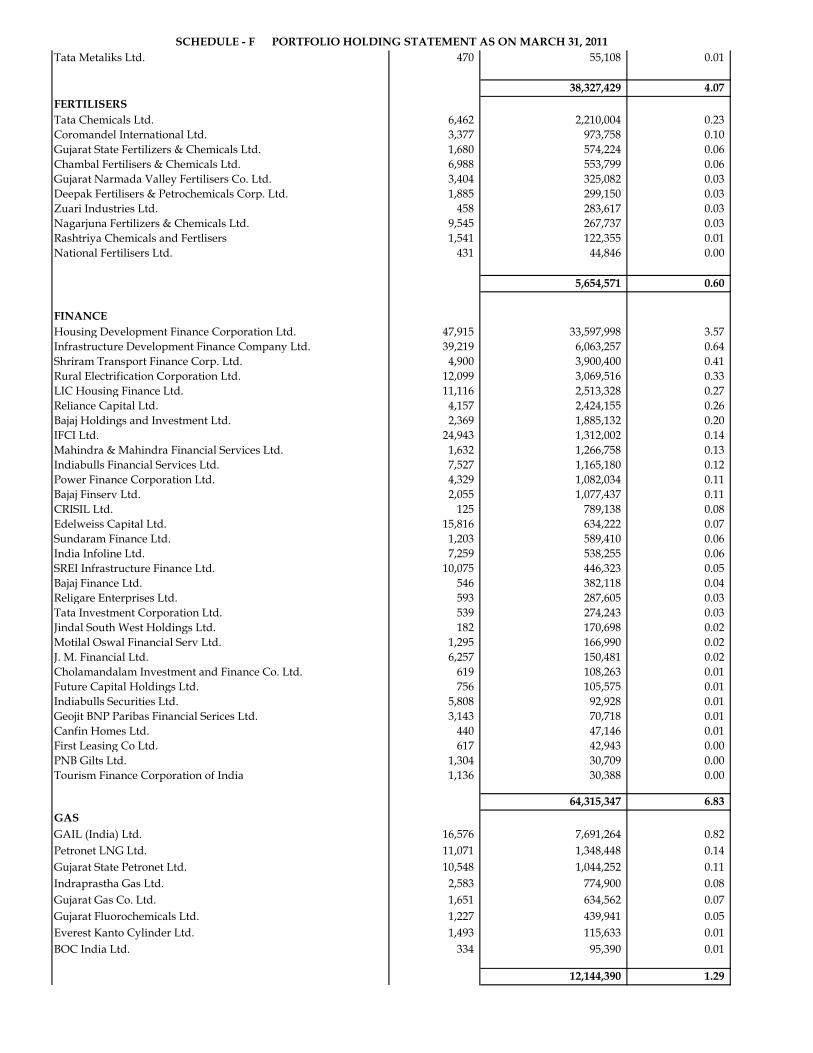
SCHEDULE - F PORTFOLIO HOLDING STATEMENT AS ON MARCH 31, 2011Tata Metaliks Ltd. 470 55,108 0.01
38,327,429 4.07 FERTILISERS Tata Chemicals Ltd. 6,462 2,210,004 0.23 Coromandel International Ltd. 3,377 973,758 0.10 Gujarat State Fertilizers & Chemicals Ltd. 1,680 574,224 0.06 Chambal Fertilisers & Chemicals Ltd. 6,988 553,799 0.06 Gujarat Narmada Valley Fertilisers Co. Ltd. 3,404 325,082 0.03 Deepak Fertilisers & Petrochemicals Corp. Ltd. 1,885 299,150 0.03 Zuari Industries Ltd. 458 283,617 0.03 Nagarjuna Fertilizers & Chemicals Ltd. 9,545 267,737 0.03 Rashtriya Chemicals and Fertlisers 1,541 122,355 0.01 National Fertilisers Ltd. 431 44,846 0.00
5,654,571 0.60
FINANCEHousing Development Finance Corporation Ltd. 47,915 33,597,998 3.57 Infrastructure Development Finance Company Ltd. 39,219 6,063,257 0.64 Shriram Transport Finance Corp. Ltd. 4,900 3,900,400 0.41 Rural Electrification Corporation Ltd. 12,099 3,069,516 0.33 LIC Housing Finance Ltd. 11,116 2,513,328 0.27 Reliance Capital Ltd. 4,157 2,424,155 0.26 Bajaj Holdings and Investment Ltd. 2,369 1,885,132 0.20 IFCI Ltd. 24,943 1,312,002 0.14 Mahindra & Mahindra Financial Services Ltd. 1,632 1,266,758 0.13 Indiabulls Financial Services Ltd. 7,527 1,165,180 0.12 Power Finance Corporation Ltd. 4,329 1,082,034 0.11 Bajaj Finserv Ltd. 2,055 1,077,437 0.11 CRISIL Ltd. 125 789,138 0.08 Edelweiss Capital Ltd. 15,816 634,222 0.07 Sundaram Finance Ltd. 1,203 589,410 0.06 India Infoline Ltd. 7,259 538,255 0.06 SREI Infrastructure Finance Ltd. 10,075 446,323 0.05 Bajaj Finance Ltd. 546 382,118 0.04 Religare Enterprises Ltd. 593 287,605 0.03 Tata Investment Corporation Ltd. 539 274,243 0.03 Jindal South West Holdings Ltd. 182 170,698 0.02 Motilal Oswal Financial Serv Ltd. 1,295 166,990 0.02 J. M. Financial Ltd. 6,257 150,481 0.02 Cholamandalam Investment and Finance Co. Ltd. 619 108,263 0.01 Future Capital Holdings Ltd. 756 105,575 0.01 Indiabulls Securities Ltd. 5,808 92,928 0.01 Geojit BNP Paribas Financial Serices Ltd. 3,143 70,718 0.01 Canfin Homes Ltd. 440 47,146 0.01 First Leasing Co Ltd. 617 42,943 0.00 PNB Gilts Ltd. 1,304 30,709 0.00 Tourism Finance Corporation of India 1,136 30,388 0.00
64,315,347 6.83 GASGAIL (India) Ltd. 16,576 7,691,264 0.82 Petronet LNG Ltd. 11,071 1,348,448 0.14 Gujarat State Petronet Ltd. 10,548 1,044,252 0.11 Indraprastha Gas Ltd. 2,583 774,900 0.08 Gujarat Gas Co. Ltd. 1,651 634,562 0.07 Gujarat Fluorochemicals Ltd. 1,227 439,941 0.05 Everest Kanto Cylinder Ltd. 1,493 115,633 0.01 BOC India Ltd. 334 95,390 0.01
12,144,390 1.29

SCHEDULE - F PORTFOLIO HOLDING STATEMENT AS ON MARCH 31, 2011HARDWARECMC Ltd. 276 574,494 0.06 Moser Baer India Ltd. 2,420 99,462 0.01 Allied Digital Services Ltd. 981 84,415 0.01
758,371 0.08 HEALTHCARE SERVICESApollo Hospitals Enterprise Ltd. 3,073 1,452,300 0.15 Fortis Healthcare Ltd. 2,790 421,011 0.04 Indraprasth Medical Corporation Ltd. 1,673 57,133 0.01
1,930,444 0.20 HOTELSIndian Hotels Company Ltd. 18,614 1,563,576 0.17 EIH Ltd. 7,995 644,797 0.07 Hotel Leela Venture Ltd. 5,363 207,548 0.02 Oriental Hotels Ltd. 2,236 64,956 0.01 Taj GVK Hotels and Resorts Ltd. 584 54,137 0.01
2,535,013 0.27 INDUSTRIAL CAPITAL GOODSBharat Heavy Electricals Ltd. 5,831 12,027,312 1.28 Siemens Ltd. 5,577 4,913,616 0.52 Crompton Greaves Ltd. 13,985 3,814,409 0.40 ABB Ltd. 1,955 1,557,744 0.17 Suzlon Energy Ltd. 26,963 1,202,550 0.13 Bharat Electronics Ltd. 713 1,200,193 0.13 Pipavav Shipyard Ltd. 13,515 1,065,658 0.11 Thermax India Ltd. 1,565 943,539 0.10 Areva T & D India Ltd. 2,374 588,277 0.06 Lakshmi Machine Works Ltd. 259 578,334 0.06 Alstom Projects India Ltd. 837 493,579 0.05 BEML Ltd. 713 486,230 0.05 Sterlite Technologies Ltd. 6,618 387,484 0.04 Praj Industries Ltd. 4,351 312,402 0.03 ABG Shipyard Ltd. 752 273,540 0.03 BGR Energy Systems Ltd. 507 241,788 0.03 Reliance Industrial Infrastrure Ltd. 307 193,640 0.02 Honeywell Automation India Ltd. 62 139,252 0.01 Ingersoll Rand (India) Ltd. 306 136,476 0.01 Alfa Laval (India) Ltd. 76 115,243 0.01 Nelco Ltd. 392 27,812 0.00
30,699,077 3.26 INDUSTRIAL PRODUCTSCummins India Ltd. 3,580 2,498,482 0.27 Jain Irrigation Systems Ltd. 9,740 1,742,486 0.18 Bharat Forge Ltd. 4,978 1,728,859 0.18 Sintex Industries Ltd. 6,589 1,000,869 0.11 Max India Ltd. 5,448 870,318 0.09 SKF India Ltd. 911 524,690 0.06 Carborundum Universal Ltd. 2,007 462,413 0.05 Greaves Cotton Ltd. 4,413 423,207 0.04 ELGI Equipments Ltd. 3,919 355,061 0.04 Supreme Industries Ltd. 2,383 348,275 0.04 Jai Corporation Ltd. 1,795 291,598 0.03 Graphite India Ltd. 3,111 290,101 0.03 FAG Bearings India Ltd. 301 251,937 0.03 Jindal Poly Films Ltd. 559 234,333 0.02 Uflex Ltd. 1,517 217,841 0.02 Kemrock Industries and Exports Limited 363 193,334 0.02 Finolex Industries Ltd. 2,211 193,131 0.02 Electrosteel Castings Ltd. 5,564 171,649 0.02
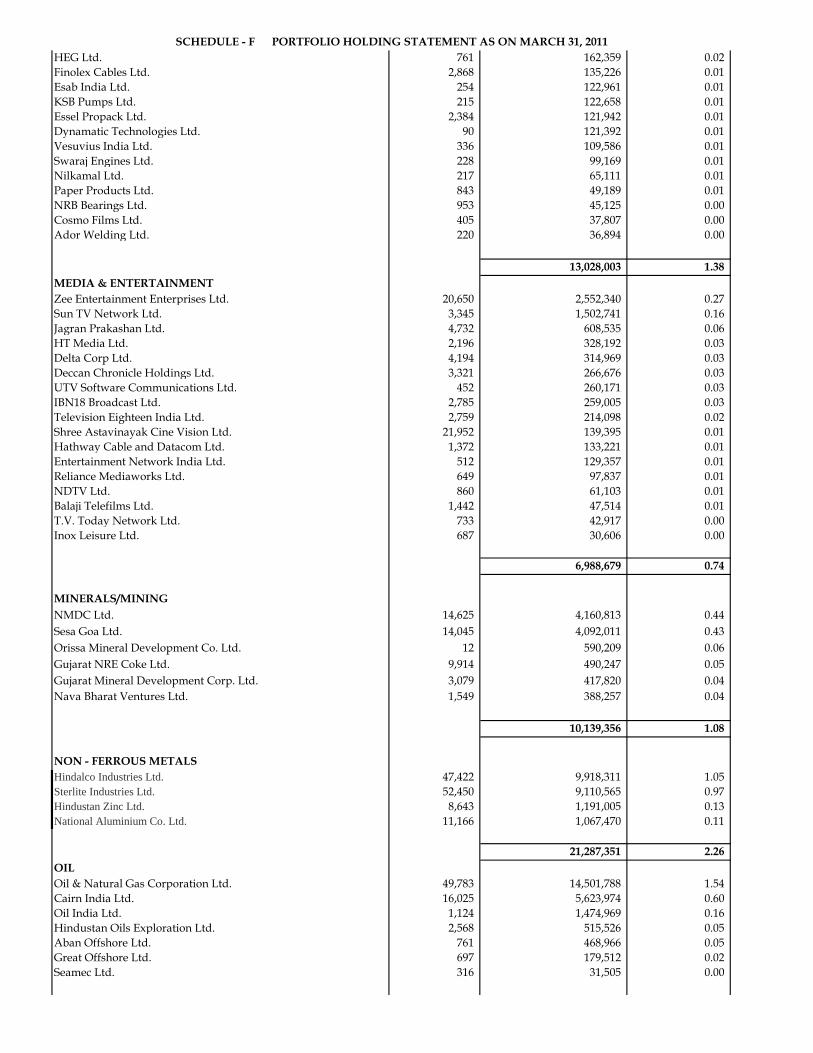
SCHEDULE - F PORTFOLIO HOLDING STATEMENT AS ON MARCH 31, 2011HEG Ltd. 761 162,359 0.02 Finolex Cables Ltd. 2,868 135,226 0.01 Esab India Ltd. 254 122,961 0.01 KSB Pumps Ltd. 215 122,658 0.01 Essel Propack Ltd. 2,384 121,942 0.01 Dynamatic Technologies Ltd. 90 121,392 0.01 Vesuvius India Ltd. 336 109,586 0.01 Swaraj Engines Ltd. 228 99,169 0.01 Nilkamal Ltd. 217 65,111 0.01 Paper Products Ltd. 843 49,189 0.01 NRB Bearings Ltd. 953 45,125 0.00 Cosmo Films Ltd. 405 37,807 0.00 Ador Welding Ltd. 220 36,894 0.00
13,028,003 1.38 MEDIA & ENTERTAINMENTZee Entertainment Enterprises Ltd. 20,650 2,552,340 0.27 Sun TV Network Ltd. 3,345 1,502,741 0.16 Jagran Prakashan Ltd. 4,732 608,535 0.06 HT Media Ltd. 2,196 328,192 0.03 Delta Corp Ltd. 4,194 314,969 0.03 Deccan Chronicle Holdings Ltd. 3,321 266,676 0.03 UTV Software Communications Ltd. 452 260,171 0.03 IBN18 Broadcast Ltd. 2,785 259,005 0.03 Television Eighteen India Ltd. 2,759 214,098 0.02 Shree Astavinayak Cine Vision Ltd. 21,952 139,395 0.01 Hathway Cable and Datacom Ltd. 1,372 133,221 0.01 Entertainment Network India Ltd. 512 129,357 0.01 Reliance Mediaworks Ltd. 649 97,837 0.01 NDTV Ltd. 860 61,103 0.01 Balaji Telefilms Ltd. 1,442 47,514 0.01 T.V. Today Network Ltd. 733 42,917 0.00 Inox Leisure Ltd. 687 30,606 0.00
6,988,679 0.74
MINERALS/MININGNMDC Ltd. 14,625 4,160,813 0.44 Sesa Goa Ltd. 14,045 4,092,011 0.43 Orissa Mineral Development Co. Ltd. 12 590,209 0.06 Gujarat NRE Coke Ltd. 9,914 490,247 0.05 Gujarat Mineral Development Corp. Ltd. 3,079 417,820 0.04 Nava Bharat Ventures Ltd. 1,549 388,257 0.04
10,139,356 1.08
NON - FERROUS METALSHindalco Industries Ltd. 47,422 9,918,311 1.05 Sterlite Industries Ltd. 52,450 9,110,565 0.97 Hindustan Zinc Ltd. 8,643 1,191,005 0.13 National Aluminium Co. Ltd. 11,166 1,067,470 0.11
21,287,351 2.26 OILOil & Natural Gas Corporation Ltd. 49,783 14,501,788 1.54 Cairn India Ltd. 16,025 5,623,974 0.60 Oil India Ltd. 1,124 1,474,969 0.16 Hindustan Oils Exploration Ltd. 2,568 515,526 0.05 Aban Offshore Ltd. 761 468,966 0.05 Great Offshore Ltd. 697 179,512 0.02 Seamec Ltd. 316 31,505 0.00
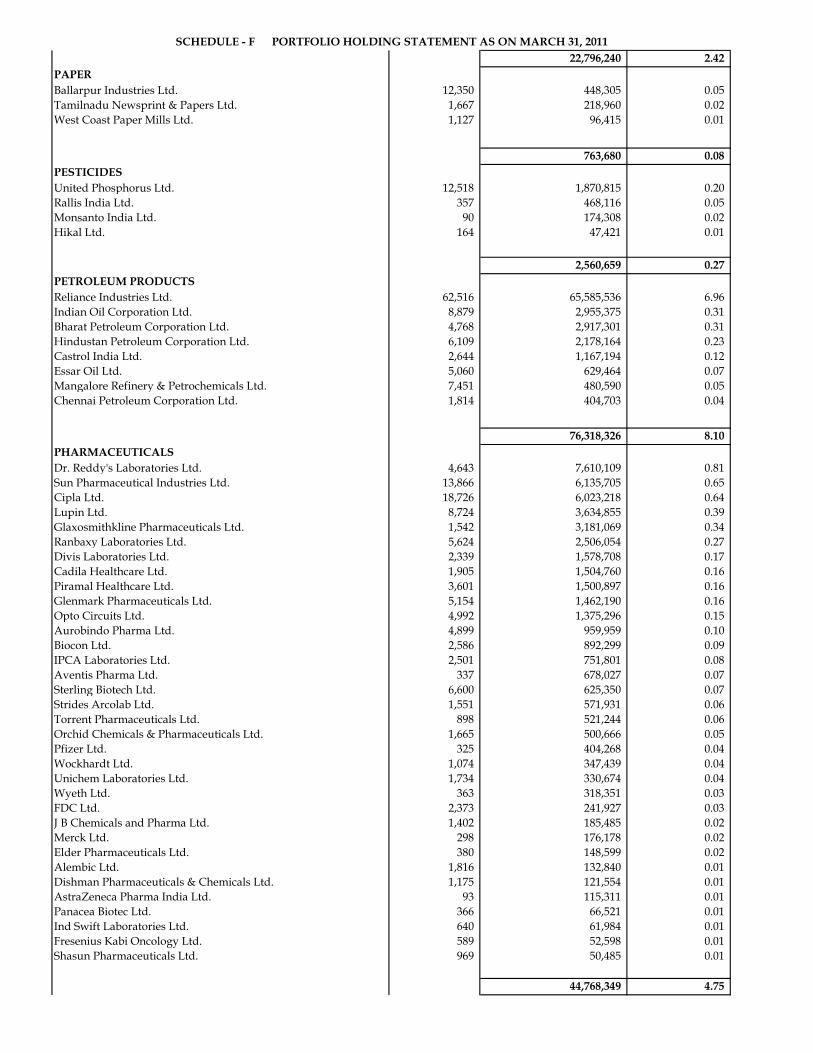
SCHEDULE - F PORTFOLIO HOLDING STATEMENT AS ON MARCH 31, 201122,796,240 2.42
PAPERBallarpur Industries Ltd. 12,350 448,305 0.05 Tamilnadu Newsprint & Papers Ltd. 1,667 218,960 0.02 West Coast Paper Mills Ltd. 1,127 96,415 0.01
763,680 0.08 PESTICIDESUnited Phosphorus Ltd. 12,518 1,870,815 0.20 Rallis India Ltd. 357 468,116 0.05 Monsanto India Ltd. 90 174,308 0.02 Hikal Ltd. 164 47,421 0.01
2,560,659 0.27 PETROLEUM PRODUCTSReliance Industries Ltd. 62,516 65,585,536 6.96 Indian Oil Corporation Ltd. 8,879 2,955,375 0.31 Bharat Petroleum Corporation Ltd. 4,768 2,917,301 0.31 Hindustan Petroleum Corporation Ltd. 6,109 2,178,164 0.23 Castrol India Ltd. 2,644 1,167,194 0.12 Essar Oil Ltd. 5,060 629,464 0.07 Mangalore Refinery & Petrochemicals Ltd. 7,451 480,590 0.05 Chennai Petroleum Corporation Ltd. 1,814 404,703 0.04
76,318,326 8.10 PHARMACEUTICALSDr. Reddy's Laboratories Ltd. 4,643 7,610,109 0.81 Sun Pharmaceutical Industries Ltd. 13,866 6,135,705 0.65 Cipla Ltd. 18,726 6,023,218 0.64 Lupin Ltd. 8,724 3,634,855 0.39 Glaxosmithkline Pharmaceuticals Ltd. 1,542 3,181,069 0.34 Ranbaxy Laboratories Ltd. 5,624 2,506,054 0.27 Divis Laboratories Ltd. 2,339 1,578,708 0.17 Cadila Healthcare Ltd. 1,905 1,504,760 0.16 Piramal Healthcare Ltd. 3,601 1,500,897 0.16 Glenmark Pharmaceuticals Ltd. 5,154 1,462,190 0.16 Opto Circuits Ltd. 4,992 1,375,296 0.15 Aurobindo Pharma Ltd. 4,899 959,959 0.10 Biocon Ltd. 2,586 892,299 0.09 IPCA Laboratories Ltd. 2,501 751,801 0.08 Aventis Pharma Ltd. 337 678,027 0.07 Sterling Biotech Ltd. 6,600 625,350 0.07 Strides Arcolab Ltd. 1,551 571,931 0.06 Torrent Pharmaceuticals Ltd. 898 521,244 0.06 Orchid Chemicals & Pharmaceuticals Ltd. 1,665 500,666 0.05 Pfizer Ltd. 325 404,268 0.04 Wockhardt Ltd. 1,074 347,439 0.04 Unichem Laboratories Ltd. 1,734 330,674 0.04 Wyeth Ltd. 363 318,351 0.03 FDC Ltd. 2,373 241,927 0.03 J B Chemicals and Pharma Ltd. 1,402 185,485 0.02 Merck Ltd. 298 176,178 0.02 Elder Pharmaceuticals Ltd. 380 148,599 0.02 Alembic Ltd. 1,816 132,840 0.01 Dishman Pharmaceuticals & Chemicals Ltd. 1,175 121,554 0.01 AstraZeneca Pharma India Ltd. 93 115,311 0.01 Panacea Biotec Ltd. 366 66,521 0.01 Ind Swift Laboratories Ltd. 640 61,984 0.01 Fresenius Kabi Oncology Ltd. 589 52,598 0.01 Shasun Pharmaceuticals Ltd. 969 50,485 0.01
44,768,349 4.75

SCHEDULE - F PORTFOLIO HOLDING STATEMENT AS ON MARCH 31, 2011POWER NTPC Ltd. 47,166 9,107,754.60 0.97 Tata Power Co. Ltd. 5,972 7,973,515.80 0.85 Power Grid Corporation Ltd. 52,244 5,323,663.60 0.57 Reliance Infrastructure Ltd. 5,159 3,559,452.05 0.38 Reliance Power Ltd. 20,267 2,642,816.80 0.28 Adani Power Ltd. 15,393 1,735,560.75 0.18 National Hydraulic Power Corporation 61,901 1,566,095.30 0.17 Torrent Power Ltd. 6,243 1,565,744.40 0.17 JSW Energy Ltd. 14,089 1,009,476.85 0.11 PTC India Ltd. 8,732 728,248.80 0.08 GVK Power & Infrastructure Ltd. 26,662 690,545.80 0.07 CESC Ltd. 2,191 679,867.30 0.07 KEC International Ltd. 5,492 453,639.20 0.05 Jaiprakash Power Ventures Ltd. 10,148 427,738.20 0.05 Neyveli Lignite Corporation Ltd. 4,024 418,697.20 0.04 Kalpataru Power Transmission Ltd. 2,572 346,834.20 0.04 Jyoti Structures Ltd. 2,213 185,006.80 0.02 Gujarat Industries Power Co. Ltd. 1,949 180,087.60 0.02
38,594,745 4.10
RETAILINGPantaloon Retail (India) Ltd. 4,099 1,060,411 0.11 Trent Ltd. 513 504,099 0.05 Shoppers Stop Ltd. 839 289,539 0.03
1,854,050 0.20
SOFTWAREInfosys Technologies Ltd. 17,789 57,659,486 6.12 Tata Consultancy Services Ltd. 18,741 22,187,470 2.36 Wipro Ltd. 18,677 8,968,695 0.95 HCL Technologies Ltd. 8,893 4,250,409 0.45 Oracle Financial Serv. Software Ltd. 606 1,203,940 0.13 Mphasis Ltd. 2,703 1,122,421 0.12 Tech Mahindra Ltd. 1,266 856,006 0.09 Patni Computers System Ltd. 1,790 853,920 0.09 Financial Technologies India Ltd. 929 802,470 0.09 Educomp Solutions Ltd. 1,767 741,080 0.08 Core Projects and Technologies Ltd. 2,135 663,772 0.07 Info Edge India Ltd. 897 601,842 0.06 Infotech Enterprises Ltd. 3,190 515,983 0.05 Hexaware Technologies Ltd. 7,759 512,482 0.05 Rolta India Ltd. 3,489 483,750 0.05 Polaris Software Lab 2,000 377,700 0.04 Mindtree Ltd. 764 306,479 0.03 KPIT Cummins Infosystem Ltd. 1,714 288,381 0.03 3i Infotech Ltd. 5,695 249,726 0.03 NIIT Ltd. 3,939 231,416 0.02 Tata Elxsi Ltd. 636 161,480 0.02 Firstsource Solutions Ltd. 6,704 120,337 0.01 Aptech Ltd. 1,084 106,503 0.01 Sonata Software Ltd. 2,223 95,700 0.01 Geometric Ltd. 1,449 88,824 0.01 Zensar Technologies Ltd. 460 71,990 0.01 Mastek Ltd. 575 69,920 0.01 Aftek Ltd. 2,983 36,691 0.00
103,628,871 11.00
TELECOM - EQUIPMENT & ACCESSORIES
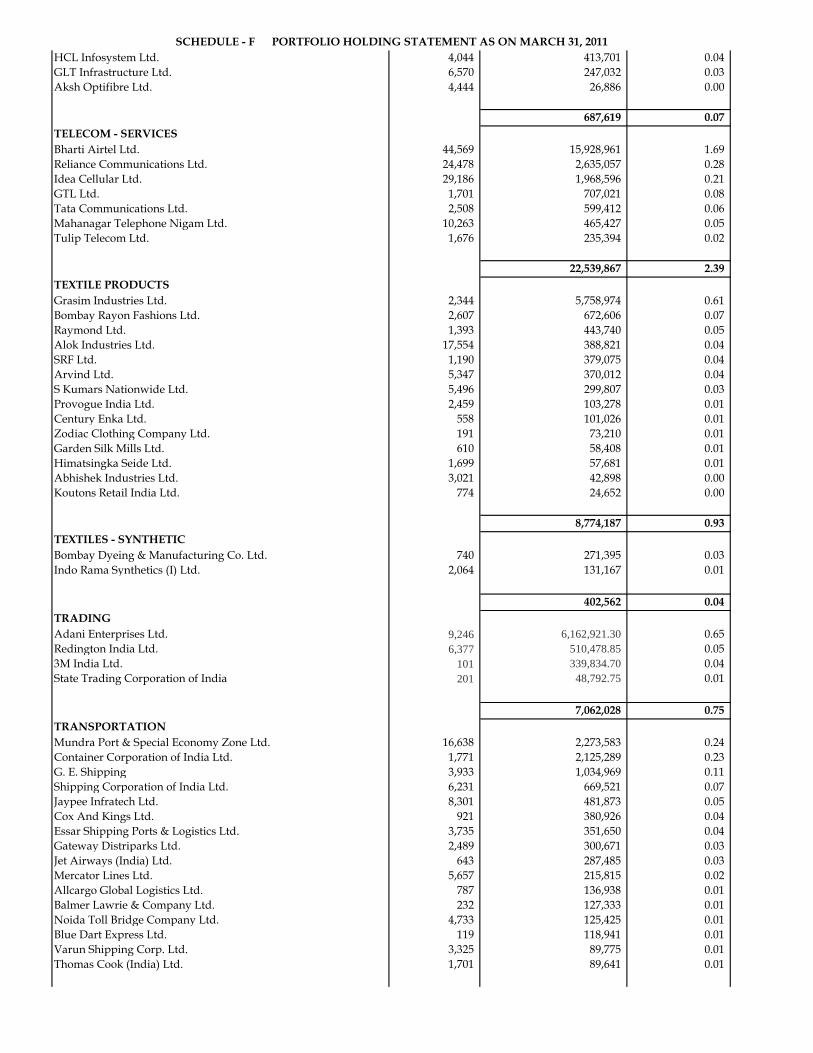
SCHEDULE - F PORTFOLIO HOLDING STATEMENT AS ON MARCH 31, 2011HCL Infosystem Ltd. 4,044 413,701 0.04 GLT Infrastructure Ltd. 6,570 247,032 0.03 Aksh Optifibre Ltd. 4,444 26,886 0.00
687,619 0.07 TELECOM - SERVICESBharti Airtel Ltd. 44,569 15,928,961 1.69 Reliance Communications Ltd. 24,478 2,635,057 0.28 Idea Cellular Ltd. 29,186 1,968,596 0.21 GTL Ltd. 1,701 707,021 0.08 Tata Communications Ltd. 2,508 599,412 0.06 Mahanagar Telephone Nigam Ltd. 10,263 465,427 0.05 Tulip Telecom Ltd. 1,676 235,394 0.02
22,539,867 2.39 TEXTILE PRODUCTSGrasim Industries Ltd. 2,344 5,758,974 0.61 Bombay Rayon Fashions Ltd. 2,607 672,606 0.07 Raymond Ltd. 1,393 443,740 0.05 Alok Industries Ltd. 17,554 388,821 0.04 SRF Ltd. 1,190 379,075 0.04 Arvind Ltd. 5,347 370,012 0.04 S Kumars Nationwide Ltd. 5,496 299,807 0.03 Provogue India Ltd. 2,459 103,278 0.01 Century Enka Ltd. 558 101,026 0.01 Zodiac Clothing Company Ltd. 191 73,210 0.01 Garden Silk Mills Ltd. 610 58,408 0.01 Himatsingka Seide Ltd. 1,699 57,681 0.01 Abhishek Industries Ltd. 3,021 42,898 0.00 Koutons Retail India Ltd. 774 24,652 0.00
8,774,187 0.93 TEXTILES - SYNTHETICBombay Dyeing & Manufacturing Co. Ltd. 740 271,395 0.03 Indo Rama Synthetics (I) Ltd. 2,064 131,167 0.01
402,562 0.04 TRADINGAdani Enterprises Ltd. 9,246 6,162,921.30 0.65 Redington India Ltd. 6,377 510,478.85 0.05 3M India Ltd. 101 339,834.70 0.04 State Trading Corporation of India 201 48,792.75 0.01
7,062,028 0.75 TRANSPORTATIONMundra Port & Special Economy Zone Ltd. 16,638 2,273,583 0.24 Container Corporation of India Ltd. 1,771 2,125,289 0.23 G. E. Shipping 3,933 1,034,969 0.11 Shipping Corporation of India Ltd. 6,231 669,521 0.07 Jaypee Infratech Ltd. 8,301 481,873 0.05 Cox And Kings Ltd. 921 380,926 0.04 Essar Shipping Ports & Logistics Ltd. 3,735 351,650 0.04 Gateway Distriparks Ltd. 2,489 300,671 0.03 Jet Airways (India) Ltd. 643 287,485 0.03 Mercator Lines Ltd. 5,657 215,815 0.02 Allcargo Global Logistics Ltd. 787 136,938 0.01 Balmer Lawrie & Company Ltd. 232 127,333 0.01 Noida Toll Bridge Company Ltd. 4,733 125,425 0.01 Blue Dart Express Ltd. 119 118,941 0.01 Varun Shipping Corp. Ltd. 3,325 89,775 0.01 Thomas Cook (India) Ltd. 1,701 89,641 0.01
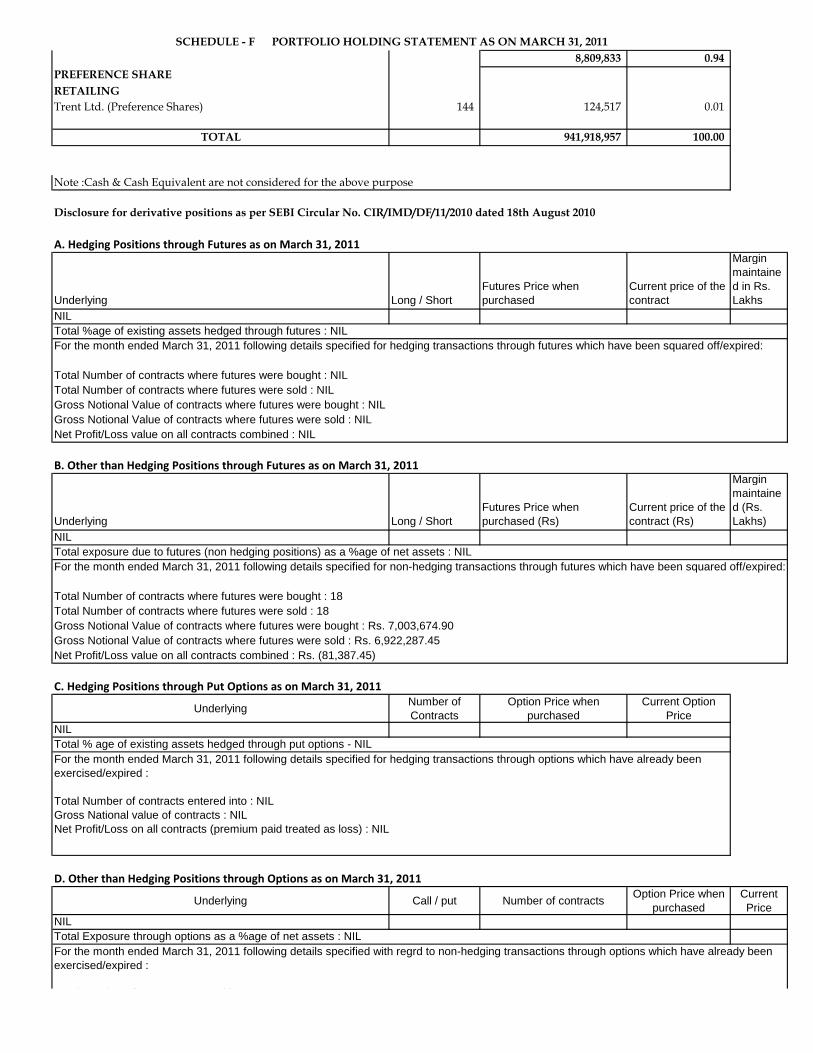
SCHEDULE - F PORTFOLIO HOLDING STATEMENT AS ON MARCH 31, 20118,809,833 0.94
PREFERENCE SHARERETAILINGTrent Ltd. (Preference Shares) 144 124,517 0.01
TOTAL 941,918,957 100.00
Note :Cash & Cash Equivalent are not considered for the above purpose
Disclosure for derivative positions as per SEBI Circular No. CIR/IMD/DF/11/2010 dated 18th August 2010
A. Hedging Positions through Futures as on March 31, 2011
Underlying Long / ShortFutures Price when purchased
Current price of the contract
Margin maintained in Rs. Lakhs
NILTotal %age of existing assets hedged through futures : NIL
Total Number of contracts where futures were bought : NILTotal Number of contracts where futures were sold : NILGross Notional Value of contracts where futures were bought : NILGross Notional Value of contracts where futures were sold : NILNet Profit/Loss value on all contracts combined : NIL
B. Other than Hedging Positions through Futures as on March 31, 2011
Underlying Long / ShortFutures Price when purchased (Rs)
Current price of the contract (Rs)
Margin maintained (Rs. Lakhs)
NILTotal exposure due to futures (non hedging positions) as a %age of net assets : NIL
Total Number of contracts where futures were bought : 18Total Number of contracts where futures were sold : 18Gross Notional Value of contracts where futures were bought : Rs. 7,003,674.90Gross Notional Value of contracts where futures were sold : Rs. 6,922,287.45Net Profit/Loss value on all contracts combined : Rs. (81,387.45)
C. Hedging Positions through Put Options as on March 31, 2011
Underlying Number of Contracts
Option Price when purchased
Current Option Price
NIL
D. Other than Hedging Positions through Options as on March 31, 2011
Underlying Call / put Number of contracts Option Price when purchased
Current Price
NIL
For the month ended March 31, 2011 following details specified for hedging transactions through futures which have been squared off/expired:
For the month ended March 31, 2011 following details specified for non-hedging transactions through futures which have been squared off/expired:
Total % age of existing assets hedged through put options - NILFor the month ended March 31, 2011 following details specified for hedging transactions through options which have already been exercised/expired :
Total Number of contracts entered into : NILGross National value of contracts : NILNet Profit/Loss on all contracts (premium paid treated as loss) : NIL
Total Exposure through options as a %age of net assets : NILFor the month ended March 31, 2011 following details specified with regrd to non-hedging transactions through options which have already been exercised/expired :
Total Number of contracts entered into : NIL

SCHEDULE - F PORTFOLIO HOLDING STATEMENT AS ON MARCH 31, 2011
E. Hedging Positions through swaps as on March 31, 2011 - NIL
Total Number of contracts entered into : NILGross National Value of contracts : NILNet Profit/Loss on all contracts (premium paid treated as loss) : NIL

BENCHMARK S&P CNX 500 FUND
Schedule G - Accounting Policies and Notes To Accounts 1. BACKGROUND
Benchmark Mutual Fund (“the Fund”) has been sponsored by Niche Financial Services Pvt. Ltd. and has been set up as a Trust under the Indian Trust Act, 1882 through Trust Deed dated February 14, 2001. Benchmark Trustee Company Pvt. Ltd. (“the Trustee”) is the sole Trustee of the Fund. In accordance with Securities and Exchange Board of India (Mutual Funds) Regulations, 1996, Benchmark Asset Management Company Pvt. Ltd. (BAMC) has been appointed as Asset Management Company (“the AMC”) to the Fund. Benchmark S&P CNX 500 Fund is an open-ended index scheme of Benchmark Mutual Fund tracking S&P CNX 500 Index. The scheme has Growth and Dividend Option. The investment objective of the Scheme is to generate capital appreciation through equity investments by investing in securities which are constituents of S&P CNX 500 Index in the same proportion as in the Index
2. SIGNIFICANT ACCOUNTING POLICIES
1. The method of accounting is on accrual basis.
2. Investments a. Purchase and sale of securities are recognised on trade date i.e. on the date of transaction and not on
the date of settlement.
b. All investments are accounted at acquisition cost. Such cost includes stamp duty, brokerage and any other charges customarily included in broker’s note.
c. Cost of right shares, if any, is considered at issue price plus premium paid, if any, to acquire rights renunciation.
d. Bonus entitlements, if any, are recognized on ex-bonus dates. Similarly right entitlements, if any, are recognized only when original shares on which right entitlements accrue are traded on ex-right basis.
e. An investment is regarded as non-performing, if the interest and/or principal amount have not been received or remained outstanding for one quarter from the day such income/instalment has fallen due.
f. In determining the holding cost of investments and gain or loss on sale of investments weighted average method has been followed.
3. Portfolio Valuation
For the purpose of financial statements, the Fund marks all investments to market and carries investment in the Balance Sheet at the market value. Unrealised gain, if any, arising out of appreciation of the investments, is carried to the Balance Sheet. In valuing the Scheme’s investments: Traded Securities are valued at last quoted closing price on the National Stock Exchange of India
Ltd. (NSE). In absence of a quoted price on the valuation date, the last available quoted price within a period of thirty days prior to the valuation date is used for valuation purpose.
Debt securities, if any, listed on a recognised stock exchange are valued at the last quoted closing price on the principal exchange on which the security is traded. If no sale is reported at that date, debt securities are valued at fair value as determined in accordance with the valuation policy of the Fund.
Non-traded and Thinly-traded debt securities, if any, are valued at fair value in good faith by the AMC in accordance with the guidelines for valuation of such securities specified by SEBI.
Privately placed debt securities are valued at fair value in good faith by the AMC in accordance with the guidelines for valuation of such securities specified by SEBI.
Upto 1st August 2010 : Money market securities/Non traded/ Collateralised borrowing lending obligation /Thinly traded Non-Government Debt securities of up to182 days of maturity are valued on the basis of amortization (cost plus accrued interest basis) as prescribed by SEBI.
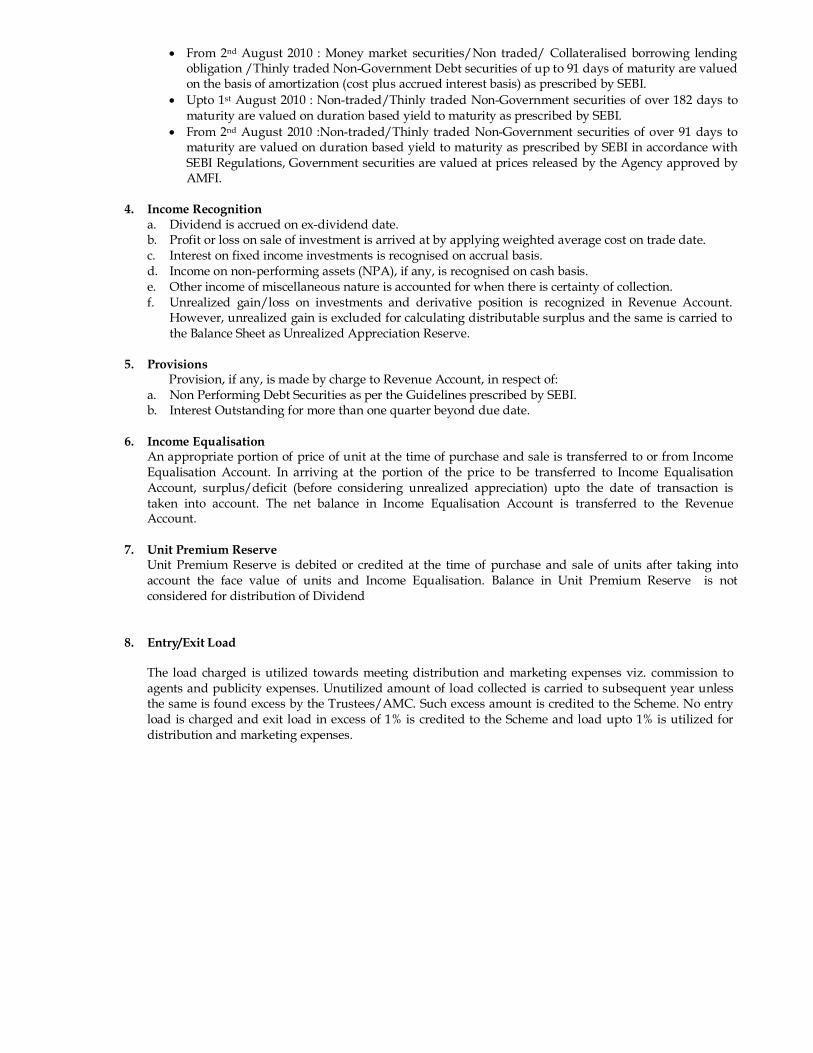
From 2nd August 2010 : Money market securities/Non traded/ Collateralised borrowing lending obligation /Thinly traded Non-Government Debt securities of up to 91 days of maturity are valued on the basis of amortization (cost plus accrued interest basis) as prescribed by SEBI.
Upto 1st August 2010 : Non-traded/Thinly traded Non-Government securities of over 182 days to maturity are valued on duration based yield to maturity as prescribed by SEBI.
From 2nd August 2010 :Non-traded/Thinly traded Non-Government securities of over 91 days to maturity are valued on duration based yield to maturity as prescribed by SEBI in accordance with SEBI Regulations, Government securities are valued at prices released by the Agency approved by AMFI.
4. Income Recognition
a. Dividend is accrued on ex-dividend date. b. Profit or loss on sale of investment is arrived at by applying weighted average cost on trade date. c. Interest on fixed income investments is recognised on accrual basis. d. Income on non-performing assets (NPA), if any, is recognised on cash basis. e. Other income of miscellaneous nature is accounted for when there is certainty of collection. f. Unrealized gain/loss on investments and derivative position is recognized in Revenue Account.
However, unrealized gain is excluded for calculating distributable surplus and the same is carried to the Balance Sheet as Unrealized Appreciation Reserve.
5. Provisions
Provision, if any, is made by charge to Revenue Account, in respect of: a. Non Performing Debt Securities as per the Guidelines prescribed by SEBI. b. Interest Outstanding for more than one quarter beyond due date.
6. Income Equalisation
An appropriate portion of price of unit at the time of purchase and sale is transferred to or from Income Equalisation Account. In arriving at the portion of the price to be transferred to Income Equalisation Account, surplus/deficit (before considering unrealized appreciation) upto the date of transaction is taken into account. The net balance in Income Equalisation Account is transferred to the Revenue Account.
7. Unit Premium Reserve
Unit Premium Reserve is debited or credited at the time of purchase and sale of units after taking into account the face value of units and Income Equalisation. Balance in Unit Premium Reserve is not considered for distribution of Dividend
8. Entry/Exit Load
The load charged is utilized towards meeting distribution and marketing expenses viz. commission to agents and publicity expenses. Unutilized amount of load collected is carried to subsequent year unless the same is found excess by the Trustees/AMC. Such excess amount is credited to the Scheme. No entry load is charged and exit load in excess of 1% is credited to the Scheme and load upto 1% is utilized for distribution and marketing expenses.

3. NOTES ON ACCOUNTS
1. Net Asset Value (NAV) is calculated after considering market/fair value of investments and after providing for expenses on an estimated basis.
2. There are no underwriting obligations undertaken by the Scheme with respect to issue of securities of associate companies.
3. There is no contingent liability on underwriting commitment. There is Rs.80,100 uncalled in case of rights issue
of Karur Vysya Bank Limited.
4. All investments are marked to market and accordingly reflected in the Balance Sheet. The cost and market value of investments are shown in Note No.13.
5. The AMC has not dealt in any securities through brokers associated with the Sponsor.
6. Purchase of investments yet to be settled: Rs. NIL (Previous year Rs. NIL)
7. Sale of investments yet to be settled: Rs.78.45 Lacs (Previous year Rs.NIL)
8. Entry/Exit Load As of March 31, 2011 the unutilised load is NIL (Previous NIL)
9. Income and Expenses
(In Rupees)
Average Daily Net Assets
Year Ended March 31, 2011 Period Ended March 31, 2010 92,91,60,031
104,28,90,164
Aggregate Value (Rs)
Percentage of Average Net Assets
Aggregate Value (Rs)
Percentage of Average Net
Assets Total income (including net profit/(loss) on sale/ redemption of investments, profit on inter-scheme transfers and net change in unrealised appreciation/ (depreciation) in value of investments)
82,141,779
8.84 106,825,306 10.24
Total Expenditure (annual recurring expenses)
13,943,852 1.50 156,43,704 1.50
10. Aggregate Value of Purchases and Sales of Investments (including matured) during the year
(Rupees in Lacs) 2010-11 2009-10
Average Daily Net Assets 9,291.60 10,428.90 Purchases 7,719.83 31,185.71
% to Daily Average Net Assets 83.08% 299.03% Sales 5,893.58 25,503.61
% to Daily Average Net Assets 63.43% 244.55% .
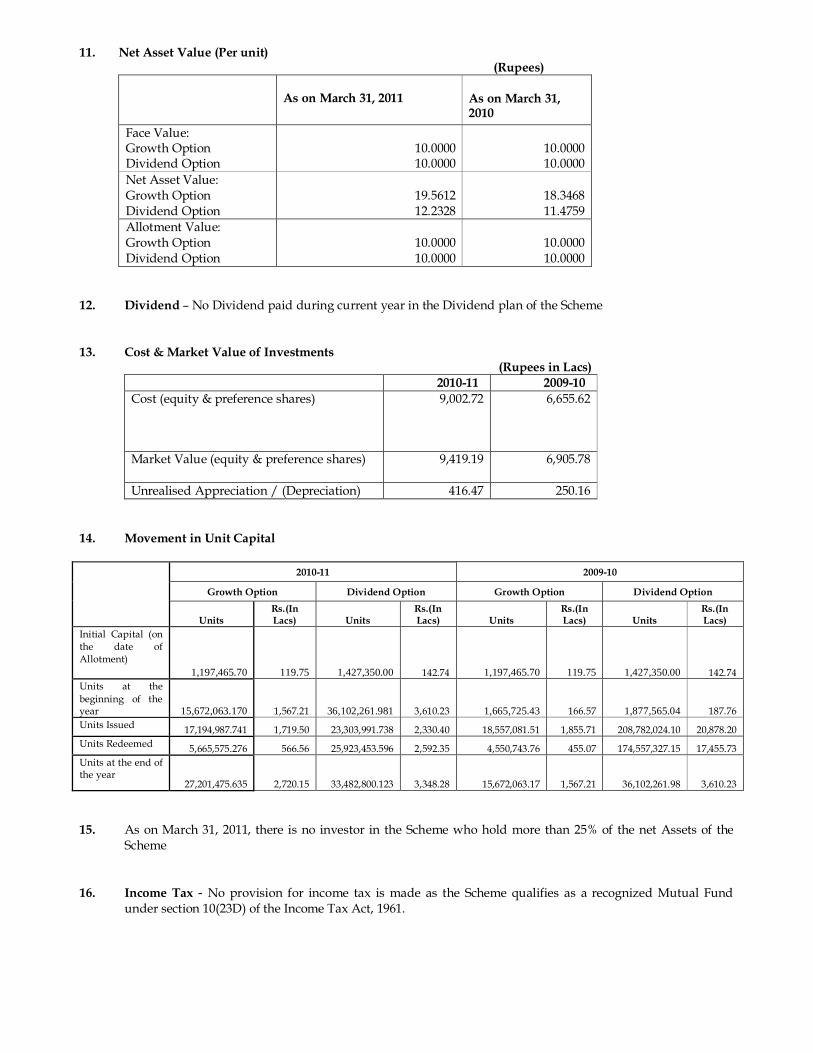
11. Net Asset Value (Per unit) (Rupees)
As on March 31, 2011 As on March 31,
2010 Face Value: Growth Option Dividend Option
10.0000 10.0000
10.0000 10.0000
Net Asset Value: Growth Option Dividend Option
19.5612 12.2328
18.3468 11.4759
Allotment Value: Growth Option Dividend Option
10.0000 10.0000
10.0000 10.0000
12. Dividend – No Dividend paid during current year in the Dividend plan of the Scheme 13. Cost & Market Value of Investments (Rupees in Lacs)
2010-11 2009-10 Cost (equity & preference shares) 9,002.72
6,655.62
Market Value (equity & preference shares) 9,419.19
6,905.78
Unrealised Appreciation / (Depreciation) 416.47 250.16 14. Movement in Unit Capital
2010-11 2009-10
Growth Option Dividend Option Growth Option Dividend Option
Units Rs.(In Lacs) Units
Rs.(In Lacs) Units
Rs.(In Lacs) Units
Rs.(In Lacs)
Initial Capital (on the date of Allotment)
1,197,465.70 119.75 1,427,350.00 142.74 1,197,465.70 119.75 1,427,350.00 142.74 Units at the beginning of the year 15,672,063.170 1,567.21 36,102,261.981 3,610.23 1,665,725.43 166.57 1,877,565.04 187.76 Units Issued 17,194,987.741 1,719.50 23,303,991.738 2,330.40 18,557,081.51 1,855.71 208,782,024.10 20,878.20 Units Redeemed 5,665,575.276 566.56 25,923,453.596 2,592.35 4,550,743.76 455.07 174,557,327.15 17,455.73 Units at the end of the year
27,201,475.635 2,720.15 33,482,800.123 3,348.28 15,672,063.17 1,567.21 36,102,261.98 3,610.23
15. As on March 31, 2011, there is no investor in the Scheme who hold more than 25% of the net Assets of the
Scheme
16. Income Tax - No provision for income tax is made as the Scheme qualifies as a recognized Mutual Fund
under section 10(23D) of the Income Tax Act, 1961.

17. Investment Management Fees - Investment Management Fees is calculated on the daily average net assets (NAV) of the Scheme. The details of management fees levied on an annualized basis are as follows:
(In Rupees) 2010-11 2009-10
Daily Average Net Assets 92,91,60,031 104,28,90,164 Management Fees (in percentage) 0.75% 0.75%
Management Fees 69,71,926 78,21,837
18. Trustee Fees - In accordance with the terms of Offer Document, the Trustee fee has been charged @ 0.01 % of the daily average net assets of the Scheme.
19. Custodial Fees and Expenses – Deutsche Bank AG provides custodial services to the Scheme for which it
receives custody fees including safekeeping. In addition, Deutsche Bank AG is reimbursed for custody and transaction charges levied by Depositories (i.e. NSDL/CDSL.)
20. Registrar and Transfer Agents Fees and Expenses - Karvy Computershare Pvt. Ltd. provides Registrar and Transfer Agency Services to the Scheme for which it receives the fees based on daily average net assets of the Scheme.
21. During the Year ended March 31, 2011, Benchmark Trustee Company Pvt. Ltd. and Benchmark Asset
Management Company Pvt. Ltd. have not invested in the Scheme. 22. The Scheme has made the following investments in associate/group company.
Name of the Company Nature of Instruments
Aggregate purchases during the year at cost
(Rs. In Lacs)
Outstanding Investment as at March 31, 2011 at
Market Value (Rs. In Lacs) Bajaj Finance Limited Equity Shares 1.85 3.82
Bajaj Auto Limited Equity Shares 39.75 73.03 Bajaj Hindustan Ltd. Equity Shares 4.23 3.93 GTL Ltd Equity Shares 3.97 7.07
23. The Scheme has not made any investments in the issues lead managed by associate companies. 24. No brokerage, custodial fees or any other payment for services have been paid or is payable to any entity in
which the AMC or its major shareholders have a substantial interest. 25. Details of transactions with associates in terms of Regulation 25 (8) Brokerage paid to associates/related parties/group companies of Sponsor/AMC
Name of associate/related
parties/group companies of
Sponsor/AMC
Nature of Association /
Nature of Relation
Period Covered (April 2010 to March 2011 and
April 2009 to March 2011)
Value of transaction ( in Rs. Cr. & % of total value of
transaction of the Fund )
Brokerage (Rs Cr & % of total brokerage paid by the
Fund)
NIL
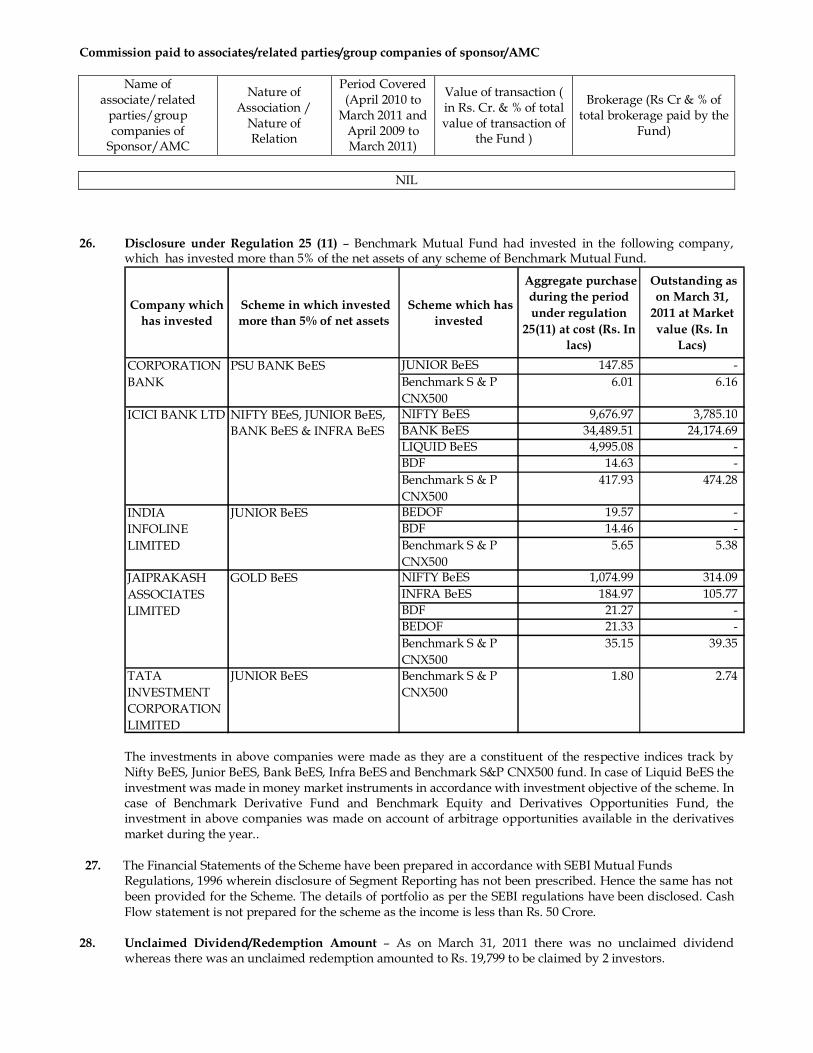
Commission paid to associates/related parties/group companies of sponsor/AMC
Name of associate/related
parties/group companies of
Sponsor/AMC
Nature of Association /
Nature of Relation
Period Covered (April 2010 to
March 2011 and April 2009 to March 2011)
Value of transaction ( in Rs. Cr. & % of total value of transaction of
the Fund )
Brokerage (Rs Cr & % of total brokerage paid by the
Fund)
NIL
26. Disclosure under Regulation 25 (11) – Benchmark Mutual Fund had invested in the following company,
which has invested more than 5% of the net assets of any scheme of Benchmark Mutual Fund.
Company which has invested
Scheme in which invested more than 5% of net assets
Scheme which has invested
Aggregate purchase during the period under regulation
25(11) at cost (Rs. In lacs)
Outstanding as on March 31,
2011 at Market value (Rs. In
Lacs)JUNIOR BeES 147.85 -Benchmark S & P CNX500
6.01 6.16
NIFTY BeES 9,676.97 3,785.10 BANK BeES 34,489.51 24,174.69 LIQUID BeES 4,995.08 -BDF 14.63 -Benchmark S & P CNX500
417.93 474.28
BEDOF 19.57 -BDF 14.46 -Benchmark S & P CNX500
5.65 5.38
NIFTY BeES 1,074.99 314.09 INFRA BeES 184.97 105.77 BDF 21.27 -BEDOF 21.33 -Benchmark S & P CNX500
35.15 39.35
TATA INVESTMENT CORPORATION LIMITED
JUNIOR BeES Benchmark S & P CNX500
1.80 2.74
INDIA INFOLINE LIMITED
JUNIOR BeES
JAIPRAKASH ASSOCIATES LIMITED
GOLD BeES
CORPORATION BANK
PSU BANK BeES
ICICI BANK LTD NIFTY BEeS, JUNIOR BeES, BANK BeES & INFRA BeES
The investments in above companies were made as they are a constituent of the respective indices track by Nifty BeES, Junior BeES, Bank BeES, Infra BeES and Benchmark S&P CNX500 fund. In case of Liquid BeES the investment was made in money market instruments in accordance with investment objective of the scheme. In case of Benchmark Derivative Fund and Benchmark Equity and Derivatives Opportunities Fund, the investment in above companies was made on account of arbitrage opportunities available in the derivatives market during the year..
27. The Financial Statements of the Scheme have been prepared in accordance with SEBI Mutual Funds
Regulations, 1996 wherein disclosure of Segment Reporting has not been prescribed. Hence the same has not been provided for the Scheme. The details of portfolio as per the SEBI regulations have been disclosed. Cash Flow statement is not prepared for the scheme as the income is less than Rs. 50 Crore.
28. Unclaimed Dividend/Redemption Amount – As on March 31, 2011 there was no unclaimed dividend
whereas there was an unclaimed redemption amounted to Rs. 19,799 to be claimed by 2 investors.
29. Registered Securities In accordance with Regulation 44(1) of the SEBI (Mutual Funds) Regulations, 1996, the securities of the
Scheme are held by the trustees for the benefit of Scheme’s unit holders
30. A complete list of investments of the Scheme is given in Schedule F. 31. On March 15, 2011 Goldman Sachs Asset Management, L.P., through its subsidiaries Goldman Sachs Asset
Management (India) Private Limited (“GS AMC”) and Goldman Sachs Trustee Company (India) Private Limited (“GS Trustee”), executed a sale and purchase agreement relating to the acquisition of all the outstanding shares in Benchmark Asset Management Company Private Limited (“BAMC”) and Benchmark Trustee Company Private Limited (“BTC”) from Niche Financial Services Private Limited, the sponsor of Benchmark Mutual Fund (“Benchmark MF”), and the other shareholders of BAMC and BTC. The sale and purchase agreement contemplates that BAMC shall transfer the rights to manage the schemes of Benchmark MF to GS AMC and BTC shall transfer the schemes of Benchmark MF to GS Trustee as part of the transaction. This transaction has been approved by the regulator, Securities and Exchange Board of India (“SEBI”) on June 27, 2011.
32. The Previous Year Figure have been regrouped / rearrange wherever necessary.
33. The audited results for the year ended March 31, 2011 have been approved by the Boards of Benchmark Asset Management Company Pvt. Ltd (AMC) and Benchmark Trustee Company Pvt. Ltd (Trustee) at their meeting held on June 29, 2011 respectively.
NOTES: III 1. On written request, present and prospective unit holders/investors can obtain a copy of the Trust Deed, the
Annual Report, at a price if any, and the text of the Scheme. 2. On written request, the present and prospective unit holder/investor may request a copy of the Annual
Report of the AMC. 3. On written request, present and prospective unit holders/investors can inspect a full list of investment of the
Scheme at the office of the AMC.
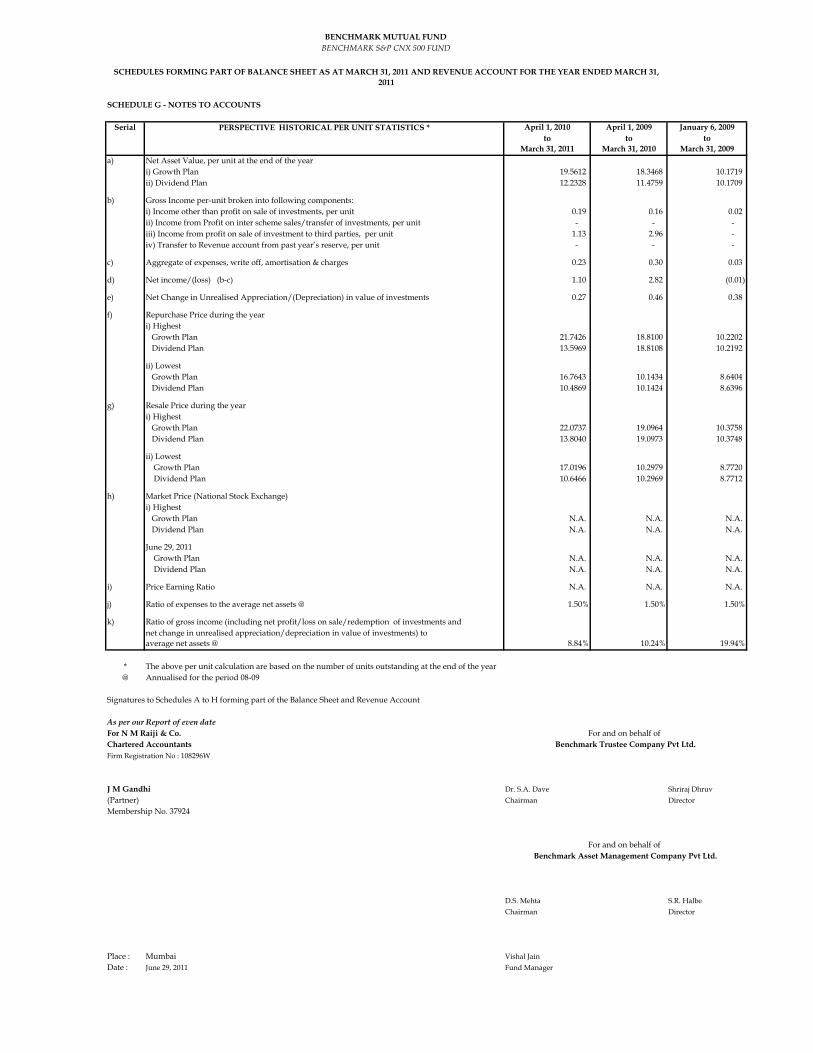
SCHEDULE G - NOTES TO ACCOUNTS
Serial PERSPECTIVE HISTORICAL PER UNIT STATISTICS * April 1, 2010 April 1, 2009 January 6, 2009to to to
March 31, 2011 March 31, 2010 March 31, 2009a) Net Asset Value, per unit at the end of the year
i) Growth Plan 19.5612 18.3468 10.1719 ii) Dividend Plan 12.2328 11.4759 10.1709
b) Gross Income per-unit broken into following components: i) Income other than profit on sale of investments, per unit 0.19 0.16 0.02
ii) Income from Profit on inter scheme sales/transfer of investments, per unit - - - iii) Income from profit on sale of investment to third parties, per unit 1.13 2.96 - iv) Transfer to Revenue account from past year’s reserve, per unit - - -
c) Aggregate of expenses, write off, amortisation & charges 0.23 0.30 0.03
d) Net income/(loss) (b-c) 1.10 2.82 (0.01)
e) Net Change in Unrealised Appreciation/(Depreciation) in value of investments 0.27 0.46 0.38
f) Repurchase Price during the yeari) Highest Growth Plan 21.7426 18.8100 10.2202 Dividend Plan 13.5969 18.8108 10.2192
ii) Lowest Growth Plan 16.7643 10.1434 8.6404 Dividend Plan 10.4869 10.1424 8.6396
g) Resale Price during the yeari) Highest Growth Plan 22.0737 19.0964 10.3758 Dividend Plan 13.8040 19.0973 10.3748
ii) Lowest Growth Plan 17.0196 10.2979 8.7720 Dividend Plan 10.6466 10.2969 8.7712
h) Market Price (National Stock Exchange)i) Highest Growth Plan N.A. N.A. N.A. Dividend Plan N.A. N.A. N.A.
June 29, 2011 Growth Plan N.A. N.A. N.A. Dividend Plan N.A. N.A. N.A.
i) Price Earning Ratio N.A. N.A. N.A.
j) Ratio of expenses to the average net assets @ 1.50% 1.50% 1.50%
k) Ratio of gross income (including net profit/loss on sale/redemption of investments andnet change in unrealised appreciation/depreciation in value of investments) toaverage net assets @ 8.84% 10.24% 19.94%
* The above per unit calculation are based on the number of units outstanding at the end of the year@ Annualised for the period 08-09
Signatures to Schedules A to H forming part of the Balance Sheet and Revenue Account
As per our Report of even dateFor N M Raiji & Co.Chartered AccountantsFirm Registration No : 108296W
J M Gandhi Dr. S.A. Dave Shriraj Dhruv(Partner) Chairman DirectorMembership No. 37924
D.S. Mehta S.R. HalbeChairman Director
Place : Mumbai Vishal JainDate : June 29, 2011 Fund Manager
SCHEDULES FORMING PART OF BALANCE SHEET AS AT MARCH 31, 2011 AND REVENUE ACCOUNT FOR THE YEAR ENDED MARCH 31, 2011
BENCHMARK MUTUAL FUND BENCHMARK S&P CNX 500 FUND
Benchmark Asset Management Company Pvt Ltd.
For and on behalf of Benchmark Trustee Company Pvt Ltd.
For and on behalf of
AUDITORS’ REPORT The Board of Directors, Benchmark Trustee Company Private Limited
We have audited the attached Balance Sheet as at March 31, 2011, the Revenue Account and the Cash
Flow Statement for the year ended on that date annexed thereto, of Shariah Benchmark Exchange
Traded Scheme (the Scheme), of Benchmark Mutual Fund. These financial statements are prepared in
accordance with SEBI (Mutual Fund) Regulations, 1996 (the Regulations) and are the responsibility
of the Management. Our responsibility is to express an opinion on these financial statements based on
our audit.
We conducted our audit in accordance with the standards on auditing issued by Institute of Chartered
Accountants of India. An audit includes examining on a test basis, evidence supporting the amounts
and disclosures in the financial statements. An audit also includes assessing the accounting principles
used and significant estimates made by the management, as well as evaluating the overall financial
statement presentation. We believe that our audit provides a reasonable basis for our opinion.
We report that:
1. We have obtained all information and explanations, which, to the best of our knowledge and
belief were necessary for the purpose of our audit.
2. The Balance Sheet, the Revenue Account and the Cash Flow Statement referred to above are in
agreement with the books of accounts of the Scheme.
3. The accounts have been prepared in accordance with the accounting policies adopted by the
trustees of the Fund and as specified in the Ninth Schedule to the Regulations.

4. In our opinion, valuation methods for Non Traded Securities, if any, adopted by the scheme are
fair and reasonable and are in accordance with the guidelines for valuation issued by SEBI and
approved by the Trustee.
5. Without qualifying our opinion, we draw attention to note no. 25 in Schedule G of the financial
statements whereby the management has not provided the Segment Reporting for reasons
mentioned therein.
6. In our opinion and to the best of our information and according to the explanations given to us,
the financial statements read with the accounting policies and notes to accounts attached thereto,
give the information required as per the Regulations and give a true & fair view in accordance
with the generally accepted accounting principles in India:
a. in the case of Balance Sheet, of the state of affairs of the scheme as at March 31, 2011;
b. in the case of Revenue Account, of the surplus of the scheme for the year ended on that date;
and
c. in the case of Cash Flow Statement, of the cash flows for the year ended on that date.
For N.M.RAIJI & CO. Chartered Accountants
Firm Reg. No:108296W
J. M. GANDHI Partner Membership No. 37924
Place: Mumbai Dated: June 29, 2011
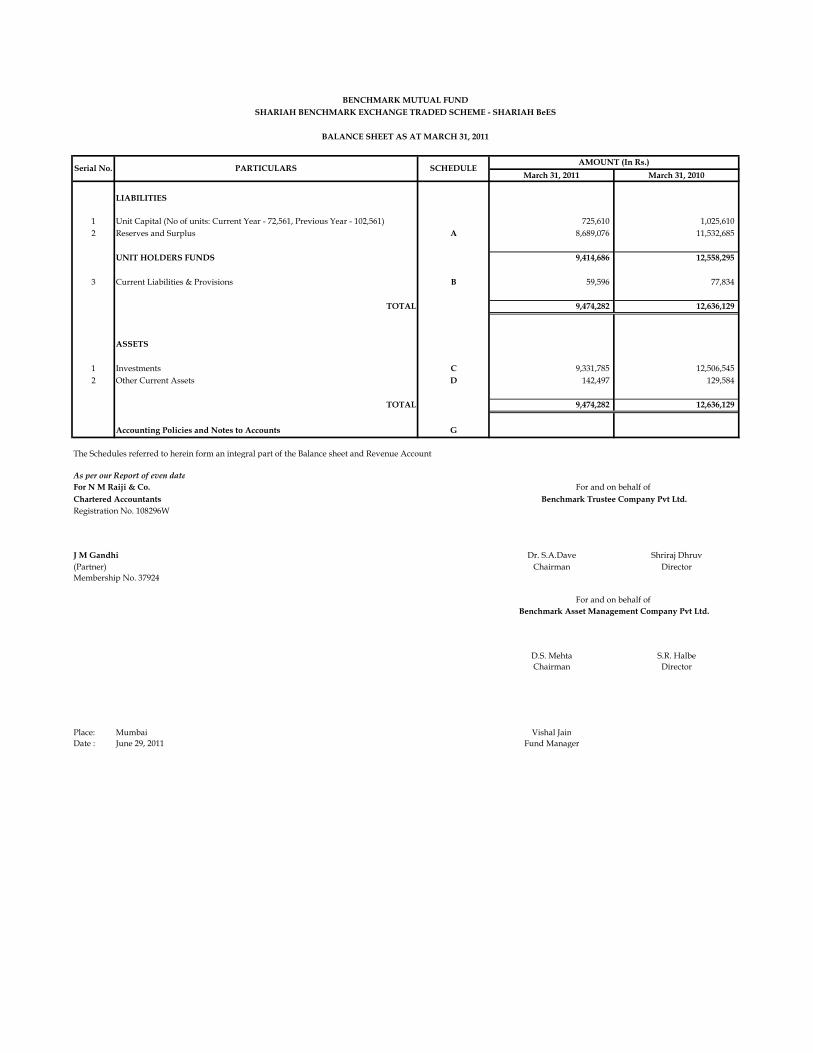
March 31, 2011 March 31, 2010
LIABILITIES
1 Unit Capital (No of units: Current Year - 72,561, Previous Year - 102,561) 725,610 1,025,610 2 Reserves and Surplus A 8,689,076 11,532,685
UNIT HOLDERS FUNDS 9,414,686 12,558,295
3 Current Liabilities & Provisions B 59,596 77,834
TOTAL 9,474,282 12,636,129
ASSETS
1 Investments C 9,331,785 12,506,545 2 Other Current Assets D 142,497 129,584
TOTAL 9,474,282 12,636,129
Accounting Policies and Notes to Accounts G
The Schedules referred to herein form an integral part of the Balance sheet and Revenue Account
As per our Report of even dateFor N M Raiji & Co.Chartered AccountantsRegistration No. 108296W
J M Gandhi Dr. S.A.Dave Shriraj Dhruv(Partner) Chairman DirectorMembership No. 37924
D.S. Mehta S.R. HalbeChairman Director
Place: Mumbai Vishal JainDate : June 29, 2011 Fund Manager
BENCHMARK MUTUAL FUNDSHARIAH BENCHMARK EXCHANGE TRADED SCHEME - SHARIAH BeES
BALANCE SHEET AS AT MARCH 31, 2011
SCHEDULESerial No. PARTICULARSAMOUNT (In Rs.)
For and on behalf of Benchmark Trustee Company Pvt Ltd.
For and on behalf of Benchmark Asset Management Company Pvt Ltd.
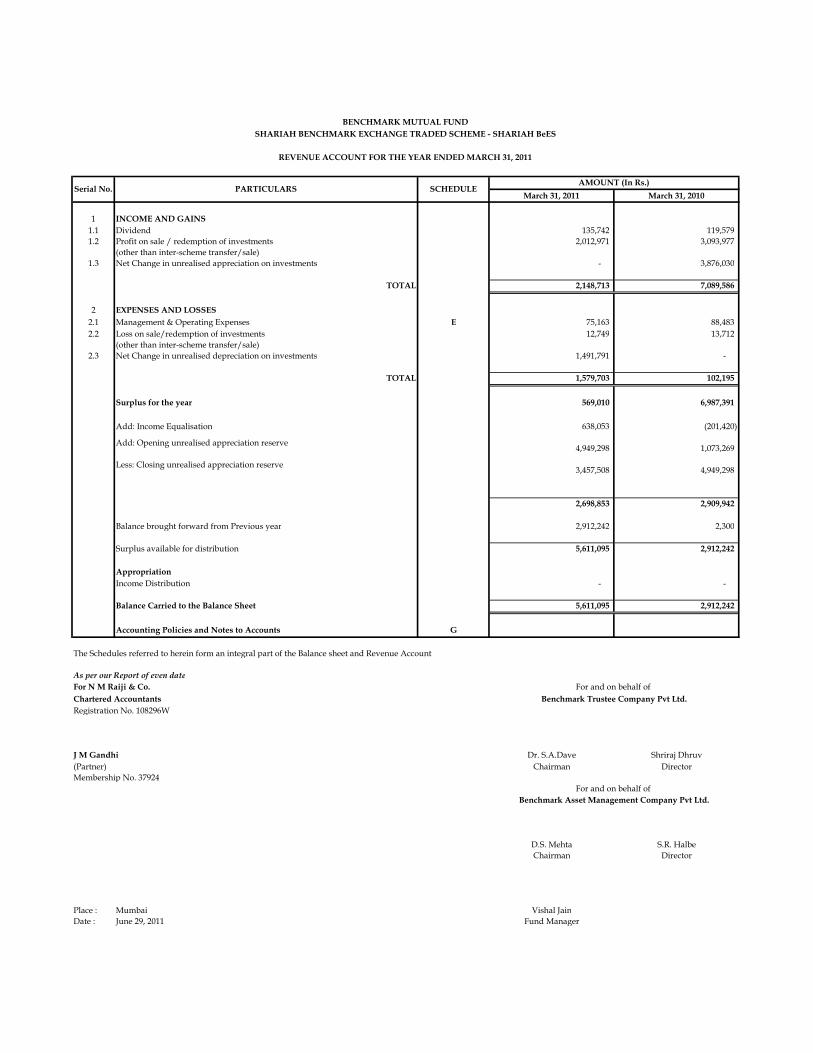
March 31, 2011 March 31, 2010
1 INCOME AND GAINS1.1 Dividend 135,742 119,579 1.2 Profit on sale / redemption of investments 2,012,971 3,093,977
(other than inter-scheme transfer/sale)1.3 Net Change in unrealised appreciation on investments - 3,876,030
TOTAL 2,148,713 7,089,586
2 EXPENSES AND LOSSES2.1 Management & Operating Expenses E 75,163 88,483 2.2 Loss on sale/redemption of investments 12,749 13,712
(other than inter-scheme transfer/sale)2.3 Net Change in unrealised depreciation on investments 1,491,791 -
TOTAL 1,579,703 102,195
Surplus for the year 569,010 6,987,391
Add: Income Equalisation 638,053 (201,420)
2,698,853 2,909,942
Balance brought forward from Previous year 2,912,242 2,300
Surplus available for distribution 5,611,095 2,912,242
AppropriationIncome Distribution - -
Balance Carried to the Balance Sheet 5,611,095 2,912,242
Accounting Policies and Notes to Accounts G
The Schedules referred to herein form an integral part of the Balance sheet and Revenue Account
As per our Report of even dateFor N M Raiji & Co.Chartered AccountantsRegistration No. 108296W
J M Gandhi Dr. S.A.Dave Shriraj Dhruv(Partner) Chairman DirectorMembership No. 37924
D.S. Mehta S.R. HalbeChairman Director
Place : Mumbai Vishal JainDate : June 29, 2011 Fund Manager
Add: Opening unrealised appreciation reserve
Less: Closing unrealised appreciation reserve
For and on behalf of Benchmark Trustee Company Pvt Ltd.
For and on behalf of Benchmark Asset Management Company Pvt Ltd.
BENCHMARK MUTUAL FUNDSHARIAH BENCHMARK EXCHANGE TRADED SCHEME - SHARIAH BeES
REVENUE ACCOUNT FOR THE YEAR ENDED MARCH 31, 2011
SCHEDULEPARTICULARSSerial No.
4,949,298
3,457,508
AMOUNT (In Rs.)
1,073,269
4,949,298
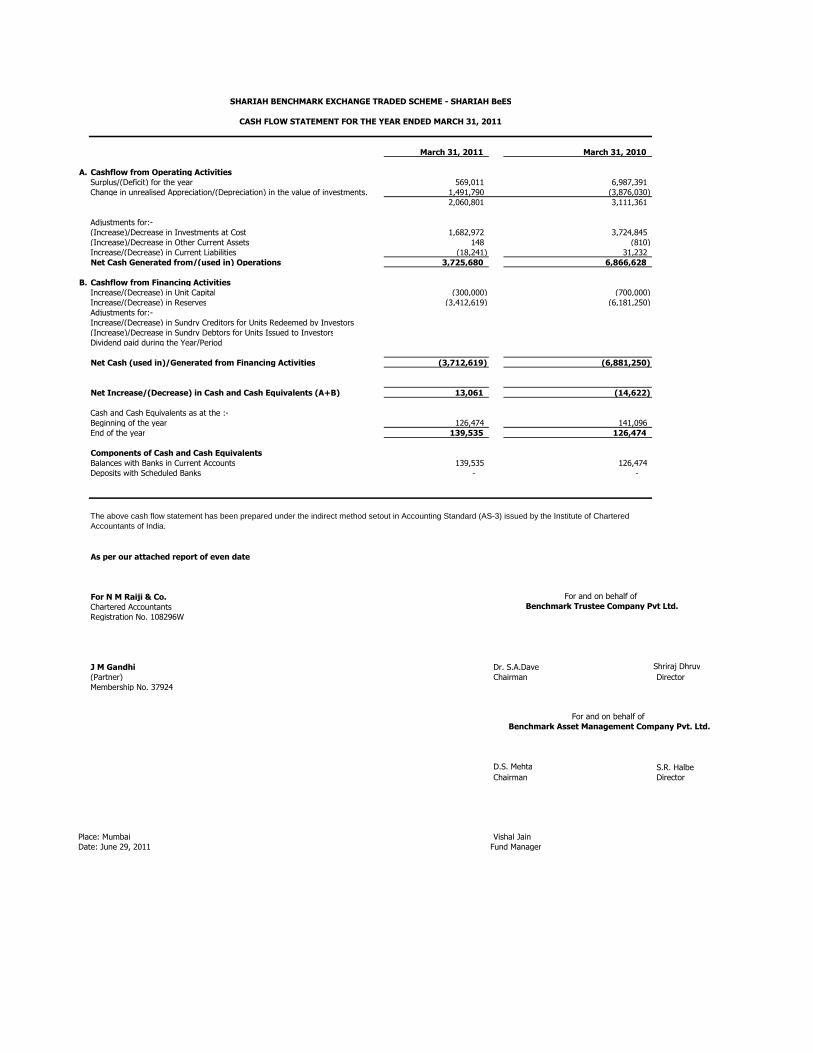
March 31, 2011 March 31, 2010
A. Cashflow from Operating ActivitiesSurplus/(Deficit) for the year 569,011 6,987,391 Change in unrealised Appreciation/(Depreciation) in the value of investments. 1,491,790 (3,876,030)
2,060,801 3,111,361
Adjustments for:-(Increase)/Decrease in Investments at Cost 1,682,972 3,724,845 (Increase)/Decrease in Other Current Assets 148 (810) Increase/(Decrease) in Current Liabilities (18,241) 31,232 Net Cash Generated from/(used in) Operations 3,725,680 6,866,628
B. Cashflow from Financing ActivitiesIncrease/(Decrease) in Unit Capital (300,000) (700,000) Increase/(Decrease) in Reserves (3,412,619) (6,181,250) Adjustments for:-Increase/(Decrease) in Sundry Creditors for Units Redeemed by Investors(Increase)/Decrease in Sundry Debtors for Units Issued to InvestorsDividend paid during the Year/Period
Net Cash (used in)/Generated from Financing Activities (3,712,619) (6,881,250)
Net Increase/(Decrease) in Cash and Cash Equivalents (A+B) 13,061 (14,622)
Cash and Cash Equivalents as at the :-Beginning of the year 126,474 141,096 End of the year 139,535 126,474
Components of Cash and Cash EquivalentsBalances with Banks in Current Accounts 139,535 126,474 Deposits with Scheduled Banks - -
As per our attached report of even date
For N M Raiji & Co. Chartered Accountants Registration No. 108296W
J M Gandhi Dr. S.A.Dave Shriraj Dhruv(Partner) Chairman DirectorMembership No. 37924
D.S. Mehta S.R. HalbeChairman Director
Place: Mumbai Vishal JainDate: June 29, 2011 Fund Manager
Benchmark Asset Management Company Pvt. Ltd.
SHARIAH BENCHMARK EXCHANGE TRADED SCHEME - SHARIAH BeES
CASH FLOW STATEMENT FOR THE YEAR ENDED MARCH 31, 2011
The above cash flow statement has been prepared under the indirect method setout in Accounting Standard (AS-3) issued by the Institute of Chartered Accountants of India.
For and on behalf of
For and on behalf of Benchmark Trustee Company Pvt Ltd.
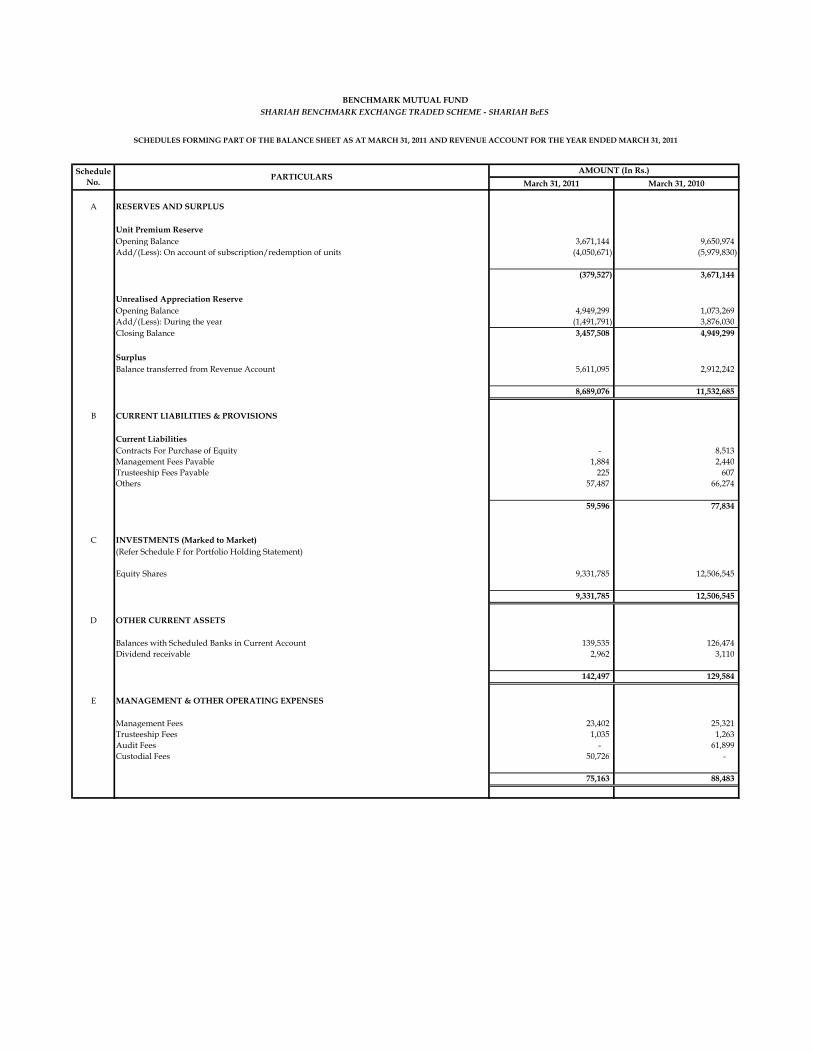
March 31, 2011 March 31, 2010
A RESERVES AND SURPLUS
Unit Premium ReserveOpening Balance 3,671,144 9,650,974 Add/(Less): On account of subscription/redemption of units (4,050,671) (5,979,830)
(379,527) 3,671,144
Unrealised Appreciation ReserveOpening Balance 4,949,299 1,073,269 Add/(Less): During the year (1,491,791) 3,876,030 Closing Balance 3,457,508 4,949,299
SurplusBalance transferred from Revenue Account 5,611,095 2,912,242
8,689,076 11,532,685
B CURRENT LIABILITIES & PROVISIONS
Current LiabilitiesContracts For Purchase of Equity - 8,513 Management Fees Payable 1,884 2,440 Trusteeship Fees Payable 225 607 Others 57,487 66,274
59,596 77,834
C INVESTMENTS (Marked to Market)(Refer Schedule F for Portfolio Holding Statement)
Equity Shares 9,331,785 12,506,545
9,331,785 12,506,545
D OTHER CURRENT ASSETS
Balances with Scheduled Banks in Current Account 139,535 126,474 Dividend receivable 2,962 3,110
142,497 129,584
E MANAGEMENT & OTHER OPERATING EXPENSES
Management Fees 23,402 25,321 Trusteeship Fees 1,035 1,263 Audit Fees - 61,899 Custodial Fees 50,726 -
75,163 88,483
BENCHMARK MUTUAL FUNDSHARIAH BENCHMARK EXCHANGE TRADED SCHEME - SHARIAH BeES
Schedule No.
SCHEDULES FORMING PART OF THE BALANCE SHEET AS AT MARCH 31, 2011 AND REVENUE ACCOUNT FOR THE YEAR ENDED MARCH 31, 2011
PARTICULARSAMOUNT (In Rs.)
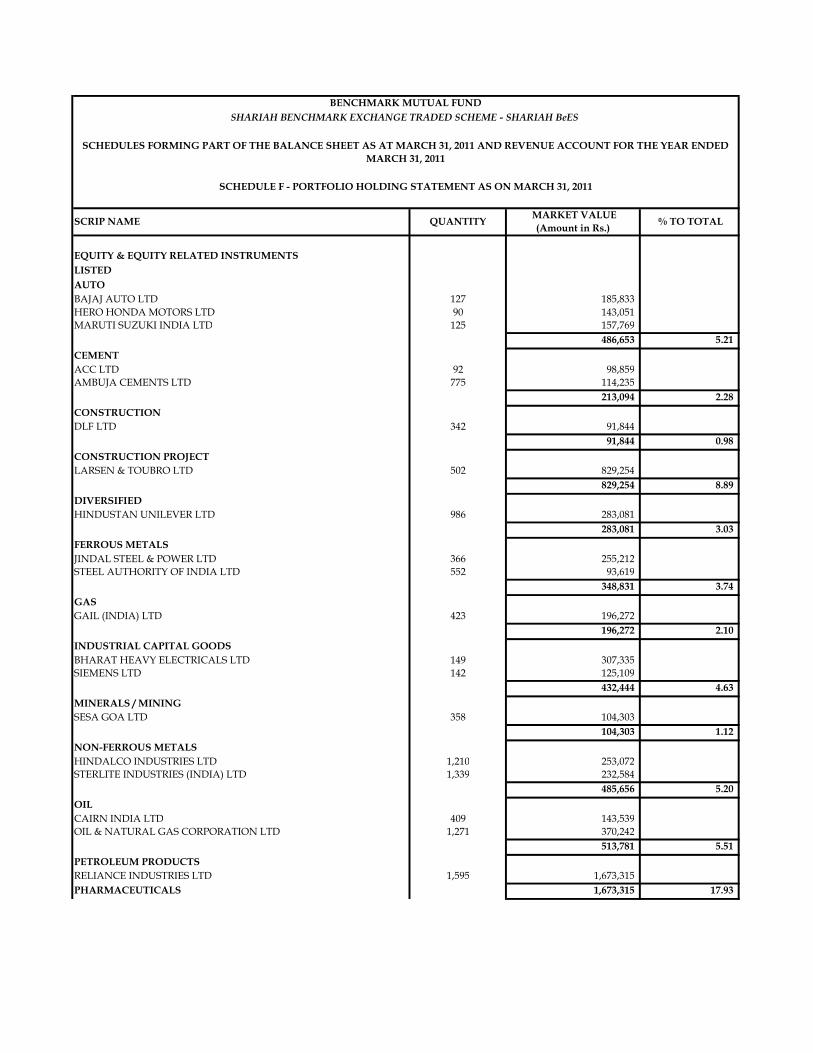
EQUITY & EQUITY RELATED INSTRUMENTSLISTEDAUTOBAJAJ AUTO LTD 127 185,833 HERO HONDA MOTORS LTD 90 143,051 MARUTI SUZUKI INDIA LTD 125 157,769
486,653 5.21 CEMENTACC LTD 92 98,859 AMBUJA CEMENTS LTD 775 114,235
213,094 2.28 CONSTRUCTIONDLF LTD 342 91,844
91,844 0.98 CONSTRUCTION PROJECTLARSEN & TOUBRO LTD 502 829,254
829,254 8.89 DIVERSIFIEDHINDUSTAN UNILEVER LTD 986 283,081
283,081 3.03 FERROUS METALSJINDAL STEEL & POWER LTD 366 255,212 STEEL AUTHORITY OF INDIA LTD 552 93,619
348,831 3.74 GASGAIL (INDIA) LTD 423 196,272
196,272 2.10 INDUSTRIAL CAPITAL GOODSBHARAT HEAVY ELECTRICALS LTD 149 307,335 SIEMENS LTD 142 125,109
432,444 4.63 MINERALS / MININGSESA GOA LTD 358 104,303
104,303 1.12 NON-FERROUS METALSHINDALCO INDUSTRIES LTD 1,210 253,072 STERLITE INDUSTRIES (INDIA) LTD 1,339 232,584
485,656 5.20 OILCAIRN INDIA LTD 409 143,539 OIL & NATURAL GAS CORPORATION LTD 1,271 370,242
513,781 5.51 PETROLEUM PRODUCTSRELIANCE INDUSTRIES LTD 1,595 1,673,315 PHARMACEUTICALS 1,673,315 17.93
BENCHMARK MUTUAL FUND
% TO TOTAL MARKET VALUE (Amount in Rs.) QUANTITYSCRIP NAME
SHARIAH BENCHMARK EXCHANGE TRADED SCHEME - SHARIAH BeES
SCHEDULES FORMING PART OF THE BALANCE SHEET AS AT MARCH 31, 2011 AND REVENUE ACCOUNT FOR THE YEAR ENDED MARCH 31, 2011
SCHEDULE F - PORTFOLIO HOLDING STATEMENT AS ON MARCH 31, 2011
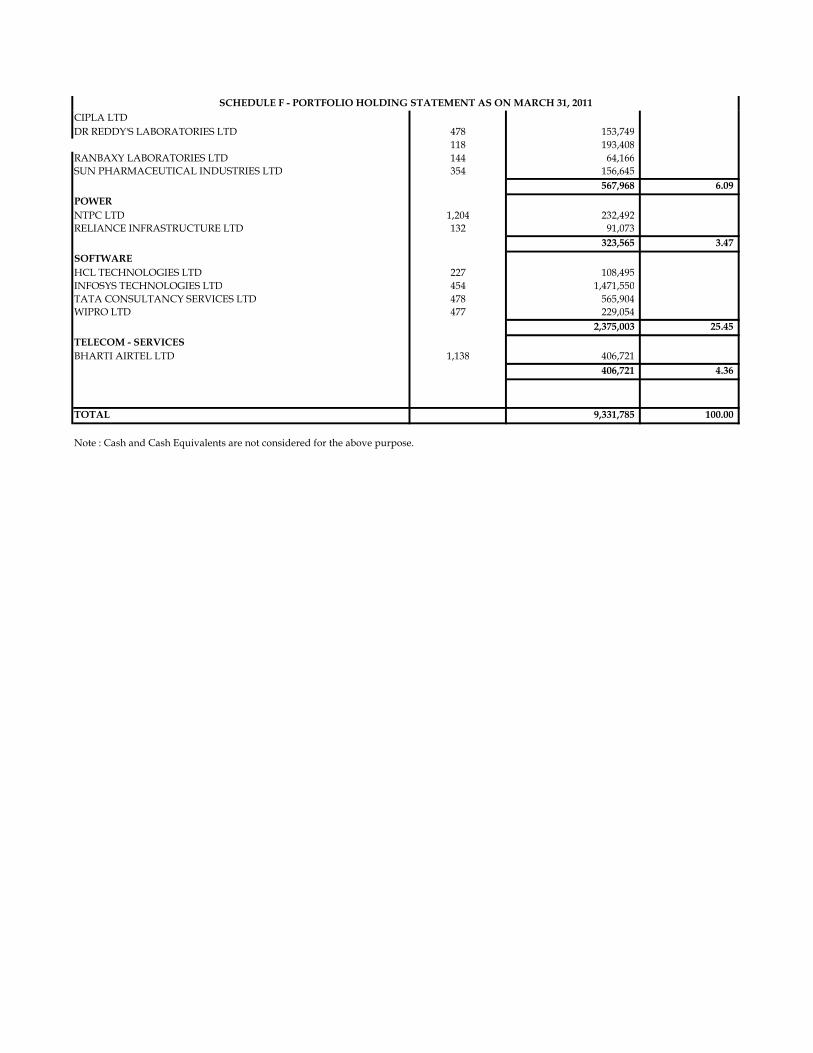
SCHEDULE F - PORTFOLIO HOLDING STATEMENT AS ON MARCH 31, 2011CIPLA LTDDR REDDY'S LABORATORIES LTD 478 153,749
118 193,408 RANBAXY LABORATORIES LTD 144 64,166 SUN PHARMACEUTICAL INDUSTRIES LTD 354 156,645
567,968 6.09 POWERNTPC LTD 1,204 232,492 RELIANCE INFRASTRUCTURE LTD 132 91,073
323,565 3.47 SOFTWAREHCL TECHNOLOGIES LTD 227 108,495 INFOSYS TECHNOLOGIES LTD 454 1,471,550 TATA CONSULTANCY SERVICES LTD 478 565,904 WIPRO LTD 477 229,054
2,375,003 25.45 TELECOM - SERVICESBHARTI AIRTEL LTD 1,138 406,721
406,721 4.36
TOTAL 9,331,785 100.00
Note : Cash and Cash Equivalents are not considered for the above purpose.
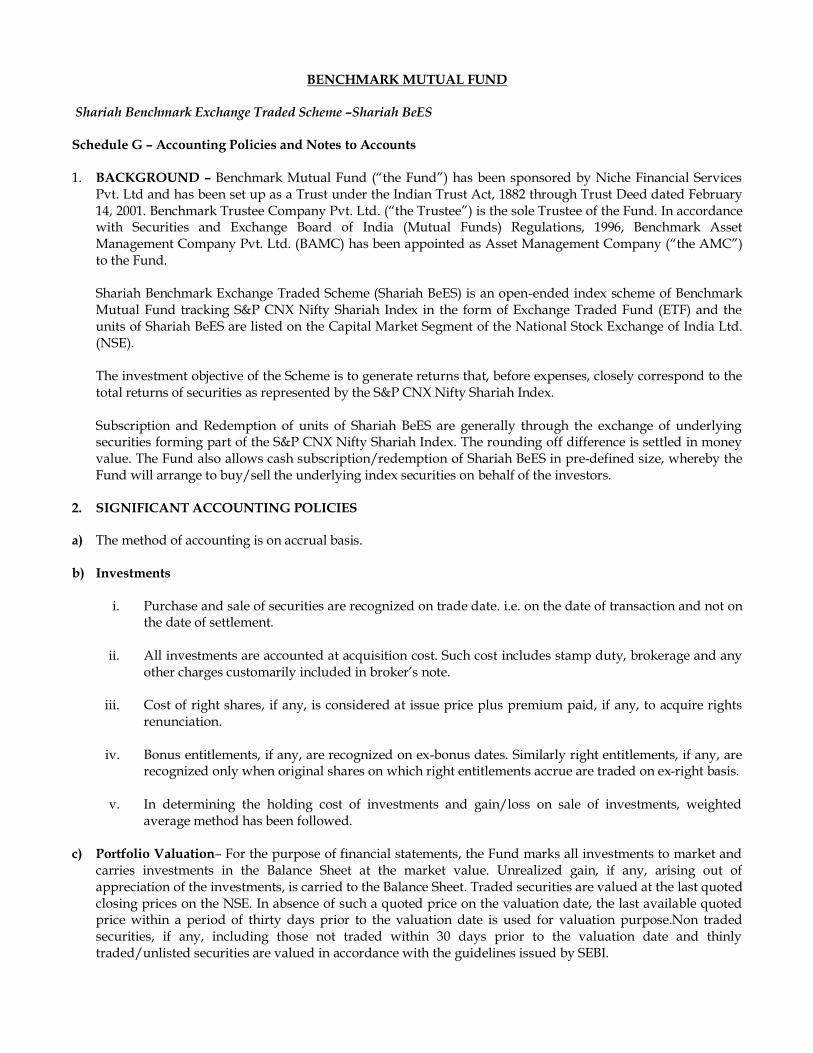
BENCHMARK MUTUAL FUND Shariah Benchmark Exchange Traded Scheme –Shariah BeES Schedule G – Accounting Policies and Notes to Accounts 1. BACKGROUND – Benchmark Mutual Fund (“the Fund”) has been sponsored by Niche Financial Services
Pvt. Ltd and has been set up as a Trust under the Indian Trust Act, 1882 through Trust Deed dated February 14, 2001. Benchmark Trustee Company Pvt. Ltd. (“the Trustee”) is the sole Trustee of the Fund. In accordance with Securities and Exchange Board of India (Mutual Funds) Regulations, 1996, Benchmark Asset Management Company Pvt. Ltd. (BAMC) has been appointed as Asset Management Company (“the AMC”) to the Fund.
Shariah Benchmark Exchange Traded Scheme (Shariah BeES) is an open-ended index scheme of Benchmark Mutual Fund tracking S&P CNX Nifty Shariah Index in the form of Exchange Traded Fund (ETF) and the units of Shariah BeES are listed on the Capital Market Segment of the National Stock Exchange of India Ltd. (NSE). The investment objective of the Scheme is to generate returns that, before expenses, closely correspond to the total returns of securities as represented by the S&P CNX Nifty Shariah Index. Subscription and Redemption of units of Shariah BeES are generally through the exchange of underlying securities forming part of the S&P CNX Nifty Shariah Index. The rounding off difference is settled in money value. The Fund also allows cash subscription/redemption of Shariah BeES in pre-defined size, whereby the Fund will arrange to buy/sell the underlying index securities on behalf of the investors.
2. SIGNIFICANT ACCOUNTING POLICIES a) The method of accounting is on accrual basis.
b) Investments
i. Purchase and sale of securities are recognized on trade date. i.e. on the date of transaction and not on
the date of settlement.
ii. All investments are accounted at acquisition cost. Such cost includes stamp duty, brokerage and any other charges customarily included in broker’s note.
iii. Cost of right shares, if any, is considered at issue price plus premium paid, if any, to acquire rights
renunciation.
iv. Bonus entitlements, if any, are recognized on ex-bonus dates. Similarly right entitlements, if any, are recognized only when original shares on which right entitlements accrue are traded on ex-right basis.
v. In determining the holding cost of investments and gain/loss on sale of investments, weighted
average method has been followed. c) Portfolio Valuation– For the purpose of financial statements, the Fund marks all investments to market and
carries investments in the Balance Sheet at the market value. Unrealized gain, if any, arising out of appreciation of the investments, is carried to the Balance Sheet. Traded securities are valued at the last quoted closing prices on the NSE. In absence of such a quoted price on the valuation date, the last available quoted price within a period of thirty days prior to the valuation date is used for valuation purpose.Non traded securities, if any, including those not traded within 30 days prior to the valuation date and thinly traded/unlisted securities are valued in accordance with the guidelines issued by SEBI.
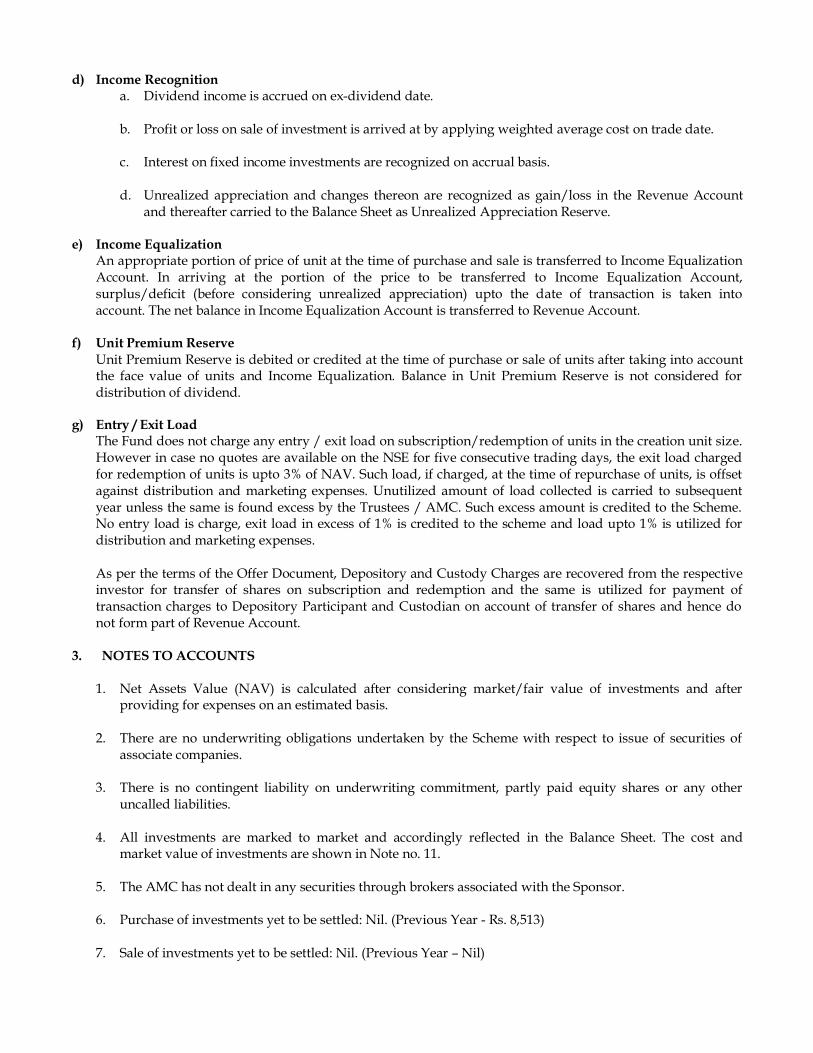
d) Income Recognition a. Dividend income is accrued on ex-dividend date. b. Profit or loss on sale of investment is arrived at by applying weighted average cost on trade date.
c. Interest on fixed income investments are recognized on accrual basis.
d. Unrealized appreciation and changes thereon are recognized as gain/loss in the Revenue Account
and thereafter carried to the Balance Sheet as Unrealized Appreciation Reserve. e) Income Equalization
An appropriate portion of price of unit at the time of purchase and sale is transferred to Income Equalization Account. In arriving at the portion of the price to be transferred to Income Equalization Account, surplus/deficit (before considering unrealized appreciation) upto the date of transaction is taken into account. The net balance in Income Equalization Account is transferred to Revenue Account.
f) Unit Premium Reserve Unit Premium Reserve is debited or credited at the time of purchase or sale of units after taking into account the face value of units and Income Equalization. Balance in Unit Premium Reserve is not considered for distribution of dividend.
g) Entry / Exit Load The Fund does not charge any entry / exit load on subscription/redemption of units in the creation unit size. However in case no quotes are available on the NSE for five consecutive trading days, the exit load charged for redemption of units is upto 3% of NAV. Such load, if charged, at the time of repurchase of units, is offset against distribution and marketing expenses. Unutilized amount of load collected is carried to subsequent year unless the same is found excess by the Trustees / AMC. Such excess amount is credited to the Scheme. No entry load is charge, exit load in excess of 1% is credited to the scheme and load upto 1% is utilized for distribution and marketing expenses. As per the terms of the Offer Document, Depository and Custody Charges are recovered from the respective investor for transfer of shares on subscription and redemption and the same is utilized for payment of transaction charges to Depository Participant and Custodian on account of transfer of shares and hence do not form part of Revenue Account.
3. NOTES TO ACCOUNTS 1. Net Assets Value (NAV) is calculated after considering market/fair value of investments and after
providing for expenses on an estimated basis. 2. There are no underwriting obligations undertaken by the Scheme with respect to issue of securities of
associate companies. 3. There is no contingent liability on underwriting commitment, partly paid equity shares or any other
uncalled liabilities. 4. All investments are marked to market and accordingly reflected in the Balance Sheet. The cost and
market value of investments are shown in Note no. 11. 5. The AMC has not dealt in any securities through brokers associated with the Sponsor. 6. Purchase of investments yet to be settled: Nil. (Previous Year - Rs. 8,513) 7. Sale of investments yet to be settled: Nil. (Previous Year – Nil)
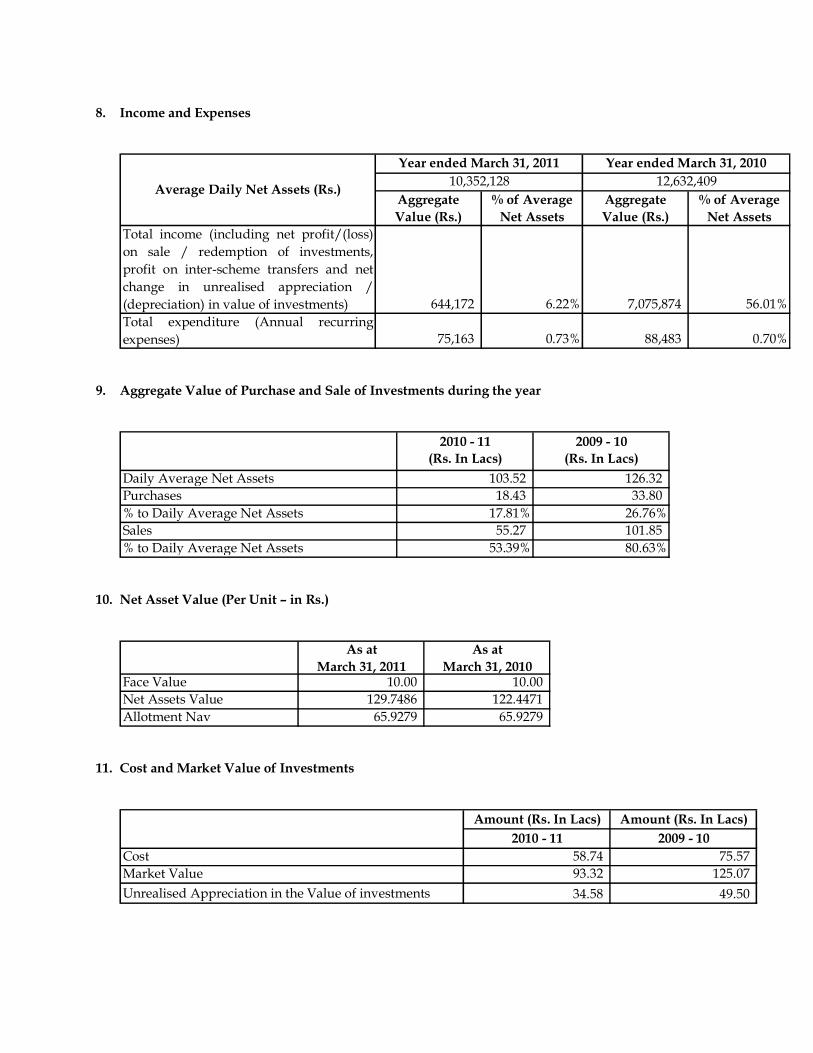
8. Income and Expenses
Total income (including net profit/(loss)on sale / redemption of investments,profit on inter-scheme transfers and netchange in unrealised appreciation /(depreciation) in value of investments) 644,172 6.22% 7,075,874 56.01%Total expenditure (Annual recurringexpenses) 75,163 0.73% 88,483 0.70%
Average Daily Net Assets (Rs.)
Year ended March 31, 2011 Year ended March 31, 201010,352,128 12,632,409
Aggregate Value (Rs.)
% of Average Net Assets
Aggregate Value (Rs.)
% of Average Net Assets
9. Aggregate Value of Purchase and Sale of Investments during the year
2010 - 11(Rs. In Lacs)
2009 - 10(Rs. In Lacs)
Daily Average Net Assets 103.52 126.32 Purchases 18.43 33.80 % to Daily Average Net Assets 17.81% 26.76%Sales 55.27 101.85 % to Daily Average Net Assets 53.39% 80.63%
10. Net Asset Value (Per Unit – in Rs.)
As at March 31, 2011
As at March 31, 2010
Face Value 10.00 10.00 Net Assets Value 129.7486 122.4471 Allotment Nav 65.9279 65.9279
11. Cost and Market Value of Investments
Amount (Rs. In Lacs) Amount (Rs. In Lacs)2010 - 11 2009 - 10
Cost 58.74 75.57 Market Value 93.32 125.07 Unrealised Appreciation in the Value of investments 34.58 49.50
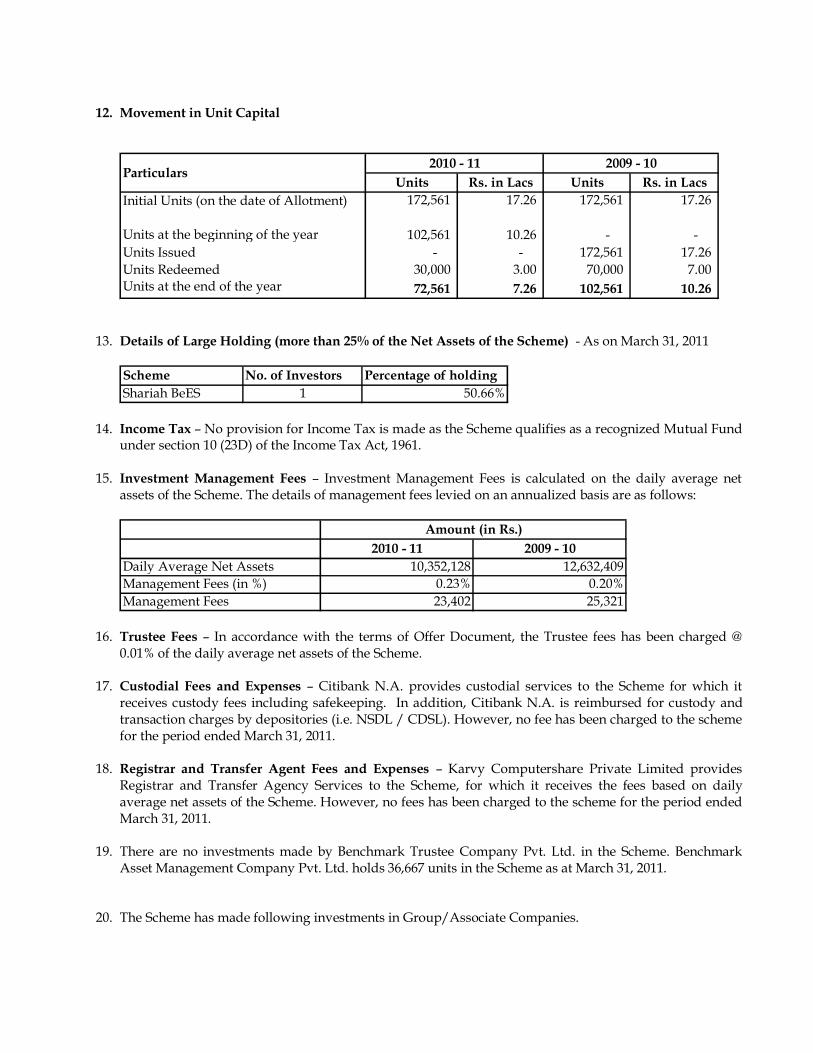
12. Movement in Unit Capital
Units Rs. in Lacs Units Rs. in LacsInitial Units (on the date of Allotment) 172,561 17.26 172,561 17.26
Units at the beginning of the year 102,561 10.26 - - Units Issued - - 172,561 17.26 Units Redeemed 30,000 3.00 70,000 7.00 Units at the end of the year 72,561 7.26 102,561 10.26
Particulars2010 - 11 2009 - 10
13. Details of Large Holding (more than 25% of the Net Assets of the Scheme) - As on March 31, 2011
Scheme No. of Investors Percentage of holdingShariah BeES 1 50.66%
14. Income Tax – No provision for Income Tax is made as the Scheme qualifies as a recognized Mutual Fund
under section 10 (23D) of the Income Tax Act, 1961. 15. Investment Management Fees – Investment Management Fees is calculated on the daily average net
assets of the Scheme. The details of management fees levied on an annualized basis are as follows:
2010 - 11 2009 - 10Daily Average Net Assets 10,352,128 12,632,409Management Fees (in %) 0.23% 0.20%Management Fees 23,402 25,321
Amount (in Rs.)
16. Trustee Fees – In accordance with the terms of Offer Document, the Trustee fees has been charged @
0.01% of the daily average net assets of the Scheme.
17. Custodial Fees and Expenses – Citibank N.A. provides custodial services to the Scheme for which it receives custody fees including safekeeping. In addition, Citibank N.A. is reimbursed for custody and transaction charges by depositories (i.e. NSDL / CDSL). However, no fee has been charged to the scheme for the period ended March 31, 2011.
18. Registrar and Transfer Agent Fees and Expenses – Karvy Computershare Private Limited provides
Registrar and Transfer Agency Services to the Scheme, for which it receives the fees based on daily average net assets of the Scheme. However, no fees has been charged to the scheme for the period ended March 31, 2011.
19. There are no investments made by Benchmark Trustee Company Pvt. Ltd. in the Scheme. Benchmark
Asset Management Company Pvt. Ltd. holds 36,667 units in the Scheme as at March 31, 2011.
20. The Scheme has made following investments in Group/Associate Companies.
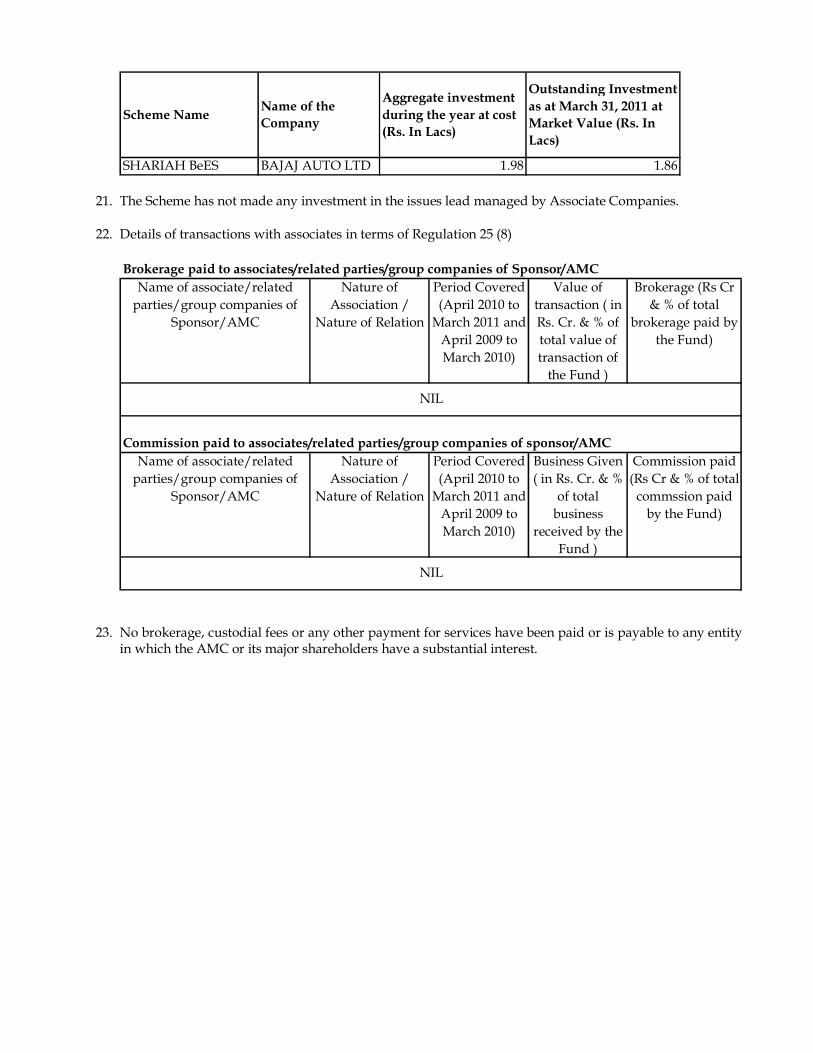
SHARIAH BeES BAJAJ AUTO LTD 1.98 1.86
Scheme Name Name of the Company
Aggregate investment during the year at cost (Rs. In Lacs)
Outstanding Investment as at March 31, 2011 at Market Value (Rs. In Lacs)
21. The Scheme has not made any investment in the issues lead managed by Associate Companies. 22. Details of transactions with associates in terms of Regulation 25 (8)
Brokerage paid to associates/related parties/group companies of Sponsor/AMC
Name of associate/related parties/group companies of
Sponsor/AMC
Nature of Association /
Nature of Relation
Period Covered (April 2010 to
March 2011 and April 2009 to March 2010)
Value of transaction ( in Rs. Cr. & % of total value of transaction of
the Fund )
Brokerage (Rs Cr & % of total
brokerage paid by the Fund)
Commission paid to associates/related parties/group companies of sponsor/AMCName of associate/related
parties/group companies of Sponsor/AMC
Nature of Association /
Nature of Relation
Period Covered (April 2010 to
March 2011 and April 2009 to March 2010)
Business Given ( in Rs. Cr. & %
of total business
received by the Fund )
Commission paid (Rs Cr & % of total
commssion paid by the Fund)
NIL
NIL
23. No brokerage, custodial fees or any other payment for services have been paid or is payable to any entity
in which the AMC or its major shareholders have a substantial interest.
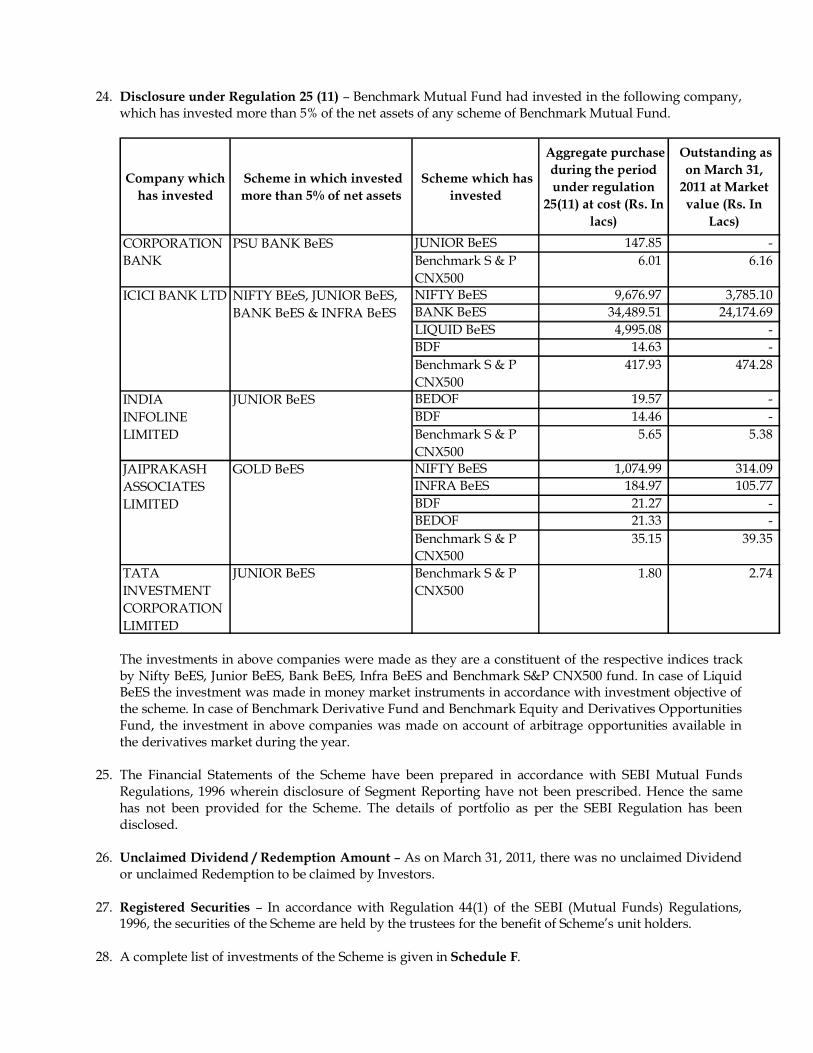
24. Disclosure under Regulation 25 (11) – Benchmark Mutual Fund had invested in the following company,
which has invested more than 5% of the net assets of any scheme of Benchmark Mutual Fund.
Company which has invested
Scheme in which invested more than 5% of net assets
Scheme which has invested
Aggregate purchase during the period under regulation
25(11) at cost (Rs. In lacs)
Outstanding as on March 31,
2011 at Market value (Rs. In
Lacs)JUNIOR BeES 147.85 -Benchmark S & P CNX500
6.01 6.16
NIFTY BeES 9,676.97 3,785.10 BANK BeES 34,489.51 24,174.69 LIQUID BeES 4,995.08 -BDF 14.63 -Benchmark S & P CNX500
417.93 474.28
BEDOF 19.57 -BDF 14.46 -Benchmark S & P CNX500
5.65 5.38
NIFTY BeES 1,074.99 314.09 INFRA BeES 184.97 105.77 BDF 21.27 -BEDOF 21.33 -Benchmark S & P CNX500
35.15 39.35
TATA INVESTMENT CORPORATION LIMITED
JUNIOR BeES Benchmark S & P CNX500
1.80 2.74
INDIA INFOLINE LIMITED
JUNIOR BeES
JAIPRAKASH ASSOCIATES LIMITED
GOLD BeES
CORPORATION BANK
PSU BANK BeES
ICICI BANK LTD NIFTY BEeS, JUNIOR BeES, BANK BeES & INFRA BeES
The investments in above companies were made as they are a constituent of the respective indices track by Nifty BeES, Junior BeES, Bank BeES, Infra BeES and Benchmark S&P CNX500 fund. In case of Liquid BeES the investment was made in money market instruments in accordance with investment objective of the scheme. In case of Benchmark Derivative Fund and Benchmark Equity and Derivatives Opportunities Fund, the investment in above companies was made on account of arbitrage opportunities available in the derivatives market during the year.
25. The Financial Statements of the Scheme have been prepared in accordance with SEBI Mutual Funds Regulations, 1996 wherein disclosure of Segment Reporting have not been prescribed. Hence the same has not been provided for the Scheme. The details of portfolio as per the SEBI Regulation has been disclosed.
26. Unclaimed Dividend / Redemption Amount – As on March 31, 2011, there was no unclaimed Dividend
or unclaimed Redemption to be claimed by Investors.
27. Registered Securities – In accordance with Regulation 44(1) of the SEBI (Mutual Funds) Regulations, 1996, the securities of the Scheme are held by the trustees for the benefit of Scheme’s unit holders.
28. A complete list of investments of the Scheme is given in Schedule F.
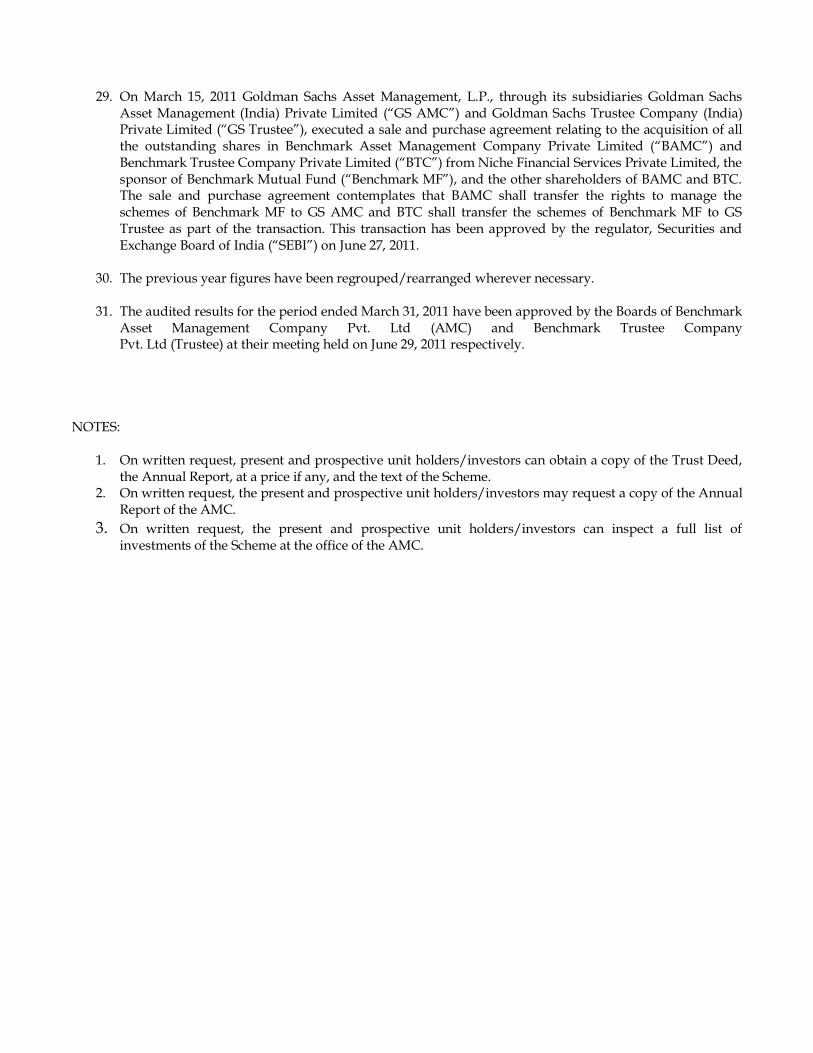
29. On March 15, 2011 Goldman Sachs Asset Management, L.P., through its subsidiaries Goldman Sachs
Asset Management (India) Private Limited (“GS AMC”) and Goldman Sachs Trustee Company (India) Private Limited (“GS Trustee”), executed a sale and purchase agreement relating to the acquisition of all the outstanding shares in Benchmark Asset Management Company Private Limited (“BAMC”) and Benchmark Trustee Company Private Limited (“BTC”) from Niche Financial Services Private Limited, the sponsor of Benchmark Mutual Fund (“Benchmark MF”), and the other shareholders of BAMC and BTC. The sale and purchase agreement contemplates that BAMC shall transfer the rights to manage the schemes of Benchmark MF to GS AMC and BTC shall transfer the schemes of Benchmark MF to GS Trustee as part of the transaction. This transaction has been approved by the regulator, Securities and Exchange Board of India (“SEBI”) on June 27, 2011.
30. The previous year figures have been regrouped/rearranged wherever necessary.
31. The audited results for the period ended March 31, 2011 have been approved by the Boards of Benchmark
Asset Management Company Pvt. Ltd (AMC) and Benchmark Trustee Company Pvt. Ltd (Trustee) at their meeting held on June 29, 2011 respectively.
NOTES:
1. On written request, present and prospective unit holders/investors can obtain a copy of the Trust Deed, the Annual Report, at a price if any, and the text of the Scheme.
2. On written request, the present and prospective unit holders/investors may request a copy of the Annual Report of the AMC.
3. On written request, the present and prospective unit holders/investors can inspect a full list of investments of the Scheme at the office of the AMC.
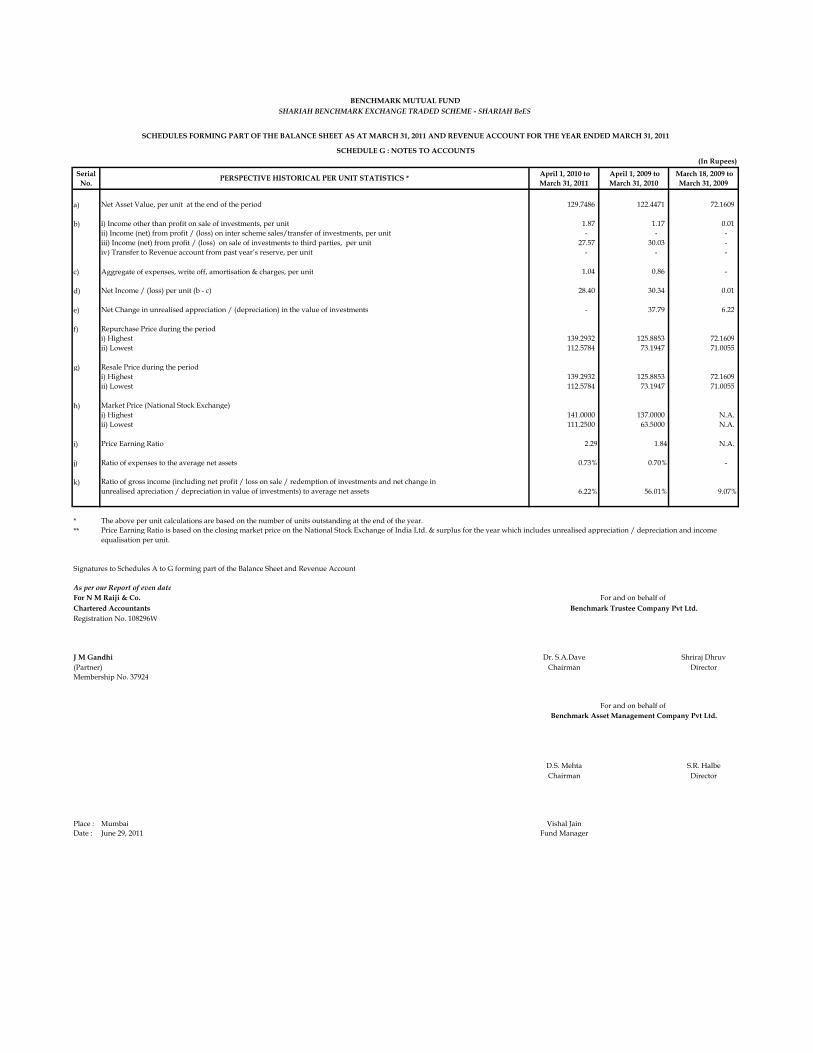
(In Rupees)
Serial No.
April 1, 2010 to March 31, 2011
April 1, 2009 to March 31, 2010
March 18, 2009 to March 31, 2009
a) Net Asset Value, per unit at the end of the period 129.7486 122.4471 72.1609
b) i) Income other than profit on sale of investments, per unit 1.87 1.17 0.01 ii) Income (net) from profit / (loss) on inter scheme sales/transfer of investments, per unit - - - iii) Income (net) from profit / (loss) on sale of investments to third parties, per unit 27.57 30.03 - iv) Transfer to Revenue account from past year’s reserve, per unit - - -
c) Aggregate of expenses, write off, amortisation & charges, per unit 1.04 0.86 -
d) Net Income / (loss) per unit (b - c) 28.40 30.34 0.01
e) Net Change in unrealised appreciation / (depreciation) in the value of investments - 37.79 6.22
f) Repurchase Price during the periodi) Highest 139.2932 125.8853 72.1609 ii) Lowest 112.5784 73.1947 71.0055
g) Resale Price during the periodi) Highest 139.2932 125.8853 72.1609 ii) Lowest 112.5784 73.1947 71.0055
h) Market Price (National Stock Exchange)i) Highest 141.0000 137.0000 N.A.ii) Lowest 111.2500 63.5000 N.A.
i) Price Earning Ratio 2.29 1.84 N.A.
j) Ratio of expenses to the average net assets 0.73% 0.70% -
k) Ratio of gross income (including net profit / loss on sale / redemption of investments and net change in unrealised apreciation / depreciation in value of investments) to average net assets 6.22% 56.01% 9.07%
***
Signatures to Schedules A to G forming part of the Balance Sheet and Revenue Account
As per our Report of even dateFor N M Raiji & Co.Chartered AccountantsRegistration No. 108296W
J M Gandhi Dr. S.A.Dave Shriraj Dhruv(Partner) Chairman DirectorMembership No. 37924
D.S. Mehta S.R. HalbeChairman Director
Place : Mumbai Vishal JainDate : June 29, 2011 Fund Manager
For and on behalf of Benchmark Asset Management Company Pvt Ltd.
For and on behalf of Benchmark Trustee Company Pvt Ltd.
Price Earning Ratio is based on the closing market price on the National Stock Exchange of India Ltd. & surplus for the year which includes unrealised appreciation / depreciation and income equalisation per unit.
BENCHMARK MUTUAL FUND
SCHEDULES FORMING PART OF THE BALANCE SHEET AS AT MARCH 31, 2011 AND REVENUE ACCOUNT FOR THE YEAR ENDED MARCH 31, 2011
The above per unit calculations are based on the number of units outstanding at the end of the year.
SCHEDULE G : NOTES TO ACCOUNTS
SHARIAH BENCHMARK EXCHANGE TRADED SCHEME - SHARIAH BeES
PERSPECTIVE HISTORICAL PER UNIT STATISTICS *

AUDITORS’ REPORT The Board of Directors, Benchmark Trustee Company Private Limited
We have audited the attached Balance Sheet as at March 31, 2011, the Revenue Account and the Cash
Flow Statement for the year ended on that date annexed thereto, of Hang Seng Benchmark Exchange
Traded Scheme (the Scheme), of Benchmark Mutual Fund. These financial statements are prepared in
accordance with SEBI (Mutual Fund) Regulations, 1996 (the Regulations) and are the responsibility
of the Management. Our responsibility is to express an opinion on these financial statements based on
our audit.
We conducted our audit in accordance with the standards on auditing issued by Institute of Chartered
Accountants of India. An audit includes examining on a test basis, evidence supporting the amounts
and disclosures in the financial statements. An audit also includes assessing the accounting principles
used and significant estimates made by the management, as well as evaluating the overall financial
statement presentation. We believe that our audit provides a reasonable basis for our opinion.
We report that:
1. We have obtained all information and explanations, which, to the best of our knowledge and
belief were necessary for the purpose of our audit.
2. The Balance Sheet, the Revenue Account and the Cash Flow Statement referred to above are
in agreement with the books of accounts of the Scheme.
3. The accounts have been prepared in accordance with the accounting policies adopted by the
trustees of the Fund and as specified in the Ninth Schedule to the Regulations.
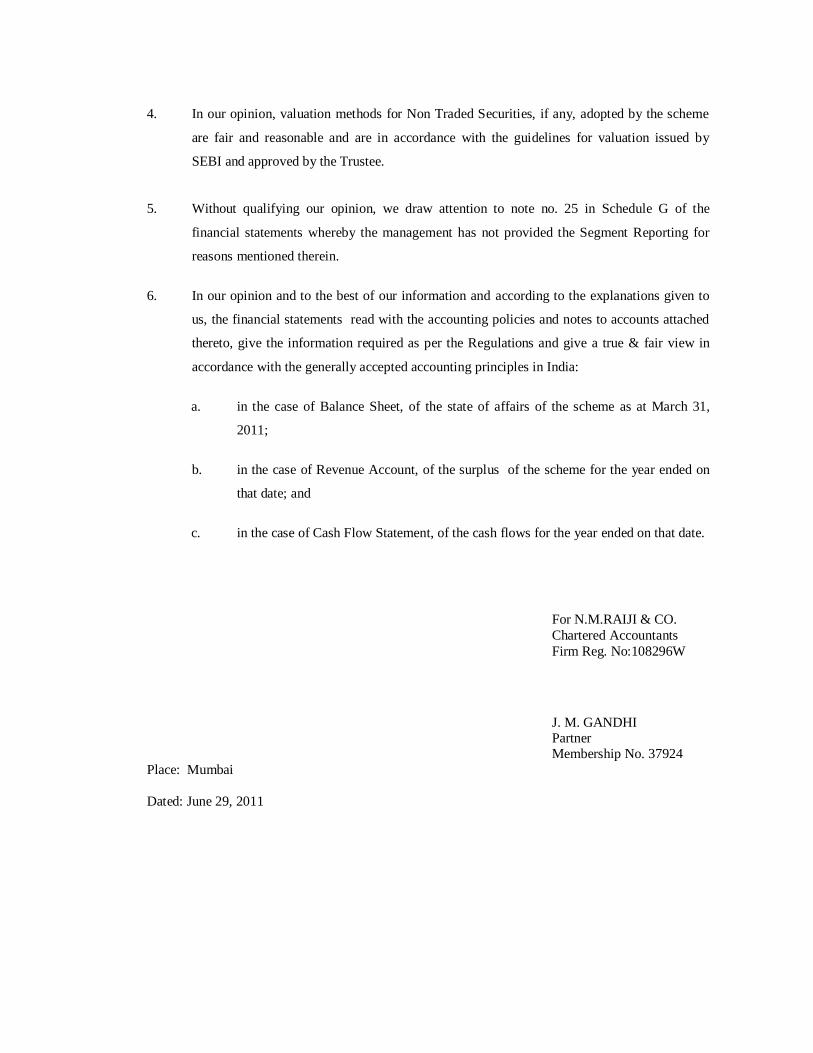
4. In our opinion, valuation methods for Non Traded Securities, if any, adopted by the scheme
are fair and reasonable and are in accordance with the guidelines for valuation issued by
SEBI and approved by the Trustee.
5. Without qualifying our opinion, we draw attention to note no. 25 in Schedule G of the
financial statements whereby the management has not provided the Segment Reporting for
reasons mentioned therein.
6. In our opinion and to the best of our information and according to the explanations given to
us, the financial statements read with the accounting policies and notes to accounts attached
thereto, give the information required as per the Regulations and give a true & fair view in
accordance with the generally accepted accounting principles in India:
a. in the case of Balance Sheet, of the state of affairs of the scheme as at March 31,
2011;
b. in the case of Revenue Account, of the surplus of the scheme for the year ended on
that date; and
c. in the case of Cash Flow Statement, of the cash flows for the year ended on that date.
For N.M.RAIJI & CO. Chartered Accountants
Firm Reg. No:108296W
J. M. GANDHI Partner Membership No. 37924
Place: Mumbai Dated: June 29, 2011
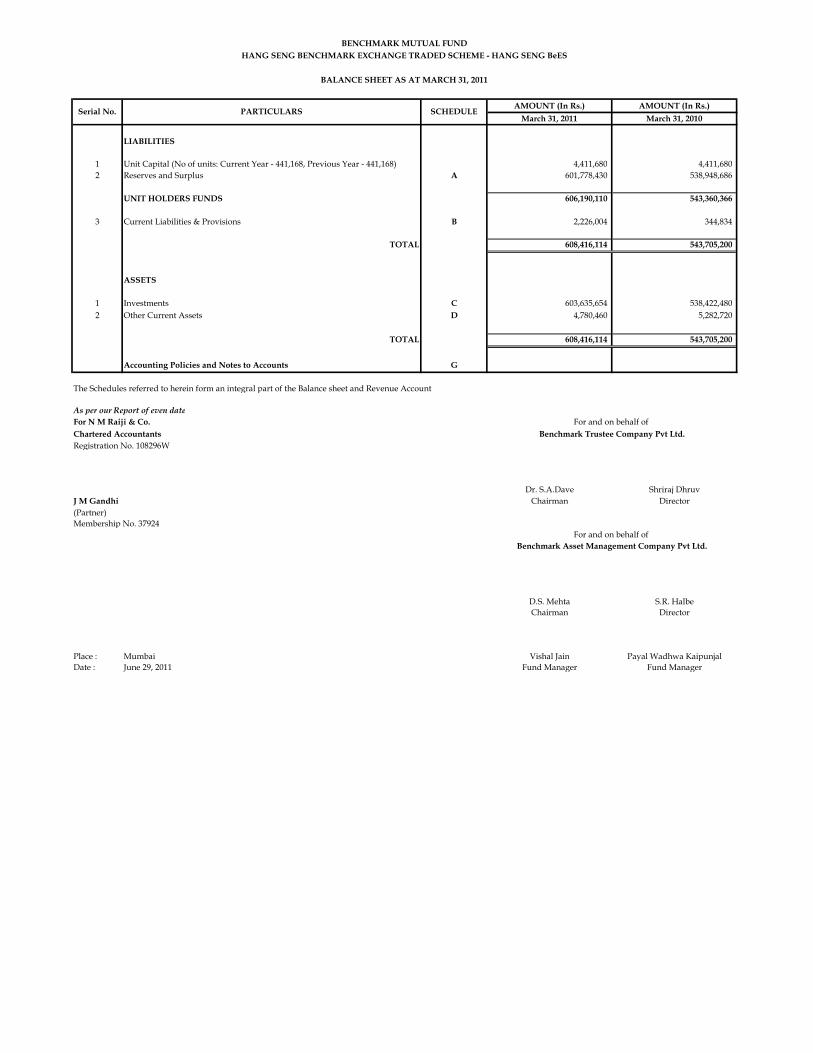
AMOUNT (In Rs.) AMOUNT (In Rs.)March 31, 2011 March 31, 2010
LIABILITIES
1 Unit Capital (No of units: Current Year - 441,168, Previous Year - 441,168) 4,411,680 4,411,680 2 Reserves and Surplus A 601,778,430 538,948,686
UNIT HOLDERS FUNDS 606,190,110 543,360,366
3 Current Liabilities & Provisions B 2,226,004 344,834
TOTAL 608,416,114 543,705,200
ASSETS
1 Investments C 603,635,654 538,422,480 2 Other Current Assets D 4,780,460 5,282,720
TOTAL 608,416,114 543,705,200
Accounting Policies and Notes to Accounts G
The Schedules referred to herein form an integral part of the Balance sheet and Revenue Account
As per our Report of even dateFor N M Raiji & Co.Chartered AccountantsRegistration No. 108296W
Dr. S.A.Dave Shriraj DhruvJ M Gandhi Chairman Director(Partner)Membership No. 37924
D.S. Mehta S.R. HalbeChairman Director
Place : Mumbai Vishal Jain Payal Wadhwa KaipunjalDate : June 29, 2011 Fund Manager Fund Manager
BENCHMARK MUTUAL FUNDHANG SENG BENCHMARK EXCHANGE TRADED SCHEME - HANG SENG BeES
BALANCE SHEET AS AT MARCH 31, 2011
Serial No. PARTICULARS SCHEDULE
For and on behalf of Benchmark Trustee Company Pvt Ltd.
For and on behalf of Benchmark Asset Management Company Pvt Ltd.
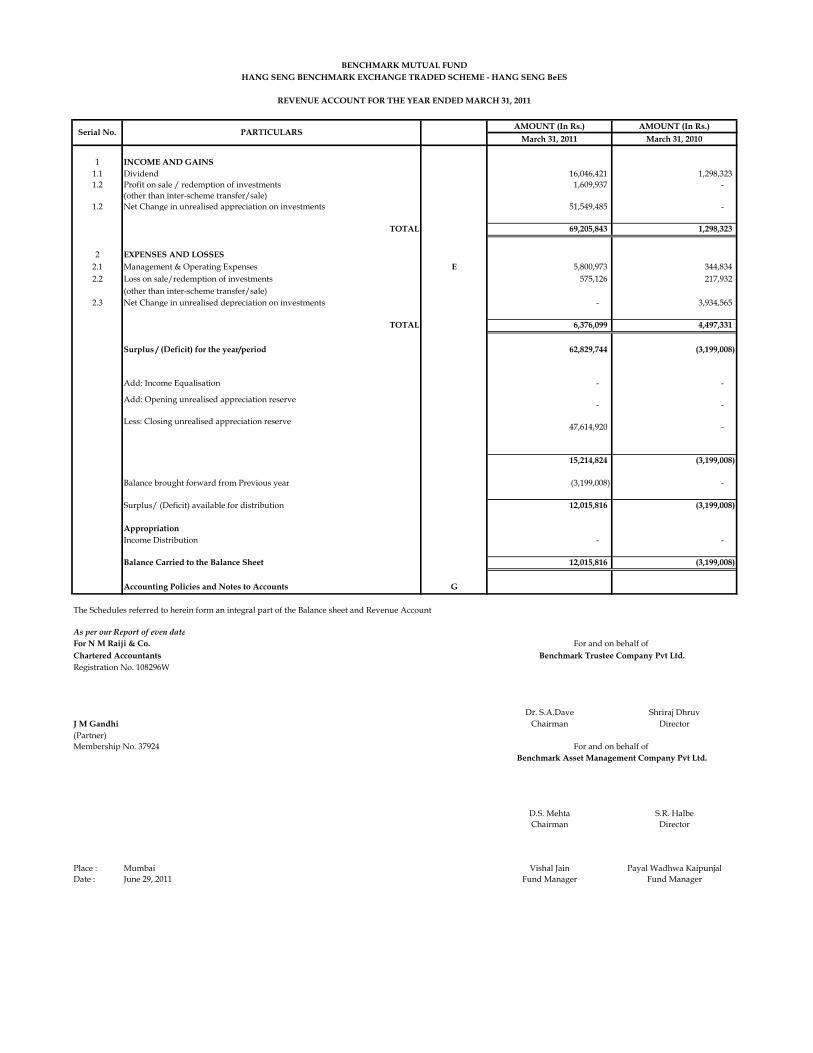
AMOUNT (In Rs.) AMOUNT (In Rs.)March 31, 2011 March 31, 2010
1 INCOME AND GAINS1.1 Dividend 16,046,421 1,298,323 1.2 Profit on sale / redemption of investments 1,609,937 -
(other than inter-scheme transfer/sale)1.2 Net Change in unrealised appreciation on investments 51,549,485 -
TOTAL 69,205,843 1,298,323
2 EXPENSES AND LOSSES2.1 Management & Operating Expenses E 5,800,973 344,834 2.2 Loss on sale/redemption of investments 575,126 217,932
(other than inter-scheme transfer/sale)2.3 Net Change in unrealised depreciation on investments - 3,934,565
TOTAL 6,376,099 4,497,331
Surplus / (Deficit) for the year/period 62,829,744 (3,199,008)
Add: Income Equalisation - -
15,214,824 (3,199,008)
Balance brought forward from Previous year (3,199,008) -
Surplus/ (Deficit) available for distribution 12,015,816 (3,199,008)
AppropriationIncome Distribution - -
Balance Carried to the Balance Sheet 12,015,816 (3,199,008)
Accounting Policies and Notes to Accounts G
The Schedules referred to herein form an integral part of the Balance sheet and Revenue Account
As per our Report of even dateFor N M Raiji & Co.Chartered AccountantsRegistration No. 108296W
Dr. S.A.Dave Shriraj DhruvJ M Gandhi Chairman Director(Partner)Membership No. 37924
D.S. Mehta S.R. HalbeChairman Director
Place : Mumbai Vishal Jain Payal Wadhwa KaipunjalDate : June 29, 2011 Fund Manager Fund Manager
Less: Closing unrealised appreciation reserve
-
-
-
PARTICULARSSerial No.
Benchmark Asset Management Company Pvt Ltd.
For and on behalf of
Add: Opening unrealised appreciation reserve
BENCHMARK MUTUAL FUNDHANG SENG BENCHMARK EXCHANGE TRADED SCHEME - HANG SENG BeES
47,614,920
Benchmark Trustee Company Pvt Ltd.
For and on behalf of
REVENUE ACCOUNT FOR THE YEAR ENDED MARCH 31, 2011
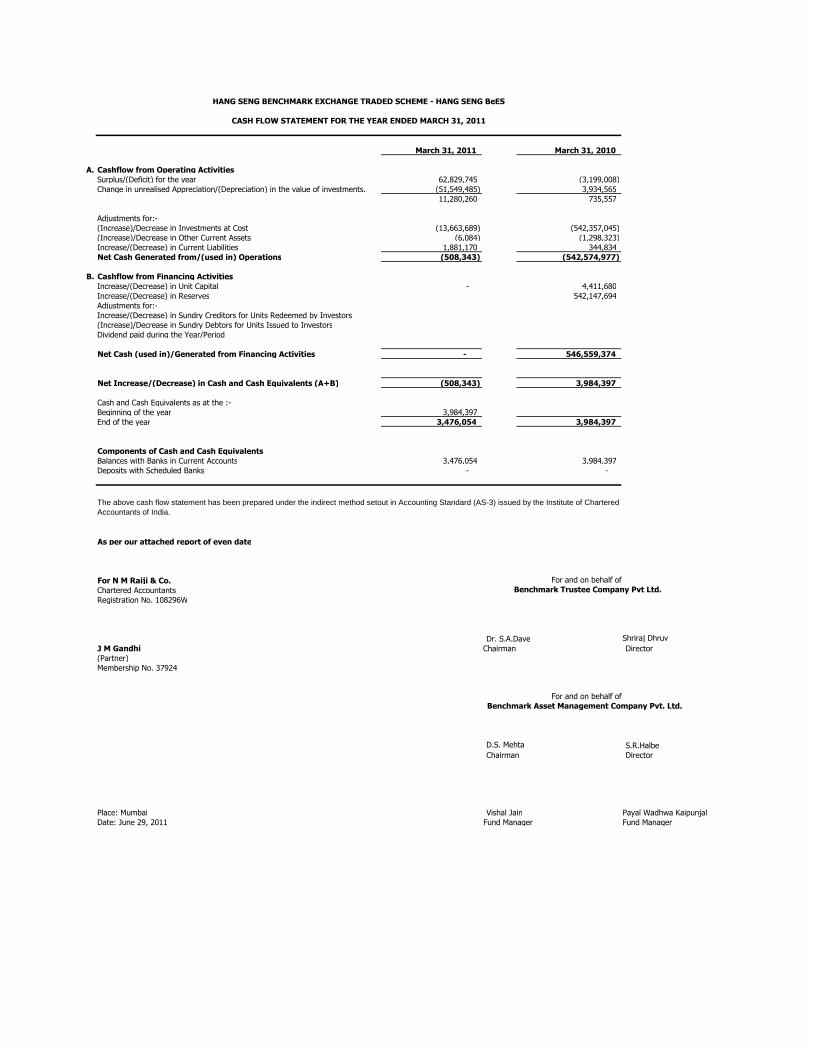
March 31, 2011 March 31, 2010
A. Cashflow from Operating ActivitiesSurplus/(Deficit) for the year 62,829,745 (3,199,008) Change in unrealised Appreciation/(Depreciation) in the value of investments. (51,549,485) 3,934,565
11,280,260 735,557
Adjustments for:-(Increase)/Decrease in Investments at Cost (13,663,689) (542,357,045) (Increase)/Decrease in Other Current Assets (6,084) (1,298,323) Increase/(Decrease) in Current Liabilities 1,881,170 344,834 Net Cash Generated from/(used in) Operations (508,343) (542,574,977)
B. Cashflow from Financing ActivitiesIncrease/(Decrease) in Unit Capital - 4,411,680 Increase/(Decrease) in Reserves 542,147,694 Adjustments for:-Increase/(Decrease) in Sundry Creditors for Units Redeemed by Investors(Increase)/Decrease in Sundry Debtors for Units Issued to InvestorsDividend paid during the Year/Period
Net Cash (used in)/Generated from Financing Activities - 546,559,374
Net Increase/(Decrease) in Cash and Cash Equivalents (A+B) (508,343) 3,984,397
Cash and Cash Equivalents as at the :-Beginning of the year 3,984,397 End of the year 3,476,054 3,984,397
Components of Cash and Cash EquivalentsBalances with Banks in Current Accounts 3,476,054 3,984,397 Deposits with Scheduled Banks - -
As per our attached report of even date
For N M Raiji & Co. Chartered Accountants Registration No. 108296W
Dr. S.A.Dave Shriraj DhruvJ M Gandhi Chairman Director(Partner)Membership No. 37924
Benchmark Asset Management Company Pvt. Ltd.
D.S. Mehta S.R.HalbeChairman Director
Place: Mumbai Vishal Jain Payal Wadhwa KaipunjalDate: June 29, 2011 Fund Manager Fund Manager
HANG SENG BENCHMARK EXCHANGE TRADED SCHEME - HANG SENG BeES
The above cash flow statement has been prepared under the indirect method setout in Accounting Standard (AS-3) issued by the Institute of Chartered Accountants of India.
For and on behalf of
For and on behalf of Benchmark Trustee Company Pvt Ltd.
CASH FLOW STATEMENT FOR THE YEAR ENDED MARCH 31, 2011
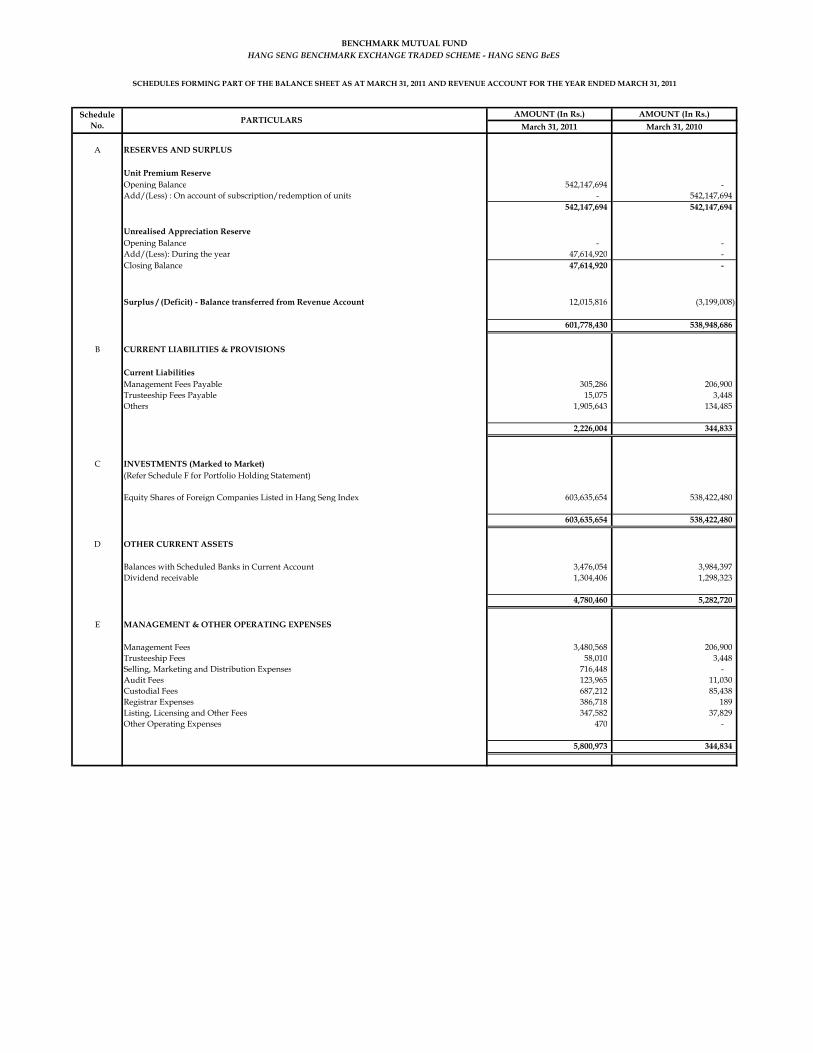
AMOUNT (In Rs.) AMOUNT (In Rs.)March 31, 2011 March 31, 2010
A RESERVES AND SURPLUS
Unit Premium ReserveOpening Balance 542,147,694 - Add/(Less) : On account of subscription/redemption of units - 542,147,694
542,147,694 542,147,694
Unrealised Appreciation ReserveOpening Balance - - Add/(Less): During the year 47,614,920 - Closing Balance 47,614,920 -
Surplus / (Deficit) - Balance transferred from Revenue Account 12,015,816 (3,199,008)
601,778,430 538,948,686
B CURRENT LIABILITIES & PROVISIONS
Current LiabilitiesManagement Fees Payable 305,286 206,900 Trusteeship Fees Payable 15,075 3,448 Others 1,905,643 134,485
2,226,004 344,833
C INVESTMENTS (Marked to Market)(Refer Schedule F for Portfolio Holding Statement)
Equity Shares of Foreign Companies Listed in Hang Seng Index 603,635,654 538,422,480
603,635,654 538,422,480
D OTHER CURRENT ASSETS
Balances with Scheduled Banks in Current Account 3,476,054 3,984,397 Dividend receivable 1,304,406 1,298,323
4,780,460 5,282,720
E MANAGEMENT & OTHER OPERATING EXPENSES
Management Fees 3,480,568 206,900 Trusteeship Fees 58,010 3,448 Selling, Marketing and Distribution Expenses 716,448 - Audit Fees 123,965 11,030 Custodial Fees 687,212 85,438 Registrar Expenses 386,718 189 Listing, Licensing and Other Fees 347,582 37,829 Other Operating Expenses 470 -
5,800,973 344,834
HANG SENG BENCHMARK EXCHANGE TRADED SCHEME - HANG SENG BeES
Schedule No.
SCHEDULES FORMING PART OF THE BALANCE SHEET AS AT MARCH 31, 2011 AND REVENUE ACCOUNT FOR THE YEAR ENDED MARCH 31, 2011
PARTICULARS
BENCHMARK MUTUAL FUND
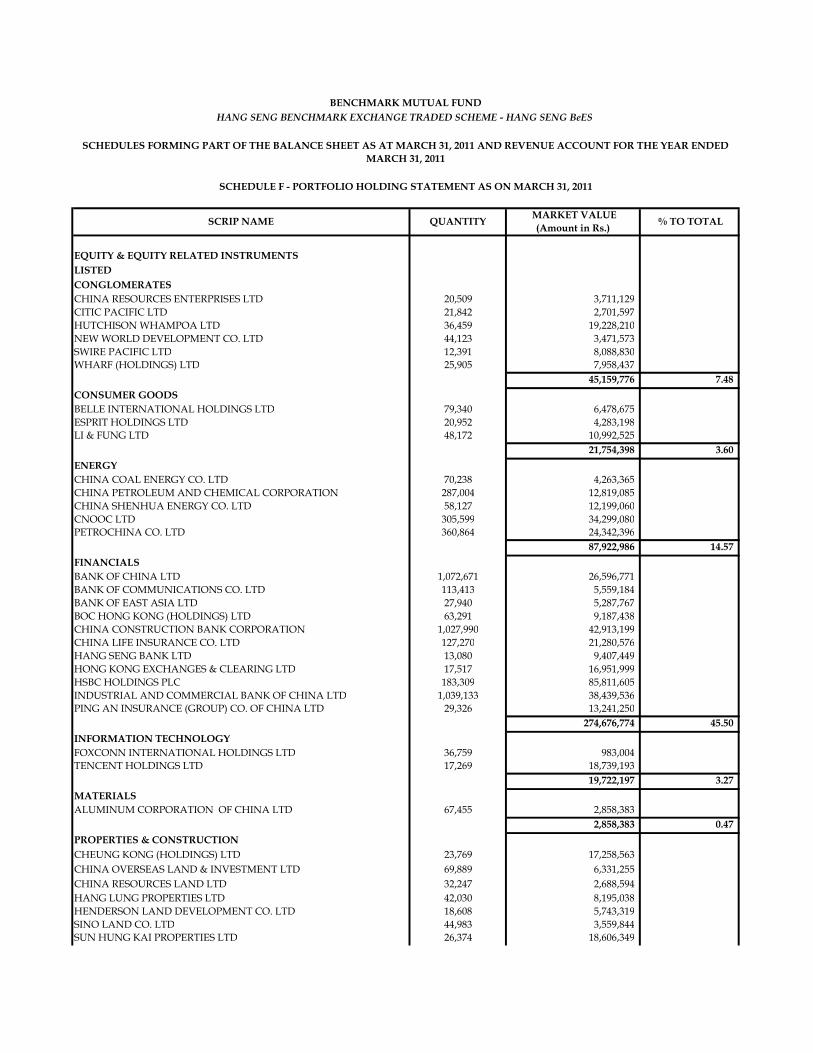
EQUITY & EQUITY RELATED INSTRUMENTSLISTEDCONGLOMERATESCHINA RESOURCES ENTERPRISES LTD 20,509 3,711,129 CITIC PACIFIC LTD 21,842 2,701,597 HUTCHISON WHAMPOA LTD 36,459 19,228,210 NEW WORLD DEVELOPMENT CO. LTD 44,123 3,471,573 SWIRE PACIFIC LTD 12,391 8,088,830 WHARF (HOLDINGS) LTD 25,905 7,958,437
45,159,776 7.48 CONSUMER GOODSBELLE INTERNATIONAL HOLDINGS LTD 79,340 6,478,675 ESPRIT HOLDINGS LTD 20,952 4,283,198 LI & FUNG LTD 48,172 10,992,525
21,754,398 3.60 ENERGYCHINA COAL ENERGY CO. LTD 70,238 4,263,365 CHINA PETROLEUM AND CHEMICAL CORPORATION 287,004 12,819,085 CHINA SHENHUA ENERGY CO. LTD 58,127 12,199,060 CNOOC LTD 305,599 34,299,080 PETROCHINA CO. LTD 360,864 24,342,396
87,922,986 14.57 FINANCIALSBANK OF CHINA LTD 1,072,671 26,596,771 BANK OF COMMUNICATIONS CO. LTD 113,413 5,559,184 BANK OF EAST ASIA LTD 27,940 5,287,767 BOC HONG KONG (HOLDINGS) LTD 63,291 9,187,438 CHINA CONSTRUCTION BANK CORPORATION 1,027,990 42,913,199 CHINA LIFE INSURANCE CO. LTD 127,270 21,280,576 HANG SENG BANK LTD 13,080 9,407,449 HONG KONG EXCHANGES & CLEARING LTD 17,517 16,951,999 HSBC HOLDINGS PLC 183,309 85,811,605 INDUSTRIAL AND COMMERCIAL BANK OF CHINA LTD 1,039,133 38,439,536 PING AN INSURANCE (GROUP) CO. OF CHINA LTD 29,326 13,241,250
274,676,774 45.50 INFORMATION TECHNOLOGYFOXCONN INTERNATIONAL HOLDINGS LTD 36,759 983,004 TENCENT HOLDINGS LTD 17,269 18,739,193
19,722,197 3.27 MATERIALSALUMINUM CORPORATION OF CHINA LTD 67,455 2,858,383
2,858,383 0.47 PROPERTIES & CONSTRUCTIONCHEUNG KONG (HOLDINGS) LTD 23,769 17,258,563 CHINA OVERSEAS LAND & INVESTMENT LTD 69,889 6,331,255 CHINA RESOURCES LAND LTD 32,247 2,688,594 HANG LUNG PROPERTIES LTD 42,030 8,195,038 HENDERSON LAND DEVELOPMENT CO. LTD 18,608 5,743,319 SINO LAND CO. LTD 44,983 3,559,844 SUN HUNG KAI PROPERTIES LTD 26,374 18,606,349
BENCHMARK MUTUAL FUND
SCHEDULES FORMING PART OF THE BALANCE SHEET AS AT MARCH 31, 2011 AND REVENUE ACCOUNT FOR THE YEAR ENDED MARCH 31, 2011
% TO TOTAL MARKET VALUE (Amount in Rs.) QUANTITYSCRIP NAME
HANG SENG BENCHMARK EXCHANGE TRADED SCHEME - HANG SENG BeES
SCHEDULE F - PORTFOLIO HOLDING STATEMENT AS ON MARCH 31, 2011
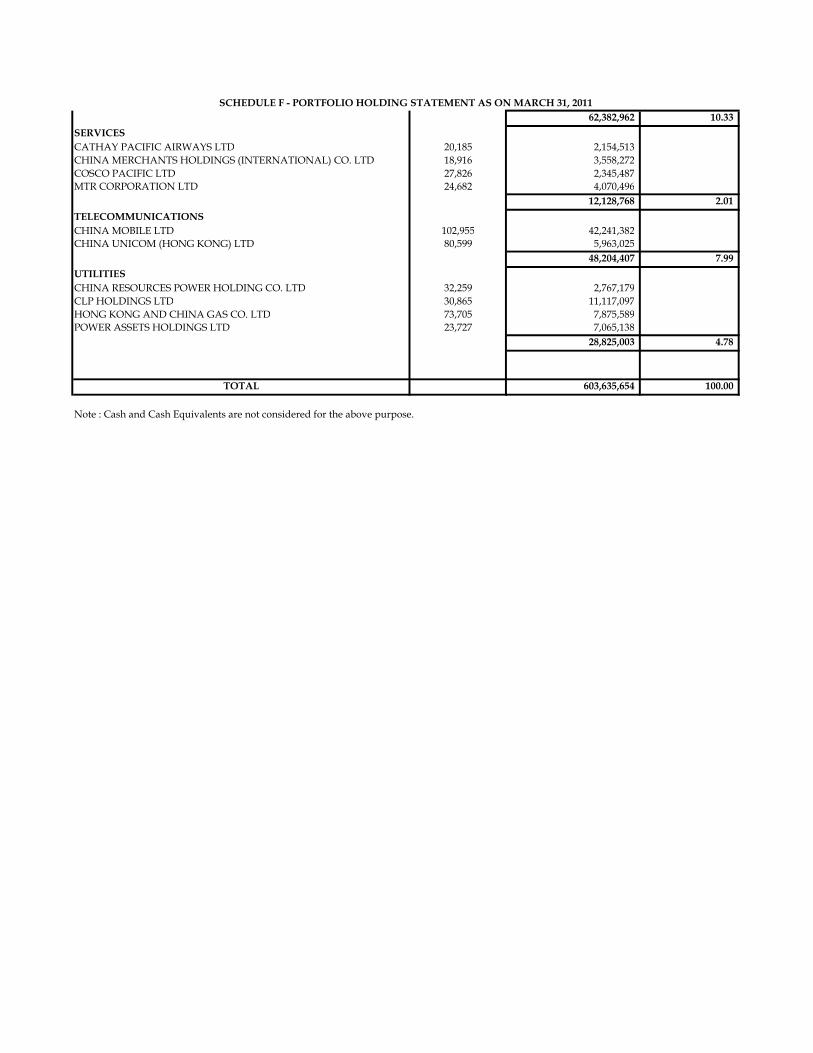
SCHEDULE F - PORTFOLIO HOLDING STATEMENT AS ON MARCH 31, 201162,382,962 10.33
SERVICESCATHAY PACIFIC AIRWAYS LTD 20,185 2,154,513 CHINA MERCHANTS HOLDINGS (INTERNATIONAL) CO. LTD 18,916 3,558,272 COSCO PACIFIC LTD 27,826 2,345,487 MTR CORPORATION LTD 24,682 4,070,496
12,128,768 2.01 TELECOMMUNICATIONSCHINA MOBILE LTD 102,955 42,241,382 CHINA UNICOM (HONG KONG) LTD 80,599 5,963,025
48,204,407 7.99 UTILITIESCHINA RESOURCES POWER HOLDING CO. LTD 32,259 2,767,179 CLP HOLDINGS LTD 30,865 11,117,097 HONG KONG AND CHINA GAS CO. LTD 73,705 7,875,589 POWER ASSETS HOLDINGS LTD 23,727 7,065,138
28,825,003 4.78
TOTAL 603,635,654 100.00
Note : Cash and Cash Equivalents are not considered for the above purpose.
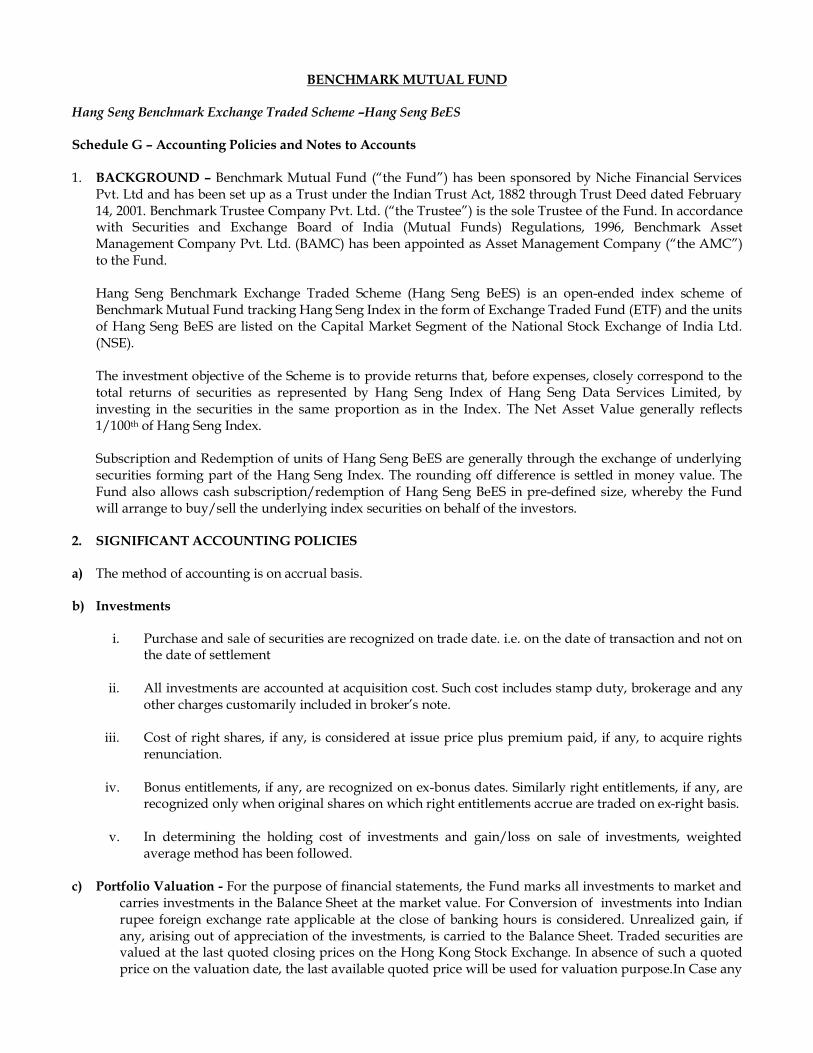
BENCHMARK MUTUAL FUND Hang Seng Benchmark Exchange Traded Scheme –Hang Seng BeES Schedule G – Accounting Policies and Notes to Accounts 1. BACKGROUND – Benchmark Mutual Fund (“the Fund”) has been sponsored by Niche Financial Services
Pvt. Ltd and has been set up as a Trust under the Indian Trust Act, 1882 through Trust Deed dated February 14, 2001. Benchmark Trustee Company Pvt. Ltd. (“the Trustee”) is the sole Trustee of the Fund. In accordance with Securities and Exchange Board of India (Mutual Funds) Regulations, 1996, Benchmark Asset Management Company Pvt. Ltd. (BAMC) has been appointed as Asset Management Company (“the AMC”) to the Fund.
Hang Seng Benchmark Exchange Traded Scheme (Hang Seng BeES) is an open-ended index scheme of Benchmark Mutual Fund tracking Hang Seng Index in the form of Exchange Traded Fund (ETF) and the units of Hang Seng BeES are listed on the Capital Market Segment of the National Stock Exchange of India Ltd. (NSE). The investment objective of the Scheme is to provide returns that, before expenses, closely correspond to the total returns of securities as represented by Hang Seng Index of Hang Seng Data Services Limited, by investing in the securities in the same proportion as in the Index. The Net Asset Value generally reflects 1/100th of Hang Seng Index. Subscription and Redemption of units of Hang Seng BeES are generally through the exchange of underlying securities forming part of the Hang Seng Index. The rounding off difference is settled in money value. The Fund also allows cash subscription/redemption of Hang Seng BeES in pre-defined size, whereby the Fund will arrange to buy/sell the underlying index securities on behalf of the investors.
2. SIGNIFICANT ACCOUNTING POLICIES a) The method of accounting is on accrual basis.
b) Investments
i. Purchase and sale of securities are recognized on trade date. i.e. on the date of transaction and not on the date of settlement
ii. All investments are accounted at acquisition cost. Such cost includes stamp duty, brokerage and any
other charges customarily included in broker’s note.
iii. Cost of right shares, if any, is considered at issue price plus premium paid, if any, to acquire rights renunciation.
iv. Bonus entitlements, if any, are recognized on ex-bonus dates. Similarly right entitlements, if any, are
recognized only when original shares on which right entitlements accrue are traded on ex-right basis.
v. In determining the holding cost of investments and gain/loss on sale of investments, weighted average method has been followed.
c) Portfolio Valuation - For the purpose of financial statements, the Fund marks all investments to market and
carries investments in the Balance Sheet at the market value. For Conversion of investments into Indian rupee foreign exchange rate applicable at the close of banking hours is considered. Unrealized gain, if any, arising out of appreciation of the investments, is carried to the Balance Sheet. Traded securities are valued at the last quoted closing prices on the Hong Kong Stock Exchange. In absence of such a quoted price on the valuation date, the last available quoted price will be used for valuation purpose.In Case any
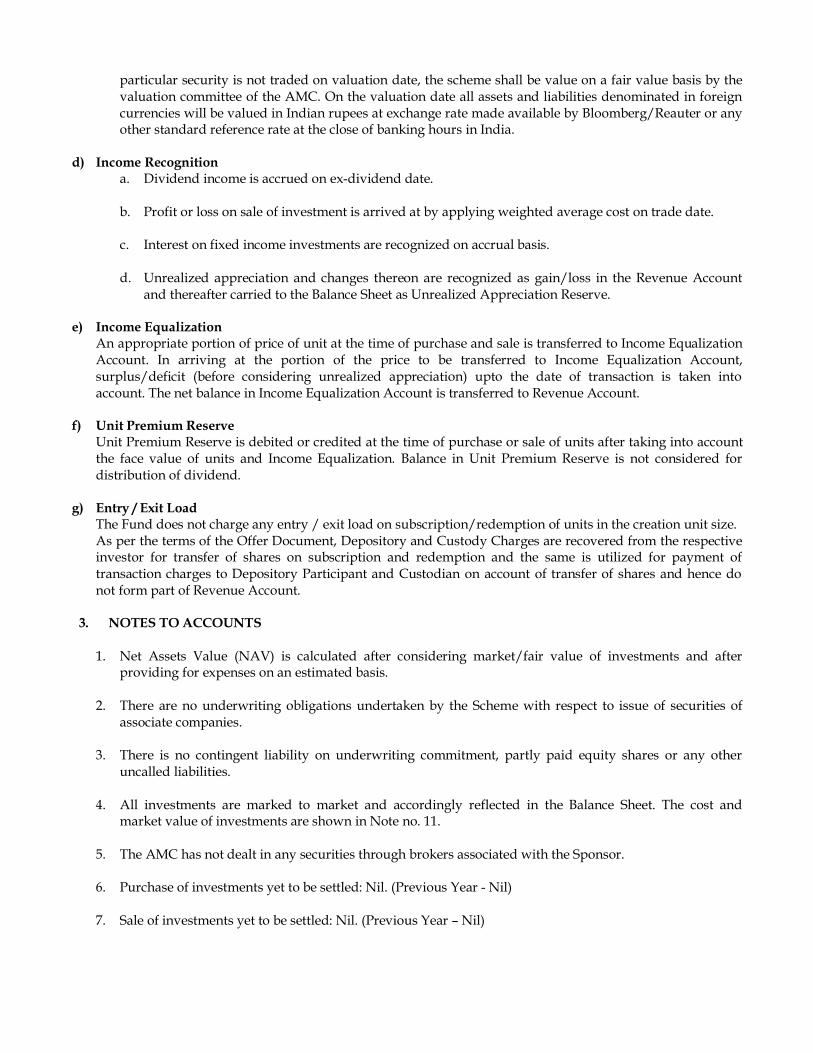
particular security is not traded on valuation date, the scheme shall be value on a fair value basis by the valuation committee of the AMC. On the valuation date all assets and liabilities denominated in foreign currencies will be valued in Indian rupees at exchange rate made available by Bloomberg/Reauter or any other standard reference rate at the close of banking hours in India.
d) Income Recognition a. Dividend income is accrued on ex-dividend date. b. Profit or loss on sale of investment is arrived at by applying weighted average cost on trade date.
c. Interest on fixed income investments are recognized on accrual basis.
d. Unrealized appreciation and changes thereon are recognized as gain/loss in the Revenue Account
and thereafter carried to the Balance Sheet as Unrealized Appreciation Reserve. e) Income Equalization
An appropriate portion of price of unit at the time of purchase and sale is transferred to Income Equalization Account. In arriving at the portion of the price to be transferred to Income Equalization Account, surplus/deficit (before considering unrealized appreciation) upto the date of transaction is taken into account. The net balance in Income Equalization Account is transferred to Revenue Account.
f) Unit Premium Reserve Unit Premium Reserve is debited or credited at the time of purchase or sale of units after taking into account the face value of units and Income Equalization. Balance in Unit Premium Reserve is not considered for distribution of dividend.
g) Entry / Exit Load The Fund does not charge any entry / exit load on subscription/redemption of units in the creation unit size. As per the terms of the Offer Document, Depository and Custody Charges are recovered from the respective investor for transfer of shares on subscription and redemption and the same is utilized for payment of transaction charges to Depository Participant and Custodian on account of transfer of shares and hence do not form part of Revenue Account.
3. NOTES TO ACCOUNTS 1. Net Assets Value (NAV) is calculated after considering market/fair value of investments and after
providing for expenses on an estimated basis. 2. There are no underwriting obligations undertaken by the Scheme with respect to issue of securities of
associate companies. 3. There is no contingent liability on underwriting commitment, partly paid equity shares or any other
uncalled liabilities. 4. All investments are marked to market and accordingly reflected in the Balance Sheet. The cost and
market value of investments are shown in Note no. 11. 5. The AMC has not dealt in any securities through brokers associated with the Sponsor. 6. Purchase of investments yet to be settled: Nil. (Previous Year - Nil) 7. Sale of investments yet to be settled: Nil. (Previous Year – Nil)

8. Income and Expenses
Total income (including net profit/(loss)on sale / redemption of investments,profit on inter-scheme transfers and netchange in unrealised appreciation /(depreciation) in value of investments) 68,630,717 11.83% (2,854,174) (8.28%) *Total expenditure (Annual recurring
expenses) 5,800,973 1.00% 344,834 1.00%
* Annualised for the period
Period ended March 31, 2010547,143,069
Aggregate Value (Rs.)
% of Average Net Assets
Average Daily Net Assets (Rs.)
Year ended March 31, 2011580,097,433
Aggregate Value (Rs.)
% of Average Net Assets
9. Aggregate Value of Purchase and Sale of Investments during the year
2010 - 11(Rs. In Lacs)
2009 - 10(Rs. In Lacs)
Daily Average Net Assets 5,800.97 5,471.43 Purchases 334.56 5,619.48 % to Daily Average Net Assets 5.77% 102.71%Sales 259.99 193.73 % to Daily Average Net Assets 4.48% 3.54%
10. Net Asset Value (Per Unit – in Rs.)
As at March 31, 2011
As at March 31, 2010
Face Value 10.00 10.00 Net Assets Value 1,374.0573 1,231.6405 Allotment Nav 1,238.8917 1,238.8917
11. Cost and Market Value of Investments
Amount (Rs. In Lacs) Amount (Rs. In Lacs)2010 - 11 2009 - 10
Cost 5,560.21 5,423.57 Market Value 6,036.36 5,384.22 Unrealised Appreciation in the Value of investments 476.15 (39.35)

12. Movement in Unit Capital
Units Rs. in Lacs Units Rs. in Lacs
Initial Units (on the date of Allotment) 441,168 44.12 441,168 44.12
Units at the beginning of the period 441,168 44.12 - - Units Issued - - 441,168 44.12 Units Redeemed - - - - Units at the end of the period 441,168 44.12 441,168 44.12
Particulars2009 - 102010 - 11
13. Details of Large Holding (more than 25% of the Net Assets of the Scheme) - As on March 31, 2011,
Scheme No. of Investors Percentage of holdingHang Seng BeES 1 58.09%
14. Income Tax – No provision for Income Tax is made as the Scheme qualifies as a recognized Mutual Fund
under section 10 (23D) of the Income Tax Act, 1961. 15. Investment Management Fees – Investment Management Fees is calculated on the daily average net
assets of the Scheme. The details of management fees levied on an annualized basis are as follows:
Amount (in Rs.) Amount (in Rs.)2010 - 11 2009 - 10
Daily Average Net Assets 580,097,433 547,143,069Management Fees (in %) 0.60% 0.60% *Management Fees 3,480,568 206,900
* Annualised for the period 16. Trustee Fees – In accordance with the terms of Offer Document, the Trustee fees is charged @ 0.01% of
the daily average net assets of the Scheme.
17. Custodial Fees and Expenses – Citibank N.A. provides custodial services to the Scheme for which it receives custody fees including safekeeping. In addition, Citibank N.A. is reimbursed for custody and transaction charges by depositories (i.e. NSDL / CDSL).
18. Registrar and Transfer Agent Fees and Expenses – Karvy Computershare Private Limited provides
Registrar and Transfer Agency Services to the Scheme, for which it receives the fees based on daily average net assets of the Scheme.
19. There are no investments made by Benchmark Trustee Company Pvt. Ltd. and Benchmark Asset
Management Company Pvt Ltd in the Scheme during the year ended March 31, 2011.
20. The Scheme has not made any investments in Group/Associate Companies.
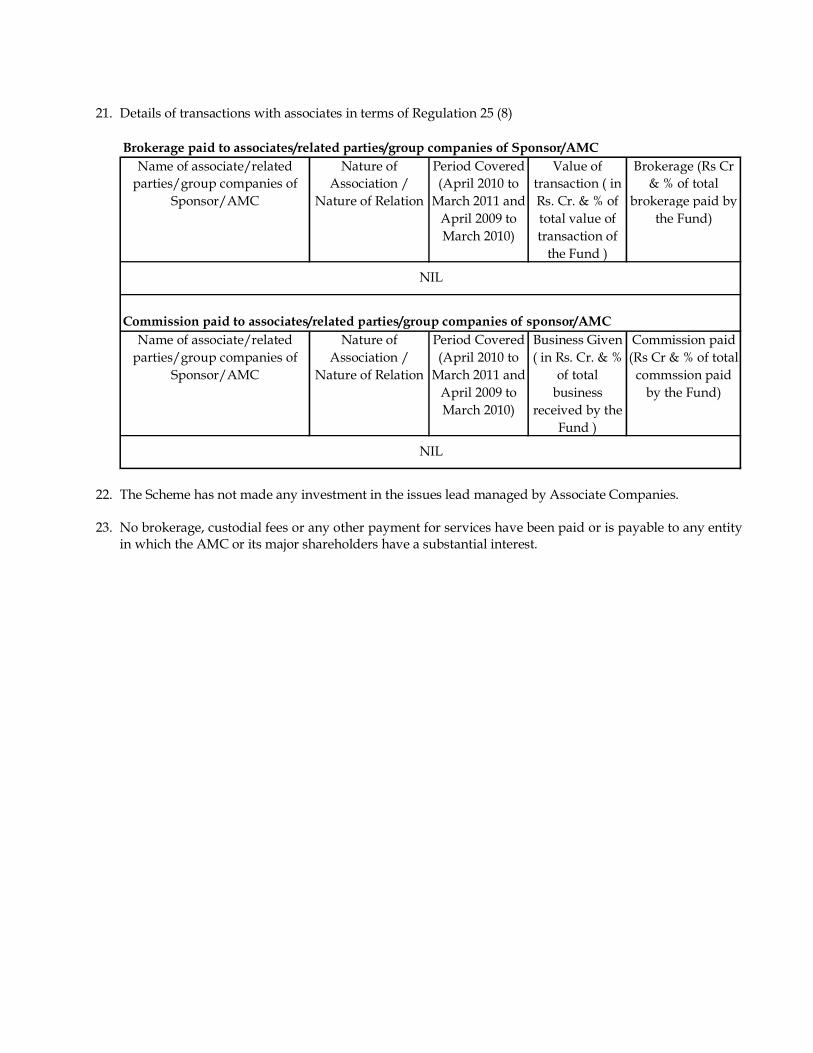
21. Details of transactions with associates in terms of Regulation 25 (8) Brokerage paid to associates/related parties/group companies of Sponsor/AMC
Name of associate/related parties/group companies of
Sponsor/AMC
Nature of Association /
Nature of Relation
Period Covered (April 2010 to
March 2011 and April 2009 to March 2010)
Value of transaction ( in Rs. Cr. & % of total value of transaction of
the Fund )
Brokerage (Rs Cr & % of total
brokerage paid by the Fund)
Commission paid to associates/related parties/group companies of sponsor/AMCName of associate/related
parties/group companies of Sponsor/AMC
Nature of Association /
Nature of Relation
Period Covered (April 2010 to
March 2011 and April 2009 to March 2010)
Business Given ( in Rs. Cr. & %
of total business
received by the Fund )
Commission paid (Rs Cr & % of total
commssion paid by the Fund)
NIL
NIL
22. The Scheme has not made any investment in the issues lead managed by Associate Companies. 23. No brokerage, custodial fees or any other payment for services have been paid or is payable to any entity
in which the AMC or its major shareholders have a substantial interest.

24. Disclosure under Regulation 25 (11) – Benchmark Mutual Fund had invested in the following company, which has invested more than 5% of the net assets of any scheme of Benchmark Mutual Fund.
Company which has invested
Scheme in which invested more than 5% of net assets
Scheme which has invested
Aggregate purchase during the period under regulation
25(11) at cost (Rs. In lacs)
Outstanding as on March 31,
2011 at Market value (Rs. In
Lacs)JUNIOR BeES 147.85 -Benchmark S & P CNX500
6.01 6.16
NIFTY BeES 9,676.97 3,785.10 BANK BeES 34,489.51 24,174.69 LIQUID BeES 4,995.08 -BDF 14.63 -Benchmark S & P CNX500
417.93 474.28
BEDOF 19.57 -BDF 14.46 -Benchmark S & P CNX500
5.65 5.38
NIFTY BeES 1,074.99 314.09 INFRA BeES 184.97 105.77 BDF 21.27 -BEDOF 21.33 -Benchmark S & P CNX500
35.15 39.35
TATA INVESTMENT CORPORATION LIMITED
JUNIOR BeES Benchmark S & P CNX500
1.80 2.74
INDIA INFOLINE LIMITED
JUNIOR BeES
JAIPRAKASH ASSOCIATES LIMITED
GOLD BeES
CORPORATION BANK
PSU BANK BeES
ICICI BANK LTD NIFTY BEeS, JUNIOR BeES, BANK BeES & INFRA BeES
The investments in above companies were made as they are a constituent of the respective indices track by Nifty BeES, Junior BeES, Bank BeES, Infra BeES and Benchmark S&P CNX500 fund. In case of Liquid BeES the investment was made in money market instruments in accordance with investment objective of the scheme. In case of Benchmark Derivative Fund and Benchmark Equity and Derivatives Opportunities Fund, the investment in above companies was made on account of arbitrage opportunities available in the derivatives market during the year.
25. The Financial Statements of the Scheme have been prepared in accordance with SEBI Mutual Funds Regulations, 1996 wherein disclosure of Segment Reporting have not been prescribed. Hence the same has not been provided for the Scheme. The details of portfolio as per the SEBI Regulation has been disclosed.
26. Unclaimed Dividend / Redemption Amount – As on March 31, 2011, there was no unclaimed Dividend
or unclaimed Redemption to be claimed by Investors.
27. Registered Securities – In accordance with Regulation 44(1) of the SEBI (Mutual Funds) Regulations, 1996, the securities of the Scheme are held by the trustees for the benefit of Scheme’s unit holders.
28. A complete list of investments of the Scheme is given in Schedule F.

29. On March 15, 2011 Goldman Sachs Asset Management, L.P., through its subsidiaries Goldman Sachs Asset Management (India) Private Limited (“GS AMC”) and Goldman Sachs Trustee Company (India) Private Limited (“GS Trustee”), executed a sale and purchase agreement relating to the acquisition of all the outstanding shares in Benchmark Asset Management Company Private Limited (“BAMC”) and Benchmark Trustee Company Private Limited (“BTC”) from Niche Financial Services Private Limited, the sponsor of Benchmark Mutual Fund (“Benchmark MF”), and the other shareholders of BAMC and BTC. The sale and purchase agreement contemplates that BAMC shall transfer the rights to manage the schemes of Benchmark MF to GS AMC and BTC shall transfer the schemes of Benchmark MF to GS Trustee as part of the transaction. This transaction has been approved by the regulator, Securities and Exchange Board of India (“SEBI”) on June 27, 2011.
30. The previous year figures have been regrouped/rearranged wherever necessary.
31. The audited results for the period ended March 31, 2011 have been approved by the Boards of Benchmark
Asset Management Company Pvt. Ltd (AMC) and Benchmark Trustee Company Pvt. Ltd (Trustee) at their meeting held on June 29, 2011 respectively.
NOTES:
1. On written request, present and prospective unit holders/investors can obtain a copy of the Trust Deed, the Annual Report, at a price if any, and the text of the Scheme.
2. On written request, the present and prospective unit holders/investors may request a copy of the Annual Report of the AMC.
3. On written request, the present and prospective unit holders/investors can inspect a full list of investments of the Scheme at the office of the AMC.
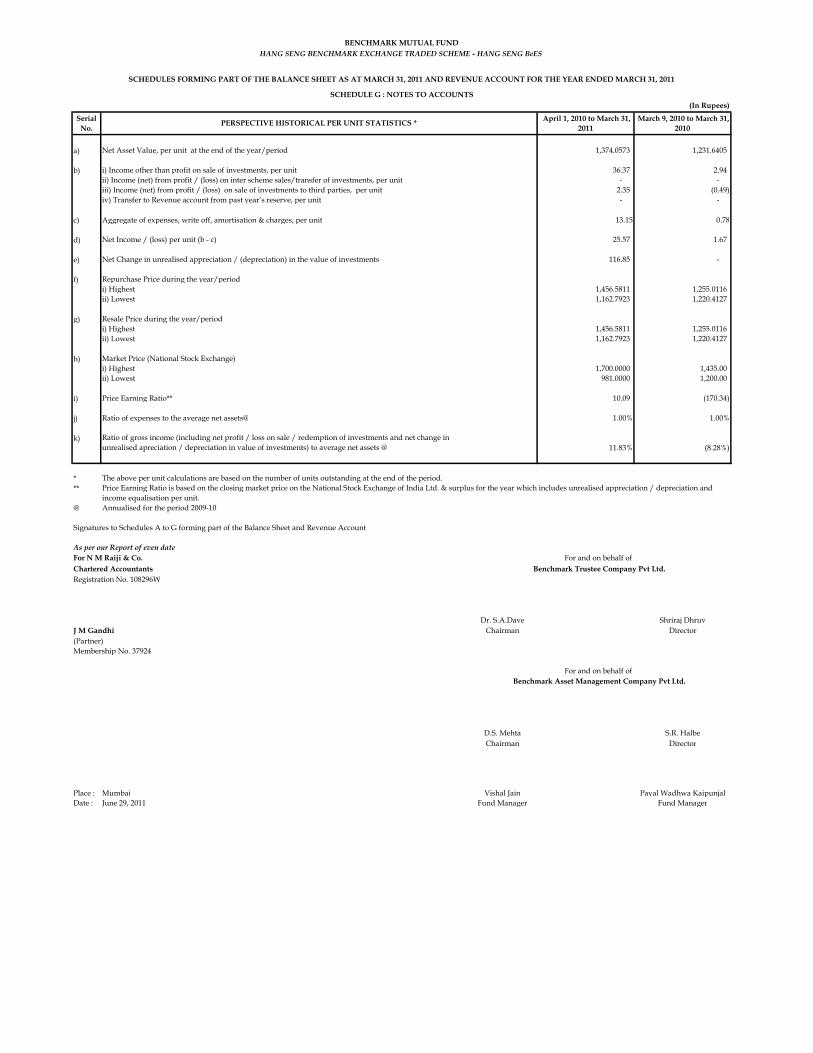
(In Rupees)
Serial No.
April 1, 2010 to March 31, 2011
March 9, 2010 to March 31, 2010
a) Net Asset Value, per unit at the end of the year/period 1,374.0573 1,231.6405
b) i) Income other than profit on sale of investments, per unit 36.37 2.94 ii) Income (net) from profit / (loss) on inter scheme sales/transfer of investments, per unit - - iii) Income (net) from profit / (loss) on sale of investments to third parties, per unit 2.35 (0.49) iv) Transfer to Revenue account from past year’s reserve, per unit - -
c) Aggregate of expenses, write off, amortisation & charges, per unit 13.15 0.78
d) Net Income / (loss) per unit (b - c) 25.57 1.67
e) Net Change in unrealised appreciation / (depreciation) in the value of investments 116.85 -
f) Repurchase Price during the year/periodi) Highest 1,456.5811 1,255.0116 ii) Lowest 1,162.7923 1,220.4127
g) Resale Price during the year/periodi) Highest 1,456.5811 1,255.0116 ii) Lowest 1,162.7923 1,220.4127
h) Market Price (National Stock Exchange)i) Highest 1,700.0000 1,435.00 ii) Lowest 981.0000 1,200.00
i) Price Earning Ratio** 10.09 (170.34)
j) Ratio of expenses to the average net assets@ 1.00% 1.00%
k) Ratio of gross income (including net profit / loss on sale / redemption of investments and net change in unrealised apreciation / depreciation in value of investments) to average net assets @ 11.83% (8.28%)
***
@
Signatures to Schedules A to G forming part of the Balance Sheet and Revenue Account
As per our Report of even dateFor N M Raiji & Co.Chartered AccountantsRegistration No. 108296W
Dr. S.A.Dave Shriraj DhruvJ M Gandhi Chairman Director(Partner)Membership No. 37924
D.S. Mehta S.R. HalbeChairman Director
Place : Mumbai Vishal Jain Payal Wadhwa KaipunjalDate : June 29, 2011 Fund Manager Fund Manager
Benchmark Asset Management Company Pvt Ltd.
Annualised for the period 2009-10
BENCHMARK MUTUAL FUND
SCHEDULES FORMING PART OF THE BALANCE SHEET AS AT MARCH 31, 2011 AND REVENUE ACCOUNT FOR THE YEAR ENDED MARCH 31, 2011
The above per unit calculations are based on the number of units outstanding at the end of the period.
PERSPECTIVE HISTORICAL PER UNIT STATISTICS *
HANG SENG BENCHMARK EXCHANGE TRADED SCHEME - HANG SENG BeES
Price Earning Ratio is based on the closing market price on the National Stock Exchange of India Ltd. & surplus for the year which includes unrealised appreciation / depreciation and income equalisation per unit.
SCHEDULE G : NOTES TO ACCOUNTS
For and on behalf of Benchmark Trustee Company Pvt Ltd.
For and on behalf of
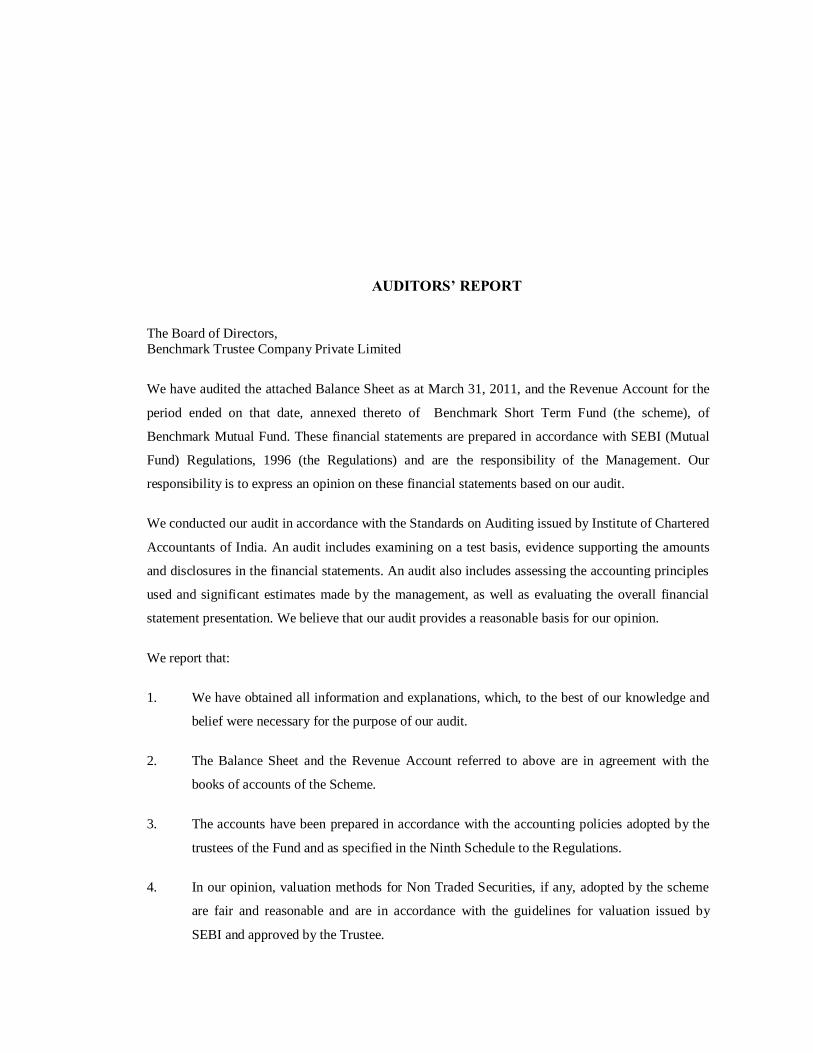
AUDITORS’ REPORT The Board of Directors, Benchmark Trustee Company Private Limited
We have audited the attached Balance Sheet as at March 31, 2011, and the Revenue Account for the
period ended on that date, annexed thereto of Benchmark Short Term Fund (the scheme), of
Benchmark Mutual Fund. These financial statements are prepared in accordance with SEBI (Mutual
Fund) Regulations, 1996 (the Regulations) and are the responsibility of the Management. Our
responsibility is to express an opinion on these financial statements based on our audit.
We conducted our audit in accordance with the Standards on Auditing issued by Institute of Chartered
Accountants of India. An audit includes examining on a test basis, evidence supporting the amounts
and disclosures in the financial statements. An audit also includes assessing the accounting principles
used and significant estimates made by the management, as well as evaluating the overall financial
statement presentation. We believe that our audit provides a reasonable basis for our opinion.
We report that:
1. We have obtained all information and explanations, which, to the best of our knowledge and
belief were necessary for the purpose of our audit.
2. The Balance Sheet and the Revenue Account referred to above are in agreement with the
books of accounts of the Scheme.
3. The accounts have been prepared in accordance with the accounting policies adopted by the
trustees of the Fund and as specified in the Ninth Schedule to the Regulations.
4. In our opinion, valuation methods for Non Traded Securities, if any, adopted by the scheme
are fair and reasonable and are in accordance with the guidelines for valuation issued by
SEBI and approved by the Trustee.
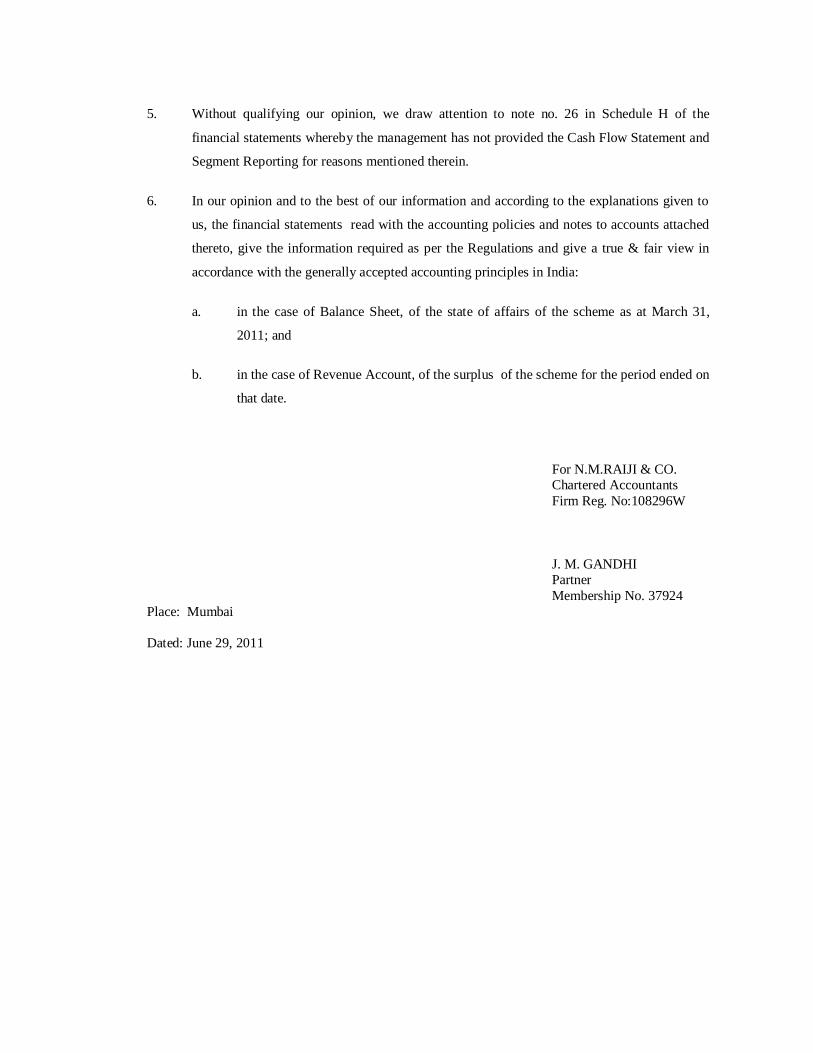
5. Without qualifying our opinion, we draw attention to note no. 26 in Schedule H of the
financial statements whereby the management has not provided the Cash Flow Statement and
Segment Reporting for reasons mentioned therein.
6. In our opinion and to the best of our information and according to the explanations given to
us, the financial statements read with the accounting policies and notes to accounts attached
thereto, give the information required as per the Regulations and give a true & fair view in
accordance with the generally accepted accounting principles in India:
a. in the case of Balance Sheet, of the state of affairs of the scheme as at March 31,
2011; and
b. in the case of Revenue Account, of the surplus of the scheme for the period ended on
that date.
For N.M.RAIJI & CO. Chartered Accountants
Firm Reg. No:108296W
J. M. GANDHI Partner Membership No. 37924
Place: Mumbai Dated: June 29, 2011

AMOUNT (In Rs.)March 31, 2011
LIABILITIES
1 Unit Capital (No of units: Current Year - DD : 1,003,757.75 , GP : 6,723,419.533 , WD : 1,463,335.896) 91,915,132
2 Reserves and Surplus A 2,334,992 3 Provision for Unrealised Appreciation in the value of Investments -
UNIT HOLDERS FUNDS 94,250,124
3 Current Liabilities & Provisions B 165,310
TOTAL 94,415,434
ASSETS
1 Investments C 9,806,567 2 Deposits D 82,909,124
TOTAL 94,415,434
Accounting Policies and Notes to Accounts H
The Schedules referred to herein form an integral part of the Balance sheet and Revenue Account
As per our Report of even dateFor N M Raiji & Co.Chartered AccountantsRegistration No. 108296W
J M Gandhi Dr. S.A.Dave Shriraj Dhruv(Partner) Chairman DirectorMembership No. 37924
For and on behalf of Benchmark Asset Management Company Pvt Ltd.
D.S. Mehta S.R. HalbeChairman Director
Place : Mumbai Payal Wadhwa KaipunjalDate : June 29, 2011 Fund Manager
PARTICULARS
For and on behalf of Benchmark Trustee Company Pvt Ltd.
BENCHMARK MUTUAL FUNDBENCHMARK SHORT TERM FUND
BALANCE SHEET AS AT MARCH 31, 2011
SCHEDULESerial No.

AMOUNT (In Rs.)March 31, 2011
1 INCOME AND GAINS1.1 Interest 2,866,320 1.2 Other Income 4,090 1.3 Net Change in unrealised appreciation/(depreciation) on investments
TOTAL 2,870,410
2 EXPENSES AND LOSSES2.1 Management & Operating Expenses F 289,498 2.2 Loss on sale/redemption of investments -
(other than inter-scheme transfer/sale)2.3 Loss on Sale of Futures - 2.3 Depreciation on Investments -
TOTAL 289,498
Surplus for the period 2,580,912
Add: Income Equalisation 547,994
3,128,906
Balance brought forward from Previous year -
Surplus available for distribution 3,128,906
AppropriationIncome Distribution (Inclusive of distribution tax of Rs. 101,044/-) 793,914
Balance Carried to the Balance Sheet 2,334,992
Accounting Policies and Notes to Accounts H
The Schedules referred to herein form an integral part of the Balance sheet and Revenue Account
As per our Report of even dateFor N M Raiji & Co.Chartered AccountantsRegistration No. 108296W
Dr. S.A.Dave Shriraj DhruvJ M Gandhi Chairman Director(Partner)
Membership No. 37924
D.S. Mehta S.R. HalbeChairman Director
Place : Mumbai Payal Wadhwa KaipunjalDate : June 29, 2011 Fund Manager
For and on behalf of
BENCHMARK MUTUAL FUNDBENCHMARK SHORT TERM FUND
REVENUE ACCOUNT FOR THE PERIOD ENDED MARCH 31, 2011
SCHEDULEPARTICULARSSerial No.
Add: Opening unrealised appreciation reserve
Benchmark Asset Management Company Pvt Ltd.
-
-
Benchmark Trustee Company Pvt Ltd.
For and on behalf of
Less: Closing unrealised appreciation reserve

AMOUNT (In Rs.)March 31, 2011
UNIT CAPITAL 91,915,132
91,915,132 No. of units of face value of Rs.10 each 9,191,513
A RESERVES AND SURPLUS
Unit Premium ReserveOpening Balance - Add/(Less): Transfer to Revenue & Surplus A/cAdd/(Less) : On account of subscription/redemption of units -
-
SurplusBalance transferred from Revenue Account 2,334,992 Add/(Less): Transfer from Unit Premium Reserve A/c -
2,334,992
2,334,992
B CURRENT LIABILITIES & PROVISIONS
Current LiabilitiesManagement Fees Payable 23,415 Trusteeship Fees Payable 2,259 Unit redemption payable - Others 139,636
165,310
Provisions -
165,310
C INVESTMENTS (Marked to Market)(Refer Schedule F for Portfolio Holding Statement)
Certificates of Deposits 9,806,567
9,806,567
D DEPOSITS
Margin Deposit 500,000 Collateralised Borrowing and Lending Obligation (CBLO) 82,409,124
82,909,124 E OTHER CURRENT ASSETS
Balances with Scheduled Banks in Current Account 1,266,218 Outstanding and Accrued income 18,175 Units Subscription receivable 415,350
1,699,743
F MANAGEMENT & OTHER OPERATING EXPENSES
Management Fees 143,056 Trusteeship Fees 4,883 Selling, Marketing and Distribution ExpensesAudit Fees 82,725 Custodial Fees 8,911 Registrar Expenses 49,923 Listing, Licensing and Other FeesOther Operating Expenses - Investor Communication Expenses -
289,498
BENCHMARK MUTUAL FUNDBENCHMARK SHORT TERM FUND
Schedule No.
SCHEDULES FORMING PART OF THE BALANCE SHEET AS AT MARCH 31, 2011 AND REVENUE ACCOUNT FOR THE PERIOD ENDED MARCH 31, 2011
PARTICULARS
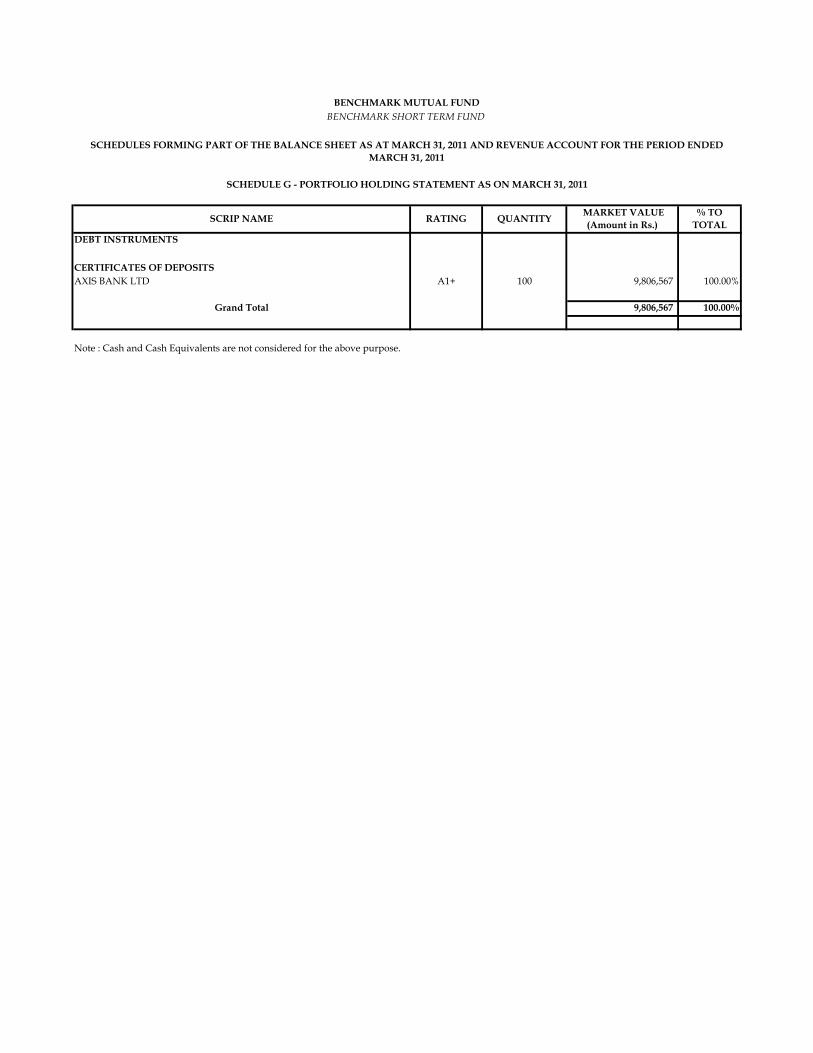
DEBT INSTRUMENTS
CERTIFICATES OF DEPOSITSAXIS BANK LTD A1+ 100 9,806,567 100.00%
Grand Total 9,806,567 100.00%
BENCHMARK SHORT TERM FUNDBENCHMARK MUTUAL FUND
SCHEDULES FORMING PART OF THE BALANCE SHEET AS AT MARCH 31, 2011 AND REVENUE ACCOUNT FOR THE PERIOD ENDED MARCH 31, 2011
SCHEDULE G - PORTFOLIO HOLDING STATEMENT AS ON MARCH 31, 2011
% TO TOTAL
Note : Cash and Cash Equivalents are not considered for the above purpose.
MARKET VALUE (Amount in Rs.) QUANTITYRATINGSCRIP NAME

BENCHMARK MUTUAL FUND BENCHMARK SHORT TERM FUND Schedule H – Accounting Policies and Notes to Accounts 1. BACKGROUND – Benchmark Mutual Fund (“the Fund”) has been sponsored by Niche Financial Services Pvt.
Ltd and has been set up as a Trust under the Indian Trust Act, 1882 through Trust Deed dated February 14, 2001. Benchmark Trustee Company Pvt. Ltd. (“the Trustee”) is the sole Trustee of the Fund. In accordance with Securities and Exchange Board of India (Mutual Funds) Regulations, 1996, Benchmark Asset Management Company Pvt. Ltd. (BAMC) has been appointed as Asset Management Company (“the AMC”) to the Fund.
The New Fund Offer of Benchmark Short Term Fund opened for public subscription on June 29, 2010 and closed on July 27, 2010. The scheme collected Rs. 48,378,312/- (Growth Option - 35,836,000/- , Daily Dividend Option - 10,720,000/- , Weekly Dividend Option - 1,822,312/-) in the New Fund Offer and 4,837,831.17 (Growth Option – 3,583,600, Daily Dividend Option – 1,072,000, Weekly Dividend Option - 182,231.17) units were allotted at an allotment price per unit of Rs 10 on August 04, 2010. Benchmark Short Term Fund is an open-ended Debt Scheme. The scheme has Growth, Daily dividend and Weekly Dividend Option. No New Fund Offer expenses have been charged to the Scheme and the same has been borne by the AMC. The investment objective of the Scheme is to enhance returns with minimum risk by investing in a portfolio of money market and debt instruments while maintaining the safety and liquidity.
2. SIGNIFICANT ACCOUNTING POLICIES a) The method of accounting is on accrual basis.
b) Investments
i. Purchase and sale of securities are recognized on trade date. i.e. on the date of transaction and not on the date of settlement.
ii. All investments are accounted at acquisition cost. Such cost includes stamp duty, brokerage and any
other charges customarily included in broker’s note. In respect of any privately placed debt instruments any front-end discount offered is reduced from the cost of investments.
c) Portfolio Valuation - For the purpose of financial statements, the Fund marks all investments to market and
carries investments in the Balance Sheet at the market value. Unrealized gain, if any, arising out of appreciation of the investments, is carried to the Balance Sheet. In valuing the Scheme’s investments:
Debt securities listed on a recognized stock exchange are valued at the last quoted closing
price on the principal exchange on which the security is traded. Non-traded and Thinly traded debt securities are valued at fair value in good faith by the
AMC in accordance with the guidelines for valuation of such securities specified by SEBI. Privately placed debt securities are valued at fair value in good faith by the AMC in
accordance with the guidelines for valuation of such securities as specified by SEBI. Money market securities/Collateralised Borrowing and Lending Obligations/Non
traded/Thinly traded Non-Government Debt securities of upto 91 days of maturity are valued on the basis of amortization (cost plus accrued interest basis) plus the difference between the redemption value and the cost spread uniformly over the remaining maturity period of the instruments, as prescribed by SEBI.
Money Market/Non traded/Thinly trade Non-Government securities of over 91 days to maturity are valued on duration basis yield to maturity as prescribed by SEBI.
In accordance with SEBI Regulations, Government securities are valued at prices released by the Agency approved by AMFI. An investment is regarded as non-performing, if the interest

and / or principal amount have not been received or remained outstanding for one quarter from the day such income / installment has fallen due.
d) Income Recognition
a. Interest on fixed income investments are recognized on accrual basis. b. Profit or loss on sale of investment is arrived at by applying weighted average cost on trade date.
c. Income on non-performing assets (NPA) is recognized on cash basis.
d. Other income of miscellaneous nature is accounted for when there is certainty of collection.
e) Provisions
Provision, if any, is made by charge to Revenue Account, in respect of: a. Non Performing Debt Securities as per the guidelines prescribed by SEBI.
b. Interest outstanding for more than one quarter beyond due date.
f) Income Equalization
An appropriate portion of price of unit at the time of purchase and sale is transferred to Income Equalization Account. In arriving at the portion of the price to be transferred to Income Equalization Account, surplus/deficit (before considering unrealized appreciation) upto the date of transaction is taken into account. The net balance in Income Equalization Account is transferred to Revenue Account.
g) Unit Premium Reserve Unit Premium Reserve is debited or credited at the time of purchase or sale of units after taking into account the face value of units and Income Equalization. Balance in Unit Premium Reserve is not considered for distribution of dividend.
h) Entry / Exit Load The Fund is currently not charging any entry / exit load on subscription/redemption of units in the scheme. However, as per SEBI regulations and based on the load structure applicable from time to time, exit load in excess of 1% is credited to the scheme and load upto 1% is utilized for distribution and marketing expenses.
3. NOTES TO ACCOUNTS
1. Net Assets Value (NAV) is calculated after considering market/fair value of investments and after
providing for expenses on an estimated basis. 2. There are no underwriting obligations undertaken by the Scheme with respect to issue of securities of
associate companies. 3. There is no contingent liability on underwriting commitment, partly paid equity shares or any other
uncalled liabilities. 4. All investments are marked to market and accordingly reflected in the Balance Sheet. The cost and
market value of investments are shown in Note no. 11. 5. The AMC has not dealt in any securities through brokers associated with the Sponsor. 6. Purchase of investments yet to be settled: NIL
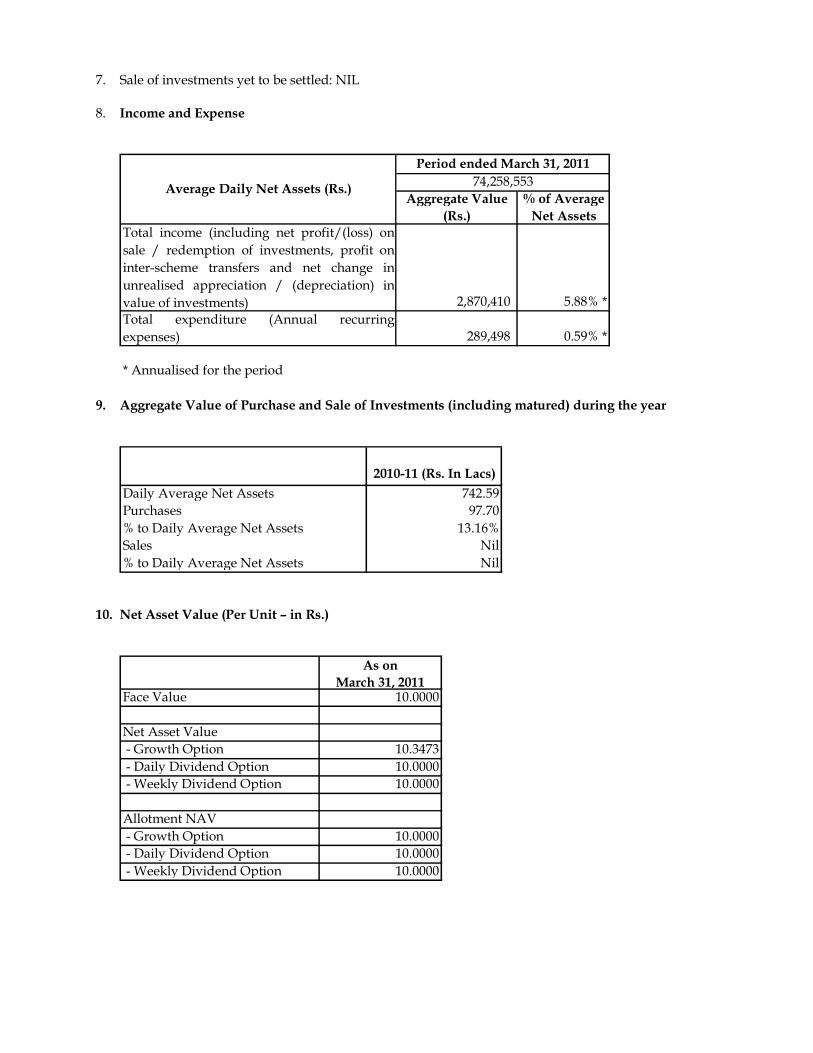
7. Sale of investments yet to be settled: NIL
8. Income and Expense
Total income (including net profit/(loss) onsale / redemption of investments, profit oninter-scheme transfers and net change inunrealised appreciation / (depreciation) invalue of investments) 2,870,410 5.88% *Total expenditure (Annual recurringexpenses) 289,498 0.59% *
* Annualised for the period
Average Daily Net Assets (Rs.)
Period ended March 31, 201174,258,553
Aggregate Value (Rs.)
% of Average Net Assets
9. Aggregate Value of Purchase and Sale of Investments (including matured) during the year
2010-11 (Rs. In Lacs)Daily Average Net Assets 742.59Purchases 97.70% to Daily Average Net Assets 13.16%Sales Nil% to Daily Average Net Assets Nil
10. Net Asset Value (Per Unit – in Rs.)
As on March 31, 2011
Face Value 10.0000
Net Asset Value - Growth Option 10.3473 - Daily Dividend Option 10.0000 - Weekly Dividend Option 10.0000
Allotment NAV - Growth Option 10.0000 - Daily Dividend Option 10.0000 - Weekly Dividend Option 10.0000
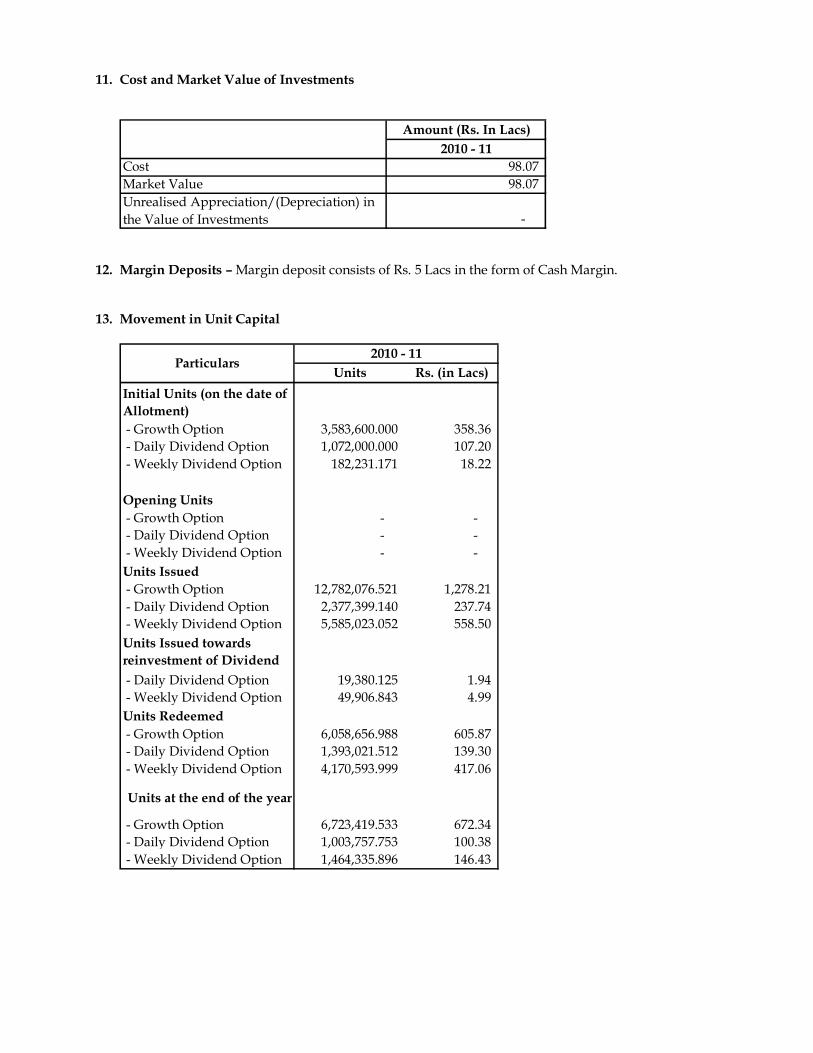
11. Cost and Market Value of Investments
Amount (Rs. In Lacs)
2010 - 11Cost 98.07 Market Value 98.07 Unrealised Appreciation/(Depreciation) in the Value of Investments -
12. Margin Deposits – Margin deposit consists of Rs. 5 Lacs in the form of Cash Margin.
13. Movement in Unit Capital
Units Rs. (in Lacs)Initial Units (on the date of Allotment) - Growth Option 3,583,600.000 358.36 - Daily Dividend Option 1,072,000.000 107.20 - Weekly Dividend Option 182,231.171 18.22
Opening Units - Growth Option - - - Daily Dividend Option - - - Weekly Dividend Option - - Units Issued - Growth Option 12,782,076.521 1,278.21 - Daily Dividend Option 2,377,399.140 237.74 - Weekly Dividend Option 5,585,023.052 558.50 Units Issued towards reinvestment of Dividend - Daily Dividend Option 19,380.125 1.94 - Weekly Dividend Option 49,906.843 4.99 Units Redeemed - Growth Option 6,058,656.988 605.87 - Daily Dividend Option 1,393,021.512 139.30 - Weekly Dividend Option 4,170,593.999 417.06
Units at the end of the year
- Growth Option 6,723,419.533 672.34 - Daily Dividend Option 1,003,757.753 100.38 - Weekly Dividend Option 1,464,335.896 146.43
2010 - 11Particulars

14. Details of Large Holding (more than 25% of the Net Assets of the Scheme) - As on March 31, 2011 there
is no investor in the Scheme who holds more than 25% of the net assets of the Scheme.
15. Income Tax – No provision for Income Tax is made as the Scheme qualifies as a recognized Mutual Fund under section 10 (23D) of the Income Tax Act, 1961.
16. Investment Management Fees – Investment Management Fees is calculated on the daily average net
assets of the Scheme. The details of management fees levied on an annualized basis are as follows:
Amount (in Rs.)2010 - 11
Daily Average Net Assets 74,258,553Management Fees (in %) 0.29% *Management Fees 143,056
* Annualised for the period
17. Trustee Fees – In accordance with the terms of Offer Document, the Trustee fees is charged @ 0.01% of the daily average net assets of the Scheme.
18. Custodial Fees and Expenses – Citibank N.A. provides custodial services to the Scheme for which it receives custody fees including safekeeping. In addition, Citibank N.A. is reimbursed for custody and transaction charges levied by depositories (i.e. NSDL / CDSL).
19. Registrar and Transfer Agent Fees and Expenses – Karvy Computershare Private Limited provides
Registrar and Transfer Agency Services to the Scheme, for which it receives fees based on daily average net assets of the Scheme.
20. There are no investments made by Benchmark Trustee Company Pvt. Ltd. Benchmark Asset
Management Company Pvt. Ltd has invested in the Scheme during the year ended March 31, 2011 but does not hold any units at the end of the year.
21. The Scheme has made no investments in Group/Associate Companies.
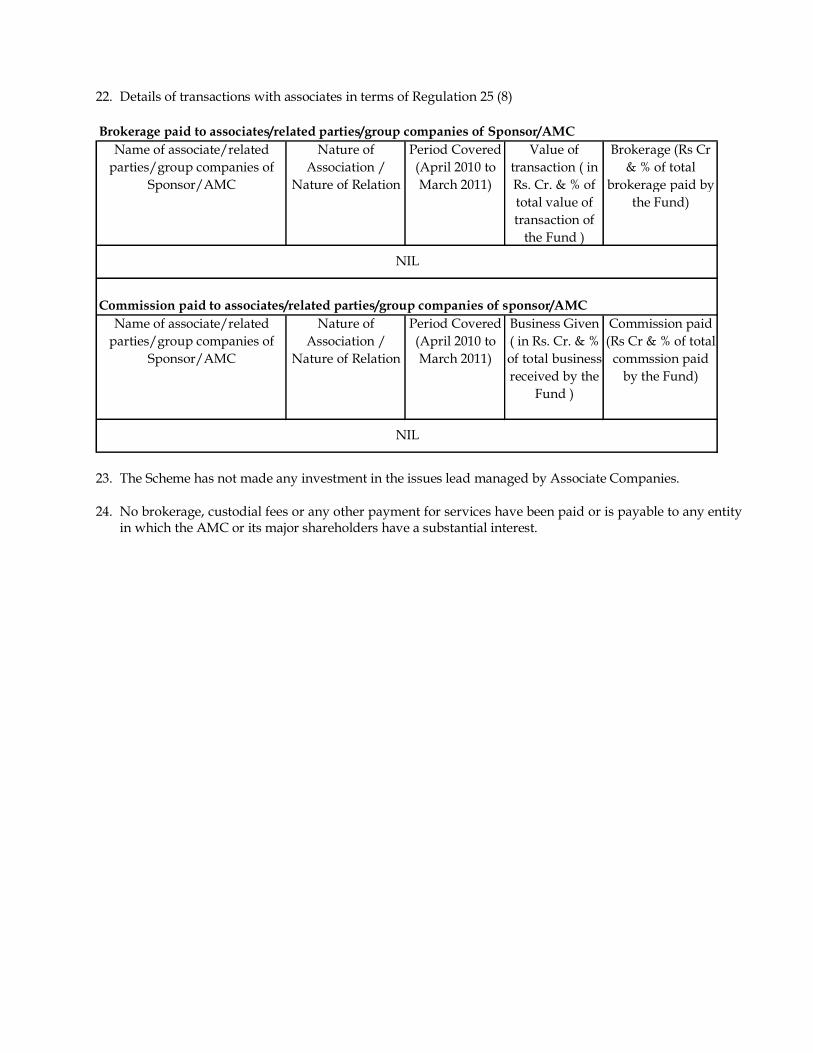
22. Details of transactions with associates in terms of Regulation 25 (8) Brokerage paid to associates/related parties/group companies of Sponsor/AMC
Name of associate/related parties/group companies of
Sponsor/AMC
Nature of Association /
Nature of Relation
Period Covered (April 2010 to March 2011)
Value of transaction ( in Rs. Cr. & % of total value of transaction of
the Fund )
Brokerage (Rs Cr & % of total
brokerage paid by the Fund)
Commission paid to associates/related parties/group companies of sponsor/AMCName of associate/related
parties/group companies of Sponsor/AMC
Nature of Association /
Nature of Relation
Period Covered (April 2010 to March 2011)
Business Given ( in Rs. Cr. & % of total business received by the
Fund )
Commission paid (Rs Cr & % of total
commssion paid by the Fund)
NIL
NIL
23. The Scheme has not made any investment in the issues lead managed by Associate Companies. 24. No brokerage, custodial fees or any other payment for services have been paid or is payable to any entity
in which the AMC or its major shareholders have a substantial interest.
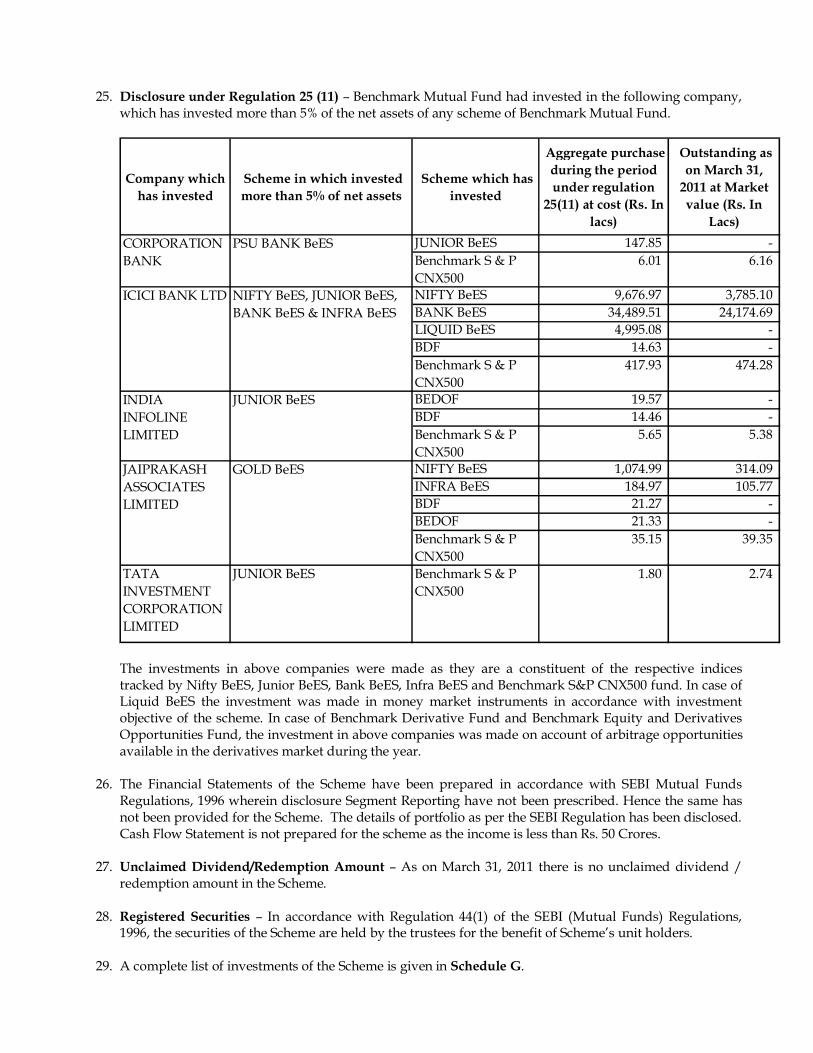
25. Disclosure under Regulation 25 (11) – Benchmark Mutual Fund had invested in the following company,
which has invested more than 5% of the net assets of any scheme of Benchmark Mutual Fund.
Company which has invested
Scheme in which invested more than 5% of net assets
Scheme which has invested
Aggregate purchase during the period under regulation
25(11) at cost (Rs. In lacs)
Outstanding as on March 31,
2011 at Market value (Rs. In
Lacs)JUNIOR BeES 147.85 -Benchmark S & P CNX500
6.01 6.16
NIFTY BeES 9,676.97 3,785.10 BANK BeES 34,489.51 24,174.69 LIQUID BeES 4,995.08 -BDF 14.63 -Benchmark S & P CNX500
417.93 474.28
BEDOF 19.57 -BDF 14.46 -Benchmark S & P CNX500
5.65 5.38
NIFTY BeES 1,074.99 314.09 INFRA BeES 184.97 105.77 BDF 21.27 -BEDOF 21.33 -Benchmark S & P CNX500
35.15 39.35
TATA INVESTMENT CORPORATION LIMITED
JUNIOR BeES Benchmark S & P CNX500
1.80 2.74
INDIA INFOLINE LIMITED
JUNIOR BeES
JAIPRAKASH ASSOCIATES LIMITED
GOLD BeES
CORPORATION BANK
PSU BANK BeES
ICICI BANK LTD NIFTY BeES, JUNIOR BeES, BANK BeES & INFRA BeES
The investments in above companies were made as they are a constituent of the respective indices tracked by Nifty BeES, Junior BeES, Bank BeES, Infra BeES and Benchmark S&P CNX500 fund. In case of Liquid BeES the investment was made in money market instruments in accordance with investment objective of the scheme. In case of Benchmark Derivative Fund and Benchmark Equity and Derivatives Opportunities Fund, the investment in above companies was made on account of arbitrage opportunities available in the derivatives market during the year.
26. The Financial Statements of the Scheme have been prepared in accordance with SEBI Mutual Funds Regulations, 1996 wherein disclosure Segment Reporting have not been prescribed. Hence the same has not been provided for the Scheme. The details of portfolio as per the SEBI Regulation has been disclosed. Cash Flow Statement is not prepared for the scheme as the income is less than Rs. 50 Crores.
27. Unclaimed Dividend/Redemption Amount – As on March 31, 2011 there is no unclaimed dividend /
redemption amount in the Scheme.
28. Registered Securities – In accordance with Regulation 44(1) of the SEBI (Mutual Funds) Regulations, 1996, the securities of the Scheme are held by the trustees for the benefit of Scheme’s unit holders.
29. A complete list of investments of the Scheme is given in Schedule G.
30. On March 15, 2011 Goldman Sachs Asset Management, L.P., through its subsidiaries Goldman Sachs Asset Management (India) Private Limited (“GS AMC”) and Goldman Sachs Trustee Company (India) Private Limited (“GS Trustee”), executed a sale and purchase agreement relating to the acquisition of all the outstanding shares in Benchmark Asset Management Company Private Limited (“BAMC”) and Benchmark Trustee Company Private Limited (“BTC”) from Niche Financial Services Private Limited, the sponsor of Benchmark Mutual Fund (“Benchmark MF”), and the other shareholders of BAMC and BTC. The sale and purchase agreement contemplates that BAMC shall transfer the rights to manage the schemes of Benchmark MF to GS AMC and BTC shall transfer the schemes of Benchmark MF to GS Trustee as part of the transaction. This transaction has been approved by the regulator, Securities and Exchange Board of India (“SEBI”) on June 27, 2011.
31. This being the first financial statement of the Scheme, the previous year figures have not been provided.
The Revenue account is drawn for the period from August 4, 2010 to March 31, 2011.
32. The audited results for the year ended March 31, 2011 have been approved by the Boards of Benchmark Asset Management Company Pvt. Ltd (AMC) and Benchmark Trustee Company Pvt. Ltd (Trustee) at their meeting held on June 29, 2011 respectively. NOTES:
1. On written request, present and prospective unit holders/investors can obtain a copy of the Trust Deed, the Annual Report, at a price if any, and the text of the Scheme.
2. On written request, the present and prospective unit holders/investors may request a copy of the Annual Report of the AMC.
3. On written request, the present and prospective unit holders/investors can inspect a full list of investments of the Scheme at the office of the AMC.
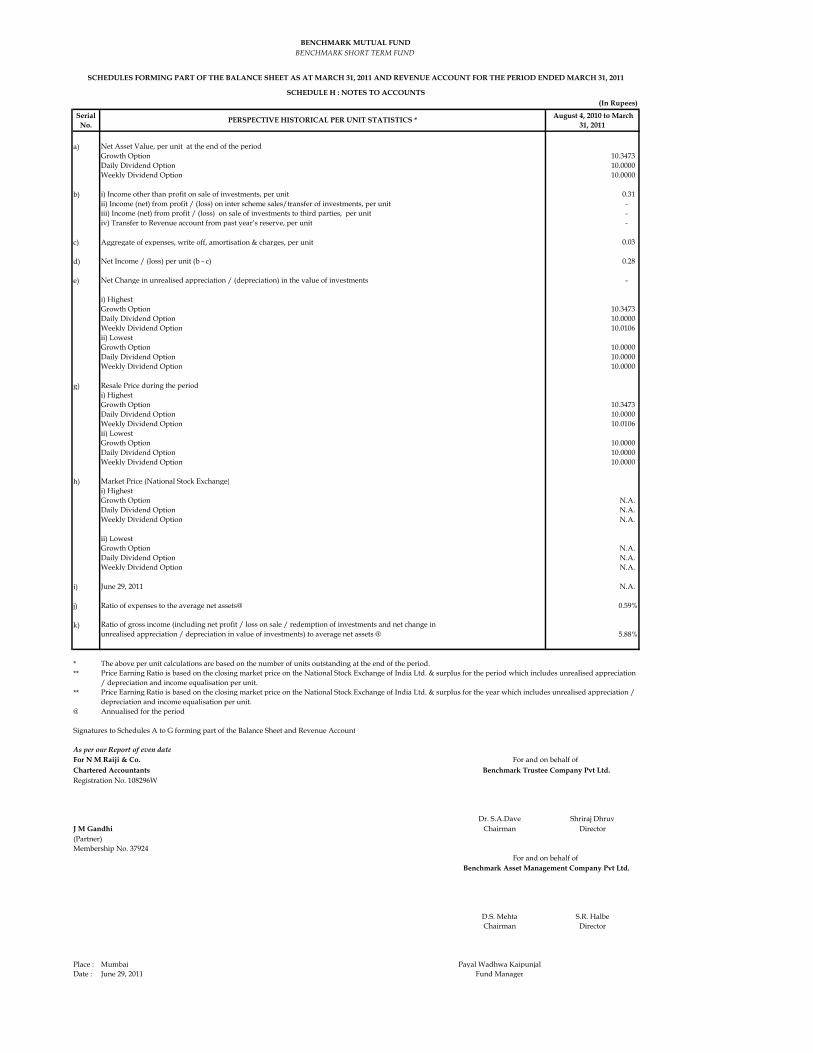
(In Rupees)
Serial No.
August 4, 2010 to March 31, 2011
a) Net Asset Value, per unit at the end of the periodGrowth Option 10.3473 Daily Dividend Option 10.0000 Weekly Dividend Option 10.0000
b) i) Income other than profit on sale of investments, per unit 0.31 ii) Income (net) from profit / (loss) on inter scheme sales/transfer of investments, per unit - iii) Income (net) from profit / (loss) on sale of investments to third parties, per unit - iv) Transfer to Revenue account from past year’s reserve, per unit -
c) Aggregate of expenses, write off, amortisation & charges, per unit 0.03
d) Net Income / (loss) per unit (b - c) 0.28
e) Net Change in unrealised appreciation / (depreciation) in the value of investments -
i) HighestGrowth Option 10.3473 Daily Dividend Option 10.0000 Weekly Dividend Option 10.0106 ii) LowestGrowth Option 10.0000 Daily Dividend Option 10.0000 Weekly Dividend Option 10.0000
g) Resale Price during the periodi) HighestGrowth Option 10.3473 Daily Dividend Option 10.0000 Weekly Dividend Option 10.0106 ii) LowestGrowth Option 10.0000 Daily Dividend Option 10.0000 Weekly Dividend Option 10.0000
h) Market Price (National Stock Exchange)i) HighestGrowth Option N.A.Daily Dividend Option N.A.Weekly Dividend Option N.A.
ii) LowestGrowth Option N.A.Daily Dividend Option N.A.Weekly Dividend Option N.A.
i) June 29, 2011 N.A.
j) Ratio of expenses to the average net assets@ 0.59%
k) Ratio of gross income (including net profit / loss on sale / redemption of investments and net change in unrealised appreciation / depreciation in value of investments) to average net assets @ 5.88%
***
**
@
Signatures to Schedules A to G forming part of the Balance Sheet and Revenue Account
As per our Report of even dateFor N M Raiji & Co.Chartered AccountantsRegistration No. 108296W
Dr. S.A.Dave Shriraj DhruvJ M Gandhi Chairman Director(Partner)Membership No. 37924
D.S. Mehta S.R. HalbeChairman Director
Place : Mumbai Payal Wadhwa KaipunjalDate : June 29, 2011 Fund Manager
BENCHMARK MUTUAL FUND
SCHEDULES FORMING PART OF THE BALANCE SHEET AS AT MARCH 31, 2011 AND REVENUE ACCOUNT FOR THE PERIOD ENDED MARCH 31, 2011
The above per unit calculations are based on the number of units outstanding at the end of the period.Price Earning Ratio is based on the closing market price on the National Stock Exchange of India Ltd. & surplus for the period which includes unrealised appreciation / depreciation and income equalisation per unit.
For and on behalf of Benchmark Asset Management Company Pvt Ltd.
SCHEDULE H : NOTES TO ACCOUNTS
BENCHMARK SHORT TERM FUND
For and on behalf of Benchmark Trustee Company Pvt Ltd.
PERSPECTIVE HISTORICAL PER UNIT STATISTICS *
Annualised for the period
Price Earning Ratio is based on the closing market price on the National Stock Exchange of India Ltd. & surplus for the year which includes unrealised appreciation / depreciation and income equalisation per unit.
AUDITORS’ REPORT The Board of Directors, Benchmark Trustee Company Private Limited
We have audited the attached Balance Sheet as at March 31, 2011, the Revenue Account and the Cash
Flow Statement for the period ended on that date annexed thereto, of Infrastructure Benchmark
Exchange Traded Scheme (the Scheme), of Benchmark Mutual Fund. These financial statements are
prepared in accordance with SEBI (Mutual Fund) Regulations, 1996 (the Regulations) and are the
responsibility of the Management. Our responsibility is to express an opinion on these financial
statements based on our audit.
We conducted our audit in accordance with the standards on auditing issued by Institute of Chartered
Accountants of India. An audit includes examining on a test basis, evidence supporting the amounts
and disclosures in the financial statements. An audit also includes assessing the accounting principles
used and significant estimates made by the management, as well as evaluating the overall financial
statement presentation. We believe that our audit provides a reasonable basis for our opinion.
We report that:
1. We have obtained all information and explanations, which, to the best of our knowledge and
belief were necessary for the purpose of our audit.
2. The Balance Sheet, the Revenue Account and the Cash Flow Statement referred to above are in
agreement with the books of accounts of the Scheme.
3. The accounts have been prepared in accordance with the accounting policies adopted by the
trustees of the Fund and as specified in the Ninth Schedule to the Regulations.

4. In our opinion, valuation methods for Non Traded Securities, if any, adopted by the scheme are
fair and reasonable and are in accordance with the guidelines for valuation issued by SEBI and
approved by the Trustee.
5. Without qualifying our opinion, we draw attention to note no. 25 in Schedule G of the financial
statements whereby the management has not provided the Segment Reporting for reasons
mentioned therein.
6. In our opinion and to the best of our information and according to the explanations given to us,
the financial statements read with the accounting policies and notes to accounts attached thereto,
give the information required as per the Regulations and give a true & fair view in accordance
with the generally accepted accounting principles in India:
a. in the case of Balance Sheet, of the state of affairs of the scheme as at March 31, 2011;
b. in the case of Revenue Account, of the surplus of the scheme for the period ended on that
date; and
c. in the case of Cash Flow Statement, of the cash flows for the period ended on that date.
For N.M.RAIJI & CO. Chartered Accountants
Firm Reg. No:108296W
J. M. GANDHI Partner Membership No. 37924
Place: Mumbai Dated: June 29, 2011
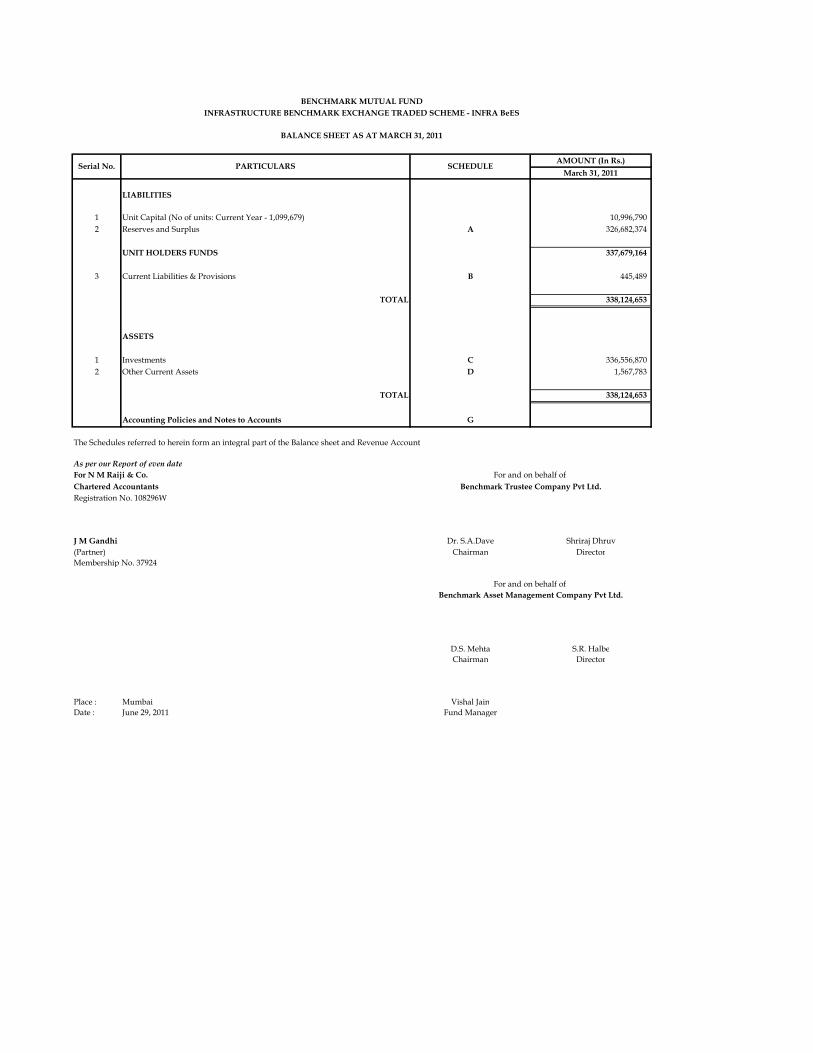
AMOUNT (In Rs.)March 31, 2011
LIABILITIES
1 Unit Capital (No of units: Current Year - 1,099,679) 10,996,790 2 Reserves and Surplus A 326,682,374
UNIT HOLDERS FUNDS 337,679,164
3 Current Liabilities & Provisions B 445,489
TOTAL 338,124,653
ASSETS
1 Investments C 336,556,870 2 Other Current Assets D 1,567,783
TOTAL 338,124,653
Accounting Policies and Notes to Accounts G
The Schedules referred to herein form an integral part of the Balance sheet and Revenue Account
As per our Report of even dateFor N M Raiji & Co.Chartered AccountantsRegistration No. 108296W
J M Gandhi Dr. S.A.Dave Shriraj Dhruv(Partner) Chairman DirectorMembership No. 37924
D.S. Mehta S.R. HalbeChairman Director
Place : Mumbai Vishal JainDate : June 29, 2011 Fund Manager
BENCHMARK MUTUAL FUNDINFRASTRUCTURE BENCHMARK EXCHANGE TRADED SCHEME - INFRA BeES
BALANCE SHEET AS AT MARCH 31, 2011
SCHEDULESerial No. PARTICULARS
For and on behalf of Benchmark Trustee Company Pvt Ltd.
Benchmark Asset Management Company Pvt Ltd.For and on behalf of
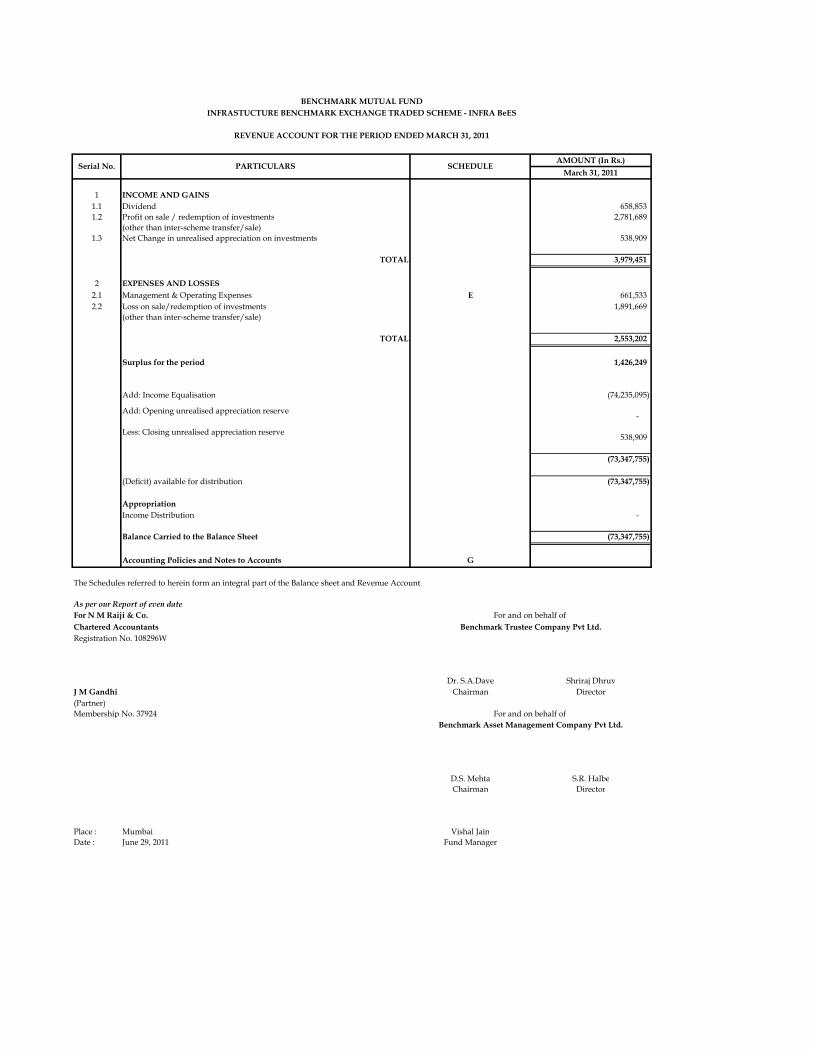
AMOUNT (In Rs.)March 31, 2011
1 INCOME AND GAINS1.1 Dividend 658,853 1.2 Profit on sale / redemption of investments 2,781,689
(other than inter-scheme transfer/sale)1.3 Net Change in unrealised appreciation on investments 538,909
TOTAL 3,979,451
2 EXPENSES AND LOSSES2.1 Management & Operating Expenses E 661,533 2.2 Loss on sale/redemption of investments 1,891,669
(other than inter-scheme transfer/sale)
TOTAL 2,553,202
Surplus for the period 1,426,249
Add: Income Equalisation (74,235,095)
(73,347,755)
(Deficit) available for distribution (73,347,755)
AppropriationIncome Distribution -
Balance Carried to the Balance Sheet (73,347,755)
Accounting Policies and Notes to Accounts G
The Schedules referred to herein form an integral part of the Balance sheet and Revenue Account
As per our Report of even dateFor N M Raiji & Co.Chartered AccountantsRegistration No. 108296W
Dr. S.A.Dave Shriraj DhruvJ M Gandhi Chairman Director(Partner)Membership No. 37924
D.S. Mehta S.R. HalbeChairman Director
Place : Mumbai Vishal JainDate : June 29, 2011 Fund Manager
Add: Opening unrealised appreciation reserve -
Less: Closing unrealised appreciation reserve
For and on behalf of
Benchmark Asset Management Company Pvt Ltd.
538,909
Benchmark Trustee Company Pvt Ltd.
For and on behalf of
REVENUE ACCOUNT FOR THE PERIOD ENDED MARCH 31, 2011
SCHEDULEPARTICULARSSerial No.
BENCHMARK MUTUAL FUNDINFRASTUCTURE BENCHMARK EXCHANGE TRADED SCHEME - INFRA BeES

March 31, 2011
A. Cashflow from Operating ActivitiesSurplus/(Deficit) for the year 1,426,249 Change in unrealised Appreciation/(Depreciation) in the value of investments. (538,909)
887,340
Adjustments for:-(Increase)/Decrease in Investments at Cost (336,017,961) (Increase)/Decrease in Other Current Assets (22,556) Increase/(Decrease) in Current Liabilities 445,489 Net Cash Generated from/(used in) Operations (334,707,688)
B Cashflow from Financing ActivitiesIncrease/(Decrease) in Unit Capital 10,996,790 Increase/(Decrease) in Reserves 325,256,125 Adjustments for:-Increase/(Decrease) in Sundry Creditors for Units Redeemed by Investors(Increase)/Decrease in Sundry Debtors for Units Issued to InvestorsDividend paid during the Year/Period
Net Cash (used in)/Generated from Financing Activities 336,252,915
Net Increase/(Decrease) in Cash and Cash Equivalents (A+B) 1,545,227
Cash and Cash Equivalents as at the :-Beginning of the yearEnd of the year 1,545,227
Components of Cash and Cash EquivalentsBalances with Banks in Current Accounts 1,545,227 Deposits with Scheduled Banks -
As per our attached report of even date
For N M Raiji & Co. Chartered Accountants Registration No. 108296W
Dr. S.A.Dave Shriraj DhruvJ M Gandhi Chairman Director(Partner)Membership No. 37924
D.S. Mehta S.R. HalbeChairman Director
Place: Mumbai Vishal JainDate: June 29, 2011 Fund Manager
For and on behalf of Benchmark Trustee Company Pvt Ltd.
For and on behalf of Benchmark Asset Management Company Pvt. Ltd.
INFRASTRUCTURE BENCHMARK EXCHANGE TRADED SCHEME - INFRA BeES
CASH FLOW STATEMENT FOR THE YEAR ENDED MARCH 31, 2011
The above cash flow statement has been prepared under the indirect method setout in Accounting Standard (AS-3) issued by the Institute of Chartered Accountants of India.
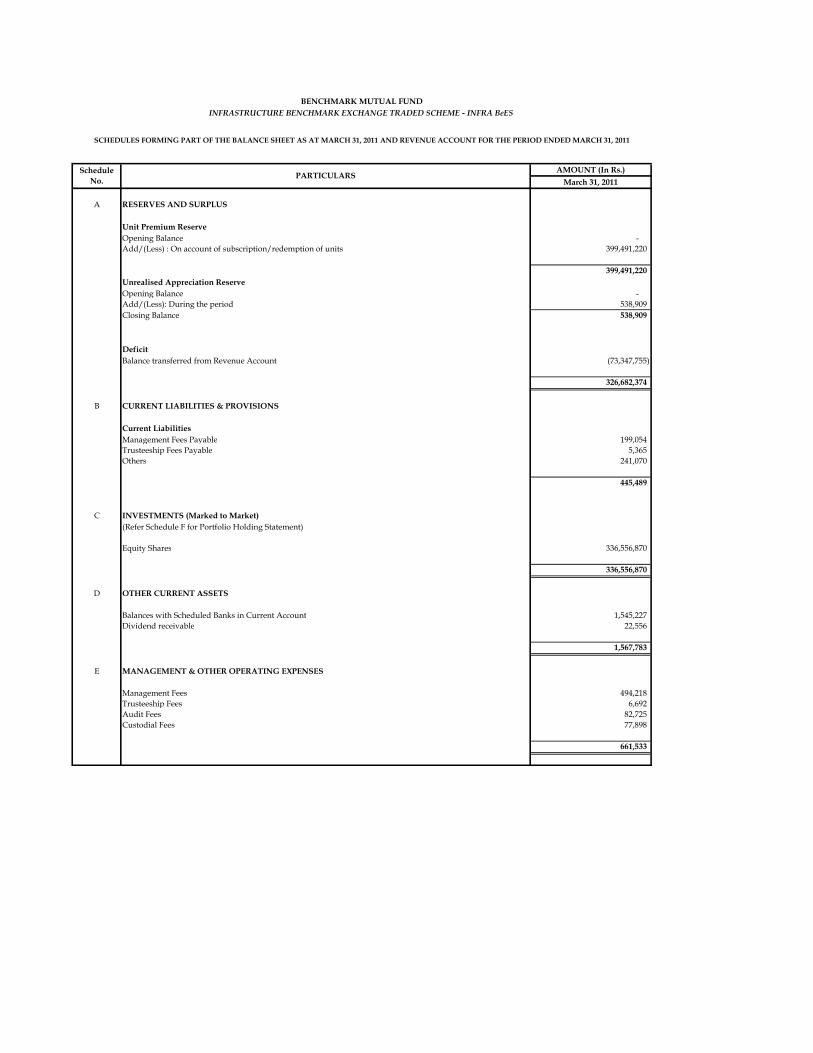
AMOUNT (In Rs.)March 31, 2011
A RESERVES AND SURPLUS
Unit Premium ReserveOpening Balance - Add/(Less) : On account of subscription/redemption of units 399,491,220
399,491,220 Unrealised Appreciation ReserveOpening Balance - Add/(Less): During the period 538,909 Closing Balance 538,909
DeficitBalance transferred from Revenue Account (73,347,755)
326,682,374
B CURRENT LIABILITIES & PROVISIONS
Current LiabilitiesManagement Fees Payable 199,054 Trusteeship Fees Payable 5,365 Others 241,070
445,489
C INVESTMENTS (Marked to Market)(Refer Schedule F for Portfolio Holding Statement)
Equity Shares 336,556,870
336,556,870
D OTHER CURRENT ASSETS
Balances with Scheduled Banks in Current Account 1,545,227 Dividend receivable 22,556
1,567,783
E MANAGEMENT & OTHER OPERATING EXPENSES
Management Fees 494,218 Trusteeship Fees 6,692 Audit Fees 82,725 Custodial Fees 77,898
661,533
INFRASTRUCTURE BENCHMARK EXCHANGE TRADED SCHEME - INFRA BeES
Schedule No.
SCHEDULES FORMING PART OF THE BALANCE SHEET AS AT MARCH 31, 2011 AND REVENUE ACCOUNT FOR THE PERIOD ENDED MARCH 31, 2011
PARTICULARS
BENCHMARK MUTUAL FUND
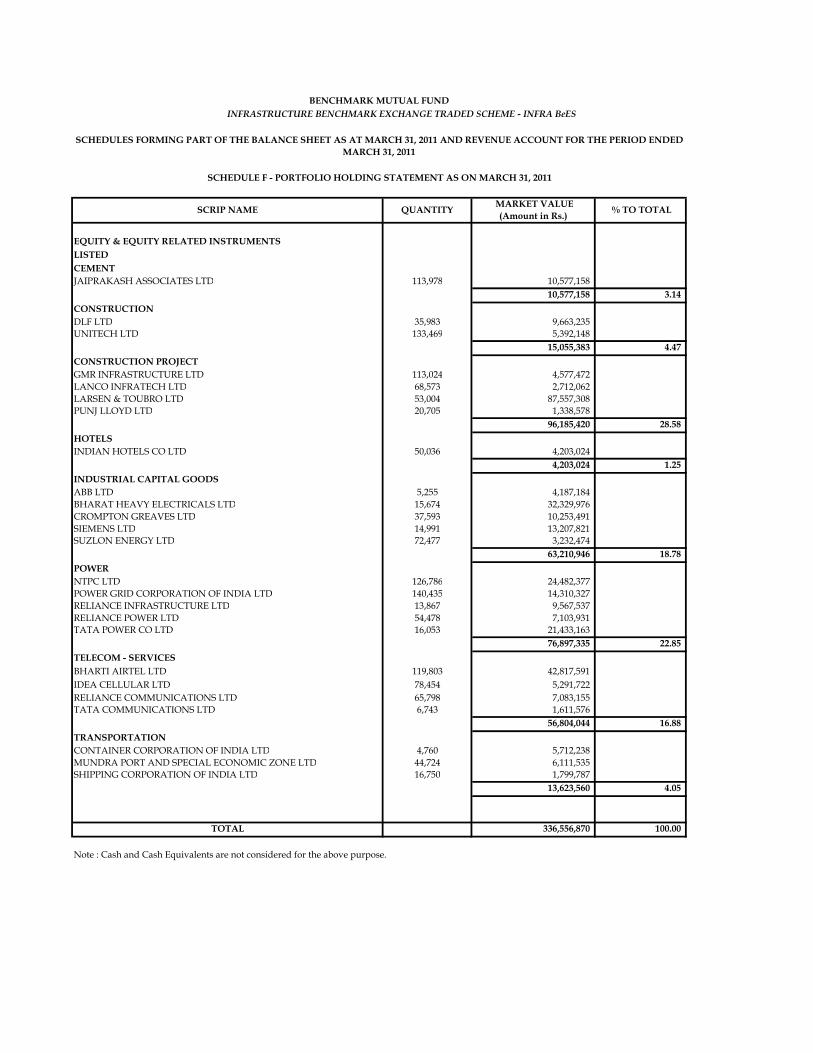
EQUITY & EQUITY RELATED INSTRUMENTSLISTEDCEMENTJAIPRAKASH ASSOCIATES LTD 113,978 10,577,158
10,577,158 3.14 CONSTRUCTIONDLF LTD 35,983 9,663,235 UNITECH LTD 133,469 5,392,148
15,055,383 4.47 CONSTRUCTION PROJECTGMR INFRASTRUCTURE LTD 113,024 4,577,472 LANCO INFRATECH LTD 68,573 2,712,062 LARSEN & TOUBRO LTD 53,004 87,557,308 PUNJ LLOYD LTD 20,705 1,338,578
96,185,420 28.58 HOTELSINDIAN HOTELS CO LTD 50,036 4,203,024
4,203,024 1.25 INDUSTRIAL CAPITAL GOODSABB LTD 5,255 4,187,184 BHARAT HEAVY ELECTRICALS LTD 15,674 32,329,976 CROMPTON GREAVES LTD 37,593 10,253,491 SIEMENS LTD 14,991 13,207,821 SUZLON ENERGY LTD 72,477 3,232,474
63,210,946 18.78 POWERNTPC LTD 126,786 24,482,377 POWER GRID CORPORATION OF INDIA LTD 140,435 14,310,327 RELIANCE INFRASTRUCTURE LTD 13,867 9,567,537 RELIANCE POWER LTD 54,478 7,103,931 TATA POWER CO LTD 16,053 21,433,163
76,897,335 22.85 TELECOM - SERVICESBHARTI AIRTEL LTD 119,803 42,817,591 IDEA CELLULAR LTD 78,454 5,291,722 RELIANCE COMMUNICATIONS LTD 65,798 7,083,155 TATA COMMUNICATIONS LTD 6,743 1,611,576
56,804,044 16.88 TRANSPORTATIONCONTAINER CORPORATION OF INDIA LTD 4,760 5,712,238 MUNDRA PORT AND SPECIAL ECONOMIC ZONE LTD 44,724 6,111,535 SHIPPING CORPORATION OF INDIA LTD 16,750 1,799,787
13,623,560 4.05
TOTAL 336,556,870 100.00
Note : Cash and Cash Equivalents are not considered for the above purpose.
BENCHMARK MUTUAL FUND
SCHEDULES FORMING PART OF THE BALANCE SHEET AS AT MARCH 31, 2011 AND REVENUE ACCOUNT FOR THE PERIOD ENDED MARCH 31, 2011
% TO TOTAL MARKET VALUE (Amount in Rs.) QUANTITYSCRIP NAME
INFRASTRUCTURE BENCHMARK EXCHANGE TRADED SCHEME - INFRA BeES
SCHEDULE F - PORTFOLIO HOLDING STATEMENT AS ON MARCH 31, 2011
BENCHMARK MUTUAL FUND
Infrastructure Benchmark Exchange Traded Scheme – Infra BeES Schedule G – Accounting Policies and Notes to Accounts 1. BACKGROUND – Benchmark Mutual Fund (“the Fund”) has been sponsored by Niche Financial Services
Pvt. Ltd and has been set up as a Trust under the Indian Trust Act, 1882 through Trust Deed dated February 14, 2001. Benchmark Trustee Company Pvt. Ltd. (“the Trustee”) is the sole Trustee of the Fund. In accordance with Securities and Exchange Board of India (Mutual Funds) Regulations, 1996, Benchmark Asset Management Company Pvt. Ltd. (BAMC) has been appointed as Asset Management Company (“the AMC”) to the Fund. Infrastructure Benchmark Exchange Traded Scheme (Infra BeES) is an open-ended index scheme of Benchmark Mutual Fund tracking CNX Infrastructure Index in the form of Exchange Traded Fund (ETF) and the units of Infra BeES are listed on the Capital Market Segment of the National Stock Exchange of India Ltd. (NSE). The New Fund Offer of Infrastructure Benchmark Exchange Traded Scheme (Infra BeES) opened for public subscription on September 09, 2010 and closed on September 23, 2010. The scheme collected Rs. 33,471,249/- in the New Fund Offer and 89,679 units were allotted at an allotment price per unit of Rs 373.2340 on September 29, 2010. Infrastructure Benchmark Exchange Traded Scheme (Infra BeES) is an open-ended index scheme of Benchmark Mutual Fund tracking CNX Infrastructure Index in the form of Exchange Traded Fund (ETF) and the units of Infra BeES are listed on the Capital Market Segment of the National Stock Exchange of India Ltd. (NSE). No New Fund Offer expenses have been charged to the Scheme, same has been borne by the AMC
The investment objective of the Scheme is to provide returns that, before expenses, closely correspond to the total returns of the securities as represented by the CNX Infrastructure Index by investing in the securities in the same proportion as in the Index. However, the performance of Scheme may differ from that of the Underlying Index due to tracking error. Subscription and Redemption of units of Infra BeES are generally through the exchange of underlying securities forming part of the CNX Infrastructure Index. The rounding off difference is settled in money value. The Fund also allows cash subscription/redemption of Infra BeES in pre-defined size, whereby the Fund will arrange to buy/sell the underlying index securities on behalf of the investors.
2. SIGNIFICANT ACCOUNTING POLICIES a) The method of accounting is on accrual basis.
b) Investments
i. Purchase and sale of securities are recognized on trade date. i.e. on the date of transaction and not on the date of settlement.
ii. All investments are accounted at acquisition cost. Such cost includes stamp duty, brokerage and any
other charges customarily included in broker’s note.
iii. Cost of right shares, if any, is considered at issue price plus premium paid, if any, to acquire rights renunciation.
iv. Bonus entitlements, if any, are recognized on ex-bonus dates. Similarly right entitlements, if any, are
recognized only when original shares on which right entitlements accrue are traded on ex-right basis.
v. In determining the holding cost of investments and gain/loss on sale of investments, weighted average method has been followed.

c) Portfolio Valuation - For the purpose of financial statements, the Fund marks all investments to market and
carries investments in the Balance Sheet at the market value. Unrealized gain, if any, arising out of appreciation of the investments, is carried to the Balance Sheet. Traded securities are valued at the last quoted closing prices on the NSE. In absence of such a quoted price on the valuation date, the last available quoted price within a period of thirty days prior to the valuation date is used for valuation purpose.Non traded securities, if any, including those not traded within 30 days prior to the valuation date and thinly traded/unlisted securities are valued in accordance with the guidelines issued by SEBI.
d) Income Recognition
a. Dividend income is accrued on ex-dividend date. b. Profit or loss on sale of investment is arrived at by applying weighted average cost on trade date.
c. Interest on fixed income investments are recognized on accrual basis.
d. Unrealized gain/loss is recognized in Revenue Account. However, unrealized gain is excluded for
calculating distributable surplus and the same is carried to the Balance Sheet as Unrealized Appreciation Reserve.
e) Income Equalization
An appropriate portion of price of unit at the time of purchase and sale is transferred to Income Equalization Account. In arriving at the portion of the price to be transferred to Income Equalization Account, surplus/deficit (before considering unrealized appreciation) upto the date of transaction is taken into account. The net balance in Income Equalization Account is transferred to Revenue Account.
f) Unit Premium Reserve Unit Premium Reserve is debited or credited at the time of purchase or sale of units after taking into account the face value of units and Income Equalization. Balance in Unit Premium Reserve is not considered for distribution of dividend.
g) Entry / Exit Load The Fund does not charge any entry / exit load on subscription/redemption of units in the creation unit size. However in case no quotes are available on the NSE for five consecutive trading days, the exit load charged for redemption of units is upto 3% of NAV. Such load, if charged, at the time of repurchase of units, is offset against distribution and marketing expenses. Unutilized amount of load collected is carried to subsequent year unless the same is found excess by the Trustees / AMC. Such excess amount is credited to the Scheme. No entry load is charge, exit load in excess of 1% is credited to the scheme and load upto 1% is utilized for distribution and marketing expenses. As per the terms of the Offer Document, Depository and Custody Charges are recovered from the respective investor for transfer of shares on subscription and redemption and the same is utilized for payment of transaction charges to Depository Participant and Custodian on account of transfer of shares and hence do not form part of Revenue Account.
3. NOTES TO ACCOUNTS 1. Net Assets Value (NAV) is calculated after considering market/fair value of investments and after
providing for expenses on an estimated basis.
2. There are no underwriting obligations undertaken by the Scheme with respect to issue of securities of associate companies.
3. There is no contingent liability on underwriting commitment, partly paid equity shares or any other
uncalled liabilities.
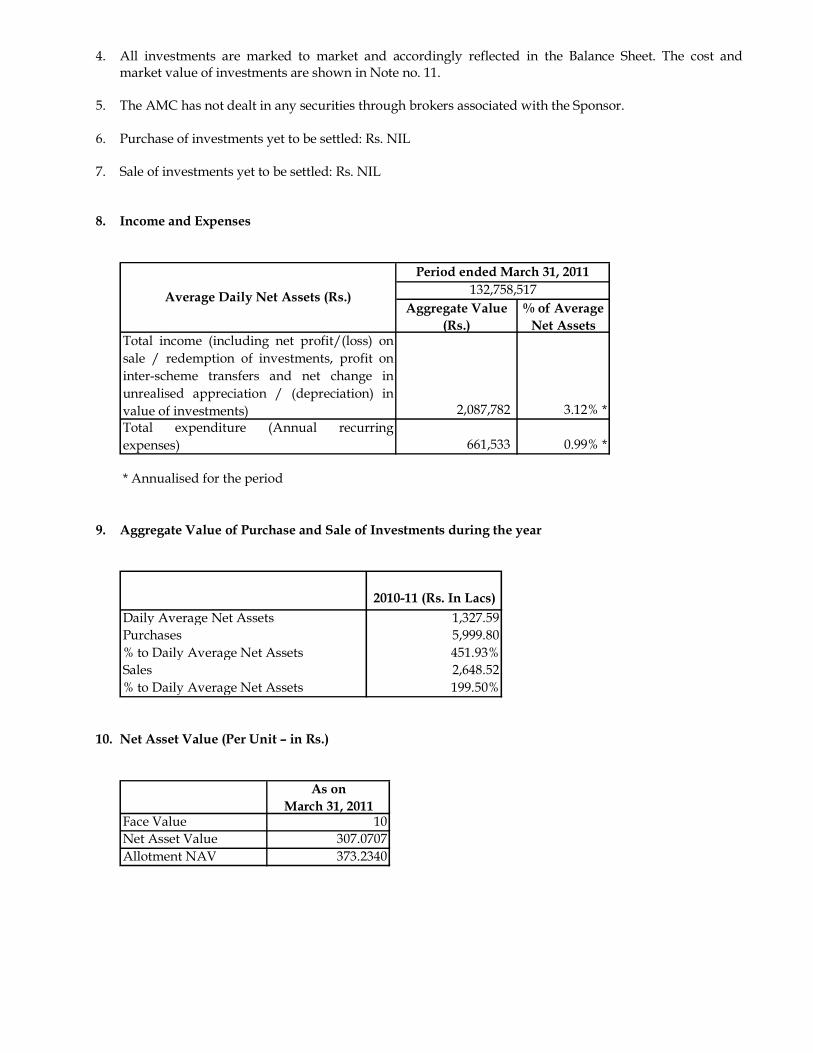
4. All investments are marked to market and accordingly reflected in the Balance Sheet. The cost and market value of investments are shown in Note no. 11.
5. The AMC has not dealt in any securities through brokers associated with the Sponsor. 6. Purchase of investments yet to be settled: Rs. NIL 7. Sale of investments yet to be settled: Rs. NIL 8. Income and Expenses
Total income (including net profit/(loss) onsale / redemption of investments, profit oninter-scheme transfers and net change inunrealised appreciation / (depreciation) invalue of investments) 2,087,782 3.12% *Total expenditure (Annual recurringexpenses) 661,533 0.99% *
* Annualised for the period
Average Daily Net Assets (Rs.)
Period ended March 31, 2011132,758,517
Aggregate Value (Rs.)
% of Average Net Assets
9. Aggregate Value of Purchase and Sale of Investments during the year
2010-11 (Rs. In Lacs)Daily Average Net Assets 1,327.59Purchases 5,999.80% to Daily Average Net Assets 451.93%Sales 2,648.52% to Daily Average Net Assets 199.50%
10. Net Asset Value (Per Unit – in Rs.)
As on
March 31, 2011Face Value 10Net Asset Value 307.0707Allotment NAV 373.2340
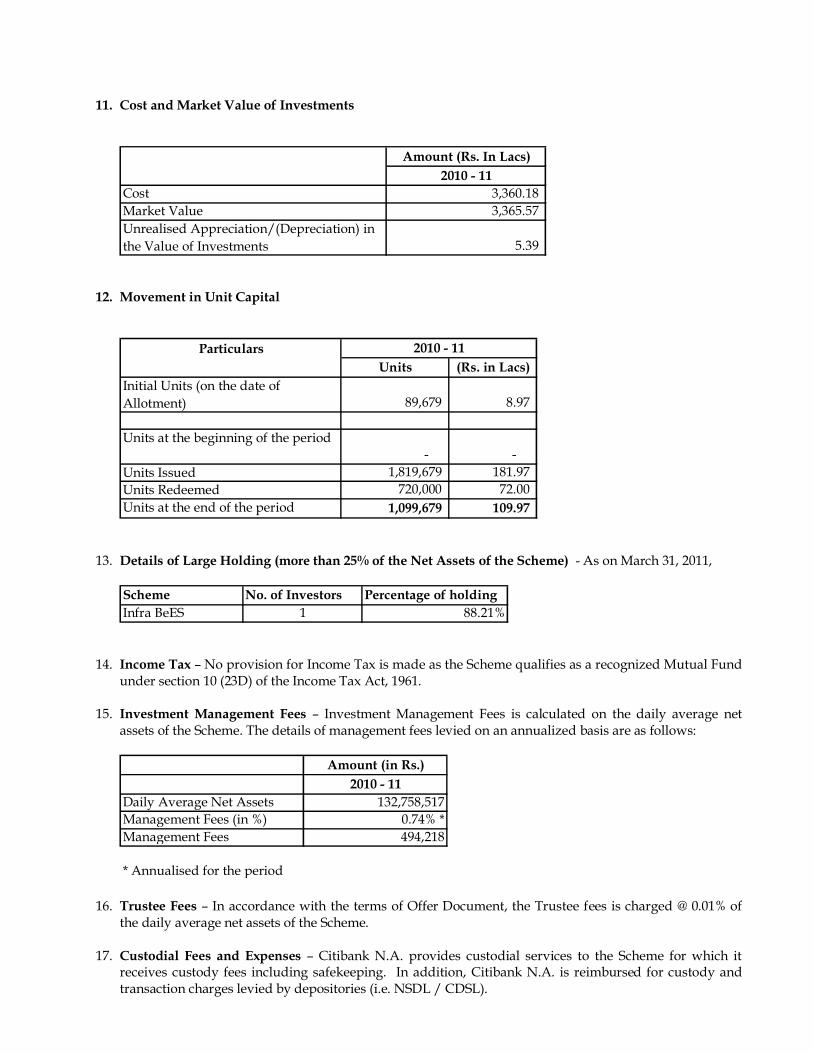
11. Cost and Market Value of Investments
Amount (Rs. In Lacs)2010 - 11
Cost 3,360.18 Market Value 3,365.57 Unrealised Appreciation/(Depreciation) in the Value of Investments 5.39
12. Movement in Unit Capital
ParticularsUnits (Rs. in Lacs)
Initial Units (on the date of Allotment) 89,679 8.97
Units at the beginning of the period- -
Units Issued 1,819,679 181.97 Units Redeemed 720,000 72.00 Units at the end of the period 1,099,679 109.97
2010 - 11
13. Details of Large Holding (more than 25% of the Net Assets of the Scheme) - As on March 31, 2011,
Scheme No. of Investors Percentage of holdingInfra BeES 1 88.21%
14. Income Tax – No provision for Income Tax is made as the Scheme qualifies as a recognized Mutual Fund
under section 10 (23D) of the Income Tax Act, 1961. 15. Investment Management Fees – Investment Management Fees is calculated on the daily average net
assets of the Scheme. The details of management fees levied on an annualized basis are as follows:
Amount (in Rs.)2010 - 11
Daily Average Net Assets 132,758,517Management Fees (in %) 0.74% *Management Fees 494,218
* Annualised for the period
16. Trustee Fees – In accordance with the terms of Offer Document, the Trustee fees is charged @ 0.01% of the daily average net assets of the Scheme.
17. Custodial Fees and Expenses – Citibank N.A. provides custodial services to the Scheme for which it receives custody fees including safekeeping. In addition, Citibank N.A. is reimbursed for custody and transaction charges levied by depositories (i.e. NSDL / CDSL).

18. Registrar and Transfer Agent Fees and Expenses – Karvy Computershare Private Limited provides Registrar and Transfer Agency Services to the Scheme, for which it receives the fees based on daily average net assets of the Scheme.
19. There are no investments made by Benchmark Trustee Company Pvt. Ltd. in the Scheme. Benchmark
Asset Management Company Pvt. Ltd. holds 8,461 units in the Scheme as at March 31, 2011.
20. The Scheme has not made any investments in any Group/Associate Companies.
21. Details of transactions with associates in terms of Regulation 25 (8)
Brokerage paid to associates/related parties/group companies of Sponsor/AMCName of associate/related
parties/group companies of Sponsor/AMC
Nature of Association /
Nature of Relation
Period Covered (April 2010 to March 2011)
Value of transaction ( in Rs. Cr. & % of total value of transaction of
the Fund )
Brokerage (Rs Cr & % of total
brokerage paid by the Fund)
Commission paid to associates/related parties/group companies of sponsor/AMCName of associate/related
parties/group companies of Sponsor/AMC
Nature of Association /
Nature of Relation
Period Covered (April 2010 to March 2011)
Business Given ( in Rs. Cr. & % of total business received by the
Fund )
Commission paid (Rs Cr & % of total
commssion paid by the Fund)
NIL
NIL
22. The Scheme has not made any investment in the issues lead managed by Associate Companies. 23. No brokerage, custodial fees or any other payment for services have been paid or is payable to any entity
in which the AMC or its major shareholders have a substantial interest.
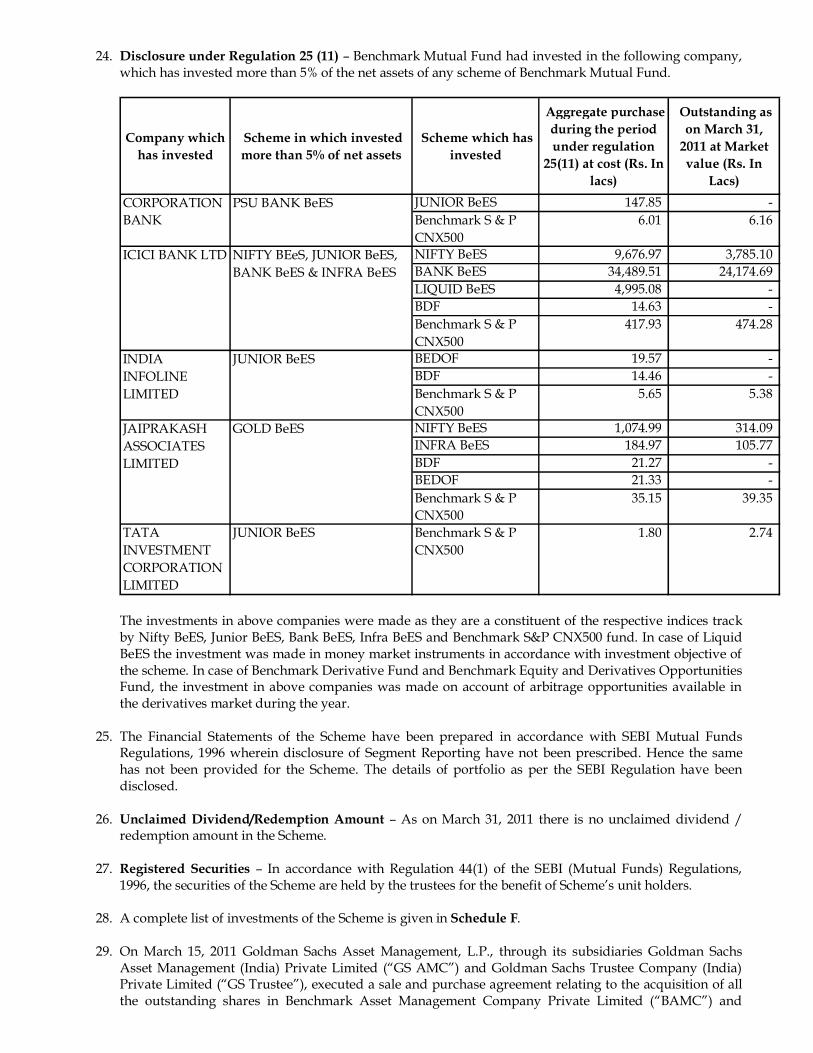
24. Disclosure under Regulation 25 (11) – Benchmark Mutual Fund had invested in the following company, which has invested more than 5% of the net assets of any scheme of Benchmark Mutual Fund.
Company which has invested
Scheme in which invested more than 5% of net assets
Scheme which has invested
Aggregate purchase during the period under regulation
25(11) at cost (Rs. In lacs)
Outstanding as on March 31,
2011 at Market value (Rs. In
Lacs)JUNIOR BeES 147.85 -Benchmark S & P CNX500
6.01 6.16
NIFTY BeES 9,676.97 3,785.10 BANK BeES 34,489.51 24,174.69 LIQUID BeES 4,995.08 -BDF 14.63 -Benchmark S & P CNX500
417.93 474.28
BEDOF 19.57 -BDF 14.46 -Benchmark S & P CNX500
5.65 5.38
NIFTY BeES 1,074.99 314.09 INFRA BeES 184.97 105.77 BDF 21.27 -BEDOF 21.33 -Benchmark S & P CNX500
35.15 39.35
TATA INVESTMENT CORPORATION LIMITED
JUNIOR BeES Benchmark S & P CNX500
1.80 2.74
INDIA INFOLINE LIMITED
JUNIOR BeES
JAIPRAKASH ASSOCIATES LIMITED
GOLD BeES
CORPORATION BANK
PSU BANK BeES
ICICI BANK LTD NIFTY BEeS, JUNIOR BeES, BANK BeES & INFRA BeES
The investments in above companies were made as they are a constituent of the respective indices track by Nifty BeES, Junior BeES, Bank BeES, Infra BeES and Benchmark S&P CNX500 fund. In case of Liquid BeES the investment was made in money market instruments in accordance with investment objective of the scheme. In case of Benchmark Derivative Fund and Benchmark Equity and Derivatives Opportunities Fund, the investment in above companies was made on account of arbitrage opportunities available in the derivatives market during the year.
25. The Financial Statements of the Scheme have been prepared in accordance with SEBI Mutual Funds Regulations, 1996 wherein disclosure of Segment Reporting have not been prescribed. Hence the same has not been provided for the Scheme. The details of portfolio as per the SEBI Regulation have been disclosed.
26. Unclaimed Dividend/Redemption Amount – As on March 31, 2011 there is no unclaimed dividend /
redemption amount in the Scheme.
27. Registered Securities – In accordance with Regulation 44(1) of the SEBI (Mutual Funds) Regulations, 1996, the securities of the Scheme are held by the trustees for the benefit of Scheme’s unit holders.
28. A complete list of investments of the Scheme is given in Schedule F.
29. On March 15, 2011 Goldman Sachs Asset Management, L.P., through its subsidiaries Goldman Sachs
Asset Management (India) Private Limited (“GS AMC”) and Goldman Sachs Trustee Company (India) Private Limited (“GS Trustee”), executed a sale and purchase agreement relating to the acquisition of all the outstanding shares in Benchmark Asset Management Company Private Limited (“BAMC”) and
Benchmark Trustee Company Private Limited (“BTC”) from Niche Financial Services Private Limited, the sponsor of Benchmark Mutual Fund (“Benchmark MF”), and the other shareholders of BAMC and BTC. The sale and purchase agreement contemplates that BAMC shall transfer the rights to manage the schemes of Benchmark MF to GS AMC and BTC shall transfer the schemes of Benchmark MF to GS Trustee as part of the transaction. This transaction has been approved by the regulator, Securities and Exchange Board of India (“SEBI”) on June 27, 2011.
30. This being the first financial statement of the Scheme, the previous year figures have not been provided.
The Revenue account is drawn for the period from September 29, 2010 to March 31, 2011.
31. The audited results for the year ended March 31, 2011 have been approved by the Boards of Benchmark Asset Management Company Pvt. Ltd (AMC) and Benchmark Trustee Company Pvt. Ltd (Trustee) at their meeting held on June 29, 2011 respectively.
NOTES:
1. On written request, present and prospective unit holders/investors can obtain a copy of the Trust Deed, the Annual Report, at a price if any, and the text of the Scheme.
2. On written request, the present and prospective unit holders/investors may request a copy of the Annual Report of the AMC.
3. On written request, the present and prospective unit holders/investors can inspect a full list of investments of the Scheme at the office of the AMC.
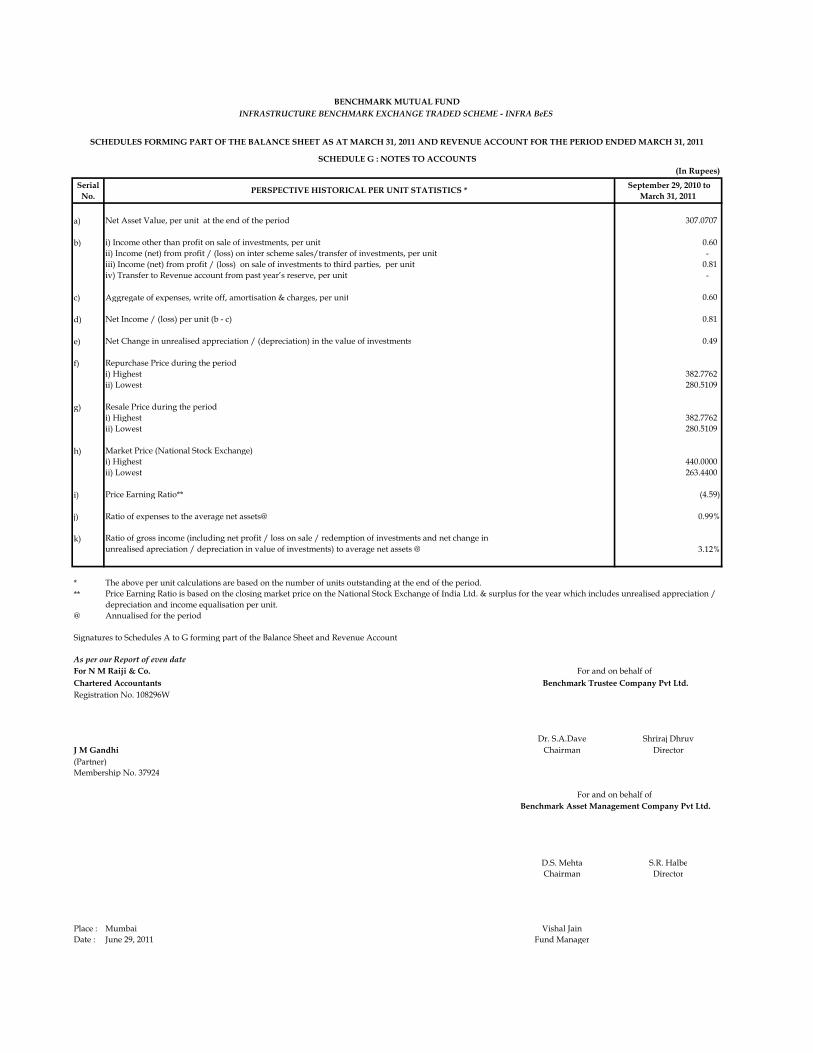
(In Rupees)
Serial No.
September 29, 2010 to March 31, 2011
a) Net Asset Value, per unit at the end of the period 307.0707
b) i) Income other than profit on sale of investments, per unit 0.60 ii) Income (net) from profit / (loss) on inter scheme sales/transfer of investments, per unit - iii) Income (net) from profit / (loss) on sale of investments to third parties, per unit 0.81 iv) Transfer to Revenue account from past year’s reserve, per unit -
c) Aggregate of expenses, write off, amortisation & charges, per unit 0.60
d) Net Income / (loss) per unit (b - c) 0.81
e) Net Change in unrealised appreciation / (depreciation) in the value of investments 0.49
f) Repurchase Price during the periodi) Highest 382.7762 ii) Lowest 280.5109
g) Resale Price during the periodi) Highest 382.7762 ii) Lowest 280.5109
h) Market Price (National Stock Exchange)i) Highest 440.0000 ii) Lowest 263.4400
i) Price Earning Ratio** (4.59)
j) Ratio of expenses to the average net assets@ 0.99%
k) Ratio of gross income (including net profit / loss on sale / redemption of investments and net change in unrealised apreciation / depreciation in value of investments) to average net assets @ 3.12%
***
@
Signatures to Schedules A to G forming part of the Balance Sheet and Revenue Account
As per our Report of even dateFor N M Raiji & Co.Chartered AccountantsRegistration No. 108296W
Dr. S.A.Dave Shriraj DhruvJ M Gandhi Chairman Director(Partner)Membership No. 37924
D.S. Mehta S.R. HalbeChairman Director
Place : Mumbai Vishal JainDate : June 29, 2011 Fund Manager
For and on behalf of Benchmark Asset Management Company Pvt Ltd.
SCHEDULE G : NOTES TO ACCOUNTS
INFRASTRUCTURE BENCHMARK EXCHANGE TRADED SCHEME - INFRA BeES
For and on behalf of Benchmark Trustee Company Pvt Ltd.
PERSPECTIVE HISTORICAL PER UNIT STATISTICS *
Annualised for the period
Price Earning Ratio is based on the closing market price on the National Stock Exchange of India Ltd. & surplus for the year which includes unrealised appreciation / depreciation and income equalisation per unit.
BENCHMARK MUTUAL FUND
SCHEDULES FORMING PART OF THE BALANCE SHEET AS AT MARCH 31, 2011 AND REVENUE ACCOUNT FOR THE PERIOD ENDED MARCH 31, 2011
The above per unit calculations are based on the number of units outstanding at the end of the period.