annual report 2008 - bankmed · 2016-01-05 · board of directors 7...
TRANSCRIPT

BankMed
2008Annual Report

A Word Of Introduction . . . . . . . . . . . . . . . . . . .
Board Of Directors . . . . . . . . . . . . . . . . . . . . ...
Chairman’s Letter . . . . . . . . . . . . . . . . . . . . . . . .
Executive General Manager's Letter . . . . . . . . .
Management Team . . . . . . . . . . . . . . . . . . . . . .
Group Structure . . . . . . . . . . . . . . . . . . . . . . . . .
BankMed History . . . . . . . . . . . . . . . . . . . . . . . .
International Presence . . . . . . . . . . . . . . . . . . . .
A Bank For All . . . . . . . . . . . . . . . . . . . . . . . . . .
The Support System . . . . . . . . . . . . . . . . . . . . .10
Risk, Audit And Corporate Governance . . . . . .
Community Contribution . . . . . . . . . . . . . . . . . .
Independent Auditor's Report . . . . . . . . . . . . . .
Corporate Directory . . . . . . . . . . . . . . . . . . . . . . Table of Contents


“Change is inevitable, but growth is intentional”


Board of Directors
02

The principal shareholder of the Bank.
GROUPMED SAL HOLDING - Members
Mohammed Hariri is the Chairman – General Manager of GroupMed sal(Holding), IRAD Investment Sal Holding, Al Mal Investment Sal Holding,SaudiMed Investment Company, the Bank, Méditerranée Investment BankSAL and Saudi Lebanese Bank SAL. He is also Senior Vice-President andGeneral Secretary of the Board of Directors of Saudi Oger Ltd. He is incharge of investments and transactions on behalf of Saudi Oger Ltd. andits associates. Mr. Hariri is the Chairman of Oger Telecom, AVEA IletisimHizmelteri (AVEA), Turk Telekom A.S. and Ojer Telekomunikasyon (inTurkey) and serves on the boards of directors of various companiesincluding 3C Telecommunications (in South Africa), Medgulf Holding sal,Oger International S.A. and Entreprise de Travaux Internationaux (ETI). Mr.Hariri is also a board member of Arab Bank PLC - Jordan.
02
6
MR. MOHAMMED HARIRI - Chairman of the Board
BOARD OF DIRECTORS - Members

BOARD OF DIRECTORS
7
Mrs. Hariri, the wife of H.E late Prime Minister, Mr. Rafic Hariri, is a boardmember of GroupMed S.A.L. (Holding) and Arab Bank plc - Jordan. Sheis also the President of the Rafic Hariri Foundation and several otherhumanitarian, cultural and educational institutions in the LebaneseRepublic and the Gulf region. She is the First Ambassador of theInternational Osteoporosis Foundation, as well as President of thisFoundation's 206-A Bone Fund.
MRS. NAZEK AUDI HARIRI - Member
Mr. Yared is an attorney at law, with law offices in Beirut. He is a BoardMember of GroupMed S.A.L. (Holding), The Lebanese Company for theDevelopment and Reconstruction of the Beirut Central District S.A.L.(Solidere), Medgulf, Saudi Oger Ltd. ,Oger International andMéditerranée Investment Bank S.A.L and Turk Telecom
MR. BASILE YARED, ESQ - Member
Mr. Asmar is the Advisor of the Management Committee at BankMed.He is also the Chairman General Manager of MIB S.A.L. (Holding).He is the former Dean of the Faculty of Engineering at Saint JosephUniversity. Mr. Asmar served as the Chairman of the Board ofDirectors of Electricité du Liban.
MR. MAROUN ASMAR - Member
Mr. Mikdashi is a former Managing Director of Citigroup, Corporate andInvestment Banking-Risk Management for Europe, Middle East and Africa.Mr. Mikdashi spent his entire career with Citibank and Citigroup working inmany countries. He held senior responsibilities in the areas of corporatelending, risk management, operations, project finance and general man-agement. Mr. Mikdashi serves as a non executive director on a number ofbusiness entities and in several non-profit organizations. Mr. Mikdashiholds a BBA and an MBA from the American University of Beirut.
MR. USAMA MIKDASHI - Member
Mr. Nemeh Sabbagh is Executive General Manager and Board memberof BankMed and its banking subsidiaries. He is also Chairman ofTurkland Bank (T-Bank) in Turkey, Board member of Oger Telecom (inDubai), The Mediterranean and Gulf Insurance and Reinsurance Co. (inSaudi Arabia), the Mediterranean and Gulf Insurance Co. P.L.C.-Jordan,SaudiMed Investment Company (in Saudi Arabia) and Chairman of MedSecurities Investment Company (in Lebanon). Previously he wasManaging Director and Chief Executive Officer of Arab National Bank (inSaudi Arabia).
MR. NEMEH SABBAGH - Member


Chairman’s Letter
03

03
10
2008 has marked the opening of a new chapter in Lebanon with the election of a new President and a return to the properfunctioning of institutions. But what was noteworthy after all, was the impressive economic performance which wasachieved even under very difficult circumstances. Final official figures now show that the Lebanese economy grew by animpressive 7.5% in real terms during 2007. Furthermore, economic indicators point that growth in 2008 exceeded 8% inreal terms, an all time record. This was achieved, among other things, through strong capital inflows by the largeLebanese expatriate community as well as Arab investors and tourists. These figures are very telling in their reflection ofthe great potential of Lebanon.
Equally impressive, were the results achieved by the domestic banking sector, especially in light of the global financial crisisand its implications on most local banking sectors around the world. Assets of the domestic banks increased by 14.6%,while customer deposits were also up by 15.6 % over the year to reach $94.3 billion and $77.8 billion respectively. Strongremittances, which topped $6 billion in 2008, constituting over a quarter of GDP, are among the highest in the world. Theinternational financial crisis which turned into a global economic crisis and caused a significant loss of confidence and abreakdown of the intermediation process at the global level, fortunately did not hit the Lebanese banks. With the ratio ofprivate sector loans-to-customer’s deposits around 32% and a solid profitability for the year 2008; banks in Lebanon wereamong the outliers in the world in terms of their liquidity and their profitability, having benefited from a strong regulatoryframework and a deep rooted conservative banking culture.
At BankMed, 2008 was a veritable leap forward. The labor of restructuring, reorganization, and re-branding bore fruit. Theprogress that was achieved on the retail and corporate fronts, and the achievements in investment, hedging and brokerageservices were all translated into the bottom line, as profits recorded a 74% growth to reach US$70.2 million in 2008. Anindispensable component of this success was the fundamental change in the breadth and depth of customer service, whichtoday constitutes one of the cornerstones of BankMed’s new culture, putting customers’ needs first while using the latesttechnology. A valuable addition was made to the Board of Directors in early 2009 through the appointment of a new memberwho has extensive international banking experience.

CHAIRMAN’S LETTER
11
Now present in five countries, BankMed feels that it has successfully completed an important round of its expansion strategy.Its commercial banking subsidiary in Turkey, Turkland Bank (T-Bank), is quickly establishing itself as a boutique bank, whilethe newly launched SaudiMed Investment Company focuses on providing investment banking services in the Kingdom ofSaudi Arabia and the Middle East, leveraging on the Group’s strong presence in the region. Meanwhile, BankMed Suisse willcontinue to focus on providing private banking services mostly to our Middle Eastern clientele through its offices in Geneva.BankMed also enjoys a presence in Cyprus via a branch in Limassol.
We can state with confidence that in 2008 we strengthened our position as a major player on the domestic banking scene.This could be confirmed through high quality service delivery across the board, through the use of state-of-the-art technology,through our customer-driven culture, and last but not least, through a significant improvement in the bottom line. Goingforward we will continue to give our domestic operations the absolute priority, seeking to consolidate our position as one ofLebanon’s top banks. In implementing this strategy, we will continue to rely on the assets that we value most: the dedicationof the staff, the leadership of management, and most importantly the trust and loyalty of our clients. To all of them, we aretruly grateful.
Mohammed Hariri


Executive General Manager’s Letter
04

04
14
The 2008 figures were a reconfirmation of the validity of the strategy that was developed and executed over the lastperiod. Building on BankMed’s privileged history as one of Lebanon’s major banking players, a clear, bold, and forwardlooking strategy was put in place: we were going to focus more on certain lines of business, we were going to go regional,and we were going to significantly boost the breadth and depth of customer service and make it one of the cornerstonesof the Bank’s new image and culture. The global financial crisis in 2008 was a challenging time for all banks. At BankMed,we proactively managed the crisis through reassessing and consistently revisiting the Bank’s overall exposure andactivities.
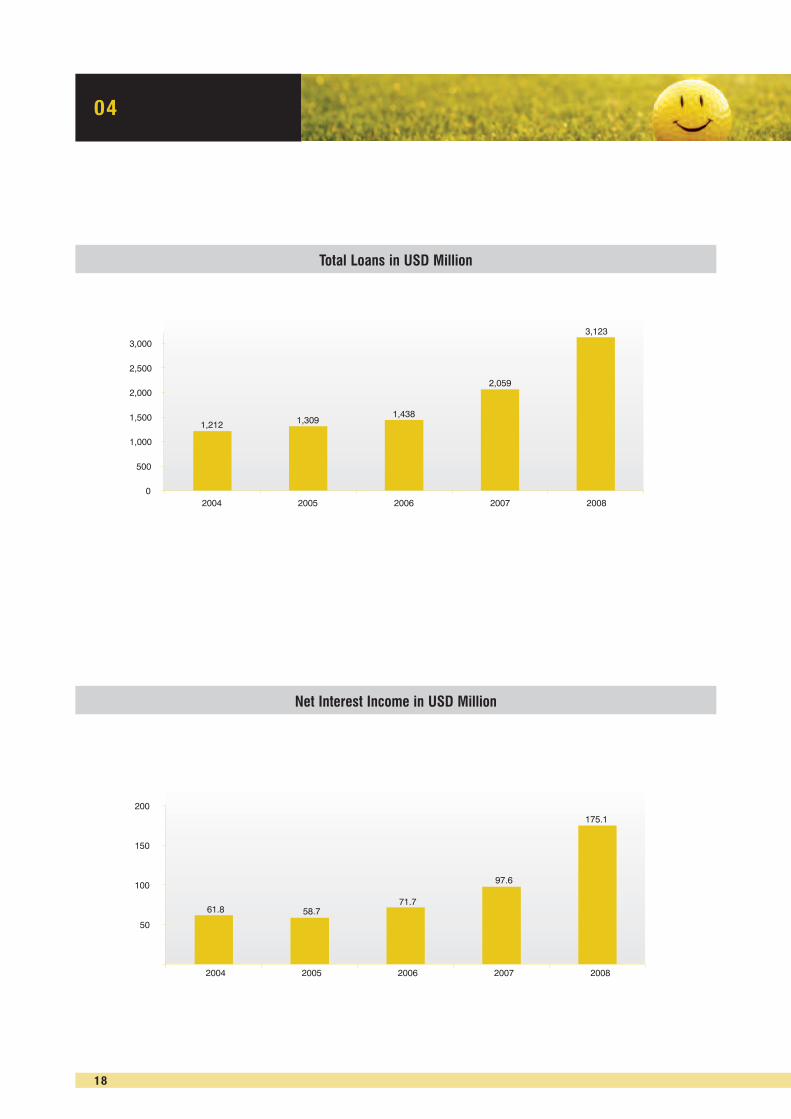
Our strategy was clear because it defined deliverables and assigned ownership and accountability for the variousinitiatives. Our strategy was bold because traditionally, and given its crucial role of rebuilding the country in the wake ofthe civil war, BankMed was perceived as the Bank of the large corporate clients that were defining the country’s businesslandscape, and not necessarily a retail bank. Our strategy was forward looking because it understood the value ofdiversification both horizontally and vertically. Carefully designed and well executed, the strategy is now delivering value-added to our clients.The numbers clearly speak for themselves. BankMed’s profits increased by 74% to reach US $70.2 million in 2008,compared to US $42 million realized in 2007. Specifically, net interest income contributed US$ 175.1million, a growth of79% over last year, while fees and commissions contributed US $39.1 million, a growth of 46% over last year.
We are conscious that our human resources remain our most valuable asset, and that none of these achievements wouldhave been possible without their hard work and dedication. Aware that this is an area where our focus should not slow orslip, we continued to aggressively recruit highly qualified individuals, and indeed new employees joined all the business linesas well as most support services in 2007 and 2008 in order to maintain our pace of growth. Training courses and seminarscontinue to be designed and delivered with a view to keeping our existing staff abreast of the latest developments andadvances in their respective domains.
Investments in infrastructure, in its broadest sense, have gone hand in hand with investments in human capital. Work hasalready started on five new branches in North, South and Mount Lebanon, enhancing our reach across the nation even inremote areas. We also modernized our ATM and Debit cards switch system, allowing additional capacity to support thegrowth of cards’ issuance. Adoption of the latest in technology has rendered our internet and phone banking serviceshighly effective and popular among our customers, and we will continue to upgrade them as needed to provide our clientbase with cutting edge customer service.

EXECUTIVE GENERAL MANAGER’S LETTER
15
Always a market leader in terms of its corporate business, BankMed saw additional success in maintaining and growingits list of top corporate players in Lebanon, with the core loan portfolio registering annual growth of over 52% in 2008. TheBank continued to support local companies as well as Lebanese firms operating in the GCC region, closing some majordeals including project and aircraft finance transactions. Meanwhile, the major boost to retail operations is paying off, withthe retail loan portfolio recording strong growth, as new creative products, catering to various clients’ needs weredesigned and introduced.
Over the last two years, BankMed has also consolidated its position as a market leader in treasury and investments products,introducing a strong variety of investment products. While some of these products were customized to meet specific investmentand hedging requests by clients, many were sold to investors at the retail level. Most importantly, most of the products that weredesigned and sold by BankMed have allowed investors to take positions on global equity and foreign exchange markets, whilesimultaneously protecting clients’ capital. This has turned out to be crucial in a year in which almost all financial markets around theglobe suffered major losses.Regional expansion, an important element of BankMed’s strategy was enhanced in 2008 with the launch of the SaudiMedInvestment Company, providing investment banking services to our clients in the Kingdom of Saudi Arabia and in theMiddle East. Meanwhile, BankMed Suisse, our private banking subsidiary operating from Geneva, is in the process ofputting in place a new strategy to enhance its ability to better target high net worth individuals in Lebanon and across theregion. Turkland Bank, our commercial bank in Turkey, has completed the second transition year of the strategy that wasdesigned upon its acquisition. Finally, our branch in Cyprus is playing an increasingly important role within the Bank.
2008 has surely brought us very close to where we should be. Tough political and security circumstances at home as wellas harsh global economic and financial conditions did not derail us from carrying through the execution of a focused andwell designed plan of action. We trust that the years ahead will see continued progress for BankMed, and to that goal, wewill continue to put our best resources and capabilities to work. The dedication and valuable contribution of all mycolleagues at BankMed remain, as always, the most appreciated.
Nemeh Sabbagh

Total Staff
Number of branches
Other Data
1,027
2004 2005 2006 2007 2008
54
989
53
961
47
1,390
63
1,530
75
Total Assets 8,115 8,858 9,835 13,769 14,391Total Deposits 6,161 6,144 7,127 10,538 11,209Total Equity 781 1,022 857 1,106 1,088
In billion LL 2004 2005 2006 2007 2008
Total Assets 5,383 5,876 6,524 9,134 9,546Total Deposits 4,087 4,076 4,727 6,991 7,435Total Equity 518 678 569 734 722
In millions US$ 2004 2005 2006 2007 2008
5,000
10,000
2004 2005 2006 2007 2008
5,3835,876
6,524
9,134 9,546
04
16
Key Financial Information
Total Assets in USD Milion

EXECUTIVE GENERAL MANAGER’S LETTER
17
0
20%
40%
60%
80%
100%
2004 2005 2006 2007 2008
85% 88% 87%94%
103%
4,000
8,000
2004 2005 2006 2007 2008
4,087 4,0764,727
6,9917,435
Loans Loss Provisions to Doubtful Loans
Total Deposits in USD Million
0
500
1,000
1,500
2,000
2,500
3,000
2004 2005 2006 2007 2008
1,212 1,3091,438
2,059
3,123
50
100
150
200
2004 2005 2006 2007 2008
61.8 58.771.7
97.6
175.1
04
18
Total Loans in USD Million
Net Interest Income in USD Million

EXECUTIVE GENERAL MANAGER’S LETTER
19
10
20
30
40
2004 2005 2006 2007 2008
14.412.1
16.3
26.8
39.1
Comissions & Fees in USD Milion


Management Team
05

05
22
FRONT ROWFaten Matar - Advisor, Omar Sultani - Saudi Lebanese Bank, Ameen Bissat - Chief Audit Executive
BACK ROWJoy Saba - Legal Management, Samir Hammoud - Remedial Management, Aref Mneimne - Legal Advisor, Ahmad Kanaan - Remedial Management
FRONT ROWDiala Choucair - Marketing & Communication, Lina Jebeile - Office Manager for Chairman General Manager, Khaled Zeidan - MedSecurities
BACK ROWZyad Ghosn - Financial Institutions & Trade Finance, Mohammed Ali Beyhum - Advisor, Mazen Soueid - Market & Economic Research

FRONT ROWAntoine Boustany - Operations, Dania Kaakani - Human Resources, Marwan Abiad - Financial Control, Technology & Central Operations,Fouad Baalbaki - InformationTechnology
BACK ROWNabil Zakka - Commercial Credit Risk, Iman Baba - Information Security & Business Continuity, Samir Mouawad - Risk Management,Mahmoud Kibbi - Administration
MANAGEMENT TEAM
23
FRONT ROWHatem Chaarani - Electronic Delivery Channels & Card Products, Muhieddine Fathallah - Consumer Credit Products, Fadi Flaihan - BranchNetwork & Retail Liability Products, Mohamad Loutfi - Corporate Banking
BACK ROWWalid Cheikha - Large Corporate Credit, Adel Jabre - Treasury, Basil Karam - Retail Banking, Fouad Saad - Advisor


06
26

GROUP STRUCTURE
27


BankMed History
07One of the oldest banking and financial groupsin Lebanon and the region, BankMed wasoriginally established in 1944 as a creditinstitution. Since then, it has grown andflourished to become one of the country'slargest financial institutions, with assetsconstituting 11% of the total of the Lebanesebanking sector.
Its role in financing commercial, industrial, andcontracting activities has contributed to thegrowth of these sectors and the resurgence ofthe Lebanese economy since 1990. BankMedis also giving increasing emphasis todeveloping its retail banking business andintends to expand its customer base byensuring that its products and services arecompetitive, relevant and innovative.


International Presence
08

08
32
Turkland Bank (T-Bank)BankMed teamed up with Arab Bank in acquiring a commercial bank in Turkey, in December 2006 and renamed itTurkland Bank, or T-Bank. Since 2007, the bank has gone through a period of considerable transformation. This includesa human resources reorganization in addition to a continued commitment to investment in infrastructure and informationtechnology.
T-Bank has remained focused on achieving the targeted growth set out at the beginning of the year, while strengtheningits risk management measures and liquidity position. Significantly increasing T-Bank’s balance sheet has been animportant milestone in the Bank’s achievements in 2008, accomplished through a capital injection by T-Bank’sshareholders totaling YTR 100 million (c/v US$ 65 million), during 2008, which has made T-Bank one of the strongest inthe Turkish sector in terms of capital adequacy.
Looking forward, T-Bank will continue to develop its business amongst the small-to-medium-size enterprises, one of thefastest-growing and most promising sectors in the increasingly liberalized and open Turkish economy.
SaudiMed Investment CompanyIncorporated as a closed joint stock in Saudi Arabia in December 2007 and regulated by the Saudi Capital MarketAuthority (CMA), SaudiMed Investment Co. has been an important addition to BankMed’s regional presence, acting as afinancial intermediary offering investment and advisory services in the Kingdom of Saudi Arabia since it started opera-tions in the second half of 2008.
This past year was a busy and exciting one for us. Timewas spent on attracting and hiring local and regional talents, setting up offices,systems and operations, all the while instilling an uncompromising business culture that focuses on integrity, transparency, and ethi-cal responsibility. In parallel, SaudiMed’smanagement and Boardmembers actively explored and initiated strategic relationships withpotential clients in the Saudi and regional markets.
Despite the dramatic changes being witnessed in the regional financial environment, with signs of uncertainty and insecurityclouding investment planning and decision making, SaudiMed is seeing good growth opportunities going forward. SaudiMed’sstrategic decision to prioritize cautiousness and controlled expansion over rapid growth, early on in its life, has placed the com-pany among the few financial services companies in the region that are able to respond flexibly to the dynamic changes in thelocal and regional business environments.

GROUP STRUCTURE
33
BankMed SuisseOffers high net worth individuals a wide range of private banking and asset management services out of Switzerland, theprivate banking hub of the world. BankMed Suisse, as well as its Beirut representative office, has been focusing onattracting new private banking business from the Middle East and the GCC. In 2008 a new range of investment productswas introduced to clients.
BankMed CyprusThis branch is both near to Lebanon and within the European community providing BankMed with a strategic location fromwhich to serve international and local customers. Many of our corporate clientele are making use of this convenientlylocated facility.


A Bank for All
09

09
36
A Bank for All InstitutionsBankMed’s corporate clientele includes names that are recognized among Lebanon’s leaders in business circlesthroughout the country and across industries. We provide banking services to around 90% of the top Lebanese groups,which include trade finance, investment, corporate restructuring and all other financing needs. In addition to the significantmarket share in the top tier local corporates, we have also strengthened the capabilities of our syndication desk for theparticipation in regional and international syndicated transactions through BankMed’s network of prime financial institutionsactive on the debt capital markets.
In addition, we enhanced our Small and Medium Enterprises sector (SME) business, as two dedicated teams have beenestablished to focus solely on attracting clients from these increasingly important segments of the Lebanese economy.We also work continuously on diversifying our funding sources and participating in international financing programs thatsupport the business growth of our customers through access to international and regional financial institutions, includingbut not limited to banks, government agencies and investment/development banks. Recently, BankMed signed anagreement with the European Investment Bank (EIB), to secure further long-term financing on behalf of its SMEcustomers. This demonstrated the EIB’s confidence in Lebanon’s dynamic, resilient economy and in BankMed’sincreasing activities in the SME sector. BankMed is committed to the development and growth of the Lebanese privatesector and will continue to enhance its role as a conduit to foreign investment into the country.
The needs of corporate clients are serviced on a daily basis, and in close coordination with relationship managers fortrade finance, treasury and correspondent banking needs. Despite the crisis that the world went through last year, not tomention the challenging moments that Lebanon has witnessed over the past years; we were able to expand andstrengthen our regional and international financial institutions network of correspondent banks which includes more than70 prime names. This has enabled us to continuously support the growing needs of our customers and our businessmodel in various areas such as trade finance, correspondent banking, cash management, treasury services, brokerage,custody, etc. Our strong credit policy and conservative judgment to protect our clientele’s assets and interests have alsobeen instrumental during the crisis, as we were able to cruise safely through the crisis without impacting the Bank’s day-to-day business or our ability to support our clientele’s needs in international trade, treasury and overseas transactions.
In addition to the aforementioned, BankMed provides investment banking services through its Saudi based, wholly ownedsubsidiary, SaudiMed Investment Company. In that context, and in line with the regulators’ decision to allow non-residentforeign investors access to Saudi public equities through the use of equity SWAP agreements, SaudiMed was among thefirst licensed institutions to establish and launch the service to its and BankMed’s global client base. SWAPs allow foreigncounterparties to gain economic exposure to any public stock trading on the Saudi Stock Exchange Tadawul.
We stand properly positioned to offer regional and international clients corporate finance advisory and asset managementservices. On the corporate finance side, we have a talented and experienced team that offers a wide range of innovativeand customized financial advisory and financing services and solutions covering debt and equity arranging, M&As,corporate restructuring, and private placements. On the asset management side, our services include structuring andmarketing a range of local, regional, and international investment funds.

A BANK FOR ALL
37
”
A Bank for all customersAs one of the largest banks in Lebanon, BankMed has naturally assumed a position as one of the major players in theconsumer business line. Our substantial growth momentum throughout 2008 was sustained by continuously developingnew products and services, a proactive sales strategy, dynamic market presence and multiple delivery channels alongwith close monitoring of customer satisfaction and loyalty.
High growth in the Retail customer base was achieved through a proactive approach to attracting clients and the retentionof our existing customers across all delivery channels.
In 2008, BankMed enriched its product offering with several new retail products and aligned existing product programs tomeet the dynamics of market conditions and customer needs. The establishment of new relationships with leadingmerchants and car dealers has been facilitated by a solid corporate image and wide network allowing us to break manybarriers to entry.
We firmly believe that high-quality service provision is a cornerstone of our long-term success. In parallel to the new rangeof products the establishment of more than 100 standardized service indicators, which are monitored daily, has helpedBankMed Retail to significantly improve the delivery and quality of its services across all delivery channels.
• We have introduced the Mystery shopping program in the Bank's branches to enhance our service delivery standards.• The Queuing system present at the majority of the Bank's branches was continued in 2008 to facilitate our customers’banking experience.
• The restructuring of our consumer credit department and implementation of new review procedures has significantlystreamlined the credit approval process.
• A new credit scoring model, customized to the Bank's eligibility and approval criteria, has been applied to all products.• The implementation of a major project to modernize the Bank's ATM controller and replace it with a state-of-the-art, moreuser friendly and larger capacity ATM switch is intended to provide our customers with advanced and more convenientservice.

To further expand our reach in customer segments and new markets beyond the geographical reach of our branchnetwork; the retail division has successfully deployed outdoor sales team to deliver BankMed products and servicesdirectly to customers. The launch of MedOnline, our e-banking service, was also undertaken as part of BankMed’sstrategy to expand our customer base and to make our customers’ banking experience both more convenient and moreefficient. Further measures include:
• The significant enhancement of BankMed’s comprehensive internet banking service - MedOnline - which utilizes the lat-est technology in terms of security protection and offers the full range of internet banking services. The MedPhone andMedOnline services, introduced to our customers, have shown to offer support and satisfaction particularly to our cus-tomers abroad. They will continue to be upgraded to offer a wider spectrum of services and to provide increased cus-tomer satisfaction.
BankMed is in the process of implementing a strategy in 2009 that increases our customer reach and grows our depositbase in Lebanon, this includes the upgrade and revamp of several of our branches, to uplift the BankMed image andcreate a more opportune banking experience. Today, our customers can apply for universal services at any of ourconveniently located branches.In line with the BankMed Retail sales strategy, where proactivity is a cornerstone, an integrated sales process has beenintroduced to our branch staff. It begins with identifying prospects, capturing sales activities, and records individualinitiatives/achievements. Last year’s process re-engineering successfully redirected much of the time and energy savedinto sales, and paid off handsomely in 2008. Our sales efforts are supported by the successful "Smile Campaign", whichheightens public perception and recognition of BankMed's Retail image.
A Bank for All investorsTreasury ServicesIn addition to the traditional Treasury services offered at BankMed, we have been one of the most active players in theLebanese market by offering a wide range of innovative investment products to our clientele. Again, 2008 was asuccessful year where our customers benefited from our capital guaranteed structured products under very adversefinancial markets.
An integral part of Treasury has been to provide BankMed’s clients with investment products, both at the retail level andin a customized manner. In 2008 Treasury launched a commodities certificate, offering clients the opportunity to invest incommodities while enjoying the comfort of having their capital guaranteed at maturity. Credit Linked Notes were alsointroduced to clients this year, offering attractive monthly interest payments.
Along with our structured investment products, we have been active in bringing the latest economic and financial updatesto our customers. In this respect, the 2008 Annual Treasury seminar gave clients an overview of a wide range of financialproducts and featured a guest speaker from a prime international bank who shed some light on the outlook for thecurrency markets in the year ahead. The seminar was attended by over 500 of the BankMed’s corporate and Retail clientsand top executives, who later described it as a great success.
The Treasury Division plays its traditional role by implementing BankMed’s funding strategy in line with the guidanceoffered by the Assets and Liabilities Committee (ALCO). Under the prevailing crisis Treasury has prudently managed theBank’s liquidity position to ensure a high level of liquidity. Treasury also supervises the foreign exchange position andsecurities portfolio and contributes to the overall profitability of the Bank.
Investments and other asset exposures are continuously monitored and reviewed, and asset allocation has been dynamicin safeguarding the interests of BankMed’s depositors and stakeholders.
09
38

Brokerage ServicesBrokerage is handled by MedSecurities Investment SAL, the brokerage subsidiary arm of BankMed, which is involved insecurities trading as well as in the distribution of both tailor-made and off-the-shelf investment products. These productsare structured with a view to capitalizing on potential changes in global financial trends in ways that benefit the clientsand investors in stocks, currencies or commodities markets.
2008 can well be described as a transformational year for the MedSecurities’ team. It was the year MedSecuritiesInvestment SAL was established after its successful move from a Division within BankMed to a wholly owned subsidiary.We have developed an active brokerage business on the local, regional and international markets and the past year hasbeen one of multiple business, operational and strategic achievements. Despite a very difficult global financialenvironment, MedSecurities managed to fully execute its strategy by growing total assets more than four fold andsignificantly increasing its customer base by 60%. The internal controls and risk management structure, installed a whileago, has been particularly instrumental in MedSecurities’ success particularly during the global crisis period and theextreme volatility in the markets.
The basic strategy has been to leverage the reach of the Bank in providing clients with a product line that is unique andcompetitive. Under the prevailing global financial conditions, a prudent policy of controlled leveraging of our customerportfolios has cushioned the severe market downturn. However, MedSecurities did not shy away from taking somecreative, bold and ultimately lucrative steps. Below is a list of milestones achieved in 2008:
• Following the launch of MedSecurities the new Omega operational system was implemented along with theconfiguration of the IT set up; which has significantly improved the way we serve our customers.
• Executing a wide range of cross-trades on local and international fixed income instruments with leading regional andglobal institutions.
• Launching several structured notes; which have been positive performers despite the economic downturn.• MedSecurities played an active role in underwriting a major regional IPO, and was able to raise US$145 million insubscriptions.
• MedSecurities was also successful in launching and closing two Real Estate private placements and raising significantfunds which exceeded US$150 million for both transactions.
A BANK FOR ALL
39


The Support System
10

10
42
The success of BankMed’s business lines would not be possible without the backingof a strong, professional and dedicated team delivering a variety of support functionsranging from operations to IT, human resources and legal.
Financial Control, Information Technology and Operations
The Financial Control, IT and Operations divisions remain committed to the highest financial and reporting standards,service excellence, cost efficiency and sound risk management practices which are closely integrated with businessobjectives and BankMed’s growth strategy. Our planning process considers both current and future needs and matchesthem with best practices and new technology.
Financial Control works closely with other divisions to establish appropriate accounting policies and procedures to ensurethat all the banking activities are properly and timely captured on the Bank’s financial records. This year, continuousimprovement in the data analysis and reporting processes was achieved with the objective of further enhancing promptinformation dissemination to the stakeholders; including investors, management, internal business segments andregulators. With the objective of streamlining the budget cycle, which translates the overall goals and strategies of theBank into concrete and measurable targets, we upgraded the performance measurement system used to gauge andcommunicate the achievement of various operating units against the set budgets.The robust, automated operations environment, staff dedication, capability and responsiveness contributed to majorbusiness initiatives and the launch of new products and services. Building on the Bank’s technological edge, severalprograms featuring Straight-Through-Processing (STP) were implemented resulting in distinct improvements in speed,accuracy, flexibility and, more importantly, capacity. Further, a major initiative has been launched to transform Operationsinto a robust, consistent and empowered servicing culture, with a goal towards service excellence and ultimate customersatisfaction. The initiative is designed to enhance the customer service chain encompassing process, people, technologyand infrastructure. Flexibility, innovation and service creativity are the intended trademarks for our service capabilities.
The year 2008 marked the successful completion of several ground-breaking initiatives, which will have a profound impacton the way BankMed conducts business. A significant project with the potential to transform operational processes is theDocument Imaging and Management system. This will provide an impetus for defining and managing an optimized processflow where geographic location no longer matters. As the system continues to be implemented across the Bank's operations,it will provide the bank with a quantum leap in its contingency preparedness and provide a platform for eliminating obsoletearchiving methods.
Technology continued to build on its proven track record in terms of business solutions, support and infrastructureoversight. A record number of system development initiatives geared towards business growth, regulatory complianceand service support were completed on schedule. Some successful projects included the establishment of a completelynew infrastructure for the newly formed securities trading subsidiary MedSecurities to meet the Bank’s decision toseparate banking and investment activities. These projects also include the creation of multi-country technology platformto support domestic organic growth and international expansion. Rapid progress was made towards enhancing and up-grading the production environment capabilities to manage capacity, scalability, high systems availability, efficientdisaster recovery and contingency management procedures, advanced intrusion detection and monitoring tools. At thesame time, migrating the Cyprus branch into the core banking system and centralizing its operations in Beirut constituteda major milestone in our goal of achieving enhanced efficiency and improving controls.

THE SUPPORT SYSTEM
43
BankMed believes that a harmonious, collegial, team-oriented work environment isideal milieu for generating value added customer-oriented banking services.
During the year, we continued to raise the bar on all aspects of customer service and successfully completed numerousautomation projects for the Consumer, Corporate, Treasury and Investment Banking segments to improve productivity andservice delivery. The Bank took a quantum leap in customer service by way of significantly boosting “MedOnline”, a high-ly scalable, modular and “state-of-the art” 24/7 internet banking service on the back of the newly deployed interactive cor-porate website. The Bank also successfully implemented a modern ATM and debit card management system “Open/2”replacing the old system. The new switch utilizes advanced technologies and provides enhanced services to customers.It also supports customer segmentation and multiple card products.
BankMed continues to invest in and deploy technology to serve customers better and increase productivity. Significantupgrades of the Bank's main computers to state-of-the-art systems are in progress. Stringent risk management andinformation security compliance processes have been put in place to protect the Bank and its customers from cybercrimes such as information theft, computer hacking and viruses.
Through our technology strategy, we continue to make significant progress in a number of areas with many activitiesfocused on ensuring adequate processing capacity, high systems availability and a robust and reliable infrastructure.
During the year the Disaster Recovery Center has been relocated to the new, modern and fully equipped hub designedto serve as the business continuity center. The well-planned and executed move went smoothly, causing no disruptionsin service or internal operations. The Disaster Recovery Center is tested on a regular basis to ensure that it will be readilyavailable for use, in case of any contingency.
We are constantly working to identify and mitigate potential risks in the Bank’s operating environment. In line with this, acomprehensive review of all operational policies and procedures has been completed. Emergency plans includingBusiness Contingency and Disaster Recovery Planning have also been put in place, ready to be activated if necessary.
Our support divisions continue to focus on creating a work environment that delivers superior customer service by leverag-ing on BankMed’s optimized processes, motivated staff and cutting-edge banking technology. We invest in our staff andcarefully plan their training and development needs, including appropriate reward and recognition programs.

Human Resources
In 2008 we concluded the "Building an Integrated HR System" project which was launched with HAY consultants. The projecthas significantly improved and developed our work definition. We have implemented a pioneering methodology for perform-ance grading and salaries based on staff initiative and merit. In addition, we have implemented a new system for promotionand career development and succession planning. The system ensures a performance oriented culture of work, and encour-ages professional development and promotion of all our employees.
Another area of focus in 2008 was training and development. In 2008 we launched a training program to qualify our stafffor the Banque du Liban (BDL) requirements. We have also invested in a range of in-house and external trainings ses-sions for the staff covering a comprehensive range of issues such as Risk management, Basel II, UCP 600, Anti moneylaundering and Customer service. During 2008 over 12,000 hours of both in-house and external training were completedby close to 500 BankMed employees.
In addition, this year we started a Talent Management program catering to staff with the potential to develop quickly alongtheir career paths. The program invests in and retains staff with a promising future; with the objective of developing thispool into managers through intensive on the job, technical and soft-training programs.
After firmly establishing our HR system and structure in 2008, we expect that 2009 will be the year of Training andDevelopment. Our training plan for the year 2009 will be aggressive; with a major focus on Risk Management. It will alsoinclude intensive workshops for our Retail Managers to improve their management skills and help them expand theirbusiness. In addition we will proceed in preparing for the BDL 103 certifications, which focuses this year on LebaneseFinancial Regulations.
In 2009 we will be launching our Retail Banking Development Program with our first group of Retail ManagementDevelopment Programs (RMDPs). The programs will train and qualify the team on the different available bankingfunctions, and will be implemented through on-the-job training in the existing dummy branch. RMDPs will give trainees asound understanding of BankMed’s banking practices in order to develop a thorough knowledge of all our products andservices offered; and ultimately prepare them to assume key positions in the Retail Division.
10
44

Legal
The Legal division is committed to providing expert legal assistance to the Bank and its various affiliates and subsidiariesat the levels of both legal support and legal risk prevention.
The Legal division at BankMed is entrusted with a key role in supporting all levels of the Bank by providing timely andcontinuous legal guidance, necessary for the successful achievement of their objectives and goals.During the year 2008, the Legal division was involved in:
• Major transactions with local and international counterparties necessitating high legal expertise, negotiating skills andlegal engineering. These included, but were not limited to: private placements, project and aircraft financing, corporatefinancing and loan syndication transactions, all of which were successfully handled.
• The legal engineering and launching of various retail and products and structured financial products; in addition to itscontinuous review and standardization of the Bank's legal documentation.
• The legal review of BankMed’s e-banking services on MedOnline; taking into consideration the practical needs and legalrequirements of such services.
• The establishment and launching of MedSecurities Investment SAL, the brokerage arm of the Bank. Legal’s participa-tion encompassed and covered the entire process of setting up the company. Most notably, our involvement in thepreparation of its policies and procedures and drafting its full set of legal documentation.
The Legal Division constantly strives to fully cover the legal advisory needs of all the Bank’s units, and has provided themwith a complete range of adapted legal services and expertise in 2008. In line with this, we undertook a restructuring ofour organization through an intensive recruitment process and the implementation of two new Departments dedicated toInternational and Capital Market businesses on the one hand and Project Structuring on the other.
The Legal Division aims to be highly responsive to meet the high expectations of the Bank and to contribute directly to itsexpansion and ongoing growth.
THE SUPPORT SYSTEM
45


Risk, Audit& Corporate Governance
11

11
48
Risk Management
Risk GovernanceBankMed considers that the foundation for successful risk management is the pragmatic and consistent implementationof strong risk governance. BankMed's risk governance platform is based on "three lines of defense" consisting of thebusiness lines, risk management and internal audit. The risk management framework includes a strong emphasis onaccountability, responsibility, independence, reporting, communications and transparency both internally and with all ourkey external stakeholders as indicated in our various existing policies and procedures.
BankMed's risk management framework has a number of essential elements:• Clearly defined management responsibilities and accountability.• Clear separation of responsibilities and reporting lines between risk management functions, business lines and supportfunctions in order to avoid or manage conflicts of interest.
• A system of approvals, limits and authorizations, delegated by the Board to senior management and then cascadedthrough the Bank.
• Detailed risk controls for each business line.• A comprehensive and independent internal audit or compliance process for reviewing and testing internal controls andrisk management systems.
Risk Culture and VisionThere is more to effective risk management than formal structures and policies. The risk "culture" of the Bank is crucial. In thatrespect, the Bank aims to ensure that the risk management framework permeates the organizational culture and that staff at alllevels understand their responsibilities with respect to risk management. Moreover, an ethos of respect of risk is developed start-ing from the top, as set by the Board and encompasses the buy-in of business line managers who "own the risk".
The vision and key set objectives of the Risk Management Division are summarized as follows:• To manage risks with a holistic approach at an enterprise-wide level (credit; market; operations; compliance; etc).• To play an integral role in supporting management's strategy and growth agenda.• To ensure that understanding, measuring and managing risk are central to everything we do.• To be a partner to growth and value creation as opposed to a controller of downside risks as banking is aboutcontrolling risk rather than avoiding it.
• To enable the business lines to achieve their targeted growth by delivering risk solutions within a well coordinated riskmanagement framework.
• To facilitate a decentralized business model based on delegation of risk-based decisions to the respective businessunits (with clear accountability) while maintaining a strong, independent group risk function and enterprise-wide riskculture.
• To achieve world-class best practice risk management methodologies.• To employ and retain high-caliber risk management professionals.

RISK, AUDIT & CORPORATE GOVERNANCE
49
Risk Measurement and ReportingRisk Management calculates and reports regulatory capital requirements under Basel I and Basel II (according toregulatory projected Quantitative impact studies). Under Basel II, credit risk is reported according to the ComprehensiveStandard methodology; market risk as per the standard methodology and operations risk along the basic Indicatormethod.
Moreover, the Bank plans to shift to the Standard calculation method for operations risk in 2009. Finally, the Bank hasenhanced its disclosure policy as required under Pillar III for market discipline and began implementing it in 2008.
There are other types of risks that BankMed assumes but that are not quantifiable and managed via the capital allocationmodel. These are mitigated through periodic management controls, formal risk management and governance.Reputation risk, which is difficult to quantify, is managed through various controls and processes, while liquidity risk ismanaged by a rigorous control process and the Asset & Liabilities Committee (ALCO).
Stress and scenario testing constitutes a critical component of the proactive risk management framework. Rapid portfolioreviews are conducted on the credit portfolio as circumstances arise and stress testing is a core component of assets andliabilities management (ALM). The robustness of these processes was tested throughout 2008, given the extreme volatilityin the markets. The portfolios of Treasury and MedSecurities were reviewed a number of times during the year in order toensure that there were no undue existing risks. Moreover, as part of BankMed’s proactive risk management framework, theportfolio of the Corporate Bank Large, Medium and Small enterprises was revisited in light of the global credit crisis, reces-sion and the potential impact of these on the Lebanese economy and its various industry sectors. Where necessary, actionplans are being undertaken to successfully weather any potentially adverse impact.
Risk AppetiteRisk appetite is established at BankMed in light of the Bank's strategy, stakeholders' requirements and risk-reward trade-offs. BankMed's risk appetite is defined across four categories within our risk appetite framework:
• Group level risk appetite metrics• Specific risk-type limit setting• Stakeholders targets (e.g. target debt rating; dividend policy etc)• Policies, procedures and controls

11
50
Operations RiskThe Operational Risk Management unit (ORMU) provides oversight and control of operational risk throughout the Bankin order to ensure that it remains within acceptable levels. The prime responsibility for the management of operational riskis embedded within the management of the Bank’s business lines; so as to manage risks efficiently and in good time asthey arise. This is supported by the oversight of the independent ORMU. In addition, an operational risk managementframework is established to ensure that an integrated and effective risk management approach is applied consistentlyacross BankMed. The process includes the following three steps: identify and assess key operational risks; establish keyrisk indicators and produce a comprehensive operational risk report.
In that respect, Operations Risk Management undertook a project, under the auspices of Risk Management Division, forthe standardization of all policies and procedures of BankMed. This was conducted in coordination with representativesfrom all the Business and Support Divisions of the Bank. These policies and procedures are now available for easyreference to all relevant staff under one manual published on the Intranet of the Bank. Moreover, this exercise led to acomprehensive assessment of key operational risks.
Market RiskBankMed’s Market Risk Management (MRM) unit supports ALCO and supervises MedSecurities, the brokerage business.The ALCO is responsible for setting and supervising the implementation of asset/liability management policy which theTreasury is mandated to execute. The objective of the MRM is to oversee interest rate, liquidity, foreign exchange andprice risks. This is done through the monitoring of periodic reports (interest rate gap; market access reporting; liquidity;etc), daily internal limits and trigger reports to ensure that actual exposure remains within applicable limits and managedagainst ALCO imposed triggers.
The MRM also oversees the brokerage business, MedSecurities, by ensuring compliance with these policies andprocedures and providing adequate preventive and detective controls of the day-to-day activities of the business. Forthat purpose policies, procedures and IT systems were established to facilitate the orderly and efficient conduct ofMedSecurities' business.
Internal AuditThe BankMed Internal Audit Division (IA) uses a risk-based audit approach that relies heavily on efficient and effective useof technology in the conduct of its business. The Division has extensive experience and know-how concerning auditingtools and techniques and is composed of dynamic, flexible, and experienced audit staff.
The Internal Audit function operates in accordance with an approved Internal Audit Charter which clearly specifies thereporting level, mission & scope of work of the Internal Audit.
IA is independent of the Management of the Bank, supervised by the Chief Audit Executive who, in turn, reports bothfunctionally and administratively to the Chairman-General Manager and the Audit Committee.
IA helps the Bank to accomplish its objectives by bringing a systematic, disciplined approach to evaluate and improvethe effectiveness of risk management, control and governance processes.
Staff of the IA, under the supervision of the Chief Audit Executive, are authorized to have unrestricted access to allfunctions, records, property, and personnel; in order to allocate resources, set frequencies, select subjects, determinescopes of work, and apply the techniques required to accomplish audit objectives.

RISK, AUDIT & CORPORATE GOVERNANCE
51
While the Internal Audit function at the Bank is guided mainly by Central Bank Regulations; IA coverage at BankMed exceedsthese requirements and rigorously complies with International Auditing Standards, the Internal Audit Charter as well stan-dards of other related professional organizations.
The Internal Audit unit’s methodology is both effective and professional. It plays the vital role of providing an internalchecking mechanism to ensure adherence to sound policies and procedures. The IA also assures the accuracy ofinformation and makes a major contribution to the overall control, compliance and corporate governance of the Bank.
Internal Audit also, as required by the Lebanese regulatory oversight bodies and professional standards, reviews theBank's affiliated branches, other Group banks and financial institutions' operations, and reports on their status andconditions to Senior Management and to the Audit Committee. The Internal Audit also reviews the quality of its functionsat BankMed’s affiliated Branches and units.
Internal Audit implements an audit methodology known as "continuous auditing", which includes an intelligent and efficienttesting of controls and risks. The use of this methodology leads to timely notification of gaps and weaknesses, which inturn allows immediate follow-up and remediation. The Internal Audit uses one of the most widely used computer aidedaudit techniques (CAATs) called ACL (Audit Command Language).
Staff and Management of the Internal Audit stay abreast of the constant changes in the Banking Inspection andSupervision fields and regularly innovate new techniques and tackle new areas in which to introduce improvements to theexisting controls at the Bank and to the audit methodology. The IA has set high standards in qualifying for the CertifiedInternal Auditor certification (CIA) and the Certified Information Systems Auditor certification (CISA), which creates aknowledgeable and well-trained team of internal auditors.
Corporate GovernanceBankMed is committed to practice and promote a responsible and sound corporate governance policy. The Board ofDirectors is actively involved in setting the highest standards of corporate governance and in exercising strong oversightof an independent management team. These standards are founded on the core principles of transparency andaccountability at all levels of the organization and are ultimately safeguarded by a long-standing commitment to a highmoral standard of honesty and integrity.
Sound corporate governance at the Bank emphasizes a set of fundamental principles that include respecting, protectingand treating the interests of all stakeholders equitably, clearly defined responsibilities of the Board of Directors andExecutive Management, pursuing a policy of full disclosure; transparency and sound practice, and enforcing the functionsof internal and external auditors, as well as those of other Banking inspectors and supervisors.
The Board also ensures that any issues with potential to prevent management from running the Bank according to thebest interests of shareholders and other stakeholders are identified, and that processes are in place to address thoseissues in a timely manner.
The Board and management are committed to complying with established best practices in corporate governanceincluding those set by the Central Bank of Lebanon (BDL) and Basel II recommendations.

11
52
To that effect, the Board has approved an organizational structure that reflects best practices in corporate governance.The Bank has an organizational structure in place, that separates functions and responsibilities, reflecting a division ofroles and duties between the Board, Executive Management and Operating Management.
Members of the Board (each in his area of specialty) are sufficiently qualified for their positions, have a clearunderstanding of their role in corporate governance and are able to exercise sound judgment about the business affairsof the Bank. The Board includes independent members who are committed to comply with best practices in corporategovernance, including those set by BDL and Basel II recommendations. The Board also observes the regulatoryrequirements of other countries in which the Bank operates.
• When needed, new qualified members are elected to the Board to address the changes in the size and complexity ofthe Bank's operations and its strategic plans. Further, several committees are established to review and study specialoperations, among these committees are the "ALCO – Assets & Liabilities Committee", "International Committee" andan "Investment Committee" to review the Bank's cash and liquid assets, real estate holdings, capital investments andforeign subsidiaries. The committees’ mandates, composition (including members who are considered to beindependent) and working procedures are well-defined and properly disclosed.
• The shareholders' assembly elects the External Auditors based on their reputation and experience, while the Boardexercises due diligence and oversight on the work of External Auditors.
• The Board reviews and approves the Bank's overall business strategy, especially those related to investment strategies,buying or financing subsidiaries and sources of borrowing and financing of the Bank's operations. The Board exercisesoversight over senior management of the Bank through its ability and authority to question and obtain straightforwardexplanations from management, and receive, on timely basis, sufficient information to judge the performance of theBank and its management.
• The Board reviews internal audit reports regularly in order to assess policies, establish communication lines and monitorprogress towards achieving corporate objectives.
• The Board selects, monitors and, where necessary, replaces key executives, ensuring at the same time that the Bankhas an appropriate plan for executives’ successions.

RISK, AUDIT & CORPORATE GOVERNANCE
53
"Code of Ethics and Professional Conduct" (The Code) issued by the Chairman of the Board and was circulated to theBank's entire staff for use as a guideline while conducting the Bank's business.
The Code:
• Requires all employees to avoid activities that may result in conflict of interest between customers, employees and theBank,
• Requires employees to exercise honesty, objectivity and due diligence in the performance of their duties andresponsibilities,
• Encourages "whistle-blowing" by employees when witnessing any form of wrongdoing or unethical behavior, even whena senior manager or colleague is involved,
• Requires the employees to be alert and exercise due diligence in monitoring anti-money laundering activities,• Defines employees' responsibilities towards current and prospective customers, which include fiduciary duties and fairdealing, respect customer confidentiality and data privacy, ensure product suitability for customers, advertise productsfairly and resolve customers' complaints in a timely fashion,
• Defines the framework that governs the professional relationship between the employees, customers and suppliers,especially those related to gifts or other monetary benefits,
• Requires the employees to inform the Bank's management about any external activity or management positions heldby them which are considered outside the Bank's scope of operations.
Control functions at the Bank, including the Internal Audit, verify that the Bank's employees are significantly adhering tothe Code. Any significant deviation is properly reported to executive management, who in return takes corrective anddisciplinary measures against the non-compliant employees.
The Board has set and enforced, through its Chairman, clear lines of responsibility and accountability at all levelsthroughout the Bank.
The Bank's By-Laws clearly defined the Board's rights, duties and responsibility in managing the Bank and monitoring thework of its top management. The By-laws also defined the powers of the Chairman of the Board, and required that anyamendment to these powers must be subject to the approval of the Shareholders Assembly.
The Board and Executive Management, acting in the discharge of their own corporate governance responsibilities, haveestablished the general strategy and policies of the corporate governance structure at affiliated foreign Banks thatcorresponds with the Bank's own policies and local laws in the hosting countries. In this respect, the Bank has establishedseveral policies in the Turkish and Swiss affiliated Banks (T-Bank & BankMed Suisse) and the Bank's investment arm inSaudi Arabia (SaudiMed Investment Company) to include a Corporate Governance Policy, Audit Committee and InternalPolicies for the Internal Audit and Internal Control functions and a Code of Ethics & Professional Conduct.
As per the Central Bank's regulations, which require Banks to perform an effective and adequate control over the Bank'saffiliated foreign Banks (units), the Bank has established an "International Committee" to follow up on the status of these"units". The Committee consists of members who are specialists in their own relevant fields. Further, the Internal Auditregularly visits these "units" to review their operations and assess the adequacy of their internal controls and financialconditions.

The Board is not involved in day-to-day operations of the Bank but works to ensure that Senior Management exerciseseffective supervision over the Bank's operations, consistent with the Board's policy and guidelines.
The Board acknowledges the importance of senior managers in contributing to the Bank’s sound corporate governanceby overseeing line managers in specific business areas and activities, consistent with policies and procedures set by theBank’s Board. In this respect, the Board ensures that individuals appointed to senior positions have the necessary skillsto manage the business under their supervision as well as have the appropriate control over the key individuals in thoseareas.
The senior management, in return, established, enforced and maintained Systems of Internal Control that requireappropriate segregation of duties and duality in completing and reviewing operations, in order to significantly ensure thatall banking operations are completed as per related policies and procedures.
The Board, executive and senior management utilize effectively the results of work conducted by the Internal Auditors,External Auditors and other control functions at the Bank.
The Board undertakes all necessary measures to ensure the independence and adequate qualifications of the InternalAudit and other control functions at the Bank. In this respect, the Chairman of the Board approved and issued an InternalAudit Charter. This would require the Chief Audit Executive to report directly to the Audit committee of the Board ofDirectors, which is currently being established. Also, the Charter authorizes the staff of the Internal Audit, under thesupervision of the Chief Audit Executive, to have unrestricted access to all functions, records, property and personnel.Further, BDL regulation requires the Board to determine the remunerations for the Chief Audit Executive.
The Internal Audit, based on its Charter and the BDL Circular, semi-annually prepares and sends activity reports aboutthe results of their audit work to the Board, they also include items that still need follow up and rectification by theconcerned Management. Also, the Internal Audit is required to opine on the adequacy, efficiency and effectiveness of theSystems of Internal Control and other control functions at the Bank. All reports sent, are thoroughly reviewed by the Board,and the related divisions are requested to comply with the Internal Audit recommendations.To emphasize independence and objectivity of the External Audit function, the shareholders’ assembly elects the ExternalAuditors based on their reputation and experience.
The Board is also responsible for exercising due diligence and oversight of the External Auditors' work. To strengthen theexternal Audit function of the Bank, starting in the fiscal year of 2008, the Board appoints a second Audit firm to serve asco-auditors of the Bank.
In addition to their responsibilities in opining on the Bank's financial statements, the External Auditors, are also requiredto review and to prepare reports to the Board concerning the Internal Audit's review methodologies and anti-moneylaundering activities.
11
54

The other control functions at the Bank (Risk Management, Financial Control, and Branch Network Quality Control and theIT Security) and as deemed necessary, review certain day-to- day operations of the Bank to verify that such operationscomply significantly with the related policies and procedures.
The Banking Control Commission (BCC – oversight body in BDL), is required to prepare periodic reports about the Bank'soperations and the degree of compliance with the Banking Laws and BDL circulars. These reports are forwarded to theBoard, who in return, reviews these reports and takes necessary measures based on the recommendations of the BankingControl Commission.
The Board, through its Chairman, is effectively involved in setting and implementing the frameworks of compensation andremuneration policies and practices that are consistent with the Bank's corporate culture, long-term business objectives& strategy and control environment.
The Bank's By-Laws required that the Shareholders' Assembly determine the remunerations of the Board members, andin return, the Board determines the compensation polices for its members who have management positions in the Bank.
During 2008, the Bank engaged an international consulting company specialized in human resources (Hay Group), toprepare new policies & procedures for employees' compensations based on the Bank's long-term and strategic businessobjectives. These new policies and procedures were implemented at the start of this year.
RISK, AUDIT & CORPORATE GOVERNANCE
55


Community Contribution
12BankMed’s community contributions and social activitiesunderscore our commitment to the betterment of societyand our belief in giving back to the community within whichwe operate. BankMed provides direct, ongoing contribu-tions to charitable organizations as part of our commitmentto help improve the well-being of all Lebanese citizens.Again in 2008, we made donations to different Lebanesehospitals and will continue with our other charitable efforts;supporting orphanages, scholarship programs and healthcare projects in the years to come.
By sponsoring the local Al Riyadhi basketball and Nijmehfootball teams, BankMed seeks to help develop the talentsand skills of young aspiring athletes and to play an activerole in Lebanon’s vibrant sports scene. Another aspect ofBankMed’s social contribution is our support of Lebanon’srich cultural heritage by sponsoring cultural events andfestivals throughout the year, particularly the Beiteddinesummer festival and the year-end festivities in Beirut’sdowntown district. The increasing importance ofenvironmental policy has lead BankMed to develop anenvironment-awareness and advocacy campaign; that willbegin in 2009 with the implementation of energy-and-resource saving measures by BankMed staff at ourbranches and head offices, in addition to other activitiesthat will be announced through the year. Being “A Bank forAll” is not only our approach to doing business: it is ourcommitment to adding value to the society we are proud tobe a part of.

12
58
Social and cultural responsibilities continue to be at the core of BankMed’s view of itsrole in and contribution to the community in which it exists and operates. The Bankconstantly acts as a direct sponsor of various events that attempt to reflect the trueface of Lebanon and the breadth and wealth of its cultural heritage.
Sponsoring the Riyadi basketball team
Ambulance offered for red cross jdeideh

COMMUNITY CONTRIBUTION
59
Direct support through donations is another avenue for BankMed to carry its moralobligations to the society it serves. In this context donations were given, amongothers, to associations or projects that are related to the disabled, orphans, students’scholarships and health care.
Sponsoring the Dar Al Aytam Ramadan camapign
Sponsoring the Nejmeh football club
Ambulance offered for red cross tyre


Independent Auditor’s Report
13

13
62

INDEPENDENT AUDITOR’S REPORT
63

BANKMED S.A.L. CONSOLIDATED BALANCE SHEET
ASSETS
Cash and central banks 5 1,719,509,619 1,440,295,836
Deposits with banks and financial institutions 6 1,523,837,125 2,905,698,206
Financial assets at fair value through profit or loss 7 77,204,891 171,352,969
Loans to banks 8 187,986,213 15,714,107
Loans and advances to customers 9 3,346,023,084 2,709,908,881
Loans and advances to related parties 10 1,361,769,875 393,664,515
Available-for-sale investment securities 11 3,961,470,532 3,622,741,068
Held-to-maturity investment securities 11 1,381,632,196 1,701,039,678
Customers' acceptance liability 12 118,431,252 62,304,148
Investments in associates and other investments 13 77,738,742 72,263,795
Investment properties 14 - 6,034,649
Assets acquired in satisfaction of loans 15 71,508,666 81,565,839
Goodwill 16 173,404,350 166,868,380
Property and equipment 17 187,941,756 181,582,521
Other assets 18 202,547,221 238,396,386
Total Assets 14,391,005,522 13,769,430,978
FINANCIAL INSTRUMENTS WITHOFF-BALANCE SHEET RISK 39
Guarantees and standby letters of credit 1,014,767,764 328,883,212
Documentary and commercial letters of credit 458,407,657 640,429,345
Forward exchange contracts 773,631,118 354,517,309
FIDUCIARY DEPOSITS AND ASSETSUNDER MANAGEMENT 40 1,423,761,272 1,958,509,804
Notes December 31, 2008 December 31, 2007LBP’000 LBP’000
THE ACCOMPANYING NOTES 1 TO 48 FORM AN INTEGRAL PART OF THE CONSOLIDATED FINANCIAL STATEMENTS
13
64

LIABILITIESDeposits from banks and financial institutions 19 715,986,668 728,889,109
Customers’ deposits at fair valuethrough profit or loss 20 239,998,608 155,797,027
Customers' deposits at amortized cost 21 8,748,449,931 7,669,874,068
Related parties' deposits at fair value throughprofit or loss 22 2,877,581 3,207,682
Related parties' deposits at amortized cost 23 2,217,568,605 2,709,500,463
Acceptances payable 12 118,431,252 62,304,148
Borrowings from banks and financial institutions 24 330,554,014 417,352,068
Certificates of deposit 25 716,356,004 715,609,642
Other liabilities 26 177,007,583 179,434,847
Provisions 27 36,074,957 21,546,043
Total liabilities 13,303,305,203 12,663,515,097
EQUITY
Share capital 28 530,000,000 530,000,000
Legal reserves 29 30,824,497 25,212,282
Property revaluation reserve 3,213,000 3,213,000
Reserve for general banking risks 29 59,332,492 41,168,527
Retained earnings 142,002,298 109,862,157
Cumulative change in fair value ofavailable-for-sale securities 30 110,153,867 251,366,987
Currency translation adjustment (15,936,133) 7,976,435
Profit for the year 104,709,679 55,154,633
Equity attributable to the Group 964,299,700 1,023,954,021
Minority interest 31 123,400,619 81,961,860
Total equity 1,087,700,319 1,105,915,881
Total Liabilities and Equity 14,391,005,522 13,769,430,978
Notes December 31, 2008 December 31, 2007LBP’000 LBP’000
THE ACCOMPANYING NOTES 1 TO 48 FORM AN INTEGRAL PART OF THE CONSOLIDATED FINANCIAL STATEMENTS
BANKMED S.A.L. CONSOLIDATED BALANCE SHEET
INDEPENDENT AUDITOR’S REPORT
65

Notes 2008 2007LBP’000 LBP’000
Year Ended December 31,
THE ACCOMPANYING NOTES 1 TO 48 FORM AN INTEGRAL PART OF THE CONSOLIDATED FINANCIAL STATEMENTS
BANKMED S.A.L. CONSOLIDATED INCOME STATEMENT
Interest income 32 935,953,180 795,671,563
Interest expense 33 (672,014,027) (648,516,296)
Net interest income 263,939,153 147,155,267
Fee and commission income 34 66,435,115 45,477,281
Fee and commission expense 35 (7,556,356) (5,035,748)
Net fee and commission income 58,878,759 40,441,533
Net results on trading portfolio 36 9,544,767 24,620,341
Net results on financial instruments designated at fairvalue through profit or loss upon initial recognition 37 (7,805,821) (4,664,338)
Other operating income 38 80,175,885 85,972,896
Net operating revenues 404,732,743 293,525,699
Allowance for impairment of loans and advancesless write-back 9 (2,363,692) 900,815
Provision for collective impairment less write-back 9 (786,508) (36,554,792)
Other provisions 18 (22,612,500) -
Loss from write-off of loans (247,418) (659,864)
Net operating revenues after impairmentcharge for credit losses 378,722,625 257,211,858
Staff costs (118,260,153) (82,023,999)
Administrative expenses (118,163,054) (87,777,450)
Depreciation and amortization 17 & 18 (17,559,964) (14,116,596)
Provision for impairment of assets acquired insatisfaction of loans 15 (272,870) (1,434,937)
Provision for contingencies 27 (7,443,020) (1,700,123)
Profit before taxes 117,023,564 70,158,753
Income tax provision 26 (11,272,938) (9,512,743)
PROFIT FOR THE YEAR 105,750,626 60,646,010
Attributable to:
Equity holders of the Group 104,709,679 61,184,633
Minority interest 1,040,947 (538,623)
105,750,626 60,646,010
13
66

THEACCOMPANYINGNOTES1TO
48FORMANINTEGRALPARTOFTHECONSOLIDATEDFINANCIALSTATEMENTS
Balance
atDecem
ber31,2006
530,000,000
23,458,080
3,213,000
40,271,533
107,734,650
146,834,366
-4,778,703
856,290,332
1,028,812
857,319,144
Profitfortheyear2007
--
--
--
-61,184,633
61,184,633
(538,623)
60,646,010
Deferredtaxon
undistributed
incomefromsubsidiaries
--
--
--
-(6,030,000)
(6,030,000)
-(6,030,000)
Changeinfairvalueof
available-for-salesecurities
--
--
-104,532,621
--
104,532,621
-104,532,621
Currencytranslationadjustment
--
--
--
7,976,435
-7,976,435
11,617,176
19,593,611
Totalresultfortheyear
--
--
-104,532,621
7,976,435
55,154,633
167,663,689
11,078,553
178,742,242
Allocationof2006profit
-1,754,202
-896,994
2,127,507
--
(4,778,703)
--
-
Minorityinterestinsubsidiarybank
--
--
--
--
-69,854,495
69,854,495
Balance
atDecem
ber31,2007
530,000,000
25,212,282
3,213,000
41,168,527
109,862,157
251,366,987
7,976,435
55,154,633
1,023,954,021
81,961,860
1,105,915,881
Profitfortheyear2008
--
--
--
-104,709,679
104,709,679
1,040,947
105,750,626
Changeinfairvalueof
available-for-salesecurities
--
--
-(141,213,120)
--(141,213,120)
-(141,213,120)
Currencytranslationadjustment
--
--
--
(23,912,568)
-(23,912,568)
(18,604,905)
(42,517,473)
Totalresultfortheyear
--
--
-(141,213,120)
(23,912,568)
104,709,679
(60,416,009)
(17,563,958)
(77,979,967)
Transfertoreserveforgeneral
bankingrisk
--
-8,627,124
(8,627,124)
--
--
--
Differenceofexchange
-24,205
--
737,483
--
-761,688
-761,688
Allocationof2007profit
-5,588,010
-9,536,841
40,029,782
--
(55,154,633)
--
-
Minorityinterestinsubsidiarybank
--
--
--
--
-59,002,717
59,002,717
Balance
atDecem
ber31,2008
530,000,000
30,824,497
3,213,000
59,332,492
142,002,298
110,153,867
(15,936,133)
104,709,679
964,299,700
123,400,619
1,087,700,319
EquityAttributabletotheGroup
Capital
LBP’000
Legal
Reserves
LBP’000
Property
Revaluation
Reserve
LBP’000
Reserve
for
General
Banking
Risk
LBP’000
Retained
Earnings
LBP’000
Cum
ulative
ChangeinFair
Valueof
Available-for-
saleSecurities
LBP’000
Currency
Translation
Adjustment
LBP’000
Profitfor
theYear
LBP’000
Total
LBP’000
Minority
Interest
LBP’000
Total
Equity
LBP’000
BANKMEDS.A.L.CONSOLIDATEDSTATEMENTOFCHANGESIN
EQUITY
67

BANKMED S.A.L. CONSOLIDATED STATEMENT OF CASH FLOWS
Notes 2008 2007LBP’000 LBP’000
Year Ended December 31,
Cash flows from operating activities:
Profit for the year 105,750,626 60,646,010
Adjustments for:
Provision for impairment of assets acquired in satisfaction of loans 272,870 1,434,937
Depreciation and amortization 17,559,964 14,116,596
Provision for credit losses/(write-back) (net) 2,363,692 (900,815)
Provision for collective impairment 786,508 36,554,792
Loss from write-off of loans 247,418 659,864
Impairment of investment in a fund 18 22,612,500 -
Effect of exchange rate fluctuation on goodwill (2,527,276) (2,527,534)
Amortization of commissions and discount on certificates of deposit 963,485 962,997
Realized gain on sale of trading securities (4,718,924) (418,506)
Realized gain on sale of available-for-sale securities (16,979,999) (5,958,748)
Unrealized gain on financial assets at fair valuethrough profit or loss upon initial recognition (259,938) (10,639,208)
Equity income from investments in associates (6,521,048) (3,493,520)
Accretion of securities premium/(discounts) 15,442,437 26,010,725
Loss on sale on investment property 1,343,978 -
(Gain)/loss from sale of property and equipment (644,366) 78,436
Gain on sale of assets acquired in satisfaction of loans (3,095,613) (634,202)
Gain from sale of investment in an associate/other investments (655,762) (11,314,653)
Currency translation adjustment (23,912,568) 7,976,435
Decrease/(increase) in financial assets at fair value through profit or loss 99,126,940 (61,209,748)
Loans to banks (172,272,106) -
Increase in loans and advances to customers 43 (647,179,842) (733,826,776)
(Increase)/decrease in loans and advances to related parties (968,105,360) 58,477,085
Increase in deposits with banks and financial institutions andcompulsory deposits and deposits with central banks (719,969,457) (410,312,921)
Decrease/(increase) in other assets 43 15,863,186 (53,244,888)
Increase/(decrease) in deposits and borrowings from banks 43,485,972 (9,561,357)
Increase in other liabilities 43 16,208,754 39,151,971
Increase in customers’ accounts at fair value through profit or loss 84,201,581 125,865,388
(Decrease)/increase in related parties’ accountsat fair value through profit or loss (330,101) 3,207,682
Increase in customers’ accounts at amortized cost 1,078,575,863 1,411,526,144
(Decrease)/increase in related parties’ accounts at amortized cost (491,931,858) 1,504,868,347
Increase in provisions for contingencies 14,528,914 659,218
Increase in minority interest 40,397,812 36,206,335
Exchange difference on retained earnings and legal reserves 761,688 -
Net cash (used in)/provided by operating activities (1,498,610,030) 2,024,360,086
13
68

THE ACCOMPANYING NOTES 1 TO 48 FORM AN INTEGRAL PART OF THE CONSOLIDATED FINANCIAL STATEMENTS
BANKMED S.A.L. CONSOLIDATED STATEMENT OF CASH FLOWS
Notes 2008 2007LBP’000 LBP’000
Year Ended December 31,
Cash flows from investing activities:
Acquisition of subsidiary bank, net of cash acquired 42 - (86,656,822)
Increase in available-for-sale and held to maturityinvestment securities 43 (178,211,786) (326,598,294)
(Increase)/decrease in investment in associates andother investments 43 (2,543,909) 14,605,275
Increase in investment properties - (859,274)
Increase in assets acquired in satisfaction of loans 43 (3,268,755) (803,099)
Increase in property and equipment (25,752,754) (18,932,511)
Increase in goodwill (4,008,694) (616,569)
Proceeds from sale of investment property 4,690,671 -
Proceeds from sale of investment in an associate 4,824,000 25,014,598
Proceeds from sale of assets acquired in satisfaction of loans 20,249,587 20,588,454
Proceeds from sale of property and equipment 3,418,505 10,666,459
Net cash used in investing activities (180,603,135) (363,591,783)
Cash flows from financing activities:
Decrease in certificates of deposit (217,123) (231,895,710)
(Decrease)/increase in other borrowings (86,798,054) 409,658,034
Net cash (used in)/provided by financing activities (87,015,177) 177,762,324
Net (decrease)/increase in cash and cash equivalents (1,766,228,342) 1,838,530,627
Cash and cash equivalents - Beginning of year 43 3,261,052,232 1,422,521,605
Cash and cash equivalents – End of year 43 1,494,823,890 3,261,052,232
INDEPENDENT AUDITOR’S REPORT
69

1. GENERAL INFORMATION
BankMed S.A.L. (the “Bank”) is a Lebanese joint stock company, registered under Number 5261 in the LebaneseCommercial Register on August 13, 1950 and under Number 22 in the list of banks published by the Central Bank ofLebanon. The principal activities of the Bank and its subsidiaries (the Group) consist of conventional commercial and privatebanking through a network of 47 branches in Lebanon in addition to a branch in Cyprus, a subsidiary in Switzerland and asubsidiary in Turkey acquired during 2007.
BankMed S.A.L. is wholly owned by GroupMed (Holding) S.A.L. and its headquarters are located in Clemenceau, Beirut,Lebanon.
2. ADOPTION OF NEW AND REVISED STANDARDS
Three Interpretations issued by the International Financial Reporting Interpretations Committee are effective for the currentperiod. These are: IFRIC 11 (IFRS 2) Group and Treasury Share Transactions; IFRIC 12 Service Concession Arrangementsand; IFRIC 14 IAS 19 The limit on a Defined Benefit Asset, Minimum Funding Requirements and their Interaction. Theadoption of these Interpretations has not led to any changes in the Group’s accounting policies.
At the date of authorisation of these financial statements the following amendments to Standards and new Interpretationswere in issue but not yet effective:
IFRS 2 (Amendment) Share based payment (effective for annual periods beginning on or after January 1, 2009);IFRS 3 (Revision) Business Combinations (effective for annual periods beginning on or after July 1, 2009);IFRS 5 (Amendment) Non-Current Assets held for sale and discontinued operations (effective for annual periods beginningon or after July 1, 2009;IFRS 7 (Amendment) Financial Instruments: Disclosures (effective for annual periods beginning on or after January 1, 2009);IFRS 8 Operating Segments (effective for annual periods beginning on or after January 1, 2009);IAS 1 (Amendment and Revision) Presentation of Financial Statements (effective for annual periods beginning on or afterJanuary 1, 2009)IAS 16 (Amendment) Property, Plant and Equipment (effective for annual periods beginning on or after January 1, 2009)IAS 19 (Amendment) Employee Benefits (effective for annual periods beginning on or after January 1, 2009)IAS 23 (Amendment and Revision) Borrowing Costs (effective for annual periods beginning on or after January 1, 2009 andfor Borrowing costs relating to qualifying assets for which the commencement date for capitalisation is on or after January 1,2009)
BANKMED S.A.L.NOTES TO THE CONSOLIDATED FINANCIAL STATEMENTS YEAR ENDED DECEMBER 31, 2008
13
70

IAS 27 (Amendment) Consolidated and Separate Financial Statements (amendments resulting from May 2008 AnnualImprovements to IFRSs - effective for annual periods beginning on or after January 1, 2009) and (consequential amendmentsarising from amendments to IFRS 3 - effective for annual periods beginning on or after July 1, 2009).IAS 28 (Amendment) Investments in Associates (amendments resulting from May 2008 Annual Improvements to IFRSs - forannual periods beginning on or after January 1, 2009) and (consequential amendments arising from amendments to IFRS 3 -effective for annual periods beginning on or after July 1, 2009)IAS 29 (Amendment) Financial Reporting in Hyperinflationary Economies (effective for annual periods beginning on or afterJanuary 1, 2009)IAS 31 (Amendment) Interests in Joint Ventures (amendments resulting from May 2008 Annual Improvements to IFRSs -effective for annual periods beginning on or after January 1, 2009) and (consequential amendments arising fromamendments to IFRS 3 - effective for annual periods beginning on or after July 1, 2009)IAS 32 (Amendment) Financial Instruments: Presentation (effective for annual periods beginning on or after January 1, 2009)IAS 36 (Amendment) Impairment of Assets (effective for annual periods beginning on or after January 1, 2009)IAS 38 (Amendment) Intangible Assets (effective for annual periods beginning on or after January 1, 2009)IAS 39 (Amendment) Financial Instruments: Recognition and Measurement (amendments resulting from May 2008 AnnualImprovements to IFRSs - effective for annual periods beginning on or after January 1, 2009) and (Amendments for embeddedderivatives when reclassifying financial instruments - effective for annual periods beginning on or after June 30, 2009) and(Amendments for eligible hedged items - effective for annual periods beginning on or after July 1, 2009)IAS 40 (Amendment) Investment Property (effective for annual periods beginning on or after January 1, 2009)IFRIC 13 Customer Loyalty Programmes (effective for annual periods beginning on or after July 1, 2008)IFRIC 15 Agreements for the Construction of Real Estate (effective for annual periods beginning on or after January 1, 2009)IFRIC 16 Hedges of a Net Investment in a Foreign Operation (effective for annual periods beginning on or after October 1,2008)IFRIC 17 Distributions of Non-cash Assets to Owners (effective for annual periods beginning on or after July 1, 2009)IFRIC 18 Transfers of Assets from Customers (for transfers received on or after July 1, 2009)
The directors anticipate that the adoption of the above Standards and Interpretations will have no material impact on thefinancial statements of the Group in the period of initial application.
INDEPENDENT AUDITOR’S REPORT
71
3. SIGNIFICANT ACCOUNTING POLICIES
A. Statement of Compliance:
The consolidated financial statements have been prepared in accordance with International Financial Reporting Standards(IFRSs) as issued by the International Accounting Standard Board (IASB).
B. Basis of Preparation and Measurement:
The consolidated financial statements have been prepared on the historical cost basis except for the following:
• Land and buildings acquired prior to 1993 are measured at their revalued amounts based on market prices prevailing during1996, to compensate for the effect of the hyper-inflationary economy prevailing in the earlier years.
• Financial assets and liabilities at fair value through profit and loss are measured at fair value.• Available-for-sale financial assets are measured at fair value.• Derivative financial instruments are measured at fair value.
Assets and liabilities are grouped according to their nature and are presented in an approximate order that reflects theirrelative liquidity.The principal accounting policies adopted are set out below:
C. Basis of Consolidation:
The consolidated financial statements of BankMed S.A.L. include the financial statements of the Bank as at December 31,2008 and companies in which the Bank has a controlling financial interest (subsidiaries and associates, as applicable). TheBank and its subsidiaries have the same financial reporting year and use consistent accounting policies. Subsidiaries arefully consolidated from the date on which control is transferred to the Group. Control is achieved where the Bank has thepower to govern the financial and operating policies of an entity so as to obtain benefits from its activities.
The results of subsidiaries acquired or disposed of during the year are included in the consolidated income statement fromthe effective date of acquisition or up to the effective date of disposal, as appropriate.
13
72
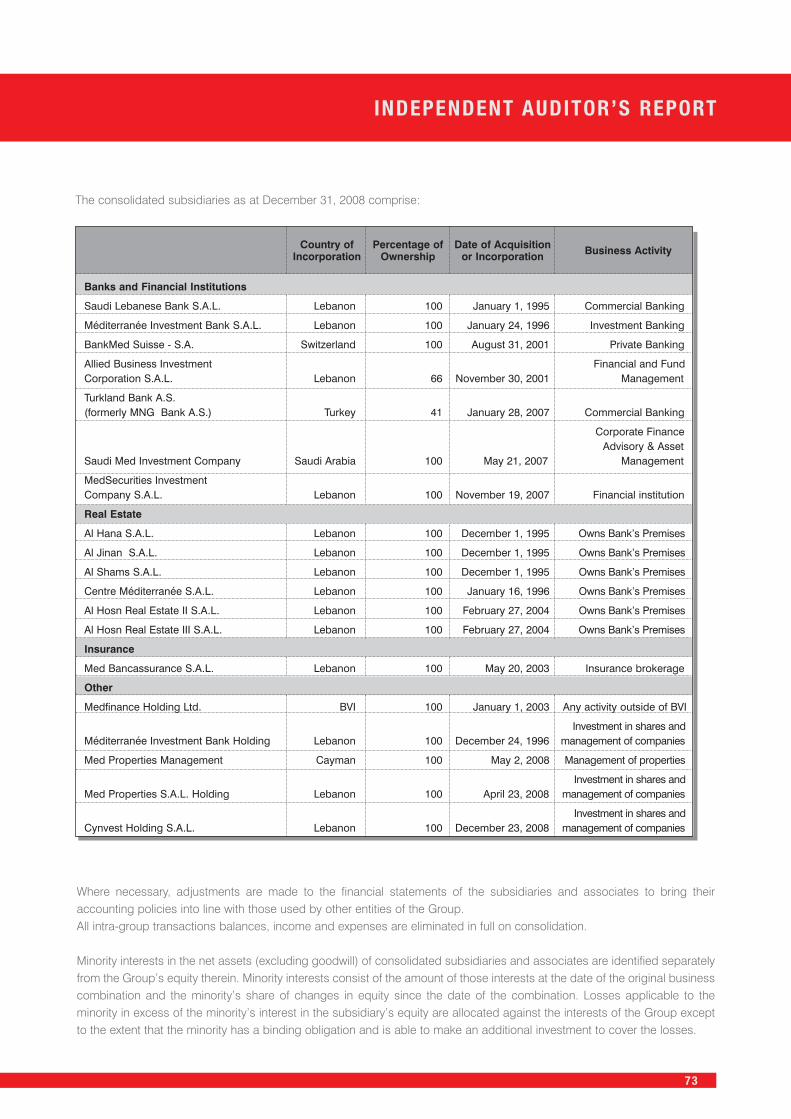
Where necessary, adjustments are made to the financial statements of the subsidiaries and associates to bring theiraccounting policies into line with those used by other entities of the Group.All intra-group transactions balances, income and expenses are eliminated in full on consolidation.
Minority interests in the net assets (excluding goodwill) of consolidated subsidiaries and associates are identified separatelyfrom the Group’s equity therein. Minority interests consist of the amount of those interests at the date of the original businesscombination and the minority’s share of changes in equity since the date of the combination. Losses applicable to theminority in excess of the minority’s interest in the subsidiary’s equity are allocated against the interests of the Group exceptto the extent that the minority has a binding obligation and is able to make an additional investment to cover the losses.
INDEPENDENT AUDITOR’S REPORT
73
Banks and Financial Institutions
Saudi Lebanese Bank S.A.L. Lebanon 100 January 1, 1995 Commercial Banking
Méditerranée Investment Bank S.A.L. Lebanon 100 January 24, 1996 Investment Banking
BankMed Suisse - S.A. Switzerland 100 August 31, 2001 Private Banking
Allied Business Investment Financial and FundCorporation S.A.L. Lebanon 66 November 30, 2001 Management
Turkland Bank A.S.(formerly MNG Bank A.S.) Turkey 41 January 28, 2007 Commercial Banking
Corporate FinanceAdvisory & Asset
Saudi Med Investment Company Saudi Arabia 100 May 21, 2007 Management
MedSecurities InvestmentCompany S.A.L. Lebanon 100 November 19, 2007 Financial institution
Real Estate
Al Hana S.A.L. Lebanon 100 December 1, 1995 Owns Bank’s Premises
Al Jinan S.A.L. Lebanon 100 December 1, 1995 Owns Bank’s Premises
Al Shams S.A.L. Lebanon 100 December 1, 1995 Owns Bank’s Premises
Centre Méditerranée S.A.L. Lebanon 100 January 16, 1996 Owns Bank’s Premises
Al Hosn Real Estate II S.A.L. Lebanon 100 February 27, 2004 Owns Bank’s Premises
Al Hosn Real Estate III S.A.L. Lebanon 100 February 27, 2004 Owns Bank’s Premises
Insurance
Med Bancassurance S.A.L. Lebanon 100 May 20, 2003 Insurance brokerage
Other
Medfinance Holding Ltd. BVI 100 January 1, 2003 Any activity outside of BVI
Investment in shares andMéditerranée Investment Bank Holding Lebanon 100 December 24, 1996 management of companies
Med Properties Management Cayman 100 May 2, 2008 Management of properties
Investment in shares andMed Properties S.A.L. Holding Lebanon 100 April 23, 2008 management of companies
Investment in shares andCynvest Holding S.A.L. Lebanon 100 December 23, 2008 management of companies
Country ofIncorporation
Percentage ofOwnership
Date of Acquisitionor Incorporation Business Activity
The consolidated subsidiaries as at December 31, 2008 comprise:

13
74
D. Business Combinations:
The acquisition of subsidiaries is accounted for using the purchase method. The cost of the acquisition is measured at theaggregate of the fair values, at the date of exchange, of assets given, liabilities incurred or assumed, and equity instrumentsissued by the Group in exchange for control of the acquiree, plus any costs directly attributable to the business combination.The acquiree's identifiable assets, liabilities and contingent liabilities that meet the conditions for recognition under IFRS 3Business Combinations are recognized at their fair values at the acquisition date, except for non-current assets (or businessunits to be disposed of) that are classified as held for sale in accordance with IFRS 5 Non-Current Assets Held for Saleand Discontinued Operations, which are recognized and measured at fair value less costs to sell.
Goodwill arising on acquisition is recognized as an asset and initially measured at cost, being the excess of the cost of thebusiness combination over the Group's interest in the net fair value of the identifiable assets, liabilities and contingentliabilities recognized. If, after reassessment, the Group's interest in the net fair value of the acquiree's identifiable assets,liabilities and contingent liabilities exceeds the cost of the business combination, the excess is recognized immediately in theincome statement.
When subsidiaries are sold, the difference between the selling price and the net assets plus cumulative translation differencesand goodwill is recognized in the consolidated income statement.
Impairment is determined by assessing the recoverable amount of the cash-generating unit (group of cash-generating units),to which the goodwill relates. Where the recoverable amount of the cash-generating unit (group of cash-generating units) isless than the carrying amount, an impairment loss is recognized. Impairment losses relating to goodwill cannot be reversedin future periods.
For the purpose of impairment testing, goodwill acquired in a business combination is, from the acquisition date, allocatedto each of the Group’s cash-generating units, or groups of cash-generating units, that are expected to benefit from thesynergies of the combination, irrespective of whether other assets or liabilities of the acquiree are assigned to those units orgroups of units.
The interest of minority shareholders in the acquiree is initially measured at the minority's proportion of the net fair value ofthe assets, liabilities and contingent liabilities recognized.
E. Foreign Currencies:
The consolidated financial statements are presented in Lebanese Pound which is the Group’s reporting currency. However,the primary currency of the economic environment in which the Group operates (functional currency) is the U.S. Dollar.
In preparing the financial statements of the individual entities, transactions in foreign currencies are recorded at the rates ofexchange prevailing at the dates of the transactions. At each balance sheet date, monetary items denominated in foreign currenciesare retranslated at the rates prevailing at the balance sheet date. Non-monetary items carried at fair value that are denominated inforeign currencies are retranslated at the rates prevailing at the date when the fair value was determined. Non-monetary items thatare measured in terms of historical cost in a foreign currency are not retranslated.
Exchange differences are recognised in profit or loss in the period in which they arise except for exchange differences ontransactions entered into in order to hedge certain foreign currency risks, and exchange differences on monetary itemsreceivable from or payable to a foreign operation for which settlement is neither planned nor likely to occur, which form partof the net investment in a foreign operation, and which are recognised in the foreign currency translation reserve andrecognised in profit or loss on disposal of the net investment.

INDEPENDENT AUDITOR’S REPORT
75
For the purpose of presenting consolidated financial statements, the assets and liabilities of the Group’s foreign operationsare expressed in Currency Units using exchange rates prevailing at the balance sheet date. Income and expense items aretranslated at the average exchange rates for the period. Exchange differences arising, if any, are classified as equity andrecognized in the Group’s foreign currency translation reserve. Such exchange differences are recognized in profit or loss inthe period in which the foreign operation is disposed of.
F. Financial Assets and Liabilities:
Recognition and Derecognition:The Group initially recognizes loans and advances, deposits debt securities issued and subordinated liabilities on the datethat they are originated. All other financial assets and liabilities are initially recognized on the trade date at which the Groupbecomes a party to the contractual provisions of the instrument.
A financial asset (or a part of a financial asset, or a part of a group of similar financial assets) is derecognized, when thecontractual rights to the cash flows from the financial asset expires.
In instances where the Group is assessed to have transferred a financial asset, the asset is derecognized if the Group hastransferred substantially all the risks and rewards of ownership. Where the Group has neither transferred nor retainedsubstantially all the risks and rewards of ownership, the financial asset is derecognized only if the Group has not retainedcontrol of the financial asset. The Group recognizes separately as assets or liabilities any rights and obligations created orretained in the process.
A financial liability (or a part of a financial liability) can only be derecognized when it is extinguished, that is when the obligationspecified in the contract is either discharged, cancelled or expires.
Offsetting:Financial assets and liabilities are set off and the net amount is presented in the balance sheet when, and only when, theGroup has a legal right to set off the amounts or intends either to settle on a net basis or to realize the asset and settle theliability simultaneously.
Fair Value Measurement:The fair values of financial assets and financial liabilities are determined as follows:
• the fair value of financial assets and financial liabilities with standard terms and conditions and traded on active liquidmarkets are determined with reference to quoted market prices;
• the fair value of other financial assets and financial liabilities and those traded in inactive markets (excluding derivativeinstruments) are determined either based on quoted prices adjusted downward for factors related to illiquidity or inaccordance with generally accepted pricing models based on discounted cash flow analysis using prices from observablecurrent market transactions, as applicable; and
• the fair value of derivative instruments, are calculated using quoted prices. Where such prices are not available, use ismade of discounted cash flow analysis using the applicable yield curve for the duration of the instruments for non-optionalderivatives, and option pricing models for optional derivatives.

13
76
Impairment of Financial Assets:Financial assets, other than those at “fair value through profit and loss”, are assessed for indicators of impairment at eachbalance sheet date. Financial assets are impaired where there is objective evidence that as a result of one or moreobservable loss events, including significant or prolonged decline in fair value beyond one business cycle that occurred afterthe initial recognition of the financial asset or group of financial assets, the estimated future cash flows of the investment havebeen impacted.
For financial assets carried at amortized cost, the amount of the impairment loss or specific provision for credit losses onnon-performing loans and advances to customers, is the difference between the asset’s carrying amount and the presentvalue of estimated future cash flows, discounted at the original effective interest rate, taking into consideration, for non-performing loans and advances to customers, the liquidating value of any security on hand.
In addition to specific provision for credit losses on non-performing loans and advances to customers, provision for collectiveimpairment is made on a portfolio basis for credit losses where there is objective evidence that unidentified losses exist atthe reporting date. This provision is estimated based on various factors including credit ratings allocated to a borrower orgroup of borrowers, the current economic conditions, the experience the Group has had in dealing with a borrower or groupof borrowers and available historical default information.
With the exception of available-for-sale equity instruments, if, in a subsequent period, the amount of the impairment lossdecreases and the decrease can be related objectively to an event occurring after the impairment was recognized, thepreviously recognized impairment loss is reversed through profit or loss to the extent that the carrying amount of theinvestment at the date the impairment is reversed does not exceed what the amortized cost would have been had theimpairment not been recognized.In respect of available-for-sale equity securities, any increase in fair value subsequent to an impairment loss is recognizeddirectly in equity.
Designation at Fair Value Through Profit or Loss:The Group has designated financial assets and liabilities at fair value through profit or loss when either:
• the assets or liabilities are managed, evaluated and reported internally on a fair value basis;• the designation eliminates or significantly reduces an accounting mismatch which would otherwise arise; or• the asset or liability contains an embedded derivative that significantly modifies the cash flows that would otherwise berequired under the contract.
Financial assets and liabilities designated at fair value through profit or loss are initially recognized and subsequentlymeasured at fair value.
G. Investment Securities:
Investment securities are initially measured at fair value plus incremental direct transaction costs, and subsequently account-ed for depending on their classification as either held-to-maturity or available-for-sale.
Held-to-Maturity Investment Securities:Held-to-maturity investments are non-derivative assets with fixed or determinable payments and fixed maturity that the Grouphas the positive intent and ability to hold to maturity, and which are not designated at fair value through profit or loss oravailable-for-sale.
Held-to-maturity investments are carried at amortized cost.

INDEPENDENT AUDITOR’S REPORT
77
Available-for-Sale Investment Securities:Available-for-sale (AFS) investments are non derivative investments that are not designated as another category of financial assets.Available-for-sale securities are stated at fair value, except for unquoted equity securities whose fair value cannot be reliably measuredare carried at cost. Fair value is determined in the manner described in note 3(F). Gains and losses arising from changes in fair valueare recognized directly in equity in the “change in fair value of available-for-sale securities” with the exception of impairment losses,interest and foreign exchange gains and losses on monetary assets, which are recognized directly in profit or loss. Where theinvestment is disposed of or is determined to be impaired, the cumulative gain or loss previously recognized in the “change in fair valueof available-for-sale securities” is included in profit or loss for the period.
The change in fair value on available-for-sale debt securities reclassified to held-to-maturity is segregated from the changein fair value of available-for-sale debt securities under equity and is amortized over the remaining term to maturity of the debtsecurity as a yield adjustment.
Exchange of Debt Securities:Debt securities exchanged against securities with longer maturities, with similar risks, and issued by the same issuer, are notderecognized from financial assets because they do not meet the conditions for derecognition. Premiums and discountsderived from the exchange of said securities are deferred to be amortized as a yield enhancement on time proportionate basis,over the period of the extended maturities.
Cost of Put Option:Cost of exercise of the put option related to the redemption right of debt securities is netted from the underlying cost of therelated securities.
Repurchase and Reverse Repurchase Agreements:Securities sold under agreements to repurchase at a specified future date (“repos”) are not derecognized from the balancesheet. The corresponding cash received, including accrued interest, is recognized on the balance sheet reflecting itseconomic substances as a loan to the Group. The difference between the sale and repurchase prices is treated as interestexpense and is accrued over the life of the agreement using the effective interest rate method.
H. Trading Assets:
A financial asset is classified as held-for-trading if:
• it has been acquired principally for the purpose of selling in the near future; or• it is a part of an identified portfolio of financial instruments that the Group manages together and has a recent actual patternof short-term profit-taking; or
• it is a derivative that is not designated and effective as a hedging instrument.
Financial assets held-for-trading are stated at fair value, with any resultant gain or loss recognized in profit or loss. Fair valueis determined in the manner described in note 3(F).
Subsequent to their initial recognition, trading securities are not reclassified except when they meet the qualifying conditionsof IAS 39 amendments on fair value.

13
78
I. Loans and Advances:
Loans and advances are non-derivative financial assets that have fixed or determinable payments that are not quoted in anactive market and are classified as ‘loans and receivables’. Loans and receivables are measured at amortized cost, less anyimpairment. Interest income is recognized by applying the effective interest rate.Non-performing loans and advances to customers are stated net of unrealized interest and provision for credit lossesbecause of doubts and the probability of non-collection of principal and/or interest.
J. Financial Liabilities and Equity Instruments Issued by the Group:
Classification as debt or equity:Debt and equity instruments are classified as either financial liabilities or as equity in accordance with the substance of thecontractual arrangement.
Equity instruments:An equity instrument is any contract that evidences a residual interest in the assets of an entity after deducting all of itsliabilities. Equity instruments are recorded at the proceeds received, net of direct issue costs.
Financial guarantee contract liabilities:Financial guarantees contracts are contracts that require the Group to make specified payments to reimburse the holder fora loss it incurs because a specified debtor fails to make payment when due in accordance with the terms of a debtinstrument. These contracts can have various judicial forms (guarantees, letters of credit, credit-insurance contracts).
Financial guarantee contract liabilities are measured initially at their fair values and are subsequently measured at the higher of:• the amount of the obligation under the contract, as determined in accordance with IAS 37 Provisions, ContingentLiabilities and Contingent Assets; and
• the amount initially recognized less, where appropriate, cumulative amortization recognized in accordance with the revenuerecognition policies set out above.
Other financial liabilities:Other financial liabilities, including customers’ deposits, money market and borrowings, are initially measured at fair value,net of transaction costs.Other financial liabilities are subsequently measured at amortized cost, with interest expense recognized on an effective yieldbasis.
K. Derivative Financial Instruments:
Derivative financial instruments including foreign exchange contracts, currency and interest rate swaps, (both written andpurchased) are initially measured at fair value at the date the derivative contract is entered into and are subsequently re-measured to their fair value at each balance sheet date. All derivatives are carried at their fair value as assets where the fairvalue is positive and as liabilities where the fair value is negative. The resulting gain or loss is recognized in the incomestatement immediately unless the derivative is designated and effective as a hedge instrument in which event the timing ofthe recognition in the income statement depends on the hedge relationship.

INDEPENDENT AUDITOR’S REPORT
79
The Group designates certain derivatives as either hedges of the fair value recognized assets or liabilities or firmcommitments (fair value hedges), hedges of highly probable forecast transactions or hedges of foreign currency risk offirm commitments (cash flow hedges), or hedges of net investments in foreign operations.
Fair values are generally obtained by reference to quoted market prices, discounted cash flow models or pricing models asappropriate as indicated under Note 3 (F).
Embedded derivatives:Derivatives embedded in other financial instruments or other host contracts are treated as separate derivatives when theirrisks and characteristics are not closely related to those of the host contracts and the host contracts are not measured at fairvalue with changes in fair value recognised in profit or loss.
Hedge accounting:The Group designates certain hedging instruments, which include derivatives, embedded derivatives and non-derivatives inrespect of foreign currency risk, as either fair value hedges, cash flow hedges, or hedges of net investments in foreignoperations. Hedges of foreign exchange risk on firm commitments are accounted for as cash flow hedges.
At the inception of the hedge relationship, the entity documents the relationship between the hedging instrument and thehedged item, along with its risk management objectives and its strategy for undertaking various hedge transactions.Furthermore, at the inception of the hedge and on an ongoing basis, the Group documents whether the hedging instrumentthat is used in a hedging relationship is highly effective in offsetting changes in fair values or cash flows of the hedged item.
Fair value hedge:Changes in the fair value of derivatives that are designated and qualify as fair value hedges are recorded in profit or lossimmediately, together with any changes in the fair value of the hedged item that are attributable to the hedged risk. Thechange in the fair value of the hedging instrument and the change in the hedged item attributable to the hedged risk arerecognised in the line of the income statement relating to the hedged item.
Hedge accounting is discontinued when the Group revokes the hedging relationship, the hedging instrument expires or issold, terminated, or exercised, or no longer qualifies for hedge accounting. The adjustment to the carrying amount of thehedged item arising from the hedged risk is amortised to profit or loss from that date.
Cash flow hedge:The effective portion of changes in the fair value of derivatives that are designated and qualify as cash flow hedges aredeferred in equity. The gain or loss relating to the ineffective portion is recognised immediately in profit or loss.
Amounts deferred in equity are recycled in profit or loss in the periods when the hedged item is recognised in profit or loss,in the same line of the income statement as the recognised hedged item. However, when the forecast transaction that ishedged results in the recognition of a non-financial asset or a non-financial liability, the gains and losses previously deferredin equity are transferred from equity and included in the initial measurement of the cost of the asset or liability.
Hedge accounting is discontinued when the Group revokes the hedging relationship, the hedging instrument expires or issold, terminated, or exercised, or no longer qualifies for hedge accounting. Any cumulative gain or loss deferred in equity atthat time remains in equity and is recognised when the forecast transaction is ultimately recognised in profit or loss. When aforecast transaction is no longer expected to occur, the cumulative gain or loss that was deferred in equity is recognisedimmediately in profit or loss.

13
80
Hedges of net investments in foreign operations:Hedges of net investments in foreign operations are accounted for similarly to cash flow hedges. Any gain or loss on thehedging instrument relating to the effective portion of the hedge is recognized in equity in the foreign currency translationreserve. The gain or loss relating to the ineffective portion is recognized immediately in profit or loss.Gains and losses deferred in the foreign currency translation reserve are recognized in profit or loss on disposal of the foreignoperation.
L. Investments in Associates:
An associate is an entity over which the Group has significant influence and that is neither a subsidiary nor an interest in ajoint venture. Significant influence is the power to participate in the financial and operating policy decisions of the investeebut is not control or joint control over those policies.
The results and assets and liabilities of associates, except where the Group has control over the associates’ financial andoperating policies, are incorporated in the consolidated financial statements using the equity method of accounting, except whenthe investment is classified as held for sale, in which case it is accounted for under IFRS 5 Non-current Assets Held for Sale andDiscontinued Operations. Under the equity method, investments in associates are carried in the consolidated balance sheet atcost as adjusted for post-acquisition changes in the Group's share of the net assets of the associate, less any impairment in thevalue of individual investments. Losses of an associate in excess of the Group's interest in that associate (which includes any long-term interests that, in substance, form part of the Group's net investment in the associate) are not recognized.
Any excess of the cost of acquisition over the Group's share of the net fair value of the identifiable assets, liabilities andcontingent liabilities of the associate recognized at the date of acquisition is recognized as goodwill. The goodwill is includedwithin the carrying amount of the investment and is assessed for impairment as part of the investment. Any excess of theGroup's share of the net fair value of the identifiable assets, liabilities and contingent liabilities over the cost of acquisition,after reassessment, is recognized immediately in the income statement.
Temporary investments in non-consolidated subsidiaries, which the management intends to dispose of within one year from theconsolidated balance sheet date, are reflected in the consolidated balance sheet at fair value that is equivalent to its net realiz-able value as determined on the date of the consolidated financial statements.
M. Property and Equipment:
Property and equipment except for buildings acquired prior to 1993 are stated at historical cost, less accumulated depreciation andany impairment loss. Buildings acquired prior to 1993 are stated at their revalued amounts, based on market prices prevailingduring 1996 less accumulated depreciation and impairment loss, if any. Resulting revaluation surplus is reflected under “Equity”.Depreciation of property and equipment, other than land and advance payments on capital expenditures, is calculatedsystematically using the straight-line method over the estimated useful lives of the related assets using the following annual rates:
Buildings . . . . . . . . . . . . . . . . . . . . . . . . . . . . . . . . . . . . . . . . . . . . . . . . . . . . . . . . . . . . . . . . . . . . . . . . . . . . . . . . . . . .2%Office improvements and installations . . . . . . . . . . . . . . . . . . . . . . . . . . . . . . . . . . . . . . . . . . . . . . . . . . . . . .12.5 % - 20%Furniture . . . . . . . . . . . . . . . . . . . . . . . . . . . . . . . . . . . . . . . . . . . . . . . . . . . . . . . . . . . . . . . . . . . . . . . . . . . . . . .8% - 20%Equipment and machines . . . . . . . . . . . . . . . . . . . . . . . . . . . . . . . . . . . . . . . . . . . . . . . . . . . . . . . . . . . . . . . . . .7% - 25%Computer equipment . . . . . . . . . . . . . . . . . . . . . . . . . . . . . . . . . . . . . . . . . . . . . . . . . . . . . . . . . . . . . . . . . .20% - 33.33%Vehicles . . . . . . . . . . . . . . . . . . . . . . . . . . . . . . . . . . . . . . . . . . . . . . . . . . . . . . . . . . . . . . . . . . . . . . . . . . . . . . .10% - 20%

INDEPENDENT AUDITOR’S REPORT
81
An item of property and equipment is derecognized upon disposal or when no future economic benefits are expected fromits use or disposal. Any gain or loss arising on derecognition of the asset (calculated as the difference between the netdisposal proceeds and the carrying amount of the asset) is recognized under “Other operating income” in the consolidatedincome statement in the year the asset is derecognized.
N. Intangible Assets other than Goodwill:
Intangible assets consisting of computer software are amortized over a period of three years and are subject to impairmenttesting. Subsequent expenditure on software assets is capitalized only when it increases the future economic benefitsembodied in the specific asset to which it relates. All other expenditure is expensed as incurred.
O. Goodwill:
Goodwill arising on the acquisition of a subsidiary or a jointly controlled entity represents the excess of the cost of acquisitionover the Group's interest in the net fair value of the identifiable assets, liabilities and contingent liabilities of the subsidiary orjointly controlled entity recognized at the date of acquisition. Goodwill is initially recognized as an asset at cost and issubsequently measured at cost less any accumulated impairment losses.
On disposal of a subsidiary or a jointly controlled entity, the attributable amount of goodwill is included in the determinationof the profit or loss on disposal.
The Group's policy for goodwill arising on the acquisition of an associate is described under “Investments in Associates”.For the purpose of impairment testing, goodwill is allocated to each of the Group's cash-generating units expected to benefitfrom the synergies of the combination. Cash-generating units to which goodwill has been allocated are tested for impairmentannually, or more frequently when there is an indication that the unit may be impaired. If the recoverable amount of the cash-generating unit is less than the carrying amount of the unit, the impairment loss is allocated first to reduce the carrying amountof any goodwill allocated to the unit and then to the other assets of the unit pro-rata on the basis of the carrying amount ofeach asset in the unit. An impairment loss recognized for goodwill is not reversed in a subsequent period.
P. Investment Properties:
Investment properties, which consist of properties held to earn rentals and/or for capital appreciation, are stated at cost whichapproximates their fair value at the balance sheet date. Gains or losses arising from changes in the fair value of investmentproperties are included in the income statement in the period in which they arise.
Q. Assets Acquired in Satisfaction of Loans:
Real estate property has been acquired through the enforcement of security over loans and advances. These assets aremeasured at cost less any accumulated impairment losses. The acquisition of such assets is regulated by the local bankingauthorities who require the liquidation of these assets within 2 years from acquisition. In case of default of liquidation theGroup’s lead regulator requires an appropriation of a special reserve from the yearly net income that is reflected under equity.

13
82
R. Impairment of Tangible and Intangible Assets:
At each balance sheet date, the carrying amounts of tangible and intangible assets are reviewed to determine whether thereis any indication that these assets have suffered an impairment loss. If any such indication exists, the recoverable amountis estimated in order to determine the extent of impairment provision required, if any.Recoverable amount is defined as the higher of:
• Fair value that reflects market conditions at the balance sheet date, less cost to sell, if any. To determine fair value the Groupadopts the market comparability approach using as indicators the current prices for similar assets in the same location andcondition.
• Value in use: the present value of estimated future cash flows expected to arise from the continuing use of the asset andfrom its disposal at the end of its useful life, only applicable to assets with cash generation units.
In this connection, the recoverable amount of the Group’s owned properties and of properties acquired in satisfaction ofdebts, is the estimated market value, as determined by real estate appraisers on the basis of market compatibility bycomparing with similar transactions in the same geographical area and on the basis of the expected value of a current salebetween a willing buyer and a willing seller, that is, other than in a forced or liquidation sale.
The impairment loss is charged to income.
S. Employees' Benefits:
Obligations for contributions to defined employees’ benefits are recognized as an expense on a current basis.Employees' End-of-Service Indemnities: (Under the Lebanese Jurisdiction)The provision for staff termination indemnities is based on the liability that would arise if the employment of all the staff wereterminated at the balance sheet date. This provision is calculated in accordance with the directives of the Lebanese SocialSecurity Fund and Labor laws based on the number of years of service multiplied by the monthly average of the last 12 monthsremunerations and less contributions paid to the Lebanese Social Security National Fund.
Defined benefit plans: (Under other jurisdictions)Obligations in respect of defined benefit pension plans is calculated separately for each plan by estimating the amount offuture benefit that employees have earned in return for their service in the current and prior periods; that benefit is discountedto determine its present value, and any unrecognized past service costs and the fair value of any plan assets are deducted.
T. Provisions:
Provisions are recognized when the Group has a present obligation as a result of a past event, and it is probable that theGroup will be required to settle that obligation. Provision is measured at the best estimate of the consideration required tosettle the obligation at the balance sheet date.Where a provision is measured using the cash flows estimated to settle the present obligation, its carrying amount is thepresent value of those cash flows determined by discounting the expected future cash flows at a pre-tax rate that reflectscurrent market assessments of the time value of money and, where appropriate, the risks specific to the liability.
When some or all of the economic benefits required to settle a provision are expected to be recovered from a third party, thereceivable is recognized as an asset if it is virtually certain that reimbursement will be received and the amount of the receivablecan be measured reliably.

INDEPENDENT AUDITOR’S REPORT
83
U. Revenue and Expense Recognition:
Interest income and expense are recognized on an accrual basis, taking account of the principal outstanding and the rateapplicable, except for non-performing loans and advances for which interest income is only recognized upon realization.Interest income and expense include the amortization discount or premium.
Interest income and expense presented in the income statement include:• Interest on financial assets and liabilities at amortized cost.• Interest on available-for-sale investment securities.• Fair value changes in qualifying derivatives and related hedged items when interest rate risk is the hedged risk.
Net trading income presented in the income statement includes:• Interest income and expense on the trading portfolio.• Dividend income on the trading equities.• Realized and unrealized gains and losses on the trading portfolio.
Interest income and expense on financial portfolio designated at fair value through profit or loss upon initial recognition isrecognized under net income from other financial instruments carried at fair value.
Fees and commission income and expense that are integral to the effective interest rate on a financial asset or liability(i.e. commissions and fees earned on the loan book) are included under interest income and expense.
Other fees and commission income are recognized as the related services are performed.
Dividend income is recognized when the right to receive payment is established.
V. Income Tax:
Income tax expense represents the sum of the tax currently payable and deferred tax. Income tax is recognized in the incomestatement except to the extent that it relates to items recognized directly in equity, in which case it is recognized in equity.
Current tax is the expected tax payable on the taxable income for the year, using rates enacted at the balance sheet date. Income taxpayable is reflected in the consolidated balance sheet net of taxes previously settled in the form of withholding tax.
Deferred tax is recognized on differences between the carrying amounts of assets and liabilities in the financial statementsand the corresponding tax base used in the computation of taxable profit, and are accounted for using the balance sheetliability method. Deferred tax liabilities are generally recognized for all taxable temporary differences and deferred tax assetsare recognized to the extent that it is probable that taxable profits will be available against which deductible temporarydifferences can be utilized.
W. Fiduciary Deposits:
All fiduciary deposits are held on a non-discretionary basis and related risks and rewards belong to the account holders.Accordingly, they are reflected as off-balance sheet accounts.

13
84
X. Operating Lease Agreements:
Lease agreements which do not transfer substantially all the risks and benefits incidental to ownership of the leased itemsare classified as operating leases. Operating lease payments are recorded in the consolidated income statement on astraight line basis over the lease term.
Y. Cash and Cash Equivalents:
Cash and cash equivalents comprise balances with maturities of a period of three months including: cash and balances withthe Central Banks, deposits with Banks and financial institutions, and deposits due to banks and financial institutions.
4. CRITICAL ACCOUNTING JUDGMENTS AND KEY SOURCES OF ESTIMATION UNCERTAINTY
In the application of the Group’s accounting policies, which are described in note 3, the directors are required to makejudgements, estimates and assumptions about the carrying amounts of assets and liabilities that are not readily apparentfrom other sources. The estimates and associated assumptions are based on historical experience and other factors that areconsidered to be relevant. Actual results may differ from these estimates.
The estimates and underlying assumptions are reviewed on an ongoing basis. Revisions to accounting estimates arerecognised in the period in which the estimate is revised if the revision affects only that period or in the period of the revisionand future periods if the revision affects both current and future periods.
A. Critical Accounting Judgments in Applying the Group’s Accounting Policies:
Classification of Financial Assets:The Group’s accounting policies provide scope for investment securities to be designated on inception into differentcategories in certain circumstances based on specific conditions. In classifying investment securities as held-to-maturity, theGroup has determined that it has both the positive intent and ability to hold these assets until their maturity as required by inaccounting policy under Note 3G.In designating financial assets or liabilities at fair value through profit or loss, the Group has determined that it has met oneof the criteria for this designation set out in accounting policy 3(F).
Qualifying Hedge Relationships:In designating financial instruments as qualifying hedge relationships, the Group has determined that it expects the hedgeto be highly effective over the life of the hedging instrument.In accounting for derivatives as cash flow hedges, the Group has determined that the hedged cash flow exposure relates tohighly probable future cash flows.
B. Key Sources of Estimation Uncertainty:
The following are the key assumptions concerning the future, and other key sources of estimation uncertainty at the balancesheet date, that have a significant risk of causing a material adjustment to the carrying amounts of assets and liabilities withinthe next financial year.
Allowances for Credit Losses:Specific impairment for credit losses is determined by assessing each case individually. This method applies to classifiedloans and advances and the factors taken into consideration when estimating the allowance for credit losses include the

INDEPENDENT AUDITOR’S REPORT
85
counterparty’s credit limit, the counterparty’s ability to generate cash flows sufficient to settle his advances and the value ofcollateral and potential repossession. Loans collectively assessed for impairment are determined based on losses incurredby loans portfolios with similar characteristics.
Determining Fair Values:The determination of fair value for financial assets for which there is no observable market price requires the use of valuationtechniques as described in Note 3F. For financial instruments that trade infrequently and have little price transparency, fairvalue is less objective, and requires varying degrees of judgment depending on liquidity, concentration, uncertainly of marketfactors, pricing assumptions and other risks affecting the specific instrument.
Where available, management has used market indicators in its mark to model approach for the valuation of the Lebanesegovernment debt securities and Central Bank certificates of deposit at fair value. The IFRS fair value hierarchy allocates thehighest priority to quoted prices (unadjusted) in active markets for identical assets or liabilities, and the lowest priority tounobservable inputs. The fair value hierarchy used in the determination of fair value consists of three levels of input data fordetermining the fair value of an asset or liability.
Level 1 - quoted prices for identical items in active, liquid and visible markets such as stock exchanges,Level 2 - observable information for similar items in active or inactive markets,Level 3 - unobservable inputs used in situations where markets either do not exist or are illiquid.
Unobservable inputs are used to measure fair value to the extent that observable inputs are not available, thereby allowingfor situations in which there is little, if any, market activity for the asset or liability at the measurement date. However, the fairvalue measurement objective should remain the same; that is, an exit price from the perspective of a market participant thatholds the asset or owes the liability. Unobservable inputs are developed based on the best information available in thecircumstances, which may include the reporting entity's own data. Where practical, the discount rate used in the mark tomodel approach included observable data collected from market participants, including risk free interest rates and creditdefault swap rates for pricing of credit risk (both own and counter party), and a liquidity risk factor which is added to theapplied discount rate. Changes in assumptions about any of these factors could affect the reported fair value of the LebaneseGovernment debt securities and Central Bank certificates of deposit.
Impairment of Goodwill:Determining whether goodwill is impaired requires an estimation of the value in use of the cash-generating units to whichgoodwill has been allocated. The value in use calculation requires the directors to estimate the future cash flows expectedto arise from the cash-generating unit and a suitable discount rate in order to calculate present value.
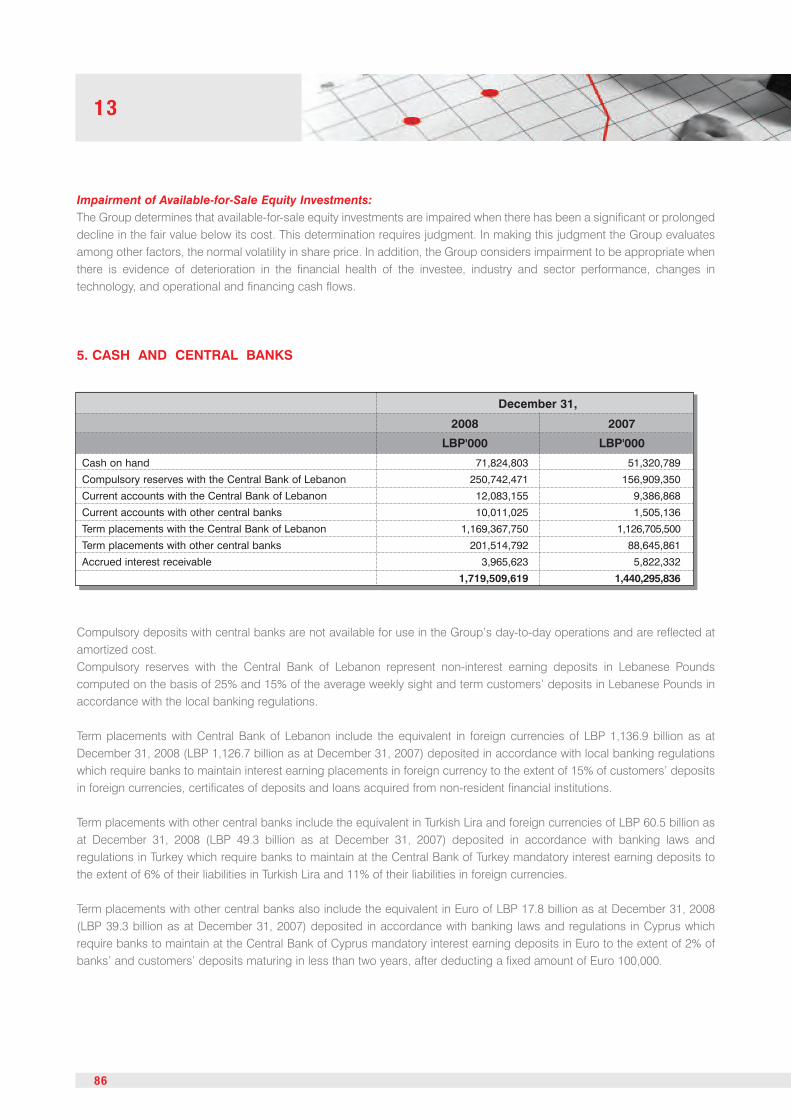
13
86
Impairment of Available-for-Sale Equity Investments:The Group determines that available-for-sale equity investments are impaired when there has been a significant or prolongeddecline in the fair value below its cost. This determination requires judgment. In making this judgment the Group evaluatesamong other factors, the normal volatility in share price. In addition, the Group considers impairment to be appropriate whenthere is evidence of deterioration in the financial health of the investee, industry and sector performance, changes intechnology, and operational and financing cash flows.
5. CASH AND CENTRAL BANKS
Compulsory deposits with central banks are not available for use in the Group’s day-to-day operations and are reflected atamortized cost.Compulsory reserves with the Central Bank of Lebanon represent non-interest earning deposits in Lebanese Poundscomputed on the basis of 25% and 15% of the average weekly sight and term customers’ deposits in Lebanese Pounds inaccordance with the local banking regulations.
Term placements with Central Bank of Lebanon include the equivalent in foreign currencies of LBP 1,136.9 billion as atDecember 31, 2008 (LBP 1,126.7 billion as at December 31, 2007) deposited in accordance with local banking regulationswhich require banks to maintain interest earning placements in foreign currency to the extent of 15% of customers’ depositsin foreign currencies, certificates of deposits and loans acquired from non-resident financial institutions.
Term placements with other central banks include the equivalent in Turkish Lira and foreign currencies of LBP 60.5 billion asat December 31, 2008 (LBP 49.3 billion as at December 31, 2007) deposited in accordance with banking laws andregulations in Turkey which require banks to maintain at the Central Bank of Turkey mandatory interest earning deposits tothe extent of 6% of their liabilities in Turkish Lira and 11% of their liabilities in foreign currencies.
Term placements with other central banks also include the equivalent in Euro of LBP 17.8 billion as at December 31, 2008(LBP 39.3 billion as at December 31, 2007) deposited in accordance with banking laws and regulations in Cyprus whichrequire banks to maintain at the Central Bank of Cyprus mandatory interest earning deposits in Euro to the extent of 2% ofbanks’ and customers’ deposits maturing in less than two years, after deducting a fixed amount of Euro 100,000.
Cash on hand 71,824,803 51,320,789
Compulsory reserves with the Central Bank of Lebanon 250,742,471 156,909,350
Current accounts with the Central Bank of Lebanon 12,083,155 9,386,868
Current accounts with other central banks 10,011,025 1,505,136
Term placements with the Central Bank of Lebanon 1,169,367,750 1,126,705,500
Term placements with other central banks 201,514,792 88,645,861
Accrued interest receivable 3,965,623 5,822,332
1,719,509,619 1,440,295,836
December 31,
2008 2007
LBP'000 LBP'000

INDEPENDENT AUDITOR’S REPORT
87
Term placements with the Central Bank of Lebanon bear the following maturities and earn fixed or floating interest rates:
Term placements with other central banks amounting to LBP 201.5 billion as at December 31, 2008 (LBP 88.6 billion as atDecember 31, 2007) mature during the first quarter of 2009 (first quarter of 2008 for December 31, 2007).
6. DEPOSITS WITH BANKS AND FINANCIAL INSTITUTIONS
Up to 1 year 359,840,250
Year 2010-2012 734,152,500
Year 2013 75,375,000
1,169,367,750
December 31, 2008
December 31, 2007
Maturity
Maturity
F/Cy Base Accounts
Amount LBP’000
Up to 1 year 489,033,000
Year 2009-2012 637,672,500
1,126,705,500
F/Cy Base AccountsAmount LBP’000
Checks in course of collection 38,001,158 33,988,702
Current accounts 237,142,535 208,547,415
Current accounts - related parties 152,846 1,011,757
Call placements 38,894,811 6,783,750
Overnight placements 119,092,500 630,127,500
Overnight placements - related parties - 19,691,784
Term placements 736,227,005 1,546,623,735
Term placements - related parties 343,557,070 457,635,711
Pledged deposits 5,914,383 -
Accrued interest receivable 3,457,683 1,280,932
Accrued interest receivable – related parties 1,397,134 6,920
1,523,837,125 2,905,698,206
December 31,
2008 2007
LBP'000 LBP'000

Financial assets designated at fair value through profitor loss upon initial recognition (a) 75,283,043 -
Trading assets (b) 1,921,848 171,352,969
77,204,891 171,352,969
December 31,
2008 2007LBP'000 LBP'000
13
88
Deposits with banks and financial institutions include term placements in the amount of LBP 15.38 billion, current accounts in theamount of LBP 306 million and purchased checks in the amount of LBP 75 million as at December 31, 2008 (LBP 9.8 billion andLBP 739 million and nil as at December 31, 2007, respectively) with right of set-off against current deposits of banks and financialinstitutions amounting to LBP 2.92 billion, long term borrowing amounting LBP 30.15 billion, acceptances payable amounting toLBP 13.37 billion, letters of guarantees amounting to LBP 16.92 billion, letters of credit amounting to LBP 29.32 billion and forwardcontracts amounting to LBP 8.02 billion (LBP 3.77 billion, nil, LBP 2.05 billion, LBP 16.16 billion, LBP 9.96 billion and LBP 23.96billion as at December 31, 2007 respectively).
7. FINANCIAL ASSETS AT FAIR VALUE THROUGH PROFIT OR LOSS
This caption consists of the following:
Term, overnight and call placements and pledged deposits bear the following maturities:
a) Financial assets designated at fair value through profit or loss upon initial recognition consist of the following:
1st quarter of 2009 1,205,108,169
2nd quarter of 2009 38,577,600
1,243,685,769
December 31, 2008
December 31, 2007
Maturity
F/Cy Base Accounts
Amount LBP’000
Maturity
Accounts in LBP Accounts in F/Cy
Amount LBP’000 Amount LBP’000
1st quarter of 2008 1,500,000 2,659,362,480
1,500,000 2,659,362,480
Credit linked notes issued by bank 75,106,665
Accrued interest receivable 176,378
75,283,043
December 31, 2008
F/Cy Base AccountsLBP'000

INDEPENDENT AUDITOR’S REPORT
89
Credit linked notes issued by banks consist of the following:
The above credit linked notes have Lebanese government bonds and certificates of deposit as underlying assets and were purchasedagainst specific customers’ deposits classified as deposits at fair value through profit or loss (Note 20).
(b) Trading assets consist of the following:
Foreign government bonds as at December 31, 2008 and 2007 represent bonds issued by the Turkish Government.
Fixed income trading debt securities are segregated by remaining periods to maturity as follows:
July 20, 2009 30,150,000 30,002,986 30,107,790
October 15, 2010 45,225,000 44,194,557 44,998,875
75,375,000 74,197,543 75,106,665
December 31, 2008
Maturity
F/Cy Base Accounts
Nominal ValueLBP’000
Amortized CostLBP’000
Fair ValueLBP’000
Lebanese Government bonds 392,213 392,213 - 1,480,895 1,480,895Foreign Government bonds 924,420 924,420 - 163,601,163 163,601,163Quoted equity securities 587,547 587,547 720,101 5,483,075 6,203,176Accrued interest receivable 17,668 17,668 - 67,735 67,735
1,921,848 1,921,848 720,101 170,632,868 171,352,969
December 31, 2008 December 31, 2007
C/V of F/CyLBP’000
TotalLBP’000
LBPLBP’000
C/V of F/CyLBP’000
TotalLBP’000
Lebanese Government bonds:Up to 1 year 392,213 -1 year to 3 years - 1,480,895
392,213 1,480,895Foreign Government Bonds:Up to 1 year 634,172 65,380,6941 year to 3 years 290,248 84,305,5933 years to 5 years - 1,738,0605 years to 10 years - 7,316,127Beyond 10 years - 4,860,689
924,420 163,601,1631,316,633 165,082,058
December 31,
2008 2007LBP'000 LBP'000

Regular accounts 186,371,958 15,528,000
Accrued interest receivable 1,614,255 186,107
187,986,213 15,714,107
December 31,
2008 2007LBP'000 LBP'000
Up to 1 year - 89,290,929 -
1 to 3 years - 6,928,029 -
3 to 5 years - 75,375,000 -
Beyond 5 years 14,778,000 - 15,528,000
14,778,000 171,593,958 15,528,000
December 31, 2008 2007
Maturity
Accounts in LBPAmountLBP’000
Accounts in F/CyAmountLBP’000
Accounts in LBPAmountLBP’000
13
90
8. LOANS TO BANKS
Loans to banks are reflected at amortized cost and consist of the following:
Loans to banks bear the following maturities:
Loans to banks in foreign currencies as at December 31, 2008 include LBP 53.67 billion representing loans purchased from aforeign bank, net of related discount in the amount of LBP 945 million. Purchased loans in the amount of LBP 6.9 billion arecovered by pledged shares.The Group has entered into an interest rate swap contract for a notional amount of USD 10,500,000 with the said bank, to fullyhedge its exposure to interest rate risk, specifically the variability in the interest amounts received on the purchased loans,whereby the Group receives fixed interest rate and pays floating interest rate.Loans to banks also include LBP 75.38 billion representing notes maturing in 2013 and earning an interest rate of 3 monthsLibor plus a margin and pledged against long term borrowings in the same amount included under “Borrowings from banksand financial institutions” (Note 24).Loans to banks also include interest bearing discounted acceptances in the nominal amount of LBP 27.57 billion, stated netof discount in the amount of LBP 95.02 million.The loans in LBP are granted to a resident housing bank and are detailed as follows:
As a guarantee of the above loans, the borrower has pledged in favor of the Group bills related to the housing loans grantedto its customers.All the above loans are for a period of 12 years with a grace period on payments of 2 years and interest is reset every threeyears.
October 15, 2004 3,000,000 2,400,000 2,700,000August 4, 2005 3,000,000 2,700,000 3,000,000December 26, 2005 1,500,000 1,350,000 1,500,000October 23, 2007 8,328,000 8,328,000 8,328,000
15,828,000 14,778,000 15,528,000
Outstanding Balance
Issuance Date Original Loan AmountLBP’000
2008LBP’000
2007LBP’000

91
9. LOANS AND ADVANCES TO CUSTOMERS
Loans and advances to customers are reflected at amortized cost and consist of the following:
December 31, 2008
Gross AmountLBP’000
UnrealizedInterestLBP’000
ImpairmentAllowanceLBP’000
CarryingAmountLBP’000
Regular Retail customers• Rescheduled - - - -• Mortgage loans 19,520,877 - - 19,520,877• Personal loans 150,437,579 - - 150,437,579• Credit cards 6,195,744 - - 6,195,744• Overdrafts 31,869,498 - - 31,869,498• Other 113,897,943 - - 113,897,943Classified Retail Customers• Substandard 2,118,730 (176,514) - 1,942,216• Bad and doubtful 25,899,353 (14,418,012) (10,037,772) 1,443,569Regular Corporate customers• Rescheduled 36,252,570 - - 36,252,570• Corporate 2,048,281,826 - - 2,048,281,826• Small and medium enterprises 269,656,823 - - 269,656,823Classified Corporate Customers• Rescheduled substandard 16,093,335 (4,051,543) - 12,041,792• Substandard 30,391,662 (6,517,097) - 23,874,565• Rescheduled bad and doubtful 173,973,011 (124,719,396) (34,896,544) 14,357,071• Bad and doubtful 218,811,026 (114,288,355) (81,891,876) 22,630,795Collective provision• Corporate - - (50,739,836) (50,739,836)• Retail - - (453,984) (453,984)Deferred penalties charged on excess over limit (11,440,043) - - (11,440,043)Accrued interest receivable 20,139,876 - - 20,139,876
3,152,099,810 (264,170,917) (178,020,012) 2,709,908,881
Regular Retail customers• Rescheduled 232,149 - - 232,149• Mortgage loans 31,818,800 - - 31,818,800• Personal loans 255,125,538 - - 255,125,538• Credit cards 7,820,514 - - 7,820,514• Overdrafts 35,961,013 - - 35,961,013• Other 99,360,058 - - 99,360,058Classified Retail Customers• Substandard 2,951,392 (878,646) (130,214) 1,942,532• Bad and doubtful 12,313,218 (2,964,934) (9,268,422) 79,862Regular Corporate customers• Rescheduled 32,491,383 - - 32,491,383• Corporate 2,386,921,315 - - 2,386,921,315• Small and medium enterprises 451,234,536 - - 451,234,536Classified Corporate Customers• Rescheduled substandard 11,880,388 (6,299,177) - 5,581,211• Substandard 34,653,711 (6,270,538) (2,336,894) 26,046,279• Rescheduled bad and doubtful 116,022,978 (79,769,593) (24,790,950) 11,462,435• Bad and doubtful 170,253,830 (93,372,966) (69,735,433) 7,145,431Collective provision• Corporate - - (49,576,990) (49,576,990)• Retail - - (1,567,392) (1,567,392)Deferred penalties charged on excess over limit (13,146,987) - - (13,146,987)Accrued interest receivable 57,091,397 - - 57,091,397
3,692,985,233 (189,555,854) (157,406,295) 3,346,023,084
December 31, 2007
Gross AmountLBP’000
UnrealizedInterestLBP’000
ImpairmentAllowanceLBP’000
CarryingAmountLBP’000

Balance January 1 253,425,763 321,113,336
Additions 32,274,462 45,698,503
Write-off (62,592,053) (34,303,951)
Write-back to income statement (8,555,432) (2,624,658)
Transfer from/(to) substandard loans 65,022 (159,523)
Transfer (to)/from off-balance sheet (net) (38,554,889) (75,220,843)
Transfer to impairment of non-consolidated subsidiary (276,938) (1,111,972)
Effect of exchange rate changes 321,558 (76,681)
Other - 111,552
Balance December 31 176,107,493 253,425,763
Contractual write-off on rescheduled debts (43,245,465) (73,480,011)
Net balance, end of year 132,862,028 179,945,752
2008 2007
LBP'000 LBP'000
Balance January 1 10,745,154 8,695,430Additions 4,011,307 3,746,417Write-back to income statement (477,488) (603,085)Write-off (759,157) (1,010,217)Transfer to off-balance sheet - (231,362)Transfer (to)/from doubtful and bad loans (65,022) 159,523Effect of exchange rate changes (6,433) -Other - (11,552)Balance December 31 13,448,361 10,745,154Contractual write-off on rescheduled debts (1,781,806) (1,358,897)Net balance, end of year 11,666,555 9,386,257
2008 2007
LBP'000 LBP'000
Balance January 1 - -Additions 3,860,604 3,233,852Write-back to income statement (29,247) (2,340)Transfer to doubtful and bad loans (790,230) (3,551,596)Effect of exchange rate changes (574,019) 320,084Balance December 31 2,467,108 -
2008 2007
LBP'000 LBP'000
13
92
Loans and advances to customers as at December 31, 2008 and 2007 are stated net of third parties’ participation to theextent of LBP 4.61 billion and LBP 4.32 billion, respectively.Loans and advances to customers as at December 31, 2008 include LBP 5.55 billion representing loans purchased from aforeign bank, net of related discount in the amount of LBP 481 million.
The Group has entered into an interest rate swap contract for a notional amount of USD 4,000,000 with the said bank, to fullyhedge its exposure to interest rate risk, specifically the variability in the interest amounts received on the purchased loans,whereby the Group receives fixed interest rate and pays floating interest rate.
The movement of unrealized interest on substandard loans during 2008 and 2007 is summarized as follows:
The movement of allowance for impairment on substandard loans during 2008 and 2007 is summarized as follows:
The movement of unrealized interest on doubtful and bad loans during 2008 and 2007 is summarized as follows:

Balance January 1 117,376,293 154,348,513
Additions from acquisition of a new subsidiary - 5,660,435
Additions 6,282,679 3,696,387
Write-off (8,123,131) (23,744,004)
Write-back to income statement (7,349,120) (7,828,714)
Transfer from allowance for collective impairment 183,861 -
Transfer from allowance for substandard loans 790,230 3,551,596
Transfer to off-balance sheet (13,000,635) (19,386,870)
Transfer to/from impairment of non-consolidated subsidiary 2,023,007 (222,300)
Transfer from escrow funds 2,398,827 -
Effect of exchange rate changes (2,857,989) 1,301,250
Balance December 31 97,724,022 117,376,293
Contractual write-off on rescheduled debts
(including regular rescheduled loans) (24,725,359) (34,399,620)
Net balance, end of year 72,998,663 82,976,673
Escrow funds 6,070,783 9,449,899
Balance end of year, (net) 79,069,446 92,426,572
2008 2007
LBP'000 LBP'000
Balance, beginning of year 9,449,899 9,950,435
Write-back to income statement (401,224) -
Write-off (579,065) -
Transfer to allowance for impairment on doubtful and bad loans (2,398,827) -
Transfer to off-balance sheet - (500,536)
Balance, end of year 6,070,783 9,449,899
December 31,
2008 2007
LBP'000 LBP'000
INDEPENDENT AUDITOR’S REPORT
93
The movement of allowance for impairment on doubtful and bad loans during 2008 and 2007 is summarizedas follows:
The movement of the escrow funds is summarized as follows:
Escrow funds in the amount of USD 4,027,053 as at December 31, 2008 (USD 6,268,590 as at December 31, 2007), arepartially funded by the Group to the extent of USD 2 million and the balance is funded by the previous shareholders of AlliedBank S.A.L., a merged subsidiary, for the purpose of covering any shortfall in the provision for doubtful accounts.The movement of the allowance for collective impairment during 2008 and 2007 is as follows:
Balance January 1 51,193,820 12,373,560
Additions 4,439,866 36,788,790
Additions due to acquisition of subsidiary - 1,787,785
Write-back to income statement (3,653,358) (233,998)
Transfer to allowance for impairment on doubtful and bad loans (183,861) -
Effect of exchange rate changes (652,085) 477,683
Balance December 31 51,144,382 51,193,820
2008 2007
LBP'000 LBP'000

Regular Retail Accounts 519,151,583 157,380,627
Regular Corporate Accounts 842,615,284 236,279,199
Accrued interest receivable 3,008 4,689
1,361,769,875 393,664,515
December 31,
2008 2007
LBP'000 LBP'000
Available-for-sale (A) 1,530,496,575 2,364,142,440 3,894,639,015
Accrued interest receivable onavailable-for-sale 33,723,620 33,107,897 66,831,517
1,564,220,195 2,397,250,337 3,961,470,532
Held-to-maturity (B) 134,124,218 1,221,682,738 1,355,806,956
Accrued interest receivable onheld-to-maturity 3,561,856 22,263,384 25,825,240
137,686,074 1,243,946,122 1,381,632,1961,701,906,269 3,641,196,459 5,343,102,728
December 31, 2008
LBPLBP’000
C/V of F/CyLBP’000
TotalLBP’000
Available-for-sale (A) 873,602,541 2,678,974,603 3,552,577,144
Accrued interest receivable onavailable-for-sale 24,798,407 45,365,517 70,163,924
898,400,948 2,724,340,120 3,622,741,068
Held-to-maturity (B) 361,793,834 1,305,561,968 1,667,355,802
Accrued interest receivable onheld-to-maturity 7,084,492 26,599,384 33,683,876
368,878,326 1,332,161,352 1,701,039,6781,267,279,274 4,056,501,472 5,323,780,746
December 31, 2007
LBPLBP’000
C/V of F/CyLBP’000
TotalLBP’000
13
94
10. LOANS AND ADVANCES TO RELATED PARTIES
Loans and advances to related parties are partially secured (Note 41).
11. INVESTMENT SECURITIES

A. Available-for-sale investment securities
INDEPENDENT AUDITOR’S REPORT
95
A. Available-for-sale investment securities
Equity securities:
Quoted equity securities - - - -
Unquoted equity securities at cost 10,304,162 11,388,902 1,084,740 -
Cumulative Preferred shares issued by a Lebanese Bank - - - -
Convertible preferred shares issued by a Lebanese bank - - - -
Non-cumulative preferred shares issued bya Lebanese bank - - - -
10,304,162 11,388,902 1,084,740 -
Debt securities:
Lebanese Government bonds 1,453,983,724 1,470,187,192 16,203,468 32,379,091
Certificates of deposit issued by theCentral Bank of Lebanon 47,605,163 48,920,481 1,315,318 1,344,529
Corporate Debt Securities - - - -
Other government bonds - - - -
1,501,588,887 1,519,107,673 17,518,786 33,723,620
1,511,893,049 1,530,496,575 18,603,526 33,723,620
Less: Deferred tax (2,790,529)
15,812,997
LBP Base Accounts
December 31, 2008
Amortized CostLBP’000
Fair ValueLBP’000
Equity securities:
Quoted equity securities 292,675,773 489,909,770 197,233,997 -
Unquoted equity securities at cost 8,538,086 8,198,401 (339,685) -
Cumulative Preferred shares issued by a Lebanese Bank 6,030,000 6,030,000 - -
Convertible preferred shares issued by a Lebanese bank 4,543,228 4,543,228 - -
Non-cumulative preferred shares issued bya Lebanese bank 31,783,678 31,783,678 - -
343,570,765 540,465,077 196,894,312 -
Debt securities:
Lebanese Government bonds 1,205,992,116 1,127,999,222 (77,992,894) 25,790,534
Certificates of deposit issued by theCentral Bank of Lebanon 520,254,364 515,430,277 (4,824,087) 5,650,488
Corporate Debt Securities 114,032,672 109,590,368 (4,442,304) 1,666,875
Other government bonds 69,902,056 70,657,496 755,440 -
1,910,181,208 1,823,677,363 (86,503,845) 33,107,897
2,253,751,973 2,364,142,440 110,390,467 33,107,897
Less: Deferred tax (22,139,882)
88,250,585
Amortized CostLBP’000
Fair ValueLBP’000
CumulativeChange inFair ValueLBP’000
CumulativeChange inFair ValueLBP’000
AccruedInterest
ReceivableLBP’000
AccruedInterest
ReceivableLBP’000
F/Cy Base Accounts

Equity securities:
Quoted equity securities 22,652 62,890 40,238 -
Unquoted equity securities at cost 10,095,407 11,180,147 1,084,740 -
Cumulative Preferred shares issued by a Lebanese Bank - - - -
Convertible preferred shares issued by a Lebanese bank - - - -
Non-cumulative preferred shares issued bya Lebanese bank - - - -
10,118,059 11,243,037 1,124,978 -
Debt securities:
Lebanese Government bonds 793,766,984 803,658,621 9,891,637 17,319,428
Certificates of deposit issued by theCentral Bank of Lebanon 57,219,266 58,700,883 1,481,617 7,478,979
Corporate Debt Securities - - - -
850,986,250 862,359,504 11,373,254 24,798,407
861,104,309 873,602,541 12,498,232 24,798,407
Less: Deferred tax (1,874,735)
10,623,497
LBP Base Accounts
December 31, 2007
Amortized CostLBP’000
Fair ValueLBP’000
Equity securities:
Quoted equity securities 199,468,416 601,771,773 402,303,357 -
Unquoted equity securities at cost 4,926,227 4,926,227 - -
Cumulative Preferred shares issued by a Lebanese Bank 6,030,000 6,030,000 - -
Convertible preferred shares issued by a Lebanese bank 4,543,228 4,543,228 - -
Non-cumulative preferred shares issued bya Lebanese bank 31,783,678 31,783,678 - -
246,751,549 649,054,906 402,303,357 -
Debt securities:
Lebanese Government bonds 1,472,222,457 1,366,484,034 (105,738,423) 35,196,079
Certificates of deposit issued by theCentral Bank of Lebanon 527,934,453 508,604,710 (19,329,743) 5,858,397
Corporate Debt Securities 153,569,025 154,830,953 1,261,928 4,311,041
2,153,725,935 2,029,919,697 (123,806,238) 45,365,517
2,400,477,484 2,678,974,603 278,497,119 45,365,517
Less: Deferred tax (42,265,167)
236,231,952
Amortized CostLBP’000
Fair ValueLBP’000
CumulativeChange inFair ValueLBP’000
CumulativeChange inFair ValueLBP’000
AccruedInterest
ReceivableLBP’000
AccruedInterest
ReceivableLBP’000
F/Cy Base Accounts
13
96

INDEPENDENT AUDITOR’S REPORT
97
Available-for-sale debt securities are segregated over their remaining periods to maturity as follows:
Lebanese Government Bonds:Up to one year 332,270,000 332,251,064 336,334,4561 year to 3 years 1,121,234,450 1,121,732,660 1,133,852,7363 years to 5 years - - -
1,453,504,450 1,453,983,724 1,470,187,192Certificates of deposit issued by the Central Bank of Lebanon:Up to one year - - -1 year to 3 years 47,000,000 47,605,163 48,920,481
47,000,000 47,605,163 48,920,481Total Lebanese Pounds Base Accounts 2008 1,500,504,450 1,501,588,887 1,519,107,673
December 31, 2008
Lebanese Pounds Base Accounts
NominalValueLBP’000
Contractual MaturityAmortizedCost
LBP’000
Fair ValueLBP’000
December 31, 2007
Lebanese Government Bonds:Up to one year 146,634,480 146,660,926 148,124,0541 year to 3 years 641,144,450 642,010,975 650,751,7873 years to 5 years 5,100,000 5,095,083 4,782,780
792,878,930 793,766,984 803,658,621Certificates of deposit issued by the Central Bank of Lebanon:Up to one year 9,000,000 9,119,985 9,287,6611 year to 3 years 47,000,000 48,099,281 49,413,222
56,000,000 57,219,266 58,700,883Total Lebanese Pounds Base Accounts 2007 848,878,930 850,986,250 862,359,504
Contractual MaturityNominalValueLBP’000
AmortizedCost
LBP’000
Fair ValueLBP’000

Lebanese Government Bonds:Up to one year 79,648,988 81,035,940 79,831,2301 year to 3 years 232,983,940 233,443,763 225,337,2423 years to 5 years 155,513,515 156,518,938 145,478,2395 years to 10 years 328,814,393 344,830,085 317,026,699Beyond 10 years 390,413,104 390,163,390 360,325,812
1,187,373,940 1,205,992,116 1,127,999,222
December 31, 2008
Foreign Currency Base Accounts
Nominal ValueLBP’000Contractual Maturity Amortized Cost
LBP’000Fair ValueLBP’000
Nominal ValueLBP’000
Amortized CostLBP’000
Fair ValueLBP’000
December 31, 2007
Lebanese Government Bonds:Up to one year 253,502,708 256,852,249 251,712,8601 year to 3 years 309,883,994 314,036,295 298,893,1763 years to 5 years 111,245,555 111,301,024 103,078,3175 years to 10 years 380,830,680 400,182,694 361,385,790Beyond 10 years 390,113,111 389,850,195 351,413,891
1,445,576,048 1,472,222,457 1,366,484,034
Contractual Maturity
Foreign Government Bonds:Up to one year 42,514,374 40,325,586 40,455,8001 year to 3 years 26,687,906 24,043,866 24,605,4765 years to 10 years 5,069,400 5,532,604 5,596,220
74,271,680 69,902,056 70,657,496
December 31, 2008
Foreign Currency Base Accounts
Nominal ValueLBP’000Contractual Maturity Amortized Cost
LBP’000Fair ValueLBP’000
Nominal ValueLBP’000
Amortized CostLBP’000
Fair ValueLBP’000
December 31, 2007
Foreign Government Bonds:Up to one year - - -1 year to 3 years - - -5 years to 10 years - - -
- - -
Contractual Maturity
13
98

Available-for-sale debt securities are segregated over theirremaining periods to maturity as follows:
Certificates of deposit issued by the Central Bank of Lebanon:1 year to 3 years 32,411,250 32,411,250 31,816,3503 years to 5 years 261,177,390 261,177,390 258,491,5215 years to 10 years 218,135,250 226,665,724 225,122,406
511,723,890 520,254,364 515,430,277
December 31, 2008
Foreign Currency Base Accounts
Nominal ValueLBP’000Contractual Maturity Amortized Cost
LBP’000Fair ValueLBP’000
Nominal ValueLBP’000
Amortized CostLBP’000
Fair ValueLBP’000
December 31, 2007
Certificates of deposit issued by the Central Bank of Lebanon:1 year to 3 years 32,411,250 32,411,250 31,097,5233 years to 5 years 261,177,390 261,177,390 257,020,5845 years to 10 years 218,195,550 234,345,813 220,486,603
511,784,190 527,934,453 508,604,710
Contractual Maturity
Corporate debt securities:Up to one year 90,930,798 90,930,798 90,868,9911 year to 3 years - - -3 years to 5 years 8,849,025 8,849,025 6,443,5075 years to 10 years 15,064,682 14,252,849 12,277,870
114,844,505 114,032,672 109,590,368
December 31, 2008
Foreign Currency Base Accounts
Nominal ValueLBP’000Contractual Maturity Amortized Cost
LBP’000Fair ValueLBP’000
Nominal ValueLBP’000
Amortized CostLBP’000
Fair ValueLBP’000
December 31, 2007
Corporate debt securities:Up to one year 128,137,500 128,137,500 129,776,9061 year to 3 years 15,075,000 15,075,000 14,547,3753 years to 5 years 10,356,525 10,356,525 10,506,6725 years to 10 years - - -
153,569,025 153,569,025 154,830,953
Contractual Maturity
INDEPENDENT AUDITOR’S REPORT
99

Available-for-sale equity securities are segregated over their remaining periods to maturity as follows:
Cumulative preferred shares issued by a Lebanese Bank:1 year to 3 years 6,030,000 6,030,000 6,030,0003 years to 5 years - - -
6,030,000 6,030,000 6,030,000
December 31, 2008
Foreign Currency Base Accounts
Nominal ValueLBP’000Contractual Maturity Amortized Cost
LBP’000Fair ValueLBP’000
December 31, 2007
Cumulative preferred shares issued by a Lebanese Bank:1 year to 3 years - - -3 years to 5 years 6,030,000 6,030,000 6,030,000
6,030,000 6,030,000 6,030,000
Contractual Maturity Nominal ValueLBP’000
Amortized CostLBP’000
Fair ValueLBP’000
Convertible preferred shares issued by a Lebanese bank:1 year to 3 years 1,516,922 1,516,922 1,516,9223 years to 5 years 3,026,306 3,026,306 3,026,306
4,543,228 4,543,228 4,543,228
December 31, 2008
Foreign Currency Base Accounts
Nominal ValueLBP’000Contractual Maturity Amortized Cost
LBP’000Fair ValueLBP’000
December 31, 2007
Convertible preferred shares issued by a Lebanese bank:1 year to 3 years 1,516,922 1,516,922 1,516,9223 years to 5 years 3,026,306 3,026,306 3,026,306
4,543,228 4,543,228 4,543,228
Contractual Maturity Nominal ValueLBP’000
Amortized CostLBP’000
Fair ValueLBP’000
Non-cumulative preferred shares issued by a Lebanese bank:1 year to 3 years 6,156,178 6,156,178 6,156,1783 years to 5 years 25,627,500 25,627,500 25,627,500
31,783,678 31,783,678 31,783,678Total Foreign Currency Base Accounts 2008 1,930,570,921 1,952,538,114 1,866,034,269
December 31, 2008
Foreign Currency Base Accounts
Nominal ValueLBP’000Contractual Maturity Amortized Cost
LBP’000Fair ValueLBP’000
December 31, 2007
Non-cumulative preferred shares issued by a Lebanese bank:1 year to 3 years 6,156,178 6,156,178 6,156,1783 years to 5 years 25,627,500 25,627,500 25,627,500
31,783,678 31,783,678 31,783,678Total Foreign Currency Base Accounts 2007 2,153,286,169 2,196,082,841 2,072,276,603
Contractual Maturity Nominal ValueLBP’000
Amortized CostLBP’000
Fair ValueLBP’000
13
100

INDEPENDENT AUDITOR’S REPORT
101
April 20, 2009 45,225,000 45,193,343
April 30, 2009 30,150,000 30,336,930
August 30, 2009 15,075,000 14,857,920
90,450,000 90,388,193
February 9, 2008 37,687,500 38,629,688
February 20, 2008 37,687,500 36,764,156
August 20, 2008 37,687,500 38,629,688
August 30, 2009 15,075,000 14,857,920
November 20, 2008 15,075,000 14,547,375
143,212,500 143,428,827
December 31, 2008
Nominal AmountLBP’000
Maturity Fair ValueLBP’000
Nominal AmountLBP’000
Maturity Fair ValueLBP’000
December 31, 2007
The above credit linked notes earn interest at Libor plus a margin. Furthermore, the underlying assets of the credit linkednotes consist of Lebanese Government bonds and certificates of deposit issued by the Central Bank of Lebanon.
The Group entered into a total return swap transaction with a non-resident related financial institution established underthe Suisse law and operating out of Geneva.
Coupled with a promissory note that pays a pre-agreed fixed interest rate, the transaction is composed of a spot and aforward contract to sell and buy back the economic benefits of a portfolio of Lebanese traded equity securities classifiedas available-for-sale. The transaction originated and matured in 2008.
Interest income in the amount of LBP 33.97 billion (LBP 24.69 billion as at December 31, 2007) on the promissory notewas recorded under “Interest Income on note receivable” net of transaction cost in the amount of LBP 361.8 million (LBP361.8 million as at December 31, 2007) in the consolidated income statement.
The fair value of Lebanese government bonds and certificates of deposits was calculated using a valuation model whichtakes into account observable market data using a discounted cash flow model based on current interest yield curveappropriate for the remaining term to maturity and credit spreads.
The available-for-sale certificates of deposit issued by the Central bank of Lebanon include certificates of depositmaturing on April 25, 2015 which are puttable at a price of 91.63 in year 2012. The Group is providing over time for thedifference between the par value and the redemption value in year 2012 by recognizing the effective yield applicable forthe period until 2012. This cost which is expected to increase year by year, is reflected as an adjustment to the carryingbook value.
As of December 31, the Group has the following credit linked notes classified under corporate debt securities:
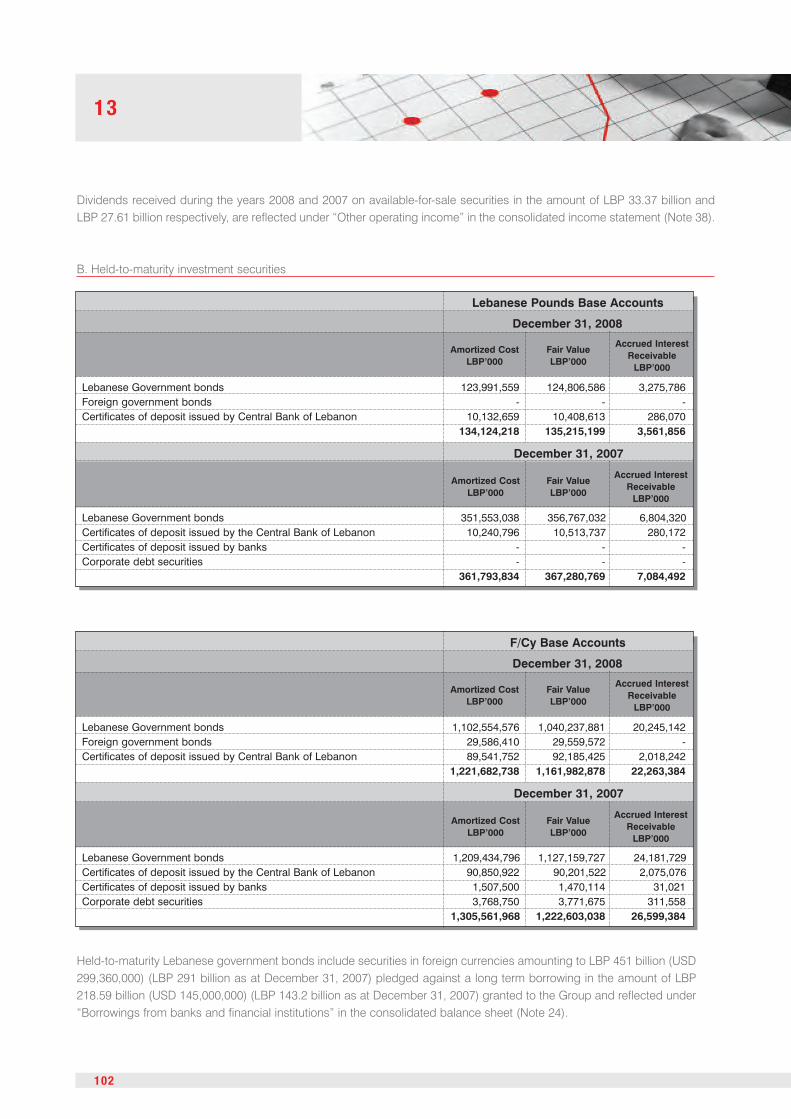
Lebanese Government bonds 123,991,559 124,806,586 3,275,786Foreign government bonds - - -Certificates of deposit issued by Central Bank of Lebanon 10,132,659 10,408,613 286,070
134,124,218 135,215,199 3,561,856
December 31, 2008
Lebanese Pounds Base Accounts
Amortized CostLBP’000
Fair ValueLBP’000
Accrued InterestReceivableLBP’000
December 31, 2007
Lebanese Government bonds 351,553,038 356,767,032 6,804,320Certificates of deposit issued by the Central Bank of Lebanon 10,240,796 10,513,737 280,172Certificates of deposit issued by banks - - -Corporate debt securities - - -
361,793,834 367,280,769 7,084,492
Amortized CostLBP’000
Fair ValueLBP’000
Accrued InterestReceivableLBP’000
Dividends received during the years 2008 and 2007 on available-for-sale securities in the amount of LBP 33.37 billion andLBP 27.61 billion respectively, are reflected under “Other operating income” in the consolidated income statement (Note 38).
B. Held-to-maturity investment securities
13
102
Lebanese Government bonds 1,102,554,576 1,040,237,881 20,245,142Foreign government bonds 29,586,410 29,559,572 -Certificates of deposit issued by Central Bank of Lebanon 89,541,752 92,185,425 2,018,242
1,221,682,738 1,161,982,878 22,263,384
December 31, 2008
F/Cy Base Accounts
Amortized CostLBP’000
Fair ValueLBP’000
Accrued InterestReceivableLBP’000
December 31, 2007
Lebanese Government bonds 1,209,434,796 1,127,159,727 24,181,729Certificates of deposit issued by the Central Bank of Lebanon 90,850,922 90,201,522 2,075,076Certificates of deposit issued by banks 1,507,500 1,470,114 31,021Corporate debt securities 3,768,750 3,771,675 311,558
1,305,561,968 1,222,603,038 26,599,384
Amortized CostLBP’000
Fair ValueLBP’000
Accrued InterestReceivableLBP’000
Held-to-maturity Lebanese government bonds include securities in foreign currencies amounting to LBP 451 billion (USD299,360,000) (LBP 291 billion as at December 31, 2007) pledged against a long term borrowing in the amount of LBP218.59 billion (USD 145,000,000) (LBP 143.2 billion as at December 31, 2007) granted to the Group and reflected under“Borrowings from banks and financial institutions” in the consolidated balance sheet (Note 24).

INDEPENDENT AUDITOR’S REPORT
Held-to-maturity investments denominated in LBP are segregated over remaining period to maturity as follows:
Lebanese Government Bonds:Up to one year 118,000,000 117,994,251 118,826,3861 year to 3 years 6,000,000 5,997,308 5,980,2003 years to 5 years - - -
124,000,000 123,991,559 124,806,586Certificates of deposit issued by the Central Bank of Lebanon:1 year to 3 years 10,000,000 10,132,659 10,408,613
10,000,000 10,132,659 10,408,613Total Lebanese Pounds Base Accounts 2008 134,000,000 134,124,218 135,215,199
December 31, 2008
Lebanese Pounds Base Accounts
RedemptionValueLBP’000
Contractual MaturityAmortizedCost
LBP’000
Fair ValueLBP’000
December 31, 2007
Lebanese Government Bonds:Up to one year 227,500,000 227,575,083 230,848,9321 year to 3 years 118,000,000 117,981,850 120,291,3003 years to 5 years 6,000,000 5,996,105 5,626,800
351,500,000 351,553,038 356,767,032Certificates of deposit issued by the Central Bank of Lebanon:1 year to 3 years 10,000,000 10,240,796 10,513,737
10,000,000 10,240,796 10,513,737Total Lebanese Pounds Base Accounts 2007 361,500,000 361,793,834 367,280,769
Contractual MaturityRedemption
ValueLBP’000
AmortizedCost
LBP’000
Fair ValueLBP’000
Held-to-maturity investments denominated in foreign currencies are segregated over remaining period to maturity asfollows:
Lebanese Government bonds:Up to one year 82,101,909 82,502,164 82,332,0731 year to 3 years 281,980,380 283,298,393 271,424,3023 years to 5 years 112,346,400 114,074,145 104,426,1915 years to 10 years 302,573,340 318,134,815 300,948,872Beyond 10 years 304,579,069 304,545,059 281,106,443
1,083,581,098 1,102,554,576 1,040,237,881
December 31, 2008
F/Cy Base Accounts
RedemptionValueLBP’000
Contractual MaturityAmortizedCost
LBP’000
Fair ValueLBP’000
December 31, 2007
Lebanese Government Bonds:Up to one year 107,447,063 108,870,042 106,604,9391 year to 3 years 270,246,766 272,872,434 261,488,7313 years to 5 years 177,178,050 178,722,161 167,021,4535 years to 10 years 325,185,840 344,427,874 317,679,779Beyond 10 years 304,579,069 304,542,285 274,364,825
1,184,636,788 1,209,434,796 1,127,159,727
Contractual MaturityRedemption
ValueLBP’000
AmortizedCost
LBP’000
Fair ValueLBP’000

Foreign Government Bonds:Up to 1 year 31,808,000 29,586,410 29,559,572
31,808,000 29,586,410 29,559,572
December 31, 2008
F/Cy Base Accounts
RedemptionValueLBP’000
Contractual MaturityAmortizedCost
LBP’000
Fair ValueLBP’000
December 31, 2007
Foreign Government Bonds:Up to 1 year - - -
- - -
Contractual MaturityRedemption
ValueLBP’000
AmortizedCost
LBP’000
Fair ValueLBP’000
Certificates of deposit issued by the Central Bank of Lebanon:Up to 1 year 27,888,750 27,888,750 27,620,2811 year to 3 years - - -5 years to 10 years 62,561,250 61,653,002 64,565,144
90,450,000 89,541,752 92,185,425
December 31, 2008
F/Cy Base Accounts
RedemptionValueLBP’000
Contractual MaturityAmortizedCost
LBP’000
Fair ValueLBP’000
December 31, 2007
Certificates of deposit issued by the Central Bank of Lebanon:Up to 1 year - - -1 year to 3 years 27,888,750 27,888,750 26,983,3795 years to 10 years 62,561,250 62,962,172 63,218,143
90,450,000 90,850,922 90,201,522
Contractual MaturityRedemption
ValueLBP’000
AmortizedCost
LBP’000
Fair ValueLBP’000
Certificates of deposit issued by banks:Up to one year - - -
- - -
December 31, 2008
F/Cy Base Accounts
RedemptionValueLBP’000
Contractual MaturityAmortizedCost
LBP’000
Fair ValueLBP’000
December 31, 2007
Certificates of deposit issued by banks:Up to one year 1,507,500 1,507,500 1,470,114
1,507,500 1,507,500 1,470,114
Contractual MaturityRedemption
ValueLBP’000
AmortizedCost
LBP’000
Fair ValueLBP’000
13
104

Corporate debt securities:Up to one year - - -1 year to 3 years - - -
- - -Total Foreign Currency Base Accounts 2008 1,205,839,098 1,221,682,738 1,161,982,878
December 31, 2008
F/Cy Base Accounts
RedemptionValueLBP’000
Contractual MaturityAmortizedCost
LBP’000
Fair ValueLBP’000
December 31, 2007
Corporate debt securities:Up to one year 753,750 753,750 753,7501 year to 3 years 3,015,000 3,015,000 3,017,925
3,768,750 3,768,750 3,771,675Total Foreign Currency Base Accounts 2007 1,280,363,038 1,305,561,968 1,222,603,038
Contractual MaturityRedemption
ValueLBP’000
AmortizedCost
LBP’000
Fair ValueLBP’000
INDEPENDENT AUDITOR’S REPORT
105
The option on the held-to-maturity certificates of deposit maturing on April 25, 2015 to redeem in year 2012, is treated inthe same manner as described under available-for-sale certificates of deposit above.
12. CUSTOMERS’ ACCEPTANCE LIABILITY
Acceptances represent documentary credits which the Group has committed to settle on behalf of its customers againstcommitments by those customers (acceptances). The commitments resulting from these acceptances are stated as aliability in the balance sheet for the same amount.
13. INVESTMENTS IN ASSOCIATES AND OTHER INVESTMENTS
This caption consists of the following:
Investments in AssociatesCreditCard Services Company S.A.L. Lebanon 40.00 21,060,027 13,236,191
21,060,027 13,236,191Other InvestmentsCiment de Sibline S.A.L. Lebanon 19.36 27,096,403 27,096,403Light Metal Products S.A.L. Lebanon 60.83 6,633,000 6,633,000Long-term loan to Light Metal Products S.A.L. 4,032,452 3,869,719Al Fanadeq S.A.L. Lebanon 48.00 1,153,539 1,153,539Beverly Hotel S.A.L. Lebanon 99.00 3,111,023 2,810,652Société Hotelière “Le Gabriel” S.A.L. Lebanon 32.00 - 4,168,238Sidem S.A.L. Lebanon 20.00 14,652,298 13,296,053
56,678,715 59,027,60477,738,742 72,263,795
2008 2007
December 31,
Country ofIncorporation
Interest Held%
Carrying ValueLBP’000
Carrying ValueLBP’000

Impairment allowanceBalance January 1, 2007 (14,470,092)Additions (3,739,387)Write-back 2,304,450Effect of exchange rate changes (1,752)Balance December 31, 2007 (15,906,781)Additions (3,119,425)Write-back 2,846,555Effect of exchange rate changes 9,316Balance December 31, 2008 (16,170,335)
Carrying amountDecember 31, 2008 71,508,666December 31, 2007 81,565,839
LBP’000
The investment in CreditCard Services Company S.A.L. is reflected as at December 31, 2008 and 2007 using the equitymethod whereby the Group accounts for its share in the net income of the associate net of deferred dividend tax, and itsshare of the change in fair value of the associate's portfolio of available-for-sale securities, and net of dividends received. Inthis connection, the Group recorded its share in the net income of the associate in the amount of LBP 7.24 billion for theyear 2008 (LBP 3.88 billion for the year 2007) net of deferred tax liability in the amount of LBP 724.56 million as at December31, 2008 (LBP 388 million as at December 31, 2007), under “Other operating income” (Note 38).
During the first half of 2007, the Group sold shares of Ciment de Sibline S.A.L. which resulted in a gain in the amount ofLBP 11.3 billion recorded under “Other operating income” in the consolidated income statement (Note 38). This salebrought down the equity stake of the Group to 19.36%.
Other investments are stated at cost which is not materially different from their fair values.
14. INVESTMENT PROPERTIESDuring the first half of 2008, the Group sold its investment property at a loss of LBP 1.34 billion which was recorded under“Other operating income” in the consolidated income statement.
15. ASSETS ACQUIRED IN SATISFACTION OF LOANSAssets acquired in satisfaction of loans have been acquired through enforcement of security over loans and advances.The movement of assets acquired in satisfaction of loans during 2008 and 2007 was as follows:
Gross amountBalance January 1, 2007 101,202,110Effect of subsidiary acquisition 377,716Additions due to settlement of loans 15,042,195Additional fees/charges paid 613,286Disposals (19,954,252)Effect of exchange rate 191,565Balance December 31, 2007 97,472,620Additions due to settlement of loans 7,668,021Additional fees/charges paid 26,012Disposal (17,153,974)Effect of exchange rate (333,678)Balance December 31, 2008 87,679,001
LBP’000
13

Goodwill from Subsidiaries:
BankMed (Suisse) S.A. 100 30,412,799 30,412,799
Saudi Lebanese Bank S.A.L. 25 31,765,458 31,765,458
Turkland Bank A.S. 41 80,871,312 76,862,623
Med Finance Holding Ltd. 100 616,568 616,568
143,666,137 139,657,448
Cumulative effect of exchange rate changes up to balance sheet date 17,955,195 14,658,742
Less: Accumulated amortization up to December 31, 2003 (11,285,880) (10,516,708)
150,335,452 143,799,482
Goodwill from Business Combination:
Allied Bank S.A.L. 23,068,898 23,068,898
Goodwill (net) 173,404,350 166,868,380
December 31,
Percentage ofAcquired
Ownership %
2008LBP’000
2007LBP’000
During the year 2008, the Group sold assets acquired in satisfaction of loans of aggregate net book value LBP 14.31 billion(LBP 17.65 billion in 2007) for a total consideration of LBP 20.53 billion (LBP 20.58 billion in 2007), thus resulting in net gainon sale in the amount of LBP 3.37 billion recorded under “Other operating income” and write-back of impairment provisionin the amount of LBP 2.85 billion recorded under “provision for impairment of assets acquired in satisfaction of loans” inthe accompanying consolidated income statement (LBP 634 million and LBP 2.3 billion, respectively in 2007). The Groupcollected LBP 16.96 billion (LBP 18.27 billion in 2007) during 2008 and LBP 3.57 billion remains outstanding as atDecember 31, 2008 and is recorded under “Other assets” (LBP 2.35 billion in 2007).
Included in the disposals of the year 2008, are disposals in the aggregate net book value of USD 1.32 million to a relatedparty for a total consideration of USD 2.2 million. The Group collected USD 0.5 million (LBP 750 million) during 2008 andthe remaining balance of USD 1.7 million (LBP 2.56 billion) was recorded under “Other assets” to be collected over 10equal annual installments starting April 17, 2009. This receivable earns interest at an annual rate of three-months LIBOR+ one basis point.Provision for impairment in the amount of LBP 273 million for the year 2008 is reflected under “provision for impairment ofassets acquired in satisfaction of debts” in the consolidated income statement (LBP 1.43 billion for year 2007).The acquisition of assets in settlement of loans requires the approval of the banking regulatory authorities and these should beliquidated within 2 years. In case of default of liquidation, a regulatory reserve should be appropriated from the yearly net profitsover a period of time.
16. GOODWILLThe goodwill balance outstanding as of the balance sheet date consists of the following:
On January 28, 2007, the Group acquired an equity stake of 41% in Turkland Bank A.S. (formerly MNG Bank A.S.) inaccordance with the resolution of the Board of Directors dated June 26, 2006 for a total consideration of USD 71,852,867(LBP 108.32 billion). The excess of the purchase price over the net asset value of the acquired interest in the amount ofLBP 76.86 billion was recognized as goodwill.During the first half of 2008, an amount of LBP 4 billion was settled to the previous shareholder of Turkland Bank A.S.representing non recurring income received by the subsidiary bank to be refunded by the Group as a price adjustmentthus increasing goodwill.
The change in accumulated amortization is due to exchange rate fluctuation.The Group tests goodwill annually for impairment or more frequently if there are indications that goodwill might beimpaired. Goodwill is considered to be impaired when the carrying value exceeds the recoverable amounts of the mergedbusiness which are determined from value in use calculations. The value in use is determined as a multiple of thecontribution generated by the business units and customers’ accounts acquired by the parent bank.
INDEPENDENT AUDITOR’S REPORT

Cost
BalanceJanuary1,2007
156,523,391
78,700,955
38,689,013
1,336,531
225,513
202,199
3,904,061
-(1,400,000)
278,181,663
Acquisitionofsubsidiary
5,524,627
4,221,719
5,992,528
509,280
--
-3,219,074
-19,467,228
Additions
150,680
6,223,728
5,449,875
193,536
--
3,056,389
626,666
-15,700,874
Disposals/retirements
(9,792,423)
(416,604)
(1,954,082)
(536,500)
(19,111)
--
(2,120,662)
-(14,839,382)
Transfers
1,352,411
76,611
368,580
--
-(1,797,602)
--
-
Effectofexchangeratechanges
1,175,793
932,367
1,309,696
108,389
--
-2,592,160
-6,118,405
BalanceDecember31,2007
154,934,479
89,738,776
49,855,610
1,611,236
206,402
202,199
5,162,848
4,317,238
(1,400,000)
304,628,788
Additions
1,346,347
12,244,303
9,241,600
586,373
--
1,258,522
1,954,204
-26,631,349
Disposals/retirements
(337,556)
(2,284,492)
(658,416)
(344,934)
--
(1,811,131)
(8,946)
-(5,445,475)
Transfers
-963,231
901,528
--
-(1,864,759)
--
-
Effectofexchangeratechanges
-(1,582,580)
(2,138,007)
(51,535)
--
-(981,193)
-(4,753,315)
BalanceDecember31,2008
155,943,270
99,079,238
57,202,315
1,801,140
206,402
202,199
2,745,480
5,281,303
(1,400,000)
321,061,347
Accum
ulated
depreciation
BalanceJanuary1,2007
(14,033,251)
(55,816,718)
(26,648,715)
(674,226)
(225,513)
(202,199)
--
-(97,600,622)
Acquisitionofsubsidiary
(594,160)
(4,058,325)
(4,779,805)
(482,755)
--
-(2,928,360)
-(12,843,405)
Additions
(1,505,574)
(7,457,400)
(4,409,364)
(174,591)
--
-(260,908)
-(13,807,837)
Write-offondisposal
1,376,955
126,628
1,872,731
530,490
19,111
--
168,572
-4,094,487
Effectofexchangeratechanges
(130,542)
(909,887)
(1,094,797)
(104,378)
--
-(649,286)
-(2,888,890)
BalanceDecember31,2007
(14,886,572)
(68,115,702)
(35,059,950)
(905,460)
(206,402)
(202,199)
-(3,669,982)
-(123,046,267)
Additions
(1,368,144)
(9,022,882)
(5,705,294)
(166,247)
--
-(356,813)
-(16,619,380)
Write-offondisposal
78,916
1,670,603
694,925
226,892
--
--
-2,671,336
Effectofexchangeratechanges
-1,384,810
1,581,060
20,292
--
-888,558
-3,874,720
BalanceDecember31,2008
(16,175,800)
(74,083,171)
(38,489,259)
(824,523)
(206,402)
(202,199)
-(3,138,237)
-(133,119,591)
Netbookvalue
December31,2008
139,767,470
24,996,067
18,713,056
976,617
--
2,745,480
2,143,066
(1,400,000)
187,941,756
December31,2007
140,047,907
21,623,074
14,795,660
705,776
--
5,162,848
647,256
(1,400,000)
181,582,521
RealEstate
Properties
LBP’000
Improvements
and
Installations
LBP’000
Furnitureand
Equipment
LBP’000
Vehicles
LBP’000
Establishment
Costs
LBP’000
Key
Money
LBP’000
Advance
paymentson
capital
expenditure
LBP’000
Other
LBP’000
Allowancefor
impairm
ent
losson
proper-
ty&equipm
ent
LBP’000
Total
LBP’000
17.PROPERTY
ANDEQUIPMENT

INDEPENDENT AUDITOR’S REPORT
109
18. OTHER ASSET
Receivable from sale of investment is due from the sale, during the first half of the year 2006, of the Group’s investmentin “Idarat Investment S.A.L. (Holding)” of net book value of LBP 13.82 billion as at December 31, 2005 for a considerationof USD 8,700,000, payable over a ten year period. An amount of USD 1,248,893 was collected up to December 31, 2008(an amount of USD 348,000 up to December 31, 2007).
During the year 2006, assets acquired in satisfaction of loans in the aggregate amount of USD 124.95 million were soldto affiliated companies for a total consideration of USD 125.03 million. The Group collected 25% of the selling price atthe date of the contract and the remaining balance of USD 93.77 million (LBP 141.4 billion) was recorded under“Receivables on properties sold with deferred payment” to be collected over three equal annual installments startingDecember 30, 2007. This receivable earns interest at an annual rate of three-months LIBOR plus a margin. During 2008,the Group collected an amount of LBP 32.4 billion related to the above sales.
Additions to intangible assets amounted to LBP 2.5 billion in 2008 (LBP 486 million in 2007). The amortization of theintangible assets amounted to LBP 941 million (LBP 309 million in 2007) and is recorded under “Depreciation andamortization” in the consolidated income statement.
The regulatory blocked deposit represents a non-interest earning compulsory deposit placed with the Lebanese Treasuryupon the inception of banks according to Article 132 of the Lebanese Code of Money and Credit, and is refundable incase of cease of operations.
“Other” includes an investment in a fund acquired in 2008 in the amount of USD 15,000,000 (LBP 22.6 billion) which wasfully provided for as at December 31, 2008. Impairment provision was recorded in the consolidated income statementunder “Other provisions”.
Receivables on properties sold with deferred payment (Note 15) 127,355,152 157,281,987
Change in fair value of derivatives 975,392 515,755
Deferred tax asset 2,085,412 2,053,749
Deferred charges 255,630 18,631
Accrued income 1,024,194 790,477
Prepayments 16,513,083 10,203,466
Due from personnel 2,604,629 1,813,667
Regulatory blocked deposit 1,507,500 1,507,500
Sundry accounts receivable 4,819,257 2,607,722
Positive fair value of derivatives 132,406 6,264,944
Intangible asset 2,537,682 1,055,184
Receivable from sale of investment 11,232,544 12,590,640
Other 31,504,340 41,692,664
202,547,221 238,396,386
December 31,
2008 2007
LBP'000 LBP'000

19. DEPOSITS FROM BANKS AND FINANCIAL INSTITUTIONS
Deposits from banks and financial institutions are reflected at amortized cost and consist of the following:
The maturities of money market and overnight deposits are as follows:
Current deposits of banks and financial institutions 464,060 82,184,792 82,648,852
Current deposits – related parties - 5,556,097 5,556,097
Overnight deposits 18,500,000 - 18,500,000
Money market deposits - 311,333,064 311,333,064
Money market deposits – related parties - 90,450,000 90,450,000
Other short term borrowings - 192,801,210 192,801,210
Other short term borrowings – related parties - 3,224,536 3,224,536
Accrued interest payable 2,218 11,470,691 11,472,909
18,966,278 697,020,390 715,986,668
December 31, 2008
LBPLBP’000
C/V of F/CyLBP’000
TotalLBP’000
December 31, 2007
Current deposits of banks and financial institutions 953,841 16,523,266 17,477,107
Money market deposits 88,500,000 562,846,791 651,346,791
Money market deposits – related parties 4,500,000 15,075,000 19,575,000
Borrowings under sale and repurchase agreements (Repos) - 30,943,090 30,943,090
Accrued interest payable 53,751 9,493,370 9,547,121
94,007,592 634,881,517 728,889,109
LBPLBP’000
C/V of F/CyLBP’000
TotalLBP’000
1st quarter of year 2009 18,500,000 21,570,116
2nd quarter of year 2009 - 18,411,520
2nd half of year 2009 - 60,301,428
Year 2010 - 301,500,000
18,500,000 401,783,064
1st quarter of year 2008 93,000,000 201,046,791
2nd Half of year 2008 - 15,075,000
Year 2009 - 361,800,000
93,000,000 577,921,791
December 31, 2008
LBP Base Accounts AmountLBP’000
F/Cy Base Accounts AmountLBP’000
LBP Base Accounts AmountLBP’000
F/Cy Base Accounts AmountLBP’000
December 31, 2007
13
110

1st quarter of year 2008 28,338,130
Year 2009 2,604,960
30,943,090
December 31, 2007
F/Cy Base Accounts Amount LBP'000
Short term borrowings as at December 31, 2008, mature during the first quarter of 2009 and carry an average interestrate of 4.98%.
Borrowings under sale and repurchase agreements (Repos) arose from the following:
The maturities of borrowings under sale and repurchase agreements (Repos) are as follows:
Held for trading foreign government bonds 31,090,616 31,090,616 28,338,130
Held-to-maturity corporate bonds 3,015,000 3,015,000 2,604,960
34,105,616 34,105,616 30,943,090
December 31, 2007
Gross AmountLBP’000
Balance Subject toRepurchase Agreement
LBP’000
Balance of Associated LiabilityLBP’000
INDEPENDENT AUDITOR’S REPORT
111
During the first half of 2008, the borrowing under sale and repurchase agreements (Repos) amounting to LBP 2.6 billionand outstanding as at December 31, 2007 was settled prior to its maturity due to the early call of the held-to-maturitysecurity subject to the repurchase agreement (Note 11).
Accrued interest payable is segregated between the different categories as follows:
Current deposits - -
Overnight Deposits 1,901 -
Money market deposits 6,358,609 1,242,558
Borrowings under sale & repurchase agreements - -
Other short term borrowings 78,526 3,791,315
6,439,036 5,033,873
Current deposits 1,583 -
Overnight Deposits - -
Money market deposits 9,450,132 68,908
Borrowings under sale & repurchase agreements 26,498 -
Other short term borrowings - -
9,478,213 68,908
December 31, 2008
Non-RelatedLBP’000
Related PartiesLBP’000
December 31, 2007
Non-RelatedLBP’000
Related PartiesLBP’000

20. CUSTOMERS’ DEPOSITS AT FAIR VALUE THROUGH PROFIT OR LOSS
This section consists of the following:
Deposits from customers which are matched with an embedded derivative have been designated at fair valuethrough profit or loss, where the underlying assets vary from product to product. An accounting mismatchwould arise if customers’ deposits were accounted for at amortized cost, because the related derivative ismeasured at fair value with movements in the fair value taken through the income statement. By designatingthose deposits from customers at fair value, the movements in the fair value of these deposits are recordedin the income statement.
Customers’ deposits at fair value through profit or loss includes deposits where the underlying monetaryvalue is invested in products yielding variable returns depending on the performance of baskets ofcurrencies, commodities, global indices or Lebanese Government bonds all hedged through an effectiveover-the-counter call option.
The changes in the fair value recognized on these deposits and the related derivative acquired for hedgingare broken down as follows:
Customers’ deposits at fair value through profit or loss 240,188,373 237,421,333
Related derivative contracts (held for hedging) 6,599,889 928,051
Customers’ deposits at fair value through profit or loss 151,810,043 153,200,828
Related derivative contracts (held for hedging) (5,517,273) (5,842,844)
December 31, 2008
Initial ValueLBP’000
Fair ValueLBP’000
December 31, 2007
Initial ValueLBP’000
Fair ValueLBP’000
Customers' deposits designated at FVTPL 237,421,333 237,421,333 153,200,828 153,200,828
Accrued interest payable 2,577,275 2,577,275 2,596,199 2,596,199
239,998,608 239,998,608 155,797,027 155,797,027
December 31, 2008
C/V of F/Cy Total
LBP'000 LBP'000
December 31, 2007
C/V of F/Cy Total
LBP'000 LBP'000
13
112

Current/demanddeposits 37,563,356 61,810,858 99,374,214 50,792,241 454,495,884 505,288,125 604,662,339
Term deposits 959,266,705 - 959,266,705 5,365,951,816 - 5,365,951,816 6,325,218,521
Collateral againstloans & advances 10,966,135 - 10,966,135 593,702,013 - 593,702,013 604,668,148
Margins for irrevocableimport letters of credit - - - 5,152,220 1,781,540 6,933,760 6,933,760
Margins on lettersof guarantee 2,068,346 485,527 2,553,873 5,427,545 2,226,462 7,654,007 10,207,880
Other margins 26,386 98,722 125,108 3,632,207 26,589,096 30,221,303 30,346,411
Accrued interestpayable 8,143,544 - 8,143,544 79,693,465 - 79,693,465 87,837,009
1,018,034,472 62,395,107 1,080,429,579 6,104,351,507 485,092,982 6,589,444,489 7,669,874,068
December 31, 2007
LBP Base Accounts F/Cy Base Accounts
InterestBearingLBP’000
Non-InterestBearingLBP’000
TotalLBP’000
InterestBearingLBP’000
Non-InterestBearingLBP’000
TotalLBP’000
TotalCutomers’AccountsLBP’000
21. CUSTOMERS’ ACCOUNTS AT AMORTIZED COST
Deposits from customers at amortized cost include at December 31, 2008 coded deposit accounts in the aggregate of LBP25.14 billion (LBP 26.09 billion in 2007). These accounts are subject to the provisions of Article 3 of the Banking Secrecy Lawdated September 3, 1956 which provides that the Bank’s management, in the normal course of business, cannot reveal theidentities of these depositors to third parties.
Deposits from customers at amortized cost at December 31, 2008 include deposits received from non-resident banks and financialinstitutions relating to their fiduciary clients for a total amount of LBP 390.58 billion (LBP 245.38 billion in 2007) out of which LBP204.87 billion are from a related company, a related bank and a subsidiary bank (LBP 70.47 billion in 2007).
Current/demanddeposits 83,091,563 47,398,529 130,490,092 158,951,353 716,260,343 875,211,696 1,005,701,788
Term deposits 1,523,066,420 - 1,523,066,420 5,353,069,932 - 5,353,069,932 6,876,136,352
Collateral againstloans & advances 4,281,297 - 4,281,297 763,306,208 - 763,306,208 767,587,505
Margins for irrevocableimport letters of credit - - - 4,944,190 1,250,724 6,194,914 6,194,914
Margins on lettersof guarantee 1,855,934 582,277 2,438,211 9,991,823 4,916,464 14,908,287 17,346,498
Other margins 37,660 135,507 173,167 5,178,208 3,544,445 8,722,653 8,895,820
Accrued interestpayable 10,169,924 - 10,169,924 56,417,130 - 56,417,130 66,587,054
1,622,502,798 48,116,313 1,670,619,111 6,351,858,844 725,971,976 7,077,830,820 8,748,449,931
December 31, 2008
LBP Base Accounts F/Cy Base Accounts
InterestBearingLBP’000
Non-InterestBearingLBP’000
TotalLBP’000
InterestBearingLBP’000
Non-InterestBearingLBP’000
TotalLBP’000
TotalCutomers’AccountsLBP’000
INDEPENDENT AUDITOR’S REPORT
113

22. RELATED PARTIES’ DEPOSITS AT FAIR VALUE THROUGH PROFIT OR LOSS
This section consists of the following:
The changes in the fair value recognized on these deposits and the related derivative acquired for hedging is brokendown as follows:
Current & demanddeposits 952,884 420,013 1,372,897 66,280,377 5,501,079 71,781,456 73,154,353
Term deposits 3,388,113 - 3,388,113 831,587,966 - 831,587,966 834,976,079
Collateral againstloans & advances 15,418,000 - 15,418,000 1,283,489,080 - 1,283,489,080 1,298,907,080Margins forletters of credit - - - - - - -
Margins on lettersof guarantee 217,558 - 217,558 9,972 - 9,972 227,530
Other margins - 150 150 302 117,874 118,176 118,326
Accrued interestpayable 65,725 - 65,725 10,119,512 - 10,119,512 10,185,237
20,042,280 420,163 20,462,443 2,191,487,209 5,618,953 2,197,106,162 2,217,568,605
December 31, 2008
LBP Base Accounts F/Cy Base Accounts
InterestBearingLBP’000
Non-InterestBearingLBP’000
TotalLBP’000
InterestBearingLBP’000
Non-InterestBearingLBP’000
TotalLBP’000
Total RelatedParties’AccountsLBP’000
Related parties' deposits at fair value through profit or loss 2,723,124 3,009,435
Accrued interest payable 154,457 198,247
2,877,581 3,207,682
December 31,
2008 2007
C/V of F/Cy C/V of F/Cy
LBP'000 LBP'000
Related parties’ deposits at fair value through profit or loss 3,005,829 2,723,124
Related derivative contracts (held for hedging) 431,145 105,525
Related parties’ deposits at fair value through profit or loss 3,005,829 3,009,435
Related derivative contracts (held for hedging) 431,145 422,100
December 31, 2008
Initial ValueLBP’000
Fair ValueLBP’000
December 31, 2007
Initial ValueLBP’000
Fair ValueLBP’000
13
114
23. RELATED PARTIES’ DEPOSITS AT AMORTIZED COST

Less than 1 year 37,520,492 187,063,436
1 to 3 years 14,942,094 12,203,571
3 to 5 years 119,205,570 49,131,464
5 to 10 years 101,738,304 102,994,554
Beyond 10 years 53,139,375 57,984,911
326,545,835 409,377,936
December 31, 2008 December 31, 2007
LBP Base Accounts Amount F/CY Base Accounts Amount
LBP'000 LBP'000
Current & demanddeposits 3,681,496 754,393 4,435,889 34,289,521 4,002,654 38,292,175 42,728,064
Term deposits 2,105,775 - 2,105,775 1,981,157,570 - 1,981,157,570 1,983,263,345
Collateral againstloans & advances 11,165,231 - 11,165,231 665,121,900 - 665,121,900 676,287,131
Margins on lettersof guarantee 220,025 - 220,025 2,346 7,538 9,884 229,909
Other margins - - - - 5,223 5,223 5,223
Accrued interestpayable 54,725 - 54,725 6,932,066 - 6,932,066 6,986,791
17,227,252 754,393 17,981,645 2,687,503,403 4,015,415 2,691,518,818 2,709,500,463
December 31, 2007
LBP Base Accounts F/Cy Base Accounts
InterestBearingLBP’000
Non-InterestBearingLBP’000
TotalLBP’000
InterestBearingLBP’000
Non-InterestBearingLBP’000
TotalLBP’000
Total RelatedParties’AccountsLBP’000
INDEPENDENT AUDITOR’S REPORT
115
24. BORROWINGS FROM BANKS AND FINANCIAL INSTITUTIONS
Long term borrowings are reflected at amortized cost and consist of the following:
“Long term borrowings” includes as at December 31, 2008 LBP 218.59 billion (LBP 143.2 billion as at December 31, 2007)granted to the Group against the pledge of held-to-maturity foreign currency Lebanese Government bonds in the amountof LBP 451 billion (LBP 291.2 billion as at December 31, 2007) and loans to banks in the amount of LBP 75.38 billion(none in 2007) (Note 8 and 11).The remaining contractual maturities of the above borrowings are as follows:
The Group has not had any defaults of principal, interest or other breaches with respect to its borrowings during 2008and 2007.
Borrowings from a non-resident investment bank 5,484,228 6,777,893
Short term borrowings - 184,012,543
Long term borrowings 321,061,607 218,587,500
Accrued interest payable 4,008,179 7,974,132
330,554,014 417,352,068
December 31,
2008 2007
C/V of F/Cy C/V of F/Cy
LBP'000 LBP'000

25. CERTIFICATES OF DEPOSIT
Certificates of deposit consist of the following as at December 31, 2008 and 2007:
Certificates of deposit are reflected at amortized cost.
During 1996, the Group set up a USD 500 million Euro Deposit Program to be issued in series through internationalfinancial institutions. Eleven series had been issued under this program up to December 2005, of which the first eightseries were redeemed. During 2006, the Group redeemed series Nº. 9 in the amount of USD 100 million at its maturityon October 6, 2006. During 2007, the Group redeemed series Nº. 10 in the amount of USD 100 million at its maturity onAugust 6, 2007.
During 2005, the Group augmented the above mentioned program by USD 500,000,000 to become USD 1 billion to beissued in series through international financial institutions. In this respect, the Group issued series No.12 in the amountof USD 300 million representing the first series of the above mentioned program after its increase.
The outstanding series are summarized as follows:
The Group has not had any defaults of principal, interest or other breaches with respect to its certificates of deposit during2008 and 2007.
Global certificates of deposit 708,525,000 708,525,000
Discount on issuance of global certificates of deposit (2,514,258) (3,477,742)
Accrued interest payable 10,345,262 10,562,384
716,356,004 715,609,642
2008 2007
C/V of F/Cy C/V of F/Cy
LBP'000 LBP'000
Nominal amount of certificates USD 170,000,000 USD 300,000,000
Issue price USD 168,218,400 USD 298,005,000
Issue date July 19, 2005 December 15, 2005
Maturity July 19, 2010 December 14, 2012
Fixed rate of interest 7.625% 7.625%
Interest payment date July & January 19 December & June 15
Outstanding amount (in LBP’000) 256,275,000 452,250,000
Series 11 Series 12
13
116

26. OTHER LIABILITIES
During 2007, the tax authorities reviewed the tax returns for the years 2003, 2004 and 2005 of BankMed S.A.L. and oneof its subsidiary banks which resulted in additional taxes in the aggregate amount of LBP 1.5 billion reflected in theconsolidated income statement.During 2008, the tax authorities reviewed the tax returns for the years 2004, 2005 and 2006 of another subsidiary bankand other subsidiaries which resulted in additional taxes in the aggregate amount of LBP 1.5 billion reflected in theconsolidated income statement.
The tax returns for the years 2006, 2007 and 2008 of BankMed S.A.L. and its remaining subsidiaries remain subject toexamination and final tax assessment by the tax authorities. Management does not expect any material additional taxliability as a result of the expected tax review.
Accrued income tax and other taxes 9,328,918 6,127,240
Withheld taxes on staff benefits and payments to non-residents 4,754,183 2,280,804
Withheld tax on interest 2,793,502 2,770,069
Deferred tax liability 32,443,729 51,079,747
Due to the Social Security National Fund 1,692,546 1,663,460
Checks and incoming payment orders in course of settlement 14,365,433 22,576,395
Blocked capital subscriptions for companies under incorporation 6,325,857 15,512,218
Accrued expenses 25,591,119 19,443,712
Derivative liabilities held for risk management - 513,437
Financial guarantee contracts issued 4,252,873 1,190,180
Negative fair value of derivatives 9,885,096 3,294,963
Payable to personnel and directors 559,815 694,662
Unearned revenues 6,107,039 5,699,076
Sundry accounts payable 58,907,473 46,588,884
177,007,583 179,434,847
December 31,
2008 2007
LBP'000 LBP'000
INDEPENDENT AUDITOR’S REPORT
Income before income tax 117,023,564 70,158,753
Income from subsidiaries and associates (46,562,900) (35,560,923)
70,460,664 34,597,830
Add: non-deductible expenses 5,117,547 4,706,028
Less: non-taxable revenues or revenues subject to tax in previous periods (29,349,175) (30,519,433)
46,229,036 8,784,425
Less: loss brought forward (13,246,590) (22,492,525)
Taxable income 32,982,446 -
Income tax expense (15%) 4,947,367 -
Over provision of income tax expense 100,000 -
Non-refundable withheld tax 1,815,719 5,818,580
6,863,086 5,818,580
Add: income tax on subsidiaries’ income 4,409,852 3,694,163Income tax expense 11,272,938 9,512,743
2008 2007
LBP'000 LBP'000

Balance January 1 13,394,324 12,346,192Acquisition of subsidiary - 1,106,623Additions 9,028,303 640,630Settlements (944,733) (930,797)Write-back - (42,628Transfer from a related company 45,090 -Effect of exchange rate charges (529,251) 274,304Balance December 31 20,993,733 13,394,324
December 31,
2008 2007
LBP'000 LBP'000
Provision for staff end-of-service indemnity 20,993,733 13,394,324
Provision for contingencies 14,380,591 7,273,668
Provision for loss on foreign currency position 340,805 412,227
Other 359,828 465,824
36,074,957 21,546,043
December 31,
2008 2007
LBP'000 LBP'000
Deferred tax liability on available-for-sale securities 24,779,323 44,139,902
Deferred tax liability on undistributed income of subsidiaries 6,030,000 6,030,000
Deferred tax liability on income from associates (Note 13) 1,634,406 909,845
32,443,729 51,079,747
December 31,
2008 2007
LBP'000 LBP'000
Deferred tax liability consists of the following:
27. PROVISIONS
Provisions consist of the following:
The movement of provision for staff end-of-service indemnity is as follows:
13
118

Legal reserve 30,824,497 25,212,282
Reserve for general banking risks 59,332,492 41,168,527
Total 90,156,989 66,380,809
December 31,
2008 2007
LBP'000 LBP'000
Balance January 1 7,273,668 5,948,305
Acquisition of subsidiary - 1,112,989
Additions 9,067,381 1,716,503
Settlements (8,569) (1,743,432)
Write-back (1,624,361) (16,380)
Effect of exchange rate changes (327,528) 255,683
Balance December 31 14,380,591 7,273,668
December 31,
2008 2007
LBP'000 LBP'000
The movement of the provision for contingencies was as follows:
28. SHARE CAPITAL
The capital of the Group as at December 31, 2008 and December 31, 2007 consists of 53,000,000 shares of LBP 10,000par value each, issued and fully paid.
The Group has set up a special foreign currency position to the extent of USD 71.5 million as of December 31, 2008 andDecember 31, 2007 as a hedge of capital within the limits authorized by local banking regulations.
29. RESERVES
Reserves consist of the following as at December 31, 2008 and 2007:
Legal reserve is constituted in conformity with the requirements of the Lebanese Money and Credit Law on the basis of10% of net profit. This reserve is not available for distribution.The reserve for general banking risks is constituted according to local banking regulations, from net profit, on the basis of aminimum of 2 per mil and a maximum of 3 per mil of the total risk weighted assets, off-balance sheet risk and globalexchange position as defined for the computation of the solvency ratio at year-end. This reserve should reach 1.25% of totalrisk weighted assets, off-balance sheet risk and global exchange position at year 10 and 2% of that amount at year 20. Thisreserve is constituted in Lebanese Pounds and in foreign currencies in proportion to the composition of the Group’s totalrisk weighted assets and off-balance sheet items. This reserve is not available for distribution.
INDEPENDENT AUDITOR’S REPORT
119

Unrealized gain/(loss) onLebanese Government Bonds (62,206,477) 3,970,919 (58,235,558) (96,263,836) 13,303,232 (82,960,604)
Unrealized gain/(loss) on certificatesof deposit issued by BDL (4,026,422) 603,963 (3,422,459) (18,365,779) 2,754,867 (15,610,912)
Unrealized gain/(loss)on corporate bonds (4,442,304) 360,828 (4,081,476) 1,261,928 56,622 1,318,550
Unrealized gain/(loss)on equity securities 197,734,797 (29,538,129) 168,196,668 403,183,679 (60,077,719) 343,105,960
Unrealized gain/(losson foreign government bonds 309,730 (61,946) 247,784 - - -
Unrealized gain/(loss) from associates 7,448,908 - 7,448,908 5,513,993 - 5,513,993
134,818,232 (24,664,365) 110,153,867 295,329,985 (43,962,998) 251,366,987
December 31, 2008 December 31, 2007CumulativeChange inFair ValueLBP’000
Deferred TaxLBP’000
NetLBP’000
CumulativeChange inFair ValueLBP’000
Deferred TaxLBP’000
NetLBP’000
30. CUMULATIVE CHANGE IN FAIR VALUE OF AVAILABLE-FOR-SALE SECURITIES
This caption consists of the following:
The unrealized gain on foreign government bonds is disclosed after deducting the minority share amounting to LBP 445.7million.As a result of the acquisition in 2006 of the 25% minority equity stake in Saudi Lebanese Bank S.A.L., a consolidatedsubsidiary, cumulative change in fair value equivalent to the minority’s share as at the purchase date, and amounting toLBP 1.18 billion, is eliminated from the consolidated cumulative change in fair value of available-for-sale securities.
31. MINORITY INTEREST
Capital 197,803,361 139,927,990
Reserves and retained earnings (68,812,528) (69,044,683)
Cumulative change in fair value of available-for-sale securities 356,568 -
Currency translation adjustment (6,987,729) 11,617,176
Profit/(loss) for the year 1,040,947 (538,623)
123,400,619 81,961,860
December 31,
2008 2007
LBP'000 LBP'000
13
120

Deposits with the central banks 53,553,585 67,487,020
Deposits with banks and financial institutions 38,412,064 61,137,415
Deposits with related party banks and financial institutions 14,461,574 9,272,360
Notes receivable - Note 11 33,607,403 24,324,946
Available-for-sale investment securities 259,873,563 225,198,412
Held to maturity investment securities 125,655,830 141,040,387
Loans to banks 6,518,370 -
Loans and advances to customers 306,123,326 209,765,031
Loans and advances to related parties 80,823,084 43,989,222
Receivable from properties sold with deferred payment – Note 18 7,891,461 10,229,027
Interest recognized on impaired loans and advances to customers 9,032,920 3,227,743
935,953,180 795,671,563
2008 2007
LBP'000 LBP'000
Year endedDecember 31,
INDEPENDENT AUDITOR’S REPORT
121
Deposits from banks and financial institutions 31,831,167 34,443,610Deposits from related party banks and financial institutions 6,552,631 2,909,841Securities lent and repurchase agreements 3,740,328 12,082,385Customers’ deposits at amortized cost 441,768,338 427,190,391Related parties’ deposits at amortized cost 106,969,211 89,721,959Borrowings from banks and financial institutions 25,749,808 18,434,040Certificates of deposit 55,402,544 63,734,070
672,014,027 648,516,296
2008 2007
LBP'000 LBP'000
Year ended December 31,
32. INTEREST INCOME
Interest income realized on impaired loans and advances to customers represent recoveries of interest. Accrued interest onimpaired loans and advances is not recognized until recovery or a rescheduling agreement is signed with customers.
Interest income on trading portfolio is included under “Net result on trading portfolio” (Note 36).
Interest income on assets designated at fair value through profit or loss upon initial recognition is included under “Netresult on financial instruments designated at fair value through profit or loss upon initial recognition” (Note 37).
33. INTEREST EXPENSE
Interest expense on customers’ and related parties’ deposits at fair value through profit or loss is included under “Net resulton financial instruments designated at fair value through profit or loss upon initial recognition” (Note 37).

Commission on documentary credits 5,196,152 3,256,340Commission on acceptances 1,457,234 902,293Commission on letters of guarantee 9,681,137 6,773,723Service fees on customers’ transactions 23,172,125 18,529,009Brokerage fees 3,333,185 4,063,662Commission on transactions with banks 95,228 712,590Asset management, placement and underwriting fees 15,659,789 6,329,454Commissions on fiduciary activities 4,785,080 3,336,854Other 3,055,185 1,573,356
66,435,115 45,477,281
2008 2007
LBP'000 LBP'000
Year ended December 31,
Commission on transactions with banks & financial institutions 1,694,468 1,548,454
Safe custody charges 598,400 411,540
Other 5,263,488 3,075,754
7,556,356 5,035,748
2008 2007
LBP'000 LBP'000
Year endedDecember 31,
Interest income on Lebanese and other Government bonds held for trading 4,437,537 13,434,219
Dividends received on trading securities 128,368 128,408
Change in fair value of trading portfolio (net) 259,938 10,639,208
Gain on sale of trading assets 18,006,004 520,445
Loss on sale of trading assets (13,287,080) (101,939)
9,544,767 24,620,341
2008 2007
LBP'000 LBP'000
Year endedDecember 31,
35. FEE AND COMMISSION EXPENSE
This caption consists of the following:
36. NET RESULTS ON TRADING PORTFOLIO
This caption consists of the following:
13
122
34. FEE AND COMMISSION INCOME
This caption consists of the following:

Interest income on assets held at fair value through profit or loss upon initial recognition 2,021,558 -
Change in fair value of assets designated at fair value through profit or lossupon initial recognition 909,023 -
Interest expense on customers’ deposits at fair value through profit or loss (9,898,311) (5,254,181)
Fee income on customers’ deposits at fair value through profit or loss 299,203 788,338
Change in fair value of customers’ deposits at fair value through profit or loss (909,023) -
Interest expense on related parties' deposits at fair value through profit or loss (228,271) (198,247)
Fee expense on related parties’ deposits at fair value through profit or loss - (248)
(7,805,821) (4,664,338)
2008 2007
LBP'000 LBP'000
December 31,
37. NET RESULTS ON FINANCIAL INSTRUMENTS DESIGNATED AT FAIR VALUE THROUGHPROFIT OR LOSS UPON INITIAL RECOGNITION
This caption consists of the following:
38. OTHER OPERATING INCOME
This caption consists of the following:
INDEPENDENT AUDITOR’S REPORT
123
Gain on sale of available-for-sale securities:Equities 16,117,888 4,980,384Lebanese and Turkish Government bonds 103,838 922,044Certificates of deposit issued by Central Bank - 56,320
Corporate bonds 758,273 -Gain on sale of an associate – Note 13 - 11,314,651Loss on sale of investment property – Note 14 (1,343,978) -Gain on sale of other investments 655,762 -Dividends from equity investment securities – Note 11 33,366,584 27,613,882Income from associates at equity method – Note 13 6,521,048 3,493,520Gain/(loss) on disposal of property and equipment 644,366 (78,436)Foreign exchange gain 7,915,063 31,052,850Income earned on derivatives 975,392 474,484Gain on sale of assets acquired in satisfaction of loans – Note 15 3,367,181 634,202Other 11,094,468 5,508,995
80,175,885 85,972,896
December 31,
2008 2007
LBP'000 LBP'000

39. FINANCIAL INSTRUMENTS WITH OFF-BALANCE SHEET RISKS
The guarantees and standby letters of credit and the documentary and commercial letters of credit represent financialinstruments with contractual amounts representing credit risk. The guarantees and standby letters of credit representirrevocable assurances that the Group will make payments in the event that a customer cannot meet its obligations to thirdparties and are not different from loans and advances on the balance sheet. However, documentary and commercial letters ofcredit, which represent written undertakings by the Group on behalf of a customer authorizing a third party to draw drafts onthe Group up to a stipulated amount under specific terms and conditions, are collateralized by the underlying shipmentsdocuments of goods to which they relate and, therefore, have significantly less risks.
Forward exchange contracts outstanding as of December 31, 2008 and 2007 represent positions held for customers'accounts and at their risk. The Group entered into such instruments to serve the needs of customers, and these contractsare fully hedged by the Group. The forward exchange contracts outstanding as at December 31, 2008 include a forwardtransaction for the purchase of USD 78.01 million versus CHF 87.10 million (USD 75.61 million versus CHF 87.10 million asat December 31, 2007). This transaction was effected to hedge an investment referred to in Note 16.
40. FIDUCIARY ACCOUNTS AND ASSETS UNDER MANAGEMENT
This caption consists of the following:
Fiduciary accounts and assets under management are segregated as follows:
Fiduciary deposits invested indeposits with non-resident banks - 656,887,454 656,887,454 - 843,377,005 843,377,005
Fiduciary deposits invested inportfolio securities - 105,631,022 105,631,022 - - -
Fiduciary deposits invested inback-to-back lending 120,702,348 11,042,383 131,744,731 402,119,079 24,981,676 427,100,755
120,702,348 773,560,859 894,263,207 402,119,079 868,358,681 1,270,477,760
Assets under managementsinvested in portfolio securities - 529,498,065 529,498,065 - 688,032,044 688,032,044
120,702,348 1,303,058,924 1,423,761,272 402,119,079 1,556,390,725 1,958,509,804
December 31, 2008
Customers’ Base Accounts
December 31, 2007
ResidentLBP’000
Non-ResidentLBP’000
TotalLBP’000
ResidentLBP’000
Non-ResidentLBP’000
TotalLBP’000
Fiduciary deposits:
Non-discretionary 120,702,348 773,560,859 402,119,079 868,358,681
Assets under management:
Discretionary - 11,453,072 - 20,186,204
Non-Discretionary - 518,044,993 - 667,845,840
- 529,498,065 - 688,032,044
120,702,348 1,303,058,924 402,119,079 1,556,390,725
December 31, 2008 December 31, 2007
ResidentLBP’000
Non-ResidentLBP’000
ResidentLBP’000
Non-ResidentLBP’000
13
124

INDEPENDENT AUDITOR’S REPORT
125
41. BALANCES / TRANSACTIONS WITH RELATED PARTIES
In the ordinary course of its activities, the Group conducts transactions with related parties including shareholders,directors, subsidiaries and associates. Balances with related parties consist of the following:
Interest rates charged on balances outstanding are the same rates that would be charged in an arm’s length transaction.
The financial statements include balances with banks and related parties that are reflected under deposits with banks andfinancial institutions, loans and advances to related parties, deposits from related parties, other assets, other liabilitiesand off balance sheet accounts. Refer to the balance sheet and notes thereto.
Related party transactions not disclosed elsewhere in the notes to the consolidated financial statements are as follows:
• General operating expenses include approximately LBP 38.55 billion for the year ended December 31, 2008 (LBP 32.59billion for the year ended December 31, 2007) representing charges transacted with affiliated companies for servicesrendered to the Group.
• Other liabilities includes an amount of LBP 1 billion due to related parties (LBP 6 billion as at December 31, 2007)representing accrued charges for services received.
• Acceptances payable include acceptances payable to a related bank in the amount of LBP 1.5 billion as at December31, 2008 (LBP 162.16 million as at December 31, 2007).
• Acceptances receivable include acceptances receivable from related parties in the amount of LBP 26.85 billion as atDecember 31, 2008 (LBP 20.76 billion as at December 31, 2007).
• Guarantees, and standby letters of credit include guarantees issued on behalf of related parties in favor of third partiesin the amount of LBP 34.73 billion as at December 31, 2008 (LBP 90.07 billion as at December 31, 2007).
• Guarantees, and standby letters of credit include guarantees issued to the benefit of related parties on behalf of thirdparties in the amount of LBP 49.6 billion as at December 31, 2008 (LBP 7.67 billion as at December 31, 2007).
• Documentary and commercial letters of credit include letters of credit issued on behalf of related parties in favor of thirdparties in the amount of LBP 136.86 billion as at December 31, 2008 (LBP 62.86 billion as at December 31, 2007).
• Documentary and commercial letters of credit include letters of credit issued to the benefit of related parties on behalf ofthird parties in the amount of LBP 11.21 billion as at December 31, 2008 (LBP 1.1 billion as at December 31, 2007).
• Forward contracts include currencies to be received from a related financial institution in the amount of LBP 14.12 billionas at December 31, 2008 and currencies to be delivered to the same related financial institution in the amount of LBP15.03 billion as at December 31, 2008 (currencies to be received in the amount of LBP 332.5 million and currencies tobe delivered in the amount of LBP 331.9 million with a related party as at December 31, 2007).
Shareholders, directors and other key managementpersonnel and close family members:
Secured loans and advances 519,149,917 157,358,472
Deposits 1,250,790,520 2,295,596,877
Associated companies:
Secured loans and advances 171,758,838 92,800,802
Unsecured loans and advances 670,858,112 143,500,552
Deposits 956,592,848 409,926,229
2008 2007
LBP'000 LBP'000
Year End Balance

Cash and cash equivalents 21,661,375Securities 94,119,188Loans and advances to customers 312,193,945Investments 14,286,365Other assets 3,597,851Property and equipment 7,749,544Customer’s deposits (367,589,816)Other liabilities (6,838,145)Provision for losses and contingencies (2,459,398)Fair value of net assets of subsidiary bank 76,720,909Less: Minority interest in net assets (45,265,336)Fair value of the Group’s equity stake 31,455,573Goodwill 76,862,624Total purchase price 108,318,197Less: Net cash of subsidiary bank at acquisition (21,661,375)Net cash flow on acquisition of investment in subsidiary bank 86,656,822
LBP’000
42. ACQUISITIONS AND SUBSIDIARIES
On January 28, 2007, the Group acquired 41% of the share capital of Turkland Bank A.S. (formerly MNG Bank A.S.) inTurkey. The Group, with the consent of the other major shareholder, has the power to govern the financial and operatingpolicies of the bank and therefore the bank is considered as a consolidated entity. At acquisition date the details of thefair value of the assets and liabilities acquired and goodwill arising are as follows:
During the first half of 2007, the Group incorporated Saudi Med Investment Company, a wholly owned financial institutionin the Kingdom of Saudi Arabia with total capital of SAR 100 million.
During November 2007, the Group incorporated Med Securities Investment Company S.A.L., a wholly owned financialinstitution incorporated in Lebanon with total capital of LBP 5 billion.
During 2007, the Group sold its investment in 333 Achrafieh S.A.L. which owned the investment properties of the Group.
During 2008, the Group incorporated Med Properties S.A.L. Holding, a wholly owned financial institution in Lebanon withtotal capital of USD 100,000.
Also during 2008, the Group incorporated Med Properties Management, a wholly owned financial institution in theCayman Islands.
The Group also incorporated during 2008, Cynvest S.A.L. Holding, a wholly owned financial institution in Lebanon withtotal capital of USD 24,000.
13
126

Cash 71,824,803 51,320,789
Checks for collection 38,001,158 33,988,702
Current accounts with central banks 22,094,180 10,892,004
Time deposits with central banks 505,275,738 569,839,861
Current accounts with banks and financial institutions 237,295,381 209,559,172
Time deposits with banks and financial institutions 733,458,743 2,554,966,230
Demand deposits from banks (88,204,949) (17,477,106)
Time deposits from banks (24,921,164) (152,037,420)
1,494,823,890 3,261,052,232
December 31,2008 2007
LBP'000 LBP'000
INDEPENDENT AUDITOR’S REPORT
127
43. NOTES TO THE CASH FLOW STATEMENT
Cash and cash equivalents for the purpose of the cash flow statement consist of the following:
Time deposits with and from Central Banks and banks and financial institutions represent inter-bank placements andborrowings with an original term of 90 day or less.
The following operating, investing and financing activities, which represent non-cash items were excluded from theconsolidated cash flow statement as follows:
(a) Net decrease in change in fair value of available-for-sale securities and deferred liability in the amounts of LBP 160.43billion and LBP 19.36 billion, respectively, against investment securities for the year ended December 31, 2008 (Netincrease of LBP 124.9 billion and LBP 19.73 billion, respectively, against investment securities for the year endedDecember 31, 2007).
(b) Assets acquired in satisfaction of debts in the amount of LBP 7.67 billion against loans and advances to customers forthe year ended December 31, 2008 (LBP 15.04 billion for the year ended December 31, 2007).
(c) Increase in deferred liability on income from associates and increase in change in fair value on available-for-sale securitiesin the amount of LBP 725 million and LBP 578 million, respectively, against investments in associates and investmentsheld for sale for the year ended December 31, 2008 (Increase of LBP 258.98 million and decrease of LBP 388.17 million,respectively, for the year ended December 31, 2007).
(d) Increase in other assets in the amount of LBP 3.57 billion against a decrease in assets acquired in satisfaction of debtsfor the year ended December 31, 2008.

Borrowing underSale and repurchase
Held to maturity corporate bonds 3,015,000 agreements 2,604,960 - -
Borrowing underHeld for trading foreign sale and repurchase Transactiongovernment bonds 88,605,876 agreements 28,338,130 guarantee 57,515,260
Held to maturity 291,188,700 Long termLebanese government bonds borrowing 143,212,500 - -
Pledged deposits with banks andfinancial institutions 301,500 Letter of guarantee 904,500 - -
Corresponding FacilitiesPledgedAmountLBP’000
Nature of FacilityAmount ofOutstanding
Facility LBP’000Nature of Facility
Amount ofOutstanding
Facility LBP’000
44. COLLATERAL GIVEN
The carrying values of financial assets given as collateral are as follows as at December 31, 2008:
The carrying values of financial assets given as collateral are as follows as at December 31, 2007:
Over and above, the Group had contractual right of setoff arrangements with correspondent banks, details of which aredisclosed under Note 6.
Held to maturity government bonds 451,285,200 Long term 218,587,500Loans to banks 75,375,000 BorrowingPledged deposits with banks & financial institutions 5,914,383 Letters of credit 5,549,543
301,500 Letter of guarantee 904,500
Corresponding Facilities
Pledged AmountLBP’000
Nature of FacilityAmount of Outstanding Facility
LBP’000
45. CAPITAL MANAGEMENT
The Group’s objectives when managing capital are to comply with the capital requirements set by Central Bank ofLebanon, the Group’s main regulator, to safeguard the Group’s ability to continue as a going concern and to maintain astrong capital base.
Risk weighted assets and capital are monitored periodically to assess the quantum of capital available to support growthand optimally deploy capital to achieve targeted returns.
The Central Bank of Lebanon requires each bank or banking group to hold a minimum level of regulatory capital of LBP 10billion for the head office and LBP 250 million for each local branch and LBP 750 million for each branch abroad. In addition,the bank is required to observe the minimum capital adequacy ratio set by the regulator is 12% (Basle Ratio).
13
128

INDEPENDENT AUDITOR’S REPORT
Consolidated assets and off-balance sheet weighted risk 5,632,819 4,820,131
Tier I and Tier II capital (including income for the year) 830,445 800,888
Risk based capital ratio 14.8% 16.6%
December 31,
2008 2007
LBP millions
The Group monitors the adequacy of its capital using the methodology and ratios established by Central Bank of Lebanon.These ratios measure capital adequacy by comparing the Group’s eligible capital with its balance sheet assets, commitmentsand contingencies, and notional amount of derivatives at a weighted amount to reflect their relative risk.
The Group’s capital is split as follows:Tier I capital: Comprises share capital after deduction of treasury shares, shareholders’ cash contribution to capital, non-cumulative perpetual preferred shares, share premium, reserves from appropriation of profits and retained earnings. Goodwilland cumulative unfavorable change in fair value of available-for-sale securities are deducted from Tier I Capital.Tier II capital: Comprises qualifying subordinated liabilities, collective impairment allowance, cumulative favorablechange in fair value of available-for-sale securities and revaluation surplus of owned properties.
Investments in associates are deducted from Tier I and Tier II capital.
Also, various limits are applied to the elements of capital base: Qualifying Tier II capital cannot exceed Tier I capital andqualifying short term subordinated loan capital may not exceed 50% of Tier I capital.The Group has complied with the regulatory capital requirement throughout the period.The Group’s consolidated risk based capital ratio as at December 31, 2008 and 2007 amounted to 14.8% and 16.6%respectively, and is determined as follows:
Tier I and Tier II capital are composed of the following:
TIER I:
Attributable to Equity holders of the Group:
Share capital 530,000,000 530,000,000
Legal reserves 30,824,497 25,212,282
Reserve for general banking risks 59,332,492 41,168,527
Retained earnings 142,002,298 109,862,157
762,159,287 706,242,966
Minority Interest 128,990,833 70,883,307
Less: Goodwill (173,404,350) (166,868,380)
Total Tier I capital 717,745,770 610,257,893
TIER II:
Attributable to Equity holders of the Group:
Property revaluation surplus 3,213,000 3,213,000
Cumulative translation adjustment (15,936,133) 7,976,435
Cumulative change in fair value of available-for-sale securities 55,076,933 125,683,494
Profit for the year 104,709,679 61,184,633
147,063,479 198,057,562
Minority interest (5,768,498) 11,078,553
Total Tier II capital 141,294,981 209,136,115
Less: Ineligible investments and intangible assets (28,596,000) (18,506,000)
Total Tier I and Tier II capital 830,444,751 800,888,008
2008 2007
LBP'000 LBP'000
Balances December 31,

46. FINANCIAL RISK MANAGEMENT
The Group’s activities are principally related to the use of financial instruments including derivatives. It accepts deposits fromcustomers at both fixed and floating rates and for various periods and seeks to earn interest margins by investing these fundsin high quality assets. It also seeks to increase these margins by consolidating short-term funds and lending for longerperiods at higher rates while maintaining sufficient liquidity to meet all claims that may fall due.
The Group also seeks to raise interest margins through lending to commercial and retail borrowers with a range of creditstanding. Such exposures include guarantees and other commitments such as letters of credit and performance and otherbonds.
With the exception of specific hedging arrangements, foreign exchange and interest rate exposures associated withderivatives are normally offset by entering into counter balancing positions, thereby controlling the variability in the net cashamounts required to liquidate market positions.
Risk management is a systematic process of identifying and assessing the Group risks and taking actions to protect theGroup against these risks.
The use of financial instruments also brings with it associated inherent risks. The Group recognizes the relationship betweenreturns and risks associated with the use of financial instruments and the management of risks forms an integral part of theGroup’s strategic objectives.
The strategy of the Group is to maintain a strong risk management culture and manage the risk/reward relationship withinand across each of the Group’s major risk-based lines of business. The Group continuously reviews its risk managementpolicies and practices to reflect changes in markets, products and emerging best practice.The Group has exposure to the following risks from its use of financial instruments:
• Credit risk• Liquidity risk• Market risk• Operational risk
A – Credit Risk
Credit risk is the risk of financial loss to the Group if counterparty to a financial instrument fails to discharge an obligation.Financial assets that are mainly exposed to credit risk are deposits with banks, loans and advances to customers and otherbanks and investment securities. Credit risk also arises from off-balance sheet financial instruments such as letters of creditand letters of guarantee.
Concentration of credit risk arises when a number of counterparties are engaged in similar business activities, or activities inthe same geographic region, or have similar economic features that would cause their ability to meet contractual obligationsto be similarly affected by changes in economic, political or other conditions. Concentrations of credit risk indicate the relativesensitivity of the Group’s performance affecting a particular industry or geographical location.
13
130

INDEPENDENT AUDITOR’S REPORT
131
Concentrations of credit risk indicate the relative sensitivity of the Group’s performance to developments affecting a particularindustry or geographical location. The Group limits the impact of concentration risk in exposure by setting progressively lowerlimits for longer tenors and taking security, where considered appropriate, to mitigate such risks.
1. Management of credit riskThe Group attempts to control credit risk by monitoring credit exposures, limiting transactions with specific counterparties,and continually assessing the creditworthiness of counterparties. The Group’s risk management policies are designed toidentify and to set appropriate risk limits and to monitor the risks and adherence to limits. Actual exposures against limits aremonitored daily. In certain cases the Group may also close out transactions or assign them to other counterparties to mitigatecredit risk. The Group’s credit risk for derivatives represents the potential cost to replace the derivative contracts ifcounterparties fail to fulfill their obligation, and to control the level of credit risk taken, the Group assesses counterpartiesusing the same techniques as for its lending activities.The Group seeks to manage its credit risk exposure also through diversification of lending activities to ensure that there is noundue concentration of risks with individuals or groups of customers in specific locations or business. It also takes securitywhen appropriate and also seeks additional collateral from the counterparty as soon as impairment indicators are noticed forthe relevant individual loans and advances.
Management monitors the market value of collateral, requests additional collateral in accordance with the underlyingagreement and monitors the market value of collateral obtained during its review of the adequacy of the allowance forimpairment losses.
The Group regularly reviews its risk management policies and systems to reflect changes in markets products and emergingbest practices.
2. Measurement of credit riska) Loans and advancesThe Group assesses the probability of default of individual counterparties using internal rating tools. The Group’s rating scalereflects the range of default probabilities defined for each rating class as explained below:
• Watch List: Loans and advances rated Watch List are loans that are not impaired but for which the Group determines thatthey require special monitoring.
• Past due but not impaired: Loans past due but not impaired are loans where contractual interest or principal are past duebut the Group’s management believes that impairment is not appropriate on the basis of the level of collateral availableand the stage of collection of amounts owed to the Group.
• Substandard loans: Substandard loans are loans that are inadequately protected by current sound worth and payingcapacity of the obligor or by any collateral pledged in favor of the group. Exposures where an indication of the possibility thatthe Group will sustain a loss if certain irregularities and deficiencies are not addressed exists are classified under this category.The Group does not provide against these loans but it defers the recognition of interest income under unrealized interest.
• Doubtful loans: Doubtful loans have, in addition to the weaknesses existing in substandard loans, characteristics indicatingthat current existing facts and figures make the collection in full highly improbable. The probability of loss is high but certainreasonable and specific pending factors which if addressed could strengthen the probability of collection, result in thedeferral of the exposure as an estimated loss until a more exact status is determined. These loans are provided for andinterest income recognition is deferred.

• Loss: Loans classified as loss are considered as uncollectible and of such minimal value that their classification as assetsis not warranted. This does not mean that the loan is absolutely unrecoverable or has no salvage value. However, theamount of loss is difficult to measure and the Group does not wish to defer the writing of the loan even partial recoverymight occur in the future. Loans are charged off in the period in which they are deemed uncollectible and thereforeclassified as loss.
The Group establishes an allowance for impairment that represents its estimate of incurred losses in its loan portfolio. Themain component of its allowance are specific loss component that relate to individually significant exposures, and a minorpart of a collective loan loss allowance established for retail and Small and Medium Enterprises (SME's) where there isobjective evidence that unidentified losses exist at the reporting date. This provision is estimated based on various factorsincluding credit ratings allocated to a borrower or group of borrowers, the current economic conditions, the experience theGroup has had in dealing with a borrower or group of borrowers and available historical default information.
The Group writes off a loan/security balance (and any related allowances for impairment losses) when it determines that theloans/securities are uncollectible. This determination is reached after considering information such as the occurrence ofsignificant changes in the borrower/issuer's financial position such as the borrower/issuer can no longer pay the obligation,or that proceeds from collateral will not be sufficient to pay back the entire exposure.
3. Risk mitigation policies
Collateral:The Group mainly employs collateral to mitigate credit risk. The principal collateral types for loans and advances are:
• Pledged deposits• Mortgages over real estate properties (land, commercial and residential properties)• Bank guarantees• Financial instruments (equities and debt securities)• Business other assets (such as inventories and accounts receivable)Collateral generally is not held over loans and advances to banks, except when securities are held as part of reverserepurchase and securities borrowing activity. Collateral usually is not held against investment securities.
Other specific risk mitigation policies include:
Netting arrangements:The Group sometimes further restricts its exposure to credit losses by entering into netting arrangements with counterparties.Netting arrangements reduce credit risk associated with favorable contracts to the extent that if a default occurs, all amountswith the counterparty are terminated and settled on a net basis.
13
132

4. Financial assets with credit risk exposure and related concentrations
a) Exposure to credit risk:
INDEPENDENT AUDITOR’S REPORT
133
Central banks 1,647,684,816 1,388,975,047
Deposits with banks and financial institutions 1,523,837,125 2,905,698,206
Financial assets at fair value through profit or loss 77,204,891 171,352,969
Loans to banks 187,986,213 15,714,107
Loans and advances to customers 3,346,023,084 2,709,908,881
Loans and advances to related parties 1,361,769,875 393,664,515
Available-for-sale investment securities 3,961,470,532 3,622,741,068
Held-to-maturity investment securities 1,381,632,196 1,701,039,678
Other assets 202,547,221 238,396,386
Total 13,690,155,953 13,147,490,857
Financial instruments with off-balance sheet risk 2,246,806,539 1,323,829,866
Fiduciary deposits 1,423,761,272 1,958,509,804
Total 3,670,567,811 3,282,339,670
Total credit risk exposure 17,360,723,764 16,429,830,527
Gross Maximum ExposureLBP’000
Gross Maximum ExposureLBP’000
December 31,
2008 2007

13
134
Below
arethedetailsoftheGroup’sexposuretocreditriskwithrespecttoloansandadvancestocustomers(excludingdeferredpenaltiesandcollectiveprovision):
Regularloansandadvances
2,696,252,737
-2,696,252,737
486,983,333
369,232,453
382,671,254
63,974,125
52,065,659
1,354,926,824
Substandard
37,858,572
-37,858,572
141,549
1,319,063
--
368,028
1,828,640
Badanddoubtful
165,257,627
(126,826,192)
38,431,435
23,163
147,087,096
1,636,124
-319,128
149,065,511
2,899,368,936(126,826,192)2,772,542,744
487,148,045
517,638,612
384,307,378
63,974,125
52,752,815
1,505,820,975
Decem
ber31,2007
FairValueofCollateralReceived
GrossExposure
Netofunrealized
interestLBP’000
Allowance
for
Impairment
LBP’000
Netexposure
LBP’000
Pledged
Funds
LBP’000
Property
LBP’000
Equity
Securities
LBP’000
Debt
Securities
LBP’000
Other
LBP’000
Total
LBP’000
Regularaccounts
3,358,056,703
-3,358,056,703
900,788,931
853,878,059
459,967,741
52,281,762
261,694,275
2,528,610,768
Substandard
36,037,130
(2,467,108)
33,570,022
-27,902,655
--
99,400
28,002,055
Badanddoubtful
122,482,533
(103,794,805)
18,687,728
14,794,963
113,497,853
37,894
676,273
2,604,919
131,611,902
3,516,576,366(106,261,913)3,410,314,453
915,583,894
995,278,567
460,005,635
52,958,035
264,398,594
2,688,224,725
Decem
ber31,2008
FairValueofCollateralReceived
GrossExposure
Netofunrealized
interestLBP’000
Allowance
for
Impairment
LBP’000
Netexposure
LBP’000
Pledged
Funds
LBP’000
Property
LBP’000
Equity
Securities
LBP’000
Debt
Securities
LBP’000
Other
LBP’000
Total
LBP’000

135
b)Concentrationoffinancialassetsbyindustry:
Balance
SheetExposure:
Cashandcentralbanks
(excluding
cashon
hand)
1,647,684,816
--
--
--
--
1,647,684,816
Depositswithbanksand
financialinstitutions
-1,523,837,125
--
--
--
-1,523,837,125
Financialassetsatfairvalue
throughprofitorloss
1,334,301
75,870,590
--
--
--
-77,204,891
Loanstobanks
-187,986,213
--
--
--
-187,986,213
Loansandadvancestocustomers
-9,136,848
543,813,424
410,248,572
298,838,407
258,353,404
1,150,048,097
434,152,392
241,431,940
3,346,023,084
Loansandadvancestorelatedparties
--
657,885,216
33,013
--
184,700,063
519,151,583
-1,361,769,875
Available-for-saleinvestmentsecurities
3,227,846,914
304,986,346
399,422,288
14,637,825
--
14,577,159
--
3,961,470,532
Held-to-maturityinvestmentSecurities
1,352,045,786
29,586,410
--
--
--
-1,381,632,196
Customers'acceptanceliability
--
27,223,805
16,866,213
28,581,367
-39,951,047
4,417,836
1,390,984
118,431,252
Otherassets
97,528
124,454
--
-4,523
138,587,695
-2,629,394
141,443,594
6,229,009,345
2,131,527,986
1,628,344,733
441,785,623
327,419,774
258,357,927
1,527,864,061
957,721,811
245,452,31813,747,483,578
Off-Balance
sheetRisks:
Guarantees&standbylettersofcredit
-54,219,671
427,073,835
148,643,953
80,794,930
3,032,983
85,090,981
60,174,050
155,737,361
1,014,767,764
Documentaryandcommercial
lettersofcredit
-65,997,105
167,599,611
78,361,337
36,000,628
5,577,750
17,490,468
26,167,753
61,213,005
458,407,657
Forwardexchangecontracts
-375,278,698
987,036
1,374,653
8,256,599
-298,200
377,436,833
9,999,099
773,631,118
Sovereign
LBP’000
Decem
ber31,2008
Financial
Services
LBP’000
RealEstate
Development
LBP’000
Manufacturing
LBP’000
Consumer
GoodsTrading
LBP’000
RealEstate
Trading
LBP’000
Services
LBP’000
Retail
LBP’000
Other
LBP’000
Total
LBP’000

136
Balance
SheetExposure:
CashandCentralBanks
(excluding
cashon
hand)
1,388,975,047
--
--
--
--
1,388,975,047
Depositswithbanksand
financialinstitutions
-2,905,698,206
--
--
--
-2,905,698,206
Financialassetsatfairvalue
throughprofitorloss
165,149,793
3,126,266
3,076,910
--
--
--
171,352,969
Loanstobanks
-15,714,107
--
--
--
-15,714,107
Loansandadvancestocustomers
-40,820,187
682,511,009
320,313,197
373,503,219
142,470,200
528,399,683
327,660,209
294,231,177
2,709,908,881
Loansandadvancestorelatedparties
-100,053
52,583,373
854,705
--
168,783,713
157,280,571
14,062,100
393,664,515
Available-for-saleinvestmentsecurities
2,474,493,872
578,907,755
554,048,758
10,365,486
--
1,910,197
-3,015,000
3,622,741,068
Held-to-maturityinvestmentsecurities
1,695,420,849
5,618,829
--
--
--
-1,701,039,678
Customers’acceptanceliability
--
198,820
5,784,260
14,274,396
-4,576,170
-37,470,502
62,304,148
Otherassets
74,172
--
--
-170,251,111
376,875
515,755
171,217,913
5,724,113,733
3,549,985,403
1,292,418,870
337,317,648
387,777,615
142,470,200
873,920,874
485,317,655
349,294,53413,142,616,532
FinancialInstrum
entswith
Off-Balance
SheetRisk
Guaranteesandstandby
lettersof
credit
-17,220,362
14,243,923
18,226,671
54,118,428
-94,109,623
25,660,120
105,304,085
328,883,212
Documentaryandcommercial
lettersofcredit
-511,719,633
-13,174,705
20,695,512
-2,894,711
7,703,828
84,240,956
640,429,345
Forwardexchangecontracts
-338,033,642
-110,628
10,149,749
--
4,249,436
1,973,854
354,517,309
Sovereign
LBP’000
Decem
ber31,2007
Financial
Services
LBP’000
RealEstate
Development
LBP’000
Manufacturing
LBP’000
Consumer
GoodsTrading
LBP’000
RealEstate
Trading
LBP’000
Services
LBP’000
Retail
LBP’000
Other
LBP’000
Total
LBP’000

INDEPENDENT AUDITOR’S REPORT
137
c) Concentration of assets and liabilities by geographical area:
ASSETS
Cash and central banks 1,495,874,033 1,205 - 223,634,381 - 1,719,509,619
Deposits with banks and
financial institutions 57,889,713 977,837,826 159,252,307 327,693,612 1,163,667 1,523,837,125
Financial assets at fair value through
profit or loss 997,428 - - 76,207,463 - 77,204,891
Loans to banks 42,428,198 22,054,415 - 123,503,600 - 187,986,213
Loans and advances to customers 1,966,217,110 747,353,203 761,121 630,877,496 814,154 3,346,023,084
Loans and advances to related parties 624,284,964 657,885,216 - 79,599,695 - 1,361,769,875
Available for sale investment securities 3,689,156,012 108,010,253 1,120,553 163,183,714 - 3,961,470,532
Held-to-maturity investment securities 1,352,045,786 - - 29,586,410 - 1,381,632,196
Customers' acceptance liability 82,869,835 21,348,211 - 14,213,206 - 118,431,252
Investments in associates
and other investments 77,738,742 - - - - 77,738,742
Assets acquired insatisfaction of loans 70,451,050 - - 1,057,616 - 71,508,666
Goodwill 173,404,350 - - - - 173,404,350
Property and equipment 169,361,161 1,465,877 - 17,114,718 - 187,941,756
Other assets 180,650,279 1,431,567 1,031 20,462,837 1,507 202,547,221
Total assets 9,983,368,661 2,537,387,773 161,135,012 1,707,134,748 1,979,328 14,391,005,522
LIABILITIES
Deposits from banks
and financial institutions 342,203,706 96,894,263 72,183,215 204,132,573 572,911 715,986,668
Customers' deposits at fair value
through profit or loss 219,151,419 12,374,431 1,946,974 3,720,760 2,805,024 239,998,608
Customers' deposits at amortized cost 6,025,206,508 1,193,371,108 65,304,830 1,242,792,463 221,775,022 8,748,449,931
Related parties' deposits at
fair value through profit or loss 2,877,581 - - - - 2,877,581
Related parties' deposits at amortized cost 246,129,581 1,539,096,020 351,588,751 80,754,253 - 2,217,568,605
Acceptances payable 14,250,634 34,106,601 30,938,872 38,096,861 1,038,284 118,431,252
Borrowings from banks and
financial institutions 5,531,682 30,560,545 - 294,461,787 - 330,554,014
Certificates of deposit - - - 716,356,004 - 716,356,004
Other liabilities 148,056,028 662,892 - 28,277,792 10,871 177,007,583
Provisions 23,651,988 23,689 - 12,399,280 - 36,074,957
Total liabilities 7,027,059,127 2,907,089,549 521,962,642 2,620,991,773 226,202,112 13,303,305,203
December 31, 2008
LebanonLBP’000
Middle East,Gulf & AfricaLBP’000
NorthAmericaLBP’000
EuropeLBP’000
OtherLBP’000
TotalLBP’000

ASSETS
Cash, Compulsory Reservesand Central Banks 1,341,603,412 - - 98,692,424 - 1,440,295,836
Deposits with banks andfinancial institutions 1,087,464,934 687,204,639 24,727,281 1,086,545,740 35,469,719 2,921,412,313
Trading assets 7,751,806 - - 163,601,163 - 171,352,969
Loans and advances to customers 1,990,616,192 110,831,947 20,881,451 580,311,602 7,267,689 2,709,908,881
Loans and advances to related parties 245,162,606 52,683,426 - 95,818,483 - 393,664,515
Available for sale investmentsecurities 3,413,935,357 60,285,575 - 148,520,136 - 3,622,741,068
Held-to-maturity investmentsecurities 1,697,723,002 - - 3,316,676 - 1,701,039,678
Customers' acceptance liability 44,144,033 18,160,115 - - - 62,304,148
Investments in associates andinvestments held for sale 72,263,795 - - - - 72,263,795
Investment properties 6,034,649 - - - - 6,034,649
Assets acquired in satisfactionof loans 80,111,744 - - 1,454,095 - 81,565,839
Goodwill 166,868,380 - - - - 166,868,380
Property and equipment 173,729,057 - - 7,853,464 - 181,582,521
Other assets 209,397,813 - - 28,998,573 - 238,396,386
Total assets 10,536,806,780 929,165,702 45,608,732 2,215,112,356 42,737,408 13,769,430,978
LIABILITIES
Deposits and borrowings from banks 599,571,655 77,510,148 2,331,680 49,449,309 26,317 728,889,109
Customers deposits designated atfair value through profit or loss 139,410,962 11,251,787 2,528,400 2,260,871 345,007 155,797,027
Customers' accounts atamortized cost 5,706,320,825 806,075,879 208,734,217 938,926,815 9,816,332 7,669,874,068
Related parties' accounts at fairvalue through profit or loss 3,207,682 - - - - 3,207,682
Related parties' accounts atamortized cost 150,704,559 2,148,428,863 331,781,038 78,579,816 6,187 2,709,500,463
Acceptances payable 8,710,217 10,821,647 22,516,490 19,794,209 461,585 62,304,148
Other borrowings 6,837,822 - 21,054,785 388,719,545 739,916 417,352,068
Certificates of deposit - - - 715,609,642 - 715,609,642
Other liabilities 139,007,991 1,912,009 - 38,311,530 203,317 179,434,847
Provisions 16,290,491 - - 5,255,552 - 21,546,043
Total liabilities 6,770,062,204 3,056,000,333 588,946,610 2,236,907,289 11,598,661 12,663,515,097
December 31, 2007
LebanonLBP’000
Middle East,Gulf & AfricaLBP’000
NorthAmericaLBP’000
EuropeLBP’000
OtherLBP’000
TotalLBP’000
13
138

B – Liquidity Risk
Liquidity risk is the risk that the Group will be unable to meet its net funding requirements. Liquidity risk can be caused by marketdisruptions or credit downgrades, which may cause certain sources of funding to dry up immediately.
1- Management of liquidity risk
To mitigate this risk, management has diversified funding sources, manages assets with liquidity in mind, maintaining anadequate balance of cash, cash equivalents and readily marketable securities and monitors future cash flows and liquidityon a daily basis. The Group also has committed lines of credit that it can access to meet liquidity needs.
Liquidity risk is the Group’s ability to ensure the availability of funding to meet commitments, both on-balance and off-balancesheet commitments, at a reasonable cost on time. The management of liquidity should not lead to threats to the Group’ssolvency.
Liquidity risk arises when in case of crisis, refinancing may only be raised at higher market rates (funding risk), or assets mayonly be liquidated at a discount to market rates (market liquidity risk). Liquidity risk is also caused by mismatches in thematurities of assets and liabilities (uses and sources of funds).
In accordance with banking regulations issued by Central Bank of Lebanon, the Group maintains compulsory reserves withCentral Bank of Lebanon of 25% and 15% of the weekly average demand and term customers’ deposits in Lebanese Pounds.The Group has the ability to raise additional funds through repurchase facilities available with Central Bank of Lebanonagainst Government debt securities.
The Group sets policies and procedures to ensure that its individual entities are in compliance with liquidity ratios imposedby the regulators in the countries in which each of these entities operates in addition to other internal limits and thresholds.
2- Exposure to liquidity risk
The tables below summarize the maturity profile of the Group’s assets, liabilities and equity. The contractual maturities ofassets and liabilities have been determined on the basis of the remaining period at the balance sheet date to the contractualmaturity date, and do not take account of the effective maturities as indicated by the Group’s deposit retention history andthe availability of liquid funds. Management monitors the maturity profile to ensure that adequate liquidity is maintained.
INDEPENDENT AUDITOR’S REPORT
139

ASSETS
Cashandcentralbanks
269,838,368
--
--
--
269,838,368
Depositswithbanksand
financialinstitutions
4,059,161
--
--
--
4,059,161
Loanstobanks
--
--
-6,540,536
8,415,632
14,956,168
Loansandadvancestocustomers
30,741,312
24,824,302
5,033,582
477,957
148,292
997,499
1,608,531
63,831,475
Loansandadvancestorelatedparties
-108,348,248
--
--
-108,348,248
Available-for-saleandheldto
maturityinvestmentsecurities
11,388,902
8,271,065
456,297,0231,225,949,281
--
-1,701,906,271
Investmentsinassociatesand
otherinvestments
35,712,927
--
--
--
35,712,927
Assetsacquiredinsatisfactionofloans
(10,332,888)
--
--
--
(10,332,888)
Goodwill
23,068,898
--
--
--
23,068,898
Propertyandequipm
ent
166,833,959
--
--
--
166,833,959
Otherassets
14,047,242
40-
--
--
14,047,282
TotalAssets
545,357,881
141,443,655
461,330,6051,226,427,238
148,292
7,538,035
10,024,163
2,392,269,869
LIABILITIES
Depositsfrombanksand
financialinstitutions
28,852
18,937,426
--
--
-18,966,278
Customers'depositsatamortizedcost
10,305,394
94,052,681
1,566,002,457
138,348
--
120,229
1,670,619,109
Relatedparties'depositsat
amortizedcost
321,386
2,553,347
17,587,709
--
--
20,462,442
Otherliabilities
43,595,654
-155,801
300,009
287,369
367,877
-44,706,710
Provisions
20,294,131
--
--
--
20,294,131
TotalLiabilities
74,545,417
115,543,454
1,583,745,967
438,357
287,369
367,877
120,229
1,775,048,670
Maturity
Gap
470,812,464
25,900,201
(1,122,415,362)1,225,988,881
(139,077)
7,170,158
9,903,934
617,221,199
LBPBaseAccounts
Decem
ber31,2008
Accountswith
Nomaturity
LBP’000
Upto3
months
LBP’000
3monthsto
1year
LBP’000
1to3years
LBP’000
3to5years
LBP’000
5to10
years
LBP’000
Over10
years
LBP’000
Total
LBP’000
Residualcontractualmaturitiesoffinancialassetsandliabilities:
Thetablesbelowshow
theBank’sassetsandliabilitiesinLebanesePoundsandforeigncurrenciesbaseaccountssegregatedbymaturity:
13
140

ASSETS
Cash,Compulsorydepositsand
depositswithCentralBanks
173,199,945
--
--
--
173,199,945
Depositswithbanksand
financialinstitutions
5,079,381
189,614
1,235
--
7,301,016
8,413,091
20,984,337
Finacialassetsatfairvalue
throughprofitorloss
--
720,101
--
--
701,101
Loansandadvancestocustomers
(64,708,592)
23,916,668
8,762,841
8,127,830
2,102,496
5,188,392
10,265,385
(6,344,980)
Loansandadvancestorelated
parties
-93,319,568
--
--
-93,319,568
Availableforsaleandheld
tomaturityinvestmentsecurities
11,243,038
38,455,016
359,563,613
846,986,082
11,031,526
--1,267,279,275
Investmentsinassociatesand
investmentsheldforsale
13,236,191
--
--
--
13,236,191
Assetsacquiredinsatisfaction
ofloans
(11,368,117)
--
--
--
(11,368,117)
Goodwill
54,834,356
--
--
--
54,834,356
Propertyandequipm
ent
168,734,693
--
--
--
168,734,693
Otherassets
8,809,892
--
--
--
8,809,892
TotalAssets
359,060,787
155,880,866
369,047,790
855,113,912
13,134,022
12,489,408
18,678,476
1,783,405,261
LIABILITIES
Depositsandborrowingsfrombanks
50,627
93,956,970
--
--
-94,007,597
Customers'accountsatamortizedcost
62,653,106
989,615,556
28,113,869
47,041
--
-1,080,429,572
Relatedparties'accountsat
amortizedcost
754,393
17,227,010
244
--
--
17,981,647
Otherliabilities
24,083,127
--
--
--
24,083,127
Provisions
16,187,780
--
--
--
16,187,780
TotalLiabilities
103,729,033
1,100,799,536
28,114,113
47,041
--
-1,232,689,723
Maturity
Gap
255,331,754
(944,918,670)
340,933,677
855,066,871
13,134,022
12,489,408
18,678,476
550,715,538
LBPBaseAccounts
Decem
ber31,2007
Accountswith
Nomaturity
LBP’000
Upto3
months
LBP’000
3monthsto
1year
LBP’000
1to3years
LBP’000
3to5years
LBP’000
5to10
years
LBP’000
Over10
years
LBP’000
Total
LBP’000
INDEPENDENT AUDITOR’S REPORT
141

ASSETS
CashandCentralBanks
88,442,625
484,668,661
64,368,256
229,937,098
582,254,611
--1,449,671,251
Depositswithbanksand
financialinstitutions
295,307,198
1,185,042,977
39,427,789
--
--
1,519,777,964
Financialassetsatfairvaluethrough
profitorloss
682,971
344,364
30,888,433
45,289,123
--
-77,204,891
Loanstobanks
-42,550,682
46,881,351
6,975,765
76,622,247
--
173,030,045
Loansandadvancestocustomers
193,285,226
780,340,395
1,748,504,114
180,176,800
147,344,984
202,753,470
29,786,620
3,282,191,609
Loansandadvancestorelatedparties
783,487,191
349,070,800
41,304,352
--
79,559,284
-1,253,421,627
Available-for-saleandheld-to-maturity
investmentsecurities
532,837,419
15,469,622
358,538,550
579,973,953
529,471,361
953,055,166
671,850,386
3,641,196,457
Customers'acceptancesliability
3,550,502
91,118,573
21,901,325
1,860,852
--
-118,431,252
Investmentsinassociatesand
otherinvestments
42,025,815
--
--
--
42,025,815
Assetsacquiredinsatisfactionofloans
81,841,554
--
--
--
81,841,554
Goodwill
150,335,452
--
--
--
150,335,452
Propertyandequipm
ent
21,107,797
--
--
--
21,107,797
Otherassets
76,752,896
11,562,208
100,184,835
--
--
188,499,939
TotalAssets
2,269,656,646
2,960,168,282
2,451,999,005
1,044,213,5911,335,693,203
1,235,367,920
701,637,00611,998,735,653
LIABILITIES
Depositsfrombanksand
financialinstitutions
91,978,748
35,762,953
261,479,642
307,799,047
--
-697,020,390
Customers'depositsatfairvalue
throughprofitorloss
--
88,305,173
151,693,435
--
-239,998,608
Customers'depositsatamortizedcost
239,182,143
1,573,228,452
4,701,809,621
544,015,826
10,647,696
8,947,084
-7,077,830,822
Relatedparties'depositsatfairvalue
throughprofitorloss
--
--
--
2,877,581
2,877,581
Relatedparties'depositsatamortizedcost
26,805,428
494,421,521
1,025,028,970
650,850,244
--
-2,197,106,163
Acceptancespayable
3,550,502
91,118,573
21,901,325
1,860,852
--
-118,431,252
Borrowingsfrombanksand
financialinstitutions
-3,161,276
34,947,719
15,212,395
121,351,548
102,416,466
53,464,610
330,554,014
Certificatesofdeposit
--
-264,177,607
452,178,397
--
716,356,004
Otherliabilities
103,561,999
26,810,512
1,040,718
887,644
--
-132,300,873
Provisions
15,780,826
--
--
--
15,780,826
TotalLiabilities
480,859,646
2,224,503,287
6,134,513,168
1,936,497,050
584,177,641
111,363,550
56,342,191
11,528,256,533
Maturity
Gap
1,788,797,000
735,664,995(3,682,514,163)
(892,283,459)
751,515,562
1,124,004,370
645,294,815
470,479,120
F/CyBaseAccounts
Decem
ber31,2008
Accountswith
Nomaturity
LBP’000
Upto3
months
LBP’000
3monthsto
1year
LBP’000
1to3years
LBP’000
3to5years
LBP’000
5to10
years
LBP’000
Over
10years
LBP’000
Total
LBP’000
13
142

ASSETS
Cashandcentralbanks
89,987,322
519,942,815
15,636,637
133,746,656
507,782,461
--
1,267,095,891
Depositswithbanksand
financialinstitutions
132,906,210
2,762,087,499
5,434,267
--
--
2,900,427,976
Financialassetsatfairvaluethrough
profitorloss
4,759,717
-66,104,052
85,854,223
1,738,060
7,316,127
4,860,689
170,632,868
Loansandadvancestocustomers
146,601,635
1,845,400,934
268,949,446
184,962,548
116,006,224
150,185,285
4,147,789
2,716,253,861
Loansandadvancestorelatedparties
2,958,547
216,295,105
7,888,415
33,761,326
-39,441,554
-300,344,947
Available-for-saleandheld-to-maturity
investmentsecurities
606,698,002
763,632
507,874,024
667,846,216
593,359,784
1,011,267,614
668,692,199
4,056,501,471
Customers'acceptancesliability
2,370,116
48,302,195
10,824,104
807,733
--
-62,304,148
Investmentsinassociatesand
otherinvestments
59,027,604
--
--
--
59,027,604
Investmentproperties
6,034,649
--
--
--
6,034,649
Assetsacquiredinsatisfactionofloans
92,933,956
--
--
--
92,933,956
Goodwill
112,034,024
--
--
--
112,034,024
Propertyandequipm
ent
12,847,828
--
--
--
12,847,828
Otherassets
206,971,035
22,615,459
--
--
-229,586,494
TotalAssets
1,476,130,645
5,415,407,639
882,710,945
1,106,978,7021,218,886,529
1,208,210,580
677,700,67711,986,025,717
LIABILITIES
Depositsfrombanksand
financialinstitutions
7,774,391
239,187,857
15,538,745
372,380,519
--
-634,881,512
Customers'depositsatfairvalue
throughprofitorloss
-13,907,877
1,206,000
140,683,150
--
-155,797,027
Customers'depositsatamortizedcost
485,983,494
4,064,666,317
1,459,066,297
530,375,426
39,975,092
9,377,870
-6,589,444,496
Relatedparties'depositsatfairvalue
throughprofitorloss
--
--
--
3,207,682
3,207,682
Relatedparties'depositsatamortizedcost
3,955,389
1,824,389,963
32,476,184
830,697,280
--
-2,691,518,816
Acceptancespayable
2,370,116
48,302,195
10,824,104
807,733
--
-62,304,148
Borrowingsfrombanksand
financialinstitutions
-16,368,223
174,659,515
12,588,175
50,579,749
104,286,750
58,869,656
417,352,068
Certificatesofdeposit
--
263,973,370
451,636,272
--
715,609,642
Otherliabilities
122,202,208
31,699,278
451,669
998,565
--
-155,351,720
Provisions
5,358,263
--
--
--
5,358,263
TotalLiabilities
627,643,861
6,238,521,710
1,694,222,514
2,152,504,218
542,191,113
113,664,620
62,077,338
11,430,825,374
Maturity
Gap
848,486,784
(823,114,071)
(811,511,569)(1,045,525,516)
676,695,416
1,094,545,960
615,623,339
555,200,343
F/CyBaseAccounts
Decem
ber31,2007
Accountswith
Nomaturity
LBP’000
Upto3
months
LBP’000
3monthsto
1year
LBP’000
1to3years
LBP’000
3to5years
LBP’000
5to10
years
LBP’000
Over
10years
LBP’000
Total
LBP’000
INDEPENDENT AUDITOR’S REPORT
143

Concentration of Liabilities by counterparty:Information regarding the concentration of liabilities by counterparty is disclosed under the respective notes to the financialstatements.
C – Market Risks
Market Risk is the risk that the fair value or future cash flows of the financial instruments will fluctuate due to changes in marketvariables such as interest rates, foreign exchange rates, and equity prices.
1- Management of market risks
The Group classifies exposures to market risk into either trading or banking (non-trading) book. The market risk for the tradingbook is managed and monitored using a combination of limits monitoring and Value at Risk (VAR) methodology. Market riskfor non-trading book includes Price and Liquidity risks that are managed and monitored through internal limits, gap analysis,stress testing and sensitivity analysis.
a) Market Risk-Trading Book
Trading Book contains the Group's positions in financial instruments which are held intentionally for short-term resale and/orwith the intent of benefiting from actual or expected short-term price movements or to lock in arbitrage profits.
The Board has set limits for the acceptable level of risks in managing the trading book. The Group applies a VARmethodology to assess the market risk positions held and to estimate the potential economic loss based upon a number ofparameters and assumptions for change in market conditions.
A VAR methodology estimates the potential negative change in market value of a portfolio at a given confidence level andover a specified time horizon. The Group uses simulation models to assess the possible changes in the market value of thetrading book based on historical data. VAR models are usually designed to measure the market risk in a normal marketenvironment and therefore the use of VAR has limitations as it is based on historical correlations and market price volatilitiesand assumes that the future movements will follow a statistical distribution.
The VAR that the Group measures is an estimate, using a confidence level of 95% of the potential loss that is not expectedto be exceeded if the current market positions were to be held unchanged for one day. The use of 95% confidence leveldepicts that within a one-day horizon, losses exceeding VAR figure should occur, on average, not more than once everyhundred days.
13
144

The VAR represents the risk of portfolios at the close of a business day, and it does not account for any losses that mayoccur beyond the defined confidence interval. The actual trading results however, may differ from the VAR calculationsand, in particular, the calculation does not provide a meaningful indication of profits and losses in stressed marketconditions.
b) Market Risk – Non-Trading Or Banking Book
Market risk on non-trading or banking positions mainly arises from the interest rate, foreign currency exposures, equityprice changes and liquidity risk.
2- Exposure to Foreign Exchange risk
Foreign exchange risk is the risk that changes in foreign currency rates will affect the Group’s income or the value of itsholdings of financial instruments. The objective of foreign currency risk management is to manage and control foreigncurrency risk exposure within acceptable parameters while optimizing the return on risk.
Foreign exchange exposure arises from normal banking activities, primarily from the receipt of deposits and theplacement of funds. Future open positions in any currency are managed by means of forward foreign exchangecontracts. It is the policy of the Group that it will, at all times, adhere to the limits laid down by the Central Bank as referredto below. It is not the Group’s intention to take open positions on its own account (proprietary trading) but rather tomaintain square or near square positions in all currencies.
The Management sets limits on the level of exposure by currency and in the aggregate for both overnight and intra-daypositions and hedging strategies, which are monitored daily and are in compliance with Central Bank of Lebanon rulesand regulations.
INDEPENDENT AUDITOR’S REPORT
145

ASSETSCash and central banks 269,838,368 1,254,514,577 195,156,674 1,719,509,619Deposits with banks and financial institutions 4,059,161 795,583,566 724,194,398 1,523,837,125Financial assets at fair value through profit or loss - 75,870,590 1,334,301 77,204,891Loans to banks 14,956,168 135,058,828 37,971,217 187,986,213Loans and advances to customers 63,831,475 2,626,761,093 655,430,516 3,346,023,084Loans and advances to related parties 108,348,248 1,129,899,084 123,522,543 1,361,769,875Available-for-sale and held-to-maturityinvestment securities 1,701,906,271 3,298,522,943 342,673,514 5,343,102,728Customers' acceptance liability - 64,431,060 54,000,192 118,431,252Investments in associates and other investments 35,712,927 42,025,815 - 77,738,742Assets acquired in satisfaction of loans (10,332,888) 80,783,938 1,057,616 71,508,666Goodwill 23,068,898 113,253,339 37,082,113 173,404,350Property and equipment 166,833,959 2,622,175 18,485,622 187,941,756Other assets 14,047,282 177,849,312 9,675,235 201,571,829Total Assets 2,392,269,869 9,797,176,320 2,200,583,941 14,390,030,130
LIABILITIESDeposits from banks and financial institutions 18,966,278 586,339,743 110,680,647 715,986,668Customers' deposits at fair value through profit or loss - 239,502,279 496,329 239,998,608Customers' deposits at amortized cost 1,670,619,109 6,289,098,050 788,732,772 8,748,449,931Related parties' deposits at fair value throughprofit or loss - 2,877,581 - 2,877,581Related parties' deposits at amortized cost 20,462,442 1,758,788,600 438,317,563 2,217,568,605Acceptances payable - 64,431,060 54,000,192 118,431,252Borrowings from banks and financial institutions - 328,484,911 2,069,103 330,554,014Certificates of deposit - 716,356,004 - 716,356,004Other liabilities 44,706,710 111,301,352 11,114,425 167,122,487Provisions 20,294,131 2,932,590 12,848,236 36,074,957Total Liabilities 1,775,048,670 10,100,112,170 1,418,259,267 13,293,420,107
Currencies to be delivered - (186,011,402) (596,289,271) (782,300,673)Currencies to be received - 535,395,452 238,235,666 773,631,118Discount/premium - (237,322) (2,827) (240,149)
- 349,146,728 (358,056,432) (8,909,704)
Net on-balance sheet financial position 617,221,199 46,210,878 424,268,242 1,087,700,319
December 31, 2008
LBPLBP’000
USDLBP’000
OtherLBP’000
TotalLBP’000
Below is the carrying value of assets and liabilities segregated by major currencies to reflect the Group’sexposure to foreign currency exchange risk at year end:
13
146
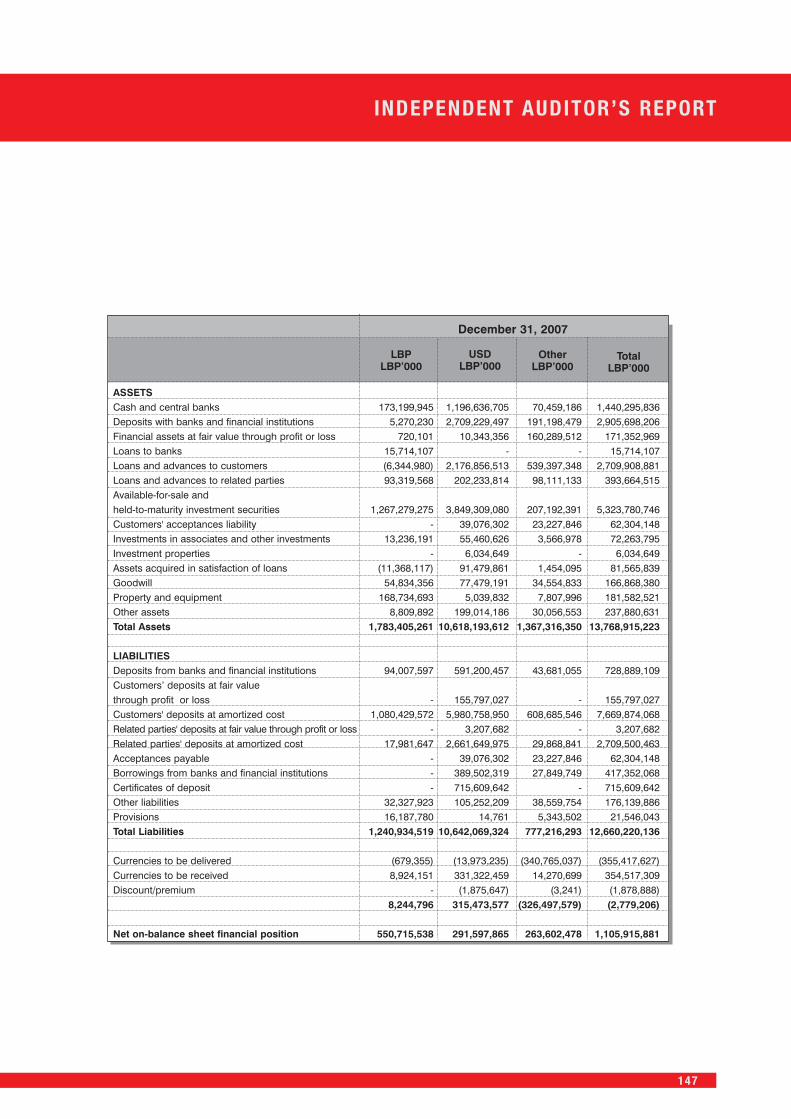
ASSETSCash and central banks 173,199,945 1,196,636,705 70,459,186 1,440,295,836Deposits with banks and financial institutions 5,270,230 2,709,229,497 191,198,479 2,905,698,206Financial assets at fair value through profit or loss 720,101 10,343,356 160,289,512 171,352,969Loans to banks 15,714,107 - - 15,714,107Loans and advances to customers (6,344,980) 2,176,856,513 539,397,348 2,709,908,881Loans and advances to related parties 93,319,568 202,233,814 98,111,133 393,664,515Available-for-sale andheld-to-maturity investment securities 1,267,279,275 3,849,309,080 207,192,391 5,323,780,746Customers' acceptances liability - 39,076,302 23,227,846 62,304,148Investments in associates and other investments 13,236,191 55,460,626 3,566,978 72,263,795Investment properties - 6,034,649 - 6,034,649Assets acquired in satisfaction of loans (11,368,117) 91,479,861 1,454,095 81,565,839Goodwill 54,834,356 77,479,191 34,554,833 166,868,380Property and equipment 168,734,693 5,039,832 7,807,996 181,582,521Other assets 8,809,892 199,014,186 30,056,553 237,880,631Total Assets 1,783,405,261 10,618,193,612 1,367,316,350 13,768,915,223
LIABILITIESDeposits from banks and financial institutions 94,007,597 591,200,457 43,681,055 728,889,109Customers’ deposits at fair valuethrough profit or loss - 155,797,027 - 155,797,027Customers' deposits at amortized cost 1,080,429,572 5,980,758,950 608,685,546 7,669,874,068Related parties' deposits at fair value through profit or loss - 3,207,682 - 3,207,682Related parties' deposits at amortized cost 17,981,647 2,661,649,975 29,868,841 2,709,500,463Acceptances payable - 39,076,302 23,227,846 62,304,148Borrowings from banks and financial institutions - 389,502,319 27,849,749 417,352,068Certificates of deposit - 715,609,642 - 715,609,642Other liabilities 32,327,923 105,252,209 38,559,754 176,139,886Provisions 16,187,780 14,761 5,343,502 21,546,043Total Liabilities 1,240,934,519 10,642,069,324 777,216,293 12,660,220,136
Currencies to be delivered (679,355) (13,973,235) (340,765,037) (355,417,627)Currencies to be received 8,924,151 331,322,459 14,270,699 354,517,309Discount/premium - (1,875,647) (3,241) (1,878,888)
8,244,796 315,473,577 (326,497,579) (2,779,206)
Net on-balance sheet financial position 550,715,538 291,597,865 263,602,478 1,105,915,881
December 31, 2007
LBPLBP’000
USDLBP’000
OtherLBP’000
TotalLBP’000
INDEPENDENT AUDITOR’S REPORT
147

3- Exposure to Interest rate risk
Interest rate risk arises when there is a mismatch between positions, which are subject to interest rate adjustment within aspecified period. The Group’s lending, funding and investment activities give rise to interest rate risk. The immediate impactof variation in interest rate is on the Group’s net interest income, while a long term impact is on the Group’s net worth sincethe economic value of the Group’s assets, liabilities and off-balance sheet exposures are affected.
The Group manages this risk by matching or hedging the repricing profile of assets and liabilities through riskmanagement strategies.
The Board has established interest rate gap limits for stipulated periods.
The effective interest rate (effective yield) of a monetary financial instrument is the rate that, when used in a present valuecalculation, results in the carrying amount of the instrument. The rate is a historical rate for a fixed rate instrument carriedat amortized cost and a current market rate for a floating rate instrument or an instrument carried at fair value.
Below is a summary of the Group’s interest rate gap position on assets and liabilities reflected at carrying amounts atyear end segregated between floating and fixed interest rate earning or bearing and between Lebanese Pound andforeign currencies base accounts:
13
148

ASSETS
Cashandcentralbanks
269,838,368
--
--
--
Depositswithbanksand
financialinstitutions
4,059,161
--
--
--
Loanstobanks
--
--
--
-Loansandadvancestocustomers
30,741,312
24,824,302
265,527
165,983
200,410
955,095
26,411,317
Loansandadvancestorelatedparties
-108,348,248
--
--
108,348,248
Available-for-saleandheld-to-maturity
investmentsecurities
11,388,902
8,271,065
--
--
8,271,065
Investmentsinassociatesand
otherinvestments
35,712,927
--
--
--
Assetsacquiredinsatisfactionofloans
(10,332,888)
--
--
--
Goodwill
23,068,898
--
--
--
Propertyandequipm
ent
166,833,959
--
--
--
Otherassets
14,047,242
40-
--
-40
TotalAssets
545,357,881
141,443,655
265,527
165,983
200,410
955,095
143,030,670
LIABILITIES
Depositsfrombanksand
financialinstitutions
28,852
18,937,426
--
--
18,937,426
Customers'depositsatamortizedcost
10,305,394
94,052,681
235,160
--
-94,287,841
Relatedparties'depositsatamortizedcost
321,386
2,553,347
--
--
2,553,347
Otherliabilities
43,595,654
--
--
--
Provisions
20,294,131
--
--
--
TotalLiabilities
74,545,417
115,543,454
235,160
--
-115,778,614
Interestrategap
position
470,812,464
25,900,201
30,367
165,983
200,410
955,095
27,252,056
FloatingInterestRate
Decem
ber31,2008
Non-interest
bearing
LBP’000
Upto3
months
LBP’000
3monthsto
1year
LBP’000
1to3years
LBP’000
5to10
years
LBP’000
Over10
years
LBP’000
Total
LBP’000
Interest rate gap position in LBP:
INDEPENDENT AUDITOR’S REPORT
149
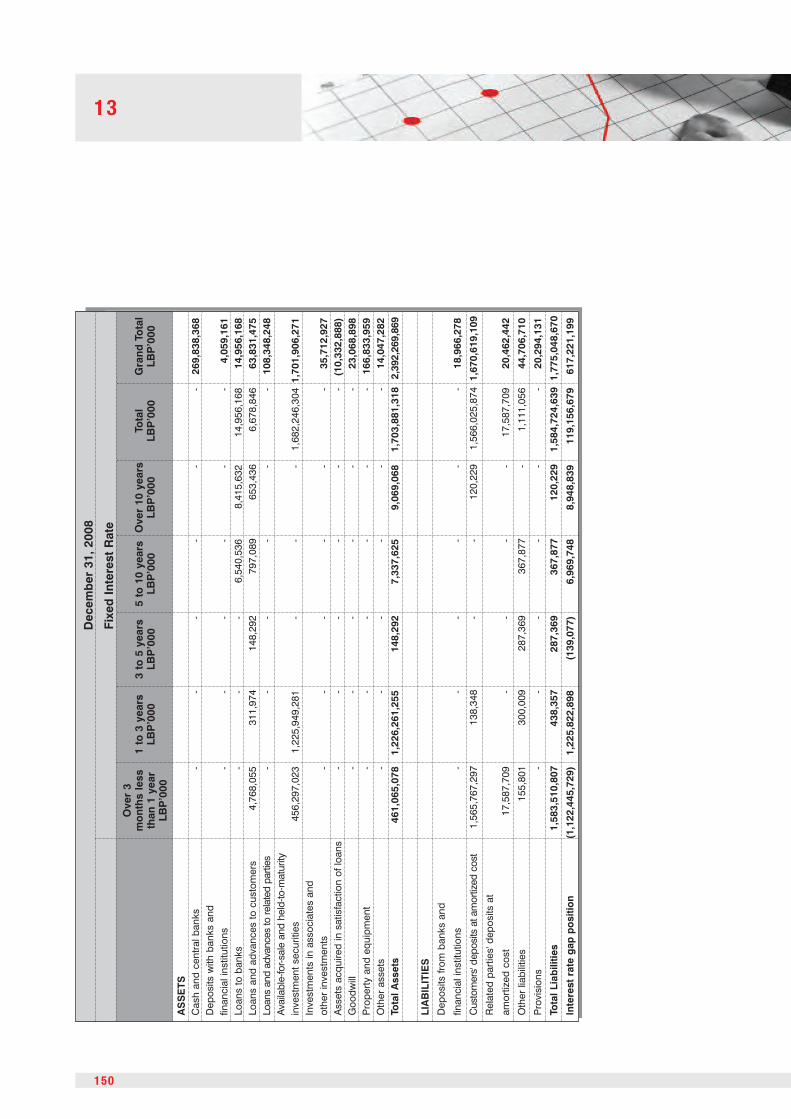
ASSETS
Cashandcentralbanks
--
--
--
269,838,368
Depositswithbanksand
financialinstitutions
--
--
--
4,059,161
Loanstobanks
--
-6,540,536
8,415,632
14,956,168
14,956,168
Loansandadvancestocustomers
4,768,055
311,974
148,292
797,089
653,436
6,678,846
63,831,475
Loansandadvancestorelatedparties
--
--
--
108,348,248
Available-for-saleandheld-to-maturity
investmentsecurities
456,297,023
1,225,949,281
--
-1,682,246,3041,701,906,271
Investmentsinassociatesand
otherinvestments
--
--
--
35,712,927
Assetsacquiredinsatisfactionofloans
--
--
--
(10,332,888)
Goodwill
--
--
--
23,068,898
Propertyandequipm
ent
--
--
--
166,833,959
Otherassets
--
--
--
14,047,282
TotalAssets
461,065,078
1,226,261,255
148,292
7,337,625
9,069,068
1,703,881,3182,392,269,869
LIABILITIES
Depositsfrombanksand
financialinstitutions
--
--
--
18,966,278
Customers'depositsatamortizedcost
1,565,767,297
138,348
--
120,229
1,566,025,8741,670,619,109
Relatedparties'depositsat
amortizedcost
17,587,709
--
--
17,587,709
20,462,442
Otherliabilities
155,801
300,009
287,369
367,877
-1,111,056
44,706,710
Provisions
--
--
--
20,294,131
TotalLiabilities
1,583,510,807
438,357
287,369
367,877
120,229
1,584,724,6391,775,048,670
Interestrategap
position
(1,122,445,729)
1,225,822,898
(139,077)
6,969,748
8,948,839
119,156,679
617,221,199
FixedInterestRate
Decem
ber31,2008
Over3
monthsless
than
1year
LBP’000
1to3years
LBP’000
3to5years
LBP’000
5to10
years
LBP’000
Over10
years
LBP’000
Total
LBP’000
Grand
Total
LBP’000
13
150

ASSETS
Cashandcentralbanks
173,199,945
--
--
--
-
Depositswithbanksand
financialinstitutions
3,538,759
1,731,471
--
--
-1,731,471
Financialassetsatfair
valuethroughprofitorloss
--
--
--
--
Loanstobanks
--
--
--
--
Loansandadvancestocustomers
(64,708,592)
22,689,899
3,206,494
1,436,520
1,687,394
5,187,685
10,265,385
44,473,377
Loansandadvancestorelatedparties
-93,319,568
--
--
-93,319,568
Available-for-saleandheld-to-maturity
investmentsecurities
11,243,037
38,455,016
--
--
-38,455,016
Investmentsinassociatesand
otherinvestments
13,236,191
--
--
--
-
Assetsacquiredinsatisfaction
ofloans
(11,368,117)
--
--
--
-
Goodwill
54,834,356
--
--
--
-
Propertyandequipm
ent
168,734,693
--
--
--
-
Otherassets
8,809,892
--
--
--
-
TotalAssets
357,520,164
156,195,954
3,206,494
1,436,520
1,687,394
5,187,685
10,265,385
177,979,432
LIABILITIES
Depositsfrombanksand
financialinstitutions
50,627
93,956,970
--
--
93,956,970
-
Customers'depositsatamortizedcost
62,395,107
989,873,555
1,824,000
--
--
991,697,555
Relatedparties'depositsat
amortizedcost
754,393
17,227,010
--
--
-17,227,010
Otherliabilities
24,083,127
--
--
--
-
Provisions
16,187,780
--
--
--
-
TotalLiabilities
103,471,034
1,101,057,535
1,824,000
--
--1,102,881,535
Interestrategap
position
254,049,130
(944,861,581)
1,382,494
1,436,520
1,687,394
5,187,685
10,265,385
(924,902,103)
FloatingInterestRate
Decem
ber31,2007
Non-interest
bearing
LBP’000
Upto3
months
LBP’000
3monthsto
1year
LBP’000
1to3years
LBP’000
3to5years
LBP’000
5to10
years
LBP’000
Over10
years
LBP’000
Total
LBP’000
Interest rate gap position in LBP:
INDEPENDENT AUDITOR’S REPORT
151

ASSETS
Cashandcentralbanks
--
--
--
173,199,945
Depositswithbanksand
financialinstitutions
--
--
--
5,270,230
Financialassetsatfair
valuethroughprofitorloss
720,101
--
--
720,101
720,101
Loanstobanks
--
-7,301,016
8,413,091
15,714,107
15,714,107
Loansandadvancestocustomers
6,783,116
6,691,310
415,102
707
-13,890,235
(6,344,980)
Loansandadvancestorelatedparties
--
--
--
93,319,568
Available-for-saleandheld-to-maturity
investmentsecurities
359,563,613
846,986,082
11,031,527
--1,217,581,2221,267,279,275
Investmentsinassociatesand
otherinvestments
--
--
--
13,236,191
Assetsacquiredinsatisfaction
ofloans
--
--
--
(11,368,117)
Goodwill
--
--
--
54,834,356
Propertyandequipm
ent
--
--
--
168,734,693
Otherassets
--
--
--
8,809,892
TotalAssets
367,066,830
853,677,392
11,446,629
7,301,723
8,413,091
1,247,905,665
1,783,405,261
LIABILITIES
Depositsfrombanksand
financialinstitutions
--
--
--
94,007,597
Customers'depositsat
amortizedcost
26,289,869
47,041
--
-26,336,910
1,080,429,572
Relatedparties'depositsat
amortizedcost
244
--
--
244
17,981,647
Otherliabilities
--
--
--
24,083,127
Provisions
--
--
--
16,187,780
TotalLiabilities
26,290,113
47,041
--
-26,337,154
1,232,689,723
Interestrategap
position
340,776,717
853,630,351
11,446,629
7,301,723
8,413,091
1,221,568,511
550,715,538
FixedInterestRate
Decem
ber31,2007
Over3
monthsless
than
1year
LBP’000
1to3years
LBP’000
3to5years
LBP’000
5to10
years
LBP’000
Over10
years
LBP’000
Total
LBP’000
Grand
Total
LBP’000
13
152

Interest rate gap position in F/CY:ASSETS
Cashandcentralbanks
88,442,625
484,668,661
9,840,548
--
--494,509,209
Depositswithbanksand
financialInstitutions
177,067,251
1,302,391,599
--
--
-1,302,391,599
Financialassetsatfairvalue
throughprofitorloss
587,547
320,068
--
--
-320,068
Loanstobanks
-42,550,682
31,557,002
6,975,765
76,622,247
--157,705,696
Loansandadvancestocustomers
131,815,507
841,536,776
8,642,753
43,107,879
74,413,786
53,985,470
3,224,034
1,024,910,698
Loansandadvancestorelatedparties
781,072,274
351,485,717
--
-21,454,183
-372,939,900
Available-for-saleandheld-to-maturity
investmentsecurities
540,465,077
22,609,524
23,698,033
--
--
46,307,557
Customers'acceptanceliability
118,431,252
--
--
--
-Investmentsinassociatesand
otherinvestments
42,025,815
--
--
--
-Assetsacquiredinsatisfactionofloans
81,841,554
--
--
--
-Goodwill
150,335,452
--
--
--
-Propertyandequipm
ent
21,107,797
--
--
--
-Otherassets
88,315,104
--
--
--
-TotalAssets
2,221,507,255
3,045,563,027
73,738,336
50,083,644
151,036,033
75,439,653
3,224,034
3,399,084,727
LIABILITIES
Depositsfrombanksand
financialinstitutions
86,198,805
41,542,896
754,037
--
--42,2
96,9
33
Customers'depositsatfairvalue
throughprofitorloss
--
--
--
--
Customers'depositsatamortizedcost
238,868,584
1,570,953,634
321
--
--
1,570,953,955
Relatedparties'depositsatfairvalue
throughprofitorloss
--
--
--
--
Relatedparties'depositsat
amortizedcost
6,609,451
517,205,876
-268,377,210
--
-785,583,086
Acceptancespayable
118,431,252
--
--
--
-Borrowingsfrombanksand
financialinstitutions
-3,161,276
33,679,012
12,473,873
119,874,549
102,416,466
53,464,610325,069,786
Certificatesofdeposit
--
--
--
--
Otherliabilities
124,411,151
5,963,350
--
--
-5,963,350
Provisions
15,780,826
--
--
--
-TotalLiabilities
590,300,069
2,138,827,032
34,433,370
280,851,083
119,874,549
102,416,466
53,464,610
2,729,867,110
Interestrategap
position
1,631,207,186
906,735,995
39,304,966
(230,767,439)
31,161,484
(26,976,813)
(50,240,576)
669,217,617
FloatingInterestRate
Decem
ber31,2008
Non-interest
bearing
LBP’000
Upto3
months
LBP’000
3monthsto
1year
LBP’000
1to3years
LBP’000
3to5years
LBP’000
5to10
years
LBP’000
Over10
years
LBP’000
Total
LBP’000
INDEPENDENT AUDITOR’S REPORT
153

ASSETS
Cashandcentralbanks
54,527,708
229,937,098
582,254,611
--
866,719,417
1,449,671,251
Depositswithbanksandfinancial
Institutions
40,319,114
--
--
40,319,114
1,519,777,964
Financialassetsatfairvalue
throughprofitorloss
30,942,223
45,355,053
--
-76,297,276
77,204,891
Loanstobanks
15,324,349
--
--
15,324,349
173,030,045
Loansandadvancestocustomers
1,740,133,705
137,067,927
72,933,186
148,768,000
26,562,586
2,125,465,4043,282,191,609
Loansandadvancestorelatedparties
41,304,352
--
58,105,101
-99,409,453
1,253,421,627
Available-for-saleandheld-to-maturity
investmentsecurities
334,337,945
571,304,970
529,470,781
947,459,741
671,850,386
3,054,423,823
3,641,196,457
Customers'acceptanceliability
--
--
--
118,431,252
Investmentsinassociatesand
otherinvestments
--
--
--
42,025,815
Assetsacquiredinsatisfactionofloans
--
--
--
81,841,554
Goodwill
--
--
--
150,335,452
Propertyandequipm
ent
--
--
--
21,107,797
Otherassets
100,184,835
--
--
100,184,835
188,499,939
TotalAssets
2,357,074,231
983,665,048
1,184,658,578
1,154,332,842
698,412,972
6,378,143,67111,998,735,653
LIABILITIES
Depositsfrombanksand
financialinstitutions
260,725,605
307,799,047
--
-568,524,652
697,020,390
Customers'depositsatfairvalue
throughprofitorloss
88,305,173
151,693,435
--
-239,998,608
239,998,608
Customers'depositsatamortizedcost
4,704,171,552
544,241,951
10,647,696
8,947,084
-5,268,008,283
7,077,830,822
Relatedparties'depositsat
fairvaluethroughprofitorloss
--
--
2,877,581
2,877,581
2,877,581
Relatedparties'depositsat
amortizedcost
1,022,665,210
382,248,416
--
-1,404,913,626
2,197,106,163
Acceptancespayable
--
--
--
118,431,252
Borrowingsfrombanksand
financialinstitutions
1,268,707
2,738,522
1,476,999
--
5,484,228
330,554,014
Certificatesofdeposit
-264,177,607
452,178,397
--
716,356,004
716,356,004
Otherliabilities
1,040,718
885,654
--
-1,926,372
132,300,873
Provisions
--
--
--
15,780,826
TotalLiabilities
6,078,176,965
1,653,784,632
464,303,092
8,947,084
2,877,581
8,208,089,35411,528,256,533
Interestrategap
position
(3,721,102,734)
(670,119,584)
720,355,486
1,145,385,758
695,535,391(1,829,945,683)
470,479,120
FixedInterestRate
Decem
ber31,2008
Over3
monthsless
than
1year
LBP’000
1to3years
LBP’000
3to5years
LBP’000
5to10
years
LBP’000
Over
10years
LBP’000
Total
LBP’000
Grand
Total
LBP’000
13
154

Interest rate gap position in F/CY:ASSETS
Cashandcentralbanks
40,006,540
569,923,597
9,070,993
--
--
578,994,590
Depositswithbanksand
financialinstitutions
35,002,492
2,860,030,466
--
--
-2,860,030,466
Financialassetsatfairvalue
throughprofitorloss
4,759,717
--
--
--
-Loansandadvancestocustomers
59,298,373
1,932,704,196
167,659,170
124,686,064
104,930,232
148,515,106
4,147,789
2,482,642,557
Loansandadvancestorelatedparties
100,053
219,153,600
7,888,415
99,153
-25,379,453
-252,520,621
Available-for-saleand
held-to-maturitysecurities
609,698,002
763,632
--
--
-763,632
Customers'acceptanceliability
62,304,148
--
--
--
-Investmentsinassociatesand
otherinvestments
59,027,604
--
--
--
-Investmentproperties
6,034,649
--
--
--
-Assetsacquiredinsatisfactionofloans
92,933,956
--
--
--
-Goodwill
112,034,024
--
--
--
-Propertyandequipm
ent
12,847,828
--
--
--
-Otherassets
229,581,347
5,147
--
--
-5,147
TotalAssets
1,323,628,733
5,582,580,638
184,618,578
124,785,217
104,930,232
173,894,559
4,147,789
6,174,957,013
LIABILITIES
Depositsandbanksand
financialinstitutions
72,201
246,890,047
662,723
--
--
247,552,770
Customers’depositsatfairvalue
throughprofitorloss
-13,907,877
--
--
-13,907,877
Customers'depositsatamortizedcost
485,092,982
4,065,556,829
14,529,883
20,343,356
--
-4,100,430,068
Relatedparties'depositsatfair
valuethroughprofitorloss
--
--
--
--
Relatedparties'depositsat
amortized
cost
4,015,415
1,824,329,937
-264,080,511
--
-2,088,410,448
Acceptancesliability
62,304,148
--
--
--
-Borrowingsfrombanksand
financialinstitutions
-16,368,223
138,719,405
--
--
155,087,628
Certificatesofdeposit
--
--
--
--
Otherliabilities
153,216,902
684,583
--
--
-684,583
Provisions
5,358,263
--
--
--
-TotalLiabilities
710,059,911
6,167,737,496
153,912,011
284,423,867
--
-6,606,073,374
Interestrategap
position
613,568,822
(585,156,858)
30,706,567
(159,638,650)
104,930,232
173,894,559
4,147,789
(431,116,361)
FloatingInterestRate
Decem
ber31,2007
Non-interest
bearing
LBP’000
Upto3
months
LBP’000
3monthsto
1year
LBP’000
1to3years
LBP’000
3to5years
LBP’000
5to10
years
LBP’000
Over10
years
LBP’000
Total
LBP’000
INDEPENDENT AUDITOR’S REPORT
155

ASSETS
Cashandcentralbanks
6,565,644
133,746,656
507,782,461
--
648,094,761
1,267,095,891
Depositswithbanksand
financialinstitutions
5,395,018
--
--
5,395,018
2,900,427,976
Financialassetsatfairvalue
throughprofitorloss
66,104,052
85,854,223
1,738,060
7,316,127
4,860,689
165,873,151
170,632,868
Loansandadvancestocustomers
101,510,350
60,276,484
11,075,992
1,450,105
-174,312,931
2,716,253,861
Loansandadvancestorelatedparties
-33,662,172
-14,062,101
-47,724,273
300,344,947
Available-for-saleand
held-to-maturitysecurities
507,874,024
667,846,216
593,359,784
1,011,267,614
668,692,199
3,449,039,837
4,059,501,471
Customers'acceptanceliability
--
--
--
62,304,148
Investmentsinassociatesand
otherinvestments
--
--
--
59,027,604
Investmentproperties
--
--
--
6,034,649
Assetsacquiredinsatisfactionofloans
--
--
--
92,933,956
Goodwill
--
--
--
112,034,024
Propertyandequipm
ent
--
--
--
12,847,828
Otherassets
--
--
--
229,586,494
TotalAssets
687,449,088
981,385,751
1,113,956,297
1,034,095,947
673,552,888
4,490,439,97111,989,025,717
LIABILITIES
Depositsandbanksand
financialinstitutions
14,876,022
372,380,519
--
-387,256,541
634,881,512
Customers’depositsatfairvalue
throughprofitorloss
1,206,000
140,683,150
--
-141,889,150
155,797,027
Customers'depositsatamortizedcost
1,444,536,414
510,032,070
39,975,092
9,377,870
-2,003,921,446
6,589,444,496
Relatedparties'depositsatfair
valuethroughprofitorloss
--
--
3,207,682
3,207,682
3,207,682
Relatedparties'depositsat
amortized
cost
32,476,184
566,616,769
--
-599,092,953
2,691,518,816
Acceptancesliability
--
--
--
62,304,148
Borrowingsfrombanksand
financialinstitutions
35,940,110
12,588,175
50,579,749
104,286,750
58,869,656
262,264,440
417,352,068
Certificatesofdeposit
-263,973,370
451,636,272
--
715,609,642
715,609,642
Otherliabilities
451,670
998,565
--
-1,450,235
155,351,720
Provisions
--
--
--
5,358,263
TotalLiabilities
1,529,486,400
1,867,272,618
542,191,113
113,664,620
62,077,338
4,114,692,08911,430,825,374
Interestrategap
position
(842,037,312)
(885,886,867)
571,765,184
920,431,327
611,475,550
375,747,882
558,200,343
FixedInterestRate
Decem
ber31,2007
Over3
monthsless
than
1year
LBP’000
1to3years
LBP’000
3to5years
LBP’000
5to10
years
LBP’000
Over10
years
LBP’000
Total
LBP’000
Grand
Total
LBP’000
13
156
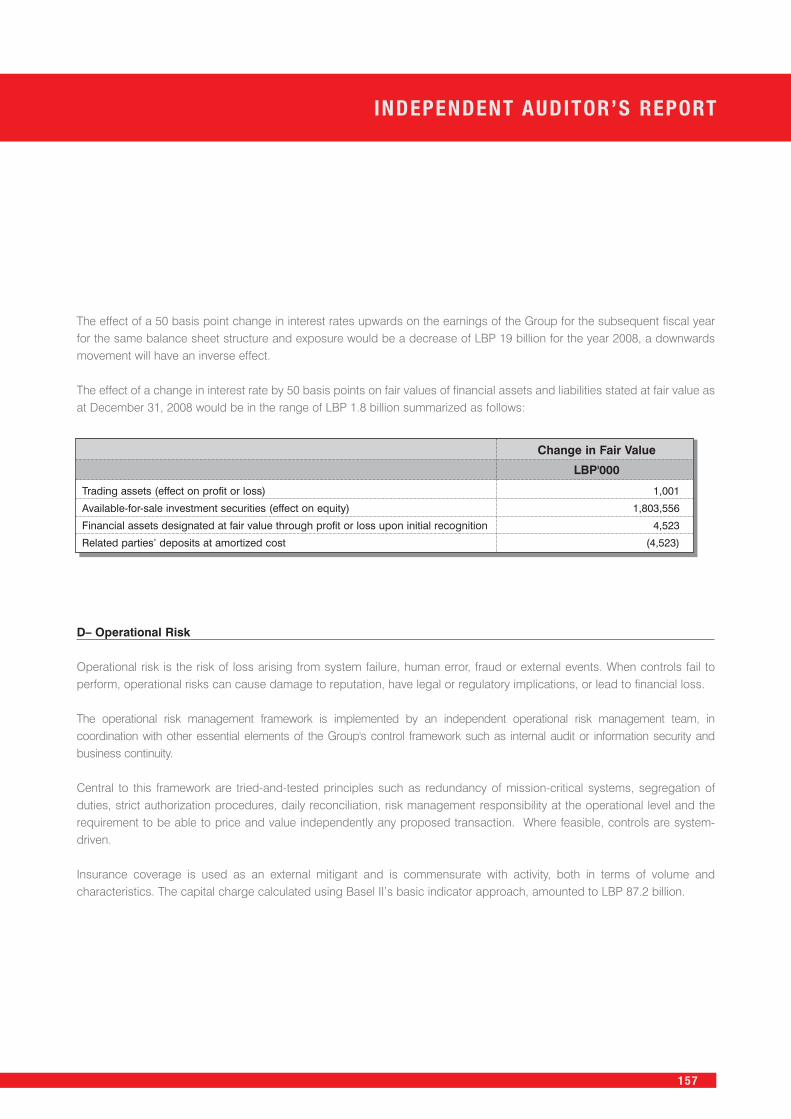
The effect of a 50 basis point change in interest rates upwards on the earnings of the Group for the subsequent fiscal yearfor the same balance sheet structure and exposure would be a decrease of LBP 19 billion for the year 2008, a downwardsmovement will have an inverse effect.
The effect of a change in interest rate by 50 basis points on fair values of financial assets and liabilities stated at fair value asat December 31, 2008 would be in the range of LBP 1.8 billion summarized as follows:
D– Operational Risk
Operational risk is the risk of loss arising from system failure, human error, fraud or external events. When controls fail toperform, operational risks can cause damage to reputation, have legal or regulatory implications, or lead to financial loss.
The operational risk management framework is implemented by an independent operational risk management team, incoordination with other essential elements of the Group's control framework such as internal audit or information security andbusiness continuity.
Central to this framework are tried-and-tested principles such as redundancy of mission-critical systems, segregation ofduties, strict authorization procedures, daily reconciliation, risk management responsibility at the operational level and therequirement to be able to price and value independently any proposed transaction. Where feasible, controls are system-driven.
Insurance coverage is used as an external mitigant and is commensurate with activity, both in terms of volume andcharacteristics. The capital charge calculated using Basel II’s basic indicator approach, amounted to LBP 87.2 billion.
Trading assets (effect on profit or loss) 1,001
Available-for-sale investment securities (effect on equity) 1,803,556
Financial assets designated at fair value through profit or loss upon initial recognition 4,523
Related parties’ deposits at amortized cost (4,523)
Change in Fair Value
LBP'000
INDEPENDENT AUDITOR’S REPORT
157

47. FAIR VALUE OF FINANCIAL ASSETS AND LIABILITIES
The summary of the Group’s classification of each class of financial assets and liabilitiescovered by IAS 39, and their fair values are as follows:
FINANCIALASSETS
Cashandcentralbanks
--
--
-1,719,509,619
1,719,509,619
1,719,509,619
Depositswithbanksand
financialinstitutions
--
--
-1,523,837,125
1,523,837,125
1,523,837,125
Financialassetsatfairvaluethrough
profitorloss
1,921,848
75,283,043
--
--
77,204,891
77,204,891
Loanstobanks
--
--
187,986,213
-187,986,213
187,986,213
Loansandadvancestocustomers
--
--
3,346,023,084
-3,346,023,084
3,334,674,670
Loansandadvancestorelatedparties
--
--
1,361,769,875
-1,361,769,875
1,361,769,875
Available-for-saleinvestmentsecurities
--
3,961,470,532
--
-3,961,470,532
3,961,470,532
Held-to-maturityinvestmentsecurities
--
-1,381,632,196
--
1,381,632,196
1,323,023,317
Otherassets
-1,099,847
--
139,810,090
533,657
141,443,594
141,443,594
Total
1,921,848
76,382,890
3,961,470,532
1,381,632,196
5,035,589,262
3,243,880,40113,700,877,129
13,630,919,836
FINANCIALLIABILITIES
Depositsfrombanksand
financialinstitutions
--
--
-715,986,668
715,986,668
747,652,884
Customers'depositsatfairvalue
throughprofitorloss
-239,998,608
--
--
239,998,608
239,998,608
Customers'depositsatamortizedcost
--
--
-8,748,449,931
8,748,449,931
8,776,739,290
Relatedparties'depositsatfairvalue
throughprofitorloss
-2,877,581
--
--
2,877,581
2,877,581
Relatedparties'depositsat
amortizedcost
--
--
-2,217,568,605
2,217,568,605
2,244,613,012
Acceptancespayable
--
--
-118,431,252
118,431,252
118,431,252
Borrowingsfrombanksand
financialinstitutions
--
--
-330,554,014
330,554,014
330,554,014
Certificatesofdeposit
--
--
-716,356,004
716,356,004
685,413,311
Otherliabilities
-9,940,604
--
--
9,940,604
9,940,604
Total
-252,816,793
--
-12,847,346,474
13,100,163,267
13,156,220,556
Decem
ber31,2008
Trading
Assets
LBP’000
AtFVTPL
LBP’000
AFS
LBP’000
HTM
LBP’000
Loans&
Receivables
LBP’000
Otherat
Amortized
cost
LBP’000
Totalcarrying
value
LBP’000
TotalFairValue
LBP’000
13
158

FINANCIALASSETS
Cashandcentralbanks
--
--
-1,440,295,836
1,440,295,836
1,440,737,961
Depositswithbanksand
financialinstitutions
--
--
-2,905,698,206
2,905,698,206
2,905,703,352
Financialassetsatfairvaluethrough
profitorloss
171,352,969
--
--
-171,352,969
171,352,969
Loanstobanks
--
--
-15,714,107
15,714,107
15,714,107
Loansandadvancestocustomers
--
--
2,709,908,881
-2,709,908,881
2,712,824,024
Loansandadvancestorelatedparties
--
--
393,664,515
-393,664,515
394,615,342
Available-for-saleinvestmentsecurities
--
3,622,741,068
--
-3,622,741,068
3,622,741,068
Held-to-maturityinvestmentsecurities
--
-1,701,039,678
--
1,701,039,678
1,589,883,807
Otherassets
-6,780,699
--
170,702,158
-177,482,857
177,482,857
Total
171,352,969
6,780,699
3,622,741,068
1,701,039,678
3,274,275,554
4,361,708,14913,137,898,117
13,031,055,487
FINANCIALLIABILITIES
Depositsfrombanksand
financialinstitutions
--
--
-728,889,109
728,889,109
744,897,053
Customers'depositsdesignatedat
fairvaluethroughprofitorloss
-155,797,027
--
--
155,797,027
155,797,027
Customers'depositsatamortizedcost
--
--
-7,669,874,068
7,669,874,068
7,769,291,925
Relatedparties'depositsatfairvalue
throughprofitorloss
-3,207,682
--
--
3,207,682
3,207,682
Relatedparties'depositsatamortizedcost
--
--
-2,709,500,463
2,709,500,463
2,790,467,979
Liabilityunderacceptances
--
--
-62,304,148
62,304,148
62,304,148
Borrowingsfrombanksand
financialinstitutions
--
--
-417,352,068
417,352,068
417,230,385
Certificatesofdeposit
--
--
-715,609,642
715,609,642
688,065,991
Otherliabilities
-3,294,963
--
--
3,294,963
3,294,963
Total
-162,299,672
--
-12,303,529,498
12,465,829,170
12,634,557,153
Decem
ber31,2007
Trading
Assets
LBP’000
AtFVTPL
LBP’000
AFS
LBP’000
HTM
LBP’000
Loans&
Receivables
LBP’000
Otherat
Amortized
cost
LBP’000
Totalcarrying
value
LBP’000
TotalFairValue
LBP’000
INDEPENDENT AUDITOR’S REPORT
159

a) Deposits with Central Bank and financial institutions:The fair value of current deposits (including non-interest earning compulsory deposits with Central Banks), and overnightdeposits is their carrying amount. The estimated fair value of fixed interest earning deposits with maturities or interest resetdates beyond one year from the balance sheet date is based on the discounted cash flows using prevailing money-marketinterest rates for debts with similar credit risk and remaining maturity.
b) Loans and advances to customers and to banks:The estimated fair value of loans and advances to customers is based on the discounted amount of expected future cashflows determined at current market rates.
c) Securities:The fair value of Lebanese Government bonds and certificates of deposits was calculated using a valuation model whichtakes into account observable market data using a discounted cash flow model based on current interest yield curveappropriate for the remaining term to maturity and credit spreads.
d) Deposits and borrowings from banks and customers’ deposits:The fair value of deposits with current maturity or no stated maturity is their carrying amount. The estimated fair value on otherdeposits is based on the discounted cash flows using interest rates for new deposits with similar remaining maturity.
e) Other borrowings and certificates of deposit:The estimated fair value of other borrowings and certificates of deposits is the discounted cash flow based on a current yieldcurve appropriate for the remaining period to maturity.
13
160

48. APPROVAL OF THE FINANCIAL STATEMENTS
The financial statements for the year ended December 31, 2008 were approved by the Board of Directors in its meeting heldon May 7, 2009.
INDEPENDENT AUDITOR’S REPORT
161


Corporate Directory
14

BankMed – Head Office482 |Clemenceau Str.Tel: 01-373937 | Fax: 01-362706 - 362806P.O. Box: 11-0348, Riad El Solh, Beirut 1107 2030, Lebanonwww.bankmed.com.lb
Clemenceau BranchBankMed Center | 482 Clemenceau Str.Tel & Fax: 01-373937
REGION 1
Phoenicia BranchPhoenix Tower | Ain Mreisseh | Tel & Fax: 01-369069/70
Hamra BranchAl Nahar Bldg. | Banque Du Liban Str.Tel & Fax: 01-353146/7/8 | 03-760007
Makdessi BranchDiab Bldg. | Makdessi Str. | HamraTel & Fax: 01-344395 | 01-346934 | 01-348167 | 03-288357
Koraytem BranchReda Mroue Bldg. | Mme Curie Str.Tel & Fax: 01-780780 | 01-803160/1/2 | 03-760064
Raouche BranchSalah Shamma Bldg. | Shouran Str.Tel & Fax: 01-862696 | 01-808610/1 | 03-760002
Movenpick BranchMovenpick Hotel | Tel & Fax: 01-799880/1
Justinian BranchJustinian Center | Justinian Str. | Sanayeh | BeirutTel: 01-354866 | 03-094718 | Fax: 01-354474
Fosh BranchFosh Str. | Beirut Central District | LebanonTel & Fax: 01-976444 | 03-922296
14
164
REGION 2
Zarif BranchKaakeh Center | Jazaer Street | BeirutTel & Fax: 01-361802/807/809/812
Verdun BranchAl Shuaa Bldg. | Rashid Karame Ave.Tel & Fax: 01-866925/6/7 | 03-760063
Mazraa BranchEtoile 2000 Center | Corniche El MazraaTel & Fax: 01-818166/7/8 | 03-760017
Msaitbe BranchAl Hana Bldg. | Mar Elias Str.Tel & Fax: 01-819202/3 | 01-314655 | 03-760011
Summerland BranchCoral Bldg. | JnahTel & Fax: 01-853444/5/6 | 03-760020
Tarik Jdideh BranchMalaab El Baladi SquareTel & Fax: 01-303444 | 01-304861/3 | 03-035251
Airport BranchMEA PREMISESTel & Fax: 01-629360/1/2/3 | 03-760026
Barbir BranchKoussa Bldg. | Corniche Mazraa | BeirutTel & Fax: 01-653120/1 | 01-645115/6 | 03-094805

CORPORATE DIRECTORY
165
REGION 3
Ashrafieh BranchHadife Bldg. | Charles Malek AvenueTel & Fax: 01-200135/6/7/8/9/40 | 03-760001
Hazmieh BranchBrazilia Str. | Tufenkjian CenterTel & Fax: 05-450186/7 | 05- 450182 | 03-652402
Mkalles BranchAl Shams Bldg. | Main RoadTel & Fax: 01-684051/2 | 03-760008
Broumana BranchRizk Plaza | Tel & Fax: 04-860995/6/7/8/9 | 03-760023
Burj Hammoud BranchGold & Jewelry Trade Center | 52 Abboud Str.Tel & Fax: 01-244000 | 03-760065
Jdeideh BranchZainoun & Saad Bldg. | Nahr El MaoutTel & Fax: 01-892055/9 | 03-760006
Zalka BranchBreezvale Center | Main RoadTel & Fax: 01-884570/1/2 | 03-760021
Furn El ChebbakAtallah Freij Bldg. | Damascus RoadTel & Fax: 01-291618/9/21 | 01-292076 | 03-760009
Sodeco BranchSodeco SquareTel & Fax: 01-611444 | 01-397762 | 03-760027
Dora BranchUnited Court Bldg. | Dora HighwayTel & Fax: 01-257960/1 | 01- 257958 | 03-095098
REGION 4
Zouk Mkayel BranchAbi Chaker Bldg, ZoukTel & Fax: 09-211116 | 09-211124 | 03-760003
Kaslik BranchDibs Center | KaslikTel & Fax: 09-639472/4 | 09-640599 | 03-241898
Jbeil BranchCordahi & Matta Center | Jbeil |Tel & Fax: 09-540195 |03-760014
Chekka BranchMikhael Karam Bldg. | Main RoadTel & Fax: 06-545121 | 06-545081 | 03-760010
Amioun BranchShamas Bldg. | Cedars Str. | AmiounTel & Fax: 06-950988/57 | 03-099122
Halba BranchHalba Main Road | Abdallah Bldg.Tel & Fax: 06-694870/1/2/3/4/5/6/7
Tripoli BranchAl Hana Bldg. | Jemmayzat Str.Tel & Fax: 06-440443 /7 | 03-760013
Tripoli (Al Maarad ) BranchAl-Maarad Street | Sara Center | TripoliTel & Fax: 06-629435 | 03-094875
Mina BranchAl Bawaba Street | Al – Shiraa Square | Jabado Bldg | TripoliTel & Fax: 06-226700/1/2/3/4/5

14
166
REGION 5
Chiyah BranchIsmail Bldg. | Hadi Nasrallah Blvd. | ChiahTel & Fax: 01-551999 - 552999 | 01- 554999 | 03-794945
Saida BranchRiad Chehab Bldg. | Riad Solh Str.Tel & Fax: 07-721788 | 07-723381 | 07-735119/21 | 03-760012
Tyr BranchSaab & Fardoun Bldg. | Central Bank Str.Tel & Fax: 07-351151 | 07-351251 | 03-332243
Wastani BranchWastani Roundabout | Saida | Boulevard Dr. Nazih BizriBankMed Bldg,Tel & Fax: 07-750362/364/365/70-867 789
Khaldé BranchSalem Center | Main RoadTel & Fax: 05-800703/4/5 | 03-760004
Saida (Eastern Boulevard) BranchAl Misbah Bldg. | Jizzine Street | SaidaTel & Fax: 07-725212 - 724892 - 728744 | 03-094868
Shehim BranchToufic Owaidat Bldg. | Shreifeh District | ShehimTel. & Fax: 07-241005/6/7 | 03-094873
Sineek BranchBoulevard Maarouf Saad | BankMed BldgTel & Fax: 07-728451/2/7
REGION 6
Chtaura BranchAl Jinan Bldg. | Main RoadTel. & Fax: 08-542491 | 03-760019
Zahlé BranchRashid Salim Khoury Bldg. | Hoshe Zaraina BlvdTel & Fax: 08-805777 | 08-802487 | 03-760015
Jib Jinnine BranchAl Hana Bldg. | West BekaaTel & Fax: 08-661503/4/5/6 | 03-760025
CYPRUS
Limassol (IBU)9 Constantinou Paparigopoulou Str. | Frema HouseCY-3106 Limassol | Cyprus.P.O.Box 54232, CY- 3722 Limassol | Cyprus.Tel: +357 25817152/3 | 25817157/8 | 25817178/9Fax: +357 25372711 | e-mail: [email protected]
SUBSIDIARIES AND AFFILIATES
BankMed Suisse3, Rue duMont-Blanc | casa postale 1523 1211Geneva 1 | SwitzerlandTel: (+41-22) 9060606
BankMed (Suisse) Representative Office - BeirutBashir Al-Kassar Street | Al-Shua'a Building | 3rd floorVerdun | Beirut | Lebanon | Tel: 01 862042 | Fax: 01 862276
Turkland Bank (T-Bank)19 Mayıs Mah Sisli Plaza A Blok No:7 | Sisli 34360Istanbul | TurkeyTel: (90-212) 3683434 | Fax: (90-212) 3683535www.turklandbank.com
Saudi Lebanese Bank S.A.L.Bashir Al-Kassar Street | Al-Shua'a Bldg. | VerdunTel: 01- 868987 | Fax: 01- 790250Telex: 43587 LABANK LE | Cable: SAULBANKP.O.Box: 11-6765 Riad El Solh | Beirut 1107 2220 | LebanonSwift: SLBL LB BX
SaudiMed Investment CompanySuite 1104 | Futuro Building | Al Ma'ather RoadP.O.Box: 63851, Riyadh 11526Kingdom of Saudi ArabiaTel: +966 920000371Fax: +966 920000372www.saudimed.com.sa
MedSecurities Investment482 | Clemenceau StrTel: 01-373937 | Fax: 01-362706 - 362806P.O. Box: 11-0348, Riad El SolhBeirut 1107 2030, Lebanon

LIST OF CORRESPONDENTS
COUNTRY CORRESPONDENT BANKS
AUSTRALIA Arab Bank Australia *AUSTRIA Bank Austria CreditanstaltBAHRAIN Arab Banking CorporationBELGIUM Fortis Bank *
ING Bank *CANADA Royal Bank of Canada *CHINA Bank of China LimitedCYPRUS Bank of Cyprus Public Company Limited *
Marfin Popular Bank Public Company Limited *DENMARK Danske Bank *EGYPT Arab BankFRANCE BNP Paribas *
Natixis *GERMANY Commerzbank *
Deutsche Bank *Bayerische Hypo-und Vereinsbank
ITALY Banca Nazionale del LavoroBanca UBAEIntesa SanPaolo *
JAPAN The Bank of Tokyo-Mitsubishi UFJ *Sumitomo Mitsui Banking Corporation
JORDAN Arab Bank *The Housing Bank for Trade & Finance *
KUWAIT Gulf Bank *National Bank of Kuwait
NORWAY DnB NOR Bank *QATAR Qatar National BankSAUDI ARABIA Banque Saudi Fransi *
Riyad Bank *Saudi Hollandi Bank *The National Commercial Bank *The Saudi Investment Bank *
SOUTH AFRICA The Standard Bank of South Africa *SPAIN Banco de Sabadell *SRI LANKA People's Bank *
Standard Chartered Bank (Pakistan) *SWEDEN Nordea Bank
Svenska Handelsbanken AB *SWITZERLAND BankMed (Suisse) *
Credit Suisse *UBS *
TURKEY Turkland Bank *UNITED ARAB EMIRATES MashreqBank *
Standard Bank PLCUNITED KINGDOM HSBC Bank *
Wachovia Bank *UNITED STATES OFAMERICA American Express Bank *
Bank of New York *Citibank *HSBC Bank USA *JPMorgan Chase Bank *National Bank of Kuwait, New York Branch *Wachovia Bank *
* BankMed maintains Nostro account(s) with those banks.
CORPORATE DIRECTORY
167

Keep Smiling
BankMed Center | 482, Clemenceau StreetTel: 961.1.373937 | Fax: 961.1.362706 | 961.1.362806
P.O.Box: 11-348 | Riad El Solh | Beirut 1107 2030 | Lebanon
www.bankmed.com.lb