annual report 2004 - bridgestone challenge is the continuing appreciation of the yen ... and by...
TRANSCRIPT

Annual Report 2004

2 Message from the President4 Our Growth Scenario
12 Regional Review20 Corporate Governance22 Operational Risk26 Financial Section55 Directors, Corporate Auditors, and Corporate Officers56 Major Subsidiaries and Affiliates58 Major Products59 Corporate Data59 Shareholder Information
Financial HighlightsBridgestone Corporation and SubsidiariesYears ended December 31, 2004 and 2003
Percent Thousands ofMillions of yen change U.S. dollars
2004 2003 2004/2003 2004
Net sales ¥2,416,685 ¥2,303,917 +4.9 $23,190,529
Net income 114,453 88,720 +29.0 1,098,292
Total assets 2,333,708 2,220,613 +5.1 22,394,281
Shareholders’ equity 934,981 887,987 +5.3 8,972,085Capital expenditure 191,000 155,742 +22.6 1,832,838
Per share in yen and U.S. dollars
Net income
Basic ¥138.96 ¥102.75 +35.2 $1.33
Diluted 138.94 102.56 +35.5 1.33
Cash dividends 19.00 16.00 – 0.18
Note: Solely for the convenience of readers, the Japanese yen amounts in this annual report are translated into U.S. dollars at the rate of ¥104.21 to $1, the approximate fiscal year-end rate.
Table of Contents

1
The Bridgestone Group is the world’s largest manufacturer of tires and other rub-
ber products. Bridgestone Corporation, headquartered in Tokyo, is the parent company
of the group. Its subsidiaries Bridgestone Americas Holding, Inc., and Bridgestone
Europe NV/SA have extensive operations in their markets. The group has also built a
large presence in China and other Asian nations besides Japan, in Australia and New
Zealand, in the Middle East, and in Africa. Tires account for 80 percent of Bridgestone
Group sales worldwide. In diversified operations, the group’s business spans industrial
rubber and chemical products, electro-materials, sporting goods, and bicycles. The
Bridgestone Group markets its tires and other products in more than 150 nations.

2 Bridgestone Annual Report 2004
This is a time of tremendous opportunity for Bridgestone,
and we are moving aggressively to capitalize on that opportunity
even while addressing huge challenges. Global demand for tires is
growing, and demand for passenger car tires in the industrialized
nations is shifting toward high-performance tires and tires of
large rim sizes. Our global production network and our unex-
celled capabilities in product development position us better than
any other tire manufacturer to serve both of these trends.
In 2004, our fiscal performance reflected the positive trends
in our markets. Net income rose 29%, to ¥114.5 billion ($1.1
billion), its highest level ever, on a 5% increase in net sales, to
¥2,416.7 billion ($23.2 billion), also a record. The growth in sales
reflected the global growth in tire demand and our success in
increasing supply capacity to meet that growth. It also reflected
a strong performance in diversified products, led by automotive
components and—in North America—by roofing materials.
The growth in net income reflected the growth in sales, but it
also reflected the challenges that we face. Chief among those chal-
lenges is an upturn of unprecedented magnitude and persistence
in prices for raw materials. That upturn diminished our operat-
ing income about ¥49 billion ($470 million) in 2004.
Another challenge is the continuing appreciation of the yen
against the dollar. The average yen/dollar exchange rate in 2004
was $1= ¥108, compared with $1= ¥116 in the previous year.
Movement in currency exchange rates diminished our operating
income about ¥6 billion ($58 million) in 2004.
We reinforced our profitability in 2004 by achieving unit sales
growth, by raising prices, by shifting our sales portfolio toward
higher-value-added products, and by employing a tax credit
available in Japan for R&D expenditures. Raw material prices
and exchange rates, however, will continue to weigh on earnings.
High and rising raw material prices, especially, are a pressing
issue of long-term ramifications for our entire industry.
While dealing with opportunity and adversity, we continued
to demonstrate a strong commitment to maximizing shareholder
value. We have repurchased shares worth approximately ¥100
billion since 2003, and we have retired shares worth about ¥50
billion. Our plans call for repurchasing shares worth ¥50 billion
in 2005.
Dividends are another important way of rewarding share-
holders. We raised our dividends for 2004 by ¥3 ($0.03), to ¥19
($0.18), and we plan a further dividend increase in 2005, to ¥20.
Management policy at Bridgestone emphasizes steady dividends.
The dividend increase for 2004 and the one planned for 2005
reflect what we regard as a fundamental improvement in our
structure of earnings.
Capitalizing on OpportunityOur management policy centers on pursuing strategic, qualitative
growth. In that spirit, we launched a capital spending program of
unprecedented scope in 2003, and we announced a broadening
of that program in February 2005. Our tire production volume
increased an average of 4% annually over the 10 years to 2004.
To maintain that growth momentum, we have earmarked ¥227
billion for capital spending over the five years from 2003 to 2007.
That capital spending addresses the overall growth in global unit
demand for tires and the shift in industrialized-nation demand
toward high-performance tires and large rim diameter tires.
We began producing tires in 2004 at two new plants in
Thailand and China. Bridgestone Group companies are building
or preparing to build two more tire plants in Brazil and Mexico,
and we will expand our Chinese production capacity further.
The Poznan Plant, in Poland, became the Bridgestone Group’s
first plant to produce runflat tires outside Japan in late 2004,
and we are preparing to produce runflat tires in South Africa.
Runflats continue to operate safely for up to specified maximum
distances and speeds after a loss of air pressure. We have estab-
lished a de facto standard for runflat tires with our sidewall-rein-
forcement technology, and we anticipate huge growth in global
demand for those tires.
Our revolutionary BIRD production system for tires began
operation in January 2005 at our Hikone Plant, in Japan.
BIRD, which stands for Bridgestone Innovative and Rational
Development, is the world’s first tire production system that
automates the entire manufacturing sequence from the process-
ing of materials to the final inspection of the finished tires. The
new Bridgestone Group plant in Mexico will also use BIRD.
Raw materials are another emphasis in our capital spending.
We recently agreed to purchase our second rubber estate in
Indonesia. In carbon black, we reinforced our production capac-
ity in Japan in the past year and opened a plant in Thailand. We
are building a steel cord plant in China, and our U.S. production
capacity for synthetic rubber is also undergoing expansion.
A Technological EdgeAsserting a technological edge is essential to the strategic, quali-
tative growth that we seek. I have already cited our leadership
in runflat tires and our revolutionary BIRD production system.
Another example is our success in motorsports. Bridgestone tires
have carried drivers and teams to seven consecutive titles in
Formula One racing, and our tires also demonstrate convincing
performance in IndyCar and Champ Car racing, where we are
the sole tire supplier.
Message from the President
A Time of Unprecedented Opportunity (and huge challenges)

3Message from the President
Our new proving ground in Italy, opened in 2004, has
strengthened our capabilities in developing high- and ultrahigh-
performance tires for Europe. With an eye to optimizing tire
performance, we continue to conduct research on peripheral
vehicle systems, and we unveiled a greatly improved version of
our in-wheel motor system for electric cars in 2004. Our expand-
ing activity in developing and producing raw materials also rein-
forces our technological capabilities in tires.
Strategic R&D is strengthening our business in diversified
products, too. A recent example is our Electronic Liquid Powder
breakthrough in electronic displays. We will begin commercializ-
ing that technology in 2005, starting with displays for rewritable
price tags.
Responsible GrowthWe expect operating income to decline 14% in 2005, to about
¥170 billion, despite a projected 3% increase in net sales, to
¥2,500 billion. We expect net income to rise 22%, to ¥140 billion,
its highest level ever, largely because of a special gain that we will
record in connection with our Japanese pension plan.
Raising prices has offset some, but not all, of the effect of
higher raw material costs, and operating profitability will also
reflect increased depreciation expenses and—most likely—the
continuing strength of the yen. In a worsening earnings environ-
ment, we are strengthening our structure of earnings through
price increases and through improvements in our sales port-
folio. We expect our capital spending program, mean-
while, to generate long-term returns that will exceed the
associated increase in depreciation.
Pursuing sustainable profitability is part of our efforts
to justify your confidence in our company. We con-
tinue working in the spirit of the Bridgestone Way,
“Trust and Pride,” to serve society with superior
quality while safeguarding the environment,
ensuring safe products and operations, and
fulfilling the highest standards of corporate
social responsibility.
April 2005
2004
Shigeo Watanabe
Chairman of the Board, CEO and President
T I M E L I N E
January• Raise prices for tire exports to Asia, Oceania,
Middle East, Africa, and nations of former Soviet Union.February
• Begin supplying GREATEC extra-wide tires toJapanese manufacturers of trucks and buses
• Cumulative shipments of runflat tires top one million
March• Unveil world’s first mass-produced film-type filters
for plasma display panels
April• Announce plans to expand production capacity for
small and medium-sized off-the-road radial tires• Receive ninth consecutive supplier of the year
award from General Motors
May• Announce agreement to supply runflat tires for
BMW’s new 6 Series models
June• Raise prices for replacement tires in Japan
• Bridgestone Europe NV/SA opens new provingground in Italy
• Announce agreement to supply runflat tires forFerrari 612 Scaglietti
July• Hold official opening for third tire plant in Thailand
August• Begin producing urethane foam for automobile
seats at joint venture in China
September• Announce plans for initial mass-production deployment of revolutionary new production
system for tires—BIRD—at Hikone Plant• Unveil improved in-wheel motor drive system for
electric vehicles• Announce collaboration with Continental AG in tire-
pressure monitoring systems for trucks• Hold official opening for third tire plant in China
October• Establish Chinese tire headquarters
• Hold official opening for carbon black plant in Thailand
• Announce plans to market electronic displays basedon original high-fluidity Electronic Liquid Powder
November• Announce plans to purchase second rubber estate
in Indonesia
December• Unveil tire simulation technology for
unprecedented range of surfaces• Announce agreement to supply tires for Boeing’s
all-new 787 Dreamliner airliners• Announce plans to build second tire plant in Brazil
• Begin producing runflat tires outside Japan forfirst time at Poznan Plant, in Poland
4 Bridgestone Annual Report 2004
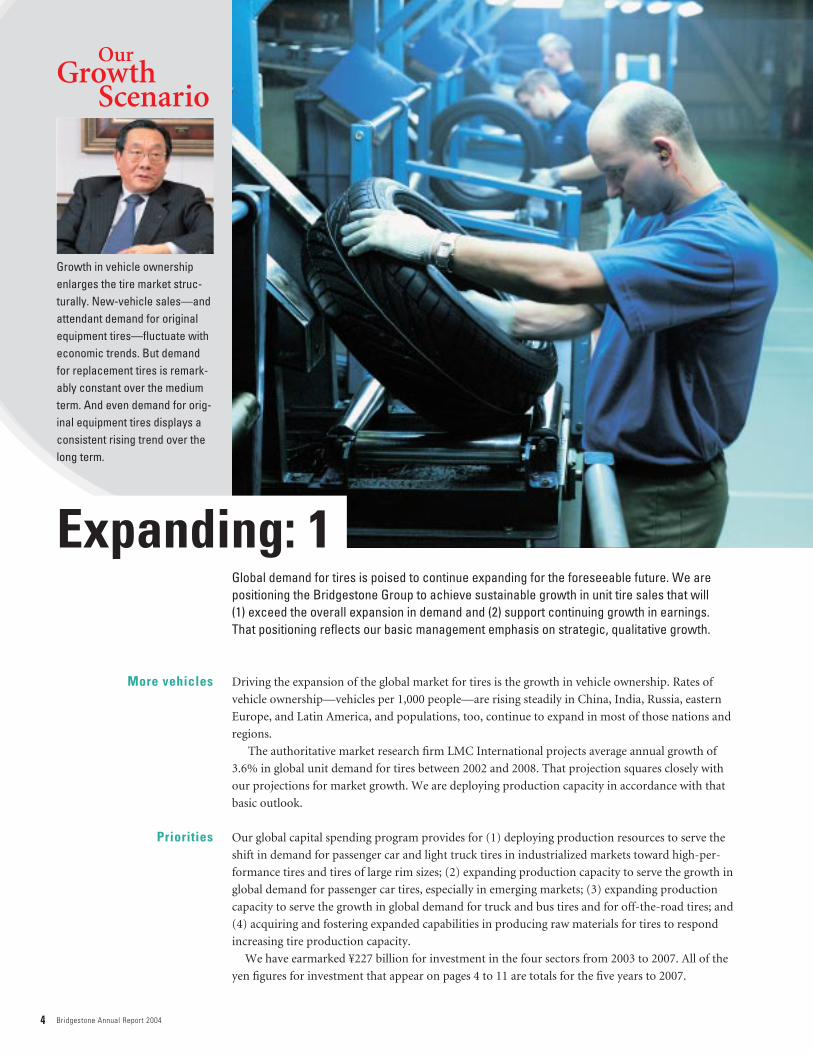
Growth in vehicle ownershipenlarges the tire market struc-turally. New-vehicle sales—andattendant demand for originalequipment tires—fluctuate witheconomic trends. But demandfor replacement tires is remark-ably constant over the mediumterm. And even demand for orig-inal equipment tires displays aconsistent rising trend over thelong term.
Expanding: 1
OurGrowth
Scenario
Driving the expansion of the global market for tires is the growth in vehicle ownership. Rates of
vehicle ownership—vehicles per 1,000 people—are rising steadily in China, India, Russia, eastern
Europe, and Latin America, and populations, too, continue to expand in most of those nations and
regions.
The authoritative market research firm LMC International projects average annual growth of
3.6% in global unit demand for tires between 2002 and 2008. That projection squares closely with
our projections for market growth. We are deploying production capacity in accordance with that
basic outlook.
Our global capital spending program provides for (1) deploying production resources to serve the
shift in demand for passenger car and light truck tires in industrialized markets toward high-per-
formance tires and tires of large rim sizes; (2) expanding production capacity to serve the growth in
global demand for passenger car tires, especially in emerging markets; (3) expanding production
capacity to serve the growth in global demand for truck and bus tires and for off-the-road tires; and
(4) acquiring and fostering expanded capabilities in producing raw materials for tires to respond
increasing tire production capacity.
We have earmarked ¥227 billion for investment in the four sectors from 2003 to 2007. All of the
yen figures for investment that appear on pages 4 to 11 are totals for the five years to 2007.
Global demand for tires is poised to continue expanding for the foreseeable future. We arepositioning the Bridgestone Group to achieve sustainable growth in unit tire sales that will (1) exceed the overall expansion in demand and (2) support continuing growth in earnings. That positioning reflects our basic management emphasis on strategic, qualitative growth.
Priorities
More vehicles
5Our Growth Scenario
Passenger car tires
Truck and bus tires
We are allocating investment of ¥88 billion to address the shift in demand toward high-performance
tires and tires of large rim sizes. That includes adding and converting production capacity—mainly
in Japan, Poland, South Africa, and Mexico—for those tires. The investment in Poland has included
adding production capacity for runflat tires, as will the investment in South Africa. The new plant in
Mexico—the Bridgestone Group’s third tire plant there—will be the first outside Japan to produce
tires with our revolutionary BIRD system.
Investment in expanding capacity to supply mass-market tires in emerging economies will total
about ¥49 billion. Capital spending projects in this sector have included building our third Chinese
tire plant, in the city of Wuxi in Jiangsu Province, and the second Bridgestone Group tire plant in
Brazil will begin operation in the second half of 2006 in the state of Bahia. Expansion is also under
way at plants in China, Thailand, Indonesia, and Costa Rica.
In truck and bus tires and in off-the-road tires, we are investing about ¥50 billion in expanding pro-
duction capacity. Our third tire plant in Thailand began producing truck and bus tires in Chonburi
Province in May 2004. That plant specializes in producing truck and bus tires for exporting world-
wide. Other investment projects are expanding production capacity for truck and bus tires at plants
in Japan, Spain, Brazil, and elsewhere. We are also expanding capacity at our Hofu Plant, in Japan,
which produces small and medium-sized off-the-road tires.
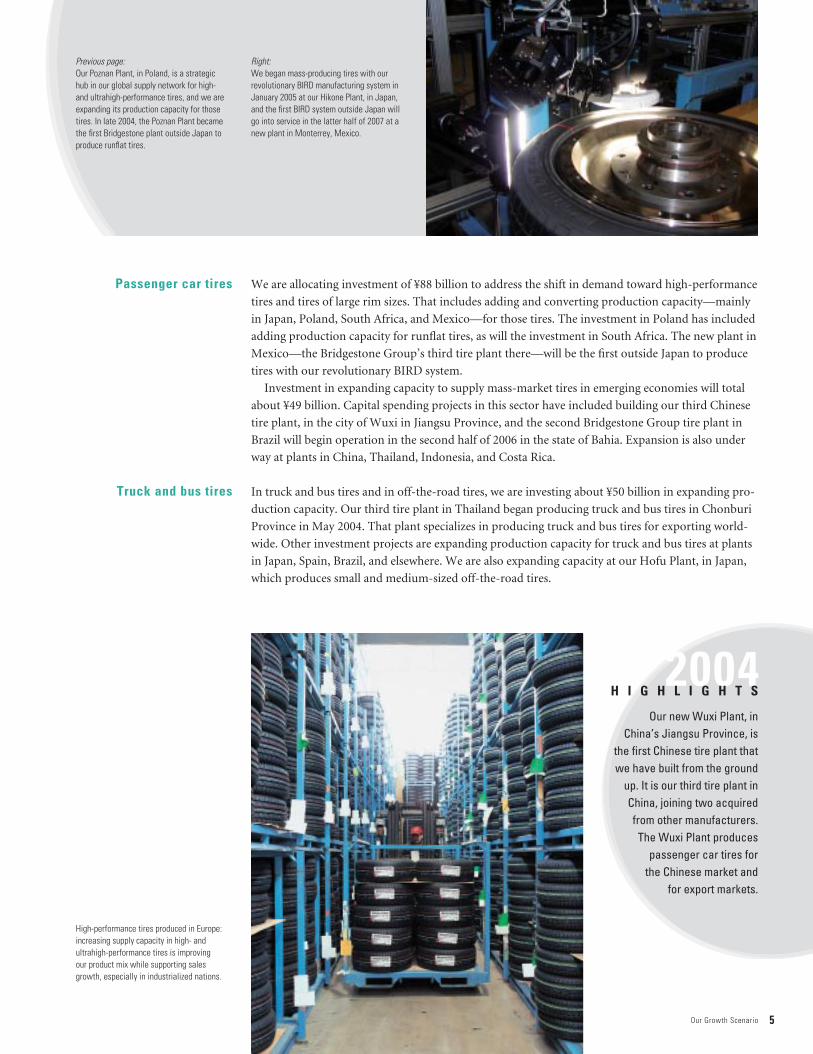
Previous page:Our Poznan Plant, in Poland, is a strategic hub in our global supply network for high- and ultrahigh-performance tires, and we areexpanding its production capacity for thosetires. In late 2004, the Poznan Plant becamethe first Bridgestone plant outside Japan toproduce runflat tires.
Right:We began mass-producing tires with our revolutionary BIRD manufacturing system inJanuary 2005 at our Hikone Plant, in Japan,and the first BIRD system outside Japan willgo into service in the latter half of 2007 at anew plant in Monterrey, Mexico.
Our new Wuxi Plant, in China’s Jiangsu Province, is
the first Chinese tire plant thatwe have built from the ground
up. It is our third tire plant inChina, joining two acquiredfrom other manufacturers. The Wuxi Plant produces
passenger car tires for the Chinese market and
for export markets.
2004H I G H L I G H T S
High-performance tires produced in Europe:increasing supply capacity in high- and ultrahigh-performance tires is improving our product mix while supporting salesgrowth, especially in industrialized nations.

6 Bridgestone Annual Report 2004
The relationship between our expanded production and our trend line for earnings is complex. We
are confident, however, of translating sales gains into earnings growth.
Overall growth in unit demand is slowing in the industrialized nations, notwithstanding the
recent vigor in North American and European demand. We expect to maintain profitable sales
growth in those nations, however, by promoting high-value tires, such as high-performance tires,
large rim size tires, runflat tires, and studless snow tires; by expanding market share; and by raising
productivity. Our revolutionary new production system, BIRD, is especially promising in regard to
improving uniformity and other aspects of quality in high-value-added tires.
In emerging and newly emerged economies, sales growth will center on mass-market tires,
though demand for large rim size tires and other high-value-added products is also growing in those
markets. Economies of scale will be decisive in maintaining sound profit margins in mass-market
tires. The Bridgestone Group is the world’s largest manufacturer of tires and other rubber products,
and that position gives us a competitive edge in economies of scale.
Profitability in all tire categories will hinge on flexibility in allocating supplies. We have built a glob-
al production network that allows for (1) supplying each principal market mainly with locally pro-
duced tires and (2) shifting supplies among regions in response to changing demand trends.
New and expanded Bridgestone plants in Southeast Asia, for example, will supply tires mainly to
export markets. We will be able to direct their output to Europe, Japan, North America, the Middle
East, and other regions as market needs warrant. Our newest Chinese plant, in Wuxi, exports part of
Output and profitability
Flexibility
The biggest challenge we facein regard to earnings is the rising cost of raw materials.Although the recent surge innatural rubber prices has abated, those prices remainnear their historic highs. Andprices for crude oil and steelcontinue to rise, which raisesour costs for synthetic rubber,carbon black, steel tire cord,and other raw materials.
Our Growth Scenario
Expanding: 2 Our tire production volume worldwide increased an average of 4% a year over the 10 years to 2004, and we expect to increase our production capacity at about that rate from 2005 to 2008.Combined with the continued strengthening of our marketing and our product developmentfunctions, that would support comparable growth in net sales.
7Our Growth Scenario
Raw material costs
its output. The tire plant scheduled for construction in Monterrey, Mexico, will supply tires mainly
to the North American market. And the new Brazilian plant will be able to export some of its output
as necessary.
In Japan, we are focusing our production capacity on high-value-added tires. That includes high-
performance tires, large rim size tires, runflat tires, and studless winter tires for passenger cars. It
also includes truck and bus tires and off-the-road tires. Japanese export capacity in these and other
tires will remain a strategic resource for us in serving global demand flexibly.
Pushing up raw material costs is the same economic expansion that is increasing demand for our
products in emergent economies. Supplies are somewhat flexible in natural rubber, and increased
planting on rubber estates will help restore the supply-and-demand balance over time. Supplies are
less flexible in oil- and steel-based raw materials, however, and users of those materials appear likely
to continue to bid prices upward.
We will recoup part of the higher costs for raw materials through price increases for our tires and
other products. We will also work to offset the higher costs by promoting high-value-added prod-
ucts and by raising productivity. But some adverse effect on our operating profit margins will pre-
sumably be unavoidable.
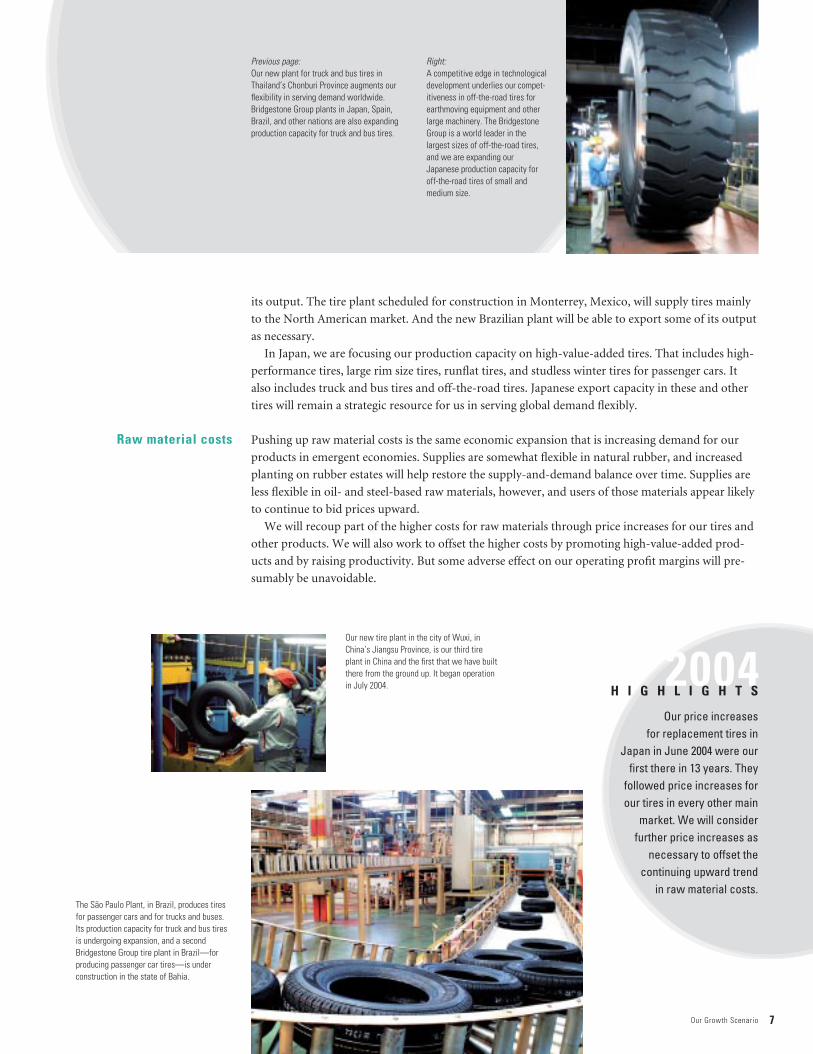
Previous page:Our new plant for truck and bus tires inThailand’s Chonburi Province augments ourflexibility in serving demand worldwide.Bridgestone Group plants in Japan, Spain,Brazil, and other nations are also expandingproduction capacity for truck and bus tires.
Our price increases for replacement tires in
Japan in June 2004 were ourfirst there in 13 years. They
followed price increases forour tires in every other main
market. We will consider further price increases as
necessary to offset the continuing upward trend
in raw material costs.
2004H I G H L I G H T S
Right:A competitive edge in technologicaldevelopment underlies our compet-itiveness in off-the-road tires forearthmoving equipment and otherlarge machinery. The BridgestoneGroup is a world leader in thelargest sizes of off-the-road tires,and we are expanding ourJapanese production capacity foroff-the-road tires of small andmedium size.
The São Paulo Plant, in Brazil, produces tiresfor passenger cars and for trucks and buses.Its production capacity for truck and bus tiresis undergoing expansion, and a secondBridgestone Group tire plant in Brazil—forproducing passenger car tires—is under construction in the state of Bahia.
Our new tire plant in the city of Wuxi, inChina’s Jiangsu Province, is our third tireplant in China and the first that we have builtthere from the ground up. It began operationin July 2004.
8 Bridgestone Annual Report 2004
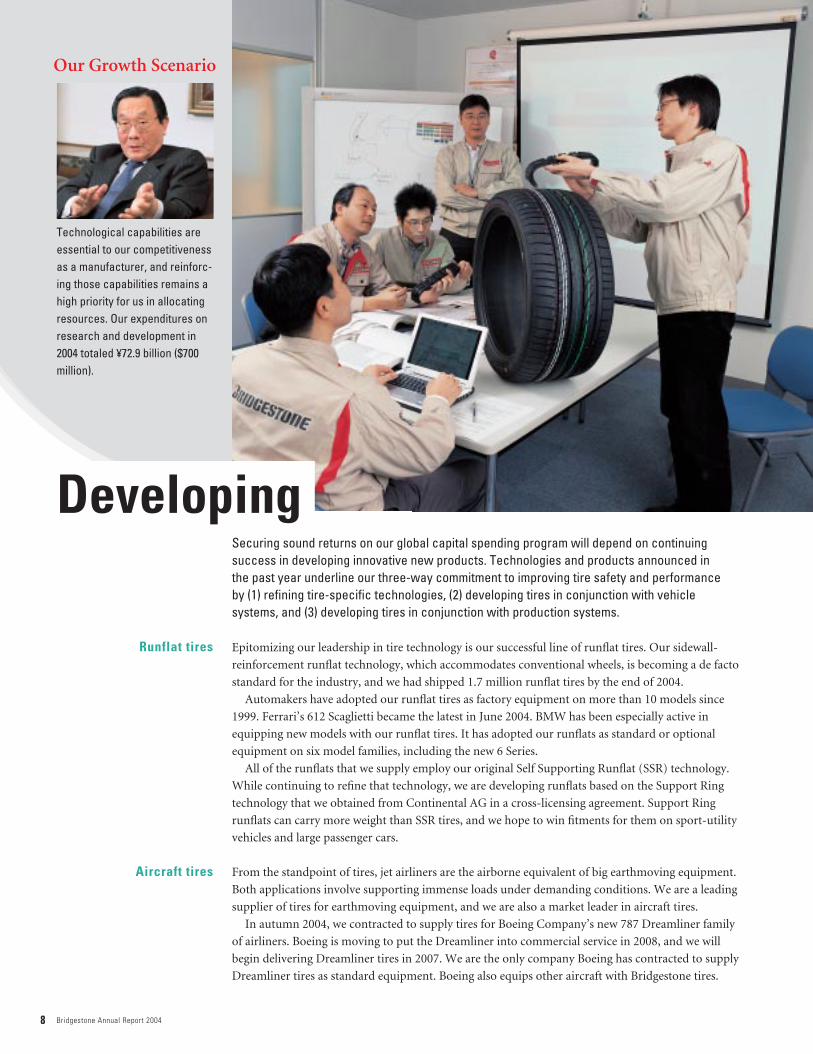
Epitomizing our leadership in tire technology is our successful line of runflat tires. Our sidewall-
reinforcement runflat technology, which accommodates conventional wheels, is becoming a de facto
standard for the industry, and we had shipped 1.7 million runflat tires by the end of 2004.
Automakers have adopted our runflat tires as factory equipment on more than 10 models since
1999. Ferrari’s 612 Scaglietti became the latest in June 2004. BMW has been especially active in
equipping new models with our runflat tires. It has adopted our runflats as standard or optional
equipment on six model families, including the new 6 Series.
All of the runflats that we supply employ our original Self Supporting Runflat (SSR) technology.
While continuing to refine that technology, we are developing runflats based on the Support Ring
technology that we obtained from Continental AG in a cross-licensing agreement. Support Ring
runflats can carry more weight than SSR tires, and we hope to win fitments for them on sport-utility
vehicles and large passenger cars.
From the standpoint of tires, jet airliners are the airborne equivalent of big earthmoving equipment.
Both applications involve supporting immense loads under demanding conditions. We are a leading
supplier of tires for earthmoving equipment, and we are also a market leader in aircraft tires.
In autumn 2004, we contracted to supply tires for Boeing Company’s new 787 Dreamliner family
of airliners. Boeing is moving to put the Dreamliner into commercial service in 2008, and we will
begin delivering Dreamliner tires in 2007. We are the only company Boeing has contracted to supply
Dreamliner tires as standard equipment. Boeing also equips other aircraft with Bridgestone tires.
Securing sound returns on our global capital spending program will depend on continuing success in developing innovative new products. Technologies and products announced in the past year underline our three-way commitment to improving tire safety and performance by (1) refining tire-specific technologies, (2) developing tires in conjunction with vehicle systems, and (3) developing tires in conjunction with production systems.
Aircraft tires
Runflat tires
Technological capabilities areessential to our competitivenessas a manufacturer, and reinforc-ing those capabilities remains ahigh priority for us in allocatingresources. Our expenditures onresearch and development in2004 totaled ¥72.9 billion ($700million).
Our Growth Scenario
Developing

9Our Growth Scenario
Beyond tires
Airbus S.A.S. offers our tires on all of the aircraft models that it produces, and we have contracted
to supply tires for Airbus’s upcoming A380 jetliner. The A380, the largest commercial airliner ever,
will go into service in 2006. We also supply tires to most of the world’s leading commercial airlines.
The latest tires that we have developed for Airbus and for Boeing employ a new belt structure
that features high-elasticity, high-strength cord. That new belt structure has earned high regard
from both manufacturers, especially for its contribution to weight savings and to wear resistance.
We unveiled an in-wheel motor system for electric vehicles in September 2003, and in 2004 we
announced a greatly improved version of the system. Installing the drive motors inside the wheels
allows for controlling each wheel individually, which supports excellent handling. It also eliminates
the need for the differential and drive shaft. That means more space for the driver and passengers.
A drawback of in-wheel motors has been the weight they add to each wheel. That affects comfort
and road-holding ability adversely, and it has limited the applicability of in-wheel motor systems.
We employ a dynamic damper to overcome this drawback. Our damper provides better traction and
a more-comfortable ride than other in-wheel systems or other kinds of electric drive.
Another Bridgestone advance that offers exciting prospects beyond tires is our technology for
automating visual inspections. That technology has simplified the inspection process and raised
inspection accuracy in our revolutionary BIRD production system for tires. It is also applicable in
other product sectors.
Right:We have reduced the size and weight of our in-wheel motor system for electric vehicles. In addition, we have improved its vibration-damping performance and itsresistance to water and to dust. We are refining the system components—includingour low rolling resistance tires—with an eye to commercializing the technology.
Previous page:The runflat performance of our SSR tires is the result of specially reinforced sidewalls.We have supplied automakers with SSR tiresfor factory installation on more than 10 vehi-cle models. A decisive advantage for our SSRtires is that they can be installed on conven-tional wheels. The Support Ring runflat tech-nology is also compatible with conventionalwheels.
Our new proving ground in Italy strengthens our response to the continuing shift in European tire demand toward high- andultrahigh-performance specifications. On-site development work there and at our technical center in Rome enables us torespond locally and quickly to automakers’ needs. Snaking around the perimeter of the site is a four-kilometer (2.5-mile) ovaltrack for high-speed testing. The proving ground also includes sections for evaluating comfort, pass-by noise, and cornering. A second phase of construction will add tracks and facilities for wet-surface and other testing in 2006.
The number of car models that leave the factory on ourrunflat tires entered doubledigits in 2004. On trucks and
buses, our AIRCEPT puncture-safety feature for our
GREATEC extra-wide tiresgained market momentum,
and we began joint work with Continental AG on
tire-pressure monitoring systems for trucks
and buses.
2004H I G H L I G H T S

10 Bridgestone Annual Report 2004
In 2004, we agreed to purchase a rubber estate in Sumatra, Indonesia, from Goodyear Tire &
Rubber Company. That will give us our second rubber estate in Indonesia, where we also cultivate
rubber trees in Kalimantan. The Bridgestone Group has a rubber estate in Liberia, too. Group com-
panies process natural rubber at the estates and at plants in Thailand and in China.
The rubber estates are invaluable as platforms for research and development. Researchers at our
rubber estates in Indonesia study plant cultivation with an eye to increasing yields and to securing
higher grades of rubber. They also conduct research on ways of raising quality and productivity in
rubber processing. Working in close coordination with our field researchers are the materials engi-
neering specialists at our technical center in Tokyo.
Bridgestone Group companies produce carbon black in Japan and in Thailand. They also work
closely with the materials engineering team at our technical center in Tokyo. Advances in carbon
black, such as the development of long-chain carbon, have figured prominently in Bridgestone
product breakthroughs. Our self-sufficiency rate is extremely high in carbon black for some special
applications in tires.
The Bridgestone Group manufactures synthetic rubber at two U.S. plants and conducts research
and development on that material in Akron, Ohio. The company-owned plants are an important
source of synthetic rubber for Bridgestone Group operations in the Americas.
Steel cord is yet another material sector where hands-on participation in R&D and in production
reinforces our technological capabilities in tires. Bridgestone Group companies produce steel cord
at plants in Japan, the United States, Italy, and Thailand. A Bridgestone plant under construction
Bridgestone is the only tire manufacturer that has in-house supply capabilities in natural rubber, synthetic rubber, carbon black, and steel cord. Our investment in expanded raw mate-rial production will total about ¥40 billion over the five years to 2007. We recently opened a carbon black plant in Thailand, and Bridgestone Group companies are expanding raw materialproduction capacity in Japan, in the United States, and in Asian nations other than Japan.
Global network
While continuing to purchasemost of our raw materials fromthird-party suppliers, we willupgrade our in-house capabili-ties in developing, producing,and using those materials. Thatwill help us create better tires,and it will help ensure reliableaccess to crucial raw materials.
Our Growth Scenario
Raw Materials
11Our Growth Scenario
Proof in speed
in Shenyang, China, will begin producing steel cord in October 2005. Our steel cord plants are an
important source of that material for our tire manufacturing in every principal market.
Textile tire cord is also an important raw material in tire production. We produce textile materi-
als for tires at several sites around the world.
Success in motorsports illustrates the value of hands-on capabilities in developing and producing
raw materials. Our tires have reigned dominant for several years in Formula One (F1) racing, in the
IndyCar series, and in the Champ Car series.
Our work in F1 and other motorsports has benefited from repeated advances, including occasion-
al breakthroughs, in raw material technologies. The molecular structure of carbon black, for exam-
ple, is a decisive factor in the grip and wear of tread compound. Our Japanese subsidiary that
produces carbon black has contributed greatly to our racing program through advances in that raw
material.
A few years ago, our U.S. subsidiary captured attention with a breakthrough in racing perfor-
mance. At the heart of that breakthrough was a new polymer structure for the synthetic rubber used
in the tread compound. The company’s hands-on capabilities in developing and manufacturing
synthetic rubber enabled its racing engineers to secure the new polymer they required.
Previous page:Our rubber estate in Kalimantan, Indonesia, allows us to gain hands-on experience in cultivating rubber trees and in processing natural rubber. We recently agreed to pur-chase a second rubber estate in Indonesia,and a Bridgestone Group company operatesthe world’s largest rubber estate, in Liberia.
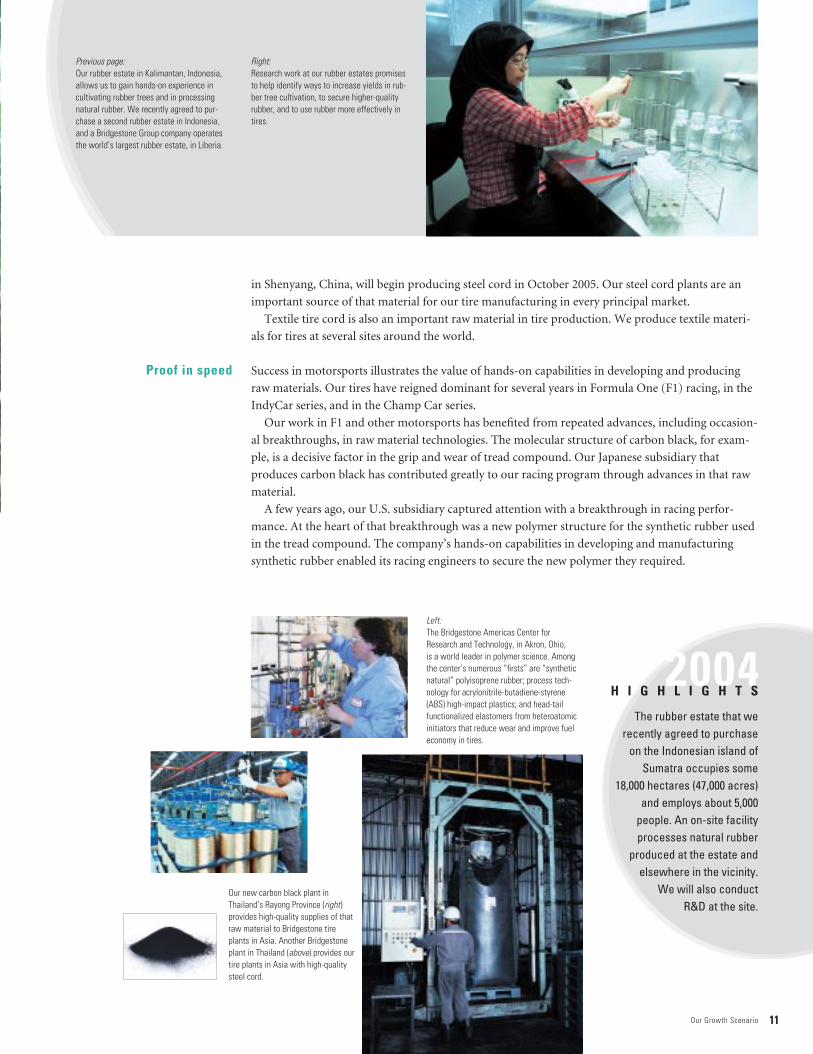
Right:Research work at our rubber estates promisesto help identify ways to increase yields in rub-ber tree cultivation, to secure higher-qualityrubber, and to use rubber more effectively intires.
The rubber estate that werecently agreed to purchase
on the Indonesian island ofSumatra occupies some
18,000 hectares (47,000 acres)and employs about 5,000
people. An on-site facilityprocesses natural rubber
produced at the estate and elsewhere in the vicinity.
We will also conduct R&D at the site.
2004H I G H L I G H T S
Left:The Bridgestone Americas Center forResearch and Technology, in Akron, Ohio, is a world leader in polymer science. Among the center’s numerous “firsts” are “syntheticnatural” polyisoprene rubber; process tech-nology for acrylonitrile-butadiene-styrene(ABS) high-impact plastics; and head-tail functionalized elastomers from heteroatomicinitiators that reduce wear and improve fueleconomy in tires.
Our new carbon black plant inThailand’s Rayong Province (right) provides high-quality supplies of thatraw material to Bridgestone tireplants in Asia. Another Bridgestoneplant in Thailand (above) provides ourtire plants in Asia with high-qualitysteel cord.

12 Bridgestone Annual Report 2004
Operating income in our Japanese operations increased 2%, to ¥131.1 billion ($1.3 billion),
despite the rising cost of raw materials and the appreciation of the yen against the dollar. Underlying
that rise was a 1% increase in sales, to ¥1,068.9 billion ($10.3 billion), including inter-segment trans-
actions. The aftereffects of the fire at our Tochigi Plant crimped our supply capacity in tires, but we
succeeded in offsetting some of that curtailment through stepped-up inventory management and
productivity gains.
Japan’s ongoing economic recovery gained momentum in 2004, notwithstanding signs of slowing
growth in the second half. Corporate earnings improved, partly on the strength of export growth,
and personal consumption was resurgent.
We posted unit sales growth in Japan’s replacement market for tires. Contributing to sales growth
was our continuing strength in low-aspect-ratio tires, in studless winter tires, and in other high-
value-added tire products.
In business with automakers, our unit tire shipments were basically unchanged from the previous
year. Exports remain an important part of our tire operations in Japan, and unit exports remained
at basically the same level as in the previous year.
Upgrading our Japanese sales networks fortified our market position. At 2004 year-end, our Tire
Kan network comprised 453 large-volume stores that sold tires and automotive accessories and pro-
vided a broad range of tire and automotive service. The number of independent tire retailers who
participate in our Mr. Tire Man network numbered 638. And our Cockpit network, which serves
motoring aficionados with tires and automotive accessories, had 143 outlets.
We raised our tire prices in Japan in June 2004 for the first time in 13 years. We raised our export
prices for tires in January 2004 and again in January 2005.
Our Japanese business in diversified products expanded, led by strong sales of automotive com-
ponents. Also contributing to growth in diversified products were strong gains in electro-materials,
including filters for plasma-display panels, and in industrial products, including rubber hoses.
Displays based on our Electronic Liquid Powder are rewritable. Used as electronic price tags, they will allow vendors to modify pricing on merchandise in retail outlets instantly and accurately.And they will allow for displaying a full range of continuously editable product information in addition to prices. The price tags retain their images when the power is turned off; they onlyrequire electric power for rewriting their displays. That saves electricity, as well as simplifying the task of displaying information.
Golf balls, along with other sporting goods and bicycles, are another facet of our business in diver-sified products. Our diversified business also includes a vast range of automotive components andindustrial and engineering materials.
We supply tires for the powerful machines of MotoGP racing. On two wheels or on four,Bridgestone tires are consistent winners ininternational motorsports.
Regional Review: Japan
Sales growth

13Regional Review
In 2005, we project a double-digit decline in operating income at Bridgestone Corporation, the
Tokyo-based parent company of the Bridgestone Group. That projection is on the basis of our
expectations of (1) a continuing upward trend in raw material prices, (2) the further appreciation of
the yen against the dollar, and (3) an increase in depreciation expenses. We project that sales at
Bridgestone Corporation will increase about 4%, led by export growth.
Efforts to fortify our position in the Japanese market for replacement tires continue to center on
qualitative improvements in our sales networks and in our sales portfolio. We will accompany those
improvements with strategic product introductions, including the newly launched Playz line of
comfort-oriented tires. Playz has been an immediate success, and the brand is contributing visibly
to invigorating our retail sales presence.
Improvements in riding comfort earned widened interest in our runflat tires among automakers. In
another safety technology, we improved the AIRCEPT units for our GREATEC extra-wide tires. An
AIRCEPT unit maintains the tire shape after a loss of air pressure to allow the drive to stop safely.
Also in 2004, we began work with Continental on tire-pressure sensors for truck and bus tires.
An improved version of our in-wheel system for electric vehicles (page 9) captured attention at
international motor shows in 2004. Also new was our terramechanical simulation, which allows for
visualizing soil as it is compacted under a rolling tire. A new era in production technology dawned
as we began mass-producing tires in Japan with our revolutionary BIRD production system.
R&D topics in diversified products included refinements in our Quick Response Liquid Powder
Displays (QR-LPD). Those displays, based on our Electronic Liquid Powder, retain their images
after the electrical power has been turned off, and they are rewritable by remote control.
We announced the world’s first mass-production technology for film-type filters for plasma
display panels (PDPs). Television manufacturers use optical filters on plasma display panels to
prevent glare and to block electromagnetic emissions. Conventional filter technology has entailed
applying numerous layers of filter material, but our filters require only three layers, which simplifies
manufacturing. The new filters and the technology for mass-producing them are the results of
original breakthroughs in precision coating and in materials design.
Fuji, a bottle-nose dolphin at the Okinawa Churaumi Aquarium, has received aprosthetic fin courtesy of Bridgestone. Around October 2002, Fuji contracted adisease that caused progressive deterioration of her tail fin. Amputating most ofthe fin saved Fuji’s life but left her unable to swim well. Employee volunteers atBridgestone went to work on a prosthesis for Fuji in December 2002. They subse-quently assembled a project team to tap the full range of Bridgestone technology.The team delivered its first prototype in September 2003 and has since supplied a series of improved versions. Fuji, a 235-kilogram female, has regained herswimming ability since receiving the prosthesis. The miraculously rejuvenateddolphin returned to public view at the aquarium in July 2004. Since August, shehas been delighting her keepers, visitors, and the Bridgestone engineers withjumps that carry her completely out of the water.
Our affiliated networks of tire retailers—Tire Kan, Mr. Tireman, and Cockpit—havebeen strategically invaluable in shaping ourmarketing in Japan.
We are concentrating our Japanese tire production on high-value-added products. The Tosu Plant, shown here, was the firstplant in the Bridgestone Group to mass-produce runflat tires.
Research anddevelopment
Challenges in 2005
14 Bridgestone Annual Report 2004
Operating income in our operations in the Americas increased 37%, to ¥26.7 billion
($256 million). A 4% rise in sales, to ¥1,018.9 billion ($9.8 billion), helped offset the adverse earn-
ings effect of rising raw material costs. That rise reflected a series of price increases for tires, as well
as unit sales gains. Our operations in the Americas posted unit sales gains in passenger car and light
truck tires and in truck and bus tires. Sales grew in both of those categories in the replacement mar-
ket and in the original equipment market.
Restoring our tire manufacturing and wholesale business in North America to profitability
remains our top priority in the Americas. The operating deficit in that business shrank further
in 2004, and we are tentatively confident of eliminating the pretax deficit completely in 2005.
Profitability in our North American tire operations has improved as management has concentrated
rigorously on upgrading their sales portfolio. That strategy has included a reduced emphasis on
market share and a sharpened focus on high-value-added products.
Our projections call for further sales growth in 2005 at our principal subsidiary in the Americas,
Bridgestone Americas Holding, Inc. We expect operating income there to remain about the same as
in 2004 because of the rising raw material prices.
Tire demand was strong across the board in the Americas in 2004. That reflected a generally strong
economic performance in the United States, where capital spending increased and the employment
picture brightened. Economic conditions were also generally favorable in Canada and in Latin
America.
Our operations in the Americas, like their Bridgestone Group counterparts elsewhere, struggled
with supply constraints throughout the year. They coped with those restraints by raising plant pro-
ductivity and by allocating production capacity to high-value products.
The plant under construction in Monterrey, Mexico, will help alleviate the now-chronic shortage
of supply capacity in North America. That plant will produce passenger car and light truck tires,
mainly in the high-performance and large rim size categories. It will feature the first installation
outside Japan of our highly automated BIRD production system. The plant will also benefit from
the impressive work ethic of the highly motivated Mexican workforce. Labor productivity at the
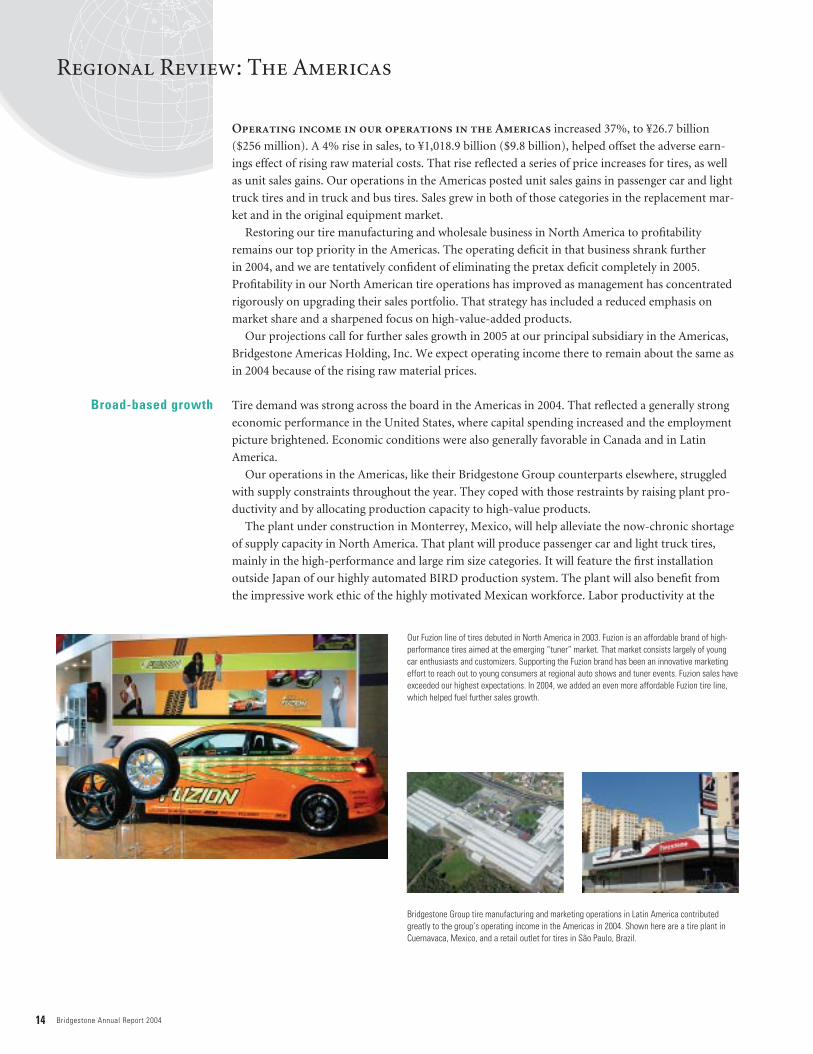
Our Fuzion line of tires debuted in North America in 2003. Fuzion is an affordable brand of high-performance tires aimed at the emerging “tuner” market. That market consists largely of youngcar enthusiasts and customizers. Supporting the Fuzion brand has been an innovative marketingeffort to reach out to young consumers at regional auto shows and tuner events. Fuzion sales haveexceeded our highest expectations. In 2004, we added an even more affordable Fuzion tire line,which helped fuel further sales growth.
Bridgestone Group tire manufacturing and marketing operations in Latin America contributedgreatly to the group’s operating income in the Americas in 2004. Shown here are a tire plant inCuernavaca, Mexico, and a retail outlet for tires in São Paulo, Brazil.
Regional Review: The Americas
Broad-based growth

15Regional Review
Bridgestone Group’s two tire plants in Cuernavaca and Mexico City is at least as high as at its other
North American plants.
Underpinning our tire manufacturing in the Americas, as in other regions, are in-house capabili-
ties for producing raw materials. Our production network in the Americas includes plants for sup-
plying synthetic rubber, steel cord, and textile cord.
The Bridgestone Group’s sales and earnings performance in the Americas also benefited from large
contributions by the Latin American tire operations, by the retail business, and by the diversified
operations, which center on roofing materials, synthetic rubber, and air springs.
Leading the strong sales and earnings performance in Latin America in 2004 were the operations
in Brazil, Argentina, and Venezuela. Demand was strong throughout the region, and the business
results also benefited from a stabilization of currency exchange rates.
Bridgestone Group companies are expanding supply capacity in Latin America to serve the struc-
tural expansion of demand occasioned by growth in vehicle ownership. That includes building a
plant in the Brazilian state of Bahia to produce passenger car tires. It also includes expanding plants
that produce truck and bus tires in Brazil and passenger car tires in Costa Rica. As in Mexico,
Brazilians’ impressive work ethic was a convincing factor in our decision to add a plant in Brazil.
The Bridgestone Group’s network of more than 2,200 company-owned stores in North America
generates revenues and earnings through automotive service, as well as through tire sales. That net-
work thus buttresses the group’s earnings structure in North America, along with underpinning its
tire marketing there.
In diversified operations, Bridgestone Americas is the market leader in rubberized roofing materi-
als and is a leading supplier of air springs for truck trailers. Its business in synthetic rubber is anoth-
er important contributor to sales and earnings. Bridgestone Group companies in the Americas also
produce and market automotive antivibration components, golf balls, and polyurethane foam for
automotive seating.
Two thousand four was the third consecutive year that stores and team membersin the Firestone Tire & Service Center network sponsored and participated inKeep America Beautiful’s Great American Cleanup. That program, which runsfrom March to May, is the nation’s largest cleanup and community improvementundertaking of its kind. President George W. Bush served as the program’s hon-orary chairman for the second year in a row. The cleanup gathered more than1,220,000 scrap tires for recycling, a 33% increase over 2003. Each of the 1,500Firestone Tire & Service Centers served as a community drop-off spot for residen-tial used engine oil, automotive batteries, and scrap tires from communitycleanups.
The roofing materials business remains a vigorous contributor to sales and earningsgrowth in the Bridgestone Group’s operationsin the Americas. The group is expanding production capacity for roofing materials andis adding new products. Meanwhile, we areexploring possibilities for broadened interna-tional marketing in roofing materials.
The legendary IndyCar racing series unfoldsexclusively on our Firestone-brand tires.Similarly, all of the teams in the Champ Carseries race on our Bridgestone-brand tires.
Latin American vigor
Retail and diversifiedmomentum, too
16 Bridgestone Annual Report 2004
Operating income in our European operations climbed 43%, to ¥22.0 billion ($211 mil-
lion), on a 12% increase in sales, to ¥325.6 billion ($3.1 billion). We more than offset the adverse
effect of rising raw material costs on earnings by achieving unit sales growth, by raising tire prices,
and by successfully promoting high-performance tires and otherwise improving our sales portfolio.
Our European unit sales increased in passenger car tires and in truck and bus tires. Those increas-
es comprised modest gains in passenger car tires in the replacement market and in the original
equipment market, a double-digit gain in truck and bus tires in the original equipment sector, and a
small decline in truck and bus replacement tires, which resulted mainly from supply constraints.
Economic growth in Europe was stronger than expected, supported by export demand. The EU
reports that overall economic growth in its 15 member nations was 2.3% in 2004, compared with an
earlier projection of 2.0%. Tire demand generally reflected the modest economic expansion.
Supply constraints, a problem for us everywhere, were especially severe in Europe. Our European
operations addressed that challenge by increasing output at existing plants and by focusing on high-
value-added products.
We project further sales growth in 2005 at our principal European subsidiary, Bridgestone
Europe NV/SA. A decline in operating income appears unavoidable, however, because of the
rising cost of raw materials.
The Poznan Plant, in Poland, became the first Bridgestone plant outside Japan to produce runflat
tires in December 2004. Production at that plant centers on high- and ultrahigh-performance tires
for passenger cars, and expanded output there is part of our strategy for strengthening our supply
capacity in Europe. We are also expanding our Bilbao Plant, in Spain, which produces truck and bus
tires. And we are studying the possibility of building another tire plant in eastern Europe.
Independent capabilities in producing raw materials fortify our tire manufacturing in Europe,
too. Those capabilities include production lines for steel cord in Italy and for textile cord in Spain.
The First Stop network of independent retailers is the cornerstone of our European marketing effort
in passenger car tires. Those dealers assert a unified identity in a network that extends throughout
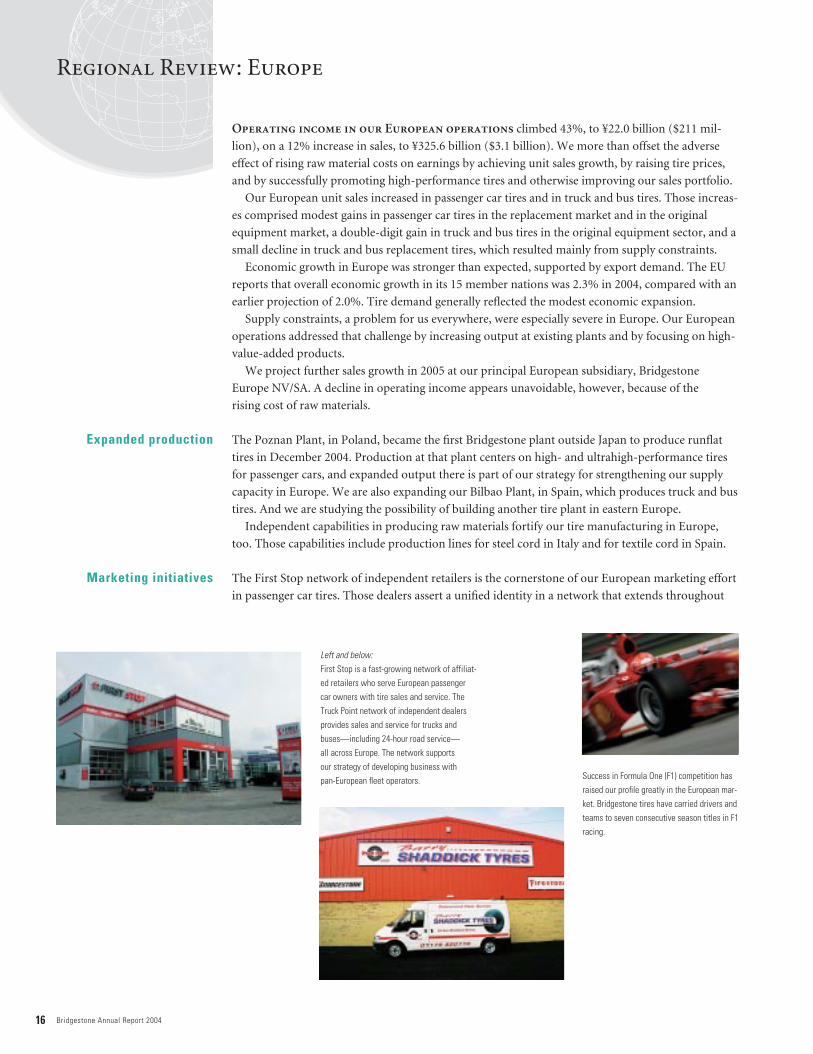
Left and below:First Stop is a fast-growing network of affiliat-ed retailers who serve European passengercar owners with tire sales and service. TheTruck Point network of independent dealersprovides sales and service for trucks andbuses—including 24-hour road service—all across Europe. The network supports our strategy of developing business with pan-European fleet operators.
Regional Review: Europe
Expanded production
Marketing initiatives
Success in Formula One (F1) competition hasraised our profile greatly in the European mar-ket. Bridgestone tires have carried drivers andteams to seven consecutive season titles in F1racing.
17Regional Review
Europe. They numbered about 1,100 at the end of 2004, and we plan to increase that number to
2,000 by 2009.
We also operate directly owned retail outlets in Europe. Those outlets number about 300, and
they are mainly in Spain and France. We are expanding our network of directly owned stores gradu-
ally to support our European marketing effort.
Our profile has risen steadily in Europe, helped by our success in Formula One competition, and
we will work to raise our market visibility further. We will strive to build a stronger corporate image
by exhibiting at international motor shows, by advertising in print and broadcast media and
through outdoor signage and displays, and by holding events and campaigns to promote tire safety
and runflat tires.
In the truck and bus sector, we are making the most of the excellent reputation of our tires for
retreadability and durability. Our efforts include expanding and upgrading our Truck Point net-
work of outlets for providing tires and service to large fleet operators. The Truck Point network
comprised about 1,800 outlets throughout Europe at the end of 2004, and we plan to increase that
number to 2,000 by 2009.
Business in diversified products will be an increasingly important facet of our European operations.
A Bridgestone plant under construction in Poland will build rubber tracks for earthmoving equip-
ment. The plant is to serve rising European demand for rubber tracks amid continuing global
growth in demand for construction machinery. It will be in southwestern Poland, near the city of
Wroclaw. Plans call for the plant to begin operation in July 2006 and for its production capacity to
reach about 26,000 tracks a year in 2007.
Also in Poland, a new Bridgestone Group plant in Wolsztyn began producing air springs for truck
trailers in December 2004. The new plant serves fast-growing European demand for those products.
We are expanding our production capacity fortruck and bus tires in Europe, as in otherregions. Our main European plant for truckand bus tires is in Bilbao, Spain.
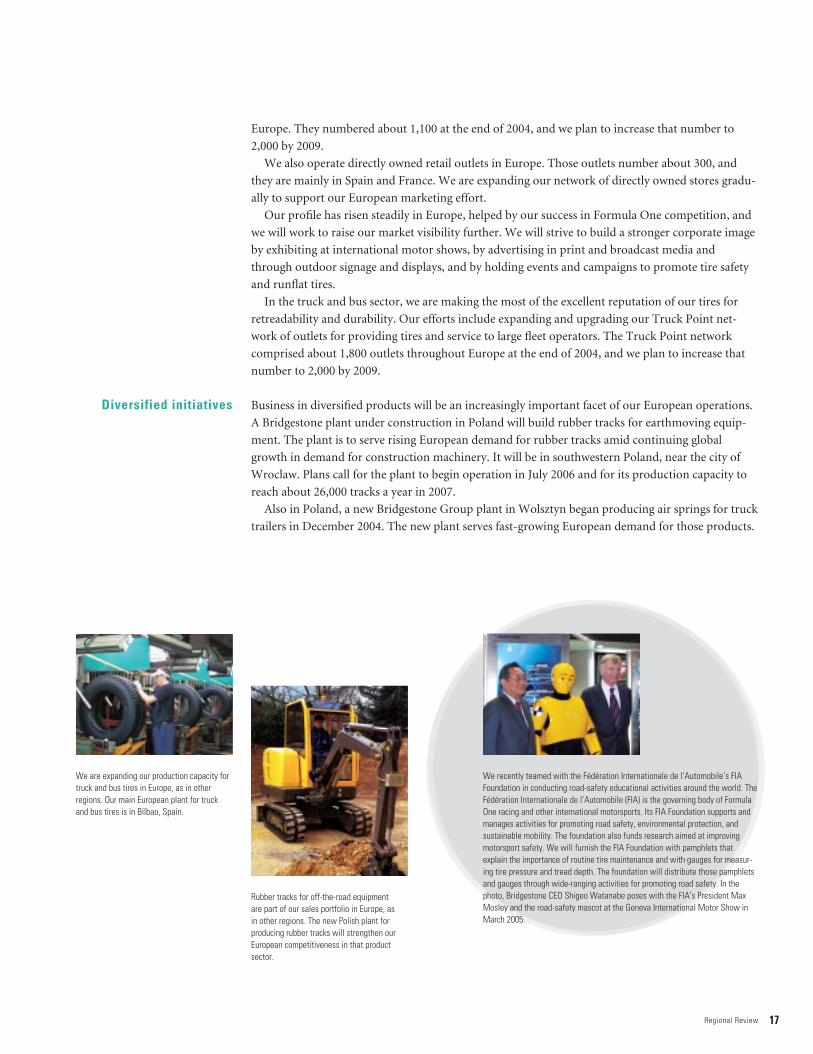
Rubber tracks for off-the-road equipment are part of our sales portfolio in Europe, as in other regions. The new Polish plant for producing rubber tracks will strengthen ourEuropean competitiveness in that product sector.
We recently teamed with the Fédération Internationale de l’Automobile’s FIAFoundation in conducting road-safety educational activities around the world. TheFédération Internationale de l’Automobile (FIA) is the governing body of FormulaOne racing and other international motorsports. Its FIA Foundation supports andmanages activities for promoting road safety, environmental protection, and sustainable mobility. The foundation also funds research aimed at improvingmotorsport safety. We will furnish the FIA Foundation with pamphlets thatexplain the importance of routine tire maintenance and with gauges for measur-ing tire pressure and tread depth. The foundation will distribute those pamphletsand gauges through wide-ranging activities for promoting road safety. In thephoto, Bridgestone CEO Shigeo Watanabe poses with the FIA’s President MaxMosley and the road-safety mascot at the Geneva International Motor Show inMarch 2005.
Diversified initiatives
18 Bridgestone Annual Report 2004
Operating income in other regions declined 18% in 2004, to ¥17.7 billion ($170 million).
That decline reflected start-up costs associated with plant construction and expansion projects,
along with the adverse earnings effect of rising prices for raw materials. Sales in other regions
increased 15%, to ¥405.4 billion ($3.9 billion). Bridgestone Group companies raised their tire prices
during the year in all of the principal markets included in this regional category.
Our unit tire sales grew strongly in Southeast Asia, China, India, and Russia. The growth in
Southeast Asia included an increase in business with Japanese automakers there. Those automakers
are expanding their vehicle production in the region, especially in Thailand, to serve export markets.
Our operations in Southeast Asia continue to achieve growth in tire exports, too, and our newly
opened plant for truck and bus tires in Chonburi, Thailand, is expressly for serving export markets
worldwide. Southeast Asia’s market for replacement tires also continues to grow steadily.
Raw materials have been a traditional emphasis in our Southeast Asian production, and that
emphasis is stronger than ever. Our Thai operations produce steel cord and process natural rubber,
and they recently gained a plant for producing carbon black. We operate two rubber estates in
Indonesia. Our manufacturing network in Southeast Asia also includes several plants for diversified
products.
In China, we posted double-digit growth in unit sales of tires. We expect our tire sales in China
to continue growing rapidly, supported by expanding local production. Our third Chinese tire
plant began operation in 2004, and we plan to continue to expand our Chinese tire production. An
emphasis on raw materials is evident in our tire manufacturing in China, as in other nations. We are
building a plant in Shenyang to produce steel cord for truck and bus tires. That is in addition to sev-
eral Chinese plants where we produce diversified products.
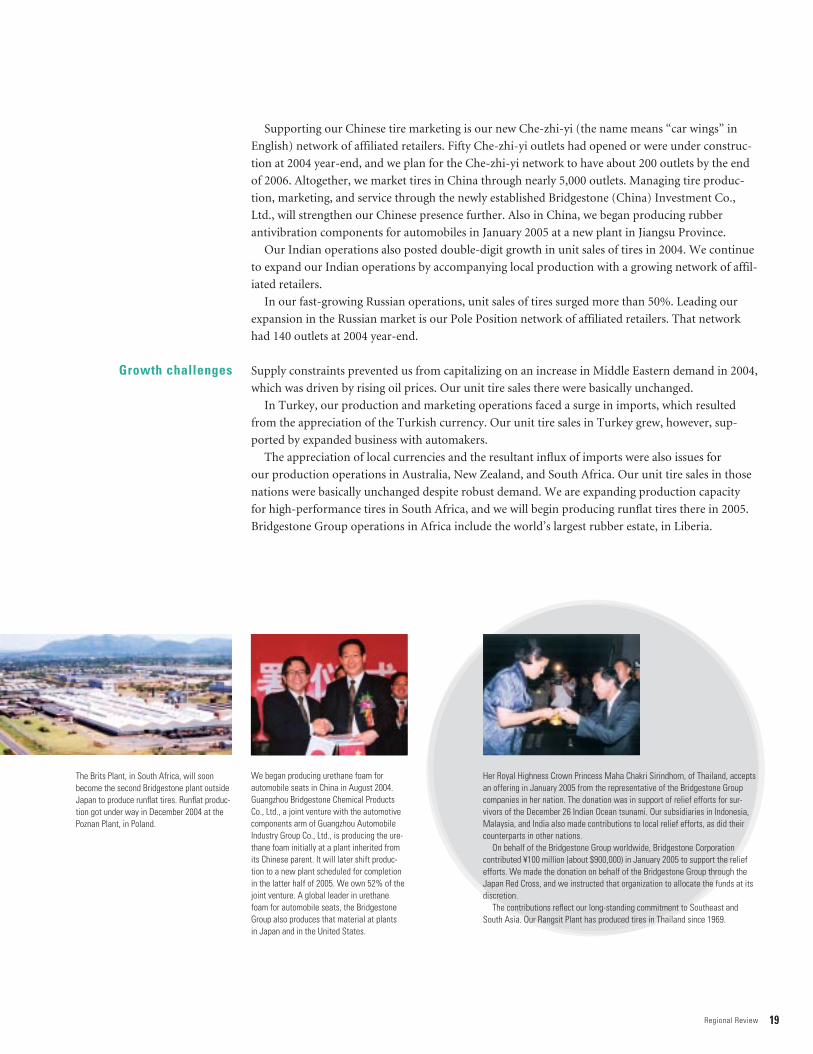
Our Pole Position network of independentRussian retailers is growing rapidly. The network’s prime selling points include a reassuring atmosphere and conscientiousservice.
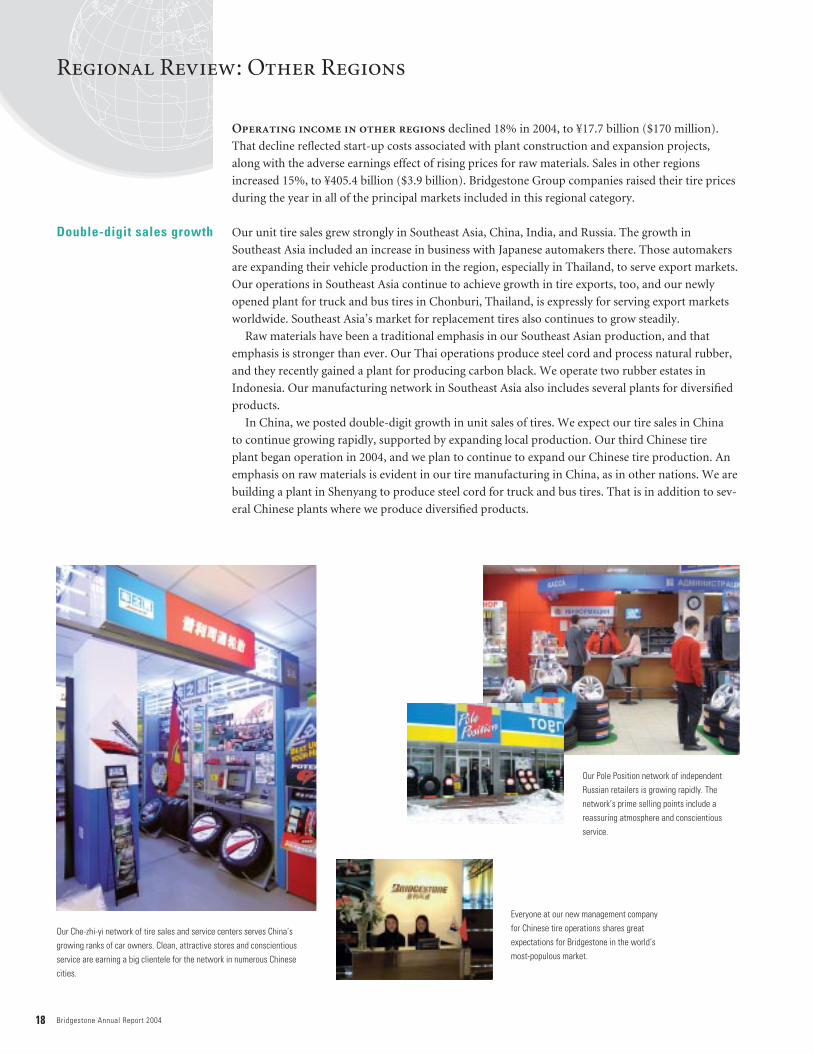
Our Che-zhi-yi network of tire sales and service centers serves China’s growing ranks of car owners. Clean, attractive stores and conscientious service are earning a big clientele for the network in numerous Chinesecities.
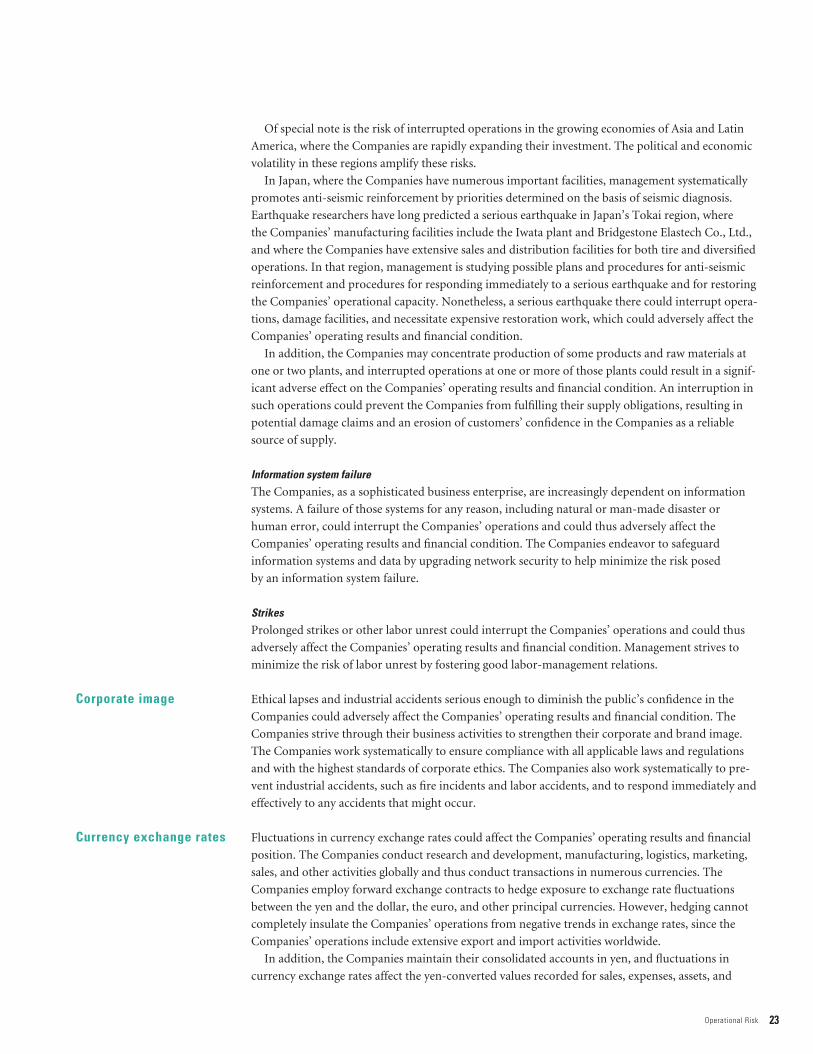
Everyone at our new management companyfor Chinese tire operations shares greatexpectations for Bridgestone in the world’smost-populous market.
Regional Review: Other Regions
Double-digit sales growth
19Regional Review
Supporting our Chinese tire marketing is our new Che-zhi-yi (the name means “car wings” in
English) network of affiliated retailers. Fifty Che-zhi-yi outlets had opened or were under construc-
tion at 2004 year-end, and we plan for the Che-zhi-yi network to have about 200 outlets by the end
of 2006. Altogether, we market tires in China through nearly 5,000 outlets. Managing tire produc-
tion, marketing, and service through the newly established Bridgestone (China) Investment Co.,
Ltd., will strengthen our Chinese presence further. Also in China, we began producing rubber
antivibration components for automobiles in January 2005 at a new plant in Jiangsu Province.
Our Indian operations also posted double-digit growth in unit sales of tires in 2004. We continue
to expand our Indian operations by accompanying local production with a growing network of affil-
iated retailers.
In our fast-growing Russian operations, unit sales of tires surged more than 50%. Leading our
expansion in the Russian market is our Pole Position network of affiliated retailers. That network
had 140 outlets at 2004 year-end.
Supply constraints prevented us from capitalizing on an increase in Middle Eastern demand in 2004,
which was driven by rising oil prices. Our unit tire sales there were basically unchanged.
In Turkey, our production and marketing operations faced a surge in imports, which resulted
from the appreciation of the Turkish currency. Our unit tire sales in Turkey grew, however, sup-
ported by expanded business with automakers.
The appreciation of local currencies and the resultant influx of imports were also issues for
our production operations in Australia, New Zealand, and South Africa. Our unit tire sales in those
nations were basically unchanged despite robust demand. We are expanding production capacity
for high-performance tires in South Africa, and we will begin producing runflat tires there in 2005.
Bridgestone Group operations in Africa include the world’s largest rubber estate, in Liberia.
The Brits Plant, in South Africa, will soonbecome the second Bridgestone plant outsideJapan to produce runflat tires. Runflat produc-tion got under way in December 2004 at thePoznan Plant, in Poland.
We began producing urethane foam for automobile seats in China in August 2004.Guangzhou Bridgestone Chemical ProductsCo., Ltd., a joint venture with the automotivecomponents arm of Guangzhou AutomobileIndustry Group Co., Ltd., is producing the ure-thane foam initially at a plant inherited fromits Chinese parent. It will later shift produc-tion to a new plant scheduled for completionin the latter half of 2005. We own 52% of thejoint venture. A global leader in urethanefoam for automobile seats, the BridgestoneGroup also produces that material at plants in Japan and in the United States.
Her Royal Highness Crown Princess Maha Chakri Sirindhorn, of Thailand, acceptsan offering in January 2005 from the representative of the Bridgestone Groupcompanies in her nation. The donation was in support of relief efforts for sur-vivors of the December 26 Indian Ocean tsunami. Our subsidiaries in Indonesia,Malaysia, and India also made contributions to local relief efforts, as did theircounterparts in other nations.
On behalf of the Bridgestone Group worldwide, Bridgestone Corporation contributed ¥100 million (about $900,000) in January 2005 to support the reliefefforts. We made the donation on behalf of the Bridgestone Group through theJapan Red Cross, and we instructed that organization to allocate the funds at itsdiscretion.
The contributions reflect our long-standing commitment to Southeast andSouth Asia. Our Rangsit Plant has produced tires in Thailand since 1969.
Growth challenges

20 Bridgestone Annual Report 2004
Corporate Governance
Ensuring that the Companies (Bridgestone Corporation (the “Company”) and its subsidiaries)
fulfill their basic corporate mission is the ultimate aim of corporate governance at the Companies.
The Companies articulate that mission in its corporate guiding principles, the Bridgestone Way, as
“serving society with superior quality.” They continue working to upgrade their corporate gover-
nance in the spirit of fulfilling that mission more fully.
Responsibility for management oversight at the Company resides in the Board of Directors, which
presently has nine members. The directors monitor business and financial performance and other
activity at the Companies on behalf of the shareholders and other stakeholders.
Since 2002, the Company has divided the responsibilities for management oversight and opera-
tional management. Dividing the two functions was a measure to clarify responsibility for each
function and—by reducing the size of the Board of Directors—to speed decision making. Members
of management report that the measure has been successful in fulfilling both of those aims.
Responsibility for operational management resides with the corporate officers. Those executives
manage the different sectors of operations in accordance with corporate policy established by the
Board of Directors. Eight of the nine present members of the Board of Directors serve concurrently
as corporate officers. Management believes that some overlap between the Board of Directors and
the corporate officers helps maximize efficiency in both the oversight and operational functions.
The Company’s Board of Corporate Auditors presently consists of five members. Three of
those members are “outside auditors”—individuals who have not been employed by any of
the Companies for at least five years before being named auditors. One of the outside auditors,
Hiroshi Ishibashi, owns 3.14% of the outstanding shares of the Company. He serves as president
of Nagasaka Corporation and as chairman of AXIS Inc., both of which conduct business with
the Companies. Their business with the Companies is subject to the same conditions that govern
the Companies’ business with nonshareholders.
Serving as a supplementary deliberative group at the Company is the Executive Committee. That
group, headed by the Company’s president, consists of some of the directors, corporate auditors,
and corporate officers. The Executive Committee is a forum for deliberating matters expressly
designated by the company rules as its responsibility and certain other matters.
Changes in the Board of Directors and in corporate officers and compensation for the directors and
officers—including severance payments—are the responsibility of the Directorial Personnel and
Compensation Committee. That committee consists of some of the directors, corporate auditors,
corporate officers, and divisional directors of the Company. Matters considered and reported by the
Directorial Personnel and Compensation Committee are subject to deliberation and decision by the
Board of Directors, by the Board of Corporate Auditors, or at the General Meeting of Shareholders.
That helps ensure transparency and objectivity.
Basic approach
Board of Directors
Corporate officers
Board of CorporateAuditors
Executive Committee
Directorial Personnel andCompensation Committee

21Corporate Governance
The Bridgestone Way includes seven core emphases, one of which is to “understand and honor
fully the ethical values, moral practices, and legal regulations of every nation and region” where
the Companies operate. The Company has established an organization to promote and monitor
compliance with high standards of corporate ethics. That organization includes the chief compli-
ance officer, the Compliance Committee, and a full-time staff. Measures for promoting ethical com-
pliance include a “hotline” for handling employee concerns, messages from the president addressed
to all employees, initiatives by the chief compliance officer, and training sessions for employees.
Despite systematic efforts to promote compliance with high standards of corporate ethics, ethical
breaches have occurred at the Company. A recent breach consisted of anticompetitive behavior in
bidding on tire-supply contracts with the Japan Defense Agency. The Company accepted a recom-
mendation from the Japan Fair Trade Commission in January 2005 in connection with that behav-
ior. Management deeply regrets that incident and has stepped up its efforts to prevent any future
breaches.
Internal audits are the responsibility of specialty teams established in the control sector and in
each of the principal business sectors at the Company and at each of the Company’s principal
subsidiaries. The audits cover accounting and operations. Management also solicits professional
opinions as necessary from outside lawyers and financial auditors.
The Company’s president serves concurrently as chief risk-management officer. Operating under
the chief risk-management officer is the Risk-Management Committee. That committee devises
and deploys measures for preventing risks from escalating into crises and for coping effectively with
any serious emergencies that might occur. Its activities have included drafting a plan for restoring
operations promptly to full functionality after emergencies. The Risk-Management Committee has
also revised and distributed a manual that details companywide risk-management procedures.
Ethical compliance
Internal auditing
Risk management

22 Bridgestone Annual Report 2004
The operating and accounting status of the Companies, as described in this document, is
subject to diverse risk. Below is a summary of the principal categories of risk that may have a bearing
on investors’ decisions. Management at the Companies is alert to these and other kinds of risk, and
the Companies work systematically to minimize risk and the effect of any adverse events on their
operations. However, events associated with the potential risk factors described below or with other
kinds of risk, difficult or impossible to predict, could adversely affect the Companies’ operations,
their business results, and their financial condition. All references to possible future developments
in the following text are as of March 30, 2005.
The Companies conduct research and development, purchasing, manufacturing, logistics, market-
ing, sales, and other activities globally. Their operating results and financial position are therefore
subject to trends in demand, interest rates, currency exchange rates, equity share prices, and other
economic variables in different regions. Operations in the Americas accounted for 42% of the
Companies’ sales (for outside customers only) in the fiscal year under review, operations in Japan
for 34%, and operations in Europe for 13%; so, an economic downturn in any of those regions
could exert a significant adverse effect on the Companies’ operating results and financial condition.
While the tire business accounts for 80% of the Companies’ net sales, the Companies’ diversified
products operations also include a large volume of business in automotive products. The
Companies’ operating results and financial position are therefore subject to business conditions in
the global automobile industry.
Demand for replacement tires in each nation where the Companies do business is also subject to
local trends in consumer spending, automotive fuel prices, and other market variables. Any combi-
nation of trends that might cause demand for replacement tires to decline or to grow more slowly
than expected could adversely affect the Companies’ operating results and financial position. In
addition, the Companies sell large volumes of winter tires in Japan, Europe, and North America,
and less-than-average snowfall in any of those regions could adversely affect the Companies’ operat-
ing results and financial position to some extent.
The Companies’ operations in each nation are subject to diverse laws and regulations that govern
investment, trade, currency exchange, competitive practices, environmental protection, and other
aspects of business activity. New or revised laws and regulations could limit the scope of the
Companies’ business activity, raise operating costs, or otherwise adversely affect the Companies’
operating results and financial condition.
Examples of legal and regulatory changes that have had an effect on the Companies’ tire opera-
tions in the past include the prohibition of spiked tires in Japan and the passage of the TREAD Act
in the United States. Legal and regulatory developments have also affected the Companies’ diversi-
fied products operations, such as prohibitions on the use of chlorofluorocarbons in urethane foam.
In addition, the Companies are rapidly expanding their investment in growing economies in
Asia—including China—and Latin America, and unpredictable legal and regulatory changes in
those nations could force modifications in the Companies’ investment programs and business plans.
These types of legal and regulatory changes could adversely affect the Companies’ operating results
and financial condition.
Natural disasters, war, terrorist action, civil strife, and social and political unrest
The Companies conduct research and development, manufacturing, logistics, marketing, sales,
and other activities globally, and they therefore may encounter the risk of earthquakes, floods, and
other kinds of natural disasters; of war, terrorist action, civil strife, and social and political unrest
in numerous nations; and other force majeures. Any of those possible events could interrupt the
Companies’ operations, which could adversely affect the Companies’ operating results and financial
position.
Operational Risk
Economic environmentand demand
Laws and regulations
Interruption of operations
23Operational Risk
Of special note is the risk of interrupted operations in the growing economies of Asia and Latin
America, where the Companies are rapidly expanding their investment. The political and economic
volatility in these regions amplify these risks.
In Japan, where the Companies have numerous important facilities, management systematically
promotes anti-seismic reinforcement by priorities determined on the basis of seismic diagnosis.
Earthquake researchers have long predicted a serious earthquake in Japan’s Tokai region, where
the Companies’ manufacturing facilities include the Iwata plant and Bridgestone Elastech Co., Ltd.,
and where the Companies have extensive sales and distribution facilities for both tire and diversified
operations. In that region, management is studying possible plans and procedures for anti-seismic
reinforcement and procedures for responding immediately to a serious earthquake and for restoring
the Companies’ operational capacity. Nonetheless, a serious earthquake there could interrupt opera-
tions, damage facilities, and necessitate expensive restoration work, which could adversely affect the
Companies’ operating results and financial condition.
In addition, the Companies may concentrate production of some products and raw materials at
one or two plants, and interrupted operations at one or more of those plants could result in a signif-
icant adverse effect on the Companies’ operating results and financial condition. An interruption in
such operations could prevent the Companies from fulfilling their supply obligations, resulting in
potential damage claims and an erosion of customers’ confidence in the Companies as a reliable
source of supply.
Information system failure
The Companies, as a sophisticated business enterprise, are increasingly dependent on information
systems. A failure of those systems for any reason, including natural or man-made disaster or
human error, could interrupt the Companies’ operations and could thus adversely affect the
Companies’ operating results and financial condition. The Companies endeavor to safeguard
information systems and data by upgrading network security to help minimize the risk posed
by an information system failure.
Strikes
Prolonged strikes or other labor unrest could interrupt the Companies’ operations and could thus
adversely affect the Companies’ operating results and financial condition. Management strives to
minimize the risk of labor unrest by fostering good labor-management relations.
Ethical lapses and industrial accidents serious enough to diminish the public’s confidence in the
Companies could adversely affect the Companies’ operating results and financial condition. The
Companies strive through their business activities to strengthen their corporate and brand image.
The Companies work systematically to ensure compliance with all applicable laws and regulations
and with the highest standards of corporate ethics. The Companies also work systematically to pre-
vent industrial accidents, such as fire incidents and labor accidents, and to respond immediately and
effectively to any accidents that might occur.
Fluctuations in currency exchange rates could affect the Companies’ operating results and financial
position. The Companies conduct research and development, manufacturing, logistics, marketing,
sales, and other activities globally and thus conduct transactions in numerous currencies. The
Companies employ forward exchange contracts to hedge exposure to exchange rate fluctuations
between the yen and the dollar, the euro, and other principal currencies. However, hedging cannot
completely insulate the Companies’ operations from negative trends in exchange rates, since the
Companies’ operations include extensive export and import activities worldwide.
In addition, the Companies maintain their consolidated accounts in yen, and fluctuations in
currency exchange rates affect the yen-converted values recorded for sales, expenses, assets, and
Corporate image
Currency exchange rates

24 Bridgestone Annual Report 2004
liabilities in nations other than Japan. The appreciation of the yen against other currencies generally
tends to adversely affect the Companies’ yen-converted results; the depreciation of the yen against
other currencies generally tends to favorably affect the Companies’ yen-converted results.
The Companies encounter numerous competitors in every market for the Companies’ entire prod-
uct line, and competitive price pressures could adversely affect the Companies’ operating results and
financial condition. In addition, large corporate customers occasionally demand price reductions.
The Companies strive to maintain profitability levels in the face of downward price pressures by
lowering costs, raising efficiencies, enhancing brand image, and continuing to introduce new prod-
ucts that provide greater customer value. However, management cannot guarantee that these efforts
will always be sufficient to offset the effects of competitive pricing pressures.
Inability to completely recover product development costs could also adversely affect the
Companies’ operating results and financial condition. The Companies’ strategy centers on main-
taining a competitive technological edge. The Companies are active in deploying new products
equipped with new technologies. Developing new products and technologies entails significant
investment and current expenditures. The Companies strive to persuade customers of the value of
technological advances and to thereby secure prices for their products that are commensurate with
the cost of developing the products. However, escalating competition and other factors could pre-
vent the Companies from recovering their development costs completely through product pricing.
A determination that a product may contain defects or a product recall could adversely affect the
Companies’ operating results and financial condition. Any such defects or recalls could occasion
replacement costs, damage to the Companies’ reputation, customer claims for compensation and
damages, and legal and litigation costs. Especially in the United States, those product liability claims
and lawsuits, including possible class action litigation, could have significant adverse effects. The
Companies strive systematically to ensure the quality of the products that they sell.
Management is especially sensitive to the importance of quality assurance in tires and in other
products that figure in personal safety, and the Companies have enhanced their quality-assurance
capabilities by refining their information-gathering systems related to the performance of their
products and by establishing an “early warning” system to identify potential issues before they
become problems. However, these efforts cannot ensure absolutely that no product defects will
occur or that no extensive product recalls will become necessary.
Information about voluntary tire recall costs and legal liabilities in the United States appears in
Note 17 in the Notes to Consolidated Financial Statements.
Any events that impede the Companies’ access to raw materials sufficiently to affect their manufac-
turing operations could adversely affect the Companies’ operating results and financial condition.
The Companies use large quantities of natural rubber in tires and in other rubber products, and
they obtain most of that natural rubber from nations in Southeast Asia. Natural disasters, war, ter-
rorist actions, civil strife, social or political unrest, or poor harvests could affect the availability of
natural rubber in quantities sufficient for the Companies’ purposes. In addition, supply shortages of
basic materials or capacity constraints of suppliers could affect the availability of raw materials other
than natural rubber in quantities sufficient for the Companies’ purposes.
The Companies rely on their operations that produce raw materials and on third-party suppliers
for important raw materials. Any interruption of activity at those operations or suppliers and any
other events that impede the Companies’ access to raw materials from those sources could adversely
affect manufacturing activity at the Companies’ plants that use those raw materials and, conse-
quently, could adversely affect the Companies’ operating results and financial condition.
Increases in the cost of raw materials could adversely affect the Companies’ operating results and
financial condition. The cost of raw materials could increase for many different reasons, including
the tightening of supply and demand. The Companies strive to absorb increases in the cost of raw
materials by raising productivity and, sometimes, by raising the prices of their products, but increas-
es in raw material costs may occur that are too large for the Companies to absorb completely
through those and other efforts.
Competition
Product defects
Procurement of raw materials

25Operational Risk
The Companies’ pension costs and obligations are dependent on assumptions, including the dis-
count rates, the expected rates of return, and other factors, which are considered reasonable at the
time of calculation. Deteriorating conditions in the financial markets and other factors could cause
the Companies’ actual pension costs and obligations to differ from those assumptions, and that
could adversely affect the Companies’ operating results and financial position.
Alleged infringement of third parties’ intellectual property rights by the Companies could interrupt
the Companies’ ability to use materials or technology and could necessitate compensation for result-
ant damages, which could adversely affect the Companies’ operating results and financial condition.
In addition, events that might not be judged as infringement of the Companies’ intellectual property
by third parties, such as the manufacturing and marketing of products or technologies confusingly
similar to those of the Companies, could diminish the differentiation and competitiveness of the
Companies’ products, which could adversely affect the Companies’ operating results and financial
condition.
The Companies treat intellectual property as a crucial management resource. They work system-
atically to employ their intellectual property effectively in improving their competitive position, to
avoid infringing the intellectual property of third parties, and to protect their wide-ranging intellec-
tual property rights from infringement.
Pension costs
Intellectual property

26 Bridgestone Annual Report 2004
Financial Section: Management’s Discussion and Analysis
The financial information in the following discussion and analysis is from the consolidated
financial statements and notes. Financial disclosure by Bridgestone Corporation (the “Company”)
is in accordance with accounting principles generally accepted in Japan (“Japanese GAAP”).
The business of the Company and its subsidiaries (the “Companies”) comprises two main segments:
“tires,” including tires, tubes, wheels, related accessories, and automotive maintenance, and “diver-
sified products,” which consist mainly of chemical products, industrial products, sporting goods,
and bicycles. The “tires” segment accounted for about 80% of the Companies’ net sales in 2004.
That percentage has remained basically constant for several years.
Net sales
Net sales increased 5%, to ¥2,416.7 billion ($23,191 million), and reached their highest level ever
for the second consecutive year. Sales increased in the tire segment and in the diversified products
segment, and sales also increased in every geographical segment.
The Companies transact a large proportion of their business outside Japan—70.4% of net sales in
2004—and fluctuations in currency exchange rates thus have a large effect on their sales as reported
in yen. In 2004, the yen appreciated against the U.S. dollar, and that diminished the value of sales in
foreign currencies as translated into yen. The average yen/dollar exchange rate in 2004 was ¥108 to
the U.S. dollar, compared with ¥116 in 2003. The Companies more than offset the negative effect on
net sales of the yen’s appreciation through unit sales growth, through price increases, and through
improvements in their product mix.
A description of the Companies’ sales and earnings performance by geographical segment appears
on pages 12 to 19 of this report.
Composition of sales by geographic segment (company location, net of inter-segment transactions)
(% of net sales)
FY 2004 2003
Japan 33.7 34.9
Americas 41.9 42.2
Europe 13.3 12.5
Other 11.1 10.4
100.0 100.0
Business and markets
Results of operations
2000 2001 2002 2003 2004
¥ billion2,416.7
2,006.92,133.8
2,247.8 2,303.9
2000 2001 2002 2003 2004
¥
¥/e
¥/$108
134
108
122 125
116
100109
118
131
Net Sales Currency Exchange Rates(annual average rates)

27Financial Section
In the tires segment, the Companies’ sales—inclusive of inter-segment transactions—increased
5%, to ¥1,931.8 billion ($18,538 million), mainly on the strength of strong demand in markets out-
side Japan. In the diversified products segment, sales increased 6%, to ¥512.8 billion ($4,921 mil-
lion), led by growth in automotive products and—in the United States—in building materials.
Composition of sales by industry segment (net of inter-segment transactions)
(% of net sales)
FY 2004 2003
Tires 79.8 79.7
Diversified products 20.2 20.3
100.0 100.0
Operating income
Operating income increased 8%, to ¥197.7 billion ($1,897 million). That increase comprised
increases of 8%, to ¥160.3 billion ($1,538 million)—inclusive of inter-segment transactions—in
the tires segment, and of 5%, to ¥36.5 billion ($350 million), in the diversified products segment.
The increase in operating income occurred despite rising prices for raw materials, an increase in
depreciation expenses, and the weakening of the U.S. dollar against the yen. It reflected the growth
in net sales and a decline in pension costs in Japan. The decline in pension costs resulted from an
exemption from payments for the future obligations attributable to the governmental portion of
its pension fund. The operating income margin rose 0.2 percentage points, to 8.2%.
Operating income margin
(% of net sales)
FY 2004 2003 2002 2001 2000
8.2 8.0 8.2 5.5 8.1
Other income and expenses
Net other income and expenses declined 21%, to ¥16.8 billion ($161 million). Net interest expense
was essentially unchanged, and foreign currency exchange loss was ¥2.7 billion ($26 million) less
than in the previous year. The Companies recorded a gain of ¥2.5 billion ($24 million) on the sale of
fixed assets, and they recorded a ¥3.2 billion ($31 million) loss on a voluntary tire replacement inau-
gurated by the Companies’ operations in the Americas in February 2004.
In the previous year, the Companies recorded an extraordinary loss of ¥3.8 billion in connection
with a fire at their Tochigi Plant, in Japan; an extraordinary gain of ¥4.3 billion in insurance claims
2000 2001 2002 2003 2004
¥ billion1,928.0
1,560.21,687.2
1,797.6 1,836.4
2000 2001 2002 2003 2004
¥ billion488.7
446.7 446.6 450.2 467.5
Sales of Tires(net of inter-segment transactions)
Sales of Diversified Products(net of inter-segment transactions)
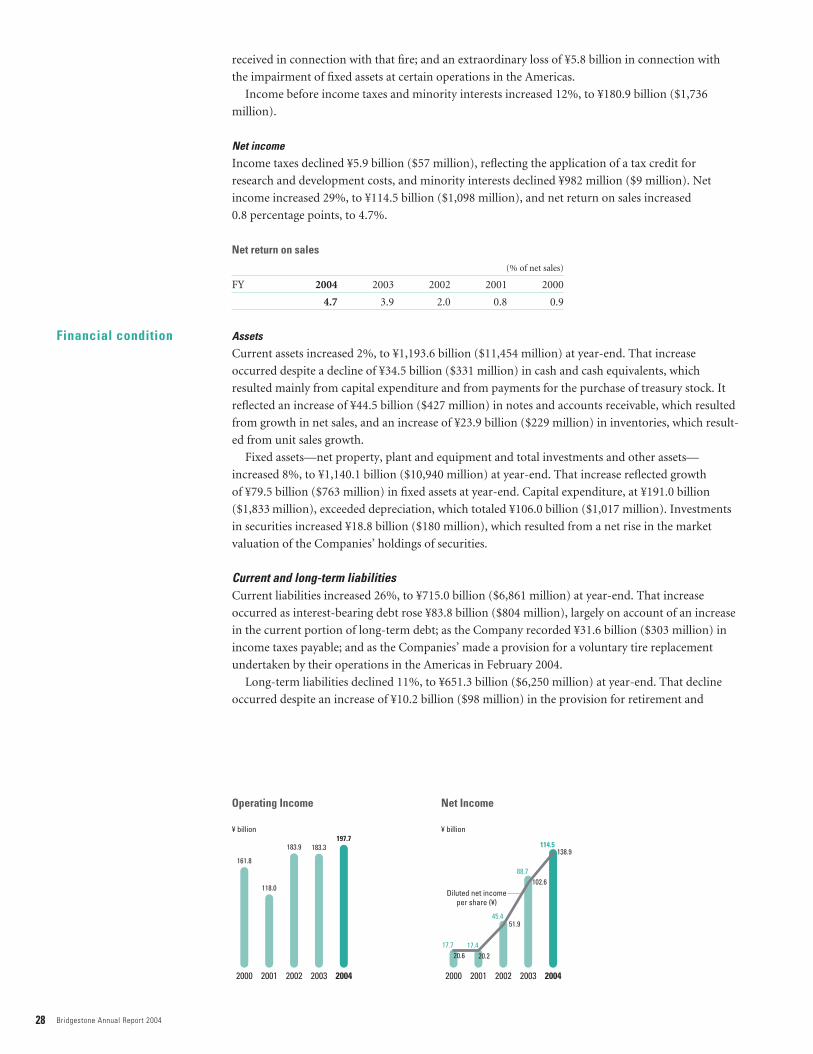
28 Bridgestone Annual Report 2004
received in connection with that fire; and an extraordinary loss of ¥5.8 billion in connection with
the impairment of fixed assets at certain operations in the Americas.
Income before income taxes and minority interests increased 12%, to ¥180.9 billion ($1,736
million).
Net income
Income taxes declined ¥5.9 billion ($57 million), reflecting the application of a tax credit for
research and development costs, and minority interests declined ¥982 million ($9 million). Net
income increased 29%, to ¥114.5 billion ($1,098 million), and net return on sales increased
0.8 percentage points, to 4.7%.
Net return on sales
(% of net sales)
FY 2004 2003 2002 2001 2000
4.7 3.9 2.0 0.8 0.9
Assets
Current assets increased 2%, to ¥1,193.6 billion ($11,454 million) at year-end. That increase
occurred despite a decline of ¥34.5 billion ($331 million) in cash and cash equivalents, which
resulted mainly from capital expenditure and from payments for the purchase of treasury stock. It
reflected an increase of ¥44.5 billion ($427 million) in notes and accounts receivable, which resulted
from growth in net sales, and an increase of ¥23.9 billion ($229 million) in inventories, which result-
ed from unit sales growth.
Fixed assets—net property, plant and equipment and total investments and other assets—
increased 8%, to ¥1,140.1 billion ($10,940 million) at year-end. That increase reflected growth
of ¥79.5 billion ($763 million) in fixed assets at year-end. Capital expenditure, at ¥191.0 billion
($1,833 million), exceeded depreciation, which totaled ¥106.0 billion ($1,017 million). Investments
in securities increased ¥18.8 billion ($180 million), which resulted from a net rise in the market
valuation of the Companies’ holdings of securities.
Current and long-term liabilitiesCurrent liabilities increased 26%, to ¥715.0 billion ($6,861 million) at year-end. That increase
occurred as interest-bearing debt rose ¥83.8 billion ($804 million), largely on account of an increase
in the current portion of long-term debt; as the Company recorded ¥31.6 billion ($303 million) in
income taxes payable; and as the Companies’ made a provision for a voluntary tire replacement
undertaken by their operations in the Americas in February 2004.
Long-term liabilities declined 11%, to ¥651.3 billion ($6,250 million) at year-end. That decline
occurred despite an increase of ¥10.2 billion ($98 million) in the provision for retirement and
Operating Income Net Income
Financial condition
2000 2001 2002 2003 2004
¥ billion197.7
161.8
118.0
183.3183.9
2000 2001 2002 2003 2004
¥ billion
17.7 17.4
114.5
45.4
88.7
20.6 20.2
138.9
51.9
102.6Diluted net income
per share (¥)
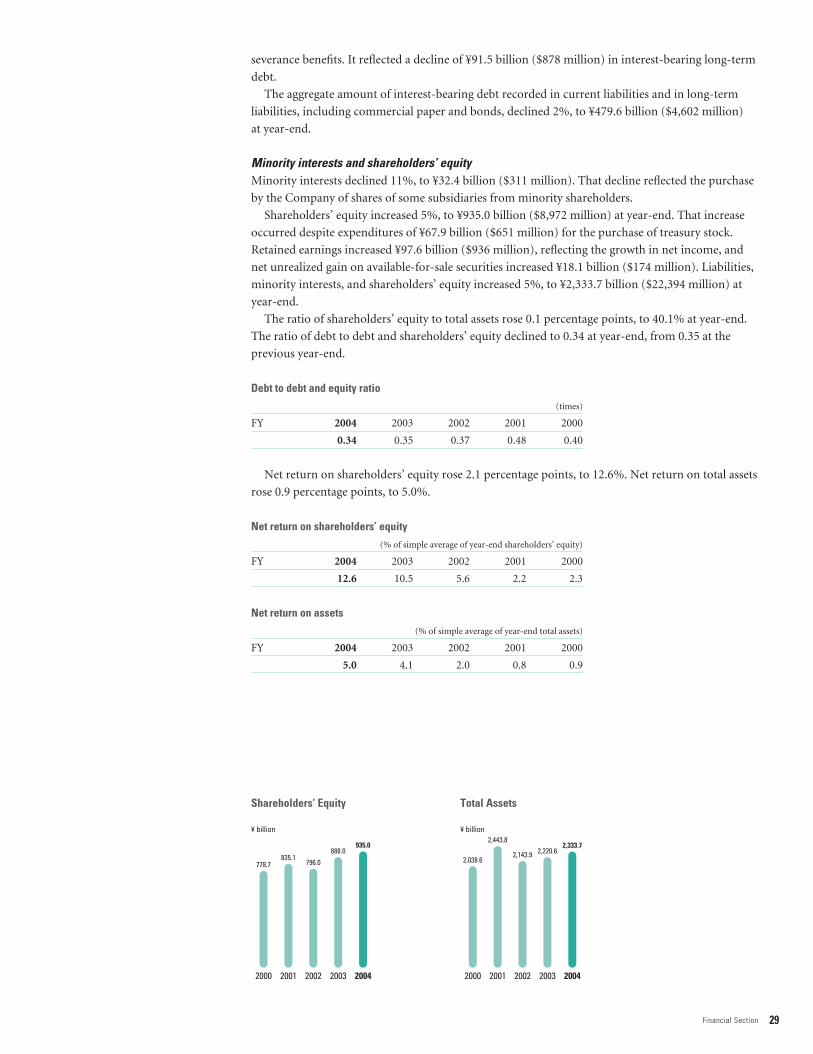
29Financial Section
severance benefits. It reflected a decline of ¥91.5 billion ($878 million) in interest-bearing long-term
debt.
The aggregate amount of interest-bearing debt recorded in current liabilities and in long-term
liabilities, including commercial paper and bonds, declined 2%, to ¥479.6 billion ($4,602 million)
at year-end.
Minority interests and shareholders’ equityMinority interests declined 11%, to ¥32.4 billion ($311 million). That decline reflected the purchase
by the Company of shares of some subsidiaries from minority shareholders.
Shareholders’ equity increased 5%, to ¥935.0 billion ($8,972 million) at year-end. That increase
occurred despite expenditures of ¥67.9 billion ($651 million) for the purchase of treasury stock.
Retained earnings increased ¥97.6 billion ($936 million), reflecting the growth in net income, and
net unrealized gain on available-for-sale securities increased ¥18.1 billion ($174 million). Liabilities,
minority interests, and shareholders’ equity increased 5%, to ¥2,333.7 billion ($22,394 million) at
year-end.
The ratio of shareholders’ equity to total assets rose 0.1 percentage points, to 40.1% at year-end.
The ratio of debt to debt and shareholders’ equity declined to 0.34 at year-end, from 0.35 at the
previous year-end.
Debt to debt and equity ratio
(times)
FY 2004 2003 2002 2001 2000
0.34 0.35 0.37 0.48 0.40
Net return on shareholders’ equity rose 2.1 percentage points, to 12.6%. Net return on total assets
rose 0.9 percentage points, to 5.0%.
Net return on shareholders’ equity
(% of simple average of year-end shareholders’ equity)
FY 2004 2003 2002 2001 2000
12.6 10.5 5.6 2.2 2.3
Net return on assets
(% of simple average of year-end total assets)
FY 2004 2003 2002 2001 2000
5.0 4.1 2.0 0.8 0.9
Shareholders’ Equity Total Assets
2000 2001 2002 2003 2004
¥ billion
935.0
778.7835.1
796.0
888.0
2000 2001 2002 2003 2004
¥ billion
2,333.7
2,038.6
2,443.8
2,143.9 2,220.6

30 Bridgestone Annual Report 2004
Cash flowCash and cash equivalents declined ¥34.5 billion ($331 million) from the previous year-end, to
¥263.7 billion ($2,531 million) at year-end. Net cash provided by operating activities totaled ¥238.7
billion ($2,291 million), including income before income taxes and minority interests of ¥180.9 bil-
lion ($1,736 million) and depreciation and amortization of ¥111.5 billion ($1,070 million). Net cash
used in investing activities totaled ¥179.9 billion ($1,726 million), principally payments for purchase
of property, plant and equipment, and net cash used in financing activities totaled ¥94.1 billion
($903 million), reflecting net repayments of debt and payments for the purchase of treasury stock.
The Company raised its annual dividends ¥3 ($0.03), to ¥19 ($0.18) per share. That comprised a
year-end dividend of ¥11 ($0.10) per share, including a special dividend of ¥5 ($0.05) per share, and
an interim dividend of ¥8 ($0.08) per share, including a special dividend of ¥2 ($0.02) per share.
Management projects that net income in 2005 will increase about 22%, to about ¥140 billion, on
a 3% increase in net sales, to about ¥2,500 billion. The projected increase in net income includes
a large extraordinary gain that the Company and its domestic subsidiaries will record on returning
the substituted governmental portion of its pension plan to the Japanese government. The projected
increase in net income is despite a projected decline in operating income of 14%, to about ¥170 bil-
lion. In preparing these projections, management has assumed an average yen/dollar exchange rate
of ¥105 to the U.S. dollar. Management has proposed to raise the annual dividends by ¥1, to ¥20
per share.
2004 2003 2002 2001
Net sales: ¥2,416,685 ¥2,303,917 ¥2,247,769 ¥2,133,825
Tires (net of inter-segment accounts) 1,927,989 1,836,395 1,797,598 1,687,235
Diversified products (net of inter-segment accounts) 488,696 467,522 450,171 446,590
Operating income 197,697 183,294 183,862 118,023
Net income 114,453 88,720 45,379 17,389
Net income per share (in yen):
Basic 138.96 102.75 51.97 20.20
Diluted 138.94 102.56 51.89 20.19
Total assets 2,333,708 2,220,613 2,143,928 2,443,793
Shareholders’ equity 934,981 887,987 796,013 835,144
Ratio of shareholders’ equity to total assets (%) 40.1 40.0 37.1 34.2
Additions to property, plant and equipment 191,000 155,742 116,764 104,313
Depreciation and amortization 111,491 104,383 119,466 132,920
Eleven-Year SummaryBridgestone Corporation and SubsidiariesYears ended December 31
Ratio of Shareholders’ Equity to Total Assets
Net Assets per Share
Outlook
2000 2001 2002 2003 2004
%
40.138.2
34.237.1
40.0
2000 2001 2002 2003 2004
¥1,163.8
904.4970.2
924.5
1,056.5
Dividends
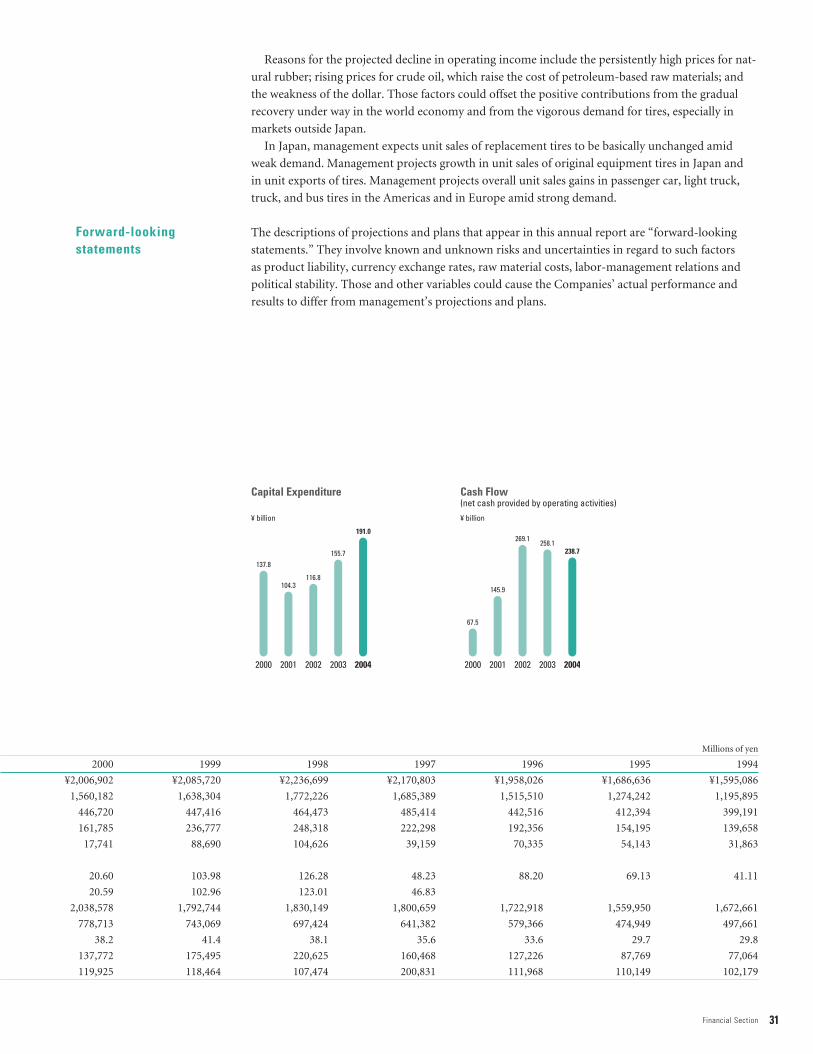
31Financial Section
Reasons for the projected decline in operating income include the persistently high prices for nat-
ural rubber; rising prices for crude oil, which raise the cost of petroleum-based raw materials; and
the weakness of the dollar. Those factors could offset the positive contributions from the gradual
recovery under way in the world economy and from the vigorous demand for tires, especially in
markets outside Japan.
In Japan, management expects unit sales of replacement tires to be basically unchanged amid
weak demand. Management projects growth in unit sales of original equipment tires in Japan and
in unit exports of tires. Management projects overall unit sales gains in passenger car, light truck,
truck, and bus tires in the Americas and in Europe amid strong demand.
The descriptions of projections and plans that appear in this annual report are “forward-looking
statements.” They involve known and unknown risks and uncertainties in regard to such factors
as product liability, currency exchange rates, raw material costs, labor-management relations and
political stability. Those and other variables could cause the Companies’ actual performance and
results to differ from management’s projections and plans.
Millions of yen
2000 1999 1998 1997 1996 1995 1994
¥2,006,902 ¥2,085,720 ¥2,236,699 ¥2,170,803 ¥1,958,026 ¥1,686,636 ¥1,595,086
1,560,182 1,638,304 1,772,226 1,685,389 1,515,510 1,274,242 1,195,895
446,720 447,416 464,473 485,414 442,516 412,394 399,191
161,785 236,777 248,318 222,298 192,356 154,195 139,658
17,741 88,690 104,626 39,159 70,335 54,143 31,863
20.60 103.98 126.28 48.23 88.20 69.13 41.11
20.59 102.96 123.01 46.83
2,038,578 1,792,744 1,830,149 1,800,659 1,722,918 1,559,950 1,672,661
778,713 743,069 697,424 641,382 579,366 474,949 497,661
38.2 41.4 38.1 35.6 33.6 29.7 29.8
137,772 175,495 220,625 160,468 127,226 87,769 77,064
119,925 118,464 107,474 200,831 111,968 110,149 102,179
Capital Expenditure Cash Flow(net cash provided by operating activities)
Forward-looking statements
2000 2001 2002 2003 2004
¥ billion
191.0
137.8
104.3116.8
155.7
2000 2001 2002 2003 2004
¥ billion
238.7
67.5
145.9
269.1258.1
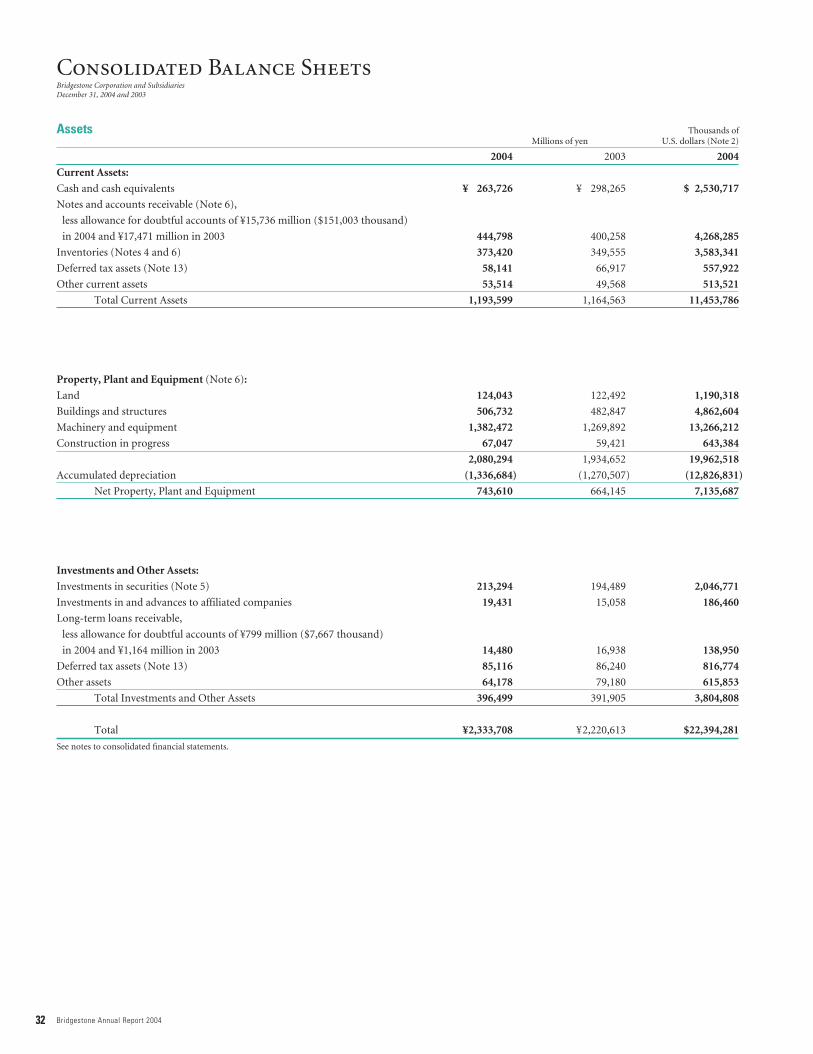
32 Bridgestone Annual Report 2004
Consolidated Balance SheetsBridgestone Corporation and SubsidiariesDecember 31, 2004 and 2003
Assets Thousands ofMillions of yen U.S. dollars (Note 2)
2004 2003 2004
Current Assets:
Cash and cash equivalents ¥ 263,726 ¥ 298,265 $ 2,530,717
Notes and accounts receivable (Note 6),
less allowance for doubtful accounts of ¥15,736 million ($151,003 thousand)
in 2004 and ¥17,471 million in 2003 444,798 400,258 4,268,285
Inventories (Notes 4 and 6) 373,420 349,555 3,583,341
Deferred tax assets (Note 13) 58,141 66,917 557,922
Other current assets 53,514 49,568 513,521
Total Current Assets 1,193,599 1,164,563 11,453,786
Property, Plant and Equipment (Note 6):
Land 124,043 122,492 1,190,318
Buildings and structures 506,732 482,847 4,862,604
Machinery and equipment 1,382,472 1,269,892 13,266,212
Construction in progress 67,047 59,421 643,384
2,080,294 1,934,652 19,962,518
Accumulated depreciation (1,336,684) (1,270,507) (12,826,831)
Net Property, Plant and Equipment 743,610 664,145 7,135,687
Investments and Other Assets:
Investments in securities (Note 5) 213,294 194,489 2,046,771
Investments in and advances to affiliated companies 19,431 15,058 186,460
Long-term loans receivable,
less allowance for doubtful accounts of ¥799 million ($7,667 thousand)
in 2004 and ¥1,164 million in 2003 14,480 16,938 138,950
Deferred tax assets (Note 13) 85,116 86,240 816,774
Other assets 64,178 79,180 615,853
Total Investments and Other Assets 396,499 391,905 3,804,808
Total ¥2,333,708 ¥2,220,613 $22,394,281
See notes to consolidated financial statements.
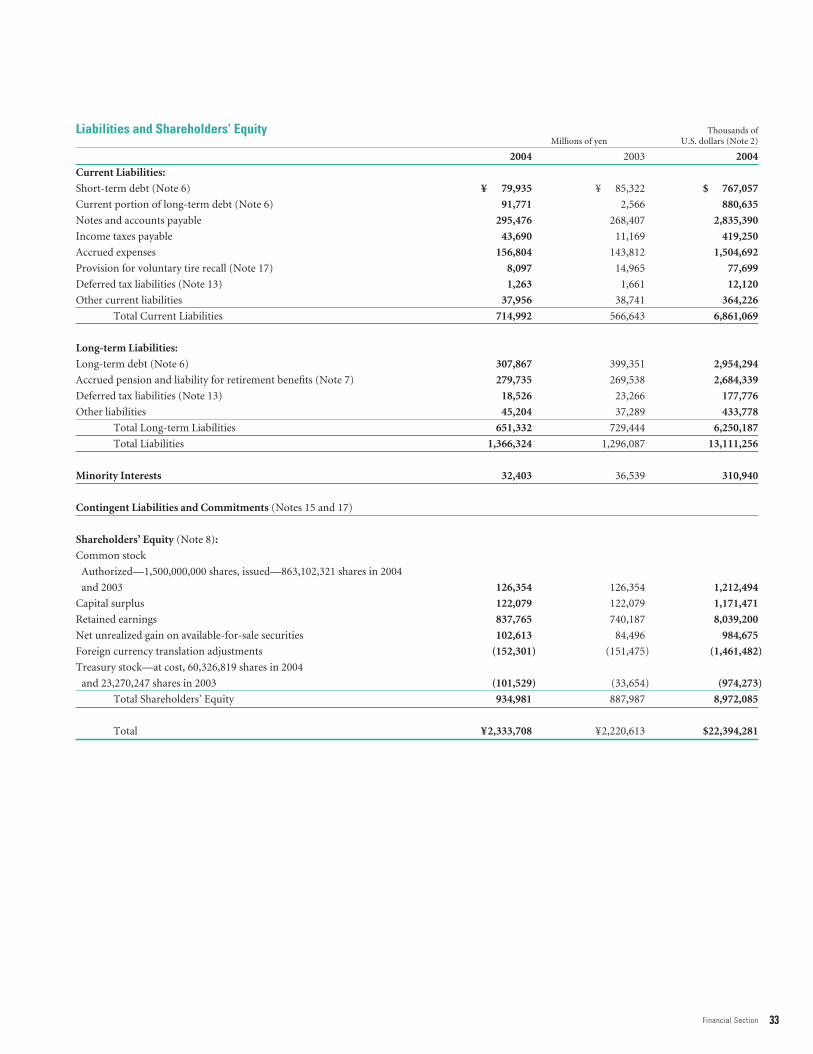
33Financial Section
Liabilities and Shareholders’ Equity Thousands ofMillions of yen U.S. dollars (Note 2)
2004 2003 2004
Current Liabilities:
Short-term debt (Note 6) ¥ 79,935 ¥ 85,322 $ 767,057
Current portion of long-term debt (Note 6) 91,771 2,566 880,635
Notes and accounts payable 295,476 268,407 2,835,390
Income taxes payable 43,690 11,169 419,250
Accrued expenses 156,804 143,812 1,504,692
Provision for voluntary tire recall (Note 17) 8,097 14,965 77,699
Deferred tax liabilities (Note 13) 1,263 1,661 12,120
Other current liabilities 37,956 38,741 364,226
Total Current Liabilities 714,992 566,643 6,861,069
Long-term Liabilities:
Long-term debt (Note 6) 307,867 399,351 2,954,294
Accrued pension and liability for retirement benefits (Note 7) 279,735 269,538 2,684,339
Deferred tax liabilities (Note 13) 18,526 23,266 177,776
Other liabilities 45,204 37,289 433,778
Total Long-term Liabilities 651,332 729,444 6,250,187
Total Liabilities 1,366,324 1,296,087 13,111,256
Minority Interests 32,403 36,539 310,940
Contingent Liabilities and Commitments (Notes 15 and 17)
Shareholders’ Equity (Note 8):
Common stock
Authorized—1,500,000,000 shares, issued—863,102,321 shares in 2004
and 2003 126,354 126,354 1,212,494
Capital surplus 122,079 122,079 1,171,471
Retained earnings 837,765 740,187 8,039,200
Net unrealized gain on available-for-sale securities 102,613 84,496 984,675
Foreign currency translation adjustments (152,301) (151,475) (1,461,482)
Treasury stock—at cost, 60,326,819 shares in 2004
and 23,270,247 shares in 2003 (101,529) (33,654) (974,273)
Total Shareholders’ Equity 934,981 887,987 8,972,085
Total ¥2,333,708 ¥2,220,613 $22,394,281

34 Bridgestone Annual Report 2004
Thousands of Millions of yen U.S. dollars (Note 2)
2004 2003 2002 2004
Net Sales (Note 16) ¥2,416,685 ¥2,303,917 ¥2,247,769 $ 23,190,529
Cost of Sales 1,533,251 1,441,639 1,405,391 14,713,089
Gross profit 883,434 862,278 842,378 8,477,440
Selling, General and Administrative Expenses 685,737 678,984 658,516 6,580,338
Operating income (Note 16) 197,697 183,294 183,862 1,897,102
Other Income (Expenses):
Interest and dividend income 4,936 5,356 4,822 47,366
Interest expense (11,331) (11,962) (16,205) (108,732)
Foreign currency exchange loss (1,657) (4,404) (8,540) (15,901)
Insurance claims received (Note 12) — 4,340 — —
Gain on sales of property, plant and equipment (Note 12) 2,523 — — 24,211
Impairment losses on assets (Note 12) — (5,768) (36,935) —
Loss on fire incident (Note 12) — (3,833) — —
Loss on voluntary tire replacement (Notes 12 and 17) (3,240) — — (31,091)
Other–net (8,051) (4,988) (16,068) (77,258)
Income before income taxes and minority interests 180,877 162,035 110,936 1,735,697
Income Taxes (Note 13):
Current 60,359 20,912 10,984 579,205
Deferred 2,459 47,815 50,191 23,597
Total 62,818 68,727 61,175 602,802
Income before minority interests 118,059 93,308 49,761 1,132,895
Minority Interests (3,606) (4,588) (4,382) (34,603)
Net Income ¥ 114,453 ¥ 88,720 ¥ 45,379 $ 1,098,292
Yen U.S. dollars (Note 2)
Per Share of Common Stock:
Basic (Notes 3 and 10) ¥138.96 ¥102.75 ¥51.97 $1.33
Diluted (Notes 3, 8 and 10) 138.94 102.56 51.89 1.33
Cash dividends applicable to the year 19.00 16.00 16.00 0.18
See notes to consolidated financial statements.
Consolidated Statements of IncomeBridgestone Corporation and SubsidiariesYears ended December 31, 2004, 2003 and 2002

35Financial Section
Consolidated Statements of Shareholders’ EquityBridgestone Corporation and SubsidiariesYears ended December 31, 2004, 2003 and 2002
Thousands Millions of yen
Outstanding Net unrealized Foreign number of gain on currency
shares of Common Capital Retained available-for-sale translation Treasurycommon stock stock surplus earnings securities adjustments stock
Balance at January 1, 2002 860,791 ¥125,115 ¥120,840 ¥667,160 ¥37,059 ¥(114,502) ¥ (528)
Net income for the year 45,379
Cash dividends (13,772)
Bonuses to directors (526)
Conversion of bonds to common stock 7 5 5
Minimum pension liability adjustments (35,893)
Net unrealized gain on available-for-sale
securities 950
Foreign currency translation adjustments (34,529)
Purchase of treasury stock, net of sales (461) (750)
Balance at December 31, 2002 860,337 125,120 120,845 662,348 38,009 (149,031) (1,278)
Net income for the year 88,720
Cash dividends (13,766)
Bonuses to directors (641)
Conversion of bonds to common stock 1,850 1,234 1,234
Minimum pension liability adjustments 3,526
Net unrealized gain on available-for-sale
securities 46,487
Foreign currency translation adjustments (2,444)
Purchase of treasury stock, net of sales (22,355) (32,376)
Balance at December 31, 2003 839,832 126,354 122,079 740,187 84,496 (151,475) (33,654)
Net income for the year 114,453
Cash dividends (13,261)
Bonuses to directors (645)
Minimum pension liability adjustments (2,966)
Net unrealized gain on available-for-sale
securities 18,117
Foreign currency translation adjustments (826)
Purchase of treasury stock, net of sales (37,056) (3) (67,875)
Balance at December 31, 2004 802,776 ¥126,354 ¥122,079 ¥837,765 ¥102,613 ¥(152,301) ¥(101,529)
Thousands of U.S. dollars (Note 2)
Net unrealized Foreigngain on currency
Common Capital Retained available-for-sale translation Treasury stock surplus earnings securities adjustments stock
Balance at December 31, 2003 $1,212,494 $1,171,471 $7,102,840 $810,824 $(1,453,555) $(322,944)
Net income for the year 1,098,292
Cash dividends (127,252)
Bonuses to directors (6,189)
Minimum pension liability adjustments (28,462)
Net unrealized gain on available-for-sale
securities 173,851
Foreign currency translation adjustments (7,927)
Purchase of treasury stock, net of sales (29) (651,329)
Balance at December 31, 2004 $1,212,494 $1,171,471 $8,039,200 $984,675 $(1,461,482) $(974,273)
See notes to consolidated financial statements.

36 Bridgestone Annual Report 2004
Consolidated Statements of Cash FlowsBridgestone Corporation and SubsidiariesYears ended December 31, 2004, 2003 and 2002
Thousands of Millions of yen U.S. dollars (Note 2)
2004 2003 2002 2004Cash Flows from Operating Activities:Income before income taxes and minority interests ¥180,877 ¥162,035 ¥110,936 $1,735,697Adjustments to reconcile income before income taxes and
minority interests to net cash provided by operating activities:Depreciation and amortization 111,491 104,383 119,466 1,069,869Increase in accrued pension and liability for retirement benefits 12,452 3,711 35,042 119,490 Interest and dividend income (4,936) (5,356) (4,822) (47,366) Interest expense 11,331 11,962 16,205 108,732 Foreign currency exchange loss 226 — 133 2,169 Gain on sales of property, plant and equipment (2,523) (2,047) (1,379) (24,211) Gain on sales of investments in securities (102) (284) (263) (979) Insurance claims received — (4,340) — —Impairment losses on assets — 5,768 36,935 —Loss on fire incident — 3,833 — —Loss on voluntary tire replacement 3,240 — — 31,091 Change in assets and liabilities:
(Increase) decrease in notes and accounts receivable (39,873) 37,940 (43,241) (382,622) Increase in inventories (21,991) (35,885) (1,709) (211,026) Increase (decrease) in notes and accounts payable 17,461 (2,628) 26,756 167,556
Bonuses paid to directors (645) (641) (526) (6,189) Other 13,231 14,849 (1,682) 126,965
Subtotal 280,239 293,300 291,851 2,689,176 Interest and dividends received 5,624 4,946 4,881 53,968 Interest paid (11,357) (12,935) (15,861) (108,982) Payments for North American plant restructuring — (989) (2,720) —Payments for voluntary tire recall (6,371) (11,088) (30,737) (61,136) Insurance claims received — 4,340 — —Payments for fire incident (1,568) (171) — (15,047) Income taxes received (paid) (27,838) (19,277) 21,668 (267,134)
Net Cash Provided by Operating Activities 238,729 258,126 269,082 2,290,845 Cash Flows from Investing Activities:Payments for purchase of property, plant and equipment (179,565) (141,606) (107,799) (1,723,107) Proceeds from sales of property, plant and equipment 6,482 3,409 9,487 62,201 Payments for investments in securities, subsidiaries
and affiliated companies (15,737) (20,049) (7,388) (151,012) Proceeds from sales of investments in securities 5,773 3,935 1,091 55,398 Other 3,131 7,353 (268) 30,045 Net Cash Used in Investing Activities (179,916) (146,958) (104,877) (1,726,475) Cash Flows from Financing Activities:Decrease in short-term debt (8,750) (29,984) (29,066) (83,965)Proceeds from long-term debt 72,112 135,254 25,306 691,987 Repayments of long-term debt (77,899) (68,820) (220,542) (747,519)Cash dividends paid (13,258) (13,493) (13,764) (127,224)Sale of accounts receivable — — 36,987 —Proceeds from sale of assets on sale-leaseback transactions 15,815 — 26,368 151,761Payments for repurchase of assets on sale-leaseback transactions (5,911) — — (56,722)Payments for purchase of treasury stock (67,935) (32,376) (750) (651,905)Repayments of lease obligations under capital lease (6,076) (6,442) (859) (58,305)Other (2,241) (2,966) (6,584) (21,505)Net Cash Used in Financing Activities (94,143) (18,827) (182,904) (903,397)Effect of Exchange Rate Changes on Cash and Cash Equivalents 791 (596) (13,694) 7,591Net Increase (Decrease) in Cash and Cash Equivalents (34,539) 91,745 (32,393) (331,436)Cash and Cash Equivalents at Beginning of Year 298,265 206,520 238,913 2,862,153 Cash and Cash Equivalents at End of Year ¥263,726 ¥298,265 ¥206,520 $2,530,717
See notes to consolidated financial statements.
37Financial Section
Notes to Consolidated Financial StatementsBridgestone Corporation and Subsidiaries
NOTE 1—NATURE OF OPERATIONS
Bridgestone Corporation (the “Company”) and its subsidiaries (hereinafter referred to collectively as the “Companies”) engage in
developing, manufacturing and marketing tires and diversified products. The Companies market their products worldwide and operate
manufacturing plants in every principal market. Development activities take place primarily in Japan, the United States of America
(the “U.S.”) and Europe. Tire operations include automotive maintenance and repairs, retail business and credit card management, as
well as tire development, manufacturing and marketing. Diversified products include industrial products, chemical products, automo-
tive components, construction materials, electronic equipment, bicycles and sporting goods.
NOTE 2—BASIS OF PRESENTING CONSOLIDATED FINANCIAL STATEMENTS
The accompanying consolidated financial statements have been prepared in accordance with the provisions set forth in the Japanese
Securities and Exchange Law and its related accounting regulations, and in conformity with accounting principles generally accepted in
Japan, which are different in certain respects as to application and disclosure requirements of the accounting principles generally
accepted in the U.S.
In preparing these consolidated financial statements, certain reclassifications and rearrangements have been made to the consolidat-
ed financial statements issued domestically in order to present them in a form which is more familiar to readers outside Japan. In addi-
tion, certain reclassifications have been made in the 2003 and 2002 financial statements to comform to the classifications used in 2004.
The consolidated financial statements are stated in Japanese yen, the currency of the country in which the Company is incorporated
and operates. The translations of Japanese yen amounts into U.S. dollar amounts are included solely for the convenience of readers
outside Japan and have been made at the rate of ¥104.21 to $1, the approximate rate of exchange at December 31, 2004. Such transla-
tions should not be construed as representations that the Japanese yen amounts could be converted into U.S. dollars at that or any
other rate.
NOTE 3—SUMMARY OF SIGNIFICANT ACCOUNTING POLICIES
(a) Consolidation
The consolidated financial statements include the accounts of the Company and all of its subsidiaries in which the Company has effec-
tive control. All significant intercompany balances and transactions have been eliminated in consolidation. All material unrealized
profits included in assets resulting from transactions within the Companies are eliminated.
Investments in affiliated companies, those owned 20% to 50%, are accounted for under the equity method with appropriate adjust-
ments for intercompany profits and dividends. Equity in earnings of the affiliated companies is included in other income (expenses) in
the consolidated statements of income.
The number of consolidated subsidiaries and affiliated companies for 2004 and 2003 is summarized below:
2004 2003
Consolidated subsidiaries 435 424
Affiliated companies 202 213
(b) Cash equivalents
Cash equivalents are short-term investments that are readily convertible into cash and that are exposed to insignificant risk of changes
in value. Cash equivalents include highly liquid investments with original maturities of three months or less.
(c) Allowance for doubtful accounts
Allowance for doubtful accounts is established in amounts considered to be appropriate based on the Companies’ past credit loss
experience and an evaluation of potential losses in the receivables outstanding.
38 Bridgestone Annual Report 2004
(d) Inventories
Inventories are substantially stated at cost determined by the moving-average method, while inventories held by subsidiaries in the U.S.
are substantially stated at the lower of cost, which is determined principally by the last-in, first-out method, or market.
(e) Investments in securities
Marketable and investment securities are classified and accounted for, depending on management’s intent, as follows: (i) trading secu-
rities, which are held for the purpose of earning capital gains in the near term, are reported at fair value, and the related unrealized
gains and losses are included in income; (ii) held-to-maturity debt securities, which are expected to be held to maturity with the posi-
tive intent and ability to hold to maturity, are reported at amortized cost; and (iii) available-for-sale securities, which are not classified
as either of the aforementioned securities, are reported at fair value, with unrealized gains and losses, net of applicable taxes, reported
in a separate component of shareholders’ equity. The Companies do not hold securities for trading purposes.
Non-marketable available-for-sale securities are stated at cost determined by the moving-average method. For other than temporary
declines in fair value, investments in securities are reduced to net realizable value by a charge to income.
(f) Property, plant and equipment
Property, plant and equipment are stated at cost. Depreciation of property, plant and equipment of the Company and its domestic
subsidiaries is computed substantially by the declining-balance method at rates based on the estimated useful lives of the assets, while
the straight-line method is applied to property, plant and equipment of foreign subsidiaries. Maintenance, repair and minor renewals
are charged to income as incurred.
(g) Impairment of long-lived assets
In August 2002, the Business Accounting Council issued a Statement of Opinion, “Accounting for Impairment of Fixed Assets”, and in
October 2003 the Accounting Standards Board of Japan (“ASBJ”) issued ASBJ Guidance No.6, “Guidance for Accounting Standard for
Impairment of Fixed Assets”. These new pronouncements are effective for fiscal years beginning on or after April 1, 2005, with early
adoption permitted for fiscal years ending on or after March 31, 2004.
The new accounting standard requires an entity to review its long-lived assets for impairment whenever events or changes in cir-
cumstances indicate that the carrying amount of an asset or asset group may not be recoverable. An impairment loss would be recog-
nized if the carrying amount of an asset or asset group exceeds the sum of the undiscounted future cash flows expected to result from
the continued use and eventual disposition of the asset or asset group. The impairment loss would be measured as the amount by
which the carrying amount of the asset or asset group exceeds its recoverable amount, which is the higher of the discounted cash flows
from the continued use and eventual disposition of the asset or asset group, or the net selling price at disposition.
The Company and its domestic subsidiaries expect to adopt these pronouncements at January 1, 2005 and is currently in the process
of assessing the effect of adoption of these pronouncements.
Management believes the adoption of these pronouncements will not have a material impact on the consolidated financial position
or results of operations of the Company.
The impairment of long-lived assets for certain foreign subsidiaries is accounted for in accordance with Statement of Financial
Accounting Standards (“SFAS”) No.144, “Accounting for the Impairment or Disposal of Long-Lived Assets,” issued by the Financial
Accounting Standards Board (the “FASB”) in the U.S. which requires long-lived assets and certain identifiable intangibles to be held
and used by an entity be reviewed for impairment whenever events or changes in circumstances indicate that the carrying amount of
an asset may not be recoverable.
(h) Goodwill
Goodwill recorded by subsidiaries and the excess of cost of the Company’s investments in subsidiaries and affiliated companies over its
equity in the net assets at the respective dates of acquisition is mainly being amortized over a period of five years on the straight-line
basis.
(i) Provision for product warranties
The provision for product warranties, included in other liabilities, is estimated and recorded at the time of sale to provide for future
potential costs, such as costs related to after-sales services, in amounts considered to be appropriate based on the Companies’ past
experience.

39Financial Section
(j) Retirement and pension plans
Japanese domestic companiesEmployees serving with the Company and its domestic subsidiaries are generally entitled to lump-sum severance and, in certain cases,
annuity payments on retirement, based on the rates of pay at the time of termination, years of service and certain other factors. Such
benefits are principally provided by funded defined benefit pension plans.
Effective January 1, 2001, the Company and its domestic subsidiaries adopted a new accounting standard for employees’ retirement
benefits and accounted for the liability for retirement benefits based on projected benefit obligations and plan assets at the balance
sheet date. The transitional obligation of ¥19,689 million, determined at January 1, 2001, is being amortized over ten years.
The liability for retirement benefits to directors (members of the Board of Directors) and corporate auditors is provided for at the
amount which would be required, based on the Company’s regulations, in the event that all directors and corporate auditors terminat-
ed their offices at the balance sheet date. Any amounts payable to directors and corporate auditors upon retirement are subject to
approval at the general shareholders meeting.
Foreign subsidiariesThe funded defined benefit pension plans for the employees of certain foreign subsidiaries are accounted for in accordance with SFAS
No.87, “Employers’ Accounting for Pensions,” while the postretirement benefits other than pensions for all health care and life insur-
ance benefit plans are accounted for in accordance with SFAS No.106, “Employers’ Accounting for Postretirement Benefits Other Than
Pensions.” SFAS No.106 requires the accrual of retiree postretirement benefits during the active service period of the employee. Other
foreign subsidiaries have defined contribution pension plans or severance indemnity plans which substantially cover all of their
employees.
(k) Leases
Finance leases are capitalized, and the present value of the related payments is recorded as a liability. Amortization of capitalized leased
assets is computed substantially by the declining-balance method at rates based on the term of the lease.
(l) Revenue recognition
Sales are recognized when products are shipped or when services are rendered to customers.
(m) Income taxes
The provision for income taxes is computed based on income before income taxes included in the consolidated statements of income.
The asset and liability approach is used to recognize deferred tax assets and liabilities for the expected future tax consequences of tem-
porary differences between the carrying amounts and the tax bases of assets and liabilities. Deferred income taxes are measured by
applying currently enacted tax laws to the temporary differences. A valuation allowance is provided for any portion of the deferred tax
assets where it is considered more likely than not that they will not be realized.
(n) Bonuses to directors
Bonuses to directors are subject to approval at the general shareholders meeting and are accounted for by an appropriation of retained
earnings for the year in which the approval and payments are made in accordance with the Japanese Commercial Code (the “Code”).
(o) Appropriations of retained earnings
Appropriations of retained earnings are reflected in the consolidated financial statements for the following year after approval by the
shareholders in accordance with the Code.
(p) Foreign currency transactions
Short-term and long-term monetary receivables and payables denominated in foreign currencies are translated into Japanese yen at the
exchange rates at the balance sheet date. The foreign currency exchange gains and losses from translation are recognized in income to
the extent that they are not hedged by foreign currency forward contracts or currency option contracts.
(q) Foreign currency financial statements
The balance sheet accounts of foreign subsidiaries are translated into Japanese yen at the current exchange rate as of the balance sheet
date except for shareholders’ equity, which is translated at the historical rate. Differences arising from such translation are shown as
foreign currency translation adjustments in a separate component of shareholders’ equity. Revenue and expense accounts of foreign
subsidiaries are translated into Japanese yen at the average annual exchange rate.
40 Bridgestone Annual Report 2004
(r) Derivatives and hedging activities
The Companies use derivative financial instruments to manage their exposures to fluctuations in foreign currency exchange, interest
rates and commodity prices. Foreign currency forward contracts, currency swap contracts and currency option contracts are utilized by
the Companies to reduce foreign currency exchange risks. Interest rate swaps are utilized by the Companies to reduce interest rate
risks. Also, commodity future contracts are utilized by the Companies to reduce commodity price risks. The Companies do not enter
into derivatives for trading or speculative purposes.
Derivative financial instruments and foreign currency transactions are classified and accounted for as follows: (i) all derivatives are recog-
nized as either assets or liabilities and measured at fair value, and gains or losses on derivative transactions are recognized in income and (ii)
for derivatives used for hedging purposes, if derivatives qualify for hedge accounting because of high correlation and effectiveness between
the hedging instruments and the hedged items, gains or losses on derivatives are deferred until maturity of the hedged transactions.
The Companies’ foreign currency forward contracts which are designated as hedging exposure to variable cash flows of forecasted
transactions are measured at the fair value and the unrealized gains/losses are deferred until the underlying transactions are completed.
Other foreign currency forward contracts, currency swap contracts and currency option contracts employed to hedge foreign currency
exchange exposures to changes in fair value and in cash flow are also measured at the fair value but the unrealized gains/losses are rec-
ognized in income. Short-term and long-term debt denominated in foreign currencies for which foreign currency forward contracts
and currency swap contracts are used to hedge the foreign currency fluctuations is translated at the contracted rate if the foreign cur-
rency forward contracts and currency swap contracts qualify for hedge accounting. The interest rate swaps which qualify for hedge
accounting and meet specific matching criteria are not remeasured at market value, but the differential paid or received under the swap
agreements is recognized and included in interest expenses or income. The gains or losses on commodity future contracts in a hedge to
fluctuations of commodity prices are recognized currently in income.
(s) Per share of common stock
Basic net income per share is computed by dividing net income available to common shareholders by the weighted-average number of
common stock outstanding for the period, retroactively adjusted for stock splits.
Diluted net income per share reflects the potential dilution that could occur if securities were exercised or converted into common
stock. Diluted net income per share of common stock assumes full conversion of the outstanding convertible notes and bonds at the
beginning of the year (or at the time of issuance) with an applicable adjustment for related interest expense, net of tax, and full exercise
of outstanding warrants.
Cash dividends per share presented in the consolidated statements of income are dividends applicable to the respective years,
including dividends to be paid after the end of the year.
NOTE 4—INVENTORIES
Inventories at December 31, 2004 and 2003 consist of the following:
Thousands ofMillions of yen U.S. dollars
2004 2003 2004
Finished products ¥244,312 ¥236,179 $2,344,420
Work in process 25,626 22,928 245,907
Raw materials and supplies 103,482 90,448 993,014
Total ¥373,420 ¥349,555 $3,583,341
NOTE 5—INVESTMENTS IN SECURITIES
Information regarding each category of available-for-sale securities at December 31, 2004 and 2003 is as follows:
Millions of yen
2004
Cost Unrealized gains Unrealized losses Fair value
Securities classified as:
Available-for-sale:
Equity securities ¥46,662 ¥158,576 ¥(47) ¥205,191
Debt securities 3,000 36 — 3,036

41Financial Section
Millions of yen
2003
Cost Unrealized gains Unrealized losses Fair value
Securities classified as:
Available-for-sale:
Equity securities ¥46,309 ¥138,324 ¥(239) ¥184,394
Debt securities 5,000 4 — 5,004
Thousands of U.S. dollars
2004
Cost Unrealized gains Unrealized losses Fair value
Securities classified as:
Available-for-sale:
Equity securities $447,769 $1,521,696 $(451) $1,969,014
Debt securities 28,788 345 — 29,133
Available-for-sale securities whose fair value is not readily determinable at December 31, 2004 and 2003 are mainly as follows:
Carrying amount
Thousands ofMillions of yen U.S. dollars
2004 2003 2004
Available-for-sale:
Equity securities ¥4,950 ¥4,924 $47,500
Proceeds from sales of available-for-sale securities for the years ended December 31, 2004, 2003 and 2002 are ¥5,754 million
($55,215 thousand), ¥3,769 million and ¥974 million, respectively. Gross realized gains and losses on these sales, computed on the
moving average cost basis, are ¥95 million ($912 thousand) and ¥78 million ($748 thousand), respectively, for the year ended
December 31, 2004, ¥309 million and ¥392 million, respectively, for the year ended December 31, 2003 and ¥199 million and ¥158 mil-
lion, respectively, for the year ended December 31, 2002.
The carrying values of debt securities by contractual maturities for securities classified as available-for-sale at December 31, 2004 are
as follows:
Thousands of Millions of yen U.S. dollars
Available-for-sale:
Debt securities:
Due 2005 — —
Due 2006 to 2009 ¥3,036 $29,133
Due 2010 to 2014 — —
Due 2015 and thereafter — —
Total ¥3,036 $29,133
NOTE 6—SHORT-TERM AND LONG-TERM DEBT
Short-term debt at December 31, 2004 and 2003 consists of the following:
Thousands of Millions of yen U.S. dollars
2004 2003 2004
Short-term bank loans, weighted average interest rate of 3.7%
at December 31, 2004 and 3.5% at December 31, 2003 ¥70,175 ¥74,394 $673,400
Commercial paper, weighted average interest rate of 2.3% at December 31, 2004 1,409 — 13,521
Unsecured Euro Medium Term Notes due 2003–2004 with interest ranging
from 0.0% to 0.1% at December 31, 2004 and December 31, 2003 8,351 10,928 80,136
Total ¥79,935 ¥85,322 $767,057
42 Bridgestone Annual Report 2004
Long-term debt at December 31, 2004 and 2003 consists of the following:
Thousands of Millions of yen U.S. dollars
2004 2003 2004
Borrowings from banks, insurance companies and others, weighted average
interest rate of 2.1% at December 31, 2004 and 1.8% at December 31, 2003
denominated in mainly Japanese yen, U.S. dollars and euros:
Secured ¥ 2,649 ¥ 1,252 $ 25,420
Unsecured 263,843 270,665 2,531,840
1.7% yen unsecured straight bonds, due 2007 20,000 20,000 191,920
2.0% yen unsecured straight bonds, due 2010 30,000 30,000 287,880
0.6% yen unsecured straight bonds, due 2010 30,000 30,000 287,880
0.9% yen unsecured straight bonds, due 2013 50,000 50,000 479,800
Unsecured 0.3% Euro Medium Term Notes due 2007 3,146 — 30,189
Total 399,638 401,917 3,834,929
Less current portion (91,771) (2,566) (880,635)
Long-term debt, less current portion ¥ 307,867 ¥399,351 $2,954,294
Annual maturities of long-term debt at December 31, 2004 are as follows:
Thousands of Year ending December 31, Millions of yen U.S. dollars
2005 ¥ 91,771 $ 880,635
2006 14,423 138,403
2007 59,942 575,204
2008 58,771 563,967
2009 11,030 105,844
2010 and thereafter 163,701 1,570,876
Total ¥399,638 $3,834,929
Notes and accounts receivable, inventories, and property, plant and equipment were pledged as collateral for certain bank loans. The
aggregate carrying amount of the assets pledged as collateral for short-term bank loans of ¥3,259 million ($31,273 thousand) and long-
term bank loans of ¥2,649 million ($25,420 thousand) at December 31, 2004 is ¥27,399 million ($262,921 thousand).
General agreements with respective banks provide, as is customary in Japan, that additional collateral must be provided under cer-
tain circumstances if requested by such banks and that certain banks have the right to offset cash deposited with them against any long-
term or short-term debt or obligation that becomes due and, in case of default and certain other specified events, against all other debt
payable to the banks. The Company has never been requested to provide any additional collateral.
At December 31, 2004, the Company had unused committed lines of credit with various banks for short-term financing, amounting
to ¥30,000 million ($287,880 thousand). The Company compensates banks for the lines of credit in the form of commitment fees,
which were not material for the year ended December 31, 2004.
Effective January 31, 2005, Bridgestone Americas Holding, Inc. (“BSAH”) and its major subsidiaries in the U.S. entered into separate
third amended and restated revolving credit agreements with a syndicate of banks providing an aggregate borrowing commitment of
$1.5 billion. These agreements expire on January 30, 2006. These agreements contain certain customary affirmative and negative
covenants, the most restrictive of which includes (i) the maintenance by BSAH and its major subsidiaries of their consolidated tangible
net worth; (ii) restrictions on entering into additional debt arrangements and the sale of assets. Further, an event of default under these
agreements by any of the major subsidiaries in the U.S. causes an event of default under the BSAH third amended and restated revolv-
ing credit agreement. The above agreements replace the separate second amended and restated revolving credit agreements entered
into on January 6, 2004, by BSAH and its major subsidiaries which provided an aggregate borrowing commitment of $1.5 billion, ini-
tially expired on January 4, 2005 and were extended to January 31, 2005. The terms of the separate second amended and restated
revolving credit agreements were substantially the same, with the exception of the removal of the guarantee by the Company, as those
of the third amended and restated revolving credit agreements discussed above.
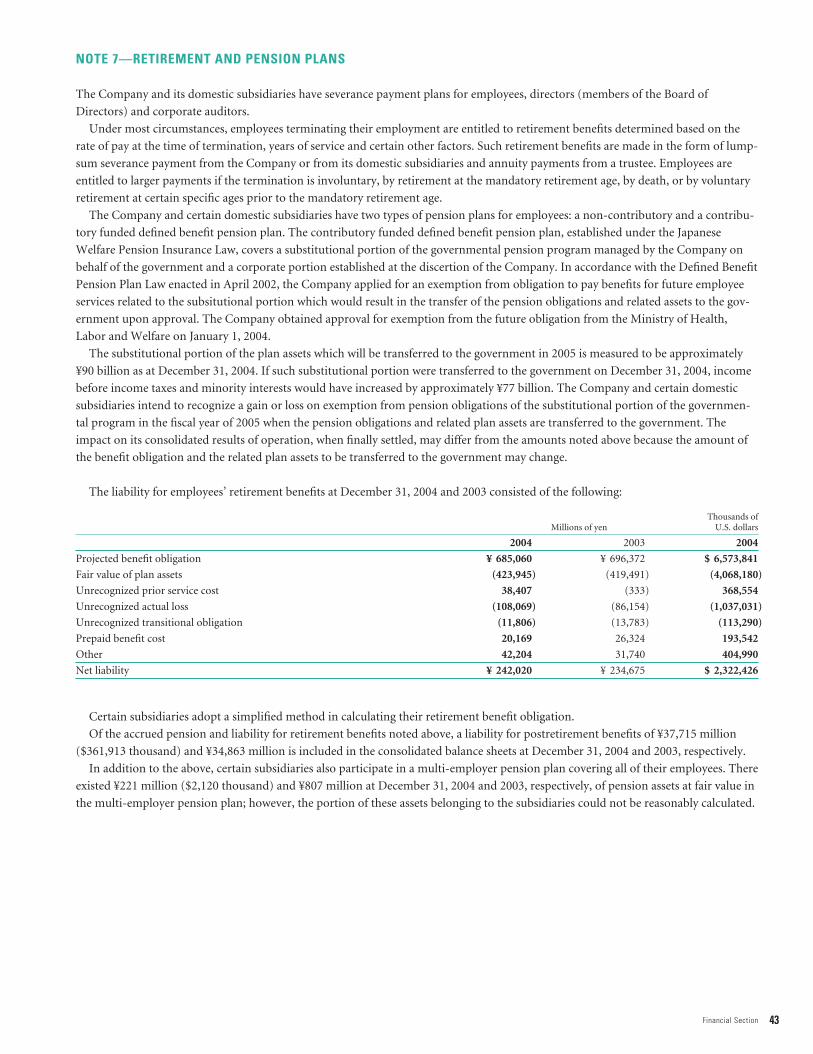
43Financial Section
NOTE 7—RETIREMENT AND PENSION PLANS
The Company and its domestic subsidiaries have severance payment plans for employees, directors (members of the Board of
Directors) and corporate auditors.
Under most circumstances, employees terminating their employment are entitled to retirement benefits determined based on the
rate of pay at the time of termination, years of service and certain other factors. Such retirement benefits are made in the form of lump-
sum severance payment from the Company or from its domestic subsidiaries and annuity payments from a trustee. Employees are
entitled to larger payments if the termination is involuntary, by retirement at the mandatory retirement age, by death, or by voluntary
retirement at certain specific ages prior to the mandatory retirement age.
The Company and certain domestic subsidiaries have two types of pension plans for employees: a non-contributory and a contribu-
tory funded defined benefit pension plan. The contributory funded defined benefit pension plan, established under the Japanese
Welfare Pension Insurance Law, covers a substitutional portion of the governmental pension program managed by the Company on
behalf of the government and a corporate portion established at the discertion of the Company. In accordance with the Defined Benefit
Pension Plan Law enacted in April 2002, the Company applied for an exemption from obligation to pay benefits for future employee
services related to the subsitutional portion which would result in the transfer of the pension obligations and related assets to the gov-
ernment upon approval. The Company obtained approval for exemption from the future obligation from the Ministry of Health,
Labor and Welfare on January 1, 2004.
The substitutional portion of the plan assets which will be transferred to the government in 2005 is measured to be approximately
¥90 billion as at December 31, 2004. If such substitutional portion were transferred to the government on December 31, 2004, income
before income taxes and minority interests would have increased by approximately ¥77 billion. The Company and certain domestic
subsidiaries intend to recognize a gain or loss on exemption from pension obligations of the substitutional portion of the governmen-
tal program in the fiscal year of 2005 when the pension obligations and related plan assets are transferred to the government. The
impact on its consolidated results of operation, when finally settled, may differ from the amounts noted above because the amount of
the benefit obligation and the related plan assets to be transferred to the government may change.
The liability for employees’ retirement benefits at December 31, 2004 and 2003 consisted of the following:
Thousands of Millions of yen U.S. dollars
2004 2003 2004
Projected benefit obligation ¥ 685,060 ¥ 696,372 $ 6,573,841
Fair value of plan assets (423,945) (419,491) (4,068,180)
Unrecognized prior service cost 38,407 (333) 368,554
Unrecognized actual loss (108,069) (86,154) (1,037,031)
Unrecognized transitional obligation (11,806) (13,783) (113,290)
Prepaid benefit cost 20,169 26,324 193,542
Other 42,204 31,740 404,990
Net liability ¥ 242,020 ¥ 234,675 $ 2,322,426
Certain subsidiaries adopt a simplified method in calculating their retirement benefit obligation.
Of the accrued pension and liability for retirement benefits noted above, a liability for postretirement benefits of ¥37,715 million
($361,913 thousand) and ¥34,863 million is included in the consolidated balance sheets at December 31, 2004 and 2003, respectively.
In addition to the above, certain subsidiaries also participate in a multi-employer pension plan covering all of their employees. There
existed ¥221 million ($2,120 thousand) and ¥807 million at December 31, 2004 and 2003, respectively, of pension assets at fair value in
the multi-employer pension plan; however, the portion of these assets belonging to the subsidiaries could not be reasonably calculated.
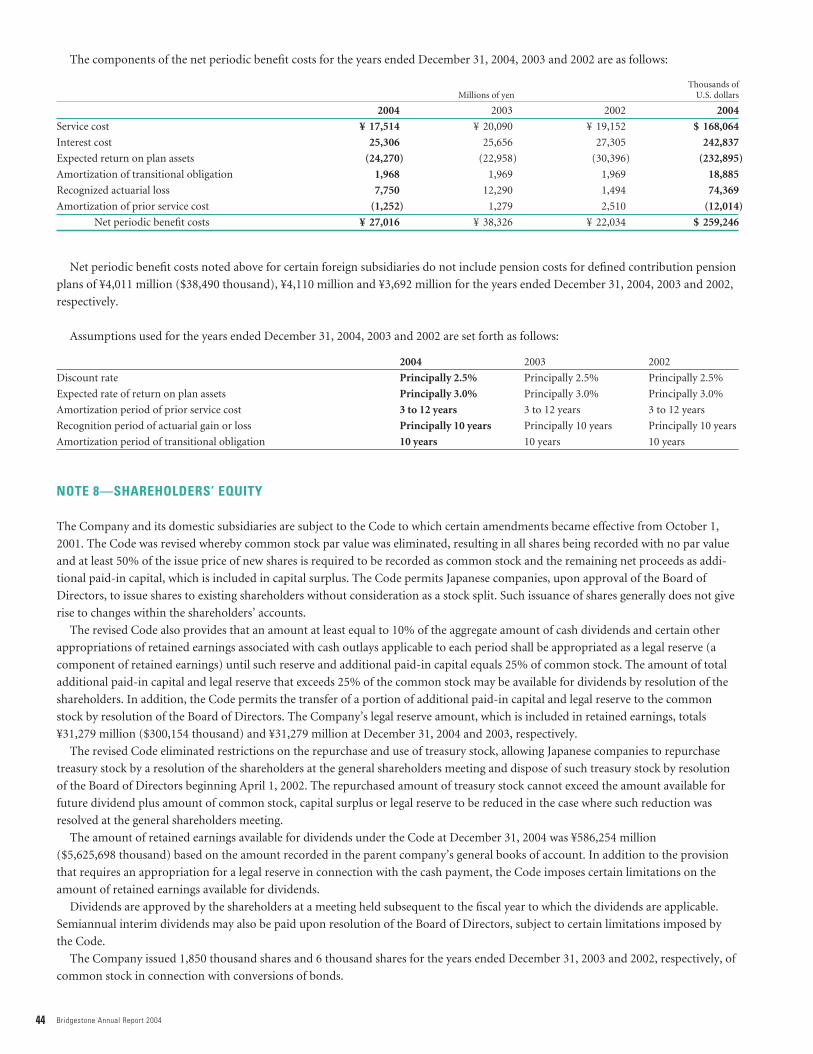
44 Bridgestone Annual Report 2004
The components of the net periodic benefit costs for the years ended December 31, 2004, 2003 and 2002 are as follows:
Thousands of Millions of yen U.S. dollars
2004 2003 2002 2004
Service cost ¥ 17,514 ¥ 20,090 ¥ 19,152 $ 168,064
Interest cost 25,306 25,656 27,305 242,837
Expected return on plan assets (24,270) (22,958) (30,396) (232,895)
Amortization of transitional obligation 1,968 1,969 1,969 18,885
Recognized actuarial loss 7,750 12,290 1,494 74,369
Amortization of prior service cost (1,252) 1,279 2,510 (12,014)
Net periodic benefit costs ¥ 27,016 ¥ 38,326 ¥ 22,034 $ 259,246
Net periodic benefit costs noted above for certain foreign subsidiaries do not include pension costs for defined contribution pension
plans of ¥4,011 million ($38,490 thousand), ¥4,110 million and ¥3,692 million for the years ended December 31, 2004, 2003 and 2002,
respectively.
Assumptions used for the years ended December 31, 2004, 2003 and 2002 are set forth as follows:
2004 2003 2002
Discount rate Principally 2.5% Principally 2.5% Principally 2.5%
Expected rate of return on plan assets Principally 3.0% Principally 3.0% Principally 3.0%
Amortization period of prior service cost 3 to 12 years 3 to 12 years 3 to 12 years
Recognition period of actuarial gain or loss Principally 10 years Principally 10 years Principally 10 years
Amortization period of transitional obligation 10 years 10 years 10 years
NOTE 8—SHAREHOLDERS’ EQUITY
The Company and its domestic subsidiaries are subject to the Code to which certain amendments became effective from October 1,
2001. The Code was revised whereby common stock par value was eliminated, resulting in all shares being recorded with no par value
and at least 50% of the issue price of new shares is required to be recorded as common stock and the remaining net proceeds as addi-
tional paid-in capital, which is included in capital surplus. The Code permits Japanese companies, upon approval of the Board of
Directors, to issue shares to existing shareholders without consideration as a stock split. Such issuance of shares generally does not give
rise to changes within the shareholders’ accounts.
The revised Code also provides that an amount at least equal to 10% of the aggregate amount of cash dividends and certain other
appropriations of retained earnings associated with cash outlays applicable to each period shall be appropriated as a legal reserve (a
component of retained earnings) until such reserve and additional paid-in capital equals 25% of common stock. The amount of total
additional paid-in capital and legal reserve that exceeds 25% of the common stock may be available for dividends by resolution of the
shareholders. In addition, the Code permits the transfer of a portion of additional paid-in capital and legal reserve to the common
stock by resolution of the Board of Directors. The Company’s legal reserve amount, which is included in retained earnings, totals
¥31,279 million ($300,154 thousand) and ¥31,279 million at December 31, 2004 and 2003, respectively.
The revised Code eliminated restrictions on the repurchase and use of treasury stock, allowing Japanese companies to repurchase
treasury stock by a resolution of the shareholders at the general shareholders meeting and dispose of such treasury stock by resolution
of the Board of Directors beginning April 1, 2002. The repurchased amount of treasury stock cannot exceed the amount available for
future dividend plus amount of common stock, capital surplus or legal reserve to be reduced in the case where such reduction was
resolved at the general shareholders meeting.
The amount of retained earnings available for dividends under the Code at December 31, 2004 was ¥586,254 million
($5,625,698 thousand) based on the amount recorded in the parent company’s general books of account. In addition to the provision
that requires an appropriation for a legal reserve in connection with the cash payment, the Code imposes certain limitations on the
amount of retained earnings available for dividends.
Dividends are approved by the shareholders at a meeting held subsequent to the fiscal year to which the dividends are applicable.
Semiannual interim dividends may also be paid upon resolution of the Board of Directors, subject to certain limitations imposed by
the Code.
The Company issued 1,850 thousand shares and 6 thousand shares for the years ended December 31, 2003 and 2002, respectively, of
common stock in connection with conversions of bonds.

45Financial Section
NOTE 9—STOCK-BASED COMPENSATION
The Company has a stock option plan. The stock option plan which was approved at the general shareholders meeting provides
options for purchases of the Company’s common stock for the directors and selected employees of the Company.
The date of grant, the number of grant options and exercise period at December 31, 2004 are as follows:
Date of grant Number of options granted (Thousands of shares) Exercise period
March 30, 2000 Directors 156 from April 1, 2002 to March 31, 2007
Selected employees 59 from April 1, 2002 to March 31, 2007
March 29, 2001 Directors 130 from April 1, 2003 to March 31, 2008
Selected employees 54 from April 1, 2003 to March 31, 2008
March 28, 2002 Directors 110 from April 1, 2004 to March 31, 2009
Selected employees 154 from April 1, 2004 to March 31, 2009
March 28, 2003 Directors 135 from April 1, 2005 to March 31, 2010
Selected employees 127 from April 1, 2005 to March 31, 2010
March 30, 2004 Directors 120 from April 1, 2006 to March 31, 2011
Selected employees 144 from April 1, 2006 to March 31, 2011
Total 1,189
The exercise price is equal to the higher of either 1.05 times the monthly average closing market price of the Company’s common
stock traded in the Tokyo Stock Exchange during the month preceding the date of grant, or the closing market price on the date of
grant.
During the year ended December 31, 2004, 24 thousand shares which were granted at March 29, 2001 were exercised. At December
31, 2004, the balance of the exercisable options was 663 thousand shares.
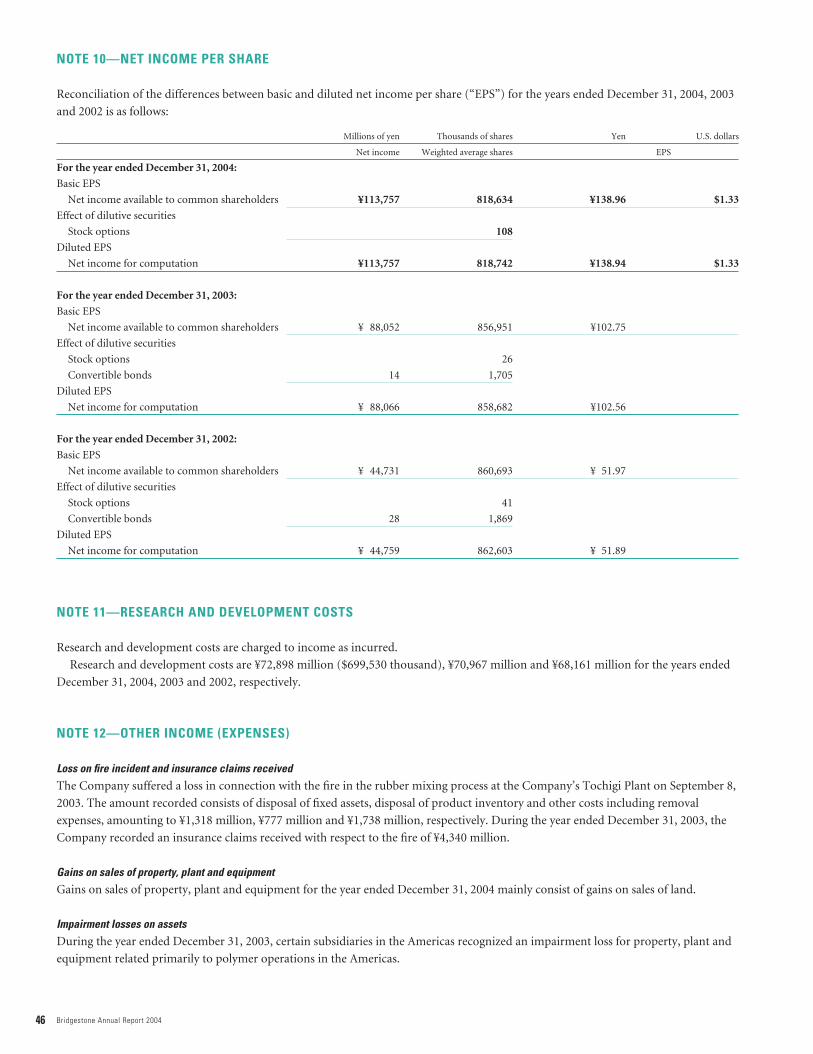
46 Bridgestone Annual Report 2004
NOTE 10—NET INCOME PER SHARE
Reconciliation of the differences between basic and diluted net income per share (“EPS”) for the years ended December 31, 2004, 2003
and 2002 is as follows:
Millions of yen Thousands of shares Yen U.S. dollars
Net income Weighted average shares EPS
For the year ended December 31, 2004:
Basic EPS
Net income available to common shareholders ¥113,757 818,634 ¥138.96 $1.33
Effect of dilutive securities
Stock options 108
Diluted EPS
Net income for computation ¥113,757 818,742 ¥138.94 $1.33
For the year ended December 31, 2003:
Basic EPS
Net income available to common shareholders ¥ 88,052 856,951 ¥102.75
Effect of dilutive securities
Stock options 26
Convertible bonds 14 1,705
Diluted EPS
Net income for computation ¥ 88,066 858,682 ¥102.56
For the year ended December 31, 2002:
Basic EPS
Net income available to common shareholders ¥ 44,731 860,693 ¥ 51.97
Effect of dilutive securities
Stock options 41
Convertible bonds 28 1,869
Diluted EPS
Net income for computation ¥ 44,759 862,603 ¥ 51.89
NOTE 11—RESEARCH AND DEVELOPMENT COSTS
Research and development costs are charged to income as incurred.
Research and development costs are ¥72,898 million ($699,530 thousand), ¥70,967 million and ¥68,161 million for the years ended
December 31, 2004, 2003 and 2002, respectively.
NOTE 12—OTHER INCOME (EXPENSES)
Loss on fire incident and insurance claims received
The Company suffered a loss in connection with the fire in the rubber mixing process at the Company’s Tochigi Plant on September 8,
2003. The amount recorded consists of disposal of fixed assets, disposal of product inventory and other costs including removal
expenses, amounting to ¥1,318 million, ¥777 million and ¥1,738 million, respectively. During the year ended December 31, 2003, the
Company recorded an insurance claims received with respect to the fire of ¥4,340 million.
Gains on sales of property, plant and equipment
Gains on sales of property, plant and equipment for the year ended December 31, 2004 mainly consist of gains on sales of land.
Impairment losses on assets
During the year ended December 31, 2003, certain subsidiaries in the Americas recognized an impairment loss for property, plant and
equipment related primarily to polymer operations in the Americas.
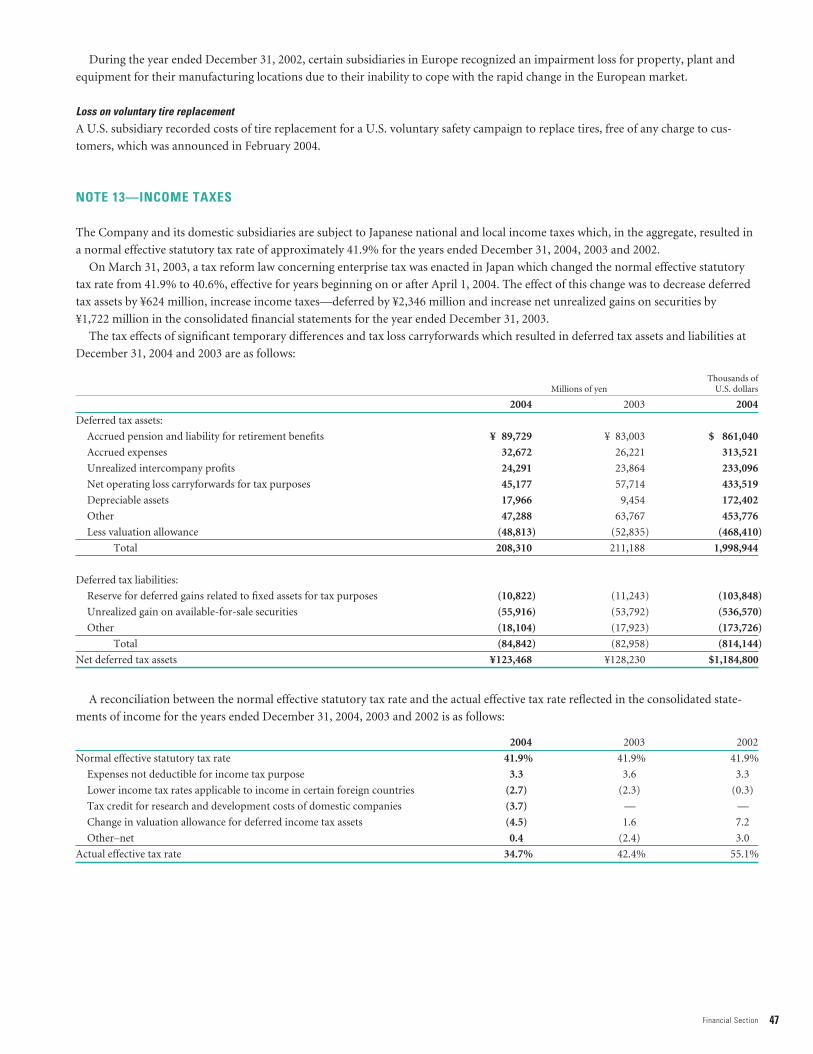
47Financial Section
During the year ended December 31, 2002, certain subsidiaries in Europe recognized an impairment loss for property, plant and
equipment for their manufacturing locations due to their inability to cope with the rapid change in the European market.
Loss on voluntary tire replacement
A U.S. subsidiary recorded costs of tire replacement for a U.S. voluntary safety campaign to replace tires, free of any charge to cus-
tomers, which was announced in February 2004.
NOTE 13—INCOME TAXES
The Company and its domestic subsidiaries are subject to Japanese national and local income taxes which, in the aggregate, resulted in
a normal effective statutory tax rate of approximately 41.9% for the years ended December 31, 2004, 2003 and 2002.
On March 31, 2003, a tax reform law concerning enterprise tax was enacted in Japan which changed the normal effective statutory
tax rate from 41.9% to 40.6%, effective for years beginning on or after April 1, 2004. The effect of this change was to decrease deferred
tax assets by ¥624 million, increase income taxes—deferred by ¥2,346 million and increase net unrealized gains on securities by
¥1,722 million in the consolidated financial statements for the year ended December 31, 2003.
The tax effects of significant temporary differences and tax loss carryforwards which resulted in deferred tax assets and liabilities at
December 31, 2004 and 2003 are as follows:
Thousands of Millions of yen U.S. dollars
2004 2003 2004
Deferred tax assets:
Accrued pension and liability for retirement benefits ¥ 89,729 ¥ 83,003 $ 861,040
Accrued expenses 32,672 26,221 313,521
Unrealized intercompany profits 24,291 23,864 233,096
Net operating loss carryforwards for tax purposes 45,177 57,714 433,519
Depreciable assets 17,966 9,454 172,402
Other 47,288 63,767 453,776
Less valuation allowance (48,813) (52,835) (468,410)
Total 208,310 211,188 1,998,944
Deferred tax liabilities:
Reserve for deferred gains related to fixed assets for tax purposes (10,822) (11,243) (103,848)
Unrealized gain on available-for-sale securities (55,916) (53,792) (536,570)
Other (18,104) (17,923) (173,726)
Total (84,842) (82,958) (814,144)
Net deferred tax assets ¥123,468 ¥128,230 $1,184,800
A reconciliation between the normal effective statutory tax rate and the actual effective tax rate reflected in the consolidated state-
ments of income for the years ended December 31, 2004, 2003 and 2002 is as follows:
2004 2003 2002
Normal effective statutory tax rate 41.9% 41.9% 41.9%
Expenses not deductible for income tax purpose 3.3 3.6 3.3
Lower income tax rates applicable to income in certain foreign countries (2.7) (2.3) (0.3)
Tax credit for research and development costs of domestic companies (3.7) — —
Change in valuation allowance for deferred income tax assets (4.5) 1.6 7.2
Other–net 0.4 (2.4) 3.0
Actual effective tax rate 34.7% 42.4% 55.1%

48 Bridgestone Annual Report 2004
NOTE 14—DERIVATIVES
The Companies enter into foreign currency forward contracts, currency swap contracts and currency option contracts to hedge foreign
currency exchange risk associated with certain assets and liabilities denominated in foreign currencies. The Companies enter into inter-
est rate swap contracts to manage their interest rate exposure on certain liabilities. In addition, the Companies enter into commodity
future contracts to hedge the risk of fluctuation of commodity prices for raw materials.
All derivative transactions are entered into to hedge foreign currency, interest and commodity price exposures that arise in the
course of the Companies’ business. Accordingly, the market risk in these derivatives is basically offset by opposite movements in the
value of hedged assets or liabilities. Because the counterparties to these derivatives are limited to major international financial institu-
tions, the Companies do not anticipate any losses arising from credit risk. Derivative transactions entered into by the Companies have
been made in accordance with internal policies which regulate the authorization and credit limit amounts.
Foreign currency forward contracts and currency swap contracts which qualify for hedge accounting for the years ended December
31, 2004 and 2003 are excluded from the disclosure of market value information.
The contract or notional amounts of derivatives which are shown in the following table do not represent the amounts exchanged by
the parties and do not measure the Companies’ exposure to credit or market risk.
The Companies had the following derivative contracts outstanding at December 31, 2004 and 2003:
Millions of yen
2004 2003
Contract Unrealized Contract Unrealizedamount Fair value gains (losses) amount Fair value gains (losses)
Foreign currency forward contracts:
Sell:
U.S. dollar ¥45,108 ¥44,085 ¥ 1,023 ¥33,697 ¥32,652 ¥ 1,045
Euro 48,097 49,443 (1,346) 35,913 37,596 (1,683)
Australian dollar 6,115 6,229 (114) 6,644 6,971 (327)
British pound 617 624 (7) 859 893 (34)
Other 6,466 6,718 (252) 5,070 5,150 (80)
Buy:
U.S. dollar 6,890 6,598 (292) 8,557 7,986 (571)
Japanese yen 712 688 (24) 1,380 1,360 (20)
Other 1,730 1,692 (38) 1,836 1,822 (14)
Currency swap contracts:
Indian rupee receipt, Japanese yen payment 1,402 (99) (99) — — —
Interest rate swap contracts:
Floating rate receipt, fixed rate payment 23,752 (1,088) (1,088) 26,598 (1,290) (1,290)
Commodity future contracts:
Natural rubber:
Buy 604 588 (16) 340 308 (32)
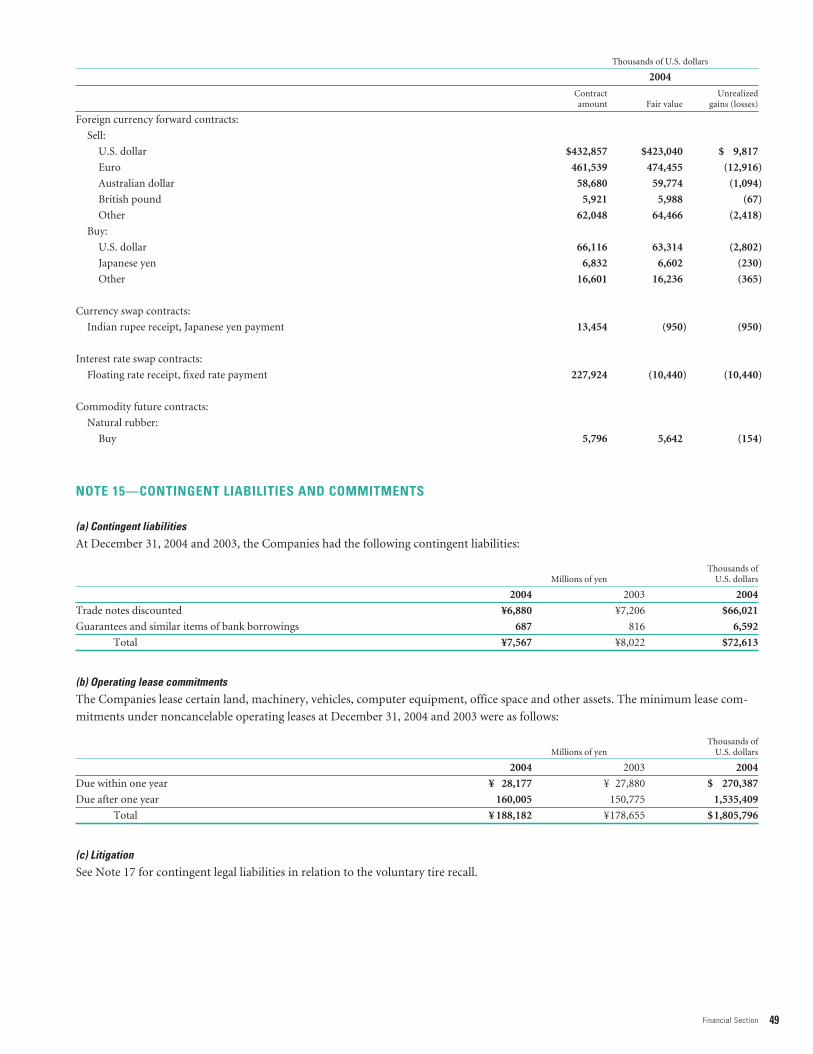
49Financial Section
Thousands of U.S. dollars
2004
Contract Unrealizedamount Fair value gains (losses)
Foreign currency forward contracts:
Sell:
U.S. dollar $432,857 $423,040 $ 9,817
Euro 461,539 474,455 (12,916)
Australian dollar 58,680 59,774 (1,094)
British pound 5,921 5,988 (67)
Other 62,048 64,466 (2,418)
Buy:
U.S. dollar 66,116 63,314 (2,802)
Japanese yen 6,832 6,602 (230)
Other 16,601 16,236 (365)
Currency swap contracts:
Indian rupee receipt, Japanese yen payment 13,454 (950) (950)
Interest rate swap contracts:
Floating rate receipt, fixed rate payment 227,924 (10,440) (10,440)
Commodity future contracts:
Natural rubber:
Buy 5,796 5,642 (154)
NOTE 15—CONTINGENT LIABILITIES AND COMMITMENTS
(a) Contingent liabilities
At December 31, 2004 and 2003, the Companies had the following contingent liabilities:
Thousands of Millions of yen U.S. dollars
2004 2003 2004
Trade notes discounted ¥6,880 ¥7,206 $66,021
Guarantees and similar items of bank borrowings 687 816 6,592
Total ¥7,567 ¥8,022 $72,613
(b) Operating lease commitments
The Companies lease certain land, machinery, vehicles, computer equipment, office space and other assets. The minimum lease com-
mitments under noncancelable operating leases at December 31, 2004 and 2003 were as follows:
Thousands of Millions of yen U.S. dollars
2004 2003 2004
Due within one year ¥ 28,177 ¥ 27,880 $ 270,387
Due after one year 160,005 150,775 1,535,409
Total ¥ 188,182 ¥178,655 $1,805,796
(c) Litigation
See Note 17 for contingent legal liabilities in relation to the voluntary tire recall.

50 Bridgestone Annual Report 2004
NOTE 16—SEGMENT INFORMATION
Information about industry segments, geographic segments and sales to customers outside of Japan, for the years ended December 31,
2004, 2003 and 2002 is as follows:
(a) Information by industry segment
Year ended December 31, 2004 Millions of yen
Tires Diversified products Total Elimination or corporate Consolidated
Net sales:
External customers ¥1,927,989 ¥ 488,696 ¥2,416,685 — ¥2,416,685
Inter-segment 3,838 24,084 27,922 ¥ (27,922) —
Total 1,931,827 512,780 2,444,607 (27,922) 2,416,685
Operating expenses 1,771,536 476,286 2,247,822 (28,834) 2,218,988
Operating income ¥ 160,291 ¥ 36,494 ¥ 196,785 ¥ 912 ¥ 197,697
Identifiable assets ¥1,945,245 ¥ 397,076 ¥2,342,321 ¥ (8,613) ¥2,333,708
Depreciatio n and amortization ¥ 94,581 ¥ 16,910 ¥ 111,491 — ¥ 111,491
Capital expenditures ¥ 170,223 ¥ 22,187 ¥ 192,410 — ¥ 192,410
Year ended December 31, 2003 Millions of yen
Tires Diversified products Total Elimination or corporate Consolidated
Net sales:
External customers ¥ 1,836,395 ¥ 467,522 ¥ 2,303,917 — ¥ 2,303,917
Inter-segment 1,577 17,049 18,626 ¥ (18,626) —
Total 1,837,972 484,571 2,322,543 (18,626) 2,303,917
Operating expenses 1,689,662 449,948 2,139,610 (18,987) 2,120,623
Operating income ¥ 148,310 ¥ 34,623 ¥ 182,933 ¥ 361 ¥ 183,294
Identifiable assets ¥ 1,862,091 ¥ 367,529 ¥ 2,229,620 ¥ (9,007) ¥ 2,220,613
Depreciation and amortization ¥ 87,693 ¥ 16,690 ¥ 104,383 — ¥ 104,383
Capital expenditures ¥ 140,186 ¥ 16,486 ¥ 156,672 — ¥ 156,672
Year ended December 31, 2002 Millions of yen
Tires Diversified products Total Elimination or corporate Consolidated
Net sales:
External customers ¥ 1,797,598 ¥ 450,171 ¥ 2,247,769 — ¥ 2,247,769
Inter-segment 943 17,370 18,313 ¥ (18,313) —
Total 1,798,541 467,541 2,266,082 (18,313) 2,247,769
Operating expenses 1,643,518 439,143 2,082,661 (18,754) 2,063,907
Operating income ¥ 155,023 ¥ 28,398 ¥ 183,421 ¥ 441 ¥ 183,862
Identifiable assets ¥ 1,786,415 ¥ 367,226 ¥ 2,153,641 ¥ (9,713) ¥ 2,143,928
Depreciation and amortization ¥ 101,363 ¥ 18,995 ¥ 120,358 ¥ (892) ¥ 119,466
Capital expenditures ¥ 99,029 ¥ 20,609 ¥ 119,638 ¥ (436) ¥ 119,202
Year ended December 31, 2004 Thousands of U.S. dollars
Tires Diversified products Total Elimination or corporate Consolidated
Net sales:
External customers $ 18,500,998 $4,689,531 $23,190,529 — $23,190,529
Inter-segment 36,830 231,110 267,940 $(267,940) —
Total 18,537,828 4,920,641 23,458,469 (267,940) 23,190,529
Operating expenses 16,999,674 4,570,444 21,570,118 (276,691) 21,293,427
Operating income $ 1,538,154 $ 350,197 $ 1,888,351 $ 8,751 $ 1,897,102
Identifiable assets $ 18,666,587 $3,810,344 $ 22,476,931 $ (82,650) $ 22,394,281
Depreciation and amortization $ 907,600 $ 162,269 $ 1,069,869 — $ 1,069,869
Capital expenditures $ 1,633,461 $ 212,907 $ 1,846,368 — $ 1,846,368
The major products and business of each industry segment are as follows:
Tires: Tires and tubes, wheels and accessories, auto maintenance, etc.
Diversified products: Chemical products, industrial products, sporting goods, bicycles, etc.

51Financial Section
(b) Information by geographic segment
Year ended December 31, 2004 Millions of yen
EliminationJapan The Americas Europe Other Total or corporate Consolidated
Net sales:
External customers ¥ 814,625 ¥1,013,520 ¥ 321,695 ¥ 266,845 ¥2,416,685 — ¥2,416,685
Inter-segment 254,237 5,419 3,901 138,538 402,095 ¥ (402,095) —
Total 1,068,862 1,018,939 325,596 405,383 2,818,780 (402,095) 2,416,685
Operating expenses 937,743 992,280 303,579 387,719 2,621,321 (402,333) 2,218,988
Operating income ¥ 131,119 ¥ 26,659 ¥ 22,017 ¥ 17,664 ¥ 197,459 ¥ 238 ¥ 197,697
Identifiable assets ¥1,249,822 ¥ 633,153 ¥ 323,718 ¥ 285,543 ¥2,492,236 ¥ (158,528) ¥2,333,708
Year ended December 31, 2003 Millions of yen
EliminationJapan The Americas Europe Other Total or corporate Consolidated
Net sales:
External customers ¥ 803,095 ¥ 972,289 ¥ 287,416 ¥ 241,117 ¥ 2,303,917 — ¥ 2,303,917
Inter-segment 252,047 5,326 3,723 111,496 372,592 ¥ (372,592) —
Total 1,055,142 977,615 291,139 352,613 2,676,509 (372,592) 2,303,917
Operating expenses 926,006 958,111 275,690 331,107 2,490,914 (370,291) 2,120,623
Operating income ¥ 129,136 ¥ 19,504 ¥ 15,449 ¥ 21,506 ¥ 185,595 ¥ (2,301) ¥ 183,294
Identifiable assets ¥ 1,235,159 ¥ 611,900 ¥ 264,172 ¥ 252,916 ¥ 2,364,147 ¥ (143,534) ¥ 2,220,613
Year ended December 31, 2002 Millions of yen
EliminationJapan The Americas Europe Other Total or corporate Consolidated
Net sales:
External customers ¥ 827,620 ¥ 980,967 ¥ 239,235 ¥ 199,947 ¥ 2,247,769 — ¥ 2,247,769
Inter-segment 206,010 5,605 4,081 92,398 308,094 ¥ (308,094) —
Total 1,033,630 986,572 243,316 292,345 2,555,863 (308,094) 2,247,769
Operating expenses 897,001 967,979 235,052 270,575 2,370,607 (306,700) 2,063,907
Operating income ¥ 136,629 ¥ 18,593 ¥ 8,264 ¥ 21,770 ¥ 185,256 ¥ (1,394) ¥ 183,862
Identifiable assets ¥ 1,145,019 ¥ 693,128 ¥ 217,205 ¥ 214,624 ¥ 2,269,976 ¥ (126,048) ¥ 2,143,928
Year ended December 31, 2004 Thousands of U.S. dollars
EliminationJapan The Americas Europe Other Total or corporate Consolidated
Net sales:
External customers $ 7,817,148 $9,725,746 $3,086,988 $2,560,647 $ 23,190,529 — $ 23,190,529
Inter-segment 2,439,660 52,001 37,434 1,329,412 3,858,507 $(3,858,507) —
Total 10,256,808 9,777,747 3,124,422 3,890,059 27,049,036 (3,858,507) 23,190,529
Operating expenses 8,998,589 9,521,927 2,913,147 3,720,555 25,154,218 (3,860,791) 21,293,427
Operating income $ 1,258,219 $ 255,820 $ 211,275 $ 169,504 $ 1,894,818 $ 2,284 $ 1,897,102
Identifiable assets $ 11,993,302 $6,075,741 $3,106,401 $2,740,073 $ 23,915,517 $(1,521,236) $ 22,394,281
Major countries and areas included in each geographic segment are as follows:
The Americas: United States, Canada, Mexico, Brazil, Argentina, etc.
Europe: Germany, United Kingdom, France, Italy, Spain, etc.
Other: Asia Pacific, Africa, etc.

52 Bridgestone Annual Report 2004
(c) Overseas sales
Overseas sales by area and percentage of overseas sales over consolidated net sales for the years ended December 31, 2004, 2003 and
2002 are as follows:
Amount Percentage
Thousands of Millions of yen U.S. dollars %
2004 2003 2002 2004 2004 2003 2002
Areas:
The Americas ¥1,007,408 ¥ 967,544 ¥ 976,863 $ 9,667,095 41.7% 42.0% 43.5%
Europe 329,424 294,900 248,228 3,161,155 13.6 12.8 11.0
Other 363,767 331,419 283,021 3,490,711 15.1 14.4 12.6
Overseas sales ¥1,700,599 ¥1,593,863 ¥1,508,112 $ 16,318,961 70.4% 69.2% 67.1%
Net sales ¥2,416,685 ¥2,303,917 ¥2,247,769 $ 23,190,529 100.0% 100.0% 100.0%
Major countries and areas included in each geographic area are as follows:
The Americas: United States, Canada, Mexico, Brazil, Argentina, etc.
Europe: Germany, United Kingdom, France, Italy, Spain, etc.
Other: Asia Pacific, Middle East, Africa, etc.
NOTE 17—VOLUNTARY TIRE RECALL COSTS AND LEGAL LIABILITIES
BSAH and/or certain of its subsidiaries (collectively, “BSA”) are defendants in numerous product liability lawsuits and claims seeking com-
pensatory and, in some cases, punitive damages based on allegations that death, personal injury, property damage and/or other loss resulted
from accidents caused by tire tread separations or other tire failures, and the Company has been named as a defendant in some of those
cases. Many of these cases involve certain Firestone Radial ATX, ATX II, and Wilderness AT tires that either were part of BSA’s voluntary
safety recall that was announced in August 2000 (and completed in August 2001) or were under investigation by the U.S. National Highway
Traffic Safety Administration (“NHTSA”), which has now closed all investigations of BSA’s products. Many of these cases also name the
Ford Motor Company (“Ford”) as a co-defendant, based on various allegations related to the Ford Explorer (the vehicle involved in many
of the alleged accidents involving tread separations).
In May 2001, Ford unilaterally announced a campaign to replace all Firestone Wilderness AT tires mounted on Ford vehicles. This cam-
paign was completed in March 2002. Since BSA’s August 2000 recall, representatives of BSA and Ford at various levels have been in commu-
nication about a number of different topics, including subjects such as supply, personal injury litigation and the impact of BSA’s recall. In
recent months, the parties have met and continue to meet in an attempt to reach an overall understanding about certain issues related to
these matters, including the resolution of each of BSA’s and Ford’s potential claims against each other related to Ford’s tire replacement
campaign. There are many complex issues involved for both companies, and it is unlikely that all these issues would ultimately be resolved
in favor of either party. The dialogue and BSA’s investigation and analysis of the issues are still at an early stage; however, BSA believes that it
generally has strong defenses to, and significant potential claims and offsets against, Ford’s overall potential claims.
In April 2003, BSA was served with a subpoena issued by a federal grand jury in Illinois which was investigating issues generally arising
from the August 2000 recall and related issues. BSA cooperated in the investigation which was closed by the Department of Justice in May
2004 without any liability incurred by BSA.
Various purported class action lawsuits have also been filed against BSA, generally seeking expansion of the August 2000 recall or relief
for alleged economic losses sustained because of either recalled tires or other tires investigated by the NHTSA, or the manner of the recall’s
implementation, and the Company has been named as a defendant in some of those cases. Many also seek punitive damages or injunctive
relief. In May 2002, the U.S. Court of Appeals for the Seventh Circuit (“Seventh Circuit”) overturned a trial court ruling certifying classes
against BSA, the Company and Ford in the consolidated federal cases and, in January 2003, the U.S. Supreme Court declined to hear plain-
tiffs’ appeal.
In June 2003, the Seventh Circuit ruled that state courts cannot certify nationwide class action lawsuits where there has been a federal
determination that nationwide certification is inappropriate. Plaintiffs have also filed purported class action lawsuits in several state jurisdic-
tions, and state courts in Illinois and South Carolina have certified state-wide classes against BSA. In July 2003, BSA reached an agreement in
principle with plaintiffs in certain of the class action cases on a settlement that would resolve the outstanding claims in the states class action
cases. The proposed settlement was filed with, and preliminarily approved by, a state court in July 2003. In March 2004, the state court ruled
that the settlement is fair, adequate and reasonable. Various objectors initially opposed the settlement and filed an appeal to have the settle-
ment set aside; however, in March 2005, the objectors filed a motion to dismiss their appeal. BSA and the Company intend to vigorously
53Financial Section
defend the settlement and to defend each of the certified and purported class action lawsuits in the absence of a reasonable and approved
settlement.
In fiscal years 2004 and 2003, BSA has paid $59 million (¥6,371 million) and $96 million (¥11,088 million), respectively, for the direct
cost of voluntary tire recall and for product liability suits and claims, and class action settlements, net of proceeds from product liability
insurance recoveries. As a result of the payments, as of December 31, 2004 and 2003, BSA has recorded liabilities for matters related to the
voluntary tire recall and resulting litigation amounting to $78 million (¥8,097 million) and $140 million (¥14,965 million), respectively.
In the individual product liability lawsuits and claims, tire replacement claims and class action lawsuits, BSA’s approach is to offer a rea-
sonable settlement and to defend its position aggressively where such settlement is not possible. There can be no assurance that product lia-
bility lawsuits and claims, tire replacement claims and class action lawsuits will be resolved as currently envisioned and, accordingly, the
ultimate liability could be significantly higher than the recorded liability. However, in the opinion of BSA management, the ultimate dispo-
sition of these product liability lawsuits and claims, tire replacement claims and class action lawsuits could possibly be material to the results
of operations in any one accounting period but will not have a material adverse effect on the financial position or liquidity of BSA.
In November 2002, an attorney who had filed a purported class action suit alleging that all the BSA’s Steeltex tires (11 million of which
are estimated to be in service as of December 31, 2004) were defective, petitioned the NHTSA to reopen an investigation of such tires which
that agency had closed in April 2002. The NHTSA denied that petition in June 2003, and in March 2004, the court denied plaintiffs’ motion
for class certification. Plaintiffs then filed a renewed motion for class certification and another petition for NHTSA to investigate (i) all
Steeltex tires generally and (ii) those Steeltex tires used on ambulances. The NHTSA denied this petition in September 2004 and closed its
investigation, and the court denied plaintiffs’ renewed motion for class certification in February 2005. BSA management has thoroughly
investigated this issue, and continues to monitor the performance of the tires in question. However, except with regard to the February 2004
voluntary safety campaign addressed below, BSA (i) does not believe that a recall or similar action concerning its Steeltex tires is necessary or
appropriate; (ii) strongly believes that the related litigation is without merit; and (iii) plans to vigorously defend its position. Accordingly,
BSA has made no provision for any related contingent liability.
In February 2004, BSA announced a U.S. voluntary safety campaign to replace, free of any charge to consumers, approximately 230,000
tires (initially estimated at 297,000 tires). The tires are Firestone-brand Steeltex Radial A/T tires in size LT265/75R16, and in Load Range D,
which are on 2000–2002 and some early model year 2003 Ford Excursion vehicles. All the affected tires were made between March 1999 and
December 2002 at BSA’s plant in Joliette, Quebec, Canada, and none are presently being manufactured by BSA. BSA also agreed to replace
approximately 20,000 exported tires meeting the same criteria. BSA estimates that the total direct costs of the voluntary safety campaign will
approximate $30 million. The voluntary safety campaign is substantially complete at December 31, 2004.
Two securities cases filed in January 2001 against BSA and the Company, alleging both misrepresentations regarding the quality of the
tires previously under investigation by the NHTSA and violations of the U.S. Securities Exchange Act, were consolidated, and, in October
2002, dismissed. In February 2003, the plaintiffs’ motion to reopen the court’s judgment was denied by the court. Plaintiffs appealed, and in
October 2004, the appellate court reversed the trial court’s dismissal, returning the case to the latter court for further proceedings. In
November 2004, BSA filed a petition for rehearing, and BSA is now awaiting a decision on that petition. BSA and the Company intend to
vigorously defend themselves and believe these cases are without merit.
Several governmental authorities in Venezuela have conducted investigations of accidents in that country involving Ford Explorers
equipped with Firestone tires, many of which were produced by BSA’s subsidiary in Venezuela, to determine whether civil fines or other
penalties should be imposed upon responsible management of either BSA’s Venezuelan subsidiary and/or Ford of Venezuela, or upon those
companies themselves. These investigations remain open. The ultimate liability, if any, with respect to the Venezuelan investigations cannot
be specifically quantified. However, in the opinion of BSA management, the ultimate disposition of these investigations will not materially
affect the BSA’s financial position, results of operations or liquidity.
NOTE 18—SUBSEQUENT EVENTS
On February 23, 2005, the Company retired 30 million shares of common stock at a cost of ¥50,494 million ($484,541 thousand) in
accordance with the approval of the Company’s Board of Directors meeting held on February 18, 2005 subject to Section 212 of the
Code. The number of issued shares after the retirement is 833,102,321 shares.
On March 30, 2005, the shareholders of the Company approved payment of a cash dividend of ¥11.0 ($0.11) per share, or a total of
¥8,831 million ($84,742 thousand), to shareholders of record as of December 31, 2004. In addition, a stock option plan was approved,
which provides options to purchase 300 thousand shares of the Company’s common stock by directors and selected employees of the
Company. The exercise price is equal to the higher of either 1.05 times the monthly average closing market price of the Company’s
common stock traded in the Tokyo Stock Exchange in the month preceding the date of grant, or the closing market price of that on the
date of grant. The exercise period of the stock options is from April 1, 2007 to March 31, 2012.
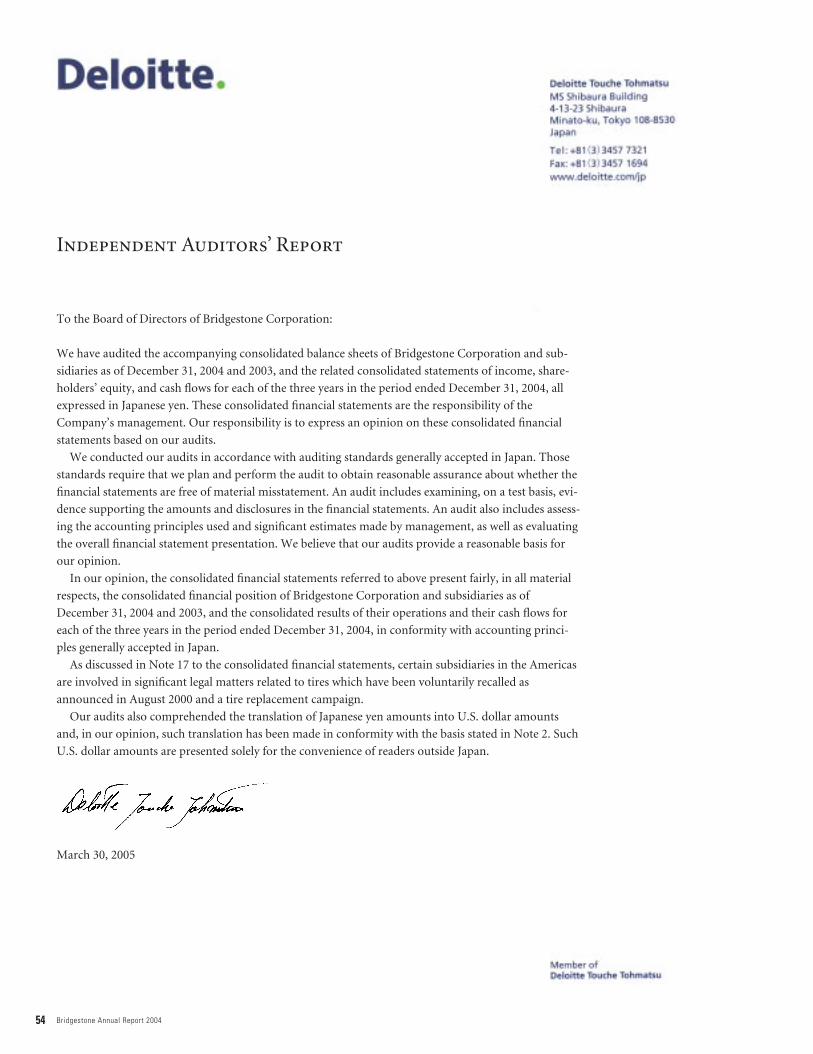
54 Bridgestone Annual Report 2004
Independent Auditors’ Report
To the Board of Directors of Bridgestone Corporation:
We have audited the accompanying consolidated balance sheets of Bridgestone Corporation and sub-
sidiaries as of December 31, 2004 and 2003, and the related consolidated statements of income, share-
holders’ equity, and cash flows for each of the three years in the period ended December 31, 2004, all
expressed in Japanese yen. These consolidated financial statements are the responsibility of the
Company’s management. Our responsibility is to express an opinion on these consolidated financial
statements based on our audits.
We conducted our audits in accordance with auditing standards generally accepted in Japan. Those
standards require that we plan and perform the audit to obtain reasonable assurance about whether the
financial statements are free of material misstatement. An audit includes examining, on a test basis, evi-
dence supporting the amounts and disclosures in the financial statements. An audit also includes assess-
ing the accounting principles used and significant estimates made by management, as well as evaluating
the overall financial statement presentation. We believe that our audits provide a reasonable basis for
our opinion.
In our opinion, the consolidated financial statements referred to above present fairly, in all material
respects, the consolidated financial position of Bridgestone Corporation and subsidiaries as of
December 31, 2004 and 2003, and the consolidated results of their operations and their cash flows for
each of the three years in the period ended December 31, 2004, in conformity with accounting princi-
ples generally accepted in Japan.
As discussed in Note 17 to the consolidated financial statements, certain subsidiaries in the Americas
are involved in significant legal matters related to tires which have been voluntarily recalled as
announced in August 2000 and a tire replacement campaign.
Our audits also comprehended the translation of Japanese yen amounts into U.S. dollar amounts
and, in our opinion, such translation has been made in conformity with the basis stated in Note 2. Such
U.S. dollar amounts are presented solely for the convenience of readers outside Japan.
(autograph)
March 30, 2005

55Directors, Corporate Auditors, and Corporate Officers
Directors, Corporate Auditors, and Corporate Officers
Board of Directors
Shigeo WatanabeChairman of the Board
Shoshi Arakawa
Masaharu Oku
Tatsuya Okajima
Giichi Miyakawa
Mark A. Emkes*
Akira Inoue
Tomoyuki Izumisawa
Shoji Mizuochi
Yasuo Asami
* Chairman and Chief Executive Officer of BridgestoneAmericas Holding, Inc.
Board of Corporate Auditors
Executive Members
Yukio Kanai
Isao Kita
Non-Executive Members
Hiroshi Ishibashi
Toshiaki Hasegawa
Yo Takeuchi
Corporate Officers
Members of the Board Serving Concurrently asCorporate Officers
Shigeo WatanabeChief Executive Officer and President
Shoshi ArakawaSenior Vice PresidentResponsible for International Operations
Masaharu OkuVice President and Senior Officer Responsible for Tire Production and DistributionConcurrently responsible for Safety, Quality and Environment
Tatsuya OkajimaVice President and Senior Officer Responsible for Original Equipment
Giichi MiyakawaVice President and Senior Officer Responsible for Replacement Tire Sales
Akira InoueVice President and Senior Officer Responsible for Technology
Tomoyuki IzumisawaVice President and Senior Officer Chief Compliance OfficerResponsible for Corporate Administration
Shoji MizuochiVice President and Senior Officer Chief Financial OfficerResponsible for Finance, Purchasing and IT & NetworkConcurrently Director, Finance Division
Yasuo AsamiVice President and Senior Officer Responsible for Diversified Products Concurrently Director, Chemical Products Division
Vice Presidents and Senior Officers
Hiromichi OdagiriChief Representative of Bridgestone Tire Operations in ChinaSeconded to Bridgestone (China) Investment Co., Ltd.Chairman and President of Bridgestone (China) Investment Co., Ltd.
Minekazu FujimuraSeconded to Bridgestone Europe NV/SAChairman, CEO and President of Bridgestone Europe NV/SA
Vice Presidents and Officers
Shigehisa SanoResearch & Development and Intellectual Property
Osamu InoueSafety, Quality and Environment
Kaoru FujiokaSteel Cord
Osamu MoriElectro-Materials
Hiroshi YamaguchiBrand Management and Product Planning
Yuji TomiyasuAssistant to Vice President and Senior OfficerChief Compliance OfficerResponsible for Corporate Administration
Kazuo KakehiChemical and Industrial Products Production & TechnologyConcurrently Director, Chemical & Industrial Products Production Division
Kazuhisa NishigaiTire Production and Distribution
Shuichi IshibashiConsumer Tire BusinessConcurrently seconded to Bridgestone FVS Corporation
Junya SatouCommercial Tire Business
Masayuki OkabeHuman Resources and General AffairsConcurrently Director, Human Resources and General Affairs Division
Yuzou KumagaiTire Production TechnologyConcurrently Director, Production Machinery DevelopmentDivision
Jiro AsadaIndustrial Products, Civil Engineering and Building Materials & Equipment
Sugio FukuokaOriginal Equipment SalesConcurrently Director, Original Equipment Tire SalesDivision
Toru TsudaTire Development
Asahiko NishiyamaSeconded to Bridgestone Americas Holding, Inc.Vice Chairman and President of Bridgestone AmericasHolding, Inc.
(as of April 1, 2005)

56 Bridgestone Annual Report 2004
Major Subsidiaries and Affiliates
Ownership(includingindirect
Country Company ownership) Capital (in thousands) Operations
Argentina Bridgestone/Firestone Argentina S.A.I.C. 100.0% US$100 Manufacture and sale of tires
Australia Bridgestone Australia Ltd. 60.3% A$18,259 Manufacture and sale of tires
Bridgestone Earthmover Tyres Pty. Ltd. 100.0% A$7,000 Sale of off-the-road tires formining and construction vehicles
Belgium Bridgestone Europe NV/SA 100.0% E724,668 Holding company for European operations and tire marketing
Bridgestone Aircraft Tire (Europe) S.A. 100.0% E1,388 Retread and sale of aircraft tires
Brazil Bridgestone/Firestone do Brasil 100.0% R$102,919 Manufacture and sale of tires Industria e Comercio Ltda.
Canada Bridgestone/Firestone Canada Inc. 100.0% C$98,401 Manufacture and sale of tires and sale of automotive components
Chile Bridgestone/Firestone Chile, S.A. 89.7% US$38,980 Manufacture and sale of tires
Bridgestone Off-the-Road 90.0% US$3,000 Sale of off-the-road tires for miningTire Latin America S.A. and construction vehicles
China Bridgestone (China) Investment Co., Ltd. 100.0% US$67,730 Management of Chinese tire operations
Bridgestone (Tianjin) Tire Co., Ltd. 94.5% US$49,016 Manufacture and sale of tires
Bridgestone (Shenyang) Tire Co., Ltd. 98.5% US$20,000 Manufacture and sale of tires
Bridgestone (Wuxi) Tire Co., Ltd. 100.0% US$48,340 Manufacture and sale of tires
Bridgestone Aircraft Tire Company (Asia) Limited 100.0% HK$21,000 Retread and sale of aircraft tires
Costa Rica Bridgestone/Firestone de Costa Rica, S.A. 98.6% US$9,631 Manufacture and sale of tires
France Bridgestone France S.A.S. 100.0% E74,090 Manufacture and sale of tires andsale of automotive components
Germany Bridgestone Deutschland G.m.b.H. 100.0% E14,000 Sale of tires and automotive components
India Bridgestone India Private Ltd. 100.0% RP2,753,000 Manufacture and sale of tires
Indonesia P.T. Bridgestone Tire Indonesia 51.0% US$24,960 Manufacture and sale of tires
Italy Bridgestone Italia S.p.A. 100.0% E38,775 Manufacture and sale of tires andsale of automotive components
Japan Bridgestone Cycle Co., Ltd. 100.0% ¥1,870,000 Manufacture and sale of bicycles and industrial machinery
Bridgestone Flowtech Corporation 100.0% ¥484,000 Manufacture and sale of industrial hydraulic hoses
Bridgestone Elastech Co., Ltd. 100.0% ¥2,000,000 Manufacture and sale of antivibration components
Bridgestone Kaseihin Seizo Corporation 100.0% ¥450,000 Manufacture and sale of synthetic resin products
Bridgestone Sports Co., Ltd. 100.0% ¥3,000,000 Manufacture and sale of sporting goods
Asahi Carbon Co., Ltd. 99.4% ¥1,720,000 Production and sale of carbon black
Bridgestone Finance Corporation 100.0% ¥50,000 Lending, purchasing of sales receivables, and outsourced processing of accounting and salary payments
Bridgestone Tire Hokkaido Hanbai K.K. 100.0% ¥2,033,200 Sale of tires(Bridgestone Tire Hokkaido Sales Co., Ltd.)
Bridgestone Tire Tokyo Hanbai K.K. 100.0% ¥1,050,000 Sale of tires(Bridgestone Tire Tokyo Sales Co., Ltd.)
Bridgestone Tire Chubu Hanbai K.K. 99.7% ¥1,380,000 Sale of tires(Bridgestone Tire Chubu Sales Co., Ltd.)
Bridgestone Tire Kyushu Hanbai K.K. 100.0% ¥2,000,000 Sale of tires(Bridgestone Tire Kyushu Sales Co., Ltd.)
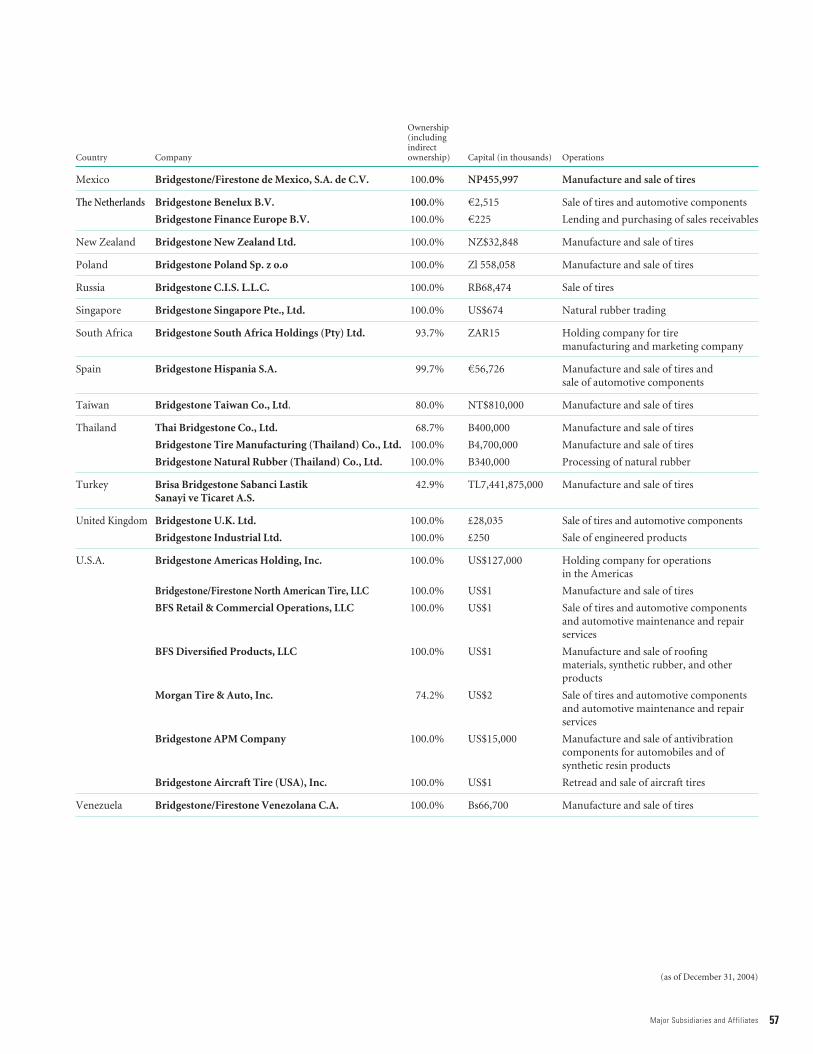
57Major Subsidiaries and Affiliates
Ownership(includingindirect
Country Company ownership) Capital (in thousands) Operations
Mexico Bridgestone/Firestone de Mexico, S.A. de C.V. 100.0% NP455,997 Manufacture and sale of tires
The Netherlands Bridgestone Benelux B.V. 100.0% E2,515 Sale of tires and automotive components
Bridgestone Finance Europe B.V. 100.0% E225 Lending and purchasing of sales receivables
New Zealand Bridgestone New Zealand Ltd. 100.0% NZ$32,848 Manufacture and sale of tires
Poland Bridgestone Poland Sp. z o.o 100.0% Zl 558,058 Manufacture and sale of tires
Russia Bridgestone C.I.S. L.L.C. 100.0% RB68,474 Sale of tires
Singapore Bridgestone Singapore Pte., Ltd. 100.0% US$674 Natural rubber trading
South Africa Bridgestone South Africa Holdings (Pty) Ltd. 93.7% ZAR15 Holding company for tiremanufacturing and marketing company
Spain Bridgestone Hispania S.A. 99.7% E56,726 Manufacture and sale of tires andsale of automotive components
Taiwan Bridgestone Taiwan Co., Ltd. 80.0% NT$810,000 Manufacture and sale of tires
Thailand Thai Bridgestone Co., Ltd. 68.7% B400,000 Manufacture and sale of tires
Bridgestone Tire Manufacturing (Thailand) Co., Ltd. 100.0% B4,700,000 Manufacture and sale of tires
Bridgestone Natural Rubber (Thailand) Co., Ltd. 100.0% B340,000 Processing of natural rubber
Turkey Brisa Bridgestone Sabanci Lastik 42.9% TL7,441,875,000 Manufacture and sale of tiresSanayi ve Ticaret A.S.
United Kingdom Bridgestone U.K. Ltd. 100.0% £28,035 Sale of tires and automotive components
Bridgestone Industrial Ltd. 100.0% £250 Sale of engineered products
U.S.A. Bridgestone Americas Holding, Inc. 100.0% US$127,000 Holding company for operations in the Americas
Bridgestone/Firestone North American Tire, LLC 100.0% US$1 Manufacture and sale of tires
BFS Retail & Commercial Operations, LLC 100.0% US$1 Sale of tires and automotive components and automotive maintenance and repair services
BFS Diversified Products, LLC 100.0% US$1 Manufacture and sale of roofing materials, synthetic rubber, and other products
Morgan Tire & Auto, Inc. 74.2% US$2 Sale of tires and automotive components and automotive maintenance and repair services
Bridgestone APM Company 100.0% US$15,000 Manufacture and sale of antivibration components for automobiles and of synthetic resin products
Bridgestone Aircraft Tire (USA), Inc. 100.0% US$1 Retread and sale of aircraft tires
Venezuela Bridgestone/Firestone Venezolana C.A. 100.0% Bs66,700 Manufacture and sale of tires
(as of December 31, 2004)

58 Bridgestone Annual Report 2004
Major Products
Tires and Tubes
for passenger cars, trucks, buses,
construction and mining vehicles,
commercial vehicles, agricultural
machinery, aircraft, motorcycles and
scooters, racing cars, karts, utility carts,
subways, monorails
Automotive Parts
wheels for passenger cars, trucks, buses
Industrial Products
Belts
• steel cord conveyor belts
• fabric conveyor belts
• belt-related commodities
• pipe conveyor systems
Hoses
• braided hoses
• hydraulic hoses
• automobile hoses
Antivibration and
Noise-Insulating Materials
• air springs
• dampers
• noise-insulating systems
Waterproofing Materials
• water stoppers
• waterproof sheets for civil engineering
Rubber Tracks
Inflatable Rubber Dams
Multi-Rubber Bearings
Marine Products
• marine fenders
• marine hoses
• dredging hoses
• oil booms
• silt barriers
Antivibration Components
for vehicles, railway cars, industrial
machinery
Chemical Products
Building Materials and Equipment
• FRP panel water tanks
• unit flooring systems
• steel fiber for concrete reinforcement
• roofing materials
• unit bath systems
• polybutylene pipes and fittings for
plumbing systems
• sealing materials for buildings and
housing
Thermal Insulating Polyurethane
Foam Products
for general building, housing
Flexible Polyurethane Foam Products
for bedding, furniture, vehicles, industry
Ceramic Foam
Electro-Materials
Office Equipment Components
• semiconductive rollers
• other semiconductive components
Performance Film Products
• performance films for plasma display
panels, liquid crystal displays, and
cathode ray tubes
• photovoltaic module encapsulants
• interlayer adhesive films for laminated
glass
Sporting Goods
• golf balls
• golf clubs
• tennis shoes
• tennis rackets
• tennis balls
• golf swing diagnostic system
Bicycles
Other Products
PureBeta Ceramic Dummy Wafers, Holders,
Rings, Heaters, Electrodes, and other items
for semiconductor manufacturing
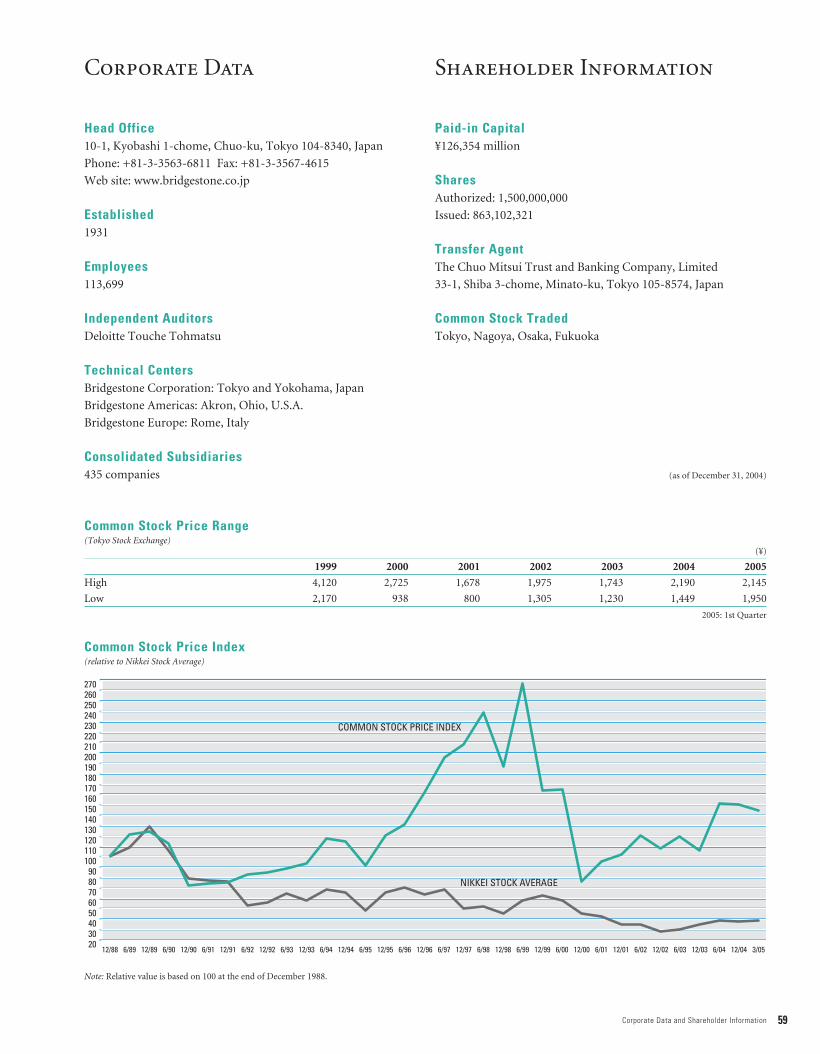
59Corporate Data and Shareholder Information
Corporate Data
2030405060708090
100110120130140150160170180190200210220230240250260270
3/0512/046/0412/036/0312/026/0212/016/0112/006/0012/996/9912/986/9812/976/9712/966/9612/956/9512/946/9412/936/9312/926/9212/916/9112/906/9012/896/8912/88
COMMON STOCK PRICE INDEX
NIKKEI STOCK AVERAGE
Head Office10-1, Kyobashi 1-chome, Chuo-ku, Tokyo 104-8340, Japan
Phone: +81-3-3563-6811 Fax: +81-3-3567-4615
Web site: www.bridgestone.co.jp
Established1931
Employees113,699
Independent AuditorsDeloitte Touche Tohmatsu
Technical Centers Bridgestone Corporation: Tokyo and Yokohama, Japan
Bridgestone Americas: Akron, Ohio, U.S.A.
Bridgestone Europe: Rome, Italy
Consolidated Subsidiaries435 companies
Paid-in Capital¥126,354 million
SharesAuthorized: 1,500,000,000
Issued: 863,102,321
Transfer AgentThe Chuo Mitsui Trust and Banking Company, Limited
33-1, Shiba 3-chome, Minato-ku, Tokyo 105-8574, Japan
Common Stock TradedTokyo, Nagoya, Osaka, Fukuoka
(as of December 31, 2004)
Shareholder Information
Common Stock Price Range(Tokyo Stock Exchange)
Common Stock Price Index(relative to Nikkei Stock Average)
(¥)
1999 2000 2001 2002 2003 2004 2005
High 4,120 2,725 1,678 1,975 1,743 2,190 2,145
Low 2,170 938 800 1,305 1,230 1,449 1,950
2005: 1st Quarter
Note: Relative value is based on 100 at the end of December 1988.

10-1, Kyobashi 1-chome, Chuo-ku, Tokyo 104-8340, Japanwww.bridgestone.co.jp
April 2005Printed in Japan with vegetable-based ink on recycled paper