annual report 1998 -...
TRANSCRIPT
developmentand agri-food policies in
the Mediterranean region
annual report1998
Centre International de Hautes Etudes Agronomiques Méditerranéennes

ii
CIHEAM
Centre International de Hautes Etudes Agronomiques MéditerranéennesInternational Centre for Advanced Mediterranean Agronomic Studies
Président/Chairman : José Jéronimo GODINHO AVO*Secrétaire Général/Secretary General : Enzo CHIOCCIOLI
11, rue Newton - 75116 PARIS (FRANCE)Tel. : +33 (01) 53 23 91 00 - Fax : +33 (01) 53 23 91 01 et 02
e-mail: [email protected]
IAMInstituts Agronomiques Méditerranéens
Mediterranean Agronomic Institutes
Bari - Chania - Montpellier - Zaragoza
IAM-Bari IAM-Chania
Directeur : Cosimo LACIRIGNOLA Directeur : Alkinoos NIKOLAIDISVia Ceglie 9 P.O. Box 85
70010 Valenzano, Bari, Italy 73100 Chania, Crete, GreeceTel. : +39 080 4606 111 Tel. : +30 (821) 81 151Fax : +39 080 4606 206 Fax : +30 (821) 81 154e-mail: [email protected] e-mail: [email protected]
IAM-Montpellier IAM-ZaragozaDirecteur : Gérard GHERSI Directeur : Miguel VALLS ORTIZ
3191, route de Mende - BP 5056 Apartado 20234033 Montpellier Cedex 1, France 50080 Zaragoza, Spain
Tel. : +33 (04) 67 04 60 10 Tel. : +34 (976) 57 60 13Fax : +33 (04) 67 54 25 27 Fax : +34 (976) 57 63 77e-mail: [email protected] e-mail: [email protected]
* His Excellency Professor Salvino BUSUTTIL was elected Chairman on April 1st1999for a 4-year period.période de quatre ans.
TABLE OF CONTENTS
iii
page
Preface vii
Foreword xv
Chapter I: Regional Analysis:the Mediterranean region in a world economiccontext towards globalisation
Introduction 3
Food security 6
Markets 13
What impact have liberalisation measures hadon NCMC preference towards the EU? 15
Regionalisation and the impact of market liberalisation 18
Trade parameters of sensitive products –the case of fruit and vegetables 20
The traditional framework of agricultural trade talks 22
The Uruguay Round and the negotiations onthe liberalisation of the agricultural trade 24
Regionalism and agriculture 31
Future negotiations 40
The stated social dumping 41
The role of private investment 42
The European question or the "prisoner's dilemma"45
The common wealth and co-operation policies 50
page
iv
Chapter II: Sectorial and national analyses
The Agriculture and the economy 55
Recent macro-economic developmentsin selected Mediterranean countries 56
The agricultural situation in selected Mediterranean countries 68
Trends in agricultural production,food consumption and trade 75
Agricultural production and food processing 75
Agri-food production 89
Consumption trends 95
Agricultural and food policies 106
Overview and perspectives 106
Price and subsidy policies 108
Investment and structural policies 115
Rural development policies 118
Rural planning and development policies in selectedMediterranean countries 119
Agricultural and environmental policies 124
Chapter III. Tools and training programmes for tomorrow’sagricultural and agri-food practitioners in the Mediterraneancountries: CIHEAM contribution (RAP)
Introduction 131
Conventional paradigms 133
page

v
Non marketable public goods 134
Is higher education in crisis? 135
Non conventional paradigms 136
Social and information capital 137
Case study: CIHEAM’s Regional Action Programme (RAP) 140
Adapting training programmes to tomorrow’s needs 144
Advanced training for agricultural and food managers 146
Future perspectives 149
ANNEXES
Major indicators of agri-food development inMediterranean and Arab countries 151
Statistical annexes to Chapter II 181
References 191
List of boxes 197
List of maps, figures and graphs 197
List of tables 198
Preface
viii
I. The publication of this report - which will then be up-dated on a yearlybasis - is the natural outcome of a long process grounded in themissions entrusted to CIHEAM by its charter in 1962, on the initiativeof a group of Southern European members of former OECD (Spain,France, Greece, Italy, Portugal, Turkey and Yugoslavia). Havingrealised that their agriculture was lagging behind that of the otherMember States of the Organisation, the above countries committedthemselves, in 1960, to accelerating their progress. The aim was tobring the development of their agriculture up to the standards of thatin more advanced Northern countries through the strengthening ofvocational training and agricultural research.
The International Centre for Advanced Mediterranean AgronomicStudies (CIHEAM) has been the result of this initiative. Initially madeup of seven founding Member States, since the 1980s it opened up tosome other Mediterranean countries, in conformity with the ruleswhich govern its establishment.
Today, thirteen countries are members of CIHEAM, five of which arealso EU Member States (Spain, France, Greece, Italy and Portugal). Theother eight are Southern and Eastern Mediterranean Countries(Albania, Algeria, Egypt, Lebanon, Malta, Morocco, Tunisia andTurkey).
Yugoslavia, which was one of the Founding Fathers of CIHEAM, is nolonger a member. The countries of former Yugoslavia, despiteCIHEAM’s official steps towards negotiations, have, so far, not takenany actions to apply for full membership.
CIHEAM’s permanent mission is to foster co-operation betweenMediterranean countries in the spheres that fall within its scope ofactivity, i.e. postgraduate agricultural training and the promotion of co-operative agronomic research.
ix
Hence, CIHEAM is a regional Organisation which focuses on a sector -agriculture - which is strictly related to a number of economicactivities, in particular the agro-food industry, as well as to manysensitive regional problems such as the use of water and land resources,the protection of the environment and rural development policy.
Thanks to its four Mediterranean Agronomic Institutes, located inSpain (Saragozza), in France (Montpellier), in Greece (Chania - Crete)and in Italy (Bari) and which are fully funded by the host countries,CIHEAM provides, according to the specialisations of the aboveInstitutes, long-term postgraduate training leading up to apostgraduate certificate (duration of the course: one year) or to aMaster of Sciences certificate (duration of the course or of the research:two years). In the academic year 1998-1999, 383 trainees followed thecourses at the four CIHEAM Institutes: 224 for the 1st year and 159 forthe 2nd year.
CIHEAM also organises short-term courses (lasting a few weeks) to up-date agronomists working for Public Administrations or professionalor academic institutions and train them in specific topics identifiedwithin the framework of co-operative networks sponsored by CIHEAM.
This training and research work is carried out by the MediterraneanAgronomic Institutes in close co-operation with the Institutions inSouthern and Eastern Mediterranean countries with a view toproviding joint and targeted training according to the needs of thevarious Mediterranean countries.
Over the period 1998-2002, CIHEAM will commit itself toimplementing a co-operation programme with the Commission of theEuropean Union aimed at transferring the management of training andresearch activities to the Southern and Eastern Mediterranean partners.This programme is based on four regional action plans and the

x
Mediterranean Agronomic Institutes will work closely withappropriate Institutions in the Member States.
The regional action plans will take place:
in Egypt, where it will be focused on water (and will be developed by BariMAI);
in Morocco, where it will be focused on rainfed agriculture (and will bedeveloped by Saragozza MAI):
in Tunisia, where it will be focused on the development of agriculturalpolicies (and will be developed by Montpellier MAI);
in Turkey, where it will be focused on renewable resources (and will bedeveloped by Chania MAI).
II. This short overview of the activities carried out by CIHEAM testifies toits firmly rooted mission and thriving activities in the fields ofagriculture and agro-food economy. It would suffice to review thetraining and research programmes implemented in the MediterraneanAgronomic Institutes and those envisaged within the framework of thenew co-operation scheme approved by the European UnionCommission to realise the deep agricultural nature of CIHEAMactivities.
However, despite such evidence and the fact that CIHEAM hasdevoted years to studies - which are published in its “OptionsMéditerranéennes”, a journal that deals with the state of agriculture insome Member States, especially Maghreb countries and Albania - thereremains a gulf which has not yet been bridged. The gap should be filledby a reference document which should reflect the progress ofagriculture in all the Mediterranean countries and provide decision-makers with insights into this field. The lack of such a document isparticularly felt under the present circumstances when Mediterraneanagricultural economies - regardless of their degree of progress - are

xi
suffering from the fall-out of trade globalisation and are being called toestablish the Euro-Mediterranean partnership initiated in Barcelona bythe EU Member States and by all the Mediterranean countries. Theneed to follow closely the developments of agriculture in theMediterranean would obviously take into due consideration thepeculiarities of the Mediterranean region. “The Mediterranean is in thefirst place a sea and the so called «Mediterranean region» includescountries encompassed in three continental sub-groups: SouthernEurope, Northern Africa and Western Asia. Each sub-group iscurrently characterised by a different geo-political scenario andparticular economic and social dynamics which lead them to drift awayfrom each other”1. But quoting Jean-Claude Flamant again, a “region”is not only defined by a homogeneous territory, but most of all by “theexistence of an active network of relationships”.
Owing to its original composition and regional calling, focusing onagriculture, food supply and relating issues, CIHEAM boasts an “activenetwork of relationships” which should be properly used in order tohelp establish an area of shared prosperity which is the ultimate goal ofthe Euro-Mediterranean partnership.
The following report on agriculture and food supply in theMediterranean is aimed at filling the gap we have acknowledged.
III Thanks to the hard work and the political impetus of its Board ofDirectors, CIHEAM is delighted to have succeeded in devising avaluable tool to thoroughly investigate, analyse and consider the majorissues and events which characterise the Mediterranean agro-foodsystems. It is too early to foresee the impact that this report - the firstedition of which is fully funded by CIHEAM - will have on the
1 Jean-Claude Flamant, Chairman of CIHEAM Scientific Committee, cf. «Les nouveaux
enjeux pour le CIHEAM...». Communication submitted at the Workshop held in Istanbul(November 9-11, 1998), organised by CIHEAM the proceedings of which will bepublished in the journal “Options Méditerranéennes”.

xii
dynamics of the investigated phenomena. This first edition - that weare confident will be improved by the experience gained in themeantime and by the readers’ critical remarks - will neverthelessremain a reference point in terms of method and structure for thefuture editions.
The method of work was devised thanks to the close co-operationbetween a network of correspondents from CIHEAM MemberCountries and the editorial staff including researchers from theInstitutes and was co-ordinated by the General Secretariat.
The report consists of three parts.
The first part, as wanted by the editorial staff, is divided in twochapters: the first chapter reviews the international or regional eventsthat have marked the Mediterranean agriculture; the second focuses onrecent macro-economic developments, in particular on the progress ofagriculture in the Mediterranean Countries. The second chapter drawsheavily on the contributions given by the local CIHEAMcorrespondents, complemented by information available in thepublications edited by international organisations.
The second part of the report focuses on a topic of major interest to theMediterranean region which will be chosen every year according to thecircumstances. In this first edition, the focus is on the training of agro-food system specialists in the Mediterranean region. The choice hasbeen conditional on the efforts made by CIHEAM in 1998 which wereunquestionably crowned with success following the workshop held inIstanbul in November 1998.
The third part of the report provides statistical data and bibliographicalnotes which will be regularly updated in the future in order to provideuseful data on key indicators to assess the progress of agricultural, foodand rural economies.
xiii
In this edition, the major events which characterise the agriculturaleconomies in the Mediterranean countries and which are described inthe first chapter are those that have occurred in the wake of theliberalisation process affecting the trade in agricultural products. Theagricultural policies of the Mediterranean countries are currentlyadjusting to a freer environment resulting from the Uruguay round ofnegotiations and the talks over a partnership with the European Unionaimed at the establishment of a Euro-Mediterranean Free Trade Area.
The analysis of the impact of these moves highlights the potential andthe weakness of the various regional agricultural economies connectedmainly to the foreseeable developments in agricultural produce prices.The European policy and the implementation of Agenda 2000 havestressed the role of the EU as the largest importer of Mediterraneanproducts and, within the EU, the role of Northern European countrieswhich import 86% of citrus, 77% of tomatoes and 76% of vegetablesfrom Southern Mediterranean countries. The role of SouthernEuropean countries in the production process, the trade inMediterranean products, the lessons which can be learnt from theirdynamic exports in a key sector such as that of fruit and vegetables, thecompeting productions in the Mediterranean region and the futuredevelopments of the co-operation policy are some of the topics whichare analysed, discussed and constantly considered with a view tosettling interest disputes the solution of which, though, remains in thehands of the regional policy-makers.
However, in order to fully understand the arguments put forward inthe first chapter, it is necessary to read the second chapter whichprovides insights into the sectorial and national scenarios based on theanalysis of the macro-economic developments - occurring inagriculture, in the agricultural and agro-food production and in theconsumption trends - which stresses the traces left in each country bythe changes which have taken place.

xiv
Hence, the first and the second chapter complement each other andshould be read carefully before drawing any conclusions. Equallydiscussed are the most sensitive issues to an Organisation, such asCIHEAM, which groups together on an equal footing both SouthernEU Member States and some other Mediterranean States which are notEU members but have committed themselves to establishing a Euro-Mediterranean partnership with the EU co-operation. The difficultiesthat some EU Southern regions are experiencing with their agriculturalproductions in increasingly freer markets are recognised and thepotential repercussions of the exports of products from SouthernMediterranean countries are foreseen. The reading of the publicationshould confirm the equilibrium which the writing of the saidpublication has aimed to achieve. The suggested response to theshortcomings that Southern EU Member States are facing is to make anincreased use of the structural funds to fuel the rural development.This strategy is likely to offset, in the long run, the impact of theremoval of protection measures for agricultural exports from non EUMediterranean countries.
But these countries - as the report points out - are also exposed to theconsequences of the establishment of a Free Trade Area which mightjeopardise any future prospects of increased agricultural productionswhich at the moment show a deficit. Why can’t a special section, withinthe framework of the MEDA programme and symmetrical to thecurrent Agricultural Guidance and Fund, be envisaged to remedy thespecific agricultural handicaps which constitute the biggest stumblingblocks to freer markets and the establishment of a Euro-Mediterraneanpartnership?
Here again, policy-makers will have to draw the relevant operationalconclusions.

xv
The objectives which the CIHEAM Board of Directors intend to achievethrough this report are the following:
- improving the knowledge of the problems relating to theagricultural, food and environmental development in theMediterranean countries,
- carrying out an economic analysis of some issues central toagriculture, food supply, and the management of natural resourcesin the Mediterranean countries,
- offering a retrospective and perspective analysis to helpunderstand the development of agricultural, food and ruraleconomies against the background of global, national andinternational economies.
We are convinced that the above objectives have been met. This reportis addressed to Governments, national parliaments, local bodies,international organisations - in particular within the EU -, professionalorganisations and Universities and Research centres which are directlyinvolved in devising the policies for the agro-food systems in theMediterranean region. It is up to them to assess and react.
In deciding to publish this report, CIHEAM has acted in accordancewith its desire to be of service to all the Mediterranean Countries andgive substance to an ambition: becoming the privileged ground for thedebate, the analysis and the monitoring of the major phenomena whichguide the progress of the Mediterranean agriculture, the mother of allits activities.
Enzo Chioccioli CIHEAM Secretary General
Foreword
xvi
The purpose of this report is to highlight the significance of the currentprocess of internationalisation of agro-food systems in the MediterraneanBasin.
It brings together the results of a number of national reports andregional case studies on development and agro-food policies in theMediterranean region either commissioned to a collaborative network ofnational correspondents or prepared by CIHEAM four MediterraneanAgronomic Institutes.
Much emphasis was put on external consultation in preparing thisreport.
The networking activity proved to be a valuable channel for clearinginformation and receive constructive feedback to prepare the report.
The national correspondent’s network included S.Bedrani (Algeria),A. Abu-Zeid (Egypt), M. Hamze (Lebanon), N. Akesby (Morocco), M. Lasram(Tunisia) and E. Isikli (Turkey).
This report was prepared under the immediate supervision of EnzoChioccioli, Ciheam Secretary General, by a team led by A. Di Giulio(Ciheam) and comprising A. Simantov ( Delegate of Greece at CiheamGoverning Board), M. Allaya ( Ciheam-Iam-M), F. Lerin (Ciheam-Iam-M),G. Mergos (University of Athens, Greece), G. Malorgio (University ofBologna, Italy), and J.M. Alvarez-Coque (University of Valencia, Spain).

CHAPTER I
Regional Analysis:

Chapter I4
the Mediterranean region in a worldeconomic context towards globalisation
Introduction
This chapter aims to provide insights into the currentinternationalisation process of agro-food systems in the MediterraneanBasin. Since the mid-1980s, much progress has been made across theMediterranean Countries (MC) to negotiate, and occasionally adopt, a newinstitutional framework aimed at enhancing greater liberalisation ofagricultural trade. Agricultural policies in Mediterranean Countries areincreasingly involved in moves towards freer markets, as witnessed by theplethora of multilateral negotiations, the GATT’s Uruguay Round of TradeTalks and the establishment of the Euro-Mediterranean Free Trade Area.Economic development is generally accepted as conditional on somedegree of agricultural liberalisation. One of the major achievement of theBarcelona Euro-Mediterranean Conference was to ratify this commonprinciple and promote “a sustainable and balanced economic development with aview to creating an area of shared prosperity, in keeping with the various levels ofgrowth”.
The Barcelona Process was initiated in the belief that it would createincentives to invest in emerging Mediterranean markets and provide thescope for commercial integration and political and human partnerships.Against the background of these policies, the Euromed ad hoc Ministerialmeeting held in Palermo (June 3-4, 1998) stressed the need for a mutuallysatisfactory compromise over agriculture to wind up the negotiations thathad led to the establishment of the Euro-Mediterranean Free Trade Area.Agriculture is one of the keys to regional integration. It plays a major rolein most Mediterranean economies, accounting for 10-15% of total GDP in

Regional Analysis: the Mediterranean region in a world economic context towards globalisation 5
Non-Community Mediterranean Countries (except oil-producingcountries) and less than 3% of aggregate GDP in EU Mediterraneancountries. However, the importance of agriculture cannot be confined to ashare of the overall economic activity. Agriculture underpins food-processing industry in advanced countries as well as in the so called“developing” countries and plays a vast array of roles that range fromproducing food for self-consumption to boosting rural development,ensuring environmental conservation and fulfilling a symbolic and culturalpurpose. But in the absence of a global market, liberalisation cannot be theonly cure.
As a result of the economic globalisation, agro-food systems have comeunder increasing pressure and have been confronted with the shortcomingsof the fierce competition among trading partners, each with differentnational rules, procedures and economic growth.
The growing share of trade (imports and exports) witnesses to theinternationalisation of the agro-food systems in the MediterraneanCountries. Biotechnology developments, rapid advances in facilities andservices, the increasing role of distributors within the food chain, theintroduction of new products, processes and production methods, the needto meet the growing demand for quality food products are some of themain challenges now facing the sector.
Despite the general consensus, many observers are sceptical about thebenefits that this strategy might bring to the Mediterranean ruraleconomies. Any assessments made so far of countries, regions and sectorshave been inevitably biased by the economic and social situation and thesector is increasingly becoming the focus of political negotiations. Differentgroups lobby powerfully on specific protection measures which, however,threaten to harm the agricultural sector and cut it out of the global tradeliberalisation and regional economic integration now underway.
Chapter I6
The vast majority of Mediterranean Countries will initiate in the nextfew years negotiations on regional and multilateral agreements. Theinclusion of agriculture in the regional round of negotiations is the mainchallenge of the Euro-Mediterranean Partnership. The CommonAgricultural Policy (CAP), as well as agricultural policies of Eastern andSouthern Mediterranean Countries and the Middle-East, will need to beretargeted to this common goal. However, in a moment of multilateral talksat the World Trade Organisation (WTO), focusing more on domesticpolicies, national institutions and on the social, economic and politicalcompromises reached in each economic context, it would be paradoxicalnot to consider the Euro-Mediterranean Free Trade Area as a frame inwhich to develop actively a dialogue and concertation on developmentpolicies.
The introduction of agriculture in the agenda of the Mediterraneanround of negotiations should be complemented by the establishment of aneconomic partnership on equal terms. A global balance should be pursuedbetween the Southern and Eastern rims of the Mediterranean and a reformof the agricultural and trade policies in act in each economic partner. A setof co-ordinated reforms would help to promote intra-regional trade addingto bilateral trading arrangements between the EU and Non-CommunityMediterranean Countries. In addition, the revision of the CAP should alsobe aimed at easing solidarity among the EU regions. It is fair to say that thereform of the agricultural policies and the reduction of barriers to trade aremore likely to be successful if world food demand stays high and economicgrowth stable. Indeed, world price fluctuations affect the capability of agro-food systems to adjust to the moves towards freer markets. Policy-makersare not insensitive to market developments and the economic and politicalexpectations of the various parties will largely determine the position theytake in the agricultural round of negotiations, both on the regional and themultilateral level.

Regional Analysis: the Mediterranean region in a world economic context towards globalisation 7
I. Food security
There are several estimates, referring to the early decades of thetwenty-first century issued by experts and international organisationsconcerning future market trends for staple food produces. The projectionsencompass a series of assumptions, such as the impact of agriculturalreforms, the increase in productivity, macro-economic developments andsome additional factors affecting food production, trade and consumption.According to (FAPRI2, USDA, IFPRI and OECD) trade will increase at thebeginning of the next century and rather high prices till the year 2005.Different scenarios are envisaged as to price fluctuations. Whereas OECDforecasts prices increase higher than that recorded in the early 90s, IFPRIand the World Bank foresee a decline in real prices in the long run. In bothscenarios, food shortage would not occur as a result of the gap betweensupply and demand.
Strong world prices would undoubtedly be conducive to theliberalisation of agricultural trade, but too many uncertainties - the recentAsian crisis to name one - make it difficult to devise reliable medium-termforecast models. Economic growth has an enormous impact on tradedemand, but if growth is not widespread, governments might be temptedto return to intervention policies which supposedly would balance thenegative externalities of the international environment.
Despite the expected future balance between supply and demand, foodsecurity remains a critical issue. Agro-food markets are experiencinggrowing instability and some developing countries are at a greater risk ofhaving to depend largely on such markets, in a foreseeable future, to meettheir needs.
However, the trade of agricultural commodities is expected to risemarkedly, but regional unbalances are bound to remain the same and
2 Food and Agricultural Policy Research Institute (Iowa State University)
Chapter I8
surpluses in some industrialised countries together with deficits indeveloping countries threaten to result in a structural world food shortage.Reportedly IFPRI projections for the next decade forecast an increase in theconsumption rate of crop and animal products higher than the productioncapabilities of most developing countries. These countries imported 90million tonnes of grain stocks in 1990. They are very likely to importapproximately 190 million tonnes in the year 2020.
According to Food and Agriculture Organisation (FAO) estimates,imports are expected to climb to a staggering 360 million tonnes in 2030against 150 million in 1994-96.
This is the case with a number of Mediterranean Countries whichimport staple food products have fluctuating agricultural yields and sufferfrom water shortage. Some of those are the most commonly cited examplesof growing dependence upon outside suppliers (e.g. in the past 3 decadesAlgeria has seen its imports of grain stocks grow from 8% - by themid-1960s - to 82% during the 90s.) The Near East and the Middle East rankas the most import-dependent regions in the world, with respect to grainstocks. Food imports account for the largest share of total imports in fourMediterranean Countries: Algeria, Egypt, Jordan and Syria.
Some of the factors that have triggered the rapid consumption growthin the past still persist today: rapid population growth, water shortage andland scarcity, technical obstacles to yield increases, lack of capitalisation offarms, poor or insufficient facilities. These constraints which have longbeen the biggest stumbling blocks to agricultural progress are heightenedby significant increases in the globalised economy. However, Southern andEastern Mediterranean Countries account a growth rate ranging between 5and 6%, which should enable them to attain unrivalled economicperformances in the 90s and lead to an increase in the demand for grainstocks and agro-food products, consistent with the 1997-98 FAO estimates.

Regional Analysis: the Mediterranean region in a world economic context towards globalisation 9
However, food security is not only an issue for the agro-food balance oftrade, it poses a real threat to the availability of enough quality food.Hence, it is not surprising that poverty and possible control measures havetaken centre stage. The globalisation of the world economy and the movetowards liberalisation in most Mediterranean Countries have increased thesocial gaps. A part of the population has brought production models andmethods up to the standards of those in the advanced countries, whereasthe remaining part has been confronted with appallingly precarious livingstandards and dreadfully insufficient food stocks. And the nationalstrategies centred on total stocks are being replaced by the income bracketpolicy (See Chapter II about national analyses).
Most Mediterranean countries started focusing on food self-sufficiencybetween the late 70s and the early 80s. EU countries had already reachedthis goal in the late 70s.
Conversely, in Southern and Eastern Mediterranean countries the needto sustain and mobilise the national products have long been a key politicalissue which has led to the reduction of the production costs of primaryproducts well below the international standards as well as aids toproduction and grants to producers.
In the meantime, governments had to maintain or increase aids toconsumption for basic commodities. These cuts in the consumptionexpenditure for food accounted for more than half the total consumptionexpenditure and, as a result of low food produce prices, also salaries werekept rather low.
Food aids, which are also a means for the State to keep social riots atbay, pose additional budget strains. As food aids were deemeduntouchable, budget cuts were diverted to some other items of socialexpenditure (namely health care and education) or investment spending.But the issue is far from solved. Aid to consumption is the only importantvariable which has not yet been adjusted and cuts in other budget items
Chapter I10
threaten to jeopardise short-term and long-term growth. Governments arecurrently trying to retarget aids and implement strategies similar to thoseadopted in Latin America in the late 80s which focused on the mostvulnerable social groups - from then on called “target groups”.
Hence, food security policies in Southern and Eastern MediterraneanCountries are still in a transitional stage and will largely depend on globaleconomic growth prospects.
Some deeply unequal trends underlie growth in freer markets. Socialexclusion and poverty, plagues which seemed to have almost completelydisappeared during the so called “glorious thirties”, are resurfacing inNorthern Mediterranean industrialised countries though to a lesser extentthan in developing countries. Food insecurity is on the increase in manycountries at various social levels. In France, almost one million people arein need of food assistance and the major Non-Government Association (LesRestos du Coeur) delivered some 59 million free hot meals in the winter ofthe 1997.
The “mad cow” disease (bovine spongiform encephalopathy), watercontamination, the threats posed to the food chain, the homologation ofGenetically Modified Organisms, etc. indicate that food security is a qualityissue as well.
Industrialised countries should set up a co-operation pole for the wholeregion, since environmental or agro-industrial contamination of the food-chain are not only confined to advanced countries and add also to the foodinsecurity of less developed countries.
Food security, both in quantity and quality terms, makes up a“common asset” in the Mediterranean region as a whole.
Regional Analysis: the Mediterranean region in a world economic context towards globalisation 11
Who is going to meet the Mediterranean growing demand?
A sound international market is essential for both exporting countries,such as France, and importing regions, such as Middle-East and NorthAfrican countries, whose trade balances will depend largely on stable andreliable agro-food markets. The question remains whether resources andtechnology will be sufficient to ensure a sustainable production growth rateworldwide and balance the demand through low or decreasing real prices.
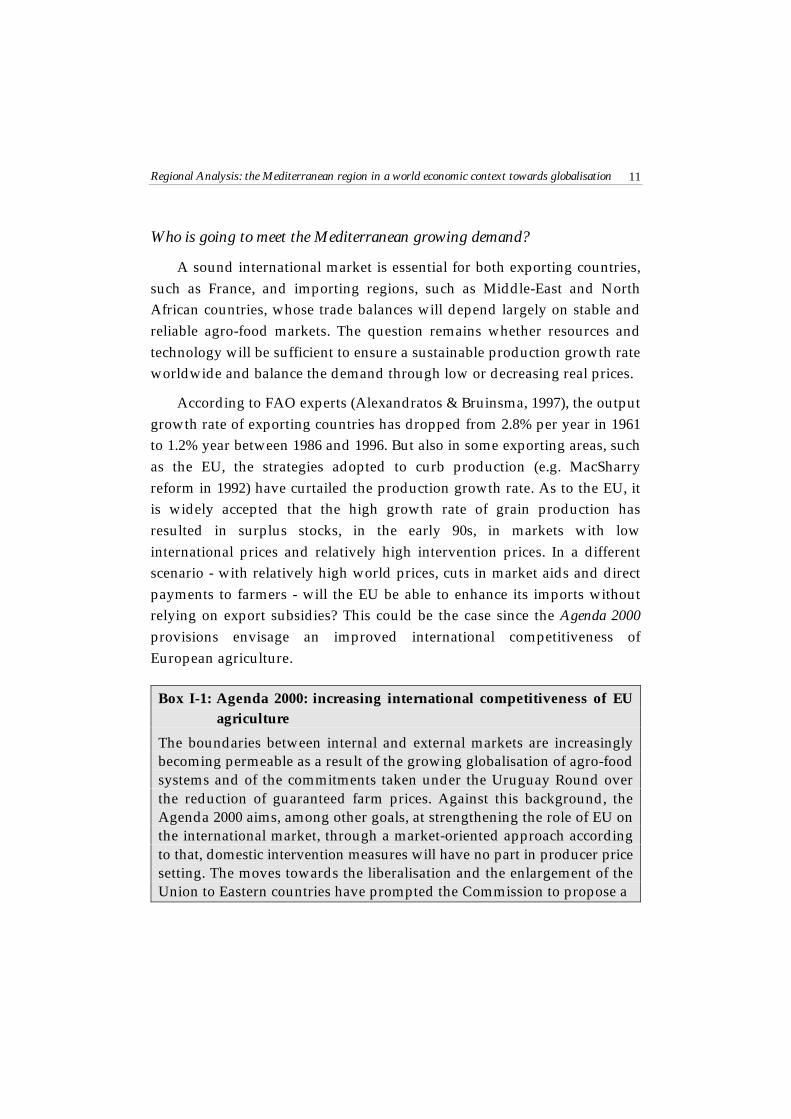
According to FAO experts (Alexandratos & Bruinsma, 1997), the outputgrowth rate of exporting countries has dropped from 2.8% per year in 1961to 1.2% year between 1986 and 1996. But also in some exporting areas, suchas the EU, the strategies adopted to curb production (e.g. MacSharryreform in 1992) have curtailed the production growth rate. As to the EU, itis widely accepted that the high growth rate of grain production hasresulted in surplus stocks, in the early 90s, in markets with lowinternational prices and relatively high intervention prices. In a differentscenario - with relatively high world prices, cuts in market aids and directpayments to farmers - will the EU be able to enhance its imports withoutrelying on export subsidies? This could be the case since the Agenda 2000provisions envisage an improved international competitiveness ofEuropean agriculture.
Box I-1: Agenda 2000: increasing international competitiveness of EUagriculture
The boundaries between internal and external markets are increasinglybecoming permeable as a result of the growing globalisation of agro-foodsystems and of the commitments taken under the Uruguay Round overthe reduction of guaranteed farm prices. Against this background, theAgenda 2000 aims, among other goals, at strengthening the role of EU onthe international market, through a market-oriented approach accordingto that, domestic intervention measures will have no part in producer pricesetting. The moves towards the liberalisation and the enlargement of theUnion to Eastern countries have prompted the Commission to propose a

Chapter I12
reduction in intervention prices at international levels. By the year 2000,intervention prices will have to be reduced as follows: by 20% for arablecrops, 30% for beef and veal and 15% for milk. Not surprisingly, thisagricultural policy has met opposition from European farmers but hasbeen accepted as inevitable. These provisions have proved rather costly.After the 1992 reform, the intervention price reduction are compensatedby direct grants and premiums to the farmers. Compensations are partialforms of payments: 50% for cereals and milk, 70% for beef and veal andare to be managed by the Member States.The Agenda 2000 includes additional proposals to develop rural areasand horizontal rules. As to the market regulation, the proposed strategyenvisions a reduction in price support to lower or abolish exportsubsidies. The orientation is self-evident, but it is too early to saywhether export subsidies will be definitely removed, namely for cerealsand milk. On the other hand, aids to farmers foster the cultivation oflands as the attempt to break the links between aid and food production(decoupling) is far from complete.Compensations in the form of payments and premiums granted on thebasis of hectares of arable lands have been strongly criticised because oftheir impact on productivity, mainly in non-irrigated areas in SouthernEurope (Italy, Portugal, Spain). Support in the form of area-based directpayments threatens to penalise skills and professionalism and leadfarmers to “crop subsidies” instead of cropping cereals, thus halting thegradual adjustment of agricultural structures and the integration of newtechnologies.During the next decade, the Mediterranean is bound to become anincreasingly wider market for EU agricultural products (cereals, foodproducts, livestock, beef, milk and dairy products, sugar and processedproducts). Statistics according to the EU is a net exporter of agriculturalproducts towards non-member countries - with a surplus of the tradebalance of ECU 1.543 billion in 1995 and of ECU 832 million in 1996.3
3 Data provided by Eurostat and European Commission (DG VI). Trade balance refers tochapters 0, 1, 21, 231, 24, 261-265, 268, 29, 4, 592.12 . Non-Community Mediterraneancountries include: Cyprus, Egypt, Jordan, Israel, Lebanon, Libya, Morocco, Malta, Tunisia,Turkey and Syria.
Regional Analysis: the Mediterranean region in a world economic context towards globalisation 13
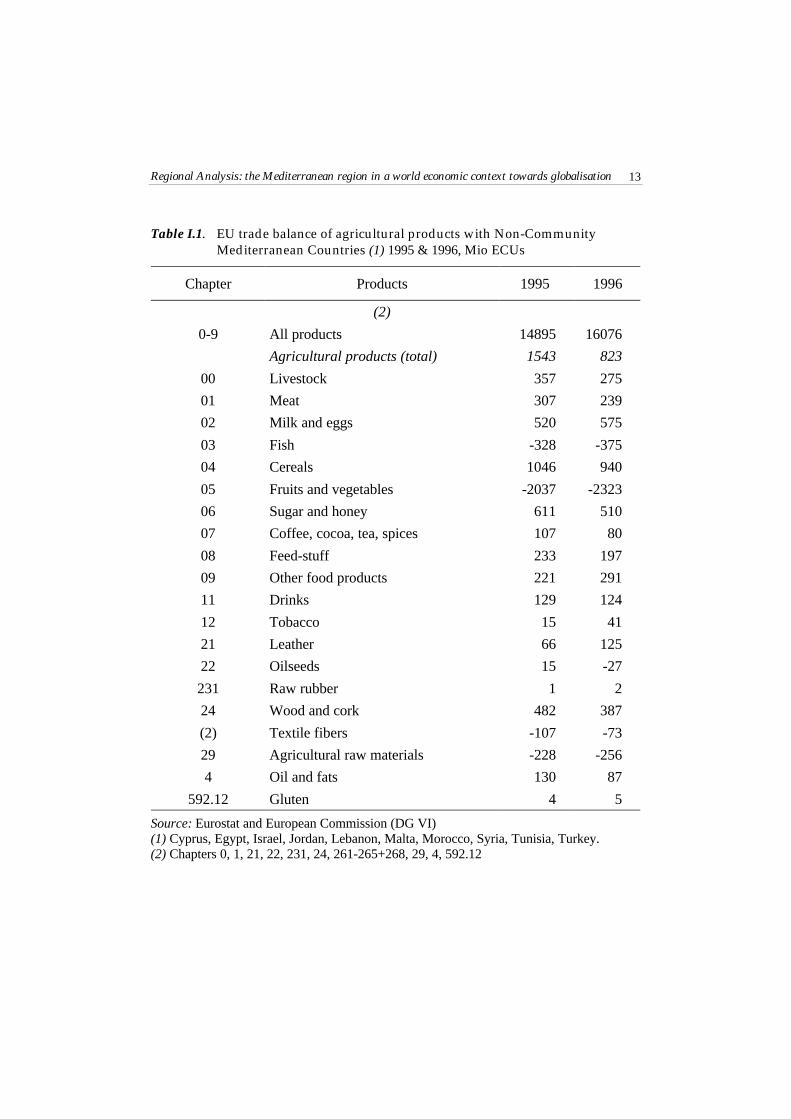
Table I.1. EU trade balance of agricultural products with Non-CommunityMediterranean Countries (1) 1995 & 1996, Mio ECUs
Chapter Products 1995 1996
(2)
0-9 All products 14895 16076
Agricultural products (total) 1543 823
00 Livestock 357 275
01 Meat 307 239
02 Milk and eggs 520 575
03 Fish -328 -375
04 Cereals 1046 940
05 Fruits and vegetables -2037 -2323
06 Sugar and honey 611 510
07 Coffee, cocoa, tea, spices 107 80
08 Feed-stuff 233 197
09 Other food products 221 291
11 Drinks 129 124
12 Tobacco 15 41
21 Leather 66 125
22 Oilseeds 15 -27
231 Raw rubber 1 2
24 Wood and cork 482 387
(2) Textile fibers -107 -73
29 Agricultural raw materials -228 -256
4 Oil and fats 130 87
592.12 Gluten 4 5
Source: Eurostat and European Commission (DG VI)(1) Cyprus, Egypt, Israel, Jordan, Lebanon, Malta, Morocco, Syria, Tunisia, Turkey.(2) Chapters 0, 1, 21, 22, 231, 24, 261-265+268, 29, 4, 592.12
Chapter I14
II. Markets
The Mediterranean region is playing an increasingly significant role inworld markets, accounting for 20% of world trade in 1995. It would beinappropriate to qualify it as a regional market given its prevailing“bilateral” character - most exports are towards European markets. Thisapplies mainly to the EU Member States such as Spain which carries out72% of its trade with the EU, France (63%), Greece (57%), Italy (57%), andPortugal (81%) and could be regarded as the logical consequence of theeconomic integration process which is in progress within the EU. Non-Community Mediterranean Countries show a similar trend: approximately50% of their exports are to Europe. The phenomenon is even more strikingin the Balkans which, prior to go democratisation process and the transitionto a market-economy, had important economic relations with the othercountries of the “Eastern bloc” and which then have had to re-orient almostall their trade towards Europe (both imports and exports). Trade amongNon-Community Mediterranean Countries is rather weak. The World Bankestimates that just 8% of the overall trade of Middle-East and North AfricanCountries could be included under the heading of inter-regional trade, apercentage which is the lowest of those recorded in all world regionalblocs.
Agricultural products account for 12% of imports and 11% of exports ofNon-Community Mediterranean Countries. These percentages aredecreasing as a result of the diversification of the economic activities, of theindustrialisation policies and of the importance of the energy sector (oil andgas). On the other hand, agricultural exports remain high for some non oil-exporting countries. In 1995, they accounted for 10% of the aggregateexports in the following countries: Albania (11%), Croatia (39%), Cyprus(51%), Egypt (16%), FYRM4 (23%), Greece (31%), Lebanon (13%), Morocco(17%), Spain (14%), Syria (21%) and Turkey (20%).
4 Former Yugoslavian Republic of Macedonia.
Regional Analysis: the Mediterranean region in a world economic context towards globalisation 15
Europe has long been the main destination of the regional agriculturaltrade. In 1994, 55% of agricultural exports by Non-CommunityMediterranean Countries were towards Europe. Some countries recordexports to the EU which exceed 35%: Algeria (79%), Egypt (35.1%), Israel(62%), Morocco (82%) and Tunisia (73%).
Hence, the access to European markets is essential for Mediterraneanagricultural exports. However, data also indicate that the diversification ofexport destinations is a must together with the development of intra-regional-oriented trading strategies. One of the main concerns of the Euro-Mediterranean association is to prevent the achievement of globalisation tothe detriment of regional markets. It is not yet clear? whether theagricultural products will be encompassed in the regional approach - whichassumes a reduction in (tariff and non-tariff) customs duties. Intra-regionalinitiatives may serve as a means to iron out strained regional relations andnegotiators will have to take them into account.
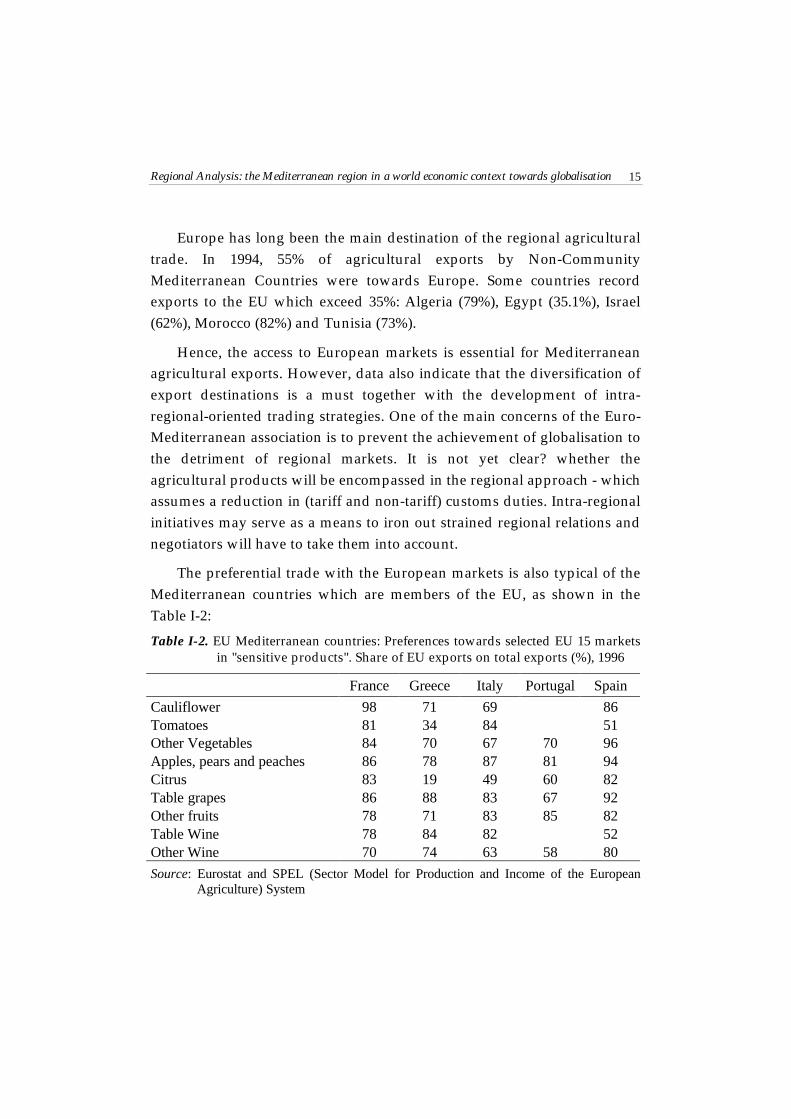
The preferential trade with the European markets is also typical of theMediterranean countries which are members of the EU, as shown in theTable I-2:
Table I-2. EU Mediterranean countries: Preferences towards selected EU 15 marketsin "sensitive products". Share of EU exports on total exports (%), 1996
France Greece Italy Portugal Spain
Cauliflower 98 71 69 86Tomatoes 81 34 84 51Other Vegetables 84 70 67 70 96Apples, pears and peaches 86 78 87 81 94Citrus 83 19 49 60 82Table grapes 86 88 83 67 92Other fruits 78 71 83 85 82Table Wine 78 84 82 52Other Wine 70 74 63 58 80
Source: Eurostat and SPEL (Sector Model for Production and Income of the EuropeanAgriculture) System

Chapter I16
The EU is the largest importer and distributor of Mediterraneanproducts. Note that these imports characterise Northern CommunityMembers and not NCMC. The latter accounted for 86% citrus imports, 77%of tomatoes, 80% of fruits and 76% of vegetables. In other words, theEuropean trade structure features Northern member States as the mainimporters - a data which partly explains the different North/South positionin the Community discussions about trade originating from Non-Community Mediterranean Countries (NCMC).
A. What impact have liberalisation measures had on NCMC preferencetowards the EU?
The whole Non-Community Mediterranean Countries show aneconomic openness rate (ratio foreign trade/GDP), among the highest inthe world (around 75%, based on IMF estimates, by the mid-1999s,compared to 72% recorded in Asia). This evidence should not betaken as an indicator of non-protectionist measures: the weighted averagetariff in the region is 22.6% compared to14.1% in Latin America.Nevertheless, this average ratio conceals some striking discrepancies –according to IMF, Israel has a rate of 7% and Tunisia, despite its structuraladjustment and liberalisation plan, still has a rate of 32%.
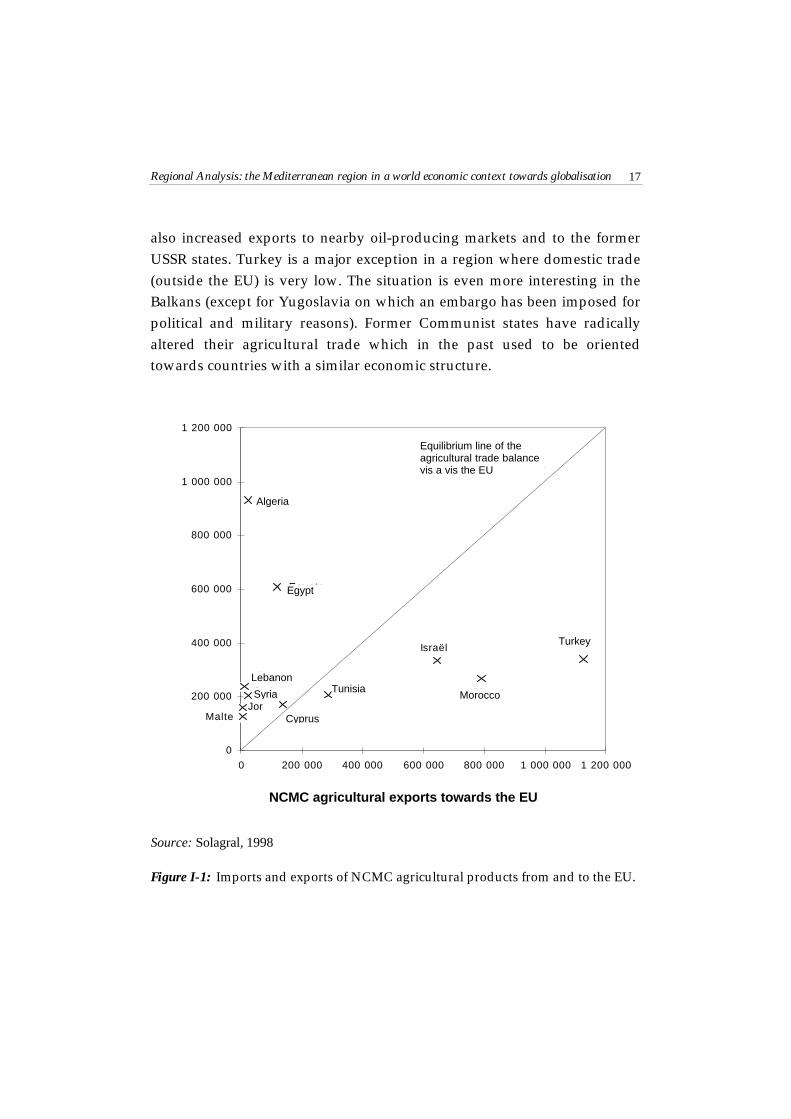
A regional preference towards the EU stands out in all Mediterraneanagricultural economies, as a rather logical choice provided the similaritiesin terms of North-South integration in a number of production andprocessed clusters, such as fresh or refrigerated products. This can apply toexporting countries, in general, and in particular to three NCMC with asurplus trade balance such as Israel, Morocco and Turkey, and for deficitcountries (Algeria) as shown in fig 1.
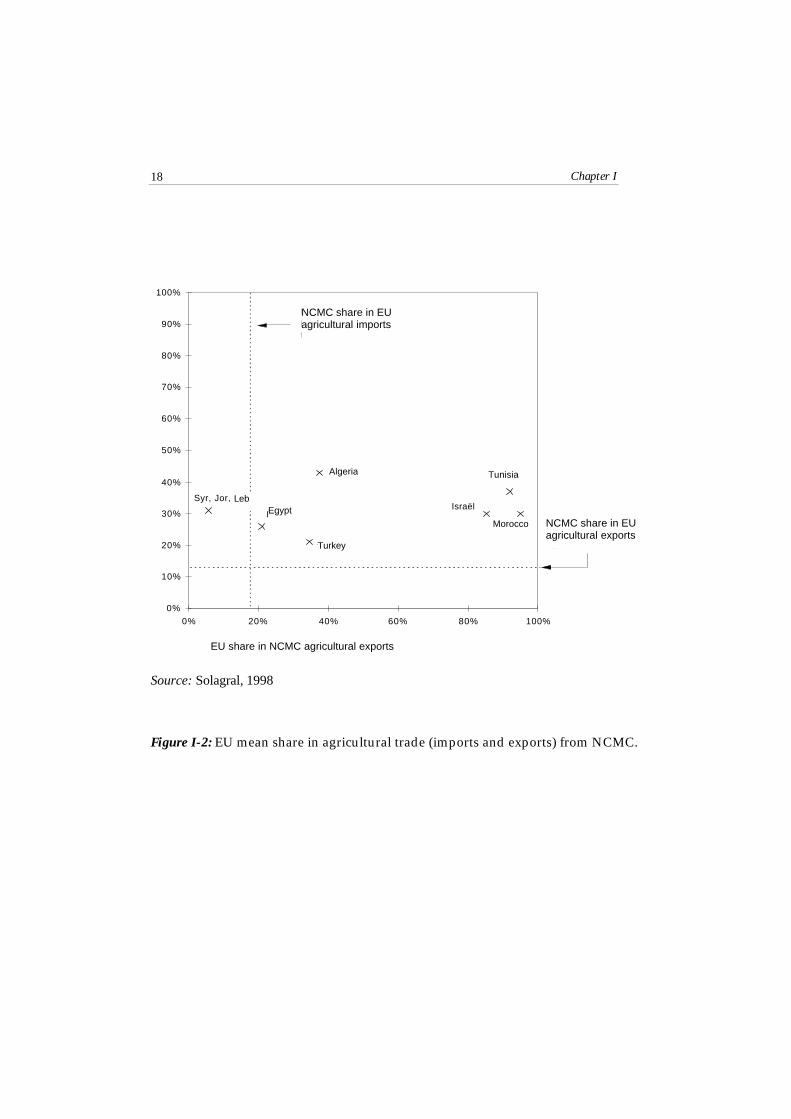
Despite Lebanon, Jordan and Syria (see fig. 2), all the remainingMediterranean Countries have increased their preferential agro-food tradewith the EU following the liberalisation of markets. This is specifically thecase for NCMC (Maghreb and Middle East) but also for Turkey, which has
Regional Analysis: the Mediterranean region in a world economic context towards globalisation 17
also increased exports to nearby oil-producing markets and to the formerUSSR states. Turkey is a major exception in a region where domestic trade(outside the EU) is very low. The situation is even more interesting in theBalkans (except for Yugoslavia on which an embargo has been imposed forpolitical and military reasons). Former Communist states have radicallyaltered their agricultural trade which in the past used to be orientedtowards countries with a similar economic structure.
Tunisie
JorChypreMalte
Liban
MarocSyrie
TurquieIsraël
Egypte
Algérie
0
200 000
400 000
600 000
800 000
1 000 000
1 200 000
0 200 000 400 000 600 000 800 000 1 000 000 1 200 000
Exportations agricoles des pays tiers vers l'UE
Imp
ort
atio
ns
agri
cole
s d
es p
ays
tier
s d
epu
is l'
UE
Ligne d'équilibre de la balance commerciale agricole vis à vis de l'UE
Source: Solagral, 1998
Figure I-1: Imports and exports of NCMC agricultural products from and to the EU.
Morocco
Turkey
Tunisia
Cyprus
Syria
Lebanon
Egypt
Algeria
Equilibrium line of theagricultural trade balancevis a vis the EU
NCMC agricultural exports towards the EU
Chapter I18
Syr, Jor, Lib
Egypte
Turquie
Israël
Maroc
TunisieAlgérie
0%
10%
20%
30%
40%
50%
60%
70%
80%
90%
100%
0% 20% 40% 60% 80% 100%
Part de l'UE dans les exportations agricoles des PTM
Par
t d
e l'U
E d
ans
les
imp
ort
atio
ns
agri
cole
s d
es P
TM
Part des PTM dans les exportations agricoles totales de l'UE
Part des PTM dans les importations agricoles totales de l'UE
Source: Solagral, 1998
Figure I-2: EU mean share in agricultural trade (imports and exports) from NCMC.
NCMC share in EUagricultural imports
Algeria Tunisia
Morocco
Egypt
Turkey
Leb
NCMC share in EUagricultural exports
EU share in NCMC agricultural exports
Regional Analysis: the Mediterranean region in a world economic context towards globalisation 19
B. Regionalisation and the impact of market liberalisation
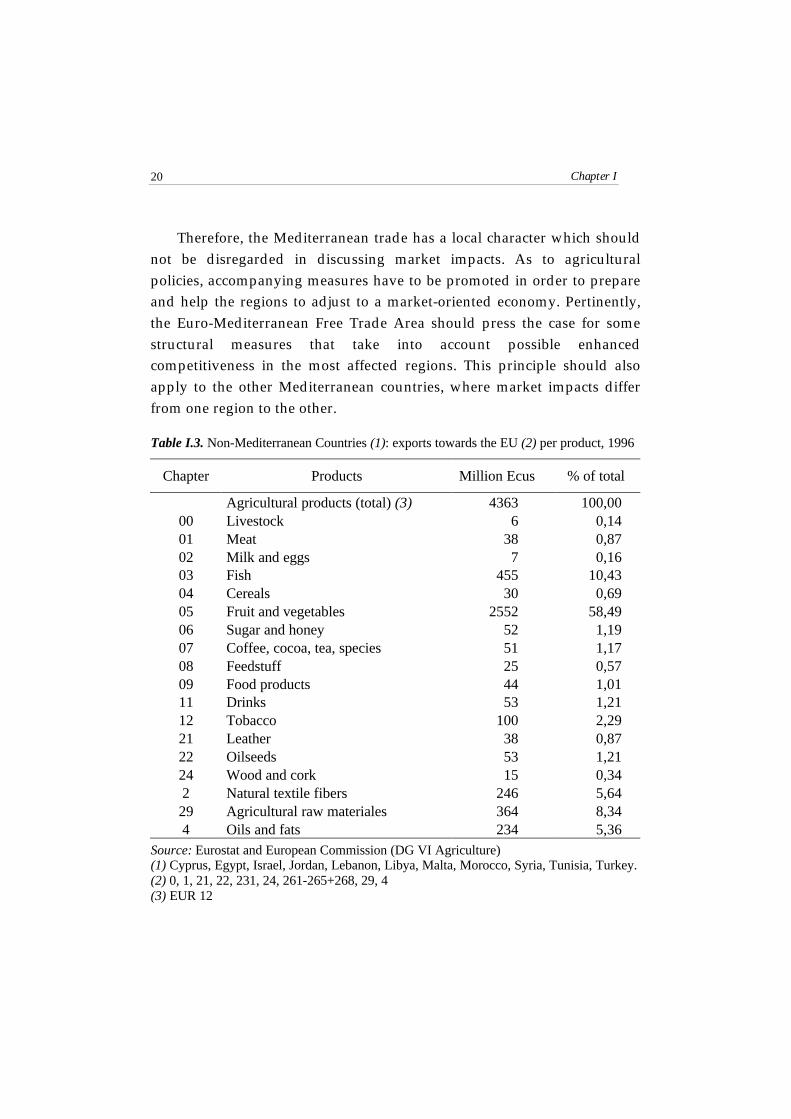
Mediterranean products account for the majority of agriculturalexports by Non-Community Member States, fruit and vegetablesrepresenting 58% of the aggregate exports in 1996 (See Table I.3). Hence, itis not surprising that most of the political debate on the tariff reductionsgranted by the EU to NCMC is focused on these products, which areamong the main sources of agricultural income in some regions of the EUMediterranean Member States. According to data compiled by EurostatSPEL (Sector Model for Production and Income of the EuropeanAgriculture), fruit and vegetables in Greece and in Spain account for morethan one-third of the agricultural gross value at market prices.
In order to asses the effects of this competition over Mediterraneanagricultural products, we should shift the attention from the “national” tothe “regional” scenario, since the effects are concentrated in a limitednumber of regions. Therefore, the Mediterranean products (fruit andvegetables, wine, olive oil and flowers) account for 40% of the overall valueof agricultural production in four Greek regions (the Islands and thePeloponnese), in six Spanish regions (La Roja, Andalusia, Murcia, Valencia,the Canary Islands and the Balearic Islands), in seven Italian regions(Liguria, Trentino-Alto-Adige, Lazio, Campania, Abruzzi, Apulia, Calabriaand Sicily), in two Portuguese regions (Algarve and Madeira) and in threeFrench regions (Languedoc-Roussillon, Provence-Alpes, Côte d’Azur andCorsica). Most of these regions are located along the Mediterranean coastalarea and show different patterns of product specialisation when comparedto the remaining regions of each respective country. This is the reason why,when Mediterranean products are qualified as “sensitive” duringnegotiation rounds with NCMC, it is not simply because they make up theEuropean agricultural output, but also because the strain of foreigncompetition is concentrated on limited territories.
Chapter I20
Therefore, the Mediterranean trade has a local character which shouldnot be disregarded in discussing market impacts. As to agriculturalpolicies, accompanying measures have to be promoted in order to prepareand help the regions to adjust to a market-oriented economy. Pertinently,the Euro-Mediterranean Free Trade Area should press the case for somestructural measures that take into account possible enhancedcompetitiveness in the most affected regions. This principle should alsoapply to the other Mediterranean countries, where market impacts differfrom one region to the other.
Table I.3. Non-Mediterranean Countries (1): exports towards the EU (2) per product, 1996
Chapter Products Million Ecus % of total
Agricultural products (total) (3) 4363 100,0000 Livestock 6 0,1401 Meat 38 0,8702 Milk and eggs 7 0,1603 Fish 455 10,4304 Cereals 30 0,6905 Fruit and vegetables 2552 58,4906 Sugar and honey 52 1,1907 Coffee, cocoa, tea, species 51 1,1708 Feedstuff 25 0,5709 Food products 44 1,0111 Drinks 53 1,2112 Tobacco 100 2,2921 Leather 38 0,8722 Oilseeds 53 1,2124 Wood and cork 15 0,342 Natural textile fibers 246 5,6429 Agricultural raw materiales 364 8,344 Oils and fats 234 5,36
Source: Eurostat and European Commission (DG VI Agriculture)(1) Cyprus, Egypt, Israel, Jordan, Lebanon, Libya, Malta, Morocco, Syria, Tunisia, Turkey.(2) 0, 1, 21, 22, 231, 24, 261-265+268, 29, 4(3) EUR 12

Regional Analysis: the Mediterranean region in a world economic context towards globalisation 21
III. Trade parameters of sensitive products - the case of fruitand vegetables
Globalisation is an old phenomenon for Mediterranean products, butits progress is much slower than that of some other products. Globalisationshould be viewed as an irreversible process which is triggered by basictechnological changes in communication and information services and byflows of goods and capital. It is impossible to halt or slow down such aprocess - even in the face of the very high protectionist measures within asingle country or groupings of countries. “The only sensible way is to makeglobalisation work for all and each” stated Renato Ruggiero at the Middle-Eastand North African Conference (MENA) III (Cairo, November 1996). Thisstatement may also apply to the Mediterranean agricultural products.Markets are governed by complex forces and so foreign trade policies,though important, are not the only forces at work in the establishment oftrade structures. The case of fruit and vegetables is an illuminatingexample.
The challenge to supply seasonal and perishable products all yearround has spurred the international trade and favoured the integration ofthe fresh fruit and vegetables sector. However, most fruit and vegetablesare for domestic consumption and only 4.4% of vegetables and 8.9% offruits are traded internationally. Exports of these products havetraditionally accounted for low percentages of the overall production(though varying widely per kind and per country), due to trade barriers,but also to the short shelf-life and to long-distance shipment costs.Breakthroughs in post-harvest techniques and in the control of the “coldchain” have made it possible to ship perishable commodities over longdistances. These advances, along with more dynamic supply and demandpatterns, have boosted the trade of horticultural products, which nowadayscovers a wide range of commodities, countries and marketing channels.Today’s demand for high quality, diversified products all the year long is
Chapter I22
on the increase. And it is this growing demand that stimulates trade, as nocountry produces enough quality fresh fruit and vegetables all year long.
The European Union is the main actor in the fresh fruit and vegetablesmarket. Its 15 Member States contribute, via their imports and exports, to1/5 of the world market. Germany is the main importer, Spain is theprincipal supplier and the Netherlands play an important part in themanagement of distribution flows. However, imports are stagnant.According to Eurostat, imports from the 15 EU Member States haveclimbed to 13.7 million tonnes (MT) in 1997, against 14.8 MT in 1998. Theincrease in fresh fruit imports (8.4 MT in 1998, against 6.1 MT in 1996) hasnot offset the drop of vegetables imports (8.6 MT in 1996 against 5.3 MT in1998).
By contrast, EU fruit and vegetables exports have increased from 2.5MT in 1996 to 3.9 MT in 1998.
To some extent, exports growth has been more marked for fruit thanfor vegetables. Nevertheless both have shared the export peak. Fruitaccounts today for 59% of the total demand and this confirms theincreasing demand in developing countries.
The changing trade patterns in the horticultural sector have attractednew private firms and entrepreneurs wanting to capitalise on andcontribute to the current trends. Strategic alliances and joint ventures enablesmall and medium-sized businesses to join the global trade and expandtheir market shares without necessarily becoming transnational firms. Theparticipation to trade of non-traditional firms, such as those of thegrower-shipper diversifies and multiplies marketing circuits. In addition, afew multinational companies and long-standing international traders arewrestling to develop truly global brands while adding to the existingproduct lines (e.g. Dole, Del Monte, Chiquita). The constant increase in thenumber of firms and countries involved in the process is bound to enhancecompetition.
Regional Analysis: the Mediterranean region in a world economic context towards globalisation 23
Consolidation of buyers is expanding across the European food-distribution chain and fostering demand for considerable volumes andhigh quality standards thus obliging firms to improve their supplymanagement capability. Buyers are increasingly establishing partnershipswith some privileged suppliers which can guarantee the availability ofsupplies on a week-in, week-out basis. Larger buyers drive consolidation atthe supplier level in order to implement scale economies particularly inshipments. The emergence of larger suppliers is the signal that a fewselected firms can handle the costs and risks associated with productionscattered in many regions or countries over protracted periods. Forinstance, some Spanish shippers may produce in various Spanish regions,in the Canary islands and in Morocco and benefit from longer productionseasons. Managing supply over a long period of time has become astrategic competitive advantage for many shippers.
The above analysis of fruit and vegetables trade shows that three mainfactors increase competition in the Mediterranean Region:
Demand for fresh fruit and vegetables in the 15 EU countries is quitemature, though varying widely per country. The growth of importssuffers from the slow production pattern changes.
Trade in the Mediterranean Region is more contentious than in areas whereproduction and marketing seasons coincide to a lesser extent. Out-of-season and complementary trade are rather less controversial. Trade inthe Mediterranean Basin is often the result of competitivenessdifferentials between growers of similar products who work during thesame period.
The European horticultural sector has increasingly become export-drivenowing to market saturation. As income levels rise in developingcountries, consumers tend to shift towards diets with heavier intake ofanimal proteins and fruit and vegetables with expanding possibilitiesfor markets.
Chapter I24
IV. The traditional framework of agricultural trade talks
Organisation, rules and arbitration are set at different levels in thecomplex Mediterranean agricultural markets, especially at national,community and international level. These negotiations take place in anenvironment of fears to the liberalisation process. Due the abovecompetition trends, the horticultural sector is particularly sensitive.Southern European producers fear that the so called “sensitive” productsmight be included in the Euro-Mediterranean Free Trade Area. Are theirfears justified? In order to answer to this question, it is necessary to assessthe weight of labour costs (and of some other production costs) oncompetition and the impact of trade distorsions (tariffs and preferences) onproduct flows.
Many european producers do not welcome the establishment of aEuro-Mediterranean Free Trade Area, considering the existing widedifferences in labour costs between the EU and NCMC. The proximity tothe European markets and the fact that the cost of labour, up to ten timescheaper in the NCMC might lead the idea to regard the SouthernMediterranean area as a natural cropping base for labour-intensivehorticultural activities. The Euro-Mediterranean Free Trade Area mightlead many global firms to exploit the more favourable regional contextestablished by the EU in the area. However, fruit and vegetables marketsare not only governed by labour costs but also differ markedly from eachanothers. As indicated above, international competitiveness is also relatedto the availability of marketing channels, post-harvest and refrigerationtechnologies and advanced shipping modes. Non-price factors such asproduct quality, capability to adjust to the rules and standards of advancedmarkets, prompt delivery and credit terms become increasingly crucial.Therefore, despite a 1 to 6 labour cost ratio, the marketing organisation inthe European countries remains an advantage. Marketing costs can easilyaccount for 2/3 of the total value in the retail markets. Hence, labour costsare far from being the deciding factor in the horticultural trade. Additional

Regional Analysis: the Mediterranean region in a world economic context towards globalisation 25
contributory factors come into play which are generally well mastered byEuropean traders.
However, this implies that the free market is not an unbearable risk forthose producers who have managed to differentiate their products andbuild on a demand on a regular basis. Quality, technology and services canreplace border protectionist measures and ensure stable market shares allthe same.
The horticultural market in temperate zones is increasingly saturated,thus making it a “market for buyers” who are rather demanding in terms ofquality standards and supply deadlines. Hence, competitiveness is morerelated to the capability to adjust to the new market conditions rather thanto costs and prices. A marked asymmetry has to be acknowledged. On theone hand, there are many producers who are not well organised and whosupply limited quantities. On the other hand, demand is relativelyconcentrated and the number of buyers is small. These trends of thehorticultural international market are rather strong and it is unlikely thatthey will be slowed down by trade barriers.
Hence, the Mediterranean producers of the so called “sensitive”products are faced with structural choices and the regions deprived ofenough organisation capabilities to meet the demands of “downstream”operators will be gradually ruled out and replaced. A structural approachto the problem is needed. No easy solution may come from keepingprotectionist trade barriers that both the World Trade Organisation (WTO)and the Euro-Mediterranean agreements cannot allow in the long run.
V. The Uruguay Round and the negotiations on theliberalisation of the agricultural trade
The international trade of agricultural and food products has been thetraditional case of unremitting price distorsions. The agricultural policiesimplemented by industrialised countries have introduce some “biases” by
Chapter I26
subsidising not only production, but also the exports of the so called“temperate” or “continental” products (cereals, oil seeds and protein crops,milk, meat, etc.). These policies adopted mainly by the United States (FarmBill) and by the European Union (Common Agricultural Policy - CAP) haveposed additional budget and deficit strains while contributing to keepingproduct prices rather low and penalising production against imports indeveloping countries.
It was within the framework of the GATT‘s Uruguay Round of TradeTalks that the exception of agriculture, as wanted by the United States afterWorld War II to boost exports, was systematically tackled for the first time.A long debate followed with the Agreements launched in Punta del Este,Uruguay, in 1986, being finalised by the Marrakech agreement in 1996. Thetalks have not abolished all trade barriers, nor have they eliminated allpolicy-related distorsions. However, they have brought agricultural tradeunder the umbrella of the GATT rules - aimed at easing the gradualliberalisation of world commodity trade. Non-tariff barriers have beenreplaced by bound tariffs and market access strengthened by bindingminimum access provisions. Export subsidies have been codified andgoverned by commodity-specific and volume restrictions. Aids to domesticproduction, measured by the Aggregate Measurement of Support (AMS), havealso been subjected to specific sets of rules. Lastly, the agreement onsanitation and plant-control measures has been tailored on internationallyaccepted rules and recommendations requiring “scientific evidence” priorto any implementations of trade restriction provisions.
Hence, despite the slow liberalisation in agricultural trade,transparency has been introduced and the rules of the “trade game” set.
In order to assess the impact of the liberalisation process, a distinctionshould be made between industrialised and developing countries. In theformer, the level of support has dropped. In 1995 the EU grantedapproximately ECU 70 billion through PSE (Producer Subsidy Equivalent),

Regional Analysis: the Mediterranean region in a world economic context towards globalisation 27
though, following the reform initiated in 1992, “only” 68% of thesetransfers have been in price supports. Budgetary payments (incomesupport, structural support, etc) are expected to increase in the next fewyears. In advanced countries, domestic budgetary agreements andmultilateral negotiations within the WTO should be conducive to areduction in trade barriers.
In developing countries, the liberalisation process has proved fasterthan originally expected in the Uruguay Round guidelines. In the past tenyears, many developing countries, some of which Mediterranean, haveimplemented unilaterally freer policies within the framework of structuraladjustment and macro-economic stabilisation measures regardless of theGATT multilateral agreements. Countries like Jordan or Egypt haveinitiated negotiations with International Organisations (IMF and the WorldBank) in order to reduce their tariffs. A few countries (namely Algeria,Jordan and Lebanon) are currently discussing their membership at theWTO and will have to apply tariff reductions, accordingly. In addition, thevast majority of Mediterranean countries have committed themselves toestablishing a Euro-Mediterranean Free Trade Area (EMFTA) within whichthe mutual liberalisation of agricultural trade will then be discussed.
Negotiations, which are due to start in 1999, will have a greater impacton the agricultural policies of the EU Member States than on Non-Community Mediterranean Members. Community members have alreadycommitted themselves, under the Uruguay Round, to lowering their exportsubsidies from US$ 13.274 billion (that is 36.5% of the aggregate value ofexports within the reference time period) to US$ 8.496 billion in the year2000. In the Mediterranean area, only Turkey, Israel and Cyprus havenotified export subsidies accounting for 5.6%, 5.2% and 8.6% of totalexports respectively.
As to the support provisions to agriculture estimated upon theAggregate Measure of Support (AMS), despite the CAP reform initiated in
Chapter I28
1992 and the Agenda 2000 agreements, the Europeans have agreed upon atotal support of US$ 76 billion by the year 2000, that is approximately halfthe agricultural gross domestic product, whereas Israel, Cyprus, Moroccoand Tunisia have committed themselves to reducing support to maximum10% of farm-gate value production.
An additional asymmetry has been reported in the Mediterraneanbetween exporting countries and net importers of food products. Asregards the former, access to markets is expected to improve and prices toincrease, whereas, the latter are most likely to experience an increase inimport prices and a corresponding impact on trade balances. A reductionin stocks is also expected in the developed countries, which might haveimplications for market stability should marked adjustments occur betweensupply and demand as was the case in 1995 and 1996.
The Uruguay Round agreements have not affected Mediterranean and“continental” products to the same extent, the former not benefiting fromthe same supports and exhibiting a different market organisation.However, some products, such as fruit and vegetables remain “sensitive”in the EU and will be subjected to “minimum import price” provisions. Inaddition, the bilateral agreements between the EU and the NCMC areexpected to result in freer regional markets than those envisioned by themultilateral framework.
In Non-Community Mediterranean Countries, the multilateralliberalisation is likely to erode the preferential schemes granted by theUnion to some countries pursuant to specific agreements. Given theguidelines set by the Barcelona Declaration and the specificity of theagricultural issue, many Non-Community Mediterranean Countries arebalancing the possible developments between the preferentialMediterranean framework and the multilateral market globalisation.
A recent study by Tangermann, shows that had the pre-UruguayRound preferential agreements remained unchanged, a 17% erosion would

Regional Analysis: the Mediterranean region in a world economic context towards globalisation 29
have been recorded in the Mediterranean countries. Israel would haveexperienced a 27% drop of its margin of preference, Morocco a 13%reduction and Tunisia a 9% decrease. However, following the newAssociation Agreements, these margins would have been increased by 17%in Israel, by 29% in Morocco (based on the tariffs foreseen for the year 2000)and would have remained unchanged in Tunisia.
Furthermore, agricultural trade is bound to be governed by preferentialschemes, but not to become free. Each single country will have to negotiaterestrictions on quantities for the so called “sensitive” products and theprinciple of product coverage. In the long run, the multilateralliberalisation established by the EU is expected to benefit the non-EUproducers too. Multilateral liberalisation will involve the dismantling of theexisting quantitative restrictions and the most protective devices, such asthe entry-price system.
Possible imbalances resulting from the implementation of bothnegotiation systems are likely to take centre stage in the next few yearswith European farmers and the CAP coming under a double pressure: fromthe gradual liberalisation, within the WTO, and from the maintenance ofpreferential schemes by Member States, namely with respect toMediterranean products historically exported by NCMC.
The state-of-the art of the Euro-Mediterranean negotiations
In the Barcelona Declaration, 27 Euro-Mediterranean partners (15 EUMember States and 12 Non-Community Mediterranean Countries) agreedon the establishment of a Free Trade Area by the year 2010 throughestablish the Euro-Mediterranean Association Agreements to becomplemented by specific agreements between NCMC. Table I-4 gives anoverview of the state of the art.
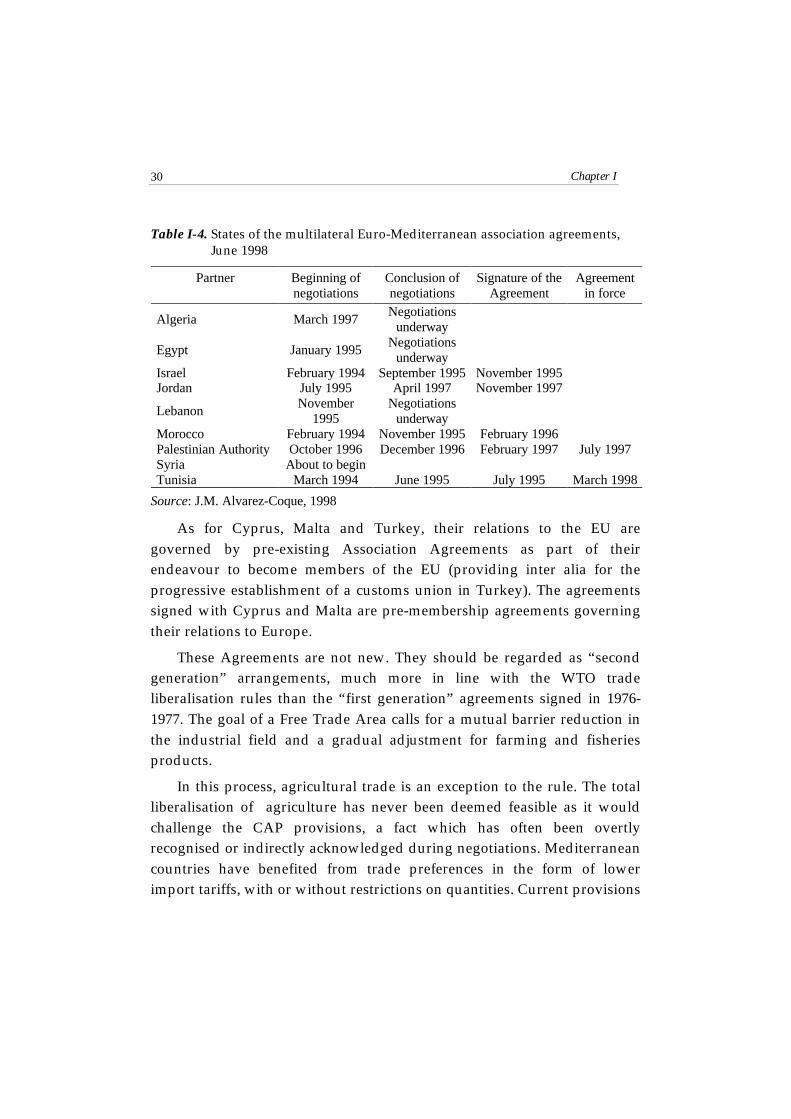
Chapter I30
Table I-4. States of the multilateral Euro-Mediterranean association agreements,June 1998
Partner Beginning ofnegotiations
Conclusion ofnegotiations
Signature of theAgreement
Agreementin force
Algeria March 1997Negotiations
underway
Egypt January 1995Negotiations
underwayIsrael February 1994 September 1995 November 1995Jordan July 1995 April 1997 November 1997
LebanonNovember
1995Negotiations
underwayMorocco February 1994 November 1995 February 1996Palestinian Authority October 1996 December 1996 February 1997 July 1997Syria About to beginTunisia March 1994 June 1995 July 1995 March 1998
Source: J.M. Alvarez-Coque, 1998
As for Cyprus, Malta and Turkey, their relations to the EU aregoverned by pre-existing Association Agreements as part of theirendeavour to become members of the EU (providing inter alia for theprogressive establishment of a customs union in Turkey). The agreementssigned with Cyprus and Malta are pre-membership agreements governingtheir relations to Europe.
These Agreements are not new. They should be regarded as “secondgeneration” arrangements, much more in line with the WTO tradeliberalisation rules than the “first generation” agreements signed in 1976-1977. The goal of a Free Trade Area calls for a mutual barrier reduction inthe industrial field and a gradual adjustment for farming and fisheriesproducts.
In this process, agricultural trade is an exception to the rule. The totalliberalisation of agriculture has never been deemed feasible as it wouldchallenge the CAP provisions, a fact which has often been overtlyrecognised or indirectly acknowledged during negotiations. Mediterraneancountries have benefited from trade preferences in the form of lowerimport tariffs, with or without restrictions on quantities. Current provisions
Regional Analysis: the Mediterranean region in a world economic context towards globalisation 31
tend to freeze existing market shares. All industrial exports already havefree access to the European market and duty-free access to those in Turkey,Israel, and Palestinian Authority Territories. Tariff dismantling is stillunderway in Cyprus, Malta and Tunisia and will be extended to theremaining partners as Association Agreements are enforced.
This is in stark contrast to the rules that govern agricultural products inthe plan for a Free Trade Area by the year 2010, as stated in the BarcelonaDeclaration:
“...choosing traditional trade flows as a starting point and, as far as thevarious agricultural policies permit it, with due respect for the results achievedwithin the GATT negotiations, agricultural trade will be progressively liberalisedthrough reciprocal preferential access agreements among the parties ...”
This different treatment of industrial and agricultural products hasoften been analysed and mentioned as a kind of paradox by NCMC. Theyare requested to free their markets of manufactured goods and restrain theliberalisation of agricultural products (to comply with the CAP rules).Many NCMC already benefit from a favourable treatment of their exportstowards the EU, but concessions on agricultural trade are regarded bythese countries as a necessary measure to avert significant short-termadjustment costs.
The short-term impact of free trade on local industries, which havelong benefited from protectionist policies, should not be merelyanticipated, but also provided for by the various governments. Moroccoand Tunisia, the first to sign agreements, estimate that one-third of firms inthe affected sectors are competitive enough to survive, whereas anotherthird will have to implement basic restructuring and will requirecontributions of capital. The remaining third will face liquidation.However, while local industries adjust to the new market laws, consumersrisk having, increasingly, to purchase goods imported from the EU.Additional trade imbalances are expected alongside necessary industrialrestructuring, which might prove collectively beneficial in the long run, but

Chapter I32
which will raise major problems in the short-term, these countries lackingin institutionalised safety nets capable of supporting the firms displaced bycompetitive pressures.
Nevertheless, the conclusions of the Euro-Mediterranean ad hocMinisterial Meeting held in Palermo (3-4 June, 1998) recalled the concernexpressed by these countries about “the lengthy national ratification procedureswithin the EU countries”. They also recognised the need for an agriculturalcompromise to be reached in order to wind up the negotiations, namelythose initiated with Algeria, Egypt, Lebanon and Syria.
The lengthy negotiations and ratification procedures are to some extentthe result of the asymmetry in the commercial relations between the EUand the NCMC - with the EU accounting for 55% of NCMC exports and theThird Mediterranean Countries accounting for a mere 8% of total Europeanexports. The combined GDP of the 12 Mediterranean partners is lower thanthat of Spain alone and corresponds to approximately 20% of that ofGermany. The result is self-evident: a ECU 12 billion deficit with regard tothe EU in 1994. This asymmetry as well as the regional interdependencecall for the implementation of an effective regional scheme which includesagriculture, regardless of the political and economic shortcomings that sucha choice might imply.
VI. Regionalism and agriculture
Regional initiatives are crucial in expediting the moves towards freermarkets of the partner countries and in strengthening their interdependenceand so paving the way to their economic development. Regionalism canhelp the integration of the various countries into the mainstream of theglobal economy. This is the role that future negotiations between the EUand the Non-Mediterranean Community Countries are called to play inorder to establish the Euro-Mediterranean Free Trade Area in the next 15years. Regionalism can foster negotiations and revive the internationaldebate. However, the Euro-Mediterranean regional approach is a powerfultool to reduce or smooth out tensions in the area. Therefore, the Euro-

Regional Analysis: the Mediterranean region in a world economic context towards globalisation 33
Mediterranean initiative, far from threatening multilateral negotiations,will favour market liberalisation by implementing tariff reductions amongpartner countries and preparing them for a broader multilateralliberalisation.
Discussions are currently underway about the insertion of agriculturein a free-trade scenario. As far as agricultural products are concerned, theEuro-Mediterranean agreements hinge on a cautious dismantling ofcustoms duties. Compatibility with the GATT rules is based on ArticleXXIV of the agreement which has never envisaged an entirely free trade inall products between the interested parties for the establishment of a freetrade area or a customs union. The text calls for the liberalisation of “mosttrade”, thus leaving space to interpretation. A restrictive regime inagriculture is possible provided that this sector forms part of the talks andmeasures are taken to implement a gradual true liberalisation.
A gradual liberalisation of the agricultural trade is indeed foreseen inthe Barcelona Declaration. Agriculture is a key sector in the debate betweenpartners because it is entrusted with the re-establishment of a balance ofcommercial opportunities via the increase in both industrial andagricultural exports in the region.
As far as manufactured goods are concerned, free access to theEuropean markets has contributed to increase the share of industrialexports from the Mediterranean countries to the EU from 45% in 1991 to58% in 1996, thus mirroring the modernisation of their industry. Bycontrast, EU food imports from the Mediterranean countries have droppedfrom 50% in the 1960s to 12% in 1994.
The issue of the role of agriculture in the Euro-Mediterranean FreeTrade Area is becoming increasingly crucial. A more ambitious role isadvocated than that envisioned by the multilateral scenario. Will theagricultural trade game rules in the Mediterranean result from a regional ora multilateral consensus? The answer to the question depends on the speedand the results of two parallel processes: the Euro-MediterraneanAssociation and the Multilateral negotiations which are due to start in 1999.
Chapter I34
Against the background of an incomplete multilateral trade liberalisation,regional agricultural negotiations have become central. If the North AmericanFree Trade Agreement (NAFTA) is taken as an example, no agricultural tradebarriers are expected to be left between the United States and Mexico by theyear 2005. The same should apply to Latin America, Central America and theCaribbean if the current liberalisation timetables are met.
However, while the Euro-Med initiative is at work to speed up theagricultural trade liberalisation process, two tricky questions remain. Towhat extent will the market access demands by the Mediterraneancountries meet the current EU commercial regime? What impact will theliberalisation of Mediterranean trade have on the most “sensitive”countries, particularly those located in Southern Europe?Impact of trade concessions on Mediterranean products
Mediterranean countries have historically benefited from tradepreferences for agricultural exports towards the EU in the form of tariffreductions with or without restrictions on quantities. Since the early 1970sand under the increasing pressure from preference recipients who fearedrepercussions from the subsequent EU enlargement, changes have beenmade in the structure of trade preferences. The enlargement of theCommunity to Southern countries has reshaped the commercial relationsamong the Mediterranean partners. The EU Member States such as -Greece, Portugal and Spain - account for 25% of EC fruit and vegetablesimports. Following political pressures from French and Italian producers,the conditions for accession to the Common Market have increasinglyhardened. In addition, the risk of a trade diversion against exports fromNon-Community Mediterranean Countries has led to a revision of theMediterranean Agreements by the late 1980s. Not to weaken the traditionaltrade relations with the EC, concessions were granted to the Mediterraneanpartners which mirrored the tariff reductions granted to Spain andPortugal on a wide range of fruit and vegetables, though often offset byquotas or reference quantities.
Trade concessions to Non-Community Mediterranean Countries arenot regarded as a major problem for the European productions of affectedproducts. This was the conclusion of the analysis carried out by theCommission on the impact of agricultural concessions to Third

Regional Analysis: the Mediterranean region in a world economic context towards globalisation 35
Mediterranean Countries.5 Only 3 countries (Israel, Morocco, Turkey,) outof 11 appeared to be large agricultural eporters towards the EU. Broadlyspeaking, imports from NCMC accounted for a relatively small share oftotal EU imports and domestic production.
There are some specific reasons for the reported lack of strongcorrelations between the existence of preferential trade agreements with theEU and the dynamics of agricultural exports from the Non-CommunityMediterranean partners towards the EU. First, the net border protectionagainst NCMC is historically lower for products and during seasons inwhich EC imports do not compete directly with domestic production.Second, the “reference price system” (prior to the implementation of theUruguay Round Agreement) and the current “entry-price” system (afterthe Uruguay Round) penalise low-cost supplies of fruit and vegetables. Thepost-Uruguay Round entry-price system is undoubtedly better than theprevious one, as it reflects the tariff preferences of lower selling prices inthe EU markets, whereas the reference price system competes with them. Inthe present system, an exporting country may choose between attractingthe preferential margin or selling at a lower price and thus gaining a largermarket share.6 However, the entry-price system still provides higherprotection to EU producers, as shown in a number of studies.7
5 See “Mediterranean concession impact study” COM(97) 477 final.6 See Tangermann (1996), cited work.7 See Swinbank, and Ritson, Op. Cit. In the present system, the “eight per cent rule”
applies. The full maximum tariff is charged even if the cif. price is only slightly higherthan 8%, below the entry price. As the maximum tariff (confined to the EU plan attachedto the Uruguay Round Agreement) is often much higher than eight per cent of the entryprice, there is an upward jump in the landed price (including customs duties) wheneverthe cif price drops below 92 per cent of the entry price.

Chapter I36Table I-5. European Union: supply balance of selected “sensitive” products, 1995-1996
ProductProduction
(000) TonsImports
(000) TonsShare of Imports
in Production(%)
Med supplies (000)Tons (1)
Share of Medsupplies in imports(%)
Tomatoes 12340 483 4 145 30
Processedtomatoes 824 90 11 42 46
Onions 3224 321 10 28 9
Hazelnuts 124 322 260 314 97
Oranges 5238 870 17 364 42
Lemons 1383 191 15 46 24
Table grapes 2394 204 9 32 16
Melons 1750 103 6 31 30
Strawberries 781 30 4 9 31
Source: Eurostat(1) Imports from Non-Community Mediterranean Countries (Cyprus, Egypt, Israel, Jordan, Lebanon, Malta, Morocco, Syrian
Arabic Republic, Tunisia and Turkey).

Regional Analysis: the Mediterranean region in a world economic context towards globalisation 37
In addition, where a tariff preference (or entry-price reduction) isgranted for a limited quantity in the form of a quota, the preference margindoes not lead to a gain in market shares. For some products, tariffreductions apply only to a limited number of seasons and to givenquantities. It follows that preference is at best an economic font whichbenefits the “owner” of the import licences granted for trade in the form oftariff quotas. Hence, exporting countries benefit partially from a protection,but it is difficult to state which part of the additional income corresponds tothe preferential margin which flows towards the Mediterranean exportingcountries (see Box I-2).
Lastly, trade preferences create favourable export conditions for theproducts which bring comparative advantages to the beneficiaries. Itcannot be excluded whether the tariff margin helps preferential exportersstrengthen their market shares in the EU and capture the economic font tothe detriment of non-preferred suppliers and European consumers at large.The “new products” are often sold to developing countries by foreigncompanies, but it is not yet known to what extent preference acts as acatalyst for the growth of market shares. Some additional factors, such asfacilities, entrepreneurial skills, investment funds and suitable policyframeworks may prove equally influential for developing a dynamichorticultural sector.

Chapter I38
Box I-2. Preference margins under the “entry-price” system.
When imports come in at cif prices below the entry price, a higher tariffis charged beside the standard tariff up to a ceiling established in the EUplan (annexed to the Uruguay Round Agreement). The entry-pricesystem replaces the old minimum-price system (reference price).Considerable reductions in entry prices have been granted to somecountries for some products. This enables them to export to the EU evenduring the high season when the EU market price is lower than the MostFavoured Nation entry price. The reduction in the entry price may beregarded as an incentive to export towards the other signatories of theagreement. Table I-6 below illustrates some cases where entry prices arereduced for given quantities (e.g. Morocco). The limit is 300 thousandtonnes for oranges, and 150,676 tonnes for tomatoes between Januaryand March.Who benefits from the preferential margins stemming from the reductionin entry prices? These margins are listed in the last column of the table.Where reductions are applied under strict quantity limits, the owners ofimport licences benefit from the preferential margins. As is the case withsome other countries, the EU usually issues these licences under apreferential regime to trading companies registered in the EU. Hence,most of the price advantage resulting from trading companies’ accruedpreferential margin doe not necessarily correspond to an increase in thepartners’ exports to the EU. The preferential margins are similar incharacter to the potential benefits granted to exporting countries, but inpractice they may fail to be taken in by these countries or may bediverted to larger market shares.

Regional Analysis: the Mediterranean region in a world economic context towards globalisation 39Table I-6. Entry prices and "MFNT *duty" compared with the entry price in Morocco (Ecu/t), 1995-1996
Product Entry priceMFNT duty
(%)
Entry price+
MFNT duty
Entry-price forMoroccan
exports
% preferenceMorocco vs
MFNTTomatoes
April 1188 10.6 1314.3 1188 10.61 - 15 May 788 10.6 871.8 788 10.616 - 31 May 788 17.4 925.1 788 17.41 June - 10 July 588 17.4 690.3 588 17.411 July - August 588 17.4 690.3 588 17.4September 588 17.4 690.3 588 17.4October 688 17.4 807.7 500 61.5November- 20 December 688 10.6 761.1 500 52.221 December -31 December 738 10.6 816.4 500 63.3January - March 908 10.6 1004.5 500 100.9Sweet OrangesDecember - March 369 19.3 440.3 275 60.1April 369 12.6 415.4 275 51.01 -15 May 369 5.8 390.4 275 42.016 - 31 May 369 3.9 383.3 275 39.4June - 15 October 3.916 October. - November 19.3
ClementinesDecember - February 648.6 19.3 774.0 500 54.8
* MFNT: Most Favoured Nation TariffSource: J.M. Alvarez-Coque, 1998

Chapter I40
However, as far as fruit and vegetables are concerned, tariffpreferences granted to NCMC have in fact limited effects.
Therefore, in spite of the evidence discussed above, Europeanproducers feel constantly threatened by Mediterranean competition.European markets for certain products suffer from severe imbalances andin some cases the gradual liberalisation of trade in the Mediterranean areais bound to increase existing market tensions8. Some EU regions, primarilyin the South, are in direct competition with trade flows from the non-EUMember States, owing to overlapping production and marketing seasons.Problems are more common with products whose seasons are beingextended, such as strawberries, tomatoes and citrus. Trade flows of“sensitive” commodities have been restricted by quotas and referencequantities, but imports from the EU have been practically liberalised forspecific products such as onion, garlic and potatoes which feature asignificant price volatility. In addition, the perishable nature of fresh fruitand vegetables means they have to be marketed over some short timeframes. Lastly, trade quotas will stop acting as trade limiting factors as themultilateral process of liberalisation implements the reduction in customstariffs agreed upon in the Uruguay Round.
The above discussion does not necessarily indicate that a freer traderegime will boost exports from NCMC to the EU. As discussed earlier,Mediterranean products are increasingly affected by non-price variablesand structural factors which constitute the present stumbling blocks to thedynamic progress of exports. The farming sector on both sides of theMediterranean is expected to shift from a “commodity-centred” approach(where price is essential) to a “product-oriented” approach (whereproduction tailors products and services to demand).
8 See the comment by COPA-COGECA EG(97) 35-CEG(97) 57 - FV/ig, as a reaction to
the Commission’s “Mediterranean concession impact study” quoted above,
Regional Analysis: the Mediterranean region in a world economic context towards globalisation 41
“ ... the new food market relies less on prices set in the trading pits of majorcommodity exchanges and more on private contract negotiations behind closeddoors to divide risks and profits among farmers, food processors and retailers.Thus, the transition in the food system raises the question of how the risks andprofits of the new market system will be shared among the players from thetraditional markets”9
However, most international food trade is supported intra-branchesexchanges and consists of imports and exports of similar products asopposed to inter-branches trade which exchanges different food products.Mediterranean products are mainly intra-branches traded owing to theirwidely differentiated range. This form of trade in the food sector has beenexpanding increasingly throughout the EU in the last few decadesindicating that there exists a wide scope for bilateral trade as traditionalcomparative advantages become less important. The outcome of thisscenario are twofold: open trade does not necessarily lead to dramaticinter-sectorial adjustments in many cropping areas and NCMC trade couldbe faced with the shortcomings of fierce competition - which cannot beovercome through cheap labour costs and favourable climatic conditions.
VII. Future negotiations
Will a co-operative approach to trade be central to future discussionsamong Mediterranean partners ?
In order to answer this question four key points need to be highlightedfirst:
Trade liberalisation is not a local issue. It is a global problem and if noregional approach is found, external solutions are likely to be imposed.
9 Barkema, A. “New Roles and Alliances in the U.S. Food System”, in Scherts, L.P. and
L.M. Daft, eds. (1994): Food and Agricultural Markets - The Quiet Revolution, EconomicResearch Service, USDA, and Food and Agriculture Committee, National PlanningAssociation report No. 270, pp. 111-112.

Chapter I42
Agriculture is only one feature of trade liberalisation and some Southernpartners view it as the equivalent of trade talks on industrial products,capitals and services.
Competition for the European markets from Non-CommunityMediterranean Countries and EU Member States is a critical issue.
EU Mediterranean countries believe that “continental” production benefitsfrom a better support system within the framework of the CommonAgricultural Policy (CAP).
However, the question remains whether trade talks face an impasse orthere exists scope for a co-operative approach.
A. The stated “social dumping”
There is a widespread concern among European Union producers,especially from the South, who fear that liberalisation threatens toimpoverish farmers in the rich countries as a result of the competition fromlow-cost labour production systems. Farm lobbies argue that cost of labouris a kind of “social dumping” and advocate a border protection system. Theissue was dismissed by the Singapore WTO Ministerial Conference in 1996on the grounds that labour standards were not on the Organisation agenda,but many industrialised countries still press the case for a regulation of“social standards” within the globalisation process.
The debate over social standards undoubtedly threatens to open aPandora’s box and lead to legitimate protectionism on the grounds ofdifferent national policies. Hence, labour legislation would be bettertackled by the International Labour Organisation (ILO) which comes underless pressures from the economic lobbies.
Protectionists also claim that in the long run such a fierce competitionis likely to destroy job opportunities. International trade economists replythat unemployment is due to market organisation strategies rather than tolabour-cost-based competition. The Spanish integration into the Common

Regional Analysis: the Mediterranean region in a world economic context towards globalisation 43
Market has shown that complementarity and reallocation of resourcesoccur at a fast pace. Contrary to all expectations, the trade balance of“sensitive” products improved in favour of France when Spain joined theEC.
The issue of different social standards ought to be encompassed in a co-operative approach and should be based on international consensus. Thedismantling of tariff and non-tariff trade barriers, the support system andthe taxation mechanism should fuel the debate over environmentalstandards, food security, the protection of intellectual, industrial andcommercial property rights and other contributory factors to faircompetition. The need for consensus-centred competition rules has beenrepeatedly acknowledged during Euro-Mediterranean meetings (Barcelona,Valetta and Palermo) and a “regional test” which would permit arethinking of the rules of the game to be proposed to the WTO.
B. The role of private investment
A further argument against the extension of the Euro-MediterraneanFree Trade Area to agriculture is that competition is biased in NCMC andthat the liberalisation of agricultural trade would prove more beneficial totraders than to growers. This is an argument which, however, does not takeinto account the dynamics that trade integration is expected to engender,mainly via direct investments in the agro-food sector, and which are likelyto knock down the existing structures.
Regional prosperity and security are conditional linked economic highgrowth rates, which in turn depend on foreign investments, theestablishment of exporting sectors and the improvement of internationalcompetition. The debate over regional liberalisation has acceleratedexpectations (positive or negative) which are all concurring to acceleratethe ongoing transition. The issues at stake are manifold. They range fromthe eradication of corruption to the implementation of legal and

Chapter I44
transparent rules, the adjustment of education systems, the regulation ofmigration flows and the use of incentives to enhance private initiatives.
It is worth mentioning that the capital flow to the region is appallinglylow. According to the World Bank, Middle East and North AfricanCountries account for 1.2% of total direct foreign investments and 3.7% ofinvestments in developing countries. According to IMF and UNCTADestimates, total private investments from the EU to NCMC and Turkeyaccounted for US$ 4.7 billion (half of which towards Israel) against US$ 42(ten folds up) to Japan and China, which is the equivalent amount ofinvestments from North America to Argentina alone (US$ 4.3 billion).Liberalisation agreements and capital flows are strictly related and a co-operative approach to trade is the only way to boost volumes which, inturn, would foster interdependence and iron out mutual reluctance.However, even in the best scenario special provisions would have to beimplemented to offset the emergence of less “attractive” areas. Thepractical and theoretical debate on the effects of structural funds is not onlyconfined to the EU Member States. The fifth report prepared by theCommission on the EU social and economic situation shows that, despiteeconomic boundries between “the core and the periphery” (and the widelyvarying performances in developing countries) the trend is towardsconvergence. The report indicates that without the structural funds growthwould have been 2.5% weaker in the eligible Spanish regions and 3% less inrespectively in Greece and Portugal. The Euro-Mediterranean partnershipmay prove helpful to this respect, though enhanced solidarity amongregions should be fostered as advocated by the EU.
Fostering human capital, the share-out of growth, the environmentalissues and a sound sustainable development should be central to a co-operative approach. The MEDA programme illustrated the prioritiestailored to the requirements of each country. ECU 4.685 billion will beallocated to this programme for the period 1995 - 1999 (European Councilof Cannes).

Regional Analysis: the Mediterranean region in a world economic context towards globalisation 45
Box I-3. The MEDA programme
The MEDA programme, the financial arm of the Euro-MediterraneanPartnership, and the EIB, the long-term lending arm, are rather aheadwith ECU 1,200 and 1,700 granted in 1995 and 1996 respectively.The MEDA programme is the main financial instrument of the EUunderlying the implementation of the Euro-Mediterranean Partnership.It accounts for ECU 3424.5 million out of the ECU 4,685 million ofbudgetary funds allocated to financial co-operation between the EU andits Mediterranean partners for the period 1995-1999. These funds arecomplemented by loans from the European Investment Bank (EIB).Some 90% of the funds allocated to MEDA are channelled bilaterally tothe partners (Algeria, Egypt, Jordan, Morocco, Palestinian Authority,Syria, Tunisia and Turkey). The remaining 10% are designed to assistregional activities. All the partners are eligible for assistance.MEDA resources are carefully planned: three-year draft plans focus onbilateral channels and a preliminary regional programme covers the vastmajority of multilateral activities.MEDA priorities for funding are the following:
• support for the economic transition to pave the way to theimplementation of free trade through improved competitiveness inorder to achieve sustainable economic growth, primarily by developingthe private sector;
• improvement of the socio-economic balance to reduce the short-termcosts of the economic transition through suitable social measures;
• regional co-operation to complement bilateral activities throughmeasures to increase exchanges at the regional level.
Respect for human rights and democratic principles are the mainstays ofthe co-operation ensured through MEDA.The following are some examples of projects funded by MEDA since1996: structural adjustment programmes in Morocco, Jordan and Tunisia;social funds for job creation in Egypt; restructuring of publicadministration in Lebanon, rural development in Morocco. In 1996, the

Chapter I46
EIB granted loans for: water treatment and management in Egypt,Lebanon, Jordan, Gaza Strip and Morocco; measures to abate pollutionand upgrade the airport traffic control system in Algeria.
On March 27, 1998 the Commission adopted the MEDA Regional DraftProgramme providing the framework for the implementation ofmultilateral activities (with the joint participation of manyMediterranean partners). During the implementation period (up to 1999)approximately 10% of MEDA financial resources will be allocated toregional activities. The regional draft program complements andstrengthens bilateral draft programmes and envisions theimplementation of activities in the three domains of the BarcelonaDeclaration.
C. The European question or the “prisoner’s dilemma”
As above mentioned, the main stumbling block to the establishment ofthe Euro-Mediterranean Free Trade Area which includes agriculturalproducts is the opposition from European producers of fruit and vegetableswho do not approve of the so called “continental” products benefiting froma more favourable support system. Only 4.5% of the subsidies allocated bythe European Agricultural Guarantee and Guidance Fund (EAGGF) go tohorticultural products which account for 16% of the total European output -whereas cereals are provided 40% (and account for 11% of the production).Horticultural producers are requested a disproportionate adjustment effortcompared to the support operators in the cereal sector benefit from.
Broadly speaking, the allocation of EAGGF-guarantee payments toMediterranean products is by far lower than the share of these products inthe Gross Value Added Domestic Product of the 12 EU Member States (seeTable I-7). A situation which will hardly change within the framework of

Regional Analysis: the Mediterranean region in a world economic context towards globalisation 47
Agenda 2000, given the “financial neutrality” advocated by negotiators forMediterranean products.
Table I-7. Mediterranean crops and EAGGF- guarantee section, 1997
ProductBudget 1997(000 Ecu's)
% of thebudget
% in GVA* EU-12
Durum Wheat 1,103 2.7 1,5
Olive Oil 2,168 5.3 2,9
Fruit and Vegetables 1,679 4.1 18,5
Wine 863 2.1 7,6
Tobacco 1,021 2.5 0,6
Cotton 748 1.8
Rice 42 0.1 0,4
Total group of product 7,624 18.5 36,7
Total EAGGF- guarantee 41,233 100.0 100,0
* GVA: Gross Value Added
Source: European Commission (DGVI) and SPEL data base (Eurostat).
However, as Mr. E. Chioccioli10 recently pointed out, some Europeancountries have an increased interest in both types of production andreportedly we notice the coming up of regional controversy among thesecountries. Therefore, the regional level is the key to solve the dilemma ofthe uneven distribution of European subsidies.
However, if we calculate the Producer Subsidy Equivalent (PSE) on aregional base, including the Mediterranean products (wine, olive oil,
10 CAP Reform, the southern products - Ed. Agricultural Policy Studies, 1998, Belgium,
pag. 11-16.
Chapter I48
tobacco, cotton, fruit and vegetables) we shall notice that, within the sameSouthern EU countries such as Spain, PSE per worker is higher in thecommunities of Navarra, Aragon, Madrid, Castilla-La Mancha,Extremadura, Catalonia and Castilla-Leon, where continental items areproduced, than in the less subsidised regions that supply Mediterraneanproducts (Canary islands, Valencia, Murcia). Reportedly, this differenceaccount to 15%. Across Europe, only Corsica (France) and Liguria (Italy)report subsidy levels lower than those recorded in the above mentionedSpanish areas. Hence, among the regions that benefit from the lowestsupport rate, only two are not located along the Mediterranean coast andone in Western Netherlands. Three Spanish regions are among the 15European Member States which benefit from the highest subsidies(Cantabria, Asturias and Castilla-Leon).
The regions with the highest rate of protection are mainly EU Northernmembers. PSE per worker exceeds ECU 24,000 in Denmark, in Belgium, infive German regions, in six French regions and in one Dutch area. PSEexceeds ECU 30,000 in Picardie and Lorraine (France) and in Mecklenburg-Vorpommern (Germany).
By contrast, PSE is less than ECU 5,000 in five Portuguese regions, inten Greek regions, in six Spanish regions, in three French regions and ineleven Italian regions.
However, this is what in the economic literature is called the“prisoner’s dilemma”. Producers from Southern Europe are reluctant toplay a different economic “game”. They ask for the support system to be re-balanced in order to restore equity in the CAP among different regions andproducers. But the alternatives are all equally unfeasible. They wouldconsist of either an increase in subsidies to Mediterranean products -impossible given the EU financial constraints - or a reduction in subsidiesto continental production (milk, sugar and cereal crops) - which isimpossible because of the political constraints it would engender. Hence,
Regional Analysis: the Mediterranean region in a world economic context towards globalisation 49
the debate over the Euro-Mediterranean Free Trade area is engulfed in theintra-European context.
The contradiction between North and South could well be summarisedin the following quotation in the Financial Times (November 27, 1995):”Asto North African countries, Southern European countries tend to stress theneed for financial support, knowing that it will be provided by NorthernEuropean countries, whereas the latter stress the need for market access,knowing that Southern farmers are bound to suffer the most in competingwith North African countries”. These diverging positions were ostensiblyclear during the signing of Association Agreements with Morocco.Northern countries were willing to grant trade concessions to Morocco,whereas Southern countries insisted on subsidies to attain food self-sufficiency. Northern countries have also urged a reduction in the Euro-Mediterranean partnership funding package proposed by commissionerManuel Marin (from ECU 5.5 billion to ECU 4.685 billion) arguing in favourof trade concessions and stressing the role of the private sector in providinginvestment funds.
However, this doctrine of “trade rather than aid” fails miserably whenvested interests are involved. The Netherlands, Belgium and Germanyexpressed last-minute concerns over possible exports of cut flowers,tomatoes and potatoes from Morocco.
European agricultural regional and sectorial interests challenge theplan for a Euro-Mediterranean partnership with its major goals of securityand shared prosperity. The future trade talks will have to find a solution tothis dilemma.
However, CAP reform and Agenda 2000 will be central to the nextEuropean trade talks. The multilateral negotiations which are due to startin 1999 following the agreements signed in Marrakech, the work of WTOand the pressures from trading partners - including the U.S.A. - will call fora radical reform of instruments, goals and subsidy allocation. A debate

Chapter I50
which is already mobilising Trade Unions across Europe along with thatover public decisions at the Community, national and regional level.
According to experts such as A. Buckwell “there is a contradictionbetween the rhetoric surrounding the Agenda 2000 and the proposed regulations”.In spite of a more balanced integration of support payments andenvironmental and rural development provisions, Agenda 2000 proposalsappear somewhat too reluctant to foster a basic CAP reform. The shift frommarket aids to direct grants and premiums to farmers makes it difficult toovercome the asymmetry in the distribution of subsidies among the variousEuropean regions and producers.
The link between multilateral negotiations, where the EU comes underincreasing pressure from powerful partners, and the Euro-Mediterraneantalks, where the EU enjoys a leading position (because of private and publicfinancial investments, like trade concessions) is bound to becomeincreasingly influential in the next few years. However, NCMC aredetermined to prevent any rapid erosion of preferences, stressing the roleof regional markets and advocating the inclusion of agriculture in theestablishment of the Euro-Mediterranean Free Trade Area.
Negotiators will have to acknowledge that not all parties benefit fromthe liberalisation of trade to the same extent. Any process of integration,and this is one of the lessons of the European experience, has its share offailures and successes. The compensation system is therefore indispensableand the “green box” authorised by the Uruguay Round Agreements is oneof the ways agricultural policies may follow. Unfortunately, the richestcountries remain a strong attraction for compensation. Hence, thegovernments of the different Mediterranean regions will have to finalisestructural programmes to ensure the successful establishment of the FreeTrade Area and the international and regional agencies will have tointegrate the goals of the Euro-Mediterranean co-operation programmes

Regional Analysis: the Mediterranean region in a world economic context towards globalisation 51
along with those of the support systems to assist the most “sensitive”groups, sectors and regions.
Free markets are not necessarily “competitive” markets andgovernmental policies (regardless of the leading doctrines on the role of theState in the economy) have to guarantee the establishment of effectivemarkets. Marketing costs are often very high. A reduction in these coststhrough the improvement of facilities, transportation and marketingstrategies should allow a sound and fair competition among the actors, tothe benefit of consumers.
All actors in the Mediterranean market should be granted access toinformation, the very key to equal market opportunities and the only wayto join the free trade project and a system governed by market rules.Information systems and their accessibility constitute a common wealth forthe Mediterranean, but not the only one. Hence, for a balanced regionalpartnership to be established, common interests should be similarlyprovided for in co-operation policies.
VIII. The “common wealth” and co-operation policies
In the agro-environmental food sector, as well as in other sectors ofeconomic and social activity, the globalisation process has highlightedsome distorsions in market regulation, which are increased by the growingconcern for environmental issues.
The 1992 UN Rio Conference and the work carried out by theInternational Union for the Conservation of Nature indicated that the needfor economically sound sustainable development has come to the forefrontin all international and regional agendas. The Mediterranean area followsclosely this general trend as the economic and trade activity (mainly inagriculture) is conditional on relatively scarce resources and fragileecosystems.
Chapter I52
As far as water management is concerned, the scenario is bound tobecome critical in the next two decades and a serious impediment to theevolution of an integrated strategy in the Mediterranean basin. With rain-fed agriculture undergoing a slow development in technical and quantityterms, the increasing withdrawal of water from water-intensive agriculturalsystems is the only means to meet the growing agricultural output. Theincrease in the surface of irrigated plots, in the rate of water withdrawnfrom dams or water tables equipped with pumping stations and theagriculture-related chemical contamination of the water tables, threaten toseverely worsen pollution.
Furthermore, the migration of the population to the coastal areas(worsened by seasonal tourism) threatens water supplies and engenderscompetition between agricultural activities and direct human consumption.This situation which is expected to deteriorate dramatically in the next fewdecades has not yet been the focus of arbitration procedures which willundoubtedly prove costly and necessary in the long run.
These phenomena have also an enormous impact on biodiversity, onthe exploitation of fish resources (mostly sea ones) and the management offorest hazards (degradation, fires, etc.). Sea contamination, the degradationof natural ecosystems (extremely rare in the Mediterranean) and thosesubject to human agency for agricultural purposes are all issues of majorconcern.
All the above threats to natural resources make up the environmentalside of the “global questions” which need to be tackled at the regional levelalongside common concerns over economic and social systems such asquality food security, measures against rural poverty and food supply tomarginal and excluded populations.

CHAPTER II

Sectorial and national analyses
I. The Agriculture and the economy
The most important event to recall within the region is the launching inthe European Union of the Economic and Monetary Union (EMU) and theintroduction of the single currency: the euro. The European single currencywill have an enormous impact on the economies of the five MediterraneanEU Member States as well as on all regional economies, being major tradingpartner. EMU is expected to pave the way for a new era of economicgrowth in the EU and price stability complemented by careful budgetaryplanning which should lead to a reduction in interest rates and thepromotion of prosperity and job creation.
However, countries which are experiencing a transition to marketeconomy (Albania and former Yugoslavia) economic revival is perceptible.Some of these countries have been riven by factional feuding and warswhich have negatively influence both the economy and the society. After arather overoptimistic assessment of the prospects for democracy andmarket economy, it is now acknowledged that economic transition will takelonger and will be more painful than originally anticipated - except forSlovenia where transition is occurring at a faster pace. For most countries,difficulties remain and progress to market economy is dramatically slow.Financial systems are hardly developed and radical structural reforms areneeded to ensure economic prosperity and stability.
In most North African and Middle East countries the growth rate ishigh, albeit accompanied by an equally high inflation rate. Despite markedimprovement in macro-economic stability, trade liberalisation and theestablishment of a market-oriented institutional framework during the1980s and 1990s, some major goals are yet to be achieved, such as basic
Chapter II56
reforms, improved economic performances and an equal distribution ofbenefits. Changes in the economic structures are noticeable and showsignificant trade and employment sectorial diversification. Exports andtourism are on the rise (tourism has brought about an improvement intrade balances which used to be negative). This progress has been mainlyspurred on by the structural adjustment policies initiated in the 1980s.However, some countries are still confronted with recession andimbalances.
II. Recent macro-economic developments in selectedMediterranean countries
Note: this section aims at providing a brief summary of the macro-economic development
which has occurred in some Mediterranean countries, namely members of CIHEAM, based
on national reports prepared by local correspondents and information available in
publications edited by international organisations.
• In Egypt, the economy is characterised by a large public sector andstrong State intervention. Considerable progress has been made over thepast fifteen years to improve the national economy, namely througheconomic stabilisation and privatisation. The annual growth rate hasincreased from 4.4% for the period 1980-1992 to 5.3% for 1992-1996 - by farexceeding five-year plan projections. The promotion of a market economy,the attraction of foreign investments, the liberalisation of foreign trade andthe upgrading of exports have been the centrepieces of the strategy devisedby the Egyptian government. The macro-economic policy has led to areduction in the inflation rate, the improvement of public finances, thestabilisation of currency and the establishment of a strong banking systemand sound balance of payments.
However, the agricultural growth rate which is well below 4% - theminimum rate deemed necessary by the Government to sustain the overalleconomic growth - is lower than the population growth and cannot ensure
Sectorial and national analyses 57
food self-sufficiency. The structure of the Egyptian economy isundoubtedly experiencing far reaching changes. Agriculture is graduallylosing its leading role while the service-sector and industry are on theincrease - 3.4% against 8.4% and 6.4% respectively. Meanwhile tourism andthe diversification of exports have remarkably improved external balances.
• The economy of Lebanon is facing the scarcity of basic resources andmodest industrial development. Since the 1950s, the service-sector has anup-word role in the economy while agriculture and industry were lagging.The Government has not led an interventionist policy in economic impetus.The country was affected by a serious civil war (1975-1990). During thoseyears of instability, the contribution of agriculture had substantiallyincreased, accounting for 23% of GDP in 1990. It then dropped to 10%, asthe economic recovered, .inflation rate is now at 7.8% (1997).
Lebanese economy suffers from an increasing deficit of the tradebalance: US$ 1.5 billion in 1988, US $ 5.9 billion in 1994 and US $ 6.8 billionin 1997. By contrast, the balance of payments has shown a continuoussurplus since 1993 owing primarily to fund inflows such as remittances andcapital deposits from Arab countries. As a consequence the exchange ratesare stable or slightly improving. Public finances face a high budgetarydeficit and increasing debt (which climbed from US$ 10 billion in 1994 toUS$ 16 in 1998).
• Turkey is one of the largest countries in the region with a populationof 63 million people. The country is rich in land and water resources andincludes several agri-climatic regions which help to boost agriculture andproduct diversity. Since 1980, the macro-economic policy is based onimport substitution policies and structural adjustment programmes,funded by the World Bank, aimed at restructuring and opening to externalmarkets through the strengthening of both private sector and marketmechanisms. Trade has been enhanced, namely exports of manufacturedgoods. These reforms have resulted in a significant increase in the growth

Chapter II58
rate despite marked annual fluctuations. In 1994, a severe recessioninduced the fall of more than 6% in GDP. The situation improved rapidlyand, between 1995 and 1997, GDP growth rate stabilised around 6-8%.
Inflation and budgetary deficit are high, despite income reformsreturns from privatisation policies. Real interest rates rank among thehighest in the world and capital volatility poses a constant threat tofinancial stability - factors which hamper the structural change and thestability of the Turkish economy.
• Cyprus and Malta are the smallest countries in the region and exhibitstrong economies and high levels of development. They have both appliedfor full EU membership. Recently, Malta has renewed its application.
Cyprus has a population of 0.75 million people, 0.66 of whom live in theSouth. The following figures refer to this part of the island. In 1997agriculture contributed 5% to the GDP, 10% to employment and 21% toexports. The economy is buoyant, unemployment is low, inflation is stable(between 3% and 4%) and so is the currency. The service-sector is the hubof present-day economic growth. The heavy trade benefit is offset by thesurplus of the balance of payments.
Malta has 370,000 inhabitants and is the smallest country in the region.Located in the middle of the Mediterranean, Malta enjoys the culturalinfluence of both sides of the basin. It stands for its trading economy andcan be considered a bridge between the North and the South. Economicgrowth is high (6% in 1997) and the economy is widely diversified. Thegrowth is fuelled by domestic consumption and external demand. Inflationis under control (< 4%). The healthy economy of the country is reflected inits positive trade balance owing mainly to food and beverages re-exports,despite the weakness of the farming sector due to scarce resourceendowments. Tourism contributes to the sound balance of payments, thusmaking the local currency rather appreciated within the basket of the main
Sectorial and national analyses 59
European currencies. Food and beverages are, somewhat unexpectedly,among the leading exported items.
• Algeria is one of the richest countries as regards natural resources(gas and oil) and by far the largest (2.38 million square kilometres) with alow population (10 inhabitants per square kilometre comparative to 60 inMorocco, in Tunisia and in Egypt). 1997 was the third year of the structuraladjustment programme which was due to end in 1998. In 1997 the GDPgrowth rate was negative owing largely to the slump in international oilprices and the sharp decline in industrial activities.
However, due to economic recession, had social consequences havebeen hard to coope. The purchasing power of the poorest householdssignificantly dropped from 1989 to 1995 (-38% for wage-earners and -15%for non wage-earners). According to analysts, this was due to the structuraladjustment programme advocated by the IMF to attain budgetaryequilibrium and inflation reduction.
• Tunisia has made significant progress towards industrialisation overthe past thirty years and has spurred on substantial growth, albeitinsufficient to achieve full employment. Over the 25-year period from 1965to 1990, GDP increased four times, whereas the population had not quitedoubled (GDP per capita has more than doubled). However, in the late1980s, a dramatic slowdown of the economy was witnessed. A number ofindicators showed up the vulnerable nature of an economy featuring highunemployment, heavy debts, declining productivity, inefficient use ofresources and social disparities.
Economic performance in 1997 was good with GDP up by 5.6%(compared to 6.9% in 1996 and 2.4% in 1995). The least performing sectorswere agriculture, industry and tourism whereas exports and investmentswere booming. Inflation is stable (4% in 1997 against 6.3% in 1995).Projections for 1998 are favourable with an estimated GDP growth rate of

Chapter II60
5.4% due mainly to manufactured goods (non-food industries) and theservice sector.
• In the 1980s, Morocco witnessed economic growth with an averagegrowth rate of 4.2%. A lower growth rate down to 1.2% was recorded in the1990s primarily as a result of the poor performance of the agriculturalsector. Agricultural GDP dropped dramatically from 6.7% in the 1980s tonegative rates in the early 1990s (World Bank data). However, itscontribution to the economy is essential: 14% of GDP and 39% ofemployment. Industry and service-sector have maintained some weak butpositive trends. The growth rate variability is striking. Trade hassignificantly increased its share in the GDP - climbing from 45% in 1980 to62% in 1995, thanks to the accrued openness of the economy.
• Slovenia is the most advanced country of all transition economies inEurope and has been accepted as a candidate for early admission to the EU.Its declaration of independence in 1991 as Yugoslavia broke up did notentail long-lasting conflicts. Also its economic transition has provedrelatively easier when compared to other centrally planned economies.Since 1993 GDP has increased over the past few years with an averageannual growth rate of 3.5% owing mainly to a soaring external demand(+7.5%) and increased investments (6%) - whereas household consumptionimproved slightly by 2.3% in 1997. Official unemployment remains high. Itincreased from 13.9% in 1996 to 14.4% in 1997. Inflation picked up (8.8% in1996 and 9.4% in 1997). Imports and exports have significantly increasedand trade deficit can be deemed marginal. Budget is almost balanced andthis has resulted in low interest rates and stable exchange rates.
• Croatia is still undergoing to change that have taken place after thebreak-up of former Yugoslavia. The flow of regional trade has stopped andthe burden of 500,000 refugees and displaced persons has led to budgetdeficits and high inflation.
Sectorial and national analyses 61
Measures taken in 1993 and 1994 to stabilise the economy (with theassistance from IMF, the World Bank and EBRD) resulted in modestprogress. GDP per capita dropped from US$ 5,100 in 1990 to US$ 2,980 in1994 due to a significant loss of productivity and hyperinflation. However,privatisation is progressing steadily and the private sector accounted for55% of the economy in 1997. For two consecutive years GDP growth wasstrong (4.3% in 1996, 6.5% in 1997), fuelled mainly by growing consumerdemand, increased building activity and a revival of tourism. Despitegrowth, inflation is low and consumer prices increased by just 3.8% in 1997.The trade deficit worsened in 1997 due to an increase in imports. Budgetarypolicies have remained cautious with a deficit of only 1.5% of GDP. Theunemployment rate is alarmingly high.
• After three and a half years of bloodshed (1992-1995) and theenforcement of the internationally brokered peace accords (negotiated inDayton, Ohio), Bosnia-Herzegovina (BH) now consists of two constituententities: the Federation of Bosnia and Herzegovina and Republika Srpska(RS). Each entity has its own constitution with a President, a governmentand an assembly. Population dropped from 4.3 million people in 1991 to2.8 million in 1995, more than 1.2 million people having fled the war-ravaged country. Land resources are poorer when compared with those ofCroatia and Serbia, but the country possesses sub-soil, forest and waterresources.
Privatisation has de facto occurred, albeit to a limited extent both duringand after the war. The private sector is currently leading in trade andservices but weak in manufacturing. Humanitarian aid continues to flowinto the country, though it is proving insufficient to meet long-term needs.A privatisation law has been passed in RS but not in the Federation.However, as most public-sector companies are disappearing or facingheavy losses, there is little prospect for privatisation in both constituententities in the foreseeable future. In addition, the Republic and theFederation use different currencies, though the adoption of a single
Chapter II62
currency is advocated. It follows that, at present, most businesses in theFederation hold their accounts in three currencies. Internationalorganisations estimated that employment soared in 1996 as a result of thereconstruction, but is still lower than unemployment (one million people).During the war the country experienced hyperinflation and real incomeswere reduced to subsistence level for the vast majority of the population.Wage earners live slightly above the poverty line.
• Albania has experienced several dramatic crises in its economictransition towards a market economy and democracy. The latest economiccrisis occurred in 1997. The pyramid investment schemes collapsed andAlbanians who had invested their savings found themselves destitute.Some major reforms had been initiated in 1991, namely the privatisation ofagriculture and a radical land reform. The country started rejoining theinternational economic system with impressive progress ever since thebeginning of the transition. After a steep decline in 1989-92, GDP grew by10% in 1993 and by 7.4% in 1994. In 1995, the growth rate had climbed to14.8% (the highest in Europe). Annual average inflation was reduced from22.5% in 1992 to 22.6% in 1994 and 7.7% in 1995.
This remarkable reversal followed the introduction in mid-1992 of tightmonetary, fiscal and structural reforms recommended by the IMF, whichincluded the liberalisation of price and exchange controls, a stricterbudgetary discipline, a tightening of money supply and, since 1992, afloating exchange rate. Structural reforms included the privatisation ofagricultural lands and of many small and medium-sized state-ownedenterprises. Central to the reform plan was the implementation of a welfaresystem. Following the continuing contraction in the state-owned industrialsector, the agriculture share of GDP increased, but with transitionprogressing and industrial growth picking up, a retraction is expected.
During the 1997 crisis, most of the macro-economic gains achievedsince 1994 were lost and inflation soared back to 40%. The move towards

Sectorial and national analyses 63
stabilisation and the help from international institutions sustained therecovery of the currency, but the forced resignation of the Prime Minister in1998 plunged Albania into its deepest political crisis since the demise of thecommunist rule in 1991. The economic development brought about byremittances from Albanian émigrés in Greece and Italy and increases intrade and agriculture, which were registering robust two-digit growth, arethreatened by political and institutional instability.
• The European Union countries of the Northern rim of theMediterranean (except Greece) are part of the first group of countriesparticipating in the Monetary Union and the adoption of the singlecurrency. Greece, despite the efforts it has been making in the last twoyears to prepare for the single currency, does not qualify for the first waveof participants under the Maastricht Treaty.
• In France, GDP bounced to 2.4% in 1997 owing mainly to an increasein industrial production and strong domestic demand. The current tradingsurplus shows a record of 2.8% GDP. Inflation recorded a all-time low(0.6%) and interest rates stood at 5% in 1998, thus qualifying France for theEU Monetary Union. However, despite the ambitious employmentprogram and the adoption of the 35-hour working week, the country’sunemployment rate remains stubbornly high. As for the fiscal deficit, it isless than 3% of GDP.
• The Spanish economy showed a clear-cut recovery which hasreduced unemployment and created new jobs. Economic activityaccelerated, with GDP increasing by 2.3% in 1996, and this was fuelledmainly by growing domestic demand. Inflation has remained stable overthe past 3 years and interest rate differentials with other Europeaneconomies are increasingly being bridged.
• Italy, spurred on by export demand, experienced an increasingeconomic growth of 1.5% in 1997 against 0.7% in 1996 spurred. The majorachievement in 1997 was the drop in average inflation rate and in the
Chapter II64
budget deficit to 1.7% and 2.7% respectively, consistent with MaastrichtTreaty criteria. A gradual reduction in interest rates is also reported.Unemployment, though declining, remains high (12.3%).
• In 1997 Portugal boasted one of the most improved economies inEurope with a 3.5% GDP growth for the fifth consecutive year. Interestrates have been lowered and inflation has fallen steadily thus enhancingdomestic demand by 5.3%. Inflation is now within the EU average and thebudget deficit has been trimmed to 2.0%, against the 2.5% governmenttarget. Also unemployment is declining thanks to the burgeoning of jobs inthe building and farming sector and despite an increase in participationrates. However, the completion of large-scale infrastructure projects is mostlikely to adversely affect economic activity in the next years. Major privateinvestments are gaining momentum as a result of steadily falling interestrates which, in early 1998, were converging towards those recorded inGermany. Portugal was one of the first countries to meet the Maastrichtconvergence criteria and its budgetary discipline has been sufficient for itto harbour legitimate ambition to join the single currency in the first wave.
• The Greek economy continued its upward course in 1997. Grossdomestic product grew by 3.5% (up from 2.6% in 1996). The alarminglyincreased trade deficit urged a realignment of the exchange rate in March1998 with a 12% devaluation of the national currency as a result of theagreement on the central rate. Inflation fell to a 25-year low (< 4.5%) butshowed strong resistance to further decline, partly as a result of theexchange rate alignment. Greece continued, however, to be plagued by alarge trade deficit in 1997 (up to 4% of GDP) owing mainly to the monetaryand exchange rate policy that has kept a strong currency as a means offighting inflation. Budget deficit fell, albeit to a still-high 3%. Macro-economic aggregates improved in 1997, but additional efforts andstructural reforms in the public sector are still needed.
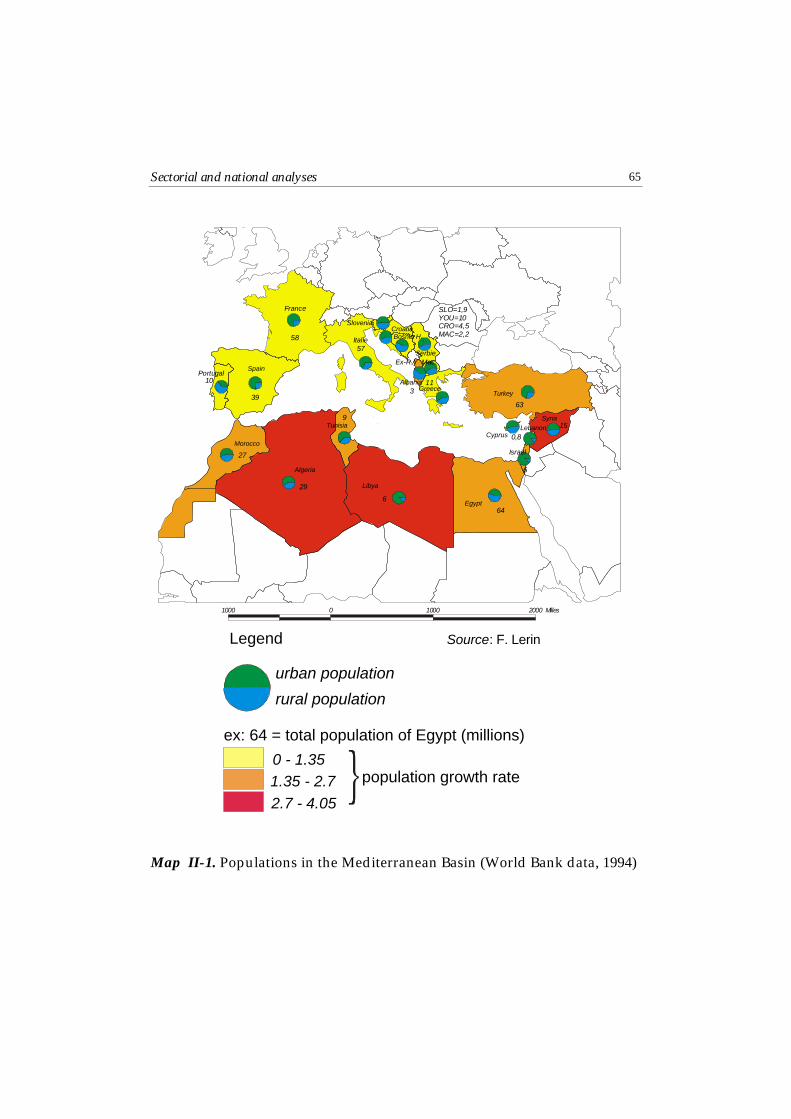
Sectorial and national analyses 65
Map II-1. Populations in the Mediterranean Basin (World Bank data, 1994)
F r a n c e
I t a l i e
S e r b i e
P o r t u g a l
.
I s r a ë l
E x - R . Y . M a c
5 8
5 7
3 9
1 0
6 3
6 4
6
2 9
2 7
9
1 1
6
1 5
0 , 8
S L O = 1 , 9 Y O U = 1 0 C R O = 4 , 5 M A C = 2 , 2
3
1 0 0 0 0 1 0 0 0 2 0 0 0 M i l l e s
urban population
rural population
Legend
ex: 64 = total population of Egypt (millions)
population growth rate0 - 1.351.35 - 2.72.7 - 4.05
Turkey
SyriaLebanon
Cyprus
Libya
Egypt
Algeria
Tunisia
GreeceAlbania
Croatia
Spain
Morocco
Slovenia
Bosnia H.
Source: F. Lerin
Chapter II66
The agricultural situation
Despite the great regional diversity of agricultural systems (importancein the economy, natural and credit resources, domestic policies, etc.) somecommon trends can be highlighted. In those countries where agriculturalcontribution to GDP and employment is low, the forces which guide theprogress of agriculture and agri-food systems persist, thus resulting in aslow growth of food consumption and productivity. The increasinglyliberal regulation framework which has been implemented is expected toslow down production and focus economic interventions on incomesupport and assistance to local rural development.
Conversely, in developing countries, where the contribution ofagriculture to GDP is significant, moves towards agricultural growth arewitnessed, namely in countries with a rapidly growing population.However, in these countries (in North Africa and the Middle East)agricultural development is hampered by the scarcity of available arableland and water resources which makes it difficult to enhance both supplyand demand. Hence, the agricultural trade balance tends to worsen with adecisive bearing on economic performance and social life. Most countrieshave launched far-reaching projects to develop land and water resources -which require significant investment funds from government budgets -with a view to boosting productivity and providing income for the growingrural population.
It is noteworthy to recall that also present-day available resources arethreatened. The already scarce amount of arable lands in Northern Africancountries is confronted with desert advancement and over-cultivationwhich have led to a massive exodus towards the cities.
Lands are also threatened by erosion and degradation. Desertificationand over-exploitation of dry soils, mainly along the southern coast, arecritical issues. However, recent studies have shown that the extent of thearea under desertification had been largely overestimated. Though the

Sectorial and national analyses 67
impact of human agency-related desertification has not been elucidated yet,there is little doubt that soil nutrient mining and over-cultivation in fragilesoils do result in dry land degradation and desertification. Hence, asustainable use of resources and conservation of soil and land resources aretwo major challenges facing Mediterranean agriculture, primarily in thecountries of the southern rim.
Additional threats to land are posed by the rapidly increasingpopulation and economic growth which contribute to further diversion ofagricultural land to other uses such as human settlements andinfrastructures. Recent developments in the system of oases in the south ofTunisia confirm this trend. Water availability and quality constitute seriousconstraints for Mediterranean farmers. Pure water is becoming increasinglyrare (Table II-1). Agriculture remains the main water user: 79% of waterbeing withdrawn for agriculture in developing countries against only 49%in advanced countries.
Water resources for agricultural use suffer also from severe qualityproblems that pose a threat to human and animal health. The major issuesrelating to agriculture are rising salinity, nitrogen and pesticide residues insurface and ground water and the discharge of organic effluents fromintensive animal breeding. The combined effect of population andeconomic growth as well as urbanisation are problems brewing for thefuture for already water-stressed countries. In order to address theseproblems, most countries in the region are investing in huge waterdevelopment projects, such as dams and river diversion works to increasewater availability for irrigation. However, these efforts are not sustainableas groundwater supply is limited and not renewable.
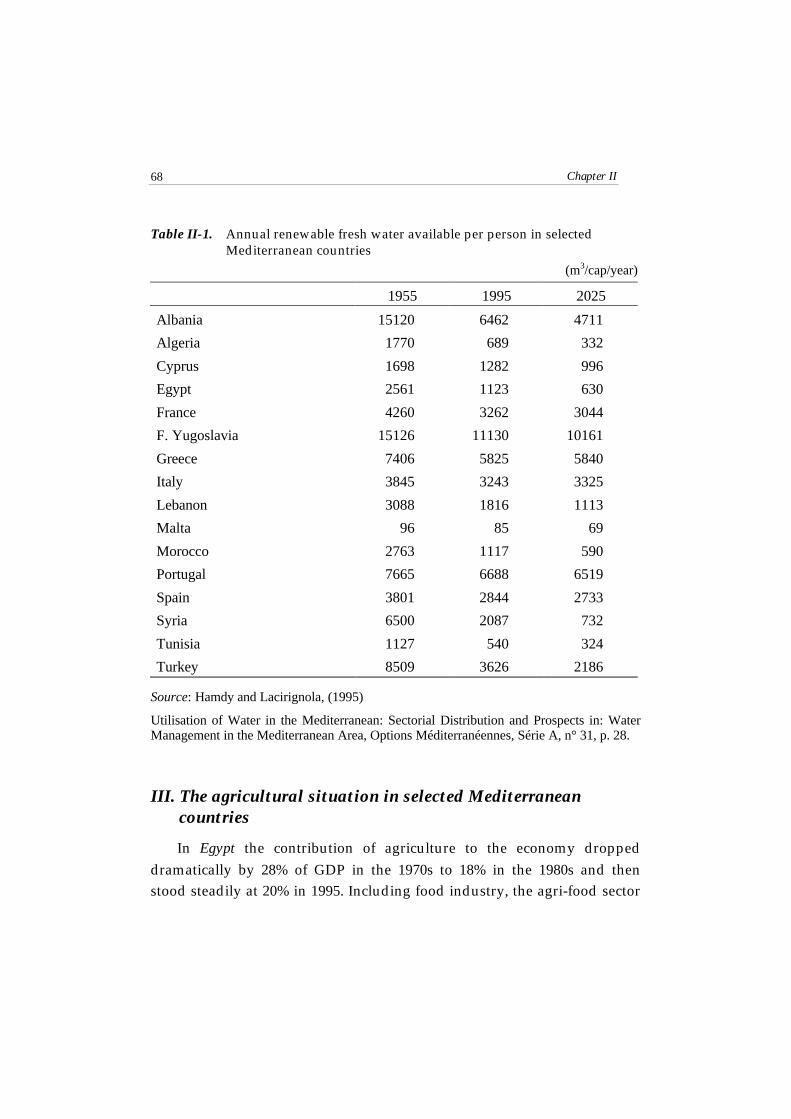
Chapter II68
Table II-1. Annual renewable fresh water available per person in selectedMediterranean countries
(m3/cap/year)
1955 1995 2025
Albania 15120 6462 4711
Algeria 1770 689 332
Cyprus 1698 1282 996
Egypt 2561 1123 630
France 4260 3262 3044
F. Yugoslavia 15126 11130 10161
Greece 7406 5825 5840
Italy 3845 3243 3325
Lebanon 3088 1816 1113
Malta 96 85 69
Morocco 2763 1117 590
Portugal 7665 6688 6519
Spain 3801 2844 2733
Syria 6500 2087 732
Tunisia 1127 540 324
Turkey 8509 3626 2186
Source: Hamdy and Lacirignola, (1995)
Utilisation of Water in the Mediterranean: Sectorial Distribution and Prospects in: WaterManagement in the Mediterranean Area, Options Méditerranéennes, Série A, n° 31, p. 28.
III. The agricultural situation in selected Mediterraneancountries
In Egypt the contribution of agriculture to the economy droppeddramatically by 28% of GDP in the 1970s to 18% in the 1980s and thenstood steadily at 20% in 1995. Including food industry, the agri-food sector
Sectorial and national analyses 69
contributes 40% to GDP and 50% to the employment. From 1981 to 1992,the average annual growth of agriculture amounted to 2% a year.Agricultural employment declined from 53% in the early 1970s to 38% inthe late 1980s.
Agricultural growth increased slightly from 3.1% in 1996 to 3.4% in1997. The agricultural reforms (price policies, abolition of quotas andcontrols on cropping patterns) initiated in the late 1980s have had agrowing impact on agricultural output. Cultivated areas were extendedbetween 1991 and 1997 and a major shift was recorded towards wheat andcash crops (sugar beet, peanuts, sesame).
The processing industry plays an influential role in the economy,especially cotton ginning, spinning and weaving. A decisive increase wasreported between 1991 and 1997 in cotton processing as well as in ricemilling and fertiliser production. Stumbling blocks to progress remain thelimited available land per inhabitant (which recorded a slump from 0.2 hain 1927 to 0.1ha in 1960 and 0.05 ha in 1990) and the rapid populationgrowth. Therefore, despite the efforts aimed at boosting and re-targetingproduction, imports are on the rise and food self-sufficiency remains amajor concern.
Egypt started to address this long-term concern in the 1950s bylaunching a land reclamation policy. The programme which has come to beknown as the “New Lands” programme, as opposed to the “Old Lands”plan implemented in the Nile Valley, has reclaimed some 740,000 habetween 1952 and 1992, thus bringing the total arable land surface to 3.2million hectares and the share of cultivated land to 6.1 million ha (mainlyas a result of double or triple yearly cropping). Despite the climbing fooddemand, most lands are traditionally allocated to cash crops, in particularcotton, which bring in the much sought after foreign currencies. Livestockproduction, especially for meat and milk, is equally important and accounts
Chapter II70
for one-third of total agricultural production. Crop production represents64% of the total.
State intervention, though shrinking significantly, still has a decisivebearing with most of cotton and rice processing and fertiliser productionunder the public sector umbrella.
In Lebanon, though the economy is quite diversified, agriculturecontinues to play a leading role contributing 9% to employment and 10% toGDP. Crop output accounts for two-thirds of total agricultural production.Agriculture represented 34% of total exports and 25% of imports in 1990and only 14% and 9% respectively in 1997. The agricultural trade deficitamounts to US$ 0.59 billion in 1997, approximately 9% of total trade deficit.Crop production systems are mainly focused on cereals, fruit andvegetables; livestock include sheep, goats, cattle and poultry. Foodprocessing, namely of alcoholic beverages, bottled water, non-alcoholicbeverages, canned food, juices and poultry products plays an undisputedpart in the economy,
In Turkey, agriculture has historically played an influential role in theeconomic development of the country. As late as 1998, agriculturecontributed 22% to GDP and 50% to employment. However, over the pastten years, a dramatic slump has been recorded. Agriculture contribution toGDP has dropped to 16% and is expected to fall to 15% by the year 2000.Also agriculture contribution to employment has declined to 43%. Unlikethe vast majority of Mediterranean countries, Turkey features a surplusagricultural trade balance and, due to its wide range of agro-ecologicalregions, it produces a variety of agricultural products, some of which areexported. Agriculture-related exports accounted for 8.8% of total exports in1997 and imports represented less than 10% (the above figures are higherwhen food-processing products are included). Agricultural growth isunstable. The only two years with positive growth rates since 1993 are 1996(+4.4%)and 1995 (+2.0%), the remainder being negative. In 1997 agriculture
Sectorial and national analyses 71
experienced a decrease (-2.8%) whereas industry was growing (9.5%) aswas the service-sector (7%) and total GDP amounted to 6.3%.
Nevertheless, agriculture remains the pillar of the Turkish economy. Itis a major contributor to GDP and a provider of employment for therapidly growing population (1.7% per year) mostly in the rural districts.There are approximately 4 million farms scattered throughout the country,most of which are small. More than half the farms cover less than 5 ha andabout 80 per cent less than 10 ha.
In Cyprus, agriculture contributed 5% to GDP in 1997, less than 10% toemployment and 21% to exports. The country suffers from a scarcity ofwater and land resources. The crop sector accounted for approximately65% of gross output in 1996. Despite its long tradition of food self-sufficiency, the country saw its position eroded in the late 1980s. In recentyears, imports of both raw and processed agricultural products haveexceeded exports giving rise to a self-sufficiency gap in 1997 (21% of grossagricultural output). 1997 was an extraordinarily hard year. In normalyears raw agricultural exports are generally in balance with imports, whilethere is usually a net deficit in the overall processed food trade.
In Algeria, agriculture contribution was to 10% to GDP in 1980, andreached 16% in 1997. With reference to employment, agriculturecontribution has remained stable since 1991 (approximately 24%). Theaverage annual growth rate of agricultural employment was 2.9% (againstthe total employment rate of 3.4%) for the period 1992-1997. Thesedevelopments are largely due to the high population growth (+2.87% from1965 to 1997, the highest in the region).
Food production has increased by 62% over the period 1986-1996(+71% for crop output and +53% for animal production). Agriculture andfood contribution to the total exports increased by 28.6% in 1996 and by29.9% in 1997 whereas exports declined from 1% in 1996 to 0.3% in 1997.Cereals and related products constitute the main items of food imports.

Chapter II72
They climbed from 38% in 1994 to 48.8% in 1997 of the overall agriculturalshare. Agricultural annual growth rate for the same period amounted to5%. Overall, trade declined as per cent of GDP from 65% in 1980 to 57% in1995, as a result of the stagnation of the economy from 1980 to 1995.
In Morocco, agriculture contribution to GDP dropped dramatically from18% in 1980 to 15% in the early 1990s and to 14% in 1997 owing largely tohigh GDP growth rates during the 1980s (+4.2%) which declined in the1990s (1.2%). This slump is partly attributable to the definitely negativeagricultural growth rates. Economic recession affected the contribution ofagriculture to employment, which declined from 56% in 1980 to 45% in1990. The share of trade bounced from 45% in 1980 to 62% in 1995, as aresult of a sensitively open economic policy.
In Tunisia, agriculture contribution to GDP declined to 14% in 1980 andthen to 12% in 1995. It increased to 14.5% in 1996 and to 14.2 in 1997.Estimates for 1998 amount to 13.5%. As for the agriculture contribution toemployment, it accounted for 22.6% in 1996 against 28% in 1990 and 39% in1980. The country features also a rapid population growth rate (averaging2.21% for the period 1965-1997 and 1.9% between 1990 and 1995).Agricultural trade balance improved in 1996 and 1997 with exports andimports climbing from 58% in 1996 to 88% in 1997 and expected to exceed90% in 1998.
In Slovenia, the importance of agriculture is relatively low. Following adramatic drop in the early years of the transition stage, agriculturalproducts have been rising since 1994. In 1997, a slight 0.3% increase wasrecorded, owing mainly to the remarkable growth in animal production(3.6%), while crop output decreased (-2.9%).
The agri-food sector contributed 9.2% to employment in 1997 whereasagriculture alone contributed 6.2% (against 7.8% in 1992). An annual 0.2%decline is expected in 1998 and 1999. Part-time agriculture and small-sizedfarms are prevailing. Only 20% of farm households derive their income

Sectorial and national analyses 73
from agriculture alone. Agriculture share of GDP is equally small (4.4% in1997), albeit stable since 1993. The agri-food sector contributed 4.6% to GDPand 3% to employment, but capacity is exploited to a limited extent. Thefood industry accounts for 10% of total manufactured goods. The share ofagri-food commodities in total trade is declining. Agricultural prices haveincreased by 6.7% whereas consumer prices have increased by 9.1%.
In Croatia, agriculture contribution to GDP increased in the early yearsof transition mainly as a result of the contraction of the economy. However,since 1992, the contribution of agriculture to GDP has continued itsdownward course from 14.5% to 9% in 1997 (57% for livestock and 43% forcrops). Also the contribution of agriculture to employment droppeddramatically from 16% in 1991 to 11% in 1997, indicating the sector’sincreasing productivity. The contribution to trade (imports and exports)varies. It ranged between 11% and 12% from 1992 to 1996. The countryfeatures good land resources and high productivity when compared to theother countries of former Yugoslavia. Gross agricultural output increasedin 1997 (2.1%) for the fourth consecutive year. Agricultural output haddropped dramatically in the early 1990s with the slump affecting mainlycereals and livestock in large farms.
Agricultural prices are generally high, mainly for livestock products,equalling in some cases those in the EU. The significant border protectionisolates the domestic market with respect to some commodities. The highlevel of farm debt and limited credit access have severe repercussions onthe whole food chain.
In Bosnia, land resources are scarce. The vast majority of the country isforested and too mountainous to be easily farmed. Hence, the major crops(wheat and maize) are only 30-40% of the output of Croatia which hassimilar land area and population size. Livestock numbers for cattle, sheepand poultry are relatively high, though lower than in Croatia in absoluteterms. Agricultural production suffered from a sharp decline after 1991 due

Chapter II74
to the economic transition underway and the war (1992-1995). Small farmscontinued to operate but humanitarian aid constituted the main source offood. The economic paralysis continued in 1996 and 1997, despite a slightimprovement after the Dayton Peace Agreement. Inputs remain in shortsupply and machinery is in poor condition.
Albania is basically agriculture-oriented and most of its population livesin rural areas. In the pre-reform years, farming accounted for about 20% ofexports and 50% of employment. Following the launching of the reform,industrial recession resulted in an increase in agriculture contribution toboth GDP and employment. The share of agriculture in GDP was estimatedat 56% in 1997 compared to 52.3% in 1996 and 32% in 1989 respectively.Over 50% of the labour force work in the farming sector. Most agriculturalactivity struggles to maintain subsistence owing to small-scale farms andthe lack of alternative income-generating activities in the rural districts.Following the land reform, more than 460,000 medium-sized farms of 1.5ha each sprouted across the country.
Albania has abundant land and water resources, but the highpopulation density calls for intensive cultivation. The most important fieldcrops are wheat and maize. Irrigation systems cover approximately 60% ofarable lands and double cropping is widespread in 20% of lands.Agricultural trade accounts for 12% of imports and one-fifth of exports -50% of which consist of tobacco and tobacco by-products, the export offresh fruit having virtually stopped in 1991.
Farming is experiencing a move towards liberalisation which isproving favourable to the reallocation of production factors. The revival ofexports and the limits imposed on imports should pave the way forimproved domestic distribution channels and increased product qualityand standardisation.
In the EU countries of the north Mediterranean rim (France, Greece, Italy,Portugal, Spain), agriculture, although remaining important for the

Sectorial and national analyses 75
economy, its contribution to GDP and employment is low and rapidlydeclining. The table II-2 summarises the general features of the agriculturalsector in 1996 in the above listed countries.
Table II-2. Some general characteristics of the EU agricultural sector, 1996
%GDP % pop. Trade balanceMio US$
% imports % exports
France 2 3.9 +12,783 9.4 13.3
Greece 7 14.9 - 210 14.4 32.5
Italy 3 6.1 - 8,682 12.4 6.7
Portugal 3 15.8 - 2,828 12.6 6.3
Spain 3 8.7 + 1,804 10.8 14.6
Source: Medagri, 1999
Despite the over-capacity of agricultural production in the EU,agricultural balances in the Mediterranean EU countries are positive onlyin France and Spain and negative in the remaining countries. An increasedoutput is a widely shared goal. Production improvement is not expected tocontrast with economic policy objectives, provided it is based on higherproductivity and lower price support levels. Increased productionefficiency should entail higher farm incomes, lower consumer prices andmacro-economic benefits.
IV. Trends in agricultural production, food consumption andtrade
A. Agricultural production and food processing
Agricultural production varies widely in the Mediterranean countriesaccording to latitude, climate, social and institutional disparities. TypicalMediterranean products are: olive oil, palm dates, wine and ewe’s milk forwhich the region ranks high at the world level. Cereals are equally

Chapter II76
important - accounting for 10% of the output - along with vegetables (16%),milk (13%) and meat (10%).
Within the region, agricultural production is mainly concentratedalong the Northern rim of the Mediterranean, except for some specialisedcrops, as a result of more favourable climatic conditions and a moreadvanced agricultural and economic development. North Mediterraneancountries, specially the EU Member States, account for almost 80% ofcereals, 65% of vegetables, 75% of fruit and 81% of meat produced in thewhole region.
As to cereals, in 1997, France was the largest regional producer with 63million tonnes (that is 38% of the overall regional production), followed byTurkey with 29.6% MT (18%), Italy and Spain with little more than 19 MT(12%), Egypt (10%), Morocco and Greece (3%). Fruit crops are widelydistributed in the Mediterranean basin.
Italy with 15.1 MT is the first producer (19% of total production),followed by Spain (14 MT, i.e 18%), France (13%), Turkey (12%), Egypt(7%), Greece (5%), Morocco (3%), Algeria, Israel, Yugoslavia and Portugal(1%).
As to citrus, Spain is the leading producer with 5 MT, that is 30% of theoverall Mediterranean production, followed by Italy (3.2 MT, 19%), Egypt(13%), Turkey (8%), Morocco and Greece (7%).
Vegetable production is much more concentrated. The six largestproducing countries account for almost 70% of the Mediterraneanproduction: Turkey (21 MT, 22%), followed by Italy (14 MT, 14%), Egypt(12%), Spain (11%), France (8%), Greece (4%) and Morocco (3%).
Livestock production is highly concentrated in three NorthMediterranean countries: France, Italy, Spain and, to a lesser extent,Turkey. In Southern countries, however, cattle stock is increasing, thankslargely to incentives to intensive breeding of imported milking breeds.
Sectorial and national analyses 77
Some major impediments undoubtedly stand out, such as the unfavourableclimate and the need to feed cattle with concentrate feed and irrigatedfodder which are scarce in South Mediterranean countries owing to thestrong competition of other crops. Goat and sheep breeding, relativelywidespread across the Mediterranean region, does not increase in numbersbut has progressed towards more advanced organisation and productionstrategies. In the North Mediterranean countries (France and Italy), largeand intensive animal breeding are being established to produce milk andtypical cheese products. In the South, where cattle is bred mainly for meatproduction, herds are larger in size and nomadic type breeding is reducedthrough a more intensive exploitation of the areas, even the most distantones, and herds transportation is made by truck. This results inovergrazing and competition with cereal production.
Tobacco, cotton, sugar beet and cane sugar are crucial crops, eventhough they vary in importance in Mediterranean economies. Theseproducts, often blamed for diverting resources from staple crops, constitutea considerable source of income for farmers.
As far as Maghreb is concerned, 1997 was a hard year for farmingbecause of adverse climatic conditions, namely drought which dramaticallyaffected yields (cereals in particular). Cereal production (wheat and barley)dropped by 60% in Tunisia and Morocco and by 80% in Algeria. Yieldsdeclined by 30-40% - they amounted to just 10-15 quintals per hectare forwheat. Wheat growing areas have undergone to a sharp decrease.Conversely, yield and overall output had been extraordinarily high in 1996(10 MT in Morocco, 4.6 in Algeria and 2.6 in Tunisia ).
Similarly, a marked reduction interested both yield and cultivatedareas of vegetables, such as tomatoes and potatoes. In Morocco, theproduction of tomatoes and onions accounted for 56% of the aggregateoutput of vegetables which decreased from 800,000 tonnes in 1996 to

Chapter II78
508,000 in 1997. In Tunisia, during the same period, production droppedfrom 700,000 tonnes to 500,000.
Crops and produces such as: olives and olive oil (in Tunisia an increasewas recorded from 60,000 tonnes in 1996 to 310,000 in 1997) and palm dates(from 74,000 tonnes to 85,000 again in Tunisia) show increases inproduction levels.
Box II-1 - Olive oil: an expanding market
According to production data from the Olive Oil International Council,world olive oil production in the yearly base 1996-1997 reached a recordof 2,635,500 tonnes, thus exceeding the output of the 1991-1992 by2,205,000 tonnes. As to the 1997-1998, production is estimated to be highat 2,446,000 tonnes, though slightly lower than that of the previous year.This trend is mainly due to the EU, whose production is expected toexceed 2.1 MT in 1997-1998, and reportedly 50% of which shouldoriginate from Spain, which has doubled its production over the lastdecade (0.947 MT for the 1996-1997 ). A slight increase was also recordedin Greece during the same period where production is currently runningat more than 400,000 tonnes. Italy has maintained a rather stable output,ranging between 400,000 and 600,000 tonnes, depending also to thereference years.Good performances are being recorded in Tunisia and Morocco whereproduction is increasing. Tunisia due to a renewed planted area reacheda record olive oil output of about 300,000 tonnes in 1996-1997. Also Turkeyproduced more than 200,000 tonnes that same year, but its productionappears stable in the long run. The relative buoyant production hasresulted in a dramatic price drop and also increased consumption.Consumption accounted to 2,170,500 tonnes in 1996-1997 and to 2,227,500in 1997-1998, an average exceeding by 20% that recorded in the early1990s. This upward consumption trend appears constant in the long run,albeit slower than production. The increased supply has fostered exportswhich have exceeded 400,000 tonnes over the past ten years, excludingintra-Community trade. The major importing countries are the UnitedStates, Japan, Canada and Australia.
Sectorial and national analyses 79
During the last decade, the EU has doubled its imports from non-Member countries, reaching 150,000 tonnes, and this accounts for one-fourth of the world trade (including intra-Community trade). Tunisia isthe major EU supplier (60 to 70% of non-EU imports), followed byTurkey with 20%. The EU is also a leading exporter. In 1996-1997, itexported 220,000 tonnes with Italy and Spain carving for themselves thelargest share, followed by Tunisia with 115,000 tonnes, Turkey with40,000 tonnes and Morocco with 35,000 tonnes.Given the favourable climatic conditions, the start-up of brand newplants and the upgrading of production techniques, the world marketappears to be entering a fresh era of growth which might engender asurplus of supply, not only owing to cyclical phenomena but also as aresult of far-reaching structural changes.A contribution to market regulation, mainly as regards the domesticmarket, came with the introduction of the EU Regulation (N° 1638/98)following the approval of a transition reform suggested by the Olive OilCommon Market Organisation. It is a transitional regime scheduled tolast till 2001 and includes provisions intended to prevent productionsurpluses and improve support policy management. The centrepieces ofthis regulation are: the maintenance, though reduced by about 6%, of aidto production paid according to current production; the revision ofintervention regimes; the removal of flat-rate aid to small farmers; theincrease in the maximum guaranteed quantity (1,562,400 tonnes) and itsbreakdown in National reference quotas; the strengthening of promotioncampaigns to enhance olive oil consumption; the suppression ofconsumer subsidies and the partial redefinition of virgin oil categories.
In Morocco, minor fruits such as musk melon account for an importantshare of the growth in fruit production, whereas olive and citrus outputsare declining. In 1997, olive production equalled 517,000 tonnes against835,000 in 1996 and citrus production amounted to 1,194 MT against 1.4 MTin 1996.

Chapter II80
Table II-3. Agricultural production in Algeria(000 tons)
1994 1995 1996 1997
Cereals 963 2138 4600 869
Wheat 714 1511 2800 661
Barley 234 582 1690 191
Vegetable 2571 3200 3147 3009
Potato 716 1200 1150 947
Processed Tomato 449 554 437 359
Citrus 376 323 334 350
Stone Fruits 250 286 373 290
Olive oil 000 (hl) 20 24,7 16,3 51
Preserved olives 19,7 14 34,5 42
Red meat 295 300 309 248
White meat 219 190 93 105
Milk 1057 1050 1100 1050
Fish 135 106 116 93
Source: National Statistical Bureau (NSB) and Ministry of Agriculture, Algiers, 1998
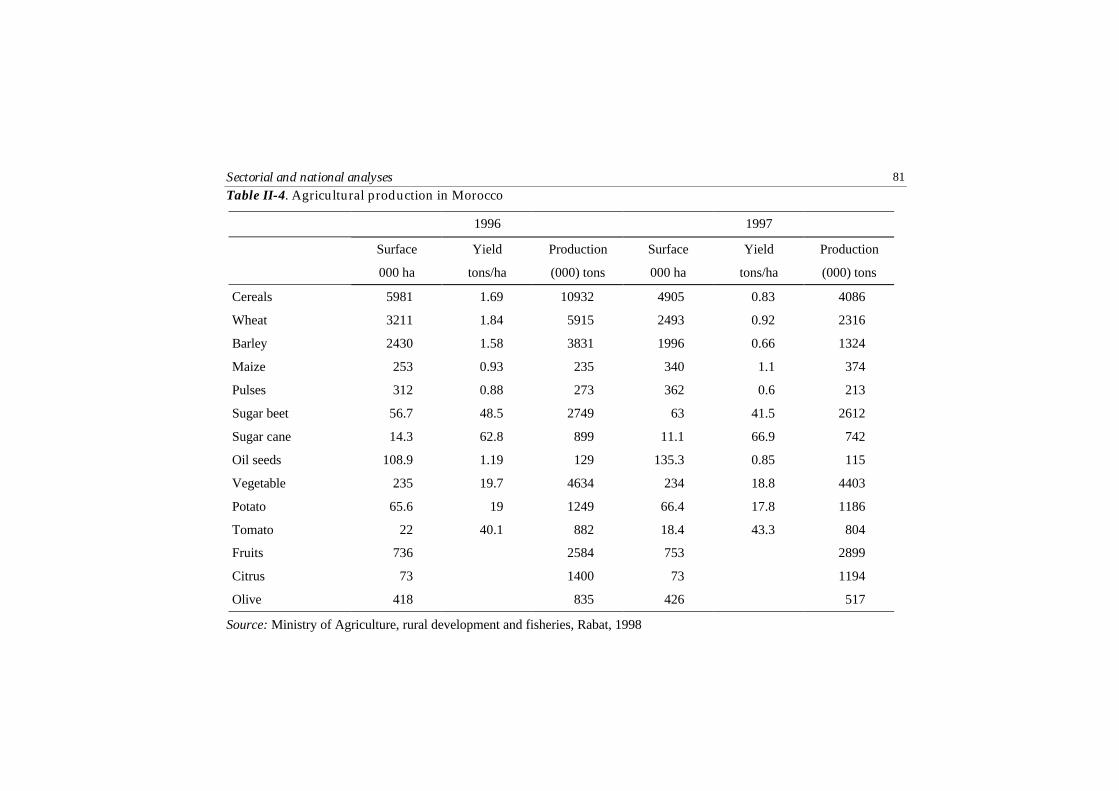
Sectorial and national analyses 81
Table II-4. Agricultural production in Morocco
1996 1997
Surface Yield Production Surface Yield Production
000 ha tons/ha (000) tons 000 ha tons/ha (000) tons
Cereals 5981 1.69 10932 4905 0.83 4086
Wheat 3211 1.84 5915 2493 0.92 2316
Barley 2430 1.58 3831 1996 0.66 1324
Maize 253 0.93 235 340 1.1 374
Pulses 312 0.88 273 362 0.6 213
Sugar beet 56.7 48.5 2749 63 41.5 2612
Sugar cane 14.3 62.8 899 11.1 66.9 742
Oil seeds 108.9 1.19 129 135.3 0.85 115
Vegetable 235 19.7 4634 234 18.8 4403
Potato 65.6 19 1249 66.4 17.8 1186
Tomato 22 40.1 882 18.4 43.3 804
Fruits 736 2584 753 2899
Citrus 73 1400 73 1194
Olive 418 835 426 517
Source: Ministry of Agriculture, rural development and fisheries, Rabat, 1998

Chapter II82
Table II-5. Cultivated surface area of the main crops in Egypt
(000 Feddan) (1)
1991 1992 1993 1994 1995 1996 1997
Wheat 2215 2092 2171 2111 2512 2421 2500
Barley 145 248 144 148 448 106 225
Bean 326 425 297 374 320 361 370
Clover 2519 2542 2615 2686 2430 2504 2574
Vegetable 940 918 991 1012 1056 1158 1660
Cotton 851 840 884 721 710 921 921
Sugar cane 263 267 271 278 301 306 265
Rice 1101 1216 1283 1379 1401 1407 1431
Maize 2068 1967 1973 2057 2133 2086 2086
Fruit crops 896 907 912 940 954 900 900
Source: Statistical Year Book, CAPMAS, 1997
(1) 1 Feddan = 0.6 ha
Sectorial and national analyses 83
Unlike fruit and vegetables which are irrigated, non-irrigated crops(cereals, oil seeds and protein crops) exhibit widely varying yields. InMaghreb, as well as in most Southern Mediterranean countries, cerealplanted areas, covering on average half the arable land, are subject to croprotations in order to save water resources and enhance soil fertility. Anyincrease in the production rate is generally conditional on rising yields,which are still low, improved production techniques, use of selected seeds,sound application of fertilisers and pesticides and a more effectivemanagement of water resources.
Livestock production in Algeria accounts for 50% of agriculturalproduction and plays a major role, mostly in range-lands and in some poorsouthern regions, whereas in Morocco and Tunisia, it represents only 30%of the total agricultural activity. As a whole, the production remainedstable over the past two years in both Tunisia and Algeria and increased inMorocco mainly as a result of the drought which caused an increasedslaughtering of stock heads to face the reduction in available fodder.
Meat production is essential, not only in Maghreb but also in SouthMediterranean countries. It is a strategic social and economic means andhelps ensure food security in the region. This is the reason why allMediterranean countries have boosted meat production applying animalhusbandry techniques suited to the varying local conditions, as well asanimal breeding strategies and new technologies. These actions which havebeen partly undertaken over the past years have stemmed from a closercollaboration between Northern and Southern Mediterranean countriesfocusing on vocational training and transfer of know-how.
In Lebanon, according to the estimates provided by the latest census bythe Ministry of Agriculture, production revival is hinged on the production of:• vegetables, specially under greenhouse;• relatively high yielding potatoes;• industrial crops such as sugar beet and tobacco which since 1991 are
subsidised by the government;

Chapter II84
• olive trees mainly following the launching of the 1994 UNDP/FAOproject to improve olive production.
Great importance is attached to fruit production which in 1997accounted for 64% of cultivated lands. Recent estimates based on the 1997census by the Ministry of Agriculture reflect some deep changes: fruit-grown areas account for 47% of the total actually cultivated land (17% ofwhich are devoted to olive trees), cereals represent 19%, vegetables andtubers 15% and industrial crops 6%.
Animal husbandry in Lebanon depends largely on sheep, goats, cattleand poultry. Cattle breeding has decreased over the past two decadesowing mostly to the reduction in grazing lands. The drop has dramaticallyaffected cow number which declined from 80,000 in 1994 to 56,000 in 1997.On the other hand, the total number of small ruminants has slightlyincreased in recent years with a general reduction in the number of goats(494,000 heads) and an increase in that of sheep (322,000).
Over the past years, Egypt has experienced a remarkable agriculturalgrowth, thanks namely to a tailored programme of economic andagricultural reforms - aimed at rescuing arable lands from pendingdesertification and improving the management of the Nile water andgroundwater resources - supplemented by the gradual introduction of newtechnologies. The major crops in the country are: cotton, maize, rice, sugarcane, fruit and vegetables.
Except for protein crops and soybean, crop surfaces and yields aredecidedly on the rise. Between 1992 and 1996, wheat production increasedby 24% reaching 6 million tonnes; sugar beet (+13%) equalled 842,000tonnes; vegetables (+33%) amounted to 12.2 million tonnes; sesame (+25%)bounced to 49,000 tonnes; peanuts (+31%) grew to 147,000 tonnes; sugarcane (+21%) recorded 14.2 million tonnes; rice (+25%) represented 5.1million tonnes and maize increased by 14%. Cotton with 900,000 tonnes in1996 decreased as a result of unexpected harmful diseases. All the above

Sectorial and national analyses 85
performances are generally attributed to the economic reforms discussedearlier.
Box II-2 - Rice production in the Mediterranean
With a production of approximately 570,000 million tonnes of paddyrice, 30 million of which for international trade, rice is one of the keycereals in the world. The increasing production over the last fifteen yearsin the major production regions does not seem to affect internationaltrade as demand follows closely the production trend.The share of Mediterranean production is undoubtedly marginal whencompared to world-wide output (9 million tonnes in 1997). However, theMediterranean market is facing growing concerns over the domesticmarketing of rice. Egypt with 5.6 million tonnes is the largestMediterranean producer, followed by Italy with 1.4 MT and Spain with800,000 tonnes.Within the EU, total production has gained momentum, bouncing from1.8 MT in 1986 to 2.7 MT in 1987. This growth followed theimplementation of the Common Market Organisation Regulation(3072/95) in keeping with the current reform of the PAC which, bycontrast, had expected a drop in production. The production increasemeets the EU domestic demand which is decidedly lagging (around 1.6MT of processed rice) and cannot intake the surplus. It follows that theEU must necessarily sell the surplus on non-community markets wherethe average price is 25-30% lower. This impasse has surfaced at a timewhen GATT Agreements press for cutting export subsidies andopening domestic markets to imports. Expected market price reductionin the next three years and could lead to European surplus crisis aneventually become a major structural crisis.
The EU trade balance is unfavourable. In 1996-1997, the EU imported539,000 tonnes and exported 279,000 tonnes. In addition, there are twomain markets for rice: that of japonica and that of indica. Europeanexports consist mainly of japonica rice (95%) whereas imports consist ofindica rice (96%). Reaching an equilibrium between supply and demandwithin the EU depends on a number of variables. The production ofprocessed rice is made of 375,000 tonnes of indica rice and 172,000 tonnesof japonica rice and consumer demand consists of approximately 930,000tonnes of japonica against 700,000 tonnes of indica.

Chapter II86
Under normal trade flows, the preferential import quotas apply only toindica rice. They include the quotas imposed by the GATT (Art. XXIV.6)(112,500 tonnes), the quantities coming from PTOM-ACP countries since1998 (160,000 tonnes) and those coming from Basmati, India (500,000tonnes).The decision of the Euro-Mediterranean agreements has not beenfinalised yet. Egypt advocates a (tax-free) tariff concession of 450,000tonnes of rice, whereas the current agreement grants a subsidy of 25% fora maximum quantity of 32,000 tonnes. The Egyptian interest is obvious.Egypt is the major rice-producing country in the Mediterranean (651,000ha) and it has seen its rice-growing surface increase by 60%over the lastdecade, the production having doubled to 5.6 MT (and yields have risenfrom 5.3 t/ha to 8.2). According to some estimates, japonica rice makes uptwo-thirds of this production.Since 1991, the government has been pursuing a policy to spurproduction through market liberalisation and the suppression ofcompulsory buying price and transport and post-harvest grindingrestrictions. In 1992, the market was completely liberalised and openedto private operators.Rice exports amount to approximately 320,000 tonnes, 35% of which toEurope. The improved competitiveness has resulted in a price rise thatfavours the expansion of rice-growing areas which are likely to boostthe production in the next few years. On the other hand, the high cropwater requirements are a critical issue. The Ministry of Irrigation seeksto foster a productivity increase which goes hand in hand with a sounduse of water resources. The fourth five-year plan (1997-2002) foresees aslight reduction in the rice growing areas.
Many factors might limit potential rice exports from Egypt:• the increase in the world production and the fierce marketcompetition;• the poor quality of Egyptian rice which does not meet the demand of
the wealthiest markets such as those in Europe and Japan;• higher domestic prices and processing costs resulting from the low
exploitation of plant capacities;• the possible removal of aid to consumption from some other food
products alternative to rice (mostly wheat flour) which might cause asoaring domestic average consumption per head.
Sectorial and national analyses 87
In Turkey, crop production accounts for approximately 70% of totaloutput. The main crops are: cereals, industrial crops, oil seeds, proteincrops and fruit and vegetables. The recent trend indicates that productionof cereals, protein and industrial crops is decreasing, whereas that of oilseeds, fruit and vegetables is increasing. An increase in total cropproduction (3.1%) was expected in 1997, 5.4% of which in cereals and 9.2%in vegetables. Over the past few years, Turkey has succeeded in increasingits agricultural production owing mainly to increased yields which haveoffset the reduction of surfaces devoted to fruit and vegetables. The yieldsof most crops have nearly doubled in the past decade as a result of thehigher efficiency of production methods. The share of livestock productionis small (17% of total agricultural output), the yields are low andtechnologies are not advanced. Livestock breeding and feeding and abalance between animal inputs and outputs remain critical issues to betackled.
In Cyprus, more than half the total production is represented by crops(53%). An average 2% increase was recorded over the last three years -despite the drought. Though relatively small, the irrigated surface accountsfor almost 72% of production (vegetables, citrus, flowers and clover). Rainfed crops are increasingly suffering from water shortage and the depletionof dams. In 1998, the priority given to household water demand causedsevere problems to agriculture and further restrictions on the use of waterfor agricultural purposes are expected. The livestock sector is progressingat a faster pace and accounted for 34.6% of total production in 1996.However, its contribution to GDP remains low, due to the dependence onimported feed. The loss of access to the major cereal-growing areas in thecentral plateau (Mesaoria) has led to increased fodder imports. Meat is thekey animal product, accounting for 64% of GDP (poultry, pork, mutton,goat and beef). Cow’s milk accounts for two-thirds of the output, followedby ewe’s and goat’s milk.

Chapter II88
In Slovenia, the cultivated area was reduced in 1997 (-4% for wheat andcoarse grains) despite the favourable price trend. Major production changesaffected potatoes and the planted area which was reduced by half.(Reportedly, this data is due to changes in the statistical data gathering).
There is no doubt that arable crops are being reduced in marginal areasand that winter cold and hail have caused severe damage, but farmers areharvesting almost the same quantities as before, thanks to technicaldevelopments. While the wheat output has decreased by 2.9%, that ofcoarse grains has increased.
Except for poultry and sheep, there were less animals at the beginningof 1997 than at the beginning of 1996. The number of cattle numbers fell by2.4% and that hogs by 5.6% respectively. This reduction is due to the factthat production is concentrated in small farms where a generation changeof many producers is now underway and the low beef price and the hardwork required to run a farm are not appealing to the young generation.
Meat production has increased as a result of higher live weights andmore intensive breeding techniques. Milk production is equally rising(+4%) thanks to relatively high milk prices and milk yields. The averagemilk yield is relatively low, but there is an abundant milk reserve. Most ofthe cows do not produce milk for the market - they are the so called“suckling” cows. The yields of specialised farms amount to some 3,500 Kgper cow, but there are some dairy farms which total 10,000 Kg. The porksector is heavily dependent on the production cycle, but remains one of themost profitable branches of agriculture. The poultry industry has recoveredafter the loss of the former Yugoslavian market and production is again onthe increase. The highest growth is in the sheep and goat sector (+ 20% oflamb meat over the past few years). Two factors contribute to this trend:favourable price relations and the restructuring of the traditionally cattle-oriented family farms.
Sectorial and national analyses 89
In the EU Mediterranean countries, crop production was relativelystable in terms of volume in 1997. Spain was the only country to experiencea strong increase in the production of olives and olive oil. Also beet and oilseed production is slightly rising, partly as a result of the increase incultivated area and yields and the reduction in fallow lands.
B. Agri-food production
Crop and livestock products constitute both a source of foodstuff fordirect consumption and a source of raw material for the agri-food industry.Hence, agriculture is involved in the general economic progress. The agri-food industry is central to the building-up of food assets, the reinforcementof exports and the creation of jobs and, moreover, drives all the othersectors of the economy.
But some basic requirements must be met for agriculture to develop anagri-industrial pattern in keeping with the associated sectors, i.e. increaseddemand, expanded production capacities, a high rate of reinvestment ofprofits and an equally high level of integration.
In developing countries, the above conditions are not alwaysconcomitant, therefore the agri-industrial development process is sloweddown. Inadequate farming techniques, difficulties in exporting products,the scarcity of agricultural products for direct processing and the loose linkbetween agriculture and industry all hinder the moves towards a balanceddevelopment of the agri-food industry.
Due its close link with the economic progress, the agri-food industry ismainly concentrated in Northern Mediterranean countries, where itaccounts for almost 92% of total production. Compared to the turnover ofthe French food industry,- which is the largest amongst otherMediterranean countries - for the period 1995-96, recorded data on otherMediterranean countries are as follows: Italy 68%, Spain 66%, Turkey 14%,Greece and Portugal 8% and Egypt and Morocco 3%.
Chapter II90
Broadly speaking, the food-industry is characterised by smallprocessing units. In the Mediterranean EU Member States, more than 90%of the processing units are run by less than 20 workers each. However, inthe North, the number of workers per processing unit is three times higherthan that in the South. The progress which this sector is experiencing inNorthern Mediterranean Countries has led to a re-assessment of traditionalproducts, an expansion of the existing processing and marketing units andan establishment of a closer link with the agricultural context and localproductions. In Southern Mediterranean countries, food-industryproduction is still carried out in a very unsophisticated way and theprocessing of staple products for local consumption is poorly technological.On the other hand, some major production units have been set up toprocess standard foreign products (i.e. milk and cereals) and supply thetowns.
In Turkey, the agri-food industry accounts for 13% of the total valueadded of the manufacturing industry and 16% of employment and relies ona wide range of marketing and service networks. The following were someof the most important production sub-sectors in 1997: cereals and millingproducts (36% of total agri-food production), fruit, vegetables andvegetable oils (13%), sugar and sugar products (11%) and slaughter houseproducts (10%). An upward production trend has been recorded in poultry,dairy, olive oil, sugar, rice and pasta industries, whereas red meat and meatproducts are dramatically declining.
In Egypt, the agri-food sector (including non-food products such ascotton) accounts for almost 40% of the whole processing industry. Run byboth publicly and privately owned companies, the agri-industrial sub-sector has increasingly developed over the past few years with an averageyearly growth ranging between 15% and 18%.
The Egyptian agri-food industry shows a peculiar structuraldichotomy. On the one hand, there are some major publicly owned

Sectorial and national analyses 91
companies that control most of the market (despite the slump which hasoccurred over the past few years), on the other hand, small and medium-sized companies are increasingly sprouting. However, a low value addedrate is reported together with the lack of links with chemical andmechanical industries and marketing and financial services. Some majorsub-sectors are flourishing, i.e. cereal milling and bread production, caneand beet sugar processing, rice polishing and dairy industries - the exportsof which have climbed over the last few years. Cotton spinning andweaving account for 25% of GDP , 50% of exports and 50% of theemployment in the publicly owned industrial sector. Some 25 publiclyowned companies (60% of the weaving capacity) and 2 private companiesmake up the weaving sub-sector.
In Lebanon, the agri-food industry is traditionally characterised bysmall-sized companies, which are heavily under-capitalised and badly inneed of restructuring and modernisation. Hence, the agri-food industry isconfined to privately owned companies, while publicly owned companiesplay no influential role in policy planning and product marketing andquality control. The share of this sector dropped dramatically from 11% oftotal exports in 1993 to 7% in 1995. A wide range of products are processed,in particular alcoholic beverages, canned food and juices, dairy products,chocolates and biscuits.
In Tunisia, the agri-food sector accounts for almost 2.5% of total GDPand approximately 19% of total manufacturing output with somefluctuations owing mainly to the variability in olive oil production. Theagri-food sector includes 5,000 companies, most of which are small-sizedand have a low technical and financial capacity. The following are somekey sectors: cereals and cereal by-products (46% of total agri-foodproduction), oils and fats (29%), animal feeding (6%), slaughtering (5%)and milk and cooling industries (45%).
Chapter II92
In Morocco, the agri-food industry accounts for almost one-fifth ofcompanies and employed people and 35% of industrial output. Mainlyoriented towards the domestic demand for staple food products, this sectornevertheless remains a remarkable source of hard currency with one-fifthof industrial exports - owing mainly to the fruit and vegetable processingsub-sector which contributes 90% to the turnover of agri-food exports - andis also a source of seasonal employment. Downstream industries are oftenhighly sophisticated and off-farm employment is the prime mover ofgrowth. In addition, the developed food preserve industry (for tomatosauce, fruit juices and canned fruit) ensures close links with sectors otherthan agriculture which either provide inputs or depend in turn on furtherprocessing sectors. The agri-food industry is estimated to purchase about70% of its raw materials from agriculture.
In Algeria, the agri-food industry plays an influential part in theindustrial sector and contributes 30% to industrial output (excluding oil)and 17% to employment. The development of agri-food industries in thelate 1980s was complemented by the increase in raw material imports, sincedomestic supply could not meet the demand - and this included fruit andvegetables. Despite the downward trend which was recorded over the pastfew years, processed cereals (flour and semolina), oils and fats and fruitand vegetables remain key activities.
In Cyprus, on-the-farm processing is of paramount importance,especially as regards the production of local cheese, halloumi, raisins, wineand spirits. These products account for 4% of GDP and 32% ofmanufacturing industry value added. The production of farm-processedfood products which has somewhat stabilised is expected to face someproblems following the implementation of stricter production standards.The most rapidly expanding sector is fishing owing to the increasing localand tourist demand. Sea aquaculture accounts today for 29% of the grossproduct of the fishing sub-sector, while trawler fishing is stagnant.
Sectorial and national analyses 93
In Slovenia, food-processing accounts for 10.4% of total manufacturingoutput and changed only slightly during the period 1990-1996. During thefirst two transitional years, production fell as a result of the loss ofYugoslavian markets (-20% for food output and a little less for animalbeverage and feeding). In 1993, production recovered and penetrated newmarkets and in 1996 it even exceeded the levels recorded at the beginningof the decade. Overall, food industry has performed much better than theother industrial sectors and in 1997 the output price level remained stable.Decreasing price levels for raw materials and the restructuring which hadtaken place, boasted production in 1998.
In Malta, the agri-food sector increased by 12.7% in 1996-97, accountingfor 19% of total industrial activity and 16% of employment. Heavilyprotected for a long time, the sector is still oriented towards the domesticmarket which constitutes a limiting factor on account of its small size. Thesector includes 380 companies, three-quarters of which are traditionallysmall-sized companies producing bakery products. Conversely, meatprocessing, tinning and animal feed industries are considerably developed.In addition to family concerns, there are also some large publicly-ownedand foreign corporations (i.e. Unilever).
The scope for agri-industrial development in the majority of Southernand Eastern Mediterranean countries is mainly conditional on theabundance of agricultural raw materials and low-cost labour. Hence, theimproved efficacy of domestic agriculture is of vital importance to boostthe activities in the sector and to facilitate the introduction of technologiesand promote competition.
In the Mediterranean EU countries, the agri-food sector has a muchmore complex technological and organisational structure and plays acrucial economic role. In 1996, approximately 84% of Mediterranean agri-food industries and more than 93% of the correlated sectors wereconcentrated in the EU. Based on past and current developments, four
Chapter II94
types of agro-food industries can be identified: 1) small and medium-sizedenterprises which apply “niche” strategies and capitalise on the reputationacquired in local and regional markets; 2) small and medium-sizedenterprises specialised in own-branded products with a strong marketpenetration capacity, but heavily dependent on mass production buyers forinformation about product characteristics, quantity and quality; 3) nationalenterprises which produce and market on domestic scale and can offer awidely diversified range of products; and 4) multinational corporationswhich are present on foreign markets with their own brand name.
In Greece, the agri-food sector accounts for 26% of total industrialoutput. The olive sub-sector is particularly important (13% of the agri-foodindustry). The agri-food sector also plays an influential part in trade andrepresents 30% of total domestic exports.
In Portugal, the agri-food sector is highly concentrated. The major fourfirms account for 40% of total production. The sector contributesapproximately 21% to production and 14% to manufacturing value added.The main sub-sectors are: dairy products (15% of the turnover), feeding(12%), beef meat (8%) and wine (almost 15%).
In Spain, the agri-food sector accounts for 14% of industrial production.Among the major sub-sectors, oil and fat industries account for 10%, milkindustries for 11%, bakery industries for 9%, and vegetable tinning andwine making for 5%.
In Italy, the agri-food sector represents 9% of manufacturing valueadded and ranks third after the energy, textile and clothing industry.Despite the heavy concentration, the agri-food sector is still fragmentedcompared to that in the other advanced European countries. The first fourleading groups represent 10% of the total turnover of the agri-food sector.Meat and dairy products (17% of total turnover), packaging (11%), house-pet feed (8.5%), animal feed (6%) and pasta (4.3%) are the major sub-sectors.

Sectorial and national analyses 95
In France, the agri-food sector is highly developed and is the industry’sleading sector with a turnover of FF 681 billions in 1996. It contributes 14%to industrial activity and 19% to employment and is relatively concentratedwith the four major companies accounting for 12% of total turnover. Meat(26% of turnover), dairy products and cheese (20%), animal feed (8%) areparticularly crucial. Mediterranean products are less important. Fruit andvegetables and olive oil amount to 12% of total turnover.
Value added per employee varies widely among countries, rangingbetween US$ 70,000 per employee in France and US$ 6,300 per employee inEgypt, the disparity reflecting the differences in the technologies used aswell as in managerial skills.
V. Consumption trends
Over the past decade all the Mediterranean countries have made hugeefforts to meet the increasing domestic food demand and improve theirnutritional standards. A rather uniform consumption pattern can beobserved in the region, the so called “Mediterranean diet”, which is richerin vegetables than in animal products and which is largely the result ofhistorical, social, cultural and climatic factors.
However, some disparities are recorded among the countries asregards the per capita consumption volume of different products, thenutritional standard as well as the consumption breakdown and the shareof food consumption in the household expenditure. First of all, thedevelopment of food habits varies considerably between developed anddeveloping countries. Since food consumption is the major outlet foragriculture, food habits are a crucial determinant for the growth of theagricultural sector and the achievement of the food-population balance.
It is generally accepted that food consumption per head is increasingthough growth rates are progressively declining all over the world and theMediterranean region is no exception. The key factors which govern the
Chapter II96
evolution of aggregate demand for food products are related to: (a) thepopulation growth and (b) the income rise. There is much difference in thepopulation growth and income rate between the developed countries andthe developing countries.
The above two factors and the income elasticity of food demand whichis decidedly higher in less developed countries has led to the estimationthat food demand will grow at a faster rate in developing countries and to alesser extent in the Mediterranean EU Member States.
The rapid increase in food demand in the North Africa and the MiddleEast - resulting mainly from the population growth and the rise in income-is generally regarded as a threat to the population-food balance as well asto water and land resources. Governments are reacting by expanding thesurface of arable lands and fostering land productivity through the use ofirrigation. But, in so doing, they are increasingly diverting public resourcesfrom some other uses which are needed to create economic and socialinfrastructures intended to raise the living standards of the population. Thealternative might be to press for a reduction in the population growth ratewhich would lead to a reduction in the food demand growth rate, thusrelieving the pressure on primary resources, such as land and water.
An additional key factor is the change in food consumption patternswhich results from increased income received per head. When the incomeper head increases, a world-wide shift is observed in the consumptiontrend from staple products such as bread, rice or maize to meat, milk anddairy products. It is generally accepted that this phenomenon is related tothe poorer income elasticity of staple products as opposed to that of meat,milk and dairy products. Hence, production facilities will have to adjust tothe new scenario and livestock productions will have to be enhanced.Given the existing constraints in the production systems, the current moveis towards more intensive productions which make use of feed grains andfodder.

Sectorial and national analyses 97
The consumption patterns for cereals, fruit and meat which wereobserved in the Mediterranean region in 1996 are provided in Table II-6.Per head consumption of staple products is higher in the countries of theSouthern rim where incomes are lower and per head consumption of meatis five times higher in Mediterranean EU countries than that in the NorthAfrica and the Middle East. Hence, meat consumption is expected to rise indeveloping countries if per head income rises and supply increases.
The upward consumption trend of animal products has importantimplications on the output. Livestock production should be increasinglyfostered through the strengthening of intensive and partially intensiveproduction systems. Given the current constraints in terms of landresources and the productivity of grass and pasture land, producers areincreasingly using irrigated lands to produce fodder for intensive livestockproduction. In rain fed areas, they will have to switch from cerealproduction for human consumption to grain production for feedingpurposes.
As far as transitional economies are concerned (especially those ofAlbania and former Yugoslavian countries), food habits are affected by awide range of factors such as centrally imposed nutritional standards,supply restrictions and subsidised prices. Food aid used to weigh heavilyon the State budget and, despite subsidised food prices, household foodexpenditure accounted for a significant part of total householdexpenditure. Calorie consumption levels in transitional economies in thepre-reform period were similar to those in market economies with similarper capita income, whereas wheat and milk consumption owing to severefood price distorsions and aid was higher. Official prices did not reflectmarket trends and food demand was artificially fuelled by macro-economicdisparities.
In many transitional economies, the liberalisation of food prices andtrade has resulted in hyper-inflation which has eroded the consumer

Chapter II98
purchasing power and deepened income-related inequalities. Consumerprices in some countries have soared whereas domestic food demand hasdramatically fallen. A significant increase in staple product consumption(i.e. bread, etc.) has also been observed together with a concomitant drop inthe consumption of meat, dairy products and fruit. The share of food intotal expenditure has markedly increased, thus indicating a general declinein the population welfare. A reduction in calorie and protein consumptioncompared to pre-reform levels has also been acknowledged with acorresponding adverse impact on nutrition.
Table II-6. Food consumption and nutrition levels, 1996
Cerealkg/cap/year
Fruitkg/cap/year
Meatkg/cap/year
Eastern Mediterranean
Cyprus 113,9 150,1 111,6Egypt 248,4 107,9 17,5Lebanon 137,9 262,5 31,5Malta 151,1 100,8 81,4Turkey 225,9 151,9 20,7
Maghreb
Algeria 230,7 56,4 19,8Morocco 265,8 84,7 16,4Tunisia 222,8 103,6 20,3
Transition countries
Albania 147,1 40,5 38,0Croatia 101,3 106,5 30,7Slovenia 137,2 92,2 100,1
EU Mediterranean Countries
France 113.8 95.9 101.2Greece 149,6 184,4 80,3Italy 157,6 141,3 84,3Portugal 127,4 124,6 84,1Spain 103.3 116.0 99.7
Source: Medagri, 1998

Sectorial and national analyses 99
The drop in food consumption is particularly significant in urban areas,though it differs according to the income bracket, and poverty isappallingly increasing. Subsistence agriculture plays an important part indomestic food consumption. The vast majority of households derive foodfrom the cultivation of small plots which they have been allocated andfamily-production accounts for most of the supply of some foodcommodities. The recent drop in inflation and macro-economic stability arenow contributing to the stabilisation of food markets.
The drop in food consumption which has occurred in most transitionaleconomies is largely documented, but the identification of the contributingfactors is no easy task. Food demand has been affected by both price andincome. Not only have real food prices climbed following the removal ofsubsidies, but consumer purchasing power has been significantly erodedby inflation.
In the Mediterranean EU countries, consumption levels have reachedsuch a threshold that only slight increases can be expected. Recent trendsare very likely to persist (i.e. the slow population growth and rise inincome) along with a low income elasticity which stems from an equallyslow increase in domestic food consumption. No major change is expectedin the food consumption patterns apart from the increase in theconsumption of quality livestock products. But the new consumer foodhabits and the increased concern for environmental and health issues willundoubtedly have a bearing on the development of future consumptionpatterns.
Perspectives in food consumption for selected Mediterranean countries
In Egypt, food accounts for the largest share of total consumerexpenditure. A survey conducted on income, consumption andexpenditure in 1990-1991, showed that food accounted for 57% and 65% ofthe total expenditure of poor households in urban and rural areas,

Chapter II100
respectively (45% and 55% of non-poor households). Meat, fish and eggsrepresented 30% of total expenditure.
Per capita consumption of food commodities shows some majorchanges. Over the period 1970-1988, the consumption of meat, fish, eggs,sugar, wheat and tubers soared, thus reflecting the high income elasticity ofdemand - i.e. meat consumption increased from 11.5 Kg in 1970 to 20 Kg in1985. Maize bread was traditionally consumed in rural areas, but theconsumption per head became stagnant during the same period as a resultof the increased supply of wheat imported at subsidised prices.Consumption of pulses, broad beans and lentils, which have historically allplayed an influential part in the Egyptian diet, dropped during the sameperiod. Some of these trends persisted over the period 1990-1995. Per headconsumption of fish, meat, oil and margarine is steadily increasing, that ofpulses (especially beans) is rising again, whereas that of sugar is declining.This reversal is generally attributed to the drop in consumer incomes.
In Lebanon, according to FAO data, a noticeable increase in food energyintake has been observed over the period 1970-1991, the average annualgrowth amounted to 1.6%. Calories intake increased from 2,330cal/head/day in 1970 to 3,260 cal/head/day in 1991. The significantimprovement in food consumption brings the country close to the averagenutrition standards in the EU. The increased protein consumption, whichwas observed during the same period, was primarily based on vegetableswhich accounted for 68% of total dietary protein uptake (with cereals alonecontributing 36% of the total).
In Turkey, some negative changes were recorded over the period 1994-1997. However, data reliability is questionable, owing to significantfluctuations and this is a common problem which is encountered whendealing with world-wide consumption data.

Sectorial and national analyses 101
Table II-7. Turkey: Consumption of some food items
1994 1995 1996 1997*
Wheat 284 281 280 279
Pulses 20 25 24 24
Citrus 24 23 23 23
Vegetables 198 221 215 230
Potatoes 65 75 72 71
Meat 23 23 23 23
Milk 140 135 137 139
Eggs 9 8 8 8
* Forecast
Source: SPO, Developments in Economic and Social Sectors, Ankara, 1996 and 1997
In Cyprus, approximately 50% of gross agricultural output in 1996 wasconsumed directly and 10% was exported as raw material. Per headconsumption is remarkably high for some products, such as fruit (146kg/head/year), meat (122 kg/head/year) and milk (92 kg/head/year).Calorie intake is similarly high. However, the interpretation of figuresrequires due caution. With the number of tourists approaching 1.9-2.2million per year (i.e. several times the population of the island), per headconsumption figures might be distorted by up to 10% on average.
In Algeria, per head consumption has probably decreased as a result ofthe drop in both demand and purchasing power. Cereal consumption ishigh (230 kg/head/year) as is the case for all Maghreb countries, whereasthe consumption of meat and dairy products, though increasing, remainslow. Some key changes have been observed in food prices, owing mainly tothe increase in demand and the implementation of new economic policies.Table 8 shows that, though general prices increased four times between1990 and 1996, those of food commodities increased five times, primarily asa result of an increase in the price of processed food products. Price trends
(kg/cap/year)
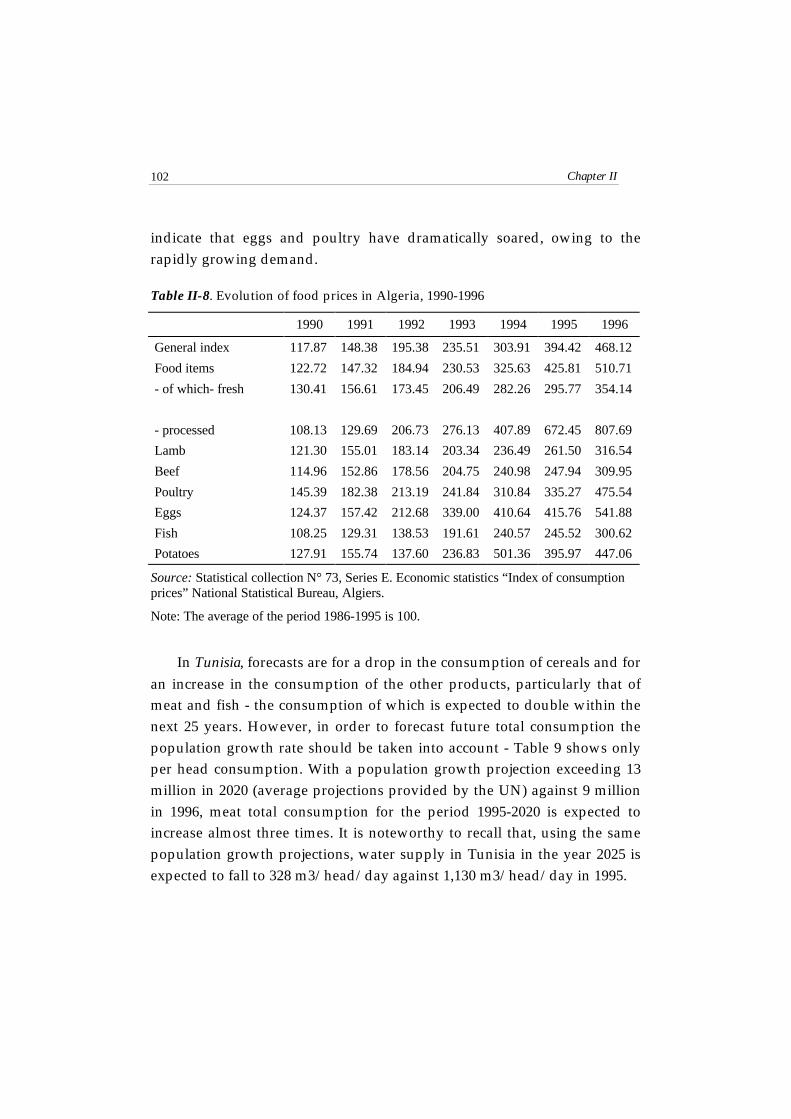
Chapter II102
indicate that eggs and poultry have dramatically soared, owing to therapidly growing demand.
Table II-8. Evolution of food prices in Algeria, 1990-1996
1990 1991 1992 1993 1994 1995 1996
General index 117.87 148.38 195.38 235.51 303.91 394.42 468.12
Food items 122.72 147.32 184.94 230.53 325.63 425.81 510.71
- of which- fresh
- processed
130.41
108.13
156.61
129.69
173.45
206.73
206.49
276.13
282.26
407.89
295.77
672.45
354.14
807.69
Lamb 121.30 155.01 183.14 203.34 236.49 261.50 316.54
Beef 114.96 152.86 178.56 204.75 240.98 247.94 309.95
Poultry 145.39 182.38 213.19 241.84 310.84 335.27 475.54
Eggs 124.37 157.42 212.68 339.00 410.64 415.76 541.88
Fish 108.25 129.31 138.53 191.61 240.57 245.52 300.62
Potatoes 127.91 155.74 137.60 236.83 501.36 395.97 447.06
Source: Statistical collection N° 73, Series E. Economic statistics “Index of consumptionprices” National Statistical Bureau, Algiers.
Note: The average of the period 1986-1995 is 100.
In Tunisia, forecasts are for a drop in the consumption of cereals and foran increase in the consumption of the other products, particularly that ofmeat and fish - the consumption of which is expected to double within thenext 25 years. However, in order to forecast future total consumption thepopulation growth rate should be taken into account - Table 9 shows onlyper head consumption. With a population growth projection exceeding 13million in 2020 (average projections provided by the UN) against 9 millionin 1996, meat total consumption for the period 1995-2020 is expected toincrease almost three times. It is noteworthy to recall that, using the samepopulation growth projections, water supply in Tunisia in the year 2025 isexpected to fall to 328 m3/head/day against 1,130 m3/head/day in 1995.

Sectorial and national analyses 103
Table II-9. Projected per capita consumption of food items in Tunisia
1990 2000 2010 2020
Cereals 196.4 181.3 167.4 154.6
Vegetables 133.7 141.8 150.5 159.6
Fruit 53.0 56.2 59.7 63.3
Milk and dairy 75.9 86.0 86.0 86.0
Meat and poultry 19.9 24.1 29.3 35.5
Fish 7.1 9.2 11.5 14.3
Edible oil 21.3 22.6 24.0 25.5
Sugar 17.4 19.3 21.5 23.9
Source: Mr. Lasram (1998) “L’agriculture tunisienne : réalisations de l’année 1997 etperspectives”
In Morocco, food consumption trends, in the long run, can be assessedbased on the long-term production progress (providing that exports andimports do not change the picture significantly). Over a 20-year period -from 1971-1975 and 1991-1995 - the consumption of livestock productsincreased markedly, as shown in Table 9, based on production calculations(the population figures used for the calculation are 16.2 and 25.5 millionover the two half-periods, respectively). The upward trend of livestockproductions, which was necessary to meet the rapidly increasing demand,is confirmed by recent figures. Between 1996 and 1997, total meatproduction (both red meat and poultry) climbed from 483 thousand tonnesto 541 thousand tonnes (+12%), the production of milk soared from 850thousand tonnes to 950 thousand tonnes (+12%) and that of eggs increasedfrom 195,000 tonnes to 200,000 tonnes (+2.5%).
(kg/cap/year)

Chapter II104
Table II-10. Evolution of agricultural production in Morocco(kg/cap/year)
1971-75 1991-95
Cereals 275 202
Pulses 28 9
Olive oil 2 2
Sugar crops 103 154
Vegetables 65 113
Fruits 89 90
Red meat 13 18
Poultry meat 2 6
Milk 32 36
Eggs 3 7
Source: Medagri, 1998 and Moroccan Statistical Collection, Rabat, 1997
In Slovenia, data gathered during a survey on household budgetscomplemented by food balance calculations provide sufficient insights intofood consumption patterns. Food expenditure is quite stable and accountsfor 26% of total expenditure, which is among the lowest rates in Europeanand former USSR transition economies. Over the past few years,consumption undoubtedly increased. Per head meat consumption reached98 kg in 1997 (against 87.7 in 1992). The highest increase was recorded forpoultry (23 kg in 1997 against 15 kg in 1992). Per head consumption ofcereals and sugar soared from 18% in 1992 to 53% in 1997. Some additionalkey trends were identified in food habits.
These trends are similar to those which are generally observed inOECD countries. The consumption of fruit and vegetables is on theincrease. Red meat is being progressively replaced by poultry. Somealternative products, such as lamb and olive oil, are increasingly gaining

Sectorial and national analyses 105
importance in the diet. And environmental awareness is similarly gainingground.
In Croatia, food consumption per head remained relatively stable orincreased slightly during the transition period. However, food habits havechanged since the early 1990s with a reduction in the consumption of beefand poultry - while the consumption of pig meat has remained relativelystable. Consumption of sugar and oil is also on the increase.
In Albania, according to data gathered in surveys on householdconsumption, diet is still heavily dependent on cereals (50%) and theenergy intake is inadequate. Per capita consumption of bread is about 200kg per year. In addition, food habits vary widely between urban and ruralareas. Urban consumers depend on imports for many food commodities,since domestic production accounts for approximately 70% of foodrequirements.
Table II-11. Food consumption in the EU Mediterranean Countries, 1996(kg/cap/year)
Country
Cer
eals
Puls
es
Mea
t
Fish
Milk
Veg
etab
les
Frui
t
Fat a
nd o
ils
France 113.8 2.1 101.2 27.9 256.2 123.5 95.9 35.2
Greece 149.6 5.2 84.1 25.6 239.8 246.1 184.4 30.8
Italy 157.6 5.5 84.3 23.1 254.2 168.4 141.3 34.9
Portugal 127. 4.7 80.3 58.7 175.6 161.3 124.6 30.1
Spain 103.3 7.3 99.7 37.1 161.1 134.4 116.0 30.8
Source: FAO-Medagri, 1998
In the Mediterranean EU Member States, despite differences among thecountries in the level of consumption per inhabitant, food habits are quitesimilar. And this is the result of some trends which have been monitored
Chapter II106
over the past decade (cf. Table II-11). Per head consumption in the post-warperiod was characterised by a fall in the direct consumption of cereals andstarchy products. The second major change was the increase in theconsumption of animal products, especially of meat, milk and eggs. Alsothe consumption of fruit and vegetables increased. These changes are inaccordance with the normal evolution of consumption patterns whichcharacterises any economic progress. On the other hand, the consumptionof olive oil is relatively high and will probably stabilise in the future, whilethat of fruit and vegetables is expected to rise and that of sugar to remainstable.
Food consumption patterns can also be explained when the actualsupplies are taken into account. The consumption of fruit and vegetables ishigher in some countries as a result of different prices and availability ofthe products.
Olive oil consumption is equally high, but may tend to decreasebecause of the low income elasticity in oil demand. The differences in sugarconsumption are probably related to income differences and theconsumption of cereals will tend to fall as it approaches the averageconsumption standards in the EU. The change in the consumption patternof meat in favour of poultry and pig meat is a common phenomenon in allthe countries. However, the issue is still controversial. Some people claim achange in taste whereas others stress the change which has occurred inrelative prices. As far as Southern Mediterranean countries are concerned,the latter explanation seems more likely to apply.
V. Agricultural and food policies
A. Overview and perspectives
Since the 1980s, the economies of most Mediterranean countries haveundergone deep structural changes which have involved all the production
Sectorial and national analyses 107
sectors and have significantly reshaped domestic policies. Thistransformation has occurred both in industrialised and in developingcountries, but in the latter the social and economic importance of agri-foodactivities has had a stronger impact on the national scene. The agri-foodpolicies constitute one of the pillars of the economic policies, mainlythrough price policies. It was generally accepted that a system of incentivesto agricultural production, which acted on the increase in supply, wouldensure a fixed domestic supply. Also the different branches of the agri-foodchain benefited from publicly-funded subsidies. Hence, agri-food policieswere based on consumer subsidies that served mainly as a means totransfer public aid to the poorest social classes.
Towards the end of the 1980s, foreign debt had soared to critical peaksin many countries. Hence, structural adjustment policies wereimplemented in a number of them (i.e. Algeria, Egypt, Morocco, Tunisia,Turkey). It seemed the only way out. Negotiations with internationalorganisations such as; the International Monetary Fund and the WorldBank, in particular; were initiated in order to curb the debt through astrong reduction in domestic demand and public expenditure. Theseobjectives were pursued through strict monetary and budgetary policies -which increased tax receipts, mobilised domestic savings and reduced thedeficit of the balance of trade - and also through sounder public investmentpolicies. Central to these strategies were the establishment of marketmechanisms, the international openness and the implementation of a bodyof legislative and financial reforms aimed at attracting foreign capital andinvestment. The adopted reforms have produced varying effects on theorganisation of the agricultural sector in the different countries anddepending on the level of consensus within each country have beenapplied in different measure.
Chapter II108
B. Price and subsidy policies
Over the past ten years, the Common Agricultural Policy (CAP)reform, the structural adjustment policies and the transition towards amarket economy have reshaped agricultural price and subsidy policies inthe Mediterranean countries. These reforms have been implemented withinthe framework of a generalised liberalisation of markets, as has alreadybeen discussed. The actions have focused on price support and supplymanagement, direct grants and premiums to farmers, subsidies toproduction and an agricultural taxation system.
In Turkey, major political and instrumental changes have been made inorder to implement the above price and subsidy policies. Despite the helpgiven to producers, through support prices and subsidies to inputs (inparticular to fertilisers), the scope and the level of implementation havedeclined. Domestic financial constraints and international commitmentshave been the prime movers of these reforms. Since their introduction, thenumber of supported products and the volumes purchased by supportingorganisations have varied over the years.
The share of guaranteed purchase of wheat, barley, beet and tobaccoincreased in 1997. The goal of the agricultural price and subsidy policy is toboost and stabilise agricultural production in order to meet the increasingdomestic consumption at relatively low prices and foster exports in orderto increase foreign currency inflow.
Subsidies to inputs play a specific role in the Turkish support system.The subsidy programme focuses on animal feeding, parent stocks,fertilisers, seeds, pesticides and processed milk, but in practice 84% of totalsubsidies go to fertilisers - the rate in 1996 was 50% of farmer purchaseprice. In addition, subsidies account for 6%-9% of total crop production.Tables II-12a & b are reporting Producer Subsidy Equivalent (PSE) andConsumer Subsidy Equivalent (CSE) values for Turkey as calculated byOECD.

Sectorial and national analyses 109
Table II-12a. Turkey: Producer Subsidy Equivalent (PSE)
1986-88 1993-95 1994 1995 1996
TL (bn) 1590 85483 56980 156981 298572
Turkey US$ 3074 1913 3432 3673
ECU (mn) 1419 2516 1613 2626 2894
% 26 30 25 31 30
US$ 158609 173908 174935 179644 166004
OECD ECU (mn) 144338 142535 147488 137428 130778
% 45 41 42 40 36
Table II-12 b. Turkey: Consumer Subsidy Equivalent (CSE)
1986-88 1993-95 1994 1995 1996
TL (bn) -1069 -65135 -36126 -121802 -241659
Turkey US$ -1087 -2431 -1213 -2623 -2973
ECU (mn) -982 -1993 -1023 -2037 -2342
% -18 -22 -14 -21 -22
US$ -118 -121938 -121326 -120201 -95219
OECD ECU (mn) -107812 -100115 -102290 -91954 -75013
% -37 -31 -32 -29 -23
Source: OECD, Agricultural Policies in OECD Countries, measurement of support andbackground informations, 1997.
Chapter II110
A difference in values can be observed till 1996. Hence, market pricesupport account for 70% to 72% of subsidies, whereas subsidies to inputsrepresent 20% to 30%. However, direct payments are very low.
In Tunisia, the price policy is aimed at trimming inflation, organisingdistribution channels and promoting product quality to boost thecompetitive power of Tunisian agricultural products.
The manufacturer price for cereals, which is set by the State before thecampaign, did not vary in 1997. The other products (fruit, vegetables, meatand milk) increased slightly, whereas the average price of olive oil wasreduced probably as a result of the extremely high harvest yield.
In 1998, regulations were introduced to organise and managewholesale markets, with the introduction of cargo books and specific rulesfor packaging, sizing and invoicing aimed at improving marketingchannels.
The policy which has been implemented for the above products isaimed at controlling subsidies, as much as possible, in order to lighten theburden of the equalisation fund. The policy proves equally useful inkeeping production costs under control.
As for input prices, no increase was recorded in 1997 (for seeds andfertilisers), despite the increase in cost prices.
Pricing policies, crop control and subsidies to inputs had hinderedagricultural growth in Egypt till the late 1980s. The prices offered by theGovernment for most cereals were low compared to import and exportprices. The Egyptian Government adopted a new price policy focused onthe removal of price restrictions for most crops in 1987, but maintainedminimum prices. This strategy resulted in the increase in real prices forwheat between 1987 and 1992. Marketing restrictions were suppressed forall crops, except for rice, cotton and sugar cane. As for wheat and maize,fixed procurement prices were removed since they depressed the farm gate
Sectorial and national analyses 111
price, on the one hand, and disrupted feed industry, on the other. Riceprices were liberalised between 75% and 90% of world prices in 1987-1990.As for cotton, procurement price was gradually increased by up to 75% ofborder price, as recorded in 1991, then to 114% and 132% of border price in1992 and 1993, respectively. Cotton marketing was fully liberalised in 1994and additional measures were introduced, such as subsidies to inputs(50%-60%) for minor crops. Fertilisers were the major input which wastaken into consideration at the time of the political reform. In kind creditwas allocated, according to priorities based on crops. Subsidies to fertiliserswere abolished in 1992 - after a 13% increase from 1985 to 1988. Subsidies tofertilisers for cotton-growing were removed in 1991, while subsidies topesticides for the same crop decreased by 25% in 1992 and became null in1994. This provision was then applied to all the crops.
Following the reforms adopted in the late 1980s, Morocco has reached ahigh level of price liberalisation for both inputs and outputs. The price ofdurum wheat, barley, maize and common wheat is no longer subjected toany control. By contrast, the price of sugar beet and sugar cane, oil seedsand cotton is still State-controlled. In the long run, the products that haveincreased the most, both as regards the surface grown and the yield(common wheat, sugar beet, tomatoes and potatoes), have not onlybenefited from relatively adjusted prices, but also from a globallyfavourable environment (access to production factors under preferentialconditions, State or co-operative services, extension services, plant controland guarantee on market outlets). Most subsidies to production have beengradually removed - except for irrigation -, thus leading to increasedinvestments. Foreign trade in agricultural products has been largelyliberalised (imports and exports). The liberalisation process is pursuedwithin the framework of the Association Agreements with the EU and theobligations established under the GATT’s Agreements in Marrakech. Butthe industrial effects have fallen far short of a genuine liberalisation. Hence,Morocco is currently negotiating new deadlines to cope with structural
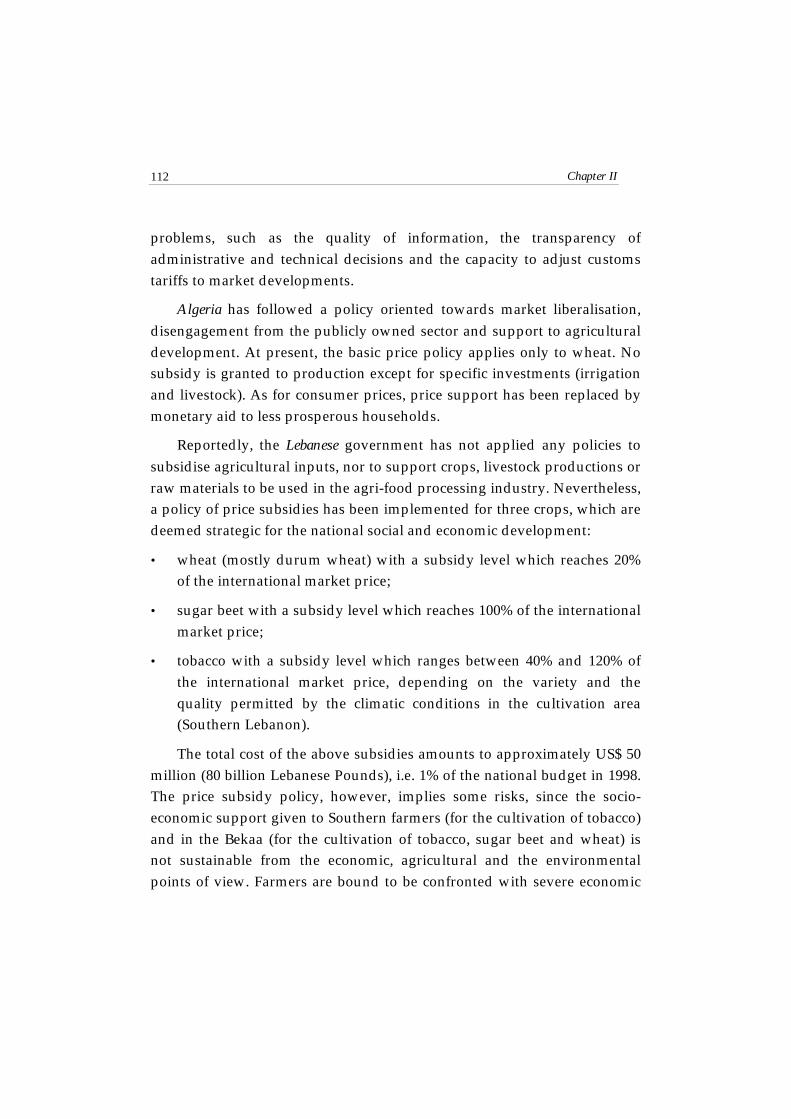
Chapter II112
problems, such as the quality of information, the transparency ofadministrative and technical decisions and the capacity to adjust customstariffs to market developments.
Algeria has followed a policy oriented towards market liberalisation,disengagement from the publicly owned sector and support to agriculturaldevelopment. At present, the basic price policy applies only to wheat. Nosubsidy is granted to production except for specific investments (irrigationand livestock). As for consumer prices, price support has been replaced bymonetary aid to less prosperous households.
Reportedly, the Lebanese government has not applied any policies tosubsidise agricultural inputs, nor to support crops, livestock productions orraw materials to be used in the agri-food processing industry. Nevertheless,a policy of price subsidies has been implemented for three crops, which aredeemed strategic for the national social and economic development:
• wheat (mostly durum wheat) with a subsidy level which reaches 20%of the international market price;
• sugar beet with a subsidy level which reaches 100% of the internationalmarket price;
• tobacco with a subsidy level which ranges between 40% and 120% ofthe international market price, depending on the variety and thequality permitted by the climatic conditions in the cultivation area(Southern Lebanon).
The total cost of the above subsidies amounts to approximately US$ 50million (80 billion Lebanese Pounds), i.e. 1% of the national budget in 1998.The price subsidy policy, however, implies some risks, since the socio-economic support given to Southern farmers (for the cultivation of tobacco)and in the Bekaa (for the cultivation of tobacco, sugar beet and wheat) isnot sustainable from the economic, agricultural and the environmentalpoints of view. Farmers are bound to be confronted with severe economic

Sectorial and national analyses 113
constraints when subsidies are lifted. In addition, subsidies deter farmersfrom applying crop rotation schemes, especially in the cultivation of sugarbeet, to the detriment of soil quality (nematodes, fungi, weeds, etc.proliferate) and the environment - which suffers from excessive anduncontrolled fertilisation.
In Croatia, current price policies combine intervention prices, Statepurchases of selected commodities and import tariffs. The Government alsoallocates price incentives and input subsidies. Average producer prices inCroatia are significantly higher than those in the other European countries(except for Slovenia) for wheat, maize and poultry, whereas they are onlyslightly higher for pork. State is gradually reducing its intervention in pricesetting, except for some staple products such as wheat, oil seeds, sugarbeet, tobacco and milk (1994-1996). However, in recent years, the StateDirector for Commodity Reserves has continued to purchase wheat inaccordance with the “strategic reserve” concept inherited from thecentrally-planned system and to react to the devastation brought about bythe war. Interest subsidies were widespread in the early 1990s andaccounted for more than 90% of total subsidies. They were abolished in1994 and replaced by input subsidies. The following is a breakdown ofsubsidies for the period 1995-1996: 27% to crop production; 44% tolivestock production; 7% to inputs; 15% to fertilisers and 7% to fishery. TheDecember 1996 law on premiums and subsidies diversified support inorder to favour some marginal sectors, specific productions (fishery, fruitand olive growing) and direct payments to farmers.
In Cyprus, subsidies are mainly given in the form of income support,price guarantees, development finance and input subsidies.
• Income support is a direct subsidy which is given to vine-growers perhectare (in the past it used to be given to citrus growers too). Indirectsubsidies are paid by the Crop Insurance Organisation which refunds

Chapter II114
farmers for crop losses, but most insurance premiums are paid by theGovernment.
• Price guarantees are subsidies to cereals, grapes and vine products.
• Development finance are loans at subsidised interest rates which areprovided for the consolidation and the construction of irrigation works,the establishment of young people in rural areas, the employment ofyoung farmers, farm mechanisation, etc.
• Input subsidies are subsidies to inputs, such as cereals used in animalfeed, and the construction of dams and reservoirs.
Agricultural prices are largely set by market mechanisms, though forcertain commodities they are set by State organisations, as is the case forcereals, grapes, milk and dairy products, poultry and olive oil. Theharmonisation with the EU will undoubtedly call for the removal of pricecontrol and the liberalisation of trade.
In Albania, the prices of agricultural products and inputs have beenliberalised, except for wheat and irrigation. The real appreciation of the lekafter 1993 has lowered the relative price of imported flour and has affectedthe viability of domestic flour mills which must pay the set minimum pricein order to mill wheat. Subsidies to food products have been suppressed.The private activity of input suppliers, such as fertiliser companies, hasdecreased as a result of price liberalisation. Export restrictions or taxesapply to a number of key products. Export licences are required for timberand raw tobacco, whereas an export tax of 100% is levied on non-processedleather. Import taxes on products range between 5% and 30% and are usedto provide price support for substitute products. All quantitativerestrictions on imports have been removed. Hence, the agriculturalprotection level in Albania is rather low at present.

Sectorial and national analyses 115
VII. Investment and structural policies
Investment and structural policies differ among the Mediterraneancountries. EU interventions are mainly aimed at enhancing forms ofproduction, which are compatible with the preservation of naturalresources, the production of quality commodities (organic and typicalproducts) and focus on favouring the establishment of young farmers andimproving living and working standards.
In Southern countries and in Turkey, the focus is mainly on theexecution and the improvement of irrigation works, the modernisation offarms, the introduction of new techniques and production systems, asounder use of collective land resources and the setting up of economicallyviable farms. These actions are aimed at reducing the constraints thathinder agricultural development and at improving the exploitation of landsthrough intensification and re-organisation strategies. Hence, theintervention instruments and the participatory forms of the State varyaccording to the objectives.
In Turkey, the agricultural investment policy is mainly orientedtowards the improvement of infrastructures and support measures in lessdeveloped regions. The share of agricultural fixed capital investmentaccounts for 6% of the total and the ratio between the agricultural fixedcapital investment and the agricultural GDP has reached 9% over the lasttwo years. Additional structural instruments have been introduced withinthe framework of structural programmes (induced investments andagricultural credit through loans at subsidised interest rates).
In Tunisia, the investments in the agricultural sector in 1997 accountedfor approximately 14.3% of total national investments. 11% growth wasexpected for 1998, i.e. 860 million Dinars (US$ 900 million), half of whichensured by private individuals who invested in the fruit, livestock andfishing sectors. Most public investments are used for water managementand irrigation purposes (dams, hilly lakes, canals and pipes). As for the
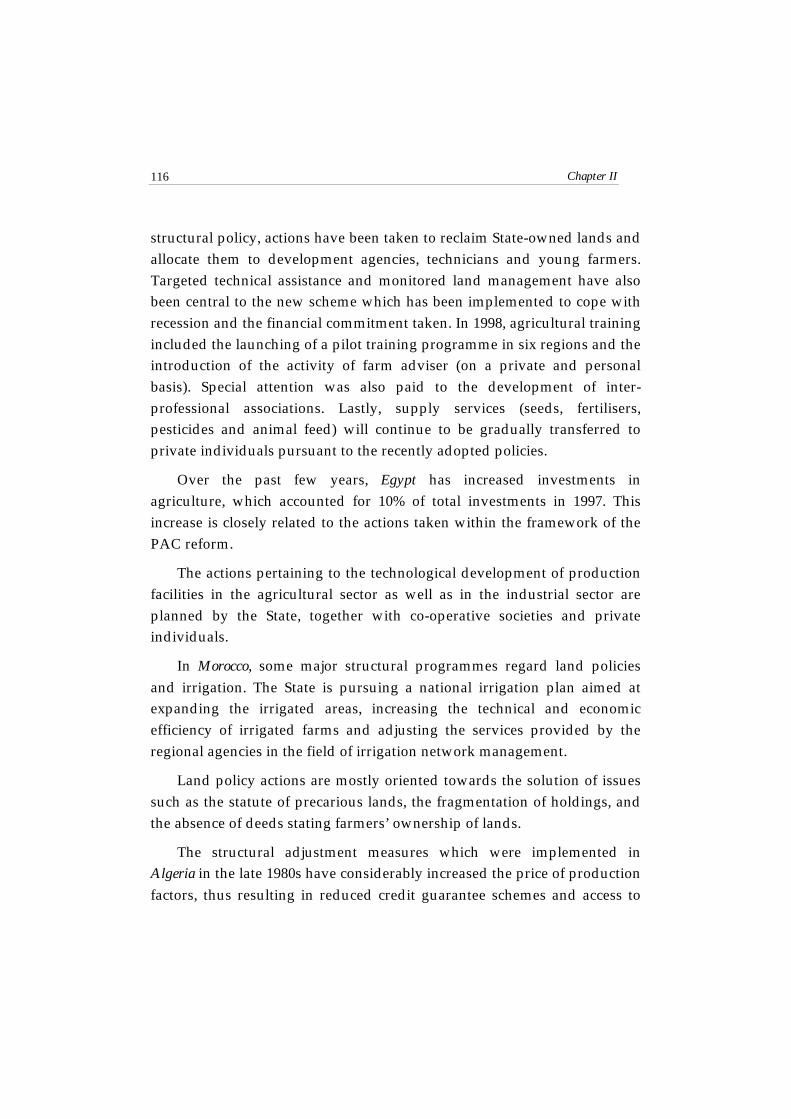
Chapter II116
structural policy, actions have been taken to reclaim State-owned lands andallocate them to development agencies, technicians and young farmers.Targeted technical assistance and monitored land management have alsobeen central to the new scheme which has been implemented to cope withrecession and the financial commitment taken. In 1998, agricultural trainingincluded the launching of a pilot training programme in six regions and theintroduction of the activity of farm adviser (on a private and personalbasis). Special attention was also paid to the development of inter-professional associations. Lastly, supply services (seeds, fertilisers,pesticides and animal feed) will continue to be gradually transferred toprivate individuals pursuant to the recently adopted policies.
Over the past few years, Egypt has increased investments inagriculture, which accounted for 10% of total investments in 1997. Thisincrease is closely related to the actions taken within the framework of thePAC reform.
The actions pertaining to the technological development of productionfacilities in the agricultural sector as well as in the industrial sector areplanned by the State, together with co-operative societies and privateindividuals.
In Morocco, some major structural programmes regard land policiesand irrigation. The State is pursuing a national irrigation plan aimed atexpanding the irrigated areas, increasing the technical and economicefficiency of irrigated farms and adjusting the services provided by theregional agencies in the field of irrigation network management.
Land policy actions are mostly oriented towards the solution of issuessuch as the statute of precarious lands, the fragmentation of holdings, andthe absence of deeds stating farmers’ ownership of lands.
The structural adjustment measures which were implemented inAlgeria in the late 1980s have considerably increased the price of productionfactors, thus resulting in reduced credit guarantee schemes and access to

Sectorial and national analyses 117
irrigation material. The focus is now on the reinforcement of theorganisation of the agricultural profession in order to establish closer linksbetween farmers and public authorities. Hence, some Sub-sector Councilshave been set up (that for “palm dates” in 1998) to help the Authoritiesplan policies to be implemented in the agri-industrial sub-sector.
In order to better identify the beneficiaries of State subsidies toagriculture, the Ministry of Agriculture adopted, in 1996, a regulationproviding the pre-requisites for qualifying as a farmer.
The budget to support agriculture accounts for 10% of total agriculturalproduction. Investments focus mainly on infrastructures, such as dams,collective irrigation networks, reforestation and desertification control. Thepublic investment aid policy includes financial aid at a variable rategranted through the National Fund for Agricultural Development andprivate investments to individual firms and co-operative societies toimprove production. However, this fund is scarcely used because of thereluctance of potential beneficiaries to provide financial statements anddata on the planned use of funds.
The main objective of the agricultural policy in Croatia is to change theagriculture structure, with the enlargement of family farms and incentivesto farmers to purchase or lease lands. But the lack of credit schemes and theunderdevelopment of the land market is slowing down the process. Theprevious economic system had fostered the self-management of collectiveenterprises. The privatisation of these enterprises remains a critical issue inthe Croatian economic transition. The privatisation process is far fromcomplete owing to objective constraints and the policies implemented sofar. The small size and scattering of family farms hinder any increases inproductivity and agricultural developments.
Political measures aimed at the improvement of the structure ofagriculture and the establishment of a solid economic background arebased (apart from the privatisation of collective farms and lands) on the

Chapter II118
reinforcement of a private marketing sector for inputs and agriculturalproducts, the suppression of monopolies, the improvement of co-operativemanagement, the introduction of a sustainable rural credit system and theallocation of subsidies to agriculture, including extension and marketresearch services. Efforts have been made so far, but progress is slow.
In Cyprus, the Government has initially focused on the development ofrural infrastructures - to spur on the development of irrigation projects -,income support, price guarantees on a product basis, the protection of non-competitive sectors (through import prohibition and quotas), and aid tofull-time and part-time farmers. Structural improvement has beenencouraged by rules and standards, lending schemes and a modestprogramme for land consolidation.
Within the development programmes, attention has been paid to cropproduction through incentives for early variety exports and high valueproducts compatible with the high local labour-costs. In the livestocksector, the emphasis has been mainly on the establishment of modern andviable units.
VIII. Rural development policies
Rural development and planning policies vary widely betweendeveloping and developed Mediterranean countries. In North Africa, theMiddle East and Southern Europe, agriculture remains the mainstay of thesocial and economic fabric. By contrast, in the Mediterranean developedcountries, agricultural activities and employment are losing much of theiroriginal importance.
In developing countries, rural planning and agricultural developmentare critical issues since very little if any non-agricultural activity existsowing to the lack of resources and facilities. But, since most of thepopulation lives in rural areas, rural development (both agricultural andnon-agricultural) plays a vital part in the fight against poverty. Hence, the

Sectorial and national analyses 119
Government has tried to expand the production capacity of agriculturethrough a sounder use of water and land resources and through ambitiousinvestment schemes aimed at boosting productivity. In most North Africanand Middle East countries, agricultural development is supported bypublicly funded irrigation projects, land reclamation works andprogrammes to foster rural settlement. Some countries have comprehensiveand well structured agricultural strategies whereas others focus mainly onwater management, the expansion of the agricultural potential or thedevelopment of agri-industry and marketing.
Conversely, in advanced countries, rural development is no longersynonymous with agricultural development as a result of thediversification of employment - only a small part of the total activepopulation works in rural areas. Hence, development policies in thesecountries aim at a broader spectrum of economic, social and environmentalobjectives.
As far as governmental measures are concerned, rural developmentimplies integrated projects rather than agricultural policies or developmentinstruments. The major concern is the establishment of a diversified ruraleconomy through aid to non-agricultural or agriculture-related activitiesand the implementation of institutional mechanisms that loosendevelopment constraints and release the endogenous developmentpotential in rural areas. The issue is particularly critical in extremely remoteareas or in those with low resource endowments. The question remains ashow to involve them in the general move towards the adjustment ofagriculture and the increased long-term viability of the sector and of itseconomic and social contribution to rural development.
A. Rural planning and development policies in selected Mediterraneancountries
In Egypt, land and water are the major limiting factors to ruraldevelopment. The Egyptian agricultural sector is fully conditional on the

Chapter II120
irrigation from the Nile. An extensive public system of delivery canalssupplies water to plots. Without this water distribution system not onlyfarming but also life would not be possible in Egypt. In order to control thegeographical distribution of water supply and to feed the canals, somedams have been built along the Nile over the past century. Additionaldams have been built over the past fifty years to increase storage capacityand water supply. Free of charge water supply to farmers has led to awasteful use of water - 98% of lands are flood irrigated and cause severeproblems of drainage, erosion and salinisation.
Efforts have also been made to favour the establishment of farmers inrural areas. It is the so-called “new land” policy, which complements theprevious “old land” policy, which had promoted agriculture along theNile. The region to the west of Nubaria is part of this land settlementproject. The Ministry of Agriculture has started a land reclamation processby allocating plots (2.1-2.4 ha per head) to first-time farmers oragronomists. Given the economic and social issues which the newcomersare confronted with, the need is felt to implement accompanyingprogrammes to help the establishment of new social infrastructures.
In Lebanon, the agricultural development plan addresses several keyissues, such as the management of agriculture, the marketing of inputs andagricultural products and the provision of agricultural credit. The planincludes the consolidation of water resources, irrigation projects, landreclamation, the development of human resources and the construction ofroads.
The plan is also aimed at promoting employment in less developedrural regions and increasing the productivity of agri-food systems throughan increase in value added.
The plan tackles issues that have been disregarded by the Governmentover the last decade - which had focused only on border protection

Sectorial and national analyses 121
measures - though these issues do not always fall within the scope of theMinistry of Agriculture.
For instance, water and irrigation management, agricultural productquality control, export promotion, agricultural product processing, themanagement of co-operative societies, tobacco production and subsidiesand agricultural teaching fall within the scope of various governmentalbodies or independent public agencies.
In Lebanon, the Ministry of Agriculture adopted a three-year plan (forthe period 1993-1995), the so called “Recovery Plan for The Reconstructionand the Development of the Lebanon” in order to cope with thedevastating state of agriculture brought about by more than 20 years ofpolitical and social insecurity. In 1997, the Ministry of Agricultureannounced the “Ministerial Working Programme till the Year 2000”.
Among the objectives of the programme there is the expansion of theagricultural area, through land reclamation and irrigation projects, to beimplemented through the Green Plan of the Ministry in co-operation withthe Council for Reconstruction and Development. Some additionalobjectives include the construction of roads and terraces to curtailproduction costs, the consolidation of water resources and the developmentof irrigation projects in co-operation with the Ministry of Electricity. Lastbut not least, a pilot project will be launched in a particular region toenhance the role of women in rural and agricultural development.
In Turkey, the rural development policy has a long history and ischaracterised by the planned development policy which was started in1963. Each five-year plan included goals and instruments to foster theagricultural and rural development. Over the last 30 years, many ruraldevelopment projects have been successfully implemented. Some of theprojects were funded through the Government budget or by internationalorganisations. Given the markedly agricultural character of most ruralregions, development projects have mainly focused on the increase in

Chapter II122
agricultural output, the development of trade in agricultural products, thepromotion of agri-food industries, the motivation of the rural populationand the improvement of infrastructures. A project has been launched in theSouth of Anatolia (the so called GAP11) to fuel the development in thesouth-east and in the country as a whole. The rural development policy isalso aimed at bridging the gulf between Eastern and Western regions.
Though Cyprus is a small island, its regions differ widely. There aresignificant disparities between urban areas (which are growing steadily)and rural areas (which show a 50% income gap), agriculture is the leadingactivity in rural areas, public services are inadequate, the road system ispoor and non-agricultural activities are rare.
Current policies have focused on rural development through villageimprovement programmes, but no targeted nor consistent plan has, so far,been launched. Despite its success, the rural development project fundedby the World Bank in 1980 in the mountainous region of Pitsila has notbeen repeated. However, the prospects for EU full membership and thosefor benefiting from structural and cohesion funds should promote furtherdevelopment actions in both urban and rural areas.
In Algeria, 1997 marked a turning point since rural development startedto be considered a priority by the Ministry for Regional Construction andDevelopment. Last year, the above Ministry together with the Ministry ofAgriculture implemented a development programme in three regions atrisk: arid areas, steppes and mountainous regions. The aim of the programwas to develop more than 630,000 ha to provide 500,000 jobs. The total costof the programme amounted to 83 billion DA for a period of 6 years.
In Tunisia, as well as in other North African countries, ruraldevelopment and planning has a long tradition. Rural development isfostered through agricultural development projects, the development of
11 Great Anatolian Project.
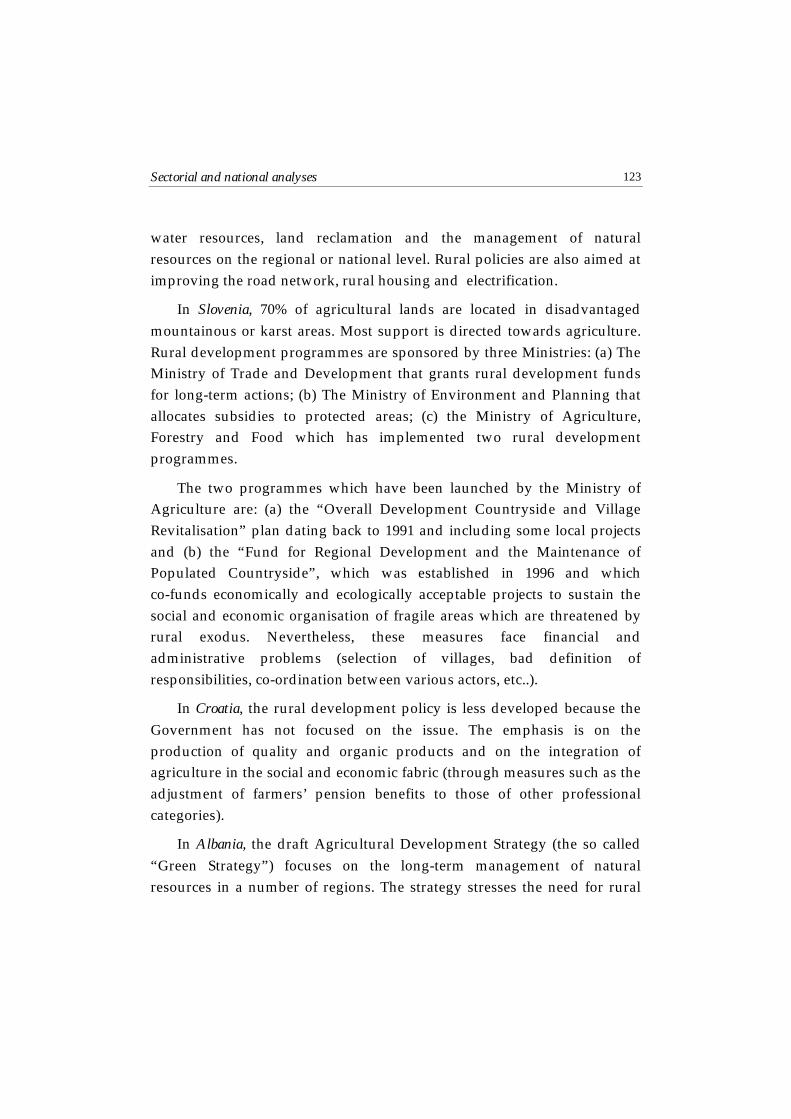
Sectorial and national analyses 123
water resources, land reclamation and the management of naturalresources on the regional or national level. Rural policies are also aimed atimproving the road network, rural housing and electrification.
In Slovenia, 70% of agricultural lands are located in disadvantagedmountainous or karst areas. Most support is directed towards agriculture.Rural development programmes are sponsored by three Ministries: (a) TheMinistry of Trade and Development that grants rural development fundsfor long-term actions; (b) The Ministry of Environment and Planning thatallocates subsidies to protected areas; (c) the Ministry of Agriculture,Forestry and Food which has implemented two rural developmentprogrammes.
The two programmes which have been launched by the Ministry ofAgriculture are: (a) the “Overall Development Countryside and VillageRevitalisation” plan dating back to 1991 and including some local projectsand (b) the “Fund for Regional Development and the Maintenance ofPopulated Countryside”, which was established in 1996 and whichco-funds economically and ecologically acceptable projects to sustain thesocial and economic organisation of fragile areas which are threatened byrural exodus. Nevertheless, these measures face financial andadministrative problems (selection of villages, bad definition ofresponsibilities, co-ordination between various actors, etc..).
In Croatia, the rural development policy is less developed because theGovernment has not focused on the issue. The emphasis is on theproduction of quality and organic products and on the integration ofagriculture in the social and economic fabric (through measures such as theadjustment of farmers’ pension benefits to those of other professionalcategories).
In Albania, the draft Agricultural Development Strategy (the so called“Green Strategy”) focuses on the long-term management of naturalresources in a number of regions. The strategy stresses the need for rural

Chapter II124
development policies which can fuel rural economic activities and off-farmincome in order to curb the growing rural exodus, especially inmountainous regions. The awareness of the issue and the widespreadconsensus gained are a promising starting point.
In the EU Member States (Greece, France, Italy, Portugal and Spain)rural development measures aim at accelerating the adjustment ofagricultural structures and promoting rural economy. Aid is given to lessfavoured areas through compensatory allowances to farmers to offsethigher production costs.
Some additional regional policies are included and sponsored by theStructural Funds in the Objective 1 and 5B regions. Under Objective 1,programmes are implemented through the European AgriculturalGuidance and Guarantee Fund (EAGGF). Some of these programmes aremulti-funded, which means they are funded by different structural funds.Among these programmes one can mention the “free-crop” conversionprogramme (Greece), a programme to develop Portuguese agriculture andseveral inter-regional and multi-funded projects in Italy and in France(Corsica and Overseas Departments). Some other initiatives promoted bythe Commission include INTERREG (cross-border co-operation andeconomic revitalisation of EU border regions), ENVIRE (improvement ofthe environment along coastal areas) and REGIS (socio-economicintegration of the most remote regions).
B. Agricultural and environmental policies
Growing attention is being paid to environmental issues byGovernments and international organisations. Soil erosion, desertification,irrigated land salinisation, over-exploitation of soils and water resourcesdue to crop-soil incompatibility problems and intensive land managementpractices are some of the major concerns in Southern Mediterraneancountries. On the other hand, landscape management and recreational useof land, bio-diversity and nature conservation, water quality and animal
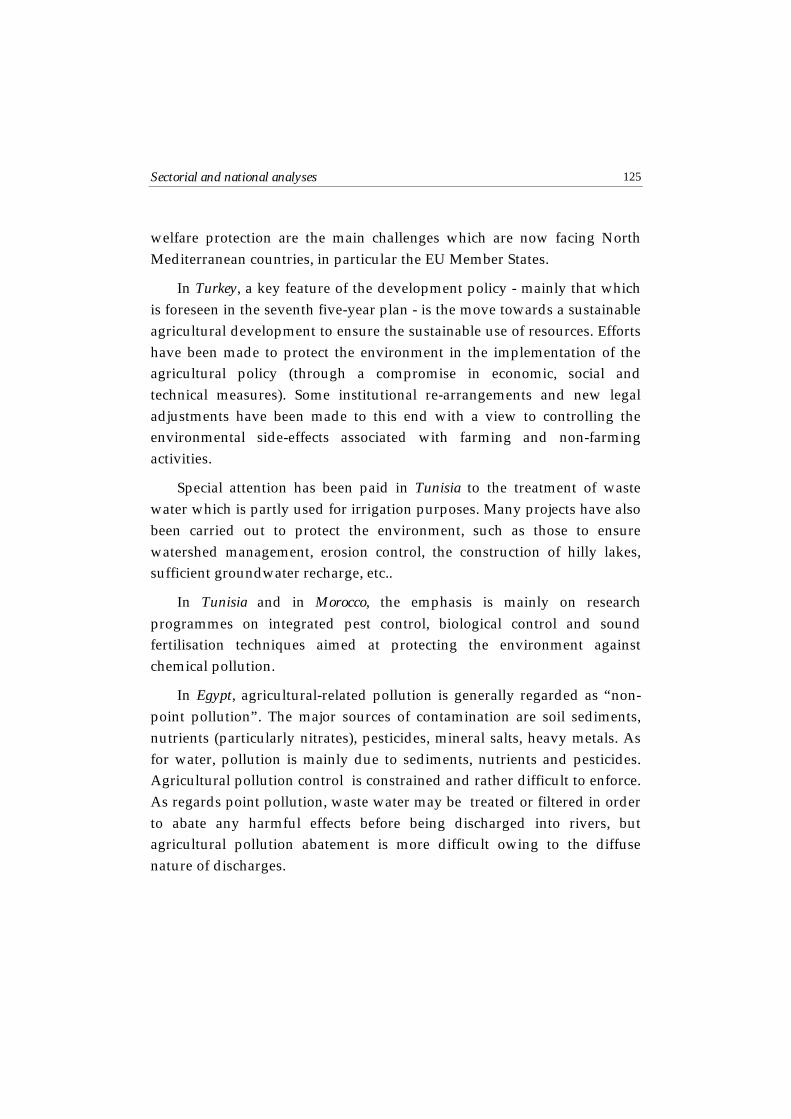
Sectorial and national analyses 125
welfare protection are the main challenges which are now facing NorthMediterranean countries, in particular the EU Member States.
In Turkey, a key feature of the development policy - mainly that whichis foreseen in the seventh five-year plan - is the move towards a sustainableagricultural development to ensure the sustainable use of resources. Effortshave been made to protect the environment in the implementation of theagricultural policy (through a compromise in economic, social andtechnical measures). Some institutional re-arrangements and new legaladjustments have been made to this end with a view to controlling theenvironmental side-effects associated with farming and non-farmingactivities.
Special attention has been paid in Tunisia to the treatment of wastewater which is partly used for irrigation purposes. Many projects have alsobeen carried out to protect the environment, such as those to ensurewatershed management, erosion control, the construction of hilly lakes,sufficient groundwater recharge, etc..
In Tunisia and in Morocco, the emphasis is mainly on researchprogrammes on integrated pest control, biological control and soundfertilisation techniques aimed at protecting the environment againstchemical pollution.
In Egypt, agricultural-related pollution is generally regarded as “non-point pollution”. The major sources of contamination are soil sediments,nutrients (particularly nitrates), pesticides, mineral salts, heavy metals. Asfor water, pollution is mainly due to sediments, nutrients and pesticides.Agricultural pollution control is constrained and rather difficult to enforce.As regards point pollution, waste water may be treated or filtered in orderto abate any harmful effects before being discharged into rivers, butagricultural pollution abatement is more difficult owing to the diffusenature of discharges.

Chapter II126
Agricultural pollution control measures must involve farmers. Somekey features can be identified in the role played by agriculture in waterpollution - the most important of which is that residues are unavoidableby-products of agriculture.
On the other hand, economic decisions which include crop rotation,changes in production practices or technological developments affect boththe composition and the timing of agricultural waste flows. And, lastly, theproduction process has an impact on water outflows (both in terms of spaceand time), which in turn affect the delivery and the transport of potentialloads.
Egyptians farmers have to apply fertilisers in order to offset the poorsilt content of soils. In the past, farmers used to rely heavily on Nile floodsto renew the lands and increase the silt content. However, the constructionof the High Dam in 1969 halted the flow of nutrient-rich silt and led to anincreasing demand in fertilisers with the corresponding sprouting ofdomestic fertiliser industries. Among the main plant nutrients (i.e.,nitrogen, phosphorus and potassium), nitrogen is the most widely appliedelement and accounts for 80% of total nutrient consumption. Fertiliser costsrepresent the most important expenditure item for crops. The budgetaryfertiliser price reform initiated in 1988 aimed at progressively reducingsubsidies to fertilisers. All budgetary subsidies to nitrogen and phosphatefertilisers were completely removed in July 1991 and nitrogen priceclimbed, while the aggregate nutrient consumption declined by 9.9% overthe 1991-1992 campaign against that in 1988-1989. The excessive use ofpesticides has had adverse effects on the quality of soil and water as well asdire consequences for the agricultural ecology and public health. Theintensive use of pesticides, especially in cotton pest control, has led to theproliferation of new pests. The number of cotton pest species soared from 8in 1965 to 14 in 1980.

Sectorial and national analyses 127
The introduction of vegetable crops in the inter-crop period hasallowed the polyphagous cotton worm and Helicoverpa armigera to maintaintheir population for two consecutive cotton crops. The increasing use ofpesticides has further worsened the problem. Pesticides, insecticides,herbicides, nematocides and fungicides are widely used in Egypt.Insecticides are the largest group of chemicals in use (65%-80% of which areapplied to cotton crops). Before the economic reforms, privately ownedcompanies were allowed to import and sell pesticides for non-traditionalcrops (mainly fruit and vegetables) at free market prices. Chemicals usedfor non-traditional crops were sold through 10 distributors, each with anetwork of dealers and technical advisers.
As far as traditional and strategic crops are concerned (cotton, rice,sugar cane and maize), the Ministry of Agriculture and Land Reclamation(MALR) provides some pesticides which have been purchased fromdomestic producers or importers. The Principal Bank for Development andAgricultural Credit (PBDAC) funds these purchases and stores thechemicals on behalf of MALR.
After the implementation of the reform programme, traditional cropsare no longer subject to governmental control. Pesticide distributors anddealers in the private sector have replaced the government in the supply ofpesticides and farmers have begun to increasingly apply pesticides totraditional crops, except for cotton. Hence, cotton production andmarketing have been liberalised, but pesticides to be used for cotton arestill State-controlled. Over the last five years, both consumption andimports of pesticides have fallen from 23.5 thousand tonnes in 1986 to 11.5thousand tonnes in 1991 and to 6.5/6.8 thousand tonnes in 1993 and 1994,respectively.
In Algeria, the environmental policy is continuing to develop. In theagricultural sectors, over the past few years, efforts have been made to halt
Chapter II128
the desertification process in the steppes, rainfall-related erosion and thedegradation of dams.
In Lebanon, the environmental policy remains a constant concern. Themain action was initiated in 1995, through a five-year reforestationprogramme of some 40,000 ha of land.
In Cyprus, the agricultural and environmental policies are included inthe Strategic Development Plan (1994-1998), which focuses mainly on:
support to farmers who apply eco-friendly methods, through incentives toreduce the use of fertilisers, promote organic farming, introduceextensive farm methods, reduce livestock concentrations, process pigwastes for energy purposes and preserve abandoned agriculturallands;
ecological control of prevention measures and sea contamination actionstaken by the Department of Fishery;
ecological monitoring of coastal areas (new species, impact of coastalinfrastructures, buildings, etc.);
improvement of forest fire fighting capability;
preparation and implementation of a plan to improve national forest parks.
Apart from the official policies, a national scheme is required tomanage groundwater quality and control pumping near coastal areas.

CHAPTER III


Tools and training programmes fortomorrow’s agricultural and agri-food
practitioners in the Mediterraneancountries: CIHEAM Contribution
Introduction
Over the past years, along with more macro-economic assistanceprogrammes, mostly implemented on a bilateral basis, EuropeanMediterranean countries, together with southern and easternMediterranean partners, have also promoted more co-operativeendogenous development programs, which have included measures tosupport training, research and, therefore, to sustain human capital.
Moreover, human development became, at the beginning of thenineties, an important policy alternative in reaction to the heavy nationalresource distribution incurred under stabilisation and structuraladjustment programmes.
Human development was meant as a tool to achieve “adjustmentprogrammes with a human face”.
Consequently, it became more evident that the existence of a highlyskilled and educated labour force would favour technology transfer and atthe same time this force would itself promote innovative technicalknowledge.
There are good reasons for considering new development trends in acommon framework.
The Barcelona Declaration of 1995 has established this commonframework in the building of an area of “shared wealth”.
Annexes132
Three major partnership areas were addressed by the said Declaration:policies and security issues, economic and financial co-operation and asocial and cultural development.
The latter action focuses also on the development of human capital andin particular on the support of decentralised co-operative programmes.
The development of human and scientific capacity in theMediterranean region has also, in the past thirty years, been a top priorityfor an international development organisation, namely the InternationalCentre for Advanced Mediterranean Agronomic Studies (CIHEAM).
In fact, CIHEAM, in pursuing its double role of Donor and ScientificPartner, has been an active promoter of human and social capitaldevelopment in the Mediterranean region.
Examination of existing higher education programmes and the futureneeds in the emerging Mediterranean labour markets, especiallyconcerning the agri-food sector, may result very valuable in designing newcapacity building programmes.
Prevailing disparate institutional developments and the setting of acommon framework must confront a crucial fact: labour markets andhigher education institutions, application of the new information andcommunication technology (ICT), differ across Mediterranean countries.
This observation has led CIHEAM to examine comparative labourmarkets and advanced agri-food training programmes and institutions inits Mediterranean member states.
This comparative exercise was carried out at an international seminar,“Advanced Training of Agricultural and Food Managers in the Countries of theMediterranean Area”, held in Istanbul, Turkey, November 9-11, 1998 whichmore specifically addressed the problem of interpreting the “Challenges tothe management of knowledge on the eve of the third millennium”.

Major indicators of agri-food development in Mediterranean and Arab countries 133
In this chapter the outcomes of this seminar will be extensively used toaddress problems and possible solutions for training tomorrow’sagricultural and agri-food practitioners.
I. Conventional paradigms
Agriculture and related higher education and research institutionsshare the same conventional interpretation on how their contributionaffects the economic development.
In the case of agriculture the prevailing view of its role in the economicdevelopment appears to be based on an incorrect interpretation of twoimportant facts regarding this sector as economic development proceeds(E.Schuh, 1997).
These two important factors are respectively the declining agriculturalshare of a nation gross domestic product (GDP) and the reduced share ofagricultural labour force as the economy develops.
On this matter, E. Schuh argues that policymakers and developersappear to conclude from these inevitable consequences of economicdevelopment that the way to promote economic development is to facilitatesuch long-term trends.
This is to concentrate on the symptoms or consequences ofdevelopment, in contrast to understanding the underlying economic andtechnological forces at work.
However, when we turn the attention to research and technologytransfer process in agriculture, it becomes apparent that agriculturaltechnology, in contrast to manufacturing technology, cannot be readilytransferred to developing economies, but must be adapted.
Adapting technologies and knowledge to the different agriculturalproduction systems, in the specific case of the Mediterranean region, or

Annexes134
elsewhere in developing countries, requires strong investments in researchand education, but also in holding a well-trained stock of human resources.
II. Non marketable public goods
Agriculture and its related higher education and research institutions,whether in developed or developing countries, are both promotingeconomic development even if their contribution to national wealthremains one of “the best kept secrets.”
In the case of agricultural research, for example, there is a consistentproduction of various outcomes, which are known as “non marketable publicgoods” such as knowledge, healthy food, environmental protection, etc.
Though considerably important matters, these outcomes are notquantitatively measurable in economic terms, and this in part explains whythe general public does not commonly understand them.
Instead, what it is more accountable to general public and policymakers is the growth of food imports in developing countries or theincrease in staple food stocks in developed countries.
This type of growth pattern, although deriving from general economicand/or population development, should advocate the cause of agricultureand related research and higher education institutions, but, instead, thesecontradictory outcomes in some cases contribute to diverting away nationalor international investments for agricultural research and related highereducation.
Nevertheless, in the last three decades developing nations haveinvested considerable resources in their higher education systemsincluding agriculture related programmes, often with the support ofexternal aid agencies.
In most countries of Northern Africa and the Middle East in the lastthree decades enrolment ratios have respectively increased from 1 to 10

Major indicators of agri-food development in Mediterranean and Arab countries 135
percent and from 8 to 16 percent. The European Mediterranean countriesinstead range from 26 to 41 percent.
As a result of their investments in higher education, Mediterraneancountries have established a comprehensive infrastructure for advancedtraining.
However, limited financial resources have hampered the developmentof a strong continuing education system, particularly in the countries of thesouthern and eastern Mediterranean rims.
III. Is higher education in crisis?
Despite the clear importance of higher education for economic growth andsocial development, investment in the sector is in crisis in industrial as well asdeveloping countries throughout the world. (The World Bank)
In all countries higher education is dependent on government funding.In a time of widespread fiscal constrains, industrial as well as developingcountries are grappling with the challenge on how to preserve or improvethe quality of higher education.
Increased competition of scarce public funds have reduced manygovernments’ capacity to support further public expenditures whichnegatively affected agricultural public spending and related highereducation teaching and research.
The decrease in resources has been particularly acute in Africa and inthe Middle East.
According to World Bank data, in the last decade public expendituresper student for higher education in the Middle East and Northern Africa,declined from 3.200 US. $ to 1.900 US $.
The Bank’s analyses by world regions, show that 66 percent of thelending for higher education in the past decade went to East and South
Annexes136
Asia, instead the Middle East and Northern Africa accounted together for7.8 percent, slightly higher than Europe and Central Asia but lower thenAfrica and Latin America respectively.
Reportedly, an expected effect of the accomplishment of the Euro-Mediterranean free trade area by 2010 will be the one of reducing the flowof money from custom duties and levies in each respective national budgetof non European Mediterranean countries.
There are some well-founded warnings that this reduced financial flowcould negatively affect also higher education and in this particular caseagricultural research.
In programming any future actions for networking and partnershipbetween southern and European Mediterranean countries, in the field ofagri-industrial higher education training and research, we do need tocarefully evaluate these types of economic externalities, and shape newfinancial instruments, in order to make financial sustainability ofagricultural higher education and research institutions a top priority.
IV. Non conventional paradigms
There is another aspect of economic development, which implies theconsideration, in the specific case of agriculture, of the increased share ofscience and economics required to farm today in a sustainable way. Thistrend can be applicable to European and non-European Mediterraneancountries.
This is the case of the so called Alternative Agriculture which representsnot a single production system, but the combinations of systems andpractices finely tuned to local ecological circumstances, replacing capitaland energy inputs with ”more information”, as well as more trained labourand time and management skills per unit of production than conventionalfarming.
Major indicators of agri-food development in Mediterranean and Arab countries 137
Flexibility and timing are accompanying practices towards careful soilpreparation (minimum tillage) and judicial application of pesticides atcritical stages.
Farming systems in the Mediterranean region are very specific andtherefore require substantial scientific, economic and technologicalknowledge accumulation in order to be more efficient and produce extrafood at low cost for the consumers.
In a such a context, even if conventional economic development trendsconfirm a lower share of the primary sector in a nation’s GDP, we need toconsider that successful economies are becoming “knowledge societies” andthus increasingly less materials and energy intensive.
These factors are being replaced with information and skill custom;tailored to specific situations and problems. Such an approach is revealingtechnology adaptive, local and particularised, depending more on organisinginformation to specific human and environmental needs. (B.Rich, 1994).
In this context it is critically important that training and researchprogrammes are well tuned to the evolving demands of the economy.
V. Social and information capital
The emerging notion of social capital extends the conventionalunderstanding of “co-operation” or collaboration and provides a link withthe economic concept of “capital”, pertinently indicating the investment orgrowth potential of groups’ abilities to work jointly.
The latter concept identifies also the structure created fromcollaborative effort as capital.
Well functioning partnership, consortia and networks are in andthemselves “a form of social capital”(J.E. Fountain, 1997).

Annexes138
How and what can we define for social capital? Like “physical capitaland human capital- tools and training that enhance individualproductivity- “social capital” refers to features of social organisation, suchas networks, norms and trust, that facilitate co-ordination and co-operationfor mutual benefit” (J.E. Fountain, 1997).
However, the featuring of networks is also meant to provide decision-makers with important information, which cannot be replaced only byusing Internet.
In fact, collaborative networks are performing the critical function ofscreening for accuracy, importance and implications.
Although open access to information, principally through the use ofInternet is an important asset for networks, the derived information capitalis not a replacement for social capital.
It is evident that social capital increases the ability to build and useinformation capital because trustful relationships increase informationflows and bring added value to information.
Reportedly, academic literature is raising the question whether theexplosive growth of Internet use and information technologies would reallymake distance and time constraints virtually meaningless.
However, the research evidence, especially on industry networks, isthat learning and information sharing is not regardless of the geographicproximity, but is actually an important component of networks.
For this reason, geographic regions that include highly adaptivenetworks have been also described as “learning regions”.
Referring to the specific case of the Mediterranean area, we could alsoapply the definition of learning region, and in order to enhance educationand training at all levels and to make the network of libraries andinformation services available throughout the region we must promote notonly investments in hardware components, but more on software andelectronically supported institutional building.

Major indicators of agri-food development in Mediterranean and Arab countries 139
III-1 Social and information capital interaction scheme
Source: CIHEAM
*IRR: Internal Rate of Revenue
HUMAN CAPITALIRR INCREASE OFPHYSICAL CAPITAL(INVESTMENTS)
Training, Research,Transfer (Extension),Co-operation
SOCIAL CAPITAL
(Networks)
Networking and use of ICTUniversities, Private Education Centres
(Industries and Tutors)
Annexes140
VI. Case study: CIHEAM’s Regional Action Programme (RAP)
There is a lack of shared vision between Mediterranean policy partnerson the direction and implications of the many factors impinging on thedevelopment of a true regional programme in areas such as agriculture andthe management of renewable natural resources, and no formal agreementon how can we be more fully integrated into decision making andoperational mechanisms of the process.
However, as the pace of technological change has intensified, as naturalresources have become more scarce, and as information technologies havemade linkages among geographically dispersed actors commonplace, thepredominant centralised form of economic and scientific co-operation hasbeen changing.
Actors in collaborative networks show an efficient form of collectivelearning. They learn of and about new technologies, opportunities andchallenges more quickly because of the strong interaction within thenetwork.
Based on latter assumption, the recent initiative of CIHEAM and theEuropean Commission to design and finance jointly a four-year (1998-2002)Regional Action Programme (RAP), is directed at building a sound anddecentralised regional co-operation in the agricultural sector on training,promotion of research and communication of scientific and technicalinformation in the context of economic transition.
This programme not only relies on a sound institutional partnership,moving away from core institutional funding into programme coresponsorship, but also encourages the support of networks of learning andinnovation.
Major indicators of agri-food development in Mediterranean and Arab countries 141
This new RAP, which is also the result of a fruitful collaborationbetween CIHEAM and the European Commission in a previous four yearprogramme (1993-1997), has involved CIHEAM, through its four sub-centres located in Spain, France, Italy and Greece, in successfullydeveloping training programmes which address subjects relevant to NonCommunity Mediterranean Countries (NCMC).
In fact, this programme through a series of short courses, traineemobility programmes and co-operative research has helped to provideskills to trainees and enabled them to participate effectively and integrateinto national management of renewable natural resources and agriculturaland agri-industrial activities.
The fundamental objective of the RAP will be attained through thecreation of four partnership programmes on joint regional activitiescovering themes such as Water and Irrigation management, Rain-fedagriculture, Food and Agricultural Policy and Utilisation and Conservationof Renewable Natural Resources.
However, the implementation of the RAP will involve two distinctphases. The first one (1998-2000) will consist in supporting post graduatetraining through 12 short courses per year, by promoting and financing co-operative research which will capitalise on eight currently existing thematicnetworks. It will also favour mobility of trainees (16 scholarships per year),the preparation of seminars, both for policy makers and science relatedactors, the organisation of studies such as the use of biotechnology or onthe aspects concerning disease free plants legislation in the Mediterraneanregion, and some logistic support measures aiming at the purchasing oflaboratory consumable goods.
The second phase (2000-2002) will be characterised by actions aiming atthe support of training and mobility as in the first phase, but also atlaunching network research projects, studies and training on the effects ofthe Euro- Mediterranean free trade zone and at managing a performant
Annexes142
communication system to improve the access and flow of informationbetween Mediterranean private and public stakeholders.
Activities will be geared to assisting in the creation of a Mediterraneansphere of joint actions on political, administrative and economic issues onthese themes, through improved partnership between countries of theNorthern, Southern and Eastern littorals.
However, the indigenous capacity for training and research is anecessary but not sufficient condition for higher education to contribute togrowth. (The World Bank).
Through the implementing of the RAP, CIHEAM will concur incomplementing such a mechanism by promoting a better use of thescientific and technical potential of tertiary institutions.
Such mechanisms include close links with industry in advancedtraining courses, co-operative research programmes, consultancies, andcontinuing education programs.
The implementation of this programme will also mean adaptingexisting CIHEAM activities to agreed regional priorities, fosteringcapitalisation on infrastructural investments which already exist in theregion and enhancing any possible action favouring the improvement ofSouth-South co-operation.
Furthermore, measures to enhance national capacity building willinclude specific aid on policy and to decision-makers in order to enlightenpolicy issues concerning the establishment of the Euro-Mediterranean freetrade zone by 2010.

Major indicators of agri-food development in Mediterranean and Arab countries 143
III-2. Budget Allocation
Budget allocation percentages show an important component of theRAP on training, mobility and co-operative research; in fact, as whole, theyrepresent 70 percent of the total budget.
The financing of this programme amounts at 10 million ECU’s, ofwhich, 6 million have been provided by the European Commission et theremaining 4 million by CIHEAM.
A series of impacts or results are expected through the different phasesof the programme. The creation of these RAP’s for selected themes, willresult in a better understanding of regional planning and implementation
15%
40%15%
30%
Training & Mobility Co-operative research
Studies & Aid to Decision Makers Logistic Support & Other
Annexes144
of collaborative continuing education and research networks; in theincreasingly efficient south-south and north-south Mediterranean regionalco-operation and information exchanges; and on the improvement of themodalities of economic transition through better understanding and co-ordination of regional economies and compatible marketing of agriculturalproducts.
Bearing in mind that the Mediterranean economic environment isaffected by scarce financial resources, which is also limiting the formationof human capital, by the modest size of labour markets and the difficulty totake advantage of economies of scale, the only way to maintain a cost-effective training and research programmes may be to organise them on aregional basis.
A. Adapting training programmes to tomorrow’s needs
According to a World Bank study, graduate unemployment indeveloping countries rose sharply during the 1980s and continues to rise.This reflects principally the sluggish growth of aggregate demand forhighly skilled labour and the diminished role of the public sector as themain employer of university graduates.
It is commonly agreed that in general higher education and trainingsystems in most Mediterranean countries are centrally managed and aretherefore facing some difficulties in adapting training programmes tolabour market changes.
Lower responsiveness to adopt or to adapt programmes and training isalso linked to the fact that current labour markets, mostly in publicemployment, are influenced by mechanisms which rely on specific jobfunctions linked to the university degree and seniority.
In other words the system is still driven by the duality “universitydegree-job career”, instead of shifting to the new concept of “knowledge- jobcareer”.

Major indicators of agri-food development in Mediterranean and Arab countries 145
This job development patterns are more typical of the civil servicerather that the modern enterprise.
A recent study of the Institut de la Mediterranée12, France, shows thatin the emerging Mediterranean countries, compared to other emergingcountries, there is an increasing number of students in social and humansciences.
Despite a relative exception for Jordan and Algeria, in Morocco forexample, law and social and economic science students represent morethan 60 percent of university enrolments.
In Egypt about 70 percent of university students are enrolled in humanand economic sciences studies of which only 23 percent in accounting andmanagement programmes.
Almost all Mediterranean countries show low rates of studentenrolment for technological and science subjects; in the United Kingdomthe social sciences account for 44% of enrolment, in Germany 40%, in Italy58%, and in Spain 54 %.
Reportedly, the expected demand increase for engineers and scientist,due to a fast and global technological transfer, may not be met by the shortsupply of scientists and engineers in the Mediterranean region, which willnegatively affect the region development patterns.
Indeed, today there are only 0,5 scientists and high tech experts every1000 habitants in Tunisia and 0,8 in Egypt, compared to 2,3 and 1,6 in theKorea and China respectively.
It is evident from these data that the gap existing in the Mediterraneanregion concerning science and technology and the emerging sector ofservices should be inverted or at least reduced.
12 La Méditerranée aux portes de l’an 2000 sous la direction de Jean-Louis Reiffers
Editions ECONOMICA, 1997
Annexes146
Teaching and training programmes as well as continuing educationshould be more consistent with those changes in labour markets andtherefore include knowledge from high tech sectors (like EDP,telecommunication, etc) and to develop also knowledge on selfempowerment and problem solving.
B. Advanced training for agricultural and food managers
In a world where continuing education becomes an important asset fornational economic development, and where obtaining a university degreedoes not empower the person for a pre determined professional career, itbecomes necessary to rethink our strategies and to design new trainingprogrammes which will eventually integrate different disciplines thattoday are not necessarily linked together.
In fact, there is clear evidence that agricultural practitioners oragricultural entrepreneurs will require a more inter disciplinary knowledgein order to carry out their work. They will need to couple advancedtechnical knowledge and management, but also to include problem solvingapproaches and use of modern information and communication in order toimprove their networking activities.
However, it is also necessary to have Universities that are more open tothese changes, which reflect the actual economic context, and that canfoster the flow of information and collaboration with the businesscommunities.
As economic and technological changes demand the Institutional actorsto be more adaptable or flexible, an inter-governmental organisation,namely CIHEAM, with its double role as Donor and Scientific partner mustalso englobe these changes and provide and adapt new training inputs.
There are also a number of questions arising from this new economiccontext which involve the activities of CIHEAM in the field of continuingeducation and its complementarity to national programmes.

Major indicators of agri-food development in Mediterranean and Arab countries 147
These questions refer in particular to how new technologies andknowledge will be integrated into the training process; what role could beplayed by agri industrial business communities, particularly as regardsnew training systems, what type of network co-operation should beestablished among development, financial and scientific institutionalactors.
To analyse and provide some answers to these questions CIHEAM hasorganised an international seminar on “Advanced training of agricultural andfood managers in the countries of the Mediterranean area”, which gatheredtogether about seventy experts from the Mediterranean countries reflectinga diversity of economic and institutional contexts, such as representativesfrom universities, international development and financial institutions,leading business operators in the field of agri-industry, agriculturalmanagers from public and private sectors and representatives of theMediterranean farming community.
The seminar which lasted two and half days enabled the participants toprovide analysis and answers to a set of question around four major topicsand organised through five round tables, each animated by a facilitator.
These four major topics were centred on 1) new job descriptions and newprofessions, 2) future training operators and new programmes, 3) new pedagogicalapproaches: tools and methods, 4) new forms of co-operation: networks, andconstituted a framework where a series of questions have been addressedand to which all participants contributed to the answers.
Pertinently, the analysis of the answers to the first topic reveals that,the future outlook for professions in the agri-food sector shows a movetowards an increase in demand for project or financial managers with asound knowledge of agri-industry investment policies, project financing, aswell as for specialists in marketing and also innovation processes andscience based extension agents.

Annexes148
The required professional skills will focus more on relationship andcommunication abilities, technical competence and capability to analysecomplex situations and solve them using network activities.
With reference to the second topic there was a clear emergence of arequest to adapt training programmes to user’s needs coupled withflexibility, multi-disciplinarity and to integrating theory and practice better.
In fact, the new programmes should well combine academic andprofessional skills, public and private institutions inputs and reach asubstantial degree of international and inter-regional co-operation.
The outcomes regarding the new pedagogical approaches haverevealed the emergence of an extended use of modern information andcommunication technologies (ICT) as a tool to support network activitiesand institutional building, to tailor customer programmes using a multisources expertise and to reduce cost of teaching per trainer.
Apart from the relevant use of ICT in formulating the newprogrammes, there is also the necessity to change pedagogical approaches,which should move more towards tutorship and counselling rather thanthe conventional academic trainer, and also foster practical training(learning by doing) and associating group interactive learning tools.
An important component of the updating process for any trainingactivity is the aspect of co-operative. Among the Mediterranean partnersthere is a clear need to establish educational consortia between private andpublic institutions in order to link training activities and research to speedup technological changes and increase the effects of training and researchon innovation. Through co-operative actions there could be established, forexample, an observatory on labour markets in the field of agronomicsciences and agro-industry to plan training programmes better.
However, besides the willingness and necessity to co-operate in orderto reach better economies of scale and institutional complementarities,

Major indicators of agri-food development in Mediterranean and Arab countries 149
there are also some constrains which are linked to the limited human andfinancial resources in the south and in the east of the Mediterranean area,to institutional and individual inertia, and to difficulties in co-ordination.
VII. Future perspectives
The major outcomes of the seminar will contribute in designing newdevelopment patterns for CIHEAM and also for national or internationalinstitutions involved in the governance of co-operative and regionalcontinuing education programmes.
These new patterns will require CIHEAM to build a mid term workplan which will include new learning tools and programmes, to adaptsupply of tools and training programmes to the emerging demand and tocontinue to serve as a catalyst for the Mediterranean region.
However, all participants at the seminars stressed the strongemergence of ICT and the expected advantages of application of newinformation and communication technologies to structure learning systems.
Considering this new working context and the increasing need tocouple economy of scale with the widespread diffusion of knowledge , aMediterranean “Virtual University” (MVU) could be envisaged to face thesenew challenges.
Based on the previous concept of learning regions the MVU could be aconcrete tool in the creation of common regional continuing educationprogrammes between the two rims.
Furthermore, the MVU could capitalise on existing institutional andexpert networks fostered by CIHEAM, in order to produce a pilotprogramme for distance learning, or CD-ROM’s to support short courseswithin a continuing education framework or even supporting the distanttutoring of doctorates and research theses.

Annexes150
Any new action or training programme, whether with conventional ordistance tools, should consider, basically, two working schemes.
In fact, addressing the typical university and post graduate trainingwill mean adapting to a strong demand for long courses stated by degreessuch as Masters or PhD; instead any specialised training, within acontinuing education framework, will require a strong correlation withlabour markets.
Nevertheless, combining the two systems will not prevent aninstitution such as CIHEAM from working alongside national systems andwill not reduce complementarity and flexibility, which are both needed toface quick technological changes.
However, the new working environment will involve operating more,with the co-operation of four CIHEAM training institutes, within an openinstitutional and expert network and to constantly screen and evaluate thepertinence of the training programmes.
In recalling these perspective remarks from Mr. Jean-Claude Flamant,President of CIHEAM Scientific Advisory Committee, it is worth pointingout the three attitudes actors will have to adopt to face the future.
These are listed as passive, anticipatory or pro-active.
Any pro-active actions refer to the actor as initiator of changes in hiseconomic and human environment.
However, in a world where the future is very uncertain and where allthe dynamic is towards globalisation, it is commonly agree that only byusing locally specific resources , will actors be pro-active in building theirfuture.
Translating this pro-active attitude to CIHEAM, we shall consider thelatter as an active partner for the Mediterranean actors and as a specificresource for this region of the world.
Major indicators of agri-fooddevelopment
in Mediterranean and Arabcountries

Annexes152
Major indicators of agri-food development in Mediterranean and Arab countries 153
Introduction
The following statistical section briefly summarises the majorindicators of agri-food development in Mediterranean and Arab countries.
Data are based on population growth, economy, resources, productionfactors, consumption and international trade.
Given the poor availability of data in most of the above countries andfor comparative purposes, the selection of indicators was confined to thosewhich are closely related to population growth, urbanisation, globaleconomic and agricultural growth, food consumption and internationaltrade.
Methodological notes
1. Data source
Agricultural statistics (land use, production and trade) have beencompiled by the UN Food and Agriculture Organisation (FAO). Data havebeen gathered by official bodies in different countries and complemented,if necessary, by FAO projections based on temporary or unofficialinformation.
Macro-economic data about the population, national budgets, theglobal trade, etc.. have been derived from the UN statistics published inyearbooks (statistical, national budget, population growth andinternational trade yearbooks) or in publications edited by the World Bandor the IMF.
Annexes154
2. Geographical breakdown
In order to facilitate the analysis, the following geographical groupingshave been suggested and are illustrated in the various tables. They willhelp compare data flows analysed for the Mediterranean, the Northern andSouthern areas and the Arab countries.
Mediterranean: Algeria, Albania, Bahrein, Bosnia and Herzegovina,Croatia, Cyprus, France, Former Yugoslavian Macedonia, Greece, Iraq,Israel, Italy, Jordan, Kuwait, Lebanon, Libya, Malta, Morocco, Oman,Portugal, Qatar, Saudi Arabia, Slovenia, Syria, Tunisia, Turkey, UnitedArab Emirates, Yemen, and Yugoslavia.
Northern Mediterranean: Albania, Bosnia and Herzegovina, Croatia,Cyprus, France, Former Yugoslavian Macedonia, Greece, Italy, Malta,Portugal, Slovenia, Spain, Turkey and Yugoslavia.
Southern Mediterranean: Algeria, Bahrein, Egypt, Iraq, Israel, Jordan,Kuwait, Lebanon, Libya, Morocco, Oman, Qatar, Saudi Arabia, Syria,Tunisia, United Arab Emirates and Yemen.
Arab countries: the whole Southern Mediterranean except for Israel, plusfour Non-Mediterranean Arab countries: Djibouty, Mauritania, Somaliaand Sudan.
3. Classification of countries in the tables:
Geographical groupings: World, Mediterranean, Northern Mediterranean,Southern Mediterranean, Arab countries.
Mediterranean EU Member States: France, Greece, Italy, Portugal andSpain.
Other Northern Mediterranean countries: Albania, Bosnia andHerzegovina, Croatia, Cyprus, Macedonia, Malta, Slovenia, Turkey andYugoslavia.
Major indicators of agri-food development in Mediterranean and Arab countries 155
Maghreb countries: Algeria, Libya, Morocco and Tunisia.
Other Southern Mediterranean countries: Bahrein, Egypt, Iraq, Israel,Jordan, Kuwait, Lebanon, Oman, Qatar, Saudi Arabia, Syria, UnitedArab Emirates and Yemen.
Other non-Mediterranean Arab countries: Djibouti, Mauritania, Somaliaand Sudan.
Place of the Mediterranean in the World.
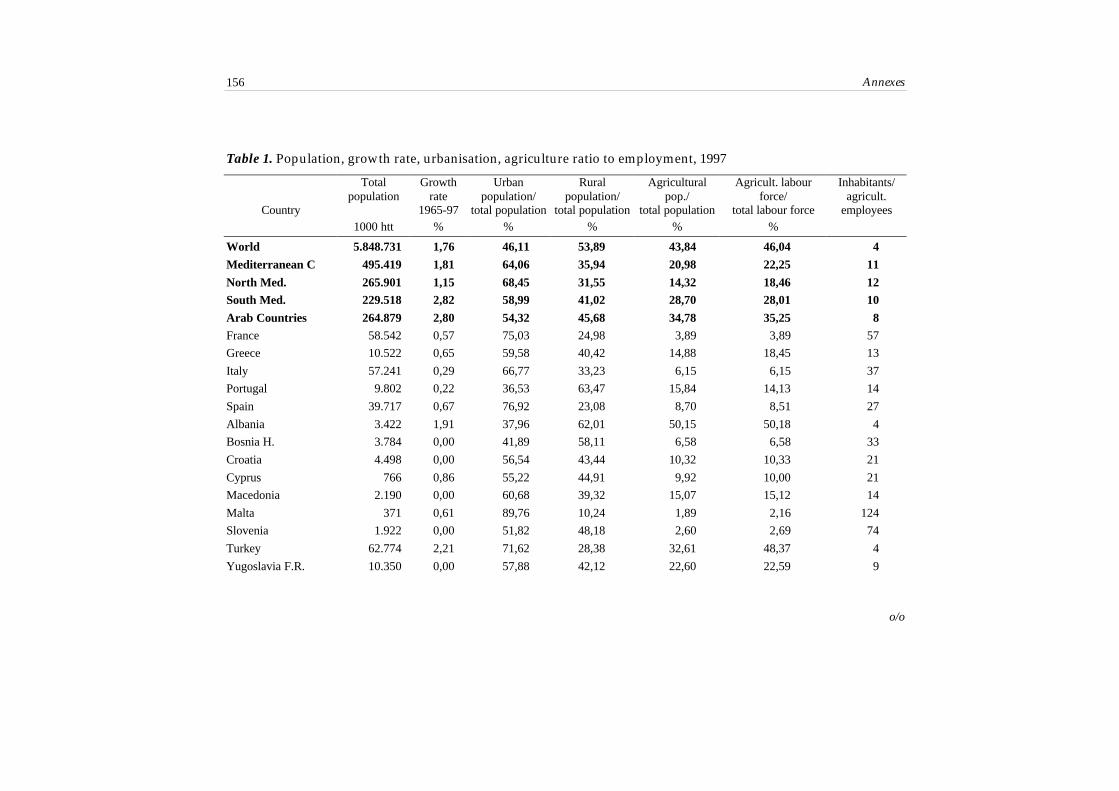
Annexes156
Table 1. Population, growth rate, urbanisation, agriculture ratio to employment, 1997
Totalpopulation
Growthrate
Urbanpopulation/
Ruralpopulation/
Agriculturalpop./
Agricult. labourforce/
Inhabitants/agricult.
Country 1965-97 total population total population total population total labour force employees1000 htt % % % % %
World 5.848.731 1,76 46,11 53,89 43,84 46,04 4
Mediterranean C 495.419 1,81 64,06 35,94 20,98 22,25 11
North Med. 265.901 1,15 68,45 31,55 14,32 18,46 12
South Med. 229.518 2,82 58,99 41,02 28,70 28,01 10
Arab Countries 264.879 2,80 54,32 45,68 34,78 35,25 8
France 58.542 0,57 75,03 24,98 3,89 3,89 57
Greece 10.522 0,65 59,58 40,42 14,88 18,45 13
Italy 57.241 0,29 66,77 33,23 6,15 6,15 37
Portugal 9.802 0,22 36,53 63,47 15,84 14,13 14
Spain 39.717 0,67 76,92 23,08 8,70 8,51 27
Albania 3.422 1,91 37,96 62,01 50,15 50,18 4
Bosnia H. 3.784 0,00 41,89 58,11 6,58 6,58 33
Croatia 4.498 0,00 56,54 43,44 10,32 10,33 21
Cyprus 766 0,86 55,22 44,91 9,92 10,00 21
Macedonia 2.190 0,00 60,68 39,32 15,07 15,12 14
Malta 371 0,61 89,76 10,24 1,89 2,16 124
Slovenia 1.922 0,00 51,82 48,18 2,60 2,69 74
Turkey 62.774 2,21 71,62 28,38 32,61 48,37 4
Yugoslavia F.R. 10.350 0,00 57,88 42,12 22,60 22,59 9
o/o
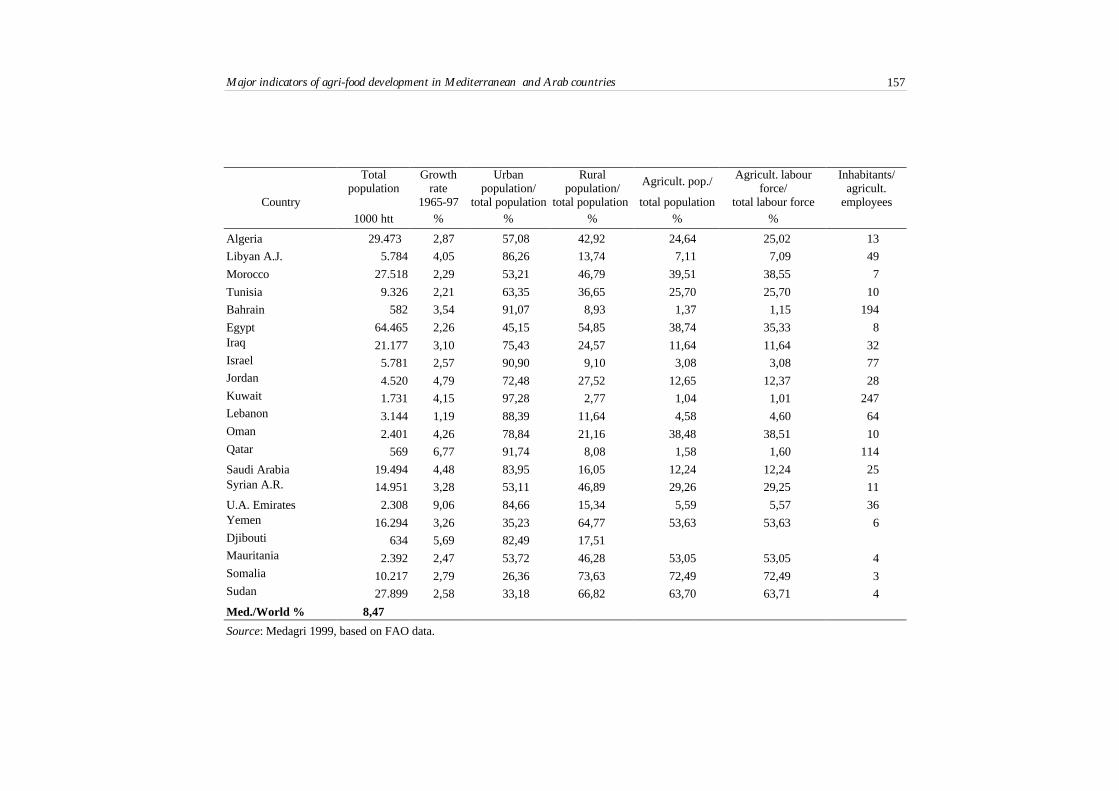
Major indicators of agri-food development in Mediterranean and Arab countries 157
Totalpopulation
Growthrate
Urbanpopulation/
Ruralpopulation/
Agricult. pop./ Agricult. labourforce/
Inhabitants/agricult.
Country 1965-97 total population total population total population total labour force employees1000 htt % % % % %
Algeria 29.473 2,87 57,08 42,92 24,64 25,02 13
Libyan A.J. 5.784 4,05 86,26 13,74 7,11 7,09 49
Morocco 27.518 2,29 53,21 46,79 39,51 38,55 7
Tunisia 9.326 2,21 63,35 36,65 25,70 25,70 10
Bahrain 582 3,54 91,07 8,93 1,37 1,15 194
Egypt 64.465 2,26 45,15 54,85 38,74 35,33 8Iraq 21.177 3,10 75,43 24,57 11,64 11,64 32Israel 5.781 2,57 90,90 9,10 3,08 3,08 77Jordan 4.520 4,79 72,48 27,52 12,65 12,37 28Kuwait 1.731 4,15 97,28 2,77 1,04 1,01 247Lebanon 3.144 1,19 88,39 11,64 4,58 4,60 64Oman 2.401 4,26 78,84 21,16 38,48 38,51 10Qatar 569 6,77 91,74 8,08 1,58 1,60 114
Saudi Arabia 19.494 4,48 83,95 16,05 12,24 12,24 25Syrian A.R. 14.951 3,28 53,11 46,89 29,26 29,25 11
U.A. Emirates 2.308 9,06 84,66 15,34 5,59 5,57 36Yemen 16.294 3,26 35,23 64,77 53,63 53,63 6Djibouti 634 5,69 82,49 17,51Mauritania 2.392 2,47 53,72 46,28 53,05 53,05 4Somalia 10.217 2,79 26,36 73,63 72,49 72,49 3Sudan 27.899 2,58 33,18 66,82 63,70 63,71 4
Med./World % 8,47
Source: Medagri 1999, based on FAO data.

Annexes158
Table 2. Gross Domestic Product, economic growth, agriculture ratio to the GDP
Year GDP Growth rate GDP GDPagricultural /
AgriculturalGDP/.
AgriculturalGDP/
Exchange
Country 1990-95 GDP agricultemployee
inhabitant rate *
millions $ % $ % $ $ MU p 1 $
France 1997 1.394.127 1,00 23.814 2 27.309 476 5,84
Greece 1997 120.948 1,10 11.495 7 10.371 816 273,06
Italy 1997 1.145.382 1,00 20.010 3 22.126 600 1.703,10
Portugal 1996 107.133 0,80 10.923 3 4.162 295 154,24
Spain 1997 531.289 1,10 13.377 3 10.939 401 146,41
Albania 1995 2.192 1,40 648 56 1.453 363 92,70
Bosnia H.
Croatia 1995 18.081 4.014 12 9.907 482 5,23
Cyprus 1996 8.873 8,91 11.736 5 10.791 528 0,47
Macedonia 1994 2.720 1.271 50,00
Malta 1997 3.323 1,17 8.956 4 38.765 313 0,39
Slovenia 1996 18.859 9,98 9.802 5 36.267 490 135,36
Turkey 1996 176.218 3,20 2.852 16 1.997 456 81.405,00
Yugoslavia F.R.
Algeria 1995 41.158 0,10 1.464 13 2.279 190 47,66
Libyan A.J. 1992 30286 6.206 6 16.049 385 0,30
Morocco 1997 33.276 1,20 1.209 14 1.121 169 9,53
Tunisia 1997 19.004 3,90 2.038 14 2.949 289 1,11
Bahrain 1996 5.361 4,93 9.405 1 21.444 113 0,38
o/o

Major indicators of agri-food development in Mediterranean and Arab countries 159
Year GDP Growth rate GDP/caput GDPagricultural /
AgriculturalGDP/.
AgriculturalGDP/
Exchange
Country 1990-95 GDP agricultemployee
inhabitant rate *
millions $ % $ % $ $ MU p 1 $
Egypt 1997 75.502 1,30 1.171 20 1.786 234 3,39
Iraq
Israel 1997 97.930 6,40 16.940 9 117.516 1.525 3,45
Jordan 1996 7.259 8,20 1.662 8 3.585 133 0,71
Kuwait 1996 30.984 12,20 18.366 1 35.411 147 0,30
Lebanon 1995 11.143 3.703 10 22.740 370 1.621,40
Oman 1997 16.153 6,00 6.728 11 7.360 760 0,38
Saudi Arabia 1995 125.266 1,70 6.862 6 8.777 377 3,75
Qatar 1995 7.515 0,84 13.714 1 15.030 137 3,64
Syrian A.R. 1996 59.922 7,40 4.112 11 4.695 432 11,23
U.A. Emirates 1996 44.620 19.743 2 13.944 395 3,67
Yemen 1995 4.790 319 22 387 70
Djibouti 1995 495 824 3 26 1,00
Mauritania 1995 904 4,00 398 27 419 107 151,85
Somalia
Sudan 10
* MU p 1 $ = ... national monetary unit per 1 US $.
Source: Medagri 1999, based on IMF, World Bank, FAO and national data.

Annexes160
Table 3. Cultivated areas, irrigated areas, means of production, 1996
Arable land & Cultivated areas Cultivated areas per Irrigated areas/ Cultivated areas Fertilizers perCountry permanent crops per 1000 htt agricultural employee cultivated areas per tractor cultivated areas
1000 ha ha ha % ha/tract. kg/ha
World 1.508.824 262 1,2 17,16 53
Mediterranean C. 133.244 278 2,8 20,58 21 108
North Med. 87.393 335 3,8 16,48 15 131
South Med. 45.851 209 1,8 28,39 86 64
Arab Countries 59.914 238 1,7 25,06 119 48
France 19.493 334 19,0 8,36 14 252
Greece 3.961 378 4,6 33,53 12 138
Italy 10.768 188 6,5 25,17 6 175
Portugal 2.900 296 4,3 21,79 14 88
Spain 20.129 507 14,6 17,52 19 91
Albania 702 206 0,8 48,43 64 16
Bosnia H. 650 0,31 17 8
Croatia 1.233 274 4,1 0,00 318 141
Cyprus 143 189 4,1 27,97 6 197
Macedonia
Malta 11 59 0,1 9,09 20 91
Slovenia 288 150 6,7 0,69 3 243
Turkey 27.115 439 1,9 15,44 32 63
Yugoslavia F.R.
Algeria 8.029 279 3,7 6,91 82 6
Libyan A.J. 2.115 378 24,3 22,22 53 49
o/o
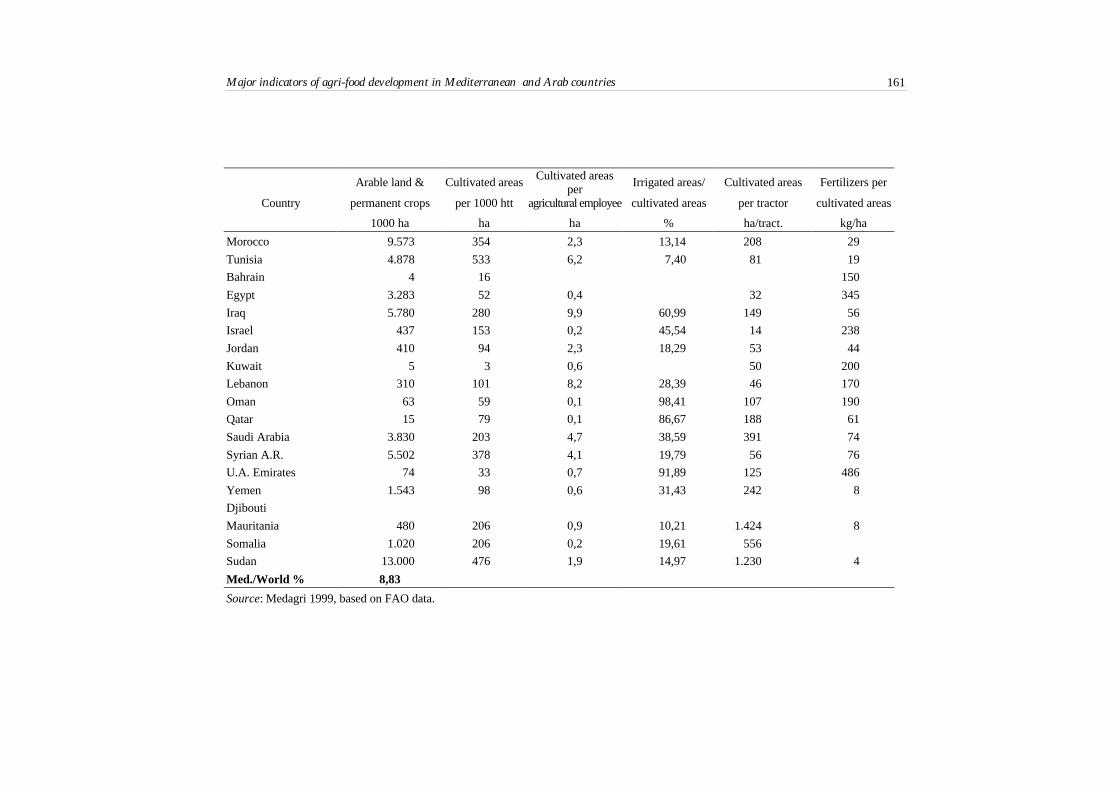
Major indicators of agri-food development in Mediterranean and Arab countries 161
Arable land & Cultivated areas Cultivated areasper
Irrigated areas/ Cultivated areas Fertilizers per
Country permanent crops per 1000 htt agricultural employee cultivated areas per tractor cultivated areas
1000 ha ha ha % ha/tract. kg/ha
Morocco 9.573 354 2,3 13,14 208 29
Tunisia 4.878 533 6,2 7,40 81 19
Bahrain 4 16 150
Egypt 3.283 52 0,4 32 345
Iraq 5.780 280 9,9 60,99 149 56
Israel 437 153 0,2 45,54 14 238
Jordan 410 94 2,3 18,29 53 44
Kuwait 5 3 0,6 50 200
Lebanon 310 101 8,2 28,39 46 170
Oman 63 59 0,1 98,41 107 190
Qatar 15 79 0,1 86,67 188 61
Saudi Arabia 3.830 203 4,7 38,59 391 74
Syrian A.R. 5.502 378 4,1 19,79 56 76
U.A. Emirates 74 33 0,7 91,89 125 486
Yemen 1.543 98 0,6 31,43 242 8
Djibouti
Mauritania 480 206 0,9 10,21 1.424 8
Somalia 1.020 206 0,2 19,61 556
Sudan 13.000 476 1,9 14,97 1.230 4
Med./World % 8,83
Source: Medagri 1999, based on FAO data.
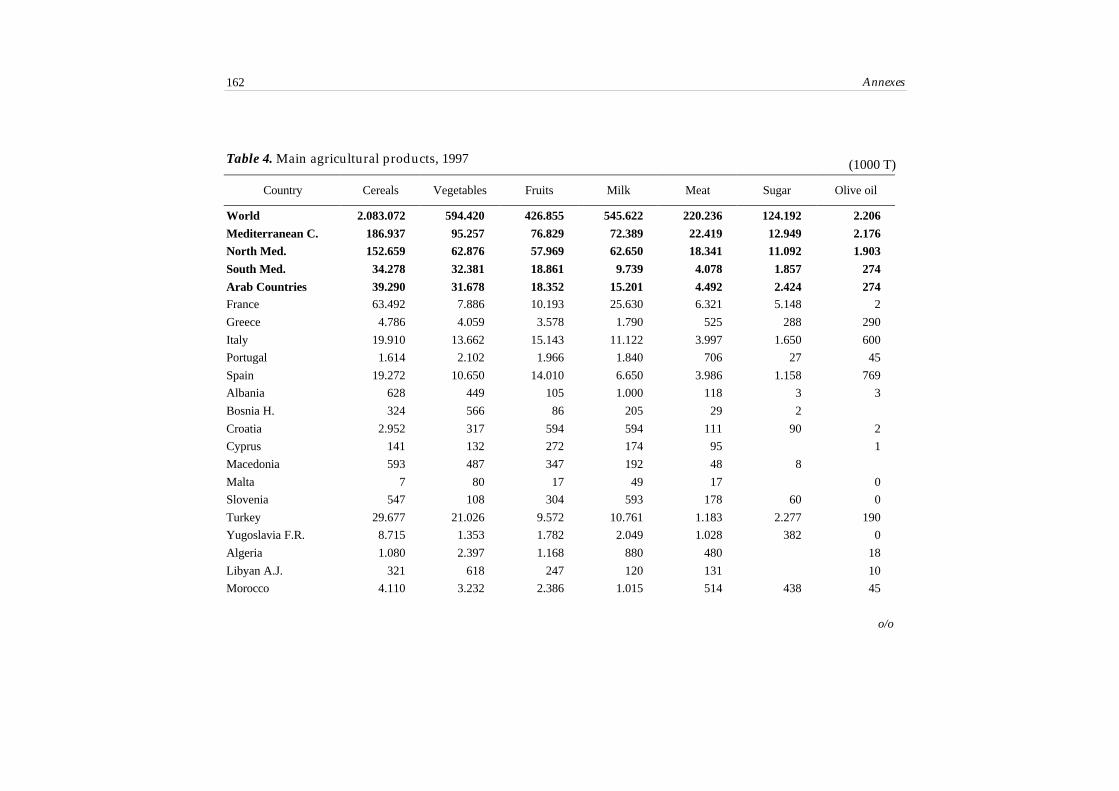
Annexes162
Table 4. Main agricultural products, 1997
Country Cereals Vegetables Fruits Milk Meat Sugar Olive oil
World 2.083.072 594.420 426.855 545.622 220.236 124.192 2.206
Mediterranean C. 186.937 95.257 76.829 72.389 22.419 12.949 2.176
North Med. 152.659 62.876 57.969 62.650 18.341 11.092 1.903
South Med. 34.278 32.381 18.861 9.739 4.078 1.857 274
Arab Countries 39.290 31.678 18.352 15.201 4.492 2.424 274France 63.492 7.886 10.193 25.630 6.321 5.148 2
Greece 4.786 4.059 3.578 1.790 525 288 290
Italy 19.910 13.662 15.143 11.122 3.997 1.650 600
Portugal 1.614 2.102 1.966 1.840 706 27 45
Spain 19.272 10.650 14.010 6.650 3.986 1.158 769
Albania 628 449 105 1.000 118 3 3
Bosnia H. 324 566 86 205 29 2
Croatia 2.952 317 594 594 111 90 2
Cyprus 141 132 272 174 95 1
Macedonia 593 487 347 192 48 8
Malta 7 80 17 49 17 0
Slovenia 547 108 304 593 178 60 0
Turkey 29.677 21.026 9.572 10.761 1.183 2.277 190
Yugoslavia F.R. 8.715 1.353 1.782 2.049 1.028 382 0
Algeria 1.080 2.397 1.168 880 480 18
Libyan A.J. 321 618 247 120 131 10
Morocco 4.110 3.232 2.386 1.015 514 438 45
o/o
(1000 T)

Major indicators of agri-food development in Mediterranean and Arab countries 163
Country Cereals Vegetables Fruit Milk Meat Sugar Olive oil
Tunisia 1.105 1.795 835 632 183 37 100
Bahrain 13 25 20 13
Egypt 17.650 11.505 5.781 2.761 979 1.230
Iraq 2.211 2.916 1.474 337 120 2
Israel 152 1.798 1.584 1.170 285 0
Jordan 98 1.186 393 153 112 14
Kuwait 2 86 2 38 62
Lebanon 74 967 1.244 187 80 22 7
Oman 5 167 202 83 27
Qatar 4 43 14 27 20
Saudi Arabia 2.530 2.395 1.041 588 589
Syrian A.R. 4.282 1.964 1.691 1.466 258 128 80
U.A. Emirates 7 775 303 60 82
Yemen 646 526 471 200 145
Djibouti 0 22 12 8
Mauritania 155 9 38 299 58
Somalia 303 73 206 2.220 154 18
Sudan 4.706 990 831 4.101 479 549
Med./World % 8,97 16,03 18,00 13,27 10,18 10,40 98,68
Source: Medagri 1999, based on FAO data.
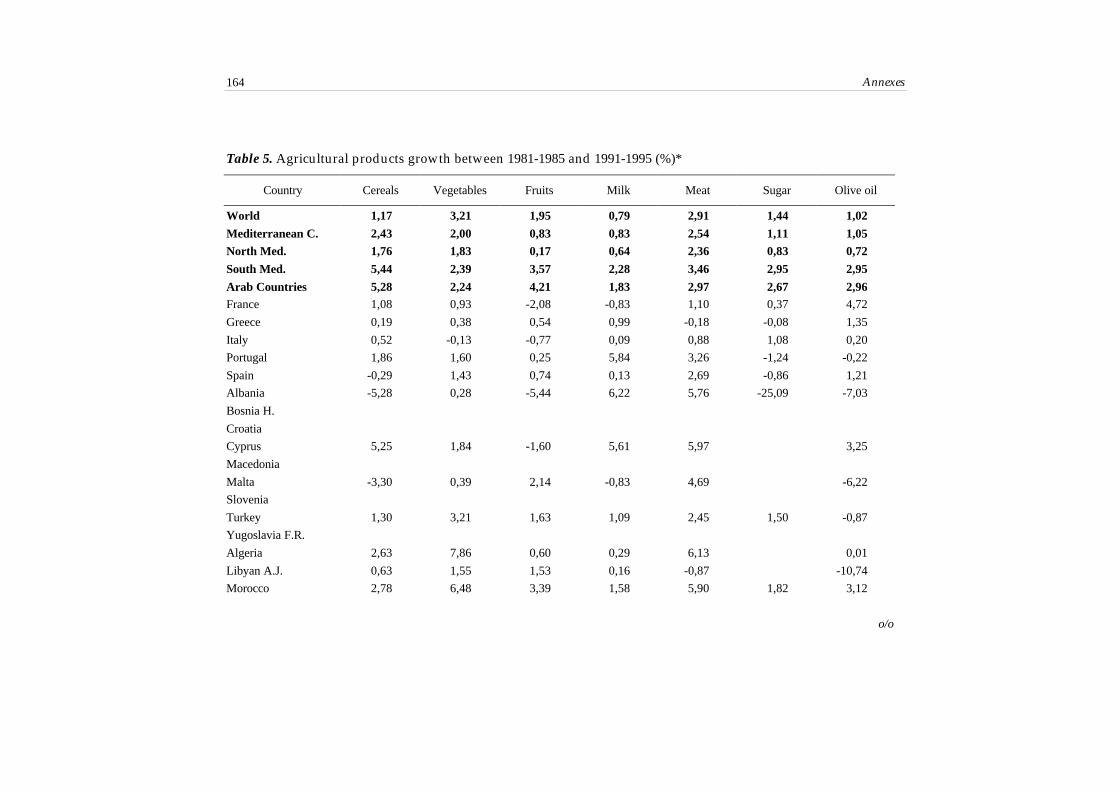
Annexes164
Table 5. Agricultural products growth between 1981-1985 and 1991-1995 (%)*
Country Cereals Vegetables Fruits Milk Meat Sugar Olive oil
World 1,17 3,21 1,95 0,79 2,91 1,44 1,02
Mediterranean C. 2,43 2,00 0,83 0,83 2,54 1,11 1,05
North Med. 1,76 1,83 0,17 0,64 2,36 0,83 0,72
South Med. 5,44 2,39 3,57 2,28 3,46 2,95 2,95
Arab Countries 5,28 2,24 4,21 1,83 2,97 2,67 2,96France 1,08 0,93 -2,08 -0,83 1,10 0,37 4,72
Greece 0,19 0,38 0,54 0,99 -0,18 -0,08 1,35
Italy 0,52 -0,13 -0,77 0,09 0,88 1,08 0,20
Portugal 1,86 1,60 0,25 5,84 3,26 -1,24 -0,22
Spain -0,29 1,43 0,74 0,13 2,69 -0,86 1,21
Albania -5,28 0,28 -5,44 6,22 5,76 -25,09 -7,03
Bosnia H.
Croatia
Cyprus 5,25 1,84 -1,60 5,61 5,97 3,25
Macedonia
Malta -3,30 0,39 2,14 -0,83 4,69 -6,22
Slovenia
Turkey 1,30 3,21 1,63 1,09 2,45 1,50 -0,87
Yugoslavia F.R.
Algeria 2,63 7,86 0,60 0,29 6,13 0,01
Libyan A.J. 0,63 1,55 1,53 0,16 -0,87 -10,74
Morocco 2,78 6,48 3,39 1,58 5,90 1,82 3,12
o/o

Major indicators of agri-food development in Mediterranean and Arab countries 165
Country Cereals Vegetables Fruit Milk Meat Sugar Olive oil
Tunisia 1,81 3,56 3,41 5,83 2,82 8,22 4,39
Bahrain 4,66 3,59 9,88 3,28
Egypt 5,80 1,83 6,19 2,63 4,36 3,87
Iraq 3,64 -0,02 2,88 -3,54 -7,55 -15,37
Israel -1,49 4,65 -2,99 2,93 2,37 -1,85
Jordan 3,87 5,41 10,80 12,37 6,97 7,61
Kuwait 2,34 1,58 0,45 -4,82 -3,23
Lebanon 10,65 7,98 5,19 3,48 0,56 7,85 -2,35
Oman 12,40 -1,30 4,28 4,88 4,65
Qatar 14,15 9,40 2,92 14,47 6,14
Saudi Arabia 16,36 5,56 4,46 6,98 7,40
Syrian A.R. 6,95 -5,80 4,82 1,83 0,78 1,15 4,11
U.A. Emirates 3,09 8,44 12,83 6,43 6,37
Yemen 1,52 2,87 6,55 3,29 2,58
Djibouti 7,89 1,18 4,68 3,91 11,61
Mauritania 9,52 2,24 4,00 2,13 1,10
Somalia -4,82 4,72 0,67 -1,55 0,73 -7,63
Sudan 4,38 0,96 0,40 3,30 0,22 2,51
* Annual mean growth rate between the means of 1981-85 and 1991-1995.
Source: Medagri 1999, based on FAO da
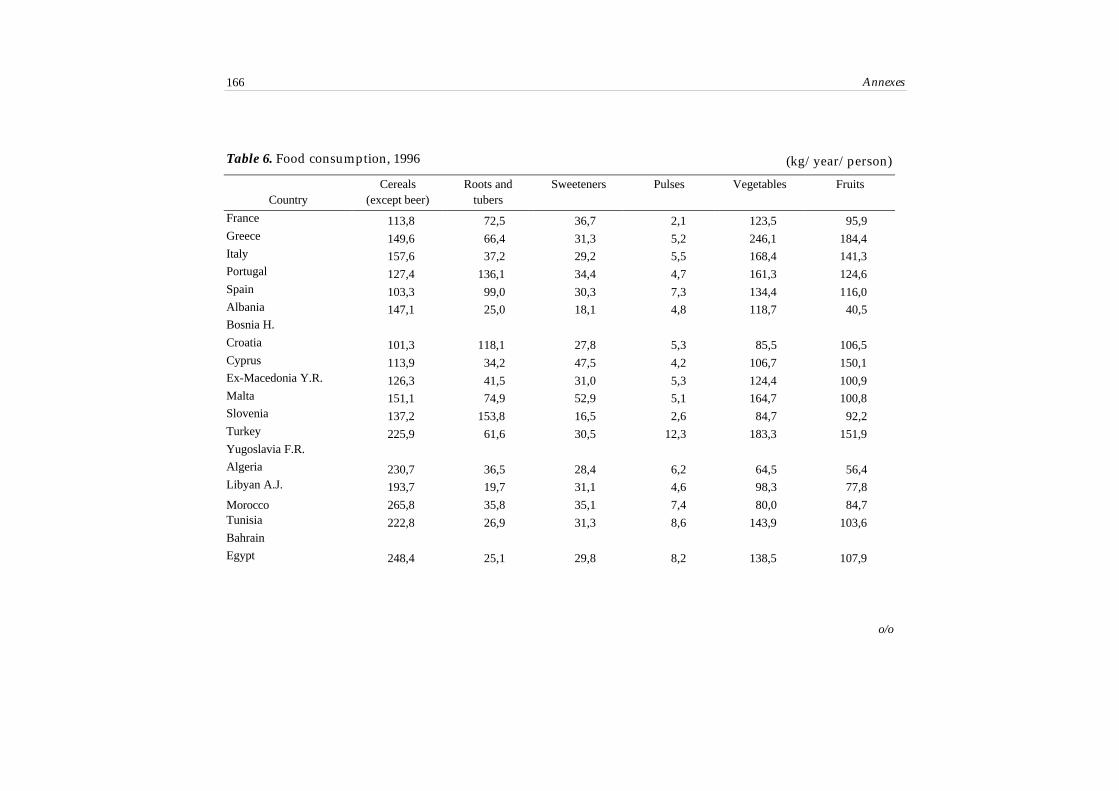
Annexes166
Table 6. Food consumption, 1996
Cereals Roots and Sweeteners Pulses Vegetables FruitsCountry (except beer) tubers
France 113,8 72,5 36,7 2,1 123,5 95,9Greece 149,6 66,4 31,3 5,2 246,1 184,4Italy 157,6 37,2 29,2 5,5 168,4 141,3Portugal 127,4 136,1 34,4 4,7 161,3 124,6Spain 103,3 99,0 30,3 7,3 134,4 116,0Albania 147,1 25,0 18,1 4,8 118,7 40,5Bosnia H.
Croatia 101,3 118,1 27,8 5,3 85,5 106,5Cyprus 113,9 34,2 47,5 4,2 106,7 150,1Ex-Macedonia Y.R. 126,3 41,5 31,0 5,3 124,4 100,9Malta 151,1 74,9 52,9 5,1 164,7 100,8Slovenia 137,2 153,8 16,5 2,6 84,7 92,2Turkey 225,9 61,6 30,5 12,3 183,3 151,9Yugoslavia F.R.
Algeria 230,7 36,5 28,4 6,2 64,5 56,4Libyan A.J. 193,7 19,7 31,1 4,6 98,3 77,8
Morocco 265,8 35,8 35,1 7,4 80,0 84,7Tunisia 222,8 26,9 31,3 8,6 143,9 103,6Bahrain
Egypt 248,4 25,1 29,8 8,2 138,5 107,9
o/o
(kg/year/person)
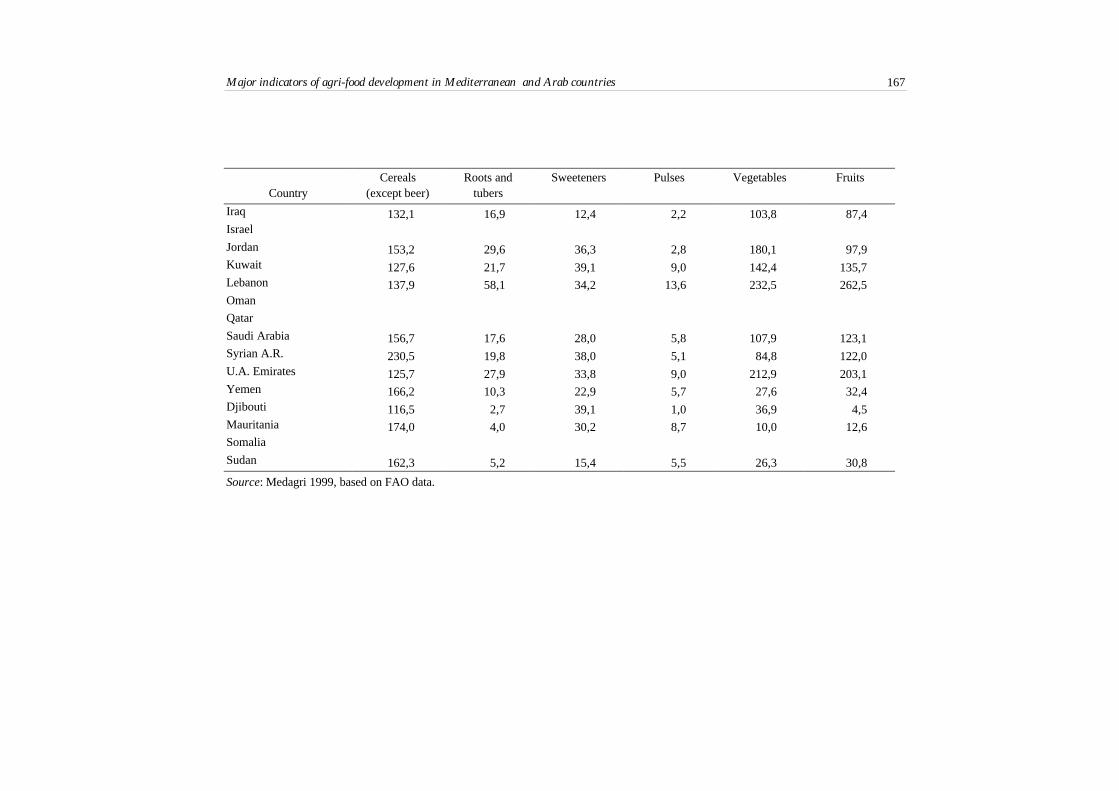
Major indicators of agri-food development in Mediterranean and Arab countries 167
Cereals Roots and Sweeteners Pulses Vegetables FruitsCountry (except beer) tubers
Iraq 132,1 16,9 12,4 2,2 103,8 87,4Israel
Jordan 153,2 29,6 36,3 2,8 180,1 97,9Kuwait 127,6 21,7 39,1 9,0 142,4 135,7Lebanon 137,9 58,1 34,2 13,6 232,5 262,5Oman
Qatar
Saudi Arabia 156,7 17,6 28,0 5,8 107,9 123,1Syrian A.R. 230,5 19,8 38,0 5,1 84,8 122,0U.A. Emirates 125,7 27,9 33,8 9,0 212,9 203,1Yemen 166,2 10,3 22,9 5,7 27,6 32,4Djibouti 116,5 2,7 39,1 1,0 36,9 4,5Mauritania 174,0 4,0 30,2 8,7 10,0 12,6Somalia
Sudan 162,3 5,2 15,4 5,5 26,3 30,8
Source: Medagri 1999, based on FAO data.

Annexes168
Table 6a. Food consumption, 1996
Country Meat Fish and Milk Oils Alcoholicsea food (except butter) and fats beverages
France 101,2 27,9 256,2 35,2 109,0Greece 80,3 25,6 239,8 30,8 59,7Italy 84,3 23,1 254,2 34,9 79,5Portugal 84,1 58,7 175,6 30,1 137,9Spain 99,7 37,1 161,1 30,8 108,5Albania 38,0 1,1 300,0 11,4 20,0Bosnia H.
Croatia 30,7 3,4 161,3 13,4 112,4Cyprus 111,6 19,8 202,4 19,1 59,1Macedonia 44,6 3,2 90,2 14,4 38,3Malta 81,4 35,7 200,0 21,1 60,0Slovenia 100,1 5,9 205,7 21,4 150,8Turkey 20,7 9,4 143,6 21,0 11,9Yugoslavia F.R.
Algeria 19,8 3,9 92,9 18,0 3,5Libyan A.J. 23,6 5,5 75,4 29,9 0,0
Morocco 16,4 8,2 29,4 15,1 6,2Tunisia 20,3 7,7 73,7 20,1 7,0Bahrain
Egypt 17,5 6,6 38,4 9,8 0,7
o/o
(kg/year/person)
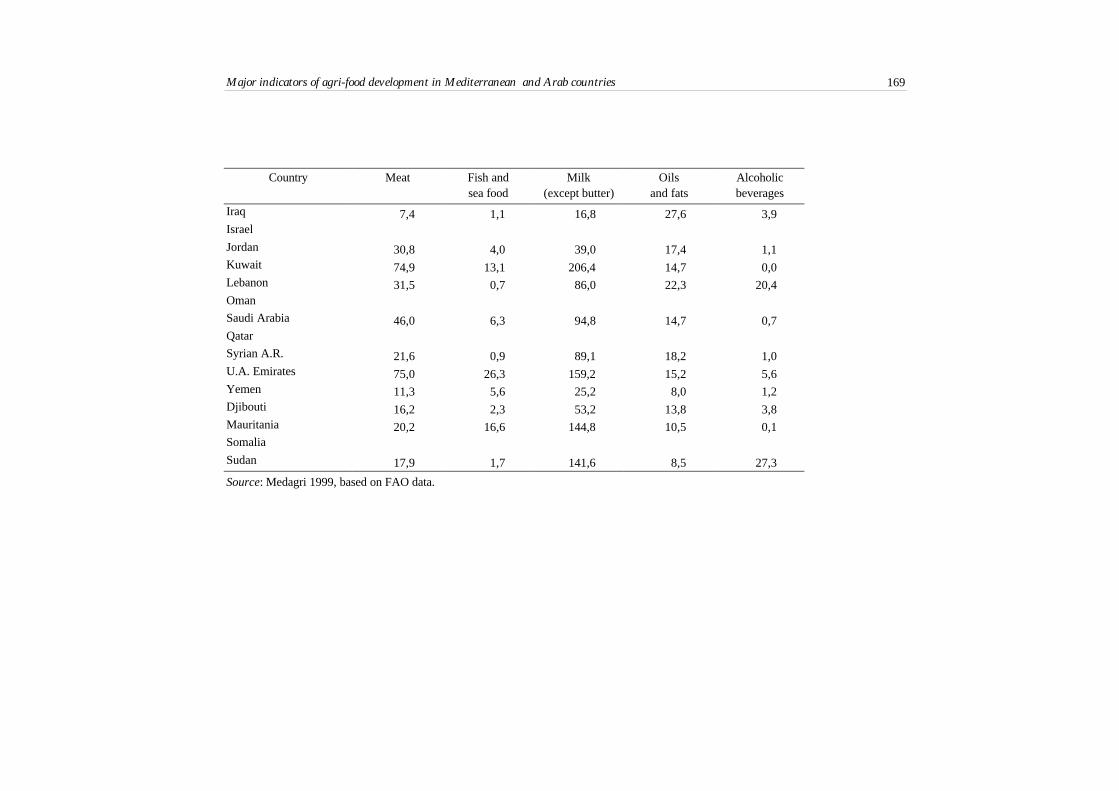
Major indicators of agri-food development in Mediterranean and Arab countries 169
Country Meat Fish and Milk Oils Alcoholicsea food (except butter) and fats beverages
Iraq 7,4 1,1 16,8 27,6 3,9Israel
Jordan 30,8 4,0 39,0 17,4 1,1Kuwait 74,9 13,1 206,4 14,7 0,0Lebanon 31,5 0,7 86,0 22,3 20,4Oman
Saudi Arabia 46,0 6,3 94,8 14,7 0,7Qatar
Syrian A.R. 21,6 0,9 89,1 18,2 1,0U.A. Emirates 75,0 26,3 159,2 15,2 5,6Yemen 11,3 5,6 25,2 8,0 1,2Djibouti 16,2 2,3 53,2 13,8 3,8Mauritania 20,2 16,6 144,8 10,5 0,1Somalia
Sudan 17,9 1,7 141,6 8,5 27,3
Source: Medagri 1999, based on FAO data.

Annexes170
Table 7. International trade of agricultural products as part of the total trade, 1996
Total Total Agricultural Agricultural (AE-AA)/
imports TI exports TE imports AI exports AE (AE+AI) AE / AI AI / TI AE / TE
Country (ET-IT)/ (AE-AI)/
(ET+IT) (AE+AI)
millions $ millions $ millions $ millions $ % % % % % %
Mediterranean C. 924.164 921.373 109.297 89.676 -0,15 99,70 -9,86 82,05 11,83 9,73
North Med. 751.948 732.697 82.495 84.100 -1,30 97,44 0,96 101,95 10,97 11,48
South Med. 172.216 188.675 26.803 5.576 4,56 109,56 -65,56 20,80 15,56 2,96
Arab Countries 144.675 170.862 25.500 5.145 8,30 118,10 -66,42 20,17 17,63 3,01France 292.936 304.699 27.619 40.402 1,97 104,02 18,79 146,28 9,43 13,26
Greece 26.935 11.243 3.867 3.657 -41,10 41,74 -2,79 94,57 14,36 32,53
Italy 206.788 250.776 25.571 16.889 9,61 121,27 -20,45 66,05 12,37 6,73
Portugal 34.145 23.453 4.315 1.487 -18,56 68,69 -48,73 34,47 12,64 6,34
Albania 876 270 310 20 -52,86 30,84 -87,69 6,56 35,43 7,54
Spain 121.911 102.129 13.160 14.964 -8,83 83,77 6,42 113,71 10,79 14,65
Bosnia H. 348 4 -97,80 1,11
Croatia 7.788 4.512 898 496 -26,63 57,94 -28,89 55,17 11,53 10,98
Cyprus 3.984 1.392 993 832 -48,21 34,94 -8,85 83,74 24,93 59,75
Macedonia 1.627 1.147 285 251 -17,28 70,53 -6,32 88,12 17,53 21,90
Malta 2.803 1.583 287 31 -27,83 56,46 -80,66 10,70 10,24 1,94
Slovenia 9.421 8.370 832 365 -5,91 88,84 -38,96 43,93 8,83 4,36
Turkey 42.734 23.123 4.008 4.700 -29,78 54,11 7,95 117,27 9,38 20,33
Yugoslavia F.R.
Algeria 10.878 9.931 2.671 71 -4,55 91,29 -94,84 2,65 24,55 0,71
Libyan A.J. 4.987 9.803 1.289 46 32,56 196,57 -93,17 3,54 25,85 0,47
o/o

Major indicators of agri-food development in Mediterranean and Arab countries 171
Total Total Agricultural Agricultural (AE-AA)/
imports TI exports TE imports AI exports AE (AE+AI) AE / AI AI / TI AE / TE
Country (ET-IT)/ (AE-AI)/
(ET+IT) (AE+AI)
millions $ millions $ millions $ millions $ % % % % % %
Morocco 8.257 4.745 1.698 896 -27,01 57,47 -30,93 52,75 20,56 18,87
Tunisia 7.746 5.517 820 322 -16,81 71,22 -43,57 39,31 10,59 5,84
Bahrain 4.274 4.700 334 16 4,76 109,99 -90,96 4,73 7,83 0,34
Egypt 13.020 3.534 3.862 521 -57,30 27,14 -76,22 13,49 29,66 14,75
Iraq 1.900 400 995 8 -65,22 21,05 -98,42 0,80 52,38 1,99
Israel 29.584 19.149 1.891 1.162 -21,41 64,73 -23,87 61,46 6,39 6,07
Jordan 4.291 1.816 704 182 -40,52 42,32 -58,86 25,90 16,41 10,04
Kuwait 8.374 14.890 1.311 73 28,01 177,81 -89,42 5,58 15,66 0,49
Lebanon 7.560 1.018 1.203 129 -76,26 13,47 -80,67 10,70 15,91 12,65
Oman 4.727 7.337 853 223 21,64 155,23 -58,53 26,16 18,05 3,04
Saudi Arabia 27.765 56.554 4.728 338 34,14 203,69 -86,67 7,14 17,03 0,60
Qatar 3.160 4.104 302 16 13,00 129,88 -90,05 5,23 9,56 0,38
Syrian A.R. 5.380 3.990 845 728 -14,83 74,17 -7,46 86,11 15,71 18,23
U.A. Emirates 28.954 39.396 2.128 803 15,28 136,06 -45,22 37,72 7,35 2,04
Yemen 1.360 1.790 1.167 43 13,65 131,61 -92,93 3,66 85,84 2,39
Djibouti 308 23 91 5 -86,10 7,47 -89,95 5,29 29,59 20,96
Mauritania 250 568 158 40 38,88 227,20 -59,23 25,60 63,07 7,11
Somalia 170 150 65 76 -6,25 88,24 7,67 116,62 38,30 50,62
Sudan 1.314 595 274 610 -37,66 45,28 37,95 222,30 20,89 102,55
Source: Medagri 1999, based on FAO data.Standardized total balance = (total exports – total imports) / (total exports + total imports) * 100Standardized total balance = (agricultural exports - agricultural imports) / (agricultural exports +agricultural imports) * 100
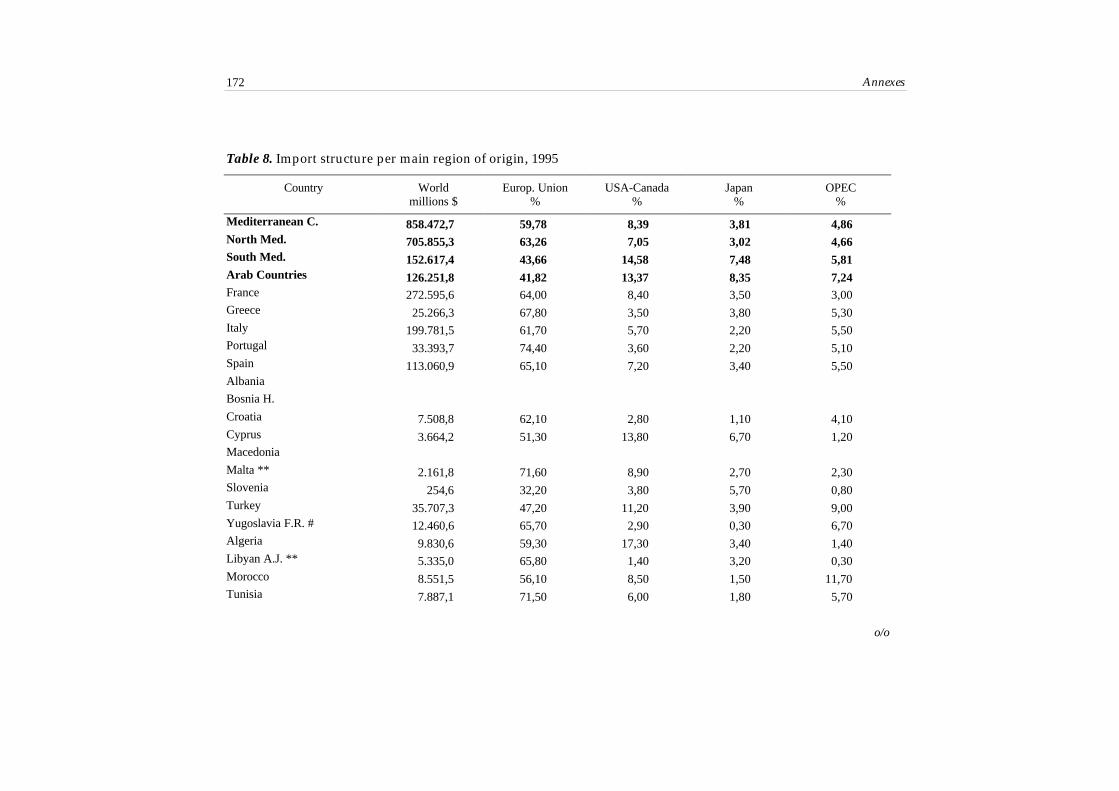
Annexes172
Table 8. Import structure per main region of origin, 1995
Country World Europ. Union USA-Canada Japan OPECmillions $ % % % %
Mediterranean C. 858.472,7 59,78 8,39 3,81 4,86North Med. 705.855,3 63,26 7,05 3,02 4,66South Med. 152.617,4 43,66 14,58 7,48 5,81Arab Countries 126.251,8 41,82 13,37 8,35 7,24France 272.595,6 64,00 8,40 3,50 3,00Greece 25.266,3 67,80 3,50 3,80 5,30Italy 199.781,5 61,70 5,70 2,20 5,50Portugal 33.393,7 74,40 3,60 2,20 5,10Spain 113.060,9 65,10 7,20 3,40 5,50Albania
Bosnia H.
Croatia 7.508,8 62,10 2,80 1,10 4,10Cyprus 3.664,2 51,30 13,80 6,70 1,20Macedonia
Malta ** 2.161,8 71,60 8,90 2,70 2,30Slovenia 254,6 32,20 3,80 5,70 0,80Turkey 35.707,3 47,20 11,20 3,90 9,00Yugoslavia F.R. # 12.460,6 65,70 2,90 0,30 6,70Algeria 9.830,6 59,30 17,30 3,40 1,40Libyan A.J. ** 5.335,0 65,80 1,40 3,20 0,30Morocco 8.551,5 56,10 8,50 1,50 11,70Tunisia 7.887,1 71,50 6,00 1,80 5,70
o/o
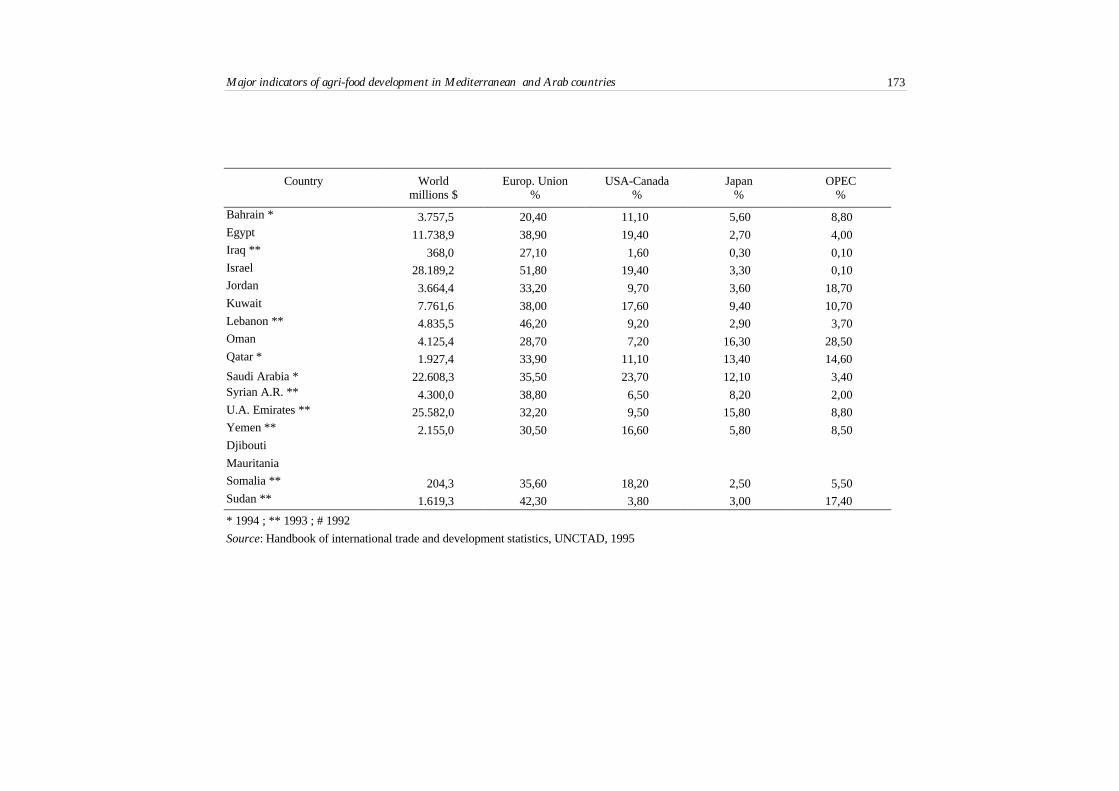
Major indicators of agri-food development in Mediterranean and Arab countries 173
Country World Europ. Union USA-Canada Japan OPECmillions $ % % % %
Bahrain * 3.757,5 20,40 11,10 5,60 8,80Egypt 11.738,9 38,90 19,40 2,70 4,00Iraq ** 368,0 27,10 1,60 0,30 0,10Israel 28.189,2 51,80 19,40 3,30 0,10Jordan 3.664,4 33,20 9,70 3,60 18,70Kuwait 7.761,6 38,00 17,60 9,40 10,70Lebanon ** 4.835,5 46,20 9,20 2,90 3,70Oman 4.125,4 28,70 7,20 16,30 28,50Qatar * 1.927,4 33,90 11,10 13,40 14,60
Saudi Arabia * 22.608,3 35,50 23,70 12,10 3,40Syrian A.R. ** 4.300,0 38,80 6,50 8,20 2,00U.A. Emirates ** 25.582,0 32,20 9,50 15,80 8,80Yemen ** 2.155,0 30,50 16,60 5,80 8,50Djibouti
Mauritania
Somalia ** 204,3 35,60 18,20 2,50 5,50Sudan ** 1.619,3 42,30 3,80 3,00 17,40
* 1994 ; ** 1993 ; # 1992
Source: Handbook of international trade and development statistics, UNCTAD, 1995

Annexes174
Table 9. Export structure per main region of destination, 1995
Country World Europ. Union USA-Canada Japan OPECmillions $ % % % %
Mediterranean C. 828.161,8 56,45 8,13 4,00 3,73North Med. 683.710,2 62,27 6,76 1,87 3,32South Med. 144.451,6 28,91 14,62 14,09 5,70Arab Countries 126.013,3 28,41 12,14 15,14 6,59France 283.600,4 63,40 6,60 2,00 3,30Greece 10.160,3 57,00 5,30 1,00 4,00Italy 231.265,9 56,90 8,20 2,30 3,30Portugal 23.369,7 80,80 5,10 0,80 0,60Spain 89.446,8 72,30 4,70 1,40 3,00Albania
Bosnia H.
Croatia 4.632,4 57,70 2,10 1,00Cyprus 528,6 59,00 1,60 0,30 6,30Macedonia
Malta ** 1.246,7 77,70 6,10 0,10 6,10Slovenia 8.314,9 67,00 3,60 0,30 0,90Turkey 21.596,5 51,30 7,40 0,80 8,10Yugoslavia F.R. ## 9.548,0 45,80 5,20 0,30 5,20Algeria 8.555,5 64,80 19,10 0,70Libyan A.J. # 10.734,2 86,20 0,10Morocco 4.728,1 62,10 4,00 7,70 7,40Tunisia 5.474,6 79,00 1,30 0,30 8,00
o/o

Major indicators of agri-food development in Mediterranean and Arab countries 175
Country World Europ. Union USA-Canada Japan OPECmillions $ % % % %
Bahrain * 3.452,1 2,40 4,40 5,60 12,60Egypt 3.444,1 45,80 15,40 1,30 7,70Iraq # 370,0 6,20 0,80 11,90Israel 19.047,3 32,30 30,70 6,90 0,20Jordan 1.431,7 6,30 1,50 1,30 37,90Kuwait 12.944,3 0,20 0,30 0,10 1,70Lebanon # 527,0 7,00 3,60 0,20 43,60Oman 5.911,1 0,80 2,80 28,60 13,80Qatar * 3.145,2 0,20 1,90 5,80 9,40Saudi Arabia # 44.352,5 18,50 26,10 18,40 7,40Syrian A.R. ** 3.273,6 58,50 3,50 0,40 8,10U.A. Emirates # 16.947,7 8,80 4,10 48,80 5,90Yemen # 112,6 48,00 6,10 14,60 1,50Djibouti
Mauritania
Somalia # 44,0 52,30 43,20Sudan # 565,0 29,90 2,70 5,10 16,30
* 1994 ; ** 1993 ; # 1992 ; ## 1991
Source: Handbook of international trade and development statistics, UNCTAD, 1995
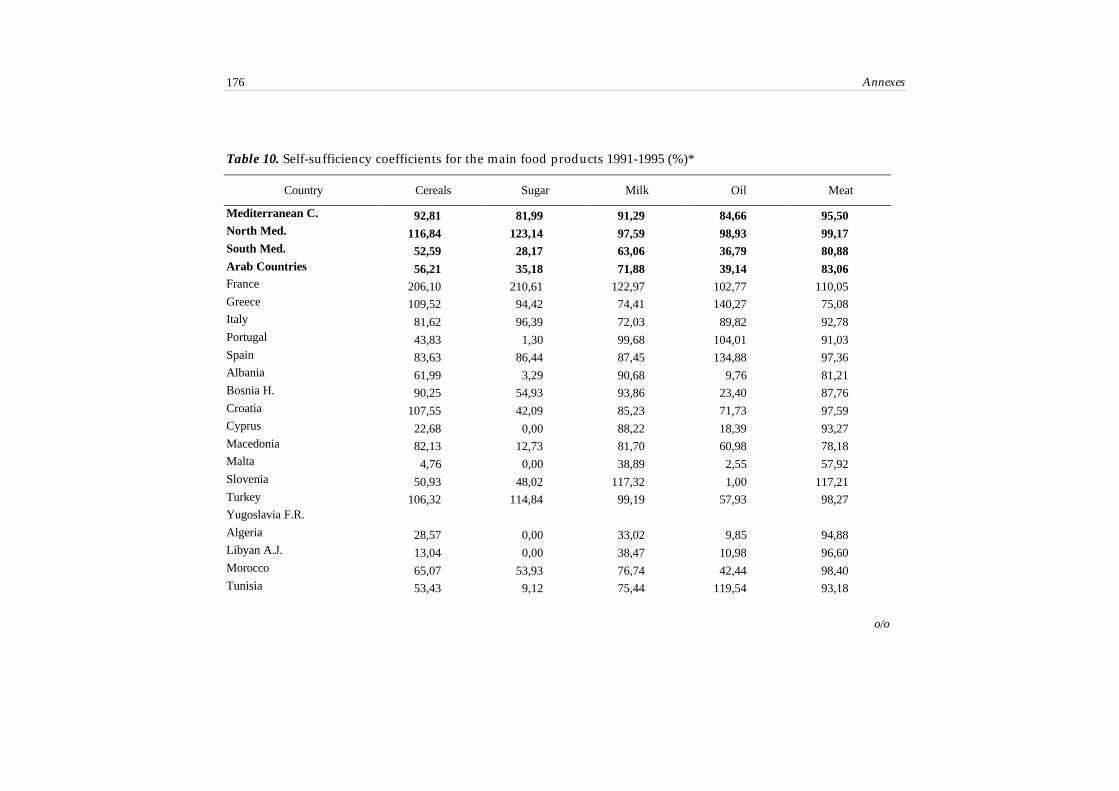
Annexes176
Table 10. Self-sufficiency coefficients for the main food products 1991-1995 (%)*
Country Cereals Sugar Milk Oil Meat
Mediterranean C. 92,81 81,99 91,29 84,66 95,50North Med. 116,84 123,14 97,59 98,93 99,17South Med. 52,59 28,17 63,06 36,79 80,88Arab Countries 56,21 35,18 71,88 39,14 83,06France 206,10 210,61 122,97 102,77 110,05Greece 109,52 94,42 74,41 140,27 75,08Italy 81,62 96,39 72,03 89,82 92,78Portugal 43,83 1,30 99,68 104,01 91,03Spain 83,63 86,44 87,45 134,88 97,36Albania 61,99 3,29 90,68 9,76 81,21Bosnia H. 90,25 54,93 93,86 23,40 87,76Croatia 107,55 42,09 85,23 71,73 97,59Cyprus 22,68 0,00 88,22 18,39 93,27Macedonia 82,13 12,73 81,70 60,98 78,18Malta 4,76 0,00 38,89 2,55 57,92Slovenia 50,93 48,02 117,32 1,00 117,21Turkey 106,32 114,84 99,19 57,93 98,27Yugoslavia F.R.
Algeria 28,57 0,00 33,02 9,85 94,88Libyan A.J. 13,04 0,00 38,47 10,98 96,60Morocco 65,07 53,93 76,74 42,44 98,40Tunisia 53,43 9,12 75,44 119,54 93,18
o/o
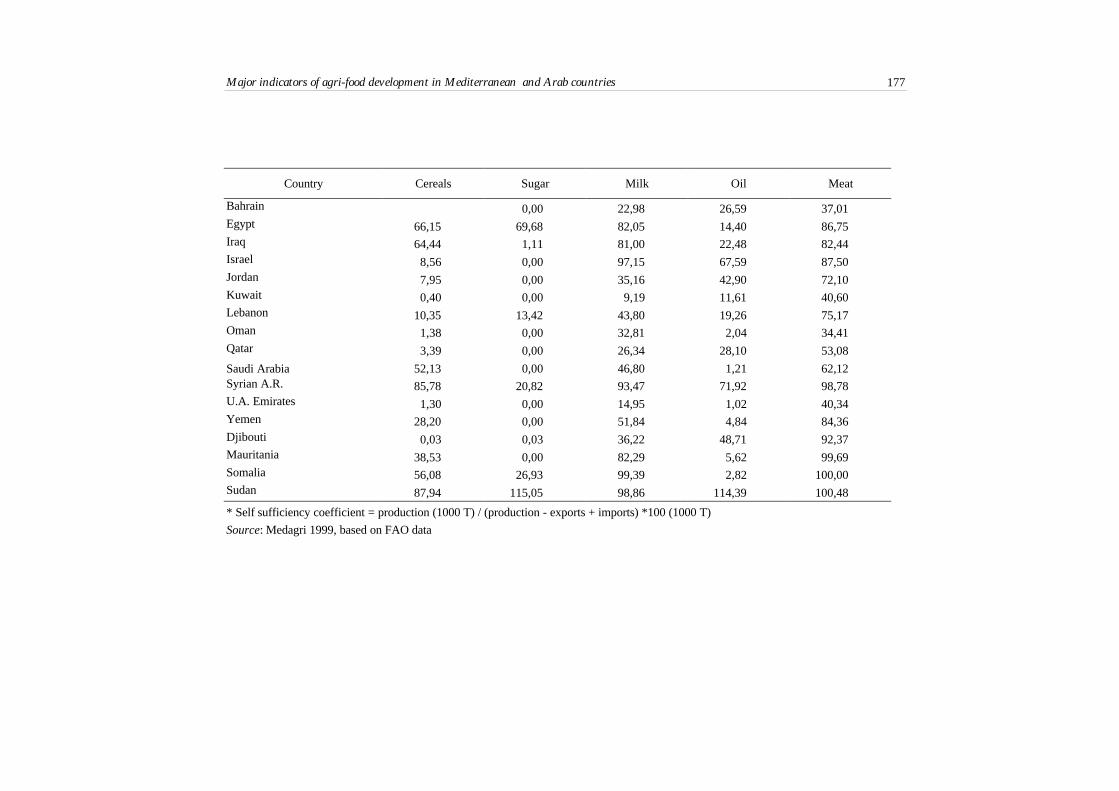
Major indicators of agri-food development in Mediterranean and Arab countries 177
Country Cereals Sugar Milk Oil Meat
Bahrain 0,00 22,98 26,59 37,01Egypt 66,15 69,68 82,05 14,40 86,75Iraq 64,44 1,11 81,00 22,48 82,44Israel 8,56 0,00 97,15 67,59 87,50Jordan 7,95 0,00 35,16 42,90 72,10Kuwait 0,40 0,00 9,19 11,61 40,60Lebanon 10,35 13,42 43,80 19,26 75,17Oman 1,38 0,00 32,81 2,04 34,41Qatar 3,39 0,00 26,34 28,10 53,08
Saudi Arabia 52,13 0,00 46,80 1,21 62,12Syrian A.R. 85,78 20,82 93,47 71,92 98,78U.A. Emirates 1,30 0,00 14,95 1,02 40,34Yemen 28,20 0,00 51,84 4,84 84,36Djibouti 0,03 0,03 36,22 48,71 92,37Mauritania 38,53 0,00 82,29 5,62 99,69Somalia 56,08 26,93 99,39 2,82 100,00Sudan 87,94 115,05 98,86 114,39 100,48
* Self sufficiency coefficient = production (1000 T) / (production - exports + imports) *100 (1000 T)
Source: Medagri 1999, based on FAO data
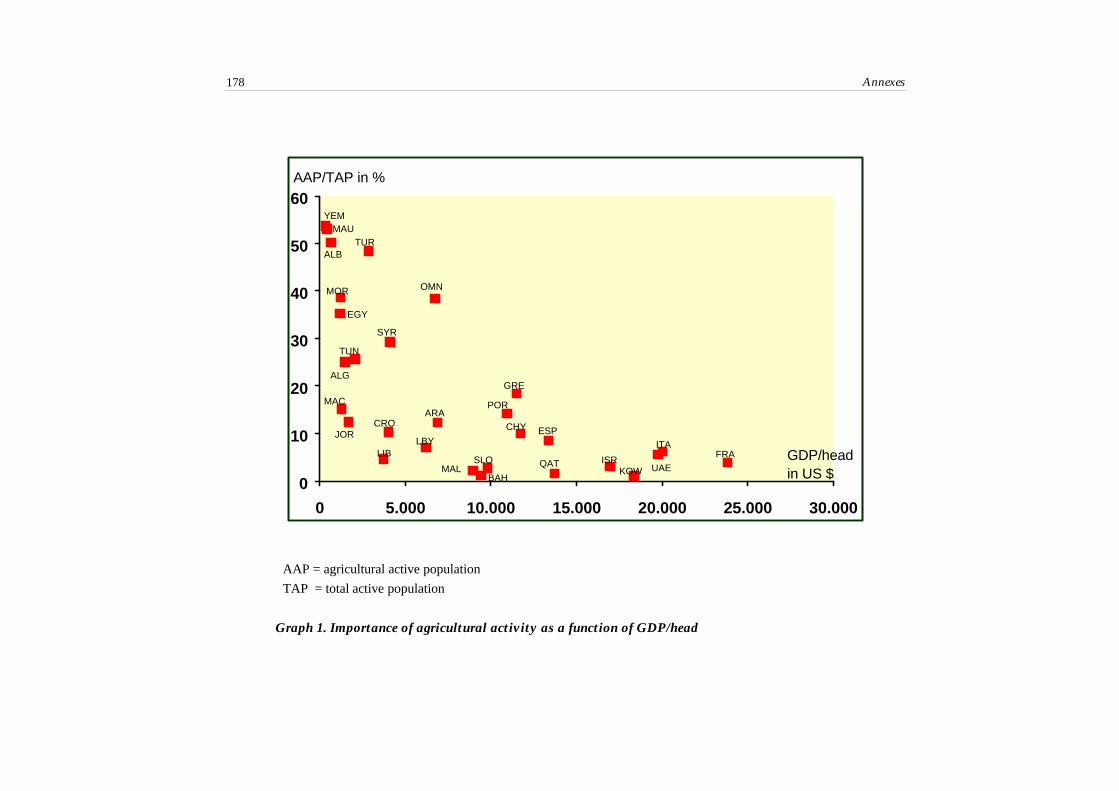
Annexes178
AAP = agricultural active population
TAP = total active population
Graph 1. Importance of agricultural activity as a function of GDP/head
0
10
20
30
40
50
60
0 5.000 10.000 15.000 20.000 25.000 30.000
AAP/TAP in %
GDP/head in US $
ITAFRA
UAEKOWISRQAT
ESPCHY
GRE
SLO
BAHMAL
ARA
OMN
LBY
SYR
CRO
LIB
TUR
JOR
ALG
MAC
MOR
EGY
ALB
MAUYEM
POR
TUN
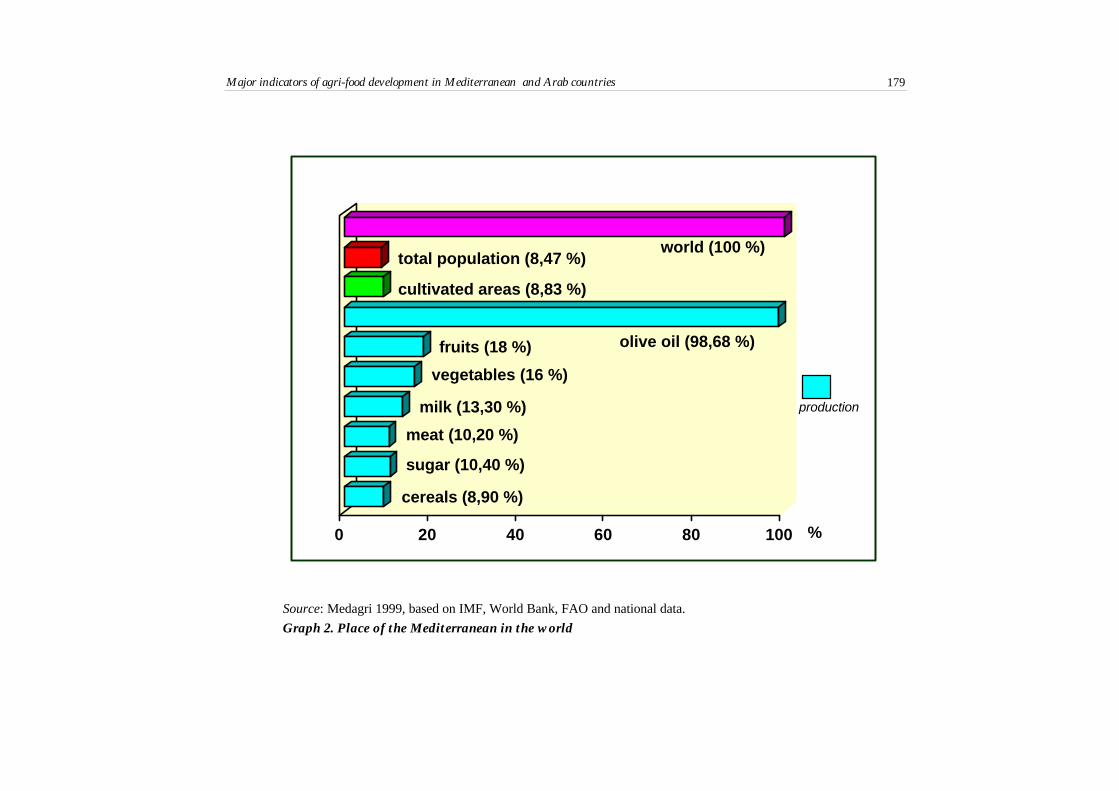
Major indicators of agri-food development in Mediterranean and Arab countries 179
Source: Medagri 1999, based on IMF, World Bank, FAO and national data.
Graph 2. Place of the Mediterranean in the world
0 20 40 60 80 100 %
world (100 %)total population (8,47 %)
cultivated areas (8,83 %)
olive oil (98,68 %)fruits (18 %)
vegetables (16 %)
milk (13,30 %)
meat (10,20 %)
sugar (10,40 %)
cereals (8,90 %)
production

Statistical annexes to Chapter II


Statistical annexes to Chapter II 183
Table II-13. Food balance: cereals, 1996
Production ImportsProduce
exchangeExports Availability
Self-sufficiency
Standardizedbalance
1000 MT 1000 MT 1000 MT 1000 MT 1000 MT % %
Albania 523 493 90 0 1106 47.3 -100Algeria 4902 3850 583 3 9330 52.5 -100Bosnia-H. 842 188 105 5 1130 74.5 -95Croatia 2762 96 0 73 2785 99.2 -14Cyprus 141 593 -4 3 727 19.4 -99Egypt 14912 7767 360 330 22709 65.7 -92FR Yugoslavia 7295 101 832 794 7433 98.1 77France 62560 2214 -3924 29313 31538 198.4 86FYR Macedonia 538 108 15 24 637 84.5 -64Greece 4518 1259 -337 605 4835 93.4 -35Israel 196 3754 -1171 14 2764 7.1 -99Italy 20437 8713 -1288 4114 23748 86.1 -36Jordan 99 1465 184 2 1746 5.7 -100Lebanon 74 854 74 0 1001 7.4 -100Libya 321 1635 53 0 2009 16.0 -100Malta 7 175 0 2 180 3.9 -98Morocco 10089 2907 -3430 32 9534 105.8 -98Portugal 1613 2630 -452 104 3686 43.8 -92Slovenia 547 510 0 35 1022 53.5 -87Spain 22113 6328 -3967 2105 22369 98.9 -50Syria 5991 483 109 835 5748 104.2 27Tunisia 2869 1243 -565 73 3475 82.6 -89Turkey 29251 3367 -400 1277 30941 94.5 -45
Source: FAO
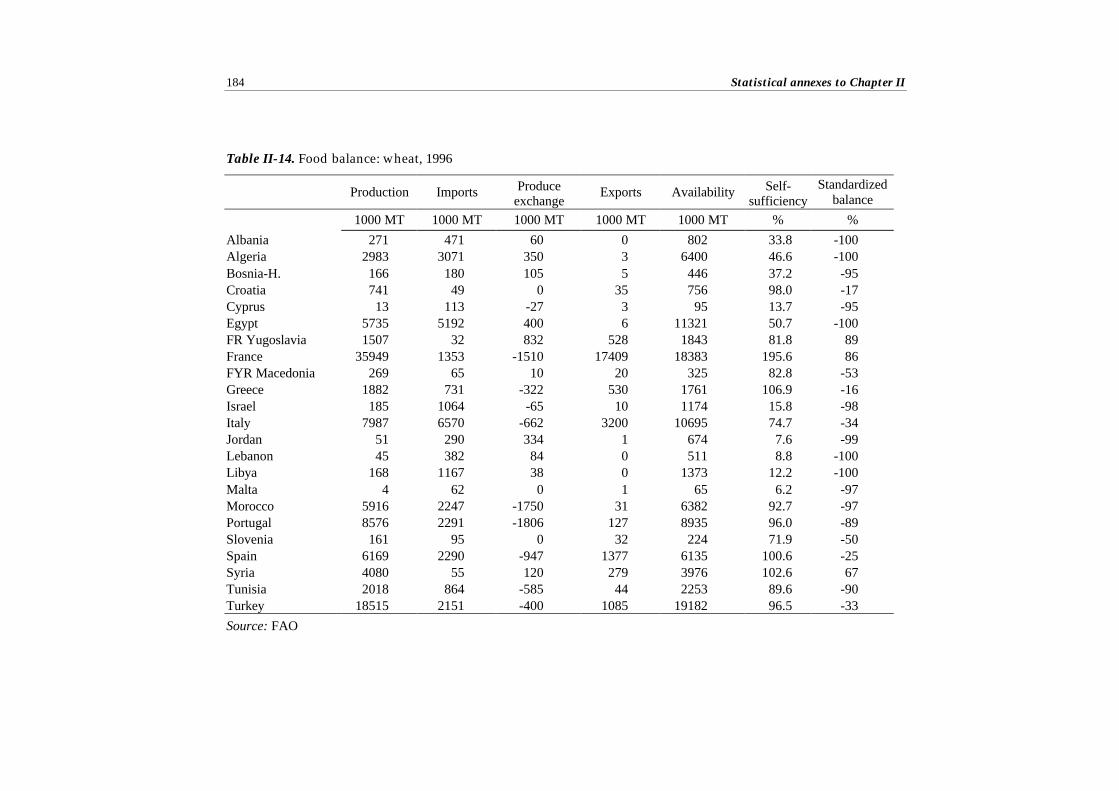
Statistical annexes to Chapter II184
Table II-14. Food balance: wheat, 1996
Production Imports Produceexchange
Exports Availability Self-sufficiency
Standardizedbalance
1000 MT 1000 MT 1000 MT 1000 MT 1000 MT % %
Albania 271 471 60 0 802 33.8 -100Algeria 2983 3071 350 3 6400 46.6 -100Bosnia-H. 166 180 105 5 446 37.2 -95Croatia 741 49 0 35 756 98.0 -17Cyprus 13 113 -27 3 95 13.7 -95Egypt 5735 5192 400 6 11321 50.7 -100FR Yugoslavia 1507 32 832 528 1843 81.8 89France 35949 1353 -1510 17409 18383 195.6 86FYR Macedonia 269 65 10 20 325 82.8 -53Greece 1882 731 -322 530 1761 106.9 -16Israel 185 1064 -65 10 1174 15.8 -98Italy 7987 6570 -662 3200 10695 74.7 -34Jordan 51 290 334 1 674 7.6 -99Lebanon 45 382 84 0 511 8.8 -100Libya 168 1167 38 0 1373 12.2 -100Malta 4 62 0 1 65 6.2 -97Morocco 5916 2247 -1750 31 6382 92.7 -97Portugal 8576 2291 -1806 127 8935 96.0 -89Slovenia 161 95 0 32 224 71.9 -50Spain 6169 2290 -947 1377 6135 100.6 -25Syria 4080 55 120 279 3976 102.6 67Tunisia 2018 864 -585 44 2253 89.6 -90Turkey 18515 2151 -400 1085 19182 96.5 -33
Source: FAO
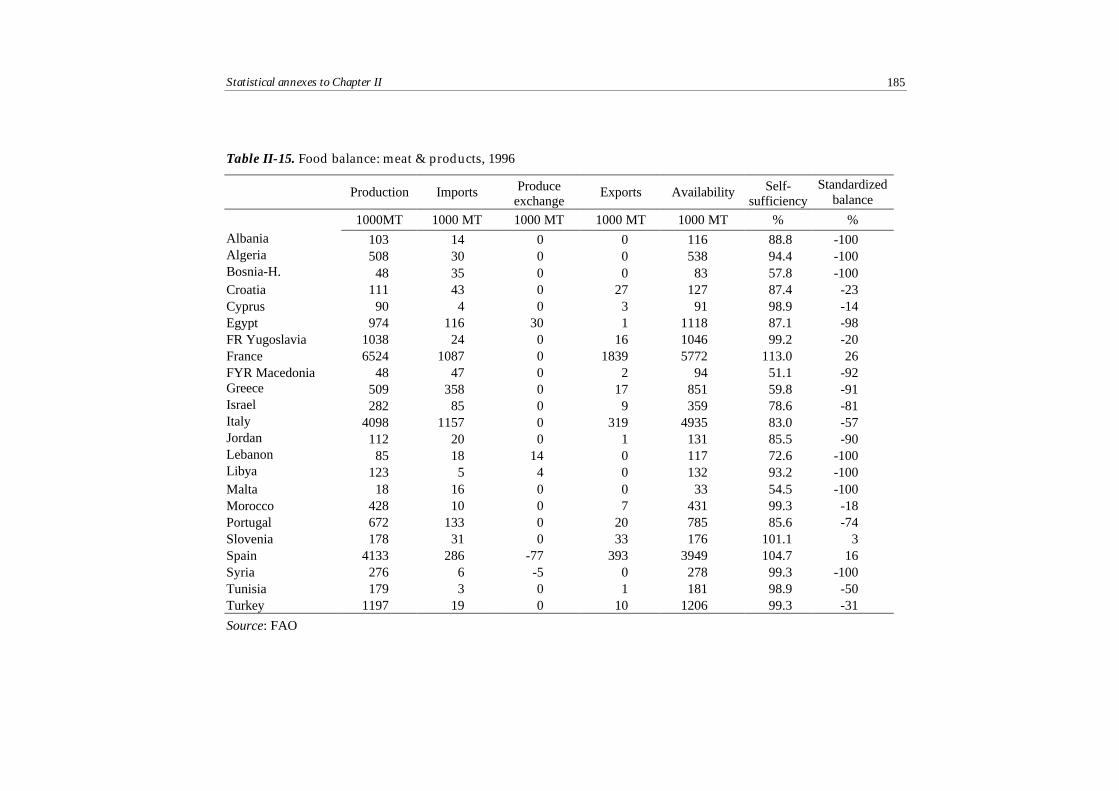
Statistical annexes to Chapter II 185
Table II-15. Food balance: meat & products, 1996
Production Imports Produceexchange
Exports Availability Self-sufficiency
Standardizedbalance
1000MT 1000 MT 1000 MT 1000 MT 1000 MT % %Albania 103 14 0 0 116 88.8 -100Algeria 508 30 0 0 538 94.4 -100Bosnia-H. 48 35 0 0 83 57.8 -100Croatia 111 43 0 27 127 87.4 -23Cyprus 90 4 0 3 91 98.9 -14Egypt 974 116 30 1 1118 87.1 -98FR Yugoslavia 1038 24 0 16 1046 99.2 -20France 6524 1087 0 1839 5772 113.0 26FYR Macedonia 48 47 0 2 94 51.1 -92Greece 509 358 0 17 851 59.8 -91Israel 282 85 0 9 359 78.6 -81Italy 4098 1157 0 319 4935 83.0 -57Jordan 112 20 0 1 131 85.5 -90Lebanon 85 18 14 0 117 72.6 -100Libya 123 5 4 0 132 93.2 -100Malta 18 16 0 0 33 54.5 -100Morocco 428 10 0 7 431 99.3 -18Portugal 672 133 0 20 785 85.6 -74Slovenia 178 31 0 33 176 101.1 3Spain 4133 286 -77 393 3949 104.7 16Syria 276 6 -5 0 278 99.3 -100Tunisia 179 3 0 1 181 98.9 -50Turkey 1197 19 0 10 1206 99.3 -31
Source: FAO

Statistical annexes to Chapter II186
Tableau II-16. Food balance: milk & products, 1996
Production Imports Produceexchange
Exports Availability Self-sufficiency
Standardizedbalance
1000 MT 1000 MT 1000MT 1000 MT 1000 MT % %Albania 1044 20 0 0 1064 98.1 -100Algeria 907 1817 0 5 2719 33.4 -99Bosnia-H. 295 56 0 0 352 83.8 -100Croatia 599 212 0 57 755 79.3 -58Cyprus 180 32 6 24 194 92.8 -14Egypt 2744 273 0 3 3013 91.1 -98FR Yugoslavia 2048 45 0 9 2084 98.3 -67France 25732 2771 77 8511 20069 128.2 51FYR Macedonia 192 27 0 0 219 87.7 -100Greece 1882 925 0 66 2741 68.7 -87Israel 1155 109 -61 17 1185 97.5 -73Italy 11777 6595 96 1217 17251 68.3 -69Jordan 153 30 0 3 179 85.5 -82Lebanon 187 228 29 1 444 42.1 -99Libya 131 282 13 0 427 30.7 -100Malta 45 53 0 0.5 98 45.9 -98Morocco 915 135 0 15 1035 88.4 -80Portugal 1738 256 0 227 1767 98.4 -6Slovenia 593 22 0 85 530 111.9 59Spain 6600 1736 75 463 7948 83.0 -58Syria 1508 64 -11 6 1555 97.0 -83Tunisia 632 73 0 2 703 89.9 -95Turkey 10760 95 0 20 10835 99.3 -65
Source: FAO

Statistical annexes to Chapter II 187
Table II-17. Food balance: vegetables & products, 1996
Production Imports Produceexchange
Exports Availability Self-sufficiency
Standardizedbalance
1000 MT 1000 MT 1000 MT 1000 MT 1000MT % %Albania 430 5 0 0 435 98.9 -100Algeria 1982 33 0 2 2013 98.5 -89Bosnia-H. 563 7 0 0 570 98.8 -100Chypre 103 6 0 14 94 109.6 40Cyprus 316 106 0 19 403 78.4 -70Egypt 10043 2 -68 218 9760 102.9 98Spain 9582 312 0 3189 6705 142.9 82FR Yugoslavia 1047 55 0 29 1073 97.6 -31France 7752 2090 8 1379 8472 91.5 -20FYR Macedonia 371 10 0 75 306 121.2 76Greece 3464 103 0 534 3033 114.2 68Israel 1298 40 0 163 1176 110.4 61Italy 14124 829 -400 3421 11133 126.9 61Jordan 1053 10 0 149 914 115.2 87Lebanon 864 130 0 58 936 92.3 -38Libya 417 171 19 25 582 71.6 -74Malta 72 7 0 0 79 91.1 -100Morocco 2558 9 0 204 2363 108.3 92Portugal 2088 136 0 416 1809 115.4 51Slovenia 108 76 0 6 178 60.7 -85Syria 1526 0 0 140 1386 110.1 100Tunisia 1476 6 0 43 1439 102.6 76Turkey 16363 11 0 1174 15201 107.6 98
Source: FAO

Statistical annexes to Chapter II188
Table II-18. Food balance: fruits & products, 1996
Production Imports Produceexchange
Exports Availability Self-sufficiency
Standardizedbalance
1000 MT 1000MT 1000 MT 1000 MT 1000 MT % %Albania 128 43 0 3 169 75.7 -87Algeria 1729 64 0 12 1781 97.1 -68Bosnia-H. 90 35 0 1 125 72.0 -94Croatia 612 243 0 38 818 74.8 -73Cyprus 337 22 0 145 214 157.5 74Egypt 7690 63 -45 106 7602 101.2 25FR Yugoslavia 2103 202 0 174 2131 98.7 -7France 12120 4931 -10 2073 14968 81.0 -41FYR Macedonia 463 65 0 81 447 103.6 11Greece 4957 227 150 2044 3290 150.7 80Israel 1995 123 -21 993 1103 180.9 78Italy 19318 1762 -100 3971 17010 113.6 39Jordan 452 83 0 59 476 95.0 -17Lebanon 1355 86 0 131 1310 103.4 21Libya 447 41 0 2 487 91.8 -91Malta 18 35 0 6 47 38.3 -71Morocco 3215 29 0 699 2544 126.4 92Portugal 2095 498 0 73 2520 83.1 -74Slovenia 304 146 0 46 404 75.2 -52Spain 14493 922 152 5279 10288 140.9 70Syria 2116 65 -24 139 2016 105.0 36Tunisia 1166 24 0 42 1148 101.6 27Turkey 15732 193 6 1948 13984 112.5 82
Source: FAO

Statistical annexes to Chapter II 189
Table II-19. Food balance: oil crops, 1996
Production Imports Produceexchange
Exports Availability Self-sufficiency
Standardizedbalance
1000MT 1000 MT 1000 MT 1000 MT 1000 MT % %Albania 47 0 0 0 47 100.0 0Algeria 416 33 0 0 449 92.7 -100Bosnia-H. 7 0 0 0 7 100.0 0Croatia 92 23 0 7 108 85.2 -53Cyprus 11 58 0 0 68 16.2 -100Egypt 1025 261 -38 23 1224 83.7 -84FR Yugoslavia 565 103 0 8 660 85.6 -86France 5220 1277 150 2496 4151 125.8 32FYR Macedonia 25 8 0 1 31 80.6 -78Greece 2533 395 133 174 2886 87.8 -39Israel 171 501 -25 207 440 38.9 -42Italy 3737 1301 -83 207 4918 76.0 -73Jordan 129 22 0 0 151 85.4 -100Lebanon 78 33 2 2 110 70.9 -89Libya 64 20 0 4 80 80.0 -67Malta 0 7 0 0 7 0.0 -100Morocco 1039 202 0 57 1185 87.7 -56Portugal 342 994 -27 14 1295 26.4 -97Slovenia 2 7 0 1 8 25.0 -75Spain 5887 3086 -21 257 8695 67.7 -85Syria 1186 31 2 67 1152 103.0 37Tunisia 1261 12 0 1 1273 99.1 -85Turkey 3942 838 10 43 4746 83.1 -90
Source: FAO


References
Chapter I
• Alexandratos, N. and Bruinsma, J., (1997). Necesidades de comercio mundial de
cereales para el año 2030. Revista Española de Economía Agraria, nº 181, pp. 49-76.
• Barkema, A., New Roles and Alliances in the U.S. Food System, in: Scherts, L.P.
and L.M: Daft, eds. (1994). Food and Agricultural Markets - The Quiet Revolution,
Economic Research Service, USDA, and Food and Agriculture Committee,
National Planning Association Report N° 270, pp. 111-112.
Benhayoun G., Cattin M., Regnault H. - dirs. (1997) L’Europe etla Méditerranée, intégration économique et libre-échange.L’Harmattan, 1997, 191p.
Bensidoun Isabelle, Chevalier Agnès, (1994). Le commerce euro-méditerranéen, in: Economie Internationale, La Revue du CEPII,Paris, N° 58, 2ème trimestre 1994, pp. 111/130.
• European Commission, (1997). Mediterranean concessions impact study, COM(97)
477 final.
• García Alvarez-Coque, J.M. and Compés, R., (1998). Análisis de la política agraria
en relación con los productos mediterráneos y sus consecuencias socioeconómicas y
financieras, Documento de Trabajo AGRI-107 ES, Dirección General de Estudios
del Parlamento Europeo, Serie "Agricultura, Bosques y Desarrollo Rural",
Bruselas.
Institut de la Méditerranée, Marseille, (1998). EconomicResearch Forum, Le Caire. Les enjeux du partenariat euro-méditerranéen, Ed. de l’Aube 1998, 312p.
• Rastoin, J.L., (1998). La mondialisation des échanges agroalimentaires invited paper
to the Globalization of the food systems, held in Caracas, July 1998.
192
Solagral, (1998). Le commerce des produits agricoles entrel’Union Européenne et les pays méditerranéens. Rapport pour laCommission Européenne, (Juin 1998), trois volumes.
• Swinbank, A. and Ritson Ch., (1995). The impact of the GATT agreement on EU
fruit and vegetable policy, Food Policy 20, 4, pp. 339-357, 1995.
• Tangermann, S., (1996). Access to EU markets for agricultural products after the
Uruguay round and export interests of the MC, UNCTAD, 1996.
Chapter II
• Abu Zeid A., (1998). Food, Rural and Agricultural Policies in Egypt. (May 1998),
The Social Found for Development, The Cabinet of Ministers, Cairo.
• Akesbi N., (1998). Maroc: une année de sécheresse et d'attentisme. Institut
Agronomique et Vétérinaire Hassan II, Département Développement Rural,
Rabat.
• Akesbi N., Maraveyas N. (ed.), (1997). Prix et suventions: effets sur les
agricultures familiales méditerranéennes, Options Méditerranéennes. CIHEAM-
IAM Montpellier.
• Allaya, M., (1993). La situation alimentaire des pays du Sud and de l’Est mediterranéen
in The situation of Agriculture in: the Mediterranean Countries, Cahiers
Options Méditerranéennes, Vol. 5(1): 7-15.
• Alexadratos, N. (editor), (1995). Eworld Agriculture: towards 2010. An FAO Study,
John Wiley and Sons, Chichester, UK.
• Apostolides, C., (1997). The Role of an Integrated Approach to Rural Development in
Development of Mountainous Regions, Cahiers Options Méditerraéennes, Vol.
28, pp. 1-11.
• Bazin, G. and Barjolle, D., (1990). La politique de la montagne en Suisse: quelques
enseignements pour la France, Economie Rurale, 1990, N° 197, pp. 3-8.
• Bedrani S., (1998). La situation de l'agriculture, de l'alimentation et de l'économie en
Algérie. INA, Département d'Economie Rurale, El Harrach, Alger.
References 193
• Black, R., (1992). Crisis and Change in Rural Europe: Agriculture Development in the
Portuguese Mountains, Avebury, Aldrshot, England.
• Blaikie, D., (1985). The political Economy of Soil Erosion in Developing Countries,
Logman, London.
• Brito Soares, F., Gomes da Silva, F., and Mendes Espada, J., (editors), (1993). EC
Agricultural Policy by the End of the Century, Wissenschaftsverlag, Kiel, Germany.
• CEC (Commision of the European Communities), (1997). The Agricultural
Situation in the Community, 1996 Report, Luxemburg.
• Distaso M., (1992). Pressione demografica e dinamica strutturale dell'economia
agricola mediterranea, Medit Edagricole, Bologna.
• Driouchi, A and Laraki, K., (1994). A monograph on agriculture and food policies in
Morocco in: Food and Agricultural Policies in the Middle East and North Africa
Cahiers Options Méditerranéenes, Vol. 7, pp. 97-156.
• EBRD, (1997). Transition Report, 1997, EBRD, London.
• El-Beltagi, A., (1993). Integrating National Agricultural Research Imperatives and
Capacity Building for Food Security in Egypt in: The situation of Agriculture in
the Mediterranean Countries, Cahiers Options Méditerraéennes, Vol. 5(1): 61-68.
• FAO, (1997). The State of Food and Agriculture. Food and Agricultural
Organization of United Nations, Roma.
• Ghamina, A. and El Amary T., (1997). A Socio-economic study of the sugar beet
cultivation in West Nubaria in: Agricultures familiales et politiques agricoles en
Méditerranée, Options Méditerranéennes Ser. B., n° 12, pp. 57-74
• Goueli, A. and El Miniawy A., (1994). Food and Agricultural Policies in Egypt in:
Food and Agricultural Policies in the Middle East and North Africa Cahiers
Options Méditerranéennes, Vol. 7, pp. 7-68.
• Hamdy, A. and Lacirignola, C., (1995). Utilization of Water in the Mediterranean:
Sectorial Distribution and Prospects in: Water Management in: the Mediterranean
Area, Options Méditerranéennes , Série A, n° 31, pp. 17-50.

194
• IMF, (1997). World Economic Outlook, October 1997, Washington D.C.
• Isikli E., Turkefuf B., Guler S., (1998). The situation of Agriculture, Food and the
Rural Economy in Turkey. Country Report. Dept of Agricultural Economics,
Faculty of Agriculture, Ege University, Bornova-Izmir, Turkey.
• Khoury W., Hamzé M., (1998). The situation of Agriculture, Food and the Rural
Economy in Lebanon, June 1998, Institut de la Recherche Agronomique du
Liban, Beyrouth.
• Lasram M., (1998). L'agriculture tunisienne: réalisations de l'année 1997 et
perspectives. Tunis.
• Malorgio G., (1998). La dinamica del sistema ovi-caprino nell'economia agricola
mediterranea. Medit (4), Edagricole, Bologna.
• Mergos G., (1998). University of Athens, Halandri, Greece. Food, rural and
agricultural policies in the Balkan zone - Cyprus, Croatia, Slovenia, Bosnia-Herzegovina.
• Mergos, G. and Donatos G., (1996). Agriculture and the Rural Economy of
Southern Europe at the Threshold of European Integration, Journal of Area Studies,
n° 9 (1996), pp. 33-52.
• Nordblom, T and Shamo F., (1993). Livestock and Feed Trends in West Asia and
North Africa: Past, Present and Future in: The situation of Agriculture in the
Mediterranean Countries, Cahiers Options Méditerranéennes, Vol. 5(1): 15-30.
• OECD, (1998). Agricultural Policies in Emerging and Transition Economies,
Monitoring and Evaluation 1998, Paris.
• OECD, (1998). OECD Economic Outlook 1998, Vol. 63, June 1998, Paris.
• OECD, (1998). Agricultural Policies in OECD Countries, Monitoring and
Evaluation 1998, Paris.
• Options Méditerranéennes, (1994). Food and Agricultural policies in the Middle
East and North Africa. CIHEAM-IAM Montpellier.
• Querini G., Turri E., (ed), (1993). L'agroindustria nell'area Mediterranea.
Franco Angeli, Milano.

References 195
• Stern, N., (1994). Growth Theories, Old and New and the Role of Agriculture in
Economic Development, FAO Economic and Social Development Paper, Rome.
Chapter III
• Flamant J.C., Président du Comité Scientifique Consultatif du CIHEAM (1998).
Les nouveaux enjeux pour le CIHEAM dans le domaine de la formation des cadres
supérieurs de l'agriculture, de l'alimentation et de l'environnement des pays du bassin
méditerranéen, Séminaire CIHEAM sur la formation supérieure des cadres de
l'agriculture dans les pays du bassin méditerranéen, Nov. 1998, Istanbul.
• Fountain J.E., (1997). Social Capital: A Key Enabler of Innovation, Chapter I.
Harvard University Press, Cambridge, USA.
• Ghersi G., Directeur de l'Institut Agronomique Méditerranéen de Montpellier
CIHEAM, (1998). Les nouvelles technologies pédagogiques: outils et méthodes.
Séminaire CIHEAM sur la formation supérieure des cadres de l'agriculture
dans les pays du bassin méditerranéen, Nov. 1998, Istanbul.
• Reiffers J.L., (1997). Rapport Général: La Méditerranée aux portes de l'an 2000.
Institut de la Méditerranée. Economica, Paris.
• Rich B., (1994). Mortgaging the Earth. The World Bank, Environmental
Impoverishment, and the Crisis of Development. Beacon Press, Boston.
Annexes and Statistical datas
• CNUCED, (1995). Manuel de statistiques du commerce international et du
développement 1995.
• EUROSTAT, (Annuaire 1997). Vue statistique sur l’Europe, 1986-1996, 512p.
• EUROSTAT 6B (1998). Echanges commerciaux intra et extra de l’UE, CDROM.
• FAOSTAT, (1998). Population, Production, Commerce.
• IMF, (1998). Statistiques Financières internationales 1998.
• MEDAGRI, (1999). Annuaire des économies agricoles et alimentaires des pays
méditerranéens et arabes - 449p, Allaya, M., CIHEAM-Institut Agronomique
Méditerranéen de Montpellier.
LIST OF BOXES
page
Chapter I
Box I-1. Agenda 2000: increasing internationalcompetitiveness of EU agriculture. 10
Box I-2. Preference margins under the “entry-price” system 37
Box I-3. The MEDA programme 44
Chapter II
Box II-1 Olive oil: an expanding market 78
Box II-2 Rice production in the Mediterranean 85
LIST OF MAPS, FIGURES AND GRAPHS
Chapter I
Figure I-1 Imports and exports of NCMC agriculturalproducts from and to the EU 16
Figure I-2 EU mean share in agricultural trade(imports and exports) from NCMC 17
Chapter II
Map II-1 Populations in the Mediterranean Basin(World Bank data, 1994) 65
Chapter III
Graph III-1 Social and information capital interaction scheme 139
Graph III-2 Budget allocation 143
Annexes
Graph 1 Importance of agricultural activity as afunction of GDP/head 178
Graph 2 Place of the Mediterranean in the world 179
LIST OF TABLES
Chapter ITable I-1 EU trade balance of agricultural products with
Non-Community Mediterranean Countries(1) 1995 & 1996, Mio ECUs 12
Table I-2 EU Mediterranean countries:preferences towards selected EU 15 marketsIn “sensitive products”. Share of EU exportson total exports (%), 1996 14
Table I-3 Non-Mediterranean Countries (1):exports towards the EU (2) per product, 1996 19
Table I-4 States of the multilateral Euro-Mediterraneanassociation agreements, June 1998 29
Table I-5 European Union: supply balance of selected“sensitive” products, 1995-1996 35
Table I-6 Entry prices and “MFNT* duty” compared withthe entry price in Morocco (ECU/t), 1995-1996 38
Table I-7 Mediterranean crops and EAGGF-guaranteesection, 1997 46

Chapter II
Table II-1 Annual renewable fresh water availableper person in selected Mediterranean countries 68
Table II-2 Some general characteristics of the EUagricultural sector, 1996 75
Table II-3 Agricultural production in Algeria 80
Table II-4 Agricultural production in Morocco 81
Table II-5 Cultivated surface area of the main crops in Egypt 82
Table II-6 Food consumption and nutrition levels, 1996 98
Table II-7 Turkey: consumption of some food items 101
Table II-8 Evolution of food prices in Algeria, 1990-1996 102
Table II-9 Projected per capita consumption of fooditems in Tunisia 103
Table II-10 Evolution of agricultural production in Morocco
Table II-11 Food consumption in the EU Mediterraneancountries, 1996 104
Table II-12a Turkey: Producer Subsidy Equivalent (PSE) 105
Table II-12b Turkey: Consumer Subsidy Equivalent (CSE) 105
Annexes
Major indicators of agri-food development inMediterranean and Arab countries 151
Table 1 Population, growth rate, urbanisation,agriculture ratio to employment, 1997 156
Table 2 Gross Domestic Product, economic growth,agriculture ratio to the GDP 158
Table 3 Cultivated areas, irrigated areas,means of production, 1996 160
Table 4 Main agricultural products, 1997 162
Table 5 Agricultural products growth between 1981-1985and 1991-1995 (%) 164
Table 6 Food consumption, 1996 166
Table 7 International trade of agricultural productsas part of the total trade, 1996 170
Table 8 Import structure per main region of origin, 1995 172
Table 9 Export structure per main region of destination, 1995 174
Table 10 Self-sufficiency coefficients for the main foodproductions, 1991-1995 (%) 176
Statistical annexes to Chapter II 181
Table II-13 Food balance: cereals, 1996 183
Table II-14 Food balance: wheat, 1996 184
Table II-15 Food balance: meat & products, 1996 185
Table II-16 Food balance: milk & products, 1996 186
Table II-17 Food balance: vegetables & products, 1996 187
Table II-18 Food balance: fruits & products, 1996 188
Table II-19 Food balance: oil crops, 1996 189