annual report 13/14 - western metropolitan regional council minutes/2014/2013-14... · council...
TRANSCRIPT

Annual Report
13/14
Western Metropolitan Regional Council

2
Table of Contents
Introduction
About WMRC ………………………..…… 3
Chairman’s Message ..……...…..…… 4
CEO’s Report ………………….…….……. 6
Council Structure …………..…....….….. 8
Our Work ……………………..…….……… 9
Strategic Priorities ………….......….…. 10
Operational Performance
2013/14 Highlights …………..…………..…… 12
Strategic Objective 1 …....………………...… 14
Achieve a comprehensive, cost effective
waste management service across the
region
Strategic Objective 2 …………………….…... 15
Increase the number of Councils,
businesses and people using our services
Strategic Objective 3 ..………..………..…… 17
Reduce waste to landfill
Strategic Objective 4 …...….…..………...… 18
Increase the knowledge and engage the
local community to improve waste
management
Strategic Objective 5 …………....……..…… 21
Become a r ecognised cata lys t
implementing innovative practices in waste
management
Strategic Objective 6 ………..………….…… 22
Develop a capable team and a great place
to work to achieve our objectives
Statutory & Financial Reports
The Year Ahead ..…………………………...... 24
Statutory Compliance .……….…….....…... 26
Financial Summary ......……...……..…..... 28
Financial Report …….....……...……..…..... 30

Our Members
About WMRC
Our Vision
We aspire for a world in which waste is not a problem but
an opportunity, when people in our local area are proud of
the great things that are done in their world, when
people from afar come to see us and admire what we do.
And once we have achieved this for waste management, we
aspire to grow our work into ultimately delivering an
inspirational natural environment for the western suburbs of
Perth.
Our Purpose
The Western Metropolitan Regional Council (WMRC) was
established to manage waste in Perth’s western suburbs
in an efficient, sustainable, environmentally sound
manner, and to provide best practice waste management
guidance to its stakeholders.
3 3
We aspire for a
world where
waste is not a
problem, but
an opportunity,
where local
residents are proud
of the great things
that we do.

Chairman’s Message
This report highlights the achievements
of Perth’s western suburbs in working
together to create a world where waste
is not a problem, but an opportunity.
The past year presented continued
challenges, but was also a year of good
progress. As with all local governments
in WA, the uncertainty around local
government reform made it difficult to
progress new initiatives; but we still
had plenty on our plate as the
commissioning of the AnaeCo
Alternative Waste Treatment (AWT)
Plant continued to progress at our
Shenton Park site.
Changing of the guard
In April our second CEO Mr John Hogg
left us to pursue a career in Queensland
after a relatively short time with the
WMRC. Council wishes John well in
Queensland.
There is considerable uncertainty about
how local government reform will impact
on the WMRC and what changes if any
will be needed. The WMRC decided the
replacement for John Hogg should be
appointed to act as CEO for one year
only. The WMRC is hopeful that after a
year it will be much clearer how the
WMRC should be managed to fit in with
local government reform and more will
be known about the impact of the
AnaeCo AWT operations. The WMRC
appointed John Stevenson to this role on
a part time basis. John has considerable
waste management experience at
executive level in Western Australia and
is well equipped to manage the
challenges of the year ahead.
Commissioning of the AnaeCo AWT Plant
Construction of the AnaeCo AWT Plant
was completed early in the financial year
and moved into the commissioning phase
in October 2013.
Commissioning was still in progress at
the end of the financial year and the
operators have had to overcome a
number of operational challenges. These
have required patience on the part of the
WMRC and perseverance in the case of
AnaeCo as these challenges are
overcome.
Although this has delayed the start of full
operations progress is now being made
and full operation may be able to start in
early 2015. It is hoped this will herald the
start of the delivery of substantial
environmental dividend to the Region.
Strategic Planning
During the year we continued to focus
on strategic planning that will take the
region forward even though in some
areas, some work at the Transfer Station
had to be delayed pending the DiCOM
AWT plant coming on line.
As Chairman of the WMRC, it gives me great pleasure to present this
report on our activities for the period 1 July 2013 to 30 June 2014.
The past year presented continued challenges and despite progress being
made these are still not yet all resolved.
4

Forum of Regional Councils
WMRC continued to actively participate
in the Forum of Regional Councils (FORC)
during 2013/14. FORC is an informal
grouping of regional councils that
agreed to work together on areas of
common interest in the important role
we play in providing waste services.
The Forum continued to promote with
State Government Ministers the need for
Regional council reform to be considered
along with local reform and is suggesting
three instead of five regional councils t o
manage waste in the metropolitan area.
At the same it continues to seek
commitment from the State Government
in relation to the planning and funding
of waste infrastructure.
The Year Ahead
The year ahead will be challenging with
the DiCOM AWT plant, if all goes well,
becoming fully operational although
there are still important issues to
resolve.
We expect the release of the State
Government’s final directions on
Metropolitan Local Government reform
in the near future. Which hopefully will
provide some clarification on how waste
management in the region may be
managed in the future. We will work
closely with our member Councils to
ensure the smooth transition of any level
of reform.
Thanks You’s
Thank you to the WMRC Councillors for
the critical decision‐making role they
play in guiding how we manage waste in
the western suburbs. The WMRC Council
and WMRC Officers effectively come
together as a team to make the
organisation work.
The Officers play an important part in
formulating and implementing strategic
initiatives. Councillors make the
important decisions on what initiatives
are progressed and what are priorities
for the region.
My thanks to John Stevenson’s office
staff as well as the Transfer Station
staff under John Cummins and the
Earth Carers in Nabilla Zayan’s group.
Thanks also to member Council staff
whose commitment and hard work give
effect to WMRC Council decisions.
Councillor Charles Hohnen
Chairman
5

CEO’s Report As WMRC’s latest Chief Executive Officer, I am pleased to report on k e y waste
project outcomes during the past year. WMRC staff have worked hard to provide
quality waste services to local residents through the effective operation of the
Waste Transfer Station and the promotion of active programmes for waste education
and sustainable living.
It is of some note that in the last three
months of the year the WMRC had two
Chief Executive Officers and in the whole
year had to make three staff changes.
Just after taking up my appointment in
April 2014 I went overseas for seven
weeks on a pre‐arranged trip. During this
time the Business Manager Peter
Thomson acted as Chief Executive Officer
and had to contend with the extra
challenge of drafting a difficult budget
for 2014/15.
There was some disruption due to the
staff changes but waste operations
continued to be effectively managed and
positive project outcomes were still
achieved for the year.
The WMRC staff are few in number but
the positive outcome for the year is
testament to their commitment both past
and present.
Transfer Station Operations
The construction of the DiCOM AWT
Plant at the Shenton Park site was
effectively completed early in the year.
Commissioning commenced in October
and was still proceeding at the end of the
year. It is true to say that commissioning
has turned out to be much longer than
anticipated. At the end of the year the
commissioning programme had slipped
by just over seven months. This has been
caused by unforeseen technical problems
with the plant.
To support the operations of the
DiCOM AWT Plant the second stage of
upgrading works to the transfer station
were virtually completed. These included
finishing work on changes to the waste
drop off building and constructing a new
handling area for green and other waste
delivered by residents and contractors
plus upgrading access to the AWT plant.
Earth Carers
Earth Carers continued to strengthen
ties with local schools and collaborated
with the Waste Wise Schools’ team to
produce a Plastic Free July Activity Guide.
The interactive waste games were a hit
at Iona, St Hilda and PLC primary schools.
Batteries w e r e c o l l e c t e d for
recycling from 12 local schools.
Earth Carers ran a series of successful
courses and events to encourage people
to think about how to reduce their waste
and these are highlighted later in the
annual report.
This year the first student intern Sarah
Belli was hosted by Earth Carers for a
semester. Sarah is from Murdoch
University studying Sustainable
Development and Environmental
Management and was a great support in
the busy lead up to Plastic Free July
2014.
6

7
Five multi‐purpose regional recycling
stations were rolled out in high traffic public
locations. The stations are a o ne‐stop‐
drop of f po int f or mobile phones,
household batteries, ink cartridges and
fluorescent lights. Already 768 kgs of
recyclables have been collected through
these stations.
I would like to express thanks to all of our
Earth Carers volunteers for the selfless
manner in which they give so many hours
of time spreading the Earth Carers “full lives,
empty bins” message.
The amazing work of the Earth Carers staff is
evidenced throughout this Annual Report.
All of this work is done with the incredible
energy of four part‐time staff.
Funding, Awards & Accolades
In the past year the WMRC was awarded:
The Waste Authority’s prestigious Infinity
Award for Local Government for the Plastic
Free July campaign. As a winner the WMRC
received $5,000.
The Chairman’s Award at the inaugural Keep
Australia Beautiful WA STAR Awards for
Plastic Free July’s exceptional effort in litter
prevention in Western Australia.
Financial Performance
WMRC finished the year with a net deficit of
($117,849). The deficit is solely attributed
to an impairment loss of ($426,747)
following the revaluation of WMRC’s assets.
Our net cash position provided by operating
activities was a surplus of $310,226.
Legislative changes to the Local
Government (Financial Management)
Regulations 1996 required all local
governments in WA to revalue their assets
on the basis of fair value instead of
historical cost basis.
WMRC’s net book value of assets at 30
June 2013 was $2,814,457. As a result of the
revaluation; our net book assets at 30 June
2014 was $2,870,341.
The impairment loss is a non‐cash item and
essentially only an accounting entry. Whilst
this has reduced the member Councils total
equity in WMRC (as shown in the
accompanying financial statements), it has
no material effect on the Members’
investment in WMRC or their operating
budgets.
WMRC finished the year with cash‐backed
Reserves of $2,953,965.
2014/15
The year ahead will be very challenging. Hard
and thoughtful work will be needed to bring
on line the new DiCOM AWT Plant with a
good environmental dividend and a
reasonable and affordable price. Dealing
professionally with the uncertainty
surrounding local government reform will
require the best of both Councillors and staff
to achieve a good result for the western
suburbs community.
Thank you
The efforts of WMRC and member Council
staff over the last year have been
appreciated. These efforts have made it
possible to achieve positive outcomes to
projects completed in the last year.
On behalf of my predecessor and WMRC staff
thanks are due to WMRC Chairman C r
C h a r l e s H o h n e n a n d W M R C Councillors
for clear policy direction and strong interest
in staff endeavours in the past year.
John Stevenson
Chief Executive Officer

Chief Executive Officer
Office
Manager
Transfer
Station
Supervisor
Waste Education
& Sustainability
Manager
Business
Manager Engineer
Earth Carers
Coordinators (3)
Operations
Staff (7)
Delegate
Cr Rob Rowell
Delegate
Cr Brett Pollock
Delegate
Cr Lee Hemsley
Delegate
Cr Charles Hohnen
(Chairman)
TOWN OF
MOSMAN PARK
SHIRE OF
PEPPERMINT GROVE
CITY OF
SUBIACO
TOWN OF
COTTESLOE TOWN OF
CLAREMONT
Deputy Delegate
Cr Katrina Downes
Deputy Delegate
Cr Libby Eustance
Deputy Delegate
Cr Hugh Richardson
Delegate
Cr Bruce Haynes
Deputy Delegate
Cr Paul Kelly
Deputy Delegate
Cr Greg Peters
Council Structure Council Representatives
The WMRC Council guides the governance and
strategic direction for the organisation. The
Council is made up of one representative from
each member Council and one deputy delegate.
The Council met seven times in 2013/14.
Committees
To assist with its planning and decision
making, WMRC’s Council has appointed
three committees. Each committee
makes recommendations to Council for
its consideration.
Audit Committee
The Audit Committee is established in
accordance with section 7.1A of the
Local Government Act 1995.
The committee consists of three
Councillors and guides the WMRC’s
audit processes and financial
management.
Strategic Review Committee
The Strategic Review Committee
considers matters that have a direct
impact on member Councils. It also
supports the strengthening of
relationships across the region.
The committee consists of member
council Chief Executive Officers and the
WMRC Chief Executive Officer.
Operations Committee
The Operations Committee consists of
one officer from each member Council
and the WMRC Chief Executive Officer.
The committee provides guidance and
technical input to the WMRC on
operational matters.
Organisation Structure
8

Our Work
Waste Transfer Station
WMRC operates the Waste Transfer Station in Shenton
Park, which receives over 40,000 tonnes of waste per
annum from Councils, commercial customers and
residents.
Earth Carers Programme
WMRC delivers the Earth Carers Programme
to member Councils and the City of Nedlands
to educate and support the community to
reduce waste.
Waste Transfer Station
General waste from the region and
surrounds is consolidated at the
facility, loaded into large trucks and
hauled to landfill.
Domestic Recycling
The facility provides free recycling
services for residents. Services include
batteries, cardboard, electronic waste
and fluorescent lights.
Greenwaste Recycling
The facility recycles over 7,000 tonnes
of greenwaste each year. Greenwaste
is hauled in bulk to a local composting
facility for reuse.
Household Hazardous Waste (HHW)
The transfer station houses a
permanent HHW drop‐off area that
allows residents to safely dispose of
hazardous items free of charge.
Problematic Waste Disposal
The facility accepts asbestos and tyres.
They are sent to specialised processors,
diverting them from landfill where
they may be harmful to the
environment.
AnaeCo AWT Plant
The AnaeCo Alternative Waste
Treatment (AWT) Plant is practically
c o m p l e t e a n d c o m m e n c e d
commissioning.
Courses
Earth Carers deliver a range of
community education and
capacity building courses on
sustainable living.
Volunteer Support
Earth Carers support volunteers
in the community to spread the
“full lives, empty bins” message.
Events
Earth Carers deliver community
events focused on re‐use,
recycling and sustainability.
School Programmes
Earth Carers provide waste
education support and resources
to local schools.
Council Support
Earth Carers work with waste
and sustainability officers to
deliver waste education
messages and programmes.
Campaigns
Earth Carers develops and runs
campaigns to raise awareness of
waste and recycling issues. This
includes the Plastic Free July
campaign to raise awareness of
single‐use plastic consumption.
9

Strategic Priorities The WMRC’s Strategic Objectives are set out in the Strategic Community Plan 2012 to 2022. To
achieve these objectives over time the WMRC adopted a Corporate Business Plan 2012 to 2017 on 7
June 2012. The Corporate Business Plan establishes strategic priorities and key actions which are to
be tackled over the four years of the Plan. The Strategic objectives and key actions are shown in
the table below.
Achieve a comprehensive, cost effective
waste management service across the region
Increase the number of Councils, businesses
and people using our services
1.1 Provide a comprehensive, cost effective waste
transfer station.
1.2 Achieve a harmonised waste collection service
across the region that encourages source
separation.
1.3 Define and communicate best practice in
waste management.
2.1 Increase the number of Councils using WMRC
services.
2.2 Increase customers at the Transfer Station.
2.3 Increase the number of residents using WMRC
services.
2.4 Build a strong identity.
Reduce waste to landfill Increase the knowledge and engage the local
community to improve waste management
3.1 Establish the DiCOM facility on a commercially
viable basis.
3.2 Remove non‐specification waste from the
waste stream.
3.3 Sort and divert waste.
3.4 Recover value from residual material before
landfill.
4.1 Develop waste education infrastructure in the
region.
4.2 Develop waste education programmes in
schools.
4.3 Change behaviour in the household to minimise
waste and foster sustainable living.
4.4 Collaborate with Councils across the region.
4.5 Provide opportunities for community input into
WMRC operations.
Become a recognised catalyst implementing
innovative practices in waste management Develop a strong and capable organisation
5.1 Establish research partnerships.
5.2 Contribute to the development of innovation
in waste management.
5.3 Participate in waste industry peak bodies.
5.4 Advocate for improved waste management.
5.5 Foster innovative regional cooperation in
waste management.
6.1 Provide exceptional service.
6.2 Develop a capable team.
6.3 Provide a safe work environment.
6.4 Deliver responsible financial management.
10
1 2
3 4
5 6

Operational
Performance
2013/2014

12
2013/14 Highlights
Transfer Station
Recycling
The Transfer Station collected for
recycling:
� 48 tonnes of televisions and
computers;
� 42 tonnes of cardboard; and
� 15 tonnes of steel.
AnaeCo AWT Plant
Construction of the AnaeCo AWT plant
reached practical completion early in
the year. Commissioning commenced in
October 2013 but delays occurred with
the programme just over seven months
behind at the end of the year.
During 2013/2014, a total of 41,077 tonnes of waste was received at the JFR (Jim)
McGeough Resource Recovery Facility. This consisted of:
� 33,841 tonnes of putrescible waste (including AWT-related tonnes);
� 7,122 tonnes of greenwaste; and
� 114 tonnes of other waste (e.g. tyres, electronic waste, household hazardous waste).
This reflects a slight decrease in waste received over the past two years. All green
waste received was sent for composting in 2013/14.
Implementation began of the Disability Access and Inclusion Plan adopted in June 2012.
This included an audit of the Transfer Station to establish priorities for access
improvement.

13
2013/14 Highlights
Battery Recyling
Programme 3.6 tonnes of batteries were collected
through the WMRC’s Household Battery
Recycling Programme up from 3.1 tonnes
last year.
Plastic Free July Plastic Free July grew from 500 participants
in 2012 to over 2000 people in 37 countries
in 2013 and won two state awards.
Less Is More Over 800 people flocked to the Less is
More Festival organised largely by an
Earth Carers volunteer.
Prize Winning
Programmes Plastic Free July campaign was awarded
the:
� Waste Authority’s Infinity Award for
Local Government; and
� Keep Australia Beautiful WA STAR
Award Chairman’s Award .

fàÜtàxz|v bu}xvà|äx D
14
“Achieve a comprehensive, cost effective waste management
service across the region”
The Waste Transfer Station receives and
consolidates waste from Perth’s western
suburbs and surrounds. Waste is received
from member Councils, non‐member
Councils, commercial customers and
residents and includes:
• Putrescible waste which is loaded into
silos or large skip bins and transported
to landfill.
• Greenwaste which is stockpiled after
receival. A contractor is engaged to
remove the greenwaste from the site
for processing into compost.
• Free recycling services for batteries,
cardboard, electronic waste,
fluorescent lights, mobile phones,
motor oil, plastic, printer cartridges and
scrap metal.
All recyclable material is transported to
companies capable of reusing the material in
order to maximise future use.
The Waste Transfer Station is a permanent
Household Hazardous Waste (HHW) disposal
site, providing safe and environmentally
responsible disposal for acids, aerosols,
chemicals, engine coolant, flammables, paint,
pesticides and poisons. The Waste Transfer
Station provides disposal services for other
problematic waste such as asbestos, tyres
and gas cylinders, ensuring these materials
are diverted from landfill where they may
cause harm to the environment.
Member Council training and education
WMRC staff continued to provide support
and advice to member Council officers,
residents and other stakeholders in the
region.

Marketing and communications
WMRC’s marketing and communications
actions continued to be guided by the
Marketing and Communications Strategy
adopted by Council in February 2011. Key
initiatives delivered in 2013/14 included:
• Quarterly advertisements in the local
community newspaper promoting the
Waste Transfer Station and Earth
Carers events and activities.
• Council meeting summaries was
distributed to member Council
Councillors and CEOs, and uploaded to
the WMRC website within one week of
each Council meeting.
• A guide to waste disposal fees
prepared for each member Council to
improve understanding of fee
structures and increases.
• Regular media releases distributed on
key WMRC projects and initiatives.
Social media
In addition to its’ websites, WMRC continues
to have a strong social media presence.
WMRC has two Facebook pages and a Twitter
account. They are well followed and have
become a fundamental way for WMRC to
interact with, engage and support the
community to live with less waste.
The Earth Carers Facebook page is an
effective two‐way communication tool for
WMRC. Visitors use the page to share reuse
and recycling ideas and inform WMRC about
sustainability initiatives around the world. At
30 June 2014, 533 people had “liked” the
Earth Carers Facebook page (up from 407 at
30 June 2013).
The Plastic Free July Facebook page supports
WMRC’s Plastic Free July campaign. The page
encourages people from around the globe to
pledge to live plastic free during July. The
page enables people to share tips, ideas and
photos on living plastic free. At 30 June 2014,
4,872 people had ‘liked’ the Plastic Free July
page (up from 2,780 at 30 June 2013).
fàÜtàxz|v bu}xvà|äx E
15 Plastic Free July Facebook page
“Increase the number of Councils, businesses and people using
our services”

Websites
WMRC has four websites:
• www.wmrc.wa.gov.au
• www.earthcarers.org.au
• www.plasticfreejuly.org
• www.dicomwesternsuburbs.weebly.com
Each website was regularly updated and
maintained during the year. The WMRC
website attracted 15,195 visits during the
year, whilst 7,978 people visited the Earth
Carers website. Visits to the WMRC website
increased by 14% from last year whilst visits
to the Earth Carers website remained the
same. The websites provide a convenient
method for stakeholders to access
information, corporate documents and news.
Transfer Station Visits
Residents continued to visit the Transfer
Station to access free domestic recycling and
household hazardous waste disposal services.
During the year, residents delivered around
140 tonnes of recyclables (excluding
greenwaste) to the Waste Transfer Station.
The number of self‐haul customers (i.e. cars
and trailers) remained steady.
16

fàÜtàxz|v bu}xvà|äx F
DiCOM AWT Plant
The completed plant will consist of three
processing vessels, three water storage
tanks, a materials recovery facility building,
power generation equipment and a waste
receival and loading area. It will be the
first time in Australia that alternative waste
processing technology has been constructed
at an existing transfer station.
Once the plant has reached its full
operating capacity the plant will process
u p t o 60,000 tonnes of waste per annum,
of which the WMRC is contracted to supply
33,000 tonnes. A further 22,000 tonnes will
be supplied, under a separate contract, by
the City of Stirling and the remaining 5,000
tonnes by DiCOM.
The amount of waste to be diverted from
landfill is yet to be confirmed but should be
significant and should provide an
environmental dividend to the WMRC
region.
Household Hazardous Waste program
During the year 2.77 tonnes of liquid
chemical waste was sent for recycling and
over 1.6 tonnes of gas bottles were de‐
gassed and recycled.
Compact fluorescent light recycling
The WMRC provides a free compact
fluorescent light collection point at the
Waste Transfer Station. The Federal
Government's decision to phase out
incandescent light globes means that
households and businesses have switched
to energy‐efficient lighting such as compact
fluorescent lights.
Whilst these lights last longer and require
less electricity, their drawback is that many
of them contain small amounts of mercury.
The recycling of fluorescent lights is funded
by the Waste Authority’s Household
Hazardous Waste Programme.
Household Battery Recycling Programme
The WMRC continued to promote its 33
household battery recycling drop‐off
locations during the year, 12 of these are in
local schools. 3.6 tonnes of household
batteries were collected during the year. This
was a increase on the 3.1 tonnes collected in
2012/13.
Batteries were stockpiled at the Waste
Transfer Station for the most part of the
year. In April 2014 the batteries were
collected as part of a joint regional council
shipment and transported to Singapore for
recycling. The recycling costs are funded
through the Waste Authority’s Household
Hazardous Waste Programme.
Electronic waste recycling
During the year, residents and small
businesses delivered around 49 tonnes of
computers and televisions to the Waste
Transfer Station for recycling (up from 30
tonnes in 2012/2013). WMRC also assisted
the City of Nedlands to recycle electronic
waste collected from bulk verge collections.
The recycling costs are funded through the
Electronic Waste Product Stewardship
Arangement
17
“Reduce waste to landfill”
fàÜtàxz|v bu}xvà|äx G “Increase the knowledge and engage the local community to
improve waste management”
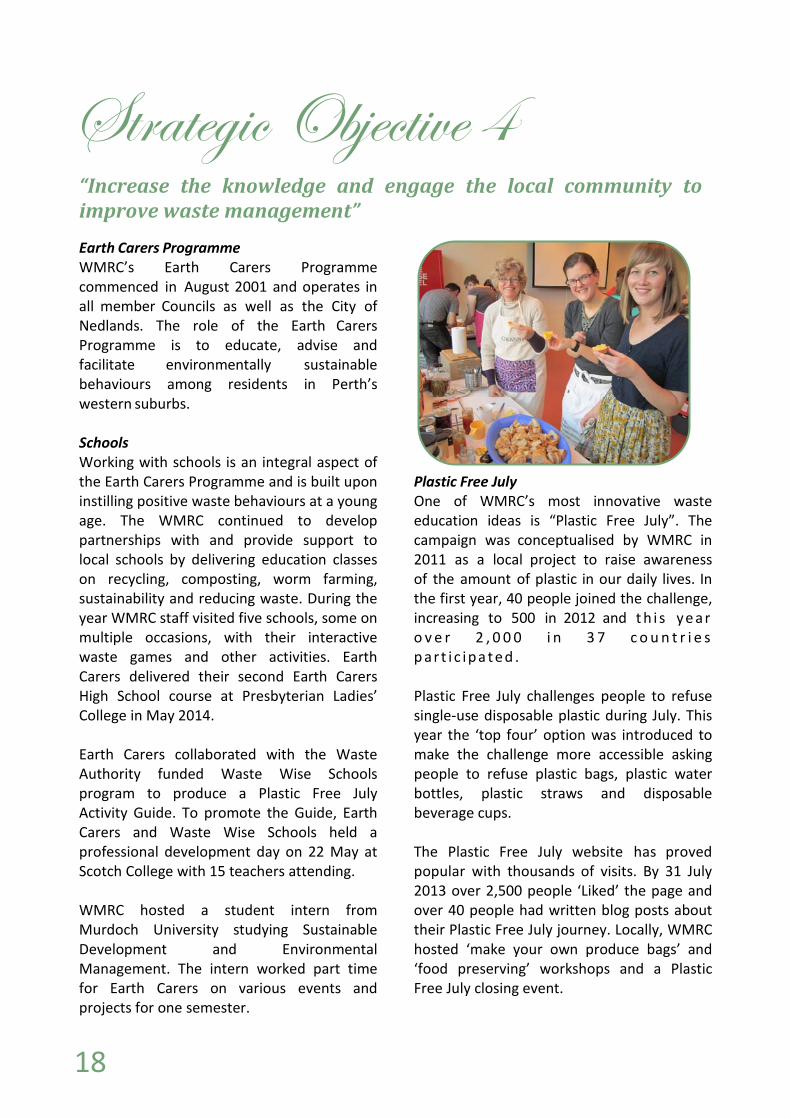
Earth Carers Programme
WMRC’s Earth Carers Programme
commenced in August 2001 and operates in
all member Councils as well as the City of
Nedlands. The role of the Earth Carers
Programme is to educate, advise and
facilitate environmentally sustainable
behaviours among residents in Perth’s
western suburbs.
Schools
Working with schools is an integral aspect of
the Earth Carers Programme and is built upon
instilling positive waste behaviours at a young
age. The WMRC continued to develop
partnerships with and provide support to
local schools by delivering education classes
on recycling, composting, worm farming,
sustainability and reducing waste. During the
year WMRC staff visited five schools, some on
multiple occasions, with their interactive
waste games and other activities. Earth
Carers delivered their second Earth Carers
High School course at Presbyterian Ladies’
College in May 2014.
Earth Carers collaborated with the Waste
Authority funded Waste Wise Schools
program to produce a Plastic Free July
Activity Guide. To promote the Guide, Earth
Carers and Waste Wise Schools held a
professional development day on 22 May at
Scotch College with 15 teachers attending.
WMRC hosted a student intern from
Murdoch University studying Sustainable
Development and Environmental
Management. The intern worked part time
for Earth Carers on various events and
projects for one semester.
Plastic Free July
One of WMRC’s most innovative waste
education ideas is “Plastic Free July”. The
campaign was conceptualised by WMRC in
2011 as a local project to raise awareness
of the amount of plastic in our daily lives. In
the first year, 40 people joined the challenge,
increasing to 500 in 2012 and t h i s ye ar
o v e r 2 , 0 0 0 i n 3 7 c o u n t r i e s
p ar t i c ip a t ed .
Plastic Free July challenges people to refuse
single‐use disposable plastic during July. This
year the ‘top four’ option was introduced to
make the challenge more accessible asking
people to refuse plastic bags, plastic water
bottles, plastic straws and disposable
beverage cups.
The Plastic Free July website has proved
popular with thousands of visits. By 31 July
2013 over 2,500 people ‘Liked’ the page and
over 40 people had written blog posts about
their Plastic Free July journey. Locally, WMRC
hosted ‘make your own produce bags’ and
‘food preserving’ workshops and a Plastic
Free July closing event.
18
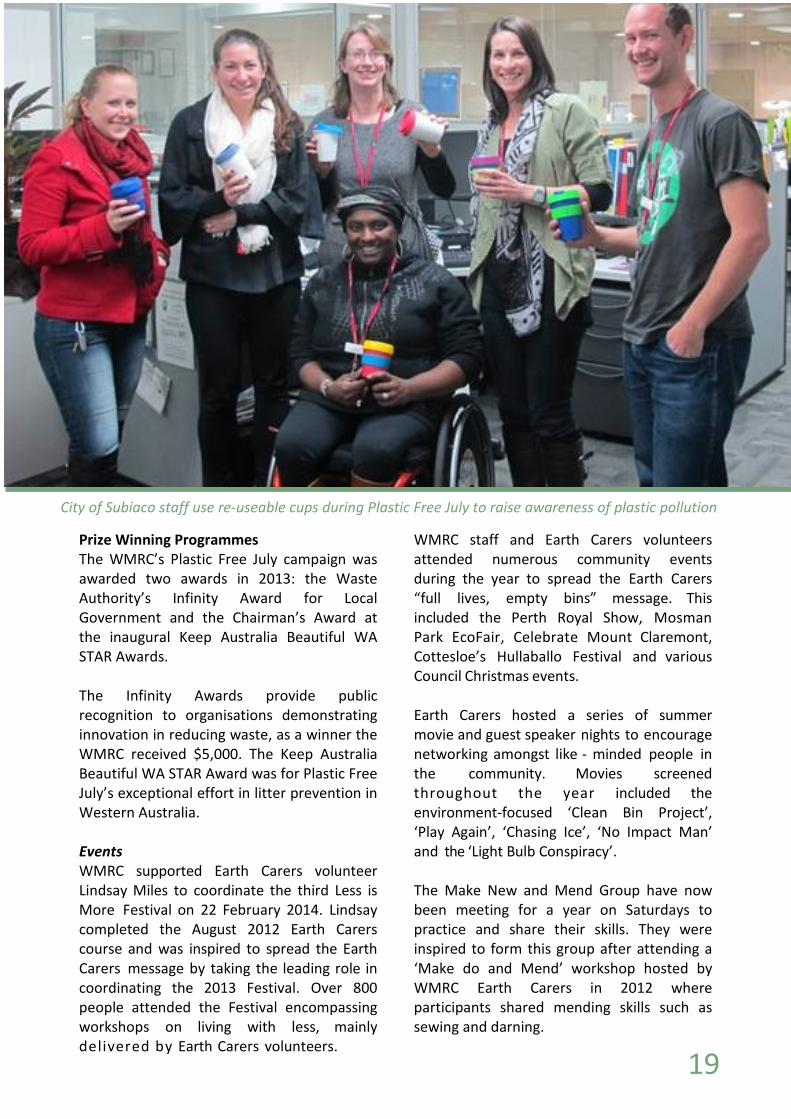
Prize Winning Programmes
The WMRC’s Plastic Free July campaign was
awarded two awards in 2013: the Waste
Authority’s Infinity Award for Local
Government and the Chairman’s Award at
the inaugural Keep Australia Beautiful WA
STAR Awards.
The Infinity Awards provide public
recognition to organisations demonstrating
innovation in reducing waste, as a winner the
WMRC received $5,000. The Keep Australia
Beautiful WA STAR Award was for Plastic Free
July’s exceptional effort in litter prevention in
Western Australia.
Events
WMRC supported Earth Carers volunteer
Lindsay Miles to coordinate the third Less is
More Festival on 22 February 2014. Lindsay
completed the August 2012 Earth Carers
course and was inspired to spread the Earth
Carers message by taking the leading role in
coordinating the 2013 Festival. Over 800
people attended the Festival encompassing
workshops on living with less, mainly
delivered by Earth Carers volunteers.
WMRC staff and Earth Carers volunteers
attended numerous community events
during the year to spread the Earth Carers
“full lives, empty bins” message. This
included the Perth Royal Show, Mosman
Park EcoFair, Celebrate Mount Claremont,
Cottesloe’s Hullaballo Festival and various
Council Christmas events.
Earth Carers hosted a series of summer
movie and guest speaker nights to encourage
networking amongst like ‐ minded people in
the community. Movies screened
throughout the year included the
environment‐focused ‘Clean Bin Project’,
‘Play Again’, ‘Chasing Ice’, ‘No Impact Man’
and the ‘Light Bulb Conspiracy’.
The Make New and Mend Group have now
been meeting for a year on Saturdays to
practice and share their skills. They were
inspired to form this group after attending a
‘Make do and Mend’ workshop hosted by
WMRC Earth Carers in 2012 where
participants shared mending skills such as
sewing and darning.
City of Subiaco staff use re-useable cups during Plastic Free July to raise awareness of plastic pollution
19

Regional recycling stations
WMRC installed five multi‐purpose regional
recycling stations during the year. The
stations accept mobile phones, household
batteries, ink cartridges and fluorescent
lights. All are placed in high traffic public
locations such as sport and leisure centers,
hardware stores and a university. Since
October 2013 when the stations began to be
installed 54 kgs of mobile phones, 560 kgs of
household batteries, 59 kgs of ink cartridges
and 95 kgs of fluorescent lights have been
collected.
A campaign has been launched to raise
awareness of the stations and to promote
avoidance and safe disposal of other
Household Hazardous Waste items. The
campaign includes posters, promotion in
council newsletters, displays in libraries and
newspaper advertisements and media
releases.
Tours
During the year, WMRC coordinated a
series of interesting tours for the
community. Tours included:
• AnaeCo AWT Plant
• MRC’s Tamala Park
Courses and workshops
The Earth Carers course provides western
suburbs residents with the skills and
knowledge to confidently live with less waste.
During 2013/14, 45 people completed the
free community Earth Carers course. Two
courses we run, in September 2013 and
March 2014, each consisting of five sessions
over three weeks.
The course provides participants with
information on local waste management;
waste and recycling facility tours; and an
organic composting and green cleaning
workshop. Upon completing the course,
participants may join t h e Earth Carers
volunteer network.
Community engagement
During the year, a number of educational
displays were placed in Council libraries
including displays focused on Household
Hazardous Waste, Plastic Free July and the
Garage Sale Trail.
WMRC’s battery, fluorescent light and worm
costumes continue to be a feature at local
community events engaging public interest
i n recycling. The battery and fluorescent
light costumes help communicate the
importance of not disposing of these items
in the general waste bin, ensuring they do
not end up in landfill or at the AnaeCo
AWT Plant. The worm costume helps
communicate the benefits of organic
composting and worm‐farming.
WMRC staff were out and about during the
year sharing their skills and knowledge on
waste and recycling with the community.
Staff presented about Plastic Free July at
the 2013 Waste and Recycling
conference. They also gave talks to
Rotary and other community groups and to
member Council staff gatherings such as a de‐
cluttering workshop for Town of Mosman
Park staff.
Meetings
In addition to the formal committee
meetings held with member Council CEOs
and waste officers, regular meetings were
also scheduled with sustainability an d
c o mm u n ic at ion officers. The meetings
ensure member Council staff are fully briefed
on key WMRC projects and provide
opportunities to assess where WMRC can
further assist members.
27 3 20

fàÜtàxz|v bu}xvà|äx H “Become a recognised catalyst implementing innovative practices
in waste management”
Forum of Regional Councils
WMRC continued to participate in the Forum
of Regional Councils (FORC) during the year.
Participation on FORC strengthens WMRC’s
ties with other WA regional councils an
provides the opportunity to collectively lobby
bodies such as the State Government, for
action around municipal solid waste.
Municipal Waste Advisory Council
The WMRC is a member of the municipal
Waste Adviosory Council (MWAC). MWAC is
a standing committee of the Western
Australian Local Government Association and
is a forum for all major local government
waste management organisations to
cooperate. Membership will benefit member
councils and residents in the region.
21
Community members tour AnaeCo AWT plant

22
Improved safety
Implementation of the WMRC
Occupational Safety and Health (OSH)
System helped deliver a safe workplace,
for employees, a safe site for visitors and
enabled a continued focus on OSH
improvement. Regular Safety Committee
Meetings provided the mechanism to
proactively identify workplace hazards,
review any incidents and review
outstanding corrective actions. Workplace
inspections of the Waste Transfer Station
and Administration Office were carried out
to identify potential safety concerns or
hazards.
Recordkeeping practices and procedures
The management of records in the
Regional Council was identified in some
areas as not fully compliant with the
Recordkeeping Plan (RKP 2010064). These
areas were highlighted for improvement in
2014/15.
Connecting the WMRC
To foster improved communications with
member Councils, WMRC has two
committees of Council made up of
member Council officers and WMRC
staff. This provides technical staff and
CEOs with an opportunity to comment on
projects and initiatives being considered
by the WMRC Council.
Long Term Financial Plan
The Long Term Financial Plan 2011‐2021
is built from a dynamic financial model
which analyses financial trends over a ten
year period, taking assumptions and
projections as inputs and producing
financial reports as outputs. The Plan
details what the WMRC proposes to do
over the decade as a means of ensuring
the WMRC’s financial sustainability. It was
last updated by Council in June 2013.
The Plan guided in part the preparation of
the 2014/15 Annual Budget.
Asset Management Plan
Data collection has continued for the
WMRC’s Asset Management Plan first
adopted in April 2102. When complete it
will allow the WMRC to manage its assets
to achieve all strategic and operational
objectives with confidence.
Strategic Community Plan
The 10 year Strategic Community Plan
2012 – 2022 adopted in April 2013
continues to guide activities to deliver a
coordinated and integrated approach to
sustainable waste management across the
region.
fàÜtàxz|v bu}xvà|äx I “Develop a strong and capable organisation”

Statutory &
Financial Reports
2013/2014
STRATEGIC OBJECTIVE 1
Achieve a comprehensive, cost effective
waste management service across the
region
� Investigate sustainable and economically
viable disposal options for waste not
processed at the AnaeCo AWT Plant.
� Seek to classify AnaeCo AWT residual
waste as Inert Waste.
� Continue to expand recycling services
available at the Waste Transfer Station.
STRATEGIC OBJECTIVE 2
Increase the number of Councils,
businesses and people using our
services
� Develop a waste education programme
for small to medium sized businesses.
� Complete installation of automated truck
weighing system.
� Continue to promote the availability and
use of Transfer Station passes.
� Continue to promote the availability and
use of free domestic recycling services at
the Waste Transfer Station.
� Attract new followers to WMRC social
media profiles.
STRATEGIC OBJECTIVE 3
Reduce waste to landfill
� Bring on line the AnaeCo Plant to process
waste with a significant environmental
dividend at an acceptable price.
� Source 18,500 tonnes of commerc ia l
waste to meet WMRC’s waste supply
obligations.
� Continue e x p a n s i o n o f the household
battery recycling programme.
� Continue expansion o f the compact
fluorescent light recycling.
� Continue bulk waste sorting.
� Investigate waste to energy options for
residual waste from the AnaeCo AWT Plant.
STRATEGIC OBJECTIVE 4
Increase the knowledge and engage the
local community to improve waste
management
� Continued promotion of t h e recycling
stations in public places around the region.
� Continue to incorporate waste aspects into
the curriculum of local schools.
� Deliver two Earth Carers courses.
� Deliver a programme of Earth Carers
volunteer networking events.
� Coordinate local events that foster the
reuse, recycling and repairing of waste.
� Deliver a series of sustainability skills
workshops and courses.
� Continue to deliver the Plastic Free July
campaign.
The Year Ahead The WMRC’s activities in 2014/15 will continue to be guided by the strategic objectives
identified in the Strategic Community Plan 2012—2022. To achieve the strategic objectives
over time the key actions identified in the Corporate Business Plan 2012—2017 will be
undertaken as resources allow. A summary of the key actions identified for 2014/15 are set out
below, under the relevant strategic objective.
24
STRATEGIC OBJECTIVE 5
Become a recognised catalyst
implementing innovative practices in
waste management
� Attend FORC and MWAC meetings.
� Engage with the State and Federal
Governments on waste related issues
important to the region.
STRATEGIC OBJECTIVE 6
Develop a strong and capable
organisation
� Prepare work procedures for operational
and administrative functions.
� Continue to implement the Occupational
Safety and Health Plan at the Transfer
Station and Administration Office.
� Continue implementation of the
Disability Access and Inclusion Plan.
� Review Record keeping system and
submit to State Records for approval prior
to implementation.
25
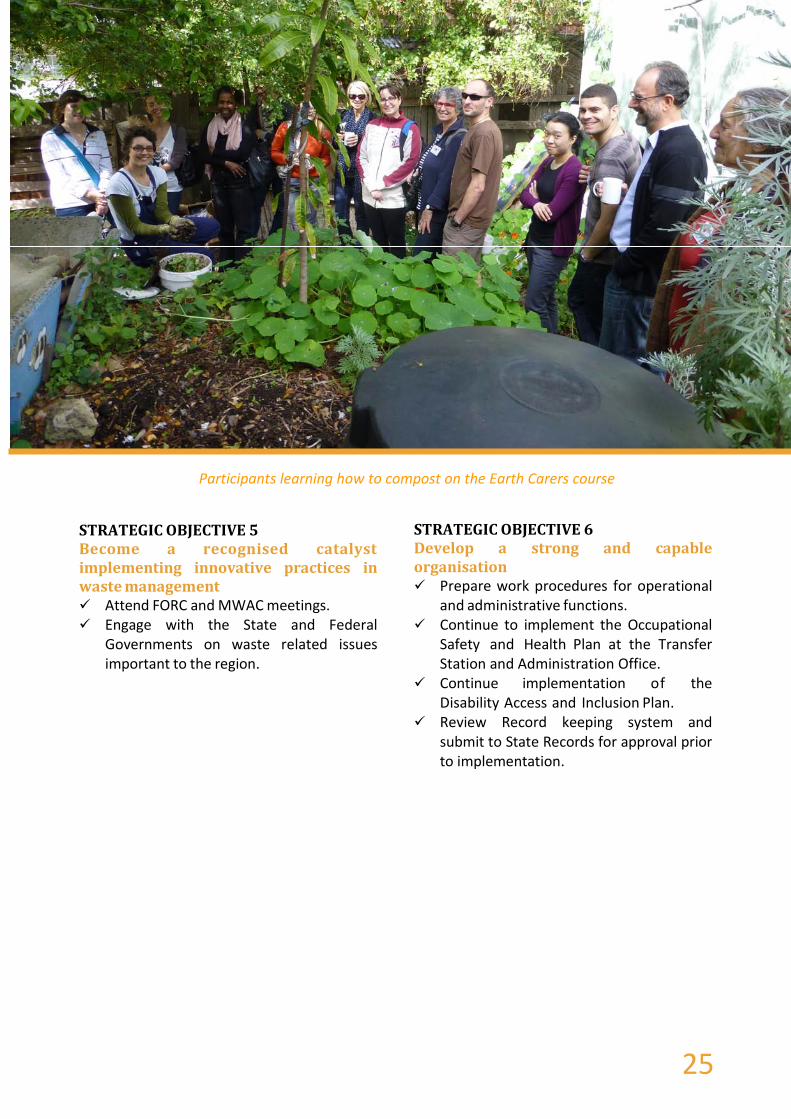
Participants learning how to compost on the Earth Carers course

Statutory Compliance Section 5.56(1) of the Local Government Act
1995 requires a local government to “plan
for the future of the district”, with detail
set out in the Local Government
(Administration) Regulations 1996. In August
2011, amendments to the Regulations were
gazetted.
This resulted in the Integrated Planning
Process which includes the:
• Strategic Community Plan;
• Corporate Business Plan;
• Asset Management Plan; and
• Long Term Financial Plan.
These plans were all in place as at 1 July 2013
and will guide an integrated approach to
waste management in the coming years.
It should be noted however that, because of
the delays in the commissioning of the
DiCOM plant, some elements of these plans
will also be delayed.
Statutory Compliance Return
The WMRC’s Statutory Compliance Return for
the period 1 January 2013 to 31 December
2013 was adopted by Council on 6 February
2014 and lodged as required. The WMRC
was fully compliant with all matters
applicable to its operations.
National Competition Policy
Clause 7 of the Competition Principles
Agreement sets out local governments’
responsibilities under the National
Competition Policy. Local governments
(including regional councils) are required to
include a statement in their Annual Report
on the structural reform of public
monopolies, the implementation of
competitive neutrality principles and
legislative review principles.
Structural reform of public monopolies
The WMRC is not classified as a natural
monopoly, nor does it conduct any
business activities that could be classed as
public monopolies. The structural reform
principles predominately apply to state
owned services such as electricity and
water supplies. Accordingly the structural
reform of public monopolies does not apply
to the WMRC.
Competitive neutrality
Competitive neutrality principles apply to
the significant business activities conducted
by (or under the control of) one or more
local governments whether they are
operating jointly or solely. A local
government is only required to implement
competitive neutrality principles to the
extent that the benefits to be realised from
implementation outweigh the costs, in
respect of individual business activities
that exceeded $200,000 annual income.
The WMRC’s only significant business
activity is the Waste Transfer Station. The
facility meets the ‘public benefit test’ in
respect to ‘user‐pay charges’. The provision
of this service is beneficial to the regional
community and is available to member
Councils, non‐member Councils and
commercial customers.
Legislative review
Under clause 7 of the Competition
Principles Agreement, all local governments
(including regional councils) are to review,
and where necessary, amend local laws to
ensure that there were no anti‐competitive
local legislation.
The WMRC had no local laws in effect during
the year. Should the WMRC have cause to
make local laws in the future then those laws
will be framed to address the National
Competition Principles. 26

27
Register of complaints
The Local Government Act 1995 s5.54
contains the provision that requires
complaints made against any Council
member during the financial year to be
registered, recorded and reported annually.
This section also details any action taken
under 5.5.110(6)(b), if the standards panel
finds that a minor breach has occurred.
There was one registered complaint against a
WMRC staff member during the 2013/14
financial year. The complaint was found to be
valid and the staff member was counselled
regarding his manner and behavior. The
complainant was thanked for bringing the
matter to management’s attention and was
advised of the action taken.
Record Keeping Plan
Principal 6 of the Record Keeping Plan
Criteria (State Records Act 2000) outlines
the requirements for local governments
(including regional councils) to report
within their Annual Reports the efficiency
and effectiveness of the organisations record
keeping systems, record keeping training and
induction programmes.
The WMRC’s Record Keeping Plan has been
adopted since December 2010 and approved
by the State Records Commission. This was
due to be reviewed in 2015 but has been
brought forward to 2014.
Disability Access and Inclusion Plan
It is a requirement of the Disability Services
Act 1993 that all local governments develop
and implement a Disability Access and
Inclusion Plan (DAIP). Whilst it is not
mandatory for regional councils to prepare a
DAIP, it is recommended as best practice.
Council adopted its first DAIP in June 2012.
The DAIP outlines the ways in which WMRC
will ensure that people with a disability have
equal access to its facilities and services
through eight desired outcomes. In April
2014, Council adopted the reviewed DIAP,
amendments included an additional
employment related outcome. During
2013/14 WMRC commenced implementation
of the DAIP. This included an audit of the
Waste Transfer Station to establish priorities
for access improvement which have been
incorporated in the refurbishment of the site.
WMRC reported to the Disability Services
Commission on progress towards the Plan in
June 2014.
Payments to employees
The Local Government (Administration)
Regulations 1996 prescribes under r19B that
for the purposes of s5.53(2) of the Local
Government Act 1995, a local governments
Annual Report must contain information on
the number of employees of the Council, in
bands of $10,000, entitled to an annual
salary of $100,000 or more.
Pay Scale Range Employees #
$140,000 to $150,000 1
(part year only)
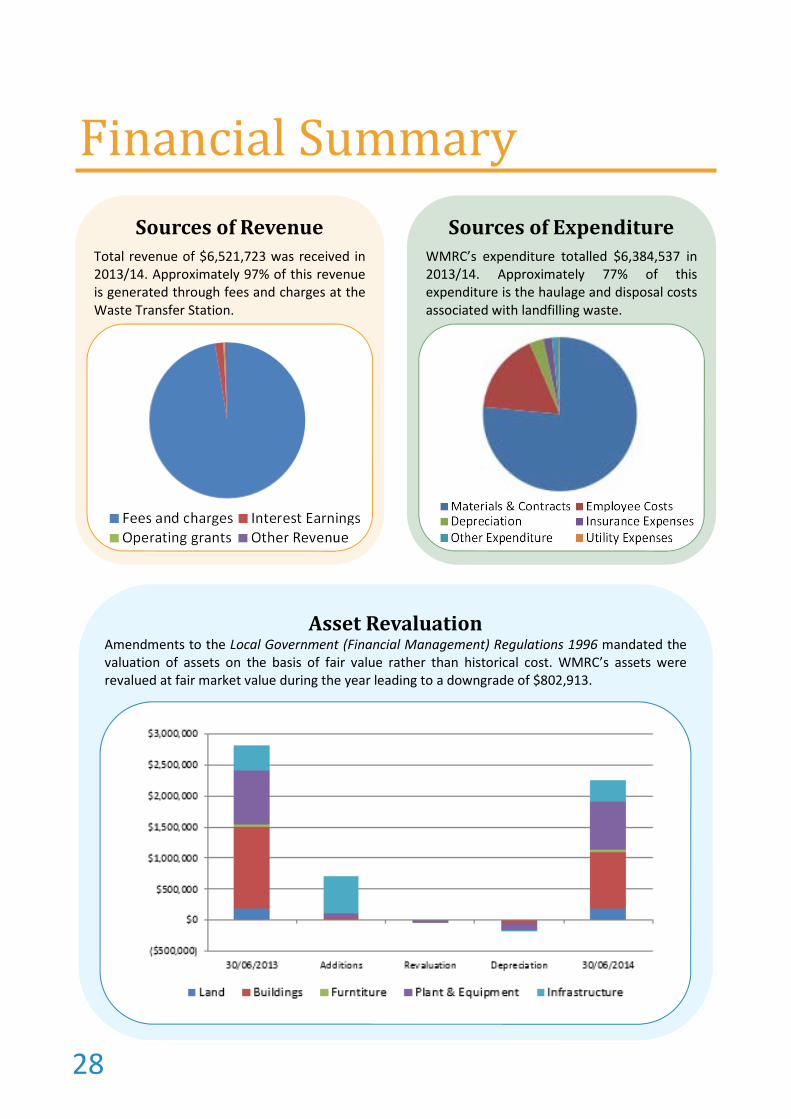
Sources of Expenditure
WMRC’s expenditure totalled $6,384,537 in
2013/14. Approximately 77% of this
expenditure is the haulage and disposal costs
associated with landfilling waste.
Asset Revaluation Amendments to the Local Government (Financial Management) Regulations 1996 mandated the
valuation of assets on the basis of fair value rather than historical cost. WMRC’s assets were
revalued at fair market value during the year leading to a downgrade of $802,913.
Financial Summary
Sources of Revenue
Total revenue of $6,521,723 was received in
2013/14. Approximately 97% of this revenue
is generated through fees and charges at the
Waste Transfer Station.
28

For the Year Ended
30 June 2014
Annual Financial Report
Western Metropolitan Regional Council

Statement by Chief Executive Officer 31 Independent Auditor’s Report 32
Financial Report Statement of Comprehensive Income - By Program 34 Statement of Comprehensive Income - By Nature or Type 35 Statement of Financial Position 36 Statement of Changes in Equity 37 Statement of Cash Flows 38 Notes to and forming part of the Annual Financial Report for the Year Ended 30 June 2013 39
Table of Contents
30

Statement by CEO
31

Auditor’s Report
32

Auditor’s Report Cont.
33
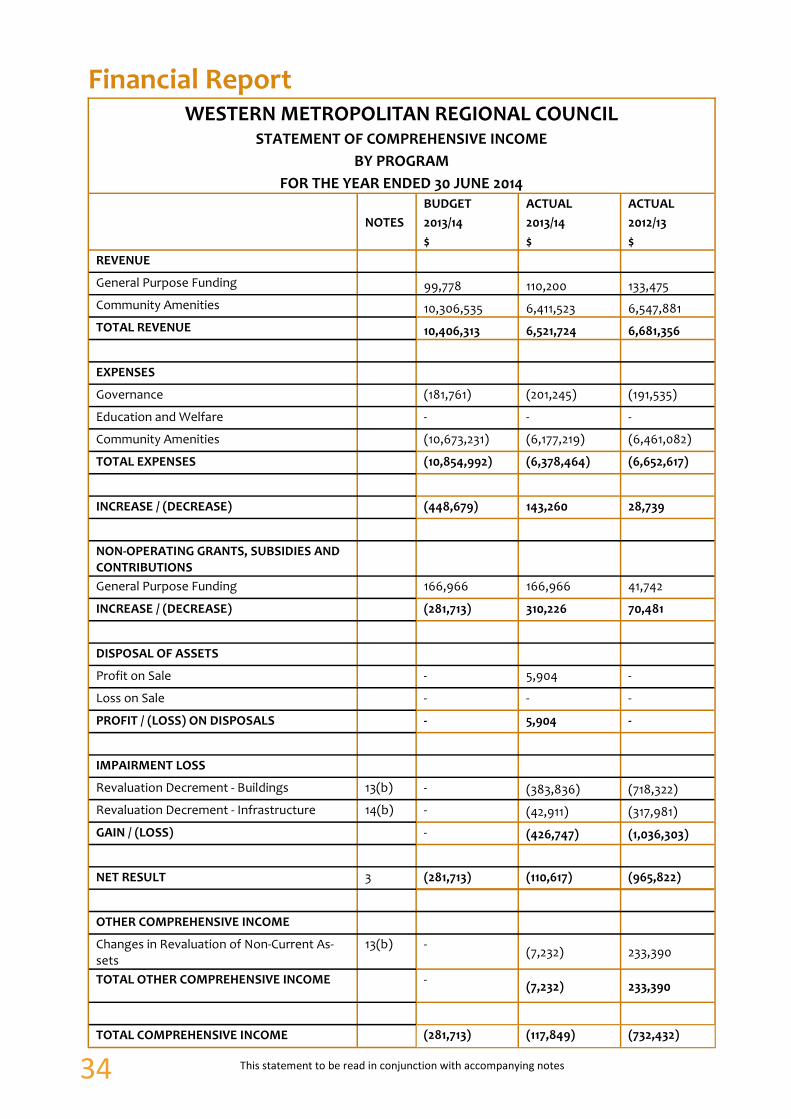
WESTERN METROPOLITAN REGIONAL COUNCIL STATEMENT OF COMPREHENSIVE INCOME
BY PROGRAM
FOR THE YEAR ENDED 30 JUNE 2014
NOTES
BUDGET
2013/14
$
ACTUAL
2013/14
$
ACTUAL
2012/13
$
REVENUE
General Purpose Funding 99,778 110,200 133,475
Community Amenities 10,306,535 6,411,523 6,547,881
TOTAL REVENUE 10,406,313 6,521,724 6,681,356
EXPENSES
Governance (181,761) (201,245) (191,535)
Education and Welfare - - -
Community Amenities (10,673,231) (6,177,219) (6,461,082)
TOTAL EXPENSES (10,854,992) (6,378,464) (6,652,617)
INCREASE / (DECREASE) (448,679) 143,260 28,739
NON-OPERATING GRANTS, SUBSIDIES AND CONTRIBUTIONS
General Purpose Funding 166,966 166,966 41,742
INCREASE / (DECREASE) (281,713) 310,226 70,481
DISPOSAL OF ASSETS
Profit on Sale - 5,904 -
Loss on Sale - - -
PROFIT / (LOSS) ON DISPOSALS - 5,904 -
IMPAIRMENT LOSS
Revaluation Decrement - Buildings 13(b) - (383,836) (718,322)
Revaluation Decrement - Infrastructure 14(b) - (42,911) (317,981)
GAIN / (LOSS) - (426,747) (1,036,303)
NET RESULT 3 (281,713) (110,617) (965,822)
OTHER COMPREHENSIVE INCOME
Changes in Revaluation of Non-Current As-sets
13(b) - (7,232) 233,390
TOTAL OTHER COMPREHENSIVE INCOME - (7,232) 233,390
TOTAL COMPREHENSIVE INCOME (281,713) (117,849) (732,432)
Financial Report
This statement to be read in conjunction with accompanying notes 34

Financial Report WESTERN METROPOLITAN REGIONAL COUNCIL
STATEMENT OF COMPREHENSIVE INCOME BY NATURE OR TYPE
FOR THE YEAR ENDED 30 JUNE 2014
NOTES BUDGET 2013/14 $
ACTUAL 2013/14 $
ACTUAL 2012/13 $
REVENUE
Fees and Charges 4(b) 10,291,650 6,356,704 6,520,860
Operating Grants, Subsidies and Contribu-tions
30
4,375 18,752 16,189
Interest Earnings 6 101,278 114,408 139,499
Other Revenue 9,010 31,859 4,808
TOTAL REVENUE 10,406,313 6,521,724 6,681,356
EXPENSES
Employee Costs (1,063,594) (1,103,153) (1,001,057)
Materials and Contracts (9,368,504) (4,878,594) (5,218,826)
Utility Expenses (10,643) (15,370) (9,200)
Insurance Expenses (120,752) (118,523) (104,311)
Interest Expenses - - -
Other Expenditure (59,404) (82,268) (52,138)
Depreciation Expenses 10 (232,095) (180,556) (267,084)
TOTAL EXPENSES (10,854,992) (6,378,464) (6,652,617)
INCREASE / (DECREASE) (448,679) 143,260 28,739
NON-OPERATING GRANTS, SUBSIDIES AND CONTRIBUTIONS
General Purpose Funding 30 166,966 166,966 41,742
INCREASE / (DECREASE) (281,713) 310,226 70,481
DISPOSAL OF ASSETS
Profit on Sale - 5,904 -
Loss on Sale 9 - - -
PROFIT / (LOSS) ON DISPOSALS - 5,904 -
IMPAIRMENT LOSS
Revaluation Decrement - Buildings 13(b) - (383,836) (718,322)
Revaluation Decrement - Infrastructure 14(b) - (42,911) (317,981)
GAIN / (LOSS) - (426,747) (1,036,303)
NET RESULT 3 (281,713) (110,617) (965,822)
OTHER COMPREHENSIVE INCOME
Changes in Revaluation of Non-Current As-sets
13(b) - (7,232) 233,390
TOTAL OTHER COMPREHENSIVE INCOME - (7,232) 233,390
TOTAL COMPREHENSIVE INCOME (281,713) (117,849) (732,432)
This statement to be read in conjunction with accompanying notes
35

Financial Report
WESTERN METROPOLITAN REGIONAL COUNCIL STATEMENT OF
FINANCIAL POSITION AS AT 30 JUNE 2014
NOTES ACTUAL 2013/14 $
ACTUAL 2012/13 $
CURRENT ASSETS
Cash and Cash Equivalents 11 3,155,874 3,164,863
Trade and Other Receivables 12 472,342 588,984
TOTAL CURRENT ASSETS 3,628,216 3,753,847
NON CURRENT ASSETS
Property, Plant and Equipment 13 1,911,573 2,406,861
Infrastructure 14 958,768 407,596
TOTAL NON CURRENT ASSETS 2,870,341 2,814,457
TOTAL ASSETS 9(b) 6,498,557 6,568,304
CURRENT LIABILITIES
Trade and Other Payables 15 571,216 544,213
Provisions 16 135,876 122,672
TOTAL CURRENT LIABILITIES 707,092 666,885
NON CURRENT LIABILITIES
Provisions 16 23,998 16,104
TOTAL NON CURRENT LIABILITIES 23,998 16,104
TOTAL LIABILITIES 731,090 682,989
NET ASSETS 5,767,467 5,885,315
EQUITY
Retained Surplus 2,587,344 2,742,095
Reserves – Cash Backed 18 2,953,965 2,909,830
Revaluation Surplus 19 226,158 233,390
TOTAL EQUITY 5,767,467 5,885,315
This statement to be read in conjunction with accompanying notes
36

WESTERN METROPOLITAN REGIONAL COUNCIL STATEMENT OF
CHANGES IN EQUITY FOR THE YEAR ENDED 30 JUNE 2014
NOTES RETAINED SURPLUS $
RESERVES CASH BACKED $
REVALUA-TION SURPLUS $
TOTAL EQUITY $
Balance as a 1 July 2012 3,140,952 3,476,795 - 6,617,747
Net Result (965,822) - - (965,822)
Total Other Comprehensive Income - - 233,390 233,390
Transfers from Reserves 18(a) 700,000 (700,000) - 833,035
Transfers to Reserves 18(a) (133,035) 133,035 - (833,035)
Closing Balance as at 30 June 2013 2,742,095 2,909,830 233,390 5,885,315
Net Result (110,617) - - (110,617)
Reversal of Revaluation Reserve - - (7,232) (7,232)
Total Other Comprehensive Income - - (7,232) (7,232)
Transfers from Reserves 18(a) 412,306 (412,306) - -
Transfers to Reserves 18(a) (456,441) 456,441 - -
Closing Balance as at 30 June 2014 2,587,343 2,953,965 226,158 5,767,467
Financial Report
This statement to be read in conjunction with accompanying notes
37

Financial Report
WESTERN METROPOLITAN REGIONAL COUNCIL STATEMENT OF CASH FLOWS
FOR THE YEAR ENDED 30 JUNE 2014
NOTES BUDGET 2013/14 $
ACTUAL 2013/14 $
ACTUAL 2012/13 $
CASH FLOWS FROM OPERATING ACTIVITIES
Receipts
Fees and Charges 10,363,337 6,452,073 6,402,696
Operating Grants, Subsidies and Contributions - 18,752 -
Interest Earnings 101,278 105,379 139,059
Other Revenue 13,385 31,859 20,967
Receipts from Operations 10,478,000 6,608,063 6,562,722
Payments
Employee Costs (1,063,594) (1,069,232) (1,019,860)
Materials and Contracts (9,215,420) (5,045,865) (5,301,938)
Utility Expenses (10,643) (15,370) (9,200)
Insurance Expenses (120,752) (118,523) (104,311)
Interest Expenses - - -
Other Expenditure (59,404) (82,268) (52,138)
Goods and Services Tax Received / (Paid) - 56,583 29,639
Payments from Operations (10,469,813) (6,274,675) (6,457,808)
NET CASH PROVIDED BY OPERATING ACTIVITIES 28(a) 8,187 333,388 104,914
CASH FLOWS FROM INVESTING ACTIVITIES
Payments for purchase of property, plant and equip-ment
(529,363) (98,619) (760,888)
Payments for purchase / construction of infrastructure (819,045) (430,927) (33,223)
Non-operating grants, subsidies and contributions 166,966 146,095 41,742
Proceeds from sale of plant and equipment 61,818 41,074 -
NET CASH USED IN INVESTING ACTIVITIES (1,119,625) (342,377) (752,369)
CASH FLOWS FROM FINANCING ACTIVITIES - - -
Cash receipts from sale of investments - - -
NET CASH PROVIDED BY FINANCING ACTIVITIES - - -
SUMMARY OF CASH FLOWS
Net increase / (decrease) in cash and cash equivalents (1,111,438) (8,989) (647,455)
Cash and cash equivalents at the beginning of the year 3,164,863 3,164,863 3,812,318
CASH AND CASH EQUIVALENTS AT THE END OF THE YEAR
28(b) 2,053,425 3,155,874 3,164,863
This statement to be read in conjunction with accompanying notes
38

Notes to and forming part of the Annual Financial Report for the Year Ended 30 June 2014 1 SIGNIFICANT ACCOUNTING POLICIES
The significant policies which have been adopted in the preparation of this financial report are
presented below and have been consistently applied unless stated otherwise:
(a) Basis of Preparation
The financial report is a general purpose financial report which has been prepared in
accordance with Australian Accounting Standards (as they apply to local government and not-
for-profit entities), Australian Accounting Interpretations, other authoritative pronouncements
of the Australian Accounting Standards Board, the Local Government Act 1995 (as amended)
and accompanying regulations (as amended).
Except for cash flow information, the report has also been prepared on the accrual basis and is
based on historical costs, modified, where applicable, by the measurement at fair value of
selected non-current assets, financial assets and liabilities.
Critical Accounting Estimates
The preparation of a financial report in conformity with Australian Accounting Standards
requires management to make judgments, estimates and assumptions that affect the
application of policies and reported amounts of assets and liabilities, income and expenses.
The estimates and associated assumptions are based on historical experience and various other
factors that are believed to be reasonable under the circumstances. The results of this
experience and other factors combine to form the basis of making judgments about carrying
values of assets and liabilities not readily apparent from other sources. Actual results may
differ from these estimates.
(b) The Local Government Reporting Entity
All funds through which the Council controls resources to carry on its functions have been
included in the Financial Statements forming part of this financial report.
In the process of reporting on the local government as a single unit, all transactions and
balances between those funds (for example, loans and transfers between Funds) have been
eliminated.
(c) Trust Funds
Monies held in the Trust Fund, which Council holds in a custodian role, are excluded from the
Financial Statements. A separate statement of those monies appears at Note 17 to these
Financial Statements.
(d) Cash and Cash Equivalents
Cash and cash equivalents in the Statement of Financial Position comprise cash at bank and in
hand and short-term that are readily convertible to known amounts of cash and which are
subject to an insignificant risk of changes in value.
For the purposes of the Statement of Cash Flows, cash and cash equivalents consist of cash and
cash equivalents as defined above, net of outstanding bank overdrafts. Bank overdrafts, where
applicable, are included as short-term borrowings in current liabilities on the Statement of
Financial Position.
39
(e) Property, Plant, Equipment and Infrastructure
Each class of fixed assets within either property, plant and equipment or infrastructure, is
carried at cost or fair value as indicated less, where applicable, any accumulated depreciation
and impairment losses.
Application of Fair Value to Local Government Financial Reporting
Regulation 17A of the Local Government (Financial Management) Regulations 1996
mandates the measurement of non-current assets at Fair Value effective from 1 July 2012.
The table provides the phased-in implementation of fair value in accordance with the
timeframe below:
Financial Year Asset Group – Resources
2012/13 Plant and Equipment
2013/14 or 2014/15 Land and Buildings
(alternate year to Infrastructure)
2013/14 or 2014/15 Infrastructure
(alternate year to Land and building)
2014/15 All other classes of assets
Thereafter, in accordance with the regulation, each asset class must be revalued at least
every 3 years.
In 2013, Council commenced the process of adopting Fair Value in accordance with the
Regulations.
Relevant disclosures, in accordance with the requirements of Australian Accounting
Standards, have been made in the financial report as necessary.
Land Under Control
In accordance with Local Government (Financial Management) Regulation 16(a), the Council
is required to include as an asset (by 30 June 2013), Crown Land operated by the local
government as a golf course, showground, racecourse or other sporting or recreational
facility of State or regional significance.
The Council does not have any crown land which comes under this regulation.
Initial Recognition and Measurement between Mandatory Revaluation Dates
All assets are initially recognised at cost and subsequently revalued in accordance with the
mandatory measurement framework detailed above.
Notes to and forming part of the Annual Financial Report for the Year Ended 30 June 2014
40

Notes to and forming part of the Annual Financial Report for the Year Ended 30 June 2014
In relation to this initial measurement, cost is determined as the fair value of the assets given
as consideration plus costs incidental to the acquisition. For assets acquired at no cost or for
nominal consideration, cost is determined as fair value at the date of acquisition. The cost of
non-current assets constructed by the Council includes the cost of all materials used in
construction, direct labour on the project and an appropriate proportion of variable and
fixed overheads.
Individual assets acquired between initial recognition and the next revaluation of the asset
class in accordance with the mandatory measurement framework detailed above, are carried
at cost less accumulated depreciation as management believes this approximates fair value.
They will be subject to subsequent revaluation at the next anniversary date in accordance
with the mandatory measurement framework detailed above.
Revaluation
Increases in the carrying amount arising on revaluation of assets are credited to a revaluation
surplus in equity. Decreases that offset previous increases of the same asset are recognised
against revaluation surplus directly in equity. All other decreases are recognised in profit or
loss.
Transitional Arrangement
During the time it takes to transition the carrying value of non-current assets from the cost
approach to the fair value approach, the Council may still be utilising both methods across
differing asset classes.
Those assets carried at cost will be carried in accordance with the policy detailed in the Initial
Recognition section as detailed above.
Those assets carried at fair value will be carried in accordance with the Revaluation
Methodology section as detailed above.
Land Under Roads
In Western Australia, all land under roads is Crown land, the responsibility for managing
which, is vested in the local government.
Effective as at 1 July 2008, Council elected not to recognise any value for land under roads
acquired on or before 30 June 2008. This accords with the treatment available in Australian
Accounting Standard AASB 1051 Land Under Roads and the fact Local Government (Financial
Management) Regulation 16 (a)(i) prohibits local governments from recognising such land as
an asset.
In respect of land under roads acquired on or after 1 July 2008, as detailed above, Local
Government (Financial Management) Regulation 16(a)(i) prohibits local governments from
recognising such land as an asset.
Whilst such treatment is inconsistent with the requirements of AASB 1051, Local Government
(Financial Management) Regulation 4(2) provides, in the event of such an inconsistency, the
Local Government (Financial Management) Regulations prevail.
41

Notes to and forming part of the Annual Financial Report for the Year Ended 30 June 2014 Consequently, any land under roads acquired on or after 1 July 2008 is not included as an asset
of the Council.
Depreciation
The depreciable amount of all fixed assets including buildings but excluding freehold land, are
depreciated on a straight-line basis over the individual asset’s useful life from the time the asset
is held ready for use. Leasehold improvements are depreciated over the shorter of either the
unexpired period of the lease or the estimated useful life of the improvements.
Major depreciation periods used for each class of depreciable asset are:
• Buildings 50 years
• Computer Equipment 5 years
• Furniture & Equipment 10 years
• Plant & Equipment 6.66 – 50 years
• Infrastructure 10 – 66.6 years
The assets residual values and useful lives are reviewed, and adjusted if appropriate, at the end
of each reporting period.
An asset’s carrying amount is written down immediately to its recoverable amount if the asset’s
carrying amount is greater than its estimated recoverable amount.
Gains and losses on disposals are determined by comparing proceeds with the carrying amount.
These gains and losses are included in the statement of comprehensive income in the period in
which they arise.
When an item of property, plant and equipment is revalued, any accumulated depreciation at
the date of the revaluation is treated in one of the following ways:
a. Restated proportionately with the change in the gross carrying amount of the asset so that
the carrying amount of the asset after revaluation equals its revalued amount; or
b. Eliminated against the gross carrying amount of the asset and the net amount restated to
the revalued amount of the asset.
(f) Fair Value of Assets and Liabilities
When performing a revaluation, the Council uses a mix of both independent and management
valuations using the following as a guide: Fair Value is the price that Council would receive to
sell the asset or would have to pay to transfer a liability, in an orderly (i.e. unforced) transaction
between independent, knowledgeable and willing market participants at the measurement
date.
As fair value is a market-based measure, the closest equivalent observable market pricing
information is used to determine fair value. Adjustments to market values may be made having
regard to the characteristics of the specific asset. The fair values of assets that are not traded in
an active market are determined using one or more valuation techniques. These valuation
techniques maximise, to the extent possible, the use of observable market data.
42

Notes to and forming part of the Annual Financial Report for the Year Ended 30 June 2014 To the extent possible, market information is extracted from either the principal market for the
asset (i.e. the market with the greatest volume and level of activity for the asset or, in the
absence of such a market, the most advantageous market available to the entity at the end of
the reporting period (ie the market that maximises the receipts from the sale of the asset after
taking into account transaction costs and transport costs).
For non-financial assets, the fair value measurement also takes into account a market
participant’s ability to use the asset in its highest and best use or to sell it to another market
participant that would use the asset in its highest and best use.
Fair Value Hierarchy
AASB 13 requires the disclosure of fair value information by level of the fair value hierarchy,
which categorises fair value measurement into one of three possible levels based on the lowest
level that an input that is significant to the measurement can be categorised into as follows:
Level 1
Measurements based on quoted prices (unadjusted) in active markets for identical assets or
liabilities that the entity can access at the measurement date.
Level 2
Measurements based on inputs other than quoted prices included in Level 1 that are observable
for the asset or liability, either directly or indirectly.
Level 3
Measurements based on unobservable inputs for the asset or liability.
The fair values of assets and liabilities that are not traded in an active market are determined
using one or more valuation techniques. These valuation techniques maximise, to the extent
possible, the use of observable market data. If all significant inputs required to measure fair
value are observable, the asset or liability is included in Level 2. If one or more significant inputs
are not based on observable market data, the asset or liability is included in Level 3.
Valuation techniques
The Council selects a valuation technique that is appropriate in the circumstances and for which
sufficient data is available to measure fair value. The availability of sufficient and relevant data
primarily depends on the specific characteristics of the asset or liability being measured. The
valuation techniques selected by the Council are consistent with one or more of the following
valuation approaches:
Market approach
Valuation techniques that use prices and other relevant information generated by market
transactions for identical or similar assets or liabilities.
Income approach
Valuation techniques that convert estimated future cash flows or income and expenses into a
single discounted present value.
43

Notes to and forming part of the Annual Financial Report for the Year Ended 30 June 2014
Cost approach
Valuation techniques that reflect the current replacement cost of an asset at its current service
capacity.
Each valuation technique requires inputs that reflect the assumptions that buyers and sellers
would use when pricing the asset or liability, including assumptions about risks. When selecting
a valuation technique, the Council gives priority to those techniques that maximise the use of
observable inputs and minimise the use of unobservable inputs. Inputs that are developed using
market data (such as publicly available information on actual transactions) and reflect the
assumptions that buyers and sellers would generally use when pricing the asset or liability and
considered observable, whereas inputs for which market data is not available and therefore are
developed using the best information available about such assumptions are considered
unobservable.
As detailed above, the mandatory measurement framework imposed by the Local Government
(Financial Management) Regulations requires, as a minimum, all assets carried at a revalued
amount to be revalued at least every 3 years.
(g) Intangible Assets
Regulation 16 of the Local Government (Financial Management) Regulations 1996 requires
easements to be recognised as assets. The WMRC does not have any easements.
(h) Rates
The WMRC does not levy rates. Accordingly the Rate Setting Statement and information
as required by the Local Government Act (Financial Management Regulations) has not
been presented in this financial report.
(i) Grants, Donations and Other Contributions
Grants, donations and other contributions are recognised as revenues when the local
government obtains control over the assets comprising the contributions.
Where contributions recognised as revenues during the reporting period were obtained on the
condition that they be expended in a particular manner or used of a particular period, and those
conditions were undischarged as at the reporting date, the nature of and amounts pertaining to
those undischarged conditions are disclosed in Note 3(b). That note also discloses the amount
of contributions recognised as revenues in a previous reporting period which were obtained in
respect of a local government’s operation for the current reporting period.
(j) Trade and Other Payables
Trade and other payables represent liabilities for goods and services provided to the Local
Government prior to the end of the financial year that are unpaid and arise when the Local
Government becomes obliged to make future payments in respect of the purchase of these
goods and services. The amounts are unsecured and are usually paid within 30 days of
recognition.
44

Notes to and forming part of the Annual Financial Report for the Year Ended 30 June 2014
(k) Impairment of Assets
In accordance with Australian Accounting Standards the Council’s assets, other than inventories,
are assessed at each reporting date to determine whether there is any indication they may be
impaired. Where such an indication exists, an estimate of the recover able amount of the asset
is made in accordance with AASB 136 ‘Impairment of Assets’ and appropriate adjustments
made.
An impairment loss is recognised whenever the carrying amount of an asset or its cash
generating unit exceeds its recoverable amount. Impairment losses are recognised immediately
in profit and loss, unless the asset is carried at a revalued amount in accordance with another
standard (e.g. AASB 116) whereby an impairment loss of a revalued asset is treated as a
revaluation decrease in accordance with that other standard.
For non-cash generating assets such as roads, drains, public buildings and the like, value in use is
represented by the depreciated replacement cost of the asset.
(l) Revenue Recognition
Sale of Goods and Disposal of Assets
Revenue from the sale of goods and disposal of other assets is recognised when the Council has
passed control of the goods or other assets to the buyer.
Rendering of Services
Revenue from the provision of services is recognised on an accrual basis.
Royalties
Royalty revenue is recognised on an accrual basis.
(m) Inventories
General
Inventories are valued at the lower of cost and net realisable value. Net realisable value is the
estimated selling price in the ordinary course of business less the estimated costs of completion
and the estimated costs necessary to make the sale.
Land Held for Resale
Land purchased for the development and/or resale is valued at the lower of cost and net
realisable value. Cost includes the cost of acquisition, development and interest incurred on the
financing of that land during its development. Interest and holding charges incurred after
development is complete are recognised as expenses.
(n) Goods and Services Tax
In accordance with recommended practice, revenues, expenses and assets capitalised are stated
net of any GST recoverable. Receivables and payables in the Statement of Financial Position are
stated inclusive of applicable GST. The net amount of GST recoverable from, or payable to, the
Australian Tax Office is included with receivables or payables in the Statement of Financial
Position.
45

Notes to and forming part of the Annual Financial Report for the Year Ended 30 June 2014
Cash flows are included in the Statement of Cash Flows on a gross basis. The GST component
of cash flows arising from investing and financing activities which is recoverable from, or
payable to, the taxation authority is classified as operating cash flows.
(o) Provisions
Provisions are recognised when: The Council has a present legal or constructive obligation as a
result of past events; it is more likely than not that an outflow of resources will be required to
settle the obligation; and the amount has been reliably estimated.
Provisions are measured using the best estimate of the amounts required to settle the
obligations at the end of the reporting period.
(p) Trade and Other Receivables
Trade and other receivables include amounts due from member Councils and non-members for
unpaid fees and charges and other amounts due from third parties for goods sold and services
performed in the ordinary course of business.
Receivables expected to be collected within 12 months of the end of the reporting period are
classified as current assets. All other receivables are classified as non-current assets.
Collectability of trade receivables is reviewed on an ongoing basis. Debts that are known to be
uncollectable are written off when identified. An allowance for doubtful debts is raised when
there is objective evidence that they will not be collectable.
(q) Employee Benefits
The provisions for employee benefits relate to amounts expected to be paid for long service
leave, annual leave, wages and salaries and are calculated as follows:
(i) Short-Term Employee Benefits
Provision is made for the Council’s obligations for short-term employee benefits. Short-term
employee benefits are benefits (other than termination benefits) that are expected to be
settled wholly before 12 months after the end of the annual reporting period in which the
employees render the related service, including wages, salaries and sick leave. Short-term
employee benefits are measured at the (undiscounted) amounts expected to be paid when the
obligation is settled.
The Council’s obligations for short-term employee benefits such as wages, salaries and sick
leave are recognised as a part of current trade and other payables in the statement of financial
position. The Council’s obligations for employees’ annual leave and long service leave
entitlements are recognised as provisions in the statement of financial position.
(ii) Other Long-Term Employee Benefits
Provision is made for employees’ long service leave and annual leave entitlements not
expected to be settled wholly within 12 months after the end of the annual reporting period in
which the employees render the related service.
46

Notes to and forming part of the Annual Financial Report for the Year Ended 30 June 2014
Other long-term employee benefits are measured at the present value of the expected future
payments to be made to employees. Expected future payments incorporate anticipated future
wage and salary levels, durations or service and employee departures and are discounted at
rates determined by reference to market yields at the end of the reporting period on
government bonds that have maturity dates that approximate the terms of the obligations.
Any remeasurements for changes in assumptions of obligations for other long-term employee
benefits are recognised in profit or loss in the periods in which the changes occur.
(iii) Superannuation Fund
The Council contributes to the WA Local Government Superannuation Plan (LGSP) and other
choice funds for qualifying employees as per statutory requirements (9.25% for 2013/14). It
also contributes to the LGSP and other choice funds for full scheme members (6% for 2013/14).
Contributions to defined contribution plans are recognised as an expense as they become
payable.
(r) Rounding of Amounts
All amounts shown in this annual financial report are rounded to the nearest dollar. As a result
of rounding, some minor reconciliation discrepancies may be present in the disclosures to the
financial report.
(s) Comparative Figures
Where required, comparatives have been adjusted to conform with changes in presentation
for the current financial year.
(t) Budget Comparative Figures
Unless otherwise stated, the budget comparative figures shown in this annual financial report
relate to the original budget estimate for the relevant item of disclosure.
(u) Leases
Leases of property, plant and equipment, where substantially all the risks and benefits
incidental to the ownership of the asset, but not legal ownership, are transferred to the
Council, are classified as finance leases. Finance leases are capitalised recording an asset and a
liability equal to the present value of the minimum lease payments, including any guaranteed
residual value. Leased assets are amortised over their estimated useful lives. Lease payments
are allocated between the reduction of the lease liability and the lease interest expense for the
period.
(v) Financial Instruments
Initial Recognition and Measurement
Financial assets and financial liabilities are recognised when the Council becomes a party to the
contractual provisions to the instrument. For financial assets, this is equivalent to the date that
the Council commits itself to either the purchase or sale of the asset (ie trade date accounting
is adopted).
47

Notes to and forming part of the Annual Financial Report for the Year Ended 30 June 2014
Financial instruments are initially measured at fair value plus transaction costs, except where
the instrument is classified ‘at fair value through profit of loss’, in which case transaction costs
are expensed to profit or loss immediately.
Classification and Subsequent Measurement
Financial instruments are subsequently measured at fair value, amortised cost using the
effective interest rate method, or cost. Amortised cost is calculated as:
(a) the amount at which the financial asset or financial liability is measured at initial recognition;
(b) less principal repayments and any reduction for impairment; and
(c) plus or minus the cumulative amortisation of the difference, if any, between the amount
initially recognised and the maturity amount calculated using the effective interest rate method.
The effective interest method used is to allocate interest income or interest expense over the
relevant period and is equivalent to the rate that discounts estimated future cash payments or
receipts (including fees, transaction costs and other premiums or discounts) through the
expected life (or when this cannot be reliably predicted, the contractual term) of the financial
instrument to the net carrying amount of the financial asset or financial liability. Revisions to
expected future net cash flows will necessitate an adjustment to the carrying value with a
consequential recognition of an income or expense in profit or loss.
(i) Financial assets at fair value through profit and loss
Financial assets are classified at “fair value through profit or loss” when they are held for trading
for the purpose of short-term profit taking. Such assets are subsequently measured at fair value
with changes in carrying amount being included in profit or loss.
Assets in this category are classified as current assets
(ii) Loans and receivables
Loans and receivables are non-derivative financial assets with fixed or determinable payments
that are not quoted in an active market and are subsequently measured at amortised cost.
Gains or losses are recognised in profit or loss.
Loans and receivables are included in current assets where they are expected to mature within
12 months after the end of the reporting period.
(iii) Held-to-maturity investments
Held-to-maturity investments are non-derivative financial assets with fixed maturities and fixed
or determinable payments that the Council has the positive intention and ability to hold to
maturity. They are subsequently measured at amortised cost. Gains or losses are recognised in
profit or loss.
Held-to-maturity investments are included in current assets where they are expected to mature
within 12 months after the end of the reporting period. All other investments are classified as
non-current.
(iv) Available-for-sale financial assets
48

Notes to and forming part of the Annual Financial Report for the Year Ended 30 June 2014
Available-for-sale financial assets are non-derivative financial assets that are either not
suitable to be classified into other categories of financial assets due to their nature, or they
are designated as such by management. They comprise investments in the equity of other
entities where there is neither a fixed maturity nor fixed or determinable payments.
They are subsequently measured at fair value with changes in such fair value (i.e. gains or
losses) recognised in other comprehensive income (except for impairment losses). When the
financial asset is derecognised, the cumulative gain or loss pertaining to that asset previously
recognised in other comprehensive income is reclassified into profit or loss.
Available-for-sale financial assets are included in current assets, where they are expected to
be sold within 12 months after the end of the reporting period. All other available-for-sale
financial assets are classified as non-current.
(v) Financial liabilities
Non-derivative financial liabilities (excluding financial guarantees) are subsequently
measured at amortised cost. Gains or losses are recognised in profit or loss.
Impairment
A financial asset is deemed to be impaired if, and only if, there is objective evidence of
impairment as a result of one or more events (a “loss event”) having occurred, which has an
impact on the estimated future cash flows of the financial asset(s).
In the case of available-for-sale financial assets, a significant or prolonged decline in the
market value of the instrument is considered a loss event. Impairment losses are recognised
in profit or loss immediately. Also, any cumulative decline in fair value previously recognised
in other comprehensive income is reclassified to profit or loss at this point.
In the case of financial assets carried at amortised cost, loss events may include: indications
that the debtors or a group of debtors are experiencing significant financial difficulty, default
or delinquency in interest or principal payments; indications that they will enter bankruptcy
or other financial reorganisation; and changes in arrears or economic conditions that
correlate with defaults.
For financial assets carried at amortised cost (including loans and receivables), a separate
allowance account is used to reduce the carrying amount of financial assets impaired by
credit losses. After having taken all possible measures of recovery, if management establishes
that the carrying amount cannot be recovered by any means, at that point the written-off
amounts are charged to the allowance account or the carrying amount of impaired financial
assets is reduced directly if no impairment amount was previously recognised in the
allowance account.
Derecognition
Financial assets are derecognised where the contractual rights to receipt of cash flows expire
or the asset is transferred to another party whereby the Council no longer has any significant
49

Notes to and forming part of the Annual Financial Report for the Year Ended 30 June 2014
continual involvement in the risks and benefits associated with the asset.
Financial liabilities are derecognised where the related obligations are discharged, cancelled
or expired. The difference between the carrying amount of the financial liability extinguished
or transferred to another party and the fair value of the consideration paid, including the
transfer of non-cash assets or liabilities assumed, is recognised in profit or loss.
(w) New Accounting Standards and Interpretations for Application in Future Periods
The Australian Accounting Standards Board (AASB) has issued a number of new and amended
Accounting Standards and Interpretations that have mandatory application dates for future
reporting periods, some of which are relevant to the Council.
Title and topic Issued/ Applicable(1) Impact
AASB 9 – Financial Instruments
December 2013
1 January 2017
Nil – The objective of this Standard is to improve and simplify the approach for classification and measurement of financial assets compared with the requirements of AASB 139. Given the nature of the financial assets of the Council, it is not anticipated the stan-dard will have any material effect.
AASB 2010 – 7 Amendments to Australian Accounting Stan-dards arising from AASB 9 (December 2010)
[AASB 1, 3, 4, 5, 7, 101, 102, 108, 112, 118, 120, 121, 127, 128, 131, 132, 136, 137, 139, 1023 & 1038 and Interpretations 2, 5, 10, 12, 19 & 127]
December 2013
1 January 2017 Nil – The revisions embodied in this standard give effect to the conse-quential changes arising from the issu-ance of AASB 9 which is not antici-pated to have any material effect on the Council (refer (i) above).
AASB 2011 – 7 Amendments to Australian Accounting Stan-dards arising from the Con-solidation and Joint Arrange-ment Standards [Not-For-Profit entities]
[AASB 1, 2, 3, 5, 7, 9, 2009-11, 101, 107, 112, 118, 121, 124, 132, 133, 131, 138, 139, 1023 & 1038 and Interpretations 5, 9, 16 & 17]
December 2012
1 January 2014
Consequential changes to various standards arising from the issuance of AASB 10, 11, 12, 127 and 128.
It is not expected to have a significant impact on Council.
50

Notes to and forming part of the Annual Financial Report for the Year Ended 30 June 2014
AASB 2012-3: Amendments to Aus-tralian Accounting Standards – Offsetting Financial Assets and Financial Liabilities
[AASB 132]
June 2012 1 January 2014 This Standard adds application guid-ance to AASB 132: Financial Instru-ments: Presentation to address poten-tial inconsistencies identified in apply-ing some of the offsetting criteria of AASB 132, including clarifying the meaning of “currently has a legally enforceable right of set-off” and that some gross settlement systems may be considered equivalent to net settle-ment. This Standard is not expected to sig-nificantly impact the Council’s financial statements.
AASB 2013-3: Amendments to AASB 136 – Recoverable Amount Disclosures for Non-Financial Assets
June 2013 1 January 2014 This standard makes amendments to AASB 136 and includes requirements to disclose additional information when present value techniques are used to measure the recoverable amount of impaired assets.
AASB 2013-8: Amendments to Aus-tralian Accounting Standards – Australian Implementation Guidance for Not-for-Profit Entities – Control and Struc-tured Entities
[AASB 10, 12 & 1049]
October 2013
1 January 2014 This standard adds Appendix E to AASB 10 to provide implementation guidance for Not-for-Profit entities regarding control criteria from the perspective of not-for-profit entities. It is not expected to have a significant impact on Council.
AASB 2013-9: Amendments to Aus-tralian Accounting Standards – Conceptual Framework, Materiality and Financial In-struments AASB 2012-2
[Operative dates: Part A Concep-tual Framework – 20 Decem-ber 2013; Part B Materiality – 1 January 2014; Part C Finan-cial Instruments – 1 January 2015]
December 2013
Refer Title col-umn
Part A of this standard makes various editorial corrections to Australian Ac-counting Standards. Part B of this standard deletes refer-ences to AASB 1031 in various Austra-lian Accounting Standards in advance of the withdrawal of AASB 1031. Part C of this standard makes conse-quential amendments to AASB 9 and numerous other standards and amends the permissions around cer-tain applications relating to financial liabilities reissued at fair value. As the bulk of changes related either to editorial or reference changes it is not expected to have a significant im-pact on Council.
Applicable to reporting periods commencing on or after the given date.
Management’s assessment of the new and amended pronouncement that are relevant to
the Council; applicable to future reporting periods and which have not yet been adopted,
are set out as follows.
51

Notes to and forming part of the Annual Financial Report for the Year Ended 30 June 2014
(x) Adoption of New and Revised Accounting Standards
During the current year, the Council adopted all of the new and revised Australian Accounting
Standards and Interpretations which became mandatory and which were applicable to its op-
erations.
These new and revised standards were:
AASB 10
AASB 11
AASB 12
AASB 119
AASB 127
AASB 128
AASB 2011-7
AASB 2011-9
AASB 2011-10
AASB 2012-2
AASB 2012-3
AASB 2012-5
AASB 2012-10
Most of the standards adopted had a minimal effect on the accounting and reporting prac-
tices of the Council as they did not have a significant impact of the accounting or reporting
practices or were either not applicable, largely editorial in nature, were revisions to help en-
sure consistency with presentation, recognition and measurement criteria of IFRSs or related
to topics not relevant to operations.
52

Notes to and forming part of the Annual Financial Report for the Year Ended 30 June 2014
2 COMPONENT FUNCTIONS/ACTIVITIES
(a) Statement of Objective
The Western Metropolitan Regional Council was formally constituted in September 1989
to undertake waste management in the Western Suburbs on behalf of the following Local
Governments:
Percentage %
2013/14 $
2012/13 $
City of Subiaco 38.33 2,210,670 2,255,841
Town of Claremont 21.34 1,230,777 1,255,926
Town of Mosman Park 18.41 1,061,791 1,083,486
Town of Cottesloe 17.94 1,034,684 1,055,826
Shire of Peppermint Grove 3.98 229,545 234,236
Total Net Assets 100.00 5,767,467 5,885,315
The Western Metropolitan Regional Council is dedicated to providing high quality services
to the member Councils’ communities for the efficient collection and disposal of waste de-
livered to the Regional Council Transfer Station through the following service orientated
program which it has established.
(b) Component of Functions
The activities relating to the Council’s functions reported in the Statement of Comprehen-
sive Income:
General Purpose Funding
Interest from investments
Governance
Member Council elected delegates, corporate support services.
Community Amenities
Costs associated with the Transfer Station operations.
Other Property and Services
Total gross salaries and wages allocated to other programmes.
53

Notes to and forming part of the Annual Financial Report for the Year Ended 30 June 2014
3 REVENUE AND EXPENSES
(a) Net Result
The Net Result includes:
(i) Charging as an expense:
Significant Expense 2013/14 $
2012/13 $
General Purpose Funding 1,027,641 1,036,303
TOTAL 1,027,641 1,036,303
The significant expense in the 2013/14 reporting period relates to the revaluation decrement
of the Council’s buildings and infrastructure assets.
Depreciation 2013/14 $
2012/13 $
Buildings 39,211 39,511
Plant & Equipment 121,531 202,426
Furniture & Equipment 6,929 12,420
Infrastructure Assets 12,885 12,727
TOTAL 180,556 267,084
Auditors Remuneration 2013/14 $
2012/13 $
Audit of the financial report 12,000 10,000
TOTAL 12,000 10,000
(ii) Crediting as Revenue:
Interest Earnings 2013/14 $
2012/13 $
Interest Earned 114,408 139,529
(b) Conditions over Grants/Contributions
Grants which were recognised as revenue during the year but have not yet been applied in
that manner at the reporting date were:
2013/14 $
2012/13 $
Regional Investment Programme 166,966 41,742
54

4 (a) TOTAL REVENUE FROM FEES AND CHARGES BY PROGRAMME
All fees and charges were adopted by Council and are included in the 2013/14 Annual Budget.
4 (b) FEES AND CHARGES
5 BAD AND DOUBTFUL DEBTS WRITTEN OFF
Nil
6 INVESTMENT INFORMATION
BUDGET
2013/14 $
ACTUAL
2013/14 $
ACTUAL
2012/13 $
Programme
Community Amenities 10,291,650 6,356,704 6,520,860
Total 10,291,650 6,356,704 6,520,860
BUDGET
2013/14 $
ACTUAL
2013/14 $
ACTUAL
2012/13 $
Tipping Fees
General Waste 9,485,291 5,628,149 5,732,766
Green Waste 519,089 477,995 472,580
Earth Carers 287,270 250,560 315,514
Total Fees and Charges 10,291,650 6,356,704 6,520,860
BUDGET
2013/14 $
ACTUAL
2013/14 $
ACTUAL
2012/13 $
Interest Received
Reserve Fund 99,778 110,200 133,475
Municipal Fund 1,500 4,207 6,024
Total 101,278 114,407 139,499
Notes to and forming part of the Annual Financial Report for the Year Ended 30 June 2014
7 MEMBER COUNCILS’ DELEGATE ALLOWANCES
BUDGET
2013/14 $
ACTUAL
2013/14 $
ACTUAL
2012/13 $
Member Councils’ Delegates Sitting Fees 22,180 33,664 21,200
Total 22,180 33,664 21,200
55

Notes to and forming part of the Annual Financial
8 SUPERANNUATION
2013/14 $
2012/13 $
Local Government Member Scheme 18,752 11,858
Local Government SGC 93,892 80,001
Total 112,644 91,859
9 (a) DISPOSAL OF ASSETS – 2013/14 FINANCIAL YEAR
9 (b) TOTAL ASSETS CLASSIFIED BY PROGRAMME
10 DEPRECIATION
(a) By Asset Classification
(b) By Function / Activity
Net Book Value Sale Price Profit/(Loss)
2013/14 2013/14 2013/14 2013/14 2013/14 2013/14
Actual Budget Actual Budget Actual Budget
Proceeds from sale of assets
35,170 61,818 41,074 61,818 5,904 -
Total 35,170 61,818 41,074 61,818 5,904 -
2013/14 $
2012/13 $
Governance 96,986 94,903
Community Amenities 2,773,355 2,719,554
Non Assigned 3,628,216 3,753,847
Total Assets 5,498,557 6,568,304
2013/14 $
2012/13 $
Buildings 39,211 39,511
Furniture & Equipment 6,929 12,420
Plant & Equipment 121,531 202,426
Infrastructure Assets 12,885 12,727
Total 180,556 267,084
Depreciation 2013/14 $
2012/13 $
Governance 22,463 29,438
Community Amenities 158,093 237,646
Total 180,556 267,084
56

11 CASH AND CASH EQUIVALENTS
The following restrictions have been imposed by regulations or other externally imposed
requirements:
12 TRADE AND OTHER RECEIVABLES
2013/14 $
2012/13 $
(a) Cash at Bank 201,709 255,033
Cash on Hand 200 -
Term Deposits 2,953,965 2,909,830
Total 3,155,874 3,164,863
(b) Unrestricted 201,909 255,033
Restricted 2,953,965 2,909,830
Total 3,155,874 3,164,863
2013/14 $
2012/13 $
Future Development Reserve 2,362,378 2,690,928
Plant & Infrastructure Reserve - -
Sustainability Reserve 225,439 218,902
Interim Service Charge Reserve 366,148 -
Total 2,953,965 2,909,830
2013/14 $
2012/13 $
Sundry Debtors 408,997 487,757
Accrued Income 32,791 2,891
Other Receivables 30,554 98,336
Total 472,342 588,984
Notes to and forming part of the Annual Financial Report for the Year Ended 30 June 2014
57

13 (a) PROPERTY AND PLANT AND EQUIPMENT
2013/14 $
2012/13 $
Land – management valuation 175,000 175,000
TOTAL: LAND 175,000 175,000
Buildings – independent valuation 30/06/2014 928,000
Buildings – at management valuation - 2,002,263
Less: accumulated depreciation - (676,908)
TOTAL: BUILDINGS 928,000 1,325,355
Furniture & Equipment – at cost 3,347 -
Furniture & Equipment – independent valuation 30/06/2012 129,973 129,973
Less: accumulated depreciation (104,870) (97,942)
TOTAL: FURNITURE & EQUIPMENT 28,450 32,031
Plant & Equipment – at cost 69,581 -
Plant & Equipment – independent valuation 30/06/2012 2,164,934 2,249,460
Less: accumulated depreciation (1,454,392) (1,374,985)
TOTAL: PLANT & EQUIPMENT 780,123 874,475
Total Property, Plant and Equipment 1,911,573 2,406,861
Notes to and forming part of the Annual Financial Report for the Year Ended 30 June 2014
(b) Movements in Carrying Amounts
Movements in the carrying amounts for each class of property, plant and equipment be-
tween the beginning and end of the current financial year:
LAND
$
BUILD-INGS
$
FURNI-TURE
$
PLANT & EQUIP-MENT
$
TOTAL
$
Balance at the beginning of the year 175,000 1,325,355 32,031 874,475 2,406,861
Additions - 25,691 3,347 69,581 98,619
Disposals - - - (35,170) (35,170)
Reversal of Revaluation Increment - - - (7,232) (7,232)
Revaluation Increment/(Decrement) - (383,836) - - (383,836)
Transfers - - - - -
Depreciation Expense - (39,211) (6,929) (121,531) (167,671)
Carrying amount at the end of the year
175,000 928,000 28,450 780,123 1,911,573
58

Notes to and forming part of the Annual Financial Report for the Year Ended 30 June 2014
The Council’s buildings were revalued at 30 June 2014 by independent valuers. Refer to Note
31 for detailed disclosures regarding the fair value measurement of the WMRC’s buildings.
The revaluation resulted in an overall decrease of $383,836 in the net value of the Council’s
buildings. Impairment losses were recognised immediately in profit and loss in the Statement
of Comprehensive Income.
14 (a) INFRASTRUCTURE
(b) Movements in Carrying Amounts
Movement in the carrying amounts of each class of infrastructure assets between the begin-
ning and the end of the current financial year.
The Council’s infrastructure was revalued at 30 June 2014 by independent valuers. Refer to
Note 31 for detailed disclosures regarding the fair value measurement of the WMRC’s infra-
structure.
The revaluation resulted in an overall decrease of $42,911 in the net value of the Council’s in-
frastructure. Impairment losses were recognised immediately in profit and loss in the State-
ment of Comprehensive Income.
2013/14 $
2012/13 $
Infrastructure – independent valuation 30/06/2014 351,800 -
Infrastructure – management valuation 30/06/2013 - 407,596
TOTAL: STRUCTURES - INFRASTRUCTURE 351,800 407,596
Work in Progress – At Cost 606,968 -
TOTAL: WORK IN PROGRESS - INFRASTRUCTURE 606,968 -
Total Infrastructure 958,768 407,596
Structures $
WIP $
Total $
Balance at the beginning of the year 407,596 - 407,596
Additions - 606,968 606,968
WIP – Transfer in/(out) - - -
Disposals - - -
Revaluation (42,911) - (42,911)
Transfers - - -
Depreciation Expense (12,885) - (12,885)
Carrying amount at the end of the year 351,800 606,968 958,768
59

Notes to and forming part of the Annual Financial Report for the Year Ended 30 June 2014
15 TRADE AND OTHER PAYABLES
16 PROVISIONS
17 TRUST FUNDS
Funds over which the Regional Council has no control and which are not included in the
Financial Report are as follows:
2013/14 $
2012/13 $
Sundry Creditors 512,314 379,514
Accrued Expenses 20,948 164,699
Accrued Salaries and Wages 37,954 -
Total 571,216 544,213
2013/14 $
2012/13 $
Current
Provision for Annual Leave 80,685 74,281
Provision for Long Service Leave 55,191 48,391
Total 135,876 122,672
Non Current
Provision for Long Service Leave 23,998 16,104
Total 23,998 16,104
Provision for An-nual Leave
$
Provision for Long Service Leave
$
Total
$
Balance at the beginning of the year 74,281 64,495 138,776
Net movement in provisions 6,404 14,694 21,098
Balance as at 30 June 2014 80,685 79,189 159,874
Balance
01/07/2013
Amount Re-ceived
Amount Paid Balance
30/06/2014
Trust Funds -
- - -
60

Notes to and forming part of the Annual Financial Report for the Year Ended 30 June 2014
18 (a)RESERVES – CASH BACKED
BUDGET
2013/14 $
ACTUAL
2013/14 $
ACTUAL
2012/13 $
Future Development Reserve
Opening Balance 2,690,928 2,690,928 3,267,836
Transfer to Reserve 90,851 83,756 123,092
Transfer from Reserve (1,116,120) (412,306) (700,000)
Closing Balance 1,665,659 2,362,378 2,690,928
Plant and Infrastructure Reserve
Opening Balance - - -
Transfer to Reserve - - -
Transfer from Reserve - - -
Closing Balance - - -
Sustainability Reserve
Opening Balance 218,902 218,902 208,959
Transfer to Reserve 8,927 6,537 9,943
Transfer from Reserve - - -
Closing Balance 227,829 225,439 218,902
Interim Service Charge Reserve
Opening Balance - - -
Transfer to Reserve - 366,148 -
Transfer from Reserve - - -
Closing Balance - 366,148 -
TOTAL RESERVES – Cash Backed
Opening Balance 2,909,830 2,909,830 3,476,795
Transfer to Reserve 99,778 456,441 133,035
Transfer from Reserve (1,116,120) (412,306) (700,000)
Closing Balance 1,893,488 2,953,965 2,909,830
61

Notes to and forming part of the Annual Financial Report for the Year Ended 30 June 2014
18 (b) PURPOSE OF RESERVES
Future Development Reserve – to fund the purchase of land, secondary waste treatment, busi-
ness development and research and development projects.
Plant and Infrastructure Reserve – to fund the purchase and replacement of Plant and Infra-
structure.
Sustainability Reserve – to fund investigations or research into waste treatment or systems for
more sustainable waste management practices.
Interim Service Charge Reserve – to fund the contingent liability from DiCOM operator
The total Reserves of $2,953,965 are cash backed as at 30 June 2014.
19 REVALUATION SURPLUS
A revaluation surplus has arisen on the revaluation of the following class of non-current assets:
20 FINANCIAL RATIOS
ACTUAL
2013/14
ACTUAL
2012/13
(a) Furniture and Equipment
Opening balance 8,198 -
Revaluation Increment - 8,198
Revaluation Decrement - -
Closing balance 8,198 8,198
(b) Plant and Equipment
Opening balance 225,192 -
Revaluation Increment - 225,192
Revaluation Decrement (7,232) -
Closing balance 217,960 225,192
TOTAL ASSET REVALUATION SURPLUS 226,158 233,390
ACTUAL
2013/14
ACTUAL
2012/13
ACTUAL
2011/12
Current ratio 0.95 : 1.00 1.27 : 1.00 1.10 : 1.00
Asset sustainability ratio 0.40 : 1.00 1.00 : 1.00 1.68 : 1.00
Operating surplus ratio -0.04 : 1.00 -0.15 : 1.00 0.01 : 1.00
Own source revenue coverage ratio 0.96 : 1.00 0.87 : 1.00 1.01 : 1.00
Debt services coverage ratio Not Applicable Not Applicable Not Applicable
62

Notes to and forming part of the Annual Financial Report for the Year Ended 30 June 2014
The following information relates to those ratios which only require an attestation they have
been checked and are supported by verifiable information.
Asset consumption ratio: depreciated replacement cost of assets
current replacement cost of depreciable assets
Asset renewal funding ratio NPV of planned capital renewals over 10 years
NPV of required capital expenditure over 10 years
N/A - In keeping with amendments to Local Government (Financial Management) Regulation 50,
comparatives for the 2011/12 year have not been reported as financial information is not avail-
able.
21 BUDGET COMPARISON
(a) Non-Operating Income and Expenditure
The following movements to and from reserve accounts are not included in the Statement of
Comprehensive Income.
(b) Net Current Asset Position as at 1 July 2013
The net current position balance carried forward from the previous financial year for the pur-
pose of the 2012/13 budget was $177,132. The actual net current position shown in the audited
financial report as at 30 June 2013, after adjustment for restricted assets, was $177,132.
ACTUAL
2013/14
ACTUAL
2012/13
ACTUAL
2011/12
Asset consumption ratio 0.69 : 1.00 0.50 : 1.00 N/A
Asset renewal funding ratio 1.00 : 1.00 1.00 : 1.00 N/A
2013/14 Actual $
2013/14 Budget $
Non-Operating Income
Transfer from Reserves 412,306 1,116,120
TOTAL 412,306 1,116,120
Non-Operating Expenditure
Transfers to Reserves 456,442 99,778
TOTAL 456,442 99,778
63

Notes to and forming part of the Annual Financial Report for the Year Ended 30 June 2014
22 CONTINGENT LIABILITIES
Nil.
23 COMMITMENTS
Nil.
24 UNUSED LOAN FACILITIES
Nil.
25 CREDIT STANDBY ARRANGEMENTS
26 EVENTS AFTER THE REPORTING PERIOD
There were no events occurring after the end of the reporting period that impact on the financial
statements.
27 FINANCIAL RISK MANAGEMENT
Council’s activities expose it to a variety of financial risks including price risk, credit risk, liquidity
risk and interest rate risk. The Council’s overall risk management focuses on the unpredictability
of financial markets and seeks to minimise potential adverse effects on the financial performance
of the Council.
Council does not engage in transactions expressed in foreign currencies and is therefore not sub-
ject to foreign currency risk. Financial risk management is carried out by the finance area under
policies approved by the Council.
The Council held the following financial instruments at balance date:
2013/14 Actual $
2012/13 Actual $
Credit limit 5,000 5,000
Credit card at balance date 2,104 3,817
Total amount of credit unused 2,896 1,183
Carrying Value Fair Value
2013/14
$
2012/13 $
2013/14
$
2012/13 $
Financial Assets
Cash and cash equivalents 3,155,874 3,164,863 3,155,874 3,164,863
Receivables & Others 472,342 584,984 472,342 588,984
TOTAL 3,628,216 3,749,847 3,628,216 3,753,847
Financial Liabilities
Payables 571,216 544,213 571,216 544,213
TOTAL 571,216 544,213 571,216 544,213
64

Notes to and forming part of the Annual Financial Report for the Year Ended 30 June 2014
Fair value is determined as follows:
Cash and Cash Equivalents, Receivables and Payables – estimated to the carrying value which
approximates net market value.
(a) Cash and Cash Equivalents
Council’s objective is to maximise its return on cash and investments whilst maintaining an ade-
quate level of liquidity and preserving capital. The finance area manages the cash and invest-
ments portfolio with the assistance of independent advisers (where applicable). Council has an
investment policy and the policy is subject to review by Council.
Cash and investments are also subject to interest rate risk – the risk that movements in interest
rates could affect returns.
Another risk associated with cash and investments is credit risk – the risk that a contracting en-
tity will not complete its obligations under a financial instrument resulting in a financial loss to
Council.
(b) Receivables
Council’s major receivables comprise user charges and fees. The major risk associated with
these receivables is credit risk – the risk that the debts may not be repaid. Council manages this
risk by monitoring outstanding debt and employing debt recovery policies.
Council makes suitable provision for doubtful receivables as required and carries out credit
checks on all debtors.
There are no material receivables that have been subject to a re-negotiation of repayment
terms.
The profile of the Council’s credit risk at balance date was:
(c) Payables
Payables are subject to liquidity risk – that is the risk that insufficient funds may be on hand to
meet payment obligations as and when they fall due. Council manages this risk by monitoring its
cash flow requirements and liquidity levels and maintaining an adequate cash buffer. Payment
terms can be extended and overdraft facilities drawn upon if required.
Impact of a 2% movement in interest rates on cash and investments
2013/14 2012/13 $
- Equity 63,117 63,297
- Statement of Comprehensive Income 63,117 63,297
Percentage of Other Receivables 2013/14 2012/13
- Current 100% 100%
- Overdue - -
65

Notes to and forming part of the Annual Financial Report for the Year Ended 30 June 2014
28 NOTES TO STATEMENT OF CASH FLOWS
(a) Reconciliation of net cash used in operating activities to net result
2013/14 $
2012/13 $
Net Result (110,617) (965,822)
Add: Non-cash flows in net result
Depreciation of property, plant, equipment and infrastructure 180,556 267,084
Loss on disposal of property, plant, equipment and infrastructure - -
Impairment Loss on revaluation of non-current assets 426,747 1,036,303
Less: Non-operating cash flows in net result
Non-operating grants, subsidies and contributions (166,966) (41,742)
Profit on disposal of property, plant, equipment and infrastructure (5,904) -
Changes in Assets and Liabilities
(increase) / decrease in trade and other receivables 137,512 (86,461)
increase / (decrease) in trade and other payables (149,038) (90,859)
increase / (decrease) in provisions 21,098 (13,588)
333,388 104,915
Due within 1 year $
Due between 1 & 5 years $
Due after 5 years $
Total contractual cash flows
Carrying values $
2013/14
Payables 571,216 571,216 571,216
Total 571,216 571,216 571,216
2012/13
Payables 544,213 544,213 544,213
Total 544,213 544,213 544,213
The contractual undiscounted cash flows of Council’s Payables are set out in the following
Liquidity Sensitivity:
66

Notes to and forming part of the Annual Financial Report for the Year Ended 30 June 2014
29 EMPLOYEE NUMBERS
30 NON OPERATING & OPERATING GRANTS, SUBSIDIES AND CONTRIBUTIONS
For the purpose of the Statement of Comprehensive Income (By Nature or Type); An
amount of $166,966 was received as non-operating grant in 2013/14 while no non-
operating grants, subsidies and contributions was budgeted in 2013/14.
31 FAIR VALUE MEASUREMENT
WMRC measures the following assets and liabilities on a recurring basis:
• Buildings;
• Furniture;
• Plant & equipment; and
• Infrastructure.
There are no assets been measured on a non-recurring basis as no assets been reclassified
as assets held for sale.
Fair value hierarchy
An IFRS 13 Fair Value requires disclosure of fair value measurements by level of the follow
ing fair value hierarchy
Level 1- Quoted prices: unadjusted in active markets for identical assets or liabilities;
Level 2 – Observable inputs: inputs other than quoted prices included within Level 1 t h a t
are observable for the asset or liability, either directly or indirectly; and
Level 3 – Unobservable inputs: inputs for the asset or liability that are based on observable
market data.
2013/14 # 2012/13 #
The number of full-time equivalent Employees at balance date 14.0 13.3
2013/14 $
2012/13 $
Cash at bank 201,709 255,033
Cash on Hand 200 -
Term deposits - restricted reserves 2,953,965 2,909,830
3,155,874 3,164,863
Reconciliation of cash
(b) For the purpose of the Statement of Cash Flows, cash includes cash and cash equiva-
lents, net of outstanding bank overdrafts. Cash at the end of the reporting period as shown
in the Statement of Cash Flows is reconciled to the related items in the Statement of Finan-
cial Position as follows:
67

Notes to and forming part of the Annual Financial Report for the Year Ended 30 June 2014
There were no assets valued where it was assumed that the highest and best use was other
than their current use.
30 June 2013
Description Note Quoted prices in active markets for identical as-sets (Level 1)
$
Significant other observ-able inputs
(Level 2)
$
Significant unobservable inputs
(Level 3)
$
TOTAL
RECURRING FAIR VALUE MEASUREMENTS
Non-Financial Assets
Buildings 13 - - 928,000 928,000
Furniture 13 - 28,450 - 28,450
Plant and Equipment 13 - 780,123 - 780,123
Infrastructure 14 - - 351,800 351,800
Total - 808,573 1,279,800 2,088,373
Description Note Quoted prices in active markets for identical as-sets (Level 1) $
Significant other observ-able inputs (Level 2) $
Significant unobservable inputs (Level 3) $
TOTAL
RECURRING FAIR VALUE MEASUREMENTS Non-Financial Assets
Buildings 13 - - 1,325,355 1,325,355
Furniture 13 - 32,031 - 32,031
Plant and Equipment 13 - 874,475 - 874,475
Infrastructure 14 - - 407,596 407,596
Total - 906,506 1,732,951 2,639,457
The policy of WMRC is to recognise transfers into and transfers out of the fair value hierarchy
levels as at the end of the reporting period. There were no transfers between fair value hier-
archy levels during the year.
Recognised fair value measurement
The following table presents the group assets and liabilities measured and recognised at fair
value at 30 June 2014.
68

Notes to and forming part of the Annual Financial Report for the Year Ended 30 June 2014
Valuation techniques used to derive fair values
Recurring fair value measurements
Buildings
All Buildings were valued at Level 3 using the cost approach.
Level 3 valuation inputs
Level 3 valuation inputs were based on a physical inspection of buildings located at the
Transfer Station. In assessing the level 3 inputs it is determined that buildings are of special-
ised non-market type assets.
The cost approach (Depreciated Replacement Cost) was applied in assessing the fair value,
which is based on determining the Gross Current Replacement Cost (GCRC) of the assets and
applying depreciation based on a combination of a rate per square meter and quantification
of the component parts of the assets. The fair value was then assessed based on the remain-
ing useful life of the assets taking into consideration of the level 3 inputs which included the
asset condition and utility.
Furniture, Plant and Equipment
Furniture, Plant and equipment were revalued in 2013 as part of the mandatory require-
ments embodied in Local Government (Financial Management) Regulation 17A. Whilst the
additions since 1 July 2013 have been brought in the books at cost, given they were acquired
at arms length and any accumulated depreciation reflects the usage of service potential, it is
considered that the recorded written down values approximate fair values.
Thus, the value of the class of assets in the WMRC’s books is considered to be in accordance
with Local Government (Financial Management (Regulation) 17A (2) which requires these
assets to be shown at fair value. Furniture, Plant and Equipment will be revalued during the
year ended 30 June 2016 in accordance with the mandatory asset measurement framework
detailed at Note 1(e).
Most plant and equipment assets are generally valued using the market and cost approach
using comparable sales and relevant industry market price reference guides, and have been
classified as being valued at Level 2 of the fair value hierarchy. The most significant inputs
into this valuation approach are the make, size, year of manufacture and condition.
Infrastructure
All infrastructure assets were valued at Level 3 using the cost approach.
Level 3 valuation inputs
Level 3 valuation inputs were based on a physical inspection of infrastructure assets located
at the Transfer Station. In assessing the level 3 inputs it is determined that infrastructure
assets are of specialised non-market type assets. The cost approach (Depreciated Replace-
69

Notes to and forming part of the Annual Financial Report for the Year Ended 30 June 2014
Description and fair value as at 30 June 2014
Valuation tech-nique(s)
Unobservable inputs
Range of inputs (probability – weighted average)
Relationship of unob-servable inputs to fair value
Specialised build-ings ($928,000)
Cost approach (depreciated re-placement cost)
Relationship be-tween asset con-sumption rating scale and the level of consumed ser-vice potential
+/– 10% A change of 10% would result in an increase/decrease of $92,800
Infrastructure ($351,800)
Cost approach (depreciated re-placement cost)
Relationship be-tween asset con-sumption rating scale and the level of consumed ser-vice potential
+/– 10% A change of 10% would result in an increase/decrease of $35,180
ment Cost) was applied in assessing the fair value, which is based on determining the Gross
Current Replacement Cost (GCRC) of the assets and applying depreciation based on a combi-
nation of a rate per square meter and quantification of the component parts of the assets. The
fair value was then assessed based on the remaining useful life of the assets taking into con-
sideration of the level 3 inputs which included the asset condition and utility.
(i) Quantitative Information about the significant unobservable inputs and relationship to
fair value
The following table summarises the quantitative information about the key significant unob-
servable inputs (level 3 fair value hierarchy), the ranges of those inputs and the relationships
of unobservable inputs to the fair value measurements. There were no significant interrela-
tionships between the unobservable inputs.
(ii) Valuation processes
WMRC engages external, independent and qualified valuers to determine the fair value of
WMRC’s buildings, infrastructure, plant & equipment and all other assets on a regular basis.
An annual assessment is undertaken to determine whether the carrying amount of the assets
is materially different from the fair value. If any variation is considered material a revaluation
is undertaken either by comprehensive revaluation or by applying an interim revaluation using
appropriate indices.
As at 30 June 2014 a comprehensive revaluation was undertaken for buildings and infrastruc-
ture assets by Griffin Valuation Advisory.
70