annual repor t 2005 · in 2005, we began ten ... wal-mart federated department stores marsh...
TRANSCRIPT

A N N U A L R E P O R T 2 0 0 5
b u i l d i n g v a l u e
FRONT COVER: Sunrise over Stoney Creek Commons
buildingng

For 45 years, our passion,
ingenuity and integrity
have been at the heart
of our success.
Dorothea Jackson
2
2005 was a year of considerable
achievement for Kite Realty Group. In
our fi rst full year as a public company, we
generated a competitive 24.3 percent total
return for our shareholders, increased
Funds from Operations to $1.13 per diluted
share and made signifi cant investments in
the Company’s future.
We also followed through on our time-
honored strategy of maximizing cash fl ow
and building shareholder value. Tapping
the resources of our expert in-house
personnel, strong broker network and
strategic joint venture partners, we started
ten new development projects in vibrant
retail markets, closed $111 million in new
acquisitions and ended the year with an
operating portfolio occupancy rate in
excess of 95 percent.
And that’s just the beginning.
In 2006, we plan to build upon this success.
We are committed to building value for
our shareholders through development,
redevelopment and accretive acquisitions.
With our strong balance sheet and
conservative capital structure, we are well-
positioned to execute on our strategy in 2006
and beyond. At year-end, we maintained
a debt-to-market capitalization ratio of
approximately 40 percent, a 3.3 times fi xed
charge ratio and a 2.9 times debt coverage
ratio. We believe Kite Realty Group is in an
excellent position to fund future growth.
While our roots in construction go back fi ve
decades, Kite Realty Group has evolved into
a full-service real estate owner, developer,
and operator, primarily focused on high-
quality neighborhood and community
shopping centers. The dynamic tenants
that occupy our properties offer customers
the highest-quality goods and services. We
believe this results in a competitive, visible
and sustainable earnings stream that can
weather economic cycles.
Finding attractive acquisition opportunities
in today’s real estate market, however,
is challenging. Competitive pressures,
low interest rates and soaring property
values have combined to depress initial
investment yields. Given this environment,
Kite Realty Group’s ability to build value
through ground-up development and
redevelopment provides us with a distinct
competitive advantage. Through our
vertically integrated approach, we control
every stage of the development cycle,
from land procurement to managing the
properties that we build. By utilizing in-
ternal resources and eliminating the need to
outsource, we are able to mitigate risk and
ultimately enhance development returns.
In 2005, we began ten development
projects at a total anticipated cost
of $138 million, exceeding the high
end of our goal by approximately 90
percent. At year end we had 14 retail
properties under development, which
are anticipated to total approximately
1.8 million square feet. We expect these
projects to generate strong returns and
enhance shareholder value as they come
online throughout 2006 and 2007. We
also continue to evaluate development
opportunities within our core markets –
particularly the dynamic South Florida
region. With roughly 180 acres in our
land inventory, we have already begun
to secure the resources necessary for
future development.
Although development is our primary
means of building shareholder value,
we also keep an eye out for compelling
acquisition opportunities. In 2005, we
acquired fi ve high-quality retail assets at
a total cost of $111 million. Among them
are Market Street Village, a 100 percent
leased community shopping center
occupying a premiere location in suburban
Dallas/Ft. Worth, and Indian River Square,
another fully leased, high-profi le property
in Vero Beach, Florida. In addition to
diversifying our asset base, we believe
these acquisitions meet our requirements
for risk-adjusted returns.
We are also pleased with the partnerships
we established in 2005. Joint ventures
allow us to share risk while providing
increased access to investment
opportunities and ancillary fee income.
One example is Estero Town Commons,
a 183,600 square foot community
T O O U R F E L L O W S H A R E H O L D E R S :
Chairman of the Board of Trustees
Alvin E. Kite
Chief Executive Offi cerPresident and Trustee
John A. Kite
shopping center that we are developing
near Naples, Florida in a joint venture
with a private developer. The land was
fully zoned when we entered into the
joint venture, signifi cantly mitigating
our risk. In addition, we are analyzing
opportunities relating to strategic
fi nancial joint venture partners.
As we look into 2006 and beyond, we
are excited by the opportunities that
we see. Already we are allocating
resources to our 2007 operating plan, as
the majority of our 2006 initiatives are
funded and underway. We are fortunate
to work with some of the brightest, most
energetic and passionate people in the
real estate industry. With a talented team
of professionals, a promising pipeline
and a strong capital base, we believe Kite
Realty Group is well positioned to build
shareholder value through development,
acquisitions, joint ventures and advisory
services. Our ability to build value
through a full range of strategies sets us
apart. We have worked hard to earn your
trust and look forward to sharing our
success with you in 2006.


Kite Realty Group Trust is a full-
service, vertically integrated real estate
investment trust engaged primarily in the
development, construction, acquisition,
ownership and operation of high-quality
neighborhood and community shopping
centers in selected growth markets in the
United States. As of December 31, 2005,
Kite Realty Group owned interests in 45
operating properties totaling 6.7 million
square feet and 14 retail properties under
development, which are anticipated
to total 1.8 million square feet.
Headquartered in Indianapolis, Indiana,
Kite Realty Group began operations
as a real estate investment trust in
August 2004 following the Company’s
initial public offering of common shares.
4
2 0 0 5 O P E R AT I N G A N D
F I N A N C I A L P E R F O R M A N C E
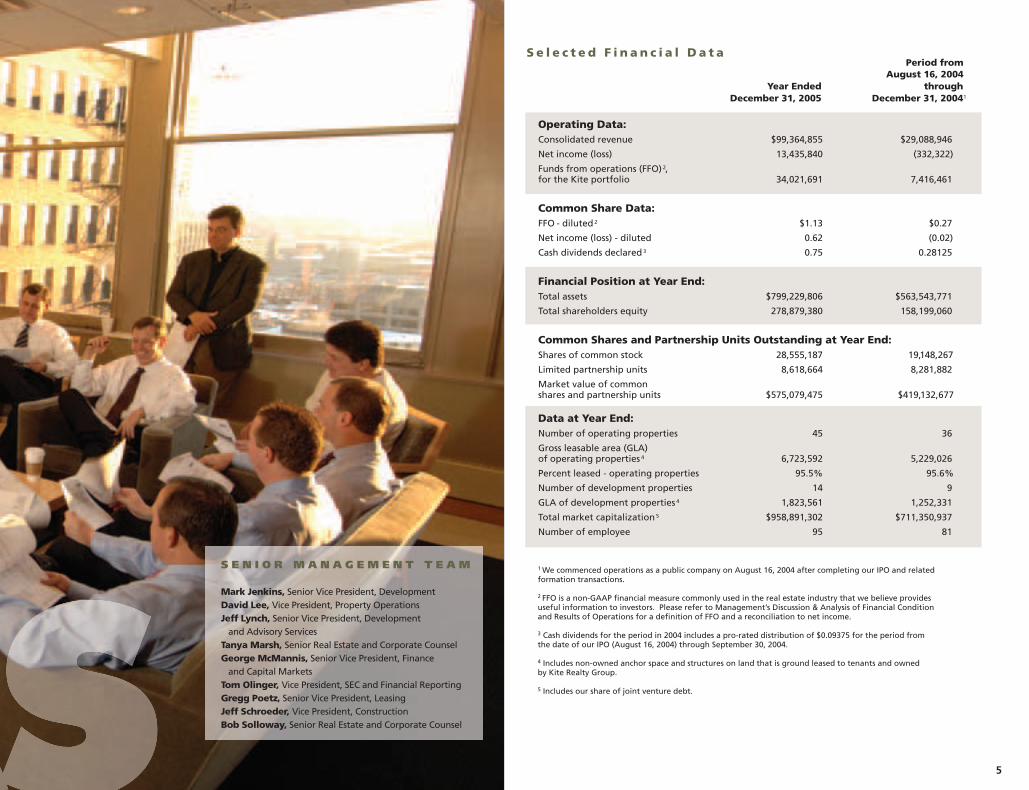
S e l e c t e d F i n a n c i a l D a t a
5
August 16, 2004 Year Ended through December 31, 2005 December 31, 20041
Operating Data:
Consolidated revenue $99,364,855 $29,088,946
Net income (loss) 13,435,840 (332,322)
Funds from operations (FFO) 2,for the Kite portfolio 34,021,691 7,416,461
Common Share Data:
FFO - diluted 2 $1.13 $0.27
Net income (loss) - diluted 0.62 (0.02)
Cash dividends declared 3 0.75 0.28125
Financial Position at Year End:
Total assets $799,229,806 $563,543,771
Total shareholders equity 278,879,380 158,199,060
Common Shares and Partnership Units Outstanding at Year End:
Shares of common stock 28,555,187 19,148,267
Limited partnership units 8,618,664 8,281,882
Market value of common shares and partnership units $575,079,475 $419,132,677
Data at Year End:
Number of operating properties 45 36
Gross leasable area (GLA) of operating properties 4 6,723,592 5,229,026
Percent leased - operating properties 95.5% 95.6%
Number of development properties 14 9
GLA of development properties 4 1,823,561 1,252,331
Total market capitalization 5 $958,891,302 $711,350,937
Number of employee 95 81
Period from
1 We commenced operations as a public company on August 16, 2004 after completing our IPO and related formation transactions.
2 FFO is a non-GAAP fi nancial measure commonly used in the real estate industry that we believe provides useful information to investors. Please refer to Management’s Discussion & Analysis of Financial Conditionand Results of Operations for a defi nition of FFO and a reconciliation to net income.
3 Cash dividends for the period in 2004 includes a pro-rated distribution of $0.09375 for the period fromthe date of our IPO (August 16, 2004) through September 30, 2004.
4 Includes non-owned anchor space and structures on land that is ground leased to tenants and ownedby Kite Realty Group.
5 Includes our share of joint venture debt.
S E N I O R M A N A G E M E N T T E A M
Mark Jenkins, Senior Vice President, DevelopmentDavid Lee, Vice President, Property OperationsJeff Lynch, Senior Vice President, Development and Advisory ServicesTanya Marsh, Senior Real Estate and Corporate CounselGeorge McMannis, Senior Vice President, Finance and Capital MarketsTom Olinger, Vice President, SEC and Financial ReportingGregg Poetz, Senior Vice President, LeasingJeff Schroeder, Vice President, ConstructionBob Solloway, Senior Real Estate and Corporate Counsel

K I T E B U I L D S VA L U E
6
Kite Realty Group’s vertically integrated
platform allows us to control all facets of
the development process, while helping
mitigate the associated risks. We began
2005 with nine projects in our development
pipeline at a total projected cost of $102
million. Over the course of the year, we
began ten new projects while moving
fi ve projects to the operating portfolio.
By year-end, our development pipeline
encompassed 14 projects at a total
projected cost of $176 million.
We believe current conditions warrant
continued investment in development, and
we expect our strong pipeline to make
healthy contributions to cash fl ow and
shareholder value in 2006 and 2007.
Circuit City Plaza, Ft. Lauderdale, FL (MSA)Traders Point, Indianapolis, IN
7
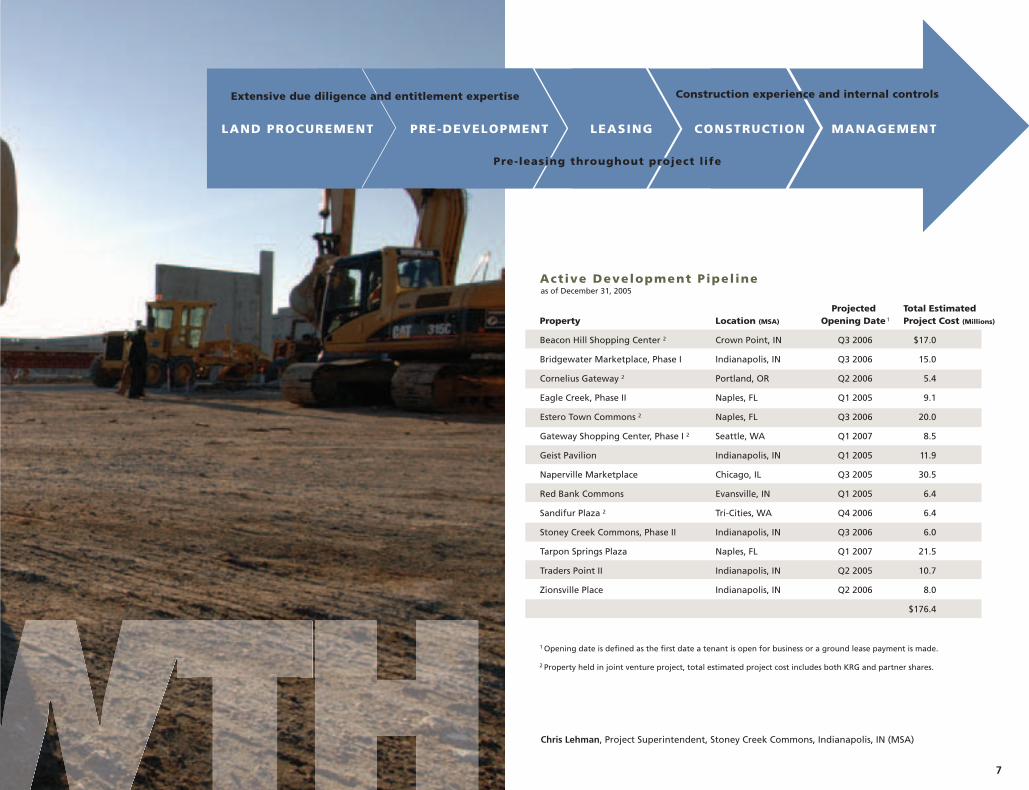
Active Development Pipel ine
Projected Total EstimatedProperty Location (MSA) Opening Date 1 Project Cost (Millions)
Beacon Hill Shopping Center 2 Crown Point, IN Q3 2006 $17.0
Bridgewater Marketplace, Phase I Indianapolis, IN Q3 2006 15.0
Cornelius Gateway 2 Portland, OR Q2 2006 5.4
Eagle Creek, Phase II Naples, FL Q1 2005 9.1
Estero Town Commons 2 Naples, FL Q3 2006 20.0
Gateway Shopping Center, Phase I 2 Seattle, WA Q1 2007 8.5
Geist Pavilion Indianapolis, IN Q1 2005 11.9
Naperville Marketplace Chicago, IL Q3 2005 30.5
Red Bank Commons Evansville, IN Q1 2005 6.4
Sandifur Plaza 2 Tri-Cities, WA Q4 2006 6.4
Stoney Creek Commons, Phase II Indianapolis, IN Q3 2006 6.0
Tarpon Springs Plaza Naples, FL Q1 2007 21.5
Traders Point II Indianapolis, IN Q2 2005 10.7
Zionsville Place Indianapolis, IN Q2 2006 8.0
$176.4
as of December 31, 2005
Chris Lehman, Project Superintendent, Stoney Creek Commons, Indianapolis, IN (MSA)
1 Opening date is defi ned as the fi rst date a tenant is open for business or a ground lease payment is made.
2 Property held in joint venture project, total estimated project cost includes both KRG and partner shares.
LAND PROCUREMENT PRE-DEVELOPMENT LEASING CONSTRUCTION MANAGEMENT
Construction experience and internal controls
Pre-leasing throughout project life
Extensive due diligence and entitlement expertise
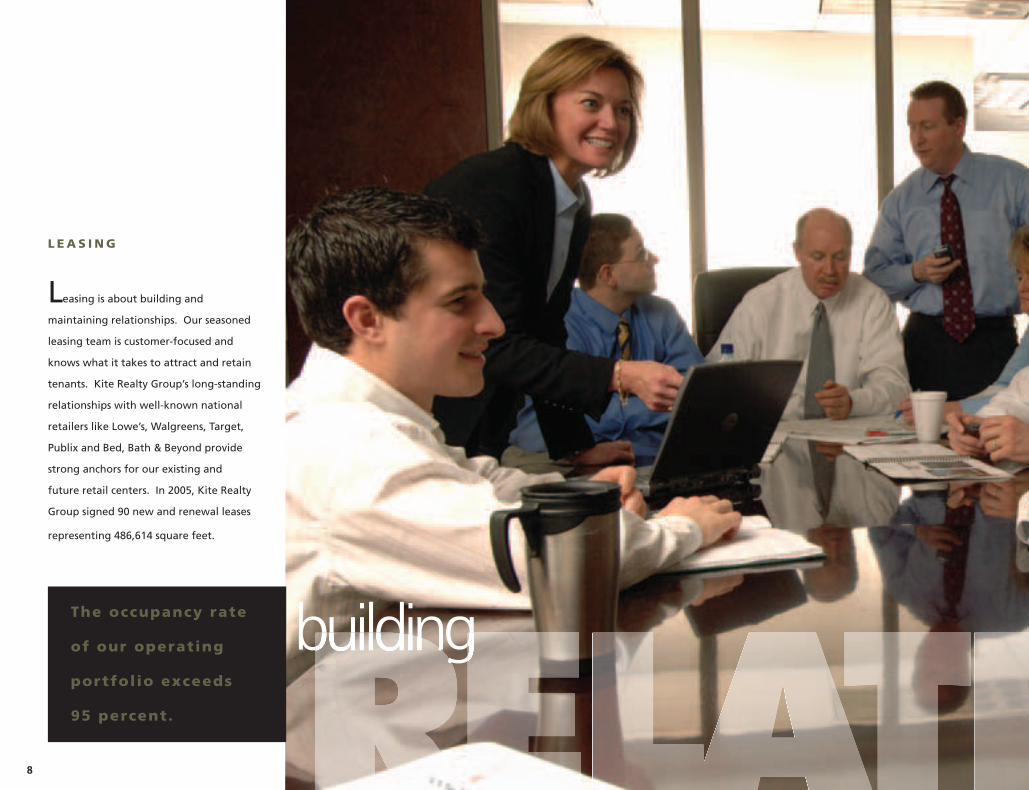
The occupancy rate
of our operating
portfol io exceeds
95 percent.
8
L E A S I N G
building
Leasing is about building and
maintaining relationships. Our seasoned
leasing team is customer-focused and
knows what it takes to attract and retain
tenants. Kite Realty Group’s long-standing
relationships with well-known national
retailers like Lowe’s, Walgreens, Target,
Publix and Bed, Bath & Beyond provide
strong anchors for our existing and
future retail centers. In 2005, Kite Realty
Group signed 90 new and renewal leases
representing 486,614 square feet.

Top Ten Retail Anchors by GLA as of December 31, 2005
Lowe’s
Wal-Mart
Federated Department Stores
Marsh Supermarkets
Circuit City
Dominick’s
Publix
Dick’s Sporting Goods
Kmart
Burlington Coat Factory
9
Marty Arrivo, Beth Patterson, Andrew Hasbrook,
John Schick, Gregg Poetz, Kim Caso, Scott Barrett,
Luke Isenbarger and Toby Davis
Portland, OR (MSA) Greyhound Commons, Indianapolis, IN (MSA)

11
In 2005, we invested $75 million in
undeveloped land – over half of which
was included in the $138 million in 2005
development starts. In total, we own
approximately 180 acres of undeveloped
land in various stages of entitlement.
At Kite Realty Group, we employ an
experienced team of pre-development
engineers accomplished in navigating
the complicated and lengthy process of
entitlement and designing attractive
environments for our tenants and
customers. Our expertise allows us to
control costs and operate more effi ciently
during this critical development phase.
Overcoming
obstacles
and designing
opportunit ies.
Eric Strickland, Jil Froelich and Doug Pedersen
Preliminary design, Delray Beach, Florida
L A N D P R O C U R E M E N T A N D P R E - D E V E L O P M E N T

building
13
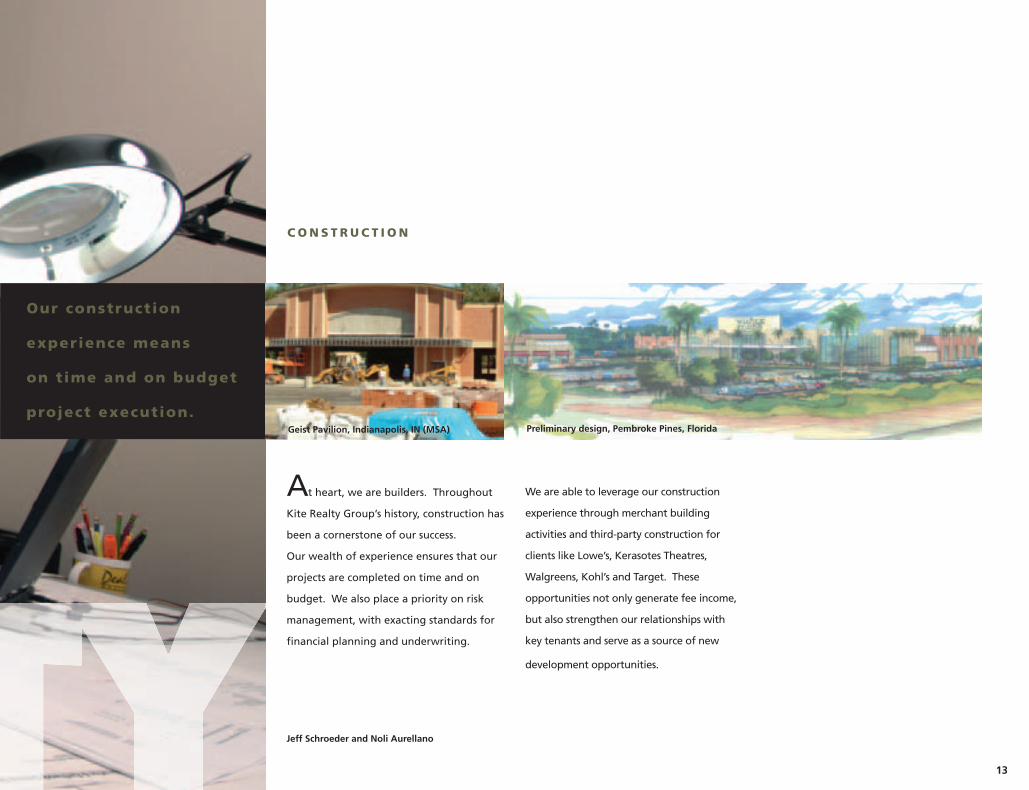
At heart, we are builders. Throughout
Kite Realty Group’s history, construction has
been a cornerstone of our success.
Our wealth of experience ensures that our
projects are completed on time and on
budget. We also place a priority on risk
management, with exacting standards for
fi nancial planning and underwriting.
We are able to leverage our construction
experience through merchant building
activities and third-party construction for
clients like Lowe’s, Kerasotes Theatres,
Walgreens, Kohl’s and Target. These
opportunities not only generate fee income,
but also strengthen our relationships with
key tenants and serve as a source of new
development opportunities.
Our construction
experience means
on t ime and on budget
project execution.
Jeff Schroeder and Noli Aurellano
Preliminary design, Pembroke Pines, FloridaGeist Pavilion, Indianapolis, IN (MSA)
C O N S T R U C T I O N

14
Putting capital
to work
in creative ways.
K I T E B U I L D S VA L U E . . .
B Y R E C Y C L I N G C A P I TA L
One of our strategies involves recycling
proceeds from the sale of non-core
properties into our core retail portfolio.
In the fourth quarter, we disposed of
Mid-America Clinical Laboratories, a
single-tenant commercial asset that we
redeveloped in 2001. We then redeployed
the $21.3 million in proceeds toward
the purchase of Market Street Village,
a 149,000 square foot, 100% leased
community shopping center in the Dallas/
Fort Worth Metroplex. This transaction
allowed us to diversify our tenant
base further by replacing a single local
commercial tenant with fi ve well-known
national retail tenants.
Wade Achenbach, Adam Chavers,
George McMannis and Lindsey Hire
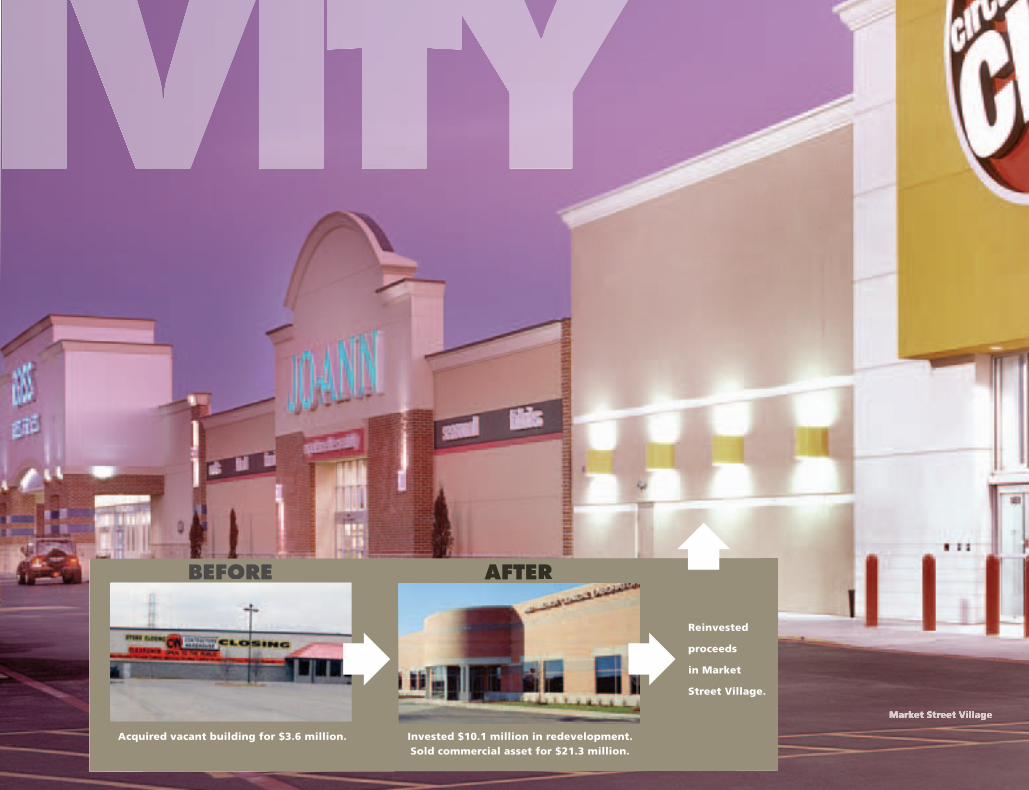
Acquired vacant building for $3.6 million. Invested $10.1 million in redevelopment.Sold commercial asset for $21.3 million.
Reinvested
proceeds
in Market
Street Village.
BEFORE AFTER
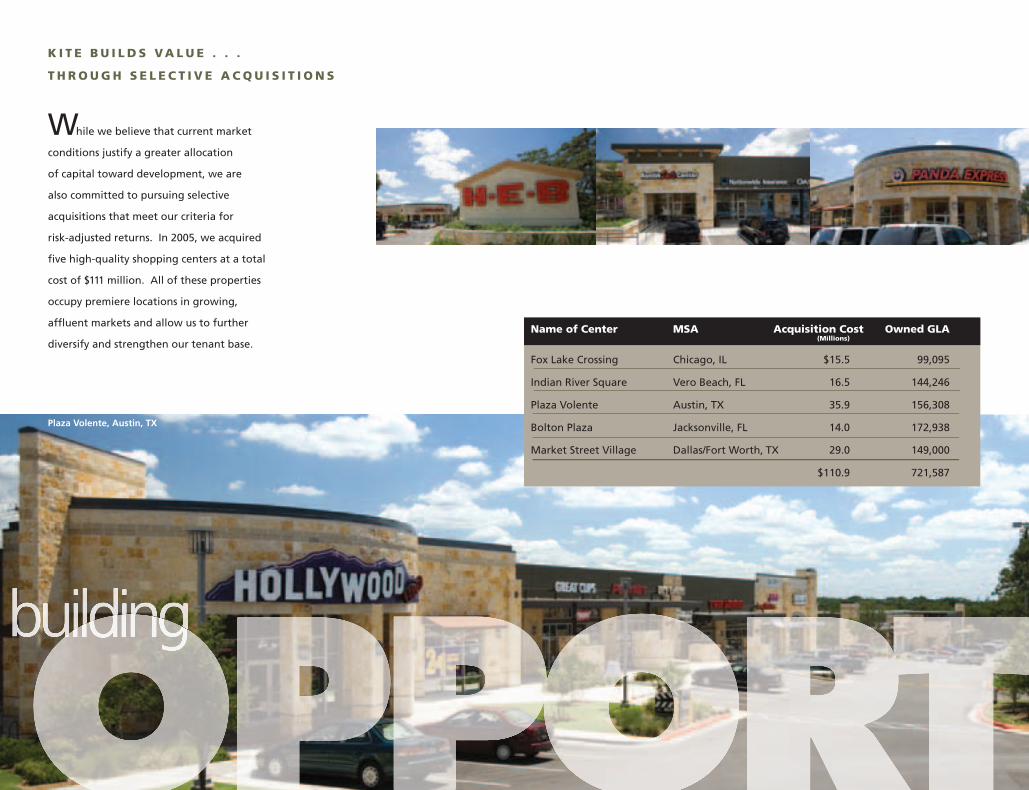
While we believe that current market
conditions justify a greater allocation
of capital toward development, we are
also committed to pursuing selective
acquisitions that meet our criteria for
risk-adjusted returns. In 2005, we acquired
fi ve high-quality shopping centers at a total
cost of $111 million. All of these properties
occupy premiere locations in growing,
affl uent markets and allow us to further
diversify and strengthen our tenant base.
K I T E B U I L D S VA L U E . . .
T H R O U G H S E L E C T I V E A C Q U I S I T I O N S
Name of Center MSA Acquisition Cost Owned GLA (Millions)
Fox Lake Crossing Chicago, IL $15.5 99,095
Indian River Square Vero Beach, FL 16.5 144,246
Plaza Volente Austin, TX 35.9 156,308
Bolton Plaza Jacksonville, FL 14.0 172,938
Market Street Village Dallas/Fort Worth, TX 29.0 149,000
$110.9 721,587
Plaza Volente, Austin, TX
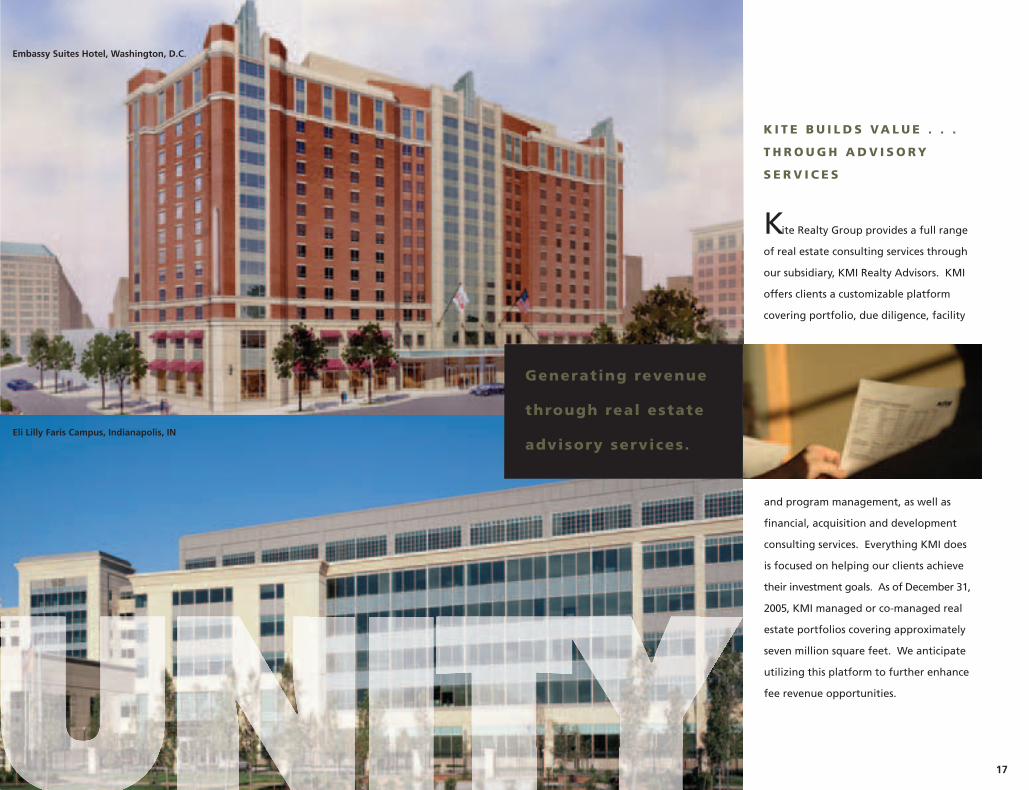
K I T E B U I L D S VA L U E . . .
T H R O U G H A D V I S O R Y
S E R V I C E S
17
Kite Realty Group provides a full range
of real estate consulting services through
our subsidiary, KMI Realty Advisors. KMI
offers clients a customizable platform
covering portfolio, due diligence, facility
Generating revenue
through real estate
advisory services.
and program management, as well as
fi nancial, acquisition and development
consulting services. Everything KMI does
is focused on helping our clients achieve
their investment goals. As of December 31,
2005, KMI managed or co-managed real
estate portfolios covering approximately
seven million square feet. We anticipate
utilizing this platform to further enhance
fee revenue opportunities.
Eli Lilly Faris Campus, Indianapolis, IN
Embassy Suites Hotel, Washington, D.C.

John A. KiteAlvin E. Kite Michael L. SmithDr. Richard A. Cosier William E. Bindley Gerald L. MossEugene Golub
BOARD OF TRUSTEES
1 Audit Committee
2 Compensation Committee
3 Corporate Government and Nominating Committee
building
Alvin E. Kite Chairman of the Board,Kite Realty Group Trust
John A. Kite President and Chief Executive Offi cer,Kite Realty Group Trust
William E. Bindley 2,3
Chairman, Bindley Capital Partners and Priority Healthcare Corporation
Dr. Richard A. Cosier 1,3
Dean, Krannert School of Management,Purdue University
Eugene Golub 2
Chairman, Golub and Company
Gerald L. Moss 1,3
Honorary Of Counsel, Bingham McHale, LLP
Michael L. Smith 1,2
Retired former Executive Vice Presidentand Chief Financial Offi cer,Anthem Blue Cross and Blue Shield
Traders Point, Indianapolis, IN
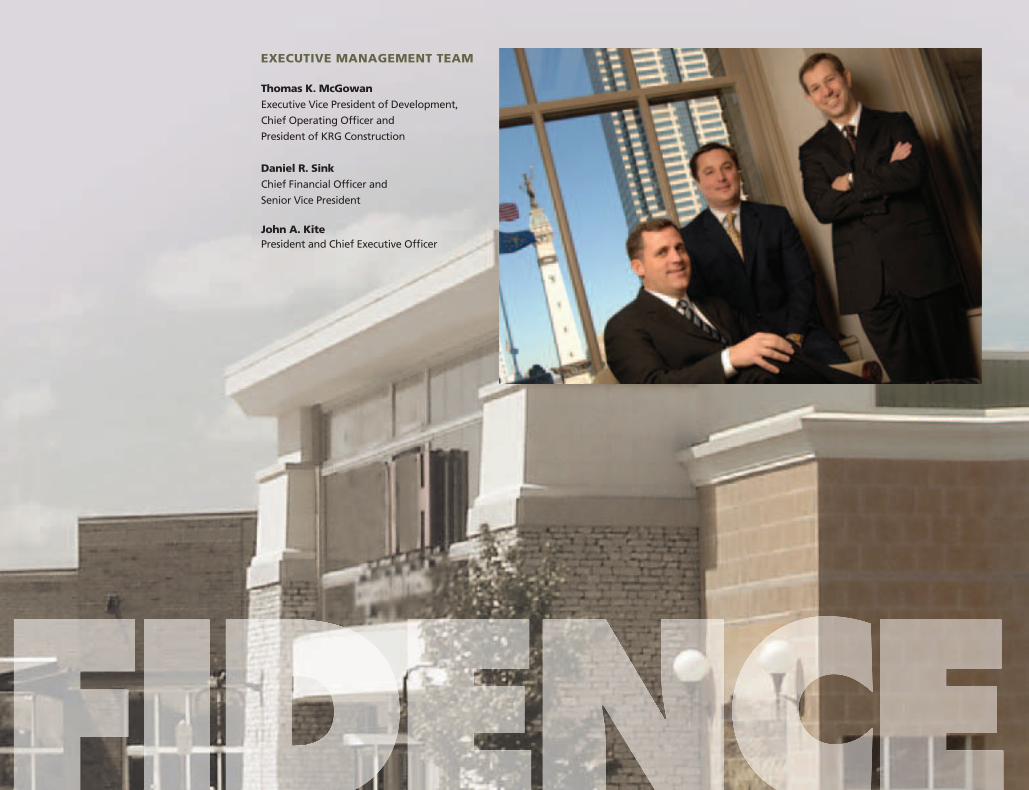
EXECUTIVE MANAGEMENT TEAM
Thomas K. McGowanExecutive Vice President of Development,
Chief Operating Offi cer and
President of KRG Construction
Daniel R. SinkChief Financial Offi cer and
Senior Vice President
John A. Kite President and Chief Executive Offi cer

This annual report contains certain statements that are not historical fact and may constitute forward-looking statements within the meaning of the Private Securities Litigation Reform Act of 1995. Such forward-looking statements
involve known and unknown risks, uncertainties and other factors which may cause the actual results of the Company to differ materially from historical results or from any results expressed or implied by such forward-looking
statements, including, without limitation: national and local economic, business, real estate and other market conditions; the competitive environment in which the Company operates; fi nancing risks; possible future downgrades
in our credit ratings; property ownership/management risks; the level and volatility of interest rates; fi nancial stability of tenants; the Company’s ability to maintain its status as a REIT for federal income tax purposes; acquisition,
disposition, development and joint venture risks, including risks that developments and redevelopments are not completed on time or on budget and strategies, actions and performance of affi liates that the Company may not
control; potential environmental and other liabilities; and other factors affecting the real estate industry generally. The Company refers you to the documents fi led by the Company from time to time with the Securities and Ex-
change Commission, specifi cally the section titled “Business Risk Factors” in the Company’s Annual Report on Form 10-K for the year ended December 31, 2005, which discuss these and other factors that could adversely affect the
Company’s results.
S H A R E H O L D E R I N F O R M AT I O N
Corporate Headquarters:
Kite Realty Group Trust, 30 South Meridian, Suite 1100, Indianapolis, Indiana 46204
Phone: (317) 577-5600 Fax: (317) 577-5605 Internet: www.kiterealty.com
Exchange Listing: New York Stock Exchange. NYSE: KRG
Independent Auditors: Ernst & Young, LLP
Transfer Agent and Registrar:
LaSalle Bank National Association
135 South LaSalle Street
Chicago, IL 60603-3499
(312) 904-2000
Shareholder Information: Shareholders seeking fi nancial and operating information
may contact Investor Relations, Kite Realty Group Trust, 30 South Meridian, Suite 1100,
Indianapolis, Indiana 46204. Current investor information, including press releases and
quarterly earnings information, can be obtained at www.kiterealty.com.
Form 10-K: Copies of the Company’s Annual Report on Form 10-K for the year ended
December 31, 2005 are available to shareholders without charge upon written request to
Investor Relations, Kite Realty Group Trust, 30 South Meridian, Suite 1100, Indianapolis,
Indiana 46204.
Securities and Exchange Commission and New York Stock Exchange Certifi cations: The certi-
fi cations of the Chief Executive Offi cer and Chief Financial Offi cer of the Company certifying
the quality of the Company’s public disclosure and required to be fi led with the Securities
and Exchange Commission pursuant to Section 302 of the Sarbanes-Oxley Act of 2002, have
been fi led as Exhibits 31.1 and 31.2, respectively, in the Company’s Annual Report on Form
10-K for the year ended December 31, 2005. The Company has submitted to the New York
Stock Exchange the certifi cation of the Chief Executive Offi cer certifying that he is not aware
of any violation by the Company of the New York Stock Exchange corporate governance
listing standards.
Annual Meeting: The Annual Meeting of Shareholders will be held at 9:00 a.m. local time on
May 4, 2006, at 30 South Meridian, 8th Floor Conference Center, Indianapolis, Indiana 46204.

UNITED STATESSECURITIES AND EXCHANGE COMMISSION
Washington, D.C. 20549
FORM 10-K
(Mark One)
H Annual report pursuant to Section 13 or 15(d) of the Securities Exchange Act of 1934
For the fiscal year ended December 31, 2005 or
h Transition report pursuant to Section 13 or 15(d) of the Securities Exchange Act of 1934
For the transition period from to
Commission File Number: 001-32268
Kite Realty Group TrustMaryland 11-3715772
State of Organization: IRS Employer Identification Number:
30 S. Meridian Street, Suite 1100Indianapolis, Indiana 46204Telephone: (317) 577-5600
(Address, including zip code and telephone number, including area code, of principal executive offices)
Title of each className of each exchange
on which registered
Common Shares, $0.01 par value New York Stock Exchange
Securities registered pursuant to Section 12(g) of the Act: NoneIndicate by checkmark if the Registrant is a well-known seasoned issuer, as defined by Rule 405 of the Securities
Act Yes h No H
Indicate by checkmark if the Registrant is not required to file reports pursuant to Section 13 of Section 15(d) of theAct Yes h No H
Indicate by check mark whether the Registrant (1) has filed all reports required to be filed by Section 13 or 15(d) of theSecurities Exchange Act of 1934 during the preceding 12 months (or for such shorter period that the Registrant was required tofile such reports), and (2) has been subject to such filing requirements for the past 90 days. Yes H No h
Indicate by check mark if disclosure of delinquent filers pursuant to Item 405 of Regulation S-K is not contained herein, andwill not be contained, to the best of Registrant’s knowledge, in any definitive proxy or information statements incorporated byreference in Part III of this Form 10-K or any amendment to this Form 10-K. h
Indicate by check mark whether the registrant is a large accelerated filer, an accelerated filer or a non-accelerated filer. Seedefinition of “accelerated filer and large accelerated filer” in Rule 12b-2 of the Exchange Act.
Large accelerated filer h Accelerated filer H Non-accelerated filer h
Indicate by checkmark whether the Registrant is a shell company (as defined in Rule 12-b of the Act) Yes h No H
The aggregate market value of the voting shares held by non-affiliates of the Registrant as the last business day of theRegistrant’s most recently completed second quarter was $272.7 million based upon the closing price of $15.00 per share on theNew York Stock Exchange on such date.
The number of Common Shares outstanding as of March 10, 2006 was 28,583,414 ($.01 par value).
Documents Incorporated by ReferencePortions of the Proxy Statement relating to the Registrant’s Annual Meeting of Shareholders, scheduled to be held on May 4,
2006, to be filed with the Securities and Exchange Commission, are incorporated by reference into Part III, Items 10-14 of thisAnnual Report on Form 10-K as indicated herein.
KITE REALTY GROUP TRUSTAnnual Report on Form 10-K
For the Fiscal Year EndedDecember 31, 2005
TABLE OF CONTENTS
Item No. Page
Part I1. Business . . . . . . . . . . . . . . . . . . . . . . . . . . . . . . . . . . . . . . . . . . . . . . . . . . . . . . . . . . . . . . . . . . . . . . . . . . . . . . . . . . . . . . . . 11.A. Risk Factors . . . . . . . . . . . . . . . . . . . . . . . . . . . . . . . . . . . . . . . . . . . . . . . . . . . . . . . . . . . . . . . . . . . . . . . . . . . . . . . . . . . . 101.B. Unresolved Staff Comments . . . . . . . . . . . . . . . . . . . . . . . . . . . . . . . . . . . . . . . . . . . . . . . . . . . . . . . . . . . . . . . . . . . . 242. Properties . . . . . . . . . . . . . . . . . . . . . . . . . . . . . . . . . . . . . . . . . . . . . . . . . . . . . . . . . . . . . . . . . . . . . . . . . . . . . . . . . . . . . . 243. Legal Proceeding . . . . . . . . . . . . . . . . . . . . . . . . . . . . . . . . . . . . . . . . . . . . . . . . . . . . . . . . . . . . . . . . . . . . . . . . . . . . . . . 374. Submission of Matters to a Vote of Security Holders . . . . . . . . . . . . . . . . . . . . . . . . . . . . . . . . . . . . . . . . . . . 37
Part II5. Market for the Registrant’s Common Equity, Related Shareholder Matters and Issuer
Purchases of Equity Securities . . . . . . . . . . . . . . . . . . . . . . . . . . . . . . . . . . . . . . . . . . . . . . . . . . . . . . . . . . . . . . . 386. Selected Financial Data . . . . . . . . . . . . . . . . . . . . . . . . . . . . . . . . . . . . . . . . . . . . . . . . . . . . . . . . . . . . . . . . . . . . . . . . 407. Management’s Discussion and Analysis of Financial Condition and Results of Operations . . . . . 417A. Quantitative and Qualitative Disclosures About Market Risk . . . . . . . . . . . . . . . . . . . . . . . . . . . . . . . . . . . 588. Financial Statements and Supplementary Data . . . . . . . . . . . . . . . . . . . . . . . . . . . . . . . . . . . . . . . . . . . . . . . . . 589. Changes in and Disagreements with Accountants on Accounting and Financial Disclosure . . . . . 589A. Controls and Procedures . . . . . . . . . . . . . . . . . . . . . . . . . . . . . . . . . . . . . . . . . . . . . . . . . . . . . . . . . . . . . . . . . . . . . . . . 589B. Other Information . . . . . . . . . . . . . . . . . . . . . . . . . . . . . . . . . . . . . . . . . . . . . . . . . . . . . . . . . . . . . . . . . . . . . . . . . . . . . . 61
Part III10. Directors and Executive Officers of the Registrant . . . . . . . . . . . . . . . . . . . . . . . . . . . . . . . . . . . . . . . . . . . . . 6111. Executive Compensation . . . . . . . . . . . . . . . . . . . . . . . . . . . . . . . . . . . . . . . . . . . . . . . . . . . . . . . . . . . . . . . . . . . . . . . 6112. Security Ownership of Certain Beneficial Owners and Management and Related
Shareholder Matters . . . . . . . . . . . . . . . . . . . . . . . . . . . . . . . . . . . . . . . . . . . . . . . . . . . . . . . . . . . . . . . . . . . . . . . . . 6113. Certain Relationships and Related Transactions . . . . . . . . . . . . . . . . . . . . . . . . . . . . . . . . . . . . . . . . . . . . . . . . 6114. Principal Accounting Fees and Services . . . . . . . . . . . . . . . . . . . . . . . . . . . . . . . . . . . . . . . . . . . . . . . . . . . . . . . . 61
Part IV15. Exhibits and Financial Statement Schedule . . . . . . . . . . . . . . . . . . . . . . . . . . . . . . . . . . . . . . . . . . . . . . . . . . . . . 62Signatures . . . . . . . . . . . . . . . . . . . . . . . . . . . . . . . . . . . . . . . . . . . . . . . . . . . . . . . . . . . . . . . . . . . . . . . . . . . . . . . . . . . . . . . . . . . . . 63
PART I
FORWARD-LOOKING STATEMENTS
This Annual Report on Form 10-K, together with other statements and information publicly disseminatedby Kite Realty Group Trust, contains certain forward-looking statements within the meaning of Section 27Aof the Securities Act of 1933 and Section 21E of the Securities Exchange Act of 1934. Such statements are basedon assumptions and expectations that may not be realized and are inherently subject to risks, uncertainties andother factors, many of which cannot be predicted with accuracy and some of which might not even be anticipated.Future events and actual results, performance, transactions or achievements, financial or otherwise, may differmaterially from the results, performance, transactions or achievements expressed or implied by the forward-looking statements. Risks, uncertainties and other factors that might cause such differences, some of which couldbe material, include, but are not limited to:
• national and local economic, business, real estate and other market conditions;
• the ability of tenants to pay rent;
• the competitive environment in which the Company operates;
• financing risks;
• property ownership and management risks;
• the level and volatility of interest rates;
• the financial stability of tenants;
• the Company’s ability to maintain its status as a real estate investment trust (“REIT”) for federal incometax purposes;
• acquisition, disposition, development and joint venture risks;
• potential environmental and other liabilities;
• other factors affecting the real estate industry generally; and
• other risks identified in this Annual Report on Form 10-K and, from time to time, in other reports wefile with the Securities and Exchange Commission (the “SEC”) or in other documents that we publiclydisseminate.
The Company undertakes no obligation to publicly update or revise these forward-looking statements,whether as a result of new information, future events or otherwise.
ITEM 1. BUSINESS
Unless the context suggests otherwise, references to “we,” “us,” “our” or the “Company” refer to Kite RealtyGroup Trust and our business and operations conducted through our directly or indirectly owned subsidiaries,including Kite Realty Group, L.P., our operating partnership (the “Operating Partnership”) and their predecessorcompanies. References to “Kite Property Group” or the “Predecessor” mean our predecessor businesses.
OverviewWe are a full-service, vertically integrated real estate company engaged primarily in the development,
construction, acquisition, ownership and operation of high quality neighborhood and community shoppingcenters in selected growth markets in the United States. We also provide real estate facility management,construction, development and other advisory services to third parties.
As of December 31, 2005, we owned interests in a portfolio of 40 retail operating properties totalingapproximately 6.2 million square feet of gross leasable area (including approximately 1.7 million square feetof non-owned anchor space) and 14 retail development properties that are expected to contain approximately1.8 million square feet of total gross leasable area (including non-owned anchor space). Our retail operatingportfolio was 95.3% leased as of December 31, 2005 to a diversified tenant base, with no single retail tenantaccounting for more than 3.3% of our total annualized base rent. We also own interests in four commercialoperating properties totaling approximately 563,000 square feet of net rentable area and a related parking garage.Occupancy of our commercial operating portfolio was 97.3% as of December 31, 2005, with no singlecommercial tenant accounting for more than 2.8% of our annualized base rent. See “Item 2. Properties” for alist of our top 25 tenants by annualized base rent. Our operating portfolio consists of properties in Indiana, Texas,Florida, Georgia, Illinois, New Jersey, Ohio, Oregon and Washington. In addition, we own interests in landparcels comprising approximately 180 acres that may be used for future development of retail or commercialproperties or for expansion of existing properties.
We were formed in March 2004 and organized as a Maryland real estate investment trust. From inceptionuntil August 16, 2004, neither we, our Operating Partnership, nor our other subsidiaries had any operations. Wecommenced operations on August 16, 2004 after completing our initial public offering (“IPO”), concurrentlywith the consummation of various formation transactions that consolidated into our Operating Partnership theownership of a portfolio of properties and property interests, and certain commercial real estate businesses ofour predecessor, the Kite Property Group, a nationally recognized real estate owner and developer. Kite, Inc.,an affiliate of Kite Property Group, was founded in 1960 by our Chairman, Al Kite, and grew from an interiorconstruction company to a full-service, vertically integrated real estate development, construction andmanagement company.
We conduct all of our business through our Operating Partnership, of which we are the sole general partner.As of December 31, 2005, we held an approximate 77% interest in our Operating Partnership.
2005 ActivitiesCompletion of Offering of Common Shares. On October 3, 2005, the Company completed an offering (the
“2005 Offering”) of 8,500,000 common shares at a price of $15.01 per share, for gross proceeds of approximately$127.6 million. On October 28, 2005, the underwriters of the offering exercised a portion of their overallotmentoption and purchased an additional 900,000 common shares at the public offering price of $15.01 per share,which resulted in additional gross proceeds of approximately $13.5 million. The Company used the net proceedsof this offering of approximately $133.2 million, after deducting underwriting discounts, commissions and otherexpenses as follows:
• to repay outstanding construction indebtedness of approximately $38.6 million and acquisitionindebtedness of approximately $0.5 million on our Traders Point property;
• to repay outstanding indebtedness on our Eagle Creek II development property and our Weston Park,Shops at Otty and Circuit City operating properties totaling approximately $13.6 million;
• to pay down our secured revolving credit facility by approximately $60.2 million;
• to acquire an 85% interest in Bolton Plaza Shopping Center in Jacksonville, Florida for approximately$14.0 million; and
• for general corporate purposes, including acquisition of land, capital expenditures, development costsand working capital of approximately $6.3 million.
2005 Acquisition Activities. During 2005, we completed the acquisition of five operating properties totalingapproximately 1.0 million square feet of gross leasable area (including non-owned anchor space) for a totalacquisition cost of approximately $111 million (including assumed debt), as described below:
• Fox Lake Crossing. On February 7, we acquired Fox Lake Crossing, a 99,095 square foot neighborhoodshopping center in Fox Lake, Illinois (a suburb of Chicago, Illinois), for a total purchase price ofapproximately $15.5 million, inclusive of $12.3 million of assumed debt;
2
• Plaza Volente. On May 16, we acquired Plaza Volente, a 160,308 square foot neighborhood shoppingcenter in Austin, Texas, for a total purchase price of approximately $35.9 million, inclusive of$28.7 million of new debt and $7.2 million of borrowings on our revolving credit facility incurred inconnection with the acquisition;
• Indian River Square. On May 16, we acquired Indian River Square, a 379,246 square foot (including235,000 square feet of non-owned anchor space) community shopping center in Vero Beach, Florida fora total purchase price of approximately $16.5 million, inclusive of $13.3 million of new debt and$3.2 million of borrowings on our revolving credit facility incurred in connection with the acquisition;
• Bolton Plaza Shopping Center. On November 1, we contributed $14.0 million to acquire an 85% interestin Bolton Plaza, a 172,938 square foot community shopping center in Orange Park, Florida (a suburbof Jacksonville, Florida). We financed this acquisition with proceeds from our 2005 Offering; and
• Market Street Village. On November 17, we acquired Market Street Village, a 156,000 square foot(including a future 7,000 square foot single tenant small shop building) community shopping center inHurst, Texas (a suburb of Dallas/Ft. Worth, Texas) for a total purchase price of approximately$29.0 million. We initially financed this acquisition with borrowings on our revolving credit facility. OnDecember 30, we executed a like-kind exchange under Section 1031 of the Internal Revenue Code andsold our Mid-America Clinical Labs property for $21.3 million and used the proceeds to pay down therevolving credit facility.
2005 Development Activities. During 2005, we added ten parcels to our development pipeline:
• Stoney Creek Commons, Phase II, Noblesville, Indiana (a suburb of Indianapolis, Indiana). This projectwill be a 49,330 square foot shopping center located adjacent to a Lowe’s developed by us in 2000 andis 100% pre-leased to Office Depot and Gregg Appliances. This project has a total estimated cost ofapproximately $6.0 million and an anticipated opening date in the third quarter of 2006;
• Bridgewater Marketplace, Phase I, Westfield, Indiana (a suburb of Indianapolis, Indiana). In October,we acquired 12 acres for approximately $4.8 million and placed an adjacent eight acres under contract.Bridgewater Marketplace is anticipated to be a two-phase development. Phase I will be developed onthe first 12 acres and is an estimated 51,000 square foot neighborhood shopping center expected to includea Walgreen’s, two outparcels and approximately 25,000 square feet of small shops. Phase I of this projecthas an expected opening date in the third quarter of 2006.
• Zionsville Place, Zionsville, Indiana (a suburb of Indianapolis, Indiana). In August, we added thisproject, a 42,400 square foot mixed use retail/commercial center, to the development pipeline. Featuringa combination of small shops and garden-style offices, Zionsville Place will be developed on a seven-acreparcel that we acquired in 2004. This project has an estimated total cost of approximately $8.0 millionand an anticipated opening date in the second quarter of 2006;
• Beacon Hill Shopping Center, Crown Point, Indiana. In July, we contributed approximately $4.0 millionand 122,733 units of the Operating Partnership valued at approximately $1.9 million for a 50% interestin a joint venture that owned 82 acres of undeveloped land. Beacon Hill Shopping Center, Phase I consistsof 36 acres and will be an estimated 161,000 square foot community shopping center (including105,000 square feet of non-owned space). This project has an estimated total cost of approximately$17.0 million and a projected opening date in the third quarter of 2006. The remaining 46 acres is beingmarketed to big box retailers;
• Gateway Shopping Center, Phase I, Marysville, Washington (a suburb of Seattle, Washington). In June,we contributed $4.1 million for a 50% interest in a joint venture that acquired 18.8 acres of undevelopedland. Phase I of Gateway Shopping Center will be an estimated 133,200 square foot community shoppingcenter (including 103,000 square feet of non-owned space to be occupied by Kohl’s). The estimated total
3
cost for Phase I of this project is approximately $8.5 million with an anticipated opening date in the firstquarter of 2007.
• Cornelius Gateway, Cornelius, Oregon (a suburb of Portland, Oregon). In June, we contributedapproximately $2.2 million to acquire an 80% interest in a joint venture that acquired 3.9 acres ofundeveloped land. Cornelius Gateway will be a 36,100 square foot neighborhood shopping centerfeaturing a 14,800 square foot non-owned Walgreen’s and 21,300 square feet of small shops. This projecthas a total estimated cost of approximately $5.4 million. In December, we sold the Walgreen’s as partof our merchant building activity for a gross sales price of approximately $5.6 million. The anticipatedopening date for the small shops is in the second quarter of 2006;
• Sandifur Plaza, Tri-Cities, Washington. In April, we contributed approximately $1.7 million to acquirean interest in two joint ventures that collectively acquired 3.5 acres of undeveloped land. Sandifur Plazawill be a 27,400 square foot neighborhood shopping center featuring a 14,800 square foot Walgreen’sand 12,600 square feet of small shops. We have an 80% interest in the entity that owns the Walgreen’sspace and a 95% interest in the entity that owns the small shop space. This project has a total estimatedcost of approximately $6.4 million and an anticipated opening date in the fourth quarter of 2006;
• Naperville Marketplace, Naperville, Illinois (a suburb of Chicago, Illinois). In March, we acquired a100% interest in a partially constructed Super K-Mart on a 21.6-acre site for approximately $9.5 million.Naperville Marketplace is an estimated 175,000 square foot neighborhood shopping center anchored bya 70,000 square foot Marsh Supermarket and includes junior box retailers and small shops. The total costof this project is approximately $30.5 million. The Marsh Supermarket opened in August and is beingmarketed for sale; however, the Company cannot presently determine whether it can sell this asset withinthe next twelve months. The remainder of the center is anticipated to open in the second quarter of 2006;
• Tarpon Springs Plaza, Naples, Florida. In March, we acquired a 15 acre site from the Company’sPrincipals in exchange for 214,049 units of our Operating Partnership valued at approximately$3.1 million. Tarpon Springs Plaza is an estimated 273,300 square foot community shopping center(including a 191,900 square foot non-owned Target) that is expected to include approximately70,000 square feet of retail junior box tenants, 25,000 square feet of retail shops and up to four outparcels.This project has an estimated total cost of approximately $21.5 million and an anticipated opening datein the first quarter of 2007; and
• Estero Town Commons, Naples, Florida. In January, we contributed approximately $10 million to acquirea 40% interest in a joint venture that acquired 33 acres of undeveloped land. Estero Town Commons isan estimated 183,600 square foot community shopping center (including 158,000 square feet of non-owned anchor and outlot space) with an expected total project cost of approximately $20 million andan anticipated opening date in the third quarter of 2006.
Also during 2005, we completed the following development properties and added them to ouroperating portfolio:
• Traders Point, a 328,278 square foot upscale community shopping center (including 75,777 square feetof non-owned anchor and outlot space) located in Indianapolis, Indiana (opened October 2004 andtransferred to the operating portfolio in September 2005);
• Cool Creek Commons, a 133,177 square foot upscale community shopping center (including12,529 square feet of outlot space) located in Carmel, Indiana, a suburb of Indianapolis, Indiana (openedOctober 2004 and transferred to the operating portfolio in March 2005);
• Weston Park, Phase I, a shopping center consisting of ground leased outlots located in Carmel, Indiana,a suburb of Indianapolis, Indiana (opened and transferred to the operating portfolio in March 2005);
• Greyhound Commons, a restaurant park of ground leased outlots located in Carmel, Indiana, asuburb of Indianapolis, Indiana (opened in March 2005 and transferred to the operating portfolio inDecember 2005); and
4
• Martinsville Shops, a 10,986 square foot shopping center located in Martinsville, Indiana (opened andtransferred to the operating portfolio in June 2005)
In addition, three of our retail development properties became partially operational during 2005:
• Traders Point II, a 50,200 square foot community shopping center in Indianapolis, Indiana locatedadjacent to our Traders Point property (June 2005);
• Red Bank Commons, a 246,500 square foot neighborhood shopping center (including 212,000 square feetof non-owned anchor space) located in Evansville, Indiana (June 2005); and
• Geist Pavilion, a 64,300 square foot neighborhood shopping center located in Fishers, Indiana, a suburbof Indianapolis, Indiana (March 2005).
2005 Land Acquisitions. During 2005, we made the following significant land acquisitions:
• Delray Marketplace, Delray Beach, Florida. In October, we contributed $16.7 million for a 50% interestin a joint venture that owns 32.5 acres of undeveloped land. Delray Beach Marketplace is a plannedmixed-use development that is zoned to support up to 322,000 square feet and is anticipated to includetwo anchors, junior boxes, small shops, restaurants and residential units; and
• Grand Palms Plaza, Pembroke Pines, Florida. In October, we contributed $11.0 million for a50% interest in a joint venture that acquired 22.2 acres of undeveloped land. Grand Palms Plaza is aplanned 145,000 square foot community shopping center to be anchored by Whole Foods and is expectedto include small shops, a junior box and outparcels.
2005 Dispositions: During 2005, we sold the following two properties:
• Mid-America Clinical Labs, Indianapolis, Indiana. In December, we sold Mid-America Clinical Labsin a like-kind exchange under Section 1031 of the Internal Revenue Code for a gross sales price ofapproximately $21.3 million and recognized a gain of approximately $7.2 million; and
• Cornelius Gateway, Cornelius, Oregon. In December, we sold the Walgreen’s as part of our merchantbuilding activity for a gross sales price of approximately $5.6 million and a net gain before income taxesand minority interest of approximately $1.6 million.
Distributions. In 2005, we declared four quarterly cash distributions of $0.1875 per common share (whichis equivalent to an annual distribution of $0.75 per common share).
Business StrategyOur primary business objectives are to generate increasing cash flow, achieve sustainable long-term growth
and maximize shareholder value primarily through the development, acquisition and operation of well-locatedcommunity and neighborhood shopping centers. We seek to implement our business objectives by:
• successfully completing the construction and lease-up of our development portfolio;
• continuing to pursue well-located land which can support development;
• acquiring well-located, high quality retail properties through our investment and market selection process;
• maintaining a focused property management and leasing strategy;
• selling certain assets and recycling capital; and
• leveraging our construction and advisory services businesses.
Development Activities. We serve as an in-house and third-party developer for national retailers and otherclients, providing a broad range of services that include site selection, development incentives procurement,design, leasing, construction and property management.As a vertically integrated real estate company, we control
5
all aspects of the development process from design to operation, which improves our ability to deliver a qualityproduct to our tenants on budget and on time. We have in-house capabilities and expertise in project design,development, leasing, construction and property management. Our construction expertise enables us to betteridentify and complete redevelopment and value-enhancing acquisition opportunities. We believe that ourvertically integrated platform allows us to achieve attractive risk-adjusted returns on our development projectswhile substantially mitigating the risks associated with ground-up development.
As of December 31, 2005, we had an extensive development pipeline, which we expect to be a significantsource of growth for us over the next several years. We had 14 retail properties under development as ofDecember 31, 2005, that are expected to contain approximately 1.8 million square feet, of which approximately690,000 square feet will be owned by us with the remainder to be owned by anchor tenants upon completionof the development. The total estimated cost for these properties is approximately $176.4 million, of whichapproximately $107.7 million had been incurred as of December 31, 2005.
Acquisition of Development Parcels. As of December 31, 2005, we owned interests in undeveloped landparcels comprising approximately 180 acres that represent future retail and commercial developmentopportunities, either in the form of expansion of existing properties or development of new retail properties.We believe our extensive development pipeline creates substantial opportunities to increase cash flow and createlong-term shareholder value.
Property Acquisitions and our Investment and Market Selection Process. We seek to develop and acquireprimarily neighborhood and community shopping centers in neighborhood trade areas with attractivedemographics. When specific markets are selected, we seek a convenient and easily accessible location,preferably occupying a dominant corner that has abundant parking facilities, is close to residential communities,and has excellent visibility for our tenants and easy access for neighborhood shoppers. Our selection processemphasizes the following factors:
Market and Trade Area: In order to take advantage of our current resources and create economies of scale,our development and acquisition activities are focused primarily in or near the markets in which we currentlyoperate or in which we have had previous experience. By having a presence in a market and developingrelationships in that market, we have a greater awareness of market trends and opportunities.
We evaluate each market based on appropriate criteria and prospective use, including:
• historical and projected population growth;
• average household income and density of population within a one-, three- or five-mile radius ofthe center depending on the characteristics of the property;
• transportation patterns and infrastructure;
• barriers to the development of competing centers; and
• diverse employment base.
We also consider opportunities to expand into other geographic markets if we believe that thosemarkets have favorable long-term growth prospects.
Property Characteristics: We focus on neighborhood and community shopping centers anchored bymarket-leading retailers or smaller operators with dominant niche positions. In addition, we focus on thepresence of one or more additional anchors for these centers, including off-price retailers, office superstores,grocers and fabric and clothing retailers, all of whom we believe increase traffic at the centers and aregenerally beneficial to the value of the center. We also seek properties with a diverse tenant mix that includesservice retailers, such as banks, florists, video stores, restaurants, and apparel and specialty shops. We targetdominant shopping centers that generate a steady, repetitive flow of traffic by providing staple goods tothe community and offering a high level of convenience with ease of access and abundant parking.
6

We plan to focus our new investments in the shopping center sector, but also may selectively pursuecommercial development opportunities in markets where we currently operate and where we believe we canleverage our existing infrastructure and relationships to generate attractive risk adjusted returns. In evaluatingfuture investments in properties other than neighborhood and community shopping centers, we seek propertiesor transactions that have unique characteristics that present a compelling case for investment. Examples mightinclude properties having high entry yields, properties that are outside of our target markets but are being soldas part of a portfolio package, properties that are debt-free, a transaction in which we might issue units inour Operating Partnership or properties that provide substantial growth potential through redevelopment.
Retailer Relationships: We seek to partner with key tenants and retailers, such as Lowe’s, Walgreen’s,Old Navy, Bed Bath & Beyond, Staples, Publix, Kohl’s, Target and Wal-Mart, to identify attractiveinvestments in new and existing markets. We seek to maintain strong tenant and retailer relationships inorder to avoid rent interruptions and reduce marketing, leasing and tenant improvement costs that resultfrom re-tenanting space.
We believe that we will continue to source a significant volume of growth opportunities through theextensive network of tenant, corporate and institutional relationships that we have established through ourPredecessor over the last four decades. Additionally, we believe our status as a publicly traded umbrellapartnership REIT will enhance our ability to acquire properties from tax-motivated sellers through the useof Operating Partnership units as consideration, thereby providing sellers with liquidity and diversificationwhile providing the opportunity for substantial deferral of income taxes that otherwise would be due asa result of a cash sale
Property Management and Leasing Strategy. We believe that focused property management, leasing andtenant retention are essential to maximizing the cash flow and value of our properties. Our property managementand leasing functions are supervised and administered by personnel at our principal executive office.
Our primary goal in property management is to maintain an attractive shopping environment on a costeffective basis for our tenants. Our property managers maintain regular contact with our tenants and frequentlyvisit each asset to supervise the local personnel and to ensure the proper implementation and execution of ourpolicies and directives. As part of our ongoing property management, we conduct regular physical propertyreviews to improve our properties, react to changing market conditions and ensure proper maintenance. Inaddition, we have a competitive bid process for the majority of our service contracts. In the future, we mayestablish regional offices in certain markets such as Texas and Florida where we plan to expand our currentoperations through additional acquisitions and development.
Our relationships with several national retailers that currently occupy space at our properties are thecornerstone of our overall leasing strategy. These nationally recognized anchors enhance the stability andattractiveness of our properties by driving customer traffic, thereby enhancing the performance of our non-anchortenants and small shops. Due to the importance of these anchors to our business, our leasing and developmentteams work closely with each of these retailers on site selection and expansion opportunities within our currentand future portfolio. This focused coverage allows us to anticipate space needs, fill vacant space in our existingportfolio and identify opportunities to enter into new markets.
Our leasing representatives have become experts in the markets in which we operate by becoming familiar withcurrent tenants as well as potential local, regional and national tenants who would complement our current tenantbase. We study demographics, tenant sales and merchandizing mix to optimize the sales performance of our centersand thereby increase rents. We believe this hands-on approach maximizes the value of our shopping centers.
Disposition Strategy. We review each of our assets on a regular basis to determine the appropriate capitalstrategy for the asset. This review involves weighing the asset’s future potential growth against its current marketvalue. Subject to REIT qualification rules, avoidance of the 100% “prohibited transactions tax” applicable to REITsand tax protection obligations that we undertook in connection with our formation transactions, we will considerdisposing of properties if our management determines that a sale of a property would be in our best interests based
7
on the price being offered for the property, the operating performance of the property, the tax consequences of thesale and other factors and circumstances surrounding the proposed sale. Property dispositions that would give riseto an indemnification obligation under the tax protection obligations we undertook in connection with our formationtransactions are subject to approval by a majority of our independent trustees.
Construction and Advisory Services Operations. We provide general construction, constructionmanagement, design/build and complete site development services and have experience in corporate,institutional, hotel, medical and retail construction. KMI Realty Advisors, one of our subsidiaries, is a registeredreal estate advisor, providing strategic property services to both the public and private sector. KMI provides afull range of real estate consulting services, including portfolio management, due diligence, acquisition,development, financial, program management, facility management and disposition services. KMI utilizesresources from our development and construction operations to customize a real estate strategy to achieve specificclient goals. In addition to being a continuing source of advisory income, we believe that KMI will help facilitatefuture access to capital and avenues for growth.
Financing StrategyWe consider a number of factors when evaluating our level of indebtedness and when making decisions
regarding the additional borrowings, including the purchase price of properties to be developed or acquired withdebt financing, the estimated market value of our properties upon refinancing and the ability of particularproperties, as well as our Company as a whole, to generate cash flow to cover expected debt service.
Generally speaking, although we may incur any of the forms of indebtedness described below, we intendto focus primarily on financing future growth through the incurrence of secured debt on an individual propertyor a portfolio of properties. We may incur debt in the form of purchase money obligations to the sellers ofproperties, or in the form of publicly or privately placed debt instruments, financing from other banks,institutional investors, or other lenders, any of which may be unsecured or may be secured by mortgages or otherinterests in our properties. This indebtedness may be recourse, non-recourse or cross-collateralized and, ifrecourse, that recourse may include our general assets and, if non-recourse, may be limited to the particularproperty to which the indebtedness relates. In addition, we may invest in properties subject to existing loanssecured by mortgages or similar liens on the properties, or may refinance properties acquired on a leveragedbasis. We may use the proceeds from any borrowings for working capital, to purchase additional interests inpartnerships or joint ventures in which we participate, to refinance existing indebtedness or to financeacquisitions, expansion, redevelopment of existing properties or development of new properties. We also mayincur indebtedness for other purposes when, in the opinion of our board or management, it is advisable to doso. In addition, we may need to borrow to make distributions (including distributions that may be required underthe Internal Revenue Code) if we do not have sufficient cash available to make those distributions.
Business SegmentsThe principal business of the Company and its consolidated subsidiaries is the development, construction,
acquisition, ownership and operation of high quality neighborhood and community shopping centers in selectedgrowth markets in the United States. We have aligned our operations into two business segments: (i) real estateoperation and development and (ii) construction and advisory services. See Note 12 — Segment Informationin our Notes to Consolidated and Combined Financial Statements contained in this Form 10-K for informationon our two business segments and the reconciliation of total segment revenues to total revenues, total segmentoperating income to operating income, total segment net income (loss) to net income (loss) and total segmentassets to total assets for the years ended December 31, 2005, 2004 and 2003.
CompetitionWe encounter competition for development and acquisitions of existing income-producing properties. We
believe that competition for the development, acquisition and operation of neighborhood and community shoppingcenters is highly fragmented. We face competition from institutional investors, other REITs and owner-operators
8
engaged in the development, acquisition, ownership and leasing of shopping centers as well as from numerouslocal, regional and national real estate developers and owners in each of our markets. We also face competitionin leasing available space at our properties to prospective tenants. The actual competition for tenants variesdepending upon the characteristics of each local market in which we own and manage property. We believe thatthe principal competitive factors in attracting tenants in our market areas are location, price, the presence of anchortenants and maintenance of properties.
Government RegulationAmericans with Disabilities Act. Our properties must comply with Title III of the Americans with
Disabilities Act, or ADA, to the extent that such properties are public accommodations as defined by the ADA.The ADA may require removal of structural barriers to access by persons with disabilities in certain public areasof our properties where such removal is readily achievable. We believe that our properties are in substantialcompliance with the ADA and that we will not be required to make substantial capital expenditures to addressthe requirements of the ADA. However, noncompliance with the ADA could result in imposition of fines or anaward of damages to private litigants. The obligation to make readily achievable accommodations is an ongoingone, and we will continue to assess our properties and to make alterations as appropriate in this respect.
Environmental Regulations. Some of the properties in our portfolio contain, may have contained or areadjacent to or near other properties that have contained or currently contain underground storage tanks for thestorage of petroleum products or other hazardous or toxic substances. These operations may have released, orhave the potential to release, such substances into the environment. In addition, some of our properties havetenants which may use hazardous or toxic substances in the routine course of their businesses. As a general rule,these tenants have covenanted to use these substances, if any, in compliance with all environmental laws andhave agreed to indemnify us for any damages that we may suffer as a result of their use of such substances.However, these lease provisions may not fully protect us in the event that a tenant becomes insolvent. Finally,one of our properties has contained asbestos-containing building materials, or ACBM and another property mayhave contained such materials based on the date of its construction. Environmental laws require that ACBM beproperly managed and maintained, and may impose fines and penalties on building owners or operators for failureto comply with these requirements. The laws also may allow third parties to seek recovery from owners oroperators for personal injury associated with exposure to asbestos fibers. We are not aware of any environmentalissues that may materially affect the operation of any of our properties.
InsuranceWe carry comprehensive liability, fire, extended coverage and rental loss insurance covering all of the
properties in our portfolio. We believe the policy specifications and insured limits are appropriate and adequategiven the relative risk of loss, the cost of the coverage and industry practice. We do not carry insurance forgenerally uninsurable losses such as loss from riots, war or acts of God, and, in some cases, flooding. Someof our policies, such as those covering losses due to terrorism and floods, are insured subject to limitationsinvolving large deductibles or co-payments and policy limits that may not be sufficient to cover losses.
OfficesOur principal executive office is located at 30 S. Meridian Street, Suite 1100, Indianapolis, IN 46204. Our
telephone number is (317) 577-5600.
EmployeesWe have approximately 95 employees. Of these employees, approximately 72 are “home office” executive
and administrative personnel and approximately 23 are on-site management and administrative personnel.
9

Available InformationOur Internet website address is www.kiterealty.com. You can obtain on our website, free of charge, a copy
of our Annual Report on Form 10-K, our quarterly reports on Form 10-Q, our current reports on Form 8-K, andany amendments to those reports, as soon as reasonably practicable after we electronically file such reports oramendments with, or furnish them to, the SEC. Our Internet website and the information contained therein orconnected thereto are not intended to be incorporated into this Annual Report on Form 10-K.
Also available on our website, free of charge, are copies of our Code of Business Conduct and Ethics, ourCode of Ethics for Principal Executive Officer and Senior Financial Officers, our Corporate GovernanceGuidelines, and the charters for each of the committees of our Board of Trustees — the Audit Committee, theCorporate Governance and Nominating Committee, and the Compensation Committee. Copies of our Code ofBusiness Conduct and Ethics, our Code of Ethics for Principal Executive Officer and Senior Financial Officers,our Corporate Governance Guidelines, and our committee charters are also available free of charge, upon request,in print to any shareholder. You can also obtain such copies in print by contacting our Investor Relationsdepartment by mail at our principal executive office.
ITEM 1.A. RISK FACTORSThe following factors, among others, could cause actual results to differ materially from those contained
in forward-looking statements made in this Annual Report on Form 10-K and presented elsewhere by ourmanagement from time to time. These factors, among others, may have a material adverse effect on our business,financial condition, operating results and cash flows, and you should carefully consider them. It is not possibleto predict or identify all such factors. You should not consider this list to be a complete statement of all potentialrisks or uncertainties. Past performance should not be considered an indication of future performance.
We have separated the risks into three groups:
• risks related to our operations;
• risks related to our organization and structure; and
• tax risks.
RISKS RELATED TO OUR OPERATIONS
We expect to continue to experience rapid growth and may not be able to adapt our management andoperational systems to respond to the integration of additional properties without significant disruptionor expense.
We are currently in a period of rapid growth. Our portfolio includes 26 operating properties that we haveacquired since 1999, including 13 since our IPO, which contain approximately 3.8 million square feet of ownedgross leasable area. Since our IPO, we have delivered nine properties from our development pipeline into ouroperating portfolio, and we are currently developing 14 additional retail properties projected to totalapproximately 1.8 million square feet of gross leasable area (including non-owned anchor space). We also expectto continue to pursue additional acquisition and development opportunities.
As a result of the rapid growth of our portfolio, we cannot assure you that we will be able to adapt ourmanagement, administrative, accounting and operational systems or hire and retain sufficient operational staffto integrate these properties into our portfolio and manage any future acquisitions of additional properties withoutoperating disruptions or unanticipated costs. As we develop or acquire additional properties, we will be subjectto risks associated with managing new properties, including tenant retention and mortgage default. In addition,acquisitions or developments may cause disruptions in our operations and divert management’s attention awayfrom day-to-day operations, which could impair our relationships with our current tenants, retailers andemployees. In addition, our profitability may suffer because of acquisition-related costs or amortization costsfor acquired goodwill and other intangible assets. Our failure to successfully integrate any future properties into
10

our portfolio could have a material adverse effect on our results of operations and financial condition and ourability to make distributions to our shareholders.
Our future developments, acquisitions and investment opportunities may not yield the returns we expector may result in shareholder dilution.
We expect to develop and/or acquire a number of real estate properties in the near future. Shareholdersultimately may not like the location, lease terms or other relevant economic and financial data of any realproperties, other assets or other companies we may develop or acquire in the future. New developments aresubject to a number of risks, including, but not limited to:
• abandonment of development activities after expending resources to determine feasibility;
• construction delays or cost overruns that may increase project costs;
• our investigation of a property or building prior to our acquisition, and any representations we mayreceive from the seller, may fail to reveal various liabilities or defects or identify necessary repairsuntil after the property is acquired, which could reduce the cash flow from the property or increaseour acquisition costs;
• financing risks;
• the failure to meet anticipated occupancy or rent levels; and
• failure to receive required zoning, occupancy, land use and other governmental permits andauthorizations and changes in applicable zoning and land use laws.
In addition, if a project is delayed, certain tenants may have the right to terminate their leases. If any ofthese problems occur, development costs for a project will increase, which will result in reduced returns, or evenlosses, from such investments. In deciding whether to acquire or develop a particular property, we make certainassumptions regarding the expected future performance of that property. If these new properties do not performas expected, our financial performance will be adversely affected. In addition, the issuance of equity securitiesfor any acquisitions could be substantially dilutive to our shareholders.
Our results of operations will be significantly influenced by the economies of the markets in which weoperate, and the market for retail space generally.
We are susceptible to adverse developments in the markets in which we operate, such as business layoffsor downsizing, industry slowdowns, relocations of businesses, changing demographics, increased Internetshopping, infrastructure quality, state budgetary constraints and priorities, increases in real estate and other taxes,costs of complying with government regulations or increased regulation and other factors. In addition, as ofDecember 31, 2005, 34% of our retail operating and development owned gross leasable area and 100% of ourcommercial operating square footage were located in the state of Indiana, which exposes us to greater economicrisks than if we owned properties in numerous geographic regions. Any adverse economic or real estatedevelopments in Indiana and the surrounding region or any of the markets in which we operate, or any decreasein demand for retail space resulting from the local regulatory environment, business climate or fiscal problems,could adversely affect our financial condition, results of operations, cash flow, the trading price of our commonshares and our ability to satisfy our debt service obligations and to pay distributions to our shareholders.
Moreover, because our portfolio of properties consists primarily of community and neighborhood shoppingcenters, a decrease in the demand for retail space may have a greater adverse effect on our business and financialcondition than if we owned a more diversified real estate portfolio. The market for retail space has been andcould be adversely affected by weakness in the national, regional and local economies, the adverse financialcondition of some large retailing companies, the ongoing consolidation in the retail sector, the excess amountof retail space in a number of markets, and increasing consumer purchases through catalogues or the Internet.To the extent that any of these conditions occur, they are likely to affect market rents for retail space and couldharm our business.
11

We had approximately $375.2 million of consolidated indebtedness outstanding as of December 31, 2005,which may impede our operating performance and reduce our ability to incur additional indebtednessto fund our growth.
Required repayments of debt and related interest can adversely affect our operating performance. We hadapproximately $375.2 million of consolidated outstanding indebtedness as of December 31, 2005.Approximately $103.8 million of this debt (as reduced by $65 million of interest rate swaps) currently bearsinterest at a variable rate. Interest rates are currently low relative to historical levels and may increase significantlyin the future. Failure to hedge effectively against interest rate changes may adversely affect results of operations.If our interest expense increased significantly, it would adversely affect our results of operations.
We also intend to incur additional debt in connection with future developments and acquisitions ofproperties. Our organizational documents do not limit the amount of indebtedness that we may incur. We mayborrow new funds to develop or acquire properties. In addition, we may incur or increase our mortgage debtby obtaining loans secured by some or all of the real estate properties we develop or acquire. We also may borrowfunds if necessary to satisfy the requirement that we distribute to shareholders at least 90% of our annual REITtaxable income or otherwise as is necessary or advisable to ensure that we maintain our qualification as a REITfor federal income tax purposes or otherwise avoid paying taxes that can be eliminated through distributionsto our shareholders.
Our substantial debt may harm our business and operating results by:
• requiring us to use a substantial portion of our funds from operations to pay interest, which reducesthe amount available for distributions;
• placing us at a competitive disadvantage compared to our competitors that have less debt;
• making us more vulnerable to economic and industry downturns and reducing our flexibility inresponding to changing business and economic conditions; and
• limiting our ability to borrow more money for operating or capital needs or to finance acquisitionsin the future.
In addition to the risks discussed above and those normally associated with debt financing, including therisk that our cash flow will be insufficient to meet required payments of principal and interest, we also are subjectto the risk that we will not be able to refinance the existing indebtedness on our properties (which, in most cases,will not have been fully amortized at maturity) or obtain permanent financing on development projects wefinanced with construction loans or mezzanine debt, and that the terms of any refinancing we could obtain wouldnot be as favorable as the terms of our existing indebtedness. If we are not successful in refinancing this debtwhen it becomes due, we may be forced to dispose of properties on disadvantageous terms, which mightadversely affect our ability to service other debt and to meet our other obligations.
Mortgage debt obligations expose us to the possibility of foreclosure, which could result in the loss of ourinvestment in a property or group of properties subject to mortgage debt.
As of December 31, 2005, all of our indebtedness was secured by our real estate assets. If a property orgroup of properties is mortgaged to secure payment of debt and we are unable to meet mortgage payments, theholder of the mortgage or lender could foreclose on the property, resulting in loss of our investment. Also, certainof these mortgages contain customary negative covenants which, among other things, limit our ability, withoutthe prior consent of the lender, to further mortgage the property, to enter into new leases or materially modifyexisting leases, and to discontinue insurance coverage.
Our financial covenants may restrict our operating and acquisition activities.Our revolving credit facility contains certain financial and operating covenants, including, among other
things, certain coverage ratios, as well as limitations on our ability to incur debt, make dividend payments, sellall or substantially all of our assets and engage in mergers and consolidations and certain acquisitions. These
12
covenants may restrict our ability to pursue certain business initiatives or certain acquisition transactions. Inaddition, failure to meet any of the financial covenants could cause an event of default under and/or acceleratesome or all of our indebtedness, which could have a material adverse effect on us.
Failure by any major tenant with leases in multiple locations to make rental payments to us, because ofa deterioration of its financial condition or otherwise, could seriously harm our performance.
We derive the majority of our revenue from tenants who lease space from us at our properties. Therefore,our ability to generate cash from operations is dependent on the rents that we are able to charge and collect fromour tenants. Our leases generally do not contain provisions designed to ensure the creditworthiness of our tenants.At any time, our tenants may experience a downturn in their business that may significantly weaken their financialcondition. As a result, our tenants may delay lease commencements, decline to extend or renew leases uponexpiration, fail to make rental payments when due, close a number of stores or declare bankruptcy. Any of theseactions could result in the termination of the tenant’s leases and the loss of rental income attributable to theterminated leases. In addition, lease terminations by a major tenant or non-owned anchor or a failure by thatmajor tenant or non-owned anchor to occupy the premises could result in lease terminations or reductions inrent by other tenants in the same shopping centers under the terms of some leases. In that event, we may beunable to re-lease the vacated space at attractive rents or at all. The occurrence of any of the situations describedabove, particularly if it involves a substantial tenant or a non-owned anchor with leases in multiple locations,could seriously harm our performance. As of December 31, 2005, the four largest tenants in our operatingportfolio in terms of annualized base rent were Circuit City, the State of Indiana, Eli Lilly and MarshSupermarkets, with scheduled annualized base rents for each representing 3.3%, 2.8%, 2.8% and 2.8%,respectively, of our total annualized base rent. In November 2005, Marsh Supermarkets announced in a pressrelease that it had retained a financial advisor to explore strategic alternatives for the enhancement of shareholdervalue, including a possible sale of the company.
We may be unable to collect balances due from any tenants in bankruptcy.We cannot assure you that any tenant that files for bankruptcy protection will continue to pay us rent. A
bankruptcy filing by or relating to one of our tenants or a lease guarantor would bar all efforts by us to collectpre-bankruptcy debts from that tenant or the lease guarantor, or their property, unless we receive an orderpermitting us to do so from the bankruptcy court. A tenant or lease guarantor bankruptcy could delay our effortsto collect past due balances under the relevant leases, and could ultimately preclude collection of these sums.If a lease is assumed by the tenant in bankruptcy, all pre-bankruptcy balances due under the lease must be paidto us in full. However, if a lease is rejected by a tenant in bankruptcy, we would have only a general unsecuredclaim for damages. Any unsecured claim we hold may be paid only to the extent that funds are available andonly in the same percentage as is paid to all other holders of unsecured claims, and there are restrictionsunder bankruptcy laws that limit the amount of the claim we can make if a lease is rejected. As a result, it islikely that we will recover substantially less than the full value of any unsecured claims we hold from a tenantin bankruptcy.
One of our current tenants, Winn-Dixie, filed for bankruptcy protection in February 2005. This tenant operatesin two locations in our portfolio (Shops at Eagle Creek and Waterford Lakes) totaling approximately 103,400 squarefeet at an average base rent of $7.80 per square foot, representing approximately 1.4% of our total annualized baserent as of December 31, 2005. The tenant continues to operate in both locations and has paid rent through March,2006 but there can be no assurance of its ability to pay rent prospectively. On February 28, 2006, Winn-Dixieannounced plans to close its store at Shops at Eagle Creek but had not at that date rejected the lease at this property.The store at Shops at Eagle Creek contains approximately 51,700 square feet leased to Winn-Dixie at a base rentof $7.69 per square foot. In its announcement, Winn-Dixie included its store at Waterford Lakes on its list of storesthat it intended to retain as of that date. The delay or failure of Winn-Dixie to make payments under its leases,or the rejection by it of its leases under federal bankruptcy law, would adversely impact our performance, whichimpact could be material. In addition, Winn-Dixie’s termination of leases or closure of stores could result inreductions in rent by other tenants in the same shopping centers.
13
We may experience reduced revenue with respect to our Glendale Mall property while we evaluatestrategic alternatives with respect to this property.
We are currently evaluating several strategic alternatives with respect to our Glendale Mall property inIndianapolis, Indiana, including the possibility of redeveloping or selling the property. At 724,000 square feetof gross leasable area (including approximately 145,000 square feet of non-owned anchor space), Glendale Mallis our largest property on a square footage basis with an annualized base rent of approximately $2.5 million asof December 31, 2005, representing approximately 4.2% of our total annualized base rent. As of December 31,2005, Glendale Mall was approximately 81% leased. We are currently evaluating several strategic alternativeswith respect to this property, including continuing to lease space in its current configuration and the possibilityof redeveloping or selling the property.
If we decide to redevelop the property, we may have to obtain the consent of various tenants in order todo so and various tenants may have the right to withdraw from Glendale Mall if the redevelopment project isnot completed on time. In addition, we will bear the risks of construction delays or cost overruns that may increaseproject costs and make a project uneconomical and the risk that occupancy or rental rates at a completed projectwill not be sufficient to enable us to pay operating expenses or earn the targeted rate of return on investment.The revenue generated from this property could potentially be lower during any redevelopment since we wouldnot be receiving rent with respect to the space being redeveloped.
Our current and future joint venture investments could be adversely affected by our lack of sole decision-making authority, our reliance on joint venture partners’ financial condition, any disputes that may arisebetween us and our joint venture partners and our exposure to potential losses from the actions of ourjoint venture partners.
As of December 31, 2005, we owned five of our operating properties through joint ventures, two of whichwere accounted for using the equity method as we do not exercise requisite control for consolidation treatment.For the twelve months ended December 31, 2005, the five properties represented approximately 10% of ourannualized base rent. In addition, five of the properties in our development pipeline are currently owned throughjoint ventures. These joint ventures involve risks not present with respect to our wholly owned properties,including the following:
• we may share decision-making authority with our joint venture partners regarding major decisionsaffecting the ownership or operation of the joint venture and the joint venture property, such as thesale of the property or the making of additional capital contributions for the benefit of the property,which may prevent us from taking actions that are opposed by our joint venture partners;
• prior consent of our joint venture partners may be required for a sale or transfer to a third party ofour interests in the joint venture, which restricts our ability to dispose of our interest in the joint venture;
• our joint venture partners might become bankrupt or fail to fund their share of required capitalcontributions, which may delay construction or development of a property or increase our financialcommitment to the joint venture;
• our joint venture partners may have business interests or goals with respect to the property that conflictwith our business interests and goals, which could increase the likelihood of disputes regarding theownership, management or disposition of the property;
• disputes may develop with our joint venture partners over decisions affecting the property or the jointventure, which may result in litigation or arbitration that would increase our expenses and distract ourofficers and/or trustees from focusing their time and effort on our business, and possibly disrupt theday-to-day operations of the property such as by delaying the implementation of important decisionsuntil the conflict or dispute is resolved; and
• we may suffer losses as a result of the actions of our joint venture partners with respect to our jointventure investments and the activities of a joint venture could adversely affect our ability to qualifyas a REIT, even though we may not control the joint venture.
14
In the future, we intend to co-invest with third parties through joint ventures that may involve similar oradditional risks.
Adverse market conditions may impede our ability to renew leases or re-let space as leases expire andrequire us to undertake unbudgeted capital improvements, which could harm our business.
The economic performance and value of our real estate assets is subject to all of the risks associated withowning and operating real estate, including risks related to adverse changes in national, regional and localeconomic and market conditions. Our operating and development properties currently are located in nine states,with approximately 41% of owned square footage and approximately 39% of total annualized base rent locatedin the State of Indiana. The economic condition of each of our markets may be dependent on one or moreindustries. An economic downturn in one of these industry sectors may result in an increase in tenantbankruptcies, which may harm our performance in the affected market. Economic and market conditions alsomay affect the ability of our tenants to make lease payments. If our properties do not generate sufficient incometo meet our operating expenses, our income and results of operations would be significantly harmed.
We face significant competition, which may impede our ability to renew leases or re-let space as leasesexpire, require us to undertake unbudgeted capital improvements, or impede our ability to make futuredevelopments or acquisitions or increase the cost of these developments or acquisitions.
We compete with numerous developers, owners and operators of retail shopping centers for tenants. Thesecompetitors include institutional investors, other REITs and other owner-operators of community andneighborhood shopping centers, some of which own or may in the future own properties similar to ours in thesame submarkets in which our properties are located, but which have greater capital resources. If our competitorsoffer space at rental rates below current market rates, or below the rental rates we currently charge our tenants,we may lose potential tenants and we may be pressured to reduce our rental rates below those we currently chargein order to retain tenants when our tenants’ leases expire. As a result, our financial condition, results of operations,cash flow, trading price of our common shares and ability to satisfy our debt service obligations and to paydistributions to our shareholders may be adversely affected. As of December 31, 2005, leases were scheduledto expire on a total of approximately 4.0% of the space at our properties in 2006. In addition, increasedcompetition for tenants may require us to make capital improvements to properties that we would not haveotherwise planned to make. Any unbudgeted capital improvements we undertake may reduce cash available fordistributions to shareholders.
We also face significant competition for development and acquisition opportunities. Many of our competitorshave greater financial resources than us and a greater ability to borrow funds to develop or acquire properties.Competition for investments may reduce the number of suitable investment opportunities available to us and mayhave the effect of increasing development or acquisition costs and/or reducing the rents we can charge and, as aresult, adversely affecting our operating results. The current market for acquisitions is extremely competitive.
We may not be successful in identifying suitable development projects or acquisitions that meet ourcriteria, which may impede our growth.
A central part of our business strategy is expansion through development projects and acquisitions, whichrequires us to identify suitable development or acquisition candidates or investment opportunities that meet ourcriteria and are compatible with our growth strategy. We may not be successful in identifying suitable real estateproperties or other assets that meet our development or acquisition criteria or in completing developments,acquisitions or investments on satisfactory terms. Failure to identify or complete developments or acquisitionscould slow our growth, which could in turn adversely affect our operations.
Redevelopment activities may be delayed or otherwise may not perform as expected.We expect to redevelop certain of our properties in the future. In connection with any redevelopment of
our properties, we will bear certain risks, including the risks of construction delays or cost overruns that mayincrease project costs and make a project uneconomical, the risk that occupancy or rental rates at a completed
15
project will not be sufficient to enable us to pay operating expenses or earn the targeted rate of return oninvestment, and the risk of incurrence of predevelopment costs in connection with projects that are not pursuedto completion. In addition, various tenants may have the right to withdraw from a property if a developmentand/or redevelopment project is not completed on time. In the case of a redevelopment project, consents maybe required from various tenants in order to redevelop a center. In case of an unsuccessful redevelopment project,our loss could exceed our investment in the project.
We may not be able to sell properties when appropriate.Real estate property investments generally cannot be sold quickly. In connection with our formation at the time
of our IPO, we entered into an agreement that restricts our ability, prior to December 31, 2016, to dispose of six ofour properties in taxable transactions and limits the amount of gain we can trigger with respect to certain otherproperties without incurring reimbursement obligations owed to certain limited partners of our Operating Partnership.We have agreed that if we dispose of any interest in six specified properties in a taxable transaction beforeDecember 31, 2016, then we will indemnify the contributors of those properties for their tax liabilities attributableto the built-in gain that exists with respect to such property interest as of the time of our IPO (and tax liabilities incurredas a result of the reimbursement payment). The six properties to which our tax indemnity obligations relate representedapproximately 24% of our annualized base rent in the aggregate as of December 31, 2005. These six properties areInternational Speedway Square, Shops at Eagle Creek, Whitehall Pike, Ridge Plaza Shopping Center, Thirty Southand Market Street Village. We also agreed to limit the aggregate gain these certain limited partners of our OperatingPartnership would recognize with respect to certain other contributed properties through December 31, 2016 to notmore than $48 million in total, with certain annual limits, unless we reimburse them for the taxes attributable to theexcess gain (and any taxes imposed on the reimbursement payments), and to take certain other steps to help themavoid incurring taxes that are deferred in connection with the formation transactions.
The agreement described above is extremely complicated and imposes a number of procedural requirementson us, which make it more difficult for us to ensure that we comply with all of the various terms of the agreementand therefore creates a greater risk that we may be required to make an indemnity payment. The complicatednature of this agreement also might adversely impact our ability to pursue other transactions, including certainkinds of strategic transactions and reorganizations.
Also, the tax laws applicable to REITs require that we hold our properties for investment, rather thanprimarily for sale in the ordinary course of business, which may cause us to forego or defer sales of propertiesthat otherwise would be in our best interest. Therefore, we may be unable to vary our portfolio promptly inresponse to market conditions, which may adversely affect our financial position. In addition, we will be subjectto income taxes on gains from the sale of any properties owned by any taxable REIT subsidiary.
Our performance and value are subject to risks associated with real estate assets and with the realestate industry.
Our ability to make expected distributions to our shareholders depends on our ability to generate substantialrevenues from our properties. Events and conditions generally applicable to owners and operators of real propertythat are beyond our control may decrease cash available for distribution and the value of our properties. Theseevents include:
• adverse changes in the national, regional and local economic climate, particularly in Indiana, whereapproximately 41% of our owned square footage and 39% of our total annualized base rent is located;
• local oversupply, increased competition or reduction in demand for space;
• inability to collect rent from tenants;
• vacancies or our inability to rent space on favorable terms;
• decreased attractiveness of our properties to tenants;
16

• changes in market rental rates;
• inability to finance property development, tenant improvements and acquisitions on favorable terms;
• increased operating costs, including costs incurred for maintenance, insurance premiums, utilities andreal estate taxes;
• the need to periodically fund the costs to repair, renovate and re-let space;
• weather conditions that may increase or decrease energy costs and other weather-related expenses;
• costs of complying with changes in governmental regulations, including those governing usage,zoning, the environment and taxes;
• civil unrest, acts of terrorism, earthquakes and other national disasters or acts of God that may resultin underinsured or uninsured losses;
• the relative illiquidity of real estate investments;
• changing demographics; and
• changing traffic patterns.
In addition, periods of economic slowdown or recession, rising interest rates or declining demand for realestate, or the public perception that any of these events may occur, could result in a general decline in rents oran increased incidence of defaults under existing leases, which would adversely affect our financial condition,results of operations, cash flow, per share trading price of our common shares and ability to satisfy our debtservice obligations and to make distributions to our shareholders.
Potential losses may not be covered by insurance.We carry comprehensive liability, fire, extended coverage and rental loss insurance covering all of the
properties in our portfolio. We do not carry insurance for generally uninsurable losses such as loss from riots,war or acts of God, and, in some cases, flooding. Some of our policies, such as those covering losses due toterrorism and floods, are insured subject to limitations involving large deductibles or co-payments and policylimits that may not be sufficient to cover losses. If we experience a loss that is uninsured or that exceeds policylimits, we could lose the capital invested in the damaged properties as well as the anticipated future cash flowsfrom those properties. Inflation, changes in building codes and ordinances, environmental considerations, andother factors also might make it impractical or undesirable to use insurance proceeds to replace a property afterit has been damaged or destroyed. In addition, if the damaged properties are subject to recourse indebtedness,we would continue to be liable for the indebtedness, even if these properties were irreparably damaged.
Rising operating expenses could reduce our cash flow and funds available for future distributions.Our existing properties and any properties we develop or acquire in the future are and will be subject to
operating risks common to real estate in general, any or all of which may negatively affect us. The expensesof owning and operating properties are not necessarily reduced when circumstances such as market factors andcompetition cause a reduction in income from the properties. As a result, if any property is not fully occupiedor if rents are being paid in an amount that is insufficient to cover operating expenses, then we could be requiredto expend funds for that property’s operating expenses. The properties will be subject to increases in realestate and other tax rates, utility costs, operating expenses, insurance costs, repairs and maintenance andadministrative expenses.
We could incur significant costs related to government regulation and environmental matters.Under various federal, state and local laws, ordinances and regulations, an owner or operator of real estate
may be required to investigate and clean up hazardous or toxic substances or petroleum product releases at aproperty and may be held liable to a governmental entity or to third parties for property damage and for
17
investigation and clean up costs incurred by such parties in connection with contamination. The cost ofinvestigation, remediation or removal of such substances may be substantial, and the presence of such substances,or the failure to properly remediate such substances, may adversely affect the owner’s ability to sell or rent suchproperty or to borrow using such property as collateral. In connection with the ownership, operation andmanagement of real properties, we are potentially liable for removal or remediation costs, as well as certain otherrelated costs, including governmental fines and injuries to persons and property.
Some of the properties in our portfolio contain, may have contained or are adjacent to or near other propertiesthat have contained or currently contain underground storage tanks for the storage of petroleum products or otherhazardous or toxic substances. These operations may have released, or have the potential to release, suchsubstances into the environment. In addition, some of our properties have tenants which may use hazardous ortoxic substances in the routine course of their businesses. As a general rule, these tenants have covenanted touse these substances, if any, in compliance with all environmental laws and have agreed to indemnify us forany damages that we may suffer as a result of their use of such substances. However, these lease provisionsmay not fully protect us in the event that a tenant becomes insolvent. Finally, one of our properties has containedasbestos-containing building materials, or ACBM and another property may have contained such materials basedon the date of its construction. Environmental laws require that ACBM be properly managed and maintained,and may impose fines and penalties on building owners or operators for failure to comply with theserequirements. The laws also may allow third parties to seek recovery from owners or operators for personal injuryassociated with exposure to asbestos fibers.
Our properties must also comply with Title III of the Americans with Disabilities Act, or ADA, to the extentthat such properties are public accommodations as defined by the ADA. The ADA may require removal ofstructural barriers to access by persons with disabilities in certain public areas of our properties where suchremoval is readily achievable. Noncompliance with the ADA could result in imposition of fines or an awardof damages to private litigants.
Our share price could be volatile and could decline, resulting in a substantial or complete loss on ourshareholders’ investment.
The stock markets, including The New York Stock Exchange (NYSE), on which we list our common shares,have experienced significant price and volume fluctuations. As a result, the market price of our common sharescould be similarly volatile, and investors in our common shares may experience a decrease in the value of theirshares, including decreases unrelated to our operating performance or prospects. Among the market conditionsthat may affect the market price of our publicly traded securities are the following:
• our financial condition and operating performance and the performance of other similar companies;
• actual or anticipated differences in our quarterly operating results;
• changes in our revenues or earnings estimates or recommendations by securities analysts;
• publication of research reports about us or our industry by securities analysts;
• additions and departures of key personnel;
• strategic decisions by us or our competitors, such as acquisitions, divestments, spin-offs, joint ventures,strategic investments or changes in business strategy;
• the reputation of REITs generally and the reputation of REITs with portfolios similar to ours;
• the attractiveness of the securities of REITs in comparison to securities issued by other entities(including securities issued by other real estate companies);
• an increase in market interest rates, which may lead prospective investors to demand a higherdistribution rate in relation to the price paid for our shares;
18
• the passage of legislation or other regulatory developments that adversely affect us or our industry;
• speculation in the press or investment community;
• actions by institutional shareholders or hedge funds;
• changes in accounting principles;
• terrorist acts; and
• general market conditions, including factors unrelated to our performance.
In the past, securities class action litigation has often been instituted against companies following periodsof volatility in their stock price. This type of litigation could result in substantial costs and divert ourmanagement’s attention and resources.
A substantial number of common shares eligible for future sale could cause our common share price todecline significantly.
If our shareholders sell, or the market perceives that our shareholders intend to sell, substantial amountsof our common shares in the public market, the market price of our common shares could decline significantly.These sales also might make it more difficult for us to sell equity or equity-related securities in the future ata time and price that we deem appropriate. As of December 31, 2005, we had outstanding 28,555,187 commonshares. Of these shares, approximately 27,700,000 are freely tradable, except for any shares held by our“affiliates,” as that term is defined by Rule 144 under the Securities Act. In addition, beginning August 16, 2005,approximately 8.3 million units of our Operating Partnership, which are owned by certain of our executiveofficers and other individuals, became redeemable by the holder for cash or, at our election, common shares.Pursuant to registration rights of certain of our executive officers and other individuals, we filed a registrationstatement with the SEC in August 2005 to register 9,115,149 common shares issued in, or issuable uponredemption of units in our Operating Partnership issued in, our formation transactions. As restrictions on resaleend and units are redeemed for common shares, the market price of our common shares could drop significantlyif the holders of such shares sell them or are perceived by the market as intending to sell them.
RISKS RELATED TO OUR ORGANIZATION AND STRUCTURE
Our organizational documents contain provisions that generally would prohibit any person (other thanmembers of the Kite family who, as a group, are currently allowed to own up to 21.5% of our outstandingcommon shares) from beneficially owning more than 7% of our outstanding common shares (or up to 9.8%in the case of certain designated investment entities, as defined in our declaration of trust), which maydiscourage third parties from conducting a tender offer or seeking other change of control transactionsthat could involve a premium price for our shares or otherwise benefit our shareholders.
Our organizational documents contain provisions that may have an anti-takeover effect and inhibit a changein our management.
(1) There are ownership limits and restrictions on transferability in our declaration of trust. In order forus to qualify as a REIT, no more than 50% of the value of our outstanding shares may be owned, actually orconstructively, by five or fewer individuals at any time during the last half of each taxable year. To make surethat we will not fail to satisfy this requirement and for anti-takeover reasons, our declaration of trust generallyprohibits any shareholder (other than an excepted holder or certain designated investment entities, as definedin our declaration of trust) from owning (actually, constructively or by attribution), more than 7% of the valueor number of our outstanding common shares. Our declaration of trust provides an excepted holder limit thatallows members of the Kite family (Al Kite, John Kite and Paul Kite, their family members and certain entitiescontrolled by one or more of the Kites), as a group, to own more than 7% of our outstanding common shares,so long as, under the applicable tax attribution rules, no one excepted holder treated as an individual would holdmore than 21.5% of our common shares, no two excepted holders treated as individuals would own more than
19
28.5% of our common shares, no three excepted holders treated as individuals would own more than 35.5% ofour common shares, no four excepted holders treated as individuals would own more than 42.5% of our commonshares, and no five excepted holders treated as individuals would own more than 49.5% of our common shares.Currently, one of the excepted holders would be attributed all of the common shares owned by each otherexcepted holder and, accordingly, the excepted holders as a group would not be allowed to own in excess of21.5% of our common shares. If at a later time, there were not one excepted holder that would be attributedall of the shares owned by the excepted holders as a group, the excepted holder limit would not permit eachexcepted holder to own 21.5% of our common shares. Rather, the excepted holder limit would prevent two ormore excepted holders who are treated as individuals under the applicable tax attribution rules from owning ahigher percentage of our common shares than the maximum amount of common shares that could be ownedby any one excepted holder (21.5%), plus the maximum amount of common shares that could be owned by anyone or more other individual common shareholders who are not excepted holders (7%). Certain entities that aredefined as designated investment entities in our declaration of trust, which generally includes pension funds,mutual funds, and certain investment management companies, are permitted to own up to 9.8% of our outstandingcommon shares, so long as each beneficial owner of the shares owned by such designated investment entity wouldsatisfy the 7% ownership limit if those beneficial owners owned directly their proportionate share of the commonshares owned by the designated investment entity. Our board of trustees may waive the 7% ownership limit orthe 9.8% designated investment entity limit for a shareholder that is not an individual if such shareholder providesinformation and makes representations to the board that are satisfactory to the board, in its reasonable discretion,to establish that such person’s ownership in excess of the 7% limit or the 9.8% limit, as applicable, would notjeopardize our qualification as a REIT. In addition, our declaration of trust contains certain other ownershiprestrictions intended to prevent us from earning income from related parties if such income would cause us tofail to comply with the REIT gross income requirements. The various ownership restrictions may:
• discourage a tender offer or other transactions or a change in management or control that might involvea premium price for our shares or otherwise be in the best interests of our shareholders; or
• compel a shareholder who has acquired our shares in excess of these ownership limitations to disposeof the additional shares and, as a result, to forfeit the benefits of owning the additional shares. Anyacquisition of our common shares in violation of these ownership restrictions will be void ab initioand will result in automatic transfers of our common shares to a charitable trust, which will beresponsible for selling the common shares to permitted transferees and distributing at least a portionof the proceeds to the prohibited transferees.
(2) Our declaration of trust permits our board of trustees to issue preferred shares with terms that maydiscourage a third party from acquiring us. Our declaration of trust permits our board of trustees to issue upto 40,000,000 preferred shares, having those preferences, conversion or other rights, voting powers, restrictions,limitations as to distributions, qualifications, or terms or conditions of redemption as determined by our board.Thus, our board could authorize the issuance of preferred shares with terms and conditions that could have theeffect of discouraging a takeover or other transaction in which holders of some or a majority of our shares mightreceive a premium for their shares over the then-prevailing market price of our shares. In addition, any preferredshares that we issue likely would rank senior to our common shares with respect to payment of distributions,in which case we could not pay any distributions on our common shares until full distributions were paid withrespect to such preferred shares.
(3) Our declaration of trust and bylaws contain other possible anti-takeover provisions. Our declarationof trust and bylaws contain other provisions that may have the effect of delaying, deferring or preventing a changein control of our company or the removal of existing management and, as a result, could prevent our shareholdersfrom being paid a premium for their common shares over the then-prevailing market prices. These provisionsinclude advance notice requirements for shareholder proposals and our board of trustees’ power to reclassifyshares and issue additional common shares or preferred shares and the absence of cumulative voting rights.
20

Certain provisions of Maryland law could inhibit changes in control.Certain provisions of Maryland law may have the effect of inhibiting a third party from making a proposal
to acquire us or of impeding a change of control under circumstances that otherwise could provide the holdersof our common shares with the opportunity to realize a premium over the then-prevailing market price of suchshares, including:
• “business combination moratorium/fair price” provisions that, subject to limitations, prohibit certainbusiness combinations between us and an “interested shareholder” (defined generally as any personwho beneficially owns 10% or more of the voting power of our shares or an affiliate thereof) for fiveyears after the most recent date on which the shareholder becomes an interested shareholder, andthereafter imposes stringent fair price and super-majority shareholder voting requirements on thesecombinations; and
• “control share” provisions that provide that “control shares” of our company (defined as shares which,when aggregated with other shares controlled by the shareholder, entitle the shareholder to exerciseone of three increasing ranges of voting power in electing trustees) acquired in a “control shareacquisition” (defined as the direct or indirect acquisition of ownership or control of “control shares”from a party other than the issuer) have no voting rights except to the extent approved by ourshareholders by the affirmative vote of at least two thirds of all the votes entitled to be cast on thematter, excluding all interested shares, and are subject to redemption in certain circumstances.
We have opted out of these provisions of Maryland law. However, our board of trustees may opt to makethese provisions applicable to us at any time.
Our management has limited experience operating a REIT or a public company.We have limited operating history as a REIT or a public company. Our board of trustees and executive
officers have overall responsibility for our management and, while certain of our officers and trustees haveextensive experience in real estate marketing, development, management, finance and law, our executive officershave limited experience in operating a business in accordance with the Internal Revenue Code requirements formaintaining qualification as a REIT or in operating a public company. We cannot assure you that our pastexperience will be sufficient to successfully operate our company as a REIT or a public company. If we failto qualify as a REIT, and are not able to avail ourselves of certain savings provisions set forth in the InternalRevenue Code, the value of our common shares and our ability to raise additional capital will be adverselyaffected because we will be required to pay corporate tax at applicable rates on our taxable income, ourdistributions to shareholders will not be deductible in computing our taxable income for federal income taxpurposes and we will no longer be required to make distributions to shareholders.
Certain officers and trustees may have interests that conflict with the interests of shareholders.Certain of our officers and members of our board of trustees own limited partnership units in our Operating
Partnership. These individuals may have personal interests that conflict with the interests of our shareholderswith respect to business decisions affecting us and our Operating Partnership, such as interests in the timingand pricing of property sales or refinancings in order to obtain favorable tax treatment. As a result, the effectof certain transactions on these unit holders may influence our decisions affecting these properties.
Certain members of our management team have outside business interests that could require timeand attention.
Certain members of our management team own interests in properties that are not part of our Company.These properties include various outlots and interests in buildings that are held for sale, a 243-room Indianapolisluxury hotel and condominium development that is planned for 2006 delivery, one option property and Kite,Inc., a full service self-performing interior construction company. In some cases, one or more of these individualsor their affiliates will have certain management and fiduciary obligations that may conflict with such person’sresponsibilities as an officer or trustee of our company and may adversely affect our operations.
21
We depend on external capital.To qualify as a REIT, we will be required to distribute to our shareholders each year at least 90% of our
net taxable income excluding net capital gains. In order to eliminate federal income tax, we will be requiredto distribute annually 100% of our net taxable income, including capital gains. Because of these distributionrequirements, we likely will not be able to fund all future capital needs, including capital for propertydevelopment and acquisitions, with income from operations. We therefore will have to rely on third-party sourcesof capital, which may or may not be available on favorable terms, if at all. Our access to third-party sourcesof capital depends on a number of things, including the market’s perception of our growth potential and ourcurrent and potential future earnings and our ability to qualify as a REIT for federal income tax purposes.
Our rights and the rights of our shareholders to take action against our trustees and officers are limited.Maryland law provides that a director or officer has no liability in that capacity if he or she performs his
or her duties in good faith, in a manner he or she reasonably believes to be in our best interests that an ordinarilyprudent person in a like position would use under similar circumstances. Our declaration of trust and bylawsrequire us to indemnify our trustees and officers for actions taken by them in those capacities to the extentpermitted by Maryland law.As a result, we and our shareholders may have more limited rights against our trusteesand officers than might otherwise exist under common law. Accordingly, in the event that actions taken in goodfaith by any of our trustees or officers impede the performance of our company, our shareholders’ ability torecover damages from such trustee or officer will be limited.
We may have assumed liabilities in connection with our formation transactions.As part of our formation transactions, we acquired entities and assets that are subject to existing liabilities,
some of which may have been unknown at the time our initial public offering was completed. Unknown liabilitiesmight include liabilities for cleanup or remediation of undisclosed environmental conditions, claims by customers,vendors or other persons dealing with our predecessor entities (that had not been asserted or threatened prior toour initial public offering), tax liabilities and accrued but unpaid liabilities incurred in the ordinary course ofbusiness. While in some instances we may have the right to seek reimbursement against an insurer or another thirdparty for certain of these liabilities, there can be no assurance that we will be entitled to any such reimbursementor that ultimately we will be able to recover in respect of such rights for any of these historical liabilities.
Our shareholders have limited ability to prevent us from making any changes to our policies that theybelieve could harm our business, prospects, operating results or share price.
Our board of trustees has adopted policies with respect to certain activities. These policies may be amendedor revised from time to time at the discretion of our board of trustees without a vote of our shareholders. Thismeans that our shareholders will have limited control over changes in our policies. Such changes in our policiesintended to improve, expand or diversify our business may not have the anticipated effects and consequentlymay adversely affect our business and prospects, results of operations and share price.
TAX RISKS
Failure of our company to qualify as a REIT would have serious adverse consequences to us andour shareholders.
We elected to be taxed as a REIT for federal income tax purposes commencing with our taxable year endingDecember 31, 2004, and we plan to operate so that we can meet the requirements for qualification and taxationas a REIT. We have not requested and do not plan to request a ruling from the IRS that we qualify as a REIT,and the statements in this Annual Report on Form 10-K are not binding on the IRS or any court. As a REIT,we generally will not be subject to federal income tax on our income that we distribute currently to ourshareholders. Many of the REIT requirements, however, are highly technical and complex. The determinationthat we are a REIT requires an analysis of various factual matters and circumstances that may not be totallywithin our control. For example, to qualify as a REIT, at least 95% of our gross income must come from specific
22
passive sources, such as rent, that are itemized in the REIT tax laws. In addition, to qualify as a REIT, we cannotown specified amounts of debt and equity securities of some issuers. We also are required to distribute to ourshareholders with respect to each year at least 90% of our REIT taxable income (excluding capital gains). Thefact that we hold substantially all of our assets through our Operating Partnership and its subsidiaries and jointventures further complicates the application of the REIT requirements for us. Even a technical or inadvertentmistake could jeopardize our REIT status and, given the highly complex nature of the rules governing REITsand the ongoing importance of factual determinations, we cannot provide any assurance that we will continueto qualify as a REIT. Furthermore, Congress and the IRS might make changes to the tax laws and regulations,and the courts might issue new rulings, that make it more difficult, or impossible, for us to remain qualified asa REIT.
If we fail to qualify as a REIT for federal income tax purposes, and are unable to avail ourselves of certainsavings provisions set forth in the Internal Revenue Code, we would be subject to federal income tax at regularcorporate rates. As a taxable corporation, we would not be allowed to take a deduction for distributions toshareholders in computing our taxable income or pass through long term capital gains to individual shareholdersat favorable rates. We also could be subject to the federal alternative minimum tax and possibly increased stateand local taxes. We would not be able to elect to be taxed as a REIT for four years following the year we firstfailed to qualify unless the IRS were to grant us relief under certain statutory provisions. If we failed to qualifyas a REIT, we would have to pay significant income taxes, which would reduce our net earnings available forinvestment or distribution to our shareholders. This likely would have a significant adverse effect on our earningsand the value of our securities. In addition, we would no longer be required to pay any distributions toshareholders. If we fail to qualify as a REIT for federal income tax purposes and are able to avail ourselves ofone or more of the statutory savings provisions in order to maintain our REIT status, we would neverthelessbe required to pay penalty taxes of $50,000 or more for each such failure.
We will pay some taxes even if we qualify as a REIT.Even if we qualify as a REIT for federal income tax purposes, we will be required to pay certain federal,
state and local taxes on our income and property. For example, we will be subject to income tax to the extentwe distribute less than 100% of our REIT taxable income (including capital gains). Additionally, we will besubject to a 4% nondeductible excise tax on the amount, if any, by which dividends paid by us in any calendaryear are less than the sum of 85% of our ordinary income, 95% of our capital gain net income and 100% ofour undistributed income from prior years. Moreover, if we have net income from “prohibited transactions,”that income will be subject to a 100% tax. In general, prohibited transactions are sales or other dispositions ofproperty held primarily for sale to customers in the ordinary course of business. The determination as to whethera particular sale is a prohibited transaction depends on the facts and circumstances related to that sale. Whilewe will undertake sales of assets if those assets become inconsistent with our long-term strategic or returnobjectives, we do not believe that those sales should be considered prohibited transactions, but there can be noassurance that the IRS would not contend otherwise. The need to avoid prohibited transactions could cause usto forego or defer sales of properties that our predecessors otherwise would have sold or that it might otherwisebe in our best interest to sell. In addition, any net taxable income earned directly by our taxable REIT subsidiaries,or through entities that are disregarded for federal income tax purposes as entities separate from our taxable REITsubsidiaries, will be subject to federal and possibly state corporate income tax. We have elected to treat KiteRealty Holdings, LLC as a taxable REIT subsidiary, and we may elect to treat other subsidiaries as taxable REITsubsidiaries in the future. In this regard, several provisions of the laws applicable to REITs and their subsidiariesensure that a taxable REIT subsidiary will be subject to an appropriate level of federal income taxation. Forexample, a taxable REIT subsidiary is limited in its ability to deduct interest payments made to an affiliated REIT.In addition, the REIT has to pay a 100% penalty tax on some payments that it receives or on some deductionstaken by the taxable REIT subsidiaries if the economic arrangements between the REIT, the REIT’s tenants,and the taxable REIT subsidiary are not comparable to similar arrangements between unrelated parties. Finally,some state and local jurisdictions may tax some of our income even though as a REIT we are not subject tofederal income tax on that income because not all states and localities treat REITs the same as they are treated
23
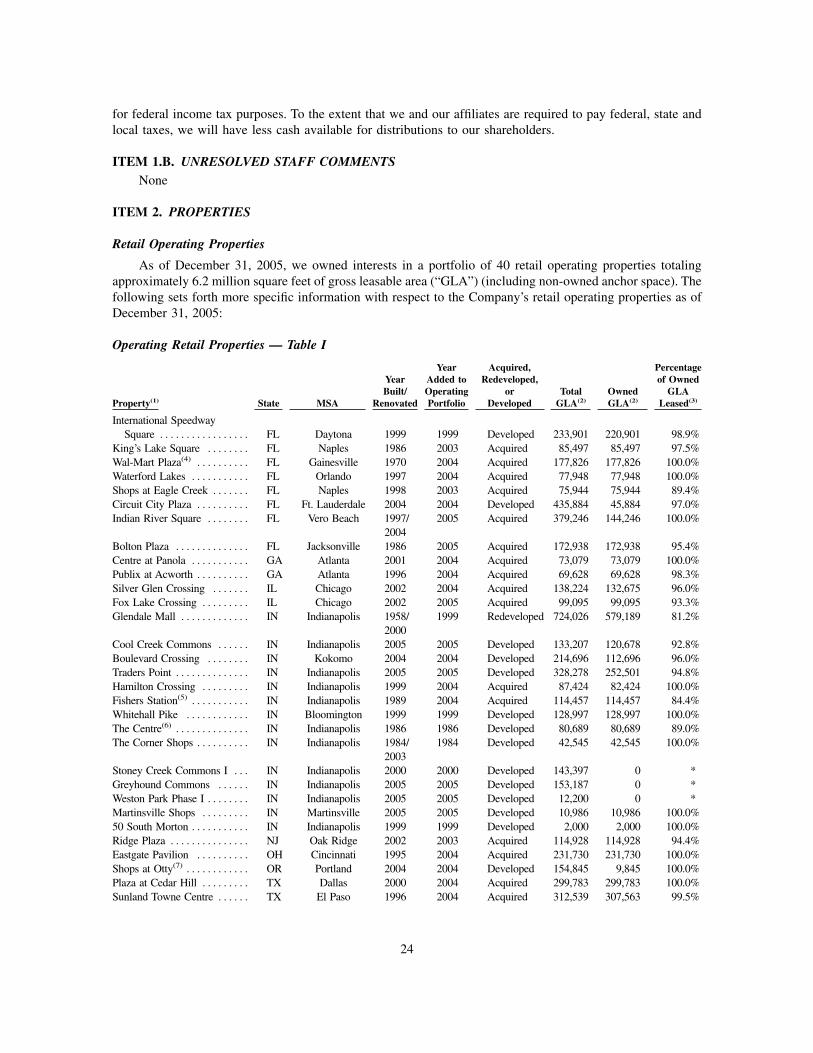
for federal income tax purposes. To the extent that we and our affiliates are required to pay federal, state andlocal taxes, we will have less cash available for distributions to our shareholders.
ITEM 1.B. UNRESOLVED STAFF COMMENTSNone
ITEM 2. PROPERTIES
Retail Operating Properties
As of December 31, 2005, we owned interests in a portfolio of 40 retail operating properties totalingapproximately 6.2 million square feet of gross leasable area (“GLA”) (including non-owned anchor space). Thefollowing sets forth more specific information with respect to the Company’s retail operating properties as ofDecember 31, 2005:
Operating Retail Properties — Table I
Property(1) State MSA
YearBuilt/
Renovated
YearAdded toOperatingPortfolio
Acquired,Redeveloped,
orDeveloped
TotalGLA(2)
OwnedGLA(2)
Percentageof Owned
GLALeased(3)
International SpeedwaySquare . . . . . . . . . . . . . . . . . FL Daytona 1999 1999 Developed 233,901 220,901 98.9%
King’s Lake Square . . . . . . . . FL Naples 1986 2003 Acquired 85,497 85,497 97.5%Wal-Mart Plaza(4) . . . . . . . . . . FL Gainesville 1970 2004 Acquired 177,826 177,826 100.0%Waterford Lakes . . . . . . . . . . . FL Orlando 1997 2004 Acquired 77,948 77,948 100.0%Shops at Eagle Creek . . . . . . . FL Naples 1998 2003 Acquired 75,944 75,944 89.4%Circuit City Plaza . . . . . . . . . . FL Ft. Lauderdale 2004 2004 Developed 435,884 45,884 97.0%Indian River Square . . . . . . . . FL Vero Beach 1997/
20042005 Acquired 379,246 144,246 100.0%
Bolton Plaza . . . . . . . . . . . . . . FL Jacksonville 1986 2005 Acquired 172,938 172,938 95.4%Centre at Panola . . . . . . . . . . . GA Atlanta 2001 2004 Acquired 73,079 73,079 100.0%Publix at Acworth . . . . . . . . . . GA Atlanta 1996 2004 Acquired 69,628 69,628 98.3%Silver Glen Crossing . . . . . . . IL Chicago 2002 2004 Acquired 138,224 132,675 96.0%Fox Lake Crossing . . . . . . . . . IL Chicago 2002 2005 Acquired 99,095 99,095 93.3%Glendale Mall . . . . . . . . . . . . . IN Indianapolis 1958/
20001999 Redeveloped 724,026 579,189 81.2%
Cool Creek Commons . . . . . . IN Indianapolis 2005 2005 Developed 133,207 120,678 92.8%Boulevard Crossing . . . . . . . . IN Kokomo 2004 2004 Developed 214,696 112,696 96.0%Traders Point . . . . . . . . . . . . . . IN Indianapolis 2005 2005 Developed 328,278 252,501 94.8%Hamilton Crossing . . . . . . . . . IN Indianapolis 1999 2004 Acquired 87,424 82,424 100.0%Fishers Station(5) . . . . . . . . . . . IN Indianapolis 1989 2004 Acquired 114,457 114,457 84.4%Whitehall Pike . . . . . . . . . . . . IN Bloomington 1999 1999 Developed 128,997 128,997 100.0%The Centre(6) . . . . . . . . . . . . . . IN Indianapolis 1986 1986 Developed 80,689 80,689 89.0%The Corner Shops . . . . . . . . . . IN Indianapolis 1984/
20031984 Developed 42,545 42,545 100.0%
Stoney Creek Commons I . . . IN Indianapolis 2000 2000 Developed 143,397 0 *Greyhound Commons . . . . . . IN Indianapolis 2005 2005 Developed 153,187 0 *Weston Park Phase I . . . . . . . . IN Indianapolis 2005 2005 Developed 12,200 0 *Martinsville Shops . . . . . . . . . IN Martinsville 2005 2005 Developed 10,986 10,986 100.0%50 South Morton . . . . . . . . . . . IN Indianapolis 1999 1999 Developed 2,000 2,000 100.0%Ridge Plaza . . . . . . . . . . . . . . . NJ Oak Ridge 2002 2003 Acquired 114,928 114,928 94.4%Eastgate Pavilion . . . . . . . . . . OH Cincinnati 1995 2004 Acquired 231,730 231,730 100.0%Shops at Otty(7) . . . . . . . . . . . . OR Portland 2004 2004 Developed 154,845 9,845 100.0%Plaza at Cedar Hill . . . . . . . . . TX Dallas 2000 2004 Acquired 299,783 299,783 100.0%Sunland Towne Centre . . . . . . TX El Paso 1996 2004 Acquired 312,539 307,563 99.5%
24
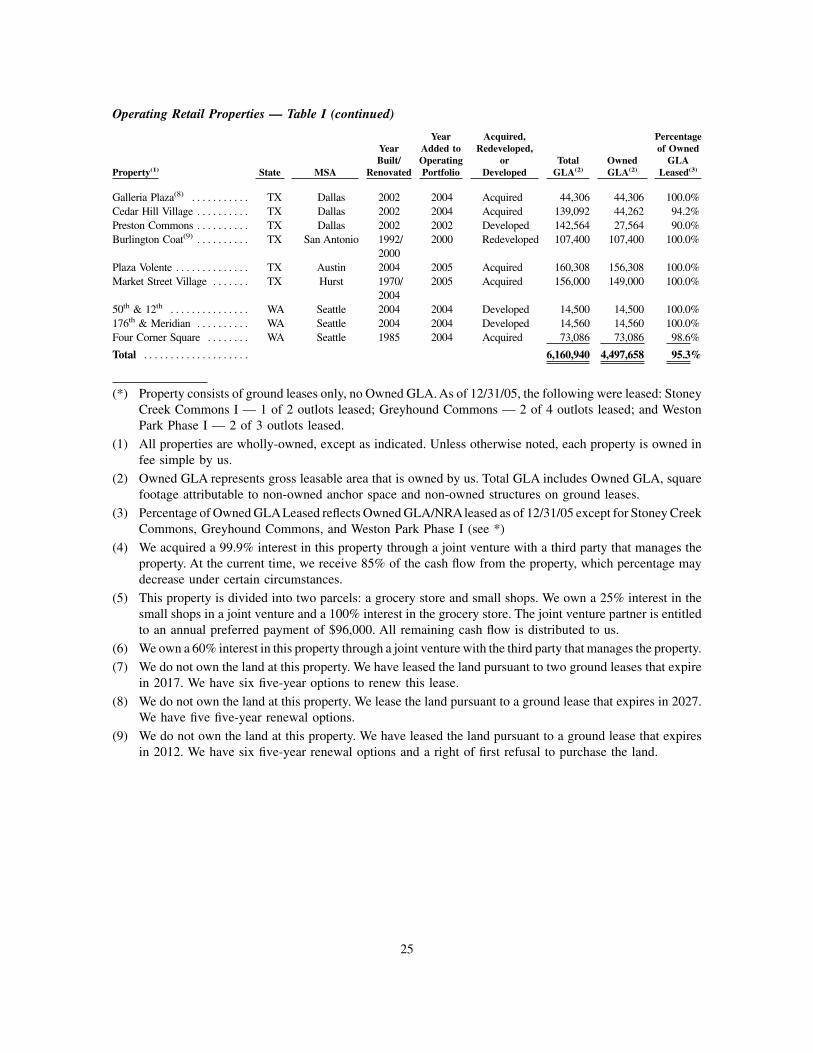
Operating Retail Properties — Table I (continued)
Property(1) State MSA
YearBuilt/
Renovated
YearAdded toOperatingPortfolio
Acquired,Redeveloped,
orDeveloped
TotalGLA(2)
OwnedGLA(2)
Percentageof Owned
GLALeased(3)
Galleria Plaza(8) . . . . . . . . . . . TX Dallas 2002 2004 Acquired 44,306 44,306 100.0%Cedar Hill Village . . . . . . . . . . TX Dallas 2002 2004 Acquired 139,092 44,262 94.2%Preston Commons . . . . . . . . . . TX Dallas 2002 2002 Developed 142,564 27,564 90.0%Burlington Coat(9) . . . . . . . . . . TX San Antonio 1992/
20002000 Redeveloped 107,400 107,400 100.0%
Plaza Volente . . . . . . . . . . . . . . TX Austin 2004 2005 Acquired 160,308 156,308 100.0%Market Street Village . . . . . . . TX Hurst 1970/
20042005 Acquired 156,000 149,000 100.0%
50th & 12th . . . . . . . . . . . . . . . WA Seattle 2004 2004 Developed 14,500 14,500 100.0%176th & Meridian . . . . . . . . . . WA Seattle 2004 2004 Developed 14,560 14,560 100.0%Four Corner Square . . . . . . . . WA Seattle 1985 2004 Acquired 73,086 73,086 98.6%
Total . . . . . . . . . . . . . . . . . . . . 6,160,940 4,497,658 95.3%
(*) Property consists of ground leases only, no Owned GLA. As of 12/31/05, the following were leased: StoneyCreek Commons I — 1 of 2 outlots leased; Greyhound Commons — 2 of 4 outlots leased; and WestonPark Phase I — 2 of 3 outlots leased.
(1) All properties are wholly-owned, except as indicated. Unless otherwise noted, each property is owned infee simple by us.
(2) Owned GLA represents gross leasable area that is owned by us. Total GLA includes Owned GLA, squarefootage attributable to non-owned anchor space and non-owned structures on ground leases.
(3) Percentage of Owned GLALeased reflects Owned GLA/NRAleased as of 12/31/05 except for Stoney CreekCommons, Greyhound Commons, and Weston Park Phase I (see *)
(4) We acquired a 99.9% interest in this property through a joint venture with a third party that manages theproperty. At the current time, we receive 85% of the cash flow from the property, which percentage maydecrease under certain circumstances.
(5) This property is divided into two parcels: a grocery store and small shops. We own a 25% interest in thesmall shops in a joint venture and a 100% interest in the grocery store. The joint venture partner is entitledto an annual preferred payment of $96,000. All remaining cash flow is distributed to us.
(6) We own a 60% interest in this property through a joint venture with the third party that manages the property.
(7) We do not own the land at this property. We have leased the land pursuant to two ground leases that expirein 2017. We have six five-year options to renew this lease.
(8) We do not own the land at this property. We lease the land pursuant to a ground lease that expires in 2027.We have five five-year renewal options.
(9) We do not own the land at this property. We have leased the land pursuant to a ground lease that expiresin 2012. We have six five-year renewal options and a right of first refusal to purchase the land.
25

Ope
rati
ngR
etai
lP
rope
rtie
s—
Tabl
eII
Pro
pert
ySt
ate
MSA
Enc
umbr
ance
s
Ann
ualiz
edB
ase
Ren
tR
even
ue
Ann
ualiz
edG
roun
dL
ease
Rev
enue
Ann
ualiz
edTo
tal
Ret
ail
Rev
enue
(1)
Per
cent
age
ofA
nnua
lized
Tota
lR
etai
lR
even
ue
Bas
eR
ent
Per
Lea
sed
Ow
ned
GL
A(2
)M
ajor
Tena
nts
and
Non
-Ow
ned
Anc
hors
(3)
Inte
rnat
iona
lSp
eedw
aySq
uare
(4)
....
....
....
..FL
Day
tona
$19,
694,
081
$2,4
18,4
19$2
32,9
00$2
,651
,319
5.2%
$11.
07St
einM
art,
Bed
Bat
h,C
ircu
itC
ityK
ing’
sL
ake
Squa
re(7
)..
...
FLN
aple
s—
$1,0
50,5
22—
$1,0
50,5
222.
1%$1
2.60
Publ
ix,
Wal
gree
nsW
al-M
art
Plaz
a(4)
....
....
.FL
Gai
nesv
ille
—$
924,
517
—$
924,
517
1.9%
$5.
20W
al-M
art,
Boo
ksA
Mill
ion,
Save
AL
otW
ater
ford
Lak
es(7
)..
....
..FL
Orl
ando
—$
909,
937
—$
909,
937
1.8%
$11.
67W
inn-
Dix
ie(5
)
Shop
sat
Eag
leC
reek
(7)
....
FLN
aple
s—
$72
9,82
0—
$72
9,82
01.
5%$1
0.75
Win
n-D
ixie
(5)
Cir
cuit
City
Plaz
a..
....
...
FLFt
.L
aude
rdal
e—
$88
0,72
7—
$88
0,72
71.
8%$1
9.78
Cir
cuit
City
,W
al-M
art
(non
-ow
ned)
,L
owe’
s(n
on-o
wne
d)In
dian
Riv
erSq
uare
....
...
FLV
ero
Bea
ch$1
3,30
0,00
0$1
,418
,445
—$1
,418
,445
2.8%
$9.
83O
ffice
Dep
ot,
Bea
lls,
Rag
shop
,L
owe’
s(n
on-o
wne
d),
Targ
et(n
on-o
wne
d)B
olto
nPl
aza
....
....
....
.FL
Jack
sonv
ille
—$1
,099
,554
—$1
,099
,554
2.2%
$6.
66W
al-M
art
Cen
tre
atPa
nola
....
....
..G
AA
tlant
a$
4,31
1,70
8$
830,
416
—$
830,
416
1.7%
$11.
36Pu
blix
Publ
ixat
Acw
orth
(7)
....
...
GA
Atla
nta
—$
776,
394
—$
776,
394
1.6%
$11.
35Pu
blix
,C
VS
Silv
erG
len
Cro
ssin
g(7)
....
ILC
hica
go—
$1,8
20,3
02$
85,0
00$1
,905
,302
3.8%
$14.
29D
omin
ick’
s,M
CSp
orts
Fox
Lak
eC
ross
ing
....
....
ILC
hica
go$1
2,12
5,40
5$1
,285
,060
—$1
,285
,060
2.6%
$13.
89D
omin
ick’
sG
lend
ale
Mal
l(4,7
)..
....
...
INIn
dian
apol
is—
$2,3
21,9
35$1
40,0
00$2
,461
,935
4.8%
$4.
94L
.S.A
yres
,K
eras
otes
The
atre
s,L
owe’
s(n
on-o
wne
d)C
ool
Cre
ekC
omm
ons
....
.IN
Indi
anap
olis
$16,
894,
800
$1,6
83,0
27$1
55,5
00$1
,838
,527
3.7%
$15.
04Fr
esh
Mar
ket,
Stei
nM
art
Bou
leva
rdC
ross
ing
....
...
INK
okom
o$1
2,48
6,01
0$1
,368
,905
—$1
,368
,905
2.7%
$12.
66T
JM
axx,
Petc
o,Sh
oeC
arni
val,
Koh
l’s(n
on-o
wne
d)T
rade
rsPo
int
....
....
....
INIn
dian
apol
is—
$3,3
10,1
70$6
35,0
00$3
,945
,171
7.8%
$13.
83D
ick’
sSp
ortin
gG
oods
,B
edB
ath
&B
eyon
d,M
icha
els,
Mar
shSu
perm
arke
ts,
Boo
ksA
Mill
ion,
Old
Nav
yH
amilt
onC
ross
ing(7
)..
....
INIn
dian
apol
is—
$1,3
93,3
51$
71,5
00$1
,464
,852
2.9%
$16.
90O
ffice
Dep
otFi
sher
sSt
atio
n..
....
....
.IN
Indi
anap
olis
$5,
159,
274
$1,1
76,8
47—
$1,1
76,8
472.
4%$1
2.19
Mar
shSu
perm
arke
tW
hite
hall
Pike
....
....
...
INB
loom
ingt
on$
9,69
1,39
3$1
,014
,000
—$1
,014
,000
2.0%
$7.
86L
owe’
sT
heC
entr
e(4,6
)..
....
....
.IN
Indi
anap
olis
—$
933,
334
—$
933,
334
1.9%
$12.
99O
sco
The
Cor
ner
Shop
s..
....
..IN
Indi
anap
olis
$1,
866,
124
$51
5,37
2—
$51
5,37
21.
0%$1
2.11
Han
cock
Fabr
ics
Ston
eyC
reek
Com
mon
s(7)
..IN
Indi
anap
olis
—$
0$
75,0
00$
75,0
000.
2%—
Low
e’s
(non
-ow
ned)
Gre
yhou
ndC
omm
ons
....
.IN
Indi
anap
olis
—$
0$2
02,5
00$
202,
500
0.4%
—L
owe’
s(n
on-o
wne
d)W
esto
nPa
rkPh
ase
I..
....
INIn
dian
apol
is—
$0
$190
,000
$19
0,00
00.
4%—
Mar
tinsv
ille
Shop
s..
....
..IN
Mar
tinsv
ille
—$
147,
620
—$
147,
620
0.3%
$13.
4450
Sout
hM
orto
n..
....
...
INIn
dian
apol
is—
$13
2,00
0—
$13
2,00
00.
3%$6
6.00
Rid
gePl
aza
....
....
....
..N
JO
akR
idge
$16,
728,
863
$1,7
42,5
24—
$1,7
42,5
243.
5%$1
6.06
A&
P,C
VS
Eas
tgat
ePa
vilio
n(7)
....
...
OH
Cin
cinn
ati
—$2
,209
,767
—$2
,209
,767
4.3%
$9.
54D
ick’
sSp
ortin
gG
oods
,V
alue
City
Furn
iture
,B
est
Buy
Shop
sat
Otty
....
....
....
OR
Port
land
—$
267,
756
$122
,500
$39
0,25
60.
8%$2
7.20
Plaz
aat
Ced
arH
ill..
....
..T
XD
alla
s$2
6,99
4,06
1$3
,560
,600
—$3
,560
,600
7.1%
$11.
88H
obby
Lob
by,
Lin
ens
‘NT
hing
s,M
arsh
all’s
Sunl
and
Tow
neC
entr
e..
...
TX
El
Paso
$17,
417,
775
$2,9
89,2
02$
95,2
80$3
,084
,482
6.1%
$9.
77K
mar
t,C
ircu
itC
ity,
Roo
mst
ore
Gal
leri
aPl
aza(7
)..
....
....
TX
Dal
las
—$1
,081
,717
—$1
,081
,717
2.2%
$24.
41Sh
oePa
vilio
nC
edar
Hill
Vill
age(7
)..
....
.T
XD
alla
s—
$67
3,08
5—
$67
3,08
51.
3%$1
6.14
24H
our
Fitn
ess,
JCPe
nney
(non
-ow
ned)
26
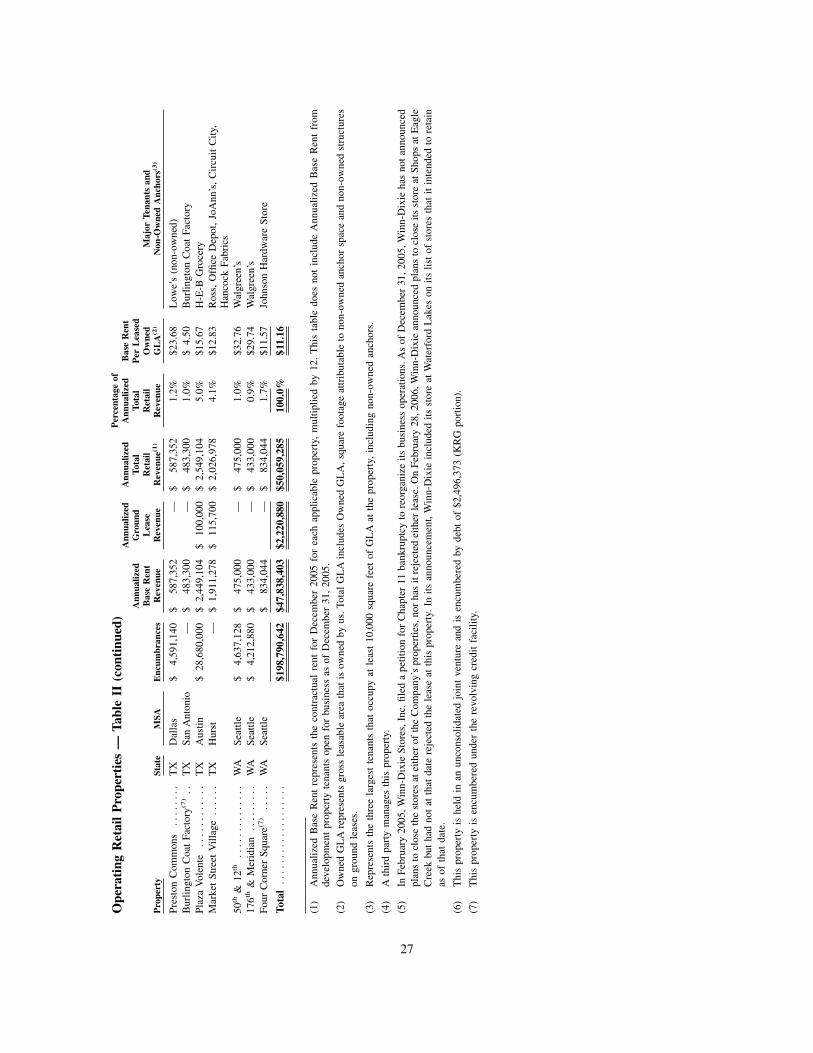
Ope
rati
ngR
etai
lP
rope
rtie
s—
Tabl
eII
(con
tinu
ed)
Pro
pert
ySt
ate
MSA
Enc
umbr
ance
s
Ann
ualiz
edB
ase
Ren
tR
even
ue
Ann
ualiz
edG
roun
dL
ease
Rev
enue
Ann
ualiz
edTo
tal
Ret
ail
Rev
enue
(1)
Per
cent
age
ofA
nnua
lized
Tota
lR
etai
lR
even
ue
Bas
eR
ent
Per
Lea
sed
Ow
ned
GL
A(2
)M
ajor
Tena
nts
and
Non
-Ow
ned
Anc
hors
(3)
Pres
ton
Com
mon
s..
....
..T
XD
alla
s$
4,59
1,14
0$
587,
352
—$
587,
352
1.2%
$23.
68L
owe’
s(n
on-o
wne
d)B
urlin
gton
Coa
tFa
ctor
y(7)
..T
XSa
nA
nton
io—
$48
3,30
0—
$48
3,30
01.
0%$
4.50
Bur
lingt
onC
oat
Fact
ory
Plaz
aV
olen
te..
....
....
..T
XA
ustin
$28
,680
,000
$2,
449,
104
$10
0,00
0$
2,54
9,10
45.
0%$1
5.67
H-E
-BG
roce
ryM
arke
tSt
reet
Vill
age
....
..T
XH
urst
—$
1,91
1,27
8$
115,
700
$2,
026,
978
4.1%
$12.
83R
oss,
Offi
ceD
epot
,Jo
Ann
’s,
Cir
cuit
City
,H
anco
ckFa
bric
s50
th&
12th
....
....
....
..W
ASe
attle
$4,
637,
128
$47
5,00
0—
$47
5,00
01.
0%$3
2.76
Wal
gree
n’s
176th
&M
erid
ian
....
....
.W
ASe
attle
$4,
212,
880
$43
3,00
0—
$43
3,00
00.
9%$2
9.74
Wal
gree
n’s
Four
Cor
ner
Squa
re(7
)..
...
WA
Seat
tle$
834,
044
—$
834,
044
1.7%
$11.
57Jo
hnso
nH
ardw
are
Stor
e
Tota
l..
....
....
....
....
.$1
98,7
90,6
42$4
7,83
8,40
3$2
,220
,880
$50,
059,
285
100.
0%$1
1.16
(1)
Ann
ualiz
edB
ase
Ren
tre
pres
ents
the
cont
ract
ual
rent
for
Dec
embe
r20
05fo
rea
chap
plic
able
prop
erty
,m
ultip
lied
by12
.T
his
tabl
edo
esno
tin
clud
eA
nnua
lized
Bas
eR
ent
from
deve
lopm
ent
prop
erty
tena
nts
open
for
busi
ness
asof
Dec
embe
r31
,20
05.
(2)
Ow
ned
GL
Are
pres
ents
gros
sle
asab
lear
eath
atis
owne
dby
us.T
otal
GL
Ain
clud
esO
wne
dG
LA
,squ
are
foot
age
attr
ibut
able
tono
n-ow
ned
anch
orsp
ace
and
non-
owne
dst
ruct
ures
ongr
ound
leas
es.
(3)
Rep
rese
nts
the
thre
ela
rges
tte
nant
sth
atoc
cupy
atle
ast
10,0
00sq
uare
feet
ofG
LA
atth
epr
oper
ty,
incl
udin
gno
n-ow
ned
anch
ors.
(4)
Ath
ird
part
ym
anag
esth
ispr
oper
ty.
(5)
InFe
brua
ry20
05,W
inn-
Dix
ieSt
ores
,Inc
.file
da
petit
ion
for
Cha
pter
11ba
nkru
ptcy
tore
orga
nize
itsbu
sine
ssop
erat
ions
.As
ofD
ecem
ber
31,2
005,
Win
n-D
ixie
has
not
anno
unce
dpl
ans
tocl
ose
the
stor
esat
eith
erof
the
Com
pany
’spr
oper
ties,
nor
has
itre
ject
edei
ther
leas
e.O
nFe
brua
ry28
,200
6,W
inn-
Dix
iean
noun
ced
plan
sto
clos
eits
stor
eat
Shop
sat
Eag
leC
reek
but
had
not
atth
atda
tere
ject
edth
ele
ase
atth
ispr
oper
ty.
Inits
anno
unce
men
t,W
inn-
Dix
iein
clud
edits
stor
eat
Wat
erfo
rdL
akes
onits
list
ofst
ores
that
itin
tend
edto
reta
inas
ofth
atda
te.
(6)
Thi
spr
oper
tyis
held
inan
unco
nsol
idat
edjo
int
vent
ure
and
isen
cum
bere
dby
debt
of$2
,496
,373
(KR
Gpo
rtio
n).
(7)
Thi
spr
oper
tyis
encu
mbe
red
unde
rth
ere
volv
ing
cred
itfa
cilit
y.
27
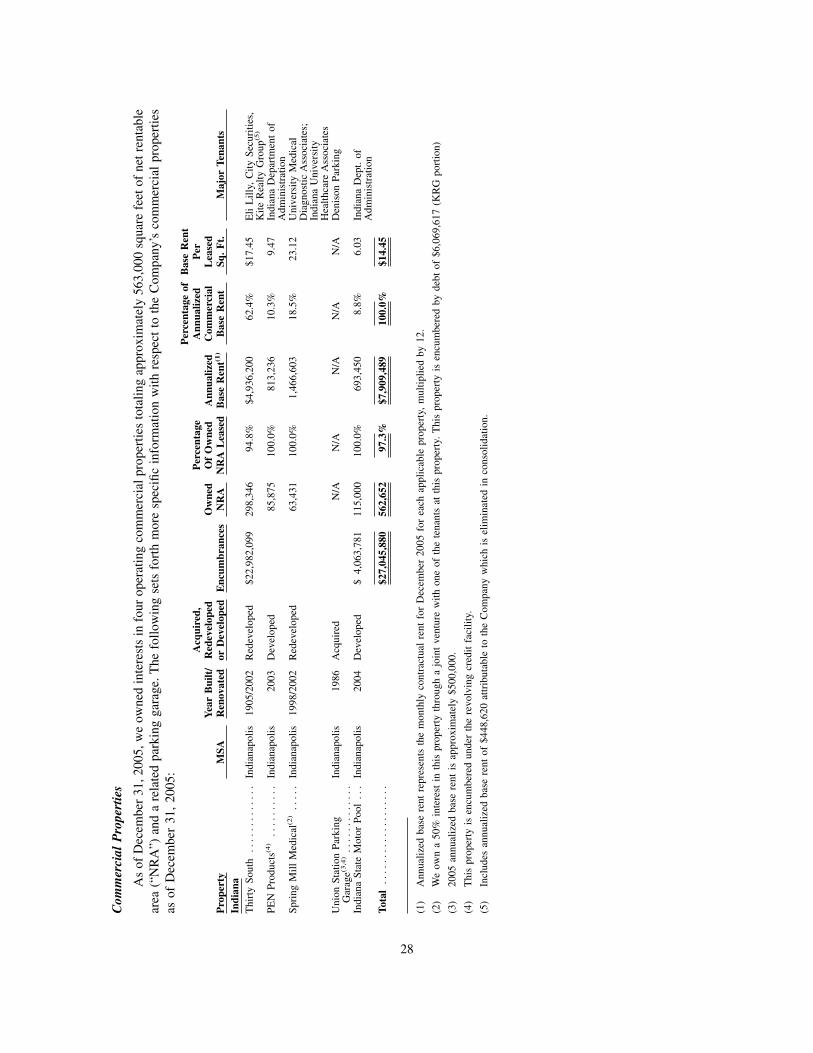
Com
mer
cial
Pro
pert
ies
As
ofD
ecem
ber
31,2
005,
we
owne
din
tere
sts
info
urop
erat
ing
com
mer
cial
prop
ertie
sto
talin
gap
prox
imat
ely
563,
000
squa
refe
etof
netr
enta
ble
area
(“N
RA
”)an
da
rela
ted
park
ing
gara
ge.T
hefo
llow
ing
sets
fort
hm
ore
spec
ific
info
rmat
ion
with
resp
ect
toth
eC
ompa
ny’s
com
mer
cial
prop
ertie
sas
ofD
ecem
ber
31,
2005
:
Pro
pert
yM
SAY
ear
Bui
lt/
Ren
ovat
ed
Acq
uire
d,R
edev
elop
edor
Dev
elop
edE
ncum
bran
ces
Ow
ned
NR
A
Per
cent
age
Of
Ow
ned
NR
AL
ease
dA
nnua
lized
Bas
eR
ent(1
)
Per
cent
age
ofA
nnua
lized
Com
mer
cial
Bas
eR
ent
Bas
eR
ent
Per
Lea
sed
Sq.
Ft.
Maj
orTe
nant
sIn
dian
aT
hirt
ySo
uth
....
....
....
.In
dian
apol
is19
05/2
002
Red
evel
oped
$22,
982,
099
298,
346
94.8
%$4
,936
,200
62.4
%$1
7.45
Eli
Lill
y,C
itySe
curi
ties,
Kite
Rea
ltyG
roup
(5)
PEN
Prod
ucts
(4)
....
....
..In
dian
apol
is20
03D
evel
oped
85,8
7510
0.0%
813,
236
10.3
%9.
47In
dian
aD
epar
tmen
tof
Adm
inis
trat
ion
Spri
ngM
illM
edic
al(2
)..
...
Indi
anap
olis
1998
/200
2R
edev
elop
ed63
,431
100.
0%1,
466,
603
18.5
%23
.12
Uni
vers
ityM
edic
alD
iagn
ostic
Ass
ocia
tes;
Indi
ana
Uni
vers
ityH
ealth
care
Ass
ocia
tes
Uni
onSt
atio
nPa
rkin
gG
arag
e(3,4
)..
....
....
...
Indi
anap
olis
1986
Acq
uire
dN
/AN
/AN
/AN
/AN
/AD
enis
onPa
rkin
g
Indi
ana
Stat
eM
otor
Pool
...
Indi
anap
olis
2004
Dev
elop
ed$
4,06
3,78
111
5,00
010
0.0%
693,
450
8.8%
6.03
Indi
ana
Dep
t.of
Adm
inis
trat
ion
Tota
l..
....
....
....
....
.$2
7,04
5,88
056
2,65
297
.3%
$7,9
09,4
8910
0.0%
$14.
45
(1)
Ann
ualiz
edba
sere
ntre
pres
ents
the
mon
thly
cont
ract
ual
rent
for
Dec
embe
r20
05fo
rea
chap
plic
able
prop
erty
,m
ultip
lied
by12
.
(2)
We
own
a50
%in
tere
stin
this
prop
erty
thro
ugh
ajo
int
vent
ure
with
one
ofth
ete
nant
sat
this
prop
erty
.T
his
prop
erty
isen
cum
bere
dby
debt
of$6
,069
,617
(KR
Gpo
rtio
n)
(3)
2005
annu
aliz
edba
sere
ntis
appr
oxim
atel
y$5
00,0
00.
(4)
Thi
spr
oper
tyis
encu
mbe
red
unde
rth
ere
volv
ing
cred
itfa
cilit
y.
(5)
Incl
udes
annu
aliz
edba
sere
ntof
$448
,620
attr
ibut
able
toth
eC
ompa
nyw
hich
isel
imin
ated
inco
nsol
idat
ion.
28

Ret
ail
Dev
elop
men
tP
rope
rtie
s
Inad
ditio
nto
our
oper
atin
gre
tail
prop
ertie
s,as
ofD
ecem
ber
31,
2005
,w
eow
ned
14re
tail
deve
lopm
ent
prop
ertie
sth
atar
eex
pect
edto
cont
ain
appr
oxim
atel
y1.
8m
illio
nsq
uare
feet
ofgr
oss
leas
able
area
(inc
ludi
ngno
n-ow
ned
anch
orsp
ace)
upon
com
plet
ion.
The
follo
win
gse
tsfo
rth
mor
esp
ecifi
cin
form
atio
nw
ithre
spec
tto
the
Com
pany
’sre
tail
deve
lopm
ent
prop
ertie
sas
ofD
ecem
ber
31,
2005
:
2005
Del
iver
ies/
2006
Stab
iliza
tion
sM
SAT
ype
ofP
rope
rty
Ope
ning
Dat
e(1)
Enc
umbr
ance
s
Pro
ject
edO
wne
dG
LA
(2)
Pro
ject
edTo
tal
GL
A(3
)
Per
cent
ofO
wne
dG
LA
Occ
upie
d
Per
cent
ofO
wne
dG
LA
Pre
-Lea
sed/
Com
mit
ted(5
)
Tota
lE
stim
ated
Pro
ject
Cos
t(4)
Cos
tIn
curr
edas
ofD
ec.
3120
05(4
)M
ajor
Tena
nts
and
Non
-ow
ned
Anc
hors
Flo
rida
Eag
leC
reek
,Ph
ase
II(9
)..
..N
aple
s,FL
Ret
ail
Q1
2005
—16
5,00
0N
/A10
0.0%
$9,
080
$8,
863
Big
box
reta
iler
Indi
ana
Tra
ders
Poin
tII
....
....
..In
dian
apol
is,
INR
etai
lQ
220
05$
7,59
5,62
646
,600
50,2
0040
.7%
46.0
%10
,650
8,72
5A
ncho
red
byT
rade
rsPo
int
Red
Ban
kC
omm
ons
....
..E
vans
ville
,IN
Ret
ail
Q1
2005
$4,
425,
246
34,5
0024
6,50
069
.0%
77.7
%6,
400
5,71
1W
al-M
art
(non
-ow
ned)
;H
ome
Dep
ot(n
on-o
wne
d)G
eist
Pavi
lion
....
....
....
Indi
anap
olis
,IN
Ret
ail
Q1
2005
$7,
761,
554
64,3
0064
,300
30.8
%84
.0%
11,9
7010
,857
Part
yT
ree
Tota
l..
....
....
....
....
.$1
9,78
2,42
614
5,40
052
6,00
043
.0%
86.1
%$3
8,10
0$3
4,15
6
2006
–200
7D
eliv
erie
sM
SAT
ype
ofP
rope
rty
Ope
ning
Dat
e(1)
Enc
umbr
ance
s
Pro
ject
edO
wne
dG
LA
(2)
Pro
ject
edTo
tal
GL
A(3
)
Per
cent
ofO
wne
dG
LA
Occ
upie
d
Per
cent
ofO
wne
dG
LA
Pre
-Lea
sed/
Com
mit
ted(5
)
Tota
lE
stim
ated
Pro
ject
Cos
t(4)
Cos
tIn
curr
edas
ofD
ec.
3120
05(4
)M
ajor
Tena
nts
and
Non
-ow
ned
Anc
hors
Flo
rida
Tarp
onSp
ring
sPl
aza
....
..N
aple
s,FL
Ret
ail
Q1
2007
$4,
747,
229
81,5
0027
3,30
00.
0%59
.9%
$21,
500
$10,
608
Targ
et(n
on-o
wne
d)E
ster
oTo
wn
Com
mon
s(7,8
)..
Nap
les,
FLR
etai
lQ
320
06$
7,80
4,58
025
,600
183,
600
0.0%
85.1
%20
,000
11,5
82B
igbo
xre
taile
r
Indi
ana
Bea
con
Hill
Shop
ping
Cen
ter(8
)..
....
....
....
Cro
wn
Poin
t,IN
Ret
ail
Q3
2006
$4,
110,
959
56,0
0016
1,00
00.
0%7.
5%17
,000
10,2
84St
rack
&V
anT
il’s
(non
-ow
ned)
Zio
nsvi
llePl
ace
....
....
..In
dian
apol
is,
INR
etai
lQ
220
0637
,400
42,4
000.
0%0.
0%8,
000
3,31
3Sm
all
shop
s,ga
rden
-sty
leof
fice
Ston
eyC
reek
Com
mon
sII
.In
dian
apol
is,
INR
etai
lQ
320
0649
,330
214,
530
0.0%
100.
0%6,
000
1,04
0H
HG
regg
,O
ffice
Dep
otB
ridg
ewat
erM
arke
tpla
ceI
..In
dian
apol
is,
INR
etai
lQ
320
0641
,031
51,0
310.
0%20
.5%
15,0
003,
530
Wal
gree
n’s
(bui
ld-t
o-su
itfo
rsa
le)
Illin
ois
Nap
ervi
lleM
arke
tpla
ce(1
0)
..C
hica
go,
ILR
etai
lQ
320
05$1
6,09
2,93
717
5,00
017
5,00
040
.0%
68.7
%30
,500
21,7
54M
arsh
Supe
rmar
ket,
TJ
Max
x
29
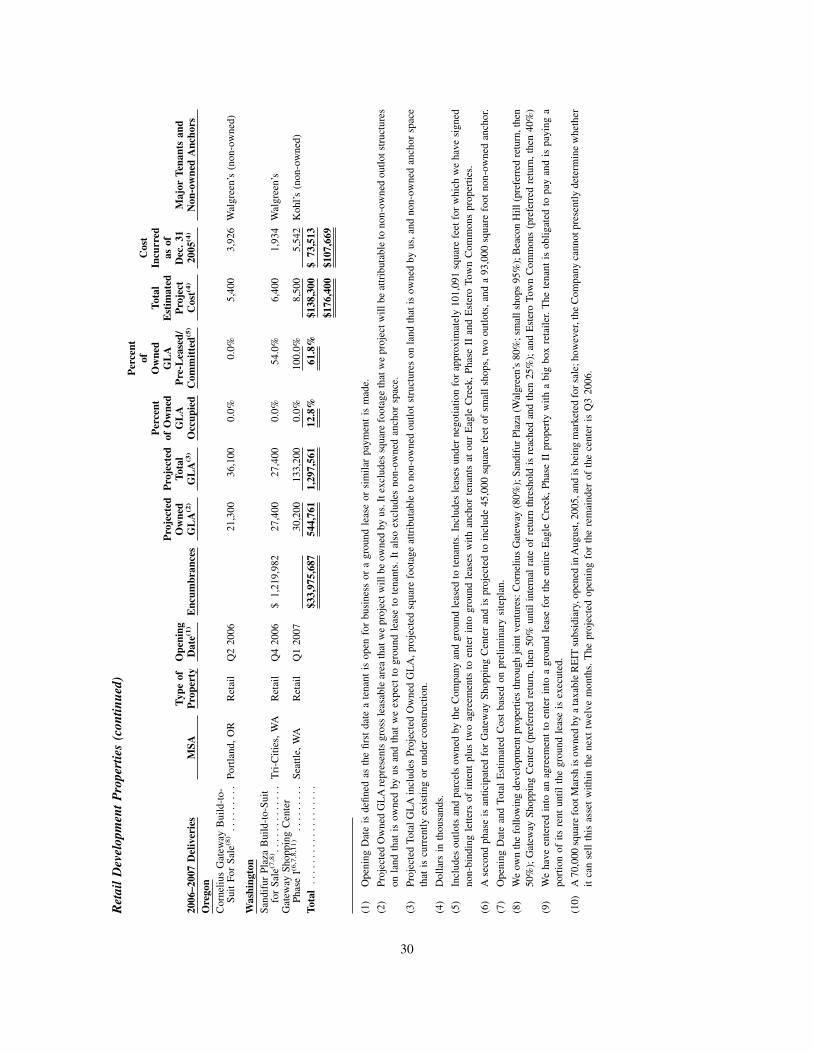
Ret
ail
Dev
elop
men
tP
rope
rtie
s(c
ontin
ued)
2006
–200
7D
eliv
erie
sM
SAT
ype
ofP
rope
rty
Ope
ning
Dat
e(1)
Enc
umbr
ance
s
Pro
ject
edO
wne
dG
LA
(2)
Pro
ject
edTo
tal
GL
A(3
)
Per
cent
ofO
wne
dG
LA
Occ
upie
d
Per
cent
ofO
wne
dG
LA
Pre
-Lea
sed/
Com
mit
ted(5
)
Tota
lE
stim
ated
Pro
ject
Cos
t(4)
Cos
tIn
curr
edas
ofD
ec.
3120
05(4
)M
ajor
Tena
nts
and
Non
-ow
ned
Anc
hors
Ore
gon
Cor
neliu
sG
atew
ayB
uild
-to-
Suit
For
Sale
(8)
....
....
.Po
rtla
nd,
OR
Ret
ail
Q2
2006
21,3
0036
,100
0.0%
0.0%
5,40
03,
926
Wal
gree
n’s
(non
-ow
ned)
Was
hing
ton
Sand
ifur
Plaz
aB
uild
-to-
Suit
for
Sale
(7,8
) ....
....
....
.T
ri-C
ities
,W
AR
etai
lQ
420
06$
1,21
9,98
227
,400
27,4
000.
0%54
.0%
6,40
01,
934
Wal
gree
n’s
Gat
eway
Shop
ping
Cen
ter
Phas
eI(6
,7,8
,11
)..
....
...
Seat
tle,
WA
Ret
ail
Q1
2007
30,2
0013
3,20
00.
0%10
0.0%
8,50
05,
542
Koh
l’s(n
on-o
wne
d)To
tal
....
....
....
....
...
$33,
975,
687
544,
761
1,29
7,56
112
.8%
61.8
%$1
38,3
00$
73,5
13
$176
,400
$107
,669
(1)
Ope
ning
Dat
eis
defin
edas
the
first
date
ate
nant
isop
enfo
rbu
sine
ssor
agr
ound
leas
eor
sim
ilar
paym
ent
ism
ade.
(2)
Proj
ecte
dO
wne
dG
LA
repr
esen
tsgr
oss
leas
able
area
that
we
proj
ectw
illbe
owne
dby
us.I
texc
lude
ssq
uare
foot
age
that
we
proj
ectw
illbe
attr
ibut
able
tono
n-ow
ned
outlo
tstr
uctu
res
onla
ndth
atis
owne
dby
usan
dth
atw
eex
pect
togr
ound
leas
eto
tena
nts.
Ital
soex
clud
esno
n-ow
ned
anch
orsp
ace.
(3)
Proj
ecte
dTo
tal
GL
Ain
clud
esPr
ojec
ted
Ow
ned
GL
A,p
roje
cted
squa
refo
otag
eat
trib
utab
leto
non-
owne
dou
tlot
stru
ctur
eson
land
that
isow
ned
byus
,and
non-
owne
dan
chor
spac
eth
atis
curr
ently
exis
ting
orun
der
cons
truc
tion.
(4)
Dol
lars
inth
ousa
nds.
(5)
Incl
udes
outlo
tsan
dpa
rcel
sow
ned
byth
eC
ompa
nyan
dgr
ound
leas
edto
tena
nts.
Incl
udes
leas
esun
der
nego
tiatio
nfo
rap
prox
imat
ely
101,
091
squa
refe
etfo
rw
hich
we
have
sign
edno
n-bi
ndin
gle
tters
ofin
tent
plus
two
agre
emen
tsto
ente
rin
togr
ound
leas
esw
ithan
chor
tena
nts
atou
rE
agle
Cre
ek,
Phas
eII
and
Est
ero
Tow
nC
omm
ons
prop
ertie
s.
(6)
Ase
cond
phas
eis
antic
ipat
edfo
rG
atew
aySh
oppi
ngC
ente
ran
dis
proj
ecte
dto
incl
ude
45,0
00sq
uare
feet
ofsm
all
shop
s,tw
oou
tlots
,and
a93
,000
squa
refo
otno
n-ow
ned
anch
or.
(7)
Ope
ning
Dat
ean
dTo
tal
Est
imat
edC
ost
base
don
prel
imin
ary
site
plan
.
(8)
We
own
the
follo
win
gde
velo
pmen
tpro
pert
ies
thro
ugh
join
tven
ture
s:C
orne
lius
Gat
eway
(80%
);Sa
ndif
urPl
aza
(Wal
gree
n’s
80%
;sm
alls
hops
95%
);B
eaco
nH
ill(p
refe
rred
retu
rn,t
hen
50%
);G
atew
aySh
oppi
ngC
ente
r(p
refe
rred
retu
rn,
then
50%
until
inte
rnal
rate
ofre
turn
thre
shol
dis
reac
hed
and
then
25%
);an
dE
ster
oTo
wn
Com
mon
s(p
refe
rred
retu
rn,
then
40%
)
(9)
We
have
ente
red
into
anag
reem
ent
toen
ter
into
agr
ound
leas
efo
rth
een
tire
Eag
leC
reek
,Ph
ase
IIpr
oper
tyw
itha
big
box
reta
iler.
The
tena
ntis
oblig
ated
topa
yan
dis
payi
nga
port
ion
ofits
rent
until
the
grou
ndle
ase
isex
ecut
ed.
(10)
A70
,000
squa
refo
otM
arsh
isow
ned
bya
taxa
ble
RE
ITsu
bsid
iary
,ope
ned
inA
ugus
t,20
05,a
ndis
bein
gm
arke
ted
for
sale
;how
ever
,the
Com
pany
cann
otpr
esen
tlyde
term
ine
whe
ther
itca
nse
llth
isas
set
with
inth
ene
xttw
elve
mon
ths.
The
proj
ecte
dop
enin
gfo
rth
ere
mai
nder
ofth
ece
nter
isQ
320
06.
30
Land Held For Future Development
As of December 31, 2005, we owned interests in land parcels comprising approximately 180 acres that maybe used for future expansion of existing properties or development of new retail or commercial properties.
Option Properties and Rights of First Refusal
In connection with our IPO, we entered into option agreements with the contributors of our properties (orentities controlled or owned by them) that granted our Operating Partnership the right to acquire the followingproperty or interests therein:
• Erskine Village. A joint venture among Kite South Bend, LLC, Kimco Realty Corporation andSchottenstein Management purchased this 800,000 square foot Scottsdale Mall location in South Bend,Indiana in August 2003 in order to redevelop it. The 58-acre parcel of land is located at the intersectionof Miami Street and Ireland Road in South Bend, Indiana. Our Operating Partnership has the rightto purchase Kite South Bend, LLC’s 25% interest in this joint venture, subject to approval of the otherjoint venture partners and the lender.
Under the terms of the option agreement, once the property reaches 85% occupancy, we may directly orindirectly acquire the property at a price equal to the lesser of:
• the annualized net operating income for the property (based on net operating income over a three-month period which includes the month of exercise) divided by 8.5% multiplied by the contributors’interest in the property; or
• the then fair market value of the property based on the average of two appraisals (or the average ofthe two closest of three appraisals in certain circumstances) multiplied by the contributors’ interestin the property.
The option price is payable in operating partnership units or cash, at our option. Each of our options expiresfour years from the date construction begins on the property. We also have a right of first refusal to acquire theproperty (or the contributors’ interest therein) if a third party offers to acquire the property (or the interest) atthe price offered by the third party or, if the option is then exercisable, at the option price described above, iflower. If we do not acquire the property during the four-year option period, then the contributors will agree tosell the property (or their interests therein) as soon as reasonably practicable.
On March 31, 2005, the Company acquired 32.7 acres of undeveloped land in Naples, Florida (TarponSprings Plaza) at a price equal to Messrs. Al Kite, John Kite, Paul Kite and Tom McGowan’s net equity in theproperty at cost plus the assumption of certain liabilities and the obligation to repay certain indebtedness. Theequity portion of the purchase price was paid through the issuance of 214,049 units of the Operating Partnershipvalued at approximately $3.1 million.
31
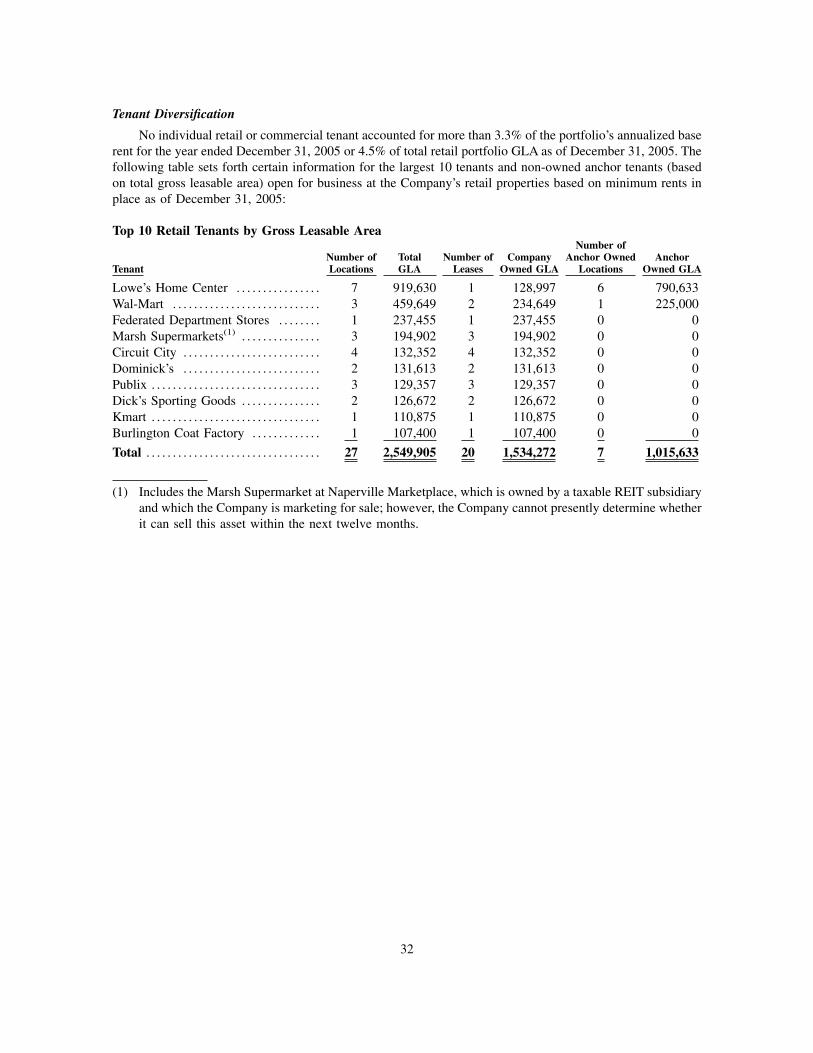
Tenant Diversification
No individual retail or commercial tenant accounted for more than 3.3% of the portfolio’s annualized baserent for the year ended December 31, 2005 or 4.5% of total retail portfolio GLA as of December 31, 2005. Thefollowing table sets forth certain information for the largest 10 tenants and non-owned anchor tenants (basedon total gross leasable area) open for business at the Company’s retail properties based on minimum rents inplace as of December 31, 2005:
Top 10 Retail Tenants by Gross Leasable Area
TenantNumber ofLocations
TotalGLA
Number ofLeases
CompanyOwned GLA
Number ofAnchor Owned
LocationsAnchor
Owned GLA
Lowe’s Home Center . . . . . . . . . . . . . . . . 7 919,630 1 128,997 6 790,633Wal-Mart . . . . . . . . . . . . . . . . . . . . . . . . . . . . 3 459,649 2 234,649 1 225,000Federated Department Stores . . . . . . . . 1 237,455 1 237,455 0 0Marsh Supermarkets(1) . . . . . . . . . . . . . . . 3 194,902 3 194,902 0 0Circuit City . . . . . . . . . . . . . . . . . . . . . . . . . . 4 132,352 4 132,352 0 0Dominick’s . . . . . . . . . . . . . . . . . . . . . . . . . . 2 131,613 2 131,613 0 0Publix . . . . . . . . . . . . . . . . . . . . . . . . . . . . . . . . 3 129,357 3 129,357 0 0Dick’s Sporting Goods . . . . . . . . . . . . . . . 2 126,672 2 126,672 0 0Kmart . . . . . . . . . . . . . . . . . . . . . . . . . . . . . . . . 1 110,875 1 110,875 0 0Burlington Coat Factory . . . . . . . . . . . . . 1 107,400 1 107,400 0 0
Total . . . . . . . . . . . . . . . . . . . . . . . . . . . . . . . . . 27 2,549,905 20 1,534,272 7 1,015,633
(1) Includes the Marsh Supermarket at Naperville Marketplace, which is owned by a taxable REIT subsidiaryand which the Company is marketing for sale; however, the Company cannot presently determine whetherit can sell this asset within the next twelve months.
32

The following table sets forth certain information for the largest 25 tenants open for business at theCompany’s retail and commercial properties based on minimum rents in place as of December 31, 2005:
Top 25 Tenants by Annualized Base Rent(1)
TenantType of
PropertyNumber ofLocations
LeasedGLA/NRA
% ofOwned
GLA/NRAof the
PortfolioAnnualized
Base Rent(1,2)
AnnualizedBase
Rent perSq. Ft.
% of TotalPortfolio
AnnualizedBase Rent
Circuit City . . . . . . . . . . . . . . . . . Retail 4 132,352 2.6% $ 1,930,110 $14.58 3.3%State of Indiana . . . . . . . . . . . . . Commercial 3 210,393 4.0% $ 1,663,733 $ 7.91 2.8%Eli Lilly . . . . . . . . . . . . . . . . . . . Commercial 1 99,542 2.0% $ 1,642,443 $16.50 2.8%Marsh Supermarkets(5) . . . . . . . . Retail 2 124,902 2.4% $ 1,633,958 $13.08 2.8%Dominick’s . . . . . . . . . . . . . . . . . Retail 2 131,613 2.6% $ 1,411,728 $10.73 2.4%Dick’s Sporting Goods . . . . . . . . Retail 2 126,672 2.5% $ 1,220,000 $ 9.63 2.1%H-E-B Grocery . . . . . . . . . . . . . . Retail 1 105,000 2.1% $ 1,155,000 $11.00 2.0%Walgreen’s . . . . . . . . . . . . . . . . . Retail 3 39,070 0.8% $ 1,031,023 $26.39 1.7%Bed Bath & Beyond . . . . . . . . . . Retail 3 85,895 1.7% $ 1,021,921 $11.90 1.7%Lowe’s Home Center . . . . . . . . . Retail 1 128,997 2.5% $ 1,014,000 $ 7.86 1.7%Publix . . . . . . . . . . . . . . . . . . . . . Retail 3 129,357 2.5% $ 989,361 $ 7.65 1.7%Wal-Mart . . . . . . . . . . . . . . . . . . . Retail 2 234,649 4.5% $ 930,927 $ 3.97 1.6%Ross Stores . . . . . . . . . . . . . . . . . Retail 3 87,656 1.7% $ 884,301 $10.09 1.5%Office Depot . . . . . . . . . . . . . . . . Retail 3 84,372 1.7% $ 873,089 $10.35 1.5%Kmart . . . . . . . . . . . . . . . . . . . . . Retail 1 110,875 2.2% $ 850,379 $ 7.67 1.4%University Medical
Diagnostics Associates(3) . . . . Commercial 1 32,256 0.6% $ 844,402 $26.18 1.4%(3)
Old Navy(6) . . . . . . . . . . . . . . . . . Retail 4 85,420 1.7% $ 824,758 $ 9.66 1.4%Winn-Dixie(4) . . . . . . . . . . . . . . . Retail 2 103,406 2.0% $ 806,266 $ 7.80 1.4%Kerasotes Theatres . . . . . . . . . . . Retail 2 43,050 0.8% $ 776,496 $18.04 1.3%A & P . . . . . . . . . . . . . . . . . . . . . Retail 1 58,732 1.2% $ 763,516 $13.00 1.3%Shoe Pavilion . . . . . . . . . . . . . . . Retail 1 31,396 0.6% $ 722,108 $23.00 1.2%City Securities . . . . . . . . . . . . . . Commercial 1 34,949 0.7% $ 694,900 $19.88 1.2%Indiana University
Healthcare Associates(3) . . . . . Commercial 1 31,175 0.6% $ 622,201 $19.96 1.0%(3)
Bealls . . . . . . . . . . . . . . . . . . . . . Retail 2 79,611 1.6% $ 576,000 $ 7.24 1.0%Petsmart . . . . . . . . . . . . . . . . . . . Retail 2 50,909 1.0% $ 537,095 $10.55 0.9%
Total . . . . . . . . . . . . . . . . . . . . . . 2,382,249 46.6% $25,419,715 $10.67 43.1%
(1) Annualized base rent represents the monthly contractual rent for December 2005 for each applicable tenant multiplied by 12.
(2) Excludes tenants at development properties which are Build-to-Suits for sale.
(3) Property held in unconsolidated joint venture. Annualized base rent is reflected at 100 percent.
(4) In February 2005, Winn-Dixie Stores, Inc. filed a petition for Chapter 11 bankruptcy to reorganize its business operations. OnFebruary 28, 2006, Winn-Dixie announced plans to close its store at Shops at Eagle Creek but had not at that date rejected the leaseat this property. In its announcement, Winn-Dixie included its store at Waterford Lakes on its list of stores that it intended to retainas of that date.
(5) Excludes the Marsh Supermarket at Naperville Marketplace, which is owned by a taxable REIT subsidiary and which the Companyis marketing for sale; however, the Company cannot presently determine whether it can sell this asset within the next twelve months.Also excludes the Marsh Supermarket at Geist Pavilion where the tenant has commenced payment of rent but has not openedfor business.
(6) This tenant’s lease at Glendale Mall for approximately 20,600 square feet at a base rent of $8.50 per square foot expired in January2006 and the tenant elected to not renew.
33

Geographic Information
The Company owns 40 operating retail properties totaling approximately 6.2 million of owned square feetin nine states. As of December 31, 2005, the Company owned interests in four operating commercial propertiestotaling approximately 563,000 square feet of net rentable area and a related parking garage. All of thesecommercial properties are located in the state of Indiana. The following table summarizes the Company’soperating properties by state as of December 31, 2005:
Number ofOperatingProperties
OwnedGLA/NRA(2)
Percent ofOwned
GLA/NRA
TotalNumberof Leases
AnnualizedBase
Rent(3)
Percent ofAnnualizedBase Rent
AnnualizedBase Rent
perLeased
SF
Indiana . . . . . . . . . . . . . . . . . . . . 19 2,089,814 41.3% 211 $21,906,051 39.3% $11.46• Retail — Mall . . . . . . . . . . . 1 579,189 11.5% 41 $ 2,321,935 4.2% $ 4.94• Retail . . . . . . . . . . . . . . . . . . 13 947,973 18.7% 147 $11,674,627 20.9% $13.05• Commercial . . . . . . . . . . . . . 5 562,652 11.1% 23 $ 7,909,489 14.2% $14.45
Texas . . . . . . . . . . . . . . . . . . . . . . 8 1,136,186 22.4% 96 $13,735,638 24.6% $12.16Florida . . . . . . . . . . . . . . . . . . . . . 8 1,001,184 19.8% 118 $ 9,431,942 16.9% $ 9.63Illinois . . . . . . . . . . . . . . . . . . . . . 2 231,770 4.6% 36 $ 3,105,362 5.6% $14.12New Jersey . . . . . . . . . . . . . . . . . 1 114,928 2.3% 16 $ 1,742,524 3.1% $16.06Georgia . . . . . . . . . . . . . . . . . . . . 2 142,707 2.8% 28 $ 1,606,810 2.9% $11.36Washington . . . . . . . . . . . . . . . . . 3 102,146 2.0% 26 $ 1,742,044 3.1% $17.22Ohio . . . . . . . . . . . . . . . . . . . . . . 1 231,730 4.6% 6 $ 2,209,767 4.0% $ 9.54Oregon . . . . . . . . . . . . . . . . . . . . 1 9,845 0.2% 7 $ 267,756 0.5% $27.20
Total . . . . . . . . . . . . . . . . . . . . . . 45 5,060,310 100.0% 544 $55,747,894 100.0% $11.53
(1) Excludes tenants at development properties which are Build-to-Suits for sale.
(2) Owned GLA/NRA represents gross leasable area or net leasable area owned by the Company. It does not include 24 parcels or outlotsowned by the Company and ground leased to tenants which contain 24 non-owned structures totaling approximately 159,319 squarefeet. It also excludes the square footage of Union Station Parking Garage.
(3) Annualized Base Rent Revenue excludes $2,220,880 in annualized ground lease revenue attributable to parcels and outlots ownedby the Company and ground leased to tenants. It also excludes approximately $500,000 in 2005 annualized minimum rent attributableto Union Station Parking Garage as well as the leases on properties classified as development properties.
Lease Expirations
Approximately 4.0% and 4.5% of total annualized base rent and total GLA/NRA, respectively, expire in2006. The following tables show scheduled lease expirations for retail and commercial tenants and developmentproperty tenants open for business and development property tenants open for business as of December 31, 2005assuming none of the tenants exercise renewal options. The tables include tenants open for business at operatingretail and commercial properties as of December 31, 2005.
34
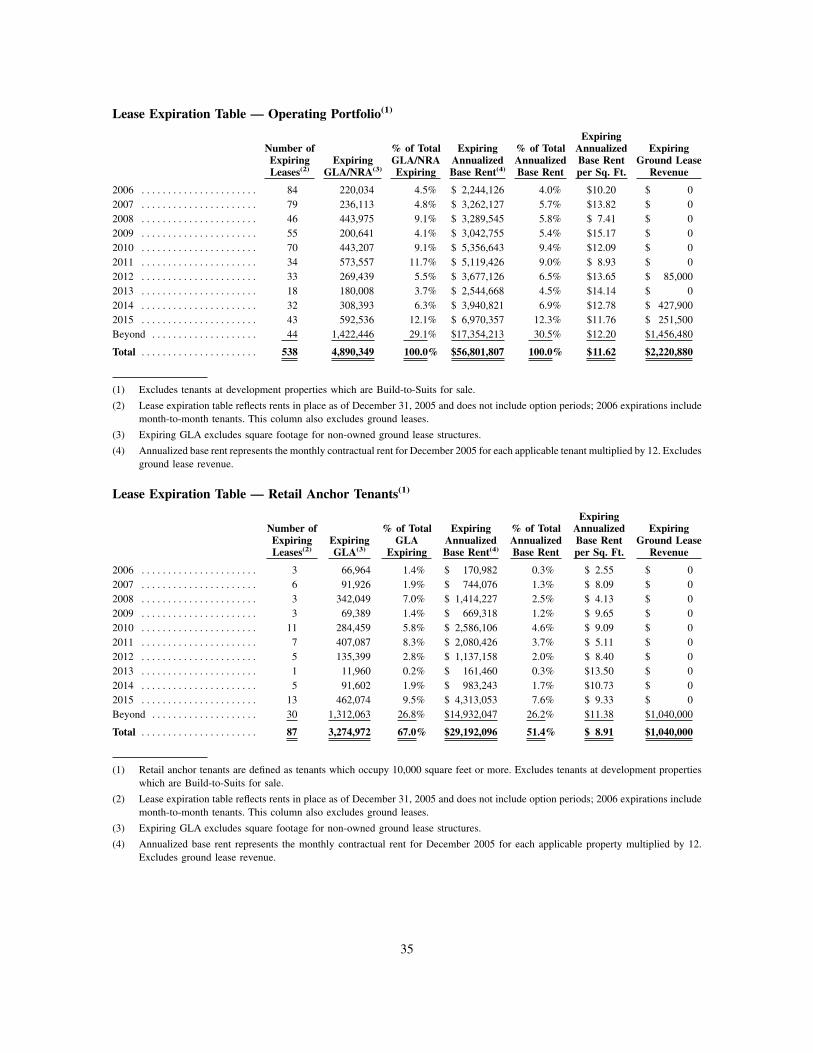
Lease Expiration Table — Operating Portfolio(1)
Number ofExpiringLeases(2)
ExpiringGLA/NRA(3)
% of TotalGLA/NRAExpiring
ExpiringAnnualizedBase Rent(4)
% of TotalAnnualizedBase Rent
ExpiringAnnualizedBase Rentper Sq. Ft.
ExpiringGround Lease
Revenue
2006 . . . . . . . . . . . . . . . . . . . . . . 84 220,034 4.5% $ 2,244,126 4.0% $10.20 $ 02007 . . . . . . . . . . . . . . . . . . . . . . 79 236,113 4.8% $ 3,262,127 5.7% $13.82 $ 02008 . . . . . . . . . . . . . . . . . . . . . . 46 443,975 9.1% $ 3,289,545 5.8% $ 7.41 $ 02009 . . . . . . . . . . . . . . . . . . . . . . 55 200,641 4.1% $ 3,042,755 5.4% $15.17 $ 02010 . . . . . . . . . . . . . . . . . . . . . . 70 443,207 9.1% $ 5,356,643 9.4% $12.09 $ 02011 . . . . . . . . . . . . . . . . . . . . . . 34 573,557 11.7% $ 5,119,426 9.0% $ 8.93 $ 02012 . . . . . . . . . . . . . . . . . . . . . . 33 269,439 5.5% $ 3,677,126 6.5% $13.65 $ 85,0002013 . . . . . . . . . . . . . . . . . . . . . . 18 180,008 3.7% $ 2,544,668 4.5% $14.14 $ 02014 . . . . . . . . . . . . . . . . . . . . . . 32 308,393 6.3% $ 3,940,821 6.9% $12.78 $ 427,9002015 . . . . . . . . . . . . . . . . . . . . . . 43 592,536 12.1% $ 6,970,357 12.3% $11.76 $ 251,500Beyond . . . . . . . . . . . . . . . . . . . . 44 1,422,446 29.1% $17,354,213 30.5% $12.20 $1,456,480
Total . . . . . . . . . . . . . . . . . . . . . . 538 4,890,349 100.0% $56,801,807 100.0% $11.62 $2,220,880
(1) Excludes tenants at development properties which are Build-to-Suits for sale.
(2) Lease expiration table reflects rents in place as of December 31, 2005 and does not include option periods; 2006 expirations includemonth-to-month tenants. This column also excludes ground leases.
(3) Expiring GLA excludes square footage for non-owned ground lease structures.
(4) Annualized base rent represents the monthly contractual rent for December 2005 for each applicable tenant multiplied by 12. Excludesground lease revenue.
Lease Expiration Table — Retail Anchor Tenants(1)
Number ofExpiringLeases(2)
ExpiringGLA(3)
% of TotalGLA
Expiring
ExpiringAnnualizedBase Rent(4)
% of TotalAnnualizedBase Rent
ExpiringAnnualizedBase Rentper Sq. Ft.
ExpiringGround Lease
Revenue
2006 . . . . . . . . . . . . . . . . . . . . . . 3 66,964 1.4% $ 170,982 0.3% $ 2.55 $ 02007 . . . . . . . . . . . . . . . . . . . . . . 6 91,926 1.9% $ 744,076 1.3% $ 8.09 $ 02008 . . . . . . . . . . . . . . . . . . . . . . 3 342,049 7.0% $ 1,414,227 2.5% $ 4.13 $ 02009 . . . . . . . . . . . . . . . . . . . . . . 3 69,389 1.4% $ 669,318 1.2% $ 9.65 $ 02010 . . . . . . . . . . . . . . . . . . . . . . 11 284,459 5.8% $ 2,586,106 4.6% $ 9.09 $ 02011 . . . . . . . . . . . . . . . . . . . . . . 7 407,087 8.3% $ 2,080,426 3.7% $ 5.11 $ 02012 . . . . . . . . . . . . . . . . . . . . . . 5 135,399 2.8% $ 1,137,158 2.0% $ 8.40 $ 02013 . . . . . . . . . . . . . . . . . . . . . . 1 11,960 0.2% $ 161,460 0.3% $13.50 $ 02014 . . . . . . . . . . . . . . . . . . . . . . 5 91,602 1.9% $ 983,243 1.7% $10.73 $ 02015 . . . . . . . . . . . . . . . . . . . . . . 13 462,074 9.5% $ 4,313,053 7.6% $ 9.33 $ 0Beyond . . . . . . . . . . . . . . . . . . . . 30 1,312,063 26.8% $14,932,047 26.2% $11.38 $1,040,000
Total . . . . . . . . . . . . . . . . . . . . . . 87 3,274,972 67.0% $29,192,096 51.4% $ 8.91 $1,040,000
(1) Retail anchor tenants are defined as tenants which occupy 10,000 square feet or more. Excludes tenants at development propertieswhich are Build-to-Suits for sale.
(2) Lease expiration table reflects rents in place as of December 31, 2005 and does not include option periods; 2006 expirations includemonth-to-month tenants. This column also excludes ground leases.
(3) Expiring GLA excludes square footage for non-owned ground lease structures.
(4) Annualized base rent represents the monthly contractual rent for December 2005 for each applicable property multiplied by 12.Excludes ground lease revenue.
35
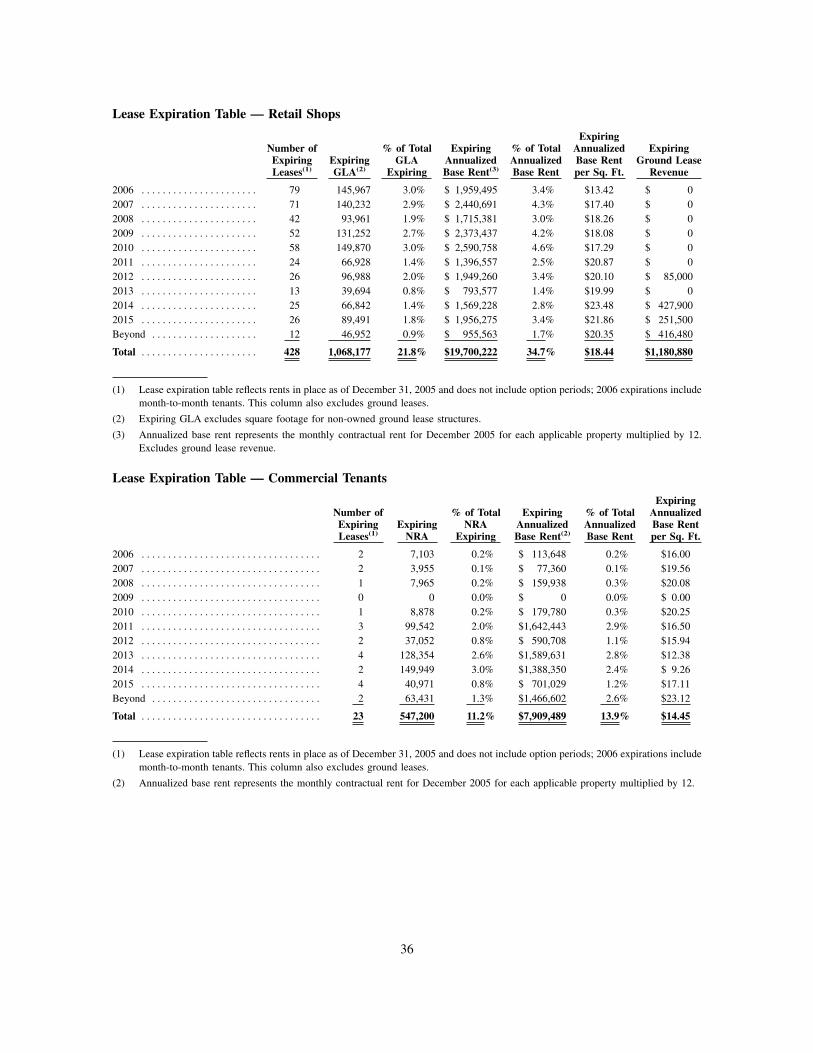
Lease Expiration Table — Retail Shops
Number ofExpiringLeases(1)
ExpiringGLA(2)
% of TotalGLA
Expiring
ExpiringAnnualizedBase Rent(3)
% of TotalAnnualizedBase Rent
ExpiringAnnualizedBase Rentper Sq. Ft.
ExpiringGround Lease
Revenue
2006 . . . . . . . . . . . . . . . . . . . . . . 79 145,967 3.0% $ 1,959,495 3.4% $13.42 $ 02007 . . . . . . . . . . . . . . . . . . . . . . 71 140,232 2.9% $ 2,440,691 4.3% $17.40 $ 02008 . . . . . . . . . . . . . . . . . . . . . . 42 93,961 1.9% $ 1,715,381 3.0% $18.26 $ 02009 . . . . . . . . . . . . . . . . . . . . . . 52 131,252 2.7% $ 2,373,437 4.2% $18.08 $ 02010 . . . . . . . . . . . . . . . . . . . . . . 58 149,870 3.0% $ 2,590,758 4.6% $17.29 $ 02011 . . . . . . . . . . . . . . . . . . . . . . 24 66,928 1.4% $ 1,396,557 2.5% $20.87 $ 02012 . . . . . . . . . . . . . . . . . . . . . . 26 96,988 2.0% $ 1,949,260 3.4% $20.10 $ 85,0002013 . . . . . . . . . . . . . . . . . . . . . . 13 39,694 0.8% $ 793,577 1.4% $19.99 $ 02014 . . . . . . . . . . . . . . . . . . . . . . 25 66,842 1.4% $ 1,569,228 2.8% $23.48 $ 427,9002015 . . . . . . . . . . . . . . . . . . . . . . 26 89,491 1.8% $ 1,956,275 3.4% $21.86 $ 251,500Beyond . . . . . . . . . . . . . . . . . . . . 12 46,952 0.9% $ 955,563 1.7% $20.35 $ 416,480
Total . . . . . . . . . . . . . . . . . . . . . . 428 1,068,177 21.8% $19,700,222 34.7% $18.44 $1,180,880
(1) Lease expiration table reflects rents in place as of December 31, 2005 and does not include option periods; 2006 expirations includemonth-to-month tenants. This column also excludes ground leases.
(2) Expiring GLA excludes square footage for non-owned ground lease structures.
(3) Annualized base rent represents the monthly contractual rent for December 2005 for each applicable property multiplied by 12.Excludes ground lease revenue.
Lease Expiration Table — Commercial Tenants
Number ofExpiringLeases(1)
ExpiringNRA
% of TotalNRA
Expiring
ExpiringAnnualizedBase Rent(2)
% of TotalAnnualizedBase Rent
ExpiringAnnualizedBase Rentper Sq. Ft.
2006 . . . . . . . . . . . . . . . . . . . . . . . . . . . . . . . . . . 2 7,103 0.2% $ 113,648 0.2% $16.002007 . . . . . . . . . . . . . . . . . . . . . . . . . . . . . . . . . . 2 3,955 0.1% $ 77,360 0.1% $19.562008 . . . . . . . . . . . . . . . . . . . . . . . . . . . . . . . . . . 1 7,965 0.2% $ 159,938 0.3% $20.082009 . . . . . . . . . . . . . . . . . . . . . . . . . . . . . . . . . . 0 0 0.0% $ 0 0.0% $ 0.002010 . . . . . . . . . . . . . . . . . . . . . . . . . . . . . . . . . . 1 8,878 0.2% $ 179,780 0.3% $20.252011 . . . . . . . . . . . . . . . . . . . . . . . . . . . . . . . . . . 3 99,542 2.0% $1,642,443 2.9% $16.502012 . . . . . . . . . . . . . . . . . . . . . . . . . . . . . . . . . . 2 37,052 0.8% $ 590,708 1.1% $15.942013 . . . . . . . . . . . . . . . . . . . . . . . . . . . . . . . . . . 4 128,354 2.6% $1,589,631 2.8% $12.382014 . . . . . . . . . . . . . . . . . . . . . . . . . . . . . . . . . . 2 149,949 3.0% $1,388,350 2.4% $ 9.262015 . . . . . . . . . . . . . . . . . . . . . . . . . . . . . . . . . . 4 40,971 0.8% $ 701,029 1.2% $17.11Beyond . . . . . . . . . . . . . . . . . . . . . . . . . . . . . . . . 2 63,431 1.3% $1,466,602 2.6% $23.12
Total . . . . . . . . . . . . . . . . . . . . . . . . . . . . . . . . . . 23 547,200 11.2% $7,909,489 13.9% $14.45
(1) Lease expiration table reflects rents in place as of December 31, 2005 and does not include option periods; 2006 expirations includemonth-to-month tenants. This column also excludes ground leases.
(2) Annualized base rent represents the monthly contractual rent for December 2005 for each applicable property multiplied by 12.
36

ITEM 3. LEGAL PROCEEDINGSWe are a party to various legal proceedings, which arise in the ordinary course of business. We are not
currently involved in any litigation nor, to our knowledge, is any litigation threatened against us the outcomeof which would, in our judgment based on information currently available to us, have a material adverse effecton our consolidated financial position or consolidated results of operations
ITEM 4. SUBMISSION OF MATTTERS TO A VOTE OF SECURITY HOLDERSNo matter was submitted to a vote of security holders through the solicitation of proxies or otherwise during
the fourth quarter of 2005.
37
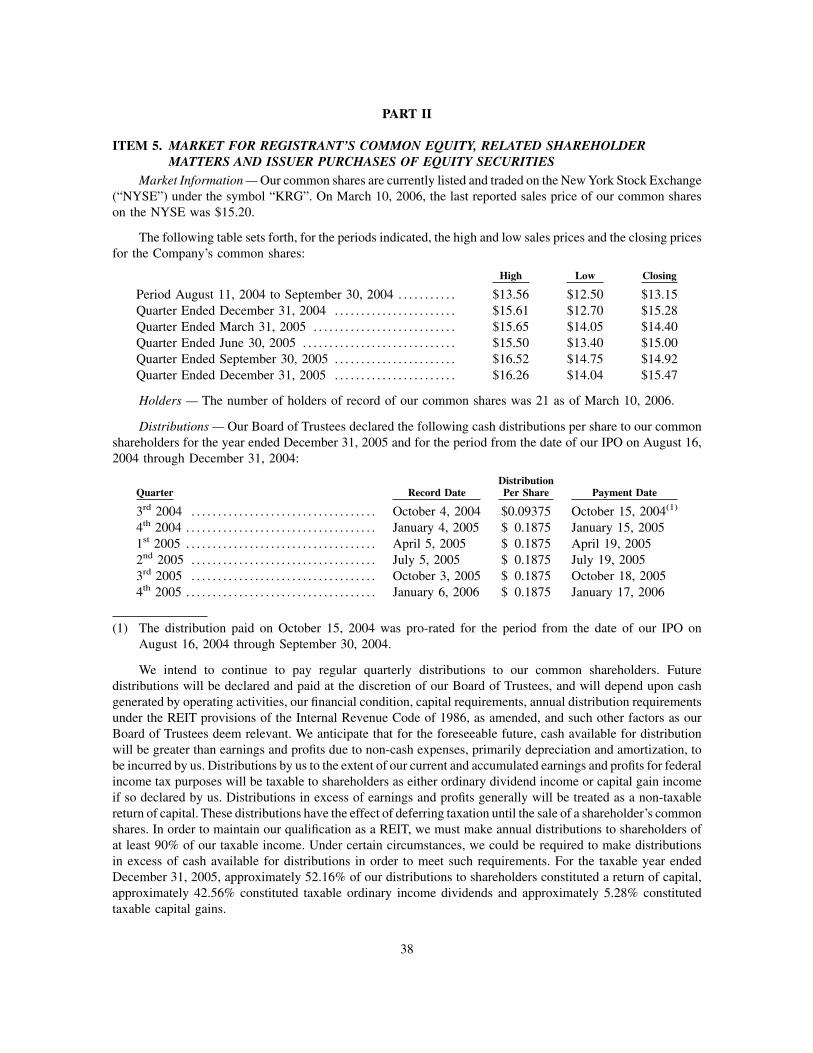
PART II
ITEM 5. MARKET FOR REGISTRANT’S COMMON EQUITY, RELATED SHAREHOLDERMATTERS AND ISSUER PURCHASES OF EQUITY SECURITIES
Market Information — Our common shares are currently listed and traded on the New York Stock Exchange(“NYSE”) under the symbol “KRG”. On March 10, 2006, the last reported sales price of our common shareson the NYSE was $15.20.
The following table sets forth, for the periods indicated, the high and low sales prices and the closing pricesfor the Company’s common shares:
High Low Closing
Period August 11, 2004 to September 30, 2004 . . . . . . . . . . . $13.56 $12.50 $13.15Quarter Ended December 31, 2004 . . . . . . . . . . . . . . . . . . . . . . . $15.61 $12.70 $15.28Quarter Ended March 31, 2005 . . . . . . . . . . . . . . . . . . . . . . . . . . . $15.65 $14.05 $14.40Quarter Ended June 30, 2005 . . . . . . . . . . . . . . . . . . . . . . . . . . . . . $15.50 $13.40 $15.00Quarter Ended September 30, 2005 . . . . . . . . . . . . . . . . . . . . . . . $16.52 $14.75 $14.92Quarter Ended December 31, 2005 . . . . . . . . . . . . . . . . . . . . . . . $16.26 $14.04 $15.47
Holders — The number of holders of record of our common shares was 21 as of March 10, 2006.
Distributions — Our Board of Trustees declared the following cash distributions per share to our commonshareholders for the year ended December 31, 2005 and for the period from the date of our IPO on August 16,2004 through December 31, 2004:
Quarter Record DateDistributionPer Share Payment Date
3rd 2004 . . . . . . . . . . . . . . . . . . . . . . . . . . . . . . . . . . . October 4, 2004 $0.09375 October 15, 2004(1)
4th 2004 . . . . . . . . . . . . . . . . . . . . . . . . . . . . . . . . . . . . January 4, 2005 $ 0.1875 January 15, 20051st 2005 . . . . . . . . . . . . . . . . . . . . . . . . . . . . . . . . . . . . April 5, 2005 $ 0.1875 April 19, 20052nd 2005 . . . . . . . . . . . . . . . . . . . . . . . . . . . . . . . . . . . July 5, 2005 $ 0.1875 July 19, 20053rd 2005 . . . . . . . . . . . . . . . . . . . . . . . . . . . . . . . . . . . October 3, 2005 $ 0.1875 October 18, 20054th 2005 . . . . . . . . . . . . . . . . . . . . . . . . . . . . . . . . . . . . January 6, 2006 $ 0.1875 January 17, 2006
(1) The distribution paid on October 15, 2004 was pro-rated for the period from the date of our IPO onAugust 16, 2004 through September 30, 2004.
We intend to continue to pay regular quarterly distributions to our common shareholders. Futuredistributions will be declared and paid at the discretion of our Board of Trustees, and will depend upon cashgenerated by operating activities, our financial condition, capital requirements, annual distribution requirementsunder the REIT provisions of the Internal Revenue Code of 1986, as amended, and such other factors as ourBoard of Trustees deem relevant. We anticipate that for the foreseeable future, cash available for distributionwill be greater than earnings and profits due to non-cash expenses, primarily depreciation and amortization, tobe incurred by us. Distributions by us to the extent of our current and accumulated earnings and profits for federalincome tax purposes will be taxable to shareholders as either ordinary dividend income or capital gain incomeif so declared by us. Distributions in excess of earnings and profits generally will be treated as a non-taxablereturn of capital. These distributions have the effect of deferring taxation until the sale of a shareholder’s commonshares. In order to maintain our qualification as a REIT, we must make annual distributions to shareholders ofat least 90% of our taxable income. Under certain circumstances, we could be required to make distributionsin excess of cash available for distributions in order to meet such requirements. For the taxable year endedDecember 31, 2005, approximately 52.16% of our distributions to shareholders constituted a return of capital,approximately 42.56% constituted taxable ordinary income dividends and approximately 5.28% constitutedtaxable capital gains.
38

Under our revolving credit facility, we are permitted to make distributions to our shareholders not to exceed95% of our Funds From Operations (“FFO”) provided that no event of default exists. See page 57 for a discussionof FFO. If an event of default exists, we may only make distributions sufficient to maintain our REIT status.
The Company did not repurchase any of its common shares nor sell any unregistered securities during theperiod covered by this report.
39

ITEM 6. SELECTED FINANCIAL DATAThe following tables set forth, on a historical basis, selected financial and operating information. The
financial information has been derived from the consolidated balance sheets and statements of operations of theCompany and the combined statements of operations of the Predecessor. This information should be read inconjunction with the audited consolidated financial statements of the Company and its Predecessor andManagement’s Discussion and Analysis of Financial Condition and Results of Operations appearing elsewherein this Annual Report on Form 10-K.
The Company The Predecessor
Year Ended December 31,Year EndedDecember 31,
2005
PeriodAugust 16,
2004through
December 31,2004
PeriodJanuary 1,
2004through
August 15,2004 2003 2002 2001
($ in thousands, except share and per share data)Operating Data:Revenues:
Rental related revenue and other . . . . . . . . . $ 72,945 $ 19,755 $12,935 $11,056 $ 5,921 $ 2,179Construction and service fees . . . . . . . . . . . . 26,420 9,334 5,257 14,852 22,445 8,585
Total revenue . . . . . . . . . . . . . . . . . . . . . . . . . . . . . 99,365 29,089 18,192 25,908 28,366 10,764Expenses:
Property operating . . . . . . . . . . . . . . . . . . . . . . 12,344 3,667 4,033 3,603 2,123 190Real estate taxes . . . . . . . . . . . . . . . . . . . . . . . . 7,459 1,927 1,409 1,132 549 57General and administrative . . . . . . . . . . . . . . 5,328 1,781 1,477 2,746 1,905 1,081Cost of construction and services . . . . . . . . 21,823 8,787 4,405 11,536 19,509 6,437Depreciation and amortization . . . . . . . . . . . 21,791 7,661 3,270 2,405 835 360Interest expense . . . . . . . . . . . . . . . . . . . . . . . . 18,089 4,449 4,557 3,809 2,206 1,249Loan prepayment penalties and expenses . . — 1,671 — — — —Income tax expense of taxable
REIT subsidiary . . . . . . . . . . . . . . . . . . . . . . 1,042 — — — — —
Total expenses . . . . . . . . . . . . . . . . . . . . . . . . . . . . 87,876 29,943 19,151 25,231 27,127 9,374Minority interest (income) loss . . . . . . . . . . . . . (1,267) (126) 215 (233) 85 (74)Equity in earnings of unconsolidated entities
and other, net . . . . . . . . . . . . . . . . . . . . . . . . . . 253 134 164 273 1,318 195
Income (loss) from continuing operations . . . 10,475 (846) (580) 717 2,642 1,511Operating income (loss) from
discontinued operations . . . . . . . . . . . . . . . . . 1,078 367 388 720 (404) —Gain on sale of operating property . . . . . . . . . 7,212 — — — — —Limited partners’ interest in
operating partnership . . . . . . . . . . . . . . . . . . . (5,329) 147 — — — —
Net income (loss) . . . . . . . . . . . . . . . . . . . . . . . . . $ 13,436 $ (332) $ (192) $ 1,437 $ 2,238 $ 1,511
Income (loss) per common share — basic:Continuing operations . . . . . . . . . . . . . . . . . . . $ 0.35 $ (0.03)Discontinued operations . . . . . . . . . . . . . . . . . 0.28 0.01
$ 0.63 $ (0.02)
Income (loss) per common share — diluted:Continuing operations . . . . . . . . . . . . . . . . . . . $ 0.35 $ (0.03)Discontinued operations . . . . . . . . . . . . . . . . . 0.27 0.01
$ 0.62 $ (0.02)
Weighted average Common Sharesoutstanding — basic . . . . . . . . . . . . . . . . . . . . 21,406,980 18,727,977
Weighted average Common Sharesoutstanding — diluted . . . . . . . . . . . . . . . . . . 21,520,061 18,727,977
Distributions paid per Common Share . . . . . . $ 0.75 $ 0.09375
40

The Company The Predecessor
Year Ended December 31, Year Ended December 31,
2005 2004 2003 2002 2001
($ in thousands)Balance Sheet Data:Investment properties, net . . . . . . . . . . . . . . . . . $738,734 $521,078 $149,346 $54,022 $36,673Cash and cash equivalents . . . . . . . . . . . . . . . . . 15,209 10,103 2,189 3,493 1,200Total assets . . . . . . . . . . . . . . . . . . . . . . . . . . . . . . . 799,230 563,544 171,336 71,388 49,091Mortgage and other indebtedness . . . . . . . . . . . 375,246 283,479 141,498 58,711 40,540Total liabilities . . . . . . . . . . . . . . . . . . . . . . . . . . . 436,106 336,922 165,778 70,954 49,626Limited partners’ interests in the
operating partnership . . . . . . . . . . . . . . . . . . . 84,245 68,423 — — —Shareholders’ equity (deficit) . . . . . . . . . . . . . . . 278,879 158,199 5,558 434 (535)Total liabilities and shareholders’
equity (deficit) . . . . . . . . . . . . . . . . . . . . . . . . . 799,230 563,544 171,336 71,388 49,091
ITEM 7. MANAGEMENT’S DISCUSSION AND ANALYSIS OF FINANCIAL CONDITION ANDRESULTS OF OPERATIONS
The following discussion should be read in connection with the accompanying historical financialstatements and related notes thereto and the “Risk Factors” appearing elsewhere in this Annual Report onForm 10-K. In this discussion, unless the context suggests otherwise, references to “our company,” “we,” “us”and “our” mean Kite Realty Group Trust and its subsidiaries and the Predecessor. Kite Property Group is thePredecessor to Kite Realty Group Trust.
OverviewWe are a full-service, vertically integrated real estate company focused primarily on the development,
construction, acquisition, ownership and operation of high quality neighborhood and community shoppingcenters in selected growth markets in the United States. We also provide real estate facility management,construction, development and other advisory services to third parties.
Kite Realty Group Trust commenced operations on August 16, 2004. Prior to that date, the entities thatowned the properties and service companies that we acquired as part of our formation transactions were underthe common control of Al Kite, John Kite and Paul Kite (the “Principals”). For the purpose of comparing ouroperating performance and cash flow results to the same periods of the prior year, we have combined theCompany’s results for the period from August 16, 2004 through December 31, 2004 with the Predecessor’s resultsfor the period from January 1, 2004 through August 15, 2004.
As of December 31, 2005, we owned interests in a portfolio of 40 operating retail properties totalingapproximately 6.2 million square feet of gross leasable area (including non-owned anchor space) and 14 retailproperties under development that are expected to contain approximately 1.8 million square feet of gross leasablearea (including non-owned anchor space) upon completion. As of December 31, 2005, we also owned interestsin four operating commercial properties totaling approximately 563,000 square feet of net rentable area and a relatedparking garage. In addition, at that date we owned interests in land parcels comprising approximately 180 acresthat may be used for expansion of existing properties or future development of new retail or commercial properties.
We derive revenues primarily from rents and reimbursement payments received from tenants under existingleases at each of our properties. We also derive revenues from providing management, leasing, real estatedevelopment, construction and real estate advisory services through subsidiaries of our taxable REITsubsidiaries. Our operating results therefore depend materially on the ability of our tenants to make requiredpayments and overall real estate market conditions.
In the future, we intend to focus on internal growth and pursuing targeted development and acquisitionsof neighborhood and community shopping centers. We expect to incur additional debt in connection with anyfuture development or acquisitions of real estate.
41
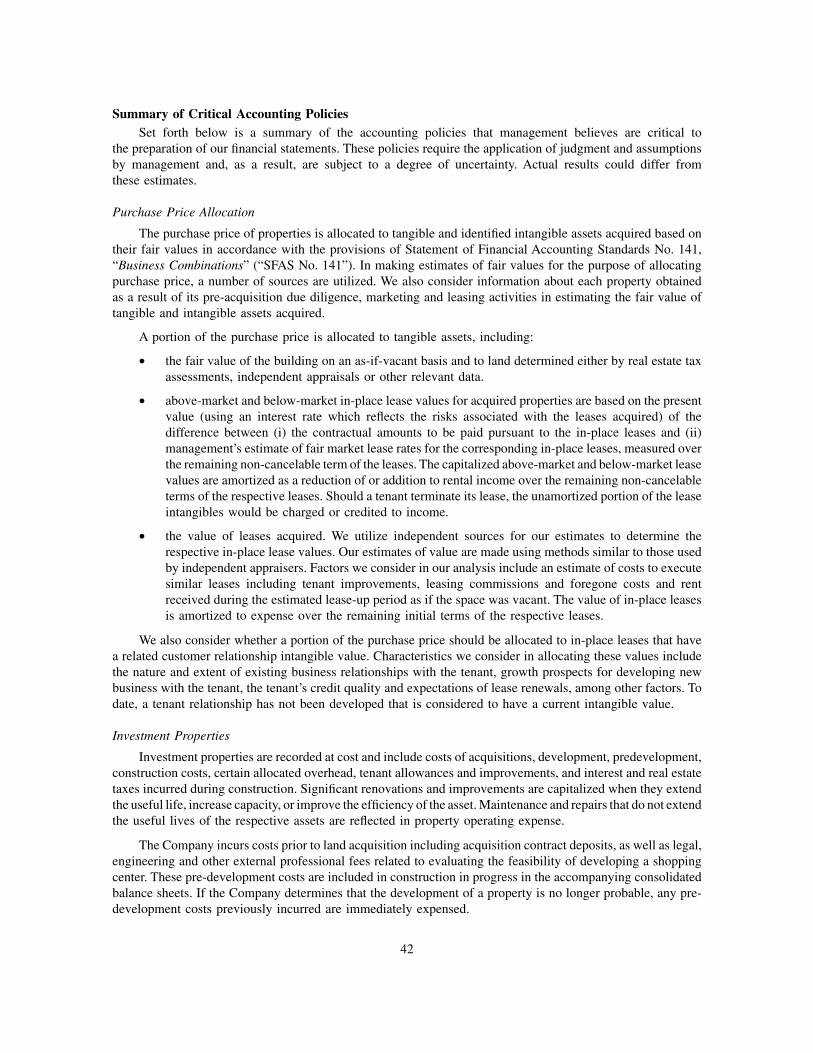
Summary of Critical Accounting PoliciesSet forth below is a summary of the accounting policies that management believes are critical to
the preparation of our financial statements. These policies require the application of judgment and assumptionsby management and, as a result, are subject to a degree of uncertainty. Actual results could differ fromthese estimates.
Purchase Price Allocation
The purchase price of properties is allocated to tangible and identified intangible assets acquired based ontheir fair values in accordance with the provisions of Statement of Financial Accounting Standards No. 141,“Business Combinations” (“SFAS No. 141”). In making estimates of fair values for the purpose of allocatingpurchase price, a number of sources are utilized. We also consider information about each property obtainedas a result of its pre-acquisition due diligence, marketing and leasing activities in estimating the fair value oftangible and intangible assets acquired.
A portion of the purchase price is allocated to tangible assets, including:
• the fair value of the building on an as-if-vacant basis and to land determined either by real estate taxassessments, independent appraisals or other relevant data.
• above-market and below-market in-place lease values for acquired properties are based on the presentvalue (using an interest rate which reflects the risks associated with the leases acquired) of thedifference between (i) the contractual amounts to be paid pursuant to the in-place leases and (ii)management’s estimate of fair market lease rates for the corresponding in-place leases, measured overthe remaining non-cancelable term of the leases. The capitalized above-market and below-market leasevalues are amortized as a reduction of or addition to rental income over the remaining non-cancelableterms of the respective leases. Should a tenant terminate its lease, the unamortized portion of the leaseintangibles would be charged or credited to income.
• the value of leases acquired. We utilize independent sources for our estimates to determine therespective in-place lease values. Our estimates of value are made using methods similar to those usedby independent appraisers. Factors we consider in our analysis include an estimate of costs to executesimilar leases including tenant improvements, leasing commissions and foregone costs and rentreceived during the estimated lease-up period as if the space was vacant. The value of in-place leasesis amortized to expense over the remaining initial terms of the respective leases.
We also consider whether a portion of the purchase price should be allocated to in-place leases that havea related customer relationship intangible value. Characteristics we consider in allocating these values includethe nature and extent of existing business relationships with the tenant, growth prospects for developing newbusiness with the tenant, the tenant’s credit quality and expectations of lease renewals, among other factors. Todate, a tenant relationship has not been developed that is considered to have a current intangible value.
Investment Properties
Investment properties are recorded at cost and include costs of acquisitions, development, predevelopment,construction costs, certain allocated overhead, tenant allowances and improvements, and interest and real estatetaxes incurred during construction. Significant renovations and improvements are capitalized when they extendthe useful life, increase capacity, or improve the efficiency of the asset. Maintenance and repairs that do not extendthe useful lives of the respective assets are reflected in property operating expense.
The Company incurs costs prior to land acquisition including acquisition contract deposits, as well as legal,engineering and other external professional fees related to evaluating the feasibility of developing a shoppingcenter. These pre-development costs are included in construction in progress in the accompanying consolidatedbalance sheets. If the Company determines that the development of a property is no longer probable, any pre-development costs previously incurred are immediately expensed.
42
The Company capitalizes costs of properties under development such as construction costs, interest costs,real estate taxes, salaries and related costs of personnel directly involved in the project and other costs incurredduring the period of development. As a development property becomes operational, the Company expensesappropriate costs pro rata based on the occupancy of the property. The Company does not capitalize costs ona project beyond 12 months after substantial completion of the building shell.
In accordance with Statement of Financial Accounting Standards No. 144, “Accounting for the Impairmentof Long-Lived Assets and for Long-Lived Assets to be Disposed Of” (“SFAS No. 144”), investment propertiesare reviewed for impairment on a property-by-property basis at least annually or whenever events or changesin circumstances indicate that the carrying value of investment properties may not be recoverable. Impairmentlosses for investment properties are recorded when the undiscounted cash flows estimated to be generated bythe investment properties during the expected hold period are less than the carrying amounts of those assets.Impairment losses are measured as the difference between the carrying value and the fair value of the asset.
In accordance with SFAS No. 144, operating properties held for sale include only those properties availablefor immediate sale in their present condition and for which management believes it is probable that a sale ofthe property will be completed within one year. Operating properties are carried at the lower of cost or fair valueless costs to sell. Depreciation and amortization are suspended during the held-for-sale period.
The Company’s properties generally have operations and cash flows that can be clearly distinguished fromthe rest of the Company. In accordance with SFAS No. 144, the operations reported in discontinued operationsinclude those operating properties that were sold or were considered held-for-sale and for which operations andcash flows can be clearly distinguished. The operations from these properties are eliminated from ongoingoperations and the Company will not have a continuing involvement after disposition. Prior periods have beenrestated to reflect the operations of these properties as discontinued operations.
Depreciation on buildings and improvements is provided utilizing the straight-line method over estimatedoriginal useful lives ranging from 10 to 35 years. Depreciation on tenant allowances and improvements isprovided utilizing the straight-line method over the term of the related lease. Depreciation on equipment andfixtures is provided utilizing the straight-line method over 5 to 10 years.
Revenue Recognition
As lessor, we retain substantially all of the risks and benefits of ownership of the investment propertiesand account for our leases as operating leases.
Base minimum rents are recognized on a straight-line basis over the terms of the respective leases. Certainlease agreements contain provisions that grant additional rents based on tenants’ sales volume (contingentpercentage rent). Percentage rents are recognized when tenants achieve the specified targets as defined in theirlease agreements and overage rents are included in other property related revenue in the accompanyingstatements of operations.
Reimbursements from tenants for real estate taxes and other recoverable operating expenses are recognizedas revenues in the period the applicable expense is incurred.
Gains on sales of real estate are recognized in accordance with Statement of Financial Standards(“SFAS”) No. 66, “Accounting for Real Estate”. In summary, gains from sales are not recognized unless a salehas been consummated, the buyer’s initial and continuing investment is adequate to demonstrate a commitmentto pay for the property, the Company has transferred to the buyer the usual risks and rewards of ownership, andthe Company does not have a substantial continuing financial involvement in the property.
Development and other advisory services fees are recognized as revenues in the period in which the servicesare rendered. Performance-based incentive fees are recorded when the fees are earned.
Revenues from construction contracts are recognized on the percentage-of-completion method, measuredby the percentage of cost incurred to date to the estimated total cost for each contract. Project costs include all
43

direct labor, subcontract, and material costs and those indirect costs related to contract performance costs incurredto date do not include uninstalled materials. Provisions for estimated losses on uncompleted contracts are madein the period in which such losses are determined. Changes in job performances, job conditions, and estimatedprofitability may result in revisions to costs and income, which are recognized in the period in which the revisionsare determined.
Accounting for Investments in Joint Ventures
In December 2003, the Financial Accounting Standards Board issued FASB Interpretation No. 46 (RevisedDecember 2003), “Consolidation of Variable Interest Entities” (“FIN 46R”). FIN 46R replacesFASB Interpretation No. 46 which was issued in January 2003. FIN 46R explains how to identify variable interestentities and how to assess whether to consolidate such entities. In general, a variable interest entity (“VIE”) isa corporation, partnership, trust or any other legal structure used for business purposes that either (a) does nothave equity investors with voting rights or (b) has equity investors that do not provide sufficient financialresources for the entity to support its activities. Prior to the issuance of FIN 46R, a company generally includedanother entity in its consolidated financial statements only if it controlled the entity through voting interests.FIN 46R changes that by requiring a VIE to be consolidated by a company if that company is subject to a majorityof the risk of loss from the VIE’s activities or entitled to receive a majority of the entity’s residual returns orboth. During 2005, we entered into nine joint venture agreements. Pursuant to the provisions of FIN 46R, allof these joint ventures have been consolidated in the accompanying financial statements because we control orthe joint venture entities have been deemed to be VIEs and we are the primary beneficiary of the entity.
On March 31, 2004 we consolidated Glendale Mall joint venture as of that date pursuant to FIN 46R. Periodsprior to March 31, 2004 were not restated as a result of the adoption of FIN 46R. As a result of the IPO andrelated formation transactions, Glendale Mall is wholly owned.
We account for our investments in unconsolidated joint ventures under the equity method of accountingas we exercise significant influence over, but do not control, operating and financial policies. These investmentsare recorded initially at cost and subsequently adjusted for equity in earnings and cash contributions anddistributions. As of December 31, 2005, we had two entities that were accounted for under the equity method(Spring Mill Medical and The Centre).
Results of Operations
Comparison of the Year Ended December 31, 2005 to the Year Ended December 31, 2004
Acquisition and Development Activities
The comparability of results of operations is significantly affected by our development and acquisitionactivities in 2005 and 2004 and the effects of the IPO and related formation transactions. At December 31, 2005,we owned interests in 45 operating properties (consisting of 40 retail properties, four commercial operatingproperties and a related parking garage) and had 14 properties under development. Of the 59 total propertiesheld at December 31, 2005, two operating properties (Spring Mill Medical and The Centre) were owned throughjoint ventures and accounted for under the equity method.
We acquired and placed in service the following operating properties during the year ended December 31, 2005:Property Name MSA Acquisition Date
Fox Lake Crossing . . . . . . . . . . . . . . . . . . . . . . . . . . . . . . . . . . Fox Lake, IL February 7Plaza Volente . . . . . . . . . . . . . . . . . . . . . . . . . . . . . . . . . . . . . . . Austin, TX May 16Indian River Square . . . . . . . . . . . . . . . . . . . . . . . . . . . . . . . . Vero Beach, FL May 16Bolton Plaza . . . . . . . . . . . . . . . . . . . . . . . . . . . . . . . . . . . . . . . . Jacksonville, FL November 1Market Street Village . . . . . . . . . . . . . . . . . . . . . . . . . . . . . . . Hurst, Texas November 17
44

In addition, the following development properties became operational or partially operational during theyear ended December 31, 2005:
Property Name MSA Operational Date
Weston Park Phase I . . . . . . . . . . . . . . . . . . . . . . . . . . . . . . . . Indianapolis, IN March 2005Greyhound Commons . . . . . . . . . . . . . . . . . . . . . . . . . . . . . . . Indianapolis, IN March 2005Geist Pavilion . . . . . . . . . . . . . . . . . . . . . . . . . . . . . . . . . . . . . . . Indianapolis, IN March 2005Martinsville Shops . . . . . . . . . . . . . . . . . . . . . . . . . . . . . . . . . . Martinsville, IN June 2005Red Bank Commons . . . . . . . . . . . . . . . . . . . . . . . . . . . . . . . . Evansville, IN June 2005Traders Point II . . . . . . . . . . . . . . . . . . . . . . . . . . . . . . . . . . . . . Indianapolis, IN June 2005
At December 31, 2004, we owned interests in 36 operating properties (consisting of 30 retail properties,five commercial properties and a related parking garage) and had nine properties under development. Of the45 total properties held at December 31, 2004, two operating properties were owned through joint ventures andwere accounted for under the equity method.
We acquired and placed in service the following operating properties during the year ended December 31, 2004:
Property Name MSA Acquisition Date
Silver Glen Crossings . . . . . . . . . . . . . . . . . . . . . . . . . . . . . . . Chicago, IL April 1Cedar Hill Village . . . . . . . . . . . . . . . . . . . . . . . . . . . . . . . . . . Dallas, TX June 28Galleria Plaza . . . . . . . . . . . . . . . . . . . . . . . . . . . . . . . . . . . . . . . Dallas, TX June 29Wal-Mart Plaza(1) . . . . . . . . . . . . . . . . . . . . . . . . . . . . . . . . . . . Gainesville, FL July 1Eagle Creek Pad 2 . . . . . . . . . . . . . . . . . . . . . . . . . . . . . . . . . . Naples, FL July 7Fishers Station(2) . . . . . . . . . . . . . . . . . . . . . . . . . . . . . . . . . . . . Indianapolis, IN July 23Hamilton Crossing . . . . . . . . . . . . . . . . . . . . . . . . . . . . . . . . . . Indianapolis, IN August 19Waterford Lakes . . . . . . . . . . . . . . . . . . . . . . . . . . . . . . . . . . . . Orlando, FL August 20Publix at Acworth . . . . . . . . . . . . . . . . . . . . . . . . . . . . . . . . . . Atlanta, GA August 20Plaza at Cedar Hill . . . . . . . . . . . . . . . . . . . . . . . . . . . . . . . . . Dallas, TX August 31Sunland Towne Centre . . . . . . . . . . . . . . . . . . . . . . . . . . . . . . El Paso, TX September 16Centre at Panola . . . . . . . . . . . . . . . . . . . . . . . . . . . . . . . . . . . . Atlanta, GA September 30Marsh Supermarket . . . . . . . . . . . . . . . . . . . . . . . . . . . . . . . . . Indianapolis, IN November 24Eastgate Pavilion . . . . . . . . . . . . . . . . . . . . . . . . . . . . . . . . . . . Cincinnati, OH December 1Four Corner Square . . . . . . . . . . . . . . . . . . . . . . . . . . . . . . . . . Seattle, WA December 20
(1) This property is owned through a joint venture with a third party. We currently receive 85% of the cash flow from this property,which percentage may decrease under certain circumstances.
(2) This property is owned through a joint venture with a third party. The joint venture partner is entitled to an annual preferredpayment of $96,000. All remaining cash flow is allocated to us.
The following development properties became operational during the year ended December 31, 2004:
Property Name MSA Operational Date
Boulevard Crossing . . . . . . . . . . . . . . . . . . . . . . . . . . . . . . . . . Kokomo, IN FebruaryCircuit City Plaza . . . . . . . . . . . . . . . . . . . . . . . . . . . . . . . . . . . Ft. Lauderdale, FL March50th & 12th . . . . . . . . . . . . . . . . . . . . . . . . . . . . . . . . . . . . . . . . . . Seattle, WA August176th & Meridian . . . . . . . . . . . . . . . . . . . . . . . . . . . . . . . . . . . Seattle, WA AugustTraders Point . . . . . . . . . . . . . . . . . . . . . . . . . . . . . . . . . . . . . . . Indianapolis, IN OctoberCool Creek Commons . . . . . . . . . . . . . . . . . . . . . . . . . . . . . . Indianapolis, IN October82nd & Otty . . . . . . . . . . . . . . . . . . . . . . . . . . . . . . . . . . . . . . . . . Portland, OR NovemberIndiana State Motor Pool . . . . . . . . . . . . . . . . . . . . . . . . . . . Indianapolis, IN November
45

Glendale Mall was consolidated on March 31, 2004 in accordance with the provisions of FIN 46R.Previously, it had been accounted for under the equity method. In connection with our IPO, we acquired theremaining joint venture and outside partner interests in a total of nine properties, including Glendale Mall. Asa result, these properties are now consolidated in the accompanying financial statements.
Comparison of Operating Results for the Years Ended December 31, 2005 and 2004
The following table reflects key line items from our consolidated and combined statements of operationsfor the years ended December 31, 2005 and 2004:
The Company
CombinedThe Company and
The Predecessor
Year Ended December 31,2005 2004
Increase (Decrease)2004 to 2005
Rental income (including tenant reimbursements) . . $66,936,189 $29,088,083 $37,848,106 130%Other property related revenue . . . . . . . . . . . . . . . . . . . 5,793,443 3,460,759 2,332,684 67%Construction and service fee revenue . . . . . . . . . . . . 26,419,801 14,591,069 11,828,732 81%Other income, net . . . . . . . . . . . . . . . . . . . . . . . . . . . . . . . . 215,422 141,265 74,157 52%Property operating expense . . . . . . . . . . . . . . . . . . . . . . 12,343,345 7,699,816 4,643,529 60%Real estate taxes . . . . . . . . . . . . . . . . . . . . . . . . . . . . . . . . . 7,458,563 3,336,110 4,122,453 124%Cost of construction and services . . . . . . . . . . . . . . . . 21,823,278 13,192,159 8,631,119 65%General, administrative, and other . . . . . . . . . . . . . . . 5,327,735 3,257,691 2,070,044 64%Depreciation and amortization . . . . . . . . . . . . . . . . . . . 21,791,136 10,931,639 10,859,497 99%
Operating income . . . . . . . . . . . . . . . . . . . . . . . . . . . . . . . . 30,620,798 8,863,761 21,757,037Interest expense . . . . . . . . . . . . . . . . . . . . . . . . . . . . . . . . . . 18,089,421 9,006,169 9,083,252 101%Loan prepayment penalties and expenses . . . . . . . . — 1,671,449 (1,671,449) –100%Income tax expense of taxable REIT subsidiary . . 1,041,463 — 1,041,463 —Minority interest (income) loss . . . . . . . . . . . . . . . . . . (1,267,122) 89,087 (1,356,209) —Equity in earnings of unconsolidated entities . . . . 252,511 297,901 (45,390) –15%Operating income from discontinued operations . 1,077,433 755,199 322,234 43%Gain on sale of operating property . . . . . . . . . . . . . . . 7,212,402 — 7,212,402 —Limited Partners’ interest in
Operating Partnership . . . . . . . . . . . . . . . . . . . . . . . . . (5,329,298) 146,968 (5,476,266) —
Net income (loss) . . . . . . . . . . . . . . . . . . . . . . . . . . . . . . . $13,435,840 $ (524,702) $13,960,542
Revenues:Rental income (including tenant reimbursements) increased from $29.1 million in 2004 to $66.9 million
in 2005, an increase of $37.8 million or 130%. Approximately $23.3 million of this increase was attributableto properties acquired in 2004 and 2005, approximately $10.5 million of the increase was due to properties thatopened in 2004 or 2005, approximately $0.3 million was due to the consolidation of Glendale Mall as ofMarch 31, 2004, approximately $3.0 million was attributable to the consolidation of properties following ouracquisition of the joint venture partners’ interests in connection with our IPO and related formation transactions,approximately $0.4 million was attributable to properties operating for all of 2005 and 2004 and approximately$0.3 million was due to the conversion of the contractual arrangement at the Union Station Parking Garage froma daily fee arrangement to a net lease.
Other property related revenue primarily consists of parking revenues, lease settlement income and gainson land sales before income taxes and minority interests. This category increased from $3.5 million in 2004 to$5.8 million in 2005, an increase of $2.3 million or 67%. This increase was attributable to incremental 2005gains on the sale of land parcels and related development rights of approximately $2.5 million and leasetermination and other revenue of $0.1 million, partially offset by a reduction of approximately $0.4 million due
46
to the conversion of the contractual arrangement at the Union Station Parking Garage from a daily feearrangement to a net lease.
Construction revenue and service fees increased from $14.6 million in 2004 to $26.4 million in 2005, anincrease of $11.8 million or 81%. Approximately $5.6 million of the increase reflects proceeds from the saleof a Walgreen’s as part of our merchant building activity, approximately $5.6 of the increase is due to increasesin construction contracts with third parties and approximately $1.3 million represents an increase is fee incomeancillary to our development activities. This increase was partially offset by a decline in advisory fees ofapproximately $0.7 million.
Expenses:Property operating expenses increased from $7.7 million in 2004 to $12.3 million in 2005, an increase of
$4.6 million or 60%. Approximately $3.1 million of this increase was attributable to properties acquired in 2004and 2005, approximately $1.0 million was due to properties opened in 2004 or 2005, approximately $0.4 millionwas due to the consolidation of the Glendale Mall property as of March 31, 2004 and approximately $0.2 millionof the increase was due to the consolidation of properties following our acquisition of the joint venture partners’interests in connection with our IPO and related formation transactions. Offsetting these increases was a decreaseof approximately $0.2 million due to the conversion of the contractual arrangement at the Union Station ParkingGarage from a daily fee arrangement to a net lease.
Real estate taxes increased from $3.3 million in 2004 to $7.4 million in 2005, an increase of $4.1 millionor 124%. Approximately $3.2 million of this increase was attributable to properties acquired in 2004 and 2005,approximately $0.9 million was attributable to properties that opened in 2004 or 2005, approximately$0.3 million was due to the consolidation of properties following our acquisition of the joint venture partners’interests in connection with our IPO and related formation transactions and approximately $0.1 million wasattributable to properties operating for all of 2005 and 2004. Offsetting the increases was a decrease ofapproximately $0.4 million at Glendale Mall from a successful property tax appeal at this property.
Cost of construction and services increased from $13.2 million in 2004 to $21.8 million in 2005, an increaseof $8.6 million or 65%. Approximately $4.1 million of this increase was attributable to costs associated withthe sale of a Walgreen’s as part of our merchant building activity. The remaining increase of approximately$4.5 million was largely due to an increase in construction contracts with third-party customers.
General, administrative and other expense increased from $3.3 million in 2004 to $5.3 million in 2005,an increase of $2.0 million or 64%. Approximately $1.5 million of this increase is attributable to incrementalcosts of operating as a public company and approximately $0.6 million is attributable to the growth in ourcompany, resulting in increased salaries, benefits and related costs.
Depreciation and amortization increased from $10.9 million in 2004 to $21.8 million in 2005, an increaseof $10.9 million or 99%. Approximately $7.6 million of the increase was attributable to properties acquired in2004 and 2005, approximately $2.4 million is attributable to properties that opened in 2004 or 2005, $0.9 millionwas due to the consolidation of properties following our acquisition of the joint venture and minority partners’interests in connection with our IPO and related formation transactions, and $0.1 million was attributable toproperties that were operating for all of 2005 and 2004.
Interest expense increased from $9.0 million in 2004 to $18.1 million in 2005, an increase of $9.1 million,or 101%. Approximately $4.6 million was attributable to properties that opened in 2004 or 2005, approximately$3.9 million was due to increased borrowings on our line of credit used primarily to finance property acquisitionactivities, approximately $3.0 million of the increase was attributable to properties acquired in 2004 and 2005,approximately $1.1 million was due to the consolidation of properties following our acquisition of the jointventure partners’ interests in connection with our IPO and related formation transactions, and approximately$0.2 million was due to the consolidation of the Glendale Mall property as of March 31, 2004. Offsetting theseincreases was a reduction of interest expense of approximately $3.9 million from the payoff of indebtednessin connection with our IPO and 2005 Offering.
47
Loan prepayment penalties and related expenses of approximately $1.7 million were incurred in 2004 inconnection with our IPO and related formation transactions.
Minority interest was income of approximately $1.3 million in 2005 and a loss of approximately $0.1 millionin 2004. The 2005 income is largely attributable to gains on the sale of land parcels and development fees. The2004 loss is attributable to certain minority interests acquired in connection with our 2004 IPO and relatedformation transactions. These interests recognized a loss of $0.1 million in 2004 prior to the date of our IPOand were consolidated from the date of their acquisition.
Operating income from discontinued operations was $1.1 million in 2005 and $0.8 million in 2004. Thisactivity relates to the Mid-America Clinical Labs property that we sold on December 30, 2005. All periods havebeen restated to reflect the effects of this transaction. The increase between years is attributable to the reductionin interest expense from the payoff of indebtedness in connection with our IPO and related formation transactions.
Gain on sale of operating property was $7.2 million in 2005. In December, we sold the Mid-America ClinicalLabs property in a like-kind exchange under Section 1031 of the Internal Revenue Code.
Comparison of the Year Ended December 31, 2004 to the Year Ended December 31, 2003
Acquisition and Development Activities
The comparability of our results of operations is significantly affected by our development, redevelopmentand acquisition activities in 2004 and 2003. At December 31, 2004 we owned interests in 36 operating properties(consisting of 30 retail properties, five commercial operating properties and a related parking garage) and hadnine properties under development. Of the 45 total properties held at December 31, 2004, two developmentproperties were owned through joint ventures and accounted for under the equity method. On March 13, 2003,we acquired and placed in service Ridge Plaza Shopping Center; on June 10, 2003, we acquired and placed inservice King’s Lake Shopping Center; and on July 8, 2003 we acquired and placed in service Shops at EagleCreek. In December 2004, PEN Products became operational.
At December 31, 2003, we owned interests in 17 operating properties (consisting of 12 retail propertiesand four commercial properties and a related parking garage) and had 13 properties under development. Of the30 total properties held at December 31, 2003, seven operating properties and two development properties wereowned through joint ventures and accounted for under the equity method.
In 2003, four significant development and redevelopment properties were completed. Mid-America ClinicalLabs opened in October, Spring Mill Medical (a joint venture) opened in September, Preston Commons openedin July and Thirty South opened in April.
48
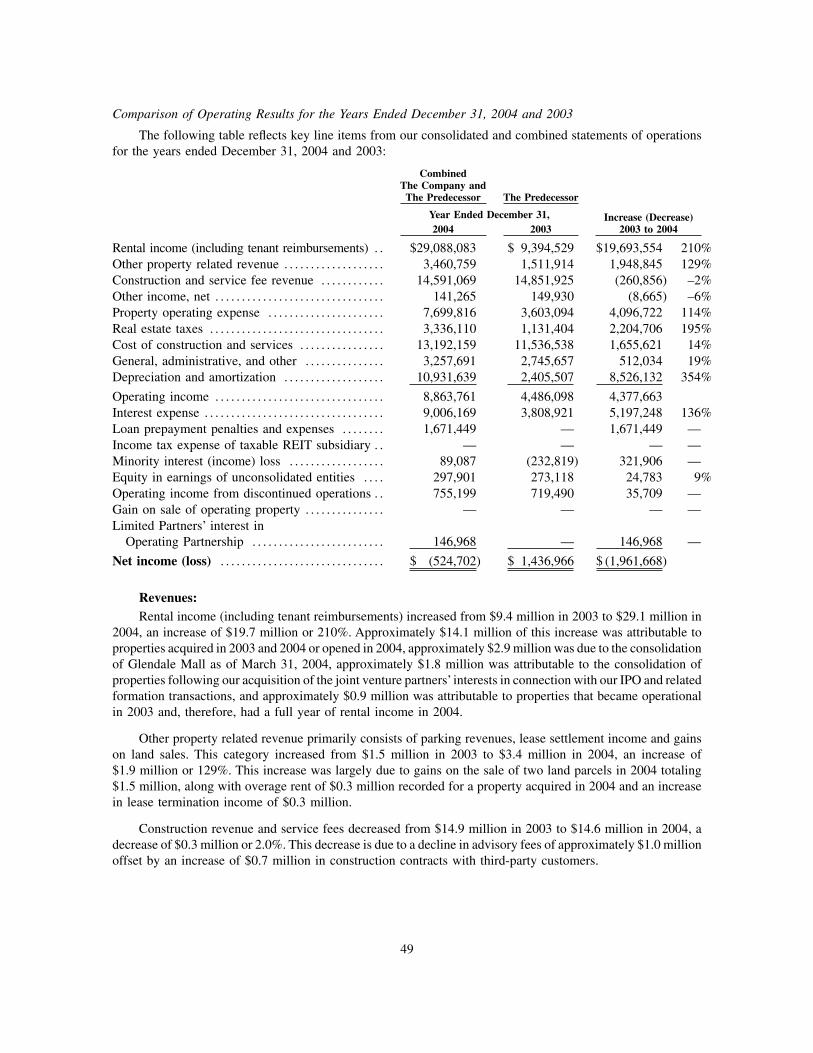
Comparison of Operating Results for the Years Ended December 31, 2004 and 2003
The following table reflects key line items from our consolidated and combined statements of operationsfor the years ended December 31, 2004 and 2003:
CombinedThe Company and
The Predecessor The Predecessor
Year Ended December 31,2004 2003
Increase (Decrease)2003 to 2004
Rental income (including tenant reimbursements) . . $29,088,083 $ 9,394,529 $19,693,554 210%Other property related revenue . . . . . . . . . . . . . . . . . . . 3,460,759 1,511,914 1,948,845 129%Construction and service fee revenue . . . . . . . . . . . . 14,591,069 14,851,925 (260,856) –2%Other income, net . . . . . . . . . . . . . . . . . . . . . . . . . . . . . . . . 141,265 149,930 (8,665) –6%Property operating expense . . . . . . . . . . . . . . . . . . . . . . 7,699,816 3,603,094 4,096,722 114%Real estate taxes . . . . . . . . . . . . . . . . . . . . . . . . . . . . . . . . . 3,336,110 1,131,404 2,204,706 195%Cost of construction and services . . . . . . . . . . . . . . . . 13,192,159 11,536,538 1,655,621 14%General, administrative, and other . . . . . . . . . . . . . . . 3,257,691 2,745,657 512,034 19%Depreciation and amortization . . . . . . . . . . . . . . . . . . . 10,931,639 2,405,507 8,526,132 354%
Operating income . . . . . . . . . . . . . . . . . . . . . . . . . . . . . . . . 8,863,761 4,486,098 4,377,663Interest expense . . . . . . . . . . . . . . . . . . . . . . . . . . . . . . . . . . 9,006,169 3,808,921 5,197,248 136%Loan prepayment penalties and expenses . . . . . . . . 1,671,449 — 1,671,449 —Income tax expense of taxable REIT subsidiary . . — — — —Minority interest (income) loss . . . . . . . . . . . . . . . . . . 89,087 (232,819) 321,906 —Equity in earnings of unconsolidated entities . . . . 297,901 273,118 24,783 9%Operating income from discontinued operations . . 755,199 719,490 35,709 —Gain on sale of operating property . . . . . . . . . . . . . . . — — — —Limited Partners’ interest in
Operating Partnership . . . . . . . . . . . . . . . . . . . . . . . . . 146,968 — 146,968 —
Net income (loss) . . . . . . . . . . . . . . . . . . . . . . . . . . . . . . . $ (524,702) $ 1,436,966 $ (1,961,668)
Revenues:Rental income (including tenant reimbursements) increased from $9.4 million in 2003 to $29.1 million in
2004, an increase of $19.7 million or 210%. Approximately $14.1 million of this increase was attributable toproperties acquired in 2003 and 2004 or opened in 2004, approximately $2.9 million was due to the consolidationof Glendale Mall as of March 31, 2004, approximately $1.8 million was attributable to the consolidation ofproperties following our acquisition of the joint venture partners’ interests in connection with our IPO and relatedformation transactions, and approximately $0.9 million was attributable to properties that became operationalin 2003 and, therefore, had a full year of rental income in 2004.
Other property related revenue primarily consists of parking revenues, lease settlement income and gainson land sales. This category increased from $1.5 million in 2003 to $3.4 million in 2004, an increase of$1.9 million or 129%. This increase was largely due to gains on the sale of two land parcels in 2004 totaling$1.5 million, along with overage rent of $0.3 million recorded for a property acquired in 2004 and an increasein lease termination income of $0.3 million.
Construction revenue and service fees decreased from $14.9 million in 2003 to $14.6 million in 2004, adecrease of $0.3 million or 2.0%. This decrease is due to a decline in advisory fees of approximately $1.0 millionoffset by an increase of $0.7 million in construction contracts with third-party customers.
49
Expenses:Property operating expenses increased from $3.6 million in 2003 to $7.7 million in 2004, an increase of
$4.1 million or 114%. Approximately $2.5 million of this increase was attributable to properties acquired in 2003and 2004 or opened in 2004, $1.7 million was due to the consolidation of the Glendale Mall property as ofMarch 31, 2004, and $0.2 million was due to the consolidation of properties following our acquisition of thejoint venture partners’ interests in connection with our IPO and related formation transactions. Offsetting theseincreases was a decrease of approximately $0.2 million due to the conversion of the contractual arrangementat the Union Station Parking Garage from a daily fee arrangement to a net lease.
Real estate taxes increased from $1.1 million in 2003 to $3.3 million in 2004, an increase of $2.2 millionor 195%. Approximately $1.7 million of this increase was attributable to properties acquired in 2003 or openedin 2004, $0.2 million was due to the consolidation of the Glendale Mall property as of March 31, 2004 and$0.2 million was attributable to properties that became operational in 2003 and, therefore, had a full year of realestate tax expense in 2004.
Cost of construction and services increased from $11.5 million in 2003 to $13.2 million in 2004, an increaseof $1.7 million or 14%. Approximately $0.9 million of this increase was due to an increase in constructioncontracts with third-party customers. Approximately $0.8 million of the increase is due to higher costs in supportof the Company’s advisory services businesses.
General, administrative and other expense increased from $2.7 million in 2003 to $3.2 million in2004, an increase of $0.5 million or 19%. This increase is primarily due to incremental costs of operating asa public company.
Depreciation and amortization increased from $2.4 million in 2003 to $10.9 million in 2004, an increaseof $8.5 million or 354%. Approximately $3.9 million of the increase was attributable to properties acquired in2003 and 2004 or opened in 2004, approximately $3.2 million was due to the consolidation of the Glendale Mallproperty as of March 31, 2004, $0.8 million was due to the consolidation of properties following our acquisitionof the joint venture and minority partners’ interests in connection with our IPO and related formation transactions,and $0.2 million was attributable to properties that became operational in 2003 and, therefore, had a full yearof depreciation and amortization expense in 2004.
Interest expense increased from $3.8 million in 2003 to $9.0 million in 2004, an increase of $5.2 million,or 136%. Approximately $2.4 million of the increase was attributable to properties acquired in 2003 and 2004or opened in 2004, approximately $0.6 million was attributable to incremental financing costs in connection withour IPO and related formation transactions, approximately $0.6 million was due to the consolidation of propertiesfollowing our acquisition of the joint venture partners’ interests in connection with our IPO and related formationtransactions, approximately $0.6 million was due to increased borrowings on our line of credit used primarilyto finance property acquisition activities, approximately $0.5 million was due to the consolidation of the GlendaleMall property as of March 31, 2004 and approximately $0.1 million was attributable to properties that becameoperational in 2003 and, therefore, had a full year of interest expense in 2004
Loan prepayment penalties and related expenses of approximately $1.7 million were incurred in 2004 inconnection with our IPO and related formation transactions.
Minority interest was a loss of approximately $0.1 million in 2004 and income of approximately $0.2 millionin 2003. The 2004 loss is attributable to certain minority interests acquired in connection with our 2004 IPOand related formation transactions. These interests recognized a loss of $0.1 million in 2004 prior to the dateof our IPO and were consolidated from the date of their acquisition.
Operating income from discontinued operations was $0.8 million in 2004 and $0.7 million in 2003. Thisactivity relates to the Mid-America Clinical Labs property that we sold on December 30, 2005. All periods havebeen restated to reflect the effects of this transaction.
50

Liquidity and Capital ResourcesAs of December 31, 2005, we had cash and cash equivalents on hand of $15.2 million.
As of December 31, 2005, our borrowing base under the revolving credit facility was approximately$117.1 million, of which approximately $24.1 million was available for additional borrowings. With the priorconsent of the lenders we have the option to increase our borrowings under the credit facility to a maximumof $250 million. We may also extend the facility for one year, provided that no events of default exist and subjectto an extension fee of $300,000. Borrowings under the credit facility bear interest at a floating rate of LIBORplus 135 to 160 basis points, depending on our leverage ratio. As of December 31, 2005, there are 32 propertiesavailable to be added to the borrowing base (upon completion of the lender’s due diligence process) as additionalfunds are required for potential additional borrowing capacity in excess of $150 million.
Our ability to borrow under this credit facility is subject to our ongoing compliance with a number offinancial and other covenants, including with respect to our amount of leverage, minimum interest and fixedcharge coverage ratios, our minimum tangible net worth, the collateral pool properties generating sufficient netoperating income to maintain a certain fixed charge ratio and minimum aggregate occupancy rate. Under theterms of the credit facility, we are permitted to make distributions to our shareholders of up to 95% of our fundsfrom operations provided that no event of default exists. If an even of default exists, we may only makedistributions sufficient to maintain our REIT status. As of December 31, 2005, we were in compliance with allof the financial covenants under the credit facility.
In October 2005, we completed an offering of common shares that provided us with an aggregate ofapproximately $133.2 million of net proceeds (including the underwriters’ exercise of their overallotment optionand after deducting underwriting discounts, commissions and other expenses). We used approximately$112.9 million of these net proceeds to pay down outstanding indebtedness. As a result, we believe that ourbalance sheet has been significantly improved, and additional amounts are available for future borrowing to fundacquisitions and development of properties and other cash needs.As a result of the paydown of debt in connectionwith our October 2005 offering, our Traders Point, Eagle Creek Phase II, Weston Park, Shops at Otty, and CircuitCity properties were available to be added to the borrowing base. We also used approximately $14.0 millionof the net proceeds to acquire Bolton Plaza and approximately $6.3 for general corporate purposes, includingacquisition of land, capital expenditures, development costs and working capital.
The nature of our business, coupled with the requirements for qualifying for REIT status (which includesthe requirement that we distribute to shareholders at least 90% of our annual REIT taxable income) and to avoidpaying tax on our income, necessitate that we distribute a substantial majority of our income on an annual basiswhich will cause us to have substantial liquidity needs over both the short term and the long term. Our short-termliquidity needs consist primarily of funds necessary to pay operating expenses associated with our operatingproperties, interest expense and scheduled principal payments on our debt, expected dividend payments(including distributions to persons who hold units in our operating partnership) and recurring capitalexpenditures. When we lease space to new tenants, or renew leases for existing tenants, we also incurexpenditures for tenant improvements and leasing commissions. This amount, as well as the amount of recurringcapital expenditures that we incur, will vary from year to year. During 2005, we incurred approximately$0.5 million of costs for recurring capital expenditures and $1.6 million of costs for tenant improvements andleasing commissions, all exclusive of amounts incurred under construction loans or our revolving credit facilityfor our development properties. We expect to meet our short-term liquidity needs through cash generated fromoperations and, to the extent necessary, borrowings under the revolving credit facility.
Our long-term liquidity needs consist primarily of funds necessary to pay for development of newproperties, redevelopment of existing properties, non-recurring capital expenditures, acquisitions of propertiesand payment of indebtedness at maturity. As of December 31, 2005, we have 14 development projects underwaythat are expected to cost approximately $176 million, of which approximately $108 million had been incurredas of December 31, 2005. In addition, we are actively pursuing the acquisition and development of otherproperties, which will require additional capital. We do not expect that we will have sufficient funds on hand
51
to meet these long-term cash requirements. We will have to satisfy these needs through either additionalborrowings, sales of common or preferred shares and/or cash generated through property dispositions and jointventure transactions.
We believe that we will have access to these sources of capital to fund our long-term liquidity requirementsbut we cannot assure that this will be the case. Our ability to access the equity capital markets will be dependenton a number of factors as well, including general market conditions for REITs and market perceptions about us.
We use derivatives to add stability to interest expense and to manage our exposure to interest rate movementsand other identified risks. To accomplish this objective, we use interest rate swaps as part of our cash flow hedgingstrategy. Interest rate swaps designated as cash flow hedges involve the receipt of variable-rate amounts inexchange for fixed-rate payments over the life of the agreements without exchange of the underlying principalamount. During 2005, such derivatives were used to hedge the variable cash flows associated with certain ofour existing variable-rate debt.
We derive the majority of our revenue from tenants who lease space from us at our properties. Therefore,our ability to generate cash from operations is dependent on the rents that we are able to charge and collect fromour tenants. While we believe that the nature of the properties in which we typically invest — primarilyneighborhood and community shopping centers — provides a relatively stable revenue flow in uncertaineconomic times, general economic downturns or downturns in the markets in which we own properties may stilladversely affect the ability of our tenants to meet their lease obligations. In that event, our cash flow fromoperations could be materially affected.
In January 2005, Ultimate Electronics filed for Chapter 11 bankruptcy protection to reorganize its businessoperations. During the second quarter of 2005 this tenant rejected its leases with us at Galleria Plaza and at CedarHill Plaza. During the third quarter of 2005, we re-leased the former Ultimate Electronics spaces at GalleriaPlaza to Shoe Pavilion and at Cedar Hill Village to 24 Hour Fitness. These two leases represent a total ofapproximately 64,000 square feet. We anticipate that both tenants will open in the spring of 2006. We anticipateinvesting approximately $1.9 million in tenant improvements in connection with re-leasing these spaces.
In February 2005, Winn-Dixie Stores, Inc. filed for Chapter 11 bankruptcy protection to reorganize itsbusiness operations. This tenant operates in two locations in our portfolio (Shops at Eagle Creek and WaterfordLakes) totaling approximately 103,400 square feet at an average base rent of $7.80 per square foot, representingapproximately 1.4% of our total annualized base rent as of December 31, 2005. The tenant continues to operatein both locations and has paid base rent (excluding a portion of common area maintenance and real estate taxreimbursements) through March 2006 but there can be no assurance of its ability to pay rent prospectively. OnFebruary 28, 2006, Winn-Dixie announced plans to close its store at Shops at Eagle Creek but had not at thatdate rejected the lease at this property. The store at Shops at Eagle Creek contains approximately 51,700 squarefeet leased to Winn-Dixie at a base rent of $7.69 per square foot. In its announcement, Winn-Dixie includedits store at Waterford Lakes in its list of stores that it intended to retain as of that date.
The delay or failure of Winn-Dixie to make payments under its leases or its rejection of both of the leasesunder federal bankruptcy laws could affect our short-term liquidity in the event we are not able to timely identifya replacement tenant. In addition, Winn-Dixie’s termination of leases or closure of stores could result in leaseterminations or reductions in rent by other tenants in the same shopping centers under the terms of some leases.
Our Glendale Mall property in Indianapolis, Indiana has an annualized base rent of approximately$2.5 million as of December 31, 2005, or approximately 4.2% of our total annualized base rent. As ofDecember 31, 2005, Glendale Mall was approximately 81% leased. We are currently evaluating several strategicalternatives with respect to this property including continuing to lease space in its current configuration and thepossibility of redeveloping or selling the property.
See Item 7A. for a discussion of the impact of inflation on the Company.
52
Cash Flows
Comparison of the Year Ended December 31, 2005 to the Year Ended December 31, 2004
Cash provided by operating activities was $23.5 million for the year ended December 31, 2005, an increaseof $10.6 million over 2004. The increase resulted largely from the addition of eleven operating propertiessubsequent to our IPO and was partially offset by cash used through changes in deferred costs and other assetsof $5.5 million, tenant receivables of $2.7 million, and accounts payables and accrued expenses of $2.0 million.
Cash used in our investing activities totaled $206.0 million in 2005, a decrease of $21.9 million from 2004.We invested $50.4 million and $66.8 million in our development properties in 2005 and 2004, respectively.During 2005, we acquired five operating properties and various development land parcels for a total net purchaseprice of $178.5 million while during 2004 we acquired 15 properties and two land parcels for a total net purchaseprice of approximately $155.6 million. In 2004, we also acquired remaining joint venture and outside minorityinterests for approximately $12.5 million.
Cash provided by financing activities totaled $187.6 million during 2005, a decrease of $35.3 million from2004. We had offerings of common shares in both years, raising $133.2 million and $215.5 million in 2005 and2004, respectively after offering costs. Loan proceeds (net of transaction costs and principal payments) increased$53.2 million between years. Net loan proceeds were primarily used to finance acquisition and developmentactivity. We made net distributions to shareholders and unitholders of $22.3 million and $2.6 million in 2005and 2004, respectively. We also made net distributions in 2004 to the Principals of the Predecessor of $8.1 million.
Comparison of the Year Ended December 31, 2004 to the Year Ended December 31, 2003
Cash provided by operating activities was $12.9 million for the year ended December 31, 2004, an increaseof $7.6 million over 2003. The increase is largely due to cash generated by 18 properties we acquired in 2003and 2004 of approximately $6.8 million, partially offset by changes in tenant receivables, deferred costs andother assets and accounts payable and accrued expenses.
Cash used in our investing activities totaled $227.9 million in 2004, an increase of $134.5 million over2003. During 2004, we acquired 15 properties for a net purchase price of approximately $155.6 million and weacquired remaining joint venture and outside minority interests for approximately $12.5 million. In addition weinvested approximately $66.8 million in our development properties.
Cash provided by financing activities totaled $222.8 million during 2004, an increase of $136.1 millionfrom 2003. This cash flow includes $206.3 million in loan proceeds (net of transaction costs), less debt paymentsof $186.2 million. We received net proceeds from our IPO of approximately $215.5 million. These proceedswere used to prepay outstanding indebtedness secured by 13 properties of approximately $100 million, acquirefour properties that were under contract at the date of our IPO for $45 million, repay the credit facility providedby Lehman Brothers of $48 million, acquire the remaining joint venture and outside minority interests in nineproperties and repay outstanding indebtedness to the Principals. Loan proceeds increased from $112.7 millionin 2003 to $212.3 million in 2004. These proceeds were primarily used to finance acquisition and developmentactivity. We made net distributions (including minority interest partners) in 2004 of $8.1 million compared tonet contributions of $4.7 million in 2003.
Off-Balance Sheet Arrangements
We do not currently have any off-balance sheet arrangements, other than operating leases, that have, orare reasonably likely to have, a material current or future effect on our financial condition, changes in financialcondition, revenues or expenses, results of operations, liquidity, capital expenditures or capital resources.
Joint venture debt is the liability of the joint venture and is typically secured by the joint venture propertyand has limited recourse to us.As of December 31, 2005, our share of joint venture indebtedness was $8.6 million.
53
Contractual Obligations
The following table summarizes our contractual obligations to third parties, excluding interest, as ofDecember 31, 2005:
ConstructionContracts
TenantImprovements
OperatingLeases
ConsolidatedLong-term
Debt
Pro rataShare of
Joint VentureDebt
EmploymentContracts(1) Total
2006 . . . . . . . . . . . . . . . . . . . . . . $37,562,133 $3,194,257 $ 856,800 $ 69,405,389 $ 191,096 $1,545,000 $112,754,6752007 . . . . . . . . . . . . . . . . . . . . . . — — 906,300 104,235,904 204,530 1,545,000 106,891,7342008 . . . . . . . . . . . . . . . . . . . . . . — — 918,300 23,496,307 217,800 — 24,632,4072009 . . . . . . . . . . . . . . . . . . . . . . — — 920,800 30,234,040 2,211,916 — 33,366,7562010 . . . . . . . . . . . . . . . . . . . . . . — — 920,800 2,810,776 96,813 — 3,828,389Thereafter . . . . . . . . . . . . . . . . . . — — 13,208,370 142,362,219 5,643,835 — 161,214,424Unamortized Debt Premiums . . . — — — 2,701,202 — — 2,701,202
Total . . . . . . . . . . . . . . . . . . . . . . $37,562,133 $3,194,257 $17,731,370 $375,245,837 $8,565,990 $3,090,000 $445,389,587
(1) In connection with the Company’s IPO and related formation transactions, it entered into employment agreements with seven membersof senior management. Under the agreements, each person receives a stipulated annual salary through December 31, 2007. Eachagreement has an automatic one-year renewal unless the Company or the employee elects not to renew the agreement.
In 2005, we incurred $18,089,421 of interest expense, net of amounts capitalized.
We intend to satisfy the approximately $113 million of contractual obligations that are due in 2006 primarilywith cash generated from operations, draws on our line of credit and, where appropriate, refinancing ofindebtedness coming due.
In connection with our formation at the time of our IPO, we entered into an agreement that restricts ourability, prior to December 31, 2016, to dispose of six of our properties in taxable transactions and limits theamount of gain we can trigger with respect to certain other properties without incurring reimbursementobligations owed to certain limited partners. We have agreed that if we dispose of any interest in six specifiedproperties in a taxable transaction before December 31, 2016, then we will indemnify the contributors of thoseproperties for their tax liabilities attributable to the built-in gain that exists with respect to such property interestas of the time of our IPO (and tax liabilities incurred as a result of the reimbursement payment). In December2005, we sold Mid-America Clinical Labs and acquired Market Street Village in a non-taxable exchangetransaction under Section 1031 of the Internal Revenue Code.
The six properties to which our tax indemnity obligations relate represented approximately 24% of ourannualized base rent in the aggregate as of December 31, 2005. These six properties are International SpeedwaySquare, Shops at Eagle Creek, Whitehall Pike, Ridge Plaza Shopping Center, Thirty South and Market Street Village.
54
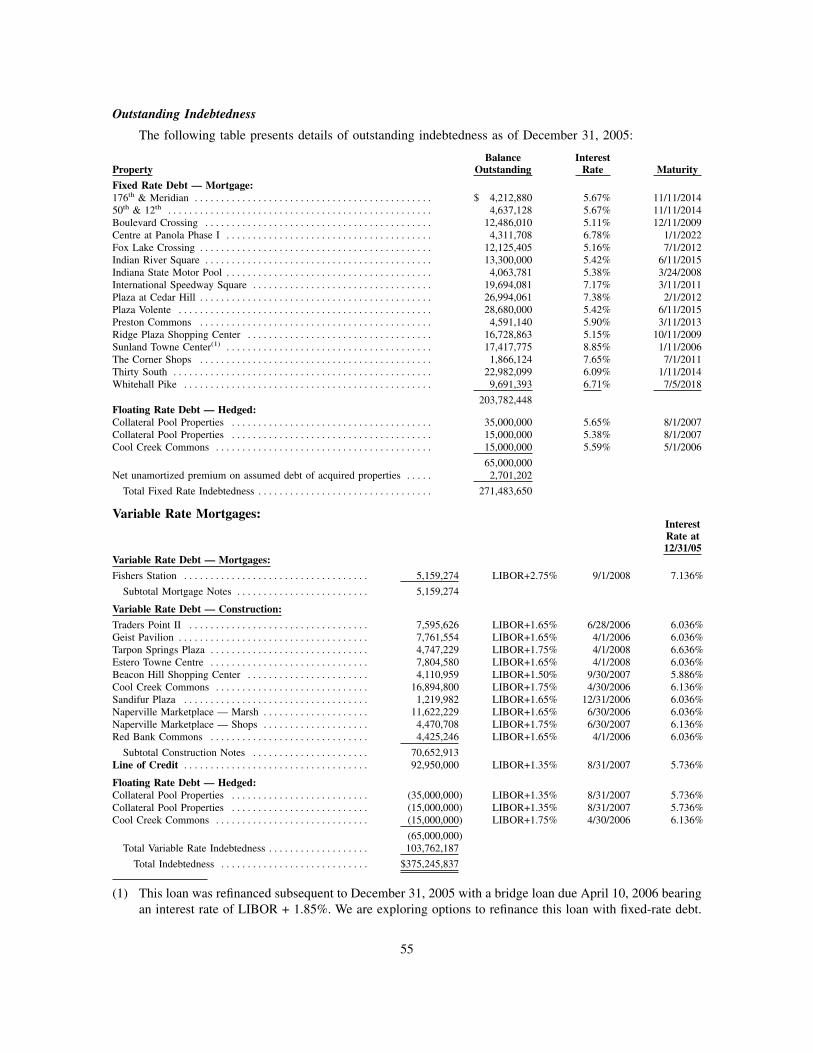
Outstanding Indebtedness
The following table presents details of outstanding indebtedness as of December 31, 2005:
PropertyBalance
OutstandingInterest
Rate Maturity
Fixed Rate Debt — Mortgage:176th & Meridian . . . . . . . . . . . . . . . . . . . . . . . . . . . . . . . . . . . . . . . . . . . . . $ 4,212,880 5.67% 11/11/201450th & 12th . . . . . . . . . . . . . . . . . . . . . . . . . . . . . . . . . . . . . . . . . . . . . . . . . . 4,637,128 5.67% 11/11/2014Boulevard Crossing . . . . . . . . . . . . . . . . . . . . . . . . . . . . . . . . . . . . . . . . . . . 12,486,010 5.11% 12/11/2009Centre at Panola Phase I . . . . . . . . . . . . . . . . . . . . . . . . . . . . . . . . . . . . . . . 4,311,708 6.78% 1/1/2022Fox Lake Crossing . . . . . . . . . . . . . . . . . . . . . . . . . . . . . . . . . . . . . . . . . . . . 12,125,405 5.16% 7/1/2012Indian River Square . . . . . . . . . . . . . . . . . . . . . . . . . . . . . . . . . . . . . . . . . . . 13,300,000 5.42% 6/11/2015Indiana State Motor Pool . . . . . . . . . . . . . . . . . . . . . . . . . . . . . . . . . . . . . . . 4,063,781 5.38% 3/24/2008International Speedway Square . . . . . . . . . . . . . . . . . . . . . . . . . . . . . . . . . . 19,694,081 7.17% 3/11/2011Plaza at Cedar Hill . . . . . . . . . . . . . . . . . . . . . . . . . . . . . . . . . . . . . . . . . . . . 26,994,061 7.38% 2/1/2012Plaza Volente . . . . . . . . . . . . . . . . . . . . . . . . . . . . . . . . . . . . . . . . . . . . . . . . 28,680,000 5.42% 6/11/2015Preston Commons . . . . . . . . . . . . . . . . . . . . . . . . . . . . . . . . . . . . . . . . . . . . 4,591,140 5.90% 3/11/2013Ridge Plaza Shopping Center . . . . . . . . . . . . . . . . . . . . . . . . . . . . . . . . . . . 16,728,863 5.15% 10/11/2009Sunland Towne Center(1) . . . . . . . . . . . . . . . . . . . . . . . . . . . . . . . . . . . . . . . 17,417,775 8.85% 1/11/2006The Corner Shops . . . . . . . . . . . . . . . . . . . . . . . . . . . . . . . . . . . . . . . . . . . . 1,866,124 7.65% 7/1/2011Thirty South . . . . . . . . . . . . . . . . . . . . . . . . . . . . . . . . . . . . . . . . . . . . . . . . . 22,982,099 6.09% 1/11/2014Whitehall Pike . . . . . . . . . . . . . . . . . . . . . . . . . . . . . . . . . . . . . . . . . . . . . . . 9,691,393 6.71% 7/5/2018
203,782,448Floating Rate Debt — Hedged:Collateral Pool Properties . . . . . . . . . . . . . . . . . . . . . . . . . . . . . . . . . . . . . . 35,000,000 5.65% 8/1/2007Collateral Pool Properties . . . . . . . . . . . . . . . . . . . . . . . . . . . . . . . . . . . . . . 15,000,000 5.38% 8/1/2007Cool Creek Commons . . . . . . . . . . . . . . . . . . . . . . . . . . . . . . . . . . . . . . . . . 15,000,000 5.59% 5/1/2006
65,000,000Net unamortized premium on assumed debt of acquired properties . . . . . 2,701,202
Total Fixed Rate Indebtedness . . . . . . . . . . . . . . . . . . . . . . . . . . . . . . . . . 271,483,650
Variable Rate Mortgages:InterestRate at12/31/05
Variable Rate Debt — Mortgages:
Fishers Station . . . . . . . . . . . . . . . . . . . . . . . . . . . . . . . . . . . 5,159,274 LIBOR+2.75% 9/1/2008 7.136%
Subtotal Mortgage Notes . . . . . . . . . . . . . . . . . . . . . . . . . 5,159,274
Variable Rate Debt — Construction:
Traders Point II . . . . . . . . . . . . . . . . . . . . . . . . . . . . . . . . . . 7,595,626 LIBOR+1.65% 6/28/2006 6.036%Geist Pavilion . . . . . . . . . . . . . . . . . . . . . . . . . . . . . . . . . . . . 7,761,554 LIBOR+1.65% 4/1/2006 6.036%Tarpon Springs Plaza . . . . . . . . . . . . . . . . . . . . . . . . . . . . . . 4,747,229 LIBOR+1.75% 4/1/2008 6.636%Estero Towne Centre . . . . . . . . . . . . . . . . . . . . . . . . . . . . . . 7,804,580 LIBOR+1.65% 4/1/2008 6.036%Beacon Hill Shopping Center . . . . . . . . . . . . . . . . . . . . . . . 4,110,959 LIBOR+1.50% 9/30/2007 5.886%Cool Creek Commons . . . . . . . . . . . . . . . . . . . . . . . . . . . . . 16,894,800 LIBOR+1.75% 4/30/2006 6.136%Sandifur Plaza . . . . . . . . . . . . . . . . . . . . . . . . . . . . . . . . . . . 1,219,982 LIBOR+1.65% 12/31/2006 6.036%Naperville Marketplace — Marsh . . . . . . . . . . . . . . . . . . . . 11,622,229 LIBOR+1.65% 6/30/2006 6.036%Naperville Marketplace — Shops . . . . . . . . . . . . . . . . . . . . 4,470,708 LIBOR+1.75% 6/30/2007 6.136%Red Bank Commons . . . . . . . . . . . . . . . . . . . . . . . . . . . . . . 4,425,246 LIBOR+1.65% 4/1/2006 6.036%
Subtotal Construction Notes . . . . . . . . . . . . . . . . . . . . . . 70,652,913Line of Credit . . . . . . . . . . . . . . . . . . . . . . . . . . . . . . . . . . . 92,950,000 LIBOR+1.35% 8/31/2007 5.736%
Floating Rate Debt — Hedged:Collateral Pool Properties . . . . . . . . . . . . . . . . . . . . . . . . . . (35,000,000) LIBOR+1.35% 8/31/2007 5.736%Collateral Pool Properties . . . . . . . . . . . . . . . . . . . . . . . . . . (15,000,000) LIBOR+1.35% 8/31/2007 5.736%Cool Creek Commons . . . . . . . . . . . . . . . . . . . . . . . . . . . . . (15,000,000) LIBOR+1.75% 4/30/2006 6.136%
(65,000,000)Total Variable Rate Indebtedness . . . . . . . . . . . . . . . . . . . 103,762,187
Total Indebtedness . . . . . . . . . . . . . . . . . . . . . . . . . . . . $375,245,837
(1) This loan was refinanced subsequent to December 31, 2005 with a bridge loan due April 10, 2006 bearingan interest rate of LIBOR + 1.85%. We are exploring options to refinance this loan with fixed-rate debt.
55
Funds From OperationsFunds from Operations (“FFO”), is a widely used performance measure for real estate companies and is
provided here as a supplemental measure of operating performance. We calculate FFO in accordance with thebest practices described in the April 2002 National Policy Bulletin of the National Association of Real EstateInvestment Trusts (NAREIT), which we refer to as the White Paper. The White Paper defines FFO as net income(computed in accordance with GAAP), excluding gains (or losses) from sales of property, plus depreciation andamortization, and after adjustments for unconsolidated partnerships and joint ventures.
Given the nature of our business as a real estate owner and operator, we believe that FFO is helpful toinvestors as a starting point in measuring our operational performance because it excludes various items includedin net income that do not relate to or are not indicative of our operating performance such as gains (or losses)from sales of property and depreciation and amortization, which can make periodic and peer analyses of operatingperformance more difficult. FFO should not be considered as an alternative to net income (determined inaccordance with GAAP) as an indicator of our financial performance, is not an alternative to cash flow fromoperating activities (determined in accordance with GAAP) as a measure of our liquidity, and is not indicativeof funds available to fund our cash needs, including our ability to make distributions. Our computation of FFOmay not be comparable to FFO reported by other REITs that do not define the term in accordance with the currentNAREIT definition or that interpret the current NAREIT definitions differently than we do.
56

Our calculation of FFO (and reconciliation to net income) is as follows:
Company Predecessor Combined
Year EndedDecember 31,
2005
August 16,2004
throughDecember 31,
2004
January 1,2004
throughAugust 15,
2004
January 1,2004
throughDecember 31,
2004
Funds From Operations:Net income (loss) . . . . . . . . . . . . . . . . . . . . . . . . . . . . . $13,435,840 $ (332,322) $ (192,380) $ (524,702)Less: gain on sale of operating property . . . . . . (7,212,402) — — —Add Limited Partners’ interests . . . . . . . . . . . . . . . 5,329,298 (146,968) — (146,968)Add depreciation and amortization of
consolidated entities and discontinuedoperations, net of minority interest . . . . . . . . . 22,124,355 7,816,339 3,563,176 11,379,515
Add depreciation and amortization ofunconsolidated entities . . . . . . . . . . . . . . . . . . . . . 344,600 103,518 493,571 597,089
Deduct minority interest* . . . . . . . . . . . . . . . . . . . . . — (24,106) (214,887) (238,993)Add joint venture partners’ interests in net
income of unconsolidated entities* . . . . . . . . . — — 288,675 288,675Add joint venture partners’ interests in
depreciation and amortization ofunconsolidated entities* . . . . . . . . . . . . . . . . . . . . — — 519,277 519,277
Funds From Operations of theKite Portfolio . . . . . . . . . . . . . . . . . . . . . . . . . . . . 34,021,691 7,416,461 4,457,432 11,873,893
Less minority interest . . . . . . . . . . . . . . . . . . . . . . . . . — — 214,887 214,887Less minority interest share of depreciation
and amortization . . . . . . . . . . . . . . . . . . . . . . . . . . . — — (1,014,248) (1,014,248)Less joint venture partners’ interests in net
income of unconsolidated entities . . . . . . . . . . — — (288,675) (288,675)Less joint venture partners’ interests in
depreciation and amortization ofunconsolidated entities . . . . . . . . . . . . . . . . . . . . . — — (519,277) (519,277)
Less Limited Partners’ interests . . . . . . . . . . . . . . . (9,629,945) (2,276,853) — (2,276,853)
Funds From Operations allocable tothe Company . . . . . . . . . . . . . . . . . . . . . . . . . . . . $24,391,746 $ 5,139,608 $ 2,850,119 $ 7,989,727
Basic FFO per Share of the Kite Portfolio . . . . $ 1.14 $ 0.27
Diluted FFO per Share of the Kite Portfolio . . $ 1.13 $ 0.27
Basic weighted average Common Sharesoutstanding . . . . . . . . . . . . . . . . . . . . . . . . . . . . . . . . . 21,406,980 18,727,977
Diluted weighted average Common Sharesoutstanding . . . . . . . . . . . . . . . . . . . . . . . . . . . . . . . . . 21,520,061 18,857,413
Basic weighted average Common Shares andUnits outstanding . . . . . . . . . . . . . . . . . . . . . . . . . . . 29,903,174 27,009,859
Diluted weighted average Common Sharesand Units outstanding . . . . . . . . . . . . . . . . . . . . . . 30,016,255 27,139,295
* 2004 amounts represent the minority and joint venture partners’ interests acquired in connection with theCompany’s initial public offering and related formation transactions.
57

ITEM 7A. QUANTITATIVE AND QUALITATIVE DISCLOSURES ABOUT MARKET RISKOur future income, cash flows and fair values relevant to financial instruments depend upon prevailing
interest rates. Market risk refers to the risk of loss from adverse changes in interest rates of debt instrumentsof similar maturities and terms.
Market Risk Related to Fixed Rate Debt
We had approximately $375.2 million of outstanding consolidated indebtedness as of December 31, 2005(inclusive of net premiums on acquired debt of $2.7 million). During 2005, we entered into interest rate swapstotaling $65 million to hedge variable cash flows associated with existing variable rate debt. Including the effectsof these swaps, our fixed and variable rate debt would have been approximately $268.8 million (72%) and$103.8 million (28%), respectively, of our total consolidated indebtedness at December 31, 2005. Reflecting ourshare of unconsolidated debt, our fixed and variable rate debt is also 72% and 28%, respectively, of totalconsolidated and our share of unconsolidated indebtedness at December 31, 2005.
Based on the amount of our fixed rate debt, a 100 basis point increase in market interest rates would resultin a decrease in its fair value of approximately $8.7 million. A 100 basis point decrease in market interest rateswould result in an increase in the fair value of our fixed rate debt of approximately $10.1 million. A 100 basispoint increase or decrease in interest rates on our variable rate debt as of December 31, 2005 would increaseor decrease our annual cash flow by approximately $1.0 million.
As a matter of policy, we do not engage in trading or speculative transactions.
Inflation
Most of our leases contain provisions designed to mitigate the adverse impact of inflation by requiring thetenant to pay its share of operating expenses, including common area maintenance, real estate taxes andinsurance. This reduces our exposure to increases in costs and operating expenses resulting from inflation.
ITEM 8. FINANCIAL STATEMENTS AND SUPPLEMENTARY DATAThe consolidated and combined financial statements of the Company and its Predecessor, respectively
included in this Report are listed in Part IV, Item 15(a) of this report.
ITEM 9. CHANGES IN AND DISAGREEMENTS WITH ACCOUNTANTS ON ACCOUNTING ANDFINANCIAL DISCLOSURE
None.
ITEM 9A. CONTROLS AND PROCEDURES
Evaluation of Disclosure Controls and Procedures
An evaluation was performed under the supervision and with the participation of the Company’smanagement, including its Chief Executive Officer and Chief Financial Officer, of the effectiveness of itsdisclosure controls and procedures (as defined in Rules 13a-15(e) and 15d-15(e) under the Securities andExchange Act of 1934, as amended (the “Exchange Act”) as of the end of the period covered by this report.Based on that evaluation, the Company’s Chief Executive Officer and Chief Financial Officer have concludedthat, as of the end of such period, the Company’s disclosure controls and procedures are effective in recording,processing, summarizing and reporting, on a timely basis, information required to be disclosed by the Companyin the reports that it files or submits under the Exchange Act.
Changes in Internal Control Over Financial Reporting
There have been no changes in the Company’s internal control over financial reporting (as such term isdefined in Rules 13a-15(f) and 15d-15(f) under the Exchange Act) during the fourth quarter to which this report
58
relates that have materially affected, or are reasonably likely to materially affect, the Company’s internal controlover financial reporting.
Management Report on Internal Control Over Financial Reporting
The Company’s management is responsible for establishing and maintaining adequate internal control overfinancial reporting, as that term is defined in Rule 13a-15(f) of the Exchange Act. Under the supervision of andwith the participation of our management, including our chief executive officer and chief financial officer, theCompany conducted an evaluation of the effectiveness of the Company’s internal control over financial reportingbased on the framework in Internal Control — Integrated Framework issued by the Committee of SponsoringOrganizations of the Treadway Commission. Based on the Company’s evaluation under the framework inInternal Control — Integrated Framework, the Company’s management has concluded that the Company’sinternal control over financial reporting was effective as of December 31, 2005.
The Company’s independent auditors, Ernst & Young, LLP, an independent registered public accountingfirm, have issued a report on management’s assessment of the Company’s internal control over financial reportingas stated in their report which is included herein.
The Company’s internal control system was designed to provide reasonable assurance to the Company’smanagement and Board of Trustees regarding the preparation and fair presentation of published financialstatements. All internal control systems, no matter how well designed, have inherent limitations. Therefore, eventhose systems determined to be effective can provide only reasonable assurance with respect to financialstatement preparation and presentation.
59
REPORT OF INDEPENDENT REGISTERED PUBLIC ACCOUNTING FIRM
To the Board of Trustees and Shareholders of Kite Realty Group Trust and Subsidiaries:
We have audited management’s assessment, included in the accompanying Management’s Report onInternal Control Over Financial Reporting included on the previous page of this Form 10-K, that Kite RealtyGroup Trust and Subsidiaries maintained effective internal control over financial reporting as of December 31,2005, based on criteria established in Internal Control — Integrated Framework issued by the Committee ofSponsoring Organizations of the Treadway Commission (the COSO criteria). Kite Realty Group Trust’smanagement is responsible for maintaining effective internal control over financial reporting and for itsassessment of the effectiveness of internal control over financial reporting. Our responsibility is to express anopinion on management’s assessment and an opinion on the effectiveness of the Company’s internal control overfinancial reporting based on our audit.
We conducted our audit in accordance with the standards of the Public Company Accounting OversightBoard (United States). Those standards require that we plan and perform the audit to obtain reasonable assuranceabout whether effective internal control over financial reporting was maintained in all material respects. Ouraudit included obtaining an understanding of internal control over financial reporting, evaluating management’sassessment, testing and evaluating the design and operating effectiveness of internal control, and performingsuch other procedures as we considered necessary in the circumstances. We believe that our audit provides areasonable basis for our opinion.
A company’s internal control over financial reporting is a process designed to provide reasonable assuranceregarding the reliability of financial reporting and the preparation of financial statements for external purposesin accordance with generally accepted accounting principles. A company’s internal control over financialreporting includes those policies and procedures that (1) pertain to the maintenance of records that, in reasonabledetail, accurately and fairly reflect the transactions and dispositions of the assets of the company; (2) providereasonable assurance that transactions are recorded as necessary to permit preparation of financial statementsin accordance with generally accepted accounting principles, and that receipts and expenditures of the companyare being made only in accordance with authorizations of management and directors of the company; and(3) provide reasonable assurance regarding prevention or timely detection of unauthorized acquisition, use, ordisposition of the company’s assets that could have a material effect on the financial statements.
Because of its inherent limitations, internal control over financial reporting may not prevent or detectmisstatements. Also, projections of any evaluation of effectiveness to future periods are subject to the risk thatcontrols may become inadequate because of changes in conditions, or that the degree of compliance with thepolicies or procedures may deteriorate.
In our opinion, management’s assessment that Kite Realty Group Trust and Subsidiaries maintained effectiveinternal control over financial reporting as of December 31, 2005, is fairly stated, in all material respects, basedon the COSO criteria. Also, in our opinion, Kite Realty Group Trust and Subsidiaries maintained, in all materialrespects, effective internal control over financial reporting as of December 31, 2005, based on the COSO criteria.
We also have audited, in accordance with the standards of the Public Company Accounting Oversight Board(United States), the consolidated balance sheets of Kite Realty Group Trust and Subsidiaries as of December 31,2005 and 2004 and Kite Realty Group Trust and Subsidiaries’ consolidated statements of operations, owners’equity, and cash flows for the year ended December 31, 2005 and for the period from August 16, 2004 throughDecember 31, 2004, and Kite Property Group’s, see Note 1, combined statements of operations, owners’ equity,and cash flows from the period January 1, 2004 through August 15, 2004, and for the year ended December 31,2003 and the related financial statement schedule listed in the Index at Item 15, and our report dated March 15,2006 expressed an unqualified opinion thereon.
ERNST & YOUNG LLP
Indianapolis, IndianaMarch 15, 2006
60
ITEM 9B. OTHER INFORMATIONNone.
PART III
ITEM 10. DIRECTORS AND EXECUTIVE OFFICERS OF THE COMPANYWe have adopted a code of ethics that applies to our principal executive officer and senior financial officers,
which is available on our Internet website at: www.kiterealty.com. Any amendment to, or waiver from, aprovision of this code of ethics will be posted on our Internet website.
This information required by this Item is hereby incorporated by reference to the material appearing in our2006 Annual Meeting Proxy Statement (the “Proxy Statement”), which we intend to file within 120 days afterour fiscal year-end, under the captions “Proposal 1: Election of Trustees”, “Executive Officers”, “InformationRegarding Corporate Governance and Board and Committee Meetings — Board Committees” and “OtherMatters — Section 16(a) Beneficial Ownership Reporting Compliance”.
ITEM 11. EXECUTIVE COMPENSATIONThe information required by this Item is hereby incorporated by reference to the material appearing in our
Proxy Statement, under the captions “Executive Compensation and Other Information, “Information RegardingCorporate Governance and Board and Committee Meetings — Trustee Compensation”, “CompensationCommittee Interlocks and Insider Participation”, “Compensation Committee Report on ExecutiveCompensation” and “Performance Graph”.
ITEM 12. SECURITY OWNERSHIP OF CERTAIN BENEFICIAL OWNERS AND MANAGEMENTAND RELATED SHAREHOLDER MATTERS
The information required by this Item is hereby incorporated by reference to the material appearing in ourProxy Statement, under the captions “Equity Compensation Plan Information” and “Principal Shareholders”.
ITEM 13. CERTAIN RELATIONSHIPS AND RELATED TRANSACTIONSThe information required by this Item is hereby incorporated by reference to the material appearing in our
Proxy Statement, under the caption “Certain Relationships and Related Transactions”.
ITEM 14. PRINCIPAL ACCOUNTING FEES AND SERVICESThe information required by this Item is hereby incorporated by reference to the material appearing in our
Proxy Statement, under the caption “Proposal 2: Ratification of Appointment of Independent RegisteredAccounting Firm — Relationship with Independent Accountants”.
61

PART IV
ITEM 15. EXHIBITS AND FINANCIAL STATEMENT SCHEDULE
(a) Documents filed as part of this report:
(1) Financial Statements:
Consolidated and combined financial statements for the Company and its Predecessor listed on theindex immediately preceeding the financial statements at the end of this report.
(2) Financial Statement Schedule:
Financial statement schedule for the Company listed on the index immediately preceding the financialstatements at the end of this report.
(3) Exhibits:
The Company files as part of this report the exhibits listed on the Exhibit Index.
(b) Exhibits:
The Company files as part of this report the exhibits listed on the Exhibit Index.
(c) Financial Statement Schedule:
The Company files as part of this report the financial statement schedule listed on the index immediatelypreceding the financial statements at the end of this report.
62

SIGNATURES
Pursuant to the requirements of Section 13 or 15(d) of the Securities Exchange Act of 1934, the Registranthas duly caused this report to be signed on its behalf by the undersigned thereunto duly authorized.
KITE REALTY GROUP TRUST(Registrant)
March 15, 2006
(Date)
/s/ JOHN A. KITE
John A. KiteChief Executive Officer and President(Principal Executive Officer)
March 15, 2006
(Date)
/s/ DANIEL R. SINK
Daniel R. SinkChief Financial Officer(Principal Financial Officer andPrincipal Accounting Officer)
Pursuant to the requirements of the Securities Exchange Act of 1934, this report has been signed belowby persons on behalf of the Registrant and in the capacities and on the dates indicated.
Signature Title Date
/s/ ALVIN E. KITE, JR.
(Alvin E. Kite, Jr.)
Chairman of the Board and Trustee March 13, 2006
/s/ JOHN A. KITE
(John A. Kite)
Chief Executive Officer, President and Trustee(Principal Executive Officer)
March 15, 2006
/s/ WILLIAM E. BINDLEY
(William E. Bindley)
Trustee March 13, 2006
/s/ RICHARD A. COSIER
(Richard A. Cosier)
Trustee March 13, 2006
/s/ EUGENE GOLUB
(Eugene Golub)
Trustee March 13, 2006
/s/ GERALD L. MOSS
(Gerald L. Moss)
Trustee March 13, 2006
/s/ MICHAEL L. SMITH
(Michael L. Smith)
Trustee March 13, 2006
/s/ DANIEL R. SINK
(Daniel R. Sink)
Senior Vice President and Chief Financial Officer(Principal Financial and Accounting Officer)
March 15, 2006
63

(This page intentionally left blank.)
Kite Realty Group Trust
Index to Financial StatementsPage
Consolidated and Combined Financial Statements:Report of Independent Registered Public Accounting Firm . . . . . . . . . . . . . . . . . . . . . . . . . . . . . . . . . . . . . F-2
Balance Sheets for the Company as of December 31, 2005 and 2004 . . . . . . . . . . . . . . . . . . . . . . . . . . F-3
Statements of Operations for the Company for the Year Ended December 31, 2005, the PeriodFrom August 16, 2004 Through December 31, 2004 and for the Predecessor for the PeriodFrom January 1, 2004 Through August 15, 2004 and the Year Ended December 31, 2003 . . F-4
Statements of Owners’ Equity for the Company for the Year Ended December 31, 2005,the Period From August 16, 2004 Through December 31, 2004 and for the Predecessorfor the Period From January 1, 2004 Through August 15, 2004 and the Year EndedDecember 31, 2003 . . . . . . . . . . . . . . . . . . . . . . . . . . . . . . . . . . . . . . . . . . . . . . . . . . . . . . . . . . . . . . . . . . . . . . . . . . F-5
Statements of Cash Flows for the Company for the Year Ended December 31, 2005,the Period From August 16, 2004 Through December 31, 2004 and for the Predecessorfor the Period From January 1, 2004 Through August 15, 2004 and the Year EndedDecember 31, 2003 . . . . . . . . . . . . . . . . . . . . . . . . . . . . . . . . . . . . . . . . . . . . . . . . . . . . . . . . . . . . . . . . . . . . . . . . . . F-6
Notes to Consolidated and Combined Financial Statements . . . . . . . . . . . . . . . . . . . . . . . . . . . . . . . . . . . . F-7
Financial Statement Schedule:Schedule III — Real Estate and Accumulated Depreciation . . . . . . . . . . . . . . . . . . . . . . . . . . . . . . . . . . . . F-35Notes to Schedule III . . . . . . . . . . . . . . . . . . . . . . . . . . . . . . . . . . . . . . . . . . . . . . . . . . . . . . . . . . . . . . . . . . . . . . . . . . . F-38
F-1

REPORT OF INDEPENDENT REGISTERED PUBLIC ACCOUNTING FIRM
To the Board of Trustees and Shareholders of Kite Realty Group Trust and Subsidiaries:
We have audited the accompanying consolidated balance sheets of Kite Realty Group Trust and Subsidiaries(the “Company”) as of December 31, 2005 and 2004 and the Company’s consolidated statements of operations,owners’ equity, and cash flows for the year ended December 31, 2005 and for the period from August 16, 2004through December 31, 2004, and Kite Property Group’s (the “Predecessor”), as defined in Note 1, combinedstatements of operations, owners’ equity, and cash flows from the period January 1, 2004 through August 15, 2004,and for the year ended December 31, 2003. Our audits also included the financial statement schedule listed in theIndex at Item 15. These financial statements and schedule are the responsibility of the Company’s management.Our responsibility is to express an opinion on these financial statements and schedule based on our audits.
We conducted our audits in accordance with the standards of the Public Company Accounting OversightBoard (United States). Those standards require that we plan and perform the audit to obtain reasonable assuranceabout whether the financial statements are free of material misstatement. An audit also includes examining, ona test basis, evidence supporting the amounts and disclosures in the financial statements. An audit also includesassessing the accounting principles used and significant estimates made by management, as well as evaluatingthe overall financial statement presentation. We believe that our audits provide a reasonable basis for our opinion.
In our opinion, the financial statements referred to above present fairly, in all material respects, theconsolidated financial position of the Company at December 31, 2005 and 2004 and the Company’s consolidatedresults of operations and cash flows for the year ended December 31, 2005 and for the period from August 16,2004 through December 31, 2004 and the Predecessor’s combined results of operations and cash flows for theperiod from January 1, 2004 through August 15, 2004 and for the year ended December 31, 2003, in conformitywith U.S. generally accepted accounting principles. Also, in our opinion, the related financial statement schedule,when considered in relation to the basic financial statements taken as a whole, presents fairly in all materialrespects the information set forth therein.
We also have audited, in accordance with the standards of the Public Company Accounting Oversight Board(United States), the effectiveness of Kite Realty Group Trust and Subsidiaries’ internal control over financialreporting as of December 31, 2005, based on criteria established in Internal Control-Integrated Framework issuedby the Committee of Sponsoring Organizations of the Treadway Commission and our report dated March 15,2006, expressed an unqualified opinion thereon.
Ernst & Young LLP
Indianapolis, IndianaMarch 15, 2006
F-2
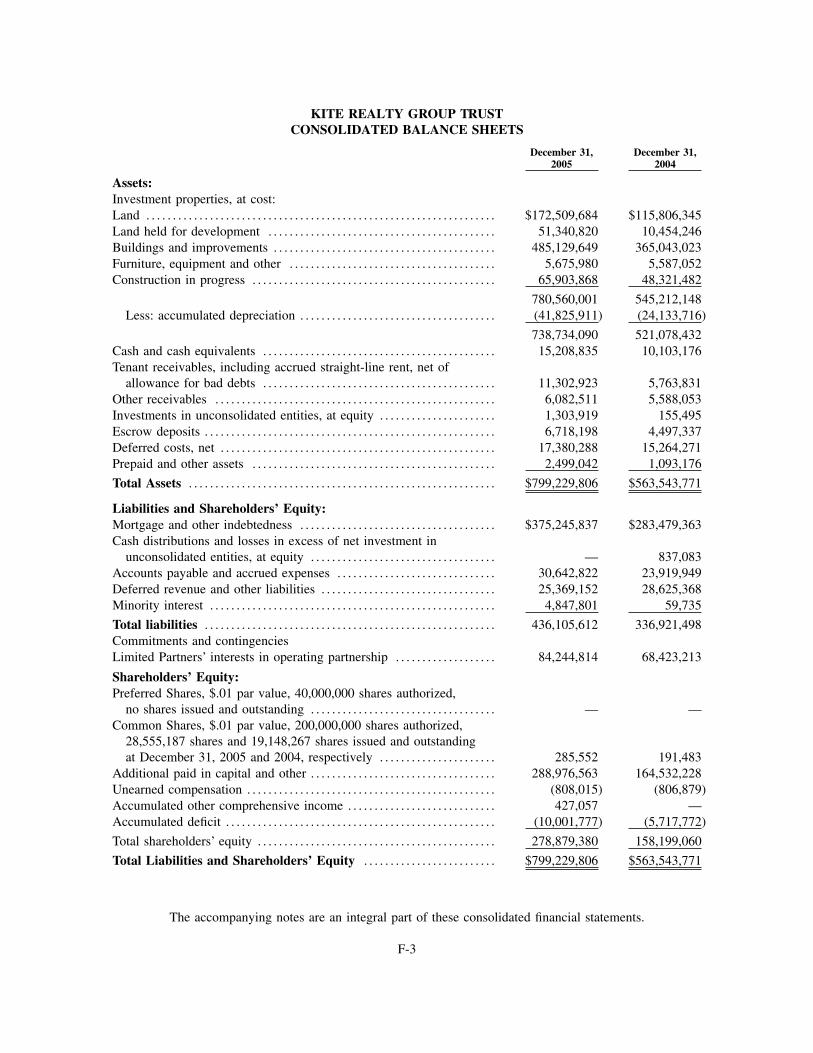
KITE REALTY GROUP TRUSTCONSOLIDATED BALANCE SHEETS
December 31,2005
December 31,2004
Assets:Investment properties, at cost:Land . . . . . . . . . . . . . . . . . . . . . . . . . . . . . . . . . . . . . . . . . . . . . . . . . . . . . . . . . . . . . . . . . . $172,509,684 $115,806,345Land held for development . . . . . . . . . . . . . . . . . . . . . . . . . . . . . . . . . . . . . . . . . . . 51,340,820 10,454,246Buildings and improvements . . . . . . . . . . . . . . . . . . . . . . . . . . . . . . . . . . . . . . . . . . 485,129,649 365,043,023Furniture, equipment and other . . . . . . . . . . . . . . . . . . . . . . . . . . . . . . . . . . . . . . . 5,675,980 5,587,052Construction in progress . . . . . . . . . . . . . . . . . . . . . . . . . . . . . . . . . . . . . . . . . . . . . . 65,903,868 48,321,482
780,560,001 545,212,148Less: accumulated depreciation . . . . . . . . . . . . . . . . . . . . . . . . . . . . . . . . . . . . . (41,825,911) (24,133,716)
738,734,090 521,078,432Cash and cash equivalents . . . . . . . . . . . . . . . . . . . . . . . . . . . . . . . . . . . . . . . . . . . . 15,208,835 10,103,176Tenant receivables, including accrued straight-line rent, net of
allowance for bad debts . . . . . . . . . . . . . . . . . . . . . . . . . . . . . . . . . . . . . . . . . . . . 11,302,923 5,763,831Other receivables . . . . . . . . . . . . . . . . . . . . . . . . . . . . . . . . . . . . . . . . . . . . . . . . . . . . . 6,082,511 5,588,053Investments in unconsolidated entities, at equity . . . . . . . . . . . . . . . . . . . . . . 1,303,919 155,495Escrow deposits . . . . . . . . . . . . . . . . . . . . . . . . . . . . . . . . . . . . . . . . . . . . . . . . . . . . . . . 6,718,198 4,497,337Deferred costs, net . . . . . . . . . . . . . . . . . . . . . . . . . . . . . . . . . . . . . . . . . . . . . . . . . . . . 17,380,288 15,264,271Prepaid and other assets . . . . . . . . . . . . . . . . . . . . . . . . . . . . . . . . . . . . . . . . . . . . . . 2,499,042 1,093,176
Total Assets . . . . . . . . . . . . . . . . . . . . . . . . . . . . . . . . . . . . . . . . . . . . . . . . . . . . . . . . . . $799,229,806 $563,543,771
Liabilities and Shareholders’ Equity:Mortgage and other indebtedness . . . . . . . . . . . . . . . . . . . . . . . . . . . . . . . . . . . . . $375,245,837 $283,479,363Cash distributions and losses in excess of net investment in
unconsolidated entities, at equity . . . . . . . . . . . . . . . . . . . . . . . . . . . . . . . . . . . — 837,083Accounts payable and accrued expenses . . . . . . . . . . . . . . . . . . . . . . . . . . . . . . 30,642,822 23,919,949Deferred revenue and other liabilities . . . . . . . . . . . . . . . . . . . . . . . . . . . . . . . . . 25,369,152 28,625,368Minority interest . . . . . . . . . . . . . . . . . . . . . . . . . . . . . . . . . . . . . . . . . . . . . . . . . . . . . . 4,847,801 59,735
Total liabilities . . . . . . . . . . . . . . . . . . . . . . . . . . . . . . . . . . . . . . . . . . . . . . . . . . . . . . . 436,105,612 336,921,498Commitments and contingenciesLimited Partners’ interests in operating partnership . . . . . . . . . . . . . . . . . . . 84,244,814 68,423,213
Shareholders’ Equity:Preferred Shares, $.01 par value, 40,000,000 shares authorized,
no shares issued and outstanding . . . . . . . . . . . . . . . . . . . . . . . . . . . . . . . . . . . — —Common Shares, $.01 par value, 200,000,000 shares authorized,
28,555,187 shares and 19,148,267 shares issued and outstandingat December 31, 2005 and 2004, respectively . . . . . . . . . . . . . . . . . . . . . . 285,552 191,483
Additional paid in capital and other . . . . . . . . . . . . . . . . . . . . . . . . . . . . . . . . . . . 288,976,563 164,532,228Unearned compensation . . . . . . . . . . . . . . . . . . . . . . . . . . . . . . . . . . . . . . . . . . . . . . . (808,015) (806,879)Accumulated other comprehensive income . . . . . . . . . . . . . . . . . . . . . . . . . . . . 427,057 —Accumulated deficit . . . . . . . . . . . . . . . . . . . . . . . . . . . . . . . . . . . . . . . . . . . . . . . . . . . (10,001,777) (5,717,772)
Total shareholders’ equity . . . . . . . . . . . . . . . . . . . . . . . . . . . . . . . . . . . . . . . . . . . . . 278,879,380 158,199,060
Total Liabilities and Shareholders’ Equity . . . . . . . . . . . . . . . . . . . . . . . . . $799,229,806 $563,543,771
The accompanying notes are an integral part of these consolidated financial statements.
F-3
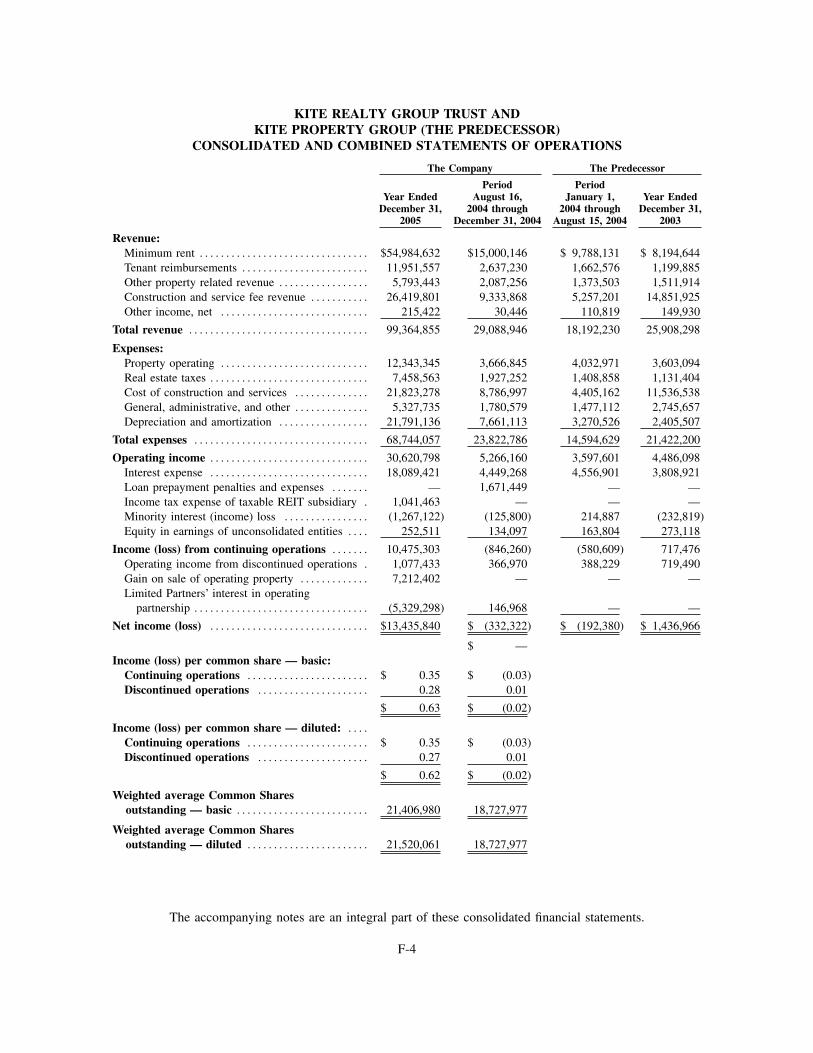
KITE REALTY GROUP TRUST ANDKITE PROPERTY GROUP (THE PREDECESSOR)
CONSOLIDATED AND COMBINED STATEMENTS OF OPERATIONS
The Company The Predecessor
Year EndedDecember 31,
2005
PeriodAugust 16,
2004 throughDecember 31, 2004
PeriodJanuary 1,
2004 throughAugust 15, 2004
Year EndedDecember 31,
2003
Revenue:Minimum rent . . . . . . . . . . . . . . . . . . . . . . . . . . . . . . . . $54,984,632 $15,000,146 $ 9,788,131 $ 8,194,644Tenant reimbursements . . . . . . . . . . . . . . . . . . . . . . . . 11,951,557 2,637,230 1,662,576 1,199,885Other property related revenue . . . . . . . . . . . . . . . . . 5,793,443 2,087,256 1,373,503 1,511,914Construction and service fee revenue . . . . . . . . . . . 26,419,801 9,333,868 5,257,201 14,851,925Other income, net . . . . . . . . . . . . . . . . . . . . . . . . . . . . 215,422 30,446 110,819 149,930
Total revenue . . . . . . . . . . . . . . . . . . . . . . . . . . . . . . . . . . 99,364,855 29,088,946 18,192,230 25,908,298
Expenses:Property operating . . . . . . . . . . . . . . . . . . . . . . . . . . . . 12,343,345 3,666,845 4,032,971 3,603,094Real estate taxes . . . . . . . . . . . . . . . . . . . . . . . . . . . . . . 7,458,563 1,927,252 1,408,858 1,131,404Cost of construction and services . . . . . . . . . . . . . . 21,823,278 8,786,997 4,405,162 11,536,538General, administrative, and other . . . . . . . . . . . . . . 5,327,735 1,780,579 1,477,112 2,745,657Depreciation and amortization . . . . . . . . . . . . . . . . . 21,791,136 7,661,113 3,270,526 2,405,507
Total expenses . . . . . . . . . . . . . . . . . . . . . . . . . . . . . . . . . 68,744,057 23,822,786 14,594,629 21,422,200
Operating income . . . . . . . . . . . . . . . . . . . . . . . . . . . . . . 30,620,798 5,266,160 3,597,601 4,486,098Interest expense . . . . . . . . . . . . . . . . . . . . . . . . . . . . . . 18,089,421 4,449,268 4,556,901 3,808,921Loan prepayment penalties and expenses . . . . . . . — 1,671,449 — —Income tax expense of taxable REIT subsidiary . 1,041,463 — — —Minority interest (income) loss . . . . . . . . . . . . . . . . (1,267,122) (125,800) 214,887 (232,819)Equity in earnings of unconsolidated entities . . . . 252,511 134,097 163,804 273,118
Income (loss) from continuing operations . . . . . . . 10,475,303 (846,260) (580,609) 717,476Operating income from discontinued operations . 1,077,433 366,970 388,229 719,490Gain on sale of operating property . . . . . . . . . . . . . 7,212,402 — — —Limited Partners’ interest in operating
partnership . . . . . . . . . . . . . . . . . . . . . . . . . . . . . . . . . (5,329,298) 146,968 — —
Net income (loss) . . . . . . . . . . . . . . . . . . . . . . . . . . . . . . $13,435,840 $ (332,322) $ (192,380) $ 1,436,966
$ —Income (loss) per common share — basic:
Continuing operations . . . . . . . . . . . . . . . . . . . . . . . $ 0.35 $ (0.03)Discontinued operations . . . . . . . . . . . . . . . . . . . . . 0.28 0.01
$ 0.63 $ (0.02)
Income (loss) per common share — diluted: . . . .Continuing operations . . . . . . . . . . . . . . . . . . . . . . . $ 0.35 $ (0.03)Discontinued operations . . . . . . . . . . . . . . . . . . . . . 0.27 0.01
$ 0.62 $ (0.02)
Weighted average Common Sharesoutstanding — basic . . . . . . . . . . . . . . . . . . . . . . . . . 21,406,980 18,727,977
Weighted average Common Sharesoutstanding — diluted . . . . . . . . . . . . . . . . . . . . . . . 21,520,061 18,727,977
The accompanying notes are an integral part of these consolidated financial statements.
F-4

KIT
ER
EA
LT
YG
RO
UP
TR
UST
AN
DK
ITE
PR
OP
ER
TY
GR
OU
P(T
HE
PR
ED
EC
ESS
OR
)C
ON
SOL
IDA
TE
DA
ND
CO
MB
INE
DST
AT
EM
EN
TS
OF
CH
AN
GE
SIN
OW
NE
RS’
EQ
UIT
Y
The
Com
pany
The
Pre
dece
ssor
Com
mon
Shar
es
Shar
esA
mou
nt
Add
itio
nal
Pai
d-in
Cap
ital
Acc
umul
ated
Defi
cit
and
Div
iden
ds
Oth
erC
ompr
ehen
sive
Inco
me
Une
arne
dC
ompe
nsat
ion
Ow
ners
’D
efici
tTo
tal
Kite
Prop
erty
Gro
up:
Ow
ners
’E
quity
,D
ecem
ber
31,
2002
....
....
....
...
—$
—$
—$
—$
—$
—$
434,
649
$43
4,64
9C
ontr
ibut
ions
....
....
....
....
....
....
....
....
.—
——
——
—11
,731
,177
11,7
31,1
77D
istr
ibut
ions
....
....
....
....
....
....
....
....
..—
——
——
—(8
,045
,283
)(8
,045
,283
)N
etin
com
e..
....
....
....
....
....
....
....
....
.—
——
——
—1,
436,
966
1,43
6,96
6
Ow
ners
’E
quity
,D
ecem
ber
31,
2003
....
....
....
...
——
——
——
5,55
7,50
95,
557,
509
Con
trib
utio
ns..
....
....
....
....
....
....
....
...
——
——
——
2,33
2,87
32,
332,
873
Dis
trib
utio
ns..
....
....
....
....
....
....
....
....
——
——
——
(8,9
92,9
39)
(8,9
92,9
39)
Net
loss
....
....
....
....
....
....
....
....
....
..—
——
——
—(1
92,3
80)
(192
,380
)
Ow
ners
’D
efici
t,A
ugus
t15
,20
04..
....
....
....
...
——
——
——
(1,2
94,9
37)
(1,2
94,9
37)
Kite
Rea
ltyG
roup
Tru
st:
Rec
lass
ify
Pred
eces
sor
owne
rs’
defic
it..
....
....
...
——
(1,2
94,9
37)
——
—1,
294,
937
—G
ross
proc
eeds
from
sale
ofco
mm
onsh
ares
....
....
18,3
00,0
0018
3,00
023
7,71
7,00
0—
——
—23
7,90
0,00
0Is
suan
ceof
shar
esto
Prin
cipa
lsin
exch
ange
for
cont
ribu
ted
inte
rest
s..
....
....
....
....
....
....
833,
267
8,33
3(8
,333
)—
——
——
Off
erin
gco
sts
....
....
....
....
....
....
....
....
.—
—(2
2,42
7,98
8)—
——
—(2
2,42
7,98
8)St
ock
com
pens
atio
nac
tivity
....
....
....
....
....
.15
,000
150
1,06
6,80
0—
—(8
06,8
79)
—26
0,07
1D
istr
ibut
ions
decl
ared
....
....
....
....
....
....
..—
——
(5,3
85,4
50)
——
—(5
,385
,450
)N
etlo
ss..
....
....
....
....
....
....
....
....
....
——
—(3
32,3
22)
——
—(3
32,3
22)
Adj
ustm
ent
toL
imite
dPa
rtne
rs’
inte
rest
sfr
omin
crea
sed
owne
rshi
pin
the
Ope
ratin
gPa
rtne
rshi
p..
——
(50,
520,
314)
——
——
(50,
520,
314)
Bal
ance
s,D
ecem
ber
31,
2004
....
....
....
....
....
19,1
48,2
6719
1,48
316
4,53
2,22
8(5
,717
,772
)—
(806
,879
)—
158,
199,
060
Gro
sspr
ocee
dsfr
omsa
leof
com
mon
shar
es..
....
..9,
400,
000
94,0
0014
1,00
0,00
0—
——
—14
1,09
4,00
0O
ffer
ing
cost
s..
....
....
....
....
....
....
....
...
——
(7,8
55,3
38)
——
——
(7,8
55,3
38)
Stoc
kco
mpe
nsat
ion
activ
ity..
....
....
....
....
...
6,92
069
106,
132
——
(1,1
36)
—10
5,06
5O
ther
com
preh
ensi
vein
com
e..
....
....
....
....
..—
——
—42
7,05
7—
—42
7,05
7D
istr
ibut
ions
decl
ared
....
....
....
....
....
....
..—
——
(17,
719,
845)
——
—(1
7,71
9,84
5)N
etin
com
e..
....
....
....
....
....
....
....
....
.—
——
13,4
35,8
40—
——
13,4
35,8
40A
djus
tmen
tto
Lim
ited
Part
ners
’in
tere
sts
from
incr
ease
dow
ners
hip
inth
eO
pera
ting
Part
ners
hip
..—
—(8
,806
,459
)—
——
—(8
,806
,459
)
Bal
ance
s,D
ecem
ber
31,
2005
....
....
....
....
....
28,5
55,1
87$2
85,5
52$2
88,9
76,5
63$(
10,0
01,7
77)
$427
,057
$(80
8,01
5)$
—$2
78,8
79,3
80
The
acco
mpa
nyin
gno
tes
are
anin
tegr
alpa
rtof
thes
eco
nsol
idat
edfin
anci
alst
atem
ents
.
F-5

KITE REALTY GROUP TRUST ANDKITE PROPERTY GROUP (THE PREDECESSOR)
CONSOLIDATED AND COMBINED STATEMENTS OF CASH FLOWS
Company Predecessor
Year EndedDecember 31,
2005
PeriodAugust 16,
2004 throughDecember 31, 2004
PeriodJanuary 1,
2004 throughAugust 15, 2004
Year EndedDecember 31,
2003
Cash flow from operating activities:Net income (loss) . . . . . . . . . . . . . . . . . . . . . . . . . . . . . . . . . . . . . $ 13,435,840 $ (332,322) $ (192,380) 1,436,966Adjustments to reconcile net income (loss) to net cash
provided by operating activities:Gain on sale of operating property . . . . . . . . . . . . . . . . . . . . . . (7,212,402) — — —Minority interest income (loss) . . . . . . . . . . . . . . . . . . . . . . . . . 1,267,122 125,800 (214,887) 232,819Equity in earnings of unconsolidated entities . . . . . . . . . . . . . (252,511) (134,097) (163,804) (273,118)Limited Partners’ interest in Operating Partnership . . . . . . . . . 5,329,298 (146,968) — —Distributions of income from unconsolidated entities . . . . . . . 271,647 80,710 343,687 891,318Straight-line rent . . . . . . . . . . . . . . . . . . . . . . . . . . . . . . . . . . . . (1,672,710) (373,944) (311,899) (324,383)Depreciation and amortization . . . . . . . . . . . . . . . . . . . . . . . . . 23,648,819 8,345,829 3,987,945 3,017,579Provision for credit losses . . . . . . . . . . . . . . . . . . . . . . . . . . . . . 1,163,204 (214,053) 658,052 30,000Compensation expense for equity awards . . . . . . . . . . . . . . . . 281,782 65,071 — —Amortization of debt fair value adjustment . . . . . . . . . . . . . . . (1,437,545) (394,617) — —Amortization of in-place lease liabilities . . . . . . . . . . . . . . . . . (3,488,609) (1,093,620) (452,564) (260,899)Distributions (including minority interest share) . . . . . . . . . . . (1,041,367) (143,864) — —Changes in assets and liabilities:
Tenant receivables . . . . . . . . . . . . . . . . . . . . . . . . . . . . . . . . . (5,381,995) (1,641,334) (1,046,616) (786,814)Deferred costs and other assets . . . . . . . . . . . . . . . . . . . . . . (3,180,789) 3,265,736 (908,837) (4,599,074)Accounts payable and accrued expenses . . . . . . . . . . . . . . . 1,793,396 3,102,015 737,697 5,976,650
Net cash provided by operating activities . . . . . . . . . . . . . . . . 23,523,180 10,510,342 2,436,394 5,341,044Cash flow from investing activities:
Acquisitions of interests in properties and land held fordevelopment . . . . . . . . . . . . . . . . . . . . . . . . . . . . . . . . . . . . . . (178,489,599) (108,805,259) (46,770,356) (45,616,460)
Net proceeds from sale of operating property . . . . . . . . . . . . . 20,785,323 — — —Acquisition of joint venture and outside minority interest . . . — (12,451,155) — —Capital and construction expenditures, net . . . . . . . . . . . . . . . (50,414,673) (31,847,935) (34,999,943) (48,550,943)Change in construction payables . . . . . . . . . . . . . . . . . . . . . . . 2,101,895 2,824,764 3,170,506 532,379Distributions of capital from unconsolidated entities . . . . . . . 44,353 — 173,546 484,182Contributions to unconsolidated entities . . . . . . . . . . . . . . . . . — — — (242,506)Consolidation of acquired joint venture and outside minority
interests’ cash . . . . . . . . . . . . . . . . . . . . . . . . . . . . . . . . . . . . — 665,604 82,778 —Consolidation of Glendale Mall’s cash as of March 31, 2004 — — 108,822 —
Net cash used in investing activities . . . . . . . . . . . . . . . . . . . . . (205,972,701) (149,613,981) (78,234,647) (93,393,348)Cash flow from financing activities:
Offering proceeds, net of issuance costs . . . . . . . . . . . . . . . . . 133,238,662 215,472,012 — —Loan proceeds . . . . . . . . . . . . . . . . . . . . . . . . . . . . . . . . . . . . . . 265,596,255 123,162,602 89,185,669 112,708,871Loan transaction costs . . . . . . . . . . . . . . . . . . . . . . . . . . . . . . . . (1,275,407) (5,373,864) (655,263) (709,043)Loan payments . . . . . . . . . . . . . . . . . . . . . . . . . . . . . . . . . . . . . (188,560,885) (176,113,029) (10,105,596) (29,921,150)Payments and advances to/from Principals . . . . . . . . . . . . . . . — (9,000,000) 6,902,818 —Distributions paid — shareholders . . . . . . . . . . . . . . . . . . . . . . (15,956,049) (1,795,150) — —Distributions paid — unitholders . . . . . . . . . . . . . . . . . . . . . . . (6,354,828) (776,426) — —Contributions (including minority interest share) . . . . . . . . . . 867,432 — 2,681,036 14,579,103Distributions (including minority interest share) . . . . . . . . . . . — — (10,769,219) (9,908,843)
Net cash provided by financing activities . . . . . . . . . . . . . . . . . 187,555,180 145,576,145 77,239,445 86,748,938Increase (decrease) in cash and cash equivalents . . . . . . . . . . 5,105,659 6,472,506 1,441,192 (1,303,366)Cash and cash equivalents, beginning of period . . . . . . . . . . . 10,103,176 3,630,670 2,189,478 3,492,844
Cash and cash equivalents, end of period . . . . . . . . . . . . . . . . $ 15,208,835 $ 10,103,176 $ 3,630,670 $ 2,189,478
The accompanying notes are an integral part of these consolidated financial statements.
F-6
Organization
Kite Realty Group Trust (the “Company” or “REIT”) was organized in Maryland on March 29, 2004 tosucceed to the development, acquisition, construction and real estate businesses of Kite Property Group (the“Predecessor”). The Predecessor was owned by Al Kite, John Kite and Paul Kite (the “Principals”) and certainexecutives and other family members and consisted of the properties, entities and interests contributed to theCompany or its subsidiaries by its founders and is the predecessor of Kite Realty Group Trust. The Companybegan operations on August 16, 2004 when it completed its initial public offering (“IPO”) and concurrentlyconsummated certain other formation transactions. The IPO consisted of the sale of 16,300,000 common sharessold to the public at $13.00 per share, resulting in net proceeds to the Company of $191.3 million. The netproceeds were contributed in exchange for a 67.4% controlling interest in Kite Realty Group, L.P., the “OperatingPartnership”. A total of 833,267 shares were issued to the Principals of the Predecessor in exchange for theirinterests of certain properties and service companies. Also, a total of 15,000 restricted shares were awarded tothe members of the Company’s Board of Trustees. On September 14, 2004, the underwriters exercised their over-allotment option to purchase an additional 2,000,000 common shares at $13.00 per share, resulting in additionalnet proceeds of $24.2 million. The exercise of the overallotment option increased the controlling interest in theOperating Partnership to 69.8%. In total, 19,148,267 shares were issued in connection with the Company’s IPOand related formation transactions. In addition, a total of 8,281,882 units of the Operating Partnership were issuedto the Principals and certain of our executive officers and other individuals in exchange for their interests incertain properties.
Concurrent with the Company’s formation, the Company utilized the net proceeds from the IPO to prepaymortgage indebtedness ($100 million), to repay a credit facility provided by affiliates of Lehman Brothers($48 million), to acquire four properties that were under contract ($45 million), to acquire joint venture andoutside minority interests in nine properties ($13 million) and to repay existing indebtedness due to the Principals($9 million).
As a result of the IPO and related formation transactions and several subsequent acquisitions, the Company,through the Operating Partnership, is engaged in the ownership, operation, management, leasing, acquisition,expansion and development of neighborhood and community shopping centers and certain commercial real estateproperties. As of December 31, 2005, 43 of the 45 entities which own properties in which the Company hasan interest were consolidated. The Company also provides real estate facilities management, construction,development and other advisory services to third parties through its taxable REIT subsidiaries.
Basis of Presentation
The accompanying financial statements of Kite Realty Group Trust are presented on a consolidated basis andinclude all of the accounts of the Company, the Operating Partnership, the taxable REIT subsidiaries of theOperating Partnership and any variable interest entities (“VIEs”) in which the Company is the primary beneficiary.The exchange of entities or interests held by the Principals for common shares of the REIT and limited partnershipinterests in the Operating Partnership was accounted for as a reorganization of entities under common control and,accordingly, related assets and liabilities were reflected at their historical cost basis. The acquisition of the jointventure and minority partners’ interests in the properties has been accounted for as a purchase.
KITE REALTY GROUP TRUST ANDKITE PROPERTY GROUP (THE PREDECESSOR)
NOTES TO CONSOLIDATED AND COMBINED FINANCIAL STATEMENTSDecember 31, 2005
Note 1. Organization and Basis of Presentation
F-7

The Company consolidates properties that are wholly-owned and properties in which it owns less than 100%but it controls. Control of a property is demonstrated by our ability to:
• manage day-to-day operations,
• refinance debt and sell the property without the consent of any other partner or owner, and
• the inability of any other partner or owner to replace us.
The Company allocates net operating results of the Operating Partnership based on the partners’ respectiveweighted average ownership interest. The Company adjusts the limited partners’ interests in the OperatingPartnership at the end of each period to reflect their interest in the Operating Partnership. This adjustment isreflected in the Company’s shareholders’ equity. The Company’s and the limited partners’ interests in theOperating Partnership for the year ended December 31, 2005 and for the period from August 16, 2004 throughDecember 31, 2004 were as follows:.
For theyear ended
December 31,2005
For theperiod fromAugust 16,
2004 ThroughDecember 31,
2004
Company’s weighted average interest in Operating Partnership . . . . . . . 71.6% 69.3%Limited Partners’ weighted average interest in Operating Partnership. . 28.4% 30.7%Company’s interest in Operating Partnership at December 31 . . . . . . . . . 76.8% 69.8%Limited Partners’ interest in Operating Partnership at December 31 . . 23.2% 30.2%
The accompanying financial statements of the Predecessor are presented on a combined historical cost basisbecause of the affiliated ownership and common management and because the assets and liabilities were thesubject of a business combination with the Operating Partnership and the REIT, which was completed onAugust 16, 2004. The Principals have operations that were not contributed to the Operating Partnership and,therefore, the accompanying financial statements of the Predecessor are not intended to represent the financialposition and results of operations of the Principals.
In management’s opinion, the combined financial statements include all the assets, liabilities, revenues andexpenses associated with the operations of the entities or interests therein transferred to the Operating Partnershipor the REIT. All significant inter-entity balances and transactions have been eliminated.
Investment in Portfolio Properties
At December 31, 2005, we owned interests in 45 operating properties (consisting of 40 retail properties,four commercial operating properties and a related parking garage) and had 14 properties under development.Of the 59 total properties held at December 31, 2005, the Company owned a non-controlling interest in twooperating properties (Spring Mill Medical and The Centre) which were accounted for under the equity method.
Prior to the completion of the Company’s IPO and related formation transactions, the Predecessor’sinvestments in certain of the properties were accounted for under the equity method. These investments, whichrepresented non-controlling 33% to 73% ownership interests, were recorded initially at cost and subsequentlyadjusted for net equity in income (loss) and cash contributions and distributions.
KITE REALTY GROUP TRUST ANDKITE PROPERTY GROUP (THE PREDECESSOR)
NOTES TO CONSOLIDATED AND COMBINED FINANCIAL STATEMENTSDecember 31, 2005
Note 1. Organization and Basis of Presentation (Continued)
F-8
Use of Estimates
The accompanying financial statements have been prepared in accordance with accounting principlesgenerally accepted in the United States (“GAAP”). GAAP requires management to make estimates andassumptions that affect the reported amounts of assets and liabilities, disclosure of contingent assets and liabilitiesat the date of the financial statements, and revenues and expenses during the reported period. Actual results coulddiffer from these estimates.
Purchase Accounting
The purchase price of properties is allocated to tangible and identified intangible assets acquired based ontheir fair values in accordance with the provisions of Statement of Financial Accounting Standards No. 141,“Business Combinations” (“SFAS No. 141”). In making estimates of fair values for the purpose of allocatingpurchase price, a number of sources are utilized. We also consider information about each property obtainedas a result of its pre-acquisition due diligence, marketing and leasing activities in estimating the fair value oftangible and intangible assets acquired.
A portion of the purchase price is allocated to tangible assets, including:
• the fair value of the building on an as-if-vacant basis and to land determined either by real estate taxassessments, independent appraisals or other relevant data.
• above-market and below-market in-place lease values for acquired properties are based on the presentvalue (using an interest rate which reflects the risks associated with the leases acquired) of thedifference between (i) the contractual amounts to be paid pursuant to the in-place leases and(ii) management’s estimate of fair market lease rates for the corresponding in-place leases, measuredover the remaining non-cancelable term of the leases. The capitalized above-market and below-marketlease values are amortized as a reduction of or addition to rental income over the remaining non-cancelable terms of the respective leases. Should a tenant terminate its lease, the unamortized portionof the lease intangibles would be charged or credited to income.
• the value of leases acquired. The Company utilizes independent sources for our estimates to determinethe respective in-place lease values. Our estimates of value are made using methods similar to thoseused by independent appraisers. Factors we consider in our analysis include an estimate of costs toexecute similar leases including tenant improvements, leasing commissions and foregone costs andrent received during the estimated lease-up period as if the space was vacant. The value of in-placeleases is amortized to expense over the remaining initial terms of the respective leases.
The Company also considers whether a portion of the purchase price should be allocated to in-place leasesthat have a related customer relationship intangible value. Characteristics we consider in allocating these valuesinclude the nature and extent of existing business relationships with the tenant, growth prospects for developingnew business with the tenant, the tenant’s credit quality and expectations of lease renewals, among other factors.To date, a tenant relationship has not been developed that is considered to have a current intangible value.
Investment Properties
Investment properties are recorded at cost and include costs of acquisitions, development, predevelopment,construction costs, certain allocated overhead, tenant allowances and improvements, and interest and real estatetaxes incurred during construction. Significant renovations and improvements are capitalized when they extend
KITE REALTY GROUP TRUST ANDKITE PROPERTY GROUP (THE PREDECESSOR)
NOTES TO CONSOLIDATED AND COMBINED FINANCIAL STATEMENTSDecember 31, 2005
Note 2. Summary of Significant Accounting Policies (Continued)
F-9
the useful life, increase capacity, or improve the efficiency of the asset. Maintenance and repairs that do not extendthe useful lives of the respective assets are reflected in property operating expense.
The Company incurs costs prior to land acquisition including acquisition contract deposits, as well as legal,engineering and other external professional fees related to evaluating the feasibility of developing a shoppingcenter. These pre-development costs are included in construction in progress in the accompanying consolidatedbalance sheets. If the Company determines that the development of a property is no longer probable, any pre-development costs previously incurred are immediately expensed.
The Company capitalizes costs of properties under development such as construction costs, interest costs,real estate taxes, salaries and related costs of personnel directly involved in the project and other costs incurredduring the period of development. As a development property becomes operational, the Company expensesappropriate costs pro rata based on the occupancy of the property. The Company does not capitalize costs ona project beyond 12 months after substantial completion of the building shell.
In accordance with Statement of Financial Accounting Standards No. 144, “Accounting for the Impairmentof Long-Lived Assets and for Long-Lived Assets to be Disposed Of” (“SFAS No. 144”), investment propertiesand intangible assets are reviewed for impairment on a property-by-property basis at least annually or wheneverevents or changes in circumstances indicate that the carrying value of investment properties may not berecoverable. Impairment losses for investment properties are recorded when the undiscounted cash flowsestimated to be generated by the investment properties during the expected hold period are less than the carryingamounts of those assets. Impairment losses are measured as the difference between the carrying value and thefair value of the asset.
In accordance with SFAS No. 144, operating properties held for sale includes only those properties availablefor immediate sale in their present condition and for which management believes it is probable that a sale ofthe property will be completed within one year. Operating properties are carried at the lower of cost or fair valueless costs to sell. Depreciation and amortization are suspended during the held-for-sale period.
The Company’s properties generally have operations and cash flows that can be clearly distinguished fromthe rest of the Company. In accordance with SFAS No. 144, the operations reported in discontinued operationsinclude those operating properties that were sold or considered held-for-sale and for which operations and cashflows can be clearly distinguished. The operations from these properties are eliminated from ongoing operationsand the Company will not have a continuing involvement after disposition. Prior periods have been restated toreflect the operations of these properties as discontinued operations.
Depreciation on buildings and improvements is provided utilizing the straight-line method over an estimatedoriginal useful lives ranging from 10 to 35 years. Depreciation on tenant allowances and improvements isprovided utilizing the straight-line method over the term of the related lease. Depreciation on equipment andfixtures is provided utilizing the straight-line method over 5 to 10 years.
Escrow Deposits
Escrow deposits generally consist of escrowed cash held for real estate taxes, property maintenance,insurance, minimum occupancy and property operating income requirements at specific properties as required.
KITE REALTY GROUP TRUST ANDKITE PROPERTY GROUP (THE PREDECESSOR)
NOTES TO CONSOLIDATED AND COMBINED FINANCIAL STATEMENTSDecember 31, 2005
Note 2. Summary of Significant Accounting Policies (Continued)
F-10
Cash and Cash Equivalents
The Company considers all highly liquid investments purchased with an original maturity of 90 days orless to be cash and cash equivalents.
Cash paid for interest, including capitalized interest, for the year ended December 31, 2005, for the periodfrom August 16, 2004 through December 31, 2004, for the period from January 1, 2004 through August 15,2004 and for the year ended December 31, 2003 was as follows:
The Company The Predecessor
For theyear ended
December 31,2005
For theperiod fromAugust 16,
2004through
December 31,2004
For theperiod fromJanuary 1,
2004through
August 15,2004
For theyear ended
December 31,2003
Cash Paid for Interest . . . . . . . . . . . . . . . . . . . . . . . . . $20,656,637 $5,174,446 $5,458,980 $4,805,933Capitalized Interest . . . . . . . . . . . . . . . . . . . . . . . . . . . 3,507,372 823,502 1,400,774 610,756
Accrued but unpaid distributions were $6,970,097 and $5,143,153 as of December 31, 2005 and 2004,respectively and are included in accounts payable and accrued expenses in the accompanying consolidatedbalance sheet.
Fair Value of Financial Instruments
The carrying amounts of cash and cash equivalents, accounts receivable, escrows and deposits, andaccounts payable and accrued expenses approximate fair value because of the relatively short maturity ofthese instruments.
Revenue Recognition
As lessor, the Company retains substantially all of the risks and benefits of ownership of the investmentproperties and account for our leases as operating leases.
Base minimum rents are recognized on a straight-line basis over the terms of the respective leases. Certainlease agreements contain provisions that grant additional rents based on tenants’ sales volume (contingentpercentage rent). Percentage rents are recognized when tenants achieve the specified targets as defined in theirlease agreements and overage rents are included in other property related revenue in the accompanyingstatements of operations.
Reimbursements from tenants for real estate taxes and other recoverable operating expenses are recognizedas revenues in the period the applicable expense is incurred.
Gains on sales of real estate are recognized in accordance with Statement of Financial Standards (“SFAS”)No. 66, “Accounting for Real Estate”. In summary, gains from sales are not recognized unless a sale has beenconsummated, the buyer’s initial and continuing investment is adequate to demonstrate a commitment to payfor the property, the Company has transferred to the buyer the usual risks and rewards of ownership, and theCompany does not have a substantial continuing financial involvement in the property.
KITE REALTY GROUP TRUST ANDKITE PROPERTY GROUP (THE PREDECESSOR)
NOTES TO CONSOLIDATED AND COMBINED FINANCIAL STATEMENTSDecember 31, 2005
Note 2. Summary of Significant Accounting Policies (Continued)
F-11
Development and other advisory services fees are recognized as revenues in the period in which the servicesare rendered. Performance-based incentive fees are recorded when the fees are earned.
Revenues from construction contracts are recognized on the percentage-of-completion method, measuredby the percentage of cost incurred to date to the estimated total cost for each contract. Project costs include alldirect labor, subcontract, and material costs and those indirect costs related to contract performance costs incurredto date do not include uninstalled materials. Provisions for estimated losses on uncompleted contracts are madein the period in which such losses are determined. Changes in job performances, job conditions, and estimatedprofitability may result in revisions to costs and income, which are recognized in the period in which the revisionsare determined.
Accounting for Investments in Joint Ventures
In December 2003, the Financial Accounting Standards Board issued FASB Interpretation No. 46 (RevisedDecember 2003), “Consolidation of Variable Interest Entities” (“FIN 46R”). FIN 46R replacesFASB Interpretation No. 46 which was issued in January 2003. FIN 46R explains how to identify variable interestentities and how to assess whether to consolidate such entities. In general, a variable interest entity (“VIE”) isa corporation, partnership, trust or any other legal structure used for business purposes that either (a) does nothave equity investors with voting rights or (b) has equity investors that do not provide sufficient financialresources for the entity to support its activities. Prior to the issuance of FIN 46R, a company generally includedanother entity in its consolidated financial statements only if it controlled the entity through voting interests.FIN 46R changes that by requiring a VIE to be consolidated by a company if that company is subject to a majorityof the risk of loss from the VIE’s activities or entitled to receive a majority of the entity’s residual returns orboth. During 2005, the Company entered into nine joint venture agreements to acquire land for futuredevelopment. Five of the joint ventures with total assets of approximately $62.8 million and construction debtof approximately $11.9 million have been consolidated because the entities have been deemed to be VIEs, theCompany guarantees the debt of the joint ventures and the Company is the primary beneficiary.
On March 31, 2004 the Company consolidated Glendale Mall joint venture as of that date pursuant toFIN 46R. Periods prior to March 31, 2004 were not restated as a result of the adoption of FIN 46R. As a resultof the IPO and related formation transactions, Glendale Mall is wholly owned.
The Company accounts for its investments in unconsolidated joint ventures under the equity method ofaccounting as we exercises significant influence over, but do not control, operating and financial policies. Theseinvestments are recorded initially at cost and subsequently adjusted for equity in earnings and cash contributionsand distributions. As of December 31, 2005, the Company had two entities that were accounted for under theequity method (Spring Mill Medical and The Centre).
Tenant Receivables and Allowance for Doubtful Accounts
Tenant receivables consist primarily of billed minimum rent, accrued and billed tenant reimbursements andaccrued straight-line rent. The Company generally does not require collateral from its tenants.
An allowance for doubtful accounts is maintained for estimated losses resulting from the inability of certaintenants or others to meet contractual obligations under their lease or other agreements. Accounts are written offwhen, in the opinion of management, the balance is uncollectible.
KITE REALTY GROUP TRUST ANDKITE PROPERTY GROUP (THE PREDECESSOR)
NOTES TO CONSOLIDATED AND COMBINED FINANCIAL STATEMENTSDecember 31, 2005
Note 2. Summary of Significant Accounting Policies (Continued)
F-12
2005 2004 2003
Balance, beginning of year . . . . . . . . . . . . . . . . . . . . . . . . . . . . . . . $ 511,974 $ 30,000 $ —Consolidation of joint venture interests . . . . . . . . . . . . . . . . . . . — 1,210,942 —Provision for credit losses . . . . . . . . . . . . . . . . . . . . . . . . . . . . . . . . 1,163,204 443,999 30,000Accounts written off, net of recoveries . . . . . . . . . . . . . . . . . . . (645,158) (1,172,967) —
Balance, end of year . . . . . . . . . . . . . . . . . . . . . . . . . . . . . . . . . . . . . . $1,030,020 $ 511,974 $30,000
Concentration of Credit Risk
The Company’s accounts receivable from tenants potentially subjects it to a concentration of credit riskis its accounts receivable. At December 31, 2005, approximately 27% of property accounts receivable was fromtenants leasing space in the state of Indiana.
Earnings Per Share
Basic earnings per share is calculated based on the weighted average number of shares outstanding duringthe period. Diluted earnings per share is determined based on the weighted average number of shares outstandingcombined with the incremental average shares that would have been outstanding assuming all potentially dilutiveshares were converted into common shares as of the earliest date possible. Share options are accounted for basedon their fair market value at the date of grant. Expense related to share options was $193,969 and $65,071 for theyear ended December 31, 2005 and for the period from August 16, 2004 through December 31, 2004, respectively.
Potential dilutive securities include outstanding share options and units of limited partnership of theOperating Partnership which may be exchanged for shares under certain circumstances. The only potentiallydilutive securities that had a dilutive effect for the year ended December 31, 2005 were outstanding share options.The outstanding share options did not have a dilutive effect for the period from August 16, 2004 throughDecember 31, 2004 as the Company recorded a net loss. Since the Company’s IPO and related formationtransactions occurred on August 16, 2004, earnings per share is not presented for periods prior to this date.
The effect of conversion of units of the Operating Partnership is not reflected in diluted shares as they areexchangeable for Common Shares on a one-for-one basis. The income allocable to such units is allocated onthe same basis and reflected as Limited Partners’ interests in the Operating Partnership in the accompanyingconsolidated statements of operations. Therefore, the assumed conversion of these units would have no effecton the determination of earnings per share.
KITE REALTY GROUP TRUST ANDKITE PROPERTY GROUP (THE PREDECESSOR)
NOTES TO CONSOLIDATED AND COMBINED FINANCIAL STATEMENTSDecember 31, 2005
Note 2. Summary of Significant Accounting Policies (Continued)
F-13
The following table sets forth the computations of our basic and diluted earnings per share.
For theyear ended
December 31, 2005
For theperiod from
August 16, 2004through
December 31, 2004
Income (loss) from continuing operations(1) . . . . . . . . . . . . . . . . . . . . . . . . . . . $ 7,500,318 $ (587,366)Discontinued operations(1) . . . . . . . . . . . . . . . . . . . . . . . . . . . . . . . . . . . . . . . . . . . . 5,935,522 255,044
Net income (loss) . . . . . . . . . . . . . . . . . . . . . . . . . . . . . . . . . . . . . . . . . . . . . . . . . . . . . $13,435,840 $ (332,322)
Weighted Average Common Shares Outstanding — Basic . . . . . . . . . . . . 21,406,980 18,727,977Effect of outstanding stock options . . . . . . . . . . . . . . . . . . . . . . . . . . . . . . . . . . . 113,081 —
Weighted Average Shares Outstanding — Diluted . . . . . . . . . . . . . . . . . . . . 21,520,061 18,727,977
(1) Reflects the Company’s share of income.
Derivative Financial Instruments
The Company applies SFAS No. 133 “Accounting for Derivative Instruments and Hedging Activities”which requires that all derivative instruments be recorded on the balance sheet at their fair value. Gains or lossesresulting from changes in the values of those derivatives are accounted for depending on the use of the derivativeand whether it qualifies for hedge accounting. The Company uses derivative financial instruments to mitigateits interest rate risk on a related financial instrument through the use of interest rate swaps or rate locks.
Statement No. 133 requires that changes in fair value of derivatives that qualify as cash flow hedges berecognized in other comprehensive income (“OCI”) while any ineffective portion of the derivative’s change infair value be recognized immediately in earnings. Upon settlement of the hedge, gains and losses associated withthe transaction are recorded in OCI and amortized over the underlying term of the hedge transaction. All of theCompany’s derivative instruments qualify for hedge accounting.
Income Taxes
The Company has elected to be taxed as a REIT pursuant to the Internal Revenue Code as amended (the“Code”), beginning with the taxable year ended December 31, 2004. To maintain its status as a REIT, theCompany is obligated to distribute 90% of its ordinary taxable income annually to its shareholders. The Companyintends to make timely distributions sufficient to satisfy the annual distribution requirements and to avoidcorporate income taxes.
Prior to our IPO, Kite Development Corporation, Kite Construction, Inc. and all of the properties were heldby entities where the owners were required to include their respective share of profits or losses generated bythese entities in their individual tax returns. Accordingly, no Federal income tax provision has been reflectedfor periods prior to the IPO.
The Company has elected taxable REIT subsidiary (“TRS”) status for some of its subsidiaries underSection 856(1) of the Code. This enables the Company to receive income and provide services that would otherwise
KITE REALTY GROUP TRUST ANDKITE PROPERTY GROUP (THE PREDECESSOR)
NOTES TO CONSOLIDATED AND COMBINED FINANCIAL STATEMENTSDecember 31, 2005
Note 2. Summary of Significant Accounting Policies (Continued)
F-14
be impermissible for REITs. In accordance with Statement of Financial Accounting Standards No. 109,“Accounting for Income Taxes” (“SFAS No. 109”), deferred tax assets and liabilities are established for temporarydifferences between the financial reporting bases and the tax bases of assets and liabilities at the enacted ratesexpected to be in effect when the temporary differences reverse. SFAS No. 109 also requires that deferred tax assetsbe reduced by a valuation allowance if it is more likely than not that some portion or all of the deferred tax assetwill not be realized.
Income tax provisions for the 2005, 2004 and 2003 were approximately $1,041,000, $57,000 and $40,000,respectively. The income tax provision is included in other expenses in the accompanying consolidated andcombined statements of operations.
Reclassifications
Certain prior year amounts have been reclassified to conform to the current year presentation. Suchreclassifications had no effect on net income previously reported.
Note 3. Deferred Costs
Deferred costs consist primarily of financing fees incurred to obtain long-term financing and broker feesand capitalized salaries and related benefits incurred in connection with lease originations. Deferred financingcosts are amortized on a straight-line basis over the terms of the respective loan agreements. Deferred leasingcosts include lease intangibles and other and are amortized on a straight-line basis over the terms of the relatedleases. At December 31, 2005 and 2004, deferred costs consisted of the following:
2005 2004
Deferred financing costs . . . . . . . . . . . . . . . . . . . . . . . . . . . . . . . . . . . . . . . . . . . . . . $ 6,046,408 $ 4,958,167Acquired lease intangibles . . . . . . . . . . . . . . . . . . . . . . . . . . . . . . . . . . . . . . . . . . . . 7,472,207 4,858,405Deferred leasing costs and other . . . . . . . . . . . . . . . . . . . . . . . . . . . . . . . . . . . . . . 9,395,983 8,391,347
22,914,598 18,207,919Less — accumulated amortization . . . . . . . . . . . . . . . . . . . . . . . . . . . . . . . . . . . . (5,534,310) (2,943,648)
Total . . . . . . . . . . . . . . . . . . . . . . . . . . . . . . . . . . . . . . . . . . . . . . . . . . . . . . . . . . . . . . . $17,380,288 $15,264,271
The estimated aggregate amortization amounts from acquired lease intangibles for each of the next fiveyears are as follows:
2006 . . . . . . . . . . . . . . . . . . . . . . . . . . . . . . $1,014,1632007 . . . . . . . . . . . . . . . . . . . . . . . . . . . . . . 911,1512008 . . . . . . . . . . . . . . . . . . . . . . . . . . . . . . 753,3982009 . . . . . . . . . . . . . . . . . . . . . . . . . . . . . . 669,3422010 . . . . . . . . . . . . . . . . . . . . . . . . . . . . . . 574,024Thereafter . . . . . . . . . . . . . . . . . . . . . . . . . 2,424,062
Total . . . . . . . . . . . . . . . . . . . . . . . . . . . $6,346,140
KITE REALTY GROUP TRUST ANDKITE PROPERTY GROUP (THE PREDECESSOR)
NOTES TO CONSOLIDATED AND COMBINED FINANCIAL STATEMENTSDecember 31, 2005
Note 2. Summary of Significant Accounting Policies (Continued)
F-15
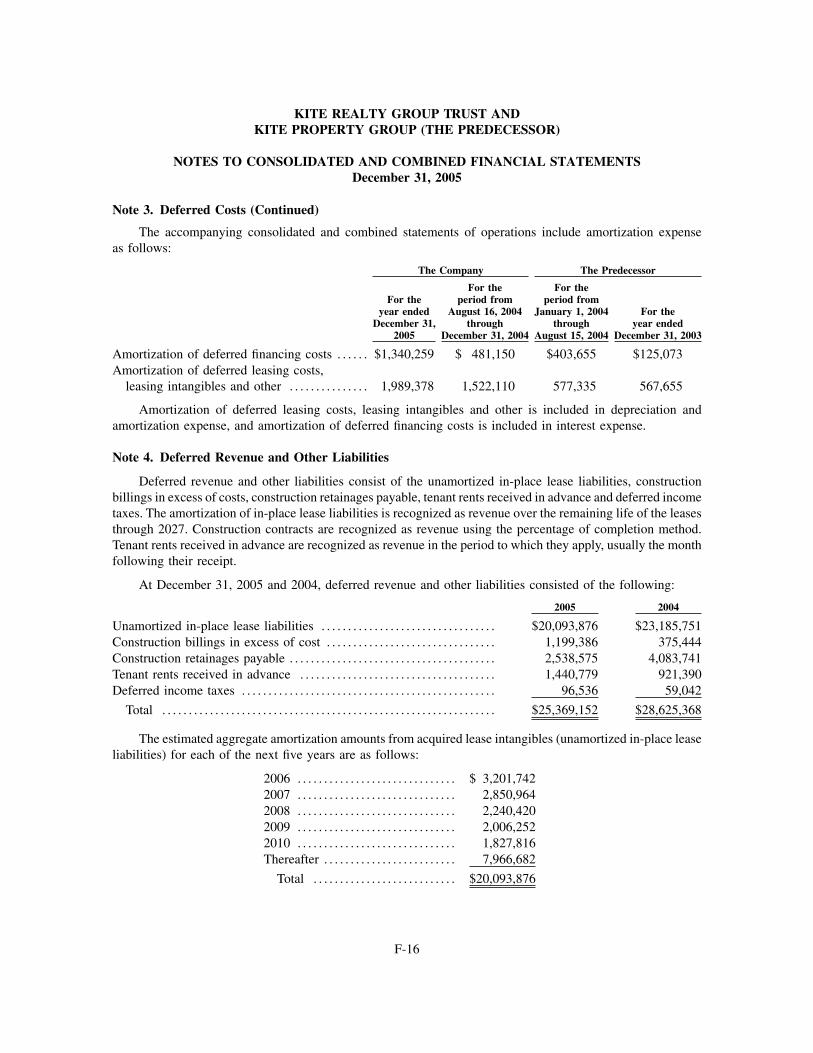
The accompanying consolidated and combined statements of operations include amortization expenseas follows:
The Company The Predecessor
For theyear ended
December 31,2005
For theperiod from
August 16, 2004through
December 31, 2004
For theperiod from
January 1, 2004through
August 15, 2004
For theyear ended
December 31, 2003
Amortization of deferred financing costs . . . . . . $1,340,259 $ 481,150 $403,655 $125,073Amortization of deferred leasing costs,
leasing intangibles and other . . . . . . . . . . . . . . . 1,989,378 1,522,110 577,335 567,655
Amortization of deferred leasing costs, leasing intangibles and other is included in depreciation andamortization expense, and amortization of deferred financing costs is included in interest expense.
Note 4. Deferred Revenue and Other Liabilities
Deferred revenue and other liabilities consist of the unamortized in-place lease liabilities, constructionbillings in excess of costs, construction retainages payable, tenant rents received in advance and deferred incometaxes. The amortization of in-place lease liabilities is recognized as revenue over the remaining life of the leasesthrough 2027. Construction contracts are recognized as revenue using the percentage of completion method.Tenant rents received in advance are recognized as revenue in the period to which they apply, usually the monthfollowing their receipt.
At December 31, 2005 and 2004, deferred revenue and other liabilities consisted of the following:
2005 2004
Unamortized in-place lease liabilities . . . . . . . . . . . . . . . . . . . . . . . . . . . . . . . . . $20,093,876 $23,185,751Construction billings in excess of cost . . . . . . . . . . . . . . . . . . . . . . . . . . . . . . . . 1,199,386 375,444Construction retainages payable . . . . . . . . . . . . . . . . . . . . . . . . . . . . . . . . . . . . . . . 2,538,575 4,083,741Tenant rents received in advance . . . . . . . . . . . . . . . . . . . . . . . . . . . . . . . . . . . . . 1,440,779 921,390Deferred income taxes . . . . . . . . . . . . . . . . . . . . . . . . . . . . . . . . . . . . . . . . . . . . . . . . 96,536 59,042
Total . . . . . . . . . . . . . . . . . . . . . . . . . . . . . . . . . . . . . . . . . . . . . . . . . . . . . . . . . . . . . . . $25,369,152 $28,625,368
The estimated aggregate amortization amounts from acquired lease intangibles (unamortized in-place leaseliabilities) for each of the next five years are as follows:
2006 . . . . . . . . . . . . . . . . . . . . . . . . . . . . . . $ 3,201,7422007 . . . . . . . . . . . . . . . . . . . . . . . . . . . . . . 2,850,9642008 . . . . . . . . . . . . . . . . . . . . . . . . . . . . . . 2,240,4202009 . . . . . . . . . . . . . . . . . . . . . . . . . . . . . . 2,006,2522010 . . . . . . . . . . . . . . . . . . . . . . . . . . . . . . 1,827,816Thereafter . . . . . . . . . . . . . . . . . . . . . . . . . 7,966,682
Total . . . . . . . . . . . . . . . . . . . . . . . . . . . $20,093,876
KITE REALTY GROUP TRUST ANDKITE PROPERTY GROUP (THE PREDECESSOR)
NOTES TO CONSOLIDATED AND COMBINED FINANCIAL STATEMENTSDecember 31, 2005
Note 3. Deferred Costs (Continued)
F-16
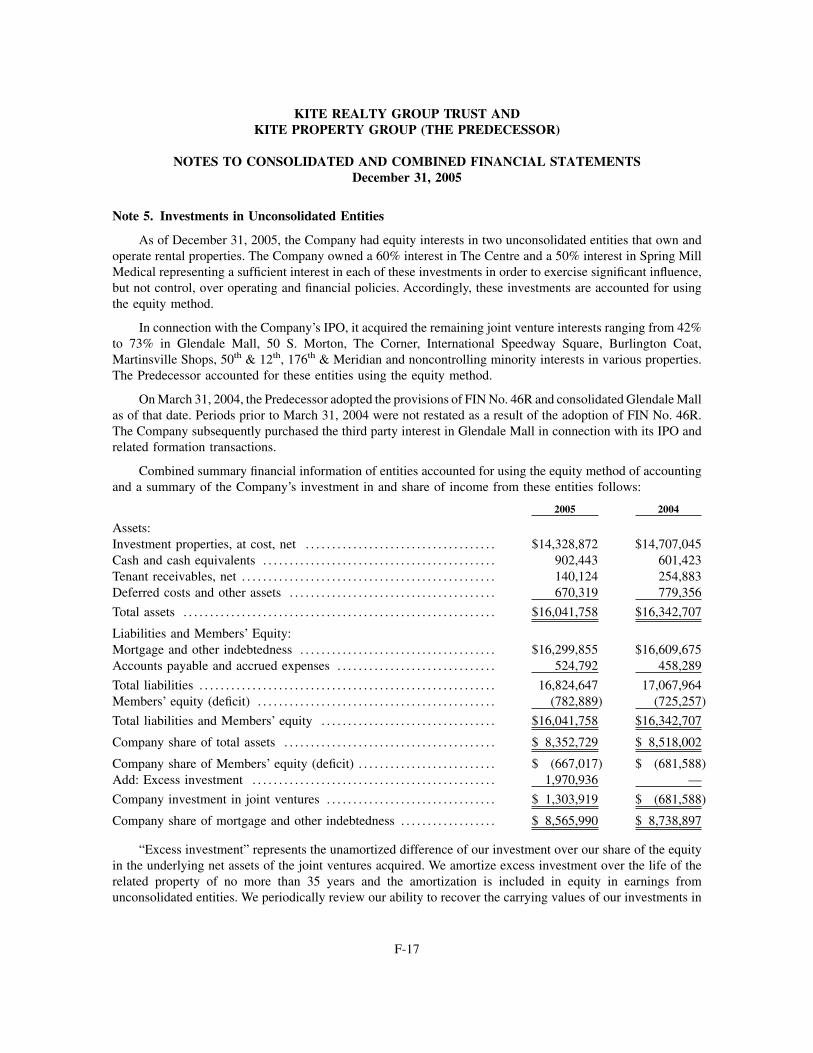
Note 5. Investments in Unconsolidated Entities
As of December 31, 2005, the Company had equity interests in two unconsolidated entities that own andoperate rental properties. The Company owned a 60% interest in The Centre and a 50% interest in Spring MillMedical representing a sufficient interest in each of these investments in order to exercise significant influence,but not control, over operating and financial policies. Accordingly, these investments are accounted for usingthe equity method.
In connection with the Company’s IPO, it acquired the remaining joint venture interests ranging from 42%to 73% in Glendale Mall, 50 S. Morton, The Corner, International Speedway Square, Burlington Coat,Martinsville Shops, 50th & 12th, 176th & Meridian and noncontrolling minority interests in various properties.The Predecessor accounted for these entities using the equity method.
On March 31, 2004, the Predecessor adopted the provisions of FIN No. 46R and consolidated Glendale Mallas of that date. Periods prior to March 31, 2004 were not restated as a result of the adoption of FIN No. 46R.The Company subsequently purchased the third party interest in Glendale Mall in connection with its IPO andrelated formation transactions.
Combined summary financial information of entities accounted for using the equity method of accountingand a summary of the Company’s investment in and share of income from these entities follows:
2005 2004
Assets:Investment properties, at cost, net . . . . . . . . . . . . . . . . . . . . . . . . . . . . . . . . . . . . $14,328,872 $14,707,045Cash and cash equivalents . . . . . . . . . . . . . . . . . . . . . . . . . . . . . . . . . . . . . . . . . . . . 902,443 601,423Tenant receivables, net . . . . . . . . . . . . . . . . . . . . . . . . . . . . . . . . . . . . . . . . . . . . . . . . 140,124 254,883Deferred costs and other assets . . . . . . . . . . . . . . . . . . . . . . . . . . . . . . . . . . . . . . . 670,319 779,356
Total assets . . . . . . . . . . . . . . . . . . . . . . . . . . . . . . . . . . . . . . . . . . . . . . . . . . . . . . . . . . . $16,041,758 $16,342,707
Liabilities and Members’ Equity:Mortgage and other indebtedness . . . . . . . . . . . . . . . . . . . . . . . . . . . . . . . . . . . . . $16,299,855 $16,609,675Accounts payable and accrued expenses . . . . . . . . . . . . . . . . . . . . . . . . . . . . . . 524,792 458,289
Total liabilities . . . . . . . . . . . . . . . . . . . . . . . . . . . . . . . . . . . . . . . . . . . . . . . . . . . . . . . . 16,824,647 17,067,964Members’ equity (deficit) . . . . . . . . . . . . . . . . . . . . . . . . . . . . . . . . . . . . . . . . . . . . . (782,889) (725,257)
Total liabilities and Members’ equity . . . . . . . . . . . . . . . . . . . . . . . . . . . . . . . . . $16,041,758 $16,342,707
Company share of total assets . . . . . . . . . . . . . . . . . . . . . . . . . . . . . . . . . . . . . . . . $ 8,352,729 $ 8,518,002
Company share of Members’ equity (deficit) . . . . . . . . . . . . . . . . . . . . . . . . . . $ (667,017) $ (681,588)Add: Excess investment . . . . . . . . . . . . . . . . . . . . . . . . . . . . . . . . . . . . . . . . . . . . . . 1,970,936 —
Company investment in joint ventures . . . . . . . . . . . . . . . . . . . . . . . . . . . . . . . . $ 1,303,919 $ (681,588)
Company share of mortgage and other indebtedness . . . . . . . . . . . . . . . . . . $ 8,565,990 $ 8,738,897
“Excess investment” represents the unamortized difference of our investment over our share of the equityin the underlying net assets of the joint ventures acquired. We amortize excess investment over the life of therelated property of no more than 35 years and the amortization is included in equity in earnings fromunconsolidated entities. We periodically review our ability to recover the carrying values of our investments in
KITE REALTY GROUP TRUST ANDKITE PROPERTY GROUP (THE PREDECESSOR)
NOTES TO CONSOLIDATED AND COMBINED FINANCIAL STATEMENTSDecember 31, 2005
F-17
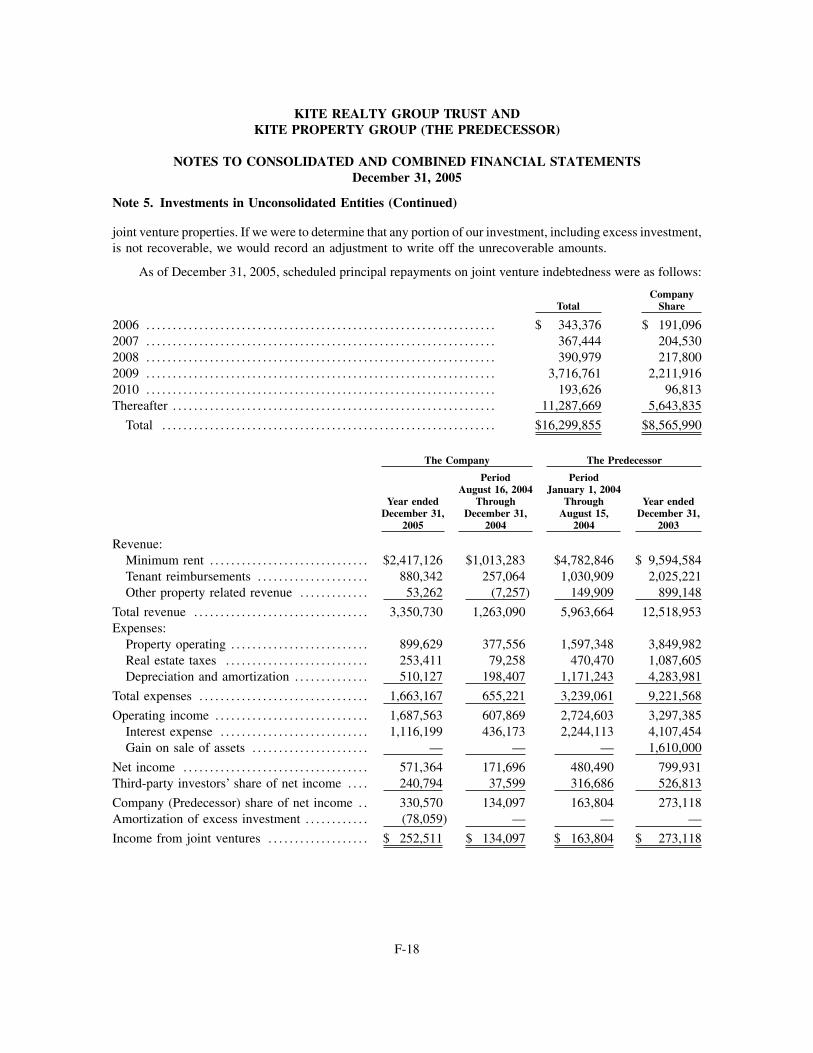
joint venture properties. If we were to determine that any portion of our investment, including excess investment,is not recoverable, we would record an adjustment to write off the unrecoverable amounts.
As of December 31, 2005, scheduled principal repayments on joint venture indebtedness were as follows:
TotalCompany
Share
2006 . . . . . . . . . . . . . . . . . . . . . . . . . . . . . . . . . . . . . . . . . . . . . . . . . . . . . . . . . . . . . . . . . . $ 343,376 $ 191,0962007 . . . . . . . . . . . . . . . . . . . . . . . . . . . . . . . . . . . . . . . . . . . . . . . . . . . . . . . . . . . . . . . . . . 367,444 204,5302008 . . . . . . . . . . . . . . . . . . . . . . . . . . . . . . . . . . . . . . . . . . . . . . . . . . . . . . . . . . . . . . . . . . 390,979 217,8002009 . . . . . . . . . . . . . . . . . . . . . . . . . . . . . . . . . . . . . . . . . . . . . . . . . . . . . . . . . . . . . . . . . . 3,716,761 2,211,9162010 . . . . . . . . . . . . . . . . . . . . . . . . . . . . . . . . . . . . . . . . . . . . . . . . . . . . . . . . . . . . . . . . . . 193,626 96,813Thereafter . . . . . . . . . . . . . . . . . . . . . . . . . . . . . . . . . . . . . . . . . . . . . . . . . . . . . . . . . . . . . 11,287,669 5,643,835
Total . . . . . . . . . . . . . . . . . . . . . . . . . . . . . . . . . . . . . . . . . . . . . . . . . . . . . . . . . . . . . . . $16,299,855 $8,565,990
The Company The Predecessor
Year endedDecember 31,
2005
PeriodAugust 16, 2004
ThroughDecember 31,
2004
PeriodJanuary 1, 2004
ThroughAugust 15,
2004
Year endedDecember 31,
2003
Revenue:Minimum rent . . . . . . . . . . . . . . . . . . . . . . . . . . . . . . $2,417,126 $1,013,283 $4,782,846 $ 9,594,584Tenant reimbursements . . . . . . . . . . . . . . . . . . . . . 880,342 257,064 1,030,909 2,025,221Other property related revenue . . . . . . . . . . . . . 53,262 (7,257) 149,909 899,148
Total revenue . . . . . . . . . . . . . . . . . . . . . . . . . . . . . . . . . 3,350,730 1,263,090 5,963,664 12,518,953Expenses:
Property operating . . . . . . . . . . . . . . . . . . . . . . . . . . 899,629 377,556 1,597,348 3,849,982Real estate taxes . . . . . . . . . . . . . . . . . . . . . . . . . . . 253,411 79,258 470,470 1,087,605Depreciation and amortization . . . . . . . . . . . . . . 510,127 198,407 1,171,243 4,283,981
Total expenses . . . . . . . . . . . . . . . . . . . . . . . . . . . . . . . . 1,663,167 655,221 3,239,061 9,221,568
Operating income . . . . . . . . . . . . . . . . . . . . . . . . . . . . . 1,687,563 607,869 2,724,603 3,297,385Interest expense . . . . . . . . . . . . . . . . . . . . . . . . . . . . 1,116,199 436,173 2,244,113 4,107,454Gain on sale of assets . . . . . . . . . . . . . . . . . . . . . . — — — 1,610,000
Net income . . . . . . . . . . . . . . . . . . . . . . . . . . . . . . . . . . . 571,364 171,696 480,490 799,931Third-party investors’ share of net income . . . . 240,794 37,599 316,686 526,813
Company (Predecessor) share of net income . . 330,570 134,097 163,804 273,118Amortization of excess investment . . . . . . . . . . . . (78,059) — — —
Income from joint ventures . . . . . . . . . . . . . . . . . . . $ 252,511 $ 134,097 $ 163,804 $ 273,118
KITE REALTY GROUP TRUST ANDKITE PROPERTY GROUP (THE PREDECESSOR)
NOTES TO CONSOLIDATED AND COMBINED FINANCIAL STATEMENTSDecember 31, 2005
Note 5. Investments in Unconsolidated Entities (Continued)
F-18

2005 Acquisitions:
During 2005, the Company acquired and placed into service the following shopping center properties:
Property Name Location Acquisition DateAcquisition Cost
(Millions) Financing Method
Fox Lake Crossing . . . . . . . . . . Fox Lake, IL February 7 $15.5(1) DebtPlaza Volente . . . . . . . . . . . . . . . Austin, TX May 16 35.9(2) DebtIndian River Square . . . . . . . . Vero Beach, FL May 16 16.5(3) DebtBolton Plaza . . . . . . . . . . . . . . . . Orange Park, FL November 1 14.0(4) Offering ProceedsMarket Street Village . . . . . . . Hurst, TX November 17 29.0(5) Debt(6)
(1) Inclusive of debt assumed of $12.3 million and tax increment financing (“TIF”) receivable of $1.5 million.
(2) Inclusive of $28.7 million of new debt and $7.2 million of borrowings under the Company’s revolving creditfacility incurred in connection with the acquisition.
(3) Inclusive of $13.3 million of new debt and $3.2 million of borrowings under the Company’s revolving creditfacility incurred in connection with the acquisition.
(4) This property is owned through a joint venture with a third party. The Company currently receives 85%of the cash flow from this property, which percentage may decrease under certain circumstances.
(5) Excludes escrow of $1.7 million subject to completion of the development of an additional 7,000 squarefoot parcel.
(6) Financed with borrowings under the Company’s revolving credit facility and subsequently partially paiddown with the proceeds from the sale of Mid-America Clinical Labs.
Following is a combined condensed balance sheet for the properties acquired in 2005 as of the dates oftheir respective acquisitions.
AssetsInvestment Properties . . . . . . . . . . . . . . . . . . . . . . . . . . . . . . . . . . $110,082,265Acquired lease intangibles . . . . . . . . . . . . . . . . . . . . . . . . . . . . . . 2,879,960Other assets . . . . . . . . . . . . . . . . . . . . . . . . . . . . . . . . . . . . . . . . . . . . 360,069
Total Assets . . . . . . . . . . . . . . . . . . . . . . . . . . . . . . . . . . . . . . . . . . . . . . $113,322,294
Liabilities:Loans payable . . . . . . . . . . . . . . . . . . . . . . . . . . . . . . . . . . . . . . . . . . $ 12,281,185Working capital assumed . . . . . . . . . . . . . . . . . . . . . . . . . . . . . . . 396,815In-place lease liabilities and deferred revenue . . . . . . . . . . 1,761,067
Total Liabilities . . . . . . . . . . . . . . . . . . . . . . . . . . . . . . . . . . . . . . . . . . $ 14,439,067
Also during 2005, the Company acquired interests in various parcels of land for a total acquisition costof approximately $86.9 million including debt assumed of $3.9 million. The Company acquired these parcelsfor future development.
Amounts allocated to intangible assets in connection with these acquisitions totaled $2.9 million and areincluded in land, buildings and improvements and deferred costs in the accompanying consolidated balance
KITE REALTY GROUP TRUST ANDKITE PROPERTY GROUP (THE PREDECESSOR)
NOTES TO CONSOLIDATED AND COMBINED FINANCIAL STATEMENTSDecember 31, 2005
Note 6. Property Acquisitions and Pro Forma Information (Continued)
F-19
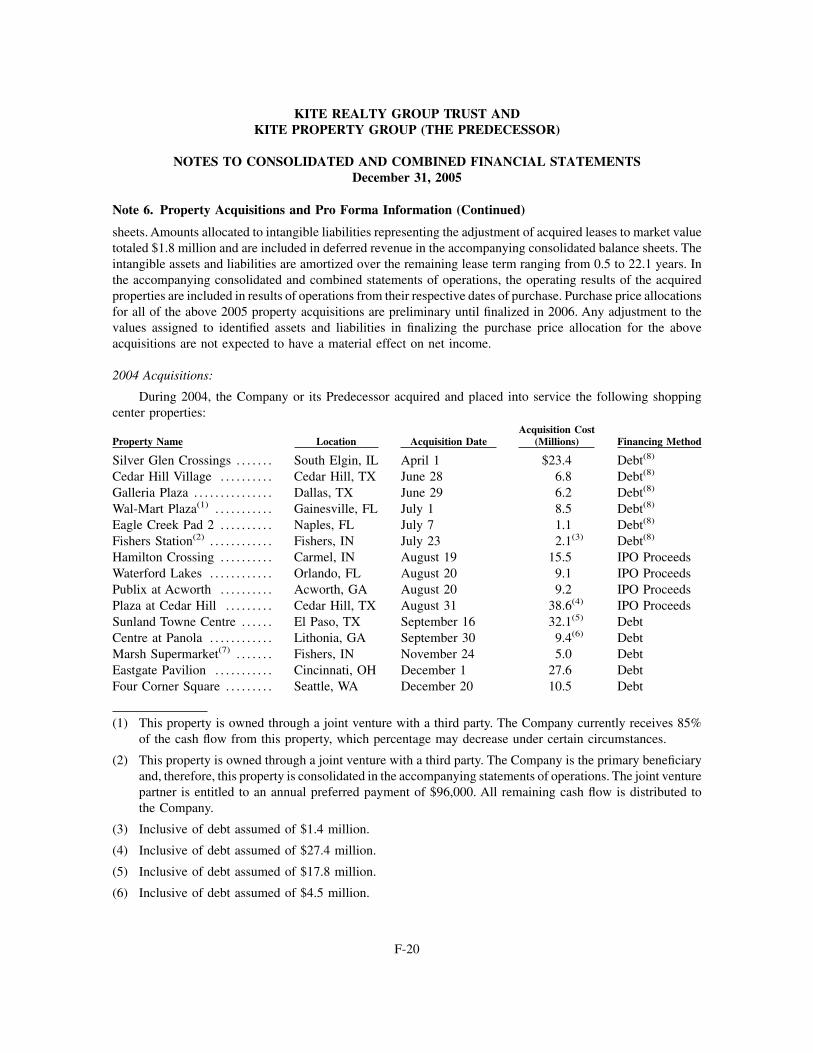
sheets. Amounts allocated to intangible liabilities representing the adjustment of acquired leases to market valuetotaled $1.8 million and are included in deferred revenue in the accompanying consolidated balance sheets. Theintangible assets and liabilities are amortized over the remaining lease term ranging from 0.5 to 22.1 years. Inthe accompanying consolidated and combined statements of operations, the operating results of the acquiredproperties are included in results of operations from their respective dates of purchase. Purchase price allocationsfor all of the above 2005 property acquisitions are preliminary until finalized in 2006. Any adjustment to thevalues assigned to identified assets and liabilities in finalizing the purchase price allocation for the aboveacquisitions are not expected to have a material effect on net income.
2004 Acquisitions:
During 2004, the Company or its Predecessor acquired and placed into service the following shoppingcenter properties:
Property Name Location Acquisition DateAcquisition Cost
(Millions) Financing Method
Silver Glen Crossings . . . . . . . South Elgin, IL April 1 $23.4 Debt(8)
Cedar Hill Village . . . . . . . . . . Cedar Hill, TX June 28 6.8 Debt(8)
Galleria Plaza . . . . . . . . . . . . . . . Dallas, TX June 29 6.2 Debt(8)
Wal-Mart Plaza(1) . . . . . . . . . . . Gainesville, FL July 1 8.5 Debt(8)
Eagle Creek Pad 2 . . . . . . . . . . Naples, FL July 7 1.1 Debt(8)
Fishers Station(2) . . . . . . . . . . . . Fishers, IN July 23 2.1(3) Debt(8)
Hamilton Crossing . . . . . . . . . . Carmel, IN August 19 15.5 IPO ProceedsWaterford Lakes . . . . . . . . . . . . Orlando, FL August 20 9.1 IPO ProceedsPublix at Acworth . . . . . . . . . . Acworth, GA August 20 9.2 IPO ProceedsPlaza at Cedar Hill . . . . . . . . . Cedar Hill, TX August 31 38.6(4) IPO ProceedsSunland Towne Centre . . . . . . El Paso, TX September 16 32.1(5) DebtCentre at Panola . . . . . . . . . . . . Lithonia, GA September 30 9.4(6) DebtMarsh Supermarket(7) . . . . . . . Fishers, IN November 24 5.0 DebtEastgate Pavilion . . . . . . . . . . . Cincinnati, OH December 1 27.6 DebtFour Corner Square . . . . . . . . . Seattle, WA December 20 10.5 Debt
(1) This property is owned through a joint venture with a third party. The Company currently receives 85%of the cash flow from this property, which percentage may decrease under certain circumstances.
(2) This property is owned through a joint venture with a third party. The Company is the primary beneficiaryand, therefore, this property is consolidated in the accompanying statements of operations. The joint venturepartner is entitled to an annual preferred payment of $96,000. All remaining cash flow is distributed tothe Company.
(3) Inclusive of debt assumed of $1.4 million.
(4) Inclusive of debt assumed of $27.4 million.
(5) Inclusive of debt assumed of $17.8 million.
(6) Inclusive of debt assumed of $4.5 million.
KITE REALTY GROUP TRUST ANDKITE PROPERTY GROUP (THE PREDECESSOR)
NOTES TO CONSOLIDATED AND COMBINED FINANCIAL STATEMENTSDecember 31, 2005
Note 6. Property Acquisitions and Pro Forma Information (Continued)
F-20
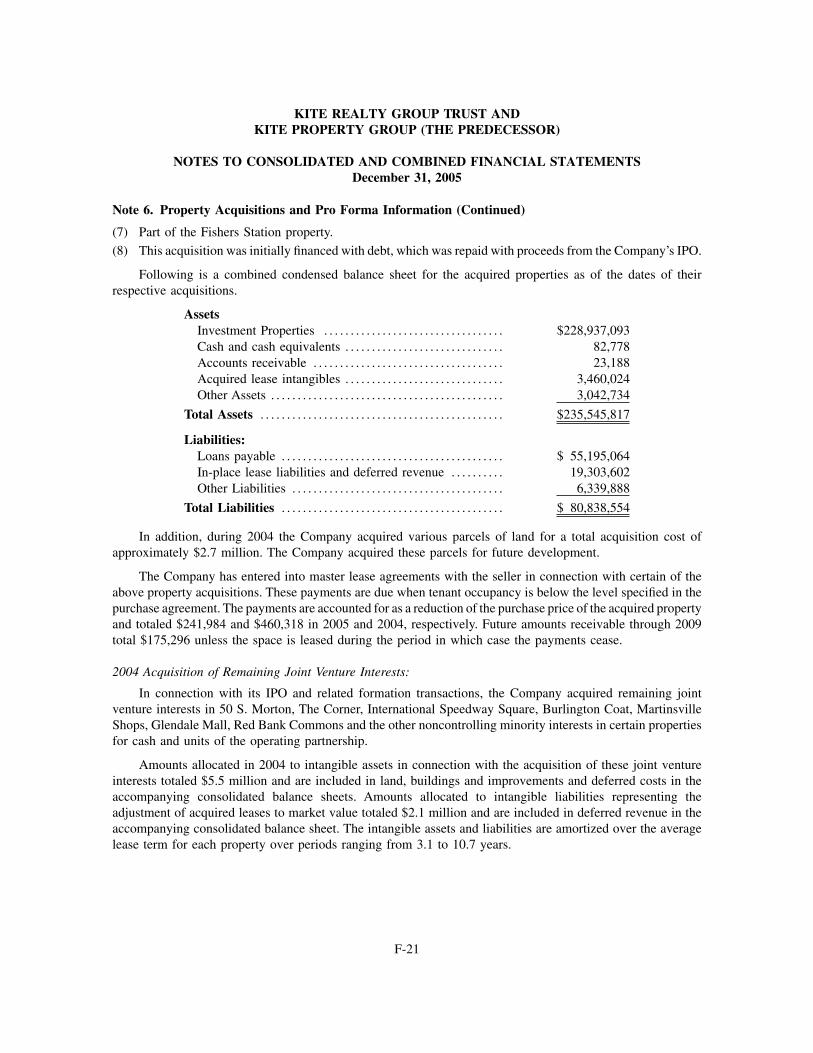
(7) Part of the Fishers Station property.
(8) This acquisition was initially financed with debt, which was repaid with proceeds from the Company’s IPO.
Following is a combined condensed balance sheet for the acquired properties as of the dates of theirrespective acquisitions.
AssetsInvestment Properties . . . . . . . . . . . . . . . . . . . . . . . . . . . . . . . . . . $228,937,093Cash and cash equivalents . . . . . . . . . . . . . . . . . . . . . . . . . . . . . . 82,778Accounts receivable . . . . . . . . . . . . . . . . . . . . . . . . . . . . . . . . . . . . 23,188Acquired lease intangibles . . . . . . . . . . . . . . . . . . . . . . . . . . . . . . 3,460,024Other Assets . . . . . . . . . . . . . . . . . . . . . . . . . . . . . . . . . . . . . . . . . . . . 3,042,734
Total Assets . . . . . . . . . . . . . . . . . . . . . . . . . . . . . . . . . . . . . . . . . . . . . . $235,545,817
Liabilities:Loans payable . . . . . . . . . . . . . . . . . . . . . . . . . . . . . . . . . . . . . . . . . . $ 55,195,064In-place lease liabilities and deferred revenue . . . . . . . . . . 19,303,602Other Liabilities . . . . . . . . . . . . . . . . . . . . . . . . . . . . . . . . . . . . . . . . 6,339,888
Total Liabilities . . . . . . . . . . . . . . . . . . . . . . . . . . . . . . . . . . . . . . . . . . $ 80,838,554
In addition, during 2004 the Company acquired various parcels of land for a total acquisition cost ofapproximately $2.7 million. The Company acquired these parcels for future development.
The Company has entered into master lease agreements with the seller in connection with certain of theabove property acquisitions. These payments are due when tenant occupancy is below the level specified in thepurchase agreement. The payments are accounted for as a reduction of the purchase price of the acquired propertyand totaled $241,984 and $460,318 in 2005 and 2004, respectively. Future amounts receivable through 2009total $175,296 unless the space is leased during the period in which case the payments cease.
2004 Acquisition of Remaining Joint Venture Interests:
In connection with its IPO and related formation transactions, the Company acquired remaining jointventure interests in 50 S. Morton, The Corner, International Speedway Square, Burlington Coat, MartinsvilleShops, Glendale Mall, Red Bank Commons and the other noncontrolling minority interests in certain propertiesfor cash and units of the operating partnership.
Amounts allocated in 2004 to intangible assets in connection with the acquisition of these joint ventureinterests totaled $5.5 million and are included in land, buildings and improvements and deferred costs in theaccompanying consolidated balance sheets. Amounts allocated to intangible liabilities representing theadjustment of acquired leases to market value totaled $2.1 million and are included in deferred revenue in theaccompanying consolidated balance sheet. The intangible assets and liabilities are amortized over the averagelease term for each property over periods ranging from 3.1 to 10.7 years.
KITE REALTY GROUP TRUST ANDKITE PROPERTY GROUP (THE PREDECESSOR)
NOTES TO CONSOLIDATED AND COMBINED FINANCIAL STATEMENTSDecember 31, 2005
Note 6. Property Acquisitions and Pro Forma Information (Continued)
F-21
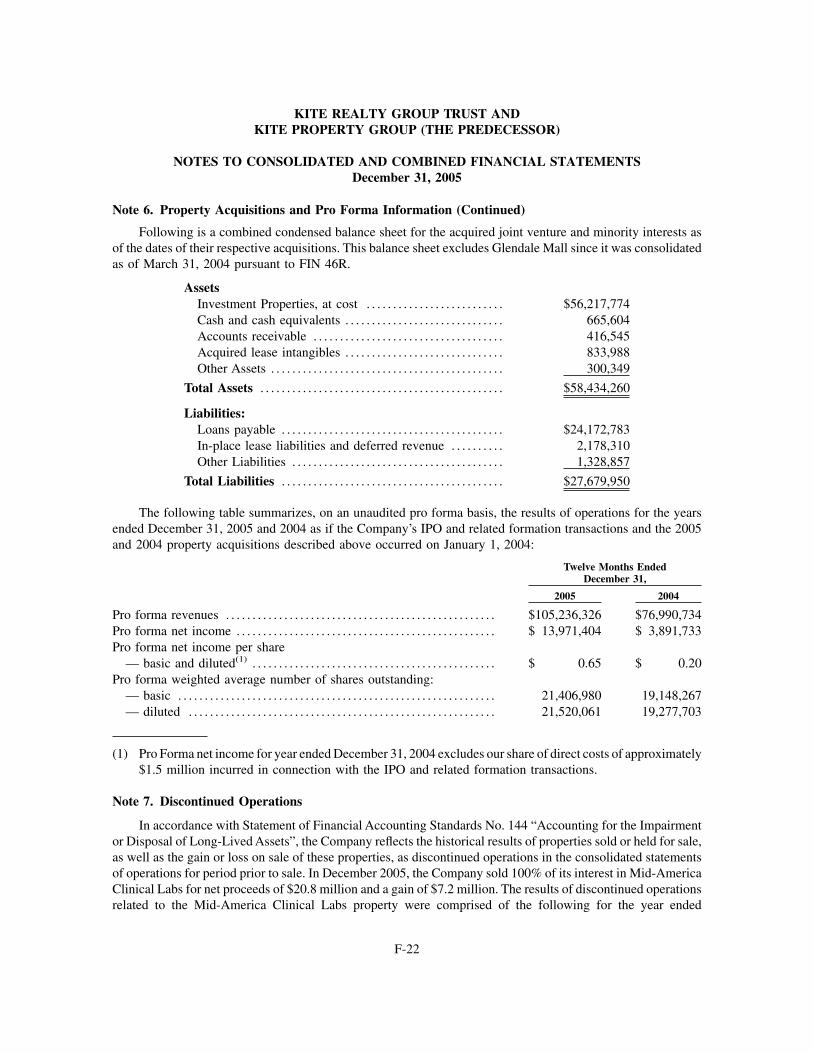
Following is a combined condensed balance sheet for the acquired joint venture and minority interests asof the dates of their respective acquisitions. This balance sheet excludes Glendale Mall since it was consolidatedas of March 31, 2004 pursuant to FIN 46R.
AssetsInvestment Properties, at cost . . . . . . . . . . . . . . . . . . . . . . . . . . $56,217,774Cash and cash equivalents . . . . . . . . . . . . . . . . . . . . . . . . . . . . . . 665,604Accounts receivable . . . . . . . . . . . . . . . . . . . . . . . . . . . . . . . . . . . . 416,545Acquired lease intangibles . . . . . . . . . . . . . . . . . . . . . . . . . . . . . . 833,988Other Assets . . . . . . . . . . . . . . . . . . . . . . . . . . . . . . . . . . . . . . . . . . . . 300,349
Total Assets . . . . . . . . . . . . . . . . . . . . . . . . . . . . . . . . . . . . . . . . . . . . . . $58,434,260
Liabilities:Loans payable . . . . . . . . . . . . . . . . . . . . . . . . . . . . . . . . . . . . . . . . . . $24,172,783In-place lease liabilities and deferred revenue . . . . . . . . . . 2,178,310Other Liabilities . . . . . . . . . . . . . . . . . . . . . . . . . . . . . . . . . . . . . . . . 1,328,857
Total Liabilities . . . . . . . . . . . . . . . . . . . . . . . . . . . . . . . . . . . . . . . . . . $27,679,950
The following table summarizes, on an unaudited pro forma basis, the results of operations for the yearsended December 31, 2005 and 2004 as if the Company’s IPO and related formation transactions and the 2005and 2004 property acquisitions described above occurred on January 1, 2004:
Twelve Months EndedDecember 31,
2005 2004
Pro forma revenues . . . . . . . . . . . . . . . . . . . . . . . . . . . . . . . . . . . . . . . . . . . . . . . . . . . $105,236,326 $76,990,734Pro forma net income . . . . . . . . . . . . . . . . . . . . . . . . . . . . . . . . . . . . . . . . . . . . . . . . . $ 13,971,404 $ 3,891,733Pro forma net income per share
— basic and diluted(1) . . . . . . . . . . . . . . . . . . . . . . . . . . . . . . . . . . . . . . . . . . . . . . $ 0.65 $ 0.20Pro forma weighted average number of shares outstanding:
— basic . . . . . . . . . . . . . . . . . . . . . . . . . . . . . . . . . . . . . . . . . . . . . . . . . . . . . . . . . . . . 21,406,980 19,148,267— diluted . . . . . . . . . . . . . . . . . . . . . . . . . . . . . . . . . . . . . . . . . . . . . . . . . . . . . . . . . . 21,520,061 19,277,703
(1) Pro Forma net income for year ended December 31, 2004 excludes our share of direct costs of approximately$1.5 million incurred in connection with the IPO and related formation transactions.
Note 7. Discontinued Operations
In accordance with Statement of Financial Accounting Standards No. 144 “Accounting for the Impairmentor Disposal of Long-Lived Assets”, the Company reflects the historical results of properties sold or held for sale,as well as the gain or loss on sale of these properties, as discontinued operations in the consolidated statementsof operations for period prior to sale. In December 2005, the Company sold 100% of its interest in Mid-AmericaClinical Labs for net proceeds of $20.8 million and a gain of $7.2 million. The results of discontinued operationsrelated to the Mid-America Clinical Labs property were comprised of the following for the year ended
KITE REALTY GROUP TRUST ANDKITE PROPERTY GROUP (THE PREDECESSOR)
NOTES TO CONSOLIDATED AND COMBINED FINANCIAL STATEMENTSDecember 31, 2005
Note 6. Property Acquisitions and Pro Forma Information (Continued)
F-22
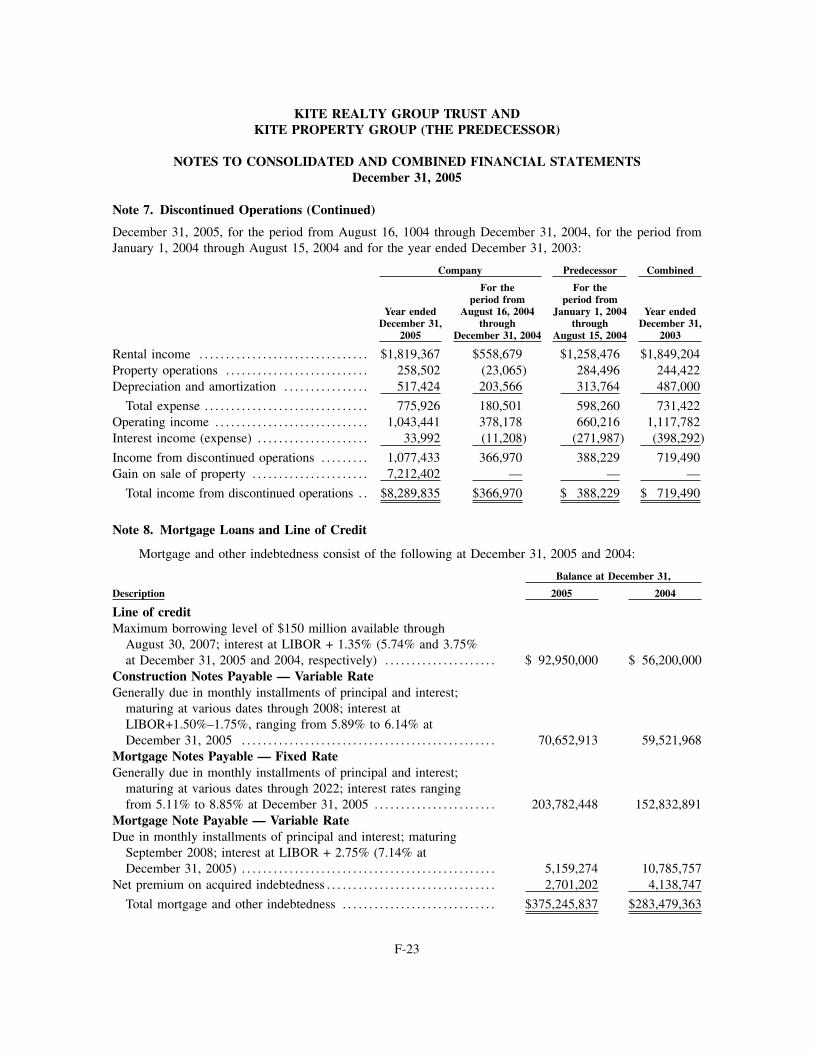
December 31, 2005, for the period from August 16, 1004 through December 31, 2004, for the period fromJanuary 1, 2004 through August 15, 2004 and for the year ended December 31, 2003:
Company Predecessor Combined
Year endedDecember 31,
2005
For theperiod from
August 16, 2004through
December 31, 2004
For theperiod from
January 1, 2004through
August 15, 2004
Year endedDecember 31,
2003
Rental income . . . . . . . . . . . . . . . . . . . . . . . . . . . . . . . . $1,819,367 $558,679 $1,258,476 $1,849,204Property operations . . . . . . . . . . . . . . . . . . . . . . . . . . . 258,502 (23,065) 284,496 244,422Depreciation and amortization . . . . . . . . . . . . . . . . 517,424 203,566 313,764 487,000
Total expense . . . . . . . . . . . . . . . . . . . . . . . . . . . . . . . 775,926 180,501 598,260 731,422Operating income . . . . . . . . . . . . . . . . . . . . . . . . . . . . . 1,043,441 378,178 660,216 1,117,782Interest income (expense) . . . . . . . . . . . . . . . . . . . . . 33,992 (11,208) (271,987) (398,292)
Income from discontinued operations . . . . . . . . . 1,077,433 366,970 388,229 719,490Gain on sale of property . . . . . . . . . . . . . . . . . . . . . . 7,212,402 — — —
Total income from discontinued operations . . $8,289,835 $366,970 $ 388,229 $ 719,490
Note 8. Mortgage Loans and Line of Credit
Mortgage and other indebtedness consist of the following at December 31, 2005 and 2004:
Balance at December 31,
Description 2005 2004
Line of creditMaximum borrowing level of $150 million available through
August 30, 2007; interest at LIBOR + 1.35% (5.74% and 3.75%at December 31, 2005 and 2004, respectively) . . . . . . . . . . . . . . . . . . . . . $ 92,950,000 $ 56,200,000
Construction Notes Payable — Variable RateGenerally due in monthly installments of principal and interest;
maturing at various dates through 2008; interest atLIBOR+1.50%–1.75%, ranging from 5.89% to 6.14% atDecember 31, 2005 . . . . . . . . . . . . . . . . . . . . . . . . . . . . . . . . . . . . . . . . . . . . . . . . 70,652,913 59,521,968
Mortgage Notes Payable — Fixed RateGenerally due in monthly installments of principal and interest;
maturing at various dates through 2022; interest rates rangingfrom 5.11% to 8.85% at December 31, 2005 . . . . . . . . . . . . . . . . . . . . . . . 203,782,448 152,832,891
Mortgage Note Payable — Variable RateDue in monthly installments of principal and interest; maturing
September 2008; interest at LIBOR + 2.75% (7.14% atDecember 31, 2005) . . . . . . . . . . . . . . . . . . . . . . . . . . . . . . . . . . . . . . . . . . . . . . . . 5,159,274 10,785,757
Net premium on acquired indebtedness . . . . . . . . . . . . . . . . . . . . . . . . . . . . . . . . 2,701,202 4,138,747
Total mortgage and other indebtedness . . . . . . . . . . . . . . . . . . . . . . . . . . . . . $375,245,837 $283,479,363
KITE REALTY GROUP TRUST ANDKITE PROPERTY GROUP (THE PREDECESSOR)
NOTES TO CONSOLIDATED AND COMBINED FINANCIAL STATEMENTSDecember 31, 2005
Note 7. Discontinued Operations (Continued)
F-23
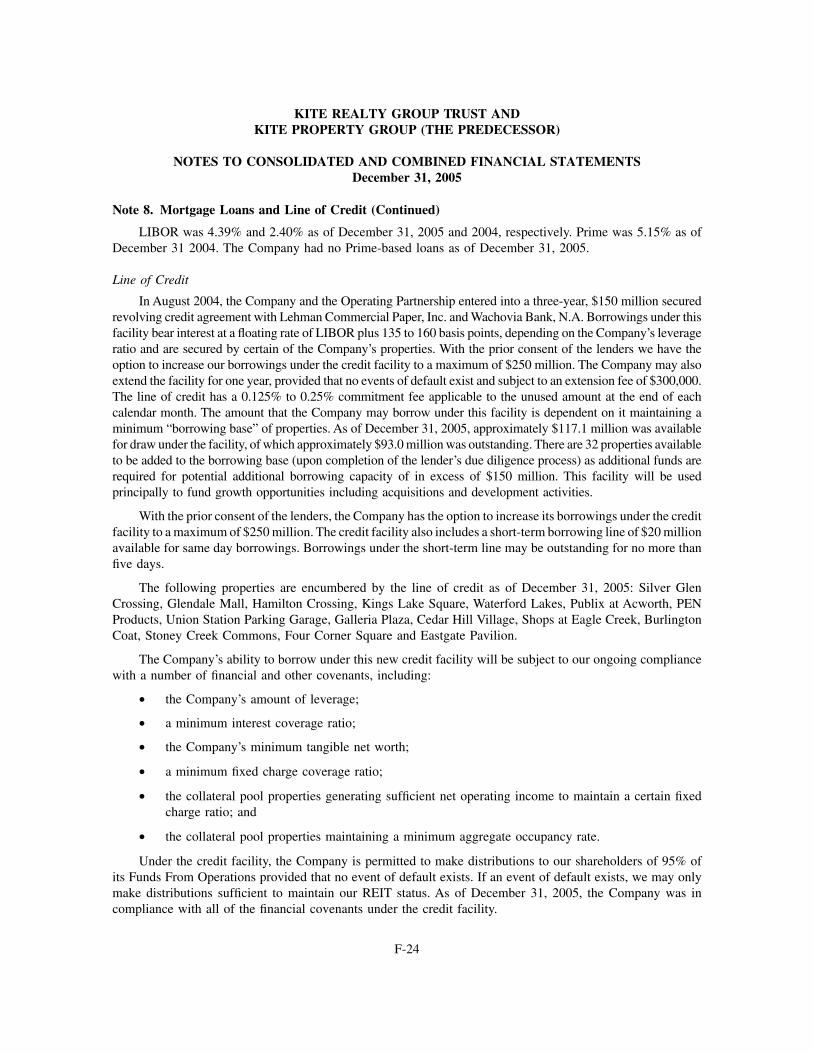
LIBOR was 4.39% and 2.40% as of December 31, 2005 and 2004, respectively. Prime was 5.15% as ofDecember 31 2004. The Company had no Prime-based loans as of December 31, 2005.
Line of Credit
In August 2004, the Company and the Operating Partnership entered into a three-year, $150 million securedrevolving credit agreement with Lehman Commercial Paper, Inc. and Wachovia Bank, N.A. Borrowings under thisfacility bear interest at a floating rate of LIBOR plus 135 to 160 basis points, depending on the Company’s leverageratio and are secured by certain of the Company’s properties. With the prior consent of the lenders we have theoption to increase our borrowings under the credit facility to a maximum of $250 million. The Company may alsoextend the facility for one year, provided that no events of default exist and subject to an extension fee of $300,000.The line of credit has a 0.125% to 0.25% commitment fee applicable to the unused amount at the end of eachcalendar month. The amount that the Company may borrow under this facility is dependent on it maintaining aminimum “borrowing base” of properties. As of December 31, 2005, approximately $117.1 million was availablefor draw under the facility, of which approximately $93.0 million was outstanding. There are 32 properties availableto be added to the borrowing base (upon completion of the lender’s due diligence process) as additional funds arerequired for potential additional borrowing capacity of in excess of $150 million. This facility will be usedprincipally to fund growth opportunities including acquisitions and development activities.
With the prior consent of the lenders, the Company has the option to increase its borrowings under the creditfacility to a maximum of $250 million. The credit facility also includes a short-term borrowing line of $20 millionavailable for same day borrowings. Borrowings under the short-term line may be outstanding for no more thanfive days.
The following properties are encumbered by the line of credit as of December 31, 2005: Silver GlenCrossing, Glendale Mall, Hamilton Crossing, Kings Lake Square, Waterford Lakes, Publix at Acworth, PENProducts, Union Station Parking Garage, Galleria Plaza, Cedar Hill Village, Shops at Eagle Creek, BurlingtonCoat, Stoney Creek Commons, Four Corner Square and Eastgate Pavilion.
The Company’s ability to borrow under this new credit facility will be subject to our ongoing compliancewith a number of financial and other covenants, including:
• the Company’s amount of leverage;
• a minimum interest coverage ratio;
• the Company’s minimum tangible net worth;
• a minimum fixed charge coverage ratio;
• the collateral pool properties generating sufficient net operating income to maintain a certain fixedcharge ratio; and
• the collateral pool properties maintaining a minimum aggregate occupancy rate.
Under the credit facility, the Company is permitted to make distributions to our shareholders of 95% ofits Funds From Operations provided that no event of default exists. If an event of default exists, we may onlymake distributions sufficient to maintain our REIT status. As of December 31, 2005, the Company was incompliance with all of the financial covenants under the credit facility.
KITE REALTY GROUP TRUST ANDKITE PROPERTY GROUP (THE PREDECESSOR)
NOTES TO CONSOLIDATED AND COMBINED FINANCIAL STATEMENTSDecember 31, 2005
Note 8. Mortgage Loans and Line of Credit (Continued)
F-24
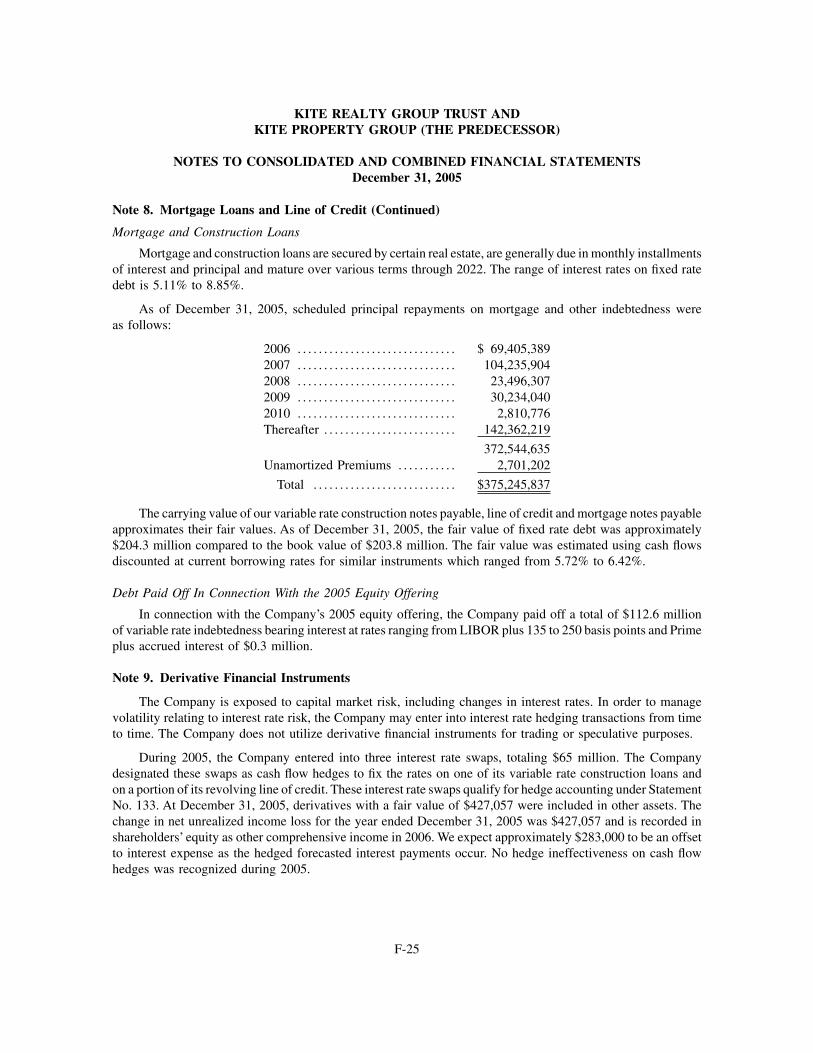
Mortgage and Construction Loans
Mortgage and construction loans are secured by certain real estate, are generally due in monthly installmentsof interest and principal and mature over various terms through 2022. The range of interest rates on fixed ratedebt is 5.11% to 8.85%.
As of December 31, 2005, scheduled principal repayments on mortgage and other indebtedness wereas follows:
2006 . . . . . . . . . . . . . . . . . . . . . . . . . . . . . . $ 69,405,3892007 . . . . . . . . . . . . . . . . . . . . . . . . . . . . . . 104,235,9042008 . . . . . . . . . . . . . . . . . . . . . . . . . . . . . . 23,496,3072009 . . . . . . . . . . . . . . . . . . . . . . . . . . . . . . 30,234,0402010 . . . . . . . . . . . . . . . . . . . . . . . . . . . . . . 2,810,776Thereafter . . . . . . . . . . . . . . . . . . . . . . . . . 142,362,219
372,544,635Unamortized Premiums . . . . . . . . . . . 2,701,202
Total . . . . . . . . . . . . . . . . . . . . . . . . . . . $375,245,837
The carrying value of our variable rate construction notes payable, line of credit and mortgage notes payableapproximates their fair values. As of December 31, 2005, the fair value of fixed rate debt was approximately$204.3 million compared to the book value of $203.8 million. The fair value was estimated using cash flowsdiscounted at current borrowing rates for similar instruments which ranged from 5.72% to 6.42%.
Debt Paid Off In Connection With the 2005 Equity Offering
In connection with the Company’s 2005 equity offering, the Company paid off a total of $112.6 millionof variable rate indebtedness bearing interest at rates ranging from LIBOR plus 135 to 250 basis points and Primeplus accrued interest of $0.3 million.
Note 9. Derivative Financial Instruments
The Company is exposed to capital market risk, including changes in interest rates. In order to managevolatility relating to interest rate risk, the Company may enter into interest rate hedging transactions from timeto time. The Company does not utilize derivative financial instruments for trading or speculative purposes.
During 2005, the Company entered into three interest rate swaps, totaling $65 million. The Companydesignated these swaps as cash flow hedges to fix the rates on one of its variable rate construction loans andon a portion of its revolving line of credit. These interest rate swaps qualify for hedge accounting under StatementNo. 133. At December 31, 2005, derivatives with a fair value of $427,057 were included in other assets. Thechange in net unrealized income loss for the year ended December 31, 2005 was $427,057 and is recorded inshareholders’ equity as other comprehensive income in 2006. We expect approximately $283,000 to be an offsetto interest expense as the hedged forecasted interest payments occur. No hedge ineffectiveness on cash flowhedges was recognized during 2005.
KITE REALTY GROUP TRUST ANDKITE PROPERTY GROUP (THE PREDECESSOR)
NOTES TO CONSOLIDATED AND COMBINED FINANCIAL STATEMENTSDecember 31, 2005
Note 8. Mortgage Loans and Line of Credit (Continued)
F-25
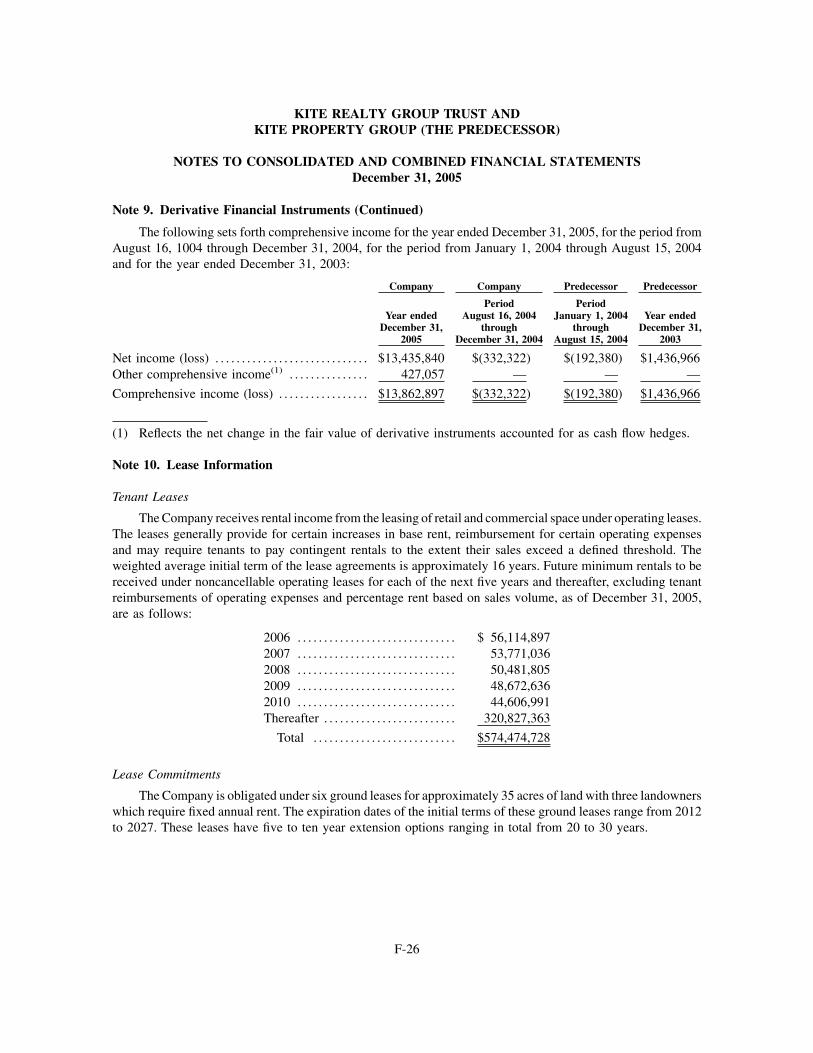
The following sets forth comprehensive income for the year ended December 31, 2005, for the period fromAugust 16, 1004 through December 31, 2004, for the period from January 1, 2004 through August 15, 2004and for the year ended December 31, 2003:
Company Company Predecessor Predecessor
Year endedDecember 31,
2005
PeriodAugust 16, 2004
throughDecember 31, 2004
PeriodJanuary 1, 2004
throughAugust 15, 2004
Year endedDecember 31,
2003
Net income (loss) . . . . . . . . . . . . . . . . . . . . . . . . . . . . . $13,435,840 $(332,322) $(192,380) $1,436,966Other comprehensive income(1) . . . . . . . . . . . . . . . 427,057 — — —
Comprehensive income (loss) . . . . . . . . . . . . . . . . . $13,862,897 $(332,322) $(192,380) $1,436,966
(1) Reflects the net change in the fair value of derivative instruments accounted for as cash flow hedges.
Note 10. Lease Information
Tenant Leases
The Company receives rental income from the leasing of retail and commercial space under operating leases.The leases generally provide for certain increases in base rent, reimbursement for certain operating expensesand may require tenants to pay contingent rentals to the extent their sales exceed a defined threshold. Theweighted average initial term of the lease agreements is approximately 16 years. Future minimum rentals to bereceived under noncancellable operating leases for each of the next five years and thereafter, excluding tenantreimbursements of operating expenses and percentage rent based on sales volume, as of December 31, 2005,are as follows:
2006 . . . . . . . . . . . . . . . . . . . . . . . . . . . . . . $ 56,114,8972007 . . . . . . . . . . . . . . . . . . . . . . . . . . . . . . 53,771,0362008 . . . . . . . . . . . . . . . . . . . . . . . . . . . . . . 50,481,8052009 . . . . . . . . . . . . . . . . . . . . . . . . . . . . . . 48,672,6362010 . . . . . . . . . . . . . . . . . . . . . . . . . . . . . . 44,606,991Thereafter . . . . . . . . . . . . . . . . . . . . . . . . . 320,827,363
Total . . . . . . . . . . . . . . . . . . . . . . . . . . . $574,474,728
Lease Commitments
The Company is obligated under six ground leases for approximately 35 acres of land with three landownerswhich require fixed annual rent. The expiration dates of the initial terms of these ground leases range from 2012to 2027. These leases have five to ten year extension options ranging in total from 20 to 30 years.
KITE REALTY GROUP TRUST ANDKITE PROPERTY GROUP (THE PREDECESSOR)
NOTES TO CONSOLIDATED AND COMBINED FINANCIAL STATEMENTSDecember 31, 2005
Note 9. Derivative Financial Instruments (Continued)
F-26
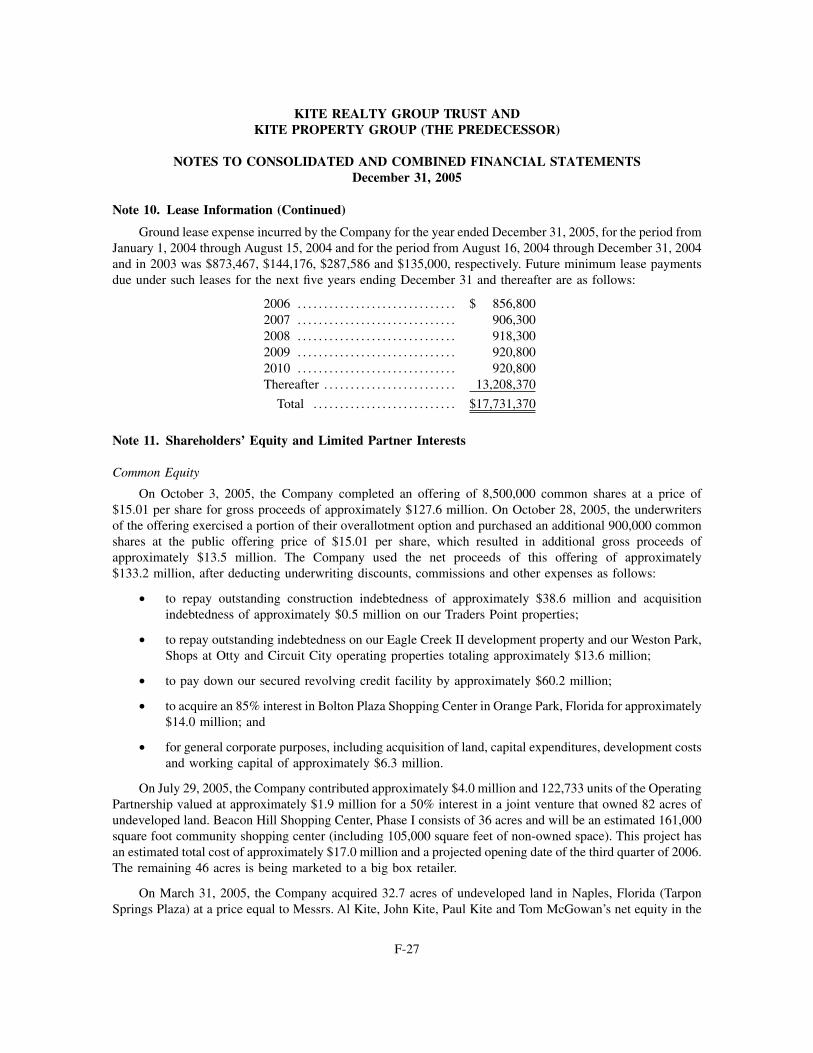
Ground lease expense incurred by the Company for the year ended December 31, 2005, for the period fromJanuary 1, 2004 through August 15, 2004 and for the period from August 16, 2004 through December 31, 2004and in 2003 was $873,467, $144,176, $287,586 and $135,000, respectively. Future minimum lease paymentsdue under such leases for the next five years ending December 31 and thereafter are as follows:
2006 . . . . . . . . . . . . . . . . . . . . . . . . . . . . . . $ 856,8002007 . . . . . . . . . . . . . . . . . . . . . . . . . . . . . . 906,3002008 . . . . . . . . . . . . . . . . . . . . . . . . . . . . . . 918,3002009 . . . . . . . . . . . . . . . . . . . . . . . . . . . . . . 920,8002010 . . . . . . . . . . . . . . . . . . . . . . . . . . . . . . 920,800Thereafter . . . . . . . . . . . . . . . . . . . . . . . . . 13,208,370
Total . . . . . . . . . . . . . . . . . . . . . . . . . . . $17,731,370
Note 11. Shareholders’ Equity and Limited Partner Interests
Common Equity
On October 3, 2005, the Company completed an offering of 8,500,000 common shares at a price of$15.01 per share for gross proceeds of approximately $127.6 million. On October 28, 2005, the underwritersof the offering exercised a portion of their overallotment option and purchased an additional 900,000 commonshares at the public offering price of $15.01 per share, which resulted in additional gross proceeds ofapproximately $13.5 million. The Company used the net proceeds of this offering of approximately$133.2 million, after deducting underwriting discounts, commissions and other expenses as follows:
• to repay outstanding construction indebtedness of approximately $38.6 million and acquisitionindebtedness of approximately $0.5 million on our Traders Point properties;
• to repay outstanding indebtedness on our Eagle Creek II development property and our Weston Park,Shops at Otty and Circuit City operating properties totaling approximately $13.6 million;
• to pay down our secured revolving credit facility by approximately $60.2 million;
• to acquire an 85% interest in Bolton Plaza Shopping Center in Orange Park, Florida for approximately$14.0 million; and
• for general corporate purposes, including acquisition of land, capital expenditures, development costsand working capital of approximately $6.3 million.
On July 29, 2005, the Company contributed approximately $4.0 million and 122,733 units of the OperatingPartnership valued at approximately $1.9 million for a 50% interest in a joint venture that owned 82 acres ofundeveloped land. Beacon Hill Shopping Center, Phase I consists of 36 acres and will be an estimated 161,000square foot community shopping center (including 105,000 square feet of non-owned space). This project hasan estimated total cost of approximately $17.0 million and a projected opening date of the third quarter of 2006.The remaining 46 acres is being marketed to a big box retailer.
On March 31, 2005, the Company acquired 32.7 acres of undeveloped land in Naples, Florida (TarponSprings Plaza) at a price equal to Messrs. Al Kite, John Kite, Paul Kite and Tom McGowan’s net equity in the
KITE REALTY GROUP TRUST ANDKITE PROPERTY GROUP (THE PREDECESSOR)
NOTES TO CONSOLIDATED AND COMBINED FINANCIAL STATEMENTSDecember 31, 2005
Note 10. Lease Information (Continued)
F-27
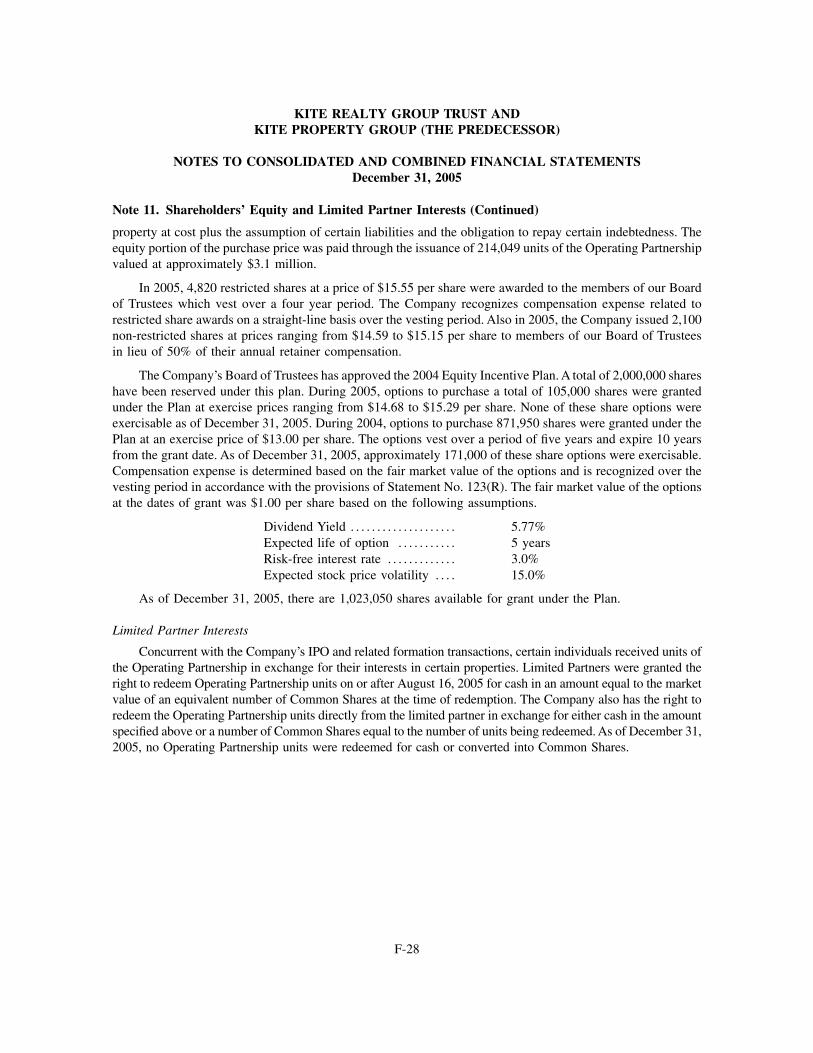
property at cost plus the assumption of certain liabilities and the obligation to repay certain indebtedness. Theequity portion of the purchase price was paid through the issuance of 214,049 units of the Operating Partnershipvalued at approximately $3.1 million.
In 2005, 4,820 restricted shares at a price of $15.55 per share were awarded to the members of our Boardof Trustees which vest over a four year period. The Company recognizes compensation expense related torestricted share awards on a straight-line basis over the vesting period. Also in 2005, the Company issued 2,100non-restricted shares at prices ranging from $14.59 to $15.15 per share to members of our Board of Trusteesin lieu of 50% of their annual retainer compensation.
The Company’s Board of Trustees has approved the 2004 Equity Incentive Plan. A total of 2,000,000 shareshave been reserved under this plan. During 2005, options to purchase a total of 105,000 shares were grantedunder the Plan at exercise prices ranging from $14.68 to $15.29 per share. None of these share options wereexercisable as of December 31, 2005. During 2004, options to purchase 871,950 shares were granted under thePlan at an exercise price of $13.00 per share. The options vest over a period of five years and expire 10 yearsfrom the grant date. As of December 31, 2005, approximately 171,000 of these share options were exercisable.Compensation expense is determined based on the fair market value of the options and is recognized over thevesting period in accordance with the provisions of Statement No. 123(R). The fair market value of the optionsat the dates of grant was $1.00 per share based on the following assumptions.
Dividend Yield . . . . . . . . . . . . . . . . . . . . 5.77%Expected life of option . . . . . . . . . . . 5 yearsRisk-free interest rate . . . . . . . . . . . . . 3.0%Expected stock price volatility . . . . 15.0%
As of December 31, 2005, there are 1,023,050 shares available for grant under the Plan.
Limited Partner Interests
Concurrent with the Company’s IPO and related formation transactions, certain individuals received units ofthe Operating Partnership in exchange for their interests in certain properties. Limited Partners were granted theright to redeem Operating Partnership units on or after August 16, 2005 for cash in an amount equal to the marketvalue of an equivalent number of Common Shares at the time of redemption. The Company also has the right toredeem the Operating Partnership units directly from the limited partner in exchange for either cash in the amountspecified above or a number of Common Shares equal to the number of units being redeemed. As of December 31,2005, no Operating Partnership units were redeemed for cash or converted into Common Shares.
KITE REALTY GROUP TRUST ANDKITE PROPERTY GROUP (THE PREDECESSOR)
NOTES TO CONSOLIDATED AND COMBINED FINANCIAL STATEMENTSDecember 31, 2005
Note 11. Shareholders’ Equity and Limited Partner Interests (Continued)
F-28

Note 12. Segment Information
The Company and its Predecessor’s operations are aligned into two business segments: (i) real estateoperation and development and (ii) construction and advisory services. The Company’s segments operate in theUnited States. Combined segment data of the Company and its Predecessor for the years ended December 31,2005, 2004 and 2003 are as follows:
Year EndedDecember 31, 2005
Real EstateOperation andDevelopment
Constructionand
Advisory Services SubtotalIntersegmentEliminations Total
Revenues . . . . . . . . . . . . . . . . . . . . . . . . . . $ 72,055,405 $50,528,158 $122,583,563 $(23,218,708) $ 99,364,855Operating expenses, cost of
construction and services, general,administrative and other . . . . . . . . . . . 23,801,274 45,470,595 69,271,869 (22,318,948) 46,952,921
Depreciation and amortization . . . . . . . 21,611,586 179,550 21,791,136 — 21,791,136
Operating income . . . . . . . . . . . . . . . . . . . 26,642,545 4,878,013 31,520,558 (899,760) 30,620,798Interest expense . . . . . . . . . . . . . . . . . . . . 17,915,170 530,830 18,446,000 (356,579) 18,089,421Minority interest . . . . . . . . . . . . . . . . . . . . (249,378) (1,017,744) (1,267,122) — (1,267,122)Income tax expense of taxable
REIT subsidiary . . . . . . . . . . . . . . . . . . — 1,041,463 1,041,463 — 1,041,463Equity in earnings of unconsolidated
entities . . . . . . . . . . . . . . . . . . . . . . . . . . 252,511 — 252,511 — 252,511Operating income from discontinued
operations . . . . . . . . . . . . . . . . . . . . . . . . 1,077,433 — 1,077,433 1,077,433Gain on sale of operating property . . . 7,212,402 — 7,212,402 — 7,212,402Limited partners’ interests in
Operating Partnership . . . . . . . . . . . . . (5,329,298) — (5,329,298) — (5,329,298)
Net income (loss) . . . . . . . . . . . . . . . . . . . $ 11,691,045 $ 2,287,976 $ 13,979,021 $ (543,181) $ 13,435,840
Total assets . . . . . . . . . . . . . . . . . . . . . . . . . $780,934,227 $36,472,950 $817,407,177 $(18,177,371) $799,229,806
KITE REALTY GROUP TRUST ANDKITE PROPERTY GROUP (THE PREDECESSOR)
NOTES TO CONSOLIDATED AND COMBINED FINANCIAL STATEMENTSDecember 31, 2005
F-29

Year EndedDecember 31, 2004
Real EstateOperation andDevelopment
Constructionand
Advisory Services SubtotalIntersegmentEliminations Total
Revenues . . . . . . . . . . . . . . . . . . . . . . . . . . $ 33,536,197 $67,874,686 $101,410,883 $(54,129,707) $ 47,281,176Operating expenses, cost of
construction and services, general,administrative and other . . . . . . . . . . . 12,623,178 67,956,031 80,579,209 (53,093,433) 27,485,776
Depreciation and amortization . . . . . . . 10,879,362 52,277 10,931,639 — 10,931,639
Operating income (loss) . . . . . . . . . . . . . 10,033,657 (133,622) 9,900,035 (1,036,274) 8,863,761Interest expense . . . . . . . . . . . . . . . . . . . . 8,945,086 61,083 9,006,169 — 9,006,169
Loan prepayment penaltiesand expenses . . . . . . . . . . . . . . . . . . . 1,671,449 1,671,449 1,671,449
Minority interest . . . . . . . . . . . . . . . . . . . . 89,087 — 89,087 — 89,087Equity in earnings of
unconsolidated entities . . . . . . . . . . . . 297,901 — 297,901 — 297,901Operating income from
discontinued operations . . . . . . . . . . . 755,199 — 755,199 — 755,199Limited partners’ interests in
Operating Partnership . . . . . . . . . . . . . 146,968 — 146,968 — 146,968
Net income (loss) . . . . . . . . . . . . . . . . . . . $ 706,277 $ (194,705) $ 511,572 $ (1,036,274) $ (524,702)
Total assets . . . . . . . . . . . . . . . . . . . . . . . . . $563,861,792 $10,692,117 $574,553,909 $(11,010,138) $563,543,771
Year EndedDecember 31, 2003
Real EstateOperation andDevelopment
Constructionand
Advisory Services SubtotalIntersegmentEliminations Total
Revenues . . . . . . . . . . . . . . . . . . . . . . . . . . $ 10,906,923 $30,563,597 $ 41,470,520 $(15,562,222) $ 25,908,298Operating expenses, cost of
construction and services, general,administrative and other . . . . . . . . . . . 4,651,268 29,417,647 34,068,915 (15,052,222) 19,016,693
Depreciation and amortization . . . . . . . 2,401,078 4,429 2,405,507 — 2,405,507
Operating income (loss) . . . . . . . . . . . . . 3,854,577 1,141,521 4,996,098 (510,000) 4,486,098Interest expense . . . . . . . . . . . . . . . . . . . . 3,746,353 62,568 3,808,921 3,808,921Minority interest . . . . . . . . . . . . . . . . . . . . (232,819) — (232,819) — (232,819)Equity in earnings of
unconsolidated entities . . . . . . . . . . . . 273,118 — 273,118 — 273,118Operating income from
discontinued operations . . . . . . . . . . . 719,490 719,490 719,490
Net income (loss) . . . . . . . . . . . . . . . . . . . $ 868,013 $ 1,078,953 $ 1,946,966 $ (510,000) $ 1,436,966
Total assets . . . . . . . . . . . . . . . . . . . . . . . . . $160,279,464 $13,029,371 $173,308,835 $ (1,973,129) $171,335,706
KITE REALTY GROUP TRUST ANDKITE PROPERTY GROUP (THE PREDECESSOR)
NOTES TO CONSOLIDATED AND COMBINED FINANCIAL STATEMENTSDecember 31, 2005
Note 12. Segment Information (Continued)
F-30
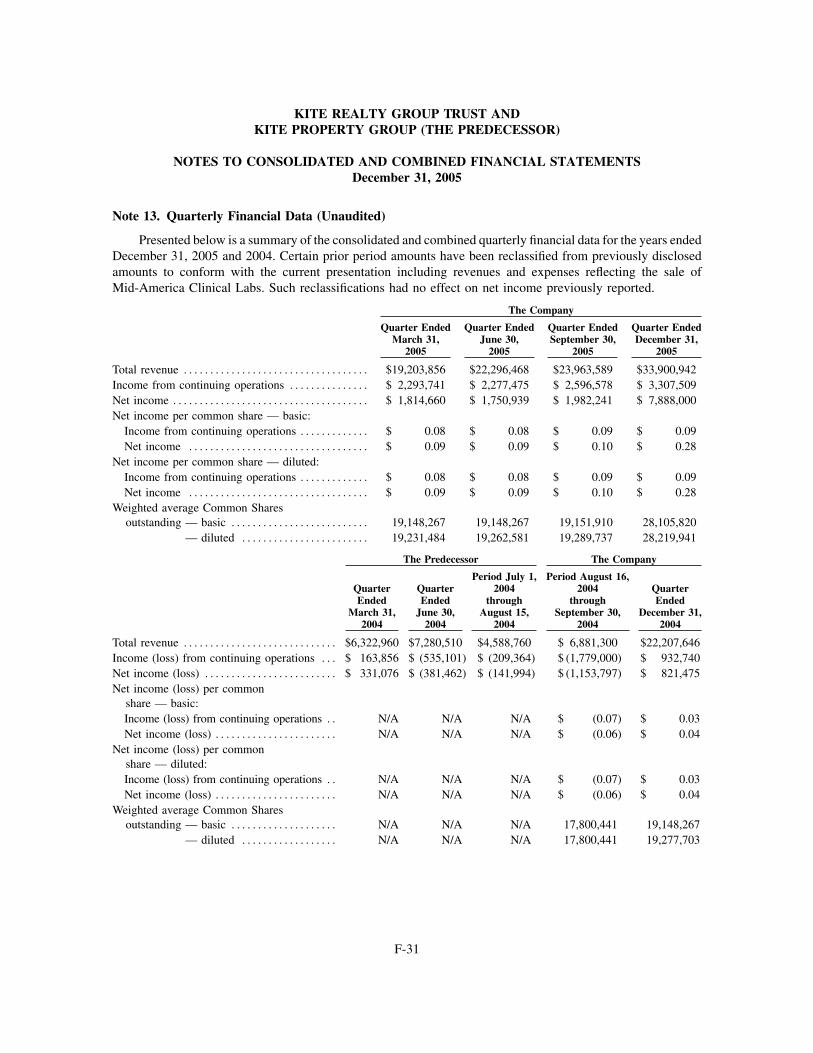
Note 13. Quarterly Financial Data (Unaudited)
Presented below is a summary of the consolidated and combined quarterly financial data for the years endedDecember 31, 2005 and 2004. Certain prior period amounts have been reclassified from previously disclosedamounts to conform with the current presentation including revenues and expenses reflecting the sale ofMid-America Clinical Labs. Such reclassifications had no effect on net income previously reported.
The Company
Quarter EndedMarch 31,
2005
Quarter EndedJune 30,
2005
Quarter EndedSeptember 30,
2005
Quarter EndedDecember 31,
2005
Total revenue . . . . . . . . . . . . . . . . . . . . . . . . . . . . . . . . . . . $19,203,856 $22,296,468 $23,963,589 $33,900,942Income from continuing operations . . . . . . . . . . . . . . . $ 2,293,741 $ 2,277,475 $ 2,596,578 $ 3,307,509Net income . . . . . . . . . . . . . . . . . . . . . . . . . . . . . . . . . . . . . $ 1,814,660 $ 1,750,939 $ 1,982,241 $ 7,888,000Net income per common share — basic:
Income from continuing operations . . . . . . . . . . . . . $ 0.08 $ 0.08 $ 0.09 $ 0.09Net income . . . . . . . . . . . . . . . . . . . . . . . . . . . . . . . . . . $ 0.09 $ 0.09 $ 0.10 $ 0.28
Net income per common share — diluted:Income from continuing operations . . . . . . . . . . . . . $ 0.08 $ 0.08 $ 0.09 $ 0.09Net income . . . . . . . . . . . . . . . . . . . . . . . . . . . . . . . . . . $ 0.09 $ 0.09 $ 0.10 $ 0.28
Weighted average Common Sharesoutstanding — basic . . . . . . . . . . . . . . . . . . . . . . . . . . 19,148,267 19,148,267 19,151,910 28,105,820
— diluted . . . . . . . . . . . . . . . . . . . . . . . . 19,231,484 19,262,581 19,289,737 28,219,941
The Predecessor The Company
QuarterEnded
March 31,2004
QuarterEnded
June 30,2004
Period July 1,2004
throughAugust 15,
2004
Period August 16,2004
throughSeptember 30,
2004
QuarterEnded
December 31,2004
Total revenue . . . . . . . . . . . . . . . . . . . . . . . . . . . . . $6,322,960 $7,280,510 $4,588,760 $ 6,881,300 $22,207,646Income (loss) from continuing operations . . . $ 163,856 $ (535,101) $ (209,364) $ (1,779,000) $ 932,740Net income (loss) . . . . . . . . . . . . . . . . . . . . . . . . . $ 331,076 $ (381,462) $ (141,994) $ (1,153,797) $ 821,475Net income (loss) per common
share — basic:Income (loss) from continuing operations . . N/A N/A N/A $ (0.07) $ 0.03Net income (loss) . . . . . . . . . . . . . . . . . . . . . . . N/A N/A N/A $ (0.06) $ 0.04
Net income (loss) per commonshare — diluted:Income (loss) from continuing operations . . N/A N/A N/A $ (0.07) $ 0.03Net income (loss) . . . . . . . . . . . . . . . . . . . . . . . N/A N/A N/A $ (0.06) $ 0.04
Weighted average Common Sharesoutstanding — basic . . . . . . . . . . . . . . . . . . . . N/A N/A N/A 17,800,441 19,148,267
— diluted . . . . . . . . . . . . . . . . . . N/A N/A N/A 17,800,441 19,277,703
KITE REALTY GROUP TRUST ANDKITE PROPERTY GROUP (THE PREDECESSOR)
NOTES TO CONSOLIDATED AND COMBINED FINANCIAL STATEMENTSDecember 31, 2005
F-31
The Company is not subject to any material litigation nor, to management’s knowledge, is any materiallitigation currently threatened against the Company other than routine litigation, claims and administrativeproceedings arising in the ordinary course of business. Management believes that such routine litigation, claimsand administrative proceedings will not have a material adverse impact on the Company’s consolidated financialposition or consolidated results of operations.
As of December 31, 2005, the Company had outstanding letters of credit totaling $2.9 million. At that date,there were no amounts advanced against these instruments.
Joint venture debt is the liability of the joint venture and is typically secured by the joint venture propertyand has limited recourse to us. As of December 31, 2005, the Company’s share of joint venture indebtednesswas approximately $8.6 million.
Note 15. Employee 401(k) Plan
The Company maintains a 401(k) plan for employees under which it matches 25% of the employee’scontribution up to 3% of the employee’s salary not to exceed an annual maximum of $750. Effective January 1,2006, this plan was amended to provide for a Company match of 100% of the employee’s contribution up to3% of the employee’s salary and 50% of the employee’s contribution up to 5% of the employee’s salary. TheCompany and the Predecessor contributed to this plan $30,345, $27,633 and $25,608 for the years endedDecember 31, 2005, 2004 and 2003, respectively.
Note 16. Transactions With Related Parties
Common costs for management, leasing, development, consulting, accounting, legal, marketing andmanagement information systems are allocated to the various Company entities and certain other entities ownedby the Principals and not included as part of the Company (“Excluded Entities”). Common payroll and other relatedcosts are allocated proportionately based on an estimate of time spent on behalf of each entity. Management believesthe methodologies and assumptions used are reasonable. Common costs recovered from the Excluded Entities were$1,739,124 for the period from January 1, 2004 through August 15, 2004 and $0 for the period from August 16,2004 through December 31, 2004 and for the year ended December 31, 2005. Common costs totaling $1,461,128were recovered from the Excluded Entities for the year ended December 31, 2003.
The Company received subcontractor interior construction services totaling $42,650, $3,131,471 and$3,017,162 from Kite, Inc. (one of the Excluded Entities) during 2005, 2004 and 2003, respectively. The amountspayable to Kite, Inc. as of December 31, 2005 and 2004 were $166,812 and $157,252, respectively and areincluded in accounts payable in the accompanying consolidated balance sheets.
The Company received rental income from three Excluded Entities of $366,057 in 2005, $55,523 for theperiod from January 1, 2004 through August 15, 2004, $43,502 for the period from August 16, 2004 throughDecember 31, 2004 and $12,170 for the year ended December 31, 2003.
In 2005, the Company entered into fee-based construction management contracts totaling $7,288,954 withan Excluded Entity, Circle Block Partners, LLC.
On March 31, 2005, the Company acquired 32.7 acres of undeveloped land in Naples, Florida (TarponSprings Plaza) at a price equal to Messrs. Al Kite, John Kite, Paul Kite and Tom McGowan’s net equity in the
KITE REALTY GROUP TRUST ANDKITE PROPERTY GROUP (THE PREDECESSOR)
NOTES TO CONSOLIDATED AND COMBINED FINANCIAL STATEMENTSDecember 31, 2005
Note 14. Commitments and Contingencies (Continued)
F-32
property at cost plus the assumption of certain liabilities and the obligation to repay certain indebtedness. Theequity portion of the purchase price was paid through the issuance of 214,049 units of the Operating Partnershipvalued at approximately $3.1 million.
Note 17. Recent Accounting Pronouncements
During 2005, the FASB issued FASB Interpretation No. 47, “Accounting for Conditional Asset RetirementObligations,” an interpretation of Statement of Financial Accounting Standards “FASB” Statement No. 143,Asset Retirement Obligations (“FIN 47”). FIN 47 provides clarification of the term “conditional asset retirementobligation” as used in SFAS 143, defined as a legal obligation to perform an asset retirement activity in whichthe timing or method of settlement are conditional on a future event that may or may not be within the controlof the Company. Under this standard, a company must record a liability for a conditional asset retirementobligation if the fair value of the obligation can be reasonably estimated. FIN 47 became effective for theCompany’s year ended December 31, 2005. The adoption of FIN 47 did not have a material effect on theCompany’s consolidated financial statements. Certain of the Company’s real estate assets contain asbestos. Theasbestos is appropriately contained, in accordance with current environmental regulations, and the Company hasno current plans to remove the asbestos. If these properties were demolished, certain environmental regulationsare in place which specify the manner in which the asbestos must be handled and disposed. Because the obligationto remove the asbestos has an indeterminable settlement date, the Company is not able to reasonably estimatethe fair value of this asset retirement obligation.
In June 2005, the FASB ratified the consensus of the Emerging Issues Task Force (“EITF”) on Issue No. 04-5“Determining Whether a General Partner, or the General Partners as a Group, controls a Limited Partnershipor Similar Entity When the Limited Partners Have Certain Rights”. This consensus establishes the presumptionthat general partners in a limited partnership control that limited partnership regardless of the extent of the generalpartners’ ownership interest in the limited partnership. The consensus further establishes that the rights of thelimited partners can overcome the presumption of control by the general partners if the limited partners haveeither (a) the substantive ability to dissolve (liquidate) the limited partnership or otherwise remove the generalpartners without cause or (b) substantive participating rights. Whether the presumption of control is overcomeis a matter of judgment based on the facts and circumstances, for which the consensus provides additionalguidance. The consensus is currently applicable to the Company for new or modified partnerships and willotherwise be applicable to existing partnerships in 2006. This consensus applies to limited partnerships or similarentities, such as limited liability companies that have governing provisions that are the functional equivalentof a limited partnership. The Company will adopt this consensus as of January 1, 2006 and does not expect amaterial effect on its consolidated financial position or results of operations.
In December 2004, the FASB issued Statement of Financial Accounting Standards No. 123 (revised 2004)“Share-Based Payments” (“SFAS No. 123(R)”), which supersedesAPB Opinion No. 25,Accounting for Stock Issuedto Employees and its related implementation guidance. SFAS No. 123(R) establishes standards for the accountingfor transactions in which an entity exchanges its equity instruments for goods and services. SFAS No 123(R) iseffective for fiscal years beginning after June 15, 2005. The impact of adopting SFAS No. 123(R) is not expectedto have a material impact on the Company’s financial condition or results of operations.
KITE REALTY GROUP TRUST ANDKITE PROPERTY GROUP (THE PREDECESSOR)
NOTES TO CONSOLIDATED AND COMBINED FINANCIAL STATEMENTSDecember 31, 2005
Note 16. Transactions With Related Parties (Continued)
F-33

The following schedule summarizes the non-cash investing and financing activities of the Company forthe year ended December 31, 2005, for the period from August 16, 2004 through December 31, 2004, for theperiod from January 1, 2004 through August 15, 2004 and for the year ended December 31, 2003:
Year EndedDecember 31,
2005
PeriodAugust 16, 2004
throughDecember 31,
2004
PeriodJanuary 1, 2004
throughAugust 15,
2004
Year EndedDecember 31,
2003
Acquisition of real estate interests byassumption of mortgage debt . . . . . . . . . . . . . . . $16,168,557 $49,550,510 $5,644,553 $—
Acquisition of real estate interests by issuanceof Operating Partnership units . . . . . . . . . . . . . . 5,054,818 — — —
Note 19. Subsequent Events
On January 11, 2006, the Company refinanced its $17.4 million Sunland Towne Center mortgage loanbearing a fixed interest rate of 8.85% with a bridge loan due April 11, 2006 and bearing interest at LIBOR plus1.85%. The Company is exploring options to refinance this loan with fixed-rate debt.
KITE REALTY GROUP TRUST ANDKITE PROPERTY GROUP (THE PREDECESSOR)
NOTES TO CONSOLIDATED AND COMBINED FINANCIAL STATEMENTSDecember 31, 2005
Note 18. Supplemental Schedule of Non-Cash Investing/Financing Activities
F-34
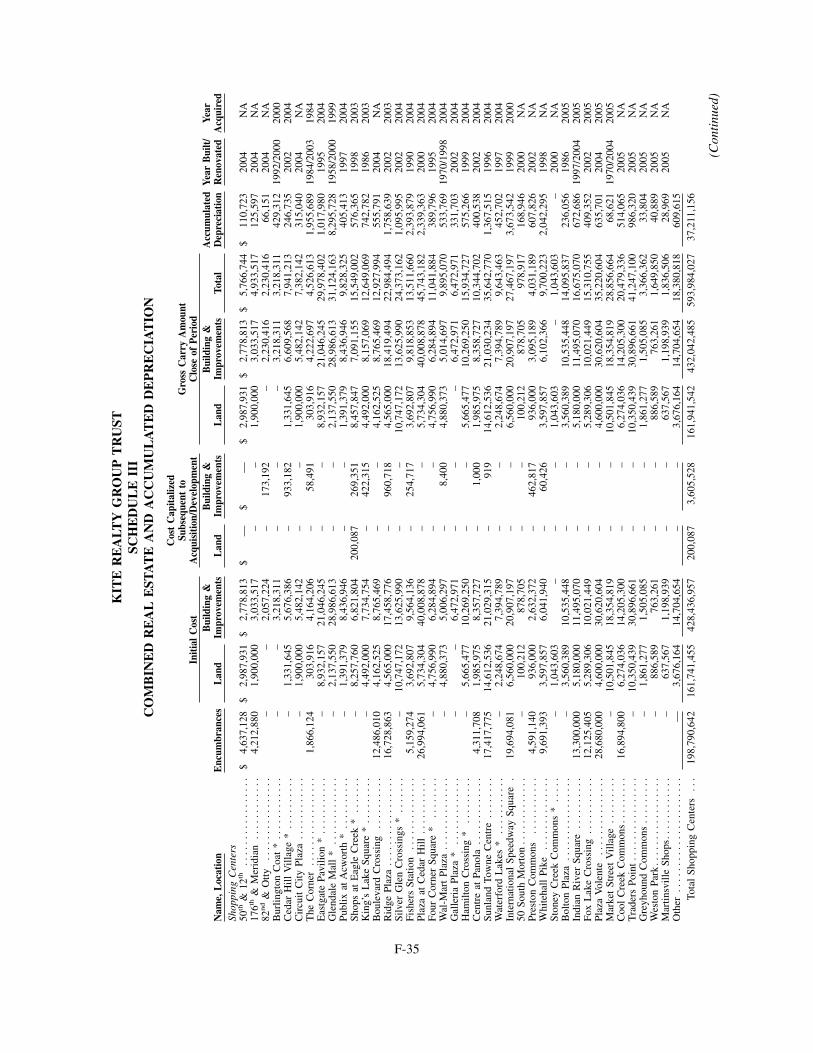
KIT
ER
EA
LTY
GR
OU
PT
RU
STSC
HE
DU
LE
III
CO
MB
INE
DR
EA
LE
STA
TE
AN
DA
CC
UM
UL
AT
ED
DE
PR
EC
IAT
ION
Initi
alC
ost
Cos
tC
apita
lized
Subs
eque
ntto
Acq
uisi
tion/
Dev
elop
men
tG
ross
Car
ryA
mou
ntC
lose
ofPe
riod
Nam
e,L
ocat
ion
Enc
umbr
ance
sL
and
Bui
ldin
g&
Impr
ovem
ents
Lan
dB
uild
ing
&Im
prov
emen
tsL
and
Bui
ldin
g&
Impr
ovem
ents
Tota
lA
ccum
ulat
edD
epre
ciat
ion
Year
Bui
lt/R
enov
ated
Year
Acq
uire
dSh
oppi
ngC
ente
rs50
th&
12th
....
....
....
....
.$
4,63
7,12
8$
2,98
7,93
1$
2,77
8,81
3$
—$
—$
2,98
7,93
1$
2,77
8,81
3$
5,76
6,74
4$
110,
723
2004
NA
176th
&M
erid
ian
....
....
....
4,21
2,88
01,
900,
000
3,03
3,51
7–
–1,
900,
000
3,03
3,51
74,
933,
517
125,
597
2004
NA
82n
d&
Otty
....
....
....
....
––
2,05
7,22
4–
173,
192
–2,
230,
416
2,23
0,41
666
,151
2004
NA
Bur
lingt
onC
oat
*..
....
....
..–
–3,
218,
311
––
–3,
218,
311
3,21
8,31
142
9,31
219
92/2
000
2000
Ced
arH
illV
illag
e*
....
....
..–
1,33
1,64
55,
676,
386
–93
3,18
21,
331,
645
6,60
9,56
87,
941,
213
246,
735
2002
2004
Cir
cuit
City
Plaz
a..
....
....
..–
1,90
0,00
05,
482,
142
––
1,90
0,00
05,
482,
142
7,38
2,14
231
5,04
020
04N
AT
heC
orne
r..
....
....
....
...
1,86
6,12
430
3,91
64,
164,
206
–58
,491
303,
916
4,22
2,69
74,
526,
613
1,95
5,68
919
84/2
003
1984
Eas
tgat
ePa
vilio
n*
....
....
...
–8,
932,
157
21,0
46,2
45–
–8,
932,
157
21,0
46,2
4529
,978
,402
1,01
7,98
019
9520
04G
lend
ale
Mal
l*
....
....
....
.–
2,13
7,55
028
,986
,613
––
2,13
7,55
028
,986
,613
31,1
24,1
638,
295,
728
1958
/200
019
99Pu
blix
atA
cwor
th*
....
....
..–
1,39
1,37
98,
436,
946
––
1,39
1,37
98,
436,
946
9,82
8,32
540
5,41
319
9720
04Sh
ops
atE
agle
Cre
ek*
....
...
–8,
257,
760
6,82
1,80
420
0,08
726
9,35
18,
457,
847
7,09
1,15
515
,549
,002
576,
365
1998
2003
Kin
g’s
Lak
eSq
uare
*..
....
...
–4,
492,
000
7,73
4,75
4–
422,
315
4,49
2,00
08,
157,
069
12,6
49,0
6974
2,78
219
8620
03B
oule
vard
Cro
ssin
g..
....
....
12,4
86,0
104,
162,
525
8,76
5,46
9–
–4,
162,
525
8,76
5,46
912
,927
,994
555,
791
2004
NA
Rid
gePl
aza
....
....
....
....
.16
,728
,863
4,56
5,00
017
,458
,776
–96
0,71
84,
565,
000
18,4
19,4
9422
,984
,494
1,75
8,63
920
0220
03Si
lver
Gle
nC
ross
ings
*..
....
.–
10,7
47,1
7213
,625
,990
––
10,7
47,1
7213
,625
,990
24,3
73,1
621,
095,
995
2002
2004
Fish
ers
Stat
ion
....
....
....
..5,
159,
274
3,69
2,80
79,
564,
136
–25
4,71
73,
692,
807
9,81
8,85
313
,511
,660
2,39
3,87
919
9020
04Pl
aza
atC
edar
Hill
....
....
...
26,9
94,0
615,
734,
304
40,0
08,8
78–
–5,
734,
304
40,0
08,8
7845
,743
,182
2,33
9,36
320
0020
04Fo
urC
orne
rSq
uare
*..
....
..–
4,75
6,99
06,
284,
894
––
4,75
6,99
06,
284,
894
11,0
41,8
8438
9,79
619
9520
04W
al-M
art
Plaz
a..
....
....
....
–4,
880,
373
5,00
6,29
7–
8,40
04,
880,
373
5,01
4,69
79,
895,
070
533,
769
1970
/199
820
04G
alle
ria
Plaz
a*
....
....
....
.–
–6,
472,
971
––
–6,
472,
971
6,47
2,97
133
1,70
320
0220
04H
amilt
onC
ross
ing
*..
....
...
–5,
665,
477
10,2
69,2
50–
–5,
665,
477
10,2
69,2
5015
,934
,727
575,
266
1999
2004
Cen
tre
atPa
nola
....
....
....
.4,
311,
708
1,98
5,97
58,
357,
727
–1,
000
1,98
5,97
58,
358,
727
10,3
44,7
0240
0,53
820
0220
04Su
nlan
dTo
wne
Cen
tre
....
....
17,4
17,7
7514
,612
,536
21,0
29,3
15–
919
14,6
12,5
3621
,030
,234
35,6
42,7
701,
367,
515
1996
2004
Wat
erfo
rdL
akes
*..
....
....
.–
2,24
8,67
47,
394,
789
––
2,24
8,67
47,
394,
789
9,64
3,46
345
2,70
219
9720
04In
tern
atio
nal
Spee
dway
Squa
re.
19,6
94,0
816,
560,
000
20,9
07,1
97–
–6,
560,
000
20,9
07,1
9727
,467
,197
3,67
3,54
219
9920
0050
Sout
hM
orto
n..
....
....
...
–10
0,21
287
8,70
5–
–10
0,21
287
8,70
597
8,91
716
8,94
620
00N
APr
esto
nC
omm
ons
....
....
...
4,59
1,14
093
6,00
02,
632,
372
–46
2,81
793
6,00
03,
095,
189
4,03
1,18
960
7,82
620
02N
AW
hite
hall
Pike
....
....
....
..9,
691,
393
3,59
7,85
76,
041,
940
–60
,426
3,59
7,85
76,
102,
366
9,70
0,22
32,
042,
295
1998
NA
Ston
eyC
reek
Com
mon
s*
....
.–
1,04
3,60
3–
––
1,04
3,60
3–
1,04
3,60
3–
2000
NA
Bol
ton
Plaz
a..
....
....
....
..–
3,56
0,38
910
,535
,448
––
3,56
0,38
910
,535
,448
14,0
95,8
3723
6,05
619
8620
05In
dian
Riv
erSq
uare
....
....
..13
,300
,000
5,18
0,00
011
,495
,070
––
5,18
0,00
011
,495
,070
16,6
75,0
7067
2,68
619
97/2
004
2005
Fox
Lak
eC
ross
ing
....
....
...
12,1
25,4
055,
289,
306
10,0
21,4
49–
–5,
289,
306
10,0
21,4
4915
,310
,755
409,
352
2002
2005
Plaz
aV
olen
te..
....
....
....
.28
,680
,000
4,60
0,00
030
,620
,604
––
4,60
0,00
030
,620
,604
35,2
20,6
0463
5,70
120
0420
05M
arke
tSt
reet
Vill
age
....
....
.–
10,5
01,8
4518
,354
,819
––
10,5
01,8
4518
,354
,819
28,8
56,6
6468
,621
1970
/200
420
05C
ool
Cre
ekC
omm
ons.
....
....
16,8
94,8
006,
274,
036
14,2
05,3
00–
–6,
274,
036
14,2
05,3
0020
,479
,336
514,
065
2005
NA
Tra
ders
Poin
t..
....
....
....
..–
10,3
50,4
3930
,896
,661
––
10,3
50,4
3930
,896
,661
41,2
47,1
0098
6,32
020
05N
AG
reyh
ound
Com
mon
s..
....
...
–1,
861,
277
1,50
5,08
5–
–1,
861,
277
1,50
5,08
53,
366,
362
33,8
0420
05N
AW
esto
nPa
rk..
....
....
....
...
–88
6,58
976
3,26
1–
–88
6,58
976
3,26
11,
649,
850
40,8
8920
05N
AM
artin
svill
eSh
ops.
....
....
...
–63
7,56
71,
198,
939
––
637,
567
1,19
8,93
91,
836,
506
28,9
6920
05N
AO
ther
....
....
....
....
....
..—
3,67
6,16
414
,704
,654
––
3,67
6,16
414
,704
,654
18,3
80,8
1860
9,61
5To
tal
Shop
ping
Cen
ters
...
198,
790,
642
161,
741,
455
428,
436,
957
200,
087
3,60
5,52
816
1,94
1,54
243
2,04
2,48
559
3,98
4,02
737
,211
,156
(Con
tinu
ed)
F-35
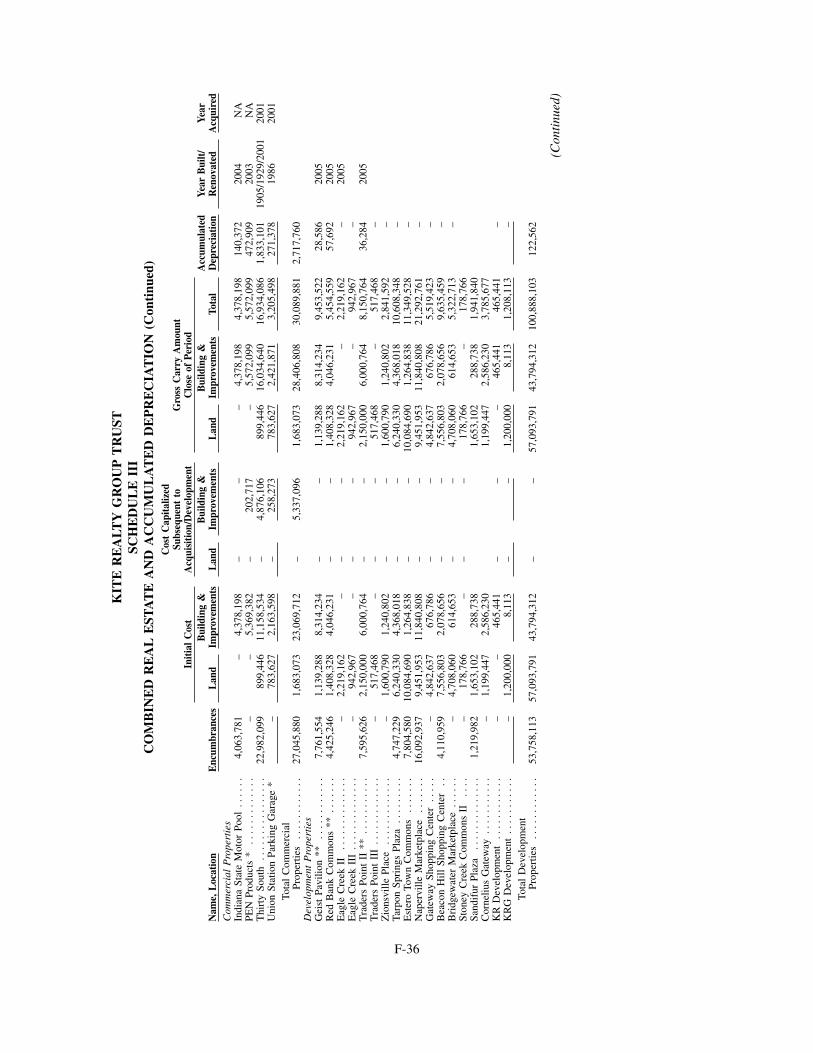
KIT
ER
EA
LTY
GR
OU
PT
RU
STSC
HE
DU
LE
III
CO
MB
INE
DR
EA
LE
STA
TE
AN
DA
CC
UM
UL
AT
ED
DE
PR
EC
IAT
ION
(Con
tinu
ed)
Initi
alC
ost
Cos
tC
apita
lized
Subs
eque
ntto
Acq
uisi
tion/
Dev
elop
men
tG
ross
Car
ryA
mou
ntC
lose
ofPe
riod
Nam
e,L
ocat
ion
Enc
umbr
ance
sL
and
Bui
ldin
g&
Impr
ovem
ents
Lan
dB
uild
ing
&Im
prov
emen
tsL
and
Bui
ldin
g&
Impr
ovem
ents
Tota
lA
ccum
ulat
edD
epre
ciat
ion
Year
Bui
lt/R
enov
ated
Year
Acq
uire
dC
omm
erci
alP
rope
rtie
sIn
dian
aSt
ate
Mot
orPo
ol..
....
4,06
3,78
1–
4,37
8,19
8–
––
4,37
8,19
84,
378,
198
140,
372
2004
NA
PEN
Prod
ucts
*..
....
....
...
––
5,36
9,38
2–
202,
717
–5,
572,
099
5,57
2,09
947
2,90
920
03N
AT
hirt
ySo
uth
....
....
....
....
22,9
82,0
9989
9,44
611
,158
,534
–4,
876,
106
899,
446
16,0
34,6
4016
,934
,086
1,83
3,10
119
05/1
929/
2001
2001
Uni
onSt
atio
nPa
rkin
gG
arag
e*
–78
3,62
72,
163,
598
–25
8,27
378
3,62
72,
421,
871
3,20
5,49
827
1,37
819
8620
01To
tal
Com
mer
cial
Prop
ertie
s..
....
....
..27
,045
,880
1,68
3,07
323
,069
,712
–5,
337,
096
1,68
3,07
328
,406
,808
30,0
89,8
812,
717,
760
Dev
elop
men
tP
rope
rtie
sG
eist
Pavi
lion
**..
....
....
..7,
761,
554
1,13
9,28
88,
314,
234
––
1,13
9,28
88,
314,
234
9,45
3,52
228
,586
2005
Red
Ban
kC
omm
ons
**..
....
.4,
425,
246
1,40
8,32
84,
046,
231
––
1,40
8,32
84,
046,
231
5,45
4,55
957
,692
2005
Eag
leC
reek
II..
....
....
....
–2,
219,
162
––
–2,
219,
162
–2,
219,
162
–20
05E
agle
Cre
ekII
I..
....
....
....
–94
2,96
7–
––
942,
967
–94
2,96
7–
Tra
ders
Poin
tII
**..
....
....
.7,
595,
626
2,15
0,00
06,
000,
764
––
2,15
0,00
06,
000,
764
8,15
0,76
436
,284
2005
Tra
ders
Poin
tII
I..
....
....
...
–51
7,46
8–
––
517,
468
–51
7,46
8–
Zio
nsvi
llePl
ace
....
....
....
.–
1,60
0,79
01,
240,
802
––
1,60
0,79
01,
240,
802
2,84
1,59
2–
Tarp
onSp
ring
sPl
aza
....
....
.4,
747,
229
6,24
0,33
04,
368,
018
––
6,24
0,33
04,
368,
018
10,6
08,3
48–
Est
ero
Tow
nC
omm
ons
....
...
7,80
4,58
010
,084
,690
1,26
4,83
8–
–10
,084
,690
1,26
4,83
811
,349
,528
–N
aper
ville
Mar
ketp
lace
....
...
16,0
92,9
379,
451,
953
11,8
40,8
08–
–9,
451,
953
11,8
40,8
0821
,292
,761
–G
atew
aySh
oppi
ngC
ente
r..
...
–4,
842,
637
676,
786
––
4,84
2,63
767
6,78
65,
519,
423
–B
eaco
nH
illSh
oppi
ngC
ente
r..
4,11
0,95
97,
556,
803
2,07
8,65
6–
–7,
556,
803
2,07
8,65
69,
635,
459
–B
ridg
ewat
erM
arke
tpla
ce..
....
–4,
708,
060
614,
653
––
4,70
8,06
061
4,65
35,
322,
713
–St
oney
Cre
ekC
omm
ons
II..
..–
178,
766
––
–17
8,76
6–
178,
766
Sand
ifur
Plaz
a..
....
....
....
1,21
9,98
21,
653,
102
288,
738
1,65
3,10
228
8,73
81,
941,
840
Cor
neliu
sG
atew
ay..
....
....
.–
1,19
9,44
72,
586,
230
1,19
9,44
72,
586,
230
3,78
5,67
7K
RD
evel
opm
ent
....
....
....
––
465,
441
––
–46
5,44
146
5,44
1–
KR
GD
evel
opm
ent
....
....
...
–1,
200,
000
8,11
3–
–1,
200,
000
8,11
31,
208,
113
–To
tal
Dev
elop
men
tPr
oper
ties
....
....
....
53,7
58,1
1357
,093
,791
43,7
94,3
12–
–57
,093
,791
43,7
94,3
1210
0,88
8,10
312
2,56
2
(Con
tinu
ed)
F-36
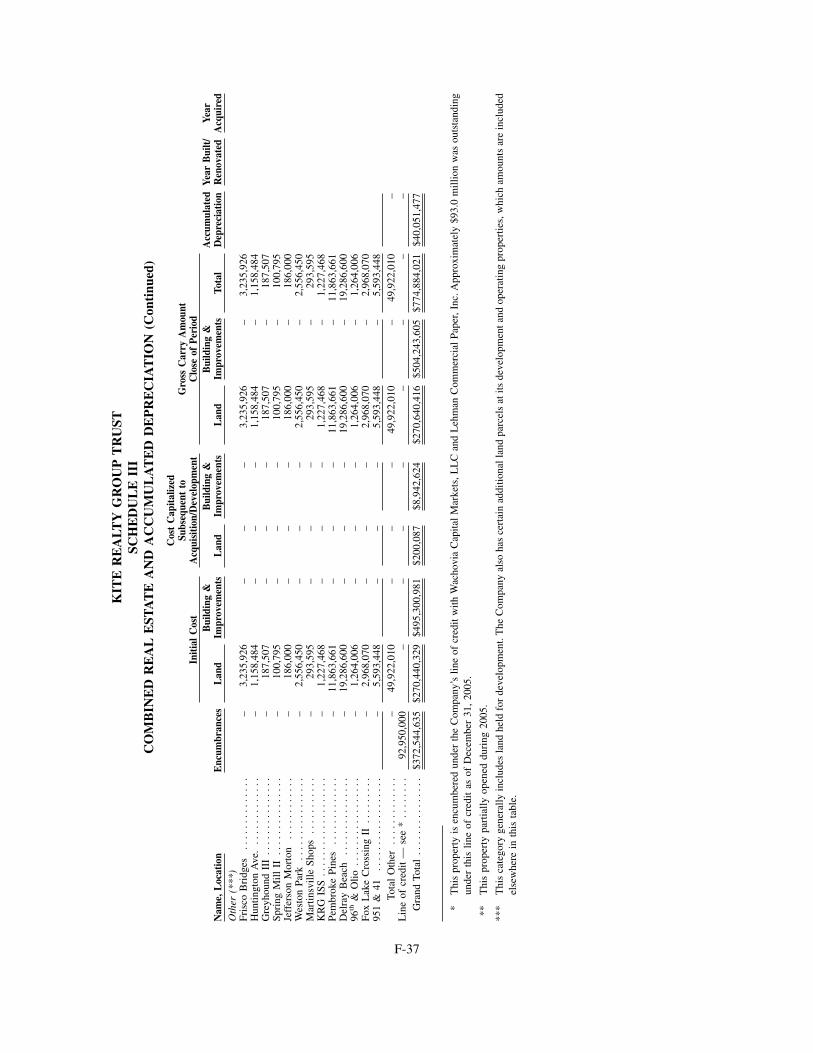
KIT
ER
EA
LTY
GR
OU
PT
RU
STSC
HE
DU
LE
III
CO
MB
INE
DR
EA
LE
STA
TE
AN
DA
CC
UM
UL
AT
ED
DE
PR
EC
IAT
ION
(Con
tinu
ed)
Initi
alC
ost
Cos
tC
apita
lized
Subs
eque
ntto
Acq
uisi
tion/
Dev
elop
men
tG
ross
Car
ryA
mou
ntC
lose
ofPe
riod
Nam
e,L
ocat
ion
Enc
umbr
ance
sL
and
Bui
ldin
g&
Impr
ovem
ents
Lan
dB
uild
ing
&Im
prov
emen
tsL
and
Bui
ldin
g&
Impr
ovem
ents
Tota
lA
ccum
ulat
edD
epre
ciat
ion
Year
Bui
lt/R
enov
ated
Year
Acq
uire
dO
ther
(***
)Fr
isco
Bri
dges
....
....
....
..–
3,23
5,92
6–
––
3,23
5,92
6–
3,23
5,92
6H
untin
gton
Ave
...
....
....
...
–1,
158,
484
––
–1,
158,
484
–1,
158,
484
Gre
yhou
ndII
I..
....
....
....
.–
187,
507
––
–18
7,50
7–
187,
507
Spri
ngM
illII
....
....
....
...
–10
0,79
5–
––
100,
795
–10
0,79
5Je
ffer
son
Mor
ton
....
....
....
–18
6,00
0–
––
186,
000
–18
6,00
0W
esto
nPa
rk..
....
....
....
..–
2,55
6,45
0–
––
2,55
6,45
0–
2,55
6,45
0M
artin
svill
eSh
ops
....
....
...
–29
3,59
5–
––
293,
595
–29
3,59
5K
RG
ISS
....
....
....
....
...
–1,
227,
468
––
–1,
227,
468
–1,
227,
468
Pem
brok
ePi
nes
....
....
....
.–
11,8
63,6
61–
––
11,8
63,6
61–
11,8
63,6
61D
elra
yB
each
....
....
....
...
–19
,286
,600
––
–19
,286
,600
–19
,286
,600
96th
&O
lio..
....
....
....
...
–1,
264,
006
––
–1,
264,
006
–1,
264,
006
Fox
Lak
eC
ross
ing
II..
....
...
–2,
968,
070
––
–2,
968,
070
–2,
968,
070
951
&41
....
....
....
....
..–
5,59
3,44
8–
––
5,59
3,44
8–
5,59
3,44
8To
tal
Oth
er..
....
....
...
–49
,922
,010
––
–49
,922
,010
–49
,922
,010
–L
ine
ofcr
edit
—se
e*
....
....
92,9
50,0
00–
––
––
––
–G
rand
Tota
l..
....
....
....
.$3
72,5
44,6
35$2
70,4
40,3
29$4
95,3
00,9
81$2
00,0
87$8
,942
,624
$270
,640
,416
$504
,243
,605
$774
,884
,021
$40,
051,
477
*T
his
prop
erty
isen
cum
bere
dun
der
the
Com
pany
’slin
eof
cred
itw
ithW
acho
via
Cap
ital
Mar
kets
,LL
Can
dL
ehm
anC
omm
erci
alPa
per,
Inc.
App
roxi
mat
ely
$93.
0m
illio
nw
asou
tsta
ndin
gun
der
this
line
ofcr
edit
asof
Dec
embe
r31
,20
05.
**T
his
prop
erty
part
ially
open
eddu
ring
2005
.
***
Thi
sca
tego
ryge
nera
llyin
clud
esla
ndhe
ldfo
rde
velo
pmen
t.T
heC
ompa
nyal
soha
sce
rtai
nad
ditio
nall
and
parc
els
atits
deve
lopm
enta
ndop
erat
ing
prop
ertie
s,w
hich
amou
nts
are
incl
uded
else
whe
rein
this
tabl
e.
F-37
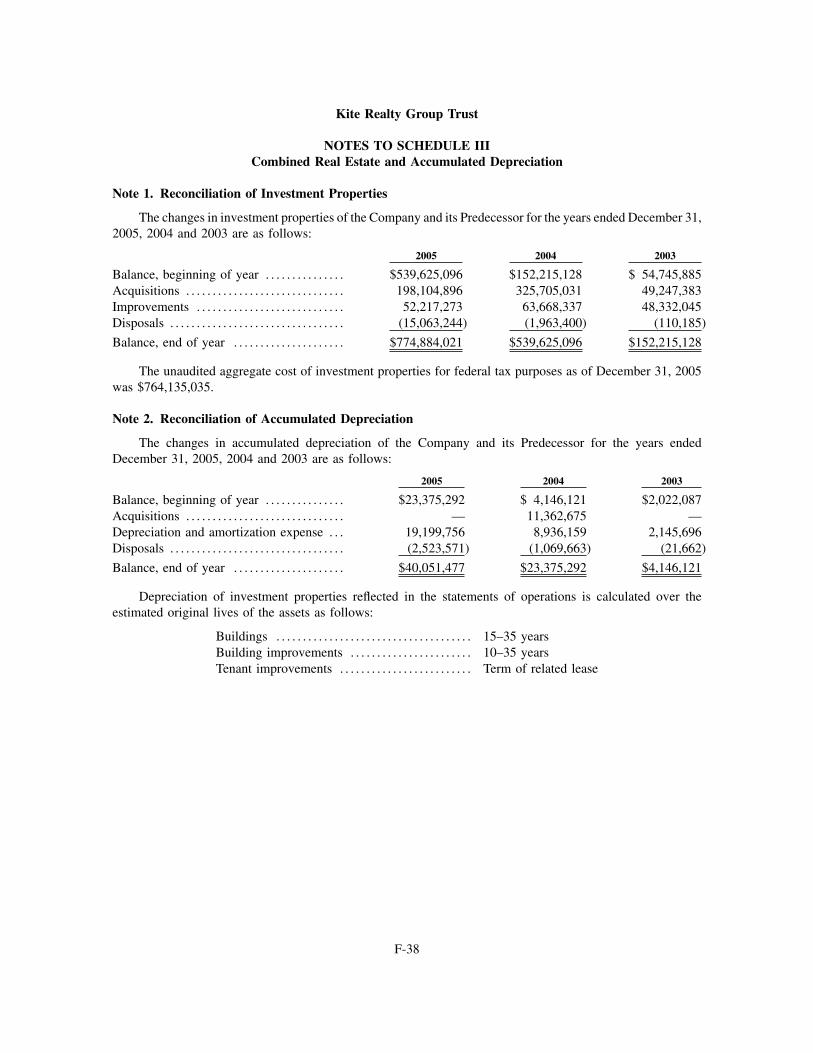
Kite Realty Group Trust
NOTES TO SCHEDULE IIICombined Real Estate and Accumulated Depreciation
Note 1. Reconciliation of Investment Properties
The changes in investment properties of the Company and its Predecessor for the years ended December 31,2005, 2004 and 2003 are as follows:
2005 2004 2003
Balance, beginning of year . . . . . . . . . . . . . . . $539,625,096 $152,215,128 $ 54,745,885Acquisitions . . . . . . . . . . . . . . . . . . . . . . . . . . . . . . 198,104,896 325,705,031 49,247,383Improvements . . . . . . . . . . . . . . . . . . . . . . . . . . . . 52,217,273 63,668,337 48,332,045Disposals . . . . . . . . . . . . . . . . . . . . . . . . . . . . . . . . . (15,063,244) (1,963,400) (110,185)
Balance, end of year . . . . . . . . . . . . . . . . . . . . . $774,884,021 $539,625,096 $152,215,128
The unaudited aggregate cost of investment properties for federal tax purposes as of December 31, 2005was $764,135,035.
Note 2. Reconciliation of Accumulated Depreciation
The changes in accumulated depreciation of the Company and its Predecessor for the years endedDecember 31, 2005, 2004 and 2003 are as follows:
2005 2004 2003
Balance, beginning of year . . . . . . . . . . . . . . . $23,375,292 $ 4,146,121 $2,022,087Acquisitions . . . . . . . . . . . . . . . . . . . . . . . . . . . . . . — 11,362,675 —Depreciation and amortization expense . . . 19,199,756 8,936,159 2,145,696Disposals . . . . . . . . . . . . . . . . . . . . . . . . . . . . . . . . . (2,523,571) (1,069,663) (21,662)
Balance, end of year . . . . . . . . . . . . . . . . . . . . . $40,051,477 $23,375,292 $4,146,121
Depreciation of investment properties reflected in the statements of operations is calculated over theestimated original lives of the assets as follows:
Buildings . . . . . . . . . . . . . . . . . . . . . . . . . . . . . . . . . . . . . 15–35 yearsBuilding improvements . . . . . . . . . . . . . . . . . . . . . . . 10–35 yearsTenant improvements . . . . . . . . . . . . . . . . . . . . . . . . . Term of related lease
F-38
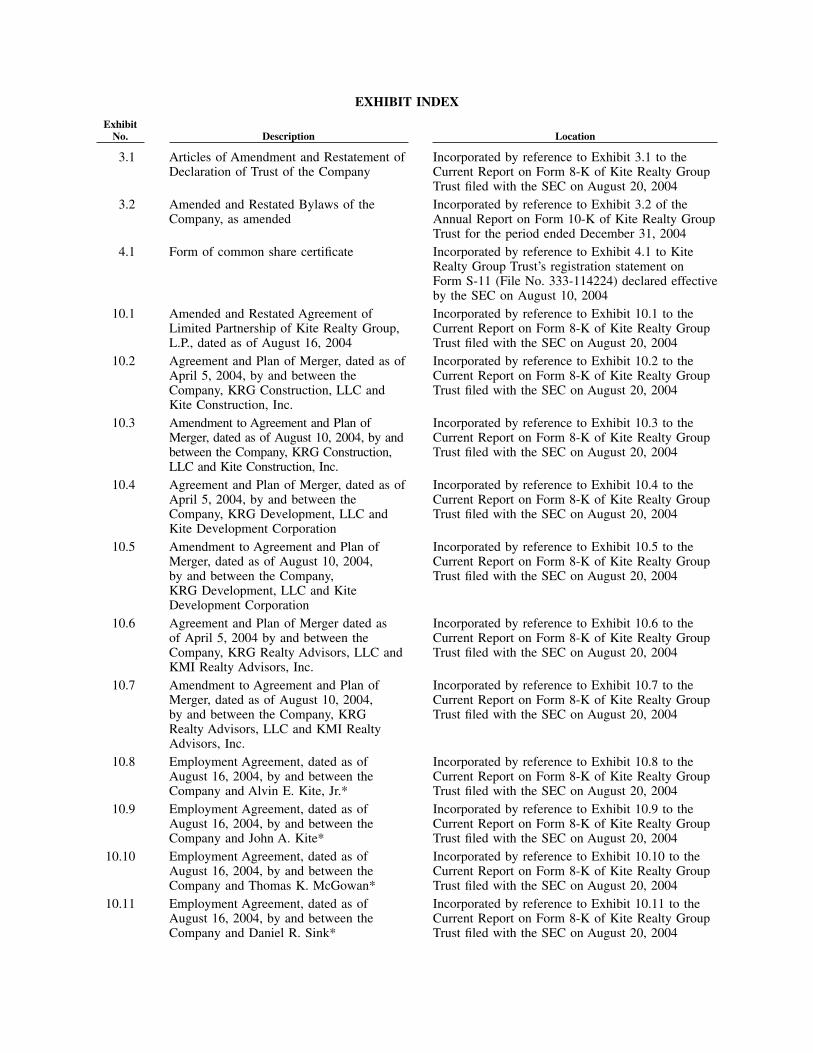
EXHIBIT INDEX
ExhibitNo. Description Location
3.1 Articles of Amendment and Restatement ofDeclaration of Trust of the Company
Incorporated by reference to Exhibit 3.1 to theCurrent Report on Form 8-K of Kite Realty GroupTrust filed with the SEC on August 20, 2004
3.2 Amended and Restated Bylaws of theCompany, as amended
Incorporated by reference to Exhibit 3.2 of theAnnual Report on Form 10-K of Kite Realty GroupTrust for the period ended December 31, 2004
4.1 Form of common share certificate Incorporated by reference to Exhibit 4.1 to KiteRealty Group Trust’s registration statement onForm S-11 (File No. 333-114224) declared effectiveby the SEC on August 10, 2004
10.1 Amended and Restated Agreement ofLimited Partnership of Kite Realty Group,L.P., dated as of August 16, 2004
Incorporated by reference to Exhibit 10.1 to theCurrent Report on Form 8-K of Kite Realty GroupTrust filed with the SEC on August 20, 2004
10.2 Agreement and Plan of Merger, dated as ofApril 5, 2004, by and between theCompany, KRG Construction, LLC andKite Construction, Inc.
Incorporated by reference to Exhibit 10.2 to theCurrent Report on Form 8-K of Kite Realty GroupTrust filed with the SEC on August 20, 2004
10.3 Amendment to Agreement and Plan ofMerger, dated as of August 10, 2004, by andbetween the Company, KRG Construction,LLC and Kite Construction, Inc.
Incorporated by reference to Exhibit 10.3 to theCurrent Report on Form 8-K of Kite Realty GroupTrust filed with the SEC on August 20, 2004
10.4 Agreement and Plan of Merger, dated as ofApril 5, 2004, by and between theCompany, KRG Development, LLC andKite Development Corporation
Incorporated by reference to Exhibit 10.4 to theCurrent Report on Form 8-K of Kite Realty GroupTrust filed with the SEC on August 20, 2004
10.5 Amendment to Agreement and Plan ofMerger, dated as of August 10, 2004,by and between the Company,KRG Development, LLC and KiteDevelopment Corporation
Incorporated by reference to Exhibit 10.5 to theCurrent Report on Form 8-K of Kite Realty GroupTrust filed with the SEC on August 20, 2004
10.6 Agreement and Plan of Merger dated asof April 5, 2004 by and between theCompany, KRG Realty Advisors, LLC andKMI Realty Advisors, Inc.
Incorporated by reference to Exhibit 10.6 to theCurrent Report on Form 8-K of Kite Realty GroupTrust filed with the SEC on August 20, 2004
10.7 Amendment to Agreement and Plan ofMerger, dated as of August 10, 2004,by and between the Company, KRGRealty Advisors, LLC and KMI RealtyAdvisors, Inc.
Incorporated by reference to Exhibit 10.7 to theCurrent Report on Form 8-K of Kite Realty GroupTrust filed with the SEC on August 20, 2004
10.8 Employment Agreement, dated as ofAugust 16, 2004, by and between theCompany and Alvin E. Kite, Jr.*
Incorporated by reference to Exhibit 10.8 to theCurrent Report on Form 8-K of Kite Realty GroupTrust filed with the SEC on August 20, 2004
10.9 Employment Agreement, dated as ofAugust 16, 2004, by and between theCompany and John A. Kite*
Incorporated by reference to Exhibit 10.9 to theCurrent Report on Form 8-K of Kite Realty GroupTrust filed with the SEC on August 20, 2004
10.10 Employment Agreement, dated as ofAugust 16, 2004, by and between theCompany and Thomas K. McGowan*
Incorporated by reference to Exhibit 10.10 to theCurrent Report on Form 8-K of Kite Realty GroupTrust filed with the SEC on August 20, 2004
10.11 Employment Agreement, dated as ofAugust 16, 2004, by and between theCompany and Daniel R. Sink*
Incorporated by reference to Exhibit 10.11 to theCurrent Report on Form 8-K of Kite Realty GroupTrust filed with the SEC on August 20, 2004
10.12 Noncompetition Agreement, dated as ofAugust 16, 2004, by and between theCompany and Alvin E. Kite, Jr.*
Incorporated by reference to Exhibit 10.12 to theCurrent Report on Form 8-K of Kite Realty GroupTrust filed with the SEC on August 20, 2004
10.13 Noncompetition Agreement, dated as ofAugust 16, 2004, by and between theCompany and John A. Kite*
Incorporated by reference to Exhibit 10.13 to theCurrent Report on Form 8-K of Kite Realty GroupTrust filed with the SEC on August 20, 2004
10.14 Noncompetition Agreement, dated as ofAugust 16, 2004, by and between theCompany and Thomas K. McGowan*
Incorporated by reference to Exhibit 10.14 to theCurrent Report on Form 8-K of Kite Realty GroupTrust filed with the SEC on August 20, 2004
10.15 Noncompetition Agreement, dated as ofAugust 16, 2004, by and between theCompany and Daniel R. Sink*
Incorporated by reference to Exhibit 10.15 to theCurrent Report on Form 8-K of Kite Realty GroupTrust filed with the SEC on August 20, 2004
10.16 Indemnification Agreement, dated as ofAugust 16, 2004, by and between KiteRealty Group, L.P. and Alvin E. Kite*
Incorporated by reference to Exhibit 10.16 to theCurrent Report on Form 8-K of Kite Realty GroupTrust filed with the SEC on August 20, 2004
10.17 Indemnification Agreement, dated as ofAugust 16, 2004, by and between KiteRealty Group, L.P. and John A. Kite*
Incorporated by reference to Exhibit 10.17 to theCurrent Report on Form 8-K of Kite Realty GroupTrust filed with the SEC on August 20, 2004
10.18 Indemnification Agreement, dated as ofAugust 16, 2004, by and betweenKite Realty Group, L.P. andThomas K. McGowan*
Incorporated by reference to Exhibit 10.18 to theCurrent Report on Form 8-K of Kite Realty GroupTrust filed with the SEC on August 20, 2004
10.19 Indemnification Agreement, dated as ofAugust 16, 2004, by and between KiteRealty Group, L.P. and Daniel R. Sink*
Incorporated by reference to Exhibit 10.19 to theCurrent Report on Form 8-K of Kite Realty GroupTrust filed with the SEC on August 20, 2004
10.20 Indemnification Agreement, dated as ofAugust 16, 2004, by and betweenKite Realty Group, L.P. andWilliam E. Bindley*
Incorporated by reference to Exhibit 10.20 to theCurrent Report on Form 8-K of Kite Realty GroupTrust filed with the SEC on August 20, 2004
10.21 Indemnification Agreement, dated as ofAugust 16, 2004, by and between KiteRealty Group, L.P. and Michael L. Smith*
Incorporated by reference to Exhibit 10.21 to theCurrent Report on Form 8-K of Kite Realty GroupTrust filed with the SEC on August 20, 2004
10.22 Indemnification Agreement, dated as ofAugust 16, 2004, by and between KiteRealty Group, L.P. and Eugene Golub*
Incorporated by reference to Exhibit 10.22 to theCurrent Report on Form 8-K of Kite Realty GroupTrust filed with the SEC on August 20, 2004
10.23 Indemnification Agreement, dated as ofAugust 16, 2004, by and between KiteRealty Group, L.P. and Richard A. Cosier*
Incorporated by reference to Exhibit 10.23 to theCurrent Report on Form 8-K of Kite Realty GroupTrust filed with the SEC on August 20, 2004
10.24 Indemnification Agreement, dated as ofAugust 16, 2004, by and between KiteRealty Group, L.P. and Gerald L. Moss*
Incorporated by reference to Exhibit 10.24 to theCurrent Report on Form 8-K of Kite Realty GroupTrust filed with the SEC on August 20, 2004
10.25 Contributor Indemnity Agreement, datedAugust 16, 2004, by and among KiteRealty Group, L.P., Alvin E. Kite, Jr.,John A. Kite, Paul W. Kite, Thomas K.McGowan, Daniel R. Sink, George F.McMannis, IV, and Mark Jenkins*
Incorporated by reference to Exhibit 10.25 to theCurrent Report on Form 8-K of Kite Realty GroupTrust filed with the SEC on August 20, 2004
10.26 Kite Realty Group Trust 2004 EquityIncentive Plan*
Incorporated by reference to Exhibit 10.26 to theCurrent Report on Form 8-K of Kite Realty GroupTrust filed with the SEC on August 20, 2004
10.27 Kite Realty Group Trust ExecutiveBonus Plan*
Incorporated by reference to Exhibit 10.27 to theCurrent Report on Form 8-K of Kite Realty GroupTrust filed with the SEC on August 20, 2004
10.28 Option Agreement (Tarpon Spring Plaza),dated as of August 16, 2004, by andamong Kite Realty Group, L.P.,Brentwood Land Partners, LLC, Alvin E.Kite, Jr., John A. Kite, Paul W. Kite andThomas K. McGowan
Incorporated by reference to Exhibit 10.28 to theCurrent Report on Form 8-K of Kite Realty GroupTrust filed with the SEC on August 20, 2004
10.29 Option Agreement (Erskine Village), datedas of August 16, 2004, by and among KiteRealty Group, L.P., Kite South Bend, LLC,Alvin E. Kite, Jr., John A. Kite, Paul W.Kite and Thomas K. McGowan
Incorporated by reference to Exhibit 10.29 to theCurrent Report on Form 8-K of Kite Realty GroupTrust filed with the SEC on August 20, 2004
10.30 Option Agreement (126th Street &Meridian Medical Complex), dated as ofAugust 16, 2004, by and among KiteRealty Group, L.P., Kite 126th StreetMedical, LLC, Alvin E. Kite, Jr.,John A. Kite, Paul W. Kite andThomas K. McGowan
Incorporated by reference to Exhibit 10.30 to theCurrent Report on Form 8-K of Kite Realty GroupTrust filed with the SEC on August 20, 2004
10.31 Option Agreement (126th Street &Meridian II Medical Complex), datedas of August 16, 2004, by and among KiteRealty Group, L.P., Kite 126th StreetMedical II, LLC, Alvin E. Kite, Jr.,John A. Kite, Paul W. Kite andThomas K. McGowan
Incorporated by reference to Exhibit 10.31 to theCurrent Report on Form 8-K of Kite Realty GroupTrust filed with the SEC on August 20, 2004
10.32 Registration Rights Agreement, dated as ofAugust 16, 2004, by and among theCompany, Alvin E. Kite, Jr., John A. Kite,Paul W. Kite, Thomas K. McGowan,Daniel R. Sink, George F. McMannis,Mark Jenkins, Ken Kite, David Grieve andKMI Holdings, LLC
Incorporated by reference to Exhibit 10.32 to theCurrent Report on Form 8-K of Kite Realty GroupTrust filed with the SEC on August 20, 2004
10.33 Amendment No. 1 to Registration RightsAgreement, dated August 29, 2005, by andamong the Company and the other partieslisted on the signature page thereto
Incorporated by reference to Exhibit 10.2 to theQuarterly Report on Form 10-Q of Kite RealtyGroup Trust for the period ended September 30,2005
10.34 Tax Protection Agreement, datedAugust 16, 2004, by and among theCompany, Kite Realty Group, L.P., AlvinE. Kite, Jr., John A. Kite, Paul W. Kite,Thomas K. McGowan and C. Kenneth Kite
Incorporated by reference to Exhibit 10.33 to theCurrent Report on Form 8-K of Kite Realty GroupTrust filed with the SEC on August 20, 2004
10.35 Consulting Agreement, dated August 16,2004, by and between Kite RealtyGroup, L.P and Paul W. Kite
Incorporated by reference to Exhibit 10.34 to theCurrent Report on Form 8-K of Kite Realty GroupTrust filed with the SEC on August 20, 2004
10.36 Credit Agreement, dated as of August 31,2004, by and among Kite Realty Group,L.P., as Borrower, Kite Realty Group Trust,Wachovia Capital Markets, LLC andLehman Brothers Inc., as Joint LeadArrangers and Joint Book Runners,Wachovia Bank, National Association, asAgent, Lehman Commercial Paper Inc., asSyndication Agent, and the FinancialInstitutions signatory thereto, as Lenders
Incorporated by reference to Exhibit 10.1 to theCurrent Report on Form 8-K of Kite Realty GroupTrust filed with the SEC on September 7, 2004

10.37 First Amendment to Credit Agreement,dated as of December 15, 2004, by andamong Kite Realty Group, L.P., Kite RealtyGroup Trust, the financial institutionssignatory thereto and Wachovia Bank,National Association, as Agent
Incorporated by reference to Exhibit 10.1 to theCurrent Report on Form 8-K of Kite Realty GroupTrust filed with the SEC on December 20, 2004
10.38 Third Amendment to Credit Agreement,dated as of June 30, 2005, by and amongKite Realty Group, L.P., Kite Realty GroupTrust, the financial institutions signatorythereto and Wachovia Bank, NationalAssociation, as Agent
Incorporated by reference to Exhibit 10.1 to theCurrent Report on Form 8-K of Kite Realty GroupTrust filed with the SEC on July 7, 2005
10.39 Contribution Agreement dated as ofApril 5, 2004 by and among Kite RealtyGroup, L.P., Alvin E. Kite, Jr., John A.Kite, Paul W. Kite, Thomas K. McGowan,Daniel R. Sink, George F. McMannis andMark Jenkins
Incorporated by reference to Exhibit 10.2 to KiteRealty Group Trust’s registration statement on FormS-11 (File No. 333-114224) declared effective bythe SEC on August 10, 2004
10.40 Schedule of 2005 Bonus Benchmarks forExecutive Officers*
Incorporated by reference to Exhibit 10.38 to theAnnual Report on Form 10-K of Kite Realty GroupTrust for the period ended December 31, 2004
10.41 Form of Share Option Agreement under2004 Equity Incentive Plan*
Incorporated by reference to Exhibit 10.39 to theAnnual Report on Form 10-K of Kite Realty GroupTrust for the period ended December 31, 2004
10.42 Form of Restricted Share Agreement under2004 Equity Incentive Plan*
Incorporated by reference to Exhibit 10.40 of theAnnual Report on Form 10-K of Kite Realty GroupTrust for the period ended December 31, 2004
10.43 Schedule of Non-Employee Trustee Feesand Other Compensation*
Incorporated by reference to Exhibit 10.2 to theQuarterly Report on Form 10-Q of Kite RealtyGroup Trust for the period ended June 30, 2005
10.44 Contribution Agreement, dated as ofMarch 31, 2005, by and among Kite RealtyGroup, L.P., Brentwood Holdings, LLC andAlvin E. Kite, Jr., John A. Kite, Paul W.Kite and Thomas K. McGowan
Incorporated by reference to Exhibit 10.1 to theCurrent Report on Form 8-K of Kite Realty GroupTrust filed with the SEC on April 5, 2005
10.45 Purchase and Sale Agreement, dated as ofMarch 3, 2005, by and among Kite RealtyGroup Trust and U.S. Retail Income FundVIII-E, Limited Partnership
Incorporated by reference to Exhibit 10.4 to theQuarterly Report on Form 10-Q/A of Kite RealtyGroup Trust for the period ended March 31, 2005
10.46 Purchase and Sale Agreement, dated as ofMarch 3, 2005, by and among Kite RealtyGroup Trust and U.S. Retail Income FundIV, Limited Partnership
Incorporated by reference to Exhibit 10.5 to theQuarterly Report on Form 10-Q of Kite RealtyGroup Trust for the period ended March 31, 2005
10.47 Purchase and Sale Agreement, dated as ofMarch 3, 2005, by and among Kite RealtyGroup Trust and U.S. Retail Income FundVIII-D, Limited Partnership
Incorporated by reference to Exhibit 10.6 to theQuarterly Report on Form 10-Q of Kite RealtyGroup Trust for the period ended March 31, 2005
10.48 Underwriting Agreement, datedSeptember 27, 2005, by and among theCompany, Kite Realty Group, L.P. and theunderwriters named therein
Incorporated by reference to Exhibit 1.1 to theCurrent Report on Form 8-K of Kite Realty GroupTrust filed with the SEC on September 29, 2005
21.1 List of Subsidiaries Filed herewith23.1 Consent of Ernst & Young LLP Filed herewith

31.1 Certification of principal executive officerrequired by Rule 13a-14(a)/15d-14(a)under the Exchange Act, as adoptedpursuant to Section 302 of theSarbanes-Oxley Act of 2002
Filed herewith
31.2 Certification of principal financial officerrequired by Rule 13a-14(a)/15d-14(a)under the Exchange Act, as adoptedpursuant to Section 302 of theSarbanes-Oxley Act of 2002
Filed herewith
32.1 Certification of Chief Executive Officerand Chief Financial Officer pursuant to18 U.S.C. Section 1350, as adoptedpursuant to Section 906 of theSarbanes-Oxley Act of 2002
Filed herewith
* Denotes a management contract or compensatory, plan contract or arrangement.

(This page intentionally left blank.)


3 0 S o u t h M e r i d i a n
S u i t e 11 0 0
I n d i a n a p o l i s , I n d i a n a 4 6 2 0 4
317. 577. 5 6 0 0
w w w. k i t e r e a l t y. c o m