annual regulatory report - transpower | we connect … · 2014/15 annual regulatory report ©...
TRANSCRIPT

2014/15 Annual Regulatory Report © Transpower New Zealand Limited 2015. All rights reserved. i
Annual Regulatory Report
on performance for the year ended 30 June 2015 and transmission pricing for the four years starting 1 April 2016
[Report Date]


2014/15 Annual Regulatory Report © Transpower New Zealand Limited 2015. All rights reserved. iii
Table of contents
Table of contents ................................................................................................................ iii
Table of figures .................................................................................................................... v
Table of tables .................................................................................................................... vi
Executive summary ............................................................................................................ vii
1 Introduction ............................................................................................................. 12
1.1 Maximum Allowable Revenue .............................................................................. 12
2 RCP2 revenue forecasts ......................................................................................... 14
2.1 Update to our revenue forecast ............................................................................ 14
2.2 Revenue in real terms .......................................................................................... 15
2.3 Interconnection Rate for 2016/17 ......................................................................... 16
2.4 HVDC Rate for 2016/17 ....................................................................................... 16
3 MAR wash-up .......................................................................................................... 17
3.1 Forecast and actual MAR for 2014/15 .................................................................. 17
3.2 MAR wash-up ...................................................................................................... 18
4 Network performance .............................................................................................. 20
4.1 RCP1 network performance measures and targets .............................................. 20
4.2 Interruptions greater than 1.0 system minute ....................................................... 21
4.2.1 Whirinaki Bus urgent remove from service (RFS) Event 11 July 2014 ........... 21
4.3 Historical network performance ............................................................................ 22
4.4 RCP2 revenue-linked network performance measures ........................................ 23
5 Capital expenditure ................................................................................................. 24
5.1 Commissioning-based accounting ....................................................................... 24
5.2 Comparison of actual with forecast base capex ................................................... 25
5.3 Base capex adjustments ...................................................................................... 26
5.4 Historical base capex ........................................................................................... 27
5.5 RCP2 base capex ................................................................................................ 28
6 Major projects .......................................................................................................... 29
6.1 Progress reports – costs ...................................................................................... 29
6.2 Progress reports – timing ..................................................................................... 31
6.3 Close-out reports ................................................................................................. 32
6.3.1 National Auto-synchronisation Points Project ................................................. 33
6.3.2 Wairakei Ring Project .................................................................................... 35
7 Controllable operating expenditure .......................................................................... 37
7.1 Historical operating expenditure ........................................................................... 38

2014/15 Annual Regulatory Report © Transpower New Zealand Limited. All rights reserved. iv
7.2 RCP2 opex allowance .......................................................................................... 39
8 Pass-through and recoverable costs ....................................................................... 40
8.1 2014/15 wash-up ................................................................................................. 40
8.2 Historical pass-through and recoverable costs ..................................................... 41
8.3 Forecast pass-through and recoverable costs ...................................................... 41
9 Other regulatory documents .................................................................................... 43
9.1 Initiatives Plan ...................................................................................................... 43
9.2 Integrated Transmission Plan .............................................................................. 43
A.1 RCP2 performance measures – Points of Service by category ................................ 44
A.2 RCP2 performance measures – selected circuits for HVAC availability measure .... 48
A.3 Detailed base capex variance explanation ............................................................... 49
2014/15 Annual Regulatory Report © Transpower New Zealand Limited. All rights reserved. v
Table of figures
Figure 1: Components of the year-on-year movement in HVAC revenue ............................ viii
Figure 2: Components of the year-on-year movement in HVDC revenue .............................. ix
Figure 3: Regulation of Transpower's activities ................................................................... 12
Figure 4: MAR building blocks and inputs ........................................................................... 13
Figure 5: Disclosure and update cycle ................................................................................ 13
Figure 6: Revenue in real terms .......................................................................................... 15
Figure 7: Simplified representation of main MAR building blocks ........................................ 17
Figure 8: Movement of commissioning dates within and between control periods ............... 24

2014/15 Annual Regulatory Report © Transpower New Zealand Limited. All rights reserved. vi
Table of tables
Table 1: Latest RCP2 revenue forecast (determined on 5 November 2015) ......................... vii
Table 2: Actual performance against target for four performance measures ......................... x
Table 3: HVAC updated revenue forecast (detail) ............................................................... 14
Table 4: HVDC updated revenue forecast (detail) ............................................................... 14
Table 5: Total updated revenue forecast ............................................................................. 15
Table 6: Summary calculation of the MAR wash-up for 2014/15 ......................................... 18
Table 7: Actual 2014/15 performance against targets for four network performance
measures ..................................................................................................................... 20
Table 8: Historical network performance ............................................................................. 22
Table 9: RCP2 network performance measures .................................................................. 23
Table 10: Forecast and actual 2014/15 base capital expenditure (commissioned basis) ..... 25
Table 11: Total RCP1 allowance and actual base capital expenditure (commissioned basis)
.................................................................................................................................... 26
Table 12: Adjustments that can apply to base capex .......................................................... 26
Table 13: Adjustment to base capex allowance for CPI movement ..................................... 27
Table 14: Historical base capex .......................................................................................... 27
Table 15: RCP2 base capex commissioning allowance ...................................................... 28
Table 16: Updated cost forecasts for partially completed major projects ............................. 29
Table 17: Updated timing forecasts for partially completed major projects .......................... 31
Table 18: Summary of possible adjustments to major projects ............................................ 32
Table 19: Actual operating expenditure for 2014/15 ........................................................... 37
Table 20: Historical and forecast operating expenditure ...................................................... 38
Table 21: Opex allowance and the CPI adjustment ............................................................. 39
Table 22: RCP2 opex allowance ......................................................................................... 39
Table 23: Allocation of pass-through and recoverable wash-up amounts ............................ 40
Table 24: Historical pass-through and recoverable costs .................................................... 41
Table 25: Current forecast RCP2 pass-through and recoverable costs ............................... 42

2014/15 Annual Regulatory Report © Transpower New Zealand Limited. All rights reserved. vii
Executive summary
This report provides an overview of network and expenditure performance for our most
recent disclosure year (ended 30 June 2015) and information on transmission prices for the
coming pricing year (starting 1 April 2016).
The report complements more comprehensive and detailed spreadsheet-based disclosures,
which are available on our website:
https://www.transpower.co.nz/about-us/industry-information/revenue-and-pricing
This our fourth Annual Regulatory Report. It reports on the final year of our first regulatory
control period (RCP1). Next year’s report will introduce new performance measures that we
developed for our second control period (RCP2).
Updated revenue forecast
Following a thorough proposal and evaluation process, the Commerce Commission
published a determination in November 2014 setting forecast transmission revenue for the
five years of RCP2. These forecasts provide the basis for setting prices for the five years of
RCP2. Each year we update the revenue determination to take account of:
a wash-up of revenue inputs ( or “building blocks”) for the year just ended to ensure that
we do not under- or over-recover revenue from customers
costs associated with any newly-approved major capex projects
updated forecasts of pass-through and recoverable costs
financial incentives designed to promote ongoing performance improvements.
The table below presents updated revenue figures for all years of RCP2 (changes from the
previous forecast are detailed in Section 2.1).
Table 1: Latest RCP2 revenue forecast (determined on 5 November 2015)
2015/16 2016/17 2017/18 2018/19 2019/20
$m $m $m $m $m
HVAC 766.6 793.5 842.8 817.7 827.4
HVDC 149.9 152.8 151.4 152.3 150.0
Total transmission revenue 916.6 946.2 994.2 970.0 977.4
Note: figures are in nominal terms and may not add exactly due to rounding.

2014/15 Annual Regulatory Report © Transpower New Zealand Limited. All rights reserved. viii
Year-on-Year Movement
The following charts analyse factors contributing to the year-on-year increase in
transmission revenue from 2015/16 to 2016/17. HVAC and HVDC1 are analysed separately.
We recover HVAC costs via three types of transmission fee:
connection ($128.6 million in 2016/17) – covers the cost of owning and operating assets
used to connect customers to the grid
prudent discount ($2.8 million in 2016/17) – customers who could avoid charges by
reconfiguring their connection to the grid can receive discounted transmission charges in
return for paying prudent discount fees
interconnection ($662.1 million in 2016/17) – the balance of costs are recovered from
offtake customers based on their contribution to regional demand peaks.
Figure 1: Components of the year-on-year movement in HVAC revenue
Movement explanations:
our HVAC regulatory asset base (RAB) is forecast to increase due to $233 million of
forecast base capex commissioning and $10 million of forecast major capex
commissioning during 2015/16
HVAC depreciation, write-offs and dismantling costs are forecast to be about $6 million
more in aggregate for the 2016/17 year than they were for the 2015/16 year. Of that
1 New Zealand’s transmission grid has a high voltage direct current (HVDC) link between Benmore (in the central South Island) and Haywards (near Wellington). The HVDC link connects the South Island and North Island high voltage alternating current (HVAC) grids. HVDC and HVAC costs are treated separately.

2014/15 Annual Regulatory Report © Transpower New Zealand Limited. All rights reserved. ix
increase, $12 million is due to a higher Regulatory Asset Base (RAB), which is offset by
a $6 million decrease in the depreciation of our Pseudo Asset2
The operating expenses allowance is forecast to increase by about $8 million (or 3%)
from 2015/16 to 2016/17
The return to customers from the wash-up of the 2014/15 year is $4.5 million less than
from the wash-up of the 2013/14 year. That is principally because the over-estimate of
revenue building blocks for the year was about $14 million less than the previous year,
offset by the pass-through and recoverable costs wash-up, which was about $9 million
more than the previous year.
We recover HVDC revenue from customers who inject energy into the South Island grid.
Figure 2: Components of the year-on-year movement in HVDC revenue
Movement explanations (excluding items common to HVAC and HVDC):
our HVDC regulatory asset base (RAB) is forecast to decrease overall, because
depreciation in 2015/16 (reducing the RAB) is forecast to be $37.6 million whilst
commissioning (increasing the RAB) is forecast to be just $3.7 million
opex incentive credits contribute $5.7 million to HVDC revenue in 2016/17, up from $0.8
million in 2015/16
The additional charge to HVDC customers as a result of the 2014/15 wash-up is $3.5
million lower (at $3.4 million) than the wash-up for 2013/14, which was $6.9 million.
That’s principally because the under-estimate of revenue building blocks for the year was
about $5 million lower than the previous year, offset by an increase in the pass-through
and recoverable costs wash-up.
2 From 2011/12 to 2015/16 we had a pseudo asset on our RAB. That asset was depreciating at a rate of $6.4
million per year. This asset was fully depreciated at the end of 2015/16.

2014/15 Annual Regulatory Report © Transpower New Zealand Limited. All rights reserved. x
Network Performance
We outperformed three of our four network performance targets during 2014/15.
Table 2: Actual performance against target for four performance measures
Performance measures Target Actual Target
achieved?
Number of loss of supply events greater than 0.05 system minutes3
21 13 Y
Number of loss of supply events greater than 1 system minute
3 1 Y
Unplanned HVAC circuit unavailability (%) 0.054 0.068 N
Unplanned HVDC bi-pole unavailability (%) (no target
set) 0.130 n/a
Total impact of interruptions (measured in system minutes) 16.69 12.21 Y
From 2015/16, we will be reporting against a new set of measures and will be subject to a
financial incentive linked to performance. The new measures cover the frequency and
duration of interruptions, and the availability of key market-sensitive circuits.
Detailed information on specific events that contributed to the missed HVAC unavailability
target can be found in the 2014/15 IPP disclosures on our website:
https://www.transpower.co.nz/about-us/industry-information/regulatory-control-
periods/rcp1/updates-rcp-1.
Other regulatory documents
Earlier this year we published two other sets of regulatory reports:
RCP2 Initiatives Plan – provides information on how we intend to develop service
measures and targets for our next control period (RCP3) and how we intend to improve
aspects of our asset planning and forecasting
2015 Integrated Transmission Plan (ITP) – an overview of our plans. Includes full
schedules of planned expenditure and information on what has changed since we
published our last ITP in 2013. The 2015 ITP is supported by a Transmission Planning
Report identifying backbone grid and regional development plans; a Service Report
defining our service offering and performance targets; and an Asset Management Plan
explaining our asset management framework, management of each asset class and
planning works.
The Improvement Plan and the ITP are available on our website:
https://www.transpower.co.nz/about-us/industry-information/regulatory-control-
periods/rcp2/updates. 3 A ‘system minute’ is a loss of supply equivalent to losing peak demand for one minute. For example, losing supply to a city the size of Hamilton for around 40 minutes during a peak winter night would be roughly equivalent to one system minute.

2014/15 Annual Regulatory Report © Transpower New Zealand Limited. All rights reserved. xi
North Island Grid Upgrade (NIGU)
In August 2015 the Commission published its final decision on our application to amend the
allowance for the major North Island Grid Upgrade (NIGU) project we completed in 2012.
The decision permitted recovery of $876.3 million against a total project cost of $894 million.
We had previously built voluntary reductions into our revenues for the six years from
2014/15 that are consistent with this decision, so no further adjustments to revenue are
required.
Full details of the Commission’s decision can be found on the Commerce Commission
website4.
4 http://www.comcom.govt.nz/regulated-industries/electricity/electricity-transmission/transpower-major-capital-
proposal/amending-the-allowance-and-outputs-for-the-north-island-grid-upgrade-project/

2014/15 Annual Regulatory Report © Transpower New Zealand Limited. All rights reserved. 12
1 Introduction
This report details Transpower’s regulated transmission revenue for the remaining four years
of RCP2 (from 1 April 2016 to 31 March 2020). This updated revenue forecast was
determined by the Commerce Commission on 5 November 20155.
The report also covers Transpower’s activities for the period from 1 July 2014 to 30 June
2015 (the ‘disclosure year’). It reviews capital and operating expenditure and the
performance of our transmission network.
Figure 3: Regulation of Transpower's activities
This is the fourth and final report from our first regulatory control period (‘RCP1’), which runs
from 2011/12 to 2014/15. We welcome any feedback you have on this report.
1.1 Maximum Allowable Revenue
The Commerce Commission (“the Commission”) has established rules that are used to set
the Maximum Allowable Revenue (“MAR”) for transmission services. The MAR is calculated
by adding together revenue ‘building blocks’.
5 Technically the Commission determine our MAR, but the number most relevant to customers is our total
transmission revenue, which comprises our MAR, the forecast pass-through and recoverable costs together with voluntary reductions in our revenue. This is the figure applied to the TPM to calculate transmission charges.

2014/15 Annual Regulatory Report © Transpower New Zealand Limited. All rights reserved. 13
Figure 4: MAR building blocks and inputs
Some of the inputs to the building blocks are set by the Commission at the beginning of each
control period. These are:
operating expenditure allowances for each year
‘base’ capital expenditure for each year
cost of capital (WACC) for each control period.
The operating and base capital expenditure allowances for RCP2 were set by the
Commission on 29 August 2014 and the regulatory cost of capital for the period was set on
31 October 2014. We use these inputs to calculate an initial forecast of transmission
revenue, which is then updated each year to take account of actual expenditure and
performance.
Figure 5: Disclosure and update cycle

2014/15 Annual Regulatory Report © Transpower New Zealand Limited. All rights reserved. 14
2 RCP2 revenue forecasts
This section presents details of our forecast revenue for the five years of RCP2, and
provides details of the main transmission pricing rates for 2016/17. Our regulated
transmission revenue consists of our MAR plus pass-through and recoverable costs and any
voluntary reductions.
2.1 Update to our revenue forecast
In November 2014 the Commerce Commission approved our revenue forecast for RCP2.
Every year we update6 this forecast for the remaining years of RCP2. This is our first such
update. The tables below show the revenue as determined last year, together with the
changes we have just made.
Table 3: HVAC updated revenue forecast (detail)
2016/17 2017/18 2018/19 2019/20
$m $m $m $m
Amount determined in November 2014 799.7 832.6 817.2 825.9
New major capex approval7 0.2 0.4 0.5 0.5
Wash-ups from 2014/15 (see Table 6) (16.1) - - -
Movement in the calculation of IRIS credits8 9.6 9.8 - 1.0
Updated amount 793.5 842.8 817.7 827.4
Table 4: HVDC updated revenue forecast (detail)
2016/17 2017/18 2018/19 2019/20
$m $m $m $m
Amount determined in November 2014 143.9 145.8 149.4 144.7
Wash-ups from 2014/15 (see Table 6) 3.4 - - -
Movement in the calculation of IRIS credits 5.5 5.6 2.9 5.2
Updated amount 152.8 151.4 152.3 150.0
6 We’re only permitted to update the revenue for certain changes, being new major or listed project approvals, the
effect of wash-ups from previous years and revised pass-through and recoverable costs. 7 Amendment to the Upper South Island Grid Upgrade.
8 IRIS (Incremental Rolling Incentive Scheme) is our opex incentive regime.

2014/15 Annual Regulatory Report © Transpower New Zealand Limited. All rights reserved. 15
Table 5: Total updated revenue forecast
2016/17 2017/18 2018/19 2019/20
$m $m $m $m
HVAC 793.5 842.8 817.7 827.4
HVDC 152.8 151.4 152.3 150.0
Total transmission revenue 946.2 994.2 970.0 977.4
2.2 Revenue in real terms
The graph below shows how the updated RCP2 revenue for HVAC and HVDC in Table 5
trends in real terms (2015/16 prices). The graph also shows our expected revenue, once
forecast wash-ups and other adjustments are included. 2015/16 is included for comparison.
Figure 6: Revenue in real terms
The revenue in 2015/16 includes the effect of wash-ups of the 2013/14 year ($20 million
reduction to HVAC and $6 million increase to HVDC). The revenue in 2016/17 includes
the effect of wash-ups of the 2014/15 year ($16 million reduction to HVAC and $3 million
increase to HVDC).
Major projects that are not yet approved by the Commerce Commission are excluded
from the inputs used to set our revenue path. The revenue numbers in Table 5 also
exclude forecast future wash-ups. The dotted lines show what our revenue path would
be if those were included.

2014/15 Annual Regulatory Report © Transpower New Zealand Limited. All rights reserved. 16
2.3 Interconnection Rate for 2016/17
Customers’ annual interconnection charge is determined by multiplying their contribution to
‘regional coincident peak demand’ (RCPD) by the Interconnection Rate. That rate is
calculated using the formula:
𝐼𝑅 =𝐴𝐶𝑟𝑒𝑣 − ∑ 𝐶𝑜𝑛𝑛𝑟𝑒𝑣 − ∑ 𝑃𝐷𝐴𝑟𝑒𝑣
∑ 𝑅𝐶𝑃𝐷𝑡𝑜𝑡𝑎𝑙
Where:
𝐴𝐶𝑟𝑒𝑣 = HVAC pricing revenue $ 793,434,669
∑ 𝐶𝑜𝑛𝑛𝑟𝑒𝑣 = revenue from connection charges $128,569,151
∑ 𝑃𝐷𝐴𝑟𝑒𝑣 = revenue from prudent discount agreements $2,794,513
∑ 𝑅𝐶𝑃𝐷𝑡𝑜𝑡𝑎𝑙 = regional coincident peak demand across all regions9 5,775,201 kW
The result is an Interconnection Rate for 2015/16 of $114.64 /kW
This is a 3.9% increase from the 2015/16 rate ($110.35 /kW), resulting from a 4.7% increase
in interconnection revenue, partially offset by a 0.8% increase in demand (total RCPD).
The 2015/16 rate was a 3.6% reduction from the 2014/15 rate ($114.47 /kW).
2.4 HVDC Rate for 2016/17
The HVDC charge on customers who inject energy into the South Island grid10 is determined
by multiplying their ‘historic anytime maximum injection’ (HAMI) by the HVDC Rate. That rate
is calculated using the formula:
𝐻𝑉𝐷𝐶 𝑅𝑎𝑡𝑒 =𝐷𝐶𝑟𝑒𝑣 − ∑ 𝑃𝐷𝐴𝑟𝑒𝑣
∑ 𝐻𝐴𝑀𝐼𝑡𝑜𝑡𝑎𝑙
Where:
𝐷𝐶𝑟𝑒𝑣 = HVDC pricing revenue $ 152,775,845
∑ 𝑃𝐷𝐴𝑟𝑒𝑣 = revenue from prudent discount agreements $491,018
∑ 𝐻𝐴𝑀𝐼𝑡𝑜𝑡𝑎𝑙 = total HAMI across all customers9 3,223,405 kW
The result is an HVDC Rate for 2015/16 of $47.24 /kW
This is a 1.6% increase from the 2015/16 rate ($46.49/kW), resulting from a 1.6% increase in
transmission pricing revenue.
The 2015/16 rate was a 4.2% increase from the 2014/15 rate ($44.60/kW).
9 Our TPM Operational Review will result in changes to the way RCPD and HAMI are calculated from April 2017
(see https://www.transpower.co.nz/about-us/industry-information/tpm-development#transpower-tpm). 10
Meridian Energy, Contact Energy and Genesis Energy account for 96% of South Island injection in 2015/16.

2014/15 Annual Regulatory Report © Transpower New Zealand Limited. All rights reserved. 17
3 MAR wash-up
This section covers the revenue ‘wash-up’ calculation included in forecast revenue for
2016/17 (and therefore prices for the pricing year starting April 2016).
The wash-up compares revenues we earned in 2014/15 with an ex post assessment of
revenue permitted under the Individual Price-Quality Path (IPP) framework. Any over- or
under-recovery from 2014/15 is returned to, or recovered from, customers via an adjustment
to our 2016/17 revenues (and prices).
3.1 Forecast and actual MAR for 2014/15
We calculated prices for our 2014/15 pricing year (starting 1 April 2014) based on forecasts
of the MAR ‘building blocks’ for the year11. The main building blocks are illustrated again
below.
Figure 7: Simplified representation of main MAR building blocks
Our forecast MAR for 2014/15 was determined by the Commission in October 2011 and was
updated in October 2013 to $934.6 million. Included in that forecast was a net reduction in
revenue of $12.2 million relating to net over-recovery in prior years. When we calculated
prices for 2014/15 we also applied a $4.0 million voluntary revenue reduction, relating to the
NIGU project overspend and cancellation of some RCP1 maintenance projects. That
reduced our target revenue for the year to $930.6 million.
We have now recalculated our MAR for 2014/15 to reflect the actual opening regulatory
asset base (RAB) value at 1 July 2014, the timing and value of assets commissioned during
2014/15, and actual CPI movement to the end of 2014/15.
11
Prices are set based on a forecast total revenue number that includes the forecast MAR, plus estimates of pass-through and recoverable costs. Pass-through and recoverable costs are covered in Section 7 of this report.

2014/15 Annual Regulatory Report © Transpower New Zealand Limited. All rights reserved. 18
3.2 MAR wash-up
The table below calculates our 2014/15 MAR wash-up by comparing HVAC and HVDC
revenues received in the pricing year with our actual MAR, broken down by revenue building
blocks.
Table 6: Summary calculation of the MAR wash-up for 2014/15
Building blocks (all in $m)
Forecast Revised Due (to) or from customers
A B B - A
Total Total Total HVAC HVDC
Return on assets 383.7 374.9 (8.7) (7.4) (1.3)
Tax 36.4 41.1 4.7 (0.9) 5.6
Depreciation 238.7 242.0 3.3 1.5 1.8
Opex allowance (CPI-adjusted) 287.9 271.9 (16.0) (14.6) (1.4)
Term Credit Spread Differential12 0.1 2.6 2.5 2.1 0.4
Building block revenue 946.8 932.5 (14.2) (19.3) 5.1
Historic EV adjustment13 12.2 12.2 - - -
Forecast MAR 958.9 944.7 (14.2) (19.3) 5.1
Subsequent EV adjustment14 (24.3) (24.3) - - -
Voluntary revenue reductions (4.0) (4.0) - - -
Charging variations in the year15 (6.1) 6.1 5.6 0.5
Tax on both EV adjustments 3.4 3.4 7.4 (4.0)
919.8
Revenue actually charged 924.5 924.5
Due (to) or from customers (4.7) (4.7) (6.3) 1.5
Other adjustments - prior year adjustments
- 0.3 (0.3)
(4.7) (6.0) 1.3
Interest for 2 years (2014/15 to 2016/17) (0.6) (0.8) 0.2
(5.4) (6.8) 1.5
Grossing up for tax at 28%
(2.1) (2.6) 0.6
Adjustment to the MAR for 2016/17 (7.4) (9.5) 2.0
RCP2 cash flow timing adjustment 0.2 0.3 (0.1)
(7.2) (9.2) 2.0
Pass-through and recoverable cost wash-up (5.5) (6.9) 1.4
Total 2014/15 wash-ups applied to 2016/17 revenue (12.7) (16.1) 3.4
Note: Figures may not add exactly due to rounding.
In summary, we recovered $4.7 million more than permitted in 2014/15, comprising a
$6.0 million over-recovery from HVAC customers and a $1.3 million under-recovery from
12
This is an ‘allowance’ to compensate us for the extra cost of debt that has a tenor of more than 5 years. 13
This is the payment to/from customers to clear historical accumulated EV balances (see Appendix Error! Reference source not found.). 14
This is the wash-up of the 2012/13 disclosure year. 15
Changes to the configuration of the grid can lead to over- or under-recovery of our revenue in the year.

2014/15 Annual Regulatory Report © Transpower New Zealand Limited. All rights reserved. 19
HVDC customers. Other adjustments, including the addition of interest, tax and the wash-up
of our pass-through and recoverable costs, result in a total adjustment to revenues for
2016/17 of $12.7 million. That comprises a deduction of $16.1 million from HVAC revenue
and an addition of $3.4 million to HVDC revenue.
The Forecast revenue calculations for RCP1 assumed mid-financial year (i.e. December)
commissioning of all assets. If we actually commission assets earlier in the year, then the
forecast revenue figure will be too low. The wash-up allows us to make up for this shortfall.
Conversely, if we commission assets later in the year, then the wash-up allows us to return
our over-recovery to customers in the next pricing year. The wash-up similarly allows future
prices to be adjusted if we commission assets at a higher or lower cost than forecast.
The key drivers of the wash-up in 2014/15 are:
RAB assets at the start of the year were $98 million lower than forecast, resulting in an
$7.9 million over-recovery. That was partly offset by higher commissioning in the year,
which was $35 million higher than forecast. The higher-than-forecast commissioning
resulted in an under-recovery of $2.9 million and later-than-forecast commissioning
resulted in a $3.7 million over-recovery. The net effect is that our return on assets was
$8.7 million too high ($7.4 million for HVAC and $1.3 million for HVDC).
The operating expenditure allowance incorporates forecast CPI movement of 2.4% each
year on average over RCP1. Actual CPI movement has been less than forecast, so we
have over-recovered $16 million compared to the CPI-adjusted allowance.
The lower-than-forecast allowable tax deductions for the HVAC line of business has
resulted in a greater-than-forecast tax building block (an increase of $8 million). The
allowable opex was lower because of the CPI adjustment and the asset-based
allowances (tax depreciation and notional interest) were lower because of the lower
opening RAB.

2014/15 Annual Regulatory Report © Transpower New Zealand Limited. All rights reserved. 20
4 Network performance
This section reports on network performance measures that are monitored by the
Commission for RCP1.
A new suite of ‘grid output measures’ for RCP2 apply from 1 July 2015. These are the basis
of a financial incentive linked to network performance. There was no such arrangement for
RCP1.
4.1 RCP1 network performance measures and targets
The Commission has specified a set of measures, and target service quality levels for each
of those targets. The following table compares actual performance against the Commission
targets.
Table 7: Actual 2014/15 performance against targets for four network performance measures
Performance measures Target Actual Target
achieved?
Number of loss of supply events greater than 0.05 system minutes16
21 13 Y
Number of loss of supply events greater than 1 system minute
3 1 Y
Unplanned HVAC circuit unavailability (%) 0.054 0.068 N
Unplanned HVDC bi-pole unavailability (%) n/a 0.130 n/a
Total impact of interruptions (measured in system minutes) 16.69 12.21 Y
We met all of the network performance targets for 2014/15, except for the HVAC circuit
unavailability target. A detailed explanation of factors contributing to this missed target can
be found on our website in the 2014/15 IPP Disclosures document17.
16
A ‘system minute’ is a loss of supply equivalent to losing peak demand for one minute. For example, losing supply to a city the size of Hamilton for around 40 minutes during a peak winter night would be roughly equivalent to one system minute.
17
https://www.transpower.co.nz/about-us/industry-information/regulatory-control-periods/rcp1/updates-rcp-1

2014/15 Annual Regulatory Report © Transpower New Zealand Limited. All rights reserved. 21
4.2 Interruptions greater than 1.0 system minute
There was one loss-of-supply event greater than 1.0 system minute in 2014/15, which
caused a loss of supply of 5.28 system minutes.
4.2.1 Whirinaki Bus urgent remove from service (RFS) Event 11 July 2014
Impact This event resulted in 5.28 system minutes of non-supply to Pan Pac.
Reason
On 11 July 2014, an urgent forced outage of the 11 kV Bus B at Whirinaki was required to investigate unusual noises from this switchgear and reports of the smell of ozone in the switchgear room. The decision was made to proceed with the urgent shutdown because of concerns about the possibility of a major failure occurring, with severe consequences for the supply to Pan Pac Forest Products Limited (Pan Pac). Pan Pac was advised that an urgent outage to Whirinaki 11kV Bus B was required to investigate an unusual noise. This resulted in interruptions to Pan Pac for 696 minutes (T3, average 11.2MW) and 764 minutes (T2, average 34.2MW).
Our response
While it cannot be conclusively proven, we consider that the most likely cause of the unusual noise was loose clamping arrangements of the vertically stacked current transformer assembly in the CB31 cubicle. Following this event, we completed an Incident Investigation Report and a number of remedial actions, including :-
1. Manufacturer of the Areva PIX switchgear has been advised of the defect in the CB2872 truck, and advice has been sought about an appropriate repair procedure.
2. A business case has been approved for a set of spare 11 kV voltage transformers to be procured that will cover the Whirinaki and Central Park substation Merlin Gerin switchgear.
The Investigation identified a number initiatives which are being implemented, including:-
1. Revise and clarify inspection requirements for metalclad switchgear 2. Research feasibility of a training resource on noises from indoor switchgear 3. Review the engineering on-site response to major failure incidents 4. Investigate decision support systems for reports of equipment in distress 5. Review the risk management approach for legacy indoor switchboards

2014/15 Annual Regulatory Report © Transpower New Zealand Limited. All rights reserved. 22
4.3 Historical network performance
For comparison, the following table sets out performance against each of the Commission’s
targets, plus total outages in system minutes, from 2011/12 to 2014/15.
Table 8: Historical network performance
Measure 2011/12 2012/13 2013/14 2014/15
Events >0.05 system minutes 19 12 17 13
Events >1 system minute 2 2 2 1
Unplanned HVAC circuit unavailability (%) 0.064 0.032 0.051 0.068
Unplanned HVDC bi-pole unavailability (%) 0.109 0.684 0.071 0.130
Total impact of interruptions (in system minutes)
14.45 7.62 12.12 12.21

2014/15 Annual Regulatory Report © Transpower New Zealand Limited. All rights reserved. 23
4.4 RCP2 revenue-linked network performance measures
The following table lists the details of the performance measures that will apply in RCP2. A
full list of the Points of Service in each of the categories (High Priority, Important, Standard,
Generator and N-security) is included in Appendix A.1 and the circuits included in the HVAC
availability measure are listed in Appendix A.2.
Table 9: RCP2 network performance measures
Measure and category Number of sites
RCP2 Targets
Incentive rate
($k per unit from
target) Target Cap Collar
Number of interruptions (p.a.)
High Priority 23 2 0 4 606
Important 43 9 4 14 242
Standard 78 26 21 31 133
Generator 40 11 6 16 133
N-security 46 56 38 74 10
Average duration of interruptions (min)
High Priority 23 70 30 110 15
Important 43 100 30 170 9
Standard 78 65 0 130 5
Generator 40 130 50 210 4
N-security 46 80 45 115 3
P90 Longest durations (min)
High Priority 23 120 80 160 15
Important 43 240 170 310 9
Standard 78 130 60 200 5
Generator 40 350 260 440 4
N-security 46 215 170 260 3
Availability (%)
HVDC - 98.5 99.5 97.5 1,000
HVAC - 99.6 100.0 99.2 2,500
2014/15 Annual Regulatory Report © Transpower New Zealand Limited. All rights reserved. 24
5 Capital expenditure
This section covers ‘base’ capital expenditure (base capex). For 2014/15, base capex
includes:
all grid asset replacement and refurbishment
grid asset enhancement projects or programmes less than $5 million18
non-grid capital expenditure.
The Commission has approved an overall base capex allowance for RCP1, based on its
assessment of forecasts we made in 2011 for each year of RCP1. The allowances relate to
the value of the assets we commission, rather than to the amount we spend. This is a
change from the way allowances operated prior to RCP1.
Assets are classed as ‘commissioned’ when they are brought into use to provide electricity
transmission services – i.e. only once construction and testing is complete and they are
actually being used. Commissioned assets are added to our regulatory asset base (RAB)
and we then earn a return on capital (the assets in our RAB), plus a return of capital (via
depreciation of the assets in our RAB).
The remainder of this section:
discusses commissioning-based accounting
compares actual commissioned values for 2014/15 with forecast values
explains material variances between forecast and actual figures
reports on base capex adjustments.
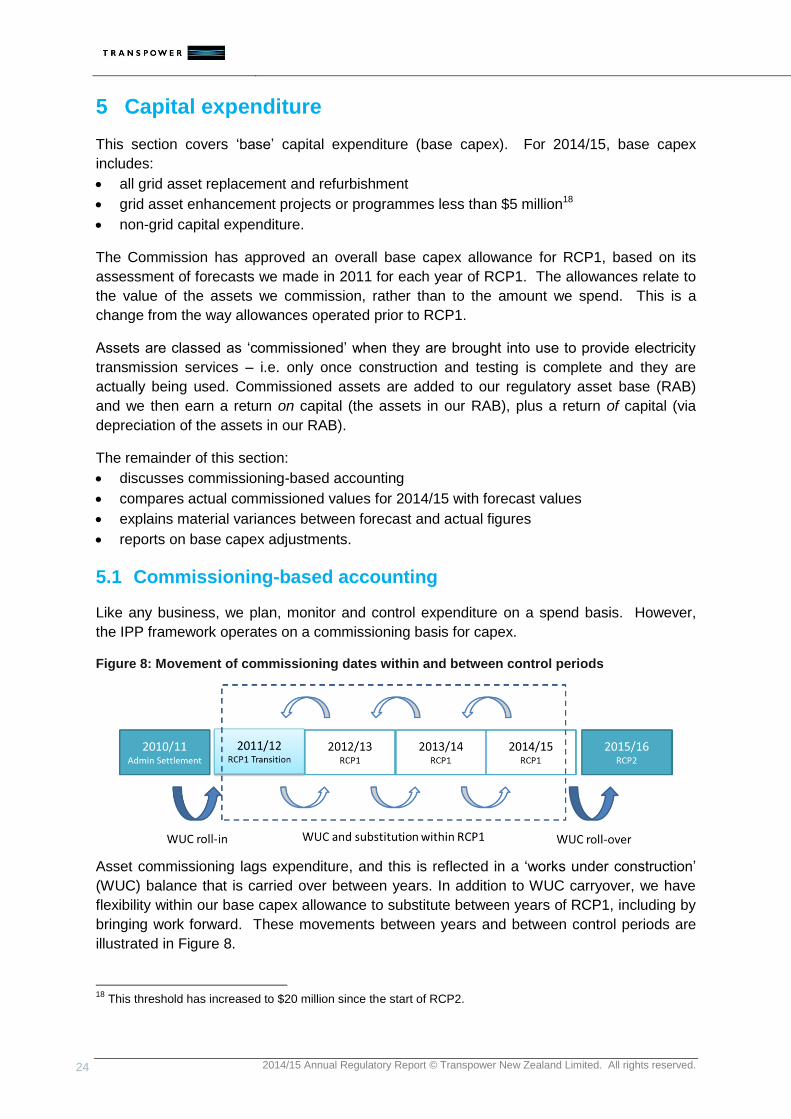
5.1 Commissioning-based accounting
Like any business, we plan, monitor and control expenditure on a spend basis. However,
the IPP framework operates on a commissioning basis for capex.
Figure 8: Movement of commissioning dates within and between control periods
Asset commissioning lags expenditure, and this is reflected in a ‘works under construction’
(WUC) balance that is carried over between years. In addition to WUC carryover, we have
flexibility within our base capex allowance to substitute between years of RCP1, including by
bringing work forward. These movements between years and between control periods are
illustrated in Figure 8.
18
This threshold has increased to $20 million since the start of RCP2.

2014/15 Annual Regulatory Report © Transpower New Zealand Limited. All rights reserved. 25
5.2 Comparison of actual with forecast base capex
This section compares forecast and actual base capex at a ‘category’ level, and explains any
material variances.
Actual and forecast values are set out below. The Commerce Commission has specified
‘material variance’ to be a variance that is both greater than $10 million and more than 10%
of the category forecast.
Table 10: Forecast and actual 2014/15 base capital expenditure (commissioned basis)
Category Allowance Actual Variance
$m $m $m
Asset Enhancement 7.3 4.9 (2.4)
Asset Refurbishment and Replacement 175.4 229.9 54.5
TOTAL GRID CAPEX 182.7 234.8 52.1
Information Services and Technology (IST) 67.4 72.4 5.0
Business Support 14.1 10.2 (3.8)
TOTAL 264.1 317.4 53.3
Note: Figures may not add exactly due to rounding.
Asset refurbishment and replacement
Overall we commissioned $54 million more than the allowance, primarily driven by a completion of works initially scheduled for earlier in the RCP1 period. The main contributors to this are:
Refurbishment of Haywards Synchronous Condensers: $24 million more than forecast
due to commissioning two refurbished Synchronous Condensers (C9 &C10) and other
refurbishment work related to the condensers. We initially forecast completion in
2012/13. However commissioning was rearranged to align with the completion of Pole 3,
which was later than planned.
Buildings, Grounds and Seismic: We commissioned $13 million more than forecast due
to the need to catch up after a slower start to the programme than anticipated in the early
part of RCP1. This was due to a review of the programme and further assessment of
seismic strengthening requirements in the early part of RCP1. Over the RCP1 period the
programme has remained within the allowance.
Outdoor to indoor conversion: $8 million more due to the commissioning of five
conversions versus the four we forecast in the allowance.
Information Services and Technology (IST)
We commissioned $5 million more on the data centre because we decided to implement a
hybrid approach, resulting in higher initial expenditure of $5 million over the RCP1
allowance. This will be offset by future benefits delivered through more cost efficient data
facility upgrades.

2014/15 Annual Regulatory Report © Transpower New Zealand Limited. All rights reserved. 26
Business support
A $4 million under-spend. The RCP1 allowance assumed a move of the Wellington Head
office to a new location. This is now planned to occur in 2017/18. This underspend was
partially offset by completion of new office in Auckland at Transpower's Otahuhu site which
was not planned in the RCP1 allowance.
The table below is a summary of the CPI-adjusted base capex allowance for the full RCP1
period, compared to the actual commissioning over that period.
Table 11: Total RCP1 allowance and actual base capital expenditure (commissioned basis)
Category Allowance Actual Variance Variance
$m $m $m %
Asset Enhancement 20.9 12.8 (8.1) (38.8)
Asset Refurbishment and Replacement 737.8 693.1 (44.7) (6.1)
TOTAL GRID CAPEX 758.8 705.9 (52.8) (7.0)
Information Services and Technology (IST) 209.6 229.2 19.6 9.3
Business Support 32.2 31.0 (1.3) (3.9)
TOTAL 1,000.6 966.1 (34.5) (3.5)
Appendix A.3 sets out forecast variances and explanations for base capex over the full
RCP1 period.
5.3 Base capex adjustments
The following table summarises the adjustments relating to base capex that can apply
through RCP1 or at the end of the period.
Table 12: Adjustments that can apply to base capex
Description When it applies
Unapproved amount
Revenue is adjusted to remove the benefit of any base capex that has not been through our internal approval processes.
Each year
Conversion Expenditure that was included in the base capex allowance may instead be covered by a new major project. The base capex allowance is reduced accordingly.
Each year
CPI The base capex allowance is adjusted to account for any disparity between forecast and actual consumer price index (CPI) rates.
Each year, from 2012/13
Excess amount
Revenue is adjusted to remove the revenue benefit of any base capex that exceeds the overall allowance for RCP1.
End of RCP1

2014/15 Annual Regulatory Report © Transpower New Zealand Limited. All rights reserved. 27
All base capex for 2014/15 has been through internal processes, so no ‘unapproved amount’
adjustment to revenue is required this year.
The Kawerau Generation Export Enhancement project was previously included in the base
capex allowance and has now been designated as a major capex project. We have reduced
our 2013/14 base capex allowance by $4.2 million accordingly.
The following table shows the base capex allowance for each year as set at the start of
RCP1, and compares CPI forecasts made at the time with actual CPI to date. This data is
used to produce an adjusted base capex allowance for 2014/15 and an updated forecast
allowance for 2014/15.
Table 13: Adjustment to base capex allowance for CPI movement
2011/12 2012/13 2013/14 2014/15
Allowance set at the start of RCP1 ($m) 208.6 301.9 240.3 278.4
Forecast CPI for the year at that time 2.40% 2.40% 2.40% 2.30%
CPI-adjusted base capex allowance ($m) n/a 295.3 232.6 264.1
Actual CPI 0.95% 0.68% 1.62% 0.42%
Note: figures are in nominal dollar terms
5.4 Historical base capex
For comparison with the figures in Table 10, the following table sets out historical base
capex for the four years of RCP1.
Table 14: Historical base capex
Category 2011/12 2012/13 2013/14 2014/15
$m $m $m $m
Basis Commissioned Commissioned Commissioned Commissioned
Enhancement and Development 4.9 3.0 - 4.9
Refurbishment and Replacement 168.9 145.9 148.5 229.8
IST 46.2 50.2 60.4 72.4
Business support 1.7 7.9 11.1 10.2
Total 221.7 207.0 220.0 317.4
Note: figures are in nominal dollar terms and may not add exactly due to rounding.

2014/15 Annual Regulatory Report © Transpower New Zealand Limited. All rights reserved. 28
5.5 RCP2 base capex
In August 2014 the Commission determined the level of our base capex ‘allowance’ for
RCP2. In RCP1 the total base capex allowance for the period was a hard threshold, above
which we would have had to repay 100%19 of the excess.
In contrast, the RCP2 allowance is more of a ‘benchmark’ against which base capex
incentive rewards or penalties are calculated. In each year of RCP2 our actual base capex
spending will be compared to the allowance for that year and our revenue for the next pricing
year will be adjusted up or down by an amount equal to 33% of the base capex under- or
over-spend. There will be no hard, full-RCP threshold, but we are incentivised year-on-year
to minimise costs.
As with RCP1, the RCP2 base capex allowance will be adjusted each year for the disparity
between forecast and actual CPI rates (see Table 13). In addition, the allowance will be
adjusted for any disparity between the forecast and actual foreign exchange rates.
The allowance for the 5 years of RCP2 is set out in the table below.
Table 15: RCP2 base capex commissioning allowance
2015/16 2016/17 2017/18 2018/19 2019/20
$m $m $m $m $m
Base capex allowance (commissioning basis)
235.2 249.5 242.0 231.6 213.1
19
100% of the future benefit we would get from the excess assets on our RAB.

2014/15 Annual Regulatory Report © Transpower New Zealand Limited. All rights reserved. 29
6 Major projects
Grid enhancement projects and programmes expected to cost more than $5 million were
approved by the Commission individually, based on an assessment of the market benefit of
the project compared to other viable alternatives. Each of these ‘major projects’ has an
approved allowance, timeframe and ‘outputs’.
This section covers:
progress reports on major projects partially commissioned during 2014/15 and close-out
reports on completed major projects
major projects newly approved by the Commission
other variations and adjustments.
6.1 Progress reports – costs
Table 16 compares the current expected cost of our partially-completed projects to the
expected cost at the time the projects were approved.
Table 16: Updated cost forecasts for partially completed major projects
Title
Major Capex
Allowance
Expected cost Expected cost
variance
Expected cost
variance Current Forecast
Original Forecast
$m $m $m $m (%)
Bunnythorpe-Haywards Reconductoring
161.0 136.7 151.0 (14.3) (9.5)
Clutha Upper Waitaki Lines Programme
196.9 45.7 147.2 (101.5) (69.0)
Upper North Island Dynamic Reactive Support20
98.2 52.9 91.4 (38.5) (42.1)
Lower South Island Reliability 62.4 31.6 55.6 (24.0) (43.2)
Upper South Island Grid Upgrade 8.0 6.6 6.6 - -
Wanganui-Stratford Transmission 44.1 25.8 42.3 (16.5) (39.0)
North Auckland and Northland grid upgrade
418.9 353.0 333.6 19.4 5.8
TOTAL 989.5 652.3 827.7 (175.4) (21.2)
Note: Figures may not add exactly due to rounding.
As with base capex, the Commerce Commission has specified ‘material variance’ as being
both more than $10 million and greater than 10% of the forecast value. Explanations for
material variances are provided below.
20
Excluding amounts in relation to demand response initiatives.

2014/15 Annual Regulatory Report © Transpower New Zealand Limited. All rights reserved. 30
Bunnythorpe-Haywards Reconductoring
We have reduced the forecast cost of the conductors (mainly sections 1 and 2) as a result of the tendering process for those portions of the project. Clutha Upper Waitaki Lines Programme (CUWLP)
The reduction on the programme forecast cost is in the context that three of the five projects of the CUWLP programme are on hold and under review. The forecast expenditures are a considered anticipation of the results of that review, but should not be taken as prejudging the circumstances that prevail at the time, and hence the outcome. Upper North Island Dynamic Reactive Support
The reduction in costs from the original budget can be attributed to two main factors. The first being for the Marsden and Penrose STATCOMs where the main contract for design, supply and installation was lower than budgeted due to contract efficiencies achieved by working in conjunction with the HVDC project and due to favourable foreign exchange rates. The second main factor has been a reduction in the forecast for the Auckland Reactive Power Controller where alternative solution approaches have been evaluated to provide outcomes at a cost $27.8 million below the original budget estimate. Lower South Island Reliability Transmission Investment
The expected cost in the approval includes $16.7 million for a 220 kV series capacitor at Three Mile Hill that is now not expected to be required until 2020 or later. This cost is excluded from the forecast end cost and we will review it before completing all remaining components of the project, and prepare a variation to the regulatory approval for the project and close it out. Other savings include the cost of two transformers and a pair of shunt capacitors being less than the forecast, and having successfully avoided draw down of $4 million of the contingencies provision. Wanganui-Stratford Transmission Investment
Construction costs were forecast to be $25.8 million including contingencies. Successful management of most construction risks meant that there was limited draw-down of contingencies and actual construction costs were $16 million. This also reflects a successful procurement strategy of awarding all line sections to a single contractor. Other savings against forecast included $2.3 million on procurement and $4.8 million on property. North Auckland and Northland Grid Upgrade
The cost increase of 6% arises principally from additional unforeseen costs in relation to cabling, together with some general cost increases caused by delayed commissioning.

2014/15 Annual Regulatory Report © Transpower New Zealand Limited. All rights reserved. 31
6.2 Progress reports – timing
The following table compares the current forecast commissioning date for partially
completed major projects with the forecast made in the last Annual Regulatory Report or at
the time the projects were approved. Material variances are explained below.
Table 17: Updated timing forecasts for partially completed major projects
Title
Forecast commissioning date
(at approval or in the 2012/13 ARR)
Forecast commissioning date
(updated)
Bunnythorpe-Haywards Reconductoring 2014 to 2020 2014 to 2020
Clutha Upper Waitaki Lines Programme 2012 to 2017 2014 to 2016
Upper North Island Dynamic Reactive Support 2011 to 2015 2011 to 2017
Lower South Island Reliability 2012 to 2015 April 2017
Upper South Island Grid Upgrade June 2018 June 2018
Wanganui-Stratford Transmission 2011 December 2017
North Auckland and Northland grid upgrade 2014 June 2016
Upper North Island Dynamic Reactive Support
The programme was affected by resource constraints caused by the HVDC project. Once the HVDC project was completed, the final component of the program (Auckland Reactive Power Controller) was deferred so an assessment could be made into alternative solution options to deliver the required solution options at lower cost. This assessment and planning is now complete, saving $27.8 million. The programme is now forecast to complete in June 2017. Lower South Island Reliability Transmission Investment
The forecast end date has been revised to April 2017 due to delay in securing designation and easements to construct a 2.25 km long 220 kV double circuit line from the 220 kV North Makarewa – Three Mile Hill A line to Gore Substation, for the new 220/110 kV interconnection at Gore. The designation over the chosen line route was obtained in late 2013. However, efforts to acquire easements through negotiations were not successful due to the 3 landowners' unwillingness to grant easements and strong preference for an outright sale of their farms to Transpower. Easements are now being pursued through the compulsory acquisition process, which is being led by Land Information New Zealand (LINZ). Wanganui-Stratford Transmission Investment
Commissioning of individual lines sections was phased more slowly than originally forecast to better manage outages and to fit with contractor resourcing. The first, second and third sections were completed in 2010, early 2012 and 2013.

2014/15 Annual Regulatory Report © Transpower New Zealand Limited. All rights reserved. 32
Substation work at Stratford and Waverly has been completed, but work at Hawera is scheduled to be completed by December 2017 so that we can minimise disruption and avoid major outages. North Auckland and Northland Grid Upgrade
The forecast end date has been affected by delays in completing the required works at Penrose substation. The delays were caused by the October 2014 fire event, installation challenges for the 220 kV Ring Bus Cable during November 2015 to March 2015 and discovery of asbestos contamination inside the old Penrose control and relay room in March 2015.
6.3 Close-out reports
Two major projects were commissioned in 2014/15.
When a project is commissioned, several revenue or allowance adjustments may occur.
The following table summarises these potential adjustments.
Table 18: Summary of possible adjustments to major projects
Adjustment Description
CPI and FX The approved allowance may be updated to account for differences between CPI and foreign exchange rates anticipated when the project was approved, and the rates that actually occurred during the project.
Excess amount If the actual cost of a project exceeds the relevant approved allowance, then a revenue adjustment is made to remove the value of the ‘excess amount’.
Output If a project does not deliver the relevant approved outputs, then a revenue adjustment may be made to remove one-third of the value of the project.
In addition to these adjustments, we may apply to the Commission for approval of an
amended allowance, and/or agreement to vary agreed project outputs.
The following tables provide close out reports for each major project completed in 2014/15:
National Auto-synchronisation Points Project
Wairakei Ring Project

2014/15 Annual Regulatory Report © Transpower New Zealand Limited. All rights reserved. 33
6.3.1 National Auto-synchronisation Points Project
Project Description
The project is for the installation of auto synchronisation points at ten substations across the National Grid. The substations have been selected on the basis of their significance in restoring the supply to consumers and return the grid to a secure event after low probability high impact system event. The benefits of the project relate to the reduction in system average restoration times for those consumers disconnected and also avoids the need to disconnect generation and/or load in order to tie the power system together again after such an event.
Commissioned values
Final End
Cost P50 cost at approval
Variance Material?
Project costs $5.6m $9.1m ($3.5m) Y
Commissioning dates
Output Actual Approved
date Variance Material?
Designing, procuring, installing and commissioning auto synchronisation capability at ten locations: 1. Invercargill 2. Clyde 3. Bunnythorpe 4. Whakamaru 5. Whakamaru (Bay of Plenty) 6. Waitaki 7. West Coast 8. Redclyffe 9. Tuai 10. Hamilton
May 2013 to
May 2015
In parts over 2011 through
2013
Y Y
Project Outputs
Achieved Outputs Variance to Approved
Outputs?
Designing, procuring, installing and commissioning auto synchronisation capability at nine locations: 1. Invercargill 2. Clyde 3. Bunnythorpe 4. Whakamaru 5. Whakamaru/Wairakei (Bay of Plenty) 6. Waitaki 7. West Coast 8. Tuai 9. Hamilton
Y
Output adjustment
17 points were installed at 9 locations, rather than 24 points installed at 10 locations.
2014/15 Annual Regulatory Report © Transpower New Zealand Limited. All rights reserved. 34
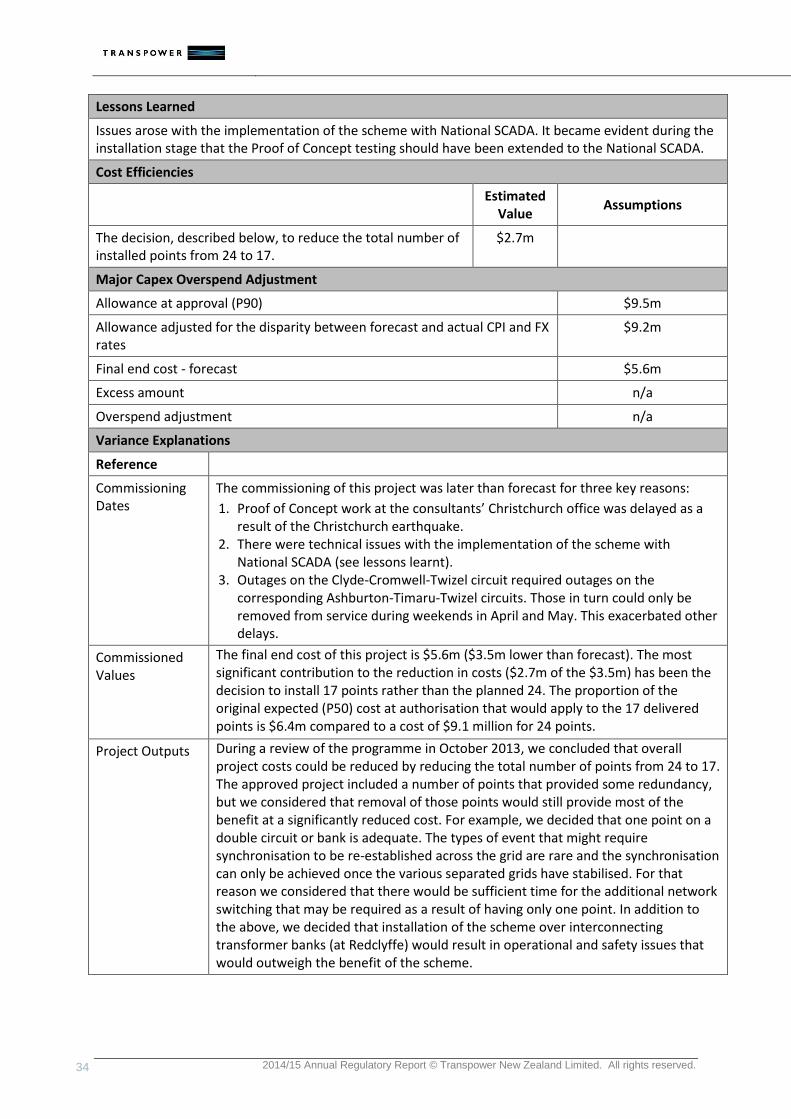
Lessons Learned
Issues arose with the implementation of the scheme with National SCADA. It became evident during the installation stage that the Proof of Concept testing should have been extended to the National SCADA.
Cost Efficiencies
Estimated
Value Assumptions
The decision, described below, to reduce the total number of installed points from 24 to 17.
$2.7m
Major Capex Overspend Adjustment
Allowance at approval (P90) $9.5m
Allowance adjusted for the disparity between forecast and actual CPI and FX rates
$9.2m
Final end cost - forecast $5.6m
Excess amount n/a
Overspend adjustment n/a
Variance Explanations
Reference
Commissioning Dates
The commissioning of this project was later than forecast for three key reasons:
1. Proof of Concept work at the consultants’ Christchurch office was delayed as a result of the Christchurch earthquake.
2. There were technical issues with the implementation of the scheme with National SCADA (see lessons learnt).
3. Outages on the Clyde-Cromwell-Twizel circuit required outages on the corresponding Ashburton-Timaru-Twizel circuits. Those in turn could only be removed from service during weekends in April and May. This exacerbated other delays.
Commissioned Values
The final end cost of this project is $5.6m ($3.5m lower than forecast). The most significant contribution to the reduction in costs ($2.7m of the $3.5m) has been the decision to install 17 points rather than the planned 24. The proportion of the original expected (P50) cost at authorisation that would apply to the 17 delivered points is $6.4m compared to a cost of $9.1 million for 24 points.
Project Outputs During a review of the programme in October 2013, we concluded that overall project costs could be reduced by reducing the total number of points from 24 to 17. The approved project included a number of points that provided some redundancy, but we considered that removal of those points would still provide most of the benefit at a significantly reduced cost. For example, we decided that one point on a double circuit or bank is adequate. The types of event that might require synchronisation to be re-established across the grid are rare and the synchronisation can only be achieved once the various separated grids have stabilised. For that reason we considered that there would be sufficient time for the additional network switching that may be required as a result of having only one point. In addition to the above, we decided that installation of the scheme over interconnecting transformer banks (at Redclyffe) would result in operational and safety issues that would outweigh the benefit of the scheme.

2014/15 Annual Regulatory Report © Transpower New Zealand Limited. All rights reserved. 35
6.3.2 Wairakei Ring Project
Project Description
The transmission lines north of Lake Taupo comprising the Wairakei Ring are a critical part of New Zealand’s National Grid. The Wairakei Ring:
enables transfer of electricity northwards into the Auckland and Bay of Plenty regions;
helps supply the Hawkes Bay region;
supports southward transfer out of the Auckland and Bay of Plenty regions during low South Island hydro periods;
transports existing geothermal generation out of the Wairakei area; and
connects to the southern end of the new 220/400 kV line at Whakamaru. Accordingly, upgrading the Wairakei Ring assists in facilitating competition and security of supply by removing constraints.
Commissioned values
Final End
Cost P50 cost at approval
Variance Material?
Project costs $140.0m $124.9m $15.1m Y
Commissioning dates
Output Actual Approved
date Variance Material?
procuring, constructing and commissioning a new double circuit line that: is capable of 220kV operation;
has a continuous rating of around 2300A per circuit;
includes the termination of both circuits at Wairakei substation;
includes the termination of one circuit into Whakamaru North substation and the other circuit into Whakamaru substation; and
has a single circuit diversion into Te Mihi substation.
From October 2013 to July
2014
Mid
2013
Y Y
procuring, constructing and commissioning substation facilities to facilitate the above connections and equipment.
From Jan 2012 to July
2014
Mid
2013 Y Y
decommissioning and dismantling components of existing connections, circuits and substations made redundant by these works.
Dec 2013 to
July 2015 April 2013 Y Y
obtaining designations, easements, resource consents and property purchases for these works.
Completed by Sept 2014
April 2013 Y Y

2014/15 Annual Regulatory Report © Transpower New Zealand Limited. All rights reserved. 36
Project Outputs
Achieved Outputs Variance to Approved
Outputs?
procuring, constructing and commissioning a new double circuit line that: is capable of 220kV operation;
has a continuous rating of around 2300A per circuit;
includes the termination of both circuits at Wairakei substation;
includes the termination of one circuit into Whakamaru North substation and the other circuit into Whakamaru substation; and
has a single circuit diversion into Te Mihi substation.
N
procuring, constructing and commissioning substation facilities to facilitate the above connections and equipment.
N
decommissioning and dismantling components of existing connections, circuits and substations made redundant by these works.
N
obtaining designations, easements, resource consents and property purchases for these works.
N
Output adjustment n/a
Lessons Learned
Effective co-ordination of substation and line design consultants is required to ensure the design at the point of interface is practical and considers the physical aspects of the site.
Increase the level of quality assurance on site particularly in the earlier stages of individual work packages to enable discrepancies to be identified and addressed early in the process.
Ensure landowners understand what type of work activity is intended to be undertaken to minimise the risk of disputes and limit pre-construction activity to surveying and geotech activity.
Cost Efficiencies
Est. value Assumptions
n/a
Major Capex Overspend Adjustment
Allowance at approval (P90) $141.0m
Allowance adjusted for the disparity between forecast and actual CPI and FX rates
$120.5m
Final end cost - forecast $140.0m
Excess amount n/a
Overspend adjustment n/a
Variance Explanations
Commissioning dates
The final property agreements were not secured until September 2014. This combined with the decision to avoid undertaking stringing works during winter delayed the commissioning of the new circuits.
Project costs The decision to alter the transmission route to address concerns raised by the community during the consenting phase of the project resulted in an increase in civil and property costs.
Project outputs n/a
2014/15 Annual Regulatory Report © Transpower New Zealand Limited. All rights reserved. 37
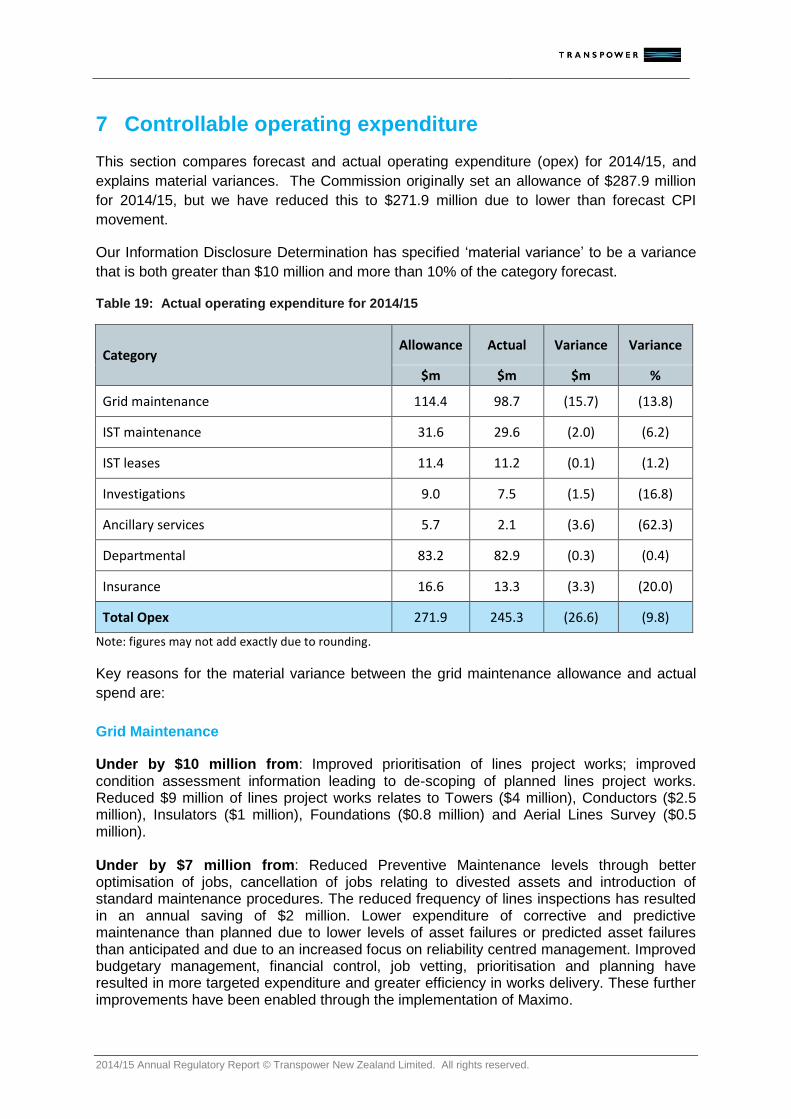
7 Controllable operating expenditure
This section compares forecast and actual operating expenditure (opex) for 2014/15, and
explains material variances. The Commission originally set an allowance of $287.9 million
for 2014/15, but we have reduced this to $271.9 million due to lower than forecast CPI
movement.
Our Information Disclosure Determination has specified ‘material variance’ to be a variance
that is both greater than $10 million and more than 10% of the category forecast.
Table 19: Actual operating expenditure for 2014/15
Category Allowance Actual Variance Variance
$m $m $m %
Grid maintenance 114.4 98.7 (15.7) (13.8)
IST maintenance 31.6 29.6 (2.0) (6.2)
IST leases 11.4 11.2 (0.1) (1.2)
Investigations 9.0 7.5 (1.5) (16.8)
Ancillary services 5.7 2.1 (3.6) (62.3)
Departmental 83.2 82.9 (0.3) (0.4)
Insurance 16.6 13.3 (3.3) (20.0)
Total Opex 271.9 245.3 (26.6) (9.8)
Note: figures may not add exactly due to rounding.
Key reasons for the material variance between the grid maintenance allowance and actual
spend are:
Grid Maintenance
Under by $10 million from: Improved prioritisation of lines project works; improved condition assessment information leading to de-scoping of planned lines project works. Reduced $9 million of lines project works relates to Towers ($4 million), Conductors ($2.5 million), Insulators ($1 million), Foundations ($0.8 million) and Aerial Lines Survey ($0.5 million). Under by $7 million from: Reduced Preventive Maintenance levels through better optimisation of jobs, cancellation of jobs relating to divested assets and introduction of standard maintenance procedures. The reduced frequency of lines inspections has resulted in an annual saving of $2 million. Lower expenditure of corrective and predictive maintenance than planned due to lower levels of asset failures or predicted asset failures than anticipated and due to an increased focus on reliability centred management. Improved budgetary management, financial control, job vetting, prioritisation and planning have resulted in more targeted expenditure and greater efficiency in works delivery. These further improvements have been enabled through the implementation of Maximo.

2014/15 Annual Regulatory Report © Transpower New Zealand Limited. All rights reserved. 38
Over by $1 million from: Lower capitalisation levels of SCADA modelling team than expected. Additional modelling resources were employed in the second half of the year to deliver the large volume of project work. Over by $3 million from: Unbudgeted Service Provider transition costs associated with our service provider reset programme. Core Grid Service Provides will reduce from 5 to 4 in 15/16 resulting in future savings in service provider overhead costs. Investigations
Lower number of investigation projects, particularly in our grid development and grid performance divisions. Ancillary Services
We have a provision of $2m for HVDC outages extending beyond 14 days (where only 50% of costs would be recoverable). There were no HVDC events in 2014/15. Insurance
Uncalled provision of $0.9 million for self-insurance in the allowance. General decrease in insurance costs.
7.1 Historical operating expenditure
For comparison, the table below shows actual operating expenditure for 2011/12 to 2014/15.
Expenditure is broken down by categories for each year.
Total operating expenditure for RCP1 was $986.4 million, compared to a CPI-adjusted
allowance of $1,062.2 million.
Table 20: Historical and forecast operating expenditure
2011/12 2012/13 2013/14 2014/15
$m $m $m $m
Grid maintenance 96.6 91.1 92.9 98.7
IST maintenance 26.6 26.1 29.1 29.6
IST leases 12.4 13.3 13.1 11.2
Investigations 12.2 10.4 8.3 7.5
Ancillary services 1.8 2.1 2.0 2.1
Departmental 80.4 94.1 90.4 82.9
Insurance 11.2 13.2 13.8 13.3
Total operating expenditure 241.3 250.2 249.6 245.3
Note: figures are in nominal dollar terms and may not add exactly due to rounding
2014/15 Annual Regulatory Report © Transpower New Zealand Limited. All rights reserved. 39
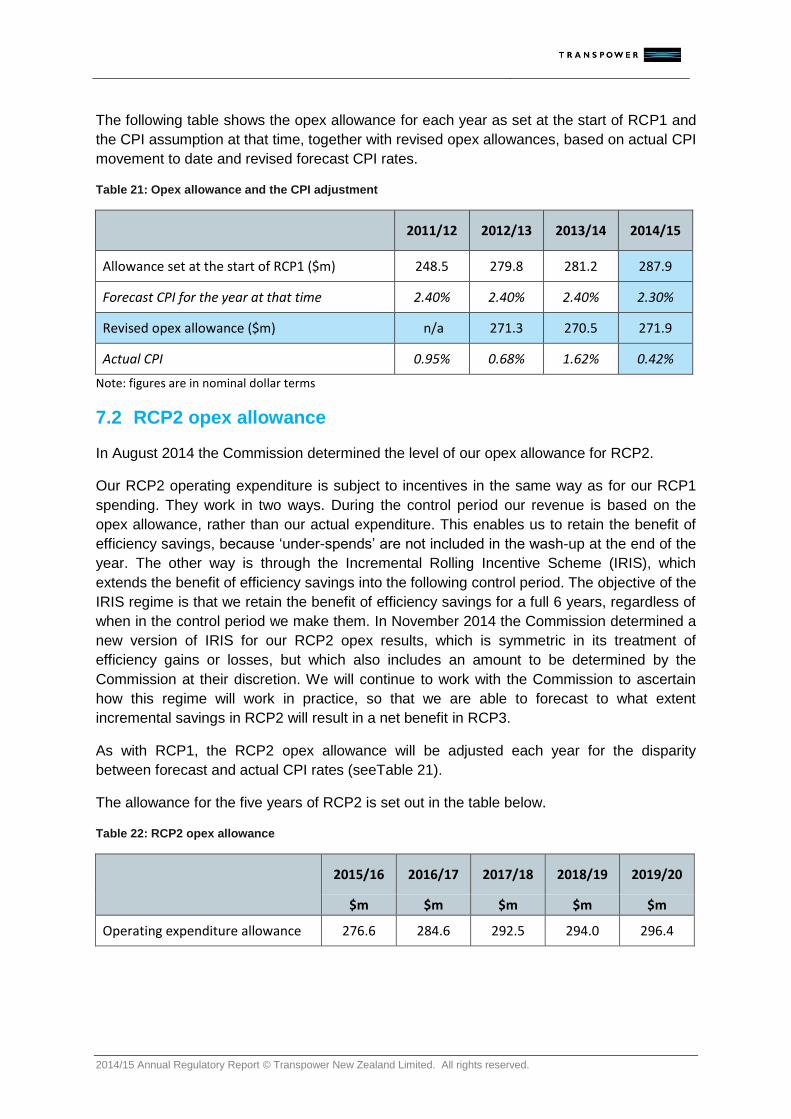
The following table shows the opex allowance for each year as set at the start of RCP1 and
the CPI assumption at that time, together with revised opex allowances, based on actual CPI
movement to date and revised forecast CPI rates.
Table 21: Opex allowance and the CPI adjustment
2011/12 2012/13 2013/14 2014/15
Allowance set at the start of RCP1 ($m) 248.5 279.8 281.2 287.9
Forecast CPI for the year at that time 2.40% 2.40% 2.40% 2.30%
Revised opex allowance ($m) n/a 271.3 270.5 271.9
Actual CPI 0.95% 0.68% 1.62% 0.42%
Note: figures are in nominal dollar terms
7.2 RCP2 opex allowance
In August 2014 the Commission determined the level of our opex allowance for RCP2.
Our RCP2 operating expenditure is subject to incentives in the same way as for our RCP1
spending. They work in two ways. During the control period our revenue is based on the
opex allowance, rather than our actual expenditure. This enables us to retain the benefit of
efficiency savings, because ‘under-spends’ are not included in the wash-up at the end of the
year. The other way is through the Incremental Rolling Incentive Scheme (IRIS), which
extends the benefit of efficiency savings into the following control period. The objective of the
IRIS regime is that we retain the benefit of efficiency savings for a full 6 years, regardless of
when in the control period we make them. In November 2014 the Commission determined a
new version of IRIS for our RCP2 opex results, which is symmetric in its treatment of
efficiency gains or losses, but which also includes an amount to be determined by the
Commission at their discretion. We will continue to work with the Commission to ascertain
how this regime will work in practice, so that we are able to forecast to what extent
incremental savings in RCP2 will result in a net benefit in RCP3.
As with RCP1, the RCP2 opex allowance will be adjusted each year for the disparity
between forecast and actual CPI rates (seeTable 21).
The allowance for the five years of RCP2 is set out in the table below.
Table 22: RCP2 opex allowance
2015/16 2016/17 2017/18 2018/19 2019/20
$m $m $m $m $m
Operating expenditure allowance 276.6 284.6 292.5 294.0 296.4

2014/15 Annual Regulatory Report © Transpower New Zealand Limited. All rights reserved. 40
8 Pass-through and recoverable costs
Our operating expenditure allowance is intended to be limited to controllable expenditure.
This helps to ensure that regulatory incentives to pursue efficiencies and reduce ongoing
expenditure can operate as intended.
Costs that are not controllable are treated separately and classed as either ‘pass through’ or
‘recoverable’. In both cases, we forecast costs annually and wash-up any over- or under-
recovery. These costs comprise:
Pass-through costs Recoverable costs
Local government rates
Commerce Commission levies
Electricity Authority levies.
instantaneous reserves (IR) charges21
non-transmission solutions (NTS)22.
8.1 2014/15 wash-up
The table below shows the wash up of 2014/15 pass-through and recoverable costs,
calculated by comparing the forecast costs used for pricing with the actual costs we incurred.
Table 23: Allocation of pass-through and recoverable wash-up amounts
Description TOTAL HVAC HVDC
$m $m $m
Forecast pass through costs 16.2 16.1 0.1
Actual pass-through costs 13.7 13.7 -
Wash-up amount due (to) from customers (2.5) (2.4) (0.1)
Forecast recoverable costs 6.1 5.1 1.0
Actual recoverable costs 3.1 0.6 2.5
Wash-up amount due (to) from customers (3.0) (4.5) 1.5
Total wash-up due (to) from customers (5.5) (6.9) 1.4
Note: Figures may not add exactly due to rounding.
21
We purchase back up supply (or demand interruption) from the IR market to cover the risk of a failure of the HVDC link causing an under-frequency event in the island receiving supply from the link.
22
Most major grid upgrade projects are designed to improve the reliability of the grid. In some cases, it is possible to achieve similar reliability improvements by non-transmission means (i.e., by use of a ‘non-transmission solution). For example, paying some customers to reduce their consumption at times of peak demand may defer the need for a grid upgrade.

2014/15 Annual Regulatory Report © Transpower New Zealand Limited. All rights reserved. 41
Pass-through costs were $2.5 million lower than forecast as a result of local government
rates being $3.9 million lower than forecast, offset by Commerce Commission and Electricity
Authority levies that were $1.4 million more than forecast.
HVDC recoverable costs comprise just instantaneous reserves charges. They were $1.5
million higher than forecast.
HVAC recoverable costs comprise just non-transmission solution costs. They were $4.5
million less than we had forecast.
8.2 Historical pass-through and recoverable costs
For comparison, this section presents forecast and actual pass-through and recoverable
costs for RCP1.
Table 24: Historical pass-through and recoverable costs
2011/12 2012/13 2013/14 2014/15
$m $m $m $m
Pass-through costs
Forecast 13.4 13.4 13.0 16.2
Actual 10.1 11.0 14.2 13.7
HVAC wash-up (3.3) (2.4) 1.5 (2.4)
HVDC wash-up - - (0.3) (0.1)
Recoverable costs
Forecast 25.8 9.7 3.2 6.1
Actual 18.5 9.1 3.0 3.1
HVAC wash-up (6.7) 0.7 0.6 (4.5)
HVDC wash-up (0.7) (1.3) (0.9) 1.5
Note: figures are in nominal dollar terms and may not add exactly due to rounding.
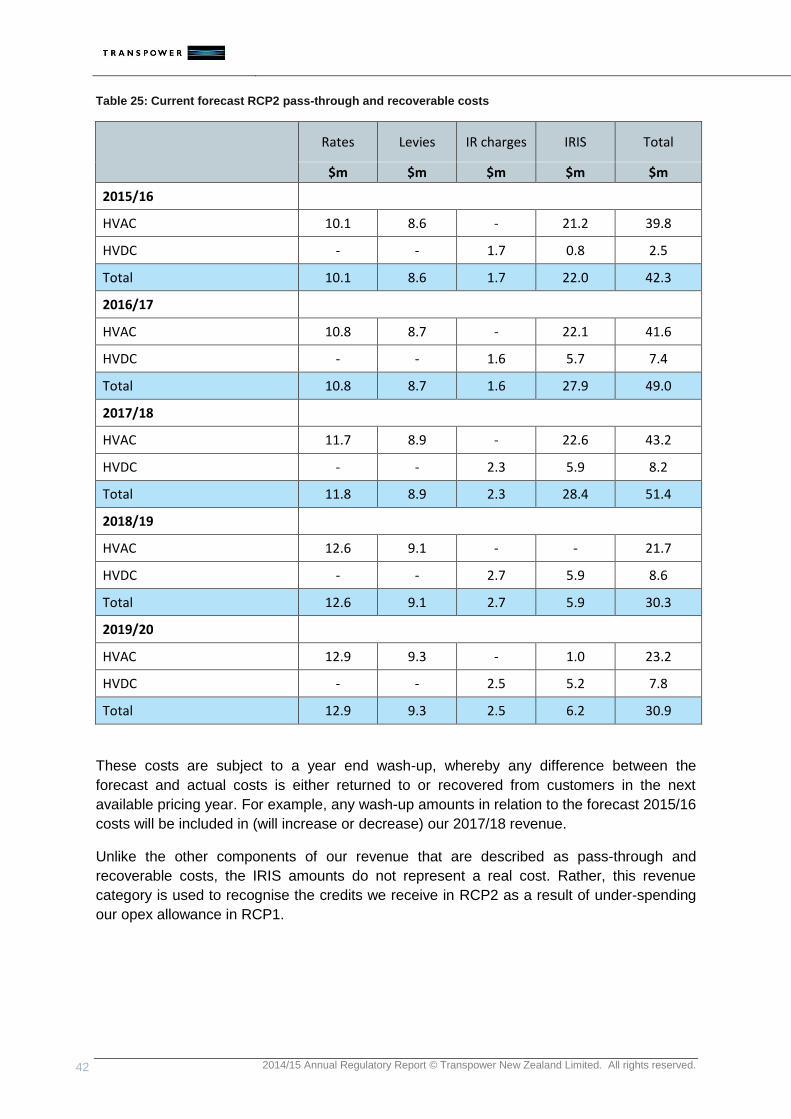
8.3 Forecast pass-through and recoverable costs
The table below shows the forecast of the pass-through and recoverable costs that has been
included in our recent revenue forecast (see Section 2.1).
2014/15 Annual Regulatory Report © Transpower New Zealand Limited. All rights reserved. 42
Table 25: Current forecast RCP2 pass-through and recoverable costs
Rates Levies IR charges IRIS Total
$m $m $m $m $m
2015/16
HVAC 10.1 8.6 - 21.2 39.8
HVDC - - 1.7 0.8 2.5
Total 10.1 8.6 1.7 22.0 42.3
2016/17
HVAC 10.8 8.7 - 22.1 41.6
HVDC - - 1.6 5.7 7.4
Total 10.8 8.7 1.6 27.9 49.0
2017/18
HVAC 11.7 8.9 - 22.6 43.2
HVDC - - 2.3 5.9 8.2
Total 11.8 8.9 2.3 28.4 51.4
2018/19
HVAC 12.6 9.1 - - 21.7
HVDC - - 2.7 5.9 8.6
Total 12.6 9.1 2.7 5.9 30.3
2019/20
HVAC 12.9 9.3 - 1.0 23.2
HVDC - - 2.5 5.2 7.8
Total 12.9 9.3 2.5 6.2 30.9
These costs are subject to a year end wash-up, whereby any difference between the
forecast and actual costs is either returned to or recovered from customers in the next
available pricing year. For example, any wash-up amounts in relation to the forecast 2015/16
costs will be included in (will increase or decrease) our 2017/18 revenue.
Unlike the other components of our revenue that are described as pass-through and
recoverable costs, the IRIS amounts do not represent a real cost. Rather, this revenue
category is used to recognise the credits we receive in RCP2 as a result of under-spending
our opex allowance in RCP1.

2014/15 Annual Regulatory Report © Transpower New Zealand Limited. All rights reserved. 43
9 Other regulatory documents
We have published two other sets of reports this year as part of our regulatory processes.
9.1 Initiatives Plan
The Commerce Commission’s RCP2 determination requires us to develop and publish an
‘Initiatives Plan’ identifying:
business improvement initiatives that we plan to develop during RCP2; and
our plans for developing RCP3 performance measures and targets.
We have published an initial report covering these topics:
https://www.transpower.co.nz/sites/default/files/plain-page/attachments/Transpower-
2015_16-Initiatives-Plan.pdf
9.2 Integrated Transmission Plan
At the end of September we published our 2015 Integrated Transmission Plan (ITP) and
supporting documents23. This package brings our plans together into an accessible set of
public documents:
Integrated Transmission Plan 2015 – concise, accessible overview of our plans and
explanation of changes since 2013
Services Report 2015 – defines our service offering and performance targets, and
explains how we use these in our business
Asset Management Plan (AMP) 2015 – explains our asset management framework, our
management of each asset class and a summary of planned works
Transmission Planning Report 2015 (published July 2015) – identifies backbone grid and
regional development plans.
We will publish an updated ITP and AMP each year and will update the supporting
documents most years. In 2018 we will publish a full update of the ITP and supporting
documents and this will provide the core of our proposal for RCP3.
23
https://www.transpower.co.nz/about-us/industry-information/regulatory-control-periods/rcp2/updates

2014/15 Annual Regulatory Report © Transpower New Zealand Limited. All rights reserved. 44
A.1 RCP2 performance measures – Points of Service by category
Category Description Points of service as specified in our IPP
High priority Point of service that serve very
large or essential loads such as
the Auckland CBD or the oil
refinery at Bream Bay
ISL0661 Islington 66 kV OPK0331 Opunake ALB0331 Albany 33 kV PAK0331 Pakuranga ALB1101 Albany 110 kV PEN0331 Penrose 33 kV (A) BPE0331 Bunnythorpe 33 kV PEN1101 Penrose 110 kV BRB0331 Bream Bay INV0331 Invercargill
ROS0221 Mt Roskill 22 kV BRY0661 Bromley 66 kV SVL0331 Silverdale CPK0331 Central Park 33 kV TAK0331 Takanini HAM0331 Hamilton 33 kV TKR0331 Takapu Road HEN0331 Henderson TWI2201 Tiwai HEP0331 Hepburn Road HOB1101 Hobson St 110kV
INV0331 Invercargill
Important Point of service that serve key industrial loads or large numbers of customers such as Kaiwharawhara
ASY0111 Ashley MNI0111 Motunui BDE0111 Brydone MPE1101 Maungatapere OTA0221 Otahuhu 22 kV (A) CBG0111 Cambridge PEN0221 Penrose 22 kV CPK0111 Central Park 11 kV PRM0331 Paraparaumu EDN0331 Edendale ROS1101 Mt Roskill 110 kV GFD0331 Gracefield HAM0111 Hamilton 11 kV HAY0111 Haywards 11 kV TGA0331 Tauranga 33 kV HOR0331 Hororata 33 kV TMK0331 Temuka HOR0661 Hororata 66 kV TNG0111 Tangiwai 11 kV
HUI0331 Huirangi TWH0331 Te Kowhai HWA0331 Hawera (A) WHU0331 Waihou HWB0331 Halfway Bush WIL0331 Wilton ISL0331 Islington 33 kV WIR0331 Wiri KAW0112 Kawerau (B) EDG0331 Edgecumbe KOE1101 Kaikohe MGM0331 Mangamaire KWA0111 Kaiwharawhara SFD0331 Stratford LFD1101 Lichfield HWA1101 Hawera (A) KBY0661 Kimberley MNG0331 Mangere 33 kV WRD0331 Wairau Road MNG1101 Mangere 110 kV

2014/15 Annual Regulatory Report © Transpower New Zealand Limited. All rights reserved. 45
Category Description Points of service as specified in our IPP
Standard Those remaining points of service that serve demand customers and are not served by a single line/transformer
ASB0331 Ashburton 33 kV MTM0331 Mt Maunganui 33 kV ASB0661 Ashburton 66 kV MTN0331 Marton BAL0331 Balclutha MTO0331 Maungaturoto BDE0112 Brydone NMA0331 North Makarewa BLN0331 Blenheim NPL0331 New Plymouth 33 kV (A) NPL0332 New Plymouth 33 kV (B) BOB0331 Bombay 33 kV NSY0331 Naseby BOB1101 Bombay 110 kV OAM0331 Oamaru BPE0551 Bunnythorpe 55 kV ORO1101 Orowaiti CML0331 Cromwell OWH0111 Owhata CST0331 Carrington St PAO1101 Piako CUL0331 Culverden PEN0332 Penrose 33 kV (B) CYD0331 Clyde PNI0331 Pauatahanui DOB0331 Dobson RDF0331 Redclyffe DVK0111 Dannevirke RFN1101 Reefton FHL0331 Fernhill ROT0111 Rotorua 11 kV FKN0331 Frankton (A) ROT0331 Rotorua 33 kV FKN0332 Frankton (B)
GYM0661 Greymouth TGA0111 Tauranga 11 kV GYT0331 Greytown TIM0111 Timaru HAM0551 Hamilton 55 kV TKU0331 Tokaanu (A) HAY0331 Haywards 33 kV TMI0331 Te Matai HKK0661 Hokitika TMN0551 Taumarunui HLY0331 Huntly TNG0551 Tangiwai 55 kV HTI0331 Hangatiki UHT0331 Upper Hutt KAI0111 Kaiapoi WDV0111 Woodville KAW0111 Kawerau (A) WEL0331 Wellsford KIN0111 Kinleith 11 kV WGN0331 Wanganui KMO0331 Kaitimako WKO0331 Waikino KPU0661 Kopu WPR0661 Waipara 66 kV KUM0661 Kumara WPT0111 Westport LTN0331 Linton WPW0331 Waipawa 33 kV MHO0331 Mangahao MLG0111 Melling 11kV WRK0331 Wairakei MLG0331 Melling 33 kV WTK0331 Waitaki WTU0331 Whakatu
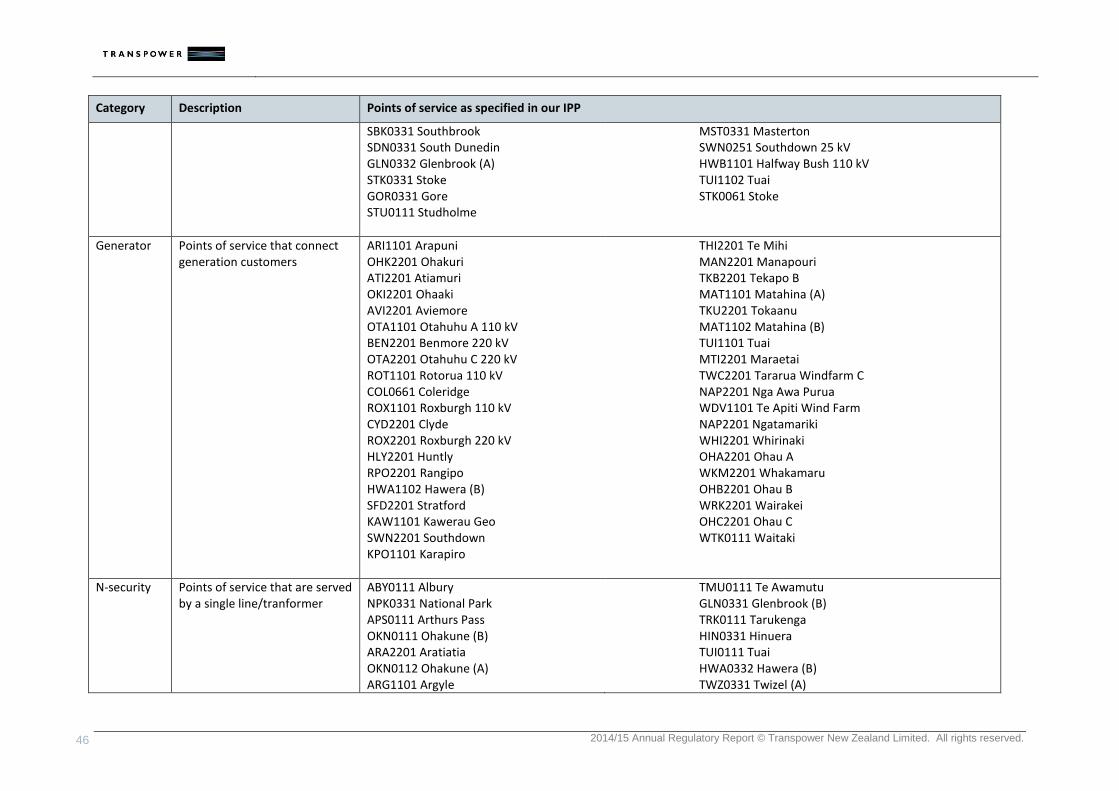
2014/15 Annual Regulatory Report © Transpower New Zealand Limited. All rights reserved. 46
Category Description Points of service as specified in our IPP
SBK0331 Southbrook SDN0331 South Dunedin GLN0332 Glenbrook (A) STK0331 Stoke GOR0331 Gore STU0111 Studholme
MST0331 Masterton SWN0251 Southdown 25 kV HWB1101 Halfway Bush 110 kV TUI1102 Tuai STK0061 Stoke
Generator Points of service that connect generation customers
ARI1101 Arapuni OHK2201 Ohakuri ATI2201 Atiamuri OKI2201 Ohaaki AVI2201 Aviemore OTA1101 Otahuhu A 110 kV BEN2201 Benmore 220 kV OTA2201 Otahuhu C 220 kV ROT1101 Rotorua 110 kV COL0661 Coleridge ROX1101 Roxburgh 110 kV CYD2201 Clyde ROX2201 Roxburgh 220 kV HLY2201 Huntly RPO2201 Rangipo HWA1102 Hawera (B) SFD2201 Stratford KAW1101 Kawerau Geo SWN2201 Southdown KPO1101 Karapiro
THI2201 Te Mihi MAN2201 Manapouri TKB2201 Tekapo B MAT1101 Matahina (A) TKU2201 Tokaanu MAT1102 Matahina (B) TUI1101 Tuai MTI2201 Maraetai TWC2201 Tararua Windfarm C NAP2201 Nga Awa Purua WDV1101 Te Apiti Wind Farm NAP2201 Ngatamariki WHI2201 Whirinaki OHA2201 Ohau A WKM2201 Whakamaru OHB2201 Ohau B WRK2201 Wairakei OHC2201 Ohau C WTK0111 Waitaki
N-security Points of service that are served by a single line/tranformer
ABY0111 Albury NPK0331 National Park APS0111 Arthurs Pass OKN0111 Ohakune (B) ARA2201 Aratiatia OKN0112 Ohakune (A) ARG1101 Argyle
TMU0111 Te Awamutu GLN0331 Glenbrook (B) TRK0111 Tarukenga HIN0331 Hinuera TUI0111 Tuai HWA0332 Hawera (B) TWZ0331 Twizel (A)

2014/15 Annual Regulatory Report © Transpower New Zealand Limited. All rights reserved. 47
Category Description Points of service as specified in our IPP
ONG0331 Ongarue ATU1101 Atarau OTI0111 Otira BPD1101 Bells Pond BPT1101 BlackPoint PEN0251 Penrose 25 kV BRK0331 Brunswick PPI2201 Poihipi BWK1101 Berwick TKA0111 Tekapo A CLH0111 Castle Hill TKA0331 Tekapo A COL0111 Coleridge TKH0111 Te Kaha CUL0661 Culverden
KIK0111 Kikiwa TWZ0332 Twizel (B) KIN0331 Kinleith 33 kV WAI0111 Waiotahi KPA1101 Kaponga WHI0111 Whirinaki MCH0111 Murchison WPA2201 Waipapa MER0331 Meremere WPR0331 Waipara 33 kV MKE1101 McKee WPW0111 Waipawa 11 kV WVY0111 Waverley MTR0331 Mataroa WWD1101 West Wind
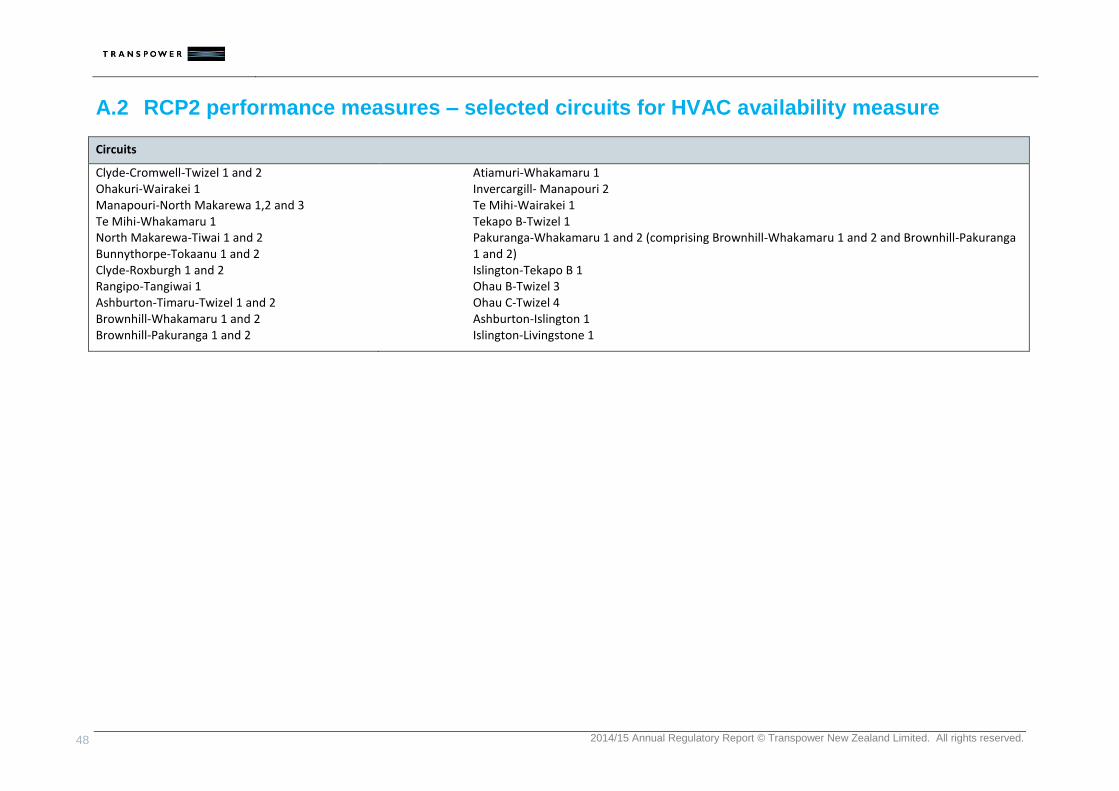
2014/15 Annual Regulatory Report © Transpower New Zealand Limited. All rights reserved. 48
A.2 RCP2 performance measures – selected circuits for HVAC availability measure
Circuits
Clyde-Cromwell-Twizel 1 and 2 Ohakuri-Wairakei 1 Manapouri-North Makarewa 1,2 and 3 Te Mihi-Whakamaru 1 North Makarewa-Tiwai 1 and 2 Bunnythorpe-Tokaanu 1 and 2 Clyde-Roxburgh 1 and 2 Rangipo-Tangiwai 1 Ashburton-Timaru-Twizel 1 and 2 Brownhill-Whakamaru 1 and 2 Brownhill-Pakuranga 1 and 2
Atiamuri-Whakamaru 1 Invercargill- Manapouri 2 Te Mihi-Wairakei 1 Tekapo B-Twizel 1 Pakuranga-Whakamaru 1 and 2 (comprising Brownhill-Whakamaru 1 and 2 and Brownhill-Pakuranga 1 and 2) Islington-Tekapo B 1 Ohau B-Twizel 3 Ohau C-Twizel 4 Ashburton-Islington 1 Islington-Livingstone 1

2014/15 Annual Regulatory Report © Transpower New Zealand Limited. All rights reserved. 49
A.3 Detailed base capex variance explanation
Actual/Forecast RCP1 Allowance Variance Comments / Status
11/12 12/13 13/14 14/15 Total 11/12 12/13 13/14 14/15 Total 11/12 12/13 13/14 14/15 Total
Power Transformers
$ 34 10 29 27 100
14 24 45 27 109
20 (14) (16) 0 (9) RCP1 - commissioned five fewer transformers than planned mainly due to divestments and re-prioritisation into RCP2.
# 9 2 7 7 26
6 5 9 11 31
3 (3) (2) (4) (5)
Outdoor to indoor conversion (ODID)
$ 9 22 15 27 73
6 26 26 20 77
3 (4) (11) 8 (4) RCP1 - commissioned four fewer ODID conversions due to divestment, reprioritisation of work and delays early in some of the projects.
# 1 4 2 6 13
3 4 6 4 17
(2) - (4) 2 (4)
Outdoor Circuit Breakers
$ 6 2 2 11 20
5 2 9 5 21
1 (1) (6) 5 (1) RCP1 - commissioned 25 fewer outdoor circuit breakers due to deferment of work to RCP2 (7 units) and divestments (18 units).
# 35 11 17 28 91
23 19 44 30 116
12 (8) (27) (2) (25)
Dynamic Reactive Power
$ 10 14 5 24 52
17 22 0 0 39
(7) (8) 5 24 13 RCP1 - variance due to roll in of $6m expected to commission prior to RCP1 and $7m higher cost of refurbishment (more worn state). Four condensers will be commissioned.
Buildings & Grounds
$ 7 1 5 15 28
14 7 6 7 33
(7) (6) (1) 9 (5) RCP1 - commissioned less as a number of jobs rolled into RCP2 due to reprioritisation and a number of projects with resource consent requirements.
Buildings & Seismic $ 0 0 5 8 14
0 5 5 5 14
0 (4) 0 4 (1)
RCP1 - Work completed to plan bar the upgrade at Penrose (Albany completed) due to the discovery of asbestos. Work will be completed in RCP2. HAY seismic upgrade was rolled into RCP2 to allow the condensor project on site to be completed first.
Substation Mgmt Systems
$ 4 3 4 10 20
7 4 4 5 21
(4) (1) (0) 5 (1) RCP1 - commissioned fewer than anticipated at the same cost due to resource and process constraints. Higher average cost due to design and installation cost increases, size variations, site tech training and test lab.
Metering $ 8 4 2 0 15
6 10 1 0 18
2 (6) 1 0 (3) RCP1 - commissioned 393 meters, 11 fewer than the RCP1 Allowance due to improved site design.
Protection $ 9 5 5 15 34
12 7 5 15 40
(3) (1) (0) (0) (5) RCP1 - variance mainly relates to bus zone protection with a combination of savings and work moved to RCP2.
HVDC $ 6 3 4 4 17
14 1 4 2 22
(8) 2 (0) 2 (5) RCP1 - Commissioned less due to cancelling jobs and work deferred to RCP2.

2014/15 Annual Regulatory Report © Transpower New Zealand Limited. All rights reserved. 50
Actual/Forecast RCP1 Allowance Variance Comments / Status
11/12 12/13 13/14 14/15 Total 11/12 12/13 13/14 14/15 Total 11/12 12/13 13/14 14/15 Total
Indoor Switchgear $ 14 0 5 4 24
4 2 2 5 13
10 (2) 3 (1) 11
RCP1 - commissioned more than the RCP1 Allowance due to $6m roll ins from 10/11, $3m from work re-prioritised into RCP1 from RCP2, $4m higher civil and cabling costs across several sites offset by $2m saved as a site was divested.
Other $ 9 6 9 5 29
7 13 9 14 43
2 (8) (0) (9) (14) RCP1 - commissioned below the RCP1 Allowance mainly due to priority deferment of structure and buswork jobs to RCP2 (Wilton, Hawera and Waihou).
Total Substations $ 114 70 91 151 427
105 124 117 104 450
9 (53) (26) 47 (23)
Tower Painting
$ 11 27 29 33 101
26 30 36 39 132
(15) (3) (7) (6) (31) RCP1 - commissioned less due to resource constraints. The average cost, particularly recoats, have cost more due to greater deterioration than expected leading to increased levels of preparation. # 184 470 532 543 1,730
608 455 613 489 2,165
(424) 15 (81) 54 (435)
TL Grillage
$ 4 18 8 17 48
15 14 12 17 58
(11) 4 (3) (0) (10) RCP1 - commissioned less due to a reduction in the programme. Substitution to the Conductor portfolio which had a shortfall. Overall, higher average costs due to additional access requirements and more design and engineering. # 170 617 274 507 1,568
575 514 430 625 2,144
(405) 103 (156) (118) (576)
TL Insulators
$ 5 8 7 6 26
4 7 6 7 23
1 1 1 (0) 3 RCP1 - variance mainly due to generator costs incurred to ensure there were no outages whilst work was undertaken on the Te Kaha and Waiotahi lines (East Coast/Bay of Plenty), not included in the RCP1 Allowance (in 13/14). Note - Work was undertaken within other portfolio's but generator costs were allocated to this Portfolio.
# 568 1,228 1,392 1,706 4,894
812 1,323 1,163 1,164 4,462
(244) (95) 229 542 432
TL Conductor $ 32 13 3 3 51
13 17 7 5 42
20 (4) (4) (3) 9
RCP1 - commissioned more due to higher costs of the OTB-HAY A reconductoring project (extra costs associated with by-pass line required, not in the RCP1 Allowance). Substitution from the Grillage portfolio to cover the shortfall.
TL Pole $ 4 7 6 11 28
6 8 7 7 27
(2) (0) (0) 4 2 RCP1 - Commissioned the number of poles according to the RCP1 Allowance at a slightly higher cost due to additional design and consents.
Other Lines $ 1 2 3 2 9
3 7 6 7 23
(1) (5) (3) (5) (14) RCP1 - commissioned less based on better asset health and reprioritisation.
Total Lines $ 58 75 57 72 264
66 82 74 82 305
(8) (6) (17) (10) (41)
Total Grid R&R $ 172 146 148 224 690
171 206 191 187 755
1 (60) (42) 37 (64)
Total Grid E&D $ 1 5 0 11 16
0 5 3 8 16
0 (1) (3) 3 (1)

2014/15 Annual Regulatory Report © Transpower New Zealand Limited. All rights reserved. 51
Actual/Forecast RCP1 Allowance Variance Comments / Status
11/12 12/13 13/14 14/15 Total 11/12 12/13 13/14 14/15 Total 11/12 12/13 13/14 14/15 Total
IT Telecoms Networks
$ 20 18 32 12 82
13 54 0 0 67
7 (36) 32 12 15 RCP1 - commissioned 10/11 work in 11/12 due to a slower start of the telecommunications network build than initially planned at the time the RCP1 Allowance was compiled.
IT Asset Management
$ (1) 15 11 6 32
2 1 3 33 38
(2) 14 9 (26) (6) RCP1 - commissioned the Asset Management Information System (AMIS) programme with savings.
IT SCADA/RTS $ 4 1 1 3 10
4 4 11 4 24
0 (3) (10) (1) (14) RCP1 - commissioned less than anticipated with the remainder of the commissioning, of the upgraded SCADA system, now occurring in early RCP2.
IT Enabling Infrastructure
$ 5 4 4 7 20
4 4 4 4 16
1 0 (0) 3 4 RCP1 - commissioned more due to additional Oracle licensing requirements.
IT Security Infrastructure
$ 2 0 1 11 13
2 3 3 7 15
(1) (2) (3) 3 (2) RCP1 - commissioned less due to efficiency gains through implementing firewalls at aggregated sites rather than individual sites as per the RCP1 Allowance.
IT Data Centre $ 0 0 0 14 14
0 0 0 9 9
0 0 0 5 5 RCP1 - commissioned more due to higher cost than original estimates together with bringing forward some work from RCP2.
Other IT $ 13 12 11 21 56
12 15 11 14 51
0 (3) 0 7 5 RCP1 - commissioned more due to additional work in the Workforce Mobility portfolio and the Corporate Information and Document Management portfolio.
Total IT&T $ 43 51 60 73 227
38 80 32 71 221
6 (30) 28 2 7
Total Business Support
$ 5 8 11 10 34
4 11 13 17 45
1 (3) (2) (6) (11) RCP1 - commissioned less as little to no properties identified for strategic purposes in the Strategic Properties portfolio.
Adjustments $ 0 0 0 0 0
(5) (7) (7) (14) (33)
5 7 7 14 33 Mainly CPI adjustments.
TOTAL $ 222 207 220 317 966
209 295 233 264 1,001
13 (88) (13) 53 (35)