annual progress report - national food security missionnfsm.gov.in/project/icrisat/2016-17/annual...
TRANSCRIPT
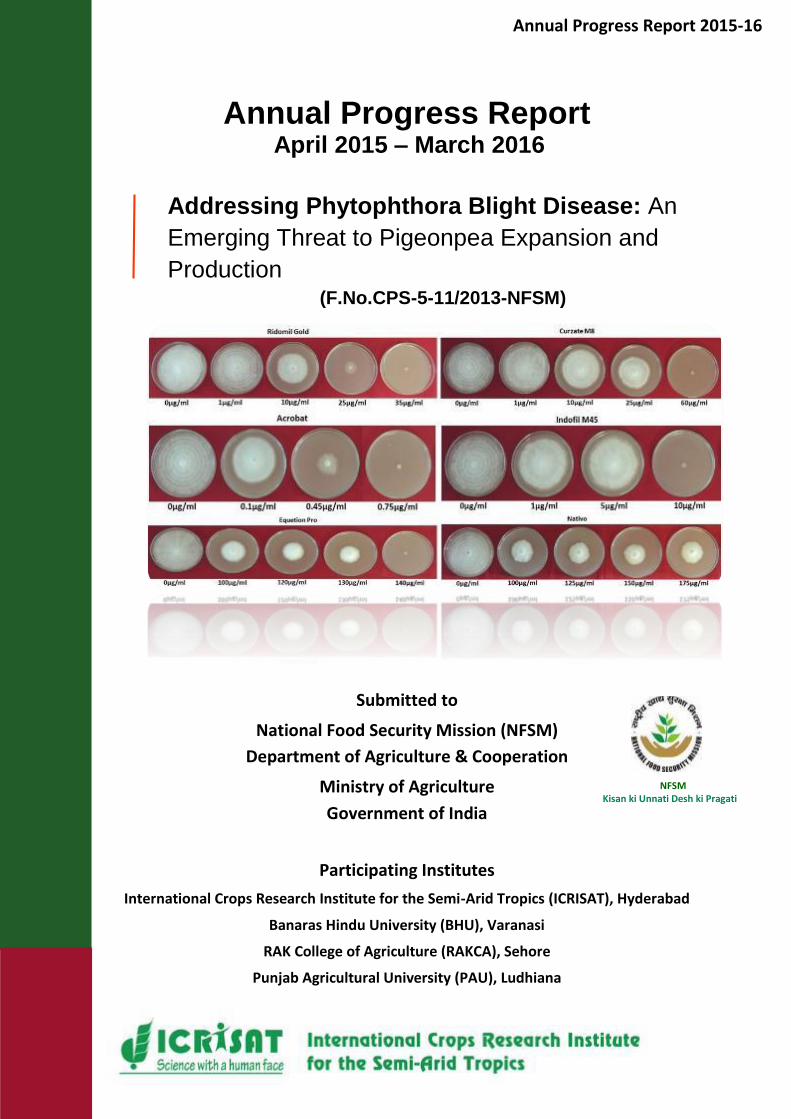
Annual Progress Report April 2015 – March 2016
Addressing Phytophthora Blight Disease: An
Emerging Threat to Pigeonpea Expansion and
Production (F.No.CPS-5-11/2013-NFSM)
Submitted to
National Food Security Mission (NFSM)
Department of Agriculture & Cooperation
Ministry of Agriculture
Government of India
Participating Institutes
International Crops Research Institute for the Semi-Arid Tropics (ICRISAT), Hyderabad
Banaras Hindu University (BHU), Varanasi
RAK College of Agriculture (RAKCA), Sehore
Punjab Agricultural University (PAU), Ludhiana
NFSM Kisan ki Unnati Desh ki Pragati
Annual Progress Report 2015-16

1
Collaborating Institutions and Scientists
International Crops Research Institute for the Semi-Arid Tropics (ICRISAT), Patancheru, Hyderabad, Telangana Mamta Sharma
Raju Ghosh
CV Sameer Kumar
RAK Collage of Agriculture (RAKCA), Sehore, Madhya Preadesh DR Saxena
AK Chaudhary
Banaras Hindu University (BHU), Varanasi, Uttar Pradesh Ramesh Chand
Vineetha Singh
Punjab Agricultural University (PAU), Ludhiana, Punjab Asmita Sirari

2
Annual Progress Report
2015-16
Project Title: Addressing Phytophthora Blight Disease: An Emerging Threat to Pigeonpea Expansion and Production
(F.No.CPS-5-11/2013-NFSM)
Funding Agency: National Food Security Mission (NFSM) - Pulses, Department of
Agriculture & Cooperation, Ministry of Agriculture, Govt. of India
Executive Agency: International Crops Research Institute for the Semi-Arid Tropics
(ICRISAT), Patancheru – 502 324, Hyderbad, Telangana
Principal Investigator:
Dr Mamta Sharma, Principal Scientist, Legumes Pathology, International Crops
Research Institute for the Semi-Arid Tropics (ICRISAT), Patancheru – 502324,
Telangana
Co- Investigators:
BHU, Varanasi: Dr Ramesh Chand (PI), Dr Vineetha Singh (Co-PI),
RAKCA, Sehore: Dr DR Saxena (PI), Dr AK Chaudhary (Co-PI)
PAU, Ludhiana: Dr Asmita Sirari (PI)
Project Duration: 4 years
Objectives
1. Identify pigeonpea genotypes with resistance to Phytophthora blight of
pigeonpea.
2. Evaluate resistant genotypes for stability of resistance at multi-locations.
3. Evaluate Phytophthora blight resistant genotypes in farmers’ fields.
4. Technology exchange and capacity building in integrated management of
Phytophthora blight.

3
Technical progress (April 2015 – March 2016)
1. Survey: Monitoring for occurrence and distribution of Phytophthora
blight
Phytophthora Blight (PB) survey was carried out by all the project partners (ICRISAT, BHU,
PAU, and RAKCA) in different pigeonpea growing areas [southern India (Telangana, Andhra
Pradesh, Karnataka, and Tamil Nadu), northern India (Uttar Pradesh and Punjab) and central
India (Madhya Pradesh)]. PB was distributed throughout the pigeonpea cultivation area and
its incidence was found in 60% of fields surveyed, though its severity was low this year. Fields
with high number of plants with severe symptoms or dead plants was rare due to scanty
rainfall as compared to previous years. According to the survey, and greenhouse and field
experiments, heavy rainfall and high humidity during the growth period favor disease
development and can cause significant yield losses. Details of survey results are as follows:
ICRISAT: Total 49 farmers fields in nine districts of three states (Karnataka, Telangana and
Madhya Pradesh) were surveyed by ICRISAT scientists. PB incidence ranged from 0-50%
(Annexure 1) (Figure 1) in the surveyed fields. The highest mean PB incidence (24.1%) was
recorded in Gulbarga district and also in Karnataka state (20.1%). Moreover, 75% fields were
observed to be infected with PB. The detailed report of survey is provided in Annexure 1 and
natural incidence of PB in pigeonpea fields is given in Figure 1.
Figure 1: Natural PB incidence during survey 2015-16 crop season.
4
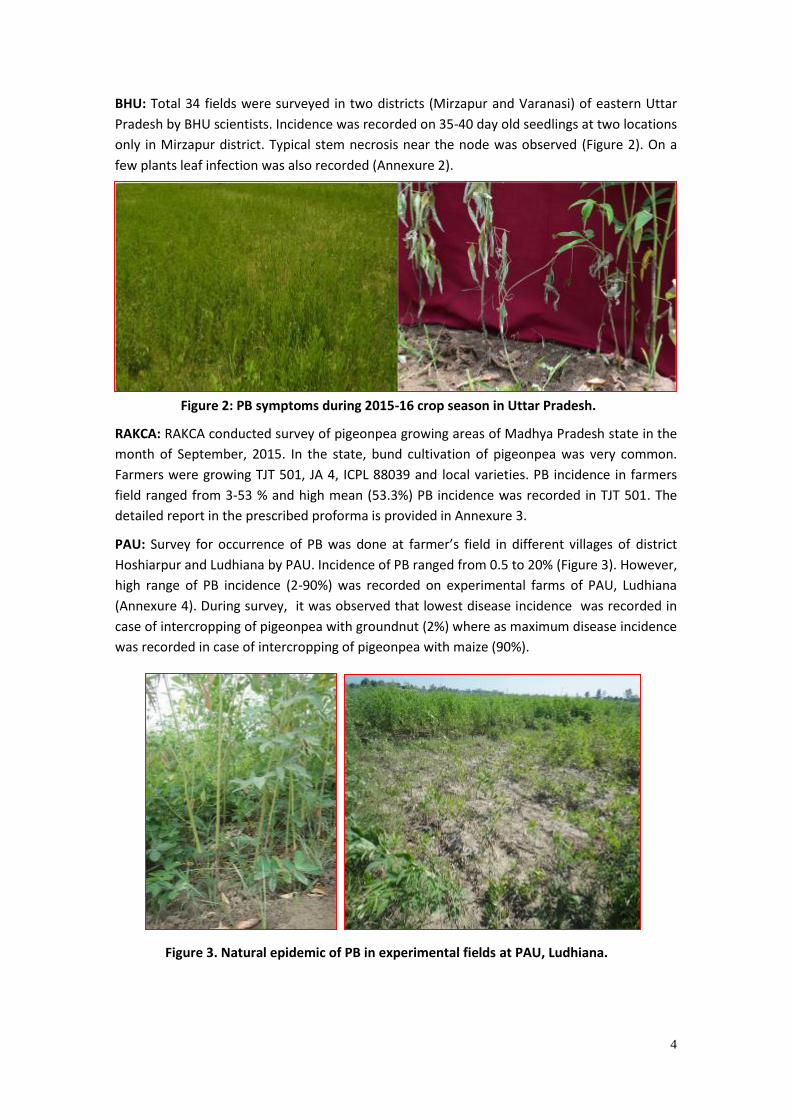
BHU: Total 34 fields were surveyed in two districts (Mirzapur and Varanasi) of eastern Uttar
Pradesh by BHU scientists. Incidence was recorded on 35-40 day old seedlings at two locations
only in Mirzapur district. Typical stem necrosis near the node was observed (Figure 2). On a
few plants leaf infection was also recorded (Annexure 2).
RAKCA: RAKCA conducted survey of pigeonpea growing areas of Madhya Pradesh state in the
month of September, 2015. In the state, bund cultivation of pigeonpea was very common.
Farmers were growing TJT 501, JA 4, ICPL 88039 and local varieties. PB incidence in farmers
field ranged from 3-53 % and high mean (53.3%) PB incidence was recorded in TJT 501. The
detailed report in the prescribed proforma is provided in Annexure 3.
PAU: Survey for occurrence of PB was done at farmer’s field in different villages of district
Hoshiarpur and Ludhiana by PAU. Incidence of PB ranged from 0.5 to 20% (Figure 3). However,
high range of PB incidence (2-90%) was recorded on experimental farms of PAU, Ludhiana
(Annexure 4). During survey, it was observed that lowest disease incidence was recorded in
case of intercropping of pigeonpea with groundnut (2%) where as maximum disease incidence
was recorded in case of intercropping of pigeonpea with maize (90%).
Figure 2: PB symptoms during 2015-16 crop season in Uttar Pradesh.
Figure 3. Natural epidemic of PB in experimental fields at PAU, Ludhiana.

5
2. Updated list of P. cajani isolates from different pigeonpea growing
areas of India
Isolate collection status
Similar to year 1 and 2, pigeonpea plants exhibiting symptoms of PB were collected from
epidemic block in the field from different locations. Symptomatic plant materials were placed
in labelled plastic bags, which were transported in cooler box and stored in 4°C until fungal
culture wsd purified from the samples in the laboratory (Legumes Pathology, ICRISAT). Stem
tissues with typical PB lesions were selected for isolation of the Phytophthora. Symptomatic
tissues were cut and surface sterilized using 1% sodium hypochlorite for 1 min followed by
washing in sterile distilled water. The tissues were then plated onto sterilized V8 juice agar
media (V8 juice supplemented with L-Asparagine, CaCO3, glucose, yeast extract and agar)
amended with PARP antibiotics (pimarcin 400 μL; ampicillin 250 mg; rifampicin 1000 μL; and
pentachloronitrobenzene 5 ml L-1 media). Plates were incubated at 25°C in the 12 h/12 h day-
night photoperiod for 3 to 4 days. Putative Phytophthora colonies were transferred to 20%
tomato extract agar (tomato extract 200 ml, CaCO3 2 g and agar 20 g L-1) and incubated at 25°C
in the 12 h/12 h day-night for 7 days. Cultures are then maintained under in vitro at 18 ±1°C in
dark condition. To maintain the pathogen virulence, new cultures were prepared every 2-3
months by passing the pathogen through the host and reisolating from infected plants. Total
28 isolates were purified and identified as Phytophthora cajani and 14 isolates have been
deposited in NCBI genebank (Table 1). The isolates collected during the year 2015-16 by BHU
were amplified using ITS 1 (Forward – 5’TCCGTAGGTGAACCTGCGG 3’) and ITS 4 (Reverse – 3’
TCCTCCGCTTTATTGATATG 5’) and submitted to NFCCI- Agharkar Research Institute, Pune,
India (Table 2).
Table 1. Details of P. cajani isolates from different pigeonpea growing areas of India.
S. No. Isolates Sampled from Length of ITS
(nt)
Accession
number
1 ICPC1 ICRISAT, Hyderabad, TS 504 KJ010534
2 ICPC2 BP09 534 KJ010535
3 ICPC3 RM1 728 KJ010536
4 ICPC4 BP5 698 KJ010537
5 ICPC5 BP15 518 KJ010538
6 ICPC6 Mahbubnagar, TS 772 KJ622200
7 ICPC7 Adilabad, TS 570 KJ622201
8 ICPC8 DHF4 698 KJ622202
9 ICPC 9 DHF4 467 KJ622203
10 ICPC10 BP14 686 KJ622204
11 ICPC11 BP14 506 KJ622205
12 ICPC12 BP14 687 KJ622206
13 ICPC13 BP14 749 KJ622207
14 ICPC14 BP14 822 KJ622208
15 ICPC 15 BP14 - -
16 ICPC 16 Ludhiana - -
17 ICPC 17 RCW 01 - -

6
S. No. Isolates Sampled from Length of ITS
(nt)
Accession
number
18 ICPC 18 Khochawa, Varanasi, UP - -
19 ICPC 19 Khochawa, Varanasi, UP - -
20 ICPC 20 Anantpur, Mirzapur, UP - -
21 ICPC 21 Jakhhine, Varanasi, UP - -
22 ICPC 22 Mahbubnagar, TS - -
23 ICPC23 Mahbubnagar, TS - -
24 ICPC 24 Raichur, KA - -
25 ICPC 25 Raichur, KA - -
26 ICPC 26 Gulbarga, KA - -
27 ICPC 27 Gulbarga, KA - -
28 ICPC 28 Sehore, MP - -
Table 2: Cultural and morphological characteristics of different Phytophthora isolates collectd by BHU.
Sl. No.
Accession (NCBI)*
Accession (NFCCI)**
Isolates Name
Morphology Karyotyping
1. KT207291 3828 PDC014-1 Fast cottony white growth on PDA medium.
2. KT207292 3829 PDC014-2 Cottony white growth that was comparatively slow.
3. KT207293 3830 PDC014-3 Fast cottony white growth on PDA medium.
4. KJ412453 PDC013-1 Fast cottony white growth on PDA medium.
*= National Center for Biotechnology Information, ** = National Fungal Culture Collection of India.

7
3. Identification of resistance sources
Screening of germplasm and breeding lines as well as confirmation of resistant sources were
continued at different partners locations to identify the resistance sources to PB disease.
Location-wise details of the material evaluated and their reaction to PB is described in the
following section.
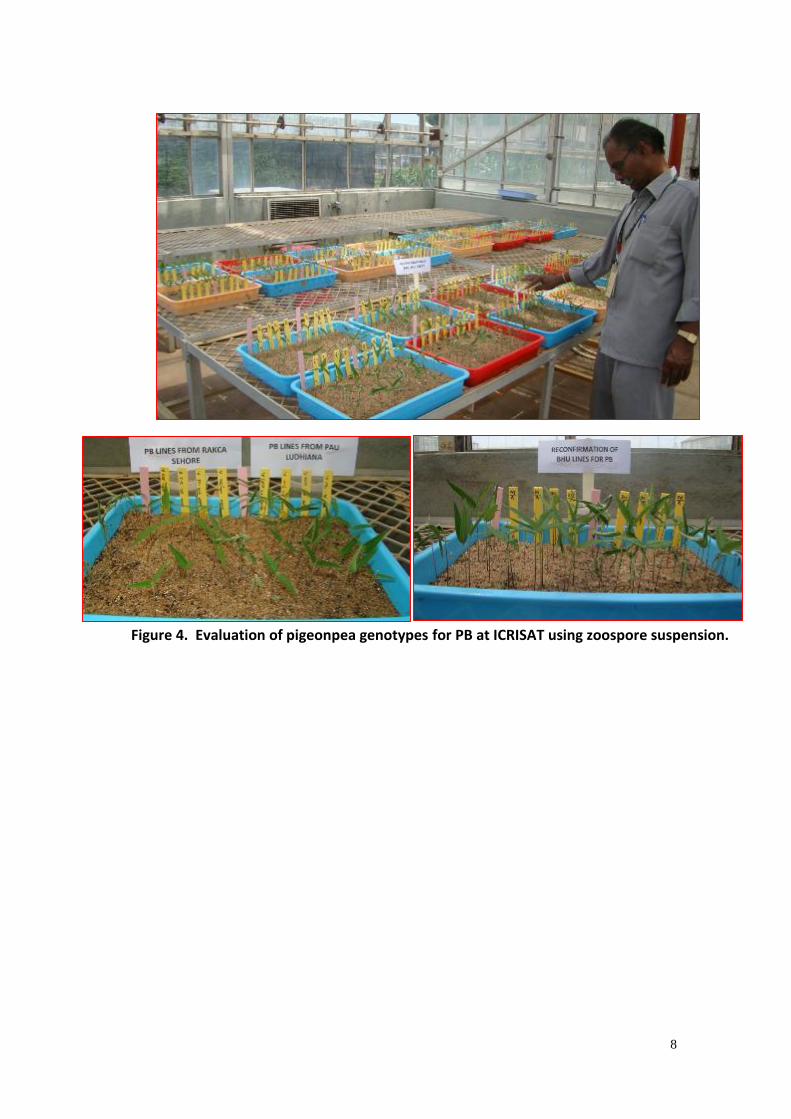
3.1.1 ICRISAT: Controlled environment screening using zoospore suspension inoculation technique
Pigeonpea FW,SM and FABL Lines: Out of 59 wilt and SMD resistant lines, only one line
(ICPL 99010) was found resistant and two lines (ICPL 99102, ICPL 8859) moderately
resistant to PB.
Pigeonpea composite core collection: Total 1251 accessions from pigeonpea composite
core collection representing wide diversity in germplasm collection worldwide were
screened for PB under greenhouse using standardized zoospore screening technique
(Figure 4). Initial screening showed that out of 1251, 58 lines were resistant with <10%
incidence and 51 lines moderately resistant having incidence between 10-20%. Remaining
all lines were susceptible or highly susceptible to PB. These lines will be evaluated again to
confirm the resisnce to PB (Table 3).
Evaluation of AICRP Pigeonpea AVT, IVT lines: Total 84 elite lines from AICRP-pigeonpea
were evaluated against PB. Seven lines were found resistant with <10% incidence, 9 lines
with moderate resistance having 10-20% incidence (Table 3).
RAKCA Sehore–PB resistant lines: Total 12 breeding lines found resistant at RAKCA Sehore
were evaluated for PB at ICRISAT. Three lines had moderate resistance against PB (Table 3).
PAU Ludhiana–PB resistant lines: Five breeding lines found resistant at PAU were
evaluated for PB at ICRISAT. One line was found to have resistance against PB (Table 3).
Extra early lines DT, NDT and WHDLE Lines: Out of 12 extra early DT lines, one line ICPL
11253 was found resistant, out of 22 NDT lines, 3 lines were found resistant (ICPL 11245,
ICPL 20333, ICPL 20329) and none of the 10 WHDLE lines were found resistant (Table 3).
Lines from Kalyani University, West Bengal: Five lines were obtained from Kalyani
University as PB incidence is very high in that area. Out of these Richa (MP) and Desi Tur
(MP) were found reistant and moderately resistant respectively.
Lines from UAS, Raichur: Total 50 lines from UAS Raichur were evaluated of which 2 lines
(AKT 8811, RKV 277) were found resistant and 4 lines (ICP 11320, Kari togari, Raichur pink,
RVK 275) were found moderately resistant to PB.
8
Figure 4. Evaluation of pigeonpea genotypes for PB at ICRISAT using zoospore suspension.

9
Table 3. Pigeonpea germplasm and breeding lines evaluated to Phytophthora blight at ICRISAT under controlled environment using zoospore suspension.
S. No Detail No. of Lines
Screened
PB incidence (%)
0-10 11-20
1 Pigeonpea FW,SM and FABL Lines
59 ICPL 99010 ICPL 99102, ICPL 8859
2 Pigeonpea composite core collection lines
1251 ICP 3925, ICP 4015, ICP 4488, ICP 5275, ICP 5346, ICP 6788, ICP 7057, ICP 7323, ICP 8211, ICP 8516, ICP 8522, ICP 8675, ICP 8700, ICP 8757, ICP 8776, ICP 8921, ICP 8928, ICP 8996, ICP 9045, ICP 11213, ICP 11230, ICP 11592, ICP 11823, ICP 14653, ICP 15091, ICP 15095, ICP 15401, ICP 6035, ICP 7426, ICP 8266, ICP 8914, ICP 14975, ICP 3945, ICP 4089, ICP 5239, ICP 5240, ICP 5252, ICP 5335, ICP 5455, ICP 6419, ICP 8558, ICP 8568, ICP 8891, ICP 9764, ICP 11277, ICP 11785, ICP 4605, ICP 4822, ICP 8562, ICP 8793, ICP 9096, ICP 11361, ICP 12334, ICP 4167, ICP 5388, ICP 7242, ICP 8131, ICP 8265
ICP 2467, ICP 3955, ICP 4029, ICP 4317, ICP 4983, ICP 7072, ICP 7284, ICP 8227, ICP 8368, ICP 8685, ICP 8817, ICP 8997, ICP 9252, ICP 10404, ICP 16264, ICP 16266, ICP 4241, ICP 2641, ICP 4519, ICP 4903, ICP 5325, ICP 5515, ICP 7269, ICP 8784, ICP 11097, ICP 11769, ICP 2500, ICP 3451, ICP 3842, ICP 4266, ICP 7172, ICP 8132, ICP 8369, ICP 10241, ICP 14900, ICP 4257, ICP 2463, ICP 5255, ICP 7370, ICP 7701, ICP 11246, ICP 4476, ICP 5066, ICP 5161, ICP 4633, ICP 4991, ICP 5006, ICP 6929, ICP 8382, ICP 8537, ICP 10615
3 AICRP - Pigeonpea AVT, IVT, Material
84 PA 426, WRG 246, WRG 286, GRG 2009-1, WRG 285, KPL 43, KA 12-2
CORG 9701, CO 6, RVSA 2014-1, WRG 280, WRG 293, KPL 44, WRG 242, WRG 297, WRG 252
4 RAKCA Sehore lines
12 Nil RVSA 7-10, SRGK 1, RVSA 7-22
5 PAU lines 5 AL 1836 Nil
6 Extra early lines (DT)
12 ICPL 11253 ICPL 11256, ICPL 20336, ICPL 11255, ICPL 11249, ICPL 20338
7 Extra early lines (NDT)
22 ICPL 11245, ICPL 20333, ICPL 20329
ICPL 20326, ICPL 11318, ICPL 20327, ICPL 20335, ICPL 11244, ICPL 20325, ICPL 20328, ICPL 11298, ICPL 11324
8 WHDLE Lines
10 Nil ICPL 15009, ICPL 15006
9 Lines from Kalyani
5 Richa (MP) Desi Tur (MP)
10
S. No Detail No. of Lines
Screened
PB incidence (%)
0-10 11-20
University, West Bangal
10 Lines from UAS, Raichur
50 AKT 8811, RKV 277 ICP 11320, Kari togari, Raichur pink, RVK 275
Total 1510 73 86
3.1.2 Confirmation of PB resistance:
Total 2572 lines (2013-2016) including germplasm and breeding lines have been screened so
far at ICRISAT using the zoospore suspension technique under greenhouse. From this
prelimnary screening, 73 lines with resistance reaction to PB at ICRISAT were selected for
further confirmation using large number of seeds (Figure 5). Approximately 100 plants of each
line was inoculated and screened for PB.
Three lines with high level of resistance and nine with moderate level of reisistance were
selected for further testing at multiple locations (Table 4). From BHU selections, 91 lines were
further evaluated at ICRISAT and 15 were found resistant and 9 were moderately resistant
(Figure 5).
Table 4. Confirmation of resistnace to Phytophthora blight at ICRISAT under controlled environment using zoospore suspension.
Sr no
Particular of Source
Genotypes Duration
1 ICRISAT ICPL 20331, ICPL 11273, ICPL 11254 Super early
ICPL 99009, ICPL 11265, MN-1, ICPL 11270
Short-medium
ICPL 99010, ICP 8859, ICP 580, ICP 14282, ICPL 99008, ICPL 99004, ICPL 20135, ICPL 99102, ICPL 20124, ICPL 20114
Medium
ICPL 99048, ICPL 99099 Long
ICP 332 WR, ICPL 20236 -
2 Kalyani University
Parvati (MP), Desi Tur (MP) -
3 PAU AL 1836 -
4 AICRP KPL 43 Long

11
Susceptible check Resistant
Susceptible check Resistant
Figure 5. Confirmation of PB resistance in pigeonpea genotypes at ICRISAT.
12
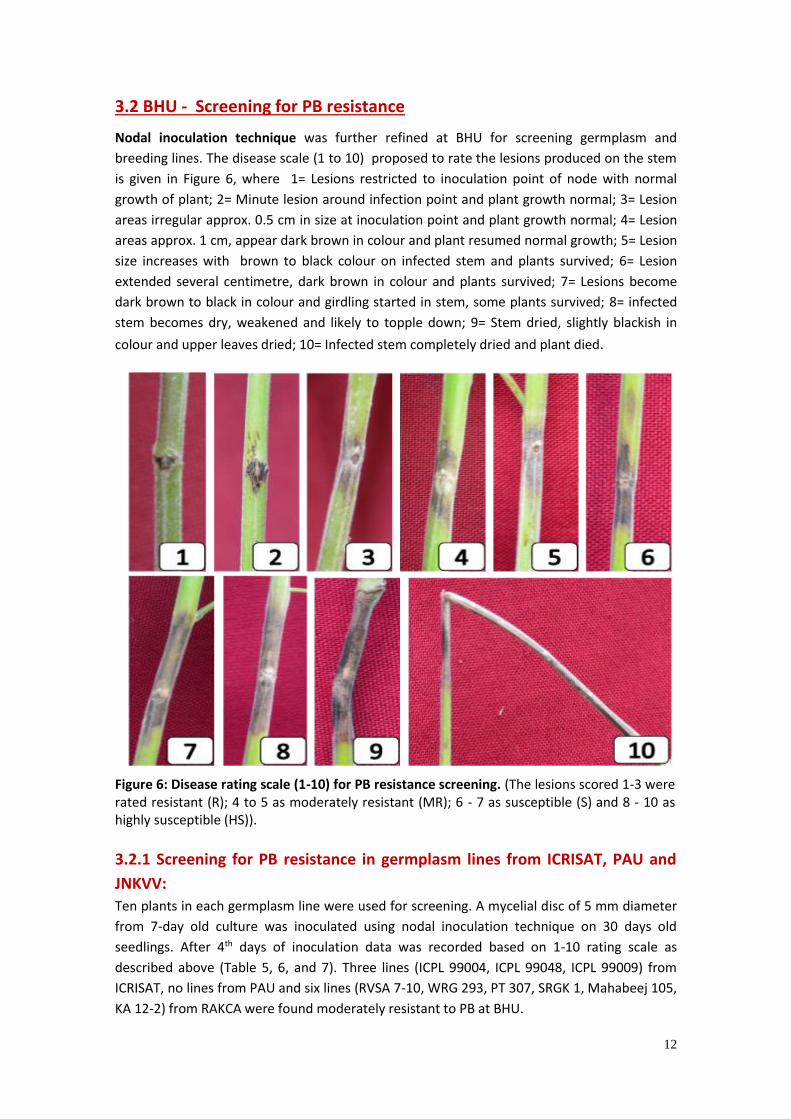
3.2 BHU - Screening for PB resistance
Nodal inoculation technique was further refined at BHU for screening germplasm and
breeding lines. The disease scale (1 to 10) proposed to rate the lesions produced on the stem
is given in Figure 6, where 1= Lesions restricted to inoculation point of node with normal
growth of plant; 2= Minute lesion around infection point and plant growth normal; 3= Lesion
areas irregular approx. 0.5 cm in size at inoculation point and plant growth normal; 4= Lesion
areas approx. 1 cm, appear dark brown in colour and plant resumed normal growth; 5= Lesion
size increases with brown to black colour on infected stem and plants survived; 6= Lesion
extended several centimetre, dark brown in colour and plants survived; 7= Lesions become
dark brown to black in colour and girdling started in stem, some plants survived; 8= infected
stem becomes dry, weakened and likely to topple down; 9= Stem dried, slightly blackish in
colour and upper leaves dried; 10= Infected stem completely dried and plant died.
Figure 6: Disease rating scale (1-10) for PB resistance screening. (The lesions scored 1-3 were rated resistant (R); 4 to 5 as moderately resistant (MR); 6 - 7 as susceptible (S) and 8 - 10 as highly susceptible (HS)).
3.2.1 Screening for PB resistance in germplasm lines from ICRISAT, PAU and
JNKVV:
Ten plants in each germplasm line were used for screening. A mycelial disc of 5 mm diameter
from 7-day old culture was inoculated using nodal inoculation technique on 30 days old
seedlings. After 4th days of inoculation data was recorded based on 1-10 rating scale as
described above (Table 5, 6, and 7). Three lines (ICPL 99004, ICPL 99048, ICPL 99009) from
ICRISAT, no lines from PAU and six lines (RVSA 7-10, WRG 293, PT 307, SRGK 1, Mahabeej 105,
KA 12-2) from RAKCA were found moderately resistant to PB at BHU.
13
The coefficient of infection was calculated by assigning the R= 0.25, MR=0.5, S= 0.75, HS=1.
These values were multiplied with the rating scale and coefficient of infection was derived.
Table 5: PB disease reaction of 7 (ICRISAT) lines.
Sl. No. Accession Rating mean*
% PB incidence
Disease Reaction
Coefficient of infection
1 ICPL 99004 3.1 12.5 MR 1.6
2 ICPL 99048 4.0 20.0 MR 2.0
3 ICPL 99009 4.6 30.0 MR 2.3
4 ICPL 99008 5.1 100.0 S 3.8
5 ICPL 20135 5.8 60.0 S 4.4
6 ICPL 99099 6.0 90.9 S 4.5
7 ICPL 20124 6.5 61.5 S 4.9
* based on 10 plants. Table 6: PB disease reaction of 5 (PAU) lines
Sl. No. Accession Rating mean*
% PB incidence
Disease Reaction
Coefficient of infection
1 AL 1789 5.8 100.0 S 4.4
2 AL 1957 7.0 75.0 S 5.3
3 AL 1960 7.2 60.0 HS 7.2
4 CORG 6012 8.0 100.0 HS 8.0
5 AL 1836 8.3 100.0 HS 8.3
* based on 10 plants. Table 7: PB disease reaction of 12 RAKCA lines
Sl. No.
Accession Rating mean*
% PB incidence
Disease Reaction
Coefficient of infection
1 RVSA 7-10 3.6 16.7 MR 1.8
2 WRG 293 3.8 18.0 MR 1.9
3 PT 307 4.2 22.3 MR 2.1
4 SRGK 1 4.6 25.0 MR 2.3
5 Mahabeej 105 4.6 25.0 MR 2.3
6 KA 12-2 4.7 26.5 MR 2.4
7 PT 257 5.1 36.7 S 3.8
8 WRG 289 5.6 71.4 S 4.2
9 WRG 297 6.0 80.0 S 4.5
10 KA 12-3 6.0 80.0 S 4.5
11 RVSA 7-22 6.0 80.0 S 4.5
12 JSA 28 6.6 83.3 S 4.5
* based on 10 plants.

14
3.2.2 Screening of 600 germplasms collected from BHU centre for PB resistance:
The screening of 586 germplasm lines out of 600 germplasm collected last year from eastern UP were carried out under field conditions. 30-day old seedlings were inoculated with the mycelia disc of 5 mm diameter from 7-day old culture. At 96 hours after inoculation, data was recorded on 10 plants in each germplasms lines (Figure 7 and Table 8).
Fig 7: Frequency distribution of germplasm lines (586) based on 1- 10 rating scale.
Frequency distribution of disease severity showed normal distribution in the lines. Very few
(9.9%) lines were found resistant (1-3 rating) to PB in field. 35% lines exhibit moderately
resistant rating (4-5 rating) and that of 55 were found susceptible to PB. Total 58 lines were
found resistant with a disease rating of < 3 on 1-10 scale (Table 8).
Table 8: Screening result of 586 germplasm lines collected from farmers’ fields.
Disease reaction Disease rating scale Total lines
Resistant (R) 1 to 3 58
Moderately Resistant (MR) 4 to 5 206
Susceptible (S) 6 to 7 223
Highly Susceptible (HS) 8 to 10 99
15
3.3 RAKCA-Sehore – Screening for PB disease resistance
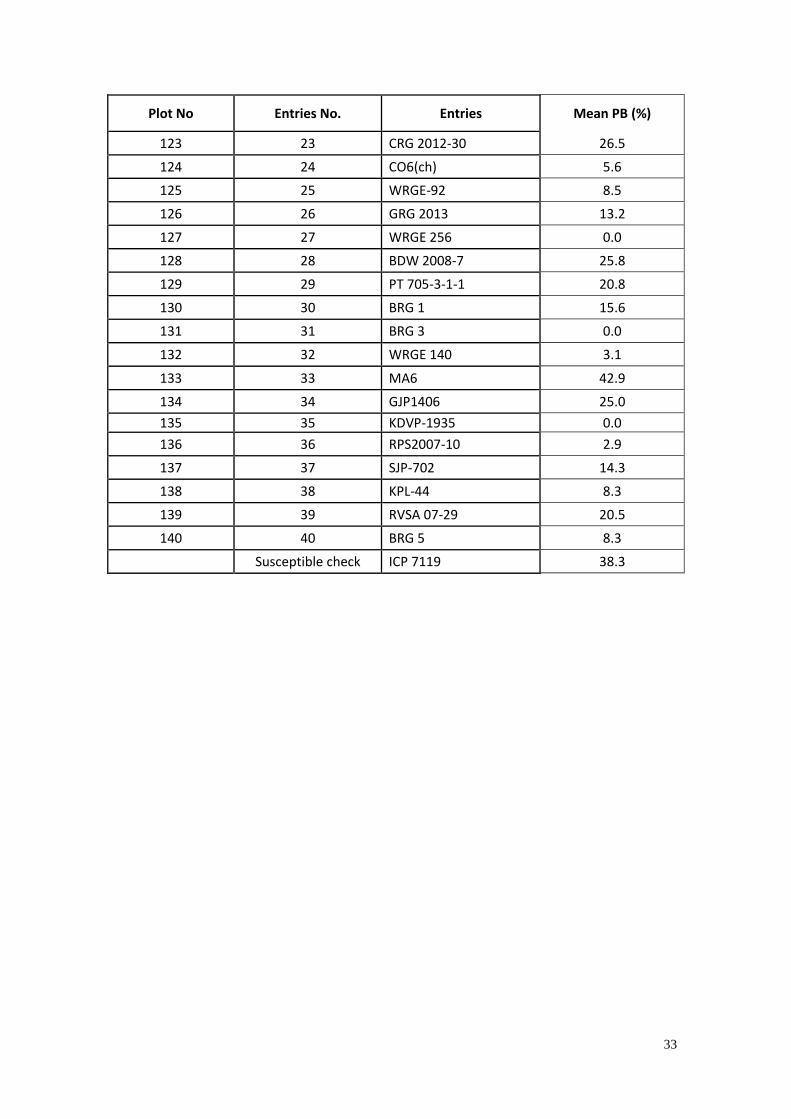
3.3.1 Screening of pigeonpea AICRP lines: Total 40 pigeonpea lines were screened in
PB sick plot during 2015-16 at RAKCA, Sehore. The entries were sown in two replications
alternated with susceptible check ICP 7119. Data recorded till date showed 13 entries (SJP
102, CRG 2012-20, AL 2046, GRG 2013, WRGE 92, CO6, WRGE 256, BRG 3, WRGE 140, KDVP
1935, RPS 2007-10, KPL 44, BRG 5) resistant to PB (Annexure 5).
3.4 PAU-Ludhiana – Screening for PB resistance
3.4.1 Screening of pigeonpea released/advanced germplasm & breeding lines:
A set of 100 advanced breeding lines from Ludhiana centre and 64 pigeonpea germplasm lines
from different centers were evaluated against PB at PAU, Ludhiana. Both mini sick plot and
green house technique were used for reliable screening of pigeonpea breeding and
germplasm lines.
Mini sick plot technique: A set of 164 test entries were sown in 4m row with 40 cm row to
row spacing. The susceptible check AL 201 was sown after every fourth test entry. The
inoculum of PB was mass multiplied on sterilized pigeonpea grains. At 15 DAS, the inoculum
was mixed with soil and smeared on stems of test entries. The inoculum was also added in the
soil at the time of sowing to develop a sick plot. The water logging conditions were maintained
till 45 days. The stem showed black discoloration with blighting of foliage. First observation on
blighted plants was recorded and 60 entries were found resistant to PB (Table 9). Final
observations on disease incidence will be recorded as diseased plants percentage.
Green house technique: Sowing of 10 seeds per test entry was done in pots filled with soil
and PSB inoculum. The inoculum was smeared on stem of 20 days old seedlings and pots were
watered regularly for 7 days. The screening is going on in pots, after which observations on
blighted plants will be recorded.
Table 9: Disease reaction of Pigeonpea germplasm lines to PB.
Sr. no. Entry PSB incidence (%) Sr. no. Entry PSB incidence (%)
1 AL-1843 16.58 43 AL-2102 18.55
2 AL-1931 17.64 44 ICPL-11301 17.04
3 AL-1932 23.91 45 AL-1992 24.24
4 AL-1933 50.08 46 AL-2024 35.83
5 AL-1957 41.04 47 AL-2128 29.69
6 AL-1960 37.50 48 ICPL-20336 26.11
7 AL-1965 52.10 49 ICPL-201153 18.63
8 AL-2000 42.66 50 MN-1 (CH) 16.35
9 AL-2009 43.59 51 MN-5 (CH) 19.85
0 AL-2046 30.83 52 AL-15 (CH) 28.04
11 AL-2049 35.14 53 AL-1760 10.00
12 ICPL-11301 25.63 54 AL-1765 18.06
13 AL-1758 27.53 55 AL-1779 36.67
14 AL-1849 44.08 56 AL-1781 0.00
15 AL-1922 21.47 57 AL-1782 31.25
16 AL-2019 40.00 58 AL-1786 0.00

16
Sr. no. Entry PSB incidence (%) Sr. no. Entry PSB incidence (%)
17 AL-2021 31.99 59 AL-1790 0.00
18 AL-2025 32.38 60 AL-1793 17.07
19 AL-2028 25.96 61 AL-1789 8.33
20 AL-1994 27.08 62 AL-1798 5.00
21 AL-1976 41.03 63 AL-1801 5.00
22 AL-2060 25.14 64 AL-1813 0.00
23 AL-2061 17.76 65 AL-1820 18.22
24 AL-2062 24.04 66 AL-1840 6.67
25 AL-2063 12.26 67 AL-1845 25.00
26 AL-2067 11.66 68 AL-1846 37.50
27 AL-2071 16.40 69 AL-1848 7.28
28 AL-2078 18.42 70 AL-1853 17.50
29 AL-2086 25.55 71 AL-1837 7.14
30 AL-2087 24.06 72 AL-1842 26.88
31 AL-2122 41.60 73 AL-1844 Not germinated
32 AL-2016 15.09 74 AL-1847 4.20
33 AL-2028 15.02 75 AL-1957 0.00
34 AL-2088 11.04 76 IC245-318 Not germinated
35 AL-2090 17.70 77 IC245-350 23.81
36 AL-2091 6.61 78 H02-59 21.27
37 AL-2092 13.88 79 H94-8 10.52
38 AL-2094 17.13 80 H200014 19.23
39 AL-2095 13.60 81 IC245-183 12.75
40 AL-2096 13.13 82 IC245-186 18.51
41 AL-2098 9.65 83 IC245-219 12.22
42 AL-2101 21.33 84 IC245-314 12.60
85 IC245-409 0.00 85 Pant A-250 17.16
86 IC245-439 11.81 126 Pant A-251 14.26
87 IC245-443 22.22 127 Pant A-252 11.54
88 IC245-479 12.50 128 TAT-108 33.33
89 IC45561 12.50 129 SP-2-2 0.00
90 IC45362 15.76 130 Pusa-855 25.00
91 H03-28 4.00 131 AL1505 6.98
92 H86-22 6.25 132 AL1506 14.47
93 H92-14 4.55 133 AL1508 9.38
94 H93-32 14.29 134 AL1524 21.43
95 AF-370 4.17 135 AL1525 16.21
96 CORG-108 0.00 136 AL1527 7.76
97 CORG-105 0.00 137 AL1584 4.50
98 Pusa2001 4.03 138 AL1627 13.12
99 P-2002 15.88 139 AL1628 15.00
100 H02-65 0.00 140 AL1629 5.92
101 H05-7 7.14 141 AL1634 11.81
102 H05-35 10.00 142 AL1847 14.58

17
Sr. no. Entry PSB incidence (%) Sr. no. Entry PSB incidence (%)
103 AH06-1 4.17 143 CORG 9704 6.25
104 AH06-3 5.56 144 ICPL 90245 0.00
105 AH06-9 0.00 145 Pusa 2001 13.57
106 AH09-3 22.50 146 P-226 0.00
107 AH09-36 8.82 147 HOL 59 17.38
108 13-71AP 0.00 148 H005 11.69
109 VRG-62 0.00 149 HO2-45 7.14
110 V10099 0.00 150 HO4-20 3.57
111 ICPL92045 16.67 151 HO5-7 15.00
112 MTH-103 16.67 152 HO5-12 60.00
113 ICP11250 16.67 153 HO5-33 8.33
114 ICP3977 Not germinated 154 HO5-62 0.00
115 ICP45523 0.00 155 H200014 36.46
116 IC245507 0.00 156 AH-09-11 9.00
117 IC245/Pusa991 50.00 157 AH-09-29 9.09
118 IC245-504 5.56 158 AH-09-30 15.38
119 PBR-2 0.00 159 AH-09-41 0.00
120 P226 7.14 160 H86-22 14.24
121 P2001-6 2.94 161 H-93-2 8.67
122 Pant-37 0.00 162 H-94-8 42.11
123 Pant A-169 12.50 163 H-93-32 10.00
124 Pant A -234 3.13 164 P-95-1-1 9.09

18
4. Selection of fungicides and sensitivity testing against Phytophthora cajani
Based on the last review meeting at Krishi Bhawan, New Delhi and also in literature , a few
fungicides were selected for testing their efficacy against P. cajani in vitro as well as under
greenhouse conditions. List of fungicides selected is given in Table 10. These fungicides has
also been provided to the project partners for testing against the respective isolate of their
locations. The fungicide testing against P. cajani was done at ICRISAT, BHU and RAKCA center.
Table 10. Fungicide selected for efficacy study against P. cajani. No Fungicide (Trade name) Active ingredient
1. Ridomil gold Metalaxyl (4%) + Mancozeb (64%)
2. Indofil M-45 Mancozeb (75%) WP
3. Curzate M-8 Cymoxanil (8%) + Mancozeb (64%)
4. Nativo Tebuconazole (50%) + Trifloxystrobin (25%)
5. Acrobat Dimethomorph (50%) WP
6. Equation pro Famoxadone (16.6%) + Cymoxanil (22.1%)
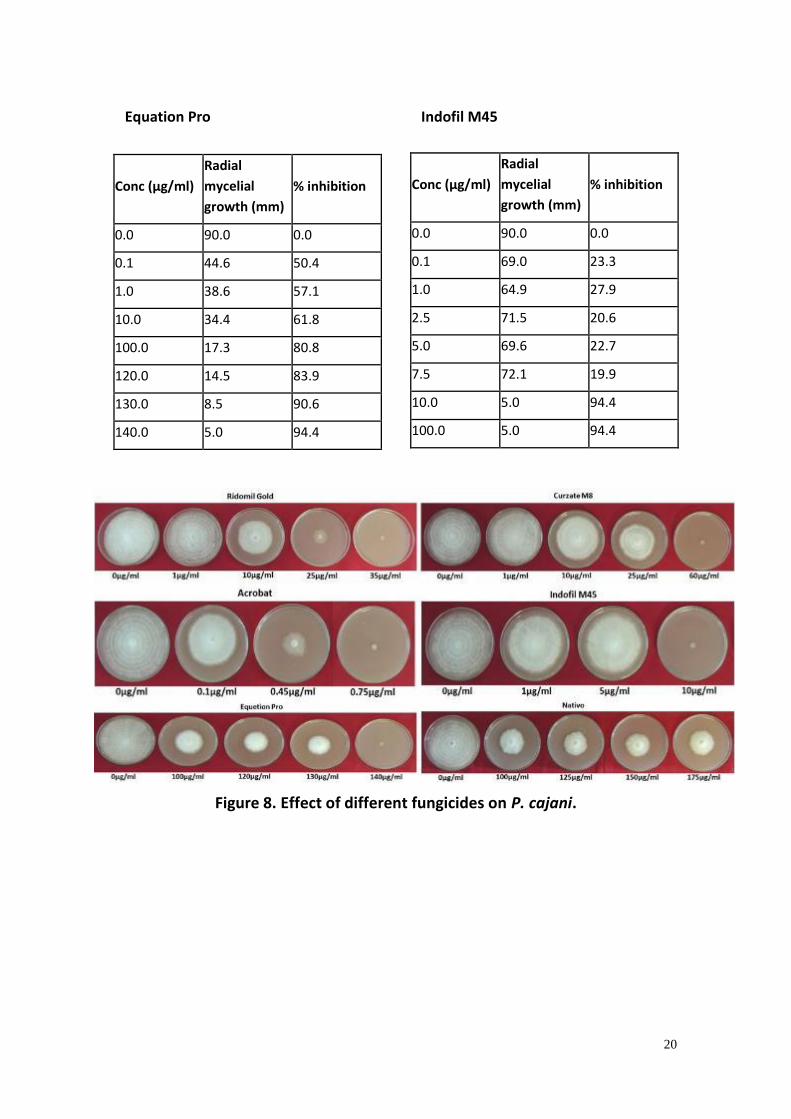
4.1 In vitro evaluation of fungicides at ICRISAT: The above mentioned fungicides
were tested against P. cajani under in vitro conditions using poisoned food technique. In the
first set of experiments, different concentrations of each fungicide was tested to select the
optimum dosage required to inhibit the fungus growth (Figure 8 and Table 10). Data on per
cent inhibition of radial growth of fungus was calculated by comparing with control where no
fungicide treatment was done (Figure 8 and Table 11). Results indicated that out of 6
fungicides, Acrobat was found most effective for inhibiting the mycelial growth of P. cajani,
while Nativo was not found effective. Acrobat fungicide inhibited the fungus growth at very
low concentration (0.75 µg/ml) followed by Indofil (10 µg/ml). While Nativo was able to inhibit
only 54% of mycelial growth even at 175 µg/ml concentration.
The effective fungicide selected from above experiment was tested for their efficacy on
sporangia and zoospore formation. A series of experiments was conducted by giving the
fungicide treatment at different stages of sporangia formation and release of zoospores to
identify the stage where the treatment will be most effective. Five fungicides were tested and
the treatment details are given in Table 12. All the five fungicides tested strongly inhibited
sporangia and zoospore production (Table 12). Concentration recommended for mycelial
growth, sporangia and zoospore production are given in Table 13.
19
Table 11: Effect of different fungicides on radial growth of P. cajani.
Conc (µg/ml) Radial mycelial growth (mm)
% inhibition
0.0 90.0 0.0
0.1 79.9 11.2
1.0 64.9 27.9
10.0 49.0 45.6
25.0 40.5 55.0
50.0 9.4 89.6
60.0 5.0 94.4
70.0 5.0 94.4
75.0 5.0 94.4
100.0 5.0 94.4
Conc (µg/ml) Radial mycelial growth (mm)
% inhibition
0.0 90.0 0.0
0.1 77.1 14.3
1.0 56.0 37.8
10.0 23.9 73.4
25.0 10.8 88.0
35.0 5.0 94.4
45.0 5.0 94.4
50.0 5.0 94.4
75.0 5.0 94.4
100.0 5.0 94.4
Conc (µg/ml) Radial mycelial growth (mm)
% inhibition
0.0 90.0 0.0
0.1 56.0 37.8
0.25 10.1 88.8
0.35 30.9 65.7
0.45 6.8 92.4
0.75 5.0 94.4
1.0 5.0 94.4
10.0 5.0 94.4
100.0 5.0 94.4
Conc (µg/ml) Radial mycelial growth (mm)
% inhibition
0.0 90.0 0.0
0.1 67.1 25.4
1.0 57.5 36.1
10.0 48.8 45.8
100.0 41.1 54.3
125.0 38.0 57.8
150.0 38.1 57.7
175.0 41.4 54.0
Ridomil Gold
Curzate M8
Acrobat
Nativo
20
Figure 8. Effect of different fungicides on P. cajani.
Conc (µg/ml)
Radial
mycelial
growth (mm)
% inhibition
0.0 90.0 0.0
0.1 44.6 50.4
1.0 38.6 57.1
10.0 34.4 61.8
100.0 17.3 80.8
120.0 14.5 83.9
130.0 8.5 90.6
140.0 5.0 94.4
Conc (µg/ml)
Radial
mycelial
growth (mm)
% inhibition
0.0 90.0 0.0
0.1 69.0 23.3
1.0 64.9 27.9
2.5 71.5 20.6
5.0 69.6 22.7
7.5 72.1 19.9
10.0 5.0 94.4
100.0 5.0 94.4
Equation Pro
Indofil M45

21
Table 12 : Effect of different fungicides on sporangia inhibition of Phytophthora cajani
Fungicide Name
Concentration (µg/ml)
No of sporangia
% sporangia inhibition
No of zoospores
% zoospore inhibition
No fungicide 0.0 19.7 0.0 54.3 0.0
Ridomil Gold 25.0 2.0 89.8 0.7 98.8
Indofil M45 10.0 7.7 61.0 3.0 94.5
Curzate M8 50.0 1.3 93.2 0.0 100.0
Acrobat 0.45 3.0 84.7 2.3 95.7
Equarion Pro 130.0 3.0 84.7 0.0 100.0
Table 13: Recommended concentration of fungicide for mycelial growth, sporangia and zoospore production inhibition.
Fungicde Fungicide concentration (µg/ml)
Mycelial growth Sporangia and zoospore production
Ridomil Gold 35 25
Indofil M45 10 10
Curzate M8 60 50
Acrobat 0.75 0.45
Equarion Pro 140 130
22
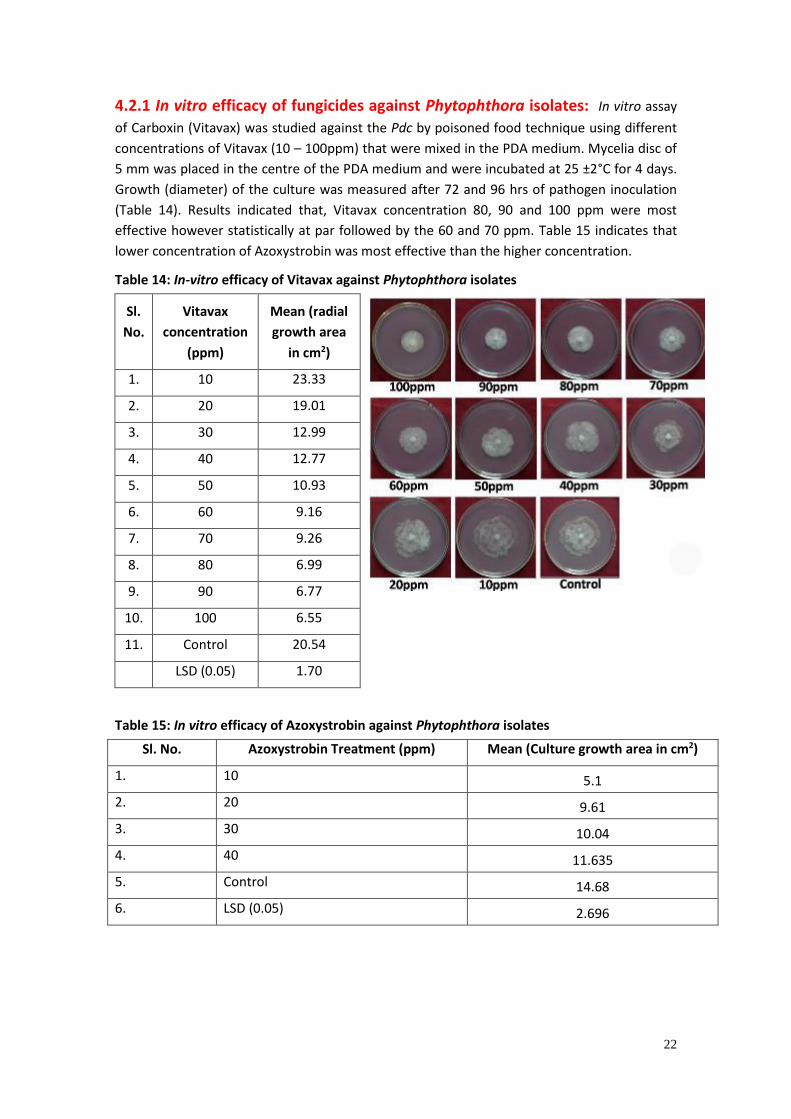
4.2.1 In vitro efficacy of fungicides against Phytophthora isolates: In vitro assay
of Carboxin (Vitavax) was studied against the Pdc by poisoned food technique using different
concentrations of Vitavax (10 – 100ppm) that were mixed in the PDA medium. Mycelia disc of
5 mm was placed in the centre of the PDA medium and were incubated at 25 ±2°C for 4 days.
Growth (diameter) of the culture was measured after 72 and 96 hrs of pathogen inoculation
(Table 14). Results indicated that, Vitavax concentration 80, 90 and 100 ppm were most
effective however statistically at par followed by the 60 and 70 ppm. Table 15 indicates that
lower concentration of Azoxystrobin was most effective than the higher concentration.
Table 14: In-vitro efficacy of Vitavax against Phytophthora isolates
Sl.
No.
Vitavax
concentration
(ppm)
Mean (radial
growth area
in cm2)
1. 10 23.33
2. 20 19.01
3. 30 12.99
4. 40 12.77
5. 50 10.93
6. 60 9.16
7. 70 9.26
8. 80 6.99
9. 90 6.77
10. 100 6.55
11. Control 20.54
LSD (0.05) 1.70
Table 15: In vitro efficacy of Azoxystrobin against Phytophthora isolates
Sl. No. Azoxystrobin Treatment (ppm) Mean (Culture growth area in cm2)
1. 10 5.1
2. 20 9.61
3. 30 10.04
4. 40 11.635
5. Control 14.68
6. LSD (0.05) 2.696

23
4.2.2 Biochemical analysis of pigeonpea plants after fungicide treatment:
The pigeonpea plants were treated (seed treatment) with the different concentrations and
combination of fungicides. After 15 days of sowing, plants were inoculated with P. cajani as
per the treatment given in Table 16. Samples were collected for biochemical analysis at 24
hours, 96 hours and 168 hours. The enzyme activity of Catalase, MDA (Malon di-aldehyde),
Lignin and SOD (Super Oxide Dismutase) was analyzed (Table 17).
Table 16: Different treatments of fungicides
Treatments Treatment details
T1 Without seed treatment and without inoculation of pathogen,
T2 Vitavax Power WP (4gm/kg) of seed treatment and without inoculation of pathogen,
T3 Ridomil (4gm/kg) seed treatment and without pathogen,
T4 Azoxystrobin (1mg/kg) seed treatment and without pathogen,
T5 Vitavax (4gm/kg) seed treatment and with pathogen,
T6 Ridomil (4gm/kg) seed treatment and with pathogen,
T7 Azoxystrobin (1mg/kg) seed treatment and with pathogen,
T8 Control, without seed treatment and with pathogen.
Table 17: Assays of different enzymatic activities in fungicide treated and untreated plants
Treatments and sample
collected time
Catalase
(Enzyme Unit/gm press weight)
Lignin (mg/g)
Blank 15.87 0.08536
T1- 1day 7.73 0.00159
T1- 4 days 2.27 0.00144
T1- 7 days 12.18 0.00139
T2- 1 day 7.73 0.00131
T2- 4 day 69.20 0.00137
T2- 7 day 1.44 0.00147
T3- 1 day 3.00 0.00137
T3- 4 days 1.79 0.00139
T3- 7 days 8.26 0.00147
T4- 1 day 2.96 0.00135
T4- 4 day 7.76 0.00139
T4- 7days 3.86 0.00141
T5- 4days 4.31 0.00141
T5- 7days 1.92 0.00137
T6- 4days 10.84 0.00139
T6- 7days 3.41 0.00134
T7- 4days 1.23 0.00144
24
Treatments and sample
collected time
Catalase
(Enzyme Unit/gm press weight)
Lignin (mg/g)
T7- 7 days 1.28 0.00135
T8- 4 days 4.00 0.00135
T8- 7 days 2.67 0.00137
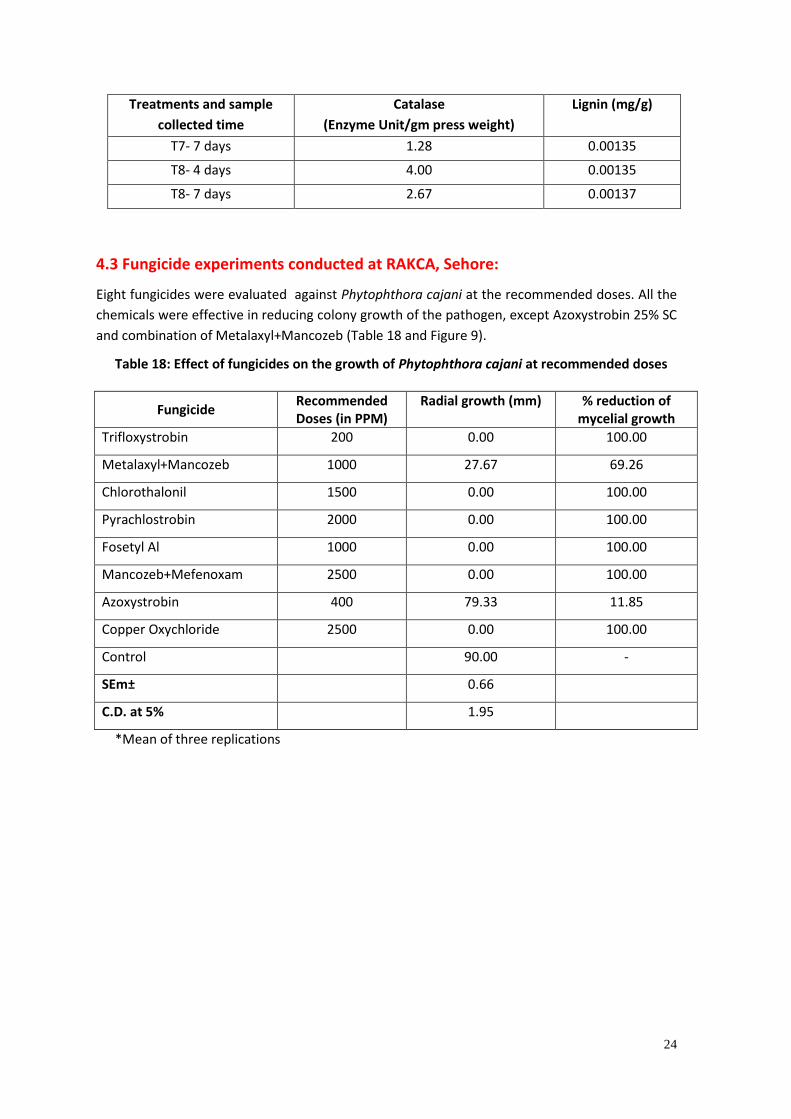
4.3 Fungicide experiments conducted at RAKCA, Sehore:
Eight fungicides were evaluated against Phytophthora cajani at the recommended doses. All the
chemicals were effective in reducing colony growth of the pathogen, except Azoxystrobin 25% SC
and combination of Metalaxyl+Mancozeb (Table 18 and Figure 9).
Table 18: Effect of fungicides on the growth of Phytophthora cajani at recommended doses
Fungicide Recommended Doses (in PPM)
Radial growth (mm) % reduction of mycelial growth
Trifloxystrobin 200 0.00 100.00
Metalaxyl+Mancozeb 1000 27.67 69.26
Chlorothalonil 1500 0.00 100.00
Pyrachlostrobin 2000 0.00 100.00
Fosetyl Al 1000 0.00 100.00
Mancozeb+Mefenoxam 2500 0.00 100.00
Azoxystrobin 400 79.33 11.85
Copper Oxychloride 2500 0.00 100.00
Control 90.00 -
SEm± 0.66
C.D. at 5% 1.95
*Mean of three replications

25
Figure 9: Growth of Phytophthora cajani in different fungicides
Seed multiplication
Total 600 lines were collected during 2014-15 were multiplied and supplied to all the
centers. These lines were multiplied but this year less number of seeds are expected to due
to storm during the month of March.
Seed multiplication was carefully done for promising and resistant lines at ICRISAT, taking
care of cross pollination and maintaining the genetic purity.
Some of the promising lines from partner locatons were also multiplied to have enough
seed to go for field trials this year.
The on-farm trials will be taken up in few stations and farmers field identified as endemic
for PB.

26
Publications
Node inoculation: A quick and easy technique for screening of resistance in Phytophthora
blight of Pigeonpea. Journal of General Plant Pathology (Under revision).
5. Acknowledgements
We gratefully acknowledge the National Food Secrtiy Mission, Govt. of India, Ministry of
Agriculture, Department of Agriculture and Cooperation, New Delhi for providing funding
support for this research project. We extend our sincere thanks to the SAUs and regional
research centres for helping in conducting the surveys.

27
Annexures
Annexure 1. Occurrence and distribution of Phytophthora blight in major pigeonpea
growing areas in India during 2015-2016 crop season (survey conducted by ICRISAT).
S No District Village PB incidence (%)
Madhya Pradesh
1 Sehore RAKCA 16.1
2 Sehore RAKCA 0.0
3 Sehore RAKCA 6.9
4 Sehore Magaspur 45.7
5 Sehore Gattakheda 24.3
6 Sehore Bhaukhedi 4.4
7 Sehore Pangra 32.9
8 Sehore Pangra 27.1
9 Sahajapur Ranayal 46.3
10 Sahajapur Pochaner 0.0
11 Sahajapur Pochaner 4.2
12 Sahajapur Amlaha 6.1
13 Sahajapur Amlaha 0.0
14 Rajgadh Bavdikheda 0.0
15 Rajgadh Bavdikheda 0.0
16 Rajgadh Malkhedi 0.0
17 Rajgadh Eklera 4.6
18 Hoshangabad Suhagpur 0.0
19 Hoshangabad Suhagpur 0.0
20 Hoshangabad Suhagpur 0.0
21 Raisen Mangrul 5.5
22 Raisen Mangrul 2.0
Telangana
23 Mahboobnagar Marikal 22.5
24 Mahboobnagar Eliganela 7.6
25 Mahboobnagar Eliganela 0.0
26 Mahboobnagar Eliganela 32.2
27 Mahboobnagar Magnoor 11.4
28 Mahboobnagar Indanoor 2.6
29 Ranga Reddy Tandoor 0.0

28
30 Ranga Reddy Tandoor 1.2
31 Ranga Reddy Tandoor 0.0
Karnataka
28 Raichur UAS 0.0
32 Raichur UAS 8.1
33 Raichur Masarkal 48.5
34 Raichur Masarkal 5.9
35 Raichur Masarkal 15.0
36 Raichur Masarkal 9.6
37 Raichur Masarkal 2.9
38 Raichur Masarkal 26.9
39 Gulbarga ARS 22.7
40 Gulbarga Kalnoor 49.5
41 Gulbarga Gundargurti 43.3
42 Gulbarga Gundargurti 3.4
43 Gulbarga Gundargurti 20.7
44 Gulbarga Malkhed 5.8
45 Gulbarga Malkhed 42.5
46 Gulbarga Unkanade 9.6
47 Gulbarga Bomanhalli 38.6
48 Gulbarga Vibbali 13.1
49 Gulbarga Adaki 16.0

29
Annexure 2- Pigeonpea disease survey conducted in Varanasi during 2015-16 (survey conducted by BHU- Varanasi)
S No.
Village Name Date of collection GPS Value Fungi identified
1. Adalpura (Mirzapur) 02/09/2015 ELEV: 382 Ft N 250 11.052’ E 0820 53.166’
-
2. Madeya (Mirzapur) 02/09/2015 ELEV: 541 Ft N 250 08.434’ E 0820 52.201’
-
3. Madeya (Mirzapur) 02/09/2015 ELEV: 521 Ft N 250 08.430’ E 0820 52.203’
-
4. Madeya- Adalpura (Mirzapur)
02/09/2015 ELEV: 510 Ft N 250 08.427’ E 0820 52.201’
Phytophthora
5. Katerhawa- Mediya (Mirzapur)
02/09/2015 ELEV: 198 Ft N 250 07.929’ E 0820 51.597’
-
6. Katerhawa (Mirzapur) 02/09/2015 ELEV: 205 Ft N 250 07.615’ E 0820 50.985’
Phytophthora
7. Bagaha (Mirzapur) 02/09/2015 ELEV: 210 Ft N 250 07.615’ E 0820 50.985’
-
8. Bagaha (Mirzapur) 02/09/2015 ELEV: 369 Ft N 250 10.055’ E 0820 48.193’
-
9. Bagaha (Mirzapur) 02/09/2015 ELEV: 302 Ft N 250 10.182’ E 0820 48.146’
-
10. Bagaha (Mirzapur) 02/09/2015 ELEV: 309 Ft N 250 10.181’ E 0820 48.147’
-
11. Jalalpur (Mirzapur) 02/09/2015 ELEV: 224 Ft N 250 15.048’ E 0820 49.125’
-
12. Jogapur (Varanasi) 02/09/2015 ELEV: 258 Ft N 250 12.578’ E 0820 50.704’
-
13. Maniyaripur (Varanasi) 02/09/2015 ELEV: 218 Ft N 250 15.049’ E 0820 49.125’
-
14. Udairajpur (Varanasi) 02/09/2015 ELEV: 240 Ft N 250 17.513’
-

30
S No.
Village Name Date of collection GPS Value Fungi identified
E 0820 54.582’
15. Vishunpur (Varanasi) 02/09/2015 ELEV: 239 Ft N 250 17.953’ E 0820 55.323’
-
16. Sherpur (Mirzapur) 03/09/2015 ELEV: 235 Ft N 250 17.954’ E 0820 55.322’
-
17. Sherpur (Mirzapur) 03/09/2015 ELEV: 561 Ft N 250 12.052’ E 0830 00.664’
-
18. Sherpur (Mirzapur) 03/09/2015 ELEV: 563 Ft N 250 12.057’ E 0830 00.654’
-
19. Sherpur (Mirzapur) 03/09/2015 ELEV: 168 Ft N 250 12.097’ E 0830 00.596’
-
20. Sherpur (Mirzapur) 03/09/2015 ELEV:199 Ft N 250 12.084’ E 0830 00.614’
-
21. Sherpur (Mirzapur) 03/09/2015 ELEV: 363 Ft N 250 12.009’ E 0830 00.007’
-
22. Sherpur (Mirzapur) 03/09/2015 ELEV: 202 Ft N 250 12.014’ E 0830 00.037’
-
23. Sherpur (Mirzapur) 03/09/2015 ELEV: 189 Ft N 250 12.030’ E 0830 00.044’
-
24. Sherpur (Mirzapur) 03/09/2015 ELEV: 186 Ft N 250 12.044’ E 0830 00.032’
-
25. Neyamatpur Kala (Mirzapur)
03/09/2015 ELEV: 360 Ft N 250 12.073’ E 0820 59.618’
-
26. Neyamatpur Kala (Mirzapur)
03/09/2015 ELEV: 204 Ft N 250 12.095’ E 0820 59.615’
-
27. Neyamatpur Kala 03/09/2015 ELEV: 195 Ft -
31
S No.
Village Name Date of collection GPS Value Fungi identified
(Mirzapur) N 250 11.119’ E 0820 58.039’
28. Neyamatpur Kala (Mirzapur)
03/09/2015 ELEV: 324 Ft N 250 11.243’ E 0820 58.025’
-
29. Dharahara (Mirzapur) 03/09/2015 ELEV: 391 Ft N 250 06.157’ E 0820 51.705’
-
30. Dharahara (Mirzapur) 03/09/2015 ELEV: 213 Ft N 250 06.120’ E 0820 51.700’
-
31. Bhurahiya (Mirzapur) 03/09/2015 ELEV: 324 Ft N 250 06.001’ E 0820 50.466’
-
32. Bhurahiya (Mirzapur) 03/09/2015 ELEV: 217 Ft N 250 06.001’ E 0820 50.466’
-
33. Bhurahiya (Mirzapur) 03/09/2015 ELEV: 251 Ft N 250 05.887’ E 0820 49.161’
-
34. Bhurahiya (Mirzapur) 03/09/2015 ELEV: 185 Ft N 250 05.892’ E 0820 49.160’
-
Annexure 3- Pigeonpea disease survey conducted in Madhya Pradesh during 2015-16 (survey conducted by RAKCA-Sehore).
S.No. Farmer Name District/Tehsile/ Village Cultivar Phytophthora blight (%)
1 Rajaram Patel Sehore/Sehore/Kondra chhity TJT 501 13.33
2 Saiyad Sehore/Sehore/Phoolmogra TJT 501 53.33
3 Dharmendra Bhayal Sehore/Ichhawar/chhawar TJT 501 20.67
4 Naresh Yadav Sehore/Rehti/Rehti Local 15.33
5 Ram Chopadia Shore/Asta/Asta JA-4 6.66
6 Vishnu Prashad Shore/Ichhawer/Mongra ram TJT 501 3.33
7 Mahesh Parmar Sajapur/Kalapipal/Pochaner ICP-88039 20.00
8 Kisan Parmar Sajapur/Kalapipal/Pochaner ICP-88039 3.33
9 Kailash Tomar Rajgarh/Talen/Tikariya Lokal 10.00
10 Sudhir Thakur Rajgarh/Talen/Tikariya Lokal 6.66

32
Annexure 4- Pigeonpea disease survey conducted in Punjab during 2015-16 (survey conducted by PAU-Ludhiana).
Annxure 5. Screening of pigeonpea lines against PB at Sehore.
Plot No Entries No. Entries Mean PB (%)
101 1 LRG 151 34.1
102 2 WRGE102 11.3
103 3 NTL-30 22.9
104 4 BRG 15-1 27.7
105 5 ICP7119 47.2
106 6 GJP 1401 26.8
107 7 KPL 43 15.4
108 8 BSMR 736 44.4
109 9 SJP102 9.1
110 10 MAL-13(ch) 10.1
111 11 AKTM 10-12 15.4
112 12 CRG 2012-25 31.0
113 13 RVSA 07-31 29.2
114 14 CRG 2012-20 0.0
115 15 AL 2046 3.9
116 16 ASHA 16.7
117 17 RVSA07-22 18.8
118 18 BSMR 853 30.7
119 19 WRGE65 19.1
120 20 GRG 2013 9.1
121 21 WRGE-92 4.2
122 22 NTL-740 30.0
Sr.
No.
Visited field Area sown (acres)
under varieties
D.O.S % disease
incidence
PAU 881 AL 201
1 Village Megowal, District Hoshiarpur 2 acre - 21.6.2015 0.5-5
2 Village Bichohi, District Hoshiarpur - 1 acre 25.6.2015 2.5-10
3 Village Sarhala Khurd, District Hoshiarpur 1 acre 16.6.2015 0.1-5
4 Village Lalwan, District Hoshiarpur 1 acre 22.6.2015 2.5-10
5 Village Shekh Daulat, District Ludhiana 3 acre 7.6.2015 5-10
6 Village Boparai Kalan, District Ludhiana 1.5 acre 10.6.2015 6-10
7 Village Rakba, District Ludhiana 1.5 acre 10.6.2015 2-20
8 Village Issewal Dhaka, District Ludhiana 0.5acre 0.5 acre 25.6.2015 2-15
9 Experiment area, PAU, Ludhiana - 0.5 acre 11.6.15 2-90
33
Plot No Entries No. Entries Mean PB (%)
123 23 CRG 2012-30 26.5
124 24 CO6(ch) 5.6
125 25 WRGE-92 8.5
126 26 GRG 2013 13.2
127 27 WRGE 256 0.0
128 28 BDW 2008-7 25.8
129 29 PT 705-3-1-1 20.8
130 30 BRG 1 15.6
131 31 BRG 3 0.0
132 32 WRGE 140 3.1
133 33 MA6 42.9
134 34 GJP1406 25.0
135 35 KDVP-1935 0.0
136 36 RPS2007-10 2.9
137 37 SJP-702 14.3
138 38 KPL-44 8.3
139 39 RVSA 07-29 20.5
140 40 BRG 5 8.3
Susceptible check ICP 7119 38.3