contentbsmedia.business-standard.com/_media/bs/data/market-reports/...content annual overview...
TRANSCRIPT

Wednesday| Jan 11, 2017
www.angelcommodities.com
Agri-Commodities Annual Review and Outlook 2017
Content
Annual Overview
- Soybean - Soybean NCDEX technical
- Mustard seed
- Cotton - Cotton MCX technical
- Jeera (Cumin)
Ritesh Kumar Sahu Research Analyst - Agri Commodities [email protected] (022) 3935 8165
Angel Commodities Broking Pvt. Ltd.
Registered Office: G-1, Ackruti Trade Centre, Rd. No. 7, MIDC, Andheri (E), Mumbai - 400 093.
Corporate Office: 6th Floor, Ackruti Star, MIDC, Andheri (E), Mumbai - 400 093. Tel: (022) 2921 2000
MCX Member ID: 12685 / FMC Regn No: MCX / TCM / CORP / 0037 NCDEX : Member ID 00220 / FMC Regn No: NCDEX / TCM / CORP / 0302
Disclaimer: The information and opinions contained in the document have been compiled from sources believed to be reliable. The company does not warrant its accuracy, completeness and
correctness. The document is not, and should not be construed as an offer to sell or solicitation to buy any commodities. This document may not be reproduced, distributed or published, in
whole or in part, by any recipient hereof for any purpose without prior permission from “Angel Commodities Broking (P) Ltd”. Your feedback is appreciated on
Wednesday| Jan 11, 2017
www.angelcommodities.com
Agri-Commodities Annual Review and Outlook 2017
Government announced MSP for kharif crop in June and rabi crops in mid-November. It has increase the minimum prices for almost all the commodities, however, price increase was the highest for pulses and oilseeds crops.
Demonetization also affected the prices and supplies of the agri-commodities. The entire supply chain of agri-commodity has been affected due to cash crunch. It has affected cotton arrivals in the market as farmers are not bringing cotton to the physical market due to shortage of cash payments by the bulk buyers. The consumption and demand of edible oil too was affected due to demonetization.
After two years of drought, India received normal rains in the Jun-Sep monsoon season during 2016. Normal rains have boosted sowing of kharif crops and the country expected a record food grain production, are now pressurizing the prices of both kharif and rabi crops of Soybean, Turmeric, guar complex and Mustard.
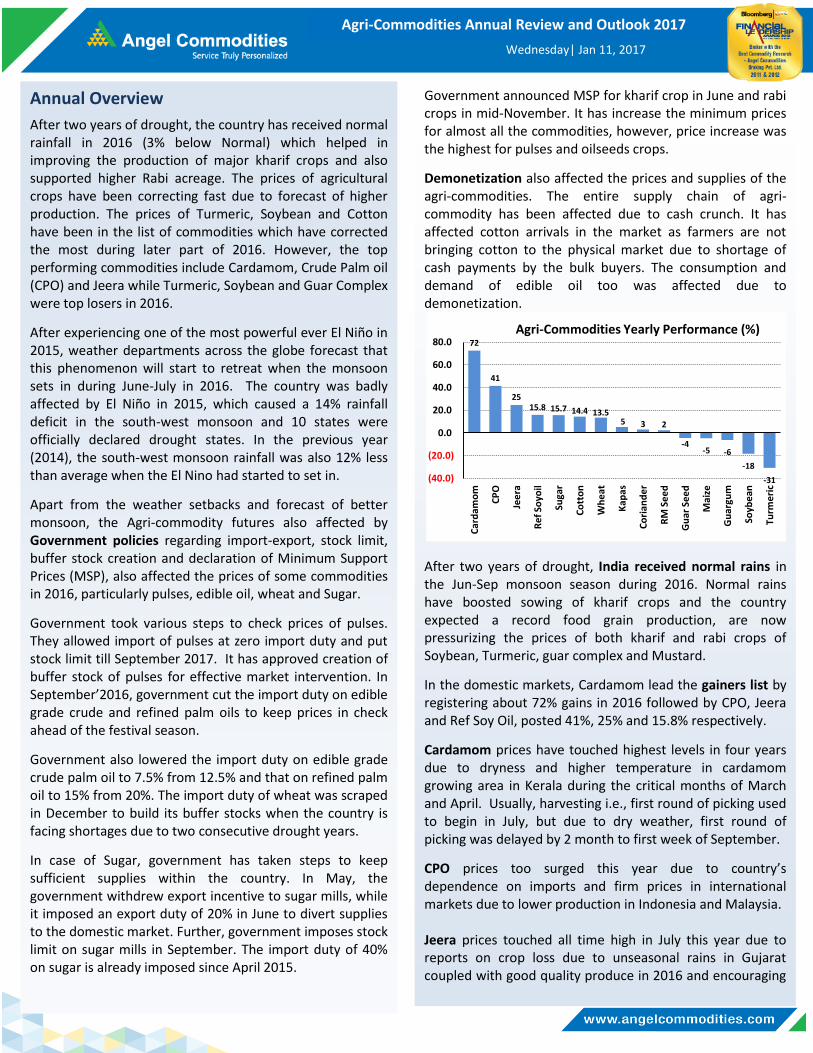
In the domestic markets, Cardamom lead the gainers list by registering about 72% gains in 2016 followed by CPO, Jeera and Ref Soy Oil, posted 41%, 25% and 15.8% respectively.
Cardamom prices have touched highest levels in four years due to dryness and higher temperature in cardamom growing area in Kerala during the critical months of March and April. Usually, harvesting i.e., first round of picking used to begin in July, but due to dry weather, first round of picking was delayed by 2 month to first week of September.
CPO prices too surged this year due to country’s dependence on imports and firm prices in international markets due to lower production in Indonesia and Malaysia. Jeera prices touched all time high in July this year due to reports on crop loss due to unseasonal rains in Gujarat coupled with good quality produce in 2016 and encouraging
72
41
25 15.8 15.7 14.4 13.5
5 3 2
-4 -5 -6
-18
-31 (40.0)
(20.0)
0.0
20.0
40.0
60.0
80.0
Car
dam
om
CP
O
Jee
ra
Re
f So
yoil
Suga
r
Co
tto
n
Wh
eat
Kap
as
Co
rian
de
r
RM
Se
ed
Gu
ar S
ee
d
Mai
ze
Gu
argu
m
Soyb
ean
Turm
eri
c
Agri-Commodities Yearly Performance (%)
Annual Overview
After two years of drought, the country has received normal rainfall in 2016 (3% below Normal) which helped in improving the production of major kharif crops and also supported higher Rabi acreage. The prices of agricultural crops have been correcting fast due to forecast of higher production. The prices of Turmeric, Soybean and Cotton have been in the list of commodities which have corrected the most during later part of 2016. However, the top performing commodities include Cardamom, Crude Palm oil (CPO) and Jeera while Turmeric, Soybean and Guar Complex were top losers in 2016.
After experiencing one of the most powerful ever El Niño in 2015, weather departments across the globe forecast that this phenomenon will start to retreat when the monsoon sets in during June-July in 2016. The country was badly affected by El Niño in 2015, which caused a 14% rainfall deficit in the south-west monsoon and 10 states were officially declared drought states. In the previous year (2014), the south-west monsoon rainfall was also 12% less than average when the El Nino had started to set in.
Apart from the weather setbacks and forecast of better monsoon, the Agri-commodity futures also affected by Government policies regarding import-export, stock limit, buffer stock creation and declaration of Minimum Support Prices (MSP), also affected the prices of some commodities in 2016, particularly pulses, edible oil, wheat and Sugar.
Government took various steps to check prices of pulses. They allowed import of pulses at zero import duty and put stock limit till September 2017. It has approved creation of buffer stock of pulses for effective market intervention. In September’2016, government cut the import duty on edible grade crude and refined palm oils to keep prices in check ahead of the festival season.
Government also lowered the import duty on edible grade crude palm oil to 7.5% from 12.5% and that on refined palm oil to 15% from 20%. The import duty of wheat was scraped in December to build its buffer stocks when the country is facing shortages due to two consecutive drought years.
In case of Sugar, government has taken steps to keep sufficient supplies within the country. In May, the government withdrew export incentive to sugar mills, while it imposed an export duty of 20% in June to divert supplies to the domestic market. Further, government imposes stock limit on sugar mills in September. The import duty of 40% on sugar is already imposed since April 2015.
Wednesday| Jan 11, 2017
www.angelcommodities.com
Agri-Commodities Annual Review and Outlook 2017
First Advance Estimate 2016/17
According to the first advance estimate 2016/17, country is likely to harvest record food grain, pulses and oilseeds crops in the 2016-17 kharif season, as rainfall during the monsoon months have been well distributed compared to last year. Last two years have been drought years witnessed by the country owing to El Nino phenomenon.
Rabi Sowing Progress
According to latest data released by agriculture ministry, total area sown as on Dec 30, 2016 was 583 lakh hectare as against 545.5 lakh hectare (lh) reported year ago. Total sowing of all five rabi crops so far is about 7% higher than normal sowing average for corresponding week last year.
Agriculture Ministry’s latest sowing data shows wheat, pulses & oilseeds sowing in on-going rabi season has picked pace & out-stripped avg. acreage of past five years.
Due to good monsoon and higher support price, wheat acreage has risen by 8% to 292.39 lh, while sowing area of pulses is up 13% at 148.11 lh so far in current Rabi (winter-sown) season. Oilseeds sowing area has risen to 79.48 lh from 71.83 lh. Among Oilseeds, the area under mustard was at 69 lh up 12.6% on year while groundnut was sown across 405,000 ha, up 24.2% on year.
However, the area under coverage under paddy and coarse cereals is lower than last year. Paddy acreage has fallen, however, to 10.68 lh so far this rabi season from 14.77 lh in the same period last year. Coarse cereals sowing area, too, dropped to 52.21 lh from 56.29 lh.
Kharif Crops 2016-17 * 2015-16 ** % chg
Rice 93.88 91.31 2.8
Maize 19.30 15.24 26.6
Coarse Cereals 32.45 27.20 19.3
Tur 4.29 2.46 74.4
Total Pulses 8.70 5.54 57.0
Total Food Grains 135.03 124.01 8.9
Groundnut 6.50 5.34 21.7
Soybean 14.20 8.60 65.1
Total Oilseeds 23.40 16.60 41.0
Cotton # 32.12 30.15 6.5
Sugarcane 305.20 352.10 (13.3)
1st Adv Estimates* Vs 4th Advance Estimates**
(Million tonnes)
Source: Ministry of Agriculture # Million Bales
exports from the country.
Earlier in 2016, Sugar and Cotton prices touch their highs due to reports of lower acreage, weather phenomenon- El Nino (for Sugar) and infestation of pest and diseases led to lower profits for farmers (for cotton). However, prices have corrected due to normal monsoon rains and expectation of better yield. Ref Soy oil prices have also surged due to firm international prices as 85% of soy oil demand of the country is imported.
In case of Wheat, supply deficiency pushed up prices in the domestic market. On NCDEX, from the level of Rs 1,660 a quintal in the beginning of the year, wheat prices have surged to trade currently at Rs 2,100 in November and now easeb by about 5.7% to Rs. 1,980 in December.
Top losers in 2016 were Turmeric, Soybean and Guar complex. Turmeric was the top loser with negative returns of (-) 31% followed by Soybean with (-)18% and Guar Complex prices lost about 4-6% annually but have recovered about 25% at the end of the year from its low prices in May. Turmeric prices were under pressure in 2016 due to good production in previous year and higher carryover stocks. Despite the fall, the prices have been on higher side compared to last two year on good export demand.
In case of Soybean, the reports of good monsoon and forecast of bumper yield dragged lower, the prices during the second half of 2016 while prices of guar complex was under pressure due to lower export demand and good supplies throughout the year. Moreover, the production forecast of higher area and production of guar seed during the current year also weighed on the prices.
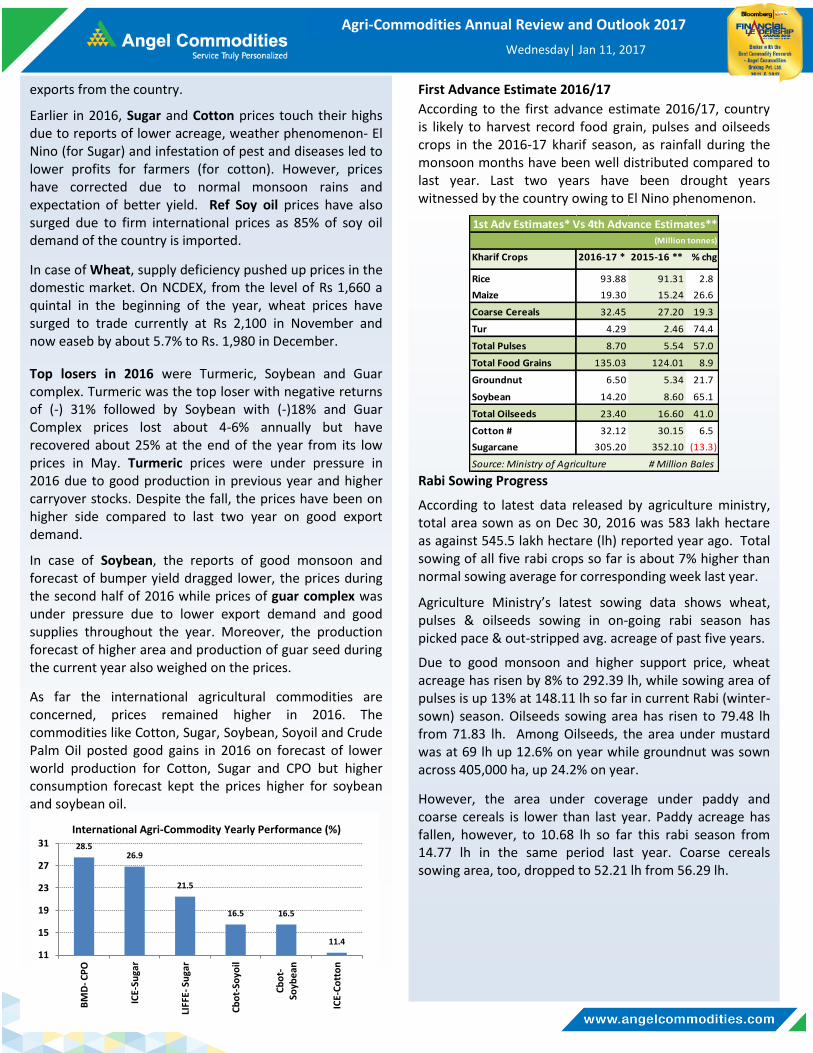
As far the international agricultural commodities are concerned, prices remained higher in 2016. The commodities like Cotton, Sugar, Soybean, Soyoil and Crude Palm Oil posted good gains in 2016 on forecast of lower world production for Cotton, Sugar and CPO but higher consumption forecast kept the prices higher for soybean and soybean oil.
28.5 26.9
21.5
16.5 16.5
11.4
11
15
19
23
27
31
BM
D- C
PO
ICE-
Suga
r
LIFF
E- S
uga
r
Cb
ot-
Soyo
il
Cb
ot-
Soyb
ean
ICE-
Co
tto
n
International Agri-Commodity Yearly Performance (%)

Wednesday| Jan 11, 2017
www.angelcommodities.com
Agri-Commodities Annual Review and Outlook 2017
Higher production forecast
According to Soybean Processors Association of India (SOPA), in December’2016, expected soybean production in the country to touch 114.91 lakh tonnes (lt) in 2016/17 as against 70 lt a year back because of well distributed monsoon rains and good weather conditions across the top soybean producing states of Madhya Pradesh, Maharashtra and Gujarat. In 2015-16, the country had produced 69 lt of soybean.
However, agriculture ministry has pegged India's soybean output in 2016-17 (Jul-Jun) at 14.2 million tonnes (mt), up from 8.6 mt the previous year.
The soybean yield this year (2016-17) is, however, seen higher because of favorable weather conditions in most parts of the country. This year, the yield is seen at 1,047 kg per ha, almost double the yield of 626 kg per ha last year which is the main reason for jump in soybean production despite lower acreage that last year.
According to farm ministry data, the area under the soybean crop across the country was down 1.4% on year at 11.47 million hectares in 2016/17 compared to last year. The acreage is, however, higher than the five-year average of 11.18 mln ha for the period.
The fall in the area under soybean can be attributed to lower acreage in Madhya Pradesh, India's top producer of the oilseed. Soybean was planted across 540 lakh hectares in the state, down 8.6% on year. Floods in most parts of the state during Jul-Aug had damaged the standing crop in these areas. The decline in soybean acreage was also due to the fact that many farmers have shifted to pulses in anticipation of better returns.
Higher Soybean Crushing leads to higher meal export and lower soy oil imports
USDA has increase the soybean crush for India in 2016/17
115 107
95 85.0
69.3
114.9
65 75 85 95
105 115 125 135
2011-12 2012-13 2013-14 2014-15 2015-16 2016-17*
Area and Production of Soybean - India Production (Lakh Tonnes) Area (Lakh Hac)
Source- COOIT *SEA estimate
Soybean
Soybean prices on the NCDEX have been in a down trend for most of 2016, and registered a fall of around 18.3% in 2016, to settle at Rs. 3,029 a quintal (Rs.3700/quintal in January). However, prices have plunged by around 30% from its high of Rs. 4,290, touched in April 2016. In April 2016, Soybean prices made a peak due to lower soybean production in 2015-16, higher import cost of edible oil and lower than expected Rabi oilseed production. However, the prices declined from thereon on forecast of good monsoon, higher imports of cheaper soy oil and low demand for Indian meals in the world market.
On the contrary, soybean price on Chicago Board of Trade (CBOT) ended on positive note, up about 11.7% in 2016. During the first half of 2016, prices increased by 25% due to erratic weather during early part of US planting and heavy rains in Argentina destroyed soybean crop. The record import demand from China also helped in surging the soybean prices.
While during the second half, there was a sharp fall in the soybean prices on expectations of record US and South American output. However, the prices have recovered more than 4.63% since September, well above the $10 bushel mark, due to good export demand for the US soybean and concern about dryness in South American soybean regions.
If we compare the current supply and demand estimates against those from one year ago it looks all too similar and does not seem to justify soybeans above $10 a bushel – especially if the price was below $9 last year. The only thing that supports the world soybean futures price above $10, is the expected weather problems in south America, good US export demand from China, and increase in bio-diesel usage in US.
850
900
950
1000
1050
1100
1150
1200
3000
3200
3400
3600
3800
4000
4200
Jan-1
6
Feb
-16
Mar-1
6
Ap
r-16
May-1
6
Jun
-16
Jul-1
6
Au
g-16
Sep
-16
Oct-1
6
No
v-16
De
c-16
Cbot (Cents/Bushels) NCDEX (Rs/Qtl)
Monthly Average Soybean Price-NCDEX & CBOT - 2016

Wednesday| Jan 11, 2017
www.angelcommodities.com
Agri-Commodities Annual Review and Outlook 2017
last year imports.
According to the SEA latest circular, the import of soybean
oil (degummed) rose sharply to 42.4 lt in 2015-16 soil year
(Oct-Nov) from 29.9 lt last year. The increase of about 42%
on year but the imports in the first month of new oil year
decreased by 37.3% to 1.64 lt compared to 2.62 lt last year
for November.
Global Update
On the global front, world soybean production is forecast at record level in 2016/17 at 338 million tonnes (mt), up 7.9% compared to last year production of 313 mt. The demand-supply situation for soybean in 2016/17 expected to be at comfortable levels due to higher production in top producing countries viz. US, Brazil and China expected to increase about 11%, 5.7% and 6.1% respectively but the production may decrease slightly in Argentina.
The ending stock is expected at 82.9 mt, which is sixth consecutive yearly increase in world ending stocks starting 2011/12.
Thus, global soybean supply and demand estimates for 2016/17 include higher production, exports, and ending
10.9
19.5
29.9
42.4 38.0
0
10
20
30
40
50
2012-13 2013-14 2014-15 2015-16 2016-17*
Yearly Soy oil Imports (in 'lakh tonnes)
Source: SEA (*USDA estimates)
50
55
60
65
70
75
80
85
200
220
240
260
280
300
320
340
360
2011-12 2012-13 2013-14 2014-15 2015-16 2016-17*
Soybean - World Production, Consumption and Ending Stocks (mt)
Source : USDA
< Production < Consumption Ending Stock >
*Forecast
due to abundant harvest this season. The soybean crush figures increased by 51.8% to 85 lt in December report compared to last year estimates of 56 lt.
Due to higher crushing, the soy meal production in 2016/17 will increased to 68 lt from 45 lt estimated last year. Therefore, the export of soy meal is also forecasted to increase this year by more than double to 1.8 lt compared to last years’ exports of 70,000 tons.
The soy meal exports from the country declined continuously since 2013-14 season due to higher prices of soy meal in domestic market compared to price offered by the South American countries. The exports of 34.4 lakh tonnes in 2013-14 came down to 70,000 tonnes in 2015-16.
In 2016-17, according to the Solvent Extractors Association of India (SEA), soya meal exports are higher by about 22.5%, in first eight months of current financial year at 68,470 tonnes compared to 55,889 tonnes last year same period.
Higher crushing of soybean will also affect the soybean oil
imports forecast in the country. The imports of soy oil have
been revised down to 38 lt from 42.4 lt last year. Thus in
2016/17 the imports will be lower by 12.8% compared to
100
82
67
56
76
85
50
60
70
80
90
100
110
2016/17 2016/17
2012/13 2013/14 2014/15 2015/16 Nov Dec
Hu
nd
red
s
Domestic Soybean Crush (Lakh Tonnes)
Source: USDA
34.4
27.8
6.6
0.7 1.8
-
10
20
30
40
2012-13 2013-14 2014-15 2015-16 2016-17*
x 1
00
00
0
Yearly Soy meal exports (in lakh tonnes)
Source: SEA (*USDA estimate)

Wednesday| Jan 11, 2017
www.angelcommodities.com
Agri-Commodities Annual Review and Outlook 2017
stocks compared to last year. There is also an increase in soybean crush volume for all the top producing countries including India. The harvesting in the US, India and China is almost over and the production is on the higher side.
However, record estimates for soybean production depends largely on how the weather will behave in Brazil and Argentina where the crop is still in sowing to developmental stage.
In 2016/17, Brazil and Argentina together are projected to harvest a record 159 mt of soybeans, compared with last year’s production of 153.3 mt. However, in 2015 December, USDA had forecasted a production of 157 mt for 2015/16 season thus the production was short by 3.7 mt due to late-season weather issues like dryness in Brazil and excess rains in Argentina.
Last year it was EL Nino, which was supposed to bring ideal growing conditions for soybean in south America. But this year La Niña- phenomena, is expected in the Eastern Pacific, which has historically suppressed rainfall in South America during the key growing season of soybean (Jan-Mar), mostly in Argentina and Southern Brazil.
Dryness in Argentina has already delayed the sowing progress of soybean this season and the much expected spell of rain in December too missed the key southeastern part of the bread-basket province of Buenos Aires, where dryness is threatening to dent soybean production.
China is the major importer of soybean which imports more than 60% of soybean import volume in world. In 2016-17, soybean imports are expected to increase by 3.33% or 2.8 mt to 86.0 mt due buoyant demand for both food and feed for a China market that is consuming more meat. Similarly, crushing demand too increased in China by 6.6% or 5.2 mt to 86.5 mt in 2016/17.
Fundamental Outlook
The soybean prices already touched it low this season on forecast of record production, record soyoil import in 2015/16 and poor export demand for the domestic soy meal.
The new season soybean arrivals have not yet peaked due to demonetization as farmers are not bringing their produce amid lack of buyers in the physical market. The bulk buyers or oil mills are not willing to procure soybean at higher prices which is putting pressure on price.
We expect the prices to be range bound during the first half of 2017 as arrival of new season crop may continue for next 3-4 months. As per SOPA release, the arrivals of
soybean in the country during Oct-Nov were pegged at 24 lakh tonnes, while availability with farmers was pegged at about 81.3 lt, and 10.5 lt with traders and plant owners. So with the estimate output of more than 114 lt in 2016/17, the arrival pressure will continue till first half of 2017.
At a time when the country is expecting record domestic production of Soybean, high imports figures may further put pressure in domestic prices. About 40,323 tonnes of Soybean have already been imported into India in the first six month of 2016/17 (Apr-Sep) as compared to 20,557 tonnes last year for the whole year, as per Department of Commerce, GoI figures. Imports this year are mainly happening from Ethiopia (Africa).
Internationally, soybean prices have been on uptrend after a torrid 2015, helped by buoyant demand from China, higher use of bio-diesel and disruptions due to weather uncertainties in Argentina and Brazil, two major producers of the commodity. The International soybean prices, is expected to remain volatile and remain at higher levels till the South America crop is harvested in 2017. Any effect of La Nini and weather damage to the soybean during the harvesting time in South America may be positive for soybean prices.
If we see, the historic price movement for the past three years, the prices tends to increase during first three to four months of the year and then there is pressure on the prices, mostly due to low crushing needs as the imports of soyoil get cheaper with the South American harvest end by April-May.
Domestically, the soybean stocks are sufficient but the prices will depend on soy meal export volume and the import dependence of crude soyoil, as India is the largest importer. Technical Levels for 2017
Contract Unit Support Resistance
NCDEX - Soybean ₹/qtl 2,500 / 2,000 3,400 / 3,900
2800
3300
3800
4300
4800
Jan Feb Mar Apr May Jun Jul Aug Sep Oct Nov Dec
Yearly price Comparison of Soybean- NCDEX (Rs per Quintal)
Y 2014 Y 2015 Y2016 Source- NCDEX
Wednesday| Jan 11, 2017
www.angelcommodities.com
Agri-Commodities Annual Review and Outlook 2017
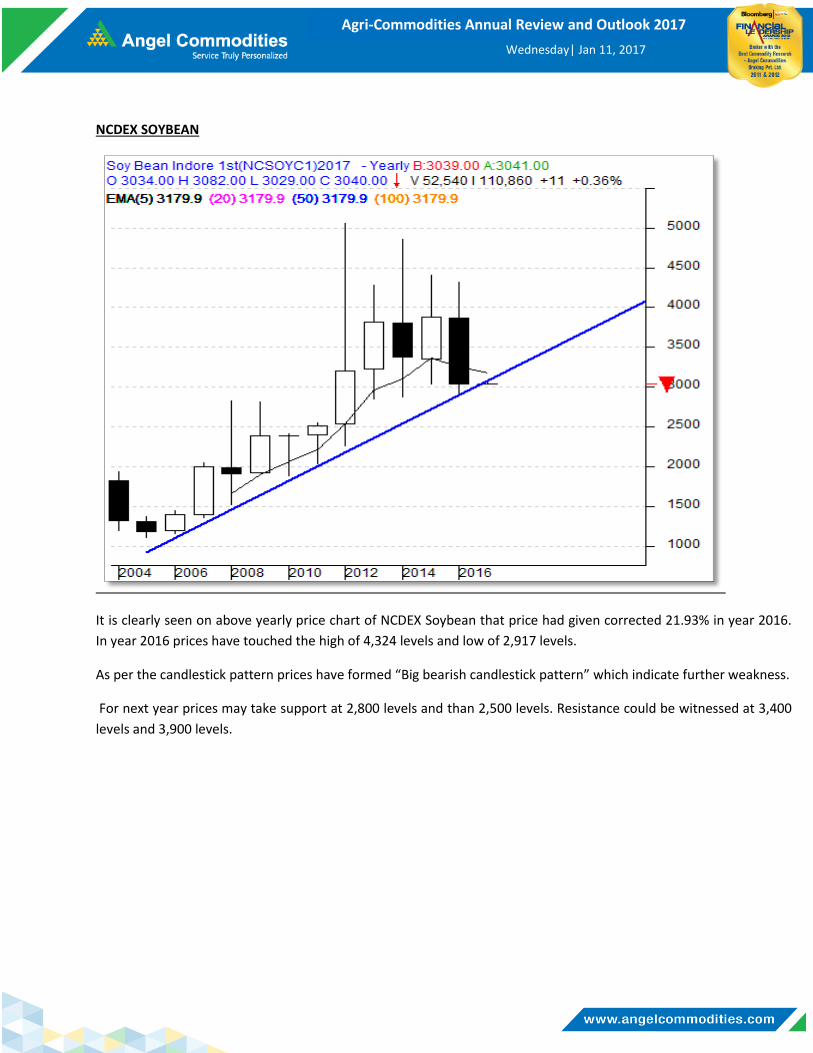
NCDEX SOYBEAN
It is clearly seen on above yearly price chart of NCDEX Soybean that price had given corrected 21.93% in year 2016.
In year 2016 prices have touched the high of 4,324 levels and low of 2,917 levels.
As per the candlestick pattern prices have formed “Big bearish candlestick pattern” which indicate further weakness.
For next year prices may take support at 2,800 levels and than 2,500 levels. Resistance could be witnessed at 3,400
levels and 3,900 levels.

Wednesday| Jan 11, 2017
www.angelcommodities.com
Agri-Commodities Annual Review and Outlook 2017
Mustard seed
In 2016, mustard seed prices moved higher during first half and declined in the second half to close just 2% higher in the year. However, the prices of mustard seed during the calendar year was higher compared to last three years prices due to increasing demand and lower supplies from new year crop to the oil mills as major chunk of mustard seeds was bought by the stockists.
On National Commodities and Derivative Exchange (NCDEX), mustard prices followed seasonality pattern and witnessed a steep decline in first three month of the year to touch its lowest level of Rs.3,800 a quintal in March 2016 and surged about 30% to Rs.4,970 in July. A bullish trend in first half of 2016 was due to good demand for new season crop from the stockists and oil mills on reports of lower output and lower carryover stocks from previous year.
However, the prices started to decline after July due to reports of good monsoon and considerable stocks held by the traders and stockists. Prices slide by more than 10% on chances of normal sowing due to good monsoon showers in mustard growing states. Moreover, extending the stock holding limits for edible oils and oilseeds, by Government for one year in September 2016, also pressurized prices.
In the month of November, sowing picked up pace and soil conditions were favorable for planting in Rajasthan and Gujarat. As a result, prices have again started declining on hopes of better output next season.
Good Sowing Progress
The mustard acreage this season was higher as the farmers have started their sowing early due to better monsoon rains. As per latest agricultural ministry data, as on 30th December, 2016, acreage of mustard seed in the current rabi season was at 68.9 lakh hectares (lh), up 12.6% from 61.2 lh a year ago.
4234
3956
4939
4544.5
3800
4000
4200
4400
4600
4800
5000
Jan-1
6
Feb
-16
Mar-1
6
Ap
r-16
May-1
6
Jun
-16
Jul-1
6
Au
g-16
Sep
-16
Oct-1
6
No
v-16
De
c-16
Source: NCDEX
Monthly Avg Prices of Mustardseed (Rs/Quintal) - NCDEX
The acreage in Rajasthan, the country's largest grower of the oilseed, was at 27.8 lh, up 14.6% on year. Sowing of mustard seed was up in the key growing states of Uttar Pradesh, Madhya Pradesh, Chhattisgarh, Assam, Odisha and Gujarat. In Uttar Pradesh, the area under acreage was at 11.8 lh, up from 11.1 lh a year ago, while in Madhya Pradesh, farmers have sown mustard in 7 lh Vs 6.23 lh last year. Due to demonetization, mustard sowing operations were not affected much, as sowing was started early and farmers had already bought the seeds when it was announced.
Higher Production Estimate
Rajasthan, Uttar Pradesh and Madhya Pradesh are the top three producing states in the country. For 2016/17 rabi season, government has set production target of 85 lakh tonnes (lt) for mustard seed, higher than last year's production of 68 lt, boosted by favorable weather conditions and a higher level of moisture in the soil.
As per fourth Advance estimate for 2015/16, mustard production is pegged at 68.2 lt, up by 8.6% from 62.8 lt produced in 2014/15. The production of mustard seed improved in 2015/16 due to limited loss of crop during the harvesting season despite lower acreage in the country.
In 2014/15, mustard output fell to record low as farmer’s sowed mustard crop on a smaller area than the previous season due to lower price realization in earlier years. Moreover, there was loss due to unseasonal rains during the harvest season.
Rape Oil imports low and meals export may recover
Mustard or rapeseed is known for its rich oil content, is one of the major vegetable oil for human consumption. Moreover, the meal also is quite useful, which contains high-protein, mainly used for animal feed, is mostly in demand in countries like China and Europe for their meat industry.
66.0
80.3 78.8
62.8 68.2
85.0
45
55
65
75
85
95
20
11-
12
20
12-
13
20
13-
14
20
14-
15
20
15-
16
20
16
-17
*
Area and Production of Rape/Mustard seed
Production (lt) Area (Lakh Hac)
Source: Dept of Agriculture, GoI * Target

Wednesday| Jan 11, 2017
www.angelcommodities.com
Agri-Commodities Annual Review and Outlook 2017
India imports oil while exports the meal. The import of mustard oil over the year increased in the country due to cheaper availability, lower import duty and higher demand. In 2016/17, India is expected to import only 4 lt of mustard oil compared to 6.7 lt last year. As per latest USDA report, country will produce about 22 lt of mustard oil while the estimated consumption demand is about 25.4 lt.
Thus, to meet the requirement, country imports rapeseed oil mainly from Canada and European Union but imports are expected to be lower this season due to good mustard production.
India exports rape meal mostly to south-east Asian countries like South Korea, Taiwan, Vietnam, Indonesia and Japan. It is expected that the exports will be little higher in 2016/17 to 3.5 lt from 3.3 lt last year.
Global output to drop in 2016/17
According to the latest estimates by USDA in Dec’16, world rapeseed seed output in 2016/17 may fall for the fourth consecutive year to 67.6 mt, down 3% from last year, led by sharp decline in production in the European Union (EU) and China. Thus, this is the second consecutive year when the production estimates are lower than the consumption forecast. The main rapeseed production countries are European Union (EU), Canada, China, and India.
As the production is declining, the overall consumption and the trade of rapeseed and its derivatives are also waning.
12,943
1,99,891
3,55,824
6,70,538
4,00,000
0
2,00,000
4,00,000
6,00,000
8,00,000
2012-13 2013/14 2014/15 2015/16 2016/17*
Mustard Oil Imports (Tonnes) - (Nov-Oct)
Source: SEA *USDA forecast
9,16,050
10,67,159
3,31,301 3,50,000
-
5,00,000
10,00,000
15,00,000
2013/14 2014/15 2015/16 2016/17*
Mustard Meal Exports (Tonnes) - (Apr-Sep)
Source: SEA *USDA forecast
China the top importer of rapeseed, will import 5.26% less in 2016/17 but imports for EU and Japan increased marginally.
Moreover, the top rapeseed and its derivative consuming countries -China and EU- will consume less of rape meal and oil in 2016/17 compared to last year. China is expected to consume only 10 mt of rape meal, down 10.7% on year while EU will consume 24.2 mt of meal, down by 4.7%. Similarly, rape oil consumption is forecasted to go down by 200,000 tonnes each in China to 8.1 mt and EU to 9.9 mt.
Thus, the supply and demand for the rapeseed is looking quite comfortable; the world ending stock figure for the rapeseed and rapeseed oil is at lowest levels in 4 year.
Outlook In the last one month, prices have been under pressure in the domestic market mainly on good sowing progress in top all the producing states in the country. The higher acreage in the country is due to sizable hike in Minimum Support Price (MSP). From Rs. 3,100 per quintal in 2014/15, MSP was increased to Rs. 3,700 in 2016/17, an increase of Rs. 600. Now the sowing is almost over, weather during the next two month shall be crucial. Favorable weather will boost output and keep prices under check.
The mustard oil imports are expected to be lower in 2016/17 which means there will be good domestic demand for crushing but the prices may not get further boost due to lull export demand for Indian mustard meal.
Mustard price in 2017 will react to the weather forecast over the main mustard growing states. The weather condition during harvesting season is very crucial for a good production after a record sowing. The main price drivers will be weather and export demand for mustard meal.
Technical Levels for 2017
Contract Unit Support Resistance
NCDEX Mustard Seed ₹/qtl 3,700 / 3,100 4,990 / 5,630
62,000
64,000
66,000
68,000
70,000
72,000
74,000
2013/14 2014/15 2015/16 2016/17
World- Production & Consumption of Rapeseed ('000 tonnes)
Production Consumption Source: USDA
Wednesday| Jan 11, 2017
www.angelcommodities.com
Agri-Commodities Annual Review and Outlook 2017
have also supported the prices.
In the International market, the prices have witnessed a steady increase since March due to good appetite for cotton auction in China, lower acreage in China as lower prices prompted farmers to plant other crops. In the US, cotton sowing has affected by tropical storm and dryness in some parts and USDA reports of world consumption to exceed production for the second consecutive year, helped support prices. But the prices corrected in August – September as concerns over weather in top producing regions in India and the United States started to ease & with the cotton imports to China decreasing.
Since September, the domestic prices have corrected but the international prices have surged higher. The domestic prices cooled down on the reports of 4% higher production at 351 lakh bales by Cotton Advisory Board (CAB) due to good yield despite lower acreage while the exports forecast is likely to drop by about 28% to 50 lakh bales as top buyer Pakistan may halve its purchase from India. International prices continue its uptrend due to good exports from the US and ideas that world stock might decrease further than had been thought, fuelled by China's stocks going down.
Domestic Scenario
India's cotton output is forecasted higher compared to last year despite a decline in acreage due to lower incidence of pest attacks in northern India and better weather and soil conditions leading to higher cotton yields in the country.
As per latest forecast by Cotton Association of India (CAI) the forecast is raised for India's cotton production in 2016-17 (Aug-Jul) to 346 lakh bales (1 bale = 170 kg) from 339 lakh bales estimated earlier. With the carryover stocks of about 45 lakh bales and import forecast of 17 lakh bales, the total supplies will be about 408 lakh bales, down 4.4% or 19 lakh bales compared to last year.
On the demand side, the consumption from mills, SSI and non-mills is about 310 lakh bales and the exports are expected to fall to 50 lakh bales in 2016/17 from about 72 lakh bales in the
353
342
398
390
338 336
100
105
110
115
120
125
130
330
340
350
360
370
380
390
400
410
2011-12 2012-13 2013-14 2014-15 2015-16* 2016-17#
Production (Lakh Bales) Area (Lakh Hac) Source: CAB
Yearwise Cotton Area & Production
Cotton
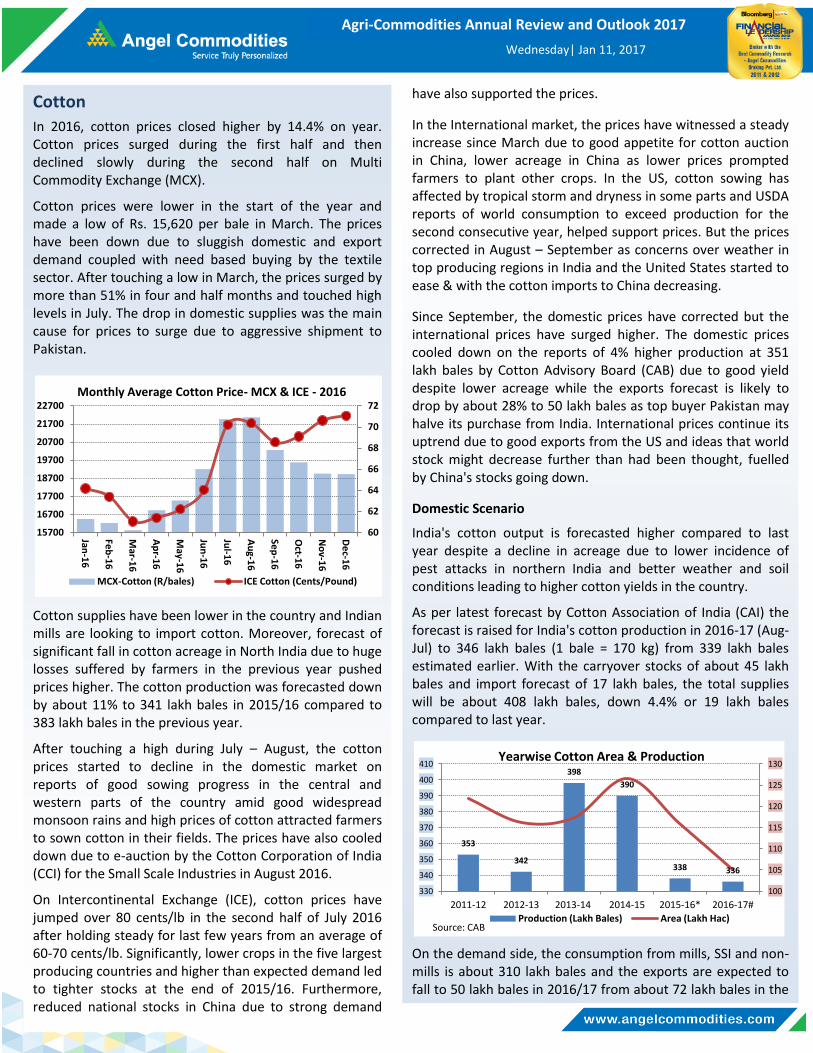
In 2016, cotton prices closed higher by 14.4% on year. Cotton prices surged during the first half and then declined slowly during the second half on Multi Commodity Exchange (MCX).
Cotton prices were lower in the start of the year and made a low of Rs. 15,620 per bale in March. The prices have been down due to sluggish domestic and export demand coupled with need based buying by the textile sector. After touching a low in March, the prices surged by more than 51% in four and half months and touched high levels in July. The drop in domestic supplies was the main cause for prices to surge due to aggressive shipment to Pakistan.
Cotton supplies have been lower in the country and Indian mills are looking to import cotton. Moreover, forecast of significant fall in cotton acreage in North India due to huge losses suffered by farmers in the previous year pushed prices higher. The cotton production was forecasted down by about 11% to 341 lakh bales in 2015/16 compared to 383 lakh bales in the previous year.
After touching a high during July – August, the cotton prices started to decline in the domestic market on reports of good sowing progress in the central and western parts of the country amid good widespread monsoon rains and high prices of cotton attracted farmers to sown cotton in their fields. The prices have also cooled down due to e-auction by the Cotton Corporation of India (CCI) for the Small Scale Industries in August 2016.
On Intercontinental Exchange (ICE), cotton prices have jumped over 80 cents/lb in the second half of July 2016 after holding steady for last few years from an average of 60-70 cents/lb. Significantly, lower crops in the five largest producing countries and higher than expected demand led to tighter stocks at the end of 2015/16. Furthermore, reduced national stocks in China due to strong demand
60
62
64
66
68
70
72
15700
16700
17700
18700
19700
20700
21700
22700
Jan-1
6
Feb
-16
Mar-1
6
Ap
r-16
May-1
6
Jun
-16
Jul-1
6
Au
g-16
Sep
-16
Oct-1
6
No
v-16
De
c-16
MCX-Cotton (R/bales) ICE Cotton (Cents/Pound)
Monthly Average Cotton Price- MCX & ICE - 2016
Wednesday| Jan 11, 2017
www.angelcommodities.com
Agri-Commodities Annual Review and Outlook 2017
consecutive season, which will affect export prospects for India and Pakistan whose mill consumption will decrease by 2% and 1% respectively.
Despite stable world cotton consumption, the overall demand is forecast to exceed world production by 1.7 mt which results into ending stocks for 2016/17 shrinking by 9% to 17.4 mt, which is lowest in five years.
Outlook
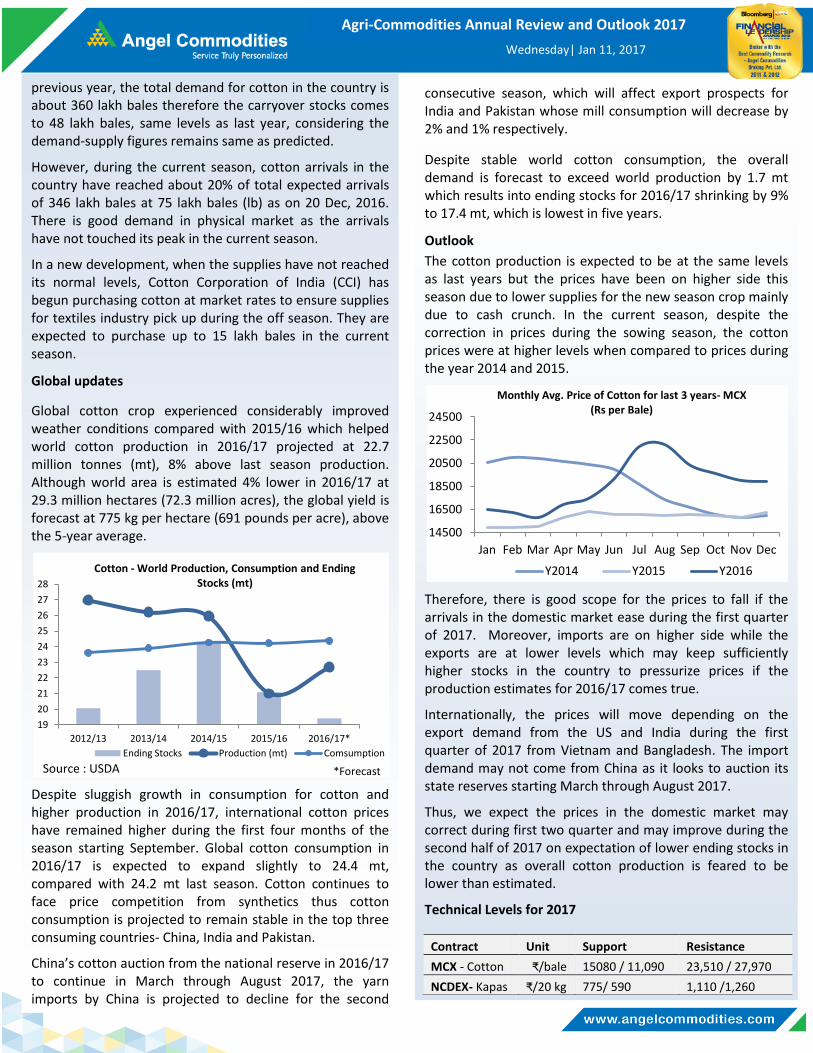
The cotton production is expected to be at the same levels as last years but the prices have been on higher side this season due to lower supplies for the new season crop mainly due to cash crunch. In the current season, despite the correction in prices during the sowing season, the cotton prices were at higher levels when compared to prices during the year 2014 and 2015.
Therefore, there is good scope for the prices to fall if the arrivals in the domestic market ease during the first quarter of 2017. Moreover, imports are on higher side while the exports are at lower levels which may keep sufficiently higher stocks in the country to pressurize prices if the production estimates for 2016/17 comes true.
Internationally, the prices will move depending on the export demand from the US and India during the first quarter of 2017 from Vietnam and Bangladesh. The import demand may not come from China as it looks to auction its state reserves starting March through August 2017.
Thus, we expect the prices in the domestic market may correct during first two quarter and may improve during the second half of 2017 on expectation of lower ending stocks in the country as overall cotton production is feared to be lower than estimated.
Technical Levels for 2017
Contract Unit Support Resistance
MCX - Cotton ₹/bale 15080 / 11,090 23,510 / 27,970
NCDEX- Kapas ₹/20 kg 775/ 590 1,110 /1,260
14500
16500
18500
20500
22500
24500
Jan Feb Mar Apr May Jun Jul Aug Sep Oct Nov Dec
Monthly Avg. Price of Cotton for last 3 years- MCX (Rs per Bale)
Y2014 Y2015 Y2016
previous year, the total demand for cotton in the country is about 360 lakh bales therefore the carryover stocks comes to 48 lakh bales, same levels as last year, considering the demand-supply figures remains same as predicted.
However, during the current season, cotton arrivals in the country have reached about 20% of total expected arrivals of 346 lakh bales at 75 lakh bales (lb) as on 20 Dec, 2016. There is good demand in physical market as the arrivals have not touched its peak in the current season.
In a new development, when the supplies have not reached its normal levels, Cotton Corporation of India (CCI) has begun purchasing cotton at market rates to ensure supplies for textiles industry pick up during the off season. They are expected to purchase up to 15 lakh bales in the current season.
Global updates
Global cotton crop experienced considerably improved weather conditions compared with 2015/16 which helped world cotton production in 2016/17 projected at 22.7 million tonnes (mt), 8% above last season production. Although world area is estimated 4% lower in 2016/17 at 29.3 million hectares (72.3 million acres), the global yield is forecast at 775 kg per hectare (691 pounds per acre), above the 5-year average.
Despite sluggish growth in consumption for cotton and higher production in 2016/17, international cotton prices have remained higher during the first four months of the season starting September. Global cotton consumption in 2016/17 is expected to expand slightly to 24.4 mt, compared with 24.2 mt last season. Cotton continues to face price competition from synthetics thus cotton consumption is projected to remain stable in the top three consuming countries- China, India and Pakistan.
China’s cotton auction from the national reserve in 2016/17 to continue in March through August 2017, the yarn imports by China is projected to decline for the second
19
20
21
22
23
24
25
26
27
28
2012/13 2013/14 2014/15 2015/16 2016/17*
Tho
usa
nd
s
Cotton - World Production, Consumption and Ending Stocks (mt)
Ending Stocks Production (mt) Comsumption
Source : USDA *Forecast
Wednesday| Jan 11, 2017
www.angelcommodities.com
Agri-Commodities Annual Review and Outlook 2017
MCX COTTON
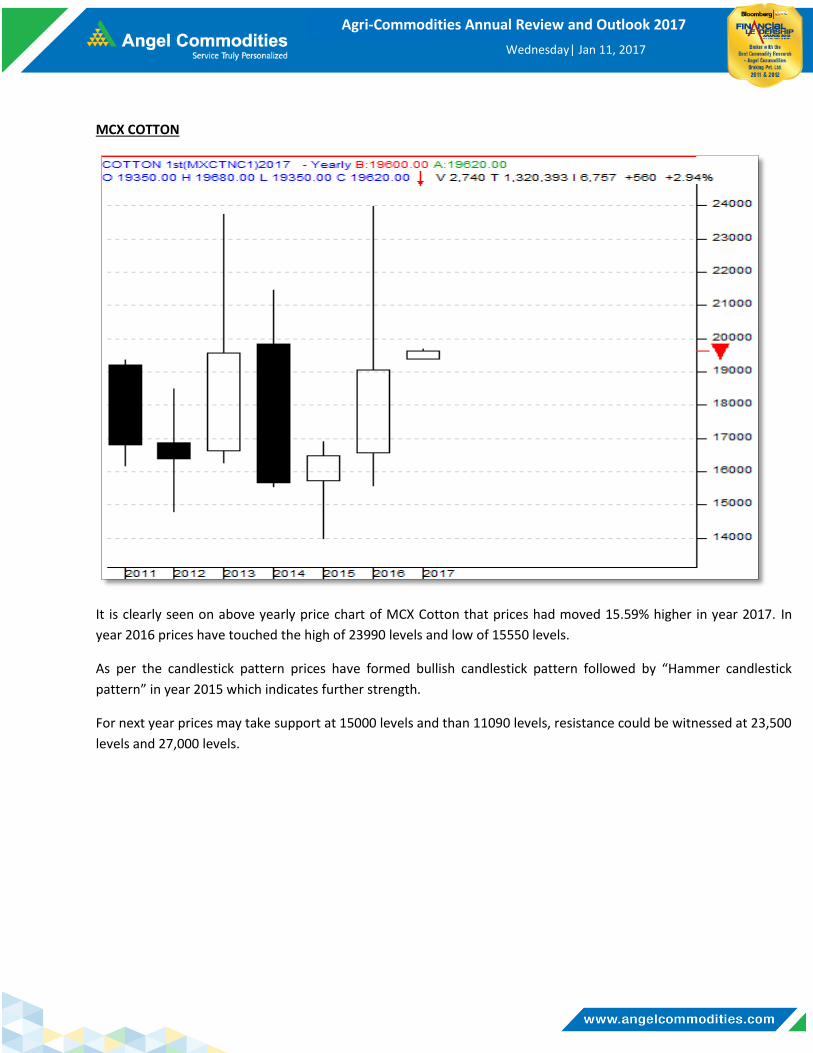
It is clearly seen on above yearly price chart of MCX Cotton that prices had moved 15.59% higher in year 2017. In
year 2016 prices have touched the high of 23990 levels and low of 15550 levels.
As per the candlestick pattern prices have formed bullish candlestick pattern followed by “Hammer candlestick
pattern” in year 2015 which indicates further strength.
For next year prices may take support at 15000 levels and than 11090 levels, resistance could be witnessed at 23,500
levels and 27,000 levels.

Wednesday| Jan 11, 2017
www.angelcommodities.com
Agri-Commodities Annual Review and Outlook 2017
Jeera
Jeera ended 2016 with a gain of 24.6% over last year due to good domestic demand and improved exports amid good quality production during 2015/16 season. On NCDEX, Jeera prices touched all time high of Rs. 19,810 per quintal in July from the low of 13,145 levels in February. However, Jeera prices ended 10% lower, from high levels to settle at Rs. 17,810 per quintal at the end of the year.
In 2016, traders and stockists have received higher domestic demand for new season Jeera early in the season when the harvest started in March due to good quality production. During the last two years there were quality issues. This is the second straight year when the prices have been higher during the harvesting season.
In 2016, jeera prices were nearly up 10-15 % during March and for the first half prices have surges about 37% from February lows, solely due to increased demand and fears of crop damage on account of the recent unseasonal rains in the key growing regions of western India. Moreover, arrival had been a bit late in Gujarat due to delayed planting as the weather was quite hot at the early stage of sowing.
After attaining higher levels, the prices started to correct during August, September and October due to limited export demand at comparatively higher prices in domestic market, harvesting season in Syria & Turkey and promising start to monsoon rain, put pressure on the price.
However, the prices again started to recover in November and December due to emergence of fresh buying in domestic as well as export demand emerged since the prices fell to a fresh low during October.
Sowing Progress
The Jeera crop is expected to be good in 2016/17 due to higher prices realization by the farmers during last year. Moreover, most parts of North-West India have received normal to excess rainfall during the monsoon months will
13000
14000
15000
16000
17000
18000
19000
20000
Jan-1
6
Feb
-16
Mar-1
6
Ap
r-16
May-1
6
Jun
-16
Jul-1
6
Au
g-16
Sep
-16
Oct-1
6
No
v-16
De
c-16
Source: NCDEX
Monthly Avg Closing Price- Jeera (Rs/Qtl)- 2016
support good yield and higher acreage.
However, the progress of Jeera sowing in Gujarat is lower than the last year acreage. As on 26-Dec-16, Gujarat farmers have planted jeera in 2,67,100 hectares, down by 1200 hectares compared to last year acreage of 2,68,300 hectares same period.
Production forecast higher
Rajasthan and Gujarat are the top jeera producing states in the country which account for 80% of crop. In 2015-16, country produce highest ever jeera recorded in the country as per Department of Agriculture, Cooperation and Farmers Welfare (Horticulture Division). In its 3rd advance estimate, total production of Cumin (Jeera) seed is projected at 3.74 lt, up by 18% compared to previous year production.
In 2016-17, the production will depend on the acreage in Gujarat and Rajasthan, which according to market sources, may be at the same levels or little better than the last year production.
However, the production will depend on the weather and climate during the growth season of jeera crop which requires cool temperature and lower moisture. Jeera is very sensitive to change in temperature and moisture as it is susceptible to pest and disease attack. Moreover, weather during the harvesting period in March is very crucial for the production and quality purpose.
Exports to remain good
According to Dept of Commerce data, the export of jeera during first 6 month of 2016/17 (Apr-Sep) is 70,800 tonnes, up 51% to last year same period. Moreover, as per traders, India's jeera exports are likely to rise 30% to 88,000 tonnes in Apr-Dec, because of robust demand from overseas market and negligible stocks in other exporting nations.
2.20 2.48
3.41 3.17
3.74 4
1.50
2.00
2.50
3.00
3.50
4.00
4.50
20
11
-12
20
12
-13
20
13
-14
20
14
-15
20
15
-16
20
16
-17
*
Jeera Production (Lakh Tonnes)
Source: Spice Board *Forecast
Wednesday| Jan 11, 2017
www.angelcommodities.com
Agri-Commodities Annual Review and Outlook 2017
In the first six months of FY 2016/17, jeera exports has achieved about 72% of last year’s export volume due to good export demand which means that the exports will surpass last year figures of 98, 600 tonnes.
The top six-export destinations for jeera are Vietnam, USA, Bangladesh, UAE, Brazil and Malaysia. Vietnam is the largest importer in 2016/17, crossing last year’s import figures by 5.4% to 26,000 tonnes and is expected to import more in coming months. It imports more than 41 % of total jeera from India.
Low availability of stocks in Syria, Turkey and China is another reason that the India’s exports will be higher this financial year. Geopolitical uncertainties in Syria and lower output in the other two countries have left India being the sole supplier in the global market. The new crop in Syria and Turkey is harvested in Aug-Sep, so until then, Indian jeera will find a good market overseas. The harvest period in India for cumin starts around Feb-Mar. Fundamental Outlook
As the sowing of jeera commenced in Gujarat and Rajasthan in full swing during December 2016, the prices started to correct from the higher levels. The sowing progress was quite rapid during the early part of Rabi season on adequate moisture and farmers getting good returns in 2015 and 2016.
During the second half of 2016, the prices were above last 2 years levels due to good demand from the stockists and exporters while the supplies were steady in the domestic market.
The domestic prices of cumin seed mainly depends on the forecast of area and production, weather during crop development stages, carryover stocks and export demand. Market is expecting a bumper crop during 2016-17 due to good sowing progress.
0
50000
100000
150000
200000
20
11
-12
20
12
-13
20
13
-14
20
14
-15
20
15
-16
20
16
-17
*
Cumin Exports ( Tonnes) : India
Source: Spice Board * Dept of Commerce (Apr-Sep)
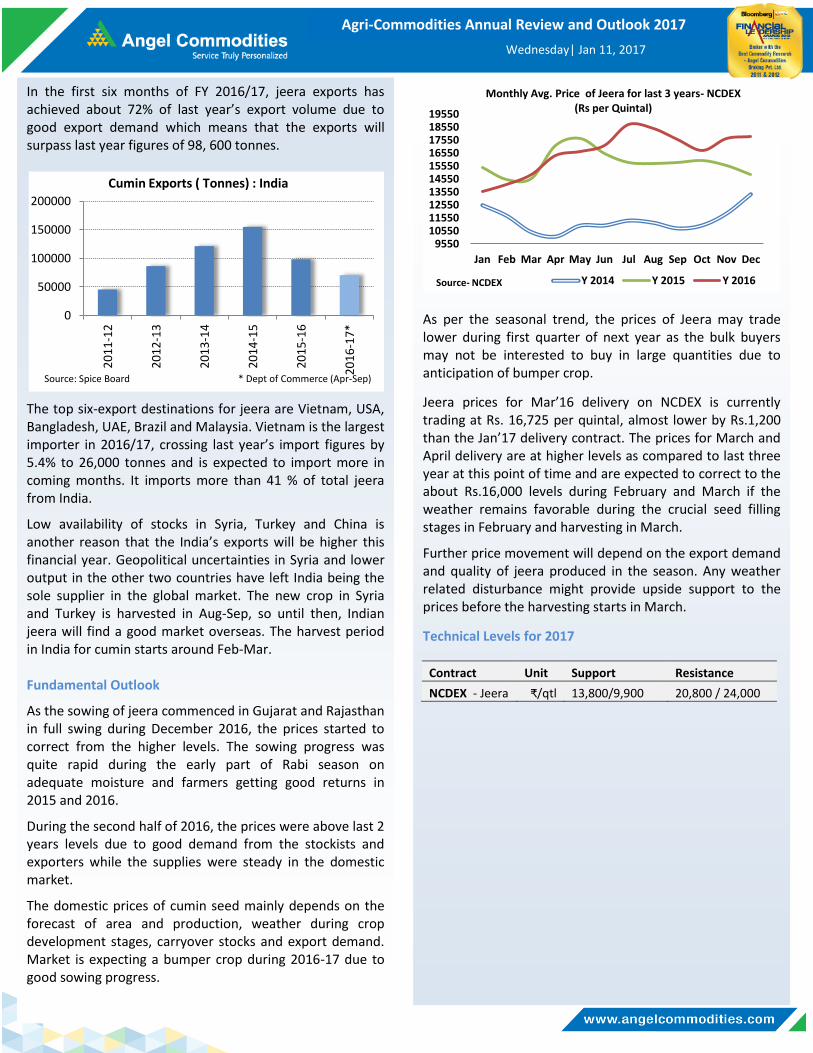
As per the seasonal trend, the prices of Jeera may trade lower during first quarter of next year as the bulk buyers may not be interested to buy in large quantities due to anticipation of bumper crop.
Jeera prices for Mar’16 delivery on NCDEX is currently trading at Rs. 16,725 per quintal, almost lower by Rs.1,200 than the Jan’17 delivery contract. The prices for March and April delivery are at higher levels as compared to last three year at this point of time and are expected to correct to the about Rs.16,000 levels during February and March if the weather remains favorable during the crucial seed filling stages in February and harvesting in March.
Further price movement will depend on the export demand and quality of jeera produced in the season. Any weather related disturbance might provide upside support to the prices before the harvesting starts in March. Technical Levels for 2017
Contract Unit Support Resistance
NCDEX - Jeera ₹/qtl 13,800/9,900 20,800 / 24,000
9550 10550 11550 12550 13550 14550 15550 16550 17550 18550 19550
Jan Feb Mar Apr May Jun Jul Aug Sep Oct Nov Dec
Monthly Avg. Price of Jeera for last 3 years- NCDEX (Rs per Quintal)
Y 2014 Y 2015 Y 2016 Source- NCDEX