annual market report - indianapolis business journal · in 2011 cassidy turley will continue to...
TRANSCRIPT

Annual Market ReportIndianapolis, Indiana 2011
Copyright aboveallphoto.com 2010

January 2011
www.cassidyturley.com | 1
Dear Colleagues,
On behalf of all of our associates, I would like to thank you, our clients and friends, for your tremendous
support over the year. I am pleased to report that despite a challenging economy, with your help,
2010 was a year of exciting change and growth for our company. As of March 1 we launched a new
corporate brand, Cassidy Turley, with 60 locations and over 2,800 associates, including 900 brokers.
More importantly, we have been recognized for our performance; we are the #1 commercial
brokerage fi rm and #1 commercial property management fi rm in Indianapolis, as ranked
by Indianapolis Business Journal, and the #1 property management fi rm in the Midwest, as
ranked by Midwest Real Estate News. Nationally we are a dominant advisor in capital markets
transactions, recently ranked #1 in offi ce sales in three of the six top markets by Real Estate
Alert. At the same time, we support over 25,000 corporate services locations domestically.
The Indianapolis commercial real estate market endured another trying year in 2010 as the lingering burdens
on the fi nancial markets continued, credit conditions remained tight, and the employment engine failed
to gather steam. Although these obstacles hampered the market and challenged business and consumer
confi dence, at year’s end we witnessed growth, albeit limited, in virtually every commercial real estate sector.
Of particular note, the industrial sector absorbed more than 3 million square feet in 2010, and the offi ce
sector moved into positive territory, thanks to a rebound in the second half of the year when occupancy
increased by 335,000 square feet. As we embark upon 2011, the Central Indiana market is in better
condition than many of our peer cities with strong assets and new development opportunities on the horizon.
In 2011 Cassidy Turley will continue to expand our reach into more major markets across the country, to
supplement our service delivery for our clients. Internationally, in 2010 we created a partnership with GVA
Grimley, the founder and majority shareholder of GVA Worldwide, to enhance our global service delivery.
Challenging economic times make insight into the real estate market even more critical to business
success. To help you identify the opportunities that exist within the Central Indiana commercial real
estate market, we are pleased to provide you with this 2011 Annual Market Report. As you review
the enclosed information, we hope you continue to think of us to fulfi ll your commercial real estate
service needs. Our team of more than 200 Indianapolis associates stands ready to assist you!
Sincerely,
Jeffrey L. Henry, SIOR
Managing Principal, Indianapolis
Regional Leader, North Central Region
2011 Market ReportIndianapolis, Indiana
Economic Overview 2
Industrial Market 8
Offi ce Market 18
Retail Market 25
Investment Market 28
Land Market 34
Associates 40
CONTENTS

2 | We know The State of Real Estate®
2011 Market Report
ECONOMYAt a glance
Economic Overview
the PMI of 56.6 percent for November is
annualized, it corresponds to a 4.9 percent
increase in GDP annually. The continued
expansion of new orders and the pace
of production within the manufacturing
sectors will be important drivers in
boosting GDP between 4 and 7 percent.
While GDP growth has been disappointing,
corporate profi ts have been a clear silver
lining in this recovery. According to the U.S.
Department of Commerce, corporations
earned profi ts at an annual rate of $1.7
trillion in the third quarter. This marked
the seventh consecutive quarter of growth
at some of the fastest rates in history.
This historical rate is partly attributable to
strong productivity growth as well as profi ts
from abroad. As a share of GDP, corporate
profi ts have also been increasing and now
represent 11.2 percent of total output,
which is the highest share since the fourth
quarter of 2006. Historically, corporate
profi ts would translate into healthy job
creation six to nine quarters later. However,
small businesses are still struggling, and
they typically account for 60 percent of
total job creation. Positively for corporate
profi ts, according to the Institute of Supply
Management, overall expectations for the
manufacturing sector are for a continuation
of the economic recovery that began in mid-
2009 with overall manufacturing revenues
increasing by 5.6 percent in 2011. The
non-manufacturing sector appears slightly
less positive about 2011, expecting revenues
to increase by 3.4 percent during the year.
Confi dence remains the key variable
underlying the pace of improvement of
virtually every segment of the economy and,
correspondingly, the commercial real estate
market. The Conference Board Consumer
Confi dence Index, which had improved in
October, increased further in November. At
U.S. EconomyThe U.S. economy lost the momentum
it originally exhibited coming out of the
recession with many of the economic
drivers that were propelling growth, such
as homes sales, retail sales and exports,
having all declined signifi cantly from the
levels recorded at the midpoint of 2010.
Real Gross Domestic Product (GDP), the
output of goods and services produced
by labor and property within the country,
increased at an annual rate of 2.5 percent
in the third quarter of 2010. This increase
primarily refl ected positive contributions
from personal consumption expenditures,
private inventory investment, nonresidential
fi xed investment, exports, and federal
government spending that were partly offset
by a negative contribution from residential
fi xed investment. Real GDP is now on
pace to grow at a rate below 3 percent
for all of 2011. For perspective, the last
strong recovery in the U.S. occurred in the
early 1980s when GDP ranged between
4 and 7 percent immediately following
the decade’s economic downturn.
Optimistically, fourth-quarter reports from
the Institute for Supply Management’s
Report on Business bode well for an increase
in GDP growth. According to the report,
economic activity in the manufacturing
sector expanded in November for the 16th
consecutive month with both new orders
and production continuing to expand as
the Production Managers Index (PMI)
registered 56.6 percent. A reading above
50 percent indicates the manufacturing
economy is generally expanding; below 50
percent indicates it is generally contracting.
The past relationship between the PMI
and the overall economy indicates that the
average PMI for January through November
of 57.3 percent corresponds to a 5.1
percent increase in GDP. Additionally, if
Economic Trajectory Is Up, Commercial Real Estate Markets
Will See Limited Improvement in 2011
U.S.
Economy
2009 2010 Outlook
2011
Real GDP
Non-farm
Equipment
Offi ce-Using
Equipment
Industrial
Employment
Retail
Employment
Consumer
Confi dence
CPI Infl ation
Unemployment
Manufacturing
Index (ISM)
Retail Sales
Existing
Home Sales
Existing
Home Prices
Housing Starts
U.S. Industrial
Absorption
U.S. Offi ce
Absorption

January 2011
www.cassidyturley.com | 3
Economic / MARKET TRACKERthe close of November, the Index stood at
54.1 (1985=100), up from 49.9 in October.
Consumer confi dence now stands at its
highest level in fi ve months, and although
the October-to-November increase was
slight, the index suggests the economy is
still expanding, albeit slowly. Importantly,
consumer expectations, the main driver
of the November increase in confi dence,
are now at the highest level since May.
Consumers’ appraisal of business conditions
was more optimistic in November than
October. Those anticipating an improvement
in business conditions over the next six
months rose to 16.7 percent from 15.8
percent, while those anticipating business
conditions will worsen declined to 12.1
percent from 14.4 percent. Consumers were
also more upbeat about future job prospects.
Those expecting fewer jobs in the months
ahead declined to 18.8 percent from 22.3
percent, while the percentage expecting
more jobs rose to 15.5 percent from 14.5
percent. Just as importantly, the proportion
of consumers expecting an increase in
their incomes increased to 10.6 percent
from 9.7 percent. What remains to be seen,
however, is whether the improvement in
consumers’ moods will translate into an
improved employment picture in 2011.
Commercial real estate demand is highly
dependent upon job creation. Employment
dropped drastically during the 2007-2009
recession, and the economic malaise was
especially burdensome on small businesses.
Nationally, employment for small businesses
with fewer than 50 employees has already
decreased by 1.9 million workers over the
past two years. Domestic employment levels
for professional and business services, a key
driver of offi ce sector demand, bottomed
out in the third quarter of 2009, while
employment in the retail and manufacturing
sectors declined in the fourth quarter
of 2009. Since then, employment has
improved in all three sectors, but the U.S.
economy still needs to replace the 6.7
million jobs that were lost in 2008 and
2009 in order for vacancy to return close
to its pre-recession levels. From January
through November 2010, the U.S. created
1.2 million private sector jobs according to
the Bureau of Labor Statistics (BLS). While
that was a healthy number relative to the
job increases experienced in the 1991 and
2001 recession-recovery periods, it was not
enough to lower the unemployment rate,
which rose to 9.8 percent in November.
With the current recovery tracking much
slower, as demonstrated by employment
increasing by just 39,000 from October
to November, national unemployment
is now expected to remain elevated
above 9.5 percent through 2011.
2010 levels of worker productivity offer the
promise of helping to support job creation in
2011, thereby strengthening a commercial
real estate rebound. Companies cut payrolls
during the recession by 8.4 million jobs from
December 2007 to December 2009, and
productivity surged as companies were able
to produce more with fewer workers. The
slow pace of worker productivity witnessed in
2010 is an encouraging sign that companies
will have to step up their hiring of laid-off
workers as declining labor productivity
has historically correlated with improved
job growth. Productivity grew at an annual
rate of 1.9 percent in the third quarter, a
rebound from a decline of 1.8 percent in
the second quarter. Notably, the second-
quarter decline had been the biggest drop
in nearly four years, indicating that many
companies have reached the limit of how
much they can stretch their existing work
forces. Even with the slight improvement
in productivity in the third quarter, the
1.9 percent rate is still well below the 3.5
percent increase turned in for all of 2009.
Another development that will support job
creation in the short term is the December
enactment of the $858 billion tax-cut
package that extends for two years all of
the Bush-era income tax cuts which were
scheduled to expire at the end of 2010. It
Private Sector Employment
Source: BLS; Cassidy Turley Research
Source: BLS; Cassidy Turley Research
Source: BLS; Cassidy Turley Research
Unemployment too High to Push Rents
Modest Increase in Demand Continues
-100
-50
0
50
100
150
200
250
300
Nov-09
Dec-09
Jan-10
Feb-10
Mar-10
Apr-10
May-10
Jun-10
Jul-10
Aug-10
Sep-10
Oct-10
Nov-10
Thousa
nds
Month/Month Net Change, SA
Historical Monthly
Avg = 96,000
Square
Feet
(Millions)
Job G
row
th (
Year/Year %
Change)
Office Absorption Industrial Absorption
Private Sector Jobs
-60
-40
-20
0
20
40
60
2000
2001
2002
2003
2004
2005
2006
2007
2008
2009
2010
-8%
-6%
-4%
-2%
0%
2%
4%
0
2
4
6
8
10
12
2000
Q1
2001
Q4
2003
Q3
2005
Q2
2007
Q1
2008
Q4
2010
Q3
Unem
plo
yment
(%)
$10
$14
$18
$22
$26
$30
Ask
ing R
ents
Office Asking Rents Unemployment

4 | We know The State of Real Estate®
2011 Market ReportEconomic Overview
also provides workers a one-year payroll
tax cut, extends emergency unemployment
benefi ts for 13 months, renews various tax
breaks for specifi c types of important local
businesses ranging from renewable-energy
producers to motor speedways, and gives
businesses an incentive to invest in new
equipment by allowing them to expense 100
percent of their capital expenditures in 2011.
In the near term, the temporary tax cuts
and spending increases will help boost the
economy. Moody’s Analytics estimates that
an additional 1.6 million jobs could be added
in 2011 by the extension of the tax cuts and
increased spending. Historically offi ce-using
jobs account for 20 percent of job growth, so
assuming Moody’s estimates are accurate,
this would equate to an additional 320,000
offi ce-using jobs for the U.S. economy.
What is more uncertain is the long-term
economic impact of the tax cuts and how
heavily the ballooning federal debt will
weigh upon the nation’s economic output.
There is no doubt that federal spending
plays a signifi cant role in the U.S. economy.
Public debt has increased signifi cantly over
the past two years due to increased federal
spending. Federal outlays currently account
for an estimated 19 percent of national
GDP, and that percentage is growing. Over
the past year, federal outlays increased 2.7
percent annually, slightly higher than the
30-year average increase of 2.5 percent.
To address debt, the 112th Congress will
need to examine federal revenues and
spending and determine which programs
to curtail or cut. Looking back over the past
25 years, a divided or unifi ed government
has not made a signifi cant impact on federal
spending. The federal government has
continued to increase spending, regardless
of political party control. The main issue
continues to be which federal programs
or initiatives are retained or cut. History
also demonstrates that funding for specifi c
programs signifi cantly impacts procurement
expenditures for private sector contracts.
Additionally, changes in federal government
employment affect the private sector with
1.1 to 3 contractor jobs created for every
federal government job. Depending on how
aggressively Congress implements spending
cuts to combat the economic burden caused
by the increasing debt, commercial offi ce
demand across the country tied to federal
contracting could be strongly impacted.
The Federal Reserve has also been engaged
in actions intended to support the growth of
the U.S. economy. The Federal Reserve has
kept the federal funds rate, a benchmark
for interest rates and the central bank’s
key tool to spur the economy, at historic
lows near zero since the fourth quarter
of 2008 and recently stated that it would
continue to keep the rate at low levels for an
“extended period.” Despite this, consumers
and businesses have remained reluctant
to spend and economic growth has been
abysmal. As a result, in November the
Federal Reserve announced its second
round of Quantitative Easing, known as QE2,
whereby the central bank will purchase
$600 billion in long-term U.S. Treasury
bonds in an effort to push down long-term
interest rates. The fi rst round of quantitative
easing, from January 2009 to March 2010,
resulted in the repurchase of approximately
$1.4 trillion in mortgage-backed securities
and Treasury securities. Although it is
generally credited for helping the U.S. avoid
an economic collapse, the U.S. recovery has
failed to return to healthy growth. According
to Moody’s Analytics, QE2 will raise GDP
growth by an additional 60 bps, promote
job creation, and lower the unemployment
rate by half a percentage point in 2011.
Any boost to the economy will generate
greater demand for offi ce and warehouse
space. Perhaps the greater impact from
QE2 will be a general loosening of overall
lending conditions. The Federal Reserve
has reported that banks’ loan volume for
commercial real estate is down 8 percent
in 2010 compared to a year ago. Injection
of additional liquidity into an economy that
is already on the mend should result in
increased loan volume. Another important
side effect to watch for is whether or not QE2
will have an impact on consumer confi dence,
which is highly correlated with occupancy
rates in commercial real estate. Although the
impact and effi cacy of QE2 is the subject of
debate by many economists and commercial
real estate professionals, it demonstrates
that the Federal Reserve remains engaged in
taking actions to support economic growth.
Despite the Federal Reserve’s engagement
in keeping interest rates low through the
implementation of policies such as QE2,
rates continue to rise in the U.S. and,
indeed, around the world for a multitude of
reasons. An important determination which
remains to be seen is whether rising interest
rates are a function of the newly elevated
risks associated with U.S. long-term debt
or if it is a manifestation of an economic
recovery. Historically, a rise in interest rates
has been a harbinger of a strengthening
economy. This was the case following nearly
every recession post World War II. If interest
rates are rising because the economy
is becoming more robust, then all the
metrics that go into a building’s pro forma
should also be improving (e.g., stronger
absorption, lower vacancy, eventually
leading to higher rents). Although the pro
forma repair work has begun, the reality is
that slow job growth and an oversupply of
empty space make it unrealistic to expect
that net operating income growth will keep
pace with a sudden spike in treasuries.
Of course there are factors other than
interest rates to consider in determining
the future direction of property values. In
2010 national investment sales volume,
though better than 2009, was still down
82 percent from its peak in 2007. In other
words, record low interest rates have not
translated into robust sales. A primary
reason for this is the fact that in 2010 large
commercial banks were still, on net, paying
down debt. If lending conditions return to
normal prompted by a stronger economic

www.cassidyturley.com | 5
January 2011
Economic / MARKET TRACKERrecovery which will be refl ected in part
in rising interest rates, then debt should
begin to resemble something that looks a
bit like normal. That would create a new
wave of demand which would ultimately
produce cap rate compression and drive
commercial real estate values upward.
Central Indiana EconomyThe Central Indiana economic outlook for
2011 brightened somewhat at the close of
2010 as the Leading Index for Indiana (LII)
increased slightly for the third consecutive
month to 96.9. The LII saw a substantial
increase in October, rising from 96.4 to
96.8, and a smaller but still encouraging
increase in November to 96.9. The LII is an
index developed by the Indiana Business
Research Center designed to refl ect the
structure of the state economy and predict,
in a general way, the direction of economic
activity within the next several quarters.
It is comprised of fi ve national measures
that become available more quickly than
do state-level data, thereby offering a more
timely view of future conditions. The fi ve
components of the index are the National
Association of Home Builders Housing
Market Index, the Census Bureau’s value of
unfi lled motor vehicle and parts orders, the
interest rate spread between the Federal
Funds rate and the 10-year Treasury yield,
the Purchasing Managers Index, and the
Dow Jones Transportation Average.
Elevated levels of unsold homes within
Central Indiana continued to be a drag on
new residential construction and home
prices. According to the National Association
of Home Builders (NAHB), the fourth quarter
saw only a modest improvement in sales
with showroom traffi c weak but conversion
rates increasing. After inching up a mere
point in October, the NAHB Index remained
at 16 in November. Regionally, the HMI
regional score declined four points in the
Midwest as a result of the ongoing weakness
in the job market, the rising number of
foreclosures and short-sales, and very
challenging credit conditions. Residential
development of new properties was minimal
as builders were instead concentrating
on the disposition of existing distressed
properties. Likewise, private nonresidential
construction remained subdued, although
there was a small increase in industrial
projects during the fourth quarter. On the
other hand, public construction, driven by
highway and bridge work, remained robust.
Although indications are that the housing
market has reached its bottom, default
and delinquencies will remain intense in
the coming year, and we expect to see a
marked increase in bank notes being issued
in 2011 as it relates to an ever-increasing
number of REO properties. Further, the
availability of mortgage fi nancing, particularly
for condominiums, will remain a constraint
for homebuyers, although lower mortgage
rates will continue to lead to an increase
in refi nancing. Unfortunately, our outlook
gives little reason for Indiana builders to
be optimistic about the fi rst half of 2011.
Things look somewhat brighter for other
sectors of the Central Indiana economy.
Notably, unfi lled orders of motor vehicles
and parts witnessed three consecutive
months of increases through November
after a nearly continuous 41-month slide.
November auto sales numbers continued
September and October’s improvement on
a seasonally adjusted annual basis to 12.2
million units. Year-to-date, auto sales are
up 11.1 percent over last year. According
to CNW Research, December was also off
to a strong start with a “staggering increase
in fl oor traffi c” versus 2009, but inclement
weather may adversely affect the full month’s
sales. Importantly, banks and other lending
institutions continue to approve more auto
loans even among sub-prime borrowers
who, until recently, have been locked out
of the new vehicle market the last two
years. Positively, this trend is expected to
continue in the near term and should equate
to a fairly positive fi rst quarter of 2011.
U.S. Unemployment Remains Elevated
Corporate Profi ts: Trend is Up
Worker Productivity Has Peaked
Source: BLS
Source: BLS
Source: BLS; U.S. Census Bureau; Cassidy Turley Research
S&L CRISIS 2001 RECESSION
Current unemployment = 9.8%
0%
2%
4%
6%
8%
10%
12%
1980 1985 1990 1995 2000 2005 2010
Unem
plo
yment
Rate
Unemployment
-8%
-6%
-4%
-2%
0%
2%
4%
6%
8%
1997
1998
1999
2000
2001
2002
2003
2004
2005
2006
2007
2008
2009
2010
Output Per Hour (%) Employment (Y/Y%)
-30%
-20%
-10%
0%
10%
20%
30%
40%
1996 1998 2000 2002 2004 2006 2008 2010
Y/Y
% C
hange C
orp
ora
te P
rofits
-2%
0%
2%
4%
Y/Y
Job G
row
th
Corporate Profits Nonfarm Job Growth

6 | We know The State of Real Estate®
2011 Market ReportEconomic Overview
Other economic indicators of the LII are
showing positive signs as well. Initial
reports for holiday retail sales in November
were encouraging. The Ceridian-UCLA
Pulse of Commerce Index (PCI), a real-
time measure of the fl ow of goods to U.S.
factories, retailers and consumers, also
rose 0.4 percent in November after three
months of decline. Also, the Dow Jones
Transportation Average (DJTA), a stock
market index of the transportation sector,
rose just over 100 points, or 2.1 percent,
in November. Similarly, manufacturing
production continued to improve through
October and early November with the
fabricated metals, automotive, and heavy
equipment sectors remaining strong
sources of growth. A positive indicator
for the region’s factory producers is that
automobile manufacturers are beginning to
make major capital investments and expand
capacity. As a result, automobile-related
manufacturing and the associated industry
of metal fabrication will witness further job
growth as more buyers begin returning
to dealer showrooms, thereby supporting
demand for industrial space within the
manufacturing and distribution sectors.
Further encouragement for the Central
Indiana economy was offered by the Federal
Reserve in its year-end commentary on the
Federal Reserve’s Seventh District, which
includes the Indianapolis MSA. According
to the Fed, business spending continued
to increase at a steady pace and consumer
spending was up moderately from the
third to fourth quarters of 2010. We have
also witnessed better conditions within
banking and fi nance. Credit conditions are
improving, and competition for high-quality
borrowers is leading to aggressive terms
and structure for business credit, although
core business demand remains weak.
In contrast to soft core business activity,
demand increased for refi nancing, merger
and acquisition lending, and agribusiness
working capital. Welcome news came from
the Federal Reserve’s report that from
their vantage point commercial real estate
conditions were improving, with both CMBS
issuance and bank lending for distressed
commercial property investment increasing
through November. Despite the fact that loan
quality and bank earnings are improving,
the Federal Reserve’s forecast remains
modest for asset growth in 2011 as business
and household deleveraging continues.
Despite these positive indications in
business and consumer spending and
banking and fi nance, meaningful commercial
real estate improvement will not occur until
we see a dramatic improvement in the
Central Indiana job market. Preliminary data
from the U.S. Bureau of Labor Statistics
reported that the Indianapolis metropolitan
area’s not seasonally adjusted (NSA)
unemployment rate stood at 8.7 percent in
November, with hiring again limited most
to manufacturers bringing on temporary
workers. The fourth quarter also saw
manufacturers increasing the number of
work shifts, which could translate into the
hiring of additional permanent employees
in 2011. Outside manufacturing, hiring in
information technology, engineering and
healthcare remained strong. Additionally,
both retail and offi ce employment levels
were higher in 2010, with seasonal hiring in
retail trade and small increases in demand
for temporary offi ce and clerical workers
causing employment to tick upward.
Within Central Indiana, Marion County
witnessed the highest NSA unemployment
rate in November at 9.6 percent, which was
0.7 percent higher than in 2009, when the
rate was 8.9 percent. Shelby County’s NSA
unemployment rate stood at 9 percent in
November, having declined from 9.2 percent
the previous November. Morgan County’s
NSA unemployment rate increased from 8.4
percent in November 2009 to 8.9 percent
in November 2010. Meanwhile, Hancock
County watched its NSA unemployment
rate move from 8.1 percent in November
2009 to 8.4 percent at the end of November
2010. Both Hendricks County and Johnson
County had an NSA unemployment rate of
7.9 percent in November, with both having
increased from a 2009 rate of 7.7 percent.
Countering this trend was Boone County,
which witnessed its NSA unemployment
rate decrease from the previous year,
from 7.3 percent in 2009 to 7.1 percent
in November 2010. Hamilton County had
the lowest NSA November unemployment
rate at 6.7 percent but was still higher than
in 2009, when the rate was 6.5 percent.
Taking a historical viewpoint of our
employment picture offers valuable
perspective. Over 280,000 Indiana jobs
have been lost since the beginning of the
recession through January 2010, when the
state began to once again add jobs. This
equates to nearly one in ten Hoosier workers
and is a larger loss than occurred during
the 2001 recession, the S&L crisis, or the
double-dip recession lasting from the fi rst
quarter of 1980 to the fourth quarter of
1982. According to the Indiana Department
of Workforce Development, total Indiana
nonfarm employment rose 1 percent through
November and stood at 2,795,000. This
equates to the addition of only 35,000
jobs from January through November; yet
despite the slow improvement seen in the
Hoosier job market, overall private sector
employment in the state increased at twice
the national rate for the majority of 2010.
Another promising trend for commercial real
estate within Indiana is that professional
and business services, the primary users
of offi ce space, had the greatest 12-month
percentage increase of any sector in the
state at nearly 9 percent through November.
OutlookLooking forward, a subpar economy
will translate into a subpar recovery for
commercial real estate. Nevertheless,
with the exception of retail, demand for
commercial real estate space has improved
across the board, and that trend will
continue. For the fi rst time in two years,

www.cassidyturley.com | 7
January 2011
Economic / MARKET TRACKER
Demand Rising for Industrial Space:U.S. Net Absorption and Vacancy
Demand Rising for Offi ce Space:U.S. Net Absorption and Vacancy
Investment Sales Gradually Improving:All Property Types
demand for offi ce, industrial, and apartment
units all registered positive levels in the
second quarter of 2010. Although the
current pace of hiring has not been enough
to cause the unemployment rate to drop
measurably, it has been suffi cient to keep
vacancy rates generally even. Nevertheless,
with vacancy running between 200 and
400 bps above the historical average for all
commercial real estate sectors, rents will
remain largely fl at for the next two years.
Class A and trophy space will continue
to benefi t from a fl ight to quality and an
inelastic tenant base. The same can be
said for investment sales, where quality
assets in major markets will dominate
sales activity in 2011. Moreover, core/
stabilized assets in major markets will begin
pricing similar to pre-recession levels.
For the balance of 2011, real GDP will
remain well below the 3 percent growth
rate needed to keep unemployment stable.
Expect the labor markets to remain stagnant
in 2011 and improve in 2012 when the
economy will be growing at a more robust
4 to 6 percent rate; uncertainty will have
abated, and confi dence will have returned
to the market. After reaching a low point
in the third quarter of 2009, national
offi ce-using employment is projected to
improve, adding an estimated 700,000 to
800,000 jobs annually over the next fi ve
years. However, there is the likelihood that
national offi ce employment, mainly within
the professional and business services and
fi nancial activities sectors, will continue to
decline for the next two to four quarters
if the economy is slow to recover. In the
near term, the Indianapolis metropolitan
employment forecast is for annual job growth
to be about 1.4 percent through 2011,
with professional and business services
rebounding fi rst and the greatest job gains
revolving around re-employment. Corporate
profi ts will remain a catalyst, with both
manufacturing and non-manufacturing
revenues increasing, and job growth will
remain a brake on economic growth. Expect
overall manufacturing revenues to increase
by 5.6 percent and non-manufacturing
revenues to increase by 3.4 percent in 2011.
Persistently high unemployment levels,
restricted credit access for small businesses,
a weak housing market, budget challenges
facing state and local governments, and
uncertainty undercutting business and
consumer confi dence will make 2011
another challenging year for commercial
real estate. However, there are reasons for
optimism, including the continued favorable
outlook of corporate earnings in 2011, an
easing in the pace of bank failures, and
stabilization of commercial real estate
values that should aid in accelerating the
resolution of problem loans and increase
lending capacity for small businesses. In
short, although 2011 will be somewhat better
than the past year, we will experience much
of the same in 2011 with economic growth
being tepid and the job market remaining
a major impediment to realizing signifi cant
increases in commercial real estate demand.
-60
-40
-20
0
20
40
60
2007
1Q
2007
2Q
2007
3Q
2007
4Q
2008
1Q
2008
2Q
2008
3Q
2008
4Q
2009
1Q
2009
2Q
2009
3Q
2009
4Q
2010
1Q
2010
2Q
2010
3Q
Abso
rpti
on (
MS
F)
0%
2%
4%
6%
8%
10%
12%
Vacancy
Absorption Vacancy
Recession ends June 2009
-30
-20
-10
0
10
20
30
2007
1Q
2007
2Q
2007
3Q
2007
4Q
2008
1Q
2008
2Q
2008
3Q
2008
4Q
2009
1Q
2009
2Q
2009
3Q
2009
4Q
2010
1Q
2010
2Q
2010
3Q
Abso
rpti
on (
MS
F)
Vacancy
0%
2%
4%
6%
8%
10%
12%
14%
16%
18%
Absorption Vacancy
Source: Cassidy Turley Research
Source: Cassidy Turley Research
Source: Real Capital Analytics
$0
$5
$10
$15
$20
$25
$30
$35
$40
$45
2007 2008 2009 2010
Closed Offered

8 | We know The State of Real Estate®
2011 Market ReportIndustrial Market
INDIANAPOLIS INDUSTRIAL MARKETAt a glance
U.S. Industrial MarketThroughout 2010, nearly all metrics that
drive demand for U.S. industrial space
continued to show modest improvement
relative to a year ago. Business sales and
inventories, as measured by the Census
Bureau, trended upward. The Institute for
Supply Management (ISM) Manufacturing
Index increased again in November for
the 16th consecutive month, indicating
the manufacturing sector remains in
expansion mode. Industrial employment
has added over 188,000 jobs since
December 2009. Consumer spending,
as measured by personal consumption
expenditures, and retail sales are both
trending higher compared to a year prior.
Finally, exports and imports have returned
to their near pre-recession levels.
As a result, net absorption of industrial
space nationwide registered over 2.1 million
square feet in the third quarter of 2010,
marking a second straight quarter of positive
demand. Fueled by improved demand
for automobiles, construction equipment,
industrial machinery and consumer-related
goods, the Midwest region led the nation
in absorption through September, with
4.9 million square feet of net demand for
industrial space in the third quarter of 2010
alone, marking the largest quarterly gain
in two years. Notable cities that drove the
increase in Midwestern demand included
Chicago, Milwaukee, Columbus, Dayton
and Indianapolis. The Western U.S. also
witnessed positive absorption through the
fi rst nine months, with 3.6 million square
feet absorbed, while occupancy losses of 3.4
million square feet in the Northeast and 3
million in the South countered these gains.
U.S. industrial vacancy rates are stabilizing.
In the third quarter of 2010, vacancy
held at 9.9 percent, matching the level
recorded in the second quarter of this year.
Nevertheless, national vacancy remains
nearly 200 basis points above the 10-year
historical average of 8 percent. Within
the Midwest, vacancy fell 10 basis points
during the third quarter to 9.8 percent.
Strikingly, Indianapolis posted the lowest
vacancy rate of any Midwestern peer market
through the fi rst nine months of the year.
Sublease space is eroding. The total amount
of sublease space available declined by 8.6
percent in the third quarter of 2010 from
Industrial Highlights
• The Indianapolis Industrial Market had
positive net absorption of 3.1 MSF in 2010,
aided by fourth quarter absorption of 1.8 MSF,
compared to 2.2 MSF of net absorption in
2009.
• The vacancy rate declined over the fi nal three
quarters of 2010 and ended the year at 6.7%
compared to 7.4% in 2009.
• Construction projects totaled 1.2 MSF for the
fourth quarter and 1.5 MSF for 2010.
• Asking rents remained fl at to slightly down
throughout the region with variations by
product type and geographic difference
continuing.
Indianapolis Industrial Market Posts Continued Growth in 2010,
Outshines Other Midwest Cities
Net
Statistics
2009 2010 Outlook
2011
Vacancy
Absorption
Construction
Rents
Market Trend: Increase in industrial demand because of alternative energy projects. The sale of a 781,000 SF building in Tipton, Indiana to Abound Solar occurred as a result of a $400 Million grant from the U.S. Department of Energy.

January 2011
www.cassidyturley.com | 9
-80
-60
-40
-20
0
20
40
60
2006
2007
2008
2009
2010
Thousa
nds
Square
Feet
0%
2%
4%
Absorption Vacancy %
-100
400
900
1400
1900
2006
2007
2008
2009
2010
Thousa
nds
Square
Feet
0%
2%
4%
6%
8%
10%
12%
14%
Absorption Vacancy %
-25
175
375
575
775
975
1,175
2006
2007
2008
2009
2010
Thousa
nds
Square
Feet
0%
2%
4%
6%
8%
10%
Absorption Vacancy %
Industrial / MARKET TRACKERthe second quarter. Overall, sublease space
currently accounts for 4.3 percent of the
total available space, compared to 5 percent
at its peaks in the fourth quarter of 2009.
Nationwide, rent declines are decelerating,
and new supply remains constrained. Asking
rents for industrial space fell just 3 cents,
from $5.15 at midyear to $5.12 at the end
of September. For comparison, in 2009
rents were falling at an average decline of 8
cents per quarter. Meanwhile, through the
fi rst three quarters of 2010, just 13.1 million
square feet of new warehouse construction
was completed in the U.S. For context,
the industrial sector typically averages 73
million square feet of new construction
in a given year dating back to 1993.
Indianapolis Industrial Market OverviewDespite a year plagued by uncertainty and
the continuation of challenging economic
conditions, such as restricted capital
markets and elevated unemployment,
many positive things happened in the
Indianapolis industrial market. Leasing
velocity was steady from the previous
year, and absorption for 2010 was up
with more than 4.7 million square feet
of new leases completed, more than 7.4
million square feet of lease renewals, and
almost 2 million square feet in building
sales. Net absorption, or growth, was 3.1
million square feet, about 800,000 square
feet more than in 2009. As in 2009,
about half of the market’s absorption
can be attributed to two transactions;
the sale of over 500,000 square feet to
Brightpoint and the completion of the
Johnson & Johnson distribution center.
Two submarkets endured negative
absorption: Northwest and Northeast.
However, this negative absorption did not
have a signifi cant impact on the overall
vacancy rate or the vacancy rate of each
respective submarket. Vacancy for the
total market remained steady during 2010
at 7 percent. The other seven submarkets
posted positive absorption with the West
and South submarkets having a good year
with 245,000 square feet and 915,000
square feet of absorbed space. Modern
Bulk remained the most active product type
during 2010 with nearly 2.6 million square
feet of absorption. On the opposite end of
the spectrum were Offi ce Showroom, Flex
and Medium Distribution. At year-end Offi ce
Showroom lost 260,000 square feet, Flex
fell by 105,000 square feet, and Medium
Distribution witnessed 44,000 square feet of
negative absorption. An interesting anomaly,
Medium Distribution had the greatest
number of new signed leases during the
year, but overall leased square footage fell
below the historical average, and the product
type ended the year in negative territory.
Year-over-year analysis of transaction volume
showed that the number of notable new
lease deals greater than 50,000 square
feet completed in 2010 relative to 2009
increased by 145 percent, with the total
amount of square feet transacted growing by
158 percent. New leasing volume for these
deals during the year was greatest in the
Southwest submarket, which comprised 47
percent of all leasing, followed by the East
submarket at 16 percent and the South and
Northwest submarkets each accounting
for 14 percent of total lease volume. The
remaining submarkets accounted for less
than 5 percent each of total 2010 new
leasing for deals above 50,000 square feet.
When examining year-over-year changes
occurring in deals greater than 50,000
square feet which were renewals and
expansions, the number of deals increased
by 20 percent while the total square feet
leased increase by nearly 40 percent.
Driving this increase of sizeable renewals
and expansions volume were the Northwest
(60%), Southwest (24%) and East (12%)
submarkets. What was notable was
the juxtaposition of the Southwest and
Northwest when comparing 2009 and
2010 renewals and expansions. While
Indianapolis Downtown Submarket: Absorption and Vacancy Change
Indianapolis East Submarket: Absorption and Vacancy Change
Indianapolis Northeast Submarket:Absorption and Vacancy Change
Source: Cassidy Turley Research
Source: Cassidy Turley Research
Source: Cassidy Turley Research

10 | We know The State of Real Estate®
2011 Market ReportIndustrial Market
Leases
Company Location Square Footage
Nice-Pak Products, Inc. Southwest 813,000
Caterpillar, Inc. South 456,000
Genco Southwest 426,000
Sara Lee Southwest 280,000
Life Sciences Logistics West 262,000
Undisclosed Northwest 243,000
Stanley Black & Decker East 220,000
Southern Wine & Spirits of Indiana, Inc. South 212,000
EnerDel, Inc. East 212,000
S2F Worldwide LLC Southwest 201,000
Hat World Northwest 143,752
Professional Garage Doors Southwest 130,450
MailSouth Southwest 130,000
Welch & Wilson Properties, LLC East 116,000
Transport Connection Southwest 96,000
Earnest Machine Products Northwest 90,000
Ryder Northwest 60,000
American Tire Southwest 70,000
Firestone Diversifi ed Northeast 67,200
International Paper Northwest 66,000
CPS, Inc. North 65,000
Just Packaging East 65,000
Dal-Tile/MoHawk Northeast 65,000
Goodwill Northwest 62,000
Panther Racing Southwest 60,000
Brybelly Holdings East 58,000
Waste Alternatives of Indiana East 52,000
Total Square Feet 4,721,402
Largest Signed Industrial Transactions - 2010 Leases*All square footage rounded to the nearest thousand, all transactions greater than 50,000 SF
Source: Cassidy Turley Research
the Northwest led renewal and expansion
activity in 2010 followed by the Southwest,
in 2009 the positions were reversed with the
Southwest comprising the majority (68%)
of deals followed by the Northwest (20%).
Notable user sales in excess of 50,000
square feet declined both in terms of number
and total square feet from the previous
year. The number of user sales declined by
approximately 16 percent while the square
feet sold dropped by 36 percent. Of the
1.1 million square feet of user deals within
this category, 47 percent occurred in the
Southwest, 29 percent in the Northwest, and
16 percent in the Downtown submarkets.
Speculative construction was virtually
nonexistent throughout 2010, furthering
its steady decline since the fi rst decade of
the 21st century. Positively, this indicates
that the region is not overbuilt, but it also
means we may be challenged for space as
the economy continues to recover. Two new
Class A master-planned business parks,
Westpoint Business Park and 70 West
Commerce Park, offer spec development
and build-to-suit sites for as much as 17
million square feet of industrial space
over the next decade. With the notable
exception of Johnson & Johnson, few
build-to-suit projects were completed during
the year. Several additional companies
which engaged in build-to-suit construction
were Zipp Speed Weaponry in the
Northwest submarket, Premium Composite
Technologies and Mays Chemical in the
South submarket, Restaurant Depot and
Xpress Cargo in the East submarket, and
Therametrics in the Northeast submarket.
Rents remained fl at to slightly down
throughout the region with newer properties
escaping rent compression. That being
true, rent variations by submarket and
property type based on geographic
differences continued. One factor that
aided in keeping rental rates low is the
increased involvement of lenders in industrial
leasing transactions. Because occupancy
and vacancy fi gures are held in such high
regard by lenders, in some cases landlords
have been pressed to keep rental rates
low in order to attract and hold tenants.
In short, 2010 was not a great year
by historical standards, but it was an
improvement over 2009 and our market
remains stable. This stability, accompanied
by the competitive advantage our industrial

www.cassidyturley.com | 11
January 2011
Industrial / MARKET TRACKER
Indianapolis North Submarket:Absorption and Vacancy Change
Indianapolis Northwest Submarket:Absorption and Vacancy Change
Indianapolis Southeast Submarket: Absorption and Vacancy Change
Source: Cassidy Turley Research
Source: Cassidy Turley Research
-400
-300
-200
-100
0
100
200
2006
2007
2008
2009
2010
Thousa
nds
Square
Feet
0%
2%
4%
6%
8%
10%
12%
14%
Absorption Vacancy %
-20
480
980
1,480
1,980
2,480
2006
2007
2008
2009
2010
Thousa
nds
Square
Feet
0%
2%
4%
6%
8%
10%
12%
Absorption Vacancy %
-55
-15
25
65
105
145
185
2006
2007
2008
2009
2010
Thousa
nds
Square
Feet
0%
1%
2%
3%
4%
5%
Absorption Vacancy %
real estate metrics have over other peer
Midwestern regions in terms of rates,
vacancy and absorption, bodes well for
the future. Moving forward into 2011,
expect industrial vacancy rates to remain
fl at or drop slightly and absorption to
increase moderately. By and large, rents
will remain fl at but may dip some under
pressure from increases in property taxes
and operating expenses. Do not expect a
rebound in speculative construction until
the credit markets loosen considerably and
the economy picks up with continuous
employment growth. Additionally, expect
some build-to-suit activity but at levels
well below the historical market average.
Analysis by Product Type and SubmarketTo enable a better understanding of the key
commercial real estate metrics of absorption
and vacancy occurring in a particular
area of the market, we segment our data
based on product type, and on the location
of the building, or by the geographical
submarket. The Indianapolis industrial
market is comprised of nine geographical
submarkets. These include Northwest,
Southeast, Southwest, South, West,
Downtown, Northeast, North, and East.
Seven of the nine industrial submarkets
had positive net absorption in 2010.
Submarkets with positive absorption at
year-end included Southwest (+1,100,000
SF), South (+915,000 SF), East (+600,000
SF), West (+245,000 SF), North (+201,000
SF), Southeast (+127,000 SF), and
Downtown (+62,000 SF). In contrast, the
Northwest (-130,000 SF) and Northeast
(-15,000 SF) submarkets each experienced
negative net absorption for 2010.
In 2010 three product types had positive
net absorption, and four had negative net
absorption. Modern Bulk led all types in
absorption gains with nearly 2.6 million
square feet. Notably, Manufacturing
fi nished the year with 770,000 square
feet of absorption aided in large part by
fourth quarter absorption of 400,000
square feet. Traditional Bulk was the only
other sector ending the year in the green
with a slight tick upward in absorption of
120,000 square feet. Among the other four
product types that experienced negative
net absorption, losses were the greatest
in Offi ce Showroom (-261,000 SF) and
Flex (-105,000 SF), followed by Medium
Distribution (-44,000 SF) and Transport
(-8,000 SF). Three product types saw
vacancy decline year-over-year, including
Modern Bulk (9.6% to 6.8%), Manufacturing
(3.9% to 3.3%) and Traditional Bulk
(8.8% to 8.5%). During the same period,
increases in vacancy occurred within Offi ce
Showroom (9.7% to 11.3%), Flex (12.9%
to 14.3%), Transport (1.2% to 1.6%), and
Medium Distribution (7.7% to 7.9%).
The Northwest submarket was one of only
two submarkets that had negative net
absorption for the year with 130,000 square
feet negatively absorbed. This was the result
of losses in Offi ce Showroom (-195,000 SF),
Flex (-170,000 SF) and Medium Distribution
(-82,000 SF), which were more than enough
to offset gains witnessed in Traditional Bulk
(+188,000 SF), Manufacturing (+70,000
SF), and Modern Bulk (+53,000 SF). The
majority of these losses occurred in the latter
half of the year with the fourth-quarter loss of
85,000 square feet capping a three-quarter
trend of negative absorption. Meanwhile, the
vacancy rate climbed steadily throughout the
year, rising from 6.7 percent in January to
7.4 percent in December. This rate increase
was primarily the result of noticeable annual
vacancy increases in Flex, 9.8 percent
to 19.2 percent, and Offi ce Showroom,
14.8 percent to 17.9 percent. Over the
course of the year, Traditional Bulk vacancy
decreased by nearly a percent while the
vacancy rate within Manufacturing, Medium
Distribution, and Modern Bulk remained fl at.
Growth in the Southeast submarket was
relatively fl at in 2010 with 127,000 square
feet of absorption. This was comprised of
Source: Cassidy Turley Research

12 | We know The State of Real Estate®
2011 Market ReportIndustrial Market
Renewals and Expansions
Company Location Square Footage
Case New Holland Northwest 842,000
Amazon.com Northwest 630,000
OHL Southwest 508,000
Irwin Tool East 456,000
Amazon.com (expansion) Northwest 406,000
NDC/NFI Northwest 382,615
Q-Edge Southwest 345,634
Houghton Miffl in Northwest 309,600
General Cable Northwest 307,000
MCFA Northwest 296,000
Case New Holland Northwest 250,000
Dimplex East 218,400
Storage Solutions North 212,000
Liquidity Services Southwest 186,000
Pitney Bowes, Inc. Southwest 161,000
AAF Northwest 153,600
NSK Bearing Co. Southwest 136,000
UPS Supply Chain Southwest 128,000
Butler McDonald Northwest 128,000
Americom Southwest 120,700
Storage Solutions (expansion) North 118,000
FiServe Southwest 112,710
Harding Group Northwest 110,000
ModusLink Northwest 96,000
MS Logistics East 81,000
Citadel Architectural East 80,179
TWS Southeast 80,000
Pitney Bowes, Inc. Northwest 78,000
Arvco Container Northwest 72,000
International Paper Northwest 63,000
ASI Limited Inc. Northwest 60,000
Overhead Door Northeast 57,000
Alfa Laval Northwest 54,400
Rugby International Northwest 53,000
The Habegger Corporation Northwest 52,000
Total Square Feet 7,343,838
Largest Signed Industrial Transactions - 2010 Renewals and Expansions*All square footage rounded to the nearest thousand, all transactions greater than 50,000 SF
gains in Manufacturing (+305,000 SF) and
Flex Space (+22,000 SF) which were offset
by negative absorption in the Traditional Bulk
(-182,000 SF), Offi ce Showroom (-14,200
SF), and Medium Distribution (-4,000
SF) product types. Both the Modern Bulk
and Transport product types experienced
no growth in the Southeast submarket
throughout the year. Overall vacancy in the
Southeast stood at 3.8 percent in December.
Annual and quarterly absorption gains were
the greatest in the Southwest submarket
with fourth-quarter absorption of 1.4 million
square feet and year-end absorption of 1.1
million square feet. Activity occurring within
the Southwest submarket during the fourth
quarter accounted for the majority of over
all absorption within the greater market.
Particularly, the completion of the Johnson
& Johnson distribution center at nearly 1.1
million square feet and the sale to Brightpoint
of over 500,000 square feet of an industrial
facility in Airwest Business Park pushed the
year-end absorption numbers above 2009
levels. As a result of these transactions,
absorption of Modern Bulk space in the
Southwest submarket was greater than any
other product type or submarket, with 1.2
million square feet positively absorbed.
Annual absorption in the South submarket
was 915,000 square feet. This was almost
exclusively the result of 831,000 square
feet of absorption in the Modern Bulk
product class. Positive absorption also
occurred in the Manufacturing (+100,000
SF) and Offi ce Showroom (+50,000 SF)
product types. In contrast, both the Medium
Distribution (-61,000 SF) and Flex (-6,000
SF) product types had negative absorption.
Vacancy in the South submarket registered
11 percent for the total submarket but
was comprised of dramatic differences
within product type. Leading all segments
of the entire Indianapolis market with
41.3 percent vacancy was Flex product
located in the South submarket. The fall
Source: Cassidy Turley Research

www.cassidyturley.com | 13
January 2011
Industrial / MARKET TRACKER
Indianapolis South Submarket: Absorption and Vacancy Change
Indianapolis Southwest Submarket: Absorption and Vacancy Change
Indianapolis West Submarket:Absorption and Vacancy Change
Source: Cassidy Turley Research
Source: Cassidy Turley Research
Source: Cassidy Turley Research
0
200
400
600
800
1,000
2006
2007
2008
2009
2010
Thousa
nds
Square
Feet
0%
4%
8%
12%
16%
20%
24%
Absorption Vacancy %
-1,000
0
1,000
2,000
3,000
4,000
5,000
2006
2007
2008
2009
2010
Thousa
nds
Square
Feet
0%
2%
4%
6%
8%
10%
12%
14%
Absorption Vacancy %
-300
-100
100
300
500
700
2006
2007
2008
2009
2010T
housa
nds
Square
Feet
0%
2%
4%
6%
8%
10%
Absorption Vacancy %User Sales
Company Location Square Footage
Brightpoint Southwest 533,000
Willoughby Industries Northwest 257,600
The Project School Downtown 184,000
BRS I, BRS II, LLC Northwest 65,000
Total Square Feet 1,039,600
in vacancy among the other product types
was substantial with the next highest
vacancy being Medium Distribution at 16.6
percent and Modern Bulk at 16.3 percent.
Year-end absorption in the West submarket
was 245,000 square feet. Here too
the positive absorption was primarily
attributable to gains in Modern Bulk with
262,000 square feet of absorption. Both
the Manufacturing (+60,000 SF) and Flex
(+27,000 SF) product types had positive
absorption while the Traditional Bulk
(-75,000 SF), Offi ce Showroom (-23,000 SF)
and Medium Distribution (-7,000 SF) product
types were negatively absorbed. Vacancy in
the West submarket was 7.2 percent for all
product types, within which the range varied
from 25.5 percent vacancy in Traditional
Bulk to 2.4 percent in Modern Bulk.
Downtown, the net absorption in
December was 62,164 square feet. This
was comprised of 107,000 square feet of
absorption in Manufacturing and 12,000
square feet in Transport. Other product
types located in Downtown were in
negative territory, led by losses in Offi ce
Showroom of negative 38,000 square feet
and Traditional Bulk with negative 13,000
square feet absorbed. Overall vacancy
downtown was 4.2 percent. Most notably,
Offi ce Showroom had the highest vacancy
in the submarket at 12.2 percent.
Absorption in the Northeast submarket
ended the year in the red with 15,400
square feet negatively absorbed. This
was caused by occupancy losses in
Offi ce Showroom (-31,100 SF), Medium
Distribution (-23,000 SF) and Modern Bulk
(-11,100 SF) which were too great to be
overcome by the growth which occurred
in Flex (+33,000 SF) and Manufacturing
(+25,800 SF). Vacancy in the Northeast
was slightly below the overall market
rate, registering 6.3 percent at the end
of December. Closer analysis of vacancy
by product type showed that vacancy
rates for Traditional Bulk (0.9%) and
Manufacturing (1.3%) fell well below the
market rate, Medium Distribution (7.5%)
and Flex (7.5%) tracked a bit higher, and
Modern Bulk (11.2%) and Offi ce Showroom
(12.4%) were well above market rate.
The North submarket registered 201,000
square feet of positive net absorption as a
result of 117,000 square feet absorbed in
Medium Distribution, 101,000 square feet
absorbed in Traditional Bulk, and 14,000
square feet absorbed in Flex product.
Offi ce Showroom, on the other hand, had
negative net absorption of 30,000 square
feet. During the same period, vacancy
was 6.6 percent for all product types.
Again, vacancy rates within each type
varied but not to the signifi cant degree as
in other submarkets. Medium Distribution
Largest Signed Industrial Transactions - 2010 User Sales*All square footage rounded to the nearest thousand, all transactions greater than 50,000 SF
Source: Cassidy Turley Research

14 | We know The State of Real Estate®
2011 Market ReportIndustrial Market
Type Inventory
(SF)
Net Absorption
YTD (SF)
Vacancy
Rate
Vacant
(SF)
Occupied
(SF))
Offi ce/Showroom 17,380,000 -261,000 11.3% 1,961,000 15,420,000
Medium
Distribution
50,859,000 -44,000 7.9% 3,996,000 46,863,000
Traditional Bulk 36,181,000 119,000 8.5% 3,066,000 33,116,000
Modern Bulk 57,297,000 2,580,000 6.8% 3,890,000 53,408,000
Flex 7,533,000 -105,000 14.3% 1,081,000 6,453,000
Manufacturing 69,757,000 770,000 3.3% 2,281,000 67,476,000
Other (Truck
Terminal and
Maintenance)
2,889,000 9,000 1.6% 32,000 2,857,000
Total 241,896,000 3,068,000 7.0% 16,307,000 225,593,000
4th Quarter Statistics by Building Type*All square footage rounded to the nearest thousand
Source: Cassidy Turley Research
had the highest vacancy rate at 10.7
percent, followed by Offi ce Showroom at
9.5 percent, with all other product types
having a vacancy rate below 3 percent.
Absorption in the East submarket was
positive, 588,154 square feet in December.
This was comprised of incremental growth
in the Modern Bulk (+212,000 SF),
Manufacturing (+175,000 SF), Traditional
Bulk (+160,000 SF) and Offi ce Showroom
(54,000 SF). Vacancy in the East was
6.2 percent for the year with vacancies
varying from 11.1 percent for Traditional
Bulk to 1.7 percent for Manufacturing.
Filling the gap was Offi ce Showroom
(7.3%), Medium Distribution (7.7%),
Modern Bulk (7.8%) and Flex (10.8%).
Indianapolis Industrial ConstructionAlthough prices have fallen by 40 to
60 percent off their high, investors
and developers remain bearish on the
commercial land market in Central Indiana.
Given tight credit markets, fi nancing has
been largely unavailable for any development
that is not signifi cantly pre-leased. As
such, speculative development has been
practically non-existent in the market. There
has been a small level of activity among
companies looking to purchase land for
the development of space which they can
ultimately occupy. Even among these owner-
users, development of new space competes
directly against existing space which is being
marketed at signifi cantly discounted prices.
Commercial development within the
industrial sector was slow during the
past year with large-scale Modern Bulk
slowing to a halt, build-to-suit construction
levels declining, and overall construction
levels diminishing well below the fi ve-year
historical average of 4.8 million square feet.
Early in the year, the Keystone Enterprise
Park witnessed the completion of two
developments totaling 91,000 square
feet when Restaurant Depot opened its
65,000-square-foot facility and Xpress
Cargo completed construction of its
26,000-square-foot facility. Build-to-
suit construction continued as the year
progressed with Premium Composite
Technology North America completing
construction of a 64,000-square-foot
facility in the Franklin Business Park,
and Therametric Technologies fi nishing
its 26,000-square-foot headquarters
expansion in Noblesville during the
second quarter. Industrial development
in the latter part of 2010 was marked
by Zipp Speed Weaponry’s move into its
new 70,000-square-foot manufacturing
and customer service center in the
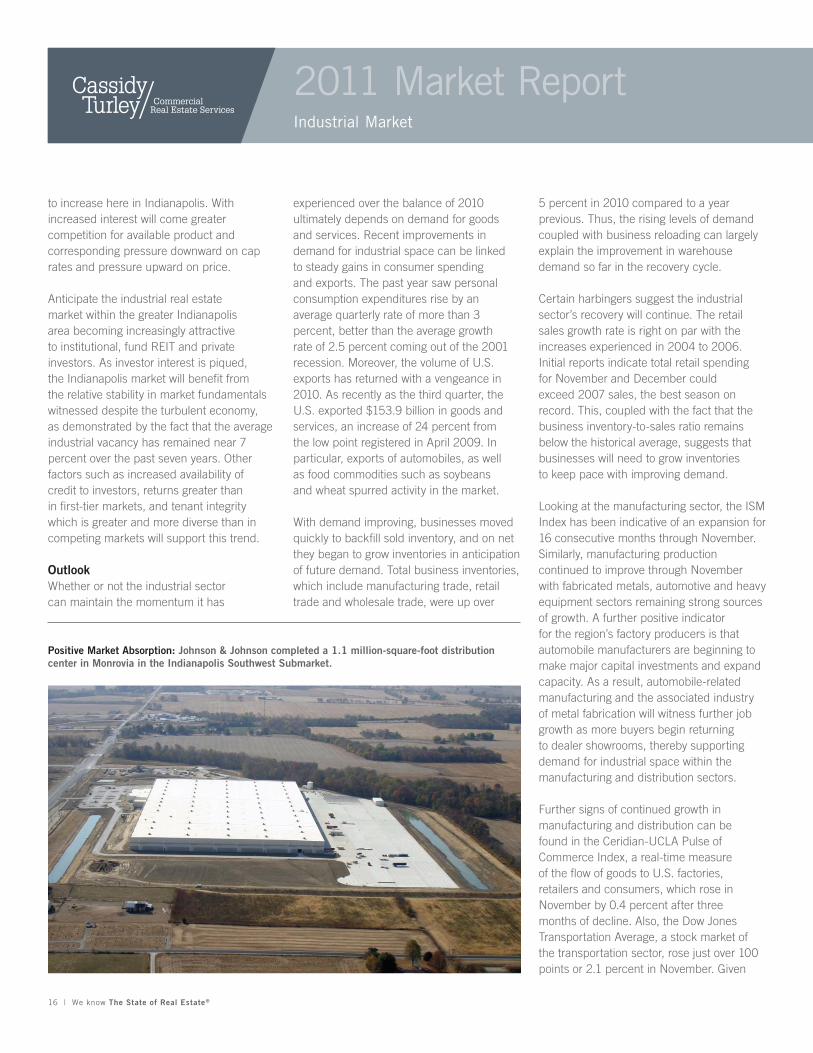
Northwest submarket, as well as Johnson
& Johnson Sales and Logistics Company’s
construction of a 1.1 million-square-foot
distribution facility located within 70West.
Other notable industrial construction
projects completed over the past year
were Mays Chemical’s 61,000-square-
foot manufacturing facility in Greenwood
and a 13,500-square-foot distribution
facility in Plainfi eld by Magnum Express.
Industrial construction currently underway
is focused in the Northwest, Southeast
and South submarkets. There is currently
over 600,000 square feet of assorted
Offi ce Showroom, Flex, and Distribution
space under construction in the Northwest,
ranging in size from the 19,200-square-foot
Sharp’s Gymnastics Academy distribution
facility in Park 100 to the 406,000-square-
foot Amazon.com expansion at AllPoints
at Anson, with projects such as Dow
AgroSciences 80,000-square-foot fl ex
construction in between. Southeast
construction activity currently underway
includes the 100,000-square-foot
AmeriCold expansion, and within the
South submarket the most notable project
currently being built is Zimmerman
Biotechnologies 50,000-square-foot
manufacturing facility at Precedent South.
Currently there is over 30 million square feet
of proposed development in the industrial
market, with the majority of proposals
focused upon Modern Bulk construction and
a sizeable amount on Medium Distribution.
How much of this will move from the drawing
board to the construction site remains to
be seen. The completion of these projects
and the return of further speculative
development will continue to be dependent
upon a dramatic improvement in fi nancing
fundamentals. Developers with solid credit,
advantageous land position, and strong
lending relationships remain in good position
www.cassidyturley.com | 15
January 2011
Industrial / MARKET TRACKER
Indianapolis Offi ce Showroom:Absorption and Vacancy Change
Indianapolis Medium Distribution: Absorption and Vacancy Change
Indianapolis Traditional Bulk:Absorption and Vacancy Change
Source: Cassidy Turley Research
Source: Cassidy Turley Research
Source: Cassidy Turley Research
-300
-200
-100
0
100
200
300
2006
2007
2008
2009
2010
Thousa
nds
Square
Feet
0%
2%
4%
6%
8%
10%
12%
Absorption Vacancy %
-120
80
280
480
680
880
1,080
1,280
2006
2007
2008
2009
2010
Thousa
nds
Square
Feet
0%
2%
4%
6%
8%
10%
Absorption Vacancy %
-800
-400
0
400
800
1,200
2006
2007
2008
2009
2010
Thousa
nds
Square
Feet
0%
2%
4%
6%
8%
10%
Absorption Vacancy %
Type Inventory
(SF)
Net Absorption
YTD (SF)
Vacancy
Rate
Vacant
(SF)
Occupied
(SF))
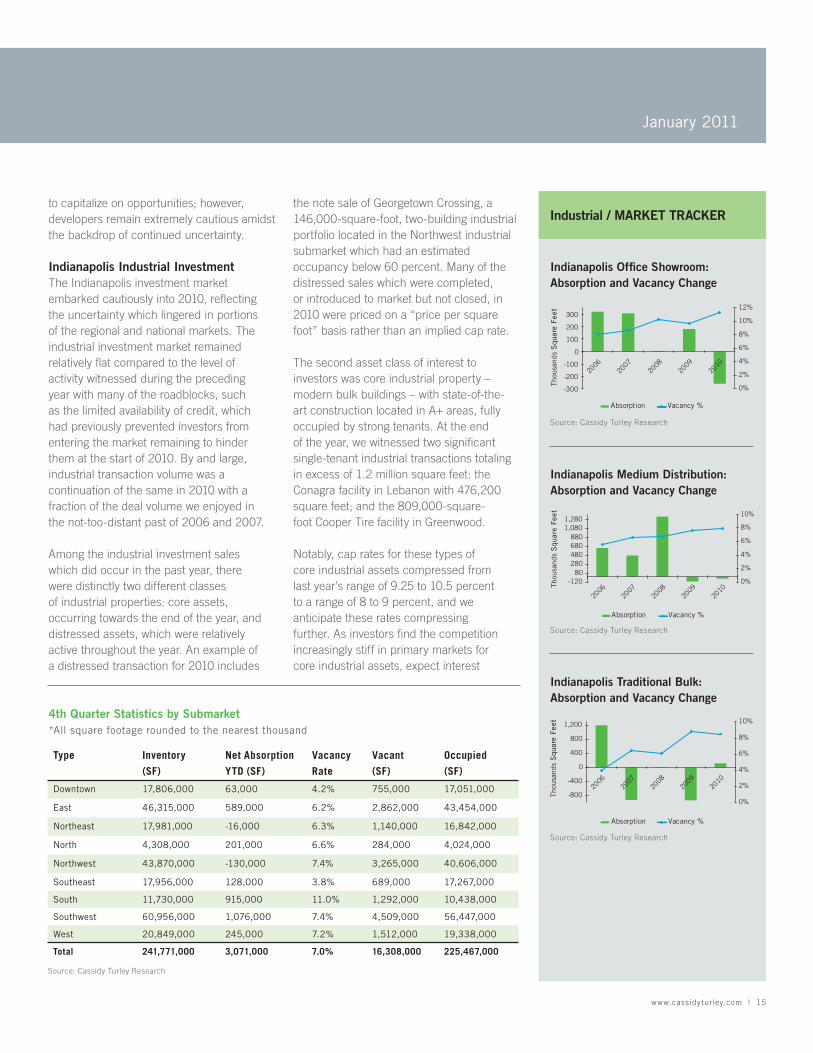
Downtown 17,806,000 63,000 4.2% 755,000 17,051,000
East 46,315,000 589,000 6.2% 2,862,000 43,454,000
Northeast 17,981,000 -16,000 6.3% 1,140,000 16,842,000
North 4,308,000 201,000 6.6% 284,000 4,024,000
Northwest 43,870,000 -130,000 7.4% 3,265,000 40,606,000
Southeast 17,956,000 128,000 3.8% 689,000 17,267,000
South 11,730,000 915,000 11.0% 1,292,000 10,438,000
Southwest 60,956,000 1,076,000 7.4% 4,509,000 56,447,000
West 20,849,000 245,000 7.2% 1,512,000 19,338,000
Total 241,771,000 3,071,000 7.0% 16,308,000 225,467,000
4th Quarter Statistics by Submarket*All square footage rounded to the nearest thousand
Source: Cassidy Turley Research
to capitalize on opportunities; however,
developers remain extremely cautious amidst
the backdrop of continued uncertainty.
Indianapolis Industrial Investment The Indianapolis investment market
embarked cautiously into 2010, refl ecting
the uncertainty which lingered in portions
of the regional and national markets. The
industrial investment market remained
relatively fl at compared to the level of
activity witnessed during the preceding
year with many of the roadblocks, such
as the limited availability of credit, which
had previously prevented investors from
entering the market remaining to hinder
them at the start of 2010. By and large,
industrial transaction volume was a
continuation of the same in 2010 with a
fraction of the deal volume we enjoyed in
the not-too-distant past of 2006 and 2007.
Among the industrial investment sales
which did occur in the past year, there
were distinctly two different classes
of industrial properties: core assets,
occurring towards the end of the year, and
distressed assets, which were relatively
active throughout the year. An example of
a distressed transaction for 2010 includes
the note sale of Georgetown Crossing, a
146,000-square-foot, two-building industrial
portfolio located in the Northwest industrial
submarket which had an estimated
occupancy below 60 percent. Many of the
distressed sales which were completed,
or introduced to market but not closed, in
2010 were priced on a “price per square
foot” basis rather than an implied cap rate.
The second asset class of interest to
investors was core industrial property –
modern bulk buildings – with state-of-the-
art construction located in A+ areas, fully
occupied by strong tenants. At the end
of the year, we witnessed two signifi cant
single-tenant industrial transactions totaling
in excess of 1.2 million square feet: the
Conagra facility in Lebanon with 476,200
square feet; and the 809,000-square-
foot Cooper Tire facility in Greenwood.
Notably, cap rates for these types of
core industrial assets compressed from
last year’s range of 9.25 to 10.5 percent
to a range of 8 to 9 percent, and we
anticipate these rates compressing
further. As investors fi nd the competition
increasingly stiff in primary markets for
core industrial assets, expect interest
16 | We know The State of Real Estate®
2011 Market ReportIndustrial Market
to increase here in Indianapolis. With
increased interest will come greater
competition for available product and
corresponding pressure downward on cap
rates and pressure upward on price.
Anticipate the industrial real estate
market within the greater Indianapolis
area becoming increasingly attractive
to institutional, fund REIT and private
investors. As investor interest is piqued,
the Indianapolis market will benefi t from
the relative stability in market fundamentals
witnessed despite the turbulent economy,
as demonstrated by the fact that the average
industrial vacancy has remained near 7
percent over the past seven years. Other
factors such as increased availability of
credit to investors, returns greater than
in fi rst-tier markets, and tenant integrity
which is greater and more diverse than in
competing markets will support this trend.
OutlookWhether or not the industrial sector
can maintain the momentum it has
experienced over the balance of 2010
ultimately depends on demand for goods
and services. Recent improvements in
demand for industrial space can be linked
to steady gains in consumer spending
and exports. The past year saw personal
consumption expenditures rise by an
average quarterly rate of more than 3
percent, better than the average growth
rate of 2.5 percent coming out of the 2001
recession. Moreover, the volume of U.S.
exports has returned with a vengeance in
2010. As recently as the third quarter, the
U.S. exported $153.9 billion in goods and
services, an increase of 24 percent from
the low point registered in April 2009. In
particular, exports of automobiles, as well
as food commodities such as soybeans
and wheat spurred activity in the market.
With demand improving, businesses moved
quickly to backfi ll sold inventory, and on net
they began to grow inventories in anticipation
of future demand. Total business inventories,
which include manufacturing trade, retail
trade and wholesale trade, were up over
5 percent in 2010 compared to a year
previous. Thus, the rising levels of demand
coupled with business reloading can largely
explain the improvement in warehouse
demand so far in the recovery cycle.
Certain harbingers suggest the industrial
sector’s recovery will continue. The retail
sales growth rate is right on par with the
increases experienced in 2004 to 2006.
Initial reports indicate total retail spending
for November and December could
exceed 2007 sales, the best season on
record. This, coupled with the fact that the
business inventory-to-sales ratio remains
below the historical average, suggests that
businesses will need to grow inventories
to keep pace with improving demand.
Looking at the manufacturing sector, the ISM
Index has been indicative of an expansion for
16 consecutive months through November.
Similarly, manufacturing production
continued to improve through November
with fabricated metals, automotive and heavy
equipment sectors remaining strong sources
of growth. A further positive indicator
for the region’s factory producers is that
automobile manufacturers are beginning to
make major capital investments and expand
capacity. As a result, automobile-related
manufacturing and the associated industry
of metal fabrication will witness further job
growth as more buyers begin returning
to dealer showrooms, thereby supporting
demand for industrial space within the
manufacturing and distribution sectors.
Further signs of continued growth in
manufacturing and distribution can be
found in the Ceridian-UCLA Pulse of
Commerce Index, a real-time measure
of the fl ow of goods to U.S. factories,
retailers and consumers, which rose in
November by 0.4 percent after three
months of decline. Also, the Dow Jones
Transportation Average, a stock market of
the transportation sector, rose just over 100
points or 2.1 percent in November. Given
Positive Market Absorption: Johnson & Johnson completed a 1.1 million-square-foot distribution center in Monrovia in the Indianapolis Southwest Submarket.

www.cassidyturley.com | 17
January 2011
Industrial / MARKET TRACKERthe general upward trend in these demand
drivers, further growth in manufacturing
and distribution can be expected.
Looking specifi cally at our market, there are
both challenges and opportunities for those
engaged in the Indianapolis industrial real
estate market over the next 12 to 36 months.
Among the challenges is the potential
impact of large former manufacturing plants
returning to the market, uncertainty as it
pertains to the recent approval of property
tax caps, and the lack of speculative
construction expected to occur.
The potential of the GM Stamping and
Visteon plants bringing an additional 4
million square feet online will affect the
market. Most likely, these buildings will be
sold to investor/developers who will redevelop
them as multi-tenant facilities like several
other large, older manufacturing buildings
in the past. In addition, 700,000 square
feet at the former Western Electric plant
will come online in the second quarter of
2011. While these buildings are sound, each
was built for a specifi c purpose, meaning
the space has physical and functional
obsolescence for the general market.
These properties will compete heavily with
the Traditional or older Bulk distribution
buildings and will be priced accordingly.
If the economy is on the upswing when
these buildings meet the market, selling or
leasing may not be quite as challenging.
Another challenge could result from the
recent approval of property tax caps.
Although this may in the long run bring
certainty to the computation of operating
costs, in the short term many businesses
may see their property taxes increase
based on the shift of the tax burden from
residential to commercial properties.
Increased operating expenses will lower
net rents in the short run and adversely
affect cap rates, thereby discouraging
investment sales in the market.
Finally, with low vacancy and no projected
speculative construction of considerable
size underway, we run the risk of missing
out on opportunities as the economy picks
up steam due to a lack of available product.
Positively, we do see several projects on the
drawing board, and some already have tax
abatement and permitting in place, but with
uncertainty pervasive and credit limited,
developers are moving forward with caution.
Despite these challenges, the Indianapolis
industrial market continues to offer
opportunity for growth. The logistics sector
remains strong with continued growth
on the horizon. Because of our central
location, lower land prices and lower
operating costs, Indianapolis will be one of
the fi rst to recover once a macro-economic
recovery gains traction. Also, continued
growth in the manufacturing sector and
our proximity to the major automotive
manufacturers will help propel the market
forward as demand begins to increase.
Indianapolis Modern Bulk:Absorption and Vacancy Change
Indianapolis Flex: Absorption and Vacancy Change
Indianapolis Manufacturing:Absorption and Vacancy Change
-1,000
1,000
3,000
5,000
2006
2007
2008
2009
2010
Thousa
nds
Square
Feet
0%
4%
8%
12%
16%
20%
Absorption Vacancy %
-110
-10
90
190
290
390
490
2006
2007
2008
2009
2010T
housa
nds
Square
Feet
0%
4%
8%
12%
16%
20%
Absorption Vacancy %
-700
-300
100
500
900
1,300
2006
2007
2008
2009
2010
Thousa
nds
Square
Feet
0%
1%
2%
3%
4%
5%
Absorption Vacancy %
Source: Cassidy Turley Research
Source: Cassidy Turley Research
Source: Cassidy Turley Research

18 | We know The State of Real Estate®
2011 Market Report
Offi ce Highlights
• The Indianapolis Offi ce Market had positive
net absorption of 80,000 SF in 2010
compared to -418,000 SF of net absorption
in 2009.
• The overall vacancy rate was 20.6%. The CBD
vacancy rate was 16.9% and the Suburban
vacancy rate was 22.9%.
• Construction remained unchanged with no new
multi-tenant offi ce buildings above 20,000 SF
constructed. Speculative development remains
uncertain.
INDIANAPOLIS OFFICE MARKETAt a glance
Offi ce Market
Source: Cassidy Turley Research
Indianapolis Market Recovering but Occupancy Growth Modest
U.S. Offi ce MarketThe U.S. offi ce sector continued to recover
in 2010. Net demand for offi ce space across
the country was 7.1 million square feet at the
end of the third quarter, marking a second
straight quarter of positive absorption.
Nationally offi ce markets absorbed 15.9
million square feet over the fi rst nine months
of 2010. For perspective, the improvement in
demand is tracking signifi cantly higher than
the recovery following the 2001 recession,
which recorded negative 20.1 million square
feet at this same stage in the cycle.
Activity in the nation’s largest metro areas
drove the improvement in multi-tenant
offi ce demand. Markets such as New York,
Washington DC, Boston, Dallas, Seattle and
San Francisco experienced a tremendous
rebound in demand for offi ce space as
well as a steady increase in sales activity.
Meanwhile, the bulk of the secondary
markets experienced only tepid improvement
or negative demand for space. Of the 80
markets tracked by Cassidy Turley, 32
returned more empty space than they
absorbed through the fi rst nine months of
2010. Within the Midwest, the strongest
performers through the third quarter of 2010
were St. Louis, Minneapolis and Indianapolis.
U.S. offi ce vacancy rates remained fl at
through the fi rst nine months of 2010 at 16.8
percent. Still, vacancy remained 270 bps
above its historical average of 14.1 percent
and is on par with the rate in effect at the
bottom of the previous savings and loan
crisis. With demand still weak and credit
tight, new supply has slowed to historic
lows with just 5.3 million square feet of new
space delivered through the third quarter, a
construction pace that rivals the slowdown
of the early 1990s. Assuming the historical
rate of absorption from this point forward,
the national offi ce market will not return to
equilibrium prior to 2013. As a result, expect
the national offi ce market recovery to follow
the arduous path of the 1990s recovery
versus the more dynamic 2004-2007
rebound.
Indianapolis Vacancy and Absorption Trends
-200
-175-150
-125
-100
-75-50
-25
0
2550
75
100
125150
175
200
2005
1Q
2005
2Q
2005
3Q
2005
4Q
2006
1Q
2006
2Q
2006
3Q
2006
4Q
2007
1Q
2007
2Q
2007
3Q
2007
4Q
2008
1Q
2008
2Q
2008
3Q
2008
4Q
2009
1Q
2009
2Q
2009
3Q
2009
4Q
2010
1Q
2010
2Q
2010
3Q
2010
4Q
Thousands S
quare
Feet
0%
5%
10%
15%
20%
25%
Absorption Vacancy
Net
Statistics
2009 2010 Outlook
2011
Vacancy
Absorption
Class A
Vacancy
Class A
Absorption
Class A
Rents

January 2011
www.cassidyturley.com | 19
Offi ce / MARKET TRACKER
IN Unemployment vs. Offi ce Vacancy
Indianapolis Offi ce LeasingVacancy vs. Asking Rents
Indianapolis Multi-Tenant Offi ce Market Historical Vacancy Rates, 4Q 2010
Source: BLS; Cassidy Turley Research
Source: Cassidy Turley Research
Source: Cassidy Turley Research
0%
2%
4%
6%
8%
10%
12%
2001 2003 2005 2007 2009 2011
Unem
plo
ym
ent
0%
5%
10%
15%
20%
25%
Vacancy
Unemployment Office Vacancy
$14
$15
$16
$17
$18
$19
$20
$21
$22
19
96
19
98
20
00
20
02
20
04
20
06
20
08
20
10
0%
5%
10%
15%
20%
25%
Asking Rents Vacancy
5%
7%
9%
11%
13%
15%
17%
19%
21%
23%
25%
1996
1995
1997
1998
1999
2000
2001
2002
2003
2004
2005
2006
2007
2008
2009
2010
CBD* Suburban
*The CBD is comprised of the Downtown and Midtown submarkets.
On a national basis, rents are stabilizing
but not appreciating. In 2010 the average
asking rental rate for the U.S. offi ce market
was $21.35, down $0.38 from a year prior.
Throughout the nation, the Northeast
region experienced the highest asking rates
at $23.34 per square foot, down $0.80.
Meanwhile, the Midwest experienced the
lowest at $18.63 per square foot, down just
$0.04. The 2010 average asking rate in the
West was $22.82 per square foot, down
$0.69, and the South average asking rate
was $20.75 per square foot, down $0.11.
Our baseline national forecast remains for
limited rental rate growth for the next 12 to
18 months.
Indianapolis Offi ce MarketThe Indianapolis multi-tenant offi ce market
is comprised of 31.9 million square feet of
space in 411 buildings, with 38 percent of
multi-tenant space located in the Central
Business District and the remaining 60
percent located in the Suburban market. The
Central Business District is comprised of two
submarkets encompassing 83 buildings and
12 million square feet. The Suburban market
is comprised of eight submarkets consisting
of 328 buildings and 19.9 million square
feet. For Cassidy Turley reporting purposes,
medical offi ce buildings and owner-occupied
buildings are not included in our statistical
analysis. The most relevant statistics, which
describe the key aspects of the commercial
real estate markets, are inventory, vacancy
rate and net absorption. This market report
reveals these key statistics for all ten of the
Indianapolis submarkets as well as for all
three classes (A, B and C) of multi-tenant
offi ce buildings.
OverviewBy dividing the statistics into two groups, the
Central Business District and the Suburban
market, the key statistics of vacancy and net
absorption become clearer and the numbers
more meaningful. Overall the vacancy rate
was 20.6 percent at the end of the fi rst
quarter of 2010 and returned there at the
end of the fourth. Under normal economic
circumstances, this would not be good news;
however, considering that vacancy climbed
to a historical high point of 21.8 percent
during the second quarter, a decline of 1.8
percent over the last two quarters to 20.6
percent is welcome news. Interestingly, when
examining the Indianapolis market relative
to vacancy, the Central Business District
continued to outperform the Suburban
market. Since 2002 the Central Business
District has maintained a lower vacancy rate
year-over-year than the Suburban market,
and there is currently a six-point spread.
The Indianapolis market achieved 80,000
square feet of positive net absorption at year-
end. In general, the tenant sectors which
drove occupancy growth were education,
information technology, health care, life
sciences, federal government and traditional
professional services. Although leasing
velocity during 2010 remained below the
market’s historical average, many companies
were engaged in exploring the market, and
multiple notable lease transactions occurred
across the market. Within the Central
Business District, businesses engaged in
leasing over the past year included: U.S.
General Services (75,000 SF in M&I Plaza);
Harrison College (34,000 SF in 500 N.
Meridian); PricewaterhouseCoopers (22,000
SF in PNC Center); Northwestern Mutual
(18,500 SF in Chase Center Tower); Clarian
Health Partners (16,500 SF in Science &
Technology Center); Backhaul Direct (16,200
SF in Allen Plaza); Vertellus Specialties
(16,000 SF in Capital Center South Tower);
Wells Fargo (14,100 in 300 N. Meridian);
USA Football (12,300 in Huntington
Plaza); and Hall Render Killian Heath and
Lyman (12,000 SF in OneAmerica Tower).
Companies active in leasing space in the
Suburban market in 2010 included: Rolls-
Royce Corporation (50,000 SF in Airwest
Business Park); Republic Airways (38,000
SF in College Park Plaza); Arlington Roe
& Company (21,000 SF in 8900 Keystone
Crossing); Strayer University (20,000 SF in

20 | We know The State of Real Estate®
2011 Market ReportOffi ce Market
River Road at Keystone); U.S. Government
(19,000 SF in Corporate Center North);
Arcadia Resources (19,000 SF in Precedent
Offi ce Park); Hoffmaster Group (18,000 SF
in Heritage Park III); Ducharmen, McMillen
& Associates (17,500 in Lake Pointe Center
III); Community Hospitals of Indiana (17,000
SF in Castleton Park); and Members United
Federal Credit Union (17,000 SF in Lake
Pointe Center II).
It is notable that during the fourth
quarter alone, Indianapolis experienced
a tremendous amount of absorption for
a single quarter with 230,000 square
feet of positive absorption. To put it into
perspective, this quarterly absorption is
equal to nearly two of the College Park
Pyramid buildings, or almost 80 percent of
our seven-year average annual absorption
of 291,000 square feet. Furthermore, the
fourth-quarter occupancy growth marked
the second consecutive quarter of positive
absorption. While two quarters of occupancy
growth is promising, the market still has
a long way to go to compensate for the
previous seven-quarter trend of negative
absorption.
Over the course of the year, the Central
Business District fared better than the
Suburban market with 81,000 square feet
of occupancy growth, compared to a loss
of 1,000 square feet recognized in the
suburbs. However, the year-end negative
absorption within the Suburban market
is a bit misleading considering the fact
that from October through December the
Suburban market posted positive absorption
gains of 216,000 square feet, with 167,000
square feet of that growth occurring within
Class A buildings. Although this was not
enough to overcome the 266,000 square
feet of negative absorption during the fi rst
half of 2010, the 265,000 square feet of
occupancy growth over the last six months
of 2010 is great news. In short, while the
net year-end absorption was modest, the
growth witnessed over the last half of the
year, particularly during the fourth quarter,
provides reason to believe that the multi-
tenant offi ce market is beginning to rebound.
Analysis by Submarket and ClassTo enable a better understanding of the
various offi ce products and the marketplace,
Cassidy Turley segments data based on
the geographical area in which the offi ce
building is located and on the class of space.
The Indianapolis multi-tenant offi ce market is
dissected into ten geographical submarkets.
These include the Central Business District
submarkets of Downtown and Midtown and
the Suburban submarkets of North/Carmel,
Keystone, Fishers, Northeast, East, South,
West and Northwest. Also, the Indianapolis
offi ce market is comprised of Class A, Class
B and Class C buildings. The 109 Class A
buildings, with over 16.7 million square feet
of rentable space, are newer structures with
spacious lobbies and various amenities for
tenants. The 243 Class B buildings, with
over 12.6 million square feet of space, are
usually slightly older and smaller and offer
fewer amenities for tenants. The 59 Class C
buildings account for over 2.6 million square
feet of rentable space and are typically older
and smaller and lack the amenities of Class
A and B buildings.
Vacant space totaled 6.5 million square feet
in the combined Central Business District
and Suburban markets with a 20.6 percent
vacancy rate. The total vacant space was 2
million square feet in the Central Business
District for a vacancy rate of 16.9 percent,
and 4.5 million square feet in the Suburban
market for a vacancy rate of 22.9 percent.
Analysis by product type demonstrates that
Class A offi ce space experienced the largest
vacancy rate decrease from the prior year
with a decline of nearly one percent to 19.5
percent. Meanwhile, Class B offi ce space
Year Inventory
(SF)
New Supply
(SF)
Net Absorption
(SF)
Occupancy
Rate (%)
Occupancy
(SF)
Vacancy
Rate (%)
Vacancy
(SF)
2000 10,934,000 214,000 -270,000 84.0 9,185,000 16.0 1,764,000
2001 11,289,000 355,000 11,000 81.5 9,200,000 18.5 2,105,000
2002 11,289,000 0 117,000 82.5 9,313,000 17.5 1,983,000
2003 11,305,000 16,000 193,000 84.2 9,512,000 15.8 1,783,000
2004 11,366,000 62,000 128,000 84.9 9,650,000 15.1 1,717,000
2005 11,306,000 -60,000 18,000 85.5 9,666,000 14.5 1,638,000
2006 11,370,000 64,000 -84,000 84.3 9,584,000 15.7 1,786,000
2007 11,518,000 212,000 208,000 85.0 9,792,000 15.0 1,725,000
2008 11,559,000 0 47,000 83.3 9,996,000 16.7 1,999,000
2009 11,995,000 0 -108,000 82.4 9,888,000 17.6 2,107,000
2010 11,995,000 0 81,000 83.1 9,964,000 16.9 2,031,000
CBD (Downtown and Midtown Submarkets)
Source: Cassidy Turley Research

www.cassidyturley.com | 21
January 2011
Offi ce / MARKET TRACKER
Net Absorption by Building Class
Multi-Tenant Offi ce Market Class A: Inventory, Absorption and Vacancy
Multi-Tenant Offi ce Market Class B: Inventory, Absorption and Vacancy
Source: Cassidy Turley Research
Source: Cassidy Turley Research
Source: Cassidy Turley Research
-80,000
-60,000
-40,000
-20,000
0
20,000
40,000
60,000
80,000
100,000
Square
Feet
Net Absorption CBD 40,000 52,000 -11,000
Net Absorption Suburban 94,000 -69,000 -26,000
Class A Class B Class C
-200
0
200
400
600
2006
2007
2008
2009
2010
Thousa
nds
Square
Feet
0%
4%
8%
12%
16%
20%
Absorption Inventory Change Vacancy %
-200
0
200
400
600
2006
2007
2008
2009
2010
Thousa
nds
Square
Feet
0%
4%
8%
12%
16%
20%
24%
Absorption Inventory Change Vacancy %
recorded the greatest increase in vacancy,
from 21 percent at the end of 2009 to 22.2
percent at the end of 2010. During this same
period, Class C offi ce vacancy rose year-
over-year by 1.1 percent, from 18.9 percent
during the fourth quarter of 2009 to 20
percent at year end.
At the end of the fourth quarter, vacancy
rates across the market varied by a large
margin. On one end of the spectrum was
the West submarket with a vacancy rate of
40.9 percent, while on the other end was the
Downtown submarket at 15.4 percent. Other
submarkets fi lled the gap with Midtown
at 26.9 percent, East at 26.4 percent,
Northeast at 25.9 percent, Keystone at 25
percent, South at 24.5 percent, Northwest at
20.8 percent, Fishers at 19.2 percent, and
North/Carmel at 17.5 percent.
Fortunately, vacancy rates fell in seven of the
ten submarkets during the fourth quarter.
Quarterly vacancy declines were registered
in the Northwest (-4.1%), North/Carmel
(-1.7%), Fishers (-1.4%) and Northeast
(-0.8%) submarkets. Simultaneously,
vacancy in the East (+10.5%), Keystone
(+1.2%) and Midtown (+0.8%) submarkets
rose from the third to the fourth quarter.
During the course of 2010, three
submarkets experienced year-over-year
vacancy declines, four endured increases,
and two remained fl at. Year-over-year
declines occurred in the Midtown (-1.4%),
Keystone (-0.7%) and Downtown (-0.6%)
submarkets. Meanwhile, year-over-year
increases happened in the West (+12.5%),
East (+10.7%), South (+0.7%) and Fishers
(+0.3%) submarkets. Vacancy in both
the Northwest and Northeast submarkets
remained relatively fl at.
Strikingly, Class A offi ce vacancy declined
over the last two quarters of 2010, with a
vacancy rate of 19.5 percent at the end of
December, 1.4 percent lower than at the
end of the third quarter and 0.9 percent
lower than a year prior. The Central Business
District Class A vacancy rate decreased
from 18.2 percent at the end of the third
quarter to 17.3 percent at the end of the
fourth. In the Suburban market, the Class
A vacancy rate decreased by 1.7 percent
from the third to the fourth quarter, moving
from 22.6 percent at the end of September
to 20.9 percent at the end of December.
This Suburban Class A vacancy rate was
nearly a percent lower than the year prior.
Submarkets which saw Class A vacancy
rates decrease over the prior year included
Northwest (-4.3%), North Fishers (-2.4%),
Keystone (-1.1%), Midtown (-1.1%) and
Carmel (-0.2%). Year-over-year Class A
vacancy increased in the West (+5.4%) and
Northeast (+2.5%) submarkets.
Overall, Class B offi ce vacancy effectively
remained fl at through the third and
fourth quarters ending at 22.2 percent in
December, 1.2 percentage points higher
than at the end of 2009. At year end, Class
B vacancy in the Central Business District
stood at 15.9 percent while Suburban
Class B vacancy registered 25.4 percent.
Submarkets which had a noticeable
decrease in Class B vacancy over the last
three months of the year included Fishers
(-3.1%), North/Carmel (-1.5%), Northeast
(-1.4%) and Northwest (-1.4%). Year-over-
year, the Class B offi ce space declined in
the Midtown (-4.7%), North/Carmel (-2%),
Keystone (-0.7%) and Downtown (-0.6%)
submarkets.
Total Class C offi ce vacancy was 20
percent at the end of December, up from
18.9 percent a year earlier. In the Central
Business District, Class C vacancy increased
from 17.5 percent to 18.2 percent over the
fi nal three months of the year. During the
same period, Suburban Class C vacancy
rose from 20.4 percent to 21.3 percent.
Only the South (-5.6%) and Downtown
(-0.6%) submarkets fi nished the year with
lower Class C vacancy than a year previous.
Year-over-year, Class C offi ce space in the
Keystone (+16.9%), Midtown (+7.9%), West

22 | We know The State of Real Estate®
2011 Market ReportOffi ce Market
(+1.8%), Northeast (+1.5%), North/Carmel
(+0.8%) and East (+0.6%) submarkets all
ticked upward.
Net absorption at the end of December
was 80,000 square feet. This was the
result of 81,000 square feet of positive
net absorption within the Central Business
District, offset by 1,000 square feet of
negative net absorption in the Suburban
market. Five of the ten Indianapolis offi ce
submarkets displayed year-end positive
absorption, including Downtown (+56,000
SF), North/Carmel (+50,000 SF), Keystone
(+28,000 SF), Midtown (+25,000 SF) and
Northwest (+2,000 SF). Meanwhile, the
other fi ve submarkets displayed negative net
absorption at year end, including the West
(-33,000 SF), East (-25,000 SF), Northeast
(-14,000 SF), South (-6,000 SF) and Fishers
(-3,000 SF) submarkets.
A clear indicator that the offi ce market
seemed to turn a corner at the midpoint of
2010 is that seven of the 10 submarkets
displayed positive absorption from the third
quarter to the fourth quarter, and in some
instances the gains were substantial. Leading
the pack in quarter-to-quarter occupancy
growth were the Northwest (+133,000
SF) and North/Carmel (+110,000 SF)
submarkets. The Downtown (+27,000 SF),
Northeast (+27,000 SF), Fishers (+11,000),
South (+5,000) and West (+2,000)
submarkets also posted positive quarter-to-
quarter absorption. The Keystone (-47,000
SF), East (-25,000 SF) and Midtown
(-12,000 SF) submarkets saw occupancy
levels decline from the third to the fourth
quarter.
Leasing activity in Class A space during
the last six months of the year, particularly
during the fourth quarter, was the primary
cause for year-end positive absorption.
Fourth-quarter occupancy growth in Class A
space occurred in the Northwest (+104,000
SF), North/Carmel (+80,000 SF), Downtown
(+67,000 SF) and South (+9,000 SF)
submarkets. As Class A leasing velocity
increased throughout 2010, year-to-date
occupancy growth of Class A space occurred
in the Northwest (+80,000 SF), Keystone
(+29,000 SF), Downtown (+29,000 SF),
Fishers (+12,000 SF), Midtown (+11,000 SF)
and North/Carmel (+9,000 SF) submarkets.
Only the Northeast (-22,000 SF) and West
(-15,000 SF) submarkets ended the year
with Class A space in the red.
Total Class B offi ce space posted positive
fourth-quarter absorption of 28,000 square
feet, but these gains were not enough to
push Class B absorption into positive territory
at year end, when total Class B space
registered 17,000 square feet of negative net
absorption. Market winds blew in different
directions for Class B space in the Central
Business District and the Suburban market
during the fourth quarter of 2010. In the
Central Business District, fourth quarter
Class B absorption was negative 36,000
square feet, while year-end net absorption
remained positive with 52,000 square
feet of occupancy growth. In contrast, the
Suburban market fourth quarter Class B
absorption was positive with 63,000 square
feet of occupancy growth, while year-end net
absorption was negative 69,000 square feet.
The Class C structures in the Central
Business District experienced a year-
end occupancy loss of 11,000 square
feet, while the Suburban Class C space
weathered 26,000 square feet of negative
net absorption through the end of 2010.
Only the South (+10,000 SF) and Downtown
(+5,000 SF) submarkets witnessed year-end
occupancy growth in the Class C buildings.
Meanwhile, year-end negative absorption
Year Inventory
(SF)
New Supply
(SF)
Net Absorption
(SF)
Occupancy
Rate (%)
Occupancy
(SF)
Vacancy
Rate (%)
Vacancy
(SF)
2000 15,600,000 1,568,000 640,000 84.3 13,150,000 15.7 2,494,000
2001 16,519,000 919,000 716,000 84.0 13,876,000 16.0 2,688,000
2002 16,958,000 439,000 -66,000 81.2 13,770,000 18.8 3,184,000
2003 17,516,000 575,000 136,000 79.3 13,890,000 20.7 3,620,000
2004 17,950,000 434,000 691,000 81.3 14,593,000 18.7 3,363,000
2005 18,217,000 267,000 314,000 81.8 14,902,000 18.2 3,316,000
2006 18,563,000 346,000 594,000 83.2 15,254,000 16.8 3,085,000
2007 19,124,000 907,000 163,000 81.8 15,442,000 18.2 3,441,000
2008 19,833,000 855,000 294,000 79.7 15,723,000 20.3 4,015,000
2009 19,880,000 142,000 -310,000 77.6 15,413,000 22.4 4,462,000
2010 19,970,000 0 -1,000 77.1 15,407,000 22.9 4,563,000
Suburban Submarkets
Source: Cassidy Turley Research
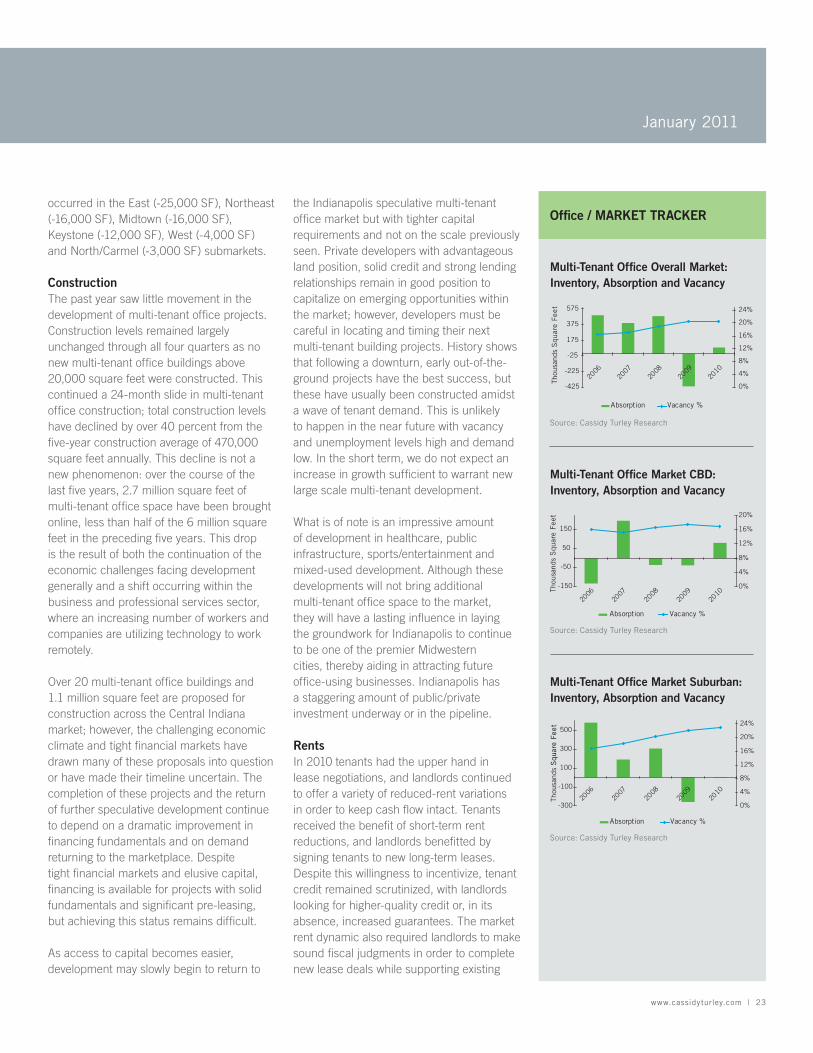
www.cassidyturley.com | 23
January 2011
Offi ce / MARKET TRACKERoccurred in the East (-25,000 SF), Northeast
(-16,000 SF), Midtown (-16,000 SF),
Keystone (-12,000 SF), West (-4,000 SF)
and North/Carmel (-3,000 SF) submarkets.
ConstructionThe past year saw little movement in the
development of multi-tenant offi ce projects.
Construction levels remained largely
unchanged through all four quarters as no
new multi-tenant offi ce buildings above
20,000 square feet were constructed. This
continued a 24-month slide in multi-tenant
offi ce construction; total construction levels
have declined by over 40 percent from the
fi ve-year construction average of 470,000
square feet annually. This decline is not a
new phenomenon: over the course of the
last fi ve years, 2.7 million square feet of
multi-tenant offi ce space have been brought
online, less than half of the 6 million square
feet in the preceding fi ve years. This drop
is the result of both the continuation of the
economic challenges facing development
generally and a shift occurring within the
business and professional services sector,
where an increasing number of workers and
companies are utilizing technology to work
remotely.
Over 20 multi-tenant offi ce buildings and
1.1 million square feet are proposed for
construction across the Central Indiana
market; however, the challenging economic
climate and tight fi nancial markets have
drawn many of these proposals into question
or have made their timeline uncertain. The
completion of these projects and the return
of further speculative development continue
to depend on a dramatic improvement in
fi nancing fundamentals and on demand
returning to the marketplace. Despite
tight fi nancial markets and elusive capital,
fi nancing is available for projects with solid
fundamentals and signifi cant pre-leasing,
but achieving this status remains diffi cult.
As access to capital becomes easier,
development may slowly begin to return to
the Indianapolis speculative multi-tenant
offi ce market but with tighter capital
requirements and not on the scale previously
seen. Private developers with advantageous
land position, solid credit and strong lending
relationships remain in good position to
capitalize on emerging opportunities within
the market; however, developers must be
careful in locating and timing their next
multi-tenant building projects. History shows
that following a downturn, early out-of-the-
ground projects have the best success, but
these have usually been constructed amidst
a wave of tenant demand. This is unlikely
to happen in the near future with vacancy
and unemployment levels high and demand
low. In the short term, we do not expect an
increase in growth suffi cient to warrant new
large scale multi-tenant development.
What is of note is an impressive amount
of development in healthcare, public
infrastructure, sports/entertainment and
mixed-used development. Although these
developments will not bring additional
multi-tenant offi ce space to the market,
they will have a lasting infl uence in laying
the groundwork for Indianapolis to continue
to be one of the premier Midwestern
cities, thereby aiding in attracting future
offi ce-using businesses. Indianapolis has
a staggering amount of public/private
investment underway or in the pipeline.
RentsIn 2010 tenants had the upper hand in
lease negotiations, and landlords continued
to offer a variety of reduced-rent variations
in order to keep cash fl ow intact. Tenants
received the benefi t of short-term rent
reductions, and landlords benefi tted by
signing tenants to new long-term leases.
Despite this willingness to incentivize, tenant
credit remained scrutinized, with landlords
looking for higher-quality credit or, in its
absence, increased guarantees. The market
rent dynamic also required landlords to make
sound fi scal judgments in order to complete
new lease deals while supporting existing
-425
-225
-25
175
375
575
2006
2007
2008
2009
2010
Thousa
nds
Square
Feet
0%
4%
8%
12%
16%
20%
24%
Absorption Vacancy %
-150
-50
50
150
2006
2007
2008
2009
2010
Thousa
nds
Square
Feet
0%
4%
8%
12%
16%
20%
Absorption Vacancy %
-300
-100
100
300
500
2006
2007
2008
2009
2010
Thousa
nds
Square
Feet
0%
4%
8%
12%
16%
20%
24%
Absorption Vacancy %
Multi-Tenant Offi ce Overall Market:Inventory, Absorption and Vacancy
Multi-Tenant Offi ce Market CBD: Inventory, Absorption and Vacancy
Multi-Tenant Offi ce Market Suburban: Inventory, Absorption and Vacancy
Source: Cassidy Turley Research
Source: Cassidy Turley Research
Source: Cassidy Turley Research

24 | We know The State of Real Estate®
2011 Market ReportOffi ce Market
mortgage obligations and maturing debt.
At the conclusion of the fourth quarter,
the average asking rental rate among
offi ce properties in the Central Business
District was $18.40 per square foot. Class
A space commanded an average asking
rate of $19.10 per square foot, Class B
space averaged $18.03 per square foot
and Class C space averaged $14.60 per
square foot. During the same period, average
asking rental rates among Suburban offi ce
properties was $17.10 per square foot.
Suburban Class A space commanded an
average asking rate of $19.47 per square
foot, Class B space averaged $15.70 per
square foot and Class C averaged $13.70 per
square foot.
Over the past year, Class A asking rents
in the Central Business District fell within
a range of $14.00 to $26.00 per square
foot, while Class A space in the Suburban
market had an asking rental rate of $11.00
to $25.00 per square foot. 2010 Class B
asking rates ranged from $11.50 to $21.00
in the Central Business District and $9.00 to
$23.50 in the Suburban market. Operating
expenses for Class A space in the Central
-45,000
-30,000
-15,000
0
15,000
30,000
45,000
60,000
Mid
town
Downt
own
Keyston
e
Nor
thwes
t
Wes
t
Nor
th/C
arm
el
Fish
ers
East
South
Nor
thea
st
Submarket
Square
Feet
of
Abso
rpti
on
Indianapolis Multi-Tenant Offi ce Market Net Absorption by Submarket
Source: Cassidy Turley Research
Business District ranged from $7.00 to
$8.00 per square foot, while the Suburban
market ranged from $8.00 to $10.00 per
square foot. Class B operating expenses
ranged from $6.00 to $7.00 per square foot
in the Central Business District and $7.00 to
$8.00 in the Suburban market.
OutlookThe direction the offi ce sector will take
depends largely on the labor markets, which
remain lackluster. Job growth is expected
to increase slightly in 2011. National offi ce
employment is projected to improve over
the next fi ve years. Nevertheless, it is likely
that offi ce employment, mainly within the
professional and business services and
fi nancial activities sectors, will continue to
decline for the next two to four quarters. In
the near term, the Indianapolis metropolitan
employment forecast is for annual job growth
to be modest through 2011. Persistently
high unemployment levels, restricted credit
access for small businesses and uncertainty
undermining business confi dence will remain
hindrances to multi-tenant offi ce demand.
There are reasons for optimism, including
the continued favorable outlook of corporate
earnings, peaking worker productivity and
the stabilization of commercial real estate
values, which should help accelerate the
resolution of problem loans and support
access to much-needed capital. Corporate
profi ts have risen over the past year by 30
to 40 percent and will continue to be robust
in 2011. Worker output per offi ce peaked
and began declining in the second quarter
of 2010, meaning that businesses can no
longer squeeze more out of current staff.
Assuming demand for goods and services
continues to rise, businesses will reach a
tipping point in the latter half of 2011 and
will be forced to hire in more meaningful
numbers.
Another indicator that bodes well for future
job growth in the state is found in the
December report of the Indiana Economic
Development Corporation which identifi ed
200 companies that are projected to
create more than 22,353 new jobs in
Indiana. Regional and local economic
development reports also bode well for
the future. Indy Partnership reports that
business development interest among
potential companies looking to relocate
remains strong, and Develop Indy recently
reported its best year in the last decade
for job growth, securing more than 8,300
commitments. These numbers have yet
to translate into offi ce-using employment,
but they are an important fi rst step in that
direction. Jobs drive demand for commercial
real estate, so increased interest and levels
of commitment are crucial for the regional
offi ce market and the scope of possibilities
moving forward.
The Indianapolis offi ce market continues to
offer a pro-business environment, high-
quality offi ce space, an extensive interstate
system, a skilled labor force and lower
costs of doing business. Opportunities for
growth exist, and factors such as low interest
rates and an infl ux of labor will continue to
support the businesses which operate in the
Indianapolis market.

January 2011
www.cassidyturley.com | 25
2011 Market Report
INDIANAPOLIS RETAIL MARKETAt a glance
Retail Market
2010 Notable New Retailers to the Market
Name Location
City Barbeque Indianapolis
Cooper's Hawk Winery & Restaurant Indianapolis
Flatwater Restaurant on the Canal Indianapolis
Jason's Deli Indianapolis
Mesh Indianapolis
Monon Food Co. Indianapolis
OshKosh B’gosh Indianapolis
Planet Fitness Indianapolis
Recess Indianapolis
Sandella’s Flatbread Café Greenwood
Scotty’s Three Wise Men Brewing Co. Indianapolis
Seasons 52 Indianapolis
The Ball & Biscuit Indianapolis
The North Face Indianapolis
The Northside Social Indianapolis
The Ripple Inn Indianapolis
The Sinking Ship Indianapolis
Turkey Hill Indianapolis/
Carmel
Which Wich Carmel/
Bloomington
Overview2010 has been a year of slow and choppy
recovery for the retail sector. Sales often
fl uctuated as unemployment fi gures and
consumer optimism seemed to change
with the wind. Lower interest rates and
increased willingness of many lenders
to renegotiate debt positions assisted
numerous retailers and landlords. Vacancy
rates and rents remained generally fl at or
improved only marginally, spurring landlords
to fi nd innovative methods to sustain
revenues. Landlords have increasingly
turned to imaginative uses for their vacant
space by adapting non-traditional retail
uses such as medical, education and call
center operations. On a positive note,
2010 saw limited retail bankruptcies.
As a result of increased consumer spending,
some retailers have begun expanding
again. Despite persistent unemployment,
sales have increased, even within the
luxury sector. Additionally, as the year
drew to a close, brisk holiday shopping
gave retailers a reason to hope for a
brighter 2011. It appears that the holiday
shopping season for 2010 will be the best
performing season since 2007, and the
highest on record. Final sales numbers
are expected to show an increase of
between 4 and 6 percent over last year.
We have also witnessed increased
acquisition activity among healthy REITs.
Action taken included Simon Property
Group’s negotiations to acquire a U.K.-
based REIT, Duke Realty’s acquisition of
a 4.9 million square foot portfolio in South
Florida, Inland’s acquisition of a signifi cant
interest in 25 shopping centers owned by
Centro Properties Group, and Kite Realty’s
issuance of additional stock to bolster its
balance sheet and acquire more property.
Indianapolis Retail Market2010 saw the continuation and increasing
velocity of the “Grade A Shift,” a trend
whereby tenants in Class B and Class C
retail properties are relocating to Class A
properties to benefi t from superior anchor
co-tenancies and increased visibility and
traffi c. Throughout the year, tenants of all
sizes and product types recognized the
benefi ts of increased sales that can be
gained by relocating to Class A properties.
Local examples include K&G Menswear
at Castleton Crossing. K&G, a long-time
Castleton retailer, identifi ed the former
Circuit City space as a superior location
and took advantage of Circuit City’s
closure as an opportunity to relocate.
Hobby Lobby took advantage of Ashley
Furniture’s departure at Village Park
Plaza in Carmel to relocate and increase
its footprint by more than 20 percent.
2010 Sees Slow Recovery for Retail Sector
Source: Cassidy Turley Research
Market Trend: Class A relocation. K&G Menswear relocated to Castleton Crossing.
Net
Statistics
2009 2010 Outlook
2011
Vacancy
Absorption
Construction
Asking Rents

26 | We know The State of Real Estate®
2011 Market ReportRetail Market
Prime small shop locations continue to
lease and hold their value. Leasing activity
has increased among local small shop and
national tenants. Since 2008, there has
been no major shopping center development
in Indiana. Occasionally a 10,000- or
15,000-square-foot outlot building was
constructed in front of a mall or on a prime
corner. However, we expect big boxes and
junior anchors to once again look to expand.
2010 saw continued activity from discount
retailers, automotive parts and accessories
retailers, drug stores, fast food and quick
service restaurants. In fast food and quick
service, an increasing number of restaurants
tested new concepts. For example, White
Castle co-located a new concept, Blaze
Modern BBQ, inside its Lafayette, Indiana,
store and is testing a new sandwich
concept, Deckers Grilled Sandwiches, and
an Asian noodle concept, the Laughing
Noodle. Chipotle is also working on an
Asian restaurant concept that follows the
Chipotle model and should debut in 2011.
We also welcomed new retailers to
the market, including The North Face,
which opened its fi rst Indiana store
at the Fashion Mall at Keystone, and
OshKosh B’gosh, which will open its fi rst
store in The Shops at River Crossing.
During the past year, we continued to
see growth in online shopping. Although
online retail sales are not growing at the
torrid pace they once were, they continue
to grow steadily at about a 10 percent
compounded annual rate. While $155 billion
worth of consumer goods were purchased
online last year, a far larger portion of
offl ine sales were infl uenced by online
research. Whether purchasing online or
not, consumers fi nd the Internet to be their
preferred method of gathering information
and comparison shopping before buying.
As a result, retailers are realizing gains can
be achieved by integrating their brick-and-
mortar locations with online sales channels.
2010 Year-Over-Year Retail Sales
Category 2009 2010 Annual Change
All Stores 3,041,924 3,963,860 6.5%
Motor Vehicle and Parts Dealers 531,762 695,652 9.9%
Gasoline Stations 265,172 395,756 16.6%
Food and Beverage Stores 436,913 534,892 2.3%
Grocery Stores 391,385 478,384 2.2%
Health and Personal Care Stores 187,432 238,818 3.5%
Building Material and Garden Equipment Stores 219,849 266,034 6.0%
General Merchandise Stores 420,608 537,942 3.0%
Department Stores (excluding leased departments) 127,871 159,285 -0.9%
Clothing and Accessories Stores 144,310 189,056 4.6%
Furniture, Home Furnishings, Electronics and
Appliance Stores
139,866 171,702 5.1%
Furniture and Home Furnishing Stores 68,818 82,309 2.2%
Electronics and Appliance Stores 71,048 89,393 2.9%
Sporting Goods, Hobby, Book and Music Stores 60,960 75,577 5.2%
Miscellaneous Store Retailers 83,248 107,986 6.9%
Nonstore Retailers 207,397 317,931 13.3%
Food Services and Drinking Places 344,407 433,054 2.8%
Source: Cassidy Turley Research
Consumer Confi dence Falls in December
Source: Conference Board
140
Consumer Confidence Index
52.5
1/1
/01
8/1
/01
3/1
/02
10
/1/0
2
5/1
/03
12
/1/0
3
7/1
/04
2/1
/05
9/1
/05
4/1
/06
11
/1/0
6
6/1
/07
1/1
/08
8/1
/08
3/1
/09
10
/1/0
9
5/1
/10
12
/1/1
0
120
100
80
60
40
20
0

www.cassidyturley.com | 27
January 2011
Retail / MARKET TRACKERBackfi lling of vacant big box space
continued, such as discount department-
store chain Shoppers World taking over a
shuttered 85,000-square-foot Target on
the south side. This marked the second
time the retailer has taken advantage of
vacant big box space to make a move in
the market. The retailer previously took
a 100,000-square-foot space formerly
occupied by JCPenney in Lafayette Square
Mall as its fi rst location in the Midwest.
Landlords have been more creative in
the reuse of vacant retail space. Tenants
have created new footprints and adapted
store fi xtures to take advantage of better
locations. A prime example of adaptive
reuse is the conversion of the former Ace
Hardware building to an Auto Collision
repair facility in Westfi eld. Another example
is the purchase and renovation of a former
Circuit City on the east side of Indianapolis
by the Marion County Health Department.
During 2010 the video rental business
was redefi ned. Struggling to keep up with
competitors such as Netfl ix, Redbox, On
Demand, Apple and others offering $1
rentals, Blockbuster Video announced
in September that it was fi ling Chapter
11, adding to the number of video rental
businesses that have signifi cantly reduced
the number of stores or simply closed
altogether. However, this obsolete business
model has created tremendous opportunity
for other retailers. For example, Family
Video took advantage of several closed
Movie Gallery sites in tertiary markets
across Indiana, and prime locations such
as endcaps and outlot buildings vacated
throughout the market have created
“blockbuster” locations for retailers and
restaurants that continue to succeed.
Since early 2008, the retail development
world has been stymied. As a result, it
was refreshing to see the redevelopment
of River’s Edge, which includes Nordstrom
Rack, Buy Buy Baby, The Container
Personal Consumption Expenditures,
(Bil. Ch. 2005 $, SAAR) for United States
0
1
2
3
4
5
-1
-2
1998 4Q
Year-
ago %
Change
2001 1Q
2003 2Q
2005 3Q
2007 4Q
2010 1Q
U.S. Consumer Spending Improving
U.S. Retail Market Recovering
U.S. Retail Rents Remain Flat
Source: Moody’s
Source: Cassidy Turley Research
-30
-20
-10
0
10
20
30
40
50
2000
2002
2004
2006
2008
2010
Square
Feet (M
illions)
0%
2%
4%
6%
8%
10%
12%
Vacancy
Net Absorption Deliveries Vacancy
Source: Reis; Cassidy Turley Research
$15.00
$16.00
$17.00
$18.00
$19.00
$20.00
2003 2004 2005 2006 2007 2008 2009 2010
Store and Jason’s Deli. This center was
formerly anchored by Offi ce Depot and
has benefi tted from its proximity to both
the Fashion Mall and the Castleton Square
Mall. When completed by Kite Realty Group
in November 2011, this redevelopment will
expand River’s Edge from 110,000 square
feet to over 142,000 square feet and will
revitalize the area by attracting many new
restaurants and retailers. Kite Realty Group
was also involved in the renovation of the
Marsh-anchored Fishers Station shopping
center, which will include the addition of
a 15,250-square-foot Goodwill store.
2010 also experienced positive development
news emerging from Marion, Indiana,
where a new shopping center is currently
underway. University Marketplace,
anchored by Meijer, will be expanded
to include a new 55,000-square-foot
Kohl’s, Petsmart and at least two other
specialty mid-sized box retailers. University
Marketplace is a mixed-use development
site that includes The Heritage at University
Marketplace and an Arbor Homes housing
development. Notably, Kohl’s signifi es
the fi rst new big box development and
expansion within the state since 2009.
OutlookOur 2011 forecast is for a modest increase in
overall retail and restaurant sales. Electronic
advertising will continue to drive sales and
traffi c to shopping centers and restaurants,
and we will see continued growth in online
shopping and electronic retail marketing.
Expect to see additional store closures,
consolidations and strategic conversions in
2011 as retailers continue to shift capital to
more profi table stores and locations. “Extend
and pretend” will come to an end as those
who have purchased notes during the last
year will begin the foreclosure process. Land
will remain a challenge and, depending on
the availability of capital, the development
pipeline, which has been dry for several
years, will begin to be replenished.

28 | We know The State of Real Estate®
2011 Market Report
INDIANAPOLIS INVESTMENT MARKETAt a glance
Investment Market
Investment Activity in Primary Markets Was Brisk In 2010
With Increased Activity in Secondary and Tertiary Markets
OverviewOver the past year national transaction
activity increased in the primary markets,
with increased activity in the secondary
and tertiary markets in the second half of
the year. Major metropolitan areas such as
New York, Washington DC, San Francisco,
Los Angeles and Dallas were the recovery
leaders. Just two to three years ago many
of these same cities were the fi rst to lead
the market downward. In 2010 they led the
charge back with national data showing
an estimated $100 billion of commercial
real estate deals closed over the past year,
exceeding the $49 billion posted in 2009
and moving closer to the $151 billion of
commercial real estate closed in 2008.
Despite this increase, the national market
remains down over 80 percent from 2007
levels when $533 billion of commercial real
estate investment deals were transacted.
Levels of distressed property activity varied
across the national landscape with activity
increasing in the Midwest as lenders
continued to cull their pools of troubled
assets. Meanwhile, the primary markets,
whose distressed timeline led the Midwest
by 12 months or more, experienced
distressed activity slowing as the year
progressed. Expect this trend to continue
in 2011, providing continued opportunities
for opportunistic buyers. Currently, less
than 38 percent of the estimated distressed
loans have been worked out, leaving at
least $186 billion of distressed property
which will need to be recapitalized, again,
good news for opportunistic buyers.
2010 witnessed a changing of the guard as
the buyer profi le changed with institutions
and publicly traded REITs stepping back
into action and becoming the predominant
players nationwide by replacing the private
buyers who prevailed in 2009. This is not
to suggest that private buyers are out of
the market; on the contrary, they remain
engaged and are increasingly focused on
the smaller transactions available in the
Midwest. We also witnessed pricing improve
2010 Year-Over-Year Indianapolis All Commercial Types (Offi ce / Industrial / Retail)Investment Sales Up 177%
0
100
200
300
400
500
600
700
800
900
J F M A M J J A S O N D
2010200920082007
Cum
ula
tive
Month
ly V
olu
me $
(M
illions)
Source: Real Capital Analytics
Investment Highlights
• Buyer interest in the market was bifurcated
between core Class A assets and distressed
assets, while the market was trifurcated
between core Class A assets, distressed assets
and the rest.
• During 2010 the number of investment
sales remained steady but the average price
fell slightly from the previous year. A major
hindrance to transaction volume and pricing
stability continued to be the restricted credit
environment.
• As 2010 progressed there was an increase
in the availability of credit which supported
property sales and the refi nancing of maturing
debt. A broader range of lenders became
engaged, including CMBS conduit originators
and life insurance companies.
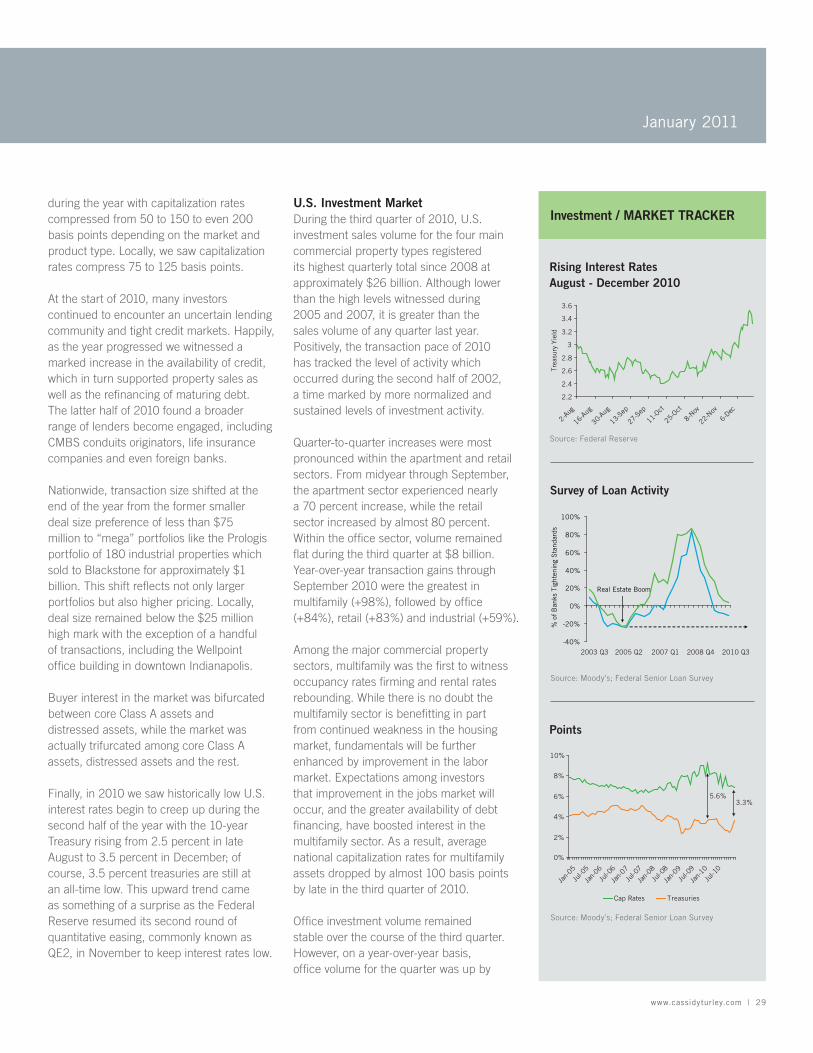
January 2011
www.cassidyturley.com | 29
Investment / MARKET TRACKER
Rising Interest RatesAugust - December 2010
Points
Survey of Loan Activity
Source: Federal Reserve
Source: Moody’s; Federal Senior Loan Survey
Source: Moody’s; Federal Senior Loan Survey
2.2
2.4
2.6
2.8
3
3.2
3.4
3.6
2-Au
g
16-A
ug
30-A
ug
13-S
ep
27-S
ep
11-O
ct
25-O
ct
8-Nov
22-N
ov
6-Dec
Tre
asury
Yie
ld
0%
2%
4%
6%
8%
10%
Jan-
05
Jul-0
5
Jan-
06
Jul-0
6
Jan-
07
Jul-0
7
Jan-
08
Jul-0
8
Jan-
09
Jul-0
9
Jan-
10
Jul-1
0
Cap Rates Treasuries
3.3%5.6%
-40%
-20%
0%
20%
40%
60%
80%
100%
% o
f B
anks T
ighte
nin
g S
tandard
s
Real Estate Boom
2003 Q3 2005 Q2 2007 Q1 2008 Q4 2010 Q3
during the year with capitalization rates
compressed from 50 to 150 to even 200
basis points depending on the market and
product type. Locally, we saw capitalization
rates compress 75 to 125 basis points.
At the start of 2010, many investors
continued to encounter an uncertain lending
community and tight credit markets. Happily,
as the year progressed we witnessed a
marked increase in the availability of credit,
which in turn supported property sales as
well as the refi nancing of maturing debt.
The latter half of 2010 found a broader
range of lenders become engaged, including
CMBS conduits originators, life insurance
companies and even foreign banks.
Nationwide, transaction size shifted at the
end of the year from the former smaller
deal size preference of less than $75
million to “mega” portfolios like the Prologis
portfolio of 180 industrial properties which
sold to Blackstone for approximately $1
billion. This shift refl ects not only larger
portfolios but also higher pricing. Locally,
deal size remained below the $25 million
high mark with the exception of a handful
of transactions, including the Wellpoint
offi ce building in downtown Indianapolis.
Buyer interest in the market was bifurcated
between core Class A assets and
distressed assets, while the market was
actually trifurcated among core Class A
assets, distressed assets and the rest.
Finally, in 2010 we saw historically low U.S.
interest rates begin to creep up during the
second half of the year with the 10-year
Treasury rising from 2.5 percent in late
August to 3.5 percent in December; of
course, 3.5 percent treasuries are still at
an all-time low. This upward trend came
as something of a surprise as the Federal
Reserve resumed its second round of
quantitative easing, commonly known as
QE2, in November to keep interest rates low.
U.S. Investment MarketDuring the third quarter of 2010, U.S.
investment sales volume for the four main
commercial property types registered
its highest quarterly total since 2008 at
approximately $26 billion. Although lower
than the high levels witnessed during
2005 and 2007, it is greater than the
sales volume of any quarter last year.
Positively, the transaction pace of 2010
has tracked the level of activity which
occurred during the second half of 2002,
a time marked by more normalized and
sustained levels of investment activity.
Quarter-to-quarter increases were most
pronounced within the apartment and retail
sectors. From midyear through September,
the apartment sector experienced nearly
a 70 percent increase, while the retail
sector increased by almost 80 percent.
Within the offi ce sector, volume remained
fl at during the third quarter at $8 billion.
Year-over-year transaction gains through
September 2010 were the greatest in
multifamily (+98%), followed by offi ce
(+84%), retail (+83%) and industrial (+59%).
Among the major commercial property
sectors, multifamily was the fi rst to witness
occupancy rates fi rming and rental rates
rebounding. While there is no doubt the
multifamily sector is benefi tting in part
from continued weakness in the housing
market, fundamentals will be further
enhanced by improvement in the labor
market. Expectations among investors
that improvement in the jobs market will
occur, and the greater availability of debt
fi nancing, have boosted interest in the
multifamily sector. As a result, average
national capitalization rates for multifamily
assets dropped by almost 100 basis points
by late in the third quarter of 2010.
Offi ce investment volume remained
stable over the course of the third quarter.
However, on a year-over-year basis,
offi ce volume for the quarter was up by

30 | We know The State of Real Estate®
2011 Market Report
3%
62%
4%
6%
26%
2007
4%
70%
9%
17%
2008
2%
89%
9%
2009
41%
27%
32%
2010 (YTD)
9%
34%
20%
8%
30%
2010 (YTD)
Institutional Cross-Border Public Listed/REITs
Indianapolis United States
Private User/Other
Investment Market
Year-Over-Year Capital Flows by Buyer Type: All Commercial Types
Source: Real Capital Analytics
67 percent. For the year-to-date period,
offi ce volumes increased by 84 percent
to nearly $21 billion. Stabilizing market
fundamentals nationally should contribute
to improving sentiment among investors
and momentum in trading into 2011.
Industrial investment activity increased
moderately during the third quarter,
with volume up almost 30 percent to
approximately $4 billion. Strikingly,
industrial volumes for third quarter
2010 were more than double the level
of a year prior. Compared with the other
product types, particularly multifamily
and offi ce, cap rate compression for the
industrial sector has been minimal.
Closed retail transactions in the third quarter
increased dramatically on a quarter-to-
quarter basis, with approximately $5.5
billion in retail assets traded. At the end of
the third quarter, retail volume increased by
nearly 80 percent over the second quarter,
aided in large part by Lightstone Group’s
sale of its Prime Outlets portfolio to Simon
Property Group. Cap rates continued to fall
for core well-anchored retail properties.
Indianapolis Investment MarketThe Indianapolis investment market
embarked cautiously into 2010, refl ecting
the uncertainty which lingered in portions
the regional and national markets. The
industrial investment market remained
relatively fl at compared to the level of
activity witnessed during the preceding
year with many of the roadblocks, such
as the limited availability of credit, which
had previously prevented investors from
entering the market remaining to hinder
them at the start of 2010. By in large,
industrial transaction volume was a
continuation of the same in 2010 with a
fraction of the deal volume we enjoyed in
the not too distant past of 2006 and 2007.
Among the industrial investment sales
which did occur in the past year there were
distinctly two different classes of industrial
properties, core assets, occurring towards
the end of the year, and distressed assets,
which were relatively active throughout
the year. An example of a distressed
transaction for 2010 includes the note sale
of Georgetown Crossing, a 146,000 square
foot two-building industrial portfolio located
in the Northwest industrial submarket
which had an estimated occupancy below
60 percent. Many of the distressed sales
which were completed, or introduced
to market but not closed, in 2010 were
priced as a “price per square foot”
basis rather than an implied cap rate.
The second asset class of interest to
investors was core industrial property –
modern bulk buildings – with state-of-the-
art construction located in A+ areas, fully
occupied by strong tenants. At the end
of the year, we witnessed two signifi cant,
single tenant industrial transactions
totaling in excess of 1.2 million SF: the
Conagra facility in Lebanon with 476,200
square feet; and the 809,000 square
foot Cooper Tire facility in Greenwood.
Notably, cap rates for these types of core
industrial assets compressed from last year’s
range of 9.25 to 10.5 percent to a range
of 8 to 9 percent, and we anticipate these
rates compressing further. As investors fi nd
the competition increasingly stiff in primary
markets for core industrial assets, expect
interest to increase here in Indianapolis.
With increased interest will come greater
competition for available product and
corresponding pressure downward on cap
rates and pressure upward on price.
One of the big national portfolios reference
above, the Prologis 180-Property
Industrial Portfolio, had an Indianapolis
component. This transaction of over 20
million square feet of warehouse property
across the U.S. included 20 properties
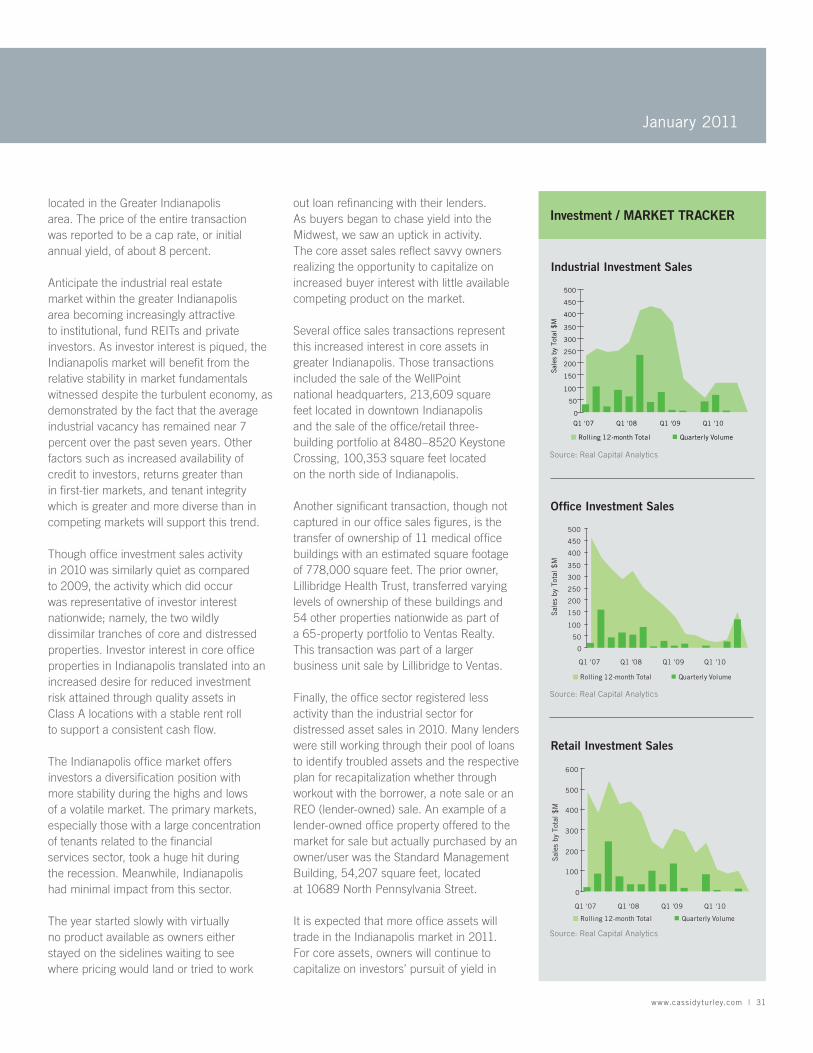
www.cassidyturley.com | 31
January 2011
Investment / MARKET TRACKER
Industrial Investment Sales
Offi ce Investment Sales
Retail Investment Sales
Source: Real Capital Analytics
Source: Real Capital Analytics
Source: Real Capital Analytics
located in the Greater Indianapolis
area. The price of the entire transaction
was reported to be a cap rate, or initial
annual yield, of about 8 percent.
Anticipate the industrial real estate
market within the greater Indianapolis
area becoming increasingly attractive
to institutional, fund REITs and private
investors. As investor interest is piqued, the
Indianapolis market will benefi t from the
relative stability in market fundamentals
witnessed despite the turbulent economy, as
demonstrated by the fact that the average
industrial vacancy has remained near 7
percent over the past seven years. Other
factors such as increased availability of
credit to investors, returns greater than
in fi rst-tier markets, and tenant integrity
which is greater and more diverse than in
competing markets will support this trend.
Though offi ce investment sales activity
in 2010 was similarly quiet as compared
to 2009, the activity which did occur
was representative of investor interest
nationwide; namely, the two wildly
dissimilar tranches of core and distressed
properties. Investor interest in core offi ce
properties in Indianapolis translated into an
increased desire for reduced investment
risk attained through quality assets in
Class A locations with a stable rent roll
to support a consistent cash fl ow.
The Indianapolis offi ce market offers
investors a diversifi cation position with
more stability during the highs and lows
of a volatile market. The primary markets,
especially those with a large concentration
of tenants related to the fi nancial
services sector, took a huge hit during
the recession. Meanwhile, Indianapolis
had minimal impact from this sector.
The year started slowly with virtually
no product available as owners either
stayed on the sidelines waiting to see
where pricing would land or tried to work
out loan refi nancing with their lenders.
As buyers began to chase yield into the
Midwest, we saw an uptick in activity.
The core asset sales refl ect savvy owners
realizing the opportunity to capitalize on
increased buyer interest with little available
competing product on the market.
Several offi ce sales transactions represent
this increased interest in core assets in
greater Indianapolis. Those transactions
included the sale of the WellPoint
national headquarters, 213,609 square
feet located in downtown Indianapolis
and the sale of the offi ce/retail three-
building portfolio at 8480–8520 Keystone
Crossing, 100,353 square feet located
on the north side of Indianapolis.
Another signifi cant transaction, though not
captured in our offi ce sales fi gures, is the
transfer of ownership of 11 medical offi ce
buildings with an estimated square footage
of 778,000 square feet. The prior owner,
Lillibridge Health Trust, transferred varying
levels of ownership of these buildings and
54 other properties nationwide as part of
a 65-property portfolio to Ventas Realty.
This transaction was part of a larger
business unit sale by Lillibridge to Ventas.
Finally, the offi ce sector registered less
activity than the industrial sector for
distressed asset sales in 2010. Many lenders
were still working through their pool of loans
to identify troubled assets and the respective
plan for recapitalization whether through
workout with the borrower, a note sale or an
REO (lender-owned) sale. An example of a
lender-owned offi ce property offered to the
market for sale but actually purchased by an
owner/user was the Standard Management
Building, 54,207 square feet, located
at 10689 North Pennsylvania Street.
It is expected that more offi ce assets will
trade in the Indianapolis market in 2011.
For core assets, owners will continue to
capitalize on investors’ pursuit of yield in
0
50
100
150
200
Sale
s by
Tota
l $
M
250
300
350
400
450
500
Q1 '07 Q1 '08 Q1 '09 Q1 '10
Rolling 12-month Total Quarterly Volume
0
100
200
300
400
500
600
Q1 '07 Q1 '08 Q1 '09 Q1 '10
Rolling 12-month Total Quarterly Volume
Sale
s by
Tota
l $
M
0
50
100
150
200
250
300
350
400
450
500
Q1 '07 Q1 '08 Q1 '09 Q1 '10
Rolling 12-month Total Quarterly Volume
Sale
s by
Tota
l $
M

32 | We know The State of Real Estate®
2011 Market ReportInvestment Market
the Midwest coupled with the availability
of credit. For potentially distressed
assets, owners with loan maturities,
partnership changes or unmanageable
capital requirements may be forced to
sell when they would otherwise have
held on to the asset. Lastly, expect more
distressed property opportunities from
the lending community with over $35
billion in REO property. Increased investor
interest and corresponding activity
will drive pricing upward in 2011.
As has been the case with industrial and
offi ce investment activity, retail investment
activity remained consistent with the
level of 2009 activity. The signifi cant
difference between retail investment sales
activities compared to offi ce and industrial
transactions is the type of assets of interest
to investors. For 2010, the two most active
areas of retail investment sales were smaller
single tenant triple net (NNN) transactions
and distressed asset transactions.
For the most part, transaction value ranged
from $1.5 million to roughly $10 million.
Approximately half of the reported deals
were NNN single-tenant transactions with
national credit tenants, including CVS
Pharmacy, Advanced Auto and Sherwin
Williams. Average square footage ranged
from 6,000 to 12,000 square feet. Cap
rates for these stable, risk-resistant assets
compressed to the low-to-mid 8 percent cap
rate range. It is anticipated this asset class
will continue to be of interest for investors
in 2011 with further cap rate compression.
The second signifi cant asset class
for retail sales came in the form of
distressed or troubled assets. We saw
several lender-owned assets introduced
to the market and close before the end
of 2010. The most signifi cant of these
deals is the sale of Metropolis on the
southwest side of Indianapolis in Plainfi eld.
This 507,770 square foot transaction
included national tenants such as JC
Penney and Dick’s Sporting Goods.
With positive signs of recovery to the
economy ongoing and a relatively stable
market in Indianapolis, it is anticipated the
retail sector will continue to be of increased
interest to investors in 2011. We predict
retail transaction activity to increase over
2010 activity in both of the previously
referenced asset classes, as well as marked
increase in core retail asset activity.
Fundamentals of the Indianapolis Class A
multifamily rental market remained strong
as occupancy levels and rental rates
Industrial SalesArranged by square feet transacted
Property Name Address Submarket Square Feet
Cooper Tire 500 Bertram Parkway South 809,000
Eagle 5 Building 1105 E. Northfi eld Drive West 526,000
ConAgra Foods Building 640 S. State Road 39 Northwest 476,200
Georgetown Commerce 7201 Georgetown Road Northwest 148,000
Mitthoeffer Building 3130 N. Mitthoeffer Road East 67,200
Offi ce SalesArranged by square feet transacted
Property Name Address Submarket Square Feet
WellPoint Headquarters 120 Monument Circle Downtown 213,609
One North Capitol 1 N. Capitol Avenue Downtown 161,984
Castle Creek 1 and 2 8604-8606 N. Allisonville Road Northeast 117,204
Keystone Crossing Portfolio 8480-8520 Keystone Crossing Keystone 100,353
Standard Management Building 10689 N. Pennsylvania Street North/Carmel 54,207
Retail SalesArranged by square feet transacted
Property Name Address Submarket Square Feet
Metropolis Shopping Center 2499 Futura Parkway West 507,770
Fall Creek Harbour 10142 Brook School Road Fishers 51,905
Heartland Landing 10302 Prosperity Circle Southwest 21,611
Brook School Road Building 116th & Brook School Road Fishers 15,168
Centre East 10600 E. Washington Street East 8,250
Multifamily SalesArranged by number of units
Property Name Address Submarket Units
Washington Village 4211 W. Potomac Drive (Greenfi eld) East 288
Eagle Pointe 6612 Eagle Pointe Drive Northwest 256
Bradford Point 1680 E. Franklin Street (Evansville) Outlying 252
Grand Reserve at Geist 8019 Glenway Drive Northeast 146
2010 Notable Investment Sales by Market
Source: Real Capital Analytics; Cassidy Turley Research
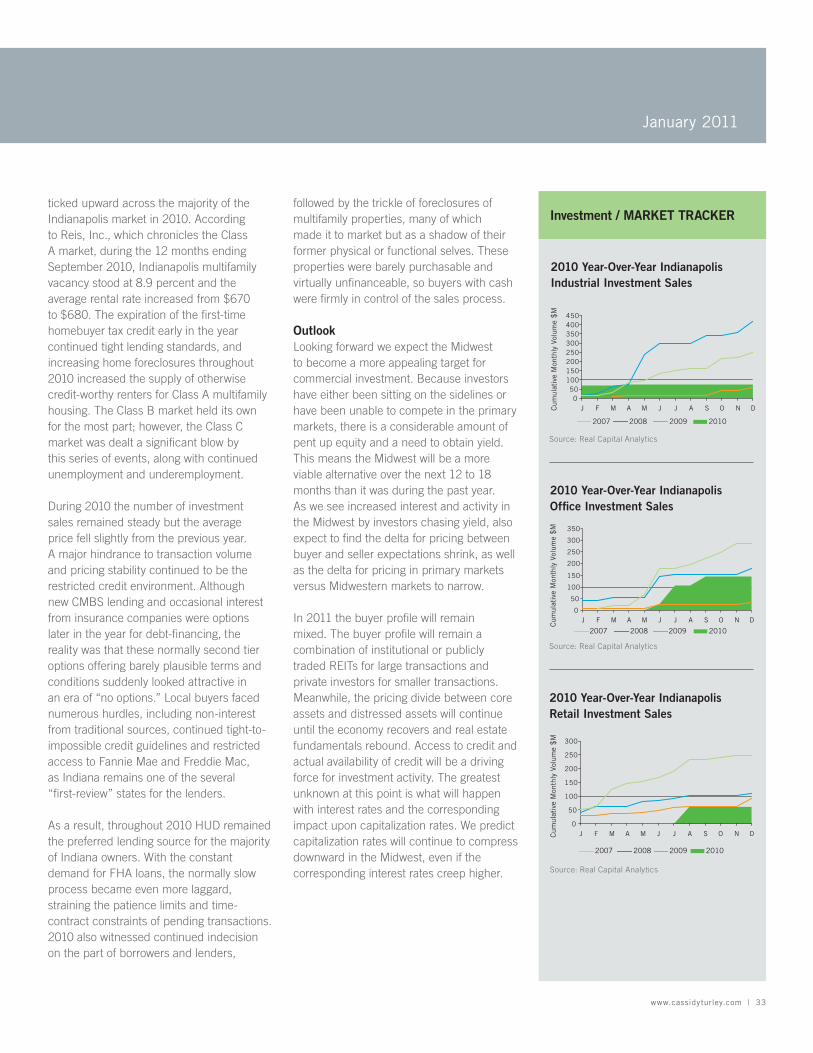
www.cassidyturley.com | 33
January 2011
Investment / MARKET TRACKER
2010 Year-Over-Year Indianapolis Industrial Investment Sales
2010 Year-Over-Year Indianapolis Offi ce Investment Sales
2010 Year-Over-Year Indianapolis Retail Investment Sales
Source: Real Capital Analytics
ticked upward across the majority of the
Indianapolis market in 2010. According
to Reis, Inc., which chronicles the Class
A market, during the 12 months ending
September 2010, Indianapolis multifamily
vacancy stood at 8.9 percent and the
average rental rate increased from $670
to $680. The expiration of the fi rst-time
homebuyer tax credit early in the year
continued tight lending standards, and
increasing home foreclosures throughout
2010 increased the supply of otherwise
credit-worthy renters for Class A multifamily
housing. The Class B market held its own
for the most part; however, the Class C
market was dealt a signifi cant blow by
this series of events, along with continued
unemployment and underemployment.
During 2010 the number of investment
sales remained steady but the average
price fell slightly from the previous year.
A major hindrance to transaction volume
and pricing stability continued to be the
restricted credit environment. Although
new CMBS lending and occasional interest
from insurance companies were options
later in the year for debt-fi nancing, the
reality was that these normally second tier
options offering barely plausible terms and
conditions suddenly looked attractive in
an era of “no options.” Local buyers faced
numerous hurdles, including non-interest
from traditional sources, continued tight-to-
impossible credit guidelines and restricted
access to Fannie Mae and Freddie Mac,
as Indiana remains one of the several
“fi rst-review” states for the lenders.
As a result, throughout 2010 HUD remained
the preferred lending source for the majority
of Indiana owners. With the constant
demand for FHA loans, the normally slow
process became even more laggard,
straining the patience limits and time-
contract constraints of pending transactions.
2010 also witnessed continued indecision
on the part of borrowers and lenders,
followed by the trickle of foreclosures of
multifamily properties, many of which
made it to market but as a shadow of their
former physical or functional selves. These
properties were barely purchasable and
virtually unfi nanceable, so buyers with cash
were fi rmly in control of the sales process.
OutlookLooking forward we expect the Midwest
to become a more appealing target for
commercial investment. Because investors
have either been sitting on the sidelines or
have been unable to compete in the primary
markets, there is a considerable amount of
pent up equity and a need to obtain yield.
This means the Midwest will be a more
viable alternative over the next 12 to 18
months than it was during the past year.
As we see increased interest and activity in
the Midwest by investors chasing yield, also
expect to fi nd the delta for pricing between
buyer and seller expectations shrink, as well
as the delta for pricing in primary markets
versus Midwestern markets to narrow.
In 2011 the buyer profi le will remain
mixed. The buyer profi le will remain a
combination of institutional or publicly
traded REITs for large transactions and
private investors for smaller transactions.
Meanwhile, the pricing divide between core
assets and distressed assets will continue
until the economy recovers and real estate
fundamentals rebound. Access to credit and
actual availability of credit will be a driving
force for investment activity. The greatest
unknown at this point is what will happen
with interest rates and the corresponding
impact upon capitalization rates. We predict
capitalization rates will continue to compress
downward in the Midwest, even if the
corresponding interest rates creep higher.
0
50
100
150
200
250
300
350
400
450
J F M A M J J A S O N D
2010
Cum
ula
tive
Month
ly V
olu
me $
M
200920082007
0
50
100
150
200
250
300
J F M A M J J A S O N D
2010200920082007
Cum
ula
tive
Month
ly V
olu
me $
M
0
50
100
150
200
250
300
350
J F M A M J J A S O N D
2010200920082007
Cum
ula
tive
Month
ly V
olu
me $
M
Source: Real Capital Analytics
Source: Real Capital Analytics

34 | We know The State of Real Estate®
2011 Market ReportLand Market
INDIANAPOLIS LAND MARKETAt a glance
OverviewLand sales slowed dramatically at the start
of the recession and continued to struggle
in 2010 with scarce fi nancing making
development activity nearly nonexistent.
Commercial land sales within Central
Indiana over the past 24 months have been
off by more than 55 percent compared
to pre-recession levels, when sales of at
least 1,200 acres annually was the norm.
While sales activity is low, the amount of
new land being brought onto the market is
rising as lenders have started to foreclose
in greater numbers on non-performing loan
commitments in an effort to clean up their
balance sheets. As lenders have attempted
to either sell off land or dispose of it through
bundling notes at discounted prices, both
commercial and residential markets have
experienced an increase in available lots
and more aggressive pricing. Meanwhile,
housing indicators leave little doubt that the
recovery within the residential real estate
market continues to remain fragile. In the
production sector, single-family housing
permits, starts and completions all fell. In
the marketing sector, sales of both new
and existing homes declined throughout
2010 while median sale prices remained
nearly the same as in the previous year.
Elevated levels of unsold homes within
Central Indiana continued to be a drag
on new residential construction and
home prices throughout 2010. According
to the National Association of Home
Builders (NAHB), the fourth quarter
saw only a modest improvement in
sales with showroom traffi c weak but
conversion rates increasing. Across the
region residential demand remained
stagnant as a result of the ongoing
weakness in the job market, the rising
number of foreclosures and short-sales,
and very challenging credit conditions.
Consequently, residential development of
new properties was minimal as builders
were instead concentrating on the
disposition of existing distressed properties.
Similarly, private nonresidential commercial
development remained subdued, particularly
for multi-tenant offi ce and retail buildings,
due to elevated vacancies and declining
commercial rents. Over the course of
the year, rising vacancy rates leveled
out and small improvements in demand,
particularly for industrial facilities, were
noted. Throughout the year the market
also experienced an increase in inquiries
and redevelopment projects related to
vacant commercial space. Both public
and private healthcare projects continued
as new hospitals were funded and built,
replacement facilities were planned, and
major acute care facilities were expanded. In
contrast to the limited private development
occurring in the market, public construction
increased throughout the year with activity
concentrated in transportation infrastructure
and healthcare-related projects.
ResidentialConsumers and builders have yet to witness
consistent indications that the economy is
improving, and this has translated into low
levels of consumer demand and muted
builder confi dence. Builder confi dence in
the market for newly built, single-family
homes remained unchanged from November
to December at 16 on the NAHB/Wells
Fargo Housing Market Index (HMI). Derived
from a monthly survey, the HMI captures
builders’ perceptions of current single-family
home sales and expectations for the next
six months. Scores from each component
are then used to calculate a seasonally
adjusted index where any number over
50 indicates that builders view conditions
favorably. Two of the three components
Development Levels Remain at Historic Lows,
Uncertainty as to Fundamentals Stalling Pace of Recovery
Land Highlights
• Elevated levels of unsold homes continued to
be a drag on new residential construction in
2010.
• Private nonresidential commercial
development also remained subdued in 2010,
particularly for offi ce and retail buildings.
• Public construction increased in 2010
with activity concentrated in transportation
infrastructure and healthcare.
Indiana
Statistics
2009 2010 Outlook
2011
Total
Housing
Starts
Single
Family
Starts
Multifamily
Starts
Median
Home Price
Developed
Lot Inventory

January 2011
www.cassidyturley.com | 35
Land / MARKET TRACKERof December’s HMI remained unchanged
from November, including the components
gauging current sales conditions and sales
expectations in the next six months, while
the component gauging prospective buyers
dropped slightly. Positively, the index and
its subcomponents remain higher than
levels experienced in the third quarter of
2010, which offers hope that an improving
job market this spring could propel more
sales activity in 2011. Nevertheless, the
continuing challenges related to obtaining
construction credit and the rising number
of foreclosures and short-sales could
signifi cantly hamper the pace of recovery.
In contrast to the muted confi dence of
single-family builders, leading indicators
of multifamily production and vacancy
indices showed increased confi dence as
the year closed. Both the NAHB composite
Multifamily Production Index (MPI) and
Multifamily Vacancy Index (MVI) improved in
December. The MPI increased to its highest
level since 2007, and the MVI showed fewer
vacant apartments for the fi fth quarter in
a row, continuing its steady decline from a
peak vacancy rate in the second quarter
of 2009. Although the multifamily indices’
continued movement into positive territory
is certainly welcome news, it is important
to note that they are rising from historically
low levels. Similar to the challenges
facing single-family development, further
improvement in the multifamily market
will depend upon resolving the formidable
obstacles to fi nancing the development and
construction of viable multifamily projects.
Home sales, although soft, are improving
in many states and metropolitan areas
throughout the Midwest. The federal
homebuyer tax credit and reduced rate
of job declines increased the number of
homes sales in the Midwest region during
the third quarter, but with the expiration of
the homebuyer tax credit, it remains to be
seen if the practical effect was more than
simply shifting demand forward without
increasing the overall level of demand within
the residential markets. According to data
from the National Association of Realtors,
during the third quarter of 2010, the annual
rate of existing home sales in the Midwest
increased by 14 percent compared with
the annual rate of home sales during the
second quarter of 2009. In Indiana, data
from the Indiana Association of Realtors
showed improved rates and prices of home
sales, with rates increasing 6 percent to
62,850 homes sold and median home
sales price gains of 3 percent to $111,500.
In the Indianapolis metropolitan area, data
from the Metropolitan Indianapolis Board of
Realtors indicate an increase in the rate of
home sales by 6.1 percent to 24,250 homes
sold and an increase in the average home
sales price up 5.8 percent to $149,300.
Unfortunately, despite this uptick in sales,
the Indianapolis region remains 34.3 percent
below the prior year’s sales volume. Just as
challenging is the fact that, according to the
Lender Processing Service, Inc. Mortgage
Performance Data, as of the start of the
fourth quarter, the percentage of regional
home loans 90 days or more delinquent,
in foreclosure or in REO was 8.6 percent,
an increase from 8.4 percent a year ago.
Both single-family and multifamily home
construction across the Midwest, as
measured by the number of building permits
issued, slowly increased during the balance
of the past year but remains below historical
levels. Single-family home construction in
the Midwest increased by 10 percent, or
nearly 44,500 homes permitted, during
the 12 months ending September 2010.
Although promising, this fi gure remains 59
percent below the prior fi ve year average for
number of homes permitted. Meanwhile,
across the region multifamily construction
activity increased by 1 percent to 14,600
units from the third quarter of 2009 through
the third quarter of 2010, but remains 39
percent below the prior fi ve-year average of
37,250 multifamily units. Among most major
metropolitan areas in the Midwest, including
$0
$50K
$100K
$150K
2009
Q1
2009
Q2
2009
Q3
2009
Q4
2010
Q1
2010
Q2
2010
Q3$0
$50K
$100K
$150K
$200K
$250K
IN Average Price IN Median Price US Average Price
# M
ult
ifam
ily
Perm
its
# S
ingle
Fam
ily
Perm
its
Central Indiana Average and Median Home Price Comparison
Source: Federal Housing Financing Authority;
Cassidy Turley Research
0
10K
20K
30K
40K
50K
60K
70K
80K
2005
2006
2007
2008
2009
2010
$0
$1M
$2M
$3M
$4M
$5M
$6M
Buildings and Housing Units Valuation of Construction
# B
uildin
g a
nd H
ousi
ng U
nit
s C
onst
ructe
d
$ V
alu
ati
on o
f C
onst
ructi
on
Indiana Privately-Owned Newly Constructed Units and Value of Construction
Source: Cassidy Turley Research
0
5
10
15
20
25
30
35
Jun-
10
Jul-1
0
Aug-10
Sep-
10
Oct-1
0
Nov
-10
0
50
100
150
200
250
300
350
400
450
Multifamily Single Family
# M
ult
ifam
ily
Perm
its
# S
ingle
Fam
ily
Perm
its
Central Indiana Single-Family and Multifamily Building Activity
Source: Cassidy Turley Research

36 | We know The State of Real Estate®
2011 Market ReportLand Market
Indianapolis, single-family homebuilding
activity followed suit. In Minneapolis, during
the 12 months ending September 2010,
single-family construction was nearly 23
percent above prior year levels with 4,175
homes permitted. In Ohio, increases
ranged from 14 percent in Columbus, or
3,000 homes permitted, to 6 percent, or
3,100 homes permitted in Cincinnati. In
the Indianapolis region, the annual rate of
increase was 10 percent, or 3,925 homes.
During the same period, Indiana witnessed
an 8 percent decline in multifamily permits,
and the Indianapolis MSA experienced
an 11 percent decline. Strikingly, the
decline in the number of multifamily units
permitted in Indianapolis accounted
for nearly the entire 250-unit decline in
multifamily permits across the state.
On a brighter note, Indianapolis-Carmel has
reclaimed the top spot as the most affordable
major housing market in the country as
housing affordability remains near its highest
level nationwide, as a result of interest
rates remaining at the lowest levels seen in
nearly two decades. In Indianapolis, 93.3
percent of all homes sold were affordable
to households earning the area’s median
family income of $68,700. Among smaller
housing markets across the nation, Kokomo
is the most affordable with 96.1 percent
of homes sold during the third quarter
of 2010 at levels affordable to families
earning a median income of $61,400.
While these favorable conditions have
drawn home buyers back into the market,
builders continue to have major problems in
obtaining credit for new-home construction
Additional positive news came from recent
estimates from the Mortgage Bankers
Association (MBA) that showed both the
delinquency rate and the rate of loans
entering foreclosure for home mortgages
decreasing, with the percentage of newly
initiated foreclosures falling for prime,
subprime and FHA loans. This indicates
that greater strength in the economy
is bringing some support to mortgage
delinquency rates, and although weak, the
economic recovery is beginning to be seen
in residential real estate fundamentals and
the mortgages they support. According
to the MBA, the percentage of mortgage
holders 90 or more days past due or in
the foreclosure process decreased for the
second consecutive quarter in 2010, after
having risen every quarter since the third
quarter of 2006. This is not to suggest that
foreclosures are no longer a challenge;
they are, especially considering the Marion
County foreclosure rate is higher than both
the state and national average with 1 in
every 384 units receiving a foreclosure
fi ling in November. Also of concern is the
rise in short-term delinquencies, those
that are less than 90 days past due, which
ticked upward in the second quarter after
having been on the decline since the
beginning of 2009. Nevertheless, with
the levels of those seriously delinquent
declining throughout the year, accompanied
by banks, willingness to avert REO
foreclosures, the overall trend is positive.
CommercialAlthough prices have fallen by 40 to
60 percent off their high, investors
and developers remain bearish on the
commercial land market in Central Indiana.
Given tight credit markets, fi nancing has
been largely unavailable for any development
that is not signifi cantly pre-leased. As
such, speculative development has been
practically non-existent in the market. There
has been a small level of activity among
companies looking to purchase land for the
development of space within which they can
ultimately occupy. Even among these owner-
users, development of new space competes
directly against existing space which is being
marketed at signifi cantly discounted prices.
Commercial development within the
industrial sector was slow during the
past year with large-scale modern bulk
slowing to a halt, build-to-suit construction
levels declining, and overall construction
levels diminishing well below the fi ve year
historical average of 4.8 million square feet.
Early in the year, the Keystone Enterprise
Park witnessed the completion of two
developments totaling 91,000 square
feet when Restaurant Depot opened its
65,000 square foot facility and Xpress
Cargo completed construction of its 26,000
square foot facility. Build-to-suit construction
continued as the year progressed with
Premium Composite Technology North
America completing construction of a
64,000 square foot facility in the Franklin
Business Park and Therametric Technologies
fi nishing its 26,000 square foot headquarters
expansion in Noblesville during the second
quarter. Industrial development in the latter
part of 2010 was marked by Zipp Speed
Weaponry’s move into its new 70,000 square
foot manufacturing and customer service
center in the Northwest submarket as well
as Johnson & Johnson Sales and Logistics
Company’s continued construction of a
1 million square foot distribution facility
located on a 115-acre newly acquired site
within 70West, the new Hendricks County
industrial park west of Plainfi eld and north
of Monrovia. The Johnson & Johnson Sales
and Logistics Company project is especially
important to the new industrial park as it
marks the fi rst development in the 1,000
acre industrial park and bodes well for
developers hoping to realize the same growth
in logistics experienced by nearby Plainfi eld.
The past year saw little movement in the
development of multi-tenant offi ce projects.
Construction levels remained largely
unchanged through all four quarters as no
new multi-tenant offi ce buildings above
20,000 square feet were constructed. This
continued a 24-month decline in multi-
tenant offi ce construction where total
construction levels have declined by over
40 percent from the fi ve-year construction
average of 470,000 square feet annually.
This decline is not a new phenomenon as
witnessed by the fact that over the course

www.cassidyturley.com | 37
Land / MARKET TRACKER
January 2011
of the last fi ve years, 2.7 million square
feet of multi-tenant offi ce space have been
brought online which is less than half of
the 6 million square feet witnessed in
the preceding fi ve years. This drop is the
result of the economic challenges facing
development generally, as well as the result
of a shift occurring within the business and
professional services sector, the primary
users of offi ce space, where an increasing
number of workers and companies are
utilizing technology to work remotely.
Over 20 multi-tenant offi ce buildings and
1.1 million square feet remains proposed
for construction across the Central Indiana
market; however, the challenging economic
climate and tight fi nancial markets have
drawn many of these proposals into
question or have made their timeline for
completion uncertain. The completion of
these projects and the return of further
speculative development continues to rest
upon a dramatic improvement in fi nancing
fundamentals and upon demand returning
to the marketplace. Despite tight fi nancial
markets and elusive capital, fi nancing is
available for projects with solid fundamentals
and signifi cant pre-leasing; nevertheless,
achieving this status remains diffi cult.
As access to capital becomes easier,
development may slowly begin to return to
the Indianapolis speculative multi-tenant
offi ce market but with tighter capital
requirements and not on the scale previously
seen. Private developers with advantageous
land position, solid credit and strong lending
relationships remain in good position to
capitalize upon emerging opportunities
within the market; however, developers must
be careful in locating and timing their next
multi-tenant building projects. History shows
that following a downturn, early out-of-the
ground projects have the best success,
but these have usually been constructed
amidst a wave of tenant demand. This is
unlikely to happen any time in the near
future with vacancy and unemployment
levels high and demand low. In the short-
term we do not expect to experience an
increase in growth suffi cient to warrant new
large scale multi-tenant development.
Within the retail sector, development activity
also declined during the past 12 months
by nearly 60 percent as both the size and
scope of development projects declined as a
result of slack tenant demand and elevated
vacancy rates, not to mention shrinking
property values. Central Indiana is not alone
in witnessing retail development levels at
the lowest levels in recent decades. In fact,
according to the Urban Land Institute, for
the fi rst time since the early 1950s, no
regional malls are under construction in the
U.S. The development fallout is not limited
to regional malls, or any other particular
product type for that matter, as strip center
development has also been hit extremely
hard. As a result, we expect to see much of
the same in terms of retail development in
2011 with development activity increasingly
focused on infi ll locations. Although there
is currently over 5 million square feet of
retail-related development which has been
announced, the same market factors that
have drawn many of the proposed multi-
tenant offi ce developments into question
will prevent many of these projects from
moving forward in 2011. One development
project that has successfully cleared early
development hurdles is Buckingham’s
$150 million North of South project, which
calls for a hotel with 158 rooms, 332
upscale apartments, a YMCA branch,
and an 800-space parking garage, all
north of South Street between Delaware
Street and Virginia Avenue in downtown
Indianapolis. If the project successfully
moves from the drawing board through the
development process it will add another
major project to the growing list of recently
completed deals in downtown Indianapolis.
The retail activity that did occur within the
market in 2010 was marked by relocation,
reposition and redevelopment. River’s
Edge, located at 82nd Street and Dean
0
10
20
30
40
50
60
70
80
2005 2006 2007 2008 2009 2010
NAHB/Wells Fargo Housing Market Index
Source: NAHB/Wells Fargo; U.S. Census Bureau;
Cassidy Turley Research
0
1M
2M
3M
4M
5M
6M
7M
Mar-1
0
Apr-10
May
-10
Jun-
10
Jul-1
0
Aug-10
Sep-
10
Oct-1
0
Nov
-10
0
100K
200K
300K
400K
500K
Existing Home Sales New Home Sales
# E
xist
ing H
om
e S
ale
s
# N
ew
Hom
e S
ale
s
U.S. New and Existing Home Sales
Source: Cassidy Turley Research
0
150K
300K
450K
600K
750K
900K
1.05M
1.20M
1.35M
1.50M
Mar-1
0
Apr-10
May
-10
Jun-
10
Jul-1
0
Aug-10
Sep-
10
Oct-1
0
Nov
-10
0
10K
20K
30K
40K
50K
60K
70K
80K
Existing Home Sales New Home Sales
# E
xist
ing H
om
e S
ale
s
# N
ew
Hom
e S
ale
s
Midwest New and Existing Home Sales
Source: Cassidy Turley Research

38 | We know The State of Real Estate®
2011 Market ReportLand Market
Road, began a redevelopment that will
include retailers such as Nordstrom’s Rack,
Buy Buy Baby, The Container Store and
Jason’s Deli. Formerly anchored by Offi ce
Depot, River’s Edge has benefi tted from
its proximity to both the Fashion Mall and
Castleton Square Mall. When completed
in November 2011, this Kite Realty Group
Trust redevelopment project will expand
River’s Edge from 110,000 square feet
to over 142,000 square feet thereby
transforming the area by attracting many
high-profi le restaurants and retailers. Kite
was also involved in the renovation of the
Marsh-anchored Fishers Station shopping
center at the northeast corner of 116th
Street and Allisonville Road. The Fishers
Station renovation will include the addition
of a 15,250 square foot Goodwill store to be
located near the Marsh as well as a Dollar
Tree on the opposite end of the center.
The past year also saw positive retail
development news emerge from Marion,
Indiana, where a new shopping center is
currently underway. University Marketplace,
anchored by Meijer, will be expanded
to include a new 55,000 square foot
Kohl’s Department Store, Petsmart, and
at least two other specialty mid-size
box retailers. University Marketplace
is a mixed-use development site that
also includes a credit union and The
Heritage at University Marketplace,
which is a housing development built by
Arbor Homes. Notably, Kohl’s signifi es
the fi rst new big box development and
expansion within Indiana since 2009.
Despite the fact that industrial, offi ce and
retail development have all diminished,
medical development continues. Within
the greater Indianapolis region, medical
development in excess of $2 billion is
currently in various stages of completion
as the big are getting bigger and the
competition is becoming increasingly
fi erce. Development is occurring as
original buildings are aging and unable
to accommodate new technologies and
the infrastructure they demand. Although
space is limited, particularly in downtown
Indianapolis, the need to collocate
hospitals and research institutions is driving
the design of medical towers and the
exploration of alternative delivery systems.
Despite increasing levels of development,
healthcare providers are not immune
to dealing with the effects of an ailing
economy which has resulted in emaciated
endowments and diminished capital fl ows.
These conditions are compounded by
unresolved questions regarding the impact
of healthcare reform. At the same time, the
healthcare sector must confront the need
to expand, whether through renovation
or new development, to meet the rapidly
changing demographics, technological
advances and increased demand.
Medical development plans are further
complicated by unresolved questions
surrounding the impact of healthcare reform
and the resulting introduction of millions
of new patients into the marketplace over
the next four years. Although the majority
of the previously uninsured have used
healthcare services in the past, that use has
been sporadic. There is little question that
healthcare providers will need to further
embrace strategies to expand and improve
facilities in order to meet the anticipated
explosion in demand. Divergent strategies
are driving current medical development
decisions on initiating capital projects.
Certain projects have been placed on
hold in an attempt to retain money and
ride out the economic turbulence. Other
projects continue but at a slower pace,
with institutions scaling back and looking
to smaller interim projects to address their
critical needs without compromising cash
fl ow or assuming unnecessary debt. Still
other projects continue relatively unabated
to ensure that requisite facilities are in place
to meet pressing demand. In fact, most
healthcare institutions are forced to move
forward in some development capacity
to keep pace with current demand.
For example, St. Francis Hospital & Health
Centers stopped and then restarted work on
a 221-bed tower at its campus on the south
side of Indianapolis where it will consolidate
operations after it closes its Beech Grove
hospital in 2012. Clarian Health, soon to
become Indiana University Health, has
resumed construction of its proposed
hospital and medical offi ce building on the
northwest corner of the Saxony Development
at I-69 and Exit 10 in Fishers, and on a
bed tower at Riley Hospital for Children in
downtown Indianapolis. Community Health
Network moved forward with its $130 million
expansion of its Community South Hospital.
Likewise, Wishard Health Services began
construction in 2010 on a new $754 million
hospital just west of the Indiana University-
Purdue University Indianapolis campus that
will replace Wishard’s existing hospital when
completed in 2013. A bit of positive news
for continued medical development came
from Clarian Health’s recent announcement
of ambitious development plans for the next
fi ve years, including the construction of more
than 500,000 square feet of offi ce, lab and
research space to consolidate their research
and patient care in brain and spine disorders
to begin in the fi rst quarter of 2011.
Agricultural land has increasingly become
a commercial play as land prices are up
almost 60 percent in value over the past
decade and still climbing. Indeed, farm land
prices in the Midwest have been shooting
up over the past year, and this dramatic rise
has led big fi nancial companies like MetLife,
John Hancock and TIAA Cref to ramp up
investment in agricultural land. The dramatic
rise has also gained the attention of the FDIC
and has prompted them to closely watch
for signs of a bubble. Part of the reason
prices have risen so high is the soaring cost
of crops, a notoriously volatile commodity.
While grain prices have risen, they have not
risen as far and as fast as land prices. This
is causing some concern that land prices are

www.cassidyturley.com | 39
Land / MARKET TRACKER
January 2011
artifi cially rising faster than the underlying
fundamentals. Positively, there seemingly
has not been an unstable debt structure
beneath it, with farmers and buyers being
able to put money down on purchases;
therefore, we have not witnessed the type
of borrowing experienced during the 1980s
farm crisis. What has gotten the attention of
the Federal Reserve Board is the fact that
some have begun to use equity to purchase
additional parcels, and some purchasers are
looking at land as a hedge against infl ation.
Nevertheless, broadly speaking, there
simply is not a lot of land on the market.
Low interest rates and an unstable stock
market have prompted many to view owning
land and holding on to a hard asset as a
better option. The key question for land
markets is whether the pricing is the result
of speculative buying or is really supported
by farm land’s ability to make money.
OutlookDramatic improvement in the land market
will not be realized until the employment
picture brightens, access to credit markets
improves, and vacancy rates within the
other sectors of commercial real estate
show meaningful declines. Unfortunately,
none of this is expected to occur at the
level needed to spur development within
Central Indiana. Although the current pace
of hiring has not been enough to cause the
unemployment rate to drop measurably, it
has been suffi cient to keep vacancy rates
generally even. Nevertheless, with vacancy
running between 200 and 400 bps above
the historical average for all commercial
real estate sectors, demand for new
development will remain at historic lows.
Although indications are that the housing
market has reached its bottom, defaults
and delinquencies will remain intense in the
coming year, and we expect to see a marked
increase in bank notes being issued in 2011
as it relates to an ever increasing number
of REO properties. Further, the availability
of mortgage fi nancing, particularly for
condominiums, will remain a constraint for
homebuyers even though lower mortgage
rates will continue to lead to an increase
in refi nancing. Unfortunately, our outlook
gives little reason for Indiana builders to
be optimistic about the fi rst half of 2011.
Persistently high unemployment levels,
restricted credit access for small
businesses, a weak housing market,
budget challenges facing state and local
governments, and uncertainty undercutting
business and consumer confi dence will
make 2011 another challenging year for
commercial real estate. Additionally, the
continuing challenges related to obtaining
construction credit and the elevated
number of foreclosures and short-sales
will hamper the pace of development. Still,
there are reasons for optimism, including
the continued favorable outlook of corporate
earnings in 2011, an easing in the pace
of bank failures, and stabilization of
commercial real estate values that should
aid in accelerating the resolution of problem
loans and increase lending capacity for
small businesses. In short, although 2011
will be somewhat better than the past year,
we will experience much of the same in
2011 with economic growth being tepid
and the job market remaining a major
impediment to realizing signifi cant increases
in commercial real estate demand.
Valuation Trends of Agricultural Acreage and New Commercial Land Development
Source: Cassidy Turley Research
0
$10M
$20M
$30M
$40M
$50M
$60M
2006
2007
2008
2009
2010
$0
$1M
$2M
$3M
$4M
$5M
$6M
Development Valuation (Building/Residence)
Agricultural Valuation (Land/Buildings)
$ V
alu
ati
on o
f A
gri
cultura
l Land/B
uildin
gs
$ V
alu
ation o
f N
ew
Const
ruction
Agricultural Real Estate:Average Value Per Acre
Source: U.S. Department of Agriculture;
Cassidy Turley Research
$0
$500
$1.0K
$1.5K
$2.0K
$2.5K
$3.0K
$3.5K
$4.0K
$4.5K
$5.0K
2006 2007 2008 2009 2010
Cornbelt IN Linear (IN)
Agricultural Real Estate:Average Value of Land and Buildings
$0
$10K
$20K
$30K
$40K
$50K
$60K
$70K
2006 2007 2008 2009 2010
Source: U.S. Department of Agriculture;
Cassidy Turley Research

40 | We know The State of Real Estate®
Executive Management Team
Jeffrey L. Henry, SIOR
Managing Principal, IndianapolisRegional Leader, North Central Region
Patrick B. Lindley, SIORPrincipal, Senior Managing DirectorBrokerage Services
Timothy J. Michel, CPAPrincipal, Senior Managing DirectorProperty Management
Industrial Services
J. Bart Book, SIORPrincipal, Senior Vice President
William W. ByramSenior Vice President
George C. Charbonneau, SIORSenior Vice President
Fritz A. Kauffman, SIORPrincipal, Vice President
Kevin B. Kempf, CCIMAssociate Vice President
Patrick B. Lindley, SIORPrincipal, Senior Managing Director
Tyler A. Mensch, LEED APAssociate Vice President
Jack B. Pence, SIORSenior Vice President
Kyle C. PowellAssociate
Bryan W. Poynter, SIOR, CCIMVice President
Donald A. TreibicPrincipal, Senior Vice President
Todd T. Vannatta, SIORPrincipal, Senior Vice President
Michael W.M. Weishaar, SIORVice President
Luke J. Wessel, SIORPrincipal, Senior Vice President
Kelly L. Williams, CCIM, LEED APAssociate Vice President
Offi ce Services
Peter N. AndersonVice President
Darrin L. Boyd, SIOR, CCIMPrincipal, Senior Vice President
John A. Crisp, SIORPrincipal, Senior Vice President
Mary Beth Kohart, SIOR, CCIMPrincipal, Vice President
Andrew D. Martin, SIOR, CCIMVice President
G. Bryan Miller, J.D., SIOR, CCIMAssociate Vice President
David A. Moore, SIOR, CCIMPrincipal, Senior Vice President
William J. MooreSenior Vice President
Jon R. Owens, SIORPrincipal, Senior Vice President
Michael R. Semler, SIORPrincipal, Senior Vice President
Russell A. Van Til, J.D.Associate Vice President
Bennett M. WilliamsAssociate
Retail Services
John G. ByrneVice President
William S. FrenchPrincipal, Senior Vice President
Jacqueline D. Haynes, CCIMVice President
Allison N. Tiefel, CCIMAssociate Vice President
Donald R. WilliamsPrincipal, Senior Vice President
Investment Services
J. Jeffrey Castell, SIOR, CCIMPrincipal, Senior Vice President
Michael B. Drew, CCIMPrincipal, Senior Vice President
T. Scott Pollom, CCIMPrincipal, Senior Vice President
Rebecca L. Wells, CCIMSenior Vice President
Angela J. Wethington, J.D., CCIMSenior Vice President
Land Services
William F. Flanary, ALCSenior Vice President
Abigail W. Hohmann, CCIMPrincipal, Senior Vice President
James M. Leffel, IVAssociate Vice President
G. Raymond Simons, III, ALCAssociate Vice President
Auction Services
J. Robert GettsDirector, Auction Services
Construction Services
Robert A. DuggerPrincipal, Senior Vice President
Location Advisory and Incentives Services
Kathleen Z. Culp, MBASenior Vice President
Timothy J. Monger, CRE, LEED APSenior Vice President
Marketing Services
Jennifer Tuttle BlattlerMarketing Director
Brian J. HollowayGraphic Designer
Barbara H. MatthewsMapping Coordinator
Danelle L. NagelMarketing Coordinator
Property Management
Timothy J. Michel, CPAPrincipal, Senior Managing Director
Cheri L. Shepherd, CPMPrincipal, Senior Vice President
Research Services
Jason W. Tolliver, J.D.
Research Director
Gerry “Spud” DickAssociate

One American Square
Suite 1300
Indianapolis, IN 46282
Phone: 317.639.0515
Fax: 317.639.0504
Investor Services• Capital Markets
• Distressed Asset Services
• Land Acquisition and Disposition
• Landlord Representation
• Owner Occupier Sales
• Project and Development Services
• Property Management
Specialty Services• Auction Services
• Financial Advisory Services
• Location Advisory and Incentives
• Sustainability Consulting
Occupier Services• Corporate Services
• Land Acquisition and Disposition
• Owner Occupier Sales
• Project and Development Services
• Tenant Representation
Practice Groups• Automotive
• Food and Beverage Facilities
• Global Supply Chain
• Golf and Resort Properties
• Healthcare
• Higher Education
• Hospitality
• Law Firm
• Life Sciences
• Mission Critical
• Not-for-Profi t
• Retail
• Self Storage
One American Square, Suite 1300
Indianapolis, IN 46282
317.634.6363
www.cassidyturley.com
About Cassidy Turley
Cassidy Turley is a leading commercial real estate services provider with over 2,800 professionals in 60 offi ces nationwide.
The firm completed transactions valued over $13 billion in 2009, manages over 420 million square feet on behalf of private,
institutional and corporate clients and supports over 25,000 domestic corporate services locations. Cassidy Turley serves
owners, investors and occupiers with a full spectrum of integrated commercial real estate services—including capital markets,
corporate services, project leasing, property management, project and development services, and tenant representation.
Outside of North America, Cassidy Turley has served the international needs of its clients since 1985. In 2010, the firm
enhanced its global service delivery through its partnership with GVA Grimley. The firm recently ranked in the Top 10 on the
Lipsey Co.’s Commercial Real Estate Top Brands Survey, and was ranked #1 by Real Estate Alert for Offi ce Sales in 3 of the
Top 6 Markets. Please visit www.cassidyturley.com for more information about the company.
Copyright © 2011 Cassidy Turley. All rights reserved.