annual financial statements - td asset managementpurcha seofi nv tm † ( 59 )26 p roc e dsf ms al n...
TRANSCRIPT

TD EXCHANGE-TRADED FUNDSAnnual Financial Statements
TD S&P/TSX Capped Composite Index ETF535250(03/18)
TD Asset Management
for the period ended December 31, 2017

December 31, 2017
Management’s Responsibility for Financial Reporting
The accompanying audited financial statements have been prepared by TD Asset Management Inc. (“TDAM”), as manager of theFunds. The manager is responsible for the integrity, objectivity and reliability of the data presented. This responsibility includesselecting appropriate accounting principles and making judgments and estimates consistent with International Financial ReportingStandards (“IFRS”). The manager is also responsible for the development of internal controls over the financial reporting process,which are designed to provide reasonable assurance that relevant and reliable financial information is produced, and thesafeguarding of all assets of the Funds.
The board of directors of TDAM is responsible for reviewing and approving the financial statements and overseeing management’sperformance of its financial reporting responsibilities.
On behalf of TDAM, manager of t he Funds
Bruce Cooper David LambieDirector and Chief Executive Officer Director and Chief Financial OfficerMarch 16, 2018 March 16, 2018
1 Annual Financial Statements
December 31, 2017
TD S&P/TSX Capped Composite Index ETF
2 Annual Financial Statements
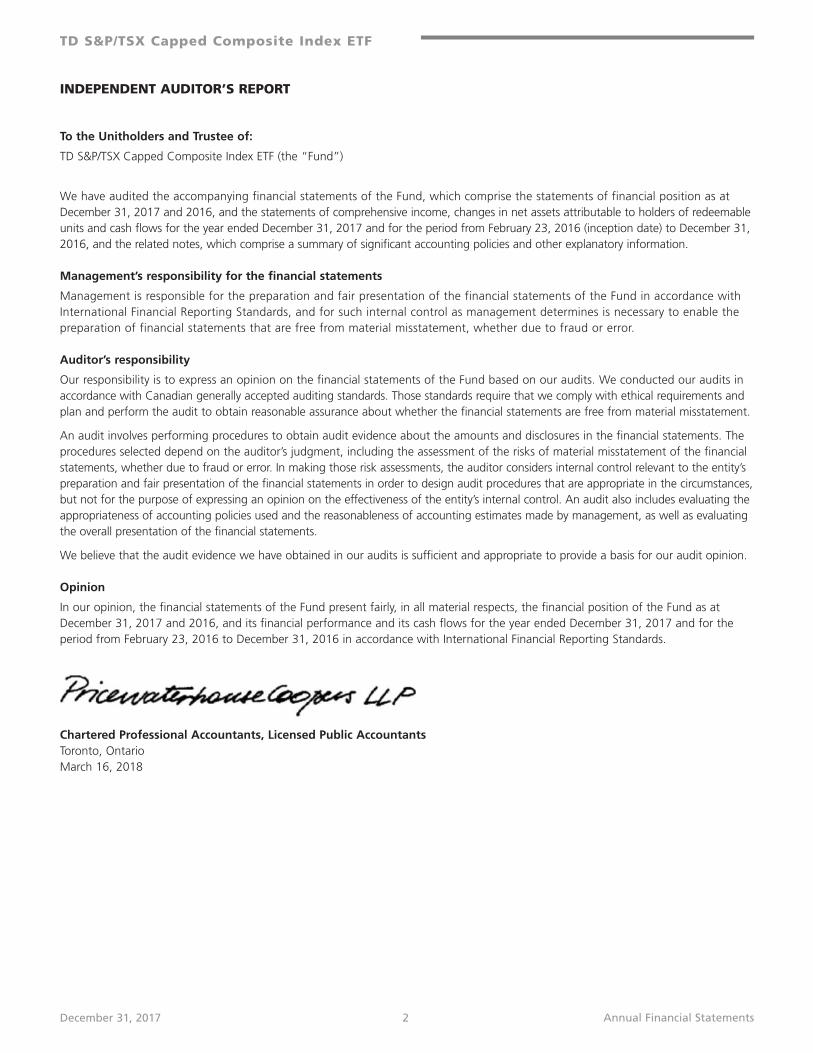
INDEPENDENT AUDITOR’S REPORT
To the Unitholders and Trustee of:
TD S&P/TSX Capped Composite Index ETF (the “Fund”)
We have audited the accompanying financial statements of the Fund, which comprise the statements of financial position as atDecember 31, 2017 and 2016, and the statements of comprehensive income, changes in net assets attributable to holders of redeemableunits and cash flows for the year ended December 31, 2017 and for the period from February 23, 2016 (inception date) to December 31,2016, and the related notes, which comprise a summary of significant accounting policies and other explanatory information.
Management’s responsibility for the financial statements
Management is responsible for the preparation and fair presentation of the financial statements of the Fund in accordance withInternational Financial Reporting Standards, and for such internal control as management determines is necessary to enable thepreparation of financial statements that are free from material misstatement, whether due to fraud or error.
Auditor’s responsibility
Our responsibility is to express an opinion on the financial statements of the Fund based on our audits. We conducted our audits inaccordance with Canadian generally accepted auditing standards. Those standards require that we comply with ethical requirements andplan and perform the audit to obtain reasonable assurance about whether the financial statements are free from material misstatement.
An audit involves performing procedures to obtain audit evidence about the amounts and disclosures in the financial statements. Theprocedures selected depend on the auditor’s judgment, including the assessment of the risks of material misstatement of the financialstatements, whether due to fraud or error. In making those risk assessments, the auditor considers internal control relevant to the entity’spreparation and fair presentation of the financial statements in order to design audit procedures that are appropriate in the circumstances,but not for the purpose of expressing an opinion on the effectiveness of the entity’s internal control. An audit also includes evaluating theappropriateness of accounting policies used and the reasonableness of accounting estimates made by management, as well as evaluatingthe overall presentation of the financial statements.
We believe that the audit evidence we have obtained in our audits is sufficient and appropriate to provide a basis for our audit opinion.
Opinion
In our opinion, the financial statements of the Fund present fairly, in all material respects, the financial position of the Fund as atDecember 31, 2017 and 2016, and its financial performance and its cash flows for the year ended December 31, 2017 and for theperiod from February 23, 2016 to December 31, 2016 in accordance with International Financial Reporting Standards.
Chartered Professional Accountants, Licensed Public AccountantsToronto, OntarioMarch 16, 2018
December 31, 2017
TD S&P/TSX Capped Composite Index ETF
3 Annual Financial Statements
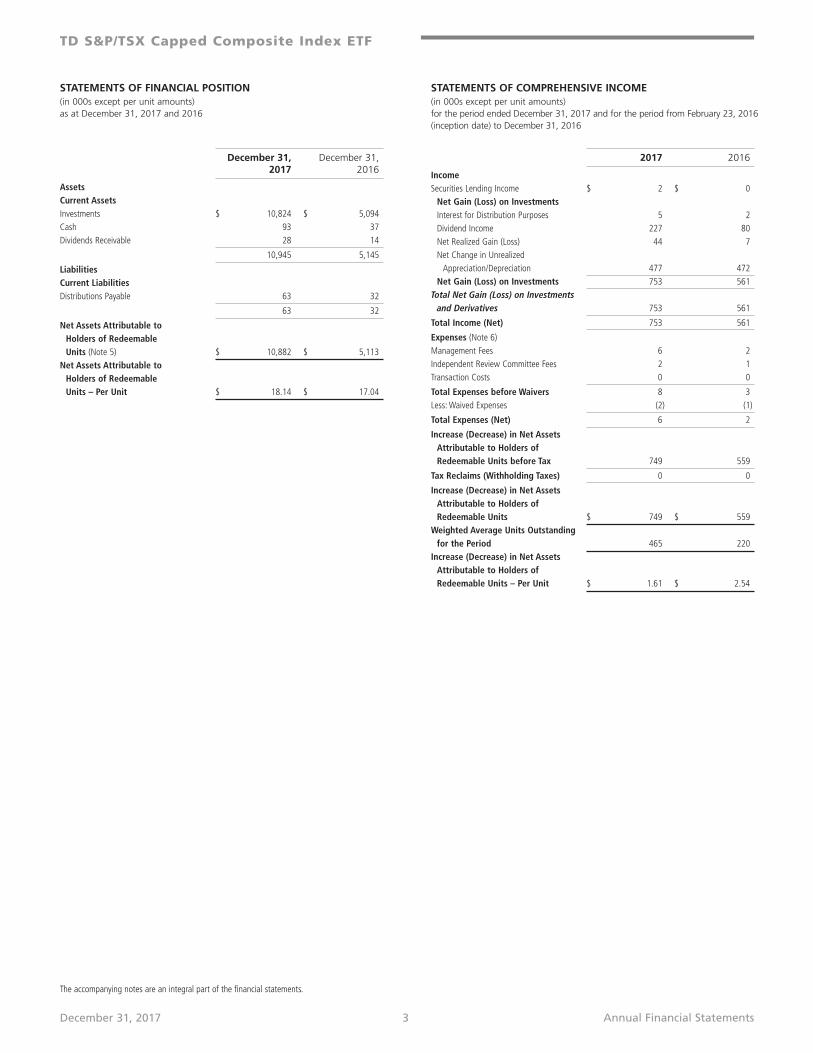
STATEMENTS OF FINANCIAL POSITION(in 000s except per unit amounts)as at December 31, 2017 and 2016
December 31, December 31,2017 2016
AssetsCurrent AssetsInvestments $ 10,824 $ 5,094Cash 93 37Dividends Receivable 28 14
10,945 5,145
LiabilitiesCurrent LiabilitiesDistributions Payable 63 32
63 32
Net Assets Attributable to Holders of Redeemable Units (Note 5) $ 10,882 $ 5,113
Net Assets Attributable to Holders of Redeemable Units – Per Unit $ 18.14 $ 17.04
STATEMENTS OF COMPREHENSIVE INCOME(in 000s except per unit amounts)for the period ended December 31, 2017 and for the period from February 23, 2016(inception date) to December 31, 2016
2017 2016
IncomeSecurities Lending Income $ 2 $ 0Net Gain (Loss) on InvestmentsInterest for Distribution Purposes 5 2Dividend Income 227 80Net Realized Gain (Loss) 44 7Net Change in Unrealized Appreciation/Depreciation 477 472
Net Gain (Loss) on Investments 753 561Total Net Gain (Loss) on Investments
and Derivatives 753 561
Total Income (Net) 753 561
Expenses (Note 6)Management Fees 6 2Independent Review Committee Fees 2 1Transaction Costs 0 0
Total Expenses before Waivers 8 3Less: Waived Expenses (2) (1)
Total Expenses (Net) 6 2
Increase (Decrease) in Net Assets Attributable to Holders of Redeemable Units before Tax 749 559
Tax Reclaims (Withholding Taxes) 0 0
Increase (Decrease) in Net Assets Attributable to Holders of Redeemable Units $ 749 $ 559
Weighted Average Units Outstandingfor the Period 465 220
Increase (Decrease) in Net Assets Attributable to Holders of Redeemable Units – Per Unit $ 1.61 $ 2.54
The accompanying notes are an integral part of the financial statements.

December 31, 2017
STATEMENTS OF CHANGES IN NET ASSETS ATTRIBUTABLETO HOLDERS OF REDEEMABLE UNITS(in 000s)for the period ended December 31, 2017 and for the period from February 23, 2016(inception date) to December 31, 2016
STATEMENTS OF CASH FLOWS(in 000s)for the period ended December 31, 2017 and for the period from February 23, 2016(inception date) to December 31, 2016
2017 2016
Net Assets Attributable to Holders of Redeemable Units at Beginning of the Period $ 5,113 $ N/A
Increase (Decrease) in Net Assets Attributable to Holders of Redeemable Units 749 559
Distributions to Holders of Redeemable Units
From Net Investment Income (200) (69)From Net Realized Gains on Investments (37) (7)Return of Capital (21) (5)
(258) (81)
Redeemable Unit TransactionsProceeds from Redeemable Units Issued 5,241 4,628Reinvestments of Distributions to Holders of Redeemable Units 37 7
Redemption of Redeemable Units 0 0
Net Increase (Decrease) from Redeemable Unit Transactions 5,278 4,635
Net Increase (Decrease) in Net Assets Attributable to Holders of Redeemable Units 5,769 5,113
Net Assets Attributable to Holders of Redeemable Units at End of the Period $ 10,882 $ 5,113
Redeemable Unit TransactionsRedeemable Units Outstanding, Beginning of the Period 300 N/A
Redeemable Units Issued 300 300Redeemable Units Issued on Reinvestments 0 0Redeemable Units Consolidated* 0 0Redeemable Units Redeemed 0 0
Redeemable Units Outstanding, End of the Period 600 300
* Redeemable units issued on reinvestments immediately consolidated with the units held priorto the distribution.
2017 2016
Cash Flows from (used in) Operating Activities
Increase (Decrease) in Net Assets Attributable to Holders of Redeemable Units $ 749 $ 559
Adjustment For:Net Realized (Gain) Loss on Sale of Investments and Deerivatives (44) (7)
Net Change in Unrealized Appreciation/ Depreciation of Investments (477) (472)
Purchase of Investments† (599) (265)Proceeds from Sale and/or Maturity of Investments 614 172
(Increase) Decrease in Dividends Receivable (14) (14)
Net Cash from (used in) Operating Activities 229 (27)
Cash Flows from (used in) Financing Activities
Distributions Paid to Holders of Redeemable Units, Net of Reinvested Distributions (190) (42)
Proceeds from Issuances of Redeemable Units† 17 106Amounts Paid on Redemption of Redeemable Units 0 0
Net Cash from (used in) Financing Activities (173) 64
Net Increase (Decrease) in Cash 56 37Cash (Bank Overdraft) at Beginning of the Period 37 0
Cash (Bank Overdraft) at End of the Period $ 93 $ 37
Interest for Distribution Purposes Received*, Net of Withholding Taxes 5 2
Dividends Received*, Net of Withholding Taxes 213 66
* Included as part of Cash Flows from (used in) Operating Activities.† Excludes in-kind subscriptions of $5,224 (2016: $4,522).
The accompanying notes are an integral part of the financial statements.
TD S&P/TSX Capped Composite Index ETF
4 Annual Financial Statements

December 31, 2017
TD S&P/TSX Capped Composite Index ETF
5 Annual Financial Statements
$ $CANADIAN EQUITIES – 98.5%
ENERGY – 19.6%
877 Advantage Oil & Gas Ltd. 7 5 833 AltaGas Ltd. 26 24
1,726 ARC Resources Ltd. 33 25 1,158 Baytex Energy Corp. 5 4 1,074 Birchcliff Energy Ltd. 7 5 1,920 Cameco Corporation 28 22 5,243 Canadian Natural Resources Limited 209 235 4,933 Cenovus Energy Inc. 79 57 1,173 CES Energy Solutions Corp. 6 8 2,660 Crescent Point Energy Corp. 40 25 719 Crew Energy Inc. 3 2
8,159 Enbridge Inc. 434 401 671 Enbridge Income Fund Holdings Inc. 21 20
4,705 Encana Corporation 58 79 431 Enerflex Ltd. 6 7
1,161 Enerplus Corporation 10 14 629 Ensign Energy Services Inc. 4 4 439 Freehold Royalties Ltd. 6 6 695 Gibson Energy Inc. 13 13
1,890 Gran Tierra Energy Inc. 6 6 1,459 Husky Energy Inc. 23 26 1,215 Imperial Oil Limited 52 48 1,816 Inter Pipeline Ltd. 49 47 689 Kelt Exploration Ltd. 4 5 986 Keyera Corp. 38 35 502 Kinder Morgan Canada Ltd. 8 8
1,102 MEG Energy Corp. 7 6 505 Mullen Group Ltd. 8 8
1,405 NexGen Energy Ltd. 5 4 845 NuVista Energy Ltd. 5 7 356 Paramount Resources Ltd., Class A 7 7 753 Parex Resources Inc. 11 14 635 Parkland Fuel Corporation 17 17 350 Pason Systems Inc. 6 6
2,431 Pembina Pipeline Corporation 98 111 790 Peyto Exploration & Development Corp. 21 12
1,024 PrairieSky Royalty Ltd. 29 33 1,427 Precision Drilling Corporation 8 5 1,047 Raging River Exploration Inc. 10 8 774 Secure Energy Services Inc. 7 7
1,351 Seven Generations Energy Ltd. 30 24 341 ShawCor Ltd., Class A SV 11 9 791 Spartan Energy Corp. 7 6
7,998 Suncor Energy Inc. 317 369 648 TORC Oil & Gas Ltd. 5 5
1,217 Tourmaline Oil Corp. 35 28 4,244 TransCanada Corporation 245 260 1,630 Trican Well Service Ltd. 6 7 589 Vermilion Energy Inc. 27 27
2,023 Whitecap Resources Inc. 19 18
2,116 2,129
MATERIALS – 11.1%
1,123 Agnico Eagle Mines Limited 63 65 668 Agrium Inc. 83 97
1,892 Alamos Gold Inc., Class A 17 16 4,706 B2Gold Corp. 15 18 5,640 Barrick Gold Corporation 122 103 328 Canfor Corporation 6 8 324 Cascades Inc. 5 4
698 CCL Industries Inc. 37 41 1,037 Centerra Gold Inc. 7 7 858 Detour Gold Corporation 15 13
3,866 Eldorado Gold Corporation 14 7 809 First Majestic Silver Corp. 8 7
3,335 First Quantum Minerals Ltd. 39 59 749 Fortuna Silver Mines Inc. 5 5 898 Franco-Nevada Corporation 79 90
4,193 Goldcorp Inc. 84 67 850 Guyana Goldfields Inc. 6 4
1,272 HudBay Minerals Inc. 10 14 2,227 IAMGOLD Corporation 11 16 317 Interfor Corporation 5 7 273 Intertape Polymer Group Inc. 6 6
2,609 Ivanhoe Mines Ltd. 8 11 6,077 Kinross Gold Corporation 28 33 893 Kirkland Lake Gold Ltd. 10 17 872 Klondex Mines Ltd. 5 3 312 Labrador Iron Ore Royalty Corporation 5 9
1,417 Lucara Diamond Corporation 5 4 3,045 Lundin Mining Corporation 18 25 353 MAG Silver Corporation 6 5 409 Methanex Corporation 22 31
1,417 Nevsun Resources Ltd. 5 4 2,836 New Gold Inc. 13 12 210 Norbord Inc. 7 9
1,038 NovaGold Resources Inc. 7 5 589 Osisko Gold Royalties Ltd. 9 9 733 Pan American Silver Corp. 14 14
4,063 Potash Corporation of Saskatchewan Inc. 94 105 745 Pretium Resources Inc. 9 11 859 Sandstorm Gold Ltd. 5 5
1,581 SEMAFO Inc. 7 6 584 SSR Mining Inc. 7 6 206 Stella-Jones Inc. 9 10
2,455 Teck Resources Limited, Class B 56 81 376 Torex Gold Resources Inc. 8 4
4,810 Turquoise Hill Resources Ltd. 19 21 287 West Fraser Timber Company Ltd. 16 22
1,926 Western Forest Products Inc. 4 5 2,139 Wheaton Precious Metals Corp. 57 59 149 Winpak Ltd. 7 7
4,556 Yamana Gold Inc. 18 18
1,115 1,205
INDUSTRIALS – 9.3%
287 Aecon Group Inc. 5 6 1,319 Air Canada 18 34 369 ATS Automation Tooling Systems Inc. 5 6 181 Badger Daylighting Ltd. 5 5
9,373 Bombardier Inc., Class B SV 19 28 1,305 CAE Inc. 24 30 3,614 Canadian National Railway Company 323 375 701 Canadian Pacific Railway Limited 134 161 606 Chorus Aviation Inc. 6 6 131 Exchange Income Corporation 5 5 819 Finning International Inc. 19 26 272 Maxar Technologies Ltd. 20 22 253 Morneau Shepell Inc. 5 6 259 New Flyer Industries Inc. 11 14 523 Ritchie Bros. Auctioneers Incorporated 20 20 301 Russel Metals Inc. 7 9
SCHEDULE OF INVESTMENT PORTFOLIO(in 000s except number of Shares or Units/Par Value)as at December 31, 2017
NO. OF SHARES ORUNITS/PAR VALUE DESCRIPTION COST FAIR VALUE
NO. OF SHARES ORUNITS/PAR VALUE DESCRIPTION COST FAIR VALUE
$ $
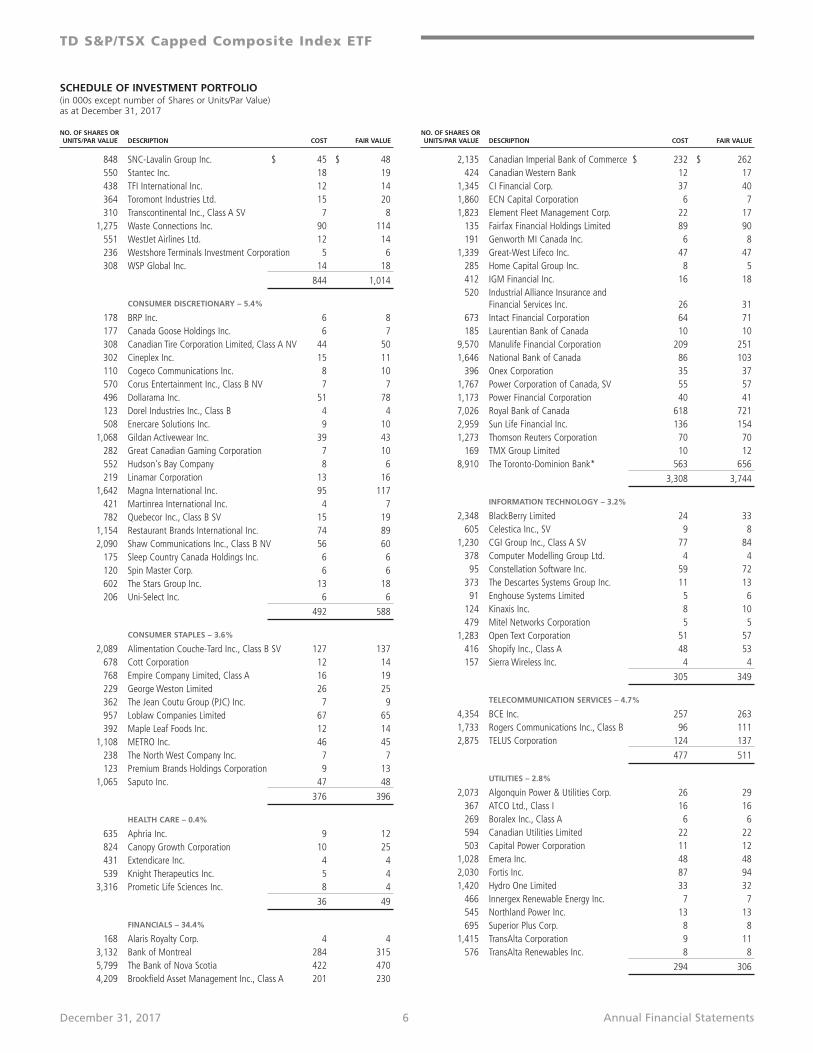
December 31, 2017
$ $$ $848 SNC-Lavalin Group Inc. 45 48 550 Stantec Inc. 18 19 438 TFI International Inc. 12 14 364 Toromont Industries Ltd. 15 20 310 Transcontinental Inc., Class A SV 7 8
1,275 Waste Connections Inc. 90 114 551 WestJet Airlines Ltd. 12 14 236 Westshore Terminals Investment Corporation 5 6 308 WSP Global Inc. 14 18
844 1,014
CONSUMER DISCRETIONARY – 5.4%
178 BRP Inc. 6 8 177 Canada Goose Holdings Inc. 6 7 308 Canadian Tire Corporation Limited, Class A NV 44 50 302 Cineplex Inc. 15 11 110 Cogeco Communications Inc. 8 10 570 Corus Entertainment Inc., Class B NV 7 7 496 Dollarama Inc. 51 78 123 Dorel Industries Inc., Class B 4 4 508 Enercare Solutions Inc. 9 10
1,068 Gildan Activewear Inc. 39 43 282 Great Canadian Gaming Corporation 7 10 552 Hudson's Bay Company 8 6 219 Linamar Corporation 13 16
1,642 Magna International Inc. 95 117 421 Martinrea International Inc. 4 7 782 Quebecor Inc., Class B SV 15 19
1,154 Restaurant Brands International Inc. 74 89 2,090 Shaw Communications Inc., Class B NV 56 60 175 Sleep Country Canada Holdings Inc. 6 6 120 Spin Master Corp. 6 6 602 The Stars Group Inc. 13 18 206 Uni-Select Inc. 6 6
492 588
CONSUMER STAPLES – 3.6%
2,089 Alimentation Couche-Tard Inc., Class B SV 127 137 678 Cott Corporation 12 14 768 Empire Company Limited, Class A 16 19 229 George Weston Limited 26 25 362 The Jean Coutu Group (PJC) Inc. 7 9 957 Loblaw Companies Limited 67 65 392 Maple Leaf Foods Inc. 12 14
1,108 METRO Inc. 46 45 238 The North West Company Inc. 7 7 123 Premium Brands Holdings Corporation 9 13
1,065 Saputo Inc. 47 48
376 396
HEALTH CARE – 0.4%
635 Aphria Inc. 9 12 824 Canopy Growth Corporation 10 25 431 Extendicare Inc. 4 4 539 Knight Therapeutics Inc. 5 4
3,316 Prometic Life Sciences Inc. 8 4
36 49
FINANCIALS – 34.4%
168 Alaris Royalty Corp. 4 4 3,132 Bank of Montreal 284 315 5,799 The Bank of Nova Scotia 422 470 4,209 Brookfield Asset Management Inc., Class A 201 230
2,135 Canadian Imperial Bank of Commerce 232 262 424 Canadian Western Bank 12 17
1,345 CI Financial Corp. 37 40 1,860 ECN Capital Corporation 6 7 1,823 Element Fleet Management Corp. 22 17 135 Fairfax Financial Holdings Limited 89 90 191 Genworth MI Canada Inc. 6 8
1,339 Great-West Lifeco Inc. 47 47 285 Home Capital Group Inc. 8 5 412 IGM Financial Inc. 16 18 520 Industrial Alliance Insurance and
Financial Services Inc. 26 31 673 Intact Financial Corporation 64 71 185 Laurentian Bank of Canada 10 10
9,570 Manulife Financial Corporation 209 251 1,646 National Bank of Canada 86 103 396 Onex Corporation 35 37
1,767 Power Corporation of Canada, SV 55 57 1,173 Power Financial Corporation 40 41 7,026 Royal Bank of Canada 618 721 2,959 Sun Life Financial Inc. 136 154 1,273 Thomson Reuters Corporation 70 70 169 TMX Group Limited 10 12
8,910 The Toronto-Dominion Bank* 563 656
3,308 3,744
INFORMATION TECHNOLOGY – 3.2%
2,348 BlackBerry Limited 24 33 605 Celestica Inc., SV 9 8
1,230 CGI Group Inc., Class A SV 77 84 378 Computer Modelling Group Ltd. 4 4 95 Constellation Software Inc. 59 72 373 The Descartes Systems Group Inc. 11 13 91 Enghouse Systems Limited 5 6 124 Kinaxis Inc. 8 10 479 Mitel Networks Corporation 5 5
1,283 Open Text Corporation 51 57 416 Shopify Inc., Class A 48 53 157 Sierra Wireless Inc. 4 4
305 349
TELECOMMUNICATION SERVICES – 4.7%
4,354 BCE Inc. 257 263 1,733 Rogers Communications Inc., Class B 96 111 2,875 TELUS Corporation 124 137
477 511
UTILITIES – 2.8%
2,073 Algonquin Power & Utilities Corp. 26 29 367 ATCO Ltd., Class I 16 16 269 Boralex Inc., Class A 6 6 594 Canadian Utilities Limited 22 22 503 Capital Power Corporation 11 12
1,028 Emera Inc. 48 48 2,030 Fortis Inc. 87 94 1,420 Hydro One Limited 33 32 466 Innergex Renewable Energy Inc. 7 7 545 Northland Power Inc. 13 13 695 Superior Plus Corp. 8 8
1,415 TransAlta Corporation 9 11 576 TransAlta Renewables Inc. 8 8
294 306
SCHEDULE OF INVESTMENT PORTFOLIO(in 000s except number of Shares or Units/Par Value)as at December 31, 2017
NO. OF SHARES ORUNITS/PAR VALUE DESCRIPTION COST FAIR VALUE
NO. OF SHARES ORUNITS/PAR VALUE DESCRIPTION COST FAIR VALUE
TD S&P/TSX Capped Composite Index ETF
6 Annual Financial Statements

December 31, 2017
TD S&P/TSX Capped Composite Index ETF
7 Annual Financial Statements
$ $$ $
ROYALTY/INCOME TRUSTS – 3.4%
454 Allied Properties Real EstateInvestment Trust 16 19
733 Artis Real Estate Investment Trust 9 10 180 Boardwalk Real Estate Investment Trust 8 8 91 Boyd Group Income Fund 7 9
1,375 Brookfield Infrastructure Partners L.P. 75 77 597 Brookfield Renewable Energy Partners L.P. 23 26 666 Canadian Apartment Properties
Real Estate Investment Trust 20 25 359 Canadian Real Estate Investment Trust 17 17
1,009 Chartwell Retirement Residences 15 16 456 Chemtrade Logistics Income Fund 8 9 863 Cominar Real Estate Investment Trust 12 12 836 Dream Global Real Estate Investment Trust 8 10 340 Dream Office Real Estate Investment Trust 7 8 223 Granite Real Estate Investment Trust 10 11
1,416 H&R Real Estate Investment Trust 31 30 392 Killam Apartment Real Estate Investment Trust 6 6 229 Northview Apartment Real Estate Investment Trust 4 6
1,489 Pure Industrial Real Estate Trust 8 10 1,590 RioCan Real Estate Investment Trust 41 39 569 SmartCentres Real Estate Investment Trust 18 18
343 366
REAL ESTATE – 0.6%
173 Altus Group Ltd. 5 6 159 Colliers International Group Inc. 9 12 419 Crombie Real Estate Investment Trust 6 6 800 First Capital Realty Inc. 16 17 149 FirstService Corporation 10 13 653 Tricon Capital Group Inc. 7 7
53 61
Total Canadian Equities 9,759 10,718
U.S. EQUITIES – 0.7%
MATERIALS – 0.1%
1,459 Alacer Gold Corporation 4 3 1,491 Tahoe Resources Inc. 17 9
21 12
HEALTH CARE – 0.4%
1,504 Valeant Pharmaceuticals International Inc. 40 39
REAL ESTATE – 0.2%
993 Brookfield Property Partners L.P. 29 28
Total U.S. Equities 90 79
INTERNATIONAL EQUITIES – 0.3%
AUSTRALIA – 0.1%
2,993 OceanaGold Corporation 11 10
BERMUDA – 0.1%
197 Brookfield Business Partners LP 7 8
MONACO – 0.1%
336 Endeavour Mining Corp. 8 9
Total International Equities 26 27
Transaction Costs 0
TOTAL INVESTMENTPORTFOLIO – 99.5% $ 9,875 $ 10,824
OTHER NET ASSETS(LIABILITIES) – 0.5% 58
TOTAL NET ASSETS – 100.0% $ 10,882
* Related party to the Fund as an affiliated entity of TD AssetManagement Inc.
SCHEDULE OF INVESTMENT PORTFOLIO(in 000s except number of Shares or Units/Par Value)as at December 31, 2017
NO. OF SHARES ORUNITS/PAR VALUE DESCRIPTION COST FAIR VALUE
NO. OF SHARES ORUNITS/PAR VALUE DESCRIPTION COST FAIR VALUE
December 31, 2017
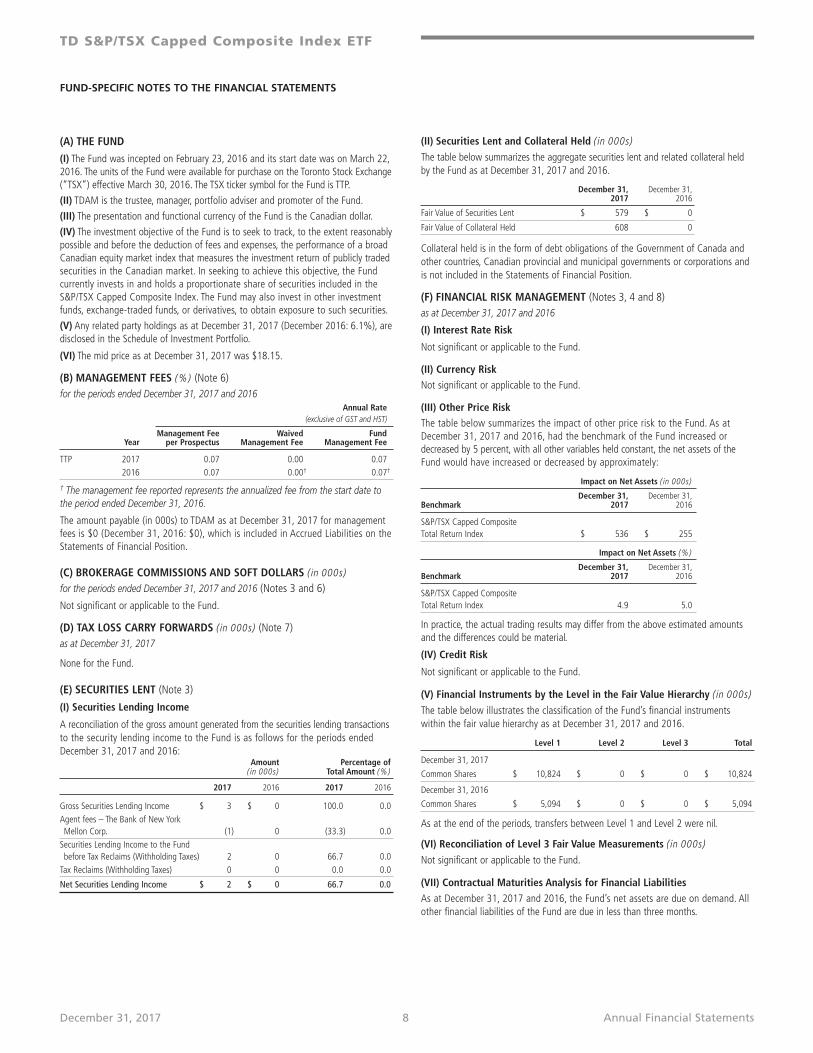
(A) THE FUND
(I) The Fund was incepted on February 23, 2016 and its start date was on March 22,2016. The units of the Fund were available for purchase on the Toronto Stock Exchange(“TSX”) effective March 30, 2016. The TSX ticker symbol for the Fund is TTP.
(II) TDAM is the trustee, manager, portfolio adviser and promoter of the Fund.(III) The presentation and functional currency of the Fund is the Canadian dollar.(IV) The investment objective of the Fund is to seek to track, to the extent reasonablypossible and before the deduction of fees and expenses, the performance of a broadCanadian equity market index that measures the investment return of publicly tradedsecurities in the Canadian market. In seeking to achieve this objective, the Fundcurrently invests in and holds a proportionate share of securities included in theS&P/TSX Capped Composite Index. The Fund may also invest in other investmentfunds, exchange-traded funds, or derivatives, to obtain exposure to such securities.
(V) Any related party holdings as at December 31, 2017 (December 2016: 6.1%), aredisclosed in the Schedule of Investment Portfolio.
(VI) The mid price as at December 31, 2017 was $18.15.
(B) MANAGEMENT FEES (%) (Note 6)for the periods ended December 31, 2017 and 2016
Annual Rate(exclusive of GST and HST)
Management Fee Waived Fund Year per Prospectus Management Fee Management Fee
TTP 2017 0.07 0.00 0.072016 0.07 0.00† 0.07†
† The management fee reported represents the annualized fee from the start date tothe period ended December 31, 2016.
The amount payable (in 000s) to TDAM as at December 31, 2017 for managementfees is $0 (December 31, 2016: $0), which is included in Accrued Liabilities on theStatements of Financial Position.
(C) BROKERAGE COMMISSIONS AND SOFT DOLLARS ( in 000s)for the periods ended December 31, 2017 and 2016 (Notes 3 and 6)
Not significant or applicable to the Fund.
(D) TAX LOSS CARRY FORWARDS ( in 000s) (Note 7)as at December 31, 2017
None for the Fund.
(E) SECURITIES LENT (Note 3)
(I) Securities Lending Income
A reconciliation of the gross amount generated from the securities lending transactionsto the security lending income to the Fund is as follows for the periods ended December 31, 2017 and 2016:
Amount Percentage of ( in 000s) Total Amount (%)
2017 2016 2017 2016
Gross Securities Lending Income $ 3 $ 0 100.0 0.0Agent fees – The Bank of New YorkMellon Corp. (1) 0 (33.3) 0.0Securities Lending Income to the Fundbefore Tax Reclaims (Withholding Taxes) 2 0 66.7 0.0Tax Reclaims (Withholding Taxes) 0 0 0.0 0.0
Net Securities Lending Income $ 2 $ 0 66.7 0.0
(II) Securities Lent and Collateral Held ( in 000s)
The table below summarizes the aggregate securities lent and related collateral heldby the Fund as at December 31, 2017 and 2016.
December 31, December 31,2017 2016
Fair Value of Securities Lent $ 579 $ 0
Fair Value of Collateral Held 608 0
Collateral held is in the form of debt obligations of the Government of Canada andother countries, Canadian provincial and municipal governments or corporations andis not included in the Statements of Financial Position.
(F) FINANCIAL RISK MANAGEMENT (Notes 3, 4 and 8)as at December 31, 2017 and 2016
(I) Interest Rate Risk
Not significant or applicable to the Fund.
(II) Currency RiskNot significant or applicable to the Fund.
(III) Other Price RiskThe table below summarizes the impact of other price risk to the Fund. As atDecember 31, 2017 and 2016, had the benchmark of the Fund increased ordecreased by 5 percent, with all other variables held constant, the net assets of theFund would have increased or decreased by approximately:
Impact on Net Assets ( in 000s)
December 31, December 31,Benchmark 2017 2016
S&P/TSX Capped Composite Total Return Index $ 536 $ 255
Impact on Net Assets (%)
December 31, December 31,Benchmark 2017 2016
S&P/TSX Capped Composite Total Return Index 4.9 5.0
In practice, the actual trading results may differ from the above estimated amountsand the differences could be material.
(IV) Credit Risk
Not significant or applicable to the Fund.
(V) Financial Instruments by the Level in the Fair Value Hierarchy ( in 000s)
The table below illustrates the classification of the Fund’s financial instrumentswithin the fair value hierarchy as at December 31, 2017 and 2016.
Level 1 Level 2 Level 3 Total
December 31, 2017
Common Shares $ 10,824 $ 0 $ 0 $ 10,824
December 31, 2016
Common Shares $ 5,094 $ 0 $ 0 $ 5,094
As at the end of the periods, transfers between Level 1 and Level 2 were nil.
(VI) Reconciliation of Level 3 Fair Value Measurements ( in 000s)
Not significant or applicable to the Fund.
(VII) Contractual Maturities Analysis for Financial LiabilitiesAs at December 31, 2017 and 2016, the Fund’s net assets are due on demand. Allother financial liabilities of the Fund are due in less than three months.
FUND-SPECIFIC NOTES TO THE FINANCIAL STATEMENTS
TD S&P/TSX Capped Composite Index ETF
8 Annual Financial Statements

9 Annual Financial StatementsDecember 31, 2017
TD S&P/TSX Capped Composite Index ETF
(G) INVESTMENT PORTFOLIO CONCENTRATION (%) (Note 8)
As at December 31, 2017 and 2016, the Fund’s investment portfolio concentrationcan be summarized as follows:
December 31, December 31,2017 2016
Canadian EquitiesEnergy 19.6 21.4Materials 11.1 11.3Industrials 9.3 8.7Consumer Discretionary 5.4 5.0Consumer Staples 3.6 3.8Health Care 0.4 0.2Financials 34.4 34.0Information Technology 3.2 2.8Telecommunication Services 4.7 4.8Utilities 2.8 2.8Royalty/Income Trusts 3.4 2.5Real Estate 0.6 0.4U.S. EquitiesMaterials 0.1 0.2Health Care 0.4 0.3Financials 0.0 0.8Real Estate 0.2 0.4International EquitiesAustralia 0.1 0.1Bermuda 0.1 0.0Monaco 0.1 0.1Other Net Assets (Liabilities) 0.5 0.4
100.0 100.0
(H) INTEREST IN UNCONSOLIDATED STRUCTURED ENTITIES ( in 000s)
(Note 3)as at December 31, 2017 and 2016
Not significant or applicable to the Fund.
(I) OFFSETTING OF FINANCIAL ASSETS AND LIABILITIES ( in 000s) (Note 3)as at December 31, 2017 and 2016
Not significant or applicable to the Fund.
FUND-SPECIFIC NOTES TO THE FINANCIAL STATEMENTS

10 Annual Financial StatementsDecember 31, 2017
The S&P/TSX Capped Composite Index is a product of S&P Dow Jones Indices LLC, a division of S&P Global, or its affiliates (“SPDJI”) and TSX Inc.,and has been licensed for use by TD Asset Management Inc. (“TDAM”). Standard & Poor’s®, S&P® and S&P 500® are registered trademarks ofStandard & Poor’s Financial Services LLC, a division of S&P Global (“S&P”); Dow Jones®, Dow Jones Industrial Average® and DJIA® areregistered trademarks of Dow Jones Trademark Holdings LLC (“Dow Jones”); TSX is a trademark of TSX Inc.; and these trademarks have beenlicensed for use by SPDJI and sublicensed for certain purposes by TDAM. The TD S&P/TSX Capped Composite Index ETF is not sponsored,endorsed, sold or promoted by SPDJI, Dow Jones, S&P, their respective affiliates, or TSX Inc. and none of such parties make any representationregarding the advisability of investing in the TD S&P/TSX Capped Composite Index ETF nor do they have any liability for any errors, omissions,or interruptions of the S&P/TSX Capped Composite Index.
TD S&P/TSX Capped Composite Index ETF

December 31, 2017 11 Annual Financial Statements
NOTES TO THE FINANCIAL STATEMENTS
1. THE FUNDThe TD Exchange-Traded Funds (collectively, the “Funds” and individually, the “Fund”) are open-end mutual funds established astrusts under the laws of the Province of Ontario and governed by the Declaration of Trust, as amended from time to time. The Fundsare authorized to issue an unlimited number of redeemable, transferrable units of an unlimited number of classes of units, each ofwhich represents an equal, undivided interest in the net assets of the Funds. The Funds currently offers one class of units denominatedin Canadian dollars. Units of the Funds are listed on the Toronto Stock Exchange (“TSX”).
TD Asset Management Inc. (“TDAM”) is the trustee, manager, portfolio adviser and promoter of the Funds. TDAM has entered into anagreement with TD Securities Inc. (“TDS”) to act as a designated broker and dealer to perform certain duties for the Funds. TDAM, TDSand TD Waterhouse Canada Inc. (“TDW”) are wholly-owned subsidiaries of The Toronto-Dominion Bank (“TD”). The registered addressof the Funds is P.O. Box 100, 66 Wellington Street West, TD Bank Tower, Toronto-Dominion Centre, Toronto, Ontario, M5K 1G8.
The financial year-end of the Funds is December 31. The Statements of Financial Position are presented as at December 31, 2017 and2016. The Statements of Comprehensive Income, Changes in Net Assets Attributable to Holders of Redeemable Units and Cash Flowsare presented for the periods ended December 31, 2017 and 2016. Where a Fund was established during either reporting period, theinformation for such Fund is provided from the inception date, except Weighted Average Units Outstanding for the Period, which iscalculated from the start date.
The Funds’ start date as indicated in the Fund-Specific Notes to the Financial Statements is the date that the Funds commenced operationsand not the inception date.
These financial statements were authorized for issue by TDAM on March 16, 2018.
2. BASIS OF PRESENTATIONThese financial statements have been prepared in compliance with International Financial Reporting Standards (“IFRS”) as published bythe International Accounting Standards Board (“IASB”). These financial statements have been prepared under the historical costconvention, as modified by the revaluation of financial assets and financial liabilities (including derivative financial instruments) at fairvalue through profit or loss (“FVTPL”).
3. SUMMARY OF SIGNIFICANT ACCOUNTING POLICIES
Financial Instruments
The Funds recognize financial instruments at fair value upon initial recognition, plus transaction costs in the case of financial instrumentsnot measured at FVTPL. Regular way purchases and sales of financial instruments are recognized at their trade date. The Funds’ non-derivative investments, which are designated at FVTPL, and derivative assets and liabilities, which are classified as held for trading(“HFT”), are measured at FVTPL.
All other financial assets and liabilities are measured at amortized cost. Under this method, financial assets and liabilities reflect theamount required to be received or paid, discounted, when appropriate, at the contract’s effective interest rate.
The Funds have determined that they meet the definition of an ‘investment entity’ and as a result, they measure subsidiaries, if any, at FVTPL. An investment entity is an entity that: obtains funds from one or more investors for the purpose of providing them withinvestment management services; commits to its investors that its business purpose is to invest funds solely for returns from capitalappreciation, investment income, or both; and measures and evaluates the performance of substantially all of its investments on a fairvalue basis. The significant judgment that the Funds have made in determining that they meet this definition is that fair value is theprimary measurement attribute used to measure and evaluate the performance of substantially all of the Funds’ investments. TheFunds’ investments may also include associates and joint ventures which are designated at FVTPL.
The Funds’ outstanding redeemable units may be redeemed for cash at a redemption discount to the closing price on the TSX. Suchreduced redemption price causes cash flows on redemption not to be substantially based on net asset value (“NAV”). Consequently,the outstanding redeemable units of the Funds are classified as financial liabilities in accordance with the requirements of IAS 32,“Financial Instruments: Presentation”.
The Funds’ accounting policies for measuring the fair value of their investments and derivatives are substantially similar to those usedin measuring their NAVs for transactions with unitholders. The NAV is the value of the total assets of a fund less the value of its totalliabilities determined, on each valuation date, in accordance with Part 14 of National Instrument 81-106, “Investment Fund ContinuousDisclosure”, for the purpose of processing unitholder transactions. Net Assets Attributable to Holders of Redeemable Units, alsoreferred to as net assets, refers to net assets calculated in accordance with IFRS. As at all dates presented, there were no differencesbetween the Funds’ NAV per unit and net assets per unit.

December 31, 2017 12 Annual Financial Statements
NOTES TO THE FINANCIAL STATEMENTS
The NAV per unit of a Fund is computed by dividing the NAV of the Fund by the total number of units of the Fund outstanding atsuch time on each valuation date.
Fair Value Measurement
Fair value is the price that would be received to sell an asset or paid to transfer a liability in an orderly transaction between marketparticipants at the measurement date. The fair values of financial assets and liabilities traded in active markets (such as publicly tradedderivatives and marketable securities) are based on quoted market prices at the close of trading on the reporting dates. The Funds usethe last traded market price for both financial assets and financial liabilities where the last traded price falls within that day’s bid-askspread. In circumstances where the last traded price is not within the bid-ask spread, TDAM determines the point within the bid-askspread that is most representative of fair value based on the specific facts and circumstances. The Funds’ policy is to recognizetransfers into and out of the fair value hierarchy levels at the end of the reporting periods.
The fair values of financial assets and liabilities that are not traded in an active market, including over-the-counter derivatives, aredetermined using valuation techniques. The Funds use a variety of methods and makes assumptions that are based on marketconditions existing at each reporting date. Valuation techniques include the use of comparable recent arm’s length transactions,reference to other instruments that are substantially the same, discounted cash flow analysis, option pricing models and othertechniques commonly used by market participants and which attempt to make the maximum use of observable inputs.
The valuation methodology for specific types of investments held by the Funds is summarized below.
(a) Securities not listed on any recognized public securities exchange are valued based on available quotations from recognizeddealers in such securities, where readily available. If securities have no available broker-dealer bid/ask quotes, TDAM uses its ownpricing model to price the securities. The pricing model will generally include the discounted cash flow valuation approach, theuse of a credit spread based on the terms of the security and the use of such credit and yield analysis comparables as TDAMbelieves are relevant in the circumstances. Debt instruments are valued based on mid prices, where readily available. Othervaluation techniques may be used, as described above, where applicable.
(b) Short-term debt instruments are valued based on quotations received from recognized investment dealers.
(c) Investments in underlying conventional mutual funds and TD Exchange-Traded Funds are generally valued at the NAV per seriesunit or NAV per class unit of the investment funds as reported by the investment funds’ managers.
(d) The Funds may use foreign exchange forward contracts to hedge against or profit from fluctuations in foreign exchange rates.These contracts are valued on each valuation day based on the difference between the contract rates and the current forwardrates at the measurement date applied to the contracts’ notional amount. The net change in unrealized appreciation or depreciationand the net realized gain or loss from closing out contracts are reflected in the Statement of Comprehensive Income as part ofNet Gain (Loss) on Derivatives.
Fair Value Hierarchy
The Funds classify their investments into fair value measurements within a hierarchy that prioritizes the inputs to fair value measurement.The fair value hierarchy has the following three levels:
Level 1 Quoted (unadjusted) prices in active markets for identical assets or liabilities;
Level 2 Inputs other than quoted prices that are observable for the asset or liability either directly (that is, as prices) or indirectly (that is,derived from prices); and
Level 3 Inputs that are not based on observable market data (that is, unobservable inputs).
All fair value measurements are recurring. The carrying values of Cash, Subscriptions Receivable, Interest Receivable, Dividends Receivable,Receivable for Investments Sold, Bank Overdrafts, Payable for Investments Purchased, Redemptions Payable, Distributions Payable andAccrued Liabilities approximate their fair values due to their short-term nature.
Fair values are classified as Level 1 when the related security or derivative is actively traded and a quoted price is available. If an instrumentclassified as Level 1 subsequently ceases to be actively traded, it is transferred out of Level 1. In such cases, an instrument is reclassifiedinto Level 2, unless the measurement of its fair value requires the use of significant unobservable inputs, in which case it is classified as Level 3.
The hierarchy gives the highest priority to unadjusted quoted prices in active markets for identical assets or liabilities (Level 1) and thelowest priority to unobservable inputs (Level 3).
The classification within the hierarchy is based on the lowest level input that is significant to the fair value measurement. For thispurpose, the significance of an input is assessed against the fair value measurement in its entirety. If a fair value measurement usesobservable inputs that require significant adjustment based on unobservable inputs, that measurement is a Level 3 measurement.

December 31, 2017 13 Annual Financial Statements
NOTES TO THE FINANCIAL STATEMENTS
Assessing the significance of a particular input to the fair value measurement in its entirety requires judgment, considering factorsspecific to the asset or liability.
The determination of what constitutes ’observable’ requires significant judgment. Observable data is considered to be that market datathat is readily available, regularly distributed or updated, reliable and verifiable, not proprietary, and provided by independent sourcesthat are actively involved in the relevant market.
TDAM has a Global Fair Value Committee which oversees the performance of the fair value measurements included in the financialstatements of the Funds, including any Level 3 measurements. TDAM utilizes a variety of methods (as listed in the Fair Value Measurementsection) in determining the fair value of securities classified as Level 3. The committee also meets quarterly to perform reviews of thevaluations of investments held by the Funds.
The classification of the Funds’ financial instruments within the fair value hierarchy as at December 31, 2017 and 2016, and any transfersbetween levels at the end of the reporting periods as a result of changes in the lowest level input that is significant to the fair valuemeasurement are disclosed in the Fund-Specific Notes to the Financial Statements, where applicable.
Interest in Unconsolidated Structured Entities
A structured entity is an entity that has been designed so that voting or similar rights are not the dominant factor in deciding whocontrols the entity, such as when any voting rights relate to administrative tasks only and the relevant activities are directed by meansof contractual arrangements. TDAM has determined that all of the underlying funds in which the Funds invest are unconsolidatedstructured entities. In making this determination, TDAM evaluated the fact that decision making about underlying funds’ activities isgenerally not governed by voting or similar rights held by the Funds and other investors in any underlying funds.
The Funds may invest in underlying funds whose investment objectives range from seeking to achieve short- to long-term income andcapital growth potential. The Funds’ interests in these securities as at December 31, 2017 and 2016 are included at their fair value inthe Statements of Financial Position, which represents the Funds’ exposure in these underlying funds. The Funds do not provide andhave not committed to provide any additional significant financial or other support to the underlying funds. Realized gain or loss andthe change in fair value of each of the underlying funds during the reporting periods are included in Net Gain (Loss) on Investments in the Statements of Comprehensive Income. Additional information on the Funds’ interests in underlying funds, where applicable, isprovided in the Schedule of Investment Portfolio and Fund-Specific Notes to the Financial Statements.
The Funds may also invest in mortgage-related and/or other asset-backed securities that directly or indirectly represent a participation in,or are secured by and payable from, mortgage loans on real property. Mortgage-related securities are created from pools of residentialor commercial mortgage loans, including mortgage loans made by savings and loan institutions, mortgage bankers, commercial banksand others. The debt and equity securities issued by these securities may include tranches with varying levels of subordination. TheFunds may invest in senior notes that have a first lien on assets and have minimum exposure to junior or subordinate tranches. Thesesecurities may provide a monthly payment which consists of both interest and principal payments. Other asset-backed securities arecreated from many types of assets, including auto loans, credit card receivables, home equity loans, and student loans.
As at December 31, 2017 and 2016, the fair values of mortgage-related and other asset-backed securities of the Funds, where applicable,are disclosed as part of Investments in the Statements of Financial Position. These amounts represent the maximum exposure to losses atthose dates. The change in fair value of mortgage-related and other asset-backed securities during the reporting periods are included inthe Net Change in Unrealized Appreciation/Depreciation in the Statements of Comprehensive Income in Net Gain (Loss) on Investments.
Translation of Foreign Currencies
A Fund’s functional currency, as disclosed in the Fund-Specific Notes to the Financial Statements, represents the currency that TDAMviews to most faithfully represent the economic effects of the Fund’s underlying transactions, events and conditions taking intoconsideration how units are issued or redeemed and how returns are measured.
Foreign currency transactions are translated into the functional currency using the exchange rates prevailing at the dates thattransactions occur. Realized foreign exchange gains and losses on income are recognized in investment income in the Statements ofComprehensive Income. Assets and liabilities denominated in a foreign currency are translated into the functional currency using theexchange rate prevailing at the measurement date. Foreign exchange gains and losses on the sale of investments are included in NetRealized Gain (Loss). Unrealized foreign exchange gains and losses on investments held and other assets and liabilities are included inNet Change in Unrealized Appreciation/Depreciation. Realized and unrealized foreign exchange gains and losses relating to cash arepresented as Foreign Exchange Gain (Loss) on Cash in the Statements of Comprehensive Income.

December 31, 2017 14 Annual Financial Statements
NOTES TO THE FINANCIAL STATEMENTS
Offsetting Financial Assets and Liabilities
Financial assets and liabilities are offset and the net amount reported in the Statements of Financial Position where the Funds have alegally enforceable right to offset the recognized amounts and there is an intention to settle on a net basis or realize the asset andsettle the liability simultaneously. In all other situations they are presented on a gross basis. In the normal course of business, the Fundsmay enter into various master netting agreements or other similar arrangements that do not meet the criteria for offsetting in theStatements of Financial Position but still allow for the related amounts to be set-off in certain circumstances, such as bankruptcy or thetermination of the contracts. Offsetting information, where applicable, is presented in the Fund-Specific Notes to the Financial Statements.
Cash
Cash includes deposits with financial institutions. Bank overdrafts are shown under Current Liabilities in the Statements of Financial Position.
Receivable for Investments Sold/Payable for Investments Purchased
Receivable for Investments Sold and Payable for Investments Purchased represent trades that have been contracted for but not yetsettled or delivered on the Statements of Financial Position dates.
Impairment of Financial Assets
At each reporting date, the Funds assess whether there is objective evidence that a financial asset at amortized cost is impaired. If suchevidence exists, the Funds recognize an impairment loss as the difference between the amortized cost of the financial asset and thepresent value of the estimated future cash flows, discounted using the instrument’s original effective interest rate. Impairment losseson financial assets at amortized cost are reversed in subsequent periods if the amount of the loss decreases and the decrease can berelated objectively to an event occurring after the impairment is recognized.
Income Recognition
The Funds may engage in securities lending pursuant to the terms of an agreement which includes restrictions as set out in Canadiansecurities legislation. The income earned from securities lending, where applicable, is included in the Statements of ComprehensiveIncome when it is received. The fair value of the securities loaned and fair value of the collateral held are determined daily. Thebreakdown of securities lending income, aggregate values of securities on loan and related collateral held by the Funds are provided in the Fund-Specific Notes to the Financial Statements, where applicable.
Interest for Distribution Purposes as shown in the Statements of Comprehensive Income includes interest income from cash and thecoupon interest on debt instruments accounted for on an accrual basis. Interest Receivable is disclosed in the Statements of FinancialPosition based on the debt instruments’ stated rates of interest. The Funds do not amortize premiums paid or discounts received onthe purchase of debt securities except for zero coupon bonds which are amortized.
Dividend income from exchange-traded funds (ETFs) and distributions from any underlying mutual funds are recognized on the ex-dividend and ex-distribution date, respectively. Distributions received from ETFs, that are not managed by TDAM, are recognizedand presented in the financial statements based on the nature of the underlying components such as interest income, dividend income,capital gains and return of capital.
Investment Transactions and Transaction Costs
For the purposes of calculating realized and unrealized gains and losses from investment transactions, the cost of each investment securityis determined on an average cost basis, excluding transactions costs.
Transaction costs, such as brokerage commissions, incurred by the Funds in the purchase and sale of investments at FVTPL are recognizedin the Statements of Comprehensive Income in the period incurred. Commissions paid, where applicable, are disclosed in the Fund-Specific Notes to the Financial Statements. No transaction costs are incurred when the Funds invest in underlying mutual funds.However, the underlying funds’ investments may be subject to transaction costs.
Increase (Decrease) in Net Assets Attributable to Holders of Redeemable Units – Per Unit
The Increase (Decrease) in Net Assets Attributable to Holders of Redeemable Units – Per Unit is calculated by dividing the Increase(Decrease) in Net Assets Attributable to Holders of Redeemable Units by the weighted average units outstanding for that reporting period.
Accounting Standards Issued but Not Yet Adopted
The final version of IFRS 9, “Financial Instruments” was issued by the IASB in July 2014 and will replace IAS 39, “Financial Instruments:Recognition and Measurement”. IFRS 9 introduces a model for classification and measurement, a single, forward-looking ‘expectedloss’ impairment model and a substantially reformed approach to hedge accounting. The new single, principle based approach fordetermining the classification of financial assets is driven by cash flow characteristics and the business model in which an asset is held.
December 31, 2017 15 Annual Financial Statements
NOTES TO THE FINANCIAL STATEMENTS
The new model also results in a single impairment model being applied to all financial instruments, which will require more timelyrecognition of expected credit losses. It also includes changes in respect of own credit risk in measuring liabilities elected to bemeasured at fair value, so that gains caused by the deterioration of an entity’s own credit risk on such liabilities are no longer recognizedin profit or loss. IFRS 9 is effective for annual periods beginning on or after January 1, 2018. The manager has assessed the impact ofIFRS 9 by analyzing the current business model of the Funds and does not anticipate significant changes to the valuation of the Funds’financial instruments. As a result, the adoption of IFRS 9 is not expected to have a material impact on the Fund’s financial statements.
4. CRITICAL ACCOUNTING ESTIMATES AND JUDGMENTSThe preparation of financial statements requires management to use judgment in applying its accounting policies and to make estimatesand assumptions about the future. The following discusses the most significant accounting judgments and estimates that the Fundshave made in preparing the financial statements:
Fair Value Measurement of Derivatives and Securities Not Quoted in an Active Market
The Funds may hold financial instruments that are not quoted in active markets, including derivatives. As described in Note 3, the useof valuation techniques for financial instruments and derivatives that are not quoted in an active market requires TDAM to makeassumptions that are based on market conditions existing as at the reporting date of the financial statements. Changes in assumptionsabout these factors could affect the reported fair values of financial instruments. Refer to the Fund-Specific Notes to the FinancialStatements for further information about the fair value measurement of the Funds’ financial instruments, where applicable.
Classification and Measurement of Investments and Application of the Fair Value Option
In classifying and measuring financial instruments held by the Funds, TDAM is required to make significant judgments about whetheror not the business of the Funds is to invest on a total return basis for the purpose of applying the fair value option for financial assetsunder IAS 39. The most significant judgments made include the determination that certain investments are HFT and that the fair valueoption can be applied to those which are not.
Investment Entity
In determining whether the Funds meet the definition of an investment entity, TDAM may be required to make significant judgmentsabout whether the Funds have the typical characteristics of an investment entity. The Funds may hold only one investment, anunderlying fund (or have only one investor or have investors that are its related parties), however, consistent with the investment entitydefinition, each Fund primarily obtains funds from one or more investors for the purpose of providing investment management services,commits to its investors that the business purpose is to invest the funds solely for returns from capital appreciation, investment incomeor both, and measures and evaluates the performance of its investments on a fair value basis.
5. REDEEMABLE UNITSThe Funds are listed on the TSX and investors are able to buy and sell units on the TSX through designated brokers and authorizeddealers in the province or territory where the investor resides. Investors may incur customary brokerage commissions in buying andselling units.
Units of the Funds are redeemable at the option of the unitholder in accordance with the provisions of the Declaration of Trust. Unitsare being issued and sold on a continuous basis and there is no maximum number of units that may be issued.
On any trading day, unitholders may redeem units of a Fund for cash at a redemption price per unit equal to the lower of: (i) 95% ofthe closing price for the units on the TSX on the effective day of the redemption; and (ii) the NAV per unit of the Fund on such tradingday. In order for a cash redemption to be effective on a trading day, a cash redemption request in the form prescribed by TDAM fromtime to time must be received by the applicable Fund at its registered office at or before the applicable cut-off time or at such othertime as TDAM may determine from time to time. If a cash redemption request is not received by the delivery deadline in respect of aparticular trading day, the cash redemption request will be effective only on the next trading day. Payment of the redemption price willbe made by no later than the second trading day after the effective day of the redemption, or such shorter period as may be requiredby Canadian securities regulatory authorities or at the discretion of TDAM.
TDAM reserves the right to cause the Funds to redeem the units held by a unitholder at a price equal to the NAV per unit on theeffective date of such redemption if TDAM believes it is in the best interest of the Funds to do so.
On any trading day, unitholders may subscribe for or exchange the prescribed number of units (or an integral multiple thereof) forbaskets of securities and cash, or with respect to TD International Equity Index ETF, cash only.

December 31, 2017 16 Annual Financial Statements
NOTES TO THE FINANCIAL STATEMENTS
The closing price or mid price of the Funds’ redeemable units listed on the TSX as at December 31, 2017, where applicable, is disclosedin the Fund-Specific Notes to the Financial Statements.
6. RELATED PARTY TRANSACTIONS
Capital
TDAM, TDS and/or other investment funds managed by TDAM may invest in units of the Funds from time to time. The investmentmade by related parties is disclosed in the Fund-Specific Notes to the Financial Statements of the applicable Funds.
Management Fee
The Funds pay TDAM a management fee based on the average daily NAV of the applicable Funds. The management fee, plus applicabletaxes, is calculated and accrued daily and paid monthly to TDAM. Where a Fund invests in any underlying funds, there are fees andexpenses payable by the underlying funds in addition to those paid by the Fund. However, there is no duplication of management feespaid to TDAM or its affiliates if a Fund invests in underlying funds that are managed by TDAM.
Prior to February 23, 2017, the prospectus disclosed the maximum annual management fee rate that TDAM could charge to the Funds(so the actual management fee charged to the Funds might have been less than the maximum annual management fee rate). TDAMwas able to charge the maximum annual management fee without notice to unitholders. Effective February 23, 2017, the prospectusdiscloses a specified annual management fee rate. TDAM may waive all or a portion of the management fees charged to the Funds,which may be discontinued at any time by TDAM at its discretion without notice to unitholders. Detailed information on themanagement fees of the Funds is provided in the Fund-Specific Notes to the Financial Statements.
Operating Expenses
Fund’s Independent Review Committee (“IRC”)
TDAM has established an IRC for each Fund to act as an impartial and independent committee to review and provide recommendationsor, if appropriate, approvals respecting any conflict of interest matters referred to it by TDAM. The IRC prepares, at least annually, areport of its activities for unitholders of the Funds.
The Funds and/or the underlying funds in which the Funds invest in relied on standing instructions from the IRC in respect of one ormore of the following transactions:
(a) trades in securities of TD or any affiliate or associate thereof;
(b) investments in the securities of an issuer where TDS, TDW, or any other affiliate of TDAM (a “Related Dealer”) acted as anunderwriter during the distribution of such securities and the 60-day period following the completion of the distribution of theunderwritten securities;
(c) purchases or sales of securities of an issuer from or to another investment fund or discretionary managed account managed byTDAM; and
(d) purchases of securities from or sales of securities to a Related Dealer, where it acted as principal.
Investments in securities of TD, interests in underlying funds managed by TDAM, or investments in any affiliates that were held by theFunds at the end of the reporting period are disclosed in the Schedule of Investment Portfolio and/or the Fund-Specific Notes to theFinancial Statements.
The compensation and relevant expenses of IRC members are allocated among the investment funds managed by TDAM and disclosedin the Statements of Comprehensive Income as Independent Review Committee Fees.
Brokerage Commissions and Soft Dollars
Brokerage commissions (including other transaction costs) paid on securities transactions and amounts paid to related parties of TD forbrokerage services provided to the Funds for the periods ended December 31, 2017 and 2016, where applicable, are disclosed in theFund-Specific Notes to the Financial Statements.
Client brokerage commissions are used as payment for order execution services or research services. The portfolio advisers or TDAMmay select brokers including its affiliates, who charge a commission in excess of that charged by other brokers (“soft dollars”) if theydetermine in good faith that the commission is reasonable in relation to the order execution and research services utilized.
For debt instruments traded in the over the counter markets where client brokerage commissions are not charged, soft dollars or clientbrokerage commissions are not generated. For equities or other securities where client brokerage commissions are charged, the softdollar portion of the amount paid or payable for goods and services other than order execution for the Funds is not generally

December 31, 2017 17 Annual Financial Statements
NOTES TO THE FINANCIAL STATEMENTS
ascertainable. Any ascertainable soft dollar value received as a percentage of total brokerage commissions paid under the soft dollar arrangement entered into by the portfolio advisers or TDAM, where applicable, is disclosed in the Fund-Specific Notes to the Financial Statements.
Other Operating Expenses
TDAM pays all of the operating expenses (including services provided by TDAM or affiliates of TDAM), other than costs and expensesassociated with: all taxes; borrowing; the IRC and compliance with any new governmental and regulatory requirements and new typesof costs or expenses.
TDAM is responsible for all other costs and expenses of the Funds, including the fees payable to the custodian, valuation agent,registrar and transfer agent and fees payable to other service providers retained by TDAM. TDAM is also responsible for all taxes forsuch cost and expenses.
TDAM, at its discretion, may waive or absorb a portion of the operating expenses otherwise payable by the Funds. These waivers orabsorptions may be terminated at any time without notice. The amount of expenses waived or absorbed for the Funds is disclosed inthe Statements of Comprehensive Income as Waived Expenses, where applicable.
The Funds also pays applicable goods and services tax and harmonized sales tax at a blended rate to TDAM, on management fees andcertain operating expenses based on the province or territory of residence of the investors of the Funds, which are included with therespective expense in the Statements of Comprehensive Income.
7. TAXATIONThe Funds qualify as mutual fund trusts under the Income Tax Act (Canada). All or substantially all of the net investment income andsufficient amounts of net capital gains realized in any period are distributed to unitholders such that no income tax is payable by theFunds. As a result, the Funds have determined that they are in substance not taxable and therefore do not record income taxes in the Statements of Comprehensive Income nor do they recognize any deferred tax assets or liabilities in the Statements of FinancialPosition. The Funds’ capital and/or non-capital losses, where applicable, are provided in the Fund-Specific Notes to the FinancialStatements. Capital losses have no expiry. Non-Capital losses can be carried forward for up to twenty years.
In determining the amount of distributions payable to unitholders at the end of the year, net realized capital gains may be allocated toredeeming unitholders. This is disclosed in the Statements of Changes in Net Assets Attributable to Holders of Redeemable Units in theannual financial statements as net realized gains on investments with an offsetting notional reinvestment of the distribution.
Notional distributions are reinvested in additional units and these units will be immediately consolidated such that the number ofoutstanding units following the distribution will equal the number of outstanding units prior to the distribution. Such distributionsincrease the adjusted cost base of the unitholder.
The Funds currently incur withholding taxes imposed by certain countries on investment income and capital gains. Such income andgains are recorded on a gross basis and the related withholding taxes are reported as Tax Reclaims (Withholding Taxes) in theStatements of Comprehensive Income.
8. FINANCIAL RISK MANAGEMENTFinancial Risk Factors
Each Fund seeks to track, to the extent possible and before the deduction of fees and expenses, the performance of an index. TheFunds are exposed to a variety of financial risks: these may include market risk (including interest rate risk, currency risk, and otherprice risk), credit risk, liquidity risk and concentration risk. All investments present a risk of loss of capital.
(a) Market Risk
(i) Interest Rate Risk
Interest rate risk arises from the possibility that changes in interest rates will affect the future cash flows or the fair values ofinterest-bearing investments.
A Fund’s exposure to interest rate risk is concentrated in its investments in debt instruments (such as bonds and debentures)and interest rate derivative instruments, if any. Short-term investments, currencies and other assets and liabilities are shortterm in nature and/or non-interest bearing and not subject to significant amounts of risk due to fluctuations in the prevailinglevels of market interest rates unless there are very significant interest rate shocks.

December 31, 2017 18 Annual Financial Statements
NOTES TO THE FINANCIAL STATEMENTS
If a Fund invests in underlying funds, it is exposed to indirect interest rate risk to the extent of the interest-bearing financialinstruments held by the underlying funds. A Fund’s sensitivity exposure to interest rate risk, where significant, is disclosed in theFund-Specific Notes to the Financial Statements.
(ii) Currency Risk
A Fund may hold assets denominated in currencies other than its functional currency, which is the Canadian dollar. It istherefore exposed to currency risk, as the value of the assets denominated in other currencies will fluctuate due to changes in the foreign exchange rates of those currencies in relation to such Fund’s functional currency. A Fund may also enter intoforeign exchange forward contracts for hedging purposes to reduce its foreign currency exposure.
Where a Fund invests in any underlying funds, it is exposed to indirect currency risk in the event that the underlying fundsinvest in financial instruments that are denominated in a currency other than the underlying funds’ functional currency.
A Fund’s direct exposure to currency risk, where significant, is disclosed in the Fund-Specific Notes to the Financial Statements.
(iii) Other Price Risk
Other price risk is the risk that securities will fluctuate in value because of changes in market prices (other than those arisingfrom interest rate risk or currency risk).
In determining each Fund’s sensitivity impact from exposure to other price risk, a historical beta may be used when applicable.Historical beta, a measure of the sensitivity of a Fund’s returns to market returns, is generally derived from comparing 36 monthsof returns between a Fund and its benchmark. As such, beta inherently includes effects previously reflected in the interest rateand currency risk disclosures. Historical beta may not be representative of future beta.
Where a Fund invests in a single underlying fund, it is exposed to indirect other price risk in the event that the underlyingfund invests in securities that trade on a market. Where a Fund invests in several underlying funds, the exposure to otherprice risk includes all investments in underlying funds.
A Fund’s direct exposure to other price risk, where applicable, is disclosed in the Fund-Specific Notes to the Financial Statements.
(b) Credit RiskCredit risk is the risk that one party to a financial instrument will cause a financial loss to the other party by failing to discharge anobligation. A Fund’s main credit risk concentration is in debt instruments and derivative instruments it holds. Each Fund’s exposureto credit risk is the risk that an issuer of investments or a counterparty to derivative instruments will be unable to pay amounts infull when due. All transactions in listed securities are settled or paid for upon delivery using approved brokers. The risk of defaultwith a broker is considered minimal, as delivery of securities sold is only made once the broker has received payment. Payment ismade on a purchase once the securities have been received by the broker. The trade will fail if either party fails to meet its obligation.
A Fund may also be exposed indirectly to credit risk if it invests in underlying funds in the event that the underlying funds invest indebt instruments and derivatives.
Where applicable, the direct exposure to credit risk is disclosed in the Fund-Specific Notes to the Financial Statements.
The Funds and the underlying funds only buy and hold short-term notes with a minimum R-1 Low credit rating by DBRS Limitedor an equivalent rating from another recognized credit rating agency. The credit risk from the use of counterparties for foreignexchange forward contracts is, where applicable, minimized by:
(i) using counterparties with a minimum credit rating of A by S&P Global Ratings (“SPGR”) or an equivalent rating from anotherrecognized credit rating agency;
(ii) limiting the term of the foreign exchange forward contracts to a maximum of 365 days; and,
(iii) limiting the mark-to-market exposure to any one counterparty to 10 percent of the portfolio value.
A Fund’s investments in short term and debt instruments, by ratings categories, where applicable, are disclosed in the Fund-SpecificNotes to the Financial Statements.
The Funds may also engage in securities lending transactions with counterparties that have a minimum credit rating of A by SPGRor an equivalent rating from another credit agency. The value of securities held as collateral by the Funds in connection with thesetransactions is at least 102 percent of the fair value of the securities loaned. The collateral and loaned securities are marked tomarket on each business day. Information about securities lending income received by the Funds, the fair values of securities lentand collateral held, where applicable, is disclosed in the Fund-Specific Notes to the Financial Statements.
19 Annual Financial StatementsDecember 31, 2017
NOTES TO THE FINANCIAL STATEMENTS
(c) Liquidity RiskLiquidity risk is defined as the risk that a fund may not be able to settle or meet its obligations on time or at a reasonable price. A Fund’s exposure to this risk is concentrated in the daily cash redemptions of redeemable units. The Funds primarily invest insecurities that are traded in active markets and can be readily disposed. Where units are exchanged for baskets of securities ratherthan cash, the Funds are not exposed to any significant liquidity risk. In addition, the Funds retain sufficient cash and cash equivalentsto maintain liquidity, and have the ability to borrow up to 5 percent of its NAV for the purpose of funding redemptions.
The contractual maturities analysis for a Fund’s financial liabilities, where applicable, is disclosed in the Fund-Specific Notes to theFinancial Statements.
(d) Concentration RiskConcentration risk arises as a result of the concentration of exposures within the same category, whether it is geographical location,security type or industry sector. A Fund’s concentration risk is disclosed in the Fund-Specific Notes to the Financial Statements.
Each Fund, which seeks to replicate the performance of an index, may have more of its net assets invested in one or more issuersthan is usually permitted for mutual funds. In addition, certain markets to which an index has exposure may be more concentratedin a particular sector or industry. Consequently, a Fund’s portfolio may be less diversified when compared to a less concentratedinvestment portfolio. Also, the NAV of such Fund may be more volatile than that of a more broadly-diversified portfolio and mayfluctuate substantially over short periods of time.
9. CAPITAL RISK MANAGEMENTUnits issued and outstanding represent the capital of the Funds. The Funds do not have any specific capital requirements on thesubscription and redemption of units, other than certain minimum subscription requirements. Changes in the Funds’ capital during thereporting periods are reflected in the Statements of Changes in Net Assets Attributable to Holders of Redeemable Units. TDAM isresponsible for managing the capital of the Funds in accordance with each Fund’s investment objectives and for managing liquidity in order to meet redemption requests.
If applicable, the most recent financial statements of the underlying funds and ETFs managed by TDAM are available, without charge,by e-mail to [email protected], or by visiting our website at tdassetmanagement.com, or the SEDAR website at sedar.com, or bywriting to:
TD Asset Management Inc.P.O. Box 10066 Wellington Street WestTD Bank TowerToronto-Dominion CentreToronto, OntarioM5K 1G8
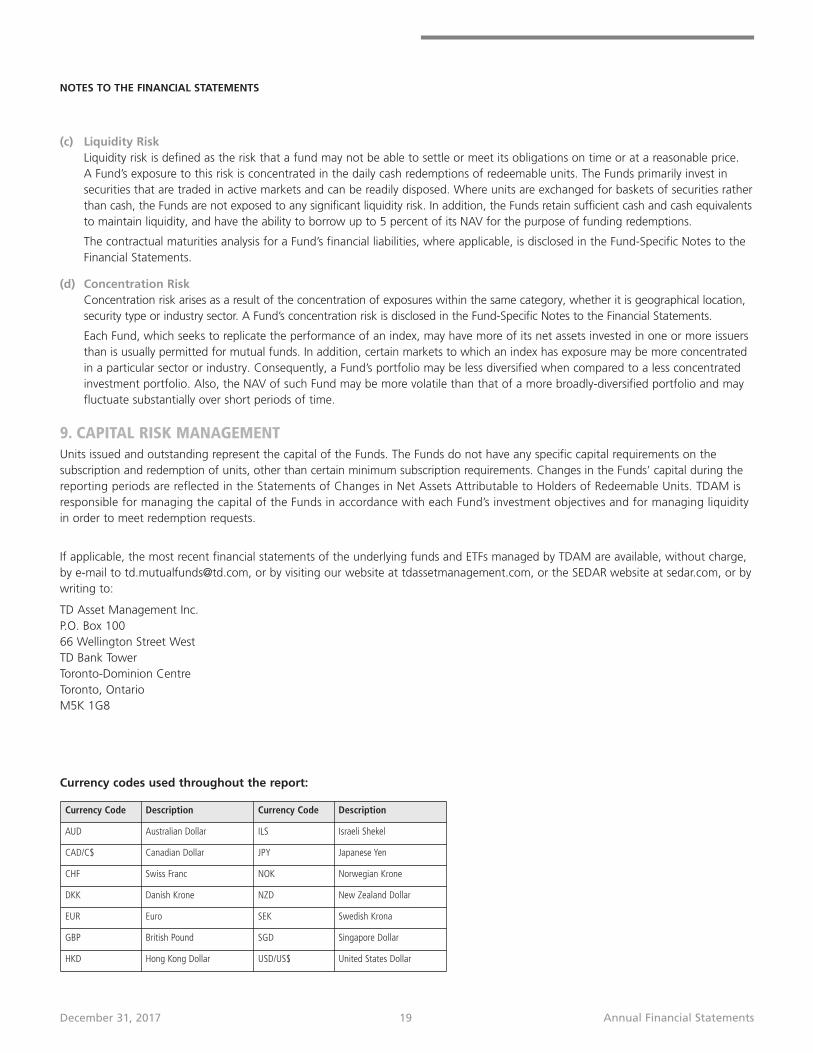
Currency Code Description Currency Code Description
AUD Australian Dollar ILS Israeli Shekel
CAD/C$ Canadian Dollar JPY Japanese Yen
CHF Swiss Franc NOK Norwegian Krone
DKK Danish Krone NZD New Zealand Dollar
EUR Euro SEK Swedish Krona
GBP British Pound SGD Singapore Dollar
HKD Hong Kong Dollar USD/US$ United States Dollar
Currency codes used throughout the report:

20 Annual Financial StatementsDecember 31, 2017
TD ETFs are managed by TD Asset Management Inc., a wholly-owned subsidiary of The Toronto-Dominion Bank.
All trademarks are the property of their respective owners.
® The TD logo and other trade-marks are the property of The Toronto-Dominion Bank.