annual financial statements - sa corporate real estate …
TRANSCRIPT

ANNUAL FINANCIALSTATEMENTS

SA CORPORATE REAL ESTATE FUND
SA CORPORATE REAL ESTATE FUNDContents To The Audited Annual Financial Statements
Page
DIRECTORS' RESPONSIBILITY............................................................................................................... 1
REPORT OF THE TRUSTEE..................................................................................................................... 2
INDEPENDENT AUDITOR'S REPORT......................................................................................................... 3
STATEMENTS OF FINANCIAL POSITION................................................................................................... 5
STATEMENTS OF COMPREHENSIVE INCOME............................................................................................ 6
STATEMENTS OF CHANGES IN UNITHOLDERS' FUNDS.............................................................................. 7
STATEMENTS OF CASH FLOWS.............................................................................................................. 9
NOTES TO THE ANNUAL FINANCIAL STATEMENTS.................................................................................... 10
APPENDIX A: STATUTORY INFORMATION.............................................................................................. 42
APPENDIX B: PROPERTY PORTFOLIO REVIEW......................................................................................... 43
APPENDIX C: PROPERTY PORTFOLIO.................................................................................................... 45
Cover pictures from left to right: Nampak, Denver, 530 Nicholson Road, Doornfontein, GautengCeltis Ridge Shopping Centre, CenturionWorld Trade Center, Sandton, Gauteng
SA CORPORATE REAL ESTATE FUND MANAGERS LIMITEDContents To The Audited Annual Financial Statements
Page
DIRECTORS' RESPONSIBILITY............................................................................................................... 49
DECLARATION BY THE SECRETARY........................................................................................................ 49
INDEPENDENT AUDITOR'S REPORT........................................................................................................ 50
REPORT OF THE AUDIT COMMITTEE....................................................................................................... 51
DIRECTORS' REPORT............................................................................................................................ 53
STATEMENT OF FINANCIAL POSITION.................................................................................................... 56
STATEMENT OF COMPREHENSIVE INCOME.............................................................................................. 57
STATEMENT OF CHANGES IN EQUITY...................................................................................................... 57
STATEMENT OF CASH FLOWS................................................................................................................ 58
NOTES TO THE ANNUAL FINANCIAL STATEMENTS.................................................................................... 59

ANNUAL FINANCIAL STATEMENTS 2013 1
RJ Biesman-SimonsChairman - Audit Committee
The directors of SA Corporate Real Estate Fund Managers Limited are responsible for the preparation and integrity ofthe annual financial statements and the related information included in the SA Corporate Real Estate Fund (“the Fund”)and all its subsidiaries (“the Group”) annual financial statements. In order for the Board to discharge its responsibilities,management has developed and continues to maintain a system of internal control. The Board has ultimate responsibilityfor the system of internal control and reviews its operation, primarily through the Risk and Compliance Committee andAudit Committee.
The internal controls include a risk-based system of internal accounting and administrative controls designed to providereasonable but not absolute assurance that the assets are safeguarded and that transactions are executed and recordedin accordance with generally accepted business practices and the Group and the Fund's policies and procedures. Thesecontrols are implemented by trained, skilled personnel with appropriate segregation of duties, are monitored by managementand the Risk, Audit and Compliance Committee, which was split into the Risk and Compliance Committee and AuditCommittee with effect from 1 January 2013, and include a comprehensive budgeting and reporting system operatingwithin an appropriate control framework.
The external auditors are responsible for reporting on the annual financial statements, and their opinion is included onpages 3 and 4. The annual financial statements are prepared in accordance with International Financial ReportingStandards and the requirements of the Collective Investment Schemes Control Act, No. 45 of 2002, and incorporatedisclosures in line with the accounting practices of the Group and the Fund. They are based on appropriate accountingpolicies consistently applied, except where otherwise stated, and are supported by reasonable judgements and estimates.
The directors believe that the Group and the Fund will be a going concern in the year ahead. Accordingly, in preparingthe annual financial statements, the going concern basis has been adopted.
The annual financial statements for the year ended 31 December 2013 as set out on pages 5 to 48 were approved bythe Board of Directors on 28 February 2014 and are signed on its behalf by:
J MolobelaIndependent Non-Executive Chairman
These annual financial statements have been prepared under the supervision of:AM BassonCA (SA)Financial Director
DIRECTORS’ RESPONSIBILITYFor And Approval Of The Annual Financial Statements

SA CORPORATE REAL ESTATE FUND2
To the unitholders of SA Corporate Real Estate Property FundAs Trustee to the SA Corporate Real Estate Trust Scheme (“the Scheme”), we are required, in terms of the CollectiveInvestment Schemes Control Act, 2002 (Act No. 45 of 2002) (“the CISCA”), to report to the unitholders on the administrationof the Scheme during each annual accounting period.
We advise, for the year 1 January 2013 to 31 December 2013, we reasonably believe that the Manager has administeredthe Scheme in accordance with:
i.) the limitations imposed on the investment and borrowing powers of the manager by the CISCA; and ii.) the provisions of the CISCA and the relevant deeds.
We confirm that, according to the records available to us, there were no material instances of compliance contraventionsand therefore no consequent losses incurred by the portfolio in the year.
Nelia De Beer Marian Rutters
First National Bank, a division of FirstRand Bank LimitedTrustee28 February 2014
1st Floor, 3 First Place, Bank CityCnr Simmons & Jeppe StreetsJohannesburg2001
REPORT OF THE TRUSTEEFor the year ended 31 December 2013
World Trade Center, Sandton, Gauteng

ANNUAL FINANCIAL STATEMENTS 2013 3
We have audited the consolidated and separate financial statements of SA Corporate Real Estate Fund set out on pages5 to 41, which comprise the statements of financial position as at 31 December 2013, and the statements of comprehensiveincome, statements of changes in unitholders' funds and statements of cash flows for the year then ended, and thenotes, comprising a summary of significant accounting policies and other explanatory information.
Directors' Responsibility for the Consolidated Financial StatementsThe Fund's directors are responsible for the preparation and fair presentation of these consolidated and separate financialstatements in accordance with International Financial Reporting Standards and the requirements of the CollectiveInvestment Schemes Control Act, No. 45 of 2002, and for such internal control as the directors determine is necessaryto enable the preparation of financial statements that are free from material misstatement, whether due to fraud orerror.
Auditor's ResponsibilityOur responsibility is to express an opinion on these consolidated and separate financial statements based on our audit.We conducted our audit in accordance with International Standards on Auditing. Those standards require that we complywith ethical requirements and plan and perform the audit to obtain reasonable assurance about whether the consolidatedand separate financial statements are free from material misstatement.
An audit involves performing procedures to obtain audit evidence about the amounts and disclosures in the financialstatements. The procedures selected depend on the auditor's judgement, including the assessment of the risks of materialmisstatement of the financial statements, whether due to fraud or error. In making those risk assessments, the auditorconsiders internal control relevant to the entity's preparation and fair presentation of the financial statements in orderto design audit procedures that are appropriate in the circumstances, but not for the purpose of expressing an opinionon the effectiveness of the entity's internal control. An audit also includes evaluating the appropriateness of accountingpolicies used and the reasonableness of accounting estimates made by management, as well as evaluating the overallpresentation of the financial statements.
We believe that the audit evidence we have obtained is sufficient and appropriate to provide a basis for our audit opinion.
OpinionIn our opinion, the consolidated and separate financial statements present fairly, in all material respects, the consolidatedand separate financial position of SA Corporate Real Estate Fund as at 31 December 2013, and its consolidated andseparate financial performance and consolidated and separate cash flows for the year then ended in accordance withInternational Financial Reporting Standards and the requirements of the Collective Investment Schemes Control Act,No. 45 of 2002.
INDEPENDENT AUDITOR’S REPORTTo The Unitholders Of SA Corporate Real Estate Fund

SA CORPORATE REAL ESTATE FUND4
Other reportsAs part of our audit of the consolidated and separate financial statements for the year ended 31 December 2013 wehave read the Report of the Trustee for the purpose of identifying whether there are material inconsistencies betweenthis report and the audited consolidated and separate financial statements. This report is the responsibility of the Trustee.Based on reading this report we have not identified material inconsistencies between this report and the auditedconsolidated and separate financial statements. However, we have not audited this report and accordingly do not expressan opinion on this report.
Deloitte & ToucheRegistered Auditors
Per: GG FortuinPartner28 February 20141st FloorThe SquareCape Quarter27 Somerset RoadCape Town8005
National Executive: LL Bam Chief Executive AE Swiegers Chief Operating Officer GM Pinnock Audit DL Kennedy RiskAdvisory NB Kader Tax TP Pillay Consulting K Black Clients & Industries JK Mazzocco Talent & Transformation CR BeukmanFinance M Jordan Strategy S Gwala Special Projects TJ Brown Chairman of the Board MJ Comber Deputy Chairman ofthe BoardRegional Leader: MN Alberts
A full list of partners and directors is available on request
B-BBEE rating: Level 2 contributor in terms of the Chartered Accountancy Profession Sector Code
Member of Deloitte Touche Tohmatsu Limited
INDEPENDENT AUDITOR’S REPORT (continued)To The Unitholders Of SA Corporate Real Estate Fund
Comaro Crossing, Oakdene, Gauteng

ANNUAL FINANCIAL STATEMENTS 2013 5
STATEMENTS OF FINANCIAL POSITIONas at 31 December 2013
Group Fund2013 2012 2013 2012
Notes R000 R000 R000 R000
Assets
Non-current assetsInvestment in subsidiary companies 7 - - 3 583 961 3 312 431 Shares - - 1 175 653 881 291 Loans - - 2 408 308 2 431 140 Investment property 8 8 654 251 7 733 791 5 084 554 4 352 314 Letting commissions and tenant installations 8 63 116 53 521 30 068 30 778 Interest rate swap derivatives 14 39 644 2 854 39 644 2 854 Rental receivable straight line adjustment 8 170 408 199 851 111 525 135 555
8 927 419 7 990 017 8 849 752 7 833 932
Current assetsProperties classified as held for disposal 9 - 182 900 - 124 900 Trade and other receivables 10 162 780 129 142 94 186 62 044 Letting commissions and tenant installations 9 - 835 - 171 Current portion of loans to subsidiary companies 7 - - 77 726 96 234 Capital gains taxation in subsidiary companies - 824 - -Interest rate swap derivatives 14 382 - 382 - Rental receivable - straight line rental adjustment 8 40 566 33 233 26 421 20 681 Cash and cash equivalents 11 311 520 407 281 306 964 373 401
515 248 754 215 505 679 677 431
Total assets 9 442 667 8 744 232 9 355 431 8 511 363
Unitholders' funds and liabilities
Unitholders' funds 12 7 280 242 6 973 355 7 280 247 6 973 359
Non-current liabilitiesInterest-bearing borrowings 13 1 625 913 620 975 1 625 913 620 975 Deferred taxation 15 - 146 744 - -
1 625 913 767 719 1 625 913 620 975
Current liabilitiesTrade and other payables 16 198 506 171 317 111 024 85 189 Current portion of interest-bearing borrowings 13 - 520 000 - 520 000Current portion of loans from subsidiary companies 7 - - 241 - Capital gains taxation - 56 - 55 Distributions payable 17 326 030 305 475 326 030 305 475 Interest rate swap derivatives 14 11 976 6 310 11 976 6 310
536 512 1 003 158 449 271 917 029
Total unitholders' funds and liabilities 9 442 667 8 744 232 9 355 431 8 511 363

SA CORPORATE REAL ESTATE FUND6
STATEMENTS OF COMPREHENSIVE INCOMEfor the year ended 31 December 2013
Group Fund2013 2012 2013 2012
Notes R000 R000 R000 R000
Revenue 6 1 186 412 1 227 838 600 749 644 726
IncomeRent 878 077 893 877 508 008 524 810 Straight line rental adjustment 8 (24 419) 8 177 (19 537) 5 155 Recovery of property expenses 332 754 325 784 112 278 114 761 Income from associate company - 1 402 - 1 402 Interest income - 1 402 - 1 402 Interest income 20 811 30 547 19 170 29 506 Dividends from subsidiary companies - - 309 218 293 952
1 207 223 1 259 787 929 137 969 586ExpensesAccounting and secretarial fees (6 082) (5 893) (4 330) (3 296)Audit fees (1 845) (1 661) (1 845) (1 661)Administrative fees (10 460) (11 594) (9 599) (11 368)Interest expense (94 562) (139 202) (94 517) (139 117)Property administration fees (29 118) (35 200) (9 944) (12 740)Property expenses (412 714) (407 387) (163 597) (160 163)Service fees (37 435) (35 559) (25 314) (20 273)
(592 216) (636 496) (309 146) (348 618)
Operating income 615 007 623 291 619 991 620 968
Amortisation of debt restructure costs (10 504) (32 739) (10 504) (32 739)Revaluation of interest rate swap derivatives 14 31 506 (30 141) 31 506 (30 141)Capital loss on disposal of investmentproperties / investments (4 086) (20 075) (3 581) (6 538)Capital profit on disposal of investment in associate - - - 6 254 Revaluation of investment properties / investments 8 380 625 246 236 222 665 194 184 Revaluation of subsidiary companies - - 299 318 (9 101)
Profit before taxation 1 012 548 786 572 1 159 395 742 887
Taxation credit / (charge) 19 146 846 (49 939) - -
Profit after taxation attributable to unitholders 1 159 394 736 633 1 159 395 742 887
Other comprehensive income, net of taxation 10 516 27 473 10 516 27 473Amounts subsequently reclassified to profit or loss
Amortisation of hedge reserve arising on early derivativesettlements 10 516 27 473 10 516 27 473
Total comprehensive income attributable to unitholders 1 169 910 764 106 1 169 911 770 360

ANNUAL FINANCIAL STATEMENTS 2013 7
Non- distributable Distributable
Capital reserves reserves TotalR000 R000 R000 R000
GROUP
Unitholders' funds at 1 January 2012 7 076 649 (108 882) - 6 967 767
Total comprehensive income for the year - 27 473 736 633 764 106 Profit after taxation - - 736 633 736 633 Amortisation of hedge reserve - 27 473 - 27 473Capital items transferred to non-distributable reserves - 120 820 (120 820) - Revaluation of interest rate swap derivatives - (30 141) 30 141 - Revaluation of investment properties - 246 236 (246 236) - Capital loss on disposal of investment properties - (20 075) 20 075 - Taxation on property revaluation and disposals - (49 792) 49 792 - Straight line rental adjustment net of taxation - 7 331 (7 331) - Amortisation of hedge reserve - (27 473) 27 473 - Early debt settlement cost - (5 266) 5 266 - 42 879 535 units repurchased (142 489) - - (142 489)Unit repurchase cost (216) - - (216)Lapsed distribution on units repurchased - - 795 795
6 933 944 39 411 616 608 7 589 963Distributions attributable to unitholders - - (616 608) (616 608)
Unitholders' funds at 31 December 2012 6 933 944 39 411 - 6 973 355
Total comprehensive income for the year - 10 516 1 159 394 1 169 910 Profit after taxation - - 1 159 394 1 159 394 Amortisation of hedge reserve - 10 516 - 10 516Capital items transferred to non-distributable reserves - 519 866 (519 866) - Revaluation of interest rate swap derivatives - 31 506 (31 506) - Revaluation of investment properties - 380 625 (380 625) - Capital loss on disposal of investment properties - (4 086) 4 086 - Reversal of taxation on property revaluation - 124 929 (124 929) - Straight line rental adjustment net of taxation - (2 604) 2 604 - Amortisation of hedge reserve - (10 516) 10 516 - Other - 12 (12) -58 896 063 units repurchased (222 986) - - (222 986)Unit repurchase cost (509) - - (509)Lapsed distribution on units repurchased - - 8 823 8 823
6 710 449 569 793 648 351 7 928 593Distributions attributable to unitholders - - (648 351) (648 351)
Unitholders' funds at 31 December 2013 6 710 449 569 793 - 7 280 242
STATEMENTS OF CHANGES IN UNITHOLDERS’ FUNDSfor the year ended 31 December 2013

SA CORPORATE REAL ESTATE FUND8
STATEMENTS OF CHANGES IN UNITHOLDERS’ FUNDS (continued)for the year ended 31 December 2013
Non- distributable Distributable
Capital reserves reserves TotalR000 R000 R000 R000
FUND
Unitholders' funds at 1 January 2012 7 076 615 (115 098) - 6 961 517
Total comprehensive income for the year - 27 473 742 887 770 360 Profit after taxation - - 742 887 742 887 Amortisation of hedge reserve - 27 473 - 27 473 Capital items transferred to non-distributable reserves - 127 074 (127 074) - Revaluation of interest rate swap derivatives - (30 141) 30 141 - Revaluation of investment properties / investments - 185 083 (185 083) - Capital loss on disposal of investment properties - (6 538) 6 538 - Capital profit on disposal of associate - 6 254 (6 254) - Straight line rental adjustment - 5 155 (5 155) - Amortisation of hedge reserve - (27 473) 27 473 - Early debt settlement cost - (5 266) 5 266 -42 879 535 units repurchased (142 489) - - (142 489)Unit repurchase cost (216) - - (216)Lapsed distribution on units repurchased - - 795 795
6 933 910 39 449 616 608 7 589 967 Distribution attributable to unitholders - - (616 608) (616 608)
Unitholders' funds at 31 December 2012 6 933 910 39 449 - 6 973 359
Total comprehensive income for the year - 10 516 1 159 395 1 169 911 Profit after taxation - - 1 159 395 1 159 395 Amortisation of hedge reserve - 10 516 - 10 516 Capital items transferred to non-distributable reserves - 519 867 (519 867) - Revaluation of interest rate swap derivatives - 31 506 (31 506) - Revaluation of investment properties / investments - 521 983 (521 983) - Capital loss on disposal of investment properties - (3 581) 3 581 - Straight line rental adjustment - (19 537) 19 537 - Amortisation of hedge reserve - (10 516) 10 516 - Other - 12 (12) -58 896 063 units repurchased (222 986) - - (222 986)Unit repurchase cost (509) - - (509)Lapsed distribution on units repurchased - - 8 823 8 823
6 710 415 569 832 648 351 7 928 598 Distribution attributable to unitholders - - (648 351) (648 351)
Unitholders' funds at 31 December 2013 6 710 415 569 832 - 7 280 247

ANNUAL FINANCIAL STATEMENTS 2013 9
Group Fund2013 2012 2013 2012
Notes R000 R000 R000 R000
Cash flows from operating activitiesProfit after taxation 1 159 394 736 633 1 159 395 742 887 Adjustments for: Interest income (20 811) (30 547) (19 170) (29 506) Income from associate company - (1 402) - (1 402) Interest expense 94 562 139 202 94 517 139 117 Allowance for doubtful debt movement 692 (14 427) 3 794 (3 990) Provision for VAT 5 717 5 925 5 717 5 925 Amortisation of letting commissions and tenant installations 25 369 30 687 15 010 14 260 Taxation (credit) / charge (146 846) 49 939 - - Revaluation of investment properties / investments (excluding straight line adjustment) (356 206) (254 413) (502 446) (190 238) Interest rate swap revaluation derivatives and amortisation of debt restructure costs (20 990) 62 880 (20 990) 62 880 Capital loss on disposal of investment properties / investments 4 086 20 075 3 581 6 538 Capital profit on disposal of associate - - - (6 254)
Operating profit before working capital changes 744 967 744 552 739 408 740 217
Working capital changes (19 333) 31 663 (22 296) 6 202 (Increase) / Decrease in trade and other receivables (34 667) 49 843 (36 276) 22 284 Increase / (Decrease) in trade and other payables 15 334 (18 180) 13 980 (16 082)
Cash generated from operations 725 634 776 215 717 112 746 419
Interest received 21 148 30 547 19 510 29 506 Interest income from associate company - 1 402 - 1 402 Interest paid (90 215) (139 202) (89 840) (139 117)Taxation refund received / (paid) 870 (1 742) (55) - Distributions paid 17 (627 796) (612 544) (627 796) (612 561)Net cash inflow from operating activities 29 641 54 676 18 931 25 649
Cash flows from investing activitiesSettlement of interest rate swap derivatives 14 - (59 230) - (59 230)Increase in investment properties / investments 8 (591 201) (117 946) (551 115) (58 404)Proceeds on disposal of investment properties / investments 230 497 754 034 163 244 513 538 Increase in letting commissions and tenant installations 8 (34 964) (43 929) (14 300) (22 266)Proceeds on disposal of investment in associate - 175 208 - 175 208Decrease in loans to subsidiary companies - - 46 537 207 3701
Net cash (outflow) / inflow from investing activities (395 668) 708 137 (355 634) 756 216
Cash flows from financing activitiesRepurchase of units (222 986) (142 489) (222 986) (142 489)Unit repurchase cost (509) (216) (509) (216)Lapsed distribution on units repurchased 8 823 795 8 823 795 Early debt settlement cost - (5 266) - (5 266)Increase / (Decrease) in interest-bearing borrowings 484 938 (582 007) 484 938 (582 007)Net cash inflow / (outflow) from financing activities 270 266 (729 183) 270 266 (729 183)
Net (decrease) / increase in cash and cash equivalents (95 761) 33 630 (66 437) 52 682 Cash and cash equivalents at the beginning of the year 407 281 373 651 373 401 320 719 Cash and cash equivalents at the end of the year 11 311 520 407 281 306 964 373 401
1This amount was included in “Proceeds on disposal of investments” and is now disclosed separately.
STATEMENTS OF CASH FLOWSfor the year ended 31 December 2013

SA CORPORATE REAL ESTATE FUND10
STATUTORY INFORMATION AND
NOTES TO THE ANNUAL FINANCIAL STATEMENTSfor the year ended 31 December 2013
1. General informationSA Corporate Real Estate Fund (“the Fund”), established in the Republic of South Africa, is a collective investmentscheme in property established in terms of the Collective Investment Schemes Control Act, No. 45 of 2002. TheFund is listed on the JSE Limited. The Fund is managed by SA Corporate Real Estate Fund Managers Limited, acompany approved by the Registrar of Collective Investment Schemes to manage the Fund.
2. Adoption of new and revised International Financial Reporting StandardsIn the current year the Group and the Fund has adopted all of the new and revised Standards and Interpretationsissued by the International Accounting Standards Board (“the IASB”) and the IFRS Interpretations Committee(“IFRIC”) of the IASB that are relevant to its operations and effective for accounting periods beginning on or before1 January 2013. The adoption of these standards and interpretations has not resulted in any adjustment to theamounts previously reported in the Annual Financial Statements for the year ended 31 December 2012.
3. Accounting policiesThe Annual Financial Statements have been prepared in accordance with International Financial Reporting Standards(“IFRS”). The accounting policies used in the preparation of the financial statements are consistent with thoseapplied in the prior year. The financial statements have been prepared on the going concern and historical costbases, except where otherwise stated.
The principal accounting policies are set out below:
3.1 Basis of consolidationThe Group Annual Financial Statements incorporate the results and financial position of the Fund and all itssubsidiaries. The results of subsidiaries are included from the effective dates of gaining control and up to the effectivedates of relinquishing control. All inter-entity transactions and balances between Group entities are eliminated.
The accounting policies of the subsidiaries are consistent with those of the Fund.
3.2 Business combinationsThe purchase method of accounting is used to account for the acquisition of subsidiaries by the Group. The costof an acquisition is measured as the aggregate of the fair value of the underlying assets acquired, equity instrumentsissued and liabilities incurred or assumed at the date of exchange. Cost directly attributable to the acquisition isrecognised in profit or loss. Identifiable assets acquired and liabilities and contingent liabilities assumed in a businesscombination are measured initially at their fair values at the acquisition date. The excess of the cost of the acquisitionover the fair value of the Group's share of the identifiable net assets acquired is recorded as goodwill. Goodwill isnot amortised and is tested for impairment on an annual basis.
If the cost of the acquisition is less than the fair value of the net assets of the subsidiary acquired, the differenceis recognised directly in profit or loss. An impairment loss recognised for goodwill is not reversed in a subsequentperiod. On disposal of a subsidiary, attributable goodwill is included in the determination of the profit or loss ondisposal.
3.3 Investment in subsidiariesInvestments in subsidiary companies are revalued to fair value at each reporting date. Surpluses or deficits onrevaluation or disposal are reflected in profit or loss and transferred to capital in the statement of changes inunitholders' funds.
3.4 Investment propertiesInvestment properties are properties held to earn rentals and appreciate in capital value. Investment propertiesare initially recognised at cost, including transaction costs on acquisition, and are stated at their fair value at eachreporting date. These fair values of property exclude accrued operating lease income. Gains or losses arising fromchanges in the fair values are reflected in profit or loss in the year in which they arise and are transferred to non-distributable reserves in the statement of changes in unitholders' funds.

ANNUAL FINANCIAL STATEMENTS 2013 11
3.4 Investment properties (continued)Properties purchased by the Group and settled by the issuing of units are recorded at the fair value of the propertiesacquired, unless that fair value cannot be reliably measured, in which case they are measured at the fair value ofthe units granted in terms of IFRS 2: Share Based Payments. This excludes purchases of properties which areregarded as business combinations as described in note 3.2.
New buildings that are acquired and developed for future use as investment property as well as existing investmentproperty that is redeveloped for continued future use as investment property are carried at fair value.
Properties held under long term operating leases are classified and accounted for as investment properties.
Partially held investment property is treated as a jointly controlled asset as the co-owners jointly control the property.The following is therefore recognised in the annual financial statements:� the undivided share of the jointly controlled assets, classified according to the nature of the assets;� any liabilities incurred;� any income from the sale or use of the undivided share of the output of the partially held investment property, together with the share of any expenses incurred by the partially held investment property; and� any expenses incurred in respect of the interest held in the partially held investment property.
3.5 Borrowing costsWhere a fixed property company undertakes a major development or refurbishment of its property, interest iscapitalised to the cost of the property concerned during the construction period. Where a property, owned by theFund, undertakes a major development or refurbishment, interest is capitalised to the extent that it is directlyincurred in the course of development.
All other borrowing costs are recognised in profit or loss in the period in which they are incurred.
3.6 Assets held for saleProperties and other non-current assets which have been earmarked for sale and have met the recognition criteriain terms of IFRS 5: Non-Current Assets Held for Sale and Discontinued Operations are classified as non-currentassets held for sale. Properties held for sale are measured at fair value in terms of IAS 40: Investment Property.Other assets held for sale are measured at their fair value less costs to sell.
3.7 TaxationThe Fund is treated as a trust for income taxation purposes and no liability for taxation arises on its profits to theextent that it is distributed by the Fund. The Fund's capital profit is exempt from capital gains taxation.
The subsidiary companies are subject to taxation. For these companies the income tax expense comprises the sumof current taxation payable and deferred taxation. Taxable profit differs from accounting profit as it excludes incomeor expenses that are taxable or deductible in other years and it excludes items never deductible or taxable.
Deferred taxation is provided for using the liability method based on temporary differences. Temporary differencesare differences between the carrying amounts of assets and liabilities for financial reporting purposes and theirtaxation bases. Deferred taxation is charged to profit or loss, except to the extent that it relates to a transactionthat is recognised directly in equity, or a business combination that is an acquisition. A deferred taxation asset isrecognised to the extent that it is probable that future taxable profits will be available against which the associatedunused tax losses and deductible temporary differences can be utilised. Deferred taxation assets are reduced tothe extent that it is no longer probable that the related tax benefit will be realised.
Deferred taxation assets and liabilities are not recognised if the temporary differences arise from goodwill, or fromthe initial recognition (other than business combinations) of other assets and liabilities in a transaction which affectsneither the taxable profit nor the accounting profit.
STATUTORY INFORMATION AND
NOTES TO THE ANNUAL FINANCIAL STATEMENTS (continued)for the year ended 31 December 2013

SA CORPORATE REAL ESTATE FUND12
3.8 Impairment (excluding goodwill)The carrying amount of the Group's assets is reviewed at each reporting date to determine whether there is anyindication of impairment. An impairment loss is recognised in profit or loss whenever the carrying amount of anasset exceeds its recoverable amount, which is the higher of an asset's net selling price and value in use. Wheneveran impairment loss is subsequently reversed, the carrying amount of the asset is increased to the extent that theincreased carrying amount does not exceed the original carrying amount. A reversal of impairment loss is recognisedimmediately in profit or loss.
3.9 Financial instrumentsA financial asset or financial liability is recognised for as long as the Group or Fund is party to the contractualprovisions of the instrument.
3.9.1 Non-derivative financial instrumentsNon-derivative financial instruments recognised on the statement of financial position include cash and cashequivalents, trade and other receivables, investments, unitholders' funds, interest- bearing borrowings and tradeand other payables.
a. Financial assets
i. Initial recognitionFinancial assets are initially measured at fair value plus, for instruments not at fair value through profit orloss (“FVTPL”), any directly attributable transaction costs. Subsequent to initial recognition, non-derivativefinancial instruments are measured as described below.
Financial assets are classified into the following specified categories: 'at FVTPL', 'held to maturity' investments,'available for sale' and 'loans and receivables'. The classification depends on the nature and purpose of thefinancial assets and is determined at the time of initial recognition.
ii. Financial assets at FVTPLA financial asset is classified as at FVTPL if it is held for trading or is designated as such upon initial recognition.
A financial asset is classified as held for trading if:� it has been acquired principally for the purpose of selling in the near future; or� it is a part of an identified portfolio of financial instruments that the Group manages together and has a recent actual pattern of short-term profit-taking; or� it is a derivative that is not designated and effective as a hedging instrument.
A financial asset other than a financial asset held for trading may be designated as at FVTPL upon initialrecognition if:� such designation eliminates or significantly reduces a measurement or recognition inconsistency that would otherwise arise; or� the financial asset forms part of a group of financial assets or financial liabilities or both, which is managed
and its performance is evaluated on a fair value basis, in accordance with the Group's documented risk management or investment strategy, and information about the grouping is provided internally on that basis; or� it forms part of a contract containing one or more embedded derivatives, and IAS 39 Financial Instruments:
Recognition and Measurement permits the entire combined contract (asset or liability) to be designatedas at FVTPL.
Financial assets at FVTPL are measured at fair value, and changes therein are recognised in profit or loss.
Investments in fixed property companies have been designated as at FVTPL.
STATUTORY INFORMATION AND
NOTES TO THE ANNUAL FINANCIAL STATEMENTS (continued)for the year ended 31 December 2013

ANNUAL FINANCIAL STATEMENTS 2013 13
3.9.1 Non-derivative financial instruments (continued)iii. Held-to-maturity investments
Held-to-maturity investments are recorded at amortised cost using the effective interest method less anyimpairment losses.
The Group and the Fund does not currently have any held-to-maturity investments.
iv. Available for sale financial assetsGains and losses arising from changes in fair value of available for sale financial assets, other than impairmentlosses, are recognised directly in equity. Where the investment is disposed of, the cumulative gain or losspreviously recognised in equity is transferred to profit or loss.
v. Loans and receivablesTrade receivables, loans, and other receivables that have fixed or determinable payments that are not quotedin an active market are classified as loans and receivables. Loans and receivables are measured at amortisedcost using the effective interest method, less any impairment.
vi. Derecognition of financial assetsThe Group and Fund derecognises a financial asset only when the contractual rights to the cash flows fromthe asset expire; or it transfers the financial asset and substantially all the risks and rewards of ownershipof the asset to another entity. If the Group and Fund neither transfers nor retains substantially all the risksand rewards of ownership and continues to control the transferred asset, the Group and Fund recognisesits retained interest in the asset and an associated liability for amounts it may have to pay. If the Group andFund retains substantially all the risks and rewards of ownership of a transferred financial asset, the Groupand Fund continues to recognise the financial asset and also recognises a collateralised borrowing for theproceeds received.
b. Financial liabilities
Financial liabilities are classified as either financial liabilities at FVTPL or other financial liabilities.
i. Financial liabilities at FVTPLFinancial liabilities are classified as at FVTPL where the financial liability is either held for trading or it isdesignated as at FVTPL.
ii. Other financial liabilitiesOther financial liabilities, including borrowings, are initially measured at fair value, net of transaction costs.
Other financial liabilities are subsequently measured at amortised cost using the effective interest method,with interest expense recognised on an effective yield basis.
The effective interest method is a method of calculating the amortised cost of a financial liability and ofallocating interest expense over the relevant period. The effective interest rate is the rate that exactlydiscounts estimated future cash payments through the expected life of the financial liability, or, whereappropriate, a shorter period.
iii. Derecognition of financial liabilitiesThe Group and Fund derecognises financial liabilities when, and only when, the Group's and Fund's obligationsare discharged, cancelled or they expire.
3.9.2 Derivative financial instrumentsThe Group and Fund use derivative financial instruments to manage its exposure to interest rate risk exposures.At inception, these instruments are either designated as cash flow hedges, or not, on an item by item basis.
STATUTORY INFORMATION AND
NOTES TO THE ANNUAL FINANCIAL STATEMENTS (continued)for the year ended 31 December 2013

SA CORPORATE REAL ESTATE FUND14
STATUTORY INFORMATION AND
NOTES TO THE ANNUAL FINANCIAL STATEMENTS (continued)for the year ended 31 December 2013
3.9.2 Derivative financial instruments (continued)Derivative financial instruments designated as a hedge:Changes in the fair value of designated cash flow hedging instruments are recognised in other comprehensiveincome and accumulated in equity to the extent that the hedge is effective. The ineffective portion of any gainor loss is recognised immediately in profit or loss.
If the hedging instrument no longer meets the criteria for hedge accounting, expires, or is sold, terminated orexercised then hedge accounting is discontinued prospectively. The cumulative gain or loss previously recognisedin equity remains there until the forecast transaction occurs. When the hedged item is a non-financial asset, theamount recognised in equity is transferred to the carrying amount of the asset when it is recognised. In othercases the amount recognised in equity is transferred to profit or loss in the same period that the hedged itemsaffects profit or loss.
Derivative financial instruments not designated as a hedge:Derivative financial instruments not designated as cash flow hedging instruments are accounted for as financialinstruments at FVTPL.
The fair value of the interest rate swaps is the estimated amount that the Group and Fund would receive or payto terminate the swap at the reporting date, taking into account current interest rates and the current creditworthiness of the swap counterparties.
3.10 ProvisionsProvisions are recognised when the Group and Fund have a present legal or constructive obligation as a result ofpast events, for which it is probable that an outflow of economic benefits will occur, and where a reliable estimatecan be made on the settlement amount of the obligation.
3.11 Revenue recognitionRevenue comprises gross rental income, including all recoveries from tenants. Variable operating cost recoveriesare recognised on the accrual basis. Rental income and fixed operating costs recoveries are recognised on thestraight line basis in accordance with IAS 17: Leases. Turnover rental income is recognised on the accrual basisand measured at fair value.
Interest income is recognised at the effective rates of interest on a time related basis.
Dividends are recognised when the right to receive them is established.
3.12 LeasesInvestment properties leased out under operating leases are reflected as investment properties on the statementof financial position. Where there are fixed increments in rental, the income is recognised on a straight line basisin accordance with IAS 17: Leases.
3.13 Deferred expensesDeferred expenses comprise tenant installation costs and letting commissions which are amortised on a straightline basis over the lease period to which they relate. The tenant installations and letting commissions are separatelydisclosed. As at date of disposal, the unamortised deferred expense is included in the capital profit or loss of theproperty.
3.14 DistributionsIn terms of the Collective Investment Schemes Act, No. 45 of 2002 the Fund is obliged to distribute to its unitholdersall net revenue profit earned and received. The Fund has elected to use its annual distributable income growth asits measurement to evaluate if a Trading Statement is required in accordance with the JSE Listings requirements.
3.15 Segment reportingInformation reported to the Group's chief operating decision makers, being the executive directors, for the purposesof resource allocation and assessment of its performance, is based on the economic sectors in which the investmentproperties operate.

ANNUAL FINANCIAL STATEMENTS 2013 15
3.15 Segment reporting (continued)On a primary basis the Group operates in the following reportable segments:� Retail� Industrial� Commercial
3.16 Unitholders' fundsUnitholders' funds represent the residual interest in the Group's and Fund's assets after deducting all of its liabilitiesand have been accounted for as equity. Units issued by the Group and Fund are recognised at the proceeds received,net of direct issue cost. Units repurchased by the Group and Fund are recognised and deducted directly in equity.No gain or loss is recognised in profit or loss on the purchase, sale, issue or cancellation of the Fund's own units.
4. Critical accounting estimates and judgementsEstimates and judgements are continually evaluated and are based on historical experience as adjusted for currentmarket conditions and other factors.
The Group and Fund makes estimates and assumptions concerning the future. The resulting accounting estimateswill, by definition, seldom equal the related actual results. The estimates or assumptions that have a significantrisk of causing a material adjustment to the carrying amounts of assets and liabilities within the next financial yearare discussed below.
(a) Estimate of the fair value of investment propertiesThe best evidence of fair value is current prices in an active market for similar leases and other contracts. Inthe absence of such information, the Group and Fund determines the amount within a range of reasonablefair value estimates. In making its judgment the Group and Fund considers information from a variety ofsources including:
� Current prices in an active market for properties of different nature, condition or location (or subject to different lease or other contracts), adjusted to reflect those differences;� Recent prices of similar properties in less active markets, with adjustments to reflect any changes in economic conditions since the date of the transactions that occurred at those prices; and� Discounted cash flow projections based on reliable estimates of future cash flows, derived from the terms
of any existing leases and other contracts and (where possible) from external evidence such as current market rents for similar properties in the same location and condition, and using discount rates that reflect
current market assessments of the uncertainty in the amount and timing of the cash flows.
Principal assumptions of management's estimation of fair valueIf information on current or recent prices is not available, the fair values of investment properties are determinedusing discounted cash flow valuation techniques. The Group and Fund used assumptions that are mainly basedon market conditions existing at each reporting date.
The principal assumptions underlying management's estimation of fair value are those related to:The receipt of contracted rentals, expected future market rentals, lease renewals, maintenance requirementsand appropriate discount and capitalisation rates. These valuations are regularly compared to actual marketyield data, actual transactions by the Group and the Fund and those reported by the market.
The expected future market rentals are determined with reference to current market rentals for similarproperties in the same location and condition.
(b) Doubtful debt provisionAll legal arrears that have been summonsed, as well as tenants with arrears older than 90 days, have beenprovided against. Exceptions are applied based on an assessment of the individual debtor.
STATUTORY INFORMATION AND
NOTES TO THE ANNUAL FINANCIAL STATEMENTS (continued)for the year ended 31 December 2013

SA CORPORATE REAL ESTATE FUND16
5. New accounting standards and IFRIC interpretationsCertain new accounting standards and IFRIC interpretations have been published that are applicable for futureaccounting periods. These new standards and interpretations have not been early adopted by the Group and Fund.The directors do not expect that the adoption of the standards and interpretations will have a material impact onfuture financial statements. The amended and new standards and interpretations in issue, but not yet effective,that are relevant to the Group and Fund are:
IFRS 7 Financial Instruments: Disclosures (effective 1 July 2015);IFRS 9 Financial Instruments (effective 1 January 2015);IFRS 10 Consolidated Financial Statements (effective 1 January 2014);IFRS 12 Disclosure of Interests in Other Entities (effective 1 January 2014);IAS 27 Separate Financial Statements (effective 1 January 2014);IAS 32 Financial Instruments: Presentation (effective 1 January 2014);IAS 36 Impairment of Assets (effective 1 January 2014); andIFRIC 21 Levies (effective 1 January 2014)
The Group and Fund adopted the following new and revised accounting standards and circular in the current year:
IFRS 7 Financial Instruments: Disclosures;IFRS 10 Consolidated Financial Statements;IFRS 11 Joint Arrangements;IFRS 12 Disclosure of Interests in Other Entities;IFRS 13 Fair Value Measurement;IAS 1 Presentation of Financial Statements;IAS 32 Financial Instruments: Presentation; andCircular 2/2013 Headline Earnings
The adoption of these new and revised accounting standards and circular has not resulted in any restatement ofinformation previously presented but has resulted in increased disclosure.
Group Fund2013 2012 2013 2012R000 R000 R000 R000
6. RevenueOperating lease income 861 528 876 136 507 277 520 691Turnover based operating lease income 16 549 17 741 731 4 119Total operating lease income 878 077 893 877 508 008 524 810
Straight line rental adjustment (24 419) 8 177 (19 537) 5 155 Recovery of property expenses 332 754 325 784 112 278 114 761
1 186 412 1 227 838 600 749 644 726
7. Investment in subsidiary companiesThe Fund has pledged and ceded the shares and loan accounts of certain of its subsidiary companies, to secureloan facilities of R500m by Old Mutual Specialised Finance Proprietary Limited (2012: R500m). At 31 December2013 the balance owing to Old Mutual Specialised Finance Proprietary Limited was R500m (2012: R500m). Referto note 13 for details of borrowings.
The Fund's claims against Madison Park Properties 24 Proprietary Limited and Jrad Investments Proprietary Limitedhave been subordinated in favour of outside creditors to the extent of the deficit on shareholder funds in thesecompanies. The total deficit on the shareholder funds in these companies amount to R93 680 000 (2012:R98 636 000).
STATUTORY INFORMATION AND
NOTES TO THE ANNUAL FINANCIAL STATEMENTS (continued)for the year ended 31 December 2013

ANNUAL FINANCIAL STATEMENTS 2013 17
7. Investment in subsidiary companies (continued)
The following property owning subsidiaries, incorporated in South Africa, are wholly owned by SA Corporate RealEstate Fund Nominees Proprietary Limited, as nominee of the Fund:
STATUTORY INFORMATION AND
NOTES TO THE ANNUAL FINANCIAL STATEMENTS (continued)for the year ended 31 December 2013
Fund Fund Fund2013 2012 2013 2012 2013 2012R000 R000 R000 R000 R000 R000
Current loans Non-current loans Investment
Fixed property companies Blue Heron Proprietary Limited 559 740 8 563 8 560 40 238 35 444 Dune Lark Investments Proprietary Limited 467 188 6 686 6 686 20 214 18 059 Erf 84-85-86 Shakas Head Proprietary Limited 907 (278) 14 968 13 665 11 709 10 538 Grey Heron Investments Proprietary Limited 120 402 4 273 4 273 19 227 15 651 Jrad Investments Proprietary Limited 117 (233) 34 806 31 063 - -1
Madison Park Properties 24 Proprietary Limited (211) 14 588 - 36 171 - -2
Rock Kestrel Investments Proprietary Limited 406 466 1 801 1 801 5 899 5 349 SA Retail Properties Proprietary Limited 63 981 66 751 2 229 124 2 224 061 911 485 653 940 Stondell Investments Proprietary Limited (30) (5) 1 489 1 489 5 299 4 440 Umlazi Mega City Proprietary Limited 8 450 8 793 65 153 65 153 63 835 52 557 Whirlprops 25 Proprietary Limited 1 696 4 457 36 133 32 906 53 857 47 200 Wood Ibis Investments Proprietary Limited 1 023 365 5 312 5 312 43 890 38 113
77 485 96 234 2 408 308 2 431 140 1 175 653 881 291
Current portion of loans to subsidiary companies 77 726 96 234Current portion of loans from subsidiary companies (241) -
77 485 96 234
The intercompany loans are unsecured, interest free and have no fixed repayment terms.
1 After reclassification of R10m impairment of investment to non-current loan in the prior year.2 After reclassification of R89m impairment of investment to non-current loan in the prior year.
PWC, 102 Essenwood Road, Durban, KwaZulu-Natal

SA CORPORATE REAL ESTATE FUND18
STATUTORY INFORMATION AND
NOTES TO THE ANNUAL FINANCIAL STATEMENTS (continued)for the year ended 31 December 2013
Group Fund2013 2012 2013 2012R000 R000 R000 R000
8. Investment property and lettingcommissions and tenant installationsCarrying value at beginning of year 7 733 791 7 812 992 4 352 314 4 350 282 at valuation 7 903 575 7 178 125 4 445 250 4 194 700 straight line rental adjustment (233 084) (210 833) (156 236) (137 118) property under development 63 300 845 700 63 300 292 700
Acquisitions and improvements 592 992 117 946 552 576 58 404 at valuation 591 201 111 053 551 115 52 729 property under development - 5 375 - 5 375
capitalised interest# 1 791 1 518 1 461 300
Disposals (81 848) - (41 754) -
Fair value adjustment 380 625 246 236 222 665 194 184 at valuation 356 206 253 788 203 128 198 714 straight line rental adjustment 24 419 (8 177) 19 537 (5 155) property under development - 625 - 625
Net transfer from property under development (79 800) (788 400) (41 800) (235 400)Net transfer to investment property 79 800 788 400 41 800 235 400
Transfer of properties classified as held for disposal 28 691 (443 383) (1 247) (250 556) at valuation 31 000 (429 309) - (236 593) straight line rental adjustment (2 309) (14 074) (1 247) (13 963)
Carrying value at end of year 8 654 251 7 733 791 5 084 554 4 352 314 at valuation 8 722 125 7 903 575 5 117 400 4 445 250 straight line rental adjustment (210 974) (233 084) (137 946) (156 236) property under development 143 100 63 300 105 100 63 300
Letting commissions and tenant installations
Carrying value at beginning of year 53 521 41 114 30 778 22 943 Amortisation during the year (25 369) (30 687) (15 010) (14 260)Additions during the year 34 964 43 929 14 300 22 266 Transfer to property held for disposal * - (835) - (171)Carrying value at end of year 63 116 53 521 30 068 30 778
# As detailed in note 18.* As detailed in note 9.
The fair value of the entire portfolio of investment properties, excluding properties subject to unconditional contracted sales,was determined by independent registered valuers, ACRES, based on the discounted cash flow method and approved on 28February 2014 by the Board of Directors.

ANNUAL FINANCIAL STATEMENTS 2013 19
2013 2012
Terminal TerminalDiscount capitalisation Discount capitalisation
rates (%) rates (%) rates (%) rates (%)
Industrial 13.75 - 15.50 8.25 - 10.00 14.25 - 16.25 8.75 - 10.75Retail 13.50 - 16.25 8.00 - 10.75 13.50 - 17.50 8.00 - 12.00Commercial 14.50 - 16.00 9.00 - 10.50 14.50 - 16.00 9.00 - 10.50
Certain properties are subject to mortgage bonds in favour of Absa Bank Limited, Old Mutual Specialised Finance ProprietaryLimited and Rand Merchant Bank, a division of FirstRand Bank Limited as detailed in note 13.
The table below analyses the investment properties that are measured at fair value, subsequent to initial recognition andprovides information about the fair value hierarchy.
Level 3 (defined in note 26):Group Fund
2013 2012 2013 2012R000 R000 R000 R000
Investment properties: at valuation 8 722 125 7 903 575 5 117 400 4 445 250 property under development 143 100 63 300 105 100 63 300
8. Investment property and letting commissions and tenant installations (continued)
The independent valuers applied current market related assumptions to the risks in rental streams of properties. Discount ratesin the respective sectors ranged as follows:
9. Properties classified as held fordisposalCarrying value at beginning of year 182 900 527 700 124 900 422 050 Net transfer (to) / from investment properties (31 000) 429 309 - 236 593 Transfer (to) / from investment properties (31 000) 413 309 - 226 705 Revaluation adjustment of buildings disposed or classified as held for disposal - 16 000 - 9 888 Disposal (151 900) (774 109) (124 900) (533 743)Carrying value at end of year - 182 900 - 124 900 Straight line rental adjustment - (2 309) - (1 246)
Straight line rental adjustment - 2 309 - 1 246 Carrying value at end of year - 182 900 - 124 900
Letting commissions and tenant installationsCarrying value at beginning of year 835 - 171 - Transfer from investment property * - 835 - 171 Disposals (835) - (171) -Carrying value at end of year - 835 - 171
* As detailed in note 8
STATUTORY INFORMATION AND
NOTES TO THE ANNUAL FINANCIAL STATEMENTS (continued)for the year ended 31 December 2013

SA CORPORATE REAL ESTATE FUND20
STATUTORY INFORMATION AND
NOTES TO THE ANNUAL FINANCIAL STATEMENTS (continued)for the year ended 31 December 2013
Group Fund2013 2012 2013 2012R000 R000 R000 R000
10. Trade and other receivables Trade receivables 44 558 47 415 15 486 14 978 Allowance for doubtful debts (27 921) (27 229) (10 010) (6 216)Trade receivables net of allowance for doubtful debts * 16 637 20 186 5 476 8 762 Other receivables and accrued interest 146 143 108 956 88 710 53 282
162 780 129 142 94 186 62 044 * As detailed in note 26.
11. Cash and cash equivalents Cash and cash equivalents include cash on hand and in banks.
Cash and bank balances 24 098 27 248 19 501 11 339 Money markets investments and call accounts 254 482 345 124 254 482 345 124 Distributions account 181 316 181 316 Tenant deposit 32 759 34 593 32 800 16 622
311 520 407 281 306 964 373 401
The tenant deposit and distributions accounts are not availablefor use by the Group and Fund, as it relates to the tenant depositand unclaimed distributions liabilities included in payables
12. Unitholders' funds Capital 1 980 093 014 (2012: 2 038 989 077) units 6 710 449 6 933 944 6 710 415 6 933 910 Non-distributable reserves 569 793 39 411 569 832 39 449
7 280 242 6 973 355 7 280 247 6 973 359
Nampak, Denver, 530 Nicholson Road, Doornfontein, Gauteng

ANNUAL FINANCIAL STATEMENTS 2013 21
12. Unitholders' funds (continued) The non-distributable reserves include items of a capital nature which may not be distributed to the unitholders in terms ofthe Trust Deed.
The statement of changes in unitholders' funds reflects a detailed analysis of movements in unitholders' funds.
The Board approved the implementation of a unit repurchase programme for which approval was given by the unitholders atthe annual general meeting in 2012. In terms of the programme, a portion of the proceeds from the sale of the properties canbe used to repurchase units in the open market which would then be cancelled. During January 2013 and February 2013, theprogramme was concluded by the repurchase of 58 896 063 units at an average price of 378.61 cents per unit (2012: 42 879535 units at an average price of 332.30 cents per unit).
Group Fund2013 2012 2013 2012R000 R000 R000 R000
13. Interest bearing borrowingsAbsa Bank Limited 1 124 787 619 835 1 124 787 619 835 Loan bearing interest at 6.775% per annum. Refer # for repayment dates. 399 831 399 835 399 831 399 835
Loan bearing interest at 6.775% per annum.Refer # for repayment dates. 299 957 220 000 299 957 220 000
Loan bearing interest at 6.375% per annum.Refer # for repayment dates. 359 999 - 359 999 -
Loan bearing interest at 6.375% per annum.Refer # for repayment dates. 65 000 - 65 000 -
Old Mutual Specialised Finance Proprietary Limited 500 000 500 000 500 000 500 000 Loan bearing interest at 6.833% per annum. Thisloan is repayable on 30 September 2018. 270 000 270 000 270 000 270 000
Loan bearing interest at 6.833% per annum. Thisloan is repayable on 30 September 2018. 30 000 30 000 30 000 30 000
Loan bearing interest at 7.642% per annum. Thisloan is repayable on 29 April 2015. 200 000 200 000 200 000 200 000
Rand Merchant Bank, a division of FirstRand Bank LimitedLoan bearing interest at 7.154% per annum.This loan is repayable on 25 July 2016 1 126 21 140 1 126 21 140
1 625 913 1 140 975 1 625 913 1 140 975 Non-current borrowings 1 625 913 620 975 1 625 913 620 975 Current borrowings - 520 000 - 520 000
1 625 913 1 140 975 1 625 913 1 140 975
STATUTORY INFORMATION AND
NOTES TO THE ANNUAL FINANCIAL STATEMENTS (continued)for the year ended 31 December 2013

SA CORPORATE REAL ESTATE FUND22
STATUTORY INFORMATION AND
NOTES TO THE ANNUAL FINANCIAL STATEMENTS (continued)for the year ended 31 December 2013
13. Interest bearing borrowings (continued)
# These loans were restructured as at 31 December 2013 as follows and changes are effective in September 2014.Previous structure - Effective at December 2013
2013 Total facility RepaymentR000 R000 date
Facility A 399 831 400 000 11 September 2014Facility B 299 957 300 000 31 December 2014Facility C 359 999 360 000 30 June 2014Facility D 65 000 390 000 30 June 2014
1 124 787 1 450 000
New structure - Effective September 2014Total facility Repayment
R000 dateFacility A 500 000 31 December 2016Facility B 300 000 31 December 2015Facility C 650 000 30 June 2015
1 450 000
Interest rate risk is mitigated by interest rate swap derivatives for all loans as detailed in note 14.
The fair value of the interest-bearing borrowings excluding the effect of interest rate swaps as at 31 December 2013 amountsto R1 626m (2012: R1 141m).
These loans are secured by first mortgage bonds over a portion of the property portfolio to the value of R4 399m (2012:R3 692m), as listed below and in note 8, as well as the cession of shares and loan accounts of certain of the Fund's propertycompanies as indicated in note 7.
Property
ABSA Bank Limited199 North Ridge Road - Durban21 Fricker Road - Illovo37 Yaldwyn Road - Jet Park40 Electron Avenue - Isando57 Sarel Baard Crescent - Centurion88 Loper Avenue - Aeroport9 Milner Road - Paarden Eiland (Tableview Industrial Park)90 Electron Avenue - IsandoAtterbury Décor - PretoriaCheckers - Somerset WestCnr Rudo Nel & Tudor Streets - Jet ParkCnr Staal & Stephenson Road - PretoriaEast Rand Galleria - DurbanMidway Mews - MidrandMusgrave Centre - Durban
Old Mutual Specialised Finance Proprietary Limited111 Mimets Road - Denver112 Yaldwyn Road - Jet Park2 Fobian Street - Boksburg27 Jet Park Road - Jet Park5 Yaldwyn Road - Jet ParkBeryl Street - Jet ParkBluff Shopping Centre - Durban

ANNUAL FINANCIAL STATEMENTS 2013 23
13. Interest bearing borrowings (continued)
Old Mutual Specialised Finance Proprietary Limited (continued)Cnr Handel & Crownwood Roads - OrmondeMontana Crossing - PretoriaStellenbosch Square - StellenboschWhirlprops 25 P Proprietary Limited - Durban
Rand Merchant Bank, a division of FirstRand Bank Limited1 Baltex Road - Isipingo1 Holwood Park La Lucia10 Yarborough Road - Pietermaritzburg11 Columbine Place - Red Hill36 Wierda Rd West - Sandton6 - 9 Mahogany Road - Mahogany Ridge6 Cedarfield Close - DurbanComaro Crossing - OakdeneLebombo Road - PretoriaNobel Street Office Park - Bloemfontein
The Fund is subject to, and is in compliance with, the following covenants:
2013 2012Covenants Ratio Ratio
ABSA Bank Limited� Interest cover ratio >2.00 >2.00� Transactional interest cover ratio >1.60 >1.60 � Total loan to value <0.40 <0.30� Transactional loan to value (excluding mark to market values) <0.65 -� Transactional loan to value (including mark to market values) <0.75 -� Total borrowings to total assets (excluding negative mark to market values) - <0.60 � Total borrowings to total assets (including negative mark to market values) - <0.65
Old Mutual Specialised Finance Proprietary Limited� Interest cover ratio >2.00 >2.00 � Security portfolio loan to value <0.50 <0.50 � Total loan to value <0.30 <0.30 � Security tenancy level >0.90 >0.90 � Vacancy level <0.10 <0.10 � Hedging - total debt <0.15 <0.15
Rand Merchant Bank, a division of FirstRand Bank Limited� Interest-bearing debt asset ratio <0.30 <0.30 � Facility outstandings mortgaged asset value ratio <0.35 <0.35 � Interest cover ratio >2.50 >2.50 � Facility interest cover ratio >2.50 >2.50 � Net asset value >R 3.5bn >R 3.5bn
STATUTORY INFORMATION AND
NOTES TO THE ANNUAL FINANCIAL STATEMENTS (continued)for the year ended 31 December 2013

SA CORPORATE REAL ESTATE FUND24
Group Fund2013 2012 2013 2012R000 R000 R000 R000
13. Interest bearing borrowings (continued)Debt funding capacityLoan and guarantee facilities 1 625 913 1 140 975 1 625 913 1 140 975 Unutilised facility 523 917 258 860 523 917 258 860 Overdraft facility 38 000 38 000 38 000 38 000 Total facilities in place 2 187 830 1 437 835 2 187 830 1 437 835 Difference between facility and debt funding capacity 471 738 1 007 098 453 653 945 929 Total debt funding capacity 2 659 568 2 444 933 2 641 483 2 383 764 Plus / (Less): Net interest rate swap asset / (liability) 28 050 (3 456) 28 050 (3 456)Less: Facility utilised (1 625 913) (1 140 975) (1 625 913) (1 140 975)
Debt funding capacity available at end of year 1 061 705 1 300 502 1 043 620 1 239 333 Adjusted for future capital commitments and proceeds ondisposal (34 323) 78 544 (13 119) 57 715 Total capital commitments (34 323) (31 284) (13 119) (25 518) Expected proceeds on disposal - 109 828 - 83 233
Anticipated available debt capacity 1 027 382 1 379 046 1 030 501 1 297 048
14. Interest rate swap derivatives Designated and accounted for at fair value through profit or loss
Non-current asset 39 644 2 854 39 644 2 854Current asset 382 - 382 - Current liability (11 976) (6 310) (11 976) (6 310)Carrying amount of net asset / (liability) 28 050 (3 456) 28 050 (3 456)
Carrying value at beginning of year (3 456) (32 545) (3 456) (32 545)Fair value adjustment 31 506 (30 141) 31 506 (30 141)Settlement - 59 230 - 59 230Carrying value at end of year 28 050 (3 456) 28 050 (3 456)
Interest rate swap agreements, for 3 - 7 years linked to JIBAR,have been concluded to convert floating rates to fixed rates. Thetotal nominal value of the swaps is R1 375m (2012: R720m).
The Fund carries the derivatives as financial assets and liabilitiesat fair value through profit or loss.
The following table indicates the periods in which the netundiscounted cash flows are expected to occur and impact profitor loss:
Expected cash inflow / (outflow) 39 269 (945) 39 269 (945)Not later than 1 year (11 872) (6 517) (11 872) (6 517)Later than 1 year and not later than five years 44 301 (816) 44 301 (816)More than 5 years 6 840 6 388 6 840 6 388
STATUTORY INFORMATION AND
NOTES TO THE ANNUAL FINANCIAL STATEMENTS (continued)for the year ended 31 December 2013

ANNUAL FINANCIAL STATEMENTS 2013 25
Group Fund2013 2012 2013 2012R000 R000 R000 R000
15. Deferred taxationBalance at the beginning of year 146 744 95 363 - - (Credited) / Charged to the statement of comprehensiveincome (146 744) 51 381 - -
Balance at the end of year - 146 744 - -
Comprising:Revaluation of investment properties - 146 744 - -
During the year, the JSE Limited approved the Fund's applicationfor the Real Estate Investment Trust (“REIT”) status. SACorporate will qualify as a REIT with effect from thecommencement of its next financial year, being 1 January 2014.In determining the aggregate capital gain or capital loss of aREIT or a controlled property company for purposes of theEighth Schedule of the Income Tax Act of 1958, as amended,any capital gain or capital loss determined in respect of thedisposal of immovable property; or a share in a controlledproperty company, must be disregarded. This resulted in areversal of the Group's deferred taxation liability.
16.Trade and other payablesTrade and other payables 197 160 170 283 109 721 84 197 Unclaimed distributions 1 346 1 034 1 303 992
198 506 171 317 111 024 85 189
The Group and Fund have cash management policies in place to ensure that all amounts are paid within the credit time frame.
STATUTORY INFORMATION AND
NOTES TO THE ANNUAL FINANCIAL STATEMENTS (continued)for the year ended 31 December 2013
Davenport Square Shopping Centre, Bulwer Road, Durban, KwaZulu-Natal

SA CORPORATE REAL ESTATE FUND26
STATUTORY INFORMATION AND
NOTES TO THE ANNUAL FINANCIAL STATEMENTS (continued)for the year ended 31 December 2013
Group Fund2013 2012 2013 2012R000 R000 R000 R000
17. Distributions payableBalance at the beginning of year 305 475 301 411 305 475 301 428 Distribution attributable to unitholders 648 351 616 608 648 351 616 608 Distributions paid (627 796) (612 544) (627 796) (612 561)Balance at the end of year 326 030 305 475 326 030 305 475
18. Capitalisation of interestInterest capitalised during development phases 1 791 1 518 1 461 300
Interest was capitalised at annual rates ranging from 7.1% to9.9% (2012: 8.3% to 8.8%)
The capitalised interest is included in the investment propertyas detailed in note 8
19. TaxationCurrent income taxation 102 1 442 - - Deferred taxation 146 744 (51 381) - - Deferred capital gains taxation * 124 929 (50 535) - - Deferred taxation on straight line rental adjustment 21 815 (846) - -
Total taxation credited / (charged) 146 846 (49 939) - -
Deferred taxation is not provided on the revaluation of propertiesowned by fixed property companies (2012: 18.7% which wasthe capital gains taxation rate). Refer note 15.
* Excluded from headline earnings
Taxation rate reconciliation % % % %
Standard rate 18.7 18.7 - -Change in capital gain taxation inclusion rate - 4.0 - -Non-taxable income (6.7) (3.0) - -Distributions vested in beneficiary (12.0) (14.6) - -Deferred taxation asset not recognised - 0.1 - -Reversal of deferred taxation balance on conversion to a REIT (14.5) - - -Utilisation of assessed losses - 1.1 - -
Effective rate (14.5) 6.3 - -
The taxation credit in the current year is primarily attributable to the revaluation adjustment credited through profit or loss.

ANNUAL FINANCIAL STATEMENTS 2013 27
19. Taxation (continued)
No taxation is provided for against operating profit, to the extent that it is declared as a tax deductible distribution in terms ofsection 11(s) of the Income Tax Act. Therefore the Group reconciles the capital gains tax rate to the effective taxation rate.
Deductible temporary differences and unutilised tax losses for which no deferred tax asset has been raised.
Group Fund2013 2012 2013 2012R000 R000 R000 R000
Deferred taxation on investment property - 18 302 - - Estimated taxation losses 14 377 16 185 - -
14 377 34 487 - -
20. Earnings and diluted earnings per unitThe calculation of earnings and diluted earnings per unit are based on a net profit of R1 159 394 000 (2012: R736 633 000)of the Group and 1 985 702 979 (2012: 2 057 569 388) weighted number of units in issue during the year. Earnings and dilutedearnings per unit are 58.39 cents (2012: 35.80 cents).
21. Headline earnings per unitThe calculation of headline earnings per unit is based on headline earnings of R657 824 000 (2012: R559 565 000) of the Groupand 1 985 702 979 (2012: 2 057 569 388) weighted number of units in issue during the year.
Reconciliation of headline earnings and distribution attributable to unitholders:
Group Group2013 2013 2012 2012R000 CPU R000 CPU
Profit after taxation 1 159 394 58.39* 736 633 35.80* Adjustments for: Capital loss on disposal of investment properties 4 086 20 075 Taxation on capital profit on disposal of investment properties (102) (1 442) Revaluation of investment properties (no taxation effect) (380 625) (245 611) Revaluation of investment property under development - (625) (Reversal of taxation) / taxation on revaluation (124 929) 50 535 Headline earnings 657 824 33.13* 559 565 27.20* Straight line rental adjustment 24 419 (8 177)Taxation on straight line rental adjustment (21 815) 846 Amortisation of debt restructure costs 10 504 32 739 Other 102 699 Revaluation of interest rate swap derivatives (31 506) 30 141 Lapsed distribution on units repurchased 8 823 795 Distributable income attributable to unitholders 648 351 32.75 616 608 30.15
Interim 322 315 16.28 311 133 15.17 Final 326 036 16.47 305 475 14.98
* Weighted average cents per unit
STATUTORY INFORMATION AND
NOTES TO THE ANNUAL FINANCIAL STATEMENTS (continued)for the year ended 31 December 2013

SA CORPORATE REAL ESTATE FUND28
STATUTORY INFORMATION AND
NOTES TO THE ANNUAL FINANCIAL STATEMENTS (continued)for the year ended 31 December 2013
Group Fund2013 2012 2013 2012R000 R000 R000 R000
22. DistributionAvailable for distribution 648 351 616 608 648 351 616 608
cents cents cents centsper unit per unit per unit per unit
No. 35 declared 20 August 2012, paid 01 October 2012 15.17 15.17 No. 36 declared 22 February 2013, paid 25 March 2013 14.98 14.98No. 37 declared 26 August 2013, paid 30 September 2013 16.28 16.28 No. 38 declared 28 February 2014, paid 31 March 2014 16.47 16.47Distributions declared 32.75 30.15 32.75 30.15
23. Operating lease arrangements The minimum future lease payments receivable under
non-cancellable operating leases are as follows: R000 R000 R000 R000
Not later than 1 year 882 695 842 384 524 627 464 638 Later than one year and not later than 5 years 1 735 469 1 878 632 1 011 174 1 059 813 Later than 5 years 251 669 321 962 172 008 241 462
2 869 833 3 042 978 1 707 809 1 765 913
24. Operating lease expense andcommitmentsRent paid recognised as an expense:
Minimum rental expense 9 656 2 457 34 12 Contingent rental expense 666 2 563 - - Total rental expense 10 322 5 020 34 12
The minimum future lease payments payable undernon-cancellable operating leases are as follows:
Not later than 1 year 12 042 3 269 - - Later than 1 year and not later than 5 years 43 096 14 148 - - Later than 5 years 217 572 238 600 - - 272 710 256 017 - -The minimum future sub-lease payments receivable undernon-cancellable operating leases are as follows:
Not later than 1 year 70 511 58 795 - - Later than 1 year and not later than 5 years 724 295 164 159 - - Later than 5 years 79 661 3 024 - - 874 467 225 978 - -
Operating lease expense relates to leases of land with leases expiring between 2025 and 2054.
Operating lease income relates to leases expiring between 2014 and 2029.
The contingent rental expense is calculated as a percentage of either the valuation or the net rental income generated by the property.

ANNUAL FINANCIAL STATEMENTS 2013 29
Industrial Retail Commercial Corporate GroupR000 R000 R000 R000 R000
25. Segment results2013 Information on reportable segments
Revenue 472 533 611 248 102 631 - 1 186 412
Rental income (excluding straight line rentaladjustment) 416 930 374 746 86 401 - 878 077Net property expenses (45 084) (47 785) (16 209) - (109 078) Property administration fees (5 611) (21 649) (1 858) - (29 118) Property expenses (104 099) (274 537) (34 078) - (412 714) Recovery of property expenses 64 626 248 401 19 727 - 332 754
Net property income 371 846 326 961 70 192 - 768 999Straight line rental adjustment (9 023) (11 899) (3 497) - (24 419)Income from associate company - - - - -Interest income - - - 20 811 20 811 Interest expense - - - (94 562) (94 562)Amortisation of debt restructure costs - - - (10 504) (10 504)Group expenses - - - (55 822) (55 822)Capital loss on disposal of investment properties (619) (1 575) (1 892) - (4 086)Revaluation of investment properties 165 273 198 739 16 613 - 380 625 Investment properties 156 250 186 840 13 116 - 356 206 Straight line rental adjustment 9 023 11 899 3 497 - 24 419Revaluation of interest rate swap derivatives - - - 31 506 31 506 Taxation 22 700 124 146 - - 146 846
Net profit / (loss) attributable to unitholders 550 177 636 372 81 416 (108 571) 1 159 394
Properties 3 781 276 3 832 793 1 040 182 - 8 654 251 At valuation 3 796 600 3 866 125 1 059 400 - 8 722 125 Straight line rental adjustment (120 424) (71 332) (19 218) - (210 974) Under development 105 100 38 000 - - 143 100
STATUTORY INFORMATION AND
NOTES TO THE ANNUAL FINANCIAL STATEMENTS (continued)for the year ended 31 December 2013
Stellenbosch Square, Western Cape

SA CORPORATE REAL ESTATE FUND30
STATUTORY INFORMATION AND
NOTES TO THE ANNUAL FINANCIAL STATEMENTS (continued)for the year ended 31 December 2013
Industrial Retail Commercial Corporate GroupR000 R000 R000 R000 R000
25. Segment results (continued)
2012 Information on reportable segments
Revenue 473 486 654 095 100 257 - 1 227 838
Rental income (excluding straight line rentaladjustment) 389 648 421 518 82 711 - 893 877Net property expenses (34 092) (64 945) (17 766) - (116 803) Property administration fees (5 973) (27 477) (1 750) - (35 200) Property expenses (84 468) (288 190) (34 729) - (407 387) Recovery of property expenses 56 349 250 722 18 713 - 325 784
Net property income 355 556 356 573 64 945 - 777 074Straight line rental adjustment 27 489 (18 145) (1 167) - 8 177Income from associate company - - - 1 402 1 402Interest income - - - 30 547 30 547 Interest expense - - - (139 202) (139 202)Amortisation of debt restructure costs - - - (32 739) (32 739)Group expenses - - - (54 707) (54 707)Capital loss on disposal of investment properties (1 044) (17 865) (1 134) (32) (20 075)Revaluation of investment properties 178 919 66 073 619 - 245 611 Investment properties 206 408 47 928 (548) - 253 788 Straight line rental adjustment (27 489) 18 145 1 167 - (8 177)Revaluation of investment properties underdevelopment 625 - - - 625Revaluation of interest rate swap derivatives - - - (30 141) (30 141)Taxation (5 689) (44 088) (162) - (49 939)
Net profit / (loss) attributable to unitholders 555 856 342 548 63 101 (224 872) 736 633
Properties 3 495 654 3 747 343 671 385 - 7 914 382 At valuation 3 556 400 3 688 075 659 100 - 7 903 575 Straight line rental adjustment (129 446) (83 232) (22 715) - (235 393) Under development 63 300 - - - 63 300 Classified as held for disposal 5 400 142 500 35 000 - 182 900
Revenue reported above represents revenue, from external tenants, generated in South Africa. The Fund does not place significantreliance on any single tenant. No single tenant contributed 10% or more to the Fund's revenue for both 2013 and 2012.

ANNUAL FINANCIAL STATEMENTS 2013 31
26. Financial instruments and financial risk managementThe Group and Fund is exposed to strategic and business risk, financial risk, regulatory and compliance risk.
This note deals with certain financial analyses relating to the financial risks.
Capital risk managementThe Group's and Fund's capital comprises unitholders' funds and interest-bearing borrowings. Capital is actively managed toensure that the Group and Fund is properly capitalised and funded at all times, having regard to its regulatory needs, prudentmanagement and the needs of its stakeholders.
The Group and Fund has a business planning process that runs on an annual cycle with regular updates to projections. It isthrough this process, which includes risk and sensitivity analyses of forecasts, that the Group's and Fund's capital is managed.Specifically, the Group and Fund has adopted the following capital management policies:
� Maintenance, as a minimum, of capital sufficient to meet the statutory requirements and such additional capital as management believes is necessary.� Maintenance of an appropriate level of liquidity at all times. The Group and Fund further ensures that it can meet its expected capital and financing needs at all times, having regard to the business plans, forecasts and any strategic initiatives.� Maintenance of an appropriate level of issued units based on approval from the unitholders and the Board.
The Group and Fund has both qualitative and quantitative risk management procedures to monitor the key risks and sensitivitiesof the business. This is achieved through scenario analyses and risk assessments. From an understanding of the principal risks,appropriate risk limits and controls are defined.
The Group's and Fund's capital risk management strategy has remained unchanged from the prior year.
Gearing ratioThe Group's and Fund's investment committee reviews the capital structure on a quarterly basis. As part of this review, thecommittee considers the cost of capital and the risks associated with each class of capital. The Group's and Fund's borrowingcapacity is limited to 30% of the total investment portfolio value in terms of the Trust Deed and 60% in terms of the CollectiveInvestment Schemes Control Act, No. 45 of 2002. The Group's and Fund's current borrowings amount to 18% (2012: 14%) ofits total investment portfolio.
The debt to total investment portfolio ratio at the year-end was as follows:
Group Fund2013 2012 2013 2012R000 R000 R000 R000
Debt (before effective interest rate adjustment) 1 625 913 1 140 975 1 625 913 1 140 975 Total investment portfolio * 8 865 225 8 149 775 8 805 060 7 945 881 Net debt to property ratio 18% 14% 18% 14%
* Total investment portfolio includes investment property (at valuation), property under development, properties classified as held for disposal and investment in fixed property companies.
Financial risk management objectivesIn the normal course of operations, the Group and Fund is exposed to interest rate risk, credit risk and liquidity risk arisingfrom its financial instruments. In order to manage these risks, the Group and Fund may enter into transactions which makeuse of derivatives. The Group and Fund does not speculate in or engage in the trading of derivative instruments.
STATUTORY INFORMATION AND
NOTES TO THE ANNUAL FINANCIAL STATEMENTS (continued)for the year ended 31 December 2013

SA CORPORATE REAL ESTATE FUND32
STATUTORY INFORMATION AND
NOTES TO THE ANNUAL FINANCIAL STATEMENTS (continued)for the year ended 31 December 2013
26. Financial instruments and financial risk management (continued)
Interest rate risk managementInterest rate movements impact on the net cost of the Group's and Fund's short term cash investments and interest-bearingborrowings. The risk is managed by the Group and Fund by maintaining an appropriate mix between fixed and floating rateborrowings, monitoring cash flows and investing surplus cash at negotiated rates. The Group and Fund enters into interest rateswap contracts, from time to time, for the purposes of cash flow hedging.
It is the Group's policy that all debt above 5% of the property portfolio value be fixed to reduce the interest rate risk to acceptablelevels. This excludes the funding of developments in progress that will be ring-fenced in order to comply with the accountingrequirements for capitalising interest.
Interest rate sensitivity analysisThe sensitivity analysis is based on the exposure to interest rates at the reporting date. For floating rate assets and liabilities,the analysis assumes that the amount of asset or liability outstanding at the reporting date was outstanding for the whole year.A 50 basis point increase or decrease is used when reporting interest rates internally to key management personnel and representsmanagement's reasonable assessment of the possible change in interest rates. If interest rates were 50 basis points higher /lower and all other variables were constant, the Group's and Fund's net profit for the year ended 31 December 2013 wouldincrease / (decrease) by R1,6m (2012: (R3,7m)) and R1,4m (2012: (R3,8m)) respectively.
Credit risk managementCredit risk refers to the risk that a counterparty will default on its contractual obligations resulting in financial loss to the Groupand Fund. The Group's and Fund's financial assets that are subject to credit risk are cash and cash equivalents and trade andother receivables. The maximum exposure to credit risk at the end of the year was:
Group Fund2013 2012 2013 2012R000 R000 R000 R000
Cash and cash equivalents 311 520 407 281 306 964 373 401 Trade receivables 16 637 20 186 5 476 8 762 Other receivables, accrued interest and current loans tosubsidiary companies (excluding VAT receivable) 146 102 108 956 166 436 149 516 Non-current portion of loans to subsidiary companies - - 2 408 308 2 431 140Loans and receivables (including cash and cash equivalents) 474 259 536 423 2 887 184 2 962 819
Credit risk with regard to trade and other receivables is minimised by the large and diverse tenant base, spread across diverseindustries and geographical areas.
The Group and Fund does not have any significant credit risk exposure to any single tenant counterparty.
Credit risk attached to the Group's and Fund's cash and cash equivalents is minimised by its cash resources being placed withseveral financial institutions of high credit standing, in terms of pre-determined exposure limits. Exposure limits are assessedbi-annually and reviewed by the Audit Committee to limit concentration to a single institution.
Management has established a credit policy in terms of which each new tenant is individually analysed for credit worthinessbefore the Group's standard payment terms and conditions are offered which include a provision of a deposit. Managementmonitors the financial position of its tenants on an ongoing basis.
Loans to subsidiary companies are monitored and provision is made, where necessary, for any irrecoverable amounts.

ANNUAL FINANCIAL STATEMENTS 2013 33
Group Fund2013 2012 2013 2012R000 R000 R000 R000
26. Financial instruments and financialrisk management (continued)
The following table represents relevant information on tradereceivables at the reporting date:
Trade receivables 44 558 47 415 15 486 14 978 Past due but not impaired 16 637 20 186 5 476 8 762 Impaired (excluding VAT) 27 921 27 229 10 010 6 216 Allowance for doubtful debts (27 921) (27 229) (10 010) (6 216)Trade receivables net of allowance for doubtful debts 16 637 20 186 5 476 8 762 Ageing of trade receivables past due but not impaired 16 637 20 186 5 476 8 762 < 30 days 5 707 5 654 2 349 2 179 30 days 3 163 3 807 914 1 369 60+ days 7 767 10 725 2 213 5 214
Ageing of impaired trade receivables 27 921 27 229 10 010 6 216 < 30 days 758 1 757 311 313 30 days 766 458 518 29 60+ days 26 397 25 014 9 181 5 874
Allowance for doubtful debtsThe movement in the allowance for doubtful debts during theyear was as follows:
Balance at the beginning of the year 27 229 41 655 6 216 11 530 Amounts written off during the year (13 557) (20 324) (3 856) (6 703)Net provisions recognised 14 249 5 898 7 650 1 389 Balance at the end of the year 27 921 27 229 10 010 6 216
The carrying amount of financial assets recorded in the financialstatements, which is net of impairment losses, represents theGroup's and Fund's maximum exposure to credit risk withouttaking into account the value of any collateral obtained.
The calculation of the allowance for doubtful debts as a percentageof arrear rentals is shown in the table below. The provision iscarried exclusive of VAT whilst the arrear rentals include VAT.This has been taken into account in the calculation below.
Provision excluding VAT 27 921 27 229 10 010 6 216 VAT thereon 3 909 3 812 1 401 870 Provision including VAT 31 830 31 041 11 411 7 086
Trade receivables 44 558 47 415 15 486 14 978
Provision as a % of trade receivables 71% 65% 74% 47%
Management and the Board do not consider there to be any material credit risk exposure, which is not adequately providedfor.
STATUTORY INFORMATION AND
NOTES TO THE ANNUAL FINANCIAL STATEMENTS (continued)for the year ended 31 December 2013

SA CORPORATE REAL ESTATE FUND34
STATUTORY INFORMATION AND
NOTES TO THE ANNUAL FINANCIAL STATEMENTS (continued)for the year ended 31 December 2013
Group Fund2013 2012 2013 2012R000 R000 R000 R000
26. Financial instruments and financialrisk management (continued)
Liquidity risk management
Repayment profile of financial liabilitiesLess than three months 231 458 191 161 144 019 105 075 Trade and other payables * 197 160 170 283 109 721 84 197 Interest rate swap derivatives 4 016 1 261 4 016 1 261 Interest on interest-bearing borrowings 30 282 19 617 30 282 19 617
Between three months and one year 104 199 578 625 104 199 578 625 Interest-bearing borrowings - 520 000 - 520 000 Interest rate swap derivatives 7 856 5 256 7 856 5 256 Interest on interest-bearing borrowings 96 343 53 369 96 343 53 369
Between one and five years 1 814 927 667 469 1 814 927 667 469 Interest-bearing borrowings 1 625 913 620 975 1 625 913 620 975 Interest rate swap derivatives (44 301) 816 (44 301) 816 Interest on interest-bearing borrowings 233 315 45 678 233 315 45 678 After five years (6 840) (6 388) (6 840) (6 388)
Interest rate swap derivatives (6 840) (6 388) (6 840) (6 388)
2 143 744 1 430 867 2 056 305 1 344 781 *Excluding unclaimed distributions.
The Group and Fund expects to meet its other obligations fromoperating cash flows, existing facilities as detailed in note 13and refinancing long term debt.
Categories of financial instruments
Non-derivative financial instruments:Financial assets Designated as at fair value through profit or loss - - 1 175 653 881 291 Investment in fixed property companies - - 1 175 653 881 291
Loans and receivables (including cash and cash equivalents) 474 259 521 547 2 887 184 2 962 819 Non-current portion of loans to subsidiary companies - - 2 408 308 2 431 140 Trade receivables 16 637 20 186 5 476 8 762 Other receivables and accrued interest (excluding VAT receivable) 146 102 94 080 88 710 53 282 Current portion of loans to subsidiary companies - - 77 726 96 234 Cash and cash equivalents 311 520 407 281 306 964 373 401
474 259 521 547 4 062 837 3 844 110

ANNUAL FINANCIAL STATEMENTS 2013 35
Group Fund2013 2012 2013 2012R000 R000 R000 R000
26. Financial instruments and financialrisk management (continued)
Financial liabilities Amortised cost 2 116 666 1 610 132 2 046 598 1 532 879 Interest-bearing borrowings 1 625 913 1 140 975 1 625 913 1 140 975 Trade and other payables 164 723 163 682 94 414 86 429 Current portion of loans from subsidiary companies - - 241 - Distributions payable 326 030 305 475 326 030 305 475
Derivative financial instruments:As at fair value through profit or loss (28 050) 3 456 (28 050) 3 456 Fair value of financial assets and liabilities that aremeasured at fair value on a recurring basis:
Fair value measurements recognised in the statement of financialposition. The table below analyses financial instruments that aremeasured at fair value, subsequent to initial recognition. Thefinancial instruments are grouped into levels 1 to 3 based on thedegree to which the fair value is observable. The different levelshave been defined as follows:
� Level 1 fair value adjustments are those derived from quotedprices (unadjusted) in active markets for identical assetsor liabilities;
� Level 2 fair value adjustments are those derived from inputs,other quoted prices included within level 1, that are
observable for the asset or liability, either directly (i.e. as prices) or indirectly (i.e. derived from prices); and� Level 3 fair value adjustments are those derived from valuation techniques that include inputs for the assets or liability that are not based on observable market data i.e.
unobservable inputs.
Level 2Derivative financial assets / (liabilities) ^ 28 050 (3 456) 28 050 (3 456)
Level 3Financial assets designated as at FVTPL # - - 1 175 653 881 291 Total 28 050 (3 456) 1 203 703 877 835
Financial assets designated as at FVTPLCarrying value at beginning of year - - 881 291 890 392Revaluation (net of taxation) recognised through profit or loss - - 299 318 (9 101)Transfer to loans to subsidiary companies - - (4 956) - Carrying value at closing of year - - 1 175 653 881 291
STATUTORY INFORMATION AND
NOTES TO THE ANNUAL FINANCIAL STATEMENTS (continued)for the year ended 31 December 2013
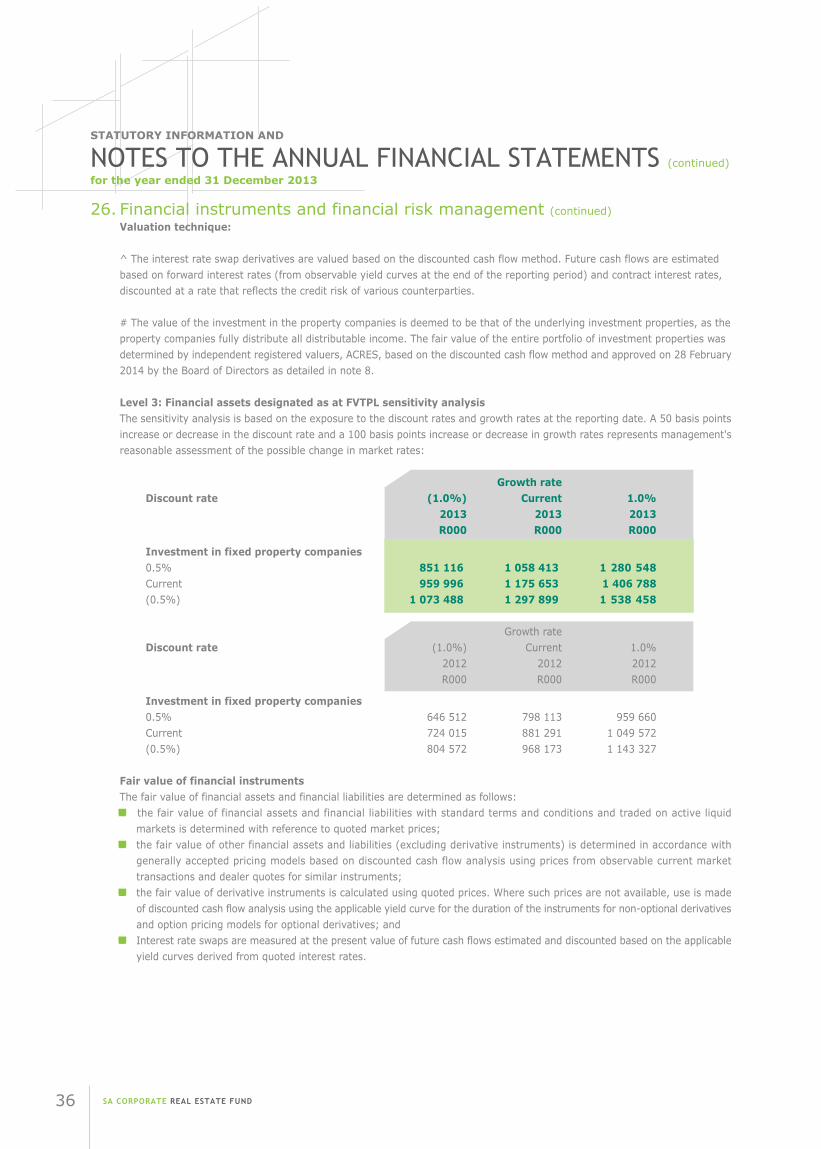
SA CORPORATE REAL ESTATE FUND36
STATUTORY INFORMATION AND
NOTES TO THE ANNUAL FINANCIAL STATEMENTS (continued)for the year ended 31 December 2013
26. Financial instruments and financial risk management (continued)Valuation technique:
^ The interest rate swap derivatives are valued based on the discounted cash flow method. Future cash flows are estimatedbased on forward interest rates (from observable yield curves at the end of the reporting period) and contract interest rates,discounted at a rate that reflects the credit risk of various counterparties.
# The value of the investment in the property companies is deemed to be that of the underlying investment properties, as theproperty companies fully distribute all distributable income. The fair value of the entire portfolio of investment properties wasdetermined by independent registered valuers, ACRES, based on the discounted cash flow method and approved on 28 February2014 by the Board of Directors as detailed in note 8.
Level 3: Financial assets designated as at FVTPL sensitivity analysisThe sensitivity analysis is based on the exposure to the discount rates and growth rates at the reporting date. A 50 basis pointsincrease or decrease in the discount rate and a 100 basis points increase or decrease in growth rates represents management'sreasonable assessment of the possible change in market rates:
Growth rateDiscount rate (1.0%) Current 1.0%
2013 2013 2013R000 R000 R000
Investment in fixed property companies0.5% 851 116 1 058 413 1 280 548Current 959 996 1 175 653 1 406 788(0.5%) 1 073 488 1 297 899 1 538 458
Growth rateDiscount rate (1.0%) Current 1.0%
2012 2012 2012R000 R000 R000
Investment in fixed property companies0.5% 646 512 798 113 959 660Current 724 015 881 291 1 049 572(0.5%) 804 572 968 173 1 143 327
Fair value of financial instrumentsThe fair value of financial assets and financial liabilities are determined as follows:� the fair value of financial assets and financial liabilities with standard terms and conditions and traded on active liquid
markets is determined with reference to quoted market prices;� the fair value of other financial assets and liabilities (excluding derivative instruments) is determined in accordance with generally accepted pricing models based on discounted cash flow analysis using prices from observable current market transactions and dealer quotes for similar instruments;� the fair value of derivative instruments is calculated using quoted prices. Where such prices are not available, use is made of discounted cash flow analysis using the applicable yield curve for the duration of the instruments for non-optional derivatives
and option pricing models for optional derivatives; and� Interest rate swaps are measured at the present value of future cash flows estimated and discounted based on the applicable
yield curves derived from quoted interest rates.

ANNUAL FINANCIAL STATEMENTS 2013 37
Group Fund2013 2012 2013 2012R000 R000 R000 R000
27.Related party transactionsPARTY TRANSACTION TERMS CONCERNED TYPE & CONDITIONS
Related party transactionsNedbank Limited Rental Income Based on market-related 9 920 8 959 1 727 1 841Sponsor of the ratesFund and subsidiary Interest expense Based on market-related - 1 969 - 1 969 of the Old Mutual on loans interest ratesGroup Sponsor fees Based on JSE regulations 136 126 136 126
Oryx Properties Distribution Minimum 90% of net - 1 402 - 1 402 Limited distributable incomeAssociate
SA Corporate Real Service fee Based on 40bps of 37 435 35 559 25 188 20 273Estate Fund enterprise valueManagers LimitedManaging company
Old Mutual Rental Income Based on market-related 2 565 796 1 274 59(South Africa) ratesLimited GroupIntermediate holdingcompany ofmanaging company
STATUTORY INFORMATION AND
NOTES TO THE ANNUAL FINANCIAL STATEMENTS (continued)for the year ended 31 December 2013
Bluff Shopping Centre Durban, Tara Road, KwaZulu-Natal

SA CORPORATE REAL ESTATE FUND38
STATUTORY INFORMATION AND
NOTES TO THE ANNUAL FINANCIAL STATEMENTS (continued)for the year ended 31 December 2013
Group Fund2013 2012 2013 2012R000 R000 R000 R000
27.Related party transactions (continued)
PARTY TRANSACTION TERMS CONCERNED TYPE & CONDITIONS
Related party transactions (continued)Old Mutual Property Property Based on a percentage of 15 994 35 200 5 161 12 740 Proprietary management fees rental collections net of Limited, including VATits wholly owned Accounting and Cost recovery basis with 6 082 5 893 4 330 3 296 subsidiary Marriott secretarial fees annual reviewProperty Services Letting commissions Based on a percentage of 15 285 21 459 6 218 9 352
Proprietary rental income onLimited # concluded deals95% owner of
managing company Disposal Sliding scale of sales 3 100 3 510 1 850 2 803 commissions, proceeds and / or
acquisition and development costsdevelopment fees On-site staff (jointly Overhead cost recovery 796 298 54 78controlled buildingonly)
Old Mutual Interest expense Based on market related 35 704 91 489 35 704 91 489 Specialised Finance on loans interest ratesProprietary LimitedSubsidiary of the OldMutual Group
Group Property Distribution 100% of net distributable - - 309 218 293 952Companies ∆ income(Subsidiaries,joint ventures)
Group Property Recovery of Recovery of service fees - - - 18 200Companies ∆ property expense accounting and secretarial(Subsidiaries, fee and revaluationjoint ventures) expense
Balances owing at year endOld Mutual Non-current 500 000 300 000 500 000 300 000 Specialised Finance borrowingsProprietary Current borrowings - 200 000 - 200 000Limited*Subsidiary of theOld Mutual Group

ANNUAL FINANCIAL STATEMENTS 2013 39
Group Fund2013 2012 2013 2012R000 R000 R000 R000
27.Related party transactions (continued)
PARTY TRANSACTION TERMS CONCERNED TYPE & CONDITIONS
Balances owing at year end (continued)SA Corporate Service fee payable Based on 40bps of 6 996 2 874 4 392 2 874Real Estate Fund enterprise value
Managers Limited Managing company
Old Mutual Property Letting Based on a percentage of 161 238 33 49Proprietary commission payable rental income on Limited, including concluded dealsits wholly owned Accounting and Cost recovery basis with 1 521 559 1 521 559subsidiary Marriott secretarial fees annual reviewProperty Services Development fees Sliding scale of sales 714 991 117 394Proprietary payable proceeds and / orLimited # development costs95% owner of Property Based on a percentage 1 4 224 1 1 684managing company management fees of rental collections
commissions, payable net of VAT Lease admin fee 2 45 - 14
payable Cost recoveries Overhead cost recovery 76 709 8 8payable
Group Property Investment in Fair value of investment - - 1 175 653 881 291Companies ∆ property companies Non-current loans - - 2 408 308 2 431 140(Subsidiaries,joint ventures)
Group Property Intercompany loan Current receivables - - 77 726 96 234Companies ∆ receivable Current payables - - 241 -(Subsidiaries,joint ventures)
No compensation was paid to key management personnel by the Group of Fund (2012: nil).* Interest rates, repayment terms, covenants and mortgage bonds of related party borrowings are detailed in note 13.# The agreement with Old Mutual Property Proprietary Limited expired on 30 June 2013.∆ The terms and conditions of both the current and non-current intercompany loans are interest free and with no repayment terms. The shareholders loan account between the Fund and Madison Park Properties 24 Proprietary Limited and Jrad Investments Proprietary Limited have been subordinated in favour of outside creditors to the extent of the deficit on shareholder funds in these companies as detailed in note 7.
STATUTORY INFORMATION AND
NOTES TO THE ANNUAL FINANCIAL STATEMENTS (continued)for the year ended 31 December 2013

SA CORPORATE REAL ESTATE FUND40
Group Fund2013 2012 2013 2012R000 R000 R000 R000
28. Capital commitmentsAuthorised and contracted capital commitments 34 323 31 284 13 119 25 518
These commitments will be funded by available cash and debt.
29. Events subsequent to the reporting dateSubsequent to the financial year end under review, the following activities have occurred:
A ballot has been sent to the unitholders, in respect of the internalisation of the management company, to obtain their approvalto certain amendments to the Trust Deed in terms of which:
1.1. the existing service charge arrangement in respect of the Fund will be changed from a monthly charge based on a value of 0.4% of the aggregate market capitalisation of the Fund plus borrowings, to a monthly charge equal to the actual operating costs incurred by the Manager in administering the Fund as well as the scrapping of the initial charge of 5% on the value of any new participatory interests ("units") issued against the payment by the Fund to the Manager of a consideration
of R185 million excluding VAT funded through borrowings; and
1.2. as a separate amendment, the borrowing limits of the Fund will be increased from 30% to 60% of the value of its underlyingassets.
The directors are not aware of other significant events between the end of the financial year under review and the date ofsignature of these financial statements.
30. Going concernThe directors are of the opinion that the Group has adequate resources to continue in operation for the foreseeable future. Thefinancial statements have accordingly been prepared on the going concern basis.
STATUTORY INFORMATION AND
NOTES TO THE ANNUAL FINANCIAL STATEMENTS (continued)for the year ended 31 December 2013
31. Contingent LiabilityRenbro Shopping CentreDuring April 2009 the Fund purchased Renbro Shopping Centre from Kaponong Developments Proprietary Limited for an amountof R106m.
The finalisation of the purchase price was subject to a contingent payment based on the income earned from the property inthe 12 months following the date of purchase. The Fund and the seller are in disagreement with respect to the calculation ofthe net property income. It is not practicable to quantify the amounts due to either party as a result of the different interpretationsof the net income calculation. Management has satisfied itself that it is improbable that the purchase price will be increased.

ANNUAL FINANCIAL STATEMENTS 2013 41
STATUTORY INFORMATION AND
NOTES TO THE ANNUAL FINANCIAL STATEMENTS (continued)for the year ended 31 December 2013
32.Investments in joint arrangementsDetails of the Group and Fund's material joint arrangements at the end of the reporting period are as follows:
Name of the Principal activity Place of incorporation and Portion of ownership Distributionjoint venture principal place of business interest and voting received
rights held2013 2012 2013 2012
% % R000 R000
Group:Umlazi Mega City Property entity Durban, KwaZulu Natal 75% 75% 28 169 23 197
earning net rentalincome
Pinecrest Shopping Property entity Durban, KwaZulu Natal 50% 50% 25 947 23 544Centre earning net rental
income
Fund:Musgrave Shopping Property entity Durban, KwaZulu Natal 50% 50% 28 916 24 211Centre earning net rental
income
Group Group FundUmlazi Mega City Pinecrest Shopping Centre Musgrave Shopping Centre2013 2012 2013 2012 2013 2012R000 R000 R000 R000 R000 R000
Current assets 22 780 26 710 8 382 10 963 131 107 124 281Non-current assets 352 283 350 499 615 133 574 908 724 633 655 969
Current liabilities (31 674) (63 783) (219 711) (285 590) (11 107) (15 372)Non-current liabilities (173 742) (173 742) (16 055) (16 105) (535 436) (521 254)
Revenue 67 265 60 351 78 932 73 682 106 883 95 954Profit 67 522 51 110 155 468 76 811 123 404 93 564
199 North Ridge Road, Durban, KwaZulu-Natal

SA CORPORATE REAL ESTATE FUND42
APPENDIX A: STATUTORY INFORMATION
DIRECTORATE:The table below sets out the directors' unit holding:
2013 2012Director Holding Type of Holding Holding Type of Holding
Units Units000 000
RJ Biesman-Simons 50 Indirect beneficial 50 Indirect beneficialAM Basson 59 Indirect beneficial (MTI's)* NilKJ Forbes 130 Direct beneficial 130 Direct beneficialTR Mackey 127 Indirect beneficial (MTI's)* Nil
MTI* = Medium Term Incentives
There have been no changes in the direct or indirect beneficial interest of the directors between the end of the financial year under reviewand the date of signature of these financial statements.
UNITHOLDER INFORMATION:Number of % of total
Unitholder Type unitholdings unitholdings Units held % Held
Non-Public Unitholders 12 0.19 521 642 638 26.34 Directors and associates of the company (direct holding) 1 0.02 130 000 0.01 Directors and associates of the company (indirect holding) 1 0.02 50 000 0.00Holders holding more than 10% Government Employees Pension Fund 2 0.03 520 972 301 26.31Unit Schemes Old Mutual Medium Term Incentive Trust 8 0.12 490 337 0.02Public Unitholders 6 305 99.81 1 458 450 376 73.66
Total 6 317 100.00 1 980 093 014 100.00
Investment Manager Unitholders (>5%)
Public Investment Corporation 524 341 303 26.48 Coronation Fund Managers 194 604 829 9.83 Stanlib Asset Management 153 258 936 7.74 Prudential Portfolio Management 127 406 627 6.43
Total 999 611 695 50.48
Beneficial Unitholders (>5%)
Government Employees Pension Fund 520 972 301 26.31 Coronation Fund Managers 151 329 942 7.64 Stanlib 108 453 489 5.48
Total 780 755 732 39.43
Holders holding more than 10% of issued capital (Excluding Directors Holding)Government Employees Pension Fund GEPF Equity c/o Public Investment Commissioner 499 984 828 GEPF Meago c/o Meago Property Managers 20 987 473
Total 520 972 301
SPECIAL RESOLUTION:It was resolved that the directors of SA Corporate Real Estate Fund Managers Limited are authorised, by way of general authority toacquire units issued by the Fund and/or its subsidiaries upon such terms and conditions and in such amounts as the directors mayfrom time to time decide, but subject to the JSE Limited Listings Requirements and the Trust Deed.

Sectoral and geographical profile:The regional and sectoral composition of the property portfolio is depicted in the following tables:
Geographical profileGauteng KwaZulu Natal Western Cape Other Total
Rental area (m2) 647 983 438 667 82 828 24 481 1 193 959Revenue (R000) 398 821 391 396 68 003 19 857 878 077
Sectoral profileSpecialised:
Specialised: AutoIndustrial Retail Commercial Hospital dealerships Total
Rental area (m2) 706 384 381 115 77 855 7 265 21 340 1 193 959Revenue (R000) 398 910 374 746 76 310 10 091 18 020 878 077
Tenant profile:The tenants are classified in terms of the following grading:“A”: large national tenants, large listed tenants, government and major franchisees; "Large national tenants" is defined as tenants occupying premises that have on average greater than 500m2 of GLA. "Large professional firms" is defined as professional firms occupying premises that have on average greater than 2000m2 of GLA.“B”: national tenants, listed tenants, franchisees, medium to large professional firms; and "Large regional tenants" is defined as tenants occupying premises that have on average greater than 1000m2 of GLA in one region. "Medium professional tenants" is defined as professional firms occupying premises that have on average between 500m2 and 2000m2 of GLA.“C”: other
Tenant profile:Grading % of occupied space
A 63.7B 31.1C 5.2 #
Total 100.0
# 651 tenants were included in the C grading.
Vacancies, expiries and average rental income:
The vacancies are set out below:
Vacancy profile: Vacancy as
Property type Vacancy as % of GLA % of rental income2013 2012 2013 2012
Industrial 0.2 1.3 0.2 1.5Retail 8.9 10.6 4.6 5.8Commercial 11.8 19.2 7.0 14.1
Portfolio total 4.0 5.9 3.2 4.9
ANNUAL FINANCIAL STATEMENTS 2013 43
APPENDIX B: PROPERTY PORTFOLIO REVIEW

SA CORPORATE REAL ESTATE FUND44
APPENDIX B: PROPERTY PORTFOLIO REVIEW (continued)
The lease expiry profile and vacancies (as a % of GLA) are set out below:
Property Vacant (%) Expiries (%)type Monthly 2014 2015 2016 2017 2018 Thereafter
Industrial 0.2 2.6 10.9 28.4 12.9 23.3 11.9 9.8Retail 8.9 5.4 15.3 18.2 15.4 7.9 17.4 11.5Commercial 11.8 3.5 25.5 24.5 19.9 7.2 3.7 3.9
Total 4.0 3.6 13.6 24.8 14.3 17.0 12.9 9.8
The lease expiry profile and vacancies (as a % of rental income) are set out below:
Property Vacant (%) Expiries (%)type Monthly 2014 2015 2016 2017 2018 Thereafter
Industrial 0.2 2.4 11.5 28.7 11.7 26.4 14.5 4.6Retail 4.6 7.0 22.4 20.9 17.6 8.7 12.2 6.6Office 7.0 2.6 26.5 27.5 20.7 8.1 3.6 4.0
Total 3.2 4.5 18.4 24.9 15.6 15.9 12.1 5.4
Weighted average rental per square metre by GLA calculated on the total of basic rent, basic operating cost and rates:
Property type R/m2
Industrial 52.14Retail 108.26Commercial 125.19
Total 73.84
Weighted average rental escalation profile by GLA:
Property type %
Industrial 8.2Retail 8.1Commercial 8.3
Total 8.1
The annualised property yield is 9.4%.
Umlazi Mega City, KwaZulu-Natal

ANNUAL FINANCIAL STATEMENTS 2013 45
Atterbury Décor (h) Cnr Atterbury Road & Nieuwhout Street Pretoria 14 784 5 987 88,49 54 400Cambridge Crossing Cnr Witkoppen Road & Stone Haven Street, Paulshof Sandton 12 478 3 650 131,49 53 600Coachman’s Crossing Cnr Peter Place & Karen Street, Bryanston West Sandton 15 860 6 466 147,20 63 000Comaro Crossing (s) Cnr Comaro Street & Boundary Lane Oakdene 24 067 16 898 116,87 120 700Cullinan Jewell Shopping Centre ($) Cnr Main Road & Oak Avenue Cullinan 10 753 6 076 85,06 26 300East Rand Galleria (h) Cnr Northrand & Rietfontein Roads, Jansen Park Boksburg 98 202 50 357 91,57 459 500Forest Road Design & Décor Centre ($) Cnr Forest Drive & Sunset Avenue, Pineslopes Fourways 21 933 11 097 55,64 72 700Kempton Shoprite Checkers Cnr Langenhoven Avenue & Voortrekker Road Kempton Park 49 124 15 948 56,18 62 300Midway Mews (h) Cnr Harry Galaun Drive & Seventh Street Halfway Gardens 28 198 8 301 121,15 55 500Montana Crossing (t) Cnr Zambesi Drive & Dr Swanepoel Road Montana 69 733 23 133 89,44 183 600Northpark Mall 526 Rachel De Beer Street Pretoria North 20 415 28 112 88,21 167 500The Boulevard - Melville (#) Cnr Main & Ayr Roads Mellville 9 907 5 352 95,73 34 900Town Square Shopping Centre Cnr Hendrik Potgieter Road & Albert Street Waltevredenpark 25 027 5 656 136,51 75 500Willow Way Shopping Centre Cnr Lynwood Road & Power Avenue Lynwood 26 482 7 951 96,58 75 600
Property address Location Site area (m2)Rentable
area (m2)
Weightedaverage rental
per m2 (R)ValueR000
Retail - Gauteng
APPENDIX C: PROPERTY PORTFOLIO
Property company/name Key
Property address Location Site area (m2)Rentable
area (m2)
Weightedaverage rental
per m2 (R)ValueR000
Retail - Kwazulu Natal
Property company/name Key
Bluff Shopping Centre (t) Cnr Grays Inn & Tara Roads Bluff 48 637 21 382 107,60 261 100Davenport Square Shopping Centre Cnr Clark & Brand Roads Glenwood 18 544 9 385 145,39 124 300Hayfields Mall Cnr Blackburrow Road & Cleland Roads, Hayfields Pietermaritzburg 34 683 12 776 148,59 176 000Musgrave Centre (h) (5) 115 Musgrave Road Musgrave 25 892 39 390 159,57 722 000Pine Crest Shopping Centre (@) Cnr Kings & Glenugie Roads Pinetown 51 175 20 067 135,63 306 950Pine Walk Centre 22 Kings Road Pinetown 13 889 8 513 102,85 76 400Springfield Value Centre Cnr Umgeni & Electron Roads Springfield 52 020 20 259 106,06 260 900Umlazi Mega City (#) (p) 50 Mangosuthu Highway Umlazi 163 300 27 011 104,90 264 675
Checkers Somerset West (h) Cnr Main & Gordon Roads Somerset West 13 961 6 259 81,35 61 400Stellenbosch Square (t) ($) Cnr R44 & Webersvallei Road Stellenbosch 34 753 10 408 81,57 81 800
Property address Location Site area (m2)Rentable
area (m2)
Weightedaverage rental
per m2 (R)ValueR000
Retail - Western Cape
Property company/name Key
Middelburg Pick ’n Pay Cnr Walter Sisulu & Joubert Streets Middelburg 9 918 7 708 57,55 38 000Rhodesdene Centre Cnr Caters Way & Selous Avenue Kimberley 8 584 2 974 85,42 25 500
Property address Location Site area (m2)Rentable
area (m2)
Weightedaverage rental
per m2 (R)ValueR000
Retail - Other
Property company/name Key
11 Enterprise Close ($) Linbro Business Park Linbro Business Park 4 414 1 913 13 10011 Wankel Street ($) 11 Wankel Street Jet Park 16 905 6 724 27 600111 Mimets Road (t) ($) 111 Mimets Road Denver 33 881 18 051 83 700112 Yaldwyn Road (t) ($) 112 Yaldwyn Road Jet Park 55 675 30 299 266 100120 Loper Avenue ($) 120 Loper Avenue Aeroport Industrial Estate 10 111 3 575 21 100137 Kuschke Street ($) 137 Kuschke Street Meadowdale 2 820 1 541 9 700141 Hertz Close ($) 141 Hertz Close Meadowdale 6 694 3 616 18 000144 Kuschke Street ($) 144 Kuschke Street Meadowdale 2 536 1 488 7 200145 Kuschke Street ($) 145 Kuschke Street Meadowdale 2 262 1 518 7 000148 Fleming Street ($) 148 Fleming Street Meadowdale 2 652 1 417 6 400
Property address Location Site area (m2)Rentable
area (m2)
Weightedaverage rental
per m2 (R)ValueR000
Industrial - Gauteng
Property company/name Key

SA CORPORATE REAL ESTATE FUND46
149 Fleming Street ($) 149 Fleming Street Meadowdale 3 382 2 090 10 70015 Patrick Road ($) 15 Patrick Road Jet Park 8 140 2 275 11 800150 Fleming Street ($) 150 Fleming Street Meadowdale 3 180 1 835 8 90018 Covora Street ($) 18 Covora Street Jet Park 10 498 4 638 23 8002 Fobian Street (t) ($) 2 Fobian Street Boksburg 12 047 5 258 28 9002 Webb Road ($) 2 Webb Road Jet Park 6 009 1 859 7 30021 Pomona Road ($) 21 Pomona Road Pomona 20 229 4 585 25 80027 Jet Park Road (t) ($) 27 Jet Park Road Jet Park 55 256 12 582 52 400293 Hebbard Road ($) 293 Hebbard Road Robertville 11 783 7 762 22 9003 Remblok Street ($) 3 Remblok Street Strydom Park 3 084 1 787 8 0003 Wankel Street ($) 3 Wankel Street Jet Park 7 391 3 952 21 60032 / 34 Yaldwyn Road ($) 32 / 34 Yaldwyn Road Jet Park 7 758 4 000 16 40033 Ontdekkers Road ($) 33 Ontdekkers Road Roodepoort 14 805 6 386 61 70036 Wankel Street ($) 36 Wankel Street Jet Park 16 800 5 090 26 10037 Yaldwyn Road (h) ($) 37 Yaldwyn Road Jet Park 59 759 39 738 211 70040 Electron Avenue (h) ($) 40 Electron Avenue Isando 28 959 13 171 60 4005 Yaldwyn Road (t) ($) 5 Yaldwyn Road Jet Park 41 194 17 552 87 000Nampak ($) 530 Nicholson Road Denver 31 009 24 880 67 30057 Sarel Baard Crescent (h) ($) 57 Sarel Baard Crescent Centurion 80 999 34 460 284 6007 Belgrade Avenue ($) 7 Belgrade Avenue Aeroport Industrial Estate 3 525 1 535 7 8008 Director Drive ($) 8 Director Drive Aeroport Industrial Estate 6 948 3 750 18 10083 Heidelburg Avenue ($) Production Park, 83 Heidelburg Ave City Deep 19 175 7 898 43 40085 Newton Street ($) 85 Newton Street Meadowdale 5 600 3 178 16 00088 Loper Avenue (h) ($) 88 Loper Avenue Aeroport Industrial Estate 10 953 7 711 40 80090 Electron Avenue (h) ($) 90 Electron Avenue Isando 13 078 5 303 25 10096 - 15th Road ($) 96, 15th Road, Randjespark Midrand 44 682 10 443 70 400Beryl Street (t) ($) Beryl Street Jet Park 130 418 27 680 277 800Cnr Bismuth & Graniet Streets ($) Cnr Bismuth & Graniet Streets Jet Park 4 005 1 800 6 800Cnr Fleming St & Koornhof Road ($) Cnr Fleming St & Koornhof Road Meadowdale 5 471 2 914 13 500Cnr Koornhof Rd & Essex Street ($) Cnr Koornhof Rd & Essex Street Meadowdale 20 929 9 783 44 6008 Paul Smit Street ($) 8 Paul Smit Street Anderbolt 40 778 18 197 53 500Cnr Rudo Nel & Tudor Streets (h) ($) Cnr Rudo Nel & Tudor Streets Jet Park 35 281 17 035 105 100Cnr Staal & Stephenson Road (h) ($) Cnr Staal & Stephenson Road Pretoria 43 957 28 538 69 200Stondell Investments Proprietary Ltd 684 Pretoria Main Road, Wynberg Wynberg 7 435 2 551 6 800
Property address Location Site area (m2)Rentable
area (m2)
Weightedaverage rental
per m2 (R)ValueR000
Industrial - Gauteng (continued)
APPENDIX C: PROPERTY PORTFOLIO (continued)
Property company/name Key
1 Baltex Road (s) ($) 1 Baltex Road Isipingo 53 080 9 964 110 70010 Yarborough Road (s) ($) 10 Yarborough Road Pietermaritzburg 38 712 3 400 44 1001 Irvine Bell Drive ($) 1 Irvine Bell Drive Empangeni 12 788 2 736 13 9001 / 5 Stockville Road ($) 1 / 5 Stockville Road Westmead 20 033 8 078 29 40011 Coconut Grove ($) 11 Coconut Grove Shakashead 1 254 453 1 10011 Columbine Place (s) ($) 11 Columbine Place Red Hill 21 172 9 947 52 000121 Intersite Avenue (#) ($) 121 Intersite Avenue Durban 7 579 2 734 17 700121 Malacca Road ($) 121 Malacca Road Red Hill 7 565 3 751 17 30014 / 24 Mahoganyfield Way ($) 14 / 24 Mahoganyfield Way Springfield Park 7 263 4 986 22 400147 / 149 Old Main Road ($) 147 / 149 Old Main Road Pinetown 12 950 6 186 51 100153 Old Main Road ($) 153 Old Main Road Pinetown 9 044 3 394 28 400155 / 157 Old Main Road ($) 155 / 157 Old Main Road Pinetown 14 576 5 858 40 30017 Young Road ($) 17 Young Road Pinetown 8 942 3 970 10 8002 Beechfield Crescent ($) 2 Beechfield Crescent, Springfield Park Durban 4 636 3 815 17 30020 Kyalami Road ($) 20 Kyalami Road Pinetown 6 614 3 052 12 40024 Westmead Road ($) 24 Westmead Road Westmead 9 952 3 542 16 100264 Aberdare Drive ($) 264 Aberdare Drive Phoenix 10 000 3 648 12 100
Property address Location Site area (m2)Rentable
area (m2)
Weightedaverage rental
per m2 (R)ValueR000
Industrial - KwaZulu Natal
Property company/name Key

ANNUAL FINANCIAL STATEMENTS 2013 47
28 Goodwood Road ($) 28 Goodwood Road Mahogany Ridge 21 409 7 848 37 6002A, B & C Kuba Avenue ($) 2A, B & C Kuba Avenue Riverhorse Valley 9 979 4 817 27 80030 / 34 Hillclimb Road ($) 30 / 34 Hillclimb Road Mahogany Ridge 15 966 10 181 35 50033 / 37 Aloefield Crescent ($) 33 / 37 Aloefield Crescent Springfield Park 6 804 5 672 27 80033 Surprise Road ($) 33 Surprise Road Pinetown 15 894 5 931 20 30035 Circuit Road ($) 35 Circuit Road Westmead 7 024 3 918 12 8005 Westgate Place ($) 5 Westgate Place Westmead 27 828 4 504 39 5006 Cedarfield Close (s) ($) 6 Cedarfield Close Springfield Park 17 137 10 064 52 4006 / 8 Mahogany Road (s) ($) 6 / 8 Mahogany Road Mahogany Ridge 15 173 7 324 44 90089 Flanders Drive ($) 89 Flanders Drive Mount Edgecombe 10 479 8 473 40 3009 Twilight Road ($) 9 Twilight Road Umhlanga 2 106 823 13 5009 / 15 Lanner Road ($) 9 / 15 Lanner Road New Germany 8 260 6 960 22 500Blue Heron Investments Proprietary Ltd (#) Cnr Shadwell & Jenkyn Roads, Maydon Wharf Durban 15 703 14 587 48 800Cnr Gillitts & Young Roads ($) Cnr Gillitts & Young Roads Pinetown 12 354 4 616 20 300Dune Lark Investments Proprietary Ltd (#) 34 Shadwell Road, Maydon Wharf Durban 16 779 13 091 26 900Erf 84 / 85 / 86 Shakas Head ProprietaryLtd 15 Coconut Grove Shakashead 24 537 10 705 27 300Grey Heron Investments Proprietary Ltd (#) 137 Johnston Road, Maydon Wharf Durban 7 894 7 394 23 500Rock Kestrel Investments Proprietary Ltd (#) Shadwell Road, Maydon Wharf Durban 14 408 398 7 700Suffert Street ($) Suffert Street Pinetown 33 653 13 943 50 600Whirlprops 25 P Proprietary Ltd (#) (t) 59 Intersite Avenue, Umgeni Business Park Durban 21 753 16 704 90 200Wood Ibis Investments Proprietary Ltd (#) Methven Road, Maydon Wharf Durban 19 150 18 060 49 200
Property address Location Site area (m2)Rentable
area (m2)
Weightedaverage rental
per m2 (R)ValueR000
Industrial - KwaZulu Natal (continued)
Property company/name Key
APPENDIX C: PROPERTY PORTFOLIO (continued)
1 Marconi Street ($) 1 Marconi Street Montague Gardens 12 141 3 970 25 70010 Industrial Avenue ($) 10 Industrial Avenue Paarl 24 875 3 259 37 6009 Milner Road (h) ($) 9 Milner Road, Paarden Eiland Paarden Eiland 31 244 16 169 82 000Cnr Bridge Street and Molecule Road ($) Cnr Bridge Street and Molecule Road Bellville 29 083 8 558 37 100Cnr Giel Basson Drive & Nathan MallachRoad ($) Cnr Giel Basson Drive & Nathan Mallach Road Goodwood 10 430 5 902 64 400Cnr Isotope & Bridge Streets ($) Cnr Isotope & Bridge Streets Bellville 10 756 4 573 18 000Tygerberg Business Park ($) Trans Karoo Street, Parow Industria Parow 49 030 17 408 124 300
Property address Location Site area (m2)Rentable
area (m2)
Weightedaverage rental
per m2 (R)ValueR000
Industrial - Western Cape
Property company/name Key
102 Essenwood Road ($) 102 Essenwood Road Durban 2 718 4 671 64 20021 Fricker Road (h) ($) 21 Fricker Road, Illovo Sandton 3 718 2 746 42 200252 Montrose Ave ($) 252 Montrose Ave Northriding 12 237 2 419 30 00036 Wierda Road West (s) ($) 36 Wierda Road West Wierda Valley 6 575 3 028 28 600Cnr Handel & Crownwood Roads (t) ($) Cnr Handel & Crownwood Roads Ormonde 36 073 6 131 33 700Cnr Old Pretoria & Alexandra Roads ($) Cnr Old Pretoria & Alexandra Roads Midrand 5 857 2 828 51 300Lebombo Road (s) ($) Lebombo Road, Garsfontein Pretoria 3 966 3 340 24 700World Trade Centre ($) Cnr West Road South & Lower Road, Morningside Sandton 23 636 15 478 375 000
Property address Location Site area (m2)Rentable
area (m2)
Weightedaverage rental
per m2 (R)ValueR000
Offices - Gauteng
Property company/name Key

SA CORPORATE REAL ESTATE FUND48
1 Holwood Park (s) ($) La Lucia Ridge Office Estate Umhlanga Ridge 16 736 7 504 91 60012 Sookhai Place ($) Derby Downs Office Park Westville 5 806 2 636 21 000199 North Ridge Road (h) ($) 199 North Ridge Road, Morningside Durban 3 765 4 648 36 8003 The Terrace ($) 3 The Terrace, Westway Westville 3 017 2 278 23 5004 School Road ($) 4 School Road Pinetown 6 941 7 292 25 300
Property address Location Site area (m2)Rentable
area (m2)
Weightedaverage rental
per m2 (R)ValueR000
Offices - KwaZulu Natal
APPENDIX C: PROPERTY PORTFOLIO (continued)
Property company/name Key
22 Voortrekker Street ($) 22 Voortrekker Street Vredenberg 9 507 3 067 43 70031 Allen Drive ($) 31 Allen Drive Bellville 2 969 3 255 27 200
Property address Location Site area (m2)Rentable
area (m2)
Weightedaverage rental
per m2 (R)ValueR000
Offices and Other - Western Cape
Property company/name Key
110 Zastron Road ($) 110 Zastron Road Bloemfontein 1 985 1 978 6 60028 Durham Road ($) 28 Durham Road Mthatha 4 342 4 198 56 30034 Mangold Street ($) 34 Mangold Street Port Elizabeth 1 606 968 5 800Unipark Offices (s) ($) Noble Street Bloemfontein 7 808 6 655 71 900
Total 2 752 057 1 193 959 73,84 8 865 225
Investment property - at valuation 8 722 125Properties classified as developments 143 100Total 8 865 225
Keys:(#) Indicates leasehold properties with leases expiring between 2025 and 2054(*) Before straight line rental adjustment(h) Indicates properties bonded with ABSA(t) Indicates properties bonded with Omsfin(s) Indicates properties bonded with RMB(p) Indicates a 75% share in property(@) Indicates a 50% share in property($) Indicates properties owned directly by the Fund(5) Indicates a 50% share owned directly by the Fund and 50% indirectly held
Due to the sensitivity of the weighted average rental per m2 in the industrial and commercial portofolios, the weighted average has been disclosed in Appendix B.
Property address Location Site area (m2)Rentable
area (m2)
Weightedaverage rental
per m2 (R)ValueR000
Offices and Other - Other
Property company/name Key

ANNUAL FINANCIAL STATEMENTS 2013 49
The Company’s directors are responsible for monitoring the preparation and fair presentation of the annual financialstatements and related information included in these the annual financial statements.
In order for the Board to discharge its responsibilities, management has developed and continues to maintain a systemof internal control. The Board has ultimate responsibility for the system of internal control and reviews its operation,primarily through the Risk & Compliance and Audit Committees.
The annual financial statements are prepared in accordance with International Financial Reporting Standards and therequirements of the Companies Act, No 71 of 2008 (“the Act”), and incorporate disclosures in line with the accountingpractices and corporate governance philosophy of the Company. They are based on appropriate accounting policiesconsistently applied, except where otherwise stated and are supported by reasonable and prudent judgements andestimates.
The external auditors are responsible for reporting on the annual financial statements, and their report is included onpage 50.
The Board has satisfied itself that the Company has adequate resources to continue in operation for the foreseeablefuture and has no reason to believe the business will not be a going concern in the year ahead. Accordingly, in preparingthe annual financial statements, the going concern basis has been adopted.
The annual financial statements for the year ended 31 December 2013 as set out on pages 51 to 68 were approved bythe Board of Directors on 28 February 2014 and are signed on its behalf by:
J Molobela R J Biesman-SimonsIndependent Non-Executive Chairman Chairman - Audit Committee
These annual financial statements have been prepared under the supervision of AM Basson CA(SA), Financial Director.
SA Corporate Real Estate Fund Managers Limited: Annual Financial Statements
DIRECTORS’ RESPONSIBILITYFor And Approval Of The Annual Financial Statements
SA Corporate Real Estate Fund Managers Limited: Annual Financial Statements
DECLARATION BY THE SECRETARYFor the year ended 31 December 2013
The secretary certifies that the Company has lodged with the Commissioner all such returns as are required of a publiccompany, in terms of section 88(2)(e) of the Companies Act, No. 71 of 2008 and that all such returns and notices aretrue, correct and up to date.
Old Mutual Property Proprietary LimitedCompany secretary28 February 2014

SA CORPORATE REAL ESTATE FUND MANAGERS LIMITED50
SA Corporate Real Estate Fund Managers Limited: Annual Financial Statements
INDEPENDENT AUDITOR’S REPORTTo The Shareholders Of SA Corporate Real Estate Fund Managers Limited
We have audited the financial statements of SA Corporate Real Estate Fund Managers Limited, set out on pages 56 to68, which comprise the statement of financial position as at 31 December 2013, and the statement of comprehensiveincome, statement of changes in equity and statement of cash flows for the year then ended, and the notes, comprisinga summary of significant accounting policies and other explanatory information.
Directors' Responsibility for the Financial StatementsThe company's directors are responsible for the preparation and fair presentation of these financial statements inaccordance with International Financial Reporting Standards and the requirements of the Companies Act of South Africa,and for such internal control as the directors determine is necessary to enable the preparation of financial statementsthat are free from material misstatement, whether due to fraud or error.
Auditor's ResponsibilityOur responsibility is to express an opinion on these financial statements based on our audit. We conducted our audit inaccordance with International Standards on Auditing. Those standards require that we comply with ethical requirementsand plan and perform the audit to obtain reasonable assurance about whether the financial statements are free frommaterial misstatement.
An audit involves performing procedures to obtain audit evidence about the amounts and disclosures in the financialstatements. The procedures selected depend on the auditor's judgment, including the assessment of the risks of materialmisstatement of the financial statements, whether due to fraud or error. In making those risk assessments, the auditorconsiders internal control relevant to the entity's preparation and fair presentation of the financial statements in orderto design audit procedures that are appropriate in the circumstances, but not for the purpose of expressing an opinionon the effectiveness of the entity's internal control. An audit also includes evaluating the appropriateness of accountingpolicies used and the reasonableness of accounting estimates made by management, as well as evaluating the overallpresentation of the financial statements.
We believe that the audit evidence we have obtained is sufficient and appropriate to provide a basis for our audit opinion.
OpinionIn our opinion, the financial statements present fairly, in all material respects, the financial position of SA Corporate RealEstate Fund Managers Limited as at 31 December 2013, and its financial performance and cash flows for the year thenended in accordance with International Financial Reporting Standards and the requirements of the Companies Act ofSouth Africa.
Other reports required by the Companies ActAs part of our audit of the financial statements for the year ended 31 December 2013, we have read the Directors' Report,the Report of the Audit Committee and the Declaration by the Company Secretary for the purpose of identifying whetherthere are material inconsistencies between these reports and the audited financial statements. These reports are theresponsibility of the respective preparers. Based on reading these reports we have not identified material inconsistenciesbetween these reports and the audited financial statements. However, we have not audited these reports and accordinglydo not express an opinion on these reports.
Deloitte & ToucheRegistered Auditors
Per: GG FortuinPartner28 February 2014

ANNUAL FINANCIAL STATEMENTS 2013 51
SA Corporate Real Estate Fund Managers Limited: Annual Financial Statements
REPORT OF THE AUDIT COMMITTEEFor the year ended 31 December 2013
The Audit Committee has pleasure in submitting their report as required by sections 61(8)(a)(iii) and 94(7)(f) of theAct.
In addition to having statutory responsibilities to the shareholders, the Audit Committee (“the Committee”) is asubcommittee of the Board of Directors. It assists the Board through advising them and making recommendations onfinancial reporting, internal financial controls, external and internal audit functions, statutory and regulatory complianceof SA Corporate Real Estate Fund Managers Limited (“the Company”). The Committee serves as a link between theBoard and the external auditors.
Terms of referenceThe Committee has adopted formal terms of reference, delegated to it by its Board of Directors as its scope andresponsibilities. The Committee follows an annual work plan to ensure all its duties and responsibilities as set out in itsterms of reference are dealt with. The Committee confirms that it has discharged its functions and complied with itsterms of reference for the year ended 31 December 2013. The Board concurred with this assessment.
CompositionThe Committee consists of four independent non-executive directors. All members are independent as described in section94(4) of the Act. The appointment of members of the Committee requires the approval of the shareholders at the AnnualGeneral Meeting each year.
As at 31 December 2013, the committee comprised:
NAME QUALIFICATIONS DATE APPOINTED
Robert John Biesman-Simons CA(SA) 19 August 2010 (Chairman) Resigned: 25 July 2012
Re-appointed: 6 December 2012Ebrahim Suleman Seedat CA(SA) 27 February 2001Gugulethu Patricia Dingaan CA(SA) 20 May 2010Kenneth John Forbes CA(SA) 19 September 2012
The Managing Director and Financial Director and representatives from the external and internal auditors attend theCommittee meetings by invitation. The Company Secretary acts as secretary to the Committee.
MeetingsThe Committee held five meetings during the year. Separate confidential meetings were held with the external auditorsand the internal auditors.
Statutory dutiesThe Committee discharged its function in terms of the Act as follows:� Nominated Deloitte & Touche as external auditor for the Company and Mr GG Fortuin as the designated independent
auditor and verified their independence.� Approved the audit fees and determined the external auditor's terms of engagement.� Ensured that the appointment of the external auditors complies with the Act and other relevant legislation and requirements.� Determined the nature and extent of allowable non-audit services.� Dealt with queries relating to the accounting practices, internal audit of the Company, the content and auditing of its financial statements, the internal financial controls of the Company and any other related matters.� Made submissions to the Board on matters concerning the Company's accounting policies, standards, financial control,
records and reporting.� Reviewed the Company's interim and year-end financial statements as well as the integrated annual report.� Took appropriate steps to ensure that the financial statements were prepared in accordance with the International Financial Reporting Standards and the requirements of the Act and other applicable legislation.

SA CORPORATE REAL ESTATE FUND MANAGERS LIMITED52
Delegated dutiesThe Committee executed the duties delegated to it as follows:� Reviewed the external auditor's approach and scope document and reviewed the quality and effectiveness of the external
audit process.� Discussed and reviewed the findings and concerns arising from the external audit.� Monitored compliance with legislation and regulations.� Reviewed the effectiveness of the Company's system of internal financial control, including receiving assurance from Old
Mutual Property Proprietary Limited (“OMP”), management and external audit.� Reviewed compliance with the Committee's terms of reference and recommended minor changes to its terms of reference
to the Board.� Reported back to the Board on matters delegated to it in terms of its terms of reference.
Assurances from OMPThe following assurances were provided by OMP for the year ended 31 December 2013:� The system of internal control within the Company has been designed to provide reasonable assurance that significant
risks are appropriately managed, that management and financial information emanating from the Company is reliable,and that relevant laws and regulations have been complied with and assets are safeguarded.
� The finance function including the senior financial management staff have the necessary skills and experience.� There were no critical breaches or breakdowns in controls, procedures and systems during the year.
Based on the processes reviewed and the assurances obtained, the Committee believes that the internal financial controlsare effective.
Regulatory complianceThe Committee confirms that it has complied with all applicable legal, regulatory and other responsibilities.
Independence of the external auditorsDuring the year under review the Committee reviewed the representation of the external auditor and, after conductingits own review, confirmed the independence of the auditor.
Expertise and experience of the financial directorAs required by the JSE Listings Requirements 3.84(h), the Committee is satisfied that the Financial Director, Ms AntoinetteBasson, possesses the appropriate expertise and experience to meet her responsibilities as required by the JSE.
Financial statementsThe Committee recommends the annual financial statements to the Board for approval.
R J Biesman-SimonsChairman - Audit Committee28 February 2014
SA Corporate Real Estate Fund Managers Limited: Annual Financial Statements
REPORT OF THE AUDIT COMMITTEE (continued)
For the year ended 31 December 2013

ANNUAL FINANCIAL STATEMENTS 2013 53
SA Corporate Real Estate Fund Managers Limited: Annual Financial Statements
DIRECTORS’ REPORT31 December 2013
2013 2012R R
Nature of businessThe business of the Company is the management of property unit trustschemes in accordance with the Collective Investment Schemes Act, No.45 of 2002.
Issued share capitalThere were no changes to the authorised and issued share capital duringthe financial year under review. The authorised and issued share capital is:
100 000 ordinary shares of R2 each 200 000 200 0001 800 000 “A” ordinary shares of 1 cent each 18 000 18 000
218 000 218 000InvestmentsThe Company's beneficial ownership of units in the SA Corporate Real EstateFund is 1 202 615 units (2012: 1 202 615 units).
DividendsNo dividends were declared for the current period (2012: Nil).
DirectorateThe following acted as directors during the year under review:
Director Date appointed Date resignedIndependent non-executive chairmanJ Molobela 03 May 2013
Independent non-executive directorsRJ Biesman-SimonsGP DingaanKJ ForbesSH MiaES Seedat
Non-executive directorsPA LevettR Morar 28 February 2014GJ van Zyl 03 June 2013
Executive DirectorsTR Mackey (Managing)AM Basson (Financial)

SA CORPORATE REAL ESTATE FUND MANAGERS LIMITED54
SA Corporate Real Estate Fund Managers Limited: Annual Financial Statements
DIRECTORS’ REPORT (continued)
31 December 2013
2013 2012R000 R000
Directorate (continued)The table below sets out the directors' fees for the year:
Non-executiveKM Roman - 117RJ Biesman-Simons 363 264PA Levett *# 189 168KJ Forbes * 279 177MN Ngcobo - 24ES Seedat 271 196WC van der Vent ^ - 55SH Mia 212 161GP Dingaan 200 170R Morar ^ 186 142J Molobela 151 -GJ Van Zyl 94 -
ExecutiveLB van Niekerk *# - 49GJ van Zyl *# - 90TR Mackey *# 199 9AM Basson*# 199 132
Total 2 343 1 754
* Fees accrue to the corporate entity where the director is employed.# These directors are employed and paid by Old Mutual Property.^ Fees accrue to the corporate entity where the director is employed up and until date of resignation from that entity.
AuditorsDeloitte & Touche continued in office as auditors of the Company for 2013. At the annual general meeting, shareholders will be requestedto reappoint Deloitte & Touche as auditors of SA Corporate Real Estate Fund Managers Limited and to confirm that Mr GG Fortuin will bethe designated audit partner for the 2014 financial year.
Events subsequent to the reporting dateThe Company has reached an agreement with OMP and Marriot Property Services Proprietary Limited, a wholly-owned subsidiary of OMPand the holder of 95% of the issued shares in the Company, on the terms of a transaction, which, if implemented will have the economiceffect of internalising the management of SA Corporate Real Estate Fund (“the Fund”). In terms of the proposed transaction, a considerationof R185 million net of VAT will be paid by the Fund to the Company and the Company has declared a distribution which will be payableimmediately after the payment of the consideration which will be the total distributable reserves after provision has been made for taxation,cost relating to finalising and implementing the transaction, amount required for working capital and regulatory capital requirements andsatisfying the solvency and liquidity test as defined in the Act. The Fund's unitholders have been asked to vote to obtain their approval forthe transaction and the results of the vote are expected to be published in the week commencing 31 March 2014.
Going concernThe directors are of the opinion that the Company has adequate resources to continue in operation for the foreseeable future. The financialstatements have accordingly been prepared on the going concern basis.

ANNUAL FINANCIAL STATEMENTS 2013 55
Company secretaryOld Mutual Property Proprietary Limited
5th floor Mutual Park P O Box 333Jan Smuts Drive Mutual ParkPinelands 74517405
Registered and business addressSouth Wing, First FloorBlock A, The ForumNorth Bank LaneCentury City7441
SA Corporate Real Estate Fund Managers Limited: Annual Financial Statements
DIRECTORS’ REPORT (continued)
31 December 2013
World Trade Center, Sandton, Gauteng

SA CORPORATE REAL ESTATE FUND MANAGERS LIMITED56
SA Corporate Real Estate Fund Managers Limited: Annual Financial Statements
STATEMENT OF FINANCIAL POSITIONas at 31 December 2013
2013 2012Notes R000 R000
Assets
Non-current assetsInvestment in property fund units 5 4 799 4 390
Current assetsCurrent tax receivable 956 1 431Trade and other receivables 6 8 650 5 990Cash and cash equivalents 7 2 450 4 903
12 056 12 324
Total assets 16 855 16 714
Equity and liabilities
Capital and reservesShare capital 8 218 218Share premium 9 1 782 1 782Non-distributable reserve 10 2 268 2 063Distributable reserve 3 409 7 147
7 677 11 210Non-current liabilitiesDeferred taxation liability 11 498 330
Current liabilitiesTrade and other payables 12 8 680 5 174
Total equity and liabilities 16 855 16 714
21 Fricker Road, Sandton, Gauteng

ANNUAL FINANCIAL STATEMENTS 2013 57
Non-Share Share distributable Distributable
capital premium reserve reserve TotalR000 R000 R000 R000 R000
Balance at 1 January 2012 218 1 782 1 866 2 819 6 685
Total comprehensive income for the year - - - 4 525 4 525Transfer to non-distributable reserve - - 197 (197) -
Balance at 31 December 2012 218 1 782 2 063 7 147 11 210
Total comprehensive loss for the year - - - (3 533) (3 533) Transfer to non-distributable reserve - - 205 (205) -
Balance at 31 December 2013 218 1 782 2 268 3 409 7 677
SA Corporate Real Estate Fund Managers Limited: Annual Financial Statements
STATEMENT OF CHANGES IN EQUITYfor the year ended 31 December 2013
2013 2012Notes R000 R000
Revenue 2.5 39 531 36 633
IncomeIncome from property fund 13 37 811 35 916Interest received 314 268Legal cost recoveries 1 406 449
39 531 36 633Expenses
Administration expenses (1 632) (943)Asset management fees (30 884) (24 002)Audit fees - Current year (111) (57)Audit fees - Prior year - (3)Directors' remuneration 14 (2 343) (1 754)Consultants and legal fees (8 195) (2 950)
(43 165) (29 709)
(Loss)/profit before taxation and revaluation of investments (3 634) 6 924 Gain on revaluation of investment 5 409 229
(Loss)/profit before taxation (3 225) 7 153
Taxation 15 (308) (2 628)
(Loss)/profit for the year (3 533) 4 525
Other comprehensive income - -
Total comprehensive (loss)/income for the year (3 533) 4 525
SA Corporate Real Estate Fund Managers Limited: Annual Financial Statements
STATEMENT OF COMPREHENSIVE INCOMEfor the year ended 31 December 2013

SA CORPORATE REAL ESTATE FUND MANAGERS LIMITED58
SA Corporate Real Estate Fund Managers Limited: Annual Financial Statements
STATEMENT OF CASH FLOWSfor the year ended 31 December 2013
2013 2012Notes R000 R000
Cash flows from operating activitiesCash (utilised in)/generated from operations 16 (3 478) 2 713Distributions received 13 376 357Interest received 314 268Income taxation refund received/(paid) 17 335 (2 542)
Net cash (outflow)/inflow from operating activities (2 453) 796
Net (decrease)/increase in cash and cash equivalents (2 453) 796
Cash and cash equivalents at beginning of year 4 903 4 107
Cash and cash equivalents at end of year 7 2 450 4 903
Musgrave Centre, Durban, KwaZulu Natal

ANNUAL FINANCIAL STATEMENTS 2013 59
SA Corporate Real Estate Fund Managers Limited: Annual Financial Statements
NOTES TO THE ANNUAL FINANCIAL STATEMENTSfor the year ended 31 December 2013
1. General informationSA Corporate Real Estate Fund Managers Limited is a public company incorporated in South Africa. The addressof its registered office and principal place of business, together with its principal activities, are disclosed and describedin the Directors' Report.
2. Accounting policiesThe financial statements provide information about the financial position, results of operations and changes infinancial position of the Company. They have been prepared in accordance with International Financial ReportingStandards. The accounting policies used in the preparation of the financial statements are consistent with thoseapplied in the prior year. The financial statements have been prepared on the going concern and historical costbases, except where otherwise stated.
The principal accounting policies are set out below:
2.1 TaxationThe income tax charge for the year comprises current and deferred tax. Income tax is recognised in profit or lossexcept to the extent that it relates to items recognised directly in equity. Current tax is the expected tax payableon the taxable income for the year and any adjustment to tax payable in respect of previous years. Deferred taxationis provided for using the liability method, based on temporary differences. Temporary differences are differencesbetween the carrying amounts of assets and liabilities for financial reporting purposes and their tax base. Theamount of deferred taxation provided is based on the expected manner of realisation or settlement of the carryingamount of assets and liabilities. Deferred taxation is charged to profit or loss except to the extent that it relatesto a transaction that is recognised directly in equity. The effect on deferred taxation of any changes in tax rates isrecognised in profit or loss, except to the extent that it relates to items previously charged or credited directly toequity. Deferred taxation liability is not recognised on temporary differences that arise from the initial recognitionof goodwill, initial recognition of an asset or liability in a transaction that is not a business combination which, atthe time of transaction, affects neither the accounting nor taxable profit or loss; and temporary differences associatedwith investments in subsidiaries, associates and joint ventures where the timing of the reversal of the temporarydifferences can be controlled by the Company and it is probable that the temporary differences will not reverse inthe foreseeable future. A deferred tax asset is recognised to the extent that it is probable that future taxable incomewill be available, against which the unutilised tax losses and deductible temporary differences can be used. Deferredtax assets are reduced to the extent that it is no longer probable that the related tax benefits will be realised.
2.2 Impairment
The Company assesses at each reporting date whether there is any objective evidence that a financial asset orgroup of assets, excluding financial assets at Fair Value Through Profit or Loss (“FVTPL”), is impaired. An impairmentloss is recognised in profit or loss whenever the carrying amount of an asset exceeds its recoverable amount, whichis the higher of an asset's net selling price and value in use. Whenever an impairment loss is subsequently reversed(except for goodwill), the carrying amount of the asset is increased to the extent that the increased carrying amountdoes not exceed the original carrying amount. A reversal of impairment loss is recognised immediately in profitor loss.
2.3 Financial instrumentsA financial asset or financial liability is recognised for as long as the Company is party to the contractual provisionsof the instrument.
Cash and cash equivalentsCash and cash equivalents comprise cash on hand and deposits held on call with banks and are stated at theirnominal value.

SA CORPORATE REAL ESTATE FUND MANAGERS LIMITED60
2.3 Financial instruments (continued)Trade and other receivablesTrade and other receivables originated by the Company are held at amortised cost, using the effective interest ratemethod, after deducting accumulated impairment losses. Receivables with no fixed maturity are held at cost.
Other investments in debt and equityThe Company classifies its other investments in debt and equity securities into the following categories:- at fair value through profit or loss;- held-to-maturity; and- available-for-sale.Held-to-maturity investments are those that the Company has the positive intent and ability to hold to maturityand these are held at amortised cost using the effective interest rate method, after deducting accumulated impairmentlosses.
Investments classified as at FVTPL and available-for-sale are held at fair value, which is the market price at thereporting date. Gains and losses arising from available-for-sale financial assets are recognised directly in equity.Gains and losses arising from investments classified as at FVTPL are recognised in profit or loss.
Financial liabilities and equityFinancial liabilities and equity instruments issued by the Company are classified according to the substance of thecontractual arrangements entered into and the definitions of a financial liability and an equity instrument. An equityinstrument is any contract that evidences a residual interest in the assets of the Company after deducting all itsliabilities. The accounting policies adopted for specific financial liabilities and equity instruments are set out below:
Equity instrumentsEquity instruments issued by the Company are recorded at the proceeds received net of direct issue costs.
Trade payablesTrade payables are carried at the fair value of the consideration to be paid in the future for goods and services thathave been received or supplied and invoiced or formally agreed with the supplier.
2.4 ProvisionsProvisions are recognised when the Company has a present legal or constructive obligation as a result of past eventsfor which it is probable that an outflow of economic benefits will occur and where a reliable estimate can be madeof the settlement amount of the obligation.
2.5 Revenue recognitionRevenue comprises service fees, income from investments and interest income. Service fees and income frominvestments are recognised at fair value when it accrues. Interest income is recognised in the statement ofcomprehensive income using the effective interest method taking into account the expected timing and amountof cash flows.
3. Critical accounting estimates and judgementsThe preparation of financial statements requires management to make judgements, estimates and assumptionsthat affect the application of accounting policies and reported amounts of assets, liabilities, income and expenses.Actual results may differ from these estimates.
Estimates and underlying assumptions are reviewed on an ongoing basis. Revisions to accounting estimates arerecognised in the period in which the estimate is revised and in any future periods affected. There are no estimatesor assumptions that have a significant risk of causing a material adjustment to the carrying amounts of assets andliabilities within the next financial year.
SA Corporate Real Estate Fund Managers Limited: Annual Financial Statements
NOTES TO THE ANNUAL FINANCIAL STATEMENTS (continued)for the year ended 31 December 2013

4. Adoption of new and revised standards and interpretations4.1 Standards and Interpretations adopted in the current year
The Company adopted the following new and revised Standards and Interpretations in the current year:
IFRS 7 Financial Instruments : Disclosures (amendments);IFRS 12 Disclosure of Interests in Other Entities;IFRS 13 Fair Value Measurement;IAS 1 Presentation of Financial Statements (amendments); andIAS 32 Financial Instruments : Presentation (amendments)
The adoption of these new and revised Standards has not resulted in the restatement of any comparative information.
4.2 Standards and Interpretations early adopted in the current yearThe Company did not early adopt any Standards and Interpretations in the current year.
4.3 Accounting Standards and Interpretations issued but not yet effectiveThe Company has not identified any Standards or Interpretations issued but not yet effective that will have amaterial impact on the Company's financial statements in the future.
The following list contains effective dates of IFRS's and recently revised IAS's, which have not been early adoptedby the Company and that might affect future financial periods and which had been issued on or before 31 December2013. It is the intention of the Company to adopt the new or revised Standards in the period they become effective.It has been assumed that the Company will maintain its current line of business in compiling the list presentedbelow. New and revised Standards not impacting the Company have not been included in the list below.
IFRS 7 Financial Instruments : Disclosures (amendments) (effective 1 January 2015);IFRS9 Financial Instruments (effective 1 January 2015);IFRS 12 Disclosure of Interests in Other Entities (amendments) (effective 1 January 2014); andIAS 32 Financial Instruments : Presentation (amendments) (effective 1 January 2014)
A reliable estimate of the impact of the adoption of the new and revised Standards for the Company has not yetbeen determined.
2013 2012R000 R000
5. Investment in property fund units1 202 615 units in SA Corporate Real Estate Fund at marketvalue at beginning of the year 4 390 4 161Gain on revaluation of investment 409 229Market value at end of the year 4 799 4 390
Market value of each unit as at 31 December 2013: R3.99 (2012: R3.65)
SA Corporate Real Estate Fund Managers Limited: Annual Financial Statements
NOTES TO THE ANNUAL FINANCIAL STATEMENTS (continued)for the year ended 31 December 2013
ANNUAL FINANCIAL STATEMENTS 2013 61

SA CORPORATE REAL ESTATE FUND MANAGERS LIMITED62
2013 2012R000 R000
6. Trade and other receivablesTrade receivables 8 519 5 990Prepayments 99 -Value-Added Tax 32 -
8 650 5 990Total trade receivables held by the Company at the reporting date amounted to R8 519 000(2012: R5 990 000). The average credit period granted is 60 days (2012: 60 days). Tradereceivables are monitored and provision is raised, where necessary, for any irrecoverableamounts.
No trade receivables were overdue at the reporting date (2012: nil).
No allowance for doubtful debts has been recorded as the directors are of the opinion that alltrade receivables are recoverable.
7. Cash and cash equivalentsCash on call 2 004 1 613Current accounts 446 3 290
2 450 4 903
8. Share capitalAuthorised and issued100 000 ordinary shares of R2 each 200 2001 800 000 “A” ordinary shares of 1 cent each 18 18
218 218
9. Share premiumArising on the issue of 1 800 000 “A” ordinary shares 1 782 1 782
10. Non-distributable reserveBalance at beginning of the year 2 063 1 866Revaluation of investment net of deferred capital gains taxation 205 197Balance at end of the year 2 268 2 063
Comprising:Capital profit arising on the sale of Marriott Property Equity Unit Trust units 34 34Surplus arising on the revaluation of investment net of deferred capital gains taxation 2 234 2 029
2 268 2 063
11. Deferred taxationBalance at beginning of the year 330 298Charge to the statement of comprehensive income 168 32Balance at end of the year 498 330
Comprising:Revaluation of investments 500 330Accrual (30) -Prepayments 28 -
498 330
SA Corporate Real Estate Fund Managers Limited: Annual Financial Statements
NOTES TO THE ANNUAL FINANCIAL STATEMENTS (continued)for the year ended 31 December 2013

ANNUAL FINANCIAL STATEMENTS 2013 63
2013 2012R000 R000
12.Trade and other payablesTrade payables and accruals 8 518 5 045Other payables 162 57Value added taxation - 72
8 680 5 174Total trade payables and accruals amounted to R8 518 000 (2012: R5 045 000). The companyhas financial risk management policies in place to ensure that all payables are paid within thecredit timeframe.
13. Income from property fundIncome from SA Corporate Real Estate Fund:Service fee 37 435 35 559Distributions received 376 357
37 811 35 916
14. Directors' remunerationDirectors' fees- Current 2 343 1 754
The executive directors are employed and paid by Old Mutual Property Proprietary Ltd and noother fees are paid by SA Corporate Real Estate Fund Managers Limited.
15. TaxationSouth African normal taxation - Current taxation - current year 140 2 605 - Current taxation - prior year - (9) - Deferred taxation - current year 90 32 - Deferred taxation - prior year (28) - - Deferred taxation - change in rate 106 -
308 2 628
% %Tax rate reconciliation: Statutory rate 28.0 28.0Differential in capital gains taxation rate 1.2 (0.5)Deferred taxation - prior year 0.9 -Deferred taxation - change in rate (3.3) -Non-deductible expenses (36.4) 9.2Effective rate (9.6) 36.7
SA Corporate Real Estate Fund Managers Limited: Annual Financial Statements
NOTES TO THE ANNUAL FINANCIAL STATEMENTS (continued)for the year ended 31 December 2013

SA CORPORATE REAL ESTATE FUND MANAGERS LIMITED64
SA Corporate Real Estate Fund Managers Limited: Annual Financial Statements
NOTES TO THE ANNUAL FINANCIAL STATEMENTS (continued)for the year ended 31 December 2013
2013 2012R000 R000
16. Cash (utilised in)/generated from operationsReconciliation of (loss)/profit before taxation to cash generated from operations
(Loss)/profit before taxation (3 225) 7 153Adjusted for:Distributions received (376) (357)Gain on revaluation of investment (409) (229)Interest received (314) (268)Operating cash flows before working capital changes (4 324) 6 299Working capital changes 846 (3 586) Increase in trade and other receivables (2 660) (3 024) Increase/(Decrease) in trade and other payables 3 506 (562)
Cash (utilised in)/generated from operations (3 478) 2 713
17. Taxation paidAmount overpaid at beginning of the year 1 431 1 485Charged to the statement of comprehensive income (net of deferred taxation) (140) (2 596)Amount overpaid at end of the year (956) (1 431)Taxation refund received/(paid) during the year 335 (2 542)
18. Capital resourcesThe Company's capital resources employed or immediately available for employmentfor the purpose of the Collective Investment Scheme at the year-end amounted to 6 721 9 725
19. Financial instruments and financial risk managementThe Company's financial instruments consist primarily of cash deposits with banks,investments, trade receivables and trade and other payables. All these financial instrumentsare carried at cost or amortised cost with the exception of the Company's investment whichis carried at fair value.
In the normal course of its operations, the Company is inter alia exposed to credit, interestrate, liquidity and price risk. The Company does not speculate in or engage in the tradingof derivative instruments.
Credit riskCredit risk refers to the risk that a counterparty will default on its contractual obligationsresulting in a financial loss to the Company. The credit risk attached to the Company's cashdeposits is low as it is only being placed with reputable financial institutions. Credit riskwith respect to trade receivables is limited in view of all fee income being received froma JSE listed Collective Investment Scheme in Property which is restricted to a maximumdebt level of 30% of the asset value and the fact that the Company is responsible for themanagement of this entity.
Trade receivables 8 519 5 990Cash and cash equivalents 2 450 4 903
10 969 10 893

ANNUAL FINANCIAL STATEMENTS 2013 65
2013 2012R000 R000
19. Financial instruments and financial risk management(continued)
Capital risk managementThe company managers its capital to ensure that it will remain a going concern. The Company'soverall strategy has remained unchanged since the previous year. The capital structure ofthe company consists of equity comprising share capital, share premium, a non-distributablereserve and a distributable reserve.
Interest rate riskInterest rate risk is the risk that fluctuating interest rates will unfavourably affect theCompany's earnings and the value of its assets, liabilities and equity. The exposure to interestrate risk is limited to cash resources and is managed through monitoring cash flows andinvesting surplus cash at negotiated rates which enables the Company to maximise returnswhile minimising risks.
Cash and cash equivalents 2 450 4 903
Due to the relatively low cash and cash equivalents balances, a change in the interest rateswould not have a significant impact on the operating results of the Company.
Liquidity riskLiquidity risk is the risk that cash may not be available to pay obligations when due at areasonable cost. The Company proactively manages its liquidity risk by regularly assessingcash requirements and monitoring cash flows, whilst ensuring surplus cash is invested in amanner to achieve maximum returns. The Company also complies with the capital adequacyrequirements of the Collective Investment Schemes Control Act and reports to the FinancialServices Board monthly in this regard.
Repayment profile of financial liabilities:
Less than 3 months:Trade and other payables 8 680 5 102
Price riskPrice risk arises from the risk of an adverse effect on the carrying value of the Company'sinvestment resulting from fluctuations in the quoted price of the equity. The Company onlyhas an investment in the Collective Investment Scheme managed by it.
Investment in property fund units 4 799 4 390
A 10% movement in the value of the quoted price of the units would result in a R479 900(2012: R439 000) change to the gain on revaluation of investment and investment value.
SA Corporate Real Estate Fund Managers Limited: Annual Financial Statements
NOTES TO THE ANNUAL FINANCIAL STATEMENTS (continued)for the year ended 31 December 2013

SA CORPORATE REAL ESTATE FUND MANAGERS LIMITED66
2013 2012R000 R000
19. Financial instruments and financial risk management(continued)
Categories of financial instruments
Financial assetsAmortised cost:Loans and receivables (including cash and cash equivalents)Trade receivables 8 519 5 990Cash and cash equivalents 2 450 4 903
10 969 10 893FVTPL:Investment in property fund units 4 799 4 390
15 768 15 283Financial liabilitiesAmortised cost:Trade and other payables 8 680 5 102
Fair value measurements recognised in the statement of financial positionThe table below analyses financial instruments that are measured at fair value, subsequent to initial recognition.The financial instruments are grouped into levels 1 to 3 based on the degree to which the fair value is observable.The different levels have been defined as follows:
Level 1 fair value adjustments are those derived from quoted prices (unadjusted) in active markets for identicalassets or liabilities;
Level 2 fair value adjustments are those derived from inputs, other quoted prices included within level 1, that areobservable for the asset or liability, either directly (i.e. as prices) or indirectly (i.e. derived from prices); and
Level 3 fair value adjustments are those derived from valuation techniques that include inputs for the assets orliability that are not based on observable market data i.e. unobservable inputs.
Level 1 Level 2 Level 3 TotalR000 R000 R000 R000
2013Financial assets measured at fair value Investment in property fund units 4 799 - - 4 799
Total 4 799 - - 4 799
2012Financial assets measured at fair value Investment in property fund units 4 390 - - 4 390
Total 4 390 - - 4 390
This asset is measured at fair value on a recurring basis.
There were no transfers between level 1 and level 2 during the year.
The directors consider that the carrying amounts of the financial assets and financial liabilities recognised in thefinancial statements approximate their fair values.
SA Corporate Real Estate Fund Managers Limited: Annual Financial Statements
NOTES TO THE ANNUAL FINANCIAL STATEMENTS (continued)for the year ended 31 December 2013

ANNUAL FINANCIAL STATEMENTS 2013 67
2013 2012R000 R000
20.Related party transactionsThe Company's immediate and ultimate controlling party is Old Mutual Property ProprietaryLimited (incorporated in South Africa) and Old Mutual plc (incorporated in the United Kingdom).
The terms and conditions of related party transactions are reviewed and negotiated periodically.Details of material transactions with those related parties that took place during the yearunder review are summarised below:
PARTY CONCERNED TRANSACTION TYPE TERMS & CONDITIONS
Related party transactionsSA Corporate Real Estate Fund Service fee income Based on 40 bps of SA 37 435 35 559and subsidiaries Corporate Real Estate Fund's
enterprise valueSA Corporate Real Estate Fund Distributions received 376 357
SA Corporate Real Estate Fund Legal cost recoveries Legal costs reimbursed for 1 406 449successful building transfers
Old Mutual Property Asset management fee Based on 30 bps of SA (30 884) (24 002)
Proprietary Limited Corporate Real Estate Fund'senterprise value
Various Directors' fees Based on shareholders (2 343) (1 754) approval at annual general
meeting
Old Mutual Property Travel expenses Reimbursed on actual cost (330) (219)Proprietary Limited incurred
Old Mutual Property Other recoveries Reimbursed on actual cost (42) -Proprietary Limited incurred
SA Corporate Real Estate Fund Managers Limited: Annual Financial Statements
NOTES TO THE ANNUAL FINANCIAL STATEMENTS (continued)for the year ended 31 December 2013
Sarel Baard Crescent, Centurion, Gauteng

SA CORPORATE REAL ESTATE FUND MANAGERS LIMITED68
2013 2012R000 R000
20.Related party transactions (continued)
Balances at year end
NATURE DISCLOSED AS TERMS & CONDITIONS
SA Corporate Real Estate Fundand subsidiariesService fee receivable Trade and other Based on 40bps of SA 6 885 2 874
receivables Corporate Real Estate Fund'senterprise value
Recovery expenses Trade and other Reimbursed on actual cost 1 634 442 receivables
Old Mutual Property ProprietaryLimitedAsset management Trade payables/ Performance fee (2 807) 2 667fee (payable)/receivable Trade and other
receivables
Asset management Trade payables Based on 30bps of SA (4 792) (4 774)fee payable Corporate Real Estate Fund's
enterprise value
Travel expenses Trade payables Reimbursed on actual cost (509) (176) incurred
Recovery expenses Trade and other Reimbursed on actual cost - 7 receivables incurred
Compensation of key management personnelShort-term benefits 2 643 1 754
21.Subsequent eventsOther than mentioned in the directors’ report, the directors are not aware of any other significant events between the end ofthe financial year under review and the date of the signature of these financial statements.
Design: Design Insight
SA Corporate Real Estate Fund Managers Limited: Annual Financial Statements
NOTES TO THE ANNUAL FINANCIAL STATEMENTS (continued)for the year ended 31 December 2013
96, 15th Road, Randjespark, Midrand, Gauteng
