annual financial statements - national … reports/2012 annu… · · 2012-08-23annual financial...
TRANSCRIPT

ANNUAL FINANCIALSTATEMENTS

ANNUAL FINANCIALSTATEMENTS
NEF ANNUAL REPORT 2012FIN
AN
CIA
LS
59

ANNUAL FINANCIAL STATEMENTS
CONTENTS PAGES
Trustee’s Responsibility and Approval 61
Report of the Independent Auditors 62
Statement of Financial Position 63
Statement of Financial Performance 64
Cash Flow Statement 65
Statement of Changes in Net Assets 66
Notes to the Annual Financial Statements 67 - 112
Administration 113
60

TRUSTEE’S RESPONSIBILITY AND APPROVAL
The Trustees are responsible for the preparation, integrity and fair presentations of the report on performance informationand the annual fi nancial statements of the Trust. The fi nancial statements presented on page 63 to 112 have been prepared in accordance with South African Statements of Generally Recognised Accounting Practice, and requirements of the PFMA and the NEF Act and include amounts based on judgements and estimates made by management. The Trustees also prepared the other information included in the Annual Report and are responsible for both its accuracy and consistency with the�nancial statements.
The going concern basis has been adopted in preparing the fi nancial statements. The Trustees have no reason to believe that the Trust will not be a going concern in the foreseeable future based on forecasts and available cash resources. These fi nancial statements support the viability of the Trust.
The report on performance information and the �nancial statements have been audited by the independent auditors, PriceWaterhouseCoopers Inc, who were given unrestricted access to all fi nancial records and related data, including minutes of all meetings of the Trustees and Committees of the Board. The Trustees believe that all representations made to theindependent auditors are valid and appropriate.
The fi nancial statements set out on pages 63 to 112, which have been prepared on the going concern basis, were approvedby the Board of Trustees on 30 July 2012 and were signed on its behalf by:
Ms Zukiswa Ntlangula (Acting Chairman) Ms Philisiwe Buthelezi (CEO)
2102 yluJ 13 2102 yluJ 13
etaDetaD
ANNUAL FINANCIALSTATEMENTS
NEF ANNUAL REPORT 2012FIN
AN
CIALS
61

62
INDEPENDENT AUDIT REPORT TO THE TRUSTEES OF THE NATIONALEMPOWERMENT FUND TRUSTReport on the Financial Statements
IntroductionWe have audited the fi nancial statements of the National Empowerment Fund Trust set out on pages 63 to 112 which comprise the statement of fi nancial position as at 31 March 2012, the statement of fi nancial performance, statement of changes in net assets and the cash fl ow statement for the year then ended, and the notes, comprising a summary of signifi cant accounting policies and other explanatory information.
Trustees’ responsibility for the fi nancial statementsThe board of trustees which constitutes the accounting authority is responsible for the preparation and fair presentation of these fi nancial statements in accordance with South African Statements of Generally Recognised Accounting Practices (GRAP) and the requirements of the Public Finance Management Act of South Africa, and the National Empowerment Fund Act, and for such internal control as the accounting authority determines is necessary to enable the preparation of fi nancial statements that are free from material misstatement, whether due to fraud or error.
Auditor’s responsibilityOur responsibility is to express an opinion on these fi nancial statements based on our audit. We conducted our audit in accordance with the Public Audit Act of South Africa (PAA), the General Notice issued in terms thereof and International Standards on Auditing. Those standards require that we comply with ethical requirements and plan and perform theaudit to obtain reasonable assurance about whether the fi nancial statements are free frommaterial misstatement.
An audit involves performing procedures to obtain audit evidence about the amounts anddisclosures in the fi nancial statements. The procedures selected depend on the auditor’s judgement, including the assessment of the risks of material misstatement of the fi nancialstatements, whether due to fraud or error. In making those risk assessments, the auditor considers internal control relevant to the entity’s preparation and fair presentation of the fi nancial statements in order to design audit procedures that are appropriate in the circumstances,but not for the purpose of expressing an opinion on the effectiveness of the entity’s internalcontrol. An audit also includes evaluating the appropriateness of accounting policies used and the reasonableness of accounting estimates made by management, as well as evaluatingthe overall presentation of the fi nancial statements.
We believe that the audit evidence we have obtained is suffi cient and appropriate to providea basis for our audit opinion.
OpinionIn our opinion, the fi nancial statements present fairly, in all material respects, the fi nancial position of the National Empowerment Fund Trust as at 31 March 2012, and its fi nancial performance and cash fl ows for the year then ended in accordance with GRAP and the requirements of the Public Finance Management Act of South Africa and the National Empowerment Fund Act.
Report on other Legal and Regulatory RequirementsIn accordance with the PAA and the General Notice issued in terms thereof, we report thefollowing which is relevant to performance against predetermined objectives, compliance with laws and regulations and internal control, but not for the purpose of expressing an opinion.
Pre-determined objectivesWe performed procedures to obtain evidence about the usefulness and reliability of the information in the performance against the Annual Performance Plan as set out on pages 30 to 34 of the annual report.
The reported performance against predetermined objectives was evaluated against the overall criteria of usefulness and reliability. The usefulness of information in the annual performance report relates to whether it is presented in accordance with the National Treasury annual reporting principles and whether the reported performance is consistent with the planned objectives. The usefulness of information further relates to whether indicators and targets are measurable (i.e. well defi ned, verifi able, specifi c, measurable and time bound) and relevant as required by the National Treasury Framework for managing programme performance information.
The reliability of the information in respect of the selected objectives is assessed to determine whether it adequately refl ects the facts (i.e. whether it is valid, accurate and complete).
There were no material fi ndings on the performance against the Annual Performance Plan concerning the usefulness and reliability of the information.
Compliance with laws and regulationsWe did not identify any instances of material non-compliance with specifi c matters in key applicable laws and regulations as set out in the General Notice issued in terms of the PAA.
Internal controlWe did not identify any defi ciencies in internal control which we considered suffi ciently signifi cant for inclusion in this report.
PricewaterhouseCoopers Inc.Director: Raj DhanlallRegistered AuditorJohannesburg31 July 2012

STATEMENT OF FINANCIAL POSITION as at 31 March 2012
2012 2011
Notes R R
ASSETS
Non-Current Assets 2 763 089 168 2 557 044 017
Property and equipment 4 7 064 715 7 976 813
Intangible assets 5 1 864 223 4 153 031
Investments in associates 6 201 855 314 102 951 249
Investments available-for-sale 7 1 449 434 153 1 490 214 567
Originated loans 8 847 653 728 749 086 331
Preference Shares 9 198 445 058 170 762 845
Finance lease receivables 10 54 886 938 31 889 180
Investments at fair value through profit and loss 12 1 885 039 10 000
Current Assets 2 539 999 768 2 758 815 621
Current portion of originated loans 8 243 760 565 87 934 546
Investments held-for-trade 13 36 644 087 46 091 412
Non-current asset held-for-sale 14 8 100 000 -
Trade and other receivables 15 49 497 475 42 234 616
Cash and cash equivalents 17 2 201 997 641 2 582 555 047
TOTAL ASSETS 5 303 088 936 5 315 859 638
NET ASSETS AND LIABILITIES
Net Assets 5 258 890 572 5 280 576 646
Trust capital 18 2 468 431 472 2 468 431 472
Fair value reserves 19 1 281 490 431 1 297 193 378
Accumulated surplus 1 508 968 669 1 514 951 796
Current Liabilities 44 198 364 35 282 992
Trade and other payables 20 44 198 364 35 282 992
TOTAL NET ASSETS AND LIABILITIES 5 303 088 936 5 315 859 638
63
ANNUAL FINANCIALSTATEMENTS - CONTINUED
NEF ANNUAL REPORT 2012FIN
AN
CIA
LS
63
64
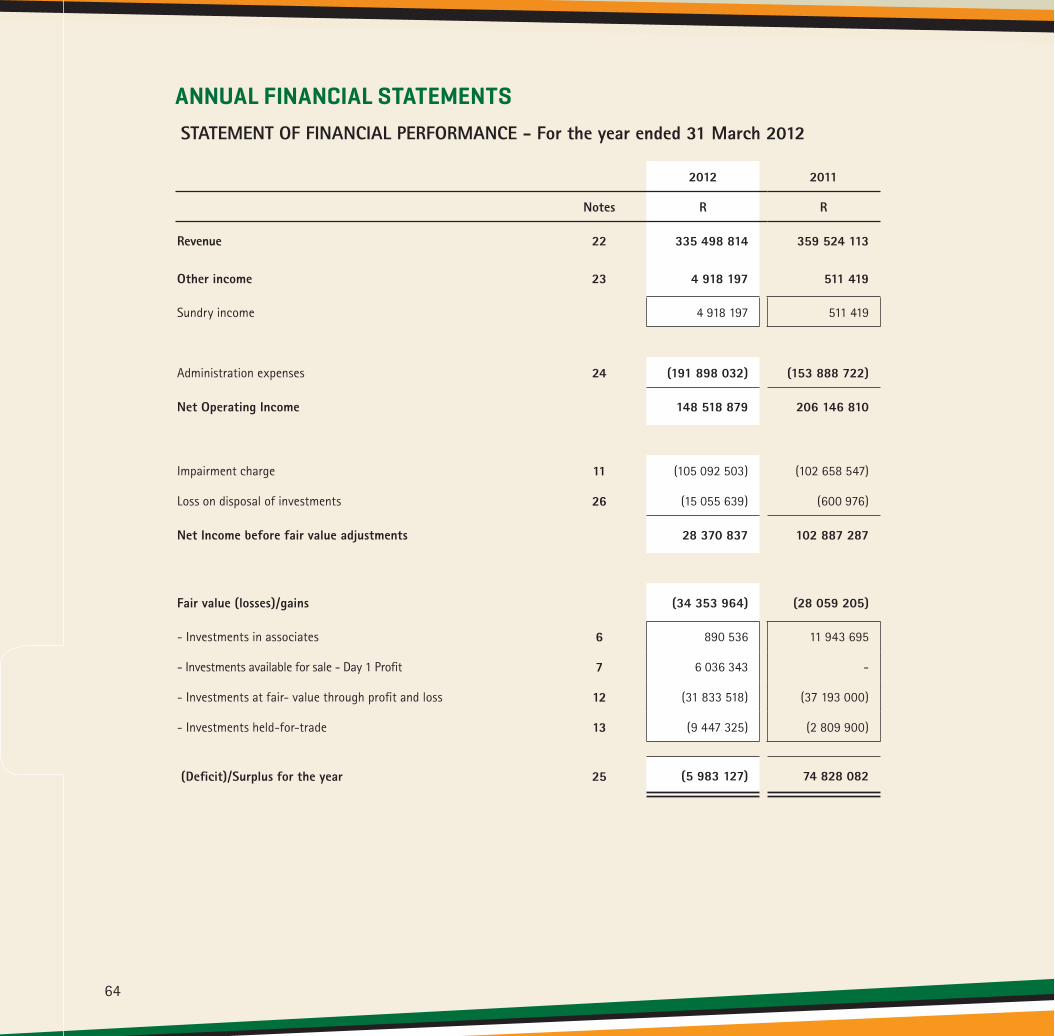
ANNUAL FINANCIAL STATEMENTSSTATEMENT OF FINANCIAL PERFORMANCE - For the year ended 31 March 2012
2012 2011
Notes R R
Revenue 22 335 498 814 359 524 113
Other income 23 4 918 197 511 419
Sundry income 4 918 197 511 419
Administration expenses 24 (191 898 032) (153 888 722)
Net Operating Income 148 518 879 206 146 810
Impairment charge 11 (105 092 503) (102 658 547)
Loss on disposal of investments 26 (15 055 639) (600 976)
Net Income before fair value adjustments 28 370 837 102 887 287
Fair value (losses)/gains (34 353 964) (28 059 205)
- Investments in associates 6 890 536 11 943 695
- Investments available for sale - Day 1 Profit 7 6 036 343 -
- Investments at fair- value through profit and loss 12 (31 833 518) (37 193 000)
- Investments held-for-trade 13 (9 447 325) (2 809 900)
(Deficit)/Surplus for the year 25 (5 983 127) 74 828 082

CASH FLOW STATEMENT - For the year ended 31 March 2012
2012 2011
Notes R R
Cash flows from operating activities 29 (168 220 477) (152 871 554)
Cash receipts from other income 4 918 198 511 419
Cash paid to suppliers and employees (173 138 672) (153 382 973)
Cash flows from investing activities (212 336 930) (52 915 989)
Additions to property and equipment 4 (2 636 323) (3 215 861)
Additions to intangible assets 5 (237 617) (2 917 198)
Investment disbursements 30 (596 636 976) (393 067 295)
Dividends received 75 412 377 42 577 239
Interest receipts 136 780 502 172 615 341
Repayment of Originated Loans, Leases and Preference Shares 155 460 587 130 391 852
Proceeds from sale of investments 19 520 519 699 933
Decrease in cash and cash equivalents (380 557 406) (205 787 543)
Cash and cash equivalents at beginning of the year 2 582 555 047 2 788 342 590
Cash and cash equivalents at end of the year 17 2 201 997 641 2 582 555 047
65
ANNUAL FINANCIALSTATEMENTS - CONTINUED
NEF ANNUAL REPORT 2012FIN
AN
CIA
LS
65
66
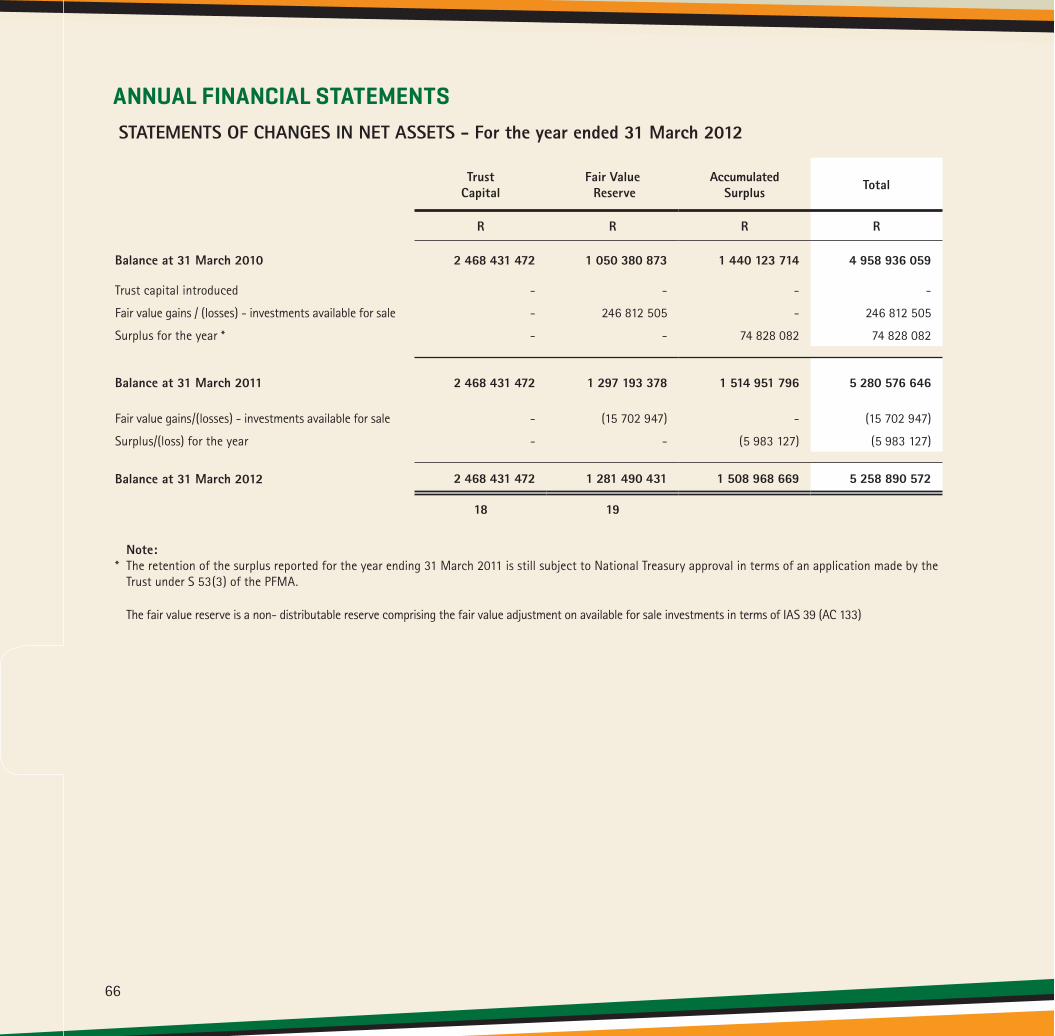
ANNUAL FINANCIAL STATEMENTSSTATEMENTS OF CHANGES IN NET ASSETS - For the year ended 31 March 2012
Trust Capital
Fair Value Reserve
Accumulated Surplus Total
R R R R
Balance at 31 March 2010 2 468 431 472 1 050 380 873 1 440 123 714 4 958 936 059
Trust capital introduced - - - -
Fair value gains / (losses) - investments available for sale - 246 812 505 - 246 812 505
Surplus for the year * - - 74 828 082 74 828 082
Balance at 31 March 2011 2 468 431 472 1 297 193 378 1 514 951 796 5 280 576 646
Fair value gains/(losses) - investments available for sale - (15 702 947) - (15 702 947)
Surplus/(loss) for the year - - (5 983 127) (5 983 127)
Balance at 31 March 2012 2 468 431 472 1 281 490 431 1 508 968 669 5 258 890 572
18 19
Note:* The retention of the surplus reported for the year ending 31 March 2011 is still subject to National Treasury approval in terms of an application made by the Trust under S 53(3) of the PFMA.
The fair value reserve is a non- distributable reserve comprising the fair value adjustment on available for sale investments in terms of IAS 39 (AC 133)

NOTES TO THE ANNUAL FINANCIAL STATEMENTS - For the year ended 31 March 20121. ACCOUNTING POLICIES AND BASIS OF PREPARATION1.1. Main business and operations The National Empowerment Fund Trust is a South African public entity under the direction of the dti. The Trust was established through the National Empowerment Fund Act (Act 105 of 1998), to provide access to funding for black entrepreneurs and black empowered businesses through the Fund Management Division and Strategic Projects Fund, which provides funding for venture capital actvities in the Industrial Policy Action Plan sectors. In addition, the promotion of investments and savings activities is undertaken by designing and offering retail investment products through the Asset Management Division which are offered for subscription to black investors.
1.2. Accounting policies The principal accounting policies applied in the preparation of these financial statements are set out below. These policies have been consistently applied unless otherwise stated.
1.3. Basis of preparation The financial statements have been prepared on the historical cost basis, apart from certain financial instruments that are carried at fair value, in accordance with South African Statements of Generally Recognised Accounting Practices (GRAP) including any interpretations, guidelines and directives issued by the Accounting Standards Board.
Paragraph 12 of Directive 5: Determining the GRAP reporting framework states that in the absence of a standard of GRAP dealing with a particular transaction or event, the pronouncements of the following professional organisations should be used, in descending order, to develop an appropriate accounting policy.
- International Public Sector Accounting Standards Board (IPSASB). - International Accounting Standards Board (IASB), including the Framework for the Preparation and Presentation of Financial Statements. - Accounting Practices Board (APB). - Accounting Practices Committee (APC) of the South African Institute of Chartered Accountants (SAICA).
Applying the guidance in Directive 5 paragraph 12 the accounting framework applied by the Trust has been impacted by the application of SA GAAP in the absence of applicable GRAP Standards. The following is a list of SA GAAP standards applied by the Trust in the absence of applicable effective GRAP standards.
IFRS 3 (AC 140) - Business Combinations IFRS 5 (AC 142) - Non-Current Assets Held for Sale and Discontinued Operations IFRS 7 (AC 144) - Financial Instruments: Disclosures IAS 19 (AC 116) - Employee Benefits IAS 32 (AC 125) - Financial Instruments: Presentation IAS 39 (AC 133) - Financial Instruments: Recognition and Measurement IFRIC 4 (AC 437) - Determining whether an Arrangement contains a Lease IFRIC 9 (AC 442) - Reassessment of Embedded Derivatives
1.4. Consolidation Investments in associates Associates are all entities over which the Trust has significant influence but not control, generally accompanying a share holding of between 20% and 50% of the voting rights.
GRAP 7 exempts venture capital organisations from equity accounting investments in associates if they, upon initial recognition, decide to designate the investment at fair value through profit and loss. As a venture capital organisation, the Trust has elected to apply this exemption and accordingly all such investments are not equity accounted but designated as investments at fair value through profit and loss.
67
ANNUAL FINANCIALSTATEMENTS - CONTINUED
NEF ANNUAL REPORT 2012FIN
AN
CIA
LS
67
68
ANNUAL FINANCIAL STATEMENTSNOTES TO THE ANNUAL FINANCIAL STATEMENTS - For the year ended 31 March 2012
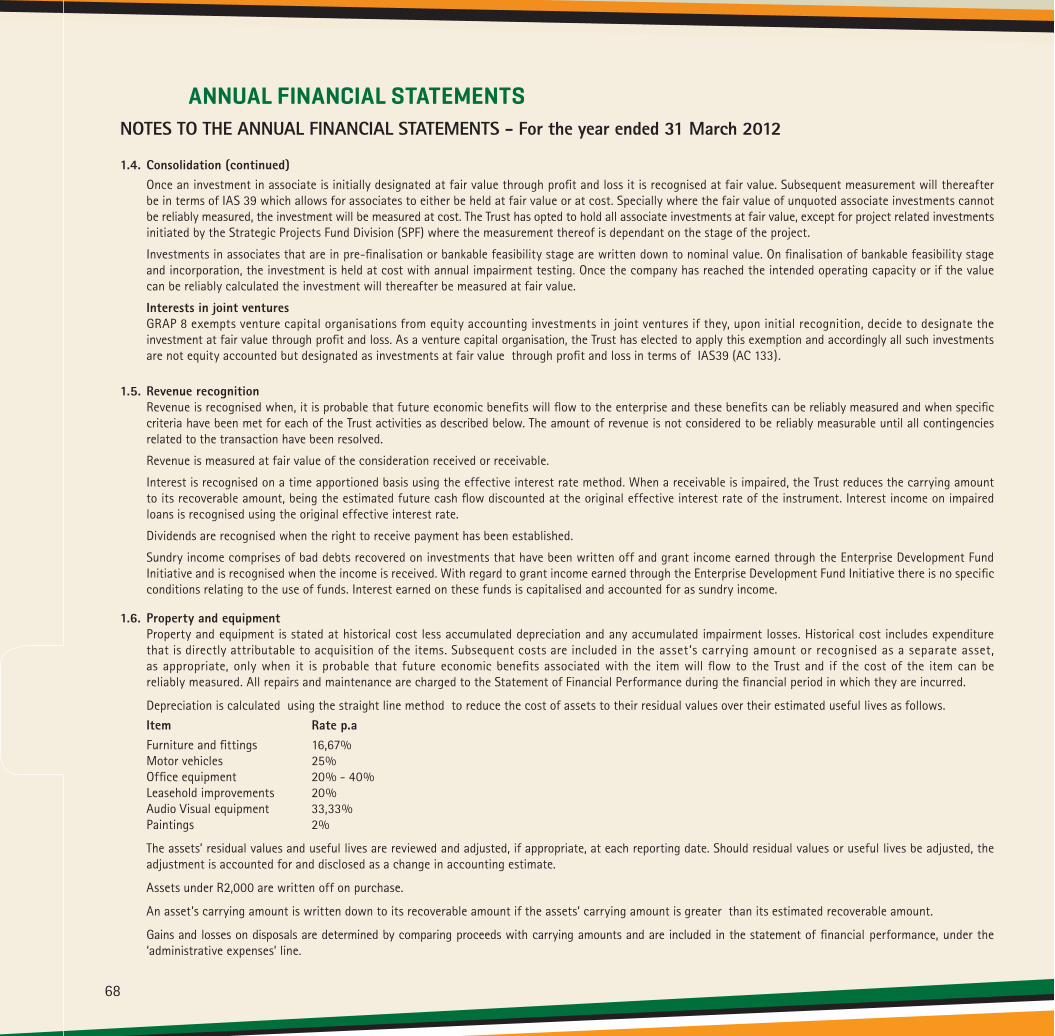
1.4. Consolidation (continued) Once an investment in associate is initially designated at fair value through profit and loss it is recognised at fair value. Subsequent measurement will thereafter be in terms of IAS 39 which allows for associates to either be held at fair value or at cost. Specially where the fair value of unquoted associate investments cannot be reliably measured, the investment will be measured at cost. The Trust has opted to hold all associate investments at fair value, except for project related investments initiated by the Strategic Projects Fund Division (SPF) where the measurement thereof is dependant on the stage of the project.
Investments in associates that are in pre-finalisation or bankable feasibility stage are written down to nominal value. On finalisation of bankable feasibility stage and incorporation, the investment is held at cost with annual impairment testing. Once the company has reached the intended operating capacity or if the value can be reliably calculated the investment will thereafter be measured at fair value.
Interests in joint ventures GRAP 8 exempts venture capital organisations from equity accounting investments in joint ventures if they, upon initial recognition, decide to designate the investment at fair value through profit and loss. As a venture capital organisation, the Trust has elected to apply this exemption and accordingly all such investments are not equity accounted but designated as investments at fair value through profit and loss in terms of IAS39 (AC 133).
1.5. Revenue recognition Revenue is recognised when, it is probable that future economic benefits will flow to the enterprise and these benefits can be reliably measured and when specific criteria have been met for each of the Trust activities as described below. The amount of revenue is not considered to be reliably measurable until all contingencies related to the transaction have been resolved.
Revenue is measured at fair value of the consideration received or receivable.
Interest is recognised on a time apportioned basis using the effective interest rate method. When a receivable is impaired, the Trust reduces the carrying amount to its recoverable amount, being the estimated future cash flow discounted at the original effective interest rate of the instrument. Interest income on impaired loans is recognised using the original effective interest rate.
Dividends are recognised when the right to receive payment has been established.
Sundry income comprises of bad debts recovered on investments that have been written off and grant income earned through the Enterprise Development Fund Initiative and is recognised when the income is received. With regard to grant income earned through the Enterprise Development Fund Initiative there is no specific conditions relating to the use of funds. Interest earned on these funds is capitalised and accounted for as sundry income.
1.6. Property and equipment Property and equipment is stated at historical cost less accumulated depreciation and any accumulated impairment losses. Historical cost includes expenditure that is directly attributable to acquisition of the items. Subsequent costs are included in the asset’s carrying amount or recognised as a separate asset, as appropriate, only when it is probable that future economic benefits associated with the item will flow to the Trust and if the cost of the item can be reliably measured. All repairs and maintenance are charged to the Statement of Financial Performance during the financial period in which they are incurred.
Depreciation is calculated using the straight line method to reduce the cost of assets to their residual values over their estimated useful lives as follows. Item Rate p.a Furniture and fittings 16,67% Motor vehicles 25% Office equipment 20% - 40% Leasehold improvements 20% Audio Visual equipment 33,33% Paintings 2%
The assets’ residual values and useful lives are reviewed and adjusted, if appropriate, at each reporting date. Should residual values or useful lives be adjusted, the adjustment is accounted for and disclosed as a change in accounting estimate.
Assets under R2,000 are written off on purchase.
An asset’s carrying amount is written down to its recoverable amount if the assets’ carrying amount is greater than its estimated recoverable amount.
Gains and losses on disposals are determined by comparing proceeds with carrying amounts and are included in the statement of financial performance, under the ‘administrative expenses’ line.

NOTES TO THE ANNUAL FINANCIAL STATEMENTS - For the year ended 31 March 2012
1.7. Intangible assets Acquired computer software is capitalised on the basis of cost incurred to acquire and bring to use the specific software purchased in order to distinguish from any internally generated assets which are not capitalised and is amortised on a straight-line basis over the expected useful lives of the assets, usually 3 to 5 years. Intangible assets with an indefinite useful life are not amortised. The useful lives of intangible assets that are not being amortised are reviewed annually to determine whether events and circumstances continue to support an indefinite useful life assessment for those assets.
Intangible assets are carried at cost less any accumulated amortisation and any impairment losses.
Item Rate p.a Computer software 33,30%
1.8. Non-current assets held for sale Non current assets held for sale comprises collateral assets against investment funding provided, that has been determined to be uncollectable and has been attached by the NEF for recovery of funds provided. Such assets are accounted for in terms of IFRS 5 (AC 142) Non-current Assets Held for Sale and Discontinued Operations. In terms of IFRS 5 (AC 142) Non-current Assets held for Sale are defined as non current assets or disposal groups for which the carrying amount will be recovered primarily through sale rather than through continuing use.
In terms in IFRS 5 (AC 142) the criteria for classification are as follows:
- The sale of the asset must be highly probable.
On initial classification such assets are initially measured in terms of the applicable standard and impaired in terms of IFRS 5 were applicable. Depreciation/Amortisation is ceased on the non current assets held for sale were applicable and thereafter the assets are measured at the lower of the carrying amount and the fair value less costs to sell.
1.9. Cash and cash equivalents Cash and cash equivalents are carried at amortised cost at reporting date. For the purposes of the cash flow statement, cash and cash equivalents comprise cash on hand, deposits held on call with banks and other short term highly liquid investments with original maturities.
1.10. Financial assets Recognition and derecognition Regular way purchases and sales of financial assets at fair value through profit and loss and available-for-sale are recognised on trade date, which is the date on which the Trust commits to purchase or sell the asset. Loan and Receivable financial assets are recognised when cash is advanced to the borrowers. Financial assets are initially recognised at fair value including transaction costs, except financial assets at fair value through profit and loss that are initially recognised at fair value with transaction costs being expensed on date of recognition. Differences on recognition between the fair value of a financial asset and the purchase price is recognised as a Day 1 profit or loss only were the fair value determined is based on observable market data.Financial assets are derecognised when the right to receive cash flows from the financial assets have expired or where the Trust has transferred substantially all risks and rewards of ownership.
Classification The Trust classifies financial assets in the following categories: investments at fair value through profit and loss, originated loans and preference shares (IAS 39 category: loans and receivable) and investments available-for-sale. Management determines the classification of investments at initial recognition.
69
ANNUAL FINANCIALSTATEMENTS - CONTINUED
NEF ANNUAL REPORT 2012FIN
AN
CIA
LS
69

70
ANNUAL FINANCIAL STATEMENTSNOTES TO THE ANNUAL FINANCIAL STATEMENTS - For the year ended 31 March 20121.10. Financial assets (continued) Originated loans Originated loans are non derivative financial assets with fixed or determinable payments that are not quoted in an active market. They are included in current assets, except for maturities greater than 12 months after balance sheet date. These are classified as non current. They arise when the Trust provides money, goods or services directly to a borrower with no intention of trading the originated loan.
Investments carried at fair value through profit or loss This category has two subcategories: financial assets held for trading and those designated at fair value through profit and loss on inception. A financial asset is classified in this category if acquired principally for the purpose of selling in the short term or if so designated. Assets in this category are classified as current assets except for investments in associates designated at fair value through profit and loss which are classified as non current.
Financial assets are designated as fair value through profit and loss in instances where: (i) they meet the definition of held for trading in that they are principally held with the intention to dispose of in the near term or (ii) they represent assets that are acquired and managed through the Strategic Projects Fund.
Available-for-sale investments Available for sale investments are non derivative financial assets that are either designated in this category or not classified in any other category. These are included in non current assets unless management intends to dispose of the investment within 12 months of the reporting date.
Available for sale investments are those intended to be held for an indefinite period of time, which may be sold in response to the needs of liquidity or changes in interest rates, exchange rates or equity prices or non derivatives that are not classified in any other category. Dividend income is recognised when the rights to receive payment has been established and interest income is recognised on a time apportionment basis using the effective interest rate method. Dividend and interest income is recognised in revenue.
Embedded derivative financial instruments The Trust has invested in instruments which in some instances contain embedded derivatives. These derivatives are part of the equity exit and conversion mechanisms used by the NEF. In such instances where an embedded derivative is identified, these are treated and disclosed as separate derivatives when their economic characteristics and risks are not closely related
the combined contract is not recognised at fair value with any gains or losses from the change in fair value being recognised in the statement of financial performance (profit and loss). Upon identification and separate disclosure, the host contracts are accounted for and measured applying the rules of the relevant category of that financial instrument with the embedded derivate portion being recognized at fair value through profit and loss.
Trade and other receivables Trade and other receivables are measured at initial recognition at fair value, and are subsequently measured at amortised cost using the effective interest rate method. Appropriate allowances for estimated irrecoverable amounts are recognised in profit or loss when there is objective evidence that the asset is impaired. Significant financial difficulties of the debtor, probability that the debtor will enter bankruptcy or financial reorganisation and default or delinquency in payments (more than 30 days overdue) are considered indicators that the trade receivable is impaired. The allowance recognised is measured as the difference between the asset’s carrying amount and the present value of estimated future cash flows discounted at the effective interest rate computed at initial recognition.
NOTES TO THE ANNUAL FINANCIAL STATEMENTS - For the year ended 31 March 20121.10. Financial assets (continued) Preference shares Preference shares are initially measured at fair value and are subsequently measured at amortised cost, using the effective interest rate method.
Subsequent measurement Available for sale financial assets and investments at fair value through profit and loss are subsequently carried at fair value. Loans and receivables investments are carried at amortised cost using the effective interest rate method. Gains and losses arising from changes in the fair value of the financial assets at fair value through profit and loss category are included in the Statement of Financial Performance in the period in which they arise. Gains and losses arising from changes in the fair value of available for sale financial assets are recognised directly in the Statement of Changes in Net Assets. When securities classified as available for sale are sold or impaired, the accumulated fair value adjustments recognised in equity are included in the Statement of Financial Performance.
Impairment of financial assets (a) Assets carried at amortised cost The Trust assesses at each reporting date whether there is objective evidence that a financial asset or group of financial assets is impaired. A financial asset or a group of financial assets is impaired and impairment losses are incurred if, and only if, there is objective evidence of impairment as a result of one or more events that occurred after the initial recognition of the assets (a loss event) and that loss event has an impact on the estimated future cash flows of the financial asset or group of financial assets that can be reliably estimated. Objective evidence that a financial asset or group of assets is impaired includes observable data that comes to the attention of the Trust about, amongst others, the following loss events:
(iii) the granting to the borrower, for economic or legal reasons relating to the borrower’s financial difficulty, a concession
(vi) observable data indicating that there is a measurable decrease in the estimated future cash flows from a group of financial assets since the initial recognition of those assets, although the decrease cannot yet be identified with the individual financial assets in the group, including:
- national or local economic conditions that correlate with defaults by borrowers.
The Trust first assesses whether objective evidence of impairment exists individually for financial assets that are individually significant, and individually or collectively for financial assets that are not individually significant. If the Trust determines that no objective evidence of impairment exists for an individually assessed financial asset, whether significant or not, it includes the assets in a group of financial assets with similar credit risk characteristics and collectively assesses them for impairment. Assets that are individually assessed for impairment and for which an impairment loss is or continues to be recognised are not included in a collective assessment of impairment.
If there is objective evidence that an impairment loss on loans and receivables or held to maturity investments carried at amortised cost has been incurred, the amount of the loss is measured as the difference between the asset’s carrying amount and the present value of estimated future cash flows (excluding future credit losses that have not been incurred) discounted at the financial asset’s original effective interest rate. The carrying amount of the asset is reduced and the amount of the loss is recognised in the Statement of Financial Performance. If a loan or held to maturity investment has a variable interest rate, the discount rate for measuring any impairment loss is the current effective interest rate determined under the contract. As a practical expedient, the Trust may measure impairment on the basis of an instrument’s fair value using an observable market price.
71
ANNUAL FINANCIALSTATEMENTS - CONTINUED
NEF ANNUAL REPORT 2012FIN
AN
CIA
LS
71

72
ANNUAL FINANCIAL STATEMENTSNOTES TO THE ANNUAL FINANCIAL STATEMENTS - For the year ended 31 March 20121.10. Financial assets (continued) The calculation of the present value of the estimated future cash flows of a financial asset reflects the cash flows that may result from foreclosure less the cost of obtaining and selling the collateral, whether or not foreclosure is probable.
For the purpose of a collective evaluation of impairment, financial assets are grouped on the basis of similar risk characteristics (i.e.on the basis of the Trust’s grading process that considers asset type, industry, geographical location, collateral type, past due status and other relevant factors). Those characteristics are relevant to the estimation of future cash flows of such assets and are indicative of the borrowers’ ability to pay all amounts due according to the contractual terms of the assets being evaluated.
Future cash flows in a group of financial assets that are collectively evaluated for impairment are estimated on the basis of the contractual cash flows of the assets in the group and historical loss experience for assets with credit risk characteristics similar to those in the group. Historical loss experience is adjusted on the basis of current observable data to reflect the effects of current conditions that did not affect the period on which the historical loss experience is based and to remove the effects of conditions in the historical period that do not exist currently.
Estimates of changes in future cash flows for a group of assets reflect and are consistent with changes in related observable data from period to period (for example, changes in unemployment rates, property prices, payment status, or other factors indicative of changes in the probability of losses in the group and their magnitude). The methodology and assumptions used for estimating future cash flows are reviewed regularly by the Trust to reduce any differences between loss estimates and actual loss experience.
When a loan becomes uncollectible, it is written off against the related provision for loan impairment. Such loans are written off after all the necessary procedures have been completed and the amount of the loss has been determined. Subsequent recoveries of amounts previously written off are recognised as bad debts recovered in the Statement of Financial Performance If, in a subsequent period, the amount of the impairment loss decreases and the decrease can be related objectively to an event occurring after the impairment was recognised, the previously recognised impairment loss is reversed. The amount of the reversal is recognised in the Statement of Financial Performance.
(b) Available-for-sale investments Available for sale investments are evaluated each year for impairment against any significant adverse changes that would have affected the investment in the market, legal, technological and economic environment. This evidence is captured through internal reporting generated by the Post Investment Department which is completed on a bi-annual basis for each investment. This reporting includes a financial evaluation of actual operating cash flows of the investment against budget and where these are seen to have permanently deteriorated, then the investment’s recoverable amount is set to its fair value less cost to sell, based on the fair value methodologies disclosed in note 1.9. The difference between the carrying amount and the recoverable amount, being the impairment loss, is recognised immediately in profit and loss.
A significantly or prolonged decline in the fair value of the security below it’s cost is also evidence that the assets are impaired. If any such evidence exists for available-for-sale financial assets, the cumulative loss measured as the difference between the acquisition cost and the current fair value, less impairment loss on that financial asset previously recognised in profit or loss is removed from equity and recognised in the Statement of Financial Performance.

NOTES TO THE ANNUAL FINANCIAL STATEMENTS - For the year ended 31 March 20121.10. Financial assets (continued)Impairment of financial assets(c) Renegotiated originated loans Originated loans that have been subject to impairment losses and whose settlement terms have been formally and legally renegotiated are reset in terms of the assessment of the objective evidence for impairment losses. Renegotiated loans are subject to ongoing review to determine whether they should thereafter be considered as impaired or past due following their reset.
Reversals of impairment losses are recognised in profit or loss except for equity investments classified as available fo sale.
Impairment of non financial assets The recoverable amount of an asset is the higher of its fair value less costs to sell and its value in use.
Property and equipment and other non current assets, including intangible assets, are reviewed for impairment losses whenever events or changes in circumstances indicate that the carrying amount may not be recoverable. Intangible assets with indefinite useful lives are reviewed for impairment at each reporting date regardless of indication of impairment or not. An impairment loss is recognised in the Statement of Financial Performance for the amount by which the carrying amount of the asset exceeds its recoverable amount, that is, the higher of the asset’s net selling price and value in use. For the purpose of assessing impairment, assets are grouped at the lowest levels for which there are separately identifiable cash flows.
An impairment loss is recognised for cash generating units if the recoverable amount of the unit is less than the carrying amount of the units. The impairment loss is allocated to reduce the carrying amount of the assets of the unit in the following order: - first, to reduce the carrying amount of any goodwill allocated to the cash generating unit and - then, to the other assets of the unit, pro rata on the basis of the carrying amount of each asset in the unit.
1.11. Trade and other payables Trade and other payables relate to goods and services for operating expenses incurred before year end but not settled as at reporting date.
Trade payables are recognised initially at fair value and subsequently measured at amortised cost using the effective interest rate.
1.12. Leases Leases, where the significant portion of the risk and rewards of ownership are retained by the lessor, are classified as operating leases. Payments made under operating leases (net of any incentive received from the lessor) are charged to the Statement of Financial Performance on the straight line basis over the period of the lease.
Suspensive sale agreements are primarily stand alone financing transactions, with rentals and instalments receivable, less unearned finance charges, being included in the gross lease receivable in the Statement of Financial Position.
Finance charges earned are computed using the effective interest rate method, which reflects a constant periodic rate of return on the investment in the finance lease. Initial direct costs and fees are capitalised to the value of the lease receivable and accounted for over the lease term as an adjustment to the effective rate of return.
1.13. Employee benefits (a) Pension obligations The Trust contributes to a provident fund, which is a defined contribution plan, on a monthly basis. A defined contribution plan is one under which the Trust pays fixed contributions into a separate entity and has no legal or constructive obligation to pay further contributions when the fund does not hold sufficient assets to pay all benefits relating to employee service in the current and prior periods. The regular contributions constitute the net periodic costs for the year in which they are due, and are included in staff costs. Short-term employee benefits are recognised as an expense in the accounting periods when the services are rendered.
73
ANNUAL FINANCIALSTATEMENTS - CONTINUED
NEF ANNUAL REPORT 2012FIN
AN
CIA
LS
73

74
ANNUAL FINANCIAL STATEMENTSNOTES TO THE ANNUAL FINANCIAL STATEMENTS - For the year ended 31 March 20121.13. Employee benefits (continued) (b) Performance Awards The Trust recognises a liability and an expense in circumstances when bonuses are approved. The Trust recognises an accrual where contractually obliged or where there is a past practice that has created a constructive obligation.
1.14. Provisions and contingencies Provisions are recognised when the Trust has a present legal or constructive obligation as a result of past events and it is probable that an outflow of resources will be required to settle the obligation, and is measured at management’s best estimate of the amount that would be required to settle or transfer the liability at balance sheet date. Long term provisions are discounted to net present value, with the relevant increase in the provision due to the passage of time being recognised as an interest expense.
1.15. Critical accounting estimates and judgements in applying accounting policies Management has to apply judgement on the basis of valuation methodologies in the estimation of the carrying value of loans (for impairments), available for sale investments (for fair values and impairments) and associates (for fair values). It is reasonably possible, on the basis of existing knowledge that outcomes within the next year that are different from the assumption could require a material adjustment to the carrying amount of the asset or liability affected.The valuation methodologies are disclosed below.
(a) Impairment losses on originated loans The Trust reviews its loan portfolios to assess impairment at half yearly intervals. In determining whether an impairment loss should be recognised in the Statement of Financial Performance, the Trust makes judgements as to whether there is any observable data indicating that there is a measurable decrease in the estimated future cash flows from a portfolio of loans before the decrease is identified for an individual loan in that portfolio. The portfolio is made up of new black empowerment investments most of which are start ups in the market. As a result there is no financial performance history which guides the impairment process. The Trust’s management has thus developed an impairment matrix and is continually refining it. The impairment matrix was benchmarked against those utilised by peers in the market. Amongst others, the impairment matrix encompasses the review of the following observable data:
- Falling markets - History of payment default - Legal action taken against the investee - Breach of contract - Non submission of financial information - General attitude of the investee as demonstrated by their repayment history - Value of security - Arrear payments
Originated Loans are individually assessed and impaired utilising management’s impairment matrix. For the carrying amount of these investments refer to note 8.

NOTES TO THE ANNUAL FINANCIAL STATEMENTS - For the year ended 31 March 20121.15. Critical accounting estimates and judgements in applying accounting policies (continued) (b) Impairment of equity investments The Trust determines that equity investments are impaired when there has been a significant or prolonged decline in the fair value below its cost. This determination of what is significant or prolonged requires judgement. In making this judgement, the Trust evaluates amongst other factors, the normal volatility in earnings. In addition, impairment may be appropriate when there is evidence of a deterioration in the financial health of the investee, industry and sector performance, changes in technology and operational and financing cash flows. For the carrying amount of these investments refer to note 6.
(c) Fair value on unlisted securities The Trust establishes the fair value of unlisted securities by enterprise valuation techniques as outlined in note 1.10 financial assets. For the carrying amount of the investments refer to note 6, 7 and 12.
2. NEW STANDARDS AND INTERPRETATIONS2.1. Standards and interpretations effective and adopted in the current year In the current year, the Trust has adopted the following standards and interpretations that are effective for the current financial year and that are relevant to its operations:
IAS 24 (AC 126) - Related Party Disclosures (Revised) The revisions to IAS 24 include clarification of the definition of a related party as well as providing a partial exemption for related party disclosures between Government related entities.
In terms of the definition, the revision clarifies that joint ventures or associates of the same third party are related parties of each other. To this end, an associate includes its subsidiaries and a joint venture includes its subsidiaries.
The partial exemption applies to related party transactions and outstanding balances with a Government which controls, jointly controls or significantly influences the reporting entity as well as to transactions or outstanding balances with another entity which is controlled, jointly controlled or significantly influenced by the same Government. In such circumstances, the entity is exempt from the disclosure requirements of paragraph 18 of IAS 24 and is required only to disclose:
- The name of the Government and nature of the relationship - Information about the nature and amount of each individually significant transaction and a quantitative or qualitative indication of the extent of collectively significant transactions. Such information is required in sufficient detail to allow users to understand the effect.
The impact of the amendments have been considered in the accounting policies of the Trust and the related party disclosures made in note 21 of the Annual Financial Statements.
75
ANNUAL FINANCIALSTATEMENTS - CONTINUED
NEF ANNUAL REPORT 2012FIN
AN
CIA
LS
75

76
ANNUAL FINANCIAL STATEMENTSNOTES TO THE ANNUAL FINANCIAL STATEMENTS - For the year ended 31 March 20122. NEW STANDARDS AND INTERPRETATIONS (continued)2.1. Standards and interpretations effective and adopted in the current year (continued) 2010 Annual Improvements Project: Amendments to IFRS 7 (AC 144) - Financial Instruments: Disclosures
The amendments to IFRS 7 provide clarification on the required qualitative risk disclosures required to enable evaluation of an entities exposure to risk. Specific clarification provided relates to the following disclosure requirements:
- For each risk arising from financial instruments disclosure of summary quantitative data regarding exposure to such risks. - Qualitative information relating to the concentration of risk. - For each class of financial instrument the amount that best represents the maximum exposure to credit risk at the end of reporting period. - A description of collateral held as security with regard to the maximum exposure to credit risk. - Information regarding the credit quality of financial assets that are neither past due nor impaired. - Disclosures relating to financial assets past due or impaired. - Removal of the disclosure requirement for collateral held as security and other credit enhancements and an estimate of their fair value for financial assets past due and not impaired, and financial assets that have been determined to be individually impaired. - Additional disclosure required for financial assets obtained by taking possession of collateral or other credit enhancements are only applicable to assets held at reporting date.
The impact of the amendments have been considered in the disclosures made by the Trust, in the notes to the Annual Financial Statements, relating to risk exposure and financial assets.
IFRIC 19 - Extinguishing Financial Liabilities with Equity Instruments This IFRIC clarifies the accounting when an entity renegotiates the terms of its debt with the result that the liability is extinguished through the borrower issuing its own equity instruments to the lender. A gain or loss is recognised in the profit and loss account based on the fair value of the equity instruments compared to the carrying amount of the debt.
The clarification provided by IFRIC 19 has had minimal impact on the Trust’s annual financial statements.
2.2. Standards and interpretations issued but not yet effective The Trust has chosen not to early adopt the following standards and interpretations, which have been published but are mandatory for the Trust’s accounting periods beginning on or after 01 April 2012 or later periods:
GRAP 21 – Impairment of non-cash-generating assets This standard prescribes the procedures that the NEF will apply to determine whether a non-cash generating asset is impaired and to ensure that impairment losses are recognised.
The effective date of the standard is for years beginning on or after 01 April 2012. The Trust expects to adopt the standard for the first time in the 2013 annual financial statements. It is unlikely that the standard will have a material impact on the Trust’s annual financial statements.

NOTES TO THE ANNUAL FINANCIAL STATEMENTS - For the year ended 31 March 20122. NEW STANDARDS AND INTERPRETATIONS (continued)2.2. Standards and interpretations issued but not yet effective (continued) GRAP 23 – Revenue from Non-exchange transactions This standard prescribes the requirements for the financial reporting of revenue from non-exchange (grants and transfer payments transactions).
The effective date of the standard is for years beginning on or after 01 April 2012. The Trust expects to adopt the standard for the first time in the 2013 annual financial statements. It is unlikely that the standard will have a material impact on the Trust’s annual financial statements.
GRAP 24 – Presentation of Budget Information in the financial statements This standard requires a comparison of budget and actual amounts and an explanation for material differences.
The effective date of the standard is for years beginning on or after 01 April 2012. The Trust expects to adopt the standard for the first time in the 2013 annual financial statements. It is unlikely that the standard will have a material impact on the Trust’s financial statements.
GRAP 26 - Impairment of Cash-generating Assets This standard prescribes the procedures to determine whether a cash generating asset is impaired and to ensure that impairment losses are recognised.
The effective date of the standard is for years beginning on or after 01 April 2012. The Trust expects to adopt the standard for the first time in the 2013 annual financial statements. It is unlikely that the standard will have a material impact on the Trust’s annual financial statements.
GRAP 104 – Financial Instrument This standard establishes principles for recognising, measuring, presenting and disclosing financial instruments.
The effective date of the standard is for years beginning on or after 01 April 2012. The Trust expects to adopt the standard for the first time in the 2013 annual financial statements. The impact of the standard on the Trust’s annual financial statements is still to be assessed.
IFRS 9 - Financial Instruments This new standard is the first phase of a three phase project to replace IAS 39 Financial Instruments: Recognition and Measurement. To date, the standard includes chapters for classification, measurement and de-recognition of financial assets and liabilities. The following are main changes from IAS 39:
- Financial assets will be categorised as those subsequently measured at fair value or at amortised cost. - Financial assets at amortised cost are those financial assets where the business model for managing the assets is to hold the assets to collect contractual cash flows (where the contractual cash flows represent payments of principal and interest only). All available for sale, carried at fair value through profit and loss and held for trade investments are to be subsequently measured at fair value. - Under certain circumstances, financial assets may be designated as at fair value. - For hybrid contracts, where the host contract is an asset within the scope of IFRS 9, then the whole instrument is classified in accordance with IFRS 9, without separation of the embedded derivative. In other circumstances, the provisions of IAS 39 still apply. - Voluntary reclassification of financial assets is prohibited. Financial assets shall be reclassified if the entity changes its business model for the management of financial assets. In such circumstances, reclassification takes place prospectively from the beginning of the first reporting period after the date of change of the business model. - Financial liabilities shall not be reclassified.
77
ANNUAL FINANCIALSTATEMENTS - CONTINUED
NEF ANNUAL REPORT 2012FIN
AN
CIA
LS
77

78
ANNUAL FINANCIAL STATEMENTSNOTES TO THE ANNUAL FINANCIAL STATEMENTS - For the year ended 31 March 20122. NEW STANDARDS AND INTERPRETATIONS (continued)2.2. Standards and interpretations issued but not yet effective (continued) - Investments in equity instruments may be measured at fair value through other comprehensive income. When such an election is made, it may not subsequently be revoked, and gains or losses accumulated in equity are not recycled to profit or loss on de-recognition of the investment. The election may be made per individual investment. - IFRS 9 does not allow for investments in equity instruments to be measured at cost. - The classification categories for financial liabilities remains unchanged. However, where a financial liability is designated as at fair value through profit or loss, the change in fair value attributable to changes in the liabilities credit risk shall be presented in other comprehensive income. This excludes situations where such presentation will create or enlarge an accounting mismatch, in which case, the full fair value adjustment shall be recognised in profit or loss.
The effective date of the standard has been revised for years beginning on or after 01 January 2015 (previously effective years beginning on or after 01 January 2013). The Trust expects to adopt the standard for the first time in the 2016 annual financial statements. The impact of the standard on the Trust’s annual financial statements is still to be assessed.
IFRS 10 – Consolidated financial statements This standard replaces the consolidation sections of IAS 27 Consolidated and Separate Financial Statements and SIC 12 Consolidation – Special Purpose Entities. The standard sets out a new definition of control, which exists only when an entity is exposed to, or has rights to, variable returns from its involvement with the entity, and has the ability to effect those returns through power over the investee.
The effective date of the standard is for years beginning on or after 01 January 2013. The Trust expects to adopt the standard for the first time in the 2014 annual financial statements. It is unlikely that the standard will have a material impact on the Trust’s annual financial statements as the Trust applies GRAP 6 Consolidated and Separate Financial Statements.
IAS 27 - Separate Financial Statements Consequential to the issue of IFRS 10 the amended IAS 27 (AC 132) now only deals with separate financial statements.
The effective date of the amendment is for years beginning on or after 01 January 2013. The Trust expects to adopt the amendment for the first time in the 2014 annual financial statements. It is unlikely that the amendment will have a material impact on the Trust’s annual financial statements as the Trust applies GRAP 6 Consolidated and Separate Financial Statements.
IFRS 11 – Joint arrangements IFRS 11 replaces IAS 31(AC 119) Interests in Joint Ventures and SIC 13 Jointly Controlled Entities – Non Monetary Contributions by Venturers. IFRS 11 provides for a change in the assessment of joint arrangements by focusing on the rights and obligations of the arrangement, rather than its legal form. There are two types of joint arrangements: joint operations and joint ventures. Joint operations arise where a joint operator has rights to the assets and obligations relating to the arrangement and hence accounts for its interest in assets, liabilities, revenue and expenses. Joint ventures arise where the joint operator has rights to the net assets of the arrangement and hence equity accounts for its interest. Proportional consolidation of joint ventures is no longer allowed under IFRS 11.
The effective date of the standard has been revised for years beginning on or after 01 January 2013. The Trust expects to adopt the standard for the first time in the 2014 annual financial statements. It is unlikely that the standard will have a material impact on the Trust’s annual financial statements as the Trust will apply the venture capital exclusions contained in the IFRS.

NOTES TO THE ANNUAL FINANCIAL STATEMENTS - For the year ended 31 March 20122. NEW STANDARDS AND INTERPRETATIONS (continued)2.2. Standards and interpretations issued but not yet effective (continued)
IAS 28 (AC 110) (revised 2011) – Associates and joint ventures Consequential to the issue of IFRS 11 the amended IAS 28 (AC 110) now includes the requirements for joint ventures, as well as associates, to be equity accounted.
The effective date of the amendment is for years beginning on or after 01 January 2013. The Trust expects to adopt the amendment for the first time in the 2014 annual financial statements. It is unlikely that the amendment will have a material impact on the Trust’s annual financial statements as the Trust applies the venture capital exclusions contained in the current IAS 31 Interest in joint Ventures (AC 119) and IAS 28 (AC 110) Investments in Associates.
IFRS 12 - Disclosure of Interests in Other Entities IFRS 12 sets out disclosure requirements for investments in subsidiaries, associates, joint ventures and unconsolidated structured entities. The disclosures are aimed to provide information about the significance and exposure to risks of such interests. The most significant impact is the disclosure requirement for unconsolidated structured entities or off balance sheet vehicles.
The effective date of the standard is for years beginning on or after 01 January 2013. The Trust expects to adopt the standard for the first time in the 2014 annual financial statements. It is unlikely that the standard will have a material impact on the Trust’s annual financial statements. IFRS 13 - Fair Value Measurement IFRS 13 sets out guidance on the measurement and disclosure of items measured at fair value or required to be disclosed at fair value in terms of other IFRS’s.
The effective date of the standard is for years beginning on or after 01 January 2013. The Trust expects to adopt the standard for the first time in the 2014 annual financial statements. It expected that the guidance provided will impact on the disclosures made by the Trust with regard to financial instruments measured at fair value.
2.3. Standards and interpretations not yet effective or relevant GRAP 18 – Segment Reporting This standard establishes principles for reporting financial information by segments.
The effective date of the standard is still to be determined by the Minister of Finance. It is unlikely that the standard will have a material impact on the Trust’s annual financial statements.
GRAP 25 - Employee Benefits This standard prescribes the accounting treatment and disclosure for employee benefits.
The effective date of the standard is still to be determined by the Minister of Finance. It is unlikely that the amendment will have a material impact on the Trust’s annual financial statements.
79
ANNUAL FINANCIALSTATEMENTS - CONTINUED
NEF ANNUAL REPORT 2012FIN
AN
CIA
LS
79

80
ANNUAL FINANCIAL STATEMENTSNOTES TO THE ANNUAL FINANCIAL STATEMENTS - For the year ended 31 March 2012
2. NEW STANDARDS AND INTERPRETATIONS (continued)2.3. Standards and interpretations not yet effective or relevant (continued) IAS 12 (AC 102) - Income taxes’ on deferred tax The amendment now provides that for investment property measured at fair value, the recovery of the carrying amount is assumed to be through sale, with the result that deferred tax arising on the valuation is measured using the prevailing tax rate for capital gains.
The effective date of the amendment is for years beginning on or after 01 January 2012. The Trust expects to adopt the amendment for the first time in the 2013 annual financial statements. The amendment will have no material impact on the Trust’s annual financial statements as the Trust is exempt from Income Tax.
IAS 19 (AC 116) - Employee Benefits Revised The amendments to IAS 19 provide for the following:
- Required recognition of changes in the net defined benefit liability/(asset) including immediate recognition of defined benefit cost, disaggregation of defined benefit cost into components, recognition of re-measurements in other comprehensive income, plan amendments, curtailments and settlements - Introduction of enhanced disclosures about defined benefit plans - Modify accounting for termination benefits, including distinguishing benefits provided in exchange for service and benefits provided in exchange for the termination of employment and affect the recognition and measurement of termination benefits - Clarification of miscellaneous issues, including the classification of employee benefits, current estimates of mortality rates, tax and administration costs and risk sharing and conditional indexation features.
The effective date of the amendment is for years beginning on or after 01 January 2013. The Trust expects to adopt the amendment for the first time in the 2014 annual financial statements. It is unlikely that the amendment will have a material impact on the Trust’s annual financial statements.

NOTES TO THE ANNUAL FINANCIAL STATEMENTS - For the year ended 31 March 2012
3. RISK MANAGEMENT3.1. Credit risk Trade and other receivables are due from reputable counterparties with no history of default.
Credit risk arises from cash and cash equivalents, deposits with banks and also comprises the potential loss on financing due to counterparty default on the advancing of Originated Loans as well as any trade and other receivables arising out of investment activities of the Trust.
The risk of default on Originated Loans is actively managed especially through the fully established Post Investment Department, responsible for the ongoing performance monitoring of the Originated Loans portfolio.
Only the National Treasury approved banks are used by the Trust for cash and call deposits, and these are split between the banks as follow:
Credit Ratings Closing Balances 2012 Closing Balances 2011
R R
Standard Bank AA+ 408 382 128 915 210 112
First National Bank A-2 532 271 330 516 820 827
South African Reserve Bank BAA 1 013 458 447 909 789 386
Rand Merchant Bank A-2 247 883 736 235 069 932
Investec A1+ 5 662 790
Total Cash held with Banks 2 201 995 641 2 582 553 047
The Trust’s maximum exposure to credit risk is represented by the carrying amount of all the financial assets determined to be exposed to credit risk (net of impairment losses where relevant).
The impairment methodology utilized by the Trust results in Originated Loans that are in excess of 60 days in arrears ie, two repayment instalments in arrears, being subjected to a level of impairment, in line with the overall period in arrears. The Originated Loans that have not been impaired all remain at the 60 day period of ageing, in that they remain regularly monitored with a high likelihood that some repayment instalments in the future will be missed by the borrowers. This risk of default is further managed with ongoing feedback on repayment activity to the Post Investment Department of the Trust.
None of the financial assets that are performing have been renegotiated in the current year.
81
ANNUAL FINANCIALSTATEMENTS - CONTINUED
NEF ANNUAL REPORT 2012FIN
AN
CIA
LS
81
82
NOTES TO THE ANNUAL FINANCIAL STATEMENTS - For the year ended 31 March 2012
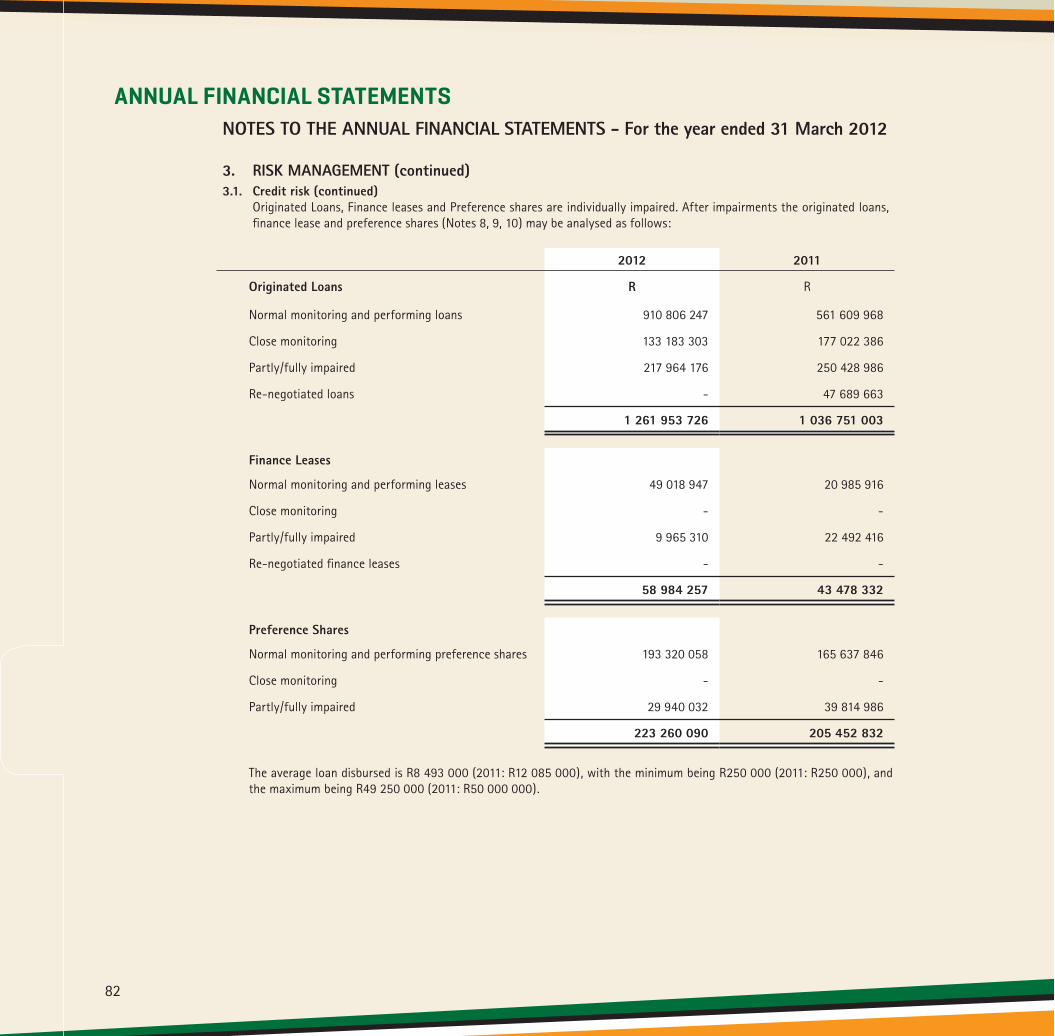
3. RISK MANAGEMENT (continued)3.1. Credit risk (continued) Originated Loans, Finance leases and Preference shares are individually impaired. After impairments the originated loans, finance lease and preference shares (Notes 8, 9, 10) may be analysed as follows:
2012 2011
Originated Loans R R
Normal monitoring and performing loans 910 806 247 561 609 968
Close monitoring 133 183 303 177 022 386
Partly/fully impaired 217 964 176 250 428 986
Re-negotiated loans - 47 689 663
1 261 953 726 1 036 751 003
Finance Leases
Normal monitoring and performing leases 49 018 947 20 985 916
Close monitoring - -
Partly/fully impaired 9 965 310 22 492 416
Re-negotiated finance leases - -
58 984 257 43 478 332
Preference Shares
Normal monitoring and performing preference shares 193 320 058 165 637 846
Close monitoring - -
Partly/fully impaired 29 940 032 39 814 986
223 260 090 205 452 832
The average loan disbursed is R8 493 000 (2011: R12 085 000), with the minimum being R250 000 (2011: R250 000), and the maximum being R49 250 000 (2011: R50 000 000).
ANNUAL FINANCIAL STATEMENTS
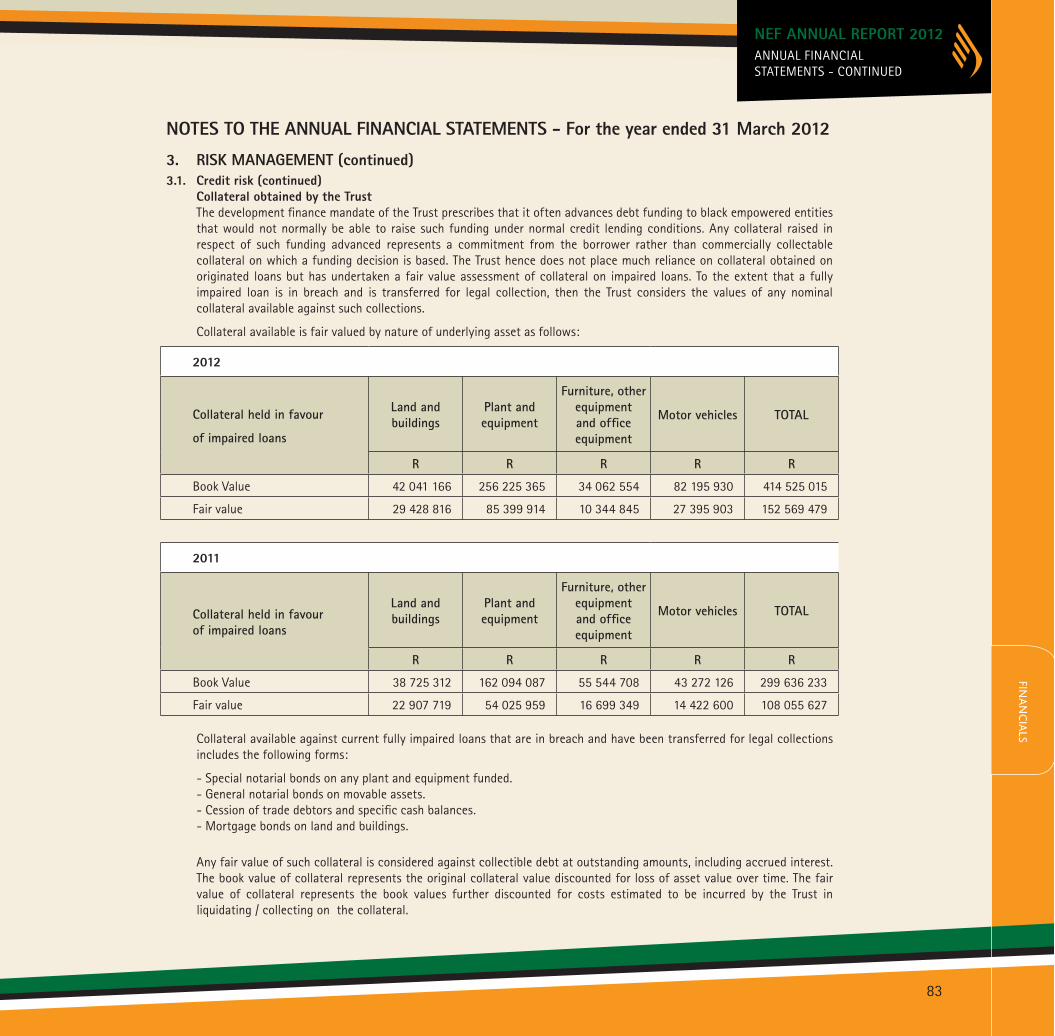
NOTES TO THE ANNUAL FINANCIAL STATEMENTS - For the year ended 31 March 20123. RISK MANAGEMENT (continued)3.1. Credit risk (continued) Collateral obtained by the Trust The development finance mandate of the Trust prescribes that it often advances debt funding to black empowered entities that would not normally be able to raise such funding under normal credit lending conditions. Any collateral raised in respect of such funding advanced represents a commitment from the borrower rather than commercially collectable collateral on which a funding decision is based. The Trust hence does not place much reliance on collateral obtained on originated loans but has undertaken a fair value assessment of collateral on impaired loans. To the extent that a fully impaired loan is in breach and is transferred for legal collection, then the Trust considers the values of any nominal collateral available against such collections.
Collateral available is fair valued by nature of underlying asset as follows:
2012
Collateral held in favour
of impaired loans
Land and buildings
Plant and equipment
Furniture, other equipment and office equipment
Motor vehicles TOTAL
R R R R R
Book Value 42 041 166 256 225 365 34 062 554 82 195 930 414 525 015
Fair value 29 428 816 85 399 914 10 344 845 27 395 903 152 569 479
2011
Collateral held in favour of impaired loans
Land and buildings
Plant and equipment
Furniture, other equipment and office equipment
Motor vehicles TOTAL
R R R R R
Book Value 38 725 312 162 094 087 55 544 708 43 272 126 299 636 233
Fair value 22 907 719 54 025 959 16 699 349 14 422 600 108 055 627
Collateral available against current fully impaired loans that are in breach and have been transferred for legal collections includes the following forms:
- Special notarial bonds on any plant and equipment funded. - General notarial bonds on movable assets. - Cession of trade debtors and specific cash balances. - Mortgage bonds on land and buildings .
Any fair value of such collateral is considered against collectible debt at outstanding amounts, including accrued interest. The book value of collateral represents the original collateral value discounted for loss of asset value over time. The fair value of collateral represents the book values further discounted for costs estimated to be incurred by the Trust in liquidating / collecting on the collateral.
83
ANNUAL FINANCIALSTATEMENTS - CONTINUED
NEF ANNUAL REPORT 2012FIN
AN
CIA
LS
83
84
NOTES TO THE ANNUAL FINANCIAL STATEMENTS - For the year ended 31 March 2012
3. RISK MANAGEMENT (continued)3.2. Market risk Market risk represents the risk that the value of investments will fluctuate because of changes in market interest rates and prices, whether those changes are caused by factors specific to individual instruments or its issuer or factors affecting all instruments traded in the market. Market risk embodies not only the potential for loss but also the potential for gain.
3.3. Interest rate risk The Trust is exposed to interest rate risk through the financing of investment proposals, at fixed as well as variable interest rates, as well as cash management activities. Changes in market interest rates affect the fair value of cash and investment assets. Investment interest rate risk is managed through the investment policy while cash returns are managed through the cash management policy.
This risk materialises in the Trust’s significant cash portfolio invested in various interest earning bank treasury and call accounts. The Trust is partially dependent on interest income from cash on call to fund its annual operations, and will become more dependent on interest income from cash balances as well as from the originated loans portfolio to fund its annual operational requirements going forward.
A significant part (2012 - 85%: 2011 – 70%) of the Trust’s investment portfolio is advanced in the form of originated loans. These loans are advanced at interest rates which are fixed as well as others that are linked to the prime lending rates over terms generally ranging from 5 to 8 years.
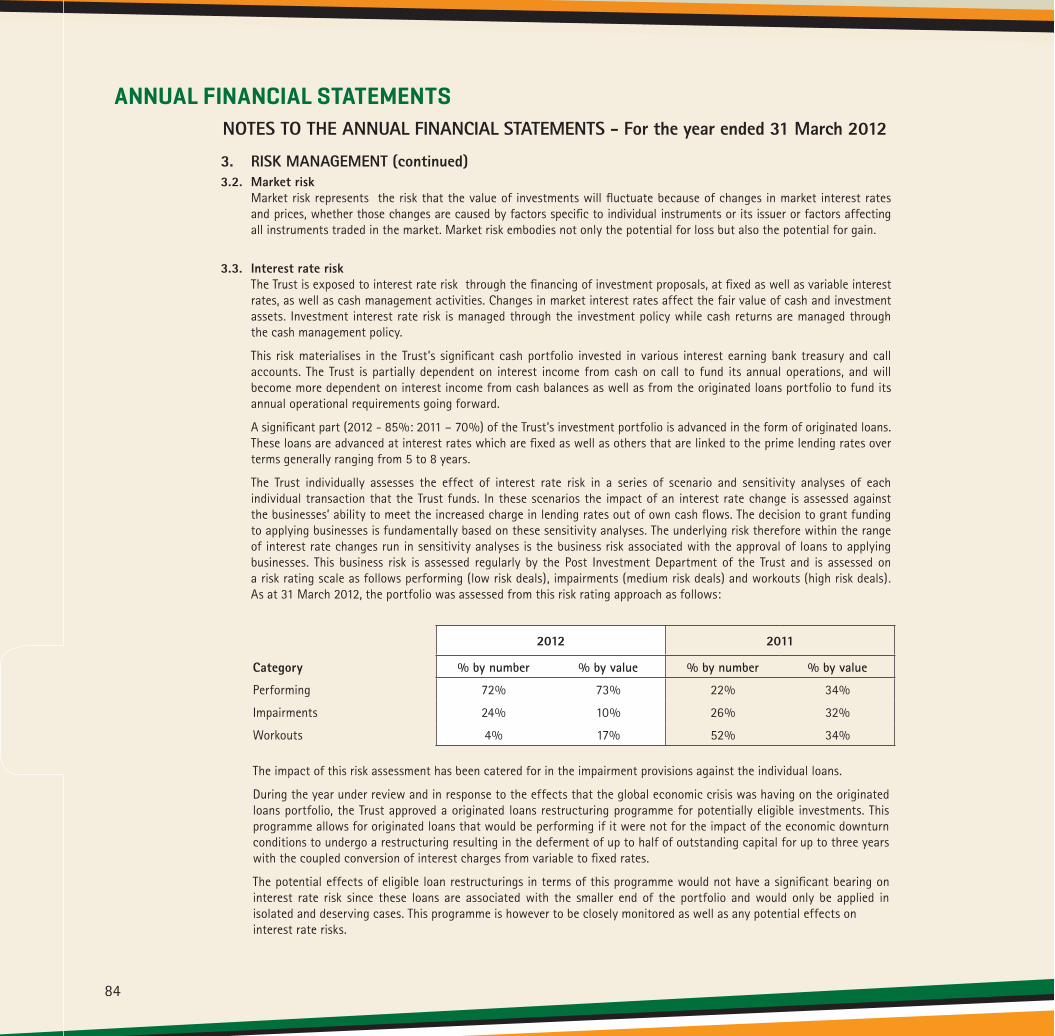
The Trust individually assesses the effect of interest rate risk in a series of scenario and sensitivity analyses of each individual transaction that the Trust funds. In these scenarios the impact of an interest rate change is assessed against the businesses’ ability to meet the increased charge in lending rates out of own cash flows. The decision to grant funding to applying businesses is fundamentally based on these sensitivity analyses. The underlying risk therefore within the range of interest rate changes run in sensitivity analyses is the business risk associated with the approval of loans to applying businesses. This business risk is assessed regularly by the Post Investment Department of the Trust and is assessed on a risk rating scale as follows performing (low risk deals), impairments (medium risk deals) and workouts (high risk deals). As at 31 March 2012, the portfolio was assessed from this risk rating approach as follows:
2012 2011
Category % by number % by value % by number % by value
Performing 72% 73% 22% 34%
Impairments 24% 10% 26% 32%
Workouts 4% 17% 52% 34%
The impact of this risk assessment has been catered for in the impairment provisions against the individual loans.
During the year under review and in response to the effects that the global economic crisis was having on the originated loans portfolio, the Trust approved a originated loans restructuring programme for potentially eligible investments. This programme allows for originated loans that would be performing if it were not for the impact of the economic downturn conditions to undergo a restructuring resulting in the deferment of up to half of outstanding capital for up to three years with the coupled conversion of interest charges from variable to fixed rates.
The potential effects of eligible loan restructurings in terms of this programme would not have a significant bearing on interest rate risk since these loans are associated with the smaller end of the portfolio and would only be applied in isolated and deserving cases. This programme is however to be closely monitored as well as any potential effects on interest rate risks.
ANNUAL FINANCIAL STATEMENTS
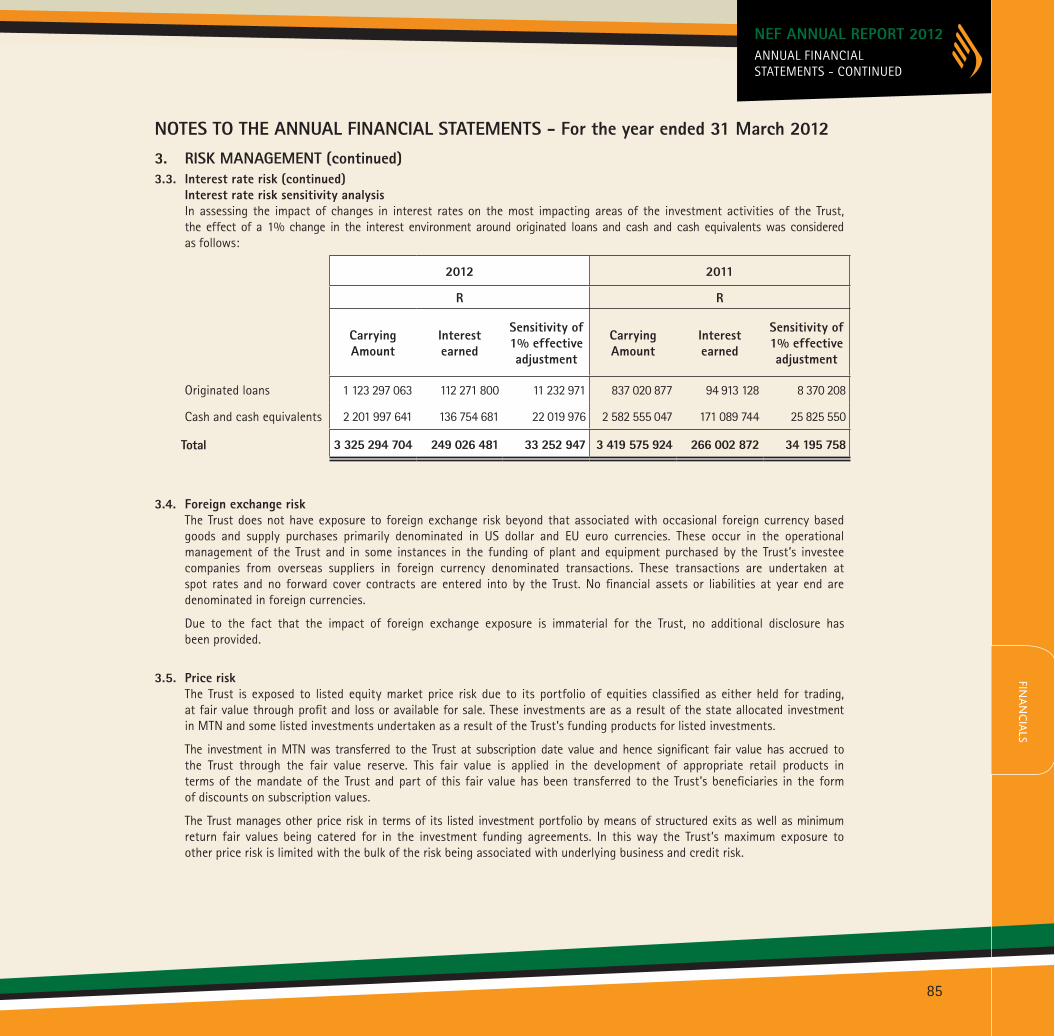
NOTES TO THE ANNUAL FINANCIAL STATEMENTS - For the year ended 31 March 20123. RISK MANAGEMENT (continued)3.3. Interest rate risk (continued) Interest rate risk sensitivity analysis In assessing the impact of changes in interest rates on the most impacting areas of the investment activities of the Trust, the effect of a 1% change in the interest environment around originated loans and cash and cash equivalents was considered as follows:
2012 2011
R R
Carrying Amount
Interest earned
Sensitivity of 1% effective adjustment
Carrying Amount
Interest earned
Sensitivity of 1% effective adjustment
Originated loans 1 123 297 063 112 271 800 11 232 971 837 020 877 94 913 128 8 370 208
Cash and cash equivalents 2 201 997 641 136 754 681 22 019 976 2 582 555 047 171 089 744 25 825 550
Total 3 325 294 704 249 026 481 33 252 947 3 419 575 924 266 002 872 34 195 758
3.4. Foreign exchange risk The Trust does not have exposure to foreign exchange risk beyond that associated with occasional foreign currency based goods and supply purchases primarily denominated in US dollar and EU euro currencies. These occur in the operational management of the Trust and in some instances in the funding of plant and equipment purchased by the Trust’s investee companies from overseas suppliers in foreign currency denominated transactions. These transactions are undertaken at spot rates and no forward cover contracts are entered into by the Trust. No financial assets or liabilities at year end are denominated in foreign currencies.
Due to the fact that the impact of foreign exchange exposure is immaterial for the Trust, no additional disclosure has been provided.
3.5. Price risk The Trust is exposed to listed equity market price risk due to its portfolio of equities classified as either held for trading, at fair value through profit and loss or available for sale. These investments are as a result of the state allocated investment in MTN and some listed investments undertaken as a result of the Trust’s funding products for listed investments.
The investment in MTN was transferred to the Trust at subscription date value and hence significant fair value has accrued to the Trust through the fair value reserve. This fair value is applied in the development of appropriate retail products in terms of the mandate of the Trust and part of this fair value has been transferred to the Trust’s beneficiaries in the form of discounts on subscription values.
The Trust manages other price risk in terms of its listed investment portfolio by means of structured exits as well as minimum return fair values being catered for in the investment funding agreements. In this way the Trust’s maximum exposure to other price risk is limited with the bulk of the risk being associated with underlying business and credit risk.
85
ANNUAL FINANCIALSTATEMENTS - CONTINUED
NEF ANNUAL REPORT 2012FIN
AN
CIA
LS
85

86
NOTES TO THE ANNUAL FINANCIAL STATEMENTS - For the year ended 31 March 2012
3. RISK MANAGEMENT (continued)3.5. Price risk (continued)
Listed Investments Number of shares at year end
Share price at year end
10% increase in share price
10% decrease in share price
R R R R
AH Vest Ltd 7 860 473 0,20 157 209 (157 209)
Hospitality Property Fund A Ltd 2 523 165 11,90 3 002 566 (3 002 566)
Hospitality Property Fund B Ltd 1 261 583 4,00 504 633 (504 633)
MTN Ltd 10 109 108 135,02 136 493 176 (136 493 176)
Total 140 157 584 (140 157 584)
Liquidity risk The Trust was historically capitalized out of voted transfers made to it for the purposes of funding operations and also for the advancing of capital to eligible black empowered businesses through its fund management products. This funding was voted annually and advanced in tranches by the dti to cover operational and fund management capital requirements for disbursements during the applicable years.
The cash balances of the Trust are invested in treasury and call accounts of its three banks. The treasury management function in the finance department under the CFO manages the investment of cash in various market quoted treasury accounts on terms commensurate with the liquidity requirements of the Trust. These liquidity requirements of the Trust are measured against forecasted liquidity requirements.
Liquidity risk would arise to the extent the Trust has committed investment disbursements that cannot be met out of fixed treasury commitments or available cash balances, or to the extent that cash held by the Trust is reclaimed by the National Treasury through the provisions of the PFMA.
All current operating liabilities are expected to be contractually due in 7 days and current fund management commitments are expected to be due within 30 days of these being approved for investment.
Capital Risk Management Trust Capital primarily comprises funds transferred from the dti for the purposes of granting funding to eligible black empowered businesses through its fund management products. To date cash funds received from the dti for these purposes totals R2 297 431 472 (2011: R2 297 431 472 - note 18). Historically funding for operations was also advanced by the dti in the form of transfer funds. These were matched against operational expenditure for the year and to the extent there was some level of operational surplus or deficit, then this was transferred or offset to Accumulated Surplus once approval is granted in this respect from National Treasury.
Capital advanced for fund management is applied only against budgeted and actual investment disbursements in terms of the fund management products and mandate of the Trust. Operational capital is strictly applied against operational expenditure only, in terms of PFMA requirements.
Proceeds raised on asset management retail product subscriptions are transferred to capital through profit and loss upon derecognition of available for sale assets fair valued through non-distributable reserves. This capital is managed separately and utilised for the purposes of reapplication into asset management activities and other related investments in consultation with the dti and National Treasury. Since inception the Trust has been funded out of transfer funds from the dti against presentation and approval of its annual business plan and budget. The Trust is moving towards self sustainability due to interest income received on its originated loans portfolio as well as on cash balances invested in bank treasury and call accounts generating sufficient revenues to sustain operations.
The Trust has complied with the requirements of the application of transfers for capital purposes and transfers for expenditure purposes as imposed through the PFMA.
ANNUAL FINANCIAL STATEMENTS

NOTES TO THE ANNUAL FINANCIAL STATEMENTS - For the year ended 31 March 2012
4. PROPERTY AND EQUIPMENT
Owned
2012 Motor Vehicles
Computer Equipment
Audio Visual Equipment
Office Equipment
Furniture and Fittings
Leasehold Improvements Paintings Total
R R R R R R R R
Opening Balance
Cost 907 003 4 748 926 706 795 2 655 640 4 329 548 6 908 209 286 304 20 542 424
Accumulated depreciation (392 941) (3 226 507) (672 002) (1 444 439) (2 958 347) (3 824 692) (46 685) (12 565 613)
Net Book Value 514 062 1 522 420 34 793 1 211 201 1 371 201 3 083 517 239 619 7 976 812 Movement for the year:
Additions - 640 082 257 427 425 728 987 894 325 192 - 2 636 323
Disposals/Derecognition at cost - (76 464) (391 133) (133 377) - (2 449 596) (101 402) (3 151 972)
Reclassifications - (195 085) - (149 821) (267 122) 521 113 - (90 915)
Depreciation on disposed /derecognised assets - 72 264 389 201 132 832 - 2 449 596 22 072 3 065 965
Depreciation (170 876) (900 691) (15 246) (701 021) (510 498) (1 066 978) (6 189) (3 371 499)
Closing Balance (170 876) (459 894) 240 249 (425 659) 210 273 (220 673) (85 519) (912 099)
Cost 907 003 5 117 459 573 089 2 798 170 5 050 320 5 304 918 184 902 19 935 862
Accumulated depreciation (563 817) (4 054 934) (298 047) (2 012 628) (3 468 845) (2 442 074) (30 802) (12 871 147)
Net Book Value 343 186 1 062 525 275 042 785 542 1 581 475 2 862 845 154 100 7 064 715
Gross carrying amount of fully depreciated assets still in use.
408 103 936 563 164 990 49 800 1 124 618 98 439 - 2 782 513
87
ANNUAL FINANCIALSTATEMENTS - CONTINUED
NEF ANNUAL REPORT 2012FIN
AN
CIA
LS
87
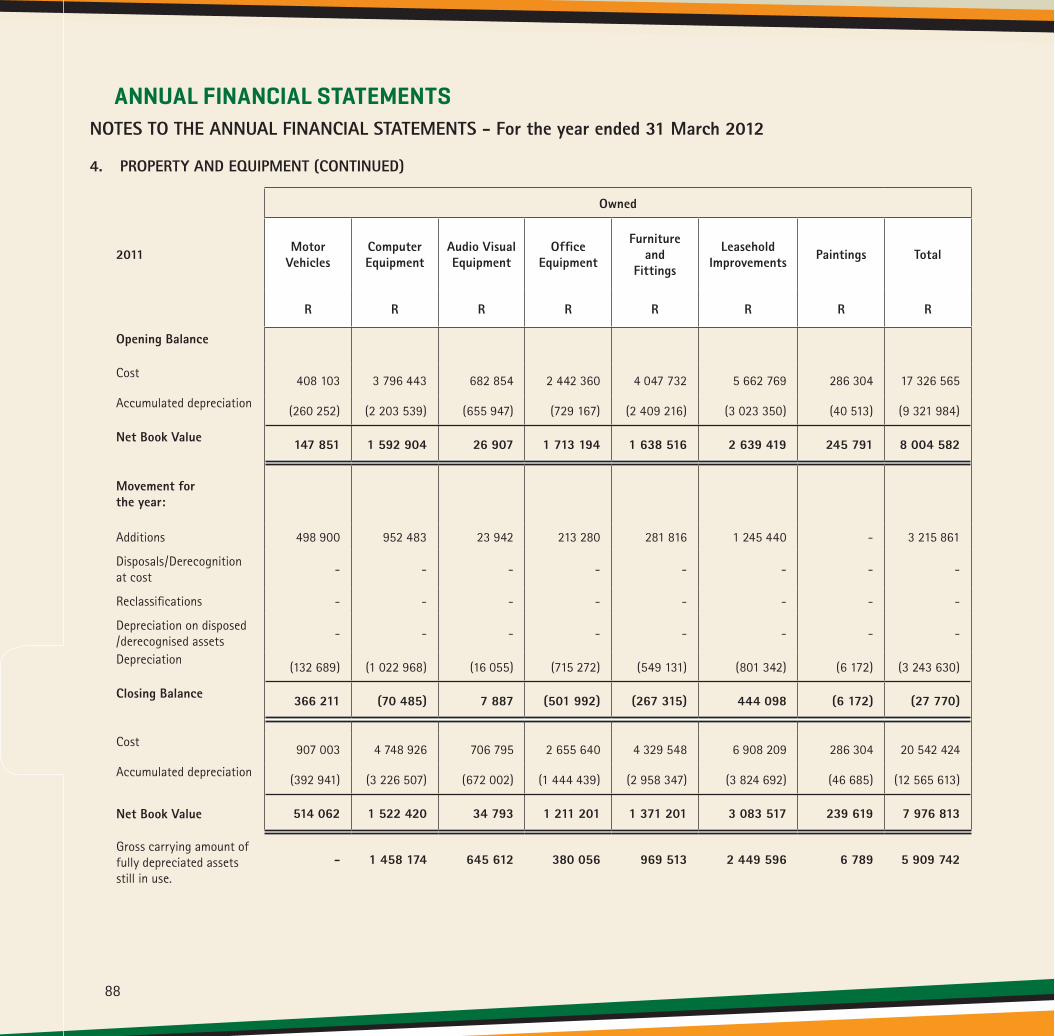
88
NOTES TO THE ANNUAL FINANCIAL STATEMENTS - For the year ended 31 March 2012
4. PROPERTY AND EQUIPMENT (CONTINUED)
Owned
2011 Motor Vehicles
Computer Equipment
Audio Visual Equipment
Office Equipment
Furniture and
Fittings
Leasehold Improvements Paintings Total
R R R R R R R R
Opening Balance
Cost 408 103 3 796 443 682 854 2 442 360 4 047 732 5 662 769 286 304 17 326 565
Accumulated depreciation (260 252) (2 203 539) (655 947) (729 167) (2 409 216) (3 023 350) (40 513) (9 321 984)
Net Book Value 147 851 1 592 904 26 907 1 713 194 1 638 516 2 639 419 245 791 8 004 582
Movement for the year:
Additions 498 900 952 483 23 942 213 280 281 816 1 245 440 - 3 215 861
Disposals/Derecognition at cost - - - - - - - -
Reclassifications - - - - - - - -
Depreciation on disposed /derecognised assets - - - - - - - -
Depreciation (132 689) (1 022 968) (16 055) (715 272) (549 131) (801 342) (6 172) (3 243 630)
Closing Balance 366 211 (70 485) 7 887 (501 992) (267 315) 444 098 (6 172) (27 770)
Cost 907 003 4 748 926 706 795 2 655 640 4 329 548 6 908 209 286 304 20 542 424
Accumulated depreciation (392 941) (3 226 507) (672 002) (1 444 439) (2 958 347) (3 824 692) (46 685) (12 565 613)
Net Book Value 514 062 1 522 420 34 793 1 211 201 1 371 201 3 083 517 239 619 7 976 813
Gross carrying amount of fully depreciated assets still in use.
- 1 458 174 645 612 380 056 969 513 2 449 596 6 789 5 909 742
ANNUAL FINANCIAL STATEMENTS
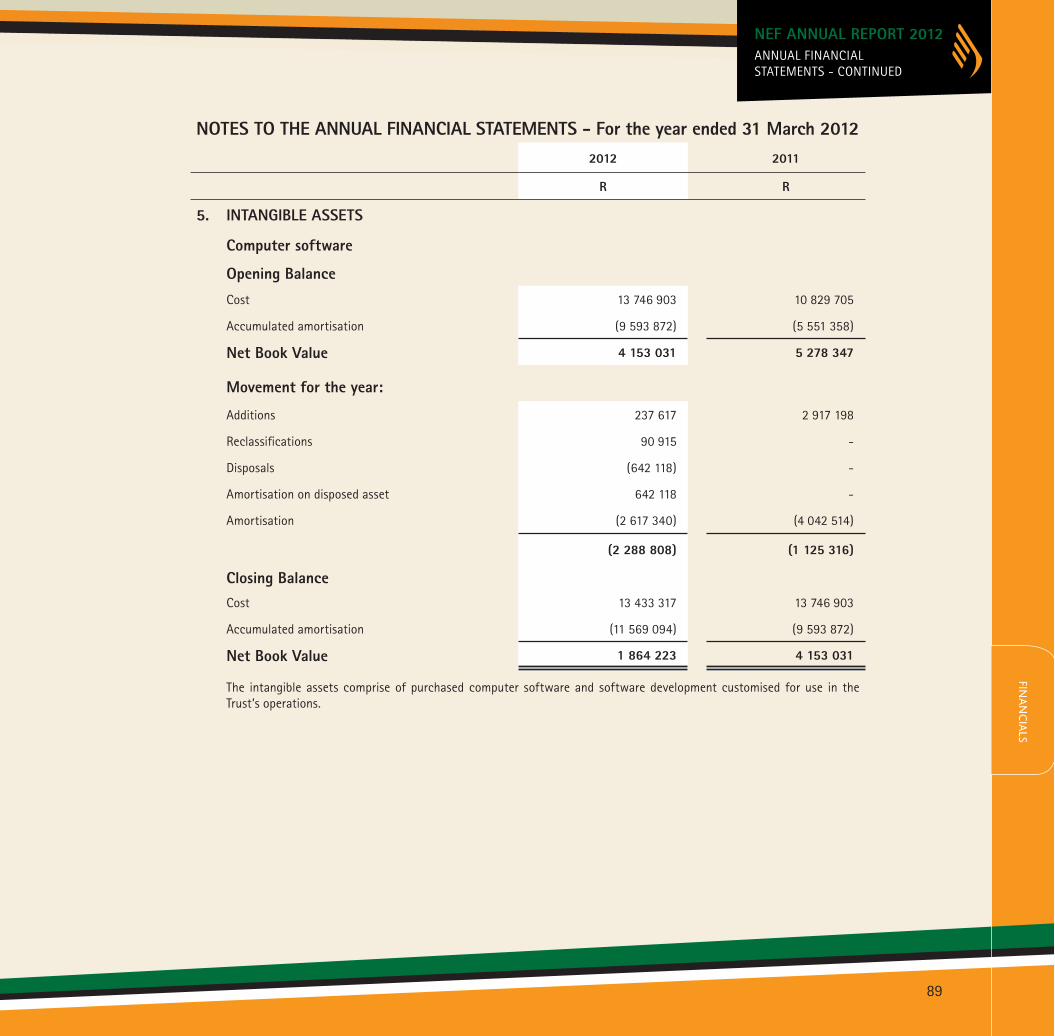
NOTES TO THE ANNUAL FINANCIAL STATEMENTS - For the year ended 31 March 20122012 2011
R R
5. INTANGIBLE ASSETS
Computer software
Opening Balance Cost 13 746 903 10 829 705
Accumulated amortisation (9 593 872) (5 551 358)
Net Book Value 4 153 031 5 278 347
Movement for the year:
Additions 237 617 2 917 198
Reclassifications 90 915 -
Disposals (642 118) -
Amortisation on disposed asset 642 118 -
Amortisation (2 617 340) (4 042 514)
(2 288 808) (1 125 316)
Closing Balance Cost 13 433 317 13 746 903
Accumulated amortisation (11 569 094) (9 593 872)
Net Book Value 1 864 223 4 153 031
The intangible assets comprise of purchased computer software and software development customised for use in the Trust’s operations.
89
ANNUAL FINANCIALSTATEMENTS - CONTINUED
NEF ANNUAL REPORT 2012FIN
AN
CIA
LS
89
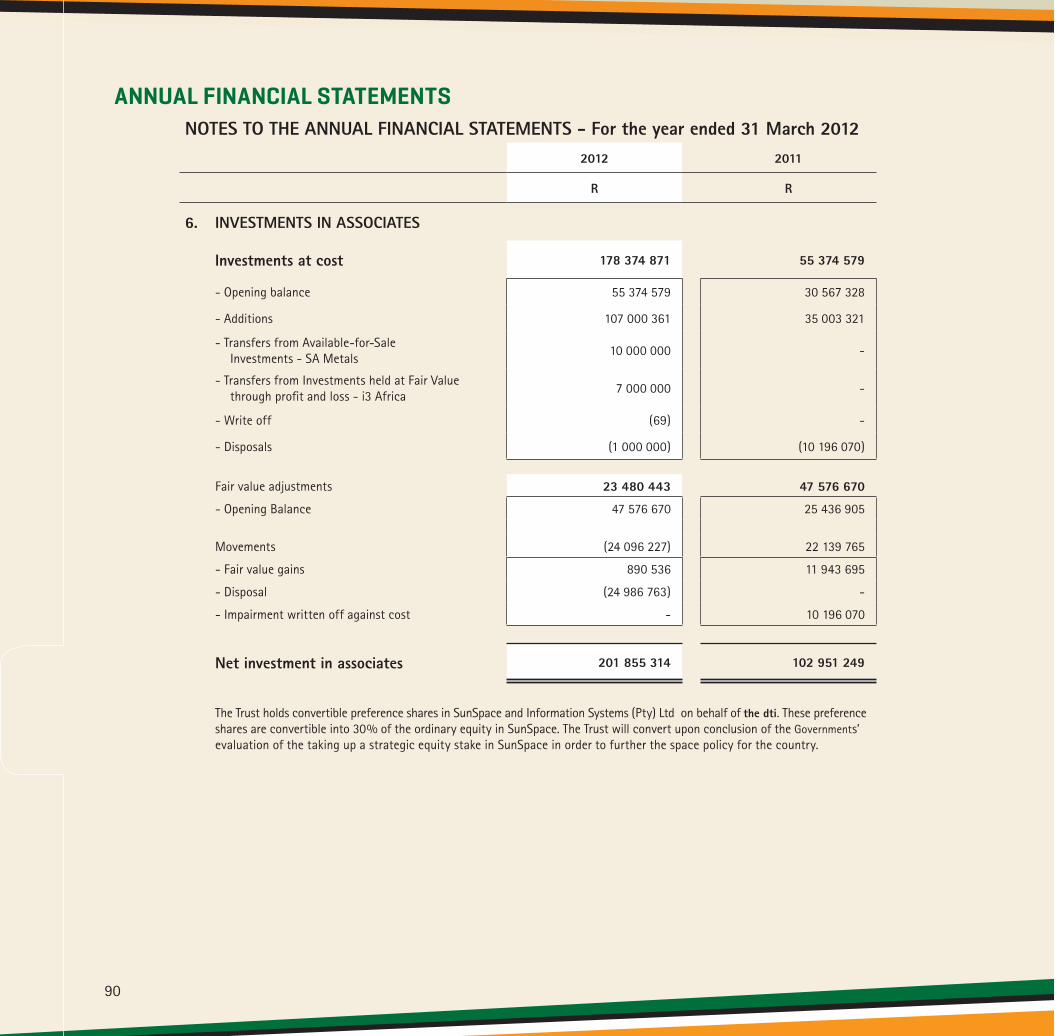
90
NOTES TO THE ANNUAL FINANCIAL STATEMENTS - For the year ended 31 March 20122012 2011
R R
6. INVESTMENTS IN ASSOCIATES
Investments at cost 178 374 871 55 374 579
- Opening balance 55 374 579 30 567 328
- Additions 107 000 361 35 003 321
- Transfers from Available-for-Sale Investments - SA Metals 10 000 000 -
- Transfers from Investments held at Fair Value through profit and loss - i3 Africa 7 000 000 -
- Write off (69) -
- Disposals (1 000 000) (10 196 070)
Fair value adjustments 23 480 443 47 576 670
- Opening Balance 47 576 670 25 436 905
Movements (24 096 227) 22 139 765
- Fair value gains 890 536 11 943 695
- Disposal (24 986 763) -
- Impairment written off against cost - 10 196 070
Net investment in associates 201 855 314 102 951 249
The Trust holds convertible preference shares in SunSpace and Information Systems (Pty) Ltd on behalf of the dti. These preference shares are convertible into 30% of the ordinary equity in SunSpace. The Trust will convert upon conclusion of the Governments’ evaluation of the taking up a strategic equity stake in SunSpace in order to further the space policy for the country.
ANNUAL FINANCIAL STATEMENTS

NOTES TO THE ANNUAL FINANCIAL STATEMENTS - For the year ended 31 March 20126. INVESTMENTS IN ASSOCIATES (continued) The Trust’s principal associates are:
2012 2011
Name Country of incorporation
Principal activity
Interest held (%)
Interest held (%)
Unlisted: Blue Glamour (Pty) Ltd South Africa Manufacturing 32,00% 32,00% DMS Powders (Pty) Ltd South Africa Mining - 20,00% Inca Concrete Masonry (Pty) Ltd South Africa Construction 35,00% 35,00% Lak Investment T/A Stone Age (Pty) Ltd South Africa Construction 25,00% 25,00% Safepak (Pty) Ltd South Africa Manufacturing 20,00% 20,00% Stutt Brick Company (Pty) Ltd South Africa Construction 45,00% 45,00% Wiredloop (Pty) Ltd South Africa ICT and Media - 25,00% Amajuba Berries (Pty)Ltd * South Africa Agro-Processing 51,00% 51,00% Colliery Dust Control (Pty) Ltd South Africa Mining 40,10% 40,10% False Bay Bricks (Pty) Ltd South Africa Construction 30,00% 30,00% Trennplast (Pty) Ltd South Africa Manufacturing 26,50% 26,50% Middelsdrift Dairy (Pty) Ltd South Africa Agro-Processing 40,00% 40,00% White Heat Trading 4 (Pty)Ltd t/a Hollywood Displays South Africa Manufacturing 34,50% 34,50% Renu Energy (Pty)Ltd South Africa Manufacturing - 26,00%
Ntsinde Royal Jozini Holdings (Pty)Ltd South Africa Tourism and Entertainment 33,40% 33,40%
Buffalo Bull (Pty) Ltd South Africa Agro-Processing 30,00% 30,00%
Busa Holdings (Pty) Ltd South Africa Healthcare 49,00% 49,00%
Africa Rising (Pty) Ltd South Africa Financial Services 25,10% 25,10%
Crowie Holdings (Pty) Ltd South Africa Construction 25,10% 25,10% Boipelo Piggery (Pty) Ltd South Africa Agro-Processing 20,00% 20,00% Inala Shipping (Pty) Ltd South Africa Shipping 30,00% 30,00% Pretamix (Pty) Ltd South Africa Services 49,00% 49,00% Sizovuna Investments Holding (Pty) Ltd South Africa Property 49,00% 49,00% Basfour (Pty) Ltd South Africa Engineering 49,00% 49,00% IM Capital (Pty) Ltd South Africa Engineering 49,00% 49,00% SA Metals (Pty) Ltd South Africa Mining 29,00% 10,00% i3 Africa (Pty) Ltd South Africa Telecommunication 30,00% - Business Venture Investments (Pty) Ltd South Africa Agro-Processing 30,00% - Karbochem Co-generation (Pty) Ltd South Africa Energy 30,00% - Imbaza Mussel (Pty) Ltd South Africa Agro-Processing 30,00% - Value Cement (Pty) Ltd South Africa Construction 31,00% -
91
ANNUAL FINANCIALSTATEMENTS - CONTINUED
NEF ANNUAL REPORT 2012FIN
AN
CIA
LS
91

92
NOTES TO THE ANNUAL FINANCIAL STATEMENTS - For the year ended 31 March 20126. INVESTMENTS IN ASSOCIATES (continued)
Voting power Equity at fair value
Name 2012 2011 2012 2011R R
Unlisted: Blue Glamour (Pty) Ltd 32,00% 32,00% 11 036 387 12 795 886 DMS Powders (Pty) Ltd - 20,00% - 25 986 673 Inca Concrete Masonry (Pty) Ltd 35,00% 35,00% 350 350 Lak Investment T/A Stone Age (Pty) Ltd 25,00% 25,00% 25 25 Safepak (Pty) Ltd 20,00% 20,00% 20 20 Stutt Brick Company (Pty) Ltd 45,00% 45,00% 45 45 Wiredloop (Pty) Ltd - 25,00% - 33 Amajuba Berries (Pty)Ltd * 31,00% 31,00% 12 928 895 19 369 051 Colliery Dust Control (Pty) Ltd 40,10% 40,10% 16 637 549 9 794 532 False Bay Bricks (Pty) Ltd 30,00% 30,00% 300 300 Trennplast (Pty) Ltd 26,50% 26,50% 2 247 349 265 Middelsdrift Dairy (Pty) Ltd 40,00% 40,00% 40 40 White Heat Trading 4 (Pty)Ltd t/a Hollywood Displays 34,50% 34,50% 300 300 Renu Energy (Pty)Ltd - 26,00% - 36 Ntsinde Royal Jozini Holdings (Pty)Ltd 33,40% 33,40% 334 334 Buffalo Bull (Pty) Ltd 30,00% 30,00% 38 38 Busa Holdings (Pty) Ltd 49,00% 49,00% 50 000 000 10 000 000 Africa Rising (Pty) Ltd 25,10% 25,10% 2 510 2 510 Crowie Holdings (Pty) Ltd 25,10% 25,10% 25 000 000 25 000 000 Boipelo Piggery (Pty) Ltd 20,00% 20,00% 200 200 Inala Shipping (Pty) Ltd 30,00% 30,00% 30 30 Pretamix (Pty) Ltd 49,00% 49,00% 240 240 Sizovuna Investments Holding (Pty) Ltd 49,00% 49,00% 49 49 Basfour (Pty) Ltd 49,00% 49,00% 146 146 IM Capital (Pty) Ltd 49,00% 49,00% 146 146 SA Metals (Pty) Ltd 29,00% 10,00% 40 000 000 - i3 Africa (Pty) Ltd 30,00% 0,00% 32 000 000 - Business Venture Investments (Pty) Ltd 30,00% 0,00% 30 - Karbochem Co-generation (Pty) Ltd 30,00% 0,00% 12 000 000 - Imbaza Mussel (Pty) Ltd 30,00% 0,00% 300 - Value Cement (Pty) Ltd 31,00% 0,00% 31 -
201 855 314 102 951 249
* Although The Trust owns 51% of the issued share capital of this community based company, 20% of the voting rights have been ceded back to the community and therefore the Trust controls only 31% of the investment, hence the classification as an associate. ** Warehoused shares of Mayborn (Royal Jozini) is 16.7% held in favour of the Jozini Community Trust. *** These investments are measured at cost less accumulated impairments in terms of IAS 39, due to the significant variance with regard to the possible range of fair values. These investments have reached bankable feasibility stage and have not yet reached financial closure.
ANNUAL FINANCIAL STATEMENTS
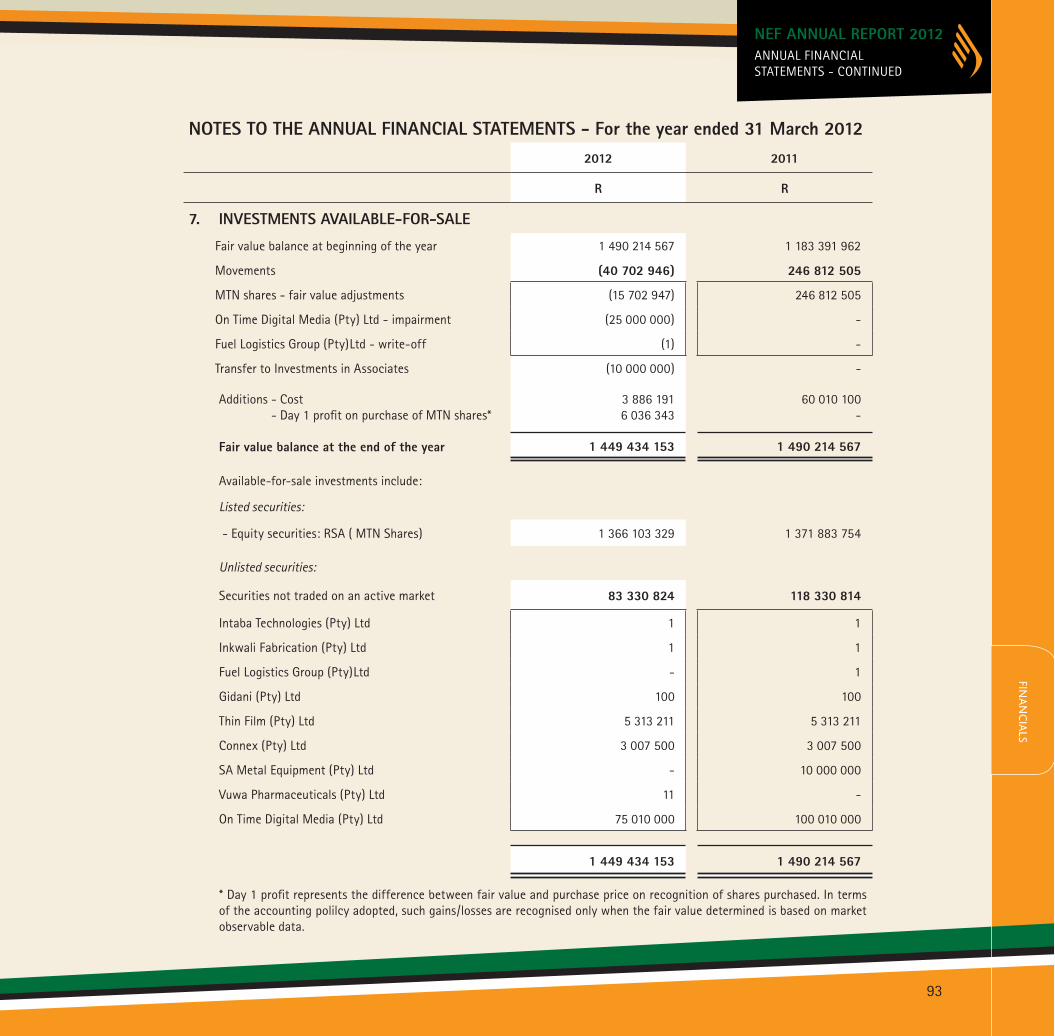
NOTES TO THE ANNUAL FINANCIAL STATEMENTS - For the year ended 31 March 20122012 2011
R R
7. INVESTMENTS AVAILABLE-FOR-SALE
Fair value balance at beginning of the year 1 490 214 567 1 183 391 962
Movements (40 702 946) 246 812 505
MTN shares - fair value adjustments (15 702 947) 246 812 505
On Time Digital Media (Pty) Ltd - impairment (25 000 000) -
Fuel Logistics Group (Pty)Ltd - write-off (1) -
Transfer to Investments in Associates (10 000 000) -
Additions - Cost - Day 1 profit on purchase of MTN shares*
3 886 1916 036 343
60 010 100-
Fair value balance at the end of the year 1 449 434 153 1 490 214 567
Available-for-sale investments include:
Listed securities:
- Equity securities: RSA ( MTN Shares) 1 366 103 329 1 371 883 754
Unlisted securities:
Securities not traded on an active market 83 330 824 118 330 814
Intaba Technologies (Pty) Ltd 1 1
Inkwali Fabrication (Pty) Ltd 1 1
Fuel Logistics Group (Pty)Ltd - 1
Gidani (Pty) Ltd 100 100
Thin Film (Pty) Ltd 5 313 211 5 313 211
Connex (Pty) Ltd 3 007 500 3 007 500
SA Metal Equipment (Pty) Ltd - 10 000 000
Vuwa Pharmaceuticals (Pty) Ltd 11 -
On Time Digital Media (Pty) Ltd 75 010 000 100 010 000
1 449 434 153 1 490 214 567
* Day 1 profit represents the difference between fair value and purchase price on recognition of shares purchased. In terms of the accounting polilcy adopted, such gains/losses are recognised only when the fair value determined is based on market observable data.
93
ANNUAL FINANCIALSTATEMENTS - CONTINUED
NEF ANNUAL REPORT 2012FIN
AN
CIA
LS
93
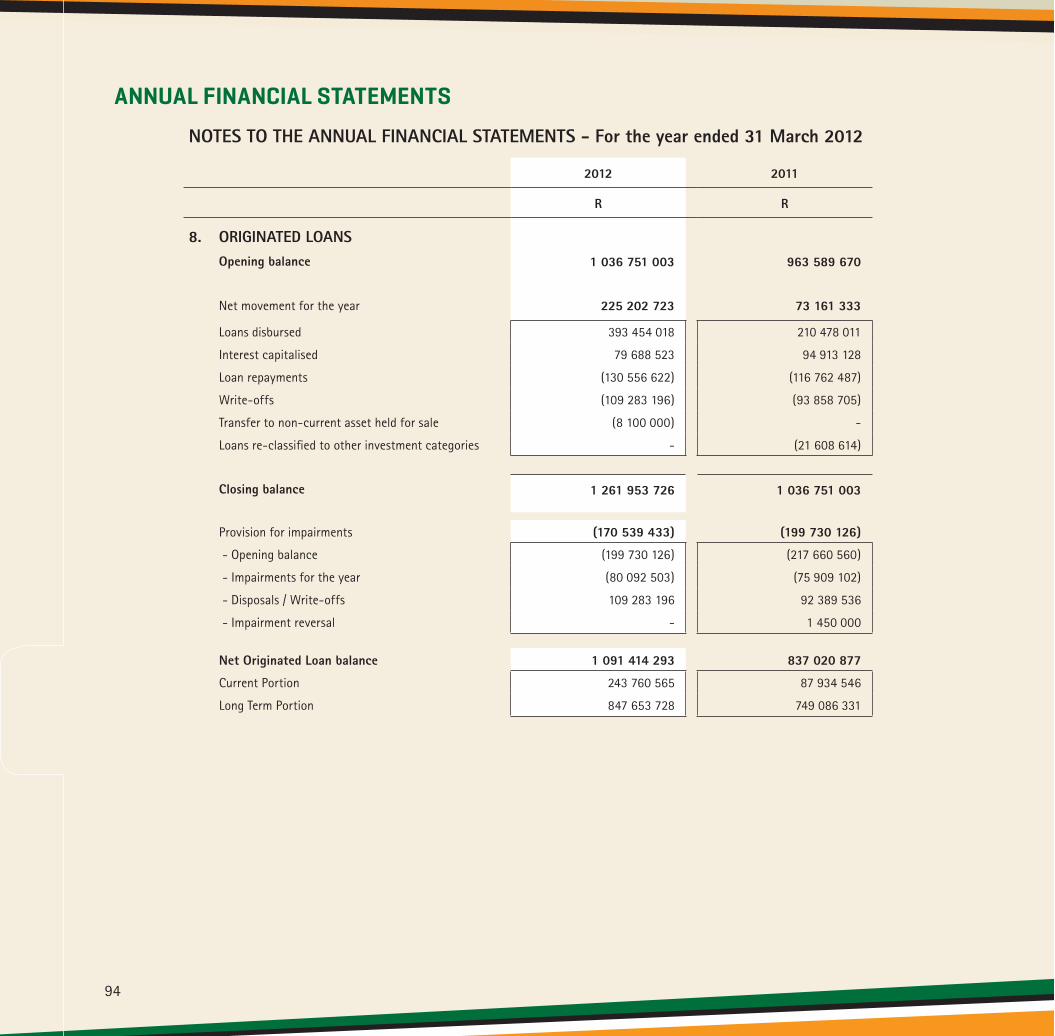
94
NOTES TO THE ANNUAL FINANCIAL STATEMENTS - For the year ended 31 March 2012
2012 2011
R R
8. ORIGINATED LOANS Opening balance 1 036 751 003 963 589 670
Net movement for the year 225 202 723 73 161 333
Loans disbursed 393 454 018 210 478 011
Interest capitalised 79 688 523 94 913 128
Loan repayments (130 556 622) (116 762 487)
Write-offs (109 283 196) (93 858 705)
Transfer to non-current asset held for sale (8 100 000) -
Loans re-classified to other investment categories - (21 608 614)
Closing balance 1 261 953 726 1 036 751 003
Provision for impairments (170 539 433) (199 730 126)
- Opening balance (199 730 126) (217 660 560)
- Impairments for the year (80 092 503) (75 909 102)
- Disposals / Write-offs 109 283 196 92 389 536
- Impairment reversal - 1 450 000
Net Originated Loan balance 1 091 414 293 837 020 877
Current Portion 243 760 565 87 934 546
Long Term Portion 847 653 728 749 086 331
ANNUAL FINANCIAL STATEMENTS

NOTES TO THE ANNUAL FINANCIAL STATEMENTS - For the year ended 31 March 2012
2012 2011
R R
9. PREFERENCE SHARES Opening balance 205 452 832 142 273 923
Net movement for the year 17 807 258 63 178 909
Additions 15 090 000 50 375 866
Loans re-classified from other investment categories - 6 394 135
Interest capitalised 27 965 009 20 038 273
Repayments (7 664 850) (13 629 365)
Disposal (17 582 901) -
Closing balance 223 260 090 205 452 832
Provision for impairment (24 815 032) (34 689 987)
- Opening balance (34 689 987) (12 629 836)
- Impairments for the year - (22 060 151)
- Disposals / Write-offs 9 874 955 -
Net Preference shares balance 198 445 058 170 762 845
Some loans and receivables are secured by general notarial bonds over movable property, cession of receivables, cession of bank accounts, personal sureties, second mortgage bonds and insurance policies, refer to note 3.1 for more details.
95
ANNUAL FINANCIALSTATEMENTS - CONTINUED
NEF ANNUAL REPORT 2012FIN
AN
CIA
LS
95
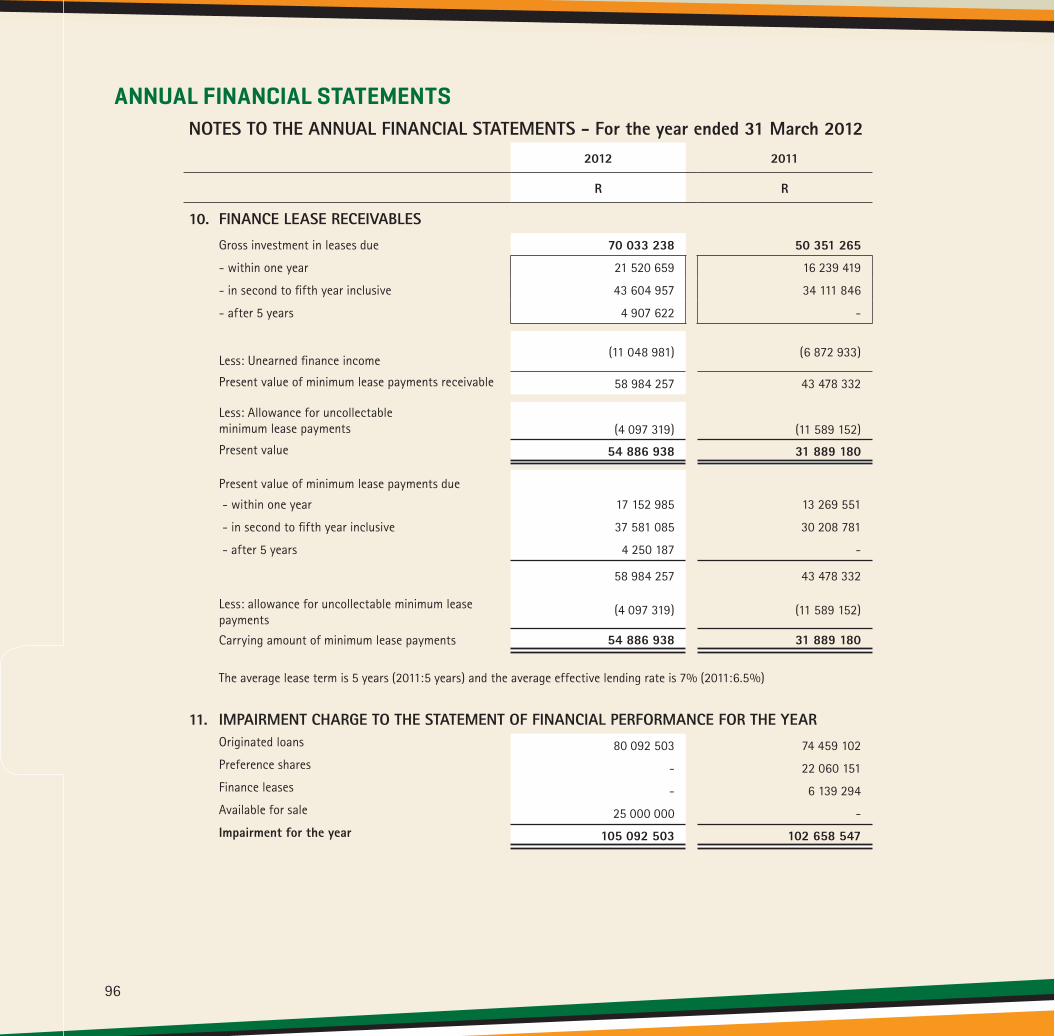
96
NOTES TO THE ANNUAL FINANCIAL STATEMENTS - For the year ended 31 March 20122012 2011
R R
10. FINANCE LEASE RECEIVABLES Gross investment in leases due 70 033 238 50 351 265
- within one year 21 520 659 16 239 419
- in second to fifth year inclusive 43 604 957 34 111 846
- after 5 years 4 907 622 -
Less: Unearned finance income(11 048 981) (6 872 933)
Present value of minimum lease payments receivable 58 984 257 43 478 332
Less: Allowance for uncollectable minimum lease payments
(4 097 319)
(11 589 152)
Present value 54 886 938 31 889 180
Present value of minimum lease payments due
- within one year 17 152 985 13 269 551
- in second to fifth year inclusive 37 581 085 30 208 781
- after 5 years 4 250 187 -
58 984 257 43 478 332
Less: allowance for uncollectable minimum lease payments
(4 097 319) (11 589 152)
Carrying amount of minimum lease payments 54 886 938 31 889 180
The average lease term is 5 years (2011:5 years) and the average effective lending rate is 7% (2011:6.5%)
11. IMPAIRMENT CHARGE TO THE STATEMENT OF FINANCIAL PERFORMANCE FOR THE YEAR Originated loans 80 092 503 74 459 102 Preference shares - 22 060 151 Finance leases - 6 139 294 Available for sale 25 000 000 - Impairment for the year 105 092 503 102 658 547
ANNUAL FINANCIAL STATEMENTS
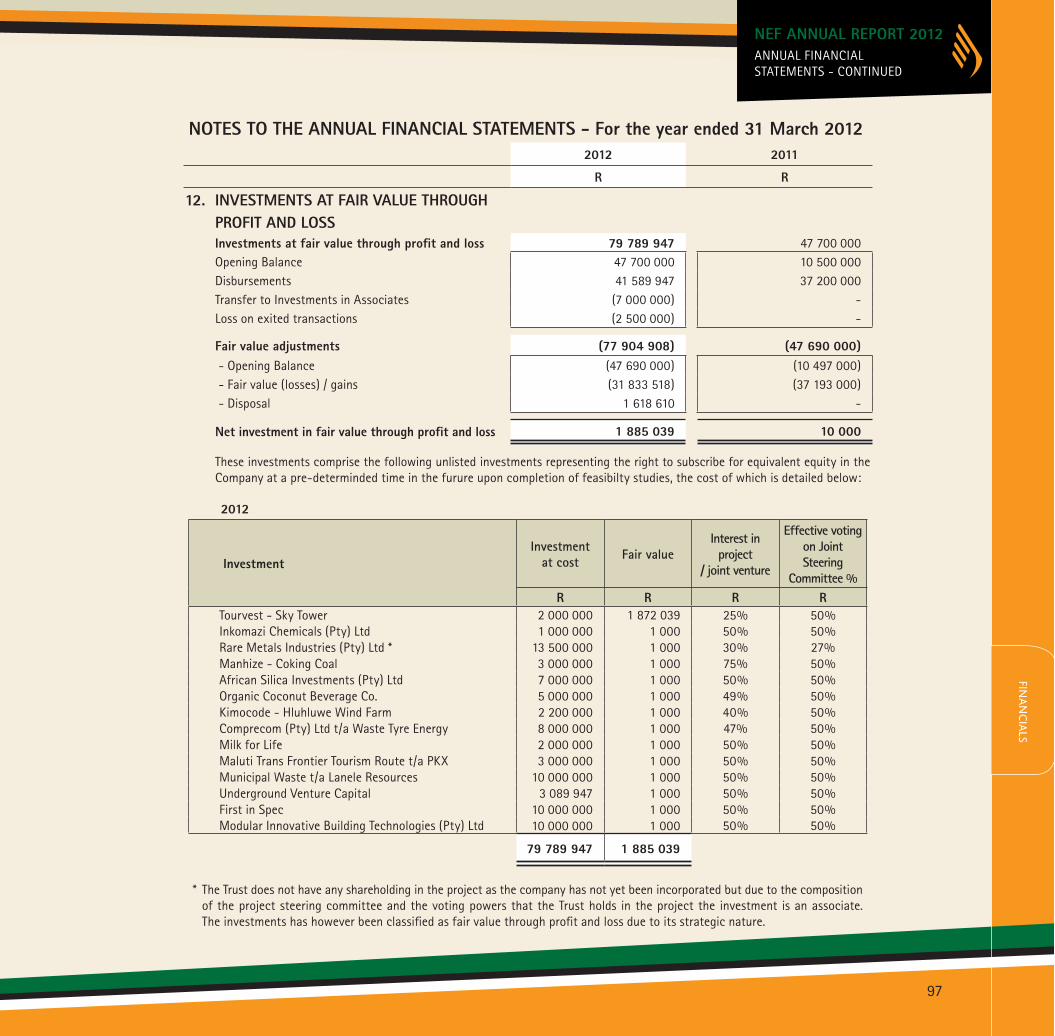
2012
InvestmentInvestment
at cost Fair valueInterest in project
/ joint venture
Effective votingon Joint Steering
Committee %R R R R
Tourvest - Sky Tower 2 000 000 1 872 039 25% 50% Inkomazi Chemicals (Pty) Ltd 1 000 000 1 000 50% 50% Rare Metals Industries (Pty) Ltd * 13 500 000 1 000 30% 27% Manhize - Coking Coal 3 000 000 1 000 75% 50% African Silica Investments (Pty) Ltd 7 000 000 1 000 50% 50% Organic Coconut Beverage Co. 5 000 000 1 000 49% 50% Kimocode - Hluhluwe Wind Farm 2 200 000 1 000 40% 50% Comprecom (Pty) Ltd t/a Waste Tyre Energy 8 000 000 1 000 47% 50% Milk for Life 2 000 000 1 000 50% 50% Maluti Trans Frontier Tourism Route t/a PKX 3 000 000 1 000 50% 50% Municipal Waste t/a Lanele Resources 10 000 000 1 000 50% 50% Underground Venture Capital 3 089 947 1 000 50% 50% First in Spec 10 000 000 1 000 50% 50% Modular Innovative Building Technologies (Pty) Ltd 10 000 000 1 000 50% 50%
79 789 947 1 885 039
* The Trust does not have any shareholding in the project as the company has not yet been incorporated but due to the composition of the project steering committee and the voting powers that the Trust holds in the project the investment is an associate. The investments has however been classified as fair value through profit and loss due to its strategic nature.
NOTES TO THE ANNUAL FINANCIAL STATEMENTS - For the year ended 31 March 20122012 2011
R R
12. INVESTMENTS AT FAIR VALUE THROUGH PROFIT AND LOSS Investments at fair value through profit and loss 79 789 947 47 700 000 Opening Balance 47 700 000 10 500 000 Disbursements 41 589 947 37 200 000 Transfer to Investments in Associates (7 000 000) - Loss on exited transactions (2 500 000) -
Fair value adjustments (77 904 908) (47 690 000) - Opening Balance (47 690 000) (10 497 000) - Fair value (losses) / gains (31 833 518) (37 193 000) - Disposal 1 618 610 -
Net investment in fair value through profit and loss 1 885 039 10 000
These investments comprise the following unlisted investments representing the right to subscribe for equivalent equity in the Company at a pre-determinded time in the furure upon completion of feasibilty studies, the cost of which is detailed below:
97
ANNUAL FINANCIALSTATEMENTS - CONTINUED
NEF ANNUAL REPORT 2012FIN
AN
CIA
LS
97

98
NOTES TO THE ANNUAL FINANCIAL STATEMENTS - For the year ended 31 March 201212. INVESTMENTS AT FAIR VALUE THROUGH PROFIT AND LOSS (continued) 2011
InvestmentInvestment
at costFair
value
Interest in project
/ joint venture
Effectivevoting
on Joint Steering Committee %
R R R R
Tourvest - Sky Tower 2 000 000 1 000 25% 50%
Inkomazi Chemicals (Pty) Ltd 1 000 000 1 000 50% 50%
Rare Metals Industries (Pty) Ltd 10 000 000 1 000 30% 27%
Manhize - Coking Coal 3 000 000 1 000 75% 50%
African Silica Investments (Pty) Ltd 7 000 000 1 000 50% 50%
Organic Coconut Beverage Co. 5 000 000 1 000 49% 50%
Premier Foods Boiler Conversion 2 500 000 1 000 n/a n/a
i3 Africa (Pty) Ltd 7 000 000 1 000 23% 50%
Kimocode - Hluhluwe Wind Farm 2 200 000 1 000 40% 50%
Comprecom (Pty) Ltd t/a Waste Tyre Energy 8 000 000 1 000 47% 50%
47 700 000 10 000
2012 2011
R R
13. INVESTMENTS HELD-FOR-TRADE Fair value balance at beginning of year 46 091 412 50 182 068 Additions - - Disposals - (106 812)
46 091 412 50 075 256 Fair value (losses) / gains (9 447 325) (2 809 900) Disposals - (1 173 944) Fair value balance at end of year 36 644 087 46 091 412
Investments Held-for-Trade include:
Listed Securities: AH Vest/All Joy Ltd 1 572 093 1 179 071
Hospitality Fund A Ltd 30 025 662 34 315 044
Hospitality Fund B Ltd 5 046 332 10 597 297
36 644 087 46 091 412
ANNUAL FINANCIAL STATEMENTS

16. FINANCIAL ASSETSCarrying amount Fair value Carrying
amount Fair value
R R R R
Loans and receivables 1 394 243 764 1 394 243 764 1 081 907 518 1 081 907 518 - Originated loans 1 091 414 293 1 091 414 293 837 020 877 837 020 877
- Preference shares 198 445 058 198 445 058 170 762 845 170 762 845
- Finance leases 54 886 938 54 886 938 31 889 180 31 889 180
- Trade and other receivables 49 497 475 49 497 475 42 234 616 42 234 616
Investments available for sale 1 449 434 153 1 449 434 153 1 490 214 568 1 490 214 568 - Unlisted equity investments 83 330 824 83 330 824 118 330 814 118 330 814
- Listed equity investments 1 366 103 329 1 366 103 329 1 371 883 754 1 371 883 754
Investment in associates 201 855 314 201 855 314 102 951 249 102 951 249
Investments at fair value through profit and loss 1 885 039 1 885 039 10 000 10 000
Investments held for trade 36 644 087 36 644 087 46 091 412 46 091 412 - Listed equity 36 644 087 36 644 087 46 091 412 46 091 412
Total 3 084 062 357 3 084 062 357 2 721 174 747 2 721 174 747
NOTES TO THE ANNUAL FINANCIAL STATEMENTS - For the year ended 31 March 2012
2012 2011
R R
14. NON-CURRENT ASSET HELD FOR SALE Opening Balance - - Transfer from Originated Loans 8 100 000 - Closing balance 8 100 000 -
Non- current asset held for sale represents collateral assets against loan defaults that have been attached by the NEF for resale. These assets are expected to be disposed of within 3 to 4 months of attachment and sale is considered to be highly probable.
15. TRADE AND OTHER RECEIVABLES Deposits 877 650 739 321 Interest receivable - cash and cash equivalents 22 879 48 700 Dividends receivable 48 119 354 37 059 398 Other receivables 477 592 4 387 197
49 497 475 42 234 616
The Trust consider that the carrying amount of trade and other receivables approximates their fair value.
99
ANNUAL FINANCIALSTATEMENTS - CONTINUED
NEF ANNUAL REPORT 2012FIN
AN
CIA
LS
99
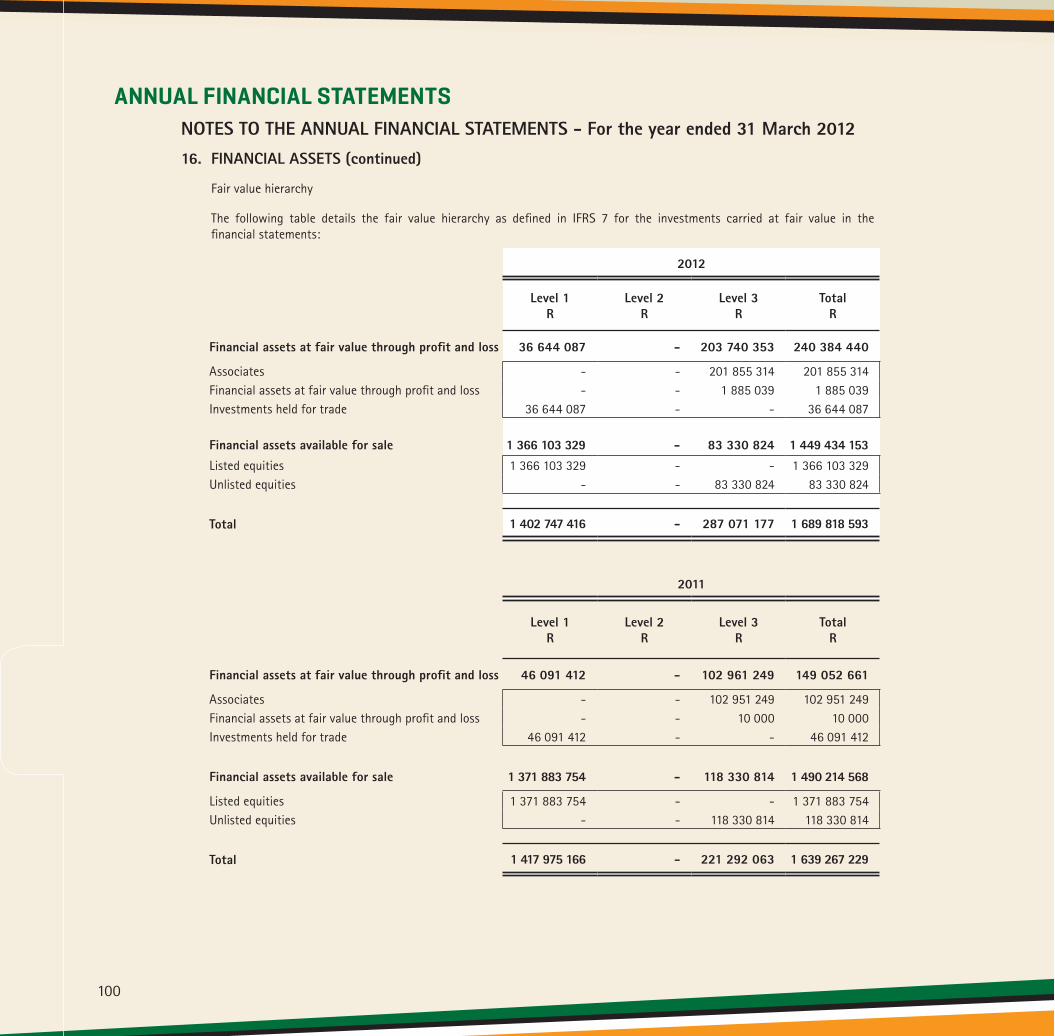
100
NOTES TO THE ANNUAL FINANCIAL STATEMENTS - For the year ended 31 March 201216. FINANCIAL ASSETS (continued)
Fair value hierarchy
The following table details the fair value hierarchy as defined in IFRS 7 for the investments carried at fair value in the financial statements:
2012
Level 1R
Level 2 R
Level 3R
Total R
Financial assets at fair value through profit and loss 36 644 087 - 203 740 353 240 384 440
Associates - - 201 855 314 201 855 314 Financial assets at fair value through profit and loss - - 1 885 039 1 885 039 Investments held for trade 36 644 087 - - 36 644 087
Financial assets available for sale 1 366 103 329 - 83 330 824 1 449 434 153 Listed equities 1 366 103 329 - - 1 366 103 329 Unlisted equities - - 83 330 824 83 330 824
Total 1 402 747 416 - 287 071 177 1 689 818 593
2011
Level 1R
Level 2 R
Level 3R
Total R
Financial assets at fair value through profit and loss 46 091 412 - 102 961 249 149 052 661
Associates - - 102 951 249 102 951 249 Financial assets at fair value through profit and loss - - 10 000 10 000 Investments held for trade 46 091 412 - - 46 091 412
Financial assets available for sale 1 371 883 754 - 118 330 814 1 490 214 568
Listed equities 1 371 883 754 - - 1 371 883 754 Unlisted equities - - 118 330 814 118 330 814
Total 1 417 975 166 - 221 292 063 1 639 267 229
ANNUAL FINANCIAL STATEMENTS

101
NOTES TO THE ANNUAL FINANCIAL STATEMENTS - For the year ended 31 March 201216. FINANCIAL ASSETS (continued)
Reconciliation of financial assets held at fair value
2012
Level 1R
Level 2 R
Level 3R
Total R
Opening balance for the year 1 417 975 166 - 221 292 063 1 639 267 229 Purchases - Cost 3 886 191 - 158 590 319 162 476 510 - Day 1 Profit 6 036 343 - - 6 036 343 Sales/Transfers - - (36 868 222) (36 868 222) Impairment of financial assets recognised - - (25 000 001) (25 000 001) Total fair value adjustments recognised: - In profit and loss (9 447 325) - (30 942 982) (40 390 307) - Directly in equity (15 702 959) - - (15 702 959)
Closing balance 1 402 747 416 - 287 071 177 1 689 818 593
2011
Level 1R
Level 2 R
Level 3R
Total R
Opening balance for the year 1 175 253 316 - 114 327 947 1 289 581 263 Purchases - - 132 213 421 132 213 421 Sales (1 280 755) - (10 196 070) (11 476 825) Impairment of financial assets recognised - - - - Total fair value adjustments recognised: - In profit and loss (2 809 900) - (37 193 000) (40 002 900) - Directly in equity 246 812 505 - 22 139 765 268 952 270
Closing balance 1 417 975 166 - 221 292 063 1 639 267 229
ANNUAL FINANCIALSTATEMENTS - CONTINUED
NEF ANNUAL REPORT 2012FIN
AN
CIA
LS
101

102
NOTES TO THE ANNUAL FINANCIAL STATEMENTS - For the year ended 31 March 2012
16. FINANCIAL ASSETS (continued) Valuations based on observable inputs Valuations based on observable inputs include:
Level 1 Financial instruments valued with reference to unadjusted quoted prices for identical assets or liabilities in active markets where the quoted price is readily available and the price represents actual and regularly occurring market transactions on an arm’s length basis.
An active market is one in which transactions occur with sufficient volume and frequency to provide pricing information on an on-going basis.
This category comprises of active listed equities. Level 2 Financial instruments valued using inputs other than quoted prices as described above for level 1 but which are observable for the asset or liability, either directly or indirectly, such as:
- valuation model using inputs derived from/corroborated by observable market data.
The portfolio of the fund does not comprise any financial assets that are valued on the basis mentioned above.
Level 3 Financial instruments valued using inputs that are not based on observable market data (unobservable data) such as an entity’s own assumptions about assumptions of market participants in pricing the asset or liability.
This category includes certain private equity investments, equity derivatives and loans and advances in the form of shareholder loans that have been classified as equity.
In determining the value of Level 3 financial instruments, the following are the principal inputs that can require judgement:
(i) Future earnings and marketability discounts Future earnings and marketability discounts are key inputs in the valuation of certain private equity investments. Forecast earnings and marketability discounts are unobservable for some investments.
(ii) Comparator multiples Comparator multiples and point of difference applied to chosen multiples are key inputs in the valuation of certain private equity investments. Price earnings multiples and point of difference applied to chosen multiples are unobservable for some investments.
(iii) Discount rates Discount rates are key inputs in the valuation of certain private equity investments. Discount rates are unobservable for some investments.
ANNUAL FINANCIAL STATEMENTS
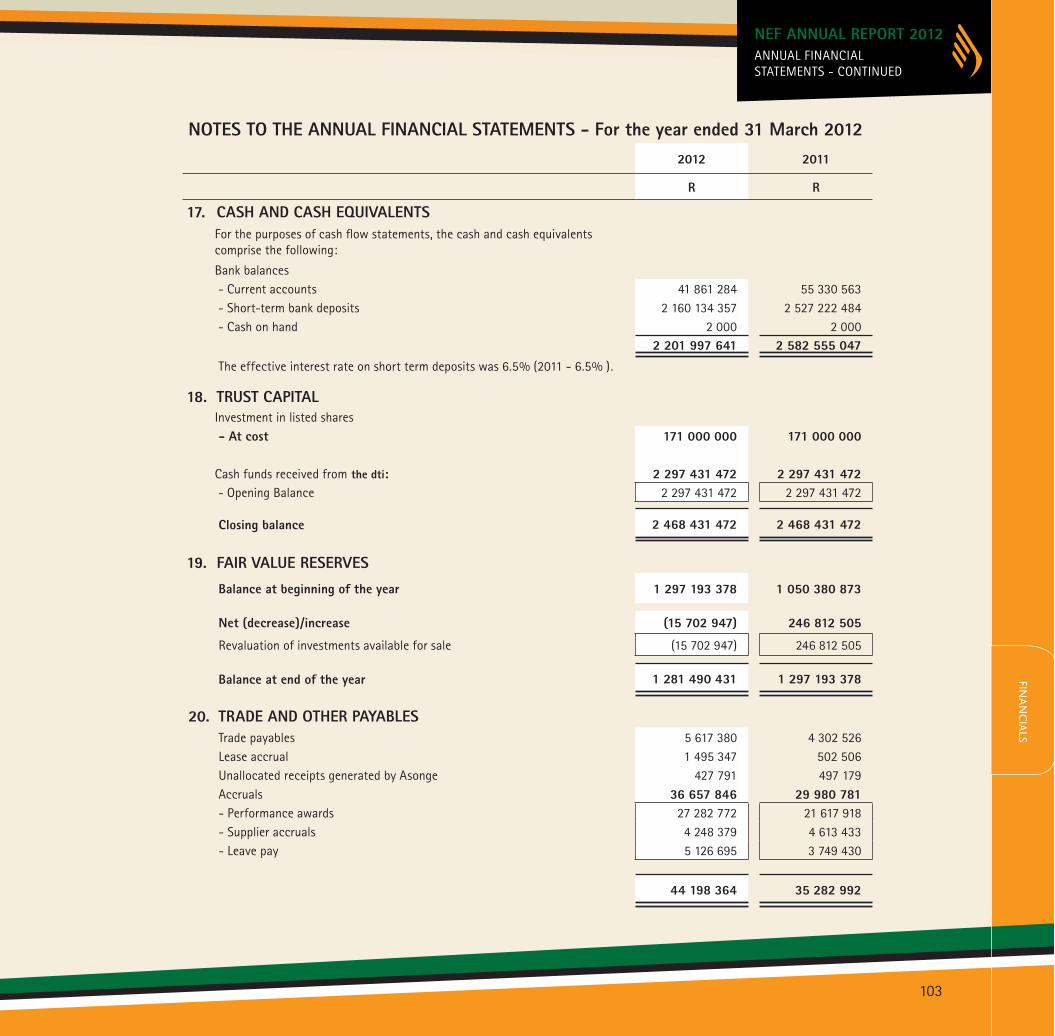
NOTES TO THE ANNUAL FINANCIAL STATEMENTS - For the year ended 31 March 20122012 2011
R R
17. CASH AND CASH EQUIVALENTS For the purposes of cash flow statements, the cash and cash equivalents comprise the following: Bank balances - Current accounts 41 861 284 55 330 563 - Short-term bank deposits 2 160 134 357 2 527 222 484 - Cash on hand 2 000 2 000
2 201 997 641 2 582 555 047 The effective interest rate on short term deposits was 6.5% (2011 - 6.5% ).
18. TRUST CAPITAL Investment in listed shares - At cost 171 000 000 171 000 000
Cash funds received from the dti: 2 297 431 472 2 297 431 472 - Opening Balance 2 297 431 472 2 297 431 472
Closing balance 2 468 431 472 2 468 431 472
19. FAIR VALUE RESERVES Balance at beginning of the year 1 297 193 378 1 050 380 873
Net (decrease)/increase (15 702 947) 246 812 505
Revaluation of investments available for sale (15 702 947) 246 812 505
Balance at end of the year 1 281 490 431 1 297 193 378
20. TRADE AND OTHER PAYABLES Trade payables 5 617 380 4 302 526 Lease accrual 1 495 347 502 506 Unallocated receipts generated by Asonge 427 791 497 179 Accruals 36 657 846 29 980 781 - Performance awards 27 282 772 21 617 918 - Supplier accruals 4 248 379 4 613 433 - Leave pay 5 126 695 3 749 430
44 198 364 35 282 992
ANNUAL FINANCIALSTATEMENTS - CONTINUED
NEF ANNUAL REPORT 2012FIN
AN
CIA
LS
103
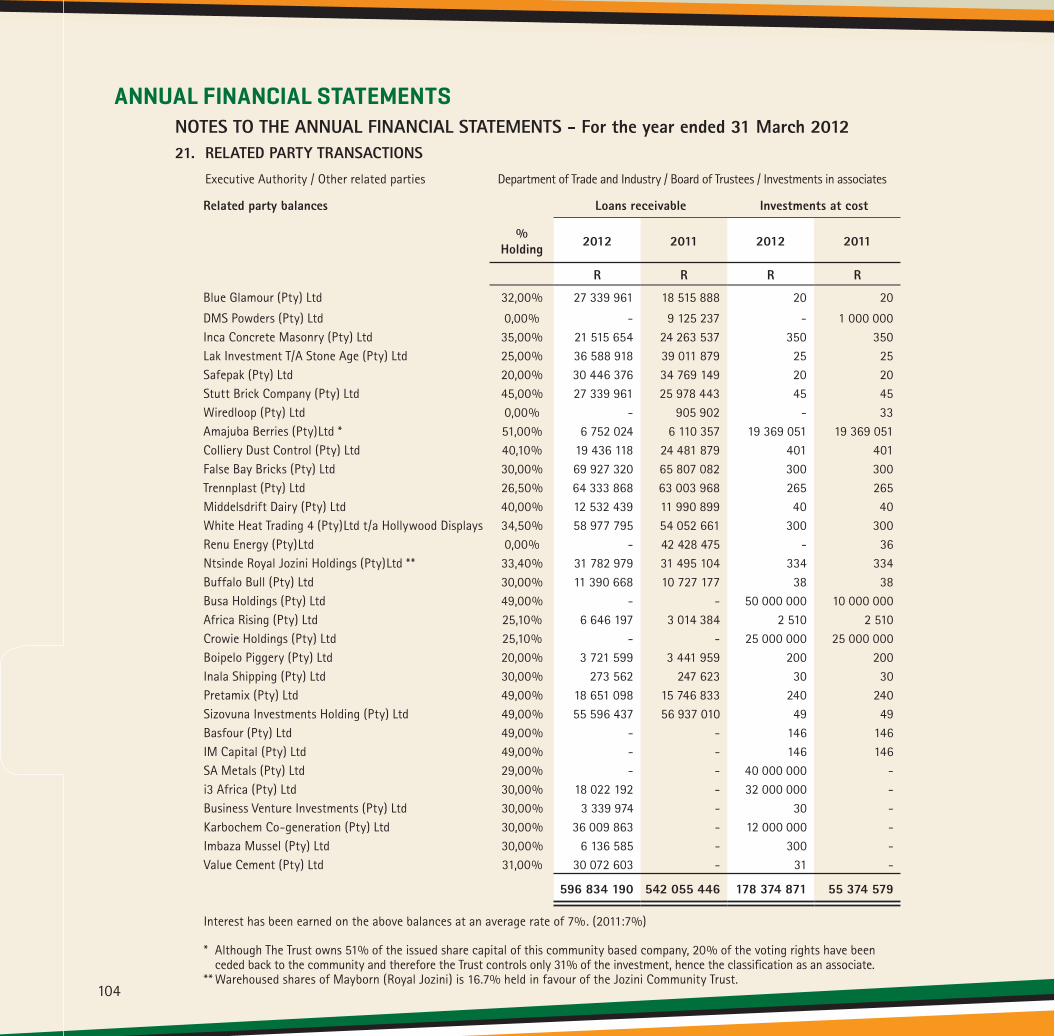
104
NOTES TO THE ANNUAL FINANCIAL STATEMENTS - For the year ended 31 March 201221. RELATED PARTY TRANSACTIONS Executive Authority / Other related parties Department of Trade and Industry / Board of Trustees / Investments in associates
Related party balances Loans receivable Investments at cost
% Holding 2012 2011 2012 2011
R R R R
Blue Glamour (Pty) Ltd 32,00% 27 339 961 18 515 888 20 20
DMS Powders (Pty) Ltd 0,00% - 9 125 237 - 1 000 000 Inca Concrete Masonry (Pty) Ltd 35,00% 21 515 654 24 263 537 350 350 Lak Investment T/A Stone Age (Pty) Ltd 25,00% 36 588 918 39 011 879 25 25 Safepak (Pty) Ltd 20,00% 30 446 376 34 769 149 20 20 Stutt Brick Company (Pty) Ltd 45,00% 27 339 961 25 978 443 45 45 Wiredloop (Pty) Ltd 0,00% - 905 902 - 33 Amajuba Berries (Pty)Ltd * 51,00% 6 752 024 6 110 357 19 369 051 19 369 051 Colliery Dust Control (Pty) Ltd 40,10% 19 436 118 24 481 879 401 401 False Bay Bricks (Pty) Ltd 30,00% 69 927 320 65 807 082 300 300 Trennplast (Pty) Ltd 26,50% 64 333 868 63 003 968 265 265 Middelsdrift Dairy (Pty) Ltd 40,00% 12 532 439 11 990 899 40 40 White Heat Trading 4 (Pty)Ltd t/a Hollywood Displays 34,50% 58 977 795 54 052 661 300 300 Renu Energy (Pty)Ltd 0,00% - 42 428 475 - 36 Ntsinde Royal Jozini Holdings (Pty)Ltd ** 33,40% 31 782 979 31 495 104 334 334 Buffalo Bull (Pty) Ltd 30,00% 11 390 668 10 727 177 38 38 Busa Holdings (Pty) Ltd 49,00% - - 50 000 000 10 000 000 Africa Rising (Pty) Ltd 25,10% 6 646 197 3 014 384 2 510 2 510 Crowie Holdings (Pty) Ltd 25,10% - - 25 000 000 25 000 000 Boipelo Piggery (Pty) Ltd 20,00% 3 721 599 3 441 959 200 200 Inala Shipping (Pty) Ltd 30,00% 273 562 247 623 30 30 Pretamix (Pty) Ltd 49,00% 18 651 098 15 746 833 240 240 Sizovuna Investments Holding (Pty) Ltd 49,00% 55 596 437 56 937 010 49 49 Basfour (Pty) Ltd 49,00% - - 146 146 IM Capital (Pty) Ltd 49,00% - - 146 146 SA Metals (Pty) Ltd 29,00% - - 40 000 000 - i3 Africa (Pty) Ltd 30,00% 18 022 192 - 32 000 000 - Business Venture Investments (Pty) Ltd 30,00% 3 339 974 - 30 - Karbochem Co-generation (Pty) Ltd 30,00% 36 009 863 - 12 000 000 - Imbaza Mussel (Pty) Ltd 30,00% 6 136 585 - 300 - Value Cement (Pty) Ltd 31,00% 30 072 603 - 31 -
596 834 190 542 055 446 178 374 871 55 374 579
Interest has been earned on the above balances at an average rate of 7%. (2011:7%)
* Although The Trust owns 51% of the issued share capital of this community based company, 20% of the voting rights have been ceded back to the community and therefore the Trust controls only 31% of the investment, hence the classification as an associate. ** Warehoused shares of Mayborn (Royal Jozini) is 16.7% held in favour of the Jozini Community Trust.
ANNUAL FINANCIAL STATEMENTS
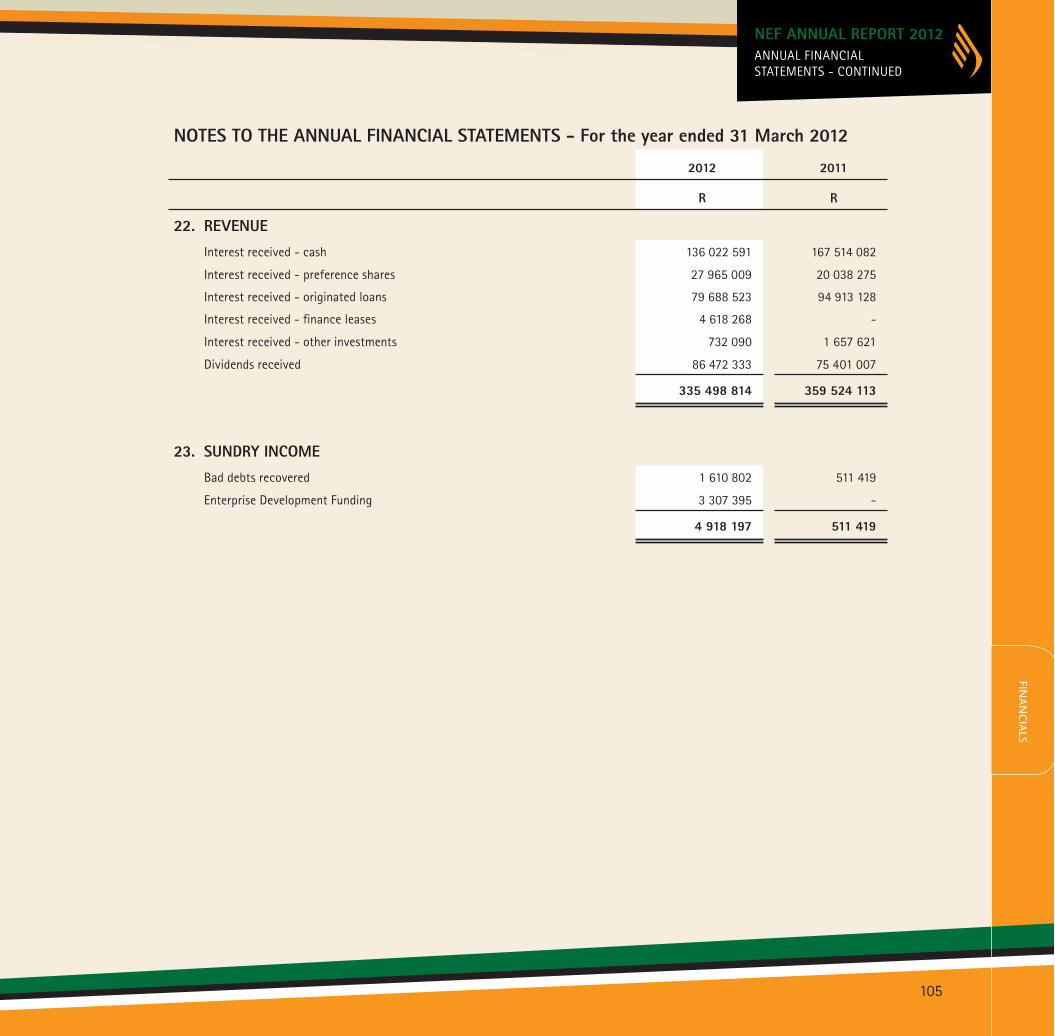
NOTES TO THE ANNUAL FINANCIAL STATEMENTS - For the year ended 31 March 2012
2012 2011
R R
22. REVENUE Interest received - cash 136 022 591 167 514 082
Interest received - preference shares 27 965 009 20 038 275
Interest received - originated loans 79 688 523 94 913 128
Interest received - finance leases 4 618 268 -
Interest received - other investments 732 090 1 657 621
Dividends received 86 472 333 75 401 007
335 498 814 359 524 113
23. SUNDRY INCOME Bad debts recovered 1 610 802 511 419
Enterprise Development Funding 3 307 395 -
4 918 197 511 419
ANNUAL FINANCIALSTATEMENTS - CONTINUED
NEF ANNUAL REPORT 2012FIN
AN
CIA
LS
105

106
NOTES TO THE ANNUAL FINANCIAL STATEMENTS - For the year ended 31 March 2012Note 2012 2011
R R
24. ADMINISTRATION EXPENDITURE BY NATURE Net operating expenditure is arrived at after taking into account:
Auditors’ Remuneration 2 821 778 2 242 888 - For external audit fees 2 452 190 1 064 228 - Internal audit 369 588 1 178 660
Professional fees 26 839 907 15 912 866 - Human Resources 219 000 - - Information technology 1 704 714 2 308 148 - Legal fees 5 327 023 4 044 488 - Administration 227 761 - - Finance 144 980 - - Risk management 1 444 067 93 923 - Marketing 11 606 083 4 306 307 - Public Relations - 1 418 924 - Professional fees - Investments 6 166 279 3 741 076
Depreciation 4 3 371 499 3 243 630 - Motor vehicles 170 876 132 689 - Owned computer equipment 900 691 1 022 968 - Audiovisual equipment 15 246 16 055 - Office equipment 701 021 715 272 - Furniture and fittings 510 498 549 131 - Other assets 6 189 6 172 - Leasehold improvements 1 066 978 801 342
Trustees and senior management emoluments 28 14 737 503 16 497 782
Amortisation of intangible assets 5 2 617 340 4 042 514
Operating lease rentals 7 947 461 6 922 584 - Property rental 7 924 672 6 281 878 - Equipment rental 22 789 640 706
Total staff costs 108 634 370 86 636 022
- Salaries and other benefits 100 349 478 80 053 225 - Provident fund contributions 8 284 892 6 582 797
Number of employees at year end 157 125
ANNUAL FINANCIAL STATEMENTS
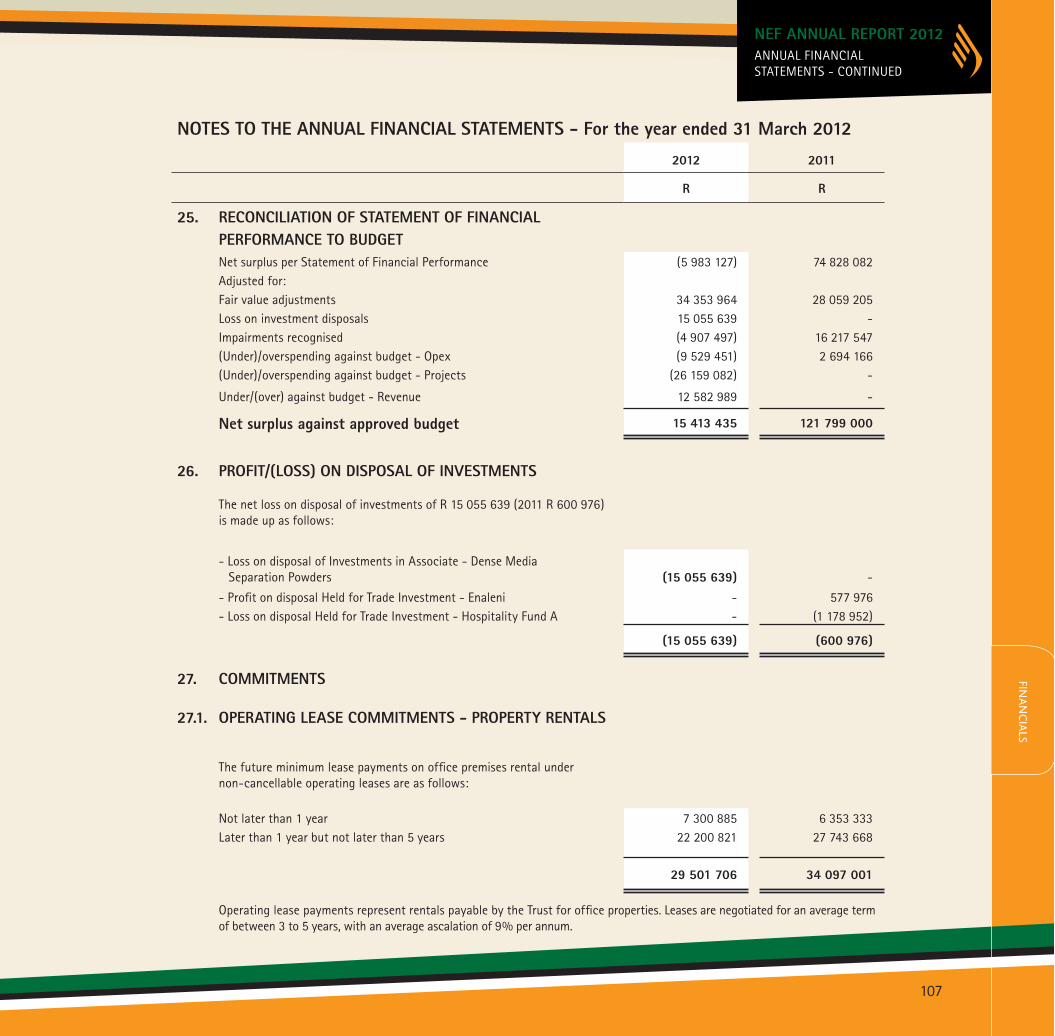
NOTES TO THE ANNUAL FINANCIAL STATEMENTS - For the year ended 31 March 20122012 2011
R R
25. RECONCILIATION OF STATEMENT OF FINANCIAL PERFORMANCE TO BUDGET Net surplus per Statement of Financial Performance (5 983 127) 74 828 082 Adjusted for: Fair value adjustments 34 353 964 28 059 205 Loss on investment disposals 15 055 639 - Impairments recognised (4 907 497) 16 217 547 (Under)/overspending against budget - Opex (9 529 451) 2 694 166 (Under)/overspending against budget - Projects (26 159 082) -
Under/(over) against budget - Revenue 12 582 989 -
Net surplus against approved budget 15 413 435 121 799 000
26. PROFIT/(LOSS) ON DISPOSAL OF INVESTMENTS
The net loss on disposal of investments of R 15 055 639 (2011 R 600 976) is made up as follows:
- Loss on disposal of Investments in Associate - Dense Media Separation Powders
(15 055 639)
-
- Profit on disposal Held for Trade Investment - Enaleni - 577 976 - Loss on disposal Held for Trade Investment - Hospitality Fund A - (1 178 952)
(15 055 639) (600 976)
27. COMMITMENTS
27.1. OPERATING LEASE COMMITMENTS - PROPERTY RENTALS
The future minimum lease payments on office premises rental under non-cancellable operating leases are as follows:
Not later than 1 year 7 300 885 6 353 333 Later than 1 year but not later than 5 years 22 200 821 27 743 668
29 501 706 34 097 001
Operating lease payments represent rentals payable by the Trust for office properties. Leases are negotiated for an average term of between 3 to 5 years, with an average ascalation of 9% per annum.
ANNUAL FINANCIALSTATEMENTS - CONTINUED
NEF ANNUAL REPORT 2012FIN
AN
CIA
LS
107
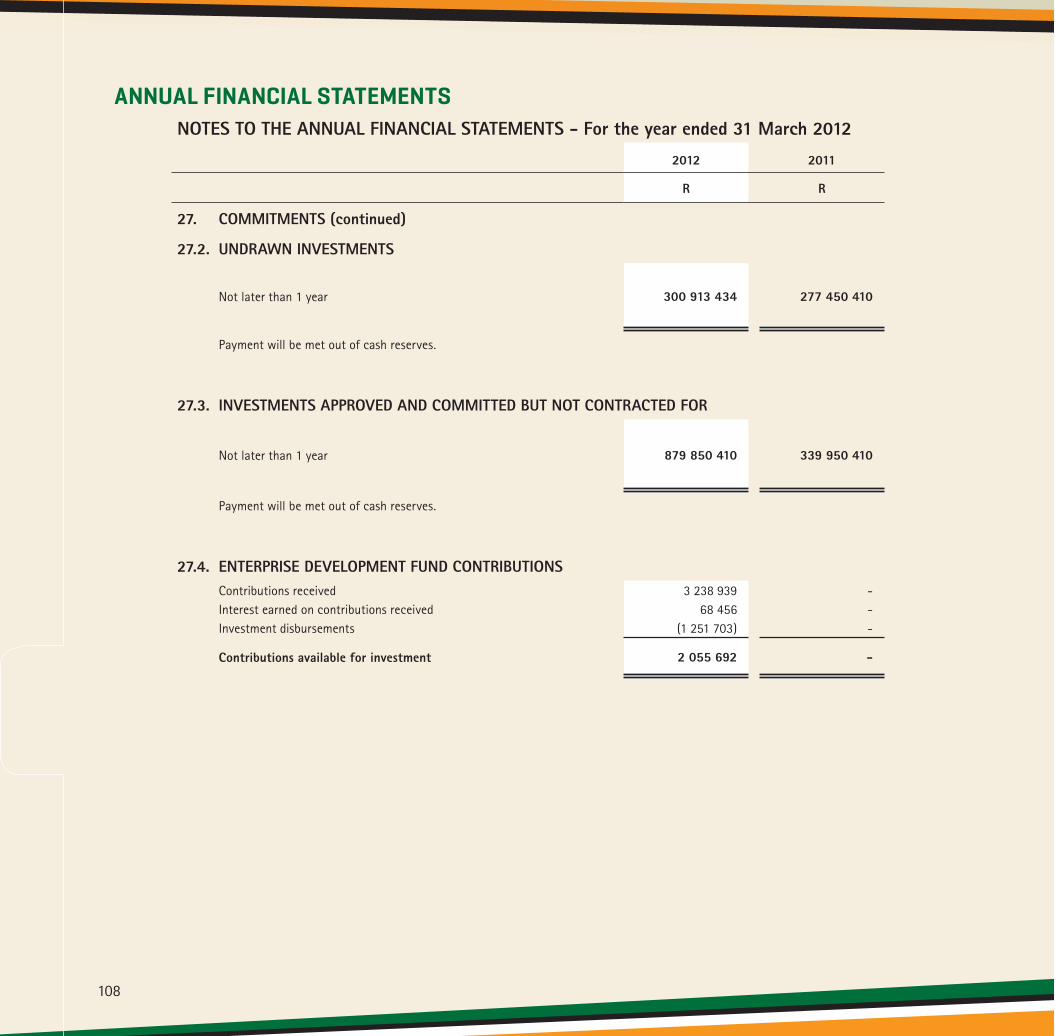
108
NOTES TO THE ANNUAL FINANCIAL STATEMENTS - For the year ended 31 March 20122012 2011
R R
27. COMMITMENTS (continued)
27.2. UNDRAWN INVESTMENTS
Not later than 1 year 300 913 434 277 450 410
Payment will be met out of cash reserves.
27.3. INVESTMENTS APPROVED AND COMMITTED BUT NOT CONTRACTED FOR
Not later than 1 year 879 850 410 339 950 410
Payment will be met out of cash reserves.
27.4. ENTERPRISE DEVELOPMENT FUND CONTRIBUTIONS Contributions received 3 238 939 - Interest earned on contributions received 68 456 - Investment disbursements (1 251 703) -
Contributions available for investment 2 055 692 -
ANNUAL FINANCIAL STATEMENTS

NOTES TO THE ANNUAL FINANCIAL STATEMENTS - For the year ended 31 March 2012
28. TRUSTEES AND SENIOR MANAGEMENT EMOLUMENTS
BasicBonuses and performance
payments
Long-term bonus
payments
Pension contributions
Other contributions
Fees to Non-Executive
TrusteesTotal
R R R R R R R
Year ended 31 March 2012
Executive trustees:
P Buthelezi (CEO) 2 449 212 1 315 559 - 441 643 109 424 - 4 315 838
A Wright (CFO) (Resigned 30/6/2012) 1 569 472 548 188 - 197 286 114 781 - 2 429 727
4 018 684 1 863 747 - 638 929 224 205 - 6 745 565
Senior management:
S Molepo (Divisional Executive - Appointed 01/04/2011) 1 486 870 765 000 - 213 130 194 143 - 2 659 143
H Makhathini (Divisional Executive - Appointed 01/04/2011) 973 717 487 080 - 145 307 117 851 - 1 723 955
B Lombard (Corporate Services Executive) 1 197 971 648 702 - 179 695 111 012 - 2 137 380
3 658 558 1 900 782 - 538 132 423 006 - 6 520 428
Non-executive trustees:
R Ntuli - Chairman (Resigned 31 October 2011) - - - - 5 073 81 551 86 624
N Mosala - - - - - 279 612 279 612
A Makwetla - - - - - 132 279 132 279
Z Ntlangula (Acting Chairman) - - - - - 284 782 284 782
A Raiz - - - - - 181 152 181 152
R Garach - - - - - 318 516 318 516
T Tlelai - - - - - 188 495 188 495
- - - - 5 073 1 466 387 1 471 460
TOTAL 7 677 242 3 764 529 - 1 177 061 647 211 1 466 387 14 737 503
ANNUAL FINANCIALSTATEMENTS - CONTINUED
NEF ANNUAL REPORT 2012FIN
AN
CIA
LS
109
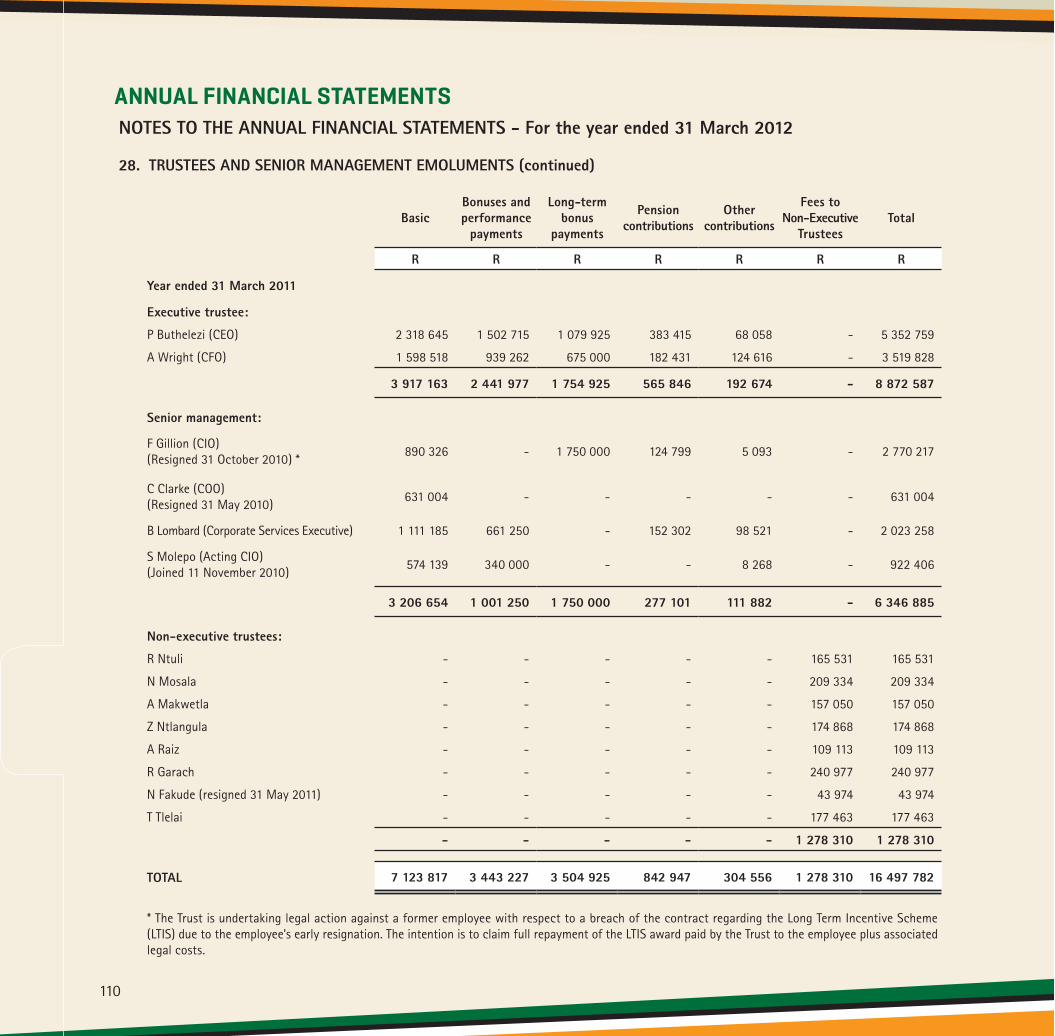
110
NOTES TO THE ANNUAL FINANCIAL STATEMENTS - For the year ended 31 March 2012
28. TRUSTEES AND SENIOR MANAGEMENT EMOLUMENTS (continued)
BasicBonuses and performance
payments
Long-term bonus
payments
Pension contributions
Other contributions
Fees to Non-Executive
TrusteesTotal
R R R R R R R
Year ended 31 March 2011
Executive trustee:
P Buthelezi (CEO) 2 318 645 1 502 715 1 079 925 383 415 68 058 - 5 352 759
A Wright (CFO) 1 598 518 939 262 675 000 182 431 124 616 - 3 519 828
3 917 163 2 441 977 1 754 925 565 846 192 674 - 8 872 587
Senior management:
F Gillion (CIO) (Resigned 31 October 2010) * 890 326 - 1 750 000 124 799 5 093 - 2 770 217
C Clarke (COO) (Resigned 31 May 2010) 631 004 - - - - - 631 004
B Lombard (Corporate Services Executive) 1 111 185 661 250 - 152 302 98 521 - 2 023 258
S Molepo (Acting CIO) (Joined 11 November 2010) 574 139 340 000 - - 8 268 - 922 406
3 206 654 1 001 250 1 750 000 277 101 111 882 - 6 346 885
Non-executive trustees:
R Ntuli - - - - - 165 531 165 531
N Mosala - - - - - 209 334 209 334
A Makwetla - - - - - 157 050 157 050
Z Ntlangula - - - - - 174 868 174 868
A Raiz - - - - - 109 113 109 113
R Garach - - - - - 240 977 240 977
N Fakude (resigned 31 May 2011) - - - - - 43 974 43 974
T Tlelai - - - - - 177 463 177 463
- - - - - 1 278 310 1 278 310
TOTAL 7 123 817 3 443 227 3 504 925 842 947 304 556 1 278 310 16 497 782
* The Trust is undertaking legal action against a former employee with respect to a breach of the contract regarding the Long Term Incentive Scheme (LTIS) due to the employee’s early resignation. The intention is to claim full repayment of the LTIS award paid by the Trust to the employee plus associated legal costs.
ANNUAL FINANCIAL STATEMENTS
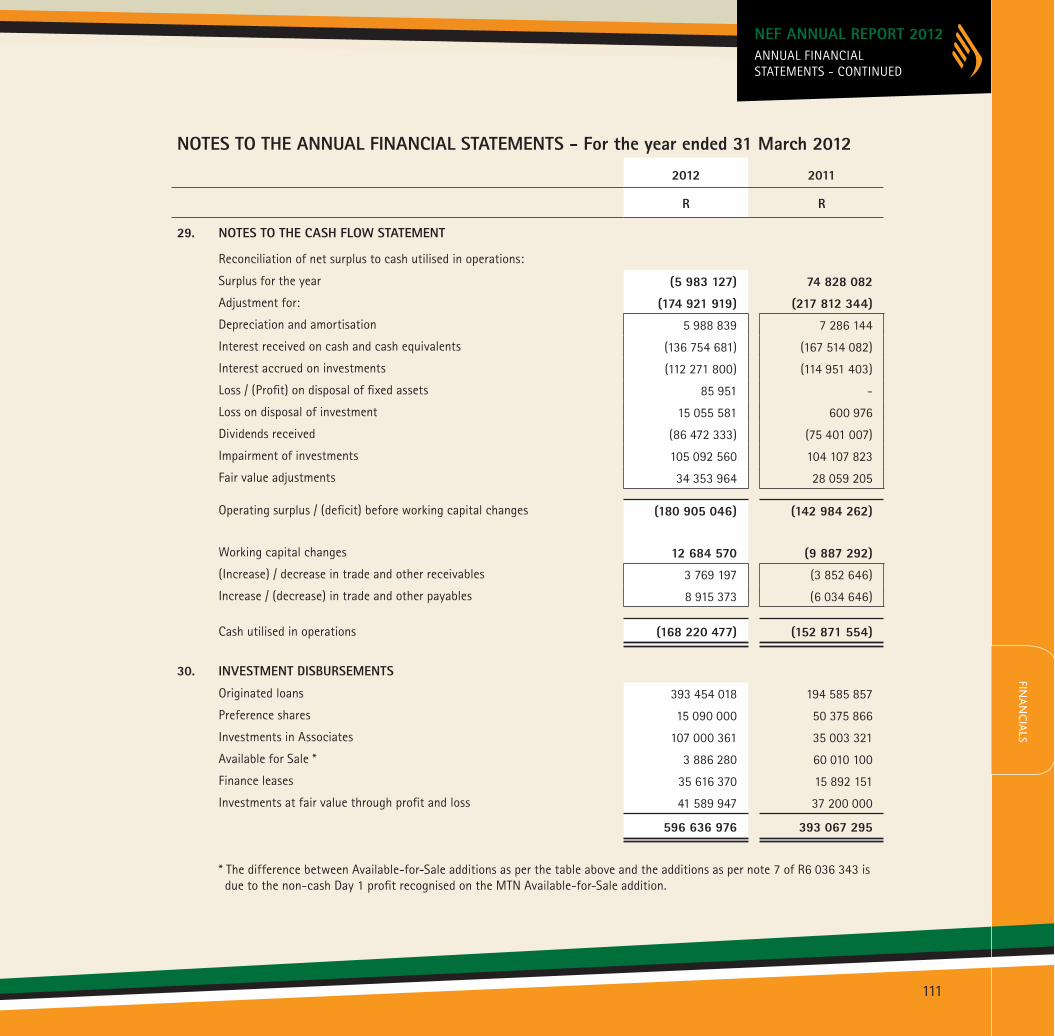
NOTES TO THE ANNUAL FINANCIAL STATEMENTS - For the year ended 31 March 20122012 2011
R R
29. NOTES TO THE CASH FLOW STATEMENT
Reconciliation of net surplus to cash utilised in operations:
Surplus for the year (5 983 127) 74 828 082 Adjustment for: (174 921 919) (217 812 344) Depreciation and amortisation 5 988 839 7 286 144
Interest received on cash and cash equivalents (136 754 681) (167 514 082)
Interest accrued on investments (112 271 800) (114 951 403)
Loss / (Profit) on disposal of fixed assets 85 951 -
Loss on disposal of investment 15 055 581 600 976
Dividends received (86 472 333) (75 401 007)
Impairment of investments 105 092 560 104 107 823
Fair value adjustments 34 353 964 28 059 205
Operating surplus / (deficit) before working capital changes (180 905 046) (142 984 262)
Working capital changes 12 684 570 (9 887 292) (Increase) / decrease in trade and other receivables 3 769 197 (3 852 646)
Increase / (decrease) in trade and other payables 8 915 373 (6 034 646)
Cash utilised in operations (168 220 477) (152 871 554)
30. INVESTMENT DISBURSEMENTS
Originated loans 393 454 018 194 585 857
Preference shares 15 090 000 50 375 866
Investments in Associates 107 000 361 35 003 321
Available for Sale * 3 886 280 60 010 100
Finance leases 35 616 370 15 892 151
Investments at fair value through profit and loss 41 589 947 37 200 000
596 636 976 393 067 295
* The difference between Available-for-Sale additions as per the table above and the additions as per note 7 of R6 036 343 is due to the non-cash Day 1 profit recognised on the MTN Available-for-Sale addition.
ANNUAL FINANCIALSTATEMENTS - CONTINUED
NEF ANNUAL REPORT 2012FIN
AN
CIA
LS
111

112
NOTES TO THE ANNUAL FINANCIAL STATEMENTS - For the year ended 31 March 201231. FRUITLESS AND WASTEFUL EXPENDITURE
No incidents ocurred during the current financial year.
32. UNAUTHORISED, IRREGULAR EXPENDITURE
No incidents ocurred during the current financial year.
33. INCOME TAX EXEMPTION
The Trust is exempt from income tax in terms of Sections 10 (1)(cA) of the Income tax Act.
34. NATIONAL EMPOWERMENT FUND CORPORATION (PTY) LTD
The Trust established the entity, in which it has a 100% interest, in 2002, as provided for in the NEF Act. To date this company remains a dormant subsidiary with no trading having ever taken place. The Trust previously obtained permission from the National Treasury under Section 54 of the PFMA that the Trust may utilise this entity in any of its future Asset Management retail activities.
35. CONTINGENT LIABILITY
The Trust’s application under S 53(3) of the PFMA to retain surpluses reported for the financial year ending 31 March 2011 (R 74 828 082) has been submitted. Should permission to retain this surplus not be granted then the Trust may be required to declare a distribution to National Treasury through its Executive Authority, the dti. The effect of such a distribution would be significant to the cash balances of the Trust.
ANNUAL FINANCIAL STATEMENTS

ADMINISTRATION - 31 MARCH 2012TRUSTEESMr R Ntuli (Chairman) (Resigned 31/10/2011)
Ms Z Ntlangula (Acting Chairman) (Appointed 01/11/2011)
Ms P Buthelezi (CEO)
Mr A Wright (CFO) (Resigned 30/06/2012)
Ms N Fakude (Resigned 16/05/2011)
Mr R Garach
Ms A Halstead
Ms A Makwetla
Ms J Molisane
Ms N Mosala
Mr A Raiz
Mr K Thaver
Mr T Tlelai
BANKERSStandard Bank Limited
First National Bank Limited
Rand Merchant Bank
South African Reserve bank
AUDITORSPricewaterhouseCoopers Inc.
BUSINESS ADDRESSWest Block, 187 Rivonia Road, Morningside 2057
POSTAL ADDRESSP.O. Box 31, Melrose Arch, Melrose North 2076
REGISTERED ADDRESSWest Block, 187 Rivonia Road, Morningside 2057
ADMINISTRATION
NEF ANNUAL REPORT 2012FIN
AN
CIA
LS
113