annual financial statements - march 31, 2020
TRANSCRIPT

Annual Financial Statements - March 31, 2020
CI Funds

Table of Contents
Annual Financial Statements - March 31, 2020
Independent Auditor’s Report .............................................................................................. 1
Equity Fund(s)
CI American Small Companies Fund ......................................................................................... 5
CI American Value Fund ............................................................................................................ 14
CI Canadian Investment Fund .................................................................................................... 23
CI Canadian Small/Mid Cap Fund ............................................................................................. 34
CI Global High Dividend Advantage Fund ................................................................................. 47
CI Global Stock Selection Fund (formerly Harbour Global Analyst Fund) ................................. 59
CI Global Value Fund ................................................................................................................. 67
CI International Value Fund ....................................................................................................... 79
CI MSCI World ESG Impact Fund .............................................................................................. 90
Munro Global Growth Equity Fund ............................................................................................ 99
Income Fund(s)
CI High Interest Savings Fund ................................................................................................... 107
CI Income Fund .......................................................................................................................... 116
CI Investment Grade Bond Fund ................................................................................................ 151
CI Money Market Fund .............................................................................................................. 167
CI U.S. Income US$ Pool ........................................................................................................... 177
CI US Money Market Fund ........................................................................................................ 193
Marret Short Duration High Yield Fund .................................................................................... 202
Notes to the Financial Statements ...................................................................................... 214
Legal Notice ............................................................................................................................. 235

CI Mutual Funds
– 1 –Annual Financial Statements - March 31, 2020
INDEPENDENT AUDITOR’S REPORT To the Unitholders of
Cambridge Canadian Dividend Fund Cambridge Canadian Equity Fund Cambridge Global Dividend Fund Cambridge Global Equity Fund Cambridge Global Smaller Companies Fund (formerly Cambridge Growth Companies Fund) Cambridge Pure Canadian Equity Fund Cambridge Stock Selection Fund Cambridge U.S. Dividend Fund Cambridge U.S. Dividend Registered Fund Cambridge U.S. Dividend US$ Fund Cambridge Asset Allocation Fund Cambridge Bond Fund Cambridge Canadian Long-Term Bond Pool Cambridge Canadian Short-Term Bond Pool Cambridge Global High Income Fund Cambridge Monthly Income Fund Cambridge Put Write Pool Black Creek Global Leaders Fund Black Creek International Equity Fund Black Creek Global Balanced Fund Synergy American Fund Signature Asian Opportunities Fund Signature Emerging Markets Fund Signature Global Dividend Fund Signature Global Equity Fund Signature Global Resource Fund Signature Select Canadian Fund Signature Canadian Balanced Fund Signature Global Income & Growth Fund Signature Income & Growth Fund Signature Canadian Bond Fund Signature Cash Management Fund Signature Core Bond Plus Fund Signature Corporate Bond Fund Signature Diversified Yield Fund (formerly Signature Diversified Yield II Fund) Signature Dividend Fund Signature Floating Rate Income Fund (formerly Signature Floating Rate Income Pool) Signature Global Bond Fund Signature High Income Fund Signature High Yield Bond Fund (formerly Signature High Yield Bond II Fund) Signature Preferred Share Fund (formerly Signature Preferred Share Pool) Signature Short-Term Bond Fund Signature Systematic Yield Pool Portfolio Series Balanced Fund Portfolio Series Balanced Growth Fund Portfolio Series Conservative Balanced Fund Portfolio Series Conservative Fund Portfolio Series Growth Fund Portfolio Series Income Fund Portfolio Series Maximum Growth Fund CI American Small Companies Fund CI American Value Fund

CI Mutual Funds
– 2 –Annual Financial Statements - March 31, 2020
CI Canadian Investment Fund CI Canadian Small/Mid Cap Fund CI Global High Dividend Advantage Fund CI Global Stock Selection Fund (formerly Harbour Global Analyst Fund) CI Global Value Fund CI International Value Fund CI MSCI World ESG Impact Fund Munro Global Growth Equity Fund CI High Interest Savings Fund CI Income Fund CI Investment Grade Bond Fund CI Money Market Fund CI U.S. Income US$ Pool CI US Money Market Fund Marret Short Duration High Yield Fund Select Canadian Equity Managed Fund Select International Equity Managed Fund Select U.S. Equity Managed Fund Select Staging Fund CI Mosaic Income ETF Portfolio CI Mosaic Balanced Income ETF Portfolio CI Mosaic Balanced ETF Portfolio CI Mosaic Balanced Growth ETF Portfolio CI Mosaic Growth ETF Portfolio CI Canadian Dividend Private Pool CI Canadian Equity Private Pool CI Global Concentrated Equity Private Pool CI Global Equity Alpha Private Pool CI Global Equity Core Private Pool CI Global Equity Momentum Private Pool CI Global Smaller Companies Private Pool CI International Equity Alpha Private Pool CI International Equity Growth Private Pool CI International Equity Value Private Pool CI North American Small / Mid Cap Equity Private Pool CI U.S. Equity Private Pool CI Global Asset Allocation Private Pool CI Global Balanced Yield Private Pool CI Canadian Fixed Income Private Pool CI Global Enhanced Government Bond Private Pool CI Global High Yield Credit Private Pool CI Global Investment Grade Credit Private Pool CI Global Unconstrained Bond Private Pool
(collectively, the “Funds”) Opinion We have audited the financial statements of the Funds, which comprise the statement of financial position as at March 31, 2020, and the statement of comprehensive income, statement of changes in net assets attributable to holders of redeemable units and statement of cash flows for the period then ended, and notes to the financial statements, including a summary of significant accounting policies.

CI Mutual Funds
– 3 –Annual Financial Statements - March 31, 2020
In our opinion, the accompanying financial statements present fairly, in all material respects, the financial position of the Funds as at March 31, 2020, and their financial performance and their cash flows for the period then ended in accordance with International Financial Reporting Standards (IFRSs). Basis for Opinion We conducted our audit in accordance with Canadian generally accepted auditing standards. Our responsibilities under those standards are further described in the Auditor’s Responsibilities for the Audit of the Financial Statements section of our report. We are independent of the Funds in accordance with the ethical requirements that are relevant to our audit of the financial statements in Canada, and we have fulfilled our other ethical responsibilities in accordance with these requirements. We believe that the audit evidence we have obtained is sufficient and appropriate to provide a basis for our opinion. Other Matter The financial statements of the Funds for the period ended March 31, 2019 were audited by another auditor who expressed an unmodified opinion on those statements on June 24, 2019. Other Information Management is responsible for the other information. The other information comprises the Management Report of Fund Performance of the Funds. Our opinion on the financial statements does not cover the other information and we do not express any form of assurance conclusion thereon. In connection with our audit of the financial statements, our responsibility is to read the other information, and in doing so, consider whether the other information is materially inconsistent with the financial statements or our knowledge obtained in the audit or otherwise appears to be materially misstated. We obtained the Management Report of Fund Performance of the Funds prior to the date of this auditor’s report. If, based on the work we have performed, we conclude that there is a material misstatement of this other information, we are required to report that fact in this auditor’s report. We have nothing to report in this regard. Responsibilities of Management and Those Charged with Governance for the Financial Statements Management is responsible for the preparation and fair presentation of the financial statements in accordance with IFRSs, and for such internal control as management determines is necessary to enable the preparation of financial statements that are free from material misstatement, whether due to fraud or error. In preparing the financial statements, management is responsible for assessing the Funds’ ability to continue as a going concern, disclosing, as applicable, matters related to going concern and using the going concern basis of accounting unless management either intends to liquidate the Funds or to cease operations, or has no realistic alternative but to do so. Those charged with governance are responsible for overseeing the Funds’ financial reporting process. Auditor’s Responsibilities for the Audit of the Financial Statements Our objectives are to obtain reasonable assurance about whether the financial statements as a whole are free from material misstatement, whether due to fraud or error, and to issue an auditor’s report that includes our opinion. Reasonable assurance is a high level of assurance, but is not a guarantee that an audit conducted in accordance with Canadian generally accepted auditing standards will always detect a material misstatement when it exists. Misstatements can arise from fraud or error and are considered material if, individually or in the aggregate, they could reasonably be expected to influence the economic decisions of users taken on the basis of these financial statements. As part of an audit in accordance with Canadian generally accepted auditing standards, we exercise professional judgment and maintain professional skepticism throughout the audit. We also:
CI Mutual Funds
– 4 –Annual Financial Statements - March 31, 2020
• Identify and assess the risks of material misstatement of the financial statements, whether due to fraud or error, design and perform audit procedures responsive to those risks, and obtain audit evidence that is sufficient and appropriate to provide a basis for our opinion. The risk of not detecting a material misstatement resulting from fraud is higher than for one resulting from error, as fraud may involve collusion, forgery, intentional omissions, misrepresentations, or the override of internal control.
• Obtain an understanding of internal control relevant to the audit in order to design audit procedures that are appropriate in the circumstances, but not for the purpose of expressing an opinion on the effectiveness of the Funds’ internal control.
• Evaluate the appropriateness of accounting policies used and the reasonableness of accounting estimates and related disclosures made by management.
• Conclude on the appropriateness of management’s use of the going concern basis of accounting and, based on the audit evidence obtained, whether a material uncertainty exists related to events or conditions that may cast significant doubt on the Funds’ ability to continue as a going concern. If we conclude that a material uncertainty exists, we are required to draw attention in our auditor’s report to the related disclosures in the financial statements or, if such disclosures are inadequate, to modify our opinion. Our conclusions are based on the audit evidence obtained up to the date of our auditor’s report. However, future events or conditions may cause the Funds to cease to continue as a going concern.
• Evaluate the overall presentation, structure, and content of the financial statements, including the disclosures, and whether the financial statements represent the underlying transactions and events in a manner that achieves fair presentation.
We communicate with those charged with governance regarding, among other matters, the planned scope and timing of the audit and significant audit findings, including any significant deficiencies in internal control that we identify during our audit. Toronto, Canada June 23, 2020

CI American Small Companies Fund
– 5 –Annual Financial Statements - March 31, 2020
Statements of Financial Position as at March 31(in $000’s except for per unit amounts and units outstanding)
2020 2019
56,765 82,389 2,426 728
- - - - - - - - - - 31 54 - - - - - - 18 577 1,059 825 60,299 84,573
- - - -
- - - - - - - - - - - 101 57 59 - - - - - - - - 57 160
60,242 84,413
Statements of Financial Position (cont’d)as at March 31(in $000’s except for per unit amounts and units outstanding)
Net assets attributable to holders of redeemable units
per class (Note 4):
Net assets attributable to holders of redeemable
units per unit: Number of redeemable
units outstanding:
2020 2019 2020 2019 2020 2019Class A 43,342 42,912 50.03 62.72 866,283 684,238Class A1 - 16,992 - 9.80 - 1,734,614Class A2 - 2,280 - 9.80 - 232,780Class A3 - 420 - 9.81 - 42,771Class A4 - 93 - 9.83 - 9,504Class A5 - 33 - 9.86 - 3,360Class E 1,689 2,294 8.90 11.14 189,738 205,849Class EF 79 118 9.37 11.61 8,480 10,139Class F 2,833 2,312 13.30 16.49 212,951 140,174Class F1 - 883 - 10.00 - 88,274Class F2 - 477 - 10.01 - 47,651Class F3 - 118 - 10.03 - 11,781Class F4 - 23 - 10.04 - 2,275Class F5 - 10 - 10.07 - 1,000Class I 10,226 12,697 29.60 36.21 345,419 350,637Class O 1,649 2,390 9.84 12.06 167,570 198,249Class P 361 350 8.32 10.20 43,420 34,349Class W 63 11 8.93 10.94 6,999 1,000
AssetsCurrent assetsInvestmentsCashUnrealized gain on futures and foreign currency forward contractsSwaps, swaptions and optionsDaily variation margin on derivative instrumentsFees rebate receivableCollateral on deposit for short saleDividends receivableInterest receivableReceivable for distribution from investmentsSecurities lending revenue receivable (Note 6)Receivable for investments soldReceivable for unit subscriptions
LiabilitiesCurrent liabilitiesInvestments sold shortBank overdraftUnrealized loss on futures and foreign currency forward contractsSwaps, swaptions and options Dividends payable on investments sold shortInterest payable on investments sold shortDaily variation margin on derivative instrumentsPayable for investments purchasedPayable for unit redemptionsDistributions payable to holders of redeemable units Management fees payableAdministration fees payableAccounts payable and accrued liabilities
Net assets attributable to holders of redeemable units
The accompanying notes are an integral part of these financial statements.
Financial Statements
CIG - 213

CI American Small Companies Fund
– 6 –Annual Financial Statements - March 31, 2020
Statements of Comprehensive Incomefor the years ended March 31(in $000’s except for per unit amounts and number of units)
2020 2019
813 1,216 31 30 - - - - - -
- - - -
2,345 9,136
(16,137) (9,160) (12,948) 1,222 114 59 - - 29 75 17 2 160 136 (12,788) 1,358
1,278 1,426 142 158 28 33 - - - - - - - - - - 120 189 144 163 1,712 1,969
(14,500) (611)
The accompanying notes are an integral part of these financial statements.
Financial Statements
Statements of Comprehensive Income (cont’d)for the years ended March 31(in $000’s except for per unit amounts and number of units)
Increase (decrease) in net assets attributable to
holders of redeemable units per class:
Increase (decrease) in net assets attributable to
holders of redeemable units per unit:
Weighted average number of units:
2020 2019 2020 2019 2020 2019Class A (10,711) (628) (12.93) (0.77) 827,660 812,843Class A1 (130) (125) (0.07) (0.09) 1,694,767 1,271,152Class A2 (20) (12) (0.09) (0.04) 231,372 245,720Class A3 (3) (3) (0.09) (0.07) 39,373 49,940Class A4 - 3 (0.04) 0.28 9,056 10,171Class A5 (1) (3) (0.16) (0.43) 3,400 5,503Class E (429) (28) (2.17) (0.14) 197,500 199,444Class EF (18) 3 (1.95) 0.23 9,222 11,816Class F (673) (6) (3.52) (0.03) 191,059 165,433Class F1 (11) (9) (0.11) (0.15) 93,605 66,922Class F2 (3) 3 (0.07) 0.06 48,884 39,842Class F3 (1) 1 (0.05) 0.13 11,849 11,022Class F4 - - (0.05) 0.06 2,334 2,404Class F5 - - (0.03) 0.03 1,000 1,000Class I (2,041) 146 (6.15) 0.42 332,036 345,055Class O (355) 32 (1.97) 0.15 180,139 206,633Class P (91) 15 (2.42) 0.61 37,481 24,962Class W (13) - (3.32) 0.09 4,090 1,000
Income Net gain (loss) on investments and derivatives Dividends Interest for distribution purposes Income distributions from investments Capital gain distributions from investments Derivative income (loss) Dividends expense on financial assets (liabilities) sold
short Interest expense on financial assets (liabilities) sold short Net realized gain (loss) on sale of investments and
derivatives Change in unrealized appreciation (depreciation) in value
of investments and derivativesTotal net gain (loss) on investments and derivativesOther income Foreign exchange gain (loss) on cash Commitment fee income Securities lending revenue (Note 6) Fees rebateTotal other incomeTotal incomeExpensesManagement fees (Note 5)Administration fees (Note 5)Commissions and other portfolio transaction costsIndependent review committee feesSecurities borrowing fees (Note 2)Margin feesService feesInterest expenseWithholding taxesHarmonized sales taxTotal expensesIncrease (decrease) in net assets attributable to holders of redeemable units

CI American Small Companies Fund
– 7 –Annual Financial Statements - March 31, 2020
Statements of Changes in Net Assets Attributable to Holders of Redeemable Unitsfor the years ended March 31 (in $000’s)
Net assets attributable to holders of redeemable units at the beginning of yearIncrease (decrease) in net assets attributable to holders of redeemable unitsDistributions to holders of redeemable units From net investment income From net realized gains Return of capitalTotal distributions to holders of redeemable units
Redeemable unit transactions Proceeds from redeemable units issued Reinvestment of distributions to holders of redeemable units Redemption of redeemable unitsNet increase (decrease) from redeemable unit transactionsNet increase (decrease) in net assets attributable to holders of redeemable unitsNet assets attributable to holders of redeemable units at the end of year
The accompanying notes are an integral part of these financial statements.
Financial Statements
Class A 2020 2019 42,912 58,089 (10,711) (628)
- - - - - - - -
23,277 7,296 - - (12,136) (21,845) 11,141 (14,549) 430 (15,177) 43,342 42,912
Class A1 2020 2019 16,992 9,024 (130) (125)
- - - - - - - -
711 11,173 - - (17,573) (3,080) (16,862) 8,093 (16,992) 7,968 - 16,992
Class A2 2020 2019 2,280 2,717 (20) (12)
- - - - - - - -
103 521 - - (2,363) (946) (2,260) (425) (2,280) (437) - 2,280
Class A3 2020 2019 420 589 (3) (3)
- - - - - - - -
7 271 - - (424) (437) (417) (166) (420) (169) - 420
Class A4 2020 2019 93 100 - 3
- - - - - - - -
7 59 - - (100) (69) (93) (10) (93) (7) - 93
Class A5 2020 2019 33 65 (1) (3)
- - - - - - - -
7 - - - (39) (29) (32) (29) (33) (32) - 33
Class E 2020 2019 2,294 2,238 (429) (28)
- - - - - - - -
272 282 - - (448) (198) (176) 84 (605) 56 1,689 2,294
Class EF 2020 2019 118 170 (18) 3
- - - - - - - -
- - - - (21) (55) (21) (55) (39) (52) 79 118
Class F 2020 2019 2,312 3,174 (673) (6)
- - - - - - - -
2,294 672 - - (1,100) (1,528) 1,194 (856) 521 (862) 2,833 2,312
Class F1 2020 2019 883 504 (11) (9)
- - - - - - - -
141 699 - - (1,013) (311) (872) 388 (883) 379 - 883
Class F2 2020 2019 477 365 (3) 3
- - - - - - - -
24 150 - - (498) (41) (474) 109 (477) 112 - 477
Class F3 2020 2019 118 68 (1) 1
- - - - - - - -
3 62 - - (120) (13) (117) 49 (118) 50 - 118

CI American Small Companies Fund
– 8 –Annual Financial Statements - March 31, 2020
The accompanying notes are an integral part of these financial statements.
Financial Statements
Statements of Changes in Net Assets Attributable to Holders of Redeemable Units (cont’d)for the years ended March 31 (in $000’s)
Net assets attributable to holders of redeemable units at the beginning of yearIncrease (decrease) in net assets attributable to holders of redeemable unitsDistributions to holders of redeemable units From net investment income From net realized gains Return of capitalTotal distributions to holders of redeemable units
Redeemable unit transactions Proceeds from redeemable units issued Reinvestment of distributions to holders of redeemable units Redemption of redeemable unitsNet increase (decrease) from redeemable unit transactionsNet increase (decrease) in net assets attributable to holders of redeemable unitsNet assets attributable to holders of redeemable units at the end of year
Class F4 2020 2019 23 24 - -
- - - - - - - -
1 6 - - (24) (7) (23) (1) (23) (1) - 23
Class F5 2020 2019 10 10 - -
- - - - - - - -
- - - - (10) - (10) - (10) - - 10
Class I 2020 2019 12,697 12,955 (2,041) 146
- - - - - - - -
1,518 1,868 - - (1,948) (2,272) (430) (404) (2,471) (258) 10,226 12,697
Class O 2020 2019 2,390 2,698 (355) 32
- - - - - - - -
131 268 - - (517) (608) (386) (340) (741) (308) 1,649 2,390
Class P 2020 2019 350 210 (91) 15
- - - - - - - -
125 130 - - (23) (5) 102 125 11 140 361 350
Class W 2020 2019 11 11 (13) -
- - - - - - - -
65 - - - - - 65 - 52 - 63 11
Total Fund 2020 2019 84,413 93,011 (14,500) (611)
- - - - - - - -
28,686 23,457 - - (38,357) (31,444) (9,671) (7,987) (24,171) (8,598) 60,242 84,413

CI American Small Companies Fund
– 9 –Annual Financial Statements - March 31, 2020
Statements of Cash Flowsfor the years ended March 31 (in $000’s)
2020 2019
(14,500) (611)
(2,345) (9,136) 14 (2) 28 33
16,137 9,160 64,077 67,492 (51,815) (58,896) - - - - - - 23 32 - - - - - - - - - - 11,619 8,072
- - 4,447 5,319 (14,354) (14,120) (9,907) (8,801)
(14) 2 1,712 (729) 728 1,455 2,426 728
718 1,067 31 30 - - - - - -
*Dividends and interest received as well as dividends and interest paid relate to operating activities of the Fund. The accompanying notes are an integral part of these financial statements.
Financial Statements
Cash flows from (used in) operating activitiesIncrease (decrease) in net assets attributable to holders of redeemable unitsAdjustments for: Net realized (gain) loss on sale of investments and derivatives Unrealized foreign exchange (gain) loss on cash Commissions and other portfolio transaction costs Change in unrealized (appreciation) depreciation in value of
investments and derivatives Proceeds from sale and maturity of investments and derivatives Purchase of investments and derivatives (Increase) decrease in collateral on deposit for short sale Non-cash distributions from investments Change in daily variation margin (Increase) decrease in dividends receivable (Increase) decrease in interest receivable (Increase) decrease in securities lending revenue receivable Increase (decrease) in management fees payable Increase (decrease) in administration fees payable Change in other accounts receivable and payableNet cash from (used in) operating activities
Cash flows from (used in) financing activitiesDistributions paid to holders of redeemable units, net of reinvested distributionsProceeds from issuance of redeemable unitsAmounts paid on redemption of redeemable unitsNet cash from (used in) financing activities Unrealized foreign exchange gain (loss) on cashNet increase (decrease) in cashCash (bank overdraft), beginning of yearCash (bank overdraft), end of year
Supplementary Information:Dividends received, net of withholding tax*Interest received, net of withholding tax*Dividends paid*Interest paid*Tax recoverable (paid)

CI American Small Companies Fund
– 10 –Annual Financial Statements - March 31, 2020
INDUSTRIALS (13.8%) 14,367 AMETEK Inc. 986,299 1,456,253 23,177 Douglas Dynamics Inc. 1,228,413 1,158,312 2,489 Hexcel Corp. 108,359 130,277 18,573 Insperity Inc. 1,539,108 975,009 1,721 Kadant Inc. 188,732 180,812 13,558 Middleby Corp. 2,128,147 1,085,357 10,381 Toro Co. 848,227 950,979 840 Watsco Inc. 177,340 186,826 6,848 Woodward Inc. 412,229 572,875 23,186 XPO Logistics Inc. 1,946,980 1,590,809 9,563,834 8,287,509 COMMUNICATION SERVICES (8.9%) 147,300 Craftsman & Scribes Co., Private Placement 2 2 39,420 Discovery Inc. 1,403,736 973,114 7,081 Electronic Arts Inc. 948,048 998,274 17,567 GCI Liberty Inc. 1,497,971 1,408,515 34,300 Liberty Media Corp. - Liberty SiriusXM 1,754,016 1,529,797 5,472 Nexstar Media Group Inc. 759,842 444,596 6,363,615 5,354,298 REAL ESTATE (3.8%) 17,481 Colliers International Group Inc. (USD) 1,568,897 1,181,179 6,194 Jones Lang LaSalle Inc. 1,150,140 880,287 5,432 Ventas Inc. 382,004 204,886 3,101,041 2,266,352 CONSUMER STAPLES (3.1%) 407 Casey’s General Stores Inc. 59,541 75,892 21,934 Performance Food Group Co. 1,332,400 763,104 9,042 Post Holdings Inc. 1,259,387 1,055,852 2,651,328 1,894,848 MATERIALS (1.2%) 15,267 Berry Plastics Group Inc. 988,253 724,319
Commissions and other portfolio transaction costs (15,147)
Total Investment Portfolio (94.2%) 68,767,485 56,765,222 Other Net Assets (Liabilities) (5.8%) 3,477,098 Net Assets Attributable to Holders of Redeemable Units (100.0%) 60,242,320
FINANCIALS (18.7%) 20,320 Artisan Partners Asset Management Inc. 801,300 614,579 67,258 Axos Financial Inc. 3,061,519 1,716,166 65,873 Bank OZK 3,319,704 1,548,251 3,355 Credit Acceptance Corp. 1,599,816 1,207,324 21,232 Eagle Bancorp Inc. 1,547,389 902,733 35,886 KKR & Co., Inc. 1,238,741 1,185,375 436 Markel Corp. 534,483 569,378 8,474 Texas Capital Bancshares Inc. 633,235 264,406 1,824 Texas Pacific Land Trust 1,547,958 975,523 34,490 Universal Insurance Holdings Inc. 1,654,645 869,859 34,128 Western Alliance Bancorp. 2,089,699 1,470,252 18,028,489 11,323,846 INFORMATION TECHNOLOGY (15.7%) 18,763 ACI Worldwide Inc. 897,892 637,730 4,981 Arista Networks Inc. 1,543,297 1,419,928 6,485 Aspen Technology Inc. 1,019,707 867,703 4,740 Cabot Microelectronics Corp. 708,173 761,437 4,490 CyberArk Software Ltd. 537,513 540,673 45,458 Dropbox Inc. 1,182,230 1,157,994 1,130,264 Energenius Inc., Private Placement 11 11 4,704 MKS Instruments Inc. 653,589 539,232 8,776 Qualys Inc. 1,030,319 1,074,443 307,926 Simex Inc., Private Placement 61,585 - 3,097 Tyler Technologies Inc. 849,013 1,292,621 6,246 Universal Display Corp. 1,340,401 1,158,428 9,823,730 9,450,200 CONSUMER DISCRETIONARY (14.6%) 17,275 CarMax Inc. 1,614,089 1,308,760 779 Dollar General Corp. 153,433 165,562 15,141 Dollar Tree Inc. 1,887,093 1,565,605 5,527 Expedia Inc. 794,732 437,707 4,112 Helen of Troy Ltd. 770,231 833,535 16,216 LGI Homes Inc. 1,333,399 1,030,431 31,823 LKQ Corp. 1,175,262 918,596 16,707 Monarch Casino & Resort Inc. 896,906 660,022 175 NVR Inc. 694,890 632,759 5,050 Restaurant Brands International Inc. (USD) 389,102 284,508 2,704 Service Corp. International 61,125 148,837 3,875 Vail Resorts Inc. 1,114,609 805,562 10,884,871 8,791,884 HEALTH CARE (14.4%) 28,510 Centene Corp. 1,627,197 2,383,825 11,605 Charles River Laboratories International Inc. 1,933,858 2,061,373 21,938 Encompass Health Corp. 1,616,314 1,976,961 6,745 Globus Medical Inc., Class A 410,763 403,734 2,852 Molina Healthcare Inc. 514,161 560,783 6,349 PRA Health Sciences Inc. 831,140 742,011 3,896 Universal Health Services Inc., Class B 444,038 543,279 7,377,471 8,671,966
Percentages shown in brackets relate investments at fair value to net assets attributable to holders of redeemable units of the Fund.
Schedule of Investment Portfolio as at March 31, 2020
No. of Shares/Par Value Description
AverageCost ($)
FairValue ($)
No. of Shares/Par Value Description
AverageCost ($)
FairValue ($)

CI American Small Companies Fund
– 11 –Annual Financial Statements - March 31, 2020
Redeemable Unit Transactions (Note 4)for the years ended March 31
Number of redeemable units at the beginning of yearRedeemable units issued for cashRedeemable units issued for reinvested distributionsRedeemable units redeemedNumber of redeemable units at the end of year
Number of redeemable units at the beginning of yearRedeemable units issued for cashRedeemable units issued for reinvested distributionsRedeemable units redeemedNumber of redeemable units at the end of year
Number of redeemable units at the beginning of yearRedeemable units issued for cashRedeemable units issued for reinvested distributionsRedeemable units redeemedNumber of redeemable units at the end of year
Number of redeemable units at the beginning of yearRedeemable units issued for cashRedeemable units issued for reinvested distributionsRedeemable units redeemedNumber of redeemable units at the end of year
Number of redeemable units at the beginning of yearRedeemable units issued for cashRedeemable units issued for reinvested distributionsRedeemable units redeemedNumber of redeemable units at the end of year
Fund Specific Notes to Financial Statements
†A portion of brokerage commissions paid was used to cover research and market data services, termed soft dollar commissions. This amount has been estimated by the Manager of the Fund.The accompanying notes are an integral part of these financial statements.
Commissions (Note 2)for the years ended March 31 (in $000’s)
2020 2019Brokerage commissions 27 33Soft dollar commissions† - -
Class A 2020 2019 684,238 914,536 373,885 117,558 - - (191,840) (347,856) 866,283 684,238
Class A1 2020 2019 1,734,614 910,495 71,203 1,139,182 - - (1,805,817) (315,063) - 1,734,614
Class A2 2020 2019 232,780 274,166 10,224 52,564 - - (243,004) (93,950) - 232,780
Class A3 2020 2019 42,771 59,384 719 27,217 - - (43,490) (43,830) - 42,771
Class A4 2020 2019 9,504 10,100 719 5,856 - - (10,223) (6,452) - 9,504
Class A5 2020 2019 3,360 6,507 726 26 - - (4,086) (3,173) - 3,360
Class E 2020 2019 205,849 198,466 27,175 25,063 - - (43,286) (17,680) 189,738 205,849
Class EF 2020 2019 10,139 14,673 - 2 - - (1,659) (4,536) 8,480 10,139
Class F 2020 2019 140,174 192,206 138,121 31,122 - - (65,344) (83,154) 212,951 140,174
Class F1 2020 2019 88,274 50,387 13,462 69,618 - - (101,736) (31,731) - 88,274
Class F2 2020 2019 47,651 36,476 2,252 15,140 - - (49,903) (3,965) - 47,651
Class F3 2020 2019 11,781 6,758 253 6,193 - - (12,034) (1,170) - 11,781
Class F4 2020 2019 2,275 2,373 147 548 - - (2,422) (646) - 2,275
Class F5 2020 2019 1,000 1,000 - - - - (1,000) - - 1,000
Class I 2020 2019 350,637 361,992 48,309 51,435 - - (53,527) (62,790) 345,419 350,637
Class O 2020 2019 198,249 226,025 10,488 21,407 - - (41,167) (49,183) 167,570 198,249
Class P 2020 2019 34,349 20,754 11,334 14,053 - - (2,263) (458) 43,420 34,349
Class W 2020 2019 1,000 1,000 5,999 - - - - - 6,999 1,000

CI American Small Companies Fund
– 12 –Annual Financial Statements - March 31, 2020
The accompanying notes are an integral part of these financial statements.
Fund Specific Notes to Financial Statements
Management and Administration Fees (Note 5) as at March 31, 2020 (%)
Annual management
fee rate:
Annual administration
fee rate:
Class A 2.000 0.21Class A1^ 1.925 0.21Class A2^ 1.900 0.20Class A3^ 1.850 0.15Class A4^ 1.800 0.12Class A5^ 1.700 0.10Class E 1.950 0.15Class EF 0.950 0.15Class F 1.000 0.21Class F1^ 0.925 0.21Class F2^ 0.900 0.20Class F3^ 0.850 0.15Class F4^ 0.800 0.12Class F5^ 0.700 0.10Class I Paid directly by investor Paid directly by investorClass O Paid directly by investor 0.15Class P Paid directly by investor 0.21Class W Paid directly by investor 0.15*
^Effective after the close of business on August 2, 2019, the classes of the Fund that were eligible for CI Preferred
Pricing Program (CIPP) transitioned from a tiered pricing model to a fee distribution model. Please refer to most
recent simplified prospectus for further details.
*Effective August 2, 2019, the annual administration fee rate was reduced for Class W from 0.21% to 0.15%.
Securities Lending (Note 6)as at March 31 (in $000’s)
2020 2019Loaned 11,406 35,844Collateral (non-cash) 11,635 36,561
Securities Lending Revenue Reconciliation (Note 6)for the years ended March 31 (in $000’s)
2020 2019Gross securities lending revenue 34 88Charges (5) (13)Securities lending revenue 29 75% of gross securities lending revenue 14.7 14.8
Loss Carry Forwards (Note 7)as at March 31 (in $000’s)
2020Capital loss carried forward: 20,072Non-capital losses expiring:2029 -2030 -2031 -2032 -2033 -2034 -2035 -2036 -2037 -2038 -2039 -Total -

CI American Small Companies Fund
– 13 –Annual Financial Statements - March 31, 2020
The accompanying notes are an integral part of these financial statements.
Currency Risk (cont’d)As at March 31, 2020, had the Canadian dollar strengthened or weakened by 10% (March 31, 2019 - 10%) in relation to all other foreign currencies held in the Fund, with all other variables held constant, net assets attributable to holders of redeemable units of the Fund would have decreased or increased, respectively, by approximately $5,923,000 (March 31, 2019 - $8,363,000). In practice, actual results may differ from this analysis and the difference may be material.
Interest Rate RiskAs at March 31, 2020 and 2019, the Fund did not have a significant exposure to interest rate risk as substantially all of its assets were invested in equities.
Fair Value Hierarchy
The tables below summarize the inputs used by the Fund in valuing the Fund’s investments and derivatives carried at fair value.
Long Positions at fair value as at March 31, 2020Level 1 Level 2 Level 3 Total
(in $000’s) (in $000’s) (in $000’s) (in $000’s)Equities 56,765 - - 56,765 Total 56,765 - - 56,765
Long Positions at fair value as at March 31, 2019Level 1 Level 2 Level 3 Total
(in $000’s) (in $000’s) (in $000’s) (in $000’s)Equities 82,389 - - 82,389 Total 82,389 - - 82,389
There were no transfers between Level 1, 2 and 3 during the years ended March 31, 2020 and 2019.
Financial Instruments Risks (Note 10)
Concentration RiskFor Concentration Risk as at March 31, 2020, refer to the Schedule of Investment Portfolio.
The Fund’s investments were concentrated in the following segments:
as at March 31, 2019 Categories Net Assets (%)Information Technology 18.3 Industrials 17.1 Financials 16.4 Consumer Discretionary 14.6 Health Care 14.1 Real Estate 4.1 Materials 3.7 Communication Services 3.7 Consumer Staples 3.5 Other Net Assets (Liabilities) 2.4 Energy 2.1 Private Placements 0.0
Credit RiskAs at March 31, 2020 and 2019, the Fund did not have a significant exposure to credit risk as substantially all of its assets were invested in equities.
Other Price RiskAs at March 31, 2020 and 2019, the Fund was predominantly invested in U.S. equities and therefore was sensitive to changes in general economic conditions in the United States.
As at March 31, 2020, had the equities in the investment portfolio increased or decreased by 10% (March 31, 2019 - 10%), with all other variables held constant, net assets attributable to holders of redeemable units of the Fund would have increased or decreased, respectively, by approximately $5,677,000 (March 31, 2019 - $8,239,000). In practice, actual results may differ from this analysis and the difference may be material.
Currency RiskThe tables below summarize the Fund’s exposure to currency risk.
as at March 31, 2020~
Currency
Financial Instruments Exposure Derivatives
Net Exposure
Net Assets
(%)(in $000’s) (in $000’s) (in $000’s)U.S. Dollar 59,233 - 59,233 98.3 Total 59,233 - 59,233 98.3
as at March 31, 2019~
Currency
Financial Instruments Exposure Derivatives
Net Exposure
Net Assets
(%)(in $000’s) (in $000’s) (in $000’s)U.S. Dollar 83,627 - 83,627 99.1 Total 83,627 - 83,627 99.1
~Includes monetary and non-monetary instruments.
Fund Specific Notes to Financial Statements

CI American Value Fund
– 14 –Annual Financial Statements - March 31, 2020
Statements of Financial Position as at March 31(in $000’s except for per unit amounts and units outstanding)
2020 2019
539,899 679,765 18,459 41,833
- - - - - - - - - - 374 358 - - - - - - 3,555 - 967 1,117 563,254 723,073
- - - -
- - - - - - - - - - - 2,900 805 2,207 - - - - - - - - 805 5,107
562,449 717,966
Statements of Financial Position (cont’d)as at March 31(in $000’s except for per unit amounts and units outstanding)
Net assets attributable to holders of redeemable units
per class (Note 4):
Net assets attributable to holders of redeemable
units per unit: Number of redeemable
units outstanding:
2020 2019 2020 2019 2020 2019Class A 275,602 235,680 31.60 38.13 8,721,015 6,181,368Class A1 - 91,513 - 10.64 - 8,603,743Class A2 - 16,604 - 10.64 - 1,560,398Class A3 - 6,851 - 10.65 - 643,160Class A4 - 1,725 - 10.66 - 161,883Class A5 - 63 - 10.66 - 5,909Class E 11,980 17,605 22.03 26.59 543,710 662,176Class EF 666 915 10.22 12.34 65,139 74,123Class F 72,955 54,309 15.88 19.18 4,594,010 2,832,255Class F1 - 26,725 - 10.74 - 2,488,463Class F2 - 3,234 - 10.74 - 301,176Class F3 - 4,408 - 10.75 - 410,013Class F4 - 110 - 10.76 - 10,181Class F5 - 68 - 10.77 - 6,353Class I 180,687 231,451 41.22 49.81 4,384,002 4,646,355Class Insight 567 711 26.37 31.83 21,508 22,347Class O 18,574 24,746 23.86 28.84 778,511 857,941Class P 1,190 1,236 8.92 10.78 133,441 114,680Class W 228 12 9.46 11.43 24,072 1,052
AssetsCurrent assetsInvestmentsCashUnrealized gain on futures and foreign currency forward contractsSwaps, swaptions and optionsDaily variation margin on derivative instrumentsFees rebate receivableCollateral on deposit for short saleDividends receivableInterest receivableReceivable for distribution from investmentsSecurities lending revenue receivable (Note 6)Receivable for investments soldReceivable for unit subscriptions
LiabilitiesCurrent liabilitiesInvestments sold shortBank overdraftUnrealized loss on futures and foreign currency forward contractsSwaps, swaptions and options Dividends payable on investments sold shortInterest payable on investments sold shortDaily variation margin on derivative instrumentsPayable for investments purchasedPayable for unit redemptionsDistributions payable to holders of redeemable units Management fees payableAdministration fees payableAccounts payable and accrued liabilities
Net assets attributable to holders of redeemable units
The accompanying notes are an integral part of these financial statements.
Financial Statements
CIG - 7500

CI American Value Fund
– 15 –Annual Financial Statements - March 31, 2020
Statements of Comprehensive Incomefor the years ended March 31(in $000’s except for per unit amounts and number of units)
2020 2019
20,347 12,192 510 379 - - - - - -
- - - -
83,246 39,099
(152,055) 11,752 (47,952) 63,422 576 56 - - 100 88 161 33 837 177 (47,115) 63,599
8,297 8,293 1,001 1,003 197 105 - - - - - - - - 3 1 1,586 1,657 984 971 12,068 12,030
(59,183) 51,569
The accompanying notes are an integral part of these financial statements.
Financial Statements
Statements of Comprehensive Income (cont’d)for the years ended March 31(in $000’s except for per unit amounts and number of units)
Increase (decrease) in net assets attributable to
holders of redeemable units per class:
Increase (decrease) in net assets attributable to
holders of redeemable units per unit:
Weighted average number of units:
2020 2019 2020 2019 2020 2019Class A (39,680) 17,248 (5.10) 2.41 7,773,642 7,163,817Class A1 3,868 3,086 0.46 0.50 8,449,602 6,163,258Class A2 702 823 0.46 0.58 1,528,935 1,423,648Class A3 297 378 0.48 0.63 615,184 602,932Class A4 76 101 0.49 0.84 160,824 121,084Class A5 1 3 0.18 1.06 6,874 2,897Class E (1,388) 1,129 (2.32) 1.65 596,710 680,643Class EF (135) 67 (1.67) 0.87 81,068 77,570Class F (10,024) 4,607 (2.57) 1.48 3,905,968 3,128,116Class F1 1,205 875 0.50 0.46 2,418,653 1,885,824Class F2 159 144 0.53 0.52 298,741 277,931Class F3 206 303 0.50 0.78 419,317 388,222Class F4 6 8 0.43 2.21 13,225 3,144Class F5 3 5 0.52 0.88 6,353 5,717Class I (12,473) 20,625 (2.77) 4.23 4,512,184 4,879,274Class Insight (67) 55 (3.13) 2.21 21,419 24,857Class O (1,824) 2,014 (2.24) 2.33 812,724 863,550Class P (140) 97 (1.16) 1.28 121,089 74,470Class W 25 1 15.97 0.93 1,580 1,018
Income Net gain (loss) on investments and derivatives Dividends Interest for distribution purposes Income distributions from investments Capital gain distributions from investments Derivative income (loss) Dividends expense on financial assets (liabilities) sold
short Interest expense on financial assets (liabilities) sold short Net realized gain (loss) on sale of investments and
derivatives Change in unrealized appreciation (depreciation) in value
of investments and derivativesTotal net gain (loss) on investments and derivativesOther income Foreign exchange gain (loss) on cash Commitment fee income Securities lending revenue (Note 6) Fees rebateTotal other incomeTotal incomeExpensesManagement fees (Note 5)Administration fees (Note 5)Commissions and other portfolio transaction costsIndependent review committee feesSecurities borrowing fees (Note 2)Margin feesService feesInterest expenseWithholding taxesHarmonized sales taxTotal expensesIncrease (decrease) in net assets attributable to holders of redeemable units

CI American Value Fund
– 16 –Annual Financial Statements - March 31, 2020
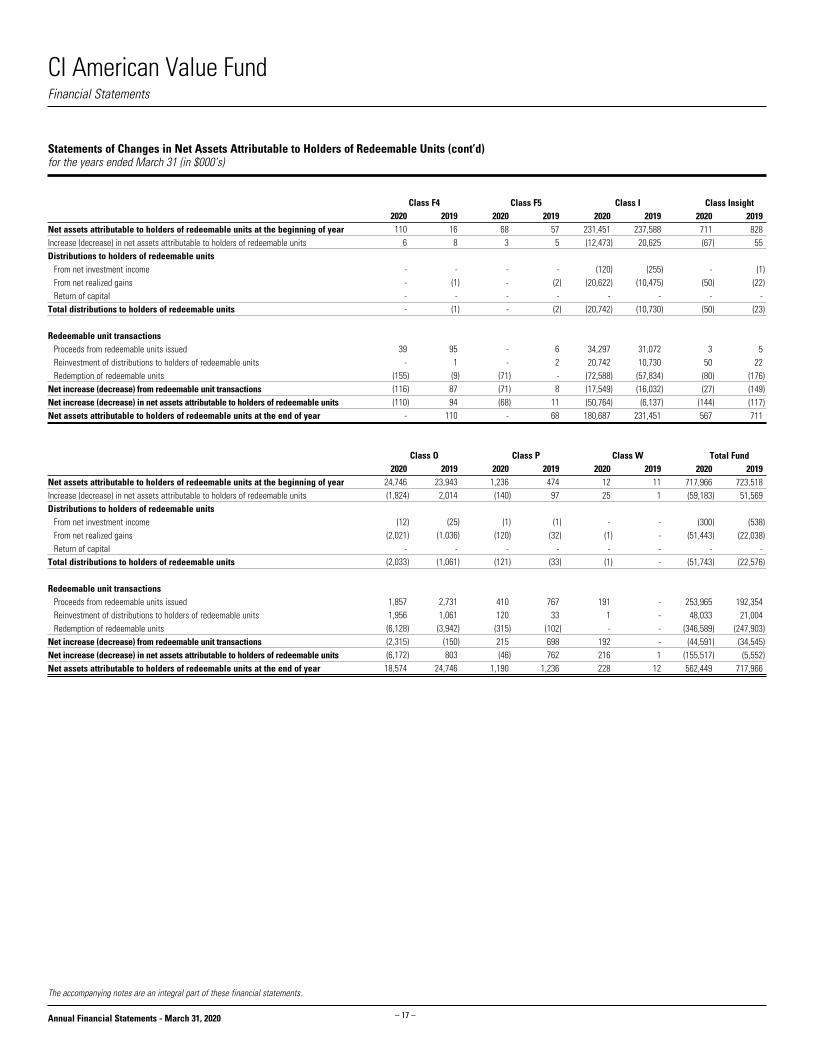
Statements of Changes in Net Assets Attributable to Holders of Redeemable Unitsfor the years ended March 31 (in $000’s)
Net assets attributable to holders of redeemable units at the beginning of yearIncrease (decrease) in net assets attributable to holders of redeemable unitsDistributions to holders of redeemable units From net investment income From net realized gains Return of capitalTotal distributions to holders of redeemable units
Redeemable unit transactions Proceeds from redeemable units issued Reinvestment of distributions to holders of redeemable units Redemption of redeemable unitsNet increase (decrease) from redeemable unit transactionsNet increase (decrease) in net assets attributable to holders of redeemable unitsNet assets attributable to holders of redeemable units at the end of year
Net assets attributable to holders of redeemable units at the beginning of yearIncrease (decrease) in net assets attributable to holders of redeemable unitsDistributions to holders of redeemable units From net investment income From net realized gains Return of capitalTotal distributions to holders of redeemable units
Redeemable unit transactions Proceeds from redeemable units issued Reinvestment of distributions to holders of redeemable units Redemption of redeemable unitsNet increase (decrease) from redeemable unit transactionsNet increase (decrease) in net assets attributable to holders of redeemable unitsNet assets attributable to holders of redeemable units at the end of year
Net assets attributable to holders of redeemable units at the beginning of yearIncrease (decrease) in net assets attributable to holders of redeemable unitsDistributions to holders of redeemable units From net investment income From net realized gains Return of capitalTotal distributions to holders of redeemable units
Redeemable unit transactions Proceeds from redeemable units issued Reinvestment of distributions to holders of redeemable units Redemption of redeemable unitsNet increase (decrease) from redeemable unit transactionsNet increase (decrease) in net assets attributable to holders of redeemable unitsNet assets attributable to holders of redeemable units at the end of year
The accompanying notes are an integral part of these financial statements.
Financial Statements
Class A 2020 2019 235,680 297,986 (39,680) 17,248
(121) (124) (20,885) (5,084) - - (21,006) (5,208)
152,639 41,385 20,472 5,087 (72,503) (120,818) 100,608 (74,346) 39,922 (62,306) 275,602 235,680
Class A1 2020 2019 91,513 43,186 3,868 3,086
- (42) - (1,738) - - - (1,780)
5,937 62,227 - 1,748 (101,318) (16,954) (95,381) 47,021 (91,513) 48,327 - 91,513
Class A2 2020 2019 16,604 12,276 702 823
- (8) - (331) - - - (339)
924 8,786 - 319 (18,230) (5,261) (17,306) 3,844 (16,604) 4,328 - 16,604
Class A3 2020 2019 6,851 5,260 297 378
- (4) - (147) - - - (151)
171 2,483 - 151 (7,319) (1,270) (7,148) 1,364 (6,851) 1,591 - 6,851
Class A4 2020 2019 1,725 1,167 76 101
- (1) - (29) - - - (30)
114 553 - 12 (1,915) (78) (1,801) 487 (1,725) 558 - 1,725
Class A5 2020 2019 63 22 1 3
- - - (1) - - - (1)
86 46 - 1 (150) (8) (64) 39 (63) 41 - 63
Class E 2020 2019 17,605 17,918 (1,388) 1,129
(6) (9) (968) (371) - - (974) (380)
914 2,109 952 372 (5,129) (3,543) (3,263) (1,062) (5,625) (313) 11,980 17,605
Class EF 2020 2019 915 974 (135) 67
(1) (1) (100) (28) - - (101) (29)
462 1 50 22 (525) (120) (13) (97) (249) (59) 666 915
Class F 2020 2019 54,309 62,569 (10,024) 4,607
(39) (41) (6,676) (1,666) - - (6,715) (1,707)
51,941 17,712 3,690 745 (20,246) (29,617) 35,385 (11,160) 18,646 (8,260) 72,955 54,309
Class F1 2020 2019 26,725 13,220 1,205 875
- (21) - (847) - - - (868)
3,107 19,580 - 568 (31,037) (6,650) (27,930) 13,498 (26,725) 13,505 - 26,725
Class F2 2020 2019 3,234 2,108 159 144
- (2) - (94) - - - (96)
432 2,161 - 55 (3,825) (1,138) (3,393) 1,078 (3,234) 1,126 - 3,234
Class F3 2020 2019 4,408 3,915 206 303
- (3) - (134) - - - (137)
441 635 - 75 (5,055) (383) (4,614) 327 (4,408) 493 - 4,408
CI American Value Fund
– 17 –Annual Financial Statements - March 31, 2020
The accompanying notes are an integral part of these financial statements.
Financial Statements
Statements of Changes in Net Assets Attributable to Holders of Redeemable Units (cont’d)for the years ended March 31 (in $000’s)
Net assets attributable to holders of redeemable units at the beginning of yearIncrease (decrease) in net assets attributable to holders of redeemable unitsDistributions to holders of redeemable units From net investment income From net realized gains Return of capitalTotal distributions to holders of redeemable units
Redeemable unit transactions Proceeds from redeemable units issued Reinvestment of distributions to holders of redeemable units Redemption of redeemable unitsNet increase (decrease) from redeemable unit transactionsNet increase (decrease) in net assets attributable to holders of redeemable unitsNet assets attributable to holders of redeemable units at the end of year
Net assets attributable to holders of redeemable units at the beginning of yearIncrease (decrease) in net assets attributable to holders of redeemable unitsDistributions to holders of redeemable units From net investment income From net realized gains Return of capitalTotal distributions to holders of redeemable units
Redeemable unit transactions Proceeds from redeemable units issued Reinvestment of distributions to holders of redeemable units Redemption of redeemable unitsNet increase (decrease) from redeemable unit transactionsNet increase (decrease) in net assets attributable to holders of redeemable unitsNet assets attributable to holders of redeemable units at the end of year
Class F4 2020 2019 110 16 6 8
- - - (1) - - - (1)
39 95 - 1 (155) (9) (116) 87 (110) 94 - 110
Class F5 2020 2019 68 57 3 5
- - - (2) - - - (2)
- 6 - 2 (71) - (71) 8 (68) 11 - 68
Class I 2020 2019 231,451 237,588 (12,473) 20,625
(120) (255) (20,622) (10,475) - - (20,742) (10,730)
34,297 31,072 20,742 10,730 (72,588) (57,834) (17,549) (16,032) (50,764) (6,137) 180,687 231,451
Class Insight 2020 2019 711 828 (67) 55
- (1) (50) (22) - - (50) (23)
3 5 50 22 (80) (176) (27) (149) (144) (117) 567 711
Class O 2020 2019 24,746 23,943 (1,824) 2,014
(12) (25) (2,021) (1,036) - - (2,033) (1,061)
1,857 2,731 1,956 1,061 (6,128) (3,942) (2,315) (150) (6,172) 803 18,574 24,746
Class P 2020 2019 1,236 474 (140) 97
(1) (1) (120) (32) - - (121) (33)
410 767 120 33 (315) (102) 215 698 (46) 762 1,190 1,236
Class W 2020 2019 12 11 25 1
- - (1) - - - (1) -
191 - 1 - - - 192 - 216 1 228 12
Total Fund 2020 2019 717,966 723,518 (59,183) 51,569
(300) (538) (51,443) (22,038) - - (51,743) (22,576)
253,965 192,354 48,033 21,004 (346,589) (247,903) (44,591) (34,545) (155,517) (5,552) 562,449 717,966
CI American Value Fund
– 18 –Annual Financial Statements - March 31, 2020
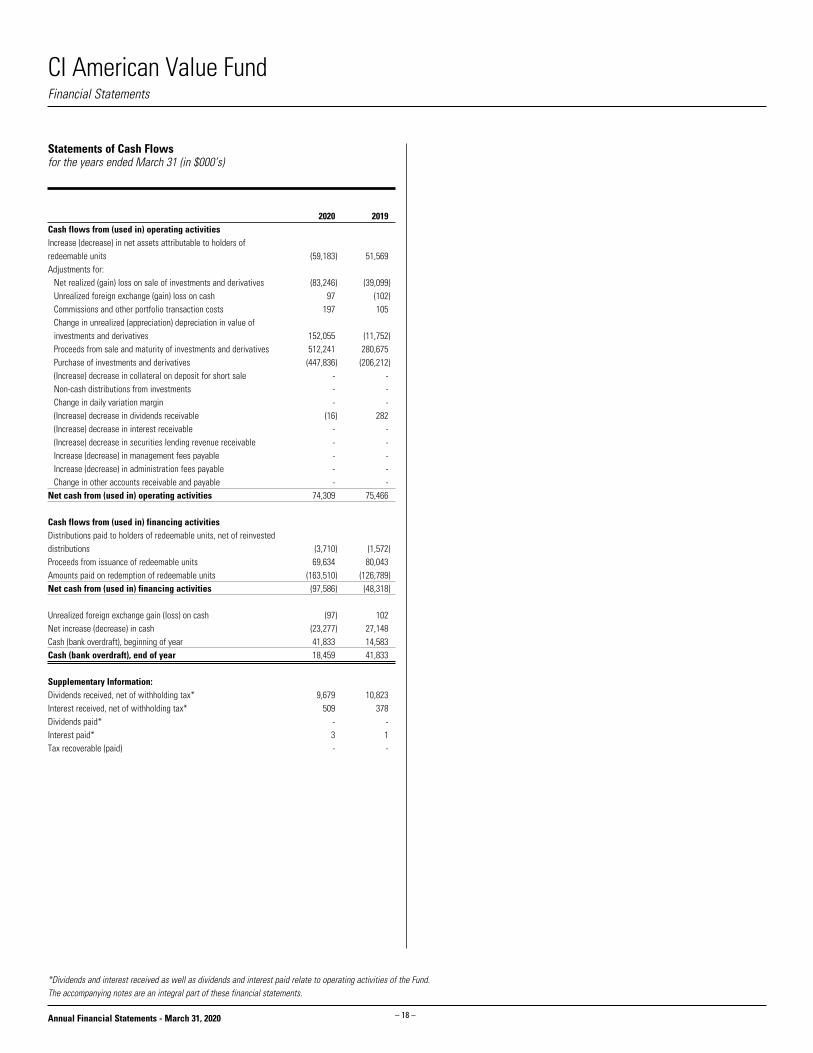
Statements of Cash Flowsfor the years ended March 31 (in $000’s)
2020 2019
(59,183) 51,569
(83,246) (39,099) 97 (102) 197 105
152,055 (11,752) 512,241 280,675 (447,836) (206,212) - - - - - - (16) 282 - - - - - - - - - - 74,309 75,466
(3,710) (1,572) 69,634 80,043 (163,510) (126,789) (97,586) (48,318)
(97) 102 (23,277) 27,148 41,833 14,583 18,459 41,833
9,679 10,823 509 378 - - 3 1 - -
*Dividends and interest received as well as dividends and interest paid relate to operating activities of the Fund. The accompanying notes are an integral part of these financial statements.
Financial Statements
Cash flows from (used in) operating activitiesIncrease (decrease) in net assets attributable to holders of redeemable unitsAdjustments for: Net realized (gain) loss on sale of investments and derivatives Unrealized foreign exchange (gain) loss on cash Commissions and other portfolio transaction costs Change in unrealized (appreciation) depreciation in value of
investments and derivatives Proceeds from sale and maturity of investments and derivatives Purchase of investments and derivatives (Increase) decrease in collateral on deposit for short sale Non-cash distributions from investments Change in daily variation margin (Increase) decrease in dividends receivable (Increase) decrease in interest receivable (Increase) decrease in securities lending revenue receivable Increase (decrease) in management fees payable Increase (decrease) in administration fees payable Change in other accounts receivable and payableNet cash from (used in) operating activities
Cash flows from (used in) financing activitiesDistributions paid to holders of redeemable units, net of reinvested distributionsProceeds from issuance of redeemable unitsAmounts paid on redemption of redeemable unitsNet cash from (used in) financing activities Unrealized foreign exchange gain (loss) on cashNet increase (decrease) in cashCash (bank overdraft), beginning of yearCash (bank overdraft), end of year
Supplementary Information:Dividends received, net of withholding tax*Interest received, net of withholding tax*Dividends paid*Interest paid*Tax recoverable (paid)
CI American Value Fund
– 19 –Annual Financial Statements - March 31, 2020
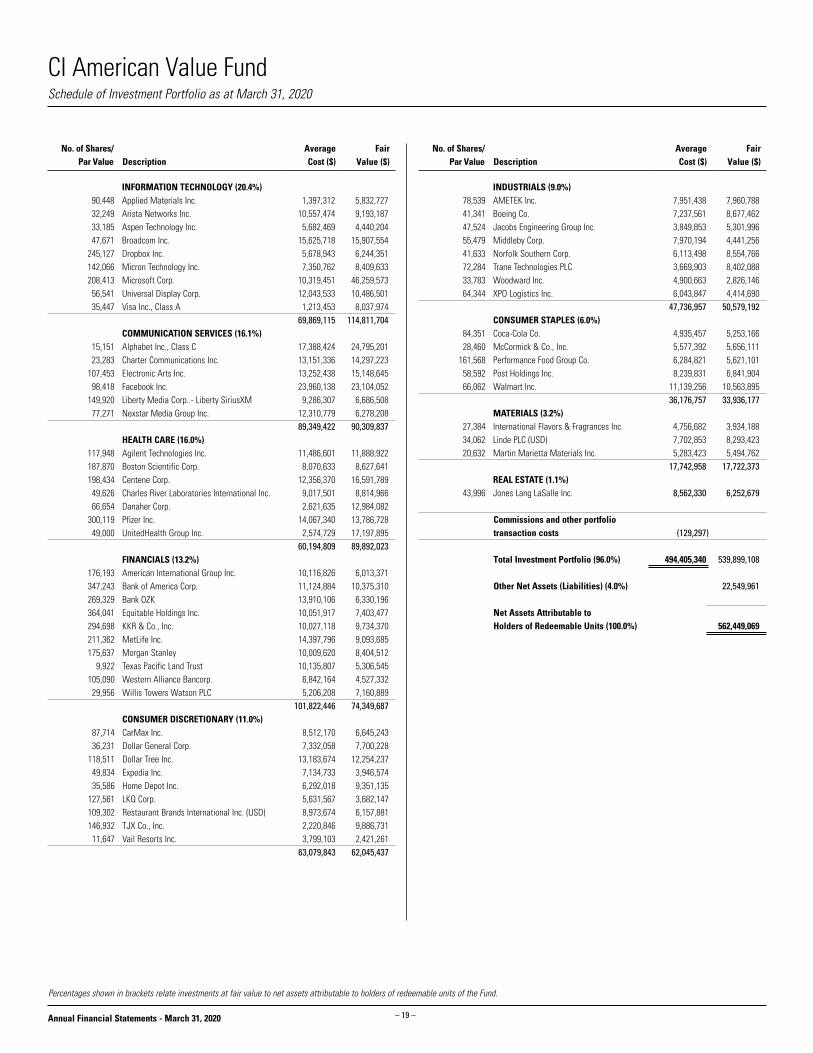
INDUSTRIALS (9.0%) 78,539 AMETEK Inc. 7,951,438 7,960,788 41,341 Boeing Co. 7,237,561 8,677,462 47,524 Jacobs Engineering Group Inc. 3,849,853 5,301,996 55,479 Middleby Corp. 7,970,194 4,441,256 41,633 Norfolk Southern Corp. 6,113,498 8,554,766 72,284 Trane Technologies PLC 3,669,903 8,402,088 33,783 Woodward Inc. 4,900,663 2,826,146 64,344 XPO Logistics Inc. 6,043,847 4,414,690 47,736,957 50,579,192 CONSUMER STAPLES (6.0%) 84,351 Coca-Cola Co. 4,935,457 5,253,166 28,460 McCormick & Co., Inc. 5,577,392 5,656,111 161,568 Performance Food Group Co. 6,284,821 5,621,101 58,592 Post Holdings Inc. 8,239,831 6,841,904 66,062 Walmart Inc. 11,139,256 10,563,895 36,176,757 33,936,177 MATERIALS (3.2%) 27,384 International Flavors & Fragrances Inc. 4,756,682 3,934,188 34,062 Linde PLC (USD) 7,702,853 8,293,423 20,632 Martin Marietta Materials Inc. 5,283,423 5,494,762 17,742,958 17,722,373 REAL ESTATE (1.1%) 43,996 Jones Lang LaSalle Inc. 8,562,330 6,252,679
Commissions and other portfolio transaction costs (129,297)
Total Investment Portfolio (96.0%) 494,405,340 539,899,108 Other Net Assets (Liabilities) (4.0%) 22,549,961 Net Assets Attributable to Holders of Redeemable Units (100.0%) 562,449,069
INFORMATION TECHNOLOGY (20.4%) 90,448 Applied Materials Inc. 1,397,312 5,832,727 32,249 Arista Networks Inc. 10,557,474 9,193,187 33,185 Aspen Technology Inc. 5,682,469 4,440,204 47,671 Broadcom Inc. 15,625,718 15,907,554 245,127 Dropbox Inc. 5,678,943 6,244,351 142,066 Micron Technology Inc. 7,350,762 8,409,633 208,413 Microsoft Corp. 10,319,451 46,259,573 56,541 Universal Display Corp. 12,043,533 10,486,501 35,447 Visa Inc., Class A 1,213,453 8,037,974 69,869,115 114,811,704 COMMUNICATION SERVICES (16.1%) 15,151 Alphabet Inc., Class C 17,388,424 24,795,201 23,283 Charter Communications Inc. 13,151,336 14,297,223 107,453 Electronic Arts Inc. 13,252,438 15,148,645 98,418 Facebook Inc. 23,960,138 23,104,052 149,920 Liberty Media Corp. - Liberty SiriusXM 9,286,307 6,686,508 77,271 Nexstar Media Group Inc. 12,310,779 6,278,208 89,349,422 90,309,837 HEALTH CARE (16.0%) 117,948 Agilent Technologies Inc. 11,486,601 11,888,922 187,870 Boston Scientific Corp. 8,070,633 8,627,641 198,434 Centene Corp. 12,356,370 16,591,789 49,626 Charles River Laboratories International Inc. 9,017,501 8,814,966 66,654 Danaher Corp. 2,621,635 12,984,082 300,119 Pfizer Inc. 14,067,340 13,786,728 49,000 UnitedHealth Group Inc. 2,574,729 17,197,895 60,194,809 89,892,023 FINANCIALS (13.2%) 176,193 American International Group Inc. 10,116,826 6,013,371 347,243 Bank of America Corp. 11,124,884 10,375,310 269,329 Bank OZK 13,910,106 6,330,196 364,041 Equitable Holdings Inc. 10,051,917 7,403,477 294,698 KKR & Co., Inc. 10,027,118 9,734,370 211,362 MetLife Inc. 14,397,796 9,093,685 175,637 Morgan Stanley 10,009,620 8,404,512 9,922 Texas Pacific Land Trust 10,135,807 5,306,545 105,090 Western Alliance Bancorp. 6,842,164 4,527,332 29,956 Willis Towers Watson PLC 5,206,208 7,160,889 101,822,446 74,349,687 CONSUMER DISCRETIONARY (11.0%) 87,714 CarMax Inc. 8,512,170 6,645,243 36,231 Dollar General Corp. 7,332,058 7,700,228 118,511 Dollar Tree Inc. 13,183,674 12,254,237 49,834 Expedia Inc. 7,134,733 3,946,574 35,586 Home Depot Inc. 6,292,018 9,351,135 127,561 LKQ Corp. 5,631,567 3,682,147 109,302 Restaurant Brands International Inc. (USD) 8,973,674 6,157,881 146,932 TJX Co., Inc. 2,220,846 9,886,731 11,647 Vail Resorts Inc. 3,799,103 2,421,261 63,079,843 62,045,437
Percentages shown in brackets relate investments at fair value to net assets attributable to holders of redeemable units of the Fund.
Schedule of Investment Portfolio as at March 31, 2020
No. of Shares/Par Value Description
AverageCost ($)
FairValue ($)
No. of Shares/Par Value Description
AverageCost ($)
FairValue ($)

CI American Value Fund
– 20 –Annual Financial Statements - March 31, 2020
Redeemable Unit Transactions (Note 4)for the years ended March 31
Number of redeemable units at the beginning of yearRedeemable units issued for cashRedeemable units issued for reinvested distributionsRedeemable units redeemedNumber of redeemable units at the end of year
Number of redeemable units at the beginning of yearRedeemable units issued for cashRedeemable units issued for reinvested distributionsRedeemable units redeemedNumber of redeemable units at the end of year
Number of redeemable units at the beginning of yearRedeemable units issued for cashRedeemable units issued for reinvested distributionsRedeemable units redeemedNumber of redeemable units at the end of year
Number of redeemable units at the beginning of yearRedeemable units issued for cashRedeemable units issued for reinvested distributionsRedeemable units redeemedNumber of redeemable units at the end of year
Number of redeemable units at the beginning of yearRedeemable units issued for cashRedeemable units issued for reinvested distributionsRedeemable units redeemedNumber of redeemable units at the end of year
Fund Specific Notes to Financial Statements
†A portion of brokerage commissions paid was used to cover research and market data services, termed soft dollar commissions. This amount has been estimated by the Manager of the Fund.The accompanying notes are an integral part of these financial statements.
Commissions (Note 2)for the years ended March 31 (in $000’s)
2020 2019Brokerage commissions 191 100Soft dollar commissions† - -
Class A 2020 2019 6,181,368 8,115,052 3,862,285 1,106,147 507,163 146,336 (1,829,801) (3,186,167) 8,721,015 6,181,368
Class A1 2020 2019 8,603,743 4,217,237 533,288 5,831,465 - 180,340 (9,137,031) (1,625,299) - 8,603,743
Class A2 2020 2019 1,560,398 1,197,977 82,861 823,844 - 32,944 (1,643,259) (494,367) - 1,560,398
Class A3 2020 2019 643,160 512,789 15,367 236,036 - 15,550 (658,527) (121,215) - 643,160
Class A4 2020 2019 161,883 113,739 10,213 54,484 - 1,251 (172,096) (7,591) - 161,883
Class A5 2020 2019 5,909 2,185 7,558 4,410 - 76 (13,467) (762) - 5,909
Class E 2020 2019 662,176 699,503 35,046 81,127 33,827 15,350 (187,339) (133,804) 543,710 662,176
Class EF 2020 2019 74,123 81,924 34,134 96 3,816 1,975 (46,934) (9,872) 65,139 74,123
Class F 2020 2019 2,832,255 3,386,507 2,610,652 931,455 182,535 42,773 (1,031,432) (1,528,480) 4,594,010 2,832,255
Class F1 2020 2019 2,488,463 1,277,653 273,473 1,792,617 - 58,173 (2,761,936) (639,980) - 2,488,463
Class F2 2020 2019 301,176 203,722 38,152 199,902 - 5,622 (339,328) (108,070) - 301,176
Class F3 2020 2019 410,013 378,022 39,125 60,106 - 7,636 (449,138) (35,751) - 410,013
Class F4 2020 2019 10,181 1,575 3,509 9,345 - 89 (13,690) (828) - 10,181
Class F5 2020 2019 6,353 5,525 - 609 - 219 (6,353) - - 6,353
Class I 2020 2019 4,646,355 4,946,407 696,450 626,506 396,888 237,921 (1,355,691) (1,164,479) 4,384,002 4,646,355
Class Insight 2020 2019 22,347 27,004 89 158 1,475 759 (2,403) (5,574) 21,508 22,347
Class O 2020 2019 857,941 861,005 61,969 94,299 64,589 40,599 (205,988) (137,962) 778,511 857,941
Class P 2020 2019 114,680 45,608 35,286 75,134 10,644 3,403 (27,169) (9,465) 133,441 114,680
Class W 2020 2019 1,052 1,005 22,927 - 93 47 - - 24,072 1,052

CI American Value Fund
– 21 –Annual Financial Statements - March 31, 2020
The accompanying notes are an integral part of these financial statements.
Fund Specific Notes to Financial Statements
Management and Administration Fees (Note 5) as at March 31, 2020 (%)
Annual management
fee rate:
Annual administration
fee rate:
Class A 2.000 0.21Class A1^ 1.925 0.21Class A2^ 1.900 0.20Class A3^ 1.850 0.15Class A4^ 1.800 0.12Class A5^ 1.700 0.10Class E 1.950 0.15Class EF 0.950 0.15Class F 1.000 0.21Class F1^ 0.925 0.21Class F2^ 0.900 0.20Class F3^ 0.850 0.15Class F4^ 0.800 0.12Class F5^ 0.700 0.10Class I Paid directly by investor Paid directly by investorClass Insight 1.110 0.21Class O Paid directly by investor 0.15Class P Paid directly by investor 0.21Class W Paid directly by investor 0.15*
^Effective after the close of business on August 2, 2019, the classes of the Fund that were eligible for CI Preferred
Pricing Program (CIPP) transitioned from a tiered pricing model to a fee distribution model. Please refer to most
recent simplified prospectus for further details.
*Effective August 2, 2019, the annual administration fee rate was reduced for Class W from 0.21% to 0.15%.
Securities Lending (Note 6)as at March 31 (in $000’s)
2020 2019Loaned 103,852 108,269Collateral (non-cash) 105,929 110,434
Securities Lending Revenue Reconciliation (Note 6)for the years ended March 31 (in $000’s)
2020 2019Gross securities lending revenue 118 104Charges (18) (16)Securities lending revenue 100 88% of gross securities lending revenue 15.3 15.4
Loss Carry Forwards (Note 7)as at March 31 (in $000’s)
2020Capital loss carried forward: -Non-capital losses expiring:2029 -2030 -2031 -2032 -2033 -2034 -2035 -2036 -2037 -2038 -2039 -Total -

CI American Value Fund
– 22 –Annual Financial Statements - March 31, 2020
The accompanying notes are an integral part of these financial statements.
Currency Risk (cont’d)As at March 31, 2020, had the Canadian dollar strengthened or weakened by 10% (March 31, 2019 - 10%) in relation to all other foreign currencies held in the Fund, with all other variables held constant, net assets attributable to holders of redeemable units of the Fund would have decreased or increased, respectively, by approximately $56,234,000 (March 31, 2019 - $71,903,000). In practice, actual results may differ from this analysis and the difference may be material.
Interest Rate RiskAs at March 31, 2020 and 2019, the Fund did not have a significant exposure to interest rate risk as substantially all of its assets were invested in equities.
Fair Value Hierarchy
The tables below summarize the inputs used by the Fund in valuing the Fund’s investments and derivatives carried at fair value.
Long Positions at fair value as at March 31, 2020Level 1 Level 2 Level 3 Total
(in $000’s) (in $000’s) (in $000’s) (in $000’s)Equities 539,899 - - 539,899 Total 539,899 - - 539,899
Long Positions at fair value as at March 31, 2019Level 1 Level 2 Level 3 Total
(in $000’s) (in $000’s) (in $000’s) (in $000’s)Equities 679,765 - - 679,765 Total 679,765 - - 679,765
There were no transfers between Level 1, 2 and 3 during the years ended March 31, 2020 and 2019.
Financial Instruments Risks (Note 10)
Concentration RiskFor Concentration Risk as at March 31, 2020, refer to the Schedule of Investment Portfolio.
The Fund’s investments were concentrated in the following segments:
as at March 31, 2019 Categories Net Assets (%)Information Technology 27.5 Financials 16.7 Health Care 13.4 Industrials 11.9 Consumer Discretionary 9.5 Materials 5.6 Other Net Assets (Liabilities) 5.3 Consumer Staples 3.7 Energy 3.3 Utilities 1.8 Communication Services 1.3
Credit RiskAs at March 31, 2020 and 2019, the Fund did not have a significant exposure to credit risk as substantially all of its assets were invested in equities.
Other Price RiskAs at March 31, 2020 and 2019, the Fund was predominantly invested in U.S. equities and therefore was sensitive to changes in general economic conditions in the United States.
As at March 31, 2020, had the equities in the investment portfolio increased or decreased by 10% (March 31, 2019 - 10%), with all other variables held constant, net assets attributable to holders of redeemable units of the Fund would have increased or decreased, respectively, by approximately $53,990,000 (March 31, 2019 - $67,977,000). In practice, actual results may differ from this analysis and the difference may be material.
Currency RiskThe tables below summarize the Fund’s exposure to currency risk.
as at March 31, 2020~
Currency
Financial Instruments Exposure Derivatives
Net Exposure
Net Assets
(%)(in $000’s) (in $000’s) (in $000’s)U.S. Dollar 562,341 - 562,341 100.0 Total 562,341 - 562,341 100.0
as at March 31, 2019~
Currency
Financial Instruments Exposure Derivatives
Net Exposure
Net Assets
(%)(in $000’s) (in $000’s) (in $000’s)U.S. Dollar 719,025 - 719,025 100.1 Total 719,025 - 719,025 100.1
~Includes monetary and non-monetary instruments.
Fund Specific Notes to Financial Statements
CI Canadian Investment Fund
– 23 –Annual Financial Statements - March 31, 2020
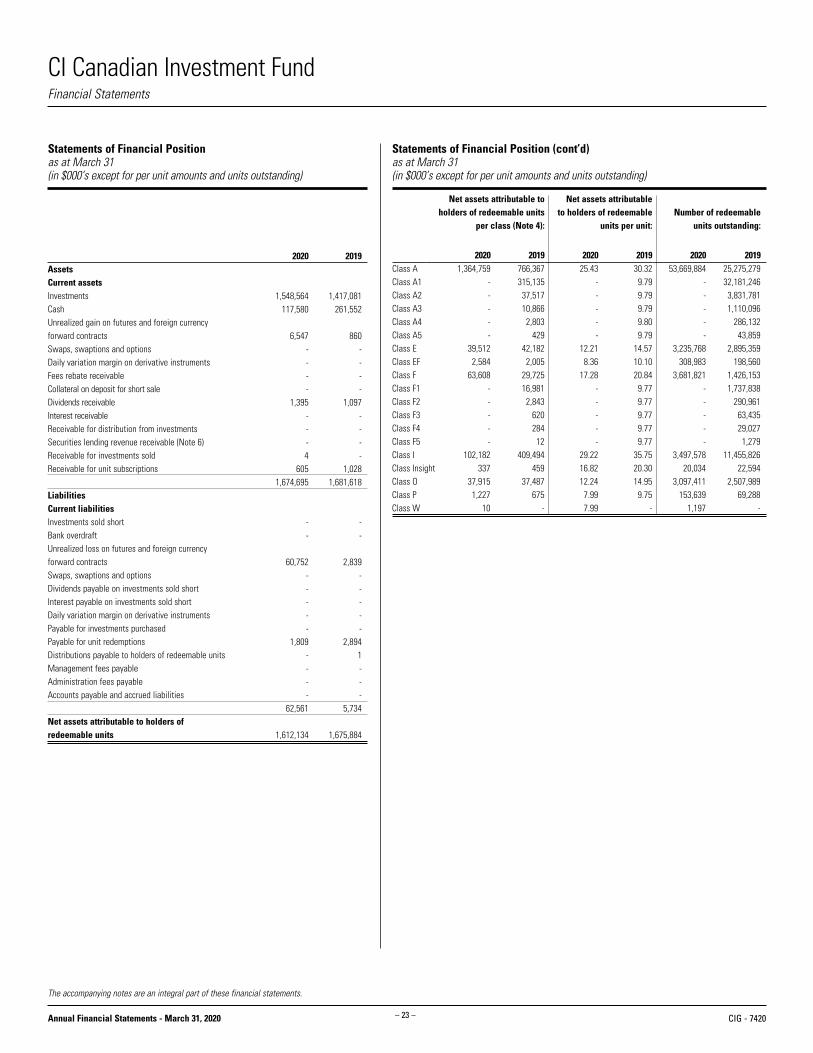
Statements of Financial Position as at March 31(in $000’s except for per unit amounts and units outstanding)
2020 2019
1,548,564 1,417,081 117,580 261,552
6,547 860 - - - - - - - - 1,395 1,097 - - - - - - 4 - 605 1,028 1,674,695 1,681,618
- - - -
60,752 2,839 - - - - - - - - - - 1,809 2,894 - 1 - - - - - - 62,561 5,734
1,612,134 1,675,884
Statements of Financial Position (cont’d)as at March 31(in $000’s except for per unit amounts and units outstanding)
Net assets attributable to holders of redeemable units
per class (Note 4):
Net assets attributable to holders of redeemable
units per unit: Number of redeemable
units outstanding:
2020 2019 2020 2019 2020 2019Class A 1,364,759 766,367 25.43 30.32 53,669,884 25,275,279Class A1 - 315,135 - 9.79 - 32,181,246Class A2 - 37,517 - 9.79 - 3,831,781Class A3 - 10,866 - 9.79 - 1,110,096Class A4 - 2,803 - 9.80 - 286,132Class A5 - 429 - 9.79 - 43,859Class E 39,512 42,182 12.21 14.57 3,235,768 2,895,359Class EF 2,584 2,005 8.36 10.10 308,983 198,560Class F 63,608 29,725 17.28 20.84 3,681,821 1,426,153Class F1 - 16,981 - 9.77 - 1,737,838Class F2 - 2,843 - 9.77 - 290,961Class F3 - 620 - 9.77 - 63,435Class F4 - 284 - 9.77 - 29,027Class F5 - 12 - 9.77 - 1,279Class I 102,182 409,494 29.22 35.75 3,497,578 11,455,826Class Insight 337 459 16.82 20.30 20,034 22,594Class O 37,915 37,487 12.24 14.95 3,097,411 2,507,989Class P 1,227 675 7.99 9.75 153,639 69,288Class W 10 - 7.99 - 1,197 -
AssetsCurrent assetsInvestmentsCashUnrealized gain on futures and foreign currency forward contractsSwaps, swaptions and optionsDaily variation margin on derivative instrumentsFees rebate receivableCollateral on deposit for short saleDividends receivableInterest receivableReceivable for distribution from investmentsSecurities lending revenue receivable (Note 6)Receivable for investments soldReceivable for unit subscriptions
LiabilitiesCurrent liabilitiesInvestments sold shortBank overdraftUnrealized loss on futures and foreign currency forward contractsSwaps, swaptions and options Dividends payable on investments sold shortInterest payable on investments sold shortDaily variation margin on derivative instrumentsPayable for investments purchasedPayable for unit redemptionsDistributions payable to holders of redeemable units Management fees payableAdministration fees payableAccounts payable and accrued liabilities
Net assets attributable to holders of redeemable units
The accompanying notes are an integral part of these financial statements.
Financial Statements
CIG - 7420
CI Canadian Investment Fund
– 24 –Annual Financial Statements - March 31, 2020
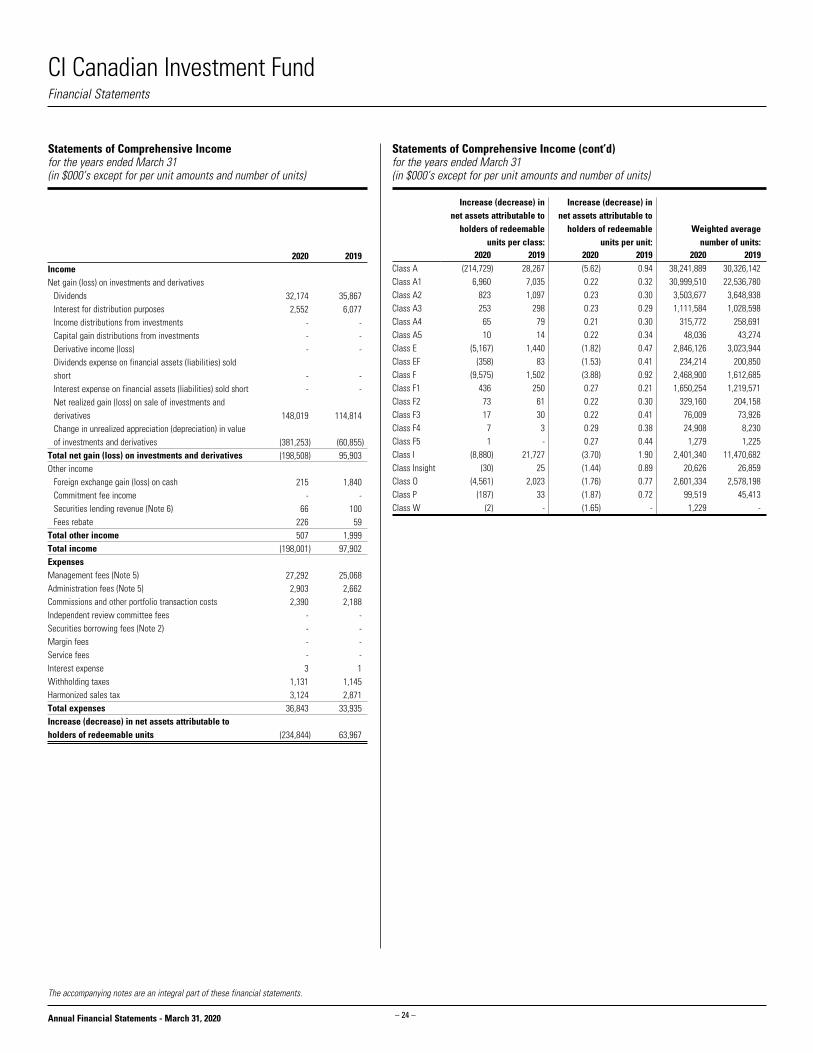
Statements of Comprehensive Incomefor the years ended March 31(in $000’s except for per unit amounts and number of units)
2020 2019
32,174 35,867 2,552 6,077 - - - - - -
- - - -
148,019 114,814
(381,253) (60,855) (198,508) 95,903 215 1,840 - - 66 100 226 59 507 1,999 (198,001) 97,902
27,292 25,068 2,903 2,662 2,390 2,188 - - - - - - - - 3 1 1,131 1,145 3,124 2,871 36,843 33,935
(234,844) 63,967
The accompanying notes are an integral part of these financial statements.
Financial Statements
Statements of Comprehensive Income (cont’d)for the years ended March 31(in $000’s except for per unit amounts and number of units)
Increase (decrease) in net assets attributable to
holders of redeemable units per class:
Increase (decrease) in net assets attributable to
holders of redeemable units per unit:
Weighted average number of units:
2020 2019 2020 2019 2020 2019Class A (214,729) 28,267 (5.62) 0.94 38,241,889 30,326,142Class A1 6,960 7,035 0.22 0.32 30,999,510 22,536,780Class A2 823 1,097 0.23 0.30 3,503,677 3,648,938Class A3 253 298 0.23 0.29 1,111,584 1,028,598Class A4 65 79 0.21 0.30 315,772 258,691Class A5 10 14 0.22 0.34 48,036 43,274Class E (5,167) 1,440 (1.82) 0.47 2,846,126 3,023,944Class EF (358) 83 (1.53) 0.41 234,214 200,850Class F (9,575) 1,502 (3.88) 0.92 2,468,900 1,612,685Class F1 436 250 0.27 0.21 1,650,254 1,219,571Class F2 73 61 0.22 0.30 329,160 204,158Class F3 17 30 0.22 0.41 76,009 73,926Class F4 7 3 0.29 0.38 24,908 8,230Class F5 1 - 0.27 0.44 1,279 1,225Class I (8,880) 21,727 (3.70) 1.90 2,401,340 11,470,682Class Insight (30) 25 (1.44) 0.89 20,626 26,859Class O (4,561) 2,023 (1.76) 0.77 2,601,334 2,578,198Class P (187) 33 (1.87) 0.72 99,519 45,413Class W (2) - (1.65) - 1,229 -
Income Net gain (loss) on investments and derivatives Dividends Interest for distribution purposes Income distributions from investments Capital gain distributions from investments Derivative income (loss) Dividends expense on financial assets (liabilities) sold
short Interest expense on financial assets (liabilities) sold short Net realized gain (loss) on sale of investments and
derivatives Change in unrealized appreciation (depreciation) in value
of investments and derivativesTotal net gain (loss) on investments and derivativesOther income Foreign exchange gain (loss) on cash Commitment fee income Securities lending revenue (Note 6) Fees rebateTotal other incomeTotal incomeExpensesManagement fees (Note 5)Administration fees (Note 5)Commissions and other portfolio transaction costsIndependent review committee feesSecurities borrowing fees (Note 2)Margin feesService feesInterest expenseWithholding taxesHarmonized sales taxTotal expensesIncrease (decrease) in net assets attributable to holders of redeemable units

CI Canadian Investment Fund
– 25 –Annual Financial Statements - March 31, 2020
Statements of Changes in Net Assets Attributable to Holders of Redeemable Unitsfor the years ended March 31 (in $000’s)
Net assets attributable to holders of redeemable units at the beginning of yearIncrease (decrease) in net assets attributable to holders of redeemable unitsDistributions to holders of redeemable units From net investment income From net realized gains Return of capitalTotal distributions to holders of redeemable units
Redeemable unit transactions Proceeds from redeemable units issued Reinvestment of distributions to holders of redeemable units Acquisition of assets from terminated funds Redemption of redeemable unitsNet increase (decrease) from redeemable unit transactionsNet increase (decrease) in net assets attributable to holders of redeemable unitsNet assets attributable to holders of redeemable units at the end of year
The accompanying notes are an integral part of these financial statements.
Financial Statements
Class A 2020 2019 766,367 1,084,281 (214,729) 28,267
- (933) (75,460) (36,709) - - (75,460) (37,642)
434,248 108,893 74,487 37,046 677,440 - (297,594) (454,478) 888,581 (308,539) 598,392 (317,914) 1,364,759 766,367
Class A1 2020 2019 315,135 157,103 6,960 7,035
- (292) - (11,484) - - - (11,776)
8,888 211,345 - 11,667 - - (330,983) (60,239) (322,095) 162,773 (315,135) 158,032 - 315,135
Class A2 2020 2019 37,517 36,261 823 1,097
- (39) - (1,541) - - - (1,580)
2,828 13,339 - 1,571 - - (41,168) (13,171) (38,340) 1,739 (37,517) 1,256 - 37,517
Class A3 2020 2019 10,866 9,592 253 298
- (12) - (477) - - - (489)
1,321 4,396 - 489 - - (12,440) (3,420) (11,119) 1,465 (10,866) 1,274 - 10,866
Class A4 2020 2019 2,803 2,227 65 79
- (3) - (117) - - - (120)
696 1,304 - 120 - - (3,564) (807) (2,868) 617 (2,803) 576 - 2,803
Class A5 2020 2019 429 418 10 14
- (1) - (23) - - - (24)
150 245 - 24 - - (589) (248) (439) 21 (429) 11 - 429
Class E 2020 2019 42,182 46,635 (5,167) 1,440
- (48) (2,602) (1,902) - - (2,602) (1,950)
994 791 2,594 1,946 14,360 - (12,849) (6,680) 5,099 (3,943) (2,670) (4,453) 39,512 42,182
Class EF 2020 2019 2,005 2,123 (358) 83
- (3) (205) (112) - - (205) (115)
135 1 175 94 1,393 - (561) (181) 1,142 (86) 579 (118) 2,584 2,005
Class F 2020 2019 29,725 36,699 (9,575) 1,502
- (42) (4,957) (1,645) - - (4,957) (1,687)
29,970 11,626 4,437 1,458 27,935 - (13,927) (19,873) 48,415 (6,789) 33,883 (6,974) 63,608 29,725
Class F1 2020 2019 16,981 6,502 436 250
- (23) - (895) - - - (918)
814 14,008 - 858 - - (18,231) (3,719) (17,417) 11,147 (16,981) 10,479 - 16,981
Class F2 2020 2019 2,843 1,239 73 61
- (3) - (137) - - - (140)
650 2,048 - 133 - - (3,566) (498) (2,916) 1,683 (2,843) 1,604 - 2,843
Class F3 2020 2019 620 688 17 30
- (1) - (37) - - - (38)
382 258 - 38 - - (1,019) (356) (637) (60) (620) (68) - 620

CI Canadian Investment Fund
– 26 –Annual Financial Statements - March 31, 2020
The accompanying notes are an integral part of these financial statements.
Financial Statements
Statements of Changes in Net Assets Attributable to Holders of Redeemable Units (cont’d)for the years ended March 31 (in $000’s)
Net assets attributable to holders of redeemable units at the beginning of yearIncrease (decrease) in net assets attributable to holders of redeemable unitsDistributions to holders of redeemable units From net investment income From net realized gains Return of capitalTotal distributions to holders of redeemable units
Redeemable unit transactions Proceeds from redeemable units issued Reinvestment of distributions to holders of redeemable units Acquisition of assets from terminated funds Redemption of redeemable unitsNet increase (decrease) from redeemable unit transactionsNet increase (decrease) in net assets attributable to holders of redeemable unitsNet assets attributable to holders of redeemable units at the end of year
Class F4 2020 2019 284 20 7 3
- - - (4) - - - (4)
9 300 - 4 - - (300) (39) (291) 265 (284) 264 - 284
Class F5 2020 2019 12 12 1 -
- - - (1) - - - (1)
- - - 1 - - (13) - (13) 1 (12) - - 12
Class I 2020 2019 409,494 417,177 (8,880) 21,727
- (703) (6,435) (27,679) - - (6,435) (28,382)
2,145 1,501 6,435 28,382 127,158 - (427,735) (30,911) (291,997) (1,028) (307,312) (7,683) 102,182 409,494
Class Insight 2020 2019 459 647 (30) 25
- (1) (38) (27) - - (38) (28)
2 - 36 27 - - (92) (212) (54) (185) (122) (188) 337 459
Class O 2020 2019 37,487 40,685 (4,561) 2,023
- (63) (4,242) (2,494) - - (4,242) (2,557)
1,263 1,542 4,198 2,533 13,683 - (9,913) (6,739) 9,231 (2,664) 428 (3,198) 37,915 37,487
Class P 2020 2019 675 289 (187) 33
- (1) (102) (27) - - (102) (28)
314 468 102 28 706 - (281) (115) 841 381 552 386 1,227 675
Class W 2020 2019 - - (2) -
- - - - - - - -
- - - - 12 - - - 12 - 10 - 10 -
Total Fund 2020 2019 1,675,884 1,842,598 (234,844) 63,967
- (2,168) (94,041) (85,311) - - (94,041) (87,479)
484,809 372,065 92,464 86,419 862,687 - (1,174,825) (601,686) 265,135 (143,202) (63,750) (166,714) 1,612,134 1,675,884

CI Canadian Investment Fund
– 27 –Annual Financial Statements - March 31, 2020
Statements of Cash Flowsfor the years ended March 31 (in $000’s)
2020 2019
(234,844) 63,967
(148,019) (114,814) 1,124 (24) 2,390 2,188
381,253 60,855 2,067,093 1,506,921 (1,523,785) (1,285,282) - - - - - - (298) 899 - - - - - - - - - - 544,914 234,710
(1,578) (1,059) 30,272 27,627 (720,948) (257,090) 4,492 - (687,762) (230,522)
(1,124) 24 (142,848) 4,188 261,552 257,340 117,580 261,552
30,749 34,851 2,551 6,073 - - 3 1 - -
*Dividends and interest received as well as dividends and interest paid relate to operating activities of the Fund. The accompanying notes are an integral part of these financial statements.
Financial Statements
Cash flows from (used in) operating activitiesIncrease (decrease) in net assets attributable to holders of redeemable unitsAdjustments for: Net realized (gain) loss on sale of investments and derivatives Unrealized foreign exchange (gain) loss on cash Commissions and other portfolio transaction costs Change in unrealized (appreciation) depreciation in value of
investments and derivatives Proceeds from sale and maturity of investments and derivatives Purchase of investments and derivatives (Increase) decrease in collateral on deposit for short sale Non-cash distributions from investments Change in daily variation margin (Increase) decrease in dividends receivable (Increase) decrease in interest receivable (Increase) decrease in securities lending revenue receivable Increase (decrease) in management fees payable Increase (decrease) in administration fees payable Change in other accounts receivable and payableNet cash from (used in) operating activities
Cash flows from (used in) financing activitiesDistributions paid to holders of redeemable units, net of reinvested distributionsProceeds from issuance of redeemable unitsAmounts paid on redemption of redeemable unitsAcquisition of assets from terminated fundsNet cash from (used in) financing activities Unrealized foreign exchange gain (loss) on cashNet increase (decrease) in cashCash (bank overdraft), beginning of yearCash (bank overdraft), end of year
Supplementary Information:Dividends received, net of withholding tax*Interest received, net of withholding tax*Dividends paid*Interest paid*Tax recoverable (paid)

CI Canadian Investment Fund
– 28 –Annual Financial Statements - March 31, 2020
UTILITIES (1.8%) 552,149 Brookfield Infrastructure Partners L.P. 34,363,256 28,214,814 Commissions and other portfolio transaction costs (488,896)
Total Investment Portfolio before Derivative Instruments (96.1%) 1,647,301,470 1,548,563,745
Foreign Currency Forward Contract(s) (-3.4%) (see Schedule A) (54,204,509)
Total Investment Portfolio (92.7%) 1,647,301,470 1,494,359,236 Other Net Assets (Liabilities) (7.3%) 117,774,784 Net Assets Attributable to Holders of Redeemable Units (100.0%) 1,612,134,020
FINANCIALS (27.5%) 367,784 American Express Co. 59,918,598 44,313,383 1,243,224 Brookfield Asset Management Inc., Class A 79,134,007 77,552,313 244,138 JPMorgan Chase & Co. 38,947,991 30,934,294 726,684 Royal Bank of Canada 59,189,651 63,345,044 161,064 S&P Global Inc. 49,056,986 55,548,299 697,469 Sun Life Financial Inc. 35,506,420 31,574,422 879,775 The Bank of Nova Scotia 58,679,990 50,560,669 322,122 TMX Group Ltd. 28,715,440 33,748,722 961,437 Toronto-Dominion Bank 58,081,156 57,522,776 467,230,239 445,099,922 INFORMATION TECHNOLOGY (21.3%) 121,455 Apple Inc. 36,863,703 43,467,260 682,271 CGI Inc. 57,000,394 51,982,227 23,580 Constellation Software Inc. 28,330,374 30,159,292 325,207 Fiserv Inc. 43,047,904 43,476,578 179,400 KLA-Tencor Corp. 34,961,718 36,292,565 235,808 Microsoft Corp. 41,784,313 52,340,196 860,943 Open Text Corp. 48,323,431 42,367,005 188,046 Visa Inc., Class A 42,827,648 42,641,368 333,139,485 342,726,491 CONSUMER DISCRETIONARY (18.5%) 15,740 Amazon.com Inc. 38,516,860 43,191,129 25,485 Booking Holdings Inc. 62,841,219 48,253,389 454,490 Canadian Tire Corp., Ltd., Class A, Non-Voting Shares 65,395,990 38,604,381 1,570,653 Dollarama Inc. 65,524,077 61,318,293 341,846 Lowe’s Cos., Inc. 48,939,489 41,399,868 820,261 Magna International Inc., Class A 56,933,559 36,837,922 503,216 Restaurant Brands International Inc. 42,108,692 28,537,379 380,259,886 298,142,361 HEALTH CARE (13.0%) 441,887 Abbott Laboratories Inc. 46,358,876 49,075,061 149,408 Humana Inc. 61,595,223 66,031,132 221,903 Stryker Corp. 46,153,106 51,995,877 119,890 UnitedHealth Group Inc. 44,733,565 42,078,685 198,840,770 209,180,755 INDUSTRIALS (5.8%) 61,349 Brookfield Infrastructure Corp. 3,579,061 3,023,892 343,485 Canadian National Railway Co. 30,268,727 37,793,655 548,410 Thomson Reuters Corp. 40,003,175 52,581,551 73,850,963 93,399,098 COMMUNICATION SERVICES (5.7%) 2,618,338 TELUS Corp. 67,952,567 58,258,020 243,004 Walt Disney Co. 32,813,194 33,037,573 100,765,761 91,295,593 CONSUMER STAPLES (2.5%) 1,625,060 US Foods Holding Corp. 59,340,006 40,504,711
Percentages shown in brackets relate investments at fair value to net assets attributable to holders of redeemable units of the Fund.
Schedule of Investment Portfolio as at March 31, 2020
No. of Shares/Par Value Description
AverageCost ($)
FairValue ($)
No. of Shares/Par Value Description
AverageCost ($)
FairValue ($)

CI Canadian Investment Fund
– 29 –Annual Financial Statements - March 31, 2020
‡Credit ratings are obtained from S&P Global Ratings, where available, otherwise ratings are obtained from: Moody’s Investors Service or Dominion Bond Rating Service.Percentages shown in brackets relate investments at fair value to net assets attributable to holders of redeemable units of the Fund.
Schedule of Investment Portfolio as at March 31, 2020 (cont’d)
Schedule AForeign Currency Forward Contract(s) (-3.4%)
Contract(s) CounterpartyCredit Rating of
the Counterparty‡Settlement
DateContract(s)
Rate Pay ReceiveUnrealized
Gain (Loss) ($)1 Bank of Montreal A-1 May 14, 2020 0.75 (4,588,962) US $ 6,085,743 Canadian $ (368,677)1 Canadian Imperial Bank of Commerce A-1 May 14, 2020 0.74 (2,768,146) Canadian $ 2,058,887 US $ 127,736 1 Canadian Imperial Bank of Commerce A-1 April 22, 2020 1.45 (4,339,701) Canadian $ 2,993,496 US $ (128,093)1 Canadian Imperial Bank of Commerce A-1 June 18, 2020 0.66 (12,228,000) Euro 18,435,728 Canadian $ (565,689)1 Canadian Imperial Bank of Commerce A-1 May 14, 2020 0.75 (3,857,674) US $ 5,115,951 Canadian $ (309,906)1 Canadian Imperial Bank of Commerce A-1 April 22, 2020 0.77 (62,208,721) US $ 81,027,170 Canadian $ (6,491,292)1 Citigroup Inc. A-2 May 14, 2020 0.75 (1,858,632) US $ 2,473,955 Canadian $ (140,238)1 Citigroup Inc. A-2 May 14, 2020 0.75 (7,434,527) US $ 9,888,404 Canadian $ (568,360)1 Citigroup Inc. A-2 April 22, 2020 0.77 (83,773,459) US $ 108,654,595 Canadian $ (9,202,049)1 HSBC Holdings PLC A-1 April 22, 2020 0.77 (118,102,834) US $ 153,769,889 Canadian $ (12,383,288)1 HSBC Holdings PLC A-1 May 14, 2020 0.75 (4,605,689) US $ 6,118,911 Canadian $ (359,047)1 JPMorgan Chase & Co. A-2 May 14, 2020 0.74 (23,230,176) Canadian $ 17,267,202 US $ 1,056,635 1 JPMorgan Chase & Co. A-2 May 14, 2020 0.72 (26,075,584) Canadian $ 18,896,520 US $ 503,542 1 JPMorgan Chase & Co. A-2 June 18, 2020 1.56 (8,911,832) Canadian $ 5,700,201 Euro (53,513)1 JPMorgan Chase & Co. A-2 June 18, 2020 1.56 (9,562,125) Canadian $ 6,114,000 Euro (60,741)1 JPMorgan Chase & Co. A-2 May 14, 2020 0.75 (4,646,579) US $ 6,161,625 Canadian $ (373,834)1 JPMorgan Chase & Co. A-2 April 22, 2020 0.77 (83,773,459) US $ 108,863,610 Canadian $ (8,993,130)1 Morgan Stanley A-2 May 14, 2020 0.72 (26,073,136) Canadian $ 18,885,480 US $ 490,473 1 Morgan Stanley A-2 April 22, 2020 1.45 (44,987,890) Canadian $ 31,023,504 US $ (1,340,312)1 Morgan Stanley A-2 June 18, 2020 1.56 (646,833) Canadian $ 413,799 Euro (3,775)1 Morgan Stanley A-2 May 14, 2020 0.75 (1,858,632) US $ 2,470,605 Canadian $ (143,585)1 Morgan Stanley A-2 April 22, 2020 0.77 (59,789,569) US $ 77,636,756 Canadian $ (6,478,208)1 Royal Bank of Canada A-1+ April 22, 2020 0.76 (23,556,312) Canadian $ 17,857,650 US $ 1,566,894 1 Royal Bank of Canada A-1+ April 22, 2020 0.76 (26,564,507) Canadian $ 20,137,350 US $ 1,765,917 1 Royal Bank of Canada A-1+ May 14, 2020 0.74 (9,698,878) Canadian $ 7,216,400 US $ 451,185 1 Royal Bank of Canada A-1+ May 14, 2020 0.74 (12,832,243) Canadian $ 9,539,511 US $ 585,350 1 Royal Bank of Canada A-1+ April 22, 2020 0.75 (1,203,132) US $ 1,603,255 Canadian $ (89,391)1 Royal Bank of Canada A-1+ May 14, 2020 0.75 (30,950,000) US $ 41,523,758 Canadian $ (2,008,187)1 Royal Bank of Canada A-1+ April 22, 2020 0.77 (35,196,820) US $ 45,642,885 Canadian $ (3,873,739)1 Toronto-Dominion Bank A-1+ May 14, 2020 0.75 (4,605,689) US $ 6,119,372 Canadian $ (358,586)1 Toronto-Dominion Bank A-1+ April 22, 2020 0.77 (59,490,622) US $ 77,235,782 Canadian $ (6,458,601)Total Foreign Currency Forward Contract(s) Value (54,204,509)

CI Canadian Investment Fund
– 30 –Annual Financial Statements - March 31, 2020
The accompanying notes are an integral part of these financial statements.
Fund Specific Notes to Financial Statements
Offsetting of Financial Instruments (Note 2)
The following tables show the net impact on the Fund’s Statements of Financial Position if all rights to offset were exercised.
as at March 31, 2020Amounts Eligible for Offset
Gross Assets/(Liabilities)
FinancialInstruments
CollateralReceived/(Paid)
NetExposure
(in $000’s) (in $000’s) (in $000’s) (in $000’s)Derivative assets - Foreign currency forward contracts 6,547 (6,547) - -Derivative assets - Swaps and swaptions - - - -Total 6,547 (6,547) - -Derivative liabilities - Foreign currency forward contracts (60,752) 6,547 - (54,205)Derivative liabilities - Swaps and swaptions - - - -Total (60,752) 6,547 - (54,205)
as at March 31, 2019Amounts Eligible for Offset
Gross Assets/(Liabilities)
FinancialInstruments
CollateralReceived/(Paid)
NetExposure
(in $000’s) (in $000’s) (in $000’s) (in $000’s)Derivative assets - Foreign currency forward contracts 860 (650) - 210Derivative assets - Swaps and swaptions - - - -Total 860 (650) - 210Derivative liabilities - Foreign currency forward contracts (2,839) 650 - (2,189)Derivative liabilities - Swaps and swaptions - - - -Total (2,839) 650 - (2,189)

CI Canadian Investment Fund
– 31 –Annual Financial Statements - March 31, 2020
Redeemable Unit Transactions (Note 4)for the years ended March 31
Number of redeemable units at the beginning of yearRedeemable units issued for cashRedeemable units issued for reinvested distributionsRedeemable units issued due to acquisition of assets from terminated fundsRedeemable units redeemedNumber of redeemable units at the end of year
Number of redeemable units at the beginning of yearRedeemable units issued for cashRedeemable units issued for reinvested distributionsRedeemable units issued due to acquisition of assets from terminated fundsRedeemable units redeemedNumber of redeemable units at the end of year
Number of redeemable units at the beginning of yearRedeemable units issued for cashRedeemable units issued for reinvested distributionsRedeemable units issued due to acquisition of assets from terminated fundsRedeemable units redeemedNumber of redeemable units at the end of year
Number of redeemable units at the beginning of yearRedeemable units issued for cashRedeemable units issued for reinvested distributionsRedeemable units issued due to acquisition of assets from terminated fundsRedeemable units redeemedNumber of redeemable units at the end of year
Number of redeemable units at the beginning of yearRedeemable units issued for cashRedeemable units issued for reinvested distributionsRedeemable units issued due to acquisition of assets from terminated fundsRedeemable units redeemedNumber of redeemable units at the end of year
Fund Specific Notes to Financial Statements
†A portion of brokerage commissions paid was used to cover research and market data services, termed soft dollar commissions. This amount has been estimated by the Manager of the Fund.The accompanying notes are an integral part of these financial statements.
Commissions (Note 2)for the years ended March 31 (in $000’s)
2020 2019Brokerage commissions 2,368 2,166Soft dollar commissions† 397 383
Class A 2020 2019 25,275,279 35,158,359 14,018,308 3,619,856 2,373,262 1,276,110 21,587,379 - (9,584,344) (14,779,046) 53,669,884 25,275,279
Class A1 2020 2019 32,181,246 15,777,282 892,996 21,240,242 - 1,244,596 - - (33,074,242) (6,080,874) - 32,181,246
Class A2 2020 2019 3,831,781 3,641,572 283,371 1,343,833 - 167,619 - - (4,115,152) (1,321,243) - 3,831,781
Class A3 2020 2019 1,110,096 963,367 132,396 437,794 - 52,352 - - (1,242,492) (343,417) - 1,110,096
Class A4 2020 2019 286,132 223,589 69,789 130,776 - 12,809 - - (355,921) (81,042) - 286,132
Class A5 2020 2019 43,859 41,958 14,956 24,333 - 2,562 - - (58,815) (24,994) - 43,859
Class E 2020 2019 2,895,359 3,147,511 70,487 56,750 172,077 139,548 952,591 - (854,746) (448,450) 3,235,768 2,895,359
Class EF 2020 2019 198,560 206,576 12,746 169 16,875 9,725 133,950 - (53,148) (17,910) 308,983 198,560
Class F 2020 2019 1,426,153 1,729,718 1,401,960 539,015 206,903 73,289 1,301,018 - (654,213) (915,869) 3,681,821 1,426,153
Class F1 2020 2019 1,737,838 653,807 81,503 1,362,231 - 91,996 - - (1,819,341) (370,196) - 1,737,838
Class F2 2020 2019 290,961 124,595 64,688 202,196 - 14,295 - - (355,649) (50,125) - 290,961
Class F3 2020 2019 63,435 69,171 38,128 26,340 - 4,039 - - (101,563) (36,115) - 63,435
Class F4 2020 2019 29,027 1,962 937 30,328 - 469 - - (29,964) (3,732) - 29,027
Class F5 2020 2019 1,279 1,204 - - - 77 - - (1,279) (2) - 1,279
Class I 2020 2019 11,455,826 11,459,260 59,572 40,827 177,385 835,195 3,472,530 - (11,667,735) (879,456) 3,497,578 11,455,826
Class Insight 2020 2019 22,594 31,314 93 20 1,741 1,387 - - (4,394) (10,127) 20,034 22,594
Class O 2020 2019 2,507,989 2,672,374 86,187 100,802 275,187 178,113 892,928 - (664,880) (443,300) 3,097,411 2,507,989
Class P 2020 2019 69,288 29,079 31,363 48,962 10,290 2,983 70,658 - (27,960) (11,736) 153,639 69,288
Class W 2020 2019 - - - - 28 - 1,169 - - - 1,197 -

CI Canadian Investment Fund
– 32 –Annual Financial Statements - March 31, 2020
The accompanying notes are an integral part of these financial statements.
Fund Specific Notes to Financial Statements
Management and Administration Fees (Note 5) as at March 31, 2020 (%)
Annual management
fee rate:
Annual administration
fee rate:
Class A 1.950 0.20Class A1^ 1.925 0.20Class A2^ 1.900 0.19Class A3^ 1.850 0.15Class A4^ 1.800 0.12Class A5^ 1.700 0.10Class E 1.950 0.15Class EF 0.950 0.15Class F 0.950 0.20Class F1^ 0.925 0.20Class F2^ 0.900 0.19Class F3^ 0.850 0.15Class F4^ 0.800 0.12Class F5^ 0.700 0.10Class I Paid directly by investor Paid directly by investorClass Insight 0.950 0.20Class O Paid directly by investor 0.15Class P Paid directly by investor 0.20Class W Paid directly by investor 0.14
^Effective after the close of business on August 2, 2019, the classes of the Fund that were eligible for CI Preferred
Pricing Program (CIPP) transitioned from a tiered pricing model to a fee distribution model. Please refer to most
recent simplified prospectus for further details.
Securities Lending (Note 6)as at March 31 (in $000’s)
2020 2019Loaned 91,848 101,088Collateral (non-cash) 93,685 103,109
Securities Lending Revenue Reconciliation (Note 6)for the years ended March 31 (in $000’s)
2020 2019Gross securities lending revenue 77 118Charges (11) (18)Securities lending revenue 66 100% of gross securities lending revenue 14.3 15.3
Loss Carry Forwards (Note 7)as at March 31 (in $000’s)
2020Capital loss carried forward: -Non-capital losses expiring:2029 -2030 -2031 -2032 -2033 -2034 -2035 -2036 -2037 -2038 -2039 -Total -

CI Canadian Investment Fund
– 33 –Annual Financial Statements - March 31, 2020
The accompanying notes are an integral part of these financial statements.
Currency Risk (cont’d)
as at March 31, 2019~
Currency
Financial Instruments Exposure Derivatives
Net Exposure
Net Assets
(%)(in $000’s) (in $000’s) (in $000’s)U.S. Dollar 480,915 (195,736) 285,179 17.0 British Pound 36,030 (17,954) 18,076 1.1 Euro 20,769 (10,433) 10,336 0.6 Total 537,714 (224,123) 313,591 18.7
~Includes monetary and non-monetary instruments.
As at March 31, 2020, had the Canadian dollar strengthened or weakened by 10% (March 31, 2019 - 10%) in relation to all other foreign currencies held in the Fund, with all other variables held constant, net assets attributable to holders of redeemable units of the Fund would have decreased or increased, respectively, by approximately $21,071,000 (March 31, 2019 - $31,359,000). In practice, actual results may differ from this analysis and the difference may be material.
Interest Rate RiskAs at March 31, 2020 and 2019, the Fund did not have a significant exposure to interest rate risk as substantially all of its assets were invested in equities and derivatives.
Fair Value Hierarchy
The tables below summarize the inputs used by the Fund in valuing the Fund’s investments and derivatives carried at fair value.
Long Positions at fair value as at March 31, 2020Level 1 Level 2 Level 3 Total
(in $000’s) (in $000’s) (in $000’s) (in $000’s)Equities 1,548,564 - - 1,548,564 Foreign currency forward contract(s), net - (54,205) - (54,205)Total 1,548,564 (54,205) - 1,494,359
Long Positions at fair value as at March 31, 2019Level 1 Level 2 Level 3 Total
(in $000’s) (in $000’s) (in $000’s) (in $000’s)Equities 1,417,081 - - 1,417,081 Foreign currency forward contract(s), net - (1,979) - (1,979)Total 1,417,081 (1,979) - 1,415,102
There were no transfers between Level 1, 2 and 3 during the years ended March 31, 2020 and 2019.
Financial Instruments Risks (Note 10)
Concentration RiskFor Concentration Risk as at March 31, 2020, refer to the Schedule of Investment Portfolio.
The Fund’s investments were concentrated in the following segments: as at March 31, 2019 Categories Net Assets (%)Financials 33.8 Other Net Assets (Liabilities) 15.5 Energy 11.7 Information Technology 10.1 Materials 6.5 Utilities 4.5 Consumer Discretionary 4.4 Industrials 4.3 Consumer Staples 3.7 Communication Services 2.7 Health Care 1.6 Real Estate 1.3 Foreign Currency Forward Contract(s) (0.1)
Credit RiskAs at March 31, 2020 and 2019, the Fund’s exposure to credit risk through derivative instruments was insignificant.
Other Price RiskAs at March 31, 2020 and 2019, the Fund was predominantly invested in Canadian equities and therefore was sensitive to changes in general economic conditions in Canada.
As at March 31, 2020, had the equities in the investment portfolio increased or decreased by 10% (March 31, 2019 - 10%), with all other variables held constant, net assets attributable to holders of redeemable units of the Fund would have increased or decreased, respectively, by approximately $154,856,000 (March 31, 2019 - $141,708,000). In practice, actual results may differ from this analysis and the difference may be material.
Currency RiskThe tables below summarize the Fund’s exposure to currency risk.
as at March 31, 2020~
Currency
Financial Instruments Exposure Derivatives
Net Exposure
Net Assets
(%)(in $000’s) (in $000’s) (in $000’s)U.S. Dollar 804,734 (594,020) 210,714 13.1 Total 804,734 (594,020) 210,714 13.1
Fund Specific Notes to Financial Statements

CI Canadian Small/Mid Cap Fund
– 34 –Annual Financial Statements - March 31, 2020
Statements of Financial Position as at March 31(in $000’s except for per unit amounts and units outstanding)
2020 2019
305,753 411,146 17,807 25,876
- - - - - - - - - - 880 861 43 49 - - - - 933 666 45 106 325,461 438,704
- - - -
- - - - - - - - - - 538 330 111 390 - - - - - - - - 649 720
324,812 437,984
Statements of Financial Position (cont’d)as at March 31(in $000’s except for per unit amounts and units outstanding)
Net assets attributable to holders of redeemable units
per class (Note 4):
Net assets attributable to holders of redeemable
units per unit: Number of redeemable
units outstanding:
2020 2019 2020 2019 2020 2019Class A 136,773 130,625 21.82 27.36 6,267,409 4,774,142Class A1 - 61,002 - 9.58 - 6,369,482Class A2 - 5,498 - 9.58 - 573,793Class A3 - 2,083 - 9.57 - 217,561Class E 7,455 11,163 8.33 10.43 894,843 1,070,215Class EF 24 62 8.46 10.49 2,851 5,885Class F 3,020 1,698 10.62 13.17 284,404 128,953Class F1 - 1,275 - 9.55 - 133,447Class F2 - 372 - 9.56 - 38,882Class F3 - 63 - 9.55 - 6,547Class I 171,236 214,147 11.06 13.68 15,483,411 15,649,396Class O 6,218 9,889 8.27 10.24 751,514 965,956Class P 78 107 7.71 9.53 10,141 11,268Class W 8 - 7.80 - 1,010 -
AssetsCurrent assetsInvestmentsCashUnrealized gain on futures and foreign currency forward contractsSwaps, swaptions and optionsDaily variation margin on derivative instrumentsFees rebate receivableCollateral on deposit for short saleDividends receivableInterest receivableReceivable for distribution from investmentsSecurities lending revenue receivable (Note 6)Receivable for investments soldReceivable for unit subscriptions
LiabilitiesCurrent liabilitiesInvestments sold shortBank overdraftUnrealized loss on futures and foreign currency forward contractsSwaps, swaptions and options Dividends payable on investments sold shortInterest payable on investments sold shortDaily variation margin on derivative instrumentsPayable for investments purchasedPayable for unit redemptionsDistributions payable to holders of redeemable units Management fees payableAdministration fees payableAccounts payable and accrued liabilities
Net assets attributable to holders of redeemable units
The accompanying notes are an integral part of these financial statements.
Financial Statements
CIG - 9023

CI Canadian Small/Mid Cap Fund
– 35 –Annual Financial Statements - March 31, 2020
Statements of Comprehensive Incomefor the years ended March 31(in $000’s except for per unit amounts and number of units)
2020 2019
7,549 8,077 990 645 21 - - - - -
- - - -
2,168 9,113
(80,134) (2,134) (69,406) 15,701 152 75 - - 258 403 52 10 462 488 (68,944) 16,189
4,036 4,506 418 467 687 773 - - - - - - - - - - 186 227 441 501 5,768 6,474
(74,712) 9,715
The accompanying notes are an integral part of these financial statements.
Financial Statements
Statements of Comprehensive Income (cont’d)for the years ended March 31(in $000’s except for per unit amounts and number of units)
Increase (decrease) in net assets attributable to
holders of redeemable units per class:
Increase (decrease) in net assets attributable to
holders of redeemable units per unit:
Weighted average number of units:
2020 2019 2020 2019 2020 2019Class A (36,146) 1,805 (6.09) 0.31 5,924,556 5,813,710Class A1 1,905 (148) 0.30 (0.03) 6,184,243 4,499,323Class A2 170 37 0.30 0.05 556,404 584,716Class A3 68 15 0.31 0.08 219,768 192,487Class E (1,821) 114 (1.88) 0.10 972,412 1,119,171Class EF (4) (1) (1.14) (0.27) 3,860 4,632Class F (802) 43 (3.55) 0.32 226,054 131,016Class F1 47 13 0.34 0.11 137,099 115,890Class F2 15 11 0.32 0.56 45,427 17,877Class F3 2 - 0.34 (0.08) 6,547 9,181Class I (36,747) 7,518 (2.39) 0.56 15,350,732 13,308,207Class O (1,379) 303 (1.62) 0.30 851,611 997,066Class P (18) 5 (1.77) 0.46 10,032 9,787Class W (2) - (2.11) - 1,006 -
Income Net gain (loss) on investments and derivatives Dividends Interest for distribution purposes Income distributions from investments Capital gain distributions from investments Derivative income (loss) Dividends expense on financial assets (liabilities) sold
short Interest expense on financial assets (liabilities) sold short Net realized gain (loss) on sale of investments and
derivatives Change in unrealized appreciation (depreciation) in value
of investments and derivativesTotal net gain (loss) on investments and derivativesOther income Foreign exchange gain (loss) on cash Commitment fee income Securities lending revenue (Note 6) Fees rebateTotal other incomeTotal incomeExpensesManagement fees (Note 5)Administration fees (Note 5)Commissions and other portfolio transaction costsIndependent review committee feesSecurities borrowing fees (Note 2)Margin feesService feesInterest expenseWithholding taxesHarmonized sales taxTotal expensesIncrease (decrease) in net assets attributable to holders of redeemable units

CI Canadian Small/Mid Cap Fund
– 36 –Annual Financial Statements - March 31, 2020
Statements of Changes in Net Assets Attributable to Holders of Redeemable Unitsfor the years ended March 31 (in $000’s)
Net assets attributable to holders of redeemable units at the beginning of yearIncrease (decrease) in net assets attributable to holders of redeemable unitsDistributions to holders of redeemable units From net investment income From net realized gains Return of capitalTotal distributions to holders of redeemable units
Redeemable unit transactions Proceeds from redeemable units issued Reinvestment of distributions to holders of redeemable units Redemption of redeemable unitsNet increase (decrease) from redeemable unit transactionsNet increase (decrease) in net assets attributable to holders of redeemable unitsNet assets attributable to holders of redeemable units at the end of year
The accompanying notes are an integral part of these financial statements.
Financial Statements
Class A 2020 2019 130,625 188,458 (36,146) 1,805
- (237) - (3,012) - - - (3,249)
74,653 10,246 - 3,229 (32,359) (69,864) 42,294 (56,389) 6,148 (57,833) 136,773 130,625
Class A1 2020 2019 61,002 28,680 1,905 (148)
- (96) - (1,224) - - - (1,320)
1,866 41,500 - 1,315 (64,773) (9,025) (62,907) 33,790 (61,002) 32,322 - 61,002
Class A2 2020 2019 5,498 5,591 170 37
- (10) - (122) - - - (132)
372 1,812 - 131 (6,040) (1,941) (5,668) 2 (5,498) (93) - 5,498
Class A3 2020 2019 2,083 1,608 68 15
- (3) - (43) - - - (46)
177 815 - 46 (2,328) (355) (2,151) 506 (2,083) 475 - 2,083
Class E 2020 2019 11,163 12,465 (1,821) 114
- (20) - (252) - - - (272)
150 216 - 272 (2,037) (1,632) (1,887) (1,144) (3,708) (1,302) 7,455 11,163
Class EF 2020 2019 62 31 (4) (1)
- - - (2) - - - (2)
7 35 - 1 (41) (2) (34) 34 (38) 31 24 62
Class F 2020 2019 1,698 1,792 (802) 43
- (4) - (50) - - - (54)
2,721 696 - 46 (597) (825) 2,124 (83) 1,322 (94) 3,020 1,698
Class F1 2020 2019 1,275 924 47 13
- (3) - (41) - - - (44)
64 504 - 43 (1,386) (165) (1,322) 382 (1,275) 351 - 1,275
Class F2 2020 2019 372 120 15 11
- - - (5) - - - (5)
85 241 - 5 (472) - (387) 246 (372) 252 - 372
Class F3 2020 2019 63 95 2 -
- - - (3) - - - (3)
- 4 - 3 (65) (36) (65) (29) (63) (32) - 63
Class I 2020 2019 214,147 180,863 (36,747) 7,518
(2,062) (586) (417) (7,427) - - (2,479) (8,013)
10,047 35,455 2,478 8,005 (16,210) (9,681) (3,685) 33,779 (42,911) 33,284 171,236 214,147
Class O 2020 2019 9,889 10,734 (1,379) 303
(69) (32) (14) (412) - - (83) (444)
113 214 82 444 (2,404) (1,362) (2,209) (704) (3,671) (845) 6,218 9,889

CI Canadian Small/Mid Cap Fund
– 37 –Annual Financial Statements - March 31, 2020
The accompanying notes are an integral part of these financial statements.
Financial Statements
Statements of Changes in Net Assets Attributable to Holders of Redeemable Units (cont’d)for the years ended March 31 (in $000’s)
Net assets attributable to holders of redeemable units at the beginning of yearIncrease (decrease) in net assets attributable to holders of redeemable unitsDistributions to holders of redeemable units From net investment income From net realized gains Return of capitalTotal distributions to holders of redeemable units
Redeemable unit transactions Proceeds from redeemable units issued Reinvestment of distributions to holders of redeemable units Redemption of redeemable unitsNet increase (decrease) from redeemable unit transactionsNet increase (decrease) in net assets attributable to holders of redeemable unitsNet assets attributable to holders of redeemable units at the end of year
Class P 2020 2019 107 91 (18) 5
(1) - - (4) - - (1) (4)
6 14 1 4 (17) (3) (10) 15 (29) 16 78 107
Class W 2020 2019 - - (2) -
- - - - - - - -
10 - - - - - 10 - 8 - 8 -
Total Fund 2020 2019 437,984 431,452 (74,712) 9,715
(2,132) (991) (431) (12,597) - - (2,563) (13,588)
90,271 91,752 2,561 13,544 (128,729) (94,891) (35,897) 10,405 (113,172) 6,532 324,812 437,984

CI Canadian Small/Mid Cap Fund
– 38 –Annual Financial Statements - March 31, 2020
Statements of Cash Flowsfor the years ended March 31 (in $000’s)
2020 2019
(74,712) 9,715
(2,168) (9,113) 25 (4) 687 773
80,134 2,134 1,319,065 1,313,024 (1,292,363) (1,309,619) - - (21) - - - (19) 65 6 (27) - - - - - - - - 30,634 6,948
(2) (44) 13,611 39,785 (52,287) (42,851) (38,678) (3,110)
(25) 4 (8,044) 3,838 25,876 22,034 17,807 25,876
7,377 7,027 996 613 - - - - - -
*Dividends and interest received as well as dividends and interest paid relate to operating activities of the Fund. The accompanying notes are an integral part of these financial statements.
Financial Statements
Cash flows from (used in) operating activitiesIncrease (decrease) in net assets attributable to holders of redeemable unitsAdjustments for: Net realized (gain) loss on sale of investments and derivatives Unrealized foreign exchange (gain) loss on cash Commissions and other portfolio transaction costs Change in unrealized (appreciation) depreciation in value of
investments and derivatives Proceeds from sale and maturity of investments and derivatives Purchase of investments and derivatives (Increase) decrease in collateral on deposit for short sale Non-cash distributions from investments Change in daily variation margin (Increase) decrease in dividends receivable (Increase) decrease in interest receivable (Increase) decrease in securities lending revenue receivable Increase (decrease) in management fees payable Increase (decrease) in administration fees payable Change in other accounts receivable and payableNet cash from (used in) operating activities
Cash flows from (used in) financing activitiesDistributions paid to holders of redeemable units, net of reinvested distributionsProceeds from issuance of redeemable unitsAmounts paid on redemption of redeemable unitsNet cash from (used in) financing activities Unrealized foreign exchange gain (loss) on cashNet increase (decrease) in cashCash (bank overdraft), beginning of yearCash (bank overdraft), end of year
Supplementary Information:Dividends received, net of withholding tax*Interest received, net of withholding tax*Dividends paid*Interest paid*Tax recoverable (paid)

CI Canadian Small/Mid Cap Fund
– 39 –Annual Financial Statements - March 31, 2020
REAL ESTATE (9.6%) 28,500 Americold Realty Trust 1,143,021 1,365,375 67,800 Automotive Properties Real Estate Investment Trust 795,357 500,364 105,757 BSR Real Estate Investment Trust 1,254,258 1,302,371 131,318 Choice Properties Real Estate Investment Trust 1,707,935 1,696,629 16,000 Colliers International Group Inc. 1,300,847 1,077,120 225,179 Cominar Real Estate Investment Trust 2,875,810 1,826,202 66,200 CT Real Estate Investment Trust 895,178 774,540 74,700 European Residential Real Estate Investment Trust 319,402 277,884 14,800 Granite Real Estate Investment Trust 681,096 860,324 2,500 Jones Lang LaSalle Inc. 489,335 355,298 36,000 Killam Apartment Real Estate Investment Trust 749,179 568,080 74,500 Minto Apartment Real Estate Investment Trust 1,200,483 1,452,750 23,326 Newcastle Investment Holdings Corp. - - 23,326 Newcastle Investment Inc., Restricted Shares - - 294,200 NorthWest Healthcare Properties REIT 3,294,452 2,841,972 34,700 Postal Realty Trust Inc. 792,887 772,598 8,800 SBA Communications Corp. 415,703 3,343,611 63,841 SmartCentres Real Estate Investment Trust 2,031,641 1,202,764 1,157,842 StorageVault Canada Inc. 2,736,068 3,346,163 12,700 Sun Communities Inc. 1,469,158 2,231,567 288,901 Tricon Capital Group Inc. 2,992,412 1,990,528 251,217 WPT Industrial Real Estate Investment Trust 3,929,188 3,249,242 31,073,410 31,035,382 MATERIALS (9.2%) 215,000 Adriatic Metals PLC 315,992 182,342 18,961 Agnico-Eagle Mines Ltd. 1,071,689 1,065,229 253,439 B2Gold Corp. 1,002,347 1,079,650 1,227,200 Champion Iron Ltd. 1,802,081 1,656,720 25,900 Constellium S.E. 424,737 189,913 13,600 Crown Holdings Inc. 1,328,010 1,110,923 144,000 Endeavour Mining Corp. 3,440,401 2,881,440 99,800 ERO Copper Corp. 1,124,452 1,054,886 77,619 Interfor Corp. 1,300,644 485,895 63,000 Intertape Polymer Group Inc. 960,149 632,520 176,300 K92 Mining Inc. 462,277 521,848 51,935 Labrador Iron Ore Royalty Corp. 718,111 873,027 18,100 Louisiana-Pacific Corp. 627,686 437,642 56,600 Lundin Gold Inc. 435,441 443,178 188,379 Lundin Mining Corp. 1,155,040 996,525 484,590 Major Drilling Group International Inc. 2,685,707 1,381,082 44,300 Norbord Inc. 1,542,740 737,595 96,461 Pan American Silver Corp. 2,094,567 1,953,335 138,200 Pan American Silver Corp., Rights (22Feb29) - 66,131 7,700 Reliance Steel & Aluminum Co. 1,038,871 949,211 1,116,500 Roxgold Inc. 1,143,707 915,530 437,100 SEMAFO Inc. 1,544,187 1,193,283 98,700 SilverCrest Metals Inc. 496,743 727,419 52,906 SSR Mining Inc. 1,083,575 849,141 41,800 Stella-Jones Inc. 1,468,182 1,281,588 240,400 Teranga Gold Corp. 1,263,209 1,661,164 365,700 Turquoise Hill Resources Ltd. 300,633 201,135 45,233 Wheaton Precious Metals Corp. 1,634,150 1,751,874 58,020 Winpak Ltd. 2,383,311 2,523,870 34,848,639 29,804,096
INDUSTRIALS (15.2%) 14,800 AECOM 861,142 621,761 47,130 AG Growth International Inc. 2,412,033 801,210 19,000 Allegion PLC 1,746,213 2,460,670 30,100 Andlauer Healthcare Group Inc. 502,733 686,280 42,447 Badger Daylighting Ltd. 1,684,323 966,518 43,870 Boyd Group Services Inc. 8,847,975 6,426,955 36,270 Brookfield Business Partners L.P., Units 1,709,836 1,290,849 72,707 Cargojet Inc. 3,603,396 7,352,859 3,900 CoStar Group Inc. 1,226,050 3,223,114 8,800 Dover Corp. 845,136 1,039,607 617,800 Drone Delivery Canada Corp. 581,552 432,460 224 Encompass Compliance Corp. 31 - 39,200 Evoqua Water Technologies Corp. 1,025,558 618,457 7,700 Generac Holdings Inc. 725,106 1,009,682 102,400 Hardwoods Distribution Inc. 1,180,056 992,256 8,200 HEICO Corp. 669,801 861,050 10,560 L3Harris Technologies Inc. 1,377,236 2,676,970 124,550 Morneau Shepell Inc. 3,429,548 3,535,974 19,350 MSC Industrial Direct Co., Inc. 2,144,379 1,497,009 321,526 Mullen Group Ltd. 4,926,713 1,318,257 445,910 People Corp. 3,389,731 3,656,462 119,681 Savaria Corp. 1,873,117 1,272,209 84,520 Stantec Inc. 3,031,492 3,042,720 27,645 Toromont Industries Ltd. 1,846,131 1,704,314 82,090 Transcontinental Inc., Class A 1,338,782 1,025,304 101,650 Westshore Terminals Investment Corp. 1,884,703 1,329,582 52,862,773 49,842,529 FINANCIALS (13.5%) 1,400,000 12997975 Ontario Inc., Private Placement 14 14 1,428 Alleghany Corp. 889,346 1,110,095 191,742 Canadian Western Bank 5,239,826 3,714,043 46,635 CI Financial Corp. 1,157,909 651,491 14,100 E*TRADE Financial Corp. 668,315 681,058 14,273 eHealth Inc. 1,540,912 2,828,767 6,330 E-L Financial Corp., Ltd. 4,275,343 3,785,340 974,687 Element Fleet Management Corp. 8,077,517 8,733,196 12,700 First American Financial Corp. 996,105 758,036 39,400 First Horizon National Corp. 850,174 446,940 17,700 First Republic Bank 1,552,150 2,049,676 381,200 GMP Capital Inc. 940,644 495,560 18,700 Goosehead Insurance Inc. 1,190,121 1,174,589 17,000 Hilltop Holdings Inc. 502,419 361,758 7,400 Houlihan Lokey Inc. 521,995 542,817 116,554 iA Financial Corp., Inc. 5,702,125 5,156,349 50,440 IGM Financial Inc. 1,710,806 1,177,774 6,610 Intact Financial Corp. 787,278 803,974 25,500 LPL Financial Holdings Inc. 2,356,910 1,953,422 101,200 Subversive Capital Acquistion Corp. 1,307,511 1,380,136 16,800 Tradeweb Markets Inc. 961,674 994,007 80,400 Trisura Group Ltd. 2,481,493 3,294,792 422,600 Uranium Participation Corp. 1,920,367 1,648,140 45,630,954 43,741,974
Percentages shown in brackets relate investments at fair value to net assets attributable to holders of redeemable units of the Fund.
Schedule of Investment Portfolio as at March 31, 2020
No. of Shares/Par Value Description
AverageCost ($)
FairValue ($)
No. of Shares/Par Value Description
AverageCost ($)
FairValue ($)

CI Canadian Small/Mid Cap Fund
– 40 –Annual Financial Statements - March 31, 2020
Percentages shown in brackets relate investments at fair value to net assets attributable to holders of redeemable units of the Fund.
Schedule of Investment Portfolio as at March 31, 2020 (cont’d)
UTILITIES (6.8%) 104,921 Algonquin Power & Utilities Corp. 1,293,636 1,988,253 319,646 AltaGas Ltd. 9,853,950 4,075,486 100,885 ATCO Ltd., Class I 4,700,591 3,931,488 87,500 Boralex Inc., Class A 1,658,951 2,187,500 167,479 Innergex Renewable Energy Inc. 2,540,776 3,207,223 19,700 NRG Energy Inc. 988,391 755,805 639,637 Superior Plus Corp. 7,427,615 5,283,402 101,100 TransAlta Corp. 974,367 744,096 29,438,277 22,173,253 ENERGY (6.2%) 674,500 Advantage Oil & Gas Ltd. 1,685,597 964,535 563,090 ARC Resources Ltd. 4,962,837 2,280,514 93,200 Enerflex Ltd. 524,620 543,356 161,382 Freehold Royalties Ltd. 1,329,335 474,463 93,997 Gibson Energy Inc. 2,145,870 1,527,451 154,100 North American Construction Group Ltd. 2,310,888 1,092,569 251,484 Parex Resources Inc. 4,479,453 2,992,660 272,133 Parkland Fuel Corp. 6,949,022 6,751,620 190,225 Pason Systems Inc. 3,058,568 1,188,906 169,045 PrairieSky Royalty Ltd. 3,605,151 1,256,004 596,149 Secure Energy Services Inc. 4,889,031 554,419 227,710 ShawCor Ltd. 5,252,188 405,324 41,192,560 20,031,821 HEALTH CARE (5.2%) 231,100 Akumin Inc. 1,123,905 585,450 5,400 AMN Healthcare Services Inc. 482,392 439,354 3,500 Bio-Techne Corp. 941,785 934,049 28,140 Capital Diagnostic Corp. - - 22,700 Elanco Animal Health Inc. 915,258 715,315 143,100 Extendicare Inc. 1,203,076 827,118 12,400 Haemonetics Corp. 957,611 1,739,243 4,800 Hill-Rom Holdings Inc. 673,436 679,605 44,700 HLS Therapeutics Inc. 939,343 771,075 2,200 Insulet Corp. 420,330 512,992 101,000 Kneat.com Inc. 206,006 187,860 276,520 Knight Therapeutics Inc. 2,266,200 1,714,424 7,000 Nevro Corp. 1,011,234 984,983 90,000 OrganiGram Holdings Inc. 342,800 255,600 5,800 Penumbra Inc. 955,781 1,316,924 2,700 Quidel Corp. 354,635 371,676 9,100 Schrodinger Inc. 523,548 552,253 80,751 Sienna Senior Living Inc. 1,408,266 988,392 13,800 Syneos Health Inc. 1,188,664 765,620 4,000 Teladoc Health Inc. 422,736 872,644 679,590 WELL Health Technologies Corp. 1,105,078 1,019,385 10,100 Zymeworks Inc. 221,203 504,197 17,663,287 16,738,159
INFORMATION TECHNOLOGY (9.0%) 1,724 Alliance Media Holdings Inc. 482 46 8,900 Anaplan Inc. 576,027 379,033 10,800 Avalara Inc. 1,044,733 1,133,914 8,300 Broadridge Financial Solutions Inc. 612,375 1,107,749 27,800 Cadence Design Systems Inc. 1,359,461 2,583,863 16,200 Celestica Inc. 193,014 80,028 15,711 Ceridian HCM Holding Inc. 740,787 1,107,131 8,700 Cognex Corp. 601,188 516,958 11,900 Crowdstrike Holdings Inc. 849,068 932,532 144,335 Docebo Inc. 2,225,602 1,999,040 15,800 Dynatrace Inc. 718,012 530,128 16,883 Everbridge Inc. 1,812,982 2,527,234 9,200 Jabil Circuit Inc. 517,613 318,264 55,558 Kinaxis Inc. 3,844,540 6,049,711 17,300 Lattice Semiconductor Corp. 473,760 433,882 80,416 Lightspeed POS Inc. 2,138,937 1,531,121 7,400 Logitech International S.A. 379,039 447,106 3,700 NICE-Systems Ltd., ADR 671,130 747,572 17,600 Nortel Networks Corp. - 11 9,300 Q2 Holdings Inc. 987,690 773,026 20,206 Rapid7 Inc. 1,423,576 1,232,215 4,400 RingCentral Inc. 926,478 1,312,265 4,400 Sylogist Ltd. 32,594 37,400 51,378 The Descartes Systems Group Inc. 1,421,083 2,487,209 36,200 Viavi Solutions Inc. 505,412 571,126 18,100 Vishay Intertechnology Inc. 532,934 367,080 24,588,517 29,205,644 CONSUMER DISCRETIONARY (7.2%) 179,735 Aritzia Inc. 2,992,822 2,212,538 124,800 AutoCanada Inc. 1,406,783 667,680 8,900 Bright Horizons Family Solutions Inc. 1,018,973 1,277,638 4,200 Burlington Stores Inc. 657,495 936,670 39,713 Canada Goose Holdings Inc. 2,099,119 1,117,524 3,600 Deckers Outdoor Corp. 825,178 678,930 5,500 Five Below Inc. 745,446 544,791 28,900 Great Canadian Gaming Corp. 796,443 721,922 18,600 IAA Inc. 1,013,766 784,282 210,280 Leon’s Furniture Ltd. 3,502,450 2,836,677 41,300 Linamar Corp. 2,405,262 1,203,069 14,300 LKQ Corp. 673,745 412,781 6,600 Lululemon Athletica Inc. (USD) 918,537 1,760,700 276,898 Park Lawn Corp. 6,117,478 4,568,817 106,700 Real Matters Inc. 1,208,288 1,493,800 734,472 Richtree Inc., Class B 3,672 7 27,425 Spin Master Corp. 1,053,881 371,334 6,300 Tempur-Pedic International Inc. 535,324 387,560 12,210 Williams-Sonoma Inc. 729,386 730,679 5,300 Wingstop Inc. 515,995 594,500 94,268 Zungui Haixi Corp. 9 9 29,220,052 23,301,908
No. of Shares/Par Value Description
AverageCost ($)
FairValue ($)
No. of Shares/Par Value Description
AverageCost ($)
FairValue ($)

CI Canadian Small/Mid Cap Fund
– 41 –Annual Financial Statements - March 31, 2020
Percentages shown in brackets relate investments at fair value to net assets attributable to holders of redeemable units of the Fund.
Schedule of Investment Portfolio as at March 31, 2020 (cont’d)
CONSUMER STAPLES (2.9%) 808,500 Concert Industries Ltd. 4,042 81 110,560 Empire Co., Ltd., Class A 2,867,198 3,043,717 14,800 Grocery Outlet Holding Corp. 634,485 715,286 7,700 Lamb Weston Holdings Inc. 625,145 618,792 18,615 Metro Inc., Class A 896,241 1,059,380 16,200 Pilgrim’s Pride Corp., 585,610 413,134 10,802 Post Holdings Inc. 1,276,483 1,261,371 55,100 Primo Water Corp. 1,061,948 703,627 23,800 Simply Good Foods Co. 845,048 645,135 356,700 Waterloo Brewing Ltd. 1,167,191 980,925 9,963,391 9,441,448 COMMUNICATION SERVICES (2.9%) 24,600 Cogeco Communications Inc. 1,641,804 2,348,562 11,400 Match Group Inc. 761,557 1,059,570 50,379 Quebecor Inc., Class B 1,186,748 1,567,291 15,700 Take-Two Interactive Software Inc. 679,635 2,620,828 23,800 United States Cellular Corp. 1,086,431 981,101 81,600 Zynga Inc. 646,589 786,680 6,002,764 9,364,032 FUND(S) (1.7%) 661,365 CI North American Small/Mid Cap Equity Private Pool (Class I) 7,020,632 5,585,161 EXCHANGE-TRADED FUND(S) (0.5%) 43,300 VanEck Vectors Junior Gold Miners ETF 1,659,669 1,712,426 WARRANTS (0.0%) 17,750 CannTrust Holdings Inc., Warrants (05Jun20) - - 18,200 Drone Delivery Canada Corp., Warrants (25Mar21) 2,803 1,365 29,564 Kew Media Group Inc., Warrants (25Jul21) 2,956 148 363,800 Oncolytics Biotech Inc., Warrants (01Jun22) 44,642 36,380 89,000 Patriot One Technologies Inc., Warrants (21Nov20) - 1,780 180,050 Sherritt International Corp., Warrants (25Jan21) 16,124 900 53,700 Subversive Capital Acquistion Corp., Warrants (26Aug24) 14,016 49,125 49,550 Valens Groworks Corp., Warrants (09Apr21) - 15,856 80,541 105,554 SHORT-TERM INVESTMENTS (4.2%) 500,000 Canadian Treasury Bill 0.27027% 10/15/2020 499,270 499,270 6,000,000 Canadian Treasury Bill 0.32045% 05/28/2020 5,996,220 5,996,220 300,000 Canadian Treasury Bill 1.64406% 07/09/2020 297,753 297,753 3,000,000 Canadian Treasury Bill 1.68491% 04/02/2020 2,976,840 2,976,840 3,900,000 Storm King Funding 1.09803% 04/01/2020 3,899,883 3,899,883 13,669,966 13,669,966
Commissions and other portfolio transaction costs (407,469)
Total Investment Portfolio (94.1%) 344,507,963 305,753,353 Other Net Assets (Liabilities) (5.9%) 19,058,307 Net Assets Attributable to Holders of Redeemable Units (100.0%) 324,811,660
No. of Shares/Par Value Description
AverageCost ($)
FairValue ($)

CI Canadian Small/Mid Cap Fund
– 42 –Annual Financial Statements - March 31, 2020
The accompanying notes are an integral part of these financial statements.
Fund Specific Notes to Financial Statements
Interest in Unconsolidated Structured Entities (Note 2)
The following tables present the Fund’s interest in Unconsolidated Structured Entities.
as at March 31, 2020 Fair Value of
the Underlying Fund(s) / ETF(s)Fair Value of the Fund’s Investment
in the Underlying Fund(s) / ETF(s)Ownership in the
Underlying Fund(s) / ETF(s)
Unconsolidated Structured Entities (in $000’s) (in $000’s) (%)CI North American Small/Mid Cap Equity Private Pool 5,657 5,585 98.7VanEck Vectors Junior Gold Miners ETF 4,685,668 1,712 -
as at March 31, 2019 Fair Value of
the Underlying Fund(s) / ETF(s)Fair Value of the Fund’s Investment
in the Underlying Fund(s) / ETF(s)Ownership in the
Underlying Fund(s) / ETF(s)
Unconsolidated Structured Entities (in $000’s) (in $000’s) (%)VanEck Vectors Junior Gold Miners ETF 5,206,267 4,791 0.1

CI Canadian Small/Mid Cap Fund
– 43 –Annual Financial Statements - March 31, 2020
Redeemable Unit Transactions (Note 4)for the years ended March 31
Number of redeemable units at the beginning of yearRedeemable units issued for cashRedeemable units issued for reinvested distributionsRedeemable units redeemedNumber of redeemable units at the end of year
Number of redeemable units at the beginning of yearRedeemable units issued for cashRedeemable units issued for reinvested distributionsRedeemable units redeemedNumber of redeemable units at the end of year
Number of redeemable units at the beginning of yearRedeemable units issued for cashRedeemable units issued for reinvested distributionsRedeemable units redeemedNumber of redeemable units at the end of year
Number of redeemable units at the beginning of yearRedeemable units issued for cashRedeemable units issued for reinvested distributionsRedeemable units redeemedNumber of redeemable units at the end of year
Fund Specific Notes to Financial Statements
†A portion of brokerage commissions paid was used to cover research and market data services, termed soft dollar commissions. This amount has been estimated by the Manager of the Fund.The accompanying notes are an integral part of these financial statements.
Commissions (Note 2)for the years ended March 31 (in $000’s)
2020 2019Brokerage commissions 682 770Soft dollar commissions† 74 102
Class A 2020 2019 4,774,142 6,764,374 2,649,327 389,490 - 131,389 (1,156,060) (2,511,111) 6,267,409 4,774,142
Class A1 2020 2019 6,369,482 2,941,742 191,585 4,213,658 - 152,905 (6,561,067) (938,823) - 6,369,482
Class A2 2020 2019 573,793 573,108 37,920 187,049 - 15,245 (611,713) (201,609) - 573,793
Class A3 2020 2019 217,561 164,954 18,218 83,483 - 5,401 (235,779) (36,277) - 217,561
Class E 2020 2019 1,070,215 1,173,791 14,801 21,567 - 29,029 (190,173) (154,172) 894,843 1,070,215
Class EF 2020 2019 5,885 2,912 653 3,012 - 108 (3,687) (147) 2,851 5,885
Class F 2020 2019 128,953 133,593 199,011 52,784 - 3,925 (43,560) (61,349) 284,404 128,953
Class F1 2020 2019 133,447 94,974 6,679 51,171 - 5,073 (140,126) (17,771) - 133,447
Class F2 2020 2019 38,882 12,369 8,754 25,923 - 620 (47,636) (30) - 38,882
Class F3 2020 2019 6,547 9,796 - 364 - 355 (6,547) (3,968) - 6,547
Class I 2020 2019 15,649,396 12,964,357 804,232 2,715,791 171,624 655,924 (1,141,841) (686,676) 15,483,411 15,649,396
Class O 2020 2019 965,956 1,028,717 10,353 19,970 7,567 48,656 (232,362) (131,387) 751,514 965,956
Class P 2020 2019 11,268 9,391 565 1,675 89 459 (1,781) (257) 10,141 11,268
Class W 2020 2019 - - 1,000 - 10 - - - 1,010 -

CI Canadian Small/Mid Cap Fund
– 44 –Annual Financial Statements - March 31, 2020
The accompanying notes are an integral part of these financial statements.
Fund Specific Notes to Financial Statements
Management and Administration Fees (Note 5) as at March 31, 2020 (%)
Annual management
fee rate:
Annual administration
fee rate:
Class A 2.000 0.20Class A1^ 1.925 0.20Class A2^ 1.900 0.19Class A3^ 1.850 0.15Class E 1.950 0.15Class EF 0.950 0.15Class F 1.000 0.20Class F1^ 0.925 0.20Class F2^ 0.900 0.19Class F3^ 0.850 0.15Class I Paid directly by investor Paid directly by investorClass O Paid directly by investor 0.15Class P Paid directly by investor 0.20Class W Paid directly by investor 0.14
^Effective after the close of business on August 2, 2019, the classes of the Fund that were eligible for CI Preferred
Pricing Program (CIPP) transitioned from a tiered pricing model to a fee distribution model. Please refer to most
recent simplified prospectus for further details.
Securities Lending (Note 6)as at March 31 (in $000’s)
2020 2019Loaned 75,901 77,529Collateral (non-cash) 77,419 79,080
Securities Lending Revenue Reconciliation (Note 6)for the years ended March 31 (in $000’s)
2020 2019Gross securities lending revenue 304 474Charges (46) (71)Securities lending revenue 258 403% of gross securities lending revenue 15.1 15.0
Related Party Investments (Note 9)as at March 31 (in $000’s)
Investments 2020CI Financial Corp. 651CI North American Small/Mid Cap Equity Private Pool (Class I) 5,585
Investments 2019CI Financial Corp. 447
Loss Carry Forwards (Note 7)as at March 31 (in $000’s)
2020Capital loss carried forward: -Non-capital losses expiring:2029 -2030 -2031 -2032 -2033 -2034 -2035 -2036 -2037 -2038 -2039 -Total -

CI Canadian Small/Mid Cap Fund
– 45 –Annual Financial Statements - March 31, 2020
The accompanying notes are an integral part of these financial statements.
Currency RiskThe tables below summarize the Fund’s exposure to currency risk.
as at March 31, 2020~
Currency
Financial Instruments Exposure Derivatives
Net Exposure
Net Assets
(%)(in $000’s) (in $000’s) (in $000’s)U.S. Dollar 96,174 - 96,174 29.6 Australian Dollar 182 - 182 0.1 Euro 1 - 1 0.0 Total 96,357 - 96,357 29.7
as at March 31, 2019~
Currency
Financial Instruments Exposure Derivatives
Net Exposure
Net Assets
(%)(in $000’s) (in $000’s) (in $000’s)U.S. Dollar 126,344 - 126,344 28.8 Australian Dollar 848 - 848 0.2 Total 127,192 - 127,192 29.0
~Includes monetary and non-monetary instruments.
As at March 31, 2020, had the Canadian dollar strengthened or weakened by 10% (March 31, 2019 - 10%) in relation to all other foreign currencies held in the Fund, with all other variables held constant, net assets attributable to holders of redeemable units of the Fund would have decreased or increased, respectively, by approximately $9,636,000 (March 31, 2019 - $12,719,000). In practice, actual results may differ from this analysis and the difference may be material.
Interest Rate RiskAs at March 31, 2020 and 2019, the Fund did not have a significant exposure to interest rate risk as substantially all of its assets were invested in equities, derivatives and short-term investments. Short-term investments exposure to interest rate risk is insignificant due to their short-term to maturity.
Fair Value Hierarchy
The tables below summarize the inputs used by the Fund in valuing the Fund’s investments and derivatives carried at fair value.
Long Positions at fair value as at March 31, 2020Level 1 Level 2 Level 3 Total
(in $000’s) (in $000’s) (in $000’s) (in $000’s)Equities 282,576 2,104 - 284,680 Fund(s) 5,585 - - 5,585 Exchange-Traded Fund(s) 1,712 - - 1,712 Short-term investments - 13,670 - 13,670 Warrants 68 38 - 106 Total 289,941 15,812 - 305,753
There were no transfers between Level 1, 2 and 3 during the year ended March 31, 2020.
Financial Instruments Risks (Note 10)
Concentration RiskFor Concentration Risk as at March 31, 2020, refer to the Schedule of Investment Portfolio.
The Fund’s investments were concentrated in the following segments: as at March 31, 2019 Categories Net Assets (%)Energy 16.1 Industrials 13.7 Financials 11.4 Real Estate 10.5 Consumer Discretionary 8.8 Materials 7.1 Information Technology 6.9 Other Net Assets (Liabilities) 6.1 Health Care 5.2 Consumer Staples 4.3 Utilities 3.9 Short-Term Investments 2.5 Communication Services 2.3 Exchange-Traded Fund(s) 1.1 Private Placements 0.1 Warrants 0.0
Credit RiskThe Fund was invested in fixed income securities, preferred securities and derivative instruments, if any, with the following credit ratings, as per the tables below.
as at March 31, 2020 Credit Rating^* Net Assets (%)AAA/Aaa/A++ 4.2 Total 4.2
as at March 31, 2019 Credit Rating^* Net Assets (%)AAA/Aaa/A++ 2.5 Total 2.5
^Credit ratings are obtained from S&P Global Ratings, where available, otherwise ratings are obtained from: Moody’s
Investors Service or Dominion Bond Rating Service, respectively.
*Refer to Note 10 for Credit Rating Chart reference.
Other Price RiskAs at March 31, 2020 and 2019, the Fund was predominantly invested in Canadian equities and therefore was sensitive to changes in general economic conditions in Canada.
As at March 31, 2020, had the equities in the investment portfolio increased or decreased by 10% (March 31, 2019 - 10%), with all other variables held constant, net assets attributable to holders of redeemable units of the Fund would have increased or decreased, respectively, by approximately $29,208,000 (March 31, 2019 - $40,007,000). In practice, actual results may differ from this analysis and the difference may be material.
Fund Specific Notes to Financial Statements

CI Canadian Small/Mid Cap Fund
– 46 –Annual Financial Statements - March 31, 2020
The accompanying notes are an integral part of these financial statements.
Fair Value Hierarchy (cont’d)
Long Positions at fair value as at March 31, 2019Level 1 Level 2 Level 3 Total
(in $000’s) (in $000’s) (in $000’s) (in $000’s)Equities 395,074 - - 395,074 Exchange-Traded Fund(s) 4,791 - - 4,791 Short-term investments - 11,078 - 11,078 Warrants 203 - - 203 Bonds - - - - Total 400,068 11,078 - 411,146
There were no transfers between Level 1 and 2 and Level 1 and 3 during the year ended March 31, 2019.
Fund Specific Notes to Financial Statements
Level 3 ReconciliationThe table below summarizes the movement in financial instruments classified as Level 3.
for the year ended March 31, 2019 Balance at
Mar. 31, 2018 Purchases SalesTransfers
InTransfers
(Out)Realized Gain
(Loss)Unrealized Gain
(Loss)*Balance at
Mar. 31, 2019(in $000’s) (in $000’s) (in $000’s) (in $000’s) (in $000’s) (in $000’s) (in $000’s) (in $000’s)
Long Positions/Assets:Equities 1,217 - - - (1,217) - - - Total 1,217 - - - (1,217) - - -
During the year ended March 31, 2019, investments with a fair value of $1,217,000 were transferred out of Level 3 into Level 2 as observable market inputs became available for these investments.
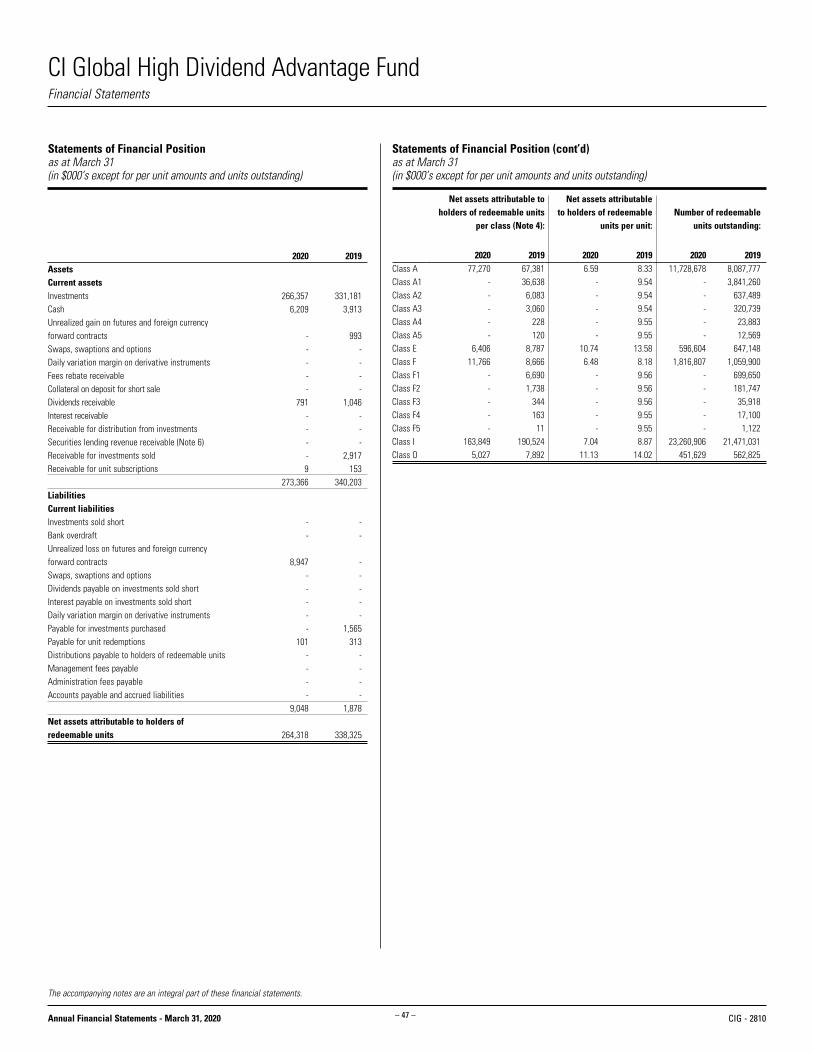
CI Global High Dividend Advantage Fund
– 47 –Annual Financial Statements - March 31, 2020
Statements of Financial Position as at March 31(in $000’s except for per unit amounts and units outstanding)
2020 2019
266,357 331,181 6,209 3,913
- 993 - - - - - - - - 791 1,046 - - - - - - - 2,917 9 153 273,366 340,203
- - - -
8,947 - - - - - - - - - - 1,565 101 313 - - - - - - - - 9,048 1,878
264,318 338,325
Statements of Financial Position (cont’d)as at March 31(in $000’s except for per unit amounts and units outstanding)
Net assets attributable to holders of redeemable units
per class (Note 4):
Net assets attributable to holders of redeemable
units per unit: Number of redeemable
units outstanding:
2020 2019 2020 2019 2020 2019Class A 77,270 67,381 6.59 8.33 11,728,678 8,087,777Class A1 - 36,638 - 9.54 - 3,841,260Class A2 - 6,083 - 9.54 - 637,489Class A3 - 3,060 - 9.54 - 320,739Class A4 - 228 - 9.55 - 23,883Class A5 - 120 - 9.55 - 12,569Class E 6,406 8,787 10.74 13.58 596,604 647,148Class F 11,766 8,666 6.48 8.18 1,816,807 1,059,900Class F1 - 6,690 - 9.56 - 699,650Class F2 - 1,738 - 9.56 - 181,747Class F3 - 344 - 9.56 - 35,918Class F4 - 163 - 9.55 - 17,100Class F5 - 11 - 9.55 - 1,122Class I 163,849 190,524 7.04 8.87 23,260,906 21,471,031Class O 5,027 7,892 11.13 14.02 451,629 562,825
AssetsCurrent assetsInvestmentsCashUnrealized gain on futures and foreign currency forward contractsSwaps, swaptions and optionsDaily variation margin on derivative instrumentsFees rebate receivableCollateral on deposit for short saleDividends receivableInterest receivableReceivable for distribution from investmentsSecurities lending revenue receivable (Note 6)Receivable for investments soldReceivable for unit subscriptions
LiabilitiesCurrent liabilitiesInvestments sold shortBank overdraftUnrealized loss on futures and foreign currency forward contractsSwaps, swaptions and options Dividends payable on investments sold shortInterest payable on investments sold shortDaily variation margin on derivative instrumentsPayable for investments purchasedPayable for unit redemptionsDistributions payable to holders of redeemable units Management fees payableAdministration fees payableAccounts payable and accrued liabilities
Net assets attributable to holders of redeemable units
The accompanying notes are an integral part of these financial statements.
Financial Statements
CIG - 2810
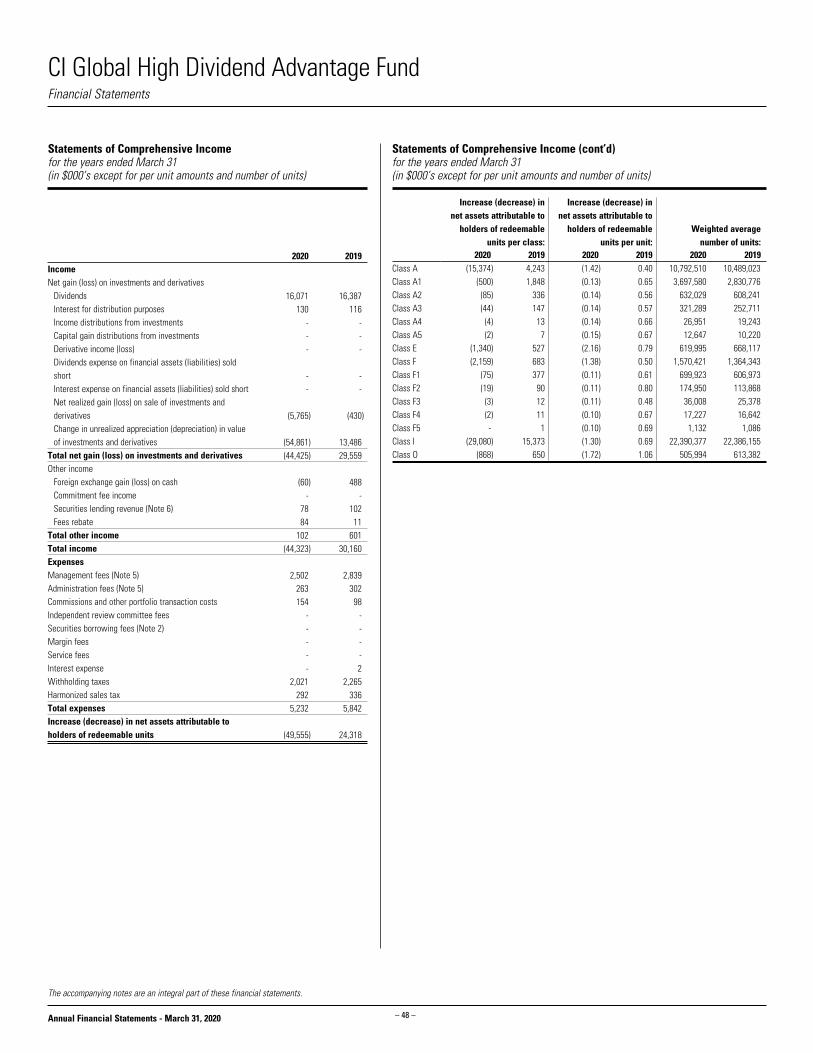
CI Global High Dividend Advantage Fund
– 48 –Annual Financial Statements - March 31, 2020
Statements of Comprehensive Incomefor the years ended March 31(in $000’s except for per unit amounts and number of units)
2020 2019
16,071 16,387 130 116 - - - - - -
- - - -
(5,765) (430)
(54,861) 13,486 (44,425) 29,559 (60) 488 - - 78 102 84 11 102 601 (44,323) 30,160
2,502 2,839 263 302 154 98 - - - - - - - - - 2 2,021 2,265 292 336 5,232 5,842
(49,555) 24,318
The accompanying notes are an integral part of these financial statements.
Financial Statements
Statements of Comprehensive Income (cont’d)for the years ended March 31(in $000’s except for per unit amounts and number of units)
Increase (decrease) in net assets attributable to
holders of redeemable units per class:
Increase (decrease) in net assets attributable to
holders of redeemable units per unit:
Weighted average number of units:
2020 2019 2020 2019 2020 2019Class A (15,374) 4,243 (1.42) 0.40 10,792,510 10,489,023Class A1 (500) 1,848 (0.13) 0.65 3,697,580 2,830,776Class A2 (85) 336 (0.14) 0.56 632,029 608,241Class A3 (44) 147 (0.14) 0.57 321,289 252,711Class A4 (4) 13 (0.14) 0.66 26,951 19,243Class A5 (2) 7 (0.15) 0.67 12,647 10,220Class E (1,340) 527 (2.16) 0.79 619,995 668,117Class F (2,159) 683 (1.38) 0.50 1,570,421 1,364,343Class F1 (75) 377 (0.11) 0.61 699,923 606,973Class F2 (19) 90 (0.11) 0.80 174,950 113,868Class F3 (3) 12 (0.11) 0.48 36,008 25,378Class F4 (2) 11 (0.10) 0.67 17,227 16,642Class F5 - 1 (0.10) 0.69 1,132 1,086Class I (29,080) 15,373 (1.30) 0.69 22,390,377 22,386,155Class O (868) 650 (1.72) 1.06 505,994 613,382
Income Net gain (loss) on investments and derivatives Dividends Interest for distribution purposes Income distributions from investments Capital gain distributions from investments Derivative income (loss) Dividends expense on financial assets (liabilities) sold
short Interest expense on financial assets (liabilities) sold short Net realized gain (loss) on sale of investments and
derivatives Change in unrealized appreciation (depreciation) in value
of investments and derivativesTotal net gain (loss) on investments and derivativesOther income Foreign exchange gain (loss) on cash Commitment fee income Securities lending revenue (Note 6) Fees rebateTotal other incomeTotal incomeExpensesManagement fees (Note 5)Administration fees (Note 5)Commissions and other portfolio transaction costsIndependent review committee feesSecurities borrowing fees (Note 2)Margin feesService feesInterest expenseWithholding taxesHarmonized sales taxTotal expensesIncrease (decrease) in net assets attributable to holders of redeemable units

CI Global High Dividend Advantage Fund
– 49 –Annual Financial Statements - March 31, 2020
Statements of Changes in Net Assets Attributable to Holders of Redeemable Unitsfor the years ended March 31 (in $000’s)
Net assets attributable to holders of redeemable units at the beginning of yearIncrease (decrease) in net assets attributable to holders of redeemable unitsDistributions to holders of redeemable units From net investment income From net realized gains Return of capitalTotal distributions to holders of redeemable units
Redeemable unit transactions Proceeds from redeemable units issued Reinvestment of distributions to holders of redeemable units Redemption of redeemable unitsNet increase (decrease) from redeemable unit transactionsNet increase (decrease) in net assets attributable to holders of redeemable unitsNet assets attributable to holders of redeemable units at the end of year
Net assets attributable to holders of redeemable units at the beginning of yearIncrease (decrease) in net assets attributable to holders of redeemable unitsDistributions to holders of redeemable units From net investment income From net realized gains Return of capitalTotal distributions to holders of redeemable units
Redeemable unit transactions Proceeds from redeemable units issued Reinvestment of distributions to holders of redeemable units Redemption of redeemable unitsNet increase (decrease) from redeemable unit transactionsNet increase (decrease) in net assets attributable to holders of redeemable unitsNet assets attributable to holders of redeemable units at the end of year
Net assets attributable to holders of redeemable units at the beginning of yearIncrease (decrease) in net assets attributable to holders of redeemable unitsDistributions to holders of redeemable units From net investment income From net realized gains Return of capitalTotal distributions to holders of redeemable units
Redeemable unit transactions Proceeds from redeemable units issued Reinvestment of distributions to holders of redeemable units Redemption of redeemable unitsNet increase (decrease) from redeemable unit transactionsNet increase (decrease) in net assets attributable to holders of redeemable unitsNet assets attributable to holders of redeemable units at the end of year
The accompanying notes are an integral part of these financial statements.
Financial Statements
Class A 2020 2019 67,381 104,474 (15,374) 4,243
(1,212) (1,500) - (808) (2,674) (1,435) (3,886) (3,743)
49,679 10,139 3,442 3,252 (23,972) (50,984) 29,149 (37,593) 9,889 (37,093) 77,270 67,381
Class A1 2020 2019 36,638 19,450 (500) 1,848
(441) (424) - (302) (109) (535) (550) (1,261)
904 24,581 503 1,159 (36,995) (9,139) (35,588) 16,601 (36,638) 17,188 - 36,638
Class A2 2020 2019 6,083 5,178 (85) 336
(75) (102) - (60) (19) (107) (94) (269)
221 2,330 89 257 (6,214) (1,749) (5,904) 838 (6,083) 905 - 6,083
Class A3 2020 2019 3,060 2,142 (44) 147
(39) (45) - (26) (10) (46) (49) (117)
104 1,330 49 115 (3,120) (557) (2,967) 888 (3,060) 918 - 3,060
Class A4 2020 2019 228 158 (4) 13
(3) (3) - (2) (1) (4) (4) (9)
55 61 4 9 (279) (4) (220) 66 (228) 70 - 228
Class A5 2020 2019 120 78 (2) 7
(2) (2) - (1) - (2) (2) (5)
12 38 2 5 (130) (3) (116) 40 (120) 42 - 120
Class E 2020 2019 8,787 9,157 (1,340) 527
(154) (164) - (91) (232) (161) (386) (416)
12 65 365 385 (1,032) (931) (655) (481) (2,381) (370) 6,406 8,787
Class F 2020 2019 8,666 13,376 (2,159) 683
(275) (295) - (104) (405) (185) (680) (584)
9,740 1,725 445 354 (4,246) (6,888) 5,939 (4,809) 3,100 (4,710) 11,766 8,666
Class F1 2020 2019 6,690 4,442 (75) 377
(106) (154) - (63) (20) (113) (126) (330)
629 4,226 91 232 (7,209) (2,257) (6,489) 2,201 (6,690) 2,248 - 6,690
Class F2 2020 2019 1,738 566 (19) 90
(26) (27) - (12) (5) (22) (31) (61)
43 1,496 16 25 (1,747) (378) (1,688) 1,143 (1,738) 1,172 - 1,738
Class F3 2020 2019 344 133 (3) 12
(6) (6) - (3) (1) (5) (7) (14)
- 316 2 5 (336) (108) (334) 213 (344) 211 - 344
Class F4 2020 2019 163 153 (2) 11
(3) (5) - (2) (1) (3) (4) (10)
- - 3 9 (160) - (157) 9 (163) 10 - 163

CI Global High Dividend Advantage Fund
– 50 –Annual Financial Statements - March 31, 2020
The accompanying notes are an integral part of these financial statements.
Financial Statements
Statements of Changes in Net Assets Attributable to Holders of Redeemable Units (cont’d)for the years ended March 31 (in $000’s)
Net assets attributable to holders of redeemable units at the beginning of yearIncrease (decrease) in net assets attributable to holders of redeemable unitsDistributions to holders of redeemable units From net investment income From net realized gains Return of capitalTotal distributions to holders of redeemable units
Redeemable unit transactions Proceeds from redeemable units issued Reinvestment of distributions to holders of redeemable units Redemption of redeemable unitsNet increase (decrease) from redeemable unit transactionsNet increase (decrease) in net assets attributable to holders of redeemable unitsNet assets attributable to holders of redeemable units at the end of year
Class F5 2020 2019 11 10 - 1
- - - - - - - -
- - - - (11) - (11) - (11) 1 - 11
Class I 2020 2019 190,524 219,947 (29,080) 15,373
(7,661) (7,790) - (1,814) (5,228) (3,220) (12,889) (12,824)
3,700 - 12,889 12,823 (1,295) (44,795) 15,294 (31,972) (26,675) (29,423) 163,849 190,524
Class O 2020 2019 7,892 9,156 (868) 650
(270) (328) - (77) (176) (137) (446) (542)
138 172 415 503 (2,104) (2,047) (1,551) (1,372) (2,865) (1,264) 5,027 7,892
Total Fund 2020 2019 338,325 388,420 (49,555) 24,318
(10,273) (10,845) - (3,365) (8,881) (5,975) (19,154) (20,185)
65,237 46,479 18,315 19,133 (88,850) (119,840) (5,298) (54,228) (74,007) (50,095) 264,318 338,325

CI Global High Dividend Advantage Fund
– 51 –Annual Financial Statements - March 31, 2020
Statements of Cash Flowsfor the years ended March 31 (in $000’s)
2020 2019
(49,555) 24,318
5,765 430 141 (34) 154 98
54,861 (13,486) 127,376 114,849 (112,040) (52,859) - - - - - - 255 (143) - - - - - - - - - - 26,957 73,173
(839) (1,052) 4,329 1,215 (28,010) (74,747) (24,520) (74,584)
(141) 34 2,437 (1,411) 3,913 5,290 6,209 3,913
13,196 13,981 130 116 - - - 2 - -
*Dividends and interest received as well as dividends and interest paid relate to operating activities of the Fund. The accompanying notes are an integral part of these financial statements.
Financial Statements
Cash flows from (used in) operating activitiesIncrease (decrease) in net assets attributable to holders of redeemable unitsAdjustments for: Net realized (gain) loss on sale of investments and derivatives Unrealized foreign exchange (gain) loss on cash Commissions and other portfolio transaction costs Change in unrealized (appreciation) depreciation in value of
investments and derivatives Proceeds from sale and maturity of investments and derivatives Purchase of investments and derivatives (Increase) decrease in collateral on deposit for short sale Non-cash distributions from investments Change in daily variation margin (Increase) decrease in dividends receivable (Increase) decrease in interest receivable (Increase) decrease in securities lending revenue receivable Increase (decrease) in management fees payable Increase (decrease) in administration fees payable Change in other accounts receivable and payableNet cash from (used in) operating activities
Cash flows from (used in) financing activitiesDistributions paid to holders of redeemable units, net of reinvested distributionsProceeds from issuance of redeemable unitsAmounts paid on redemption of redeemable unitsNet cash from (used in) financing activities Unrealized foreign exchange gain (loss) on cashNet increase (decrease) in cashCash (bank overdraft), beginning of yearCash (bank overdraft), end of year
Supplementary Information:Dividends received, net of withholding tax*Interest received, net of withholding tax*Dividends paid*Interest paid*Tax recoverable (paid)

CI Global High Dividend Advantage Fund
– 52 –Annual Financial Statements - March 31, 2020
U.S.A. (54.8%) (cont’d) 14,989 WEC Energy Group Inc. 922,158 1,859,148 31,010 Wells Fargo & Co. 1,992,471 1,252,568 36,878 Welltower Inc. 3,297,725 2,376,078 149,001,192 145,197,355 U.K. (10.1%) 43,540 AstraZeneca PLC, ADR 1,856,940 2,736,684 461,281 BAE Systems PLC 4,180,194 4,202,616 65,192 British American Tobacco PLC 4,177,945 3,140,480 23,396 British American Tobacco PLC, ADR 2,003,193 1,125,792 32,005 Coca-Cola European Partners PLC 2,230,605 1,690,495 127,927 GlaxoSmithKline PLC 3,380,910 3,383,064 2,805,470 Lloyds Banking Group PLC 3,298,915 1,567,493 283,769 National Grid PLC 5,129,480 4,690,094 56,771 Unilever PLC 3,247,612 4,039,778 29,505,794 26,576,496 FRANCE (6.9%) 149,040 AXA S.A. 5,062,345 3,649,487 18,320 Compagnie Generale des Etablissements Michelin S.C.A., Class B 2,638,090 2,303,212 25,066 Danone S.A. 2,146,973 2,279,717 30,759 Sanofi S.A. 3,478,424 3,823,169 46,471 SCOR S.E. 1,977,069 1,447,264 57,023 Total S.A. 3,774,419 3,129,915 13,958 Vinci S.A. 954,961 1,632,287 20,032,281 18,265,051 CANADA (6.1%) 65,826 BCE Inc. 3,598,307 3,800,135 43,468 Fortis Inc. 2,290,925 2,359,008 51,692 Nutrien Ltd. (USD) 3,082,118 2,469,180 51,313 Pembina Pipeline Corp. 2,265,063 1,354,663 31,089 Rogers Communications Inc., Class B 1,428,379 1,826,168 25,383 Royal Bank of Canada 2,381,138 2,212,636 76,344 TELUS Corp. 1,714,463 1,698,654 20,675 TELUS Corp. (Non-CAD) 905,442 460,019 17,665,835 16,180,463 GERMANY (5.8%) 16,813 Allianz S.E. 4,005,925 4,090,861 38,239 BASF S.E. 3,972,196 2,558,815 59,799 Deutsche Post AG 2,338,608 2,297,786 80,043 Deutsche Telekom AG 1,742,190 1,466,636 10,786 Muenchener Rueckversicherungs-Gesellschaft AG in Muenchen AG, Registered Shares 2,638,629 3,079,755 14,434 Siemens AG, Registered Shares 2,029,209 1,734,292 16,726,757 15,228,145 ITALY (3.7%) 104,292 Assicurazioni Generali SpA 2,460,603 2,007,357 706,172 Snam SpA 4,386,746 4,604,422 351,896 Terna Rete Elettrica Nazionale SpA 2,106,575 3,149,141 8,953,924 9,760,920 SWITZERLAND (3.6%) 20,166 Nestlé S.A., Registered Shares 2,147,438 2,931,773 33,865 Novartis AG, Registered Shares 3,609,516 3,953,045 5,472 Roche Holding AG 1,819,800 2,512,180 7,576,754 9,396,998
U.S.A. (54.8%) 36,121 AbbVie Inc. 3,605,275 3,873,248 70,109 Altria Group Inc. 4,667,688 3,815,624 17,923 Ameren Corp. 936,242 1,837,125 24,945 American Electric Power Co., Inc. 2,454,821 2,807,906 8,799 Amgen Inc. 2,400,706 2,510,550 96,946 AT&T Inc. 4,163,194 3,977,279 2,904 BlackRock Inc. (USD) 1,390,002 1,798,197 4,907 Broadcom Inc. 1,759,830 1,637,439 125,272 CenterPoint Energy Inc. 4,549,511 2,723,956 13,958 Chevron Corp. 2,101,330 1,423,440 59,333 Cisco Systems Inc. 2,531,173 3,282,592 6,061 CME Group Inc. 1,720,699 1,474,966 32,516 Coca-Cola Co. 1,861,388 2,025,014 32,754 Comcast Corp., Class A 1,861,087 1,584,849 50,361 Dominion Resources Inc. 5,053,962 5,116,688 44,474 Dow Inc. 3,112,321 1,830,211 43,699 Duke Energy Corp. 4,295,784 4,974,280 29,582 Emerson Electric Co. 2,286,332 1,983,846 24,198 Entergy Corp. 2,568,435 3,200,267 115,298 Enterprise Products Partners L.P. 4,341,984 2,320,467 25,775 Exxon Mobil Corp. 2,710,122 1,377,390 64,495 FirstEnergy Corp. 3,070,813 3,637,165 91,999 Hanesbrands Inc. 2,078,762 1,019,003 5,868 Home Depot Inc. 1,703,038 1,541,968 32,992 Intel Corp. 1,679,955 2,512,951 23,383 International Business Machines Corp. 4,217,844 3,650,622 83,580 Iron Mountain Inc. 3,667,055 2,799,606 18,585 Johnson & Johnson 2,861,321 3,429,906 16,515 Kimberly-Clark Corp. 2,385,982 2,972,110 11,420 KLA-Tencor Corp. 2,047,551 2,310,262 39,177 Las Vegas Sands Corp. 3,573,718 2,341,699 31,485 Leggett & Platt Inc. 1,855,546 1,182,244 4,868 Lockheed Martin Corp. 1,353,596 2,322,222 38,777 Magellan Midstream Partners L.P. 3,260,798 1,991,433 5,693 McDonald’s Corp. 800,976 1,324,839 37,989 Merck & Co., Inc. 3,427,763 4,113,653 51,947 MetLife Inc. 3,090,479 2,234,979 24,170 Microsoft Corp. 3,310,294 5,364,799 113,728 People’s United Financial Inc. 2,141,546 1,768,672 13,958 PepsiCo Inc. 1,692,903 2,359,303 103,244 Pfizer Inc. 4,643,780 4,742,775 40,368 Philip Morris International Inc. 4,388,494 4,145,144 21,610 Phillips 66 2,557,110 1,631,707 8,882 PNC Financial Services Group Inc. 1,851,941 1,196,551 81,688 PPL Corp. 3,288,968 2,837,403 14,355 Procter & Gamble Co. 1,419,369 2,222,355 15,465 Target Corp. 1,525,896 2,023,533 21,413 Texas Instruments Inc. 1,651,410 3,011,556 39,337 Truist Financial Corp. 2,657,213 1,707,392 12,372 United Parcel Service Inc., Class B 1,674,954 1,626,662 5,313 UnitedHealth Group Inc. 1,636,774 1,864,743 82,235 Verizon Communications Inc. 5,133,694 6,218,578 9,120 Watsco Inc. 1,767,409 2,028,392
Percentages shown in brackets relate investments at fair value to net assets attributable to holders of redeemable units of the Fund.
Schedule of Investment Portfolio as at March 31, 2020
No. of Shares/Par Value Description
AverageCost ($)
FairValue ($)
No. of Shares/Par Value Description
AverageCost ($)
FairValue ($)

CI Global High Dividend Advantage Fund
– 53 –Annual Financial Statements - March 31, 2020
‡Credit ratings are obtained from S&P Global Ratings, where available, otherwise ratings are obtained from: Moody’s Investors Service or Dominion Bond Rating Service.Percentages shown in brackets relate investments at fair value to net assets attributable to holders of redeemable units of the Fund.
Schedule of Investment Portfolio as at March 31, 2020 (cont’d)
BERMUDA (0.5%) 42,518 Lazard Ltd. 2,336,166 1,409,827
Commissions and other portfolio transaction costs (190,782)
Total Investment Portfolio before Derivative Instruments (100.8%) 276,927,665 266,357,233
Foreign Currency Forward Contract(s) (-3.4%) (see Schedule A) (8,947,348)
Total Investment Portfolio (97.4%) 276,927,665 257,409,885 Other Net Assets (Liabilities) (2.6%) 6,907,902 Net Assets Attributable to Holders of Redeemable Units (100.0%) 264,317,787
JAPAN (2.5%) 103,200 Takeda Pharmaceutical Co., Ltd. 5,346,810 4,465,298 31,400 Tokio Marine Holdings Inc. 2,092,495 2,033,013 7,439,305 6,498,311 IRELAND (1.0%) 24,823 Eaton Corp. PLC 1,945,668 2,714,170 SOUTH KOREA (1.0%) 1,842 Samsung Electronics Co., Ltd., GDR 2,473,862 2,574,284 AUSTRALIA (0.9%) 25,220 Commonwealth Bank of Australia 2,047,706 1,349,263 14,037 Macquarie Group Ltd. 1,696,963 1,041,672 3,744,669 2,390,935 DENMARK (0.9%) 27,892 Novo Nordisk AS 2,153,603 2,370,667 NORWAY (0.9%) 191,611 Orkla ASA 1,849,392 2,302,741 TAIWAN (0.8%) 29,498 Taiwan Semiconductor Manufacturing Co., Ltd., ADR 985,909 1,984,025 NETHERLANDS (0.7%) 26,049 Lyondellbasell Industries N.V. 3,184,027 1,819,504 SINGAPORE (0.6%) 185,400 Singapore Exchange Ltd. 1,543,309 1,687,341
Schedule AForeign Currency Forward Contract(s) (-3.4%)
Contract(s) CounterpartyCredit Rating of
the Counterparty‡Settlement
DateContract(s)
Rate Pay ReceiveUnrealized
Gain (Loss) ($)1 National Bank of Canada A-1 April 3, 2020 0.77 (82,200,000) US $ 106,734,563 Canadian $ (8,947,348) Total Foreign Currency Forward Contract(s) Value (8,947,348)
No. of Shares/Par Value Description
AverageCost ($)
FairValue ($)
No. of Shares/Par Value Description
AverageCost ($)
FairValue ($)

CI Global High Dividend Advantage Fund
– 54 –Annual Financial Statements - March 31, 2020
The accompanying notes are an integral part of these financial statements.
Fund Specific Notes to Financial Statements
Offsetting of Financial Instruments (Note 2)
The following tables show the net impact on the Fund’s Statements of Financial Position if all rights to offset were exercised.
as at March 31, 2020Amounts Eligible for Offset
Gross Assets/(Liabilities)
FinancialInstruments
CollateralReceived/(Paid)
NetExposure
(in $000’s) (in $000’s) (in $000’s) (in $000’s)Derivative assets - Foreign currency forward contracts - - - -Derivative assets - Swaps and swaptions - - - -Total - - - -Derivative liabilities - Foreign currency forward contracts (8,947) - - (8,947)Derivative liabilities - Swaps and swaptions - - - -Total (8,947) - - (8,947)
as at March 31, 2019Amounts Eligible for Offset
Gross Assets/(Liabilities)
FinancialInstruments
CollateralReceived/(Paid)
NetExposure
(in $000’s) (in $000’s) (in $000’s) (in $000’s)Derivative assets - Foreign currency forward contracts 993 - - 993Derivative assets - Swaps and swaptions - - - -Total 993 - - 993Derivative liabilities - Foreign currency forward contracts - - - -Derivative liabilities - Swaps and swaptions - - - -Total - - - -
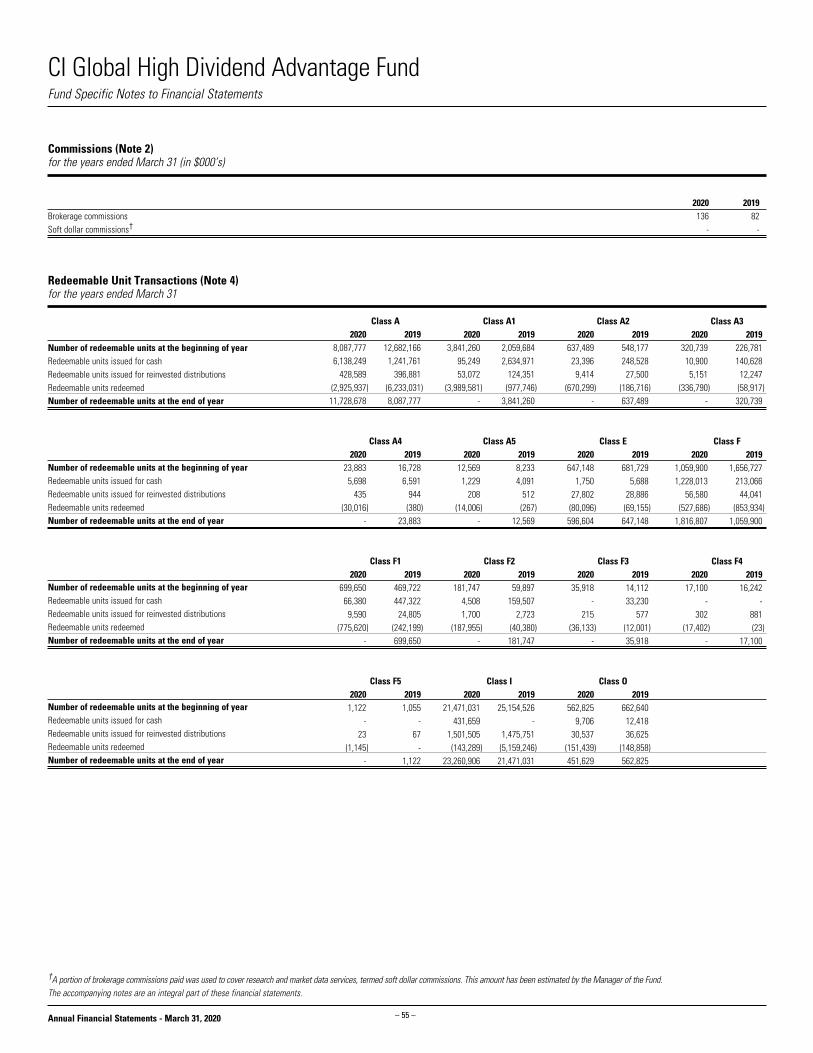
CI Global High Dividend Advantage Fund
– 55 –Annual Financial Statements - March 31, 2020
Redeemable Unit Transactions (Note 4)for the years ended March 31
Number of redeemable units at the beginning of yearRedeemable units issued for cashRedeemable units issued for reinvested distributionsRedeemable units redeemedNumber of redeemable units at the end of year
Number of redeemable units at the beginning of yearRedeemable units issued for cashRedeemable units issued for reinvested distributionsRedeemable units redeemedNumber of redeemable units at the end of year
Number of redeemable units at the beginning of yearRedeemable units issued for cashRedeemable units issued for reinvested distributionsRedeemable units redeemedNumber of redeemable units at the end of year
Number of redeemable units at the beginning of yearRedeemable units issued for cashRedeemable units issued for reinvested distributionsRedeemable units redeemedNumber of redeemable units at the end of year
Fund Specific Notes to Financial Statements
†A portion of brokerage commissions paid was used to cover research and market data services, termed soft dollar commissions. This amount has been estimated by the Manager of the Fund.The accompanying notes are an integral part of these financial statements.
Commissions (Note 2)for the years ended March 31 (in $000’s)
2020 2019Brokerage commissions 136 82Soft dollar commissions† - -
Class A 2020 2019 8,087,777 12,682,166 6,138,249 1,241,761 428,589 396,881 (2,925,937) (6,233,031) 11,728,678 8,087,777
Class A1 2020 2019 3,841,260 2,059,684 95,249 2,634,971 53,072 124,351 (3,989,581) (977,746) - 3,841,260
Class A2 2020 2019 637,489 548,177 23,396 248,528 9,414 27,500 (670,299) (186,716) - 637,489
Class A3 2020 2019 320,739 226,781 10,900 140,628 5,151 12,247 (336,790) (58,917) - 320,739
Class A4 2020 2019 23,883 16,728 5,698 6,591 435 944 (30,016) (380) - 23,883
Class A5 2020 2019 12,569 8,233 1,229 4,091 208 512 (14,006) (267) - 12,569
Class E 2020 2019 647,148 681,729 1,750 5,688 27,802 28,886 (80,096) (69,155) 596,604 647,148
Class F 2020 2019 1,059,900 1,656,727 1,228,013 213,066 56,580 44,041 (527,686) (853,934) 1,816,807 1,059,900
Class F1 2020 2019 699,650 469,722 66,380 447,322 9,590 24,805 (775,620) (242,199) - 699,650
Class F2 2020 2019 181,747 59,897 4,508 159,507 1,700 2,723 (187,955) (40,380) - 181,747
Class F3 2020 2019 35,918 14,112 - 33,230 215 577 (36,133) (12,001) - 35,918
Class F4 2020 2019 17,100 16,242 - - 302 881 (17,402) (23) - 17,100
Class F5 2020 2019 1,122 1,055 - - 23 67 (1,145) - - 1,122
Class I 2020 2019 21,471,031 25,154,526 431,659 - 1,501,505 1,475,751 (143,289) (5,159,246) 23,260,906 21,471,031
Class O 2020 2019 562,825 662,640 9,706 12,418 30,537 36,625 (151,439) (148,858) 451,629 562,825

CI Global High Dividend Advantage Fund
– 56 –Annual Financial Statements - March 31, 2020
The accompanying notes are an integral part of these financial statements.
Fund Specific Notes to Financial Statements
Management and Administration Fees (Note 5) as at March 31, 2020 (%)
Annual management
fee rate:
Annual administration
fee rate:
Class A 2.100 0.20Class A1^ 1.925 0.20Class A2^ 1.900 0.19Class A3^ 1.850 0.15Class A4^ 1.800 0.12Class A5^ 1.700 0.10Class E 1.950 0.15Class F 1.100 0.20Class F1^ 0.925 0.20Class F2^ 0.900 0.19Class F3^ 0.850 0.15Class F4^ 0.800 0.12Class F5^ 0.700 0.10Class I Paid directly by investor Paid directly by investorClass O Paid directly by investor 0.15
^Effective after the close of business on August 2, 2019, the classes of the Fund that were eligible for CI Preferred
Pricing Program (CIPP) transitioned from a tiered pricing model to a fee distribution model. Please refer to most
recent simplified prospectus for further details.
Securities Lending (Note 6)as at March 31 (in $000’s)
2020 2019Loaned 64,963 62,139Collateral (non-cash) 66,262 63,382
Securities Lending Revenue Reconciliation (Note 6)for the years ended March 31 (in $000’s)
2020 2019Gross securities lending revenue 92 120Charges (14) (18)Securities lending revenue 78 102% of gross securities lending revenue 15.2 15.0
Loss Carry Forwards (Note 7)as at March 31 (in $000’s)
2020Capital loss carried forward: 29,108Non-capital losses expiring:2029 -2030 -2031 -2032 -2033 -2034 -2035 -2036 -2037 -2038 -2039 -Total -

CI Global High Dividend Advantage Fund
– 57 –Annual Financial Statements - March 31, 2020
The accompanying notes are an integral part of these financial statements.
Currency RiskThe tables below summarize the Fund’s exposure to currency risk.
as at March 31, 2020~
Currency
Financial Instruments Exposure Derivatives
Net Exposure
Net Assets
(%)(in $000’s) (in $000’s) (in $000’s)U.S. Dollar 168,661 (115,688) 52,973 20.0 Euro 43,431 - 43,431 16.4 British Pound 21,126 - 21,126 8.0 Swiss Franc 9,397 - 9,397 3.6 Japanese Yen 6,634 - 6,634 2.5 Australian Dollar 2,435 - 2,435 0.9 Danish Krone 2,394 - 2,394 0.9 Norwegian Krone 2,303 - 2,303 0.9 Singapore Dollar 1,687 - 1,687 0.6 Total 258,068 (115,688) 142,380 53.8
as at March 31, 2019~
Currency
Financial Instruments Exposure Derivatives
Net Exposure
Net Assets
(%)(in $000’s) (in $000’s) (in $000’s)U.S. Dollar 188,731 (89,920) 98,811 29.2 Euro 65,985 - 65,985 19.5 British Pound 37,446 - 37,446 11.1 Swiss Franc 10,954 - 10,954 3.2 Australian Dollar 6,079 - 6,079 1.8 Singapore Dollar 3,394 - 3,394 1.0 Norwegian Krone 2,591 - 2,591 0.8 Swedish Krona 2,091 - 2,091 0.6 Japanese Yen 1,835 - 1,835 0.5 Total 319,106 (89,920) 229,186 67.7
~Includes monetary and non-monetary instruments.
As at March 31, 2020, had the Canadian dollar strengthened or weakened by 10% (March 31, 2019 - 10%) in relation to all other foreign currencies held in the Fund, with all other variables held constant, net assets attributable to holders of redeemable units of the Fund would have decreased or increased, respectively, by approximately $14,238,000 (March 31, 2019 - $22,919,000). In practice, actual results may differ from this analysis and the difference may be material.
Interest Rate RiskAs at March 31, 2020 and 2019, the Fund did not have a significant exposure to interest rate risk as substantially all of its assets were invested in equities and derivatives.
Financial Instruments Risks (Note 10)
Concentration RiskFor Concentration Risk as at March 31, 2020, refer to the Schedule of Investment Portfolio.
The Fund’s investments were concentrated in the following segments:
as at March 31, 2019 Categories Net Assets (%)U.S.A. 47.1 U.K. 14.3 France 7.5 Germany 7.1 Canada 6.1 Italy 3.7 Switzerland 3.2 Australia 1.8 Other Net Assets (Liabilities) 1.8 Spain 1.3 Ireland 1.2 Singapore 1.0 Norway 0.8 Netherlands 0.6 Sweden 0.6 Taiwan 0.6 South Korea 0.5 Japan 0.5 Foreign Currency Forward Contract(s) 0.3
Credit RiskAs at March 31, 2020 and 2019, the Fund’s exposure to credit risk through derivative instruments was insignificant.
Other Price RiskAs at March 31, 2020 and 2019, the Fund was predominantly invested in foreign equities and therefore was sensitive to changes in general economic conditions across the world.
As at March 31, 2020, had the equities in the investment portfolio increased or decreased by 10% (March 31, 2019 - 10%), with all other variables held constant, net assets attributable to holders of redeemable units of the Fund would have increased or decreased, respectively, by approximately $26,636,000 (March 31, 2019 - $33,118,000). In practice, actual results may differ from this analysis and the difference may be material.
Fund Specific Notes to Financial Statements

CI Global High Dividend Advantage Fund
– 58 –Annual Financial Statements - March 31, 2020
The accompanying notes are an integral part of these financial statements.
Fair Value Hierarchy
The tables below summarize the inputs used by the Fund in valuing the Fund’s investments and derivatives carried at fair value.
Long Positions at fair value as at March 31, 2020Level 1 Level 2 Level 3 Total
(in $000’s) (in $000’s) (in $000’s) (in $000’s)Equities 257,476 8,881 - 266,357 Foreign currency forward contract(s), net - (8,947) - (8,947)Total 257,476 (66) - 257,410
Long Positions at fair value as at March 31, 2019Level 1 Level 2 Level 3 Total
(in $000’s) (in $000’s) (in $000’s) (in $000’s)Equities 330,158 1,023 - 331,181 Foreign currency forward contract(s), net - 993 - 993Total 330,158 2,016 - 332,174
There were no transfers between Level 1, 2 and 3 during the years ended March 31, 2020 and 2019.
Fund Specific Notes to Financial Statements

– 59 –
CI Global Stock Selection Fund (formerly Harbour Global Analyst Fund)
Annual Financial Statements - March 31, 2020
Statements of Financial Position as at March 31(in $000’s except for per unit amounts and units outstanding)
2020 2019 1,077 1,142 - 30
- - - - - - - - - - 1 1 - - - - - - - - - - 1,078 1,173
- - 3 -
- - - - - - - - - - - - 1 15 - - - - - - - - 4 15
1,074 1,158
Statements of Financial Position (cont’d)as at March 31(in $000’s except for per unit amounts and units outstanding)
Net assets attributable to holders of redeemable units
per class (Note 4):
Net assets attributable to holders of redeemable
units per unit: Number of redeemable
units outstanding:
2020 2019 2020 2019 2020 2019Class I 1,074 1,158 8.81 10.70 121,828 108,280Assets
Current assetsInvestmentsCashUnrealized gain on futures and foreign currency forward contractsSwaps, swaptions and optionsDaily variation margin on derivative instrumentsFees rebate receivableCollateral on deposit for short saleDividends receivableInterest receivableReceivable for distribution from investmentsSecurities lending revenue receivable (Note 6)Receivable for investments soldReceivable for unit subscriptions
LiabilitiesCurrent liabilitiesInvestments sold shortBank overdraftUnrealized loss on futures and foreign currency forward contractsSwaps, swaptions and options Dividends payable on investments sold shortInterest payable on investments sold shortDaily variation margin on derivative instrumentsPayable for investments purchasedPayable for unit redemptionsDistributions payable to holders of redeemable units Management fees payableAdministration fees payableAccounts payable and accrued liabilities
Net assets attributable to holders of redeemable units
The accompanying notes are an integral part of these financial statements.
Financial Statements
CIG - 5341

– 60 –
CI Global Stock Selection Fund (formerly Harbour Global Analyst Fund)
Annual Financial Statements - March 31, 2020
Statements of Comprehensive Incomefor the years ended March 31(in $000’s except for per unit amounts and number of units)
2020 2019
26 26 - 1 - - - - - -
- - - -
90 34
(165) 27 (49) 88 (3) - - - - - - - (3) - (52) 88
- - - - 6 2 - - - - - - - - - - 3 3 - - 9 5
(61) 83
The accompanying notes are an integral part of these financial statements.
Financial Statements
Statements of Comprehensive Income (cont’d)for the years ended March 31(in $000’s except for per unit amounts and number of units)
Increase (decrease) in net assets attributable to
holders of redeemable units per class:
Increase (decrease) in net assets attributable to
holders of redeemable units per unit:
Weighted average number of units:
2020 2019 2020 2019 2020 2019Class I (61) 83 (0.54) 0.78 111,238 107,377Income
Net gain (loss) on investments and derivatives Dividends Interest for distribution purposes Income distributions from investments Capital gain distributions from investments Derivative income (loss) Dividends expense on financial assets (liabilities) sold
short Interest expense on financial assets (liabilities) sold short Net realized gain (loss) on sale of investments and
derivatives Change in unrealized appreciation (depreciation) in value
of investments and derivativesTotal net gain (loss) on investments and derivativesOther income Foreign exchange gain (loss) on cash Commitment fee income Securities lending revenue (Note 6) Fees rebateTotal other incomeTotal incomeExpensesManagement fees (Note 5)Administration fees (Note 5)Commissions and other portfolio transaction costsIndependent review committee feesSecurities borrowing fees (Note 2)Margin feesService feesInterest expenseWithholding taxesHarmonized sales taxTotal expensesIncrease (decrease) in net assets attributable to holders of redeemable units

– 61 –
CI Global Stock Selection Fund (formerly Harbour Global Analyst Fund)
Annual Financial Statements - March 31, 2020
Statements of Changes in Net Assets Attributable to Holders of Redeemable Unitsfor the years ended March 31 (in $000’s)
Net assets attributable to holders of redeemable units at the beginning of yearIncrease (decrease) in net assets attributable to holders of redeemable unitsDistributions to holders of redeemable units From net investment income From net realized gains Return of capitalTotal distributions to holders of redeemable units
Redeemable unit transactions Proceeds from redeemable units issued Reinvestment of distributions to holders of redeemable units Redemption of redeemable unitsNet increase (decrease) from redeemable unit transactionsNet increase (decrease) in net assets attributable to holders of redeemable unitsNet assets attributable to holders of redeemable units at the end of year
The accompanying notes are an integral part of these financial statements.
Financial Statements
Class I 2020 2019 1,158 1,106 (61) 83
(23) (22) (152) (14) - - (175) (36)
- 27 175 36 (23) (58) 152 5 (84) 52 1,074 1,158

– 62 –
CI Global Stock Selection Fund (formerly Harbour Global Analyst Fund)
Annual Financial Statements - March 31, 2020
Statements of Cash Flowsfor the years ended March 31 (in $000’s)
2020 2019
(61) 83
(90) (34) - - 6 2
165 (27) 3,616 1,138 (3,632) (1,135) - - - - - - - - - - - - - - - - - - 4 27
- - - 27 (37) (79) (37) (52)
- - (33) (25) 30 55 (3) 30
20 23 - 1 - - - - - -
*Dividends and interest received as well as dividends and interest paid relate to operating activities of the Fund. The accompanying notes are an integral part of these financial statements.
Financial Statements
Cash flows from (used in) operating activitiesIncrease (decrease) in net assets attributable to holders of redeemable unitsAdjustments for: Net realized (gain) loss on sale of investments and derivatives Unrealized foreign exchange (gain) loss on cash Commissions and other portfolio transaction costs Change in unrealized (appreciation) depreciation in value of
investments and derivatives Proceeds from sale and maturity of investments and derivatives Purchase of investments and derivatives (Increase) decrease in collateral on deposit for short sale Non-cash distributions from investments Change in daily variation margin (Increase) decrease in dividends receivable (Increase) decrease in interest receivable (Increase) decrease in securities lending revenue receivable Increase (decrease) in management fees payable Increase (decrease) in administration fees payable Change in other accounts receivable and payableNet cash from (used in) operating activities
Cash flows from (used in) financing activitiesDistributions paid to holders of redeemable units, net of reinvested distributionsProceeds from issuance of redeemable unitsAmounts paid on redemption of redeemable unitsNet cash from (used in) financing activities Unrealized foreign exchange gain (loss) on cashNet increase (decrease) in cashCash (bank overdraft), beginning of yearCash (bank overdraft), end of year
Supplementary Information:Dividends received, net of withholding tax*Interest received, net of withholding tax*Dividends paid*Interest paid*Tax recoverable (paid)

– 63 –
CI Global Stock Selection Fund (formerly Harbour Global Analyst Fund)
Annual Financial Statements - March 31, 2020
U.S.A. (76.6%) 352 Abbott Laboratories Inc. 38,099 39,092 9 Amazon.com Inc. 24,725 24,696 319 American Express Co. 47,458 38,436 150 Berkshire Hathaway Inc., Class B 38,618 38,597 19 Booking Holdings Inc. 44,957 35,975 390 Citigroup Inc. 30,751 23,119 340 Fidelity National Information Services Inc. 54,971 58,207 371 Fiserv Inc. 46,333 49,599 105 Humana Inc. 37,633 46,405 275 Johnson & Johnson 50,484 50,752 273 JPMorgan Chase & Co. 37,992 34,591 294 Lowe’s Cos., Inc. 40,692 35,605 137 Mastercard Inc., Class A 50,704 46,576 368 Merck & Co., Inc. 37,819 39,849 238 Microsoft Corp. 48,254 52,827 147 S&P Global Inc. 42,642 50,698 142 UnitedHealth Group Inc. 46,992 49,839 1,277 US Foods Holding Corp. 52,510 31,829 202 Visa Inc., Class A 44,874 45,806 502 Voya Financial Inc. 33,772 28,649 850,280 821,147 NETHERLANDS (10.1%) 41 ASML Holding N.V. 13,080 15,417 1,110 ASR Nederland N.V. 51,101 39,527 5,036 ING Groep N.V. 61,515 37,347 540 STMicroelectronics N.V. 14,992 16,646 140,688 108,937 BERMUDA (5.5%) 851 Brookfield Infrastructure Partners L.P. 39,189 43,486 1,365 Brookfield Property Partners L.P. 28,871 15,506 68,060 58,992 SWITZERLAND (4.2%) 386 Novartis AG, Registered Shares 46,304 45,058 CANADA (4.0%) 94 Brookfield Infrastructure Corp. 4,082 4,633 455 Canadian Tire Corp., Ltd., Class A, Non-Voting Shares 57,713 38,648 61,795 43,281
Commissions and other portfolio transaction costs (737)
Total Investment Portfolio (100.4%) 1,166,390 1,077,415 Other Net Assets (Liabilities) (-0.4%) (3,870) Net Assets Attributable to Holders of Redeemable Units (100.0%) 1,073,545
Percentages shown in brackets relate investments at fair value to net assets attributable to holders of redeemable units of the Fund.
Schedule of Investment Portfolio as at March 31, 2020
No. of Shares/Par Value Description
AverageCost ($)
FairValue ($)

– 64 –
CI Global Stock Selection Fund (formerly Harbour Global Analyst Fund)
Annual Financial Statements - March 31, 2020
Redeemable Unit Transactions (Note 4)for the years ended March 31
Number of redeemable units at the beginning of yearRedeemable units issued for cashRedeemable units issued for reinvested distributionsRedeemable units redeemedNumber of redeemable units at the end of year
Fund Specific Notes to Financial Statements
†A portion of brokerage commissions paid was used to cover research and market data services, termed soft dollar commissions. This amount has been estimated by the Manager of the Fund.The accompanying notes are an integral part of these financial statements.
Commissions (Note 2)for the years ended March 31 (in $000’s)
2020 2019Brokerage commissions 6 2Soft dollar commissions† 1 -
Class I 2020 2019 108,280 107,531 - 2,607 15,648 3,653 (2,100) (5,511) 121,828 108,280

– 65 –
CI Global Stock Selection Fund (formerly Harbour Global Analyst Fund)
Annual Financial Statements - March 31, 2020
The accompanying notes are an integral part of these financial statements.
Fund Specific Notes to Financial Statements
Securities Lending (Note 6)as at March 31 (in $000’s)
2020 2019Loaned 77 49Collateral (non-cash) 78 50
Securities Lending Revenue Reconciliation (Note 6)for the years ended March 31 (in $000’s)
2020 2019Gross securities lending revenue - -Charges - -Securities lending revenue - -% of gross securities lending revenue - -
Management and Administration Fees (Note 5) as at March 31, 2020 (%)
Annual management
fee rate:
Annual administration
fee rate: Class I Paid directly by investor Paid directly by investor
Loss Carry Forwards (Note 7)as at March 31 (in $000’s)
2020Capital loss carried forward: -Non-capital losses expiring:2029 -2030 -2031 -2032 -2033 -2034 -2035 -2036 -2037 -2038 -2039 -Total -

– 66 –
CI Global Stock Selection Fund (formerly Harbour Global Analyst Fund)
Annual Financial Statements - March 31, 2020
The accompanying notes are an integral part of these financial statements.
Currency Risk (cont’d)As at March 31, 2020, had the Canadian dollar strengthened or weakened by 10% (March 31, 2019 - 10%) in relation to all other foreign currencies held in the Fund, with all other variables held constant, net assets attributable to holders of redeemable units of the Fund would have decreased or increased, respectively, by approximately $98,000 (March 31, 2019 - $101,000). In practice, actual results may differ from this analysis and the difference may be material.
Interest Rate RiskAs at March 31, 2020 and 2019, the Fund did not have a significant exposure to interest rate risk as substantially all of its assets were invested in equities.
Fair Value Hierarchy
The tables below summarize the inputs used by the Fund in valuing the Fund’s investments and derivatives carried at fair value.
Long Positions at fair value as at March 31, 2020Level 1 Level 2 Level 3 Total
(in $000’s) (in $000’s) (in $000’s) (in $000’s)Equities 1,077 - - 1,077 Total 1,077 - - 1,077
Long Positions at fair value as at March 31, 2019Level 1 Level 2 Level 3 Total
(in $000’s) (in $000’s) (in $000’s) (in $000’s)Equities 1,142 - - 1,142 Total 1,142 - - 1,142
There were no transfers between Level 1, 2 and 3 during the years ended March 31, 2020 and 2019.
Financial Instruments Risks (Note 10)
Concentration RiskFor Concentration Risk as at March 31, 2020, refer to the Schedule of Investment Portfolio.
The Fund’s investments were concentrated in the following segments:
as at March 31, 2019Categories Net Assets (%)U.S.A. 75.9 Canada 13.4 Netherlands 4.2 U.K. 2.7 Finland 1.5 Other Net Assets (Liabilities) 1.4 Jersey Island 0.9
Credit RiskAs at March 31, 2020 and 2019, the Fund did not have a significant exposure to credit risk as substantially all of its assets were invested in equities.
Other Price RiskAs at March 31, 2020 and 2019, the Fund was predominantly invested in foreign equities and therefore was sensitive to changes in general economic conditions across the world.
As at March 31, 2020, had the equities in the investment portfolio increased or decreased by 10% (March 31, 2019 - 10%), with all other variables held constant, net assets attributable to holders of redeemable units of the Fund would have increased or decreased, respectively, by approximately $108,000 (March 31, 2019 - $114,000). In practice, actual results may differ from this analysis and the difference may be material.
Currency RiskThe tables below summarize the Fund’s exposure to currency risk.
as at March 31, 2020~
Currency
Financial Instruments Exposure Derivatives
Net Exposure
Net Assets
(%)(in $000’s) (in $000’s) (in $000’s)U.S. Dollar 823 - 823 76.6 Euro 109 - 109 10.1 Swiss Franc 45 - 45 4.2 Total 977 - 977 90.9
as at March 31, 2019~
Currency
Financial Instruments Exposure Derivatives
Net Exposure
Net Assets
(%)(in $000’s) (in $000’s) (in $000’s)U.S. Dollar 905 - 905 78.2 Euro 66 - 66 5.7 British Pound 42 - 42 3.6 Total 1,013 - 1,013 87.5
~Includes monetary and non-monetary instruments.
Fund Specific Notes to Financial Statements
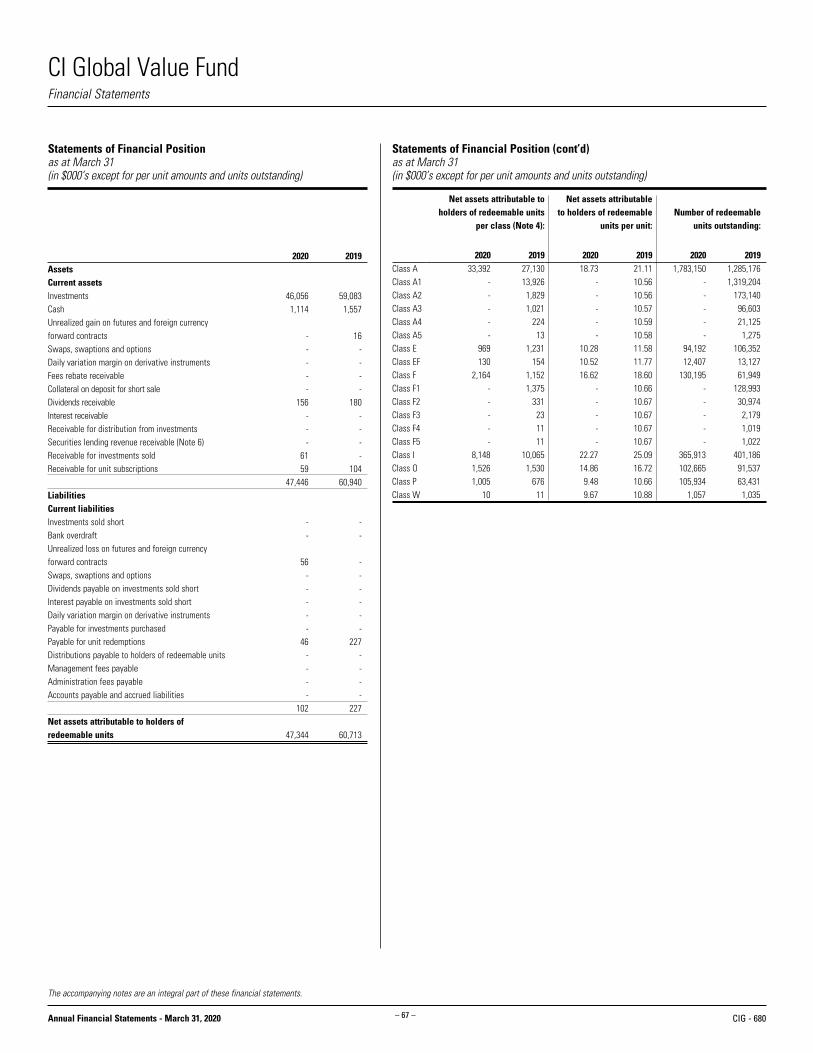
CI Global Value Fund
– 67 –Annual Financial Statements - March 31, 2020
Statements of Financial Position as at March 31(in $000’s except for per unit amounts and units outstanding)
2020 2019
46,056 59,083 1,114 1,557
- 16 - - - - - - - - 156 180 - - - - - - 61 - 59 104 47,446 60,940
- - - -
56 - - - - - - - - - - - 46 227 - - - - - - - - 102 227
47,344 60,713
Statements of Financial Position (cont’d)as at March 31(in $000’s except for per unit amounts and units outstanding)
Net assets attributable to holders of redeemable units
per class (Note 4):
Net assets attributable to holders of redeemable
units per unit: Number of redeemable
units outstanding:
2020 2019 2020 2019 2020 2019Class A 33,392 27,130 18.73 21.11 1,783,150 1,285,176Class A1 - 13,926 - 10.56 - 1,319,204Class A2 - 1,829 - 10.56 - 173,140Class A3 - 1,021 - 10.57 - 96,603Class A4 - 224 - 10.59 - 21,125Class A5 - 13 - 10.58 - 1,275Class E 969 1,231 10.28 11.58 94,192 106,352Class EF 130 154 10.52 11.77 12,407 13,127Class F 2,164 1,152 16.62 18.60 130,195 61,949Class F1 - 1,375 - 10.66 - 128,993Class F2 - 331 - 10.67 - 30,974Class F3 - 23 - 10.67 - 2,179Class F4 - 11 - 10.67 - 1,019Class F5 - 11 - 10.67 - 1,022Class I 8,148 10,065 22.27 25.09 365,913 401,186Class O 1,526 1,530 14.86 16.72 102,665 91,537Class P 1,005 676 9.48 10.66 105,934 63,431Class W 10 11 9.67 10.88 1,057 1,035
AssetsCurrent assetsInvestmentsCashUnrealized gain on futures and foreign currency forward contractsSwaps, swaptions and optionsDaily variation margin on derivative instrumentsFees rebate receivableCollateral on deposit for short saleDividends receivableInterest receivableReceivable for distribution from investmentsSecurities lending revenue receivable (Note 6)Receivable for investments soldReceivable for unit subscriptions
LiabilitiesCurrent liabilitiesInvestments sold shortBank overdraftUnrealized loss on futures and foreign currency forward contractsSwaps, swaptions and options Dividends payable on investments sold shortInterest payable on investments sold shortDaily variation margin on derivative instrumentsPayable for investments purchasedPayable for unit redemptionsDistributions payable to holders of redeemable units Management fees payableAdministration fees payableAccounts payable and accrued liabilities
Net assets attributable to holders of redeemable units
The accompanying notes are an integral part of these financial statements.
Financial Statements
CIG - 680

CI Global Value Fund
– 68 –Annual Financial Statements - March 31, 2020
Statements of Comprehensive Incomefor the years ended March 31(in $000’s except for per unit amounts and number of units)
2020 2019
1,627 1,437 23 24 - - - - - -
- - - -
3,165 4,489
(8,951) (1,721) (4,136) 4,229 (6) (6) - - 13 15 14 1 21 10 (4,115) 4,239
893 913 105 107 82 65 - - - - - - - - - - 219 191 107 109 1,406 1,385
(5,521) 2,854
The accompanying notes are an integral part of these financial statements.
Financial Statements
Statements of Comprehensive Income (cont’d)for the years ended March 31(in $000’s except for per unit amounts and number of units)
Increase (decrease) in net assets attributable to
holders of redeemable units per class:
Increase (decrease) in net assets attributable to
holders of redeemable units per unit:
Weighted average number of units:
2020 2019 2020 2019 2020 2019Class A (4,025) 1,330 (2.40) 0.86 1,679,613 1,542,736Class A1 (78) 438 (0.06) 0.46 1,273,716 952,070Class A2 (13) 64 (0.06) 0.40 177,702 155,190Class A3 (5) 44 (0.05) 0.44 105,680 100,331Class A4 (1) 9 (0.05) 0.48 20,980 17,517Class A5 - - (0.04) 0.47 1,275 1,275Class E (118) 45 (1.19) 0.51 100,016 87,542Class EF (14) 8 (1.09) 0.62 12,935 13,124Class F (186) 65 (1.64) 0.89 112,718 73,431Class F1 (5) 51 (0.05) 0.70 120,503 71,895Class F2 (1) 13 (0.04) 0.55 34,511 21,973Class F3 - 2 (0.01) 0.57 2,179 2,858Class F4 - 1 (0.01) 0.59 1,019 1,458Class F5 - 1 - 0.59 1,022 1,020Class I (761) 642 (1.97) 1.60 387,649 401,404Class O (181) 98 (1.93) 1.12 93,599 87,093Class P (132) 43 (1.59) 0.81 83,192 52,475Class W (1) - (1.00) 0.67 1,043 1,029
Income Net gain (loss) on investments and derivatives Dividends Interest for distribution purposes Income distributions from investments Capital gain distributions from investments Derivative income (loss) Dividends expense on financial assets (liabilities) sold
short Interest expense on financial assets (liabilities) sold short Net realized gain (loss) on sale of investments and
derivatives Change in unrealized appreciation (depreciation) in value
of investments and derivativesTotal net gain (loss) on investments and derivativesOther income Foreign exchange gain (loss) on cash Commitment fee income Securities lending revenue (Note 6) Fees rebateTotal other incomeTotal incomeExpensesManagement fees (Note 5)Administration fees (Note 5)Commissions and other portfolio transaction costsIndependent review committee feesSecurities borrowing fees (Note 2)Margin feesService feesInterest expenseWithholding taxesHarmonized sales taxTotal expensesIncrease (decrease) in net assets attributable to holders of redeemable units

CI Global Value Fund
– 69 –Annual Financial Statements - March 31, 2020
Statements of Changes in Net Assets Attributable to Holders of Redeemable Unitsfor the years ended March 31 (in $000’s)
Net assets attributable to holders of redeemable units at the beginning of yearIncrease (decrease) in net assets attributable to holders of redeemable unitsDistributions to holders of redeemable units From net investment income From net realized gains Return of capitalTotal distributions to holders of redeemable units
Redeemable unit transactions Proceeds from redeemable units issued Reinvestment of distributions to holders of redeemable units Acquisition of assets from terminated funds Redemption of redeemable unitsNet increase (decrease) from redeemable unit transactionsNet increase (decrease) in net assets attributable to holders of redeemable unitsNet assets attributable to holders of redeemable units at the end of year
The accompanying notes are an integral part of these financial statements.
Financial Statements
Class A 2020 2019 27,130 35,644 (4,025) 1,330
- - - - - - - -
20,272 7,286 - - 91 - (10,076) (17,130) 10,287 (9,844) 6,262 (8,514) 33,392 27,130
Class A1 2020 2019 13,926 6,508 (78) 438
- - - - - - - -
335 9,117 - - - - (14,183) (2,137) (13,848) 6,980 (13,926) 7,418 - 13,926
Class A2 2020 2019 1,829 1,557 (13) 64
- - - - - - - -
477 742 - - - - (2,293) (534) (1,816) 208 (1,829) 272 - 1,829
Class A3 2020 2019 1,021 983 (5) 44
- - - - - - - -
329 154 - - - - (1,345) (160) (1,016) (6) (1,021) 38 - 1,021
Class A4 2020 2019 224 129 (1) 9
- - - - - - - -
2 128 - - - - (225) (42) (223) 86 (224) 95 - 224
Class A5 2020 2019 13 13 - -
- - - - - - - -
- - - - - - (13) - (13) - (13) - - 13
Class E 2020 2019 1,231 816 (118) 45
- - - - - - - -
86 437 - - - - (230) (67) (144) 370 (262) 415 969 1,231
Class EF 2020 2019 154 146 (14) 8
(1) - - - - - (1) -
- - 1 - - - (10) - (9) - (24) 8 130 154
Class F 2020 2019 1,152 1,459 (186) 65
(11) - - - - - (11) -
2,313 946 10 - 93 - (1,207) (1,318) 1,209 (372) 1,012 (307) 2,164 1,152
Class F1 2020 2019 1,375 396 (5) 51
- - - - - - - -
262 1,237 - - - - (1,632) (309) (1,370) 928 (1,375) 979 - 1,375
Class F2 2020 2019 331 247 (1) 13
- - - - - - - -
145 138 - - - - (475) (67) (330) 71 (331) 84 - 331
Class F3 2020 2019 23 20 - 2
- - - - - - - -
- 10 - - - - (23) (9) (23) 1 (23) 3 - 23

CI Global Value Fund
– 70 –Annual Financial Statements - March 31, 2020
The accompanying notes are an integral part of these financial statements.
Financial Statements
Statements of Changes in Net Assets Attributable to Holders of Redeemable Units (cont’d)for the years ended March 31 (in $000’s)
Net assets attributable to holders of redeemable units at the beginning of yearIncrease (decrease) in net assets attributable to holders of redeemable unitsDistributions to holders of redeemable units From net investment income From net realized gains Return of capitalTotal distributions to holders of redeemable units
Redeemable unit transactions Proceeds from redeemable units issued Reinvestment of distributions to holders of redeemable units Acquisition of assets from terminated funds Redemption of redeemable unitsNet increase (decrease) from redeemable unit transactionsNet increase (decrease) in net assets attributable to holders of redeemable unitsNet assets attributable to holders of redeemable units at the end of year
Class F4 2020 2019 11 15 - 1
- - - - - - - -
- - - - - - (11) (5) (11) (5) (11) (4) - 11
Class F5 2020 2019 11 10 - 1
- - - - - - - -
- - - - - - (11) - (11) - (11) 1 - 11
Class I 2020 2019 10,065 9,339 (761) 642
(252) (108) - - - - (252) (108)
844 1,598 252 108 - - (2,000) (1,514) (904) 192 (1,917) 726 8,148 10,065
Class O 2020 2019 1,530 1,364 (181) 98
(34) (13) - - - - (34) (13)
465 280 32 13 12 - (298) (212) 211 81 (4) 166 1,526 1,530
Class P 2020 2019 676 439 (132) 43
(17) (5) - - - - (17) (5)
174 208 16 4 366 - (78) (13) 478 199 329 237 1,005 676
Class W 2020 2019 11 11 (1) -
- - - - - - - -
- - - - - - - - - - (1) - 10 11
Total Fund 2020 2019 60,713 59,096 (5,521) 2,854
(315) (126) - - - - (315) (126)
25,704 22,281 311 125 562 - (34,110) (23,517) (7,533) (1,111) (13,369) 1,617 47,344 60,713

CI Global Value Fund
– 71 –Annual Financial Statements - March 31, 2020
Statements of Cash Flowsfor the years ended March 31 (in $000’s)
2020 2019
(5,521) 2,854
(3,165) (4,489) - 1 82 65
8,951 1,721 29,045 21,236 (21,875) (20,415) - - - - - - 24 36 - - - - - - - - - - 7,541 1,009
(4) (1) 4,214 7,238 (12,756) (8,302) 562 - (7,984) (1,065)
- (1) (443) (56) 1,557 1,614 1,114 1,557
1,355 1,282 23 24 - - - - - -
*Dividends and interest received as well as dividends and interest paid relate to operating activities of the Fund. The accompanying notes are an integral part of these financial statements.
Financial Statements
Cash flows from (used in) operating activitiesIncrease (decrease) in net assets attributable to holders of redeemable unitsAdjustments for: Net realized (gain) loss on sale of investments and derivatives Unrealized foreign exchange (gain) loss on cash Commissions and other portfolio transaction costs Change in unrealized (appreciation) depreciation in value of
investments and derivatives Proceeds from sale and maturity of investments and derivatives Purchase of investments and derivatives (Increase) decrease in collateral on deposit for short sale Non-cash distributions from investments Change in daily variation margin (Increase) decrease in dividends receivable (Increase) decrease in interest receivable (Increase) decrease in securities lending revenue receivable Increase (decrease) in management fees payable Increase (decrease) in administration fees payable Change in other accounts receivable and payableNet cash from (used in) operating activities
Cash flows from (used in) financing activitiesDistributions paid to holders of redeemable units, net of reinvested distributionsProceeds from issuance of redeemable unitsAmounts paid on redemption of redeemable unitsAcquisition of assets from terminated fundsNet cash from (used in) financing activities Unrealized foreign exchange gain (loss) on cashNet increase (decrease) in cashCash (bank overdraft), beginning of yearCash (bank overdraft), end of year
Supplementary Information:Dividends received, net of withholding tax*Interest received, net of withholding tax*Dividends paid*Interest paid*Tax recoverable (paid)

CI Global Value Fund
– 72 –Annual Financial Statements - March 31, 2020
FRANCE (9.7%) 7,398 Accor S.A. 334,938 286,851 36,203 AXA S.A. 1,115,045 886,489 17,446 Bureau Veritas S.A. 488,916 468,376 11,782 Danone S.A. 1,117,084 1,071,556 10,797 Sanofi S.A. 1,170,632 1,342,006 9,382 Total S.A. 513,122 514,965 4,739,737 4,570,243 SWITZERLAND (8.4%) 7,065 Chubb Ltd. 979,661 1,110,565 5,553 Julius Baer Group Ltd. 301,885 268,128 4,101 Nestlé S.A., Registered Shares 262,795 596,212 2,587 Novartis AG, Registered Shares 246,810 301,979 699 Roche Holding AG 151,814 320,909 2,700 Zurich Financial Services AG 1,032,188 1,355,407 2,975,153 3,953,200 NETHERLANDS (4.8%) 50,191 ABN AMRO Group N.V., GDR 978,290 582,588 5,270 Akzo Nobel N.V. 495,475 490,497 10,060 Heineken N.V. 996,285 1,188,302 2,470,050 2,261,387 GERMANY (4.2%) 3,342 Continental AG 651,976 340,078 2,211 Fraport AG Frankfurt Airport Services Worldwide 209,811 126,537 5,758 Fresenius Medical Care AG & Co., KGaA 615,496 537,613 2,236 SAP AG 332,637 356,506 5,217 Siemens AG, Registered Shares 610,269 626,839 2,420,189 1,987,573 IRELAND (3.5%) 1,239 Linde PLC (EUR) 153,071 308,520 4,052 Medtronic PLC 320,444 514,277 3,473 Willis Towers Watson PLC 414,007 830,210 887,522 1,653,007 ISRAEL (1.7%) 5,580 Check Point Software Technologies Ltd. 715,580 789,570 CANADA (1.6%) 3,410 Agnico-Eagle Mines Ltd. (USD) 196,771 190,962 101,255 Kinross Gold Corp. 502,013 572,091 698,784 763,053 CAYMAN ISLANDS (1.5%) 3,978 Baidu Inc., ADR 867,405 564,287 4,692 Trip.com Group Ltd., ADR 197,378 154,853 1,064,783 719,140 SOUTH KOREA (0.8%) 9,562 KB Financial Group Inc. 512,781 381,217 MEXICO (0.6%) 68,912 Grupo Financiero Banorte S.A.B. de C.V. 426,059 265,824 BRAZIL (0.5%) 76,430 Ambev S.A., ADR 481,546 247,405
U.S.A. (34.0%) 6,982 Advance Auto Parts Inc. 1,209,524 917,006 13,684 Baker Hughes Co. 592,898 202,218 4,038 Berkshire Hathaway Inc., Class B 1,109,038 1,039,038 2,017 Biogen Inc. 676,522 898,116 198 Booking Holdings Inc. 361,581 374,894 11,854 Bristol-Myers Squibb Co. 785,332 929,928 14,481 Cabot Oil & Gas Corp. 371,301 350,342 1,492 Charter Communications Inc. 583,937 916,182 8,442 Cognizant Technology Solutions Corp. 681,326 552,123 24,007 Comcast Corp., Class A 619,533 1,161,613 5,760 CVS Health Corp. 516,999 480,966 1,089 Emerson Electric Co. 70,533 73,031 10,928 EOG Resources Inc. 902,277 552,452 14,583 Exelon Corp. 580,549 755,493 16,086 Hartford Financial Services Group Inc. 957,205 797,814 3,642 Intercept Pharmaceuticals Inc. 483,164 322,717 7,311 Intercontinental Exchange Inc. 318,710 830,877 5,102 Ionis Pharmaceuticals Inc. 327,290 339,497 3,209 JB Hunt Transport Services Inc. 396,689 416,543 11,939 Kroger Co. 369,645 506,105 3,432 Las Vegas Sands Corp. 280,658 205,138 6,202 Lowe’s Cos., Inc. 818,117 751,104 12,185 Nordstrom Inc. 811,424 263,068 12,579 Oracle Corp. 595,442 855,619 2,238 PepsiCo Inc. 190,991 378,286 1,751 PPG Industries Inc. 209,312 206,020 8,167 Public Service Enterprise Group Inc. 348,975 516,206 4,691 United Technologies Corp. 702,658 622,777 15,871,630 16,215,173 JAPAN (13.0%) 61,302 Astellas Pharma Inc. 1,138,487 1,339,851 3,535 Daito Trust Construction Co., Ltd. 615,482 465,381 6,328 Hitachi Ltd. 242,524 260,145 14,044 Japan Exchange Group Inc. 319,070 350,122 8,538 Makita Corp. 372,209 370,207 105,830 Mitsubishi UFJ Financial Group Inc. 714,009 557,852 728 Nintendo Co., Ltd. 200,789 396,218 21,982 Sumitomo Mitsui Trust Holdings Inc. 1,040,259 898,222 7,627 THK Co., Ltd. 228,772 220,670 16,049 Tokio Marine Holdings Inc. 595,006 1,039,103 52,064 Yahoo! Japan Corp. 294,216 236,986 5,760,823 6,134,757 U.K. (12.3%) 27,744 Antofagasta PLC 369,678 374,454 4,678 Aon PLC 345,530 1,086,593 233,491 BT Group PLC 1,059,272 480,656 20,561 Diageo PLC 743,912 928,553 45,344 GlaxoSmithKline PLC 1,184,894 1,199,134 24,909 Liberty Global PLC, Series A 890,414 578,790 262,984 Lloyds Banking Group PLC 171,654 146,936 1,999 Sensata Technologies Holding PLC 102,466 81,391 47,791 Vodafone Group PLC, ADR 1,559,438 926,185 6,427,258 5,802,692
Percentages shown in brackets relate investments at fair value to net assets attributable to holders of redeemable units of the Fund.
Schedule of Investment Portfolio as at March 31, 2020
No. of Shares/Par Value Description
AverageCost ($)
FairValue ($)
No. of Shares/Par Value Description
AverageCost ($)
FairValue ($)

CI Global Value Fund
– 73 –Annual Financial Statements - March 31, 2020
‡Credit ratings are obtained from S&P Global Ratings, where available, otherwise ratings are obtained from: Moody’s Investors Service or Dominion Bond Rating Service.Percentages shown in brackets relate investments at fair value to net assets attributable to holders of redeemable units of the Fund.
Schedule of Investment Portfolio as at March 31, 2020 (cont’d)
LUXEMBOURG (0.4%) 20,854 Tenaris S.A. 397,015 180,478 SWEDEN (0.3%) 6,562 Sandvik AB 114,222 131,693
Commissions and other portfolio transaction costs (91,227)
Total Investment Portfolio before Derivative Instruments (97.3%) 45,871,905 46,056,412
Foreign Currency Forward Contract(s) (-0.1%) (see Schedule A) (56,283)
Total Investment Portfolio (97.2%) 45,871,905 46,000,129 Other Net Assets (Liabilities) (2.8%) 1,343,544 Net Assets Attributable to Holders of Redeemable Units (100.0%) 47,343,673
Schedule AForeign Currency Forward Contract(s) (-0.1%)
Contract(s) CounterpartyCredit Rating of
the Counterparty‡Settlement
DateContract(s)
Rate Pay ReceiveUnrealized
Gain (Loss) ($)1 The Bank of New York Mellon Corp. A-1 May 28, 2020 111.17 (123,467,000) Japanese Yen 1,110,570 US $ (56,283) Total Foreign Currency Forward Contract(s) Value (56,283)
No. of Shares/Par Value Description
AverageCost ($)
FairValue ($)

CI Global Value Fund
– 74 –Annual Financial Statements - March 31, 2020
The accompanying notes are an integral part of these financial statements.
Fund Specific Notes to Financial Statements
Offsetting of Financial Instruments (Note 2)
The following tables show the net impact on the Fund’s Statements of Financial Position if all rights to offset were exercised.
as at March 31, 2020Amounts Eligible for Offset
Gross Assets/(Liabilities)
FinancialInstruments
CollateralReceived/(Paid)
NetExposure
(in $000’s) (in $000’s) (in $000’s) (in $000’s)Derivative assets - Foreign currency forward contracts - - - -Derivative assets - Swaps and swaptions - - - -Total - - - -Derivative liabilities - Foreign currency forward contracts (56) - - (56)Derivative liabilities - Swaps and swaptions - - - -Total (56) - - (56)
as at March 31, 2019Amounts Eligible for Offset
Gross Assets/(Liabilities)
FinancialInstruments
CollateralReceived/(Paid)
NetExposure
(in $000’s) (in $000’s) (in $000’s) (in $000’s)Derivative assets - Foreign currency forward contracts 16 - - 16Derivative assets - Swaps and swaptions - - - -Total 16 - - 16Derivative liabilities - Foreign currency forward contracts - - - -Derivative liabilities - Swaps and swaptions - - - -Total - - - -

CI Global Value Fund
– 75 –Annual Financial Statements - March 31, 2020
Redeemable Unit Transactions (Note 4)for the years ended March 31
Number of redeemable units at the beginning of yearRedeemable units issued for cashRedeemable units issued for reinvested distributionsRedeemable units issued due to acquisition of assets from terminated fundsRedeemable units redeemedNumber of redeemable units at the end of year
Number of redeemable units at the beginning of yearRedeemable units issued for cashRedeemable units issued for reinvested distributionsRedeemable units issued due to acquisition of assets from terminated fundsRedeemable units redeemedNumber of redeemable units at the end of year
Number of redeemable units at the beginning of yearRedeemable units issued for cashRedeemable units issued for reinvested distributionsRedeemable units issued due to acquisition of assets from terminated fundsRedeemable units redeemedNumber of redeemable units at the end of year
Number of redeemable units at the beginning of yearRedeemable units issued for cashRedeemable units issued for reinvested distributionsRedeemable units issued due to acquisition of assets from terminated fundsRedeemable units redeemedNumber of redeemable units at the end of year
Number of redeemable units at the beginning of yearRedeemable units issued for cashRedeemable units issued for reinvested distributionsRedeemable units issued due to acquisition of assets from terminated fundsRedeemable units redeemedNumber of redeemable units at the end of year
Fund Specific Notes to Financial Statements
†A portion of brokerage commissions paid was used to cover research and market data services, termed soft dollar commissions. This amount has been estimated by the Manager of the Fund.The accompanying notes are an integral part of these financial statements.
Commissions (Note 2)for the years ended March 31 (in $000’s)
2020 2019Brokerage commissions 75 60Soft dollar commissions† 13 11
Class A 2020 2019 1,285,176 1,759,722 960,662 357,274 - - 4,074 - (466,762) (831,820) 1,783,150 1,285,176
Class A1 2020 2019 1,319,204 643,116 31,424 882,982 - - - - (1,350,628) (206,894) - 1,319,204
Class A2 2020 2019 173,140 153,896 44,913 71,263 - - - - (218,053) (52,019) - 173,140
Class A3 2020 2019 96,603 97,092 30,974 15,172 - - - - (127,577) (15,661) - 96,603
Class A4 2020 2019 21,125 12,794 183 12,330 - - - - (21,308) (3,999) - 21,125
Class A5 2020 2019 1,275 1,275 - - - - - - (1,275) - - 1,275
Class E 2020 2019 106,352 73,606 7,340 38,690 - - - - (19,500) (5,944) 94,192 106,352
Class EF 2020 2019 13,127 13,121 6 6 68 - - - (794) - 12,407 13,127
Class F 2020 2019 61,949 82,662 125,092 52,632 519 - 4,702 - (62,067) (73,345) 130,195 61,949
Class F1 2020 2019 128,993 39,213 24,395 119,768 - - - - (153,388) (29,988) - 128,993
Class F2 2020 2019 30,974 24,457 13,453 13,218 - - - - (44,427) (6,701) - 30,974
Class F3 2020 2019 2,179 2,028 - 967 - - - - (2,179) (816) - 2,179
Class F4 2020 2019 1,019 1,464 - - - 1 - - (1,019) (446) - 1,019
Class F5 2020 2019 1,022 1,020 - - - 2 - - (1,022) - - 1,022
Class I 2020 2019 401,186 393,025 33,363 65,768 9,433 4,581 - - (78,069) (62,188) 365,913 401,186
Class O 2020 2019 91,537 86,156 25,993 17,628 1,772 838 675 - (17,312) (13,085) 102,665 91,537
Class P 2020 2019 63,431 43,533 15,875 20,682 1,423 443 32,387 - (7,182) (1,227) 105,934 63,431
Class W 2020 2019 1,035 1,026 - - 22 9 - - - - 1,057 1,035

CI Global Value Fund
– 76 –Annual Financial Statements - March 31, 2020
The accompanying notes are an integral part of these financial statements.
Fund Specific Notes to Financial Statements
Management and Administration Fees (Note 5) as at March 31, 2020 (%)
Annual management
fee rate:
Annual administration
fee rate:
Class A 2.000 0.22Class A1^ 1.925 0.22Class A2^ 1.900 0.21Class A3^ 1.850 0.15Class A4^ 1.800 0.12Class A5^ 1.700 0.10Class E 1.950 0.15Class EF 0.950 0.15Class F 1.000 0.22Class F1^ 0.925 0.22Class F2^ 0.900 0.21Class F3^ 0.850 0.15Class F4^ 0.800 0.12Class F5^ 0.700 0.10Class I Paid directly by investor Paid directly by investorClass O Paid directly by investor 0.15Class P Paid directly by investor 0.22Class W Paid directly by investor 0.16*
^Effective after the close of business on August 2, 2019, the classes of the Fund that were eligible for CI Preferred
Pricing Program (CIPP) transitioned from a tiered pricing model to a fee distribution model. Please refer to most
recent simplified prospectus for further details.
*Effective August 2, 2019, the annual administration fee rate was reduced for Class W from 0.22% to 0.16%.
Securities Lending (Note 6)as at March 31 (in $000’s)
2020 2019Loaned 12,852 7,549Collateral (non-cash) 13,109 7,700
Securities Lending Revenue Reconciliation (Note 6)for the years ended March 31 (in $000’s)
2020 2019Gross securities lending revenue 15 18Charges (2) (3)Securities lending revenue 13 15% of gross securities lending revenue 13.3 16.7
Loss Carry Forwards (Note 7)as at March 31 (in $000’s)
2020Capital loss carried forward: 58,281Non-capital losses expiring:2029 -2030 -2031 -2032 -2033 -2034 -2035 -2036 -2037 -2038 -2039 -Total -
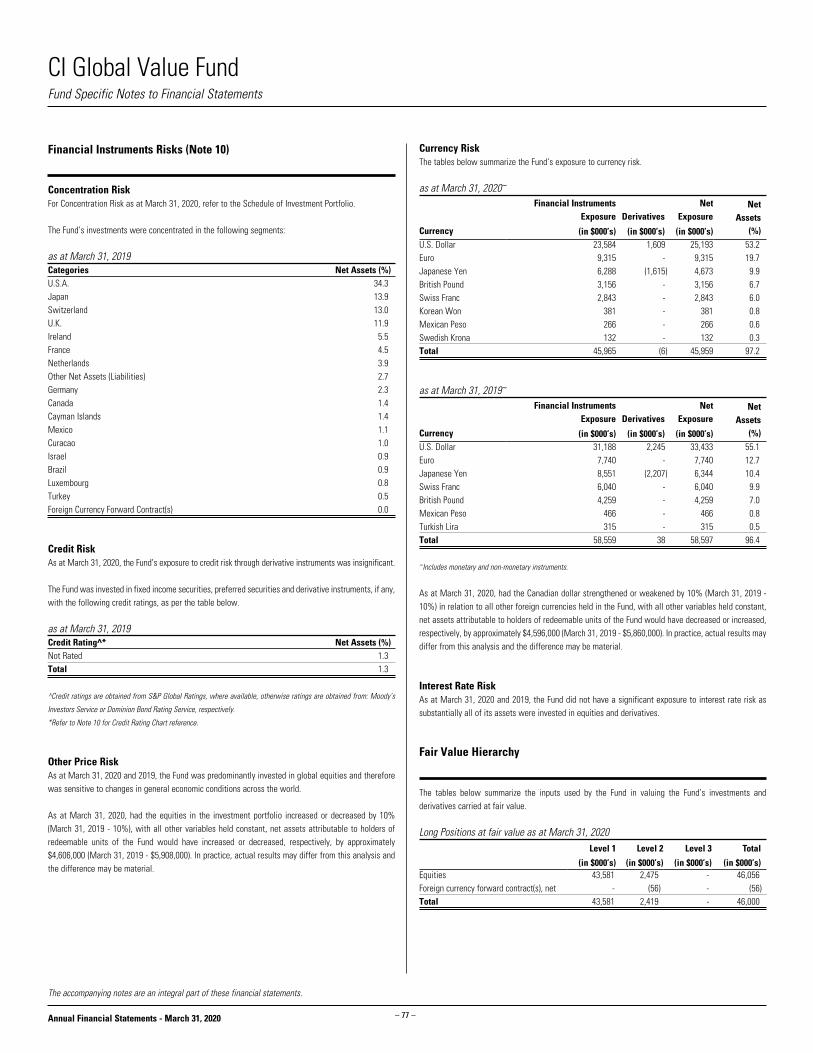
CI Global Value Fund
– 77 –Annual Financial Statements - March 31, 2020
The accompanying notes are an integral part of these financial statements.
Currency RiskThe tables below summarize the Fund’s exposure to currency risk.
as at March 31, 2020~
Currency
Financial Instruments Exposure Derivatives
Net Exposure
Net Assets
(%)(in $000’s) (in $000’s) (in $000’s)U.S. Dollar 23,584 1,609 25,193 53.2 Euro 9,315 - 9,315 19.7 Japanese Yen 6,288 (1,615) 4,673 9.9 British Pound 3,156 - 3,156 6.7 Swiss Franc 2,843 - 2,843 6.0 Korean Won 381 - 381 0.8 Mexican Peso 266 - 266 0.6 Swedish Krona 132 - 132 0.3 Total 45,965 (6) 45,959 97.2
as at March 31, 2019~
Currency
Financial Instruments Exposure Derivatives
Net Exposure
Net Assets
(%)(in $000’s) (in $000’s) (in $000’s)U.S. Dollar 31,188 2,245 33,433 55.1 Euro 7,740 - 7,740 12.7 Japanese Yen 8,551 (2,207) 6,344 10.4 Swiss Franc 6,040 - 6,040 9.9 British Pound 4,259 - 4,259 7.0 Mexican Peso 466 - 466 0.8 Turkish Lira 315 - 315 0.5 Total 58,559 38 58,597 96.4
~Includes monetary and non-monetary instruments.
As at March 31, 2020, had the Canadian dollar strengthened or weakened by 10% (March 31, 2019 - 10%) in relation to all other foreign currencies held in the Fund, with all other variables held constant, net assets attributable to holders of redeemable units of the Fund would have decreased or increased, respectively, by approximately $4,596,000 (March 31, 2019 - $5,860,000). In practice, actual results may differ from this analysis and the difference may be material.
Interest Rate RiskAs at March 31, 2020 and 2019, the Fund did not have a significant exposure to interest rate risk as substantially all of its assets were invested in equities and derivatives.
Fair Value Hierarchy
The tables below summarize the inputs used by the Fund in valuing the Fund’s investments and derivatives carried at fair value.
Long Positions at fair value as at March 31, 2020Level 1 Level 2 Level 3 Total
(in $000’s) (in $000’s) (in $000’s) (in $000’s)Equities 43,581 2,475 - 46,056 Foreign currency forward contract(s), net - (56) - (56) Total 43,581 2,419 - 46,000
Financial Instruments Risks (Note 10)
Concentration RiskFor Concentration Risk as at March 31, 2020, refer to the Schedule of Investment Portfolio.
The Fund’s investments were concentrated in the following segments: as at March 31, 2019 Categories Net Assets (%)U.S.A. 34.3 Japan 13.9 Switzerland 13.0 U.K. 11.9 Ireland 5.5 France 4.5 Netherlands 3.9 Other Net Assets (Liabilities) 2.7 Germany 2.3 Canada 1.4 Cayman Islands 1.4 Mexico 1.1 Curacao 1.0 Israel 0.9 Brazil 0.9 Luxembourg 0.8 Turkey 0.5 Foreign Currency Forward Contract(s) 0.0
Credit RiskAs at March 31, 2020, the Fund’s exposure to credit risk through derivative instruments was insignificant.
The Fund was invested in fixed income securities, preferred securities and derivative instruments, if any, with the following credit ratings, as per the table below.
as at March 31, 2019Credit Rating^* Net Assets (%)Not Rated 1.3 Total 1.3
^Credit ratings are obtained from S&P Global Ratings, where available, otherwise ratings are obtained from: Moody’s
Investors Service or Dominion Bond Rating Service, respectively.
*Refer to Note 10 for Credit Rating Chart reference.
Other Price RiskAs at March 31, 2020 and 2019, the Fund was predominantly invested in global equities and therefore was sensitive to changes in general economic conditions across the world.
As at March 31, 2020, had the equities in the investment portfolio increased or decreased by 10% (March 31, 2019 - 10%), with all other variables held constant, net assets attributable to holders of redeemable units of the Fund would have increased or decreased, respectively, by approximately $4,606,000 (March 31, 2019 - $5,908,000). In practice, actual results may differ from this analysis and the difference may be material.
Fund Specific Notes to Financial Statements
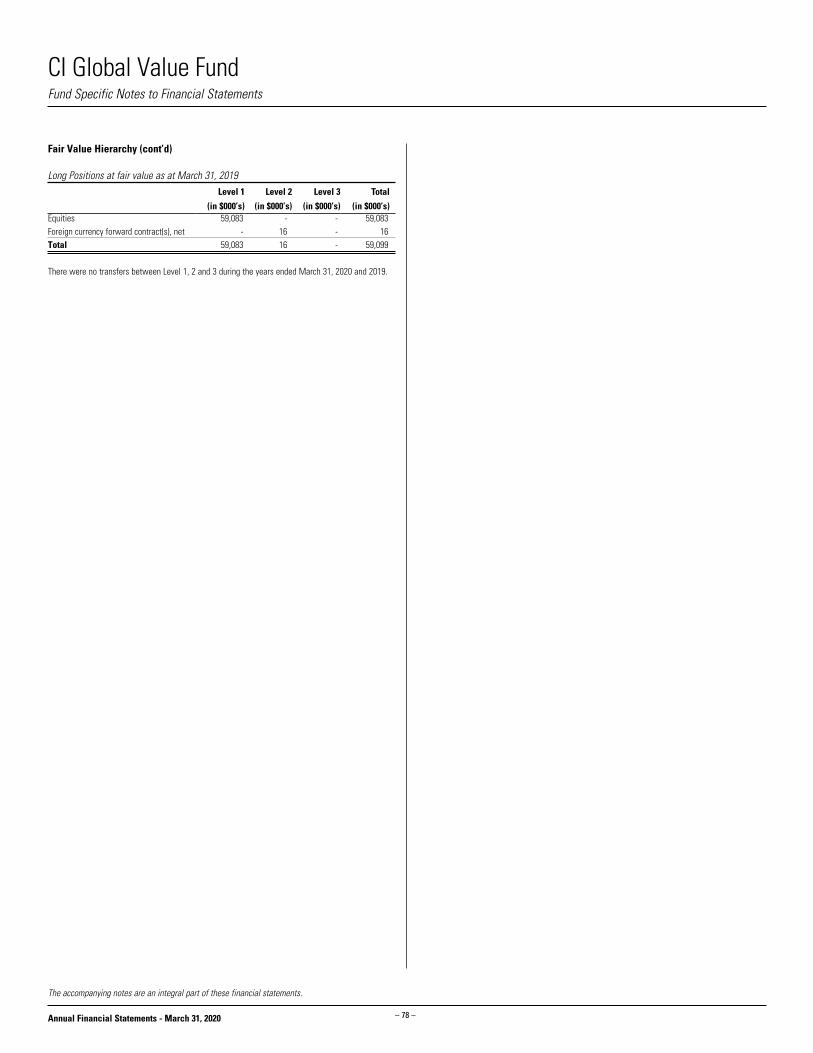
CI Global Value Fund
– 78 –Annual Financial Statements - March 31, 2020
The accompanying notes are an integral part of these financial statements.
Fair Value Hierarchy (cont’d)
Long Positions at fair value as at March 31, 2019Level 1 Level 2 Level 3 Total
(in $000’s) (in $000’s) (in $000’s) (in $000’s)Equities 59,083 - - 59,083 Foreign currency forward contract(s), net - 16 - 16 Total 59,083 16 - 59,099
There were no transfers between Level 1, 2 and 3 during the years ended March 31, 2020 and 2019.
Fund Specific Notes to Financial Statements

CI International Value Fund
– 79 –Annual Financial Statements - March 31, 2020
Statements of Financial Position as at March 31(in $000’s except for per unit amounts and units outstanding)
2020 2019
111,354 134,539 5,736 3,905
- - - - - - - - - - 490 594 - - - - - - 179 - 47 464 117,806 139,502
- - - -
- - - - - - - - - - - - 161 408 - - - - - - - - 161 408
117,645 139,094
Statements of Financial Position (cont’d)as at March 31(in $000’s except for per unit amounts and units outstanding)
Net assets attributable to holders of redeemable units
per class (Note 4):
Net assets attributable to holders of redeemable
units per unit: Number of redeemable
units outstanding:
2020 2019 2020 2019 2020 2019Class A 53,241 44,131 15.03 17.20 3,542,617 2,566,304Class A1 - 20,012 - 10.55 - 1,897,176Class A2 - 3,101 - 10.55 - 293,984Class A3 - 883 - 10.56 - 83,651Class A4 - 77 - 10.56 - 7,244Class A5 - 37 - 10.57 - 3,531Class E 1,587 2,042 10.00 11.45 158,613 178,360Class EF 243 296 10.12 11.58 24,030 25,567Class F 6,502 5,264 16.32 18.67 398,408 281,882Class F1 - 2,565 - 10.65 - 240,960Class F2 - 302 - 10.65 - 28,327Class F3 - 69 - 10.66 - 6,513Class F4 - 22 - 10.67 - 2,034Class F5 - 22 - 10.68 - 2,037Class I 50,832 53,733 18.62 21.31 2,729,974 2,522,036Class Insight 478 601 17.02 19.48 28,064 30,842Class O 4,537 5,734 13.76 15.75 329,684 364,109Class P 215 192 9.33 10.67 23,050 18,016Class W 10 11 9.35 10.70 1,057 1,030
AssetsCurrent assetsInvestmentsCashUnrealized gain on futures and foreign currency forward contractsSwaps, swaptions and optionsDaily variation margin on derivative instrumentsFees rebate receivableCollateral on deposit for short saleDividends receivableInterest receivableReceivable for distribution from investmentsSecurities lending revenue receivable (Note 6)Receivable for investments soldReceivable for unit subscriptions
LiabilitiesCurrent liabilitiesInvestments sold shortBank overdraftUnrealized loss on futures and foreign currency forward contractsSwaps, swaptions and options Dividends payable on investments sold shortInterest payable on investments sold shortDaily variation margin on derivative instrumentsPayable for investments purchasedPayable for unit redemptionsDistributions payable to holders of redeemable units Management fees payableAdministration fees payableAccounts payable and accrued liabilities
Net assets attributable to holders of redeemable units
The accompanying notes are an integral part of these financial statements.
Financial Statements
CIG - 681

CI International Value Fund
– 80 –Annual Financial Statements - March 31, 2020
Statements of Comprehensive Incomefor the years ended March 31(in $000’s except for per unit amounts and number of units)
2020 2019
4,415 4,091 64 71 - - - - - -
- - - -
310 6,381
(16,803) (5,771) (12,014) 4,772 1 (31) - - 42 46 21 4 64 19 (11,950) 4,791
1,446 1,485 177 180 213 184 - - - - - - 5 - - - 600 573 167 175 2,608 2,597
(14,558) 2,194
The accompanying notes are an integral part of these financial statements.
Financial Statements
Statements of Comprehensive Income (cont’d)for the years ended March 31(in $000’s except for per unit amounts and number of units)
Increase (decrease) in net assets attributable to
holders of redeemable units per class:
Increase (decrease) in net assets attributable to
holders of redeemable units per unit:
Weighted average number of units:
2020 2019 2020 2019 2020 2019Class A (7,252) (49) (2.19) (0.01) 3,293,181 3,050,358Class A1 (105) 302 (0.06) 0.23 1,899,320 1,331,242Class A2 (14) 21 (0.05) 0.07 291,340 286,420Class A3 (3) 7 (0.03) 0.11 86,272 62,588Class A4 (1) 1 (0.16) 0.19 7,605 5,606Class A5 - - (0.05) 0.14 3,723 3,146Class E (213) 14 (1.26) 0.08 169,497 189,436Class EF (29) 7 (1.18) 0.28 24,862 23,736Class F (811) 109 (2.21) 0.42 366,709 253,438Class F1 (1) 41 (0.01) 0.24 224,558 174,670Class F2 1 8 0.03 0.46 42,733 17,734Class F3 - 1 - 0.22 6,462 6,487Class F4 - 1 - 0.19 2,034 2,012Class F5 - 1 0.01 0.20 2,037 2,013Class I (5,526) 1,553 (2.23) 0.60 2,482,410 2,608,159Class Insight (60) 9 (2.07) 0.24 29,269 33,937Class O (515) 156 (1.47) 0.39 351,620 391,256Class P (28) 12 (1.45) 1.94 19,492 5,988Class W (1) - (1.09) 0.27 1,038 1,013
Income Net gain (loss) on investments and derivatives Dividends Interest for distribution purposes Income distributions from investments Capital gain distributions from investments Derivative income (loss) Dividends expense on financial assets (liabilities) sold
short Interest expense on financial assets (liabilities) sold short Net realized gain (loss) on sale of investments and
derivatives Change in unrealized appreciation (depreciation) in value
of investments and derivativesTotal net gain (loss) on investments and derivativesOther income Foreign exchange gain (loss) on cash Commitment fee income Securities lending revenue (Note 6) Fees rebateTotal other incomeTotal incomeExpensesManagement fees (Note 5)Administration fees (Note 5)Commissions and other portfolio transaction costsIndependent review committee feesSecurities borrowing fees (Note 2)Margin feesService feesInterest expenseWithholding taxesHarmonized sales taxTotal expensesIncrease (decrease) in net assets attributable to holders of redeemable units

CI International Value Fund
– 81 –Annual Financial Statements - March 31, 2020
Statements of Changes in Net Assets Attributable to Holders of Redeemable Unitsfor the years ended March 31 (in $000’s)
Net assets attributable to holders of redeemable units at the beginning of yearIncrease (decrease) in net assets attributable to holders of redeemable unitsDistributions to holders of redeemable units From net investment income From net realized gains Return of capitalTotal distributions to holders of redeemable units
Redeemable unit transactions Proceeds from redeemable units issued Reinvestment of distributions to holders of redeemable units Redemption of redeemable unitsNet increase (decrease) from redeemable unit transactionsNet increase (decrease) in net assets attributable to holders of redeemable unitsNet assets attributable to holders of redeemable units at the end of year
The accompanying notes are an integral part of these financial statements.
Financial Statements
Class A 2020 2019 44,131 57,988 (7,252) (49)
(231) (39) - - - - (231) (39)
34,291 13,277 226 38 (17,924) (27,084) 16,593 (13,769) 9,110 (13,857) 53,241 44,131
Class A1 2020 2019 20,012 9,019 (105) 302
- (28) - - - - - (28)
2,176 14,783 - 28 (22,083) (4,092) (19,907) 10,719 (20,012) 10,993 - 20,012
Class A2 2020 2019 3,101 2,820 (14) 21
- (4) - - - - - (4)
220 1,296 - 4 (3,307) (1,036) (3,087) 264 (3,101) 281 - 3,101
Class A3 2020 2019 883 648 (3) 7
- (2) - - - - - (2)
59 569 - 2 (939) (341) (880) 230 (883) 235 - 883
Class A4 2020 2019 77 43 (1) 1
- - - - - - - -
54 51 - - (130) (18) (76) 33 (77) 34 - 77
Class A5 2020 2019 37 24 - -
- - - - - - - -
5 15 - - (42) (2) (37) 13 (37) 13 - 37
Class E 2020 2019 2,042 2,153 (213) 14
(10) (4) - - - - (10) (4)
133 173 10 4 (375) (298) (232) (121) (455) (111) 1,587 2,042
Class EF 2020 2019 296 274 (29) 7
(5) (3) - - - - (5) (3)
- 33 5 3 (24) (18) (19) 18 (53) 22 243 296
Class F 2020 2019 5,264 4,059 (811) 109
(117) (56) - - - - (117) (56)
5,156 4,272 74 37 (3,064) (3,157) 2,166 1,152 1,238 1,205 6,502 5,264
Class F1 2020 2019 2,565 1,245 (1) 41
- (31) - - - - - (31)
460 2,127 - 19 (3,024) (836) (2,564) 1,310 (2,565) 1,320 - 2,565
Class F2 2020 2019 302 109 1 8
- (3) - - - - - (3)
497 190 - 3 (800) (5) (303) 188 (302) 193 - 302
Class F3 2020 2019 69 25 - 1
- (1) - - - - - (1)
53 56 - 1 (122) (13) (69) 44 (69) 44 - 69

CI International Value Fund
– 82 –Annual Financial Statements - March 31, 2020
The accompanying notes are an integral part of these financial statements.
Financial Statements
Statements of Changes in Net Assets Attributable to Holders of Redeemable Units (cont’d)for the years ended March 31 (in $000’s)
Net assets attributable to holders of redeemable units at the beginning of yearIncrease (decrease) in net assets attributable to holders of redeemable unitsDistributions to holders of redeemable units From net investment income From net realized gains Return of capitalTotal distributions to holders of redeemable units
Redeemable unit transactions Proceeds from redeemable units issued Reinvestment of distributions to holders of redeemable units Redemption of redeemable unitsNet increase (decrease) from redeemable unit transactionsNet increase (decrease) in net assets attributable to holders of redeemable unitsNet assets attributable to holders of redeemable units at the end of year
Class F4 2020 2019 22 21 - 1
- - - - - - - -
- - - - (22) - (22) - (22) 1 - 22
Class F5 2020 2019 22 21 - 1
- - - - - - - -
- - - - (22) - (22) - (22) 1 - 22
Class I 2020 2019 53,733 56,414 (5,526) 1,553
(1,538) (1,318) - - - - (1,538) (1,318)
7,780 4,542 1,538 1,317 (5,155) (8,775) 4,163 (2,916) (2,901) (2,681) 50,832 53,733
Class Insight 2020 2019 601 701 (60) 9
(8) (7) - - - - (8) (7)
3 2 7 6 (65) (110) (55) (102) (123) (100) 478 601
Class O 2020 2019 5,734 6,335 (515) 156
(152) (137) - - - - (152) (137)
285 443 152 137 (967) (1,200) (530) (620) (1,197) (601) 4,537 5,734
Class P 2020 2019 192 28 (28) 12
(5) (1) - - - - (5) (1)
86 153 5 1 (35) (1) 56 153 23 164 215 192
Class W 2020 2019 11 11 (1) -
- - - - - - - -
- - - - - - - - (1) - 10 11
Total Fund 2020 2019 139,094 141,938 (14,558) 2,194
(2,066) (1,634) - - - - (2,066) (1,634)
51,258 41,982 2,017 1,600 (58,100) (46,986) (4,825) (3,404) (21,449) (2,844) 117,645 139,094

CI International Value Fund
– 83 –Annual Financial Statements - March 31, 2020
Statements of Cash Flowsfor the years ended March 31 (in $000’s)
2020 2019
(14,558) 2,194
(310) (6,381) 8 (5) 213 184
16,803 5,771 51,151 49,959 (44,851) (47,936) - - - - - - 104 (14) - - - - - - - - - - 8,560 3,772
(49) (34) 17,729 19,584 (24,401) (23,490) (6,721) (3,940)
(8) 5 1,839 (168) 3,905 4,068 5,736 3,905
3,687 3,504 64 71 - - - - - -
*Dividends and interest received as well as dividends and interest paid relate to operating activities of the Fund. The accompanying notes are an integral part of these financial statements.
Financial Statements
Cash flows from (used in) operating activitiesIncrease (decrease) in net assets attributable to holders of redeemable unitsAdjustments for: Net realized (gain) loss on sale of investments and derivatives Unrealized foreign exchange (gain) loss on cash Commissions and other portfolio transaction costs Change in unrealized (appreciation) depreciation in value of
investments and derivatives Proceeds from sale and maturity of investments and derivatives Purchase of investments and derivatives (Increase) decrease in collateral on deposit for short sale Non-cash distributions from investments Change in daily variation margin (Increase) decrease in dividends receivable (Increase) decrease in interest receivable (Increase) decrease in securities lending revenue receivable Increase (decrease) in management fees payable Increase (decrease) in administration fees payable Change in other accounts receivable and payableNet cash from (used in) operating activities
Cash flows from (used in) financing activitiesDistributions paid to holders of redeemable units, net of reinvested distributionsProceeds from issuance of redeemable unitsAmounts paid on redemption of redeemable unitsNet cash from (used in) financing activities Unrealized foreign exchange gain (loss) on cashNet increase (decrease) in cashCash (bank overdraft), beginning of yearCash (bank overdraft), end of year
Supplementary Information:Dividends received, net of withholding tax*Interest received, net of withholding tax*Dividends paid*Interest paid*Tax recoverable (paid)

CI International Value Fund
– 84 –Annual Financial Statements - March 31, 2020
GERMANY (7.9%) 2,739 Adidas AG 733,522 874,682 11,204 Continental AG 2,281,024 1,140,106 6,071 Fraport AG Frankfurt Airport Services Worldwide 569,591 347,447 22,940 Fresenius Medical Care AG & Co., KGaA 2,452,115 2,141,864 9,089 SAP AG 1,450,513 1,449,143 22,683 Siemens AG, Registered Shares 3,094,584 2,725,436 17,074 Uniper S.E. 501,115 595,562 11,082,464 9,274,240 NETHERLANDS (7.0%) 142,743 ABN AMRO Group N.V., GDR 3,236,694 1,656,878 19,772 Akzo Nobel N.V. 1,945,339 1,840,247 13,415 Euronext N.V. 1,040,931 1,410,660 28,114 Heineken N.V. 3,220,190 3,320,867 9,443,154 8,228,652 IRELAND (4.3%) 4,585 Linde PLC (EUR) 710,996 1,141,699 15,540 Medtronic PLC 1,458,583 1,972,327 8,241 Willis Towers Watson PLC 1,352,578 1,969,986 3,522,157 5,084,012 SOUTH KOREA (3.3%) 36,647 KB Financial Group Inc. 1,968,300 1,461,039 785 Samsung Electronics Co., Ltd., GDR 961,524 1,097,075 39,624 Shinhan Financial Group Co., Ltd. 1,992,146 1,307,674 4,921,970 3,865,788 U.S.A. (2.8%) 530 Booking Holdings Inc. 967,897 1,003,504 34,726 Cognizant Technology Solutions Corp. 2,987,197 2,271,146 3,955,094 3,274,650 CAYMAN ISLANDS (2.2%) 10,744 Baidu Inc., ADR 2,491,701 1,524,056 114,172 Sands China Ltd. 717,894 588,622 12,884 Trip.com Group Ltd., ADR 539,611 425,218 3,749,206 2,537,896 ISRAEL (2.0%) 16,491 Check Point Software Technologies Ltd. 2,172,883 2,333,477 CANADA (1.3%) 267,065 Kinross Gold Corp. 1,359,290 1,508,917 SWEDEN (1.1%) 15,869 Sandvik AB 276,232 318,474 86,352 Telefonaktiebolaget LM Ericsson, Class B 803,621 994,525 1,079,853 1,312,999 LUXEMBOURG (0.7%) 92,317 Tenaris S.A. 1,668,514 798,947
JAPAN (19.1%) 164,541 Astellas Pharma Inc. 2,932,729 3,596,300 15,465 Daito Trust Construction Co., Ltd. 2,724,243 2,035,959 34,063 Hitachi Ltd. 1,555,034 1,400,337 86,220 Japan Exchange Group Inc. 1,857,643 2,149,494 34,343 Makita Corp. 1,435,455 1,489,111 329,984 Mitsubishi UFJ Financial Group Inc. 2,485,147 1,739,415 1,838 Nintendo Co., Ltd. 704,820 1,000,341 65,071 Sumitomo Mitsui Trust Holdings Inc. 3,211,078 2,658,910 21,317 Taisei Corp. 1,159,224 921,515 35,915 THK Co., Ltd. 1,051,164 1,039,120 57,777 Tokio Marine Holdings Inc. 2,847,589 3,740,808 172,444 Yahoo! Japan Corp. 985,964 784,932 22,950,090 22,556,242 U.K. (15.7%) 115,437 Antofagasta PLC 1,652,131 1,558,026 14,686 Aon PLC 2,033,178 3,411,225 34,310 BP PLC, ADR 1,813,375 1,177,742 662,599 BT Group PLC 2,885,614 1,364,001 49,598 Diageo PLC 2,024,327 2,239,890 133,517 GlaxoSmithKline PLC 3,174,065 3,530,893 73,387 Liberty Global PLC, Series A 2,661,648 1,705,233 1,268,143 Lloyds Banking Group PLC 1,045,603 708,546 4,812 Sensata Technologies Holding PLC 246,656 195,926 135,264 Vodafone Group PLC, ADR 4,399,266 2,621,403 21,935,863 18,512,885 SWITZERLAND (13.4%) 18,038 Chubb Ltd. 2,991,478 2,835,439 36,690 Julius Baer Group Ltd. 2,050,678 1,771,585 17,479 Nestlé S.A., Registered Shares 1,514,790 2,541,132 9,405 Novartis AG, Registered Shares 897,383 1,097,841 4,282 Roche Holding AG 1,080,355 1,965,854 17,294 Swiss Reinsurance Co., Ltd. 2,061,837 1,884,982 7,301 Zurich Financial Services AG 2,824,446 3,665,122 13,420,967 15,761,955 FRANCE (12.1%) 23,876 Accor S.A. 1,059,273 925,771 90,982 AXA S.A. 2,850,885 2,227,843 53,716 Bureau Veritas S.A. 1,535,815 1,442,124 36,949 Danone S.A. 3,646,234 3,360,459 27,529 Sanofi S.A. 3,096,938 3,421,698 17,514 SCOR S.E. 920,427 545,445 41,482 Total S.A. 2,776,345 2,276,891 15,885,917 14,200,231
Percentages shown in brackets relate investments at fair value to net assets attributable to holders of redeemable units of the Fund.
Schedule of Investment Portfolio as at March 31, 2020
No. of Shares/Par Value Description
AverageCost ($)
FairValue ($)
No. of Shares/Par Value Description
AverageCost ($)
FairValue ($)

CI International Value Fund
– 85 –Annual Financial Statements - March 31, 2020
Percentages shown in brackets relate investments at fair value to net assets attributable to holders of redeemable units of the Fund.
Schedule of Investment Portfolio as at March 31, 2020 (cont’d)
MEXICO (0.7%) 199,620 Grupo Financiero Banorte S.A.B. de C.V. 1,317,710 770,021 BRAZIL (0.6%) 214,929 Ambev S.A., ADR 1,457,714 695,730 THAILAND (0.5%) 147,775 Bangkok Bank PCL, Non-Voting Depository Receipt 1,071,772 637,446
Commissions and other portfolio transaction costs (219,054)
Total Investment Portfolio (94.7%) 120,775,564 111,354,088 Other Net Assets (Liabilities) (5.3%) 6,290,597 Net Assets Attributable to Holders of Redeemable Units (100.0%) 117,644,685
No. of Shares/Par Value Description
AverageCost ($)
FairValue ($)
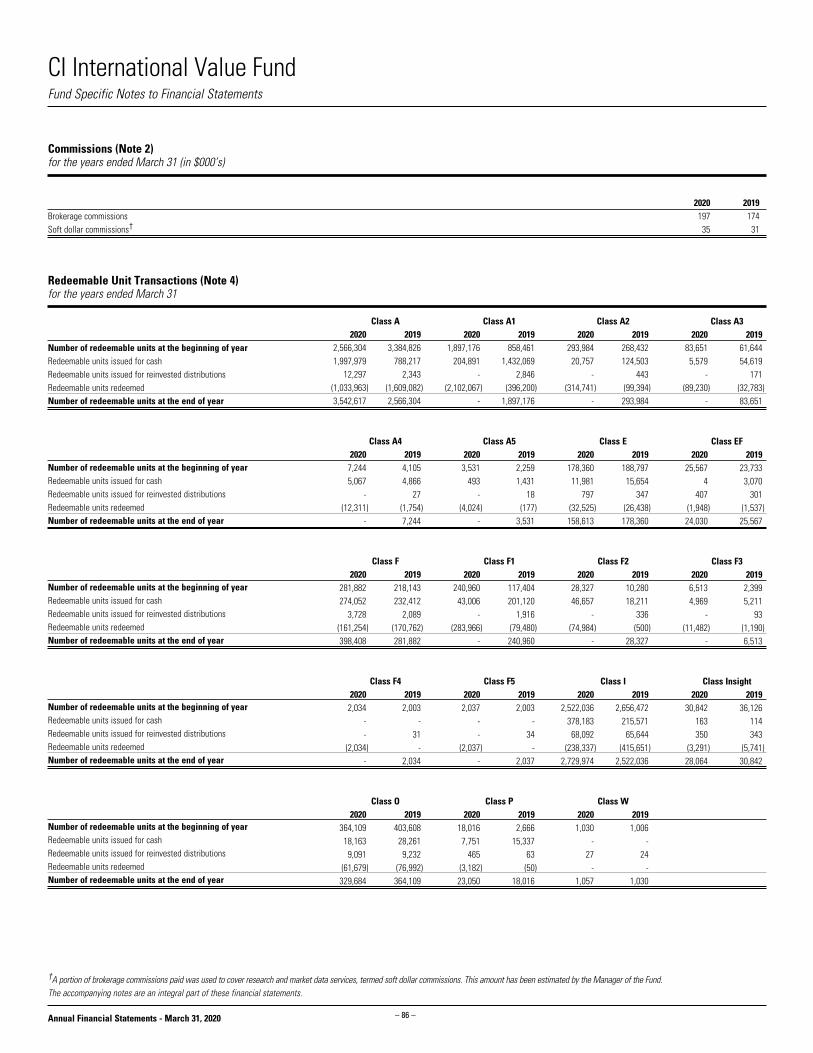
CI International Value Fund
– 86 –Annual Financial Statements - March 31, 2020
Fund Specific Notes to Financial Statements
†A portion of brokerage commissions paid was used to cover research and market data services, termed soft dollar commissions. This amount has been estimated by the Manager of the Fund.The accompanying notes are an integral part of these financial statements.
Commissions (Note 2)for the years ended March 31 (in $000’s)
2020 2019Brokerage commissions 197 174Soft dollar commissions† 35 31
Redeemable Unit Transactions (Note 4)for the years ended March 31
Number of redeemable units at the beginning of yearRedeemable units issued for cashRedeemable units issued for reinvested distributionsRedeemable units redeemedNumber of redeemable units at the end of year
Number of redeemable units at the beginning of yearRedeemable units issued for cashRedeemable units issued for reinvested distributionsRedeemable units redeemedNumber of redeemable units at the end of year
Number of redeemable units at the beginning of yearRedeemable units issued for cashRedeemable units issued for reinvested distributionsRedeemable units redeemedNumber of redeemable units at the end of year
Number of redeemable units at the beginning of yearRedeemable units issued for cashRedeemable units issued for reinvested distributionsRedeemable units redeemedNumber of redeemable units at the end of year
Number of redeemable units at the beginning of yearRedeemable units issued for cashRedeemable units issued for reinvested distributionsRedeemable units redeemedNumber of redeemable units at the end of year
Class A 2020 2019 2,566,304 3,384,826 1,997,979 788,217 12,297 2,343 (1,033,963) (1,609,082) 3,542,617 2,566,304
Class A1 2020 2019 1,897,176 858,461 204,891 1,432,069 - 2,846 (2,102,067) (396,200) - 1,897,176
Class A2 2020 2019 293,984 268,432 20,757 124,503 - 443 (314,741) (99,394) - 293,984
Class A3 2020 2019 83,651 61,644 5,579 54,619 - 171 (89,230) (32,783) - 83,651
Class A4 2020 2019 7,244 4,105 5,067 4,866 - 27 (12,311) (1,754) - 7,244
Class A5 2020 2019 3,531 2,259 493 1,431 - 18 (4,024) (177) - 3,531
Class E 2020 2019 178,360 188,797 11,981 15,654 797 347 (32,525) (26,438) 158,613 178,360
Class EF 2020 2019 25,567 23,733 4 3,070 407 301 (1,948) (1,537) 24,030 25,567
Class F 2020 2019 281,882 218,143 274,052 232,412 3,728 2,089 (161,254) (170,762) 398,408 281,882
Class F1 2020 2019 240,960 117,404 43,006 201,120 - 1,916 (283,966) (79,480) - 240,960
Class F2 2020 2019 28,327 10,280 46,657 18,211 - 336 (74,984) (500) - 28,327
Class F3 2020 2019 6,513 2,399 4,969 5,211 - 93 (11,482) (1,190) - 6,513
Class F4 2020 2019 2,034 2,003 - - - 31 (2,034) - - 2,034
Class F5 2020 2019 2,037 2,003 - - - 34 (2,037) - - 2,037
Class I 2020 2019 2,522,036 2,656,472 378,183 215,571 68,092 65,644 (238,337) (415,651) 2,729,974 2,522,036
Class Insight 2020 2019 30,842 36,126 163 114 350 343 (3,291) (5,741) 28,064 30,842
Class O 2020 2019 364,109 403,608 18,163 28,261 9,091 9,232 (61,679) (76,992) 329,684 364,109
Class P 2020 2019 18,016 2,666 7,751 15,337 465 63 (3,182) (50) 23,050 18,016
Class W 2020 2019 1,030 1,006 - - 27 24 - - 1,057 1,030
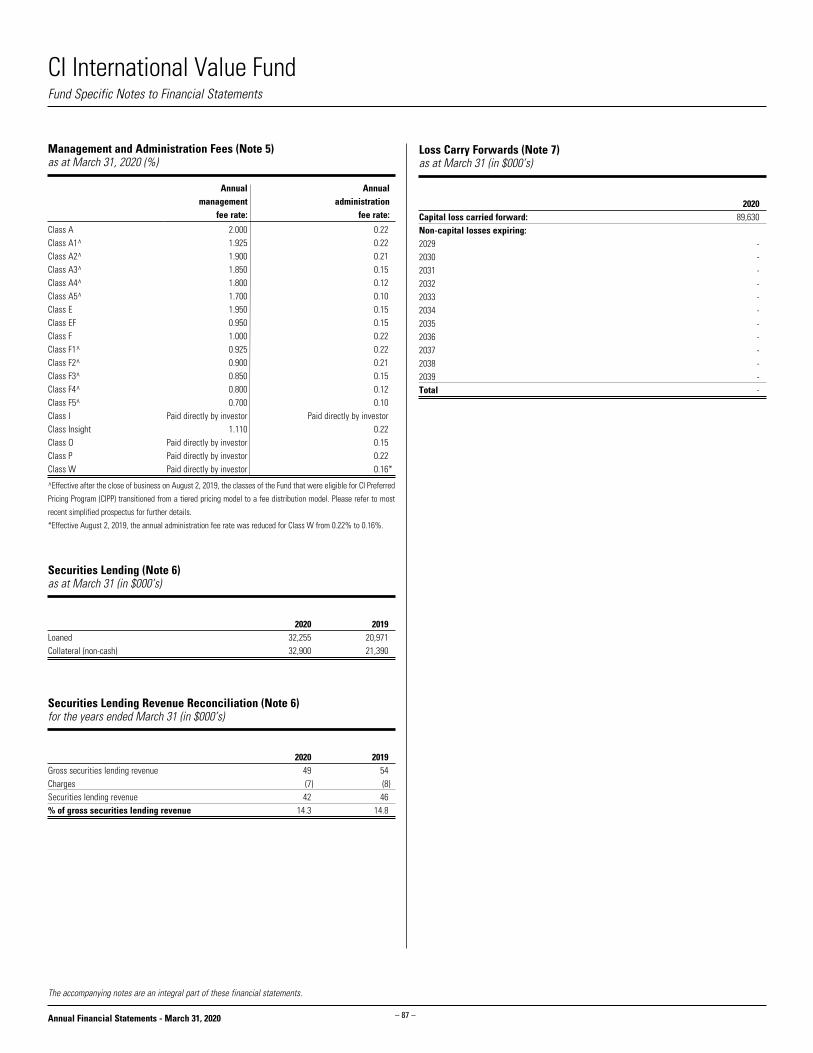
CI International Value Fund
– 87 –Annual Financial Statements - March 31, 2020
The accompanying notes are an integral part of these financial statements.
Fund Specific Notes to Financial Statements
Management and Administration Fees (Note 5) as at March 31, 2020 (%)
Annual management
fee rate:
Annual administration
fee rate:
Class A 2.000 0.22Class A1^ 1.925 0.22Class A2^ 1.900 0.21Class A3^ 1.850 0.15Class A4^ 1.800 0.12Class A5^ 1.700 0.10Class E 1.950 0.15Class EF 0.950 0.15Class F 1.000 0.22Class F1^ 0.925 0.22Class F2^ 0.900 0.21Class F3^ 0.850 0.15Class F4^ 0.800 0.12Class F5^ 0.700 0.10Class I Paid directly by investor Paid directly by investorClass Insight 1.110 0.22Class O Paid directly by investor 0.15Class P Paid directly by investor 0.22Class W Paid directly by investor 0.16*
^Effective after the close of business on August 2, 2019, the classes of the Fund that were eligible for CI Preferred
Pricing Program (CIPP) transitioned from a tiered pricing model to a fee distribution model. Please refer to most
recent simplified prospectus for further details.
*Effective August 2, 2019, the annual administration fee rate was reduced for Class W from 0.22% to 0.16%.
Securities Lending (Note 6)as at March 31 (in $000’s)
2020 2019Loaned 32,255 20,971Collateral (non-cash) 32,900 21,390
Securities Lending Revenue Reconciliation (Note 6)for the years ended March 31 (in $000’s)
2020 2019Gross securities lending revenue 49 54Charges (7) (8)Securities lending revenue 42 46% of gross securities lending revenue 14.3 14.8
Loss Carry Forwards (Note 7)as at March 31 (in $000’s)
2020Capital loss carried forward: 89,630Non-capital losses expiring:2029 -2030 -2031 -2032 -2033 -2034 -2035 -2036 -2037 -2038 -2039 -Total -
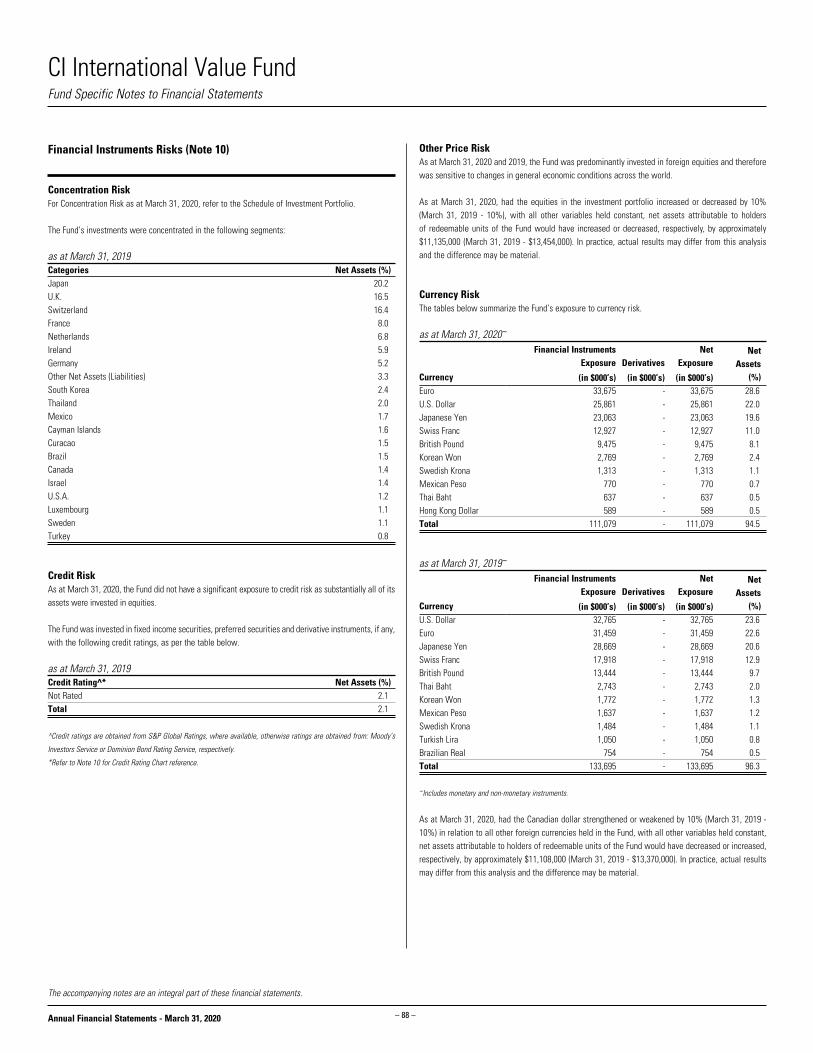
CI International Value Fund
– 88 –Annual Financial Statements - March 31, 2020
The accompanying notes are an integral part of these financial statements.
Other Price RiskAs at March 31, 2020 and 2019, the Fund was predominantly invested in foreign equities and therefore was sensitive to changes in general economic conditions across the world.
As at March 31, 2020, had the equities in the investment portfolio increased or decreased by 10% (March 31, 2019 - 10%), with all other variables held constant, net assets attributable to holders of redeemable units of the Fund would have increased or decreased, respectively, by approximately $11,135,000 (March 31, 2019 - $13,454,000). In practice, actual results may differ from this analysis and the difference may be material.
Currency RiskThe tables below summarize the Fund’s exposure to currency risk.
as at March 31, 2020~
Currency
Financial Instruments Exposure Derivatives
Net Exposure
Net Assets
(%)(in $000’s) (in $000’s) (in $000’s)Euro 33,675 - 33,675 28.6 U.S. Dollar 25,861 - 25,861 22.0 Japanese Yen 23,063 - 23,063 19.6 Swiss Franc 12,927 - 12,927 11.0 British Pound 9,475 - 9,475 8.1 Korean Won 2,769 - 2,769 2.4 Swedish Krona 1,313 - 1,313 1.1 Mexican Peso 770 - 770 0.7 Thai Baht 637 - 637 0.5 Hong Kong Dollar 589 - 589 0.5 Total 111,079 - 111,079 94.5
as at March 31, 2019~
Currency
Financial Instruments Exposure Derivatives
Net Exposure
Net Assets
(%)(in $000’s) (in $000’s) (in $000’s)U.S. Dollar 32,765 - 32,765 23.6 Euro 31,459 - 31,459 22.6 Japanese Yen 28,669 - 28,669 20.6 Swiss Franc 17,918 - 17,918 12.9 British Pound 13,444 - 13,444 9.7 Thai Baht 2,743 - 2,743 2.0 Korean Won 1,772 - 1,772 1.3 Mexican Peso 1,637 - 1,637 1.2 Swedish Krona 1,484 - 1,484 1.1 Turkish Lira 1,050 - 1,050 0.8 Brazilian Real 754 - 754 0.5 Total 133,695 - 133,695 96.3
~Includes monetary and non-monetary instruments.
As at March 31, 2020, had the Canadian dollar strengthened or weakened by 10% (March 31, 2019 - 10%) in relation to all other foreign currencies held in the Fund, with all other variables held constant, net assets attributable to holders of redeemable units of the Fund would have decreased or increased, respectively, by approximately $11,108,000 (March 31, 2019 - $13,370,000). In practice, actual results may differ from this analysis and the difference may be material.
Financial Instruments Risks (Note 10)
Concentration RiskFor Concentration Risk as at March 31, 2020, refer to the Schedule of Investment Portfolio.
The Fund’s investments were concentrated in the following segments: as at March 31, 2019 Categories Net Assets (%)Japan 20.2 U.K. 16.5 Switzerland 16.4 France 8.0 Netherlands 6.8 Ireland 5.9 Germany 5.2 Other Net Assets (Liabilities) 3.3 South Korea 2.4 Thailand 2.0 Mexico 1.7 Cayman Islands 1.6 Curacao 1.5 Brazil 1.5 Canada 1.4 Israel 1.4 U.S.A. 1.2 Luxembourg 1.1 Sweden 1.1 Turkey 0.8
Credit RiskAs at March 31, 2020, the Fund did not have a significant exposure to credit risk as substantially all of its assets were invested in equities.
The Fund was invested in fixed income securities, preferred securities and derivative instruments, if any, with the following credit ratings, as per the table below.
as at March 31, 2019 Credit Rating^* Net Assets (%)Not Rated 2.1 Total 2.1
^Credit ratings are obtained from S&P Global Ratings, where available, otherwise ratings are obtained from: Moody’s
Investors Service or Dominion Bond Rating Service, respectively.
*Refer to Note 10 for Credit Rating Chart reference.
Fund Specific Notes to Financial Statements

CI International Value Fund
– 89 –Annual Financial Statements - March 31, 2020
The accompanying notes are an integral part of these financial statements.
Interest Rate RiskAs at March 31, 2020 and 2019, the Fund did not have a significant exposure to interest rate risk as substantially all of its assets were invested in equities.
Fair Value Hierarchy
The tables below summarize the inputs used by the Fund in valuing the Fund’s investments and derivatives carried at fair value.
Long Positions at fair value as at March 31, 2020Level 1 Level 2 Level 3 Total
(in $000’s) (in $000’s) (in $000’s) (in $000’s)Equities 102,156 9,198 - 111,354 Total 102,156 9,198 - 111,354
Long Positions at fair value as at March 31, 2019Level 1 Level 2 Level 3 Total
(in $000’s) (in $000’s) (in $000’s) (in $000’s)Equities 134,539 - - 134,539 Total 134,539 - - 134,539
There were no transfers between Level 1, 2 and 3 during the years ended March 31, 2020 and 2019.
Fund Specific Notes to Financial Statements

– 90 –
CI MSCI World ESG Impact Fund
Annual Financial Statements - March 31, 2020
Statement of Financial Position as at March 31(in $000’s except for per unit amounts and units outstanding)
2020 23,745 151
- - - 12 - - - - - - 102 24,010
- -
- - - - - 112 300 - - - - 412
23,598
Statement of Financial Position (cont’d) as at March 31(in $000’s except for per unit amounts and units outstanding)
Net assets attributable to holders of redeemable units
per class (Note 4):
Net assets attributable to holders of redeemable
units per unit: Number of redeemable
units outstanding:
2020 2020 2020Class A 3,289 10.20 322,352Class E 718 10.19 70,412Class F 1,171 10.25 114,293Class I 16,499 10.26 1,608,354Class O 268 10.27 26,136Class P 1,643 10.27 160,046Class W 10 10.26 1,002
AssetsCurrent assetsInvestmentsCashUnrealized gain on futures and foreign currency forward contractsSwaps, swaptions and optionsDaily variation margin on derivative instrumentsFees rebate receivableCollateral on deposit for short saleDividends receivableInterest receivableReceivable for distribution from investmentsSecurities lending revenue receivable (Note 6)Receivable for investments soldReceivable for unit subscriptions
LiabilitiesCurrent liabilitiesInvestments sold shortBank overdraftUnrealized loss on futures and foreign currency forward contractsSwaps, swaptions and options Dividends payable on investments sold shortInterest payable on investments sold shortDaily variation margin on derivative instrumentsPayable for investments purchasedPayable for unit redemptionsDistributions payable to holders of redeemable units Management fees payableAdministration fees payableAccounts payable and accrued liabilities
Net assets attributable to holders of redeemable units
The accompanying notes are an integral part of these financial statements.
Financial Statements
CIG - 2114

– 91 –
CI MSCI World ESG Impact Fund
Annual Financial Statements - March 31, 2020
Statement of Comprehensive Income for the period ended March 31 (in $000’s except for per unit amounts and number of units)
2020
78 6 - - -
- -
76
(1,215) (1,055) - - - 41 41 (1,014)
13 2 7 - - - - - - 1 23
(1,037)
The accompanying notes are an integral part of these financial statements.
Financial Statements
Statement of Comprehensive Income (cont’d)for the period ended March 31 (in $000’s except for per unit amounts and number of units)
Increase (decrease) in net assets attributable to
holders of redeemable units per class:
Increase (decrease) in net assets attributable to
holders of redeemable units per unit:
Weighted average number of units:
2020 2020 2020Class A (229) (2.12) 108,257Class E (41) (1.87) 22,050Class F (80) (2.03) 39,511Class I (517) (0.48) 1,061,689Class O (20) (1.79) 11,047Class P (158) (4.13) 38,396Class W 8 1.12 7,496
Income Net gain (loss) on investments and derivatives Dividends Interest for distribution purposes Income distributions from investments Capital gain distributions from investments Derivative income (loss) Dividends expense on financial assets (liabilities) sold
short Interest expense on financial assets (liabilities) sold short Net realized gain (loss) on sale of investments and
derivatives Change in unrealized appreciation (depreciation) in value
of investments and derivativesTotal net gain (loss) on investments and derivativesOther income Foreign exchange gain (loss) on cash Commitment fee income Securities lending revenue (Note 6) Fees rebateTotal other incomeTotal incomeExpensesManagement fees (Note 5)Administration fees (Note 5)Commissions and other portfolio transaction costsIndependent review committee feesSecurities borrowing fees (Note 2)Margin feesService feesInterest expenseWithholding taxesHarmonized sales taxTotal expensesIncrease (decrease) in net assets attributable to holders of redeemable units

– 92 –
CI MSCI World ESG Impact Fund
Annual Financial Statements - March 31, 2020
Statement of Changes in Net Assets Attributable to Holders of Redeemable Units for the period ended March 31 (in $000’s)
Net assets attributable to holders of redeemable units at the beginning of periodIncrease (decrease) in net assets attributable to holders of redeemable unitsDistributions to holders of redeemable units From net investment income From net realized gains Return of capitalTotal distributions to holders of redeemable units
Redeemable unit transactions Proceeds from redeemable units issued Reinvestment of distributions to holders of redeemable units Redemption of redeemable unitsNet increase (decrease) from redeemable unit transactionsNet increase (decrease) in net assets attributable to holders of redeemable unitsNet assets attributable to holders of redeemable units at the end of period
The accompanying notes are an integral part of these financial statements.
Financial Statements
Class A 2020 - (229)
- - - -
3,630 - (112) 3,518 3,289 3,289
Class E 2020 - (41)
- - - -
759 - - 759 718 718
Class F 2020 - (80)
- - - -
1,261 - (10) 1,251 1,171 1,171
Class I 2020 - (517)
(59) (2) - (61)
17,916 61 (900) 17,077 16,499 16,499
Class O 2020 - (20)
- - - -
289 - (1) 288 268 268
Class P 2020 - (158)
- - - -
1,901 - (100) 1,801 1,643 1,643
Class W 2020 - 8
- - - -
177 - (175) 2 10 10
Total Fund 2020 - (1,037)
(59) (2) - (61)
25,933 61 (1,298) 24,696 23,598 23,598

– 93 –
CI MSCI World ESG Impact Fund
Annual Financial Statements - March 31, 2020
Statement of Cash Flowsfor the period ended March 31 (in $000’s)
2020
(1,037)
(76) - 7
1,215 2,024 (26,803) - - - - - - - - (12) (24,682)
- 25,827 (994) 24,833
- 151 - 151
78 6 - - -
*Dividends and interest received as well as dividends and interest paid relate to operating activities of the Fund. The accompanying notes are an integral part of these financial statements.
Financial Statements
Cash flows from (used in) operating activitiesIncrease (decrease) in net assets attributable to holders of redeemable unitsAdjustments for: Net realized (gain) loss on sale of investments and derivatives Unrealized foreign exchange (gain) loss on cash Commissions and other portfolio transaction costs Change in unrealized (appreciation) depreciation in value of
investments and derivatives Proceeds from sale and maturity of investments and derivatives Purchase of investments and derivatives (Increase) decrease in collateral on deposit for short sale Non-cash distributions from investments Change in daily variation margin (Increase) decrease in dividends receivable (Increase) decrease in interest receivable (Increase) decrease in securities lending revenue receivable Increase (decrease) in management fees payable Increase (decrease) in administration fees payable Change in other accounts receivable and payableNet cash from (used in) operating activities
Cash flows from (used in) financing activitiesDistributions paid to holders of redeemable units, net of reinvested distributionsProceeds from issuance of redeemable unitsAmounts paid on redemption of redeemable unitsNet cash from (used in) financing activities Unrealized foreign exchange gain (loss) on cashNet increase (decrease) in cashCash (bank overdraft), beginning of periodCash (bank overdraft), end of period
Supplementary Information:Dividends received, net of withholding tax*Interest received, net of withholding tax*Dividends paid*Interest paid*Tax recoverable (paid)

– 94 –
CI MSCI World ESG Impact Fund
Annual Financial Statements - March 31, 2020
EXCHANGE-TRADED FUND(S) (100.6%) 1,155,497 CI First Asset MSCI World ESG Impact ETF (Unhedged Common Units) 24,965,686 23,745,463
Commissions and other portfolio transaction costs (5,791)
Total Investment Portfolio (100.6%) 24,959,895 23,745,463 Other Net Assets (Liabilities) (-0.6%) (147,236) Net Assets Attributable to Holders of Redeemable Units (100.0%) 23,598,227
Percentages shown in brackets relate investments at fair value to net assets attributable to holders of redeemable units of the Fund.
Schedule of Investment Portfolio as at March 31, 2020
No. of Units DescriptionAverageCost ($)
FairValue ($)
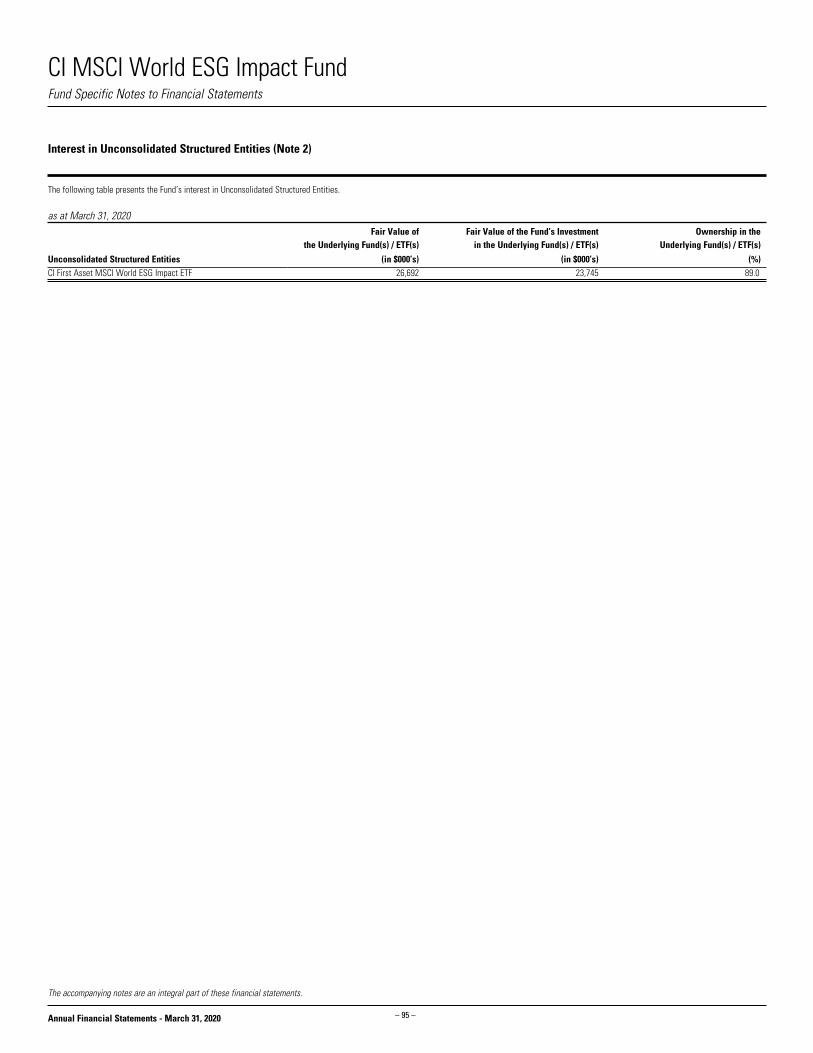
– 95 –
CI MSCI World ESG Impact Fund
Annual Financial Statements - March 31, 2020
The accompanying notes are an integral part of these financial statements.
Fund Specific Notes to Financial Statements
Interest in Unconsolidated Structured Entities (Note 2)
The following table presents the Fund’s interest in Unconsolidated Structured Entities.
as at March 31, 2020 Fair Value of
the Underlying Fund(s) / ETF(s)Fair Value of the Fund’s Investment
in the Underlying Fund(s) / ETF(s)Ownership in the
Underlying Fund(s) / ETF(s)
Unconsolidated Structured Entities (in $000’s) (in $000’s) (%)CI First Asset MSCI World ESG Impact ETF 26,692 23,745 89.0

– 96 –
CI MSCI World ESG Impact Fund
Annual Financial Statements - March 31, 2020
Redeemable Unit Transactions (Note 4)for the period ended March 31
Number of redeemable units at the beginning of periodRedeemable units issued for cashRedeemable units issued for reinvested distributionsRedeemable units redeemedNumber of redeemable units at the end of period
Number of redeemable units at the beginning of periodRedeemable units issued for cashRedeemable units issued for reinvested distributionsRedeemable units redeemedNumber of redeemable units at the end of period
Fund Specific Notes to Financial Statements
†A portion of brokerage commissions paid was used to cover research and market data services, termed soft dollar commissions. This amount has been estimated by the Manager of the Fund.The accompanying notes are an integral part of these financial statements.
Commissions (Note 2)for the period ended March 31 (in $000’s)
2020Brokerage commissions 7Soft dollar commissions† 1
Class A 2020 - 333,266 - (10,914) 322,352
Class E 2020 - 70,412 - - 70,412
Class F 2020 - 115,258 - (965) 114,293
Class I 2020 - 1,686,944 5,796 (84,386) 1,608,354
Class O 2020 - 26,219 21 (104) 26,136
Class P 2020 - 169,095 15 (9,064) 160,046
Class W 2020 - 16,796 2 (15,796) 1,002

– 97 –
CI MSCI World ESG Impact Fund
Annual Financial Statements - March 31, 2020
The accompanying notes are an integral part of these financial statements.
Fund Specific Notes to Financial Statements
Management and Administration Fees (Note 5) as at March 31, 2020 (%)
Annual management
fee rate:
Annual administration
fee rate:
Class A 1.550 0.15Class E 1.550 0.15Class F 0.550 0.15Class I Paid directly by investor Paid directly by investorClass O Paid directly by investor 0.15Class P Paid directly by investor 0.15Class W Paid directly by investor 0.09
Related Party Investments (Note 9)as at March 31 (in $000’s)
Investments 2020CI First Asset MSCI World ESG Impact ETF (Unhedged Common Units) 23,745
Securities Lending (Note 6)as at March 31 (in $000’s)
2020Loaned -Collateral (non-cash) -
Securities Lending Revenue Reconciliation (Note 6)for the period ended March 31 (in $000’s)
2020Gross securities lending revenue -Charges -Securities lending revenue -% of gross securities lending revenue -
Loss Carry Forwards (Note 7)as at March 31 (in $000’s)
2020Capital loss carried forward: -Non-capital losses expiring:2029 -2030 -2031 -2032 -2033 -2034 -2035 -2036 -2037 -2038 -2039 -Total -

– 98 –
CI MSCI World ESG Impact Fund
Annual Financial Statements - March 31, 2020
The accompanying notes are an integral part of these financial statements.
Currency RiskAs at March 31, 2020, the Fund had no significant direct exposure to currency risk.
As at March 31, 2020, the Fund indirectly bears the currency risk exposure of the Underlying Fund.
The table below summarizes the Underlying Fund’s exposure to currency risk.
as at March 31, 2020~
Currency Net Assets (%)U.S. Dollar 49.9Japanese Yen 15.9Euro 8.1Danish Krone 7.6British Pound 3.9Australian Dollar 3.8Hong Kong Dollar 3.4Singapore Dollar 1.5Swedish Krona 1.3Norwegian Krone 0.9Swiss Franc 0.2Total 96.5
~Includes monetary and non-monetary instruments.
As at March 31, 2020, had the Canadian dollar strengthened or weakened by 10% in relation to all other foreign currencies held in the Underlying Fund, with all other variables held constant, net assets attributable to holders of redeemable units of the Fund would have indirectly decreased or increased, respectively, by approximately $2,291,000. In practice, actual results may differ from this analysis and the difference may be material.
Interest Rate RiskAs at March 31, 2020, the Fund had no significant direct exposure to interest rate risk.
As at March 31, 2020, the Fund indirectly bears the interest rate risk exposure of the Underlying Fund.
As at March 31, 2020, the Underlying Fund did not have a significant exposure to interest rate risk as substantially all of its assets were invested in equities.
Fair Value Hierarchy
The table below summarizes the inputs used by the Fund in valuing the Fund’s investments and derivatives carried at fair value.
Long Positions at fair value as at March 31, 2020Level 1 Level 2 Level 3 Total
(in $000’s) (in $000’s) (in $000’s) (in $000’s)Exchange-Traded Fund(s) 23,745 - - 23,745 Total 23,745 - - 23,745
There were no transfers between Level 1, 2 and 3 during the period ended March 31, 2020.
Financial Instruments Risks (Note 10)
Concentration RiskThe Underlying Fund’s investments were concentrated in the following segments:
as at March 31, 2020 Categories Net Assets (%)U.S.A. 51.6Japan 16.4Denmark 7.8France 5.0Australia 4.0U.K. 4.0Hong Kong 3.4Singapore 1.5Sweden 1.3Portugal 1.1Ireland 1.0Belgium 0.9Norway 0.9Netherlands 0.3Austria 0.2Canada 0.2Switzerland 0.2Other Net Assets (Liabilities) 0.2
Credit RiskAs at March 31, 2020, the Fund had no significant direct exposure to credit risk.
As at March 31, 2020, the Fund indirectly bears the credit risk exposure of the Underlying Fund.
As at March 31, 2020, the Underlying Fund did not have a significant exposure to credit risk as substantially all of its assets were invested in equities.
Other Price RiskAs at March 31, 2020, the Fund bears the other price risk of the Underlying Fund.
As at March 31, 2020, the Underlying Fund was predominantly invested in foreign equities and therefore was sensitive to changes in general economic conditions across the world.
As at March 31, 2020, had the equities in the investment portfolio of the Underlying Fund increased or decreased by 10%, with all other variables held constant, net assets attributable to holders of redeemable units of the Fund would have increased or decreased, respectively, by approximately $2,369,000. In practice, actual results may differ from this analysis and the difference may be material.
Fund Specific Notes to Financial Statements
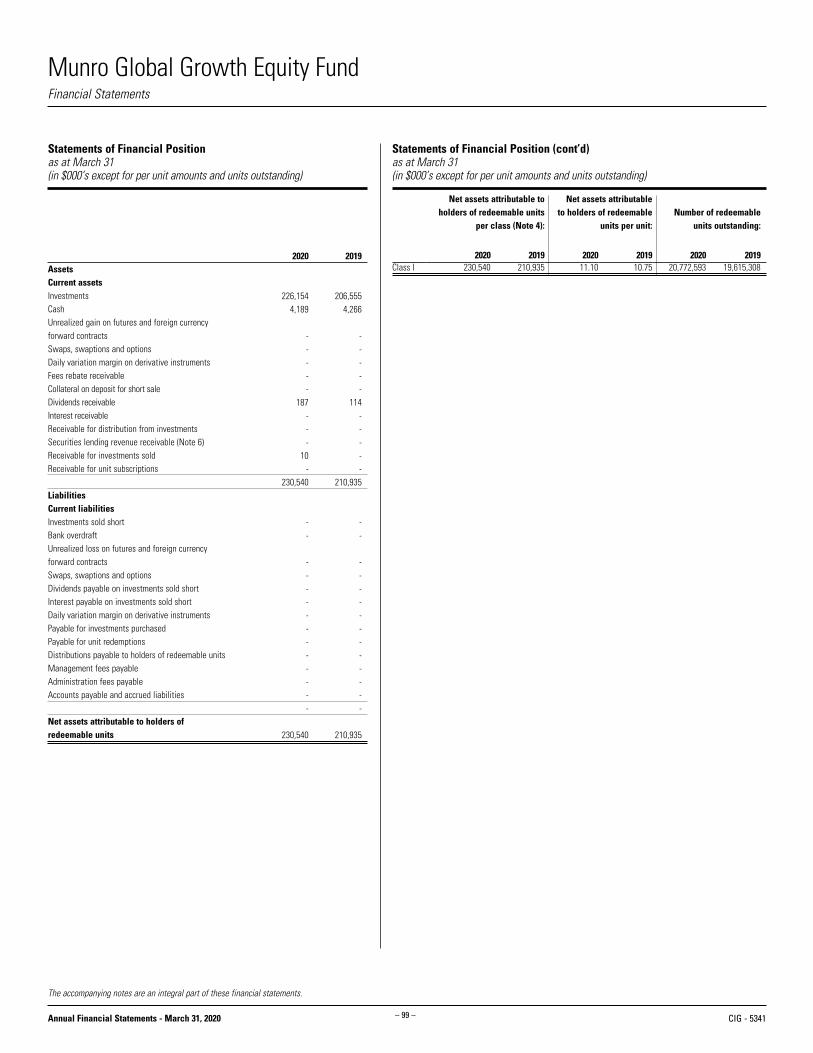
– 99 –
Munro Global Growth Equity Fund
Annual Financial Statements - March 31, 2020
Statements of Financial Position as at March 31(in $000’s except for per unit amounts and units outstanding)
2020 2019 226,154 206,555 4,189 4,266
- - - - - - - - - - 187 114 - - - - - - 10 - - - 230,540 210,935
- - - -
- - - - - - - - - - - - - - - - - - - - - - - -
230,540 210,935
Statements of Financial Position (cont’d)as at March 31(in $000’s except for per unit amounts and units outstanding)
Net assets attributable to holders of redeemable units
per class (Note 4):
Net assets attributable to holders of redeemable
units per unit: Number of redeemable
units outstanding:
2020 2019 2020 2019 2020 2019Class I 230,540 210,935 11.10 10.75 20,772,593 19,615,308Assets
Current assetsInvestmentsCashUnrealized gain on futures and foreign currency forward contractsSwaps, swaptions and optionsDaily variation margin on derivative instrumentsFees rebate receivableCollateral on deposit for short saleDividends receivableInterest receivableReceivable for distribution from investmentsSecurities lending revenue receivable (Note 6)Receivable for investments soldReceivable for unit subscriptions
LiabilitiesCurrent liabilitiesInvestments sold shortBank overdraftUnrealized loss on futures and foreign currency forward contractsSwaps, swaptions and options Dividends payable on investments sold shortInterest payable on investments sold shortDaily variation margin on derivative instrumentsPayable for investments purchasedPayable for unit redemptionsDistributions payable to holders of redeemable units Management fees payableAdministration fees payableAccounts payable and accrued liabilities
Net assets attributable to holders of redeemable units
The accompanying notes are an integral part of these financial statements.
Financial Statements
CIG - 5341

– 100 –
Munro Global Growth Equity Fund
Annual Financial Statements - March 31, 2020
Statements of Comprehensive Incomefor the periods ended March 31 (in $000’s except for per unit amounts and number of units)
2020 2019
2,479 223 87 31 - - - - - -
- - - -
(1,327) (455)
7,992 12,050 9,231 11,849 465 (392) - - 5 - - - 470 (392) 9,701 11,457
- - - - 479 201 - - - - - - - - 15 1 424 24 - - 918 226
8,783 11,231
The accompanying notes are an integral part of these financial statements.
Financial Statements
Statements of Comprehensive Income (cont’d)for the periods ended March 31 (in $000’s except for per unit amounts and number of units)
Increase (decrease) in net assets attributable to
holders of redeemable units per class:
Increase (decrease) in net assets attributable to
holders of redeemable units per unit:
Weighted average number of units:
2020 2019 2020 2019 2020 2019Class I 8,783 11,231 0.43 0.88 20,444,648 12,783,172Income
Net gain (loss) on investments and derivatives Dividends Interest for distribution purposes Income distributions from investments Capital gain distributions from investments Derivative income (loss) Dividends expense on financial assets (liabilities) sold
short Interest expense on financial assets (liabilities) sold short Net realized gain (loss) on sale of investments and
derivatives Change in unrealized appreciation (depreciation) in value
of investments and derivativesTotal net gain (loss) on investments and derivativesOther income Foreign exchange gain (loss) on cash Commitment fee income Securities lending revenue (Note 6) Fees rebateTotal other incomeTotal incomeExpensesManagement fees (Note 5)Administration fees (Note 5)Commissions and other portfolio transaction costsIndependent review committee feesSecurities borrowing fees (Note 2)Margin feesService feesInterest expenseWithholding taxesHarmonized sales taxTotal expensesIncrease (decrease) in net assets attributable to holders of redeemable units

– 101 –
Munro Global Growth Equity Fund
Annual Financial Statements - March 31, 2020
Statements of Changes in Net Assets Attributable to Holders of Redeemable Unitsfor the periods ended March 31 (in $000’s)
Net assets attributable to holders of redeemable units at the beginning of periodIncrease (decrease) in net assets attributable to holders of redeemable unitsDistributions to holders of redeemable units From net investment income From net realized gains Return of capitalTotal distributions to holders of redeemable units
Redeemable unit transactions Proceeds from redeemable units issued Reinvestment of distributions to holders of redeemable units Redemption of redeemable unitsNet increase (decrease) from redeemable unit transactionsNet increase (decrease) in net assets attributable to holders of redeemable unitsNet assets attributable to holders of redeemable units at the end of period
The accompanying notes are an integral part of these financial statements.
Financial Statements
Class I 2020 2019 210,935 - 8,783 11,231
(1,702) - (494) - - - (2,196) -
31,250 199,704 2,196 - (20,428) - 13,018 199,704 19,605 210,935 230,540 210,935

– 102 –
Munro Global Growth Equity Fund
Annual Financial Statements - March 31, 2020
Statements of Cash Flowsfor the periods ended March 31 (in $000’s)
2020 2019
8,783 11,231
1,327 455 (19) 8 479 201
(7,992) (12,050) 249,711 13,760 (263,134) (208,921) - - - - - - (73) (114) - - - - - - - - - - (10,918) (195,430)
- - 31,250 199,704 (20,428) - 10,822 199,704
19 (8) (96) 4,274 4,266 - 4,189 4,266
1,982 85 87 31 - - 15 1 - -
*Dividends and interest received as well as dividends and interest paid relate to operating activities of the Fund. The accompanying notes are an integral part of these financial statements.
Financial Statements
Cash flows from (used in) operating activitiesIncrease (decrease) in net assets attributable to holders of redeemable unitsAdjustments for: Net realized (gain) loss on sale of investments and derivatives Unrealized foreign exchange (gain) loss on cash Commissions and other portfolio transaction costs Change in unrealized (appreciation) depreciation in value of
investments and derivatives Proceeds from sale and maturity of investments and derivatives Purchase of investments and derivatives (Increase) decrease in collateral on deposit for short sale Non-cash distributions from investments Change in daily variation margin (Increase) decrease in dividends receivable (Increase) decrease in interest receivable (Increase) decrease in securities lending revenue receivable Increase (decrease) in management fees payable Increase (decrease) in administration fees payable Change in other accounts receivable and payableNet cash from (used in) operating activities
Cash flows from (used in) financing activitiesDistributions paid to holders of redeemable units, net of reinvested distributionsProceeds from issuance of redeemable unitsAmounts paid on redemption of redeemable unitsNet cash from (used in) financing activities Unrealized foreign exchange gain (loss) on cashNet increase (decrease) in cashCash (bank overdraft), beginning of periodCash (bank overdraft), end of period
Supplementary Information:Dividends received, net of withholding tax*Interest received, net of withholding tax*Dividends paid*Interest paid*Tax recoverable (paid)

– 103 –
Munro Global Growth Equity Fund
Annual Financial Statements - March 31, 2020
U.S.A. (73.3%) 57,182 Abbott Laboratories Inc. 6,346,360 6,350,515 11,575 Adobe Systems Inc. 3,987,870 5,184,338 10,296 Alphabet Inc., Class A 15,921,943 16,837,343 7,845 Amazon.com Inc. 18,716,708 21,526,964 25,100 CME Group Inc. 6,022,093 6,108,174 43,586 Danaher Corp. 6,808,095 8,490,476 35,200 Facebook Inc. 8,262,073 8,263,353 37,900 Fidelity National Information Services Inc. 6,740,226 6,488,334 34,700 Fiserv Inc. 4,921,917 4,639,006 19,100 Mastercard Inc., Class A 5,741,648 6,493,457 101,950 Microsoft Corp. 17,308,197 22,628,931 17,600 NVIDIA Corp. 5,189,915 6,529,436 69,650 PayPal Holdings Inc. 9,093,457 9,384,953 36,650 Salesforce.com Inc. 7,508,386 7,426,663 20,800 ServiceNow Inc. 6,690,688 8,389,321 38,627 Starbucks Corp. 4,528,581 3,573,866 25,975 Thermo Fisher Scientific Inc. 9,697,939 10,367,627 13,250 Trade Desk Inc. 3,857,351 3,599,074 29,383 Visa Inc., Class A 5,743,106 6,662,898 153,086,553 168,944,729 CAYMAN ISLANDS (6.5%) 452,700 Alibaba Group Holding Ltd. 13,955,246 15,071,920 NETHERLANDS (5.2%) 32,102 ASML Holding N.V. 9,090,552 12,071,360 TAIWAN (3.5%) 119,420 Taiwan Semiconductor Manufacturing Co., Ltd., ADR 7,516,854 8,032,148 FRANCE (3.4%) 38,650 Pernod Ricard S.A. 8,395,284 7,759,852 DENMARK (2.7%) 45,000 Orsted AS 6,534,242 6,229,538 U.K. (2.0%) 24,000 Atlassian Corp., PLC 4,339,757 4,636,314 PORTUGAL (1.2%) 491,000 Energias de Portugal S.A. 2,764,208 2,785,654 JAPAN (0.3%) 13,800 Freee K.K. 540,671 622,735
Commissions and other portfolio transaction costs (111,136)
Total Investment Portfolio (98.1%) 206,112,231 226,154,250 Other Net Assets (Liabilities) (1.9%) 4,385,851 Net Assets Attributable to Holders of Redeemable Units (100.0%) 230,540,101
Percentages shown in brackets relate investments at fair value to net assets attributable to holders of redeemable units of the Fund.
Schedule of Investment Portfolio as at March 31, 2020
No. of Shares/Par Value Description
AverageCost ($)
FairValue ($)

– 104 –
Munro Global Growth Equity Fund
Annual Financial Statements - March 31, 2020
Redeemable Unit Transactions (Note 4)for the periods ended March 31
Number of redeemable units at the beginning of periodRedeemable units issued for cashRedeemable units issued for reinvested distributionsRedeemable units redeemedNumber of redeemable units at the end of period
Fund Specific Notes to Financial Statements
†A portion of brokerage commissions paid was used to cover research and market data services, termed soft dollar commissions. This amount has been estimated by the Manager of the Fund.The accompanying notes are an integral part of these financial statements.
Commissions (Note 2)for the periods ended March 31 (in $000’s)
2020 2019Brokerage commissions 470 201Soft dollar commissions† 80 33
Class I 2020 2019 19,615,308 - 2,793,279 19,615,308 187,503 - (1,823,497) - 20,772,593 19,615,308
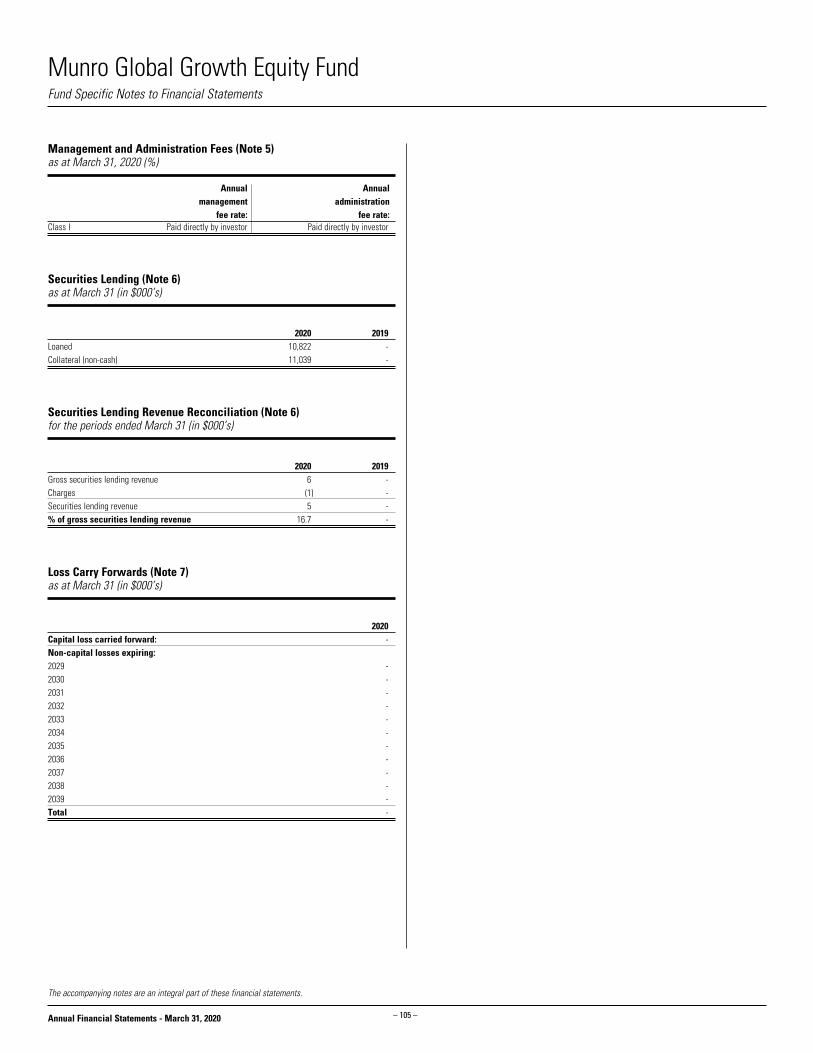
– 105 –
Munro Global Growth Equity Fund
Annual Financial Statements - March 31, 2020
The accompanying notes are an integral part of these financial statements.
Fund Specific Notes to Financial Statements
Securities Lending (Note 6)as at March 31 (in $000’s)
2020 2019Loaned 10,822 -Collateral (non-cash) 11,039 -
Securities Lending Revenue Reconciliation (Note 6)for the periods ended March 31 (in $000’s)
2020 2019Gross securities lending revenue 6 -Charges (1) -Securities lending revenue 5 -% of gross securities lending revenue 16.7 -
Management and Administration Fees (Note 5) as at March 31, 2020 (%)
Annual management
fee rate:
Annual administration
fee rate: Class I Paid directly by investor Paid directly by investor
Loss Carry Forwards (Note 7)as at March 31 (in $000’s)
2020Capital loss carried forward: -Non-capital losses expiring:2029 -2030 -2031 -2032 -2033 -2034 -2035 -2036 -2037 -2038 -2039 -Total -
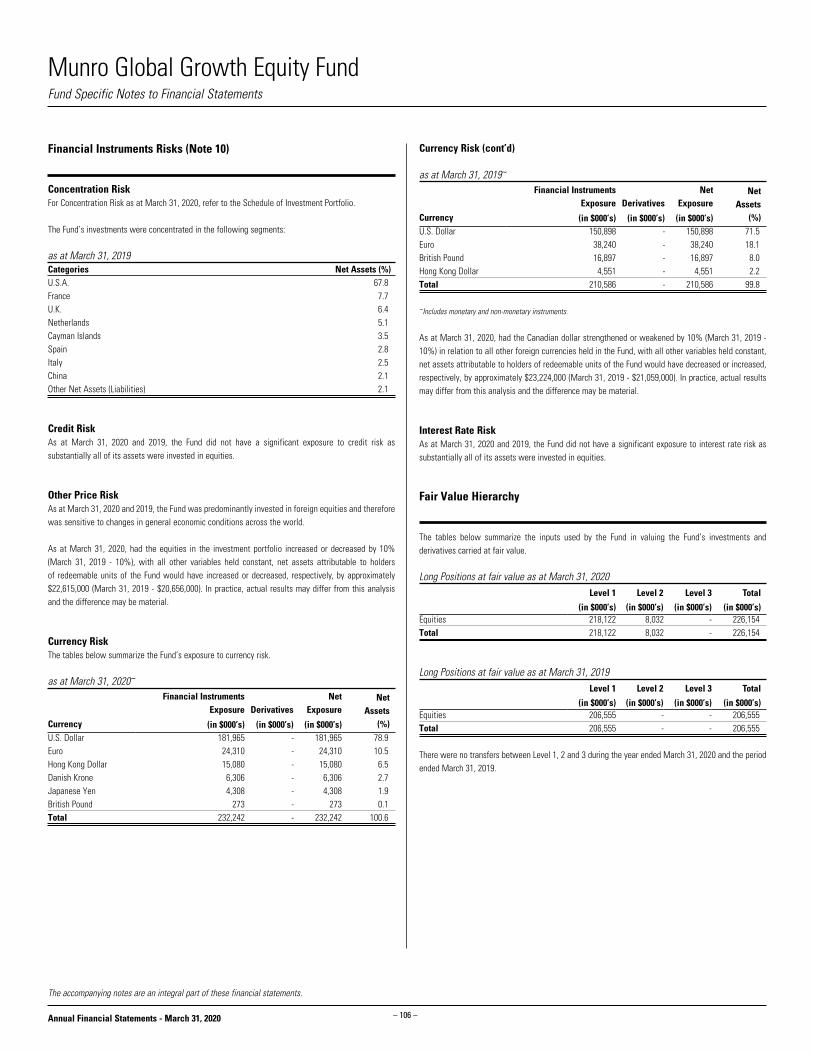
– 106 –
Munro Global Growth Equity Fund
Annual Financial Statements - March 31, 2020
The accompanying notes are an integral part of these financial statements.
Currency Risk (cont’d)
as at March 31, 2019~
Currency
Financial Instruments Exposure Derivatives
Net Exposure
Net Assets
(%)(in $000’s) (in $000’s) (in $000’s)U.S. Dollar 150,898 - 150,898 71.5 Euro 38,240 - 38,240 18.1 British Pound 16,897 - 16,897 8.0 Hong Kong Dollar 4,551 - 4,551 2.2 Total 210,586 - 210,586 99.8
~Includes monetary and non-monetary instruments.
As at March 31, 2020, had the Canadian dollar strengthened or weakened by 10% (March 31, 2019 - 10%) in relation to all other foreign currencies held in the Fund, with all other variables held constant, net assets attributable to holders of redeemable units of the Fund would have decreased or increased, respectively, by approximately $23,224,000 (March 31, 2019 - $21,059,000). In practice, actual results may differ from this analysis and the difference may be material.
Interest Rate RiskAs at March 31, 2020 and 2019, the Fund did not have a significant exposure to interest rate risk as substantially all of its assets were invested in equities.
Fair Value Hierarchy
The tables below summarize the inputs used by the Fund in valuing the Fund’s investments and derivatives carried at fair value.
Long Positions at fair value as at March 31, 2020Level 1 Level 2 Level 3 Total
(in $000’s) (in $000’s) (in $000’s) (in $000’s)Equities 218,122 8,032 - 226,154 Total 218,122 8,032 - 226,154
Long Positions at fair value as at March 31, 2019Level 1 Level 2 Level 3 Total
(in $000’s) (in $000’s) (in $000’s) (in $000’s)Equities 206,555 - - 206,555 Total 206,555 - - 206,555
There were no transfers between Level 1, 2 and 3 during the year ended March 31, 2020 and the period ended March 31, 2019.
Financial Instruments Risks (Note 10)
Concentration RiskFor Concentration Risk as at March 31, 2020, refer to the Schedule of Investment Portfolio.
The Fund’s investments were concentrated in the following segments:
as at March 31, 2019Categories Net Assets (%)U.S.A. 67.8 France 7.7 U.K. 6.4 Netherlands 5.1 Cayman Islands 3.5 Spain 2.8 Italy 2.5 China 2.1 Other Net Assets (Liabilities) 2.1
Credit RiskAs at March 31, 2020 and 2019, the Fund did not have a significant exposure to credit risk as substantially all of its assets were invested in equities.
Other Price RiskAs at March 31, 2020 and 2019, the Fund was predominantly invested in foreign equities and therefore was sensitive to changes in general economic conditions across the world.
As at March 31, 2020, had the equities in the investment portfolio increased or decreased by 10% (March 31, 2019 - 10%), with all other variables held constant, net assets attributable to holders of redeemable units of the Fund would have increased or decreased, respectively, by approximately $22,615,000 (March 31, 2019 - $20,656,000). In practice, actual results may differ from this analysis and the difference may be material.
Currency RiskThe tables below summarize the Fund’s exposure to currency risk.
as at March 31, 2020~
Currency
Financial Instruments Exposure Derivatives
Net Exposure
Net Assets
(%)(in $000’s) (in $000’s) (in $000’s)U.S. Dollar 181,965 - 181,965 78.9 Euro 24,310 - 24,310 10.5 Hong Kong Dollar 15,080 - 15,080 6.5 Danish Krone 6,306 - 6,306 2.7 Japanese Yen 4,308 - 4,308 1.9 British Pound 273 - 273 0.1 Total 232,242 - 232,242 100.6
Fund Specific Notes to Financial Statements

– 107 –
CI High Interest Savings Fund
Annual Financial Statements - March 31, 2020
Statement of Financial Position as at March 31(in $000’s except for per unit amounts and units outstanding)
2020 1,963,841 3,894
- - - 534 - 2,409 - - - - 20,808 1,991,486
- -
- - - - - - 24,854 - - - - 24,854
1,966,632
Statement of Financial Position (cont’d) as at March 31(in $000’s except for per unit amounts and units outstanding)
Net assets attributable to holders of redeemable units
per class (Note 4):
Net assets attributable to holders of redeemable
units per unit: Number of redeemable
units outstanding:
2020 2020 2020Class A 1,220,732 10.00 122,057,395Class E 41,342 10.00 4,133,883Class F 464,100 10.00 46,409,258Class I 79,604 10.00 7,961,900Class O 90,816 10.00 9,079,536Class P 17,055 10.00 1,705,197Class W 52,983 10.00 5,296,988
AssetsCurrent assetsInvestmentsCashUnrealized gain on futures and foreign currency forward contractsSwaps, swaptions and optionsDaily variation margin on derivative instrumentsFees rebate receivableCollateral on deposit for short saleDividends receivableInterest receivableReceivable for distribution from investmentsSecurities lending revenue receivable (Note 6)Receivable for investments soldReceivable for unit subscriptions
LiabilitiesCurrent liabilitiesInvestments sold shortBank overdraftUnrealized loss on futures and foreign currency forward contractsSwaps, swaptions and options Dividends payable on investments sold shortInterest payable on investments sold shortDaily variation margin on derivative instrumentsPayable for investments purchasedPayable for unit redemptionsDistributions payable to holders of redeemable units Management fees payableAdministration fees payableAccounts payable and accrued liabilities
Net assets attributable to holders of redeemable units
The accompanying notes are an integral part of these financial statements.
Financial Statements
CIG - 2113
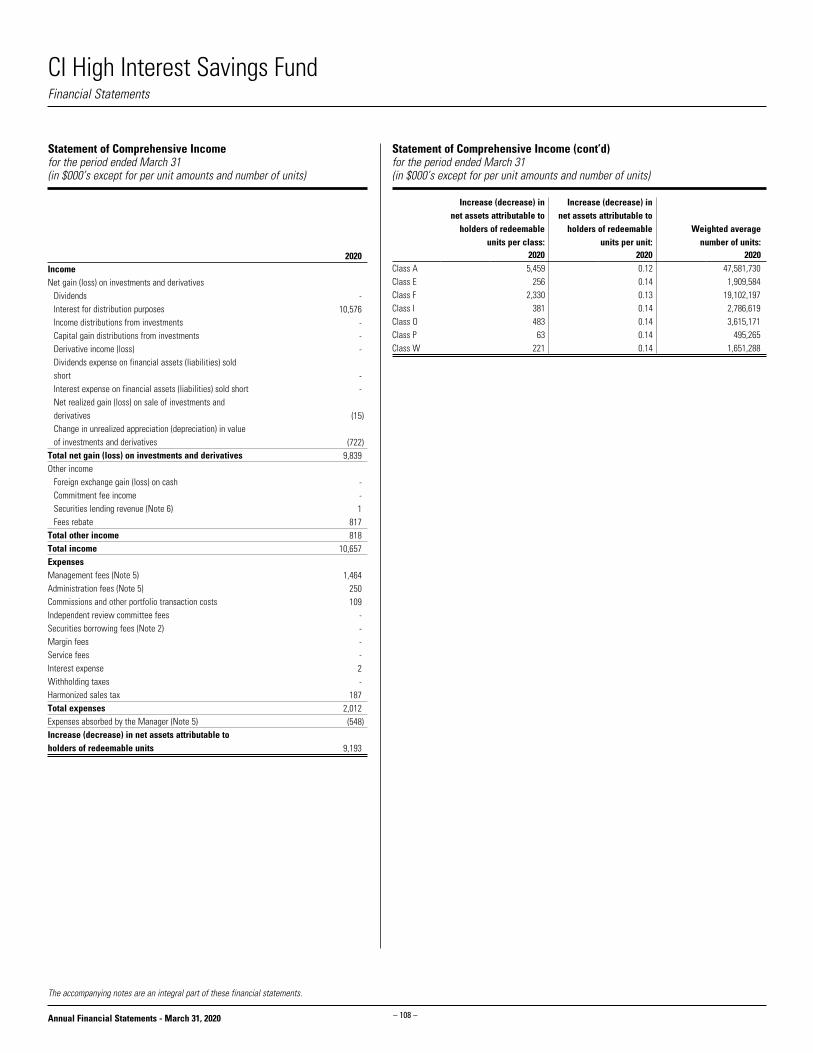
– 108 –
CI High Interest Savings Fund
Annual Financial Statements - March 31, 2020
Statement of Comprehensive Income for the period ended March 31 (in $000’s except for per unit amounts and number of units)
2020
- 10,576 - - -
- -
(15)
(722) 9,839 - - 1 817 818 10,657
1,464 250 109 - - - - 2 - 187 2,012 (548)
9,193
The accompanying notes are an integral part of these financial statements.
Financial Statements
Statement of Comprehensive Income (cont’d)for the period ended March 31 (in $000’s except for per unit amounts and number of units)
Increase (decrease) in net assets attributable to
holders of redeemable units per class:
Increase (decrease) in net assets attributable to
holders of redeemable units per unit:
Weighted average number of units:
2020 2020 2020Class A 5,459 0.12 47,581,730Class E 256 0.14 1,909,584Class F 2,330 0.13 19,102,197Class I 381 0.14 2,786,619Class O 483 0.14 3,615,171Class P 63 0.14 495,265Class W 221 0.14 1,651,288
Income Net gain (loss) on investments and derivatives Dividends Interest for distribution purposes Income distributions from investments Capital gain distributions from investments Derivative income (loss) Dividends expense on financial assets (liabilities) sold
short Interest expense on financial assets (liabilities) sold short Net realized gain (loss) on sale of investments and
derivatives Change in unrealized appreciation (depreciation) in value
of investments and derivativesTotal net gain (loss) on investments and derivativesOther income Foreign exchange gain (loss) on cash Commitment fee income Securities lending revenue (Note 6) Fees rebateTotal other incomeTotal incomeExpensesManagement fees (Note 5)Administration fees (Note 5)Commissions and other portfolio transaction costsIndependent review committee feesSecurities borrowing fees (Note 2)Margin feesService feesInterest expenseWithholding taxesHarmonized sales taxTotal expensesExpenses absorbed by the Manager (Note 5)Increase (decrease) in net assets attributable to holders of redeemable units

– 109 –
CI High Interest Savings Fund
Annual Financial Statements - March 31, 2020
Statement of Changes in Net Assets Attributable to Holders of Redeemable Units for the period ended March 31 (in $000’s)
Net assets attributable to holders of redeemable units at the beginning of periodIncrease (decrease) in net assets attributable to holders of redeemable unitsDistributions to holders of redeemable units From net investment income From net realized gains Return of capitalTotal distributions to holders of redeemable units
Redeemable unit transactions Proceeds from redeemable units issued Reinvestment of distributions to holders of redeemable units Redemption of redeemable unitsNet increase (decrease) from redeemable unit transactionsNet increase (decrease) in net assets attributable to holders of redeemable unitsNet assets attributable to holders of redeemable units at the end of period
Net assets attributable to holders of redeemable units at the beginning of periodIncrease (decrease) in net assets attributable to holders of redeemable unitsDistributions to holders of redeemable units From net investment income From net realized gains Return of capitalTotal distributions to holders of redeemable units
Redeemable unit transactions Proceeds from redeemable units issued Reinvestment of distributions to holders of redeemable units Redemption of redeemable unitsNet increase (decrease) from redeemable unit transactionsNet increase (decrease) in net assets attributable to holders of redeemable unitsNet assets attributable to holders of redeemable units at the end of period
The accompanying notes are an integral part of these financial statements.
Financial Statements
Class A 2020 - 5,459
(5,902) - - (5,902)
1,704,815 5,744 (489,384) 1,221,175 1,220,732 1,220,732
Class E 2020 - 256
(241) - - (241)
61,035 241 (19,949) 41,327 41,342 41,342
Class F 2020 - 2,330
(2,604) - - (2,604)
754,870 2,492 (292,988) 464,374 464,100 464,100
Class I 2020 - 381
(433) - - (433)
107,575 433 (28,352) 79,656 79,604 79,604
Class O 2020 - 483
(517) - - (517)
124,216 517 (33,883) 90,850 90,816 90,816
Class P 2020 - 63
(67) - - (67)
22,355 67 (5,363) 17,059 17,055 17,055
Class W 2020 - 221
(250) - - (250)
79,266 249 (26,503) 53,012 52,983 52,983
Total Fund 2020 - 9,193
(10,014) - - (10,014)
2,854,132 9,743 (896,422) 1,967,453 1,966,632 1,966,632

– 110 –
CI High Interest Savings Fund
Annual Financial Statements - March 31, 2020
Statement of Cash Flowsfor the period ended March 31 (in $000’s)
2020
9,193
15 - 109
722 88,843 (2,053,530) - - - (2,409) - - - - (534) (1,957,591)
(271) 2,752,064 (790,308) 1,961,485
- 3,894 - 3,894
- 10,576 - 2 -
*Dividends and interest received as well as dividends and interest paid relate to operating activities of the Fund. The accompanying notes are an integral part of these financial statements.
Financial Statements
Cash flows from (used in) operating activitiesIncrease (decrease) in net assets attributable to holders of redeemable unitsAdjustments for: Net realized (gain) loss on sale of investments and derivatives Unrealized foreign exchange (gain) loss on cash Commissions and other portfolio transaction costs Change in unrealized (appreciation) depreciation in value of
investments and derivatives Proceeds from sale and maturity of investments and derivatives Purchase of investments and derivatives (Increase) decrease in collateral on deposit for short sale Non-cash distributions from investments Change in daily variation margin (Increase) decrease in dividends receivable (Increase) decrease in interest receivable (Increase) decrease in securities lending revenue receivable Increase (decrease) in management fees payable Increase (decrease) in administration fees payable Change in other accounts receivable and payableNet cash from (used in) operating activities
Cash flows from (used in) financing activitiesDistributions paid to holders of redeemable units, net of reinvested distributionsProceeds from issuance of redeemable unitsAmounts paid on redemption of redeemable unitsNet cash from (used in) financing activities Unrealized foreign exchange gain (loss) on cashNet increase (decrease) in cashCash (bank overdraft), beginning of periodCash (bank overdraft), end of period
Supplementary Information:Dividends received, net of withholding tax*Interest received, net of withholding tax*Dividends paid*Interest paid*Tax recoverable (paid)

– 111 –
CI High Interest Savings Fund
Annual Financial Statements - March 31, 2020
EXCHANGE-TRADED FUND(S) (99.9%) 39,268,186 CI First Asset High Interest Savings ETF (Common Units) 1,964,661,251 1,963,841,250
Commissions and other portfolio transaction costs (98,120)
Total Investment Portfolio (99.9%) 1,964,563,131 1,963,841,250 Other Net Assets (Liabilities) (0.1%) 2,790,833 Net Assets Attributable to Holders of Redeemable Units (100.0%) 1,966,632,083
Percentages shown in brackets relate investments at fair value to net assets attributable to holders of redeemable units of the Fund.
Schedule of Investment Portfolio as at March 31, 2020
No. of Units DescriptionAverageCost ($)
FairValue ($)

– 112 –
CI High Interest Savings Fund
Annual Financial Statements - March 31, 2020
The accompanying notes are an integral part of these financial statements.
Fund Specific Notes to Financial Statements
Interest in Unconsolidated Structured Entities (Note 2)
The following table presents the Fund’s interest in Unconsolidated Structured Entities.
as at March 31, 2020 Fair Value of
the Underlying Fund(s) / ETF(s)Fair Value of the Fund’s Investment
in the Underlying Fund(s) / ETF(s)Ownership in the
Underlying Fund(s) / ETF(s)
Unconsolidated Structured Entities (in $000’s) (in $000’s) (%)CI First Asset High Interest Savings ETF 2,295,510 1,963,841 85.6
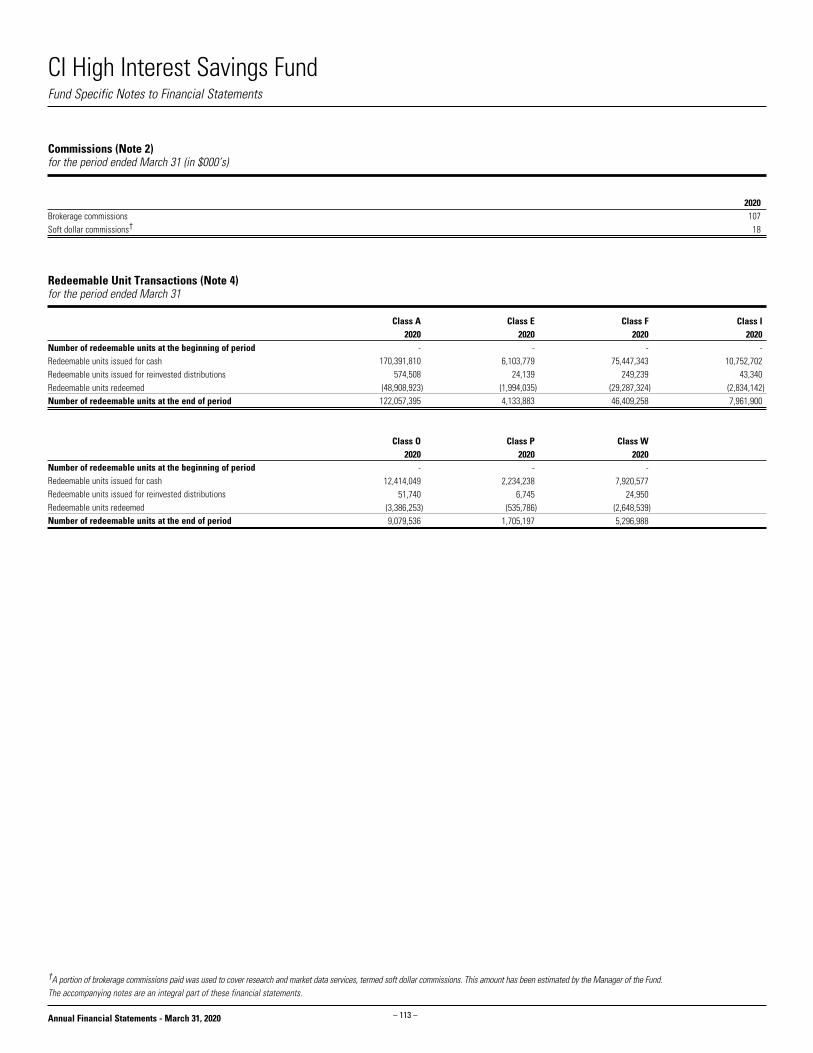
– 113 –
CI High Interest Savings Fund
Annual Financial Statements - March 31, 2020
Redeemable Unit Transactions (Note 4)for the period ended March 31
Number of redeemable units at the beginning of periodRedeemable units issued for cashRedeemable units issued for reinvested distributionsRedeemable units redeemedNumber of redeemable units at the end of period
Number of redeemable units at the beginning of periodRedeemable units issued for cashRedeemable units issued for reinvested distributionsRedeemable units redeemedNumber of redeemable units at the end of period
Fund Specific Notes to Financial Statements
†A portion of brokerage commissions paid was used to cover research and market data services, termed soft dollar commissions. This amount has been estimated by the Manager of the Fund.The accompanying notes are an integral part of these financial statements.
Commissions (Note 2)for the period ended March 31 (in $000’s)
2020Brokerage commissions 107Soft dollar commissions† 18
Class A 2020 - 170,391,810 574,508 (48,908,923) 122,057,395
Class E 2020 - 6,103,779 24,139 (1,994,035) 4,133,883
Class F 2020 - 75,447,343 249,239 (29,287,324) 46,409,258
Class I 2020 - 10,752,702 43,340 (2,834,142) 7,961,900
Class O 2020 - 12,414,049 51,740 (3,386,253) 9,079,536
Class P 2020 - 2,234,238 6,745 (535,786) 1,705,197
Class W 2020 - 7,920,577 24,950 (2,648,539) 5,296,988

– 114 –
CI High Interest Savings Fund
Annual Financial Statements - March 31, 2020
The accompanying notes are an integral part of these financial statements.
Fund Specific Notes to Financial Statements
Management and Administration Fees (Note 5) as at March 31, 2020 (%)
Annual management
fee rate:
Annual administration
fee rate:
Class A 0.390 0.05Class E 0.390 0.05Class F 0.140 0.05Class I Paid directly by investor Paid directly by investorClass O Paid directly by investor 0.05Class P Paid directly by investor 0.05Class W Paid directly by investor 0.05
Related Party Investments (Note 9)as at March 31 (in $000’s)
Investments 2020CI First Asset High Interest Savings ETF (Common Units) 1,963,841
Securities Lending (Note 6)as at March 31 (in $000’s)
2020Loaned 115Collateral (non-cash) 117
Securities Lending Revenue Reconciliation (Note 6)for the period ended March 31 (in $000’s)
2020Gross securities lending revenue 1Charges -Securities lending revenue 1% of gross securities lending revenue -
Loss Carry Forwards (Note 7)as at March 31 (in $000’s)
2020Capital loss carried forward: 14Non-capital losses expiring:2029 -2030 -2031 -2032 -2033 -2034 -2035 -2036 -2037 -2038 -2039 -Total -

– 115 –
CI High Interest Savings Fund
Annual Financial Statements - March 31, 2020
The accompanying notes are an integral part of these financial statements.
Fair Value Hierarchy
The table below summarizes the inputs used by the Fund in valuing the Fund’s investments and derivatives carried at fair value.
Long Positions at fair value as at March 31, 2020Level 1 Level 2 Level 3 Total
(in $000’s) (in $000’s) (in $000’s) (in $000’s)Exchange-Traded Fund(s) 1,963,841 - - 1,963,841 Total 1,963,841 - - 1,963,841
There were no transfers between Level 1, 2 and 3 during the period ended March 31, 2020.
Financial Instruments Risks (Note 10)
Concentration RiskThe Underlying Fund’s investments were concentrated in the following segments:
as at March 31, 2020 Categories Net Assets (%)Short-Term Investments 100.0Other Net Assets (Liabilities) 0.0
Credit RiskAs at March 31, 2020, the Fund had no significant direct exposure to credit risk.
As at March 31, 2020, the Fund indirectly bears the credit risk exposure of the Underlying Fund.
As at March 31, 2020, the Underlying Fund was not exposed to significant credit risk as all of its assets were held in cash.
Other Price RiskAs at March 31, 2020, the Fund bears the other price risk of the Underlying Fund.
As at March 31, 2020, the Underlying Fund did not have exposure to other price risk as all its assets were held in cash.
Currency RiskAs at March 31, 2020, the Fund had no significant direct exposure to currency risk.
As at March 31, 2020, the Fund indirectly bears the currency risk exposure of the Underlying Fund
As at March 31, 2020, the Underlying Fund’s assets were denominated in Canadian dollars, the functional currency of the Underlying Fund and the Fund; as a result, the Underlying Fund and the Fund had no exposure to currency risk.
Interest Rate RiskAs at March 31, 2020, the Fund had no significant direct exposure to interest rate risk.
As at March 31, 2020, the Fund indirectly bears the interest rate risk exposure of the Underlying Fund.
As at March 31, 2020, the Underlying Fund was not exposed to interest rate risk as all of its assets were held in cash.
Fund Specific Notes to Financial Statements

CI Income Fund
– 116 –Annual Financial Statements - March 31, 2020
Statements of Financial Position as at March 31(in $000’s except for per unit amounts and units outstanding)
2020 2019
5,292,645 6,165,682 676,406 507,008
1,999 1,411 - 12,918 387 2,758 97 110 - - 1,517 2,231 30,446 36,544 - - - - 4,947 4,601 5,723 3,356 6,014,167 6,736,619
- - - -
96,794 12,879 1,316 13,276 - - - - - - 30,447 30,365 181,458 5,817 - - - - - - - - 310,015 62,337
5,704,152 6,674,282
Statements of Financial Position (cont’d)as at March 31(in $000’s except for per unit amounts and units outstanding)
Net assets attributable to holders of redeemable units
per class (Note 4):
Net assets attributable to holders of redeemable
units per unit: Number of redeemable
units outstanding:
2020 2019 2020 2019 2020 2019Class A 336,086 175,707 8.22 8.72 40,901,766 20,153,730Class A1 - 142,731 - 9.26 - 15,415,661Class A2 - 33,315 - 9.26 - 3,597,790Class A3 - 15,088 - 9.25 - 1,631,284Class A4 - 2,147 - 9.26 - 231,881Class A5 - 585 - 9.26 - 63,194Class C 4,121,125 4,827,978 11.48 11.70 358,984,579 412,495,158Class E 18,808 19,404 8.06 8.54 2,333,297 2,272,822Class EF 7,911 8,065 8.27 8.76 956,749 920,931Class F 40,764 14,774 8.19 8.71 4,974,456 1,696,317Class F1 - 14,370 - 9.27 - 1,550,241Class F2 - 6,519 - 9.27 - 702,962Class F3 - 2,654 - 9.27 - 286,340Class F4 - 1,101 - 9.27 - 118,790Class F5 - 20 - 9.26 - 2,213Class I 1,132,300 1,360,506 8.15 8.66 139,004,554 157,045,969Class O 43,591 47,245 8.30 8.83 5,252,570 5,351,119Class P 2,347 2,062 8.73 9.26 268,710 222,629Class W 1,220 11 9.00 9.55 135,577 1,114
AssetsCurrent assetsInvestmentsCashUnrealized gain on futures and foreign currency forward contractsSwaps, swaptions and optionsDaily variation margin on derivative instrumentsFees rebate receivableCollateral on deposit for short saleDividends receivableInterest receivableReceivable for distribution from investmentsSecurities lending revenue receivable (Note 6)Receivable for investments soldReceivable for unit subscriptions
LiabilitiesCurrent liabilitiesInvestments sold shortBank overdraftUnrealized loss on futures and foreign currency forward contractsSwaps, swaptions and options Dividends payable on investments sold shortInterest payable on investments sold shortDaily variation margin on derivative instrumentsPayable for investments purchasedPayable for unit redemptionsDistributions payable to holders of redeemable units Management fees payableAdministration fees payableAccounts payable and accrued liabilities Net assets attributable to holders of redeemable units
The accompanying notes are an integral part of these financial statements.
Financial Statements
CIG - 2339

CI Income Fund
– 117 –Annual Financial Statements - March 31, 2020
Statements of Comprehensive Incomefor the years ended March 31(in $000’s except for per unit amounts and number of units)
2020 2019
42,321 41,827 151,350 186,598 2,725 113 519 69 2,071 (1,003)
- - - -
188,283 (155,292)
(358,975) 234,726 28,294 307,038 45,377 (405) - - 990 1,716 1,712 1,236 48,079 2,547 76,373 309,585
18,048 19,760 810 858 1,999 1,429 - - 64 56 - - - - 155 77 2,970 3,437 2,107 2,303 26,153 27,920
50,220 281,665
The accompanying notes are an integral part of these financial statements.
Financial Statements
Statements of Comprehensive Income (cont’d)for the years ended March 31(in $000’s except for per unit amounts and number of units)
Increase (decrease) in net assets attributable to
holders of redeemable units per class:
Increase (decrease) in net assets attributable to
holders of redeemable units per unit:
Weighted average number of units:
2020 2019 2020 2019 2020 2019Class A (8,089) 2,843 (0.24) 0.11 33,931,222 27,523,175Class A1 3,667 5,258 0.24 0.44 15,174,126 11,864,256Class A2 878 921 0.24 0.27 3,620,675 3,483,715Class A3 409 426 0.25 0.27 1,663,580 1,652,116Class A4 58 67 0.25 0.26 230,248 248,694Class A5 17 12 0.26 0.24 65,411 49,037Class C 38,523 204,881 0.10 0.45 393,153,196 458,812,437Class E (224) 479 (0.09) 0.19 2,375,895 2,555,458Class EF (1) 272 - 0.31 938,815 877,166Class F (959) 348 (0.26) 0.14 3,768,314 2,611,586Class F1 436 593 0.27 0.51 1,586,363 1,159,441Class F2 178 231 0.26 0.48 666,711 484,698Class F3 94 86 0.26 0.45 351,216 194,885Class F4 33 44 0.28 0.57 116,939 79,260Class F5 1 - 0.28 0.10 2,228 8,126Class I 14,889 63,067 0.10 0.43 148,829,358 145,913,058Class O 330 2,047 0.06 0.35 5,287,549 5,975,731Class P (8) 86 (0.03) 0.39 252,490 222,313Class W (12) 4 (0.90) 1.03 12,837 2,745
Income Net gain (loss) on investments and derivatives Dividends Interest for distribution purposes Income distributions from investments Capital gain distributions from investments Derivative income (loss) Dividends expense on financial assets (liabilities) sold
short Interest expense on financial assets (liabilities) sold short Net realized gain (loss) on sale of investments and
derivatives Change in unrealized appreciation (depreciation) in value
of investments and derivativesTotal net gain (loss) on investments and derivativesOther income Foreign exchange gain (loss) on cash Commitment fee income Securities lending revenue (Note 6) Fees rebateTotal other incomeTotal incomeExpensesManagement fees (Note 5)Administration fees (Note 5)Commissions and other portfolio transaction costsIndependent review committee feesSecurities borrowing fees (Note 2)Margin feesService feesInterest expenseWithholding taxesHarmonized sales taxTotal expensesIncrease (decrease) in net assets attributable to holders of redeemable units

CI Income Fund
– 118 –Annual Financial Statements - March 31, 2020
Statements of Changes in Net Assets Attributable to Holders of Redeemable Unitsfor the years ended March 31 (in $000’s)
Net assets attributable to holders of redeemable units at the beginning of yearIncrease (decrease) in net assets attributable to holders of redeemable unitsDistributions to holders of redeemable units From net investment income From net realized gains Return of capitalTotal distributions to holders of redeemable units
Redeemable unit transactions Proceeds from redeemable units issued Reinvestment of distributions to holders of redeemable units Redemption of redeemable unitsNet increase (decrease) from redeemable unit transactionsNet increase (decrease) in net assets attributable to holders of redeemable unitsNet assets attributable to holders of redeemable units at the end of year
Net assets attributable to holders of redeemable units at the beginning of yearIncrease (decrease) in net assets attributable to holders of redeemable unitsDistributions to holders of redeemable units From net investment income From net realized gains Return of capitalTotal distributions to holders of redeemable units
Redeemable unit transactions Proceeds from redeemable units issued Reinvestment of distributions to holders of redeemable units Redemption of redeemable unitsNet increase (decrease) from redeemable unit transactionsNet increase (decrease) in net assets attributable to holders of redeemable unitsNet assets attributable to holders of redeemable units at the end of year
Net assets attributable to holders of redeemable units at the beginning of yearIncrease (decrease) in net assets attributable to holders of redeemable unitsDistributions to holders of redeemable units From net investment income From net realized gains Return of capitalTotal distributions to holders of redeemable units
Redeemable unit transactions Proceeds from redeemable units issued Reinvestment of distributions to holders of redeemable units Redemption of redeemable unitsNet increase (decrease) from redeemable unit transactionsNet increase (decrease) in net assets attributable to holders of redeemable unitsNet assets attributable to holders of redeemable units at the end of year
The accompanying notes are an integral part of these financial statements.
Financial Statements
Class A 2020 2019 175,707 314,990 (8,089) 2,843
(8,276) (4,927) - - (6,042) (6,483) (14,318) (11,410)
278,103 61,019 13,973 10,999 (109,290) (202,734) 182,786 (130,716) 160,379 (139,283) 336,086 175,707
Class A1 2020 2019 142,731 83,963 3,667 5,258
(896) (2,116) - - (1,421) (3,323) (2,317) (5,439)
13,729 111,611 2,275 5,331 (160,085) (57,993) (144,081) 58,949 (142,731) 58,768 - 142,731
Class A2 2020 2019 33,315 31,536 878 921
(217) (667) - - (332) (917) (549) (1,584)
4,781 18,059 546 1,574 (38,971) (17,191) (33,644) 2,442 (33,315) 1,779 - 33,315
Class A3 2020 2019 15,088 15,079 409 426
(105) (323) - - (163) (446) (268) (769)
2,791 8,948 267 768 (18,287) (9,364) (15,229) 352 (15,088) 9 - 15,088
Class A4 2020 2019 2,147 2,038 58 67
(15) (50) - - (22) (66) (37) (116)
509 1,775 37 116 (2,714) (1,733) (2,168) 158 (2,147) 109 - 2,147
Class A5 2020 2019 585 545 17 12
(4) (9) - - (7) (14) (11) (23)
208 559 11 23 (810) (531) (591) 51 (585) 40 - 585
Class C 2020 2019 4,827,978 6,030,350 38,523 204,881
(113,292) (169,773) - - - - (113,292) (169,773)
266,302 120,737 113,286 169,057 (1,011,672) (1,527,274) (632,084) (1,237,480) (706,853) (1,202,372) 4,121,125 4,827,978
Class E 2020 2019 19,404 26,057 (224) 479
(498) (408) - - (414) (564) (912) (972)
4,387 2,210 890 949 (4,737) (9,319) 540 (6,160) (596) (6,653) 18,808 19,404
Class EF 2020 2019 8,065 9,055 (1) 272
(260) (172) - - (201) (256) (461) (428)
1,538 1,948 194 150 (1,424) (2,932) 308 (834) (154) (990) 7,911 8,065
Class F 2020 2019 14,774 33,931 (959) 348
(1,115) (551) - - (802) (748) (1,917) (1,299)
50,833 19,375 1,637 980 (23,604) (38,561) 28,866 (18,206) 25,990 (19,157) 40,764 14,774
Class F1 2020 2019 14,370 10,045 436 593
(128) (246) - - (154) (374) (282) (620)
4,652 18,589 274 581 (19,450) (14,818) (14,524) 4,352 (14,370) 4,325 - 14,370
Class F2 2020 2019 6,519 2,146 178 231
(50) (106) - - (67) (150) (117) (256)
2,649 8,566 102 181 (9,331) (4,349) (6,580) 4,398 (6,519) 4,373 - 6,519

CI Income Fund
– 119 –Annual Financial Statements - March 31, 2020
The accompanying notes are an integral part of these financial statements.
Financial Statements
Statements of Changes in Net Assets Attributable to Holders of Redeemable Units (cont’d)for the years ended March 31 (in $000’s)
Net assets attributable to holders of redeemable units at the beginning of yearIncrease (decrease) in net assets attributable to holders of redeemable unitsDistributions to holders of redeemable units From net investment income From net realized gains Return of capitalTotal distributions to holders of redeemable units
Redeemable unit transactions Proceeds from redeemable units issued Reinvestment of distributions to holders of redeemable units Redemption of redeemable unitsNet increase (decrease) from redeemable unit transactionsNet increase (decrease) in net assets attributable to holders of redeemable unitsNet assets attributable to holders of redeemable units at the end of year
Net assets attributable to holders of redeemable units at the beginning of yearIncrease (decrease) in net assets attributable to holders of redeemable unitsDistributions to holders of redeemable units From net investment income From net realized gains Return of capitalTotal distributions to holders of redeemable units
Redeemable unit transactions Proceeds from redeemable units issued Reinvestment of distributions to holders of redeemable units Redemption of redeemable unitsNet increase (decrease) from redeemable unit transactionsNet increase (decrease) in net assets attributable to holders of redeemable unitsNet assets attributable to holders of redeemable units at the end of year
Class F3 2020 2019 2,654 2,371 94 86
(32) (37) - - (32) (69) (64) (106)
2,357 2,116 62 100 (5,103) (1,913) (2,684) 303 (2,654) 283 - 2,654
Class F4 2020 2019 1,101 521 33 44
(9) (16) - - (12) (28) (21) (44)
88 1,150 21 44 (1,222) (614) (1,113) 580 (1,101) 580 - 1,101
Class F5 2020 2019 20 135 1 -
- (2) - - - (2) - (4)
- 105 - 4 (21) (220) (21) (111) (20) (115) - 20
Class I 2020 2019 1,360,506 1,182,711 14,889 63,067
(50,132) (36,057) - - (38,906) (51,686) (89,038) (87,743)
299,912 407,988 88,921 87,518 (542,890) (293,035) (154,057) 202,471 (228,206) 177,795 1,132,300 1,360,506
Class O 2020 2019 47,245 59,634 330 2,047
(1,789) (1,519) - - (1,376) (2,047) (3,165) (3,566)
7,835 6,734 3,140 3,539 (11,794) (21,143) (819) (10,870) (3,654) (12,389) 43,591 47,245
Class P 2020 2019 2,062 2,275 (8) 86
(87) (54) - - (64) (78) (151) (132)
874 581 150 132 (580) (880) 444 (167) 285 (213) 2,347 2,062
Class W 2020 2019 11 10 (12) 4
(2) - - - (6) (2) (8) (2)
1,564 102 8 2 (343) (105) 1,229 (1) 1,209 1 1,220 11
Total Fund 2020 2019 6,674,282 7,807,392 50,220 281,665
(176,907) (217,033) - - (50,021) (67,253) (226,928) (284,286)
943,112 792,172 225,794 282,048 (1,962,328) (2,204,709) (793,422) (1,130,489) (970,130) (1,133,110) 5,704,152 6,674,282

CI Income Fund
– 120 –Annual Financial Statements - March 31, 2020
Statements of Cash Flowsfor the years ended March 31 (in $000’s)
2020 2019
50,220 281,665
(188,283) 155,292 (15,090) 1,414 1,999 1,429
358,975 (234,726) 10,546,672 7,702,744 (9,759,061) (6,350,501) - - (3,244) (182) 2,371 (1,938) 714 (254) 6,098 9,887 - - - - - - 13 (21) 1,001,384 1,564,809
(1,134) (2,238) 668,221 607,312 (1,514,163) (2,079,188) (847,076) (1,474,114)
15,090 (1,414) 154,308 90,695 507,008 417,727 676,406 507,008
40,261 38,153 157,289 195,620 - - 155 77 - -
*Dividends and interest received as well as dividends and interest paid relate to operating activities of the Fund. The accompanying notes are an integral part of these financial statements.
Financial Statements
Cash flows from (used in) operating activitiesIncrease (decrease) in net assets attributable to holders of redeemable unitsAdjustments for: Net realized (gain) loss on sale of investments and derivatives Unrealized foreign exchange (gain) loss on cash Commissions and other portfolio transaction costs Change in unrealized (appreciation) depreciation in value of
investments and derivatives Proceeds from sale and maturity of investments and derivatives Purchase of investments and derivatives (Increase) decrease in collateral on deposit for short sale Non-cash distributions from investments Change in daily variation margin (Increase) decrease in dividends receivable (Increase) decrease in interest receivable (Increase) decrease in securities lending revenue receivable Increase (decrease) in management fees payable Increase (decrease) in administration fees payable Change in other accounts receivable and payableNet cash from (used in) operating activities
Cash flows from (used in) financing activitiesDistributions paid to holders of redeemable units, net of reinvested distributionsProceeds from issuance of redeemable unitsAmounts paid on redemption of redeemable unitsNet cash from (used in) financing activities Unrealized foreign exchange gain (loss) on cashNet increase (decrease) in cashCash (bank overdraft), beginning of yearCash (bank overdraft), end of year
Supplementary Information:Dividends received, net of withholding tax*Interest received, net of withholding tax*Dividends paid*Interest paid*Tax recoverable (paid)

CI Income Fund
– 121 –Annual Financial Statements - March 31, 2020
CANADA (47.8%) (cont’d) 3,657,680 Bankers Hall L.P., 4.377% 11/20/2023 3,852,242 3,855,043 USD 710,000 Bausch Health Co., Inc., 5% 01/30/2028 939,913 945,994 USD 350,000 Bausch Health Co., Inc., 5.25% 01/30/2030 439,389 465,773 USD 340,000 Bausch Health Co., Inc., 7% 01/15/2028 456,076 491,149 USD 640,000 Baytex Energy Corp., 8.75% 04/01/2027 840,899 343,631 13,625 BCE Inc., Preferred 4.4%, Series AF 16 202,082 165,816 7,100 BCE Inc., Preferred 5.55%, Series 19 102,798 75,686 15,950 BCE Inc., Preferred, Series 18 241,222 177,045 9,700 BCE Inc., Preferred, Series AB 148,851 104,760 19,200 BCE Inc., Preferred, Series AJ 283,711 213,120 4,415,000 Bell Canada Inc., 2.9% 09/10/2029 4,364,082 4,291,199 19,000,000 Bell Canada Inc., 3% 10/03/2022 19,419,330 19,205,124 6,056,000 Bell Canada Inc., 3.5% 09/30/2050 5,818,860 5,223,631 1,258,000 Bell Canada Inc., 4.35% 12/18/2045 1,279,525 1,265,180 1,158,000 Bell Canada Inc., 4.45% 02/27/2047 1,195,622 1,182,706 9,195,000 Bell Canada Inc., 4.7% 09/11/2023 10,049,378 9,727,986 USD 3,170,000 Bombardier Inc., 5.75% 03/15/2022 4,181,742 3,379,555 USD 710,000 Bombardier Inc., 7.875% 04/15/2027 873,867 692,263 USD 4,015,000 Bombardier Inc., 8.75% 12/01/2021 5,429,233 4,697,154 1,447,000 Brookfield Asset Management Inc., 3.8% 03/16/2027 1,451,457 1,460,821 2,704,000 Brookfield Asset Management Inc., 4.82% 01/28/2026 3,004,882 2,878,751 2,433,000 Brookfield Asset Management Inc., 5.04% 03/08/2024 2,659,019 2,563,566 3,500,000 Brookfield Asset Management Inc., 5.95% 06/14/2035 3,975,006 3,809,732 361,738 Brookfield Asset Management Inc., Class A 19,501,316 22,565,216 USD 242,000 Brookfield Finance Inc., 4.25% 06/02/2026 319,268 357,163 8,055 Brookfield Infrastructure Corp. 361,180 397,031 7,784,000 Brookfield Infrastructure Finance ULC 3.315% 02/22/2024 7,788,798 7,742,889 967,000 Brookfield Infrastructure Finance ULC 3.41% 10/09/2029 940,089 913,937 2,869,000 Brookfield Infrastructure Finance ULC 4.193% 09/11/2028 2,865,564 2,901,838 2,792,000 Brookfield Property Finance ULC 3.93% 01/15/2027 2,791,361 2,716,554 16,156,000 Brookfield Property Finance ULC 4.115% 10/19/2021 16,188,298 16,275,578 6,302,000 Brookfield Property Finance ULC 4.3% 03/01/2024 6,530,871 6,396,524 5,068,000 Brookfield Property Finance ULC 4.346% 07/03/2023 5,154,776 5,179,437 1,957,000 Brookfield Renewable Partners ULC 3.63% 01/15/2027 1,958,430 1,985,263 4,281,000 Brookfield Renewable Partners ULC 3.752% 06/02/2025 4,364,609 4,398,194 12,000,000 Brookfield Renewable Partners ULC 4.79% 02/07/2022 12,680,400 12,403,513 4,211,000 Brookfield Renewable Partners ULC 5.84% 11/05/2036 4,628,082 4,635,704 3,700 Brookfield Renewable Power Preferred Equity Inc., Preferred 5%, Series 5 73,562 63,307
CANADA (47.8%) USD 1,800,000 1011778 BC ULC/New Red Finance Inc., 4.25% 05/15/2024 2,451,815 2,526,962 USD 458,000 1011778 BC ULC/New Red Finance Inc., 5% 10/15/2025 601,612 615,576 2,065,000 407 International Inc., 2.84% 03/07/2050 2,062,088 1,838,689 3,024,000 407 International Inc., 3.6% 05/21/2047 3,062,165 3,128,148 2,353,000 407 International Inc., 3.65% 09/08/2044 2,432,384 2,440,938 3,115,000 407 International Inc., Callable, 5.96% 12/03/2035 4,134,196 4,150,341 USD 545,000 AAG FH L.P./AAG FH Finco Inc., 9.75% 07/15/2024 664,582 667,319 4,108,822 Access Health Abbotsford Ltd., 6.032% 03/07/2038 5,180,853 5,236,159 5,257,000 Air Canada 4.75% 10/06/2023 5,450,729 4,485,972 USD 229,000 Air Canada, Term Loan B, Private Placement, variable rate, 10/06/2023 263,779 296,511 USD 380,000 Alimentation Couche-Tard Inc., 2.95% 01/25/2030 498,685 496,561 2,286,000 Alimentation Couche-Tard Inc., 3.6% 06/02/2025 2,335,150 2,308,335 317,117 Alimentation Couche-Tard Inc., Class B 10,493,656 10,512,429 857,597 Alliance Pipeline L.P., 7.181% 06/30/2023 989,119 924,910 818,827 Alliance Pipeline L.P., 7.217% 12/31/2025 939,073 925,497 2,470,000 Allied Properties Real Estate Investment Trust 3.113% 04/08/2027 2,467,574 2,394,236 5,083,000 Allied Properties Real Estate Investment Trust 3.117% 02/21/2030 5,077,602 4,762,649 1,080,000 Allied Properties Real Estate Investment Trust 3.394% 08/15/2029 1,079,253 1,052,962 3,120,000 Allied Properties Real Estate Investment Trust 3.636% 04/21/2025 3,218,901 3,156,317 1,084,000 Allied Properties Real Estate Investment Trust 3.934% 11/14/2022 1,130,117 1,109,953 8,000,000 AltaLink Investments L.P., 2.244% 03/07/2022 7,873,760 8,011,993 11,746,000 AltaLink L.P., 3.668% 11/06/2023 12,584,547 12,306,985 1,212,000 AltaLink L.P., 3.99% 06/30/2042 1,273,593 1,330,121 1,150,000 AltaLink L.P., 4.054% 11/21/2044 1,206,831 1,279,446 1,318,000 AltaLink L.P., 4.462% 11/08/2041 1,653,402 1,543,484 2,347,000 AltaLink L.P., 4.872% 11/15/2040 2,796,583 2,872,711 1,863,104 Arrow Lakes Power Corp., 5.516% 04/05/2041 2,182,319 2,422,497 USD 1,300,000 Athabasca Oil Corp., 9.875% 02/24/2022 1,630,674 402,516 705,000 AutoCanada Inc., 8.75% 02/11/2025 698,028 683,850 5,340,000 Bank of Montreal 2.27% 07/11/2022 5,290,852 5,361,092 3,037,000 Bank of Montreal 2.28% 07/29/2024 3,033,067 2,980,993 2,980,000 Bank of Montreal 2.37% 02/03/2025 2,979,970 2,929,691 4,192,000 Bank of Montreal 2.7% 09/11/2024 4,173,493 4,267,871 2,380,000 Bank of Montreal 2.85% 03/06/2024 2,380,468 2,394,276 2,982,000 Bank of Montreal 2.88% 09/17/2029 2,981,745 2,896,883 21,720,000 Bank of Montreal 2.89% 06/20/2023 22,135,007 22,197,654 2,707,000 Bank of Montreal 3.19% 03/01/2028 2,688,552 2,851,380 8,212,000 Bank of Montreal 3.32% 06/01/2026 8,299,673 8,209,826 29,654,000 Bank of Montreal 3.34% 12/08/2025 30,342,540 29,725,621 USD 431,000 Bank of Montreal 3.803% 12/15/2032 568,614 589,183
Percentages shown in brackets relate investments at fair value to net assets attributable to holders of redeemable units of the Fund.
Schedule of Investment Portfolio as at March 31, 2020
No. of Shares/Par Value Description
AverageCost ($)
FairValue ($)
No. of Shares/Par Value Description
AverageCost ($)
FairValue ($)

CI Income Fund
– 122 –Annual Financial Statements - March 31, 2020
Schedule of Investment Portfolio as at March 31, 2020 (cont’d)
CANADA (47.8%) (cont’d) 2,722,000 Canadian Western Bank 2.737% 06/16/2022 2,718,282 2,712,316 3,896,000 Canadian Western Bank 2.788% 09/13/2021 3,887,680 3,894,271 3,649,000 Canadian Western Bank 2.881% 03/01/2021 3,641,728 3,657,807 3,697,000 Canadian Western Bank 3.668% 06/11/2029 3,692,308 3,493,389 8,659,000 Capital Power Corp., 4.284% 09/18/2024 8,885,731 8,776,248 3,368,000 Capital Power Corp., 4.424% 02/08/2030 3,360,275 3,420,422 5,451,000 Capital Power Corp., 4.986% 01/23/2026 5,452,160 5,605,533 5,995,000 Capital Power Corp., 5.276% 11/16/2020 6,298,139 6,046,400 2,710,000 CARDS II Trust 2.427% 11/15/2024 2,710,000 2,693,223 1,355,000 CARDS II Trust 3.127% 11/15/2024 1,355,000 1,422,127 2,305,000 CARDS II Trust 3.877% 11/15/2024 2,305,000 2,313,068 1,785,000 Cascades Inc./Cascades USA Inc., 5.125% 01/15/2025 1,756,100 1,740,375 3,096,000 CCL Industries Inc., 3.864% 04/13/2028 3,100,296 3,177,212 143,769 CCL Industries Inc., Class B 7,937,337 6,151,876 USD 21,000 Cenovus Energy Inc., 3.8% 09/15/2023 15,867 15,576 USD 112,000 Cenovus Energy Inc., 4.25% 04/15/2027 134,036 77,189 USD 93,000 Cenovus Energy Inc., 6.75% 11/15/2039 108,642 63,392 2,267,000 CES Energy Solutions Corp., 6.375% 10/21/2024 2,267,802 1,694,582 91,546 CGI Inc. 6,976,724 6,974,890 2,485,000 Choice Properties Real Estate Investment Trust 2.981% 03/04/2030 2,481,386 2,306,105 1,903,000 Choice Properties Real Estate Investment Trust 3.546% 01/10/2025 1,903,525 1,908,650 2,810,000 Choice Properties Real Estate Investment Trust 3.556% 09/09/2024 2,908,638 2,826,008 1,866,000 Choice Properties Real Estate Investment Trust 3.827% 03/04/2050 1,858,657 1,550,256 4,070,000 Choice Properties Real Estate Investment Trust 4.178% 03/08/2028 4,099,920 4,231,681 2,500,000 Choice Properties Real Estate Investment Trust 4.903% 07/05/2023 2,700,484 2,643,265 1,806,000 Choice Properties Real Estate Investment Trust 5.268% 03/07/2046 1,920,880 1,867,243 4,147,000 City of Montreal 2.3% 09/01/2029 4,094,872 4,166,595 10,151,000 City of Montreal 3.15% 09/01/2028 10,921,461 10,922,262 6,076,000 City of Montreal 3.5% 12/01/2038 6,974,033 6,594,827 193,000 City of Montreal 4.1% 12/01/2034 228,906 224,185 406,000 City of Montreal 6% 06/01/2043 641,480 609,990 96,000 City of Ottawa 3.05% 04/23/2046 103,188 98,742 3,342,000 City of Ottawa 4.2% 07/30/2053 4,553,150 4,310,391 462,000 City of St. John’s 4.5% 12/20/2033 548,856 545,780 202,000 City of St. John’s 4.622% 08/11/2031 239,362 242,881 3,152,000 City of Toronto 2.65% 11/09/2029 3,234,772 3,282,675 4,125,000 City of Toronto 2.8% 11/22/2049 4,117,492 3,990,176 140,000 City of Toronto 2.95% 04/28/2035 146,020 144,353 4,135,000 City of Vancouver 3.7% 10/18/2052 5,147,662 4,995,940 6,205,000 City of Winnipeg 4.3% 11/15/2051 8,381,697 7,792,255 USD 610,000 Clearwater Seafoods Inc., 6.875% 05/01/2025 807,515 731,892 2,471,641 Comber Wind Financial Corp., 5.132% 11/15/2030 2,666,289 2,762,869 5,199,000 Crew Energy Inc., 6.5% 03/14/2024 5,184,652 3,119,400
CANADA (47.8%) (cont’d) 9,100 Brookfield Renewable Power Preferred Equity Inc., Preferred 5%, Series 6 181,147 153,426 USD 1,737,000 Brookfield Residential Properties Inc., 4.875% 02/15/2030 2,310,081 1,857,204 294,200 Brookfield Residential Properties Inc., 6.125% 05/15/2023 284,645 267,657 USD 1,559,000 Brookfield Residential Properties Inc., 6.25% 09/15/2027 2,055,080 1,903,194 USD 3,508,400 Canada Goose Inc., Term Loan, Private Placement, variable rate, 12/02/2024 4,396,771 4,888,345 1,139,000 Canada Life Capital Trust 7.529% 06/30/2032 1,518,711 1,493,165 2,659,000 Canadian Imperial Bank of Commerce 1.64% 07/12/2021 2,653,414 2,645,852 30,994,000 Canadian Imperial Bank of Commerce 1.9% 04/26/2021 30,553,731 30,945,859 2,384,000 Canadian Imperial Bank of Commerce 2.04% 03/21/2022 2,378,643 2,379,969 3,016,000 Canadian Imperial Bank of Commerce 2.3% 07/11/2022 3,015,200 3,028,275 2,649,000 Canadian Imperial Bank of Commerce 2.35% 08/28/2024 2,646,626 2,605,432 5,083,000 Canadian Imperial Bank of Commerce 2.97% 07/11/2023 5,098,688 5,207,636 4,719,000 Canadian Imperial Bank of Commerce 3.3% 05/26/2025 4,731,260 4,947,086 6,771,000 Canadian Imperial Bank of Commerce 3.42% 01/26/2026 6,863,847 6,780,325 200,800 Canadian International Oil Corp., Warrants (31Dec49) 9,360 - 56,955 Canadian National Railway Co. 6,352,902 6,266,759 4,113,000 Canadian National Railway Co., 3.05% 02/08/2050 4,123,137 3,734,059 933,000 Canadian National Railway Co., 3.6% 08/01/2047 936,324 942,491 431,909 Canadian Natural Resources Ltd. 15,457,203 8,314,248 3,235,000 Canadian Natural Resources Ltd., 2.05% 06/01/2020 3,235,129 3,227,171 2,882,000 Canadian Natural Resources Ltd., 3.31% 02/11/2022 2,892,164 2,858,106 2,427,000 Canadian Natural Resources Ltd., 3.42% 12/01/2026 2,449,625 2,100,240 USD 204,000 Canadian Natural Resources Ltd., 3.85% 06/01/2027 279,970 227,047 50,940 Canadian Pacific Railway Ltd. 12,438,743 15,819,417 1,693,000 Canadian Pacific Railway Ltd., 3.05% 03/09/2050 1,676,106 1,453,631 4,336,000 Canadian Real Estate Investment Trust 2.951% 01/18/2023 4,306,492 4,347,451 180,000 Canadian Tire Corp., Ltd., 2.646% 07/06/2020 180,401 180,170 1,827,000 Canadian Tire Corp., Ltd., 3.167% 07/06/2023 1,871,329 1,838,021 1,344,000 Canadian Tire Corp., Ltd., 5.61% 09/04/2035 1,524,768 1,551,316 5,800 Canadian Utilities Ltd., Preferred 4.9%, Series BB 133,573 115,246 1,366,000 Canadian Western Bank 2.597% 09/06/2024 1,364,979 1,333,667
No. of Shares/Par Value Description
AverageCost ($)
FairValue ($)
No. of Shares/Par Value Description
AverageCost ($)
FairValue ($)
Percentages shown in brackets relate investments at fair value to net assets attributable to holders of redeemable units of the Fund.

CI Income Fund
– 123 –Annual Financial Statements - March 31, 2020
Schedule of Investment Portfolio as at March 31, 2020 (cont’d)
CANADA (47.8%) (cont’d) USD 1,088,000 First Quantum Minerals Ltd., 6.875% 03/01/2026 1,294,366 1,228,829 USD 1,341,000 First Quantum Minerals Ltd., 7.25% 04/01/2023 1,786,385 1,588,891 USD 4,009,000 First Quantum Minerals Ltd., 7.25% 05/15/2022 4,768,688 4,968,862 USD 2,811,000 First Quantum Minerals Ltd., 7.5% 04/01/2025 3,773,194 3,292,312 500,000 Ford Auto Securitization Trust 2.319% 04/15/2022 196,368 196,494 2,895,000 Ford Auto Securitization Trust 2.354% 06/15/2023 2,895,000 2,895,106 10,000,000 Ford Credit Canada Co., 2.3775% 09/21/2020 10,000,000 9,830,473 1,960,000 Ford Credit Canada Co., 2.45% 05/07/2020 1,955,512 1,953,750 2,205,000 Ford Credit Canada Co., 2.923% 09/16/2020 2,205,220 2,146,672 5,076,000 Ford Floorplan Auto Securitization Trust 2.397% 07/15/2020 5,076,000 5,068,640 4,667,000 Fortified Trust 1.67% 07/23/2021 4,657,156 4,649,714 7,804,000 Fortified Trust 2.161% 10/23/2020 7,803,184 7,813,621 4,845,000 Fortified Trust 2.34% 01/23/2023 4,845,000 4,838,388 3,828,000 Fortified Trust 2.558% 03/23/2024 3,830,364 3,833,748 290,876 Fortis Inc. 13,987,209 15,785,841 1,673,000 FortisAlberta Inc., 4.11% 09/29/2044 1,735,858 1,860,037 1,593,000 FortisAlberta Inc., 4.27% 09/22/2045 1,741,926 1,818,808 2,213,000 FortisBC Energy (Vancouver Island) Inc., 6.05% 02/15/2038 2,876,797 3,000,789 1,800,000 FortisBC Energy Inc., 2.82% 08/09/2049 1,653,536 1,616,144 2,527,000 FortisBC Inc., 5.6% 11/09/2035 3,113,301 3,240,321 1,257,000 FortisBC Inc., 6.1% 06/02/2039 1,674,529 1,720,134 84,452 Franco-Nevada Corp. 6,848,419 11,874,796 1,579,000 General Motors Financial of Canada Ltd., 3% 02/26/2021 1,584,871 1,529,396 13,225,000 General Motors Financial of Canada Ltd., 3.08% 05/22/2020 13,143,005 13,230,823 2,775,000 General Motors Financial of Canada Ltd., 3.25% 11/07/2023 2,777,424 2,414,758 1,069,000 Genesis Trust II 1.699% 04/15/2020 1,055,560 1,068,980 3,698,000 George Weston Ltd., 4.115% 06/17/2024 3,886,370 3,821,592 1,156,000 George Weston Ltd., 6.69% 03/01/2033 1,435,001 1,493,908 1,846,000 George Weston Ltd., 7.1% 02/05/2032 2,358,781 2,262,131 USD 355,000 GFL Environmental Inc., 5.125% 12/15/2026 469,645 487,136 2,465,000 Gibson Energy Inc., 3.6% 09/30/2029 2,451,497 2,177,691 8,738,000 Gibson Energy Inc., 5.25% 07/15/2024 9,267,980 8,803,535 147,852 Gildan Activewear Inc. 5,160,461 2,652,465 3,474,000 Glacier Credit Card Trust 3.298% 09/20/2022 3,403,975 3,499,708 2,527,000 Glacier Credit Card Trust 3.43% 06/06/2024 2,527,634 2,535,769 4,136,000 Glacier Credit Card Trust 4.138% 09/20/2023 4,142,614 4,248,044 USD 3,045,000 GLF Environmental Inc., 5.625% 05/01/2022 4,092,597 4,323,032 18,796,000 Government of Canada 1.25% 03/01/2025 19,024,276 19,380,203 2,130,000 Government of Canada 1.25% 11/01/2021 2,122,226 2,156,287 58,786,000 Government of Canada 1.5% 02/01/2022 59,160,509 59,943,177 18,088,000 Government of Canada 1.5% 08/01/2021 18,061,893 18,338,144 7,105,000 Government of Canada 2.25% 06/01/2029 7,559,759 8,074,711
CANADA (47.8%) (cont’d) 1,925,000 Crombie Real Estate Investment Trust 3.917% 06/21/2027 1,952,070 1,911,473 6,000,000 CT Real Estate Investment Trust 2.852% 06/09/2022 6,072,000 5,973,095 1,008,000 CT Real Estate Investment Trust 3.527% 06/09/2025 1,023,654 1,015,712 1,661,000 CU Inc., 3.548% 11/22/2047 1,710,132 1,694,304 830,000 CU Inc., 3.763% 11/19/2046 882,224 877,514 1,375,000 CU Inc., 3.95% 11/23/2048 1,499,602 1,503,067 1,899,000 CU Inc., 3.964% 07/27/2045 1,994,124 2,067,901 3,291,000 Daimler Canada Finance Inc., 1.91% 07/08/2021 3,284,532 3,252,857 1,035,000 Daimler Canada Finance Inc., 2.23% 12/16/2021 1,031,531 1,021,186 6,000,000 Daimler Canada Finance Inc., 2.57% 11/22/2022 6,012,420 5,899,425 12,000,000 Daimler Canada Finance Inc., 2.97% 03/13/2024 12,081,600 11,729,541 880,000 Daimler Canada Finance Inc., 3.3% 08/16/2022 879,691 879,265 337,307 Dollarama Inc. 13,950,774 13,168,465 54,990 Emera Inc. 2,523,408 3,051,945 USD 241,000 Emera Inc., 6.75% 06/15/2076 345,014 307,473 347,773 Empire Co., Ltd., Class A 10,223,303 9,574,191 1,440,000 Enbridge Gas Inc., 2.9% 04/01/2030 1,438,387 1,457,640 1,378,000 Enbridge Gas Inc., 3.01% 08/09/2049 1,376,009 1,271,861 1,815,000 Enbridge Gas Inc., 3.65% 04/01/2050 1,811,061 1,811,061 614,895 Enbridge Inc. 29,178,891 25,198,397 1,385,000 Enbridge Inc., 3.16% 03/11/2021 1,400,858 1,381,705 15,000,000 Enbridge Inc., 3.94% 06/30/2023 15,698,850 15,140,487 3,115,000 Enbridge Inc., 3.95% 11/19/2024 3,337,113 3,121,643 4,525,000 Enbridge Inc., 4.24% 08/27/2042 4,431,983 3,890,797 3,590,000 Enbridge Inc., 4.87% 11/21/2044 3,590,191 3,380,258 2,469,000 Enbridge Inc., 5.375% 09/27/2077 2,457,358 2,029,698 USD 3,722,000 Enbridge Inc., 5.5% 07/15/2077 4,313,709 3,771,607 USD 3,145,000 Enbridge Inc., 6% 01/15/2077 4,252,350 3,275,442 USD 8,284,000 Enbridge Inc., 6.25% 03/01/2078 10,459,305 8,744,177 3,899,000 Enbridge Inc., 6.625% 04/12/2078 3,974,393 3,783,326 1,587,000 Enbridge Pipelines Inc., 4.33% 02/22/2049 1,590,362 1,443,903 1,983,000 EPCOR Utilities Inc., 3.949% 11/26/2048 1,995,219 2,159,601 3,215,000 EPCOR Utilities Inc., 4.55% 02/28/2042 3,585,840 3,830,266 34,536 Fairfax Financial Holdings Ltd., Sub-Voting Shares 20,139,472 14,899,866 USD 589,000 Fairstone Financial Inc., 7.875% 07/15/2024 793,790 779,221 1,232,000 Fairstone Financial Issuance Trust I 5.084% 03/21/2033 1,232,400 1,236,398 4,073,934 Fifth Avenue L.P., 4.71% 08/05/2021 4,398,243 4,209,051 134,527 Finning International Inc. 3,002,094 2,031,358 148 First Capital Real Estate Investment Trust 3,087 2,017 2,405,000 First Capital Realty Inc., 5.6% 04/30/2020 2,698,594 2,411,216 4,777,000 First Nations Finance Authority 3.05% 06/01/2028 5,039,735 5,168,525 USD 656,000 First Quantum Minerals Ltd., 6.5% 03/01/2024 855,651 766,301
No. of Shares/Par Value Description
AverageCost ($)
FairValue ($)
No. of Shares/Par Value Description
AverageCost ($)
FairValue ($)
Percentages shown in brackets relate investments at fair value to net assets attributable to holders of redeemable units of the Fund.

CI Income Fund
– 124 –Annual Financial Statements - March 31, 2020
Schedule of Investment Portfolio as at March 31, 2020 (cont’d)
CANADA (47.8%) (cont’d) 7,500,000 Loblaw Co., Ltd., 3.918% 06/10/2024 7,912,800 7,790,713 2,257,000 Loblaw Co., Ltd., 6.05% 06/09/2034 2,708,257 2,681,568 2,469,000 Loblaw Co., Ltd., 6.45% 02/09/2028 3,058,880 2,972,654 4,308,000 Loblaw Co., Ltd., 6.5% 01/22/2029 5,318,705 5,262,928 3,840,000 Lower Mattagami Energy L.P., 4.944% 09/21/2043 4,629,263 4,773,604 174,810 Magna International Inc., Class A 10,705,089 7,850,717 7,894,000 Manulife Bank of Canada 2.082% 05/26/2022 7,743,959 7,845,276 522,845 Manulife Financial Corp. 11,452,086 9,238,671 510,000 Maple Leaf Sports & Entertainment Ltd., 4.94% 06/30/2023 534,057 526,626 4,384,000 Master Credit Card Trust II 3.056% 01/21/2022 4,333,659 4,353,312 2,596,000 Mattamy Group Corp., 4.625% 03/01/2028 2,554,375 2,336,400 USD 1,147,000 Mattamy Group Corp., 4.625% 03/01/2030 1,520,918 1,388,288 3,177,893 MBarc Credit Canada Inc., 2.61% 03/15/2021 916,664 917,277 USD 848,000 MEG Energy Corp., 6.5% 01/15/2025 1,074,808 754,873 USD 1,475,000 MEG Energy Corp., 7% 03/31/2024 1,506,705 957,516 USD 1,052,000 MEG Energy Corp., 7.125% 02/01/2027 1,094,006 731,587 1,418,000 Metro Inc., 3.413% 02/28/2050 1,412,233 1,183,309 2,679,000 Metro Inc., 4.27% 12/04/2047 2,678,386 2,668,175 2,421,000 Metro Inc., 5.03% 12/01/2044 2,599,819 2,627,325 4,344,000 Municipal Finance Authority of British Columbia 2.55% 10/09/2029 4,513,112 4,530,079 10,345,000 Municipal Finance Authority of British Columbia 2.65% 10/02/2025 10,771,731 10,871,430 3,097,000 Municipal Finance Authority of British Columbia 3.05% 10/23/2028 3,311,399 3,359,341 30,645,000 National Bank of Canada 1.809% 07/26/2021 29,894,664 30,545,597 4,109,000 National Bank of Canada 1.957% 06/30/2022 4,109,533 4,091,161 1,330,000 National Bank of Canada 2.545% 07/12/2024 1,330,140 1,320,735 21,631,000 National Bank of Canada 2.983% 03/04/2024 22,084,825 21,842,402 2,236,000 NBC Asset Trust 7.447% 12/31/2049 2,622,352 2,264,606 USD 4,892,000 New Gold Inc., 6.25% 11/15/2022 6,055,767 6,687,058 USD 666,000 New Gold Inc., 6.375% 05/15/2025 812,678 871,130 10,150,000 Nissan Canada Financial Services Inc., 1.75% 04/09/2020 10,105,400 10,147,333 4,001,071 Northern Courier Pipeline L.P., 3.365% 06/30/2042 4,002,420 4,237,964 243,200 Northland Power Inc. 7,142,328 6,831,488 3,240,004 NorthWestConnect Group Partnership 5.95% 04/30/2041 3,986,131 4,019,189 USD 427,000 NOVA Chemicals Corp., 4.875% 06/01/2024 552,708 527,342 USD 836,000 NOVA Chemicals Corp., 5% 05/01/2025 1,138,892 988,333 USD 1,062,000 NOVA Chemicals Corp., 5.25% 06/01/2027 1,418,295 1,259,250 USD 530,000 NOVA Chemicals Corp., 5.25% 08/01/2023 687,645 647,595 1,069,000 Nova Scotia Power Inc., 3.571% 04/05/2049 1,201,622 1,053,968 1,594,000 Nova Scotia Power Inc., 4.5% 07/20/2043 1,814,956 1,800,981 177,131 Nutrien Ltd. 11,720,618 8,521,772 947,000 NuVista Energy Ltd., 6.5% 03/02/2023 947,000 607,856 USD 355,000 Open Text Corp., 4.125% 02/15/2030 472,100 469,774 USD 332,168 Panther BF Aggregator 2 L.P., Term Loan, Private Placement, variable rate, 03/18/2026 441,192 425,418 1,735,000 Parkland Fuel Corp., 5.5% 05/28/2021 1,780,710 1,693,794 191,000 Parkland Fuel Corp., 5.75% 09/16/2024 191,224 181,450
CANADA (47.8%) (cont’d) 52,684,000 Government of Canada 2.75% 12/01/2048 72,155,598 70,619,437 3,862,000 Granite REIT Holdings L.P., 3.788% 07/05/2021 3,950,920 3,885,407 4,581,000 Granite REIT Holdings L.P., 3.873% 11/30/2023 4,598,774 4,645,180 1,484,000 Greater Toronto Airports Authority 2.75% 10/17/2039 1,478,793 1,321,169 2,450,000 Greater Toronto Airports Authority 4.53% 12/02/2041 2,888,785 2,813,610 580,000 Greater Toronto Airports Authority 5.3% 02/25/2041 743,171 728,803 391,000 Greater Toronto Airports Authority 5.63% 06/07/2040 515,309 507,918 882,673 Greater Toronto Airports Authority 6.45% 07/30/2029 1,119,776 1,042,655 395,000 Greater Toronto Airports Authority, Callable, 6.98% 10/15/2032 564,776 553,140 6,400 Great-West Lifeco Inc., Preferred 4.85%, Series H 145,920 118,976 142,920 Great-West Lifeco Inc., Preferred 5.2%, Series G 3,367,997 2,791,228 2,686,000 H&R Real Estate Investment Trust 3.416% 01/23/2023 2,683,950 2,709,960 14,024,000 Honda Canada Finance Inc., 1.823% 12/07/2021 13,797,169 13,800,881 2,549,000 Honda Canada Finance Inc., 2.537% 03/01/2023 2,550,224 2,512,887 3,287,000 Honda Canada Finance Inc., 3.176% 08/28/2023 3,297,941 3,295,663 2,667,000 HSBC Bank Canada 2.253% 09/15/2022 2,666,005 2,652,313 1,586,000 HSBC Bank Canada 2.449% 01/29/2021 1,575,503 1,588,863 4,038,000 HSBC Bank Canada 2.542% 01/31/2023 4,014,778 4,039,382 3,260,000 HSBC Bank Canada 3.245% 09/15/2023 3,262,313 3,320,564 1,452,000 Husky Energy Inc., 3.6% 03/10/2027 1,454,628 1,214,466 USD 3,677,000 Husky III Holding Ltd., 13% 02/15/2025 4,785,706 3,800,941 537,979 Hydro One Inc. 12,012,698 13,632,388 7,105,000 Hydro One Inc., 1.62% 04/30/2020 7,096,190 7,104,176 USD 328,000 IAMGOLD Corp., 7% 04/15/2025 442,056 429,313 2,850,000 IGM Financial Inc., 4.56% 01/25/2047 2,924,731 2,847,642 420,854 Innergex Renewable Energy Inc. 6,565,463 8,059,354 53,450 Intact Financial Corp. 5,157,329 6,501,124 11,000 Intact Financial Corp., Preferred 5.4% Series 9 275,000 231,110 16,055,000 Inter Pipeline Ltd., 2.608% 09/13/2023 16,094,843 15,494,210 1,381,000 Inter Pipeline Ltd., 3.776% 05/30/2022 1,483,401 1,387,251 3,623,000 Inter Pipeline Ltd., 6.875% 03/26/2079 3,635,900 3,126,921 381,000 Iron Mountain Canada Operations ULC 5.375% 09/15/2023 383,063 396,690 456,542 Keyera Corp. 14,510,781 5,971,569 2,054,000 Keyera Corp., 6.875% 06/13/2079 2,062,865 1,818,071 USD 206,000 Kinross Gold Corp., 6.875% 09/01/2041 299,342 289,924 355,000 Kruger Packaging Holdings L.P., 6% 06/01/2026 355,000 344,350 2,565,000 Kruger Products L.P., 6% 04/24/2025 2,488,276 2,369,419 2,224,000 Liberty Utilities Canada L.P., 3.315% 02/14/2050 2,219,085 1,978,139
No. of Shares/Par Value Description
AverageCost ($)
FairValue ($)
No. of Shares/Par Value Description
AverageCost ($)
FairValue ($)
Percentages shown in brackets relate investments at fair value to net assets attributable to holders of redeemable units of the Fund.

CI Income Fund
– 125 –Annual Financial Statements - March 31, 2020
Schedule of Investment Portfolio as at March 31, 2020 (cont’d)
CANADA (47.8%) (cont’d) 97,000 Regional Municipality of Halton 4.05% 10/11/2041 118,340 114,772 19,000 Regional Municipality of Waterloo 3.75% 05/13/2033 21,439 21,764 214,000 Regional Municipality of Waterloo 3.8% 05/13/2043 248,473 242,326 92,000 Regional Municipality of York 4% 05/31/2032 106,932 107,985 322,000 Regional Municipality of York 4.05% 05/01/2034 379,554 376,494 100,000 Regional Municipality of York 4.15% 11/18/2041 124,900 119,950 3,146,000 Reliance L.P., 3.75% 03/15/2026 3,133,142 3,159,385 1,022,000 Reliance L.P., 3.813% 09/15/2020 1,030,687 1,028,634 5,351,000 Reliance L.P., 3.836% 03/15/2025 5,369,466 5,467,760 1,258,000 Reliance L.P., 4.075% 08/02/2021 1,311,245 1,275,217 2,353,000 RioCan Real Estate Investment Trust 2.83% 10/03/2022 2,314,176 2,340,729 USD 1,697,000 Rockpoint Gas Storage Canada Ltd., 7% 03/31/2023 2,081,888 1,737,554 3,210,000 Rogers Communications Inc., 3.65% 03/31/2027 3,194,303 3,322,309 10,000,000 Rogers Communications Inc., 4% 03/13/2024 10,740,300 10,384,833 2,228,000 Rogers Communications Inc., 6.11% 08/25/2040 2,729,905 2,803,550 133,348 Rogers Communications Inc., Class B 9,278,693 7,832,862 151,276 Royal Bank of Canada 12,939,866 13,186,729 4,391,000 Royal Bank of Canada 1.65% 07/15/2021 4,364,676 4,369,233 4,652,000 Royal Bank of Canada 2.328% 01/28/2027 4,645,248 4,468,491 3,778,000 Royal Bank of Canada 2.352% 07/02/2024 3,775,357 3,725,273 8,188,000 Royal Bank of Canada 2.36% 12/05/2022 8,169,889 8,239,421 8,767,000 Royal Bank of Canada 2.609% 11/01/2024 8,797,123 8,725,327 3,327,000 Royal Bank of Canada 2.74% 07/25/2029 3,323,794 3,228,597 3,456,000 Royal Bank of Canada 2.88% 12/23/2029 3,451,972 3,339,317 3,945,000 Royal Bank of Canada 2.949% 05/01/2023 3,932,935 4,034,881 23,113,000 Royal Bank of Canada 3.31% 01/20/2026 23,770,774 23,125,756 4,830,887 SEC L.P. and Arci Ltd., 5.188% 08/29/2033 5,111,241 5,120,089 USD 1,107,000 Seven Generations Energy Ltd., 5.375% 09/30/2025 1,376,529 868,580 1,923,000 Shaw Communications Inc., 3.3% 12/10/2029 1,911,446 1,863,186 5,064,000 Shaw Communications Inc., 4.25% 12/09/2049 5,042,737 4,488,067 738,000 Shaw Communications Inc., 6.75% 11/09/2039 920,122 892,043 284 Sherritt International Corp., 8% 11/15/2021 172 68 1,803,000 SmartCentres Real Estate Investment Trust 2.757% 06/23/2021 1,801,600 1,798,518 3,046,000 SmartCentres Real Estate Investment Trust 3.444% 08/28/2026 3,042,866 3,077,205 3,633,000 SmartCentres Real Estate Investment Trust 3.526% 12/20/2029 3,642,803 3,524,177 4,113,000 SmartCentres Real Estate Investment Trust 3.73% 07/22/2022 4,275,438 4,178,775 1,486,000 South Coast British Columbia Transportation Authority 2.65% 10/29/2050 1,482,879 1,424,232 100,000 South Coast British Columbia Transportation Authority 4.65% 06/20/2041 132,365 128,534
CANADA (47.8%) (cont’d) USD 102,000 Parkland Fuel Corp., 5.875% 07/15/2027 134,345 134,568 896,000 Parkland Fuel Corp., 6.5% 01/21/2027 896,000 842,240 7,000,000 Pembina Pipeline Corp., 2.99% 01/22/2024 7,115,010 6,774,370 3,362,000 Pembina Pipeline Corp., 3.54% 02/03/2025 3,386,448 3,282,631 2,986,000 Pembina Pipeline Corp., 4.54% 04/03/2049 3,046,028 2,375,101 3,757,000 Pembina Pipeline Corp., 4.74% 01/21/2047 3,894,378 3,100,897 1,018,000 Pembina Pipeline Corp., 4.75% 03/26/2048 1,110,699 839,722 5,145,000 Penske Truck Leasing Canada Inc., 2.85% 12/07/2022 5,150,406 5,110,204 1,738,000 Penske Truck Leasing Canada Inc., 2.95% 06/12/2020 1,752,702 1,738,949 604,090 Power Corporation of Canada 17,783,032 13,676,598 3,307,000 Power Corporation of Canada 4.455% 07/27/2048 3,325,188 3,284,981 2,365,000 Power Corporation of Canada 4.81% 01/31/2047 2,439,356 2,424,344 2,183,000 Power Corporation of Canada 8.57% 04/22/2039 3,420,584 3,185,470 14,200 Power Corporation of Canada, Preferred 5%, Series D 319,918 271,078 USD 17,000 Precision Drilling Corp., 5.25% 11/15/2024 17,501 8,374 USD 695,000 Precision Drilling Corp., 7.75% 12/15/2023 929,482 391,257 67,640,000 Province of Alberta 2.35% 06/01/2025 69,195,720 69,657,525 7,905,000 Province of British Columbia 2.2% 06/18/2030 7,899,071 8,097,243 4,300,000 Province of British Columbia 2.95% 06/18/2050 4,274,372 4,693,446 23,696,000 Province of British Columbia 3.2% 06/18/2044 24,291,708 26,368,747 10,330,000 Province of British Columbia 4.3% 06/18/2042 13,827,067 13,393,392 11,658,000 Province of British Columbia 6.35% 06/18/2031 16,558,617 16,730,622 4,935,000 Province of New Brunswick 3.05% 08/14/2050 5,359,706 5,083,714 1,046,000 Province of Nova Scotia 3.15% 12/01/2051 1,228,527 1,146,881 7,630,000 Province of Nova Scotia 4.7% 06/01/2041 9,401,598 10,057,029 2,112,000 Province of Nova Scotia 6.6% 06/01/2027 2,800,209 2,788,078 1,471,000 Province of Ontario 1.85% 02/01/2027 1,466,984 1,489,696 10,457,000 Province of Ontario 2.4% 06/02/2026 10,549,348 10,932,728 117,438,000 Province of Ontario 2.6% 06/02/2025 121,242,264 123,775,631 69,784,000 Province of Ontario 2.65% 12/02/2050 72,207,320 71,486,820 62,818,000 Province of Ontario 2.7% 06/02/2029 65,941,150 67,248,668 5,278,000 Province of Ontario 2.8% 06/02/2048 5,053,556 5,523,268 35,314,000 Province of Ontario 2.9% 06/02/2028 36,358,636 38,294,844 783,000 Province of Ontario 2.9% 06/02/2049 810,655 837,092 54,571,000 Province of Ontario 3.5% 06/02/2024 59,296,714 59,223,650 89,255,000 Province of Quebec 2.5% 09/01/2026 89,716,285 94,031,078 40,566,000 Province of Quebec 2.75% 09/01/2025 41,952,422 43,183,155 1,900,000 Province of Quebec 2.75% 09/01/2027 1,987,020 2,039,179 32,478,000 Province of Quebec 3% 09/01/2023 33,936,032 34,412,161 32,012,000 Province of Quebec 3.1% 12/01/2051 33,428,659 36,129,650 24,134,000 Province of Quebec 3.5% 12/01/2048 26,147,881 28,802,127 29,987,000 Province of Quebec 3.75% 09/01/2024 33,085,108 32,981,542 USD 390,000 Quebecor Media Inc., 5.75% 01/15/2023 507,378 557,059 718,000 Real Estate Asset Liquidity Trust 1.856% 09/12/2021 506,583 506,598 1,398,000 Real Estate Asset Liquidity Trust 3.239% 05/12/2025 1,404,764 1,392,317
No. of Shares/Par Value Description
AverageCost ($)
FairValue ($)
No. of Shares/Par Value Description
AverageCost ($)
FairValue ($)
Percentages shown in brackets relate investments at fair value to net assets attributable to holders of redeemable units of the Fund.

CI Income Fund
– 126 –Annual Financial Statements - March 31, 2020
Schedule of Investment Portfolio as at March 31, 2020 (cont’d)
CANADA (47.8%) (cont’d) 8,542,000 TransCanada Trust 4.65% 05/18/2077 8,486,056 6,769,360 USD 209,000 TransCanada Trust 5.5% 09/15/2079 276,250 225,022 USD 2,543,000 TransCanada Trust 5.875% 08/15/2076 3,445,522 2,889,377 263,604 Trevali Mining Corp. 92,789 22,406 2,075,938 Trillium Windpower L.P., 5.803% 02/15/2033 2,324,362 2,427,091 3,000,000 Union Gas Ltd., 4.85% 04/25/2022 3,236,820 3,169,255 2,291,000 Union Gas Ltd., 4.88% 06/21/2041 2,769,746 2,791,058 1,405,000 University of Ottawa 2.635% 02/13/2060 1,405,000 1,381,874 46,000 University of Toronto 4.251% 12/07/2051 60,030 57,890 179,000 University of Toronto 4.937% 11/16/2045 248,810 241,059 USD 6,118,000 Valeant Pharmaceuticals International Inc., 6.5% 03/15/2022 8,282,294 8,696,579 USD 5,150,000 Valeant Pharmaceuticals International Inc., 7% 03/15/2024 7,135,166 7,383,940 USD 1,010,000 Velvet Energy Ltd., 9% 09/22/2023 1,295,911 1,421,474 333,231 Vermilion Energy Inc. 10,273,003 1,439,558 USD 1,255,000 Vermilion Energy Inc., 5.625% 03/15/2025 1,672,564 1,184,631 797,000 Vesta Energy Corp., 8.125% 07/24/2023 797,000 445,922 995,000 Videotron Ltd., 4.5% 01/15/2030 995,000 912,084 USD 100,000 Videotron Ltd., 5% 07/15/2022 141,586 141,144 1,100,000 Videotron Ltd., 5.75% 01/15/2026 1,110,193 1,056,000 5,823,000 VW Credit Canada Inc., 3.25% 03/29/2023 5,965,324 5,803,760 2,823,000 Waste Management of Canada Corp., 2.6% 09/23/2026 2,815,171 2,809,808 5,579,891 West Edmonton Mall Property Inc., 4.056% 02/13/2024 5,847,273 5,916,342 108,370 Xplornet Communications Inc. 2,671,691 4,659,910 USD 1,677,846 Xplornet Communications Inc., 9.625% 06/01/2022 2,227,954 2,196,103 USD 1,677,963 Xplornet Communications Inc., Term Loan, Private Placement, variable rate, 09/09/2021 2,159,806 2,267,103 2,780,667,593 2,724,920,481 U.S.A. (20.3%) USD 181,536 Acrisure LLC, Term Loan B, Private Placement, variable rate, 01/31/2027 241,007 224,834 USD 268,000 AECOM 5.125% 03/15/2027 349,726 339,465 USD 67,000 AECOM 5.875% 10/15/2024 92,447 88,233 USD 282,000 AerCap Global Aviation Trust 6.5% 06/15/2045 375,009 328,920 USD 1,366,000 AES Corp., 4% 03/15/2021 1,843,179 1,886,942 USD 275,000 Air Lease Corp., 2.3% 02/01/2025 353,904 307,499 6,806,000 Air Lease Corp., 2.625% 12/05/2024 6,725,044 5,520,568 USD 542,000 Air Lease Corp., 3.625% 04/01/2027 711,248 619,906 USD 284,000 Air Lease Corp., 4.25% 02/01/2024 380,602 338,291 3,000 Air Products & Chemicals Inc. 905,041 842,793 USD 315,000 Albertsons Co. Inc./Safeway Inc./ New Albertsons L.P., 3.5% 02/15/2023 411,490 436,459 USD 845,000 Albertsons Co. Inc./Safeway Inc./ New Albertsons L.P., 4.625% 01/15/2027 1,122,409 1,183,307 USD 1,145,000 Aleris International Inc., 10.75% 07/15/2023 1,609,459 1,627,427 65,700 Alexandria Real Estate Equities Inc. 10,655,252 12,673,416 USD 102,000 Alliance One International Inc., 9.875% 07/15/2021 114,462 25,840 USD 1,150,000 Allison Transmission Inc., 5% 10/01/2024 1,483,923 1,569,955 USD 1,084,759 Alvogen Pharma US Inc., Term Loan B-Ext, Private Placement, variable rate, 12/31/2023 1,441,215 1,305,320
CANADA (47.8%) (cont’d) 3,110,524 Sporting Life Group Ltd., Class B 3,206,726 3,206,726 7,026,772 Strait Crossing Development Inc., 6.17% 09/15/2031 7,679,457 7,816,770 4,635,000 Sun Life Capital Trust 7.093% 06/30/2052 6,042,015 5,555,389 7,241,000 Sun Life Financial Inc., 3.05% 09/19/2028 7,198,674 7,226,911 11,000,000 Sun Life Financial Inc., 3.1% 02/19/2026 11,134,750 11,029,703 6,000 Sun Life Financial Inc., Preferred 4.45%, Series 4 122,618 105,060 2,129,000 Suncor Energy Inc., 3.1% 05/24/2029 2,117,352 1,848,216 2,248,000 Suncor Energy Inc., 3.1% 11/26/2021 2,341,213 2,232,281 1,459,000 Suncor Energy Inc., 4.34% 09/13/2046 1,507,433 1,258,723 1,407,000 Suncor Energy Inc., 5.39% 03/26/2037 1,648,574 1,427,433 217,891 TC Energy Corp. 12,651,832 13,629,082 29,540,000 TD Capital Trust IV 6.631% 06/30/2108 32,003,622 31,048,406 USD 350,000 Teck Resources Ltd., 5.2% 03/01/2042 423,242 371,762 USD 65,000 Teck Resources Ltd., 5.4% 02/01/2043 83,890 72,475 USD 535,000 Telesat Canada/Telesat LLC 4.875% 06/01/2027 711,096 718,925 1,956,000 TELUS Corp., 2.75% 07/08/2026 1,951,436 1,918,718 1,331,000 TELUS Corp., 3.3% 05/02/2029 1,319,397 1,312,698 2,137,000 TELUS Corp., 3.95% 02/16/2050 2,113,035 1,973,285 455,000 TELUS Corp., 4.4% 01/29/2046 431,643 453,812 1,328,000 TELUS Corp., 4.75% 01/17/2045 1,350,625 1,389,027 6,415,000 Teranet Holdings L.P., 3.81929% 12/01/2031 7,754,144 6,648,251 4,070,000 Teranet Holdings L.P., 5.754% 12/17/2040 4,485,917 4,100,260 USD 1,345,000 Tervita Escrow Corp., 7.625% 12/01/2021 1,756,985 1,325,067 192,044 TFI International Inc. 5,208,092 5,962,966 2,784,000 The Bank of Nova Scotia 1.83% 04/27/2022 2,774,636 2,769,558 8,435,000 The Bank of Nova Scotia 2.16% 02/03/2025 8,422,861 8,214,240 3,518,000 The Bank of Nova Scotia 2.29% 06/28/2024 3,515,518 3,519,914 4,948,000 The Bank of Nova Scotia 2.36% 11/08/2022 4,947,038 4,979,309 1,636,000 The Bank of Nova Scotia 2.49% 09/23/2024 1,634,682 1,617,311 3,827,000 The Bank of Nova Scotia 2.98% 04/17/2023 3,831,871 3,918,250 5,235,000 The Bank of Nova Scotia 3.1% 02/02/2028 5,265,166 5,486,001 3,601,000 The Bank of Nova Scotia 3.89% 01/18/2029 3,605,421 3,650,872 2,523,760 THP Partnership 4.394% 10/31/2046 2,649,204 2,970,885 173,526 Toronto-Dominion Bank 10,574,903 10,382,061 4,279,000 Toronto-Dominion Bank 1.943% 03/13/2025 4,273,911 4,125,829 5,287,000 Toronto-Dominion Bank 1.994% 03/23/2022 5,260,092 5,278,510 4,671,000 Toronto-Dominion Bank 2.045% 03/08/2021 4,650,806 4,670,316 2,180,000 Toronto-Dominion Bank 2.563% 06/24/2020 2,232,064 2,183,330 3,150,000 Toronto-Dominion Bank 3.005% 05/30/2023 3,151,037 3,229,918 5,039,000 Toronto-Dominion Bank 3.06% 01/26/2032 5,032,508 4,809,633 1,289,000 Toronto-Dominion Bank 3.224% 07/25/2029 1,289,183 1,272,785 USD 374,000 Toronto-Dominion Bank 3.625% 09/15/2031 501,966 523,014 7,067,000 Toronto-Dominion Bank 4.859% 03/04/2031 7,473,688 7,504,617 328,593 Tourmaline Oil Corp. 6,926,952 2,839,044 17,566,000 Toyota Credit Canada Inc., 2.05% 05/20/2020 17,859,473 17,563,964 1,890,000 Toyota Credit Canada Inc., 2.11% 02/26/2025 1,889,376 1,810,278 1,921,000 Toyota Credit Canada Inc., 2.2% 02/25/2021 1,939,439 1,915,751 11,000,000 Toyota Credit Canada Inc., 2.64% 03/27/2024 11,111,870 10,854,536 3,195,000 TransAlta Corp., 5% 11/25/2020 3,297,651 3,241,736 4,075,000 TransCanada PipeLines Ltd., 4.18% 07/03/2048 4,103,002 3,517,174 1,856,000 TransCanada PipeLines Ltd., 4.33% 09/16/2047 1,758,302 1,646,395
No. of Shares/Par Value Description
AverageCost ($)
FairValue ($)
No. of Shares/Par Value Description
AverageCost ($)
FairValue ($)
Percentages shown in brackets relate investments at fair value to net assets attributable to holders of redeemable units of the Fund.

CI Income Fund
– 127 –Annual Financial Statements - March 31, 2020
Schedule of Investment Portfolio as at March 31, 2020 (cont’d)
U.S.A. (20.3%) (cont’d) USD 737,000 Bristol-Myers Squibb Co., 3.45% 11/15/2027 1,050,241 1,103,729 USD 265,000 Broadcom Corp./Broadcom Cayman Finance Ltd., 3.125% 01/15/2025 346,225 357,495 USD 1,150,000 Broadcom Corp./Broadcom Cayman Finance Ltd., 3.625% 01/15/2024 1,565,496 1,589,833 USD 2,525,000 Brookfield Property REIT Inc./BPR Cumulus LLC/ BPR Nimnus 5.75% 05/15/2026 3,396,773 2,883,389 USD 303,000 Bruin E&P Partners LLC 8.875% 08/01/2023 268,237 29,851 USD 1,109,350 Calfrac Holdings L.P., 10.875% 03/15/2026 1,426,189 390,325 USD 2,091,000 Calfrac Holdings L.P., 8.5% 06/15/2026 2,456,825 220,716 USD 1,095,000 California Resources Corp., 8% 12/15/2022 1,055,409 23,117 USD 187,000 Calumet Specialty Products Partners L.P./ Calumet Finance Corp., 7.625% 01/15/2022 244,268 203,967 USD 355,000 Cargo Aircraft Management Inc., 4.75% 02/01/2028 462,975 463,404 USD 550,000 Catalent Pharma Solutions Inc., 5% 07/15/2027 725,096 750,848 USD 96,000 CCO Holdings LLC/CCO Holdings Capital Corp., 4.5% 05/01/2032 128,540 131,760 USD 3,464,000 CCO Holdings LLC/CCO Holdings Capital Corp., 4.5% 08/15/2030 4,631,952 4,777,729 USD 1,310,000 CCO Holdings LLC/CCO Holdings Capital Corp., 4.75% 03/01/2030 1,733,280 1,834,476 USD 486,000 CCO Holdings LLC/CCO Holdings Capital Corp., 5% 02/01/2028 647,896 685,706 USD 5,471,000 CCO Holdings LLC/CCO Holdings Capital Corp., 5.25% 09/30/2022 7,462,929 7,565,138 USD 355,000 Cedar Fair L.P., 5.25% 07/15/2029 493,868 422,185 USD 1,205,000 Cedar Fair L.P./Canada’s Wonderland Co./Magnum Management Corp., 5.375% 06/01/2024 1,601,567 1,526,325 USD 476,000 Centene Corp., 3.375% 02/15/2030 630,661 623,028 USD 134,000 Centene Corp., 4.25% 12/15/2027 176,509 184,820 USD 170,000 Centene Corp., 4.625% 12/15/2029 225,827 240,454 USD 1,000,000 Centene Corp., 4.75% 05/15/2022 1,353,243 1,414,437 USD 1,420,000 Centene Corp., 5.25% 04/01/2025 1,995,906 1,995,710 USD 335,000 Century Communities Inc., 5.875% 07/15/2025 442,894 397,226 USD 3,835,000 CenturyLink Inc., 5.625% 04/01/2020 5,108,452 5,397,379 USD 460,000 Charles River Laboratories International Inc., 4.25% 05/01/2028 619,470 624,033 USD 316,000 Charles River Laboratories International Inc., 5.5% 04/01/2026 441,713 455,136 USD 7,082,000 Charter Communications Operating LLC 3.579% 07/23/2020 9,497,679 9,936,197 USD 230,000 Charter Communications Operating LLC 4.8% 03/01/2050 314,525 336,836 USD 575,000 Charter Communications Operating LLC 4.908% 07/23/2025 832,214 859,100 USD 345,000 Charter Communications Operating LLC 5.05% 03/30/2029 510,527 524,883 181,330 Cheniere Energy Inc. 11,710,319 8,549,329 USD 146,000 Cheniere Energy Partners L.P., 5.625% 10/01/2026 194,675 189,042 USD 1,883,715 Chinos Holdings Inc., 7% 12/31/2049 955,210 1,193,013 154,298 Chinos Intermediate Holdings Inc., Class A 255,148 284,739 3,500 CIGNA Corp. 973,948 872,771
U.S.A. (20.3%) (cont’d) 300 Amazon.com Inc. 743,882 823,211 USD 1,082,718 AMC Entertainment Holdings Inc., Term Loan B, Private Placement, variable rate, 03/20/2026 1,431,271 1,110,955 323,427 American Homes 4 Rent 9,361,780 10,560,436 34,387 American Tower Corp., Class A 8,420,951 10,538,287 50,330 American Water Works Co., Inc. 6,574,410 8,468,967 193,552 Americold Realty Trust 6,775,724 9,272,670 3,000 Amgen Inc. 941,140 855,967 USD 135,000 Anheuser-Busch Co., LLC/Anheuser-Busch InBev Worldwide Inc., 4.9% 02/01/2046 182,016 206,940 664,000 Anheuser-Busch InBev Finance Inc., 2.6% 05/15/2024 662,357 650,951 3,826,000 Anheuser-Busch InBev Finance Inc., 4.32% 05/15/2047 3,748,113 3,282,647 USD 165,000 Anheuser-Busch InBev Worldwide Inc., 5.45% 01/23/2039 262,344 267,226 89,800 Apartment Investment & Management Co. 5,884,683 4,442,416 USD 828,000 Apergy Corp., 6.375% 05/01/2026 1,072,205 897,302 2,300 Apple Inc. 940,659 823,142 USD 180,000 APX Group Inc., 6.75% 02/15/2027 239,219 210,266 USD 605,000 Archrock Partners L.P./Archrock Partners Finance Corp., 6.25% 04/01/2028 792,357 587,519 USD 370,000 Arconic Inc., 6.15% 08/15/2020 519,187 525,909 USD 170,000 Argos Merger Sub Inc., 7.125% 03/15/2023 202,895 222,809 USD 12,000 Asbury Automotive Group Inc., 4.5% 03/01/2028 15,948 14,355 USD 23,000 Asbury Automotive Group Inc., 4.75% 03/01/2030 30,567 27,515 USD 340,000 Ascent Resources Utica Holdings LLC/ ARU Finance Corp., 10% 04/01/2022 426,200 279,932 USD 355,000 Ascent Resources Utica Holdings LLC/ ARU Finance Corp., 7% 11/01/2026 393,295 138,854 USD 1,385,000 Ashtead Capital Inc., 5.25% 08/01/2026 1,805,901 1,871,883 USD 355,000 Ashton Woods USA LLC/Ashton Woods Finance Co., 6.625% 01/15/2028 463,592 394,705 USD 335,000 AT&T Inc., 3.4% 05/15/2025 461,155 490,432 33,420 Avangrid Inc. 2,298,067 2,059,206 USD 110,000 Ball Corp., 5% 03/15/2022 154,223 156,362 6,730,000 Bank of America Corp., 2.604% 03/15/2023 6,720,110 6,700,636 4,406,000 Bank of America Corp., 2.932% 04/25/2025 4,405,203 4,379,169 4,525,000 Bank of America Corp., 3.228% 06/22/2022 4,632,644 4,568,571 3,775,000 Bank of America Corp., 3.301% 04/24/2024 3,774,732 3,810,797 3,630,000 Bank of America Corp., 3.515% 03/24/2026 3,629,136 3,635,749 USD 193,000 Bank of America Corp., 4.3% 12/31/2049 252,377 233,600 USD 674,000 Bank of America Corp., 5.125% 12/31/2049 908,397 901,158 USD 2,334,000 Bank of America Corp., 6.25% 12/31/2049 3,203,946 3,334,145 USD 492,000 Bank of America Corp., FRN, 6.5% 12/31/2049 707,862 730,525 2,500 Becton Dickinson and Co. 893,063 808,446 USD 790,000 Berry Global Escrow Corp., 4.875% 07/15/2026 1,076,360 1,122,965 USD 124,000 Berry Global Escrow Corp., 5.625% 07/15/2027 166,880 180,298 USD 23,000 Block Communications Inc., 4.875% 03/01/2028 30,634 30,104 USD 2,264,000 Blue Cube Spinco Inc., 10% 10/15/2025 3,264,819 3,361,922 USD 2,012,000 Blue Cube Spinco Inc., 9.75% 10/15/2023 2,865,823 2,941,417 USD 849,000 Blue Ribbon LLC, Term Loan, Private Placement, variable rate, 11/13/2021 1,002,794 928,030 USD 710,000 Boyd Gaming Corp., 4.75% 12/01/2027 957,636 824,385 USD 565,000 Bristol-Myers Squibb Co., 3.25% 02/20/2023 777,785 834,984
No. of Shares/Par Value Description
AverageCost ($)
FairValue ($)
No. of Shares/Par Value Description
AverageCost ($)
FairValue ($)
Percentages shown in brackets relate investments at fair value to net assets attributable to holders of redeemable units of the Fund.

CI Income Fund
– 128 –Annual Financial Statements - March 31, 2020
Schedule of Investment Portfolio as at March 31, 2020 (cont’d)
U.S.A. (20.3%) (cont’d) USD 1,090,000 Diamondback Energy Inc., 3.5% 12/01/2029 1,063,700 1,061,144 USD 2,792,000 DISH DBS Corp., 5.125% 05/01/2020 3,767,607 3,898,949 USD 818,000 Dole Food Co., Inc., 7.25% 06/15/2025 1,089,665 909,490 USD 1,133,000 Dresdner Funding Trust I 8.151% 06/30/2031 1,962,944 1,855,203 USD 1,364,149 Dun & Bradstreet Corp., Term Loan B, Private Placement, variable rate, 02/01/2026 1,785,134 1,720,713 USD 1,679,875 Egalet Corp., 13% 01/31/2024 1,962,822 1,962,333 76,997 Egalet Corp., Warrants 612,221 173,385 16,750 Elanco Animal Health Inc., Preferred 5% 1,153,155 969,832 USD 245,000 Emera U.S. Finance L.P., 3.55% 06/15/2026 328,611 328,799 USD 1,358,000 Endeavor Energy Resources L.P./EER Finance Inc., 5.75% 01/30/2028 1,751,343 1,299,650 USD 245,000 Energen Corp., 4.625% 09/01/2021 332,673 332,919 USD 280,000 Energy Transfer Operating L.P., 2.9% 05/15/2025 376,397 329,515 USD 225,000 Energy Transfer Operating L.P., 3.75% 05/15/2030 306,855 244,020 USD 530,000 EnerSys 4.375% 12/15/2027 701,160 701,167 1,430 Equinix Inc. 1,027,381 1,256,998 USD 9,197,000 Equinix Inc., 5.875% 01/15/2026 12,926,565 13,207,525 98,800 Evergy Inc. 9,051,432 7,654,765 81,640 Eversource Energy 7,462,387 8,986,340 USD 1,267,000 Exela Intermediate LLC/Exela Finance Inc., 10% 07/15/2023 954,219 468,084 3,200 Facebook Inc. 909,410 751,214 USD 6,620,000 Fannie Mae Pool 3.5% 08/01/2049 7,847,543 8,577,049 USD 6,450,000 Fannie Mae Pool 3.5% 09/01/2049 7,886,199 8,655,948 USD 6,159,000 Fannie Mae Pool 4% 01/01/2050 8,444,855 9,062,237 USD 6,433,000 Fannie Mae Pool 4% 08/01/2049 7,487,425 8,187,563 USD 5,720,000 Fannie Mae Pool 4% 10/01/2049 7,280,819 7,953,711 USD 6,186,000 Fannie Mae Pool 4.5% 01/01/2050 8,512,744 9,144,912 USD 5,043,000 Fannie Mae Pool 4.5% 09/01/2049 5,978,344 6,448,479 USD 245,000 Florida Power & Light Co., 2.85% 04/01/2025 354,618 359,738 USD 267,000 Florida Power & Light Co., 3.15% 10/01/2049 350,970 389,224 USD 253,000 Foot Locker Inc., 8.5% 01/15/2022 401,633 338,269 USD 280,000 Fortress Transportation & Infrastructure Investors LLC 6.5% 10/01/2025 363,511 288,658 USD 857,000 Fortress Transportation & Infrastructure Investors LLC 6.75% 03/15/2022 1,158,311 1,116,369 USD 295,000 Foxtrot Escrow Issuer LLC/Foxtrot Escrow Corp., 12.25% 11/15/2026 378,885 323,843 USD 6,707,000 Freddie Mac Pool 3.5% 07/01/2049 7,443,364 8,162,518 USD 6,404,000 Freddie Mac Pool 3.5% 11/01/2049 8,161,053 8,915,725 USD 4,696,000 Freddie Mac Pool 4% 03/01/2050 6,521,140 7,016,924 USD 6,992,000 Freddie Mac Pool 4% 05/01/2049 7,894,486 8,591,916 USD 6,622,000 Freddie Mac Pool 4% 09/01/2049 7,801,735 8,559,031 USD 36,000 Freeport-McMoRan Inc., 3.55% 03/01/2022 44,586 48,663 USD 525,000 Freeport-McMoRan Inc., 3.875% 03/15/2023 685,171 698,246 USD 1,016,000 Front Range BidCo Inc., 4% 03/01/2027 1,344,533 1,367,360 USD 135,000 Front Range BidCo Inc., 6.125% 03/01/2028 179,009 180,499 USD 663,000 Front Range BidCo Inc., Term Loan, Private Placement, variable rate, 02/21/2027 876,938 877,120 USD 750,000 Frontier Communications Corp., 4.5% 06/15/2024 1,018,301 998,645
U.S.A. (20.3%) (cont’d) 232,500 Citigroup Capital XIII, Preferred 7.875% 8,070,842 8,376,845 USD 499,000 Citigroup Inc., 3.668% 07/24/2028 645,431 727,075 3,340,000 Citigroup Inc., 4.09% 06/09/2025 3,392,385 3,370,717 USD 300,000 Citigroup Inc., 4.45% 09/29/2027 425,792 440,808 USD 66,000 Citigroup Inc., 4.7% 12/31/2049 86,117 79,568 USD 624,000 Citigroup Inc., 5% 12/31/2049 825,867 802,831 USD 970,000 Citigroup Inc., 5.95% 12/29/2049 1,325,936 1,322,885 USD 2,317,000 Citigroup Inc., FRN, Series P, 5.95% 12/31/2049 3,046,735 3,159,041 15,950 Citigroup Inc., Preferred 6.875%, Series K 596,200 578,710 5,123 Citigroup Inc., Preferred, Perpetual 7.125% 196,001 186,670 7,376,000 Classic RMBS Trust 3.011% 08/15/2026 6,005,917 5,979,654 USD 545,000 Clean Harbors Inc., 4.875% 07/15/2027 729,321 750,849 USD 664,000 Clear Channel Worldwide Holdings Inc., 5.125% 08/15/2027 876,880 884,284 USD 235,000 Clearway Energy Operating LLC 4.75% 03/15/2028 310,084 306,760 USD 555,000 Cleveland-Cliffs Inc., 5.875% 06/01/2027 667,626 472,570 166,881 Clipper Realty Inc. 2,940,387 1,216,618 42,150 Coca-Cola Co. 2,540,111 2,624,995 USD 579,000 Comcast Corp., 3.7% 04/15/2024 813,499 874,494 USD 376,000 Comcast Corp., 4.6% 10/15/2038 540,686 647,729 USD 2,210,000 CommScope Finance LLC 5.5% 03/01/2024 3,003,196 3,147,678 USD 943,000 CommScope Finance LLC 6% 03/01/2026 1,275,897 1,325,188 USD 998,000 CommScope Finance LLC 8.25% 03/01/2027 1,321,533 1,353,880 USD 108,000 CommScope Inc., 5% 06/15/2021 144,763 150,479 USD 699,988 CommScope Inc., Term Loan B2, Private Placement, variable rate, 02/07/2026 923,622 926,054 USD 275,000 Consolidated Edison Comapny of New York Inc., 3.35% 04/01/2030 385,453 398,964 USD 1,215,000 Consolidated Edison Comapny of New York Inc., 3.95% 04/01/2050 1,695,593 1,797,419 USD 615,000 Crown Americas LLC/Crown Americas Capital Corp., 4.25% 09/30/2026 739,446 852,568 USD 154,000 Crown Americas LLC/Crown Americas Capital Corp., 4.75% 02/01/2026 212,703 222,093 55,793 Crown Castle International Corp. 9,685,771 11,338,732 USD 120,000 Crown Castle International Corp., 3.2% 09/01/2024 154,007 168,361 USD 1,282,000 CrownRock L.P./CrownRock Finance Inc., 5.625% 10/15/2025 1,604,885 938,229 USD 7,980,000 CSC Holdings LLC 10.875% 10/15/2025 12,159,441 12,143,576 USD 173,000 CSC Holdings LLC 5.375% 02/01/2028 215,697 248,350 USD 605,000 CSC Holdings LLC 5.5% 05/15/2026 799,882 883,654 USD 103,000 CSC Holdings LLC 5.75% 01/15/2030 135,311 146,189 2,100 Darden Restaurants Inc. 334,556 160,959 USD 604,000 Darling Ingredients Inc., 5.25% 04/15/2027 818,172 824,313 USD 477,000 DCP Midstream LLC, FRN, 5.85% 05/21/2043 507,656 302,098 USD 25,000 Dell EMC 2.65% 06/01/2020 33,014 34,984 USD 400,000 Denbury Resources Inc., 9% 05/15/2021 513,179 164,666 USD 1,380,000 Diamond Sports Group LLC/Diamond Sports Finance Co., 5.375% 08/15/2026 1,817,425 1,578,086 USD 768,000 Diamond Sports Group LLC/Diamond Sports Finance Co., 6.625% 08/15/2027 1,014,430 722,841 USD 365,000 Diamondback Energy Inc., 2.875% 12/01/2024 396,569 358,818
No. of Shares/Par Value Description
AverageCost ($)
FairValue ($)
No. of Shares/Par Value Description
AverageCost ($)
FairValue ($)
Percentages shown in brackets relate investments at fair value to net assets attributable to holders of redeemable units of the Fund.
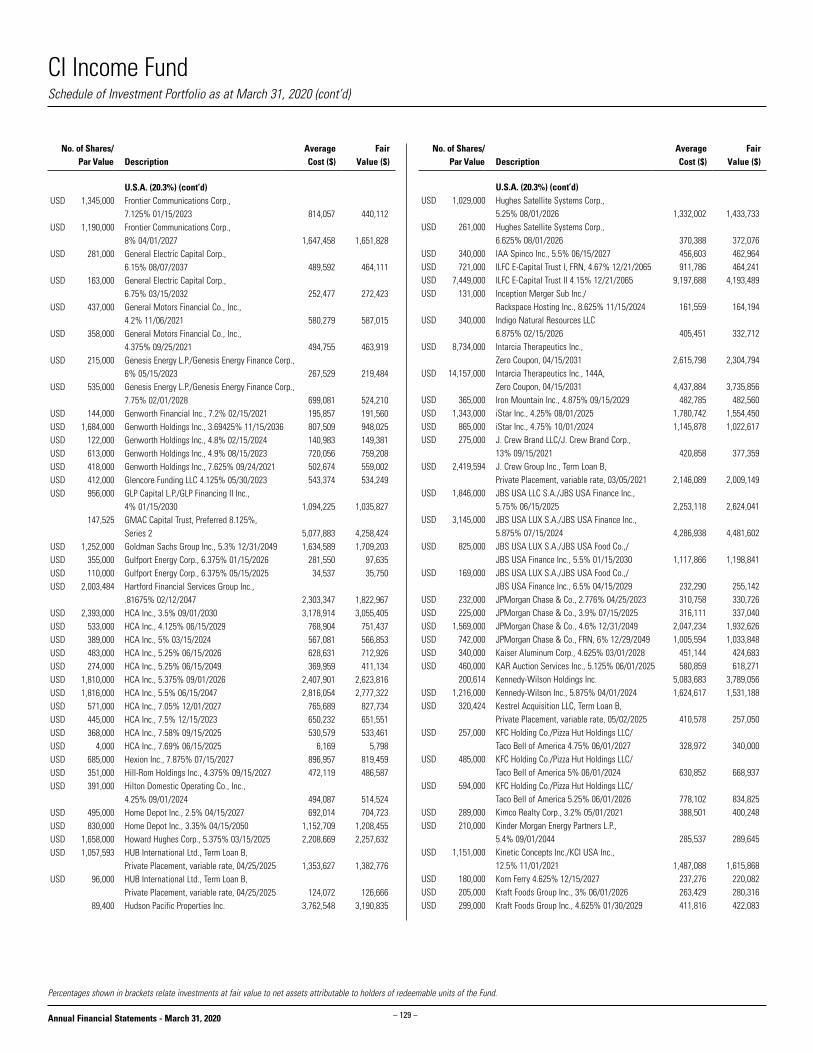
CI Income Fund
– 129 –Annual Financial Statements - March 31, 2020
Schedule of Investment Portfolio as at March 31, 2020 (cont’d)
U.S.A. (20.3%) (cont’d) USD 1,029,000 Hughes Satellite Systems Corp., 5.25% 08/01/2026 1,332,002 1,433,733 USD 261,000 Hughes Satellite Systems Corp., 6.625% 08/01/2026 370,388 372,076 USD 340,000 IAA Spinco Inc., 5.5% 06/15/2027 456,603 462,964 USD 721,000 ILFC E-Capital Trust I, FRN, 4.67% 12/21/2065 911,786 464,241 USD 7,449,000 ILFC E-Capital Trust II 4.15% 12/21/2065 9,197,688 4,193,489 USD 131,000 Inception Merger Sub Inc./ Rackspace Hosting Inc., 8.625% 11/15/2024 161,559 164,194 USD 340,000 Indigo Natural Resources LLC 6.875% 02/15/2026 405,451 332,712 USD 8,734,000 Intarcia Therapeutics Inc., Zero Coupon, 04/15/2031 2,615,798 2,304,794 USD 14,157,000 Intarcia Therapeutics Inc., 144A, Zero Coupon, 04/15/2031 4,437,884 3,735,856 USD 365,000 Iron Mountain Inc., 4.875% 09/15/2029 482,785 482,560 USD 1,343,000 iStar Inc., 4.25% 08/01/2025 1,780,742 1,554,450 USD 865,000 iStar Inc., 4.75% 10/01/2024 1,145,878 1,022,617 USD 275,000 J. Crew Brand LLC/J. Crew Brand Corp., 13% 09/15/2021 420,858 377,359 USD 2,419,594 J. Crew Group Inc., Term Loan B, Private Placement, variable rate, 03/05/2021 2,146,089 2,009,149 USD 1,846,000 JBS USA LLC S.A./JBS USA Finance Inc., 5.75% 06/15/2025 2,253,118 2,624,041 USD 3,145,000 JBS USA LUX S.A./JBS USA Finance Inc., 5.875% 07/15/2024 4,286,938 4,481,602 USD 825,000 JBS USA LUX S.A./JBS USA Food Co.,/ JBS USA Finance Inc., 5.5% 01/15/2030 1,117,866 1,198,841 USD 169,000 JBS USA LUX S.A./JBS USA Food Co.,/ JBS USA Finance Inc., 6.5% 04/15/2029 232,290 255,142 USD 232,000 JPMorgan Chase & Co., 2.776% 04/25/2023 310,758 330,726 USD 225,000 JPMorgan Chase & Co., 3.9% 07/15/2025 316,111 337,040 USD 1,569,000 JPMorgan Chase & Co., 4.6% 12/31/2049 2,047,234 1,932,626 USD 742,000 JPMorgan Chase & Co., FRN, 6% 12/29/2049 1,005,594 1,033,848 USD 340,000 Kaiser Aluminum Corp., 4.625% 03/01/2028 451,144 424,683 USD 460,000 KAR Auction Services Inc., 5.125% 06/01/2025 580,859 618,271 200,614 Kennedy-Wilson Holdings Inc. 5,083,683 3,789,056 USD 1,216,000 Kennedy-Wilson Inc., 5.875% 04/01/2024 1,624,617 1,531,188 USD 320,424 Kestrel Acquisition LLC, Term Loan B, Private Placement, variable rate, 05/02/2025 410,578 257,050 USD 257,000 KFC Holding Co./Pizza Hut Holdings LLC/ Taco Bell of America 4.75% 06/01/2027 328,972 340,000 USD 485,000 KFC Holding Co./Pizza Hut Holdings LLC/ Taco Bell of America 5% 06/01/2024 630,852 668,937 USD 594,000 KFC Holding Co./Pizza Hut Holdings LLC/ Taco Bell of America 5.25% 06/01/2026 778,102 834,825 USD 289,000 Kimco Realty Corp., 3.2% 05/01/2021 388,501 400,248 USD 210,000 Kinder Morgan Energy Partners L.P., 5.4% 09/01/2044 285,537 289,645 USD 1,151,000 Kinetic Concepts Inc./KCI USA Inc., 12.5% 11/01/2021 1,487,088 1,615,868 USD 180,000 Korn Ferry 4.625% 12/15/2027 237,276 220,082 USD 205,000 Kraft Foods Group Inc., 3% 06/01/2026 263,429 280,316 USD 299,000 Kraft Foods Group Inc., 4.625% 01/30/2029 411,816 422,083
U.S.A. (20.3%) (cont’d) USD 1,345,000 Frontier Communications Corp., 7.125% 01/15/2023 814,057 440,112 USD 1,190,000 Frontier Communications Corp., 8% 04/01/2027 1,647,458 1,651,828 USD 281,000 General Electric Capital Corp., 6.15% 08/07/2037 489,592 464,111 USD 163,000 General Electric Capital Corp., 6.75% 03/15/2032 252,477 272,423 USD 437,000 General Motors Financial Co., Inc., 4.2% 11/06/2021 580,279 587,015 USD 358,000 General Motors Financial Co., Inc., 4.375% 09/25/2021 494,755 463,919 USD 215,000 Genesis Energy L.P./Genesis Energy Finance Corp., 6% 05/15/2023 267,529 219,484 USD 535,000 Genesis Energy L.P./Genesis Energy Finance Corp., 7.75% 02/01/2028 699,081 524,210 USD 144,000 Genworth Financial Inc., 7.2% 02/15/2021 195,857 191,560 USD 1,684,000 Genworth Holdings Inc., 3.69425% 11/15/2036 807,509 948,025 USD 122,000 Genworth Holdings Inc., 4.8% 02/15/2024 140,983 149,381 USD 613,000 Genworth Holdings Inc., 4.9% 08/15/2023 720,056 759,208 USD 418,000 Genworth Holdings Inc., 7.625% 09/24/2021 502,674 559,002 USD 412,000 Glencore Funding LLC 4.125% 05/30/2023 543,374 534,249 USD 956,000 GLP Capital L.P./GLP Financing II Inc., 4% 01/15/2030 1,094,225 1,035,827 147,525 GMAC Capital Trust, Preferred 8.125%, Series 2 5,077,883 4,258,424 USD 1,252,000 Goldman Sachs Group Inc., 5.3% 12/31/2049 1,634,589 1,709,203 USD 355,000 Gulfport Energy Corp., 6.375% 01/15/2026 281,550 97,635 USD 110,000 Gulfport Energy Corp., 6.375% 05/15/2025 34,537 35,750 USD 2,003,484 Hartford Financial Services Group Inc., .81675% 02/12/2047 2,303,347 1,822,967 USD 2,393,000 HCA Inc., 3.5% 09/01/2030 3,178,914 3,055,405 USD 533,000 HCA Inc., 4.125% 06/15/2029 768,904 751,437 USD 389,000 HCA Inc., 5% 03/15/2024 567,081 566,853 USD 483,000 HCA Inc., 5.25% 06/15/2026 628,631 712,926 USD 274,000 HCA Inc., 5.25% 06/15/2049 369,959 411,134 USD 1,810,000 HCA Inc., 5.375% 09/01/2026 2,407,901 2,623,816 USD 1,816,000 HCA Inc., 5.5% 06/15/2047 2,816,054 2,777,322 USD 571,000 HCA Inc., 7.05% 12/01/2027 765,689 827,734 USD 445,000 HCA Inc., 7.5% 12/15/2023 650,232 651,551 USD 368,000 HCA Inc., 7.58% 09/15/2025 530,579 533,461 USD 4,000 HCA Inc., 7.69% 06/15/2025 6,169 5,798 USD 685,000 Hexion Inc., 7.875% 07/15/2027 896,957 819,459 USD 351,000 Hill-Rom Holdings Inc., 4.375% 09/15/2027 472,119 486,587 USD 391,000 Hilton Domestic Operating Co., Inc., 4.25% 09/01/2024 494,087 514,524 USD 495,000 Home Depot Inc., 2.5% 04/15/2027 692,014 704,723 USD 830,000 Home Depot Inc., 3.35% 04/15/2050 1,152,709 1,208,455 USD 1,658,000 Howard Hughes Corp., 5.375% 03/15/2025 2,208,669 2,257,632 USD 1,057,593 HUB International Ltd., Term Loan B, Private Placement, variable rate, 04/25/2025 1,353,627 1,382,776 USD 96,000 HUB International Ltd., Term Loan B, Private Placement, variable rate, 04/25/2025 124,072 126,666 89,400 Hudson Pacific Properties Inc. 3,762,548 3,190,835
No. of Shares/Par Value Description
AverageCost ($)
FairValue ($)
No. of Shares/Par Value Description
AverageCost ($)
FairValue ($)
Percentages shown in brackets relate investments at fair value to net assets attributable to holders of redeemable units of the Fund.
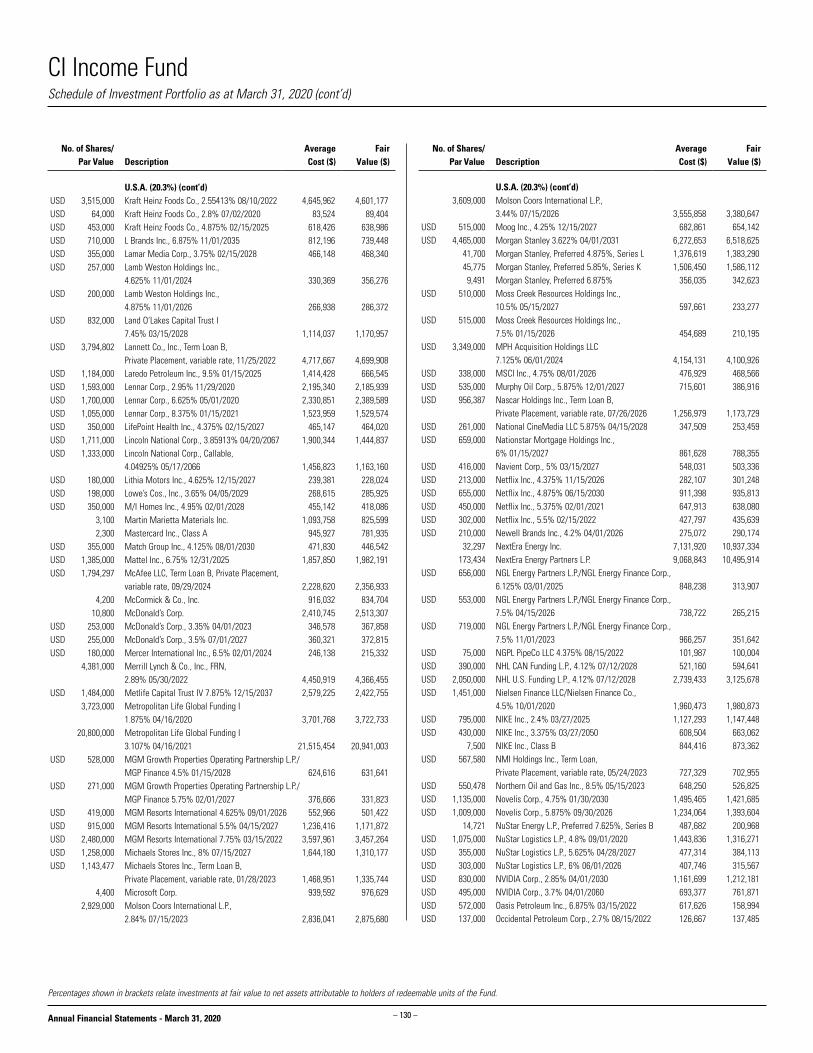
CI Income Fund
– 130 –Annual Financial Statements - March 31, 2020
Schedule of Investment Portfolio as at March 31, 2020 (cont’d)
U.S.A. (20.3%) (cont’d) 3,609,000 Molson Coors International L.P., 3.44% 07/15/2026 3,555,858 3,380,647 USD 515,000 Moog Inc., 4.25% 12/15/2027 682,861 654,142 USD 4,465,000 Morgan Stanley 3.622% 04/01/2031 6,272,653 6,518,625 41,700 Morgan Stanley, Preferred 4.875%, Series L 1,376,619 1,383,290 45,775 Morgan Stanley, Preferred 5.85%, Series K 1,506,450 1,586,112 9,491 Morgan Stanley, Preferred 6.875% 356,035 342,623 USD 510,000 Moss Creek Resources Holdings Inc., 10.5% 05/15/2027 597,661 233,277 USD 515,000 Moss Creek Resources Holdings Inc., 7.5% 01/15/2026 454,689 210,195 USD 3,349,000 MPH Acquisition Holdings LLC 7.125% 06/01/2024 4,154,131 4,100,926 USD 338,000 MSCI Inc., 4.75% 08/01/2026 476,929 468,566 USD 535,000 Murphy Oil Corp., 5.875% 12/01/2027 715,601 386,916 USD 956,387 Nascar Holdings Inc., Term Loan B, Private Placement, variable rate, 07/26/2026 1,256,979 1,173,729 USD 261,000 National CineMedia LLC 5.875% 04/15/2028 347,509 253,459 USD 659,000 Nationstar Mortgage Holdings Inc., 6% 01/15/2027 861,628 788,355 USD 416,000 Navient Corp., 5% 03/15/2027 548,031 503,336 USD 213,000 Netflix Inc., 4.375% 11/15/2026 282,107 301,248 USD 655,000 Netflix Inc., 4.875% 06/15/2030 911,398 935,813 USD 450,000 Netflix Inc., 5.375% 02/01/2021 647,913 638,080 USD 302,000 Netflix Inc., 5.5% 02/15/2022 427,797 435,639 USD 210,000 Newell Brands Inc., 4.2% 04/01/2026 275,072 290,174 32,297 NextEra Energy Inc. 7,131,920 10,937,334 173,434 NextEra Energy Partners L.P. 9,068,843 10,495,914 USD 656,000 NGL Energy Partners L.P./NGL Energy Finance Corp., 6.125% 03/01/2025 848,238 313,907 USD 553,000 NGL Energy Partners L.P./NGL Energy Finance Corp., 7.5% 04/15/2026 738,722 265,215 USD 719,000 NGL Energy Partners L.P./NGL Energy Finance Corp., 7.5% 11/01/2023 966,257 351,642 USD 75,000 NGPL PipeCo LLC 4.375% 08/15/2022 101,987 100,004 USD 390,000 NHL CAN Funding L.P., 4.12% 07/12/2028 521,160 594,641 USD 2,050,000 NHL U.S. Funding L.P., 4.12% 07/12/2028 2,739,433 3,125,678 USD 1,451,000 Nielsen Finance LLC/Nielsen Finance Co., 4.5% 10/01/2020 1,960,473 1,980,873 USD 795,000 NIKE Inc., 2.4% 03/27/2025 1,127,293 1,147,448 USD 430,000 NIKE Inc., 3.375% 03/27/2050 608,504 663,062 7,500 NIKE Inc., Class B 844,416 873,362 USD 567,580 NMI Holdings Inc., Term Loan, Private Placement, variable rate, 05/24/2023 727,329 702,955 USD 550,478 Northern Oil and Gas Inc., 8.5% 05/15/2023 648,250 526,825 USD 1,135,000 Novelis Corp., 4.75% 01/30/2030 1,495,465 1,421,685 USD 1,009,000 Novelis Corp., 5.875% 09/30/2026 1,234,064 1,393,604 14,721 NuStar Energy L.P., Preferred 7.625%, Series B 487,682 200,968 USD 1,075,000 NuStar Logistics L.P., 4.8% 09/01/2020 1,443,836 1,316,271 USD 355,000 NuStar Logistics L.P., 5.625% 04/28/2027 477,314 384,113 USD 303,000 NuStar Logistics L.P., 6% 06/01/2026 407,746 315,567 USD 830,000 NVIDIA Corp., 2.85% 04/01/2030 1,161,699 1,212,181 USD 495,000 NVIDIA Corp., 3.7% 04/01/2060 693,377 761,871 USD 572,000 Oasis Petroleum Inc., 6.875% 03/15/2022 617,626 158,994 USD 137,000 Occidental Petroleum Corp., 2.7% 08/15/2022 126,667 137,485
U.S.A. (20.3%) (cont’d) USD 3,515,000 Kraft Heinz Foods Co., 2.55413% 08/10/2022 4,645,962 4,601,177 USD 64,000 Kraft Heinz Foods Co., 2.8% 07/02/2020 83,524 89,404 USD 453,000 Kraft Heinz Foods Co., 4.875% 02/15/2025 618,426 638,986 USD 710,000 L Brands Inc., 6.875% 11/01/2035 812,196 739,448 USD 355,000 Lamar Media Corp., 3.75% 02/15/2028 466,148 468,340 USD 257,000 Lamb Weston Holdings Inc., 4.625% 11/01/2024 330,369 356,276 USD 200,000 Lamb Weston Holdings Inc., 4.875% 11/01/2026 266,938 286,372 USD 832,000 Land O’Lakes Capital Trust I 7.45% 03/15/2028 1,114,037 1,170,957 USD 3,794,802 Lannett Co., Inc., Term Loan B, Private Placement, variable rate, 11/25/2022 4,717,667 4,699,908 USD 1,184,000 Laredo Petroleum Inc., 9.5% 01/15/2025 1,414,428 666,545 USD 1,593,000 Lennar Corp., 2.95% 11/29/2020 2,195,340 2,185,939 USD 1,700,000 Lennar Corp., 6.625% 05/01/2020 2,330,851 2,389,589 USD 1,055,000 Lennar Corp., 8.375% 01/15/2021 1,523,959 1,529,574 USD 350,000 LifePoint Health Inc., 4.375% 02/15/2027 465,147 464,020 USD 1,711,000 Lincoln National Corp., 3.85913% 04/20/2067 1,900,344 1,444,837 USD 1,333,000 Lincoln National Corp., Callable, 4.04925% 05/17/2066 1,456,823 1,163,160 USD 180,000 Lithia Motors Inc., 4.625% 12/15/2027 239,381 228,024 USD 198,000 Lowe’s Cos., Inc., 3.65% 04/05/2029 268,615 285,925 USD 350,000 M/I Homes Inc., 4.95% 02/01/2028 455,142 418,086 3,100 Martin Marietta Materials Inc. 1,093,758 825,599 2,300 Mastercard Inc., Class A 945,927 781,935 USD 355,000 Match Group Inc., 4.125% 08/01/2030 471,830 446,542 USD 1,385,000 Mattel Inc., 6.75% 12/31/2025 1,857,850 1,982,191 USD 1,794,297 McAfee LLC, Term Loan B, Private Placement, variable rate, 09/29/2024 2,228,620 2,356,933 4,200 McCormick & Co., Inc. 916,032 834,704 10,800 McDonald’s Corp. 2,410,745 2,513,307 USD 253,000 McDonald’s Corp., 3.35% 04/01/2023 346,578 367,858 USD 255,000 McDonald’s Corp., 3.5% 07/01/2027 360,321 372,815 USD 180,000 Mercer International Inc., 6.5% 02/01/2024 246,138 215,332 4,381,000 Merrill Lynch & Co., Inc., FRN, 2.89% 05/30/2022 4,450,919 4,366,455 USD 1,484,000 Metlife Capital Trust IV 7.875% 12/15/2037 2,579,225 2,422,755 3,723,000 Metropolitan Life Global Funding I 1.875% 04/16/2020 3,701,768 3,722,733 20,800,000 Metropolitan Life Global Funding I 3.107% 04/16/2021 21,515,454 20,941,003 USD 528,000 MGM Growth Properties Operating Partnership L.P./ MGP Finance 4.5% 01/15/2028 624,616 631,641 USD 271,000 MGM Growth Properties Operating Partnership L.P./ MGP Finance 5.75% 02/01/2027 376,666 331,823 USD 419,000 MGM Resorts International 4.625% 09/01/2026 552,966 501,422 USD 915,000 MGM Resorts International 5.5% 04/15/2027 1,236,416 1,171,872 USD 2,480,000 MGM Resorts International 7.75% 03/15/2022 3,597,961 3,457,264 USD 1,258,000 Michaels Stores Inc., 8% 07/15/2027 1,644,180 1,310,177 USD 1,143,477 Michaels Stores Inc., Term Loan B, Private Placement, variable rate, 01/28/2023 1,468,951 1,335,744 4,400 Microsoft Corp. 939,592 976,629 2,929,000 Molson Coors International L.P., 2.84% 07/15/2023 2,836,041 2,875,680
No. of Shares/Par Value Description
AverageCost ($)
FairValue ($)
No. of Shares/Par Value Description
AverageCost ($)
FairValue ($)
Percentages shown in brackets relate investments at fair value to net assets attributable to holders of redeemable units of the Fund.

CI Income Fund
– 131 –Annual Financial Statements - March 31, 2020
Schedule of Investment Portfolio as at March 31, 2020 (cont’d)
U.S.A. (20.3%) (cont’d) USD 1,658,000 Scientific Games International Inc., 8.25% 03/15/2026 2,242,355 1,493,677 USD 240,000 Scripps Escrow Inc., 5.875% 07/15/2027 312,720 297,243 USD 340,000 Select Medical Corp., 6.25% 08/15/2026 447,357 478,516 55,051 Sempra Energy 9,132,394 8,754,328 USD 918,000 Service Corp. International 5.125% 06/01/2029 1,280,991 1,317,833 USD 1,665,000 Service Corp. International 5.375% 05/15/2024 2,300,303 2,384,329 USD 553,000 Sirius XM Radio Inc., 4.625% 07/15/2024 737,803 789,912 USD 790,000 Six Flags Entertainment Corp., 4.875% 07/31/2024 1,069,273 942,290 777 Sovereign REIT, Preferred 12%, Series 144A 1,349,760 1,142,760 USD 274,000 Spring Corp., 7.625% 03/01/2026 345,826 436,453 USD 1,391,000 Sprint Corp., 7.125% 06/15/2024 1,432,648 2,148,862 USD 189,000 Sprint Corp., 7.625% 02/15/2025 195,546 293,928 USD 180,000 Staples Inc., 7.5% 04/15/2026 238,410 223,882 8,200 Starbucks Corp. 1,034,073 758,684 USD 288,000 Starbucks Corp., 3.8% 08/15/2025 407,790 429,832 USD 212,000 Station Casinos LLC 4.5% 02/15/2028 278,548 241,679 43,300 STORE Capital Corp. 1,849,284 1,104,240 USD 753,000 Sunoco Logistics Partners Operations L.P., 5.3% 04/01/2044 983,778 833,373 USD 2,965,000 Symantec Corp., 4.2% 09/15/2020 3,795,628 4,129,090 21,300 Synchrony Financial 964,567 482,340 61,900 Synchrony Financial, Preferred 5.625%, Series A 2,039,592 1,486,234 4,800 Synopsys Inc. 926,133 870,043 USD 340,000 Talen Energy Supply LLC 6.625% 01/15/2028 449,070 401,953 USD 340,000 Tallgrass Energy Partners L.P./ Tallgrass Energy Finance Corp., 4.75% 10/01/2023 437,296 301,465 USD 3,090,000 Tapstone Energy LLC/Tapstone Energy Finance Corp., 9.75% 06/01/2022 3,983,131 30,442 USD 1,561,000 Targa Resources Partners L.P./Targa Resources Partners 5.5% 03/01/2030 2,068,481 1,696,925 USD 2,540,000 Tenet Healthcare Corp., 4.625% 07/15/2024 3,407,185 3,413,930 USD 1,340,000 Tenet Healthcare Corp., 4.625% 09/01/2024 1,836,854 1,806,330 USD 1,020,000 Tenet Healthcare Corp., 4.875% 01/01/2026 1,348,764 1,367,360 USD 1,425,000 TerraForm Power Operating LLC 4.75% 01/15/2030 1,913,058 1,945,379 USD 719,000 TerraForm Power Operating LLC 5% 01/31/2028 930,247 1,060,290 USD 485,000 Tesla Inc., 5.3% 08/15/2025 583,343 645,074 USD 895,000 The National Hockey League 3.61% 08/10/2027 1,125,107 1,320,387 USD 913,000 The National Hockey League 3.71% 08/10/2029 1,148,011 1,353,779 375,400 The Williams Co., Inc. 13,240,532 7,475,983 USD 18,000 TJX Co., Inc., 3.875% 04/15/2030 25,426 25,302 USD 1,485,000 T-Mobile USA Inc., 4% 04/15/2022 2,028,703 2,095,214 USD 355,000 T-Mobile USA Inc., 4.75% 02/01/2028 493,643 520,511 USD 3,190,000 T-Mobile USA Inc., 6% 03/01/2023 4,426,437 4,518,654 USD 723,000 T-Mobile USA Inc., 6.5% 01/15/2024 1,002,353 1,032,814 5,334 Tops Markets LLC 2,470,614 2,639,186 USD 1,089,872 Tops Markets LLC 13% 11/19/2024 1,437,501 1,487,869 USD 473,954 Tops Markets LLC, Term Loan, Private Placement, variable rate, 11/16/2023 605,705 670,379
U.S.A. (20.3%) (cont’d) USD 870,000 Olin Corp., 5% 02/01/2030 1,153,955 1,051,670 USD 436,000 Olin Corp., 5.5% 08/15/2022 613,311 564,536 USD 545,000 Oracle Corp., 2.5% 04/01/2025 770,512 778,301 USD 564,000 Ortho-Clinical Diagnostics Inc./Ortho-Clinical Diagnostics S.A., 6.625% 05/15/2022 742,432 750,116 USD 883,000 Ortho-Clinical Disgnostics Inc./Ortho-Clinical Disgnostics S.A., 7.25% 02/01/2028 1,175,133 1,068,627 USD 105,000 Outfront Media Capital LLC/Outfront Media Capital Corp., 4.625% 03/15/2030 138,983 131,522 USD 949,000 Panther BF Aggregator 2 L.P./Panther Finance Co., Inc., 6.25% 05/15/2026 1,305,932 1,262,163 USD 336,000 Panther BF Aggregator 2 L.P./Panther Finance Co., Inc., 8.5% 05/15/2027 449,358 412,546 USD 355,000 Parsley Energy LLC/Parsley Finance Corp., 4.125% 02/15/2028 442,996 339,746 USD 217,000 Parsley Energy LLC/Parsley Finance Corp., 5.25% 08/15/2025 284,092 232,108 USD 947,000 Parsley Energy LLC/Parsley Finance Corp., 5.625% 10/15/2027 1,209,296 939,630 USD 1,510,860 Party City Holdings Inc., Term Loan, Private Placement, variable rate, 08/19/2022 2,002,025 1,029,128 USD 180,000 PBF Holding Co., LLC/PBF Finance Corp., 6% 02/15/2028 234,748 167,199 USD 95,000 PDC Energy Inc., 5.75% 05/15/2026 100,084 74,874 USD 213,000 Penske Truck Leasing Co., L.P./PTL Finance Corp., 3.95% 03/10/2025 293,211 310,107 2,661,000 PepsiCo Inc., 2.15% 05/06/2024 2,634,684 2,648,007 USD 400,000 PepsiCo, Inc., 3.875% 03/19/2060 659,906 713,557 USD 355,000 Performance Food Group Inc., 5.5% 10/15/2027 501,605 463,404 USD 905,000 Pilgrim’s Pride Corp., 5.75% 03/15/2025 1,179,689 1,283,250 244,600 Plains GP Holdings L.P. 5,436,652 1,931,243 USD 65,000 Post Holdings Inc., 5% 08/15/2026 82,029 94,148 USD 525,000 Prime Security Services Borrower LLC/ Prime Finance Inc., 6.25% 01/15/2028 687,038 637,288 22,200 Procter & Gamble Co. 2,658,274 3,436,871 USD 903,000 Project Homestake Merger Corp., 8.875% 03/01/2023 1,119,331 807,010 145,909 Prologis Inc. 14,618,592 16,504,168 USD 215,000 Radiology Partners Inc., 9.25% 02/01/2028 282,490 261,968 USD 1,982,000 Rayonier AM Products Inc., 5.5% 06/01/2024 2,206,088 1,269,207 USD 685,000 Realogy Group LLC/Realogy Co-Issuer Corp., 5.25% 12/01/2021 906,999 891,764 USD 491,000 Reynolds Group Issuer Inc./Reynolds Group Issuer LLC 5.125% 07/15/2023 659,167 684,123 USD 3,888,000 Reynolds Group Issuer Inc./Reynolds Group Issuer LLC 5.33125% 07/15/2021 5,283,363 5,335,172 USD 835,000 Rite Aid Corp., 6.125% 04/01/2023 1,033,525 1,010,654 USD 485,000 Rite Aid Corp., 7.5% 07/01/2025 658,601 648,460 USD 1,138,000 Rite Aid Corp., 7.7% 02/15/2027 1,348,182 1,216,383 USD 118,000 Scientific Games International Inc., 6.625% 05/15/2021 128,874 132,460 USD 365,000 Scientific Games International Inc., 7% 05/15/2028 483,130 315,926 USD 1,030,000 Scientific Games International Inc., 7.25% 11/15/2029 1,362,002 906,014
No. of Shares/Par Value Description
AverageCost ($)
FairValue ($)
No. of Shares/Par Value Description
AverageCost ($)
FairValue ($)
Percentages shown in brackets relate investments at fair value to net assets attributable to holders of redeemable units of the Fund.

CI Income Fund
– 132 –Annual Financial Statements - March 31, 2020
Schedule of Investment Portfolio as at March 31, 2020 (cont’d)
U.S.A. (20.3%) (cont’d) USD 191,000 Verizon Communications Inc., 4.016% 12/03/2029 268,402 301,906 USD 167,000 Verizon Communications Inc., 4.522% 09/15/2048 243,387 300,900 USD 438,000 Vertiv Group Corp., Term Loan B, Private Placement, variable rate, 03/02/2027 579,188 530,139 USD 46,000 VICI Properties L.P./VICI Note Co., Inc., 3.75% 02/15/2027 60,440 61,018 USD 46,000 VICI Properties L.P./VICI Note Co., Inc., 4.125% 08/15/2030 60,440 60,613 USD 1,060,000 Vistra Operations Co., LLC 3.55% 07/15/2024 1,407,880 1,402,090 USD 183,000 Vistra Operations Co., LLC 4.3% 07/15/2029 242,236 228,350 USD 1,775,000 W.R. Grace & Co., 5.125% 10/01/2021 2,442,405 2,523,117 5,000 Walt Disney Co. 947,493 679,774 3,039,000 Walt Disney Co., 3.057% 03/30/2027 3,041,371 3,091,863 USD 537,000 Wand Merger Corp., 8.125% 07/15/2023 714,858 738,996 USD 196,000 Wand Merger Corp., 9.125% 07/15/2026 259,995 249,645 10,000,000 Wells Fargo & Co., 2.509% 10/27/2023 9,656,300 9,894,253 2,399,000 Wells Fargo & Co., 3.184% 02/08/2024 2,399,922 2,414,924 USD 235,000 Wells Fargo & Co., 4.3% 07/22/2027 336,074 352,301 USD 211,000 Wells Fargo & Co., 4.9% 11/17/2045 322,046 338,544 USD 3,553,000 Wells Fargo & Co., 5.875% 12/31/2049 4,926,773 5,075,500 USD 254,000 Whiting Petroleum Corp., 1.25% 04/01/2020 329,376 178,647 USD 319,000 Whiting Petroleum Corp., 5.75% 03/15/2021 258,799 30,170 USD 535,000 Whiting Petroleum Corp., 6.625% 01/15/2026 388,731 50,825 USD 1,285,000 WPX Energy Inc., 4.5% 01/15/2030 1,518,467 982,020 USD 180,000 Wyndham Destinations Inc., 4.625% 03/01/2030 238,193 195,066 USD 164,000 Wynn Las Vegas LLC/Wynn Las Vegas Capital Corp., 5.25% 05/15/2027 202,787 208,886 USD 15,000 Yum! Brands Inc., 7.75% 04/01/2025 21,215 21,111 114,775 Zyla Life Sciences 912,603 258,455 1,159,291,436 1,157,525,913 EXCHANGE-TRADED FUND(S) (11.0%) 1,249,100 CI First Asset Global Financial Sector ETF (Common Units) 22,946,772 15,888,552 7,000,000 CI First Asset Health Care Giants Covered Call ETF (CAD-Hedged Common Units) 69,126,707 64,610,000 730,334 CI First Asset Long Duration Fixed Income ETF (Common Units) 14,641,002 15,216,509 122,300 CI First Asset Preferred Share ETF (Common Units) 2,406,783 2,004,497 2,000,000 iShares Core Canadian Universe Bond Index ETF 61,020,000 62,920,000 251,008 iShares iBoxx $ Investment Grade Corporate Bond ETF 42,967,570 43,632,216 139,443 iShares J.P. Morgan USD Emerging Markets Bond ETF 20,160,578 18,973,652 2,000,000 iShares MSCI Hong Kong ETF 56,940,463 56,127,116 4,400,000 Mackenzie Floating Rate Income ETF 93,105,915 73,832,000 980,000 SPDR Gold Trust 193,028,128 204,198,275 6,871 SPDR S&P 500 ETF Trust 2,448,713 2,492,506 668,300 Vanguard Real Estate ETF 83,961,891 65,698,500 662,754,522 625,593,823
U.S.A. (20.3%) (cont’d) USD 188,000 Transcontinental Gas Pipe Line Co., LLC 4.6% 03/15/2048 265,926 262,270 USD 1,451,000 TransDigm Inc., 5.5% 11/15/2027 1,927,973 1,832,818 USD 1,225,000 TransDigm Inc., 6.25% 03/15/2026 1,720,051 1,717,600 USD 150,000 TransDigm Inc., 7.5% 03/15/2027 212,819 203,447 USD 1,114,000 TransMontaigne Partners L.P./TLP Finance Corp., 6.125% 02/15/2026 1,407,461 1,254,275 USD 355,000 Tronox Inc., 6.5% 04/15/2026 436,438 449,664 USD 520,000 U.S. Bancorp., 3.375% 02/05/2024 690,194 776,945 USD 481,580 Ultimate Software Group Inc., Term Loan, Private Placement, variable rate, 04/08/2026 639,334 629,200 33,677 Union Pacific Corp. 6,809,139 6,684,875 USD 1,735,000 United Rentals North America Inc., 3.875% 11/15/2027 2,202,504 2,307,538 USD 330,000 United Rentals North America Inc., 4% 07/15/2030 439,525 415,676 USD 1,025,000 United Rentals North America Inc., 4.625% 10/15/2025 1,255,856 1,384,882 USD 1,195,000 United Rentals North America Inc., 5.5% 07/15/2025 1,558,966 1,648,206 USD 5,117,000 United States Treasury Inflation Indexed Bonds 0.12533% 01/15/2030 7,260,949 7,433,753 USD 8,628,000 United States Treasury Inflation Indexed Bonds 0.12568% 10/15/2024 12,468,562 12,332,901 USD 4,423,000 United States Treasury Inflation Indexed Bonds 1.02518% 02/15/2049 7,165,061 7,927,528 USD 33,411,000 United States Treasury Note/Bond 1.125% 02/28/2022 48,034,697 47,803,294 USD 1,110,000 United States Treasury Note/Bond 1.125% 02/28/2025 1,622,474 1,619,516 USD 460,000 United States Treasury Note/Bond 1.125% 02/28/2027 671,278 672,668 USD 4,145,000 United States Treasury Note/Bond 1.5% 02/15/2030 6,221,607 6,280,998 USD 11,834,000 United States Treasury Note/Bond 1.75% 07/31/2021 15,830,613 17,003,891 USD 87,650,000 United States Treasury Note/Bond 2% 02/15/2050 139,740,443 142,908,069 USD 8,292,000 United States Treasury Note/Bond 2.25% 08/15/2049 11,458,531 14,217,083 USD 45,376,000 United States Treasury Note/Bond 2.375% 11/15/2049 63,993,243 79,563,305 USD 495,000 UnitedHealth Group Inc., 3.75% 07/15/2025 696,614 752,855 USD 208,000 UnitedHealth Group Inc., 4.75% 07/15/2045 329,162 372,768 USD 170,000 Univar Solutions USA Inc., 5.125% 12/01/2027 224,859 217,725 USD 3,687,000 Universal Health Services Inc., 4.75% 08/01/2022 4,963,881 5,159,922 USD 585,000 US Bank N.A./Cincinnati OH 1.95% 01/09/2023 770,235 824,883 USD 971,000 US Foods Inc., 5.875% 06/15/2024 1,277,965 1,244,276 USD 3,777,000 USB Realty Corp., FRN, 2.97825% 12/29/2049 4,525,996 3,986,813 USD 95,550 USI Inc., Term Loan B, Private Placement, variable rate, 05/16/2024 127,648 122,374 USD 197,000 Verizon Communications Inc., 3.376% 02/15/2025 272,531 296,167
No. of Shares/Par Value Description
AverageCost ($)
FairValue ($)
No. of Shares/Par Value Description
AverageCost ($)
FairValue ($)
Percentages shown in brackets relate investments at fair value to net assets attributable to holders of redeemable units of the Fund.

CI Income Fund
– 133 –Annual Financial Statements - March 31, 2020
Schedule of Investment Portfolio as at March 31, 2020 (cont’d)
U.K. (1.0%) (cont’d) GBP 1,275,000 United Kingdom Gilt 2.75% 09/07/2024 2,406,766 2,480,684 GBP 1,580,000 United Kingdom Gilt 3.5% 07/22/2068 4,359,745 5,974,691 USD 259,000 Virgin Media Finance PLC 5.75% 01/15/2025 343,706 353,581 USD 447,000 Virgin Media Secured Finance PLC 5.5% 05/15/2029 602,556 626,843 USD 310,000 Virgin Media Secured Finance PLC 5.5% 08/15/2026 396,294 442,838 USD 309,000 Vodafone Group PLC 3.75% 01/16/2024 430,151 452,743 USD 240,000 Vodafone Group PLC 4.25% 09/17/2050 314,499 347,180 57,184,907 57,542,878 FRANCE (0.9%) 30,483 Aeroports de Paris 6,397,565 4,134,466 USD 658,000 Altice France S.A., 5.5% 01/15/2028 889,233 867,079 USD 476,000 BNP Paribas S.A., 3.8% 01/10/2024 612,129 690,659 37,100 Gecina S.A. 7,617,530 6,945,173 EUR 2,965,000 Government of France Bond OAT Zero Coupon, 03/25/2023 4,451,490 4,670,073 EUR 2,335,000 Government of France Bond OAT Zero Coupon, 03/25/2024 3,500,697 3,685,603 EUR 6,836,000 Government of France Bond OAT Zero Coupon, 03/25/2025 10,275,467 10,783,054 EUR 443,437 Government of France Bond OAT 0.5% 05/25/2029 710,370 722,034 EUR 3,206,000 Government of France Bond OAT 2% 05/25/2048 5,794,769 6,539,391 EUR 480,000 Sanofi S.A., 1.125% 03/10/2022 740,281 753,758 USD 349,000 SFR Group S.A., 7.375% 05/01/2026 478,888 487,572 EUR 300,000 Total Capital International S.A., 0.696% 05/31/2028 462,489 444,526 80,593 Vinci S.A. 9,494,571 9,424,766 51,425,479 50,148,154 AUSTRALIA (0.7%) 1,247,671 Atlas Arteria Ltd. 6,438,184 5,949,414 1,672,000 BHP Billiton Finance Ltd., 3.23% 05/15/2023 1,680,754 1,676,256 AUD 3,553,000 Government of Australia, Treasury Bond 2.5% 05/31/2030 3,798,291 3,593,124 USD 1,375,000 Macquarie Bank Ltd., 6.125% 12/31/2049 1,669,536 1,741,658 USD 1,162,000 NuFarm Australia Ltd.,/Nufarm Americas Inc., 5.75% 04/30/2026 1,476,625 1,414,620 2,353,734 Sydney Airport 14,132,920 11,386,539 1,407,521 Transurban Group 14,885,640 14,665,737 44,081,950 40,427,348 JAPAN (0.6%) JPY 1,652,100,000 Government of Japan, Five Year Bond 0.1% 12/20/2022 19,133,587 21,750,455 JPY 938,150,000 Government of Japan, Twenty Year Bond 0.3% 06/20/2039 11,908,835 12,244,182 31,042,422 33,994,637 INDONESIA (0.5%) USD 500,000 Government of Indonesia International Bond 2.85% 02/14/2030 648,493 682,566 USD 7,702,000 Government of Indonesia International Bond 2.95% 01/11/2023 10,007,481 10,739,015 USD 2,326,000 Government of Indonesia International Bond 3.75% 04/25/2022 3,011,714 3,292,638
FUND(S) (3.0%) 7,190,124 CI Munro Alternative Global Growth Fund (Class I) 71,121,187 80,058,435 7,108,415 Signature Global Dividend Fund (Class I) 101,466,417 85,132,505 528,757 Signature Global REIT Fund (Series I) 9,957,789 8,513,205 182,545,393 173,704,145 SPAIN (1.0%) EUR 2,682,065 Abengoa Abenewco 1 S.A.U., 6% 03/31/2021 3,270,495 3,510,487 EUR 66,810 Abengoa Abenewco 1 S.A.U., Zero Coupon, 12/31/2022 - - USD 3,501,497 Abengoa Abenewco 2 BIS S.A., 1.5% 04/26/2024 607,215 280,896 47,370 Aena S.A. 10,507,447 7,311,655 264,100 Banco Santander S.A. 1,555,908 908,514 562,732 Ferrovial S.A. 16,306,182 19,087,643 EUR 11,360,000 Government of Spain Bond 0.05% 10/31/2021 16,721,464 17,690,457 EUR 1,441,000 Government of Spain Bond 0.45% 10/31/2022 2,190,409 2,264,039 EUR 3,194,000 Government of Spain Bond 0.5% 04/30/2030 4,808,705 4,862,731 EUR 320,000 Government of Spain Bond 1.4% 07/30/2028 490,742 530,181 228,576 Iberdrola S.A. 2,711,779 3,184,948 59,170,346 59,631,551 U.K. (1.0%) 16,947,000 Aviva PLC 4.5% 05/10/2021 17,364,026 17,299,837 USD 416,000 Barclays PLC 4.972% 05/16/2029 545,563 626,158 USD 1,734,000 Barclays PLC 6.278% 12/31/2049 2,521,572 2,416,027 USD 302,000 Barclays PLC 7.75% 12/31/2049 393,545 372,756 USD 878,000 Barclays PLC 7.875% 12/31/2049 1,166,574 1,130,663 USD 347,000 Barclays PLC 8% 12/31/2049 461,197 452,912 345,000 BP Capital Markets PLC 3.497% 11/09/2020 350,554 346,693 GBP 1,117,875 BrightHouse Group PLC 9% 05/15/2023 1,954,477 487,959 USD 710,000 Connect Finco S.a.r.l., 6.75% 10/01/2026 973,324 825,634 79,239 Cushman & Wakefield PLC 1,766,015 1,309,256 USD 450,000 eG Global Finance PLC 6.75% 02/07/2025 601,971 519,331 USD 1,100,000 Ferroglobe PLC/Globe Specialty Metals Inc., 9.375% 03/01/2022 1,121,020 441,220 1,946,000 HSBC Holdings PLC 3.196% 12/05/2023 1,949,041 1,956,262 USD 556,000 HSBC Holdings PLC 4.292% 09/12/2026 724,188 780,834 USD 254,000 Lloyds Banking Group PLC 6.75% 12/31/2049 338,771 294,027 USD 167,000 Lloyds Banking Group PLC 7.5% 12/31/2049 214,111 211,250 USD 773,000 Merlin Entertainments PLC 5.75% 06/15/2026 1,036,781 919,293 USD 1,082,000 National Westminster Bank PLC, FRN, 1.86325% 12/31/2049 918,118 1,164,947 USD 726,000 National Westminster Bank PLC, FRN, 1.875% 08/29/2049 614,331 781,656 USD 129,000 The Royal Bank of Scotland Group PLC 3.655% 12/31/2049 159,392 149,973 USD 823,000 The Royal Bank of Scotland Group PLC 7.5% 12/31/2049 1,075,754 1,062,013 USD 222,000 The Royal Bank of Scotland Group PLC 8% 12/31/2049 311,399 291,940 USD 604,000 The Royal Bank of Scotland Group PLC 8.625% 12/31/2049 792,762 828,818 GBP 1,481,263 United Kingdom Gilt 0.5% 07/22/2022 2,481,859 2,607,890 GBP 2,606,000 United Kingdom Gilt 0.875% 10/22/2029 4,621,864 4,797,055 GBP 2,351,000 United Kingdom Gilt 1.5% 07/22/2047 3,872,981 4,789,914
No. of Shares/Par Value Description
AverageCost ($)
FairValue ($)
No. of Shares/Par Value Description
AverageCost ($)
FairValue ($)
Percentages shown in brackets relate investments at fair value to net assets attributable to holders of redeemable units of the Fund.

CI Income Fund
– 134 –Annual Financial Statements - March 31, 2020
Schedule of Investment Portfolio as at March 31, 2020 (cont’d)
NETHERLANDS (0.3%) 19,600 AerCap Holdings N.V. 1,452,751 628,663 USD 991,000 AerCap Holdings N.V., 5.875% 10/10/2079 1,329,934 962,366 USD 535,000 Alcoa Nederland Holding B.V., 6.125% 05/15/2028 757,226 685,193 USD 499,000 Alcoa Nederland Holding B.V., 6.75% 09/30/2024 692,019 681,013 EUR 593,000 BMW Finance N.V., 1% 11/14/2024 919,432 888,978 EUR 527,000 Enel Finance International N.V., 1% 09/16/2024 810,000 811,709 USD 1,695,000 Fiat Chrysler Automobiles N.V., 4.5% 04/15/2020 2,301,478 2,378,601 USD 980,000 ING Groep N.V., 6.5% 12/31/2049 1,289,966 1,149,193 USD 232,000 ING Groep N.V., 6.75% 12/31/2049 329,418 279,988 USD 166,000 ING Groep N.V., 6.875% 12/31/2049 220,642 203,257 52,300 Koninklijke Vopak N.V. 3,330,040 3,846,495 USD 1,913,000 LBC Tank Terminals Holding Netherlands B.V., 6.875% 05/15/2023 2,617,347 2,524,084 USD 122,000 Shell International Finance B.V., 4.375% 05/11/2045 182,386 198,338 USD 1,527,000 Stars Group Holdings B.V./Stars Group U.S. Co-Borrower LLC 7% 07/15/2026 2,193,426 2,020,584 USD 158,000 Ziggo B.V., 4.875% 01/15/2030 207,690 216,573 USD 49,000 Ziggo Bond Co. B.V., 5.125% 02/28/2030 65,121 67,583 18,698,876 17,542,618 COLOMBIA (0.3%) USD 2,974,000 Government of Colombia International Bond 2.625% 03/15/2023 3,781,852 4,057,947 USD 1,734,000 Government of Colombia International Bond 3.875% 04/25/2027 2,178,687 2,403,825 USD 1,550,000 Government of Colombia International Bond 4% 02/26/2024 2,064,237 2,208,760 USD 1,156,000 Government of Colombia International Bond 4.5% 03/15/2029 1,732,590 1,667,677 USD 1,141,000 Government of Colombia International Bond 5% 06/15/2045 1,437,739 1,603,981 USD 1,933,000 Government of Colombia International Bond 5.625% 02/26/2044 3,103,868 2,867,901 14,298,973 14,810,091 GERMANY (0.2%) EUR 1,858,000 Bundesrepublik Deutschland Bundesanleihe Zero Coupon, 02/15/2030 3,002,471 3,017,293 EUR 335,000 Bundesrepublik Deutschland Bundesanleihe 0.25% 02/15/2027 542,545 551,007 EUR 1,150,000 Bundesrepublik Deutschland Bundesanleihe 0.5% 02/15/2026 1,897,035 1,905,305 EUR 2,457,000 Bundesrepublik Deutschland Bundesanleihe 1.25% 08/15/2048 4,009,701 5,154,655 USD 91,000 Deutsche Bank AG 6% 12/31/2049 120,972 85,745 47,216 Vonovia S.E. 2,852,909 3,285,113 12,425,633 13,999,118
INDONESIA (0.5%) (cont’d) USD 327,000 Government of Indonesia International Bond 4.35% 01/11/2048 401,981 470,873 USD 2,487,000 Government of Indonesia International Bond 4.75% 02/11/2029 3,634,234 3,788,046 USD 4,205,000 Government of Indonesia International Bond 5.35% 02/11/2049 6,307,576 6,723,191 USD 527,000 Government of Indonesia International Bond 5.875% 01/15/2024 744,680 804,891 24,756,159 26,501,220 BRAZIL (0.4%) 117,900 Banco do Brasil S.A. 1,633,159 889,314 USD 3,005,000 Federative Republic of Brazil International Bond 2.625% 01/05/2023 3,872,536 4,250,384 USD 4,489,000 Federative Republic of Brazil International Bond 4.25% 01/07/2025 6,146,090 6,649,505 USD 2,400,000 Federative Republic of Brazil International Bond 4.5% 05/30/2029 3,369,627 3,465,886 USD 2,584,000 Federative Republic of Brazil International Bond 4.625% 01/13/2028 3,484,013 3,873,109 USD 3,853,000 Federative Republic of Brazil International Bond 5.625% 02/21/2047 5,033,924 5,585,394 23,539,349 24,713,592 MEXICO (0.4%) USD 4,700,000 Government of Mexico International Bond 3.25% 04/16/2030 6,100,104 6,217,894 USD 793,000 Government of Mexico International Bond 3.6% 01/30/2025 995,902 1,131,626 USD 1,000 Government of Mexico International Bond 3.625% 03/15/2022 1,307 1,412 USD 5,900,000 Government of Mexico International Bond 4% 10/02/2023 8,104,814 8,469,734 USD 1,200,000 Government of Mexico International Bond 4.5% 04/22/2029 1,740,200 1,731,119 USD 4,558,000 Government of Mexico International Bond 4.6% 02/10/2048 5,560,957 6,437,446 22,503,284 23,989,231 ITALY (0.4%) 461,200 Enel SpA 4,556,483 4,534,318 EUR 2,970,000 Italy Buoni Poliennali Del Tesoro 0.65% 10/15/2023 4,409,460 4,609,497 EUR 6,511,000 Italy Buoni Poliennali Del Tesoro 1.35% 04/01/2030 9,999,515 9,941,872 EUR 1,703,000 Italy Buoni Poliennali Del Tesoro 3.85% 09/01/2049 3,370,641 3,423,977 22,336,099 22,509,664 RUSSIA (0.3%) USD 3,153,000 Government of the Russian Federation 4.25% 06/23/2027 4,139,754 4,645,475 USD 2,000,000 Government of the Russian Federation 4.375% 03/21/2029 2,622,343 3,006,252 USD 6,009,000 Government of the Russian Federation 4.75% 05/27/2026 8,438,718 8,972,948 USD 1,000,000 Government of the Russian Federation 5.25% 06/23/2047 1,624,912 1,702,954 16,825,727 18,327,629
No. of Shares/Par Value Description
AverageCost ($)
FairValue ($)
No. of Shares/Par Value Description
AverageCost ($)
FairValue ($)
Percentages shown in brackets relate investments at fair value to net assets attributable to holders of redeemable units of the Fund.

CI Income Fund
– 135 –Annual Financial Statements - March 31, 2020
Schedule of Investment Portfolio as at March 31, 2020 (cont’d)
SOUTH AFRICA (0.2%) USD 913,000 Republic of South Africa International Bond 4.3% 10/12/2028 1,088,512 1,052,395 USD 2,370,000 Republic of South Africa International Bond 4.665% 01/17/2024 3,107,064 3,127,067 USD 313,000 Republic of South Africa International Bond 4.85% 09/27/2027 397,305 386,120 USD 527,000 Republic of South Africa International Bond 4.875% 04/14/2026 664,854 660,855 USD 1,200,000 Republic of South Africa International Bond 5.875% 06/22/2030 1,656,412 1,469,326 USD 2,000,000 Republic of South Africa International Bond 5.875% 09/16/2025 2,763,996 2,700,097 9,678,143 9,395,860 LUXEMBOURG (0.2%) USD 850,000 Altice Financing S.A., 5% 01/15/2028 1,107,809 1,058,717 USD 164,000 Altice Financing S.A., 7.5% 05/15/2026 210,210 223,635 USD 180,000 Altice France Holding S.A., 6% 02/15/2028 236,357 222,851 USD 5,169,000 Evergreen Skills Lux S.a.r.l., Term Loan, Private Placement, variable rate, 04/28/2022 5,229,293 1,091,228 USD 1,214,205 Evergreen Skills Lux S.a.r.l., Term Loan, Private Placement, variable rate, 04/28/2021 1,329,503 1,090,824 USD 552,000 Intelsat Jackson Holdings S.A., 5.5% 08/01/2023 637,946 508,860 USD 1,205,000 Intelsat Jackson Holdings S.A., 8% 02/15/2024 1,655,840 1,638,663 USD 535,000 Intelsat Jackson Holdings S.A., 8.5% 10/15/2024 595,416 474,138 USD 1,370,000 Intelsat Jackson Holdings S.A., 9.5% 09/30/2022 1,986,041 1,967,684 USD 443,000 Trinseo Materials Operating S.C.A./Trinseo Materials Finance Inc., 5.375% 09/01/2025 555,206 525,280 13,543,621 8,801,880 SWEDEN (0.1%) SEK 48,000,000 Government of Sweden 0.75% 11/12/2029 7,006,825 7,405,794 PHILIPPINES (0.1%) USD 4,655,000 Government of Philippines 3% 02/01/2028 6,122,383 6,829,449 THAILAND (0.1%) 8,205,300 Digital Telecommunications Infrastructure Fund 4,368,969 5,282,772 NEW ZEALAND (0.1%) 940,191 Auckland International Airport Ltd. 5,551,663 3,937,320 BERMUDA (0.1%) 72,500 Brookfield Infrastructure Partners L.P. 3,467,756 3,704,750 PERU (0.1%) USD 1,250,000 Republic of Peru International Bond 2.844% 06/20/2030 1,666,311 1,857,768 USD 900,000 Republic of Peru International Bond 5.625% 11/18/2050 1,433,701 1,825,739 3,100,012 3,683,507
CAYMAN ISLANDS (0.2%) 2,078,700 ESR Cayman Ltd. 5,734,483 6,324,477 USD 4,046,000 Global Aircraft Leasing Co., Ltd., 6.5% 09/15/2024 5,327,716 3,667,156 USD 2,823,736 Ironshore Pharmaceuticals & Development Inc., 13% 02/28/2024 3,617,783 3,576,714 USD 317,000 MGM China Holdings Ltd., 5.875% 05/15/2026 430,291 392,608 15,110,273 13,960,955 TURKEY (0.2%) USD 1,500,000 Republic of Turkey International Bond 4.25% 03/13/2025 1,878,541 1,806,110 USD 1,500,000 Republic of Turkey International Bond 5.125% 02/17/2028 1,941,545 1,767,920 USD 3,800,000 Republic of Turkey International Bond 5.75% 05/11/2047 4,121,053 3,930,869 USD 600,000 Republic of Turkey International Bond 7.375% 02/05/2025 832,494 828,641 USD 4,000,000 Republic of Turkey International Bond 7.625% 04/26/2029 5,545,769 5,362,194 14,319,402 13,695,734 JERSEY ISLAND (0.2%) USD 470,000 Aston Martin Capital Holdings Ltd., 6.5% 04/15/2022 630,546 454,285 82,972 BrightHouse TopCo Ltd., A1 Ordinary Shares 836,340 - USD 343,000 HBOS Capital Funding L.P., 6.85% 03/29/2049 472,615 454,498 2,390,000 Heathrow Funding Ltd., 3.25% 05/21/2025 2,493,781 2,445,803 3,347,000 Heathrow Funding Ltd., 3.782% 09/04/2030 3,349,683 3,425,775 GBP 590,000 Heathrow Funding Ltd., 7.125% 02/14/2024 1,500,546 1,163,487 300,000 Heathrow Funding Ltd., FRN, 3% 06/17/2023 303,195 301,778 USD 157,000 Quotient Ltd., 12% 04/15/2024 209,901 222,067 USD 3,433,000 Quotient Ltd., 12% 10/15/2023 4,498,969 4,855,763 14,295,576 13,323,456 DENMARK (0.2%) 80,024 Orsted AS 6,060,633 11,078,057 SWITZERLAND (0.2%) USD 490,000 Credit Suisse Group AG 5.1% 12/31/2049 639,036 532,736 USD 1,496,000 Credit Suisse Group AG 6.25% 12/31/2049 2,026,086 1,939,665 USD 1,923,000 Credit Suisse Group AG 6.375% 12/31/2049 2,560,279 2,375,434 USD 328,000 Credit Suisse Group AG 7.125% 12/31/2049 429,391 427,005 USD 472,000 Credit Suisse Group AG 7.5% 12/31/2049 619,025 612,212 USD 729,000 Credit Suisse Group AG, FRN, 7.5% 12/11/2023 1,039,742 987,520 USD 215,000 UBS Group AG 6.875% 12/31/2049 288,805 287,083 USD 842,000 UBS Group AG 7.125% 12/31/2049 1,103,465 1,155,405 USD 772,000 UBS Group AG, FRN, 7% 12/31/2049 1,105,834 1,046,855 USD 482,000 UBS Group Funding Switzerland AG 4.253% 03/23/2028 629,131 710,943 USD 158,000 UBS Group Funding Switzerland AG 7% 12/31/2049 209,382 209,027 10,650,176 10,283,885
No. of Shares/Par Value Description
AverageCost ($)
FairValue ($)
No. of Shares/Par Value Description
AverageCost ($)
FairValue ($)
Percentages shown in brackets relate investments at fair value to net assets attributable to holders of redeemable units of the Fund.

CI Income Fund
– 136 –Annual Financial Statements - March 31, 2020
Schedule of Investment Portfolio as at March 31, 2020 (cont’d)
SHORT-TERM INVESTMENTS (1.4%) 62,105,000 Canadian Treasury Bill 1.61986% 01/07/2021 61,194,542 61,194,542 USD 500,000 United States Treasury Bill Zero Coupon, 05/28/2020 724,464 703,714 USD 77,000 United States Treasury Bill 1.43679% 12/31/2020 100,581 106,953 USD 12,250,000 United States Treasury Bill 1.49394% 04/16/2020 16,042,079 17,183,604 78,061,666 79,188,813 Commissions and other portfolio transaction costs (659,190)
Total Investment Portfolio before Derivative Instruments (92.8%) 5,390,551,289 5,292,645,495
Foreign Currency Forward Contract(s) (-1.7%) (see Schedule A) (94,794,484)
Short Option Contract(s) (0.0%) (see Schedule B) (2,112,205) (1,315,605)
Short Future Contract(s) (0.0%) (see Schedule C) (294)
Interest Rate Swap Contract(s) (0.0%) (see Schedule D) 775 88
Total Investment Portfolio (91.1%) 5,388,439,859 5,196,535,200 Other Net Assets (Liabilities) (8.9%) 507,616,404 Net Assets Attributable to Holders of Redeemable Units (100.0%) 5,704,151,604
Principal amounts stated in:AUD Australian Dollar GBP British Pound EUR European Currency JPY Japanese Yen SEK Swedish Krona USD U.S. Dollar
IRELAND (0.1%) 3,500 Accenture PLC 972,172 804,202 USD 500,000 Endo Dac/Endo Finance LLC/Endo Finco Inc., 5.875% 10/15/2024 670,826 657,960 USD 1,350,000 Endo International PLC, Term Loan B, Private Placement, variable rate, 04/27/2024 1,707,991 1,695,741 USD 210,000 LCPR Senior Secured Financing DAC 6.75% 10/15/2027 275,089 291,121 3,626,078 3,449,024 PANAMA (0.1%) USD 2,000,000 Republic of Panama International Bond 4.5% 04/01/2056 2,809,699 2,997,875 BRITISH VIRGIN ISLANDS (0.0%) USD 79,000 Studio City Finance Ltd., 7.25% 02/11/2024 104,923 94,618 USD 2,200,000 Government of Ukraine International Bond 7.75% 09/01/2024 3,243,564 2,847,835 3,348,487 2,942,453 HONG KONG (0.0%) 920,700 HKT Trust & HKT Ltd. 1,635,861 1,764,984 QATAR (0.0%) USD 1,040,000 Qatar Government International Bond 4% 03/14/2029 1,545,193 1,565,101 BELGIUM (0.0%) EUR 997,000 Anheuser-Busch InBev S.A./N.V., 2% 03/17/2028 1,547,652 1,554,520 SAUDI ARABIA (0.0%) USD 850,000 Government of Saudi Arabia International Bond 5% 04/17/2049 1,078,722 1,291,383
BAHAMAS (0.0%) USD 289,000 Silversea Cruises Ltd., 7.25% 02/01/2025 384,106 345,728 ST. LUCIA (0.0%) USD 257,216 Digicel International Finance Ltd., Term Loan B, Private Placement, variable rate, 05/27/2024 349,435 280,102
No. of Shares/Par Value Description
AverageCost ($)
FairValue ($)
No. of Shares/Par Value Description
AverageCost ($)
FairValue ($)
Percentages shown in brackets relate investments at fair value to net assets attributable to holders of redeemable units of the Fund.

CI Income Fund
– 137 –Annual Financial Statements - March 31, 2020
Schedule of Investment Portfolio as at March 31, 2020 (cont’d)
‡Credit ratings are obtained from S&P Global Ratings, where available, otherwise ratings are obtained from: Moody’s Investors Service or Dominion Bond Rating Service.Percentages shown in brackets relate investments at fair value to net assets attributable to holders of redeemable units of the Fund.
Schedule AForeign Currency Forward Contract(s) (-1.7%)
Contract(s) CounterpartyCredit Rating of
the Counterparty‡Settlement
DateContract(s)
Rate Pay ReceiveUnrealized
Gain (Loss) ($)1 Bank of Montreal A-1 May 14, 2020 0.75 (5,342,293) US $ 7,084,789 Canadian $ (429,199)1 Bank of Montreal A-1 June 22, 2020 0.73 (16,811,930) US $ 23,004,941 Canadian $ (631,423)1 Bank of Montreal A-1 May 14, 2020 0.75 (27,277,074) US $ 36,174,037 Canadian $ (2,191,437)1 Bank of Montreal A-1 May 14, 2020 0.75 (105,044) US $ 139,971 Canadian $ (7,775)1 Bank of Montreal A-1 June 22, 2020 1.42 (1,104,881) US $ 1,564,214 Canadian $ 10,721 1 Bank of Montreal A-1 April 22, 2020 0.75 (198,979) US $ 264,716 Canadian $ (15,220)1 Bank of Montreal A-1 June 22, 2020 1.43 (250,459) US $ 357,280 Canadian $ 5,122 1 Bank of Montreal A-1 May 14, 2020 0.73 (357,523) US $ 488,072 Canadian $ (14,801)1 Bank of Montreal A-1 May 14, 2020 0.75 (4,987,490) US $ 6,614,260 Canadian $ (400,694)1 Bank of Montreal A-1 May 14, 2020 0.75 (54,477) US $ 72,576 Canadian $ (4,047)1 Bank of Montreal A-1 June 22, 2020 0.73 (6,426,308) US $ 8,793,567 Canadian $ (241,360)1 Bank of Montreal A-1 June 22, 2020 0.73 (17,658,680) US $ 24,163,608 Canadian $ (663,225)1 Bank of Montreal A-1 May 14, 2020 0.75 (23,772,473) US $ 31,526,341 Canadian $ (1,909,878)1 Bank of Montreal A-1 May 14, 2020 0.75 (5,742,379) US $ 7,615,370 Canadian $ (461,342)1 Bank of Montreal A-1 June 22, 2020 0.73 (9,935,839) US $ 13,595,904 Canadian $ (373,171)1 Bank of Montreal A-1 May 14, 2020 0.75 (2,026,509) US $ 2,687,496 Canadian $ (162,810)1 Bank of Montreal A-1 June 22, 2020 0.73 (4,690,179) US $ 6,417,900 Canadian $ (176,154)1 Bank of Montreal A-1 May 14, 2020 0.75 (1,747,444) US $ 2,317,407 Canadian $ (140,389)1 Bank of Montreal A-1 June 22, 2020 0.73 (31,528,358) US $ 43,142,459 Canadian $ (1,184,143)1 Bank of Montreal A-1 May 14, 2020 0.75 (17,223,772) US $ 22,841,649 Canadian $ (1,383,756)1 Bank of Montreal A-1 June 22, 2020 0.73 (24,085,528) US $ 32,957,914 Canadian $ (904,605)1 Canadian Imperial Bank of Commerce A-1 April 22, 2020 0.77 (204,424) US $ 266,263 Canadian $ (21,331)1 Canadian Imperial Bank of Commerce A-1 May 14, 2020 0.75 (4,490,956) US $ 5,955,794 Canadian $ (360,780)1 Canadian Imperial Bank of Commerce A-1 April 22, 2020 0.77 (1,447,623) US $ 1,885,537 Canadian $ (151,055)1 Canadian Imperial Bank of Commerce A-1 May 14, 2020 0.75 (22,930,255) US $ 30,409,531 Canadian $ (1,842,100)1 Canadian Imperial Bank of Commerce A-1 June 22, 2020 0.73 (5,525,164) US $ 7,560,496 Canadian $ (207,487)1 Canadian Imperial Bank of Commerce A-1 June 22, 2020 0.73 (9,082,929) US $ 12,412,368 Canadian $ (357,543)1 Canadian Imperial Bank of Commerce A-1 June 22, 2020 0.73 (2,111,977) US $ 2,889,976 Canadian $ (79,311)1 Canadian Imperial Bank of Commerce A-1 April 22, 2020 0.77 (217,821) US $ 283,714 Canadian $ (22,729)1 Canadian Imperial Bank of Commerce A-1 April 22, 2020 0.75 (341,884) US $ 455,275 Canadian $ (25,709)1 Canadian Imperial Bank of Commerce A-1 June 22, 2020 0.73 (3,471,922) US $ 4,744,589 Canadian $ (136,670)1 Canadian Imperial Bank of Commerce A-1 May 14, 2020 0.75 (4,192,694) US $ 5,560,246 Canadian $ (336,820)1 Canadian Imperial Bank of Commerce A-1 May 14, 2020 0.73 (5,340) US $ 7,341 Canadian $ (170)1 Canadian Imperial Bank of Commerce A-1 May 14, 2020 0.75 (54,477) US $ 72,602 Canadian $ (4,022)1 Canadian Imperial Bank of Commerce A-1 May 14, 2020 0.73 (79,608) US $ 109,418 Canadian $ (2,556)1 Canadian Imperial Bank of Commerce A-1 April 22, 2020 0.75 (85,919) US $ 114,297 Canadian $ (6,579)1 Canadian Imperial Bank of Commerce A-1 May 14, 2020 0.75 (19,984,141) US $ 26,502,468 Canadian $ (1,605,424)

CI Income Fund
– 138 –Annual Financial Statements - March 31, 2020
Schedule of Investment Portfolio as at March 31, 2020 (cont’d)
‡Credit ratings are obtained from S&P Global Ratings, where available, otherwise ratings are obtained from: Moody’s Investors Service or Dominion Bond Rating Service.Percentages shown in brackets relate investments at fair value to net assets attributable to holders of redeemable units of the Fund.
1 Canadian Imperial Bank of Commerce A-1 April 22, 2020 0.77 (5,327,747) US $ 6,939,418 Canadian $ (555,934)1 Canadian Imperial Bank of Commerce A-1 June 22, 2020 0.73 (5,803,445) US $ 7,941,289 Canadian $ (217,937)1 Canadian Imperial Bank of Commerce A-1 June 22, 2020 0.73 (9,540,400) US $ 13,037,529 Canadian $ (375,551)1 Canadian Imperial Bank of Commerce A-1 June 18, 2020 1.17 (1,937,000) Australian $ 1,651,720 Canadian $ (23,126)1 Canadian Imperial Bank of Commerce A-1 June 18, 2020 1.18 (1,064,737) Canadian $ 1,253,000 Australian $ 18,675 1 Canadian Imperial Bank of Commerce A-1 June 18, 2020 0.90 (1,433,302) Canadian $ 1,597,000 Australian $ (52,300)1 Canadian Imperial Bank of Commerce A-1 June 18, 2020 1.56 (2,395,620) Canadian $ 1,536,000 Euro (8,632)1 Canadian Imperial Bank of Commerce A-1 June 18, 2020 1.57 (382,990) Canadian $ 244,127 Euro (3,605)1 Canadian Imperial Bank of Commerce A-1 June 18, 2020 0.66 (15,871,000) Euro 23,928,151 Canadian $ (734,220)1 Canadian Imperial Bank of Commerce A-1 June 18, 2020 0.65 (970,000) Euro 1,500,159 Canadian $ (7,224)1 Canadian Imperial Bank of Commerce A-1 April 22, 2020 0.77 (2,863,997) US $ 3,730,371 Canadian $ (298,849)1 Canadian Imperial Bank of Commerce A-1 June 22, 2020 0.73 (3,265,368) US $ 4,468,248 Canadian $ (122,625)1 Canadian Imperial Bank of Commerce A-1 May 14, 2020 0.75 (4,827,285) US $ 6,401,825 Canadian $ (387,799)1 Canadian Imperial Bank of Commerce A-1 June 22, 2020 0.73 (5,368,005) US $ 7,335,701 Canadian $ (211,308)1 Canadian Imperial Bank of Commerce A-1 June 22, 2020 0.73 (1,541,406) US $ 2,109,221 Canadian $ (57,885)1 Canadian Imperial Bank of Commerce A-1 April 22, 2020 0.77 (1,544,944) US $ 2,012,297 Canadian $ (161,210)1 Canadian Imperial Bank of Commerce A-1 May 14, 2020 0.75 (1,703,569) US $ 2,259,231 Canadian $ (136,856)1 Canadian Imperial Bank of Commerce A-1 June 22, 2020 0.73 (2,533,948) US $ 3,462,793 Canadian $ (99,747)1 Canadian Imperial Bank of Commerce A-1 June 22, 2020 0.73 (10,361,651) US $ 14,178,624 Canadian $ (389,112)1 Canadian Imperial Bank of Commerce A-1 April 22, 2020 0.77 (12,453,344) US $ 16,220,543 Canadian $ (1,299,469)1 Canadian Imperial Bank of Commerce A-1 May 14, 2020 0.75 (1,468,975) US $ 1,948,117 Canadian $ (118,010)1 Canadian Imperial Bank of Commerce A-1 June 22, 2020 0.73 (17,033,728) US $ 23,277,611 Canadian $ (670,520)1 Canadian Imperial Bank of Commerce A-1 June 22, 2020 0.73 (13,012,613) US $ 17,782,517 Canadian $ (512,232)1 Canadian Imperial Bank of Commerce A-1 May 14, 2020 0.75 (14,479,027) US $ 19,201,723 Canadian $ (1,163,171)1 Canadian Imperial Bank of Commerce A-1 April 22, 2020 0.77 (7,002,826) US $ 9,121,216 Canadian $ (730,724)1 Canadian Imperial Bank of Commerce A-1 June 22, 2020 0.73 (7,915,599) US $ 10,831,508 Canadian $ (297,255)
Schedule A (cont’d)Foreign Currency Forward Contract(s) (-1.7%)
Contract(s) CounterpartyCredit Rating of
the Counterparty‡Settlement
DateContract(s)
Rate Pay ReceiveUnrealized
Gain (Loss) ($)

CI Income Fund
– 139 –Annual Financial Statements - March 31, 2020
Schedule of Investment Portfolio as at March 31, 2020 (cont’d)
‡Credit ratings are obtained from S&P Global Ratings, where available, otherwise ratings are obtained from: Moody’s Investors Service or Dominion Bond Rating Service.Percentages shown in brackets relate investments at fair value to net assets attributable to holders of redeemable units of the Fund.
1 Citigroup Inc. A-2 May 14, 2020 0.75 (2,163,748) US $ 2,880,083 Canadian $ (163,259)1 Citigroup Inc. A-2 April 22, 2020 0.77 (275,287) US $ 357,049 Canadian $ (30,239)1 Citigroup Inc. A-2 May 14, 2020 0.75 (8,654,991) US $ 11,511,700 Canadian $ (661,662)1 Citigroup Inc. A-2 May 14, 2020 0.75 (11,047,822) US $ 14,705,342 Canadian $ (833,582)1 Citigroup Inc. A-2 April 22, 2020 0.77 (1,949,444) US $ 2,528,439 Canadian $ (214,136)1 Citigroup Inc. A-2 May 14, 2020 0.75 (44,191,290) US $ 58,777,288 Canadian $ (3,378,365)1 Citigroup Inc. A-2 May 14, 2020 0.75 (133,630) US $ 178,071 Canadian $ (9,881)1 Citigroup Inc. A-2 April 22, 2020 0.75 (183,586) US $ 244,317 Canadian $ (13,964)1 Citigroup Inc. A-2 May 14, 2020 0.75 (2,020,045) US $ 2,688,806 Canadian $ (152,417)1 Citigroup Inc. A-2 May 14, 2020 0.75 (207,237) US $ 276,153 Canadian $ (15,329)1 Citigroup Inc. A-2 May 14, 2020 0.73 (221,581) US $ 302,586 Canadian $ (9,078)1 Citigroup Inc. A-2 April 22, 2020 0.75 (252,343) US $ 335,818 Canadian $ (19,194)1 Citigroup Inc. A-2 May 14, 2020 0.73 (274,167) US $ 374,345 Canadian $ (11,284)1 Citigroup Inc. A-2 April 22, 2020 0.77 (293,330) US $ 380,450 Canadian $ (32,221)1 Citigroup Inc. A-2 May 14, 2020 0.75 (684,386) US $ 910,803 Canadian $ (51,795)1 Citigroup Inc. A-2 May 14, 2020 0.75 (691,989) US $ 920,571 Canadian $ (52,720)1 Citigroup Inc. A-2 May 14, 2020 0.75 (8,080,178) US $ 10,747,162 Canadian $ (617,719)1 Citigroup Inc. A-2 May 14, 2020 0.75 (38,513,525) US $ 51,225,491 Canadian $ (2,944,307)1 Citigroup Inc. A-2 April 22, 2020 0.77 (7,174,618) US $ 9,305,516 Canadian $ (788,092)1 Citigroup Inc. A-2 May 14, 2020 0.75 (9,628,381) US $ 12,815,977 Canadian $ (726,482)1 Citigroup Inc. A-2 May 14, 2020 0.75 (2,325,791) US $ 3,095,773 Canadian $ (175,486)1 Citigroup Inc. A-2 April 22, 2020 0.77 (3,856,806) US $ 5,002,296 Canadian $ (423,649)1 Citigroup Inc. A-2 May 14, 2020 0.75 (9,303,165) US $ 12,373,814 Canadian $ (711,214)1 Citigroup Inc. A-2 June 17, 2020 1.14 (945,361) US $ 831,374 Euro (37,256)1 Citigroup Inc. A-2 April 22, 2020 0.77 (2,080,500) US $ 2,698,419 Canadian $ (228,531)1 Citigroup Inc. A-2 May 14, 2020 0.75 (3,283,126) US $ 4,366,771 Canadian $ (250,991)1 Citigroup Inc. A-2 May 14, 2020 0.75 (820,781) US $ 1,092,511 Canadian $ (61,930)1 Citigroup Inc. A-2 April 22, 2020 0.77 (16,770,313) US $ 21,751,180 Canadian $ (1,842,126)1 Citigroup Inc. A-2 May 14, 2020 0.75 (2,831,014) US $ 3,765,433 Canadian $ (216,427)1 Citigroup Inc. A-2 May 14, 2020 0.75 (707,754) US $ 942,064 Canadian $ (53,402)1 Citigroup Inc. A-2 May 14, 2020 0.75 (27,904,045) US $ 37,114,193 Canadian $ (2,133,227)1 Citigroup Inc. A-2 May 14, 2020 0.75 (6,976,011) US $ 9,285,507 Canadian $ (526,355)1 Citigroup Inc. A-2 April 22, 2020 0.77 (9,430,366) US $ 12,231,231 Canadian $ (1,035,873)1 HSBC Holdings PLC A-1 April 22, 2020 0.77 (388,097) US $ 505,302 Canadian $ (40,693)1 HSBC Holdings PLC A-1 May 14, 2020 0.75 (5,361,767) US $ 7,123,402 Canadian $ (417,988)1 HSBC Holdings PLC A-1 May 14, 2020 0.75 (27,376,504) US $ 36,371,191 Canadian $ (2,134,195)1 HSBC Holdings PLC A-1 April 22, 2020 0.77 (2,748,303) US $ 3,578,291 Canadian $ (288,164)1 HSBC Holdings PLC A-1 May 14, 2020 0.73 (25,714) US $ 35,331 Canadian $ (837)1 HSBC Holdings PLC A-1 April 22, 2020 0.77 (413,533) US $ 538,419 Canadian $ (43,360)1 HSBC Holdings PLC A-1 May 14, 2020 0.75 (5,005,670) US $ 6,650,308 Canadian $ (390,228)1 HSBC Holdings PLC A-1 April 22, 2020 0.75 (601,024) US $ 799,740 Canadian $ (45,819)1 HSBC Holdings PLC A-1 May 14, 2020 0.75 (713,888) US $ 949,486 Canadian $ (54,608)1 HSBC Holdings PLC A-1 April 22, 2020 0.77 (10,114,692) US $ 13,169,329 Canadian $ (1,060,543)1 HSBC Holdings PLC A-1 May 14, 2020 0.75 (23,859,129) US $ 31,698,165 Canadian $ (1,859,991)1 HSBC Holdings PLC A-1 June 18, 2020 5.65 (402,770) Canadian $ 2,276,000 Hong Kong $ 9,929 1 HSBC Holdings PLC A-1 June 18, 2020 5.56 (423,084) Canadian $ 2,352,000 Hong Kong $ 3,410 1 HSBC Holdings PLC A-1 April 22, 2020 0.77 (5,437,279) US $ 7,079,338 Canadian $ (570,108)1 HSBC Holdings PLC A-1 May 14, 2020 0.75 (5,763,311) US $ 7,656,875 Canadian $ (449,292)1 HSBC Holdings PLC A-1 May 14, 2020 0.75 (2,033,896) US $ 2,702,143 Canadian $ (158,557)1 HSBC Holdings PLC A-1 April 22, 2020 0.77 (2,933,065) US $ 3,818,851 Canadian $ (307,537)1 HSBC Holdings PLC A-1 May 14, 2020 0.75 (1,753,813) US $ 2,330,038 Canadian $ (136,722)1 HSBC Holdings PLC A-1 April 22, 2020 0.77 (23,642,590) US $ 30,782,652 Canadian $ (2,478,967)1 HSBC Holdings PLC A-1 April 22, 2020 0.77 (13,294,818) US $ 17,309,853 Canadian $ (1,393,985)1 HSBC Holdings PLC A-1 May 14, 2020 0.75 (17,286,556) US $ 22,966,140 Canadian $ (1,347,611)
Schedule A (cont’d)Foreign Currency Forward Contract(s) (-1.7%)
Contract(s) CounterpartyCredit Rating of
the Counterparty‡Settlement
DateContract(s)
Rate Pay ReceiveUnrealized
Gain (Loss) ($)
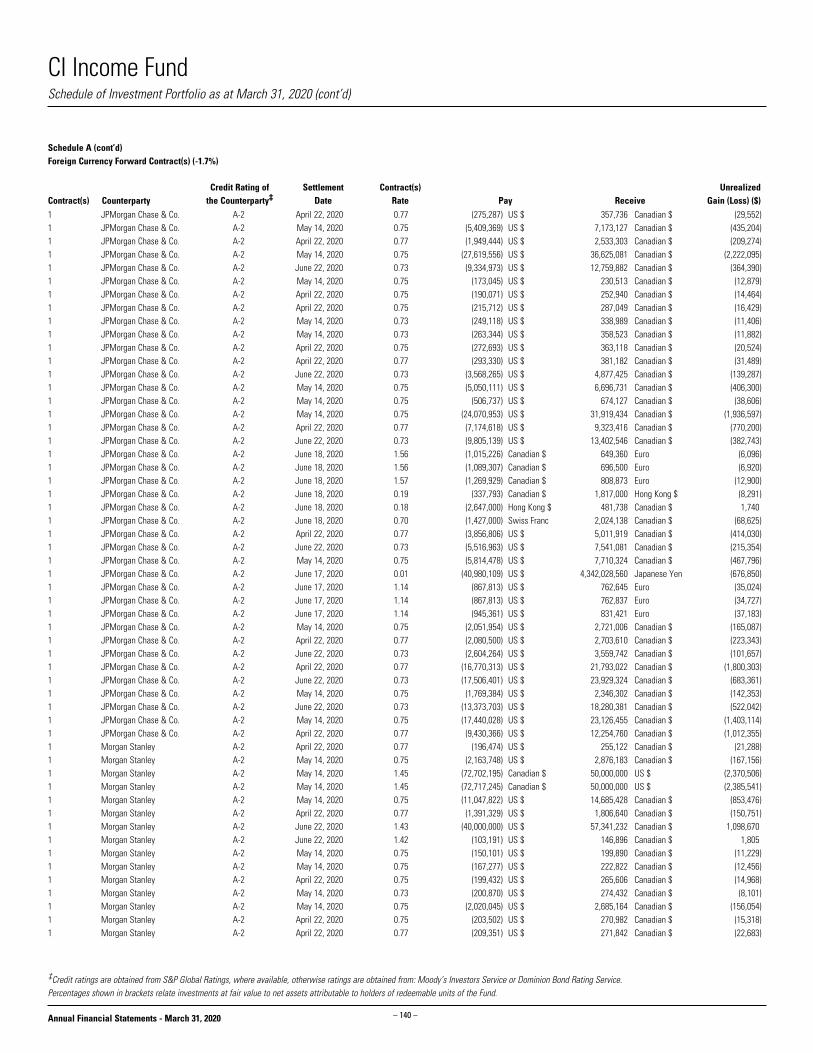
CI Income Fund
– 140 –Annual Financial Statements - March 31, 2020
Schedule of Investment Portfolio as at March 31, 2020 (cont’d)
‡Credit ratings are obtained from S&P Global Ratings, where available, otherwise ratings are obtained from: Moody’s Investors Service or Dominion Bond Rating Service.Percentages shown in brackets relate investments at fair value to net assets attributable to holders of redeemable units of the Fund.
1 JPMorgan Chase & Co. A-2 April 22, 2020 0.77 (275,287) US $ 357,736 Canadian $ (29,552)1 JPMorgan Chase & Co. A-2 May 14, 2020 0.75 (5,409,369) US $ 7,173,127 Canadian $ (435,204)1 JPMorgan Chase & Co. A-2 April 22, 2020 0.77 (1,949,444) US $ 2,533,303 Canadian $ (209,274)1 JPMorgan Chase & Co. A-2 May 14, 2020 0.75 (27,619,556) US $ 36,625,081 Canadian $ (2,222,095)1 JPMorgan Chase & Co. A-2 June 22, 2020 0.73 (9,334,973) US $ 12,759,882 Canadian $ (364,390)1 JPMorgan Chase & Co. A-2 May 14, 2020 0.75 (173,045) US $ 230,513 Canadian $ (12,879)1 JPMorgan Chase & Co. A-2 April 22, 2020 0.75 (190,071) US $ 252,940 Canadian $ (14,464)1 JPMorgan Chase & Co. A-2 April 22, 2020 0.75 (215,712) US $ 287,049 Canadian $ (16,429)1 JPMorgan Chase & Co. A-2 May 14, 2020 0.73 (249,118) US $ 338,989 Canadian $ (11,406)1 JPMorgan Chase & Co. A-2 May 14, 2020 0.73 (263,344) US $ 358,523 Canadian $ (11,882)1 JPMorgan Chase & Co. A-2 April 22, 2020 0.75 (272,693) US $ 363,118 Canadian $ (20,524)1 JPMorgan Chase & Co. A-2 April 22, 2020 0.77 (293,330) US $ 381,182 Canadian $ (31,489)1 JPMorgan Chase & Co. A-2 June 22, 2020 0.73 (3,568,265) US $ 4,877,425 Canadian $ (139,287)1 JPMorgan Chase & Co. A-2 May 14, 2020 0.75 (5,050,111) US $ 6,696,731 Canadian $ (406,300)1 JPMorgan Chase & Co. A-2 May 14, 2020 0.75 (506,737) US $ 674,127 Canadian $ (38,606)1 JPMorgan Chase & Co. A-2 May 14, 2020 0.75 (24,070,953) US $ 31,919,434 Canadian $ (1,936,597)1 JPMorgan Chase & Co. A-2 April 22, 2020 0.77 (7,174,618) US $ 9,323,416 Canadian $ (770,200)1 JPMorgan Chase & Co. A-2 June 22, 2020 0.73 (9,805,139) US $ 13,402,546 Canadian $ (382,743)1 JPMorgan Chase & Co. A-2 June 18, 2020 1.56 (1,015,226) Canadian $ 649,360 Euro (6,096)1 JPMorgan Chase & Co. A-2 June 18, 2020 1.56 (1,089,307) Canadian $ 696,500 Euro (6,920)1 JPMorgan Chase & Co. A-2 June 18, 2020 1.57 (1,269,929) Canadian $ 808,873 Euro (12,900)1 JPMorgan Chase & Co. A-2 June 18, 2020 0.19 (337,793) Canadian $ 1,817,000 Hong Kong $ (8,291)1 JPMorgan Chase & Co. A-2 June 18, 2020 0.18 (2,647,000) Hong Kong $ 481,738 Canadian $ 1,740 1 JPMorgan Chase & Co. A-2 June 18, 2020 0.70 (1,427,000) Swiss Franc 2,024,138 Canadian $ (68,625)1 JPMorgan Chase & Co. A-2 April 22, 2020 0.77 (3,856,806) US $ 5,011,919 Canadian $ (414,030)1 JPMorgan Chase & Co. A-2 June 22, 2020 0.73 (5,516,963) US $ 7,541,081 Canadian $ (215,354)1 JPMorgan Chase & Co. A-2 May 14, 2020 0.75 (5,814,478) US $ 7,710,324 Canadian $ (467,796)1 JPMorgan Chase & Co. A-2 June 17, 2020 0.01 (40,980,109) US $ 4,342,028,560 Japanese Yen (676,850)1 JPMorgan Chase & Co. A-2 June 17, 2020 1.14 (867,813) US $ 762,645 Euro (35,024)1 JPMorgan Chase & Co. A-2 June 17, 2020 1.14 (867,813) US $ 762,837 Euro (34,727)1 JPMorgan Chase & Co. A-2 June 17, 2020 1.14 (945,361) US $ 831,421 Euro (37,183)1 JPMorgan Chase & Co. A-2 May 14, 2020 0.75 (2,051,954) US $ 2,721,006 Canadian $ (165,087)1 JPMorgan Chase & Co. A-2 April 22, 2020 0.77 (2,080,500) US $ 2,703,610 Canadian $ (223,343)1 JPMorgan Chase & Co. A-2 June 22, 2020 0.73 (2,604,264) US $ 3,559,742 Canadian $ (101,657)1 JPMorgan Chase & Co. A-2 April 22, 2020 0.77 (16,770,313) US $ 21,793,022 Canadian $ (1,800,303)1 JPMorgan Chase & Co. A-2 June 22, 2020 0.73 (17,506,401) US $ 23,929,324 Canadian $ (683,361)1 JPMorgan Chase & Co. A-2 May 14, 2020 0.75 (1,769,384) US $ 2,346,302 Canadian $ (142,353)1 JPMorgan Chase & Co. A-2 June 22, 2020 0.73 (13,373,703) US $ 18,280,381 Canadian $ (522,042)1 JPMorgan Chase & Co. A-2 May 14, 2020 0.75 (17,440,028) US $ 23,126,455 Canadian $ (1,403,114)1 JPMorgan Chase & Co. A-2 April 22, 2020 0.77 (9,430,366) US $ 12,254,760 Canadian $ (1,012,355)1 Morgan Stanley A-2 April 22, 2020 0.77 (196,474) US $ 255,122 Canadian $ (21,288)1 Morgan Stanley A-2 May 14, 2020 0.75 (2,163,748) US $ 2,876,183 Canadian $ (167,156)1 Morgan Stanley A-2 May 14, 2020 1.45 (72,702,195) Canadian $ 50,000,000 US $ (2,370,506)1 Morgan Stanley A-2 May 14, 2020 1.45 (72,717,245) Canadian $ 50,000,000 US $ (2,385,541)1 Morgan Stanley A-2 May 14, 2020 0.75 (11,047,822) US $ 14,685,428 Canadian $ (853,476)1 Morgan Stanley A-2 April 22, 2020 0.77 (1,391,329) US $ 1,806,640 Canadian $ (150,751)1 Morgan Stanley A-2 June 22, 2020 1.43 (40,000,000) US $ 57,341,232 Canadian $ 1,098,670 1 Morgan Stanley A-2 June 22, 2020 1.42 (103,191) US $ 146,896 Canadian $ 1,805 1 Morgan Stanley A-2 May 14, 2020 0.75 (150,101) US $ 199,890 Canadian $ (11,229)1 Morgan Stanley A-2 May 14, 2020 0.75 (167,277) US $ 222,822 Canadian $ (12,456)1 Morgan Stanley A-2 April 22, 2020 0.75 (199,432) US $ 265,606 Canadian $ (14,968)1 Morgan Stanley A-2 May 14, 2020 0.73 (200,870) US $ 274,432 Canadian $ (8,101)1 Morgan Stanley A-2 May 14, 2020 0.75 (2,020,045) US $ 2,685,164 Canadian $ (156,054)1 Morgan Stanley A-2 April 22, 2020 0.75 (203,502) US $ 270,982 Canadian $ (15,318)1 Morgan Stanley A-2 April 22, 2020 0.77 (209,351) US $ 271,842 Canadian $ (22,683)
Schedule A (cont’d)Foreign Currency Forward Contract(s) (-1.7%)
Contract(s) CounterpartyCredit Rating of
the Counterparty‡Settlement
DateContract(s)
Rate Pay ReceiveUnrealized
Gain (Loss) ($)

CI Income Fund
– 141 –Annual Financial Statements - March 31, 2020
Schedule of Investment Portfolio as at March 31, 2020 (cont’d)
‡Credit ratings are obtained from S&P Global Ratings, where available, otherwise ratings are obtained from: Moody’s Investors Service or Dominion Bond Rating Service.Percentages shown in brackets relate investments at fair value to net assets attributable to holders of redeemable units of the Fund.
1 Morgan Stanley A-2 May 14, 2020 0.73 (238,693) US $ 325,904 Canadian $ (9,830)1 Morgan Stanley A-2 April 22, 2020 0.77 (5,120,564) US $ 6,649,052 Canadian $ (554,814)1 Morgan Stanley A-2 May 14, 2020 0.75 (9,628,381) US $ 12,798,622 Canadian $ (743,820)1 Morgan Stanley A-2 June 18, 2020 1.18 (1,165,155) Canadian $ 1,376,500 Australian $ 25,032 1 Morgan Stanley A-2 June 18, 2020 1.56 (73,687) Canadian $ 47,140 Euro (430)1 Morgan Stanley A-2 June 18, 2020 0.19 (2,145,000) Hong Kong $ 401,505 Canadian $ 12,517 1 Morgan Stanley A-2 May 14, 2020 0.75 (2,325,791) US $ 3,091,581 Canadian $ (179,674)1 Morgan Stanley A-2 April 22, 2020 0.77 (2,752,623) US $ 3,574,281 Canadian $ (298,247)1 Morgan Stanley A-2 April 22, 2020 0.77 (1,484,864) US $ 1,928,096 Canadian $ (160,885)1 Morgan Stanley A-2 May 14, 2020 0.75 (820,781) US $ 1,091,032 Canadian $ (63,408)1 Morgan Stanley A-2 April 22, 2020 0.77 (11,969,063) US $ 15,541,828 Canadian $ (1,296,850)1 Morgan Stanley A-2 May 14, 2020 0.75 (707,754) US $ 940,789 Canadian $ (54,676)1 Morgan Stanley A-2 April 22, 2020 0.77 (6,730,503) US $ 8,739,558 Canadian $ (729,251)1 Morgan Stanley A-2 May 14, 2020 0.75 (6,976,011) US $ 9,272,933 Canadian $ (538,917)1 Royal Bank of Canada A-1+ April 22, 2020 0.77 (115,660) US $ 149,987 Canadian $ (12,729)1 Royal Bank of Canada A-1+ April 22, 2020 0.75 (1,400,641) US $ 1,866,448 Canadian $ (104,066)1 Royal Bank of Canada A-1+ April 22, 2020 0.75 (7,151,494) US $ 9,529,845 Canadian $ (531,347)1 Royal Bank of Canada A-1+ April 22, 2020 0.77 (819,045) US $ 1,062,129 Canadian $ (90,144)1 Royal Bank of Canada A-1+ May 14, 2020 0.73 (4,185,938) Canadian $ 3,044,000 US $ 95,622 1 Royal Bank of Canada A-1+ May 14, 2020 0.75 (4,345,839) Canadian $ 3,279,000 US $ 266,104 1 Royal Bank of Canada A-1+ April 22, 2020 0.77 (123,240) US $ 159,817 Canadian $ (13,564)1 Royal Bank of Canada A-1+ April 22, 2020 0.75 (1,307,619) US $ 1,742,489 Canadian $ (97,154)1 Royal Bank of Canada A-1+ April 22, 2020 0.75 (157,665) US $ 209,778 Canadian $ (12,036)1 Royal Bank of Canada A-1+ May 14, 2020 0.75 (20,443) US $ 27,240 Canadian $ (1,513)1 Royal Bank of Canada A-1+ May 14, 2020 0.75 (35,292) US $ 47,021 Canadian $ (2,618)1 Royal Bank of Canada A-1+ June 22, 2020 1.41 (25,902,000) US $ 36,550,882 Canadian $ 132,223 1 Royal Bank of Canada A-1+ June 22, 2020 1.41 (383,500) US $ 540,808 Canadian $ 1,601 1 Royal Bank of Canada A-1+ May 14, 2020 0.75 (54,477) US $ 72,585 Canadian $ (4,038)1 Royal Bank of Canada A-1+ May 14, 2020 0.73 (607,184) US $ 829,777 Canadian $ (24,256)1 Royal Bank of Canada A-1+ May 14, 2020 0.73 (67,337) US $ 92,580 Canadian $ (2,134)1 Royal Bank of Canada A-1+ April 22, 2020 0.77 (3,014,365) US $ 3,908,998 Canadian $ (331,759)1 Royal Bank of Canada A-1+ April 22, 2020 0.75 (6,232,659) US $ 8,305,436 Canadian $ (463,079)1 Royal Bank of Canada A-1+ June 18, 2020 0.69 (2,060,995) Canadian $ 1,427,000 Swiss Franc 31,840 1 Royal Bank of Canada A-1+ June 18, 2020 1.57 (2,862,324) Canadian $ 1,828,000 Euro (21,538)1 Royal Bank of Canada A-1+ June 18, 2020 0.88 (999,848) Canadian $ 1,138,000 Australian $ (15,807)1 Royal Bank of Canada A-1+ June 18, 2020 0.65 (1,335,000) Euro 2,047,596 Canadian $ (26,964)1 Royal Bank of Canada A-1+ June 18, 2020 5.79 (23,128,000) Hong Kong $ 3,997,367 Canadian $ (196,168)1 Royal Bank of Canada A-1+ April 22, 2020 0.75 (1,505,535) US $ 2,006,226 Canadian $ (111,859)1 Royal Bank of Canada A-1+ April 22, 2020 0.77 (1,620,409) US $ 2,101,331 Canadian $ (178,341)1 Royal Bank of Canada A-1+ June 17, 2020 1.14 (1,973,651) US $ 1,735,627 Euro (77,858)1 Royal Bank of Canada A-1+ April 22, 2020 0.75 (531,310) US $ 708,006 Canadian $ (39,476)1 Royal Bank of Canada A-1+ April 22, 2020 0.77 (874,107) US $ 1,133,534 Canadian $ (96,204)1 Royal Bank of Canada A-1+ April 22, 2020 0.75 (458,144) US $ 610,508 Canadian $ (34,040)1 Royal Bank of Canada A-1+ April 22, 2020 0.77 (7,045,927) US $ 9,137,088 Canadian $ (775,470)1 Royal Bank of Canada A-1+ April 22, 2020 0.77 (3,962,101) US $ 5,138,013 Canadian $ (436,066)1 Royal Bank of Canada A-1+ April 22, 2020 0.75 (4,515,723) US $ 6,017,503 Canadian $ (335,513)1 Toronto-Dominion Bank A-1+ April 22, 2020 0.77 (195,492) US $ 253,804 Canadian $ (21,224)1 Toronto-Dominion Bank A-1+ May 14, 2020 0.75 (5,361,767) US $ 7,123,938 Canadian $ (417,453)1 Toronto-Dominion Bank A-1+ April 22, 2020 0.77 (1,384,372) US $ 1,797,309 Canadian $ (150,294)1 Toronto-Dominion Bank A-1+ May 14, 2020 0.75 (27,376,504) US $ 36,373,929 Canadian $ (2,131,460)1 Toronto-Dominion Bank A-1+ April 22, 2020 0.77 (208,304) US $ 270,438 Canadian $ (22,615)1 Toronto-Dominion Bank A-1+ May 14, 2020 0.75 (5,005,670) US $ 6,650,809 Canadian $ (389,728)1 Toronto-Dominion Bank A-1+ April 22, 2020 0.75 (69,191) US $ 92,091 Canadian $ (5,251)
Schedule A (cont’d)Foreign Currency Forward Contract(s) (-1.7%)
Contract(s) CounterpartyCredit Rating of
the Counterparty‡Settlement
DateContract(s)
Rate Pay ReceiveUnrealized
Gain (Loss) ($)

CI Income Fund
– 142 –Annual Financial Statements - March 31, 2020
‡Credit ratings are obtained from S&P Global Ratings, where available, otherwise ratings are obtained from: Moody’s Investors Service or Dominion Bond Rating Service.Percentages shown in brackets relate investments at fair value to net assets attributable to holders of redeemable units of the Fund.
Schedule of Investment Portfolio as at March 31, 2020 (cont’d)
Schedule BShort Option Contract(s) (0.0%)
Premium Paid FairContract(s) Underlying Interest Expiry Date Strike Price ($) Currency (Received) ($) Value ($)(35) Accenture PLC Call @ 195.00 April 17, 2020 195.00 US $ (21,428) (1,236) (148) Activision Blizzard Inc., Put @ 57.50 June 19, 2020 57.50 US $ (153,009) (83,839)(30) Air Products & Chemicals Inc., Call @ 240.00 April 17, 2020 240.00 US $ (21,960) (1,445)(3) Amazon.com Call @ 2,100.00 April 17, 2020 2,100.00 US $ (10,771) (5,795)(30) Amgen Inc., Call @ 220.00 April 17, 2020 220.00 US $ (17,311) (6,143)(23) Apple Inc., Call @ 310.00 April 17, 2020 310.00 US $ (24,278) (259)(25) Becton Dickinson and Co., Call @ 260.00 April 17, 2020 260.00 US $ (12,667) (2,503)(35) CIGNA Corp., Call @ 210.00 April 17, 2020 210.00 US $ (19,063) (2,466)(54) Crown Castle International Corp., Put @ 150.00 July 17, 2020 150.00 US $ (138,704) (120,839)(46) Danaher Corp., Put @ 140.00 June 19, 2020 140.00 US $ (143,697) (77,688)(21) Darden Restaurants Inc., Call @ 100.00 April 17, 2020 100.00 US $ (9,315) 0 (12) Equinix Inc., Put @ 610.00 June 19, 2020 610.00 US $ (146,933) (89,680)(32) Facebook Inc., Call @ 200.00 April 17, 2020 200.00 US $ (20,402) (495)(60) Fiserv Inc., Put @ 105.00 June 19, 2020 105.00 US $ (118,336) (120,333)(28) Home Depot Inc., Put @ 205.00 June 19, 2020 205.00 US $ (122,635) (108,271)(92) IHS Markit Ltd., Put @ 75.00 April 17, 2020 75.00 US $ (38,197) (190,337)(48) Johnson & Johnson, Put @ 135.00 July 17, 2020 135.00 US $ (102,250) (91,200)(31) Martin Marietta Materials Inc., Call @ 250.00 April 17, 2020 250.00 US $ (28,325) (98)(23) Mastercard Call @ 320.00 April 17, 2020 320.00 US $ (17,480) (170)(42) McCormick & Co., Call @ 160.00 April 17, 2020 160.00 US $ (16,669) (3,399)(44) Microsoft Call @ 180.00 April 17, 2020 180.00 US $ (18,484) (3,437)(126) Mondelez International Inc., Put @ 52.50 June 19, 2020 52.50 US $ (121,725) (86,893)(26) Nextera Energy Inc., Put @ 140.00 April 17, 2020 140.00 US $ (9,880) (130)(75) Nike Call @ 100.00 April 17, 2020 100.00 US $ (17,944) (1,319)(68) SPDR S&P 500 ETF Trust Call @ 280.00 April 17, 2020 280.00 US $ (36,093) (11,245)(286) SPDR S&P 500 ETF Trust Put @ 200.00 May 15, 2020 200.00 US $ (445,070) (144,705)(82) Starbucks Corp., Call @ 82.50 April 17, 2020 82.50 US $ (24,466) (1,096)(213) Synchrony Financial Call @ 31.00 April 9, 2020 31.00 US $ (20,685) 0 (48) Synopsys Call @ 150.00 April 17, 2020 150.00 US $ (26,549) (4,222)(24) Unitedhealth Group Inc., Put @ 260.00 June 19, 2020 260.00 US $ (104,472) (99,137)(111) Verizon Communications Inc., Put @ 55.00 June 19, 2020 55.00 US $ (89,685) (56,240)(50) Walt Disney Co., Call @ 125.00 April 17, 2020 125.00 US $ (13,722) (985)Total Short Option Contract(s) Value (2,112,205) (1,315,605)
1 Toronto-Dominion Bank A-1+ May 14, 2020 0.73 (853,345) US $ 1,161,364 Canadian $ (38,903)1 Toronto-Dominion Bank A-1+ May 14, 2020 0.75 (23,859,129) US $ 31,700,551 Canadian $ (1,857,607)1 Toronto-Dominion Bank A-1+ April 22, 2020 0.77 (5,094,961) US $ 6,614,711 Canadian $ (553,135)1 Toronto-Dominion Bank A-1+ June 18, 2020 0.89 (13,824,723) Australian $ 12,239,166 Canadian $ 284,600 1 Toronto-Dominion Bank A-1+ April 22, 2020 0.77 (2,738,860) US $ 3,555,821 Canadian $ (297,344)1 Toronto-Dominion Bank A-1+ May 14, 2020 0.75 (5,763,311) US $ 7,657,451 Canadian $ (448,716)1 Toronto-Dominion Bank A-1+ April 22, 2020 0.77 (1,477,440) US $ 1,918,138 Canadian $ (160,398)1 Toronto-Dominion Bank A-1+ May 14, 2020 0.75 (2,033,896) US $ 2,702,347 Canadian $ (158,354)1 Toronto-Dominion Bank A-1+ April 22, 2020 0.77 (11,909,218) US $ 15,461,559 Canadian $ (1,292,925)1 Toronto-Dominion Bank A-1+ May 14, 2020 0.75 (1,753,813) US $ 2,330,213 Canadian $ (136,546)1 Toronto-Dominion Bank A-1+ May 14, 2020 0.75 (17,286,556) US $ 22,967,869 Canadian $ (1,345,883)1 Toronto-Dominion Bank A-1+ April 22, 2020 0.77 (6,696,850) US $ 8,694,420 Canadian $ (727,043)Total Foreign Currency Forward Contract(s) Value (94,794,484)
Schedule A (cont’d)Foreign Currency Forward Contract(s) (-1.7%)
Contract(s) CounterpartyCredit Rating of
the Counterparty‡Settlement
DateContract(s)
Rate Pay ReceiveUnrealized
Gain (Loss) ($)

CI Income Fund
– 143 –Annual Financial Statements - March 31, 2020
‡Credit ratings are obtained from S&P Global Ratings, where available, otherwise ratings are obtained from: Moody’s Investors Service or Dominion Bond Rating Service.Percentages shown in brackets relate investments at fair value to net assets attributable to holders of redeemable units of the Fund.
Schedule of Investment Portfolio as at March 31, 2020 (cont’d)
Schedule CShort Future Contract(s) (0.0%)
Contract(s) Future(s) Expiry Date Price ($) Currency Contract Value ($) Fair Value ($)(21) CBOT 20Yr US T-Bond Futures June 19, 2020 179.06 US $ (5,291,970) (5,292,264) (5,291,970) (5,292,264)Exercise Price ($) (5,291,970)Total Short Future Contract(s) Value (294)
Schedule DInterest Rate Swap Contract(s) (0.0%)
Credit Rating ofContract(s) Notional (Local) ($) Swap Contract(s) the Counterparty‡ Due Date Price ($) Cost ($) Fair Value ($)5,000 (488) CI-IRS USD 1.951% Rec Flt Citi A-1 May 5, 2022 0.01 775 88 Total Interest Rate Swap Contract(s) Value 775 88

CI Income Fund
– 144 –Annual Financial Statements - March 31, 2020
The accompanying notes are an integral part of these financial statements.
Fund Specific Notes to Financial Statements
Offsetting of Financial Instruments (Note 2)
The following tables show the net impact on the Fund’s Statements of Financial Position if all rights to offset were exercised.
as at March 31, 2020Amounts Eligible for Offset
Gross Assets/(Liabilities)
FinancialInstruments
CollateralReceived/(Paid)
NetExposure
(in $000’s) (in $000’s) (in $000’s) (in $000’s)Derivative assets - Foreign currency forward contracts 1,999 (1,999) - -Derivative assets - Swaps and swaptions - - - -Total 1,999 (1,999) - -Derivative liabilities - Foreign currency forward contracts (96,794) 1,999 - (94,795)Derivative liabilities - Swaps and swaptions - - - -Total (96,794) 1,999 - (94,795)
as at March 31, 2019Amounts Eligible for Offset
Gross Assets/(Liabilities)
FinancialInstruments
CollateralReceived/(Paid)
NetExposure
(in $000’s) (in $000’s) (in $000’s) (in $000’s)Derivative assets - Foreign currency forward contracts 1,411 (1,411) - -Derivative assets - Swaps and swaptions 12,749 (12,479) - 270Total 14,160 (13,890) - 270Derivative liabilities - Foreign currency forward contracts (12,879) 1,411 - (11,468)Derivative liabilities - Swaps and swaptions (12,479) 12,479 - -Total (25,358) 13,890 - (11,468)

CI Income Fund
– 145 –Annual Financial Statements - March 31, 2020
The accompanying notes are an integral part of these financial statements.
Fund Specific Notes to Financial Statements
Interest in Unconsolidated Structured Entities (Note 2)
The following tables present the Fund’s interest in Unconsolidated Structured Entities.
as at March 31, 2020 Fair Value of
the Underlying Fund(s) / ETF(s)Fair Value of the Fund’s Investment
in the Underlying Fund(s) / ETF(s)Ownership in the
Underlying Fund(s) / ETF(s)
Unconsolidated Structured Entities (in $000’s) (in $000’s) (%)CI First Asset Long Duration Fixed Income ETF 25,128 15,217 60.6CI First Asset Health Care Giants Covered Call ETF 173,648 64,610 37.2Mackenzie Floating Rate Income ETF 364,126 73,832 20.3CI Munro Alternative Global Growth Fund 615,127 80,058 13.0Signature Global Dividend Fund 818,823 85,133 10.4CI First Asset Global Financial Sector ETF 285,626 15,889 5.6CI First Asset Preferred Share ETF 62,572 2,004 3.2iShares MSCI Hong Kong ETF 1,784,321 56,127 3.1iShares Core Canadian Universe Bond Index ETF 3,999,766 62,920 1.6Signature Global REIT Fund 718,458 8,513 1.2SPDR Gold Trust 69,396,732 204,198 0.3Vanguard Real Estate ETF 38,422,865 65,698 0.2iShares J.P. Morgan USD Emerging Markets Bond ETF 16,678,646 18,974 0.1iShares iBoxx $ Investment Grade Corporate Bond ETF 56,947,682 43,632 0.1SPDR S&P 500 ETF Trust 333,941,477 2,493 -
as at March 31, 2019 Fair Value of
the Underlying Fund(s) / ETF(s)Fair Value of the Fund’s Investment
in the Underlying Fund(s) / ETF(s)Ownership in the
Underlying Fund(s) / ETF(s)
Unconsolidated Structured Entities (in $000’s) (in $000’s) (%)First Asset Long Duration Fixed Income ETF 56,218 34,370 61.1First Asset Health Care Giants Covered Call ETF 175,461 72,415 41.3Signature Real Estate Pool 49,584 7,609 15.3Munro Alternative Global Growth Fund 518,231 72,357 14.0Mackenzie Floating Rate Income ETF 669,524 91,872 13.7First Asset Canadian REIT Income Fund 471,344 30,779 6.5First Asset Global Financial Sector ETF 213,845 9,762 4.6iShares Core S&P/TSX Capped Composite Index ETF 5,091,268 51,220 1.0iShares MSCI Japan ETF 18,229,398 123,375 0.7SPDR Gold Trust 43,515,900 199,048 0.5Vanguard REIT ETF 45,236,034 104,450 0.2iShares Core MSCI Emerging Markets ETF 79,230,144 103,634 0.1iShares JPMorgan USD Emerging Markets Bond ETF 23,046,367 30,019 0.1iShares iBoxx $ Investment Grade Corporate Bond ETF 44,961,626 25,386 0.1SPDR S&P 500 ETF Trust 355,973,856 75,484 -
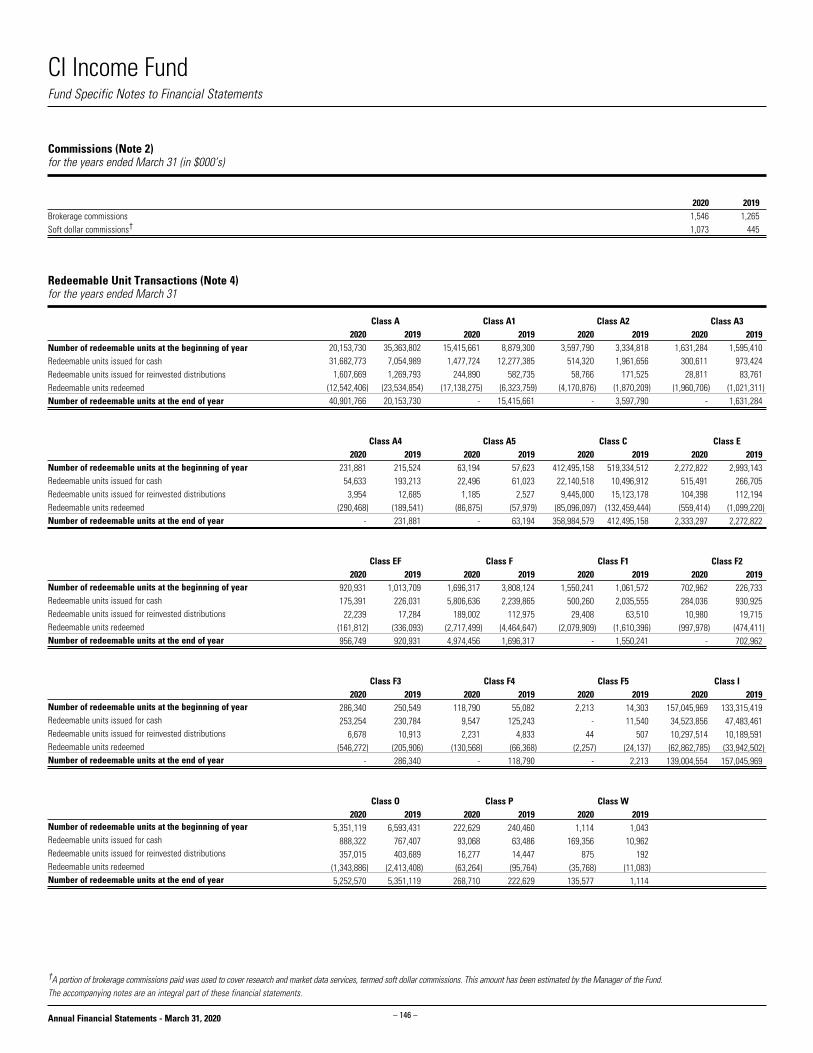
CI Income Fund
– 146 –Annual Financial Statements - March 31, 2020
Redeemable Unit Transactions (Note 4)for the years ended March 31
Number of redeemable units at the beginning of yearRedeemable units issued for cashRedeemable units issued for reinvested distributionsRedeemable units redeemedNumber of redeemable units at the end of year
Number of redeemable units at the beginning of yearRedeemable units issued for cashRedeemable units issued for reinvested distributionsRedeemable units redeemedNumber of redeemable units at the end of year
Number of redeemable units at the beginning of yearRedeemable units issued for cashRedeemable units issued for reinvested distributionsRedeemable units redeemedNumber of redeemable units at the end of year
Number of redeemable units at the beginning of yearRedeemable units issued for cashRedeemable units issued for reinvested distributionsRedeemable units redeemedNumber of redeemable units at the end of year
Number of redeemable units at the beginning of yearRedeemable units issued for cashRedeemable units issued for reinvested distributionsRedeemable units redeemedNumber of redeemable units at the end of year
Fund Specific Notes to Financial Statements
†A portion of brokerage commissions paid was used to cover research and market data services, termed soft dollar commissions. This amount has been estimated by the Manager of the Fund.The accompanying notes are an integral part of these financial statements.
Commissions (Note 2)for the years ended March 31 (in $000’s)
2020 2019Brokerage commissions 1,546 1,265Soft dollar commissions† 1,073 445
Class A 2020 2019 20,153,730 35,363,802 31,682,773 7,054,989 1,607,669 1,269,793 (12,542,406) (23,534,854) 40,901,766 20,153,730
Class A1 2020 2019 15,415,661 8,879,300 1,477,724 12,277,385 244,890 582,735 (17,138,275) (6,323,759) - 15,415,661
Class A2 2020 2019 3,597,790 3,334,818 514,320 1,961,656 58,766 171,525 (4,170,876) (1,870,209) - 3,597,790
Class A3 2020 2019 1,631,284 1,595,410 300,611 973,424 28,811 83,761 (1,960,706) (1,021,311) - 1,631,284
Class A4 2020 2019 231,881 215,524 54,633 193,213 3,954 12,685 (290,468) (189,541) - 231,881
Class A5 2020 2019 63,194 57,623 22,496 61,023 1,185 2,527 (86,875) (57,979) - 63,194
Class C 2020 2019 412,495,158 519,334,512 22,140,518 10,496,912 9,445,000 15,123,178 (85,096,097) (132,459,444) 358,984,579 412,495,158
Class E 2020 2019 2,272,822 2,993,143 515,491 266,705 104,398 112,194 (559,414) (1,099,220) 2,333,297 2,272,822
Class EF 2020 2019 920,931 1,013,709 175,391 226,031 22,239 17,284 (161,812) (336,093) 956,749 920,931
Class F 2020 2019 1,696,317 3,808,124 5,806,636 2,239,865 189,002 112,975 (2,717,499) (4,464,647) 4,974,456 1,696,317
Class F1 2020 2019 1,550,241 1,061,572 500,260 2,035,555 29,408 63,510 (2,079,909) (1,610,396) - 1,550,241
Class F2 2020 2019 702,962 226,733 284,036 930,925 10,980 19,715 (997,978) (474,411) - 702,962
Class F3 2020 2019 286,340 250,549 253,254 230,784 6,678 10,913 (546,272) (205,906) - 286,340
Class F4 2020 2019 118,790 55,082 9,547 125,243 2,231 4,833 (130,568) (66,368) - 118,790
Class F5 2020 2019 2,213 14,303 - 11,540 44 507 (2,257) (24,137) - 2,213
Class I 2020 2019 157,045,969 133,315,419 34,523,856 47,483,461 10,297,514 10,189,591 (62,862,785) (33,942,502) 139,004,554 157,045,969
Class O 2020 2019 5,351,119 6,593,431 888,322 767,407 357,015 403,689 (1,343,886) (2,413,408) 5,252,570 5,351,119
Class P 2020 2019 222,629 240,460 93,068 63,486 16,277 14,447 (63,264) (95,764) 268,710 222,629
Class W 2020 2019 1,114 1,043 169,356 10,962 875 192 (35,768) (11,083) 135,577 1,114

CI Income Fund
– 147 –Annual Financial Statements - March 31, 2020
The accompanying notes are an integral part of these financial statements.
Fund Specific Notes to Financial Statements
Management and Administration Fees (Note 5) as at March 31, 2020 (%)
Annual management
fee rate:
Annual administration
fee rate:
Class A 1.500 0.17Class A1^ 1.400 0.17Class A2^ 1.400 0.16Class A3^ 1.375 0.12Class A4^ 1.350 0.10Class A5^ 1.250 0.08Class C 0.250 -Class E 1.650 0.15Class EF 0.650 0.15Class F 0.750 0.17Class F1^ 0.650 0.17Class F2^ 0.650 0.16Class F3^ 0.625 0.12Class F4^ 0.600 0.10Class F5^ 0.500 0.08Class I Paid directly by investor Paid directly by investorClass O Paid directly by investor 0.15Class P Paid directly by investor 0.17Class W Paid directly by investor 0.11*
^Effective after the close of business on August 2, 2019, the classes of the Fund that were eligible for CI Preferred
Pricing Program (CIPP) transitioned from a tiered pricing model to a fee distribution model. Please refer to most
recent simplified prospectus for further details.
*Effective August 2, 2019, the annual administration fee rate was reduced for Class W from 0.17% to 0.11%.
Securities Lending (Note 6)as at March 31 (in $000’s)
2020 2019Loaned 517,003 1,268,078Collateral (non-cash) 527,343 1,293,658
Securities Lending Revenue Reconciliation (Note 6)for the years ended March 31 (in $000’s)
2020 2019Gross securities lending revenue 1,165 2,019Charges (175) (303)Securities lending revenue 990 1,716% of gross securities lending revenue 15.0 15.0
Related Party Investments (Note 9)as at March 31 (in $000’s)
Investments 2020CI First Asset Global Financial Sector ETF (Common Units) 15,889CI First Asset Health Care Giants Covered Call ETF (CAD-Hedged Common Units) 64,610CI First Asset Long Duration Fixed Income ETF (Common Units) 15,217CI First Asset Preferred Share ETF (Common Units) 2,004CI Munro Alternative Global Growth Fund (Class I) 80,058Signature Global Dividend Fund (Class I) 85,133Signature Global REIT Fund (Series I) 8,513
Investments 2019First Asset Canadian REIT Income Fund 30,779First Asset Global Financial Sector ETF 9,762First Asset Health Care Giants Covered Call ETF 72,415First Asset Long Duration Fixed Income ETF 34,370Munro Alternative Global Growth Fund (Class I) 72,357Signature Real Estate Pool (Class I) 7,609
Loss Carry Forwards (Note 7)as at March 31 (in $000’s)
2020Capital loss carried forward: 77,947Non-capital losses expiring:2029 -2030 -2031 -2032 -2033 -2034 -2035 -2036 -2037 -2038 -2039 -Total -

CI Income Fund
– 148 –Annual Financial Statements - March 31, 2020
The accompanying notes are an integral part of these financial statements.
Concentration Risk (cont’d)
as at March 31, 2019 (cont’d)Categories Net Assets (%)Short PositionsOption Contract(s) (0.0)Total Short Positions (0.0)
Credit RiskThe Fund was invested in fixed income securities, preferred securities and derivative instruments, if any, with the following credit ratings, as per the tables below.
as at March 31, 2020 Credit Rating^* Net Assets (%)AAA/Aaa/A++ 13.4 AA/Aa/A+ 10.4 A 16.6 BBB/Baa/B++ 15.3 BB/Ba/B+ 5.5 B 3.2 CCC/Caa/C++ 0.5 Not Rated 2.8 Total 67.7
as at March 31, 2019 Credit Rating^* Net Assets (%)AAA/Aaa/A++ 15.6 AA/Aa/A+ 12.6 A 16.0 BBB/Baa/B++ 13.3 BB/Ba/B+ 5.4 B 2.9 CCC/Caa/C++ 0.4 Not Rated 1.7 Total 67.9
^Credit ratings are obtained from S&P Global Ratings, where available, otherwise ratings are obtained from: Moody’s
Investors Service or Dominion Bond Rating Service, respectively.
*Refer to Note 10 for Credit Rating Chart reference.
Other Price RiskAs at March 31, 2020 and 2019, the Fund was invested in global equities and therefore was sensitive to changes in general economic conditions across the world.
As at March 31, 2020, had the equities in the investment portfolio increased or decreased by 10% (March 31, 2019 - 10%), with all other variables held constant, net assets attributable to holders of redeemable units of the Fund would have increased or decreased, respectively, by approximately $146,631,000 (March 31, 2019 - $173,399,000). In practice, actual results may differ from this analysis and the difference may be material.
Financial Instruments Risks (Note 10)
Concentration RiskFor Concentration Risk as at March 31, 2020, refer to the Schedule of Investment Portfolio.
The Fund’s investments were concentrated in the following segments:
as at March 31, 2019 Categories Net Assets (%)Long PositionsCanada 46.2 U.S.A. 18.1 Exchange-Traded Fund(s) 14.3 Other Net Assets (Liabilities) 7.8 U.K. 1.7 Spain 1.4 France 1.4 Fund(s) 1.2 Japan 1.2 Australia 1.0 Short-Term Investments 1.0 Italy 0.9 Indonesia 0.4 Brazil 0.4 Switzerland 0.3 Netherlands 0.3 Mexico 0.3 South Africa 0.3 Colombia 0.2 Germany 0.2 Jersey Island 0.2 Russia 0.2 Bermuda 0.2 Cayman Islands 0.2 Luxembourg 0.2 Denmark 0.1 Argentina 0.1 Turkey 0.1 New Zealand 0.1 Thailand 0.1 Ireland 0.1 Peru 0.0 India 0.0 Belgium 0.0 Hong Kong 0.0 Philippines 0.0 Saudi Arabia 0.0 Bahamas 0.0 Marshall Islands 0.0 Finland 0.0 British Virgin Islands 0.0 St. Lucia 0.0 Option Contract(s) 0.0 Total Return Swap Contract(s) 0.0Interest Rate Swaps Contract(s) 0.0 Foreign Currency Forward Contract(s) (0.2)Total Long Positions 100.0
Fund Specific Notes to Financial Statements

CI Income Fund
– 149 –Annual Financial Statements - March 31, 2020
The accompanying notes are an integral part of these financial statements.
Interest Rate RiskThe tables below summarize the Fund’s exposure to interest rate risk, categorized by the contractual maturity date.
as at March 31, 2020
Less than1 Year
1 - 3Years
3 - 5Years
Greaterthan
5 Years Total
(in $000’s) (in $000’s) (in $000’s) (in $000’s) (in $000’s)Interest Rate Exposure 239,144 658,371 699,700 2,229,121 3,826,336
as at March 31, 2019
Less than1 Year
1 - 3Years
3 - 5Years
Greaterthan
5 Years Total
(in $000’s) (in $000’s) (in $000’s) (in $000’s) (in $000’s)Interest Rate Exposure 812,018 745,284 753,670 2,627,727 4,938,699
As at March 31, 2020, had the prevailing interest rates increased or decreased by 0.25% (March 31, 2019 - 0.25%), with all other variables held constant, net assets attributable to holders of redeemable units of the Fund would have decreased or increased, respectively, by approximately $59,782,000 (March 31, 2019 - $67,043,000). In practice, actual results may differ from this analysis and the difference may be material.
Fair Value Hierarchy
The tables below summarize the inputs used by the Fund in valuing the Fund’s investments and derivatives carried at fair value.
Long Positions at fair value as at March 31, 2020Level 1 Level 2 Level 3 Total
(in $000’s) (in $000’s) (in $000’s) (in $000’s)Equities 654,647 1,574 10,790 667,011 Bonds - 3,727,724 19,423 3,747,147 Fund(s) 173,704 - - 173,704 Exchange-Traded Fund(s) 625,594 - - 625,594 Short-term investments - 79,189 - 79,189 Swap contract(s) - - - - Foreign currency forward contract(s), net - (94,795) - (94,795)Total 1,453,945 3,713,692 30,213 5,197,850
Short Positions at fair value as at March 31, 2020Level 1 Level 2 Level 3 Total
(in $000’s) (in $000’s) (in $000’s) (in $000’s)Option contract(s) (1,316) - - (1,316)Future contract(s), net - - - - Total (1,316) - - (1,316)
Currency RiskThe tables below summarize the Fund’s exposure to currency risk.
as at March 31, 2020~
Currency
Financial Instruments Exposure Derivatives
Net Exposure
Net Assets
(%)(in $000’s) (in $000’s) (in $000’s)Japanese Yen 258,371 56,793 315,164 5.5 U.S. Dollar 1,965,737 (1,691,413) 274,324 4.8 Euro 152,020 (11,542) 140,478 2.5 Australian Dollar 35,624 (8,998) 26,626 0.5 British Pound 22,473 - 22,473 0.4 Danish Krone 11,078 - 11,078 0.2 Swedish Krona 7,426 - 7,426 0.1 Thai Baht 5,283 - 5,283 0.1 Hong Kong Dollar 8,089 (3,898) 4,191 0.1 New Zealand Dollar 3,937 - 3,937 0.1 Brazilian Real 894 - 894 0.0 Indian Rupee 3 - 3 0.0 Total 2,470,935 (1,659,058) 811,877 14.3
as at March 31, 2019~
Currency
Financial Instruments Exposure Derivatives
Net Exposure
Net Assets
(%)(in $000’s) (in $000’s) (in $000’s)U.S. Dollar 2,480,386 (1,728,158) 752,228 11.3 Euro 262,293 20,641 282,934 4.2 Japanese Yen 79,439 82,817 162,256 2.4 British Pound 68,484 - 68,484 1.0 Australian Dollar 60,691 (14,981) 45,710 0.7 Danish Krone 8,377 - 8,377 0.1 New Zealand Dollar 6,775 - 6,775 0.1 Thai Baht 4,407 - 4,407 0.1 Swiss Franc 6,858 (3,390) 3,468 0.1 Indian Rupee 3,276 - 3,276 0.0 Mexican Peso 967 - 967 0.0 Hong Kong Dollar 1,616 (740) 876 0.0 Korean Won 14 - 14 0.0 Total 2,983,583 (1,643,811) 1,339,772 20.0
~Includes monetary and non-monetary instruments.
As at March 31, 2020, had the Canadian dollar strengthened or weakened by 10% (March 31, 2019 - 10%) in relation to all other foreign currencies held in the Fund, with all other variables held constant, net assets attributable to holders of redeemable units of the Fund would have decreased or increased, respectively, by approximately $81,188,000 (March 31, 2019 - $133,977,000). In practice, actual results may differ from this analysis and the difference may be material.
Fund Specific Notes to Financial Statements

CI Income Fund
– 150 –Annual Financial Statements - March 31, 2020
Fund Specific Notes to Financial Statements
The accompanying notes are an integral part of these financial statements.
Level 3 ReconciliationThe tables below summarize the movement in financial instruments classified as Level 3.
for the year ended March 31, 2020 Balance at
Mar. 31, 2019 Purchases SalesTransfers
InTransfers
(Out)Realized Gain
(Loss)Unrealized Gain
(Loss)*Balance at
Mar. 31, 2020(in $000’s) (in $000’s) (in $000’s) (in $000’s) (in $000’s) (in $000’s) (in $000’s) (in $000’s)
Long Positions/Assets:Equities 8,162 - - 2,643 - - (15) 10,790 Bonds 26,805 162 (2,633) - (2,643) 55 (2,323) 19,423 Total 34,967 162 (2,633) 2,643 (2,643) 55 (2,338) 30,213
*Change in unrealized gain (loss) related to investments held at March 31, 2020 was ($391,884). During the year ended March 31, 2020, investments with a fair value of $2,643,000 were transferred out of Level 2 into Level 3 as observable market inputs were no longer available for these investments and investments with a fair value of $2,643,000 were transferred out of Level 3 into Level 2 as observable market inputs became available for these investments.
for the year ended March 31, 2019 Balance at
Mar. 31, 2018 Purchases SalesTransfers
InTransfers
(Out)Realized Gain
(Loss)Unrealized Gain
(Loss)**Balance at
Mar. 31, 2019(in $000’s) (in $000’s) (in $000’s) (in $000’s) (in $000’s) (in $000’s) (in $000’s) (in $000’s)
Long Positions/Assets:Equities 8,012 4,904 (5,787) 260 (149) 1,214 (292) 8,162 Bonds 40,266 3,742 (454) 453 (7,056) (1,296) (8,850) 26,805 Total 48,278 8,646 (6,241) 713 (7,205) (82) (9,142) 34,967
**Change in unrealized gain (loss) related to investments held at March 31, 2019 was $180,965. During the year ended March 31, 2019, investments with a fair value of $713,000 were transferred out of Level 2 into Level 3 as observable market inputs were no longer available for these investments and investments with a fair value of $7,205,000 were transferred out of Level 3 into Level 2 as observable market inputs became available for these investments.
Investments classified as Level 3 are valued at fair value based on unobservable inputs and assumptions, which may include credit spreads, industry multipliers, and discount rates. Management has assessed that the effect of changing these inputs to reasonably possible alternatives would not have a significant impact on the net assets attributable to holders of redeemable units of the Fund as at March 31, 2020 and 2019.
The accompanying notes are an integral part of these financial statements.
Fund Specific Notes to Financial Statements
Fair Value Hierarchy (cont’d)
Short Positions at fair value as at March 31, 2019Level 1 Level 2 Level 3 Total
(in $000’s) (in $000’s) (in $000’s) (in $000’s)Option Contract(s) (797) - - (797) Total (797) - - (797)
There were no transfers between Level 1 and 2 and Level 1 and 3 during the years ended March 31, 2020 and 2019.
Fair Value Hierarchy (cont’d)
Long Positions at fair value as at March 31, 2019Level 1 Level 2 Level 3 Total
(in $000’s) (in $000’s) (in $000’s) (in $000’s)Equities 687,663 6,386 8,162 702,211 Bonds - 4,333,969 26,805 4,360,774 Asset-backed securities - 6,820 - 6,820 Fund(s) 79,966 - - 79,966 Exchange-Traded Fund(s) 951,814 - - 951,814 Short-term investments - 64,097 - 64,097 Foreign currency forward contract(s), net - (11,468) - (11,468)Swap contract(s), net - 270 - 270 Option Contract(s) 169 - - 169 Total 1,719,612 4,400,074 34,967 6,154,653

CI Investment Grade Bond Fund
– 151 –Annual Financial Statements - March 31, 2020
Statements of Financial Position as at March 31(in $000’s except for per unit amounts and units outstanding)
2020 2019
807,429 581,594 6,588 663
21 16 - - 8,299 7,653 - - - - - - 5,303 3,938 - - - - 1,250 8 1,688 5,333 830,578 599,205
4,524 - - -
9,398 5,094 - 2,464 - - 5 - - - 1,462 - 3,553 3,787 - - - - - - - - 18,942 11,345
811,636 587,860
Statements of Financial Position (cont’d)as at March 31(in $000’s except for per unit amounts and units outstanding)
Net assets attributable to holders of redeemable units
per class (Note 4):
Net assets attributable to holders of redeemable
units per unit: Number of redeemable
units outstanding:
2020 2019 2020 2019 2020 2019Class A 315,436 132,258 10.45 10.43 30,185,715 12,677,579Class A1 - 39,509 - 9.80 - 4,032,175Class A2 - 9,565 - 9.79 - 977,348Class A3 - 3,349 - 9.80 - 341,852Class A4 - 2,677 - 9.81 - 273,040Class A5 - 10 - 9.79 - 1,060Class AH 13 - 9.38* - 1,002 -Class E 29,949 19,437 10.43 10.42 2,871,921 1,864,763Class EF 50,490 59,678 10.20 10.18 4,949,569 5,861,225Class F 262,642 138,794 10.58 10.54 24,826,191 13,168,509Class F1 - 27,825 - 9.80 - 2,838,395Class F2 - 5,552 - 9.79 - 566,828Class F3 - 3,840 - 9.80 - 391,665Class F4 - 268 - 9.81 - 27,284Class F5 - 10 - 9.81 - 1,069Class FH 13 - 9.38* - 1,002 -Class I 118,421 126,083 10.43 10.43 11,349,190 12,091,133Class IH 13 - 9.37* - 1,004 -Class O 29,707 15,365 10.59 10.55 2,804,966 1,455,938Class P 4,915 3,629 9.84 9.82 499,676 369,693Class PH 13 - 9.37* - 1,003 -Class W 11 11 9.92 9.90 1,110 1,069Class WH 13 - 9.37* - 1,003 -
AssetsCurrent assetsInvestmentsCashUnrealized gain on futures and foreign currency forward contractsSwaps, swaptions and optionsDaily variation margin on derivative instrumentsFees rebate receivableCollateral on deposit for short saleDividends receivableInterest receivableReceivable for distribution from investmentsSecurities lending revenue receivable (Note 6)Receivable for investments soldReceivable for unit subscriptions
LiabilitiesCurrent liabilitiesInvestments sold shortBank overdraftUnrealized loss on futures and foreign currency forward contractsSwaps, swaptions and options Dividends payable on investments sold shortInterest payable on investments sold shortDaily variation margin on derivative instrumentsPayable for investments purchasedPayable for unit redemptionsDistributions payable to holders of redeemable units Management fees payableAdministration fees payableAccounts payable and accrued liabilities
Net assets attributable to holders of redeemable units
*Net assets attributable to holders of redeemable units per unit for Class AH, Class FH, Class IH, Class PH and Class WH are presented in U.S. dollars.The accompanying notes are an integral part of these financial statements.
Financial Statements
CIG - 2185

CI Investment Grade Bond Fund
– 152 –Annual Financial Statements - March 31, 2020
Statements of Comprehensive Incomefor the years ended March 31(in $000’s except for per unit amounts and number of units)
2020 2019
- 1 20,032 15,981 - - - - - 576
- - (33) (11)
(17,446) (7,697)
22,544 16,606 25,097 25,456 709 (135) - - 170 79 158 25 1,037 (31) 26,134 25,425
5,616 3,652 1,009 692 98 167 - - 13 12 - - - - - 2 - - 796 566 7,532 5,091
18,602 20,334
The accompanying notes are an integral part of these financial statements.
Financial Statements
Statements of Comprehensive Income (cont’d)for the years ended March 31(in $000’s except for per unit amounts and number of units)
Increase (decrease) in net assets attributable to
holders of redeemable units per class:
Increase (decrease) in net assets attributable to
holders of redeemable units per unit:
Weighted average number of units:
2020 2019 2020 2019 2020 2019Class A 2,306 3,510 0.10 0.33 23,250,022 10,931,114Class A1 1,388 1,320 0.31 0.58 4,489,575 2,295,956Class A2 334 261 0.32 0.39 1,062,391 671,129Class A3 148 41 0.33 0.14 457,407 283,756Class A4 90 80 0.32 0.34 288,023 232,999Class A5 - 1 0.31 0.44 1,064 1,310Class AH - - (0.43) - 1,001 -Class E 537 576 0.22 0.29 2,449,848 2,013,134Class EF 1,934 2,178 0.36 0.30 5,458,890 7,365,163Class F 3,698 4,575 0.19 0.34 19,397,932 13,701,529Class F1 1,028 988 0.34 0.51 3,132,274 1,926,632Class F2 242 165 0.34 0.31 713,024 538,427Class F3 160 131 0.35 0.38 463,412 339,948Class F4 16 11 0.41 0.62 38,748 17,703Class F5 33 - 0.44 0.37 75,612 1,051Class FH - - (0.43) - 1,001 -Class IH - - (0.42) - 1,001 -Class I 5,771 5,748 0.47 0.45 12,222,594 12,697,515Class O 766 621 0.32 0.59 2,414,470 1,060,923Class P 151 127 0.31 0.38 475,164 330,524Class PH - - (0.42) - 1,001 -Class W - 1 0.40 0.42 1,088 1,048Class WH - - (0.42) - 1,001 -
Income Net gain (loss) on investments and derivatives Dividends Interest for distribution purposes Income distributions from investments Capital gain distributions from investments Derivative income (loss) Dividends expense on financial assets (liabilities) sold
short Interest expense on financial assets (liabilities) sold short Net realized gain (loss) on sale of investments and
derivatives Change in unrealized appreciation (depreciation) in value
of investments and derivativesTotal net gain (loss) on investments and derivativesOther income Foreign exchange gain (loss) on cash Commitment fee income Securities lending revenue (Note 6) Fees rebateTotal other incomeTotal incomeExpensesManagement fees (Note 5)Administration fees (Note 5)Commissions and other portfolio transaction costsIndependent review committee feesSecurities borrowing fees (Note 2)Margin feesService feesInterest expenseWithholding taxesHarmonized sales taxTotal expensesIncrease (decrease) in net assets attributable to holders of redeemable units

CI Investment Grade Bond Fund
– 153 –Annual Financial Statements - March 31, 2020
Statements of Changes in Net Assets Attributable to Holders of Redeemable Unitsfor the years ended March 31 (in $000’s)
Net assets attributable to holders of redeemable units at the beginning of yearIncrease (decrease) in net assets attributable to holders of redeemable unitsDistributions to holders of redeemable units From net investment income From net realized gains Return of capitalTotal distributions to holders of redeemable units
Redeemable unit transactions Proceeds from redeemable units issued Reinvestment of distributions to holders of redeemable units Acquisition of assets from terminated funds Redemption of redeemable unitsNet increase (decrease) from redeemable unit transactionsNet increase (decrease) in net assets attributable to holders of redeemable unitsNet assets attributable to holders of redeemable units at the end of year
The accompanying notes are an integral part of these financial statements.
Financial Statements
Class A 2020 2019 132,258 81,431 2,306 3,510
(1,343) (1,741) (555) - (3,887) (921) (5,785) (2,662)
269,444 120,465 5,264 2,307 1,841 - (89,892) (72,793) 186,657 49,979 183,178 50,827 315,436 132,258
Class A1 2020 2019 39,509 9,069 1,388 1,320
- (288) (46) - (320) (274) (366) (562)
15,931 41,129 350 531 - - (56,812) (11,978) (40,531) 29,682 (39,509) 30,440 - 39,509
Class A2 2020 2019 9,565 5,461 334 261
- (102) (11) - (80) (68) (91) (170)
3,969 8,236 84 162 - - (13,861) (4,385) (9,808) 4,013 (9,565) 4,104 - 9,565
Class A3 2020 2019 3,349 2,738 148 41
- (59) (5) - (36) (14) (41) (73)
2,278 5,392 22 57 - - (5,756) (4,806) (3,456) 643 (3,349) 611 - 3,349
Class A4 2020 2019 2,677 937 90 80
- (40) (3) - (22) (23) (25) (63)
506 2,003 24 56 - - (3,272) (336) (2,742) 1,723 (2,677) 1,740 - 2,677
Class A5 2020 2019 10 10 - 1
- - - - - - - -
- 7 - - - - (10) (8) (10) (1) (10) - - 10
Class AH 2020 2019 - - - -
- - - - - - - -
13 - - - - - - - 13 - 13 - 13 -
Class E 2020 2019 19,437 21,969 537 576
(144) (394) (68) - (478) (159) (690) (553)
16,746 6,928 585 437 456 - (7,122) (9,920) 10,665 (2,555) 10,512 (2,532) 29,949 19,437
Class EF 2020 2019 59,678 94,391 1,934 2,178
(403) (1,709) (165) - (1,153) (557) (1,721) (2,266)
5,025 7,107 1,293 1,620 - - (15,719) (43,352) (9,401) (34,625) (9,188) (34,713) 50,490 59,678
Class F 2020 2019 138,794 138,744 3,698 4,575
(1,547) (2,721) (502) - (3,516) (1,063) (5,565) (3,784)
209,244 108,973 4,247 2,940 1,468 - (89,244) (112,654) 125,715 (741) 123,848 50 262,642 138,794
Class F1 2020 2019 27,825 8,586 1,028 988
- (336) (38) - (268) (220) (306) (556)
12,493 39,762 229 399 - - (41,269) (21,354) (28,547) 18,807 (27,825) 19,239 - 27,825
Class F2 2020 2019 5,552 3,600 242 165
- (119) (9) - (65) (48) (74) (167)
4,388 9,033 69 135 - - (10,177) (7,214) (5,720) 1,954 (5,552) 1,952 - 5,552

CI Investment Grade Bond Fund
– 154 –Annual Financial Statements - March 31, 2020
The accompanying notes are an integral part of these financial statements.
Financial Statements
Statements of Changes in Net Assets Attributable to Holders of Redeemable Units (cont’d)for the years ended March 31 (in $000’s)
Net assets attributable to holders of redeemable units at the beginning of yearIncrease (decrease) in net assets attributable to holders of redeemable unitsDistributions to holders of redeemable units From net investment income From net realized gains Return of capitalTotal distributions to holders of redeemable units
Redeemable unit transactions Proceeds from redeemable units issued Reinvestment of distributions to holders of redeemable units Acquisition of assets from terminated funds Redemption of redeemable unitsNet increase (decrease) from redeemable unit transactionsNet increase (decrease) in net assets attributable to holders of redeemable unitsNet assets attributable to holders of redeemable units at the end of year
Class F3 2020 2019 3,840 2,518 160 131
- (73) (6) - (43) (33) (49) (106)
1,703 3,766 36 75 - - (5,690) (2,544) (3,951) 1,297 (3,840) 1,322 - 3,840
Class F4 2020 2019 268 143 16 11
- (3) (1) - (6) (2) (7) (5)
1,346 167 7 5 - - (1,630) (53) (277) 119 (268) 125 - 268
Class F5 2020 2019 10 10 33 -
- - (1) - (6) - (7) -
1,321 - 7 - - - (1,364) - (36) - (10) - - 10
Class FH 2020 2019 - - - -
- - - - - - - -
13 - - - - - - - 13 - 13 - 13 -
Class I 2020 2019 126,083 131,001 5,771 5,748
(1,297) (3,795) (486) - (3,403) (1,527) (5,186) (5,322)
21,718 24 5,185 5,322 - - (35,150) (10,690) (8,247) (5,344) (7,662) (4,918) 118,421 126,083
Class IH 2020 2019 - - - -
- - - - - - - -
13 - - - - - - - 13 - 13 - 13 -
Class O 2020 2019 15,365 5,342 766 621
(279) (255) (81) - (568) (150) (928) (405)
20,272 13,515 904 394 1,521 - (8,193) (4,102) 14,504 9,807 14,342 10,023 29,707 15,365
Class P 2020 2019 3,629 1,006 151 127
(47) (80) (16) - (112) (36) (175) (116)
2,432 6,515 121 84 133 - (1,376) (3,987) 1,310 2,612 1,286 2,623 4,915 3,629
Class PH 2020 2019 - - - -
- - - - - - - -
13 - - - - - - - 13 - 13 - 13 -
Class W 2020 2019 11 10 - 1
- - - - - - - -
- - - - - - - - - - - 1 11 11
Class WH 2020 2019 - - - -
- - - - - - - -
13 - - - - - - - 13 - 13 - 13 -
Total Fund 2020 2019 587,860 506,966 18,602 20,334
(5,060) (11,715) (1,993) - (13,963) (5,095) (21,016) (16,810)
588,881 373,022 18,427 14,524 5,419 - (386,537) (310,176) 226,190 77,370 223,776 80,894 811,636 587,860

CI Investment Grade Bond Fund
– 155 –Annual Financial Statements - March 31, 2020
Statements of Cash Flowsfor the years ended March 31 (in $000’s)
2020 2019
18,602 20,334
17,446 7,697 43 15 98 167
(22,544) (16,606) 1,121,127 1,136,298 (1,335,001) (1,209,199) - - - - (646) (6,720) - - (1,360) (1,182) - - - - - - - - (202,235) (69,196)
(2,589) (2,286) 415,297 252,769 (209,542) (189,131) 5,037 - 208,203 61,352
(43) (15) 5,968 (7,844) 663 8,522 6,588 663
- 1 18,667 14,799 - - 28 13 - -
*Dividends and interest received as well as dividends and interest paid relate to operating activities of the Fund. The accompanying notes are an integral part of these financial statements.
Financial Statements
Cash flows from (used in) operating activitiesIncrease (decrease) in net assets attributable to holders of redeemable unitsAdjustments for: Net realized (gain) loss on sale of investments and derivatives Unrealized foreign exchange (gain) loss on cash Commissions and other portfolio transaction costs Change in unrealized (appreciation) depreciation in value of
investments and derivatives Proceeds from sale and maturity of investments and derivatives Purchase of investments and derivatives (Increase) decrease in collateral on deposit for short sale Non-cash distributions from investments Change in daily variation margin (Increase) decrease in dividends receivable (Increase) decrease in interest receivable (Increase) decrease in securities lending revenue receivable Increase (decrease) in management fees payable Increase (decrease) in administration fees payable Change in other accounts receivable and payableNet cash from (used in) operating activities
Cash flows from (used in) financing activitiesDistributions paid to holders of redeemable units, net of reinvested distributionsProceeds from issuance of redeemable unitsAmounts paid on redemption of redeemable unitsAcquisition of assets from terminated fundsNet cash from (used in) financing activities Unrealized foreign exchange gain (loss) on cashNet increase (decrease) in cashCash (bank overdraft), beginning of yearCash (bank overdraft), end of year
Supplementary Information:Dividends received, net of withholding tax*Interest received, net of withholding tax*Dividends paid*Interest paid*Tax recoverable (paid)

CI Investment Grade Bond Fund
– 156 –Annual Financial Statements - March 31, 2020
LONG POSITIONS (99.4%) (cont’d) CANADA (59.8%) (cont’d) 1,595,000 Canadian Natural Resources Ltd., 4.85% 05/30/2047 1,595,000 1,208,351 3,235,000 Canadian Tire Corp., Ltd., 3.167% 07/06/2023 3,257,600 3,254,514 2,780,000 CCL Industries Inc., 3.864% 04/13/2028 2,819,790 2,852,923 4,265,000 Central 1 Credit Union 2.584% 12/06/2023 4,265,000 4,142,593 2,000,000 Central 1 Credit Union 2.6% 11/07/2022 1,999,260 1,972,319 3,815,000 Choice Properties Real Estate Investment Trust 2.981% 03/04/2030 3,815,000 3,540,358 1,760,000 Choice Properties Real Estate Investment Trust 3.532% 06/11/2029 1,760,000 1,739,267 5,000,000 Choice Properties Real Estate Investment Trust 3.556% 09/09/2024 5,000,000 5,028,484 5,000,000 Choice Properties Real Estate Investment Trust 4.178% 03/08/2028 5,000,000 5,198,626 1,035,000 Cogeco Cable Inc., 5.15% 11/16/2020 1,131,102 1,052,166 2,000,000 Cominar Real Estate Investment Trust 4.164% 06/01/2022 2,000,000 1,979,131 7,000,000 Dollarama Inc., 3.55% 11/06/2023 6,967,590 7,112,694 1,465,000 Enbridge Gas Inc., 3.65% 04/01/2050 1,461,821 1,461,821 1,500,000 Enbridge Inc., 5.375% 09/27/2077 1,500,000 1,233,109 4,080,000 Fairfax Financial Holdings Ltd., 4.23% 06/14/2029 4,078,042 3,893,075 2,380,000 Fairfax Financial Holdings Ltd., 4.25% 12/06/2027 2,379,810 2,341,494 2,000,000 Fairfax Financial Holdings Ltd., 4.95% 03/03/2025 2,073,861 2,085,018 2,360,000 First National Financial Corp., 3.582% 11/25/2024 2,360,000 2,337,696 1,638,000 First National Financial Corp., 4.01% 04/09/2020 1,640,991 1,638,305 2,370,788 First Nations ETF L.P., 4.136% 12/31/2041 2,370,788 2,536,330 1,190,000 Ford Credit Canada Co., 2.45% 05/07/2020 1,175,898 1,186,205 1,000,000 Ford Credit Canada Co., 2.923% 09/16/2020 1,000,000 973,547 1,910,000 Genworth MI Canada Inc., 2.955% 03/01/2027 1,909,981 1,786,227 4,360,000 Government of Canada 0.5% 03/01/2022 4,204,304 4,363,564 3,205,000 Government of Canada 0.75% 09/01/2020 3,131,694 3,209,755 990,000 Government of Canada 0.75% 09/01/2021 946,163 993,957 7,106,000 Government of Canada 1% 06/01/2027 6,373,913 7,278,563 7,526,000 Government of Canada 1% 09/01/2022 7,244,738 7,621,320 2,353,000 Government of Canada 1.5% 06/01/2023 2,321,575 2,425,094 306,000 Government of Canada 1.5% 06/01/2026 294,524 321,803 12,266,000 Government of Canada 2% 06/01/2028 12,279,831 13,572,247 20,665,000 Government of Canada 2.25% 06/01/2029 22,102,304 23,485,418 110,000 Government of Canada 2.5% 06/01/2024 113,941 118,630 2,590,000 Government of Canada 2.75% 06/01/2022 2,737,042 2,716,993 75,153,000 Government of Canada 2.75% 12/01/2048 95,280,059 100,737,654 1,350,000 Greater Toronto Airports Authority 2.75% 10/17/2039 1,348,137 1,201,872 2,000,000 Great-West Lifeco Inc., 3.337% 02/28/2028 2,000,000 2,063,883 5,000,000 H&R Real Estate Investment Trust 3.369% 01/30/2024 5,038,750 5,038,749 2,000,000 Honda Canada Finance Inc., 2.268% 07/15/2022 2,000,000 1,973,214 1,820,000 HSBC Bank Canada 2.17% 06/29/2022 1,820,000 1,810,507 2,290,000 HSBC Bank Canada 2.253% 09/15/2022 2,290,023 2,277,390
LONG POSITIONS (99.4%) CANADA (59.8%) 2,500,000 407 International Inc., 2.43% 05/04/2027 2,545,875 2,499,287 2,340,000 407 International Inc., 2.47% 09/08/2022 2,333,483 2,349,847 875,000 407 International Inc., 3.14% 03/06/2030 874,519 911,654 1,000,000 407 International Inc., 3.43% 06/01/2033 999,170 1,048,995 880,000 407 International Inc., 3.67% 03/08/2049 878,882 920,780 1,200,000 407 International Inc., 3.83% 05/11/2046 1,229,222 1,287,404 2,000,000 Aeroports de Montreal 3.36% 04/24/2047 2,000,000 1,911,433 2,390,000 AIMCo Realty Investors L.P., 2.266% 06/26/2024 2,390,000 2,375,694 2,239,321 Alberta PowerLine L.P., 4.065% 12/01/2053 2,236,496 2,472,834 2,000,000 Algonquin Power Co., 4.09% 02/17/2027 1,998,580 2,057,053 USD 1,430,000 Alimentation Couche-Tard Inc., 2.95% 01/25/2030 1,876,630 1,868,637 2,080,000 Alimentation Couche-Tard Inc., 3.056% 07/26/2024 2,080,000 2,052,575 2,500,000 Alimentation Couche-Tard Inc., 3.6% 06/02/2025 2,544,265 2,524,425 USD 1,900,000 Alimentation Couche-Tard Inc., 3.8% 01/25/2050 2,486,659 2,344,832 2,460,000 Allied Properties Real Estate Investment Trust 3.117% 02/21/2030 2,460,000 2,304,961 550,000 Allied Properties Real Estate Investment Trust 3.394% 08/15/2029 550,000 536,231 3,000,000 Allied Properties Real Estate Investment Trust 3.636% 04/21/2025 3,000,000 3,034,920 2,830,000 AltaGas Ltd., 2.609% 12/16/2022 2,830,000 2,743,744 2,000,000 AltaLink L.P., 3.717% 12/03/2046 2,000,000 2,121,611 4,555,000 Bank of Montreal 2.28% 07/29/2024 4,553,087 4,470,998 2,070,000 Bank of Montreal 2.7% 09/11/2024 2,069,731 2,107,465 1,315,000 Bank of Montreal 2.85% 03/06/2024 1,314,698 1,322,888 USD 2,050,000 Bank of Montreal 3.3% 02/05/2024 2,687,639 2,977,072 2,000,000 bcIMC Realty Corp., 3% 03/31/2027 2,000,000 2,060,940 3,000,000 Bell Canada Inc., 2.7% 02/27/2024 2,996,580 2,986,271 3,125,000 Bell Canada Inc., 2.9% 09/10/2029 3,120,969 3,037,372 2,000,000 Bell Canada Inc., 3.15% 09/29/2021 2,104,558 2,021,773 1,630,000 Bell Canada Inc., 3.5% 09/30/2050 1,628,403 1,405,964 2,900,000 Bell Canada Inc., 4.45% 02/27/2047 3,008,131 2,961,872 5,000,000 Brookfield Infrastructure Finance ULC 3.315% 02/22/2024 5,012,100 4,973,592 1,905,000 Brookfield Property Finance ULC 3.93% 01/15/2027 1,905,000 1,853,523 5,170,000 Brookfield Property Finance ULC 4.115% 10/19/2021 5,176,973 5,208,266 845,000 Bruce Power L.P., 2.844% 06/23/2021 839,520 844,763 2,000,000 Bruce Power L.P., 3% 06/21/2024 1,999,780 1,986,163 1,000,000 Bruce Power L.P., 4.01% 06/21/2029 1,000,040 1,025,670 2,830,000 Bruce Power L.P., 4.746% 06/21/2049 2,829,745 2,790,688 1,000,000 Canadian Imperial Bank of Commerce 1.9% 04/26/2021 999,480 998,447 3,885,000 Canadian National Railway Co., 3.6% 08/01/2047 3,861,705 3,924,519 2,000,000 Canadian Natural Resources Ltd., 3.31% 02/11/2022 1,999,700 1,983,419 2,000,000 Canadian Natural Resources Ltd., 3.42% 12/01/2026 2,000,000 1,730,729
Percentages shown in brackets relate investments at fair value to net assets attributable to holders of redeemable units of the Fund.
Schedule of Investment Portfolio as at March 31, 2020
No. of Shares/Par Value Description
AverageCost ($)
FairValue ($)
No. of Shares/Par Value Description
AverageCost ($)
FairValue ($)

CI Investment Grade Bond Fund
– 157 –Annual Financial Statements - March 31, 2020
Percentages shown in brackets relate investments at fair value to net assets attributable to holders of redeemable units of the Fund.
Schedule of Investment Portfolio as at March 31, 2020 (cont’d)
LONG POSITIONS (99.4%) (cont’d) CANADA (59.8%) (cont’d) 2,385,000 Shaw Communications Inc., 3.3% 12/10/2029 2,373,719 2,310,816 3,610,000 Shaw Communications Inc., 4.25% 12/09/2049 3,591,192 3,199,432 595,000 SmartCentres Real Estate Investment Trust 2.757% 06/23/2021 595,000 593,521 880,000 SmartCentres Real Estate Investment Trust 3.526% 12/20/2029 880,000 853,640 750,000 SNC-Lavalin Group Inc., 2.689% 11/24/2020 744,384 747,695 1,690,000 South Coast British Columbia Transportation Authority 3.15% 11/16/2048 1,687,347 1,764,513 1,510,000 Suncor Energy Inc., 3.1% 05/24/2029 1,506,391 1,310,853 1,200,000 Suncor Energy Inc., 3.1% 11/26/2021 1,204,435 1,191,609 1,500,000 Suncor Energy Inc., 5.39% 03/26/2037 1,863,960 1,521,784 6,545,000 Sysco Canada Inc., 3.65% 04/25/2025 6,576,803 5,970,353 975,000 TELUS Corp., 2.75% 07/08/2026 973,762 956,416 2,020,000 TELUS Corp., 3.3% 05/02/2029 2,028,860 1,992,224 2,350,000 The Bank of Nova Scotia 2.29% 06/28/2024 2,349,859 2,351,279 3,000,000 The Bank of Nova Scotia 2.36% 11/08/2022 2,999,580 3,018,983 1,805,000 The Bank of Nova Scotia 2.836% 07/03/2029 1,805,000 1,748,441 1,500,000 The Bank of Nova Scotia 2.98% 04/17/2023 1,499,580 1,535,766 3,505,000 The Bank of Nova Scotia 3.1% 02/02/2028 3,503,808 3,673,053 880,000 TMX Group Ltd., 3.779% 06/05/2028 880,000 884,493 1,825,000 Toromont Industries Ltd., 3.842% 10/27/2027 1,825,000 1,876,999 7,500,000 Toronto-Dominion Bank 1.994% 03/23/2022 7,448,614 7,487,957 2,885,000 Toronto-Dominion Bank 2.85% 03/08/2024 2,911,790 2,904,828 3,000,000 Toyota Credit Canada Inc., 2.02% 02/28/2022 2,999,010 2,971,124 1,500,000 TransCanada Trust 4.65% 05/18/2077 1,500,000 1,188,719 890,000 VW Credit Canada Inc., 2.9% 03/29/2021 889,083 889,902 9,220,000 Waste Management of Canada Corp., 2.6% 09/23/2026 9,194,998 9,176,913 481,719,213 484,821,393 U.S.A. (35.4%) USD 1,890,000 Amazon.com Inc., 2.4% 02/22/2023 2,383,821 2,766,591 USD 1,000,000 American Tower Corp., 2.8% 06/01/2020 1,204,272 1,396,342 USD 1,780,000 American Tower Corp., 3.55% 07/15/2027 2,338,142 2,494,660 USD 205,000 American Tower Corp., 3.8% 08/15/2029 292,598 292,066 1,620,000 Anheuser-Busch InBev Finance Inc., 2.6% 05/15/2024 1,619,595 1,588,163 2,870,000 Anheuser-Busch InBev Finance Inc., 4.32% 05/15/2047 2,851,643 2,462,415 USD 1,355,000 Apple Inc., 1.8% 09/11/2024 1,788,171 1,941,521 USD 960,000 Apple Inc., 2.05% 09/11/2026 1,268,417 1,385,127 USD 1,000,000 AT&T Inc., 3.2% 03/01/2022 1,303,708 1,427,000 2,095,000 AT&T Inc., 3.825% 11/25/2020 2,122,737 2,114,063 2,605,000 Bank of America Corp., 2.932% 04/25/2025 2,605,000 2,589,136 2,500,000 Bank of America Corp., 3.301% 04/24/2024 2,500,000 2,523,707 USD 100,000 Bank of America Corp., 3.366% 01/23/2026 138,537 147,435 1,000,000 Bank of America Corp., 3.407% 09/20/2025 1,000,000 1,007,808 USD 935,000 Boeing Co., 2.95% 02/01/2030 1,228,791 1,233,333 USD 2,130,000 Bristol-Myers Squibb Co., 2.9% 07/26/2024 2,860,099 3,176,891 USD 1,020,000 Broadcom Corp./Broadcom Cayman Finance Ltd., 3.875% 01/15/2027 1,351,335 1,371,477 USD 575,000 Burlington Northern Santa Fe LLC 3.9% 08/01/2046 840,745 890,840 USD 2,500,000 Campbell Soup Co., 3.65% 03/15/2023 3,203,104 3,584,048 USD 2,470,000 Campbell Soup Co., 4.15% 03/15/2028 3,165,808 3,727,266
LONG POSITIONS (99.4%) (cont’d) CANADA (59.8%) (cont’d) 4,000,000 HSBC Bank Canada 2.542% 01/31/2023 4,000,000 4,001,369 3,500,000 Husky Energy Inc., 3.6% 03/10/2027 3,492,440 2,927,432 1,250,000 Hydro One Inc., 3.63% 06/25/2049 1,249,775 1,286,450 750,000 Inter Pipeline Ltd., 2.608% 09/13/2023 750,000 723,803 3,025,000 Inter Pipeline Ltd., 2.734% 04/18/2024 3,024,952 2,817,800 910,000 Inter Pipeline Ltd., 3.448% 07/20/2020 918,736 910,627 1,335,000 Inter Pipeline Ltd., 6.875% 03/26/2079 1,335,000 1,152,205 1,920,000 Ivanhoe Cambridge II Inc., 2.296% 12/12/2024 1,920,000 1,915,094 2,000,000 Ivanhoe Cambridge II Inc., 2.909% 06/27/2023 2,000,000 2,043,926 835,000 John Deere Financial Inc., 2.41% 01/14/2025 834,808 819,868 2,000,000 Keyera Corp., 3.934% 06/21/2028 2,000,000 1,925,058 1,785,000 Keyera Corp., 6.875% 06/13/2079 1,785,000 1,579,969 500,000 Magna International Inc., 3.1% 12/15/2022 499,935 505,107 405,000 Manulife Bank of Canada 2.082% 05/26/2022 403,538 402,500 1,885,000 Manulife Bank of Canada 2.378% 11/19/2024 1,885,000 1,866,823 1,330,000 Metro Inc., 2.68% 12/05/2022 1,329,934 1,327,994 1,570,000 Metro Inc., 3.39% 12/06/2027 1,569,074 1,579,354 3,345,000 Metro Inc., 3.413% 02/28/2050 3,345,000 2,791,373 2,485,000 Metro Inc., 4.27% 12/04/2047 2,482,490 2,474,959 1,000,000 National Bank of Canada 1.809% 07/26/2021 1,000,000 996,756 1,315,000 NAV Canada 3.209% 09/29/2050 1,315,000 1,269,989 1,469,520 Nouvelle Autoroute 30 Financement Inc., 3.742% 12/31/2032 1,469,520 1,579,815 1,736,628 Nouvelle Autoroute 30 Financement Inc., 3.75% 03/31/2033 1,736,628 1,841,815 2,140,000 OMERS Finance Trust 2.6% 05/14/2029 2,137,753 2,244,208 2,270,000 OMERS Realty Corp., 3.331% 06/05/2025 2,270,000 2,374,515 1,500,000 OMERS Realty Corp., 3.628% 06/05/2030 1,500,000 1,615,863 1,250,000 Pembina Pipeline Corp., 2.99% 01/22/2024 1,250,000 1,209,709 2,720,000 Pembina Pipeline Corp., 3.31% 02/01/2030 2,717,933 2,423,893 1,810,000 Pembina Pipeline Corp., 4.54% 04/03/2049 1,918,980 1,439,696 1,500,000 Pembina Pipeline Corp., 4.81% 03/25/2044 1,633,725 1,264,894 4,155,000 Penske Truck Leasing Canada Inc., 2.7% 09/30/2024 4,146,524 3,985,498 4,155,000 Penske Truck Leasing Canada Inc., 2.85% 12/07/2022 4,154,792 4,126,899 850,000 Penske Truck Leasing Canada Inc., 2.95% 06/12/2020 854,650 850,464 2,020,000 Power Corporation of Canada 4.455% 07/27/2048 2,024,115 2,006,550 4,500,000 RioCan Real Estate Investment Trust 2.194% 04/09/2021 4,499,060 4,481,379 4,985,000 RioCan Real Estate Investment Trust 2.361% 03/10/2027 4,985,000 4,587,673 1,935,000 RioCan Real Estate Investment Trust 3.62% 06/01/2020 1,950,899 1,938,701 1,460,000 Rogers Communications Inc., 3.65% 03/31/2027 1,452,861 1,511,081 2,000,000 Rogers Communications Inc., 6.56% 03/22/2041 2,809,040 2,640,342 1,000,000 Royal Bank of Canada 1.583% 09/13/2021 1,000,000 993,241 2,570,000 Royal Bank of Canada 2.609% 11/01/2024 2,570,000 2,557,784 2,990,000 Royal Bank of Canada 2.74% 07/25/2029 2,989,944 2,901,564 2,450,000 Royal Bank of Canada 2.88% 12/23/2029 2,449,780 2,367,282 4,715,000 Saputo Inc., 2.876% 11/19/2024 4,715,000 4,634,581
No. of Shares/Par Value Description
AverageCost ($)
FairValue ($)
No. of Shares/Par Value Description
AverageCost ($)
FairValue ($)

CI Investment Grade Bond Fund
– 158 –Annual Financial Statements - March 31, 2020
Schedule of Investment Portfolio as at March 31, 2020 (cont’d)
Percentages shown in brackets relate investments at fair value to net assets attributable to holders of redeemable units of the Fund.
Schedule of Investment Portfolio as at March 31, 2020 (cont’d)
LONG POSITIONS (99.4%) (cont’d) U.S.A. (35.4%) (cont’d) USD 2,206,000 United States Treasury Note/Bond 2.125% 07/31/2024 2,813,070 3,339,277 USD 5,550,000 United States Treasury Note/Bond 2.125% 12/31/2022 6,867,675 8,207,116 USD 3,359,000 United States Treasury Note/Bond 2.25% 08/15/2049 4,415,099 5,759,188 USD 5,000,000 United States Treasury Note/Bond 2.375% 11/15/2049 7,031,199 8,767,113 USD 1,905,000 United States Treasury Note/Bond 2.5% 01/15/2022 2,523,779 2,790,436 USD 1,250,000 United States Treasury Note/Bond 2.5% 03/31/2023 1,557,079 1,875,319 USD 830,000 United States Treasury Note/Bond 2.625% 12/31/2023 1,106,325 1,268,621 USD 2,185,000 United States Treasury Note/Bond 2.75% 07/31/2023 2,832,595 3,324,306 USD 895,000 United States Treasury Note/Bond 2.75% 08/15/2021 1,170,762 1,304,202 USD 720,000 United States Treasury Note/Bond 2.75% 08/31/2023 936,483 1,097,046 USD 19,326,000 United States Treasury Note/Bond 2.875% 05/15/2028 25,138,531 32,069,810 USD 295,000 United States Treasury Note/Bond 2.875% 10/31/2023 385,737 452,777 USD 15,393,000 United States Treasury Note/Bond 3% 08/15/2048 18,857,775 30,092,803 USD 3,890,000 United States Treasury Note/Bond 3.125% 05/15/2048 5,060,874 7,756,446 USD 2,899,000 United States Treasury Note/Bond 3.125% 11/15/2028 3,981,778 4,925,548 USD 4,305,000 United States Treasury Note/Bond 3.375% 11/15/2048 6,023,665 8,989,593 USD 235,000 UnitedHealth Group Inc., 3.7% 08/15/2049 307,774 366,412 USD 1,000,000 Walmart Inc., 2.65% 12/15/2024 1,246,040 1,465,010 USD 870,000 Walmart Inc., 2.85% 07/08/2024 1,160,721 1,287,234 USD 870,000 Walmart Inc., 3.05% 07/08/2026 1,160,604 1,317,184 USD 1,090,000 Walmart Inc., 3.625% 12/15/2047 1,364,374 1,747,036 USD 635,000 Waste Management Inc., 2.95% 06/15/2024 855,006 908,578 USD 860,000 Waste Management Inc., 3.45% 06/15/2029 1,155,761 1,240,992 5,260,000 Wells Fargo & Co., 2.493% 02/18/2027 5,260,000 4,932,357 USD 950,000 Western Midstream Operating L.P., 5.25% 02/01/2050 1,245,853 554,029 245,092,249 287,613,527 U.K. (0.7%) 4,225,000 BP Capital Markets PLC 3.47% 05/15/2025 4,221,780 4,254,468 795,000 BP Capital Markets PLC 3.497% 11/09/2020 805,160 798,901 865,000 Lloyds Banking Group PLC 3.5% 02/03/2025 865,000 857,769 5,891,940 5,911,138 JERSEY ISLAND (0.6%) 1,090,000 Heathrow Funding Ltd., 3.4% 03/08/2028 1,088,528 1,097,235 3,120,000 Heathrow Funding Ltd., 3.782% 09/04/2030 3,120,000 3,193,432 650,000 Heathrow Funding Ltd., FRN, 3% 06/17/2023 656,714 653,853 4,865,242 4,944,520
LONG POSITIONS (99.4%) (cont’d) U.S.A. (35.4%) (cont’d) USD 950,000 Carrier Global Corp., 2.722% 02/15/2030 1,259,829 1,231,984 USD 950,000 CCO Holdings LLC/CCO Holdings Capital Corp., 4.5% 08/15/2030 1,293,299 1,310,290 USD 1,140,000 Charter Communications Operating LLC 5.375% 05/01/2047 1,547,711 1,731,677 USD 1,695,000 Citigroup Inc., 2.7% 10/27/2022 2,142,770 2,372,025 USD 820,000 Comcast Corp., 2.65% 02/01/2030 1,158,720 1,187,289 USD 615,000 Comcast Corp., 3.55% 05/01/2028 761,316 935,408 USD 1,170,000 Cox Communications Inc., 3.15% 08/15/2024 1,461,011 1,680,759 USD 1,170,000 Cox Communications Inc., 3.5% 08/15/2027 1,456,037 1,607,467 USD 1,195,000 Crown Castle International Corp., 3.15% 07/15/2023 1,493,694 1,688,113 USD 1,530,000 Crown Castle International Corp., 3.8% 02/15/2028 1,912,140 2,201,258 USD 745,000 CVS Health Corp., 3.35% 03/09/2021 958,092 1,054,241 USD 1,455,000 CVS Health Corp., 3.7% 03/09/2023 1,857,889 2,126,950 USD 1,420,000 DR Horton Inc., 2.5% 10/15/2024 1,888,578 1,866,847 USD 1,500,000 Goldman Sachs Group Inc., 2.876% 10/31/2022 1,920,147 2,120,850 3,100,000 Goldman Sachs Group Inc., 3.307% 10/31/2025 3,100,000 3,066,861 USD 640,000 Johnson & Johnson 2.95% 03/03/2027 852,716 988,919 USD 60,000 Kraft Heinz Foods Co., 2.8% 07/02/2020 78,303 83,817 USD 1,000,000 Lowe’s Cos., Inc., 4.05% 05/03/2047 1,339,480 1,393,426 USD 1,305,000 Mars Inc., 2.7% 04/01/2025 1,745,858 1,888,108 7,810,000 McDonald’s Corp., 3.125% 03/04/2025 7,792,662 7,929,269 USD 4,765,000 Molson Coors Brewing Co., 4.2% 07/15/2046 6,603,339 5,994,755 USD 163,000 Sherwin-Williams Co., 2.75% 06/01/2022 223,498 228,918 USD 10,500 Sprint Spectrum Co., LLC/Sprint Spectrum Co., II LLC 3.36% 09/20/2021 14,082 14,704 USD 1,280,000 Starbucks Corp., 3.55% 08/15/2029 1,720,010 1,853,325 USD 905,000 Starbucks Corp., 4.45% 08/15/2049 1,216,710 1,461,328 3,000,000 United Parcel Service Inc., 2.125% 05/21/2024 2,994,360 2,962,935 USD 900,000 United States Treasury Note/Bond 1.375% 09/30/2023 1,183,642 1,313,665 USD 4,255,000 United States Treasury Note/Bond 1.5% 02/15/2030 5,623,406 6,447,683 USD 1,660,000 United States Treasury Note/Bond 1.625% 08/31/2022 2,034,358 2,412,944 USD 940,000 United States Treasury Note/Bond 1.75% 05/31/2022 1,247,994 1,366,211 USD 315,000 United States Treasury Note/Bond 1.75% 07/31/2024 420,002 469,931 USD 14,045,000 United States Treasury Note/Bond 1.75% 11/15/2029 18,773,250 21,715,831 USD 780,000 United States Treasury Note/Bond 1.875% 07/31/2022 991,977 1,139,753 USD 1,130,000 United States Treasury Note/Bond 1.875% 08/31/2024 1,376,616 1,695,289 USD 257,000 United States Treasury Note/Bond 1.875% 09/30/2022 320,741 376,368 USD 7,220,000 United States Treasury Note/Bond 2% 02/15/2050 11,686,147 11,771,777 USD 1,380,000 United States Treasury Note/Bond 2% 10/31/2022 1,774,542 2,029,005 USD 8,110,000 United States Treasury Note/Bond 2% 11/30/2022 10,342,241 11,935,225
No. of Shares/Par Value Description
AverageCost ($)
FairValue ($)
No. of Shares/Par Value Description
AverageCost ($)
FairValue ($)

CI Investment Grade Bond Fund
– 159 –Annual Financial Statements - March 31, 2020
Schedule of Investment Portfolio as at March 31, 2020 (cont’d)
Percentages shown in brackets relate investments at fair value to net assets attributable to holders of redeemable units of the Fund.
Schedule of Investment Portfolio as at March 31, 2020 (cont’d)
LONG POSITIONS (99.4%) (cont’d) BERMUDA (0.3%) USD 995,000 Bacardi Ltd., 5.15% 05/15/2038 1,271,219 1,462,200 USD 560,000 Bacardi Ltd., 5.3% 05/15/2048 714,936 855,079 1,986,155 2,317,279 MEXICO (0.2%) USD 1,400,000 Fomento Económico Mexicano, S.A.B. de C.V., 3.5% 01/16/2050 1,792,251 1,845,688 SHORT-TERM INVESTMENTS (2.5%) 20,000,000 First Banks, Inc., 1.50245% 04/02/2020 19,975,400 19,975,400 Total Long Positions 761,322,450 807,428,945 SHORT POSITIONS (-0.6%) CANADA (-0.6%) (4,355,000) Government of Canada 1.5% 09/01/2024 (4,338,146) (4,524,330) Total Short Positions (4,338,146) (4,524,330)
Commissions and other portfolio transaction costs -
Total Investment Portfolio before Derivative Instruments (98.9%) 756,984,304 802,904,615
Foreign Currency Forward Contract(s) (-0.9%) (see Schedule A) (7,275,768)
Short Future Contract(s) (-0.3%) (see Schedule B) (2,101,694)
Total Investment Portfolio (97.7%) 756,984,304 793,527,153 Other Net Assets (Liabilities) (2.3%) 18,108,601 Net Assets Attributable to Holders of Redeemable Units (100.0%) 811,635,754
Principal amounts stated in:USD U.S. Dollar
No. of Shares/Par Value Description
AverageCost ($)
FairValue ($)

CI Investment Grade Bond Fund
– 160 –Annual Financial Statements - March 31, 2020
Schedule AForeign Currency Forward Contract(s) (-0.9%)
Contract(s) CounterpartyCredit Rating of
the Counterparty‡Settlement
DateContract(s)
Rate Pay ReceiveUnrealized
Gain (Loss) ($)1 Royal Bank of Canada A-1+ April 16, 2020 1.42 (10,095,000) Canadian $ 7,091,999 US $ (116,260)1 Royal Bank of Canada A-1+ April 16, 2020 1.45 (14,468,890) Canadian $ 10,000,000 US $ (398,392)1 Royal Bank of Canada A-1+ April 16, 2020 1.56 (311,429) Canadian $ 200,000 Euro (1,129)1 Royal Bank of Canada A-1+ April 16, 2020 0.73 (206,852,700) US $ 284,358,338 Canadian $ (6,688,632)1 Royal Bank of Canada A-1+ April 16, 2020 1.41 (2,999,760) US $ 4,240,449 Canadian $ 19,671 1 Royal Bank of Canada A-1+ April 16, 2020 0.72 (4,299,660) US $ 5,957,867 Canadian $ (91,879)1 Royal Bank of Canada A-1+ April 16, 2020 0.73 (45,100) Canadian $ 32,807 US $ 1,061 1 Royal Bank of Canada A-1+ April 16, 2020 1.42 (5,000) Canadian $ 3,533 US $ (29)1 Royal Bank of Canada A-1+ April 16, 2020 1.42 (5,000) Canadian $ 3,513 US $ (58)1 Royal Bank of Canada A-1+ April 16, 2020 1.45 (5,788) Canadian $ 4,000 US $ (159)1 Royal Bank of Canada A-1+ April 16, 2020 0.71 (9,000) Canadian $ 6,408 US $ 16 1 Royal Bank of Canada A-1+ April 16, 2020 0.71 (12,831) US $ 18,000 Canadian $ (54)1 Royal Bank of Canada A-1+ April 16, 2020 1.41 (1,131) US $ 1,600 Canadian $ 8 1 Royal Bank of Canada A-1+ April 16, 2020 1.41 (240) US $ 339 Canadian $ 2 1 Royal Bank of Canada A-1+ April 16, 2020 0.72 (340) US $ 471 Canadian $ (7)1 Royal Bank of Canada A-1+ April 16, 2020 1.42 (4,674) US $ 6,650 Canadian $ 73 Total Foreign Currency Forward Contract(s) Value (7,275,768)
Schedule of Investment Portfolio as at March 31, 2020 (cont’d)
‡Credit ratings are obtained from S&P Global Ratings, where available, otherwise ratings are obtained from: Moody’s Investors Service or Dominion Bond Rating Service.Percentages shown in brackets relate investments at fair value to net assets attributable to holders of redeemable units of the Fund.
Schedule BShort Future Contract(s) (-0.3%)
Contract(s) Future(s) Expiry Date Price ($) Currency Contract Value ($) Fair Value ($)(188) CBOT 10 YR T-Note Futures June 19, 2020 138.69 US $ (35,671,814) (36,695,492)(395) CBOT 20 YR US T-Bond Futures June 19, 2020 179.06 US $ (98,994,157) (99,544,962)(95) CBOT 5 YR US T-Note Futures June 30, 2020 125.36 US $ (16,401,414) (16,760,925)(30) MTL 10 YR Canadian Bond Futures June 19, 2020 147.14 Canadian $ (4,246,500) (4,414,200) (155,313,885) (157,415,579)Exercise Price ($) (155,313,885)Total Short Future Contract(s) Value (2,101,694)

CI Investment Grade Bond Fund
– 161 –Annual Financial Statements - March 31, 2020
The accompanying notes are an integral part of these financial statements.
Fund Specific Notes to Financial Statements
Offsetting of Financial Instruments (Note 2)
The following tables show the net impact on the Fund’s Statements of Financial Position if all rights to offset were exercised.
as at March 31, 2020Amounts Eligible for Offset
Gross Assets/(Liabilities)
FinancialInstruments
CollateralReceived/(Paid)
NetExposure
(in $000’s) (in $000’s) (in $000’s) (in $000’s)Derivative assets - Foreign currency forward contracts 21 (21) - -Derivative assets - Swaps and swaptions - - - -Total 21 (21) - -Derivative liabilities - Foreign currency forward contracts (7,296) 21 - (7,275)Derivative liabilities - Swaps and swaptions - - - -Total (7,296) 21 - (7,275)
as at March 31, 2019Amounts Eligible for Offset
Gross Assets/(Liabilities)
FinancialInstruments
CollateralReceived/(Paid)
NetExposure
(in $000’s) (in $000’s) (in $000’s) (in $000’s)Derivative assets - Foreign currency forward contracts 16 (16) - -Derivative assets - Swaps and swaptions - - - -Total 16 (16) - -Derivative liabilities - Foreign currency forward contracts (2,770) 16 - (2,754)Derivative liabilities - Swaps and swaptions (2,464) - - (2,464)Total (5,234) 16 - (5,218)
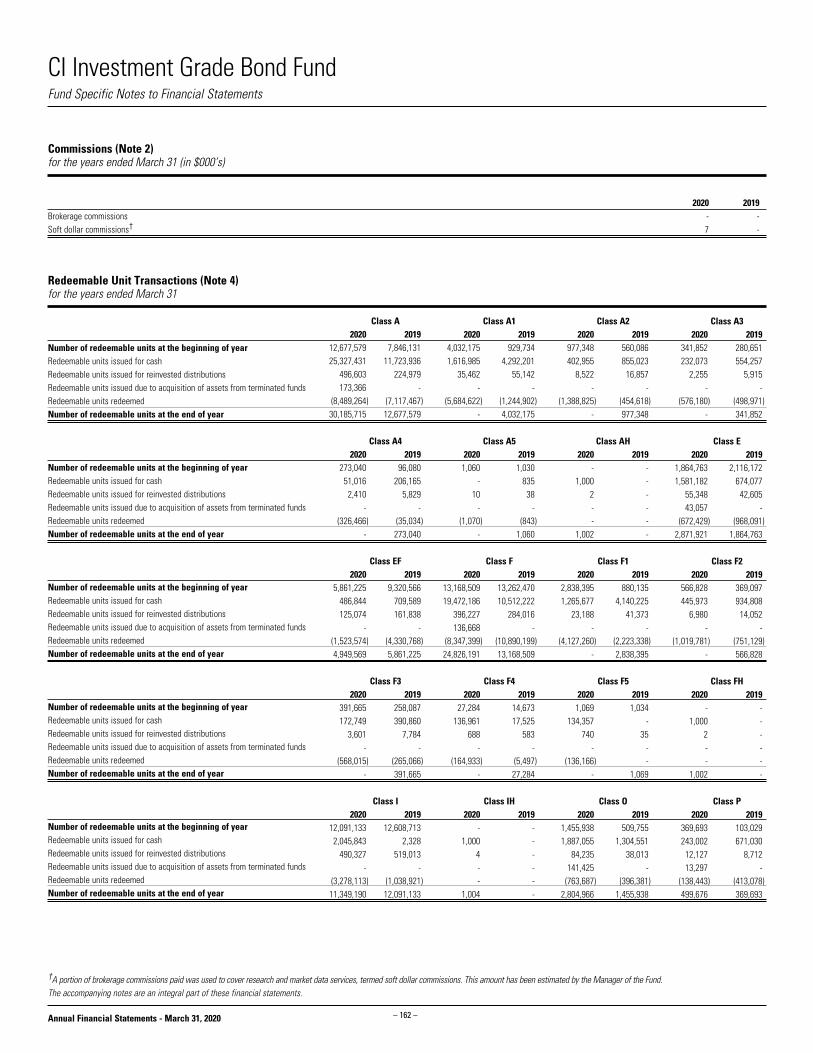
CI Investment Grade Bond Fund
– 162 –Annual Financial Statements - March 31, 2020
Redeemable Unit Transactions (Note 4)for the years ended March 31
Number of redeemable units at the beginning of yearRedeemable units issued for cashRedeemable units issued for reinvested distributionsRedeemable units issued due to acquisition of assets from terminated fundsRedeemable units redeemedNumber of redeemable units at the end of year
Number of redeemable units at the beginning of yearRedeemable units issued for cashRedeemable units issued for reinvested distributionsRedeemable units issued due to acquisition of assets from terminated fundsRedeemable units redeemedNumber of redeemable units at the end of year
Number of redeemable units at the beginning of yearRedeemable units issued for cashRedeemable units issued for reinvested distributionsRedeemable units issued due to acquisition of assets from terminated fundsRedeemable units redeemedNumber of redeemable units at the end of year
Number of redeemable units at the beginning of yearRedeemable units issued for cashRedeemable units issued for reinvested distributionsRedeemable units issued due to acquisition of assets from terminated fundsRedeemable units redeemedNumber of redeemable units at the end of year
Number of redeemable units at the beginning of yearRedeemable units issued for cashRedeemable units issued for reinvested distributionsRedeemable units issued due to acquisition of assets from terminated fundsRedeemable units redeemedNumber of redeemable units at the end of year
Fund Specific Notes to Financial Statements
†A portion of brokerage commissions paid was used to cover research and market data services, termed soft dollar commissions. This amount has been estimated by the Manager of the Fund.The accompanying notes are an integral part of these financial statements.
Commissions (Note 2)for the years ended March 31 (in $000’s)
2020 2019Brokerage commissions - -Soft dollar commissions† 7 -
Class A 2020 2019 12,677,579 7,846,131 25,327,431 11,723,936 496,603 224,979 173,366 - (8,489,264) (7,117,467) 30,185,715 12,677,579
Class A1 2020 2019 4,032,175 929,734 1,616,985 4,292,201 35,462 55,142 - - (5,684,622) (1,244,902) - 4,032,175
Class A2 2020 2019 977,348 560,086 402,955 855,023 8,522 16,857 - - (1,388,825) (454,618) - 977,348
Class A3 2020 2019 341,852 280,651 232,073 554,257 2,255 5,915 - - (576,180) (498,971) - 341,852
Class A4 2020 2019 273,040 96,080 51,016 206,165 2,410 5,829 - - (326,466) (35,034) - 273,040
Class A5 2020 2019 1,060 1,030 - 835 10 38 - - (1,070) (843) - 1,060
Class AH 2020 2019 - - 1,000 - 2 - - - - - 1,002 -
Class E 2020 2019 1,864,763 2,116,172 1,581,182 674,077 55,348 42,605 43,057 - (672,429) (968,091) 2,871,921 1,864,763
Class EF 2020 2019 5,861,225 9,320,566 486,844 709,589 125,074 161,838 - - (1,523,574) (4,330,768) 4,949,569 5,861,225
Class F 2020 2019 13,168,509 13,262,470 19,472,186 10,512,222 396,227 284,016 136,668 - (8,347,399) (10,890,199) 24,826,191 13,168,509
Class F1 2020 2019 2,838,395 880,135 1,265,677 4,140,225 23,188 41,373 - - (4,127,260) (2,223,338) - 2,838,395
Class F2 2020 2019 566,828 369,097 445,973 934,808 6,980 14,052 - - (1,019,781) (751,129) - 566,828
Class F3 2020 2019 391,665 258,087 172,749 390,860 3,601 7,784 - - (568,015) (265,066) - 391,665
Class F4 2020 2019 27,284 14,673 136,961 17,525 688 583 - - (164,933) (5,497) - 27,284
Class F5 2020 2019 1,069 1,034 134,357 - 740 35 - - (136,166) - - 1,069
Class FH 2020 2019 - - 1,000 - 2 - - - - - 1,002 -
Class I 2020 2019 12,091,133 12,608,713 2,045,843 2,328 490,327 519,013 - - (3,278,113) (1,038,921) 11,349,190 12,091,133
Class IH 2020 2019 - - 1,000 - 4 - - - - - 1,004 -
Class O 2020 2019 1,455,938 509,755 1,887,055 1,304,551 84,235 38,013 141,425 - (763,687) (396,381) 2,804,966 1,455,938
Class P 2020 2019 369,693 103,029 243,002 671,030 12,127 8,712 13,297 - (138,443) (413,078) 499,676 369,693

CI Investment Grade Bond Fund
– 163 –Annual Financial Statements - March 31, 2020
Fund Specific Notes to Financial Statements
The accompanying notes are an integral part of these financial statements.
Redeemable Unit Transactions (Note 4) (cont’d)for the years ended March 31
Number of redeemable units at the beginning of yearRedeemable units issued for cashRedeemable units issued for reinvested distributionsRedeemable units issued due to acquisition of assets from terminated fundsRedeemable units redeemedNumber of redeemable units at the end of year
Class PH 2020 2019 - - 1,000 - 3 - - - - - 1,003 -
Class W 2020 2019 1,069 1,029 - - 41 40 - - - - 1,110 1,069
Class WH 2020 2019 - - 1,000 - 3 - - - - - 1,003 -

CI Investment Grade Bond Fund
– 164 –Annual Financial Statements - March 31, 2020
The accompanying notes are an integral part of these financial statements.
Fund Specific Notes to Financial Statements
Management and Administration Fees (Note 5) as at March 31, 2020 (%)
Annual management
fee rate:
Annual administration
fee rate:
Class A 1.250 0.17Class A1^ 1.200 0.17Class A2^ 1.150 0.16Class A3^ 1.025 0.12Class A4^ 1.000 0.10Class A5^ 0.950 0.08Class AH 1.250 0.17Class E 1.050 0.15Class EF 0.550 0.15Class F 0.750 0.17Class F1^ 0.700 0.17Class F2^ 0.650 0.16Class F3^ 0.525 0.12Class F4^ 0.500 0.10Class F5^ 0.450 0.08Class FH 0.750 0.17Class I Paid directly by investor Paid directly by investorClass IH Paid directly by investor Paid directly by investorClass O Paid directly by investor 0.15Class P Paid directly by investor 0.17Class PH Paid directly by investor 0.17Class W Paid directly by investor 0.11*Class WH Paid directly by investor 0.11
^Effective after the close of business on August 2, 2019, the classes of the Fund that were eligible for CI Preferred
Pricing Program (CIPP) transitioned from a tiered pricing model to a fee distribution model. Please refer to most
recent simplified prospectus for further details.
*Effective August 2, 2019, the annual administration fee rate was reduced for Class W from 0.17% to 0.11%.
Securities Lending (Note 6)as at March 31 (in $000’s)
2020 2019Loaned 312,778 182,446Collateral (non-cash) 319,300 186,375
Securities Lending Revenue Reconciliation (Note 6)for the years ended March 31 (in $000’s)
2020 2019Gross securities lending revenue 200 93Charges (30) (14)Securities lending revenue 170 79% of gross securities lending revenue 15.0 15.1
Loss Carry Forwards (Note 7)as at March 31 (in $000’s)
2020Capital loss carried forward: -Non-capital losses expiring:2029 -2030 -2031 -2032 -2033 -2034 -2035 -2036 -2037 -2038 -2039 -Total -

CI Investment Grade Bond Fund
– 165 –Annual Financial Statements - March 31, 2020
The accompanying notes are an integral part of these financial statements.
Other Price RiskAs at March 31, 2020 and 2019, the Fund did not have a significant exposure to other price risk as the Fund did not invest in equities.
Currency RiskAs at March 31, 2020 and 2019, the Fund’s investments were denominated in Canadian dollars, the functional currency of the Fund. As a result, the Fund’s exposure to currency risk was insignificant.
Interest Rate RiskThe tables below summarize the Fund’s exposure to interest rate risk, categorized by the contractual maturity date.
as at March 31, 2020
Less than1 Year
1 - 3Years
3 - 5Years
Greaterthan
5 Years Total
(in $000’s) (in $000’s) (in $000’s) (in $000’s) (in $000’s)Interest Rate Exposure 38,819 122,035 125,131 516,920 802,905
as at March 31, 2019
Less than1 Year
1 - 3Years
3 - 5Years
Greaterthan
5 Years Total
(in $000’s) (in $000’s) (in $000’s) (in $000’s) (in $000’s)Interest Rate Exposure 28,585 71,481 132,166 350,025 582,257
As at March 31, 2020, had the prevailing interest rates increased or decreased by 0.25% (March 31, 2019 - 0.25%), with all other variables held constant, net assets attributable to holders of redeemable units of the Fund would have decreased or increased, respectively, by approximately $13,892,000 (March 31, 2019 - $10,825,000). In practice, actual results may differ from this analysis and the difference may be material.
Fair Value Hierarchy
The tables below summarize the inputs used by the Fund in valuing the Fund’s investments and derivatives carried at fair value.
Long Positions at fair value as at March 31, 2020Level 1 Level 2 Level 3 Total
(in $000’s) (in $000’s) (in $000’s) (in $000’s)Bonds - 787,455 - 787,455 Short-term investments - 19,974 - 19,974 Foreign currency forward contract(s), net - (7,276) - (7,276)Total - 800,153 - 800,153
Short Positions at fair value as at March 31, 2020Level 1 Level 2 Level 3 Total
(in $000’s) (in $000’s) (in $000’s) (in $000’s)Bonds - (4,524) - (4,524)Future contract(s), net (2,101) - - (2,101)Total (2,101) (4,524) - (6,625)
Financial Instruments Risks (Note 10)
Concentration RiskFor Concentration Risk as at March 31, 2020, refer to the Schedule of Investment Portfolio.
The Fund’s investments were concentrated in the following segments: as at March 31, 2019 Categories Net Assets (%)Long PositionsCanada 57.9 U.S.A. 37.3 Other Net Assets (Liabilities) 2.4 U.K. 1.4 Short-Term Investments 0.8 Jersey Island 0.7 France 0.5 Bermuda 0.3 Credit Default Swap Contract(s) (0.4)Foreign Currency Forward Contract(s) (0.5)Total Long Positions 100.4
Short PositionsFutures Contract(s) (0.4) Total Short Positions (0.4)
Credit RiskThe Fund was invested in fixed income securities, preferred securities and derivative instruments, if any, with the following credit ratings, as per the tables below.
as at March 31, 2020Credit Rating^* Net Assets (%)AAA/Aaa/A++ 45.9 AA/Aa/A+ 7.5 A 14.4 BBB/Baa/B++ 31.9 BB/Ba/B+ 0.8 Total 100.5
as at March 31, 2019Credit Rating^* Net Assets (%)AAA/Aaa/A++ 43.1 AA/Aa/A+ 7.8 A 11.6 BBB/Baa/B++ 35.7 BB/Ba/B+ 1.4 Total 99.6
^Credit ratings are obtained from S&P Global Ratings, where available, otherwise ratings are obtained from: Moody’s
Investors Service or Dominion Bond Rating Service, respectively.
*Refer to Note 10 for Credit Rating Chart reference.
Fund Specific Notes to Financial Statements

CI Investment Grade Bond Fund
– 166 –Annual Financial Statements - March 31, 2020
The accompanying notes are an integral part of these financial statements.
Fair Value Hierarchy (cont’d)
Long Positions at fair value as at March 31, 2019Level 1 Level 2 Level 3 Total
(in $000’s) (in $000’s) (in $000’s) (in $000’s)Bonds - 576,601 - 576,601 Short-term investments - 4,993 - 4,993 Foreign currency forward contract(s), net - (2,754) - (2,754)Swaps, net - (2,464) - (2,464) Total - 576,376 - 576,376
Short Positions at fair value as at March 31, 2019Level 1 Level 2 Level 3 Total
(in $000’s) (in $000’s) (in $000’s) (in $000’s)Futures contract(s), net (2,324) - - (2,324)Total (2,324) - - (2,324)
There were no transfers between Level 1, 2 and 3 during the years ended March 31, 2020 and 2019.
Fund Specific Notes to Financial Statements

CI Money Market Fund
– 167 –Annual Financial Statements - March 31, 2020
Statements of Financial Position as at March 31(in $000’s except for per unit amounts and units outstanding)
2020 2019
774,635 690,330 309,328 75,036
- - - - - - - - - - - - 3,668 3,714 - - - - - - 14,579 6,623 1,102,210 775,703
- - - -
- - - - - - - - - - - - 6,865 6,241 117 9 - - - - 103 102 7,085 6,352
1,095,125 769,351
Statements of Financial Position (cont’d)as at March 31(in $000’s except for per unit amounts and units outstanding)
Net assets attributable to holders of redeemable units
per class (Note 4):
Net assets attributable to holders of redeemable
units per unit: Number of redeemable
units outstanding:
2020 2019 2020 2019 2020 2019Class A 533,269 275,423 10.00 10.00 53,326,893 27,542,172Class A1 - 184,286 - 10.00 - 18,428,593Class A3 - 10,709 - 10.00 - 1,070,880Class A4 - 2,554 - 10.00 - 255,442Class A5 - 4,869 - 10.00 - 486,906Class E 37,340 39,978 10.00 10.00 3,734,008 3,997,793Class EF 934 922 10.00 10.00 93,424 92,206Class F 19,854 9,774 10.00 10.00 1,985,415 977,380Class F1 - 11,938 - 10.00 - 1,193,794Class F3 - 1,661 - 10.00 - 166,134Class F4 - 10 - 10.00 - 1,019Class F5 - 12 - 10.00 - 1,180Class I 434,119 180,178 10.00 10.00 43,411,877 18,017,827Class Insight 163 83 10.00 10.00 16,312 8,344Class O 48,287 40,184 10.00 10.00 4,828,665 4,018,352Class P 4,957 5,970 10.00 10.00 495,741 596,995Class PP 458 - 10.00 - 45,758 -Class W 10 10 10.00 10.00 1,047 1,027Class X 43 - 10.00 - 4,307 -Class Y 676 - 10.00 - 67,580 -Class Z 15,015 790 10.00 10.00 1,501,458 79,024
AssetsCurrent assetsInvestmentsCashUnrealized gain on futures and foreign currency forward contractsSwaps, swaptions and optionsDaily variation margin on derivative instrumentsFees rebate receivableCollateral on deposit for short saleDividends receivableInterest receivableReceivable for distribution from investmentsSecurities lending revenue receivable (Note 6)Receivable for investments soldReceivable for unit subscriptions
LiabilitiesCurrent liabilitiesInvestments sold shortBank overdraftUnrealized loss on futures and foreign currency forward contractsSwaps, swaptions and options Dividends payable on investments sold shortInterest payable on investments sold shortDaily variation margin on derivative instrumentsPayable for investments purchasedPayable for unit redemptionsDistributions payable to holders of redeemable units Management fees payableAdministration fees payableAccounts payable and accrued liabilities
Net assets attributable to holders of redeemable units
The accompanying notes are an integral part of these financial statements.
Financial Statements
CIG - 649

CI Money Market Fund
– 168 –Annual Financial Statements - March 31, 2020
Statements of Comprehensive Incomefor the years ended March 31(in $000’s except for per unit amounts and number of units)
2020 2019
- - 15,542 14,948 - - - - - -
- - - -
(44) (1,340)
(29) 824 15,469 14,432 - - - - 1 2 672 19 673 21 16,142 14,453
4,604 4,364 - - 7 6 - - - - - - - - 14 - - - 497 465 - 102 5,122 4,937 (1,320) (1,065)
12,340 10,581
The accompanying notes are an integral part of these financial statements.
Financial Statements
Statements of Comprehensive Income (cont’d)for the years ended March 31(in $000’s except for per unit amounts and number of units)
Increase (decrease) in net assets attributable to
holders of redeemable units per class:
Increase (decrease) in net assets attributable to
holders of redeemable units per unit:
Weighted average number of units:
2020 2019 2020 2019 2020 2019Class A 5,025 3,338 0.13 0.10 38,129,535 31,660,789Class A1 873 1,803 0.05 0.14 17,610,102 13,325,527Class A3 60 139 0.05 0.13 1,177,460 1,015,554Class A4 6 40 0.05 0.14 114,043 284,928Class A5 24 19 0.05 0.18 453,953 110,590Class E 502 522 0.14 0.13 3,543,604 3,886,966Class EF 9 13 0.14 0.13 66,168 87,762Class F 218 136 0.14 0.10 1,552,780 1,287,456Class F1 56 132 0.05 0.14 1,123,873 990,999Class F3 6 15 0.05 0.13 125,107 109,709Class F4 1 4 0.05 0.15 8,543 25,252Class F5 - - 0.05 0.14 3,533 1,045Class I 4,665 3,592 0.20 0.19 24,095,212 19,010,566Class Insight 1 - 0.10 0.11 4,521 3,587Class O 679 744 0.20 0.19 3,475,750 3,924,376Class P 104 72 0.20 0.20 528,413 372,840Class PP 3 - 0.07 - 48,383 -Class W - - 0.20 0.19 1,037 1,017Class X - - 0.06 - 4,257 -Class Y 3 - 0.06 - 45,463 -Class Z 105 12 0.16 0.10 662,968 110,427
Income Net gain (loss) on investments and derivatives Dividends Interest for distribution purposes Income distributions from investments Capital gain distributions from investments Derivative income (loss) Dividends expense on financial assets (liabilities) sold
short Interest expense on financial assets (liabilities) sold short Net realized gain (loss) on sale of investments and
derivatives Change in unrealized appreciation (depreciation) in value
of investments and derivativesTotal net gain (loss) on investments and derivativesOther income Foreign exchange gain (loss) on cash Commitment fee income Securities lending revenue (Note 6) Fees rebateTotal other incomeTotal incomeExpensesManagement fees (Note 5)Administration fees (Note 5)Commissions and other portfolio transaction costsIndependent review committee feesSecurities borrowing fees (Note 2)Margin feesService feesInterest expenseWithholding taxesHarmonized sales taxOther expensesTotal expensesExpenses absorbed by the Manager (Note 5)Increase (decrease) in net assets attributable to holders of redeemable units

CI Money Market Fund
– 169 –Annual Financial Statements - March 31, 2020
Statements of Changes in Net Assets Attributable to Holders of Redeemable Unitsfor the years ended March 31 (in $000’s)
Net assets attributable to holders of redeemable units at the beginning of yearIncrease (decrease) in net assets attributable to holders of redeemable unitsDistributions to holders of redeemable units From net investment income From net realized gains Return of capitalTotal distributions to holders of redeemable units
Redeemable unit transactions Proceeds from redeemable units issued Reinvestment of distributions to holders of redeemable units Acquisition of assets from terminated funds Redemption of redeemable unitsNet increase (decrease) from redeemable unit transactionsNet increase (decrease) in net assets attributable to holders of redeemable unitsNet assets attributable to holders of redeemable units at the end of year
Net assets attributable to holders of redeemable units at the beginning of yearIncrease (decrease) in net assets attributable to holders of redeemable unitsDistributions to holders of redeemable units From net investment income From net realized gains Return of capitalTotal distributions to holders of redeemable units
Redeemable unit transactions Proceeds from redeemable units issued Reinvestment of distributions to holders of redeemable units Acquisition of assets from terminated funds Redemption of redeemable unitsNet increase (decrease) from redeemable unit transactionsNet increase (decrease) in net assets attributable to holders of redeemable unitsNet assets attributable to holders of redeemable units at the end of year
Net assets attributable to holders of redeemable units at the beginning of yearIncrease (decrease) in net assets attributable to holders of redeemable unitsDistributions to holders of redeemable units From net investment income From net realized gains Return of capitalTotal distributions to holders of redeemable units
Redeemable unit transactions Proceeds from redeemable units issued Reinvestment of distributions to holders of redeemable units Acquisition of assets from terminated funds Redemption of redeemable unitsNet increase (decrease) from redeemable unit transactionsNet increase (decrease) in net assets attributable to holders of redeemable unitsNet assets attributable to holders of redeemable units at the end of year
The accompanying notes are an integral part of these financial statements.
Financial Statements
Class A 2020 2019 275,423 350,937 5,025 3,338
(4,415) (3,337) - - - - (4,415) (3,337)
715,723 543,720 4,342 3,337 - - (462,829) (622,572) 257,236 (75,515) 257,846 (75,514) 533,269 275,423
Class A1 2020 2019 184,286 94,087 873 1,803
(873) (1,802) - - - - (873) (1,802)
77,648 316,925 868 1,792 - - (262,802) (228,519) (184,286) 90,198 (184,286) 90,199 - 184,286
Class A3 2020 2019 10,709 8,841 60 139
(60) (139) - - - - (60) (139)
11,903 35,979 60 138 - - (22,672) (34,249) (10,709) 1,868 (10,709) 1,868 - 10,709
Class A4 2020 2019 2,554 8,182 6 40
(6) (40) - - - - (6) (40)
234 16,415 6 40 - - (2,794) (22,083) (2,554) (5,628) (2,554) (5,628) - 2,554
Class A5 2020 2019 4,869 124 24 19
(24) (19) - - - - (24) (19)
318 37,180 24 19 - - (5,211) (32,454) (4,869) 4,745 (4,869) 4,745 - 4,869
Class E 2020 2019 39,978 38,612 502 522
(480) (503) - - - - (480) (503)
44,175 48,147 477 503 - - (47,312) (47,303) (2,660) 1,347 (2,638) 1,366 37,340 39,978
Class EF 2020 2019 922 657 9 13
(9) (11) - - - - (9) (11)
1,750 938 9 11 - - (1,747) (686) 12 263 12 265 934 922
Class F 2020 2019 9,774 14,517 218 136
(178) (136) - - - - (178) (136)
53,276 46,355 175 135 - - (43,411) (51,233) 10,040 (4,743) 10,080 (4,743) 19,854 9,774
Class F1 2020 2019 11,938 8,417 56 132
(56) (132) - - - - (56) (132)
5,821 29,000 56 131 - - (17,815) (25,610) (11,938) 3,521 (11,938) 3,521 - 11,938
Class F3 2020 2019 1,661 568 6 15
(6) (15) - - - - (6) (15)
1,893 6,469 6 15 - - (3,560) (5,391) (1,661) 1,093 (1,661) 1,093 - 1,661
Class F4 2020 2019 10 10 1 4
- (4) - - - - - (4)
240 1,268 - 4 - - (251) (1,272) (11) - (10) - - 10
Class F5 2020 2019 12 10 - -
- - - - - - - -
240 2 - - - - (252) - (12) 2 (12) 2 - 12
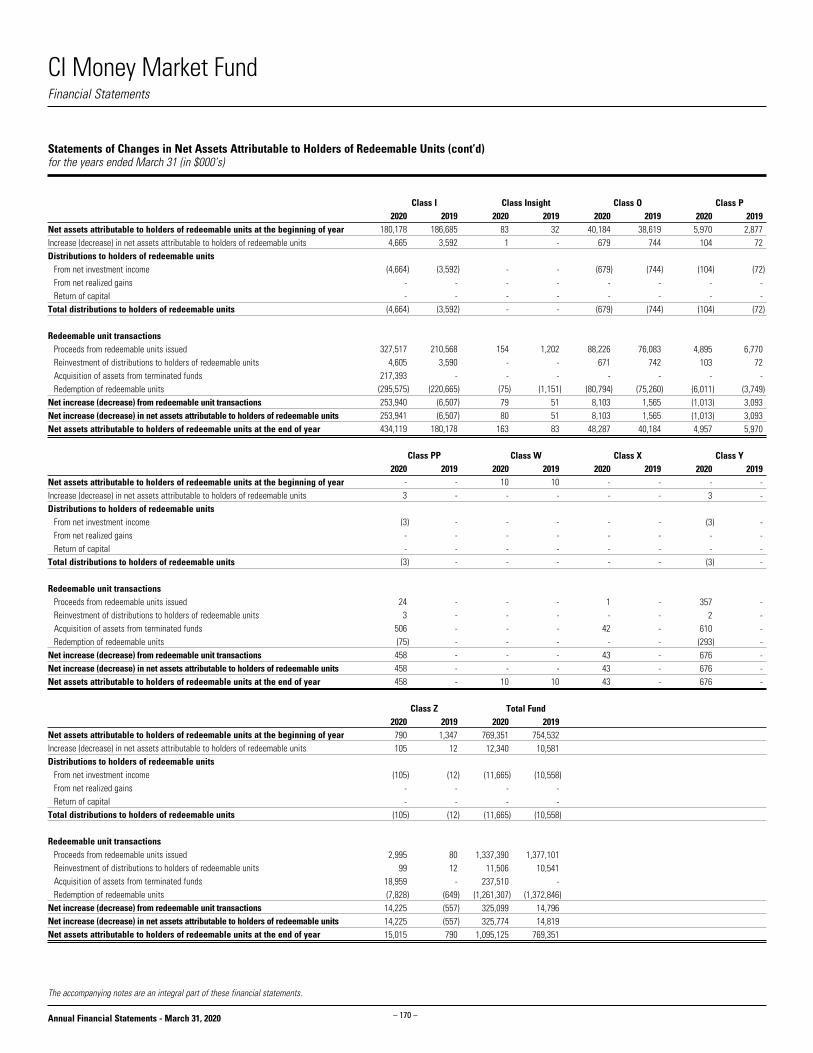
CI Money Market Fund
– 170 –Annual Financial Statements - March 31, 2020
The accompanying notes are an integral part of these financial statements.
Financial Statements
Statements of Changes in Net Assets Attributable to Holders of Redeemable Units (cont’d)for the years ended March 31 (in $000’s)
Net assets attributable to holders of redeemable units at the beginning of yearIncrease (decrease) in net assets attributable to holders of redeemable unitsDistributions to holders of redeemable units From net investment income From net realized gains Return of capitalTotal distributions to holders of redeemable units
Redeemable unit transactions Proceeds from redeemable units issued Reinvestment of distributions to holders of redeemable units Acquisition of assets from terminated funds Redemption of redeemable unitsNet increase (decrease) from redeemable unit transactionsNet increase (decrease) in net assets attributable to holders of redeemable unitsNet assets attributable to holders of redeemable units at the end of year
Net assets attributable to holders of redeemable units at the beginning of yearIncrease (decrease) in net assets attributable to holders of redeemable unitsDistributions to holders of redeemable units From net investment income From net realized gains Return of capitalTotal distributions to holders of redeemable units
Redeemable unit transactions Proceeds from redeemable units issued Reinvestment of distributions to holders of redeemable units Acquisition of assets from terminated funds Redemption of redeemable unitsNet increase (decrease) from redeemable unit transactionsNet increase (decrease) in net assets attributable to holders of redeemable unitsNet assets attributable to holders of redeemable units at the end of year
Net assets attributable to holders of redeemable units at the beginning of yearIncrease (decrease) in net assets attributable to holders of redeemable unitsDistributions to holders of redeemable units From net investment income From net realized gains Return of capitalTotal distributions to holders of redeemable units
Redeemable unit transactions Proceeds from redeemable units issued Reinvestment of distributions to holders of redeemable units Acquisition of assets from terminated funds Redemption of redeemable unitsNet increase (decrease) from redeemable unit transactionsNet increase (decrease) in net assets attributable to holders of redeemable unitsNet assets attributable to holders of redeemable units at the end of year
Class I 2020 2019 180,178 186,685 4,665 3,592
(4,664) (3,592) - - - - (4,664) (3,592)
327,517 210,568 4,605 3,590 217,393 - (295,575) (220,665) 253,940 (6,507) 253,941 (6,507) 434,119 180,178
Class Insight 2020 2019 83 32 1 -
- - - - - - - -
154 1,202 - - - - (75) (1,151) 79 51 80 51 163 83
Class O 2020 2019 40,184 38,619 679 744
(679) (744) - - - - (679) (744)
88,226 76,083 671 742 - - (80,794) (75,260) 8,103 1,565 8,103 1,565 48,287 40,184
Class P 2020 2019 5,970 2,877 104 72
(104) (72) - - - - (104) (72)
4,895 6,770 103 72 - - (6,011) (3,749) (1,013) 3,093 (1,013) 3,093 4,957 5,970
Class PP 2020 2019 - - 3 -
(3) - - - - - (3) -
24 - 3 - 506 - (75) - 458 - 458 - 458 -
Class W 2020 2019 10 10 - -
- - - - - - - -
- - - - - - - - - - - - 10 10
Class X 2020 2019 - - - -
- - - - - - - -
1 - - - 42 - - - 43 - 43 - 43 -
Class Y 2020 2019 - - 3 -
(3) - - - - - (3) -
357 - 2 - 610 - (293) - 676 - 676 - 676 -
Class Z 2020 2019 790 1,347 105 12
(105) (12) - - - - (105) (12)
2,995 80 99 12 18,959 - (7,828) (649) 14,225 (557) 14,225 (557) 15,015 790
Total Fund 2020 2019 769,351 754,532 12,340 10,581
(11,665) (10,558) - - - - (11,665) (10,558)
1,337,390 1,377,101 11,506 10,541 237,510 - (1,261,307) (1,372,846) 325,099 14,796 325,774 14,819 1,095,125 769,351

CI Money Market Fund
– 171 –Annual Financial Statements - March 31, 2020
Statements of Cash Flowsfor the years ended March 31 (in $000’s)
2020 2019
12,340 10,581
44 1,340 - - 7 6
29 (824) 2,762,817 2,419,680 (2,821,861) (2,658,601) - - - - - - - - 46 (1,439) - - - - - - 1 102 (46,577) (229,155)
(51) (118) 1,030,245 955,209 (961,494) (949,262) 212,169 - 280,869 5,829
- - 234,292 (223,326) 75,036 298,362 309,328 75,036
- - 15,588 13,509 - - 14 - - -
*Dividends and interest received as well as dividends and interest paid relate to operating activities of the Fund. The accompanying notes are an integral part of these financial statements.
Financial Statements
Cash flows from (used in) operating activitiesIncrease (decrease) in net assets attributable to holders of redeemable unitsAdjustments for: Net realized (gain) loss on sale of investments and derivatives Unrealized foreign exchange (gain) loss on cash Commissions and other portfolio transaction costs Change in unrealized (appreciation) depreciation in value of
investments and derivatives Proceeds from sale and maturity of investments and derivatives Purchase of investments and derivatives (Increase) decrease in collateral on deposit for short sale Non-cash distributions from investments Change in daily variation margin (Increase) decrease in dividends receivable (Increase) decrease in interest receivable (Increase) decrease in securities lending revenue receivable Increase (decrease) in management fees payable Increase (decrease) in administration fees payable Change in other accounts receivable and payableNet cash from (used in) operating activities
Cash flows from (used in) financing activitiesDistributions paid to holders of redeemable units, net of reinvested distributionsProceeds from issuance of redeemable unitsAmounts paid on redemption of redeemable unitsAcquisition of assets from terminated fundsNet cash from (used in) financing activities Unrealized foreign exchange gain (loss) on cashNet increase (decrease) in cashCash (bank overdraft), beginning of yearCash (bank overdraft), end of year
Supplementary Information:Dividends received, net of withholding tax*Interest received, net of withholding tax*Dividends paid*Interest paid*Tax recoverable (paid)

CI Money Market Fund
– 172 –Annual Financial Statements - March 31, 2020
SHORT-TERM INVESTMENTS (57.2%) (cont’d) 19,544,000 Province of British Columbia 1.49184% 04/22/2020 19,521,720 19,521,720 33,160,000 Province of Ontario 0.68348% 06/12/2020 33,114,239 33,114,239 19,042,000 Province of Ontario 0.73275% 05/20/2020 18,995,076 18,995,076 4,200,000 Province of Ontario 1.17844% 04/15/2020 4,196,892 4,196,892 19,537,000 Province of Ontario 1.25527% 05/06/2020 19,510,234 19,510,234 24,918,000 Province of Quebec 1.72475% 05/22/2020 24,811,600 24,811,600 16,511,000 Province of Quebec 1.73286% 05/08/2020 16,440,168 16,440,168 24,400,000 Royal Bank of Canada 1.9151% 06/30/2020 23,945,184 23,945,184 26,847,000 Royal Bank of Canada 1.97521% 04/21/2020 26,333,954 26,333,954 7,702,000 Suncor Energy Inc., 1.44536% 06/10/2020 7,674,119 7,674,119 5,544,000 Suncor Energy Inc., 1.90332% 05/21/2020 5,517,888 5,517,888 8,908,000 Suncor Energy Inc., 2.04547% 04/03/2020 8,862,926 8,862,926 5,000,000 The Bank of Nova Scotia Zero Coupon, 08/25/2020 4,919,700 4,919,700 18,117,000 Toronto-Dominion Bank 1.87483% 08/25/2020 17,793,430 17,793,430 23,559,000 Toronto-Dominion Bank 1.87546% 07/28/2020 23,126,457 23,126,457 16,287,000 Toronto-Dominion Bank 1.8952% 11/25/2020 15,987,319 15,987,319 18,671,000 TransCanada PipeLines Ltd., 1.45314% 06/08/2020 18,603,784 18,603,784 32,100,000 TransCanada PipeLines Ltd., 1.64759% 04/08/2020 32,088,444 32,088,444 17,493,000 TransCanada PipeLines Ltd., 1.9561% 05/05/2020 17,408,334 17,408,334 9,200,000 Volkswagen Canada Inc., 1.64759% 04/08/2020 9,196,688 9,196,688 7,500,000 Volkswagen Canada Inc., 1.70219% 04/21/2020 7,482,600 7,482,600 626,846,750 626,846,750
Commissions and other portfolio transaction costs -
Total Investment Portfolio (70.7%) 774,716,263 774,634,968 Other Net Assets (Liabilities) (29.3%) 320,489,888 Net Assets Attributable to Holders of Redeemable Units (100.0%) 1,095,124,856
FINANCIALS (11.7%) 21,022,000 Bank of Montreal 1.445% 10/14/2020 21,022,000 21,022,000 26,151,000 Bank of Montreal 2.1% 10/06/2020 26,184,444 26,169,897 8,749,000 Bank of Montreal 2.1% 10/06/2020 8,760,724 8,756,102 11,427,000 Canadian Imperial Bank of Commerce 2.25625% 12/08/2020 11,449,436 11,437,231 8,500,000 HSBC Bank Canada 2.449% 01/29/2021 8,581,005 8,574,623 21,266,000 The Bank of Nova Scotia 1.6575% 01/13/2021 21,266,000 21,266,000 9,886,000 The Bank of Nova Scotia 2.09% 09/09/2020 9,898,456 9,894,774 10,710,000 The Bank of Nova Scotia 3.27% 01/11/2021 10,854,585 10,826,812 10,409,000 Toronto-Dominion Bank 1.5175% 10/06/2020 10,409,000 10,409,000 128,425,650 128,356,439 INDUSTRIALS (0.9%) 6,398,000 John Deere Canada Funding Inc., 1.8675% 09/21/2020 6,412,268 6,404,973 1,809,000 John Deere Canada Funding Inc., 1.8675% 09/21/2020 1,812,603 1,810,968 1,654,000 John Deere Canada Funding Inc., 1.8675% 09/21/2020 1,657,150 1,655,803 9,882,021 9,871,744 CONSUMER DISCRETIONARY (0.9%) 7,808,000 Honda Canada Finance Inc., 1.84% 09/13/2021 7,836,916 7,835,080 1,581,000 Toyota Credit Canada Inc., 2.35625% 10/13/2020 1,581,000 1,581,000 116,000 Toyota Credit Canada Inc., 2.35625% 10/13/2020 115,936 115,961 28,000 Toyota Credit Canada Inc., 2.35625% 10/13/2020 27,990 27,994 9,561,842 9,560,035 SHORT-TERM INVESTMENTS (57.2%) 26,078,000 Bank of Montreal 1.90567% 06/01/2020 25,592,949 25,592,949 9,560,000 Daimler Canada Finance Inc., 1.706% 06/02/2020 9,522,322 9,522,322 17,948,000 Daimler Canada Finance Inc., 2.02726% 04/22/2020 17,857,004 17,857,004 4,500,000 Daimler Canada Finance Inc., 2.46331% 04/13/2020 4,494,555 4,494,555 24,700,000 Honda Canada Finance Inc., 1.75236% 04/22/2020 24,672,350 24,672,350 2,600,000 HSBC Bank Canada Zero Coupon, 07/02/2020 2,564,822 2,564,822 27,022,000 HSBC Bank Canada 1.9549% 09/22/2020 26,509,317 26,509,317 4,056,000 Inter Pipeline (Corridor) Inc., 1.42586% 06/10/2020 4,041,358 4,041,358 11,901,000 Inter Pipeline (Corridor) Inc., 1.48567% 06/02/2020 11,857,680 11,857,680 24,614,000 Inter Pipeline (Corridor) Inc., 1.77832% 04/06/2020 24,517,401 24,517,401 24,089,000 Manulife Bank of Canada 1.99553% 01/05/2021 23,620,228 23,620,228 21,774,000 Province of Alberta 0.79784% 04/28/2020 21,760,718 21,760,718 14,740,000 Province of Alberta 1.74807% 04/13/2020 14,701,381 14,701,381 22,058,000 Province of Alberta 1.76532% 04/14/2020 21,961,607 21,961,607 4,100,000 Province of British Columbia 0.75007% 05/11/2020 4,096,474 4,096,474 10,938,000 Province of British Columbia 0.75392% 05/21/2020 10,916,264 10,916,264 6,698,000 Province of British Columbia 1.30536% 04/24/2020 6,690,364 6,690,364 16,000,000 Province of British Columbia 1.4246% 06/09/2020 15,939,200 15,939,200
Percentages shown in brackets relate investments at fair value to net assets attributable to holders of redeemable units of the Fund.
Schedule of Investment Portfolio as at March 31, 2020
No. of Shares/Par Value Description
AverageCost ($)
FairValue ($)
No. of Shares/Par Value Description
AverageCost ($)
FairValue ($)

CI Money Market Fund
– 173 –Annual Financial Statements - March 31, 2020
Redeemable Unit Transactions (Note 4)for the years ended March 31
Number of redeemable units at the beginning of yearRedeemable units issued for cashRedeemable units issued for reinvested distributionsRedeemable units issued due to acquisition of assets from terminated fundsRedeemable units redeemedNumber of redeemable units at the end of year
Number of redeemable units at the beginning of yearRedeemable units issued for cashRedeemable units issued for reinvested distributionsRedeemable units issued due to acquisition of assets from terminated fundsRedeemable units redeemedNumber of redeemable units at the end of year
Number of redeemable units at the beginning of yearRedeemable units issued for cashRedeemable units issued for reinvested distributionsRedeemable units issued due to acquisition of assets from terminated fundsRedeemable units redeemedNumber of redeemable units at the end of year
Number of redeemable units at the beginning of yearRedeemable units issued for cashRedeemable units issued for reinvested distributionsRedeemable units issued due to acquisition of assets from terminated fundsRedeemable units redeemedNumber of redeemable units at the end of year
Number of redeemable units at the beginning of yearRedeemable units issued for cashRedeemable units issued for reinvested distributionsRedeemable units issued due to acquisition of assets from terminated fundsRedeemable units redeemedNumber of redeemable units at the end of year
Fund Specific Notes to Financial Statements
†A portion of brokerage commissions paid was used to cover research and market data services, termed soft dollar commissions. This amount has been estimated by the Manager of the Fund.The accompanying notes are an integral part of these financial statements.
Commissions (Note 2)for the years ended March 31 (in $000’s)
2020 2019Brokerage commissions - -Soft dollar commissions† - -
Class A 2020 2019 27,542,172 35,093,823 71,633,276 54,365,789 434,222 339,824 - - (46,282,777) (62,257,264) 53,326,893 27,542,172
Class A1 2020 2019 18,428,593 9,408,709 7,764,806 31,692,520 86,791 179,227 - - (26,280,190) (22,851,863) - 18,428,593
Class A3 2020 2019 1,070,880 884,054 1,190,254 3,597,858 6,034 13,831 - - (2,267,168) (3,424,863) - 1,070,880
Class A4 2020 2019 255,442 818,239 23,382 1,641,465 589 3,967 - - (279,413) (2,208,229) - 255,442
Class A5 2020 2019 486,906 12,370 31,754 3,718,003 2,425 1,937 - - (521,085) (3,245,404) - 486,906
Class E 2020 2019 3,997,793 3,861,168 4,419,678 4,816,623 47,741 50,327 - - (4,731,204) (4,730,325) 3,734,008 3,997,793
Class EF 2020 2019 92,206 65,731 175,032 93,878 876 1,147 - - (174,690) (68,550) 93,424 92,206
Class F 2020 2019 977,380 1,451,711 5,331,574 4,635,439 17,526 13,513 - - (4,341,065) (5,123,283) 1,985,415 977,380
Class F1 2020 2019 1,193,794 841,709 582,146 2,899,967 5,554 13,061 - - (1,781,494) (2,560,943) - 1,193,794
Class F3 2020 2019 166,134 56,782 189,251 646,998 618 1,488 - - (356,003) (539,134) - 166,134
Class F4 2020 2019 1,019 1,006 24,001 126,848 45 396 - - (25,065) (127,231) - 1,019
Class F5 2020 2019 1,180 1,006 24,004 174 19 14 - - (25,203) (14) - 1,180
Class I 2020 2019 18,017,827 18,668,489 32,751,677 21,056,843 460,489 358,966 21,739,336 - (29,557,452) (22,066,471) 43,411,877 18,017,827
Class Insight 2020 2019 8,344 3,199 15,427 120,242 45 39 - - (7,504) (115,136) 16,312 8,344
Class O 2020 2019 4,018,352 3,861,874 8,822,641 7,608,254 67,075 74,226 - - (8,079,403) (7,526,002) 4,828,665 4,018,352
Class P 2020 2019 596,995 287,672 489,467 677,042 10,336 7,224 - - (601,057) (374,943) 495,741 596,995
Class PP 2020 2019 - - 2,411 - 313 - 50,606 - (7,572) - 45,758 -
Class W 2020 2019 1,027 1,008 - - 20 19 - - - - 1,047 1,027
Class X 2020 2019 - - 85 - 23 - 4,199 - - - 4,307 -
Class Y 2020 2019 - - 35,673 - 244 - 60,956 - (29,293) - 67,580 -

CI Money Market Fund
– 174 –Annual Financial Statements - March 31, 2020
Fund Specific Notes to Financial Statements
The accompanying notes are an integral part of these financial statements.
Redeemable Unit Transactions (Note 4) (cont’d)for the years ended March 31
Number of redeemable units at the beginning of yearRedeemable units issued for cashRedeemable units issued for reinvested distributionsRedeemable units issued due to acquisition of assets from terminated fundsRedeemable units redeemedNumber of redeemable units at the end of year
Class Z 2020 2019 79,024 134,721 299,473 8,036 9,908 1,190 1,895,864 - (782,811) (64,923) 1,501,458 79,024

CI Money Market Fund
– 175 –Annual Financial Statements - March 31, 2020
The accompanying notes are an integral part of these financial statements.
Fund Specific Notes to Financial Statements
Management and Administration Fees (Note 5) as at March 31, 2020 (%)
Annual management
fee rate:
Annual administration
fee rate:
Class A 1.000 NilClass A1^ 0.550 NilClass A3^ 0.525 NilClass A4^ 0.500 NilClass A5^ 0.450 NilClass E 0.550 NilClass EF 0.550 NilClass F 0.750 NilClass F1^ 0.550 NilClass F3^ 0.525 NilClass F4^ 0.500 NilClass F5^ 0.450 NilClass I Paid directly by investor NilClass Insight 0.800 NilClass O Paid directly by investor NilClass P Paid directly by investor NilClass PP Paid directly by investor NilClass W Paid directly by investor NilClass X 0.450 NilClass Y 0.700 NilClass Z 0.700 Nil
^Effective after the close of business on August 2, 2019, the classes of the Fund that were eligible for CI Preferred
Pricing Program (CIPP) transitioned from a tiered pricing model to a fee distribution model. Please refer to most
recent simplified prospectus for further details.
Securities Lending (Note 6)as at March 31 (in $000’s)
2020 2019Loaned - -Collateral (non-cash) - -
Securities Lending Revenue Reconciliation (Note 6)for the years ended March 31 (in $000’s)
2020 2019Gross securities lending revenue 1 2Charges - -Securities lending revenue 1 2% of gross securities lending revenue - -
Loss Carry Forwards (Note 7)as at March 31 (in $000’s)
2020Capital loss carried forward: -Non-capital losses expiring:2029 -2030 -2031 -2032 -2033 -2034 -2035 -2036 -2037 -2038 -2039 -Total -
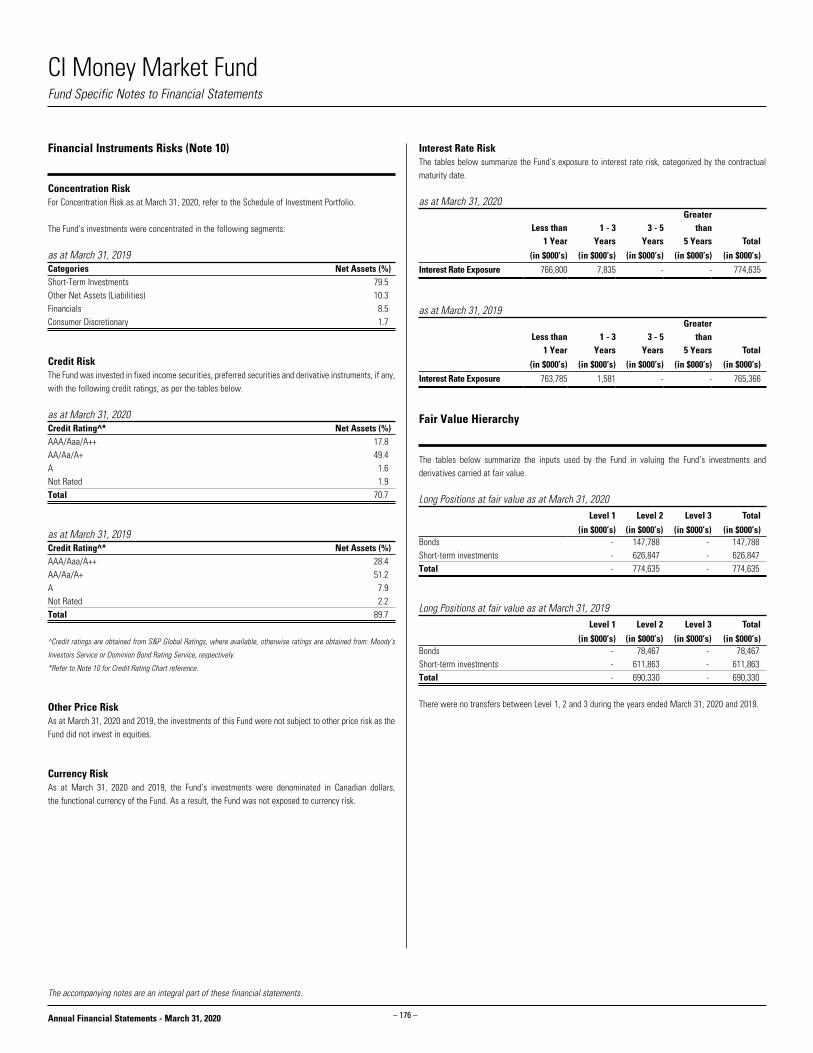
CI Money Market Fund
– 176 –Annual Financial Statements - March 31, 2020
The accompanying notes are an integral part of these financial statements.
Interest Rate RiskThe tables below summarize the Fund’s exposure to interest rate risk, categorized by the contractual maturity date.
as at March 31, 2020
Less than1 Year
1 - 3Years
3 - 5Years
Greaterthan
5 Years Total
(in $000’s) (in $000’s) (in $000’s) (in $000’s) (in $000’s)Interest Rate Exposure 766,800 7,835 - - 774,635
as at March 31, 2019
Less than1 Year
1 - 3Years
3 - 5Years
Greaterthan
5 Years Total
(in $000’s) (in $000’s) (in $000’s) (in $000’s) (in $000’s)Interest Rate Exposure 763,785 1,581 - - 765,366
Fair Value Hierarchy
The tables below summarize the inputs used by the Fund in valuing the Fund’s investments and derivatives carried at fair value.
Long Positions at fair value as at March 31, 2020Level 1 Level 2 Level 3 Total
(in $000’s) (in $000’s) (in $000’s) (in $000’s)Bonds - 147,788 - 147,788 Short-term investments - 626,847 - 626,847 Total - 774,635 - 774,635
Long Positions at fair value as at March 31, 2019Level 1 Level 2 Level 3 Total
(in $000’s) (in $000’s) (in $000’s) (in $000’s)Bonds - 78,467 - 78,467 Short-term investments - 611,863 - 611,863 Total - 690,330 - 690,330
There were no transfers between Level 1, 2 and 3 during the years ended March 31, 2020 and 2019.
Financial Instruments Risks (Note 10)
Concentration RiskFor Concentration Risk as at March 31, 2020, refer to the Schedule of Investment Portfolio.
The Fund’s investments were concentrated in the following segments: as at March 31, 2019 Categories Net Assets (%)Short-Term Investments 79.5 Other Net Assets (Liabilities) 10.3 Financials 8.5 Consumer Discretionary 1.7
Credit RiskThe Fund was invested in fixed income securities, preferred securities and derivative instruments, if any, with the following credit ratings, as per the tables below.
as at March 31, 2020 Credit Rating^* Net Assets (%)AAA/Aaa/A++ 17.8 AA/Aa/A+ 49.4 A 1.6 Not Rated 1.9 Total 70.7
as at March 31, 2019 Credit Rating^* Net Assets (%)AAA/Aaa/A++ 28.4 AA/Aa/A+ 51.2 A 7.9 Not Rated 2.2 Total 89.7
^Credit ratings are obtained from S&P Global Ratings, where available, otherwise ratings are obtained from: Moody’s
Investors Service or Dominion Bond Rating Service, respectively.
*Refer to Note 10 for Credit Rating Chart reference.
Other Price RiskAs at March 31, 2020 and 2019, the investments of this Fund were not subject to other price risk as the Fund did not invest in equities.
Currency RiskAs at March 31, 2020 and 2019, the Fund’s investments were denominated in Canadian dollars, the functional currency of the Fund. As a result, the Fund was not exposed to currency risk.
Fund Specific Notes to Financial Statements

CI U.S. Income US$ Pool
– 177 –Annual Financial Statements - March 31, 2020
Statements of Financial Position as at March 31(in $000’s except for per unit amounts and units outstanding)
2020 2019
171,399 172,677 34,136 14,033
- - - - - - - - - - 127 46 782 971 - - - - 3,472 71 24 75 209,940 187,873
- - - -
- - - - - - - - - - 3,874 348 203 149 - - - - - - - - 4,077 497
205,863 187,376
Statements of Financial Position (cont’d)as at March 31(in $000’s except for per unit amounts and units outstanding)
Net assets attributable to holders of redeemable units
per class (Note 4):
Net assets attributable to holders of redeemable
units per unit: Number of redeemable
units outstanding:
2020 2019 2020 2019 2020 2019Class A 9,084 2,540 9.96 9.97 911,764 254,762Class A1 - 1,865 - 9.95 - 187,448Class A2 - 1,290 - 9.95 - 129,652Class A3 - 1,757 - 9.97 - 176,228Class A4 - 205 - 9.95 - 20,655Class A5 - 1,055 - 9.95 - 106,106Class E 894 895 9.96 9.97 89,758 89,797Class EF 363 552 9.93 9.94 36,578 55,487Class F 10,126 486 9.93 9.95 1,019,308 48,845Class F1 - 1,073 - 9.97 - 107,559Class F2 - 1,245 - 9.96 - 124,964Class F3 - 487 - 9.98 - 48,819Class F4 - 404 - 9.97 - 40,544Class F5 - 1,498 - 9.96 - 150,333Class I 171,411 157,847 9.97 9.98 17,185,736 15,819,944Class O 11,427 14,063 9.94 9.95 1,149,360 1,413,063Class P 1,603 70 9.99 9.98 160,493 7,010Class W 955 44 9.90 9.91 96,535 4,406
AssetsCurrent assetsInvestmentsCashUnrealized gain on futures and foreign currency forward contractsSwaps, swaptions and optionsDaily variation margin on derivative instrumentsFees rebate receivableCollateral on deposit for short saleDividends receivableInterest receivableReceivable for distribution from investmentsSecurities lending revenue receivable (Note 6)Receivable for investments soldReceivable for unit subscriptions
LiabilitiesCurrent liabilitiesInvestments sold shortBank overdraftUnrealized loss on futures and foreign currency forward contractsSwaps, swaptions and options Dividends payable on investments sold shortInterest payable on investments sold shortDaily variation margin on derivative instrumentsPayable for investments purchasedPayable for unit redemptionsDistributions payable to holders of redeemable units Management fees payableAdministration fees payableAccounts payable and accrued liabilities
Net assets attributable to holders of redeemable units
The accompanying notes are an integral part of these financial statements.
Financial Statements (Expressed in US$)
CIG - 2340

CI U.S. Income US$ Pool
– 178 –Annual Financial Statements - March 31, 2020
Statements of Comprehensive Incomefor the years ended March 31(in $000’s except for per unit amounts and number of units)
2020 2019
1,881 1,178 4,893 4,914 - - - - 6 59
- - - -
6,950 11
(5,769) 5,334 7,961 11,496 (630) (5) - - 44 55 31 1 (555) 51 7,406 11,547
209 163 55 48 40 28 - - 12 12 - - - - - 3 212 174 31 24 559 452
6,847 11,095
The accompanying notes are an integral part of these financial statements.
Financial Statements (Expressed in US$)
Statements of Comprehensive Income (cont’d)for the years ended March 31(in $000’s except for per unit amounts and number of units)
Increase (decrease) in net assets attributable to
holders of redeemable units per class:
Increase (decrease) in net assets attributable to
holders of redeemable units per unit:
Weighted average number of units:
2020 2019 2020 2019 2020 2019Class A (57) 103 (0.09) 0.33 724,372 323,915Class A1 74 90 0.37 0.47 202,867 196,057Class A2 37 52 0.32 0.30 117,228 172,343Class A3 55 83 0.34 0.44 163,382 192,797Class A4 8 9 0.34 0.32 21,994 28,383Class A5 58 50 0.42 0.49 139,220 102,653Class E 10 45 0.10 0.40 99,924 109,123Class EF 16 27 0.37 0.46 42,163 56,797Class F (197) 23 (0.31) 0.38 650,340 63,100Class F1 35 38 0.35 0.46 96,845 80,036Class F2 42 63 0.37 0.56 114,524 112,923Class F3 34 21 0.42 0.75 80,374 28,457Class F4 11 19 0.32 1.58 32,893 11,320Class F5 58 81 0.38 0.53 151,004 152,101Class I 6,223 9,487 0.37 0.58 16,529,253 16,368,890Class O 469 898 0.33 0.54 1,388,528 1,681,581Class P 1 4 0.01 0.67 115,300 5,336Class W (30) 2 (1.10) 0.86 27,725 1,339
Income Net gain (loss) on investments and derivatives Dividends Interest for distribution purposes Income distributions from investments Capital gain distributions from investments Derivative income (loss) Dividends expense on financial assets (liabilities) sold
short Interest expense on financial assets (liabilities) sold short Net realized gain (loss) on sale of investments and
derivatives Change in unrealized appreciation (depreciation) in value
of investments and derivativesTotal net gain (loss) on investments and derivativesOther income Foreign exchange gain (loss) on cash Commitment fee income Securities lending revenue (Note 6) Fees rebateTotal other incomeTotal incomeExpensesManagement fees (Note 5)Administration fees (Note 5)Commissions and other portfolio transaction costsIndependent review committee feesSecurities borrowing fees (Note 2)Margin feesService feesInterest expenseWithholding taxesHarmonized sales taxTotal expensesIncrease (decrease) in net assets attributable to holders of redeemable units

CI U.S. Income US$ Pool
– 179 –Annual Financial Statements - March 31, 2020
Statements of Changes in Net Assets Attributable to Holders of Redeemable Unitsfor the years ended March 31 (in $000’s)
Net assets attributable to holders of redeemable units at the beginning of yearIncrease (decrease) in net assets attributable to holders of redeemable unitsDistributions to holders of redeemable units From net investment income From net realized gains Return of capitalTotal distributions to holders of redeemable units
Redeemable unit transactions Proceeds from redeemable units issued Reinvestment of distributions to holders of redeemable units Redemption of redeemable unitsNet increase (decrease) from redeemable unit transactionsNet increase (decrease) in net assets attributable to holders of redeemable unitsNet assets attributable to holders of redeemable units at the end of year
The accompanying notes are an integral part of these financial statements.
Financial Statements (Expressed in US$)
Class A 2020 2019 2,540 3,726 (57) 103
(115) (45) (2) - (59) (33) (176) (78)
11,359 2,079 172 73 (4,754) (3,363) 6,777 (1,211) 6,544 (1,186) 9,084 2,540
Class A1 2020 2019 1,865 1,620 74 90
(12) (31) - - (5) (19) (17) (50)
545 1,316 17 50 (2,484) (1,161) (1,922) 205 (1,865) 245 - 1,865
Class A2 2020 2019 1,290 2,285 37 52
(8) (27) - - (3) (17) (11) (44)
200 929 10 44 (1,526) (1,976) (1,316) (1,003) (1,290) (995) - 1,290
Class A3 2020 2019 1,757 2,213 55 83
(11) (34) - - (3) (17) (14) (51)
332 1,069 14 51 (2,144) (1,608) (1,798) (488) (1,757) (456) - 1,757
Class A4 2020 2019 205 1,288 8 9
(2) (5) - - (1) (3) (3) (8)
233 41 3 7 (446) (1,132) (210) (1,084) (205) (1,083) - 205
Class A5 2020 2019 1,055 10 58 50
(9) (20) - - (4) (10) (13) (30)
584 1,213 13 30 (1,697) (218) (1,100) 1,025 (1,055) 1,045 - 1,055
Class E 2020 2019 895 1,273 10 45
(18) (18) - - (8) (11) (26) (29)
258 170 24 25 (267) (589) 15 (394) (1) (378) 894 895
Class EF 2020 2019 552 685 16 27
(10) (13) - - (4) (6) (14) (19)
51 - 13 18 (255) (159) (191) (141) (189) (133) 363 552
Class F 2020 2019 486 710 (197) 23
(136) (12) (2) - (62) (7) (200) (19)
18,768 1,638 183 16 (8,914) (1,882) 10,037 (228) 9,640 (224) 10,126 486
Class F1 2020 2019 1,073 853 35 38
(7) (17) - - (2) (7) (9) (24)
253 847 8 17 (1,360) (658) (1,099) 206 (1,073) 220 - 1,073
Class F2 2020 2019 1,245 706 42 63
(9) (25) - - (3) (10) (12) (35)
223 907 12 35 (1,510) (431) (1,275) 511 (1,245) 539 - 1,245
Class F3 2020 2019 487 309 34 21
(6) (7) - - (2) (3) (8) (10)
594 427 8 9 (1,115) (269) (513) 167 (487) 178 - 487

CI U.S. Income US$ Pool
– 180 –Annual Financial Statements - March 31, 2020
The accompanying notes are an integral part of these financial statements.
Financial Statements (Expressed in US$)
Statements of Changes in Net Assets Attributable to Holders of Redeemable Units (cont’d)for the years ended March 31 (in $000’s)
Net assets attributable to holders of redeemable units at the beginning of yearIncrease (decrease) in net assets attributable to holders of redeemable unitsDistributions to holders of redeemable units From net investment income From net realized gains Return of capitalTotal distributions to holders of redeemable units
Redeemable unit transactions Proceeds from redeemable units issued Reinvestment of distributions to holders of redeemable units Redemption of redeemable unitsNet increase (decrease) from redeemable unit transactionsNet increase (decrease) in net assets attributable to holders of redeemable unitsNet assets attributable to holders of redeemable units at the end of year
Class F4 2020 2019 404 10 11 19
(3) (3) - - (1) (1) (4) (4)
104 542 3 3 (518) (166) (411) 379 (404) 394 - 404
Class F5 2020 2019 1,498 1,292 58 81
(13) (37) - - (3) (14) (16) (51)
63 225 16 51 (1,619) (100) (1,540) 176 (1,498) 206 - 1,498
Class I 2020 2019 157,847 160,601 6,223 9,487
(4,952) (5,013) (68) - (1,727) (1,658) (6,747) (6,671)
42,776 6,620 6,747 6,670 (35,435) (18,860) 14,088 (5,570) 13,564 (2,754) 171,411 157,847
Class O 2020 2019 14,063 18,102 469 898
(398) (491) (6) - (140) (170) (544) (661)
3,352 4,816 540 657 (6,453) (9,749) (2,561) (4,276) (2,636) (4,039) 11,427 14,063
Class P 2020 2019 70 47 1 4
(32) (2) - - (11) - (43) (2)
1,792 20 42 2 (259) (1) 1,575 21 1,533 23 1,603 70
Class W 2020 2019 44 10 (30) 2
(8) - - - (3) - (11) -
1,078 42 11 - (137) (10) 952 32 911 34 955 44
Total Fund 2020 2019 187,376 195,740 6,847 11,095
(5,749) (5,800) (78) - (2,041) (1,986) (7,868) (7,786)
82,565 22,901 7,836 7,758 (70,893) (42,332) 19,508 (11,673) 18,487 (8,364) 205,863 187,376

CI U.S. Income US$ Pool
– 181 –Annual Financial Statements - March 31, 2020
Statements of Cash Flowsfor the years ended March 31 (in $000’s)
2020 2019
6,847 11,095
(6,950) (11) 426 3 40 28
5,769 (5,334) 207,195 171,054 (204,651) (185,209) - - - - - 481 (81) (19) 189 (76) - - - - - - - - 8,784 (7,988)
(32) (28) 67,160 16,126 (55,383) (34,895) 11,745 (18,797)
(426) (3) 20,529 (26,785) 14,033 40,821 34,136 14,033
1,241 993 5,074 4,833 - - - 4 - -
*Dividends and interest received as well as dividends and interest paid relate to operating activities of the Fund. The accompanying notes are an integral part of these financial statements.
Financial Statements (Expressed in US$)
Cash flows from (used in) operating activitiesIncrease (decrease) in net assets attributable to holders of redeemable unitsAdjustments for: Net realized (gain) loss on sale of investments and derivatives Unrealized foreign exchange (gain) loss on cash Commissions and other portfolio transaction costs Change in unrealized (appreciation) depreciation in value of
investments and derivatives Proceeds from sale and maturity of investments and derivatives Purchase of investments and derivatives (Increase) decrease in collateral on deposit for short sale Non-cash distributions from investments Change in daily variation margin (Increase) decrease in dividends receivable (Increase) decrease in interest receivable (Increase) decrease in securities lending revenue receivable Increase (decrease) in management fees payable Increase (decrease) in administration fees payable Change in other accounts receivable and payableNet cash from (used in) operating activities
Cash flows from (used in) financing activitiesDistributions paid to holders of redeemable units, net of reinvested distributionsProceeds from issuance of redeemable unitsAmounts paid on redemption of redeemable unitsNet cash from (used in) financing activities Unrealized foreign exchange gain (loss) on cashNet increase (decrease) in cashCash (bank overdraft), beginning of yearCash (bank overdraft), end of year
Supplementary Information:Dividends received, net of withholding tax*Interest received, net of withholding tax*Dividends paid*Interest paid*Tax recoverable (paid)

CI U.S. Income US$ Pool
– 182 –Annual Financial Statements - March 31, 2020
CORPORATE BONDS (32.9%) (cont’d) 233,000 BNP Paribas S.A., 3.8% 01/10/2024 232,631 240,212 89,000 Bristol-Myers Squibb Co., 3.25% 02/20/2023 92,303 93,455 139,000 Bristol-Myers Squibb Co., 3.45% 11/15/2027 148,919 147,908 432,000 Brookfield Finance Inc., 4.25% 06/02/2026 444,106 453,020 174,000 Brookfield Property REIT Inc./BPR Cumulus LLC/ BPR Nimnus 5.75% 05/15/2026 172,432 141,180 131,000 Brookfield Residential Properties Inc., 4.875% 02/15/2030 130,948 99,521 132,000 Brookfield Residential Properties Inc., 6.25% 09/15/2027 128,414 114,497 34,650 Calfrac Holdings L.P., 10.875% 03/15/2026 33,602 8,662 66,000 Calfrac Holdings L.P., 8.5% 06/15/2026 66,000 4,950 112,000 California Resources Corp., 8% 12/15/2022 80,408 1,680 80,267 Canada Goose Inc., Term Loan, variable rate, 12/02/2024 79,063 79,464 52,000 Canadian National Railway Co., 4.5% 11/07/2043 62,485 62,906 262,000 Canadian Natural Resources Ltd., 3.85% 06/01/2027 258,184 207,190 110,000 Carrier Global Corp., 2.722% 02/15/2030 109,991 101,358 135,000 Carrier Global Corp., 3.577% 04/05/2050 134,995 115,636 7,000 CCO Holdings LLC/CCO Holdings Capital Corp., 4.5% 05/01/2032 7,000 6,826 2,000 CCO Holdings LLC/CCO Holdings Capital Corp., 4.5% 08/15/2030 2,050 1,960 81,000 CCO Holdings LLC/CCO Holdings Capital Corp., 4.75% 03/01/2030 81,439 80,595 43,000 CCO Holdings LLC/CCO Holdings Capital Corp., 5% 02/01/2028 44,752 43,108 10,000 CCO Holdings LLC/CCO Holdings Capital Corp., 5.5% 05/01/2026 10,221 10,150 3,000 Cenovus Energy Inc., 3.8% 09/15/2023 1,620 1,581 14,000 Cenovus Energy Inc., 4.25% 04/15/2027 12,189 6,856 9,000 Cenovus Energy Inc., 6.75% 11/15/2039 7,695 4,359 19,000 Centene Corp., 3.375% 02/15/2030 19,000 17,670 13,000 Centene Corp., 4.25% 12/15/2027 12,891 12,740 16,000 Centene Corp., 4.625% 12/15/2029 16,000 16,080 115,000 Charter Communications Operating LLC 4.8% 03/01/2050 119,965 119,666 285,000 Charter Communications Operating LLC 4.908% 07/23/2025 313,539 302,554 170,000 Charter Communications Operating LLC 5.05% 03/30/2029 191,784 183,770 32,000 Cheniere Corpus Christi Holdings LLC 5.125% 06/30/2027 32,000 28,419 10,000 Cheniere Energy Partners L.P., 5.625% 10/01/2026 9,950 9,200 44,900 Chinos Holdings Inc., 7% 12/31/2049 18,167 20,205 267,000 Citigroup Inc., 3.668% 07/24/2028 269,046 276,422 456,000 Citigroup Inc., 4.45% 09/29/2027 452,356 476,075 6,000 Citigroup Inc., 4.7% 12/31/2049 6,000 5,140 25,000 Citigroup Inc., 5.95% 12/29/2049 26,906 24,226 17,000 Clear Channel Worldwide Holdings Inc., 5.125% 08/15/2027 17,000 16,086 160,000 Clearwater Seafoods Inc., 6.875% 05/01/2025 159,356 136,402
CORPORATE BONDS (32.9%) 68,000 1011778 BC ULC/New Red Finance Inc., 5% 10/15/2025 62,744 64,939 EUR 70,053 Abengoa Abenewco 1 S.A.U., 6% 03/31/2021 64,283 65,149 91,454 Abengoa Abenewco 2 BIS S.A., 1.5% 04/26/2024 11,949 5,213 16,957 Acrisure LLC, Term Loan B, variable rate, 01/31/2027 16,978 14,922 21,000 AECOM 5.125% 03/15/2027 20,720 18,900 52,000 AECOM 5.875% 10/15/2024 52,392 48,656 19,000 AerCap Global Aviation Trust 6.5% 06/15/2045 19,351 15,746 80,000 AerCap Holdings N.V., 5.875% 10/10/2079 80,517 55,200 23,000 Air Canada, Term Loan B, variable rate, 10/06/2023 18,285 21,160 140,000 Air Lease Corp., 2.3% 02/01/2025 138,548 111,230 371,000 Air Lease Corp., 3.625% 04/01/2027 359,115 301,497 187,000 Air Lease Corp., 4.25% 02/01/2024 188,187 158,269 195,000 Alimentation Couche-Tard Inc., 2.95% 01/25/2030 194,766 181,053 230,000 Alliance One International Inc., 9.875% 07/15/2021 170,046 41,400 12,000 Altice Financing S.A., 5% 01/15/2028 12,000 10,620 12,000 Altice Financing S.A., 7.5% 05/15/2026 12,318 11,627 16,000 Altice France Holding S.A., 6% 02/15/2028 16,000 14,075 13,000 Altice France S.A., 5.5% 01/15/2028 13,000 12,172 146,520 Alvogen Pharma US Inc., Term Loan B-Ext, variable rate, 12/31/2023 146,520 125,275 98,134 AMC Entertainment Holdings Inc., Term Loan B, variable rate, 03/20/2026 98,052 71,546 281,000 Anheuser-Busch Co., LLC/Anheuser-Busch InBev Worldwide Inc., 4.9% 02/01/2046 263,598 306,055 170,000 Anheuser-Busch InBev Worldwide Inc., 4.15% 01/23/2025 184,562 182,497 200,000 Anheuser-Busch InBev Worldwide Inc., 5.45% 01/23/2039 199,444 230,148 211,000 Apergy Corp., 6.375% 05/01/2026 213,749 162,470 30,000 Archrock Partners L.P./Archrock Partners Finance Corp., 6.25% 04/01/2028 30,000 20,700 1,000 Asbury Automotive Group Inc., 4.5% 03/01/2028 1,000 850 2,000 Asbury Automotive Group Inc., 4.75% 03/01/2030 2,000 1,700 34,000 Aston Martin Capital Holdings Ltd., 6.5% 04/15/2022 34,110 23,350 180,000 AT&T Inc., 3.4% 05/15/2025 187,972 187,236 119,000 Bank of America Corp., 4.3% 12/31/2049 119,000 102,340 453,000 Bank of America Corp., 5.125% 12/31/2049 453,524 430,350 216,000 Bank of America Corp., 5.875% 12/31/2049 216,000 213,840 327,000 Bank of Montreal 3.803% 12/15/2032 315,771 317,617 229,000 Barclays PLC 4.972% 05/16/2029 233,464 244,911 187,000 Barclays PLC 6.278% 12/31/2049 202,242 185,130 27,000 Barclays PLC 7.75% 12/31/2049 26,963 23,679 162,000 Barclays PLC 7.875% 12/31/2049 163,959 148,230 106,000 Barclays PLC 8% 12/31/2049 111,487 98,304 10,000 Berry Global Escrow Corp., 5.625% 07/15/2027 10,000 10,331 2,000 Block Communications Inc., 4.875% 03/01/2028 2,000 1,860 269,955 Blue Ribbon LLC, Term Loan, variable rate, 11/13/2021 251,774 209,666
Percentages shown in brackets relate investments at fair value to net assets attributable to holders of redeemable units of the Fund.
Schedule of Investment Portfolio as at March 31, 2020 (Expressed in US$)
No. of Shares/Par Value Description
AverageCost ($)
FairValue ($)
No. of Shares/Par Value Description
AverageCost ($)
FairValue ($)

CI U.S. Income US$ Pool
– 183 –Annual Financial Statements - March 31, 2020
Percentages shown in brackets relate investments at fair value to net assets attributable to holders of redeemable units of the Fund.
Schedule of Investment Portfolio as at March 31, 2020 (Expressed in US$) (cont’d)
CORPORATE BONDS (32.9%) (cont’d) 125,000 Fairstone Financial Inc., 7.875% 07/15/2024 129,027 117,500 1,150,000 Fannie Mae Pool 2.5% 04/01/2050 1,197,797 1,192,371 1,716,000 Fannie Mae Pool 3% 03/01/2050 1,807,162 1,801,508 1,995,000 Fannie Mae Pool 3.5% 01/01/2046 1,102,393 1,168,268 1,677,000 Fannie Mae Pool 3.5% 01/01/2046 961,507 1,015,348 985,000 Fannie Mae Pool 3.5% 01/01/2046 531,975 560,670 1,344,000 Fannie Mae Pool 3.5% 01/01/2050 1,376,027 1,398,156 2,501,000 Fannie Mae Pool 3.5% 03/01/2050 2,592,963 2,630,499 2,223,000 Fannie Mae Pool 3.5% 05/01/2046 1,294,301 1,365,336 343,000 Fannie Mae Pool 3.5% 08/01/2045 208,586 214,588 1,144,000 Fannie Mae Pool 3.5% 09/01/2045 600,615 617,729 382,000 Fannie Mae Pool 3.5% 10/01/2045 192,212 199,370 940,000 Fannie Mae Pool 3.5% 10/01/2045 499,309 517,464 420,000 Fannie Mae Pool 3.5% 12/01/2045 242,764 249,642 781,000 Fannie Mae Pool 3.5% 12/01/2045 456,068 470,818 476,000 Fannie Mae Pool 3.5% 12/01/2045 259,265 266,853 382,000 Fannie Mae Pool 3.5% 12/01/2045 233,785 241,007 880,000 Fannie Mae Pool 4% 01/01/2050 910,443 920,005 234,000 Fannie Mae Pool 4% 02/01/2046 100,616 102,447 1,547,000 Fannie Mae Pool 4% 02/01/2050 1,618,280 1,634,337 941,000 Fannie Mae Pool 4% 08/01/2049 783,599 803,987 900,000 Fannie Mae Pool 4% 10/01/2049 869,247 889,199 1,035,000 Fannie Mae Pool 4% 11/01/2044 323,813 331,798 876,000 Fannie Mae Pool 4.5% 01/01/2050 909,603 920,145 965,000 Fannie Mae Pool 4.5% 09/01/2049 863,192 876,755 14,000 First Quantum Minerals Ltd., 6.5% 03/01/2024 13,729 11,620 105,000 First Quantum Minerals Ltd., 6.875% 03/01/2026 92,578 84,262 44,000 First Quantum Minerals Ltd., 7.25% 04/01/2023 43,950 37,042 227,000 First Quantum Minerals Ltd., 7.5% 04/01/2025 230,024 188,907 265,000 Florida Power & Light Co., 2.85% 04/01/2025 264,730 276,470 296,000 Florida Power & Light Co., 3.15% 10/01/2049 294,208 306,593 71,000 Foot Locker Inc., 8.5% 01/15/2022 83,870 67,450 104,000 Fortress Transportation & Infrastructure Investors LLC 6.5% 10/01/2025 105,524 76,180 81,000 Fortress Transportation & Infrastructure Investors LLC 6.75% 03/15/2022 81,455 74,971 1,120,000 Freddie Mac Gold Pool 3.5% 01/01/2046 588,508 613,625 1,602,000 Freddie Mac Gold Pool 3.5% 02/01/2046 833,794 873,440 1,301,000 Freddie Mac Gold Pool 3.5% 03/01/2046 703,924 740,333 1,358,000 Freddie Mac Gold Pool 3.5% 09/01/2046 797,029 836,556 687,000 Freddie Mac Gold Pool 3.5% 12/01/2045 366,263 378,186 1,143,000 Freddie Mac Gold Pool 4% 01/01/2046 498,890 510,841 1,193,000 Freddie Mac Gold Pool 4% 02/01/2046 540,491 557,667 1,464,000 Freddie Mac Gold Pool 4% 08/01/2045 564,314 583,613 600,000 Freddie Mac Gold Pool 4.5% 11/01/2048 362,403 381,237 873,000 Freddie Mac Pool 4% 03/01/2050 914,740 926,863 100,000 Front Range BidCo Inc., 4% 03/01/2027 100,000 95,625 13,000 Front Range BidCo Inc., 6.125% 03/01/2028 13,000 12,350 62,000 Front Range BidCo Inc., Term Loan, variable rate, 02/21/2027 61,845 58,280 141,000 General Electric Capital Corp., 6.15% 08/07/2037 184,930 165,469 77,000 General Electric Capital Corp., 6.75% 03/15/2032 87,864 91,438 350,000 General Motors Financial Co., Inc., 4.2% 11/06/2021 354,472 334,055
CORPORATE BONDS (32.9%) (cont’d) 525,000 Comcast Corp., 3.7% 04/15/2024 547,433 563,404 346,000 Comcast Corp., 4.6% 10/15/2038 351,522 423,510 20,000 CommScope Finance LLC 5.5% 03/01/2024 20,189 20,240 8,000 CommScope Finance LLC 6% 03/01/2026 8,122 7,988 21,000 CommScope Finance LLC 8.25% 03/01/2027 21,294 20,242 57,854 CommScope Inc., Term Loan B2, variable rate, 02/07/2026 57,731 54,383 200,000 Consolidated Edison Comapny of New York Inc., 3.35% 04/01/2030 199,544 206,164 435,000 Consolidated Edison Comapny of New York Inc., 3.95% 04/01/2050 432,120 457,240 45,000 Credit Suisse Group AG 5.1% 12/31/2049 45,000 34,762 82,000 Credit Suisse Group AG 6.25% 12/31/2049 82,252 75,542 80,000 Credit Suisse Group AG 6.375% 12/31/2049 80,000 70,216 38,000 Credit Suisse Group AG 7.125% 12/31/2049 38,000 35,150 34,000 Credit Suisse Group AG 7.5% 12/31/2049 34,000 31,334 145,000 Credit Suisse Group AG, FRN, 7.5% 12/11/2023 151,591 139,562 91,000 Crown Americas LLC/Crown Americas Capital Corp., 4.25% 09/30/2026 83,647 89,635 115,000 Crown Americas LLC/Crown Americas Capital Corp., 4.75% 02/01/2026 110,868 117,840 94,000 CrownRock L.P./CrownRock Finance Inc., 5.625% 10/15/2025 92,760 48,880 9,000 CSC Holdings LLC 5.375% 02/01/2028 9,000 9,180 9,000 CSC Holdings LLC 5.75% 01/15/2030 9,000 9,076 69,000 Darling Ingredients Inc., 5.25% 04/15/2027 68,285 66,909 57,000 DCP Midstream LLC, FRN, 5.85% 05/21/2043 35,224 25,650 8,000 Deutsche Bank AG 6% 12/31/2049 8,002 5,356 122,000 Diamond Sports Group LLC/Diamond Sports Finance Co., 5.375% 08/15/2026 124,978 99,127 21,000 Diamond Sports Group LLC/Diamond Sports Finance Co., 6.625% 08/15/2027 21,000 14,044 7,800 Digicel International Finance Ltd., Term Loan B, variable rate, 05/27/2024 7,761 6,035 77,000 Dole Food Co., Inc., 7.25% 06/15/2025 75,149 60,830 172,000 Dresdner Funding Trust I 8.151% 06/30/2031 219,926 200,112 155,496 Dun & Bradstreet Corp., Term Loan B, variable rate, 02/01/2026 154,838 139,363 76,125 Egalet Corp., 13% 01/31/2024 67,119 63,184 240,000 Emera U.S. Finance L.P., 3.55% 06/15/2026 238,319 228,853 279,000 Enbridge Inc., 5.5% 07/15/2077 243,900 200,880 559,000 Enbridge Inc., 6% 01/15/2077 555,909 413,660 224,000 Enbridge Inc., 6.25% 03/01/2078 229,600 168,000 127,000 Endeavor Energy Resources L.P./EER Finance Inc., 5.75% 01/30/2028 130,300 86,360 150,000 Energy Transfer Operating L.P., 2.9% 05/15/2025 151,725 125,427 120,000 Energy Transfer Operating L.P., 3.75% 05/15/2030 123,143 92,471 300,000 Energy Transfer Operating L.P., 5% 05/15/2050 246,882 233,533 293,000 Evergreen Skills Lux S.a.r.l., Term Loan, variable rate, 04/28/2022 66,218 43,950 98,140 Evergreen Skills Lux S.a.r.l., Term Loan, variable rate, 04/28/2021 80,714 62,646 450,000 Exelon Corp., 4.05% 04/15/2030 449,073 457,767 400,000 Exelon Corp., 4.7% 04/15/2050 399,544 399,544
No. of Shares/Par Value Description
AverageCost ($)
FairValue ($)
No. of Shares/Par Value Description
AverageCost ($)
FairValue ($)

CI U.S. Income US$ Pool
– 184 –Annual Financial Statements - March 31, 2020
Percentages shown in brackets relate investments at fair value to net assets attributable to holders of redeemable units of the Fund.
Schedule of Investment Portfolio as at March 31, 2020 (Expressed in US$) (cont’d)
CORPORATE BONDS (32.9%) (cont’d) 44,000 JBS USA LLC S.A./JBS USA Finance Inc., 5.75% 06/15/2025 37,269 44,440 440,000 JPMorgan Chase & Co., 2.776% 04/25/2023 440,404 445,672 483,000 JPMorgan Chase & Co., 3.9% 07/15/2025 496,305 514,077 392,000 JPMorgan Chase & Co., 4.6% 12/31/2049 392,000 343,078 85,000 JPMorgan Chase & Co., FRN, 6% 12/29/2049 88,049 84,150 129,000 Kennedy-Wilson Inc., 5.875% 04/01/2024 124,372 115,416 76,406 Kestrel Acquisition LLC, Term Loan B, variable rate, 05/02/2025 76,024 43,552 19,000 KFC Holding Co./Pizza Hut Holdings LLC/ Taco Bell of America 4.75% 06/01/2027 18,159 17,860 27,000 KFC Holding Co./Pizza Hut Holdings LLC/ Taco Bell of America 5.25% 06/01/2026 27,050 26,962 489,000 Kimco Realty Corp., 3.2% 05/01/2021 492,811 481,197 277,000 Kinder Morgan Energy Partners L.P., 5.4% 09/01/2044 285,747 271,462 86,000 Kinetic Concepts Inc./KCI USA Inc., 12.5% 11/01/2021 81,570 85,785 52,000 Kinross Gold Corp., 6.875% 09/01/2041 59,660 52,000 50,000 Kraft Foods Group Inc., 4.625% 01/30/2029 48,500 50,151 45,000 Kraft Heinz Foods Co., 4.875% 02/15/2025 46,350 45,101 26,000 Lamb Weston Holdings Inc., 4.625% 11/01/2024 25,572 25,610 18,000 Lamb Weston Holdings Inc., 4.875% 11/01/2026 17,988 18,313 64,000 Land O’Lakes Capital Trust I 7.45% 03/15/2028 69,411 64,000 27,685 Lannett Co., Inc., Term Loan B, variable rate, 11/25/2022 26,716 24,363 66,000 Laredo Petroleum Inc., 9.5% 01/15/2025 59,669 26,400 82,000 LBC Tank Terminals Holding Netherlands B.V., 6.875% 05/15/2023 79,652 76,875 36,000 LCPR Senior Secured Financing DAC 6.75% 10/15/2027 36,000 35,460 86,000 Lincoln National Corp., 3.85913% 04/20/2067 66,499 51,600 44,000 Lincoln National Corp., Callable, 4.04925% 05/17/2066 33,271 27,280 21,000 Lloyds Banking Group PLC 6.75% 12/31/2049 21,000 17,272 17,000 Lloyds Banking Group PLC 7.5% 12/31/2049 17,000 15,280 140,000 Lowe’s Cos., Inc., 3.65% 04/05/2029 140,667 143,647 122,000 Macquarie Bank Ltd., 6.125% 12/31/2049 120,166 109,800 75,000 Mattamy Group Corp., 4.625% 03/01/2030 75,000 64,500 104,058 McAfee LLC, Term Loan B, variable rate, 09/29/2024 103,187 97,121 296,000 McDonald’s Corp., 3.35% 04/01/2023 295,999 305,797 200,000 McDonald’s Corp., 3.5% 07/01/2027 199,030 207,762 105,000 MEG Energy Corp., 6.5% 01/15/2025 102,647 66,412 59,000 MEG Energy Corp., 7% 03/31/2024 50,862 27,214 32,000 MEG Energy Corp., 7.125% 02/01/2027 30,780 15,812 172,000 Merlin Entertainments PLC 5.75% 06/15/2026 175,661 145,340 171,000 Metlife Capital Trust IV 7.875% 12/15/2037 225,049 198,360 52,000 MGM China Holdings Ltd., 5.875% 05/15/2026 52,363 45,760 71,000 MGM Growth Properties Operating Partnership L.P./ MGP Finance 4.5% 01/15/2028 65,639 60,350 79,000 MGM Growth Properties Operating Partnership L.P./ MGP Finance 5.75% 02/01/2027 85,447 68,730 186,000 MGM Resorts International 4.625% 09/01/2026 182,143 158,156
CORPORATE BONDS (32.9%) (cont’d) 13,000 Genworth Financial Inc., 7.2% 02/15/2021 13,359 12,288 206,000 Genworth Holdings Inc., 3.69425% 11/15/2036 95,901 82,400 45,000 Genworth Holdings Inc., 4.8% 02/15/2024 40,175 39,150 103,000 Genworth Holdings Inc., 4.9% 08/15/2023 94,972 90,640 43,000 Genworth Holdings Inc., 7.625% 09/24/2021 30,815 40,859 299,000 Glencore Finance Canada Ltd., 5.55% 10/25/2042 290,110 240,117 222,000 Glencore Funding LLC 4.125% 05/30/2023 222,441 204,542 234,000 Global Aircraft Leasing Co., Ltd., 6.5% 09/15/2024 233,625 150,696 42,000 Goldman Sachs Group Inc., 5.3% 12/31/2049 42,034 40,740 57,000 H&E Equipment Services Inc., 5.625% 09/01/2025 56,615 52,868 151,220 Hartford Financial Services Group Inc., 3.81675% 02/12/2047 126,031 97,765 117,000 HBOS Capital Funding L.P., 6.85% 03/29/2049 117,186 110,156 233,000 HCA Inc., 3.5% 09/01/2030 232,933 211,380 228,000 HCA Inc., 4.125% 06/15/2029 236,887 228,393 83,000 HCA Inc., 5% 03/15/2024 85,217 85,937 153,000 HCA Inc., 5.25% 06/15/2026 154,522 160,462 258,000 HCA Inc., 5.25% 06/15/2049 256,297 275,065 139,000 HCA Inc., 5.375% 09/01/2026 143,698 143,170 70,000 HCA Inc., 5.5% 06/15/2047 73,192 76,066 228,000 HCA Inc., 7.05% 12/01/2027 265,600 234,840 84,000 HCA Inc., 7.5% 12/15/2023 93,839 87,388 13,000 HCA Inc., 7.58% 09/15/2025 14,448 13,390 9,000 HCA Inc., 7.69% 06/15/2025 10,343 9,270 185,000 Home Depot Inc., 2.5% 04/15/2027 184,099 187,140 310,000 Home Depot Inc., 3.35% 04/15/2050 306,460 320,698 145,000 Howard Hughes Corp., 5.375% 03/15/2025 145,421 140,288 329,000 HSBC Holdings PLC 4.292% 09/12/2026 333,224 328,293 71,000 HUB International Ltd., 7% 05/01/2026 70,387 70,290 150,705 HUB International Ltd., Term Loan B, variable rate, 04/25/2025 150,850 140,005 172,000 Hughes Satellite Systems Corp., 5.25% 08/01/2026 166,484 170,280 14,000 Hughes Satellite Systems Corp., 6.625% 08/01/2026 14,860 14,181 303,000 Husky III Holding Ltd., 13% 02/15/2025 298,695 222,547 27,000 ILFC E-Capital Trust I, FRN, 4.67% 12/21/2065 24,322 12,352 80,000 ILFC E-Capital Trust II 4.15% 12/21/2065 75,407 32,000 80,000 ING Groep N.V., 6.5% 12/31/2049 77,420 66,656 22,000 ING Groep N.V., 6.75% 12/31/2049 23,430 18,865 15,000 ING Groep N.V., 6.875% 12/31/2049 15,290 13,050 162,000 Intarcia Therapeutics Inc., 144A, Zero Coupon, 04/15/2031 36,818 30,375 90,000 Intelsat Jackson Holdings S.A., 5.5% 08/01/2023 77,106 58,950 30,000 Iron Mountain Inc., 4.875% 09/15/2029 30,000 28,181 193,042 Ironshore Pharmaceuticals & Development Inc., 13% 02/28/2024 190,284 173,738 125,000 iStar Inc., 4.25% 08/01/2025 125,000 102,800 70,000 iStar Inc., 4.75% 10/01/2024 70,140 58,800 71,000 J. Crew Brand LLC/J. Crew Brand Corp., 13% 09/15/2021 84,866 69,225 27,987 J. Crew Group Inc., Term Loan B, variable rate, 03/05/2021 18,935 16,512
No. of Shares/Par Value Description
AverageCost ($)
FairValue ($)
No. of Shares/Par Value Description
AverageCost ($)
FairValue ($)

CI U.S. Income US$ Pool
– 185 –Annual Financial Statements - March 31, 2020
Percentages shown in brackets relate investments at fair value to net assets attributable to holders of redeemable units of the Fund.
Schedule of Investment Portfolio as at March 31, 2020 (Expressed in US$) (cont’d)
CORPORATE BONDS (32.9%) (cont’d) 9,000 Parkland Fuel Corp., 5.875% 07/15/2027 9,000 8,437 8,000 Parsley Energy LLC/Parsley Finance Corp., 5.25% 08/15/2025 8,006 6,080 80,000 Parsley Energy LLC/Parsley Finance Corp., 5.625% 10/15/2027 81,466 56,400 265,000 Penske Truck Leasing Co., L.P./PTL Finance Corp., 3.95% 03/10/2025 265,426 274,133 200,000 PepsiCo, Inc., 2.625% 03/19/2027 198,974 209,120 300,000 PepsiCo, Inc., 3.875% 03/19/2060 313,026 380,253 140,000 PNC Bank N.A., 2.7% 10/22/2029 139,416 133,128 26,000 Precision Drilling Corp., 5.25% 11/15/2024 15,408 9,100 82,000 Precision Drilling Corp., 7.125% 01/15/2026 82,535 30,135 114,000 Precision Drilling Corp., 7.75% 12/15/2023 110,225 45,600 111,000 Project Homestake Merger Corp., 8.875% 03/01/2023 99,361 70,485 50,000 Quotient Ltd., 12% 04/15/2024 50,000 50,250 60,000 Quotient Ltd., 12% 10/15/2023 60,000 60,300 163,000 Rayonier AM Products Inc., 5.5% 06/01/2024 135,387 74,165 63,000 Reynolds Group Issuer Inc./Reynolds Group Issuer LLC 5.125% 07/15/2023 63,434 62,370 130,000 Rite Aid Corp., 6.125% 04/01/2023 120,031 111,800 74,000 Rite Aid Corp., 7.5% 07/01/2025 75,606 70,300 60,000 Rite Aid Corp., 7.7% 02/15/2027 55,416 45,568 202,000 Rockpoint Gas Storage Canada Ltd., 7% 03/31/2023 200,983 146,957 9,000 Scientific Games International Inc., 6.625% 05/15/2021 8,004 7,178 43,000 Scientific Games International Inc., 7% 05/15/2028 43,000 26,445 94,000 Scientific Games International Inc., 7.25% 11/15/2029 93,629 58,750 159,000 Scientific Games International Inc., 8.25% 03/15/2026 161,210 101,777 195,000 Seven Generations Energy Ltd., 5.375% 09/30/2025 193,458 108,712 80,000 Seven Generations Energy Ltd., 6.875% 06/30/2023 74,728 54,800 45,000 SFR Group S.A., 7.375% 05/01/2026 45,793 44,669 122,000 Shell International Finance B.V., 4.375% 05/11/2045 120,305 140,925 37,000 Silversea Cruises Ltd., 7.25% 02/01/2025 38,276 31,450 15,000 Spring Corp., 7.625% 03/01/2026 14,973 16,977 100,000 Sprint Capital Corp., 6.875% 11/15/2028 71,775 114,220 94,000 Sprint Corp., 7.125% 06/15/2024 67,218 103,179 69,000 Sprint Corp., 7.625% 02/15/2025 53,973 76,245 150,000 Starbucks Corp., 3.8% 08/15/2025 161,385 159,067 136,000 Stars Group Holdings B.V./Stars Group U.S. Co-Borrower LLC 7% 07/15/2026 137,290 127,867 300,000 State Street Corp., 2.901% 03/30/2026 300,000 304,881 19,000 Station Casinos LLC 4.5% 02/15/2028 19,000 15,390 8,000 Studio City Finance Ltd., 7.25% 02/11/2024 8,000 6,808 373,000 Sunoco Logistics Partners Operations L.P., 5.3% 04/01/2044 352,313 293,316 125,000 Targa Resources Partners L.P./ Targa Resources Partners 5.5% 03/01/2030 125,000 96,550
CORPORATE BONDS (32.9%) (cont’d) 148,000 MGM Resorts International 5.5% 04/15/2027 150,612 134,680 94,000 Michaels Stores Inc., 8% 07/15/2027 93,208 69,560 172,019 Michaels Stores Inc., Term Loan B, variable rate, 01/28/2023 167,102 142,776 170,000 Microsoft Corp., 3.3% 02/06/2027 182,233 188,644 700,000 Morgan Stanley 3.622% 04/01/2031 700,000 726,131 32,000 Moss Creek Resources Holdings Inc., 10.5% 05/15/2027 31,745 10,400 268,000 MPH Acquisition Holdings LLC 7.125% 06/01/2024 254,517 233,176 78,656 Nascar Holdings Inc., Term Loan B, variable rate, 07/26/2026 78,538 68,588 21,000 National CineMedia LLC 5.875% 04/15/2028 21,000 14,490 46,000 National Westminster Bank PLC, FRN, 1.86325% 12/31/2049 28,353 35,190 30,000 National Westminster Bank PLC, FRN, 1.875% 08/29/2049 18,615 22,950 61,000 Nationstar Mortgage Holdings Inc., 6% 01/15/2027 55,608 51,850 127,000 Navient Corp., 5% 03/15/2027 127,005 109,182 262,000 New Gold Inc., 6.25% 11/15/2022 234,404 254,468 61,000 New Gold Inc., 6.375% 05/15/2025 58,498 56,692 21,000 Newell Brands Inc., 4.2% 04/01/2026 19,372 20,618 119,000 NGL Energy Partners L.P./NGL Energy Finance Corp., 6.125% 03/01/2025 118,400 40,460 120,000 NGL Energy Partners L.P./NGL Energy Finance Corp., 7.5% 04/15/2026 114,414 40,892 35,000 NGL Energy Partners L.P./NGL Energy Finance Corp., 7.5% 11/01/2023 35,602 12,162 350,000 NIKE Inc., 2.4% 03/27/2025 349,524 358,936 200,000 NIKE Inc., 3.375% 03/27/2050 199,326 219,128 93,338 NMI Holdings Inc., Term Loan, variable rate, 05/24/2023 92,871 82,137 70,788 Northern Oil and Gas Inc., 8.5% 05/15/2023 66,440 48,136 407,000 NOVA Chemicals Corp., 4.875% 06/01/2024 412,731 357,142 75,000 NOVA Chemicals Corp., 5% 05/01/2025 77,376 63,000 47,000 NOVA Chemicals Corp., 5.25% 06/01/2027 46,510 39,598 19,000 NOVA Chemicals Corp., 5.25% 08/01/2023 18,701 16,495 91,000 NuFarm Australia Ltd.,/Nufarm Americas Inc., 5.75% 04/30/2026 90,657 78,715 41,000 NuStar Logistics L.P., 6% 06/01/2026 41,000 30,340 310,000 NVIDIA Corp., 2.85% 04/01/2030 308,850 321,687 185,000 NVIDIA Corp., 3.7% 04/01/2060 184,462 202,316 55,000 Oasis Petroleum Inc., 6.875% 03/15/2022 44,611 10,862 15,000 Occidental Petroleum Corp., 2.7% 08/15/2022 9,690 10,696 99,000 Ortho-Clinical Disgnostics Inc./Ortho-Clinical Disgnostics S.A., 7.25% 02/01/2028 99,490 85,130 15,000 Outfront Media Capital LLC/Outfront Media Capital Corp., 4.625% 03/15/2030 15,000 13,350 43,890 Panther BF Aggregator 2 L.P., Term Loan, variable rate, 03/18/2026 43,690 39,940 8,000 Panther BF Aggregator 2 L.P./Panther Finance Co., Inc., 6.25% 05/15/2026 8,000 7,560 28,000 Panther BF Aggregator 2 L.P./Panther Finance Co., Inc., 8.5% 05/15/2027 28,115 24,427
No. of Shares/Par Value Description
AverageCost ($)
FairValue ($)
No. of Shares/Par Value Description
AverageCost ($)
FairValue ($)

CI U.S. Income US$ Pool
– 186 –Annual Financial Statements - March 31, 2020
CORPORATE BONDS (32.9%) (cont’d) 5,000 VICI Properties L.P./VICI Note Co., Inc., 4.125% 08/15/2030 5,000 4,681 41,000 Virgin Media Finance PLC 5.75% 01/15/2025 41,000 39,770 76,000 Virgin Media Secured Finance PLC 5.5% 05/15/2029 77,801 75,726 9,000 Virgin Media Secured Finance PLC 5.5% 08/15/2026 9,025 9,135 230,000 Vodafone Group PLC 3.75% 01/16/2024 241,298 239,444 190,000 Vodafone Group PLC 4.25% 09/17/2050 189,286 195,290 32,000 Wand Merger Corp., 8.125% 07/15/2023 32,260 31,290 59,000 Wand Merger Corp., 9.125% 07/15/2026 63,008 53,395 328,000 Wells Fargo & Co., 4.3% 07/22/2027 343,234 349,383 323,000 Wells Fargo & Co., 4.9% 11/17/2045 341,984 368,229 16,000 Wyndham Hotels & Resorts Inc., 5.375% 04/15/2026 16,000 13,920 17,000 Wynn Las Vegas LLC/Wynn Las Vegas Capital Corp., 5.25% 05/15/2027 15,385 15,385 59,282 Xplornet Communications Inc., 9.625% 06/01/2022 59,554 55,132 122,037 Xplornet Communications Inc., Term Loan, variable rate, 09/09/2021 121,203 117,155 9,000 Ziggo B.V., 4.875% 01/15/2030 9,000 8,765 4,000 Ziggo Bond Co. B.V., 5.125% 02/28/2030 4,000 3,920 70,024,688 67,579,377 FOREIGN GOVERNMENT BONDS (29.8%) 102,000 Federative Republic of Brazil International Bond 2.625% 01/05/2023 95,412 102,510 47,000 Federative Republic of Brazil International Bond 4.25% 01/07/2025 46,455 49,468 150,000 Federative Republic of Brazil International Bond 4.5% 05/30/2029 161,074 153,914 182,000 Federative Republic of Brazil International Bond 4.625% 01/13/2028 171,308 193,830 10,000 Federative Republic of Brazil International Bond 5.625% 02/21/2047 9,458 10,300 178,000 Government of Colombia International Bond 2.625% 03/15/2023 169,189 172,571 162,000 Government of Colombia International Bond 3.875% 04/25/2027 155,827 159,570 13,000 Government of Colombia International Bond 4.5% 03/15/2029 13,056 13,325 177,000 Government of Indonesia International Bond 2.95% 01/11/2023 168,760 175,354 102,000 Government of Indonesia International Bond 3.75% 04/25/2022 102,162 102,593 259,000 Government of Indonesia International Bond 4.75% 02/11/2029 295,038 280,299 70,000 Government of Indonesia International Bond 5.35% 02/11/2049 78,040 79,522 520,000 Government of Mexico International Bond 3.25% 04/16/2030 520,120 488,800 180,000 Government of the Russian Federation 4.25% 06/23/2027 188,890 188,435 45,000 Government of the Russian Federation 4.75% 05/27/2026 47,049 47,745
CORPORATE BONDS (32.9%) (cont’d) 22,000 Teck Resources Ltd., 5.4% 02/01/2043 22,212 17,429 66,000 Teck Resources Ltd., 6% 08/15/2040 72,998 56,580 33,000 Teck Resources Ltd., 6.125% 10/01/2035 37,292 30,299 30,000 Teine Energy Ltd., 6.875% 09/30/2022 24,309 27,900 126,000 TerraForm Power Operating LLC 5% 01/31/2028 121,922 132,023 9,000 The Royal Bank of Scotland Group PLC 3.655% 12/31/2049 8,560 7,434 94,000 The Royal Bank of Scotland Group PLC 7.5% 12/31/2049 92,571 86,187 29,000 The Royal Bank of Scotland Group PLC 8% 12/31/2049 31,582 27,097 47,000 The Royal Bank of Scotland Group PLC 8.625% 12/31/2049 47,497 45,825 2,000 TJX Co., Inc., 3.875% 04/15/2030 1,998 1,998 29,423 Tops Markets LLC 13% 11/19/2024 29,423 28,540 30,780 Tops Markets LLC, Term Loan, variable rate, 11/16/2023 29,857 30,934 534,000 Toronto-Dominion Bank 3.625% 09/15/2031 530,029 530,598 190,000 TransCanada Trust 5.5% 09/15/2079 190,926 145,350 555,000 TransCanada Trust 5.875% 08/15/2076 568,455 448,057 299,000 Transcontinental Gas Pipe Line Co., LLC 4.6% 03/15/2048 297,931 296,377 166,000 TransDigm Inc., 5.5% 11/15/2027 166,652 148,985 30,000 TransDigm Inc., 7.5% 03/15/2027 30,575 28,911 103,000 TransMontaigne Partners L.P./TLP Finance Corp., 6.125% 02/15/2026 101,672 82,400 289,000 U.S. Bancorp., 3.375% 02/05/2024 292,503 306,808 100,000 U.S. Bancorp., 5.3% 12/31/2049 100,000 96,000 23,000 UBS Group AG 6.875% 12/31/2049 23,144 22,425 108,000 UBS Group AG 6.875% 12/31/2049 105,624 102,465 51,000 UBS Group AG 7.125% 12/31/2049 51,522 49,725 205,000 UBS Group AG, FRN, 7% 12/31/2049 211,318 197,518 327,000 UBS Group Funding Switzerland AG 4.253% 03/23/2028 331,986 342,703 19,000 UBS Group Funding Switzerland AG 7% 12/31/2049 19,000 17,860 38,805 Ultimate Software Group Inc., Term Loan, variable rate, 04/08/2026 38,708 36,024 32,000 United Rentals North America Inc., 4% 07/15/2030 32,000 28,640 333,000 UnitedHealth Group Inc., 3.75% 07/15/2025 342,583 359,859 247,000 UnitedHealth Group Inc., 4.75% 07/15/2045 271,369 314,524 305,000 US Bank N.A./Cincinnati OH 1.95% 01/09/2023 304,744 305,576 51,000 US Foods Inc., 5.875% 06/15/2024 51,396 46,436 428,000 USB Realty Corp., FRN, 2.97825% 12/29/2049 368,666 321,000 1,950 USI Inc., Term Loan B, variable rate, 05/16/2024 1,940 1,774 58,000 Velvet Energy Ltd., 9% 09/22/2023 56,630 58,000 252,000 Verizon Communications Inc., 3.376% 02/15/2025 249,744 269,187 250,000 Verizon Communications Inc., 4.016% 12/03/2029 250,371 280,776 353,000 Verizon Communications Inc., 4.522% 09/15/2048 335,862 451,921 42,000 Vertiv Group Corp., Term Loan B, variable rate, 03/02/2027 41,790 36,120 5,000 VICI Properties L.P./VICI Note Co., Inc., 3.75% 02/15/2027 5,000 4,712
Percentages shown in brackets relate investments at fair value to net assets attributable to holders of redeemable units of the Fund.
Schedule of Investment Portfolio as at March 31, 2020 (Expressed in US$) (cont’d)
No. of Shares/Par Value Description
AverageCost ($)
FairValue ($)
No. of Shares/Par Value Description
AverageCost ($)
FairValue ($)

CI U.S. Income US$ Pool
– 187 –Annual Financial Statements - March 31, 2020
COMMON EQUITIES (8.9%) (cont’d) 3,561 Chubb Ltd. 471,690 397,728 3,723 Crown Holdings Inc. 196,563 216,083 15,389 CSX Corp. 940,764 881,790 17,635 DuPont de Nemours Inc. 923,950 601,354 52,033 Extended Stay America Inc. 687,348 380,361 5,594 Franco-Nevada Corp. (USD) 401,487 556,715 14,538 Gilead Sciences Inc. 1,001,217 1,086,861 49,414 Imperial Brands PLC, ADR 1,116,347 907,686 4,978 Intercontinental Exchange Inc. 465,927 401,974 8,485 Jacobs Engineering Group Inc. 586,451 672,606 3,923 Linde PLC (USD) 576,971 678,679 9,951 McKesson Corp. 1,288,830 1,345,972 4,546 Microsoft Corp. 359,574 716,950 14,940 Nutrien Ltd. (USD) 746,876 507,064 12,777 Philip Morris International Inc. 1,100,564 932,210 144 Tops Markets LLC 50,625 50,625 26,149 Verizon Communications Inc. 1,396,541 1,404,986 36,981 Viper Energy Partners L.P. 913,678 245,184 3,072 Visa Inc., Class A 524,357 494,961 34,131 Wells Fargo & Co. 1,528,146 979,560 2,598 Zyla Life Sciences 15,588 4,157 22,734,113 18,387,615 PREFERRED SHARES (0.5%) 10,600 Citigroup Capital XIII, Preferred 7.875% 289,804 271,360 3,919 Citigroup Inc., Preferred 6.875%, Series K 106,935 101,032 2,500 Delphi Financial Group Inc., Preferred 56,250 55,625 1,800 Elanco Animal Health Inc., Preferred 5% 94,483 74,052 16,400 GMAC Capital Trust, Preferred 8.125%, Series 2 427,527 336,364 3,400 Morgan Stanley, Preferred 4.875%, Series L 85,000 80,138 4,300 Morgan Stanley, Preferred 5.85%, Series K 107,500 105,866 778 NuStar Energy L.P., Preferred 7.625%, Series B 19,811 7,547 5,000 Synchrony Financial, Preferred 5.625%, Series A 125,000 85,300 1,312,310 1,117,284 REITS (0.3%) 95 Sovereign REIT, Preferred 12%, Series 144A 118,750 99,275 26,418 STORE Capital Corp. 631,130 478,694 749,880 577,969 WARRANTS (0.0%) 1,743 Egalet Corp., Warrants 10,458 2,789
Commissions and other portfolio transaction costs (14,811)
Total Investment Portfolio (83.3%) 173,018,082 171,399,216 Other Net Assets (Liabilities) (16.7%) 34,463,383 Net Assets Attributable to Holders of Redeemable Units (100.0%) 205,862,599
Principal amounts stated in:EUR European Currency
FOREIGN GOVERNMENT BONDS (29.8%) (cont’d) 9,000 Republic of South Africa International Bond 4.3% 10/12/2028 8,627 7,371 97,000 Republic of South Africa International Bond 4.85% 09/27/2027 95,534 85,022 68,000 Republic of South Africa International Bond 4.875% 04/14/2026 68,320 60,588 80,000 Republic of South Africa International Bond 5.875% 09/16/2025 84,155 76,740 1,516,000 United States Treasury Inflation Indexed Bonds 0.12533% 01/15/2030 1,537,600 1,564,856 5,156,000 United States Treasury Inflation Indexed Bonds 0.12568% 10/15/2024 5,270,204 5,236,613 1,415,000 United States Treasury Inflation Indexed Bonds 1.02518% 02/15/2049 1,750,897 1,802,020 6,169,000 United States Treasury Note/Bond 1.125% 02/28/2022 6,255,002 6,271,415 892,000 United States Treasury Note/Bond 1.125% 02/28/2025 917,348 924,718 7,272,000 United States Treasury Note/Bond 1.125% 02/28/2027 7,475,537 7,555,778 6,000,000 United States Treasury Note/Bond 2.25% 02/15/2027 5,889,258 6,691,172 4,000,000 United States Treasury Note/Bond 2.25% 08/15/2027 3,979,688 4,487,969 1,000,000 United States Treasury Note/Bond 2.25% 11/15/2027 949,922 1,124,375 5,000,000 United States Treasury Note/Bond 2.375% 05/15/2027 5,025,351 5,640,234 141,000 United States Treasury Note/Bond 2.375% 11/15/2049 176,607 175,666 4,000,000 United States Treasury Note/Bond 2.75% 08/15/2047 3,950,128 5,299,688 7,000,000 United States Treasury Note/Bond 2.75% 11/15/2047 6,790,431 9,285,117 2,000,000 United States Treasury Note/Bond 3% 05/15/2047 2,038,809 2,772,344 54,485,256 61,279,922 EXCHANGE-TRADED FUND(S) (10.9%) 14,766 iShares Core MSCI EAFE ETF 724,121 736,676 8,110 iShares iBoxx $ High Yield Corporate Bond ETF 628,042 625,038 12,643 iShares J.P. Morgan USD Emerging Markets Bond ETF 1,431,308 1,222,325 59,205 SPDR Gold Trust 7,845,620 8,765,300 34,643 SPDR S&P 500 ETF Trust 10,460,933 8,929,233 31,148 Vanguard Real Estate ETF 2,626,164 2,175,688 23,716,188 22,454,260 COMMON EQUITIES (8.9%) 4,540 Anthem Inc. 1,143,735 1,030,762 16,361 Athene Holding Ltd. 716,651 406,080 89,136 Black Stone Minerals L.P. 1,521,240 417,156 1,500 BlackRock Inc. (USD) 627,536 659,955 2,754 Boeing Co. 969,581 410,732 4,054 Broadcom Inc. 966,607 961,203 25,504 Canadian Natural Resources Ltd. (USD) 701,806 345,579 7,703 CBOE Holdings Inc. 787,454 687,493 3,927 Chinos Intermediate Holdings Inc., Class A 6,009 5,149
Percentages shown in brackets relate investments at fair value to net assets attributable to holders of redeemable units of the Fund.
Schedule of Investment Portfolio as at March 31, 2020 (Expressed in US$) (cont’d)
No. of Shares/Par Value Description
AverageCost ($)
FairValue ($)
No. of Shares/Par Value Description
AverageCost ($)
FairValue ($)

CI U.S. Income US$ Pool
– 188 –Annual Financial Statements - March 31, 2020
Fund Specific Notes to Financial Statements (Expressed in US$)
The accompanying notes are an integral part of these financial statements.
Interest in Unconsolidated Structured Entities (Note 2)
The following tables present the Fund’s interest in Unconsolidated Structured Entities.
as at March 31, 2020 Fair Value of
the Underlying Fund(s) / ETF(s)Fair Value of the Fund’s Investment
in the Underlying Fund(s) / ETF(s)Ownership in the
Underlying Fund(s) / ETF(s)
Unconsolidated Structured Entities (in $000’s) (in $000’s) (%)iShares iBoxx $ High Yield Corporate Bond ETF 21,911,577 625 -Vanguard Real Estate ETF 38,422,865 2,176 -iShares J.P. Morgan USD Emerging Markets Bond ETF 16,678,646 1,222 -SPDR Gold Trust 69,396,732 8,765 -iShares Core MSCI EAFE ETF 84,552,525 737 -SPDR S&P 500 ETF Trust 333,941,477 8,929 -
as at March 31, 2019 Fair Value of
the Underlying Fund(s) / ETF(s)Fair Value of the Fund’s Investment
in the Underlying Fund(s) / ETF(s)Ownership in the
Underlying Fund(s) / ETF(s)
Unconsolidated Structured Entities (in $000’s) (in $000’s) (%)iShares 20+ Year Treasury Bond ETF 13,432,461 6,372 -iShares MSCI Japan ETF 18,229,398 4,843 -SPDR Gold Trust 43,515,900 4,228 -iShares Core MSCI Emerging Markets ETF 79,230,144 3,982 -SPDR S&P 500 ETF Trust 355,973,856 2,825 -Vanguard REIT ETF 45,236,034 1,842 -iShares JPMorgan USD Emerging Markets Bond ETF 23,046,367 344 -

CI U.S. Income US$ Pool
– 189 –Annual Financial Statements - March 31, 2020
Redeemable Unit Transactions (Note 4)for the years ended March 31
Number of redeemable units at the beginning of yearRedeemable units issued for cashRedeemable units issued for reinvested distributionsRedeemable units redeemedNumber of redeemable units at the end of year
Number of redeemable units at the beginning of yearRedeemable units issued for cashRedeemable units issued for reinvested distributionsRedeemable units redeemedNumber of redeemable units at the end of year
Number of redeemable units at the beginning of yearRedeemable units issued for cashRedeemable units issued for reinvested distributionsRedeemable units redeemedNumber of redeemable units at the end of year
Number of redeemable units at the beginning of yearRedeemable units issued for cashRedeemable units issued for reinvested distributionsRedeemable units redeemedNumber of redeemable units at the end of year
Number of redeemable units at the beginning of yearRedeemable units issued for cashRedeemable units issued for reinvested distributionsRedeemable units redeemedNumber of redeemable units at the end of year
Fund Specific Notes to Financial Statements (Expressed in US$)
†A portion of brokerage commissions paid was used to cover research and market data services, termed soft dollar commissions. This amount has been estimated by the Manager of the Fund.The accompanying notes are an integral part of these financial statements.
Commissions (Note 2)for the years ended March 31 (in $000’s)
2020 2019Brokerage commissions 27 25Soft dollar commissions† 7 5
Class A 2020 2019 254,762 380,194 1,107,450 213,280 16,781 7,484 (467,229) (346,196) 911,764 254,762
Class A1 2020 2019 187,448 165,756 54,099 136,714 1,749 5,129 (243,296) (120,151) - 187,448
Class A2 2020 2019 129,652 233,797 20,044 95,148 1,035 4,532 (150,731) (203,825) - 129,652
Class A3 2020 2019 176,228 226,179 32,772 109,630 1,407 5,215 (210,407) (164,796) - 176,228
Class A4 2020 2019 20,655 131,824 23,417 4,221 245 742 (44,317) (116,132) - 20,655
Class A5 2020 2019 106,106 1,027 58,884 124,265 1,296 3,102 (166,286) (22,288) - 106,106
Class E 2020 2019 89,797 130,043 24,999 17,505 2,328 2,591 (27,366) (60,342) 89,758 89,797
Class EF 2020 2019 55,487 70,108 5,030 - 1,323 1,875 (25,262) (16,496) 36,578 55,487
Class F 2020 2019 48,845 72,565 1,825,216 168,651 17,947 1,630 (872,700) (194,001) 1,019,308 48,845
Class F1 2020 2019 107,559 87,179 25,060 86,612 816 1,797 (133,435) (68,029) - 107,559
Class F2 2020 2019 124,964 72,188 22,341 93,546 1,203 3,617 (148,508) (44,387) - 124,964
Class F3 2020 2019 48,819 31,552 59,179 43,943 846 930 (108,844) (27,606) - 48,819
Class F4 2020 2019 40,544 1,030 10,193 56,040 254 344 (50,991) (16,870) - 40,544
Class F5 2020 2019 150,333 132,138 6,250 23,131 1,673 5,259 (158,256) (10,195) - 150,333
Class I 2020 2019 15,819,944 16,383,167 4,161,599 675,807 661,210 686,212 (3,457,017) (1,925,242) 17,185,736 15,819,944
Class O 2020 2019 1,413,063 1,850,406 326,711 496,841 53,055 67,793 (643,469) (1,001,977) 1,149,360 1,413,063
Class P 2020 2019 7,010 4,805 175,441 2,065 4,069 206 (26,027) (66) 160,493 7,010
Class W 2020 2019 4,406 1,027 104,254 4,336 1,145 60 (13,270) (1,017) 96,535 4,406
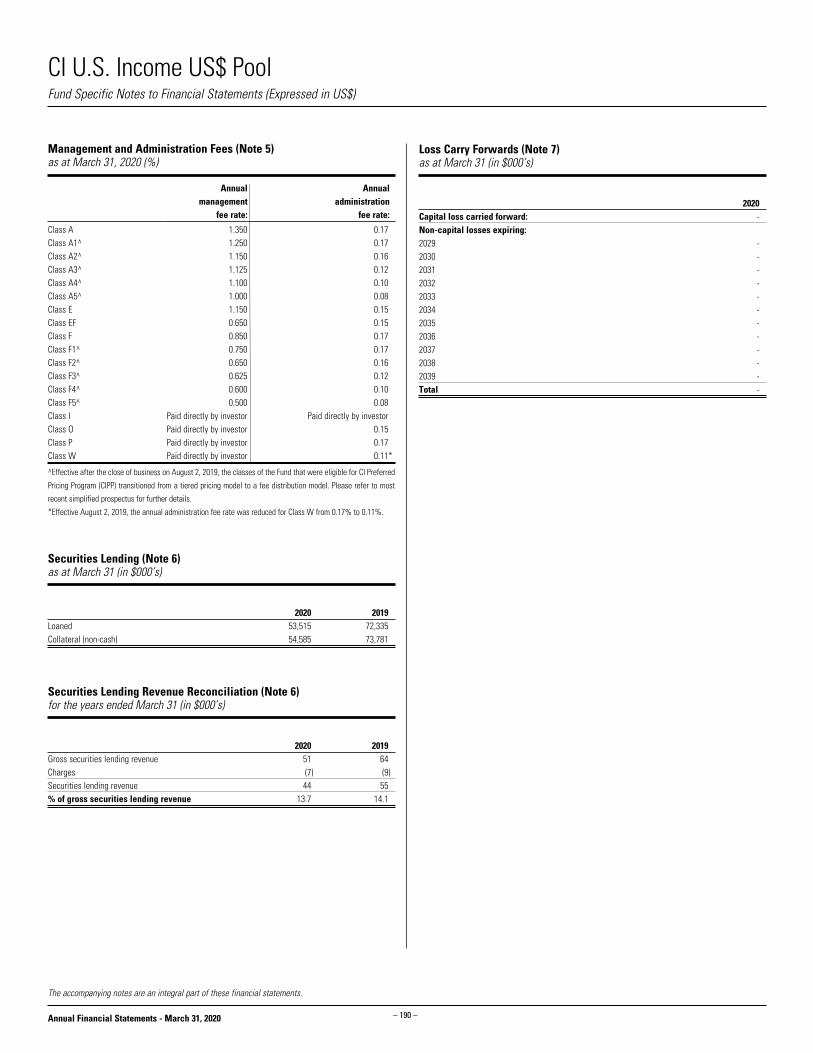
CI U.S. Income US$ Pool
– 190 –Annual Financial Statements - March 31, 2020
The accompanying notes are an integral part of these financial statements.
Fund Specific Notes to Financial Statements (Expressed in US$)
Management and Administration Fees (Note 5) as at March 31, 2020 (%)
Annual management
fee rate:
Annual administration
fee rate:
Class A 1.350 0.17Class A1^ 1.250 0.17Class A2^ 1.150 0.16Class A3^ 1.125 0.12Class A4^ 1.100 0.10Class A5^ 1.000 0.08Class E 1.150 0.15Class EF 0.650 0.15Class F 0.850 0.17Class F1^ 0.750 0.17Class F2^ 0.650 0.16Class F3^ 0.625 0.12Class F4^ 0.600 0.10Class F5^ 0.500 0.08Class I Paid directly by investor Paid directly by investorClass O Paid directly by investor 0.15Class P Paid directly by investor 0.17Class W Paid directly by investor 0.11*
^Effective after the close of business on August 2, 2019, the classes of the Fund that were eligible for CI Preferred
Pricing Program (CIPP) transitioned from a tiered pricing model to a fee distribution model. Please refer to most
recent simplified prospectus for further details.
*Effective August 2, 2019, the annual administration fee rate was reduced for Class W from 0.17% to 0.11%.
Securities Lending (Note 6)as at March 31 (in $000’s)
2020 2019Loaned 53,515 72,335Collateral (non-cash) 54,585 73,781
Securities Lending Revenue Reconciliation (Note 6)for the years ended March 31 (in $000’s)
2020 2019Gross securities lending revenue 51 64Charges (7) (9)Securities lending revenue 44 55% of gross securities lending revenue 13.7 14.1
Loss Carry Forwards (Note 7)as at March 31 (in $000’s)
2020Capital loss carried forward: -Non-capital losses expiring:2029 -2030 -2031 -2032 -2033 -2034 -2035 -2036 -2037 -2038 -2039 -Total -

CI U.S. Income US$ Pool
– 191 –Annual Financial Statements - March 31, 2020
The accompanying notes are an integral part of these financial statements.
Other Price RiskAs at March 31, 2020 and 2019, the Fund was invested in U.S. equities and therefore was sensitive to changes in general economic conditions in United States.
As at March 31, 2020, had the equities in the investment portfolio increased or decreased by 10% (March 31, 2019 - 10%), with all other variables held constant, net assets attributable to holders of redeemable units of the Fund would have increased or decreased, respectively, by approximately $4,254,000 (March 31, 2019 - $4,798,000). In practice, actual results may differ from this analysis and the difference may be material.
Currency RiskThe table below summarizes the Fund’s exposure to currency risk.
as at March 31, 2020~
Currency
Financial Instruments Exposure Derivatives
Net Exposure
Net Assets
(%)(in $000’s) (in $000’s) (in $000’s)Canadian Dollars 2,392 - 2,392 1.2 Japanese Yen 10,646 - 10,646 5.2 Euro 66 - 66 0.0 Total 13,104 - 13,104 6.4
~Includes monetary and non-monetary instruments.
As at March 31, 2020, had the U.S. dollar strengthened or weakened by 10% in relation to all other foreign currencies held in the Fund, with all other variables held constant, net assets attributable to holders of redeemable units of the Fund would have decreased or increased, respectively, by approximately $1,310,000. In practice, actual results may differ from this analysis and the difference may be material.
As at March 31, 2019, the Fund’s investments were denominated in U.S. dollars, the functional currency of the Fund. As a result, the Fund had no significant exposure to currency risk.
Interest Rate RiskThe tables below summarize the Fund’s exposure to interest rate risk, categorized by the contractual maturity date.
as at March 31, 2020
Less than1 Year
1 - 3Years
3 - 5Years
Greaterthan
5 Years Total
(in $000’s) (in $000’s) (in $000’s) (in $000’s) (in $000’s)Interest Rate Exposure 94 9,628 13,848 105,289 128,859
as at March 31, 2019
Less than1 Year
1 - 3Years
3 - 5Years
Greaterthan
5 Years Total
(in $000’s) (in $000’s) (in $000’s) (in $000’s) (in $000’s)Interest Rate Exposure 15,111 10,159 16,853 96,606 138,729
As at March 31, 2020, had the prevailing interest rates increased or decreased by 0.25% (March 31, 2019 - 0.25%), with all other variables held constant, net assets attributable to holders of redeemable units of the Fund would have decreased or increased, respectively, by approximately $1,922,000 (March 31, 2019 - $2,438,000). In practice, actual results may differ from this analysis and the difference may be material.
Financial Instruments Risks (Note 10)
Concentration RiskFor Concentration Risk as at March 31, 2020, refer to the Schedule of Investment Portfolio.
The Fund’s investments were concentrated in the following segments:
as at March 31, 2019 Categories Net Assets (%)Corporate Bonds 34.7 Foreign Government Bonds 31.9 Exchange-Traded Fund(s) 13.0 Common Equities 11.7 Other Net Assets (Liabilities) 7.8 Preferred Shares 0.5 REITS 0.4 Warrants 0.0 Foreign Currency Forward Contract(s) 0.0
Credit RiskThe Fund was invested in fixed income securities, preferred securities and derivative instruments, if any, with the following credit ratings, as per the tables below.
as at March 31, 2020Credit Rating^* Net Assets (%)AAA/Aaa/A++ 28.7 AA/Aa/A+ 0.5 A 4.4 BBB/Baa/B++ 8.5 BB/Ba/B+ 4.3 B 2.6 CCC/Caa/C++ 0.5 Not Rated 13.5 Total 63.0
as at March 31, 2019 Credit Rating^* Net Assets (%)AAA/Aaa/A++ 29.6 AA/Aa/A+ 0.3 A 4.6 BBB/Baa/B++ 9.0 BB/Ba/B+ 5.8 B 3.8 CCC/Caa/C++ 0.6 Not Rated 13.4 Total 67.1
^Credit ratings are obtained from S&P Global Ratings, where available, otherwise ratings are obtained from: Moody’s
Investors Service or Dominion Bond Rating Service, respectively.
*Refer to Note 10 for Credit Rating Chart reference.
Fund Specific Notes to Financial Statements (Expressed in US$)

CI U.S. Income US$ Pool
– 192 –Annual Financial Statements - March 31, 2020
The accompanying notes are an integral part of these financial statements.
Fund Specific Notes to Financial Statements (Expressed in US$)
Level 3 ReconciliationThe tables below summarize the movement in financial instruments classified as Level 3.
for the year ended March 31, 2020 Balance at
Mar. 31, 2019 Purchases SalesTransfers
InTransfers
(Out)Realized Gain
(Loss)Unrealized Gain
(Loss)*Balance at
Mar. 31, 2020(in $000’s) (in $000’s) (in $000’s) (in $000’s) (in $000’s) (in $000’s) (in $000’s) (in $000’s)
Long Positions/Assets:Equities 56 - - - - - - 56 Bonds 204 - - - - - (5) 199 Total 260 - - - - - (5) 255
*Change in unrealized gain (loss) related to investments held at March 31, 2020 was ($5,343).
for the year ended March 31, 2019 Balance at
Mar. 31, 2018 Purchases SalesTransfers
InTransfers
(Out)Realized Gain
(Loss)Unrealized Gain
(Loss)**Balance at
Mar. 31, 2019(in $000’s) (in $000’s) (in $000’s) (in $000’s) (in $000’s) (in $000’s) (in $000’s) (in $000’s)
Long Positions/Assets:Equities 44 95 (9) - (104) 4 26 56 Bonds 342 - - - (18) (5) (115) 204 Total 386 95 (9) - (122) (1) (89) 260
**Change in unrealized gain (loss) related to investments held at March 31, 2019 was ($4,917).
During the year ended March 31, 2019, investments with a fair value of $122,000 were transferred out of Level 3 into Level 2 as observable market inputs became available for these investments.
Investments classified as Level 3 are valued at fair value based on unobservable inputs and assumptions, which may include credit spreads, industry multipliers, and discount rates. Management has assessed that the effect of changing these inputs to reasonably possible alternatives would not have a significant impact on the net assets attributable to holders of redeemable units of the Fund as at March 31, 2020 and 2019.
Fair Value Hierarchy (cont’d)
Long Positions at fair value as at March 31, 2019Level 1 Level 2 Level 3 Total
(in $000’s) (in $000’s) (in $000’s) (in $000’s)Equities 23,321 163 56 23,540 Bonds - 124,492 204 124,696 Exchange-Traded fund(s) 24,436 - - 24,436 Warrants - 5 - 5 Total 47,757 124,660 260 172,677
There were no transfers between Level 1 and 2 and Level 1 and 3 during the year ended March 31, 2019.
Fair Value Hierarchy
The tables below summarize the inputs used by the Fund in valuing the Fund’s investments and derivatives carried at fair value.
Long Positions at fair value as at March 31, 2020Level 1 Level 2 Level 3 Total
(in $000’s) (in $000’s) (in $000’s) (in $000’s)Equities 18,960 1,067 56 20,083 Bonds - 101,869 199 102,068 Asset-backed securities - 26,791 - 26,791 Exchange-Traded Fund(s) 22,454 - - 22,454 Warrants - 3 - 3 Total 41,414 129,730 255 171,399
There were no transfers between Level 1, 2 and 3 during the year ended March 31, 2020.

CI US Money Market Fund
– 193 –Annual Financial Statements - March 31, 2020
Statements of Financial Position as at March 31(in $000’s except for per unit amounts and units outstanding)
2020 2019
12,428 21,319 8,186 3,796
- - - - - - - - - - - - 81 123 - - - - - - 77 364 20,772 25,602
- - - -
- - - - - - - - - - - - 1 110 2 5 - - - - - - 3 115
20,769 25,487
Statements of Financial Position (cont’d)as at March 31(in $000’s except for per unit amounts and units outstanding)
Net assets attributable to holders of redeemable units
per class (Note 4):
Net assets attributable to holders of redeemable
units per unit: Number of redeemable
units outstanding:
2020 2019 2020 2019 2020 2019Class A 9,689 3,168 10.00 10.00 968,975 316,529Class A1 - 2,418 - 10.00 - 241,824Class A3 - 546 - 10.00 - 54,629Class A4 - 77 - 10.00 - 7,744Class A5 - 11 - 10.00 - 1,075Class F 268 10 10.00 10.00 26,773 1,023Class F1 - 197 - 10.00 - 19,729Class F3 - 10 - 10.00 - 1,025Class F4 - 10 - 10.00 - 1,026Class F5 - 10 - 10.00 - 1,027Class I 10,796 19,008 10.00 10.00 1,079,594 1,900,803Class P 16 22 10.00 10.00 1,568 2,243
AssetsCurrent assetsInvestmentsCashUnrealized gain on futures and foreign currency forward contractsSwaps, swaptions and optionsDaily variation margin on derivative instrumentsFees rebate receivableCollateral on deposit for short saleDividends receivableInterest receivableReceivable for distribution from investmentsSecurities lending revenue receivable (Note 6)Receivable for investments soldReceivable for unit subscriptions
LiabilitiesCurrent liabilitiesInvestments sold shortBank overdraftUnrealized loss on futures and foreign currency forward contractsSwaps, swaptions and options Dividends payable on investments sold shortInterest payable on investments sold shortDaily variation margin on derivative instrumentsPayable for investments purchasedPayable for unit redemptionsDistributions payable to holders of redeemable units Management fees payableAdministration fees payableAccounts payable and accrued liabilities
Net assets attributable to holders of redeemable units
The accompanying notes are an integral part of these financial statements.
Financial Statements (Expressed in US$)
CIG - 125

CI US Money Market Fund
– 194 –Annual Financial Statements - March 31, 2020
Statements of Comprehensive Incomefor the years ended March 31(in $000’s except for per unit amounts and number of units)
2020 2019
- - 529 784 - - - - - -
- - - -
(6) 5
6 (5) 529 784 - - - - - - 18 - 18 - 547 784
67 59 - - 1 - - - - - - - - - - - - - 6 6 74 65 (19) (15) 492 734
The accompanying notes are an integral part of these financial statements.
Financial Statements (Expressed in US$)
Statements of Comprehensive Income (cont’d)for the years ended March 31(in $000’s except for per unit amounts and number of units)
Increase (decrease) in net assets attributable to
holders of redeemable units per class:
Increase (decrease) in net assets attributable to
holders of redeemable units per unit:
Weighted average number of units:
2020 2019 2020 2019 2020 2019Class A 99 70 0.17 0.15 587,822 449,708Class A1 17 33 0.07 0.18 235,497 171,074Class A3 5 11 0.07 0.18 69,488 58,394Class A4 1 2 0.07 0.18 8,012 9,070Class A5 - - 0.07 0.19 1,076 1,040Class F 4 - 0.17 0.14 22,130 2,842Class F1 2 3 0.07 0.19 31,497 16,723Class F3 - - 0.07 0.22 1,020 1,140Class F4 - 1 0.07 0.19 1,029 3,731Class F5 - - 0.07 0.19 1,030 1,016Class I 363 614 0.23 0.23 1,559,967 2,652,360Class P 1 - 0.24 0.24 1,928 1,232
Income Net gain (loss) on investments and derivatives Dividends Interest for distribution purposes Income distributions from investments Capital gain distributions from investments Derivative income (loss) Dividends expense on financial assets (liabilities) sold
short Interest expense on financial assets (liabilities) sold short Net realized gain (loss) on sale of investments and
derivatives Change in unrealized appreciation (depreciation) in value
of investments and derivativesTotal net gain (loss) on investments and derivativesOther income Foreign exchange gain (loss) on cash Commitment fee income Securities lending revenue (Note 6) Fees rebateTotal other incomeTotal incomeExpensesManagement fees (Note 5)Administration fees (Note 5)Commissions and other portfolio transaction costsIndependent review committee feesSecurities borrowing fees (Note 2)Margin feesService feesInterest expenseWithholding taxesHarmonized sales taxTotal expensesExpenses absorbed by the Manager (Note 5)Increase (decrease) in net assets attributable to holders of redeemable units

CI US Money Market Fund
– 195 –Annual Financial Statements - March 31, 2020
Statements of Changes in Net Assets Attributable to Holders of Redeemable Unitsfor the years ended March 31 (in $000’s)
Net assets attributable to holders of redeemable units at the beginning of yearIncrease (decrease) in net assets attributable to holders of redeemable unitsDistributions to holders of redeemable units From net investment income From net realized gains Return of capitalTotal distributions to holders of redeemable units
Redeemable unit transactions Proceeds from redeemable units issued Reinvestment of distributions to holders of redeemable units Redemption of redeemable unitsNet increase (decrease) from redeemable unit transactionsNet increase (decrease) in net assets attributable to holders of redeemable unitsNet assets attributable to holders of redeemable units at the end of year
Net assets attributable to holders of redeemable units at the beginning of yearIncrease (decrease) in net assets attributable to holders of redeemable unitsDistributions to holders of redeemable units From net investment income From net realized gains Return of capitalTotal distributions to holders of redeemable units
Redeemable unit transactions Proceeds from redeemable units issued Reinvestment of distributions to holders of redeemable units Redemption of redeemable unitsNet increase (decrease) from redeemable unit transactionsNet increase (decrease) in net assets attributable to holders of redeemable unitsNet assets attributable to holders of redeemable units at the end of year
Net assets attributable to holders of redeemable units at the beginning of yearIncrease (decrease) in net assets attributable to holders of redeemable unitsDistributions to holders of redeemable units From net investment income From net realized gains Return of capitalTotal distributions to holders of redeemable units
Redeemable unit transactions Proceeds from redeemable units issued Reinvestment of distributions to holders of redeemable units Redemption of redeemable unitsNet increase (decrease) from redeemable unit transactionsNet increase (decrease) in net assets attributable to holders of redeemable unitsNet assets attributable to holders of redeemable units at the end of year
The accompanying notes are an integral part of these financial statements.
Financial Statements (Expressed in US$)
Class A 2020 2019 3,168 5,807 99 70
(81) (70) - - - - (81) (70)
21,037 5,249 76 67 (14,610) (7,955) 6,503 (2,639) 6,521 (2,639) 9,689 3,168
Class A1 2020 2019 2,418 1,569 17 33
(17) (32) - - - - (17) (32)
825 2,950 17 31 (3,260) (2,133) (2,418) 848 (2,418) 849 - 2,418
Class A3 2020 2019 546 594 5 11
(5) (11) - - - - (5) (11)
740 1,066 5 10 (1,291) (1,124) (546) (48) (546) (48) - 546
Class A4 2020 2019 77 202 1 2
(1) (2) - - - - (1) (2)
4 329 1 2 (82) (456) (77) (125) (77) (125) - 77
Class A5 2020 2019 11 11 - -
- - - - - - - -
- - - - (11) - (11) - (11) - - 11
Class F 2020 2019 10 10 4 -
(3) - - - - - (3) -
1,749 1,590 3 - (1,495) (1,590) 257 - 258 - 268 10
Class F1 2020 2019 197 185 2 3
(2) (3) - - - - (2) (3)
306 336 2 3 (505) (327) (197) 12 (197) 12 - 197
Class F3 2020 2019 10 10 - -
- - - - - - - -
- 367 - - (10) (367) (10) - (10) - - 10
Class F4 2020 2019 10 10 - 1
- (1) - - - - - (1)
- 157 - 1 (10) (158) (10) - (10) - - 10
Class F5 2020 2019 10 10 - -
- - - - - - - -
- - - - (10) - (10) - (10) - - 10
Class I 2020 2019 19,008 43,367 363 614
(363) (614) - - - - (363) (614)
11,296 22,599 343 583 (19,851) (47,541) (8,212) (24,359) (8,212) (24,359) 10,796 19,008
Class P 2020 2019 22 10 1 -
- - - - - - - -
11 12 - - (18) - (7) 12 (6) 12 16 22

CI US Money Market Fund
– 196 –Annual Financial Statements - March 31, 2020
The accompanying notes are an integral part of these financial statements.
Financial Statements (Expressed in US$)
Statements of Changes in Net Assets Attributable to Holders of Redeemable Units (cont’d)for the years ended March 31 (in $000’s)
Net assets attributable to holders of redeemable units at the beginning of yearIncrease (decrease) in net assets attributable to holders of redeemable unitsDistributions to holders of redeemable units From net investment income From net realized gains Return of capitalTotal distributions to holders of redeemable units
Redeemable unit transactions Proceeds from redeemable units issued Reinvestment of distributions to holders of redeemable units Redemption of redeemable unitsNet increase (decrease) from redeemable unit transactionsNet increase (decrease) in net assets attributable to holders of redeemable unitsNet assets attributable to holders of redeemable units at the end of year
Total Fund 2020 2019 25,487 51,785 492 734
(472) (733) - - - - (472) (733)
35,968 34,655 447 697 (41,153) (61,651) (4,738) (26,299) (4,718) (26,298) 20,769 25,487

CI US Money Market Fund
– 197 –Annual Financial Statements - March 31, 2020
Statements of Cash Flowsfor the years ended March 31 (in $000’s)
2020 2019
492 734
6 (5) - - 1 -
(6) 5 69,359 116,424 (60,469) (101,617) - - - - - - - - 42 17 - - - - - - - - 9,425 15,558
(28) (38) 31,170 29,646 (36,177) (56,944) (5,035) (27,336)
- - 4,390 (11,778) 3,796 15,574 8,186 3,796
- - 571 801 - - - - - -
*Dividends and interest received as well as dividends and interest paid relate to operating activities of the Fund. The accompanying notes are an integral part of these financial statements.
Financial Statements (Expressed in US$)
Cash flows from (used in) operating activitiesIncrease (decrease) in net assets attributable to holders of redeemable unitsAdjustments for: Net realized (gain) loss on sale of investments and derivatives Unrealized foreign exchange (gain) loss on cash Commissions and other portfolio transaction costs Change in unrealized (appreciation) depreciation in value of
investments and derivatives Proceeds from sale and maturity of investments and derivatives Purchase of investments and derivatives (Increase) decrease in collateral on deposit for short sale Non-cash distributions from investments Change in daily variation margin (Increase) decrease in dividends receivable (Increase) decrease in interest receivable (Increase) decrease in securities lending revenue receivable Increase (decrease) in management fees payable Increase (decrease) in administration fees payable Change in other accounts receivable and payableNet cash from (used in) operating activities
Cash flows from (used in) financing activitiesDistributions paid to holders of redeemable units, net of reinvested distributionsProceeds from issuance of redeemable unitsAmounts paid on redemption of redeemable unitsNet cash from (used in) financing activities Unrealized foreign exchange gain (loss) on cashNet increase (decrease) in cashCash (bank overdraft), beginning of yearCash (bank overdraft), end of year
Supplementary Information:Dividends received, net of withholding tax*Interest received, net of withholding tax*Dividends paid*Interest paid*Tax recoverable (paid)
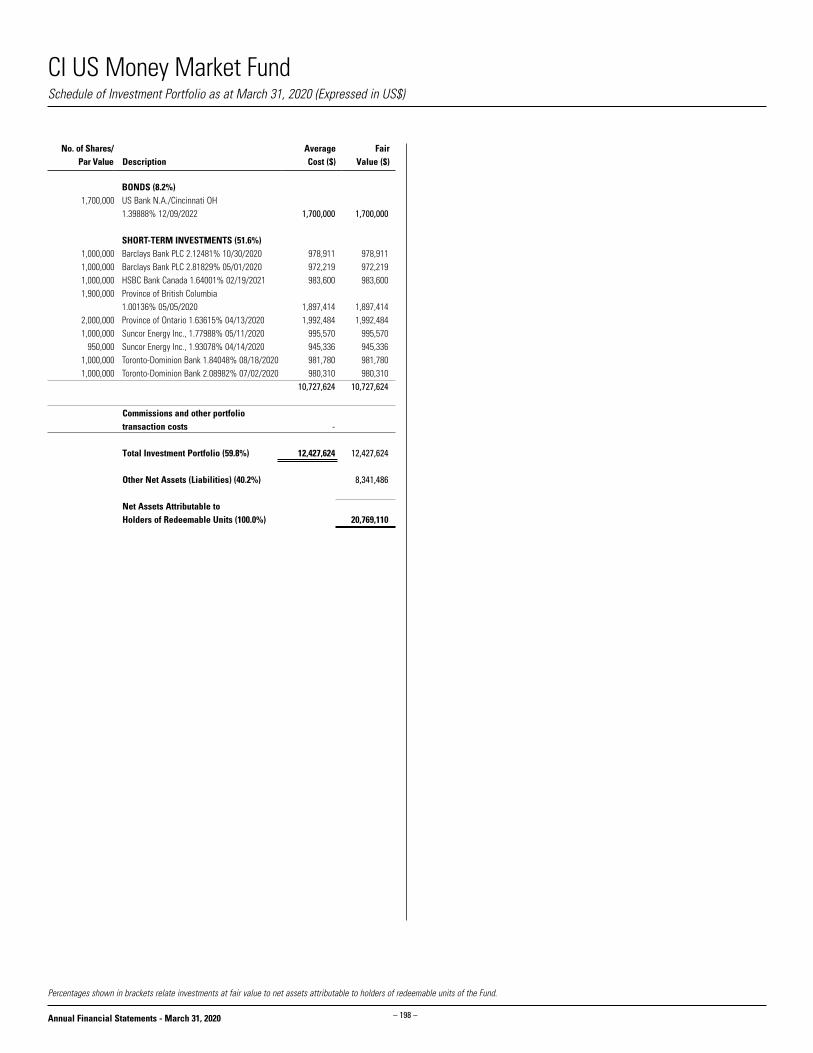
CI US Money Market Fund
– 198 –Annual Financial Statements - March 31, 2020
BONDS (8.2%) 1,700,000 US Bank N.A./Cincinnati OH 1.39888% 12/09/2022 1,700,000 1,700,000
SHORT-TERM INVESTMENTS (51.6%) 1,000,000 Barclays Bank PLC 2.12481% 10/30/2020 978,911 978,911 1,000,000 Barclays Bank PLC 2.81829% 05/01/2020 972,219 972,219 1,000,000 HSBC Bank Canada 1.64001% 02/19/2021 983,600 983,600 1,900,000 Province of British Columbia 1.00136% 05/05/2020 1,897,414 1,897,414 2,000,000 Province of Ontario 1.63615% 04/13/2020 1,992,484 1,992,484 1,000,000 Suncor Energy Inc., 1.77988% 05/11/2020 995,570 995,570 950,000 Suncor Energy Inc., 1.93078% 04/14/2020 945,336 945,336 1,000,000 Toronto-Dominion Bank 1.84048% 08/18/2020 981,780 981,780 1,000,000 Toronto-Dominion Bank 2.08982% 07/02/2020 980,310 980,310 10,727,624 10,727,624
Commissions and other portfolio transaction costs -
Total Investment Portfolio (59.8%) 12,427,624 12,427,624 Other Net Assets (Liabilities) (40.2%) 8,341,486 Net Assets Attributable to Holders of Redeemable Units (100.0%) 20,769,110
Percentages shown in brackets relate investments at fair value to net assets attributable to holders of redeemable units of the Fund.
Schedule of Investment Portfolio as at March 31, 2020 (Expressed in US$)
No. of Shares/Par Value Description
AverageCost ($)
FairValue ($)

CI US Money Market Fund
– 199 –Annual Financial Statements - March 31, 2020
Redeemable Unit Transactions (Note 4)for the years ended March 31
Number of redeemable units at the beginning of yearRedeemable units issued for cashRedeemable units issued for reinvested distributionsRedeemable units redeemedNumber of redeemable units at the end of year
Number of redeemable units at the beginning of yearRedeemable units issued for cashRedeemable units issued for reinvested distributionsRedeemable units redeemedNumber of redeemable units at the end of year
Number of redeemable units at the beginning of yearRedeemable units issued for cashRedeemable units issued for reinvested distributionsRedeemable units redeemedNumber of redeemable units at the end of year
Fund Specific Notes to Financial Statements (Expressed in US$)
†A portion of brokerage commissions paid was used to cover research and market data services, termed soft dollar commissions. This amount has been estimated by the Manager of the Fund.The accompanying notes are an integral part of these financial statements.
Commissions (Note 2)for the years ended March 31 (in $000’s)
2020 2019Brokerage commissions - -Soft dollar commissions† - -
Class A 2020 2019 316,529 580,642 2,105,576 524,884 7,717 6,571 (1,460,847) (795,568) 968,975 316,529
Class A1 2020 2019 241,824 156,856 82,487 295,054 1,659 3,158 (325,970) (213,244) - 241,824
Class A3 2020 2019 54,629 59,436 73,983 106,621 494 1,013 (129,106) (112,441) - 54,629
Class A4 2020 2019 7,744 20,238 350 32,881 57 162 (8,151) (45,537) - 7,744
Class A5 2020 2019 1,075 1,055 49 49 8 19 (1,132) (48) - 1,075
Class F 2020 2019 1,023 1,005 174,937 159,016 310 38 (149,497) (159,036) 26,773 1,023
Class F1 2020 2019 19,729 18,543 30,585 33,562 220 311 (50,534) (32,687) - 19,729
Class F3 2020 2019 1,025 1,007 - 36,731 8 25 (1,033) (36,738) - 1,025
Class F4 2020 2019 1,026 1,007 - 15,720 7 71 (1,033) (15,772) - 1,026
Class F5 2020 2019 1,027 1,008 - - 7 19 (1,034) - - 1,027
Class I 2020 2019 1,900,803 4,336,662 1,129,577 2,259,908 34,301 58,278 (1,985,087) (4,754,045) 1,079,594 1,900,803
Class P 2020 2019 2,243 1,012 1,091 1,203 45 30 (1,811) (2) 1,568 2,243

CI US Money Market Fund
– 200 –Annual Financial Statements - March 31, 2020
The accompanying notes are an integral part of these financial statements.
Fund Specific Notes to Financial Statements (Expressed in US$)
Management and Administration Fees (Note 5) as at March 31, 2020 (%)
Annual management
fee rate:
Annual administration
fee rate:
Class A 1.000 NilClass A1^ 0.550 NilClass A3^ 0.525 NilClass A4^ 0.500 NilClass A5^ 0.450 NilClass F 0.750 NilClass F1^ 0.550 NilClass F3^ 0.525 NilClass F4^ 0.500 NilClass F5^ 0.450 NilClass I Paid directly by investor NilClass P Paid directly by investor Nil
^Effective after the close of business on August 2, 2019, the classes of the Fund that were eligible for CI Preferred
Pricing Program (CIPP) transitioned from a tiered pricing model to a fee distribution model. Please refer to most
recent simplified prospectus for further details.
Securities Lending (Note 6)as at March 31 (in $000’s)
2020 2019Loaned - -Collateral (non-cash) - -
Securities Lending Revenue Reconciliation (Note 6)for the years ended March 31 (in $000’s)
2020 2019Gross securities lending revenue - -Charges - -Securities lending revenue - -% of gross securities lending revenue - -
Loss Carry Forwards (Note 7)as at March 31 (in $000’s)
2020Capital loss carried forward: 24,413Non-capital losses expiring:2029 -2030 -2031 -2032 -2033 -2034 -2035 -2036 -2037 -2038 -2039 -Total -
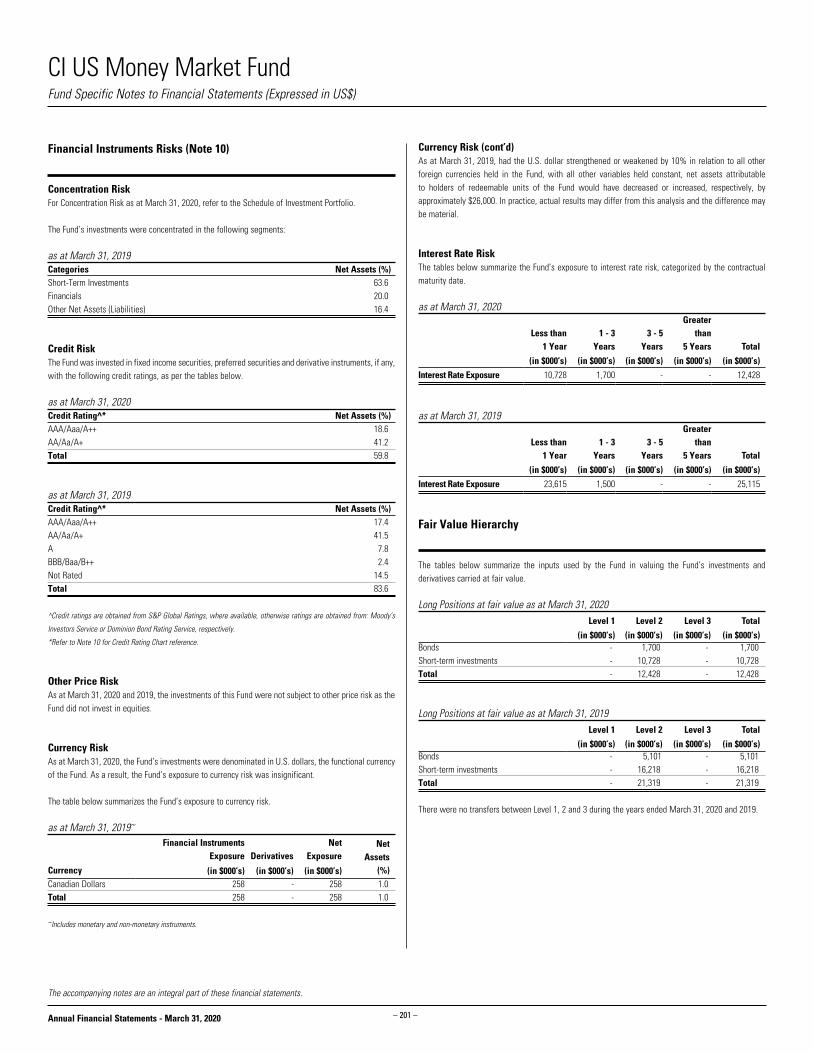
CI US Money Market Fund
– 201 –Annual Financial Statements - March 31, 2020
The accompanying notes are an integral part of these financial statements.
Fund Specific Notes to Financial Statements (Expressed in US$)
Financial Instruments Risks (Note 10)
Concentration RiskFor Concentration Risk as at March 31, 2020, refer to the Schedule of Investment Portfolio.
The Fund’s investments were concentrated in the following segments:
as at March 31, 2019 Categories Net Assets (%)Short-Term Investments 63.6 Financials 20.0 Other Net Assets (Liabilities) 16.4
Credit RiskThe Fund was invested in fixed income securities, preferred securities and derivative instruments, if any, with the following credit ratings, as per the tables below.
as at March 31, 2020 Credit Rating^* Net Assets (%)AAA/Aaa/A++ 18.6 AA/Aa/A+ 41.2 Total 59.8
as at March 31, 2019 Credit Rating^* Net Assets (%)AAA/Aaa/A++ 17.4 AA/Aa/A+ 41.5 A 7.8 BBB/Baa/B++ 2.4 Not Rated 14.5 Total 83.6
^Credit ratings are obtained from S&P Global Ratings, where available, otherwise ratings are obtained from: Moody’s
Investors Service or Dominion Bond Rating Service, respectively.
*Refer to Note 10 for Credit Rating Chart reference.
Other Price Risk As at March 31, 2020 and 2019, the investments of this Fund were not subject to other price risk as the Fund did not invest in equities.
Currency RiskAs at March 31, 2020, the Fund’s investments were denominated in U.S. dollars, the functional currency of the Fund. As a result, the Fund’s exposure to currency risk was insignificant.
The table below summarizes the Fund’s exposure to currency risk.
as at March 31, 2019~
Currency
Financial Instruments Exposure Derivatives
Net Exposure
Net Assets
(%)(in $000’s) (in $000’s) (in $000’s)Canadian Dollars 258 - 258 1.0 Total 258 - 258 1.0
~Includes monetary and non-monetary instruments.
Currency Risk (cont’d)As at March 31, 2019, had the U.S. dollar strengthened or weakened by 10% in relation to all other foreign currencies held in the Fund, with all other variables held constant, net assets attributable to holders of redeemable units of the Fund would have decreased or increased, respectively, by approximately $26,000. In practice, actual results may differ from this analysis and the difference may be material.
Interest Rate RiskThe tables below summarize the Fund’s exposure to interest rate risk, categorized by the contractual maturity date.
as at March 31, 2020
Less than1 Year
1 - 3Years
3 - 5Years
Greaterthan
5 Years Total
(in $000’s) (in $000’s) (in $000’s) (in $000’s) (in $000’s)Interest Rate Exposure 10,728 1,700 - - 12,428
as at March 31, 2019
Less than1 Year
1 - 3Years
3 - 5Years
Greaterthan
5 Years Total
(in $000’s) (in $000’s) (in $000’s) (in $000’s) (in $000’s)Interest Rate Exposure 23,615 1,500 - - 25,115
Fair Value Hierarchy
The tables below summarize the inputs used by the Fund in valuing the Fund’s investments and derivatives carried at fair value.
Long Positions at fair value as at March 31, 2020Level 1 Level 2 Level 3 Total
(in $000’s) (in $000’s) (in $000’s) (in $000’s)Bonds - 1,700 - 1,700 Short-term investments - 10,728 - 10,728 Total - 12,428 - 12,428
Long Positions at fair value as at March 31, 2019Level 1 Level 2 Level 3 Total
(in $000’s) (in $000’s) (in $000’s) (in $000’s)Bonds - 5,101 - 5,101 Short-term investments - 16,218 - 16,218 Total - 21,319 - 21,319
There were no transfers between Level 1, 2 and 3 during the years ended March 31, 2020 and 2019.

Marret Short Duration High Yield Fund
– 202 –Annual Financial Statements - March 31, 2020
Statements of Financial Position as at March 31(in $000’s except for per unit amounts and units outstanding)
2020 2019
3,430 6,523 300 583
3 1 - - - - - - - - - - 47 81 - - - - 116 33 - 20 3,896 7,241
- - - -
77 80 - - - - - - - - 47 434 - 8 - - - - - - - - 124 522
3,772 6,719
Statements of Financial Position (cont’d)as at March 31(in $000’s except for per unit amounts and units outstanding)
Net assets attributable to holders of redeemable units
per class (Note 4):
Net assets attributable to holders of redeemable
units per unit: Number of redeemable
units outstanding:
2020 2019 2020 2019 2020 2019Class A 2,766 2,014 8.94 9.21 309,158 218,765Class A1 - 902 - 9.61 - 93,867Class A2 - 271 - 9.61 - 28,253Class A3 - 2,094 - 9.62 - 217,734Class E 369 549 8.93 9.20 41,313 59,612Class EF 11 11 9.06 9.34 1,243 1,197Class F 397 295 8.90 9.18 44,652 32,099Class F1 - 337 - 9.61 - 35,088Class F2 - 110 - 9.62 - 11,476Class I 155 1 8.82 9.11 17,625 110Class O 53 123 8.91 9.20 5,967 13,363Class P 11 12 9.35 9.63 1,160 1,239Class W 10 - 9.76 - 1,022 -
AssetsCurrent assetsInvestmentsCashUnrealized gain on futures and foreign currency forward contractsSwaps, swaptions and optionsDaily variation margin on derivative instrumentsFees rebate receivableCollateral on deposit for short saleDividends receivableInterest receivableReceivable for distribution from investmentsSecurities lending revenue receivable (Note 6)Receivable for investments soldReceivable for unit subscriptions
LiabilitiesCurrent liabilitiesInvestments sold shortBank overdraftUnrealized loss on futures and foreign currency forward contractsSwaps, swaptions and options Dividends payable on investments sold shortInterest payable on investments sold shortDaily variation margin on derivative instrumentsPayable for investments purchasedPayable for unit redemptionsDistributions payable to holders of redeemable units Management fees payableAdministration fees payableAccounts payable and accrued liabilities
Net assets attributable to holders of redeemable units
The accompanying notes are an integral part of these financial statements.
Financial Statements
CIG - 2631

Marret Short Duration High Yield Fund
– 203 –Annual Financial Statements - March 31, 2020
Statements of Comprehensive Incomefor the years ended March 31(in $000’s except for per unit amounts and number of units)
2020 2019
- - 226 2,885 - - - - - -
- - - -
(89) (1,336)
(53) 501 84 2,050 16 (133) - - - 1 2 - 18 (132) 102 1,918
60 54 10 9 2 1 - - 12 12 - - - - - - - - 8 7 92 83
10 1,835
The accompanying notes are an integral part of these financial statements.
Financial Statements
Statements of Comprehensive Income (cont’d)for the years ended March 31(in $000’s except for per unit amounts and number of units)
Increase (decrease) in net assets attributable to
holders of redeemable units per class:
Increase (decrease) in net assets attributable to
holders of redeemable units per unit:
Weighted average number of units:
2020 2019 2020 2019 2020 2019Class A (6) 52 (0.01) 0.31 323,532 167,419Class A1 3 18 0.03 0.36 97,370 48,478Class A2 1 6 0.03 0.33 32,079 19,689Class A3 9 41 0.06 0.27 145,855 151,134Class E (2) 17 (0.03) 0.31 52,568 51,841Class EF - - 0.06 0.36 1,218 1,162Class F 4 9 0.09 0.32 50,302 28,567Class F1 1 8 0.07 0.37 20,653 23,176Class F2 1 2 0.03 0.39 25,010 6,981Class I (2) 1,678 (0.67) 0.33 3,580 5,038,181Class O 1 3 0.17 0.52 8,114 5,642Class P - 1 0.13 0.43 1,174 1,107Class W - - (0.03) - 1,010 -
Income Net gain (loss) on investments and derivatives Dividends Interest for distribution purposes Income distributions from investments Capital gain distributions from investments Derivative income (loss) Dividends expense on financial assets (liabilities) sold
short Interest expense on financial assets (liabilities) sold short Net realized gain (loss) on sale of investments and
derivatives Change in unrealized appreciation (depreciation) in value
of investments and derivativesTotal net gain (loss) on investments and derivativesOther income Foreign exchange gain (loss) on cash Commitment fee income Securities lending revenue (Note 6) Fees rebateTotal other incomeTotal incomeExpensesManagement fees (Note 5)Administration fees (Note 5)Commissions and other portfolio transaction costsIndependent review committee feesSecurities borrowing fees (Note 2)Margin feesService feesInterest expenseWithholding taxesHarmonized sales taxTotal expensesIncrease (decrease) in net assets attributable to holders of redeemable units

Marret Short Duration High Yield Fund
– 204 –Annual Financial Statements - March 31, 2020
Statements of Changes in Net Assets Attributable to Holders of Redeemable Unitsfor the years ended March 31 (in $000’s)
Net assets attributable to holders of redeemable units at the beginning of yearIncrease (decrease) in net assets attributable to holders of redeemable unitsDistributions to holders of redeemable units From net investment income From net realized gains Return of capitalTotal distributions to holders of redeemable units
Redeemable unit transactions Proceeds from redeemable units issued Reinvestment of distributions to holders of redeemable units Redemption of redeemable unitsNet increase (decrease) from redeemable unit transactionsNet increase (decrease) in net assets attributable to holders of redeemable unitsNet assets attributable to holders of redeemable units at the end of year
Net assets attributable to holders of redeemable units at the beginning of yearIncrease (decrease) in net assets attributable to holders of redeemable unitsDistributions to holders of redeemable units From net investment income From net realized gains Return of capitalTotal distributions to holders of redeemable units
Redeemable unit transactions Proceeds from redeemable units issued Reinvestment of distributions to holders of redeemable units Redemption of redeemable unitsNet increase (decrease) from redeemable unit transactionsNet increase (decrease) in net assets attributable to holders of redeemable unitsNet assets attributable to holders of redeemable units at the end of year
Net assets attributable to holders of redeemable units at the beginning of yearIncrease (decrease) in net assets attributable to holders of redeemable unitsDistributions to holders of redeemable units From net investment income From net realized gains Return of capitalTotal distributions to holders of redeemable units
Redeemable unit transactions Proceeds from redeemable units issued Reinvestment of distributions to holders of redeemable units Redemption of redeemable unitsNet increase (decrease) from redeemable unit transactionsNet increase (decrease) in net assets attributable to holders of redeemable unitsNet assets attributable to holders of redeemable units at the end of year
The accompanying notes are an integral part of these financial statements.
Financial Statements
Class A 2020 2019 2,014 1,119 (6) 52
(78) (59) - (4) - - (78) (63)
2,964 3,872 77 61 (2,205) (3,027) 836 906 752 895 2,766 2,014
Class A1 2020 2019 902 268 3 18
(9) (21) - (2) - - (9) (23)
137 917 9 23 (1,042) (301) (896) 639 (902) 634 - 902
Class A2 2020 2019 271 257 1 6
(3) (7) - - - - (3) (7)
54 122 3 7 (326) (114) (269) 15 (271) 14 - 271
Class A3 2020 2019 2,094 16 9 41
(13) (75) - (6) - - (13) (81)
3 2,769 13 81 (2,106) (732) (2,090) 2,118 (2,094) 2,078 - 2,094
Class E 2020 2019 549 255 (2) 17
(14) (24) - (2) - - (14) (26)
202 535 14 25 (380) (257) (164) 303 (180) 294 369 549
Class EF 2020 2019 11 11 - -
- (1) - - - - - (1)
- - - 1 - - - 1 - - 11 11
Class F 2020 2019 295 205 4 9
(17) (12) - (1) - - (17) (13)
493 343 11 7 (389) (256) 115 94 102 90 397 295
Class F1 2020 2019 337 176 1 8
(2) (10) - (1) - - (2) (11)
4 171 2 11 (342) (18) (336) 164 (337) 161 - 337
Class F2 2020 2019 110 10 1 2
(3) (3) - - - - (3) (3)
173 98 3 3 (284) - (108) 101 (110) 100 - 110
Class I 2020 2019 1 60,657 (2) 1,678
(2) (2,810) - (25) - - (2) (2,835)
160 1 2 2,835 (4) (62,335) 158 (59,499) 154 (60,656) 155 1
Class O 2020 2019 123 12 1 3
(3) (4) - (1) - - (3) (5)
- 135 3 5 (71) (27) (68) 113 (70) 111 53 123
Class P 2020 2019 12 10 - 1
- (1) - - - - - (1)
- 1 - 1 (1) - (1) 2 (1) 2 11 12

Marret Short Duration High Yield Fund
– 205 –Annual Financial Statements - March 31, 2020
The accompanying notes are an integral part of these financial statements.
Financial Statements
Statements of Changes in Net Assets Attributable to Holders of Redeemable Units (cont’d)for the years ended March 31 (in $000’s)
Net assets attributable to holders of redeemable units at the beginning of yearIncrease (decrease) in net assets attributable to holders of redeemable unitsDistributions to holders of redeemable units From net investment income From net realized gains Return of capitalTotal distributions to holders of redeemable units
Redeemable unit transactions Proceeds from redeemable units issued Reinvestment of distributions to holders of redeemable units Redemption of redeemable unitsNet increase (decrease) from redeemable unit transactionsNet increase (decrease) in net assets attributable to holders of redeemable unitsNet assets attributable to holders of redeemable units at the end of year
Class W 2020 2019 - - - -
- - - - - - - -
10 - - - - - 10 - 10 - 10 -
Total Fund 2020 2019 6,719 62,996 10 1,835
(144) (3,027) - (42) - - (144) (3,069)
4,200 8,964 137 3,060 (7,150) (67,067) (2,813) (55,043) (2,947) (56,277) 3,772 6,719

Marret Short Duration High Yield Fund
– 206 –Annual Financial Statements - March 31, 2020
Statements of Cash Flowsfor the years ended March 31 (in $000’s)
2020 2019
10 1,835
89 1,336 (3) 2 2 1
53 (501) 20,093 197,262 (17,619) (142,657) - - - - - - - - 34 879 - - - - - - - - 2,659 58,157
(7) (9) 1,141 5,715 (4,079) (63,812) (2,945) (58,106)
3 (2) (286) 51 583 534 300 583
- - 260 3,764 - - - - - -
*Dividends and interest received as well as dividends and interest paid relate to operating activities of the Fund. The accompanying notes are an integral part of these financial statements.
Financial Statements
Cash flows from (used in) operating activitiesIncrease (decrease) in net assets attributable to holders of redeemable unitsAdjustments for: Net realized (gain) loss on sale of investments and derivatives Unrealized foreign exchange (gain) loss on cash Commissions and other portfolio transaction costs Change in unrealized (appreciation) depreciation in value of
investments and derivatives Proceeds from sale and maturity of investments and derivatives Purchase of investments and derivatives (Increase) decrease in collateral on deposit for short sale Non-cash distributions from investments Change in daily variation margin (Increase) decrease in dividends receivable (Increase) decrease in interest receivable (Increase) decrease in securities lending revenue receivable Increase (decrease) in management fees payable Increase (decrease) in administration fees payable Change in other accounts receivable and payableNet cash from (used in) operating activities
Cash flows from (used in) financing activitiesDistributions paid to holders of redeemable units, net of reinvested distributionsProceeds from issuance of redeemable unitsAmounts paid on redemption of redeemable unitsNet cash from (used in) financing activities Unrealized foreign exchange gain (loss) on cashNet increase (decrease) in cashCash (bank overdraft), beginning of yearCash (bank overdraft), end of year
Supplementary Information:Dividends received, net of withholding tax*Interest received, net of withholding tax*Dividends paid*Interest paid*Tax recoverable (paid)

Marret Short Duration High Yield Fund
– 207 –Annual Financial Statements - March 31, 2020
U.S.A. (69.9%) (cont’d) USD 5,000 Netflix Inc., 4.875% 06/15/2030 7,197 7,144 USD 35,000 Netflix Inc., 5.375% 02/01/2021 50,393 49,628 USD 15,000 Netflix Inc., 5.5% 02/15/2022 21,124 21,638 USD 30,000 Nielsen Finance LLC/Nielsen Finance Co., 4.5% 10/01/2020 40,654 40,955 USD 2,000 Oasis Petroleum Inc., 6.875% 03/15/2022 2,383 556 USD 3,000 Post Holdings Inc., 5% 08/15/2026 3,786 4,345 USD 5,000 Reynolds Group Issuer Inc./Reynolds Group Issuer LLC 5.125% 07/15/2023 6,763 6,967 USD 70,000 Reynolds Group Issuer Inc./Reynolds Group Issuer LLC 5.33125% 07/15/2021 95,379 96,055 USD 10,000 Service Corp. International 5.125% 06/01/2029 14,294 14,355 USD 30,000 Service Corp. International 5.375% 05/15/2024 41,655 42,961 USD 10,000 Six Flags Entertainment Corp., 4.875% 07/31/2024 13,558 11,928 USD 75,000 Sprint Spectrum Co., LLC/Sprint Spectrum Co., II LLC 3.36% 09/20/2021 100,240 105,027 USD 30,000 Symantec Corp., 4.2% 09/15/2020 38,404 41,778 USD 25,000 Tenet Healthcare Corp., 4.625% 07/15/2024 33,639 33,602 USD 15,000 Tenet Healthcare Corp., 4.625% 09/01/2024 20,573 20,220 USD 5,000 TerraForm Power Operating LLC 5% 01/31/2028 7,087 7,373 USD 50,000 T-Mobile USA Inc., 4% 04/15/2022 68,504 70,546 USD 40,000 T-Mobile USA Inc., 6% 03/01/2023 55,504 56,660 USD 15,000 T-Mobile USA Inc., 6.5% 01/15/2024 20,721 21,428 USD 10,000 United Rentals North America Inc., 3.875% 11/15/2027 12,680 13,300 USD 8,000 United Rentals North America Inc., 5.5% 07/15/2025 10,594 11,034 USD 135,000 Universal Health Services Inc., 4.75% 08/01/2022 181,222 188,931 USD 10,000 Vistra Operations Co., LLC 3.55% 07/15/2024 13,157 13,227 USD 10,000 W.R. Grace & Co., 5.125% 10/01/2021 13,795 14,215 USD 1,000 Whiting Petroleum Corp., 1.25% 04/01/2020 1,300 703 USD 6,000 Whiting Petroleum Corp., 5.75% 03/15/2021 4,693 567 USD 13,000 WPX Energy Inc., 4.5% 01/15/2030 14,983 9,935 USD 10,000 Yum! Brands Inc., 3.875% 11/01/2020 13,735 13,863 2,582,929 2,637,950 CANADA (19.2%) USD 15,000 1011778 BC ULC/New Red Finance Inc., 4.25% 05/15/2024 20,449 21,058 55,000 Air Canada 4.75% 10/06/2023 57,037 46,933 USD 5,000 Athabasca Oil Corp., 9.875% 02/24/2022 6,099 1,548 5,000 AutoCanada Inc., 8.75% 02/11/2025 4,951 4,850 USD 5,000 Bausch Health Co., Inc., 5.25% 01/30/2030 6,277 6,654 USD 33,000 Bombardier Inc., 5.75% 03/15/2022 44,886 35,181 USD 25,000 Bombardier Inc., 8.75% 12/01/2021 34,025 29,248 45,000 Canadian Natural Resources Ltd., 2.05% 06/01/2020 45,002 44,891 5,000 Canadian Tire Corp., Ltd., 2.646% 07/06/2020 5,011 5,005 20,000 Cascades Inc./Cascades USA Inc., 5.125% 01/15/2025 19,600 19,500 20,000 Enbridge Inc., 3.16% 03/11/2021 20,229 19,952 30,000 Ford Credit Canada Co., 2.45% 05/07/2020 29,931 29,904 40,000 Ford Credit Canada Co., 2.923% 09/16/2020 40,008 38,942 USD 45,000 GLF Environmental Inc., 5.625% 05/01/2022 60,926 63,887 10,000 Kruger Products L.P., 6% 04/24/2025 8,950 9,238 USD 5,000 MEG Energy Corp., 6.5% 01/15/2025 5,398 4,451
U.S.A. (69.9%) USD 60,000 Activision Blizzard Inc., 2.3% 09/15/2021 74,465 85,041 USD 75,000 AES Corp., 4% 03/15/2021 99,796 103,602 USD 15,000 Albertsons Co. Inc./Safeway Inc./ New Albertsons L.P., 3.5% 02/15/2023 19,595 20,784 USD 10,000 Albertsons Co. Inc./Safeway Inc./ New Albertsons L.P., 4.625% 01/15/2027 13,223 14,004 USD 10,000 Aleris International Inc., 10.75% 07/15/2023 14,056 14,213 USD 5,000 Allison Transmission Inc., 5% 10/01/2024 6,795 6,826 USD 5,000 Arconic Inc., 6.15% 08/15/2020 7,016 7,107 USD 15,000 Ball Corp., 5% 03/15/2022 21,035 21,322 USD 5,000 Berry Global Escrow Corp., 4.875% 07/15/2026 6,845 7,107 USD 150,000 Blue Cube Spinco Inc., 9.75% 10/15/2023 211,309 219,291 USD 15,000 Broadcom Corp./Broadcom Cayman Finance Ltd., 3.625% 01/15/2024 20,463 20,737 USD 10,000 CCO Holdings LLC/CCO Holdings Capital Corp., 4.5% 08/15/2030 13,463 13,793 USD 10,000 CCO Holdings LLC/CCO Holdings Capital Corp., 4.75% 03/01/2030 13,046 14,004 USD 135,000 CCO Holdings LLC/CCO Holdings Capital Corp., 5.25% 09/30/2022 183,893 186,674 USD 15,000 Cedar Fair L.P./Canada’s Wonderland Co./ Magnum Management Corp., 5.375% 06/01/2024 20,371 19,000 USD 5,000 Centene Corp., 4.75% 05/15/2022 6,766 7,072 USD 100,000 CenturyLink Inc., 5.625% 04/01/2020 133,564 140,740 USD 5,000 Charles River Laboratories International Inc., 5.5% 04/01/2026 6,989 7,202 USD 35,000 CommScope Finance LLC 5.5% 03/01/2024 46,869 49,850 USD 5,000 CommScope Finance LLC 6% 03/01/2026 6,578 7,026 USD 2,000 CommScope Inc., 5% 06/15/2021 2,682 2,787 USD 5,000 Dell EMC 2.65% 06/01/2020 6,603 6,997 USD 4,000 Denbury Resources Inc., 9% 05/15/2021 4,689 1,647 USD 5,000 Diamondback Energy Inc., 2.875% 12/01/2024 5,432 4,915 USD 80,000 DISH DBS Corp., 5.125% 05/01/2020 109,348 111,718 USD 5,000 Energen Corp., 4.625% 09/01/2021 6,789 6,794 USD 145,000 Equinix Inc., 5.875% 01/15/2026 205,862 208,230 USD 3,000 Freeport-McMoRan Inc., 3.55% 03/01/2022 3,716 4,055 USD 3,000 Genesis Energy L.P./Genesis Energy Finance Corp., 6% 05/15/2023 3,801 3,063 USD 5,000 GLP Capital L.P./GLP Financing II Inc., 4% 01/15/2030 5,289 5,418 USD 5,000 Hill-Rom Holdings Inc., 4.375% 09/15/2027 6,725 6,931 USD 5,000 Inception Merger Sub Inc./Rackspace Hosting Inc., 8.625% 11/15/2024 6,166 6,267 USD 10,000 Iron Mountain Inc., 4.375% 06/01/2021 13,737 13,933 USD 25,000 JBS USA LUX S.A./JBS USA Finance Inc., 5.875% 07/15/2024 34,269 35,625 USD 50,000 Kraft Heinz Foods Co., 2.55413% 08/10/2022 66,088 65,451 USD 1,000 Kraft Heinz Foods Co., 2.8% 07/02/2020 1,305 1,397 USD 3,000 Laredo Petroleum Inc., 9.5% 01/15/2025 2,900 1,689 USD 23,000 Lennar Corp., 2.95% 11/29/2020 30,540 31,561 USD 15,000 Lennar Corp., 4.125% 01/15/2022 19,257 20,953 USD 20,000 Lennar Corp., 6.625% 05/01/2020 27,295 28,113 USD 80,000 Lennar Corp., 8.375% 01/15/2021 115,658 115,987 USD 5,000 Level 3 Financing Inc., 5.375% 08/15/2022 6,878 7,046 USD 30,000 MGM Resorts International 7.75% 03/15/2022 43,887 41,822 USD 15,000 Netflix Inc., 4.375% 11/15/2026 19,859 21,215
Percentages shown in brackets relate investments at fair value to net assets attributable to holders of redeemable units of the Fund.
Schedule of Investment Portfolio as at March 31, 2020
No. of Shares/Par Value Description
AverageCost ($)
FairValue ($)
No. of Shares/Par Value Description
AverageCost ($)
FairValue ($)

Marret Short Duration High Yield Fund
– 208 –Annual Financial Statements - March 31, 2020
LUXEMBOURG (0.5%) USD 10,000 Intelsat Jackson Holdings S.A., 8% 02/15/2024 13,787 13,599 USD 3,000 Intelsat Jackson Holdings S.A., 9.5% 09/30/2022 4,349 4,309 18,136 17,908
Commissions and other portfolio transaction costs -
Total Investment Portfolio before Derivative Instruments (90.9%) 3,409,942 3,430,027
Foreign Currency Forward Contract(s) (-2.0%) (see Schedule A) (73,874)
Total Investment Portfolio (88.9%) 3,409,942 3,356,153 Other Net Assets (Liabilities) (11.1%) 416,080 Net Assets Attributable to Holders of Redeemable Units (100.0%) 3,772,233
Principal amounts stated in:USD U.S. Dollar
CANADA (19.2%) (cont’d) USD 15,000 MEG Energy Corp., 7% 03/31/2024 13,975 9,737 USD 40,000 New Gold Inc., 6.25% 11/15/2022 54,281 54,677 100,000 Parkland Fuel Corp., 5.5% 05/28/2021 102,157 97,625 10,000 Penske Truck Leasing Canada Inc., 2.95% 06/12/2020 10,055 10,005 USD 15,000 Tervita Escrow Corp., 7.625% 12/01/2021 19,574 14,778 USD 50,000 Valeant Pharmaceuticals International Inc., 6.5% 03/15/2022 68,554 71,074 USD 55,000 Valeant Pharmaceuticals International Inc., 7% 03/15/2024 76,905 78,858 USD 5,000 Videotron Ltd., 5% 07/15/2022 7,079 7,057 761,359 725,053 NETHERLANDS (1.3%) USD 35,000 Fiat Chrysler Automobiles N.V., 4.5% 04/15/2020 47,518 49,116
‡Credit ratings are obtained from S&P Global Ratings, where available, otherwise ratings are obtained from: Moody’s Investors Service or Dominion Bond Rating Service.Percentages shown in brackets relate investments at fair value to net assets attributable to holders of redeemable units of the Fund.
Schedule of Investment Portfolio as at March 31, 2020
No. of Shares/Par Value Description
AverageCost ($)
FairValue ($)
No. of Shares/Par Value Description
AverageCost ($)
FairValue ($)
Schedule AForeign Currency Forward Contract(s) (-2.0%)
Contract(s) CounterpartyCredit Rating of
the Counterparty‡Settlement
DateContract(s)
Rate Pay ReceiveUnrealized
Gain (Loss) ($)1 Royal Bank of Canada A-1+ April 16, 2020 1.45 (43,496) Canadian $ 30,000 US $ (1,284)1 Royal Bank of Canada A-1+ April 16, 2020 1.41 (56,486) Canadian $ 40,000 US $ (204)1 Royal Bank of Canada A-1+ April 16, 2020 1.45 (72,344) Canadian $ 50,000 US $ (1,992)1 Royal Bank of Canada A-1+ April 16, 2020 1.41 (100,000) US $ 141,098 Canadian $ 394 1 Royal Bank of Canada A-1+ April 16, 2020 1.42 (100,000) US $ 142,343 Canadian $ 1,639 1 Royal Bank of Canada A-1+ April 16, 2020 0.73 (2,267,050) US $ 3,116,491 Canadian $ (73,306)1 Royal Bank of Canada A-1+ April 16, 2020 1.41 (30,000) US $ 42,434 Canadian $ 223 1 Royal Bank of Canada A-1+ April 16, 2020 1.42 (40,000) US $ 56,937 Canadian $ 656 Total Foreign Currency Forward Contract(s) Value (73,874)

Marret Short Duration High Yield Fund
– 209 –Annual Financial Statements - March 31, 2020
The accompanying notes are an integral part of these financial statements.
Fund Specific Notes to Financial Statements
Offsetting of Financial Instruments (Note 2)
The following tables show the net impact on the Fund’s Statements of Financial Position if all rights to offset were exercised.
as at March 31, 2020Amounts Eligible for Offset
Gross Assets/(Liabilities)
FinancialInstruments
CollateralReceived/(Paid)
NetExposure
(in $000’s) (in $000’s) (in $000’s) (in $000’s)Derivative assets - Foreign currency forward contracts 3 (3) - -Derivative assets - Swaps and swaptions - - - -Total 3 (3) - -Derivative liabilities - Foreign currency forward contracts (77) 3 - (74)Derivative liabilities - Swaps and swaptions - - - -Total (77) 3 - (74)
as at March 31, 2019Amounts Eligible for Offset
Gross Assets/(Liabilities)
FinancialInstruments
CollateralReceived/(Paid)
NetExposure
(in $000’s) (in $000’s) (in $000’s) (in $000’s)Derivative assets - Foreign currency forward contracts 1 (1) - -Derivative assets - Swaps and swaptions - - - -Total 1 (1) - -Derivative liabilities - Foreign currency forward contracts (80) 1 - (79)Derivative liabilities - Swaps and swaptions - - - -Total (80) 1 - (79)

Marret Short Duration High Yield Fund
– 210 –Annual Financial Statements - March 31, 2020
Redeemable Unit Transactions (Note 4)for the years ended March 31
Number of redeemable units at the beginning of yearRedeemable units issued for cashRedeemable units issued for reinvested distributionsRedeemable units redeemedNumber of redeemable units at the end of year
Number of redeemable units at the beginning of yearRedeemable units issued for cashRedeemable units issued for reinvested distributionsRedeemable units redeemedNumber of redeemable units at the end of year
Number of redeemable units at the beginning of yearRedeemable units issued for cashRedeemable units issued for reinvested distributionsRedeemable units redeemedNumber of redeemable units at the end of year
Number of redeemable units at the beginning of yearRedeemable units issued for cashRedeemable units issued for reinvested distributionsRedeemable units redeemedNumber of redeemable units at the end of year
Fund Specific Notes to Financial Statements
†A portion of brokerage commissions paid was used to cover research and market data services, termed soft dollar commissions. This amount has been estimated by the Manager of the Fund.The accompanying notes are an integral part of these financial statements.
Commissions (Note 2)for the years ended March 31 (in $000’s)
2020 2019Brokerage commissions - -Soft dollar commissions† - -
Class A 2020 2019 218,765 120,069 323,867 417,214 8,420 6,647 (241,894) (325,165) 309,158 218,765
Class A1 2020 2019 93,867 27,507 14,305 95,132 940 2,358 (109,112) (31,130) - 93,867
Class A2 2020 2019 28,253 26,350 5,600 12,816 329 818 (34,182) (11,731) - 28,253
Class A3 2020 2019 217,734 1,603 333 283,697 1,346 8,429 (219,413) (75,995) - 217,734
Class E 2020 2019 59,612 27,289 22,099 57,458 1,539 2,772 (41,937) (27,907) 41,313 59,612
Class EF 2020 2019 1,197 1,137 - 1 46 59 - - 1,243 1,197
Class F 2020 2019 32,099 21,986 54,024 37,096 1,193 718 (42,664) (27,701) 44,652 32,099
Class F1 2020 2019 35,088 18,098 368 17,720 237 1,182 (35,693) (1,912) - 35,088
Class F2 2020 2019 11,476 1,046 17,941 10,060 277 370 (29,694) - - 11,476
Class I 2020 2019 110 6,524,843 17,799 110 183 307,961 (467) (6,832,804) 17,625 110
Class O 2020 2019 13,363 1,239 - 14,508 362 543 (7,758) (2,927) 5,967 13,363
Class P 2020 2019 1,239 1,052 - 125 49 62 (128) - 1,160 1,239
Class W 2020 2019 - - 1,000 - 22 - - - 1,022 -

Marret Short Duration High Yield Fund
– 211 –Annual Financial Statements - March 31, 2020
The accompanying notes are an integral part of these financial statements.
Fund Specific Notes to Financial Statements
Management and Administration Fees (Note 5) as at March 31, 2020 (%)
Annual management
fee rate:
Annual administration
fee rate:
Class A 1.300 0.20Class A1^ 1.250 0.20Class A2^ 1.150 0.19Class A3^ 1.025 0.15Class E 1.300 0.15Class EF 0.550 0.15Class F 0.800 0.20Class F1^ 0.750 0.20Class F2^ 0.650 0.19Class I Paid directly by investor Paid directly by investorClass O Paid directly by investor 0.15Class P Paid directly by investor 0.20Class W Paid directly by investor 0.14
^Effective after the close of business on August 2, 2019, the classes of the Fund that were eligible for CI Preferred
Pricing Program (CIPP) transitioned from a tiered pricing model to a fee distribution model. Please refer to most
recent simplified prospectus for further details.
Securities Lending (Note 6)as at March 31 (in $000’s)
2020 2019Loaned - 219Collateral (non-cash) - 223
Securities Lending Revenue Reconciliation (Note 6)for the years ended March 31 (in $000’s)
2020 2019Gross securities lending revenue - 2Charges - (1)Securities lending revenue - 1% of gross securities lending revenue - 50.0
Loss Carry Forwards (Note 7)as at March 31 (in $000’s)
2020Capital loss carried forward: 4,104Non-capital losses expiring:2029 -2030 -2031 -2032 -2033 -2034 -2035 -2036 -2037 -2038 -2039 -Total -

Marret Short Duration High Yield Fund
– 212 –Annual Financial Statements - March 31, 2020
The accompanying notes are an integral part of these financial statements.
Currency RiskThe table below summarizes the Fund’s exposure to currency risk.
as at March 31, 2020~
Currency
Financial Instruments Exposure Derivatives
Net Exposure
Net Assets
(%)(in $000’s) (in $000’s) (in $000’s)U.S. Dollar 3,427 (3,402) 25 0.7 Total 3,427 (3,402) 25 0.7
~Includes monetary and non-monetary instruments.
As at March 31, 2020, had the Canadian dollar strengthened or weakened by 10% in relation to all other foreign currencies held in the Fund, with all other variables held constant, net assets attributable to holders of redeemable units of the Fund would have decreased or increased, respectively, by approximately $3,000. In practice, actual results may differ from this analysis and the difference may be material.
As at March 31, 2019, the Fund’s investments were denominated in Canadian dollars, the functional currency of the Fund. As a result, the Fund exposure to currency risk was insignificant.
Interest Rate RiskThe tables below summarize the Fund’s exposure to interest rate risk, categorized by the contractual maturity date.
as at March 31, 2020
Less than1 Year
1 - 3Years
3 - 5Years
Greaterthan
5 Years Total
(in $000’s) (in $000’s) (in $000’s) (in $000’s) (in $000’s)Interest Rate Exposure 893 1,418 731 388 3,430
as at March 31, 2019
Less than1 Year
1 - 3Years
3 - 5Years
Greaterthan
5 Years Total
(in $000’s) (in $000’s) (in $000’s) (in $000’s) (in $000’s)Interest Rate Exposure 2,527 3,146 985 448 7,106
As at March 31, 2020, had the prevailing interest rates increased or decreased by 0.25% (March 31, 2019 - 0.25%), with all other variables held constant, net assets attributable to holders of redeemable units of the Fund would have decreased or increased, respectively, by approximately $11,000 (March 31, 2019 - $17,000). In practice, actual results may differ from this analysis and the difference may be material.
Fair Value Hierarchy
The tables below summarize the inputs used by the Fund in valuing the Fund’s investments and derivatives carried at fair value.
Long Positions at fair value as at March 31, 2020Level 1 Level 2 Level 3 Total
(in $000’s) (in $000’s) (in $000’s) (in $000’s)Bonds - 3,430 - 3,430 Foreign currency forward contract(s), net - (74) - (74) Total - 3,356 - 3,356
Financial Instruments Risks (Note 10)
Concentration RiskFor Concentration Risk as at March 31, 2020, refer to the Schedule of Investment Portfolio.
The Fund’s investments were concentrated in the following segments: as at March 31, 2019 Categories Net Assets (%)U.S.A. 70.5 Canada 15.4 Netherlands 4.9 Other Net Assets (Liabilities) 4.1 Ireland 3.9 Short-Term Investments 1.5 Luxembourg 0.9 Foreign Currency Forward Contract(s) (1.2)
Credit RiskThe Fund was invested in fixed income securities, preferred securities and derivative instruments, if any, with the following credit ratings, as per the tables below.
as at March 31, 2020 Credit Rating^* Net Assets (%)AAA/Aaa/A++ 0.1 BBB/Baa/B++ 22.9 BB/Ba/B+ 48.9 B 17.0 CCC/Caa/C++ 2.1 Total 91.0
as at March 31, 2019 Credit Rating^* Net Assets (%)AAA/Aaa/A++ 9.1 BBB/Baa/B++ 21.7 BB/Ba/B+ 52.7 B 10.3 CCC/Caa/C++ 3.3 Total 97.1
^Credit ratings are obtained from S&P Global Ratings, where available, otherwise ratings are obtained from: Moody’s
Investors Service or Dominion Bond Rating Service, respectively.
*Refer to Note 10 for Credit Rating Chart reference.
Other Price RiskAs at March 31, 2020 and 2019, the Fund did not have a significant exposure to other price risk as the Fund did not invest in equities.
Fund Specific Notes to Financial Statements

Marret Short Duration High Yield Fund
– 213 –Annual Financial Statements - March 31, 2020
The accompanying notes are an integral part of these financial statements.
Fair Value Hierarchy (cont’d)
Long Positions at fair value as at March 31, 2019Level 1 Level 2 Level 3 Total
(in $000’s) (in $000’s) (in $000’s) (in $000’s)Bonds - 6,423 - 6,423 Short-term investments - 100 - 100 Foreign currency forward contract(s), net - (79) - (79) Total - 6,444 - 6,444
There were no transfers between Level 1, 2 and 3 during the years ended March 31, 2020 and 2019.
Fund Specific Notes to Financial Statements

– 214 –
CI Mutual Funds
Annual Financial Statements - March 31, 2020
Notes to the Financial Statements
1. THE FUNDS
The following Funds are open-ended mutual fund trusts created under the laws of Province of Ontario by declarations of trust. The address of the Funds’ registered office is 2 Queen Street East, Twentieth Floor,
Toronto, Ontario, M5C 3G7. CI Investments Inc. is the manager and the trustee (the Manager and the Trustee) to the Funds. RBC Investor Services Trust is the custodian (the Custodian) of the Funds.
These financial statements were authorized for issue by the Manager on June 23, 2020. CI Investments Inc. is a subsidiary of CI Financial Corp.
Effective after the close of business on August 2, 2019, the classes of the Funds that were eligible for CI Preferred Pricing Program (CIPP) transitioned from a tiered pricing model to a fee distribution model.
The objective of each Fund is to pool and manage money contributed by investors (Unitholders) with similar investment goals. The Funds may invest in equities, fixed income securities, derivatives, underlying fund(s)
or some combination thereof according to their specific investment objectives and strategies. Investments may be held for income or capital appreciation or both. Unitholders share a Fund’s income, expenses and
any gains or losses the Fund makes on its investments generally in proportion to the value of the securities they own.
The “Inception Date” is the date upon which units of a class of a Fund commenced operations.
*These Classes are no longer available for new purchases.
†Please refer to Note 1.
Inception Date:
Class A Class A1 Class A2 Class A3 Class A4 Class A5 Class AH
CI FUNDS
CI American Small Companies Fund Apr. 29, 91 May 01, 17† May 01, 17† May 01, 17† May 01, 17† May 01, 17† -
CI American Value Fund Feb. 1, 77 May 01, 17† May 01, 17† May 01, 17† May 01, 17† May 01, 17† -
CI Canadian Investment Fund Jan. 29, 77 May 01, 17† May 01, 17† May 01, 17† May 01, 17† May 01, 17† -
CI Canadian Small/Mid Cap Fund Nov. 27, 92 May 01, 17† May 01, 17† May 01, 17† - - -
CI Global High Dividend Advantage Fund Feb. 28, 06* May 01, 17† May 01, 17† May 01, 17† May 01, 17† May 01, 17† -
CI Global Stock Selection Fund
(formerly Harbour Global Analyst Fund) - - - - - - -
CI Global Value Fund Jun. 12, 96 May 01, 17† May 01, 17† May 01, 17† May 01, 17† May 01, 17† -
CI High Interest Savings Fund Jul. 30, 19 - - - - - -
CI Income Fund Oct. 5, 10 May 01, 17† May 01, 17† May 01, 17† May 01, 17† May 01, 17† -
CI International Value Fund Jun. 12, 96 May 01, 17† May 01, 17† May 01, 17† May 01, 17† May 01, 17† -
CI Investment Grade Bond Fund Dec. 24, 14 May 01, 17† May 01, 17† May 01, 17† May 01, 17† May 01, 17† Mar. 9, 20
CI Money Market Fund Oct. 1, 90 May 01, 17† - May 01, 17† May 01, 17† May 01, 17† -
CI MSCI World ESG Impact Fund Sep. 17, 19 - - - - - -
CI U.S. Income US$ Pool Aug. 4, 15 May 01, 17† May 01, 17† May 01, 17† May 01, 17† May 01, 17† -
CI US Money Market Fund Jan. 30, 95 May 01, 17† - May 01, 17† May 01, 17† May 01, 17† -
Marret Short Duration High Yield Fund Feb. 14, 14 May 01, 17† May 01, 17† May 01, 17† - - -
Munro Global Growth Equity Fund - - - - - - -
Class C Class E Class EF Class F Class F1 Class F2 Class F3
CI FUNDS (cont’d)
CI American Small Companies Fund - Aug. 4, 15 Aug. 4, 15 Aug. 8, 00 May 01, 17† May 01, 17† May 01, 17†
CI American Value Fund - Jul. 27, 11 Aug. 4, 15 Nov. 17, 00 May 01, 17† May 01, 17† May 01, 17†
CI Canadian Investment Fund - Jul. 27, 11 Aug. 4, 15 Nov. 17, 00 May 01, 17† May 01, 17† May 01, 17†
CI Canadian Small/Mid Cap Fund - Aug. 4, 15 Aug. 4, 15 Jun. 29, 05 May 01, 17† May 01, 17† May 01, 17†
CI Global High Dividend Advantage Fund - Jul. 27, 11 - Feb. 28, 06 May 01, 17† May 01, 17† May 01, 17†
CI Global Stock Selection Fund
(formerly Harbour Global Analyst Fund) - - - - - - -
CI Global Value Fund - Aug. 4, 15 Aug. 4, 15 Aug. 8, 00 May 01, 17† May 01, 17† May 01, 17†
CI High Interest Savings Fund - Jul. 30, 19 - Jul. 30, 19 - - -
CI Income Fund Sep. 20, 10* Aug. 4, 15 Nov. 27, 14 Oct. 5, 10 May 01, 17† May 01, 17† May 01, 17†
CI International Value Fund - Aug. 4, 15 Aug. 4, 15 Dec. 18, 01 May 01, 17† May 01, 17† May 01, 17†

– 215 –
CI Mutual Funds
Annual Financial Statements - March 31, 2020
Notes to the Financial Statements (cont’d)
Inception Date:
Class C Class E Class EF Class F Class F1 Class F2 Class F3
CI FUNDS (cont’d)
CI Investment Grade Bond Fund - Dec. 24, 14 Aug. 4, 15 Dec. 24, 14 May 01, 17† May 01, 17† May 01, 17†
CI Money Market Fund - Jul. 27, 11 Aug. 4, 15 Dec. 18, 01 May 01, 17† - May 01, 17†
CI MSCI World ESG Impact Fund - Sep. 17, 19 - Sep. 17, 19 - - -
CI U.S. Income US$ Pool - Aug. 4, 15 Aug. 4, 15 Aug. 4, 15 May 01, 17† May 01, 17† May 01, 17†
CI US Money Market Fund - - - May. 1, 17 May 01, 17† - May 01, 17†
Marret Short Duration High Yield Fund - Feb. 14, 14 Aug. 4, 15 Feb. 14, 14 May 01, 17† May 01, 17† -
Munro Global Growth Equity Fund - - - - - - -
Class F4 Class F5 Class FH Class I Class IH Class Insight Class O
CI FUNDS (cont’d)
CI American Small Companies Fund May 01, 17† May 01, 17† - Dec. 17, 01 - - Aug. 4, 15
CI American Value Fund May 01, 17† May 01, 17† - Oct. 31, 96 - Aug. 29, 03 Jul. 27, 11
CI Canadian Investment Fund May 01, 17† May 01, 17† - Oct. 31, 96 - Aug. 29, 03 Jul. 27, 11
CI Canadian Small/Mid Cap Fund - - - Jun. 29, 05 - - Jul. 30, 13
CI Global High Dividend Advantage Fund May 01, 17† May 01, 17† - Feb. 28, 06 - - Jul. 27, 11
CI Global Stock Selection Fund
(formerly Harbour Global Analyst Fund) - - - Jun. 1, 17 - - -
CI Global Value Fund May 01, 17† May 01, 17† - Dec. 17, 01 - - Jul. 30, 13
CI High Interest Savings Fund - - - Jul. 30, 19 - - Jul. 30, 19
CI Income Fund May 01, 17† May 01, 17† - Oct. 5, 10 - - Jul. 30, 13
CI International Value Fund May 01, 17† May 01, 17† - Dec. 17, 01 - Aug. 29, 03 Jul. 30, 13
CI Investment Grade Bond Fund May 01, 17† May 01, 17† Mar. 9, 20 Dec. 24, 14 Mar. 9, 20 - Dec. 24, 14
CI Money Market Fund May 01, 17† May 01, 17† - Dec. 18, 01 - Aug. 29, 03 Jul. 27, 11
CI MSCI World ESG Impact Fund - - - Sep. 17, 19 - - Sep. 17, 19
CI U.S. Income US$ Pool May 01, 17† May 01, 17† - Aug. 4, 15 - - Aug. 4, 15
CI US Money Market Fund May 01, 17† May 01, 17† - Jul. 4, 16 - - -
Marret Short Duration High Yield Fund - - - Feb. 14, 14 - - Feb. 14, 14
Munro Global Growth Equity Fund - - - Jan. 14, 19 - - -
Class P Class PH Class PP Class W Class WH Class X Class Y
CI FUNDS (cont’d)
CI American Small Companies Fund May 1, 17 - - Jul. 27, 17^ - - -
CI American Value Fund May 1, 17 - - Jul. 27, 17^ - - -
CI Canadian Investment Fund May 1, 17 - - Nov. 22, 19 - - -
CI Canadian Small/Mid Cap Fund May 1, 17 - - Sept. 27, 19^ - - -
CI Global High Dividend Advantage Fund - - - - - - -
CI Global Stock Selection Fund
(formerly Harbour Global Analyst Fund) - - - - - - -
CI Global Value Fund May 1, 17 - - Jul. 27, 17^ - - -
CI High Interest Savings Fund Jul. 30, 19 - - Jul. 30, 19 - - -
CI Income Fund May 1, 17 - - Jul. 27, 17^ - - -
CI International Value Fund May 1, 17 - - Jul. 27, 17^ - - -
CI Investment Grade Bond Fund May 1, 17 Mar. 9, 20 - Jul. 27, 17^ Mar. 9, 20 - -
CI Money Market Fund May 1, 17 - Nov. 22, 19 Jul. 27, 17^ - Nov. 22, 19 Nov. 22, 19
CI MSCI World ESG Impact Fund Sept. 17, 19 - - Sept. 17, 19 - - -
CI U.S. Income US$ Pool May 1, 17 - - Jul. 27, 17^ - - -
^Private Client Managed Portfolios are made available through Assante Private Client, a division of CI Private Counsel LP. The pools used in the Private Client Managed Portfolios are managed by CI Investments Inc., and affiliate of CI Private Counsel LP.
†Please refer to Note 1.

– 216 –
CI Mutual Funds
Annual Financial Statements - March 31, 2020
Notes to the Financial Statements (cont’d)
Inception Date:
Class P Class PH Class PP Class W Class WH Class X Class Y
CI FUNDS (cont’d)
CI US Money Market Fund May 1, 17 - - - - - -
Marret Short Duration High Yield Fund May 1, 17 - - Sept. 27, 19^ - - -
Munro Global Growth Equity Fund - - - - - - -
Class Z
CI FUNDS (cont’d)
CI American Small Companies Fund -
CI American Value Fund -
CI Canadian Investment Fund -
CI Canadian Small/Mid Cap Fund -
CI Global High Dividend Advantage Fund -
CI Global Stock Selection Fund
(formerly Harbour Global Analyst Fund) -
CI Global Value Fund -
CI High Interest Savings Fund -
CI Income Fund -
CI International Value Fund -
CI Investment Grade Bond Fund -
CI Money Market Fund Sept. 17, 10*
CI MSCI World ESG Impact Fund -
CI U.S. Income US$ Pool -
CI US Money Market Fund -
Marret Short Duration High Yield Fund -
Munro Global Growth Equity Fund -
Class A Class F Class I Class W
PORTFOLIO SELECT SERIES
Select Canadian Equity Managed Fund - - Nov. 22, 06 -
Select International Equity Managed Fund - - Nov. 22, 06 -
Select Staging Fund Nov. 7, 05 Dec. 30, 05 Mar. 22, 06 Dec. 30, 05
Select U.S. Equity Managed Fund - - Nov. 22, 06 -
Class A Class A1 Class A2 Class A3 Class A4 Class A5 Class AT5
CAMBRIDGE FUNDS
Cambridge Asset Allocation Fund Jul. 27, 17 Jul. 28, 17 Jul. 28, 17 Jul. 28, 17 Jul. 28, 17 Jul. 28, 17 -
Cambridge Bond Fund Dec. 12, 18 Dec. 12, 18† Dec. 12, 18† Dec. 12, 18† Dec. 12, 18† Dec. 12, 18† -
Cambridge Canadian Dividend Fund Feb. 1, 05 May 01, 17† May 01, 17† May 01, 17† May 01, 17† - -
Cambridge Canadian Equity Fund Jul. 27, 17 Jul. 28, 17† Jul. 28, 17† Jul. 28, 17† Jul. 28, 17† Jul. 28, 17† -
Cambridge Canadian Long-Term Bond Pool - - - - - - -
Cambridge Canadian Short-Term Bond Pool - - - - - - -
Cambridge Global Dividend Fund Jul. 30, 13 May 01, 17† May 01, 17† May 01, 17† May 01, 17† May 01, 17† -
Cambridge Global Equity Fund Jul. 27, 17 Jul. 28, 17† Jul. 28, 17† Jul. 28, 17† Jul. 28, 17† Jul. 28, 17† -
Cambridge Global High Income Fund Jul. 2, 04 May 01, 17† May 01, 17† May 01, 17† May 01, 17† May 01, 17† -
Cambridge Global Smaller Companies Fund
(formerly Cambridge Growth Companies Fund) Jul. 27, 17 Jul. 28, 17† Jul. 28, 17† Jul. 28, 17† Jul. 28, 17† Jul. 28, 17† Nov. 22, 19
Cambridge Monthly Income Fund Jan. 9, 12 May 01, 17† May 01, 17† May 01, 17† May 01, 17† - -
*These Classes are no longer available for new purchases.
^Private Client Managed Portfolios are made available through Assante Private Client, a division of CI Private Counsel LP. The pools used in the Private Client Managed Portfolios are managed by CI Investments Inc., and affiliate of CI Private Counsel LP.
†Please refer to Note 1.

– 217 –
CI Mutual Funds
Annual Financial Statements - March 31, 2020
Notes to the Financial Statements (cont’d)
Inception Date:
Class A Class A1 Class A2 Class A3 Class A4 Class A5 Class AT5
CAMBRIDGE FUNDS (cont’d)
Cambridge Pure Canadian Equity Fund Feb. 14, 11 May 01, 17† May 01, 17† May 01, 17† May 01, 17† - -
Cambridge Put Write Pool - - - - - - -
Cambridge Stock Selection Fund - - - - - - -
Cambridge U.S. Dividend Fund Jun. 13, 06 May 01, 17† May 01, 17† May 01, 17† May 01, 17† - -
Cambridge U.S. Dividend Registered Fund Dec. 24, 14 May 01, 17† May 01, 17† May 01, 17† - - -
Cambridge U.S. Dividend US$ Fund Mar. 27, 15 May 01, 17† May 01, 17† May 01, 17† - - -
Class AT6 Class AT8 Class A1T8 Class A2T8 Class A3T8 Class D Class E
CAMBRIDGE FUNDS (cont’d)
Cambridge Asset Allocation Fund - - - - - - Jul. 27, 17
Cambridge Bond Fund - - - - - - -
Cambridge Canadian Dividend Fund - - - - - Aug. 31, 04* Jan. 7, 14
Cambridge Canadian Equity Fund - - - - - - Jul. 27, 17
Cambridge Canadian Long-Term Bond Pool - - - - - - -
Cambridge Canadian Short-Term Bond Pool - - - - - - -
Cambridge Global Dividend Fund - - - - - - Jul. 30, 13
Cambridge Global Equity Fund - - - - - - Jul. 27, 17
Cambridge Global High Income Fund - - - - - - Jul. 30, 13
Cambridge Global Smaller Companies Fund
(formerly Cambridge Growth Companies Fund) - - - - - - Jul. 27, 17
Cambridge Monthly Income Fund - - - - - - Jan. 9, 12
Cambridge Pure Canadian Equity Fund - - - - - - Jul. 30, 13
Cambridge Put Write Pool - - - - - - -
Cambridge Stock Selection Fund - - - - - - -
Cambridge U.S. Dividend Fund Jul. 7, 08* - - - - Jun. 13, 06* Jan. 7, 14
Cambridge U.S. Dividend Registered Fund - - - - - - Dec. 24, 14
Cambridge U.S. Dividend US$ Fund - Jul. 24, 17 Jun. 28, 17† Jun. 28, 17† Jun. 28, 17† - Mar. 27, 15
Class EF Class F Class F1 Class F2 Class F3 Class F4 Class F5
CAMBRIDGE FUNDS (cont’d)
Cambridge Asset Allocation Fund Jul. 27, 17 Jul. 27, 17 Jul. 28, 17† Jul. 28, 17† Jul. 28, 17† Jul. 28, 17† -
Cambridge Bond Fund - Dec. 12, 18 Dec. 12, 18† Dec. 12, 18† Dec. 12, 18† Dec. 12, 18† Dec. 12, 18†
Cambridge Canadian Dividend Fund Nov. 27, 14 Jun. 12, 06 May 01, 17† May 01, 17† May 01, 17† May 01, 17† May 01, 17†
Cambridge Canadian Equity Fund Jul. 27, 17 Jul. 27, 17 Jul. 28, 17† Jul. 28, 17† Jul. 28, 17† Jul. 28, 17† Jul. 28, 17†
Cambridge Canadian Long-Term Bond Pool - - - - - - -
Cambridge Canadian Short-Term Bond Pool - - - - - - -
Cambridge Global Dividend Fund Aug. 4, 15 Jul. 30, 13 May 01, 17† May 01, 17† May 01, 17† May 01, 17† May 01, 17†
Cambridge Global Equity Fund Jul. 27, 17 Jul. 27, 17 Jul. 28, 17† Jul. 28, 17† Jul. 28, 17† Jul. 28, 17† Jul. 28, 17†
Cambridge Global High Income Fund Nov. 27, 14 Jul. 20, 04 May 01, 17† May 01, 17† May 01, 17† May 01, 17† -
Cambridge Global Smaller Companies Fund
(formerly Cambridge Growth Companies Fund) Jul. 27, 17 Jul. 27, 17 Jul. 28, 17† Jul. 28, 17† Jul. 28, 17† Jul. 28, 17† Jul. 28, 17†
Cambridge Monthly Income Fund - Jan. 9, 12 May 01, 17† May 01, 17† - - -
Cambridge Pure Canadian Equity Fund Aug. 4, 15 Feb. 14, 11 May 01, 17† May 01, 17† May 01, 17† May 01, 17† -
Cambridge Put Write Pool - - - - - - -
Cambridge Stock Selection Fund - - - - - - -
Cambridge U.S. Dividend Fund Nov. 27, 14 Jun. 13, 06 May 01, 17† May 01, 17† May 01, 17† May 01, 17† May 01, 17†
*These Classes are no longer available for new purchases.
†Please refer to Note 1.

– 218 –
CI Mutual Funds
Annual Financial Statements - March 31, 2020
Notes to the Financial Statements (cont’d)
Inception Date:
Class EF Class F Class F1 Class F2 Class F3 Class F4 Class F5
CAMBRIDGE FUNDS (cont’d)
Cambridge U.S. Dividend Registered Fund Aug. 4, 15 Dec. 24, 14 May 01, 17† - - - -
Cambridge U.S. Dividend US$ Fund Mar. 27, 15 Mar. 27, 15 May 01, 17† May 01, 17† May 01, 17† - -
Class FT8 Class F1T8 Class F2T8 Class F3T8 Class I Class IT8 Class IU
CAMBRIDGE FUNDS (cont’d)
Cambridge Asset Allocation Fund - - - - Jul. 27, 17 - -
Cambridge Bond Fund - - - - Mar. 27, 15*~ - -
Cambridge Canadian Dividend Fund - - - - Jun. 7, 06 - -
Cambridge Canadian Equity Fund - - - - Jul. 27, 17 - -
Cambridge Canadian Long-Term Bond Pool - - - - Nov. 15, 18 - -
Cambridge Canadian Short-Term Bond Pool - - - - Jun. 1, 17* - -
Cambridge Global Dividend Fund - - - - Jul. 30, 13 - -
Cambridge Global Equity Fund - - - - Jul. 27, 17 - -
Cambridge Global High Income Fund - - - - Sept. 3, 04 - -
Cambridge Global Smaller Companies Fund
(formerly Cambridge Growth Companies Fund) - - - - Jul. 27, 17 - Nov. 22, 19
Cambridge Monthly Income Fund - - - - - - -
Cambridge Pure Canadian Equity Fund - - - - Jan. 5, 12 - -
Cambridge Put Write Pool - - - - Jun. 1, 17* - -
Cambridge Stock Selection Fund - - - - Dec. 21, 15 - -
Cambridge U.S. Dividend Fund - - - - Jun. 13, 06 - -
Cambridge U.S. Dividend Registered Fund - - - - Dec. 24, 14 - -
Cambridge U.S. Dividend US$ Fund Jul. 24, 17 Jun. 28, 17† Jun. 28, 17† Jun. 28, 17† Mar. 27, 15 Jun. 24, 17 -
Class O Class P Class PP Class PT8 Class W Class Y Class Z
CAMBRIDGE FUNDS (cont’d)
Cambridge Asset Allocation Fund Jul. 27, 17 Jul. 27, 17 - - - - -
Cambridge Bond Fund - Dec. 12, 18 - - Sept. 27, 19^ - -
Cambridge Canadian Dividend Fund Jul. 30, 13 May 1, 17 - - Sept. 27, 19^ - -
Cambridge Canadian Equity Fund Jul. 27, 17 Jul. 27, 17 - - - - -
Cambridge Canadian Long-Term Bond Pool - - - - - - -
Cambridge Canadian Short-Term Bond Pool - - - - - - -
Cambridge Global Dividend Fund Jul. 30, 13 May 1, 17 Nov. 22, 19 - Jul. 27, 17^ Nov. 22, 19 Nov. 22, 19
Cambridge Global Equity Fund Jul. 27, 17 Jul. 27, 17 - - - - -
Cambridge Global High Income Fund Jul. 30, 13 May 1, 17 - - Sept. 27, 19^ - -
Cambridge Global Smaller Companies Fund
(formerly Cambridge Growth Companies Fund) Jul. 27, 17 Jul. 27, 17 Nov. 22, 19 - - - -
Cambridge Monthly Income Fund Jan. 9, 12 Nov. 6, 17 - - - - -
Cambridge Pure Canadian Equity Fund Jul. 30, 13 May 1, 17 - - Sept. 27, 19^ - -
Cambridge Put Write Pool - - - - - - -
Cambridge Stock Selection Fund - - - - - - -
Cambridge U.S. Dividend Fund Jul. 30, 13 May 1, 17 - - Sept. 27, 19^ - -
Cambridge U.S. Dividend Registered Fund Dec. 24, 14 May 1, 17 - - - - -
Cambridge U.S. Dividend US$ Fund Mar. 27, 15 May 1, 17 - - - - -
*These Classes are no longer available for new purchases.
^Private Client Managed Portfolios are made available through Assante Private Client, a division of CI Private Counsel LP. The pools used in the Private Client Managed Portfolios are managed by CI Investments Inc., and affiliate of CI Private Counsel LP.
~Effective December 31, 2017, Class C units were re-designated as Class I units.
†Please refer to Note 1.
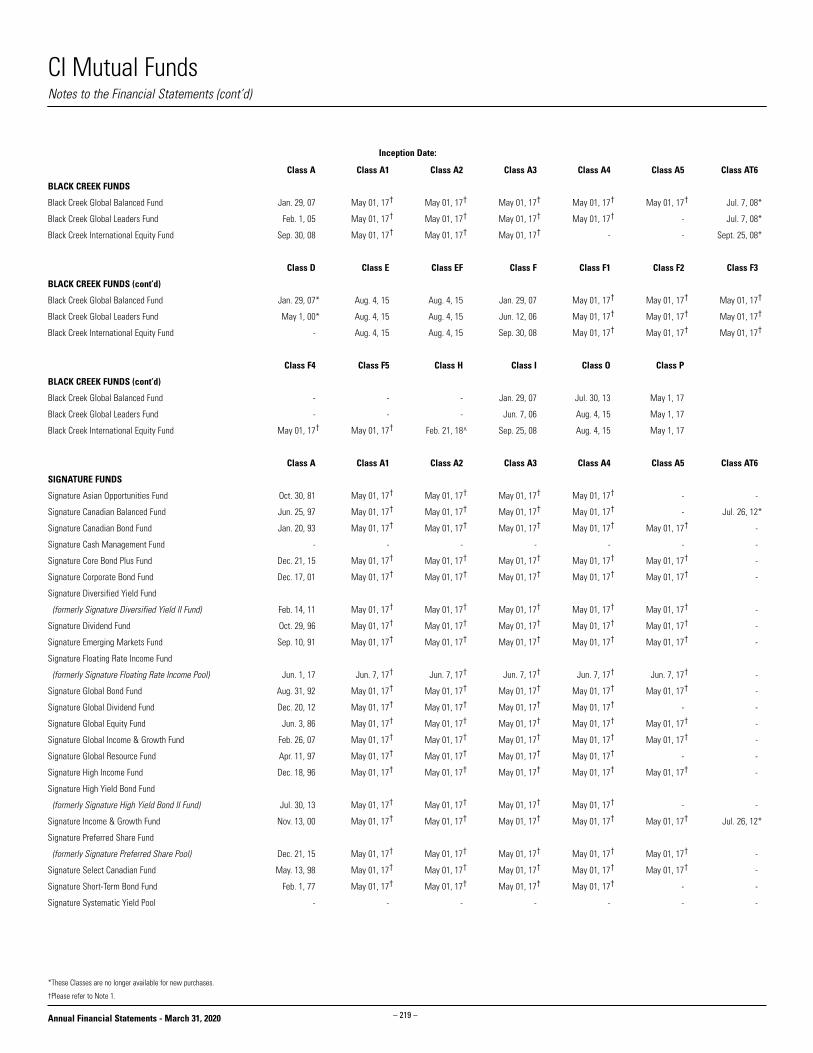
– 219 –
CI Mutual Funds
Annual Financial Statements - March 31, 2020
Notes to the Financial Statements (cont’d)
Inception Date:
Class A Class A1 Class A2 Class A3 Class A4 Class A5 Class AT6
BLACK CREEK FUNDS
Black Creek Global Balanced Fund Jan. 29, 07 May 01, 17† May 01, 17† May 01, 17† May 01, 17† May 01, 17† Jul. 7, 08*
Black Creek Global Leaders Fund Feb. 1, 05 May 01, 17† May 01, 17† May 01, 17† May 01, 17† - Jul. 7, 08*
Black Creek International Equity Fund Sep. 30, 08 May 01, 17† May 01, 17† May 01, 17† - - Sept. 25, 08*
Class D Class E Class EF Class F Class F1 Class F2 Class F3
BLACK CREEK FUNDS (cont’d)
Black Creek Global Balanced Fund Jan. 29, 07* Aug. 4, 15 Aug. 4, 15 Jan. 29, 07 May 01, 17† May 01, 17† May 01, 17†
Black Creek Global Leaders Fund May 1, 00* Aug. 4, 15 Aug. 4, 15 Jun. 12, 06 May 01, 17† May 01, 17† May 01, 17†
Black Creek International Equity Fund - Aug. 4, 15 Aug. 4, 15 Sep. 30, 08 May 01, 17† May 01, 17† May 01, 17†
Class F4 Class F5 Class H Class I Class O Class P
BLACK CREEK FUNDS (cont’d)
Black Creek Global Balanced Fund - - - Jan. 29, 07 Jul. 30, 13 May 1, 17
Black Creek Global Leaders Fund - - - Jun. 7, 06 Aug. 4, 15 May 1, 17
Black Creek International Equity Fund May 01, 17† May 01, 17† Feb. 21, 18^ Sep. 25, 08 Aug. 4, 15 May 1, 17
Class A Class A1 Class A2 Class A3 Class A4 Class A5 Class AT6
SIGNATURE FUNDS
Signature Asian Opportunities Fund Oct. 30, 81 May 01, 17† May 01, 17† May 01, 17† May 01, 17† - -
Signature Canadian Balanced Fund Jun. 25, 97 May 01, 17† May 01, 17† May 01, 17† May 01, 17† - Jul. 26, 12*
Signature Canadian Bond Fund Jan. 20, 93 May 01, 17† May 01, 17† May 01, 17† May 01, 17† May 01, 17† -
Signature Cash Management Fund - - - - - - -
Signature Core Bond Plus Fund Dec. 21, 15 May 01, 17† May 01, 17† May 01, 17† May 01, 17† May 01, 17† -
Signature Corporate Bond Fund Dec. 17, 01 May 01, 17† May 01, 17† May 01, 17† May 01, 17† May 01, 17† -
Signature Diversified Yield Fund
(formerly Signature Diversified Yield II Fund) Feb. 14, 11 May 01, 17† May 01, 17† May 01, 17† May 01, 17† May 01, 17† -
Signature Dividend Fund Oct. 29, 96 May 01, 17† May 01, 17† May 01, 17† May 01, 17† May 01, 17† -
Signature Emerging Markets Fund Sep. 10, 91 May 01, 17† May 01, 17† May 01, 17† May 01, 17† May 01, 17† -
Signature Floating Rate Income Fund
(formerly Signature Floating Rate Income Pool) Jun. 1, 17 Jun. 7, 17† Jun. 7, 17† Jun. 7, 17† Jun. 7, 17† Jun. 7, 17† -
Signature Global Bond Fund Aug. 31, 92 May 01, 17† May 01, 17† May 01, 17† May 01, 17† May 01, 17† -
Signature Global Dividend Fund Dec. 20, 12 May 01, 17† May 01, 17† May 01, 17† May 01, 17† - -
Signature Global Equity Fund Jun. 3, 86 May 01, 17† May 01, 17† May 01, 17† May 01, 17† May 01, 17† -
Signature Global Income & Growth Fund Feb. 26, 07 May 01, 17† May 01, 17† May 01, 17† May 01, 17† May 01, 17† -
Signature Global Resource Fund Apr. 11, 97 May 01, 17† May 01, 17† May 01, 17† May 01, 17† - -
Signature High Income Fund Dec. 18, 96 May 01, 17† May 01, 17† May 01, 17† May 01, 17† May 01, 17† -
Signature High Yield Bond Fund
(formerly Signature High Yield Bond II Fund) Jul. 30, 13 May 01, 17† May 01, 17† May 01, 17† May 01, 17† - -
Signature Income & Growth Fund Nov. 13, 00 May 01, 17† May 01, 17† May 01, 17† May 01, 17† May 01, 17† Jul. 26, 12*
Signature Preferred Share Fund
(formerly Signature Preferred Share Pool) Dec. 21, 15 May 01, 17† May 01, 17† May 01, 17† May 01, 17† May 01, 17† -
Signature Select Canadian Fund May. 13, 98 May 01, 17† May 01, 17† May 01, 17† May 01, 17† May 01, 17† -
Signature Short-Term Bond Fund Feb. 1, 77 May 01, 17† May 01, 17† May 01, 17† May 01, 17† - -
Signature Systematic Yield Pool - - - - - - -
*These Classes are no longer available for new purchases.
†Please refer to Note 1.
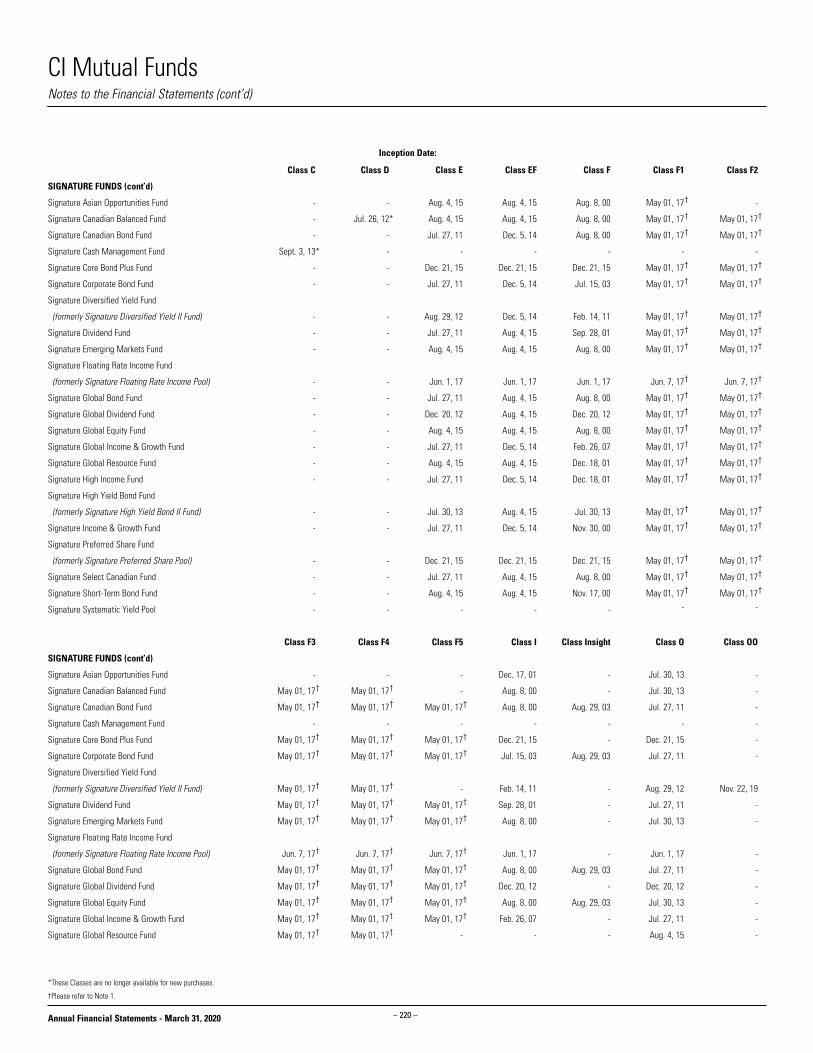
– 220 –
CI Mutual Funds
Annual Financial Statements - March 31, 2020
Notes to the Financial Statements (cont’d)
Inception Date:
Class C Class D Class E Class EF Class F Class F1 Class F2
SIGNATURE FUNDS (cont’d)
Signature Asian Opportunities Fund - - Aug. 4, 15 Aug. 4, 15 Aug. 8, 00 May 01, 17† -
Signature Canadian Balanced Fund - Jul. 26, 12* Aug. 4, 15 Aug. 4, 15 Aug. 8, 00 May 01, 17† May 01, 17†
Signature Canadian Bond Fund - - Jul. 27, 11 Dec. 5, 14 Aug. 8, 00 May 01, 17† May 01, 17†
Signature Cash Management Fund Sept. 3, 13* - - - - - -
Signature Core Bond Plus Fund - - Dec. 21, 15 Dec. 21, 15 Dec. 21, 15 May 01, 17† May 01, 17†
Signature Corporate Bond Fund - - Jul. 27, 11 Dec. 5, 14 Jul. 15, 03 May 01, 17† May 01, 17†
Signature Diversified Yield Fund
(formerly Signature Diversified Yield II Fund) - - Aug. 29, 12 Dec. 5, 14 Feb. 14, 11 May 01, 17† May 01, 17†
Signature Dividend Fund - - Jul. 27, 11 Aug. 4, 15 Sep. 28, 01 May 01, 17† May 01, 17†
Signature Emerging Markets Fund - - Aug. 4, 15 Aug. 4, 15 Aug. 8, 00 May 01, 17† May 01, 17†
Signature Floating Rate Income Fund
(formerly Signature Floating Rate Income Pool) - - Jun. 1, 17 Jun. 1, 17 Jun. 1, 17 Jun. 7, 17† Jun. 7, 17†
Signature Global Bond Fund - - Jul. 27, 11 Aug. 4, 15 Aug. 8, 00 May 01, 17† May 01, 17†
Signature Global Dividend Fund - - Dec. 20, 12 Aug. 4, 15 Dec. 20, 12 May 01, 17† May 01, 17†
Signature Global Equity Fund - - Aug. 4, 15 Aug. 4, 15 Aug. 8, 00 May 01, 17† May 01, 17†
Signature Global Income & Growth Fund - - Jul. 27, 11 Dec. 5, 14 Feb. 26, 07 May 01, 17† May 01, 17†
Signature Global Resource Fund - - Aug. 4, 15 Aug. 4, 15 Dec. 18, 01 May 01, 17† May 01, 17†
Signature High Income Fund - - Jul. 27, 11 Dec. 5, 14 Dec. 18, 01 May 01, 17† May 01, 17†
Signature High Yield Bond Fund
(formerly Signature High Yield Bond II Fund) - - Jul. 30, 13 Aug. 4, 15 Jul. 30, 13 May 01, 17† May 01, 17†
Signature Income & Growth Fund - - Jul. 27, 11 Dec. 5, 14 Nov. 30, 00 May 01, 17† May 01, 17†
Signature Preferred Share Fund
(formerly Signature Preferred Share Pool) - - Dec. 21, 15 Dec. 21, 15 Dec. 21, 15 May 01, 17† May 01, 17†
Signature Select Canadian Fund - - Jul. 27, 11 Aug. 4, 15 Aug. 8, 00 May 01, 17† May 01, 17†
Signature Short-Term Bond Fund - - Aug. 4, 15 Aug. 4, 15 Nov. 17, 00 May 01, 17† May 01, 17†
Signature Systematic Yield Pool - - - - - - -
Class F3 Class F4 Class F5 Class I Class Insight Class O Class OO
SIGNATURE FUNDS (cont’d)
Signature Asian Opportunities Fund - - - Dec. 17, 01 - Jul. 30, 13 -
Signature Canadian Balanced Fund May 01, 17† May 01, 17† - Aug. 8, 00 - Jul. 30, 13 -
Signature Canadian Bond Fund May 01, 17† May 01, 17† May 01, 17† Aug. 8, 00 Aug. 29, 03 Jul. 27, 11 -
Signature Cash Management Fund - - - - - - -
Signature Core Bond Plus Fund May 01, 17† May 01, 17† May 01, 17† Dec. 21, 15 - Dec. 21, 15 -
Signature Corporate Bond Fund May 01, 17† May 01, 17† May 01, 17† Jul. 15, 03 Aug. 29, 03 Jul. 27, 11 -
Signature Diversified Yield Fund
(formerly Signature Diversified Yield II Fund) May 01, 17† May 01, 17† - Feb. 14, 11 - Aug. 29, 12 Nov. 22, 19
Signature Dividend Fund May 01, 17† May 01, 17† May 01, 17† Sep. 28, 01 - Jul. 27, 11 -
Signature Emerging Markets Fund May 01, 17† May 01, 17† May 01, 17† Aug. 8, 00 - Jul. 30, 13 -
Signature Floating Rate Income Fund
(formerly Signature Floating Rate Income Pool) Jun. 7, 17† Jun. 7, 17† Jun. 7, 17† Jun. 1, 17 - Jun. 1, 17 -
Signature Global Bond Fund May 01, 17† May 01, 17† May 01, 17† Aug. 8, 00 Aug. 29, 03 Jul. 27, 11 -
Signature Global Dividend Fund May 01, 17† May 01, 17† May 01, 17† Dec. 20, 12 - Dec. 20, 12 -
Signature Global Equity Fund May 01, 17† May 01, 17† May 01, 17† Aug. 8, 00 Aug. 29, 03 Jul. 30, 13 -
Signature Global Income & Growth Fund May 01, 17† May 01, 17† May 01, 17† Feb. 26, 07 - Jul. 27, 11 -
Signature Global Resource Fund May 01, 17† May 01, 17† - - - Aug. 4, 15 -
*These Classes are no longer available for new purchases.
†Please refer to Note 1.

– 221 –
CI Mutual Funds
Annual Financial Statements - March 31, 2020
Notes to the Financial Statements (cont’d)
Inception Date:
Class F3 Class F4 Class F5 Class I Class Insight Class O Class OO
SIGNATURE FUNDS (cont’d)
Signature High Income Fund May 01, 17† May 01, 17† May 01, 17† Dec. 18, 01 - Jul. 27, 11 -
Signature High Yield Bond Fund
(formerly Signature High Yield Bond II Fund) May 01, 17† - - Jul. 30, 13 - Jul. 30, 13 -
Signature Income & Growth Fund May 01, 17† - - Nov. 30, 00 - Jul. 27, 11 -
Signature Preferred Share Fund
(formerly Signature Preferred Share Pool) May 01, 17† May 01, 17† May 01, 17† Dec. 21, 15 - Dec. 21, 15 -
Signature Select Canadian Fund May 01, 17† May 01, 17† May 01, 17† Aug. 8, 00 Aug. 29, 03 Jul. 27, 11 -
Signature Short-Term Bond Fund - - - Nov. 17, 00 - Jul. 30, 13 -
Signature Systematic Yield Pool - - - Oct. 31, 18 - - -
Class P Class PP Class U Class W Class X Class Y Class Y1
SIGNATURE FUNDS (cont’d)
Signature Asian Opportunities Fund May 1, 17 - - - - - -
Signature Canadian Balanced Fund May 1, 17 - Aug. 14, 09* - - - -
Signature Canadian Bond Fund May 1, 17 - - Jul. 27, 17^ - Jul. 26, 12* -
Signature Cash Management Fund - - - - - - -
Signature Core Bond Plus Fund May 1, 17 - - Sept. 27, 19^ - - -
Signature Corporate Bond Fund May 1, 17 - - Sept. 27, 19^ - - -
Signature Diversified Yield Fund
(formerly Signature Diversified Yield II Fund) May 1, 17 Nov. 22, 19 - Sept. 27, 19^ - Nov. 22, 19 -
Signature Dividend Fund May 1, 17 - - Jul. 27, 17^ Aug. 29, 03* - -
Signature Emerging Markets Fund May 1, 17 - - - - - -
Signature Floating Rate Income Fund
(formerly Signature Floating Rate Income Pool) Jun. 7, 17 - - Sept. 27, 19^ - - -
Signature Global Bond Fund May 1, 17 - - Jul. 27, 17^ - - -
Signature Global Dividend Fund May 1, 17 - - - - - -
Signature Global Equity Fund May 1, 17 - - Jul. 27, 17^ - - -
Signature Global Income & Growth Fund May 1, 17 - - - - - -
Signature Global Resource Fund May 1, 17 - - - - - -
Signature High Income Fund May 1, 17 - - Sept. 27, 19^ - - -
Signature High Yield Bond Fund
(formerly Signature High Yield Bond II Fund) May 1, 17 - - Sept. 27, 19^ - - -
Signature Income & Growth Fund May 1, 17 - - - - Nov. 3, 17 Nov. 3, 17†
Signature Preferred Share Fund
(formerly Signature Preferred Share Pool) May 1, 17 - - Sept. 27, 19^ - - -
Signature Select Canadian Fund May 1, 17 - - Jul. 27, 17^ - - -
Signature Short-Term Bond Fund May 1, 17 - - Sept. 27, 19^ - - -
Signature Systematic Yield Pool - - - - - - -
Class Y2 Class Y3 Class Z Class Z1 Class Z2 Class Z3 Class Z4
SIGNATURE FUNDS (cont’d)
Signature Asian Opportunities Fund - - - - - - -
Signature Canadian Balanced Fund - - Jun. 29, 05* - - - -
Signature Canadian Bond Fund - - Jul. 26, 12* - - - -
Signature Cash Management Fund - - - - - - -
Signature Core Bond Plus Fund - - - - - - -
*These Classes are no longer available for new purchases.
^Private Client Managed Portfolios are made available through Assante Private Client, a division of CI Private Counsel LP. The pools used in the Private Client Managed Portfolios are managed by CI Investments Inc., and affiliate of CI Private Counsel LP.
†Please refer to Note 1.

– 222 –
CI Mutual Funds
Annual Financial Statements - March 31, 2020
Notes to the Financial Statements (cont’d)
Inception Date:
Class Y2 Class Y3 Class Z Class Z1 Class Z2 Class Z3 Class Z4
SIGNATURE FUNDS (cont’d)
Signature Corporate Bond Fund - - Jul. 26, 12* - - - -
Signature Diversified Yield Fund
(formerly Signature Diversified Yield II Fund) - - Nov. 22, 19 - - - -
Signature Dividend Fund - - Aug. 29, 03* - - - -
Signature Emerging Markets Fund - - - - - - -
Signature Floating Rate Income Fund
(formerly Signature Floating Rate Income Pool) - - - - - - -
Signature Global Bond Fund - - - - - - -
Signature Global Dividend Fund - - - - - - -
Signature Global Equity Fund - - - - - - -
Signature Global Income & Growth Fund - - - - - - -
Signature Global Resource Fund - - - - - - -
Signature High Income Fund - - - - - - -
Signature High Yield Bond Fund
(formerly Signature High Yield Bond II Fund) - - - - - - -
Signature Income & Growth Fund Nov. 3, 17† Nov. 3, 17† Nov. 3, 17 Nov. 3, 17† Nov. 3, 17† Nov. 3, 17† Nov. 3, 17†
Signature Preferred Share Fund
(formerly Signature Preferred Share Pool) - - - - - - -
Signature Select Canadian Fund - - Jun. 29, 05 - - - -
Signature Short-Term Bond Fund - - - - - - -
Signature Systematic Yield Pool - - - - - - -
Class A Class A1 Class A2 Class A3 Class A4 Class A5 Class E
SYNERGY FUNDS
Synergy American Fund Aug. 31, 92 May 01, 17† May 01, 17† May 01, 17† May 01, 17† May 01, 17† Aug. 4, 15
Class EF Class F Class F1 Class F2 Class F3 Class F4 Class F5
SYNERGY FUNDS (cont’d)
Synergy American Fund Aug. 4, 15 Aug. 8, 00 May 01, 17† May 01, 17† May 01, 17† May 01, 17† May 01, 17†
Class I Class O Class P Class W
SYNERGY FUNDS (cont’d)
Synergy American Fund Dec. 17, 01 Aug. 4, 15 May 1, 17 Jul. 27, 17^
Class A Class A1 Class A2 Class A3 Class A4 Class A5 Class AT5
PORTFOLIO SERIES FUNDS
Portfolio Series Balanced Fund Nov. 9, 88 May 01, 17† May 01, 17† May 01, 17† May 01, 17† May 01, 17† Sep. 28, 07
Portfolio Series Balanced Growth Fund Dec. 17, 01 May 01, 17† May 01, 17† May 01, 17† May 01, 17† May 01, 17† Sep. 28, 07
Portfolio Series Conservative Balanced Fund Dec. 17, 01 May 01, 17† May 01, 17† May 01, 17† May 01, 17† May 01, 17† -
Portfolio Series Conservative Fund Nov. 17, 97 May 01, 17† May 01, 17† May 01, 17† May 01, 17† May 01, 17† -
Portfolio Series Growth Fund Dec. 18, 01 May 01, 17† May 01, 17† May 01, 17† May 01, 17† May 01, 17† Sep. 28, 07
Portfolio Series Income Fund Nov. 17, 97 May 01, 17† May 01, 17† May 01, 17† May 01, 17† May 01, 17† -
Portfolio Series Maximum Growth Fund Dec. 18, 01 May 01, 17† May 01, 17† May 01, 17† May 01, 17† May 01, 17† Sep. 28, 07
*These Classes are no longer available for new purchases.
†Please refer to Note 1.

– 223 –
CI Mutual Funds
Annual Financial Statements - March 31, 2020
Notes to the Financial Statements (cont’d)
Inception Date:
Class A1T5 Class A2T5 Class A3T5 Class AT6 Class AT8 Class A1T8 Class A2T8
PORTFOLIO SERIES FUNDS (cont’d)
Portfolio Series Balanced Fund May 01, 17† May 01, 17† May 01, 17† - Sep. 28, 07 May 01, 17† May 01, 17†
Portfolio Series Balanced Growth Fund May 01, 17† May 01, 17† - Sept. 9, 12* Sep. 28, 07 May 01, 17† -
Portfolio Series Conservative Balanced Fund - - - Sept. 9, 12* - - -
Portfolio Series Conservative Fund - - - Sept. 9, 12* - - -
Portfolio Series Growth Fund May 01, 17† May 01, 17† May 01, 17† Sept. 9, 12* Sep. 28, 07 May 01, 17† -
Portfolio Series Income Fund - - - - - - -
Portfolio Series Maximum Growth Fund - - - - Sep. 28, 07 May 01, 17† -
Class A3T8 Class E Class ET5 Class ET8 Class EF Class EFT5 Class EFT8
PORTFOLIO SERIES FUNDS (cont’d)
Portfolio Series Balanced Fund May 01, 17† Aug. 4, 15 Aug. 4, 15 Aug. 4, 15 Aug. 4, 15 Aug. 4, 15 Aug. 4, 15
Portfolio Series Balanced Growth Fund - Aug. 4, 15 Aug. 4, 15 Aug. 4, 15 Aug. 4, 15 Aug. 4, 15 Aug. 4, 15
Portfolio Series Conservative Balanced Fund - Aug. 4, 15 - - Aug. 4, 15 - -
Portfolio Series Conservative Fund - Aug. 4, 15 - - Aug. 4, 15 - -
Portfolio Series Growth Fund - Aug. 4, 15 Aug. 4, 15 Aug. 4, 15 Aug. 4, 15 Aug. 4, 15 Aug. 4, 15
Portfolio Series Income Fund - Aug. 4, 15 - - Aug. 4, 15 - -
Portfolio Series Maximum Growth Fund - Aug. 4, 15 Aug. 4, 15 Aug. 4, 15 Aug. 4, 15 Aug. 4, 15 Aug. 4, 15
Class F Class F1 Class F2 Class F3 Class F4 Class F5 Class FT5
PORTFOLIO SERIES FUNDS (cont’d)
Portfolio Series Balanced Fund Nov. 17, 00 May 01, 17† May 01, 17† May 01, 17† May 01, 17† May 01, 17† Sep. 28, 07
Portfolio Series Balanced Growth Fund Dec. 18, 01 May 01, 17† May 01, 17† May 01, 17† May 01, 17† May 01, 17† -
Portfolio Series Conservative Balanced Fund Dec. 18, 01 May 01, 17† May 01, 17† May 01, 17† May 01, 17† May 01, 17† -
Portfolio Series Conservative Fund Nov. 17, 00 May 01, 17† May 01, 17† May 01, 17† May 01, 17† May 01, 17† -
Portfolio Series Growth Fund Dec. 18, 01 May 01, 17† May 01, 17† May 01, 17† May 01, 17† May 01, 17† -
Portfolio Series Income Fund Nov. 17, 00 May 01, 17† May 01, 17† May 01, 17† May 01, 17† May 01, 17† -
Portfolio Series Maximum Growth Fund Dec. 18, 01 May 01, 17† May 01, 17† May 01, 17† May 01, 17† May 01, 17† -
Class F1T5 Class FT8 Class F1T8 Class F2T8 Class F3T8 Class I Class O
PORTFOLIO SERIES FUNDS (cont’d)
Portfolio Series Balanced Fund May 01, 17† Sep. 28, 07 May 01, 17† May 01, 17† May 01, 17† Oct. 31, 96 Jul. 30, 13
Portfolio Series Balanced Growth Fund - Sep. 28, 07 May 01, 17† - - Jun. 29, 05 Jul. 30, 13
Portfolio Series Conservative Balanced Fund - - - - - Jun. 29, 05 Jul. 30, 13
Portfolio Series Conservative Fund - - - - - Nov. 17, 97 Jul. 30, 13
Portfolio Series Growth Fund - Sep. 28, 07 - - - Oct. 9, 02 Jul. 30, 13
Portfolio Series Income Fund - - - - - Nov. 17, 97 Jul. 30, 13
Portfolio Series Maximum Growth Fund - Sep. 28, 07 - - - Jun. 29, 05 Jul. 30, 13
Class OT5 Class OT8 Class P Class PT5 Class PT8 Class U Class UT6
PORTFOLIO SERIES FUNDS (cont’d)
Portfolio Series Balanced Fund Aug. 4, 15 Aug. 4, 15 May 1, 17 May 1, 17 May 1, 17 - -
Portfolio Series Balanced Growth Fund Aug. 4, 15 Aug. 4, 15 May 1, 17 - May 1, 17 - -
Portfolio Series Conservative Balanced Fund - - May 1, 17 - - - -
Portfolio Series Conservative Fund - - May 1, 17 - - Jul. 26, 12* Jul. 26, 12*
Portfolio Series Growth Fund Aug. 4, 15 Aug. 4, 15 May 1, 17 - May 1, 17 - -
Portfolio Series Income Fund - - May 1, 17 - - - -
Portfolio Series Maximum Growth Fund Aug. 4, 15 Aug. 4, 15 May 1, 17 - May 1, 17 - -
*These Classes are no longer available for new purchases.
†Please refer to Note 1.
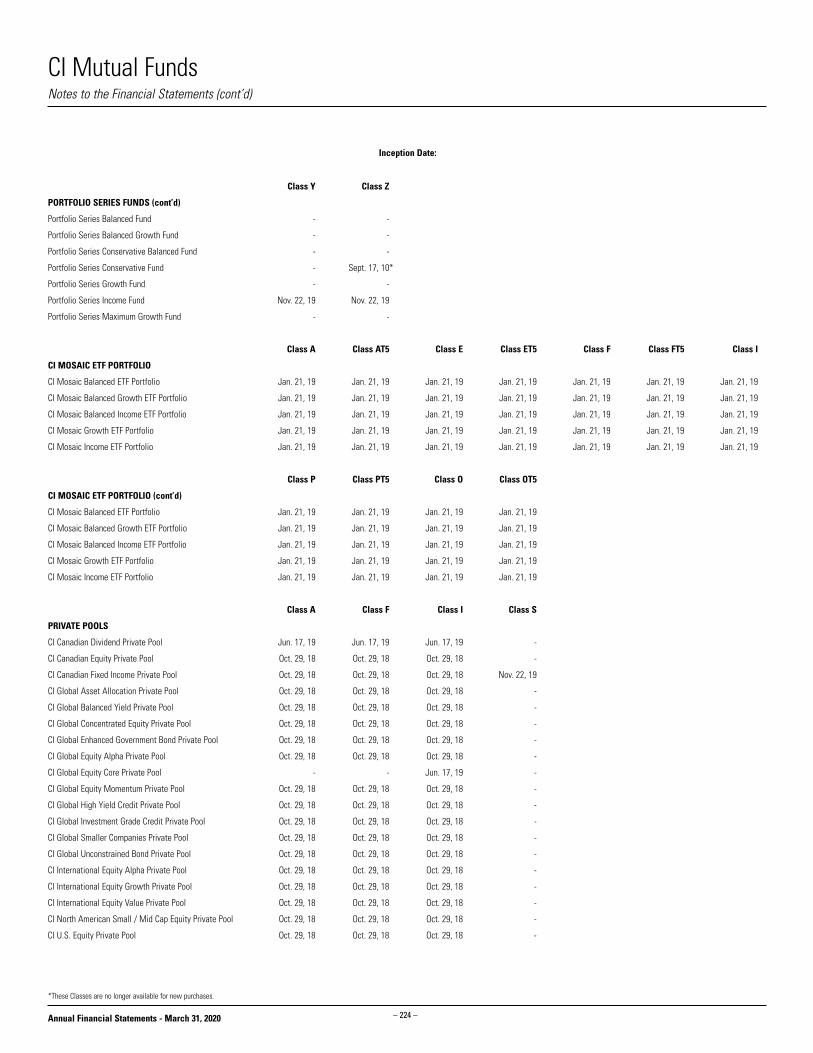
– 224 –
CI Mutual Funds
Annual Financial Statements - March 31, 2020
Inception Date:
Class Y Class Z
PORTFOLIO SERIES FUNDS (cont’d)
Portfolio Series Balanced Fund - -
Portfolio Series Balanced Growth Fund - -
Portfolio Series Conservative Balanced Fund - -
Portfolio Series Conservative Fund - Sept. 17, 10*
Portfolio Series Growth Fund - -
Portfolio Series Income Fund Nov. 22, 19 Nov. 22, 19
Portfolio Series Maximum Growth Fund - -
Class A Class AT5 Class E Class ET5 Class F Class FT5 Class I
CI MOSAIC ETF PORTFOLIO
CI Mosaic Balanced ETF Portfolio Jan. 21, 19 Jan. 21, 19 Jan. 21, 19 Jan. 21, 19 Jan. 21, 19 Jan. 21, 19 Jan. 21, 19
CI Mosaic Balanced Growth ETF Portfolio Jan. 21, 19 Jan. 21, 19 Jan. 21, 19 Jan. 21, 19 Jan. 21, 19 Jan. 21, 19 Jan. 21, 19
CI Mosaic Balanced Income ETF Portfolio Jan. 21, 19 Jan. 21, 19 Jan. 21, 19 Jan. 21, 19 Jan. 21, 19 Jan. 21, 19 Jan. 21, 19
CI Mosaic Growth ETF Portfolio Jan. 21, 19 Jan. 21, 19 Jan. 21, 19 Jan. 21, 19 Jan. 21, 19 Jan. 21, 19 Jan. 21, 19
CI Mosaic Income ETF Portfolio Jan. 21, 19 Jan. 21, 19 Jan. 21, 19 Jan. 21, 19 Jan. 21, 19 Jan. 21, 19 Jan. 21, 19
Class P Class PT5 Class O Class OT5
CI MOSAIC ETF PORTFOLIO (cont’d)
CI Mosaic Balanced ETF Portfolio Jan. 21, 19 Jan. 21, 19 Jan. 21, 19 Jan. 21, 19
CI Mosaic Balanced Growth ETF Portfolio Jan. 21, 19 Jan. 21, 19 Jan. 21, 19 Jan. 21, 19
CI Mosaic Balanced Income ETF Portfolio Jan. 21, 19 Jan. 21, 19 Jan. 21, 19 Jan. 21, 19
CI Mosaic Growth ETF Portfolio Jan. 21, 19 Jan. 21, 19 Jan. 21, 19 Jan. 21, 19
CI Mosaic Income ETF Portfolio Jan. 21, 19 Jan. 21, 19 Jan. 21, 19 Jan. 21, 19
Class A Class F Class I Class S
PRIVATE POOLS
CI Canadian Dividend Private Pool Jun. 17, 19 Jun. 17, 19 Jun. 17, 19 -
CI Canadian Equity Private Pool Oct. 29, 18 Oct. 29, 18 Oct. 29, 18 -
CI Canadian Fixed Income Private Pool Oct. 29, 18 Oct. 29, 18 Oct. 29, 18 Nov. 22, 19
CI Global Asset Allocation Private Pool Oct. 29, 18 Oct. 29, 18 Oct. 29, 18 -
CI Global Balanced Yield Private Pool Oct. 29, 18 Oct. 29, 18 Oct. 29, 18 -
CI Global Concentrated Equity Private Pool Oct. 29, 18 Oct. 29, 18 Oct. 29, 18 -
CI Global Enhanced Government Bond Private Pool Oct. 29, 18 Oct. 29, 18 Oct. 29, 18 -
CI Global Equity Alpha Private Pool Oct. 29, 18 Oct. 29, 18 Oct. 29, 18 -
CI Global Equity Core Private Pool - - Jun. 17, 19 -
CI Global Equity Momentum Private Pool Oct. 29, 18 Oct. 29, 18 Oct. 29, 18 -
CI Global High Yield Credit Private Pool Oct. 29, 18 Oct. 29, 18 Oct. 29, 18 -
CI Global Investment Grade Credit Private Pool Oct. 29, 18 Oct. 29, 18 Oct. 29, 18 -
CI Global Smaller Companies Private Pool Oct. 29, 18 Oct. 29, 18 Oct. 29, 18 -
CI Global Unconstrained Bond Private Pool Oct. 29, 18 Oct. 29, 18 Oct. 29, 18 -
CI International Equity Alpha Private Pool Oct. 29, 18 Oct. 29, 18 Oct. 29, 18 -
CI International Equity Growth Private Pool Oct. 29, 18 Oct. 29, 18 Oct. 29, 18 -
CI International Equity Value Private Pool Oct. 29, 18 Oct. 29, 18 Oct. 29, 18 -
CI North American Small / Mid Cap Equity Private Pool Oct. 29, 18 Oct. 29, 18 Oct. 29, 18 -
CI U.S. Equity Private Pool Oct. 29, 18 Oct. 29, 18 Oct. 29, 18 -
Notes to the Financial Statements (cont’d)
*These Classes are no longer available for new purchases.
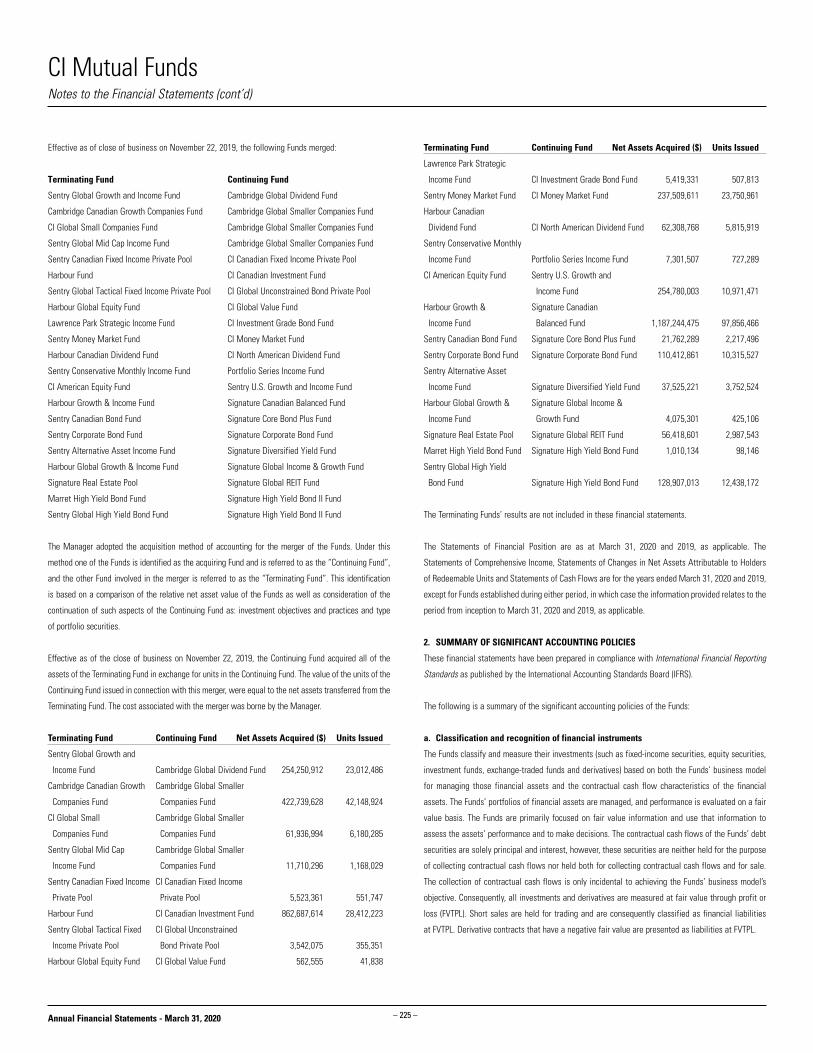
– 225 –
CI Mutual Funds
Annual Financial Statements - March 31, 2020
Notes to the Financial Statements (cont’d)
Effective as of close of business on November 22, 2019, the following Funds merged:
Terminating Fund Continuing Fund
Sentry Global Growth and Income Fund Cambridge Global Dividend Fund
Cambridge Canadian Growth Companies Fund Cambridge Global Smaller Companies Fund
CI Global Small Companies Fund Cambridge Global Smaller Companies Fund
Sentry Global Mid Cap Income Fund Cambridge Global Smaller Companies Fund
Sentry Canadian Fixed Income Private Pool CI Canadian Fixed Income Private Pool
Harbour Fund CI Canadian Investment Fund
Sentry Global Tactical Fixed Income Private Pool CI Global Unconstrained Bond Private Pool
Harbour Global Equity Fund CI Global Value Fund
Lawrence Park Strategic Income Fund CI Investment Grade Bond Fund
Sentry Money Market Fund CI Money Market Fund
Harbour Canadian Dividend Fund CI North American Dividend Fund
Sentry Conservative Monthly Income Fund Portfolio Series Income Fund
CI American Equity Fund Sentry U.S. Growth and Income Fund
Harbour Growth & Income Fund Signature Canadian Balanced Fund
Sentry Canadian Bond Fund Signature Core Bond Plus Fund
Sentry Corporate Bond Fund Signature Corporate Bond Fund
Sentry Alternative Asset Income Fund Signature Diversified Yield Fund
Harbour Global Growth & Income Fund Signature Global Income & Growth Fund
Signature Real Estate Pool Signature Global REIT Fund
Marret High Yield Bond Fund Signature High Yield Bond II Fund
Sentry Global High Yield Bond Fund Signature High Yield Bond II Fund
The Manager adopted the acquisition method of accounting for the merger of the Funds. Under this
method one of the Funds is identified as the acquiring Fund and is referred to as the “Continuing Fund”,
and the other Fund involved in the merger is referred to as the “Terminating Fund”. This identification
is based on a comparison of the relative net asset value of the Funds as well as consideration of the
continuation of such aspects of the Continuing Fund as: investment objectives and practices and type
of portfolio securities.
Effective as of the close of business on November 22, 2019, the Continuing Fund acquired all of the
assets of the Terminating Fund in exchange for units in the Continuing Fund. The value of the units of the
Continuing Fund issued in connection with this merger, were equal to the net assets transferred from the
Terminating Fund. The cost associated with the merger was borne by the Manager.
Terminating Fund Continuing Fund Net Assets Acquired ($) Units Issued
Sentry Global Growth and
Income Fund Cambridge Global Dividend Fund 254,250,912 23,012,486
Cambridge Canadian Growth Cambridge Global Smaller
Companies Fund Companies Fund 422,739,628 42,148,924
CI Global Small Cambridge Global Smaller
Companies Fund Companies Fund 61,936,994 6,180,285
Sentry Global Mid Cap Cambridge Global Smaller
Income Fund Companies Fund 11,710,296 1,168,029
Sentry Canadian Fixed Income CI Canadian Fixed Income
Private Pool Private Pool 5,523,361 551,747
Harbour Fund CI Canadian Investment Fund 862,687,614 28,412,223
Sentry Global Tactical Fixed CI Global Unconstrained
Income Private Pool Bond Private Pool 3,542,075 355,351
Harbour Global Equity Fund CI Global Value Fund 562,555 41,838
Terminating Fund Continuing Fund Net Assets Acquired ($) Units Issued
Lawrence Park Strategic
Income Fund CI Investment Grade Bond Fund 5,419,331 507,813
Sentry Money Market Fund CI Money Market Fund 237,509,611 23,750,961
Harbour Canadian
Dividend Fund CI North American Dividend Fund 62,308,768 5,815,919
Sentry Conservative Monthly
Income Fund Portfolio Series Income Fund 7,301,507 727,289
CI American Equity Fund Sentry U.S. Growth and
Income Fund 254,780,003 10,971,471
Harbour Growth & Signature Canadian
Income Fund Balanced Fund 1,187,244,475 97,856,466
Sentry Canadian Bond Fund Signature Core Bond Plus Fund 21,762,289 2,217,496
Sentry Corporate Bond Fund Signature Corporate Bond Fund 110,412,861 10,315,527
Sentry Alternative Asset
Income Fund Signature Diversified Yield Fund 37,525,221 3,752,524
Harbour Global Growth & Signature Global Income &
Income Fund Growth Fund 4,075,301 425,106
Signature Real Estate Pool Signature Global REIT Fund 56,418,601 2,987,543
Marret High Yield Bond Fund Signature High Yield Bond Fund 1,010,134 98,146
Sentry Global High Yield
Bond Fund Signature High Yield Bond Fund 128,907,013 12,438,172
The Terminating Funds’ results are not included in these financial statements.
The Statements of Financial Position are as at March 31, 2020 and 2019, as applicable. The
Statements of Comprehensive Income, Statements of Changes in Net Assets Attributable to Holders
of Redeemable Units and Statements of Cash Flows are for the years ended March 31, 2020 and 2019,
except for Funds established during either period, in which case the information provided relates to the
period from inception to March 31, 2020 and 2019, as applicable.
2. SUMMARY OF SIGNIFICANT ACCOUNTING POLICIES
These financial statements have been prepared in compliance with International Financial Reporting
Standards as published by the International Accounting Standards Board (IFRS).
The following is a summary of the significant accounting policies of the Funds:
a. Classification and recognition of financial instruments
The Funds classify and measure their investments (such as fixed-income securities, equity securities,
investment funds, exchange-traded funds and derivatives) based on both the Funds’ business model
for managing those financial assets and the contractual cash flow characteristics of the financial
assets. The Funds’ portfolios of financial assets are managed, and performance is evaluated on a fair
value basis. The Funds are primarily focused on fair value information and use that information to
assess the assets’ performance and to make decisions. The contractual cash flows of the Funds’ debt
securities are solely principal and interest, however, these securities are neither held for the purpose
of collecting contractual cash flows nor held both for collecting contractual cash flows and for sale.
The collection of contractual cash flows is only incidental to achieving the Funds’ business model’s
objective. Consequently, all investments and derivatives are measured at fair value through profit or
loss (FVTPL). Short sales are held for trading and are consequently classified as financial liabilities
at FVTPL. Derivative contracts that have a negative fair value are presented as liabilities at FVTPL.

– 226 –
CI Mutual Funds
Annual Financial Statements - March 31, 2020
Notes to the Financial Statements (cont’d)
The Funds’ obligations for net assets attributable to holders of redeemable units are presented at the
redemption amount, which approximates their fair value. All other financial assets and liabilities are
measured at amortized cost, which approximates their fair value. Under this method, financial assets
and liabilities reflect the amount required to be received or paid, discounted, when appropriate, at the
effective rate of interest.
Financial assets and liabilities are offset, and the net amounts are presented in the Statements of
Financial Position when, and only when, the Funds have a legal right to offset the amounts and
intend either to settle on a net basis or to realize the asset and settle the liability simultaneously.
In the normal course of business, the Funds enter into various master netting agreements or similar
agreements that do not meet the criteria for offsetting in the Statements of Financial Position, but still
allow for the related amounts to be offset in certain circumstances, such as bankruptcy or termination
of the contracts.
b. Fair value of financial instruments
At the financial reporting date, listed securities are valued based on the last traded market price
for financial assets and financial liabilities where the last traded price falls within the day’s bid-ask
spread. In circumstances where the last traded price is not within the bid-ask spread, the Manager
determines the point within the bid-ask spread that is most representative of fair value based on the
existing market conditions. Unlisted securities are valued based on price quotations from recognized
investment dealers, or failing that, their fair value is determined by the Manager based on the
latest reported information available. Unlisted warrants, if any, are valued based on a pricing model
which considers factors such as the market value of the underlying security, strike price and terms
of the warrant. Fixed income securities, debentures and other debt instruments including short-term
investments, are valued at the quotation received from recognized investment dealers. Underlying
fund(s) are valued on each business day at their net asset value as reported by the underlying fund(s)’
managers.
The fair value of securities where no market price exists is determined by using valuation models that
may be based, in part, on assumptions that are not supported by observable market inputs. These
methods and procedures may include, but are not limited to, performing comparisons with prices of
comparable or similar securities, obtaining valuation related information from issuers and/or other
analytical data relating to the investment and using other available indications of value. These values
are independently assessed by the Manager to ensure that they are reasonable. However, because of
the inherent uncertainty of valuation, the estimated fair values for these securities may be materially
different from the values that would have been used had a ready market for the investment existed.
The fair values of securities where no market price exists are affected by the perceived credit risks of
the issuer, predictability of cash flows and the length of time to maturity.
c. Cash
Cash is comprised of cash on deposit and bank overdraft.
d. Cost of investments
Cost of investments represents the amount paid for each security and is determined on an average
cost basis excluding commissions and transactions costs. Average cost does not include amortization
of premiums or discounts on fixed income securities with the exception of zero-coupon bonds.
e. Investment transactions and income recognition
Investment transactions are recorded on the trade date - the date on which a Fund commits to
purchase or sell an investment. The interest for distribution purposes disclosed in the Statements of
Comprehensive Income, represents the coupon interest received by the Funds and is accounted for on
an accrual basis. The Funds do not amortize premiums paid or discounts received on the purchase of
fixed income securities, except for zero coupon bonds which are amortized on a straight-line basis.
Dividends and distributions from investments are recognized on the ex-dividend/ex-distribution date.
Distributions received from income trust(s) and underlying fund(s) holdings are recorded as income,
capital gains or a return of capital based on the best information available to the Manager. Due to the
nature of these investments, actual allocations could vary from this information. Distributions from
income trust(s) and underlying fund(s) that are treated as a return of capital for income tax purposes
reduce the average cost of the income trust(s) and underlying fund(s).
f. Functional and presentation currency
The Funds’ functional and presentation currency is the Canadian dollar, except for CI US Money Market
Fund, CI U.S. Income US$ Pool and Cambridge U.S. Dividend US$ Fund as those Funds’ functional and
presentation currency is U.S. dollar. For Funds that offer Class AH, Class FH, Class IH, Class PH and
Class WH units, the Net Asset Value per unit for those Class is stated in U.S. dollars.
g. Foreign exchange
Foreign currency amounts are translated into the functional currency as follows: fair value of
investments, foreign currency forward contracts and other assets and liabilities at the closing rate
of exchange on each business day; income and expenses, purchases and sales and settlements of
investments at the rate of exchange prevailing on the respective dates of such transactions. Foreign
exchange gains (losses) relating to cash are presented as “Foreign exchange gain (loss) on cash” and
those relating to other financial assets and liabilities are presented within “Net realized gain (loss) on
sale of investments and derivatives” and “Change in unrealized appreciation (depreciation) in value of
investments and derivatives” in the Statements of Comprehensive Income.
h. Unit valuation
Net asset value (NAV) per unit of each class is calculated at the end of each day on which the Toronto
Stock Exchange is open for business by dividing the total NAV of each class of a Fund by the number
of units of that class outstanding.
The NAV of each class is computed by calculating the value of that class’ proportionate share of
the Fund’s assets less that class’ proportionate share of the Fund’s common liabilities and less class
specific liabilities. Expenses directly attributable to a class are charged to that class. Other income,
expenses, gains and losses, are allocated to each class proportionately based upon the relative total
NAV of each class.
As at March 31, 2020 and 2019, there were no differences between the NAV used for transactions
with unitholders and the net assets attributable to holders of redeemable units used for reporting
purposes under IFRS, except for Funds as noted below.
Subsequent to March 31, 2020, one security was found to be inaccurately valued in the following
Funds as of March 31, 2020: Cambridge Canadian Dividend Fund, Cambridge Asset Allocation Fund
and CI Canadian Dividend Private Pool. The financial statements of these Funds were adjusted to
reflect the correct valuation. This created a difference between the NAV used for transactions with
unitholders and the net assets attributable to holders of redeemable units on the financial statements .

– 227 –
CI Mutual Funds
Annual Financial Statements - March 31, 2020
Notes to the Financial Statements (cont’d)
The table below provides a comparison of Transactional NAV per unit and Net Assets per unit on the
financial statements:
as at March 31, 2020
Net Assets per
Transactional unit as per the
Fund Name Class NAV per unit financial statements
Cambridge Canadian Dividend Fund A $18.07 $18.00
Cambridge Canadian Dividend Fund D $17.90 $17.83
Cambridge Canadian Dividend Fund E $9.80 $9.76
Cambridge Canadian Dividend Fund EF $8.49 $8.46
Cambridge Canadian Dividend Fund F $18.92 $18.85
Cambridge Canadian Dividend Fund I $16.11 $16.05
Cambridge Canadian Dividend Fund O $10.67 $10.63
Cambridge Canadian Dividend Fund P $7.64 $7.61
Cambridge Canadian Dividend Fund W $7.50 $7.46
Cambridge Asset Allocation Fund A $9.32 $9.31
Cambridge Asset Allocation Fund E $9.33 $9.32
Cambridge Asset Allocation Fund EF $9.39 $9.38
Cambridge Asset Allocation Fund F $9.38 $9.37
Cambridge Asset Allocation Fund I $9.46 $9.45
Cambridge Asset Allocation Fund O $9.45 $9.44
Cambridge Asset Allocation Fund P $9.44 $9.43
CI Canadian Dividend Private Pool A $7.37 $7.32
CI Canadian Dividend Private Pool F $7.38 $7.33
CI Canadian Dividend Private Pool I $7.34 $7.29
Adjustments were made in accordance with the Manager’s NAV error policy.
i. Classification of units
The units of each of the Funds are classified as financial liabilities in accordance with IAS 32, as they
do not meet the definition of puttable instruments to be classified as equity in accordance with IAS
32 for financial reporting purposes.
j. Commissions and other portfolio transaction costs
Transaction costs, such as brokerage commissions, incurred in the purchase and sale of securities, are
included in “Commissions and other portfolio transaction costs” in the Statements of Comprehensive
Income.
k. Increase (decrease) in net assets attributable to holders of redeemable units per unit
“Increase (decrease) in net assets attributable to holders of redeemable units per unit” in the
Statements of Comprehensive Income is calculated by dividing the increase (decrease) in net assets
attributable to holders of redeemable units of each class of a Fund by the weighted average number
of units of that class outstanding during the year.
l. Foreign currency forward contract(s)
A Fund may, from time to time, enter into foreign currency forward contracts. Foreign currency forward
contracts are valued on each valuation day based on the difference between the contract rate and the
current forward rate at the measurement date applied to the contract’s notional amount and adjusted
for counterparty risk. All unrealized gains (losses) arising from foreign currency forward contracts are
recorded as part of “Change in unrealized appreciation (depreciation) in value of investments and
derivatives” in the Statements of Comprehensive Income and “Unrealized gain (loss) on futures and
foreign currency forward contracts” in the Statements of Financial Position until the contracts are
closed out or expire, at which time the gains (losses) are realized and reported as “Net realized gain
(loss) on sale of investments and derivatives” in the Statements of Comprehensive Income.
m. Future contract(s)
Future contracts are valued on each valuation day using the closing price posted on the relevant
public exchange. Cash and cash equivalents are held as margin against futures contracts which are
reflected in the “Daily variation margin on derivative instruments” in the Statements of Financial
Position. All unrealized gains (losses) arising from futures contracts are recorded as part of “Change
in unrealized appreciation (depreciation) in value of investments and derivatives” in the Statements of
Comprehensive Income and “Unrealized gain (loss) on futures and foreign currency forward contracts”
in the Statements of Financial Position until the contracts are closed out or expire, at which time
the gains (losses) are realized and reported as “Net realized gain (loss) on sale of investments and
derivatives” in the Statements of Comprehensive Income.
n. Option contract(s)
Over-the-counter (OTC) options are valued using the Black Scholes model, whereas, exchange traded
options are valued at last traded price taken from the exchange. Options contracts are valued each
valuation day according to the gain or loss that would be realized if the contracts were closed
out. All unrealized gains (losses) arising from option contracts are recorded as part of “Change in
unrealized appreciation (depreciation) in value of investments and derivatives” in the Statements of
Comprehensive Income until the contracts are closed out or expire, at which time the gains (losses)
are realized and reflected in the Statements of Comprehensive Income in “Net realized gain (loss) on
sale of investments and derivatives”. Any expired option premiums are recorded as part of “Derivative
income (loss)” in the Statements of Comprehensive Income.
o. Interest rate swap contract(s)
The fair value of interest rate swaps is determined using indicative closing market values obtained
from third-party broker-dealers. The broker-dealers determine the fair value using valuation models
that are based on assumptions that are supported by observable market inputs, including the interest
rates for that day. The indicative closing market values are independently assessed internally to ensure
that they are reasonable. Any income (expense) received (incurred) for interest rate swaps contracts
is recorded as “Derivative income (loss)” in the Statements of Comprehensive Income. The unrealized
gain or loss on interest rate swaps is reflected in the Statements of Comprehensive Income as part
of “Change in unrealized appreciation (depreciation) in value of investments and derivatives”. When
the interest rate swaps contracts are closed out, any gains (losses) are recorded as “Net realized gain
(loss) on sale of investments and derivatives” in the Statements of Comprehensive Income.
p. Total return swap contract(s)
A total return swap is an agreement between a Fund and a counterparty where single or multiple
cash flows are exchanged based on the price of an underlying reference asset and based on a fixed
or variable rate. Over the term of the contract, the Fund will pay to the counterparty a periodic stream
of payments based on fixed or variable rate. Such periodic payments paid are accrued daily and are
included in the Statement of Comprehensive Income in “Interest expense”. At the maturity date, a net
cash flow is exchanged where the total return is equivalent to the return of the underlying reference
asset less a rate, if any. As a receiver, the Fund would receive payments based on any net positive
total return and would owe payments in the event of a net negative total return.

– 228 –
CI Mutual Funds
Annual Financial Statements - March 31, 2020
Notes to the Financial Statements (cont’d)
The unrealized gain or loss on total return swaps is reflected in the Statements of Comprehensive
Income as part of “Change in unrealized appreciation (depreciation) in value of investments and
derivatives”. When the total return swaps contracts are closed out, any gains (losses) are recorded as
“Net realized gain (loss) on sale of investments and derivatives” in the Statements of Comprehensive
Income.
q. Credit default swaps contract(s)
Credit default swaps are agreements that help to mitigate credit risk exposure to certain issuing
entities (Referenced Entity) or to increase credit risk exposure to the Referenced Entity by creating a
notional investment position. When a notional investment position is created, the credit risk exposure
is comparable to the exposure that would have resulted had a Fund invested directly in the Referenced
Entity. Under a credit default swap agreement, the protection buyer, whose intention is to reduce its
credit risk exposure to the Referenced Entity, pays a premium to the protection seller, who assumes the
credit risk of a default of the bond of a Referenced Entity. This premium is paid at regular intervals over
the term of the credit default swap agreement. In return for the premium paid, the protection buyer
is entitled to receive from the protection seller full payment for a loss arising from a credit default
event of the Referenced Entity. A credit default event may be triggered by bankruptcy, failure to pay or
restructuring of the Referenced Entity. If a credit default event occurs, the credit default swap may be
settled by either the physical delivery of the bond for proceeds equal to par value or a cash payment
equal to the loss amount. Credit default swaps are valued based on dealer-supplied valuations.
Changes in value of credit default swap agreements are recorded as part of “Change in
unrealized appreciation (depreciation) in value of investments and derivatives” in the Statements of
Comprehensive Income. Premiums paid or received from credit default swap agreements are included
in “Derivative income (loss)” in the Statements of Comprehensive Income. When credit default swap
agreements expire or are closed out, gains or losses are included in “Net realized gain (loss) on sale
of investments and derivatives” in the Statements of Comprehensive Income.
r. Mortgage-backed and asset-backed securities
Certain Funds invest in mortgage-related and other asset-backed securities. These securities may
include: mortgage pass-through securities, collateralized mortgage obligations, commercial mortgage-
backed securities, asset-backed securities, collateralized debt obligations and other securities that
directly or indirectly represent a participation in, or are secured by and payable from, mortgage loans
on real property. The debt and equity securities issued by these securities may include tranches with
varying levels of subordination. These securities may provide a monthly payment which consists of
both interest and principal payments.
Mortgage-related securities are created from pools of residential or commercial mortgage loans,
including mortgage loans made by savings and loan institutions, mortgage bankers, commercial banks
and others. Asset-backed securities are created from many types of assets, including auto loans, credit
card receivables, home equity loans and student loans.
Mortgage-related and asset-backed securities are issued as separate tranches, or classes, of
securities within each deal. The securities are also normally valued by pricing service providers
that use broker- dealer quotations or valuation estimates from their internal pricing models. The
pricing models for these securities usually consider tranche-level attributes, current market data,
estimated cash-flows, and market-based yield spreads for each tranche and incorporate deal collateral
performance, as available. The carrying values of mortgage-related and other asset-backed securities
are included in “Investments” in the Statements of Financial Position. The change in fair values of
mortgage-related and other asset-backed securities are included in the Statements of Comprehensive
Income in “Change in unrealized appreciation (depreciation) in value of investments and derivatives”.
s. Short selling
When a Fund sells a security short, it will borrow that security from a broker to complete the sale. As
the Fund borrows a security from the broker, the Fund is required to maintain a margin account with
the broker containing cash or liquid securities. The cash held on margin in respect of short sale activity
is included in the “Collateral on deposit for short sale” in the Statements of Financial Position. The
maximum loss on securities sold short can be unlimited. The Fund will incur a loss as a result of a short
sale if the price of the borrowed security increases between the date of the short sale and the date on
which the Fund closes out its short position by buying that security. The Fund will realize a gain if the
security declines in price between those dates. The gain or loss that would be realized if the position
was to be closed out on the valuation date is reflected in the Statements of Comprehensive Income as
part of “Change in unrealized appreciation (depreciation) in value of investments and derivatives” and
in the Statements of Financial Position in “Investments sold short”. When the short position is closed
out, gains and losses are realized and included in “Net realized gain (loss) on sale of investments
and derivatives” in the Statements of Comprehensive Income. Fees paid to a broker for borrowing
a security are included in “Securities borrowing fees” in the Statements of Comprehensive Income.
t. Offsetting of financial instruments
The disclosures set out in the Offsetting of Financial Instruments tables in the Fund Specific Notes
to Financial Statements of each Fund, where applicable, include foreign currency forward contracts
assets and liabilities that are subject to an enforceable master netting arrangement. Transactions
with individual Counterparties are governed by separate master netting agreements. Each agreement
allows for net settlement of certain open contracts where the Funds and respective counterparty both
elect to settle on a net basis. In the absence of such an election, contracts will be settled on a gross
basis. However, each party to the master netting agreement will have the option to settle all open
contracts on a net basis in the event of default of the other party.
International Swaps and Derivatives Association Inc. Master Agreements (ISDA Master Agreements)
govern OTC financial derivative transactions entered into by the Funds and select counterparties. The
ISDA Master Agreements maintain provisions for general obligations, representations, agreements,
collateral and events of default or termination. Events of termination include conditions that may
entitle counterparties to elect to terminate early and cause settlement of all outstanding transactions
under the applicable ISDA Master Agreement. Any election to terminate early could be material to the
financial statements. The fair value of OTC financial derivative transactions net of collateral received
in or pledged by counterparty is disclosed in the Fund Specific Notes to Financial Statements.
Funds may be subject to various master agreements or netting arrangements with select counterparties.
These master agreements reduce the counterparty risk associated with relevant transactions by
specifying credit protection mechanisms and providing standardization that improves legal certainty.
Since different types of transactions have different mechanics and are sometimes traded out of
different legal entities of a particular counterparty organization, each type of transaction may be
covered by a different master agreement resulting in the need for multiple agreements with a single
counterparty. As the master agreements are specific to unique operations of different asset types, they
allow the Funds to close out and net their total exposure to a counterparty in the event of a default
with respect to the transactions governed under a single agreement with a counterparty.
u. Investments in associates, joint ventures, subsidiaries and unconsolidated structured
entities
Subsidiaries are entities, including investments in other investment entities, over which a Fund has
control. A Fund controls an entity when it is exposed to, or has rights to, variable returns from its
involvement with the entity, and has the ability to affect those returns through its power over the
entity. Associates and joint ventures are investments over which a Fund has significant influence
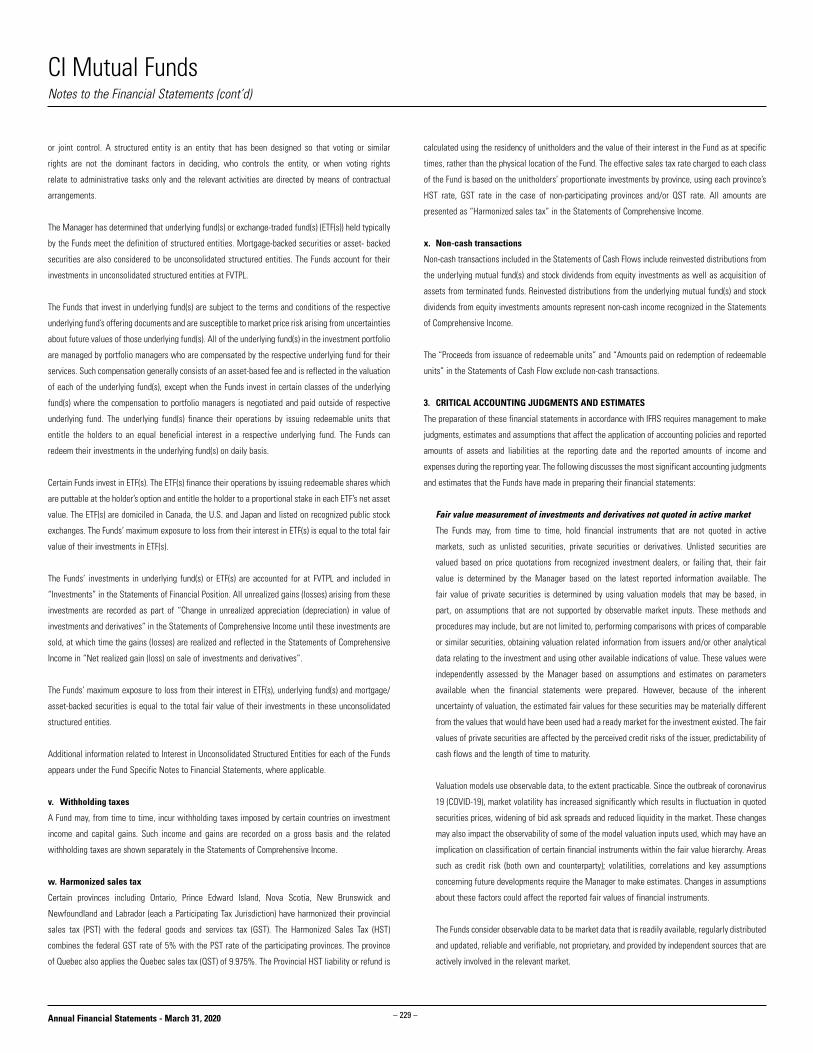
– 229 –
CI Mutual Funds
Annual Financial Statements - March 31, 2020
Notes to the Financial Statements (cont’d)
or joint control. A structured entity is an entity that has been designed so that voting or similar
rights are not the dominant factors in deciding, who controls the entity, or when voting rights
relate to administrative tasks only and the relevant activities are directed by means of contractual
arrangements.
The Manager has determined that underlying fund(s) or exchange-traded fund(s) (ETF(s)) held typically
by the Funds meet the definition of structured entities. Mortgage-backed securities or asset- backed
securities are also considered to be unconsolidated structured entities. The Funds account for their
investments in unconsolidated structured entities at FVTPL.
The Funds that invest in underlying fund(s) are subject to the terms and conditions of the respective
underlying fund’s offering documents and are susceptible to market price risk arising from uncertainties
about future values of those underlying fund(s). All of the underlying fund(s) in the investment portfolio
are managed by portfolio managers who are compensated by the respective underlying fund for their
services. Such compensation generally consists of an asset-based fee and is reflected in the valuation
of each of the underlying fund(s), except when the Funds invest in certain classes of the underlying
fund(s) where the compensation to portfolio managers is negotiated and paid outside of respective
underlying fund. The underlying fund(s) finance their operations by issuing redeemable units that
entitle the holders to an equal beneficial interest in a respective underlying fund. The Funds can
redeem their investments in the underlying fund(s) on daily basis.
Certain Funds invest in ETF(s). The ETF(s) finance their operations by issuing redeemable shares which
are puttable at the holder’s option and entitle the holder to a proportional stake in each ETF’s net asset
value. The ETF(s) are domiciled in Canada, the U.S. and Japan and listed on recognized public stock
exchanges. The Funds’ maximum exposure to loss from their interest in ETF(s) is equal to the total fair
value of their investments in ETF(s).
The Funds’ investments in underlying fund(s) or ETF(s) are accounted for at FVTPL and included in
“Investments” in the Statements of Financial Position. All unrealized gains (losses) arising from these
investments are recorded as part of “Change in unrealized appreciation (depreciation) in value of
investments and derivatives” in the Statements of Comprehensive Income until these investments are
sold, at which time the gains (losses) are realized and reflected in the Statements of Comprehensive
Income in “Net realized gain (loss) on sale of investments and derivatives”.
The Funds’ maximum exposure to loss from their interest in ETF(s), underlying fund(s) and mortgage/
asset-backed securities is equal to the total fair value of their investments in these unconsolidated
structured entities.
Additional information related to Interest in Unconsolidated Structured Entities for each of the Funds
appears under the Fund Specific Notes to Financial Statements, where applicable.
v. Withholding taxes
A Fund may, from time to time, incur withholding taxes imposed by certain countries on investment
income and capital gains. Such income and gains are recorded on a gross basis and the related
withholding taxes are shown separately in the Statements of Comprehensive Income.
w. Harmonized sales tax
Certain provinces including Ontario, Prince Edward Island, Nova Scotia, New Brunswick and
Newfoundland and Labrador (each a Participating Tax Jurisdiction) have harmonized their provincial
sales tax (PST) with the federal goods and services tax (GST). The Harmonized Sales Tax (HST)
combines the federal GST rate of 5% with the PST rate of the participating provinces. The province
of Quebec also applies the Quebec sales tax (QST) of 9.975%. The Provincial HST liability or refund is
calculated using the residency of unitholders and the value of their interest in the Fund as at specific
times, rather than the physical location of the Fund. The effective sales tax rate charged to each class
of the Fund is based on the unitholders’ proportionate investments by province, using each province’s
HST rate, GST rate in the case of non-participating provinces and/or QST rate. All amounts are
presented as “Harmonized sales tax” in the Statements of Comprehensive Income.
x. Non-cash transactions
Non-cash transactions included in the Statements of Cash Flows include reinvested distributions from
the underlying mutual fund(s) and stock dividends from equity investments as well as acquisition of
assets from terminated funds. Reinvested distributions from the underlying mutual fund(s) and stock
dividends from equity investments amounts represent non-cash income recognized in the Statements
of Comprehensive Income.
The “Proceeds from issuance of redeemable units” and “Amounts paid on redemption of redeemable
units” in the Statements of Cash Flow exclude non-cash transactions.
3. CRITICAL ACCOUNTING JUDGMENTS AND ESTIMATES
The preparation of these financial statements in accordance with IFRS requires management to make
judgments, estimates and assumptions that affect the application of accounting policies and reported
amounts of assets and liabilities at the reporting date and the reported amounts of income and
expenses during the reporting year. The following discusses the most significant accounting judgments
and estimates that the Funds have made in preparing their financial statements:
Fair value measurement of investments and derivatives not quoted in active market
The Funds may, from time to time, hold financial instruments that are not quoted in active
markets, such as unlisted securities, private securities or derivatives. Unlisted securities are
valued based on price quotations from recognized investment dealers, or failing that, their fair
value is determined by the Manager based on the latest reported information available. The
fair value of private securities is determined by using valuation models that may be based, in
part, on assumptions that are not supported by observable market inputs. These methods and
procedures may include, but are not limited to, performing comparisons with prices of comparable
or similar securities, obtaining valuation related information from issuers and/or other analytical
data relating to the investment and using other available indications of value. These values were
independently assessed by the Manager based on assumptions and estimates on parameters
available when the financial statements were prepared. However, because of the inherent
uncertainty of valuation, the estimated fair values for these securities may be materially different
from the values that would have been used had a ready market for the investment existed. The fair
values of private securities are affected by the perceived credit risks of the issuer, predictability of
cash flows and the length of time to maturity.
Valuation models use observable data, to the extent practicable. Since the outbreak of coronavirus
19 (COVID-19), market volatility has increased significantly which results in fluctuation in quoted
securities prices, widening of bid ask spreads and reduced liquidity in the market. These changes
may also impact the observability of some of the model valuation inputs used, which may have an
implication on classification of certain financial instruments within the fair value hierarchy. Areas
such as credit risk (both own and counterparty); volatilities, correlations and key assumptions
concerning future developments require the Manager to make estimates. Changes in assumptions
about these factors could affect the reported fair values of financial instruments.
The Funds consider observable data to be market data that is readily available, regularly distributed
and updated, reliable and verifiable, not proprietary, and provided by independent sources that are
actively involved in the relevant market.
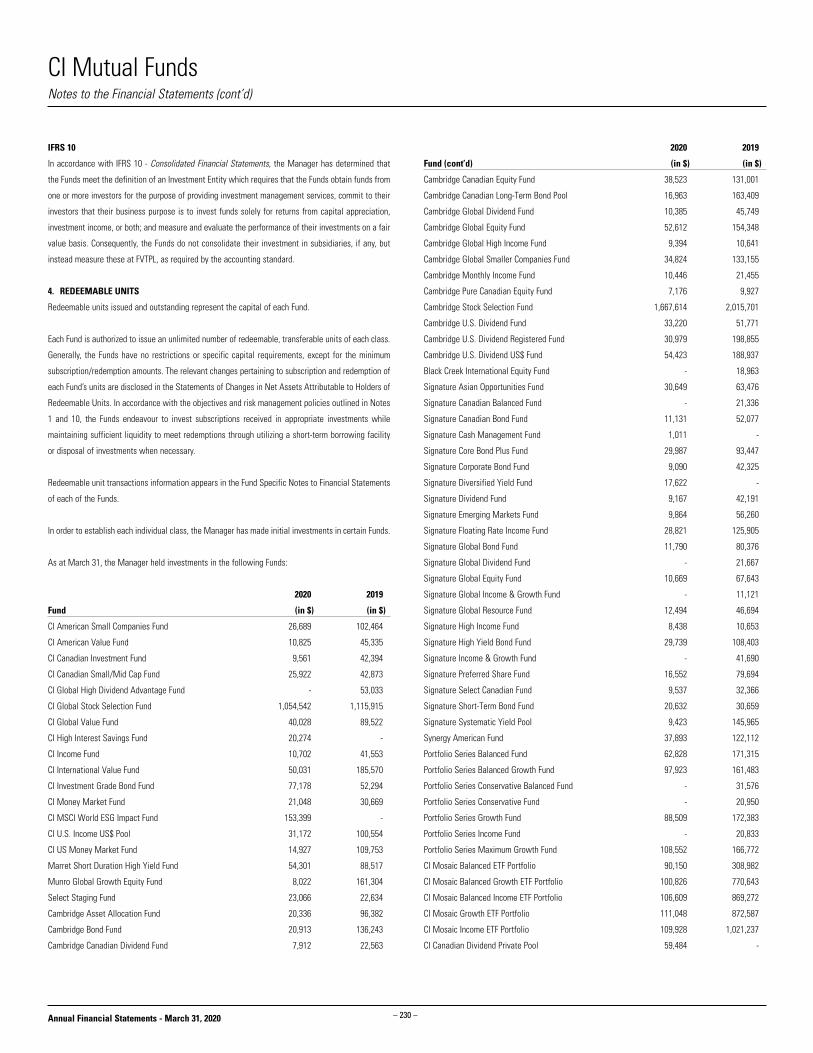
– 230 –
CI Mutual Funds
Annual Financial Statements - March 31, 2020
Notes to the Financial Statements (cont’d)
IFRS 10
In accordance with IFRS 10 - Consolidated Financial Statements, the Manager has determined that
the Funds meet the definition of an Investment Entity which requires that the Funds obtain funds from
one or more investors for the purpose of providing investment management services, commit to their
investors that their business purpose is to invest funds solely for returns from capital appreciation,
investment income, or both; and measure and evaluate the performance of their investments on a fair
value basis. Consequently, the Funds do not consolidate their investment in subsidiaries, if any, but
instead measure these at FVTPL, as required by the accounting standard.
4. REDEEMABLE UNITS
Redeemable units issued and outstanding represent the capital of each Fund.
Each Fund is authorized to issue an unlimited number of redeemable, transferable units of each class.
Generally, the Funds have no restrictions or specific capital requirements, except for the minimum
subscription/redemption amounts. The relevant changes pertaining to subscription and redemption of
each Fund’s units are disclosed in the Statements of Changes in Net Assets Attributable to Holders of
Redeemable Units. In accordance with the objectives and risk management policies outlined in Notes
1 and 10, the Funds endeavour to invest subscriptions received in appropriate investments while
maintaining sufficient liquidity to meet redemptions through utilizing a short-term borrowing facility
or disposal of investments when necessary.
Redeemable unit transactions information appears in the Fund Specific Notes to Financial Statements
of each of the Funds.
In order to establish each individual class, the Manager has made initial investments in certain Funds.
As at March 31, the Manager held investments in the following Funds:
2020 2019
Fund (in $) (in $)
CI American Small Companies Fund 26,689 102,464
CI American Value Fund 10,825 45,335
CI Canadian Investment Fund 9,561 42,394
CI Canadian Small/Mid Cap Fund 25,922 42,873
CI Global High Dividend Advantage Fund - 53,033
CI Global Stock Selection Fund 1,054,542 1,115,915
CI Global Value Fund 40,028 89,522
CI High Interest Savings Fund 20,274 -
CI Income Fund 10,702 41,553
CI International Value Fund 50,031 185,570
CI Investment Grade Bond Fund 77,178 52,294
CI Money Market Fund 21,048 30,669
CI MSCI World ESG Impact Fund 153,399 -
CI U.S. Income US$ Pool 31,172 100,554
CI US Money Market Fund 14,927 109,753
Marret Short Duration High Yield Fund 54,301 88,517
Munro Global Growth Equity Fund 8,022 161,304
Select Staging Fund 23,066 22,634
Cambridge Asset Allocation Fund 20,336 96,382
Cambridge Bond Fund 20,913 136,243
Cambridge Canadian Dividend Fund 7,912 22,563
2020 2019
Fund (cont’d) (in $) (in $)
Cambridge Canadian Equity Fund 38,523 131,001
Cambridge Canadian Long-Term Bond Pool 16,963 163,409
Cambridge Global Dividend Fund 10,385 45,749
Cambridge Global Equity Fund 52,612 154,348
Cambridge Global High Income Fund 9,394 10,641
Cambridge Global Smaller Companies Fund 34,824 133,155
Cambridge Monthly Income Fund 10,446 21,455
Cambridge Pure Canadian Equity Fund 7,176 9,927
Cambridge Stock Selection Fund 1,667,614 2,015,701
Cambridge U.S. Dividend Fund 33,220 51,771
Cambridge U.S. Dividend Registered Fund 30,979 198,855
Cambridge U.S. Dividend US$ Fund 54,423 188,937
Black Creek International Equity Fund - 18,963
Signature Asian Opportunities Fund 30,649 63,476
Signature Canadian Balanced Fund - 21,336
Signature Canadian Bond Fund 11,131 52,077
Signature Cash Management Fund 1,011 -
Signature Core Bond Plus Fund 29,987 93,447
Signature Corporate Bond Fund 9,090 42,325
Signature Diversified Yield Fund 17,622 -
Signature Dividend Fund 9,167 42,191
Signature Emerging Markets Fund 9,864 56,260
Signature Floating Rate Income Fund 28,821 125,905
Signature Global Bond Fund 11,790 80,376
Signature Global Dividend Fund - 21,667
Signature Global Equity Fund 10,669 67,643
Signature Global Income & Growth Fund - 11,121
Signature Global Resource Fund 12,494 46,694
Signature High Income Fund 8,438 10,653
Signature High Yield Bond Fund 29,739 108,403
Signature Income & Growth Fund - 41,690
Signature Preferred Share Fund 16,552 79,694
Signature Select Canadian Fund 9,537 32,366
Signature Short-Term Bond Fund 20,632 30,659
Signature Systematic Yield Pool 9,423 145,965
Synergy American Fund 37,893 122,112
Portfolio Series Balanced Fund 62,828 171,315
Portfolio Series Balanced Growth Fund 97,923 161,483
Portfolio Series Conservative Balanced Fund - 31,576
Portfolio Series Conservative Fund - 20,950
Portfolio Series Growth Fund 88,509 172,383
Portfolio Series Income Fund - 20,833
Portfolio Series Maximum Growth Fund 108,552 166,772
CI Mosaic Balanced ETF Portfolio 90,150 308,982
CI Mosaic Balanced Growth ETF Portfolio 100,826 770,643
CI Mosaic Balanced Income ETF Portfolio 106,609 869,272
CI Mosaic Growth ETF Portfolio 111,048 872,587
CI Mosaic Income ETF Portfolio 109,928 1,021,237
CI Canadian Dividend Private Pool 59,484 -
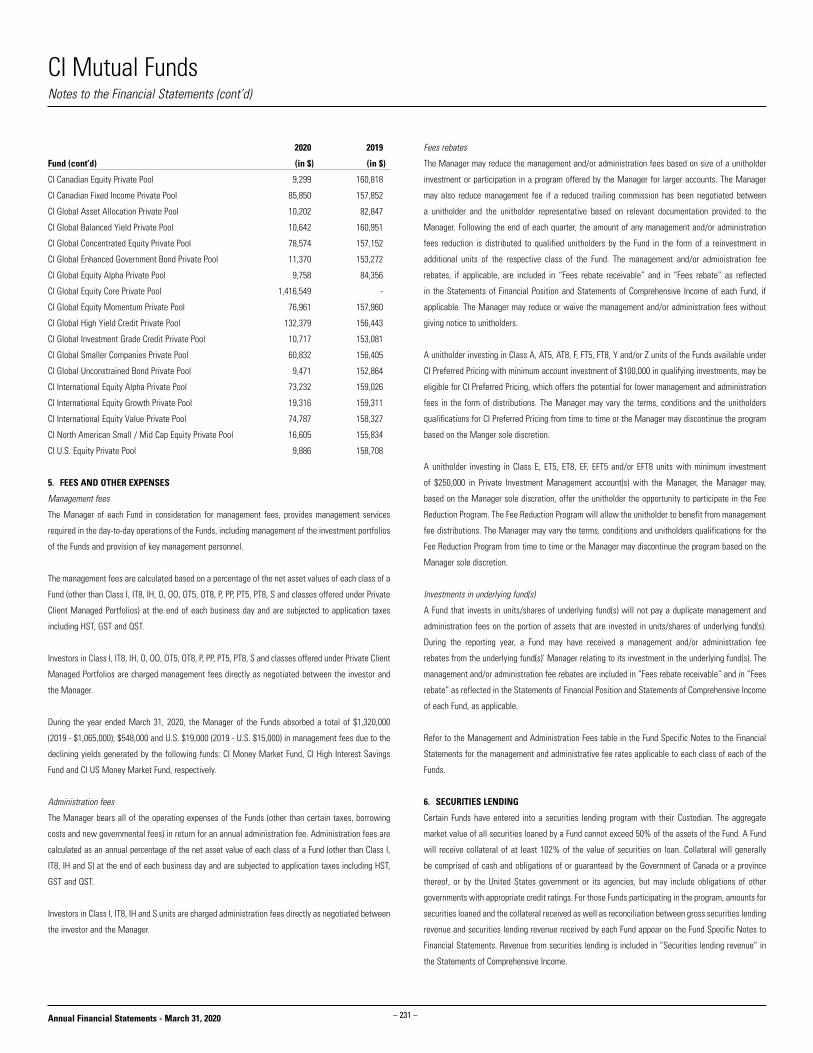
– 231 –
CI Mutual Funds
Annual Financial Statements - March 31, 2020
Notes to the Financial Statements (cont’d)
2020 2019
Fund (cont’d) (in $) (in $)
CI Canadian Equity Private Pool 9,299 160,818
CI Canadian Fixed Income Private Pool 85,850 157,852
CI Global Asset Allocation Private Pool 10,202 82,847
CI Global Balanced Yield Private Pool 10,642 160,951
CI Global Concentrated Equity Private Pool 78,574 157,152
CI Global Enhanced Government Bond Private Pool 11,370 153,272
CI Global Equity Alpha Private Pool 9,758 84,356
CI Global Equity Core Private Pool 1,416,549 -
CI Global Equity Momentum Private Pool 76,961 157,960
CI Global High Yield Credit Private Pool 132,379 156,443
CI Global Investment Grade Credit Private Pool 10,717 153,081
CI Global Smaller Companies Private Pool 60,832 156,405
CI Global Unconstrained Bond Private Pool 9,471 152,864
CI International Equity Alpha Private Pool 73,232 159,026
CI International Equity Growth Private Pool 19,316 159,311
CI International Equity Value Private Pool 74,787 158,327
CI North American Small / Mid Cap Equity Private Pool 16,605 155,834
CI U.S. Equity Private Pool 9,886 158,708
5. FEES AND OTHER EXPENSES
Management fees
The Manager of each Fund in consideration for management fees, provides management services
required in the day-to-day operations of the Funds, including management of the investment portfolios
of the Funds and provision of key management personnel.
The management fees are calculated based on a percentage of the net asset values of each class of a
Fund (other than Class I, IT8, IH, O, OO, OT5, OT8, P, PP, PT5, PT8, S and classes offered under Private
Client Managed Portfolios) at the end of each business day and are subjected to application taxes
including HST, GST and QST.
Investors in Class I, IT8, IH, O, OO, OT5, OT8, P, PP, PT5, PT8, S and classes offered under Private Client
Managed Portfolios are charged management fees directly as negotiated between the investor and
the Manager.
During the year ended March 31, 2020, the Manager of the Funds absorbed a total of $1,320,000
(2019 - $1,065,000), $548,000 and U.S. $19,000 (2019 - U.S. $15,000) in management fees due to the
declining yields generated by the following funds: CI Money Market Fund, CI High Interest Savings
Fund and CI US Money Market Fund, respectively.
Administration fees
The Manager bears all of the operating expenses of the Funds (other than certain taxes, borrowing
costs and new governmental fees) in return for an annual administration fee. Administration fees are
calculated as an annual percentage of the net asset value of each class of a Fund (other than Class I,
IT8, IH and S) at the end of each business day and are subjected to application taxes including HST,
GST and QST.
Investors in Class I, IT8, IH and S units are charged administration fees directly as negotiated between
the investor and the Manager.
Fees rebates
The Manager may reduce the management and/or administration fees based on size of a unitholder
investment or participation in a program offered by the Manager for larger accounts. The Manager
may also reduce management fee if a reduced trailing commission has been negotiated between
a unitholder and the unitholder representative based on relevant documentation provided to the
Manager. Following the end of each quarter, the amount of any management and/or administration
fees reduction is distributed to qualified unitholders by the Fund in the form of a reinvestment in
additional units of the respective class of the Fund. The management and/or administration fee
rebates, if applicable, are included in “Fees rebate receivable” and in “Fees rebate” as reflected
in the Statements of Financial Position and Statements of Comprehensive Income of each Fund, if
applicable. The Manager may reduce or waive the management and/or administration fees without
giving notice to unitholders.
A unitholder investing in Class A, AT5, AT8, F, FT5, FT8, Y and/or Z units of the Funds available under
CI Preferred Pricing with minimum account investment of $100,000 in qualifying investments, may be
eligible for CI Preferred Pricing, which offers the potential for lower management and administration
fees in the form of distributions. The Manager may vary the terms, conditions and the unitholders
qualifications for CI Preferred Pricing from time to time or the Manager may discontinue the program
based on the Manger sole discretion.
A unitholder investing in Class E, ET5, ET8, EF, EFT5 and/or EFT8 units with minimum investment
of $250,000 in Private Investment Management account(s) with the Manager, the Manager may,
based on the Manager sole discretion, offer the unitholder the opportunity to participate in the Fee
Reduction Program. The Fee Reduction Program will allow the unitholder to benefit from management
fee distributions. The Manager may vary the terms, conditions and unitholders qualifications for the
Fee Reduction Program from time to time or the Manager may discontinue the program based on the
Manager sole discretion.
Investments in underlying fund(s)
A Fund that invests in units/shares of underlying fund(s) will not pay a duplicate management and
administration fees on the portion of assets that are invested in units/shares of underlying fund(s).
During the reporting year, a Fund may have received a management and/or administration fee
rebates from the underlying fund(s)’ Manager relating to its investment in the underlying fund(s). The
management and/or administration fee rebates are included in “Fees rebate receivable” and in “Fees
rebate” as reflected in the Statements of Financial Position and Statements of Comprehensive Income
of each Fund, as applicable.
Refer to the Management and Administration Fees table in the Fund Specific Notes to the Financial
Statements for the management and administrative fee rates applicable to each class of each of the
Funds.
6. SECURITIES LENDING
Certain Funds have entered into a securities lending program with their Custodian. The aggregate
market value of all securities loaned by a Fund cannot exceed 50% of the assets of the Fund. A Fund
will receive collateral of at least 102% of the value of securities on loan. Collateral will generally
be comprised of cash and obligations of or guaranteed by the Government of Canada or a province
thereof, or by the United States government or its agencies, but may include obligations of other
governments with appropriate credit ratings. For those Funds participating in the program, amounts for
securities loaned and the collateral received as well as reconciliation between gross securities lending
revenue and securities lending revenue received by each Fund appear on the Fund Specific Notes to
Financial Statements. Revenue from securities lending is included in “Securities lending revenue” in
the Statements of Comprehensive Income.

– 232 –
CI Mutual Funds
Annual Financial Statements - March 31, 2020
Notes to the Financial Statements (cont’d)
7. INCOME TAXES
The Funds, except for Munro Global Growth Equity Fund, Select Canadian Equity Managed Fund,
Select International Equity Managed Fund, Select Staging Fund, Select U.S. Equity Managed Fund,
Cambridge Bond Fund, Cambridge Canadian Long-Term Bond Pool, Cambridge Canadian Short-Term
Pool, Cambridge Put Write Pool, Cambridge Stock Selection Fund, CI Global Stock Selection Fund,
Signature Cash Management Fund, Signature Systematic Yield Pool and CI Global Equity Core Private
Pool qualify as a mutual fund trust under the Income Tax Act (Canada). All of the Funds’ net income
for tax purposes and sufficient net capital gains realized in any year are required to be distributed to
unitholders such that no income tax is payable by each of the Funds. As a result, the Funds do not
record income taxes. Since the Funds do not record income taxes, the tax benefit of capital and non-
capital losses has not been reflected in the Statements of Financial Position as a deferred income
tax asset. Income tax on net realized capital gains not paid or payable will generally be recoverable
by virtue of refunding provisions contained in the Income Tax Act (Canada) and provincial income tax
legislation, as redemptions occur. Occasionally, the Funds may distribute more than they earn. This
excess distribution is a return of capital and is not taxable to unitholders.
Signature Select Canadian Fund under distributed net realizable capital gains during the year ended
March 31, 2017, which resulted in a tax payable. Under the terms of an agreement dated March 1,
2018, a third-party administrator has acknowledged its responsibility and unconditionally assumed
the tax liability, and the Fund has agreed to undertake all commercially reasonable and legally
permissible measures, not to the detriment of unitholders, to recover tax payments and remit such
recovered amounts, if any, to the third-party administrator as they occur. In 2016, the taxes were paid
in accordance with the agreement. The under distribution of realized capital gains did not adversely
impact the unitholders of the Fund as the balance was paid by the 3rd party administrator.
The remaining tax payable and tax recoverable amounts are included in “Other” in the Statements
of Financial Position.
The Munro Global Growth Equity Fund, Select Canadian Equity Managed Fund, Select International
Equity Managed Fund, Select Staging Fund, Select U.S. Equity Managed Fund, Cambridge Bond
Fund, Cambridge Canadian Long-Term Bond Pool, Cambridge Canadian Short- Term Pool, Cambridge
Put Write Pool, Cambridge Stock Selection Fund, CI Global Sock Selection Fund, Signature Cash
Management Fund, Signature Systematic Yield Pool and CI Global Equity Core Private Pool qualify as
a unit trust under the Income Tax Act (Canada) and are not subject to tax on their net income, including
net realized capital gains for the taxation year, which is paid or payable to their unitholders at the end
of the taxation year. However, such part of each Fund’s taxable income and net realized capital gains
that is not so paid or payable to its unitholders will be taxable to that Fund. It is the intention of each
Fund to distribute all net taxable income and sufficient net realized capital gains so that the Funds will
not be subject to income tax. As a result, the Funds do not record income taxes. Since the Funds do
not record income taxes, the tax benefit of capital and non-capital losses has not been reflected in the
Statements of Financial Position as a deferred income tax asset. Occasionally, a Fund may distribute
more than it earns. This excess distribution is a return of capital and is not taxable to unitholders.
Refer to Loss Carry Forwards table in the Fund Specific Notes to Financial Statements for further
information relating to loss carry forwards.
8. REINVESTMENT OF DISTRIBUTIONS
When a Fund pays a distribution to a unitholder, it will be paid in the same currency in which the units
are held. Distributions are automatically reinvested without charge in the same Fund or paid out in
cash to the unitholder. The Manager may change the distribution policy at its discretion.
9. RELATED PARTY TRANSACTIONS
The Funds may have direct or indirect holdings in CI Financial Corp., or its affiliates or other funds
managed by the Manager.
The Manager of the Funds may, from time to time, make initial investments in certain classes of
certain Funds to help establish a class or a Fund. Details of the investments made by the Manager
are disclosed in Note 4.
Related issuer trading
Related issuer trading occurs when a Fund purchases or sells securities of CI Financial Corp. These
transactions are executed through market intermediaries and under prevailing market terms and
conditions. The IRC reviews such transactions during scheduled meetings. During the years ended
March 31, 2020 and 2019, certain Funds engaged in related issuer trading or held position(s) in CI
Financial Corp. at the end of each year.
Related fund trading
Related fund trading occurs when a Fund purchases or sells units/shares of another Fund managed by
the Manager. During the years ended March 31, 2020 and 2019, certain Funds engaged in related fund
trading or held position(s) in related fund(s) at the end of each year.
Inter fund trading
Inter fund trading occurs when a Fund purchases or sells a security of any issuer from or to another
Fund managed by the Manager. These transactions are executed through market intermediaries and
under prevailing market terms and conditions. The Independent Review Committee reviews such
transactions during scheduled meetings. During the years ended March 31, 2020 and 2019, the Funds
executed inter fund trades.
10. FINANCIAL INSTRUMENTS RISK
Risk management
The Funds are exposed to a variety of financial instruments risks: leverage and short selling risk,
concentration risk, credit risk, liquidity risk and market risk (including other price risk, currency risk
and interest rate risk). The level of risk to which each Fund is exposed to depends on the investment
objective and the type of investments the Fund holds. The value of investments within a portfolio can
fluctuate daily as a result of changes in prevailing interest rates, economic and market conditions,
political changes, global pandemics and company specific news related to investments held by the
Fund. The Manager of the Funds may minimize potential adverse effects of these risks on the Funds’
performance by, but not limited to, regular monitoring of the Funds’ positions and market events,
diversification of the investment portfolio by asset type, country, sector, term to maturity within
the constraints of the stated objectives, and through the usage of derivatives to hedge certain risk
exposures.
Leverage and short selling risk
When a Fund makes investments in derivatives, borrows cash for investment purposes, or uses
physical short sales on equities or other portfolio assets, leverage may be introduced into the Fund.
Leverage occurs when the Fund’s notional exposure to underlying assets is greater than the amount
invested. It is an investment technique the magnifies gains and losses. Consequently, any adverse
change in the value or level of the underlying asset, rate or index may amplify losses compared to
those that would have been incurred if the underlying asset had been directly held by the Fund and
may result in losses greater than the amount invested in the derivative itself. Leverage may increase
volatility, may impair the Fund’s liquidity and may cause the Fund to liquidate positions at unfavorable
times.

– 233 –
CI Mutual Funds
Annual Financial Statements - March 31, 2020
Notes to the Financial Statements (cont’d)
To achieve its investment objective the CI Investment Grade Bond Fund exercise leverage through
participating in short selling transactions.
The Fund may borrow cash up to a maximum of 20% of the Fund’s net asset value and may sell
securities short, whereby the aggregate market value of securities sold short will be limited to 20%
of the Fund’s net asset value. The combined use of short selling and cash borrowing by the Fund is
subject to an overall limit of 20% of the Fund’s net asset value.
During the year ended March 31, 2020, the lowest aggregated fair value amount of the leverage
exercised by the Fund was $2.6 million (0.3% of net asset value), (March 31, 2019 - $1.4 million, 0.3%
of net asset value) and the highest aggregated fair value amount of the leverage used during the year
was $6.8 million (1.1% of net asset value), (March 31, 2019 - $1.4 million, 0.3% of net asset value).
Concentration risk
Concentration risk arises as a result of the concentration of exposures within the same category,
whether it is a geographical allocation, asset type, industry sector or counterparty.
Details of each Fund’s exposure to concentration risk are available in the Fund Specific Notes to
Financial Statements of each of the Funds.
Credit risk
Credit risk is the risk that a security issuer or counterparty to a financial instrument will fail to meet
its financial obligations. The fair value of a debt instrument includes consideration for the credit
worthiness of the debt issuer. The carrying amount of debt instruments as shown on the Schedule
of Investment Portfolio represents the credit risk exposure of each Fund. Credit risk exposure for
derivative instruments is based on each Fund’s unrealized gain on the contractual obligations with the
counterparty as at the reporting date. The credit rating of a counterparty to a derivative instrument is
disclosed in Schedule of Investment Portfolio or in Fund Specific Notes to Financial Statements of each
Fund, if applicable. The credit risk exposure of the Fund’s other assets is represented by their carrying
amount as disclosed in the Statements of Financial Position.
The Portfolio Series Funds and CI Mosaic Funds invest only in units/shares of underlying fund(s)
and may be exposed to indirect credit risk in the event that the underlying fund(s) invest in debt
instruments, preferred securities and derivatives.
Credit ratings for debt securities, preferred securities and derivative instruments are obtained from
S&P Global Ratings, where available, otherwise ratings are obtained from: Moody’s Investors Service
or Dominion Bond Rating Service, respectively.
Credit ratings can be either long-term or short-term. Short-term credit ratings are generally assigned
to those obligations and derivative instruments considered short-term in nature. The table below
provides a cross-reference between the long-term credit ratings disclosed in the Credit Rating table
inclusive of the short-term credit ratings disclosed in the derivatives schedules in the Schedule of
Investment Portfolio.
Credit Rating as per Credit Risk Table Credit Rating as per Derivative Schedules
AAA/Aaa/A++ A-1+
AA/Aa/A+ A-1, A-2, A-3
A B, B-1
BBB/Baa/B++ B-2
BB/Ba/B+ B-3
B C
CCC/Caa/C++ -
CC/Ca/C+ -
C and Lower D
Not Rated WR
Cash balances, with exception of restricted cash balances and margin accounts, as disclosed in
the Statements of Financial Position are maintained by the Custodian. The Manager monitors the
credit worthiness of the Custodian on a regular basis. As at March 31, 2020, the credit rating of the
Custodian was AA - (March 31, 2019 - AA-).
All transactions executed by a Fund in listed securities are settled/paid for upon delivery using
approved brokers. The risk of default is considered minimal, as delivery of securities sold is only made
once the broker has received payment. Payment is made on a purchase once the securities have been
received by the broker. The trade will fail if either party fails to meet its obligation.
Liquidity risk
Liquidity risk is the risk that a Fund may not be able to settle or meet its obligations, on time or at
a reasonable price. The Funds are exposed to daily cash redemption of redeemable units. Therefore,
the Funds invest the majority of their assets in investments that are traded in active markets and can
be readily disposed of. In addition, the Funds retain sufficient cash and cash equivalents positions to
maintain liquidity. From time to time, the Funds may enter into derivative contracts or invest in unlisted
securities that may not trade in an organized market and may be illiquid. All financial liabilities are
due within three months.
Market risk
The Funds’ investments are subject to market risk which is the risk that the fair value of future cash
flows of a financial instrument will fluctuate due to changes in market conditions.
Other price risk
Other price risk is the risk that the value of financial instruments will fluctuate as a result of
changes in market prices (other than those arising from currency risk or interest rate risk). The
value of each investment is influenced by the outlook of the issuer and by general economic and
political conditions, as well as industry and market trends. All securities present a risk of loss of
capital. Except for options written, future contracts sold short and investments sold short, the
maximum risk resulting from financial instruments is equivalent to their fair value. On written call
options, short future positions and on equity and debt sold short, the maximum loss of capital can
be unlimited.
Other assets and liabilities are monetary items that are short-term in nature and therefore are not
subject to significant other price risk.

– 234 –
CI Mutual Funds
Annual Financial Statements - March 31, 2020
Notes to the Financial Statements (cont’d)
Currency risk
Currency risk arises from financial instruments that are denominated in a currency other than the
functional currency of the Funds. As a result, the Funds may be exposed to the risk that the value
of securities denominated in other currencies will fluctuate due to changes in exchange rates.
The Schedule of Investment Portfolio identifies all bonds and derivative instruments denominated
in foreign currencies. Equities traded in foreign markets are also exposed to currency risk as
the prices denominated in foreign currencies are converted to the Funds’ functional currency to
determine their fair value.
The Portfolio Series Funds and CI Mosaic ETF Portfolios invest only in units/shares of underlying
fund(s) and may be exposed to indirect currency risk in the event that the underlying fund(s) invest
in financial instruments that are denominated in a currency other than the functional currency of
the Fund.
Interest rate risk
Interest rate risk is the risk that the fair value of interest-bearing investments will fluctuate due to
changes in prevailing levels of market interest rates. As a result, the value of the Funds that invest
in debt securities and/or income trusts will be affected by changes in applicable interest rates.
If interest rates fall, the fair value of existing debt securities may increase due to the increase in
yield. Alternatively, if interest rates rise, the yield of existing debt securities may decrease which
may then lead to a decrease in their fair value. The magnitude of the decline will generally be
greater for long-term debt securities than for short-term debt securities.
Interest rate risk also applies to Funds that invest in convertible securities. The fair value of these
securities varies inversely with interest rates, similar to other debt securities. However, since they
may be converted into common units, convertible securities are generally less affected by interest
rate fluctuations than other debt securities.
The Portfolio Series Funds and CI Mosaic ETF Portfolios invest only in units/shares of underlying
fund(s) and may be exposed to indirect interest rate risk in the event that the underlying fund(s)
invest in interest bearing financial instruments.
Fair value hierarchy
The Funds are required to classify financial instruments measured at fair value using a fair value
hierarchy. Investments whose values are based on quoted market prices in active markets are
classified as Level 1. This Level includes publicly traded equities, exchange-traded and retail mutual
funds, exchange-traded warrants, futures contracts and traded options.
Financial instruments that trade in markets that are not considered to be active but are valued based
on quoted market prices, dealer quotations or alternative pricing sources supported by observable
inputs are classified as Level 2. These include fixed income securities, mortgage-backed securities,
short-term instruments, non-traded warrants, over-the-counter options, structured notes of indexed
securities, foreign currency forward contracts, swap instruments, American depositary receipts and
Global depositary receipts.
Investments classified as Level 3 have significant unobservable inputs. Level 3 instruments include
private equities, private term-loans, private equity funds and certain derivatives. As observable prices
are not available for these securities, the Funds may use a variety of valuation techniques to derive
the fair value.
The Funds’ policy is to recognize transfers into and out of the fair value hierarchy levels as of the date
of the event or change in circumstances giving rise to the transfer.
Details of each Fund’s exposure to financial instruments risks including concentration risk and fair
value hierarchy classification are available in the Fund Specific Notes to Financial Statements for
each Fund.
11. SUBSEQUENT EVENTS
Since the outbreak of COVID-19, emergency measures taken in response to the spread of COVID-19
have resulted in significant disruption to business operations globally, resulting in an economic
slowdown. Global equity and capital markets have also experienced significant volatility and
weakness. The governments have reacted with significant monetary and fiscal interventions designed
to stabilize economic conditions. These developments are constantly evolving and the duration and
impact of the COVID-19 pandemic is highly uncertain and cannot be predicted at this time but could
have a material impact on the future performance of the Funds. In the face of the current environment
of heightened uncertainty and market volatility, the Manager continues to closely monitor its impact
on the Funds’ risk exposures from the portfolio holdings.

Annual Financial Statements - March 31, 2020 – 235 –
SEND TO DAVIA WANG - FOR REVIEW AND SIGN OFF - EACH QUARTER
You can get additional copies of these Financial Statements at your request, and at no cost, by calling
1-800-792-9374, by emailing [email protected], or by asking your representative.
Certain names, words, phrases, graphics or designs in this document may constitute trade names,
registered or unregistered trademarks or service marks of CI Investments Inc. CI Funds, CI Financial,
CI Investments, CI Investments design, Cambridge, Harbour Funds, Global Managers, American
Managers and G5|20 Series are registered trademarks of CI Investments Inc. The CI Mosaic ETF
Portfolios, CI Private Pools, Portfolio Select Series, Signature Funds, Sentry Investment Management,
the Sentry Investment Management logo, Signature Global Asset Management and Trusted Partner
in Wealth are trademarks of CI Investments Inc.
Each of Sentry Investment Management, Cambridge Global Asset Management, Harbour Advisors
and Signature Global Asset Management is a division of CI Investments Inc.
This document, and other information about the funds, is available at www.ci.com or at
www.sedar.com.
CI Mutual Funds Legal Notice

CI_AR_06/20E
2 Queen Street East, Twentieth Floor, Toronto, Ontario M5C 3G7 I www.ci.comHead Office / Toronto416-364-11451-800-268-9374
Calgary403-205-43961-800-776-9027
Montreal514-875-0090 1-800-268-1602
Vancouver604-681-3346 1-800-665-6994
Client ServicesEnglish: 1-800-563-5181French: 1-800-668-3528