annual financial statements -...
TRANSCRIPT
Annual financial statementsDecember 31, 2015
POOLED AND INDEXED FUNDS
Annual financial statements
4 Manulife Asset Management Canadian Equity Fund
7 Manulife Asset Management Canadian Value Equity Fund
8 Manulife Canadian Equity Index Fund (Manulife Asset Management)
13 Manulife Capped Canadian Equity Fund (Manulife Asset Management)
16 Manulife Canadian Equity Capped Index Fund (Manulife Asset Management)
21 Manulife Asset Management Canadian Small-Cap Equity Fund
23 Manulife Equity Tri-Plan Fund (Manulife Asset Management)
26 Manulife SLI US Equity Fund
29 Manulife US Equity Index Fund (Manulife Asset Management)
36 Manulife Asset Management US Equity Direct Index Registered Fund
43 Manulife SLI US Equity Non-Registered Fund
46 Manulife Asset Management Hedged US Equity Index Fund
48 Manulife SLI International Equity Fund
49 Manulife SLI Global Absolute Return Strategies Fund
50 Manulife Standard Life Investments Absolute Return Global Bond Strategies Fund
51 Manulife Asset Management Bond Fund
54 Manulife Asset Management Short Term Bond Fund
55 Manulife Asset Management Long Term Bond Fund
58 Manulife Asset Management Short-Term Liability Government Bond Fund
59 Manulife Asset Management Mid-Term Liability Government Bond Fund
60 Manulife Asset Management Long-Term Liability Government Bond Fund
61 Manulife Canadian Bond Index Fund (Manulife Asset Management)
75 Manulife Asset Management Real Return Bond Fund
77 Manulife Asset Management Diversified Fund
82 Manulife Diversified Tri-Plan Fund (Manulife Asset Management)
87 Manulife Money Market Fund (Manulife Asset Management)
90 Manulife Canadian Pooled Real Estate Fund
96 Manulife Canadian Mortgage Fund
99 Manulife Small Cap Portfolio Fund (Multi-Manager)
100 Manulife Income Index Portfolio Fund
102 Manulife Balanced Index Portfolio Fund
103 Manulife Growth Index Portfolio Fund
104 Manulife Multi-manager Target Date 2015 Fund
105 Manulife Multi-manager Target Date 2020 Fund
106 Manulife Multi-manager Target Date 2025 Fund
107 Manulife Multi-manager Target Date 2030 Fund
108 Manulife Multi-manager Target Date 2035 Fund
109 Manulife Multi-manager Target Date 2040 Fund
110 Manulife Multi-manager Target Date 2045 Fund
111 Manulife Multi-manager Target Date 2050 Fund
112 Manulife Multi-manager Target Date 2055 Fund
113 Manulife Multi-manager Retirement Fund
115 Manulife Target Date 2015 Index Fund (Manulife)
Contents
116 Manulife Target Date 2020 Index Fund (Manulife)
117 Manulife Target Date 2025 Index Fund (Manulife)
118 Manulife Target Date 2030 Index Fund (Manulife)
119 Manulife Target Date 2035 Index Fund (Manulife)
120 Manulife Target Date 2040 Index Fund (Manulife)
121 Manulife Target Date 2045 Index Fund (Manulife)
122 Manulife Target Date 2050 Index Fund (Manulife)
123 Manulife Target Date 2055 Index Fund (Manulife)
124 Manulife Retirement Index Fund (Manulife)
125 Manulife MMF Corporate Bond Fund
126 Manulife MMF Monthly Income Fund
127 Manulife MMF Canadian Dividend Fund
128 Manulife MMF Global Dividend Fund (SLI)
129 Manulife MMF Global Unconstrained Equity Fund (SLI)
130 Manulife MMF Global Bond Fund
131 Manulife MMF Conservative Income Fund
132 Manulife MMF Tactical Income Fund
133 Manulife MMF Dividend Income Fund
134 Manulife MMF US Dividend Income Fund
135 Manulife MMF Global REIT Unconstrained Fund (SLI)
136 Notes to annual financial statements
161 Independent auditor’s report
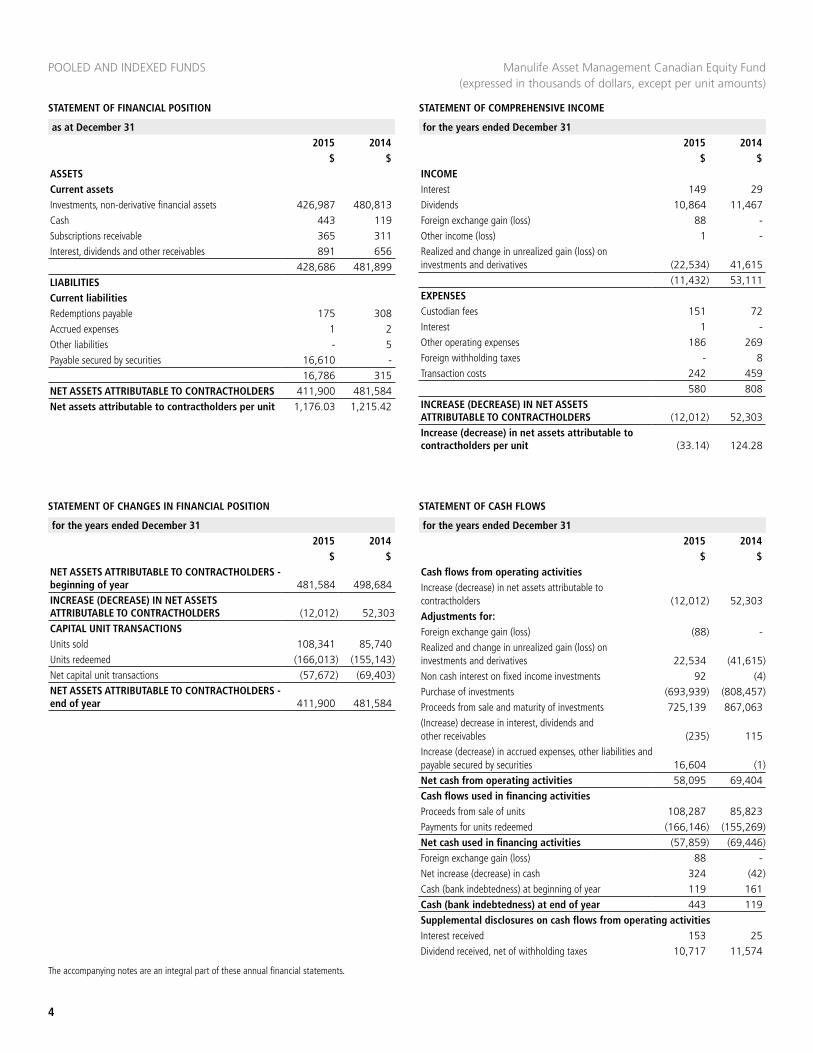
STATEMENT OF FINANCIAL POSITION
POOLED AND INDEXED FUNDS
STATEMENT OF COMPREHENSIVE INCOME
as at December 31 2015 2014
$ $
for the years ended December 312015 2014
$ $
4
The accompanying notes are an integral part of these annual financial statements.
Manulife Asset Management Canadian Equity Fund (expressed in thousands of dollars, except per unit amounts)
INCOMEInterest 149 29Dividends 10,864 11,467Foreign exchange gain (loss) 88 -Other income (loss) 1 -Realized and change in unrealized gain (loss) on investments and derivatives (22,534) 41,615
(11,432) 53,111EXPENSESCustodian fees 151 72Interest 1 -Other operating expenses 186 269Foreign withholding taxes - 8Transaction costs 242 459
580 808INCREASE (DECREASE) IN NET ASSETS ATTRIBUTABLE TO CONTRACTHOLDERS (12,012) 52,303Increase (decrease) in net assets attributable to contractholders per unit (33.14) 124.28
ASSETSCurrent assetsInvestments, non-derivative financial assets 426,987 480,813Cash 443 119Subscriptions receivable 365 311Interest, dividends and other receivables 891 656
428,686 481,899LIABILITIESCurrent liabilitiesRedemptions payable 175 308Accrued expenses 1 2Other liabilities - 5Payable secured by securities 16,610 -
16,786 315NET ASSETS ATTRIBUTABLE TO CONTRACTHOLDERS 411,900 481,584Net assets attributable to contractholders per unit 1,176.03 1,215.42
STATEMENT OF CASH FLOWS
for the years ended December 312015 2014
$ $Cash flows from operating activitiesIncrease (decrease) in net assets attributable to contractholders (12,012) 52,303Adjustments for:Foreign exchange gain (loss) (88) -Realized and change in unrealized gain (loss) on investments and derivatives 22,534 (41,615)Non cash interest on fixed income investments 92 (4)Purchase of investments (693,939) (808,457)Proceeds from sale and maturity of investments 725,139 867,063(Increase) decrease in interest, dividends and other receivables (235) 115Increase (decrease) in accrued expenses, other liabilities and payable secured by securities 16,604 (1)Net cash from operating activities 58,095 69,404Cash flows used in financing activitiesProceeds from sale of units 108,287 85,823Payments for units redeemed (166,146) (155,269)Net cash used in financing activities (57,859) (69,446)Foreign exchange gain (loss) 88 -Net increase (decrease) in cash 324 (42)Cash (bank indebtedness) at beginning of year 119 161Cash (bank indebtedness) at end of year 443 119Supplemental disclosures on cash flows from operating activitiesInterest received 153 25Dividend received, net of withholding taxes 10,717 11,574
STATEMENT OF CHANGES IN FINANCIAL POSITION
for the years ended December 312015 2014
$ $NET ASSETS ATTRIBUTABLE TO CONTRACTHOLDERS - beginning of year 481,584 498,684INCREASE (DECREASE) IN NET ASSETS ATTRIBUTABLE TO CONTRACTHOLDERS (12,012) 52,303CAPITAL UNIT TRANSACTIONSUnits sold 108,341 85,740Units redeemed (166,013) (155,143)Net capital unit transactions (57,672) (69,403)NET ASSETS ATTRIBUTABLE TO CONTRACTHOLDERS - end of year 411,900 481,584
SCHEDULE OF PORTFOLIO INVESTMENTS as at December 31, 2015
SCHEDULE OF PORTFOLIO INVESTMENTS as at December 31, 2015
5
The accompanying notes are an integral part of these annual financial statements.
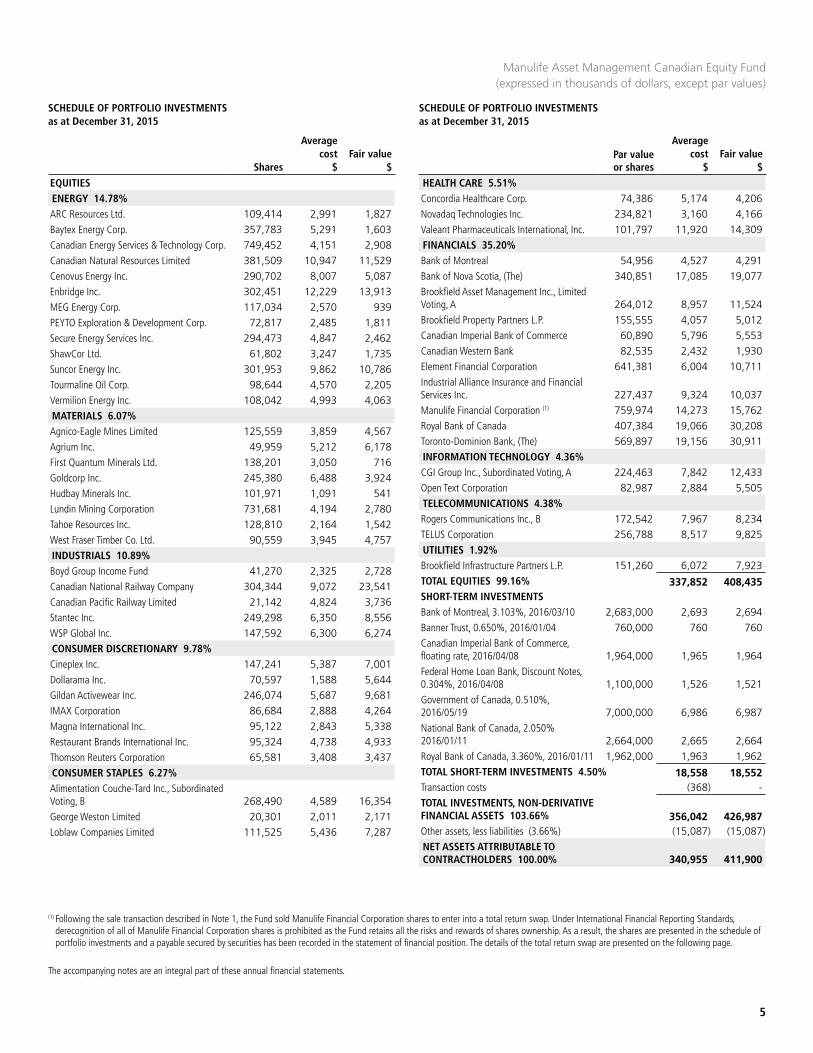
Manulife Asset Management Canadian Equity Fund (expressed in thousands of dollars, except par values)
EQUITIESENERGY 14.78%ARC Resources Ltd. 109,414 2,991 1,827 Baytex Energy Corp. 357,783 5,291 1,603 Canadian Energy Services & Technology Corp. 749,452 4,151 2,908 Canadian Natural Resources Limited 381,509 10,947 11,529 Cenovus Energy Inc. 290,702 8,007 5,087 Enbridge Inc. 302,451 12,229 13,913 MEG Energy Corp. 117,034 2,570 939 PEYTO Exploration & Development Corp. 72,817 2,485 1,811 Secure Energy Services Inc. 294,473 4,847 2,462 ShawCor Ltd. 61,802 3,247 1,735 Suncor Energy Inc. 301,953 9,862 10,786 Tourmaline Oil Corp. 98,644 4,570 2,205 Vermilion Energy Inc. 108,042 4,993 4,063 MATERIALS 6.07%Agnico-Eagle Mines Limited 125,559 3,859 4,567 Agrium Inc. 49,959 5,212 6,178 First Quantum Minerals Ltd. 138,201 3,050 716 Goldcorp Inc. 245,380 6,488 3,924 Hudbay Minerals Inc. 101,971 1,091 541 Lundin Mining Corporation 731,681 4,194 2,780 Tahoe Resources Inc. 128,810 2,164 1,542 West Fraser Timber Co. Ltd. 90,559 3,945 4,757 INDUSTRIALS 10.89%Boyd Group Income Fund 41,270 2,325 2,728 Canadian National Railway Company 304,344 9,072 23,541 Canadian Pacific Railway Limited 21,142 4,824 3,736 Stantec Inc. 249,298 6,350 8,556 WSP Global Inc. 147,592 6,300 6,274 CONSUMER DISCRETIONARY 9.78%Cineplex Inc. 147,241 5,387 7,001 Dollarama Inc. 70,597 1,588 5,644 Gildan Activewear Inc. 246,074 5,687 9,681 IMAX Corporation 86,684 2,888 4,264 Magna International Inc. 95,122 2,843 5,338 Restaurant Brands International Inc. 95,324 4,738 4,933 Thomson Reuters Corporation 65,581 3,408 3,437 CONSUMER STAPLES 6.27%Alimentation Couche-Tard Inc., Subordinated Voting, B 268,490 4,589 16,354 George Weston Limited 20,301 2,011 2,171 Loblaw Companies Limited 111,525 5,436 7,287
HEALTH CARE 5.51%Concordia Healthcare Corp. 74,386 5,174 4,206 Novadaq Technologies Inc. 234,821 3,160 4,166 Valeant Pharmaceuticals International, Inc. 101,797 11,920 14,309 FINANCIALS 35.20%Bank of Montreal 54,956 4,527 4,291 Bank of Nova Scotia, (The) 340,851 17,085 19,077 Brookfield Asset Management Inc., Limited Voting, A 264,012 8,957 11,524 Brookfield Property Partners L.P. 155,555 4,057 5,012 Canadian Imperial Bank of Commerce 60,890 5,796 5,553 Canadian Western Bank 82,535 2,432 1,930 Element Financial Corporation 641,381 6,004 10,711 Industrial Alliance Insurance and Financial Services Inc. 227,437 9,324 10,037 Manulife Financial Corporation (1) 759,974 14,273 15,762 Royal Bank of Canada 407,384 19,066 30,208 Toronto-Dominion Bank, (The) 569,897 19,156 30,911 INFORMATION TECHNOLOGY 4.36%CGI Group Inc., Subordinated Voting, A 224,463 7,842 12,433 Open Text Corporation 82,987 2,884 5,505 TELECOMMUNICATIONS 4.38%Rogers Communications Inc., B 172,542 7,967 8,234 TELUS Corporation 256,788 8,517 9,825 UTILITIES 1.92%Brookfield Infrastructure Partners L.P. 151,260 6,072 7,923 TOTAL EQUITIES 99.16% 337,852 408,435 SHORT-TERM INVESTMENTSBank of Montreal, 3.103%, 2016/03/10 2,683,000 2,693 2,694 Banner Trust, 0.650%, 2016/01/04 760,000 760 760 Canadian Imperial Bank of Commerce, floating rate, 2016/04/08 1,964,000 1,965 1,964 Federal Home Loan Bank, Discount Notes, 0.304%, 2016/04/08 1,100,000 1,526 1,521 Government of Canada, 0.510%, 2016/05/19 7,000,000 6,986 6,987 National Bank of Canada, 2.050% 2016/01/11 2,664,000 2,665 2,664 Royal Bank of Canada, 3.360%, 2016/01/11 1,962,000 1,963 1,962 TOTAL SHORT-TERM INVESTMENTS 4.50% 18,558 18,552 Transaction costs (368) - TOTAL INVESTMENTS, NON-DERIVATIVE FINANCIAL ASSETS 103.66% 356,042 426,987 Other assets, less liabilities (3.66%) (15,087) (15,087)NET ASSETS ATTRIBUTABLE TO CONTRACTHOLDERS 100.00% 340,955 411,900
(1) Following the sale transaction described in Note 1, the Fund sold Manulife Financial Corporation shares to enter into a total return swap. Under International Financial Reporting Standards, derecognition of all of Manulife Financial Corporation shares is prohibited as the Fund retains all the risks and rewards of shares ownership. As a result, the shares are presented in the schedule of portfolio investments and a payable secured by securities has been recorded in the statement of financial position. The details of the total return swap are presented on the following page.
Shares
Average cost
$Fair value
$Par value or shares
Average cost
$Fair value
$
POOLED AND INDEXED FUNDS
6
SCHEDULE OF PORTFOLIO INVESTMENTS as at December 31, 2015
The accompanying notes are an integral part of these annual financial statements.
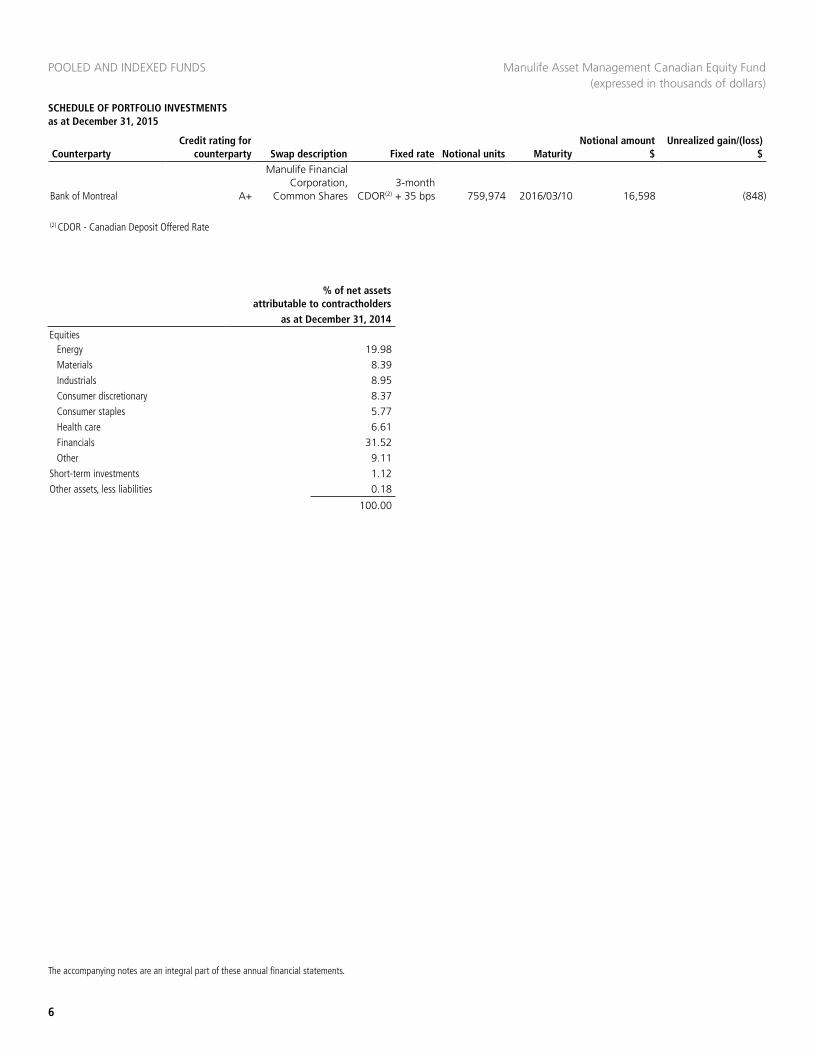
CounterpartyCredit rating for
counterparty Swap description Fixed rate Notional units MaturityNotional amount
$Unrealized gain/(loss)
$
Bank of Montreal A+
Manulife Financial Corporation,
Common Shares3-month
CDOR(2) + 35 bps 759,974 2016/03/10 16,598 (848)
(2) CDOR - Canadian Deposit Offered Rate
% of net assets attributable to contractholders
as at December 31, 2014Equities
Energy 19.98 Materials 8.39 Industrials 8.95 Consumer discretionary 8.37 Consumer staples 5.77 Health care 6.61 Financials 31.52 Other 9.11
Short-term investments 1.12 Other assets, less liabilities 0.18
100.00
Manulife Asset Management Canadian Equity Fund (expressed in thousands of dollars)

STATEMENT OF FINANCIAL POSITION STATEMENT OF COMPREHENSIVE INCOME
as at December 31 2015 2014
$ $
for the years ended December 312015 2014
$ $
7
The accompanying notes are an integral part of these annual financial statements.
Manulife Asset Management Canadian Value Equity Fund (expressed in thousands of dollars, except per unit amounts)
STATEMENT OF CASH FLOWS
for the years ended December 312015 2014
$ $Cash flows from operating activitiesIncrease (decrease) in net assets attributable to contractholders (671) 1,245Adjustments for:Realized and change in unrealized gain (loss) on investments and derivatives 2,309 (498)Purchase of investments (6,921) (5,146)Proceeds from sale and maturity of investments 1,950 2,278Net cash from operating activities (3,333) (2,121)Cash flows used in financing activitiesProceeds from sale of units 6,391 5,581Payments for units redeemed (3,027) (3,460)Net cash used in financing activities 3,364 2,121Net increase (decrease) in cash 31 -Cash (bank indebtedness) at beginning of year - -Cash (bank indebtedness) at end of year 31 -
STATEMENT OF CHANGES IN FINANCIAL POSITION
for the years ended December 312015 2014
$ $
NET ASSETS ATTRIBUTABLE TO CONTRACTHOLDERS - beginning of year 12,150 8,788INCREASE (DECREASE) IN NET ASSETS ATTRIBUTABLE TO CONTRACTHOLDERS (671) 1,245CAPITAL UNIT TRANSACTIONSUnits sold 6,390 5,578Units redeemed (3,026) (3,461)Net capital unit transactions 3,364 2,117NET ASSETS ATTRIBUTABLE TO CONTRACTHOLDERS - end of year 14,843 12,150
INCOMEDistribution income from underlying funds 1,641 751Realized and change in unrealized gain (loss) on investments and derivatives (2,309) 498
(668) 1,249EXPENSESInterest 1 -Other operating expenses 2 4
3 4INCREASE (DECREASE) IN NET ASSETS ATTRIBUTABLE TO CONTRACTHOLDERS (671) 1,245Increase (decrease) in net assets attributable to contractholders per unit (1.43) 3.52
ASSETSCurrent assetsInvestments, non-derivative financial assets 14,843 12,150Cash 31 -Subscriptions receivable - 1Receivable from investments sold 4 -
14,878 12,151LIABILITIESCurrent liabilitiesRedemptions payable - 1Payable on investments purchased 35 -
35 1NET ASSETS ATTRIBUTABLE TO CONTRACTHOLDERS 14,843 12,150Net assets attributable to contractholders per unit 27.84 28.88
Manulife Asset Management Canadian Value Equity Pooled Fund 152,152 15,579 14,843 TOTAL INVESTMENTS, NON-DERIVATIVE FINANCIAL ASSETS 100.00% 15,579 14,843 Other assets, less liabilities 0.00% - - NET ASSETS ATTRIBUTABLE TO CONTRACTHOLDERS 100.00% 15,579 14,843
Units
Average cost
$Fair value
$
SCHEDULE OF PORTFOLIO INVESTMENTS as at December 31, 2015
STATEMENT OF FINANCIAL POSITION
POOLED AND INDEXED FUNDS
STATEMENT OF COMPREHENSIVE INCOME
as at December 31 2015 2014
$ $
for the years ended December 312015 2014
$ $
8
The accompanying notes are an integral part of these annual financial statements.
Manulife Canadian Equity Index Fund (Manulife Asset Management) (expressed in thousands of dollars, except per unit amounts)
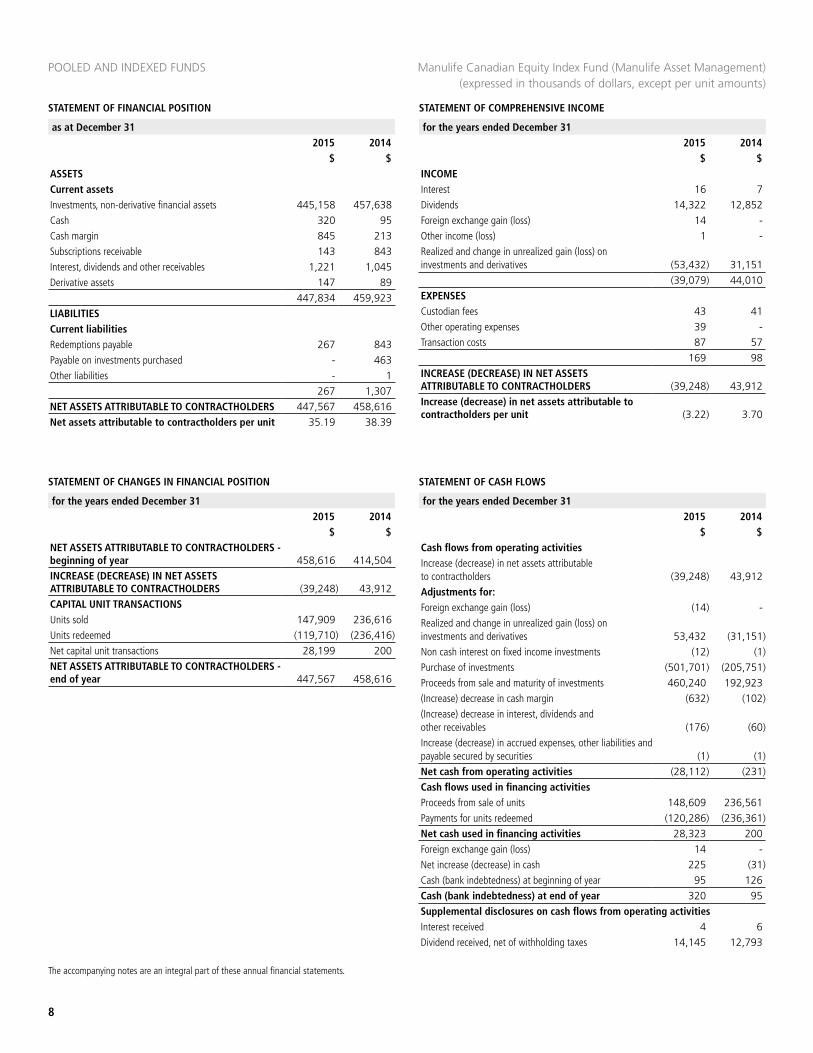
INCOMEInterest 16 7Dividends 14,322 12,852Foreign exchange gain (loss) 14 -Other income (loss) 1 -Realized and change in unrealized gain (loss) on investments and derivatives (53,432) 31,151
(39,079) 44,010EXPENSESCustodian fees 43 41Other operating expenses 39 -Transaction costs 87 57
169 98INCREASE (DECREASE) IN NET ASSETS ATTRIBUTABLE TO CONTRACTHOLDERS (39,248) 43,912Increase (decrease) in net assets attributable to contractholders per unit (3.22) 3.70
ASSETSCurrent assetsInvestments, non-derivative financial assets 445,158 457,638Cash 320 95Cash margin 845 213Subscriptions receivable 143 843Interest, dividends and other receivables 1,221 1,045Derivative assets 147 89
447,834 459,923LIABILITIESCurrent liabilitiesRedemptions payable 267 843Payable on investments purchased - 463Other liabilities - 1
267 1,307NET ASSETS ATTRIBUTABLE TO CONTRACTHOLDERS 447,567 458,616Net assets attributable to contractholders per unit 35.19 38.39
STATEMENT OF CASH FLOWS
for the years ended December 312015 2014
$ $
STATEMENT OF CHANGES IN FINANCIAL POSITION
for the years ended December 312015 2014
$ $Cash flows from operating activitiesIncrease (decrease) in net assets attributable to contractholders (39,248) 43,912Adjustments for:Foreign exchange gain (loss) (14) -Realized and change in unrealized gain (loss) on investments and derivatives 53,432 (31,151)Non cash interest on fixed income investments (12) (1)Purchase of investments (501,701) (205,751)Proceeds from sale and maturity of investments 460,240 192,923(Increase) decrease in cash margin (632) (102)(Increase) decrease in interest, dividends and other receivables (176) (60)Increase (decrease) in accrued expenses, other liabilities and payable secured by securities (1) (1)Net cash from operating activities (28,112) (231)Cash flows used in financing activitiesProceeds from sale of units 148,609 236,561Payments for units redeemed (120,286) (236,361)Net cash used in financing activities 28,323 200Foreign exchange gain (loss) 14 -Net increase (decrease) in cash 225 (31)Cash (bank indebtedness) at beginning of year 95 126Cash (bank indebtedness) at end of year 320 95Supplemental disclosures on cash flows from operating activitiesInterest received 4 6Dividend received, net of withholding taxes 14,145 12,793
NET ASSETS ATTRIBUTABLE TO CONTRACTHOLDERS - beginning of year 458,616 414,504INCREASE (DECREASE) IN NET ASSETS ATTRIBUTABLE TO CONTRACTHOLDERS (39,248) 43,912CAPITAL UNIT TRANSACTIONSUnits sold 147,909 236,616Units redeemed (119,710) (236,416)Net capital unit transactions 28,199 200NET ASSETS ATTRIBUTABLE TO CONTRACTHOLDERS - end of year 447,567 458,616
SCHEDULE OF PORTFOLIO INVESTMENTS as at December 31, 2015
SCHEDULE OF PORTFOLIO INVESTMENTS as at December 31, 2015
9
The accompanying notes are an integral part of these annual financial statements.
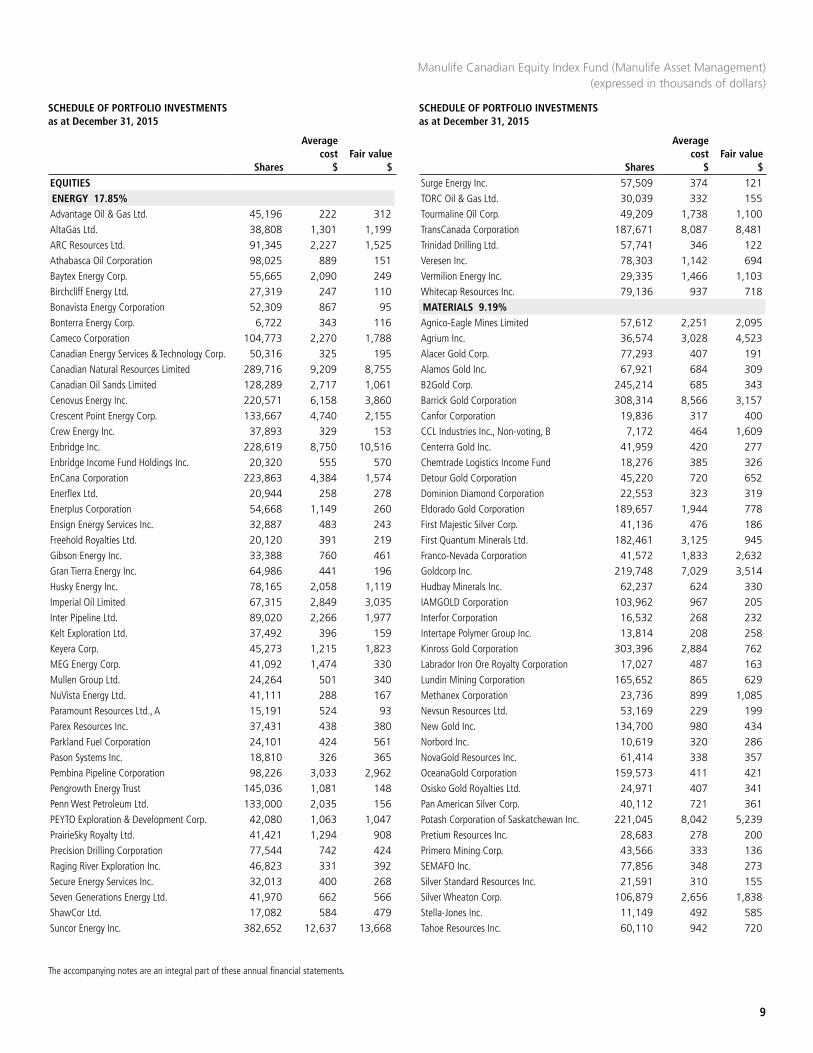
EQUITIESENERGY 17.85%Advantage Oil & Gas Ltd. 45,196 222 312 AltaGas Ltd. 38,808 1,301 1,199 ARC Resources Ltd. 91,345 2,227 1,525 Athabasca Oil Corporation 98,025 889 151 Baytex Energy Corp. 55,665 2,090 249 Birchcliff Energy Ltd. 27,319 247 110 Bonavista Energy Corporation 52,309 867 95 Bonterra Energy Corp. 6,722 343 116 Cameco Corporation 104,773 2,270 1,788 Canadian Energy Services & Technology Corp. 50,316 325 195 Canadian Natural Resources Limited 289,716 9,209 8,755 Canadian Oil Sands Limited 128,289 2,717 1,061 Cenovus Energy Inc. 220,571 6,158 3,860 Crescent Point Energy Corp. 133,667 4,740 2,155 Crew Energy Inc. 37,893 329 153 Enbridge Inc. 228,619 8,750 10,516 Enbridge Income Fund Holdings Inc. 20,320 555 570 EnCana Corporation 223,863 4,384 1,574 Enerflex Ltd. 20,944 258 278 Enerplus Corporation 54,668 1,149 260 Ensign Energy Services Inc. 32,887 483 243 Freehold Royalties Ltd. 20,120 391 219 Gibson Energy Inc. 33,388 760 461 Gran Tierra Energy Inc. 64,986 441 196 Husky Energy Inc. 78,165 2,058 1,119 Imperial Oil Limited 67,315 2,849 3,035 Inter Pipeline Ltd. 89,020 2,266 1,977 Kelt Exploration Ltd. 37,492 396 159 Keyera Corp. 45,273 1,215 1,823 MEG Energy Corp. 41,092 1,474 330 Mullen Group Ltd. 24,264 501 340 NuVista Energy Ltd. 41,111 288 167 Paramount Resources Ltd., A 15,191 524 93 Parex Resources Inc. 37,431 438 380 Parkland Fuel Corporation 24,101 424 561 Pason Systems Inc. 18,810 326 365 Pembina Pipeline Corporation 98,226 3,033 2,962 Pengrowth Energy Trust 145,036 1,081 148 Penn West Petroleum Ltd. 133,000 2,035 156 PEYTO Exploration & Development Corp. 42,080 1,063 1,047 PrairieSky Royalty Ltd. 41,421 1,294 908 Precision Drilling Corporation 77,544 742 424 Raging River Exploration Inc. 46,823 331 392 Secure Energy Services Inc. 32,013 400 268 Seven Generations Energy Ltd. 41,970 662 566 ShawCor Ltd. 17,082 584 479 Suncor Energy Inc. 382,652 12,637 13,668
Surge Energy Inc. 57,509 374 121 TORC Oil & Gas Ltd. 30,039 332 155 Tourmaline Oil Corp. 49,209 1,738 1,100 TransCanada Corporation 187,671 8,087 8,481 Trinidad Drilling Ltd. 57,741 346 122 Veresen Inc. 78,303 1,142 694 Vermilion Energy Inc. 29,335 1,466 1,103 Whitecap Resources Inc. 79,136 937 718 MATERIALS 9.19%Agnico-Eagle Mines Limited 57,612 2,251 2,095 Agrium Inc. 36,574 3,028 4,523 Alacer Gold Corp. 77,293 407 191 Alamos Gold Inc. 67,921 684 309 B2Gold Corp. 245,214 685 343 Barrick Gold Corporation 308,314 8,566 3,157 Canfor Corporation 19,836 317 400 CCL Industries Inc., Non-voting, B 7,172 464 1,609 Centerra Gold Inc. 41,959 420 277 Chemtrade Logistics Income Fund 18,276 385 326 Detour Gold Corporation 45,220 720 652 Dominion Diamond Corporation 22,553 323 319 Eldorado Gold Corporation 189,657 1,944 778 First Majestic Silver Corp. 41,136 476 186 First Quantum Minerals Ltd. 182,461 3,125 945 Franco-Nevada Corporation 41,572 1,833 2,632 Goldcorp Inc. 219,748 7,029 3,514 Hudbay Minerals Inc. 62,237 624 330 IAMGOLD Corporation 103,962 967 205 Interfor Corporation 16,532 268 232 Intertape Polymer Group Inc. 13,814 208 258 Kinross Gold Corporation 303,396 2,884 762 Labrador Iron Ore Royalty Corporation 17,027 487 163 Lundin Mining Corporation 165,652 865 629 Methanex Corporation 23,736 899 1,085 Nevsun Resources Ltd. 53,169 229 199 New Gold Inc. 134,700 980 434 Norbord Inc. 10,619 320 286 NovaGold Resources Inc. 61,414 338 357 OceanaGold Corporation 159,573 411 421 Osisko Gold Royalties Ltd. 24,971 407 341 Pan American Silver Corp. 40,112 721 361 Potash Corporation of Saskatchewan Inc. 221,045 8,042 5,239 Pretium Resources Inc. 28,683 278 200 Primero Mining Corp. 43,566 333 136 SEMAFO Inc. 77,856 348 273 Silver Standard Resources Inc. 21,591 310 155 Silver Wheaton Corp. 106,879 2,656 1,838 Stella-Jones Inc. 11,149 492 585 Tahoe Resources Inc. 60,110 942 720
Manulife Canadian Equity Index Fund (Manulife Asset Management) (expressed in thousands of dollars)
Shares
Average cost
$Fair value
$ Shares
Average cost
$Fair value
$
POOLED AND INDEXED FUNDS
10
SCHEDULE OF PORTFOLIO INVESTMENTS as at December 31, 2015
SCHEDULE OF PORTFOLIO INVESTMENTS as at December 31, 2015
The accompanying notes are an integral part of these annual financial statements.
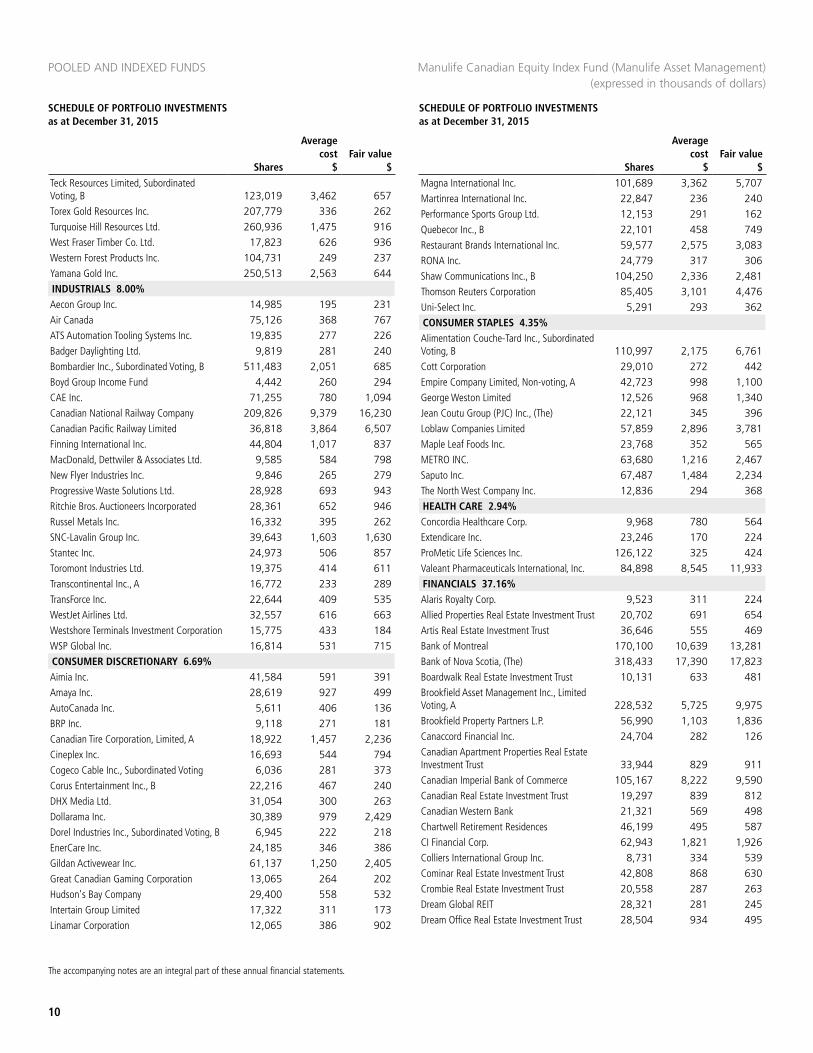
Teck Resources Limited, Subordinated Voting, B 123,019 3,462 657 Torex Gold Resources Inc. 207,779 336 262 Turquoise Hill Resources Ltd. 260,936 1,475 916 West Fraser Timber Co. Ltd. 17,823 626 936 Western Forest Products Inc. 104,731 249 237 Yamana Gold Inc. 250,513 2,563 644 INDUSTRIALS 8.00%Aecon Group Inc. 14,985 195 231 Air Canada 75,126 368 767 ATS Automation Tooling Systems Inc. 19,835 277 226 Badger Daylighting Ltd. 9,819 281 240 Bombardier Inc., Subordinated Voting, B 511,483 2,051 685 Boyd Group Income Fund 4,442 260 294 CAE Inc. 71,255 780 1,094 Canadian National Railway Company 209,826 9,379 16,230 Canadian Pacific Railway Limited 36,818 3,864 6,507 Finning International Inc. 44,804 1,017 837 MacDonald, Dettwiler & Associates Ltd. 9,585 584 798 New Flyer Industries Inc. 9,846 265 279 Progressive Waste Solutions Ltd. 28,928 693 943 Ritchie Bros. Auctioneers Incorporated 28,361 652 946 Russel Metals Inc. 16,332 395 262 SNC-Lavalin Group Inc. 39,643 1,603 1,630 Stantec Inc. 24,973 506 857 Toromont Industries Ltd. 19,375 414 611 Transcontinental Inc., A 16,772 233 289 TransForce Inc. 22,644 409 535 WestJet Airlines Ltd. 32,557 616 663 Westshore Terminals Investment Corporation 15,775 433 184 WSP Global Inc. 16,814 531 715 CONSUMER DISCRETIONARY 6.69%Aimia Inc. 41,584 591 391 Amaya Inc. 28,619 927 499 AutoCanada Inc. 5,611 406 136 BRP Inc. 9,118 271 181 Canadian Tire Corporation, Limited, A 18,922 1,457 2,236 Cineplex Inc. 16,693 544 794 Cogeco Cable Inc., Subordinated Voting 6,036 281 373 Corus Entertainment Inc., B 22,216 467 240 DHX Media Ltd. 31,054 300 263 Dollarama Inc. 30,389 979 2,429 Dorel Industries Inc., Subordinated Voting, B 6,945 222 218 EnerCare Inc. 24,185 346 386 Gildan Activewear Inc. 61,137 1,250 2,405 Great Canadian Gaming Corporation 13,065 264 202 Hudson's Bay Company 29,400 558 532 Intertain Group Limited 17,322 311 173 Linamar Corporation 12,065 386 902
Magna International Inc. 101,689 3,362 5,707 Martinrea International Inc. 22,847 236 240 Performance Sports Group Ltd. 12,153 291 162 Quebecor Inc., B 22,101 458 749 Restaurant Brands International Inc. 59,577 2,575 3,083 RONA Inc. 24,779 317 306 Shaw Communications Inc., B 104,250 2,336 2,481 Thomson Reuters Corporation 85,405 3,101 4,476 Uni-Select Inc. 5,291 293 362 CONSUMER STAPLES 4.35%Alimentation Couche-Tard Inc., Subordinated Voting, B 110,997 2,175 6,761 Cott Corporation 29,010 272 442 Empire Company Limited, Non-voting, A 42,723 998 1,100 George Weston Limited 12,526 968 1,340 Jean Coutu Group (PJC) Inc., (The) 22,121 345 396 Loblaw Companies Limited 57,859 2,896 3,781 Maple Leaf Foods Inc. 23,768 352 565 METRO INC. 63,680 1,216 2,467 Saputo Inc. 67,487 1,484 2,234 The North West Company Inc. 12,836 294 368 HEALTH CARE 2.94%Concordia Healthcare Corp. 9,968 780 564 Extendicare Inc. 23,246 170 224 ProMetic Life Sciences Inc. 126,122 325 424 Valeant Pharmaceuticals International, Inc. 84,898 8,545 11,933 FINANCIALS 37.16%Alaris Royalty Corp. 9,523 311 224 Allied Properties Real Estate Investment Trust 20,702 691 654 Artis Real Estate Investment Trust 36,646 555 469 Bank of Montreal 170,100 10,639 13,281 Bank of Nova Scotia, (The) 318,433 17,390 17,823 Boardwalk Real Estate Investment Trust 10,131 633 481 Brookfield Asset Management Inc., Limited Voting, A 228,532 5,725 9,975 Brookfield Property Partners L.P. 56,990 1,103 1,836 Canaccord Financial Inc. 24,704 282 126 Canadian Apartment Properties Real Estate Investment Trust 33,944 829 911 Canadian Imperial Bank of Commerce 105,167 8,222 9,590 Canadian Real Estate Investment Trust 19,297 839 812 Canadian Western Bank 21,321 569 498 Chartwell Retirement Residences 46,199 495 587 CI Financial Corp. 62,943 1,821 1,926 Colliers International Group Inc. 8,731 334 539 Cominar Real Estate Investment Trust 42,808 868 630 Crombie Real Estate Investment Trust 20,558 287 263 Dream Global REIT 28,321 281 245 Dream Office Real Estate Investment Trust 28,504 934 495
Manulife Canadian Equity Index Fund (Manulife Asset Management) (expressed in thousands of dollars)
Shares
Average cost
$Fair value
$ Shares
Average cost
$Fair value
$
SCHEDULE OF PORTFOLIO INVESTMENTS as at December 31, 2015
SCHEDULE OF PORTFOLIO INVESTMENTS as at December 31, 2015
11
The accompanying notes are an integral part of these annual financial statements.
Par value or shares
Average cost
$Fair value
$
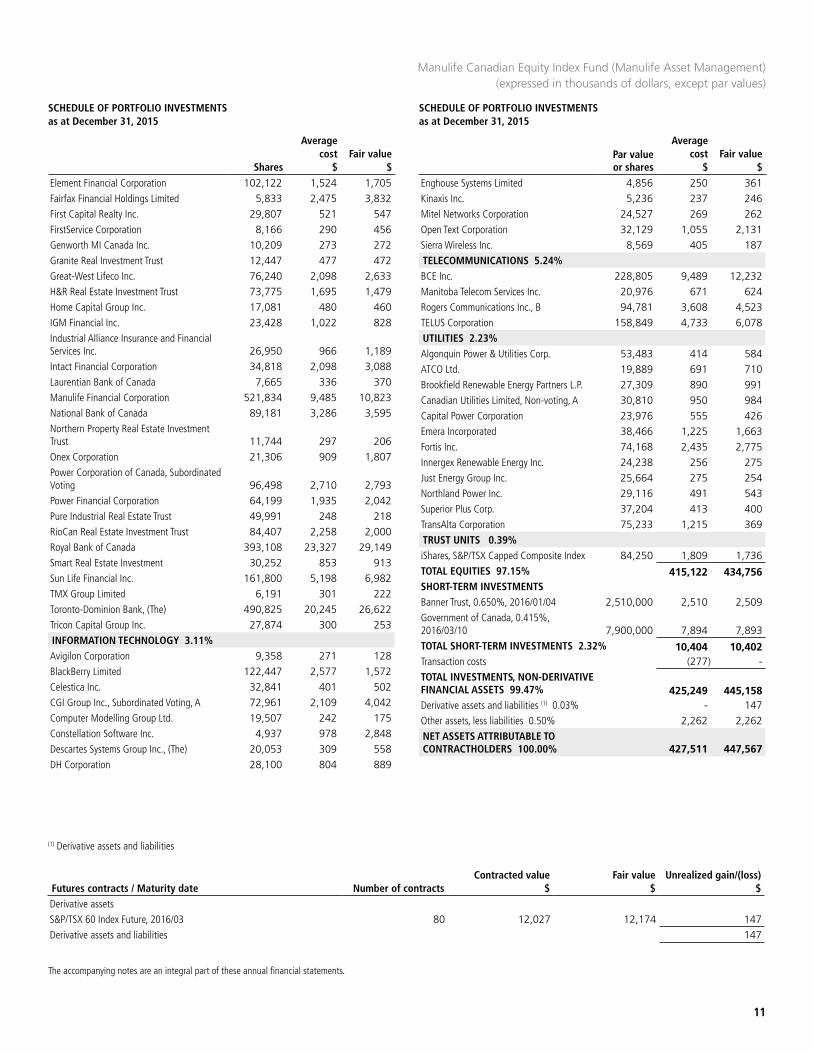
Element Financial Corporation 102,122 1,524 1,705 Fairfax Financial Holdings Limited 5,833 2,475 3,832 First Capital Realty Inc. 29,807 521 547 FirstService Corporation 8,166 290 456 Genworth MI Canada Inc. 10,209 273 272 Granite Real Investment Trust 12,447 477 472 Great-West Lifeco Inc. 76,240 2,098 2,633 H&R Real Estate Investment Trust 73,775 1,695 1,479 Home Capital Group Inc. 17,081 480 460 IGM Financial Inc. 23,428 1,022 828 Industrial Alliance Insurance and Financial Services Inc. 26,950 966 1,189 Intact Financial Corporation 34,818 2,098 3,088 Laurentian Bank of Canada 7,665 336 370 Manulife Financial Corporation 521,834 9,485 10,823 National Bank of Canada 89,181 3,286 3,595 Northern Property Real Estate Investment Trust 11,744 297 206 Onex Corporation 21,306 909 1,807 Power Corporation of Canada, Subordinated Voting 96,498 2,710 2,793 Power Financial Corporation 64,199 1,935 2,042 Pure Industrial Real Estate Trust 49,991 248 218 RioCan Real Estate Investment Trust 84,407 2,258 2,000 Royal Bank of Canada 393,108 23,327 29,149 Smart Real Estate Investment 30,252 853 913 Sun Life Financial Inc. 161,800 5,198 6,982 TMX Group Limited 6,191 301 222 Toronto-Dominion Bank, (The) 490,825 20,245 26,622 Tricon Capital Group Inc. 27,874 300 253 INFORMATION TECHNOLOGY 3.11%Avigilon Corporation 9,358 271 128 BlackBerry Limited 122,447 2,577 1,572 Celestica Inc. 32,841 401 502 CGI Group Inc., Subordinated Voting, A 72,961 2,109 4,042 Computer Modelling Group Ltd. 19,507 242 175 Constellation Software Inc. 4,937 978 2,848 Descartes Systems Group Inc., (The) 20,053 309 558 DH Corporation 28,100 804 889
Enghouse Systems Limited 4,856 250 361 Kinaxis Inc. 5,236 237 246 Mitel Networks Corporation 24,527 269 262 Open Text Corporation 32,129 1,055 2,131 Sierra Wireless Inc. 8,569 405 187 TELECOMMUNICATIONS 5.24%BCE Inc. 228,805 9,489 12,232 Manitoba Telecom Services Inc. 20,976 671 624 Rogers Communications Inc., B 94,781 3,608 4,523 TELUS Corporation 158,849 4,733 6,078 UTILITIES 2.23%Algonquin Power & Utilities Corp. 53,483 414 584 ATCO Ltd. 19,889 691 710 Brookfield Renewable Energy Partners L.P. 27,309 890 991 Canadian Utilities Limited, Non-voting, A 30,810 950 984 Capital Power Corporation 23,976 555 426 Emera Incorporated 38,466 1,225 1,663 Fortis Inc. 74,168 2,435 2,775 Innergex Renewable Energy Inc. 24,238 256 275 Just Energy Group Inc. 25,664 275 254 Northland Power Inc. 29,116 491 543 Superior Plus Corp. 37,204 413 400 TransAlta Corporation 75,233 1,215 369 TRUST UNITS 0.39%iShares, S&P/TSX Capped Composite Index 84,250 1,809 1,736 TOTAL EQUITIES 97.15% 415,122 434,756 SHORT-TERM INVESTMENTSBanner Trust, 0.650%, 2016/01/04 2,510,000 2,510 2,509 Government of Canada, 0.415%, 2016/03/10 7,900,000 7,894 7,893 TOTAL SHORT-TERM INVESTMENTS 2.32% 10,404 10,402 Transaction costs (277) - TOTAL INVESTMENTS, NON-DERIVATIVE FINANCIAL ASSETS 99.47% 425,249 445,158 Derivative assets and liabilities (1) 0.03% - 147 Other assets, less liabilities 0.50% 2,262 2,262 NET ASSETS ATTRIBUTABLE TO CONTRACTHOLDERS 100.00% 427,511 447,567
Shares
Average cost
$Fair value
$
Manulife Canadian Equity Index Fund (Manulife Asset Management) (expressed in thousands of dollars, except par values)
(1) Derivative assets and liabilities
Futures contracts / Maturity date Number of contractsContracted value
$Fair value
$Unrealized gain/(loss)
$Derivative assetsS&P/TSX 60 Index Future, 2016/03 80 12,027 12,174 147 Derivative assets and liabilities 147
POOLED AND INDEXED FUNDS
12
The accompanying notes are an integral part of these annual financial statements.
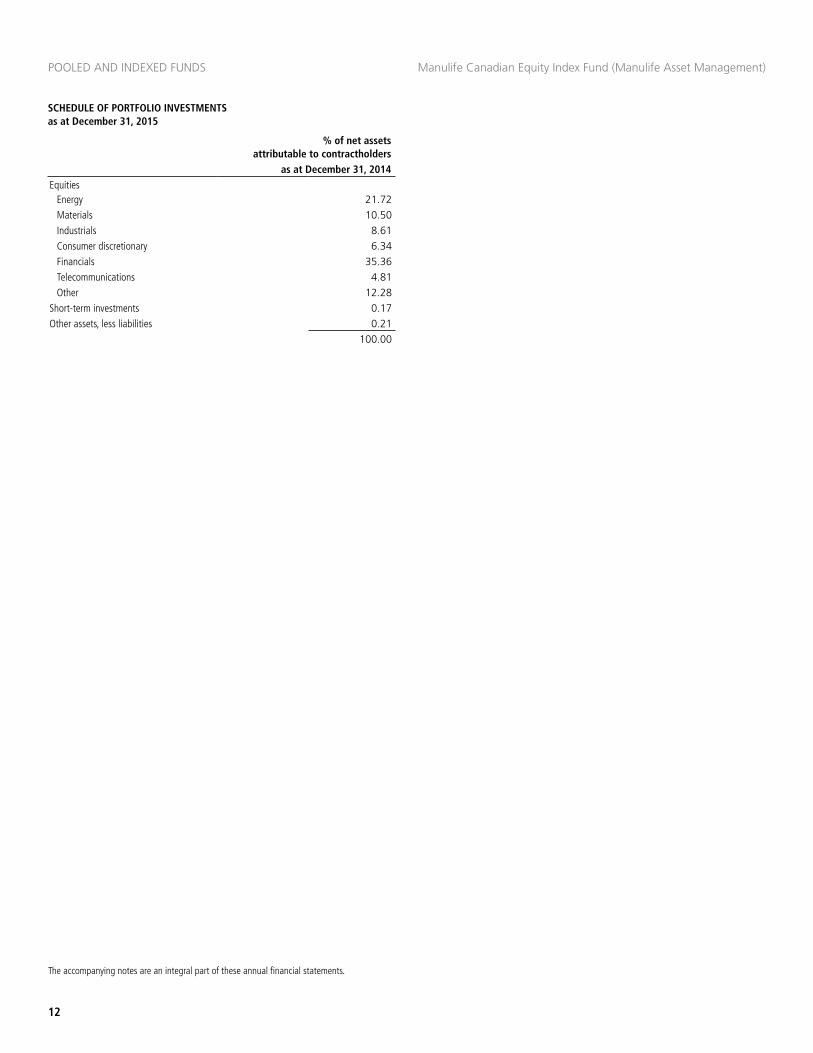
% of net assets attributable to contractholders
as at December 31, 2014Equities
Energy 21.72 Materials 10.50 Industrials 8.61 Consumer discretionary 6.34 Financials 35.36 Telecommunications 4.81 Other 12.28
Short-term investments 0.17 Other assets, less liabilities 0.21
100.00
Manulife Canadian Equity Index Fund (Manulife Asset Management)
SCHEDULE OF PORTFOLIO INVESTMENTS as at December 31, 2015
STATEMENT OF FINANCIAL POSITION STATEMENT OF COMPREHENSIVE INCOME
as at December 31 2015 2014
$ $
for the years ended December 312015 2014
$ $
13
The accompanying notes are an integral part of these annual financial statements.
Manulife Capped Canadian Equity Fund (Manulife Asset Management)(expressed in thousands of dollars, except per unit amounts)
STATEMENT OF CASH FLOWS
for the years ended December 312015 2014
$ $
STATEMENT OF CHANGES IN FINANCIAL POSITION
for the years ended December 312015 2014
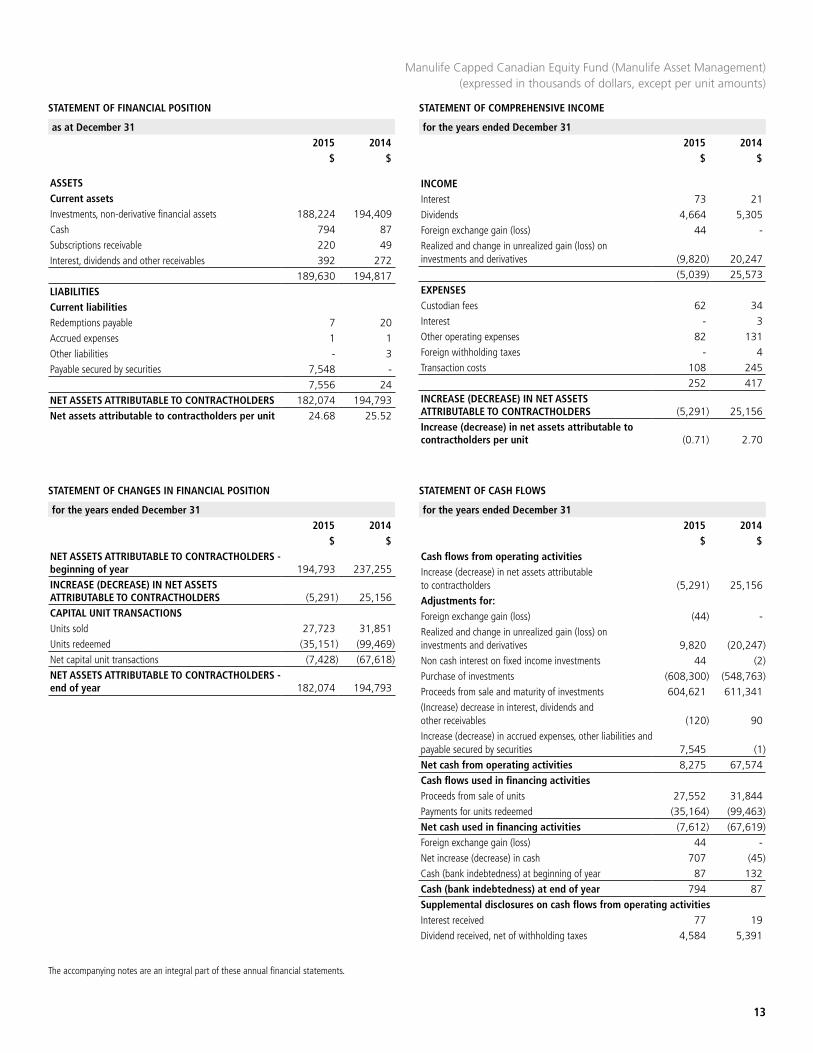
$ $Cash flows from operating activitiesIncrease (decrease) in net assets attributable to contractholders (5,291) 25,156Adjustments for:Foreign exchange gain (loss) (44) -Realized and change in unrealized gain (loss) on investments and derivatives 9,820 (20,247)Non cash interest on fixed income investments 44 (2)Purchase of investments (608,300) (548,763)Proceeds from sale and maturity of investments 604,621 611,341(Increase) decrease in interest, dividends and other receivables (120) 90Increase (decrease) in accrued expenses, other liabilities and payable secured by securities 7,545 (1)Net cash from operating activities 8,275 67,574Cash flows used in financing activitiesProceeds from sale of units 27,552 31,844Payments for units redeemed (35,164) (99,463)Net cash used in financing activities (7,612) (67,619)Foreign exchange gain (loss) 44 -Net increase (decrease) in cash 707 (45)Cash (bank indebtedness) at beginning of year 87 132Cash (bank indebtedness) at end of year 794 87Supplemental disclosures on cash flows from operating activitiesInterest received 77 19Dividend received, net of withholding taxes 4,584 5,391
NET ASSETS ATTRIBUTABLE TO CONTRACTHOLDERS - beginning of year 194,793 237,255INCREASE (DECREASE) IN NET ASSETS ATTRIBUTABLE TO CONTRACTHOLDERS (5,291) 25,156CAPITAL UNIT TRANSACTIONSUnits sold 27,723 31,851Units redeemed (35,151) (99,469)Net capital unit transactions (7,428) (67,618)NET ASSETS ATTRIBUTABLE TO CONTRACTHOLDERS - end of year 182,074 194,793
INCOMEInterest 73 21Dividends 4,664 5,305Foreign exchange gain (loss) 44 -Realized and change in unrealized gain (loss) on investments and derivatives (9,820) 20,247
(5,039) 25,573EXPENSESCustodian fees 62 34Interest - 3Other operating expenses 82 131Foreign withholding taxes - 4Transaction costs 108 245
252 417INCREASE (DECREASE) IN NET ASSETS ATTRIBUTABLE TO CONTRACTHOLDERS (5,291) 25,156Increase (decrease) in net assets attributable to contractholders per unit (0.71) 2.70
ASSETSCurrent assetsInvestments, non-derivative financial assets 188,224 194,409Cash 794 87Subscriptions receivable 220 49Interest, dividends and other receivables 392 272
189,630 194,817LIABILITIESCurrent liabilitiesRedemptions payable 7 20Accrued expenses 1 1Other liabilities - 3Payable secured by securities 7,548 -
7,556 24NET ASSETS ATTRIBUTABLE TO CONTRACTHOLDERS 182,074 194,793Net assets attributable to contractholders per unit 24.68 25.52
POOLED AND INDEXED FUNDS
14
SCHEDULE OF PORTFOLIO INVESTMENTS as at December 31, 2015
SCHEDULE OF PORTFOLIO INVESTMENTS as at December 31, 2015
The accompanying notes are an integral part of these annual financial statements.
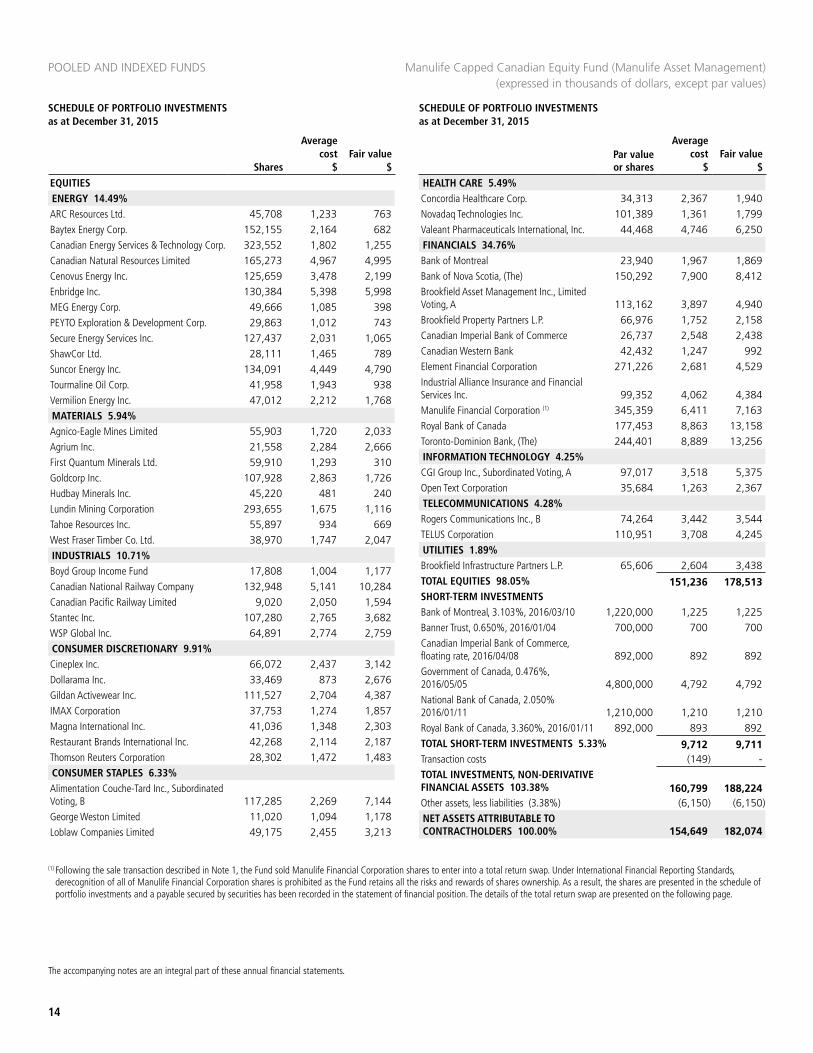
Manulife Capped Canadian Equity Fund (Manulife Asset Management)(expressed in thousands of dollars, except par values)
EQUITIESENERGY 14.49%ARC Resources Ltd. 45,708 1,233 763 Baytex Energy Corp. 152,155 2,164 682 Canadian Energy Services & Technology Corp. 323,552 1,802 1,255 Canadian Natural Resources Limited 165,273 4,967 4,995 Cenovus Energy Inc. 125,659 3,478 2,199 Enbridge Inc. 130,384 5,398 5,998 MEG Energy Corp. 49,666 1,085 398 PEYTO Exploration & Development Corp. 29,863 1,012 743 Secure Energy Services Inc. 127,437 2,031 1,065 ShawCor Ltd. 28,111 1,465 789 Suncor Energy Inc. 134,091 4,449 4,790 Tourmaline Oil Corp. 41,958 1,943 938 Vermilion Energy Inc. 47,012 2,212 1,768 MATERIALS 5.94%Agnico-Eagle Mines Limited 55,903 1,720 2,033 Agrium Inc. 21,558 2,284 2,666 First Quantum Minerals Ltd. 59,910 1,293 310 Goldcorp Inc. 107,928 2,863 1,726 Hudbay Minerals Inc. 45,220 481 240 Lundin Mining Corporation 293,655 1,675 1,116 Tahoe Resources Inc. 55,897 934 669 West Fraser Timber Co. Ltd. 38,970 1,747 2,047 INDUSTRIALS 10.71%Boyd Group Income Fund 17,808 1,004 1,177 Canadian National Railway Company 132,948 5,141 10,284 Canadian Pacific Railway Limited 9,020 2,050 1,594 Stantec Inc. 107,280 2,765 3,682 WSP Global Inc. 64,891 2,774 2,759 CONSUMER DISCRETIONARY 9.91%Cineplex Inc. 66,072 2,437 3,142 Dollarama Inc. 33,469 873 2,676 Gildan Activewear Inc. 111,527 2,704 4,387 IMAX Corporation 37,753 1,274 1,857 Magna International Inc. 41,036 1,348 2,303 Restaurant Brands International Inc. 42,268 2,114 2,187 Thomson Reuters Corporation 28,302 1,472 1,483 CONSUMER STAPLES 6.33%Alimentation Couche-Tard Inc., Subordinated Voting, B 117,285 2,269 7,144 George Weston Limited 11,020 1,094 1,178 Loblaw Companies Limited 49,175 2,455 3,213
HEALTH CARE 5.49%Concordia Healthcare Corp. 34,313 2,367 1,940 Novadaq Technologies Inc. 101,389 1,361 1,799 Valeant Pharmaceuticals International, Inc. 44,468 4,746 6,250 FINANCIALS 34.76%Bank of Montreal 23,940 1,967 1,869 Bank of Nova Scotia, (The) 150,292 7,900 8,412 Brookfield Asset Management Inc., Limited Voting, A 113,162 3,897 4,940 Brookfield Property Partners L.P. 66,976 1,752 2,158 Canadian Imperial Bank of Commerce 26,737 2,548 2,438 Canadian Western Bank 42,432 1,247 992 Element Financial Corporation 271,226 2,681 4,529 Industrial Alliance Insurance and Financial Services Inc. 99,352 4,062 4,384 Manulife Financial Corporation (1) 345,359 6,411 7,163 Royal Bank of Canada 177,453 8,863 13,158 Toronto-Dominion Bank, (The) 244,401 8,889 13,256 INFORMATION TECHNOLOGY 4.25%CGI Group Inc., Subordinated Voting, A 97,017 3,518 5,375 Open Text Corporation 35,684 1,263 2,367 TELECOMMUNICATIONS 4.28%Rogers Communications Inc., B 74,264 3,442 3,544 TELUS Corporation 110,951 3,708 4,245 UTILITIES 1.89%Brookfield Infrastructure Partners L.P. 65,606 2,604 3,438 TOTAL EQUITIES 98.05% 151,236 178,513 SHORT-TERM INVESTMENTSBank of Montreal, 3.103%, 2016/03/10 1,220,000 1,225 1,225 Banner Trust, 0.650%, 2016/01/04 700,000 700 700 Canadian Imperial Bank of Commerce, floating rate, 2016/04/08 892,000 892 892 Government of Canada, 0.476%, 2016/05/05 4,800,000 4,792 4,792 National Bank of Canada, 2.050% 2016/01/11 1,210,000 1,210 1,210 Royal Bank of Canada, 3.360%, 2016/01/11 892,000 893 892 TOTAL SHORT-TERM INVESTMENTS 5.33% 9,712 9,711 Transaction costs (149) - TOTAL INVESTMENTS, NON-DERIVATIVE FINANCIAL ASSETS 103.38% 160,799 188,224 Other assets, less liabilities (3.38%) (6,150) (6,150)NET ASSETS ATTRIBUTABLE TO CONTRACTHOLDERS 100.00% 154,649 182,074
(1) Following the sale transaction described in Note 1, the Fund sold Manulife Financial Corporation shares to enter into a total return swap. Under International Financial Reporting Standards, derecognition of all of Manulife Financial Corporation shares is prohibited as the Fund retains all the risks and rewards of shares ownership. As a result, the shares are presented in the schedule of portfolio investments and a payable secured by securities has been recorded in the statement of financial position. The details of the total return swap are presented on the following page.
Par value or shares
Average cost
$Fair value
$Shares
Average cost
$Fair value
$
SCHEDULE OF PORTFOLIO INVESTMENTS as at December 31, 2015
15
The accompanying notes are an integral part of these annual financial statements.
Manulife Capped Canadian Equity Fund (Manulife Asset Management)(expressed in thousands of dollars)
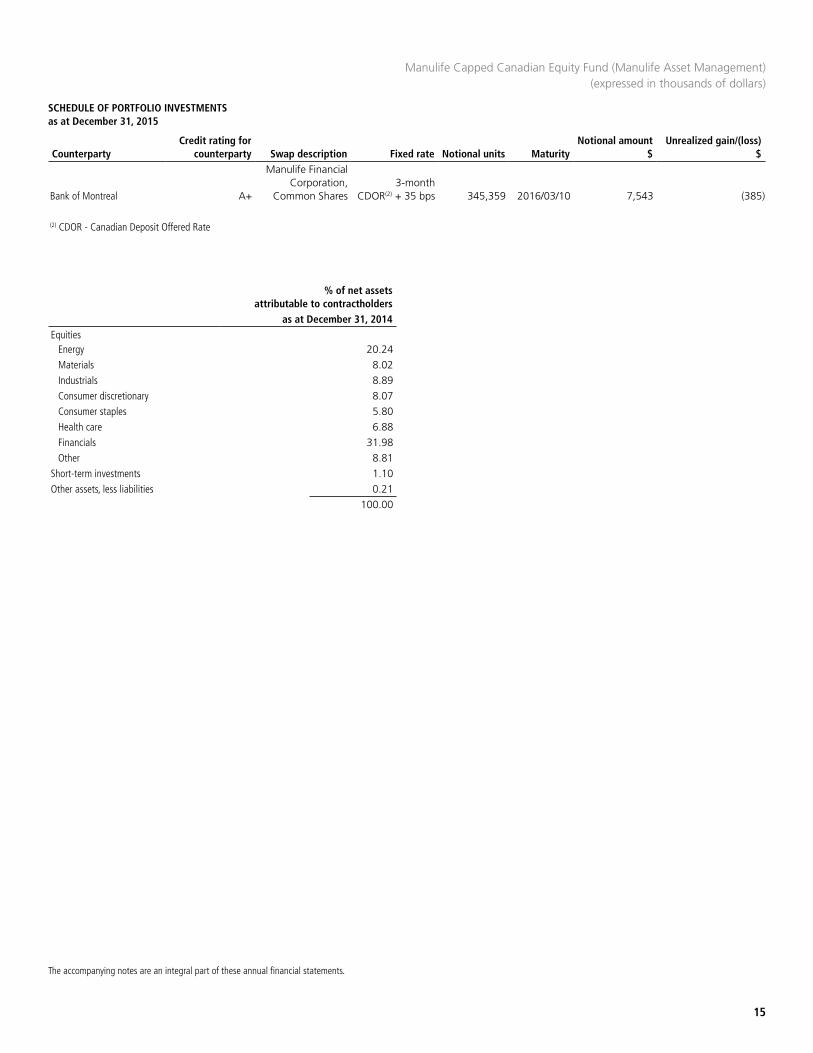
% of net assets attributable to contractholders
as at December 31, 2014Equities
Energy 20.24 Materials 8.02 Industrials 8.89 Consumer discretionary 8.07 Consumer staples 5.80 Health care 6.88 Financials 31.98 Other 8.81
Short-term investments 1.10 Other assets, less liabilities 0.21
100.00
CounterpartyCredit rating for
counterparty Swap description Fixed rate Notional units MaturityNotional amount
$Unrealized gain/(loss)
$
Bank of Montreal A+
Manulife Financial Corporation,
Common Shares3-month
CDOR(2) + 35 bps 345,359 2016/03/10 7,543 (385)
(2) CDOR - Canadian Deposit Offered Rate
STATEMENT OF FINANCIAL POSITION
POOLED AND INDEXED FUNDS
STATEMENT OF COMPREHENSIVE INCOME
as at December 31 2015 2014
$ $
for the years ended December 312015 2014
$ $
16
The accompanying notes are an integral part of these annual financial statements.
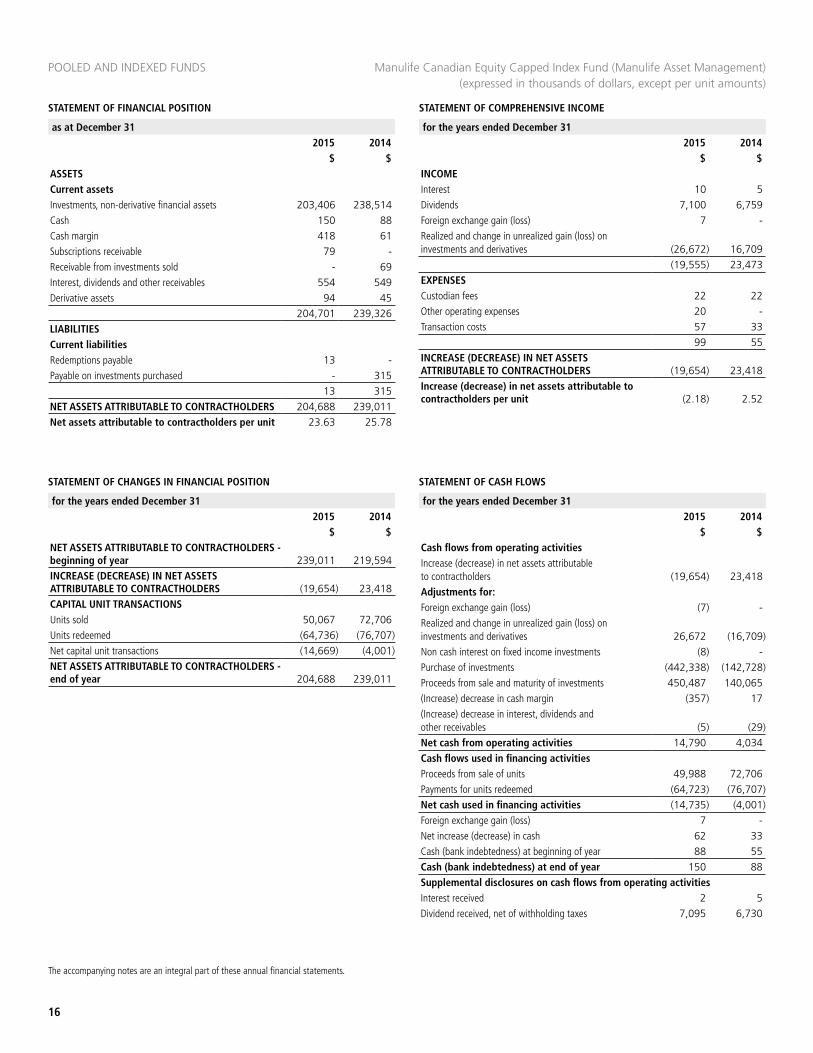
INCOMEInterest 10 5Dividends 7,100 6,759Foreign exchange gain (loss) 7 -Realized and change in unrealized gain (loss) on investments and derivatives (26,672) 16,709
(19,555) 23,473EXPENSESCustodian fees 22 22Other operating expenses 20 -Transaction costs 57 33
99 55INCREASE (DECREASE) IN NET ASSETS ATTRIBUTABLE TO CONTRACTHOLDERS (19,654) 23,418Increase (decrease) in net assets attributable to contractholders per unit (2.18) 2.52
ASSETSCurrent assetsInvestments, non-derivative financial assets 203,406 238,514Cash 150 88Cash margin 418 61Subscriptions receivable 79 -Receivable from investments sold - 69Interest, dividends and other receivables 554 549Derivative assets 94 45
204,701 239,326LIABILITIESCurrent liabilitiesRedemptions payable 13 -Payable on investments purchased - 315
13 315NET ASSETS ATTRIBUTABLE TO CONTRACTHOLDERS 204,688 239,011Net assets attributable to contractholders per unit 23.63 25.78
STATEMENT OF CHANGES IN FINANCIAL POSITION STATEMENT OF CASH FLOWS
for the years ended December 312015 2014
$ $
for the years ended December 312015 2014
$ $Cash flows from operating activitiesIncrease (decrease) in net assets attributable to contractholders (19,654) 23,418Adjustments for:Foreign exchange gain (loss) (7) -Realized and change in unrealized gain (loss) on investments and derivatives 26,672 (16,709)Non cash interest on fixed income investments (8) -Purchase of investments (442,338) (142,728)Proceeds from sale and maturity of investments 450,487 140,065(Increase) decrease in cash margin (357) 17(Increase) decrease in interest, dividends and other receivables (5) (29)Net cash from operating activities 14,790 4,034Cash flows used in financing activitiesProceeds from sale of units 49,988 72,706Payments for units redeemed (64,723) (76,707)Net cash used in financing activities (14,735) (4,001)Foreign exchange gain (loss) 7 -Net increase (decrease) in cash 62 33Cash (bank indebtedness) at beginning of year 88 55Cash (bank indebtedness) at end of year 150 88Supplemental disclosures on cash flows from operating activitiesInterest received 2 5Dividend received, net of withholding taxes 7,095 6,730
NET ASSETS ATTRIBUTABLE TO CONTRACTHOLDERS - beginning of year 239,011 219,594INCREASE (DECREASE) IN NET ASSETS ATTRIBUTABLE TO CONTRACTHOLDERS (19,654) 23,418CAPITAL UNIT TRANSACTIONSUnits sold 50,067 72,706Units redeemed (64,736) (76,707)Net capital unit transactions (14,669) (4,001)NET ASSETS ATTRIBUTABLE TO CONTRACTHOLDERS - end of year 204,688 239,011
Manulife Canadian Equity Capped Index Fund (Manulife Asset Management) (expressed in thousands of dollars, except per unit amounts)
SCHEDULE OF PORTFOLIO INVESTMENTS as at December 31, 2015
SCHEDULE OF PORTFOLIO INVESTMENTS as at December 31, 2015
17
The accompanying notes are an integral part of these annual financial statements.
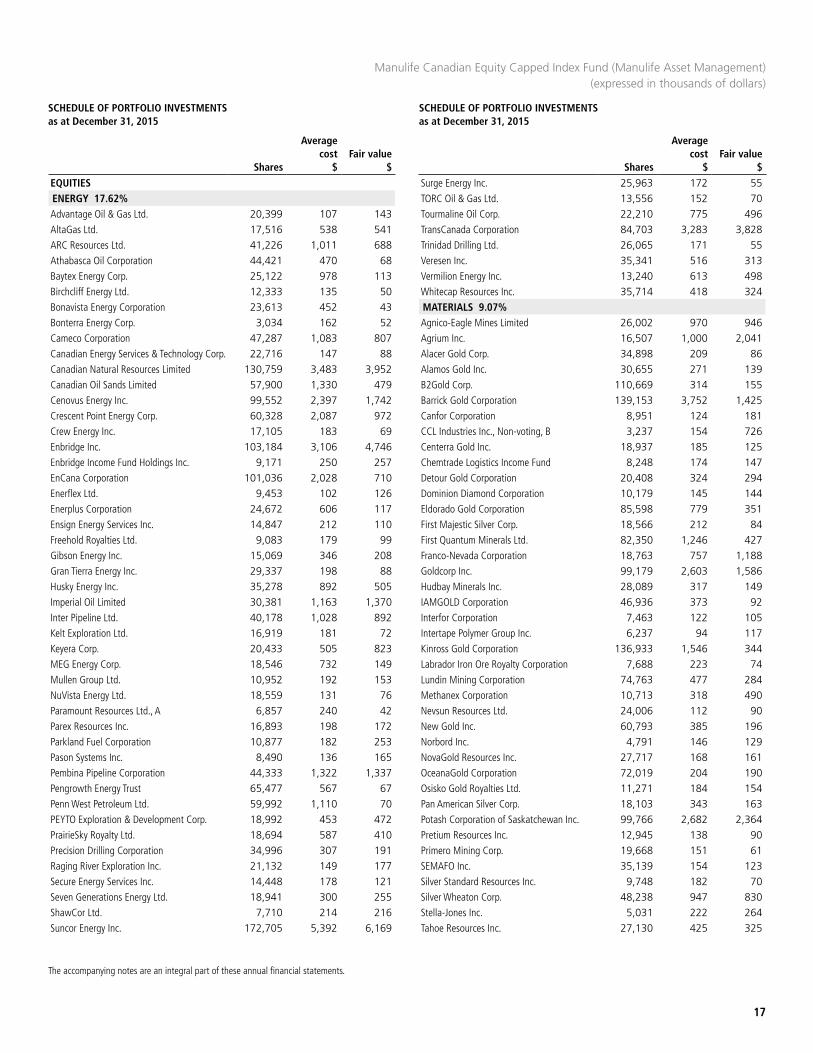
Manulife Canadian Equity Capped Index Fund (Manulife Asset Management) (expressed in thousands of dollars)
EQUITIESENERGY 17.62%Advantage Oil & Gas Ltd. 20,399 107 143 AltaGas Ltd. 17,516 538 541 ARC Resources Ltd. 41,226 1,011 688 Athabasca Oil Corporation 44,421 470 68 Baytex Energy Corp. 25,122 978 113 Birchcliff Energy Ltd. 12,333 135 50 Bonavista Energy Corporation 23,613 452 43 Bonterra Energy Corp. 3,034 162 52 Cameco Corporation 47,287 1,083 807 Canadian Energy Services & Technology Corp. 22,716 147 88 Canadian Natural Resources Limited 130,759 3,483 3,952 Canadian Oil Sands Limited 57,900 1,330 479 Cenovus Energy Inc. 99,552 2,397 1,742 Crescent Point Energy Corp. 60,328 2,087 972 Crew Energy Inc. 17,105 183 69 Enbridge Inc. 103,184 3,106 4,746 Enbridge Income Fund Holdings Inc. 9,171 250 257 EnCana Corporation 101,036 2,028 710 Enerflex Ltd. 9,453 102 126 Enerplus Corporation 24,672 606 117 Ensign Energy Services Inc. 14,847 212 110 Freehold Royalties Ltd. 9,083 179 99 Gibson Energy Inc. 15,069 346 208 Gran Tierra Energy Inc. 29,337 198 88 Husky Energy Inc. 35,278 892 505 Imperial Oil Limited 30,381 1,163 1,370 Inter Pipeline Ltd. 40,178 1,028 892 Kelt Exploration Ltd. 16,919 181 72 Keyera Corp. 20,433 505 823 MEG Energy Corp. 18,546 732 149 Mullen Group Ltd. 10,952 192 153 NuVista Energy Ltd. 18,559 131 76 Paramount Resources Ltd., A 6,857 240 42 Parex Resources Inc. 16,893 198 172 Parkland Fuel Corporation 10,877 182 253 Pason Systems Inc. 8,490 136 165 Pembina Pipeline Corporation 44,333 1,322 1,337 Pengrowth Energy Trust 65,477 567 67 Penn West Petroleum Ltd. 59,992 1,110 70 PEYTO Exploration & Development Corp. 18,992 453 472 PrairieSky Royalty Ltd. 18,694 587 410 Precision Drilling Corporation 34,996 307 191 Raging River Exploration Inc. 21,132 149 177 Secure Energy Services Inc. 14,448 178 121 Seven Generations Energy Ltd. 18,941 300 255 ShawCor Ltd. 7,710 214 216 Suncor Energy Inc. 172,705 5,392 6,169
Surge Energy Inc. 25,963 172 55 TORC Oil & Gas Ltd. 13,556 152 70 Tourmaline Oil Corp. 22,210 775 496 TransCanada Corporation 84,703 3,283 3,828 Trinidad Drilling Ltd. 26,065 171 55 Veresen Inc. 35,341 516 313 Vermilion Energy Inc. 13,240 613 498 Whitecap Resources Inc. 35,714 418 324 MATERIALS 9.07%Agnico-Eagle Mines Limited 26,002 970 946 Agrium Inc. 16,507 1,000 2,041 Alacer Gold Corp. 34,898 209 86 Alamos Gold Inc. 30,655 271 139 B2Gold Corp. 110,669 314 155 Barrick Gold Corporation 139,153 3,752 1,425 Canfor Corporation 8,951 124 181 CCL Industries Inc., Non-voting, B 3,237 154 726 Centerra Gold Inc. 18,937 185 125 Chemtrade Logistics Income Fund 8,248 174 147 Detour Gold Corporation 20,408 324 294 Dominion Diamond Corporation 10,179 145 144 Eldorado Gold Corporation 85,598 779 351 First Majestic Silver Corp. 18,566 212 84 First Quantum Minerals Ltd. 82,350 1,246 427 Franco-Nevada Corporation 18,763 757 1,188 Goldcorp Inc. 99,179 2,603 1,586 Hudbay Minerals Inc. 28,089 317 149 IAMGOLD Corporation 46,936 373 92 Interfor Corporation 7,463 122 105 Intertape Polymer Group Inc. 6,237 94 117 Kinross Gold Corporation 136,933 1,546 344 Labrador Iron Ore Royalty Corporation 7,688 223 74 Lundin Mining Corporation 74,763 477 284 Methanex Corporation 10,713 318 490 Nevsun Resources Ltd. 24,006 112 90 New Gold Inc. 60,793 385 196 Norbord Inc. 4,791 146 129 NovaGold Resources Inc. 27,717 168 161 OceanaGold Corporation 72,019 204 190 Osisko Gold Royalties Ltd. 11,271 184 154 Pan American Silver Corp. 18,103 343 163 Potash Corporation of Saskatchewan Inc. 99,766 2,682 2,364 Pretium Resources Inc. 12,945 138 90 Primero Mining Corp. 19,668 151 61 SEMAFO Inc. 35,139 154 123 Silver Standard Resources Inc. 9,748 182 70 Silver Wheaton Corp. 48,238 947 830 Stella-Jones Inc. 5,031 222 264 Tahoe Resources Inc. 27,130 425 325
Shares
Average cost
$Fair value
$Shares
Average cost
$Fair value
$

POOLED AND INDEXED FUNDS
18
SCHEDULE OF PORTFOLIO INVESTMENTS as at December 31, 2015
SCHEDULE OF PORTFOLIO INVESTMENTS as at December 31, 2015
The accompanying notes are an integral part of these annual financial statements.
Manulife Canadian Equity Capped Index Fund (Manulife Asset Management) (expressed in thousands of dollars)
Teck Resources Limited, Subordinated Voting, B 55,521 1,340 296 Torex Gold Resources Inc. 93,806 159 118 Turquoise Hill Resources Ltd. 117,767 658 413 West Fraser Timber Co. Ltd. 8,047 238 423 Western Forest Products Inc. 47,284 114 107 Yamana Gold Inc. 113,062 1,135 291 INDUSTRIALS 7.90%Aecon Group Inc. 6,766 105 104 Air Canada 33,911 156 346 ATS Automation Tooling Systems Inc. 8,956 124 102 Badger Daylighting Ltd. 4,433 126 108 Bombardier Inc., Subordinated Voting, B 230,856 1,030 309 Boyd Group Income Fund 2,004 117 132 CAE Inc. 32,167 335 494 Canadian National Railway Company 94,704 3,353 7,325 Canadian Pacific Railway Limited 16,618 1,456 2,937 Finning International Inc. 20,227 418 378 MacDonald, Dettwiler & Associates Ltd. 4,327 211 360 New Flyer Industries Inc. 4,445 120 126 Progressive Waste Solutions Ltd. 13,059 283 426 Ritchie Bros. Auctioneers Incorporated 12,803 290 427 Russel Metals Inc. 7,373 164 119 SNC-Lavalin Group Inc. 17,894 582 736 Stantec Inc. 11,273 200 387 Toromont Industries Ltd. 8,746 156 276 Transcontinental Inc., A 7,571 127 131 TransForce Inc. 10,141 154 239 WestJet Airlines Ltd. 14,698 256 299 Westshore Terminals Investment Corporation 7,121 191 83 WSP Global Inc. 7,589 234 323 CONSUMER DISCRETIONARY 6.60%Aimia Inc. 18,774 292 177 Amaya Inc. 12,917 419 225 AutoCanada Inc. 2,533 187 61 BRP Inc. 4,116 122 82 Canadian Tire Corporation, Limited, A 8,543 557 1,009 Cineplex Inc. 7,535 212 358 Cogeco Cable Inc., Subordinated Voting 2,725 101 168 Corus Entertainment Inc., B 10,029 188 108 DHX Media Ltd. 14,018 136 119 Dollarama Inc. 13,716 350 1,096 Dorel Industries Inc., Subordinated Voting, B 3,136 106 98 EnerCare Inc. 10,917 156 174 Gildan Activewear Inc. 27,594 478 1,086 Great Canadian Gaming Corporation 5,899 120 91 Hudson's Bay Company 13,270 251 240 Intertain Group Limited 7,820 142 78 Linamar Corporation 5,445 152 407
Magna International Inc. 45,897 1,296 2,576 Martinrea International Inc. 10,313 101 108 Performance Sports Group Ltd. 5,486 132 73 Quebecor Inc., B 9,977 171 338 Restaurant Brands International Inc. 26,890 1,157 1,392 RONA Inc. 11,031 170 136 Shaw Communications Inc., B 47,055 938 1,120 Thomson Reuters Corporation 38,559 1,494 2,021 Uni-Select Inc. 2,389 132 164 CONSUMER STAPLES 4.29%Alimentation Couche-Tard Inc., Subordinated Voting, B 50,097 773 3,051 Cott Corporation 13,093 125 200 Empire Company Limited, Non-voting, A 19,283 401 496 George Weston Limited 5,653 482 605 Jean Coutu Group (PJC) Inc., (The) 9,985 157 179 Loblaw Companies Limited 26,114 1,301 1,706 Maple Leaf Foods Inc. 10,729 160 255 METRO INC. 28,742 423 1,114 Saputo Inc. 30,459 527 1,008 The North West Company Inc. 5,794 129 166 HEALTH CARE 2.90%Concordia Healthcare Corp. 4,499 351 254 Extendicare Inc. 10,496 78 101 ProMetic Life Sciences Inc. 56,921 148 191 Valeant Pharmaceuticals International, Inc. 38,318 3,157 5,386 FINANCIALS 36.67%Alaris Royalty Corp. 4,299 141 101 Allied Properties Real Estate Investment Trust 9,343 312 295 Artis Real Estate Investment Trust 16,540 255 212 Bank of Montreal 76,772 4,500 5,994 Bank of Nova Scotia, (The) 143,720 7,022 8,044 Boardwalk Real Estate Investment Trust 4,573 293 217 Brookfield Asset Management Inc., Limited Voting, A 103,145 2,326 4,502 Brookfield Property Partners L.P. 25,720 509 829 Canaccord Financial Inc. 11,152 129 57 Canadian Apartment Properties Real Estate Investment Trust 15,321 379 411 Canadian Imperial Bank of Commerce 47,466 3,568 4,328 Canadian Real Estate Investment Trust 8,710 383 366 Canadian Western Bank 9,624 213 225 Chartwell Retirement Residences 20,854 224 265 CI Financial Corp. 28,410 753 869 Colliers International Group Inc. 3,941 130 243 Cominar Real Estate Investment Trust 19,322 401 284 Crombie Real Estate Investment Trust 9,283 131 119 Dream Global REIT 12,785 129 111 Dream Office Real Estate Investment Trust 12,865 440 223
Shares
Average cost
$Fair value
$Shares
Average cost
$Fair value
$
SCHEDULE OF PORTFOLIO INVESTMENTS as at December 31, 2015
SCHEDULE OF PORTFOLIO INVESTMENTS as at December 31, 2015
19
The accompanying notes are an integral part of these annual financial statements.
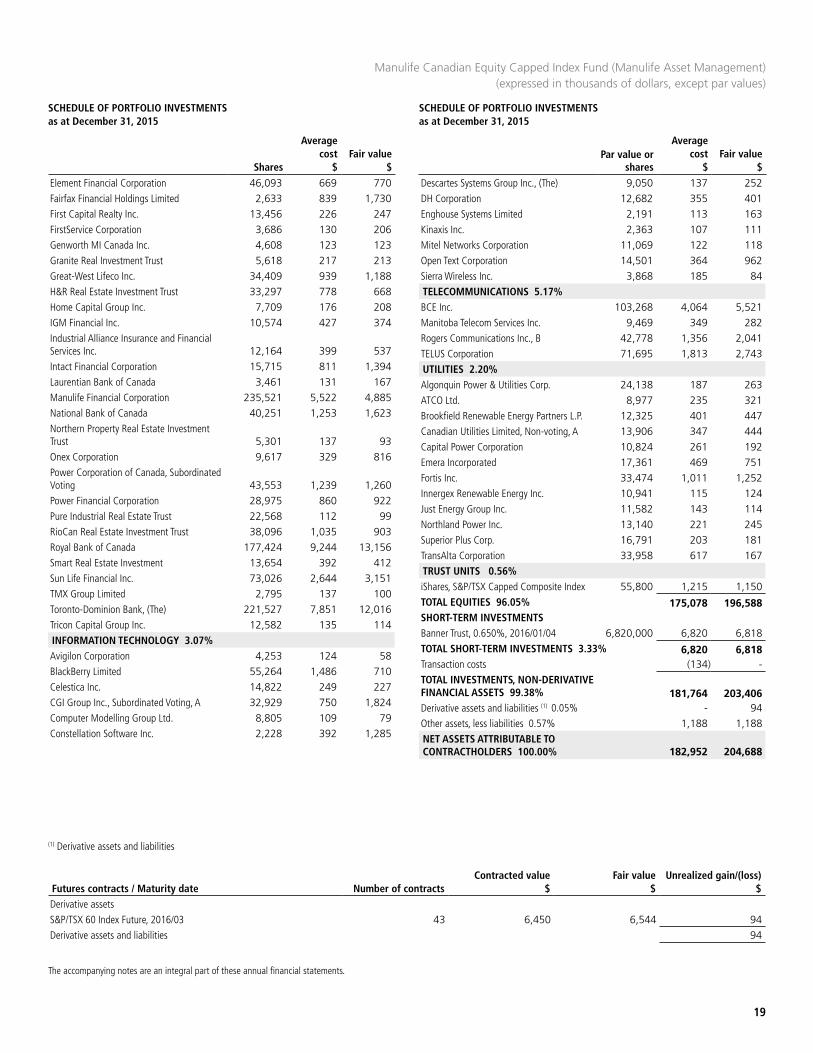
Manulife Canadian Equity Capped Index Fund (Manulife Asset Management) (expressed in thousands of dollars, except par values)
Element Financial Corporation 46,093 669 770 Fairfax Financial Holdings Limited 2,633 839 1,730 First Capital Realty Inc. 13,456 226 247 FirstService Corporation 3,686 130 206 Genworth MI Canada Inc. 4,608 123 123 Granite Real Investment Trust 5,618 217 213 Great-West Lifeco Inc. 34,409 939 1,188 H&R Real Estate Investment Trust 33,297 778 668 Home Capital Group Inc. 7,709 176 208 IGM Financial Inc. 10,574 427 374 Industrial Alliance Insurance and Financial Services Inc. 12,164 399 537 Intact Financial Corporation 15,715 811 1,394 Laurentian Bank of Canada 3,461 131 167 Manulife Financial Corporation 235,521 5,522 4,885 National Bank of Canada 40,251 1,253 1,623 Northern Property Real Estate Investment Trust 5,301 137 93 Onex Corporation 9,617 329 816 Power Corporation of Canada, Subordinated Voting 43,553 1,239 1,260 Power Financial Corporation 28,975 860 922 Pure Industrial Real Estate Trust 22,568 112 99 RioCan Real Estate Investment Trust 38,096 1,035 903 Royal Bank of Canada 177,424 9,244 13,156 Smart Real Estate Investment 13,654 392 412 Sun Life Financial Inc. 73,026 2,644 3,151 TMX Group Limited 2,795 137 100 Toronto-Dominion Bank, (The) 221,527 7,851 12,016 Tricon Capital Group Inc. 12,582 135 114 INFORMATION TECHNOLOGY 3.07%Avigilon Corporation 4,253 124 58 BlackBerry Limited 55,264 1,486 710 Celestica Inc. 14,822 249 227 CGI Group Inc., Subordinated Voting, A 32,929 750 1,824 Computer Modelling Group Ltd. 8,805 109 79 Constellation Software Inc. 2,228 392 1,285
Descartes Systems Group Inc., (The) 9,050 137 252 DH Corporation 12,682 355 401 Enghouse Systems Limited 2,191 113 163 Kinaxis Inc. 2,363 107 111 Mitel Networks Corporation 11,069 122 118 Open Text Corporation 14,501 364 962 Sierra Wireless Inc. 3,868 185 84 TELECOMMUNICATIONS 5.17%BCE Inc. 103,268 4,064 5,521 Manitoba Telecom Services Inc. 9,469 349 282 Rogers Communications Inc., B 42,778 1,356 2,041 TELUS Corporation 71,695 1,813 2,743 UTILITIES 2.20%Algonquin Power & Utilities Corp. 24,138 187 263 ATCO Ltd. 8,977 235 321 Brookfield Renewable Energy Partners L.P. 12,325 401 447 Canadian Utilities Limited, Non-voting, A 13,906 347 444 Capital Power Corporation 10,824 261 192 Emera Incorporated 17,361 469 751 Fortis Inc. 33,474 1,011 1,252 Innergex Renewable Energy Inc. 10,941 115 124 Just Energy Group Inc. 11,582 143 114 Northland Power Inc. 13,140 221 245 Superior Plus Corp. 16,791 203 181 TransAlta Corporation 33,958 617 167 TRUST UNITS 0.56%iShares, S&P/TSX Capped Composite Index 55,800 1,215 1,150 TOTAL EQUITIES 96.05% 175,078 196,588 SHORT-TERM INVESTMENTSBanner Trust, 0.650%, 2016/01/04 6,820,000 6,820 6,818 TOTAL SHORT-TERM INVESTMENTS 3.33% 6,820 6,818 Transaction costs (134) - TOTAL INVESTMENTS, NON-DERIVATIVE FINANCIAL ASSETS 99.38% 181,764 203,406 Derivative assets and liabilities (1) 0.05% - 94 Other assets, less liabilities 0.57% 1,188 1,188 NET ASSETS ATTRIBUTABLE TO CONTRACTHOLDERS 100.00% 182,952 204,688
(1) Derivative assets and liabilities
Futures contracts / Maturity date Number of contractsContracted value
$Fair value
$Unrealized gain/(loss)
$Derivative assetsS&P/TSX 60 Index Future, 2016/03 43 6,450 6,544 94 Derivative assets and liabilities 94
Par value or shares
Average cost
$Fair value
$Shares
Average cost
$Fair value
$
POOLED AND INDEXED FUNDS
20
SCHEDULE OF PORTFOLIO INVESTMENTS as at December 31, 2015
The accompanying notes are an integral part of these annual financial statements.
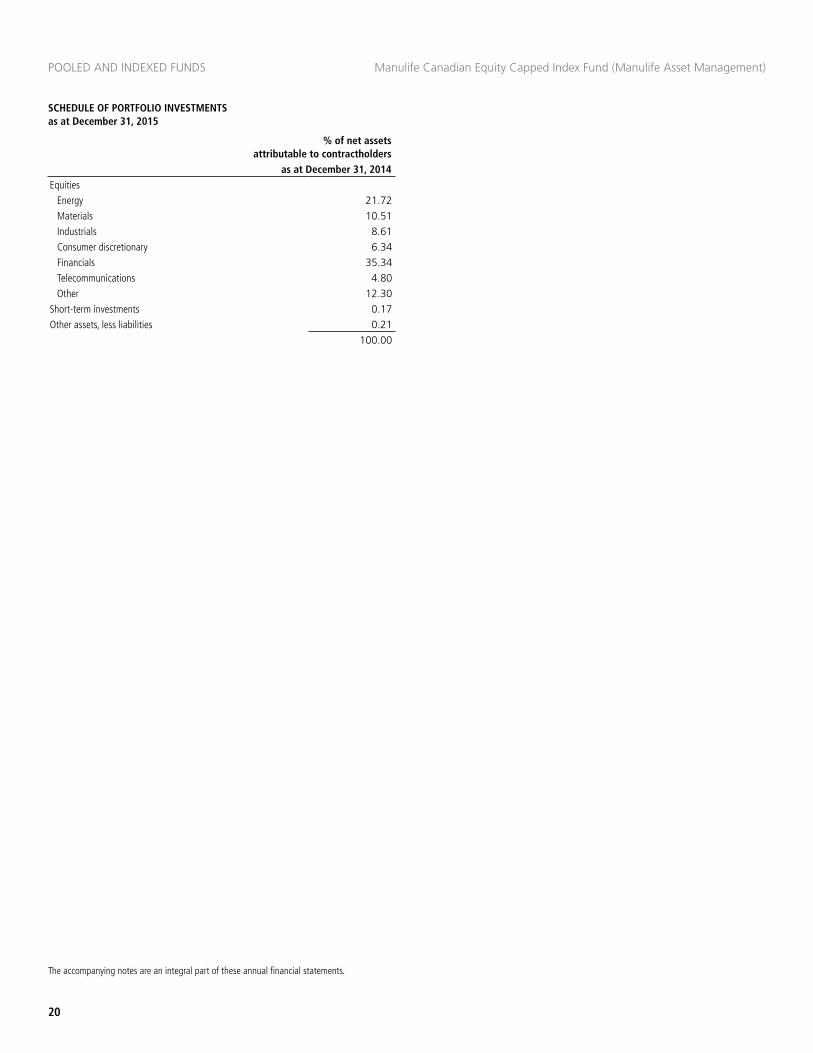
Manulife Canadian Equity Capped Index Fund (Manulife Asset Management)
% of net assets attributable to contractholders
as at December 31, 2014Equities
Energy 21.72Materials 10.51Industrials 8.61Consumer discretionary 6.34Financials 35.34Telecommunications 4.80Other 12.30
Short-term investments 0.17 Other assets, less liabilities 0.21
100.00
STATEMENT OF FINANCIAL POSITION STATEMENT OF COMPREHENSIVE INCOME
as at December 31 2015 2014
$ $
for the years ended December 312015 2014
$ $
21
The accompanying notes are an integral part of these annual financial statements.
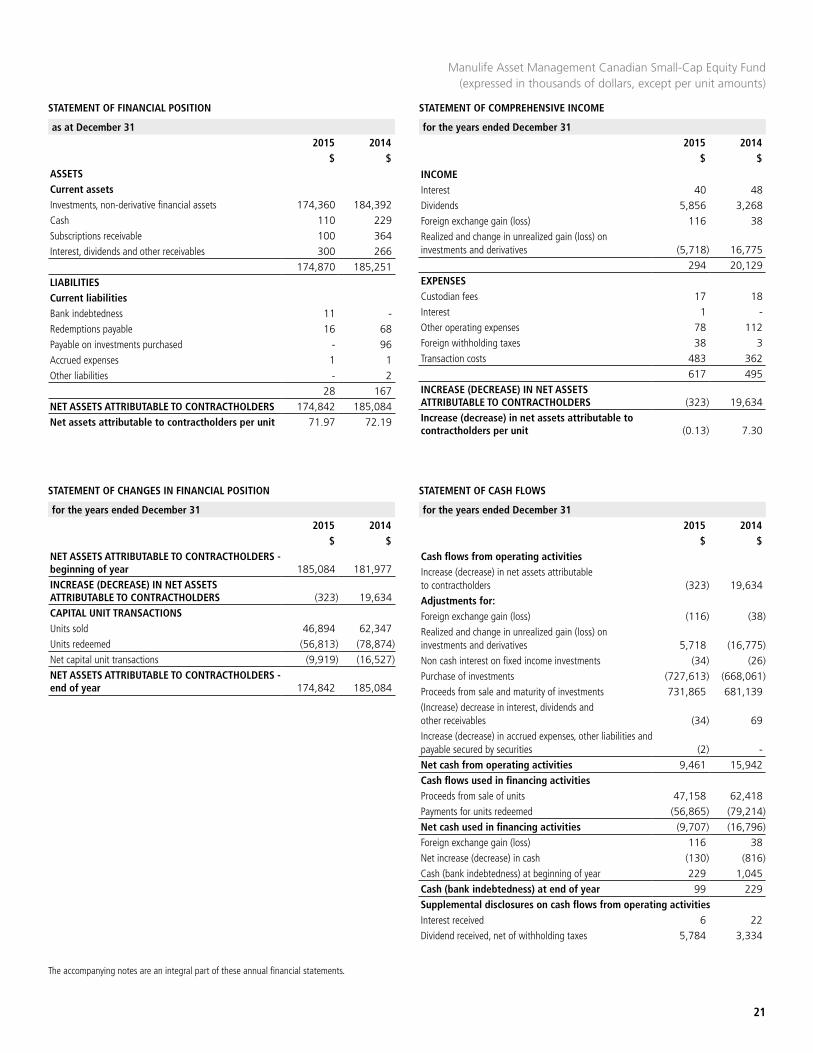
Manulife Asset Management Canadian Small-Cap Equity Fund(expressed in thousands of dollars, except per unit amounts)
ASSETSCurrent assetsInvestments, non-derivative financial assets 174,360 184,392Cash 110 229Subscriptions receivable 100 364Interest, dividends and other receivables 300 266
174,870 185,251LIABILITIESCurrent liabilitiesBank indebtedness 11 -Redemptions payable 16 68Payable on investments purchased - 96Accrued expenses 1 1Other liabilities - 2
28 167NET ASSETS ATTRIBUTABLE TO CONTRACTHOLDERS 174,842 185,084Net assets attributable to contractholders per unit 71.97 72.19
INCOMEInterest 40 48Dividends 5,856 3,268Foreign exchange gain (loss) 116 38Realized and change in unrealized gain (loss) on investments and derivatives (5,718) 16,775
294 20,129EXPENSESCustodian fees 17 18Interest 1 -Other operating expenses 78 112Foreign withholding taxes 38 3Transaction costs 483 362
617 495INCREASE (DECREASE) IN NET ASSETS ATTRIBUTABLE TO CONTRACTHOLDERS (323) 19,634Increase (decrease) in net assets attributable to contractholders per unit (0.13) 7.30
STATEMENT OF CHANGES IN FINANCIAL POSITION STATEMENT OF CASH FLOWS
for the years ended December 312015 2014
$ $
for the years ended December 312015 2014
$ $NET ASSETS ATTRIBUTABLE TO CONTRACTHOLDERS - beginning of year 185,084 181,977INCREASE (DECREASE) IN NET ASSETS ATTRIBUTABLE TO CONTRACTHOLDERS (323) 19,634CAPITAL UNIT TRANSACTIONSUnits sold 46,894 62,347Units redeemed (56,813) (78,874)Net capital unit transactions (9,919) (16,527)NET ASSETS ATTRIBUTABLE TO CONTRACTHOLDERS - end of year 174,842 185,084
Cash flows from operating activitiesIncrease (decrease) in net assets attributable to contractholders (323) 19,634Adjustments for:Foreign exchange gain (loss) (116) (38)Realized and change in unrealized gain (loss) on investments and derivatives 5,718 (16,775)Non cash interest on fixed income investments (34) (26)Purchase of investments (727,613) (668,061)Proceeds from sale and maturity of investments 731,865 681,139(Increase) decrease in interest, dividends and other receivables (34) 69Increase (decrease) in accrued expenses, other liabilities and payable secured by securities (2) -Net cash from operating activities 9,461 15,942Cash flows used in financing activitiesProceeds from sale of units 47,158 62,418Payments for units redeemed (56,865) (79,214)Net cash used in financing activities (9,707) (16,796)Foreign exchange gain (loss) 116 38Net increase (decrease) in cash (130) (816)Cash (bank indebtedness) at beginning of year 229 1,045Cash (bank indebtedness) at end of year 99 229Supplemental disclosures on cash flows from operating activitiesInterest received 6 22Dividend received, net of withholding taxes 5,784 3,334
POOLED AND INDEXED FUNDS
22
SCHEDULE OF PORTFOLIO INVESTMENTS as at December 31, 2015
SCHEDULE OF PORTFOLIO INVESTMENTS as at December 31, 2015
The accompanying notes are an integral part of these annual financial statements.
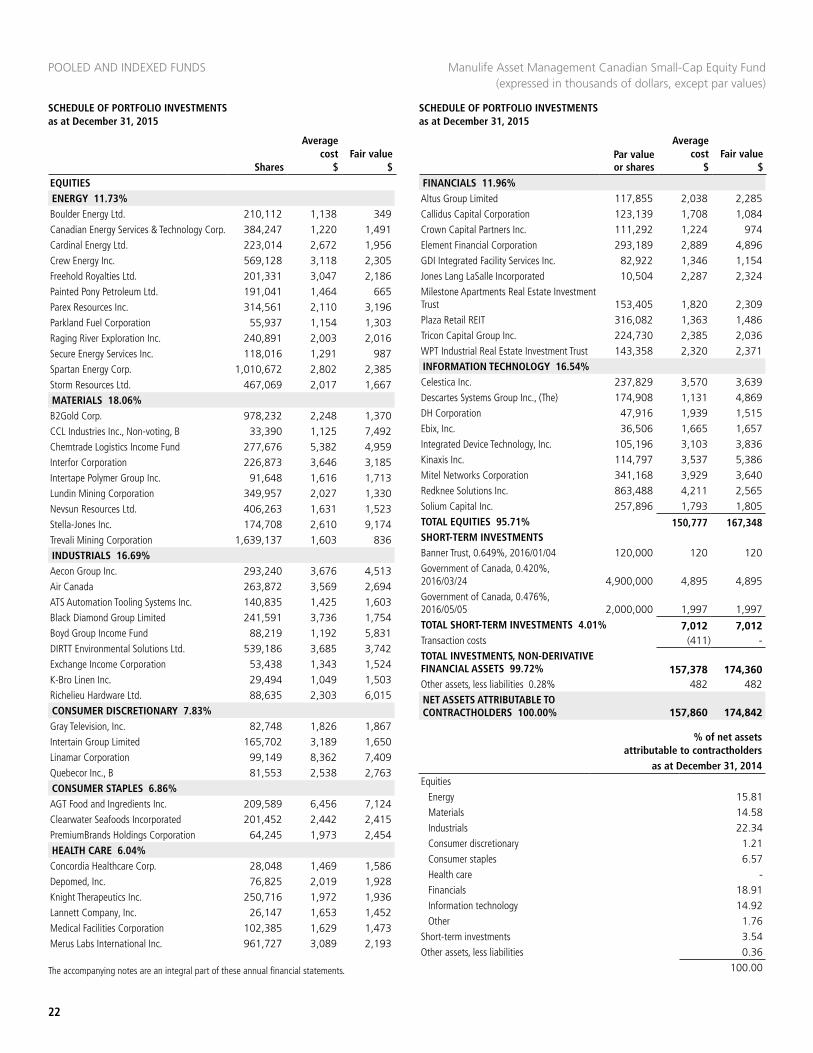
Manulife Asset Management Canadian Small-Cap Equity Fund(expressed in thousands of dollars, except par values)
EQUITIESENERGY 11.73%Boulder Energy Ltd. 210,112 1,138 349 Canadian Energy Services & Technology Corp. 384,247 1,220 1,491 Cardinal Energy Ltd. 223,014 2,672 1,956 Crew Energy Inc. 569,128 3,118 2,305 Freehold Royalties Ltd. 201,331 3,047 2,186 Painted Pony Petroleum Ltd. 191,041 1,464 665 Parex Resources Inc. 314,561 2,110 3,196 Parkland Fuel Corporation 55,937 1,154 1,303 Raging River Exploration Inc. 240,891 2,003 2,016 Secure Energy Services Inc. 118,016 1,291 987 Spartan Energy Corp. 1,010,672 2,802 2,385 Storm Resources Ltd. 467,069 2,017 1,667 MATERIALS 18.06%B2Gold Corp. 978,232 2,248 1,370 CCL Industries Inc., Non-voting, B 33,390 1,125 7,492 Chemtrade Logistics Income Fund 277,676 5,382 4,959 Interfor Corporation 226,873 3,646 3,185 Intertape Polymer Group Inc. 91,648 1,616 1,713 Lundin Mining Corporation 349,957 2,027 1,330 Nevsun Resources Ltd. 406,263 1,631 1,523 Stella-Jones Inc. 174,708 2,610 9,174 Trevali Mining Corporation 1,639,137 1,603 836 INDUSTRIALS 16.69%Aecon Group Inc. 293,240 3,676 4,513 Air Canada 263,872 3,569 2,694 ATS Automation Tooling Systems Inc. 140,835 1,425 1,603 Black Diamond Group Limited 241,591 3,736 1,754 Boyd Group Income Fund 88,219 1,192 5,831 DIRTT Environmental Solutions Ltd. 539,186 3,685 3,742 Exchange Income Corporation 53,438 1,343 1,524 K-Bro Linen Inc. 29,494 1,049 1,503 Richelieu Hardware Ltd. 88,635 2,303 6,015 CONSUMER DISCRETIONARY 7.83%Gray Television, Inc. 82,748 1,826 1,867 Intertain Group Limited 165,702 3,189 1,650 Linamar Corporation 99,149 8,362 7,409 Quebecor Inc., B 81,553 2,538 2,763 CONSUMER STAPLES 6.86%AGT Food and Ingredients Inc. 209,589 6,456 7,124 Clearwater Seafoods Incorporated 201,452 2,442 2,415 PremiumBrands Holdings Corporation 64,245 1,973 2,454 HEALTH CARE 6.04%Concordia Healthcare Corp. 28,048 1,469 1,586 Depomed, Inc. 76,825 2,019 1,928 Knight Therapeutics Inc. 250,716 1,972 1,936 Lannett Company, Inc. 26,147 1,653 1,452 Medical Facilities Corporation 102,385 1,629 1,473 Merus Labs International Inc. 961,727 3,089 2,193
FINANCIALS 11.96%Altus Group Limited 117,855 2,038 2,285 Callidus Capital Corporation 123,139 1,708 1,084 Crown Capital Partners Inc. 111,292 1,224 974 Element Financial Corporation 293,189 2,889 4,896 GDI Integrated Facility Services Inc. 82,922 1,346 1,154 Jones Lang LaSalle Incorporated 10,504 2,287 2,324 Milestone Apartments Real Estate Investment Trust 153,405 1,820 2,309 Plaza Retail REIT 316,082 1,363 1,486 Tricon Capital Group Inc. 224,730 2,385 2,036 WPT Industrial Real Estate Investment Trust 143,358 2,320 2,371 INFORMATION TECHNOLOGY 16.54%Celestica Inc. 237,829 3,570 3,639 Descartes Systems Group Inc., (The) 174,908 1,131 4,869 DH Corporation 47,916 1,939 1,515 Ebix, Inc. 36,506 1,665 1,657 Integrated Device Technology, Inc. 105,196 3,103 3,836 Kinaxis Inc. 114,797 3,537 5,386 Mitel Networks Corporation 341,168 3,929 3,640 Redknee Solutions Inc. 863,488 4,211 2,565 Solium Capital Inc. 257,896 1,793 1,805 TOTAL EQUITIES 95.71% 150,777 167,348 SHORT-TERM INVESTMENTSBanner Trust, 0.649%, 2016/01/04 120,000 120 120 Government of Canada, 0.420%, 2016/03/24 4,900,000 4,895 4,895 Government of Canada, 0.476%, 2016/05/05 2,000,000 1,997 1,997 TOTAL SHORT-TERM INVESTMENTS 4.01% 7,012 7,012 Transaction costs (411) - TOTAL INVESTMENTS, NON-DERIVATIVE FINANCIAL ASSETS 99.72% 157,378 174,360 Other assets, less liabilities 0.28% 482 482 NET ASSETS ATTRIBUTABLE TO CONTRACTHOLDERS 100.00% 157,860 174,842
% of net assets attributable to contractholders
as at December 31, 2014Equities
Energy 15.81 Materials 14.58 Industrials 22.34 Consumer discretionary 1.21 Consumer staples 6.57 Health care - Financials 18.91 Information technology 14.92 Other 1.76
Short-term investments 3.54 Other assets, less liabilities 0.36
100.00
Par value or shares
Average cost
$Fair value
$Shares
Average cost
$Fair value
$
STATEMENT OF FINANCIAL POSITION STATEMENT OF COMPREHENSIVE INCOME
as at December 31 2015 2014
$ $
for the years ended December 312015 2014
$ $
23
The accompanying notes are an integral part of these annual financial statements.
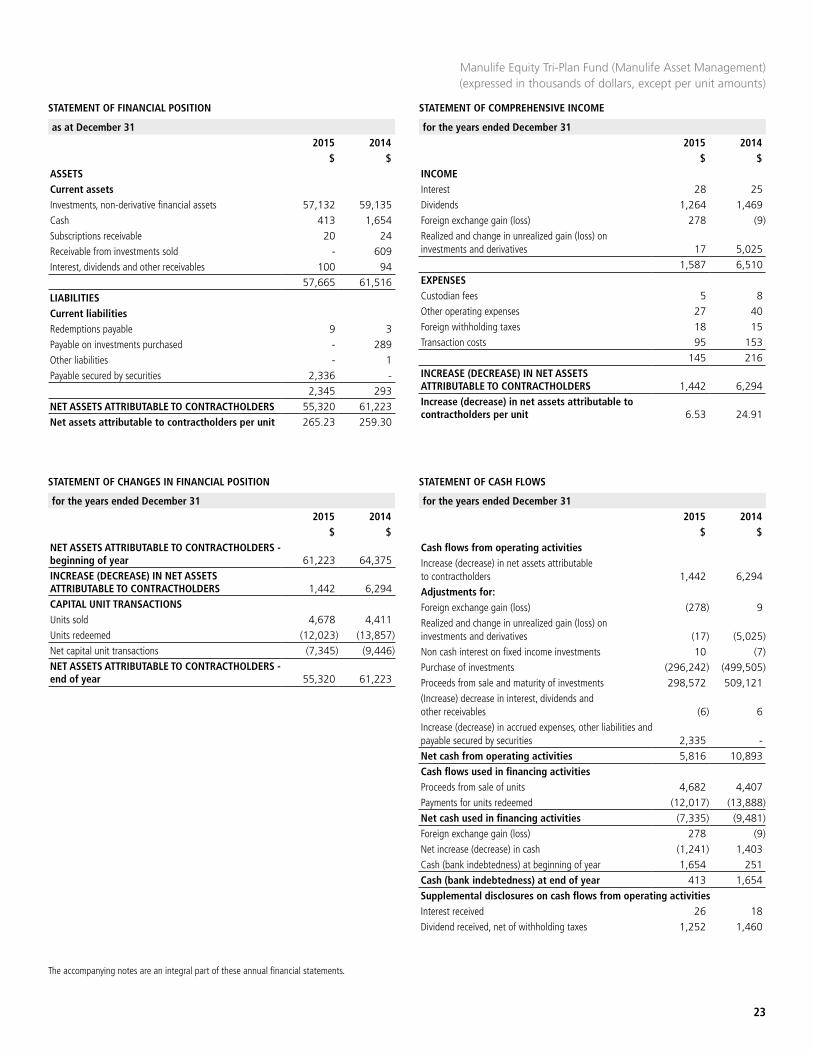
Manulife Equity Tri-Plan Fund (Manulife Asset Management) (expressed in thousands of dollars, except per unit amounts)
ASSETSCurrent assetsInvestments, non-derivative financial assets 57,132 59,135Cash 413 1,654Subscriptions receivable 20 24Receivable from investments sold - 609Interest, dividends and other receivables 100 94
57,665 61,516LIABILITIESCurrent liabilitiesRedemptions payable 9 3Payable on investments purchased - 289Other liabilities - 1Payable secured by securities 2,336 -
2,345 293NET ASSETS ATTRIBUTABLE TO CONTRACTHOLDERS 55,320 61,223Net assets attributable to contractholders per unit 265.23 259.30
INCOMEInterest 28 25Dividends 1,264 1,469Foreign exchange gain (loss) 278 (9)Realized and change in unrealized gain (loss) on investments and derivatives 17 5,025
1,587 6,510EXPENSESCustodian fees 5 8Other operating expenses 27 40Foreign withholding taxes 18 15Transaction costs 95 153
145 216INCREASE (DECREASE) IN NET ASSETS ATTRIBUTABLE TO CONTRACTHOLDERS 1,442 6,294Increase (decrease) in net assets attributable to contractholders per unit 6.53 24.91
STATEMENT OF CHANGES IN FINANCIAL POSITION STATEMENT OF CASH FLOWS
for the years ended December 312015 2014
$ $
for the years ended December 312015 2014
$ $NET ASSETS ATTRIBUTABLE TO CONTRACTHOLDERS - beginning of year 61,223 64,375INCREASE (DECREASE) IN NET ASSETS ATTRIBUTABLE TO CONTRACTHOLDERS 1,442 6,294CAPITAL UNIT TRANSACTIONSUnits sold 4,678 4,411Units redeemed (12,023) (13,857)Net capital unit transactions (7,345) (9,446)NET ASSETS ATTRIBUTABLE TO CONTRACTHOLDERS - end of year 55,320 61,223
Cash flows from operating activitiesIncrease (decrease) in net assets attributable to contractholders 1,442 6,294Adjustments for:Foreign exchange gain (loss) (278) 9Realized and change in unrealized gain (loss) on investments and derivatives (17) (5,025)Non cash interest on fixed income investments 10 (7)Purchase of investments (296,242) (499,505)Proceeds from sale and maturity of investments 298,572 509,121(Increase) decrease in interest, dividends and other receivables (6) 6Increase (decrease) in accrued expenses, other liabilities and payable secured by securities 2,335 -Net cash from operating activities 5,816 10,893Cash flows used in financing activitiesProceeds from sale of units 4,682 4,407Payments for units redeemed (12,017) (13,888)Net cash used in financing activities (7,335) (9,481)Foreign exchange gain (loss) 278 (9)Net increase (decrease) in cash (1,241) 1,403Cash (bank indebtedness) at beginning of year 1,654 251Cash (bank indebtedness) at end of year 413 1,654Supplemental disclosures on cash flows from operating activitiesInterest received 26 18Dividend received, net of withholding taxes 1,252 1,460
POOLED AND INDEXED FUNDS
24
SCHEDULE OF PORTFOLIO INVESTMENTS as at December 31, 2015
SCHEDULE OF PORTFOLIO INVESTMENTS as at December 31, 2015
The accompanying notes are an integral part of these annual financial statements.
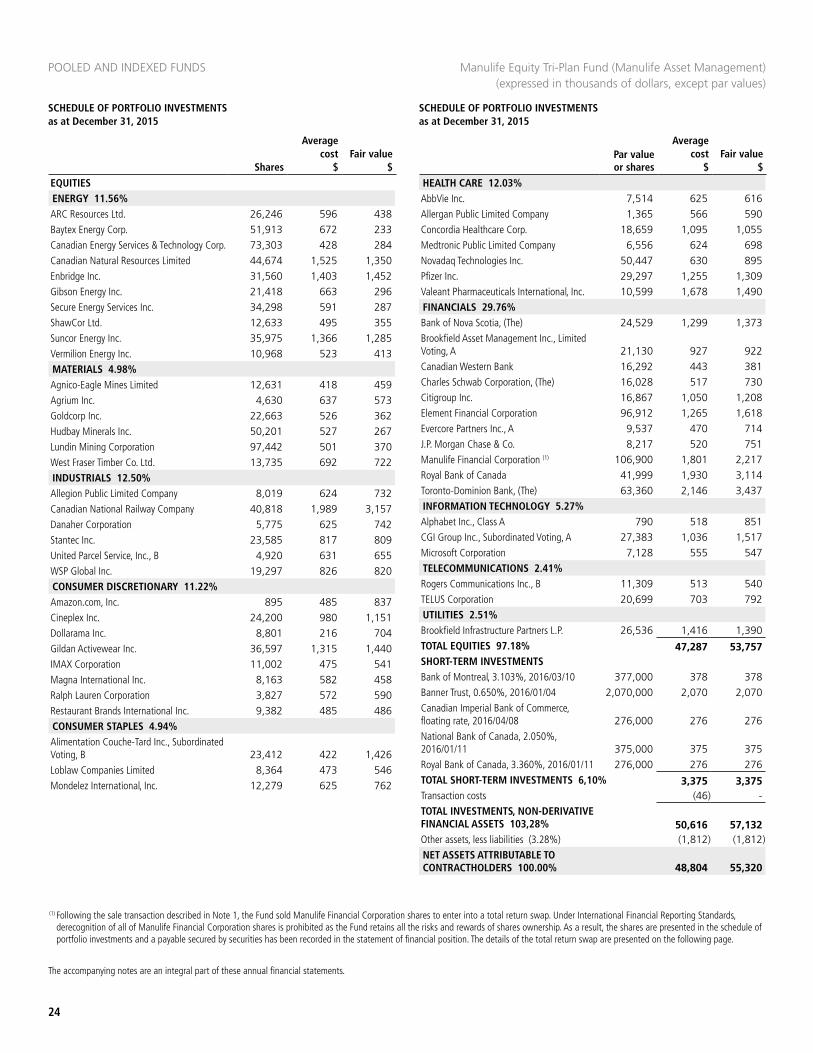
Manulife Equity Tri-Plan Fund (Manulife Asset Management) (expressed in thousands of dollars, except par values)
EQUITIESENERGY 11.56%ARC Resources Ltd. 26,246 596 438 Baytex Energy Corp. 51,913 672 233 Canadian Energy Services & Technology Corp. 73,303 428 284 Canadian Natural Resources Limited 44,674 1,525 1,350 Enbridge Inc. 31,560 1,403 1,452 Gibson Energy Inc. 21,418 663 296 Secure Energy Services Inc. 34,298 591 287 ShawCor Ltd. 12,633 495 355 Suncor Energy Inc. 35,975 1,366 1,285 Vermilion Energy Inc. 10,968 523 413 MATERIALS 4.98%Agnico-Eagle Mines Limited 12,631 418 459 Agrium Inc. 4,630 637 573 Goldcorp Inc. 22,663 526 362 Hudbay Minerals Inc. 50,201 527 267 Lundin Mining Corporation 97,442 501 370 West Fraser Timber Co. Ltd. 13,735 692 722 INDUSTRIALS 12.50%Allegion Public Limited Company 8,019 624 732 Canadian National Railway Company 40,818 1,989 3,157 Danaher Corporation 5,775 625 742 Stantec Inc. 23,585 817 809 United Parcel Service, Inc., B 4,920 631 655 WSP Global Inc. 19,297 826 820 CONSUMER DISCRETIONARY 11.22%Amazon.com, Inc. 895 485 837 Cineplex Inc. 24,200 980 1,151 Dollarama Inc. 8,801 216 704 Gildan Activewear Inc. 36,597 1,315 1,440 IMAX Corporation 11,002 475 541 Magna International Inc. 8,163 582 458 Ralph Lauren Corporation 3,827 572 590 Restaurant Brands International Inc. 9,382 485 486 CONSUMER STAPLES 4.94%Alimentation Couche-Tard Inc., Subordinated Voting, B 23,412 422 1,426 Loblaw Companies Limited 8,364 473 546 Mondelez International, Inc. 12,279 625 762
HEALTH CARE 12.03%AbbVie Inc. 7,514 625 616 Allergan Public Limited Company 1,365 566 590 Concordia Healthcare Corp. 18,659 1,095 1,055 Medtronic Public Limited Company 6,556 624 698 Novadaq Technologies Inc. 50,447 630 895 Pfizer Inc. 29,297 1,255 1,309 Valeant Pharmaceuticals International, Inc. 10,599 1,678 1,490 FINANCIALS 29.76%Bank of Nova Scotia, (The) 24,529 1,299 1,373 Brookfield Asset Management Inc., Limited Voting, A 21,130 927 922 Canadian Western Bank 16,292 443 381 Charles Schwab Corporation, (The) 16,028 517 730 Citigroup Inc. 16,867 1,050 1,208 Element Financial Corporation 96,912 1,265 1,618 Evercore Partners Inc., A 9,537 470 714 J.P. Morgan Chase & Co. 8,217 520 751 Manulife Financial Corporation (1) 106,900 1,801 2,217 Royal Bank of Canada 41,999 1,930 3,114 Toronto-Dominion Bank, (The) 63,360 2,146 3,437 INFORMATION TECHNOLOGY 5.27%Alphabet Inc., Class A 790 518 851 CGI Group Inc., Subordinated Voting, A 27,383 1,036 1,517 Microsoft Corporation 7,128 555 547 TELECOMMUNICATIONS 2.41%Rogers Communications Inc., B 11,309 513 540 TELUS Corporation 20,699 703 792 UTILITIES 2.51%Brookfield Infrastructure Partners L.P. 26,536 1,416 1,390 TOTAL EQUITIES 97.18% 47,287 53,757 SHORT-TERM INVESTMENTSBank of Montreal, 3.103%, 2016/03/10 377,000 378 378 Banner Trust, 0.650%, 2016/01/04 2,070,000 2,070 2,070 Canadian Imperial Bank of Commerce, floating rate, 2016/04/08 276,000 276 276 National Bank of Canada, 2.050%, 2016/01/11 375,000 375 375 Royal Bank of Canada, 3.360%, 2016/01/11 276,000 276 276 TOTAL SHORT-TERM INVESTMENTS 6,10% 3,375 3,375 Transaction costs (46) - TOTAL INVESTMENTS, NON-DERIVATIVE FINANCIAL ASSETS 103,28% 50,616 57,132 Other assets, less liabilities (3.28%) (1,812) (1,812)NET ASSETS ATTRIBUTABLE TO CONTRACTHOLDERS 100.00% 48,804 55,320
(1) Following the sale transaction described in Note 1, the Fund sold Manulife Financial Corporation shares to enter into a total return swap. Under International Financial Reporting Standards, derecognition of all of Manulife Financial Corporation shares is prohibited as the Fund retains all the risks and rewards of shares ownership. As a result, the shares are presented in the schedule of portfolio investments and a payable secured by securities has been recorded in the statement of financial position. The details of the total return swap are presented on the following page.
Par value or shares
Average cost
$Fair value
$Shares
Average cost
$Fair value
$
SCHEDULE OF PORTFOLIO INVESTMENTS as at December 31, 2015
25
The accompanying notes are an integral part of these annual financial statements.
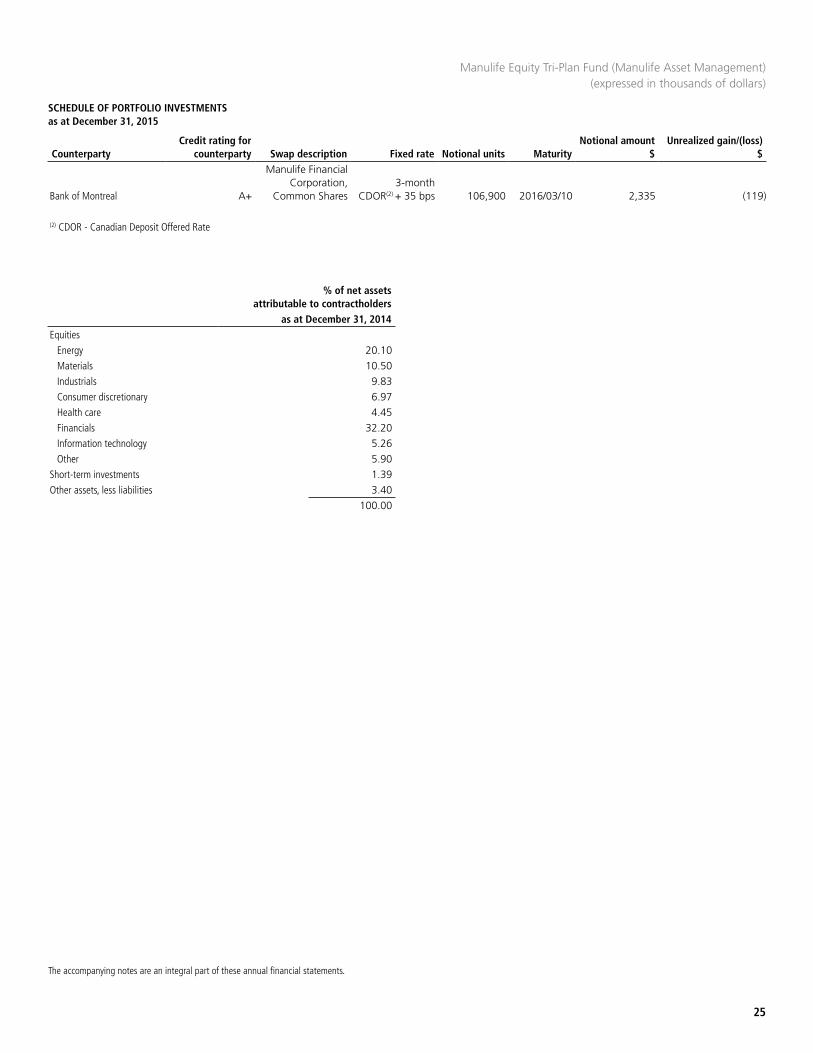
Manulife Equity Tri-Plan Fund (Manulife Asset Management) (expressed in thousands of dollars)
% of net assets attributable to contractholders
as at December 31, 2014Equities
Energy 20.10 Materials 10.50 Industrials 9.83 Consumer discretionary 6.97 Health care 4.45 Financials 32.20 Information technology 5.26 Other 5.90
Short-term investments 1.39 Other assets, less liabilities 3.40
100.00
CounterpartyCredit rating for
counterparty Swap description Fixed rate Notional units MaturityNotional amount
$Unrealized gain/(loss)
$
Bank of Montreal A+
Manulife Financial Corporation,
Common Shares3-month
CDOR(2) + 35 bps 106,900 2016/03/10 2,335 (119)
(2) CDOR - Canadian Deposit Offered Rate
STATEMENT OF FINANCIAL POSITION
POOLED AND INDEXED FUNDS
STATEMENT OF COMPREHENSIVE INCOME
as at December 31 2015 2014
$ $
for the years ended December 312015 2014
$ $
26
The accompanying notes are an integral part of these annual financial statements.
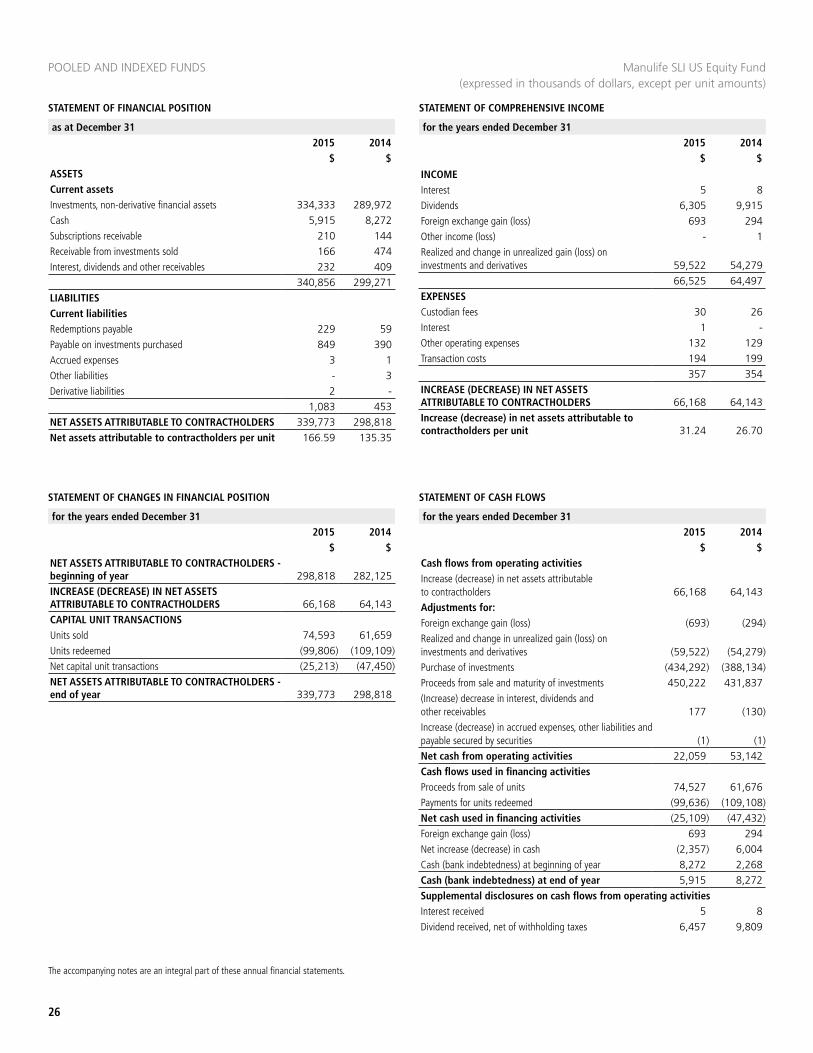
Manulife SLI US Equity Fund (expressed in thousands of dollars, except per unit amounts)
ASSETSCurrent assetsInvestments, non-derivative financial assets 334,333 289,972Cash 5,915 8,272Subscriptions receivable 210 144Receivable from investments sold 166 474Interest, dividends and other receivables 232 409
340,856 299,271LIABILITIESCurrent liabilitiesRedemptions payable 229 59Payable on investments purchased 849 390Accrued expenses 3 1Other liabilities - 3Derivative liabilities 2 -
1,083 453NET ASSETS ATTRIBUTABLE TO CONTRACTHOLDERS 339,773 298,818Net assets attributable to contractholders per unit 166.59 135.35
INCOMEInterest 5 8Dividends 6,305 9,915Foreign exchange gain (loss) 693 294Other income (loss) - 1Realized and change in unrealized gain (loss) on investments and derivatives 59,522 54,279
66,525 64,497EXPENSESCustodian fees 30 26Interest 1 -Other operating expenses 132 129Transaction costs 194 199
357 354INCREASE (DECREASE) IN NET ASSETS ATTRIBUTABLE TO CONTRACTHOLDERS 66,168 64,143Increase (decrease) in net assets attributable to contractholders per unit 31.24 26.70
STATEMENT OF CHANGES IN FINANCIAL POSITION STATEMENT OF CASH FLOWS
for the years ended December 312015 2014
$ $
for the years ended December 312015 2014
$ $NET ASSETS ATTRIBUTABLE TO CONTRACTHOLDERS - beginning of year 298,818 282,125INCREASE (DECREASE) IN NET ASSETS ATTRIBUTABLE TO CONTRACTHOLDERS 66,168 64,143CAPITAL UNIT TRANSACTIONSUnits sold 74,593 61,659Units redeemed (99,806) (109,109)Net capital unit transactions (25,213) (47,450)NET ASSETS ATTRIBUTABLE TO CONTRACTHOLDERS - end of year 339,773 298,818
Cash flows from operating activitiesIncrease (decrease) in net assets attributable to contractholders 66,168 64,143Adjustments for:Foreign exchange gain (loss) (693) (294)Realized and change in unrealized gain (loss) on investments and derivatives (59,522) (54,279)Purchase of investments (434,292) (388,134)Proceeds from sale and maturity of investments 450,222 431,837(Increase) decrease in interest, dividends and other receivables 177 (130)Increase (decrease) in accrued expenses, other liabilities and payable secured by securities (1) (1)Net cash from operating activities 22,059 53,142Cash flows used in financing activitiesProceeds from sale of units 74,527 61,676Payments for units redeemed (99,636) (109,108)Net cash used in financing activities (25,109) (47,432)Foreign exchange gain (loss) 693 294Net increase (decrease) in cash (2,357) 6,004Cash (bank indebtedness) at beginning of year 8,272 2,268Cash (bank indebtedness) at end of year 5,915 8,272Supplemental disclosures on cash flows from operating activitiesInterest received 5 8Dividend received, net of withholding taxes 6,457 9,809
SCHEDULE OF PORTFOLIO INVESTMENTS as at December 31, 2015
SCHEDULE OF PORTFOLIO INVESTMENTS as at December 31, 2015
27
The accompanying notes are an integral part of these annual financial statements.
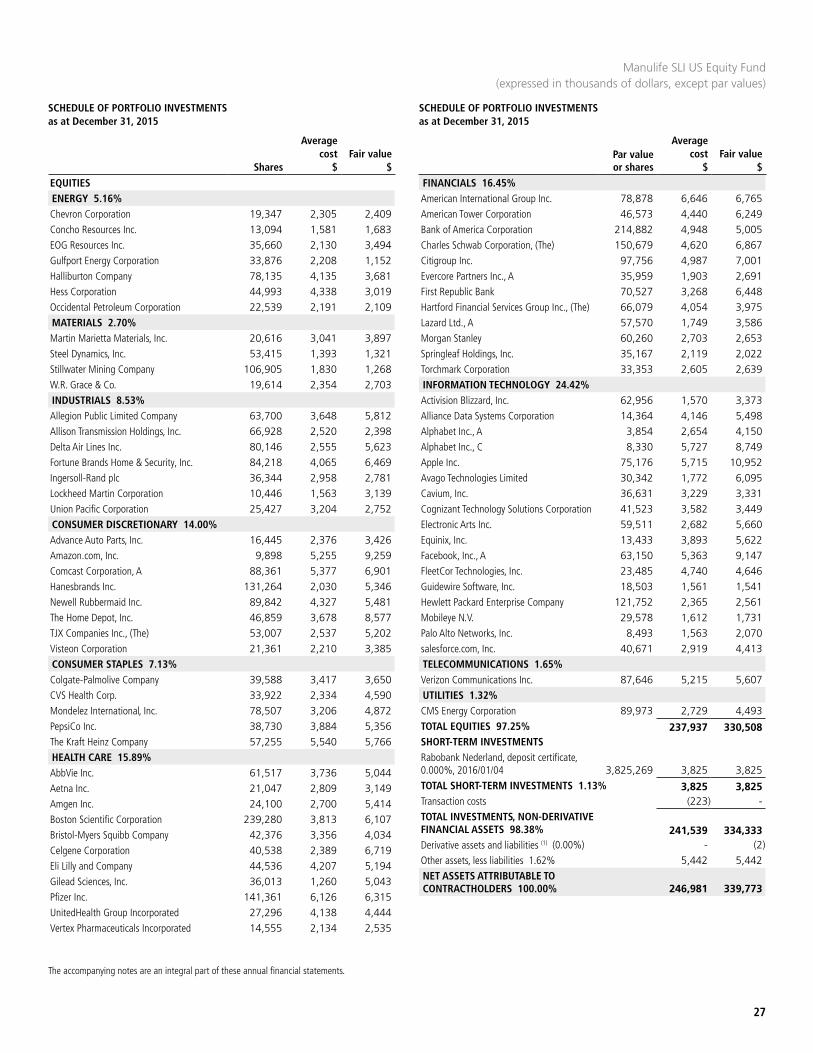
Manulife SLI US Equity Fund (expressed in thousands of dollars, except par values)
EQUITIESENERGY 5.16%Chevron Corporation 19,347 2,305 2,409 Concho Resources Inc. 13,094 1,581 1,683 EOG Resources Inc. 35,660 2,130 3,494 Gulfport Energy Corporation 33,876 2,208 1,152 Halliburton Company 78,135 4,135 3,681 Hess Corporation 44,993 4,338 3,019 Occidental Petroleum Corporation 22,539 2,191 2,109 MATERIALS 2.70%Martin Marietta Materials, Inc. 20,616 3,041 3,897 Steel Dynamics, Inc. 53,415 1,393 1,321 Stillwater Mining Company 106,905 1,830 1,268 W.R. Grace & Co. 19,614 2,354 2,703 INDUSTRIALS 8.53%Allegion Public Limited Company 63,700 3,648 5,812 Allison Transmission Holdings, Inc. 66,928 2,520 2,398 Delta Air Lines Inc. 80,146 2,555 5,623 Fortune Brands Home & Security, Inc. 84,218 4,065 6,469 Ingersoll-Rand plc 36,344 2,958 2,781 Lockheed Martin Corporation 10,446 1,563 3,139 Union Pacific Corporation 25,427 3,204 2,752 CONSUMER DISCRETIONARY 14.00%Advance Auto Parts, Inc. 16,445 2,376 3,426 Amazon.com, Inc. 9,898 5,255 9,259 Comcast Corporation, A 88,361 5,377 6,901 Hanesbrands Inc. 131,264 2,030 5,346 Newell Rubbermaid Inc. 89,842 4,327 5,481 The Home Depot, Inc. 46,859 3,678 8,577 TJX Companies Inc., (The) 53,007 2,537 5,202 Visteon Corporation 21,361 2,210 3,385 CONSUMER STAPLES 7.13%Colgate-Palmolive Company 39,588 3,417 3,650 CVS Health Corp. 33,922 2,334 4,590 Mondelez International, Inc. 78,507 3,206 4,872 PepsiCo Inc. 38,730 3,884 5,356 The Kraft Heinz Company 57,255 5,540 5,766 HEALTH CARE 15.89%AbbVie Inc. 61,517 3,736 5,044 Aetna Inc. 21,047 2,809 3,149 Amgen Inc. 24,100 2,700 5,414 Boston Scientific Corporation 239,280 3,813 6,107 Bristol-Myers Squibb Company 42,376 3,356 4,034 Celgene Corporation 40,538 2,389 6,719 Eli Lilly and Company 44,536 4,207 5,194 Gilead Sciences, Inc. 36,013 1,260 5,043 Pfizer Inc. 141,361 6,126 6,315 UnitedHealth Group Incorporated 27,296 4,138 4,444 Vertex Pharmaceuticals Incorporated 14,555 2,134 2,535
FINANCIALS 16.45%American International Group Inc. 78,878 6,646 6,765 American Tower Corporation 46,573 4,440 6,249 Bank of America Corporation 214,882 4,948 5,005 Charles Schwab Corporation, (The) 150,679 4,620 6,867 Citigroup Inc. 97,756 4,987 7,001 Evercore Partners Inc., A 35,959 1,903 2,691 First Republic Bank 70,527 3,268 6,448 Hartford Financial Services Group Inc., (The) 66,079 4,054 3,975 Lazard Ltd., A 57,570 1,749 3,586 Morgan Stanley 60,260 2,703 2,653 Springleaf Holdings, Inc. 35,167 2,119 2,022 Torchmark Corporation 33,353 2,605 2,639 INFORMATION TECHNOLOGY 24.42%Activision Blizzard, Inc. 62,956 1,570 3,373 Alliance Data Systems Corporation 14,364 4,146 5,498 Alphabet Inc., A 3,854 2,654 4,150 Alphabet Inc., C 8,330 5,727 8,749 Apple Inc. 75,176 5,715 10,952 Avago Technologies Limited 30,342 1,772 6,095 Cavium, Inc. 36,631 3,229 3,331 Cognizant Technology Solutions Corporation 41,523 3,582 3,449 Electronic Arts Inc. 59,511 2,682 5,660 Equinix, Inc. 13,433 3,893 5,622 Facebook, Inc., A 63,150 5,363 9,147 FleetCor Technologies, Inc. 23,485 4,740 4,646 Guidewire Software, Inc. 18,503 1,561 1,541 Hewlett Packard Enterprise Company 121,752 2,365 2,561 Mobileye N.V. 29,578 1,612 1,731 Palo Alto Networks, Inc. 8,493 1,563 2,070 salesforce.com, Inc. 40,671 2,919 4,413 TELECOMMUNICATIONS 1.65%Verizon Communications Inc. 87,646 5,215 5,607 UTILITIES 1.32%CMS Energy Corporation 89,973 2,729 4,493 TOTAL EQUITIES 97.25% 237,937 330,508 SHORT-TERM INVESTMENTSRabobank Nederland, deposit certificate, 0.000%, 2016/01/04 3,825,269 3,825 3,825 TOTAL SHORT-TERM INVESTMENTS 1.13% 3,825 3,825 Transaction costs (223) - TOTAL INVESTMENTS, NON-DERIVATIVE FINANCIAL ASSETS 98.38% 241,539 334,333 Derivative assets and liabilities (1) (0.00%) - (2)Other assets, less liabilities 1.62% 5,442 5,442 NET ASSETS ATTRIBUTABLE TO CONTRACTHOLDERS 100.00% 246,981 339,773
Par value or shares
Average cost
$Fair value
$Shares
Average cost
$Fair value
$
POOLED AND INDEXED FUNDS
28
SCHEDULE OF PORTFOLIO INVESTMENTS as at December 31, 2015
The accompanying notes are an integral part of these annual financial statements.
Manulife SLI US Equity Fund (expressed in thousands of dollars, except par values)
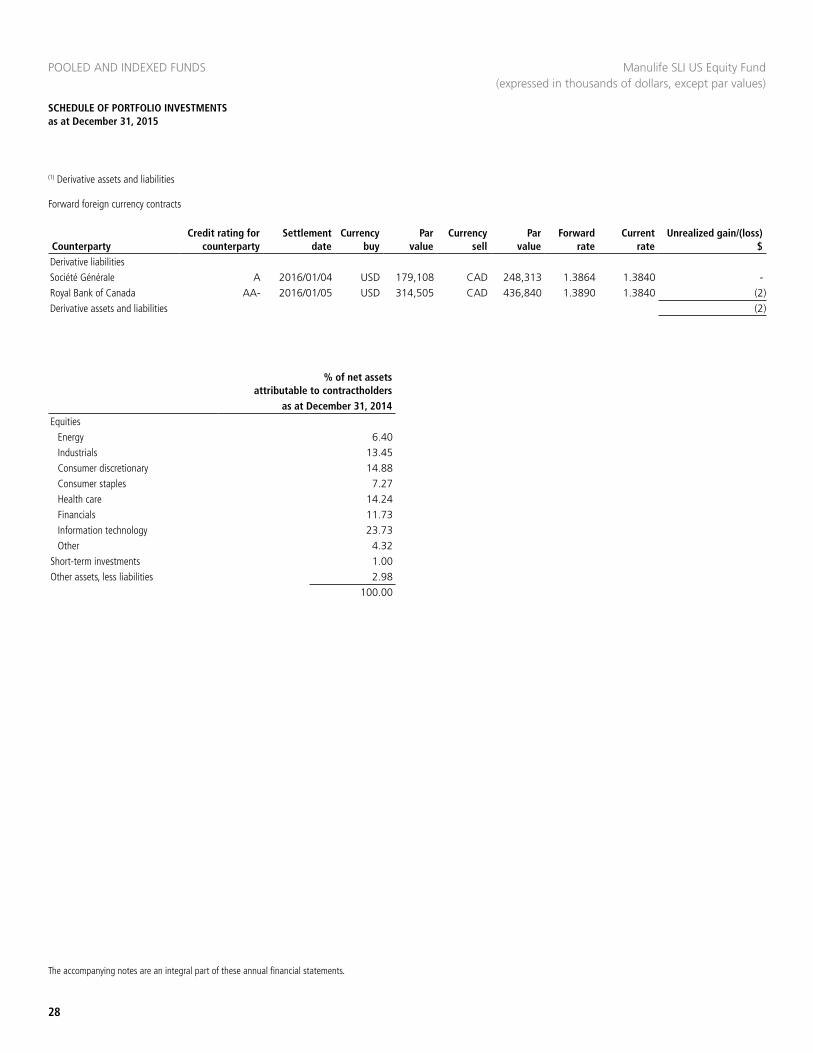
(1) Derivative assets and liabilities
Forward foreign currency contracts
CounterpartyCredit rating for
counterpartySettlement
dateCurrency
buyPar
valueCurrency
sellPar
valueForward
rateCurrent
rateUnrealized gain/(loss)
$Derivative liabilities Société Générale A 2016/01/04 USD 179,108 CAD 248,313 1.3864 1.3840 - Royal Bank of Canada AA- 2016/01/05 USD 314,505 CAD 436,840 1.3890 1.3840 (2)Derivative assets and liabilities (2)
% of net assets attributable to contractholders
as at December 31, 2014Equities
Energy 6.40 Industrials 13.45 Consumer discretionary 14.88 Consumer staples 7.27 Health care 14.24 Financials 11.73 Information technology 23.73 Other 4.32
Short-term investments 1.00 Other assets, less liabilities 2.98
100.00
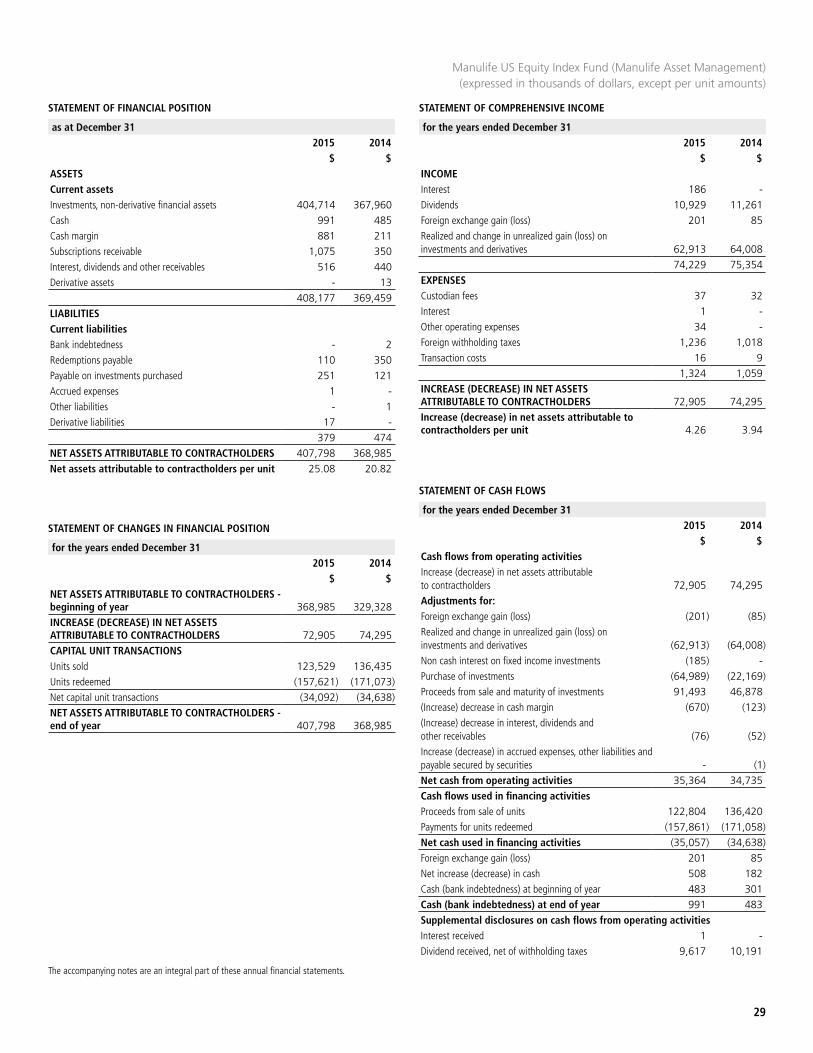
STATEMENT OF FINANCIAL POSITION STATEMENT OF COMPREHENSIVE INCOME
as at December 31 2015 2014
$ $
for the years ended December 312015 2014
$ $
29
The accompanying notes are an integral part of these annual financial statements.
Manulife US Equity Index Fund (Manulife Asset Management) (expressed in thousands of dollars, except per unit amounts)
ASSETSCurrent assetsInvestments, non-derivative financial assets 404,714 367,960Cash 991 485Cash margin 881 211Subscriptions receivable 1,075 350Interest, dividends and other receivables 516 440Derivative assets - 13
408,177 369,459LIABILITIESCurrent liabilitiesBank indebtedness - 2Redemptions payable 110 350Payable on investments purchased 251 121Accrued expenses 1 -Other liabilities - 1Derivative liabilities 17 -
379 474NET ASSETS ATTRIBUTABLE TO CONTRACTHOLDERS 407,798 368,985Net assets attributable to contractholders per unit 25.08 20.82
INCOMEInterest 186 -Dividends 10,929 11,261Foreign exchange gain (loss) 201 85Realized and change in unrealized gain (loss) on investments and derivatives 62,913 64,008
74,229 75,354EXPENSESCustodian fees 37 32Interest 1 -Other operating expenses 34 -Foreign withholding taxes 1,236 1,018Transaction costs 16 9
1,324 1,059INCREASE (DECREASE) IN NET ASSETS ATTRIBUTABLE TO CONTRACTHOLDERS 72,905 74,295Increase (decrease) in net assets attributable to contractholders per unit 4.26 3.94
STATEMENT OF CHANGES IN FINANCIAL POSITION
for the years ended December 312015 2014
$ $NET ASSETS ATTRIBUTABLE TO CONTRACTHOLDERS - beginning of year 368,985 329,328INCREASE (DECREASE) IN NET ASSETS ATTRIBUTABLE TO CONTRACTHOLDERS 72,905 74,295CAPITAL UNIT TRANSACTIONSUnits sold 123,529 136,435Units redeemed (157,621) (171,073)Net capital unit transactions (34,092) (34,638)NET ASSETS ATTRIBUTABLE TO CONTRACTHOLDERS - end of year 407,798 368,985
STATEMENT OF CASH FLOWS
for the years ended December 312015 2014
$ $Cash flows from operating activitiesIncrease (decrease) in net assets attributable to contractholders 72,905 74,295Adjustments for:Foreign exchange gain (loss) (201) (85)Realized and change in unrealized gain (loss) on investments and derivatives (62,913) (64,008)Non cash interest on fixed income investments (185) -Purchase of investments (64,989) (22,169)Proceeds from sale and maturity of investments 91,493 46,878(Increase) decrease in cash margin (670) (123)(Increase) decrease in interest, dividends and other receivables (76) (52)Increase (decrease) in accrued expenses, other liabilities and payable secured by securities - (1)Net cash from operating activities 35,364 34,735Cash flows used in financing activitiesProceeds from sale of units 122,804 136,420Payments for units redeemed (157,861) (171,058)Net cash used in financing activities (35,057) (34,638)Foreign exchange gain (loss) 201 85Net increase (decrease) in cash 508 182Cash (bank indebtedness) at beginning of year 483 301Cash (bank indebtedness) at end of year 991 483Supplemental disclosures on cash flows from operating activitiesInterest received 1 -Dividend received, net of withholding taxes 9,617 10,191
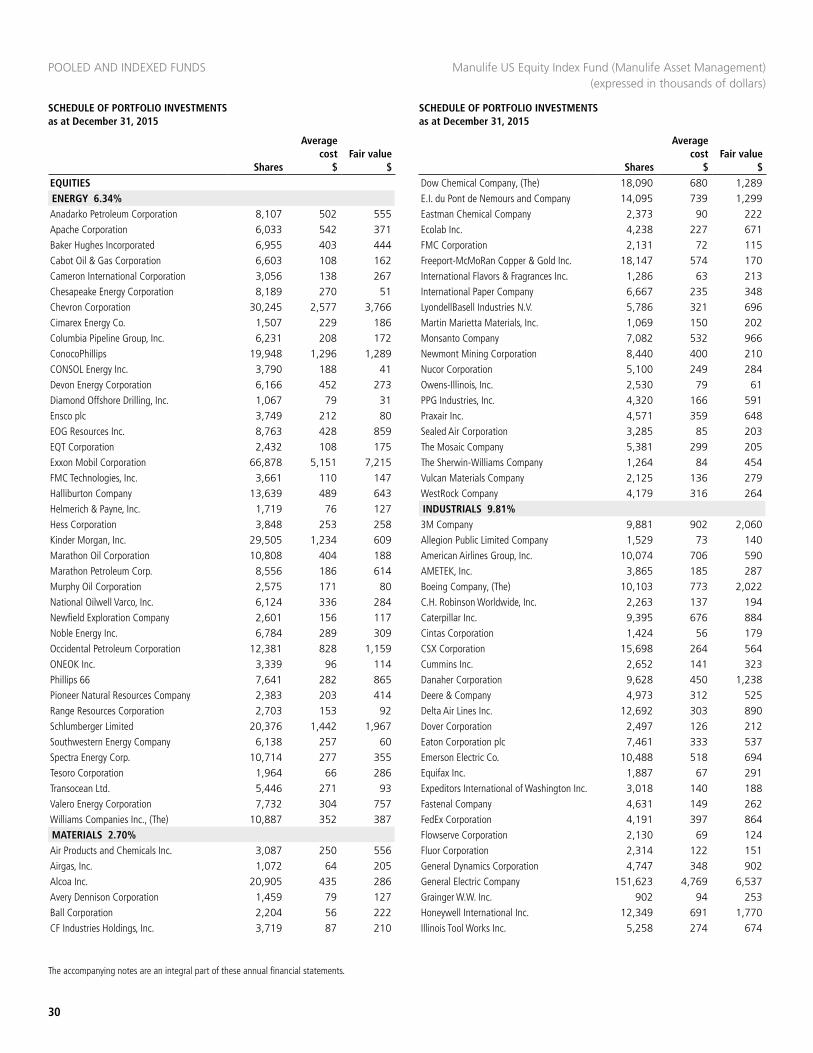
POOLED AND INDEXED FUNDS
30
SCHEDULE OF PORTFOLIO INVESTMENTS as at December 31, 2015
SCHEDULE OF PORTFOLIO INVESTMENTS as at December 31, 2015
The accompanying notes are an integral part of these annual financial statements.
Manulife US Equity Index Fund (Manulife Asset Management) (expressed in thousands of dollars)
EQUITIESENERGY 6.34%Anadarko Petroleum Corporation 8,107 502 555 Apache Corporation 6,033 542 371 Baker Hughes Incorporated 6,955 403 444 Cabot Oil & Gas Corporation 6,603 108 162 Cameron International Corporation 3,056 138 267 Chesapeake Energy Corporation 8,189 270 51 Chevron Corporation 30,245 2,577 3,766 Cimarex Energy Co. 1,507 229 186 Columbia Pipeline Group, Inc. 6,231 208 172 ConocoPhillips 19,948 1,296 1,289 CONSOL Energy Inc. 3,790 188 41 Devon Energy Corporation 6,166 452 273 Diamond Offshore Drilling, Inc. 1,067 79 31 Ensco plc 3,749 212 80 EOG Resources Inc. 8,763 428 859 EQT Corporation 2,432 108 175 Exxon Mobil Corporation 66,878 5,151 7,215 FMC Technologies, Inc. 3,661 110 147 Halliburton Company 13,639 489 643 Helmerich & Payne, Inc. 1,719 76 127 Hess Corporation 3,848 253 258 Kinder Morgan, Inc. 29,505 1,234 609 Marathon Oil Corporation 10,808 404 188 Marathon Petroleum Corp. 8,556 186 614 Murphy Oil Corporation 2,575 171 80 National Oilwell Varco, Inc. 6,124 336 284 Newfield Exploration Company 2,601 156 117 Noble Energy Inc. 6,784 289 309 Occidental Petroleum Corporation 12,381 828 1,159 ONEOK Inc. 3,339 96 114 Phillips 66 7,641 282 865 Pioneer Natural Resources Company 2,383 203 414 Range Resources Corporation 2,703 153 92 Schlumberger Limited 20,376 1,442 1,967 Southwestern Energy Company 6,138 257 60 Spectra Energy Corp. 10,714 277 355 Tesoro Corporation 1,964 66 286 Transocean Ltd. 5,446 271 93 Valero Energy Corporation 7,732 304 757 Williams Companies Inc., (The) 10,887 352 387 MATERIALS 2.70%Air Products and Chemicals Inc. 3,087 250 556 Airgas, Inc. 1,072 64 205 Alcoa Inc. 20,905 435 286 Avery Dennison Corporation 1,459 79 127 Ball Corporation 2,204 56 222 CF Industries Holdings, Inc. 3,719 87 210
Dow Chemical Company, (The) 18,090 680 1,289 E.I. du Pont de Nemours and Company 14,095 739 1,299 Eastman Chemical Company 2,373 90 222 Ecolab Inc. 4,238 227 671 FMC Corporation 2,131 72 115 Freeport-McMoRan Copper & Gold Inc. 18,147 574 170 International Flavors & Fragrances Inc. 1,286 63 213 International Paper Company 6,667 235 348 LyondellBasell Industries N.V. 5,786 321 696 Martin Marietta Materials, Inc. 1,069 150 202 Monsanto Company 7,082 532 966 Newmont Mining Corporation 8,440 400 210 Nucor Corporation 5,100 249 284 Owens-Illinois, Inc. 2,530 79 61 PPG Industries, Inc. 4,320 166 591 Praxair Inc. 4,571 359 648 Sealed Air Corporation 3,285 85 203 The Mosaic Company 5,381 299 205 The Sherwin-Williams Company 1,264 84 454 Vulcan Materials Company 2,125 136 279 WestRock Company 4,179 316 264 INDUSTRIALS 9.81%3M Company 9,881 902 2,060 Allegion Public Limited Company 1,529 73 140 American Airlines Group, Inc. 10,074 706 590 AMETEK, Inc. 3,865 185 287 Boeing Company, (The) 10,103 773 2,022 C.H. Robinson Worldwide, Inc. 2,263 137 194 Caterpillar Inc. 9,395 676 884 Cintas Corporation 1,424 56 179 CSX Corporation 15,698 264 564 Cummins Inc. 2,652 141 323 Danaher Corporation 9,628 450 1,238 Deere & Company 4,973 312 525 Delta Air Lines Inc. 12,692 303 890 Dover Corporation 2,497 126 212 Eaton Corporation plc 7,461 333 537 Emerson Electric Co. 10,488 518 694 Equifax Inc. 1,887 67 291 Expeditors International of Washington Inc. 3,018 140 188 Fastenal Company 4,631 149 262 FedEx Corporation 4,191 397 864 Flowserve Corporation 2,130 69 124 Fluor Corporation 2,314 122 151 General Dynamics Corporation 4,747 348 902 General Electric Company 151,623 4,769 6,537 Grainger W.W. Inc. 902 94 253 Honeywell International Inc. 12,349 691 1,770 Illinois Tool Works Inc. 5,258 274 674
Shares
Average cost
$Fair value
$ Shares
Average cost
$Fair value
$
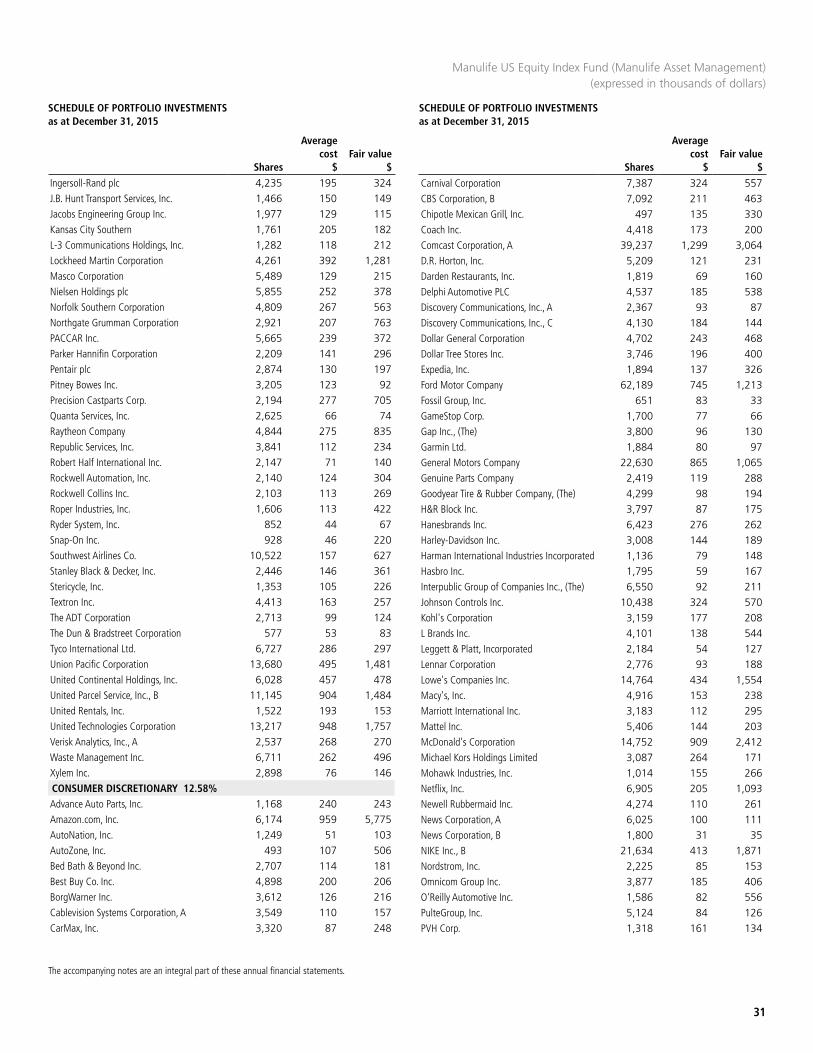
SCHEDULE OF PORTFOLIO INVESTMENTS as at December 31, 2015
SCHEDULE OF PORTFOLIO INVESTMENTS as at December 31, 2015
31
The accompanying notes are an integral part of these annual financial statements.
Manulife US Equity Index Fund (Manulife Asset Management) (expressed in thousands of dollars)
Ingersoll-Rand plc 4,235 195 324 J.B. Hunt Transport Services, Inc. 1,466 150 149 Jacobs Engineering Group Inc. 1,977 129 115 Kansas City Southern 1,761 205 182 L-3 Communications Holdings, Inc. 1,282 118 212 Lockheed Martin Corporation 4,261 392 1,281 Masco Corporation 5,489 129 215 Nielsen Holdings plc 5,855 252 378 Norfolk Southern Corporation 4,809 267 563 Northgate Grumman Corporation 2,921 207 763 PACCAR Inc. 5,665 239 372 Parker Hannifin Corporation 2,209 141 296 Pentair plc 2,874 130 197 Pitney Bowes Inc. 3,205 123 92 Precision Castparts Corp. 2,194 277 705 Quanta Services, Inc. 2,625 66 74 Raytheon Company 4,844 275 835 Republic Services, Inc. 3,841 112 234 Robert Half International Inc. 2,147 71 140 Rockwell Automation, Inc. 2,140 124 304 Rockwell Collins Inc. 2,103 113 269 Roper Industries, Inc. 1,606 113 422 Ryder System, Inc. 852 44 67 Snap-On Inc. 928 46 220 Southwest Airlines Co. 10,522 157 627 Stanley Black & Decker, Inc. 2,446 146 361 Stericycle, Inc. 1,353 105 226 Textron Inc. 4,413 163 257 The ADT Corporation 2,713 99 124 The Dun & Bradstreet Corporation 577 53 83 Tyco International Ltd. 6,727 286 297 Union Pacific Corporation 13,680 495 1,481 United Continental Holdings, Inc. 6,028 457 478 United Parcel Service, Inc., B 11,145 904 1,484 United Rentals, Inc. 1,522 193 153 United Technologies Corporation 13,217 948 1,757 Verisk Analytics, Inc., A 2,537 268 270 Waste Management Inc. 6,711 262 496 Xylem Inc. 2,898 76 146 CONSUMER DISCRETIONARY 12.58%Advance Auto Parts, Inc. 1,168 240 243 Amazon.com, Inc. 6,174 959 5,775 AutoNation, Inc. 1,249 51 103 AutoZone, Inc. 493 107 506 Bed Bath & Beyond Inc. 2,707 114 181 Best Buy Co. Inc. 4,898 200 206 BorgWarner Inc. 3,612 126 216 Cablevision Systems Corporation, A 3,549 110 157 CarMax, Inc. 3,320 87 248
Carnival Corporation 7,387 324 557 CBS Corporation, B 7,092 211 463 Chipotle Mexican Grill, Inc. 497 135 330 Coach Inc. 4,418 173 200 Comcast Corporation, A 39,237 1,299 3,064 D.R. Horton, Inc. 5,209 121 231 Darden Restaurants, Inc. 1,819 69 160 Delphi Automotive PLC 4,537 185 538 Discovery Communications, Inc., A 2,367 93 87 Discovery Communications, Inc., C 4,130 184 144 Dollar General Corporation 4,702 243 468 Dollar Tree Stores Inc. 3,746 196 400 Expedia, Inc. 1,894 137 326 Ford Motor Company 62,189 745 1,213 Fossil Group, Inc. 651 83 33 GameStop Corp. 1,700 77 66 Gap Inc., (The) 3,800 96 130 Garmin Ltd. 1,884 80 97 General Motors Company 22,630 865 1,065 Genuine Parts Company 2,419 119 288 Goodyear Tire & Rubber Company, (The) 4,299 98 194 H&R Block Inc. 3,797 87 175 Hanesbrands Inc. 6,423 276 262 Harley-Davidson Inc. 3,008 144 189 Harman International Industries Incorporated 1,136 79 148 Hasbro Inc. 1,795 59 167 Interpublic Group of Companies Inc., (The) 6,550 92 211 Johnson Controls Inc. 10,438 324 570 Kohl's Corporation 3,159 177 208 L Brands Inc. 4,101 138 544 Leggett & Platt, Incorporated 2,184 54 127 Lennar Corporation 2,776 93 188 Lowe's Companies Inc. 14,764 434 1,554 Macy's, Inc. 4,916 153 238 Marriott International Inc. 3,183 112 295 Mattel Inc. 5,406 144 203 McDonald's Corporation 14,752 909 2,412 Michael Kors Holdings Limited 3,087 264 171 Mohawk Industries, Inc. 1,014 155 266 Netflix, Inc. 6,905 205 1,093 Newell Rubbermaid Inc. 4,274 110 261 News Corporation, A 6,025 100 111 News Corporation, B 1,800 31 35 NIKE Inc., B 21,634 413 1,871 Nordstrom, Inc. 2,225 85 153 Omnicom Group Inc. 3,877 185 406 O'Reilly Automotive Inc. 1,586 82 556 PulteGroup, Inc. 5,124 84 126 PVH Corp. 1,318 161 134
Shares
Average cost
$Fair value
$ Shares
Average cost
$Fair value
$
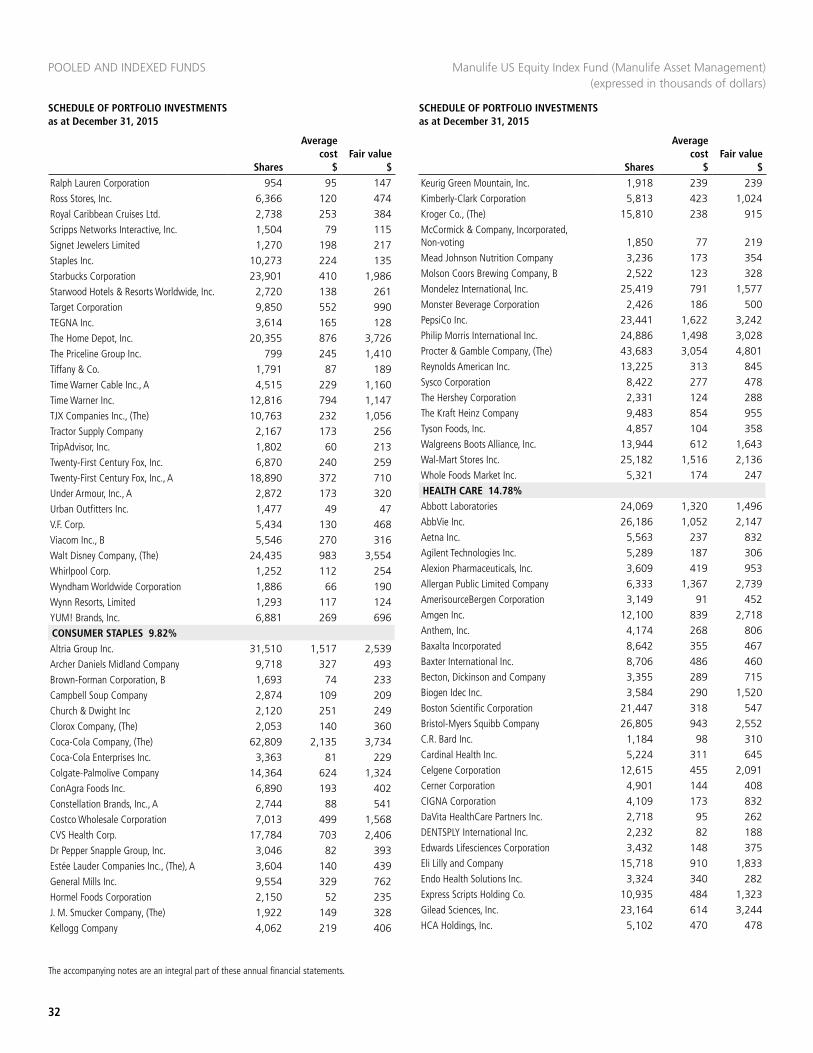
POOLED AND INDEXED FUNDS
32
SCHEDULE OF PORTFOLIO INVESTMENTS as at December 31, 2015
SCHEDULE OF PORTFOLIO INVESTMENTS as at December 31, 2015
The accompanying notes are an integral part of these annual financial statements.
Manulife US Equity Index Fund (Manulife Asset Management) (expressed in thousands of dollars)
Ralph Lauren Corporation 954 95 147 Ross Stores, Inc. 6,366 120 474 Royal Caribbean Cruises Ltd. 2,738 253 384 Scripps Networks Interactive, Inc. 1,504 79 115 Signet Jewelers Limited 1,270 198 217 Staples Inc. 10,273 224 135 Starbucks Corporation 23,901 410 1,986 Starwood Hotels & Resorts Worldwide, Inc. 2,720 138 261 Target Corporation 9,850 552 990 TEGNA Inc. 3,614 165 128 The Home Depot, Inc. 20,355 876 3,726 The Priceline Group Inc. 799 245 1,410 Tiffany & Co. 1,791 87 189 Time Warner Cable Inc., A 4,515 229 1,160 Time Warner Inc. 12,816 794 1,147 TJX Companies Inc., (The) 10,763 232 1,056 Tractor Supply Company 2,167 173 256 TripAdvisor, Inc. 1,802 60 213 Twenty-First Century Fox, Inc. 6,870 240 259 Twenty-First Century Fox, Inc., A 18,890 372 710 Under Armour, Inc., A 2,872 173 320 Urban Outfitters Inc. 1,477 49 47 V.F. Corp. 5,434 130 468 Viacom Inc., B 5,546 270 316 Walt Disney Company, (The) 24,435 983 3,554 Whirlpool Corp. 1,252 112 254 Wyndham Worldwide Corporation 1,886 66 190 Wynn Resorts, Limited 1,293 117 124 YUM! Brands, Inc. 6,881 269 696 CONSUMER STAPLES 9.82%Altria Group Inc. 31,510 1,517 2,539 Archer Daniels Midland Company 9,718 327 493 Brown-Forman Corporation, B 1,693 74 233 Campbell Soup Company 2,874 109 209 Church & Dwight Inc 2,120 251 249 Clorox Company, (The) 2,053 140 360 Coca-Cola Company, (The) 62,809 2,135 3,734 Coca-Cola Enterprises Inc. 3,363 81 229 Colgate-Palmolive Company 14,364 624 1,324 ConAgra Foods Inc. 6,890 193 402 Constellation Brands, Inc., A 2,744 88 541 Costco Wholesale Corporation 7,013 499 1,568 CVS Health Corp. 17,784 703 2,406 Dr Pepper Snapple Group, Inc. 3,046 82 393 Estée Lauder Companies Inc., (The), A 3,604 140 439 General Mills Inc. 9,554 329 762 Hormel Foods Corporation 2,150 52 235 J. M. Smucker Company, (The) 1,922 149 328 Kellogg Company 4,062 219 406
Keurig Green Mountain, Inc. 1,918 239 239 Kimberly-Clark Corporation 5,813 423 1,024 Kroger Co., (The) 15,810 238 915 McCormick & Company, Incorporated, Non-voting 1,850 77 219 Mead Johnson Nutrition Company 3,236 173 354 Molson Coors Brewing Company, B 2,522 123 328 Mondelez International, Inc. 25,419 791 1,577 Monster Beverage Corporation 2,426 186 500 PepsiCo Inc. 23,441 1,622 3,242 Philip Morris International Inc. 24,886 1,498 3,028 Procter & Gamble Company, (The) 43,683 3,054 4,801 Reynolds American Inc. 13,225 313 845 Sysco Corporation 8,422 277 478 The Hershey Corporation 2,331 124 288 The Kraft Heinz Company 9,483 854 955 Tyson Foods, Inc. 4,857 104 358 Walgreens Boots Alliance, Inc. 13,944 612 1,643 Wal-Mart Stores Inc. 25,182 1,516 2,136 Whole Foods Market Inc. 5,321 174 247 HEALTH CARE 14.78%Abbott Laboratories 24,069 1,320 1,496 AbbVie Inc. 26,186 1,052 2,147 Aetna Inc. 5,563 237 832 Agilent Technologies Inc. 5,289 187 306 Alexion Pharmaceuticals, Inc. 3,609 419 953 Allergan Public Limited Company 6,333 1,367 2,739 AmerisourceBergen Corporation 3,149 91 452 Amgen Inc. 12,100 839 2,718 Anthem, Inc. 4,174 268 806 Baxalta Incorporated 8,642 355 467 Baxter International Inc. 8,706 486 460 Becton, Dickinson and Company 3,355 289 715 Biogen Idec Inc. 3,584 290 1,520 Boston Scientific Corporation 21,447 318 547 Bristol-Myers Squibb Company 26,805 943 2,552 C.R. Bard Inc. 1,184 98 310 Cardinal Health Inc. 5,224 311 645 Celgene Corporation 12,615 455 2,091 Cerner Corporation 4,901 144 408 CIGNA Corporation 4,109 173 832 DaVita HealthCare Partners Inc. 2,718 95 262 DENTSPLY International Inc. 2,232 82 188 Edwards Lifesciences Corporation 3,432 148 375 Eli Lilly and Company 15,718 910 1,833 Endo Health Solutions Inc. 3,324 340 282 Express Scripts Holding Co. 10,935 484 1,323 Gilead Sciences, Inc. 23,164 614 3,244 HCA Holdings, Inc. 5,102 470 478
Shares
Average cost
$Fair value
$ Shares
Average cost
$Fair value
$

SCHEDULE OF PORTFOLIO INVESTMENTS as at December 31, 2015
SCHEDULE OF PORTFOLIO INVESTMENTS as at December 31, 2015
33
The accompanying notes are an integral part of these annual financial statements.
Manulife US Equity Index Fund (Manulife Asset Management) (expressed in thousands of dollars)
Henry Schein, Inc. 1,331 235 291 Humana Inc. 2,364 119 584 Illumina, Inc. 2,357 557 626 Intuitive Surgical, Inc. 591 181 447 Johnson & Johnson 44,453 3,175 6,320 Laboratory Corporation of America Holdings 1,606 131 275 Mallinckrodt plc 1,873 152 193 McKesson Corporation 3,709 258 1,012 Medtronic Public Limited Company 22,567 1,465 2,402 Merck & Co., Inc. 44,946 2,033 3,286 Mylan N.V. 6,589 178 493 Patterson Companies Inc. 1,386 50 87 PerkinElmer, Inc. 1,810 46 134 Perrigo Company 2,334 304 467 Pfizer Inc. 99,168 2,662 4,430 Quest Diagnostics Incorporated 2,292 124 226 Regeneron Pharmaceuticals, Inc. 1,257 321 944 St. Jude Medical, Inc. 4,496 194 384 Stryker Corporation 5,047 318 649 Tenet Healthcare Corporation 1,575 64 66 Thermo Fisher Scientific Inc. 6,452 405 1,267 UnitedHealth Group Incorporated 15,326 714 2,495 Universal Health Services Inc., B 1,464 183 242 Varian Medical Systems, Inc. 1,576 85 176 Vertex Pharmaceuticals Incorporated 3,904 321 680 Waters Corporation 1,313 79 245 Zimmer Holdings Inc. 2,726 185 387 Zoetis Inc. 7,326 238 486 FINANCIALS 15.97%ACE Limited 5,167 325 836 Affiliated Managers Group, Inc. 866 190 191 AFLAC Incorporated 6,876 363 570 Allstate Corporation, (The) 6,183 302 531 American Express Company 13,396 684 1,289 American International Group Inc. 19,889 2,334 1,706 American Tower Corporation 6,754 365 906 Ameriprise Financial, Inc. 2,844 133 419 Aon plc 4,334 226 553 Apartment Investment and Management Company 2,495 64 138 Assurant, Inc. 1,067 58 119 AvalonBay Communities Inc. 2,206 290 562 Bank of America Corporation 167,056 3,619 3,891 Bank of New York Mellon Corporation, (The) 17,657 680 1,007 BB&T Corporation 12,440 458 651 Berkshire Hathaway Inc, B 30,081 2,754 5,497 BlackRock, Inc. 2,044 414 963 Boston Properties, Inc. 2,451 237 433 Capital One Financial Corporation 8,484 505 848
CB Richard Ellis Group, Inc., A 4,627 100 221 Charles Schwab Corporation, (The) 19,105 376 871 Chubb Corporation, (The) 3,622 201 665 Cincinnati Financial Corporation 2,356 97 193 Citigroup Inc. 47,788 3,741 3,423 CME Group Inc. 5,389 479 676 Comerica Incorporated 2,841 132 164 Crown Castle International Corp. 5,326 325 637 Discover Financial Services LLC 6,947 164 516 E*TRADE Financial Corporation 4,632 123 190 Equity Residential 5,972 309 674 Essex Property Trust, Inc. 1,049 206 348 Fifth Third Bancorp 12,819 286 357 Franklin Resources Inc. 6,172 224 315 General Growth Properties, Inc. 9,329 220 351 Goldman Sachs Group, Inc., (The) 6,354 975 1,585 Hartford Financial Services Group Inc., (The) 6,621 327 398 HCP, Inc. 7,382 272 391 Health Care REIT, Inc. 5,813 347 547 Host Hotels & Resorts, Inc. 11,990 225 255 Huntington Bancshares Incorporated 12,817 128 196 Intercontinental Exchange, Inc. 1,763 302 625 Invesco Ltd. 6,843 171 317 Iron Mountain Incorporated 3,062 94 114 J.P. Morgan Chase & Co. 59,205 2,733 5,410 KeyCorp 13,422 203 245 Kimco Realty Corporation 6,594 171 241 Legg Mason, Inc. 1,750 121 95 Leucadia National Corp. 5,385 175 130 Lincoln National Corporation 4,007 180 279 Loews Corporation 4,577 175 243 M&T Bank Corporation 2,577 276 432 Marsh & McLennan Companies, Inc. 8,457 300 649 McGraw Hill Financial, Inc. 4,348 208 593 MetLife Inc. 17,825 842 1,189 Moody's Corporation 2,781 112 386 Morgan Stanley 24,316 1,002 1,071 Navient Corporation 5,949 109 94 Northern Trust Corporation 3,493 220 349 People's United Financial, Inc. 4,943 93 110 Plum Creek Timber Company, Inc. 2,789 119 184 PNC Financial Services Group, (The) 8,195 531 1,081 Principal Financial Group 4,375 182 272 Progressive Corporation, (The) 9,349 215 411 Prologis, Inc. 8,365 298 497 Prudential Financial Inc. 7,197 467 811 Public Storage, Inc. 2,345 240 804 Realty Income Corporation 4,051 260 289 Regions Financial Corporation 21,151 303 281
Shares
Average cost
$Fair value
$ Shares
Average cost
$Fair value
$
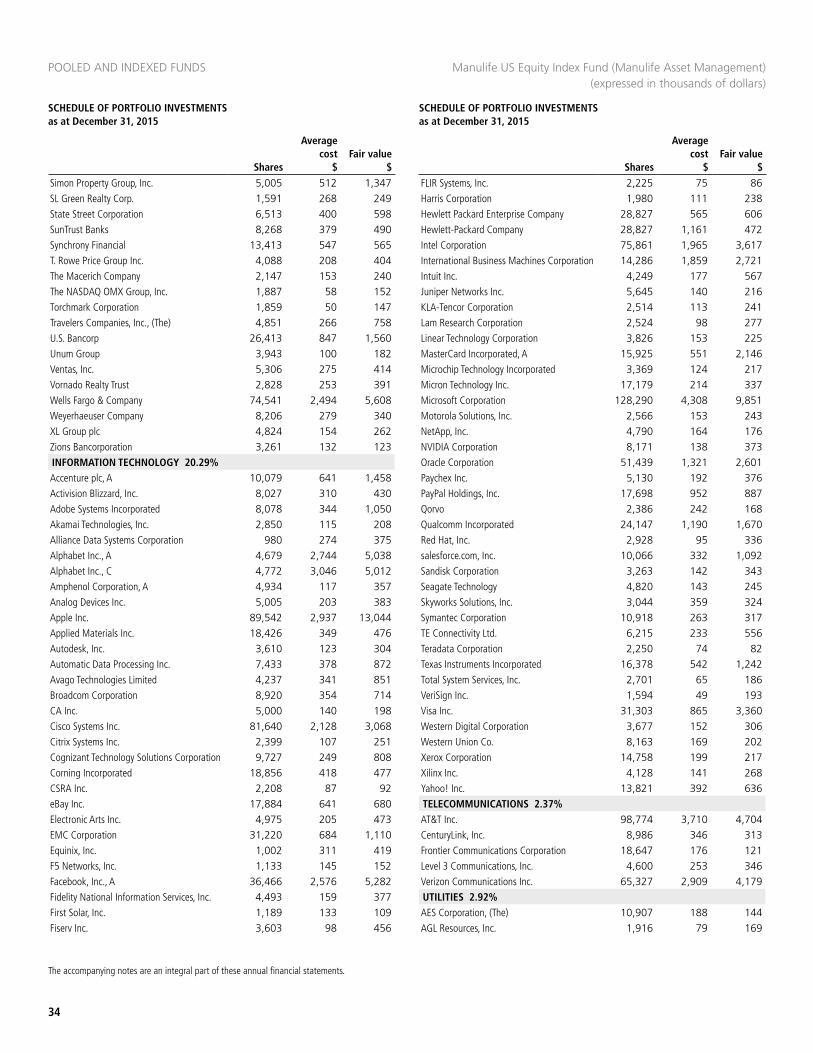
POOLED AND INDEXED FUNDS
34
SCHEDULE OF PORTFOLIO INVESTMENTS as at December 31, 2015
SCHEDULE OF PORTFOLIO INVESTMENTS as at December 31, 2015
The accompanying notes are an integral part of these annual financial statements.
Manulife US Equity Index Fund (Manulife Asset Management) (expressed in thousands of dollars)
Simon Property Group, Inc. 5,005 512 1,347 SL Green Realty Corp. 1,591 268 249 State Street Corporation 6,513 400 598 SunTrust Banks 8,268 379 490 Synchrony Financial 13,413 547 565 T. Rowe Price Group Inc. 4,088 208 404 The Macerich Company 2,147 153 240 The NASDAQ OMX Group, Inc. 1,887 58 152 Torchmark Corporation 1,859 50 147 Travelers Companies, Inc., (The) 4,851 266 758 U.S. Bancorp 26,413 847 1,560 Unum Group 3,943 100 182 Ventas, Inc. 5,306 275 414 Vornado Realty Trust 2,828 253 391 Wells Fargo & Company 74,541 2,494 5,608 Weyerhaeuser Company 8,206 279 340 XL Group plc 4,824 154 262 Zions Bancorporation 3,261 132 123 INFORMATION TECHNOLOGY 20.29%Accenture plc, A 10,079 641 1,458 Activision Blizzard, Inc. 8,027 310 430 Adobe Systems Incorporated 8,078 344 1,050 Akamai Technologies, Inc. 2,850 115 208 Alliance Data Systems Corporation 980 274 375 Alphabet Inc., A 4,679 2,744 5,038 Alphabet Inc., C 4,772 3,046 5,012 Amphenol Corporation, A 4,934 117 357 Analog Devices Inc. 5,005 203 383 Apple Inc. 89,542 2,937 13,044 Applied Materials Inc. 18,426 349 476 Autodesk, Inc. 3,610 123 304 Automatic Data Processing Inc. 7,433 378 872 Avago Technologies Limited 4,237 341 851 Broadcom Corporation 8,920 354 714 CA Inc. 5,000 140 198 Cisco Systems Inc. 81,640 2,128 3,068 Citrix Systems Inc. 2,399 107 251 Cognizant Technology Solutions Corporation 9,727 249 808 Corning Incorporated 18,856 418 477 CSRA Inc. 2,208 87 92 eBay Inc. 17,884 641 680 Electronic Arts Inc. 4,975 205 473 EMC Corporation 31,220 684 1,110 Equinix, Inc. 1,002 311 419 F5 Networks, Inc. 1,133 145 152 Facebook, Inc., A 36,466 2,576 5,282 Fidelity National Information Services, Inc. 4,493 159 377 First Solar, Inc. 1,189 133 109 Fiserv Inc. 3,603 98 456
FLIR Systems, Inc. 2,225 75 86 Harris Corporation 1,980 111 238 Hewlett Packard Enterprise Company 28,827 565 606 Hewlett-Packard Company 28,827 1,161 472 Intel Corporation 75,861 1,965 3,617 International Business Machines Corporation 14,286 1,859 2,721 Intuit Inc. 4,249 177 567 Juniper Networks Inc. 5,645 140 216 KLA-Tencor Corporation 2,514 113 241 Lam Research Corporation 2,524 98 277 Linear Technology Corporation 3,826 153 225 MasterCard Incorporated, A 15,925 551 2,146 Microchip Technology Incorporated 3,369 124 217 Micron Technology Inc. 17,179 214 337 Microsoft Corporation 128,290 4,308 9,851 Motorola Solutions, Inc. 2,566 153 243 NetApp, Inc. 4,790 164 176 NVIDIA Corporation 8,171 138 373 Oracle Corporation 51,439 1,321 2,601 Paychex Inc. 5,130 192 376 PayPal Holdings, Inc. 17,698 952 887 Qorvo 2,386 242 168 Qualcomm Incorporated 24,147 1,190 1,670 Red Hat, Inc. 2,928 95 336 salesforce.com, Inc. 10,066 332 1,092 Sandisk Corporation 3,263 142 343 Seagate Technology 4,820 143 245 Skyworks Solutions, Inc. 3,044 359 324 Symantec Corporation 10,918 263 317 TE Connectivity Ltd. 6,215 233 556 Teradata Corporation 2,250 74 82 Texas Instruments Incorporated 16,378 542 1,242 Total System Services, Inc. 2,701 65 186 VeriSign Inc. 1,594 49 193 Visa Inc. 31,303 865 3,360 Western Digital Corporation 3,677 152 306 Western Union Co. 8,163 169 202 Xerox Corporation 14,758 199 217 Xilinx Inc. 4,128 141 268 Yahoo! Inc. 13,821 392 636 TELECOMMUNICATIONS 2.37%AT&T Inc. 98,774 3,710 4,704 CenturyLink, Inc. 8,986 346 313 Frontier Communications Corporation 18,647 176 121 Level 3 Communications, Inc. 4,600 253 346 Verizon Communications Inc. 65,327 2,909 4,179 UTILITIES 2.92%AES Corporation, (The) 10,907 188 144 AGL Resources, Inc. 1,916 79 169
Shares
Average cost
$Fair value
$ Shares
Average cost
$Fair value
$
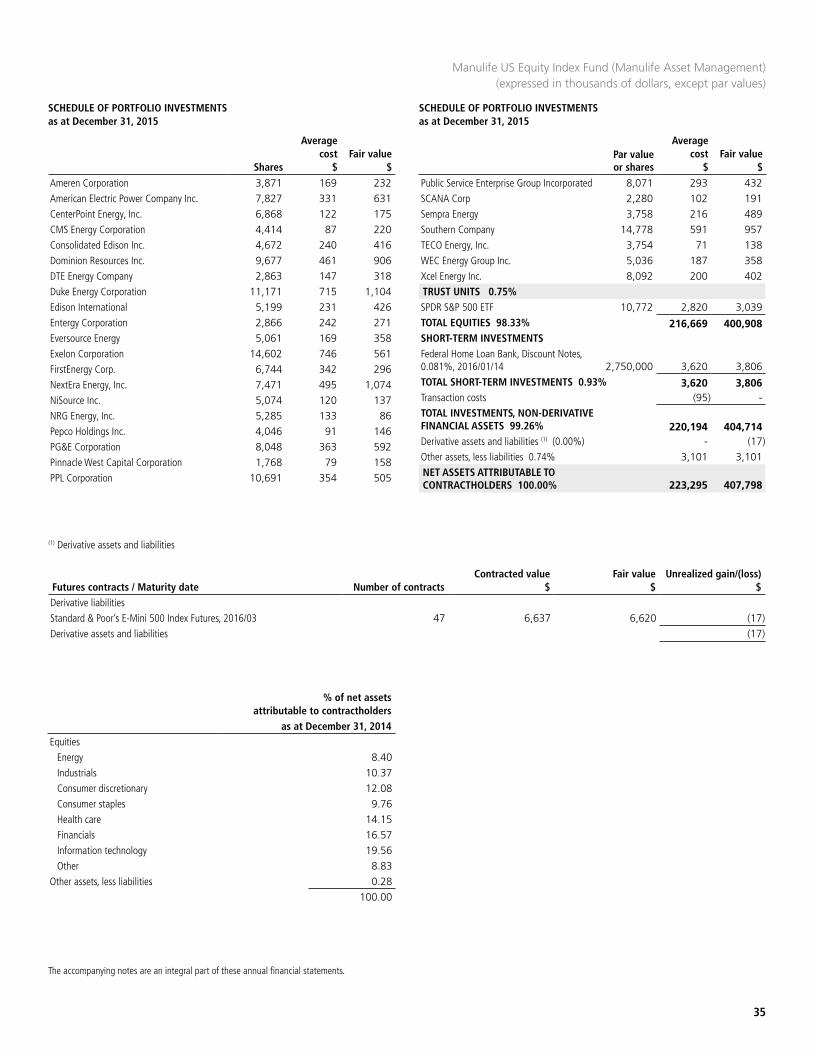
SCHEDULE OF PORTFOLIO INVESTMENTS as at December 31, 2015
SCHEDULE OF PORTFOLIO INVESTMENTS as at December 31, 2015
35
The accompanying notes are an integral part of these annual financial statements.
Manulife US Equity Index Fund (Manulife Asset Management) (expressed in thousands of dollars, except par values)
Ameren Corporation 3,871 169 232 American Electric Power Company Inc. 7,827 331 631 CenterPoint Energy, Inc. 6,868 122 175 CMS Energy Corporation 4,414 87 220 Consolidated Edison Inc. 4,672 240 416 Dominion Resources Inc. 9,677 461 906 DTE Energy Company 2,863 147 318 Duke Energy Corporation 11,171 715 1,104 Edison International 5,199 231 426 Entergy Corporation 2,866 242 271 Eversource Energy 5,061 169 358 Exelon Corporation 14,602 746 561 FirstEnergy Corp. 6,744 342 296 NextEra Energy, Inc. 7,471 495 1,074 NiSource Inc. 5,074 120 137 NRG Energy, Inc. 5,285 133 86 Pepco Holdings Inc. 4,046 91 146 PG&E Corporation 8,048 363 592 Pinnacle West Capital Corporation 1,768 79 158 PPL Corporation 10,691 354 505
Public Service Enterprise Group Incorporated 8,071 293 432 SCANA Corp 2,280 102 191 Sempra Energy 3,758 216 489 Southern Company 14,778 591 957 TECO Energy, Inc. 3,754 71 138 WEC Energy Group Inc. 5,036 187 358 Xcel Energy Inc. 8,092 200 402 TRUST UNITS 0.75%SPDR S&P 500 ETF 10,772 2,820 3,039 TOTAL EQUITIES 98.33% 216,669 400,908 SHORT-TERM INVESTMENTSFederal Home Loan Bank, Discount Notes, 0.081%, 2016/01/14 2,750,000 3,620 3,806 TOTAL SHORT-TERM INVESTMENTS 0.93% 3,620 3,806 Transaction costs (95) - TOTAL INVESTMENTS, NON-DERIVATIVE FINANCIAL ASSETS 99.26% 220,194 404,714 Derivative assets and liabilities (1) (0.00%) - (17)Other assets, less liabilities 0.74% 3,101 3,101 NET ASSETS ATTRIBUTABLE TO CONTRACTHOLDERS 100.00% 223,295 407,798
(1) Derivative assets and liabilities
Futures contracts / Maturity date Number of contractsContracted value
$Fair value
$Unrealized gain/(loss)
$Derivative liabilitiesStandard & Poor’s E-Mini 500 Index Futures, 2016/03 47 6,637 6,620 (17)Derivative assets and liabilities (17)
% of net assets attributable to contractholders
as at December 31, 2014Equities
Energy 8.40 Industrials 10.37 Consumer discretionary 12.08 Consumer staples 9.76 Health care 14.15 Financials 16.57 Information technology 19.56 Other 8.83
Other assets, less liabilities 0.28 100.00
Shares
Average cost
$Fair value
$Par value or shares
Average cost
$Fair value
$
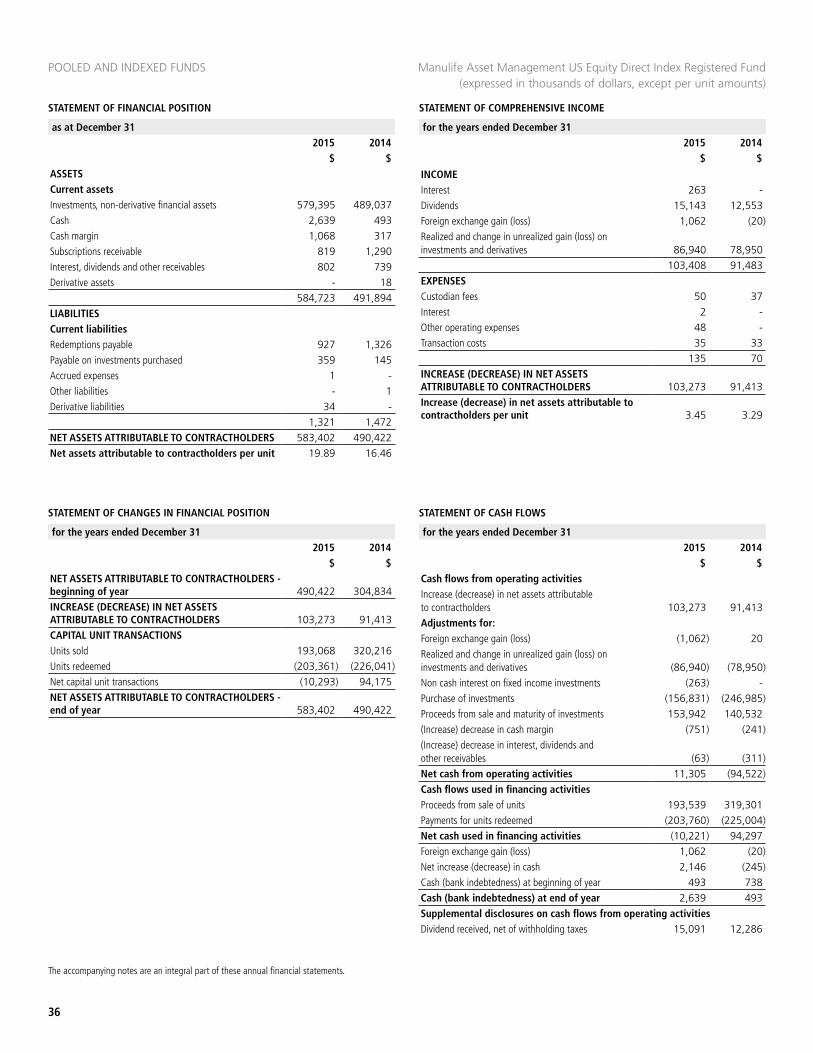
STATEMENT OF FINANCIAL POSITION
POOLED AND INDEXED FUNDS
STATEMENT OF COMPREHENSIVE INCOME
as at December 31 2015 2014
$ $
for the years ended December 312015 2014
$ $
36
The accompanying notes are an integral part of these annual financial statements.
Manulife Asset Management US Equity Direct Index Registered Fund (expressed in thousands of dollars, except per unit amounts)
ASSETSCurrent assetsInvestments, non-derivative financial assets 579,395 489,037Cash 2,639 493Cash margin 1,068 317Subscriptions receivable 819 1,290Interest, dividends and other receivables 802 739Derivative assets - 18
584,723 491,894LIABILITIESCurrent liabilitiesRedemptions payable 927 1,326Payable on investments purchased 359 145Accrued expenses 1 -Other liabilities - 1Derivative liabilities 34 -
1,321 1,472NET ASSETS ATTRIBUTABLE TO CONTRACTHOLDERS 583,402 490,422Net assets attributable to contractholders per unit 19.89 16.46
INCOMEInterest 263 -Dividends 15,143 12,553Foreign exchange gain (loss) 1,062 (20)Realized and change in unrealized gain (loss) on investments and derivatives 86,940 78,950
103,408 91,483EXPENSESCustodian fees 50 37Interest 2 -Other operating expenses 48 -Transaction costs 35 33
135 70INCREASE (DECREASE) IN NET ASSETS ATTRIBUTABLE TO CONTRACTHOLDERS 103,273 91,413Increase (decrease) in net assets attributable to contractholders per unit 3.45 3.29
STATEMENT OF CHANGES IN FINANCIAL POSITION STATEMENT OF CASH FLOWS
for the years ended December 312015 2014
$ $
for the years ended December 312015 2014
$ $NET ASSETS ATTRIBUTABLE TO CONTRACTHOLDERS - beginning of year 490,422 304,834INCREASE (DECREASE) IN NET ASSETS ATTRIBUTABLE TO CONTRACTHOLDERS 103,273 91,413CAPITAL UNIT TRANSACTIONSUnits sold 193,068 320,216Units redeemed (203,361) (226,041)Net capital unit transactions (10,293) 94,175NET ASSETS ATTRIBUTABLE TO CONTRACTHOLDERS - end of year 583,402 490,422
Cash flows from operating activitiesIncrease (decrease) in net assets attributable to contractholders 103,273 91,413Adjustments for:Foreign exchange gain (loss) (1,062) 20Realized and change in unrealized gain (loss) on investments and derivatives (86,940) (78,950)Non cash interest on fixed income investments (263) -Purchase of investments (156,831) (246,985)Proceeds from sale and maturity of investments 153,942 140,532(Increase) decrease in cash margin (751) (241)(Increase) decrease in interest, dividends and other receivables (63) (311)Net cash from operating activities 11,305 (94,522)Cash flows used in financing activitiesProceeds from sale of units 193,539 319,301Payments for units redeemed (203,760) (225,004)Net cash used in financing activities (10,221) 94,297Foreign exchange gain (loss) 1,062 (20)Net increase (decrease) in cash 2,146 (245)Cash (bank indebtedness) at beginning of year 493 738Cash (bank indebtedness) at end of year 2,639 493Supplemental disclosures on cash flows from operating activitiesDividend received, net of withholding taxes 15,091 12,286
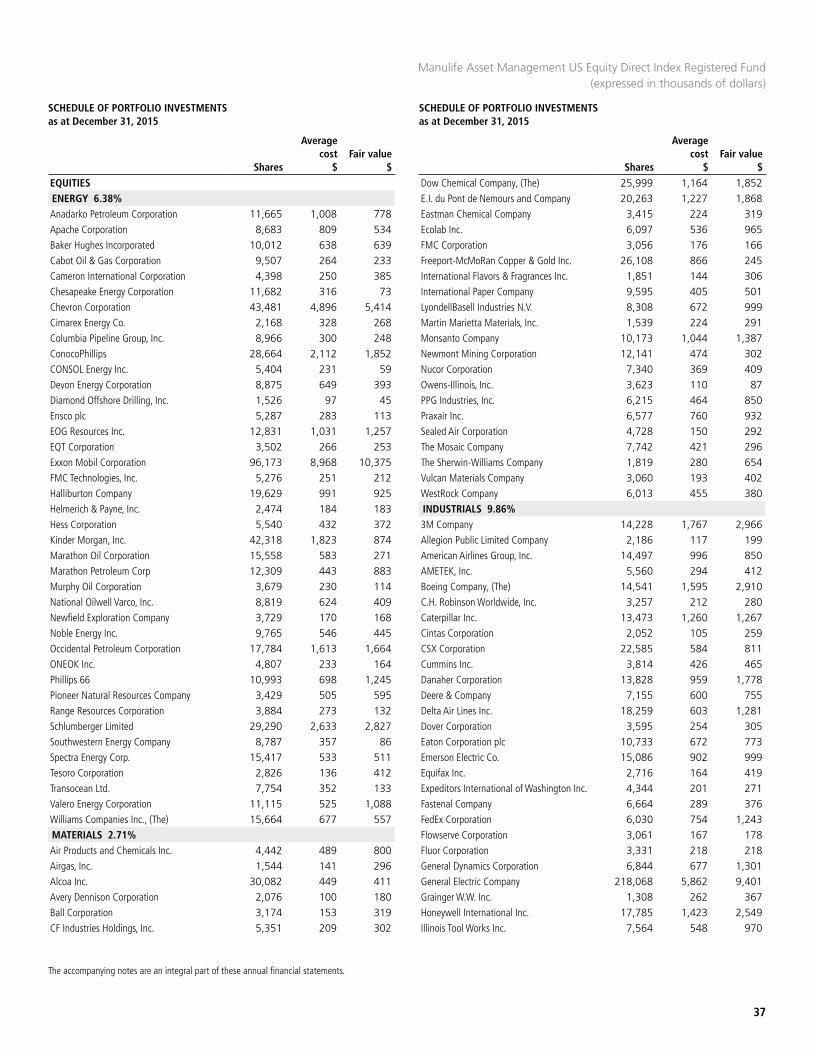
SCHEDULE OF PORTFOLIO INVESTMENTS as at December 31, 2015
SCHEDULE OF PORTFOLIO INVESTMENTS as at December 31, 2015
37
The accompanying notes are an integral part of these annual financial statements.
Manulife Asset Management US Equity Direct Index Registered Fund (expressed in thousands of dollars)
EQUITIESENERGY 6.38%Anadarko Petroleum Corporation 11,665 1,008 778 Apache Corporation 8,683 809 534 Baker Hughes Incorporated 10,012 638 639 Cabot Oil & Gas Corporation 9,507 264 233 Cameron International Corporation 4,398 250 385 Chesapeake Energy Corporation 11,682 316 73 Chevron Corporation 43,481 4,896 5,414 Cimarex Energy Co. 2,168 328 268 Columbia Pipeline Group, Inc. 8,966 300 248 ConocoPhillips 28,664 2,112 1,852 CONSOL Energy Inc. 5,404 231 59 Devon Energy Corporation 8,875 649 393 Diamond Offshore Drilling, Inc. 1,526 97 45 Ensco plc 5,287 283 113 EOG Resources Inc. 12,831 1,031 1,257 EQT Corporation 3,502 266 253 Exxon Mobil Corporation 96,173 8,968 10,375 FMC Technologies, Inc. 5,276 251 212 Halliburton Company 19,629 991 925 Helmerich & Payne, Inc. 2,474 184 183 Hess Corporation 5,540 432 372 Kinder Morgan, Inc. 42,318 1,823 874 Marathon Oil Corporation 15,558 583 271 Marathon Petroleum Corp 12,309 443 883 Murphy Oil Corporation 3,679 230 114 National Oilwell Varco, Inc. 8,819 624 409 Newfield Exploration Company 3,729 170 168 Noble Energy Inc. 9,765 546 445 Occidental Petroleum Corporation 17,784 1,613 1,664 ONEOK Inc. 4,807 233 164 Phillips 66 10,993 698 1,245 Pioneer Natural Resources Company 3,429 505 595 Range Resources Corporation 3,884 273 132 Schlumberger Limited 29,290 2,633 2,827 Southwestern Energy Company 8,787 357 86 Spectra Energy Corp. 15,417 533 511 Tesoro Corporation 2,826 136 412 Transocean Ltd. 7,754 352 133 Valero Energy Corporation 11,115 525 1,088 Williams Companies Inc., (The) 15,664 677 557 MATERIALS 2.71%Air Products and Chemicals Inc. 4,442 489 800 Airgas, Inc. 1,544 141 296 Alcoa Inc. 30,082 449 411 Avery Dennison Corporation 2,076 100 180 Ball Corporation 3,174 153 319 CF Industries Holdings, Inc. 5,351 209 302
Dow Chemical Company, (The) 25,999 1,164 1,852 E.I. du Pont de Nemours and Company 20,263 1,227 1,868 Eastman Chemical Company 3,415 224 319 Ecolab Inc. 6,097 536 965 FMC Corporation 3,056 176 166 Freeport-McMoRan Copper & Gold Inc. 26,108 866 245 International Flavors & Fragrances Inc. 1,851 144 306 International Paper Company 9,595 405 501 LyondellBasell Industries N.V. 8,308 672 999 Martin Marietta Materials, Inc. 1,539 224 291 Monsanto Company 10,173 1,044 1,387 Newmont Mining Corporation 12,141 474 302 Nucor Corporation 7,340 369 409 Owens-Illinois, Inc. 3,623 110 87 PPG Industries, Inc. 6,215 464 850 Praxair Inc. 6,577 760 932 Sealed Air Corporation 4,728 150 292 The Mosaic Company 7,742 421 296 The Sherwin-Williams Company 1,819 280 654 Vulcan Materials Company 3,060 193 402 WestRock Company 6,013 455 380 INDUSTRIALS 9.86%3M Company 14,228 1,767 2,966 Allegion Public Limited Company 2,186 117 199 American Airlines Group, Inc. 14,497 996 850 AMETEK, Inc. 5,560 294 412 Boeing Company, (The) 14,541 1,595 2,910 C.H. Robinson Worldwide, Inc. 3,257 212 280 Caterpillar Inc. 13,473 1,260 1,267 Cintas Corporation 2,052 105 259 CSX Corporation 22,585 584 811 Cummins Inc. 3,814 426 465 Danaher Corporation 13,828 959 1,778 Deere & Company 7,155 600 755 Delta Air Lines Inc. 18,259 603 1,281 Dover Corporation 3,595 254 305 Eaton Corporation plc 10,733 672 773 Emerson Electric Co. 15,086 902 999 Equifax Inc. 2,716 164 419 Expeditors International of Washington Inc. 4,344 201 271 Fastenal Company 6,664 289 376 FedEx Corporation 6,030 754 1,243 Flowserve Corporation 3,061 167 178 Fluor Corporation 3,331 218 218 General Dynamics Corporation 6,844 677 1,301 General Electric Company 218,068 5,862 9,401 Grainger W.W. Inc. 1,308 262 367 Honeywell International Inc. 17,785 1,423 2,549 Illinois Tool Works Inc. 7,564 548 970
Shares
Average cost
$Fair value
$ Shares
Average cost
$Fair value
$
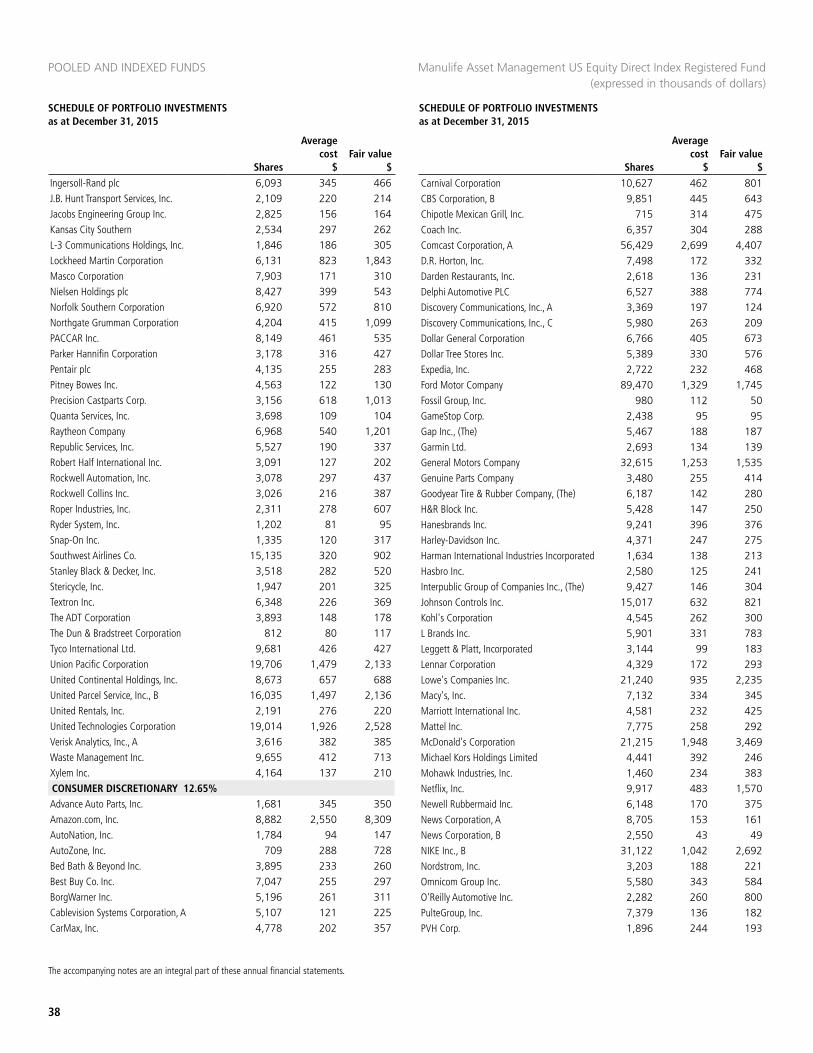
POOLED AND INDEXED FUNDS
38
SCHEDULE OF PORTFOLIO INVESTMENTS as at December 31, 2015
SCHEDULE OF PORTFOLIO INVESTMENTS as at December 31, 2015
The accompanying notes are an integral part of these annual financial statements.
Manulife Asset Management US Equity Direct Index Registered Fund (expressed in thousands of dollars)
Ingersoll-Rand plc 6,093 345 466 J.B. Hunt Transport Services, Inc. 2,109 220 214 Jacobs Engineering Group Inc. 2,825 156 164 Kansas City Southern 2,534 297 262 L-3 Communications Holdings, Inc. 1,846 186 305 Lockheed Martin Corporation 6,131 823 1,843 Masco Corporation 7,903 171 310 Nielsen Holdings plc 8,427 399 543 Norfolk Southern Corporation 6,920 572 810 Northgate Grumman Corporation 4,204 415 1,099 PACCAR Inc. 8,149 461 535 Parker Hannifin Corporation 3,178 316 427 Pentair plc 4,135 255 283 Pitney Bowes Inc. 4,563 122 130 Precision Castparts Corp. 3,156 618 1,013 Quanta Services, Inc. 3,698 109 104 Raytheon Company 6,968 540 1,201 Republic Services, Inc. 5,527 190 337 Robert Half International Inc. 3,091 127 202 Rockwell Automation, Inc. 3,078 297 437 Rockwell Collins Inc. 3,026 216 387 Roper Industries, Inc. 2,311 278 607 Ryder System, Inc. 1,202 81 95 Snap-On Inc. 1,335 120 317 Southwest Airlines Co. 15,135 320 902 Stanley Black & Decker, Inc. 3,518 282 520 Stericycle, Inc. 1,947 201 325 Textron Inc. 6,348 226 369 The ADT Corporation 3,893 148 178 The Dun & Bradstreet Corporation 812 80 117 Tyco International Ltd. 9,681 426 427 Union Pacific Corporation 19,706 1,479 2,133 United Continental Holdings, Inc. 8,673 657 688 United Parcel Service, Inc., B 16,035 1,497 2,136 United Rentals, Inc. 2,191 276 220 United Technologies Corporation 19,014 1,926 2,528 Verisk Analytics, Inc., A 3,616 382 385 Waste Management Inc. 9,655 412 713 Xylem Inc. 4,164 137 210 CONSUMER DISCRETIONARY 12.65%Advance Auto Parts, Inc. 1,681 345 350 Amazon.com, Inc. 8,882 2,550 8,309 AutoNation, Inc. 1,784 94 147 AutoZone, Inc. 709 288 728 Bed Bath & Beyond Inc. 3,895 233 260 Best Buy Co. Inc. 7,047 255 297 BorgWarner Inc. 5,196 261 311 Cablevision Systems Corporation, A 5,107 121 225 CarMax, Inc. 4,778 202 357
Carnival Corporation 10,627 462 801 CBS Corporation, B 9,851 445 643 Chipotle Mexican Grill, Inc. 715 314 475 Coach Inc. 6,357 304 288 Comcast Corporation, A 56,429 2,699 4,407 D.R. Horton, Inc. 7,498 172 332 Darden Restaurants, Inc. 2,618 136 231 Delphi Automotive PLC 6,527 388 774 Discovery Communications, Inc., A 3,369 197 124 Discovery Communications, Inc., C 5,980 263 209 Dollar General Corporation 6,766 405 673 Dollar Tree Stores Inc. 5,389 330 576 Expedia, Inc. 2,722 232 468 Ford Motor Company 89,470 1,329 1,745 Fossil Group, Inc. 980 112 50 GameStop Corp. 2,438 95 95 Gap Inc., (The) 5,467 188 187 Garmin Ltd. 2,693 134 139 General Motors Company 32,615 1,253 1,535 Genuine Parts Company 3,480 255 414 Goodyear Tire & Rubber Company, (The) 6,187 142 280 H&R Block Inc. 5,428 147 250 Hanesbrands Inc. 9,241 396 376 Harley-Davidson Inc. 4,371 247 275 Harman International Industries Incorporated 1,634 138 213 Hasbro Inc. 2,580 125 241 Interpublic Group of Companies Inc., (The) 9,427 146 304 Johnson Controls Inc. 15,017 632 821 Kohl's Corporation 4,545 262 300 L Brands Inc. 5,901 331 783 Leggett & Platt, Incorporated 3,144 99 183 Lennar Corporation 4,329 172 293 Lowe's Companies Inc. 21,240 935 2,235 Macy's, Inc. 7,132 334 345 Marriott International Inc. 4,581 232 425 Mattel Inc. 7,775 258 292 McDonald's Corporation 21,215 1,948 3,469 Michael Kors Holdings Limited 4,441 392 246 Mohawk Industries, Inc. 1,460 234 383 Netflix, Inc. 9,917 483 1,570 Newell Rubbermaid Inc. 6,148 170 375 News Corporation, A 8,705 153 161 News Corporation, B 2,550 43 49 NIKE Inc., B 31,122 1,042 2,692 Nordstrom, Inc. 3,203 188 221 Omnicom Group Inc. 5,580 343 584 O'Reilly Automotive Inc. 2,282 260 800 PulteGroup, Inc. 7,379 136 182 PVH Corp. 1,896 244 193
Shares
Average cost
$Fair value
$ Shares
Average cost
$Fair value
$
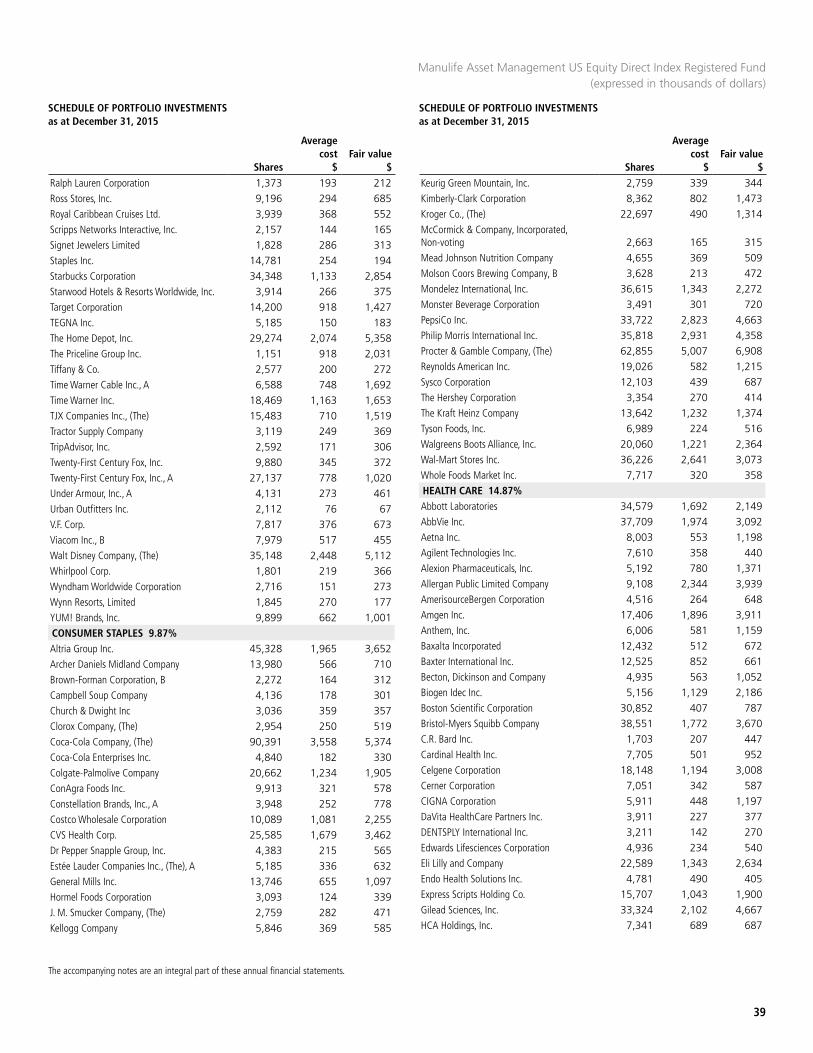
SCHEDULE OF PORTFOLIO INVESTMENTS as at December 31, 2015
SCHEDULE OF PORTFOLIO INVESTMENTS as at December 31, 2015
39
The accompanying notes are an integral part of these annual financial statements.
Manulife Asset Management US Equity Direct Index Registered Fund (expressed in thousands of dollars)
Ralph Lauren Corporation 1,373 193 212 Ross Stores, Inc. 9,196 294 685 Royal Caribbean Cruises Ltd. 3,939 368 552 Scripps Networks Interactive, Inc. 2,157 144 165 Signet Jewelers Limited 1,828 286 313 Staples Inc. 14,781 254 194 Starbucks Corporation 34,348 1,133 2,854 Starwood Hotels & Resorts Worldwide, Inc. 3,914 266 375 Target Corporation 14,200 918 1,427 TEGNA Inc. 5,185 150 183 The Home Depot, Inc. 29,274 2,074 5,358 The Priceline Group Inc. 1,151 918 2,031 Tiffany & Co. 2,577 200 272 Time Warner Cable Inc., A 6,588 748 1,692 Time Warner Inc. 18,469 1,163 1,653 TJX Companies Inc., (The) 15,483 710 1,519 Tractor Supply Company 3,119 249 369 TripAdvisor, Inc. 2,592 171 306 Twenty-First Century Fox, Inc. 9,880 345 372 Twenty-First Century Fox, Inc., A 27,137 778 1,020 Under Armour, Inc., A 4,131 273 461 Urban Outfitters Inc. 2,112 76 67 V.F. Corp. 7,817 376 673 Viacom Inc., B 7,979 517 455 Walt Disney Company, (The) 35,148 2,448 5,112 Whirlpool Corp. 1,801 219 366 Wyndham Worldwide Corporation 2,716 151 273 Wynn Resorts, Limited 1,845 270 177 YUM! Brands, Inc. 9,899 662 1,001 CONSUMER STAPLES 9.87%Altria Group Inc. 45,328 1,965 3,652 Archer Daniels Midland Company 13,980 566 710 Brown-Forman Corporation, B 2,272 164 312 Campbell Soup Company 4,136 178 301 Church & Dwight Inc 3,036 359 357 Clorox Company, (The) 2,954 250 519 Coca-Cola Company, (The) 90,391 3,558 5,374 Coca-Cola Enterprises Inc. 4,840 182 330 Colgate-Palmolive Company 20,662 1,234 1,905 ConAgra Foods Inc. 9,913 321 578 Constellation Brands, Inc., A 3,948 252 778 Costco Wholesale Corporation 10,089 1,081 2,255 CVS Health Corp. 25,585 1,679 3,462 Dr Pepper Snapple Group, Inc. 4,383 215 565 Estée Lauder Companies Inc., (The), A 5,185 336 632 General Mills Inc. 13,746 655 1,097 Hormel Foods Corporation 3,093 124 339 J. M. Smucker Company, (The) 2,759 282 471 Kellogg Company 5,846 369 585
Keurig Green Mountain, Inc. 2,759 339 344 Kimberly-Clark Corporation 8,362 802 1,473 Kroger Co., (The) 22,697 490 1,314 McCormick & Company, Incorporated, Non-voting 2,663 165 315 Mead Johnson Nutrition Company 4,655 369 509 Molson Coors Brewing Company, B 3,628 213 472 Mondelez International, Inc. 36,615 1,343 2,272 Monster Beverage Corporation 3,491 301 720 PepsiCo Inc. 33,722 2,823 4,663 Philip Morris International Inc. 35,818 2,931 4,358 Procter & Gamble Company, (The) 62,855 5,007 6,908 Reynolds American Inc. 19,026 582 1,215 Sysco Corporation 12,103 439 687 The Hershey Corporation 3,354 270 414 The Kraft Heinz Company 13,642 1,232 1,374 Tyson Foods, Inc. 6,989 224 516 Walgreens Boots Alliance, Inc. 20,060 1,221 2,364 Wal-Mart Stores Inc. 36,226 2,641 3,073 Whole Foods Market Inc. 7,717 320 358 HEALTH CARE 14.87%Abbott Laboratories 34,579 1,692 2,149 AbbVie Inc. 37,709 1,974 3,092 Aetna Inc. 8,003 553 1,198 Agilent Technologies Inc. 7,610 358 440 Alexion Pharmaceuticals, Inc. 5,192 780 1,371 Allergan Public Limited Company 9,108 2,344 3,939 AmerisourceBergen Corporation 4,516 264 648 Amgen Inc. 17,406 1,896 3,911 Anthem, Inc. 6,006 581 1,159 Baxalta Incorporated 12,432 512 672 Baxter International Inc. 12,525 852 661 Becton, Dickinson and Company 4,935 563 1,052 Biogen Idec Inc. 5,156 1,129 2,186 Boston Scientific Corporation 30,852 407 787 Bristol-Myers Squibb Company 38,551 1,772 3,670 C.R. Bard Inc. 1,703 207 447 Cardinal Health Inc. 7,705 501 952 Celgene Corporation 18,148 1,194 3,008 Cerner Corporation 7,051 342 587 CIGNA Corporation 5,911 448 1,197 DaVita HealthCare Partners Inc. 3,911 227 377 DENTSPLY International Inc. 3,211 142 270 Edwards Lifesciences Corporation 4,936 234 540 Eli Lilly and Company 22,589 1,343 2,634 Endo Health Solutions Inc. 4,781 490 405 Express Scripts Holding Co. 15,707 1,043 1,900 Gilead Sciences, Inc. 33,324 2,102 4,667 HCA Holdings, Inc. 7,341 689 687
Shares
Average cost
$Fair value
$ Shares
Average cost
$Fair value
$
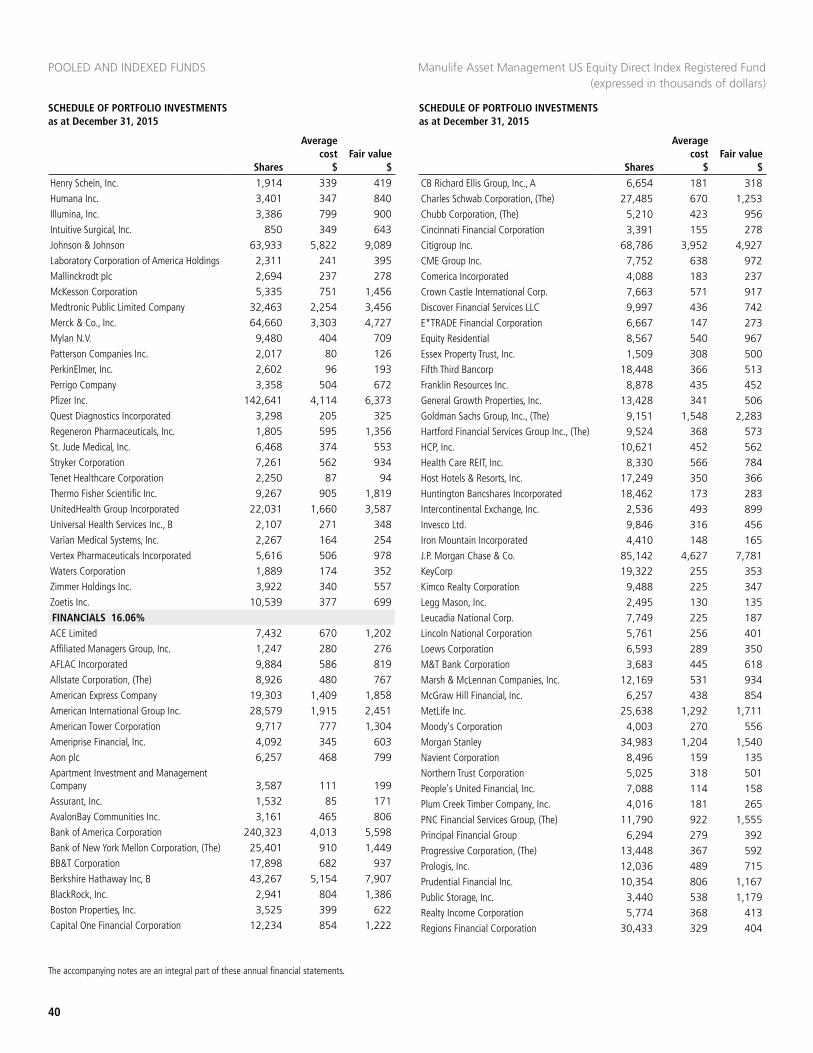
POOLED AND INDEXED FUNDS
40
SCHEDULE OF PORTFOLIO INVESTMENTS as at December 31, 2015
SCHEDULE OF PORTFOLIO INVESTMENTS as at December 31, 2015
The accompanying notes are an integral part of these annual financial statements.
Manulife Asset Management US Equity Direct Index Registered Fund (expressed in thousands of dollars)
Henry Schein, Inc. 1,914 339 419 Humana Inc. 3,401 347 840 Illumina, Inc. 3,386 799 900 Intuitive Surgical, Inc. 850 349 643 Johnson & Johnson 63,933 5,822 9,089 Laboratory Corporation of America Holdings 2,311 241 395 Mallinckrodt plc 2,694 237 278 McKesson Corporation 5,335 751 1,456 Medtronic Public Limited Company 32,463 2,254 3,456 Merck & Co., Inc. 64,660 3,303 4,727 Mylan N.V. 9,480 404 709 Patterson Companies Inc. 2,017 80 126 PerkinElmer, Inc. 2,602 96 193 Perrigo Company 3,358 504 672 Pfizer Inc. 142,641 4,114 6,373 Quest Diagnostics Incorporated 3,298 205 325 Regeneron Pharmaceuticals, Inc. 1,805 595 1,356 St. Jude Medical, Inc. 6,468 374 553 Stryker Corporation 7,261 562 934 Tenet Healthcare Corporation 2,250 87 94 Thermo Fisher Scientific Inc. 9,267 905 1,819 UnitedHealth Group Incorporated 22,031 1,660 3,587 Universal Health Services Inc., B 2,107 271 348 Varian Medical Systems, Inc. 2,267 164 254 Vertex Pharmaceuticals Incorporated 5,616 506 978 Waters Corporation 1,889 174 352 Zimmer Holdings Inc. 3,922 340 557 Zoetis Inc. 10,539 377 699 FINANCIALS 16.06%ACE Limited 7,432 670 1,202 Affiliated Managers Group, Inc. 1,247 280 276 AFLAC Incorporated 9,884 586 819 Allstate Corporation, (The) 8,926 480 767 American Express Company 19,303 1,409 1,858 American International Group Inc. 28,579 1,915 2,451 American Tower Corporation 9,717 777 1,304 Ameriprise Financial, Inc. 4,092 345 603 Aon plc 6,257 468 799 Apartment Investment and Management Company 3,587 111 199 Assurant, Inc. 1,532 85 171 AvalonBay Communities Inc. 3,161 465 806 Bank of America Corporation 240,323 4,013 5,598 Bank of New York Mellon Corporation, (The) 25,401 910 1,449 BB&T Corporation 17,898 682 937 Berkshire Hathaway Inc, B 43,267 5,154 7,907 BlackRock, Inc. 2,941 804 1,386 Boston Properties, Inc. 3,525 399 622 Capital One Financial Corporation 12,234 854 1,222
CB Richard Ellis Group, Inc., A 6,654 181 318 Charles Schwab Corporation, (The) 27,485 670 1,253 Chubb Corporation, (The) 5,210 423 956 Cincinnati Financial Corporation 3,391 155 278 Citigroup Inc. 68,786 3,952 4,927 CME Group Inc. 7,752 638 972 Comerica Incorporated 4,088 183 237 Crown Castle International Corp. 7,663 571 917 Discover Financial Services LLC 9,997 436 742 E*TRADE Financial Corporation 6,667 147 273 Equity Residential 8,567 540 967 Essex Property Trust, Inc. 1,509 308 500 Fifth Third Bancorp 18,448 366 513 Franklin Resources Inc. 8,878 435 452 General Growth Properties, Inc. 13,428 341 506 Goldman Sachs Group, Inc., (The) 9,151 1,548 2,283 Hartford Financial Services Group Inc., (The) 9,524 368 573 HCP, Inc. 10,621 452 562 Health Care REIT, Inc. 8,330 566 784 Host Hotels & Resorts, Inc. 17,249 350 366 Huntington Bancshares Incorporated 18,462 173 283 Intercontinental Exchange, Inc. 2,536 493 899 Invesco Ltd. 9,846 316 456 Iron Mountain Incorporated 4,410 148 165 J.P. Morgan Chase & Co. 85,142 4,627 7,781 KeyCorp 19,322 255 353 Kimco Realty Corporation 9,488 225 347 Legg Mason, Inc. 2,495 130 135 Leucadia National Corp. 7,749 225 187 Lincoln National Corporation 5,761 256 401 Loews Corporation 6,593 289 350 M&T Bank Corporation 3,683 445 618 Marsh & McLennan Companies, Inc. 12,169 531 934 McGraw Hill Financial, Inc. 6,257 438 854 MetLife Inc. 25,638 1,292 1,711 Moody's Corporation 4,003 270 556 Morgan Stanley 34,983 1,204 1,540 Navient Corporation 8,496 159 135 Northern Trust Corporation 5,025 318 501 People's United Financial, Inc. 7,088 114 158 Plum Creek Timber Company, Inc. 4,016 181 265 PNC Financial Services Group, (The) 11,790 922 1,555 Principal Financial Group 6,294 279 392 Progressive Corporation, (The) 13,448 367 592 Prologis, Inc. 12,036 489 715 Prudential Financial Inc. 10,354 806 1,167 Public Storage, Inc. 3,440 538 1,179 Realty Income Corporation 5,774 368 413 Regions Financial Corporation 30,433 329 404
Shares
Average cost
$Fair value
$ Shares
Average cost
$Fair value
$
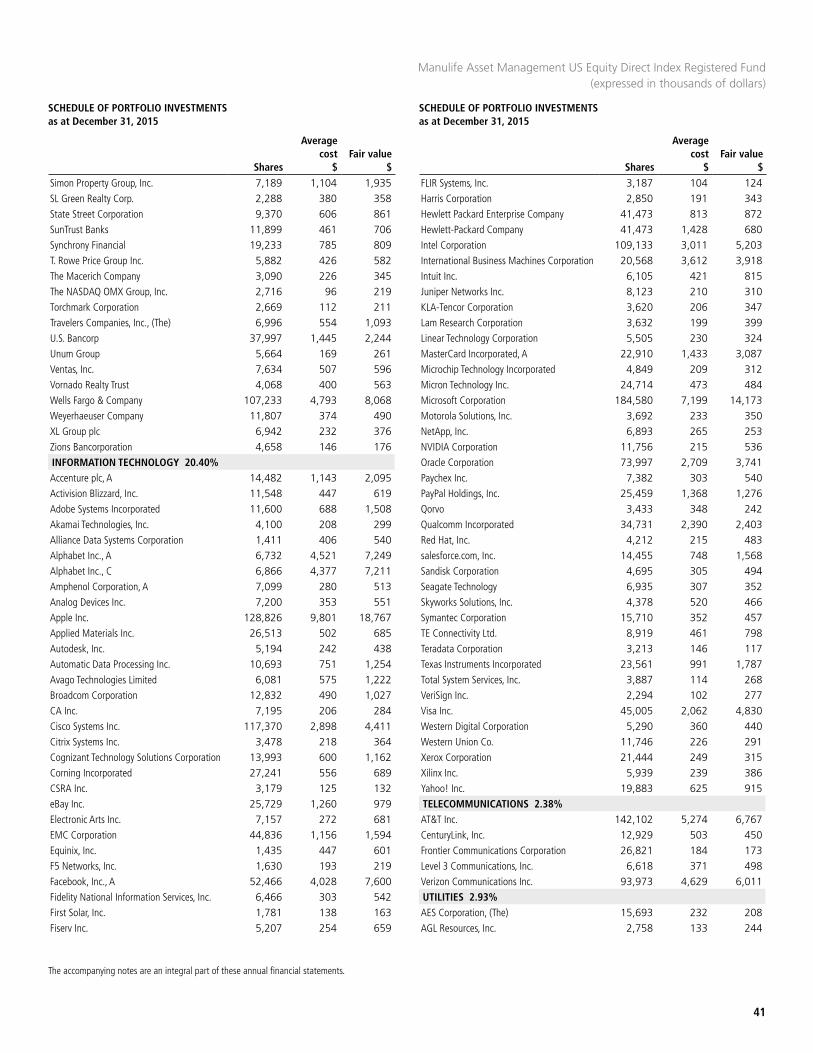
SCHEDULE OF PORTFOLIO INVESTMENTS as at December 31, 2015
SCHEDULE OF PORTFOLIO INVESTMENTS as at December 31, 2015
41
The accompanying notes are an integral part of these annual financial statements.
Simon Property Group, Inc. 7,189 1,104 1,935 SL Green Realty Corp. 2,288 380 358 State Street Corporation 9,370 606 861 SunTrust Banks 11,899 461 706 Synchrony Financial 19,233 785 809 T. Rowe Price Group Inc. 5,882 426 582 The Macerich Company 3,090 226 345 The NASDAQ OMX Group, Inc. 2,716 96 219 Torchmark Corporation 2,669 112 211 Travelers Companies, Inc., (The) 6,996 554 1,093 U.S. Bancorp 37,997 1,445 2,244 Unum Group 5,664 169 261 Ventas, Inc. 7,634 507 596 Vornado Realty Trust 4,068 400 563 Wells Fargo & Company 107,233 4,793 8,068 Weyerhaeuser Company 11,807 374 490 XL Group plc 6,942 232 376 Zions Bancorporation 4,658 146 176 INFORMATION TECHNOLOGY 20.40%Accenture plc, A 14,482 1,143 2,095 Activision Blizzard, Inc. 11,548 447 619 Adobe Systems Incorporated 11,600 688 1,508 Akamai Technologies, Inc. 4,100 208 299 Alliance Data Systems Corporation 1,411 406 540 Alphabet Inc., A 6,732 4,521 7,249 Alphabet Inc., C 6,866 4,377 7,211 Amphenol Corporation, A 7,099 280 513 Analog Devices Inc. 7,200 353 551 Apple Inc. 128,826 9,801 18,767 Applied Materials Inc. 26,513 502 685 Autodesk, Inc. 5,194 242 438 Automatic Data Processing Inc. 10,693 751 1,254 Avago Technologies Limited 6,081 575 1,222 Broadcom Corporation 12,832 490 1,027 CA Inc. 7,195 206 284 Cisco Systems Inc. 117,370 2,898 4,411 Citrix Systems Inc. 3,478 218 364 Cognizant Technology Solutions Corporation 13,993 600 1,162 Corning Incorporated 27,241 556 689 CSRA Inc. 3,179 125 132 eBay Inc. 25,729 1,260 979 Electronic Arts Inc. 7,157 272 681 EMC Corporation 44,836 1,156 1,594 Equinix, Inc. 1,435 447 601 F5 Networks, Inc. 1,630 193 219 Facebook, Inc., A 52,466 4,028 7,600 Fidelity National Information Services, Inc. 6,466 303 542 First Solar, Inc. 1,781 138 163 Fiserv Inc. 5,207 254 659
FLIR Systems, Inc. 3,187 104 124 Harris Corporation 2,850 191 343 Hewlett Packard Enterprise Company 41,473 813 872 Hewlett-Packard Company 41,473 1,428 680 Intel Corporation 109,133 3,011 5,203 International Business Machines Corporation 20,568 3,612 3,918 Intuit Inc. 6,105 421 815 Juniper Networks Inc. 8,123 210 310 KLA-Tencor Corporation 3,620 206 347 Lam Research Corporation 3,632 199 399 Linear Technology Corporation 5,505 230 324 MasterCard Incorporated, A 22,910 1,433 3,087 Microchip Technology Incorporated 4,849 209 312 Micron Technology Inc. 24,714 473 484 Microsoft Corporation 184,580 7,199 14,173 Motorola Solutions, Inc. 3,692 233 350 NetApp, Inc. 6,893 265 253 NVIDIA Corporation 11,756 215 536 Oracle Corporation 73,997 2,709 3,741 Paychex Inc. 7,382 303 540 PayPal Holdings, Inc. 25,459 1,368 1,276 Qorvo 3,433 348 242 Qualcomm Incorporated 34,731 2,390 2,403 Red Hat, Inc. 4,212 215 483 salesforce.com, Inc. 14,455 748 1,568 Sandisk Corporation 4,695 305 494 Seagate Technology 6,935 307 352 Skyworks Solutions, Inc. 4,378 520 466 Symantec Corporation 15,710 352 457 TE Connectivity Ltd. 8,919 461 798 Teradata Corporation 3,213 146 117 Texas Instruments Incorporated 23,561 991 1,787 Total System Services, Inc. 3,887 114 268 VeriSign Inc. 2,294 102 277 Visa Inc. 45,005 2,062 4,830 Western Digital Corporation 5,290 360 440 Western Union Co. 11,746 226 291 Xerox Corporation 21,444 249 315 Xilinx Inc. 5,939 239 386 Yahoo! Inc. 19,883 625 915 TELECOMMUNICATIONS 2.38%AT&T Inc. 142,102 5,274 6,767 CenturyLink, Inc. 12,929 503 450 Frontier Communications Corporation 26,821 184 173 Level 3 Communications, Inc. 6,618 371 498 Verizon Communications Inc. 93,973 4,629 6,011 UTILITIES 2.93%AES Corporation, (The) 15,693 232 208 AGL Resources, Inc. 2,758 133 244
Manulife Asset Management US Equity Direct Index Registered Fund (expressed in thousands of dollars)
Shares
Average cost
$Fair value
$ Shares
Average cost
$Fair value
$
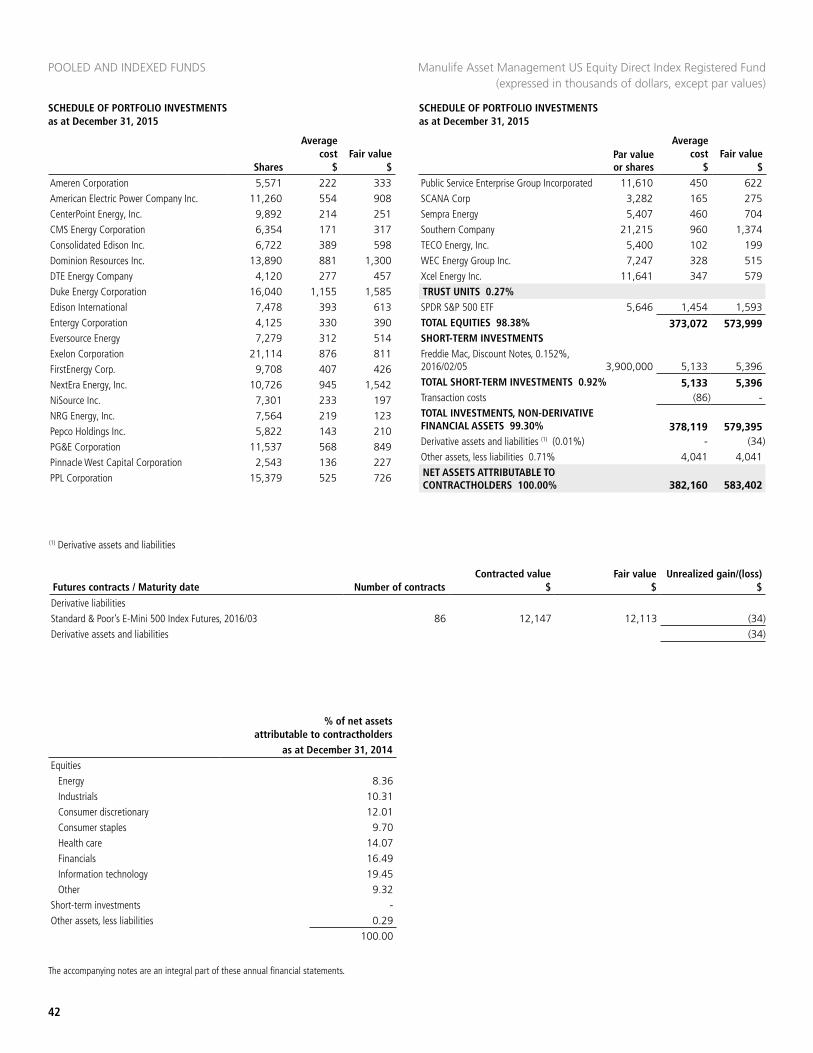
POOLED AND INDEXED FUNDS
42
SCHEDULE OF PORTFOLIO INVESTMENTS as at December 31, 2015
SCHEDULE OF PORTFOLIO INVESTMENTS as at December 31, 2015
The accompanying notes are an integral part of these annual financial statements.
% of net assets attributable to contractholders
as at December 31, 2014Equities
Energy 8.36 Industrials 10.31 Consumer discretionary 12.01 Consumer staples 9.70 Health care 14.07 Financials 16.49 Information technology 19.45 Other 9.32
Short-term investments -Other assets, less liabilities 0.29
100.00
(1) Derivative assets and liabilities
Futures contracts / Maturity date Number of contractsContracted value
$Fair value
$Unrealized gain/(loss)
$
Derivative liabilitiesStandard & Poor’s E-Mini 500 Index Futures, 2016/03 86 12,147 12,113 (34)Derivative assets and liabilities (34)
Ameren Corporation 5,571 222 333 American Electric Power Company Inc. 11,260 554 908 CenterPoint Energy, Inc. 9,892 214 251 CMS Energy Corporation 6,354 171 317 Consolidated Edison Inc. 6,722 389 598 Dominion Resources Inc. 13,890 881 1,300 DTE Energy Company 4,120 277 457 Duke Energy Corporation 16,040 1,155 1,585 Edison International 7,478 393 613 Entergy Corporation 4,125 330 390 Eversource Energy 7,279 312 514 Exelon Corporation 21,114 876 811 FirstEnergy Corp. 9,708 407 426 NextEra Energy, Inc. 10,726 945 1,542 NiSource Inc. 7,301 233 197 NRG Energy, Inc. 7,564 219 123 Pepco Holdings Inc. 5,822 143 210 PG&E Corporation 11,537 568 849 Pinnacle West Capital Corporation 2,543 136 227 PPL Corporation 15,379 525 726
Public Service Enterprise Group Incorporated 11,610 450 622 SCANA Corp 3,282 165 275 Sempra Energy 5,407 460 704 Southern Company 21,215 960 1,374 TECO Energy, Inc. 5,400 102 199 WEC Energy Group Inc. 7,247 328 515 Xcel Energy Inc. 11,641 347 579 TRUST UNITS 0.27%SPDR S&P 500 ETF 5,646 1,454 1,593 TOTAL EQUITIES 98.38% 373,072 573,999 SHORT-TERM INVESTMENTSFreddie Mac, Discount Notes, 0.152%, 2016/02/05 3,900,000 5,133 5,396 TOTAL SHORT-TERM INVESTMENTS 0.92% 5,133 5,396 Transaction costs (86) - TOTAL INVESTMENTS, NON-DERIVATIVE FINANCIAL ASSETS 99.30% 378,119 579,395 Derivative assets and liabilities (1) (0.01%) - (34)Other assets, less liabilities 0.71% 4,041 4,041 NET ASSETS ATTRIBUTABLE TO CONTRACTHOLDERS 100.00% 382,160 583,402
Manulife Asset Management US Equity Direct Index Registered Fund (expressed in thousands of dollars, except par values)
Shares
Average cost
$Fair value
$Par value or shares
Average cost
$Fair value
$
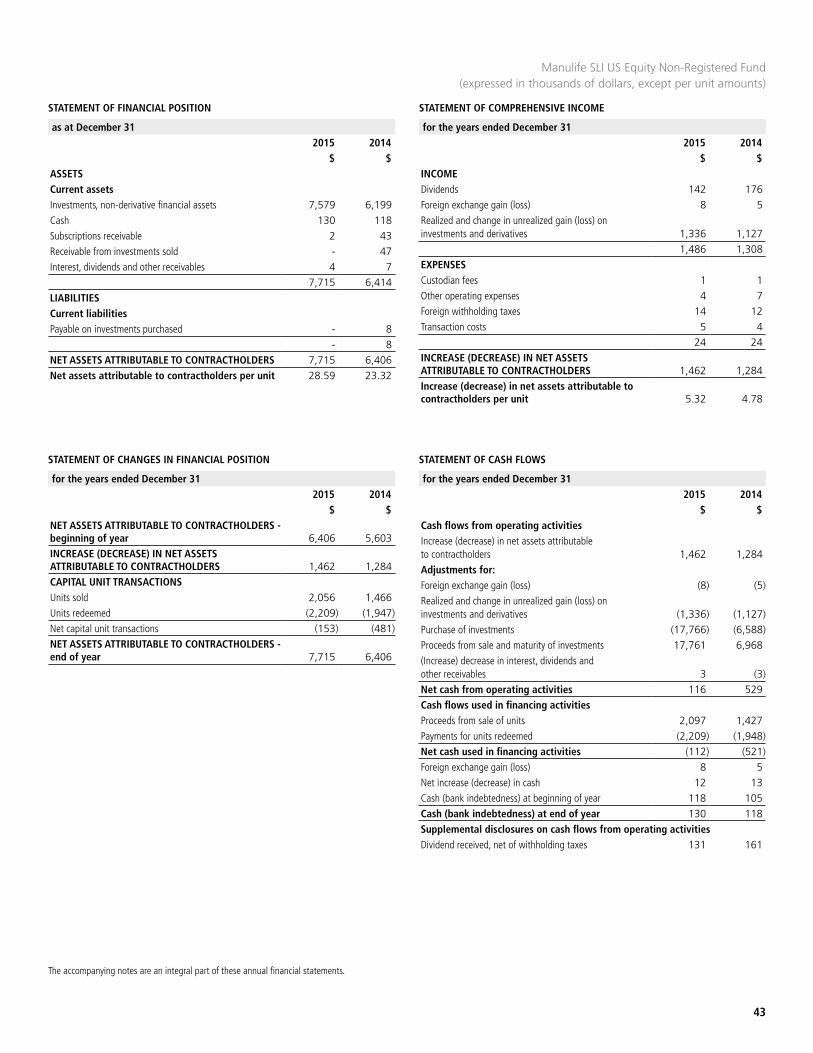
STATEMENT OF FINANCIAL POSITION STATEMENT OF COMPREHENSIVE INCOME
as at December 31 2015 2014
$ $
for the years ended December 312015 2014
$ $
43
The accompanying notes are an integral part of these annual financial statements.
Manulife SLI US Equity Non-Registered Fund (expressed in thousands of dollars, except per unit amounts)
ASSETSCurrent assetsInvestments, non-derivative financial assets 7,579 6,199Cash 130 118Subscriptions receivable 2 43Receivable from investments sold - 47Interest, dividends and other receivables 4 7
7,715 6,414LIABILITIESCurrent liabilitiesPayable on investments purchased - 8
- 8NET ASSETS ATTRIBUTABLE TO CONTRACTHOLDERS 7,715 6,406Net assets attributable to contractholders per unit 28.59 23.32
INCOMEDividends 142 176Foreign exchange gain (loss) 8 5Realized and change in unrealized gain (loss) on investments and derivatives 1,336 1,127
1,486 1,308EXPENSESCustodian fees 1 1Other operating expenses 4 7Foreign withholding taxes 14 12Transaction costs 5 4
24 24INCREASE (DECREASE) IN NET ASSETS ATTRIBUTABLE TO CONTRACTHOLDERS 1,462 1,284Increase (decrease) in net assets attributable to contractholders per unit 5.32 4.78
STATEMENT OF CHANGES IN FINANCIAL POSITION STATEMENT OF CASH FLOWS
for the years ended December 312015 2014
$ $
for the years ended December 312015 2014
$ $NET ASSETS ATTRIBUTABLE TO CONTRACTHOLDERS - beginning of year 6,406 5,603INCREASE (DECREASE) IN NET ASSETS ATTRIBUTABLE TO CONTRACTHOLDERS 1,462 1,284CAPITAL UNIT TRANSACTIONSUnits sold 2,056 1,466Units redeemed (2,209) (1,947)Net capital unit transactions (153) (481)NET ASSETS ATTRIBUTABLE TO CONTRACTHOLDERS - end of year 7,715 6,406
Cash flows from operating activitiesIncrease (decrease) in net assets attributable to contractholders 1,462 1,284Adjustments for:Foreign exchange gain (loss) (8) (5)Realized and change in unrealized gain (loss) on investments and derivatives (1,336) (1,127)Purchase of investments (17,766) (6,588)Proceeds from sale and maturity of investments 17,761 6,968(Increase) decrease in interest, dividends and other receivables 3 (3)Net cash from operating activities 116 529Cash flows used in financing activitiesProceeds from sale of units 2,097 1,427Payments for units redeemed (2,209) (1,948)Net cash used in financing activities (112) (521)Foreign exchange gain (loss) 8 5Net increase (decrease) in cash 12 13Cash (bank indebtedness) at beginning of year 118 105Cash (bank indebtedness) at end of year 130 118Supplemental disclosures on cash flows from operating activitiesDividend received, net of withholding taxes 131 161
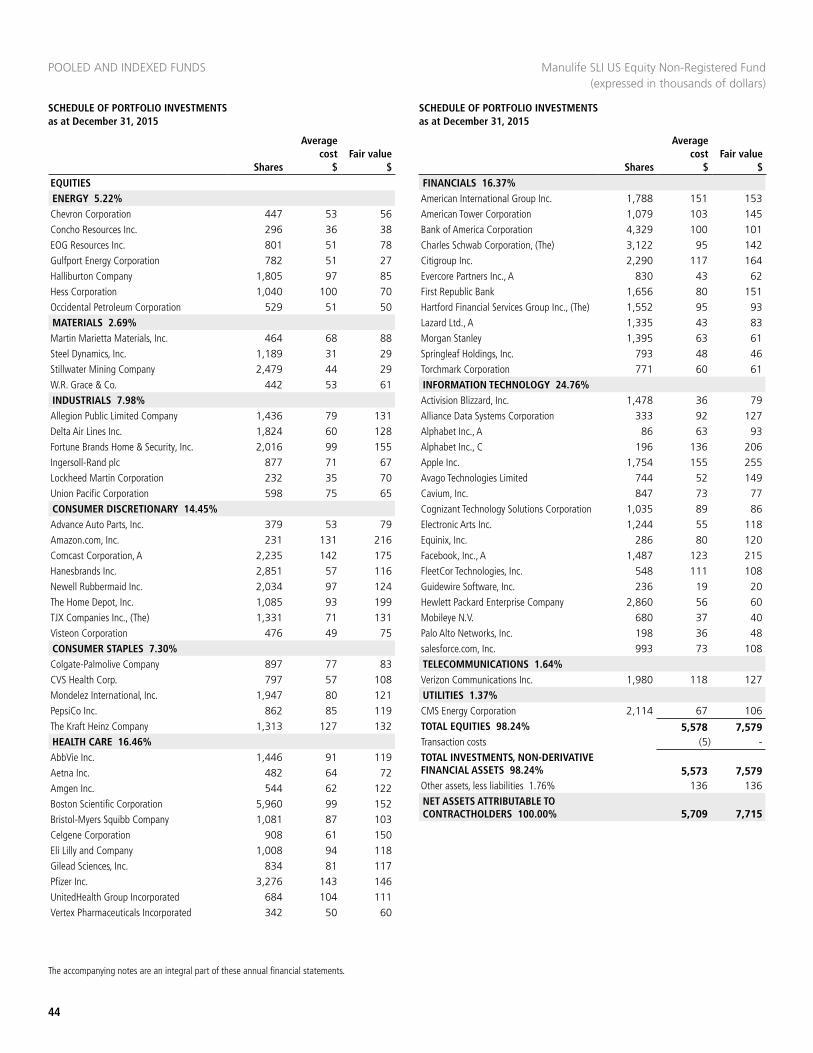
POOLED AND INDEXED FUNDS
44
SCHEDULE OF PORTFOLIO INVESTMENTS as at December 31, 2015
SCHEDULE OF PORTFOLIO INVESTMENTS as at December 31, 2015
The accompanying notes are an integral part of these annual financial statements.
EQUITIESENERGY 5.22%Chevron Corporation 447 53 56 Concho Resources Inc. 296 36 38 EOG Resources Inc. 801 51 78 Gulfport Energy Corporation 782 51 27 Halliburton Company 1,805 97 85 Hess Corporation 1,040 100 70 Occidental Petroleum Corporation 529 51 50 MATERIALS 2.69%Martin Marietta Materials, Inc. 464 68 88 Steel Dynamics, Inc. 1,189 31 29 Stillwater Mining Company 2,479 44 29 W.R. Grace & Co. 442 53 61 INDUSTRIALS 7.98%Allegion Public Limited Company 1,436 79 131 Delta Air Lines Inc. 1,824 60 128 Fortune Brands Home & Security, Inc. 2,016 99 155 Ingersoll-Rand plc 877 71 67 Lockheed Martin Corporation 232 35 70 Union Pacific Corporation 598 75 65 CONSUMER DISCRETIONARY 14.45%Advance Auto Parts, Inc. 379 53 79 Amazon.com, Inc. 231 131 216 Comcast Corporation, A 2,235 142 175 Hanesbrands Inc. 2,851 57 116 Newell Rubbermaid Inc. 2,034 97 124 The Home Depot, Inc. 1,085 93 199 TJX Companies Inc., (The) 1,331 71 131 Visteon Corporation 476 49 75 CONSUMER STAPLES 7.30%Colgate-Palmolive Company 897 77 83 CVS Health Corp. 797 57 108 Mondelez International, Inc. 1,947 80 121 PepsiCo Inc. 862 85 119 The Kraft Heinz Company 1,313 127 132 HEALTH CARE 16.46%AbbVie Inc. 1,446 91 119 Aetna Inc. 482 64 72 Amgen Inc. 544 62 122 Boston Scientific Corporation 5,960 99 152 Bristol-Myers Squibb Company 1,081 87 103 Celgene Corporation 908 61 150 Eli Lilly and Company 1,008 94 118 Gilead Sciences, Inc. 834 81 117 Pfizer Inc. 3,276 143 146 UnitedHealth Group Incorporated 684 104 111 Vertex Pharmaceuticals Incorporated 342 50 60
FINANCIALS 16.37%American International Group Inc. 1,788 151 153 American Tower Corporation 1,079 103 145 Bank of America Corporation 4,329 100 101 Charles Schwab Corporation, (The) 3,122 95 142 Citigroup Inc. 2,290 117 164 Evercore Partners Inc., A 830 43 62 First Republic Bank 1,656 80 151 Hartford Financial Services Group Inc., (The) 1,552 95 93 Lazard Ltd., A 1,335 43 83 Morgan Stanley 1,395 63 61 Springleaf Holdings, Inc. 793 48 46 Torchmark Corporation 771 60 61 INFORMATION TECHNOLOGY 24.76%Activision Blizzard, Inc. 1,478 36 79 Alliance Data Systems Corporation 333 92 127 Alphabet Inc., A 86 63 93 Alphabet Inc., C 196 136 206 Apple Inc. 1,754 155 255 Avago Technologies Limited 744 52 149 Cavium, Inc. 847 73 77 Cognizant Technology Solutions Corporation 1,035 89 86 Electronic Arts Inc. 1,244 55 118 Equinix, Inc. 286 80 120 Facebook, Inc., A 1,487 123 215 FleetCor Technologies, Inc. 548 111 108 Guidewire Software, Inc. 236 19 20 Hewlett Packard Enterprise Company 2,860 56 60 Mobileye N.V. 680 37 40 Palo Alto Networks, Inc. 198 36 48 salesforce.com, Inc. 993 73 108 TELECOMMUNICATIONS 1.64%Verizon Communications Inc. 1,980 118 127 UTILITIES 1.37%CMS Energy Corporation 2,114 67 106 TOTAL EQUITIES 98.24% 5,578 7,579 Transaction costs (5) - TOTAL INVESTMENTS, NON-DERIVATIVE FINANCIAL ASSETS 98.24% 5,573 7,579 Other assets, less liabilities 1.76% 136 136 NET ASSETS ATTRIBUTABLE TO CONTRACTHOLDERS 100.00% 5,709 7,715
Manulife SLI US Equity Non-Registered Fund (expressed in thousands of dollars)
Shares
Average cost
$Fair value
$ Shares
Average cost
$Fair value
$
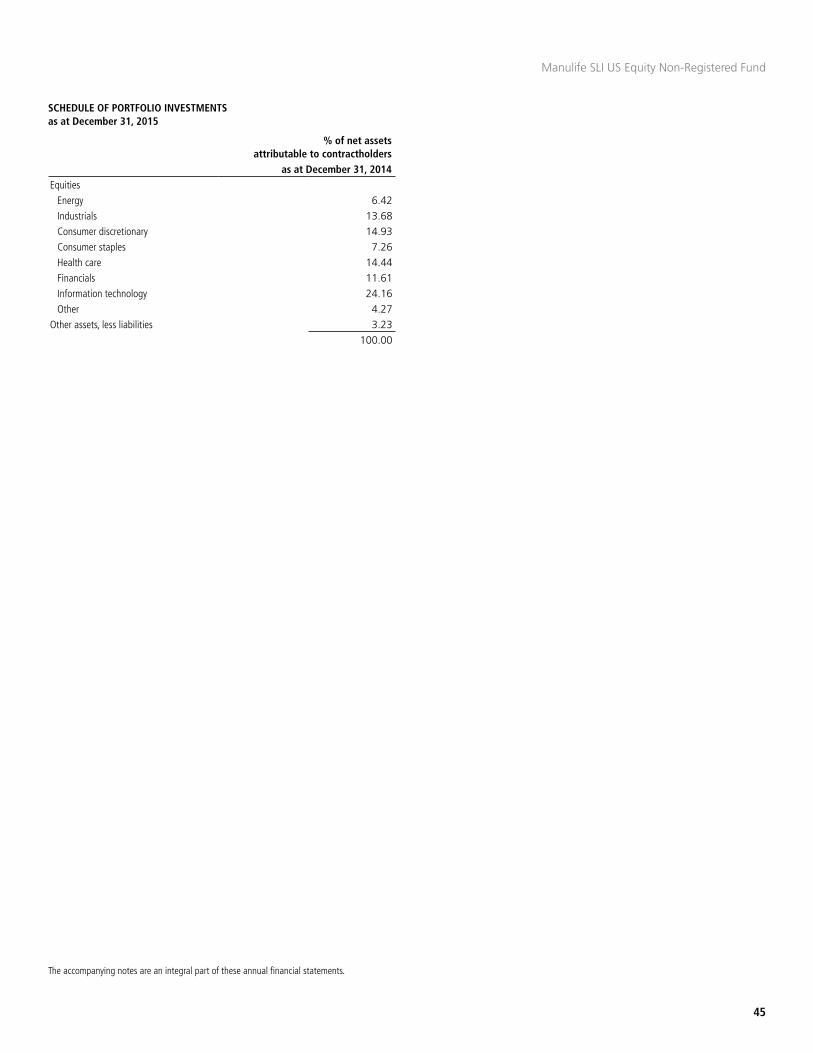
SCHEDULE OF PORTFOLIO INVESTMENTS as at December 31, 2015
45
The accompanying notes are an integral part of these annual financial statements.
% of net assets attributable to contractholders
as at December 31, 2014Equities
Energy 6.42Industrials 13.68 Consumer discretionary 14.93 Consumer staples 7.26 Health care 14.44 Financials 11.61 Information technology 24.16 Other 4.27
Other assets, less liabilities 3.23 100.00
Manulife SLI US Equity Non-Registered Fund
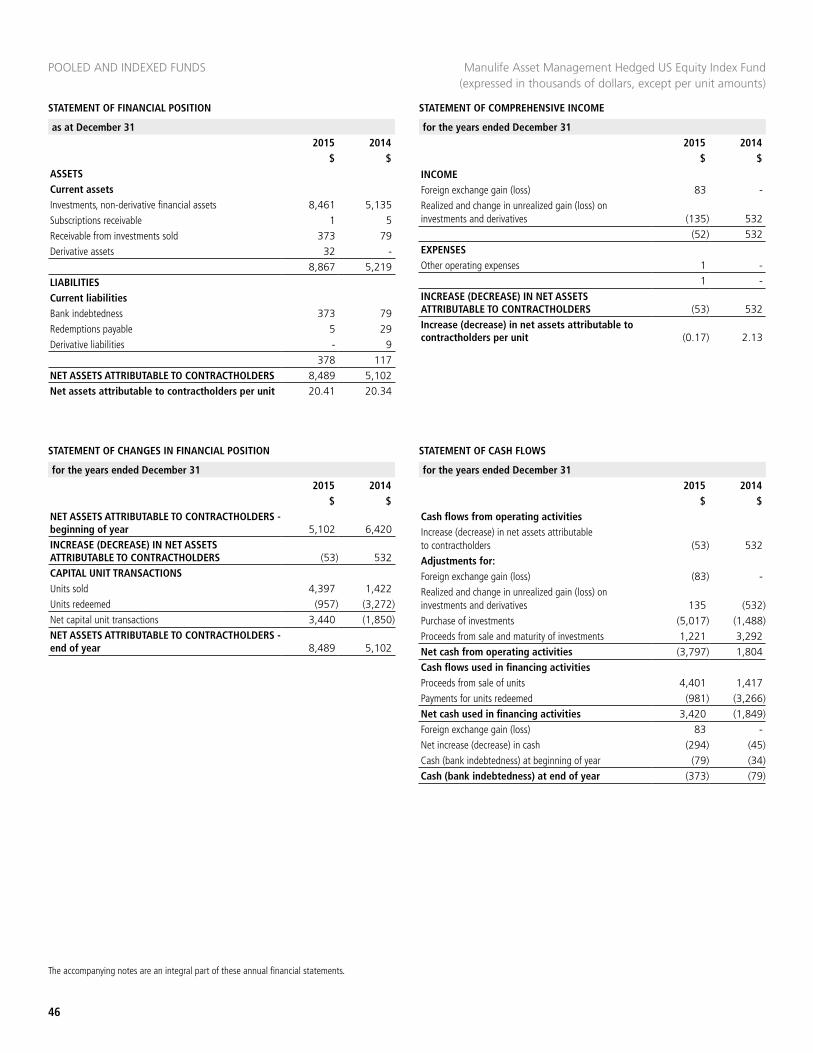
STATEMENT OF FINANCIAL POSITION
POOLED AND INDEXED FUNDS
STATEMENT OF COMPREHENSIVE INCOME
as at December 31 2015 2014
$ $
for the years ended December 312015 2014
$ $
46
The accompanying notes are an integral part of these annual financial statements.
Manulife Asset Management Hedged US Equity Index Fund (expressed in thousands of dollars, except per unit amounts)
ASSETSCurrent assetsInvestments, non-derivative financial assets 8,461 5,135Subscriptions receivable 1 5Receivable from investments sold 373 79Derivative assets 32 -
8,867 5,219LIABILITIESCurrent liabilitiesBank indebtedness 373 79Redemptions payable 5 29Derivative liabilities - 9
378 117NET ASSETS ATTRIBUTABLE TO CONTRACTHOLDERS 8,489 5,102Net assets attributable to contractholders per unit 20.41 20.34
INCOMEForeign exchange gain (loss) 83 -Realized and change in unrealized gain (loss) on investments and derivatives (135) 532
(52) 532EXPENSESOther operating expenses 1 -
1 -INCREASE (DECREASE) IN NET ASSETS ATTRIBUTABLE TO CONTRACTHOLDERS (53) 532Increase (decrease) in net assets attributable to contractholders per unit (0.17) 2.13
STATEMENT OF CHANGES IN FINANCIAL POSITION STATEMENT OF CASH FLOWS
for the years ended December 312015 2014
$ $
for the years ended December 312015 2014
$ $NET ASSETS ATTRIBUTABLE TO CONTRACTHOLDERS - beginning of year 5,102 6,420INCREASE (DECREASE) IN NET ASSETS ATTRIBUTABLE TO CONTRACTHOLDERS (53) 532CAPITAL UNIT TRANSACTIONSUnits sold 4,397 1,422Units redeemed (957) (3,272)Net capital unit transactions 3,440 (1,850)NET ASSETS ATTRIBUTABLE TO CONTRACTHOLDERS - end of year 8,489 5,102
Cash flows from operating activitiesIncrease (decrease) in net assets attributable to contractholders (53) 532Adjustments for:Foreign exchange gain (loss) (83) -Realized and change in unrealized gain (loss) on investments and derivatives 135 (532)Purchase of investments (5,017) (1,488)Proceeds from sale and maturity of investments 1,221 3,292Net cash from operating activities (3,797) 1,804Cash flows used in financing activitiesProceeds from sale of units 4,401 1,417Payments for units redeemed (981) (3,266)Net cash used in financing activities 3,420 (1,849)Foreign exchange gain (loss) 83 -Net increase (decrease) in cash (294) (45)Cash (bank indebtedness) at beginning of year (79) (34)Cash (bank indebtedness) at end of year (373) (79)
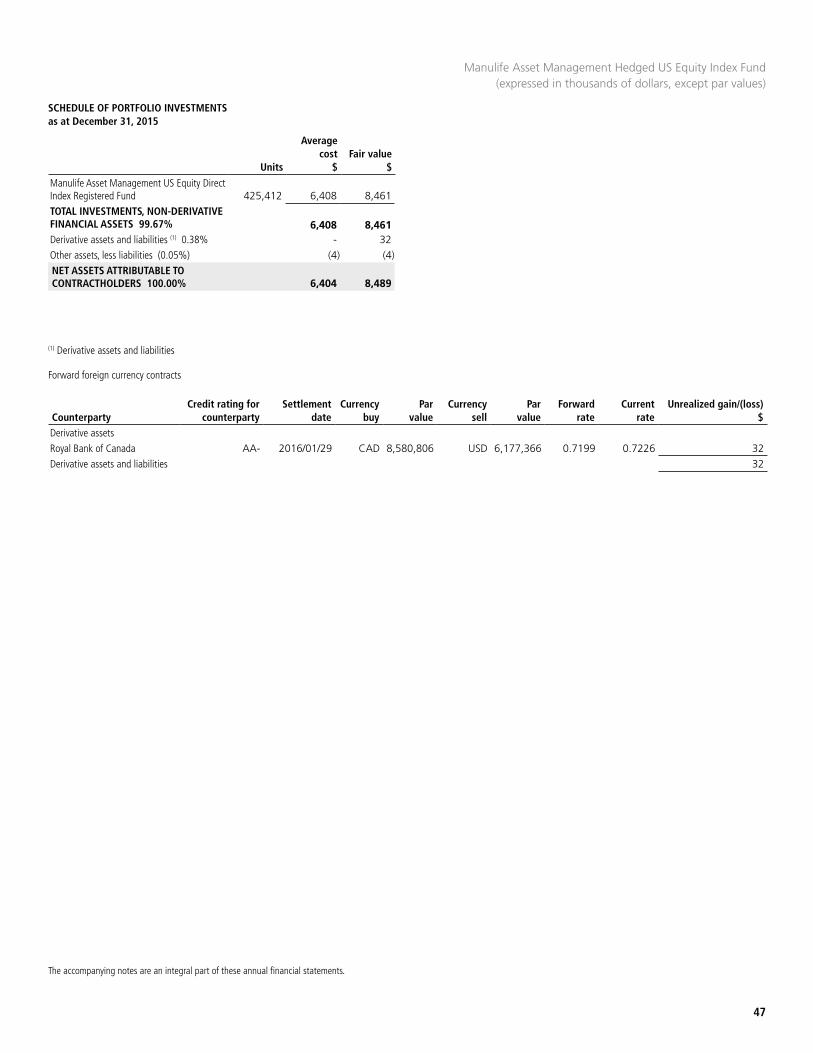
SCHEDULE OF PORTFOLIO INVESTMENTS as at December 31, 2015
47
The accompanying notes are an integral part of these annual financial statements.
Manulife Asset Management Hedged US Equity Index Fund (expressed in thousands of dollars, except par values)
Manulife Asset Management US Equity Direct Index Registered Fund 425,412 6,408 8,461 TOTAL INVESTMENTS, NON-DERIVATIVE FINANCIAL ASSETS 99.67% 6,408 8,461 Derivative assets and liabilities (1) 0.38% - 32 Other assets, less liabilities (0.05%) (4) (4)NET ASSETS ATTRIBUTABLE TO CONTRACTHOLDERS 100.00% 6,404 8,489
(1) Derivative assets and liabilities
Forward foreign currency contracts
CounterpartyCredit rating for
counterpartySettlement
dateCurrency
buyPar
valueCurrency
sellPar
valueForward
rateCurrent
rateUnrealized gain/(loss)
$Derivative assets Royal Bank of Canada AA- 2016/01/29 CAD 8,580,806 USD 6,177,366 0.7199 0.7226 32 Derivative assets and liabilities 32
Units
Average cost
$Fair value
$

STATEMENT OF FINANCIAL POSITION
POOLED AND INDEXED FUNDS
STATEMENT OF COMPREHENSIVE INCOME
as at December 31 2015 2014
$ $
for the years ended December 312015 2014
$ $
48
The accompanying notes are an integral part of these annual financial statements.
Manulife SLI International Equity Fund (expressed in thousands of dollars, except per unit amounts)
ASSETSCurrent assetsInvestments, non-derivative financial assets 425,821 367,321Cash 15 -Subscriptions receivable 354 125Receivable from investments sold - 337
426,190 367,783LIABILITIESCurrent liabilitiesBank indebtedness - 337Redemptions payable 115 89Payable on investments purchased 15 -Accrued expenses 1 1Other liabilities - 4
131 431NET ASSETS ATTRIBUTABLE TO CONTRACTHOLDERS 426,059 367,352Net assets attributable to contractholders per unit 42.06 35.56
INCOMEDistribution income from underlying funds 10,601 9,686Realized and change in unrealized gain (loss) on investments and derivatives 56,025 (18,290)
66,626 (8,604)EXPENSESOther operating expenses 78 210
78 210INCREASE (DECREASE) IN NET ASSETS ATTRIBUTABLE TO CONTRACTHOLDERS 66,548 (8,814)Increase (decrease) in net assets attributable to contractholders per unit 6.48 (0.84)
STATEMENT OF CHANGES IN FINANCIAL POSITION STATEMENT OF CASH FLOWS
for the years ended December 312015 2014
$ $
for the years ended December 312015 2014
$ $NET ASSETS ATTRIBUTABLE TO CONTRACTHOLDERS - beginning of year 367,352 394,521INCREASE (DECREASE) IN NET ASSETS ATTRIBUTABLE TO CONTRACTHOLDERS 66,548 (8,814)CAPITAL UNIT TRANSACTIONSUnits sold 112,933 87,338Units redeemed (120,774) (105,693)Net capital unit transactions (7,841) (18,355)NET ASSETS ATTRIBUTABLE TO CONTRACTHOLDERS - end of year 426,059 367,352
Cash flows from operating activitiesIncrease (decrease) in net assets attributable to contractholders 66,548 (8,814)Adjustments for:Realized and change in unrealized gain (loss) oninvestments and derivatives (56,025) 18,290Purchase of investments (54,209) (50,774)Proceeds from sale and maturity of investments 52,086 59,317Increase (decrease) in accrued expenses, other liabilities and payable secured by securities (4) (1)Net cash from operating activities 8,396 18,018Cash flows used in financing activitiesProceeds from sale of units 112,704 87,458Payments for units redeemed (120,748) (105,776)Net cash used in financing activities (8,044) (18,318)Net increase (decrease) in cash 352 (300)Cash (bank indebtedness) at beginning of year (337) (37)Cash (bank indebtedness) at end of year 15 (337)
Units
Average cost
$Fair value
$
SCHEDULE OF PORTFOLIO INVESTMENTS as at December 31, 2015
Manulife International Stock Fund UT 22,923,565 340,108 425,821 TOTAL INVESTMENTS, NON-DERIVATIVE FINANCIAL ASSETS 99.94% 340,108 425,821 Other assets, less liabilities 0.06% 238 238 NET ASSETS ATTRIBUTABLE TO CONTRACTHOLDERS 100.00% 340,346 426,059

STATEMENT OF FINANCIAL POSITION STATEMENT OF COMPREHENSIVE INCOME
as at December 31 2015 2014
$ $
for the years ended December 312015 2014
$ $
49
The accompanying notes are an integral part of these annual financial statements.
Manulife SLI Global Absolute Return Strategies Fund(expressed in thousands of dollars, except per unit amounts)
ASSETSCurrent assetsInvestments, non-derivative financial assets 294,690 249,303Cash 672 144Subscriptions receivable 494 514
295,856 249,961LIABILITIESCurrent liabilitiesRedemptions payable 23 7Payable on investments purchased 511 126
534 133NET ASSETS ATTRIBUTABLE TO CONTRACTHOLDERS 295,322 249,828Net assets attributable to contractholders per unit 13.74 13.16
INCOMEDistribution income from underlying funds 2,887 1,279Other income (loss) 171 -Realized and change in unrealized gain (loss) on investments and derivatives 8,502 13,293
11,560 14,572EXPENSESOther operating expenses 66 6
66 6INCREASE (DECREASE) IN NET ASSETS ATTRIBUTABLE TO CONTRACTHOLDERS 11,494 14,566Increase (decrease) in net assets attributable to contractholders per unit 0.57 0.88
STATEMENT OF CHANGES IN FINANCIAL POSITION STATEMENT OF CASH FLOWS
for the years ended December 312015 2014
$ $
for the years ended December 312015 2014
$ $NET ASSETS ATTRIBUTABLE TO CONTRACTHOLDERS - beginning of year 249,828 141,019INCREASE (DECREASE) IN NET ASSETS ATTRIBUTABLE TO CONTRACTHOLDERS 11,494 14,566CAPITAL UNIT TRANSACTIONSUnits sold 107,081 137,763Units redeemed (73,081) (43,520)Net capital unit transactions 34,000 94,243NET ASSETS ATTRIBUTABLE TO CONTRACTHOLDERS - end of year 295,322 249,828
Cash flows from operating activitiesIncrease (decrease) in net assets attributable to contractholders 11,494 14,566Adjustments for:Realized and change in unrealized gain (loss) on investments and derivatives (8,502) (13,293)Purchase of investments (93,651) (103,799)Proceeds from sale and maturity of investments 57,151 8,444Net cash from operating activities (33,508) (94,082)Cash flows used in financing activitiesProceeds from sale of units 107,101 137,358Payments for units redeemed (73,065) (43,551)Net cash used in financing activities 34,036 93,807Net increase (decrease) in cash 528 (275)Cash (bank indebtedness) at beginning of year 144 419Cash (bank indebtedness) at end of year 672 144
Units
Average cost
$Fair value
$
SCHEDULE OF PORTFOLIO INVESTMENTS as at December 31, 2015
SLI Global SICAV Global Absolute Return Strategies Fund, Class Z* 25,249,588 275,219 294,690 TOTAL INVESTMENTS, NON-DERIVATIVE FINANCIAL ASSETS 99.79% 275,219 294,690 Other assets, less liabilities 0.21% 632 632 NET ASSETS ATTRIBUTABLE TO CONTRACTHOLDERS 100.00% 275,851 295,322
*Canadian dollar hedged distribution Z unit class
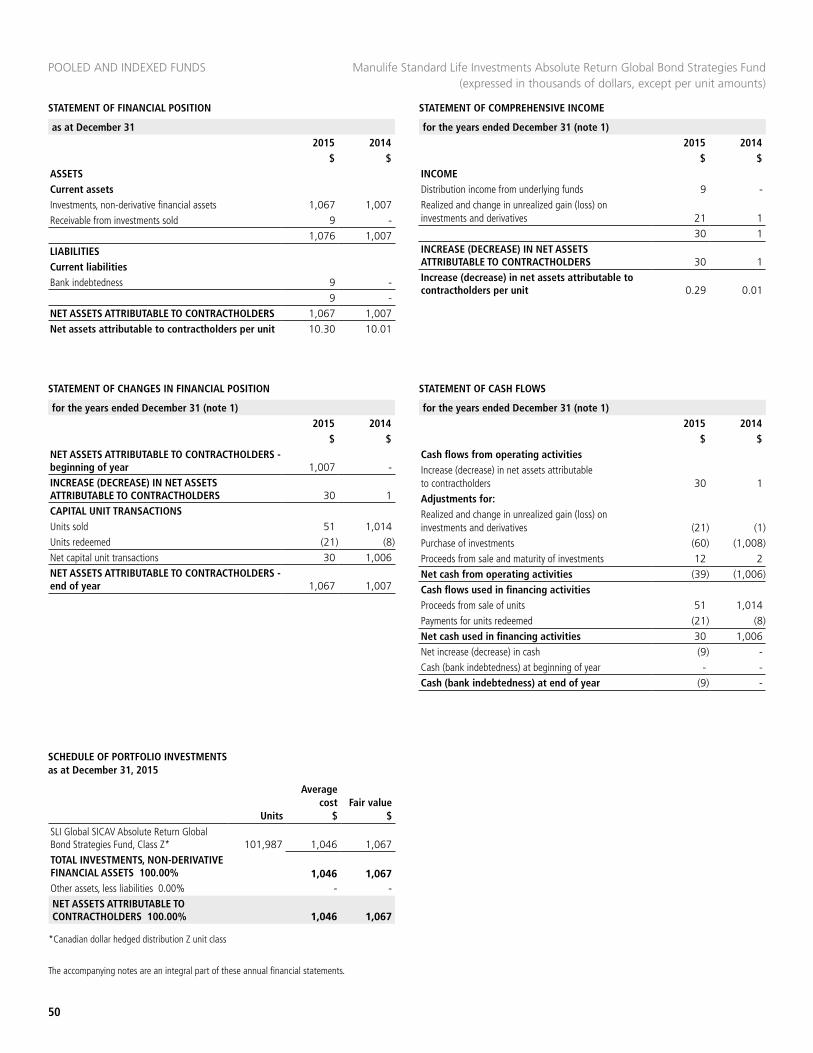
STATEMENT OF FINANCIAL POSITION
POOLED AND INDEXED FUNDS
STATEMENT OF COMPREHENSIVE INCOME
as at December 31 2015 2014
$ $
50
The accompanying notes are an integral part of these annual financial statements.
for the years ended December 31 (note 1)2015 2014
$ $
Manulife Standard Life Investments Absolute Return Global Bond Strategies Fund (expressed in thousands of dollars, except per unit amounts)
ASSETSCurrent assetsInvestments, non-derivative financial assets 1,067 1,007Receivable from investments sold 9 -
1,076 1,007LIABILITIESCurrent liabilitiesBank indebtedness 9 -
9 -NET ASSETS ATTRIBUTABLE TO CONTRACTHOLDERS 1,067 1,007Net assets attributable to contractholders per unit 10.30 10.01
INCOMEDistribution income from underlying funds 9 -Realized and change in unrealized gain (loss) on investments and derivatives 21 1
30 1INCREASE (DECREASE) IN NET ASSETS ATTRIBUTABLE TO CONTRACTHOLDERS 30 1Increase (decrease) in net assets attributable to contractholders per unit 0.29 0.01
STATEMENT OF CHANGES IN FINANCIAL POSITION STATEMENT OF CASH FLOWS
for the years ended December 31 (note 1)2015 2014
$ $
for the years ended December 31 (note 1)2015 2014
$ $NET ASSETS ATTRIBUTABLE TO CONTRACTHOLDERS - beginning of year 1,007 -INCREASE (DECREASE) IN NET ASSETS ATTRIBUTABLE TO CONTRACTHOLDERS 30 1CAPITAL UNIT TRANSACTIONSUnits sold 51 1,014Units redeemed (21) (8)Net capital unit transactions 30 1,006NET ASSETS ATTRIBUTABLE TO CONTRACTHOLDERS - end of year 1,067 1,007
Cash flows from operating activitiesIncrease (decrease) in net assets attributable to contractholders 30 1Adjustments for:Realized and change in unrealized gain (loss) on investments and derivatives (21) (1)Purchase of investments (60) (1,008)Proceeds from sale and maturity of investments 12 2Net cash from operating activities (39) (1,006)Cash flows used in financing activitiesProceeds from sale of units 51 1,014Payments for units redeemed (21) (8)Net cash used in financing activities 30 1,006Net increase (decrease) in cash (9) -Cash (bank indebtedness) at beginning of year - -Cash (bank indebtedness) at end of year (9) -
SCHEDULE OF PORTFOLIO INVESTMENTS as at December 31, 2015
Units
Average cost
$Fair value
$
SLI Global SICAV Absolute Return Global Bond Strategies Fund, Class Z* 101,987 1,046 1,067 TOTAL INVESTMENTS, NON-DERIVATIVE FINANCIAL ASSETS 100.00% 1,046 1,067 Other assets, less liabilities 0.00% - - NET ASSETS ATTRIBUTABLE TO CONTRACTHOLDERS 100.00% 1,046 1,067
*Canadian dollar hedged distribution Z unit class
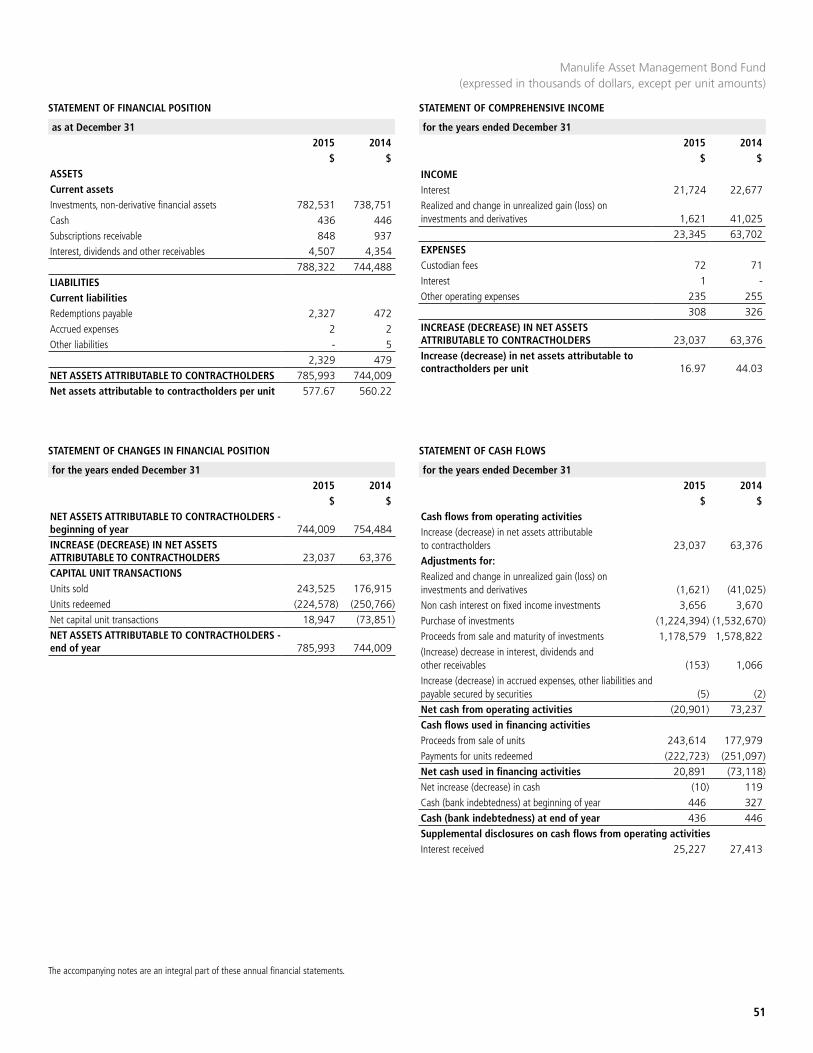
STATEMENT OF FINANCIAL POSITION STATEMENT OF COMPREHENSIVE INCOME
as at December 31 2015 2014
$ $
for the years ended December 312015 2014
$ $
51
The accompanying notes are an integral part of these annual financial statements.
Manulife Asset Management Bond Fund (expressed in thousands of dollars, except per unit amounts)
ASSETSCurrent assetsInvestments, non-derivative financial assets 782,531 738,751Cash 436 446Subscriptions receivable 848 937Interest, dividends and other receivables 4,507 4,354
788,322 744,488LIABILITIESCurrent liabilitiesRedemptions payable 2,327 472Accrued expenses 2 2Other liabilities - 5
2,329 479NET ASSETS ATTRIBUTABLE TO CONTRACTHOLDERS 785,993 744,009Net assets attributable to contractholders per unit 577.67 560.22
INCOMEInterest 21,724 22,677Realized and change in unrealized gain (loss) on investments and derivatives 1,621 41,025
23,345 63,702EXPENSESCustodian fees 72 71Interest 1 -Other operating expenses 235 255
308 326INCREASE (DECREASE) IN NET ASSETS ATTRIBUTABLE TO CONTRACTHOLDERS 23,037 63,376Increase (decrease) in net assets attributable to contractholders per unit 16.97 44.03
STATEMENT OF CHANGES IN FINANCIAL POSITION STATEMENT OF CASH FLOWS
for the years ended December 312015 2014
$ $
for the years ended December 312015 2014
$ $NET ASSETS ATTRIBUTABLE TO CONTRACTHOLDERS - beginning of year 744,009 754,484INCREASE (DECREASE) IN NET ASSETS ATTRIBUTABLE TO CONTRACTHOLDERS 23,037 63,376CAPITAL UNIT TRANSACTIONSUnits sold 243,525 176,915Units redeemed (224,578) (250,766)Net capital unit transactions 18,947 (73,851)NET ASSETS ATTRIBUTABLE TO CONTRACTHOLDERS - end of year 785,993 744,009
Cash flows from operating activitiesIncrease (decrease) in net assets attributable to contractholders 23,037 63,376Adjustments for:Realized and change in unrealized gain (loss) on investments and derivatives (1,621) (41,025)Non cash interest on fixed income investments 3,656 3,670Purchase of investments (1,224,394) (1,532,670)Proceeds from sale and maturity of investments 1,178,579 1,578,822(Increase) decrease in interest, dividends and other receivables (153) 1,066Increase (decrease) in accrued expenses, other liabilities and payable secured by securities (5) (2)Net cash from operating activities (20,901) 73,237Cash flows used in financing activitiesProceeds from sale of units 243,614 177,979Payments for units redeemed (222,723) (251,097)Net cash used in financing activities 20,891 (73,118)Net increase (decrease) in cash (10) 119Cash (bank indebtedness) at beginning of year 446 327Cash (bank indebtedness) at end of year 436 446Supplemental disclosures on cash flows from operating activitiesInterest received 25,227 27,413
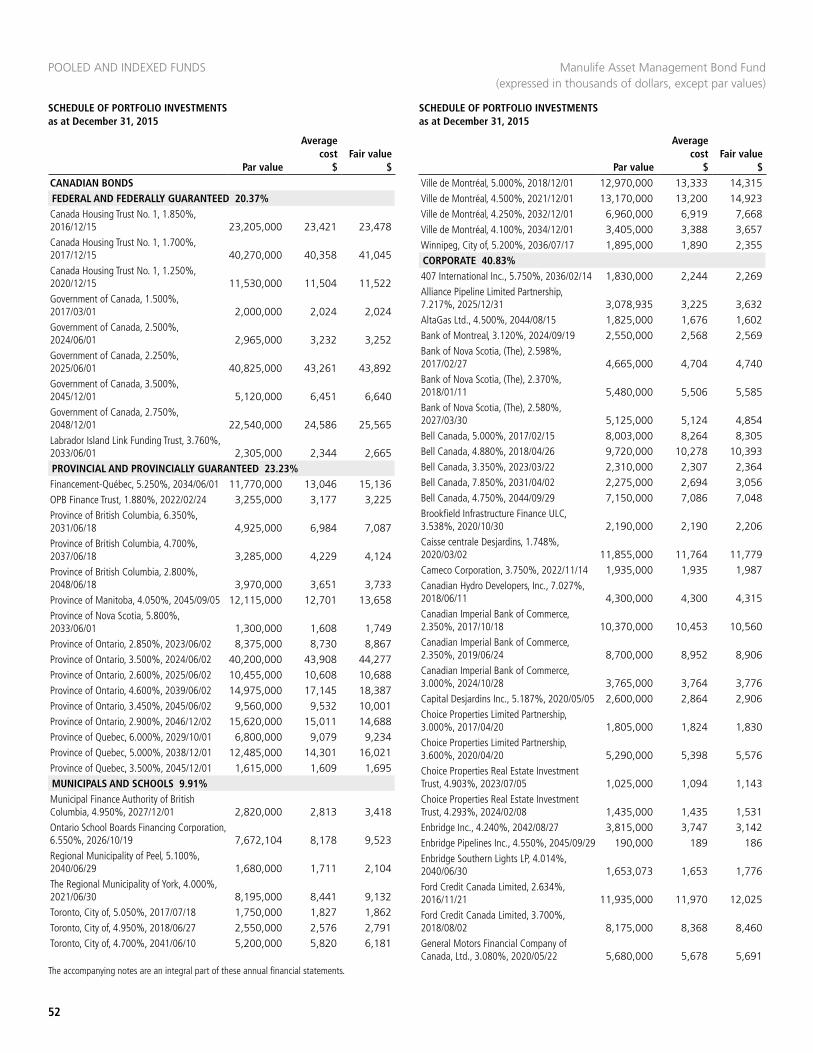
POOLED AND INDEXED FUNDS
52
SCHEDULE OF PORTFOLIO INVESTMENTS as at December 31, 2015
SCHEDULE OF PORTFOLIO INVESTMENTS as at December 31, 2015
The accompanying notes are an integral part of these annual financial statements.
CANADIAN BONDSFEDERAL AND FEDERALLY GUARANTEED 20.37%Canada Housing Trust No. 1, 1.850%, 2016/12/15 23,205,000 23,421 23,478 Canada Housing Trust No. 1, 1.700%, 2017/12/15 40,270,000 40,358 41,045 Canada Housing Trust No. 1, 1.250%, 2020/12/15 11,530,000 11,504 11,522 Government of Canada, 1.500%, 2017/03/01 2,000,000 2,024 2,024 Government of Canada, 2.500%, 2024/06/01 2,965,000 3,232 3,252 Government of Canada, 2.250%, 2025/06/01 40,825,000 43,261 43,892 Government of Canada, 3.500%, 2045/12/01 5,120,000 6,451 6,640 Government of Canada, 2.750%, 2048/12/01 22,540,000 24,586 25,565 Labrador Island Link Funding Trust, 3.760%, 2033/06/01 2,305,000 2,344 2,665 PROVINCIAL AND PROVINCIALLY GUARANTEED 23.23%Financement-Québec, 5.250%, 2034/06/01 11,770,000 13,046 15,136 OPB Finance Trust, 1.880%, 2022/02/24 3,255,000 3,177 3,225 Province of British Columbia, 6.350%, 2031/06/18 4,925,000 6,984 7,087 Province of British Columbia, 4.700%, 2037/06/18 3,285,000 4,229 4,124 Province of British Columbia, 2.800%, 2048/06/18 3,970,000 3,651 3,733 Province of Manitoba, 4.050%, 2045/09/05 12,115,000 12,701 13,658 Province of Nova Scotia, 5.800%, 2033/06/01 1,300,000 1,608 1,749 Province of Ontario, 2.850%, 2023/06/02 8,375,000 8,730 8,867 Province of Ontario, 3.500%, 2024/06/02 40,200,000 43,908 44,277 Province of Ontario, 2.600%, 2025/06/02 10,455,000 10,608 10,688 Province of Ontario, 4.600%, 2039/06/02 14,975,000 17,145 18,387 Province of Ontario, 3.450%, 2045/06/02 9,560,000 9,532 10,001 Province of Ontario, 2.900%, 2046/12/02 15,620,000 15,011 14,688 Province of Quebec, 6.000%, 2029/10/01 6,800,000 9,079 9,234 Province of Quebec, 5.000%, 2038/12/01 12,485,000 14,301 16,021 Province of Quebec, 3.500%, 2045/12/01 1,615,000 1,609 1,695 MUNICIPALS AND SCHOOLS 9.91%Municipal Finance Authority of British Columbia, 4.950%, 2027/12/01 2,820,000 2,813 3,418 Ontario School Boards Financing Corporation, 6.550%, 2026/10/19 7,672,104 8,178 9,523 Regional Municipality of Peel, 5.100%, 2040/06/29 1,680,000 1,711 2,104 The Regional Municipality of York, 4.000%, 2021/06/30 8,195,000 8,441 9,132 Toronto, City of, 5.050%, 2017/07/18 1,750,000 1,827 1,862 Toronto, City of, 4.950%, 2018/06/27 2,550,000 2,576 2,791 Toronto, City of, 4.700%, 2041/06/10 5,200,000 5,820 6,181
Ville de Montréal, 5.000%, 2018/12/01 12,970,000 13,333 14,315 Ville de Montréal, 4.500%, 2021/12/01 13,170,000 13,200 14,923 Ville de Montréal, 4.250%, 2032/12/01 6,960,000 6,919 7,668 Ville de Montréal, 4.100%, 2034/12/01 3,405,000 3,388 3,657 Winnipeg, City of, 5.200%, 2036/07/17 1,895,000 1,890 2,355 CORPORATE 40.83%407 International Inc., 5.750%, 2036/02/14 1,830,000 2,244 2,269 Alliance Pipeline Limited Partnership, 7.217%, 2025/12/31 3,078,935 3,225 3,632 AltaGas Ltd., 4.500%, 2044/08/15 1,825,000 1,676 1,602 Bank of Montreal, 3.120%, 2024/09/19 2,550,000 2,568 2,569 Bank of Nova Scotia, (The), 2.598%, 2017/02/27 4,665,000 4,704 4,740 Bank of Nova Scotia, (The), 2.370%, 2018/01/11 5,480,000 5,506 5,585 Bank of Nova Scotia, (The), 2.580%, 2027/03/30 5,125,000 5,124 4,854 Bell Canada, 5.000%, 2017/02/15 8,003,000 8,264 8,305 Bell Canada, 4.880%, 2018/04/26 9,720,000 10,278 10,393 Bell Canada, 3.350%, 2023/03/22 2,310,000 2,307 2,364 Bell Canada, 7.850%, 2031/04/02 2,275,000 2,694 3,056 Bell Canada, 4.750%, 2044/09/29 7,150,000 7,086 7,048 Brookfield Infrastructure Finance ULC, 3.538%, 2020/10/30 2,190,000 2,190 2,206 Caisse centrale Desjardins, 1.748%, 2020/03/02 11,855,000 11,764 11,779 Cameco Corporation, 3.750%, 2022/11/14 1,935,000 1,935 1,987 Canadian Hydro Developers, Inc., 7.027%, 2018/06/11 4,300,000 4,300 4,315 Canadian Imperial Bank of Commerce, 2.350%, 2017/10/18 10,370,000 10,453 10,560 Canadian Imperial Bank of Commerce, 2.350%, 2019/06/24 8,700,000 8,952 8,906 Canadian Imperial Bank of Commerce, 3.000%, 2024/10/28 3,765,000 3,764 3,776 Capital Desjardins Inc., 5.187%, 2020/05/05 2,600,000 2,864 2,906 Choice Properties Limited Partnership, 3.000%, 2017/04/20 1,805,000 1,824 1,830 Choice Properties Limited Partnership, 3.600%, 2020/04/20 5,290,000 5,398 5,576 Choice Properties Real Estate Investment Trust, 4.903%, 2023/07/05 1,025,000 1,094 1,143 Choice Properties Real Estate Investment Trust, 4.293%, 2024/02/08 1,435,000 1,435 1,531 Enbridge Inc., 4.240%, 2042/08/27 3,815,000 3,747 3,142 Enbridge Pipelines Inc., 4.550%, 2045/09/29 190,000 189 186 Enbridge Southern Lights LP, 4.014%, 2040/06/30 1,653,073 1,653 1,776 Ford Credit Canada Limited, 2.634%, 2016/11/21 11,935,000 11,970 12,025 Ford Credit Canada Limited, 3.700%, 2018/08/02 8,175,000 8,368 8,460 General Motors Financial Company of Canada, Ltd., 3.080%, 2020/05/22 5,680,000 5,678 5,691
Manulife Asset Management Bond Fund (expressed in thousands of dollars, except par values)
Par value
Average cost
$Fair value
$ Par value
Average cost
$Fair value
$
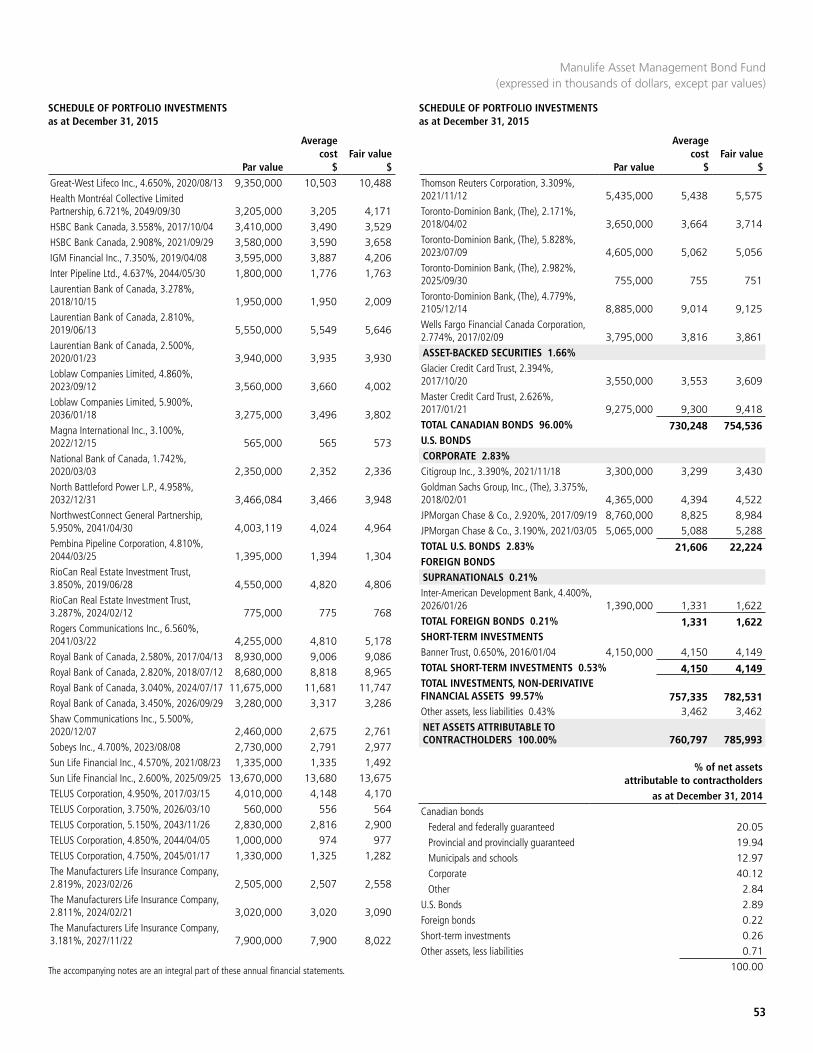
SCHEDULE OF PORTFOLIO INVESTMENTS as at December 31, 2015
SCHEDULE OF PORTFOLIO INVESTMENTS as at December 31, 2015
53
The accompanying notes are an integral part of these annual financial statements.
Great-West Lifeco Inc., 4.650%, 2020/08/13 9,350,000 10,503 10,488 Health Montréal Collective Limited Partnership, 6.721%, 2049/09/30 3,205,000 3,205 4,171 HSBC Bank Canada, 3.558%, 2017/10/04 3,410,000 3,490 3,529 HSBC Bank Canada, 2.908%, 2021/09/29 3,580,000 3,590 3,658 IGM Financial Inc., 7.350%, 2019/04/08 3,595,000 3,887 4,206 Inter Pipeline Ltd., 4.637%, 2044/05/30 1,800,000 1,776 1,763 Laurentian Bank of Canada, 3.278%, 2018/10/15 1,950,000 1,950 2,009 Laurentian Bank of Canada, 2.810%, 2019/06/13 5,550,000 5,549 5,646 Laurentian Bank of Canada, 2.500%, 2020/01/23 3,940,000 3,935 3,930 Loblaw Companies Limited, 4.860%, 2023/09/12 3,560,000 3,660 4,002 Loblaw Companies Limited, 5.900%, 2036/01/18 3,275,000 3,496 3,802 Magna International Inc., 3.100%, 2022/12/15 565,000 565 573 National Bank of Canada, 1.742%, 2020/03/03 2,350,000 2,352 2,336 North Battleford Power L.P., 4.958%, 2032/12/31 3,466,084 3,466 3,948 NorthwestConnect General Partnership, 5.950%, 2041/04/30 4,003,119 4,024 4,964 Pembina Pipeline Corporation, 4.810%, 2044/03/25 1,395,000 1,394 1,304 RioCan Real Estate Investment Trust, 3.850%, 2019/06/28 4,550,000 4,820 4,806 RioCan Real Estate Investment Trust, 3.287%, 2024/02/12 775,000 775 768 Rogers Communications Inc., 6.560%, 2041/03/22 4,255,000 4,810 5,178 Royal Bank of Canada, 2.580%, 2017/04/13 8,930,000 9,006 9,086 Royal Bank of Canada, 2.820%, 2018/07/12 8,680,000 8,818 8,965 Royal Bank of Canada, 3.040%, 2024/07/17 11,675,000 11,681 11,747 Royal Bank of Canada, 3.450%, 2026/09/29 3,280,000 3,317 3,286 Shaw Communications Inc., 5.500%, 2020/12/07 2,460,000 2,675 2,761 Sobeys Inc., 4.700%, 2023/08/08 2,730,000 2,791 2,977 Sun Life Financial Inc., 4.570%, 2021/08/23 1,335,000 1,335 1,492 Sun Life Financial Inc., 2.600%, 2025/09/25 13,670,000 13,680 13,675 TELUS Corporation, 4.950%, 2017/03/15 4,010,000 4,148 4,170 TELUS Corporation, 3.750%, 2026/03/10 560,000 556 564 TELUS Corporation, 5.150%, 2043/11/26 2,830,000 2,816 2,900 TELUS Corporation, 4.850%, 2044/04/05 1,000,000 974 977 TELUS Corporation, 4.750%, 2045/01/17 1,330,000 1,325 1,282 The Manufacturers Life Insurance Company, 2.819%, 2023/02/26 2,505,000 2,507 2,558 The Manufacturers Life Insurance Company, 2.811%, 2024/02/21 3,020,000 3,020 3,090 The Manufacturers Life Insurance Company, 3.181%, 2027/11/22 7,900,000 7,900 8,022
Thomson Reuters Corporation, 3.309%, 2021/11/12 5,435,000 5,438 5,575 Toronto-Dominion Bank, (The), 2.171%, 2018/04/02 3,650,000 3,664 3,714 Toronto-Dominion Bank, (The), 5.828%, 2023/07/09 4,605,000 5,062 5,056 Toronto-Dominion Bank, (The), 2.982%, 2025/09/30 755,000 755 751 Toronto-Dominion Bank, (The), 4.779%, 2105/12/14 8,885,000 9,014 9,125 Wells Fargo Financial Canada Corporation, 2.774%, 2017/02/09 3,795,000 3,816 3,861 ASSET-BACKED SECURITIES 1.66%Glacier Credit Card Trust, 2.394%, 2017/10/20 3,550,000 3,553 3,609 Master Credit Card Trust, 2.626%, 2017/01/21 9,275,000 9,300 9,418 TOTAL CANADIAN BONDS 96.00% 730,248 754,536 U.S. BONDSCORPORATE 2.83%Citigroup Inc., 3.390%, 2021/11/18 3,300,000 3,299 3,430 Goldman Sachs Group, Inc., (The), 3.375%, 2018/02/01 4,365,000 4,394 4,522 JPMorgan Chase & Co., 2.920%, 2017/09/19 8,760,000 8,825 8,984 JPMorgan Chase & Co., 3.190%, 2021/03/05 5,065,000 5,088 5,288 TOTAL U.S. BONDS 2.83% 21,606 22,224 FOREIGN BONDSSUPRANATIONALS 0.21%Inter-American Development Bank, 4.400%, 2026/01/26 1,390,000 1,331 1,622 TOTAL FOREIGN BONDS 0.21% 1,331 1,622 SHORT-TERM INVESTMENTSBanner Trust, 0.650%, 2016/01/04 4,150,000 4,150 4,149 TOTAL SHORT-TERM INVESTMENTS 0.53% 4,150 4,149 TOTAL INVESTMENTS, NON-DERIVATIVE FINANCIAL ASSETS 99.57% 757,335 782,531 Other assets, less liabilities 0.43% 3,462 3,462 NET ASSETS ATTRIBUTABLE TO CONTRACTHOLDERS 100.00% 760,797 785,993
% of net assets attributable to contractholders
as at December 31, 2014Canadian bonds
Federal and federally guaranteed 20.05Provincial and provincially guaranteed 19.94Municipals and schools 12.97Corporate 40.12Other 2.84
U.S. Bonds 2.89Foreign bonds 0.22Short-term investments 0.26Other assets, less liabilities 0.71
100.00
Manulife Asset Management Bond Fund (expressed in thousands of dollars, except par values)
Par value
Average cost
$Fair value
$ Par value
Average cost
$Fair value
$
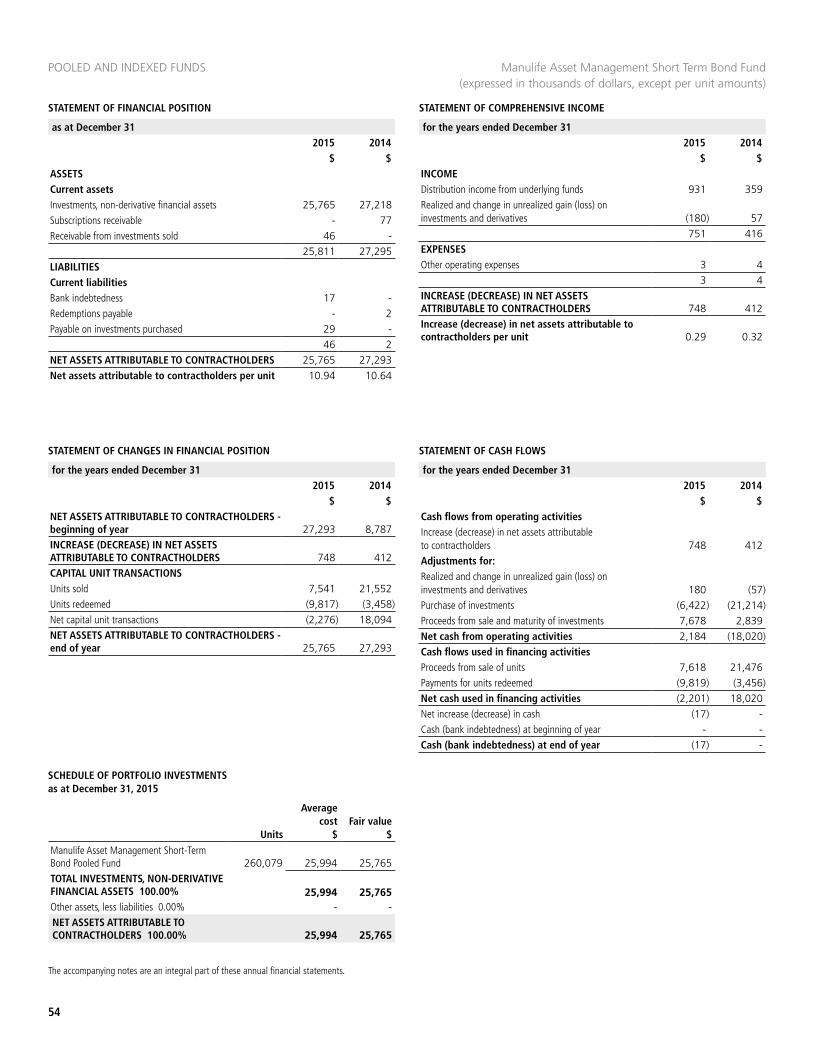
STATEMENT OF FINANCIAL POSITION
POOLED AND INDEXED FUNDS
STATEMENT OF COMPREHENSIVE INCOME
as at December 31 2015 2014
$ $
for the years ended December 312015 2014
$ $
54
The accompanying notes are an integral part of these annual financial statements.
Manulife Asset Management Short Term Bond Fund (expressed in thousands of dollars, except per unit amounts)
ASSETSCurrent assetsInvestments, non-derivative financial assets 25,765 27,218Subscriptions receivable - 77Receivable from investments sold 46 -
25,811 27,295LIABILITIESCurrent liabilitiesBank indebtedness 17 -Redemptions payable - 2Payable on investments purchased 29 -
46 2NET ASSETS ATTRIBUTABLE TO CONTRACTHOLDERS 25,765 27,293Net assets attributable to contractholders per unit 10.94 10.64
INCOMEDistribution income from underlying funds 931 359Realized and change in unrealized gain (loss) on investments and derivatives (180) 57
751 416EXPENSESOther operating expenses 3 4
3 4INCREASE (DECREASE) IN NET ASSETS ATTRIBUTABLE TO CONTRACTHOLDERS 748 412Increase (decrease) in net assets attributable to contractholders per unit 0.29 0.32
STATEMENT OF CHANGES IN FINANCIAL POSITION STATEMENT OF CASH FLOWS
for the years ended December 312015 2014
$ $
for the years ended December 312015 2014
$ $NET ASSETS ATTRIBUTABLE TO CONTRACTHOLDERS - beginning of year 27,293 8,787INCREASE (DECREASE) IN NET ASSETS ATTRIBUTABLE TO CONTRACTHOLDERS 748 412CAPITAL UNIT TRANSACTIONSUnits sold 7,541 21,552Units redeemed (9,817) (3,458)Net capital unit transactions (2,276) 18,094NET ASSETS ATTRIBUTABLE TO CONTRACTHOLDERS - end of year 25,765 27,293
Cash flows from operating activitiesIncrease (decrease) in net assets attributable to contractholders 748 412Adjustments for:Realized and change in unrealized gain (loss) on investments and derivatives 180 (57)Purchase of investments (6,422) (21,214)Proceeds from sale and maturity of investments 7,678 2,839Net cash from operating activities 2,184 (18,020)Cash flows used in financing activitiesProceeds from sale of units 7,618 21,476Payments for units redeemed (9,819) (3,456)Net cash used in financing activities (2,201) 18,020Net increase (decrease) in cash (17) -Cash (bank indebtedness) at beginning of year - -Cash (bank indebtedness) at end of year (17) -
SCHEDULE OF PORTFOLIO INVESTMENTS as at December 31, 2015
Units
Average cost
$Fair value
$
Manulife Asset Management Short-Term Bond Pooled Fund 260,079 25,994 25,765 TOTAL INVESTMENTS, NON-DERIVATIVE FINANCIAL ASSETS 100.00% 25,994 25,765 Other assets, less liabilities 0.00% - - NET ASSETS ATTRIBUTABLE TO CONTRACTHOLDERS 100.00% 25,994 25,765
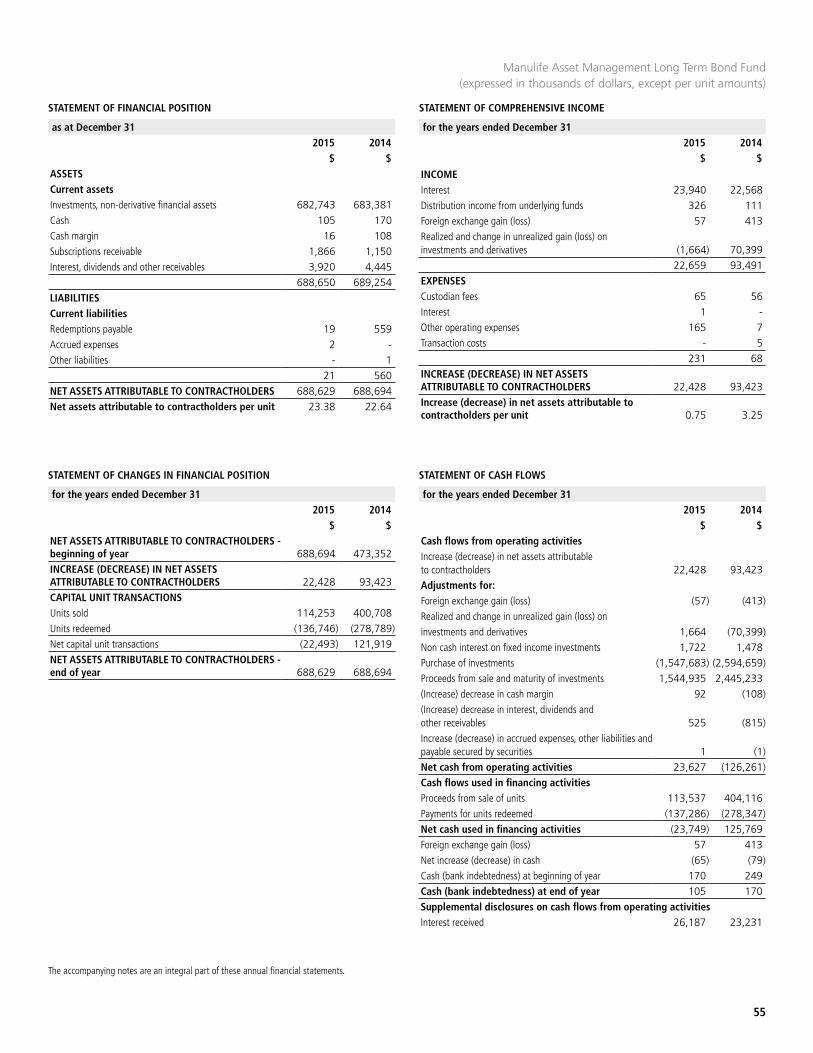
STATEMENT OF FINANCIAL POSITION STATEMENT OF COMPREHENSIVE INCOME
as at December 31 2015 2014
$ $
for the years ended December 312015 2014
$ $
55
The accompanying notes are an integral part of these annual financial statements.
Manulife Asset Management Long Term Bond Fund (expressed in thousands of dollars, except per unit amounts)
ASSETSCurrent assetsInvestments, non-derivative financial assets 682,743 683,381Cash 105 170Cash margin 16 108Subscriptions receivable 1,866 1,150Interest, dividends and other receivables 3,920 4,445
688,650 689,254LIABILITIESCurrent liabilitiesRedemptions payable 19 559Accrued expenses 2 -Other liabilities - 1
21 560NET ASSETS ATTRIBUTABLE TO CONTRACTHOLDERS 688,629 688,694Net assets attributable to contractholders per unit 23.38 22.64
INCOMEInterest 23,940 22,568Distribution income from underlying funds 326 111Foreign exchange gain (loss) 57 413Realized and change in unrealized gain (loss) on investments and derivatives (1,664) 70,399
22,659 93,491EXPENSESCustodian fees 65 56Interest 1 -Other operating expenses 165 7Transaction costs - 5
231 68INCREASE (DECREASE) IN NET ASSETS ATTRIBUTABLE TO CONTRACTHOLDERS 22,428 93,423Increase (decrease) in net assets attributable to contractholders per unit 0.75 3.25
STATEMENT OF CHANGES IN FINANCIAL POSITION STATEMENT OF CASH FLOWS
for the years ended December 312015 2014
$ $
for the years ended December 312015 2014
$ $NET ASSETS ATTRIBUTABLE TO CONTRACTHOLDERS - beginning of year 688,694 473,352INCREASE (DECREASE) IN NET ASSETS ATTRIBUTABLE TO CONTRACTHOLDERS 22,428 93,423CAPITAL UNIT TRANSACTIONSUnits sold 114,253 400,708Units redeemed (136,746) (278,789)Net capital unit transactions (22,493) 121,919NET ASSETS ATTRIBUTABLE TO CONTRACTHOLDERS - end of year 688,629 688,694
Cash flows from operating activitiesIncrease (decrease) in net assets attributable to contractholders 22,428 93,423Adjustments for:Foreign exchange gain (loss) (57) (413)Realized and change in unrealized gain (loss) oninvestments and derivatives 1,664 (70,399)Non cash interest on fixed income investments 1,722 1,478Purchase of investments (1,547,683) (2,594,659)Proceeds from sale and maturity of investments 1,544,935 2,445,233(Increase) decrease in cash margin 92 (108)(Increase) decrease in interest, dividends and other receivables 525 (815)Increase (decrease) in accrued expenses, other liabilities and payable secured by securities 1 (1)Net cash from operating activities 23,627 (126,261)Cash flows used in financing activitiesProceeds from sale of units 113,537 404,116Payments for units redeemed (137,286) (278,347)Net cash used in financing activities (23,749) 125,769Foreign exchange gain (loss) 57 413Net increase (decrease) in cash (65) (79)Cash (bank indebtedness) at beginning of year 170 249Cash (bank indebtedness) at end of year 105 170Supplemental disclosures on cash flows from operating activitiesInterest received 26,187 23,231
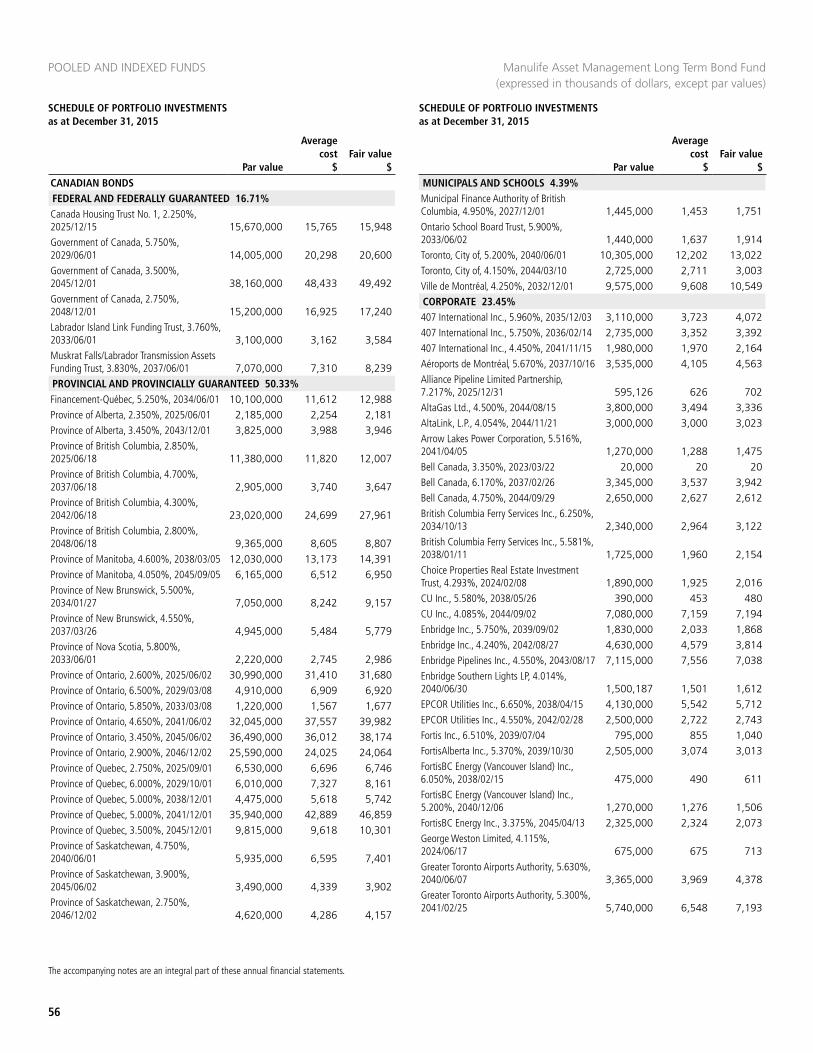
POOLED AND INDEXED FUNDS
56
SCHEDULE OF PORTFOLIO INVESTMENTS as at December 31, 2015
SCHEDULE OF PORTFOLIO INVESTMENTS as at December 31, 2015
The accompanying notes are an integral part of these annual financial statements.
CANADIAN BONDSFEDERAL AND FEDERALLY GUARANTEED 16.71%Canada Housing Trust No. 1, 2.250%, 2025/12/15 15,670,000 15,765 15,948 Government of Canada, 5.750%, 2029/06/01 14,005,000 20,298 20,600 Government of Canada, 3.500%, 2045/12/01 38,160,000 48,433 49,492 Government of Canada, 2.750%, 2048/12/01 15,200,000 16,925 17,240 Labrador Island Link Funding Trust, 3.760%, 2033/06/01 3,100,000 3,162 3,584 Muskrat Falls/Labrador Transmission Assets Funding Trust, 3.830%, 2037/06/01 7,070,000 7,310 8,239 PROVINCIAL AND PROVINCIALLY GUARANTEED 50.33%Financement-Québec, 5.250%, 2034/06/01 10,100,000 11,612 12,988 Province of Alberta, 2.350%, 2025/06/01 2,185,000 2,254 2,181 Province of Alberta, 3.450%, 2043/12/01 3,825,000 3,988 3,946 Province of British Columbia, 2.850%, 2025/06/18 11,380,000 11,820 12,007 Province of British Columbia, 4.700%, 2037/06/18 2,905,000 3,740 3,647 Province of British Columbia, 4.300%, 2042/06/18 23,020,000 24,699 27,961 Province of British Columbia, 2.800%, 2048/06/18 9,365,000 8,605 8,807 Province of Manitoba, 4.600%, 2038/03/05 12,030,000 13,173 14,391 Province of Manitoba, 4.050%, 2045/09/05 6,165,000 6,512 6,950 Province of New Brunswick, 5.500%, 2034/01/27 7,050,000 8,242 9,157 Province of New Brunswick, 4.550%, 2037/03/26 4,945,000 5,484 5,779 Province of Nova Scotia, 5.800%, 2033/06/01 2,220,000 2,745 2,986 Province of Ontario, 2.600%, 2025/06/02 30,990,000 31,410 31,680 Province of Ontario, 6.500%, 2029/03/08 4,910,000 6,909 6,920 Province of Ontario, 5.850%, 2033/03/08 1,220,000 1,567 1,677 Province of Ontario, 4.650%, 2041/06/02 32,045,000 37,557 39,982 Province of Ontario, 3.450%, 2045/06/02 36,490,000 36,012 38,174 Province of Ontario, 2.900%, 2046/12/02 25,590,000 24,025 24,064 Province of Quebec, 2.750%, 2025/09/01 6,530,000 6,696 6,746 Province of Quebec, 6.000%, 2029/10/01 6,010,000 7,327 8,161 Province of Quebec, 5.000%, 2038/12/01 4,475,000 5,618 5,742 Province of Quebec, 5.000%, 2041/12/01 35,940,000 42,889 46,859 Province of Quebec, 3.500%, 2045/12/01 9,815,000 9,618 10,301 Province of Saskatchewan, 4.750%, 2040/06/01 5,935,000 6,595 7,401 Province of Saskatchewan, 3.900%, 2045/06/02 3,490,000 4,339 3,902 Province of Saskatchewan, 2.750%, 2046/12/02 4,620,000 4,286 4,157
MUNICIPALS AND SCHOOLS 4.39%Municipal Finance Authority of British Columbia, 4.950%, 2027/12/01 1,445,000 1,453 1,751 Ontario School Board Trust, 5.900%, 2033/06/02 1,440,000 1,637 1,914 Toronto, City of, 5.200%, 2040/06/01 10,305,000 12,202 13,022 Toronto, City of, 4.150%, 2044/03/10 2,725,000 2,711 3,003 Ville de Montréal, 4.250%, 2032/12/01 9,575,000 9,608 10,549 CORPORATE 23.45%407 International Inc., 5.960%, 2035/12/03 3,110,000 3,723 4,072 407 International Inc., 5.750%, 2036/02/14 2,735,000 3,352 3,392 407 International Inc., 4.450%, 2041/11/15 1,980,000 1,970 2,164 Aéroports de Montréal, 5.670%, 2037/10/16 3,535,000 4,105 4,563 Alliance Pipeline Limited Partnership, 7.217%, 2025/12/31 595,126 626 702 AltaGas Ltd., 4.500%, 2044/08/15 3,800,000 3,494 3,336 AltaLink, L.P., 4.054%, 2044/11/21 3,000,000 3,000 3,023 Arrow Lakes Power Corporation, 5.516%, 2041/04/05 1,270,000 1,288 1,475 Bell Canada, 3.350%, 2023/03/22 20,000 20 20 Bell Canada, 6.170%, 2037/02/26 3,345,000 3,537 3,942 Bell Canada, 4.750%, 2044/09/29 2,650,000 2,627 2,612 British Columbia Ferry Services Inc., 6.250%, 2034/10/13 2,340,000 2,964 3,122 British Columbia Ferry Services Inc., 5.581%, 2038/01/11 1,725,000 1,960 2,154 Choice Properties Real Estate Investment Trust, 4.293%, 2024/02/08 1,890,000 1,925 2,016 CU Inc., 5.580%, 2038/05/26 390,000 453 480 CU Inc., 4.085%, 2044/09/02 7,080,000 7,159 7,194 Enbridge Inc., 5.750%, 2039/09/02 1,830,000 2,033 1,868 Enbridge Inc., 4.240%, 2042/08/27 4,630,000 4,579 3,814 Enbridge Pipelines Inc., 4.550%, 2043/08/17 7,115,000 7,556 7,038 Enbridge Southern Lights LP, 4.014%, 2040/06/30 1,500,187 1,501 1,612 EPCOR Utilities Inc., 6.650%, 2038/04/15 4,130,000 5,542 5,712 EPCOR Utilities Inc., 4.550%, 2042/02/28 2,500,000 2,722 2,743 Fortis Inc., 6.510%, 2039/07/04 795,000 855 1,040 FortisAlberta Inc., 5.370%, 2039/10/30 2,505,000 3,074 3,013 FortisBC Energy (Vancouver Island) Inc., 6.050%, 2038/02/15 475,000 490 611 FortisBC Energy (Vancouver Island) Inc., 5.200%, 2040/12/06 1,270,000 1,276 1,506 FortisBC Energy Inc., 3.375%, 2045/04/13 2,325,000 2,324 2,073 George Weston Limited, 4.115%, 2024/06/17 675,000 675 713 Greater Toronto Airports Authority, 5.630%, 2040/06/07 3,365,000 3,969 4,378 Greater Toronto Airports Authority, 5.300%, 2041/02/25 5,740,000 6,548 7,193
Manulife Asset Management Long Term Bond Fund (expressed in thousands of dollars, except par values)
Par value
Average cost
$Fair value
$ Par value
Average cost
$Fair value
$
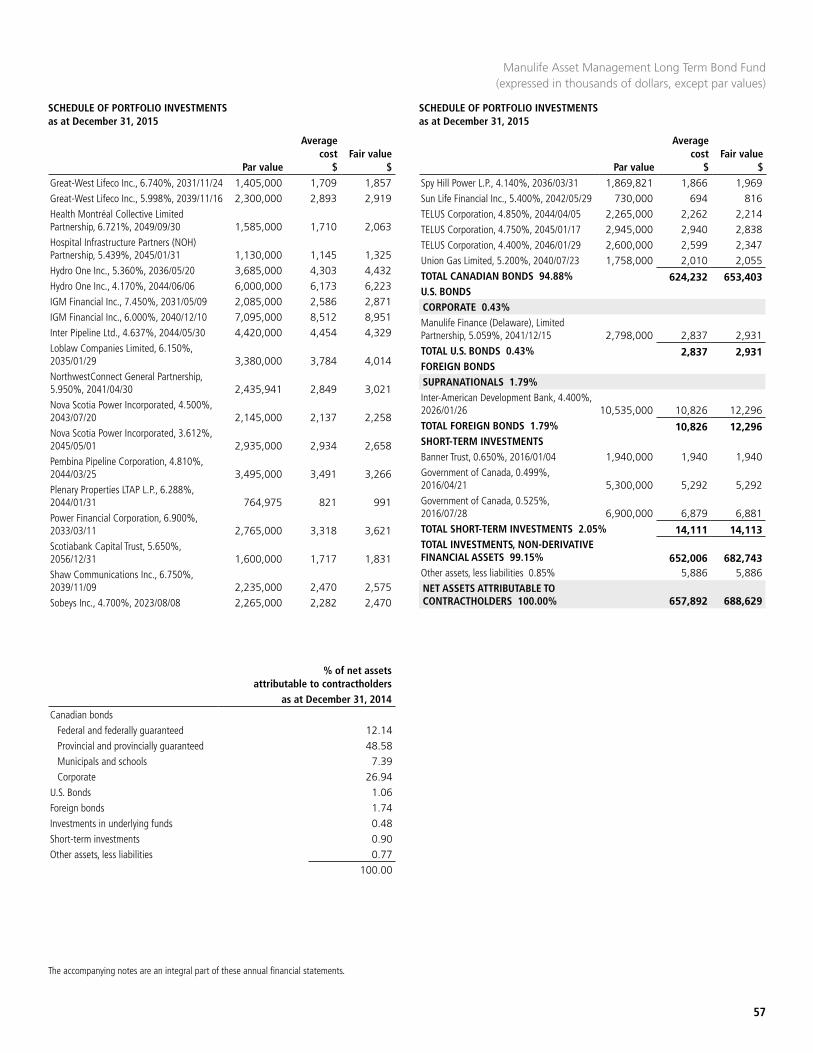
SCHEDULE OF PORTFOLIO INVESTMENTS as at December 31, 2015
SCHEDULE OF PORTFOLIO INVESTMENTS as at December 31, 2015
57
The accompanying notes are an integral part of these annual financial statements.
Great-West Lifeco Inc., 6.740%, 2031/11/24 1,405,000 1,709 1,857 Great-West Lifeco Inc., 5.998%, 2039/11/16 2,300,000 2,893 2,919 Health Montréal Collective Limited Partnership, 6.721%, 2049/09/30 1,585,000 1,710 2,063 Hospital Infrastructure Partners (NOH) Partnership, 5.439%, 2045/01/31 1,130,000 1,145 1,325 Hydro One Inc., 5.360%, 2036/05/20 3,685,000 4,303 4,432 Hydro One Inc., 4.170%, 2044/06/06 6,000,000 6,173 6,223 IGM Financial Inc., 7.450%, 2031/05/09 2,085,000 2,586 2,871 IGM Financial Inc., 6.000%, 2040/12/10 7,095,000 8,512 8,951 Inter Pipeline Ltd., 4.637%, 2044/05/30 4,420,000 4,454 4,329 Loblaw Companies Limited, 6.150%, 2035/01/29 3,380,000 3,784 4,014 NorthwestConnect General Partnership, 5.950%, 2041/04/30 2,435,941 2,849 3,021 Nova Scotia Power Incorporated, 4.500%, 2043/07/20 2,145,000 2,137 2,258 Nova Scotia Power Incorporated, 3.612%, 2045/05/01 2,935,000 2,934 2,658 Pembina Pipeline Corporation, 4.810%, 2044/03/25 3,495,000 3,491 3,266 Plenary Properties LTAP L.P., 6.288%, 2044/01/31 764,975 821 991 Power Financial Corporation, 6.900%, 2033/03/11 2,765,000 3,318 3,621 Scotiabank Capital Trust, 5.650%, 2056/12/31 1,600,000 1,717 1,831 Shaw Communications Inc., 6.750%, 2039/11/09 2,235,000 2,470 2,575 Sobeys Inc., 4.700%, 2023/08/08 2,265,000 2,282 2,470
Spy Hill Power L.P., 4.140%, 2036/03/31 1,869,821 1,866 1,969 Sun Life Financial Inc., 5.400%, 2042/05/29 730,000 694 816 TELUS Corporation, 4.850%, 2044/04/05 2,265,000 2,262 2,214 TELUS Corporation, 4.750%, 2045/01/17 2,945,000 2,940 2,838 TELUS Corporation, 4.400%, 2046/01/29 2,600,000 2,599 2,347 Union Gas Limited, 5.200%, 2040/07/23 1,758,000 2,010 2,055 TOTAL CANADIAN BONDS 94.88% 624,232 653,403 U.S. BONDSCORPORATE 0.43%Manulife Finance (Delaware), Limited Partnership, 5.059%, 2041/12/15 2,798,000 2,837 2,931 TOTAL U.S. BONDS 0.43% 2,837 2,931 FOREIGN BONDSSUPRANATIONALS 1.79%Inter-American Development Bank, 4.400%, 2026/01/26 10,535,000 10,826 12,296 TOTAL FOREIGN BONDS 1.79% 10,826 12,296 SHORT-TERM INVESTMENTSBanner Trust, 0.650%, 2016/01/04 1,940,000 1,940 1,940 Government of Canada, 0.499%, 2016/04/21 5,300,000 5,292 5,292 Government of Canada, 0.525%, 2016/07/28 6,900,000 6,879 6,881 TOTAL SHORT-TERM INVESTMENTS 2.05% 14,111 14,113 TOTAL INVESTMENTS, NON-DERIVATIVE FINANCIAL ASSETS 99.15% 652,006 682,743 Other assets, less liabilities 0.85% 5,886 5,886 NET ASSETS ATTRIBUTABLE TO CONTRACTHOLDERS 100.00% 657,892 688,629
% of net assets attributable to contractholders
as at December 31, 2014Canadian bonds
Federal and federally guaranteed 12.14Provincial and provincially guaranteed 48.58Municipals and schools 7.39Corporate 26.94
U.S. Bonds 1.06Foreign bonds 1.74Investments in underlying funds 0.48Short-term investments 0.90Other assets, less liabilities 0.77
100.00
Manulife Asset Management Long Term Bond Fund (expressed in thousands of dollars, except par values)
Par value
Average cost
$Fair value
$ Par value
Average cost
$Fair value
$

STATEMENT OF FINANCIAL POSITION
POOLED AND INDEXED FUNDS
STATEMENT OF COMPREHENSIVE INCOME
as at December 31 2015 2014
$ $
for the years ended December 312015 2014
$ $
58
The accompanying notes are an integral part of these annual financial statements.
Manulife Asset Management Short-Term Liability Government Bond Fund (expressed in thousands of dollars, except per unit amounts)
ASSETSCurrent assetsInvestments, non-derivative financial assets 53,471 29,086Subscriptions receivable - 85Receivable from investments sold 129 -
53,600 29,171LIABILITIESCurrent liabilitiesBank indebtedness 129 -Redemptions payable - 29
129 29NET ASSETS ATTRIBUTABLE TO CONTRACTHOLDERS 53,471 29,142Net assets attributable to contractholders per unit 11.28 10.85
INCOMEDistribution income from underlying funds 1,485 384Realized and change in unrealized gain (loss) on investments and derivatives (287) 592
1,198 976EXPENSESOther operating expenses 4 3
4 3INCREASE (DECREASE) IN NET ASSETS ATTRIBUTABLE TO CONTRACTHOLDERS 1,194 973Increase (decrease) in net assets attributable to contractholders per unit 0.30 0.89
STATEMENT OF CHANGES IN FINANCIAL POSITION STATEMENT OF CASH FLOWS
for the years ended December 312015 2014
$ $
for the years ended December 312015 2014
$ $NET ASSETS ATTRIBUTABLE TO CONTRACTHOLDERS - beginning of year 29,142 9,851INCREASE (DECREASE) IN NET ASSETS ATTRIBUTABLE TO CONTRACTHOLDERS 1,194 973CAPITAL UNIT TRANSACTIONSUnits sold 28,121 19,040Units redeemed (4,986) (722)Net capital unit transactions 23,135 18,318NET ASSETS ATTRIBUTABLE TO CONTRACTHOLDERS - end of year 53,471 29,142
Cash flows from operating activitiesIncrease (decrease) in net assets attributable to contractholders 1,194 973Adjustments for:Realized and change in unrealized gain (loss) on investments and derivatives 287 (592)Purchase of investments (29,574) (19,399)Proceeds from sale and maturity of investments 4,773 756Net cash from operating activities (23,320) (18,262)Cash flows used in financing activitiesProceeds from sale of units 28,206 18,955Payments for units redeemed (5,015) (693)Net cash used in financing activities 23,191 18,262
Net increase (decrease) in cash (129) -Cash (bank indebtedness) at beginning of year - -Cash (bank indebtedness) at end of year (129) -
SCHEDULE OF PORTFOLIO INVESTMENTS as at December 31, 2015
Units
Average cost
$Fair value
$
Manulife Asset Management Short-Term Liability Government Bond Pooled Fund 514,878 53,488 53,471 TOTAL INVESTMENTS, NON-DERIVATIVE FINANCIAL ASSETS 100.00% 53,488 53,471 Other assets, less liabilities 0.00% - - NET ASSETS ATTRIBUTABLE TO CONTRACTHOLDERS 100.00% 53,488 53,471
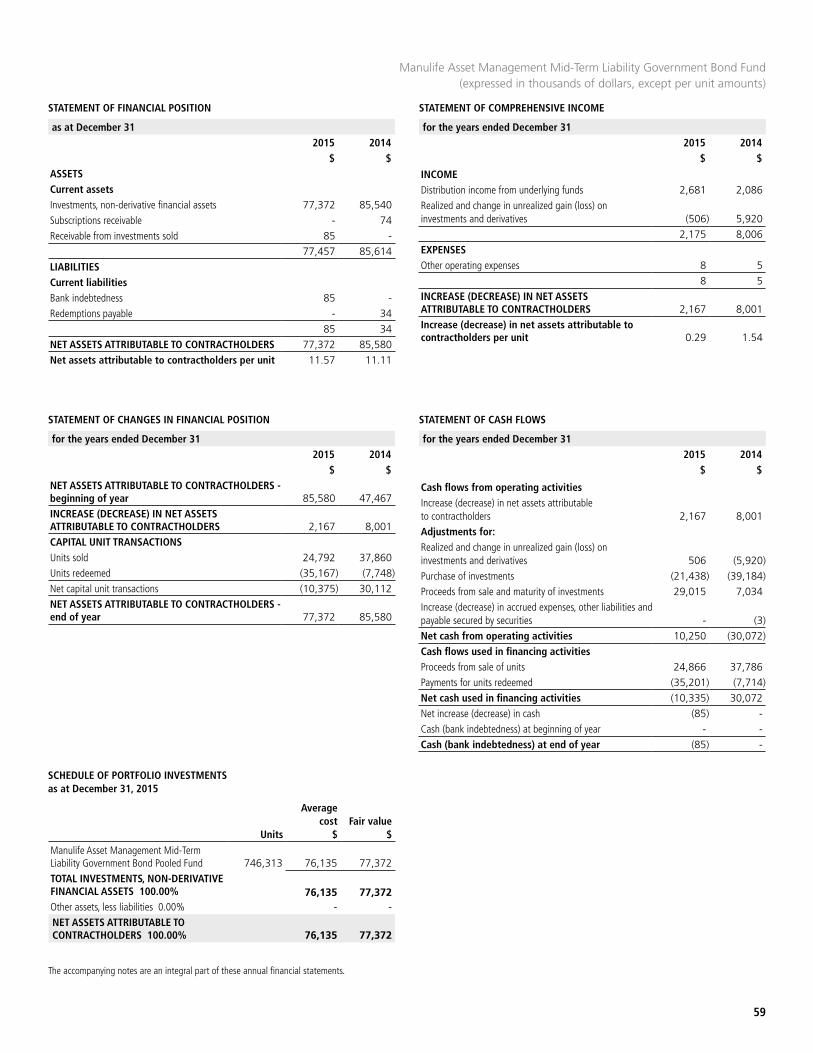
STATEMENT OF FINANCIAL POSITION STATEMENT OF COMPREHENSIVE INCOME
as at December 31 2015 2014
$ $
for the years ended December 312015 2014
$ $
59
The accompanying notes are an integral part of these annual financial statements.
Manulife Asset Management Mid-Term Liability Government Bond Fund(expressed in thousands of dollars, except per unit amounts)
ASSETSCurrent assetsInvestments, non-derivative financial assets 77,372 85,540Subscriptions receivable - 74Receivable from investments sold 85 -
77,457 85,614LIABILITIESCurrent liabilitiesBank indebtedness 85 -Redemptions payable - 34
85 34NET ASSETS ATTRIBUTABLE TO CONTRACTHOLDERS 77,372 85,580Net assets attributable to contractholders per unit 11.57 11.11
INCOMEDistribution income from underlying funds 2,681 2,086Realized and change in unrealized gain (loss) on investments and derivatives (506) 5,920
2,175 8,006EXPENSESOther operating expenses 8 5
8 5INCREASE (DECREASE) IN NET ASSETS ATTRIBUTABLE TO CONTRACTHOLDERS 2,167 8,001Increase (decrease) in net assets attributable to contractholders per unit 0.29 1.54
STATEMENT OF CHANGES IN FINANCIAL POSITION STATEMENT OF CASH FLOWS
for the years ended December 312015 2014
$ $
for the years ended December 312015 2014
$ $NET ASSETS ATTRIBUTABLE TO CONTRACTHOLDERS - beginning of year 85,580 47,467INCREASE (DECREASE) IN NET ASSETS ATTRIBUTABLE TO CONTRACTHOLDERS 2,167 8,001CAPITAL UNIT TRANSACTIONSUnits sold 24,792 37,860Units redeemed (35,167) (7,748)Net capital unit transactions (10,375) 30,112NET ASSETS ATTRIBUTABLE TO CONTRACTHOLDERS - end of year 77,372 85,580
Cash flows from operating activitiesIncrease (decrease) in net assets attributable to contractholders 2,167 8,001Adjustments for:Realized and change in unrealized gain (loss) on investments and derivatives 506 (5,920)Purchase of investments (21,438) (39,184)Proceeds from sale and maturity of investments 29,015 7,034Increase (decrease) in accrued expenses, other liabilities and payable secured by securities - (3)Net cash from operating activities 10,250 (30,072)Cash flows used in financing activitiesProceeds from sale of units 24,866 37,786Payments for units redeemed (35,201) (7,714)Net cash used in financing activities (10,335) 30,072Net increase (decrease) in cash (85) -Cash (bank indebtedness) at beginning of year - -Cash (bank indebtedness) at end of year (85) -
SCHEDULE OF PORTFOLIO INVESTMENTS as at December 31, 2015
Units
Average cost
$Fair value
$
Manulife Asset Management Mid-Term Liability Government Bond Pooled Fund 746,313 76,135 77,372 TOTAL INVESTMENTS, NON-DERIVATIVE FINANCIAL ASSETS 100.00% 76,135 77,372 Other assets, less liabilities 0.00% - - NET ASSETS ATTRIBUTABLE TO CONTRACTHOLDERS 100.00% 76,135 77,372
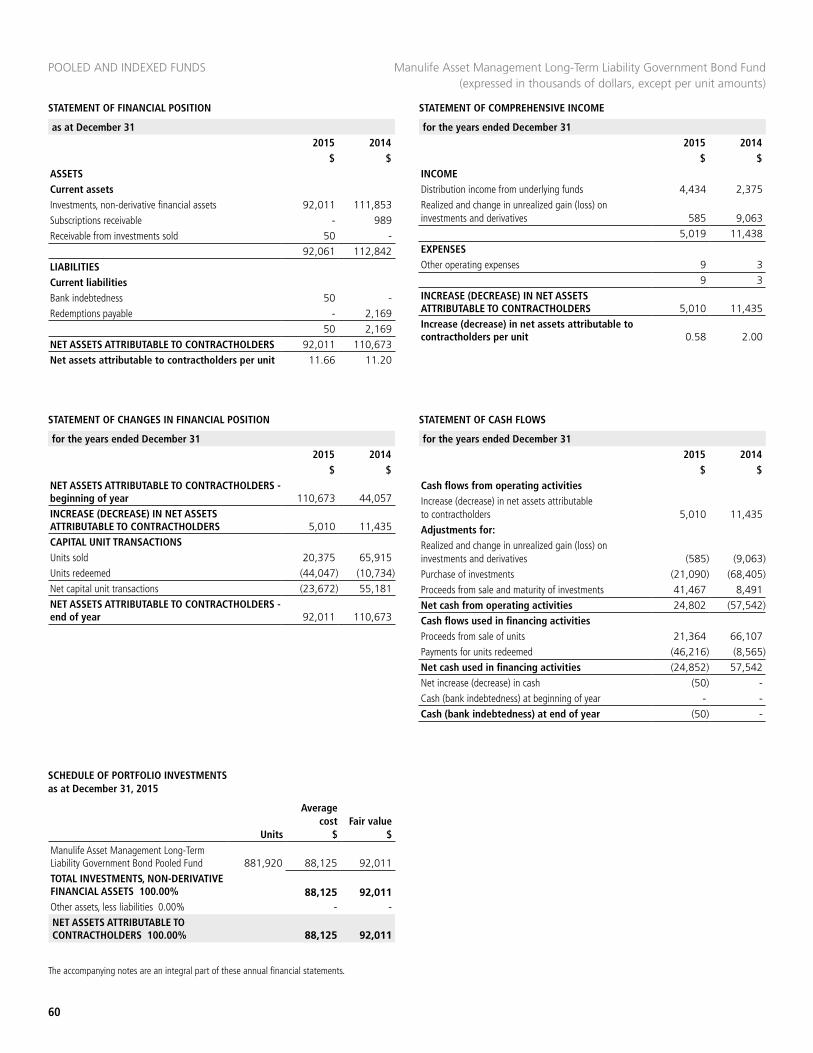
STATEMENT OF FINANCIAL POSITION
POOLED AND INDEXED FUNDS
STATEMENT OF COMPREHENSIVE INCOME
as at December 31 2015 2014
$ $
for the years ended December 312015 2014
$ $
60
The accompanying notes are an integral part of these annual financial statements.
Manulife Asset Management Long-Term Liability Government Bond Fund (expressed in thousands of dollars, except per unit amounts)
ASSETSCurrent assetsInvestments, non-derivative financial assets 92,011 111,853Subscriptions receivable - 989Receivable from investments sold 50 -
92,061 112,842LIABILITIESCurrent liabilitiesBank indebtedness 50 -Redemptions payable - 2,169
50 2,169NET ASSETS ATTRIBUTABLE TO CONTRACTHOLDERS 92,011 110,673Net assets attributable to contractholders per unit 11.66 11.20
INCOMEDistribution income from underlying funds 4,434 2,375Realized and change in unrealized gain (loss) on investments and derivatives 585 9,063
5,019 11,438EXPENSESOther operating expenses 9 3
9 3INCREASE (DECREASE) IN NET ASSETS ATTRIBUTABLE TO CONTRACTHOLDERS 5,010 11,435Increase (decrease) in net assets attributable to contractholders per unit 0.58 2.00
STATEMENT OF CHANGES IN FINANCIAL POSITION STATEMENT OF CASH FLOWS
for the years ended December 312015 2014
$ $
for the years ended December 312015 2014
$ $NET ASSETS ATTRIBUTABLE TO CONTRACTHOLDERS - beginning of year 110,673 44,057INCREASE (DECREASE) IN NET ASSETS ATTRIBUTABLE TO CONTRACTHOLDERS 5,010 11,435CAPITAL UNIT TRANSACTIONSUnits sold 20,375 65,915Units redeemed (44,047) (10,734)Net capital unit transactions (23,672) 55,181NET ASSETS ATTRIBUTABLE TO CONTRACTHOLDERS - end of year 92,011 110,673
Cash flows from operating activitiesIncrease (decrease) in net assets attributable to contractholders 5,010 11,435Adjustments for:Realized and change in unrealized gain (loss) on investments and derivatives (585) (9,063)Purchase of investments (21,090) (68,405)Proceeds from sale and maturity of investments 41,467 8,491Net cash from operating activities 24,802 (57,542)Cash flows used in financing activitiesProceeds from sale of units 21,364 66,107Payments for units redeemed (46,216) (8,565)Net cash used in financing activities (24,852) 57,542Net increase (decrease) in cash (50) -Cash (bank indebtedness) at beginning of year - -Cash (bank indebtedness) at end of year (50) -
SCHEDULE OF PORTFOLIO INVESTMENTS as at December 31, 2015
Units
Average cost
$Fair value
$
Manulife Asset Management Long-Term Liability Government Bond Pooled Fund 881,920 88,125 92,011 TOTAL INVESTMENTS, NON-DERIVATIVE FINANCIAL ASSETS 100.00% 88,125 92,011 Other assets, less liabilities 0.00% - - NET ASSETS ATTRIBUTABLE TO CONTRACTHOLDERS 100.00% 88,125 92,011
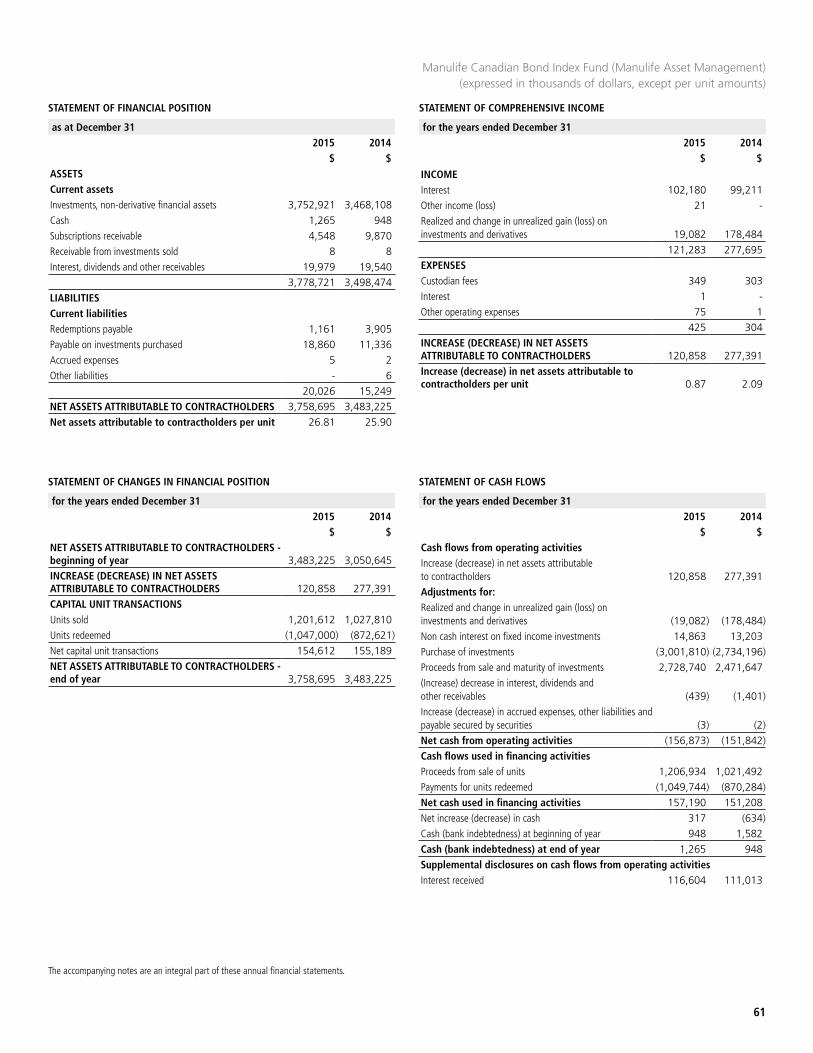
STATEMENT OF FINANCIAL POSITION STATEMENT OF COMPREHENSIVE INCOME
as at December 31 2015 2014
$ $
for the years ended December 312015 2014
$ $
61
The accompanying notes are an integral part of these annual financial statements.
Manulife Canadian Bond Index Fund (Manulife Asset Management) (expressed in thousands of dollars, except per unit amounts)
ASSETSCurrent assetsInvestments, non-derivative financial assets 3,752,921 3,468,108Cash 1,265 948Subscriptions receivable 4,548 9,870Receivable from investments sold 8 8Interest, dividends and other receivables 19,979 19,540
3,778,721 3,498,474LIABILITIESCurrent liabilitiesRedemptions payable 1,161 3,905Payable on investments purchased 18,860 11,336Accrued expenses 5 2Other liabilities - 6
20,026 15,249NET ASSETS ATTRIBUTABLE TO CONTRACTHOLDERS 3,758,695 3,483,225Net assets attributable to contractholders per unit 26.81 25.90
INCOMEInterest 102,180 99,211Other income (loss) 21 -Realized and change in unrealized gain (loss) on investments and derivatives 19,082 178,484
121,283 277,695EXPENSESCustodian fees 349 303Interest 1 -Other operating expenses 75 1
425 304INCREASE (DECREASE) IN NET ASSETS ATTRIBUTABLE TO CONTRACTHOLDERS 120,858 277,391Increase (decrease) in net assets attributable to contractholders per unit 0.87 2.09
STATEMENT OF CHANGES IN FINANCIAL POSITION STATEMENT OF CASH FLOWS
for the years ended December 312015 2014
$ $
for the years ended December 312015 2014
$ $NET ASSETS ATTRIBUTABLE TO CONTRACTHOLDERS - beginning of year 3,483,225 3,050,645INCREASE (DECREASE) IN NET ASSETS ATTRIBUTABLE TO CONTRACTHOLDERS 120,858 277,391CAPITAL UNIT TRANSACTIONSUnits sold 1,201,612 1,027,810Units redeemed (1,047,000) (872,621)Net capital unit transactions 154,612 155,189NET ASSETS ATTRIBUTABLE TO CONTRACTHOLDERS - end of year 3,758,695 3,483,225
Cash flows from operating activitiesIncrease (decrease) in net assets attributable to contractholders 120,858 277,391Adjustments for:Realized and change in unrealized gain (loss) on investments and derivatives (19,082) (178,484)Non cash interest on fixed income investments 14,863 13,203Purchase of investments (3,001,810) (2,734,196)Proceeds from sale and maturity of investments 2,728,740 2,471,647(Increase) decrease in interest, dividends and other receivables (439) (1,401)Increase (decrease) in accrued expenses, other liabilities and payable secured by securities (3) (2)Net cash from operating activities (156,873) (151,842)Cash flows used in financing activitiesProceeds from sale of units 1,206,934 1,021,492Payments for units redeemed (1,049,744) (870,284)Net cash used in financing activities 157,190 151,208Net increase (decrease) in cash 317 (634)Cash (bank indebtedness) at beginning of year 948 1,582Cash (bank indebtedness) at end of year 1,265 948Supplemental disclosures on cash flows from operating activitiesInterest received 116,604 111,013
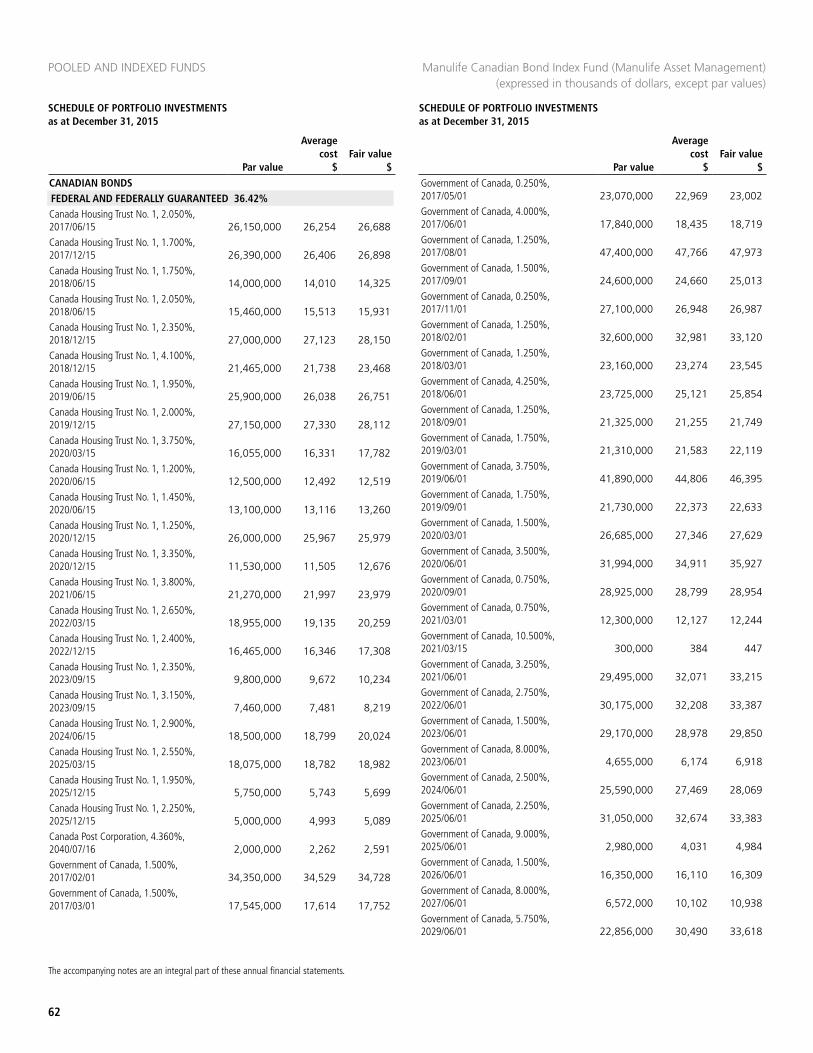
POOLED AND INDEXED FUNDS
62
SCHEDULE OF PORTFOLIO INVESTMENTS as at December 31, 2015
SCHEDULE OF PORTFOLIO INVESTMENTS as at December 31, 2015
The accompanying notes are an integral part of these annual financial statements.
CANADIAN BONDSFEDERAL AND FEDERALLY GUARANTEED 36.42%Canada Housing Trust No. 1, 2.050%, 2017/06/15 26,150,000 26,254 26,688 Canada Housing Trust No. 1, 1.700%, 2017/12/15 26,390,000 26,406 26,898 Canada Housing Trust No. 1, 1.750%, 2018/06/15 14,000,000 14,010 14,325 Canada Housing Trust No. 1, 2.050%, 2018/06/15 15,460,000 15,513 15,931 Canada Housing Trust No. 1, 2.350%, 2018/12/15 27,000,000 27,123 28,150 Canada Housing Trust No. 1, 4.100%, 2018/12/15 21,465,000 21,738 23,468 Canada Housing Trust No. 1, 1.950%, 2019/06/15 25,900,000 26,038 26,751 Canada Housing Trust No. 1, 2.000%, 2019/12/15 27,150,000 27,330 28,112 Canada Housing Trust No. 1, 3.750%, 2020/03/15 16,055,000 16,331 17,782 Canada Housing Trust No. 1, 1.200%, 2020/06/15 12,500,000 12,492 12,519 Canada Housing Trust No. 1, 1.450%, 2020/06/15 13,100,000 13,116 13,260 Canada Housing Trust No. 1, 1.250%, 2020/12/15 26,000,000 25,967 25,979 Canada Housing Trust No. 1, 3.350%, 2020/12/15 11,530,000 11,505 12,676 Canada Housing Trust No. 1, 3.800%, 2021/06/15 21,270,000 21,997 23,979 Canada Housing Trust No. 1, 2.650%, 2022/03/15 18,955,000 19,135 20,259 Canada Housing Trust No. 1, 2.400%, 2022/12/15 16,465,000 16,346 17,308 Canada Housing Trust No. 1, 2.350%, 2023/09/15 9,800,000 9,672 10,234 Canada Housing Trust No. 1, 3.150%, 2023/09/15 7,460,000 7,481 8,219 Canada Housing Trust No. 1, 2.900%, 2024/06/15 18,500,000 18,799 20,024 Canada Housing Trust No. 1, 2.550%, 2025/03/15 18,075,000 18,782 18,982 Canada Housing Trust No. 1, 1.950%, 2025/12/15 5,750,000 5,743 5,699 Canada Housing Trust No. 1, 2.250%, 2025/12/15 5,000,000 4,993 5,089 Canada Post Corporation, 4.360%, 2040/07/16 2,000,000 2,262 2,591 Government of Canada, 1.500%, 2017/02/01 34,350,000 34,529 34,728 Government of Canada, 1.500%, 2017/03/01 17,545,000 17,614 17,752
Government of Canada, 0.250%, 2017/05/01 23,070,000 22,969 23,002 Government of Canada, 4.000%, 2017/06/01 17,840,000 18,435 18,719 Government of Canada, 1.250%, 2017/08/01 47,400,000 47,766 47,973 Government of Canada, 1.500%, 2017/09/01 24,600,000 24,660 25,013 Government of Canada, 0.250%, 2017/11/01 27,100,000 26,948 26,987 Government of Canada, 1.250%, 2018/02/01 32,600,000 32,981 33,120 Government of Canada, 1.250%, 2018/03/01 23,160,000 23,274 23,545 Government of Canada, 4.250%, 2018/06/01 23,725,000 25,121 25,854 Government of Canada, 1.250%, 2018/09/01 21,325,000 21,255 21,749 Government of Canada, 1.750%, 2019/03/01 21,310,000 21,583 22,119 Government of Canada, 3.750%, 2019/06/01 41,890,000 44,806 46,395 Government of Canada, 1.750%, 2019/09/01 21,730,000 22,373 22,633 Government of Canada, 1.500%, 2020/03/01 26,685,000 27,346 27,629 Government of Canada, 3.500%, 2020/06/01 31,994,000 34,911 35,927 Government of Canada, 0.750%, 2020/09/01 28,925,000 28,799 28,954 Government of Canada, 0.750%, 2021/03/01 12,300,000 12,127 12,244 Government of Canada, 10.500%, 2021/03/15 300,000 384 447 Government of Canada, 3.250%, 2021/06/01 29,495,000 32,071 33,215 Government of Canada, 2.750%, 2022/06/01 30,175,000 32,208 33,387 Government of Canada, 1.500%, 2023/06/01 29,170,000 28,978 29,850 Government of Canada, 8.000%, 2023/06/01 4,655,000 6,174 6,918 Government of Canada, 2.500%, 2024/06/01 25,590,000 27,469 28,069 Government of Canada, 2.250%, 2025/06/01 31,050,000 32,674 33,383 Government of Canada, 9.000%, 2025/06/01 2,980,000 4,031 4,984 Government of Canada, 1.500%, 2026/06/01 16,350,000 16,110 16,309 Government of Canada, 8.000%, 2027/06/01 6,572,000 10,102 10,938 Government of Canada, 5.750%, 2029/06/01 22,856,000 30,490 33,618
Manulife Canadian Bond Index Fund (Manulife Asset Management) (expressed in thousands of dollars, except par values)
Par value
Average cost
$Fair value
$ Par value
Average cost
$Fair value
$
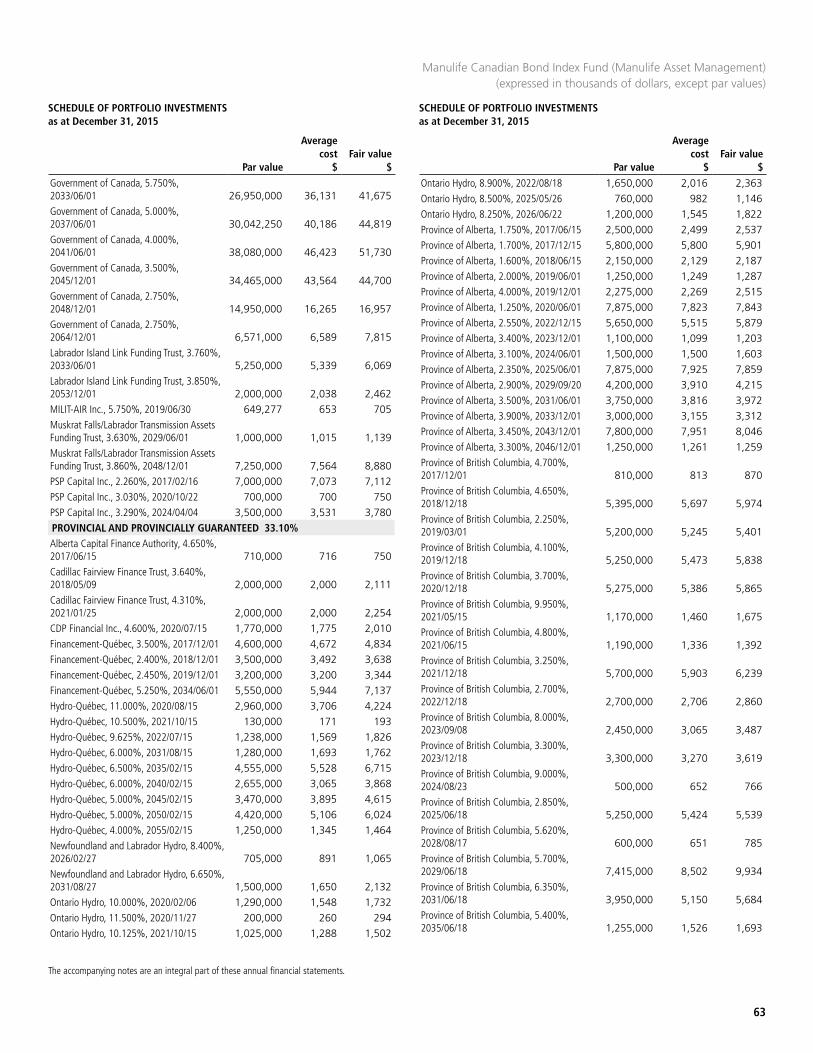
SCHEDULE OF PORTFOLIO INVESTMENTS as at December 31, 2015
SCHEDULE OF PORTFOLIO INVESTMENTS as at December 31, 2015
63
The accompanying notes are an integral part of these annual financial statements.
Government of Canada, 5.750%, 2033/06/01 26,950,000 36,131 41,675 Government of Canada, 5.000%, 2037/06/01 30,042,250 40,186 44,819 Government of Canada, 4.000%, 2041/06/01 38,080,000 46,423 51,730 Government of Canada, 3.500%, 2045/12/01 34,465,000 43,564 44,700 Government of Canada, 2.750%, 2048/12/01 14,950,000 16,265 16,957 Government of Canada, 2.750%, 2064/12/01 6,571,000 6,589 7,815 Labrador Island Link Funding Trust, 3.760%, 2033/06/01 5,250,000 5,339 6,069 Labrador Island Link Funding Trust, 3.850%, 2053/12/01 2,000,000 2,038 2,462 MILIT-AIR Inc., 5.750%, 2019/06/30 649,277 653 705 Muskrat Falls/Labrador Transmission Assets Funding Trust, 3.630%, 2029/06/01 1,000,000 1,015 1,139 Muskrat Falls/Labrador Transmission Assets Funding Trust, 3.860%, 2048/12/01 7,250,000 7,564 8,880 PSP Capital Inc., 2.260%, 2017/02/16 7,000,000 7,073 7,112 PSP Capital Inc., 3.030%, 2020/10/22 700,000 700 750 PSP Capital Inc., 3.290%, 2024/04/04 3,500,000 3,531 3,780 PROVINCIAL AND PROVINCIALLY GUARANTEED 33.10%Alberta Capital Finance Authority, 4.650%, 2017/06/15 710,000 716 750 Cadillac Fairview Finance Trust, 3.640%, 2018/05/09 2,000,000 2,000 2,111 Cadillac Fairview Finance Trust, 4.310%, 2021/01/25 2,000,000 2,000 2,254 CDP Financial Inc., 4.600%, 2020/07/15 1,770,000 1,775 2,010 Financement-Québec, 3.500%, 2017/12/01 4,600,000 4,672 4,834 Financement-Québec, 2.400%, 2018/12/01 3,500,000 3,492 3,638 Financement-Québec, 2.450%, 2019/12/01 3,200,000 3,200 3,344 Financement-Québec, 5.250%, 2034/06/01 5,550,000 5,944 7,137 Hydro-Québec, 11.000%, 2020/08/15 2,960,000 3,706 4,224 Hydro-Québec, 10.500%, 2021/10/15 130,000 171 193 Hydro-Québec, 9.625%, 2022/07/15 1,238,000 1,569 1,826 Hydro-Québec, 6.000%, 2031/08/15 1,280,000 1,693 1,762 Hydro-Québec, 6.500%, 2035/02/15 4,555,000 5,528 6,715 Hydro-Québec, 6.000%, 2040/02/15 2,655,000 3,065 3,868 Hydro-Québec, 5.000%, 2045/02/15 3,470,000 3,895 4,615 Hydro-Québec, 5.000%, 2050/02/15 4,420,000 5,106 6,024 Hydro-Québec, 4.000%, 2055/02/15 1,250,000 1,345 1,464 Newfoundland and Labrador Hydro, 8.400%, 2026/02/27 705,000 891 1,065 Newfoundland and Labrador Hydro, 6.650%, 2031/08/27 1,500,000 1,650 2,132 Ontario Hydro, 10.000%, 2020/02/06 1,290,000 1,548 1,732 Ontario Hydro, 11.500%, 2020/11/27 200,000 260 294 Ontario Hydro, 10.125%, 2021/10/15 1,025,000 1,288 1,502
Ontario Hydro, 8.900%, 2022/08/18 1,650,000 2,016 2,363 Ontario Hydro, 8.500%, 2025/05/26 760,000 982 1,146 Ontario Hydro, 8.250%, 2026/06/22 1,200,000 1,545 1,822 Province of Alberta, 1.750%, 2017/06/15 2,500,000 2,499 2,537 Province of Alberta, 1.700%, 2017/12/15 5,800,000 5,800 5,901 Province of Alberta, 1.600%, 2018/06/15 2,150,000 2,129 2,187 Province of Alberta, 2.000%, 2019/06/01 1,250,000 1,249 1,287 Province of Alberta, 4.000%, 2019/12/01 2,275,000 2,269 2,515 Province of Alberta, 1.250%, 2020/06/01 7,875,000 7,823 7,843 Province of Alberta, 2.550%, 2022/12/15 5,650,000 5,515 5,879 Province of Alberta, 3.400%, 2023/12/01 1,100,000 1,099 1,203 Province of Alberta, 3.100%, 2024/06/01 1,500,000 1,500 1,603 Province of Alberta, 2.350%, 2025/06/01 7,875,000 7,925 7,859 Province of Alberta, 2.900%, 2029/09/20 4,200,000 3,910 4,215 Province of Alberta, 3.500%, 2031/06/01 3,750,000 3,816 3,972 Province of Alberta, 3.900%, 2033/12/01 3,000,000 3,155 3,312 Province of Alberta, 3.450%, 2043/12/01 7,800,000 7,951 8,046 Province of Alberta, 3.300%, 2046/12/01 1,250,000 1,261 1,259 Province of British Columbia, 4.700%, 2017/12/01 810,000 813 870 Province of British Columbia, 4.650%, 2018/12/18 5,395,000 5,697 5,974 Province of British Columbia, 2.250%, 2019/03/01 5,200,000 5,245 5,401 Province of British Columbia, 4.100%, 2019/12/18 5,250,000 5,473 5,838 Province of British Columbia, 3.700%, 2020/12/18 5,275,000 5,386 5,865 Province of British Columbia, 9.950%, 2021/05/15 1,170,000 1,460 1,675 Province of British Columbia, 4.800%, 2021/06/15 1,190,000 1,336 1,392 Province of British Columbia, 3.250%, 2021/12/18 5,700,000 5,903 6,239 Province of British Columbia, 2.700%, 2022/12/18 2,700,000 2,706 2,860 Province of British Columbia, 8.000%, 2023/09/08 2,450,000 3,065 3,487 Province of British Columbia, 3.300%, 2023/12/18 3,300,000 3,270 3,619 Province of British Columbia, 9.000%, 2024/08/23 500,000 652 766 Province of British Columbia, 2.850%, 2025/06/18 5,250,000 5,424 5,539 Province of British Columbia, 5.620%, 2028/08/17 600,000 651 785 Province of British Columbia, 5.700%, 2029/06/18 7,415,000 8,502 9,934 Province of British Columbia, 6.350%, 2031/06/18 3,950,000 5,150 5,684 Province of British Columbia, 5.400%, 2035/06/18 1,255,000 1,526 1,693
Manulife Canadian Bond Index Fund (Manulife Asset Management) (expressed in thousands of dollars, except par values)
Par value
Average cost
$Fair value
$ Par value
Average cost
$Fair value
$
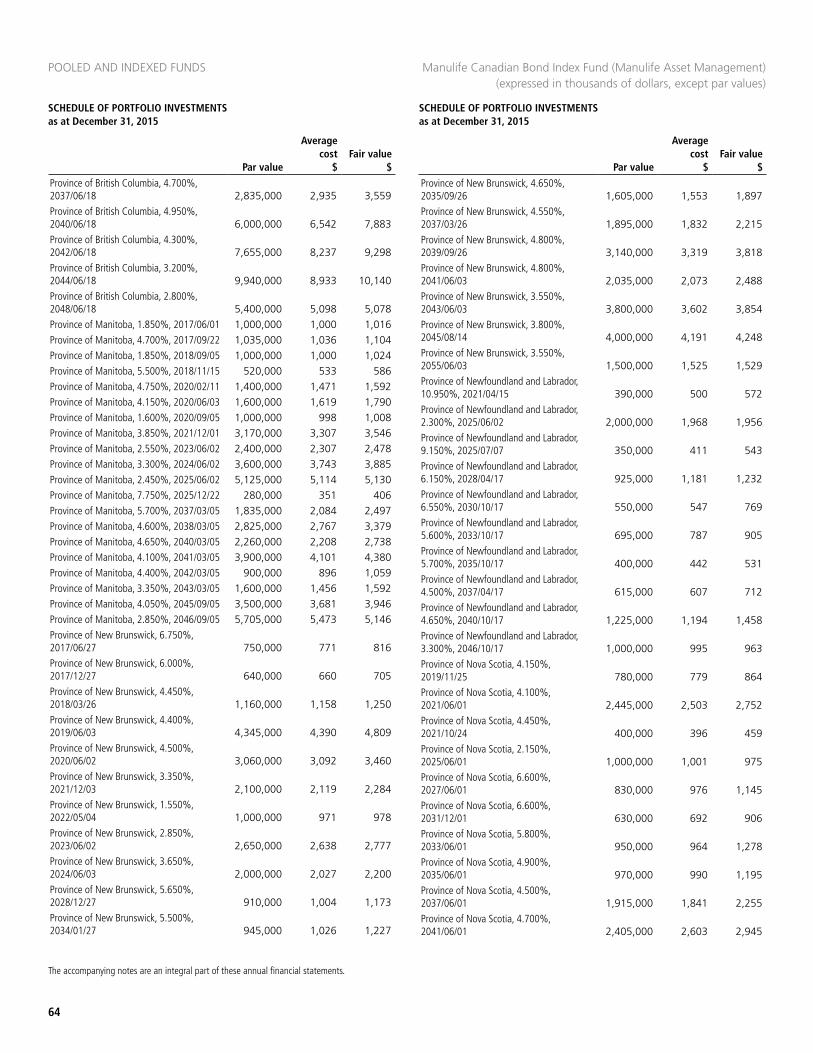
POOLED AND INDEXED FUNDS
64
SCHEDULE OF PORTFOLIO INVESTMENTS as at December 31, 2015
SCHEDULE OF PORTFOLIO INVESTMENTS as at December 31, 2015
The accompanying notes are an integral part of these annual financial statements.
Province of British Columbia, 4.700%, 2037/06/18 2,835,000 2,935 3,559 Province of British Columbia, 4.950%, 2040/06/18 6,000,000 6,542 7,883 Province of British Columbia, 4.300%, 2042/06/18 7,655,000 8,237 9,298 Province of British Columbia, 3.200%, 2044/06/18 9,940,000 8,933 10,140 Province of British Columbia, 2.800%, 2048/06/18 5,400,000 5,098 5,078 Province of Manitoba, 1.850%, 2017/06/01 1,000,000 1,000 1,016 Province of Manitoba, 4.700%, 2017/09/22 1,035,000 1,036 1,104 Province of Manitoba, 1.850%, 2018/09/05 1,000,000 1,000 1,024 Province of Manitoba, 5.500%, 2018/11/15 520,000 533 586 Province of Manitoba, 4.750%, 2020/02/11 1,400,000 1,471 1,592 Province of Manitoba, 4.150%, 2020/06/03 1,600,000 1,619 1,790 Province of Manitoba, 1.600%, 2020/09/05 1,000,000 998 1,008 Province of Manitoba, 3.850%, 2021/12/01 3,170,000 3,307 3,546 Province of Manitoba, 2.550%, 2023/06/02 2,400,000 2,307 2,478 Province of Manitoba, 3.300%, 2024/06/02 3,600,000 3,743 3,885 Province of Manitoba, 2.450%, 2025/06/02 5,125,000 5,114 5,130 Province of Manitoba, 7.750%, 2025/12/22 280,000 351 406 Province of Manitoba, 5.700%, 2037/03/05 1,835,000 2,084 2,497 Province of Manitoba, 4.600%, 2038/03/05 2,825,000 2,767 3,379 Province of Manitoba, 4.650%, 2040/03/05 2,260,000 2,208 2,738 Province of Manitoba, 4.100%, 2041/03/05 3,900,000 4,101 4,380 Province of Manitoba, 4.400%, 2042/03/05 900,000 896 1,059 Province of Manitoba, 3.350%, 2043/03/05 1,600,000 1,456 1,592 Province of Manitoba, 4.050%, 2045/09/05 3,500,000 3,681 3,946 Province of Manitoba, 2.850%, 2046/09/05 5,705,000 5,473 5,146 Province of New Brunswick, 6.750%, 2017/06/27 750,000 771 816 Province of New Brunswick, 6.000%, 2017/12/27 640,000 660 705 Province of New Brunswick, 4.450%, 2018/03/26 1,160,000 1,158 1,250 Province of New Brunswick, 4.400%, 2019/06/03 4,345,000 4,390 4,809 Province of New Brunswick, 4.500%, 2020/06/02 3,060,000 3,092 3,460 Province of New Brunswick, 3.350%, 2021/12/03 2,100,000 2,119 2,284 Province of New Brunswick, 1.550%, 2022/05/04 1,000,000 971 978 Province of New Brunswick, 2.850%, 2023/06/02 2,650,000 2,638 2,777 Province of New Brunswick, 3.650%, 2024/06/03 2,000,000 2,027 2,200 Province of New Brunswick, 5.650%, 2028/12/27 910,000 1,004 1,173 Province of New Brunswick, 5.500%, 2034/01/27 945,000 1,026 1,227
Province of New Brunswick, 4.650%, 2035/09/26 1,605,000 1,553 1,897 Province of New Brunswick, 4.550%, 2037/03/26 1,895,000 1,832 2,215 Province of New Brunswick, 4.800%, 2039/09/26 3,140,000 3,319 3,818 Province of New Brunswick, 4.800%, 2041/06/03 2,035,000 2,073 2,488 Province of New Brunswick, 3.550%, 2043/06/03 3,800,000 3,602 3,854 Province of New Brunswick, 3.800%, 2045/08/14 4,000,000 4,191 4,248 Province of New Brunswick, 3.550%, 2055/06/03 1,500,000 1,525 1,529 Province of Newfoundland and Labrador, 10.950%, 2021/04/15 390,000 500 572 Province of Newfoundland and Labrador, 2.300%, 2025/06/02 2,000,000 1,968 1,956 Province of Newfoundland and Labrador, 9.150%, 2025/07/07 350,000 411 543 Province of Newfoundland and Labrador, 6.150%, 2028/04/17 925,000 1,181 1,232 Province of Newfoundland and Labrador, 6.550%, 2030/10/17 550,000 547 769 Province of Newfoundland and Labrador, 5.600%, 2033/10/17 695,000 787 905 Province of Newfoundland and Labrador, 5.700%, 2035/10/17 400,000 442 531 Province of Newfoundland and Labrador, 4.500%, 2037/04/17 615,000 607 712 Province of Newfoundland and Labrador, 4.650%, 2040/10/17 1,225,000 1,194 1,458 Province of Newfoundland and Labrador, 3.300%, 2046/10/17 1,000,000 995 963 Province of Nova Scotia, 4.150%, 2019/11/25 780,000 779 864 Province of Nova Scotia, 4.100%, 2021/06/01 2,445,000 2,503 2,752 Province of Nova Scotia, 4.450%, 2021/10/24 400,000 396 459 Province of Nova Scotia, 2.150%, 2025/06/01 1,000,000 1,001 975 Province of Nova Scotia, 6.600%, 2027/06/01 830,000 976 1,145 Province of Nova Scotia, 6.600%, 2031/12/01 630,000 692 906 Province of Nova Scotia, 5.800%, 2033/06/01 950,000 964 1,278 Province of Nova Scotia, 4.900%, 2035/06/01 970,000 990 1,195 Province of Nova Scotia, 4.500%, 2037/06/01 1,915,000 1,841 2,255 Province of Nova Scotia, 4.700%, 2041/06/01 2,405,000 2,603 2,945
Manulife Canadian Bond Index Fund (Manulife Asset Management) (expressed in thousands of dollars, except par values)
Par value
Average cost
$Fair value
$ Par value
Average cost
$Fair value
$
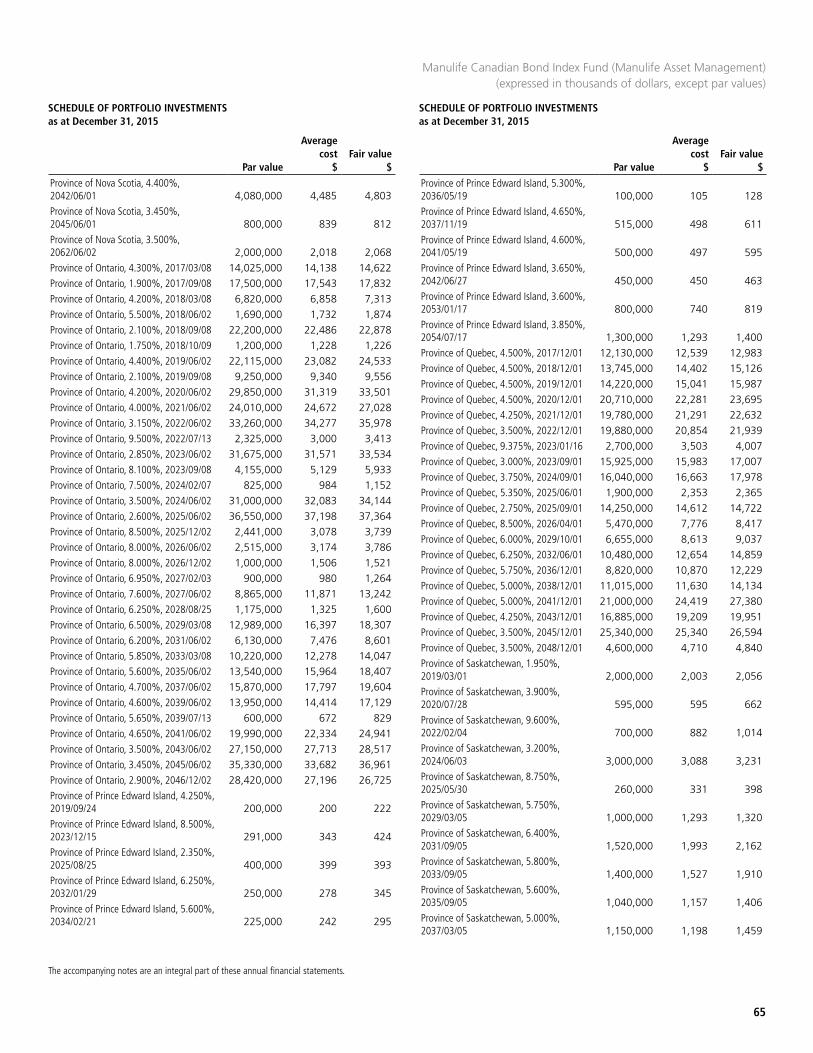
SCHEDULE OF PORTFOLIO INVESTMENTS as at December 31, 2015
SCHEDULE OF PORTFOLIO INVESTMENTS as at December 31, 2015
65
The accompanying notes are an integral part of these annual financial statements.
Province of Nova Scotia, 4.400%, 2042/06/01 4,080,000 4,485 4,803 Province of Nova Scotia, 3.450%, 2045/06/01 800,000 839 812 Province of Nova Scotia, 3.500%, 2062/06/02 2,000,000 2,018 2,068 Province of Ontario, 4.300%, 2017/03/08 14,025,000 14,138 14,622 Province of Ontario, 1.900%, 2017/09/08 17,500,000 17,543 17,832 Province of Ontario, 4.200%, 2018/03/08 6,820,000 6,858 7,313 Province of Ontario, 5.500%, 2018/06/02 1,690,000 1,732 1,874 Province of Ontario, 2.100%, 2018/09/08 22,200,000 22,486 22,878 Province of Ontario, 1.750%, 2018/10/09 1,200,000 1,228 1,226 Province of Ontario, 4.400%, 2019/06/02 22,115,000 23,082 24,533 Province of Ontario, 2.100%, 2019/09/08 9,250,000 9,340 9,556 Province of Ontario, 4.200%, 2020/06/02 29,850,000 31,319 33,501 Province of Ontario, 4.000%, 2021/06/02 24,010,000 24,672 27,028 Province of Ontario, 3.150%, 2022/06/02 33,260,000 34,277 35,978 Province of Ontario, 9.500%, 2022/07/13 2,325,000 3,000 3,413 Province of Ontario, 2.850%, 2023/06/02 31,675,000 31,571 33,534 Province of Ontario, 8.100%, 2023/09/08 4,155,000 5,129 5,933 Province of Ontario, 7.500%, 2024/02/07 825,000 984 1,152 Province of Ontario, 3.500%, 2024/06/02 31,000,000 32,083 34,144 Province of Ontario, 2.600%, 2025/06/02 36,550,000 37,198 37,364 Province of Ontario, 8.500%, 2025/12/02 2,441,000 3,078 3,739 Province of Ontario, 8.000%, 2026/06/02 2,515,000 3,174 3,786 Province of Ontario, 8.000%, 2026/12/02 1,000,000 1,506 1,521 Province of Ontario, 6.950%, 2027/02/03 900,000 980 1,264 Province of Ontario, 7.600%, 2027/06/02 8,865,000 11,871 13,242 Province of Ontario, 6.250%, 2028/08/25 1,175,000 1,325 1,600 Province of Ontario, 6.500%, 2029/03/08 12,989,000 16,397 18,307 Province of Ontario, 6.200%, 2031/06/02 6,130,000 7,476 8,601 Province of Ontario, 5.850%, 2033/03/08 10,220,000 12,278 14,047 Province of Ontario, 5.600%, 2035/06/02 13,540,000 15,964 18,407 Province of Ontario, 4.700%, 2037/06/02 15,870,000 17,797 19,604 Province of Ontario, 4.600%, 2039/06/02 13,950,000 14,414 17,129 Province of Ontario, 5.650%, 2039/07/13 600,000 672 829 Province of Ontario, 4.650%, 2041/06/02 19,990,000 22,334 24,941 Province of Ontario, 3.500%, 2043/06/02 27,150,000 27,713 28,517 Province of Ontario, 3.450%, 2045/06/02 35,330,000 33,682 36,961 Province of Ontario, 2.900%, 2046/12/02 28,420,000 27,196 26,725 Province of Prince Edward Island, 4.250%, 2019/09/24 200,000 200 222 Province of Prince Edward Island, 8.500%, 2023/12/15 291,000 343 424 Province of Prince Edward Island, 2.350%, 2025/08/25 400,000 399 393 Province of Prince Edward Island, 6.250%, 2032/01/29 250,000 278 345 Province of Prince Edward Island, 5.600%, 2034/02/21 225,000 242 295
Province of Prince Edward Island, 5.300%, 2036/05/19 100,000 105 128 Province of Prince Edward Island, 4.650%, 2037/11/19 515,000 498 611 Province of Prince Edward Island, 4.600%, 2041/05/19 500,000 497 595 Province of Prince Edward Island, 3.650%, 2042/06/27 450,000 450 463 Province of Prince Edward Island, 3.600%, 2053/01/17 800,000 740 819 Province of Prince Edward Island, 3.850%, 2054/07/17 1,300,000 1,293 1,400 Province of Quebec, 4.500%, 2017/12/01 12,130,000 12,539 12,983 Province of Quebec, 4.500%, 2018/12/01 13,745,000 14,402 15,126 Province of Quebec, 4.500%, 2019/12/01 14,220,000 15,041 15,987 Province of Quebec, 4.500%, 2020/12/01 20,710,000 22,281 23,695 Province of Quebec, 4.250%, 2021/12/01 19,780,000 21,291 22,632 Province of Quebec, 3.500%, 2022/12/01 19,880,000 20,854 21,939 Province of Quebec, 9.375%, 2023/01/16 2,700,000 3,503 4,007 Province of Quebec, 3.000%, 2023/09/01 15,925,000 15,983 17,007 Province of Quebec, 3.750%, 2024/09/01 16,040,000 16,663 17,978 Province of Quebec, 5.350%, 2025/06/01 1,900,000 2,353 2,365 Province of Quebec, 2.750%, 2025/09/01 14,250,000 14,612 14,722 Province of Quebec, 8.500%, 2026/04/01 5,470,000 7,776 8,417 Province of Quebec, 6.000%, 2029/10/01 6,655,000 8,613 9,037 Province of Quebec, 6.250%, 2032/06/01 10,480,000 12,654 14,859 Province of Quebec, 5.750%, 2036/12/01 8,820,000 10,870 12,229 Province of Quebec, 5.000%, 2038/12/01 11,015,000 11,630 14,134 Province of Quebec, 5.000%, 2041/12/01 21,000,000 24,419 27,380 Province of Quebec, 4.250%, 2043/12/01 16,885,000 19,209 19,951 Province of Quebec, 3.500%, 2045/12/01 25,340,000 25,340 26,594 Province of Quebec, 3.500%, 2048/12/01 4,600,000 4,710 4,840 Province of Saskatchewan, 1.950%, 2019/03/01 2,000,000 2,003 2,056 Province of Saskatchewan, 3.900%, 2020/07/28 595,000 595 662 Province of Saskatchewan, 9.600%, 2022/02/04 700,000 882 1,014 Province of Saskatchewan, 3.200%, 2024/06/03 3,000,000 3,088 3,231 Province of Saskatchewan, 8.750%, 2025/05/30 260,000 331 398 Province of Saskatchewan, 5.750%, 2029/03/05 1,000,000 1,293 1,320 Province of Saskatchewan, 6.400%, 2031/09/05 1,520,000 1,993 2,162 Province of Saskatchewan, 5.800%, 2033/09/05 1,400,000 1,527 1,910 Province of Saskatchewan, 5.600%, 2035/09/05 1,040,000 1,157 1,406 Province of Saskatchewan, 5.000%, 2037/03/05 1,150,000 1,198 1,459
Manulife Canadian Bond Index Fund (Manulife Asset Management) (expressed in thousands of dollars, except par values)
Par value
Average cost
$Fair value
$ Par value
Average cost
$Fair value
$
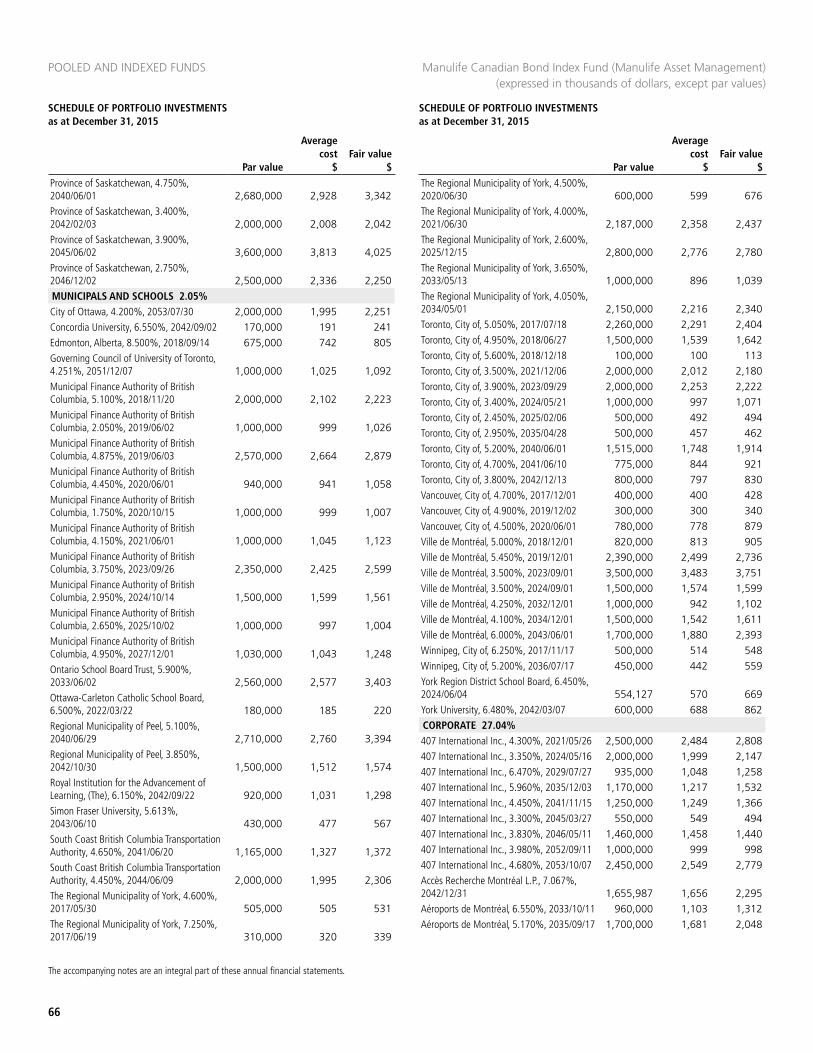
POOLED AND INDEXED FUNDS
66
SCHEDULE OF PORTFOLIO INVESTMENTS as at December 31, 2015
SCHEDULE OF PORTFOLIO INVESTMENTS as at December 31, 2015
The accompanying notes are an integral part of these annual financial statements.
Province of Saskatchewan, 4.750%, 2040/06/01 2,680,000 2,928 3,342 Province of Saskatchewan, 3.400%, 2042/02/03 2,000,000 2,008 2,042 Province of Saskatchewan, 3.900%, 2045/06/02 3,600,000 3,813 4,025 Province of Saskatchewan, 2.750%, 2046/12/02 2,500,000 2,336 2,250 MUNICIPALS AND SCHOOLS 2.05%City of Ottawa, 4.200%, 2053/07/30 2,000,000 1,995 2,251 Concordia University, 6.550%, 2042/09/02 170,000 191 241 Edmonton, Alberta, 8.500%, 2018/09/14 675,000 742 805 Governing Council of University of Toronto, 4.251%, 2051/12/07 1,000,000 1,025 1,092 Municipal Finance Authority of British Columbia, 5.100%, 2018/11/20 2,000,000 2,102 2,223 Municipal Finance Authority of British Columbia, 2.050%, 2019/06/02 1,000,000 999 1,026 Municipal Finance Authority of British Columbia, 4.875%, 2019/06/03 2,570,000 2,664 2,879 Municipal Finance Authority of British Columbia, 4.450%, 2020/06/01 940,000 941 1,058 Municipal Finance Authority of British Columbia, 1.750%, 2020/10/15 1,000,000 999 1,007 Municipal Finance Authority of British Columbia, 4.150%, 2021/06/01 1,000,000 1,045 1,123 Municipal Finance Authority of British Columbia, 3.750%, 2023/09/26 2,350,000 2,425 2,599 Municipal Finance Authority of British Columbia, 2.950%, 2024/10/14 1,500,000 1,599 1,561 Municipal Finance Authority of British Columbia, 2.650%, 2025/10/02 1,000,000 997 1,004 Municipal Finance Authority of British Columbia, 4.950%, 2027/12/01 1,030,000 1,043 1,248 Ontario School Board Trust, 5.900%, 2033/06/02 2,560,000 2,577 3,403 Ottawa-Carleton Catholic School Board, 6.500%, 2022/03/22 180,000 185 220 Regional Municipality of Peel, 5.100%, 2040/06/29 2,710,000 2,760 3,394 Regional Municipality of Peel, 3.850%, 2042/10/30 1,500,000 1,512 1,574 Royal Institution for the Advancement of Learning, (The), 6.150%, 2042/09/22 920,000 1,031 1,298 Simon Fraser University, 5.613%, 2043/06/10 430,000 477 567 South Coast British Columbia Transportation Authority, 4.650%, 2041/06/20 1,165,000 1,327 1,372 South Coast British Columbia Transportation Authority, 4.450%, 2044/06/09 2,000,000 1,995 2,306 The Regional Municipality of York, 4.600%, 2017/05/30 505,000 505 531 The Regional Municipality of York, 7.250%, 2017/06/19 310,000 320 339
The Regional Municipality of York, 4.500%, 2020/06/30 600,000 599 676 The Regional Municipality of York, 4.000%, 2021/06/30 2,187,000 2,358 2,437 The Regional Municipality of York, 2.600%, 2025/12/15 2,800,000 2,776 2,780 The Regional Municipality of York, 3.650%, 2033/05/13 1,000,000 896 1,039 The Regional Municipality of York, 4.050%, 2034/05/01 2,150,000 2,216 2,340 Toronto, City of, 5.050%, 2017/07/18 2,260,000 2,291 2,404 Toronto, City of, 4.950%, 2018/06/27 1,500,000 1,539 1,642 Toronto, City of, 5.600%, 2018/12/18 100,000 100 113 Toronto, City of, 3.500%, 2021/12/06 2,000,000 2,012 2,180 Toronto, City of, 3.900%, 2023/09/29 2,000,000 2,253 2,222 Toronto, City of, 3.400%, 2024/05/21 1,000,000 997 1,071 Toronto, City of, 2.450%, 2025/02/06 500,000 492 494 Toronto, City of, 2.950%, 2035/04/28 500,000 457 462 Toronto, City of, 5.200%, 2040/06/01 1,515,000 1,748 1,914 Toronto, City of, 4.700%, 2041/06/10 775,000 844 921 Toronto, City of, 3.800%, 2042/12/13 800,000 797 830 Vancouver, City of, 4.700%, 2017/12/01 400,000 400 428 Vancouver, City of, 4.900%, 2019/12/02 300,000 300 340 Vancouver, City of, 4.500%, 2020/06/01 780,000 778 879 Ville de Montréal, 5.000%, 2018/12/01 820,000 813 905 Ville de Montréal, 5.450%, 2019/12/01 2,390,000 2,499 2,736 Ville de Montréal, 3.500%, 2023/09/01 3,500,000 3,483 3,751 Ville de Montréal, 3.500%, 2024/09/01 1,500,000 1,574 1,599 Ville de Montréal, 4.250%, 2032/12/01 1,000,000 942 1,102 Ville de Montréal, 4.100%, 2034/12/01 1,500,000 1,542 1,611 Ville de Montréal, 6.000%, 2043/06/01 1,700,000 1,880 2,393 Winnipeg, City of, 6.250%, 2017/11/17 500,000 514 548 Winnipeg, City of, 5.200%, 2036/07/17 450,000 442 559 York Region District School Board, 6.450%, 2024/06/04 554,127 570 669 York University, 6.480%, 2042/03/07 600,000 688 862 CORPORATE 27.04%407 International Inc., 4.300%, 2021/05/26 2,500,000 2,484 2,808 407 International Inc., 3.350%, 2024/05/16 2,000,000 1,999 2,147 407 International Inc., 6.470%, 2029/07/27 935,000 1,048 1,258 407 International Inc., 5.960%, 2035/12/03 1,170,000 1,217 1,532 407 International Inc., 4.450%, 2041/11/15 1,250,000 1,249 1,366 407 International Inc., 3.300%, 2045/03/27 550,000 549 494 407 International Inc., 3.830%, 2046/05/11 1,460,000 1,458 1,440 407 International Inc., 3.980%, 2052/09/11 1,000,000 999 998 407 International Inc., 4.680%, 2053/10/07 2,450,000 2,549 2,779 Accès Recherche Montréal L.P., 7.067%, 2042/12/31 1,655,987 1,656 2,295 Aéroports de Montréal, 6.550%, 2033/10/11 960,000 1,103 1,312 Aéroports de Montréal, 5.170%, 2035/09/17 1,700,000 1,681 2,048
Manulife Canadian Bond Index Fund (Manulife Asset Management) (expressed in thousands of dollars, except par values)
Par value
Average cost
$Fair value
$ Par value
Average cost
$Fair value
$
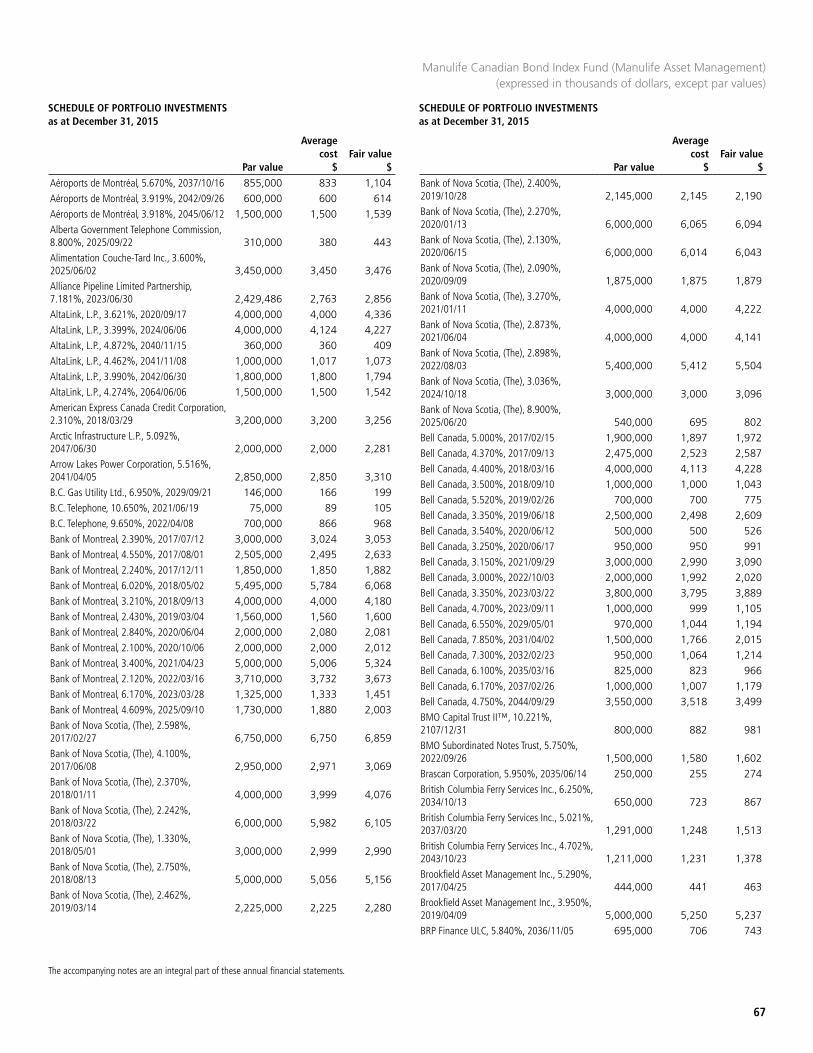
SCHEDULE OF PORTFOLIO INVESTMENTS as at December 31, 2015
SCHEDULE OF PORTFOLIO INVESTMENTS as at December 31, 2015
67
The accompanying notes are an integral part of these annual financial statements.
Aéroports de Montréal, 5.670%, 2037/10/16 855,000 833 1,104 Aéroports de Montréal, 3.919%, 2042/09/26 600,000 600 614 Aéroports de Montréal, 3.918%, 2045/06/12 1,500,000 1,500 1,539 Alberta Government Telephone Commission, 8.800%, 2025/09/22 310,000 380 443 Alimentation Couche-Tard Inc., 3.600%, 2025/06/02 3,450,000 3,450 3,476 Alliance Pipeline Limited Partnership, 7.181%, 2023/06/30 2,429,486 2,763 2,856 AltaLink, L.P., 3.621%, 2020/09/17 4,000,000 4,000 4,336 AltaLink, L.P., 3.399%, 2024/06/06 4,000,000 4,124 4,227 AltaLink, L.P., 4.872%, 2040/11/15 360,000 360 409 AltaLink, L.P., 4.462%, 2041/11/08 1,000,000 1,017 1,073 AltaLink, L.P., 3.990%, 2042/06/30 1,800,000 1,800 1,794 AltaLink, L.P., 4.274%, 2064/06/06 1,500,000 1,500 1,542 American Express Canada Credit Corporation, 2.310%, 2018/03/29 3,200,000 3,200 3,256 Arctic Infrastructure L.P., 5.092%, 2047/06/30 2,000,000 2,000 2,281 Arrow Lakes Power Corporation, 5.516%, 2041/04/05 2,850,000 2,850 3,310 B.C. Gas Utility Ltd., 6.950%, 2029/09/21 146,000 166 199 B.C. Telephone, 10.650%, 2021/06/19 75,000 89 105 B.C. Telephone, 9.650%, 2022/04/08 700,000 866 968 Bank of Montreal, 2.390%, 2017/07/12 3,000,000 3,024 3,053 Bank of Montreal, 4.550%, 2017/08/01 2,505,000 2,495 2,633 Bank of Montreal, 2.240%, 2017/12/11 1,850,000 1,850 1,882 Bank of Montreal, 6.020%, 2018/05/02 5,495,000 5,784 6,068 Bank of Montreal, 3.210%, 2018/09/13 4,000,000 4,000 4,180 Bank of Montreal, 2.430%, 2019/03/04 1,560,000 1,560 1,600 Bank of Montreal, 2.840%, 2020/06/04 2,000,000 2,080 2,081 Bank of Montreal, 2.100%, 2020/10/06 2,000,000 2,000 2,012 Bank of Montreal, 3.400%, 2021/04/23 5,000,000 5,006 5,324 Bank of Montreal, 2.120%, 2022/03/16 3,710,000 3,732 3,673 Bank of Montreal, 6.170%, 2023/03/28 1,325,000 1,333 1,451 Bank of Montreal, 4.609%, 2025/09/10 1,730,000 1,880 2,003 Bank of Nova Scotia, (The), 2.598%, 2017/02/27 6,750,000 6,750 6,859 Bank of Nova Scotia, (The), 4.100%, 2017/06/08 2,950,000 2,971 3,069 Bank of Nova Scotia, (The), 2.370%, 2018/01/11 4,000,000 3,999 4,076 Bank of Nova Scotia, (The), 2.242%, 2018/03/22 6,000,000 5,982 6,105 Bank of Nova Scotia, (The), 1.330%, 2018/05/01 3,000,000 2,999 2,990 Bank of Nova Scotia, (The), 2.750%, 2018/08/13 5,000,000 5,056 5,156 Bank of Nova Scotia, (The), 2.462%, 2019/03/14 2,225,000 2,225 2,280
Bank of Nova Scotia, (The), 2.400%, 2019/10/28 2,145,000 2,145 2,190 Bank of Nova Scotia, (The), 2.270%, 2020/01/13 6,000,000 6,065 6,094 Bank of Nova Scotia, (The), 2.130%, 2020/06/15 6,000,000 6,014 6,043 Bank of Nova Scotia, (The), 2.090%, 2020/09/09 1,875,000 1,875 1,879 Bank of Nova Scotia, (The), 3.270%, 2021/01/11 4,000,000 4,000 4,222 Bank of Nova Scotia, (The), 2.873%, 2021/06/04 4,000,000 4,000 4,141 Bank of Nova Scotia, (The), 2.898%, 2022/08/03 5,400,000 5,412 5,504 Bank of Nova Scotia, (The), 3.036%, 2024/10/18 3,000,000 3,000 3,096 Bank of Nova Scotia, (The), 8.900%, 2025/06/20 540,000 695 802 Bell Canada, 5.000%, 2017/02/15 1,900,000 1,897 1,972 Bell Canada, 4.370%, 2017/09/13 2,475,000 2,523 2,587 Bell Canada, 4.400%, 2018/03/16 4,000,000 4,113 4,228 Bell Canada, 3.500%, 2018/09/10 1,000,000 1,000 1,043 Bell Canada, 5.520%, 2019/02/26 700,000 700 775 Bell Canada, 3.350%, 2019/06/18 2,500,000 2,498 2,609 Bell Canada, 3.540%, 2020/06/12 500,000 500 526 Bell Canada, 3.250%, 2020/06/17 950,000 950 991 Bell Canada, 3.150%, 2021/09/29 3,000,000 2,990 3,090 Bell Canada, 3.000%, 2022/10/03 2,000,000 1,992 2,020 Bell Canada, 3.350%, 2023/03/22 3,800,000 3,795 3,889 Bell Canada, 4.700%, 2023/09/11 1,000,000 999 1,105 Bell Canada, 6.550%, 2029/05/01 970,000 1,044 1,194 Bell Canada, 7.850%, 2031/04/02 1,500,000 1,766 2,015 Bell Canada, 7.300%, 2032/02/23 950,000 1,064 1,214 Bell Canada, 6.100%, 2035/03/16 825,000 823 966 Bell Canada, 6.170%, 2037/02/26 1,000,000 1,007 1,179 Bell Canada, 4.750%, 2044/09/29 3,550,000 3,518 3,499 BMO Capital Trust II™, 10.221%, 2107/12/31 800,000 882 981 BMO Subordinated Notes Trust, 5.750%, 2022/09/26 1,500,000 1,580 1,602 Brascan Corporation, 5.950%, 2035/06/14 250,000 255 274 British Columbia Ferry Services Inc., 6.250%, 2034/10/13 650,000 723 867 British Columbia Ferry Services Inc., 5.021%, 2037/03/20 1,291,000 1,248 1,513 British Columbia Ferry Services Inc., 4.702%, 2043/10/23 1,211,000 1,231 1,378 Brookfield Asset Management Inc., 5.290%, 2017/04/25 444,000 441 463 Brookfield Asset Management Inc., 3.950%, 2019/04/09 5,000,000 5,250 5,237 BRP Finance ULC, 5.840%, 2036/11/05 695,000 706 743
Manulife Canadian Bond Index Fund (Manulife Asset Management) (expressed in thousands of dollars, except par values)
Par value
Average cost
$Fair value
$ Par value
Average cost
$Fair value
$
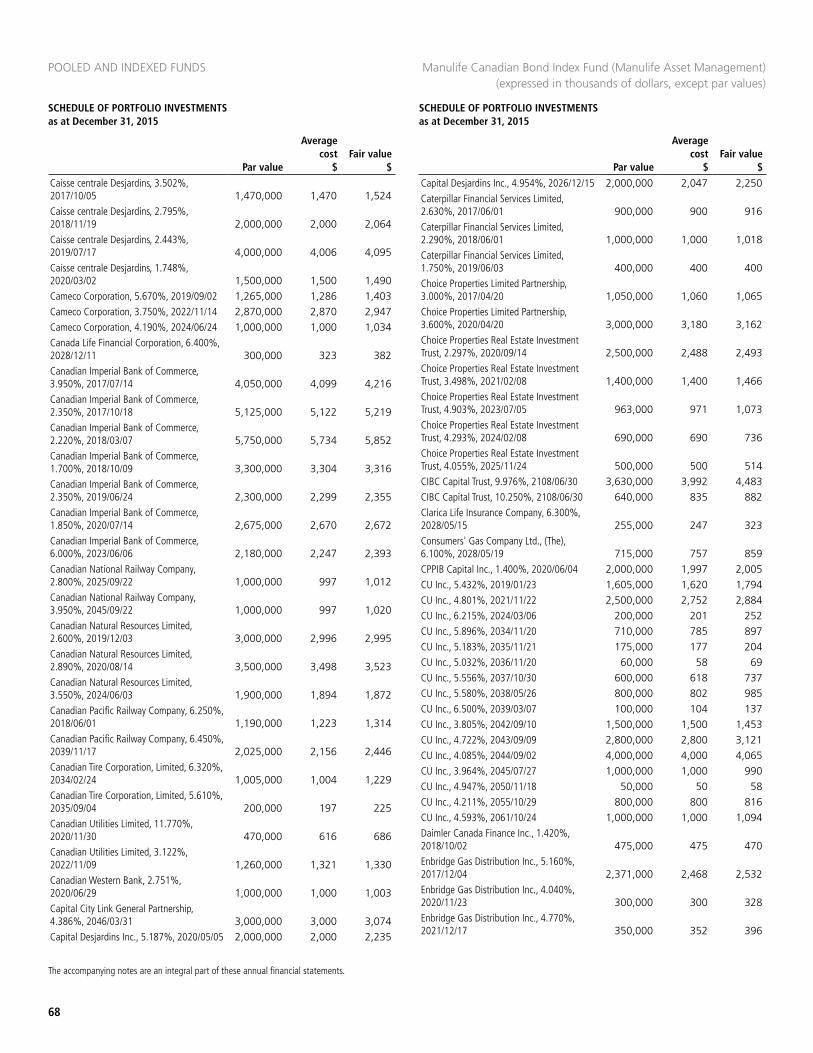
POOLED AND INDEXED FUNDS
68
SCHEDULE OF PORTFOLIO INVESTMENTS as at December 31, 2015
SCHEDULE OF PORTFOLIO INVESTMENTS as at December 31, 2015
The accompanying notes are an integral part of these annual financial statements.
Caisse centrale Desjardins, 3.502%, 2017/10/05 1,470,000 1,470 1,524 Caisse centrale Desjardins, 2.795%, 2018/11/19 2,000,000 2,000 2,064 Caisse centrale Desjardins, 2.443%, 2019/07/17 4,000,000 4,006 4,095 Caisse centrale Desjardins, 1.748%, 2020/03/02 1,500,000 1,500 1,490 Cameco Corporation, 5.670%, 2019/09/02 1,265,000 1,286 1,403 Cameco Corporation, 3.750%, 2022/11/14 2,870,000 2,870 2,947 Cameco Corporation, 4.190%, 2024/06/24 1,000,000 1,000 1,034 Canada Life Financial Corporation, 6.400%, 2028/12/11 300,000 323 382 Canadian Imperial Bank of Commerce, 3.950%, 2017/07/14 4,050,000 4,099 4,216 Canadian Imperial Bank of Commerce, 2.350%, 2017/10/18 5,125,000 5,122 5,219 Canadian Imperial Bank of Commerce, 2.220%, 2018/03/07 5,750,000 5,734 5,852 Canadian Imperial Bank of Commerce, 1.700%, 2018/10/09 3,300,000 3,304 3,316 Canadian Imperial Bank of Commerce, 2.350%, 2019/06/24 2,300,000 2,299 2,355 Canadian Imperial Bank of Commerce, 1.850%, 2020/07/14 2,675,000 2,670 2,672 Canadian Imperial Bank of Commerce, 6.000%, 2023/06/06 2,180,000 2,247 2,393 Canadian National Railway Company, 2.800%, 2025/09/22 1,000,000 997 1,012 Canadian National Railway Company, 3.950%, 2045/09/22 1,000,000 997 1,020 Canadian Natural Resources Limited, 2.600%, 2019/12/03 3,000,000 2,996 2,995 Canadian Natural Resources Limited, 2.890%, 2020/08/14 3,500,000 3,498 3,523 Canadian Natural Resources Limited, 3.550%, 2024/06/03 1,900,000 1,894 1,872 Canadian Pacific Railway Company, 6.250%, 2018/06/01 1,190,000 1,223 1,314 Canadian Pacific Railway Company, 6.450%, 2039/11/17 2,025,000 2,156 2,446 Canadian Tire Corporation, Limited, 6.320%, 2034/02/24 1,005,000 1,004 1,229 Canadian Tire Corporation, Limited, 5.610%, 2035/09/04 200,000 197 225 Canadian Utilities Limited, 11.770%, 2020/11/30 470,000 616 686 Canadian Utilities Limited, 3.122%, 2022/11/09 1,260,000 1,321 1,330 Canadian Western Bank, 2.751%, 2020/06/29 1,000,000 1,000 1,003 Capital City Link General Partnership, 4.386%, 2046/03/31 3,000,000 3,000 3,074 Capital Desjardins Inc., 5.187%, 2020/05/05 2,000,000 2,000 2,235
Capital Desjardins Inc., 4.954%, 2026/12/15 2,000,000 2,047 2,250 Caterpillar Financial Services Limited, 2.630%, 2017/06/01 900,000 900 916 Caterpillar Financial Services Limited, 2.290%, 2018/06/01 1,000,000 1,000 1,018 Caterpillar Financial Services Limited, 1.750%, 2019/06/03 400,000 400 400 Choice Properties Limited Partnership, 3.000%, 2017/04/20 1,050,000 1,060 1,065 Choice Properties Limited Partnership, 3.600%, 2020/04/20 3,000,000 3,180 3,162 Choice Properties Real Estate Investment Trust, 2.297%, 2020/09/14 2,500,000 2,488 2,493 Choice Properties Real Estate Investment Trust, 3.498%, 2021/02/08 1,400,000 1,400 1,466 Choice Properties Real Estate Investment Trust, 4.903%, 2023/07/05 963,000 971 1,073 Choice Properties Real Estate Investment Trust, 4.293%, 2024/02/08 690,000 690 736 Choice Properties Real Estate Investment Trust, 4.055%, 2025/11/24 500,000 500 514 CIBC Capital Trust, 9.976%, 2108/06/30 3,630,000 3,992 4,483 CIBC Capital Trust, 10.250%, 2108/06/30 640,000 835 882 Clarica Life Insurance Company, 6.300%, 2028/05/15 255,000 247 323 Consumers' Gas Company Ltd., (The), 6.100%, 2028/05/19 715,000 757 859 CPPIB Capital Inc., 1.400%, 2020/06/04 2,000,000 1,997 2,005 CU Inc., 5.432%, 2019/01/23 1,605,000 1,620 1,794 CU Inc., 4.801%, 2021/11/22 2,500,000 2,752 2,884 CU Inc., 6.215%, 2024/03/06 200,000 201 252 CU Inc., 5.896%, 2034/11/20 710,000 785 897 CU Inc., 5.183%, 2035/11/21 175,000 177 204 CU Inc., 5.032%, 2036/11/20 60,000 58 69 CU Inc., 5.556%, 2037/10/30 600,000 618 737 CU Inc., 5.580%, 2038/05/26 800,000 802 985 CU Inc., 6.500%, 2039/03/07 100,000 104 137 CU Inc., 3.805%, 2042/09/10 1,500,000 1,500 1,453 CU Inc., 4.722%, 2043/09/09 2,800,000 2,800 3,121 CU Inc., 4.085%, 2044/09/02 4,000,000 4,000 4,065 CU Inc., 3.964%, 2045/07/27 1,000,000 1,000 990 CU Inc., 4.947%, 2050/11/18 50,000 50 58 CU Inc., 4.211%, 2055/10/29 800,000 800 816 CU Inc., 4.593%, 2061/10/24 1,000,000 1,000 1,094 Daimler Canada Finance Inc., 1.420%, 2018/10/02 475,000 475 470 Enbridge Gas Distribution Inc., 5.160%, 2017/12/04 2,371,000 2,468 2,532 Enbridge Gas Distribution Inc., 4.040%, 2020/11/23 300,000 300 328 Enbridge Gas Distribution Inc., 4.770%, 2021/12/17 350,000 352 396
Manulife Canadian Bond Index Fund (Manulife Asset Management) (expressed in thousands of dollars, except par values)
Par value
Average cost
$Fair value
$ Par value
Average cost
$Fair value
$
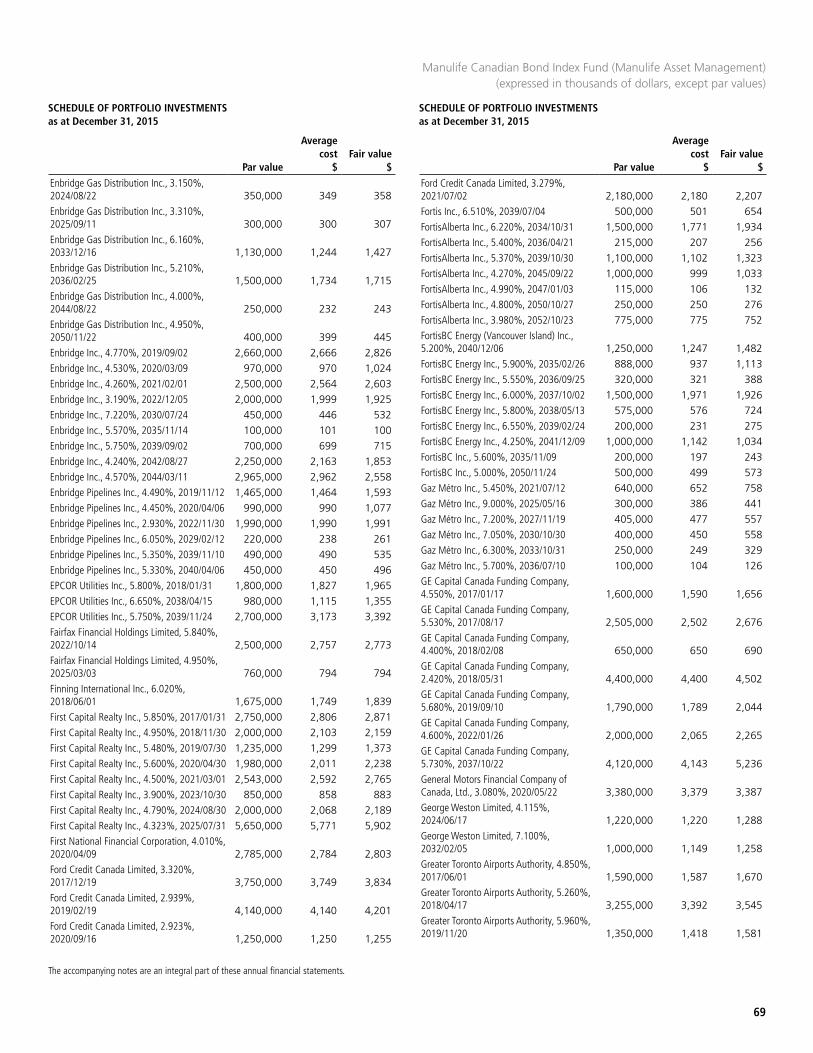
SCHEDULE OF PORTFOLIO INVESTMENTS as at December 31, 2015
SCHEDULE OF PORTFOLIO INVESTMENTS as at December 31, 2015
69
The accompanying notes are an integral part of these annual financial statements.
Enbridge Gas Distribution Inc., 3.150%, 2024/08/22 350,000 349 358 Enbridge Gas Distribution Inc., 3.310%, 2025/09/11 300,000 300 307 Enbridge Gas Distribution Inc., 6.160%, 2033/12/16 1,130,000 1,244 1,427 Enbridge Gas Distribution Inc., 5.210%, 2036/02/25 1,500,000 1,734 1,715 Enbridge Gas Distribution Inc., 4.000%, 2044/08/22 250,000 232 243 Enbridge Gas Distribution Inc., 4.950%, 2050/11/22 400,000 399 445 Enbridge Inc., 4.770%, 2019/09/02 2,660,000 2,666 2,826 Enbridge Inc., 4.530%, 2020/03/09 970,000 970 1,024 Enbridge Inc., 4.260%, 2021/02/01 2,500,000 2,564 2,603 Enbridge Inc., 3.190%, 2022/12/05 2,000,000 1,999 1,925 Enbridge Inc., 7.220%, 2030/07/24 450,000 446 532 Enbridge Inc., 5.570%, 2035/11/14 100,000 101 100 Enbridge Inc., 5.750%, 2039/09/02 700,000 699 715 Enbridge Inc., 4.240%, 2042/08/27 2,250,000 2,163 1,853 Enbridge Inc., 4.570%, 2044/03/11 2,965,000 2,962 2,558 Enbridge Pipelines Inc., 4.490%, 2019/11/12 1,465,000 1,464 1,593 Enbridge Pipelines Inc., 4.450%, 2020/04/06 990,000 990 1,077 Enbridge Pipelines Inc., 2.930%, 2022/11/30 1,990,000 1,990 1,991 Enbridge Pipelines Inc., 6.050%, 2029/02/12 220,000 238 261 Enbridge Pipelines Inc., 5.350%, 2039/11/10 490,000 490 535 Enbridge Pipelines Inc., 5.330%, 2040/04/06 450,000 450 496 EPCOR Utilities Inc., 5.800%, 2018/01/31 1,800,000 1,827 1,965 EPCOR Utilities Inc., 6.650%, 2038/04/15 980,000 1,115 1,355 EPCOR Utilities Inc., 5.750%, 2039/11/24 2,700,000 3,173 3,392 Fairfax Financial Holdings Limited, 5.840%, 2022/10/14 2,500,000 2,757 2,773 Fairfax Financial Holdings Limited, 4.950%, 2025/03/03 760,000 794 794 Finning International Inc., 6.020%, 2018/06/01 1,675,000 1,749 1,839 First Capital Realty Inc., 5.850%, 2017/01/31 2,750,000 2,806 2,871 First Capital Realty Inc., 4.950%, 2018/11/30 2,000,000 2,103 2,159 First Capital Realty Inc., 5.480%, 2019/07/30 1,235,000 1,299 1,373 First Capital Realty Inc., 5.600%, 2020/04/30 1,980,000 2,011 2,238 First Capital Realty Inc., 4.500%, 2021/03/01 2,543,000 2,592 2,765 First Capital Realty Inc., 3.900%, 2023/10/30 850,000 858 883 First Capital Realty Inc., 4.790%, 2024/08/30 2,000,000 2,068 2,189 First Capital Realty Inc., 4.323%, 2025/07/31 5,650,000 5,771 5,902 First National Financial Corporation, 4.010%, 2020/04/09 2,785,000 2,784 2,803 Ford Credit Canada Limited, 3.320%, 2017/12/19 3,750,000 3,749 3,834 Ford Credit Canada Limited, 2.939%, 2019/02/19 4,140,000 4,140 4,201 Ford Credit Canada Limited, 2.923%, 2020/09/16 1,250,000 1,250 1,255
Ford Credit Canada Limited, 3.279%, 2021/07/02 2,180,000 2,180 2,207 Fortis Inc., 6.510%, 2039/07/04 500,000 501 654 FortisAlberta Inc., 6.220%, 2034/10/31 1,500,000 1,771 1,934 FortisAlberta Inc., 5.400%, 2036/04/21 215,000 207 256 FortisAlberta Inc., 5.370%, 2039/10/30 1,100,000 1,102 1,323 FortisAlberta Inc., 4.270%, 2045/09/22 1,000,000 999 1,033 FortisAlberta Inc., 4.990%, 2047/01/03 115,000 106 132 FortisAlberta Inc., 4.800%, 2050/10/27 250,000 250 276 FortisAlberta Inc., 3.980%, 2052/10/23 775,000 775 752 FortisBC Energy (Vancouver Island) Inc., 5.200%, 2040/12/06 1,250,000 1,247 1,482 FortisBC Energy Inc., 5.900%, 2035/02/26 888,000 937 1,113 FortisBC Energy Inc., 5.550%, 2036/09/25 320,000 321 388 FortisBC Energy Inc., 6.000%, 2037/10/02 1,500,000 1,971 1,926 FortisBC Energy Inc., 5.800%, 2038/05/13 575,000 576 724 FortisBC Energy Inc., 6.550%, 2039/02/24 200,000 231 275 FortisBC Energy Inc., 4.250%, 2041/12/09 1,000,000 1,142 1,034 FortisBC Inc., 5.600%, 2035/11/09 200,000 197 243 FortisBC Inc., 5.000%, 2050/11/24 500,000 499 573 Gaz Métro Inc., 5.450%, 2021/07/12 640,000 652 758 Gaz Métro Inc., 9.000%, 2025/05/16 300,000 386 441 Gaz Métro Inc., 7.200%, 2027/11/19 405,000 477 557 Gaz Métro Inc., 7.050%, 2030/10/30 400,000 450 558 Gaz Métro Inc., 6.300%, 2033/10/31 250,000 249 329 Gaz Métro Inc., 5.700%, 2036/07/10 100,000 104 126 GE Capital Canada Funding Company, 4.550%, 2017/01/17 1,600,000 1,590 1,656 GE Capital Canada Funding Company, 5.530%, 2017/08/17 2,505,000 2,502 2,676 GE Capital Canada Funding Company, 4.400%, 2018/02/08 650,000 650 690 GE Capital Canada Funding Company, 2.420%, 2018/05/31 4,400,000 4,400 4,502 GE Capital Canada Funding Company, 5.680%, 2019/09/10 1,790,000 1,789 2,044 GE Capital Canada Funding Company, 4.600%, 2022/01/26 2,000,000 2,065 2,265 GE Capital Canada Funding Company, 5.730%, 2037/10/22 4,120,000 4,143 5,236 General Motors Financial Company of Canada, Ltd., 3.080%, 2020/05/22 3,380,000 3,379 3,387 George Weston Limited, 4.115%, 2024/06/17 1,220,000 1,220 1,288 George Weston Limited, 7.100%, 2032/02/05 1,000,000 1,149 1,258 Greater Toronto Airports Authority, 4.850%, 2017/06/01 1,590,000 1,587 1,670 Greater Toronto Airports Authority, 5.260%, 2018/04/17 3,255,000 3,392 3,545 Greater Toronto Airports Authority, 5.960%, 2019/11/20 1,350,000 1,418 1,581
Manulife Canadian Bond Index Fund (Manulife Asset Management) (expressed in thousands of dollars, except par values)
Par value
Average cost
$Fair value
$ Par value
Average cost
$Fair value
$
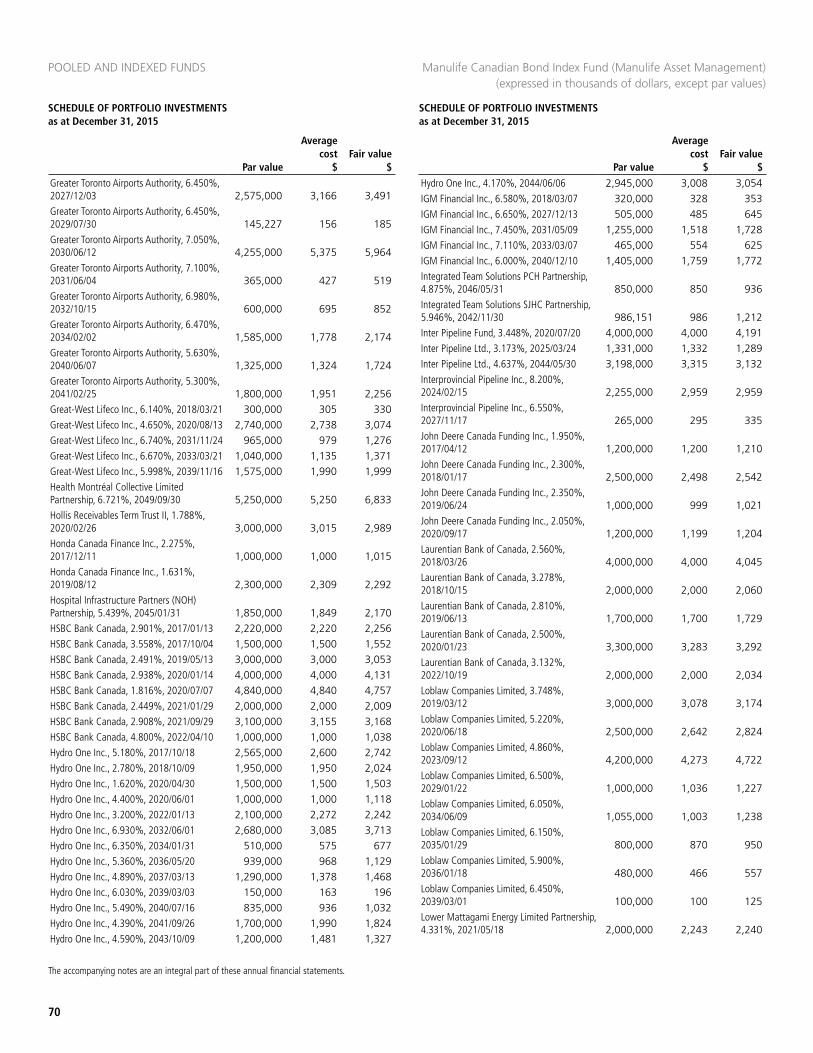
POOLED AND INDEXED FUNDS
70
SCHEDULE OF PORTFOLIO INVESTMENTS as at December 31, 2015
SCHEDULE OF PORTFOLIO INVESTMENTS as at December 31, 2015
The accompanying notes are an integral part of these annual financial statements.
Greater Toronto Airports Authority, 6.450%, 2027/12/03 2,575,000 3,166 3,491 Greater Toronto Airports Authority, 6.450%, 2029/07/30 145,227 156 185 Greater Toronto Airports Authority, 7.050%, 2030/06/12 4,255,000 5,375 5,964 Greater Toronto Airports Authority, 7.100%, 2031/06/04 365,000 427 519 Greater Toronto Airports Authority, 6.980%, 2032/10/15 600,000 695 852 Greater Toronto Airports Authority, 6.470%, 2034/02/02 1,585,000 1,778 2,174 Greater Toronto Airports Authority, 5.630%, 2040/06/07 1,325,000 1,324 1,724 Greater Toronto Airports Authority, 5.300%, 2041/02/25 1,800,000 1,951 2,256 Great-West Lifeco Inc., 6.140%, 2018/03/21 300,000 305 330 Great-West Lifeco Inc., 4.650%, 2020/08/13 2,740,000 2,738 3,074 Great-West Lifeco Inc., 6.740%, 2031/11/24 965,000 979 1,276 Great-West Lifeco Inc., 6.670%, 2033/03/21 1,040,000 1,135 1,371 Great-West Lifeco Inc., 5.998%, 2039/11/16 1,575,000 1,990 1,999 Health Montréal Collective Limited Partnership, 6.721%, 2049/09/30 5,250,000 5,250 6,833 Hollis Receivables Term Trust II, 1.788%, 2020/02/26 3,000,000 3,015 2,989 Honda Canada Finance Inc., 2.275%, 2017/12/11 1,000,000 1,000 1,015 Honda Canada Finance Inc., 1.631%, 2019/08/12 2,300,000 2,309 2,292 Hospital Infrastructure Partners (NOH) Partnership, 5.439%, 2045/01/31 1,850,000 1,849 2,170 HSBC Bank Canada, 2.901%, 2017/01/13 2,220,000 2,220 2,256 HSBC Bank Canada, 3.558%, 2017/10/04 1,500,000 1,500 1,552 HSBC Bank Canada, 2.491%, 2019/05/13 3,000,000 3,000 3,053 HSBC Bank Canada, 2.938%, 2020/01/14 4,000,000 4,000 4,131 HSBC Bank Canada, 1.816%, 2020/07/07 4,840,000 4,840 4,757 HSBC Bank Canada, 2.449%, 2021/01/29 2,000,000 2,000 2,009 HSBC Bank Canada, 2.908%, 2021/09/29 3,100,000 3,155 3,168 HSBC Bank Canada, 4.800%, 2022/04/10 1,000,000 1,000 1,038 Hydro One Inc., 5.180%, 2017/10/18 2,565,000 2,600 2,742 Hydro One Inc., 2.780%, 2018/10/09 1,950,000 1,950 2,024 Hydro One Inc., 1.620%, 2020/04/30 1,500,000 1,500 1,503 Hydro One Inc., 4.400%, 2020/06/01 1,000,000 1,000 1,118 Hydro One Inc., 3.200%, 2022/01/13 2,100,000 2,272 2,242 Hydro One Inc., 6.930%, 2032/06/01 2,680,000 3,085 3,713 Hydro One Inc., 6.350%, 2034/01/31 510,000 575 677 Hydro One Inc., 5.360%, 2036/05/20 939,000 968 1,129 Hydro One Inc., 4.890%, 2037/03/13 1,290,000 1,378 1,468 Hydro One Inc., 6.030%, 2039/03/03 150,000 163 196 Hydro One Inc., 5.490%, 2040/07/16 835,000 936 1,032 Hydro One Inc., 4.390%, 2041/09/26 1,700,000 1,990 1,824 Hydro One Inc., 4.590%, 2043/10/09 1,200,000 1,481 1,327
Hydro One Inc., 4.170%, 2044/06/06 2,945,000 3,008 3,054 IGM Financial Inc., 6.580%, 2018/03/07 320,000 328 353 IGM Financial Inc., 6.650%, 2027/12/13 505,000 485 645 IGM Financial Inc., 7.450%, 2031/05/09 1,255,000 1,518 1,728 IGM Financial Inc., 7.110%, 2033/03/07 465,000 554 625 IGM Financial Inc., 6.000%, 2040/12/10 1,405,000 1,759 1,772 Integrated Team Solutions PCH Partnership, 4.875%, 2046/05/31 850,000 850 936 Integrated Team Solutions SJHC Partnership, 5.946%, 2042/11/30 986,151 986 1,212 Inter Pipeline Fund, 3.448%, 2020/07/20 4,000,000 4,000 4,191 Inter Pipeline Ltd., 3.173%, 2025/03/24 1,331,000 1,332 1,289 Inter Pipeline Ltd., 4.637%, 2044/05/30 3,198,000 3,315 3,132 Interprovincial Pipeline Inc., 8.200%, 2024/02/15 2,255,000 2,959 2,959 Interprovincial Pipeline Inc., 6.550%, 2027/11/17 265,000 295 335 John Deere Canada Funding Inc., 1.950%, 2017/04/12 1,200,000 1,200 1,210 John Deere Canada Funding Inc., 2.300%, 2018/01/17 2,500,000 2,498 2,542 John Deere Canada Funding Inc., 2.350%, 2019/06/24 1,000,000 999 1,021 John Deere Canada Funding Inc., 2.050%, 2020/09/17 1,200,000 1,199 1,204 Laurentian Bank of Canada, 2.560%, 2018/03/26 4,000,000 4,000 4,045 Laurentian Bank of Canada, 3.278%, 2018/10/15 2,000,000 2,000 2,060 Laurentian Bank of Canada, 2.810%, 2019/06/13 1,700,000 1,700 1,729 Laurentian Bank of Canada, 2.500%, 2020/01/23 3,300,000 3,283 3,292 Laurentian Bank of Canada, 3.132%, 2022/10/19 2,000,000 2,000 2,034 Loblaw Companies Limited, 3.748%, 2019/03/12 3,000,000 3,078 3,174 Loblaw Companies Limited, 5.220%, 2020/06/18 2,500,000 2,642 2,824 Loblaw Companies Limited, 4.860%, 2023/09/12 4,200,000 4,273 4,722 Loblaw Companies Limited, 6.500%, 2029/01/22 1,000,000 1,036 1,227 Loblaw Companies Limited, 6.050%, 2034/06/09 1,055,000 1,003 1,238 Loblaw Companies Limited, 6.150%, 2035/01/29 800,000 870 950 Loblaw Companies Limited, 5.900%, 2036/01/18 480,000 466 557 Loblaw Companies Limited, 6.450%, 2039/03/01 100,000 100 125 Lower Mattagami Energy Limited Partnership, 4.331%, 2021/05/18 2,000,000 2,243 2,240
Manulife Canadian Bond Index Fund (Manulife Asset Management) (expressed in thousands of dollars, except par values)
Par value
Average cost
$Fair value
$ Par value
Average cost
$Fair value
$
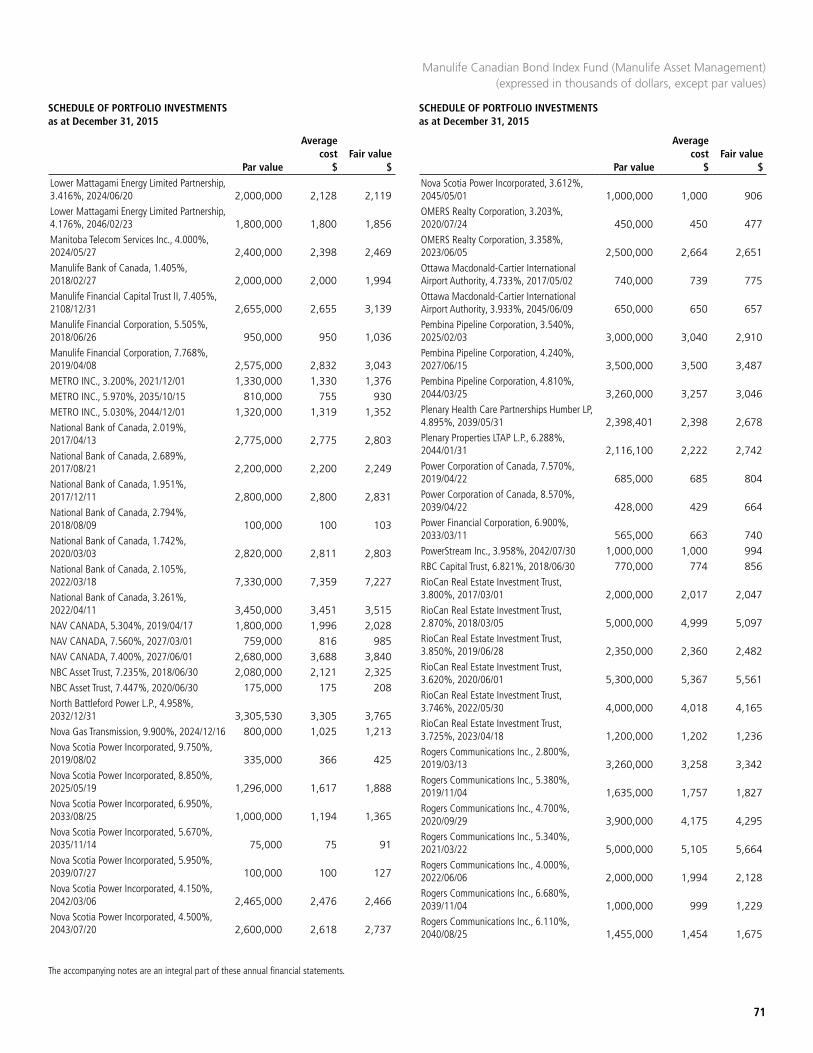
SCHEDULE OF PORTFOLIO INVESTMENTS as at December 31, 2015
SCHEDULE OF PORTFOLIO INVESTMENTS as at December 31, 2015
71
The accompanying notes are an integral part of these annual financial statements.
Lower Mattagami Energy Limited Partnership, 3.416%, 2024/06/20 2,000,000 2,128 2,119 Lower Mattagami Energy Limited Partnership, 4.176%, 2046/02/23 1,800,000 1,800 1,856 Manitoba Telecom Services Inc., 4.000%, 2024/05/27 2,400,000 2,398 2,469 Manulife Bank of Canada, 1.405%, 2018/02/27 2,000,000 2,000 1,994 Manulife Financial Capital Trust II, 7.405%, 2108/12/31 2,655,000 2,655 3,139 Manulife Financial Corporation, 5.505%, 2018/06/26 950,000 950 1,036 Manulife Financial Corporation, 7.768%, 2019/04/08 2,575,000 2,832 3,043 METRO INC., 3.200%, 2021/12/01 1,330,000 1,330 1,376 METRO INC., 5.970%, 2035/10/15 810,000 755 930 METRO INC., 5.030%, 2044/12/01 1,320,000 1,319 1,352 National Bank of Canada, 2.019%, 2017/04/13 2,775,000 2,775 2,803 National Bank of Canada, 2.689%, 2017/08/21 2,200,000 2,200 2,249 National Bank of Canada, 1.951%, 2017/12/11 2,800,000 2,800 2,831 National Bank of Canada, 2.794%, 2018/08/09 100,000 100 103 National Bank of Canada, 1.742%, 2020/03/03 2,820,000 2,811 2,803 National Bank of Canada, 2.105%, 2022/03/18 7,330,000 7,359 7,227 National Bank of Canada, 3.261%, 2022/04/11 3,450,000 3,451 3,515 NAV CANADA, 5.304%, 2019/04/17 1,800,000 1,996 2,028 NAV CANADA, 7.560%, 2027/03/01 759,000 816 985 NAV CANADA, 7.400%, 2027/06/01 2,680,000 3,688 3,840 NBC Asset Trust, 7.235%, 2018/06/30 2,080,000 2,121 2,325 NBC Asset Trust, 7.447%, 2020/06/30 175,000 175 208 North Battleford Power L.P., 4.958%, 2032/12/31 3,305,530 3,305 3,765 Nova Gas Transmission, 9.900%, 2024/12/16 800,000 1,025 1,213 Nova Scotia Power Incorporated, 9.750%, 2019/08/02 335,000 366 425 Nova Scotia Power Incorporated, 8.850%, 2025/05/19 1,296,000 1,617 1,888 Nova Scotia Power Incorporated, 6.950%, 2033/08/25 1,000,000 1,194 1,365 Nova Scotia Power Incorporated, 5.670%, 2035/11/14 75,000 75 91 Nova Scotia Power Incorporated, 5.950%, 2039/07/27 100,000 100 127 Nova Scotia Power Incorporated, 4.150%, 2042/03/06 2,465,000 2,476 2,466 Nova Scotia Power Incorporated, 4.500%, 2043/07/20 2,600,000 2,618 2,737
Nova Scotia Power Incorporated, 3.612%, 2045/05/01 1,000,000 1,000 906 OMERS Realty Corporation, 3.203%, 2020/07/24 450,000 450 477 OMERS Realty Corporation, 3.358%, 2023/06/05 2,500,000 2,664 2,651 Ottawa Macdonald-Cartier International Airport Authority, 4.733%, 2017/05/02 740,000 739 775 Ottawa Macdonald-Cartier International Airport Authority, 3.933%, 2045/06/09 650,000 650 657 Pembina Pipeline Corporation, 3.540%, 2025/02/03 3,000,000 3,040 2,910 Pembina Pipeline Corporation, 4.240%, 2027/06/15 3,500,000 3,500 3,487 Pembina Pipeline Corporation, 4.810%, 2044/03/25 3,260,000 3,257 3,046 Plenary Health Care Partnerships Humber LP, 4.895%, 2039/05/31 2,398,401 2,398 2,678 Plenary Properties LTAP L.P., 6.288%, 2044/01/31 2,116,100 2,222 2,742 Power Corporation of Canada, 7.570%, 2019/04/22 685,000 685 804 Power Corporation of Canada, 8.570%, 2039/04/22 428,000 429 664 Power Financial Corporation, 6.900%, 2033/03/11 565,000 663 740 PowerStream Inc., 3.958%, 2042/07/30 1,000,000 1,000 994 RBC Capital Trust, 6.821%, 2018/06/30 770,000 774 856 RioCan Real Estate Investment Trust, 3.800%, 2017/03/01 2,000,000 2,017 2,047 RioCan Real Estate Investment Trust, 2.870%, 2018/03/05 5,000,000 4,999 5,097 RioCan Real Estate Investment Trust, 3.850%, 2019/06/28 2,350,000 2,360 2,482 RioCan Real Estate Investment Trust, 3.620%, 2020/06/01 5,300,000 5,367 5,561 RioCan Real Estate Investment Trust, 3.746%, 2022/05/30 4,000,000 4,018 4,165 RioCan Real Estate Investment Trust, 3.725%, 2023/04/18 1,200,000 1,202 1,236 Rogers Communications Inc., 2.800%, 2019/03/13 3,260,000 3,258 3,342 Rogers Communications Inc., 5.380%, 2019/11/04 1,635,000 1,757 1,827 Rogers Communications Inc., 4.700%, 2020/09/29 3,900,000 4,175 4,295 Rogers Communications Inc., 5.340%, 2021/03/22 5,000,000 5,105 5,664 Rogers Communications Inc., 4.000%, 2022/06/06 2,000,000 1,994 2,128 Rogers Communications Inc., 6.680%, 2039/11/04 1,000,000 999 1,229 Rogers Communications Inc., 6.110%, 2040/08/25 1,455,000 1,454 1,675
Manulife Canadian Bond Index Fund (Manulife Asset Management) (expressed in thousands of dollars, except par values)
Par value
Average cost
$Fair value
$ Par value
Average cost
$Fair value
$
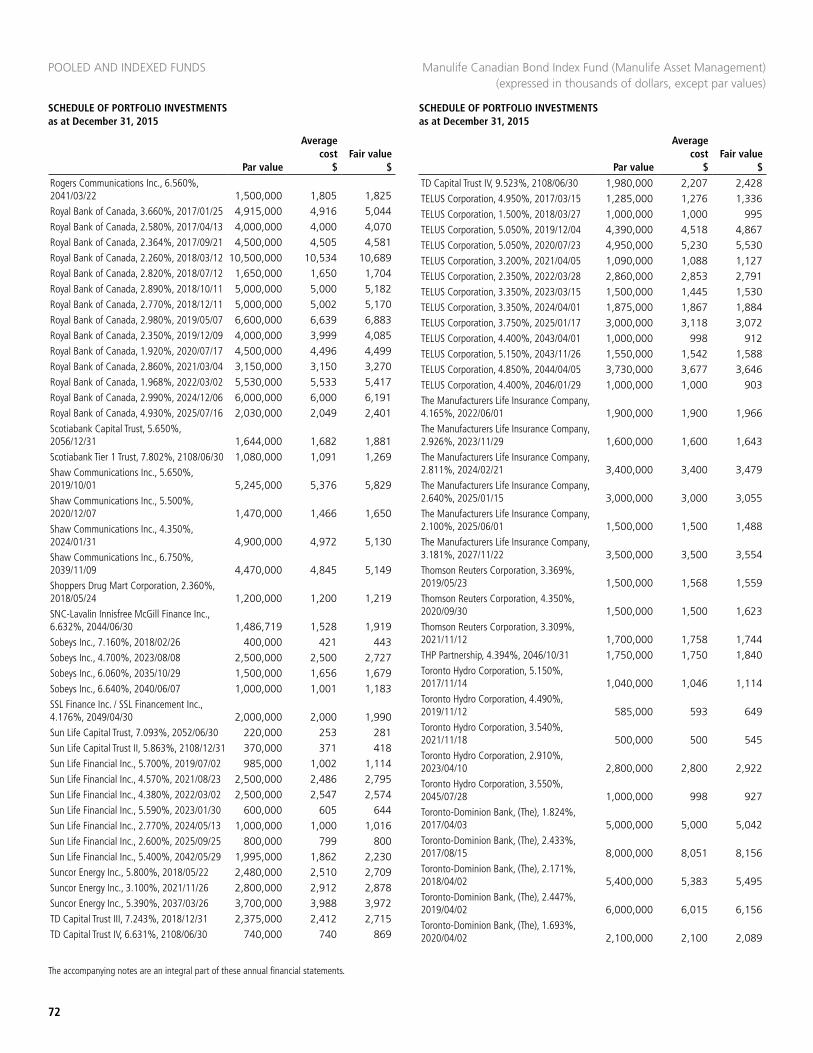
POOLED AND INDEXED FUNDS
72
SCHEDULE OF PORTFOLIO INVESTMENTS as at December 31, 2015
SCHEDULE OF PORTFOLIO INVESTMENTS as at December 31, 2015
The accompanying notes are an integral part of these annual financial statements.
Rogers Communications Inc., 6.560%, 2041/03/22 1,500,000 1,805 1,825 Royal Bank of Canada, 3.660%, 2017/01/25 4,915,000 4,916 5,044 Royal Bank of Canada, 2.580%, 2017/04/13 4,000,000 4,000 4,070 Royal Bank of Canada, 2.364%, 2017/09/21 4,500,000 4,505 4,581 Royal Bank of Canada, 2.260%, 2018/03/12 10,500,000 10,534 10,689 Royal Bank of Canada, 2.820%, 2018/07/12 1,650,000 1,650 1,704 Royal Bank of Canada, 2.890%, 2018/10/11 5,000,000 5,000 5,182 Royal Bank of Canada, 2.770%, 2018/12/11 5,000,000 5,002 5,170 Royal Bank of Canada, 2.980%, 2019/05/07 6,600,000 6,639 6,883 Royal Bank of Canada, 2.350%, 2019/12/09 4,000,000 3,999 4,085 Royal Bank of Canada, 1.920%, 2020/07/17 4,500,000 4,496 4,499 Royal Bank of Canada, 2.860%, 2021/03/04 3,150,000 3,150 3,270 Royal Bank of Canada, 1.968%, 2022/03/02 5,530,000 5,533 5,417 Royal Bank of Canada, 2.990%, 2024/12/06 6,000,000 6,000 6,191 Royal Bank of Canada, 4.930%, 2025/07/16 2,030,000 2,049 2,401 Scotiabank Capital Trust, 5.650%, 2056/12/31 1,644,000 1,682 1,881 Scotiabank Tier 1 Trust, 7.802%, 2108/06/30 1,080,000 1,091 1,269 Shaw Communications Inc., 5.650%, 2019/10/01 5,245,000 5,376 5,829 Shaw Communications Inc., 5.500%, 2020/12/07 1,470,000 1,466 1,650 Shaw Communications Inc., 4.350%, 2024/01/31 4,900,000 4,972 5,130 Shaw Communications Inc., 6.750%, 2039/11/09 4,470,000 4,845 5,149 Shoppers Drug Mart Corporation, 2.360%, 2018/05/24 1,200,000 1,200 1,219 SNC-Lavalin Innisfree McGill Finance Inc., 6.632%, 2044/06/30 1,486,719 1,528 1,919 Sobeys Inc., 7.160%, 2018/02/26 400,000 421 443 Sobeys Inc., 4.700%, 2023/08/08 2,500,000 2,500 2,727 Sobeys Inc., 6.060%, 2035/10/29 1,500,000 1,656 1,679 Sobeys Inc., 6.640%, 2040/06/07 1,000,000 1,001 1,183 SSL Finance Inc. / SSL Financement Inc., 4.176%, 2049/04/30 2,000,000 2,000 1,990 Sun Life Capital Trust, 7.093%, 2052/06/30 220,000 253 281 Sun Life Capital Trust II, 5.863%, 2108/12/31 370,000 371 418 Sun Life Financial Inc., 5.700%, 2019/07/02 985,000 1,002 1,114 Sun Life Financial Inc., 4.570%, 2021/08/23 2,500,000 2,486 2,795 Sun Life Financial Inc., 4.380%, 2022/03/02 2,500,000 2,547 2,574 Sun Life Financial Inc., 5.590%, 2023/01/30 600,000 605 644 Sun Life Financial Inc., 2.770%, 2024/05/13 1,000,000 1,000 1,016 Sun Life Financial Inc., 2.600%, 2025/09/25 800,000 799 800 Sun Life Financial Inc., 5.400%, 2042/05/29 1,995,000 1,862 2,230 Suncor Energy Inc., 5.800%, 2018/05/22 2,480,000 2,510 2,709 Suncor Energy Inc., 3.100%, 2021/11/26 2,800,000 2,912 2,878 Suncor Energy Inc., 5.390%, 2037/03/26 3,700,000 3,988 3,972 TD Capital Trust III, 7.243%, 2018/12/31 2,375,000 2,412 2,715 TD Capital Trust IV, 6.631%, 2108/06/30 740,000 740 869
TD Capital Trust IV, 9.523%, 2108/06/30 1,980,000 2,207 2,428 TELUS Corporation, 4.950%, 2017/03/15 1,285,000 1,276 1,336 TELUS Corporation, 1.500%, 2018/03/27 1,000,000 1,000 995 TELUS Corporation, 5.050%, 2019/12/04 4,390,000 4,518 4,867 TELUS Corporation, 5.050%, 2020/07/23 4,950,000 5,230 5,530 TELUS Corporation, 3.200%, 2021/04/05 1,090,000 1,088 1,127 TELUS Corporation, 2.350%, 2022/03/28 2,860,000 2,853 2,791 TELUS Corporation, 3.350%, 2023/03/15 1,500,000 1,445 1,530 TELUS Corporation, 3.350%, 2024/04/01 1,875,000 1,867 1,884 TELUS Corporation, 3.750%, 2025/01/17 3,000,000 3,118 3,072 TELUS Corporation, 4.400%, 2043/04/01 1,000,000 998 912 TELUS Corporation, 5.150%, 2043/11/26 1,550,000 1,542 1,588 TELUS Corporation, 4.850%, 2044/04/05 3,730,000 3,677 3,646 TELUS Corporation, 4.400%, 2046/01/29 1,000,000 1,000 903 The Manufacturers Life Insurance Company, 4.165%, 2022/06/01 1,900,000 1,900 1,966 The Manufacturers Life Insurance Company, 2.926%, 2023/11/29 1,600,000 1,600 1,643 The Manufacturers Life Insurance Company, 2.811%, 2024/02/21 3,400,000 3,400 3,479 The Manufacturers Life Insurance Company, 2.640%, 2025/01/15 3,000,000 3,000 3,055 The Manufacturers Life Insurance Company, 2.100%, 2025/06/01 1,500,000 1,500 1,488 The Manufacturers Life Insurance Company, 3.181%, 2027/11/22 3,500,000 3,500 3,554 Thomson Reuters Corporation, 3.369%, 2019/05/23 1,500,000 1,568 1,559 Thomson Reuters Corporation, 4.350%, 2020/09/30 1,500,000 1,500 1,623 Thomson Reuters Corporation, 3.309%, 2021/11/12 1,700,000 1,758 1,744 THP Partnership, 4.394%, 2046/10/31 1,750,000 1,750 1,840 Toronto Hydro Corporation, 5.150%, 2017/11/14 1,040,000 1,046 1,114 Toronto Hydro Corporation, 4.490%, 2019/11/12 585,000 593 649 Toronto Hydro Corporation, 3.540%, 2021/11/18 500,000 500 545 Toronto Hydro Corporation, 2.910%, 2023/04/10 2,800,000 2,800 2,922 Toronto Hydro Corporation, 3.550%, 2045/07/28 1,000,000 998 927 Toronto-Dominion Bank, (The), 1.824%, 2017/04/03 5,000,000 5,000 5,042 Toronto-Dominion Bank, (The), 2.433%, 2017/08/15 8,000,000 8,051 8,156 Toronto-Dominion Bank, (The), 2.171%, 2018/04/02 5,400,000 5,383 5,495 Toronto-Dominion Bank, (The), 2.447%, 2019/04/02 6,000,000 6,015 6,156 Toronto-Dominion Bank, (The), 1.693%, 2020/04/02 2,100,000 2,100 2,089
Manulife Canadian Bond Index Fund (Manulife Asset Management) (expressed in thousands of dollars, except par values)
Par value
Average cost
$Fair value
$ Par value
Average cost
$Fair value
$
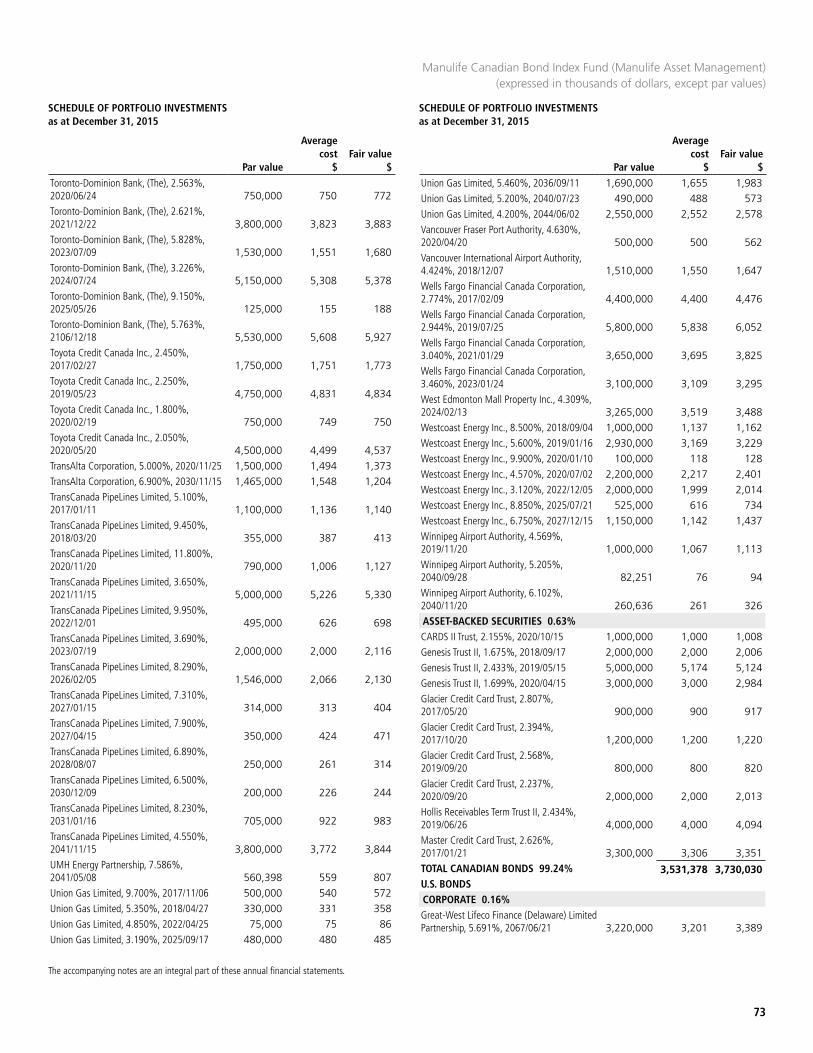
SCHEDULE OF PORTFOLIO INVESTMENTS as at December 31, 2015
SCHEDULE OF PORTFOLIO INVESTMENTS as at December 31, 2015
73
The accompanying notes are an integral part of these annual financial statements.
Toronto-Dominion Bank, (The), 2.563%, 2020/06/24 750,000 750 772 Toronto-Dominion Bank, (The), 2.621%, 2021/12/22 3,800,000 3,823 3,883 Toronto-Dominion Bank, (The), 5.828%, 2023/07/09 1,530,000 1,551 1,680 Toronto-Dominion Bank, (The), 3.226%, 2024/07/24 5,150,000 5,308 5,378 Toronto-Dominion Bank, (The), 9.150%, 2025/05/26 125,000 155 188 Toronto-Dominion Bank, (The), 5.763%, 2106/12/18 5,530,000 5,608 5,927 Toyota Credit Canada Inc., 2.450%, 2017/02/27 1,750,000 1,751 1,773 Toyota Credit Canada Inc., 2.250%, 2019/05/23 4,750,000 4,831 4,834 Toyota Credit Canada Inc., 1.800%, 2020/02/19 750,000 749 750 Toyota Credit Canada Inc., 2.050%, 2020/05/20 4,500,000 4,499 4,537 TransAlta Corporation, 5.000%, 2020/11/25 1,500,000 1,494 1,373 TransAlta Corporation, 6.900%, 2030/11/15 1,465,000 1,548 1,204 TransCanada PipeLines Limited, 5.100%, 2017/01/11 1,100,000 1,136 1,140 TransCanada PipeLines Limited, 9.450%, 2018/03/20 355,000 387 413 TransCanada PipeLines Limited, 11.800%, 2020/11/20 790,000 1,006 1,127 TransCanada PipeLines Limited, 3.650%, 2021/11/15 5,000,000 5,226 5,330 TransCanada PipeLines Limited, 9.950%, 2022/12/01 495,000 626 698 TransCanada PipeLines Limited, 3.690%, 2023/07/19 2,000,000 2,000 2,116 TransCanada PipeLines Limited, 8.290%, 2026/02/05 1,546,000 2,066 2,130 TransCanada PipeLines Limited, 7.310%, 2027/01/15 314,000 313 404 TransCanada PipeLines Limited, 7.900%, 2027/04/15 350,000 424 471 TransCanada PipeLines Limited, 6.890%, 2028/08/07 250,000 261 314 TransCanada PipeLines Limited, 6.500%, 2030/12/09 200,000 226 244 TransCanada PipeLines Limited, 8.230%, 2031/01/16 705,000 922 983 TransCanada PipeLines Limited, 4.550%, 2041/11/15 3,800,000 3,772 3,844 UMH Energy Partnership, 7.586%, 2041/05/08 560,398 559 807 Union Gas Limited, 9.700%, 2017/11/06 500,000 540 572 Union Gas Limited, 5.350%, 2018/04/27 330,000 331 358 Union Gas Limited, 4.850%, 2022/04/25 75,000 75 86 Union Gas Limited, 3.190%, 2025/09/17 480,000 480 485
Union Gas Limited, 5.460%, 2036/09/11 1,690,000 1,655 1,983 Union Gas Limited, 5.200%, 2040/07/23 490,000 488 573 Union Gas Limited, 4.200%, 2044/06/02 2,550,000 2,552 2,578 Vancouver Fraser Port Authority, 4.630%, 2020/04/20 500,000 500 562 Vancouver International Airport Authority, 4.424%, 2018/12/07 1,510,000 1,550 1,647 Wells Fargo Financial Canada Corporation, 2.774%, 2017/02/09 4,400,000 4,400 4,476 Wells Fargo Financial Canada Corporation, 2.944%, 2019/07/25 5,800,000 5,838 6,052 Wells Fargo Financial Canada Corporation, 3.040%, 2021/01/29 3,650,000 3,695 3,825 Wells Fargo Financial Canada Corporation, 3.460%, 2023/01/24 3,100,000 3,109 3,295 West Edmonton Mall Property Inc., 4.309%, 2024/02/13 3,265,000 3,519 3,488 Westcoast Energy Inc., 8.500%, 2018/09/04 1,000,000 1,137 1,162 Westcoast Energy Inc., 5.600%, 2019/01/16 2,930,000 3,169 3,229 Westcoast Energy Inc., 9.900%, 2020/01/10 100,000 118 128 Westcoast Energy Inc., 4.570%, 2020/07/02 2,200,000 2,217 2,401 Westcoast Energy Inc., 3.120%, 2022/12/05 2,000,000 1,999 2,014 Westcoast Energy Inc., 8.850%, 2025/07/21 525,000 616 734 Westcoast Energy Inc., 6.750%, 2027/12/15 1,150,000 1,142 1,437 Winnipeg Airport Authority, 4.569%, 2019/11/20 1,000,000 1,067 1,113 Winnipeg Airport Authority, 5.205%, 2040/09/28 82,251 76 94 Winnipeg Airport Authority, 6.102%, 2040/11/20 260,636 261 326 ASSET-BACKED SECURITIES 0.63%CARDS II Trust, 2.155%, 2020/10/15 1,000,000 1,000 1,008 Genesis Trust II, 1.675%, 2018/09/17 2,000,000 2,000 2,006 Genesis Trust II, 2.433%, 2019/05/15 5,000,000 5,174 5,124 Genesis Trust II, 1.699%, 2020/04/15 3,000,000 3,000 2,984 Glacier Credit Card Trust, 2.807%, 2017/05/20 900,000 900 917 Glacier Credit Card Trust, 2.394%, 2017/10/20 1,200,000 1,200 1,220 Glacier Credit Card Trust, 2.568%, 2019/09/20 800,000 800 820 Glacier Credit Card Trust, 2.237%, 2020/09/20 2,000,000 2,000 2,013 Hollis Receivables Term Trust II, 2.434%, 2019/06/26 4,000,000 4,000 4,094 Master Credit Card Trust, 2.626%, 2017/01/21 3,300,000 3,306 3,351 TOTAL CANADIAN BONDS 99.24% 3,531,378 3,730,030 U.S. BONDSCORPORATE 0.16%Great-West Lifeco Finance (Delaware) Limited Partnership, 5.691%, 2067/06/21 3,220,000 3,201 3,389
Manulife Canadian Bond Index Fund (Manulife Asset Management) (expressed in thousands of dollars, except par values)
Par value
Average cost
$Fair value
$ Par value
Average cost
$Fair value
$
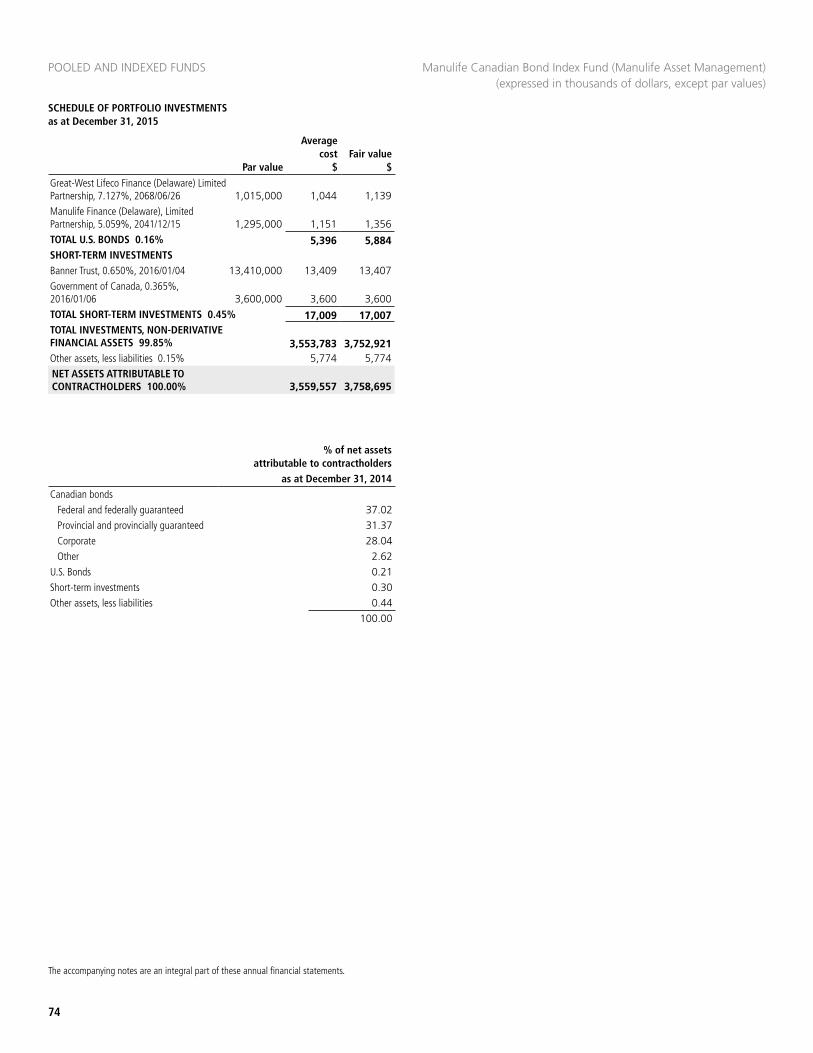
POOLED AND INDEXED FUNDS
74
SCHEDULE OF PORTFOLIO INVESTMENTS as at December 31, 2015
The accompanying notes are an integral part of these annual financial statements.
Great-West Lifeco Finance (Delaware) Limited Partnership, 7.127%, 2068/06/26 1,015,000 1,044 1,139 Manulife Finance (Delaware), Limited Partnership, 5.059%, 2041/12/15 1,295,000 1,151 1,356 TOTAL U.S. BONDS 0.16% 5,396 5,884 SHORT-TERM INVESTMENTSBanner Trust, 0.650%, 2016/01/04 13,410,000 13,409 13,407 Government of Canada, 0.365%, 2016/01/06 3,600,000 3,600 3,600 TOTAL SHORT-TERM INVESTMENTS 0.45% 17,009 17,007 TOTAL INVESTMENTS, NON-DERIVATIVE FINANCIAL ASSETS 99.85% 3,553,783 3,752,921 Other assets, less liabilities 0.15% 5,774 5,774 NET ASSETS ATTRIBUTABLE TO CONTRACTHOLDERS 100.00% 3,559,557 3,758,695
Manulife Canadian Bond Index Fund (Manulife Asset Management) (expressed in thousands of dollars, except par values)
% of net assets attributable to contractholders
as at December 31, 2014Canadian bonds
Federal and federally guaranteed 37.02Provincial and provincially guaranteed 31.37Corporate 28.04Other 2.62
U.S. Bonds 0.21Short-term investments 0.30Other assets, less liabilities 0.44
100.00
Par value
Average cost
$Fair value
$
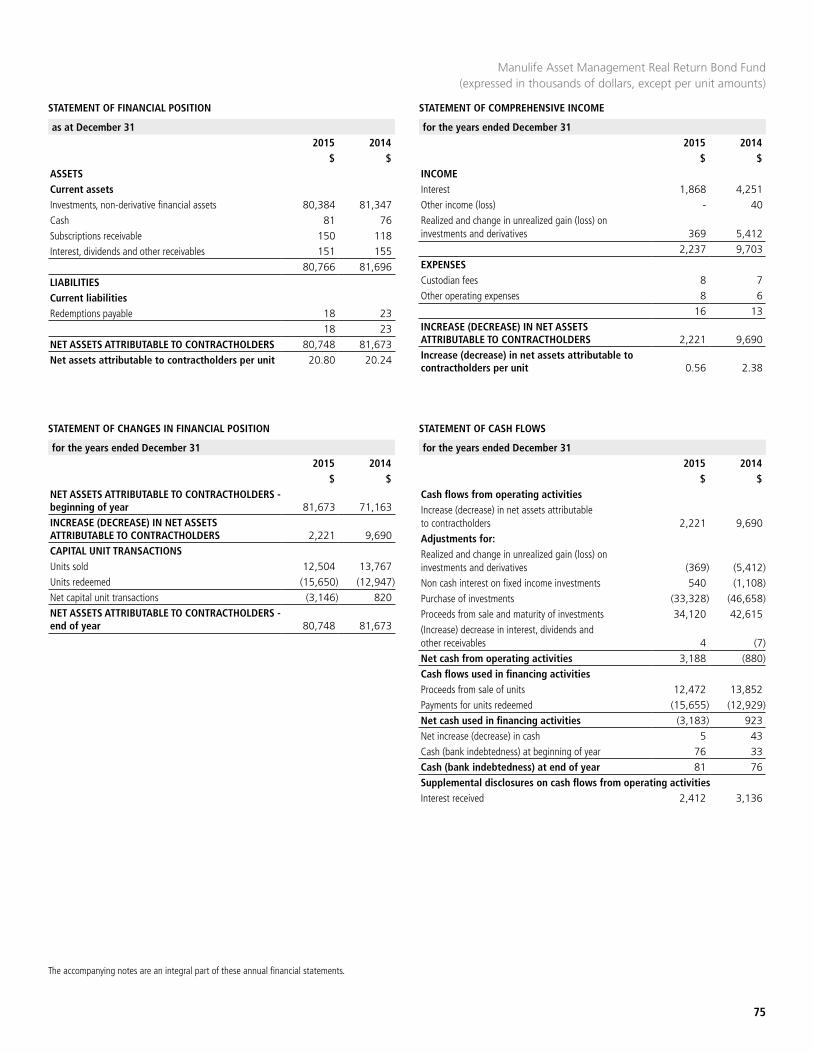
STATEMENT OF FINANCIAL POSITION STATEMENT OF COMPREHENSIVE INCOME
as at December 31 2015 2014
$ $
for the years ended December 312015 2014
$ $
75
The accompanying notes are an integral part of these annual financial statements.
Manulife Asset Management Real Return Bond Fund (expressed in thousands of dollars, except per unit amounts)
ASSETSCurrent assetsInvestments, non-derivative financial assets 80,384 81,347Cash 81 76Subscriptions receivable 150 118Interest, dividends and other receivables 151 155
80,766 81,696LIABILITIESCurrent liabilitiesRedemptions payable 18 23
18 23NET ASSETS ATTRIBUTABLE TO CONTRACTHOLDERS 80,748 81,673Net assets attributable to contractholders per unit 20.80 20.24
INCOMEInterest 1,868 4,251Other income (loss) - 40Realized and change in unrealized gain (loss) on investments and derivatives 369 5,412
2,237 9,703EXPENSESCustodian fees 8 7Other operating expenses 8 6
16 13INCREASE (DECREASE) IN NET ASSETS ATTRIBUTABLE TO CONTRACTHOLDERS 2,221 9,690Increase (decrease) in net assets attributable to contractholders per unit 0.56 2.38
STATEMENT OF CHANGES IN FINANCIAL POSITION STATEMENT OF CASH FLOWS
for the years ended December 312015 2014
$ $
for the years ended December 312015 2014
$ $NET ASSETS ATTRIBUTABLE TO CONTRACTHOLDERS - beginning of year 81,673 71,163INCREASE (DECREASE) IN NET ASSETS ATTRIBUTABLE TO CONTRACTHOLDERS 2,221 9,690CAPITAL UNIT TRANSACTIONSUnits sold 12,504 13,767Units redeemed (15,650) (12,947)Net capital unit transactions (3,146) 820NET ASSETS ATTRIBUTABLE TO CONTRACTHOLDERS - end of year 80,748 81,673
Cash flows from operating activitiesIncrease (decrease) in net assets attributable to contractholders 2,221 9,690Adjustments for:Realized and change in unrealized gain (loss) on investments and derivatives (369) (5,412)Non cash interest on fixed income investments 540 (1,108)Purchase of investments (33,328) (46,658)Proceeds from sale and maturity of investments 34,120 42,615(Increase) decrease in interest, dividends and other receivables 4 (7)Net cash from operating activities 3,188 (880)Cash flows used in financing activitiesProceeds from sale of units 12,472 13,852Payments for units redeemed (15,655) (12,929)Net cash used in financing activities (3,183) 923Net increase (decrease) in cash 5 43Cash (bank indebtedness) at beginning of year 76 33Cash (bank indebtedness) at end of year 81 76Supplemental disclosures on cash flows from operating activitiesInterest received 2,412 3,136
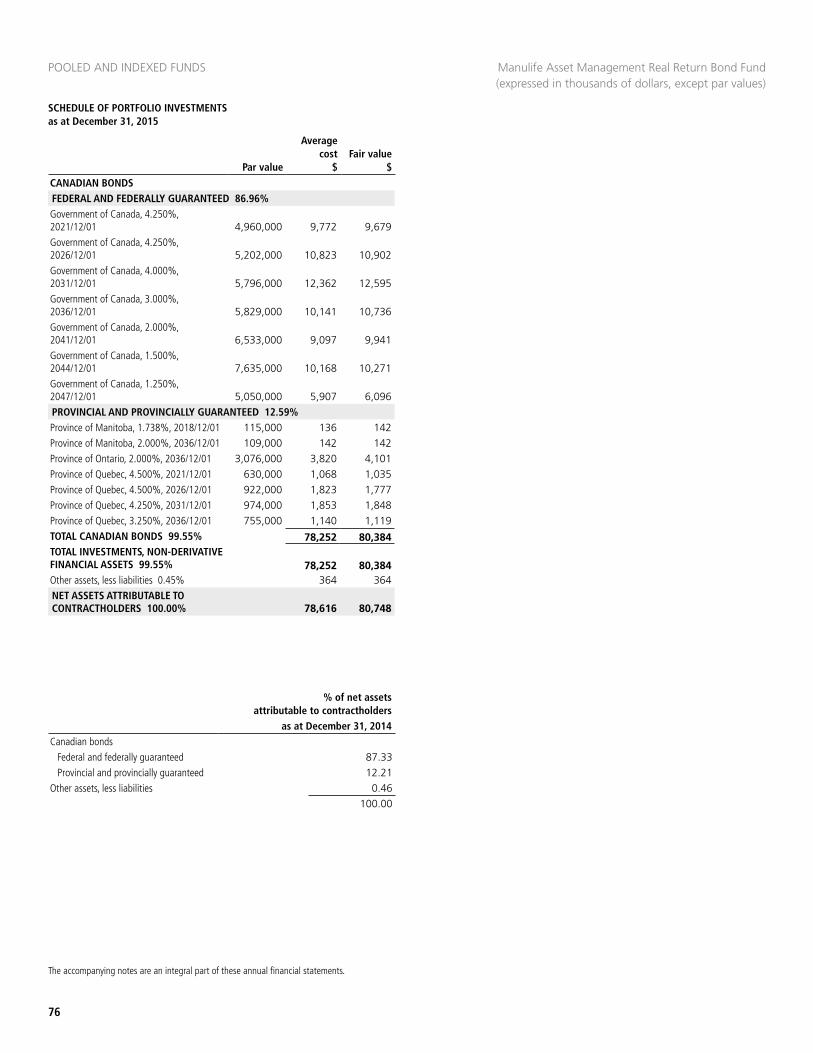
POOLED AND INDEXED FUNDS
76
SCHEDULE OF PORTFOLIO INVESTMENTS as at December 31, 2015
The accompanying notes are an integral part of these annual financial statements.
CANADIAN BONDSFEDERAL AND FEDERALLY GUARANTEED 86.96%Government of Canada, 4.250%, 2021/12/01 4,960,000 9,772 9,679 Government of Canada, 4.250%, 2026/12/01 5,202,000 10,823 10,902 Government of Canada, 4.000%, 2031/12/01 5,796,000 12,362 12,595 Government of Canada, 3.000%, 2036/12/01 5,829,000 10,141 10,736 Government of Canada, 2.000%, 2041/12/01 6,533,000 9,097 9,941 Government of Canada, 1.500%, 2044/12/01 7,635,000 10,168 10,271 Government of Canada, 1.250%, 2047/12/01 5,050,000 5,907 6,096 PROVINCIAL AND PROVINCIALLY GUARANTEED 12.59%Province of Manitoba, 1.738%, 2018/12/01 115,000 136 142 Province of Manitoba, 2.000%, 2036/12/01 109,000 142 142 Province of Ontario, 2.000%, 2036/12/01 3,076,000 3,820 4,101 Province of Quebec, 4.500%, 2021/12/01 630,000 1,068 1,035 Province of Quebec, 4.500%, 2026/12/01 922,000 1,823 1,777 Province of Quebec, 4.250%, 2031/12/01 974,000 1,853 1,848 Province of Quebec, 3.250%, 2036/12/01 755,000 1,140 1,119 TOTAL CANADIAN BONDS 99.55% 78,252 80,384 TOTAL INVESTMENTS, NON-DERIVATIVE FINANCIAL ASSETS 99.55% 78,252 80,384 Other assets, less liabilities 0.45% 364 364 NET ASSETS ATTRIBUTABLE TO CONTRACTHOLDERS 100.00% 78,616 80,748
% of net assets attributable to contractholders
as at December 31, 2014Canadian bonds
Federal and federally guaranteed 87.33Provincial and provincially guaranteed 12.21
Other assets, less liabilities 0.46100.00
Manulife Asset Management Real Return Bond Fund (expressed in thousands of dollars, except par values)
Par value
Average cost
$Fair value
$
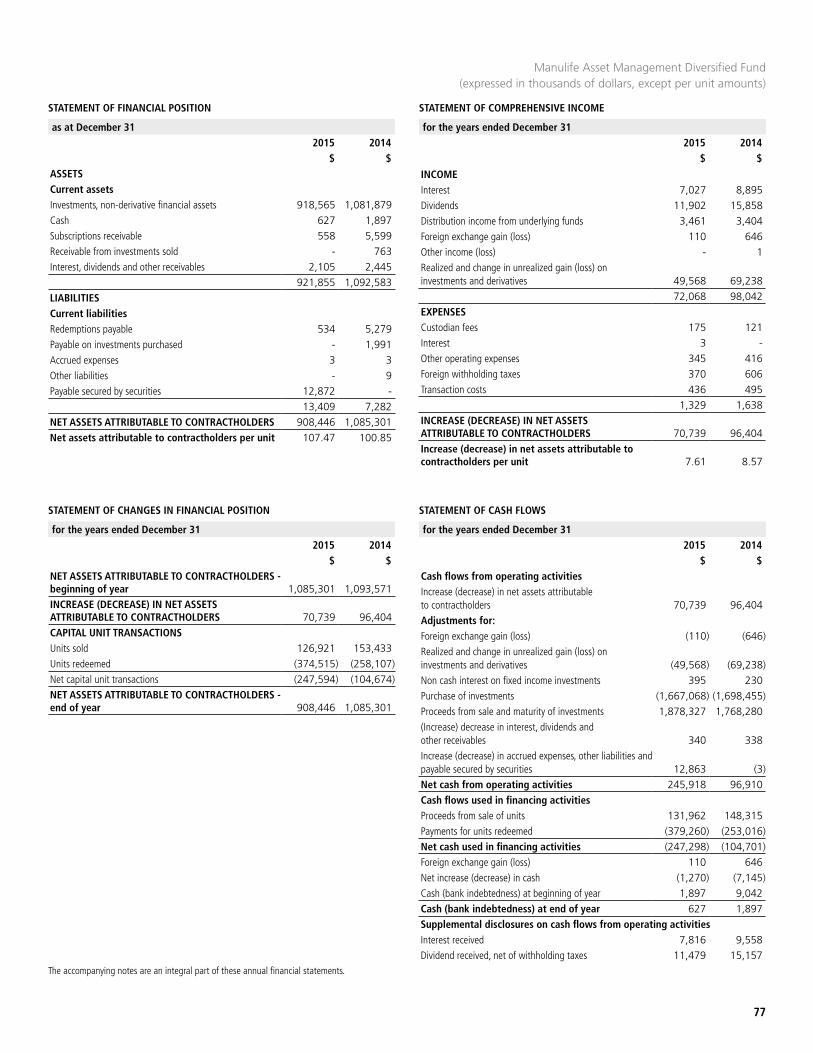
STATEMENT OF FINANCIAL POSITION STATEMENT OF COMPREHENSIVE INCOME
as at December 31 2015 2014
$ $
for the years ended December 312015 2014
$ $
77
The accompanying notes are an integral part of these annual financial statements.
Manulife Asset Management Diversified Fund (expressed in thousands of dollars, except per unit amounts)
STATEMENT OF CHANGES IN FINANCIAL POSITION STATEMENT OF CASH FLOWS
for the years ended December 312015 2014
$ $
for the years ended December 312015 2014
$ $NET ASSETS ATTRIBUTABLE TO CONTRACTHOLDERS - beginning of year 1,085,301 1,093,571INCREASE (DECREASE) IN NET ASSETS ATTRIBUTABLE TO CONTRACTHOLDERS 70,739 96,404CAPITAL UNIT TRANSACTIONSUnits sold 126,921 153,433Units redeemed (374,515) (258,107)Net capital unit transactions (247,594) (104,674)NET ASSETS ATTRIBUTABLE TO CONTRACTHOLDERS - end of year 908,446 1,085,301
Cash flows from operating activitiesIncrease (decrease) in net assets attributable to contractholders 70,739 96,404Adjustments for:Foreign exchange gain (loss) (110) (646)Realized and change in unrealized gain (loss) on investments and derivatives (49,568) (69,238)Non cash interest on fixed income investments 395 230Purchase of investments (1,667,068) (1,698,455)Proceeds from sale and maturity of investments 1,878,327 1,768,280(Increase) decrease in interest, dividends and other receivables 340 338Increase (decrease) in accrued expenses, other liabilities and payable secured by securities 12,863 (3)Net cash from operating activities 245,918 96,910Cash flows used in financing activitiesProceeds from sale of units 131,962 148,315Payments for units redeemed (379,260) (253,016)Net cash used in financing activities (247,298) (104,701)Foreign exchange gain (loss) 110 646Net increase (decrease) in cash (1,270) (7,145)Cash (bank indebtedness) at beginning of year 1,897 9,042Cash (bank indebtedness) at end of year 627 1,897Supplemental disclosures on cash flows from operating activitiesInterest received 7,816 9,558Dividend received, net of withholding taxes 11,479 15,157
INCOMEInterest 7,027 8,895Dividends 11,902 15,858Distribution income from underlying funds 3,461 3,404Foreign exchange gain (loss) 110 646Other income (loss) - 1Realized and change in unrealized gain (loss) on investments and derivatives 49,568 69,238
72,068 98,042EXPENSESCustodian fees 175 121Interest 3 -Other operating expenses 345 416Foreign withholding taxes 370 606Transaction costs 436 495
1,329 1,638INCREASE (DECREASE) IN NET ASSETS ATTRIBUTABLE TO CONTRACTHOLDERS 70,739 96,404Increase (decrease) in net assets attributable to contractholders per unit 7.61 8.57
ASSETSCurrent assetsInvestments, non-derivative financial assets 918,565 1,081,879Cash 627 1,897Subscriptions receivable 558 5,599Receivable from investments sold - 763Interest, dividends and other receivables 2,105 2,445
921,855 1,092,583LIABILITIESCurrent liabilitiesRedemptions payable 534 5,279Payable on investments purchased - 1,991Accrued expenses 3 3Other liabilities - 9Payable secured by securities 12,872 -
13,409 7,282NET ASSETS ATTRIBUTABLE TO CONTRACTHOLDERS 908,446 1,085,301Net assets attributable to contractholders per unit 107.47 100.85
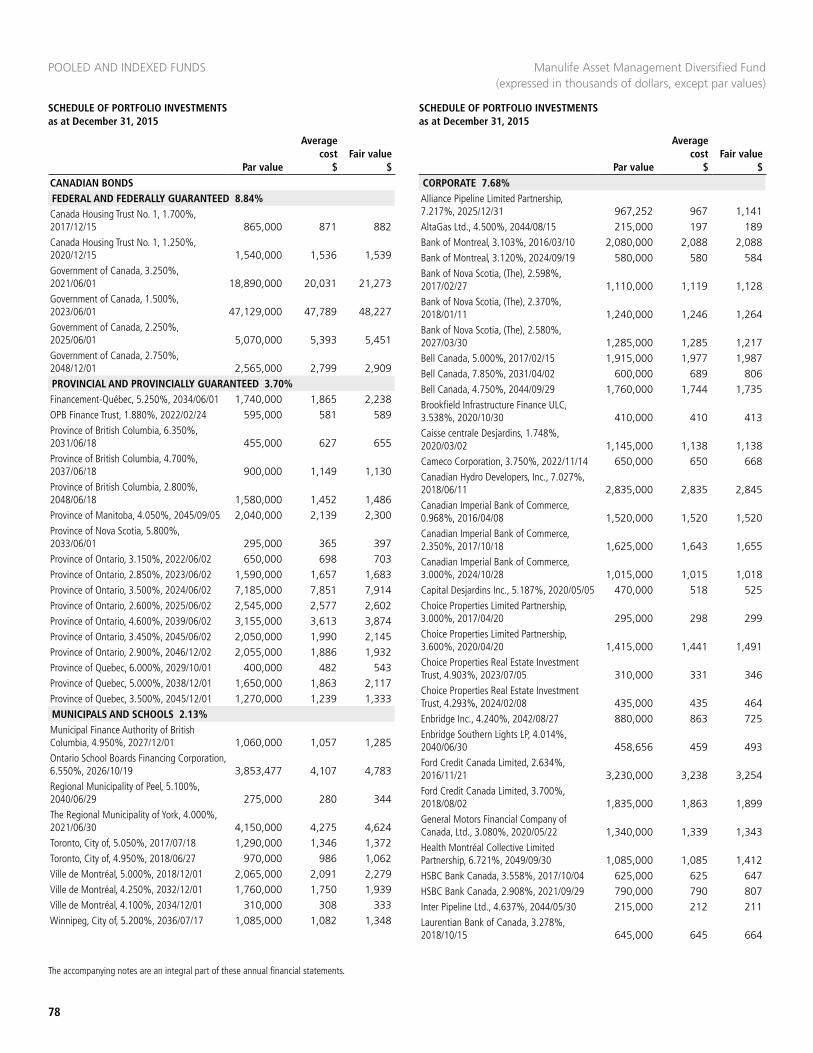
POOLED AND INDEXED FUNDS
78
SCHEDULE OF PORTFOLIO INVESTMENTS as at December 31, 2015
SCHEDULE OF PORTFOLIO INVESTMENTS as at December 31, 2015
The accompanying notes are an integral part of these annual financial statements.
CANADIAN BONDSFEDERAL AND FEDERALLY GUARANTEED 8.84%Canada Housing Trust No. 1, 1.700%, 2017/12/15 865,000 871 882 Canada Housing Trust No. 1, 1.250%, 2020/12/15 1,540,000 1,536 1,539 Government of Canada, 3.250%, 2021/06/01 18,890,000 20,031 21,273 Government of Canada, 1.500%, 2023/06/01 47,129,000 47,789 48,227 Government of Canada, 2.250%, 2025/06/01 5,070,000 5,393 5,451 Government of Canada, 2.750%, 2048/12/01 2,565,000 2,799 2,909 PROVINCIAL AND PROVINCIALLY GUARANTEED 3.70%Financement-Québec, 5.250%, 2034/06/01 1,740,000 1,865 2,238 OPB Finance Trust, 1.880%, 2022/02/24 595,000 581 589 Province of British Columbia, 6.350%, 2031/06/18 455,000 627 655 Province of British Columbia, 4.700%, 2037/06/18 900,000 1,149 1,130 Province of British Columbia, 2.800%, 2048/06/18 1,580,000 1,452 1,486 Province of Manitoba, 4.050%, 2045/09/05 2,040,000 2,139 2,300 Province of Nova Scotia, 5.800%, 2033/06/01 295,000 365 397 Province of Ontario, 3.150%, 2022/06/02 650,000 698 703 Province of Ontario, 2.850%, 2023/06/02 1,590,000 1,657 1,683 Province of Ontario, 3.500%, 2024/06/02 7,185,000 7,851 7,914 Province of Ontario, 2.600%, 2025/06/02 2,545,000 2,577 2,602 Province of Ontario, 4.600%, 2039/06/02 3,155,000 3,613 3,874 Province of Ontario, 3.450%, 2045/06/02 2,050,000 1,990 2,145 Province of Ontario, 2.900%, 2046/12/02 2,055,000 1,886 1,932 Province of Quebec, 6.000%, 2029/10/01 400,000 482 543 Province of Quebec, 5.000%, 2038/12/01 1,650,000 1,863 2,117 Province of Quebec, 3.500%, 2045/12/01 1,270,000 1,239 1,333 MUNICIPALS AND SCHOOLS 2.13%Municipal Finance Authority of British Columbia, 4.950%, 2027/12/01 1,060,000 1,057 1,285 Ontario School Boards Financing Corporation, 6.550%, 2026/10/19 3,853,477 4,107 4,783 Regional Municipality of Peel, 5.100%, 2040/06/29 275,000 280 344 The Regional Municipality of York, 4.000%, 2021/06/30 4,150,000 4,275 4,624 Toronto, City of, 5.050%, 2017/07/18 1,290,000 1,346 1,372 Toronto, City of, 4.950%, 2018/06/27 970,000 986 1,062 Ville de Montréal, 5.000%, 2018/12/01 2,065,000 2,091 2,279 Ville de Montréal, 4.250%, 2032/12/01 1,760,000 1,750 1,939 Ville de Montréal, 4.100%, 2034/12/01 310,000 308 333 Winnipeg, City of, 5.200%, 2036/07/17 1,085,000 1,082 1,348
CORPORATE 7.68%Alliance Pipeline Limited Partnership, 7.217%, 2025/12/31 967,252 967 1,141 AltaGas Ltd., 4.500%, 2044/08/15 215,000 197 189 Bank of Montreal, 3.103%, 2016/03/10 2,080,000 2,088 2,088 Bank of Montreal, 3.120%, 2024/09/19 580,000 580 584 Bank of Nova Scotia, (The), 2.598%, 2017/02/27 1,110,000 1,119 1,128 Bank of Nova Scotia, (The), 2.370%, 2018/01/11 1,240,000 1,246 1,264 Bank of Nova Scotia, (The), 2.580%, 2027/03/30 1,285,000 1,285 1,217 Bell Canada, 5.000%, 2017/02/15 1,915,000 1,977 1,987 Bell Canada, 7.850%, 2031/04/02 600,000 689 806 Bell Canada, 4.750%, 2044/09/29 1,760,000 1,744 1,735 Brookfield Infrastructure Finance ULC, 3.538%, 2020/10/30 410,000 410 413 Caisse centrale Desjardins, 1.748%, 2020/03/02 1,145,000 1,138 1,138 Cameco Corporation, 3.750%, 2022/11/14 650,000 650 668 Canadian Hydro Developers, Inc., 7.027%, 2018/06/11 2,835,000 2,835 2,845 Canadian Imperial Bank of Commerce, 0.968%, 2016/04/08 1,520,000 1,520 1,520 Canadian Imperial Bank of Commerce, 2.350%, 2017/10/18 1,625,000 1,643 1,655 Canadian Imperial Bank of Commerce, 3.000%, 2024/10/28 1,015,000 1,015 1,018 Capital Desjardins Inc., 5.187%, 2020/05/05 470,000 518 525 Choice Properties Limited Partnership, 3.000%, 2017/04/20 295,000 298 299 Choice Properties Limited Partnership, 3.600%, 2020/04/20 1,415,000 1,441 1,491 Choice Properties Real Estate Investment Trust, 4.903%, 2023/07/05 310,000 331 346 Choice Properties Real Estate Investment Trust, 4.293%, 2024/02/08 435,000 435 464 Enbridge Inc., 4.240%, 2042/08/27 880,000 863 725 Enbridge Southern Lights LP, 4.014%, 2040/06/30 458,656 459 493 Ford Credit Canada Limited, 2.634%, 2016/11/21 3,230,000 3,238 3,254 Ford Credit Canada Limited, 3.700%, 2018/08/02 1,835,000 1,863 1,899 General Motors Financial Company of Canada, Ltd., 3.080%, 2020/05/22 1,340,000 1,339 1,343 Health Montréal Collective Limited Partnership, 6.721%, 2049/09/30 1,085,000 1,085 1,412 HSBC Bank Canada, 3.558%, 2017/10/04 625,000 625 647 HSBC Bank Canada, 2.908%, 2021/09/29 790,000 790 807 Inter Pipeline Ltd., 4.637%, 2044/05/30 215,000 212 211 Laurentian Bank of Canada, 3.278%, 2018/10/15 645,000 645 664
Manulife Asset Management Diversified Fund (expressed in thousands of dollars, except par values)
Par value
Average cost
$Fair value
$ Par value
Average cost
$Fair value
$
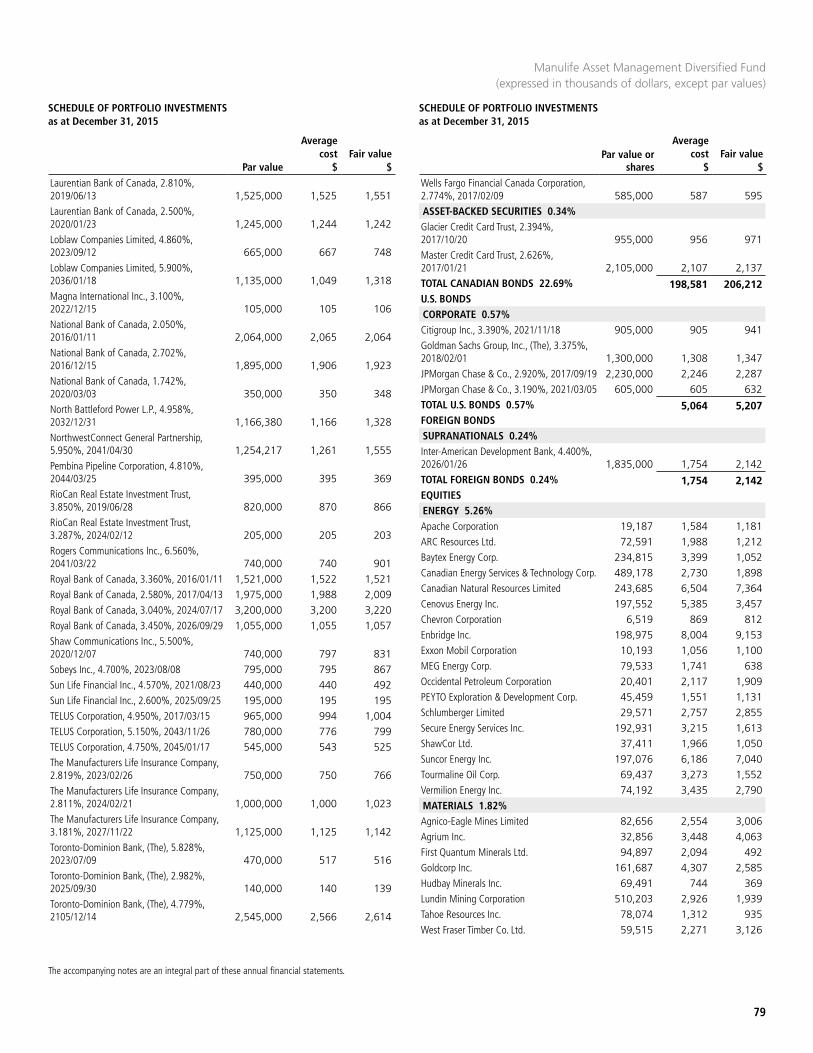
SCHEDULE OF PORTFOLIO INVESTMENTS as at December 31, 2015
SCHEDULE OF PORTFOLIO INVESTMENTS as at December 31, 2015
79
The accompanying notes are an integral part of these annual financial statements.
Laurentian Bank of Canada, 2.810%, 2019/06/13 1,525,000 1,525 1,551 Laurentian Bank of Canada, 2.500%, 2020/01/23 1,245,000 1,244 1,242 Loblaw Companies Limited, 4.860%, 2023/09/12 665,000 667 748 Loblaw Companies Limited, 5.900%, 2036/01/18 1,135,000 1,049 1,318 Magna International Inc., 3.100%, 2022/12/15 105,000 105 106 National Bank of Canada, 2.050%, 2016/01/11 2,064,000 2,065 2,064 National Bank of Canada, 2.702%, 2016/12/15 1,895,000 1,906 1,923 National Bank of Canada, 1.742%, 2020/03/03 350,000 350 348 North Battleford Power L.P., 4.958%, 2032/12/31 1,166,380 1,166 1,328 NorthwestConnect General Partnership, 5.950%, 2041/04/30 1,254,217 1,261 1,555 Pembina Pipeline Corporation, 4.810%, 2044/03/25 395,000 395 369 RioCan Real Estate Investment Trust, 3.850%, 2019/06/28 820,000 870 866 RioCan Real Estate Investment Trust, 3.287%, 2024/02/12 205,000 205 203 Rogers Communications Inc., 6.560%, 2041/03/22 740,000 740 901 Royal Bank of Canada, 3.360%, 2016/01/11 1,521,000 1,522 1,521 Royal Bank of Canada, 2.580%, 2017/04/13 1,975,000 1,988 2,009 Royal Bank of Canada, 3.040%, 2024/07/17 3,200,000 3,200 3,220 Royal Bank of Canada, 3.450%, 2026/09/29 1,055,000 1,055 1,057 Shaw Communications Inc., 5.500%, 2020/12/07 740,000 797 831 Sobeys Inc., 4.700%, 2023/08/08 795,000 795 867 Sun Life Financial Inc., 4.570%, 2021/08/23 440,000 440 492 Sun Life Financial Inc., 2.600%, 2025/09/25 195,000 195 195 TELUS Corporation, 4.950%, 2017/03/15 965,000 994 1,004 TELUS Corporation, 5.150%, 2043/11/26 780,000 776 799 TELUS Corporation, 4.750%, 2045/01/17 545,000 543 525 The Manufacturers Life Insurance Company, 2.819%, 2023/02/26 750,000 750 766 The Manufacturers Life Insurance Company, 2.811%, 2024/02/21 1,000,000 1,000 1,023 The Manufacturers Life Insurance Company, 3.181%, 2027/11/22 1,125,000 1,125 1,142 Toronto-Dominion Bank, (The), 5.828%, 2023/07/09 470,000 517 516 Toronto-Dominion Bank, (The), 2.982%, 2025/09/30 140,000 140 139 Toronto-Dominion Bank, (The), 4.779%, 2105/12/14 2,545,000 2,566 2,614
Wells Fargo Financial Canada Corporation, 2.774%, 2017/02/09 585,000 587 595 ASSET-BACKED SECURITIES 0.34%Glacier Credit Card Trust, 2.394%, 2017/10/20 955,000 956 971 Master Credit Card Trust, 2.626%, 2017/01/21 2,105,000 2,107 2,137 TOTAL CANADIAN BONDS 22.69% 198,581 206,212 U.S. BONDSCORPORATE 0.57%Citigroup Inc., 3.390%, 2021/11/18 905,000 905 941 Goldman Sachs Group, Inc., (The), 3.375%, 2018/02/01 1,300,000 1,308 1,347 JPMorgan Chase & Co., 2.920%, 2017/09/19 2,230,000 2,246 2,287 JPMorgan Chase & Co., 3.190%, 2021/03/05 605,000 605 632 TOTAL U.S. BONDS 0.57% 5,064 5,207 FOREIGN BONDSSUPRANATIONALS 0.24%Inter-American Development Bank, 4.400%, 2026/01/26 1,835,000 1,754 2,142 TOTAL FOREIGN BONDS 0.24% 1,754 2,142 EQUITIESENERGY 5.26%Apache Corporation 19,187 1,584 1,181 ARC Resources Ltd. 72,591 1,988 1,212 Baytex Energy Corp. 234,815 3,399 1,052 Canadian Energy Services & Technology Corp. 489,178 2,730 1,898 Canadian Natural Resources Limited 243,685 6,504 7,364 Cenovus Energy Inc. 197,552 5,385 3,457 Chevron Corporation 6,519 869 812 Enbridge Inc. 198,975 8,004 9,153 Exxon Mobil Corporation 10,193 1,056 1,100 MEG Energy Corp. 79,533 1,741 638 Occidental Petroleum Corporation 20,401 2,117 1,909 PEYTO Exploration & Development Corp. 45,459 1,551 1,131 Schlumberger Limited 29,571 2,757 2,855 Secure Energy Services Inc. 192,931 3,215 1,613 ShawCor Ltd. 37,411 1,966 1,050 Suncor Energy Inc. 197,076 6,186 7,040 Tourmaline Oil Corp. 69,437 3,273 1,552 Vermilion Energy Inc. 74,192 3,435 2,790 MATERIALS 1.82%Agnico-Eagle Mines Limited 82,656 2,554 3,006 Agrium Inc. 32,856 3,448 4,063 First Quantum Minerals Ltd. 94,897 2,094 492 Goldcorp Inc. 161,687 4,307 2,585 Hudbay Minerals Inc. 69,491 744 369 Lundin Mining Corporation 510,203 2,926 1,939 Tahoe Resources Inc. 78,074 1,312 935 West Fraser Timber Co. Ltd. 59,515 2,271 3,126
Manulife Asset Management Diversified Fund (expressed in thousands of dollars, except par values)
Par value
Average cost
$Fair value
$Par value or
shares
Average cost
$Fair value
$
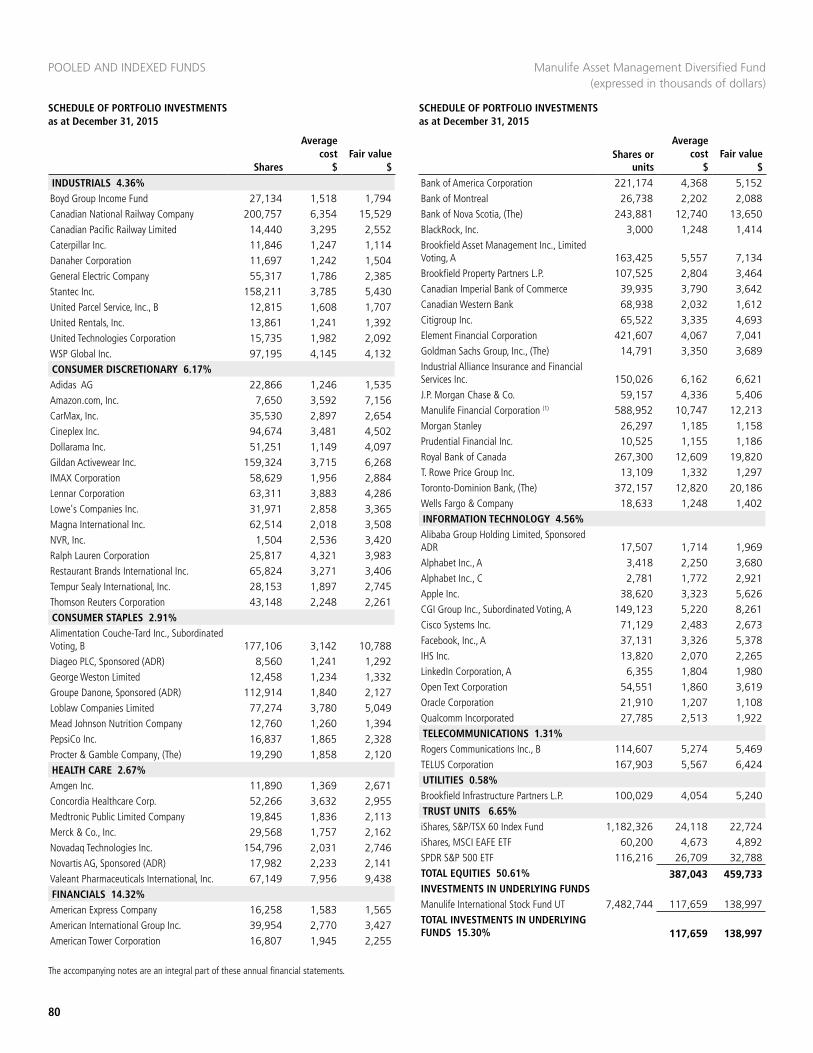
POOLED AND INDEXED FUNDS
80
SCHEDULE OF PORTFOLIO INVESTMENTS as at December 31, 2015
SCHEDULE OF PORTFOLIO INVESTMENTS as at December 31, 2015
The accompanying notes are an integral part of these annual financial statements.
INDUSTRIALS 4.36%Boyd Group Income Fund 27,134 1,518 1,794 Canadian National Railway Company 200,757 6,354 15,529 Canadian Pacific Railway Limited 14,440 3,295 2,552 Caterpillar Inc. 11,846 1,247 1,114 Danaher Corporation 11,697 1,242 1,504 General Electric Company 55,317 1,786 2,385 Stantec Inc. 158,211 3,785 5,430 United Parcel Service, Inc., B 12,815 1,608 1,707 United Rentals, Inc. 13,861 1,241 1,392 United Technologies Corporation 15,735 1,982 2,092 WSP Global Inc. 97,195 4,145 4,132 CONSUMER DISCRETIONARY 6.17%Adidas AG 22,866 1,246 1,535 Amazon.com, Inc. 7,650 3,592 7,156 CarMax, Inc. 35,530 2,897 2,654 Cineplex Inc. 94,674 3,481 4,502 Dollarama Inc. 51,251 1,149 4,097 Gildan Activewear Inc. 159,324 3,715 6,268 IMAX Corporation 58,629 1,956 2,884 Lennar Corporation 63,311 3,883 4,286 Lowe's Companies Inc. 31,971 2,858 3,365 Magna International Inc. 62,514 2,018 3,508 NVR, Inc. 1,504 2,536 3,420 Ralph Lauren Corporation 25,817 4,321 3,983 Restaurant Brands International Inc. 65,824 3,271 3,406 Tempur Sealy International, Inc. 28,153 1,897 2,745 Thomson Reuters Corporation 43,148 2,248 2,261 CONSUMER STAPLES 2.91%Alimentation Couche-Tard Inc., Subordinated Voting, B 177,106 3,142 10,788 Diageo PLC, Sponsored (ADR) 8,560 1,241 1,292 George Weston Limited 12,458 1,234 1,332 Groupe Danone, Sponsored (ADR) 112,914 1,840 2,127 Loblaw Companies Limited 77,274 3,780 5,049 Mead Johnson Nutrition Company 12,760 1,260 1,394 PepsiCo Inc. 16,837 1,865 2,328 Procter & Gamble Company, (The) 19,290 1,858 2,120 HEALTH CARE 2.67%Amgen Inc. 11,890 1,369 2,671 Concordia Healthcare Corp. 52,266 3,632 2,955 Medtronic Public Limited Company 19,845 1,836 2,113 Merck & Co., Inc. 29,568 1,757 2,162 Novadaq Technologies Inc. 154,796 2,031 2,746 Novartis AG, Sponsored (ADR) 17,982 2,233 2,141 Valeant Pharmaceuticals International, Inc. 67,149 7,956 9,438 FINANCIALS 14.32%American Express Company 16,258 1,583 1,565 American International Group Inc. 39,954 2,770 3,427 American Tower Corporation 16,807 1,945 2,255
Bank of America Corporation 221,174 4,368 5,152 Bank of Montreal 26,738 2,202 2,088 Bank of Nova Scotia, (The) 243,881 12,740 13,650 BlackRock, Inc. 3,000 1,248 1,414 Brookfield Asset Management Inc., Limited Voting, A 163,425 5,557 7,134 Brookfield Property Partners L.P. 107,525 2,804 3,464 Canadian Imperial Bank of Commerce 39,935 3,790 3,642 Canadian Western Bank 68,938 2,032 1,612 Citigroup Inc. 65,522 3,335 4,693 Element Financial Corporation 421,607 4,067 7,041 Goldman Sachs Group, Inc., (The) 14,791 3,350 3,689 Industrial Alliance Insurance and Financial Services Inc. 150,026 6,162 6,621 J.P. Morgan Chase & Co. 59,157 4,336 5,406 Manulife Financial Corporation (1) 588,952 10,747 12,213 Morgan Stanley 26,297 1,185 1,158 Prudential Financial Inc. 10,525 1,155 1,186 Royal Bank of Canada 267,300 12,609 19,820 T. Rowe Price Group Inc. 13,109 1,332 1,297 Toronto-Dominion Bank, (The) 372,157 12,820 20,186 Wells Fargo & Company 18,633 1,248 1,402 INFORMATION TECHNOLOGY 4.56%Alibaba Group Holding Limited, Sponsored ADR 17,507 1,714 1,969 Alphabet Inc., A 3,418 2,250 3,680 Alphabet Inc., C 2,781 1,772 2,921 Apple Inc. 38,620 3,323 5,626 CGI Group Inc., Subordinated Voting, A 149,123 5,220 8,261 Cisco Systems Inc. 71,129 2,483 2,673 Facebook, Inc., A 37,131 3,326 5,378 IHS Inc. 13,820 2,070 2,265 LinkedIn Corporation, A 6,355 1,804 1,980 Open Text Corporation 54,551 1,860 3,619 Oracle Corporation 21,910 1,207 1,108 Qualcomm Incorporated 27,785 2,513 1,922 TELECOMMUNICATIONS 1.31%Rogers Communications Inc., B 114,607 5,274 5,469 TELUS Corporation 167,903 5,567 6,424 UTILITIES 0.58%Brookfield Infrastructure Partners L.P. 100,029 4,054 5,240 TRUST UNITS 6.65%iShares, S&P/TSX 60 Index Fund 1,182,326 24,118 22,724 iShares, MSCI EAFE ETF 60,200 4,673 4,892 SPDR S&P 500 ETF 116,216 26,709 32,788 TOTAL EQUITIES 50.61% 387,043 459,733 INVESTMENTS IN UNDERLYING FUNDS Manulife International Stock Fund UT 7,482,744 117,659 138,997 TOTAL INVESTMENTS IN UNDERLYING FUNDS 15.30% 117,659 138,997
Manulife Asset Management Diversified Fund (expressed in thousands of dollars)
Shares
Average cost
$Fair value
$Shares or
units
Average cost
$Fair value
$
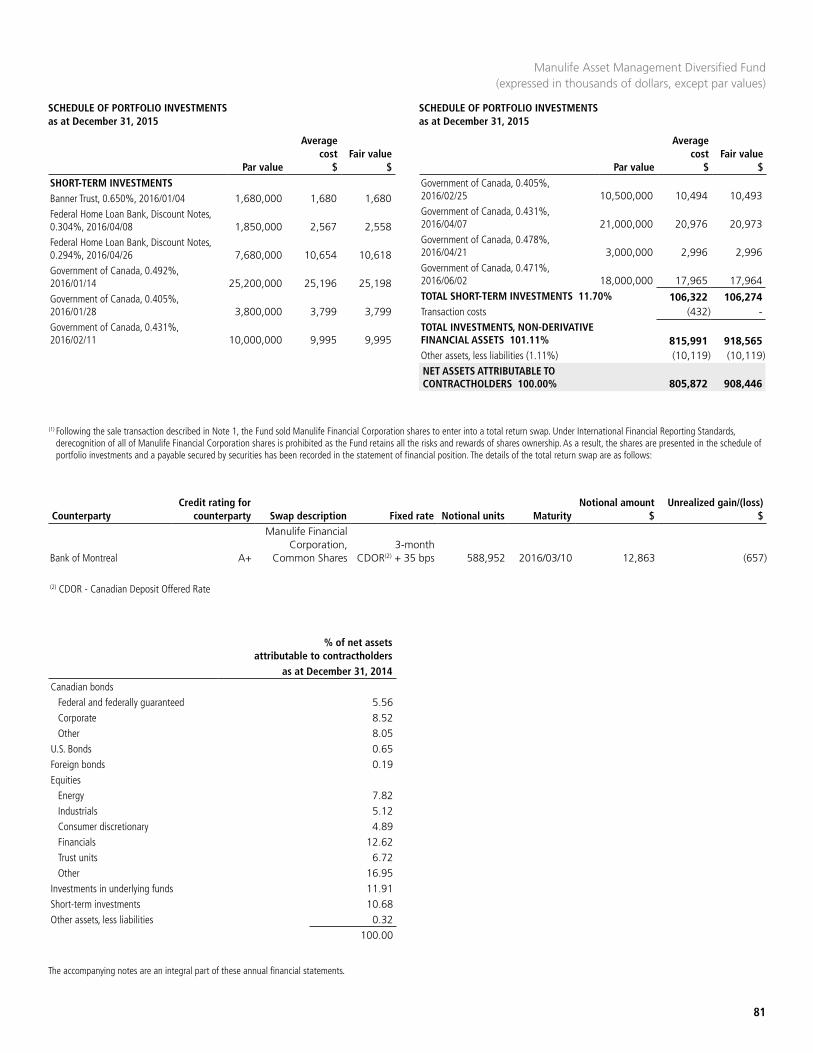
SCHEDULE OF PORTFOLIO INVESTMENTS as at December 31, 2015
SCHEDULE OF PORTFOLIO INVESTMENTS as at December 31, 2015
81
The accompanying notes are an integral part of these annual financial statements.
SHORT-TERM INVESTMENTSBanner Trust, 0.650%, 2016/01/04 1,680,000 1,680 1,680 Federal Home Loan Bank, Discount Notes, 0.304%, 2016/04/08 1,850,000 2,567 2,558 Federal Home Loan Bank, Discount Notes, 0.294%, 2016/04/26 7,680,000 10,654 10,618 Government of Canada, 0.492%, 2016/01/14 25,200,000 25,196 25,198 Government of Canada, 0.405%, 2016/01/28 3,800,000 3,799 3,799 Government of Canada, 0.431%, 2016/02/11 10,000,000 9,995 9,995
% of net assets attributable to contractholders
as at December 31, 2014Canadian bonds
Federal and federally guaranteed 5.56 Corporate 8.52 Other 8.05
U.S. Bonds 0.65 Foreign bonds 0.19 Equities
Energy 7.82 Industrials 5.12 Consumer discretionary 4.89 Financials 12.62 Trust units 6.72 Other 16.95
Investments in underlying funds 11.91 Short-term investments 10.68 Other assets, less liabilities 0.32
100.00
(1) Following the sale transaction described in Note 1, the Fund sold Manulife Financial Corporation shares to enter into a total return swap. Under International Financial Reporting Standards, derecognition of all of Manulife Financial Corporation shares is prohibited as the Fund retains all the risks and rewards of shares ownership. As a result, the shares are presented in the schedule of portfolio investments and a payable secured by securities has been recorded in the statement of financial position. The details of the total return swap are as follows:
CounterpartyCredit rating for
counterparty Swap description Fixed rate Notional units MaturityNotional amount
$Unrealized gain/(loss)
$
Bank of Montreal A+
Manulife Financial Corporation,
Common Shares3-month
CDOR(2) + 35 bps 588,952 2016/03/10 12,863 (657)
(2) CDOR - Canadian Deposit Offered Rate
Government of Canada, 0.405%, 2016/02/25 10,500,000 10,494 10,493 Government of Canada, 0.431%, 2016/04/07 21,000,000 20,976 20,973 Government of Canada, 0.478%, 2016/04/21 3,000,000 2,996 2,996 Government of Canada, 0.471%, 2016/06/02 18,000,000 17,965 17,964 TOTAL SHORT-TERM INVESTMENTS 11.70% 106,322 106,274 Transaction costs (432) - TOTAL INVESTMENTS, NON-DERIVATIVE FINANCIAL ASSETS 101.11% 815,991 918,565 Other assets, less liabilities (1.11%) (10,119) (10,119)NET ASSETS ATTRIBUTABLE TO CONTRACTHOLDERS 100.00% 805,872 908,446
Manulife Asset Management Diversified Fund (expressed in thousands of dollars, except par values)
Par value
Average cost
$Fair value
$ Par value
Average cost
$Fair value
$
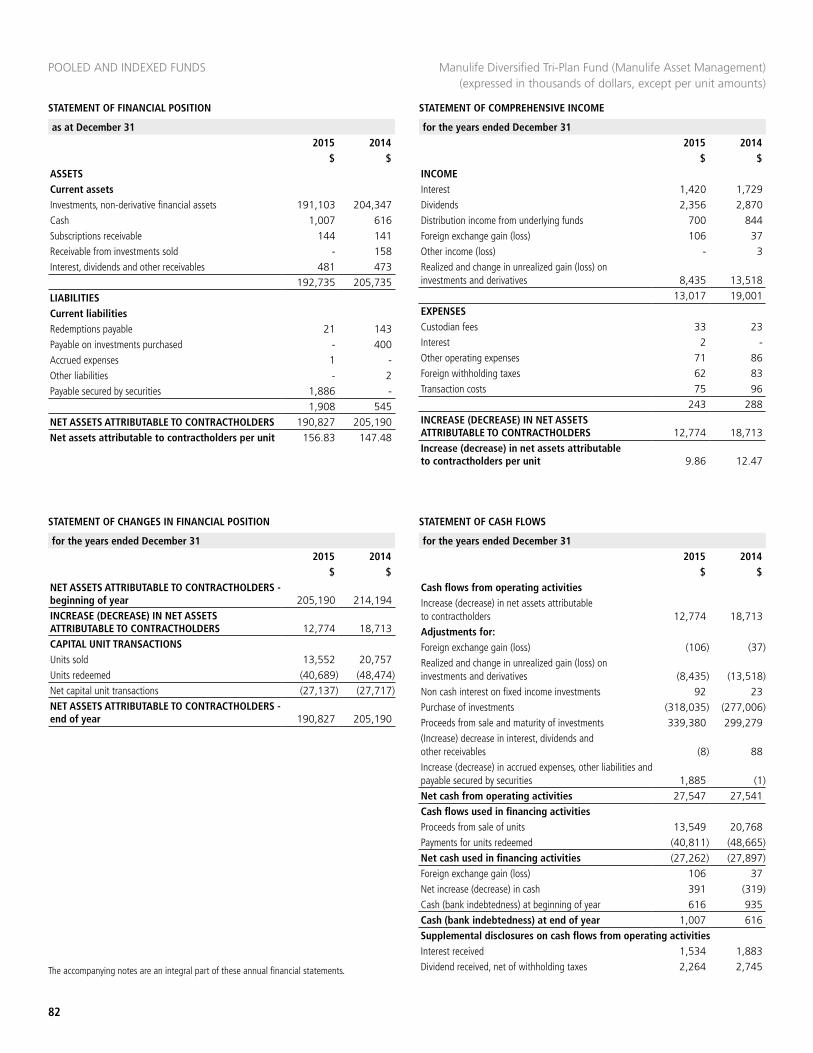
STATEMENT OF FINANCIAL POSITION
POOLED AND INDEXED FUNDS
STATEMENT OF COMPREHENSIVE INCOME
as at December 31 2015 2014
$ $
for the years ended December 312015 2014
$ $
82
The accompanying notes are an integral part of these annual financial statements.
STATEMENT OF CHANGES IN FINANCIAL POSITION STATEMENT OF CASH FLOWS
for the years ended December 312015 2014
$ $
for the years ended December 312015 2014
$ $NET ASSETS ATTRIBUTABLE TO CONTRACTHOLDERS - beginning of year 205,190 214,194INCREASE (DECREASE) IN NET ASSETS ATTRIBUTABLE TO CONTRACTHOLDERS 12,774 18,713CAPITAL UNIT TRANSACTIONSUnits sold 13,552 20,757Units redeemed (40,689) (48,474)Net capital unit transactions (27,137) (27,717)NET ASSETS ATTRIBUTABLE TO CONTRACTHOLDERS - end of year 190,827 205,190
Cash flows from operating activitiesIncrease (decrease) in net assets attributable to contractholders 12,774 18,713Adjustments for:Foreign exchange gain (loss) (106) (37)Realized and change in unrealized gain (loss) on investments and derivatives (8,435) (13,518)Non cash interest on fixed income investments 92 23Purchase of investments (318,035) (277,006)Proceeds from sale and maturity of investments 339,380 299,279(Increase) decrease in interest, dividends and other receivables (8) 88Increase (decrease) in accrued expenses, other liabilities and payable secured by securities 1,885 (1)Net cash from operating activities 27,547 27,541Cash flows used in financing activitiesProceeds from sale of units 13,549 20,768Payments for units redeemed (40,811) (48,665)Net cash used in financing activities (27,262) (27,897)Foreign exchange gain (loss) 106 37Net increase (decrease) in cash 391 (319)Cash (bank indebtedness) at beginning of year 616 935Cash (bank indebtedness) at end of year 1,007 616Supplemental disclosures on cash flows from operating activitiesInterest received 1,534 1,883Dividend received, net of withholding taxes 2,264 2,745
INCOMEInterest 1,420 1,729Dividends 2,356 2,870Distribution income from underlying funds 700 844Foreign exchange gain (loss) 106 37Other income (loss) - 3Realized and change in unrealized gain (loss) on investments and derivatives 8,435 13,518
13,017 19,001EXPENSESCustodian fees 33 23Interest 2 -Other operating expenses 71 86Foreign withholding taxes 62 83Transaction costs 75 96
243 288INCREASE (DECREASE) IN NET ASSETS ATTRIBUTABLE TO CONTRACTHOLDERS 12,774 18,713Increase (decrease) in net assets attributable to contractholders per unit 9.86 12.47
ASSETSCurrent assetsInvestments, non-derivative financial assets 191,103 204,347Cash 1,007 616Subscriptions receivable 144 141Receivable from investments sold - 158Interest, dividends and other receivables 481 473
192,735 205,735LIABILITIESCurrent liabilitiesRedemptions payable 21 143Payable on investments purchased - 400Accrued expenses 1 -Other liabilities - 2Payable secured by securities 1,886 -
1,908 545NET ASSETS ATTRIBUTABLE TO CONTRACTHOLDERS 190,827 205,190Net assets attributable to contractholders per unit 156.83 147.48
Manulife Diversified Tri-Plan Fund (Manulife Asset Management)(expressed in thousands of dollars, except per unit amounts)
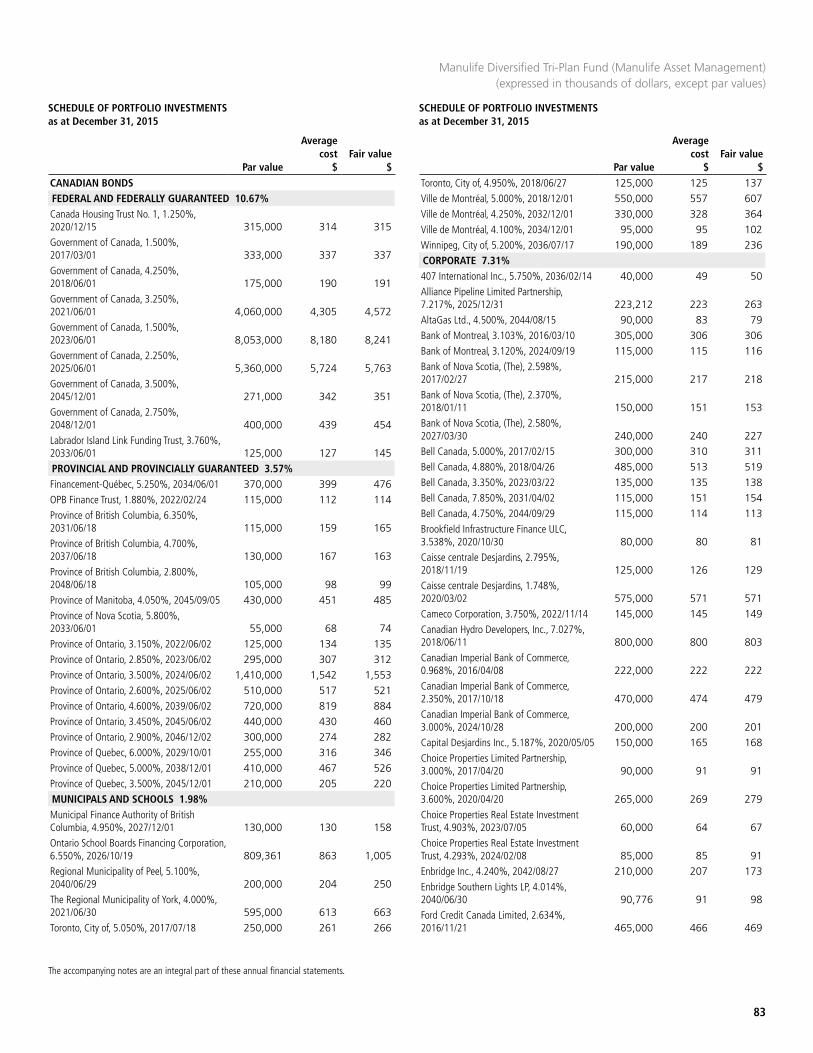
SCHEDULE OF PORTFOLIO INVESTMENTS as at December 31, 2015
SCHEDULE OF PORTFOLIO INVESTMENTS as at December 31, 2015
83
The accompanying notes are an integral part of these annual financial statements.
CANADIAN BONDSFEDERAL AND FEDERALLY GUARANTEED 10.67%Canada Housing Trust No. 1, 1.250%, 2020/12/15 315,000 314 315 Government of Canada, 1.500%, 2017/03/01 333,000 337 337 Government of Canada, 4.250%, 2018/06/01 175,000 190 191 Government of Canada, 3.250%, 2021/06/01 4,060,000 4,305 4,572 Government of Canada, 1.500%, 2023/06/01 8,053,000 8,180 8,241 Government of Canada, 2.250%, 2025/06/01 5,360,000 5,724 5,763 Government of Canada, 3.500%, 2045/12/01 271,000 342 351 Government of Canada, 2.750%, 2048/12/01 400,000 439 454 Labrador Island Link Funding Trust, 3.760%, 2033/06/01 125,000 127 145 PROVINCIAL AND PROVINCIALLY GUARANTEED 3.57%Financement-Québec, 5.250%, 2034/06/01 370,000 399 476 OPB Finance Trust, 1.880%, 2022/02/24 115,000 112 114 Province of British Columbia, 6.350%, 2031/06/18 115,000 159 165 Province of British Columbia, 4.700%, 2037/06/18 130,000 167 163 Province of British Columbia, 2.800%, 2048/06/18 105,000 98 99 Province of Manitoba, 4.050%, 2045/09/05 430,000 451 485 Province of Nova Scotia, 5.800%, 2033/06/01 55,000 68 74 Province of Ontario, 3.150%, 2022/06/02 125,000 134 135 Province of Ontario, 2.850%, 2023/06/02 295,000 307 312 Province of Ontario, 3.500%, 2024/06/02 1,410,000 1,542 1,553 Province of Ontario, 2.600%, 2025/06/02 510,000 517 521 Province of Ontario, 4.600%, 2039/06/02 720,000 819 884 Province of Ontario, 3.450%, 2045/06/02 440,000 430 460 Province of Ontario, 2.900%, 2046/12/02 300,000 274 282 Province of Quebec, 6.000%, 2029/10/01 255,000 316 346 Province of Quebec, 5.000%, 2038/12/01 410,000 467 526 Province of Quebec, 3.500%, 2045/12/01 210,000 205 220 MUNICIPALS AND SCHOOLS 1.98%Municipal Finance Authority of British Columbia, 4.950%, 2027/12/01 130,000 130 158 Ontario School Boards Financing Corporation, 6.550%, 2026/10/19 809,361 863 1,005 Regional Municipality of Peel, 5.100%, 2040/06/29 200,000 204 250 The Regional Municipality of York, 4.000%, 2021/06/30 595,000 613 663 Toronto, City of, 5.050%, 2017/07/18 250,000 261 266
Toronto, City of, 4.950%, 2018/06/27 125,000 125 137 Ville de Montréal, 5.000%, 2018/12/01 550,000 557 607 Ville de Montréal, 4.250%, 2032/12/01 330,000 328 364 Ville de Montréal, 4.100%, 2034/12/01 95,000 95 102 Winnipeg, City of, 5.200%, 2036/07/17 190,000 189 236 CORPORATE 7.31%407 International Inc., 5.750%, 2036/02/14 40,000 49 50 Alliance Pipeline Limited Partnership, 7.217%, 2025/12/31 223,212 223 263 AltaGas Ltd., 4.500%, 2044/08/15 90,000 83 79 Bank of Montreal, 3.103%, 2016/03/10 305,000 306 306 Bank of Montreal, 3.120%, 2024/09/19 115,000 115 116 Bank of Nova Scotia, (The), 2.598%, 2017/02/27 215,000 217 218 Bank of Nova Scotia, (The), 2.370%, 2018/01/11 150,000 151 153 Bank of Nova Scotia, (The), 2.580%, 2027/03/30 240,000 240 227 Bell Canada, 5.000%, 2017/02/15 300,000 310 311 Bell Canada, 4.880%, 2018/04/26 485,000 513 519 Bell Canada, 3.350%, 2023/03/22 135,000 135 138 Bell Canada, 7.850%, 2031/04/02 115,000 151 154 Bell Canada, 4.750%, 2044/09/29 115,000 114 113 Brookfield Infrastructure Finance ULC, 3.538%, 2020/10/30 80,000 80 81 Caisse centrale Desjardins, 2.795%, 2018/11/19 125,000 126 129 Caisse centrale Desjardins, 1.748%, 2020/03/02 575,000 571 571 Cameco Corporation, 3.750%, 2022/11/14 145,000 145 149 Canadian Hydro Developers, Inc., 7.027%, 2018/06/11 800,000 800 803 Canadian Imperial Bank of Commerce, 0.968%, 2016/04/08 222,000 222 222 Canadian Imperial Bank of Commerce, 2.350%, 2017/10/18 470,000 474 479 Canadian Imperial Bank of Commerce, 3.000%, 2024/10/28 200,000 200 201 Capital Desjardins Inc., 5.187%, 2020/05/05 150,000 165 168 Choice Properties Limited Partnership, 3.000%, 2017/04/20 90,000 91 91 Choice Properties Limited Partnership, 3.600%, 2020/04/20 265,000 269 279 Choice Properties Real Estate Investment Trust, 4.903%, 2023/07/05 60,000 64 67 Choice Properties Real Estate Investment Trust, 4.293%, 2024/02/08 85,000 85 91 Enbridge Inc., 4.240%, 2042/08/27 210,000 207 173 Enbridge Southern Lights LP, 4.014%, 2040/06/30 90,776 91 98 Ford Credit Canada Limited, 2.634%, 2016/11/21 465,000 466 469
Manulife Diversified Tri-Plan Fund (Manulife Asset Management)(expressed in thousands of dollars, except par values)
Par value
Average cost
$Fair value
$ Par value
Average cost
$Fair value
$
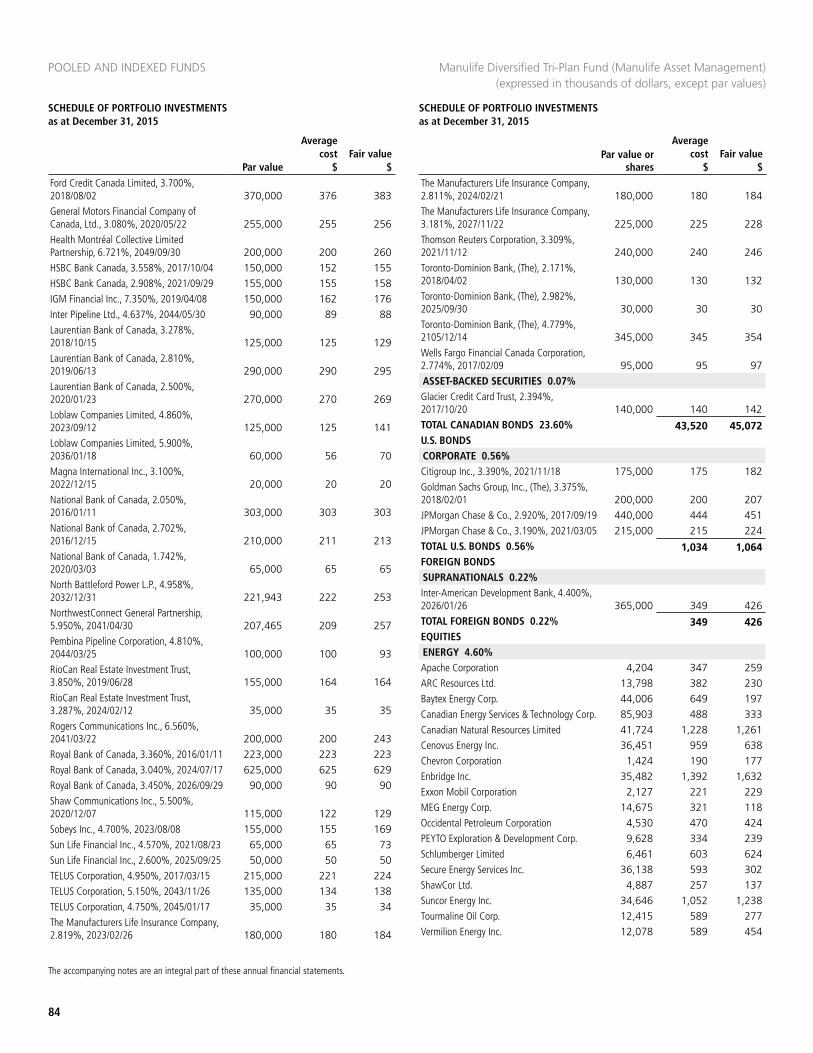
POOLED AND INDEXED FUNDS
84
SCHEDULE OF PORTFOLIO INVESTMENTS as at December 31, 2015
SCHEDULE OF PORTFOLIO INVESTMENTS as at December 31, 2015
The accompanying notes are an integral part of these annual financial statements.
Ford Credit Canada Limited, 3.700%, 2018/08/02 370,000 376 383 General Motors Financial Company of Canada, Ltd., 3.080%, 2020/05/22 255,000 255 256 Health Montréal Collective Limited Partnership, 6.721%, 2049/09/30 200,000 200 260 HSBC Bank Canada, 3.558%, 2017/10/04 150,000 152 155 HSBC Bank Canada, 2.908%, 2021/09/29 155,000 155 158 IGM Financial Inc., 7.350%, 2019/04/08 150,000 162 176 Inter Pipeline Ltd., 4.637%, 2044/05/30 90,000 89 88 Laurentian Bank of Canada, 3.278%, 2018/10/15 125,000 125 129 Laurentian Bank of Canada, 2.810%, 2019/06/13 290,000 290 295 Laurentian Bank of Canada, 2.500%, 2020/01/23 270,000 270 269 Loblaw Companies Limited, 4.860%, 2023/09/12 125,000 125 141 Loblaw Companies Limited, 5.900%, 2036/01/18 60,000 56 70 Magna International Inc., 3.100%, 2022/12/15 20,000 20 20 National Bank of Canada, 2.050%, 2016/01/11 303,000 303 303 National Bank of Canada, 2.702%, 2016/12/15 210,000 211 213 National Bank of Canada, 1.742%, 2020/03/03 65,000 65 65 North Battleford Power L.P., 4.958%, 2032/12/31 221,943 222 253 NorthwestConnect General Partnership, 5.950%, 2041/04/30 207,465 209 257 Pembina Pipeline Corporation, 4.810%, 2044/03/25 100,000 100 93 RioCan Real Estate Investment Trust, 3.850%, 2019/06/28 155,000 164 164 RioCan Real Estate Investment Trust, 3.287%, 2024/02/12 35,000 35 35 Rogers Communications Inc., 6.560%, 2041/03/22 200,000 200 243 Royal Bank of Canada, 3.360%, 2016/01/11 223,000 223 223 Royal Bank of Canada, 3.040%, 2024/07/17 625,000 625 629 Royal Bank of Canada, 3.450%, 2026/09/29 90,000 90 90 Shaw Communications Inc., 5.500%, 2020/12/07 115,000 122 129 Sobeys Inc., 4.700%, 2023/08/08 155,000 155 169 Sun Life Financial Inc., 4.570%, 2021/08/23 65,000 65 73 Sun Life Financial Inc., 2.600%, 2025/09/25 50,000 50 50 TELUS Corporation, 4.950%, 2017/03/15 215,000 221 224 TELUS Corporation, 5.150%, 2043/11/26 135,000 134 138 TELUS Corporation, 4.750%, 2045/01/17 35,000 35 34 The Manufacturers Life Insurance Company, 2.819%, 2023/02/26 180,000 180 184
The Manufacturers Life Insurance Company, 2.811%, 2024/02/21 180,000 180 184 The Manufacturers Life Insurance Company, 3.181%, 2027/11/22 225,000 225 228 Thomson Reuters Corporation, 3.309%, 2021/11/12 240,000 240 246 Toronto-Dominion Bank, (The), 2.171%, 2018/04/02 130,000 130 132 Toronto-Dominion Bank, (The), 2.982%, 2025/09/30 30,000 30 30 Toronto-Dominion Bank, (The), 4.779%, 2105/12/14 345,000 345 354 Wells Fargo Financial Canada Corporation, 2.774%, 2017/02/09 95,000 95 97 ASSET-BACKED SECURITIES 0.07%Glacier Credit Card Trust, 2.394%, 2017/10/20 140,000 140 142 TOTAL CANADIAN BONDS 23.60% 43,520 45,072 U.S. BONDSCORPORATE 0.56%Citigroup Inc., 3.390%, 2021/11/18 175,000 175 182 Goldman Sachs Group, Inc., (The), 3.375%, 2018/02/01 200,000 200 207 JPMorgan Chase & Co., 2.920%, 2017/09/19 440,000 444 451 JPMorgan Chase & Co., 3.190%, 2021/03/05 215,000 215 224 TOTAL U.S. BONDS 0.56% 1,034 1,064 FOREIGN BONDSSUPRANATIONALS 0.22%Inter-American Development Bank, 4.400%, 2026/01/26 365,000 349 426 TOTAL FOREIGN BONDS 0.22% 349 426 EQUITIESENERGY 4.60%Apache Corporation 4,204 347 259 ARC Resources Ltd. 13,798 382 230 Baytex Energy Corp. 44,006 649 197 Canadian Energy Services & Technology Corp. 85,903 488 333 Canadian Natural Resources Limited 41,724 1,228 1,261 Cenovus Energy Inc. 36,451 959 638 Chevron Corporation 1,424 190 177 Enbridge Inc. 35,482 1,392 1,632 Exxon Mobil Corporation 2,127 221 229 MEG Energy Corp. 14,675 321 118 Occidental Petroleum Corporation 4,530 470 424 PEYTO Exploration & Development Corp. 9,628 334 239 Schlumberger Limited 6,461 603 624 Secure Energy Services Inc. 36,138 593 302 ShawCor Ltd. 4,887 257 137 Suncor Energy Inc. 34,646 1,052 1,238 Tourmaline Oil Corp. 12,415 589 277 Vermilion Energy Inc. 12,078 589 454
Manulife Diversified Tri-Plan Fund (Manulife Asset Management)(expressed in thousands of dollars, except par values)
Par value
Average cost
$Fair value
$Par value or
shares
Average cost
$Fair value
$
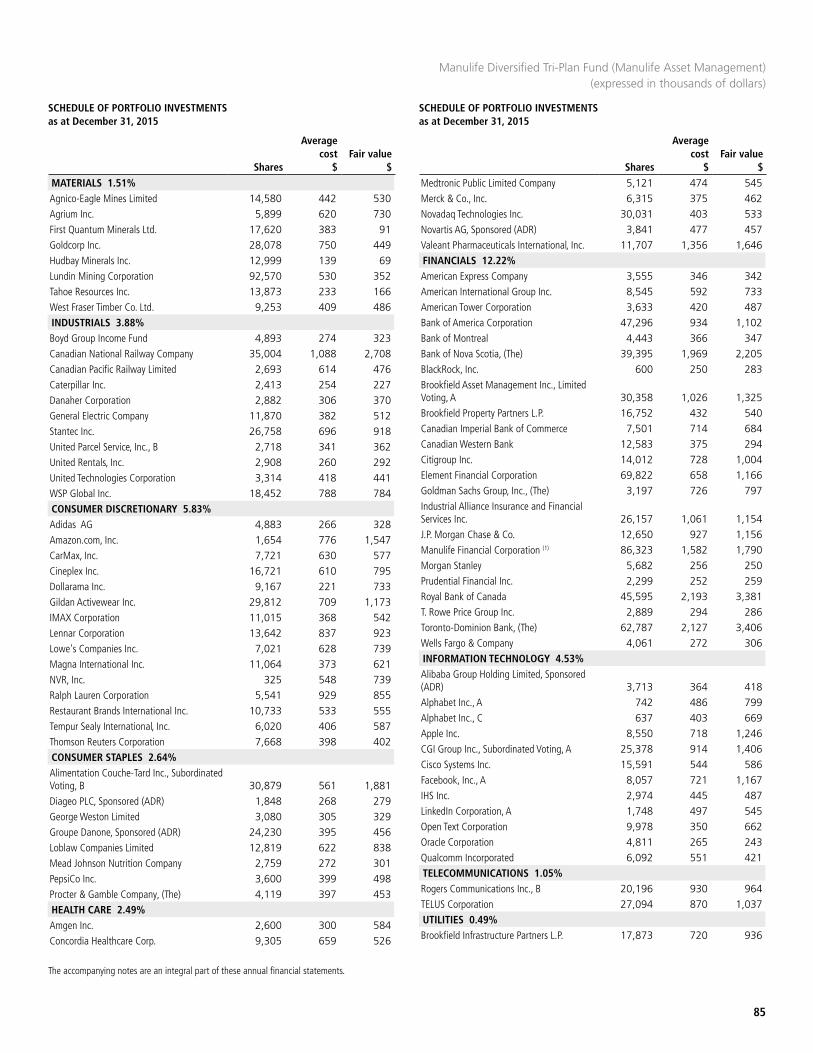
SCHEDULE OF PORTFOLIO INVESTMENTS as at December 31, 2015
SCHEDULE OF PORTFOLIO INVESTMENTS as at December 31, 2015
85
The accompanying notes are an integral part of these annual financial statements.
MATERIALS 1.51%Agnico-Eagle Mines Limited 14,580 442 530 Agrium Inc. 5,899 620 730 First Quantum Minerals Ltd. 17,620 383 91 Goldcorp Inc. 28,078 750 449 Hudbay Minerals Inc. 12,999 139 69 Lundin Mining Corporation 92,570 530 352 Tahoe Resources Inc. 13,873 233 166 West Fraser Timber Co. Ltd. 9,253 409 486 INDUSTRIALS 3.88%Boyd Group Income Fund 4,893 274 323 Canadian National Railway Company 35,004 1,088 2,708 Canadian Pacific Railway Limited 2,693 614 476 Caterpillar Inc. 2,413 254 227 Danaher Corporation 2,882 306 370 General Electric Company 11,870 382 512 Stantec Inc. 26,758 696 918 United Parcel Service, Inc., B 2,718 341 362 United Rentals, Inc. 2,908 260 292 United Technologies Corporation 3,314 418 441 WSP Global Inc. 18,452 788 784 CONSUMER DISCRETIONARY 5.83%Adidas AG 4,883 266 328 Amazon.com, Inc. 1,654 776 1,547 CarMax, Inc. 7,721 630 577 Cineplex Inc. 16,721 610 795 Dollarama Inc. 9,167 221 733 Gildan Activewear Inc. 29,812 709 1,173 IMAX Corporation 11,015 368 542 Lennar Corporation 13,642 837 923 Lowe's Companies Inc. 7,021 628 739 Magna International Inc. 11,064 373 621 NVR, Inc. 325 548 739 Ralph Lauren Corporation 5,541 929 855 Restaurant Brands International Inc. 10,733 533 555 Tempur Sealy International, Inc. 6,020 406 587 Thomson Reuters Corporation 7,668 398 402 CONSUMER STAPLES 2.64%Alimentation Couche-Tard Inc., Subordinated Voting, B 30,879 561 1,881 Diageo PLC, Sponsored (ADR) 1,848 268 279 George Weston Limited 3,080 305 329 Groupe Danone, Sponsored (ADR) 24,230 395 456 Loblaw Companies Limited 12,819 622 838 Mead Johnson Nutrition Company 2,759 272 301 PepsiCo Inc. 3,600 399 498 Procter & Gamble Company, (The) 4,119 397 453 HEALTH CARE 2.49%Amgen Inc. 2,600 300 584 Concordia Healthcare Corp. 9,305 659 526
Medtronic Public Limited Company 5,121 474 545 Merck & Co., Inc. 6,315 375 462 Novadaq Technologies Inc. 30,031 403 533 Novartis AG, Sponsored (ADR) 3,841 477 457 Valeant Pharmaceuticals International, Inc. 11,707 1,356 1,646 FINANCIALS 12.22%American Express Company 3,555 346 342 American International Group Inc. 8,545 592 733 American Tower Corporation 3,633 420 487 Bank of America Corporation 47,296 934 1,102 Bank of Montreal 4,443 366 347 Bank of Nova Scotia, (The) 39,395 1,969 2,205 BlackRock, Inc. 600 250 283 Brookfield Asset Management Inc., Limited Voting, A 30,358 1,026 1,325 Brookfield Property Partners L.P. 16,752 432 540 Canadian Imperial Bank of Commerce 7,501 714 684 Canadian Western Bank 12,583 375 294 Citigroup Inc. 14,012 728 1,004 Element Financial Corporation 69,822 658 1,166 Goldman Sachs Group, Inc., (The) 3,197 726 797 Industrial Alliance Insurance and Financial Services Inc. 26,157 1,061 1,154 J.P. Morgan Chase & Co. 12,650 927 1,156 Manulife Financial Corporation (1) 86,323 1,582 1,790 Morgan Stanley 5,682 256 250 Prudential Financial Inc. 2,299 252 259 Royal Bank of Canada 45,595 2,193 3,381 T. Rowe Price Group Inc. 2,889 294 286 Toronto-Dominion Bank, (The) 62,787 2,127 3,406 Wells Fargo & Company 4,061 272 306 INFORMATION TECHNOLOGY 4.53%Alibaba Group Holding Limited, Sponsored (ADR) 3,713 364 418 Alphabet Inc., A 742 486 799 Alphabet Inc., C 637 403 669 Apple Inc. 8,550 718 1,246 CGI Group Inc., Subordinated Voting, A 25,378 914 1,406 Cisco Systems Inc. 15,591 544 586 Facebook, Inc., A 8,057 721 1,167 IHS Inc. 2,974 445 487 LinkedIn Corporation, A 1,748 497 545 Open Text Corporation 9,978 350 662 Oracle Corporation 4,811 265 243 Qualcomm Incorporated 6,092 551 421 TELECOMMUNICATIONS 1.05%Rogers Communications Inc., B 20,196 930 964 TELUS Corporation 27,094 870 1,037 UTILITIES 0.49%Brookfield Infrastructure Partners L.P. 17,873 720 936
Manulife Diversified Tri-Plan Fund (Manulife Asset Management)(expressed in thousands of dollars)
Shares
Average cost
$Fair value
$ Shares
Average cost
$Fair value
$
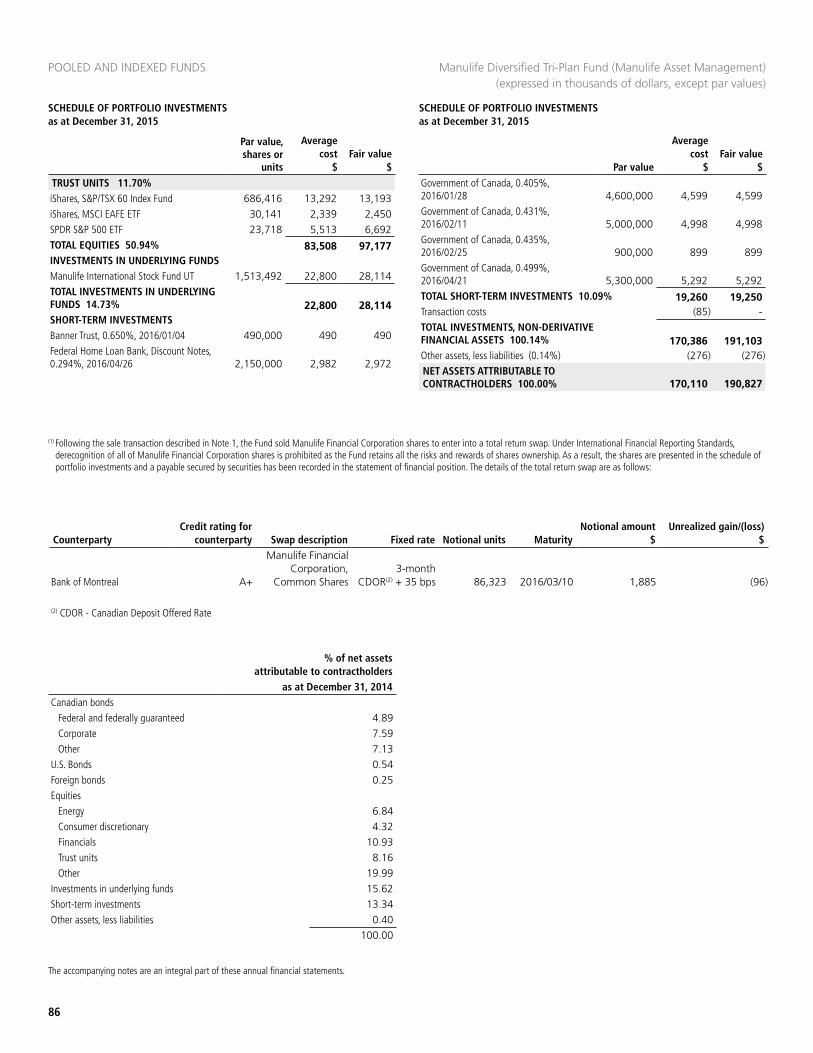
POOLED AND INDEXED FUNDS
86
SCHEDULE OF PORTFOLIO INVESTMENTS as at December 31, 2015
SCHEDULE OF PORTFOLIO INVESTMENTS as at December 31, 2015
The accompanying notes are an integral part of these annual financial statements.
TRUST UNITS 11.70%iShares, S&P/TSX 60 Index Fund 686,416 13,292 13,193 iShares, MSCI EAFE ETF 30,141 2,339 2,450 SPDR S&P 500 ETF 23,718 5,513 6,692 TOTAL EQUITIES 50.94% 83,508 97,177 INVESTMENTS IN UNDERLYING FUNDS Manulife International Stock Fund UT 1,513,492 22,800 28,114 TOTAL INVESTMENTS IN UNDERLYING FUNDS 14.73% 22,800 28,114 SHORT-TERM INVESTMENTSBanner Trust, 0.650%, 2016/01/04 490,000 490 490 Federal Home Loan Bank, Discount Notes, 0.294%, 2016/04/26 2,150,000 2,982 2,972
Government of Canada, 0.405%, 2016/01/28 4,600,000 4,599 4,599 Government of Canada, 0.431%, 2016/02/11 5,000,000 4,998 4,998 Government of Canada, 0.435%, 2016/02/25 900,000 899 899 Government of Canada, 0.499%, 2016/04/21 5,300,000 5,292 5,292 TOTAL SHORT-TERM INVESTMENTS 10.09% 19,260 19,250 Transaction costs (85) - TOTAL INVESTMENTS, NON-DERIVATIVE FINANCIAL ASSETS 100.14% 170,386 191,103 Other assets, less liabilities (0.14%) (276) (276)NET ASSETS ATTRIBUTABLE TO CONTRACTHOLDERS 100.00% 170,110 190,827
(1) Following the sale transaction described in Note 1, the Fund sold Manulife Financial Corporation shares to enter into a total return swap. Under International Financial Reporting Standards, derecognition of all of Manulife Financial Corporation shares is prohibited as the Fund retains all the risks and rewards of shares ownership. As a result, the shares are presented in the schedule of portfolio investments and a payable secured by securities has been recorded in the statement of financial position. The details of the total return swap are as follows:
% of net assets attributable to contractholders
as at December 31, 2014Canadian bonds
Federal and federally guaranteed 4.89 Corporate 7.59 Other 7.13
U.S. Bonds 0.54 Foreign bonds 0.25 Equities
Energy 6.84 Consumer discretionary 4.32 Financials 10.93 Trust units 8.16 Other 19.99
Investments in underlying funds 15.62 Short-term investments 13.34 Other assets, less liabilities 0.40
100.00
Manulife Diversified Tri-Plan Fund (Manulife Asset Management)(expressed in thousands of dollars, except par values)
CounterpartyCredit rating for
counterparty Swap description Fixed rate Notional units MaturityNotional amount
$Unrealized gain/(loss)
$
Bank of Montreal A+
Manulife Financial Corporation,
Common Shares3-month
CDOR(2) + 35 bps 86,323 2016/03/10 1,885 (96)
(2) CDOR - Canadian Deposit Offered Rate
Par value, shares or
units
Average cost
$Fair value
$ Par value
Average cost
$Fair value
$
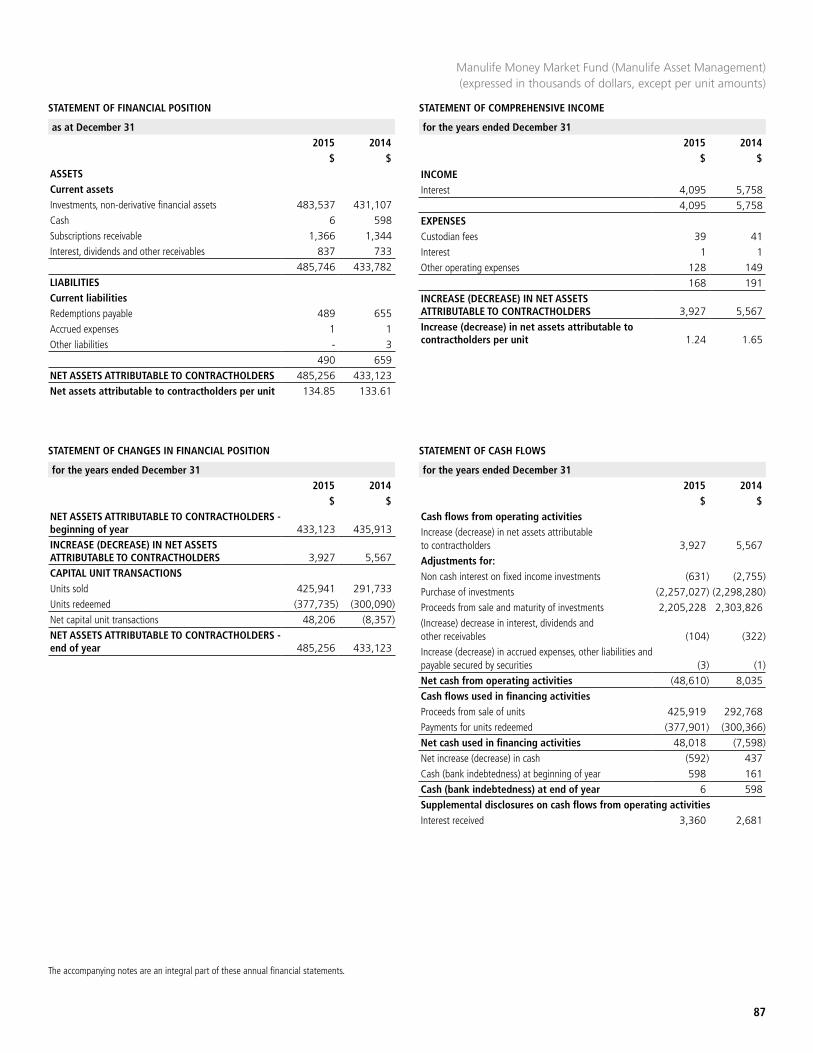
STATEMENT OF FINANCIAL POSITION STATEMENT OF COMPREHENSIVE INCOME
as at December 31 2015 2014
$ $
for the years ended December 312015 2014
$ $
87
The accompanying notes are an integral part of these annual financial statements.
ASSETSCurrent assetsInvestments, non-derivative financial assets 483,537 431,107Cash 6 598Subscriptions receivable 1,366 1,344Interest, dividends and other receivables 837 733
485,746 433,782LIABILITIESCurrent liabilitiesRedemptions payable 489 655Accrued expenses 1 1Other liabilities - 3
490 659NET ASSETS ATTRIBUTABLE TO CONTRACTHOLDERS 485,256 433,123Net assets attributable to contractholders per unit 134.85 133.61
INCOMEInterest 4,095 5,758
4,095 5,758EXPENSESCustodian fees 39 41Interest 1 1Other operating expenses 128 149
168 191INCREASE (DECREASE) IN NET ASSETS ATTRIBUTABLE TO CONTRACTHOLDERS 3,927 5,567Increase (decrease) in net assets attributable to contractholders per unit 1.24 1.65
STATEMENT OF CHANGES IN FINANCIAL POSITION STATEMENT OF CASH FLOWS
for the years ended December 312015 2014
$ $
for the years ended December 312015 2014
$ $NET ASSETS ATTRIBUTABLE TO CONTRACTHOLDERS - beginning of year 433,123 435,913INCREASE (DECREASE) IN NET ASSETS ATTRIBUTABLE TO CONTRACTHOLDERS 3,927 5,567CAPITAL UNIT TRANSACTIONSUnits sold 425,941 291,733Units redeemed (377,735) (300,090)Net capital unit transactions 48,206 (8,357)NET ASSETS ATTRIBUTABLE TO CONTRACTHOLDERS - end of year 485,256 433,123
Cash flows from operating activitiesIncrease (decrease) in net assets attributable to contractholders 3,927 5,567Adjustments for:Non cash interest on fixed income investments (631) (2,755)Purchase of investments (2,257,027) (2,298,280)Proceeds from sale and maturity of investments 2,205,228 2,303,826(Increase) decrease in interest, dividends and other receivables (104) (322)Increase (decrease) in accrued expenses, other liabilities and payable secured by securities (3) (1)Net cash from operating activities (48,610) 8,035Cash flows used in financing activitiesProceeds from sale of units 425,919 292,768Payments for units redeemed (377,901) (300,366)Net cash used in financing activities 48,018 (7,598)Net increase (decrease) in cash (592) 437Cash (bank indebtedness) at beginning of year 598 161Cash (bank indebtedness) at end of year 6 598Supplemental disclosures on cash flows from operating activitiesInterest received 3,360 2,681
Manulife Money Market Fund (Manulife Asset Management) (expressed in thousands of dollars, except per unit amounts)
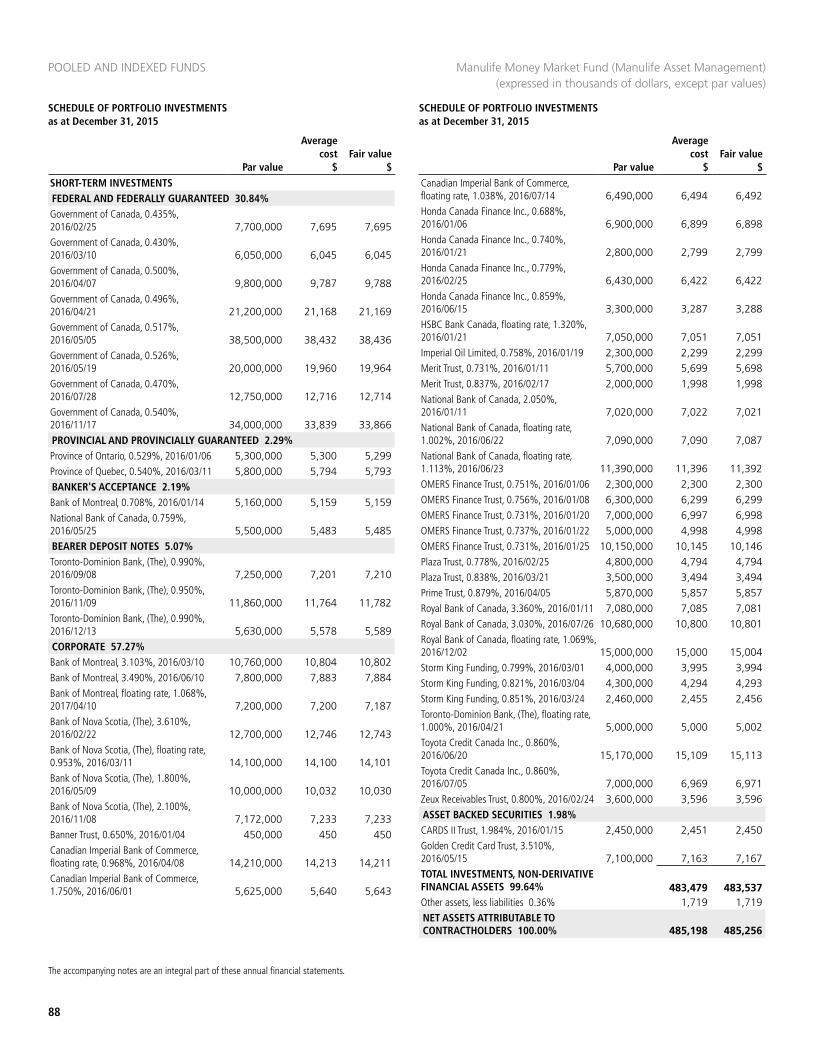
POOLED AND INDEXED FUNDS
88
SCHEDULE OF PORTFOLIO INVESTMENTS as at December 31, 2015
SCHEDULE OF PORTFOLIO INVESTMENTS as at December 31, 2015
The accompanying notes are an integral part of these annual financial statements.
SHORT-TERM INVESTMENTSFEDERAL AND FEDERALLY GUARANTEED 30.84%Government of Canada, 0.435%, 2016/02/25 7,700,000 7,695 7,695 Government of Canada, 0.430%, 2016/03/10 6,050,000 6,045 6,045 Government of Canada, 0.500%, 2016/04/07 9,800,000 9,787 9,788 Government of Canada, 0.496%, 2016/04/21 21,200,000 21,168 21,169 Government of Canada, 0.517%, 2016/05/05 38,500,000 38,432 38,436 Government of Canada, 0.526%, 2016/05/19 20,000,000 19,960 19,964 Government of Canada, 0.470%, 2016/07/28 12,750,000 12,716 12,714 Government of Canada, 0.540%, 2016/11/17 34,000,000 33,839 33,866 PROVINCIAL AND PROVINCIALLY GUARANTEED 2.29%Province of Ontario, 0.529%, 2016/01/06 5,300,000 5,300 5,299 Province of Quebec, 0.540%, 2016/03/11 5,800,000 5,794 5,793 BANKER'S ACCEPTANCE 2.19%Bank of Montreal, 0.708%, 2016/01/14 5,160,000 5,159 5,159 National Bank of Canada, 0.759%, 2016/05/25 5,500,000 5,483 5,485 BEARER DEPOSIT NOTES 5.07%Toronto-Dominion Bank, (The), 0.990%, 2016/09/08 7,250,000 7,201 7,210 Toronto-Dominion Bank, (The), 0.950%, 2016/11/09 11,860,000 11,764 11,782 Toronto-Dominion Bank, (The), 0.990%, 2016/12/13 5,630,000 5,578 5,589 CORPORATE 57.27%Bank of Montreal, 3.103%, 2016/03/10 10,760,000 10,804 10,802 Bank of Montreal, 3.490%, 2016/06/10 7,800,000 7,883 7,884 Bank of Montreal, floating rate, 1.068%, 2017/04/10 7,200,000 7,200 7,187 Bank of Nova Scotia, (The), 3.610%, 2016/02/22 12,700,000 12,746 12,743 Bank of Nova Scotia, (The), floating rate, 0.953%, 2016/03/11 14,100,000 14,100 14,101 Bank of Nova Scotia, (The), 1.800%, 2016/05/09 10,000,000 10,032 10,030 Bank of Nova Scotia, (The), 2.100%, 2016/11/08 7,172,000 7,233 7,233 Banner Trust, 0.650%, 2016/01/04 450,000 450 450 Canadian Imperial Bank of Commerce, floating rate, 0.968%, 2016/04/08 14,210,000 14,213 14,211 Canadian Imperial Bank of Commerce, 1.750%, 2016/06/01 5,625,000 5,640 5,643
Canadian Imperial Bank of Commerce, floating rate, 1.038%, 2016/07/14 6,490,000 6,494 6,492 Honda Canada Finance Inc., 0.688%, 2016/01/06 6,900,000 6,899 6,898 Honda Canada Finance Inc., 0.740%, 2016/01/21 2,800,000 2,799 2,799 Honda Canada Finance Inc., 0.779%, 2016/02/25 6,430,000 6,422 6,422 Honda Canada Finance Inc., 0.859%, 2016/06/15 3,300,000 3,287 3,288 HSBC Bank Canada, floating rate, 1.320%, 2016/01/21 7,050,000 7,051 7,051 Imperial Oil Limited, 0.758%, 2016/01/19 2,300,000 2,299 2,299 Merit Trust, 0.731%, 2016/01/11 5,700,000 5,699 5,698 Merit Trust, 0.837%, 2016/02/17 2,000,000 1,998 1,998 National Bank of Canada, 2.050%, 2016/01/11 7,020,000 7,022 7,021 National Bank of Canada, floating rate, 1.002%, 2016/06/22 7,090,000 7,090 7,087 National Bank of Canada, floating rate, 1.113%, 2016/06/23 11,390,000 11,396 11,392 OMERS Finance Trust, 0.751%, 2016/01/06 2,300,000 2,300 2,300 OMERS Finance Trust, 0.756%, 2016/01/08 6,300,000 6,299 6,299 OMERS Finance Trust, 0.731%, 2016/01/20 7,000,000 6,997 6,998 OMERS Finance Trust, 0.737%, 2016/01/22 5,000,000 4,998 4,998 OMERS Finance Trust, 0.731%, 2016/01/25 10,150,000 10,145 10,146 Plaza Trust, 0.778%, 2016/02/25 4,800,000 4,794 4,794 Plaza Trust, 0.838%, 2016/03/21 3,500,000 3,494 3,494 Prime Trust, 0.879%, 2016/04/05 5,870,000 5,857 5,857 Royal Bank of Canada, 3.360%, 2016/01/11 7,080,000 7,085 7,081 Royal Bank of Canada, 3.030%, 2016/07/26 10,680,000 10,800 10,801 Royal Bank of Canada, floating rate, 1.069%, 2016/12/02 15,000,000 15,000 15,004 Storm King Funding, 0.799%, 2016/03/01 4,000,000 3,995 3,994 Storm King Funding, 0.821%, 2016/03/04 4,300,000 4,294 4,293 Storm King Funding, 0.851%, 2016/03/24 2,460,000 2,455 2,456 Toronto-Dominion Bank, (The), floating rate, 1.000%, 2016/04/21 5,000,000 5,000 5,002 Toyota Credit Canada Inc., 0.860%, 2016/06/20 15,170,000 15,109 15,113 Toyota Credit Canada Inc., 0.860%, 2016/07/05 7,000,000 6,969 6,971 Zeux Receivables Trust, 0.800%, 2016/02/24 3,600,000 3,596 3,596 ASSET BACKED SECURITIES 1.98%CARDS II Trust, 1.984%, 2016/01/15 2,450,000 2,451 2,450 Golden Credit Card Trust, 3.510%, 2016/05/15 7,100,000 7,163 7,167 TOTAL INVESTMENTS, NON-DERIVATIVE FINANCIAL ASSETS 99.64% 483,479 483,537 Other assets, less liabilities 0.36% 1,719 1,719 NET ASSETS ATTRIBUTABLE TO CONTRACTHOLDERS 100.00% 485,198 485,256
Manulife Money Market Fund (Manulife Asset Management) (expressed in thousands of dollars, except par values)
Par value
Average cost
$Fair value
$ Par value
Average cost
$Fair value
$
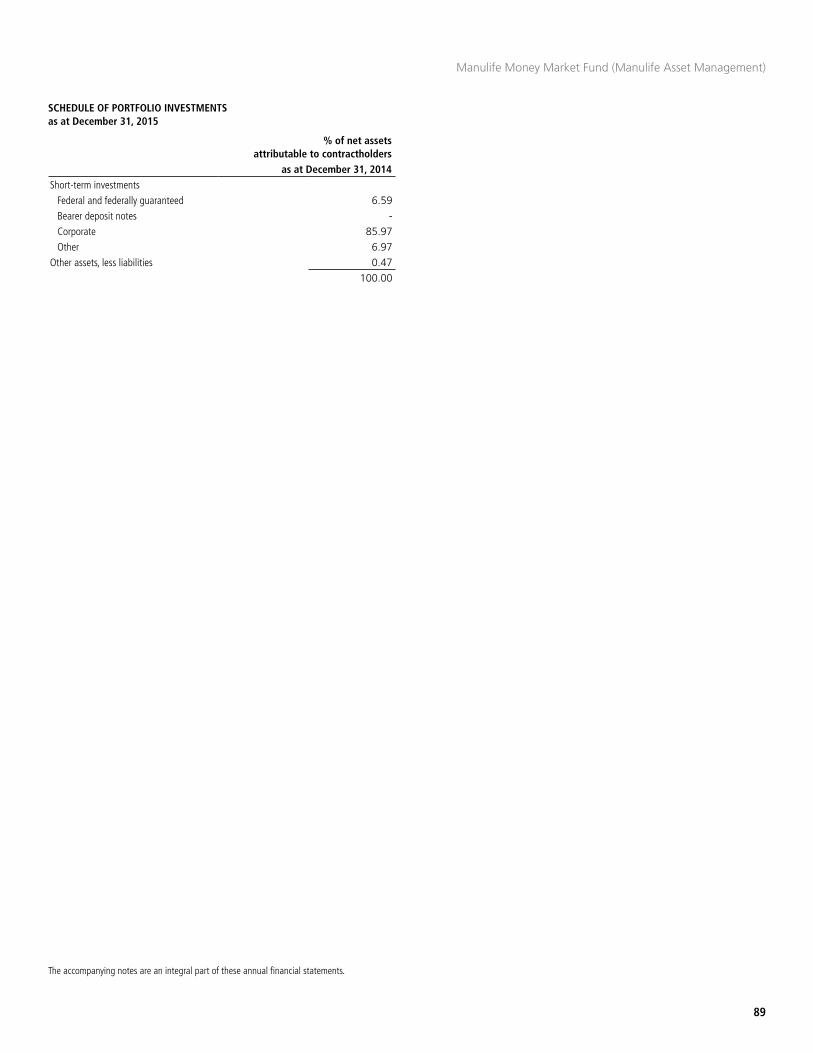
SCHEDULE OF PORTFOLIO INVESTMENTS as at December 31, 2015
89
The accompanying notes are an integral part of these annual financial statements.
% of net assets attributable to contractholders
as at December 31, 2014Short-term investments
Federal and federally guaranteed 6.59Bearer deposit notes -Corporate 85.97Other 6.97
Other assets, less liabilities 0.47 100.00
Manulife Money Market Fund (Manulife Asset Management)
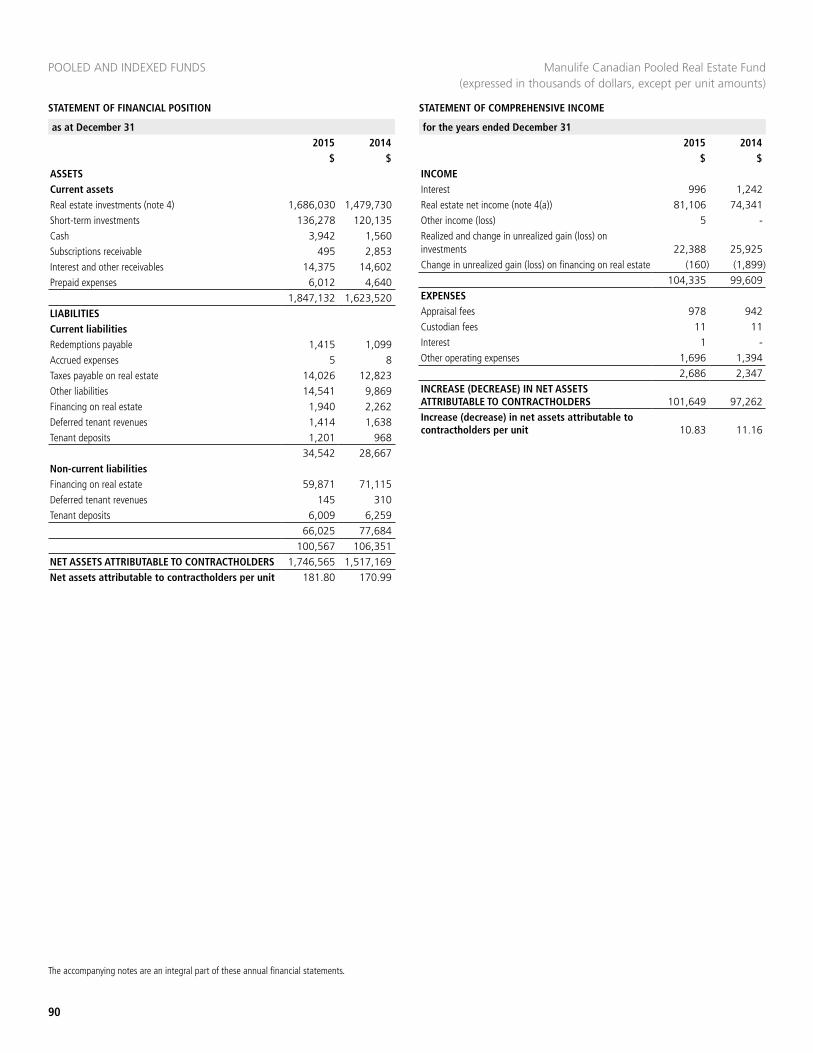
STATEMENT OF FINANCIAL POSITION
POOLED AND INDEXED FUNDS
STATEMENT OF COMPREHENSIVE INCOME
as at December 31 2015 2014
$ $
for the years ended December 312015 2014
$ $
90
The accompanying notes are an integral part of these annual financial statements.
ASSETSCurrent assetsReal estate investments (note 4) 1,686,030 1,479,730Short-term investments 136,278 120,135Cash 3,942 1,560Subscriptions receivable 495 2,853Interest and other receivables 14,375 14,602Prepaid expenses 6,012 4,640
1,847,132 1,623,520LIABILITIESCurrent liabilitiesRedemptions payable 1,415 1,099Accrued expenses 5 8Taxes payable on real estate 14,026 12,823Other liabilities 14,541 9,869Financing on real estate 1,940 2,262Deferred tenant revenues 1,414 1,638Tenant deposits 1,201 968
34,542 28,667Non-current liabilitiesFinancing on real estate 59,871 71,115Deferred tenant revenues 145 310Tenant deposits 6,009 6,259
66,025 77,684100,567 106,351
NET ASSETS ATTRIBUTABLE TO CONTRACTHOLDERS 1,746,565 1,517,169Net assets attributable to contractholders per unit 181.80 170.99
INCOMEInterest 996 1,242Real estate net income (note 4(a)) 81,106 74,341Other income (loss) 5 -Realized and change in unrealized gain (loss) on investments 22,388 25,925Change in unrealized gain (loss) on financing on real estate (160) (1,899)
104,335 99,609EXPENSESAppraisal fees 978 942Custodian fees 11 11Interest 1 -Other operating expenses 1,696 1,394
2,686 2,347INCREASE (DECREASE) IN NET ASSETS ATTRIBUTABLE TO CONTRACTHOLDERS 101,649 97,262Increase (decrease) in net assets attributable to contractholders per unit 10.83 11.16
Manulife Canadian Pooled Real Estate Fund (expressed in thousands of dollars, except per unit amounts)
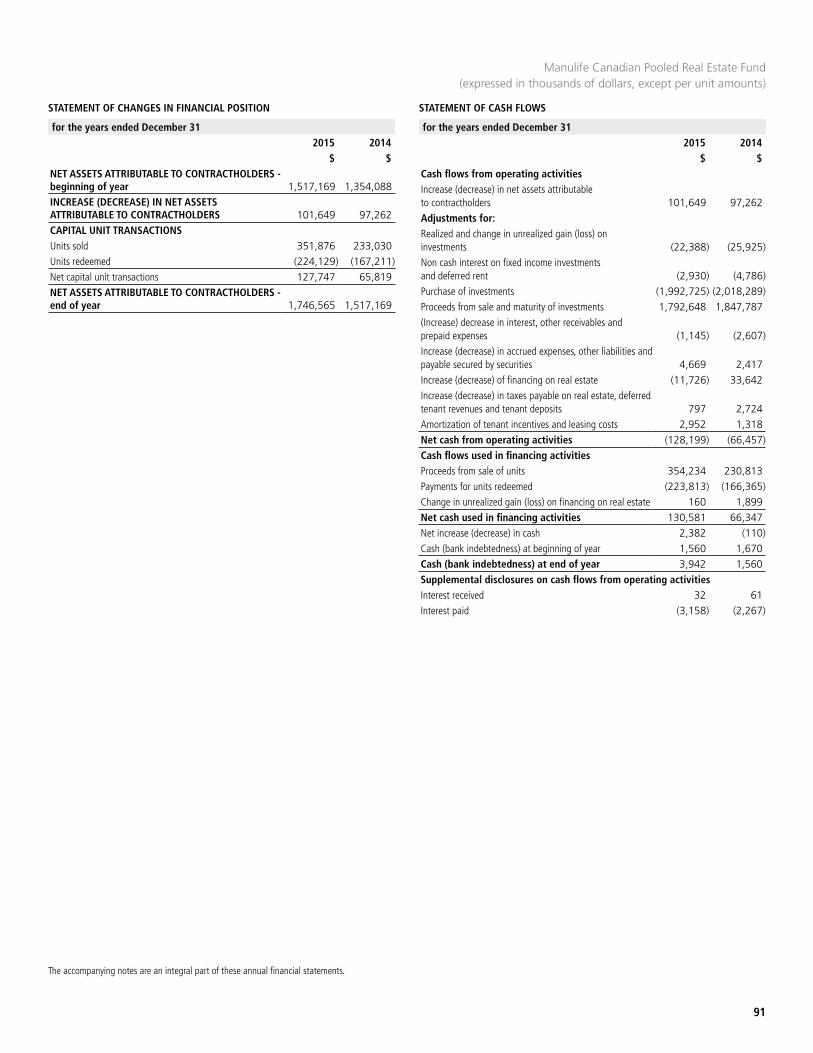
STATEMENT OF CHANGES IN FINANCIAL POSITION STATEMENT OF CASH FLOWS
for the years ended December 312015 2014
$ $
for the years ended December 312015 2014
$ $
91
The accompanying notes are an integral part of these annual financial statements.
Cash flows from operating activitiesIncrease (decrease) in net assets attributable to contractholders 101,649 97,262Adjustments for:Realized and change in unrealized gain (loss) on investments (22,388) (25,925)Non cash interest on fixed income investments and deferred rent (2,930) (4,786)Purchase of investments (1,992,725) (2,018,289)Proceeds from sale and maturity of investments 1,792,648 1,847,787(Increase) decrease in interest, other receivables and prepaid expenses (1,145) (2,607)Increase (decrease) in accrued expenses, other liabilities and payable secured by securities 4,669 2,417Increase (decrease) of financing on real estate (11,726) 33,642Increase (decrease) in taxes payable on real estate, deferred tenant revenues and tenant deposits 797 2,724Amortization of tenant incentives and leasing costs 2,952 1,318Net cash from operating activities (128,199) (66,457)Cash flows used in financing activitiesProceeds from sale of units 354,234 230,813Payments for units redeemed (223,813) (166,365)Change in unrealized gain (loss) on financing on real estate 160 1,899Net cash used in financing activities 130,581 66,347Net increase (decrease) in cash 2,382 (110)Cash (bank indebtedness) at beginning of year 1,560 1,670Cash (bank indebtedness) at end of year 3,942 1,560Supplemental disclosures on cash flows from operating activitiesInterest received 32 61Interest paid (3,158) (2,267)
NET ASSETS ATTRIBUTABLE TO CONTRACTHOLDERS - beginning of year 1,517,169 1,354,088INCREASE (DECREASE) IN NET ASSETS ATTRIBUTABLE TO CONTRACTHOLDERS 101,649 97,262CAPITAL UNIT TRANSACTIONSUnits sold 351,876 233,030Units redeemed (224,129) (167,211)Net capital unit transactions 127,747 65,819NET ASSETS ATTRIBUTABLE TO CONTRACTHOLDERS - end of year 1,746,565 1,517,169
Manulife Canadian Pooled Real Estate Fund (expressed in thousands of dollars, except per unit amounts)
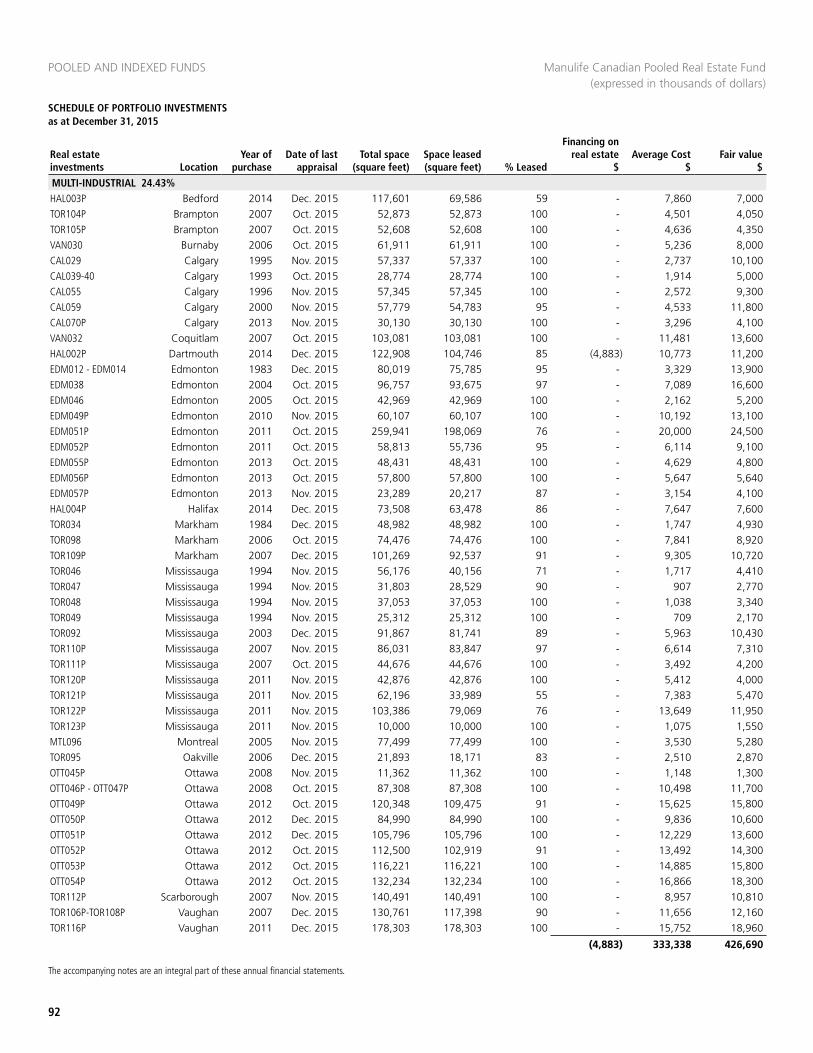
POOLED AND INDEXED FUNDS
92
SCHEDULE OF PORTFOLIO INVESTMENTS as at December 31, 2015
The accompanying notes are an integral part of these annual financial statements.
MULTI-INDUSTRIAL 24.43%HAL003P Bedford 2014 Dec. 2015 117,601 69,586 59 - 7,860 7,000 TOR104P Brampton 2007 Oct. 2015 52,873 52,873 100 - 4,501 4,050 TOR105P Brampton 2007 Oct. 2015 52,608 52,608 100 - 4,636 4,350 VAN030 Burnaby 2006 Oct. 2015 61,911 61,911 100 - 5,236 8,000 CAL029 Calgary 1995 Nov. 2015 57,337 57,337 100 - 2,737 10,100 CAL039-40 Calgary 1993 Oct. 2015 28,774 28,774 100 - 1,914 5,000 CAL055 Calgary 1996 Nov. 2015 57,345 57,345 100 - 2,572 9,300 CAL059 Calgary 2000 Nov. 2015 57,779 54,783 95 - 4,533 11,800 CAL070P Calgary 2013 Nov. 2015 30,130 30,130 100 - 3,296 4,100 VAN032 Coquitlam 2007 Oct. 2015 103,081 103,081 100 - 11,481 13,600 HAL002P Dartmouth 2014 Dec. 2015 122,908 104,746 85 (4,883) 10,773 11,200 EDM012 - EDM014 Edmonton 1983 Dec. 2015 80,019 75,785 95 - 3,329 13,900 EDM038 Edmonton 2004 Oct. 2015 96,757 93,675 97 - 7,089 16,600 EDM046 Edmonton 2005 Oct. 2015 42,969 42,969 100 - 2,162 5,200 EDM049P Edmonton 2010 Nov. 2015 60,107 60,107 100 - 10,192 13,100 EDM051P Edmonton 2011 Oct. 2015 259,941 198,069 76 - 20,000 24,500 EDM052P Edmonton 2011 Oct. 2015 58,813 55,736 95 - 6,114 9,100 EDM055P Edmonton 2013 Oct. 2015 48,431 48,431 100 - 4,629 4,800 EDM056P Edmonton 2013 Oct. 2015 57,800 57,800 100 - 5,647 5,640 EDM057P Edmonton 2013 Nov. 2015 23,289 20,217 87 - 3,154 4,100 HAL004P Halifax 2014 Dec. 2015 73,508 63,478 86 - 7,647 7,600 TOR034 Markham 1984 Dec. 2015 48,982 48,982 100 - 1,747 4,930 TOR098 Markham 2006 Oct. 2015 74,476 74,476 100 - 7,841 8,920 TOR109P Markham 2007 Dec. 2015 101,269 92,537 91 - 9,305 10,720 TOR046 Mississauga 1994 Nov. 2015 56,176 40,156 71 - 1,717 4,410 TOR047 Mississauga 1994 Nov. 2015 31,803 28,529 90 - 907 2,770 TOR048 Mississauga 1994 Nov. 2015 37,053 37,053 100 - 1,038 3,340 TOR049 Mississauga 1994 Nov. 2015 25,312 25,312 100 - 709 2,170 TOR092 Mississauga 2003 Dec. 2015 91,867 81,741 89 - 5,963 10,430 TOR110P Mississauga 2007 Nov. 2015 86,031 83,847 97 - 6,614 7,310 TOR111P Mississauga 2007 Oct. 2015 44,676 44,676 100 - 3,492 4,200 TOR120P Mississauga 2011 Nov. 2015 42,876 42,876 100 - 5,412 4,000 TOR121P Mississauga 2011 Nov. 2015 62,196 33,989 55 - 7,383 5,470 TOR122P Mississauga 2011 Nov. 2015 103,386 79,069 76 - 13,649 11,950 TOR123P Mississauga 2011 Nov. 2015 10,000 10,000 100 - 1,075 1,550 MTL096 Montreal 2005 Nov. 2015 77,499 77,499 100 - 3,530 5,280 TOR095 Oakville 2006 Dec. 2015 21,893 18,171 83 - 2,510 2,870 OTT045P Ottawa 2008 Nov. 2015 11,362 11,362 100 - 1,148 1,300 OTT046P - OTT047P Ottawa 2008 Oct. 2015 87,308 87,308 100 - 10,498 11,700 OTT049P Ottawa 2012 Oct. 2015 120,348 109,475 91 - 15,625 15,800 OTT050P Ottawa 2012 Dec. 2015 84,990 84,990 100 - 9,836 10,600 OTT051P Ottawa 2012 Dec. 2015 105,796 105,796 100 - 12,229 13,600 OTT052P Ottawa 2012 Oct. 2015 112,500 102,919 91 - 13,492 14,300 OTT053P Ottawa 2012 Oct. 2015 116,221 116,221 100 - 14,885 15,800 OTT054P Ottawa 2012 Oct. 2015 132,234 132,234 100 - 16,866 18,300 TOR112P Scarborough 2007 Nov. 2015 140,491 140,491 100 - 8,957 10,810 TOR106P-TOR108P Vaughan 2007 Dec. 2015 130,761 117,398 90 - 11,656 12,160 TOR116P Vaughan 2011 Dec. 2015 178,303 178,303 100 - 15,752 18,960
(4,883) 333,338 426,690
Real estate investments Location
Year of purchase
Date of last appraisal
Total space (square feet)
Space leased (square feet) % Leased
Financing on real estate
$Average Cost
$Fair value
$
Manulife Canadian Pooled Real Estate Fund (expressed in thousands of dollars)
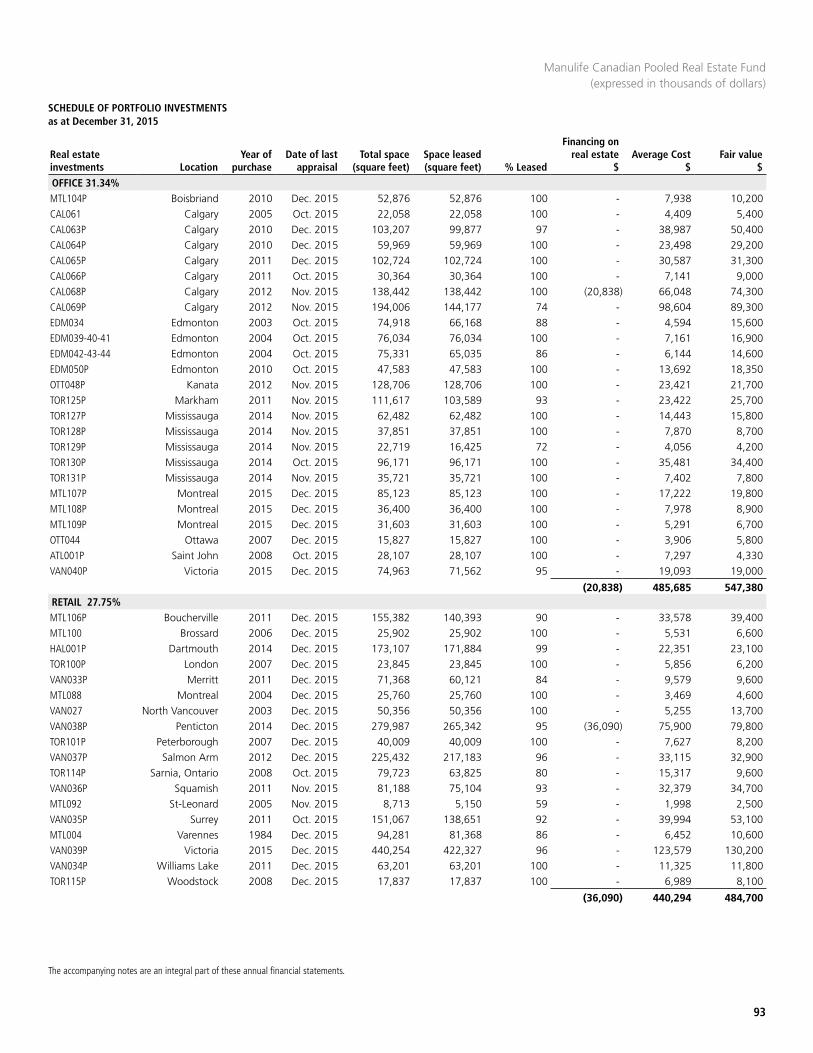
SCHEDULE OF PORTFOLIO INVESTMENTS as at December 31, 2015
93
The accompanying notes are an integral part of these annual financial statements.
OFFICE 31.34%MTL104P Boisbriand 2010 Dec. 2015 52,876 52,876 100 - 7,938 10,200 CAL061 Calgary 2005 Oct. 2015 22,058 22,058 100 - 4,409 5,400 CAL063P Calgary 2010 Dec. 2015 103,207 99,877 97 - 38,987 50,400 CAL064P Calgary 2010 Dec. 2015 59,969 59,969 100 - 23,498 29,200 CAL065P Calgary 2011 Dec. 2015 102,724 102,724 100 - 30,587 31,300 CAL066P Calgary 2011 Oct. 2015 30,364 30,364 100 - 7,141 9,000 CAL068P Calgary 2012 Nov. 2015 138,442 138,442 100 (20,838) 66,048 74,300 CAL069P Calgary 2012 Nov. 2015 194,006 144,177 74 - 98,604 89,300 EDM034 Edmonton 2003 Oct. 2015 74,918 66,168 88 - 4,594 15,600 EDM039-40-41 Edmonton 2004 Oct. 2015 76,034 76,034 100 - 7,161 16,900 EDM042-43-44 Edmonton 2004 Oct. 2015 75,331 65,035 86 - 6,144 14,600 EDM050P Edmonton 2010 Oct. 2015 47,583 47,583 100 - 13,692 18,350 OTT048P Kanata 2012 Nov. 2015 128,706 128,706 100 - 23,421 21,700 TOR125P Markham 2011 Nov. 2015 111,617 103,589 93 - 23,422 25,700 TOR127P Mississauga 2014 Nov. 2015 62,482 62,482 100 - 14,443 15,800 TOR128P Mississauga 2014 Nov. 2015 37,851 37,851 100 - 7,870 8,700 TOR129P Mississauga 2014 Nov. 2015 22,719 16,425 72 - 4,056 4,200 TOR130P Mississauga 2014 Oct. 2015 96,171 96,171 100 - 35,481 34,400 TOR131P Mississauga 2014 Nov. 2015 35,721 35,721 100 - 7,402 7,800 MTL107P Montreal 2015 Dec. 2015 85,123 85,123 100 - 17,222 19,800 MTL108P Montreal 2015 Dec. 2015 36,400 36,400 100 - 7,978 8,900 MTL109P Montreal 2015 Dec. 2015 31,603 31,603 100 - 5,291 6,700 OTT044 Ottawa 2007 Dec. 2015 15,827 15,827 100 - 3,906 5,800 ATL001P Saint John 2008 Oct. 2015 28,107 28,107 100 - 7,297 4,330 VAN040P Victoria 2015 Dec. 2015 74,963 71,562 95 - 19,093 19,000
(20,838) 485,685 547,380 RETAIL 27.75%MTL106P Boucherville 2011 Dec. 2015 155,382 140,393 90 - 33,578 39,400 MTL100 Brossard 2006 Dec. 2015 25,902 25,902 100 - 5,531 6,600 HAL001P Dartmouth 2014 Dec. 2015 173,107 171,884 99 - 22,351 23,100 TOR100P London 2007 Dec. 2015 23,845 23,845 100 - 5,856 6,200 VAN033P Merritt 2011 Dec. 2015 71,368 60,121 84 - 9,579 9,600 MTL088 Montreal 2004 Dec. 2015 25,760 25,760 100 - 3,469 4,600 VAN027 North Vancouver 2003 Dec. 2015 50,356 50,356 100 - 5,255 13,700 VAN038P Penticton 2014 Dec. 2015 279,987 265,342 95 (36,090) 75,900 79,800 TOR101P Peterborough 2007 Dec. 2015 40,009 40,009 100 - 7,627 8,200 VAN037P Salmon Arm 2012 Dec. 2015 225,432 217,183 96 - 33,115 32,900 TOR114P Sarnia, Ontario 2008 Oct. 2015 79,723 63,825 80 - 15,317 9,600 VAN036P Squamish 2011 Nov. 2015 81,188 75,104 93 - 32,379 34,700 MTL092 St-Leonard 2005 Nov. 2015 8,713 5,150 59 - 1,998 2,500 VAN035P Surrey 2011 Oct. 2015 151,067 138,651 92 - 39,994 53,100 MTL004 Varennes 1984 Dec. 2015 94,281 81,368 86 - 6,452 10,600 VAN039P Victoria 2015 Dec. 2015 440,254 422,327 96 - 123,579 130,200 VAN034P Williams Lake 2011 Dec. 2015 63,201 63,201 100 - 11,325 11,800 TOR115P Woodstock 2008 Dec. 2015 17,837 17,837 100 - 6,989 8,100
(36,090) 440,294 484,700
Real estate investments Location
Year of purchase
Date of last appraisal
Total space (square feet)
Space leased (square feet) % Leased
Financing on real estate
$Average Cost
$Fair value
$
Manulife Canadian Pooled Real Estate Fund (expressed in thousands of dollars)
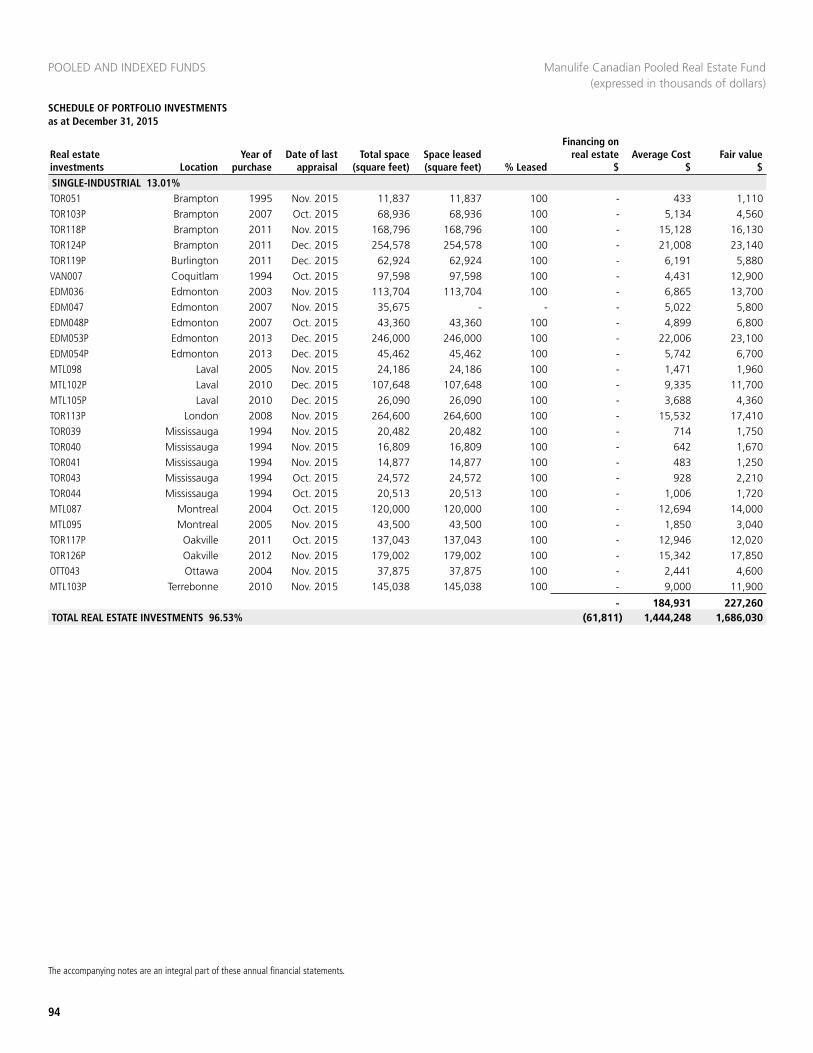
POOLED AND INDEXED FUNDS
94
SCHEDULE OF PORTFOLIO INVESTMENTS as at December 31, 2015
The accompanying notes are an integral part of these annual financial statements.
SINGLE-INDUSTRIAL 13.01%TOR051 Brampton 1995 Nov. 2015 11,837 11,837 100 - 433 1,110 TOR103P Brampton 2007 Oct. 2015 68,936 68,936 100 - 5,134 4,560 TOR118P Brampton 2011 Nov. 2015 168,796 168,796 100 - 15,128 16,130 TOR124P Brampton 2011 Dec. 2015 254,578 254,578 100 - 21,008 23,140 TOR119P Burlington 2011 Dec. 2015 62,924 62,924 100 - 6,191 5,880 VAN007 Coquitlam 1994 Oct. 2015 97,598 97,598 100 - 4,431 12,900 EDM036 Edmonton 2003 Nov. 2015 113,704 113,704 100 - 6,865 13,700 EDM047 Edmonton 2007 Nov. 2015 35,675 - - - 5,022 5,800 EDM048P Edmonton 2007 Oct. 2015 43,360 43,360 100 - 4,899 6,800 EDM053P Edmonton 2013 Dec. 2015 246,000 246,000 100 - 22,006 23,100 EDM054P Edmonton 2013 Dec. 2015 45,462 45,462 100 - 5,742 6,700 MTL098 Laval 2005 Nov. 2015 24,186 24,186 100 - 1,471 1,960 MTL102P Laval 2010 Dec. 2015 107,648 107,648 100 - 9,335 11,700 MTL105P Laval 2010 Dec. 2015 26,090 26,090 100 - 3,688 4,360 TOR113P London 2008 Nov. 2015 264,600 264,600 100 - 15,532 17,410 TOR039 Mississauga 1994 Nov. 2015 20,482 20,482 100 - 714 1,750 TOR040 Mississauga 1994 Nov. 2015 16,809 16,809 100 - 642 1,670 TOR041 Mississauga 1994 Nov. 2015 14,877 14,877 100 - 483 1,250 TOR043 Mississauga 1994 Oct. 2015 24,572 24,572 100 - 928 2,210 TOR044 Mississauga 1994 Oct. 2015 20,513 20,513 100 - 1,006 1,720 MTL087 Montreal 2004 Oct. 2015 120,000 120,000 100 - 12,694 14,000 MTL095 Montreal 2005 Nov. 2015 43,500 43,500 100 - 1,850 3,040 TOR117P Oakville 2011 Oct. 2015 137,043 137,043 100 - 12,946 12,020 TOR126P Oakville 2012 Nov. 2015 179,002 179,002 100 - 15,342 17,850 OTT043 Ottawa 2004 Nov. 2015 37,875 37,875 100 - 2,441 4,600 MTL103P Terrebonne 2010 Nov. 2015 145,038 145,038 100 - 9,000 11,900
- 184,931 227,260 TOTAL REAL ESTATE INVESTMENTS 96.53% (61,811) 1,444,248 1,686,030
Real estate investments Location
Year of purchase
Date of last appraisal
Total space (square feet)
Space leased (square feet) % Leased
Financing on real estate
$Average Cost
$Fair value
$
Manulife Canadian Pooled Real Estate Fund (expressed in thousands of dollars)
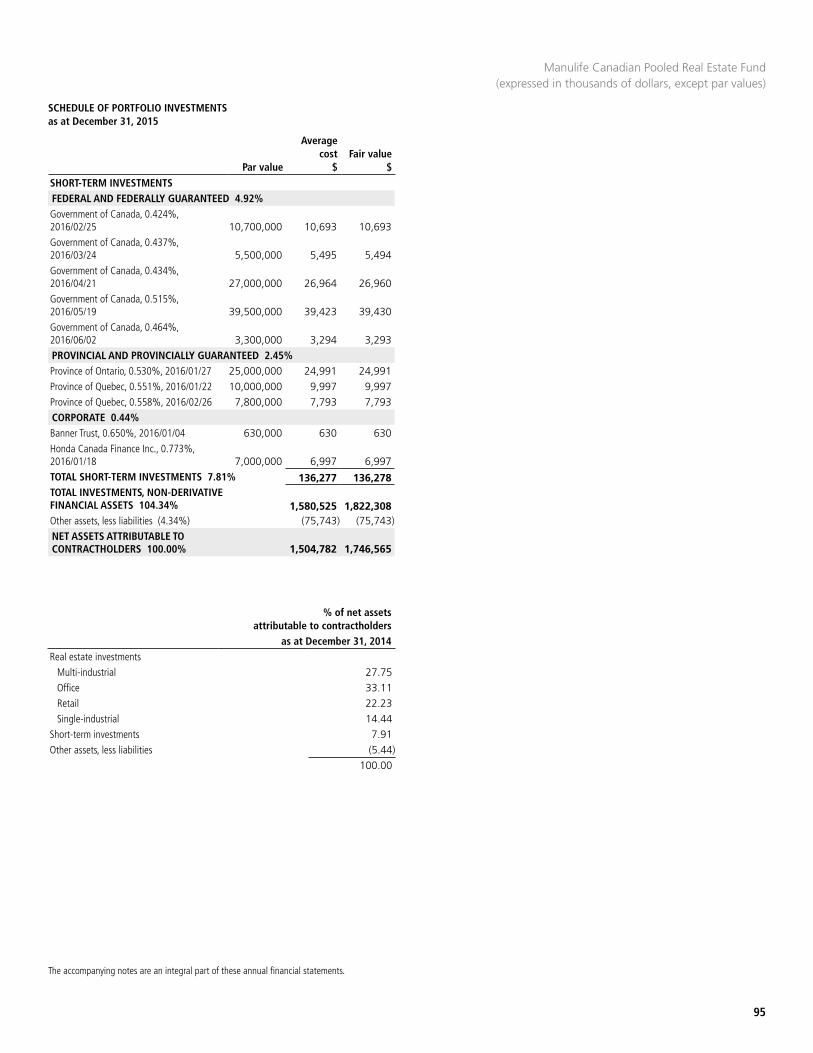
SCHEDULE OF PORTFOLIO INVESTMENTS as at December 31, 2015
95
The accompanying notes are an integral part of these annual financial statements.
SHORT-TERM INVESTMENTSFEDERAL AND FEDERALLY GUARANTEED 4.92%Government of Canada, 0.424%, 2016/02/25 10,700,000 10,693 10,693 Government of Canada, 0.437%, 2016/03/24 5,500,000 5,495 5,494 Government of Canada, 0.434%, 2016/04/21 27,000,000 26,964 26,960 Government of Canada, 0.515%, 2016/05/19 39,500,000 39,423 39,430 Government of Canada, 0.464%, 2016/06/02 3,300,000 3,294 3,293 PROVINCIAL AND PROVINCIALLY GUARANTEED 2.45%Province of Ontario, 0.530%, 2016/01/27 25,000,000 24,991 24,991 Province of Quebec, 0.551%, 2016/01/22 10,000,000 9,997 9,997 Province of Quebec, 0.558%, 2016/02/26 7,800,000 7,793 7,793 CORPORATE 0.44%Banner Trust, 0.650%, 2016/01/04 630,000 630 630 Honda Canada Finance Inc., 0.773%, 2016/01/18 7,000,000 6,997 6,997 TOTAL SHORT-TERM INVESTMENTS 7.81% 136,277 136,278 TOTAL INVESTMENTS, NON-DERIVATIVE FINANCIAL ASSETS 104.34% 1,580,525 1,822,308 Other assets, less liabilities (4.34%) (75,743) (75,743)NET ASSETS ATTRIBUTABLE TO CONTRACTHOLDERS 100.00% 1,504,782 1,746,565
% of net assets attributable to contractholders
as at December 31, 2014Real estate investments
Multi-industrial 27.75Office 33.11Retail 22.23Single-industrial 14.44
Short-term investments 7.91Other assets, less liabilities (5.44)
100.00
Manulife Canadian Pooled Real Estate Fund (expressed in thousands of dollars, except par values)
Par value
Average cost
$Fair value
$
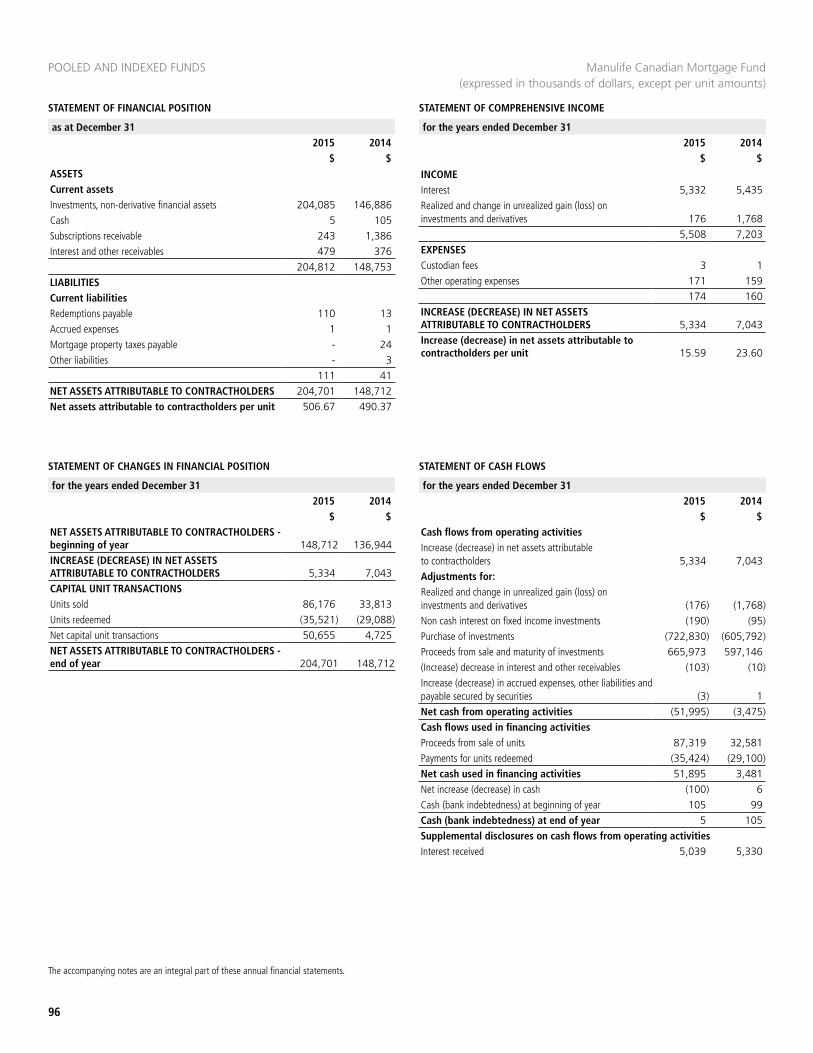
STATEMENT OF FINANCIAL POSITION
POOLED AND INDEXED FUNDS
STATEMENT OF COMPREHENSIVE INCOME
as at December 31 2015 2014
$ $
for the years ended December 312015 2014
$ $
96
The accompanying notes are an integral part of these annual financial statements.
ASSETSCurrent assetsInvestments, non-derivative financial assets 204,085 146,886Cash 5 105Subscriptions receivable 243 1,386Interest and other receivables 479 376
204,812 148,753LIABILITIESCurrent liabilitiesRedemptions payable 110 13Accrued expenses 1 1Mortgage property taxes payable - 24Other liabilities - 3
111 41NET ASSETS ATTRIBUTABLE TO CONTRACTHOLDERS 204,701 148,712Net assets attributable to contractholders per unit 506.67 490.37
INCOMEInterest 5,332 5,435Realized and change in unrealized gain (loss) on investments and derivatives 176 1,768
5,508 7,203EXPENSESCustodian fees 3 1Other operating expenses 171 159
174 160INCREASE (DECREASE) IN NET ASSETS ATTRIBUTABLE TO CONTRACTHOLDERS 5,334 7,043Increase (decrease) in net assets attributable to contractholders per unit 15.59 23.60
STATEMENT OF CHANGES IN FINANCIAL POSITION STATEMENT OF CASH FLOWS
for the years ended December 312015 2014
$ $
for the years ended December 312015 2014
$ $NET ASSETS ATTRIBUTABLE TO CONTRACTHOLDERS - beginning of year 148,712 136,944INCREASE (DECREASE) IN NET ASSETS ATTRIBUTABLE TO CONTRACTHOLDERS 5,334 7,043CAPITAL UNIT TRANSACTIONSUnits sold 86,176 33,813Units redeemed (35,521) (29,088)Net capital unit transactions 50,655 4,725NET ASSETS ATTRIBUTABLE TO CONTRACTHOLDERS - end of year 204,701 148,712
Cash flows from operating activitiesIncrease (decrease) in net assets attributable to contractholders 5,334 7,043Adjustments for:Realized and change in unrealized gain (loss) on investments and derivatives (176) (1,768)Non cash interest on fixed income investments (190) (95)Purchase of investments (722,830) (605,792)Proceeds from sale and maturity of investments 665,973 597,146(Increase) decrease in interest and other receivables (103) (10)Increase (decrease) in accrued expenses, other liabilities and payable secured by securities (3) 1Net cash from operating activities (51,995) (3,475)Cash flows used in financing activitiesProceeds from sale of units 87,319 32,581Payments for units redeemed (35,424) (29,100)Net cash used in financing activities 51,895 3,481Net increase (decrease) in cash (100) 6Cash (bank indebtedness) at beginning of year 105 99Cash (bank indebtedness) at end of year 5 105Supplemental disclosures on cash flows from operating activitiesInterest received 5,039 5,330
Manulife Canadian Mortgage Fund (expressed in thousands of dollars, except per unit amounts)
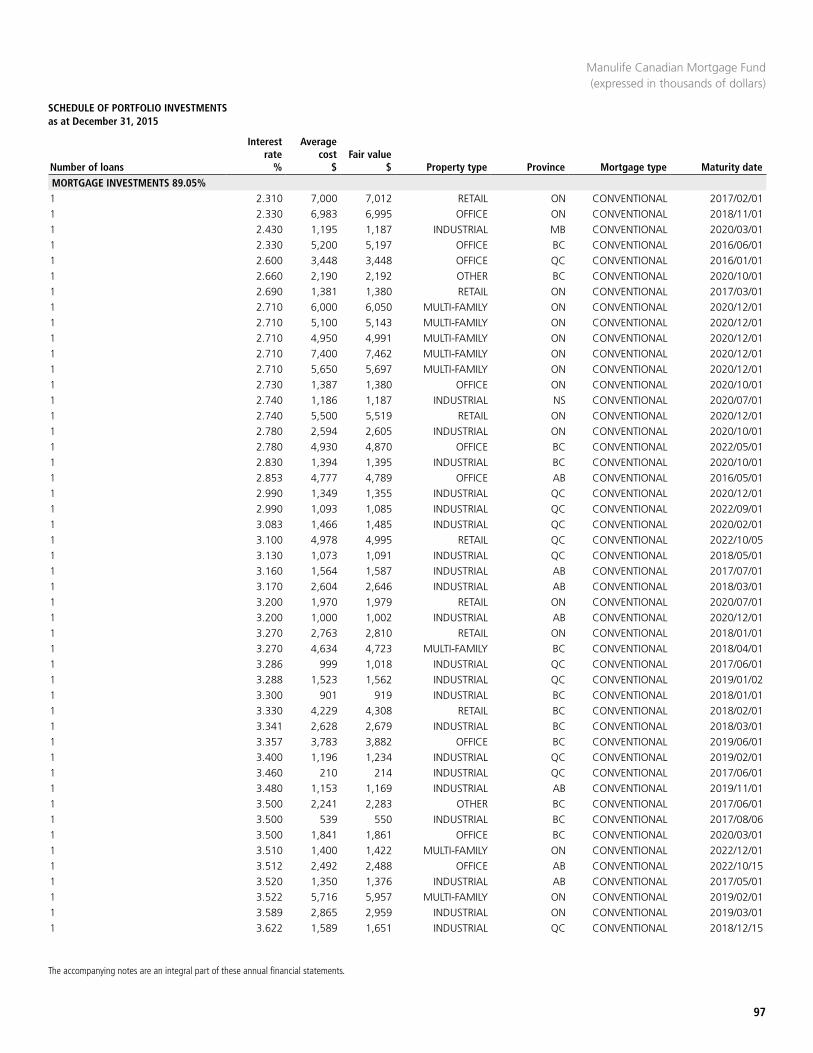
SCHEDULE OF PORTFOLIO INVESTMENTS as at December 31, 2015
97
The accompanying notes are an integral part of these annual financial statements.
Number of loans
Interest rate
%
Average cost
$Fair value
$ Property type Province Mortgage type Maturity date
MORTGAGE INVESTMENTS 89.05%1 2.310 7,000 7,012 RETAIL ON CONVENTIONAL 2017/02/011 2.330 6,983 6,995 OFFICE ON CONVENTIONAL 2018/11/011 2.430 1,195 1,187 INDUSTRIAL MB CONVENTIONAL 2020/03/011 2.330 5,200 5,197 OFFICE BC CONVENTIONAL 2016/06/011 2.600 3,448 3,448 OFFICE QC CONVENTIONAL 2016/01/011 2.660 2,190 2,192 OTHER BC CONVENTIONAL 2020/10/011 2.690 1,381 1,380 RETAIL ON CONVENTIONAL 2017/03/011 2.710 6,000 6,050 MULTI-FAMILY ON CONVENTIONAL 2020/12/011 2.710 5,100 5,143 MULTI-FAMILY ON CONVENTIONAL 2020/12/011 2.710 4,950 4,991 MULTI-FAMILY ON CONVENTIONAL 2020/12/011 2.710 7,400 7,462 MULTI-FAMILY ON CONVENTIONAL 2020/12/011 2.710 5,650 5,697 MULTI-FAMILY ON CONVENTIONAL 2020/12/011 2.730 1,387 1,380 OFFICE ON CONVENTIONAL 2020/10/011 2.740 1,186 1,187 INDUSTRIAL NS CONVENTIONAL 2020/07/011 2.740 5,500 5,519 RETAIL ON CONVENTIONAL 2020/12/011 2.780 2,594 2,605 INDUSTRIAL ON CONVENTIONAL 2020/10/011 2.780 4,930 4,870 OFFICE BC CONVENTIONAL 2022/05/011 2.830 1,394 1,395 INDUSTRIAL BC CONVENTIONAL 2020/10/011 2.853 4,777 4,789 OFFICE AB CONVENTIONAL 2016/05/011 2.990 1,349 1,355 INDUSTRIAL QC CONVENTIONAL 2020/12/011 2.990 1,093 1,085 INDUSTRIAL QC CONVENTIONAL 2022/09/011 3.083 1,466 1,485 INDUSTRIAL QC CONVENTIONAL 2020/02/011 3.100 4,978 4,995 RETAIL QC CONVENTIONAL 2022/10/051 3.130 1,073 1,091 INDUSTRIAL QC CONVENTIONAL 2018/05/011 3.160 1,564 1,587 INDUSTRIAL AB CONVENTIONAL 2017/07/011 3.170 2,604 2,646 INDUSTRIAL AB CONVENTIONAL 2018/03/011 3.200 1,970 1,979 RETAIL ON CONVENTIONAL 2020/07/011 3.200 1,000 1,002 INDUSTRIAL AB CONVENTIONAL 2020/12/011 3.270 2,763 2,810 RETAIL ON CONVENTIONAL 2018/01/011 3.270 4,634 4,723 MULTI-FAMILY BC CONVENTIONAL 2018/04/011 3.286 999 1,018 INDUSTRIAL QC CONVENTIONAL 2017/06/011 3.288 1,523 1,562 INDUSTRIAL QC CONVENTIONAL 2019/01/021 3.300 901 919 INDUSTRIAL BC CONVENTIONAL 2018/01/011 3.330 4,229 4,308 RETAIL BC CONVENTIONAL 2018/02/011 3.341 2,628 2,679 INDUSTRIAL BC CONVENTIONAL 2018/03/011 3.357 3,783 3,882 OFFICE BC CONVENTIONAL 2019/06/011 3.400 1,196 1,234 INDUSTRIAL QC CONVENTIONAL 2019/02/011 3.460 210 214 INDUSTRIAL QC CONVENTIONAL 2017/06/011 3.480 1,153 1,169 INDUSTRIAL AB CONVENTIONAL 2019/11/011 3.500 2,241 2,283 OTHER BC CONVENTIONAL 2017/06/011 3.500 539 550 INDUSTRIAL BC CONVENTIONAL 2017/08/061 3.500 1,841 1,861 OFFICE BC CONVENTIONAL 2020/03/011 3.510 1,400 1,422 MULTI-FAMILY ON CONVENTIONAL 2022/12/011 3.512 2,492 2,488 OFFICE AB CONVENTIONAL 2022/10/151 3.520 1,350 1,376 INDUSTRIAL AB CONVENTIONAL 2017/05/011 3.522 5,716 5,957 MULTI-FAMILY ON CONVENTIONAL 2019/02/011 3.589 2,865 2,959 INDUSTRIAL ON CONVENTIONAL 2019/03/011 3.622 1,589 1,651 INDUSTRIAL QC CONVENTIONAL 2018/12/15
Manulife Canadian Mortgage Fund (expressed in thousands of dollars)
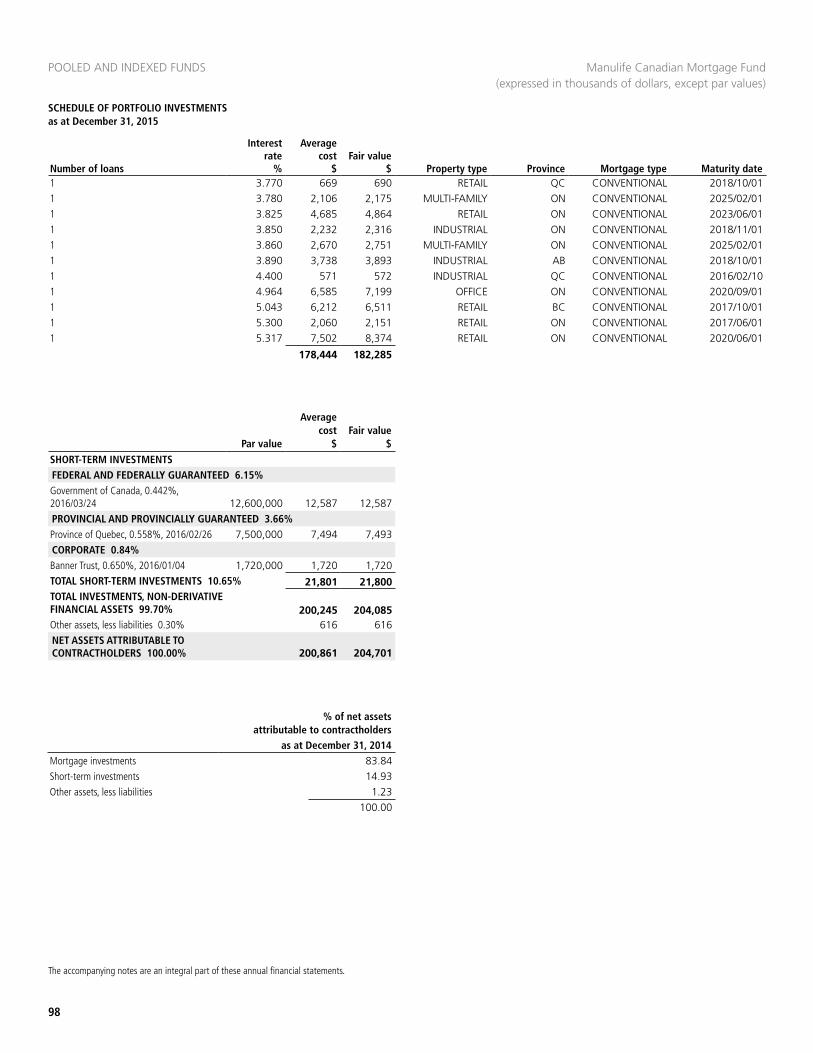
POOLED AND INDEXED FUNDS
98
SCHEDULE OF PORTFOLIO INVESTMENTS as at December 31, 2015
The accompanying notes are an integral part of these annual financial statements.
1 3.770 669 690 RETAIL QC CONVENTIONAL 2018/10/011 3.780 2,106 2,175 MULTI-FAMILY ON CONVENTIONAL 2025/02/011 3.825 4,685 4,864 RETAIL ON CONVENTIONAL 2023/06/011 3.850 2,232 2,316 INDUSTRIAL ON CONVENTIONAL 2018/11/011 3.860 2,670 2,751 MULTI-FAMILY ON CONVENTIONAL 2025/02/011 3.890 3,738 3,893 INDUSTRIAL AB CONVENTIONAL 2018/10/011 4.400 571 572 INDUSTRIAL QC CONVENTIONAL 2016/02/101 4.964 6,585 7,199 OFFICE ON CONVENTIONAL 2020/09/011 5.043 6,212 6,511 RETAIL BC CONVENTIONAL 2017/10/011 5.300 2,060 2,151 RETAIL ON CONVENTIONAL 2017/06/011 5.317 7,502 8,374 RETAIL ON CONVENTIONAL 2020/06/01
178,444 182,285
% of net assets attributable to contractholders
as at December 31, 2014Mortgage investments 83.84Short-term investments 14.93Other assets, less liabilities 1.23
100.00
Number of loans
Interest rate
%
Average cost
$Fair value
$ Property type Province Mortgage type Maturity date
Manulife Canadian Mortgage Fund (expressed in thousands of dollars, except par values)
SHORT-TERM INVESTMENTSFEDERAL AND FEDERALLY GUARANTEED 6.15%Government of Canada, 0.442%, 2016/03/24 12,600,000 12,587 12,587 PROVINCIAL AND PROVINCIALLY GUARANTEED 3.66%Province of Quebec, 0.558%, 2016/02/26 7,500,000 7,494 7,493 CORPORATE 0.84%Banner Trust, 0.650%, 2016/01/04 1,720,000 1,720 1,720 TOTAL SHORT-TERM INVESTMENTS 10.65% 21,801 21,800 TOTAL INVESTMENTS, NON-DERIVATIVE FINANCIAL ASSETS 99.70% 200,245 204,085 Other assets, less liabilities 0.30% 616 616 NET ASSETS ATTRIBUTABLE TO CONTRACTHOLDERS 100.00% 200,861 204,701
Par value
Average cost
$Fair value
$
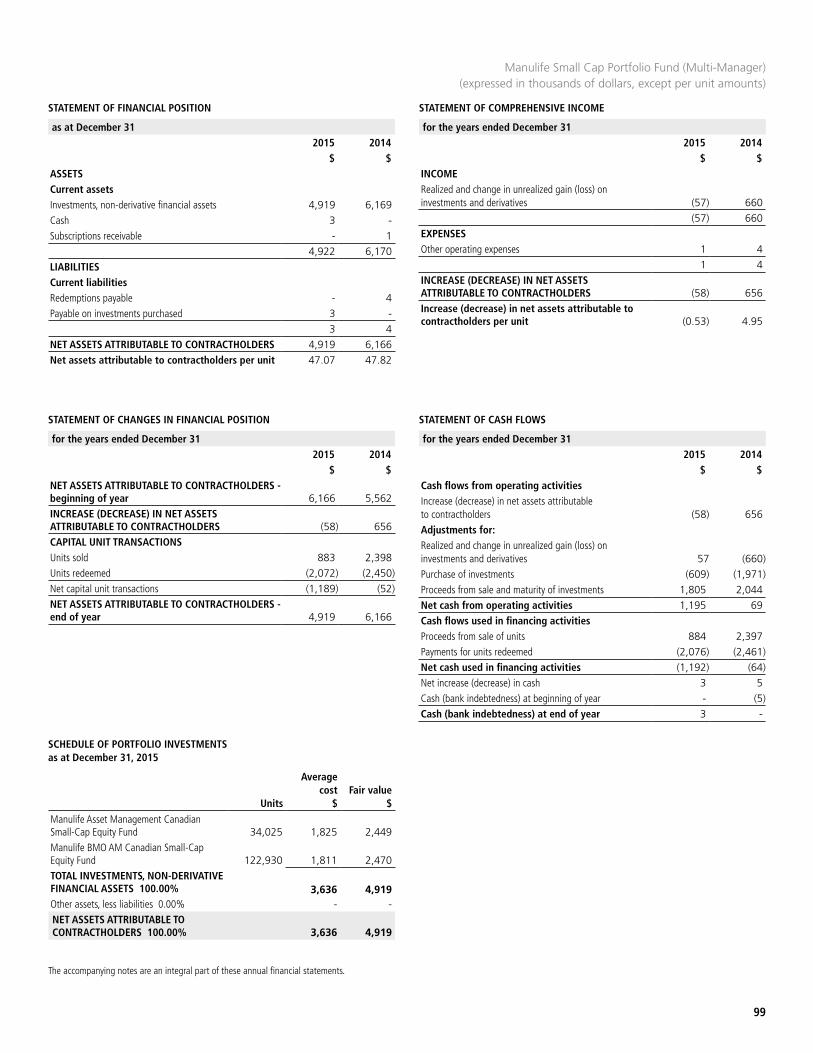
STATEMENT OF FINANCIAL POSITION STATEMENT OF COMPREHENSIVE INCOME
as at December 31 2015 2014
$ $
for the years ended December 312015 2014
$ $
99
The accompanying notes are an integral part of these annual financial statements.
ASSETSCurrent assetsInvestments, non-derivative financial assets 4,919 6,169Cash 3 -Subscriptions receivable - 1
4,922 6,170LIABILITIESCurrent liabilitiesRedemptions payable - 4Payable on investments purchased 3 -
3 4NET ASSETS ATTRIBUTABLE TO CONTRACTHOLDERS 4,919 6,166Net assets attributable to contractholders per unit 47.07 47.82
INCOMERealized and change in unrealized gain (loss) on investments and derivatives (57) 660
(57) 660EXPENSESOther operating expenses 1 4
1 4INCREASE (DECREASE) IN NET ASSETS ATTRIBUTABLE TO CONTRACTHOLDERS (58) 656Increase (decrease) in net assets attributable to contractholders per unit (0.53) 4.95
STATEMENT OF CHANGES IN FINANCIAL POSITION
for the years ended December 312015 2014
$ $NET ASSETS ATTRIBUTABLE TO CONTRACTHOLDERS - beginning of year 6,166 5,562INCREASE (DECREASE) IN NET ASSETS ATTRIBUTABLE TO CONTRACTHOLDERS (58) 656CAPITAL UNIT TRANSACTIONSUnits sold 883 2,398Units redeemed (2,072) (2,450)Net capital unit transactions (1,189) (52)NET ASSETS ATTRIBUTABLE TO CONTRACTHOLDERS - end of year 4,919 6,166
STATEMENT OF CASH FLOWS
for the years ended December 312015 2014
$ $Cash flows from operating activitiesIncrease (decrease) in net assets attributable to contractholders (58) 656Adjustments for:Realized and change in unrealized gain (loss) on investments and derivatives 57 (660)Purchase of investments (609) (1,971)Proceeds from sale and maturity of investments 1,805 2,044Net cash from operating activities 1,195 69Cash flows used in financing activitiesProceeds from sale of units 884 2,397Payments for units redeemed (2,076) (2,461)Net cash used in financing activities (1,192) (64)Net increase (decrease) in cash 3 5Cash (bank indebtedness) at beginning of year - (5)Cash (bank indebtedness) at end of year 3 -
Manulife Small Cap Portfolio Fund (Multi-Manager)(expressed in thousands of dollars, except per unit amounts)
SCHEDULE OF PORTFOLIO INVESTMENTS as at December 31, 2015
Units
Average cost
$Fair value
$
Manulife Asset Management Canadian Small-Cap Equity Fund 34,025 1,825 2,449 Manulife BMO AM Canadian Small-Cap Equity Fund 122,930 1,811 2,470 TOTAL INVESTMENTS, NON-DERIVATIVE FINANCIAL ASSETS 100.00% 3,636 4,919 Other assets, less liabilities 0.00% - - NET ASSETS ATTRIBUTABLE TO CONTRACTHOLDERS 100.00% 3,636 4,919
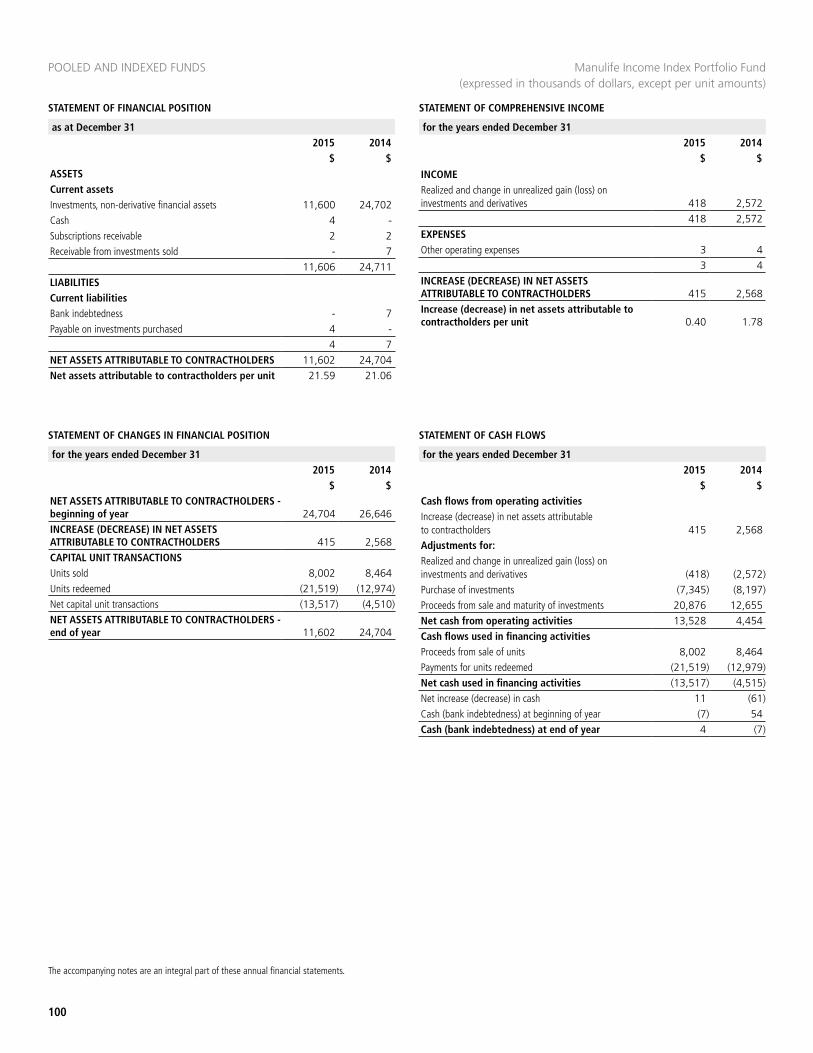
STATEMENT OF FINANCIAL POSITION
POOLED AND INDEXED FUNDS
STATEMENT OF COMPREHENSIVE INCOME
as at December 31 2015 2014
$ $
for the years ended December 312015 2014
$ $
100
The accompanying notes are an integral part of these annual financial statements.
Manulife Income Index Portfolio Fund(expressed in thousands of dollars, except per unit amounts)
ASSETSCurrent assetsInvestments, non-derivative financial assets 11,600 24,702Cash 4 -Subscriptions receivable 2 2Receivable from investments sold - 7
11,606 24,711LIABILITIESCurrent liabilitiesBank indebtedness - 7Payable on investments purchased 4 -
4 7NET ASSETS ATTRIBUTABLE TO CONTRACTHOLDERS 11,602 24,704Net assets attributable to contractholders per unit 21.59 21.06
INCOMERealized and change in unrealized gain (loss) on investments and derivatives 418 2,572
418 2,572EXPENSESOther operating expenses 3 4
3 4INCREASE (DECREASE) IN NET ASSETS ATTRIBUTABLE TO CONTRACTHOLDERS 415 2,568Increase (decrease) in net assets attributable to contractholders per unit 0.40 1.78
STATEMENT OF CHANGES IN FINANCIAL POSITION
for the years ended December 312015 2014
$ $NET ASSETS ATTRIBUTABLE TO CONTRACTHOLDERS - beginning of year 24,704 26,646INCREASE (DECREASE) IN NET ASSETS ATTRIBUTABLE TO CONTRACTHOLDERS 415 2,568CAPITAL UNIT TRANSACTIONSUnits sold 8,002 8,464Units redeemed (21,519) (12,974)Net capital unit transactions (13,517) (4,510)NET ASSETS ATTRIBUTABLE TO CONTRACTHOLDERS - end of year 11,602 24,704
STATEMENT OF CASH FLOWS
for the years ended December 312015 2014
$ $Cash flows from operating activitiesIncrease (decrease) in net assets attributable to contractholders 415 2,568Adjustments for:Realized and change in unrealized gain (loss) on investments and derivatives (418) (2,572)Purchase of investments (7,345) (8,197)Proceeds from sale and maturity of investments 20,876 12,655Net cash from operating activities 13,528 4,454Cash flows used in financing activitiesProceeds from sale of units 8,002 8,464Payments for units redeemed (21,519) (12,979)Net cash used in financing activities (13,517) (4,515)Net increase (decrease) in cash 11 (61)Cash (bank indebtedness) at beginning of year (7) 54Cash (bank indebtedness) at end of year 4 (7)
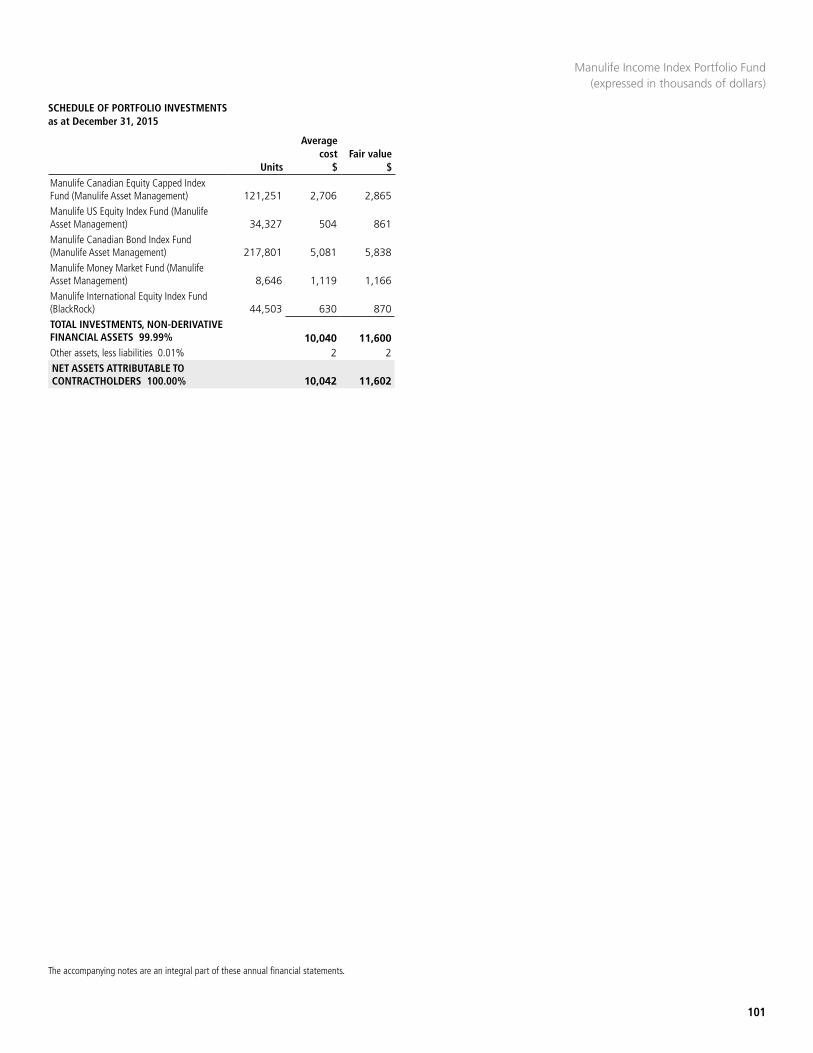
SCHEDULE OF PORTFOLIO INVESTMENTS as at December 31, 2015
101
The accompanying notes are an integral part of these annual financial statements.
Manulife Canadian Equity Capped Index Fund (Manulife Asset Management) 121,251 2,706 2,865 Manulife US Equity Index Fund (Manulife Asset Management) 34,327 504 861 Manulife Canadian Bond Index Fund (Manulife Asset Management) 217,801 5,081 5,838 Manulife Money Market Fund (Manulife Asset Management) 8,646 1,119 1,166 Manulife International Equity Index Fund (BlackRock) 44,503 630 870 TOTAL INVESTMENTS, NON-DERIVATIVE FINANCIAL ASSETS 99.99% 10,040 11,600 Other assets, less liabilities 0.01% 2 2 NET ASSETS ATTRIBUTABLE TO CONTRACTHOLDERS 100.00% 10,042 11,602
Manulife Income Index Portfolio Fund(expressed in thousands of dollars)
Units
Average cost
$Fair value
$
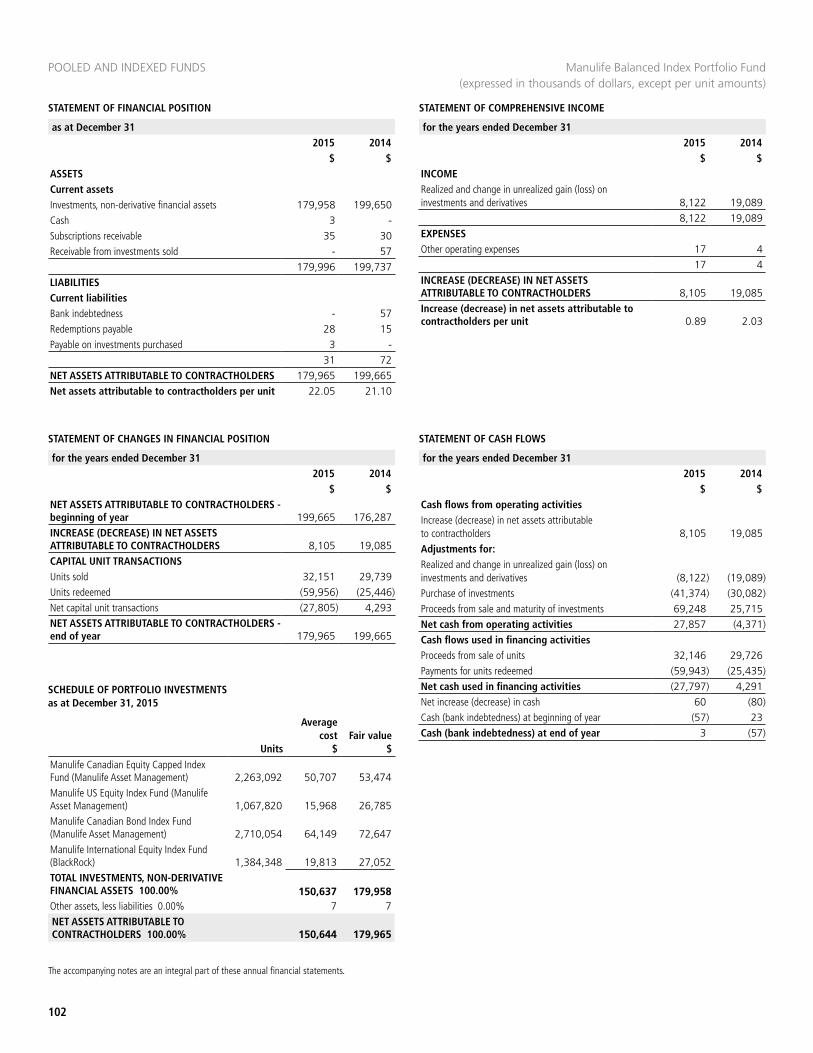
STATEMENT OF FINANCIAL POSITION
POOLED AND INDEXED FUNDS
STATEMENT OF COMPREHENSIVE INCOME
as at December 31 2015 2014
$ $
for the years ended December 312015 2014
$ $
102
The accompanying notes are an integral part of these annual financial statements.
Manulife Balanced Index Portfolio Fund (expressed in thousands of dollars, except per unit amounts)
ASSETSCurrent assetsInvestments, non-derivative financial assets 179,958 199,650Cash 3 -Subscriptions receivable 35 30Receivable from investments sold - 57
179,996 199,737LIABILITIESCurrent liabilitiesBank indebtedness - 57Redemptions payable 28 15Payable on investments purchased 3 -
31 72NET ASSETS ATTRIBUTABLE TO CONTRACTHOLDERS 179,965 199,665Net assets attributable to contractholders per unit 22.05 21.10
INCOMERealized and change in unrealized gain (loss) on investments and derivatives 8,122 19,089
8,122 19,089EXPENSESOther operating expenses 17 4
17 4INCREASE (DECREASE) IN NET ASSETS ATTRIBUTABLE TO CONTRACTHOLDERS 8,105 19,085Increase (decrease) in net assets attributable to contractholders per unit 0.89 2.03
STATEMENT OF CHANGES IN FINANCIAL POSITION
for the years ended December 312015 2014
$ $NET ASSETS ATTRIBUTABLE TO CONTRACTHOLDERS - beginning of year 199,665 176,287INCREASE (DECREASE) IN NET ASSETS ATTRIBUTABLE TO CONTRACTHOLDERS 8,105 19,085CAPITAL UNIT TRANSACTIONSUnits sold 32,151 29,739Units redeemed (59,956) (25,446)Net capital unit transactions (27,805) 4,293NET ASSETS ATTRIBUTABLE TO CONTRACTHOLDERS - end of year 179,965 199,665
STATEMENT OF CASH FLOWS
for the years ended December 312015 2014
$ $Cash flows from operating activitiesIncrease (decrease) in net assets attributable to contractholders 8,105 19,085Adjustments for:Realized and change in unrealized gain (loss) on investments and derivatives (8,122) (19,089)Purchase of investments (41,374) (30,082)Proceeds from sale and maturity of investments 69,248 25,715Net cash from operating activities 27,857 (4,371)Cash flows used in financing activitiesProceeds from sale of units 32,146 29,726Payments for units redeemed (59,943) (25,435)Net cash used in financing activities (27,797) 4,291Net increase (decrease) in cash 60 (80)Cash (bank indebtedness) at beginning of year (57) 23Cash (bank indebtedness) at end of year 3 (57)
SCHEDULE OF PORTFOLIO INVESTMENTS as at December 31, 2015
Units
Average cost
$Fair value
$
Manulife Canadian Equity Capped Index Fund (Manulife Asset Management) 2,263,092 50,707 53,474 Manulife US Equity Index Fund (Manulife Asset Management) 1,067,820 15,968 26,785 Manulife Canadian Bond Index Fund (Manulife Asset Management) 2,710,054 64,149 72,647 Manulife International Equity Index Fund (BlackRock) 1,384,348 19,813 27,052 TOTAL INVESTMENTS, NON-DERIVATIVE FINANCIAL ASSETS 100.00% 150,637 179,958 Other assets, less liabilities 0.00% 7 7 NET ASSETS ATTRIBUTABLE TO CONTRACTHOLDERS 100.00% 150,644 179,965
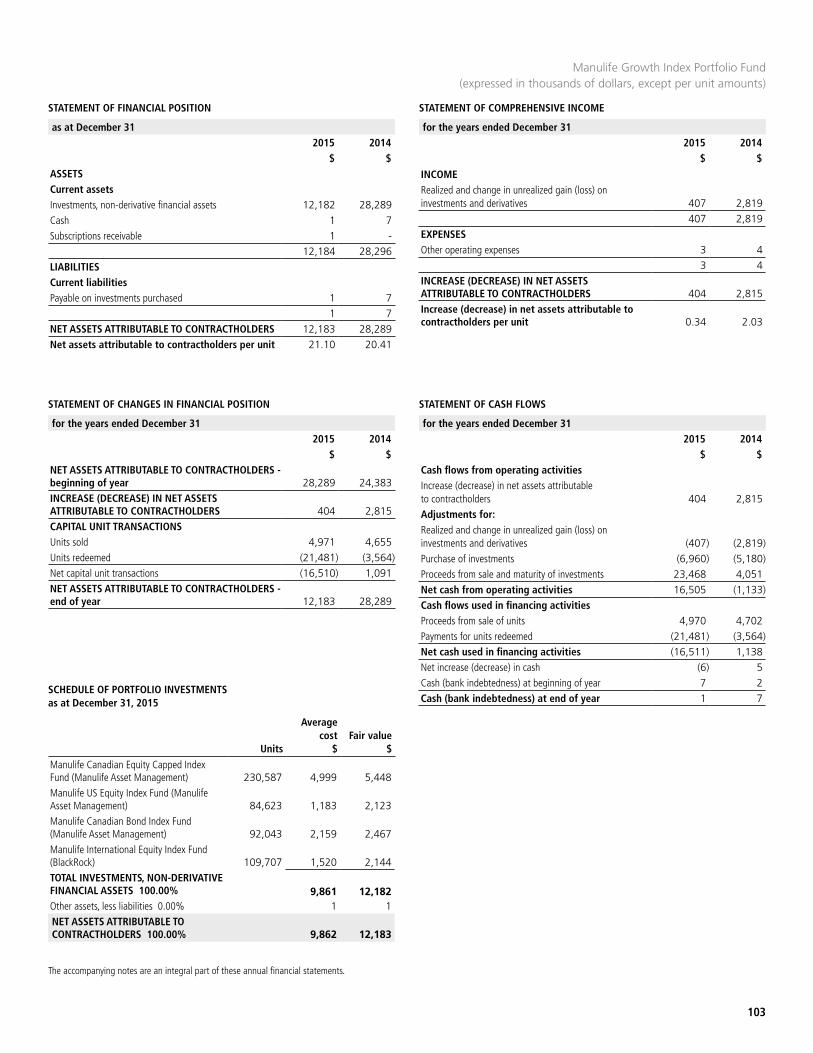
STATEMENT OF FINANCIAL POSITION STATEMENT OF COMPREHENSIVE INCOME
as at December 31 2015 2014
$ $
for the years ended December 312015 2014
$ $
103
The accompanying notes are an integral part of these annual financial statements.
ASSETSCurrent assetsInvestments, non-derivative financial assets 12,182 28,289Cash 1 7Subscriptions receivable 1 -
12,184 28,296LIABILITIESCurrent liabilitiesPayable on investments purchased 1 7
1 7NET ASSETS ATTRIBUTABLE TO CONTRACTHOLDERS 12,183 28,289Net assets attributable to contractholders per unit 21.10 20.41
INCOMERealized and change in unrealized gain (loss) on investments and derivatives 407 2,819
407 2,819EXPENSESOther operating expenses 3 4
3 4INCREASE (DECREASE) IN NET ASSETS ATTRIBUTABLE TO CONTRACTHOLDERS 404 2,815Increase (decrease) in net assets attributable to contractholders per unit 0.34 2.03
STATEMENT OF CHANGES IN FINANCIAL POSITION STATEMENT OF CASH FLOWS
for the years ended December 312015 2014
$ $
for the years ended December 312015 2014
$ $NET ASSETS ATTRIBUTABLE TO CONTRACTHOLDERS - beginning of year 28,289 24,383INCREASE (DECREASE) IN NET ASSETS ATTRIBUTABLE TO CONTRACTHOLDERS 404 2,815CAPITAL UNIT TRANSACTIONSUnits sold 4,971 4,655Units redeemed (21,481) (3,564)Net capital unit transactions (16,510) 1,091NET ASSETS ATTRIBUTABLE TO CONTRACTHOLDERS - end of year 12,183 28,289
Cash flows from operating activitiesIncrease (decrease) in net assets attributable to contractholders 404 2,815Adjustments for:Realized and change in unrealized gain (loss) on investments and derivatives (407) (2,819)Purchase of investments (6,960) (5,180)Proceeds from sale and maturity of investments 23,468 4,051Net cash from operating activities 16,505 (1,133)Cash flows used in financing activitiesProceeds from sale of units 4,970 4,702Payments for units redeemed (21,481) (3,564)Net cash used in financing activities (16,511) 1,138Net increase (decrease) in cash (6) 5Cash (bank indebtedness) at beginning of year 7 2Cash (bank indebtedness) at end of year 1 7
Manulife Growth Index Portfolio Fund(expressed in thousands of dollars, except per unit amounts)
SCHEDULE OF PORTFOLIO INVESTMENTS as at December 31, 2015
Units
Average cost
$Fair value
$
Manulife Canadian Equity Capped Index Fund (Manulife Asset Management) 230,587 4,999 5,448 Manulife US Equity Index Fund (Manulife Asset Management) 84,623 1,183 2,123 Manulife Canadian Bond Index Fund (Manulife Asset Management) 92,043 2,159 2,467 Manulife International Equity Index Fund (BlackRock) 109,707 1,520 2,144 TOTAL INVESTMENTS, NON-DERIVATIVE FINANCIAL ASSETS 100.00% 9,861 12,182 Other assets, less liabilities 0.00% 1 1 NET ASSETS ATTRIBUTABLE TO CONTRACTHOLDERS 100.00% 9,862 12,183
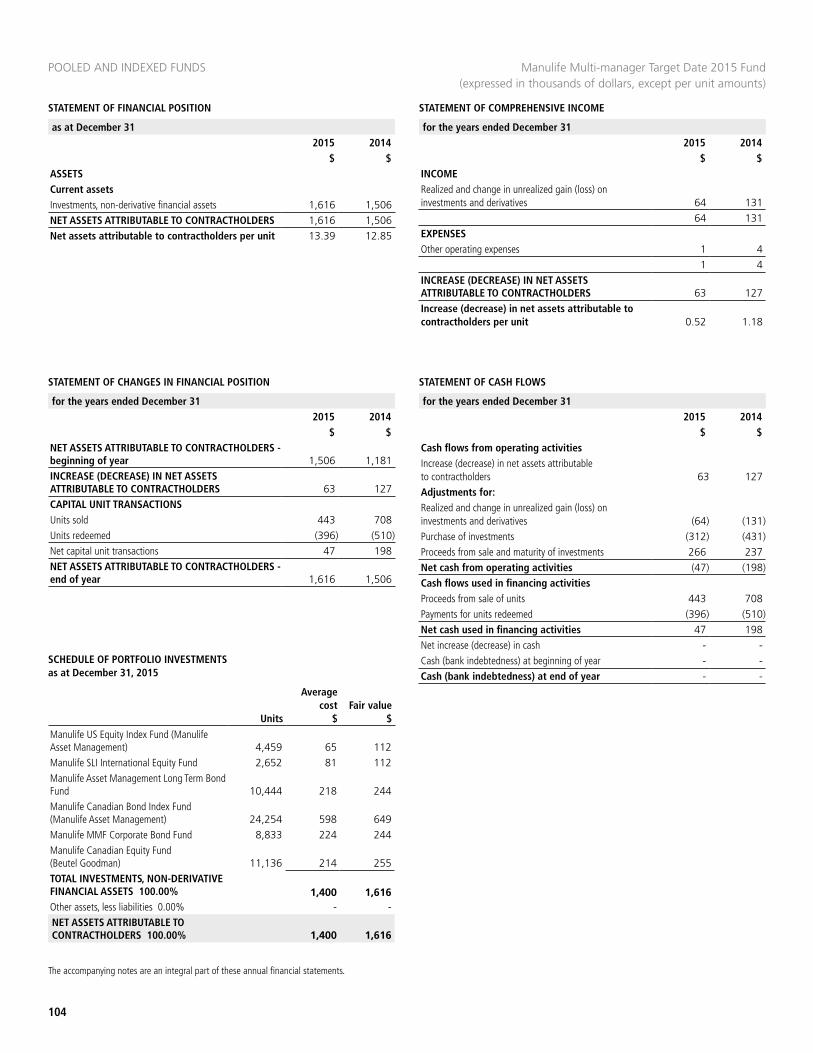
STATEMENT OF FINANCIAL POSITION
POOLED AND INDEXED FUNDS
STATEMENT OF COMPREHENSIVE INCOME
as at December 31 2015 2014
$ $
for the years ended December 312015 2014
$ $
104
The accompanying notes are an integral part of these annual financial statements.
ASSETSCurrent assetsInvestments, non-derivative financial assets 1,616 1,506NET ASSETS ATTRIBUTABLE TO CONTRACTHOLDERS 1,616 1,506Net assets attributable to contractholders per unit 13.39 12.85
INCOMERealized and change in unrealized gain (loss) on investments and derivatives 64 131
64 131EXPENSESOther operating expenses 1 4
1 4INCREASE (DECREASE) IN NET ASSETS ATTRIBUTABLE TO CONTRACTHOLDERS 63 127Increase (decrease) in net assets attributable to contractholders per unit 0.52 1.18
STATEMENT OF CHANGES IN FINANCIAL POSITION STATEMENT OF CASH FLOWS
for the years ended December 312015 2014
$ $
for the years ended December 312015 2014
$ $NET ASSETS ATTRIBUTABLE TO CONTRACTHOLDERS - beginning of year 1,506 1,181INCREASE (DECREASE) IN NET ASSETS ATTRIBUTABLE TO CONTRACTHOLDERS 63 127CAPITAL UNIT TRANSACTIONSUnits sold 443 708Units redeemed (396) (510)Net capital unit transactions 47 198NET ASSETS ATTRIBUTABLE TO CONTRACTHOLDERS - end of year 1,616 1,506
Cash flows from operating activitiesIncrease (decrease) in net assets attributable to contractholders 63 127Adjustments for:Realized and change in unrealized gain (loss) on investments and derivatives (64) (131)Purchase of investments (312) (431)Proceeds from sale and maturity of investments 266 237Net cash from operating activities (47) (198)Cash flows used in financing activitiesProceeds from sale of units 443 708Payments for units redeemed (396) (510)Net cash used in financing activities 47 198Net increase (decrease) in cash - -Cash (bank indebtedness) at beginning of year - -Cash (bank indebtedness) at end of year - -
Manulife Multi-manager Target Date 2015 Fund (expressed in thousands of dollars, except per unit amounts)
SCHEDULE OF PORTFOLIO INVESTMENTS as at December 31, 2015
Units
Average cost
$Fair value
$
Manulife US Equity Index Fund (Manulife Asset Management) 4,459 65 112 Manulife SLI International Equity Fund 2,652 81 112 Manulife Asset Management Long Term Bond Fund 10,444 218 244 Manulife Canadian Bond Index Fund (Manulife Asset Management) 24,254 598 649 Manulife MMF Corporate Bond Fund 8,833 224 244 Manulife Canadian Equity Fund (Beutel Goodman) 11,136 214 255 TOTAL INVESTMENTS, NON-DERIVATIVE FINANCIAL ASSETS 100.00% 1,400 1,616 Other assets, less liabilities 0.00% - - NET ASSETS ATTRIBUTABLE TO CONTRACTHOLDERS 100.00% 1,400 1,616
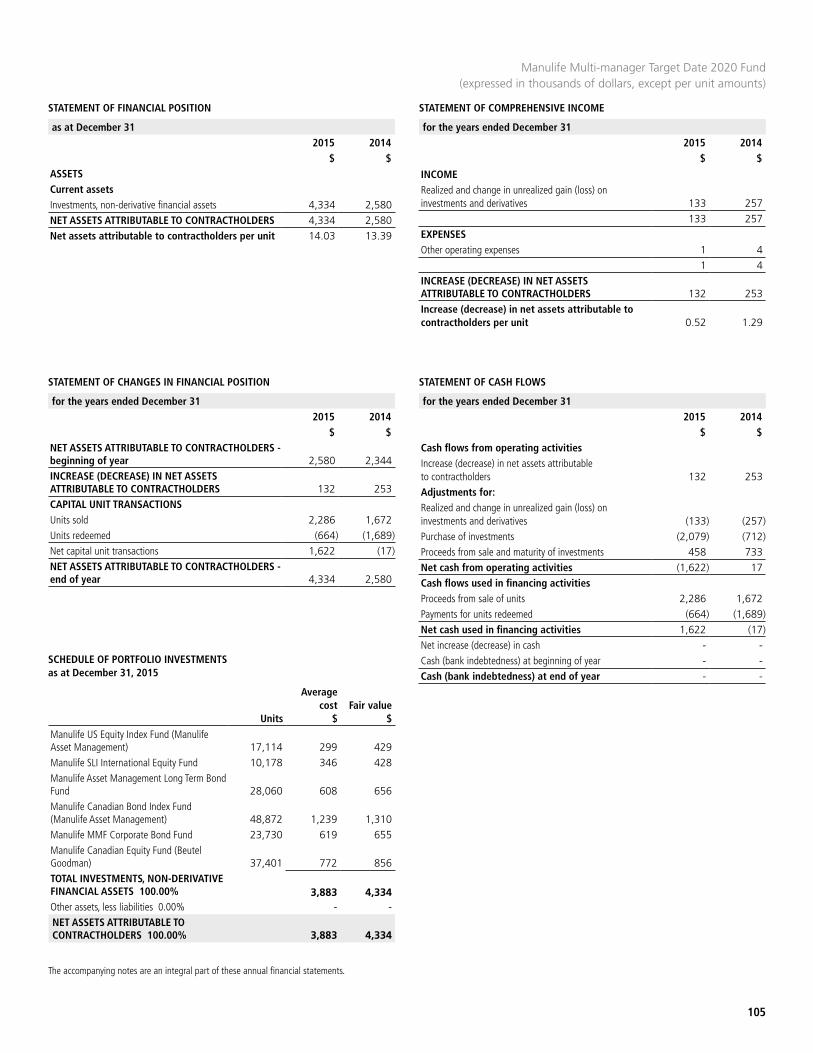
STATEMENT OF FINANCIAL POSITION STATEMENT OF COMPREHENSIVE INCOME
as at December 31 2015 2014
$ $
for the years ended December 312015 2014
$ $
105
The accompanying notes are an integral part of these annual financial statements.
ASSETSCurrent assetsInvestments, non-derivative financial assets 4,334 2,580NET ASSETS ATTRIBUTABLE TO CONTRACTHOLDERS 4,334 2,580Net assets attributable to contractholders per unit 14.03 13.39
INCOMERealized and change in unrealized gain (loss) on investments and derivatives 133 257
133 257EXPENSESOther operating expenses 1 4
1 4INCREASE (DECREASE) IN NET ASSETS ATTRIBUTABLE TO CONTRACTHOLDERS 132 253Increase (decrease) in net assets attributable to contractholders per unit 0.52 1.29
STATEMENT OF CHANGES IN FINANCIAL POSITION STATEMENT OF CASH FLOWS
for the years ended December 312015 2014
$ $
for the years ended December 312015 2014
$ $NET ASSETS ATTRIBUTABLE TO CONTRACTHOLDERS - beginning of year 2,580 2,344INCREASE (DECREASE) IN NET ASSETS ATTRIBUTABLE TO CONTRACTHOLDERS 132 253CAPITAL UNIT TRANSACTIONSUnits sold 2,286 1,672Units redeemed (664) (1,689)Net capital unit transactions 1,622 (17)NET ASSETS ATTRIBUTABLE TO CONTRACTHOLDERS - end of year 4,334 2,580
Cash flows from operating activitiesIncrease (decrease) in net assets attributable to contractholders 132 253Adjustments for:Realized and change in unrealized gain (loss) on investments and derivatives (133) (257)Purchase of investments (2,079) (712)Proceeds from sale and maturity of investments 458 733Net cash from operating activities (1,622) 17Cash flows used in financing activitiesProceeds from sale of units 2,286 1,672Payments for units redeemed (664) (1,689)Net cash used in financing activities 1,622 (17)Net increase (decrease) in cash - -Cash (bank indebtedness) at beginning of year - -Cash (bank indebtedness) at end of year - -
Manulife Multi-manager Target Date 2020 Fund (expressed in thousands of dollars, except per unit amounts)
SCHEDULE OF PORTFOLIO INVESTMENTS as at December 31, 2015
Units
Average cost
$Fair value
$Manulife US Equity Index Fund (Manulife Asset Management) 17,114 299 429 Manulife SLI International Equity Fund 10,178 346 428 Manulife Asset Management Long Term Bond Fund 28,060 608 656 Manulife Canadian Bond Index Fund (Manulife Asset Management) 48,872 1,239 1,310 Manulife MMF Corporate Bond Fund 23,730 619 655 Manulife Canadian Equity Fund (Beutel Goodman) 37,401 772 856 TOTAL INVESTMENTS, NON-DERIVATIVE FINANCIAL ASSETS 100.00% 3,883 4,334 Other assets, less liabilities 0.00% - - NET ASSETS ATTRIBUTABLE TO CONTRACTHOLDERS 100.00% 3,883 4,334
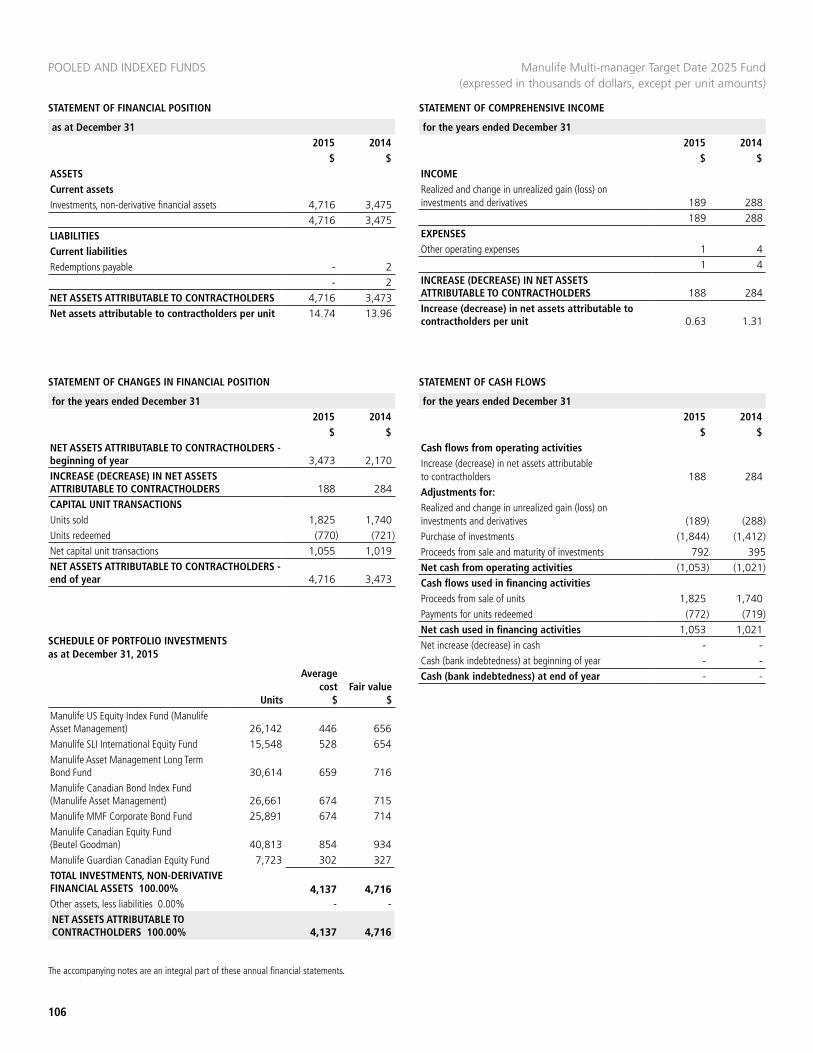
STATEMENT OF FINANCIAL POSITION
POOLED AND INDEXED FUNDS
STATEMENT OF COMPREHENSIVE INCOME
as at December 31 2015 2014
$ $
for the years ended December 312015 2014
$ $
106
The accompanying notes are an integral part of these annual financial statements.
ASSETSCurrent assetsInvestments, non-derivative financial assets 4,716 3,475
4,716 3,475LIABILITIESCurrent liabilitiesRedemptions payable - 2
- 2NET ASSETS ATTRIBUTABLE TO CONTRACTHOLDERS 4,716 3,473Net assets attributable to contractholders per unit 14.74 13.96
INCOMERealized and change in unrealized gain (loss) on investments and derivatives 189 288
189 288EXPENSESOther operating expenses 1 4
1 4INCREASE (DECREASE) IN NET ASSETS ATTRIBUTABLE TO CONTRACTHOLDERS 188 284Increase (decrease) in net assets attributable to contractholders per unit 0.63 1.31
STATEMENT OF CASH FLOWS
for the years ended December 312015 2014
$ $
STATEMENT OF CHANGES IN FINANCIAL POSITION
for the years ended December 312015 2014
$ $NET ASSETS ATTRIBUTABLE TO CONTRACTHOLDERS - beginning of year 3,473 2,170INCREASE (DECREASE) IN NET ASSETS ATTRIBUTABLE TO CONTRACTHOLDERS 188 284CAPITAL UNIT TRANSACTIONSUnits sold 1,825 1,740Units redeemed (770) (721)Net capital unit transactions 1,055 1,019NET ASSETS ATTRIBUTABLE TO CONTRACTHOLDERS - end of year 4,716 3,473
Cash flows from operating activitiesIncrease (decrease) in net assets attributable to contractholders 188 284Adjustments for:Realized and change in unrealized gain (loss) on investments and derivatives (189) (288)Purchase of investments (1,844) (1,412)Proceeds from sale and maturity of investments 792 395Net cash from operating activities (1,053) (1,021)Cash flows used in financing activitiesProceeds from sale of units 1,825 1,740Payments for units redeemed (772) (719)Net cash used in financing activities 1,053 1,021Net increase (decrease) in cash - -Cash (bank indebtedness) at beginning of year - -Cash (bank indebtedness) at end of year - -
Manulife Multi-manager Target Date 2025 Fund(expressed in thousands of dollars, except per unit amounts)
SCHEDULE OF PORTFOLIO INVESTMENTS as at December 31, 2015
Units
Average cost
$Fair value
$
Manulife US Equity Index Fund (Manulife Asset Management) 26,142 446 656 Manulife SLI International Equity Fund 15,548 528 654 Manulife Asset Management Long Term Bond Fund 30,614 659 716 Manulife Canadian Bond Index Fund (Manulife Asset Management) 26,661 674 715 Manulife MMF Corporate Bond Fund 25,891 674 714 Manulife Canadian Equity Fund (Beutel Goodman) 40,813 854 934 Manulife Guardian Canadian Equity Fund 7,723 302 327 TOTAL INVESTMENTS, NON-DERIVATIVE FINANCIAL ASSETS 100.00% 4,137 4,716 Other assets, less liabilities 0.00% - - NET ASSETS ATTRIBUTABLE TO CONTRACTHOLDERS 100.00% 4,137 4,716
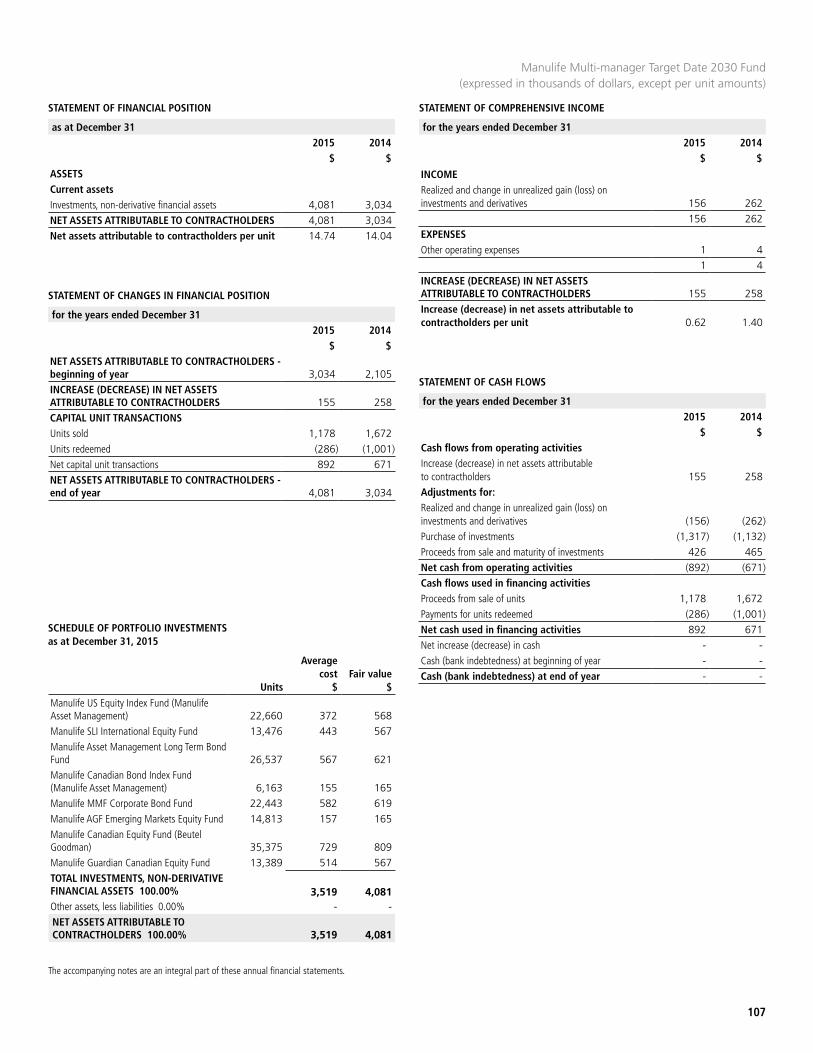
STATEMENT OF FINANCIAL POSITION STATEMENT OF COMPREHENSIVE INCOME
as at December 31 2015 2014
$ $
for the years ended December 312015 2014
$ $
107
The accompanying notes are an integral part of these annual financial statements.
ASSETSCurrent assetsInvestments, non-derivative financial assets 4,081 3,034NET ASSETS ATTRIBUTABLE TO CONTRACTHOLDERS 4,081 3,034Net assets attributable to contractholders per unit 14.74 14.04
INCOMERealized and change in unrealized gain (loss) on investments and derivatives 156 262
156 262EXPENSESOther operating expenses 1 4
1 4INCREASE (DECREASE) IN NET ASSETS ATTRIBUTABLE TO CONTRACTHOLDERS 155 258Increase (decrease) in net assets attributable to contractholders per unit 0.62 1.40
Manulife Multi-manager Target Date 2030 Fund (expressed in thousands of dollars, except per unit amounts)
STATEMENT OF CASH FLOWS
for the years ended December 312015 2014
$ $
STATEMENT OF CHANGES IN FINANCIAL POSITION
for the years ended December 312015 2014
$ $NET ASSETS ATTRIBUTABLE TO CONTRACTHOLDERS - beginning of year 3,034 2,105INCREASE (DECREASE) IN NET ASSETS ATTRIBUTABLE TO CONTRACTHOLDERS 155 258CAPITAL UNIT TRANSACTIONSUnits sold 1,178 1,672Units redeemed (286) (1,001)Net capital unit transactions 892 671NET ASSETS ATTRIBUTABLE TO CONTRACTHOLDERS - end of year 4,081 3,034
Cash flows from operating activitiesIncrease (decrease) in net assets attributable to contractholders 155 258Adjustments for:Realized and change in unrealized gain (loss) on investments and derivatives (156) (262)Purchase of investments (1,317) (1,132)Proceeds from sale and maturity of investments 426 465Net cash from operating activities (892) (671)Cash flows used in financing activitiesProceeds from sale of units 1,178 1,672Payments for units redeemed (286) (1,001)Net cash used in financing activities 892 671Net increase (decrease) in cash - -Cash (bank indebtedness) at beginning of year - -Cash (bank indebtedness) at end of year - -
SCHEDULE OF PORTFOLIO INVESTMENTS as at December 31, 2015
Units
Average cost
$Fair value
$
Manulife US Equity Index Fund (Manulife Asset Management) 22,660 372 568 Manulife SLI International Equity Fund 13,476 443 567 Manulife Asset Management Long Term Bond Fund 26,537 567 621 Manulife Canadian Bond Index Fund (Manulife Asset Management) 6,163 155 165 Manulife MMF Corporate Bond Fund 22,443 582 619 Manulife AGF Emerging Markets Equity Fund 14,813 157 165 Manulife Canadian Equity Fund (Beutel Goodman) 35,375 729 809 Manulife Guardian Canadian Equity Fund 13,389 514 567 TOTAL INVESTMENTS, NON-DERIVATIVE FINANCIAL ASSETS 100.00% 3,519 4,081 Other assets, less liabilities 0.00% - - NET ASSETS ATTRIBUTABLE TO CONTRACTHOLDERS 100.00% 3,519 4,081

STATEMENT OF FINANCIAL POSITION
POOLED AND INDEXED FUNDS
STATEMENT OF COMPREHENSIVE INCOME
as at December 31 2015 2014
$ $
for the years ended December 312015 2014
$ $
108
The accompanying notes are an integral part of these annual financial statements.
ASSETSCurrent assetsInvestments, non-derivative financial assets 4,445 2,669Cash 3 -
4,448 2,669LIABILITIESCurrent liabilitiesPayable on investments purchased 3 -
3 -NET ASSETS ATTRIBUTABLE TO CONTRACTHOLDERS 4,445 2,669Net assets attributable to contractholders per unit 14.81 14.12
INCOMERealized and change in unrealized gain (loss) on investments and derivatives 129 236
129 236EXPENSESOther operating expenses 1 4
1 4INCREASE (DECREASE) IN NET ASSETS ATTRIBUTABLE TO CONTRACTHOLDERS 128 232Increase (decrease) in net assets attributable to contractholders per unit 0.51 1.41
STATEMENT OF CHANGES IN FINANCIAL POSITION STATEMENT OF CASH FLOWS
for the years ended December 312015 2014
$ $
for the years ended December 312015 2014
$ $NET ASSETS ATTRIBUTABLE TO CONTRACTHOLDERS - beginning of year 2,669 1,682INCREASE (DECREASE) IN NET ASSETS ATTRIBUTABLE TO CONTRACTHOLDERS 128 232CAPITAL UNIT TRANSACTIONSUnits sold 2,125 1,553Units redeemed (477) (798)Net capital unit transactions 1,648 755NET ASSETS ATTRIBUTABLE TO CONTRACTHOLDERS - end of year 4,445 2,669
Cash flows from operating activitiesIncrease (decrease) in net assets attributable to contractholders 128 232Adjustments for:Realized and change in unrealized gain (loss) on investments and derivatives (129) (236)Purchase of investments (2,098) (1,089)Proceeds from sale and maturity of investments 454 338Net cash from operating activities (1,645) (755)Cash flows used in financing activitiesProceeds from sale of units 2,125 1,553Payments for units redeemed (477) (798)Net cash used in financing activities 1,648 755Net increase (decrease) in cash 3 -Cash (bank indebtedness) at beginning of year - -Cash (bank indebtedness) at end of year 3 -
Manulife Multi-manager Target Date 2035 Fund (expressed in thousands of dollars, except per unit amounts)
SCHEDULE OF PORTFOLIO INVESTMENTS as at December 31, 2015
Units
Average cost
$Fair value
$
Manulife US Equity Index Fund (Manulife Asset Management) 24,693 443 619 Manulife SLI International Equity Fund 14,686 512 618 Manulife Asset Management Long Term Bond Fund 28,917 627 676 Manulife MMF Corporate Bond Fund 21,196 559 585 Manulife AGF Emerging Markets Equity Fund 32,282 347 359 Manulife Canadian Equity Fund (Beutel Goodman) 28,914 613 662 Manulife Guardian Canadian Equity Fund 21,884 869 926 TOTAL INVESTMENTS, NON-DERIVATIVE FINANCIAL ASSETS 100.00% 3,970 4,445 Other assets, less liabilities 0.00% - - NET ASSETS ATTRIBUTABLE TO CONTRACTHOLDERS 100.00% 3,970 4,445
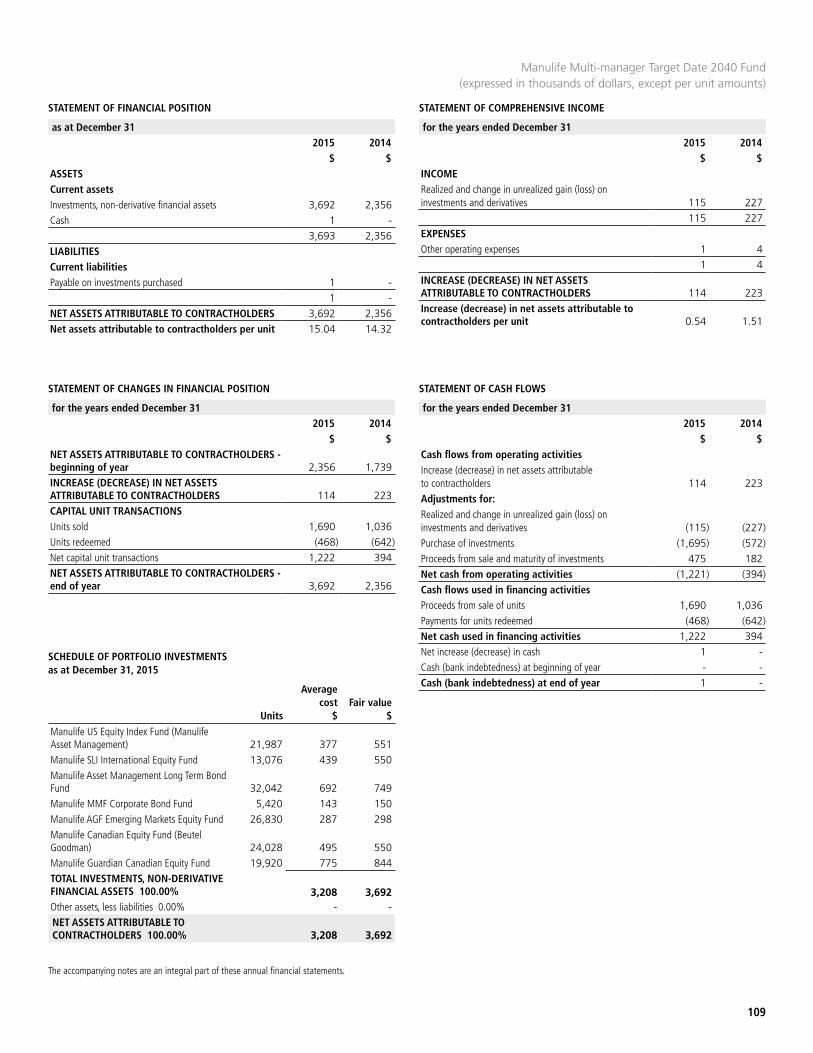
STATEMENT OF FINANCIAL POSITION STATEMENT OF COMPREHENSIVE INCOME
as at December 31 2015 2014
$ $
for the years ended December 312015 2014
$ $
109
The accompanying notes are an integral part of these annual financial statements.
ASSETSCurrent assetsInvestments, non-derivative financial assets 3,692 2,356Cash 1 -
3,693 2,356LIABILITIESCurrent liabilitiesPayable on investments purchased 1 -
1 -NET ASSETS ATTRIBUTABLE TO CONTRACTHOLDERS 3,692 2,356Net assets attributable to contractholders per unit 15.04 14.32
INCOMERealized and change in unrealized gain (loss) on investments and derivatives 115 227
115 227EXPENSESOther operating expenses 1 4
1 4INCREASE (DECREASE) IN NET ASSETS ATTRIBUTABLE TO CONTRACTHOLDERS 114 223Increase (decrease) in net assets attributable to contractholders per unit 0.54 1.51
STATEMENT OF CHANGES IN FINANCIAL POSITION STATEMENT OF CASH FLOWS
for the years ended December 312015 2014
$ $
for the years ended December 312015 2014
$ $NET ASSETS ATTRIBUTABLE TO CONTRACTHOLDERS - beginning of year 2,356 1,739INCREASE (DECREASE) IN NET ASSETS ATTRIBUTABLE TO CONTRACTHOLDERS 114 223CAPITAL UNIT TRANSACTIONSUnits sold 1,690 1,036Units redeemed (468) (642)Net capital unit transactions 1,222 394NET ASSETS ATTRIBUTABLE TO CONTRACTHOLDERS - end of year 3,692 2,356
Cash flows from operating activitiesIncrease (decrease) in net assets attributable to contractholders 114 223Adjustments for:Realized and change in unrealized gain (loss) on investments and derivatives (115) (227)Purchase of investments (1,695) (572)Proceeds from sale and maturity of investments 475 182Net cash from operating activities (1,221) (394)Cash flows used in financing activitiesProceeds from sale of units 1,690 1,036Payments for units redeemed (468) (642)Net cash used in financing activities 1,222 394Net increase (decrease) in cash 1 -Cash (bank indebtedness) at beginning of year - -Cash (bank indebtedness) at end of year 1 -
Manulife Multi-manager Target Date 2040 Fund (expressed in thousands of dollars, except per unit amounts)
SCHEDULE OF PORTFOLIO INVESTMENTS as at December 31, 2015
Units
Average cost
$Fair value
$
Manulife US Equity Index Fund (Manulife Asset Management) 21,987 377 551 Manulife SLI International Equity Fund 13,076 439 550 Manulife Asset Management Long Term Bond Fund 32,042 692 749 Manulife MMF Corporate Bond Fund 5,420 143 150 Manulife AGF Emerging Markets Equity Fund 26,830 287 298 Manulife Canadian Equity Fund (Beutel Goodman) 24,028 495 550 Manulife Guardian Canadian Equity Fund 19,920 775 844 TOTAL INVESTMENTS, NON-DERIVATIVE FINANCIAL ASSETS 100.00% 3,208 3,692 Other assets, less liabilities 0.00% - - NET ASSETS ATTRIBUTABLE TO CONTRACTHOLDERS 100.00% 3,208 3,692
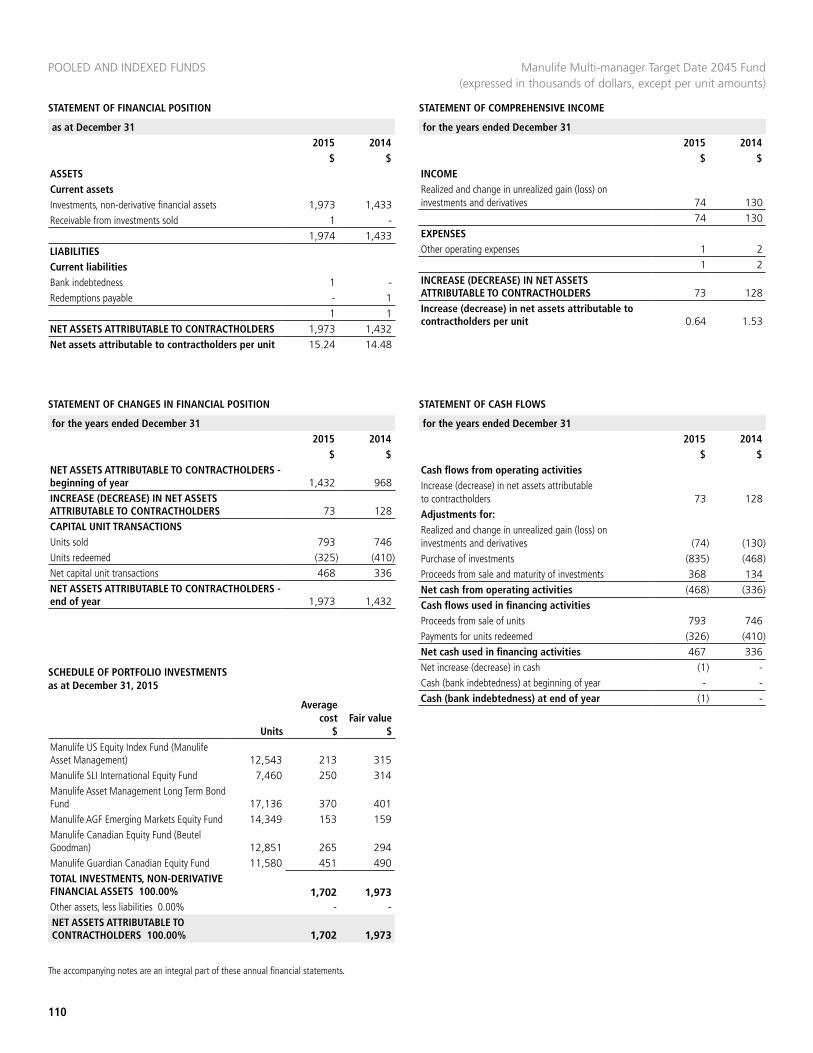
STATEMENT OF FINANCIAL POSITION
POOLED AND INDEXED FUNDS
STATEMENT OF COMPREHENSIVE INCOME
as at December 31 2015 2014
$ $
for the years ended December 312015 2014
$ $
110
The accompanying notes are an integral part of these annual financial statements.
ASSETSCurrent assetsInvestments, non-derivative financial assets 1,973 1,433Receivable from investments sold 1 -
1,974 1,433LIABILITIESCurrent liabilitiesBank indebtedness 1 -Redemptions payable - 1
1 1NET ASSETS ATTRIBUTABLE TO CONTRACTHOLDERS 1,973 1,432Net assets attributable to contractholders per unit 15.24 14.48
INCOMERealized and change in unrealized gain (loss) on investments and derivatives 74 130
74 130EXPENSESOther operating expenses 1 2
1 2INCREASE (DECREASE) IN NET ASSETS ATTRIBUTABLE TO CONTRACTHOLDERS 73 128Increase (decrease) in net assets attributable to contractholders per unit 0.64 1.53
STATEMENT OF CHANGES IN FINANCIAL POSITION STATEMENT OF CASH FLOWS
for the years ended December 312015 2014
$ $
for the years ended December 312015 2014
$ $NET ASSETS ATTRIBUTABLE TO CONTRACTHOLDERS - beginning of year 1,432 968INCREASE (DECREASE) IN NET ASSETS ATTRIBUTABLE TO CONTRACTHOLDERS 73 128CAPITAL UNIT TRANSACTIONSUnits sold 793 746Units redeemed (325) (410)Net capital unit transactions 468 336NET ASSETS ATTRIBUTABLE TO CONTRACTHOLDERS - end of year 1,973 1,432
Cash flows from operating activitiesIncrease (decrease) in net assets attributable to contractholders 73 128Adjustments for:Realized and change in unrealized gain (loss) on investments and derivatives (74) (130)Purchase of investments (835) (468)Proceeds from sale and maturity of investments 368 134Net cash from operating activities (468) (336)Cash flows used in financing activitiesProceeds from sale of units 793 746Payments for units redeemed (326) (410)Net cash used in financing activities 467 336Net increase (decrease) in cash (1) -Cash (bank indebtedness) at beginning of year - -Cash (bank indebtedness) at end of year (1) -
Manulife Multi-manager Target Date 2045 Fund (expressed in thousands of dollars, except per unit amounts)
SCHEDULE OF PORTFOLIO INVESTMENTS as at December 31, 2015
Units
Average cost
$Fair value
$
Manulife US Equity Index Fund (Manulife Asset Management) 12,543 213 315 Manulife SLI International Equity Fund 7,460 250 314 Manulife Asset Management Long Term Bond Fund 17,136 370 401 Manulife AGF Emerging Markets Equity Fund 14,349 153 159 Manulife Canadian Equity Fund (Beutel Goodman) 12,851 265 294 Manulife Guardian Canadian Equity Fund 11,580 451 490 TOTAL INVESTMENTS, NON-DERIVATIVE FINANCIAL ASSETS 100.00% 1,702 1,973 Other assets, less liabilities 0.00% - - NET ASSETS ATTRIBUTABLE TO CONTRACTHOLDERS 100.00% 1,702 1,973
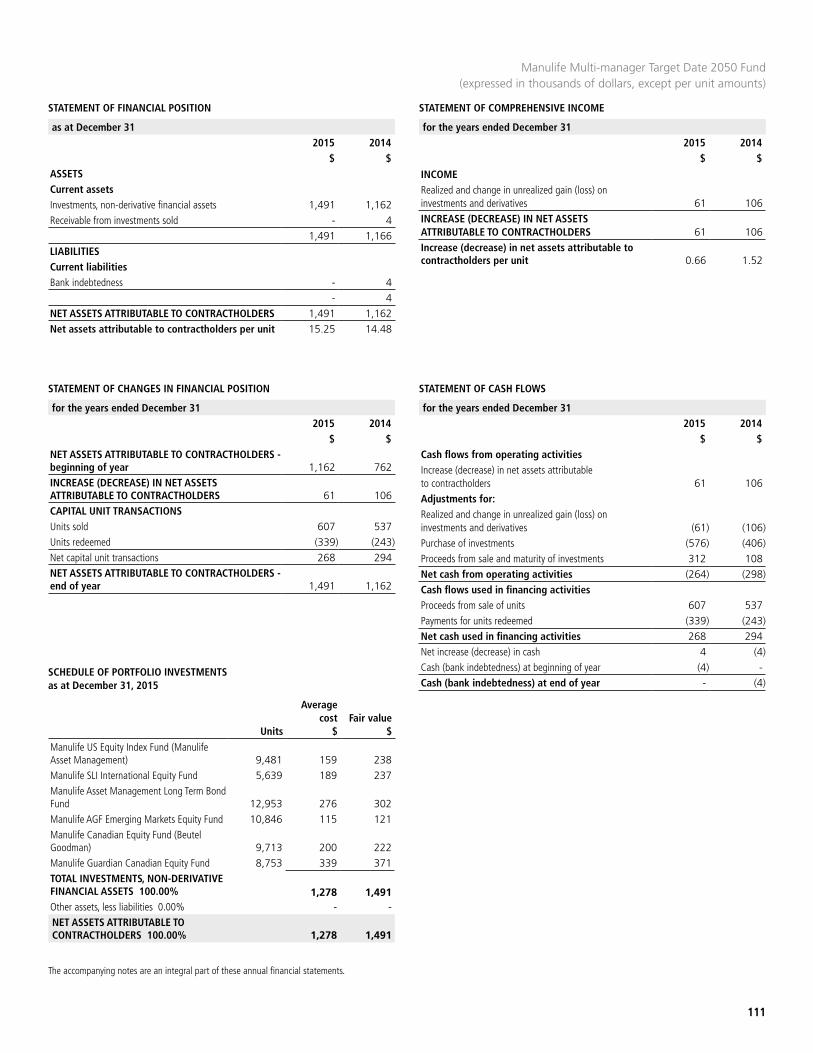
STATEMENT OF FINANCIAL POSITION STATEMENT OF COMPREHENSIVE INCOME
as at December 31 2015 2014
$ $
for the years ended December 312015 2014
$ $
111
The accompanying notes are an integral part of these annual financial statements.
ASSETSCurrent assetsInvestments, non-derivative financial assets 1,491 1,162Receivable from investments sold - 4
1,491 1,166LIABILITIESCurrent liabilitiesBank indebtedness - 4
- 4NET ASSETS ATTRIBUTABLE TO CONTRACTHOLDERS 1,491 1,162Net assets attributable to contractholders per unit 15.25 14.48
INCOMERealized and change in unrealized gain (loss) on investments and derivatives 61 106INCREASE (DECREASE) IN NET ASSETS ATTRIBUTABLE TO CONTRACTHOLDERS 61 106Increase (decrease) in net assets attributable to contractholders per unit 0.66 1.52
STATEMENT OF CHANGES IN FINANCIAL POSITION STATEMENT OF CASH FLOWS
for the years ended December 312015 2014
$ $
for the years ended December 312015 2014
$ $NET ASSETS ATTRIBUTABLE TO CONTRACTHOLDERS - beginning of year 1,162 762INCREASE (DECREASE) IN NET ASSETS ATTRIBUTABLE TO CONTRACTHOLDERS 61 106CAPITAL UNIT TRANSACTIONSUnits sold 607 537Units redeemed (339) (243)Net capital unit transactions 268 294NET ASSETS ATTRIBUTABLE TO CONTRACTHOLDERS - end of year 1,491 1,162
Cash flows from operating activitiesIncrease (decrease) in net assets attributable to contractholders 61 106Adjustments for:Realized and change in unrealized gain (loss) on investments and derivatives (61) (106)Purchase of investments (576) (406)Proceeds from sale and maturity of investments 312 108Net cash from operating activities (264) (298)Cash flows used in financing activitiesProceeds from sale of units 607 537Payments for units redeemed (339) (243)Net cash used in financing activities 268 294Net increase (decrease) in cash 4 (4)Cash (bank indebtedness) at beginning of year (4) -Cash (bank indebtedness) at end of year - (4)
Manulife Multi-manager Target Date 2050 Fund (expressed in thousands of dollars, except per unit amounts)
SCHEDULE OF PORTFOLIO INVESTMENTS as at December 31, 2015
Units
Average cost
$Fair value
$
Manulife US Equity Index Fund (Manulife Asset Management) 9,481 159 238 Manulife SLI International Equity Fund 5,639 189 237 Manulife Asset Management Long Term Bond Fund 12,953 276 302 Manulife AGF Emerging Markets Equity Fund 10,846 115 121 Manulife Canadian Equity Fund (Beutel Goodman) 9,713 200 222 Manulife Guardian Canadian Equity Fund 8,753 339 371 TOTAL INVESTMENTS, NON-DERIVATIVE FINANCIAL ASSETS 100.00% 1,278 1,491 Other assets, less liabilities 0.00% - - NET ASSETS ATTRIBUTABLE TO CONTRACTHOLDERS 100.00% 1,278 1,491

STATEMENT OF FINANCIAL POSITION
POOLED AND INDEXED FUNDS
STATEMENT OF COMPREHENSIVE INCOME
as at December 31 2015 2014
$ $
for the years ended December 312015 2014
$ $
112
The accompanying notes are an integral part of these annual financial statements.
ASSETSCurrent assetsInvestments, non-derivative financial assets 158 83NET ASSETS ATTRIBUTABLE TO CONTRACTHOLDERS 158 83Net assets attributable to contractholders per unit 12.97 12.33
INCOMERealized and change in unrealized gain (loss) on investments and derivatives 5 4INCREASE (DECREASE) IN NET ASSETS ATTRIBUTABLE TO CONTRACTHOLDERS 5 4Increase (decrease) in net assets attributable to contractholders per unit 0.51 1.05
STATEMENT OF CHANGES IN FINANCIAL POSITION STATEMENT OF CASH FLOWS
for the years ended December 312015 2014
$ $
for the years ended December 312015 2014
$ $NET ASSETS ATTRIBUTABLE TO CONTRACTHOLDERS - beginning of year 83 12INCREASE (DECREASE) IN NET ASSETS ATTRIBUTABLE TO CONTRACTHOLDERS 5 4CAPITAL UNIT TRANSACTIONSUnits sold 102 71Units redeemed (32) (4)Net capital unit transactions 70 67NET ASSETS ATTRIBUTABLE TO CONTRACTHOLDERS - end of year 158 83
Cash flows from operating activitiesIncrease (decrease) in net assets attributable to contractholders 5 4Adjustments for:Realized and change in unrealized gain (loss) on investments and derivatives (5) (4)Purchase of investments (105) (73)Proceeds from sale and maturity of investments 35 6Net cash from operating activities (70) (67)Cash flows used in financing activitiesProceeds from sale of units 102 71Payments for units redeemed (32) (4)Net cash used in financing activities 70 67Net increase (decrease) in cash - -Cash (bank indebtedness) at beginning of year - -Cash (bank indebtedness) at end of year - -
Manulife Multi-manager Target Date 2055 Fund (expressed in thousands of dollars, except per unit amounts)
SCHEDULE OF PORTFOLIO INVESTMENTS as at December 31, 2015
Units
Average cost
$Fair value
$Manulife US Equity Index Fund (Manulife Asset Management) 1,007 21 25 Manulife SLI International Equity Fund 599 23 25 Manulife Asset Management Long Term Bond Fund 1,376 31 32 Manulife AGF Emerging Markets Equity Fund 1,152 13 13 Manulife Canadian Equity Fund (Beutel Goodman) 1,032 24 24 Manulife Guardian Canadian Equity Fund 930 40 39 TOTAL INVESTMENTS, NON-DERIVATIVE FINANCIAL ASSETS 100.00% 152 158 Other assets, less liabilities 0.00% - - NET ASSETS ATTRIBUTABLE TO CONTRACTHOLDERS 100.00% 152 158
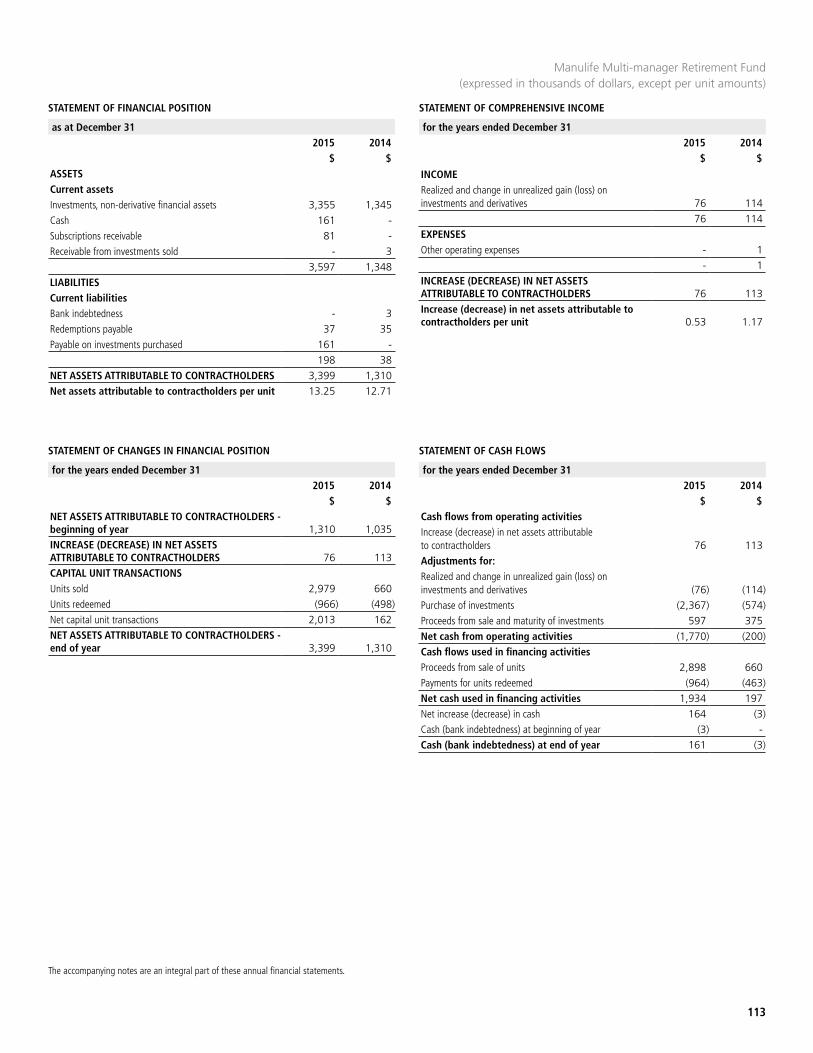
STATEMENT OF FINANCIAL POSITION STATEMENT OF COMPREHENSIVE INCOME
as at December 31 2015 2014
$ $
for the years ended December 312015 2014
$ $
113
The accompanying notes are an integral part of these annual financial statements.
Manulife Multi-manager Retirement Fund(expressed in thousands of dollars, except per unit amounts)
ASSETSCurrent assetsInvestments, non-derivative financial assets 3,355 1,345Cash 161 -Subscriptions receivable 81 -Receivable from investments sold - 3
3,597 1,348LIABILITIESCurrent liabilitiesBank indebtedness - 3Redemptions payable 37 35Payable on investments purchased 161 -
198 38NET ASSETS ATTRIBUTABLE TO CONTRACTHOLDERS 3,399 1,310Net assets attributable to contractholders per unit 13.25 12.71
INCOMERealized and change in unrealized gain (loss) on investments and derivatives 76 114
76 114EXPENSESOther operating expenses - 1
- 1INCREASE (DECREASE) IN NET ASSETS ATTRIBUTABLE TO CONTRACTHOLDERS 76 113Increase (decrease) in net assets attributable to contractholders per unit 0.53 1.17
STATEMENT OF CHANGES IN FINANCIAL POSITION
for the years ended December 312015 2014
$ $NET ASSETS ATTRIBUTABLE TO CONTRACTHOLDERS - beginning of year 1,310 1,035INCREASE (DECREASE) IN NET ASSETS ATTRIBUTABLE TO CONTRACTHOLDERS 76 113CAPITAL UNIT TRANSACTIONSUnits sold 2,979 660Units redeemed (966) (498)Net capital unit transactions 2,013 162NET ASSETS ATTRIBUTABLE TO CONTRACTHOLDERS - end of year 3,399 1,310
STATEMENT OF CASH FLOWS
for the years ended December 312015 2014
$ $Cash flows from operating activitiesIncrease (decrease) in net assets attributable to contractholders 76 113Adjustments for:Realized and change in unrealized gain (loss) on investments and derivatives (76) (114)Purchase of investments (2,367) (574)Proceeds from sale and maturity of investments 597 375Net cash from operating activities (1,770) (200)Cash flows used in financing activitiesProceeds from sale of units 2,898 660Payments for units redeemed (964) (463)Net cash used in financing activities 1,934 197Net increase (decrease) in cash 164 (3)Cash (bank indebtedness) at beginning of year (3) -Cash (bank indebtedness) at end of year 161 (3)
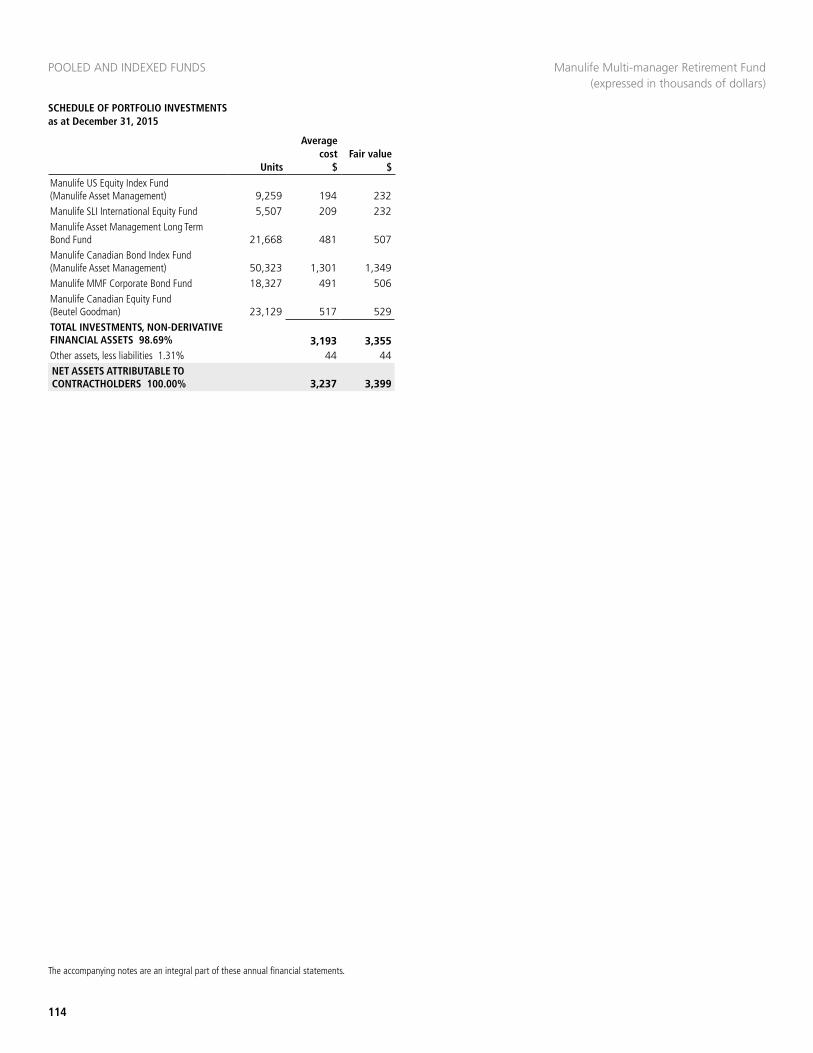
POOLED AND INDEXED FUNDS
114
SCHEDULE OF PORTFOLIO INVESTMENTS as at December 31, 2015
The accompanying notes are an integral part of these annual financial statements.
Manulife US Equity Index Fund (Manulife Asset Management) 9,259 194 232 Manulife SLI International Equity Fund 5,507 209 232 Manulife Asset Management Long Term Bond Fund 21,668 481 507 Manulife Canadian Bond Index Fund (Manulife Asset Management) 50,323 1,301 1,349 Manulife MMF Corporate Bond Fund 18,327 491 506 Manulife Canadian Equity Fund (Beutel Goodman) 23,129 517 529 TOTAL INVESTMENTS, NON-DERIVATIVE FINANCIAL ASSETS 98.69% 3,193 3,355 Other assets, less liabilities 1.31% 44 44 NET ASSETS ATTRIBUTABLE TO CONTRACTHOLDERS 100.00% 3,237 3,399
Manulife Multi-manager Retirement Fund(expressed in thousands of dollars)
Units
Average cost
$Fair value
$
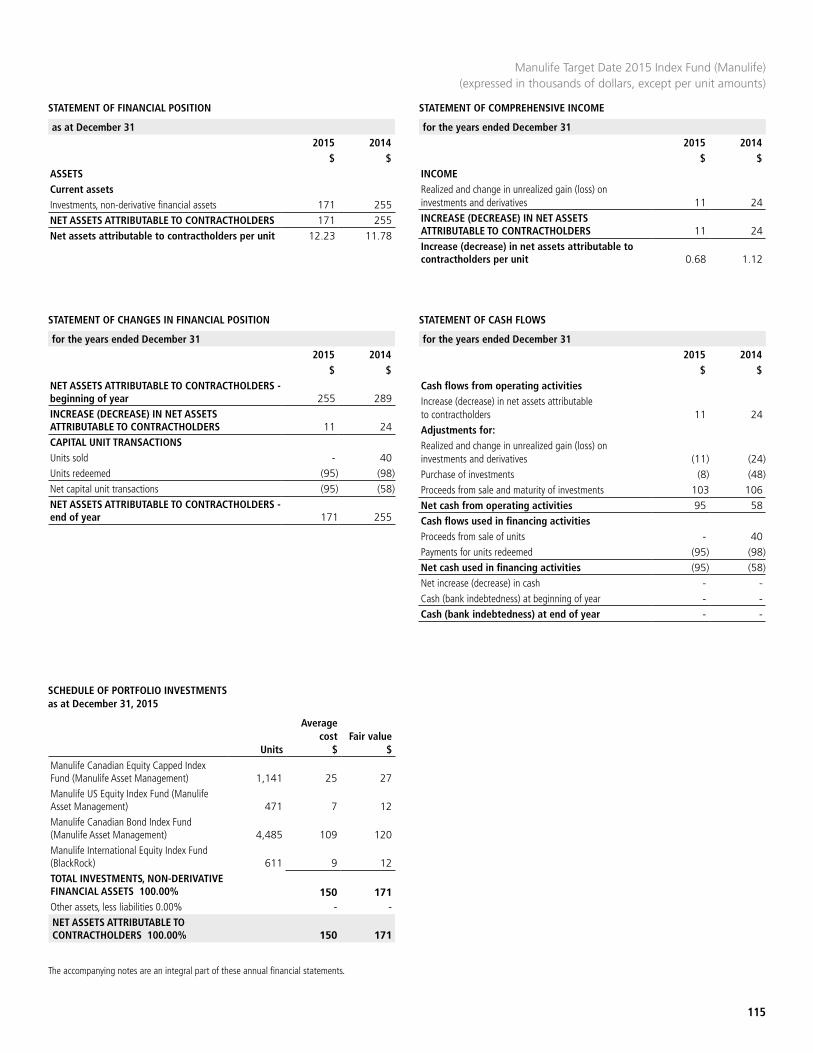
STATEMENT OF FINANCIAL POSITION STATEMENT OF COMPREHENSIVE INCOME
as at December 31 2015 2014
$ $
for the years ended December 312015 2014
$ $
115
The accompanying notes are an integral part of these annual financial statements.
Manulife Target Date 2015 Index Fund (Manulife) (expressed in thousands of dollars, except per unit amounts)
ASSETSCurrent assetsInvestments, non-derivative financial assets 171 255NET ASSETS ATTRIBUTABLE TO CONTRACTHOLDERS 171 255Net assets attributable to contractholders per unit 12.23 11.78
INCOMERealized and change in unrealized gain (loss) on investments and derivatives 11 24INCREASE (DECREASE) IN NET ASSETS ATTRIBUTABLE TO CONTRACTHOLDERS 11 24Increase (decrease) in net assets attributable to contractholders per unit 0.68 1.12
STATEMENT OF CHANGES IN FINANCIAL POSITION STATEMENT OF CASH FLOWS
for the years ended December 312015 2014
$ $
for the years ended December 312015 2014
$ $NET ASSETS ATTRIBUTABLE TO CONTRACTHOLDERS - beginning of year 255 289INCREASE (DECREASE) IN NET ASSETS ATTRIBUTABLE TO CONTRACTHOLDERS 11 24CAPITAL UNIT TRANSACTIONSUnits sold - 40Units redeemed (95) (98)Net capital unit transactions (95) (58)NET ASSETS ATTRIBUTABLE TO CONTRACTHOLDERS - end of year 171 255
Cash flows from operating activitiesIncrease (decrease) in net assets attributable to contractholders 11 24Adjustments for:Realized and change in unrealized gain (loss) on investments and derivatives (11) (24)Purchase of investments (8) (48)Proceeds from sale and maturity of investments 103 106Net cash from operating activities 95 58Cash flows used in financing activitiesProceeds from sale of units - 40Payments for units redeemed (95) (98)Net cash used in financing activities (95) (58)Net increase (decrease) in cash - -Cash (bank indebtedness) at beginning of year - -Cash (bank indebtedness) at end of year - -
SCHEDULE OF PORTFOLIO INVESTMENTS as at December 31, 2015
Units
Average cost
$Fair value
$
Manulife Canadian Equity Capped Index Fund (Manulife Asset Management) 1,141 25 27 Manulife US Equity Index Fund (Manulife Asset Management) 471 7 12 Manulife Canadian Bond Index Fund (Manulife Asset Management) 4,485 109 120 Manulife International Equity Index Fund (BlackRock) 611 9 12 TOTAL INVESTMENTS, NON-DERIVATIVE FINANCIAL ASSETS 100.00% 150 171 Other assets, less liabilities 0.00% - - NET ASSETS ATTRIBUTABLE TO CONTRACTHOLDERS 100.00% 150 171

STATEMENT OF FINANCIAL POSITION
POOLED AND INDEXED FUNDS
STATEMENT OF COMPREHENSIVE INCOME
as at December 31 2015 2014
$ $
for the years ended December 312015 2014
$ $
116
The accompanying notes are an integral part of these annual financial statements.
Manulife Target Date 2020 Index Fund (Manulife) (expressed in thousands of dollars, except per unit amounts)
ASSETSCurrent assetsInvestments, non-derivative financial assets 415 415Receivable from investments sold 1 -
416 415LIABILITIESCurrent liabilitiesBank indebtedness 1 -
1 -NET ASSETS ATTRIBUTABLE TO CONTRACTHOLDERS 415 415Net assets attributable to contractholders per unit 12.70 12.19
INCOMERealized and change in unrealized gain (loss) on investments and derivatives 17 43INCREASE (DECREASE) IN NET ASSETS ATTRIBUTABLE TO CONTRACTHOLDERS 17 43Increase (decrease) in net assets attributable to contractholders per unit 0.52 1.19
STATEMENT OF CHANGES IN FINANCIAL POSITION STATEMENT OF CASH FLOWS
for the years ended December 312015 2014
$ $
for the years ended December 312015 2014
$ $NET ASSETS ATTRIBUTABLE TO CONTRACTHOLDERS - beginning of year 415 477INCREASE (DECREASE) IN NET ASSETS ATTRIBUTABLE TO CONTRACTHOLDERS 17 43CAPITAL UNIT TRANSACTIONSUnits sold 26 100Units redeemed (43) (205)Net capital unit transactions (17) (105)NET ASSETS ATTRIBUTABLE TO CONTRACTHOLDERS - end of year 415 415
Cash flows from operating activitiesIncrease (decrease) in net assets attributable to contractholders 17 43Adjustments for:Realized and change in unrealized gain (loss) on investments and derivatives (17) (43)Purchase of investments (45) (117)Proceeds from sale and maturity of investments 61 221Net cash from operating activities 16 104Cash flows used in financing activitiesProceeds from sale of units 26 100Payments for units redeemed (43) (205)Net cash used in financing activities (17) (105)Net increase (decrease) in cash (1) (1)Cash (bank indebtedness) at beginning of year - 1Cash (bank indebtedness) at end of year (1) -
SCHEDULE OF PORTFOLIO INVESTMENTS as at December 31, 2015
Units
Average cost
$Fair value
$
Manulife Canadian Equity Capped Index Fund (Manulife Asset Management) 3,472 78 82 Manulife US Equity Index Fund (Manulife Asset Management) 1,638 26 41 Manulife Canadian Bond Index Fund (Manulife Asset Management) 9,355 228 251 Manulife International Equity Index Fund (BlackRock) 2,124 31 41 TOTAL INVESTMENTS, NON-DERIVATIVE FINANCIAL ASSETS 100.00% 363 415 Other assets, less liabilities 0.00% - - NET ASSETS ATTRIBUTABLE TO CONTRACTHOLDERS 100.00% 363 415

STATEMENT OF FINANCIAL POSITION STATEMENT OF COMPREHENSIVE INCOME
as at December 31 2015 2014
$ $
for the years ended December 312015 2014
$ $
117
The accompanying notes are an integral part of these annual financial statements.
Manulife Target Date 2025 Index Fund (Manulife) (expressed in thousands of dollars, except per unit amounts)
ASSETSCurrent assetsInvestments, non-derivative financial assets 829 779NET ASSETS ATTRIBUTABLE TO CONTRACTHOLDERS 829 779Net assets attributable to contractholders per unit 13.21 12.63
INCOMERealized and change in unrealized gain (loss) on investments and derivatives 36 74INCREASE (DECREASE) IN NET ASSETS ATTRIBUTABLE TO CONTRACTHOLDERS 36 74Increase (decrease) in net assets attributable to contractholders per unit 0.57 1.22
STATEMENT OF CHANGES IN FINANCIAL POSITION STATEMENT OF CASH FLOWS
for the years ended December 312015 2014
$ $
for the years ended December 312015 2014
$ $NET ASSETS ATTRIBUTABLE TO CONTRACTHOLDERS - beginning of year 779 728INCREASE (DECREASE) IN NET ASSETS ATTRIBUTABLE TO CONTRACTHOLDERS 36 74CAPITAL UNIT TRANSACTIONSUnits sold 124 80Units redeemed (110) (103)Net capital unit transactions 14 (23)NET ASSETS ATTRIBUTABLE TO CONTRACTHOLDERS - end of year 829 779
Cash flows from operating activitiesIncrease (decrease) in net assets attributable to contractholders 36 74Adjustments for:Realized and change in unrealized gain (loss) on investments and derivatives (36) (74)Purchase of investments (162) (104)Proceeds from sale and maturity of investments 148 125Net cash from operating activities (14) 21Cash flows used in financing activitiesProceeds from sale of units 124 80Payments for units redeemed (110) (103)Net cash used in financing activities 14 (23)Net increase (decrease) in cash - (2)Cash (bank indebtedness) at beginning of year - 2Cash (bank indebtedness) at end of year - -
SCHEDULE OF PORTFOLIO INVESTMENTS as at December 31, 2015
Units
Average cost
$Fair value
$
Manulife Canadian Equity Capped Index Fund (Manulife Asset Management) 9,379 210 222 Manulife US Equity Index Fund (Manulife Asset Management) 4,589 73 115 Manulife Canadian Bond Index Fund (Manulife Asset Management) 14,040 342 376 Manulife International Equity Index Fund (BlackRock) 5,950 89 116 TOTAL INVESTMENTS, NON-DERIVATIVE FINANCIAL ASSETS 100.00% 714 829 Other assets, less liabilities 0.00% - - NET ASSETS ATTRIBUTABLE TO CONTRACTHOLDERS 100.00% 714 829
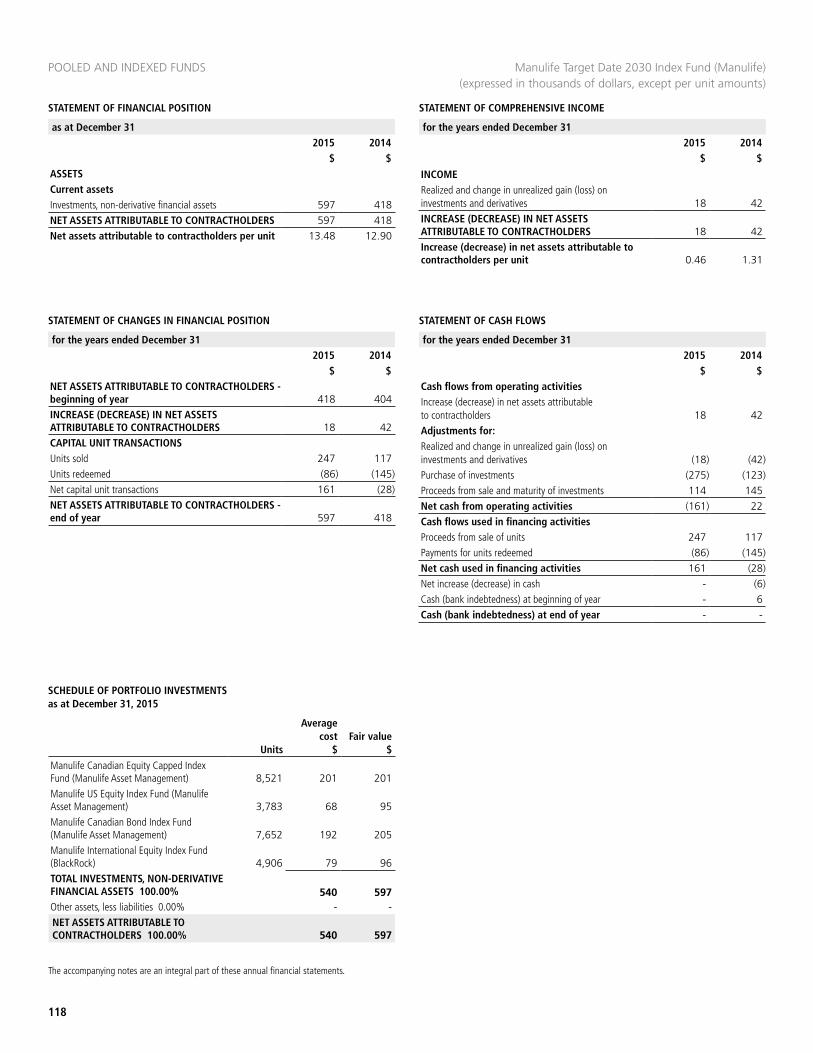
STATEMENT OF FINANCIAL POSITION
POOLED AND INDEXED FUNDS
STATEMENT OF COMPREHENSIVE INCOME
as at December 31 2015 2014
$ $
for the years ended December 312015 2014
$ $
118
The accompanying notes are an integral part of these annual financial statements.
Manulife Target Date 2030 Index Fund (Manulife) (expressed in thousands of dollars, except per unit amounts)
ASSETSCurrent assetsInvestments, non-derivative financial assets 597 418NET ASSETS ATTRIBUTABLE TO CONTRACTHOLDERS 597 418Net assets attributable to contractholders per unit 13.48 12.90
INCOMERealized and change in unrealized gain (loss) on investments and derivatives 18 42INCREASE (DECREASE) IN NET ASSETS ATTRIBUTABLE TO CONTRACTHOLDERS 18 42Increase (decrease) in net assets attributable to contractholders per unit 0.46 1.31
STATEMENT OF CHANGES IN FINANCIAL POSITION STATEMENT OF CASH FLOWS
for the years ended December 312015 2014
$ $
for the years ended December 312015 2014
$ $NET ASSETS ATTRIBUTABLE TO CONTRACTHOLDERS - beginning of year 418 404INCREASE (DECREASE) IN NET ASSETS ATTRIBUTABLE TO CONTRACTHOLDERS 18 42CAPITAL UNIT TRANSACTIONSUnits sold 247 117Units redeemed (86) (145)Net capital unit transactions 161 (28)NET ASSETS ATTRIBUTABLE TO CONTRACTHOLDERS - end of year 597 418
Cash flows from operating activitiesIncrease (decrease) in net assets attributable to contractholders 18 42Adjustments for:Realized and change in unrealized gain (loss) on investments and derivatives (18) (42)Purchase of investments (275) (123)Proceeds from sale and maturity of investments 114 145Net cash from operating activities (161) 22Cash flows used in financing activitiesProceeds from sale of units 247 117Payments for units redeemed (86) (145)Net cash used in financing activities 161 (28)Net increase (decrease) in cash - (6)Cash (bank indebtedness) at beginning of year - 6Cash (bank indebtedness) at end of year - -
SCHEDULE OF PORTFOLIO INVESTMENTS as at December 31, 2015
Units
Average cost
$Fair value
$
Manulife Canadian Equity Capped Index Fund (Manulife Asset Management) 8,521 201 201 Manulife US Equity Index Fund (Manulife Asset Management) 3,783 68 95 Manulife Canadian Bond Index Fund (Manulife Asset Management) 7,652 192 205 Manulife International Equity Index Fund (BlackRock) 4,906 79 96 TOTAL INVESTMENTS, NON-DERIVATIVE FINANCIAL ASSETS 100.00% 540 597 Other assets, less liabilities 0.00% - - NET ASSETS ATTRIBUTABLE TO CONTRACTHOLDERS 100.00% 540 597
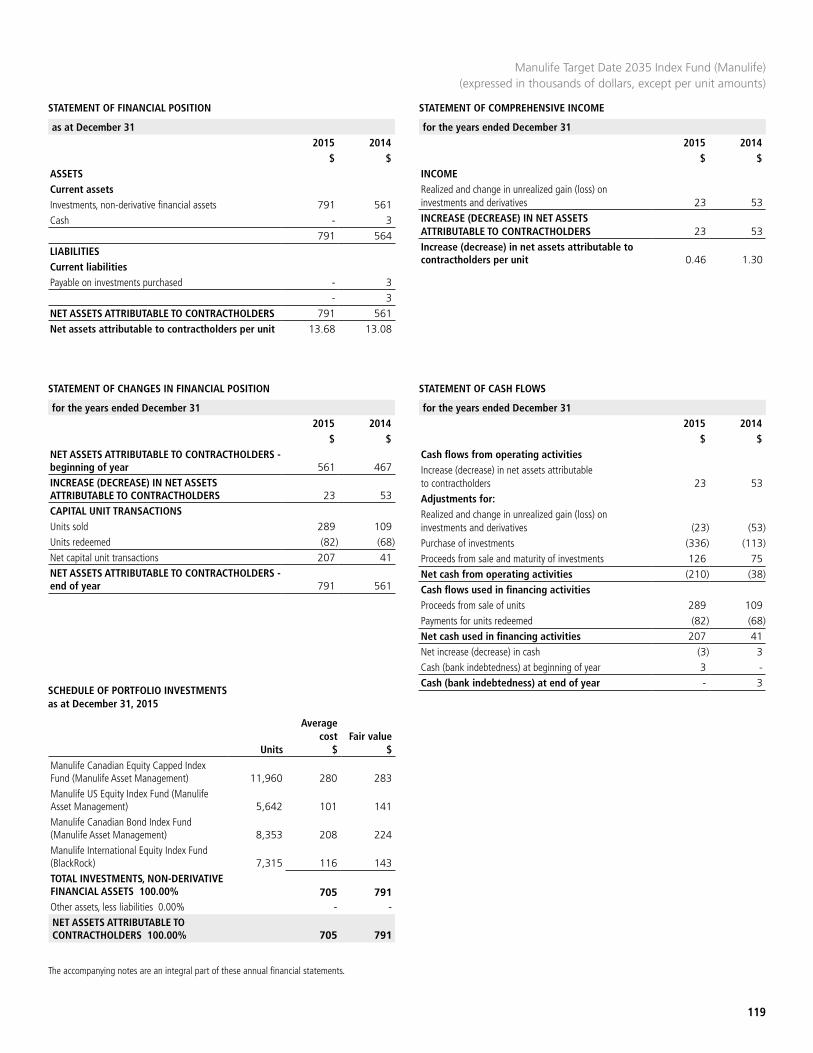
STATEMENT OF FINANCIAL POSITION STATEMENT OF COMPREHENSIVE INCOME
as at December 31 2015 2014
$ $
for the years ended December 312015 2014
$ $
119
The accompanying notes are an integral part of these annual financial statements.
Manulife Target Date 2035 Index Fund (Manulife) (expressed in thousands of dollars, except per unit amounts)
ASSETSCurrent assetsInvestments, non-derivative financial assets 791 561Cash - 3
791 564LIABILITIESCurrent liabilitiesPayable on investments purchased - 3
- 3NET ASSETS ATTRIBUTABLE TO CONTRACTHOLDERS 791 561Net assets attributable to contractholders per unit 13.68 13.08
INCOMERealized and change in unrealized gain (loss) on investments and derivatives 23 53INCREASE (DECREASE) IN NET ASSETS ATTRIBUTABLE TO CONTRACTHOLDERS 23 53Increase (decrease) in net assets attributable to contractholders per unit 0.46 1.30
STATEMENT OF CHANGES IN FINANCIAL POSITION STATEMENT OF CASH FLOWS
for the years ended December 312015 2014
$ $
for the years ended December 312015 2014
$ $NET ASSETS ATTRIBUTABLE TO CONTRACTHOLDERS - beginning of year 561 467INCREASE (DECREASE) IN NET ASSETS ATTRIBUTABLE TO CONTRACTHOLDERS 23 53CAPITAL UNIT TRANSACTIONSUnits sold 289 109Units redeemed (82) (68)Net capital unit transactions 207 41NET ASSETS ATTRIBUTABLE TO CONTRACTHOLDERS - end of year 791 561
Cash flows from operating activitiesIncrease (decrease) in net assets attributable to contractholders 23 53Adjustments for:Realized and change in unrealized gain (loss) on investments and derivatives (23) (53)Purchase of investments (336) (113)Proceeds from sale and maturity of investments 126 75Net cash from operating activities (210) (38)Cash flows used in financing activitiesProceeds from sale of units 289 109Payments for units redeemed (82) (68)Net cash used in financing activities 207 41Net increase (decrease) in cash (3) 3Cash (bank indebtedness) at beginning of year 3 -Cash (bank indebtedness) at end of year - 3
SCHEDULE OF PORTFOLIO INVESTMENTS as at December 31, 2015
Units
Average cost
$Fair value
$
Manulife Canadian Equity Capped Index Fund (Manulife Asset Management) 11,960 280 283 Manulife US Equity Index Fund (Manulife Asset Management) 5,642 101 141 Manulife Canadian Bond Index Fund (Manulife Asset Management) 8,353 208 224 Manulife International Equity Index Fund (BlackRock) 7,315 116 143 TOTAL INVESTMENTS, NON-DERIVATIVE FINANCIAL ASSETS 100.00% 705 791 Other assets, less liabilities 0.00% - - NET ASSETS ATTRIBUTABLE TO CONTRACTHOLDERS 100.00% 705 791
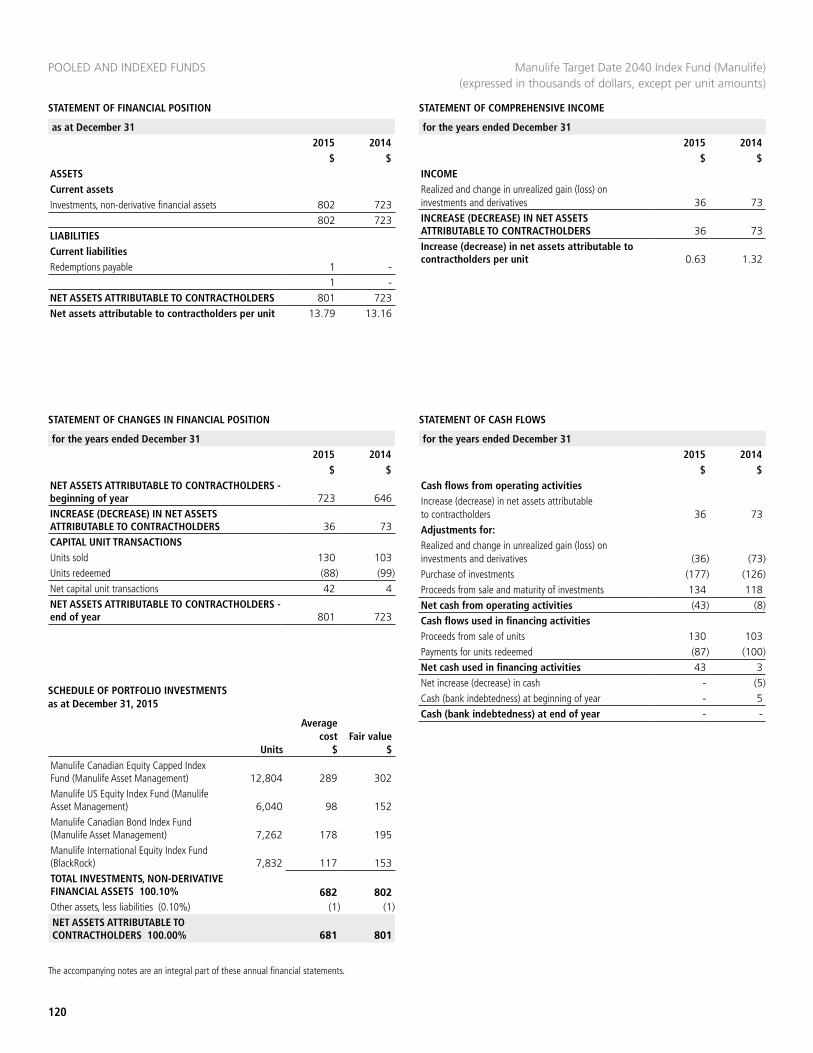
STATEMENT OF FINANCIAL POSITION
POOLED AND INDEXED FUNDS
STATEMENT OF COMPREHENSIVE INCOME
as at December 31 2015 2014
$ $
for the years ended December 312015 2014
$ $
120
The accompanying notes are an integral part of these annual financial statements.
Manulife Target Date 2040 Index Fund (Manulife) (expressed in thousands of dollars, except per unit amounts)
ASSETSCurrent assetsInvestments, non-derivative financial assets 802 723
802 723LIABILITIESCurrent liabilitiesRedemptions payable 1 -
1 -NET ASSETS ATTRIBUTABLE TO CONTRACTHOLDERS 801 723Net assets attributable to contractholders per unit 13.79 13.16
INCOMERealized and change in unrealized gain (loss) on investments and derivatives 36 73INCREASE (DECREASE) IN NET ASSETS ATTRIBUTABLE TO CONTRACTHOLDERS 36 73Increase (decrease) in net assets attributable to contractholders per unit 0.63 1.32
STATEMENT OF CHANGES IN FINANCIAL POSITION STATEMENT OF CASH FLOWS
for the years ended December 312015 2014
$ $
for the years ended December 312015 2014
$ $NET ASSETS ATTRIBUTABLE TO CONTRACTHOLDERS - beginning of year 723 646INCREASE (DECREASE) IN NET ASSETS ATTRIBUTABLE TO CONTRACTHOLDERS 36 73CAPITAL UNIT TRANSACTIONSUnits sold 130 103Units redeemed (88) (99)Net capital unit transactions 42 4NET ASSETS ATTRIBUTABLE TO CONTRACTHOLDERS - end of year 801 723
Cash flows from operating activitiesIncrease (decrease) in net assets attributable to contractholders 36 73Adjustments for:Realized and change in unrealized gain (loss) on investments and derivatives (36) (73)Purchase of investments (177) (126)Proceeds from sale and maturity of investments 134 118Net cash from operating activities (43) (8)Cash flows used in financing activitiesProceeds from sale of units 130 103Payments for units redeemed (87) (100)Net cash used in financing activities 43 3Net increase (decrease) in cash - (5)Cash (bank indebtedness) at beginning of year - 5Cash (bank indebtedness) at end of year - -
SCHEDULE OF PORTFOLIO INVESTMENTS as at December 31, 2015
Units
Average cost
$Fair value
$
Manulife Canadian Equity Capped Index Fund (Manulife Asset Management) 12,804 289 302 Manulife US Equity Index Fund (Manulife Asset Management) 6,040 98 152 Manulife Canadian Bond Index Fund (Manulife Asset Management) 7,262 178 195 Manulife International Equity Index Fund (BlackRock) 7,832 117 153 TOTAL INVESTMENTS, NON-DERIVATIVE FINANCIAL ASSETS 100.10% 682 802 Other assets, less liabilities (0.10%) (1) (1)NET ASSETS ATTRIBUTABLE TO CONTRACTHOLDERS 100.00% 681 801
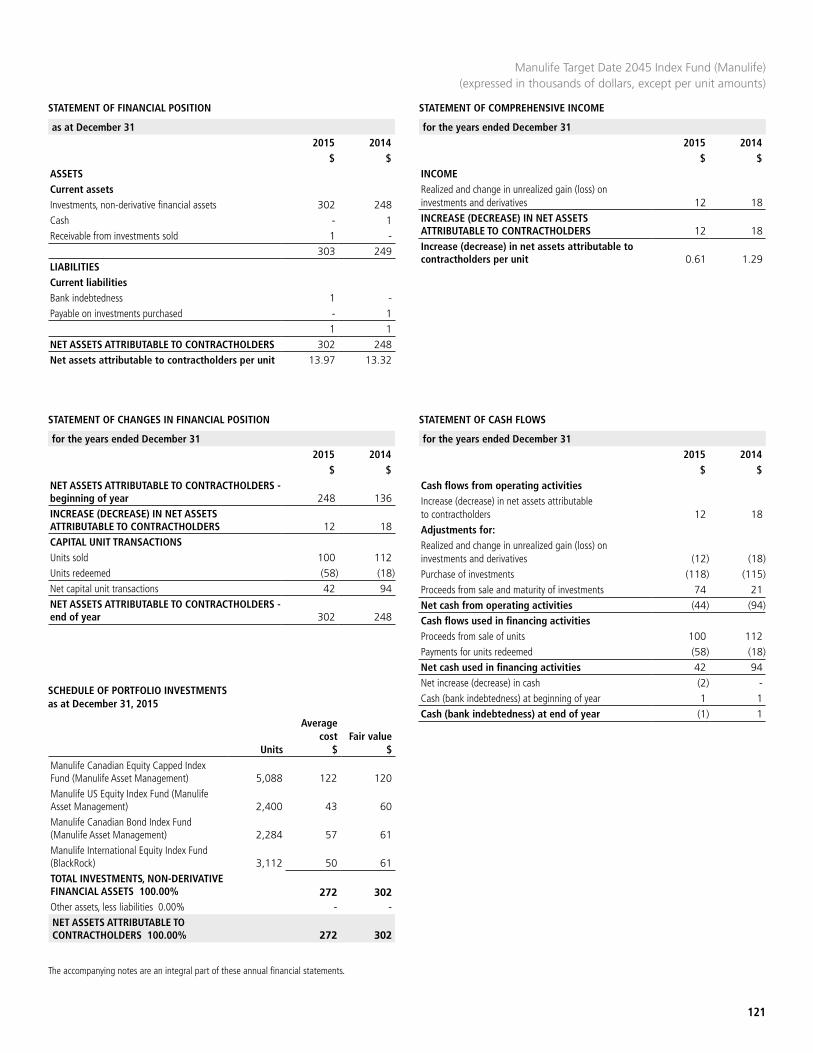
STATEMENT OF FINANCIAL POSITION STATEMENT OF COMPREHENSIVE INCOME
as at December 31 2015 2014
$ $
for the years ended December 312015 2014
$ $
121
The accompanying notes are an integral part of these annual financial statements.
Manulife Target Date 2045 Index Fund (Manulife) (expressed in thousands of dollars, except per unit amounts)
ASSETSCurrent assetsInvestments, non-derivative financial assets 302 248Cash - 1Receivable from investments sold 1 -
303 249LIABILITIESCurrent liabilitiesBank indebtedness 1 -Payable on investments purchased - 1
1 1NET ASSETS ATTRIBUTABLE TO CONTRACTHOLDERS 302 248Net assets attributable to contractholders per unit 13.97 13.32
INCOMERealized and change in unrealized gain (loss) on investments and derivatives 12 18INCREASE (DECREASE) IN NET ASSETS ATTRIBUTABLE TO CONTRACTHOLDERS 12 18Increase (decrease) in net assets attributable to contractholders per unit 0.61 1.29
STATEMENT OF CHANGES IN FINANCIAL POSITION STATEMENT OF CASH FLOWS
for the years ended December 312015 2014
$ $
for the years ended December 312015 2014
$ $NET ASSETS ATTRIBUTABLE TO CONTRACTHOLDERS - beginning of year 248 136INCREASE (DECREASE) IN NET ASSETS ATTRIBUTABLE TO CONTRACTHOLDERS 12 18CAPITAL UNIT TRANSACTIONSUnits sold 100 112Units redeemed (58) (18)Net capital unit transactions 42 94NET ASSETS ATTRIBUTABLE TO CONTRACTHOLDERS - end of year 302 248
Cash flows from operating activitiesIncrease (decrease) in net assets attributable to contractholders 12 18Adjustments for:Realized and change in unrealized gain (loss) on investments and derivatives (12) (18)Purchase of investments (118) (115)Proceeds from sale and maturity of investments 74 21Net cash from operating activities (44) (94)Cash flows used in financing activitiesProceeds from sale of units 100 112Payments for units redeemed (58) (18)Net cash used in financing activities 42 94Net increase (decrease) in cash (2) -Cash (bank indebtedness) at beginning of year 1 1Cash (bank indebtedness) at end of year (1) 1
SCHEDULE OF PORTFOLIO INVESTMENTS as at December 31, 2015
Units
Average cost
$Fair value
$
Manulife Canadian Equity Capped Index Fund (Manulife Asset Management) 5,088 122 120 Manulife US Equity Index Fund (Manulife Asset Management) 2,400 43 60 Manulife Canadian Bond Index Fund (Manulife Asset Management) 2,284 57 61 Manulife International Equity Index Fund (BlackRock) 3,112 50 61 TOTAL INVESTMENTS, NON-DERIVATIVE FINANCIAL ASSETS 100.00% 272 302 Other assets, less liabilities 0.00% - - NET ASSETS ATTRIBUTABLE TO CONTRACTHOLDERS 100.00% 272 302
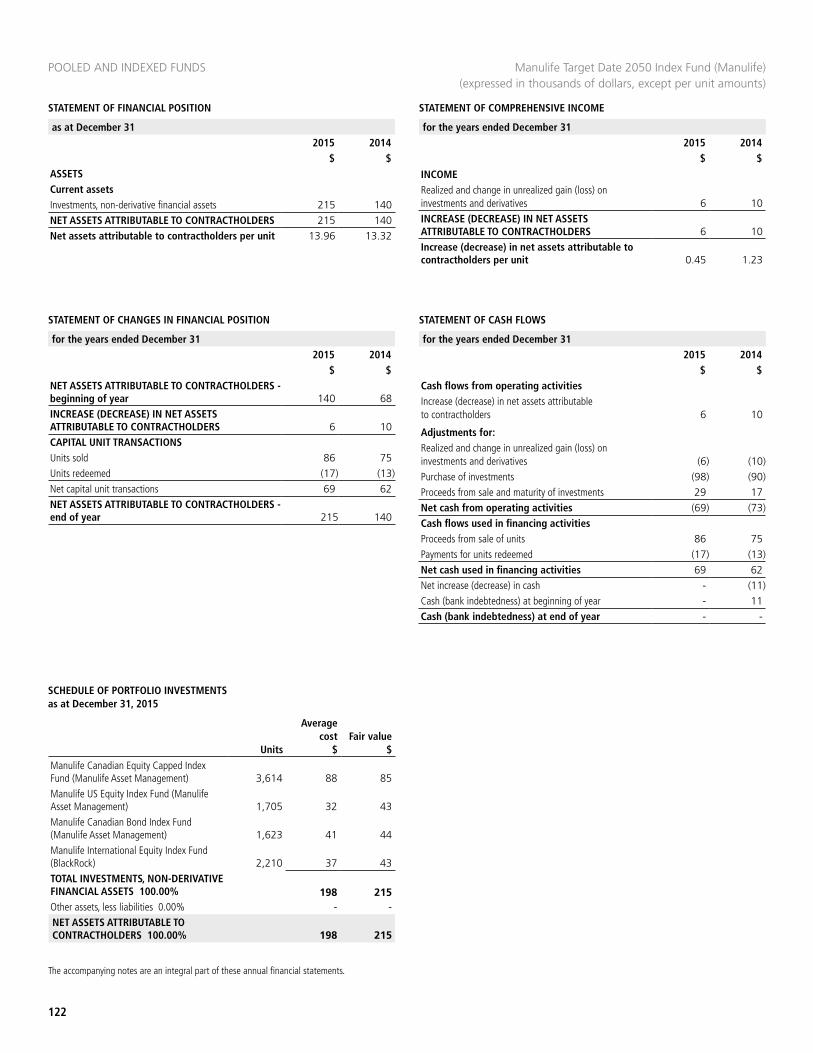
STATEMENT OF FINANCIAL POSITION
POOLED AND INDEXED FUNDS
STATEMENT OF COMPREHENSIVE INCOME
as at December 31 2015 2014
$ $
for the years ended December 312015 2014
$ $
122
The accompanying notes are an integral part of these annual financial statements.
Manulife Target Date 2050 Index Fund (Manulife) (expressed in thousands of dollars, except per unit amounts)
ASSETSCurrent assetsInvestments, non-derivative financial assets 215 140NET ASSETS ATTRIBUTABLE TO CONTRACTHOLDERS 215 140Net assets attributable to contractholders per unit 13.96 13.32
INCOMERealized and change in unrealized gain (loss) on investments and derivatives 6 10INCREASE (DECREASE) IN NET ASSETS ATTRIBUTABLE TO CONTRACTHOLDERS 6 10Increase (decrease) in net assets attributable to contractholders per unit 0.45 1.23
STATEMENT OF CHANGES IN FINANCIAL POSITION STATEMENT OF CASH FLOWS
for the years ended December 312015 2014
$ $
for the years ended December 312015 2014
$ $NET ASSETS ATTRIBUTABLE TO CONTRACTHOLDERS - beginning of year 140 68INCREASE (DECREASE) IN NET ASSETS ATTRIBUTABLE TO CONTRACTHOLDERS 6 10CAPITAL UNIT TRANSACTIONSUnits sold 86 75Units redeemed (17) (13)Net capital unit transactions 69 62NET ASSETS ATTRIBUTABLE TO CONTRACTHOLDERS - end of year 215 140
Cash flows from operating activitiesIncrease (decrease) in net assets attributable to contractholders 6 10
Adjustments for:Realized and change in unrealized gain (loss) on investments and derivatives (6) (10)Purchase of investments (98) (90)Proceeds from sale and maturity of investments 29 17Net cash from operating activities (69) (73)Cash flows used in financing activitiesProceeds from sale of units 86 75Payments for units redeemed (17) (13)Net cash used in financing activities 69 62Net increase (decrease) in cash - (11)Cash (bank indebtedness) at beginning of year - 11Cash (bank indebtedness) at end of year - -
SCHEDULE OF PORTFOLIO INVESTMENTS as at December 31, 2015
Units
Average cost
$Fair value
$
Manulife Canadian Equity Capped Index Fund (Manulife Asset Management) 3,614 88 85 Manulife US Equity Index Fund (Manulife Asset Management) 1,705 32 43 Manulife Canadian Bond Index Fund (Manulife Asset Management) 1,623 41 44 Manulife International Equity Index Fund (BlackRock) 2,210 37 43 TOTAL INVESTMENTS, NON-DERIVATIVE FINANCIAL ASSETS 100.00% 198 215 Other assets, less liabilities 0.00% - - NET ASSETS ATTRIBUTABLE TO CONTRACTHOLDERS 100.00% 198 215
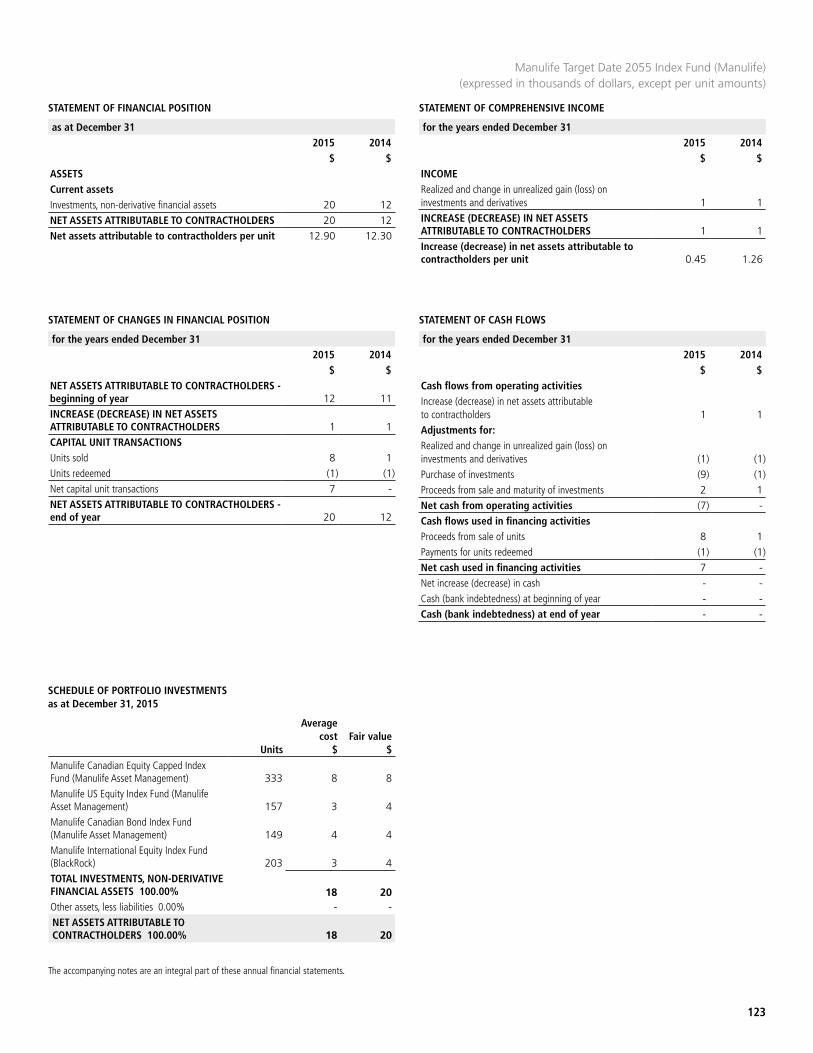
STATEMENT OF FINANCIAL POSITION STATEMENT OF COMPREHENSIVE INCOME
as at December 31 2015 2014
$ $
for the years ended December 312015 2014
$ $
123
The accompanying notes are an integral part of these annual financial statements.
Manulife Target Date 2055 Index Fund (Manulife) (expressed in thousands of dollars, except per unit amounts)
ASSETSCurrent assetsInvestments, non-derivative financial assets 20 12NET ASSETS ATTRIBUTABLE TO CONTRACTHOLDERS 20 12Net assets attributable to contractholders per unit 12.90 12.30
INCOMERealized and change in unrealized gain (loss) on investments and derivatives 1 1INCREASE (DECREASE) IN NET ASSETS ATTRIBUTABLE TO CONTRACTHOLDERS 1 1Increase (decrease) in net assets attributable to contractholders per unit 0.45 1.26
STATEMENT OF CHANGES IN FINANCIAL POSITION STATEMENT OF CASH FLOWS
for the years ended December 312015 2014
$ $
for the years ended December 312015 2014
$ $NET ASSETS ATTRIBUTABLE TO CONTRACTHOLDERS - beginning of year 12 11INCREASE (DECREASE) IN NET ASSETS ATTRIBUTABLE TO CONTRACTHOLDERS 1 1CAPITAL UNIT TRANSACTIONSUnits sold 8 1Units redeemed (1) (1)Net capital unit transactions 7 -NET ASSETS ATTRIBUTABLE TO CONTRACTHOLDERS - end of year 20 12
Cash flows from operating activitiesIncrease (decrease) in net assets attributable to contractholders 1 1Adjustments for:Realized and change in unrealized gain (loss) on investments and derivatives (1) (1)Purchase of investments (9) (1)Proceeds from sale and maturity of investments 2 1Net cash from operating activities (7) -Cash flows used in financing activitiesProceeds from sale of units 8 1Payments for units redeemed (1) (1)Net cash used in financing activities 7 -Net increase (decrease) in cash - -Cash (bank indebtedness) at beginning of year - -Cash (bank indebtedness) at end of year - -
SCHEDULE OF PORTFOLIO INVESTMENTS as at December 31, 2015
Units
Average cost
$Fair value
$
Manulife Canadian Equity Capped Index Fund (Manulife Asset Management) 333 8 8 Manulife US Equity Index Fund (Manulife Asset Management) 157 3 4 Manulife Canadian Bond Index Fund (Manulife Asset Management) 149 4 4 Manulife International Equity Index Fund (BlackRock) 203 3 4 TOTAL INVESTMENTS, NON-DERIVATIVE FINANCIAL ASSETS 100.00% 18 20 Other assets, less liabilities 0.00% - - NET ASSETS ATTRIBUTABLE TO CONTRACTHOLDERS 100.00% 18 20

STATEMENT OF FINANCIAL POSITION
POOLED AND INDEXED FUNDS
STATEMENT OF COMPREHENSIVE INCOME
as at December 31 2015 2014
$ $
for the years ended December 312015 2014
$ $
124
The accompanying notes are an integral part of these annual financial statements.
Manulife Retirement Index Fund (Manulife) (expressed in thousands of dollars, except per unit amounts)
ASSETSCurrent assetsInvestments, non-derivative financial assets 629 219Receivable from investments sold 2 -
631 219LIABILITIESCurrent liabilitiesBank indebtedness 2 -
2 -NET ASSETS ATTRIBUTABLE TO CONTRACTHOLDERS 629 219Net assets attributable to contractholders per unit 12.09 11.63
INCOMERealized and change in unrealized gain (loss) on investments and derivatives 8 19INCREASE (DECREASE) IN NET ASSETS ATTRIBUTABLE TO CONTRACTHOLDERS 8 19Increase (decrease) in net assets attributable to contractholders per unit 0.13 1.05
STATEMENT OF CHANGES IN FINANCIAL POSITION STATEMENT OF CASH FLOWS
for the years ended December 312015 2014
$ $
for the years ended December 312015 2014
$ $NET ASSETS ATTRIBUTABLE TO CONTRACTHOLDERS - beginning of year 219 212INCREASE (DECREASE) IN NET ASSETS ATTRIBUTABLE TO CONTRACTHOLDERS 8 19CAPITAL UNIT TRANSACTIONSUnits sold 717 58Units redeemed (315) (70)Net capital unit transactions 402 (12)NET ASSETS ATTRIBUTABLE TO CONTRACTHOLDERS - end of year 629 219
Cash flows from operating activitiesIncrease (decrease) in net assets attributable to contractholders 8 19Adjustments for:Realized and change in unrealized gain (loss) on investments and derivatives (8) (19)Purchase of investments (742) (26)Proceeds from sale and maturity of investments 338 38Net cash from operating activities (404) 12Cash flows used in financing activitiesProceeds from sale of units 717 58Payments for units redeemed (315) (70)Net cash used in financing activities 402 (12)Net increase (decrease) in cash (2) -Cash (bank indebtedness) at beginning of year - -Cash (bank indebtedness) at end of year (2) -
SCHEDULE OF PORTFOLIO INVESTMENTS as at December 31, 2015
Units
Average cost
$Fair value
$
Manulife Canadian Equity Capped Index Fund (Manulife Asset Management) 4,201 105 99 Manulife US Equity Index Fund (Manulife Asset Management) 1,734 35 44 Manulife Canadian Bond Index Fund (Manulife Asset Management) 16,511 432 442 Manulife International Equity Index Fund (BlackRock) 2,249 38 44 TOTAL INVESTMENTS, NON-DERIVATIVE FINANCIAL ASSETS 100.00% 610 629 Other assets, less liabilities 0.00% - - NET ASSETS ATTRIBUTABLE TO CONTRACTHOLDERS 100.00% 610 629
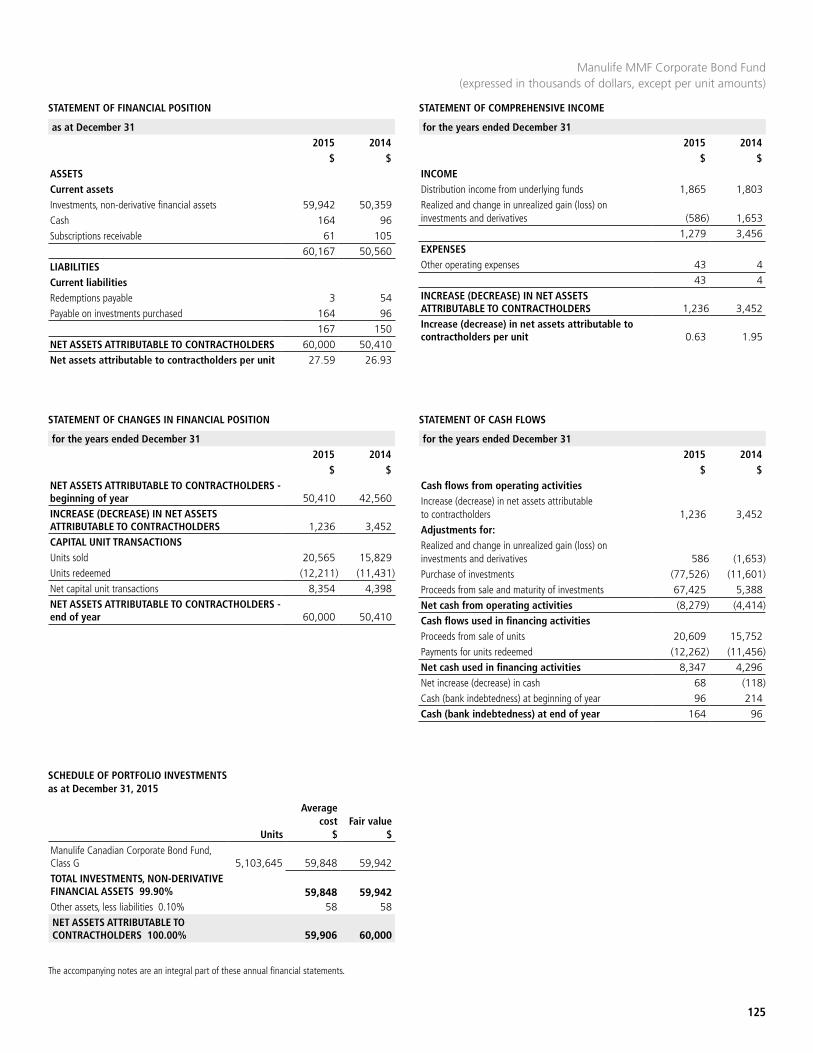
STATEMENT OF FINANCIAL POSITION STATEMENT OF COMPREHENSIVE INCOME
as at December 31 2015 2014
$ $
for the years ended December 312015 2014
$ $
125
The accompanying notes are an integral part of these annual financial statements.
Manulife MMF Corporate Bond Fund (expressed in thousands of dollars, except per unit amounts)
ASSETSCurrent assetsInvestments, non-derivative financial assets 59,942 50,359Cash 164 96Subscriptions receivable 61 105
60,167 50,560LIABILITIESCurrent liabilitiesRedemptions payable 3 54Payable on investments purchased 164 96
167 150NET ASSETS ATTRIBUTABLE TO CONTRACTHOLDERS 60,000 50,410Net assets attributable to contractholders per unit 27.59 26.93
INCOMEDistribution income from underlying funds 1,865 1,803Realized and change in unrealized gain (loss) on investments and derivatives (586) 1,653
1,279 3,456EXPENSESOther operating expenses 43 4
43 4INCREASE (DECREASE) IN NET ASSETS ATTRIBUTABLE TO CONTRACTHOLDERS 1,236 3,452Increase (decrease) in net assets attributable to contractholders per unit 0.63 1.95
STATEMENT OF CHANGES IN FINANCIAL POSITION STATEMENT OF CASH FLOWS
for the years ended December 312015 2014
$ $
for the years ended December 312015 2014
$ $NET ASSETS ATTRIBUTABLE TO CONTRACTHOLDERS - beginning of year 50,410 42,560INCREASE (DECREASE) IN NET ASSETS ATTRIBUTABLE TO CONTRACTHOLDERS 1,236 3,452CAPITAL UNIT TRANSACTIONSUnits sold 20,565 15,829Units redeemed (12,211) (11,431)Net capital unit transactions 8,354 4,398NET ASSETS ATTRIBUTABLE TO CONTRACTHOLDERS - end of year 60,000 50,410
Cash flows from operating activitiesIncrease (decrease) in net assets attributable to contractholders 1,236 3,452Adjustments for:Realized and change in unrealized gain (loss) on investments and derivatives 586 (1,653)Purchase of investments (77,526) (11,601)Proceeds from sale and maturity of investments 67,425 5,388Net cash from operating activities (8,279) (4,414)Cash flows used in financing activitiesProceeds from sale of units 20,609 15,752Payments for units redeemed (12,262) (11,456)Net cash used in financing activities 8,347 4,296Net increase (decrease) in cash 68 (118)Cash (bank indebtedness) at beginning of year 96 214Cash (bank indebtedness) at end of year 164 96
SCHEDULE OF PORTFOLIO INVESTMENTS as at December 31, 2015
Units
Average cost
$Fair value
$
Manulife Canadian Corporate Bond Fund, Class G 5,103,645 59,848 59,942 TOTAL INVESTMENTS, NON-DERIVATIVE FINANCIAL ASSETS 99.90% 59,848 59,942 Other assets, less liabilities 0.10% 58 58 NET ASSETS ATTRIBUTABLE TO CONTRACTHOLDERS 100.00% 59,906 60,000

STATEMENT OF FINANCIAL POSITION
POOLED AND INDEXED FUNDS
STATEMENT OF COMPREHENSIVE INCOME
as at December 31 2015 2014
$ $
for the years ended December 312015 2014
$ $
126
The accompanying notes are an integral part of these annual financial statements.
Manulife MMF Monthly Income Fund (expressed in thousands of dollars, except per unit amounts)
ASSETSCurrent assetsInvestments, non-derivative financial assets 7,700 6,083Subscriptions receivable 267 -Receivable from investments sold 4 -
7,971 6,083LIABILITIESCurrent liabilitiesBank indebtedness 4 -
4 -NET ASSETS ATTRIBUTABLE TO CONTRACTHOLDERS 7,967 6,083Net assets attributable to contractholders per unit 13.70 13.40
INCOMEDistribution income from underlying funds 274 277Realized and change in unrealized gain (loss) on investments and derivatives (114) 247
160 524EXPENSESOther operating expenses 12 22
12 22INCREASE (DECREASE) IN NET ASSETS ATTRIBUTABLE TO CONTRACTHOLDERS 148 502Increase (decrease) in net assets attributable to contractholders per unit 0.27 1.21
STATEMENT OF CHANGES IN FINANCIAL POSITION STATEMENT OF CASH FLOWS
for the years ended December 312015 2014
$ $
for the years ended December 312015 2014
$ $NET ASSETS ATTRIBUTABLE TO CONTRACTHOLDERS - beginning of year 6,083 4,217INCREASE (DECREASE) IN NET ASSETS ATTRIBUTABLE TO CONTRACTHOLDERS 148 502CAPITAL UNIT TRANSACTIONSUnits sold 4,267 3,138Units redeemed (2,531) (1,774)Net capital unit transactions 1,736 1,364NET ASSETS ATTRIBUTABLE TO CONTRACTHOLDERS - end of year 7,967 6,083
Cash flows from operating activitiesIncrease (decrease) in net assets attributable to contractholders 148 502Adjustments for:Realized and change in unrealized gain (loss) on investments and derivatives 114 (247)Purchase of investments (10,487) (2,636)Proceeds from sale and maturity of investments 8,752 1,038Net cash from operating activities (1,473) (1,343)Cash flows used in financing activitiesProceeds from sale of units 4,000 3,138Payments for units redeemed (2,531) (1,795)Net cash used in financing activities 1,469 1,343Net increase (decrease) in cash (4) -Cash (bank indebtedness) at beginning of year - -Cash (bank indebtedness) at end of year (4) -
SCHEDULE OF PORTFOLIO INVESTMENTS as at December 31, 2015
Units
Average cost
$Fair value
$
Manulife Canadian Monthly Income Fund, Class G 802,061 8,013 7,700 TOTAL INVESTMENTS, NON-DERIVATIVE FINANCIAL ASSETS 96.65% 8,013 7,700 Other assets, less liabilities 3.35% 267 267 NET ASSETS ATTRIBUTABLE TO CONTRACTHOLDERS 100.00% 8,280 7,967
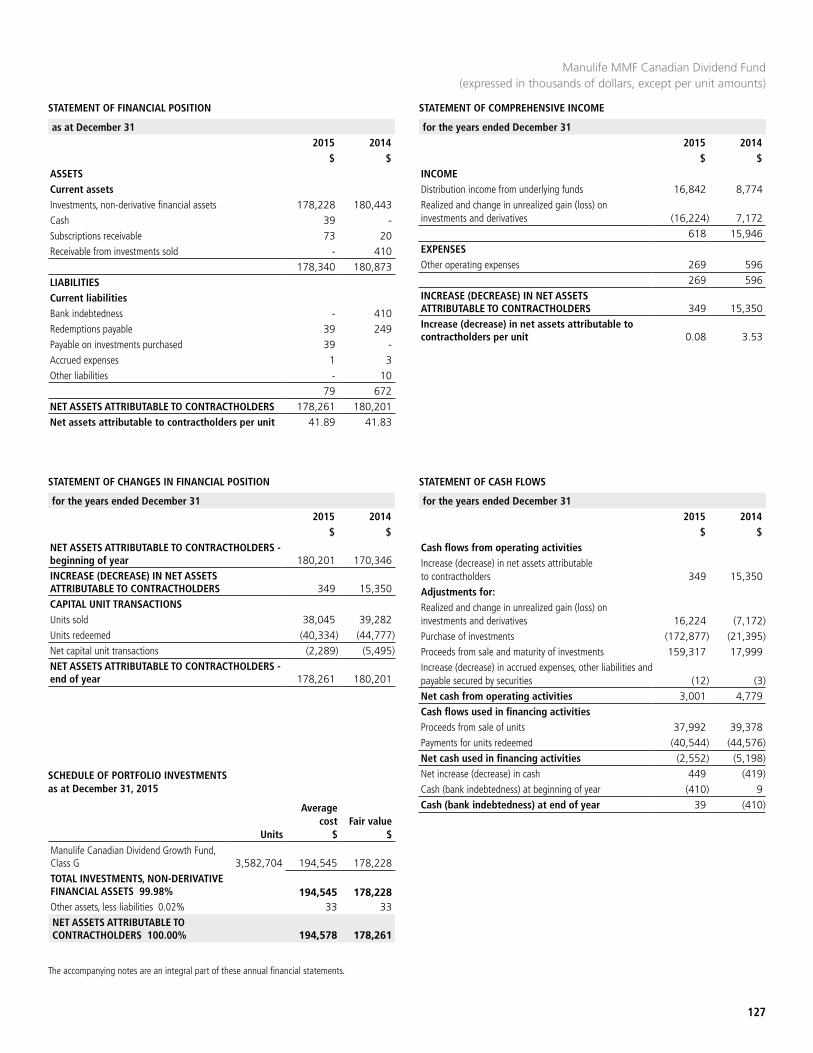
STATEMENT OF FINANCIAL POSITION STATEMENT OF COMPREHENSIVE INCOME
as at December 31 2015 2014
$ $
for the years ended December 312015 2014
$ $
127
The accompanying notes are an integral part of these annual financial statements.
Manulife MMF Canadian Dividend Fund (expressed in thousands of dollars, except per unit amounts)
ASSETSCurrent assetsInvestments, non-derivative financial assets 178,228 180,443Cash 39 -Subscriptions receivable 73 20Receivable from investments sold - 410
178,340 180,873LIABILITIESCurrent liabilitiesBank indebtedness - 410Redemptions payable 39 249Payable on investments purchased 39 -Accrued expenses 1 3Other liabilities - 10
79 672NET ASSETS ATTRIBUTABLE TO CONTRACTHOLDERS 178,261 180,201Net assets attributable to contractholders per unit 41.89 41.83
INCOMEDistribution income from underlying funds 16,842 8,774Realized and change in unrealized gain (loss) on investments and derivatives (16,224) 7,172
618 15,946EXPENSESOther operating expenses 269 596
269 596INCREASE (DECREASE) IN NET ASSETS ATTRIBUTABLE TO CONTRACTHOLDERS 349 15,350Increase (decrease) in net assets attributable to contractholders per unit 0.08 3.53
STATEMENT OF CHANGES IN FINANCIAL POSITION STATEMENT OF CASH FLOWS
for the years ended December 312015 2014
$ $
for the years ended December 312015 2014
$ $NET ASSETS ATTRIBUTABLE TO CONTRACTHOLDERS - beginning of year 180,201 170,346INCREASE (DECREASE) IN NET ASSETS ATTRIBUTABLE TO CONTRACTHOLDERS 349 15,350CAPITAL UNIT TRANSACTIONSUnits sold 38,045 39,282Units redeemed (40,334) (44,777)Net capital unit transactions (2,289) (5,495)NET ASSETS ATTRIBUTABLE TO CONTRACTHOLDERS - end of year 178,261 180,201
Cash flows from operating activitiesIncrease (decrease) in net assets attributable to contractholders 349 15,350Adjustments for:Realized and change in unrealized gain (loss) on investments and derivatives 16,224 (7,172)Purchase of investments (172,877) (21,395)Proceeds from sale and maturity of investments 159,317 17,999Increase (decrease) in accrued expenses, other liabilities and payable secured by securities (12) (3)Net cash from operating activities 3,001 4,779Cash flows used in financing activitiesProceeds from sale of units 37,992 39,378Payments for units redeemed (40,544) (44,576)Net cash used in financing activities (2,552) (5,198)Net increase (decrease) in cash 449 (419)Cash (bank indebtedness) at beginning of year (410) 9Cash (bank indebtedness) at end of year 39 (410)
SCHEDULE OF PORTFOLIO INVESTMENTS as at December 31, 2015
Units
Average cost
$Fair value
$
Manulife Canadian Dividend Growth Fund, Class G 3,582,704 194,545 178,228 TOTAL INVESTMENTS, NON-DERIVATIVE FINANCIAL ASSETS 99.98% 194,545 178,228 Other assets, less liabilities 0.02% 33 33 NET ASSETS ATTRIBUTABLE TO CONTRACTHOLDERS 100.00% 194,578 178,261

STATEMENT OF FINANCIAL POSITION
POOLED AND INDEXED FUNDS
STATEMENT OF COMPREHENSIVE INCOME
as at December 31 2015 2014
$ $
for the years ended December 312015 2014
$ $
128
The accompanying notes are an integral part of these annual financial statements.
Manulife MMF Global Dividend Fund (SLI) (expressed in thousands of dollars, except per unit amounts)
ASSETSCurrent assetsInvestments, non-derivative financial assets 23,381 19,395Cash 14 -Subscriptions receivable 7 79Receivable from investments sold - 1
23,402 19,475LIABILITIESCurrent liabilitiesBank indebtedness - 1Redemptions payable 1 83Payable on investments purchased 14 -
15 84NET ASSETS ATTRIBUTABLE TO CONTRACTHOLDERS 23,387 19,391Net assets attributable to contractholders per unit 17.04 13.68
INCOMEDistribution income from underlying funds 698 422Realized and change in unrealized gain (loss) on investments and derivatives 4,146 653
4,844 1,075EXPENSESOther operating expenses 23 21
23 21INCREASE (DECREASE) IN NET ASSETS ATTRIBUTABLE TO CONTRACTHOLDERS 4,821 1,054Increase (decrease) in net assets attributable to contractholders per unit 3.48 1.03
STATEMENT OF CHANGES IN FINANCIAL POSITION STATEMENT OF CASH FLOWS
for the years ended December 312015 2014
$ $
for the years ended December 312015 2014
$ $NET ASSETS ATTRIBUTABLE TO CONTRACTHOLDERS - beginning of year 19,391 9,801INCREASE (DECREASE) IN NET ASSETS ATTRIBUTABLE TO CONTRACTHOLDERS 4,821 1,054CAPITAL UNIT TRANSACTIONSUnits sold 8,641 11,997Units redeemed (9,466) (3,461)Net capital unit transactions (825) 8,536NET ASSETS ATTRIBUTABLE TO CONTRACTHOLDERS - end of year 23,387 19,391
Cash flows from operating activitiesIncrease (decrease) in net assets attributable to contractholders 4,821 1,054Adjustments for:Realized and change in unrealized gain (loss) on investments and derivatives (4,146) (653)Purchase of investments (24,005) (10,589)Proceeds from sale and maturity of investments 24,180 1,651Increase (decrease) in accrued expenses, other liabilities and payable secured by securities - (1)Net cash from operating activities 850 (8,538)Cash flows used in financing activitiesProceeds from sale of units 8,713 11,929Payments for units redeemed (9,548) (3,401)Net cash used in financing activities (835) 8,528Net increase (decrease) in cash 15 (10)Cash (bank indebtedness) at beginning of year (1) 9Cash (bank indebtedness) at end of year 14 (1)SCHEDULE OF PORTFOLIO INVESTMENTS
as at December 31, 2015
Units
Average cost
$Fair value
$
Manulife Global Dividend Growth Fund, Class G 1,325,702 22,375 23,381 TOTAL INVESTMENTS, NON-DERIVATIVE FINANCIAL ASSETS 99.97% 22,375 23,381 Other assets, less liabilities 0.03% 6 6 NET ASSETS ATTRIBUTABLE TO CONTRACTHOLDERS 100.00% 22,381 23,387
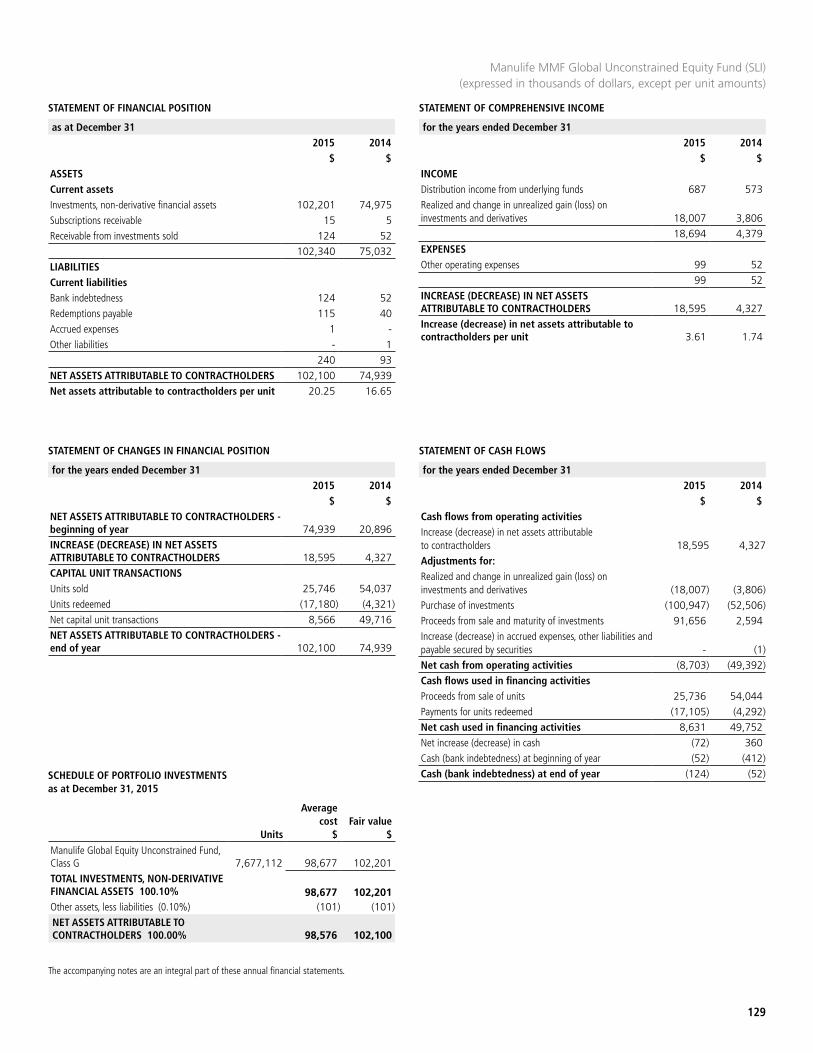
STATEMENT OF FINANCIAL POSITION STATEMENT OF COMPREHENSIVE INCOME
as at December 31 2015 2014
$ $
for the years ended December 312015 2014
$ $
129
The accompanying notes are an integral part of these annual financial statements.
Manulife MMF Global Unconstrained Equity Fund (SLI) (expressed in thousands of dollars, except per unit amounts)
ASSETSCurrent assetsInvestments, non-derivative financial assets 102,201 74,975Subscriptions receivable 15 5Receivable from investments sold 124 52
102,340 75,032LIABILITIESCurrent liabilitiesBank indebtedness 124 52Redemptions payable 115 40Accrued expenses 1 -Other liabilities - 1
240 93NET ASSETS ATTRIBUTABLE TO CONTRACTHOLDERS 102,100 74,939Net assets attributable to contractholders per unit 20.25 16.65
INCOMEDistribution income from underlying funds 687 573Realized and change in unrealized gain (loss) on investments and derivatives 18,007 3,806
18,694 4,379EXPENSESOther operating expenses 99 52
99 52INCREASE (DECREASE) IN NET ASSETS ATTRIBUTABLE TO CONTRACTHOLDERS 18,595 4,327Increase (decrease) in net assets attributable to contractholders per unit 3.61 1.74
STATEMENT OF CHANGES IN FINANCIAL POSITION STATEMENT OF CASH FLOWS
for the years ended December 312015 2014
$ $
for the years ended December 312015 2014
$ $NET ASSETS ATTRIBUTABLE TO CONTRACTHOLDERS - beginning of year 74,939 20,896INCREASE (DECREASE) IN NET ASSETS ATTRIBUTABLE TO CONTRACTHOLDERS 18,595 4,327CAPITAL UNIT TRANSACTIONSUnits sold 25,746 54,037Units redeemed (17,180) (4,321)Net capital unit transactions 8,566 49,716NET ASSETS ATTRIBUTABLE TO CONTRACTHOLDERS - end of year 102,100 74,939
Cash flows from operating activitiesIncrease (decrease) in net assets attributable to contractholders 18,595 4,327Adjustments for:Realized and change in unrealized gain (loss) on investments and derivatives (18,007) (3,806)Purchase of investments (100,947) (52,506)Proceeds from sale and maturity of investments 91,656 2,594Increase (decrease) in accrued expenses, other liabilities and payable secured by securities - (1)Net cash from operating activities (8,703) (49,392)Cash flows used in financing activitiesProceeds from sale of units 25,736 54,044Payments for units redeemed (17,105) (4,292)Net cash used in financing activities 8,631 49,752Net increase (decrease) in cash (72) 360Cash (bank indebtedness) at beginning of year (52) (412)Cash (bank indebtedness) at end of year (124) (52)SCHEDULE OF PORTFOLIO INVESTMENTS
as at December 31, 2015
Units
Average cost
$Fair value
$
Manulife Global Equity Unconstrained Fund, Class G 7,677,112 98,677 102,201 TOTAL INVESTMENTS, NON-DERIVATIVE FINANCIAL ASSETS 100.10% 98,677 102,201 Other assets, less liabilities (0.10%) (101) (101)NET ASSETS ATTRIBUTABLE TO CONTRACTHOLDERS 100.00% 98,576 102,100
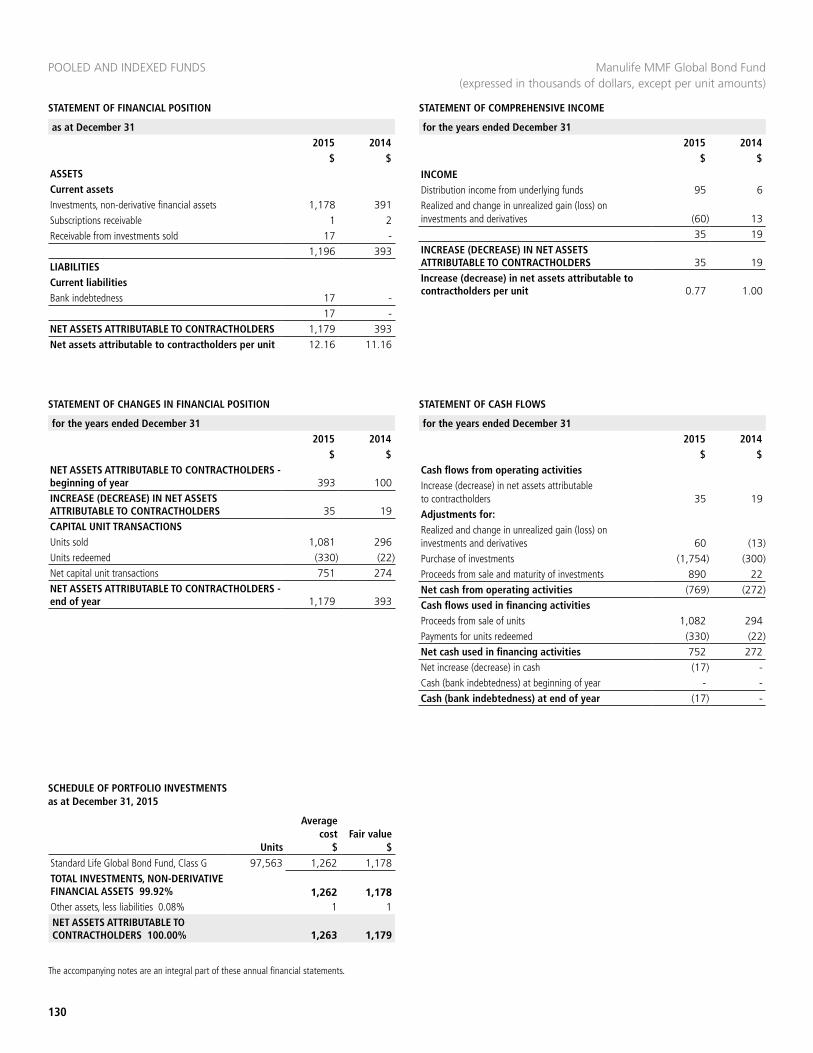
STATEMENT OF FINANCIAL POSITION
POOLED AND INDEXED FUNDS
STATEMENT OF COMPREHENSIVE INCOME
as at December 31 2015 2014
$ $
for the years ended December 312015 2014
$ $
130
The accompanying notes are an integral part of these annual financial statements.
Manulife MMF Global Bond Fund(expressed in thousands of dollars, except per unit amounts)
ASSETSCurrent assetsInvestments, non-derivative financial assets 1,178 391Subscriptions receivable 1 2Receivable from investments sold 17 -
1,196 393LIABILITIESCurrent liabilitiesBank indebtedness 17 -
17 -NET ASSETS ATTRIBUTABLE TO CONTRACTHOLDERS 1,179 393Net assets attributable to contractholders per unit 12.16 11.16
INCOMEDistribution income from underlying funds 95 6Realized and change in unrealized gain (loss) on investments and derivatives (60) 13
35 19INCREASE (DECREASE) IN NET ASSETS ATTRIBUTABLE TO CONTRACTHOLDERS 35 19Increase (decrease) in net assets attributable to contractholders per unit 0.77 1.00
STATEMENT OF CHANGES IN FINANCIAL POSITION
for the years ended December 312015 2014
$ $NET ASSETS ATTRIBUTABLE TO CONTRACTHOLDERS - beginning of year 393 100INCREASE (DECREASE) IN NET ASSETS ATTRIBUTABLE TO CONTRACTHOLDERS 35 19CAPITAL UNIT TRANSACTIONSUnits sold 1,081 296Units redeemed (330) (22)Net capital unit transactions 751 274NET ASSETS ATTRIBUTABLE TO CONTRACTHOLDERS - end of year 1,179 393
STATEMENT OF CASH FLOWS
for the years ended December 312015 2014
$ $Cash flows from operating activitiesIncrease (decrease) in net assets attributable to contractholders 35 19Adjustments for:Realized and change in unrealized gain (loss) on investments and derivatives 60 (13)Purchase of investments (1,754) (300)Proceeds from sale and maturity of investments 890 22Net cash from operating activities (769) (272)Cash flows used in financing activitiesProceeds from sale of units 1,082 294Payments for units redeemed (330) (22)Net cash used in financing activities 752 272Net increase (decrease) in cash (17) -Cash (bank indebtedness) at beginning of year - -Cash (bank indebtedness) at end of year (17) -
SCHEDULE OF PORTFOLIO INVESTMENTS as at December 31, 2015
Units
Average cost
$Fair value
$
Standard Life Global Bond Fund, Class G 97,563 1,262 1,178 TOTAL INVESTMENTS, NON-DERIVATIVE FINANCIAL ASSETS 99.92% 1,262 1,178 Other assets, less liabilities 0.08% 1 1 NET ASSETS ATTRIBUTABLE TO CONTRACTHOLDERS 100.00% 1,263 1,179
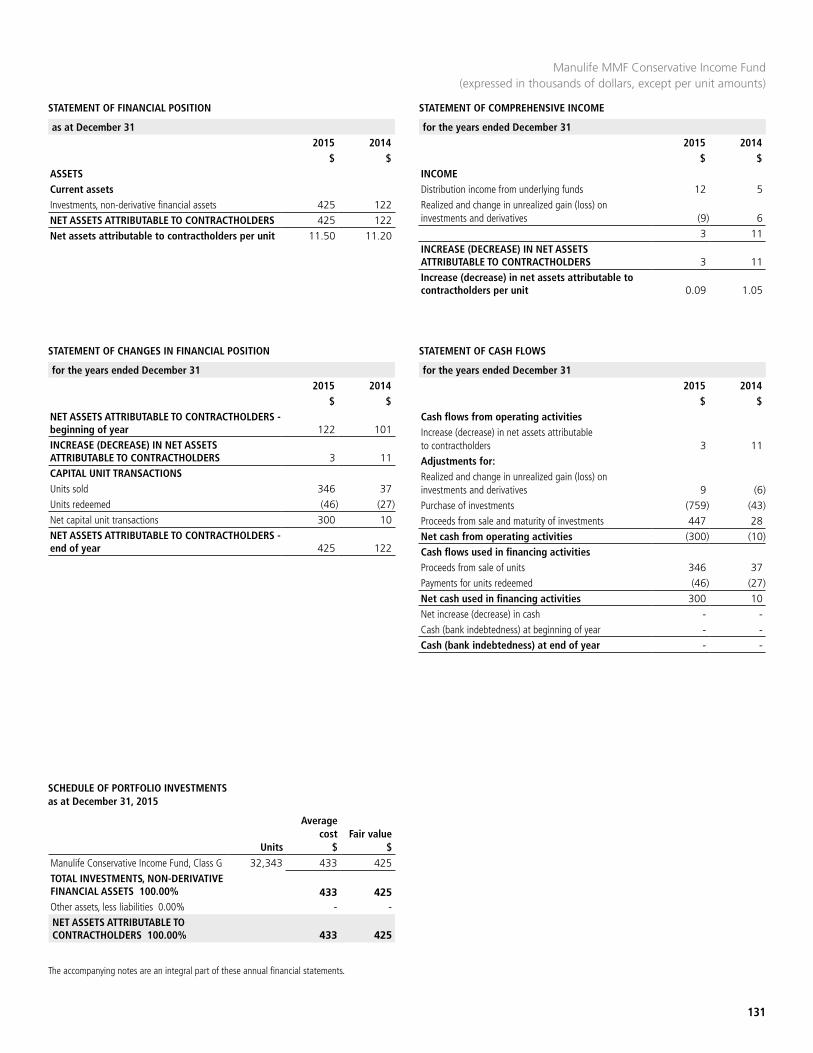
STATEMENT OF FINANCIAL POSITION STATEMENT OF COMPREHENSIVE INCOME
as at December 31 2015 2014
$ $
for the years ended December 312015 2014
$ $
131
The accompanying notes are an integral part of these annual financial statements.
Manulife MMF Conservative Income Fund (expressed in thousands of dollars, except per unit amounts)
ASSETSCurrent assetsInvestments, non-derivative financial assets 425 122NET ASSETS ATTRIBUTABLE TO CONTRACTHOLDERS 425 122Net assets attributable to contractholders per unit 11.50 11.20
INCOMEDistribution income from underlying funds 12 5Realized and change in unrealized gain (loss) on investments and derivatives (9) 6
3 11INCREASE (DECREASE) IN NET ASSETS ATTRIBUTABLE TO CONTRACTHOLDERS 3 11Increase (decrease) in net assets attributable to contractholders per unit 0.09 1.05
STATEMENT OF CHANGES IN FINANCIAL POSITION STATEMENT OF CASH FLOWS
for the years ended December 312015 2014
$ $
for the years ended December 312015 2014
$ $NET ASSETS ATTRIBUTABLE TO CONTRACTHOLDERS - beginning of year 122 101INCREASE (DECREASE) IN NET ASSETS ATTRIBUTABLE TO CONTRACTHOLDERS 3 11CAPITAL UNIT TRANSACTIONSUnits sold 346 37Units redeemed (46) (27)Net capital unit transactions 300 10NET ASSETS ATTRIBUTABLE TO CONTRACTHOLDERS - end of year 425 122
Cash flows from operating activitiesIncrease (decrease) in net assets attributable to contractholders 3 11Adjustments for:Realized and change in unrealized gain (loss) on investments and derivatives 9 (6)Purchase of investments (759) (43)Proceeds from sale and maturity of investments 447 28Net cash from operating activities (300) (10)Cash flows used in financing activitiesProceeds from sale of units 346 37Payments for units redeemed (46) (27)Net cash used in financing activities 300 10Net increase (decrease) in cash - -Cash (bank indebtedness) at beginning of year - -Cash (bank indebtedness) at end of year - -
SCHEDULE OF PORTFOLIO INVESTMENTS as at December 31, 2015
Units
Average cost
$Fair value
$
Manulife Conservative Income Fund, Class G 32,343 433 425 TOTAL INVESTMENTS, NON-DERIVATIVE FINANCIAL ASSETS 100.00% 433 425 Other assets, less liabilities 0.00% - - NET ASSETS ATTRIBUTABLE TO CONTRACTHOLDERS 100.00% 433 425
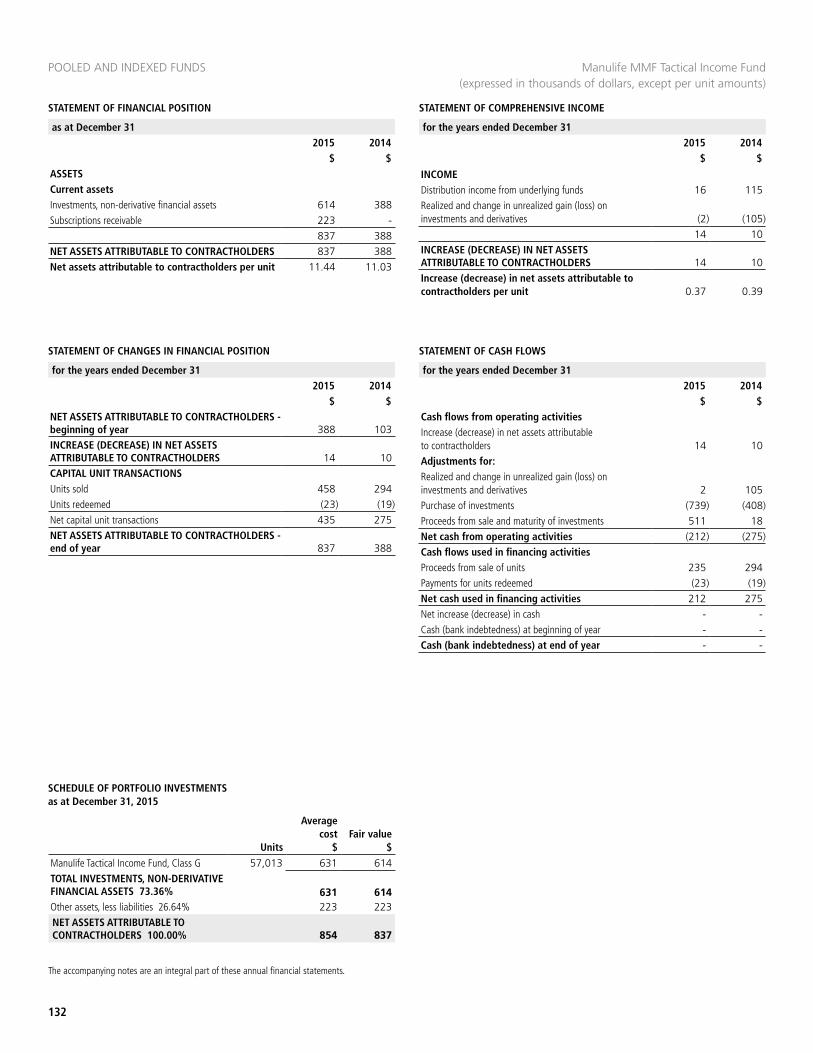
STATEMENT OF FINANCIAL POSITION
POOLED AND INDEXED FUNDS
STATEMENT OF COMPREHENSIVE INCOME
as at December 31 2015 2014
$ $
for the years ended December 312015 2014
$ $
132
The accompanying notes are an integral part of these annual financial statements.
Manulife MMF Tactical Income Fund (expressed in thousands of dollars, except per unit amounts)
ASSETSCurrent assetsInvestments, non-derivative financial assets 614 388Subscriptions receivable 223 -
837 388NET ASSETS ATTRIBUTABLE TO CONTRACTHOLDERS 837 388Net assets attributable to contractholders per unit 11.44 11.03
INCOMEDistribution income from underlying funds 16 115Realized and change in unrealized gain (loss) on investments and derivatives (2) (105)
14 10INCREASE (DECREASE) IN NET ASSETS ATTRIBUTABLE TO CONTRACTHOLDERS 14 10Increase (decrease) in net assets attributable to contractholders per unit 0.37 0.39
STATEMENT OF CHANGES IN FINANCIAL POSITION STATEMENT OF CASH FLOWS
for the years ended December 312015 2014
$ $
for the years ended December 312015 2014
$ $NET ASSETS ATTRIBUTABLE TO CONTRACTHOLDERS - beginning of year 388 103INCREASE (DECREASE) IN NET ASSETS ATTRIBUTABLE TO CONTRACTHOLDERS 14 10CAPITAL UNIT TRANSACTIONSUnits sold 458 294Units redeemed (23) (19)Net capital unit transactions 435 275NET ASSETS ATTRIBUTABLE TO CONTRACTHOLDERS - end of year 837 388
Cash flows from operating activitiesIncrease (decrease) in net assets attributable to contractholders 14 10Adjustments for:Realized and change in unrealized gain (loss) on investments and derivatives 2 105Purchase of investments (739) (408)Proceeds from sale and maturity of investments 511 18Net cash from operating activities (212) (275)Cash flows used in financing activitiesProceeds from sale of units 235 294Payments for units redeemed (23) (19)Net cash used in financing activities 212 275Net increase (decrease) in cash - -Cash (bank indebtedness) at beginning of year - -Cash (bank indebtedness) at end of year - -
SCHEDULE OF PORTFOLIO INVESTMENTS as at December 31, 2015
Units
Average cost
$Fair value
$
Manulife Tactical Income Fund, Class G 57,013 631 614 TOTAL INVESTMENTS, NON-DERIVATIVE FINANCIAL ASSETS 73.36% 631 614 Other assets, less liabilities 26.64% 223 223 NET ASSETS ATTRIBUTABLE TO CONTRACTHOLDERS 100.00% 854 837

STATEMENT OF FINANCIAL POSITION STATEMENT OF COMPREHENSIVE INCOME
as at December 31 2015 2014
$ $
for the years ended December 312015 2014
$ $
133
The accompanying notes are an integral part of these annual financial statements.
Manulife MMF Dividend Income Fund (expressed in thousands of dollars, except per unit amounts)
ASSETSCurrent assetsInvestments, non-derivative financial assets 444 377NET ASSETS ATTRIBUTABLE TO CONTRACTHOLDERS 444 377Net assets attributable to contractholders per unit 11.50 11.24
INCOMEDistribution income from underlying funds 19 19Realized and change in unrealized gain (loss) on investments and derivatives (13) 5
6 24INCREASE (DECREASE) IN NET ASSETS ATTRIBUTABLE TO CONTRACTHOLDERS 6 24Increase (decrease) in net assets attributable to contractholders per unit 0.15 0.93
STATEMENT OF CHANGES IN FINANCIAL POSITION STATEMENT OF CASH FLOWS
for the years ended December 312015 2014
$ $
for the years ended December 312015 2014
$ $NET ASSETS ATTRIBUTABLE TO CONTRACTHOLDERS - beginning of year 377 104INCREASE (DECREASE) IN NET ASSETS ATTRIBUTABLE TO CONTRACTHOLDERS 6 24CAPITAL UNIT TRANSACTIONSUnits sold 369 437Units redeemed (308) (188)Net capital unit transactions 61 249NET ASSETS ATTRIBUTABLE TO CONTRACTHOLDERS - end of year 444 377
Cash flows from operating activitiesIncrease (decrease) in net assets attributable to contractholders 6 24Adjustments for:Realized and change in unrealized gain (loss) on investments and derivatives 13 (5)Purchase of investments (840) (452)Proceeds from sale and maturity of investments 760 184Net cash from operating activities (61) (249)Cash flows used in financing activitiesProceeds from sale of units 369 437Payments for units redeemed (308) (188)Net cash used in financing activities 61 249Net increase (decrease) in cash - -Cash (bank indebtedness) at beginning of year - -Cash (bank indebtedness) at end of year - -
SCHEDULE OF PORTFOLIO INVESTMENTS as at December 31, 2015
Units
Average cost
$Fair value
$
Manulife Canadian Dividend Income Fund, Class G 38,198 468 444 TOTAL INVESTMENTS, NON-DERIVATIVE FINANCIAL ASSETS 100.00% 468 444 Other assets, less liabilities 0.00% - - NET ASSETS ATTRIBUTABLE TO CONTRACTHOLDERS 100.00% 468 444

STATEMENT OF FINANCIAL POSITION
POOLED AND INDEXED FUNDS
STATEMENT OF COMPREHENSIVE INCOME
134
The accompanying notes are an integral part of these annual financial statements.
Manulife MMF US Dividend Income Fund (expressed in thousands of dollars, except per unit amounts)
as at December 31 2015 2014
$ $
for the years ended December 312015 2014
$ $ASSETSCurrent assetsInvestments, non-derivative financial assets 1,636 710Cash 5 3Subscriptions receivable - 1
1,641 714LIABILITIESCurrent liabilitiesRedemptions payable - 7Payable on investments purchased 5 3
5 10NET ASSETS ATTRIBUTABLE TO CONTRACTHOLDERS 1,636 704Net assets attributable to contractholders per unit 15.67 13.08
INCOMEDistribution income from underlying funds 93 11Realized and change in unrealized gain (loss) on investments and derivatives 107 58
200 69EXPENSESOther operating expenses 1 -
1 -INCREASE (DECREASE) IN NET ASSETS ATTRIBUTABLE TO CONTRACTHOLDERS 199 69Increase (decrease) in net assets attributable to contractholders per unit 2.17 2.80
STATEMENT OF CHANGES IN FINANCIAL POSITION STATEMENT OF CASH FLOWS
for the years ended December 312015 2014
$ $
for the years ended December 312015 2014
$ $NET ASSETS ATTRIBUTABLE TO CONTRACTHOLDERS - beginning of year 704 104INCREASE (DECREASE) IN NET ASSETS ATTRIBUTABLE TO CONTRACTHOLDERS 199 69CAPITAL UNIT TRANSACTIONSUnits sold 1,128 576Units redeemed (395) (45)Net capital unit transactions 733 531NET ASSETS ATTRIBUTABLE TO CONTRACTHOLDERS - end of year 1,636 704
Cash flows from operating activitiesIncrease (decrease) in net assets attributable to contractholders 199 69Adjustments for:Realized and change in unrealized gain (loss) on investments and derivatives (107) (58)Purchase of investments (2,425) (577)Proceeds from sale and maturity of investments 1,608 32Net cash from operating activities (725) (534)Cash flows used in financing activitiesProceeds from sale of units 1,129 575Payments for units redeemed (402) (38)Net cash used in financing activities 727 537Net increase (decrease) in cash 2 3Cash (bank indebtedness) at beginning of year 3 -Cash (bank indebtedness) at end of year 5 3
SCHEDULE OF PORTFOLIO INVESTMENTS as at December 31, 2015
Units
Average cost
$Fair value
$
Manulife U.S. Dividend Income Fund, Class G 107,243 1,652 1,636 TOTAL INVESTMENTS, NON-DERIVATIVE FINANCIAL ASSETS 100.00% 1,652 1,636 Other assets, less liabilities 0.00% - - NET ASSETS ATTRIBUTABLE TO CONTRACTHOLDERS 100.00% 1,652 1,636
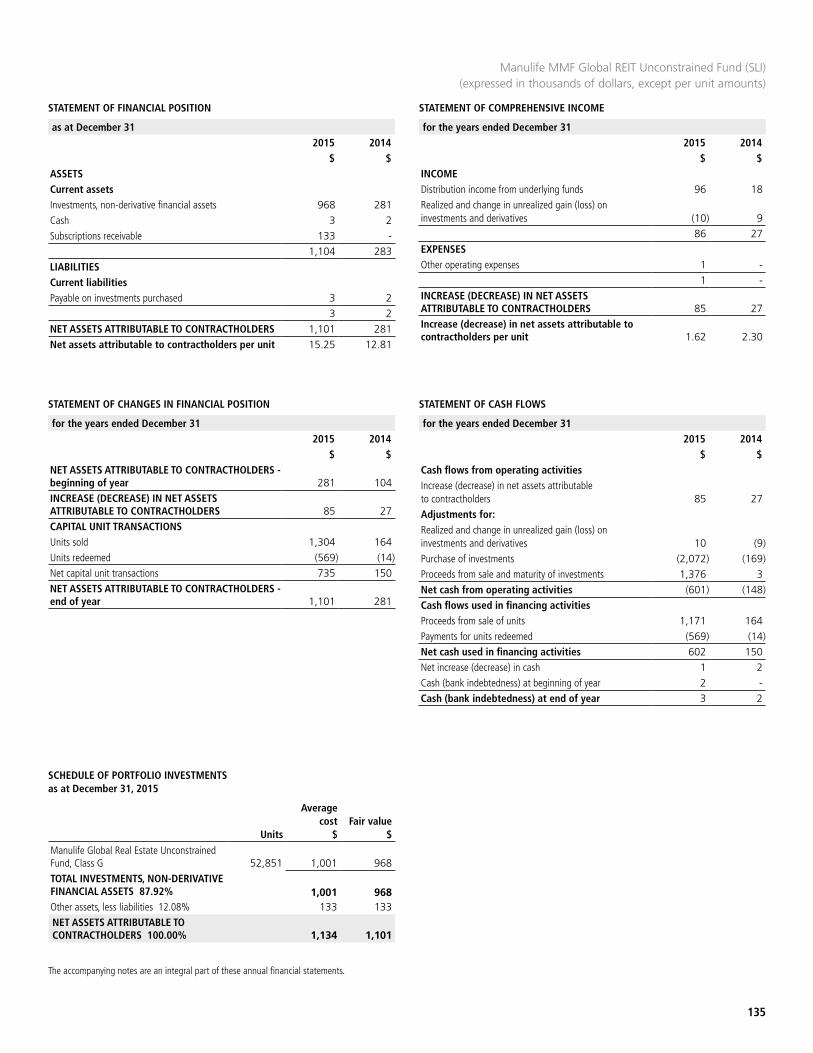
STATEMENT OF FINANCIAL POSITION STATEMENT OF COMPREHENSIVE INCOME
as at December 31 2015 2014
$ $
for the years ended December 312015 2014
$ $
135
The accompanying notes are an integral part of these annual financial statements.
STATEMENT OF CHANGES IN FINANCIAL POSITION STATEMENT OF CASH FLOWS
for the years ended December 312015 2014
$ $
for the years ended December 312015 2014
$ $NET ASSETS ATTRIBUTABLE TO CONTRACTHOLDERS - beginning of year 281 104INCREASE (DECREASE) IN NET ASSETS ATTRIBUTABLE TO CONTRACTHOLDERS 85 27CAPITAL UNIT TRANSACTIONSUnits sold 1,304 164Units redeemed (569) (14)Net capital unit transactions 735 150NET ASSETS ATTRIBUTABLE TO CONTRACTHOLDERS - end of year 1,101 281
Cash flows from operating activitiesIncrease (decrease) in net assets attributable to contractholders 85 27Adjustments for:Realized and change in unrealized gain (loss) on investments and derivatives 10 (9)Purchase of investments (2,072) (169)Proceeds from sale and maturity of investments 1,376 3Net cash from operating activities (601) (148)Cash flows used in financing activitiesProceeds from sale of units 1,171 164Payments for units redeemed (569) (14)Net cash used in financing activities 602 150Net increase (decrease) in cash 1 2Cash (bank indebtedness) at beginning of year 2 -Cash (bank indebtedness) at end of year 3 2
ASSETSCurrent assetsInvestments, non-derivative financial assets 968 281Cash 3 2Subscriptions receivable 133 -
1,104 283LIABILITIESCurrent liabilitiesPayable on investments purchased 3 2
3 2NET ASSETS ATTRIBUTABLE TO CONTRACTHOLDERS 1,101 281Net assets attributable to contractholders per unit 15.25 12.81
INCOMEDistribution income from underlying funds 96 18Realized and change in unrealized gain (loss) on investments and derivatives (10) 9
86 27EXPENSESOther operating expenses 1 -
1 -INCREASE (DECREASE) IN NET ASSETS ATTRIBUTABLE TO CONTRACTHOLDERS 85 27Increase (decrease) in net assets attributable to contractholders per unit 1.62 2.30
Manulife MMF Global REIT Unconstrained Fund (SLI) (expressed in thousands of dollars, except per unit amounts)
SCHEDULE OF PORTFOLIO INVESTMENTS as at December 31, 2015
Units
Average cost
$Fair value
$
Manulife Global Real Estate Unconstrained Fund, Class G 52,851 1,001 968 TOTAL INVESTMENTS, NON-DERIVATIVE FINANCIAL ASSETS 87.92% 1,001 968 Other assets, less liabilities 12.08% 133 133 NET ASSETS ATTRIBUTABLE TO CONTRACTHOLDERS 100.00% 1,134 1,101
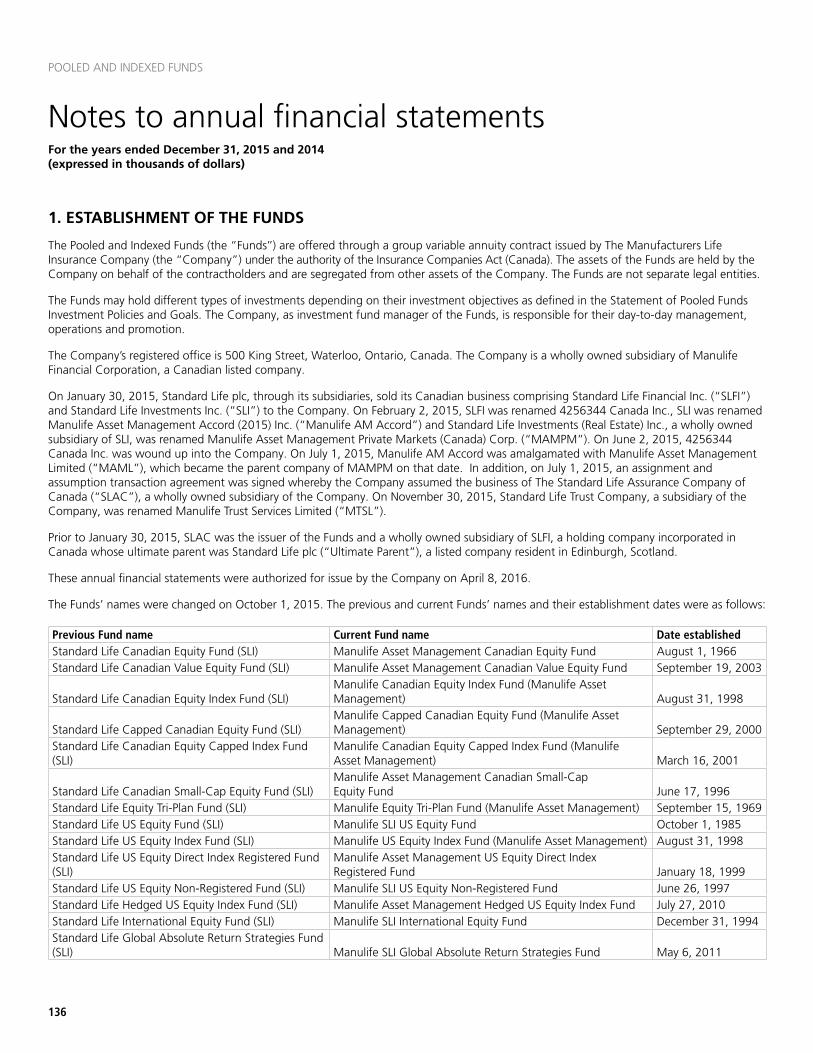
136
POOLED AND INDEXED FUNDS
Notes to annual financial statementsFor the years ended December 31, 2015 and 2014 (expressed in thousands of dollars)
1. ESTABLISHMENT OF THE FUNDS
The Pooled and Indexed Funds (the “Funds’’) are offered through a group variable annuity contract issued by The Manufacturers Life Insurance Company (the “Company”) under the authority of the Insurance Companies Act (Canada). The assets of the Funds are held by the Company on behalf of the contractholders and are segregated from other assets of the Company. The Funds are not separate legal entities.
The Funds may hold different types of investments depending on their investment objectives as defined in the Statement of Pooled Funds Investment Policies and Goals. The Company, as investment fund manager of the Funds, is responsible for their day-to-day management, operations and promotion.
The Company’s registered office is 500 King Street, Waterloo, Ontario, Canada. The Company is a wholly owned subsidiary of Manulife Financial Corporation, a Canadian listed company.
On January 30, 2015, Standard Life plc, through its subsidiaries, sold its Canadian business comprising Standard Life Financial Inc. (“SLFI”) and Standard Life Investments Inc. (“SLI”) to the Company. On February 2, 2015, SLFI was renamed 4256344 Canada Inc., SLI was renamed Manulife Asset Management Accord (2015) Inc. (“Manulife AM Accord”) and Standard Life Investments (Real Estate) Inc., a wholly owned subsidiary of SLI, was renamed Manulife Asset Management Private Markets (Canada) Corp. (“MAMPM”). On June 2, 2015, 4256344 Canada Inc. was wound up into the Company. On July 1, 2015, Manulife AM Accord was amalgamated with Manulife Asset Management Limited (“MAML”), which became the parent company of MAMPM on that date. In addition, on July 1, 2015, an assignment and assumption transaction agreement was signed whereby the Company assumed the business of The Standard Life Assurance Company of Canada (“SLAC”), a wholly owned subsidiary of the Company. On November 30, 2015, Standard Life Trust Company, a subsidiary of the Company, was renamed Manulife Trust Services Limited (“MTSL”).
Prior to January 30, 2015, SLAC was the issuer of the Funds and a wholly owned subsidiary of SLFI, a holding company incorporated in Canada whose ultimate parent was Standard Life plc (“Ultimate Parent”), a listed company resident in Edinburgh, Scotland.
These annual financial statements were authorized for issue by the Company on April 8, 2016.
The Funds’ names were changed on October 1, 2015. The previous and current Funds’ names and their establishment dates were as follows:
Previous Fund name Current Fund name Date establishedStandard Life Canadian Equity Fund (SLI) Manulife Asset Management Canadian Equity Fund August 1, 1966Standard Life Canadian Value Equity Fund (SLI) Manulife Asset Management Canadian Value Equity Fund September 19, 2003
Standard Life Canadian Equity Index Fund (SLI)Manulife Canadian Equity Index Fund (Manulife Asset Management) August 31, 1998
Standard Life Capped Canadian Equity Fund (SLI)Manulife Capped Canadian Equity Fund (Manulife Asset Management) September 29, 2000
Standard Life Canadian Equity Capped Index Fund (SLI)
Manulife Canadian Equity Capped Index Fund (Manulife Asset Management) March 16, 2001
Standard Life Canadian Small-Cap Equity Fund (SLI)Manulife Asset Management Canadian Small-Cap Equity Fund June 17, 1996
Standard Life Equity Tri-Plan Fund (SLI) Manulife Equity Tri-Plan Fund (Manulife Asset Management) September 15, 1969Standard Life US Equity Fund (SLI) Manulife SLI US Equity Fund October 1, 1985Standard Life US Equity Index Fund (SLI) Manulife US Equity Index Fund (Manulife Asset Management) August 31, 1998Standard Life US Equity Direct Index Registered Fund (SLI)
Manulife Asset Management US Equity Direct Index Registered Fund January 18, 1999
Standard Life US Equity Non-Registered Fund (SLI) Manulife SLI US Equity Non-Registered Fund June 26, 1997Standard Life Hedged US Equity Index Fund (SLI) Manulife Asset Management Hedged US Equity Index Fund July 27, 2010Standard Life International Equity Fund (SLI) Manulife SLI International Equity Fund December 31, 1994Standard Life Global Absolute Return Strategies Fund (SLI) Manulife SLI Global Absolute Return Strategies Fund May 6, 2011
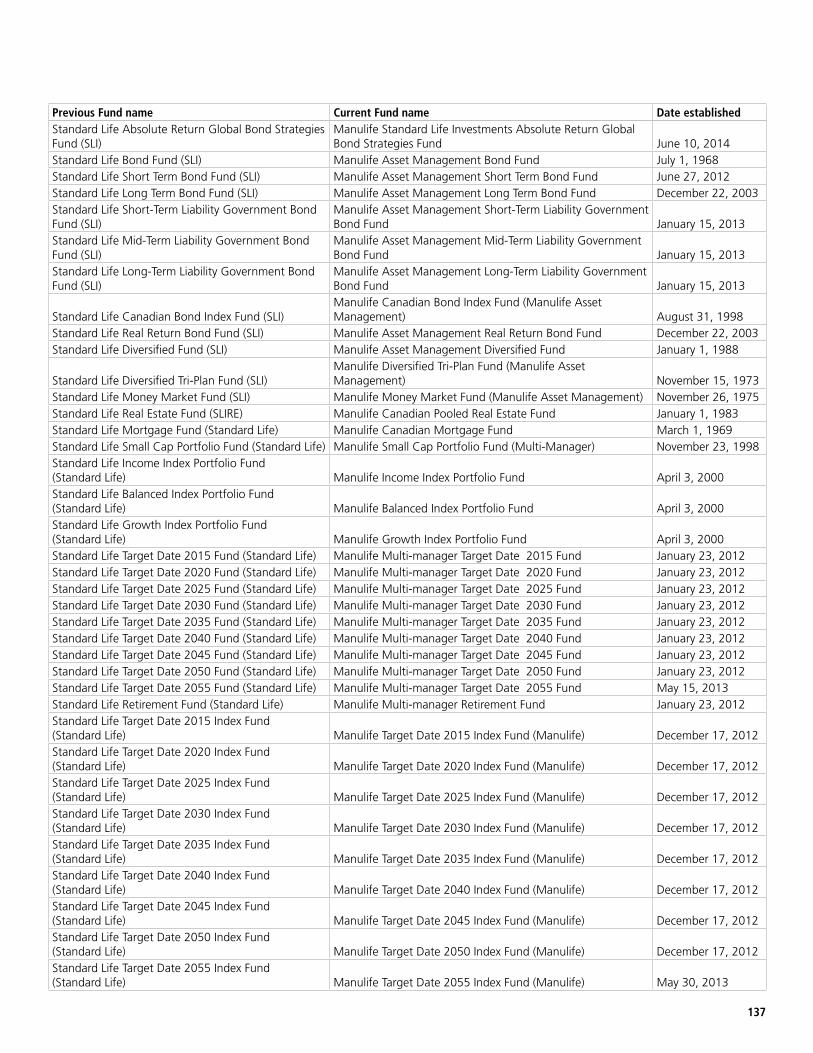
137
Standard Life Absolute Return Global Bond Strategies Fund (SLI)
Manulife Standard Life Investments Absolute Return Global Bond Strategies Fund June 10, 2014
Standard Life Bond Fund (SLI) Manulife Asset Management Bond Fund July 1, 1968Standard Life Short Term Bond Fund (SLI) Manulife Asset Management Short Term Bond Fund June 27, 2012Standard Life Long Term Bond Fund (SLI) Manulife Asset Management Long Term Bond Fund December 22, 2003Standard Life Short-Term Liability Government Bond Fund (SLI)
Manulife Asset Management Short-Term Liability Government Bond Fund January 15, 2013
Standard Life Mid-Term Liability Government Bond Fund (SLI)
Manulife Asset Management Mid-Term Liability Government Bond Fund January 15, 2013
Standard Life Long-Term Liability Government Bond Fund (SLI)
Manulife Asset Management Long-Term Liability Government Bond Fund January 15, 2013
Standard Life Canadian Bond Index Fund (SLI)Manulife Canadian Bond Index Fund (Manulife Asset Management) August 31, 1998
Standard Life Real Return Bond Fund (SLI) Manulife Asset Management Real Return Bond Fund December 22, 2003Standard Life Diversified Fund (SLI) Manulife Asset Management Diversified Fund January 1, 1988
Standard Life Diversified Tri-Plan Fund (SLI)Manulife Diversified Tri-Plan Fund (Manulife Asset Management) November 15, 1973
Standard Life Money Market Fund (SLI) Manulife Money Market Fund (Manulife Asset Management) November 26, 1975Standard Life Real Estate Fund (SLIRE) Manulife Canadian Pooled Real Estate Fund January 1, 1983Standard Life Mortgage Fund (Standard Life) Manulife Canadian Mortgage Fund March 1, 1969Standard Life Small Cap Portfolio Fund (Standard Life) Manulife Small Cap Portfolio Fund (Multi-Manager) November 23, 1998Standard Life Income Index Portfolio Fund (Standard Life) Manulife Income Index Portfolio Fund April 3, 2000Standard Life Balanced Index Portfolio Fund (Standard Life) Manulife Balanced Index Portfolio Fund April 3, 2000Standard Life Growth Index Portfolio Fund (Standard Life) Manulife Growth Index Portfolio Fund April 3, 2000Standard Life Target Date 2015 Fund (Standard Life) Manulife Multi-manager Target Date 2015 Fund January 23, 2012Standard Life Target Date 2020 Fund (Standard Life) Manulife Multi-manager Target Date 2020 Fund January 23, 2012Standard Life Target Date 2025 Fund (Standard Life) Manulife Multi-manager Target Date 2025 Fund January 23, 2012Standard Life Target Date 2030 Fund (Standard Life) Manulife Multi-manager Target Date 2030 Fund January 23, 2012Standard Life Target Date 2035 Fund (Standard Life) Manulife Multi-manager Target Date 2035 Fund January 23, 2012Standard Life Target Date 2040 Fund (Standard Life) Manulife Multi-manager Target Date 2040 Fund January 23, 2012Standard Life Target Date 2045 Fund (Standard Life) Manulife Multi-manager Target Date 2045 Fund January 23, 2012Standard Life Target Date 2050 Fund (Standard Life) Manulife Multi-manager Target Date 2050 Fund January 23, 2012Standard Life Target Date 2055 Fund (Standard Life) Manulife Multi-manager Target Date 2055 Fund May 15, 2013Standard Life Retirement Fund (Standard Life) Manulife Multi-manager Retirement Fund January 23, 2012Standard Life Target Date 2015 Index Fund (Standard Life) Manulife Target Date 2015 Index Fund (Manulife) December 17, 2012Standard Life Target Date 2020 Index Fund (Standard Life) Manulife Target Date 2020 Index Fund (Manulife) December 17, 2012Standard Life Target Date 2025 Index Fund (Standard Life) Manulife Target Date 2025 Index Fund (Manulife) December 17, 2012Standard Life Target Date 2030 Index Fund (Standard Life) Manulife Target Date 2030 Index Fund (Manulife) December 17, 2012Standard Life Target Date 2035 Index Fund (Standard Life) Manulife Target Date 2035 Index Fund (Manulife) December 17, 2012Standard Life Target Date 2040 Index Fund (Standard Life) Manulife Target Date 2040 Index Fund (Manulife) December 17, 2012Standard Life Target Date 2045 Index Fund (Standard Life) Manulife Target Date 2045 Index Fund (Manulife) December 17, 2012Standard Life Target Date 2050 Index Fund (Standard Life) Manulife Target Date 2050 Index Fund (Manulife) December 17, 2012Standard Life Target Date 2055 Index Fund (Standard Life) Manulife Target Date 2055 Index Fund (Manulife) May 30, 2013
Previous Fund name Current Fund name Date established
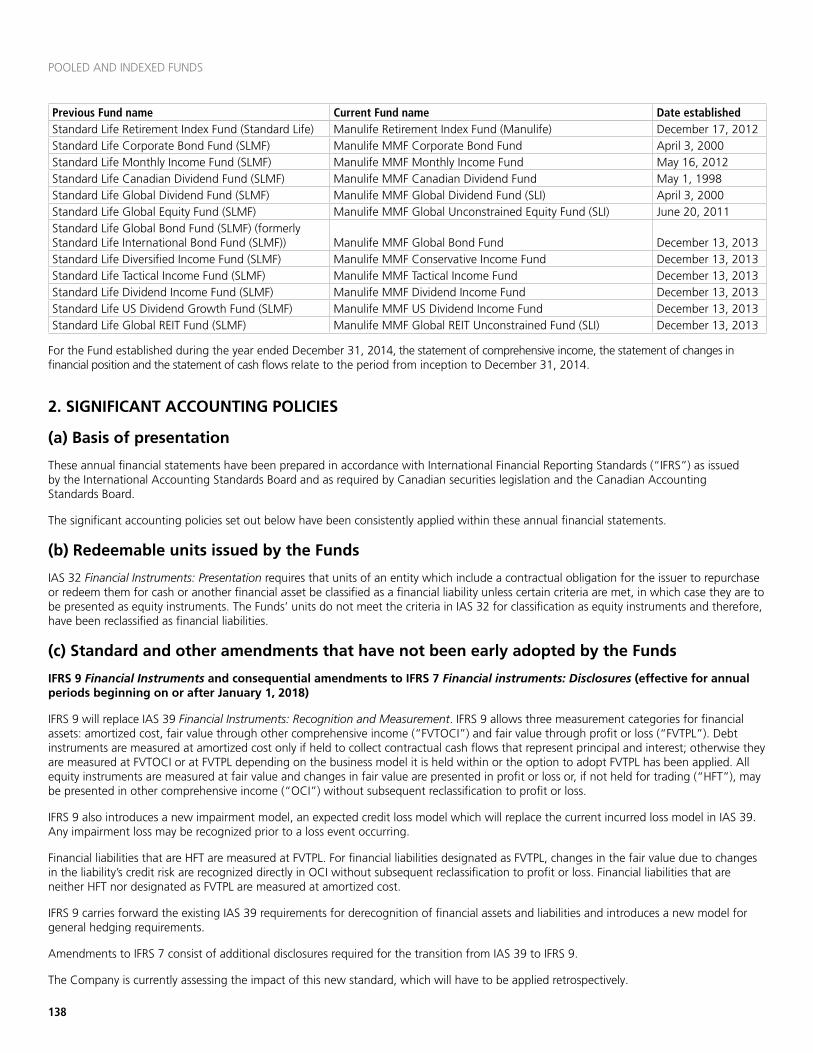
138
POOLED AND INDEXED FUNDS
Standard Life Retirement Index Fund (Standard Life) Manulife Retirement Index Fund (Manulife) December 17, 2012Standard Life Corporate Bond Fund (SLMF) Manulife MMF Corporate Bond Fund April 3, 2000Standard Life Monthly Income Fund (SLMF) Manulife MMF Monthly Income Fund May 16, 2012Standard Life Canadian Dividend Fund (SLMF) Manulife MMF Canadian Dividend Fund May 1, 1998Standard Life Global Dividend Fund (SLMF) Manulife MMF Global Dividend Fund (SLI) April 3, 2000Standard Life Global Equity Fund (SLMF) Manulife MMF Global Unconstrained Equity Fund (SLI) June 20, 2011Standard Life Global Bond Fund (SLMF) (formerly Standard Life International Bond Fund (SLMF)) Manulife MMF Global Bond Fund December 13, 2013Standard Life Diversified Income Fund (SLMF) Manulife MMF Conservative Income Fund December 13, 2013Standard Life Tactical Income Fund (SLMF) Manulife MMF Tactical Income Fund December 13, 2013Standard Life Dividend Income Fund (SLMF) Manulife MMF Dividend Income Fund December 13, 2013Standard Life US Dividend Growth Fund (SLMF) Manulife MMF US Dividend Income Fund December 13, 2013Standard Life Global REIT Fund (SLMF) Manulife MMF Global REIT Unconstrained Fund (SLI) December 13, 2013
For the Fund established during the year ended December 31, 2014, the statement of comprehensive income, the statement of changes in financial position and the statement of cash flows relate to the period from inception to December 31, 2014.
2. SIGNIFICANT ACCOUNTING POLICIES
(a) Basis of presentation
These annual financial statements have been prepared in accordance with International Financial Reporting Standards (“IFRS”) as issued by the International Accounting Standards Board and as required by Canadian securities legislation and the Canadian Accounting Standards Board.
The significant accounting policies set out below have been consistently applied within these annual financial statements.
(b) Redeemable units issued by the Funds
IAS 32 Financial Instruments: Presentation requires that units of an entity which include a contractual obligation for the issuer to repurchase or redeem them for cash or another financial asset be classified as a financial liability unless certain criteria are met, in which case they are to be presented as equity instruments. The Funds’ units do not meet the criteria in IAS 32 for classification as equity instruments and therefore, have been reclassified as financial liabilities.
(c) Standard and other amendments that have not been early adopted by the Funds
IFRS 9 Financial Instruments and consequential amendments to IFRS 7 Financial instruments: Disclosures (effective for annual periods beginning on or after January 1, 2018)
IFRS 9 will replace IAS 39 Financial Instruments: Recognition and Measurement. IFRS 9 allows three measurement categories for financial assets: amortized cost, fair value through other comprehensive income (“FVTOCI”) and fair value through profit or loss (“FVTPL”). Debt instruments are measured at amortized cost only if held to collect contractual cash flows that represent principal and interest; otherwise they are measured at FVTOCI or at FVTPL depending on the business model it is held within or the option to adopt FVTPL has been applied. All equity instruments are measured at fair value and changes in fair value are presented in profit or loss or, if not held for trading (“HFT”), may be presented in other comprehensive income (“OCI”) without subsequent reclassification to profit or loss.
IFRS 9 also introduces a new impairment model, an expected credit loss model which will replace the current incurred loss model in IAS 39. Any impairment loss may be recognized prior to a loss event occurring.
Financial liabilities that are HFT are measured at FVTPL. For financial liabilities designated as FVTPL, changes in the fair value due to changes in the liability’s credit risk are recognized directly in OCI without subsequent reclassification to profit or loss. Financial liabilities that are neither HFT nor designated as FVTPL are measured at amortized cost.
IFRS 9 carries forward the existing IAS 39 requirements for derecognition of financial assets and liabilities and introduces a new model for general hedging requirements.
Amendments to IFRS 7 consist of additional disclosures required for the transition from IAS 39 to IFRS 9.
The Company is currently assessing the impact of this new standard, which will have to be applied retrospectively.
Previous Fund name Current Fund name Date established
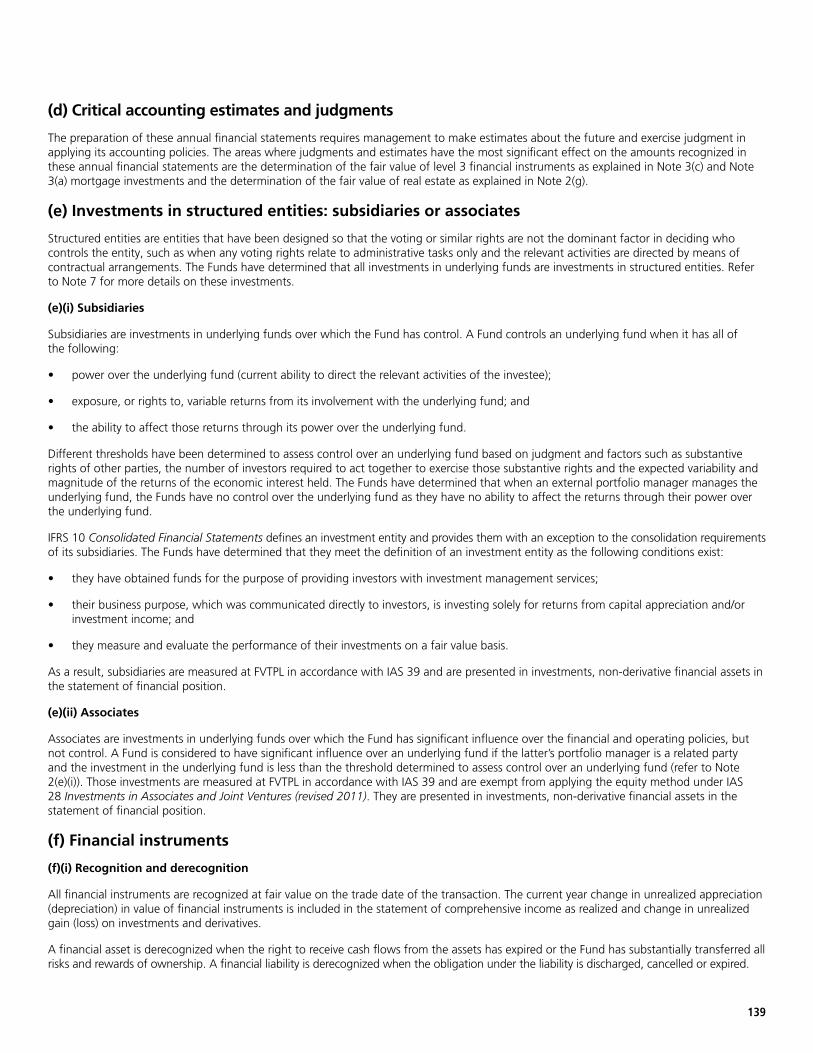
139
(d) Critical accounting estimates and judgments
The preparation of these annual financial statements requires management to make estimates about the future and exercise judgment in applying its accounting policies. The areas where judgments and estimates have the most significant effect on the amounts recognized in these annual financial statements are the determination of the fair value of level 3 financial instruments as explained in Note 3(c) and Note 3(a) mortgage investments and the determination of the fair value of real estate as explained in Note 2(g).
(e) Investments in structured entities: subsidiaries or associates
Structured entities are entities that have been designed so that the voting or similar rights are not the dominant factor in deciding who controls the entity, such as when any voting rights relate to administrative tasks only and the relevant activities are directed by means of contractual arrangements. The Funds have determined that all investments in underlying funds are investments in structured entities. Refer to Note 7 for more details on these investments.
(e)(i) Subsidiaries
Subsidiaries are investments in underlying funds over which the Fund has control. A Fund controls an underlying fund when it has all of the following:
• power over the underlying fund (current ability to direct the relevant activities of the investee);
• exposure, or rights to, variable returns from its involvement with the underlying fund; and
• the ability to affect those returns through its power over the underlying fund.
Different thresholds have been determined to assess control over an underlying fund based on judgment and factors such as substantive rights of other parties, the number of investors required to act together to exercise those substantive rights and the expected variability and magnitude of the returns of the economic interest held. The Funds have determined that when an external portfolio manager manages the underlying fund, the Funds have no control over the underlying fund as they have no ability to affect the returns through their power over the underlying fund.
IFRS 10 Consolidated Financial Statements defines an investment entity and provides them with an exception to the consolidation requirements of its subsidiaries. The Funds have determined that they meet the definition of an investment entity as the following conditions exist:
• they have obtained funds for the purpose of providing investors with investment management services;
• their business purpose, which was communicated directly to investors, is investing solely for returns from capital appreciation and/or investment income; and
• they measure and evaluate the performance of their investments on a fair value basis.
As a result, subsidiaries are measured at FVTPL in accordance with IAS 39 and are presented in investments, non-derivative financial assets in the statement of financial position.
(e)(ii) Associates
Associates are investments in underlying funds over which the Fund has significant influence over the financial and operating policies, but not control. A Fund is considered to have significant influence over an underlying fund if the latter’s portfolio manager is a related party and the investment in the underlying fund is less than the threshold determined to assess control over an underlying fund (refer to Note 2(e)(i)). Those investments are measured at FVTPL in accordance with IAS 39 and are exempt from applying the equity method under IAS 28 Investments in Associates and Joint Ventures (revised 2011). They are presented in investments, non-derivative financial assets in the statement of financial position.
(f) Financial instruments
(f)(i) Recognition and derecognition
All financial instruments are recognized at fair value on the trade date of the transaction. The current year change in unrealized appreciation (depreciation) in value of financial instruments is included in the statement of comprehensive income as realized and change in unrealized gain (loss) on investments and derivatives.
A financial asset is derecognized when the right to receive cash flows from the assets has expired or the Fund has substantially transferred all risks and rewards of ownership. A financial liability is derecognized when the obligation under the liability is discharged, cancelled or expired.
140
POOLED AND INDEXED FUNDS
(f)(ii) Classification
Financial instruments ClassificationInvestments, non-derivative financial assets FVTPLShort-term investments FVTPLCash Loans and receivablesCash margin Loans and receivablesSubscriptions receivable Loans and receivablesReceivable from investments sold Loans and receivablesInterest, dividends and other receivables Loans and receivablesDerivative assets and liabilities FVTPLFinancing on real estate FVTPL
Investments, non-derivative financial assets consist of short-term investments, bonds (including asset-backed securities), equities, investments in one or multiple underlying funds and mortgage investments.
Short-term investments have terms to maturity of less than one year from the date of acquisition.
Cash comprises deposits with financial institutions. Bank indebtedness is disclosed separately in the statement of financial position.
All financial liabilities except derivative liabilities and financing on real estate, are classified as other financial liabilities. They consist of bank indebtedness, redemptions payable, payable on investments purchased, accrued expenses, tenant deposits, other liabilities and payable secured by securities.
(f)(iii) Measurement
Investments, non-derivative financial assets and short-term investments were designated as FVTPL as these investments are managed and their performance is evaluated and measured on a fair value basis in accordance with each Fund’s documented investment strategy. Furthermore, this designation eliminates an accounting mismatch with the basis of measurement of the financial liabilities for the redeemable units. Directly attributable transaction costs are recognized and disclosed separately in the statement of comprehensive income.
Financial assets classified as loans and receivables are initially recognized at fair value including transaction costs. They are subsequently measured at amortized cost using the effective interest rate (“EIR”) method.
Derivative assets and liabilities are required to be classified as HFT, which falls under the FVTPL classification. They consist of forward foreign currency contracts and futures contracts. The initial margin on deposit with brokers relating to futures contracts is recorded in the statement of financial position as cash margin. Any change in the margin requirement is settled daily on the following day.
Financing on real estate was designated as FVTPL to eliminate the inconsistency that would result from measuring real estate investments at fair value and the associated mortgages on an amortized cost basis. All other financial liabilities are measured at amortized cost using the EIR method.
The Funds’ obligation for net assets attributable to contractholders is classified as a financial liability and is presented at the redemption amount. The redemption amount is determined as the net difference between total assets and all other liabilities, for which accounting policies are described above.
The Funds do not hold any financial instruments subject to master netting agreements or similar arrangements which would provide a right to offset, enforceable only in the event of default, insolvency, or bankruptcy. Therefore, the Funds do not offset financial assets and liabilities in their statement of financial position, as there are no unconditional rights to offset.
(g) Real estate investments
Real estate investments are properties held to earn rental income or for capital appreciation and are presented as such in the statement of financial position of Manulife Canadian Pooled Real Estate Fund. They are initially recorded at cost, including transaction costs, and subsequently measured at fair value with changes in fair value recognized in the statement of comprehensive income. Fair value is determined without any deduction for transaction costs that may be incurred on sale or other disposal.
Initial direct costs incurred in arranging an operating lease are added to the carrying amount of real estate investments and are recognized as an expense over the lease term on the same basis as the lease income (refer to Note 2(h)).
141
(h) Income recognition
Interest income is recognized based on the EIR method and is accrued daily.
Real estate net income, presented in the statement of comprehensive income of the Manulife Canadian Pooled Real Estate Fund, includes rental income and direct operating expenses. Rental income is recognized on a straight-line basis over the term of the lease. Lease incentives are recognized as an integral part of the total rental income and are also spread over the term of the lease. Contingent rents are recognized as revenue in the period in which they are earned.
Dividend income is recognized on the ex-dividend date.
Distribution income from the underlying funds can include dividends, interest and capital gains, the proceeds of which are used to purchase additional units in the underlying funds. Distribution income is recognized at the date of the distribution by the underlying funds.
All expenses are accrued daily.
The cost of investments is determined using the average cost method.
(i) Foreign currency translation
The Funds’ functional and presentation currency is the Canadian dollar. The fair values of investments and other assets and liabilities denominated in foreign currencies are translated into Canadian dollars at the exchange rates on the day of valuation. Purchases and sales of investments, income and expenses, denominated in foreign currencies, are translated into Canadian dollars at the rates of exchange prevailing on the dates of such transactions. The Funds do not separately report the effect of changes in foreign exchange rates from changes in fair value of securities held. Such changes are included in the realized and change in unrealized gain (loss) on investments and derivatives, in the statement of comprehensive income. The impact of changes in currency rates on assets, other than investments and liabilities, is included in foreign exchange gain (loss) in the statement of comprehensive income.
(j) Currency legend
The following is a list of abbreviations used in these annual financial statements:
CAD – Canadian dollar HKD – Hong Kong dollarCHF – Swiss franc JPY – Japanese yenEUR – Euro USD – United States dollarGBP – Pound sterling
(k) Increase (decrease) in net assets attributable to contractholders per unit
The increase (decrease) in net assets attributable to contractholders per unit of each Fund represents the increase (decrease) in net assets attributable to contractholders of each Fund, divided by the daily average number of units outstanding of each Fund for the year.
(l) Income taxes
The Funds are deemed to be trusts under the Income Tax Act (Canada). The Funds’ income and net realized capital gains and losses are deemed to be allocated to the beneficiaries. Therefore, the Funds are not subject to income tax on their income and net realized capital gains. Accordingly, no provisions for income taxes are recorded in these financial statements.
3. FINANCIAL INSTRUMENTS MEASUREMENT
(a) Fair value measurement
Fair value is the price that would be received to sell an asset or paid to transfer a liability in an orderly transaction between market participants at the measurement date.

142
POOLED AND INDEXED FUNDS
The following methods and assumptions were used to determine the fair value of financial instruments:
Financial instruments whose fair values approximate their carrying values
Given their short-term nature, the carrying values of all current financial instruments measured at amortized cost approximate their fair values.
Due to its nature, the carrying values of non-current financial instruments measured at amortized cost approximates their fair values.
Short-term investments and bonds
The fair value of short-term investments and bonds (including asset-backed securities) is based on closing quoted market prices obtained from one or more recognized investment dealers.
Equities
The fair value of equities is determined as the closing quoted market price on the recognized stock exchange on which the equities are listed or principally traded.
In circumstances where the closing quoted market price is not within the bid-ask spread, the Company determines the point within the bid-ask spread that is most representative of fair value based on the specific facts and circumstances.
Mortgage investments
The fair value of mortgage investments is estimated as the net present value of expected future cash flows using current market interest rates. The internal valuation methodology uses both observable and unobservable inputs. Unobservable inputs include credit assumptions and liquidity spread adjustments.
Investments in underlying funds
Investments in underlying funds are valued at the net assets attributable to unitholders per unit of each of the underlying fund’s series on the day of valuation.
Futures contracts
The fair value of futures contracts is determined by using the closing quoted market price on the recognized stock exchange on which the futures are listed or principally traded.
Forward foreign currency contracts
The fair value of forward foreign currency contracts is determined by comparing the forward rate at the inception of the contract and the forward rate at the year-end date to determine the gain or loss that would arise if the contract was closed.
Total return swap contracts
The total return swap contracts are valued at the estimated amount that the Fund would receive or pay to terminate the swap, based on the current value of the underlying interest on the valuation date.
Financing real estate
The fair value of financing on real estate is estimated as the net present value of expected future cash flows using current market interest rates.
(b) Determination of the fair value hierarchy
All financial instruments have been analyzed using a fair value hierarchy that reflects the significance of inputs used in valuing those instruments. The fair value hierarchy is based on the following levels:
Level 1 — Fair values measured using unadjusted quoted prices in active markets for identical assets or liabilities.
Level 2 — Fair values measured using inputs other than quoted prices included within Level 1 that are observable for the asset or liability, either directly (i.e. as prices) or indirectly (i.e. derived from prices).
Level 3 — Fair values measured using inputs that are not based on observable market data (refer to Note 3(c)).
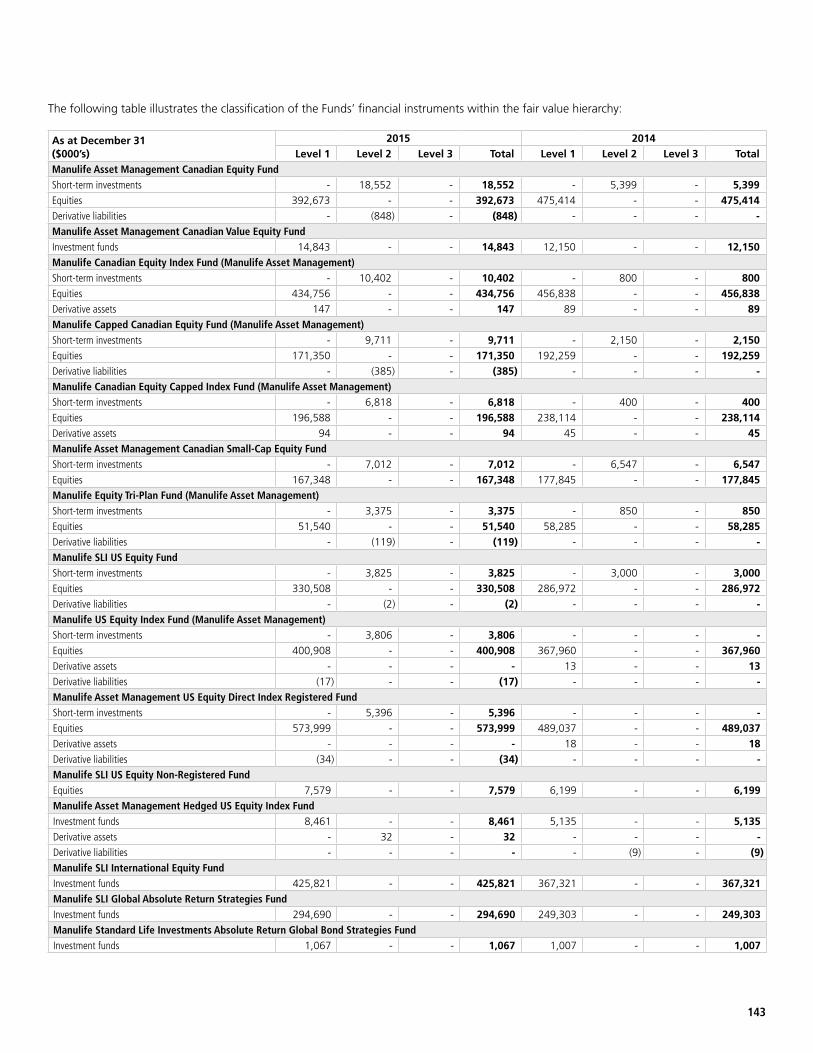
143
The following table illustrates the classification of the Funds’ financial instruments within the fair value hierarchy:
As at December 31 ($000’s)
2015 2014Level 1 Level 2 Level 3 Total Level 1 Level 2 Level 3 Total
Manulife Asset Management Canadian Equity FundShort-term investments - 18,552 - 18,552 - 5,399 - 5,399 Equities 392,673 - - 392,673 475,414 - - 475,414 Derivative liabilities - (848) - (848) - - - - Manulife Asset Management Canadian Value Equity FundInvestment funds 14,843 - - 14,843 12,150 - - 12,150 Manulife Canadian Equity Index Fund (Manulife Asset Management)Short-term investments - 10,402 - 10,402 - 800 - 800 Equities 434,756 - - 434,756 456,838 - - 456,838 Derivative assets 147 - - 147 89 - - 89 Manulife Capped Canadian Equity Fund (Manulife Asset Management)Short-term investments - 9,711 - 9,711 - 2,150 - 2,150 Equities 171,350 - - 171,350 192,259 - - 192,259 Derivative liabilities - (385) - (385) - - - - Manulife Canadian Equity Capped Index Fund (Manulife Asset Management)Short-term investments - 6,818 - 6,818 - 400 - 400 Equities 196,588 - - 196,588 238,114 - - 238,114 Derivative assets 94 - - 94 45 - - 45 Manulife Asset Management Canadian Small-Cap Equity FundShort-term investments - 7,012 - 7,012 - 6,547 - 6,547 Equities 167,348 - - 167,348 177,845 - - 177,845 Manulife Equity Tri-Plan Fund (Manulife Asset Management)Short-term investments - 3,375 - 3,375 - 850 - 850 Equities 51,540 - - 51,540 58,285 - - 58,285 Derivative liabilities - (119) - (119) - - - - Manulife SLI US Equity FundShort-term investments - 3,825 - 3,825 - 3,000 - 3,000 Equities 330,508 - - 330,508 286,972 - - 286,972 Derivative liabilities - (2) - (2) - - - - Manulife US Equity Index Fund (Manulife Asset Management)Short-term investments - 3,806 - 3,806 - - - - Equities 400,908 - - 400,908 367,960 - - 367,960 Derivative assets - - - - 13 - - 13 Derivative liabilities (17) - - (17) - - - - Manulife Asset Management US Equity Direct Index Registered FundShort-term investments - 5,396 - 5,396 - - - - Equities 573,999 - - 573,999 489,037 - - 489,037 Derivative assets - - - - 18 - - 18 Derivative liabilities (34) - - (34) - - - - Manulife SLI US Equity Non-Registered FundEquities 7,579 - - 7,579 6,199 - - 6,199 Manulife Asset Management Hedged US Equity Index FundInvestment funds 8,461 - - 8,461 5,135 - - 5,135 Derivative assets - 32 - 32 - - - - Derivative liabilities - - - - - (9) - (9)Manulife SLI International Equity FundInvestment funds 425,821 - - 425,821 367,321 - - 367,321 Manulife SLI Global Absolute Return Strategies FundInvestment funds 294,690 - - 294,690 249,303 - - 249,303 Manulife Standard Life Investments Absolute Return Global Bond Strategies FundInvestment funds 1,067 - - 1,067 1,007 - - 1,007
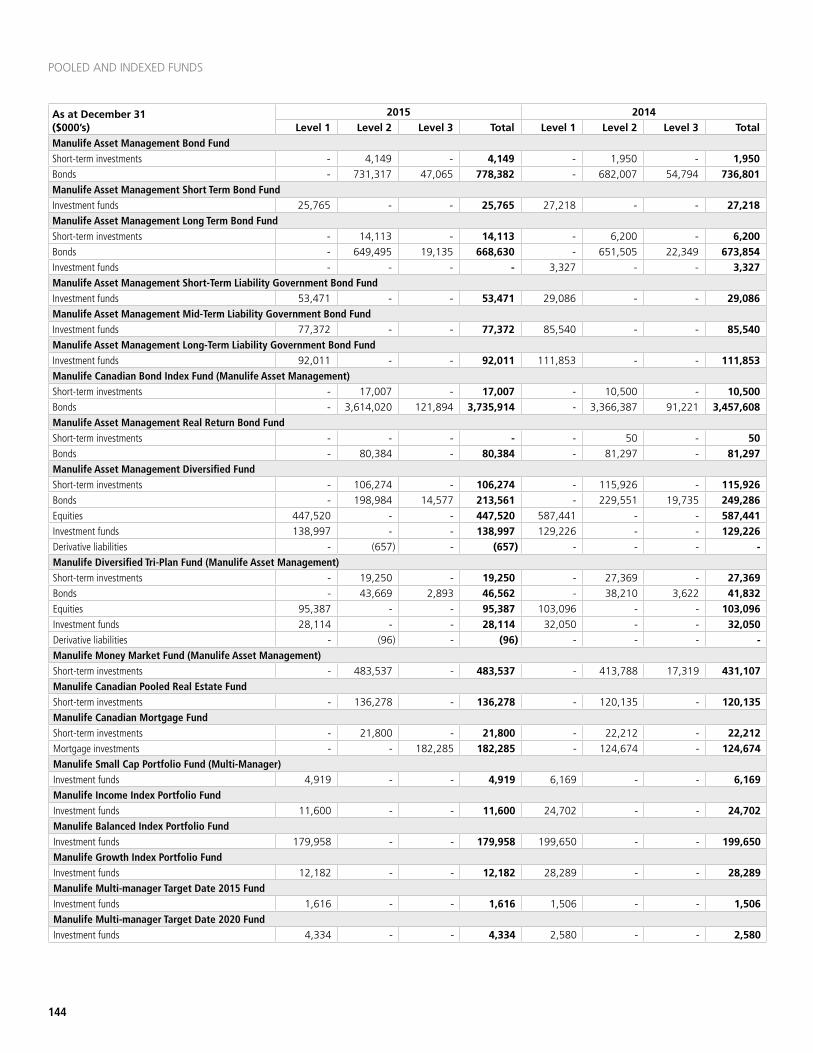
144
POOLED AND INDEXED FUNDS
Manulife Asset Management Bond FundShort-term investments - 4,149 - 4,149 - 1,950 - 1,950 Bonds - 731,317 47,065 778,382 - 682,007 54,794 736,801 Manulife Asset Management Short Term Bond FundInvestment funds 25,765 - - 25,765 27,218 - - 27,218 Manulife Asset Management Long Term Bond FundShort-term investments - 14,113 - 14,113 - 6,200 - 6,200 Bonds - 649,495 19,135 668,630 - 651,505 22,349 673,854 Investment funds - - - - 3,327 - - 3,327 Manulife Asset Management Short-Term Liability Government Bond FundInvestment funds 53,471 - - 53,471 29,086 - - 29,086 Manulife Asset Management Mid-Term Liability Government Bond FundInvestment funds 77,372 - - 77,372 85,540 - - 85,540 Manulife Asset Management Long-Term Liability Government Bond FundInvestment funds 92,011 - - 92,011 111,853 - - 111,853 Manulife Canadian Bond Index Fund (Manulife Asset Management)Short-term investments - 17,007 - 17,007 - 10,500 - 10,500 Bonds - 3,614,020 121,894 3,735,914 - 3,366,387 91,221 3,457,608 Manulife Asset Management Real Return Bond FundShort-term investments - - - - - 50 - 50 Bonds - 80,384 - 80,384 - 81,297 - 81,297 Manulife Asset Management Diversified FundShort-term investments - 106,274 - 106,274 - 115,926 - 115,926 Bonds - 198,984 14,577 213,561 - 229,551 19,735 249,286 Equities 447,520 - - 447,520 587,441 - - 587,441 Investment funds 138,997 - - 138,997 129,226 - - 129,226 Derivative liabilities - (657) - (657) - - - - Manulife Diversified Tri-Plan Fund (Manulife Asset Management)Short-term investments - 19,250 - 19,250 - 27,369 - 27,369 Bonds - 43,669 2,893 46,562 - 38,210 3,622 41,832 Equities 95,387 - - 95,387 103,096 - - 103,096 Investment funds 28,114 - - 28,114 32,050 - - 32,050 Derivative liabilities - (96) - (96) - - - - Manulife Money Market Fund (Manulife Asset Management)Short-term investments - 483,537 - 483,537 - 413,788 17,319 431,107 Manulife Canadian Pooled Real Estate FundShort-term investments - 136,278 - 136,278 - 120,135 - 120,135 Manulife Canadian Mortgage FundShort-term investments - 21,800 - 21,800 - 22,212 - 22,212 Mortgage investments - - 182,285 182,285 - 124,674 - 124,674 Manulife Small Cap Portfolio Fund (Multi-Manager)Investment funds 4,919 - - 4,919 6,169 - - 6,169 Manulife Income Index Portfolio FundInvestment funds 11,600 - - 11,600 24,702 - - 24,702 Manulife Balanced Index Portfolio FundInvestment funds 179,958 - - 179,958 199,650 - - 199,650 Manulife Growth Index Portfolio FundInvestment funds 12,182 - - 12,182 28,289 - - 28,289 Manulife Multi-manager Target Date 2015 FundInvestment funds 1,616 - - 1,616 1,506 - - 1,506 Manulife Multi-manager Target Date 2020 FundInvestment funds 4,334 - - 4,334 2,580 - - 2,580
As at December 31 ($000’s)
2015 2014Level 1 Level 2 Level 3 Total Level 1 Level 2 Level 3 Total
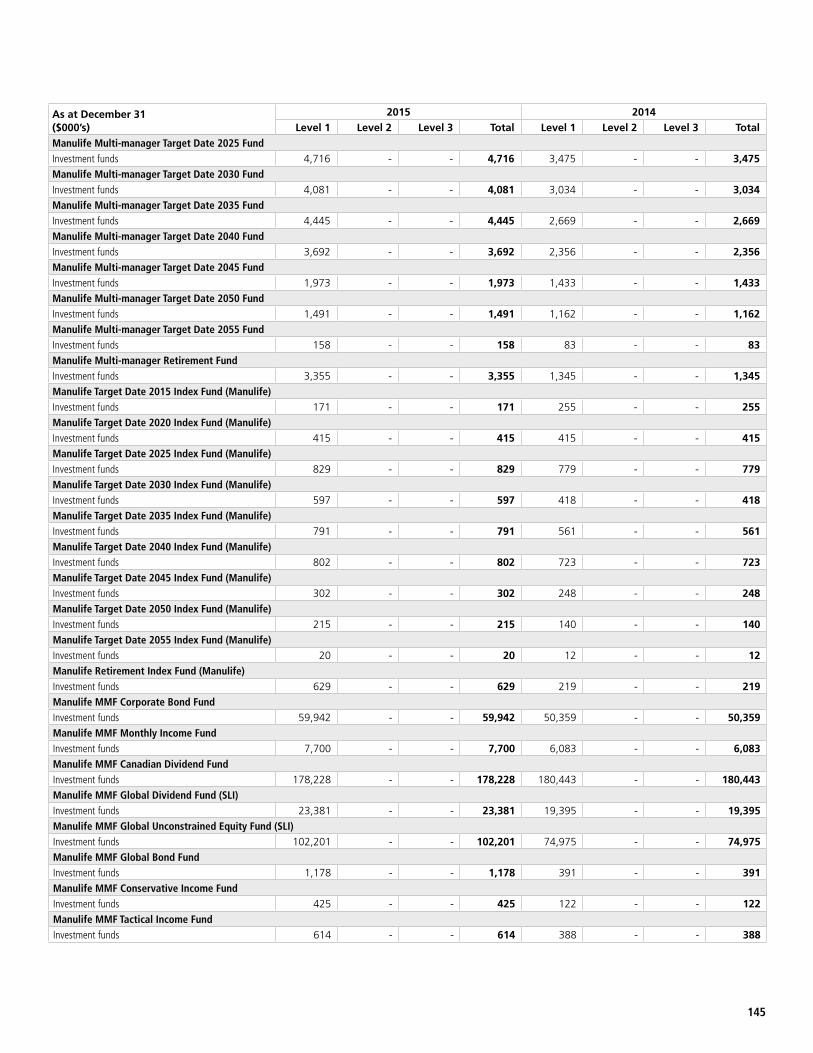
145
Manulife Multi-manager Target Date 2025 FundInvestment funds 4,716 - - 4,716 3,475 - - 3,475 Manulife Multi-manager Target Date 2030 FundInvestment funds 4,081 - - 4,081 3,034 - - 3,034 Manulife Multi-manager Target Date 2035 FundInvestment funds 4,445 - - 4,445 2,669 - - 2,669 Manulife Multi-manager Target Date 2040 FundInvestment funds 3,692 - - 3,692 2,356 - - 2,356 Manulife Multi-manager Target Date 2045 FundInvestment funds 1,973 - - 1,973 1,433 - - 1,433 Manulife Multi-manager Target Date 2050 FundInvestment funds 1,491 - - 1,491 1,162 - - 1,162 Manulife Multi-manager Target Date 2055 FundInvestment funds 158 - - 158 83 - - 83 Manulife Multi-manager Retirement FundInvestment funds 3,355 - - 3,355 1,345 - - 1,345 Manulife Target Date 2015 Index Fund (Manulife)Investment funds 171 - - 171 255 - - 255 Manulife Target Date 2020 Index Fund (Manulife)Investment funds 415 - - 415 415 - - 415 Manulife Target Date 2025 Index Fund (Manulife)Investment funds 829 - - 829 779 - - 779 Manulife Target Date 2030 Index Fund (Manulife)Investment funds 597 - - 597 418 - - 418 Manulife Target Date 2035 Index Fund (Manulife)Investment funds 791 - - 791 561 - - 561 Manulife Target Date 2040 Index Fund (Manulife)Investment funds 802 - - 802 723 - - 723 Manulife Target Date 2045 Index Fund (Manulife)Investment funds 302 - - 302 248 - - 248 Manulife Target Date 2050 Index Fund (Manulife)Investment funds 215 - - 215 140 - - 140 Manulife Target Date 2055 Index Fund (Manulife)Investment funds 20 - - 20 12 - - 12 Manulife Retirement Index Fund (Manulife)Investment funds 629 - - 629 219 - - 219 Manulife MMF Corporate Bond FundInvestment funds 59,942 - - 59,942 50,359 - - 50,359 Manulife MMF Monthly Income FundInvestment funds 7,700 - - 7,700 6,083 - - 6,083 Manulife MMF Canadian Dividend FundInvestment funds 178,228 - - 178,228 180,443 - - 180,443 Manulife MMF Global Dividend Fund (SLI)Investment funds 23,381 - - 23,381 19,395 - - 19,395 Manulife MMF Global Unconstrained Equity Fund (SLI)Investment funds 102,201 - - 102,201 74,975 - - 74,975 Manulife MMF Global Bond FundInvestment funds 1,178 - - 1,178 391 - - 391 Manulife MMF Conservative Income FundInvestment funds 425 - - 425 122 - - 122 Manulife MMF Tactical Income FundInvestment funds 614 - - 614 388 - - 388
As at December 31 ($000’s)
2015 2014Level 1 Level 2 Level 3 Total Level 1 Level 2 Level 3 Total
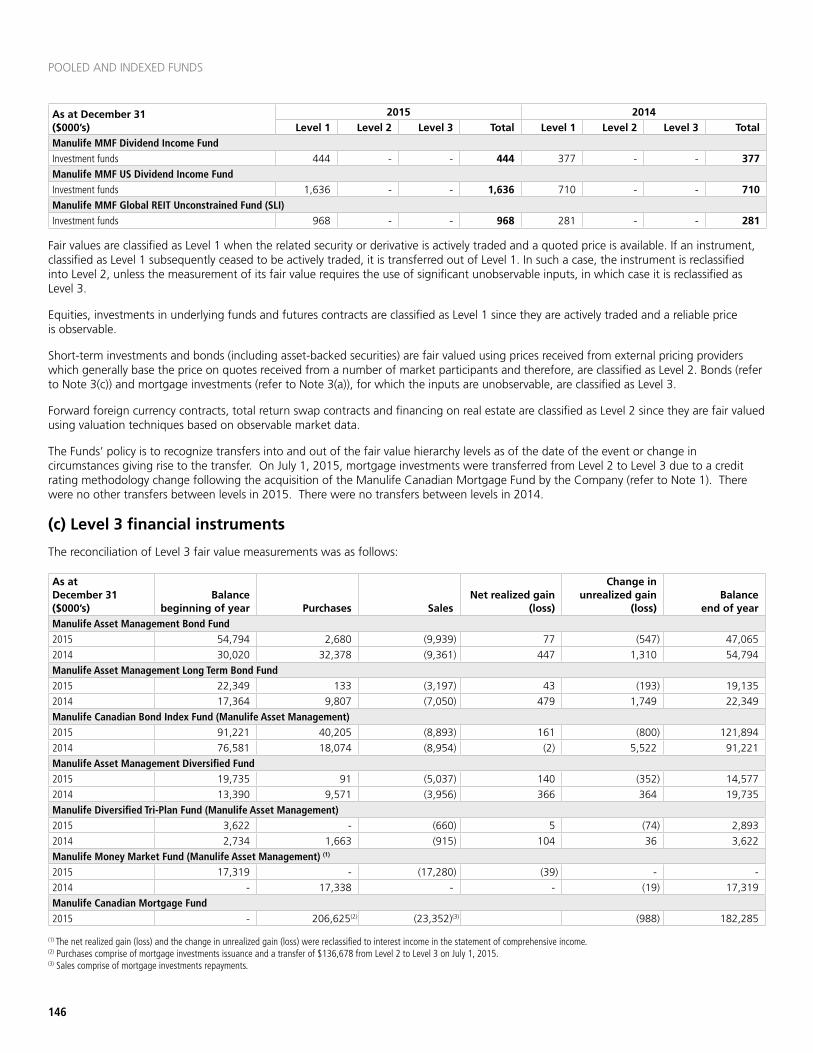
146
POOLED AND INDEXED FUNDS
Manulife MMF Dividend Income FundInvestment funds 444 - - 444 377 - - 377 Manulife MMF US Dividend Income FundInvestment funds 1,636 - - 1,636 710 - - 710 Manulife MMF Global REIT Unconstrained Fund (SLI)Investment funds 968 - - 968 281 - - 281
Fair values are classified as Level 1 when the related security or derivative is actively traded and a quoted price is available. If an instrument, classified as Level 1 subsequently ceased to be actively traded, it is transferred out of Level 1. In such a case, the instrument is reclassified into Level 2, unless the measurement of its fair value requires the use of significant unobservable inputs, in which case it is reclassified as Level 3.
Equities, investments in underlying funds and futures contracts are classified as Level 1 since they are actively traded and a reliable price is observable.
Short-term investments and bonds (including asset-backed securities) are fair valued using prices received from external pricing providers which generally base the price on quotes received from a number of market participants and therefore, are classified as Level 2. Bonds (refer to Note 3(c)) and mortgage investments (refer to Note 3(a)), for which the inputs are unobservable, are classified as Level 3.
Forward foreign currency contracts, total return swap contracts and financing on real estate are classified as Level 2 since they are fair valued using valuation techniques based on observable market data.
The Funds’ policy is to recognize transfers into and out of the fair value hierarchy levels as of the date of the event or change in circumstances giving rise to the transfer. On July 1, 2015, mortgage investments were transferred from Level 2 to Level 3 due to a credit rating methodology change following the acquisition of the Manulife Canadian Mortgage Fund by the Company (refer to Note 1). There were no other transfers between levels in 2015. There were no transfers between levels in 2014.
(c) Level 3 financial instruments
The reconciliation of Level 3 fair value measurements was as follows:
As at December 31 ($000’s)
Balance beginning of year Purchases Sales
Net realized gain (loss)
Change in unrealized gain
(loss)Balance
end of yearManulife Asset Management Bond Fund2015 54,794 2,680 (9,939) 77 (547) 47,065 2014 30,020 32,378 (9,361) 447 1,310 54,794 Manulife Asset Management Long Term Bond Fund2015 22,349 133 (3,197) 43 (193) 19,135 2014 17,364 9,807 (7,050) 479 1,749 22,349 Manulife Canadian Bond Index Fund (Manulife Asset Management)2015 91,221 40,205 (8,893) 161 (800) 121,894 2014 76,581 18,074 (8,954) (2) 5,522 91,221 Manulife Asset Management Diversified Fund2015 19,735 91 (5,037) 140 (352) 14,577 2014 13,390 9,571 (3,956) 366 364 19,735 Manulife Diversified Tri-Plan Fund (Manulife Asset Management)2015 3,622 - (660) 5 (74) 2,893 2014 2,734 1,663 (915) 104 36 3,622 Manulife Money Market Fund (Manulife Asset Management) (1)
2015 17,319 - (17,280) (39) - - 2014 - 17,338 - - (19) 17,319 Manulife Canadian Mortgage Fund2015 - 206,625(2) (23,352)(3) (988) 182,285
(1) The net realized gain (loss) and the change in unrealized gain (loss) were reclassified to interest income in the statement of comprehensive income. (2) Purchases comprise of mortgage investments issuance and a transfer of $136,678 from Level 2 to Level 3 on July 1, 2015. (3) Sales comprise of mortgage investments repayments.
As at December 31 ($000’s)
2015 2014Level 1 Level 2 Level 3 Total Level 1 Level 2 Level 3 Total

147
The change in unrealized gain (loss) attributable to the Level 3 financial instruments held at the reporting date is included in the realized and change in unrealized gain (loss) on investments and derivatives in the statement of comprehensive income.
Some of the Funds hold private bonds for which only single broker quotes are obtained from external parties. The appropriateness of those valuations is reviewed by the Company and a comparison with the previous day’s price is done on a daily basis where any significant variance is investigated. Due to the externally generated nature of the valuations used for Level 3 instruments, the Company has limited access to the significant assumptions and data sources used by the external party. Accordingly, no impact of a change to alternative assumptions has been calculated.
(d) Financial instruments by category
The following table presents the net gain (loss) on derivatives, classified as HFT, included in realized and change in unrealized gain (loss) on investments and derivatives in the statement of comprehensive income for the years ended December 31:
($000’s) 2015 2014Manulife Asset Management Canadian Equity Fund 333 - Manulife Canadian Equity Index Fund (Manulife Asset Management) 317 (145)Manulife Capped Canadian Equity Fund (Manulife Asset Management) 153 - Manulife Canadian Equity Capped Index Fund (Manulife Asset Management) 144 (71)Manulife Asset Management Canadian Small-Cap Equity Fund 32 (1)Manulife Equity Tri-Plan Fund (Manulife Asset Management) 58 (2)Manulife SLI US Equity Fund (29) (2)Manulife US Equity Index Fund (Manulife Asset Management) (944) (61)Manulife Asset Management US Equity Direct Index Registered Fund (679) (124)Manulife Asset Management Hedged US Equity Index Fund 1,247 302 Manulife Asset Management Long Term Bond Fund (25) 642 Manulife Asset Management Diversified Fund 210 106 Manulife Diversified Tri-Plan Fund (Manulife Asset Management) 44 3
4. REAL ESTATE INVESTMENTS
(a) Changes in real estate investments
For the years ended December 31 2015 2014
($000’s) ($000’s)Real estate investments, beginning of year 1,479,730 1,265,950 Purchases 173,009 197,944 Additions-subsequent expenditure 187 170 Tenant incentives, deferred rent and leasing costs 10,716 19,777 Realized and change in unrealized gains (loss) 22,388 25,925 Disposals - (30,036)Real estate investments, end of year 1,686,030 1,479,730 Change in unrealized gain (loss) included in the statement of comprehensive income for real estate investments held at the reporting date 22,388 25,894
Rental income, including chargebacks to tenants, arising from real estate investments during the year ended December 31, 2015 amounted to $155,894 (2014 – $133,951). Direct operating expenses arising in respect of such rented properties during the year ended December 31, 2015 amounted to $74,788 (2014 – $59,610).
(b) Future minimum lease rental receivables
The future minimum lease rental receivables, excluding chargebacks to tenants, under non-cancellable operating leases on real estate investments were as follows:
As at December 31 ($000’s) <1 year 1-5 years >5 years Total2015 92,243 253,400 133,648 479,2912014 83,862 234,037 97,812 415,711
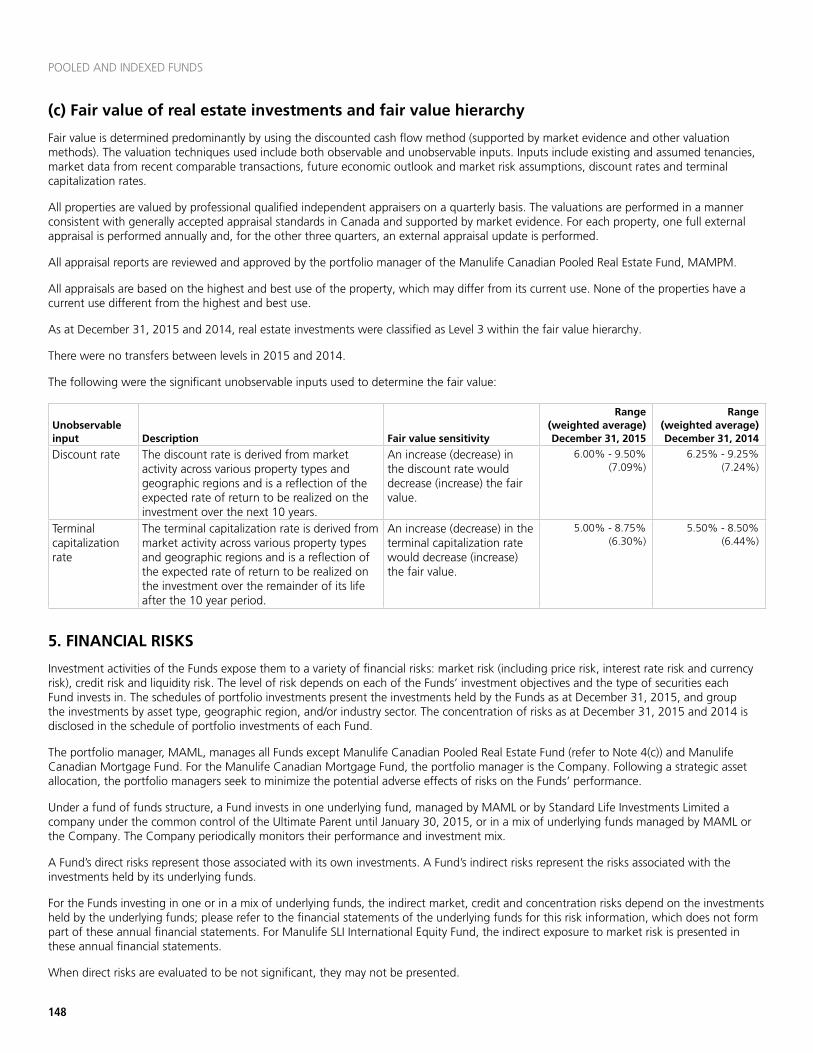
148
POOLED AND INDEXED FUNDS
(c) Fair value of real estate investments and fair value hierarchy
Fair value is determined predominantly by using the discounted cash flow method (supported by market evidence and other valuation methods). The valuation techniques used include both observable and unobservable inputs. Inputs include existing and assumed tenancies, market data from recent comparable transactions, future economic outlook and market risk assumptions, discount rates and terminal capitalization rates.
All properties are valued by professional qualified independent appraisers on a quarterly basis. The valuations are performed in a manner consistent with generally accepted appraisal standards in Canada and supported by market evidence. For each property, one full external appraisal is performed annually and, for the other three quarters, an external appraisal update is performed.
All appraisal reports are reviewed and approved by the portfolio manager of the Manulife Canadian Pooled Real Estate Fund, MAMPM.
All appraisals are based on the highest and best use of the property, which may differ from its current use. None of the properties have a current use different from the highest and best use.
As at December 31, 2015 and 2014, real estate investments were classified as Level 3 within the fair value hierarchy.
There were no transfers between levels in 2015 and 2014.
The following were the significant unobservable inputs used to determine the fair value:
Unobservable input Description Fair value sensitivity
Range (weighted average) December 31, 2015
Range (weighted average) December 31, 2014
Discount rate The discount rate is derived from market activity across various property types and geographic regions and is a reflection of the expected rate of return to be realized on the investment over the next 10 years.
An increase (decrease) in the discount rate would decrease (increase) the fair value.
6.00% - 9.50% (7.09%)
6.25% - 9.25% (7.24%)
Terminal capitalization rate
The terminal capitalization rate is derived from market activity across various property types and geographic regions and is a reflection of the expected rate of return to be realized on the investment over the remainder of its life after the 10 year period.
An increase (decrease) in the terminal capitalization rate would decrease (increase) the fair value.
5.00% - 8.75% (6.30%)
5.50% - 8.50% (6.44%)
5. FINANCIAL RISKS
Investment activities of the Funds expose them to a variety of financial risks: market risk (including price risk, interest rate risk and currency risk), credit risk and liquidity risk. The level of risk depends on each of the Funds’ investment objectives and the type of securities each Fund invests in. The schedules of portfolio investments present the investments held by the Funds as at December 31, 2015, and group the investments by asset type, geographic region, and/or industry sector. The concentration of risks as at December 31, 2015 and 2014 is disclosed in the schedule of portfolio investments of each Fund.
The portfolio manager, MAML, manages all Funds except Manulife Canadian Pooled Real Estate Fund (refer to Note 4(c)) and Manulife Canadian Mortgage Fund. For the Manulife Canadian Mortgage Fund, the portfolio manager is the Company. Following a strategic asset allocation, the portfolio managers seek to minimize the potential adverse effects of risks on the Funds’ performance.
Under a fund of funds structure, a Fund invests in one underlying fund, managed by MAML or by Standard Life Investments Limited a company under the common control of the Ultimate Parent until January 30, 2015, or in a mix of underlying funds managed by MAML or the Company. The Company periodically monitors their performance and investment mix.
A Fund’s direct risks represent those associated with its own investments. A Fund’s indirect risks represent the risks associated with the investments held by its underlying funds.
For the Funds investing in one or in a mix of underlying funds, the indirect market, credit and concentration risks depend on the investments held by the underlying funds; please refer to the financial statements of the underlying funds for this risk information, which does not form part of these annual financial statements. For Manulife SLI International Equity Fund, the indirect exposure to market risk is presented in these annual financial statements.
When direct risks are evaluated to be not significant, they may not be presented.
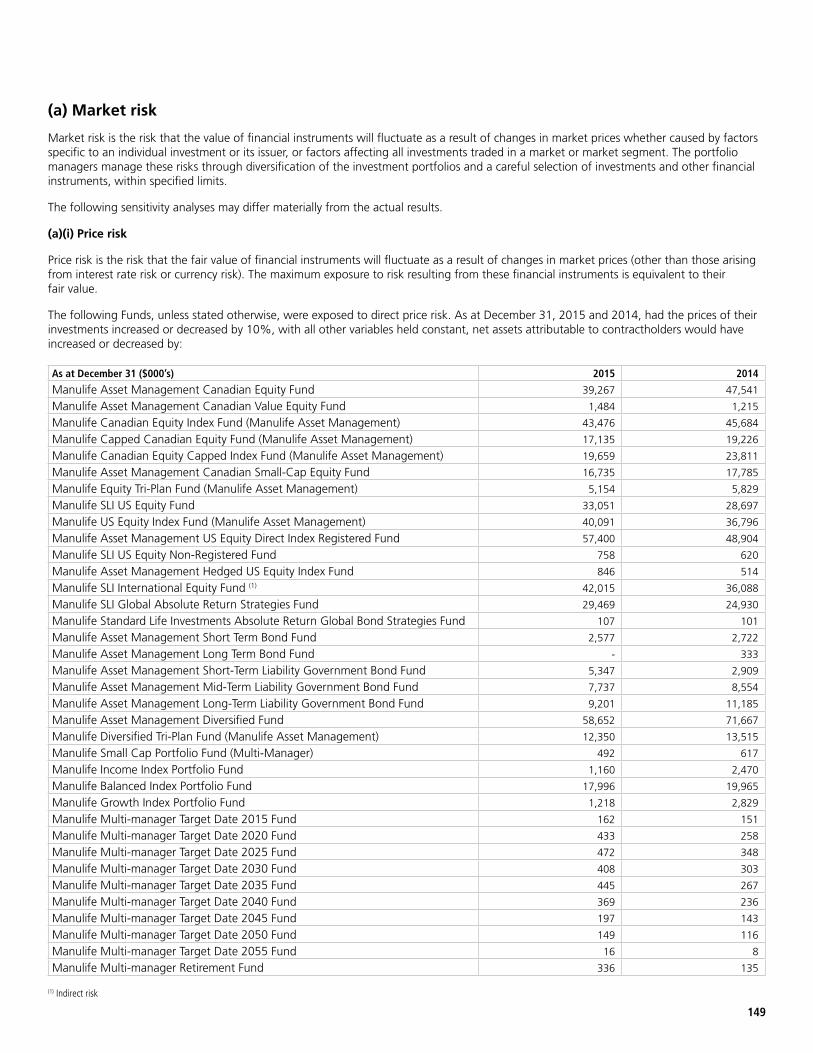
149
(a) Market risk
Market risk is the risk that the value of financial instruments will fluctuate as a result of changes in market prices whether caused by factors specific to an individual investment or its issuer, or factors affecting all investments traded in a market or market segment. The portfolio managers manage these risks through diversification of the investment portfolios and a careful selection of investments and other financial instruments, within specified limits.
The following sensitivity analyses may differ materially from the actual results.
(a)(i) Price risk
Price risk is the risk that the fair value of financial instruments will fluctuate as a result of changes in market prices (other than those arising from interest rate risk or currency risk). The maximum exposure to risk resulting from these financial instruments is equivalent to their fair value.
The following Funds, unless stated otherwise, were exposed to direct price risk. As at December 31, 2015 and 2014, had the prices of their investments increased or decreased by 10%, with all other variables held constant, net assets attributable to contractholders would have increased or decreased by:
As at December 31 ($000’s) 2015 2014
Manulife Asset Management Canadian Equity Fund 39,267 47,541
Manulife Asset Management Canadian Value Equity Fund 1,484 1,215
Manulife Canadian Equity Index Fund (Manulife Asset Management) 43,476 45,684
Manulife Capped Canadian Equity Fund (Manulife Asset Management) 17,135 19,226
Manulife Canadian Equity Capped Index Fund (Manulife Asset Management) 19,659 23,811
Manulife Asset Management Canadian Small-Cap Equity Fund 16,735 17,785
Manulife Equity Tri-Plan Fund (Manulife Asset Management) 5,154 5,829
Manulife SLI US Equity Fund 33,051 28,697
Manulife US Equity Index Fund (Manulife Asset Management) 40,091 36,796
Manulife Asset Management US Equity Direct Index Registered Fund 57,400 48,904
Manulife SLI US Equity Non-Registered Fund 758 620
Manulife Asset Management Hedged US Equity Index Fund 846 514
Manulife SLI International Equity Fund (1) 42,015 36,088
Manulife SLI Global Absolute Return Strategies Fund 29,469 24,930
Manulife Standard Life Investments Absolute Return Global Bond Strategies Fund 107 101
Manulife Asset Management Short Term Bond Fund 2,577 2,722
Manulife Asset Management Long Term Bond Fund - 333
Manulife Asset Management Short-Term Liability Government Bond Fund 5,347 2,909
Manulife Asset Management Mid-Term Liability Government Bond Fund 7,737 8,554
Manulife Asset Management Long-Term Liability Government Bond Fund 9,201 11,185
Manulife Asset Management Diversified Fund 58,652 71,667
Manulife Diversified Tri-Plan Fund (Manulife Asset Management) 12,350 13,515
Manulife Small Cap Portfolio Fund (Multi-Manager) 492 617
Manulife Income Index Portfolio Fund 1,160 2,470
Manulife Balanced Index Portfolio Fund 17,996 19,965
Manulife Growth Index Portfolio Fund 1,218 2,829
Manulife Multi-manager Target Date 2015 Fund 162 151
Manulife Multi-manager Target Date 2020 Fund 433 258
Manulife Multi-manager Target Date 2025 Fund 472 348
Manulife Multi-manager Target Date 2030 Fund 408 303
Manulife Multi-manager Target Date 2035 Fund 445 267
Manulife Multi-manager Target Date 2040 Fund 369 236
Manulife Multi-manager Target Date 2045 Fund 197 143
Manulife Multi-manager Target Date 2050 Fund 149 116
Manulife Multi-manager Target Date 2055 Fund 16 8
Manulife Multi-manager Retirement Fund 336 135 (1) Indirect risk
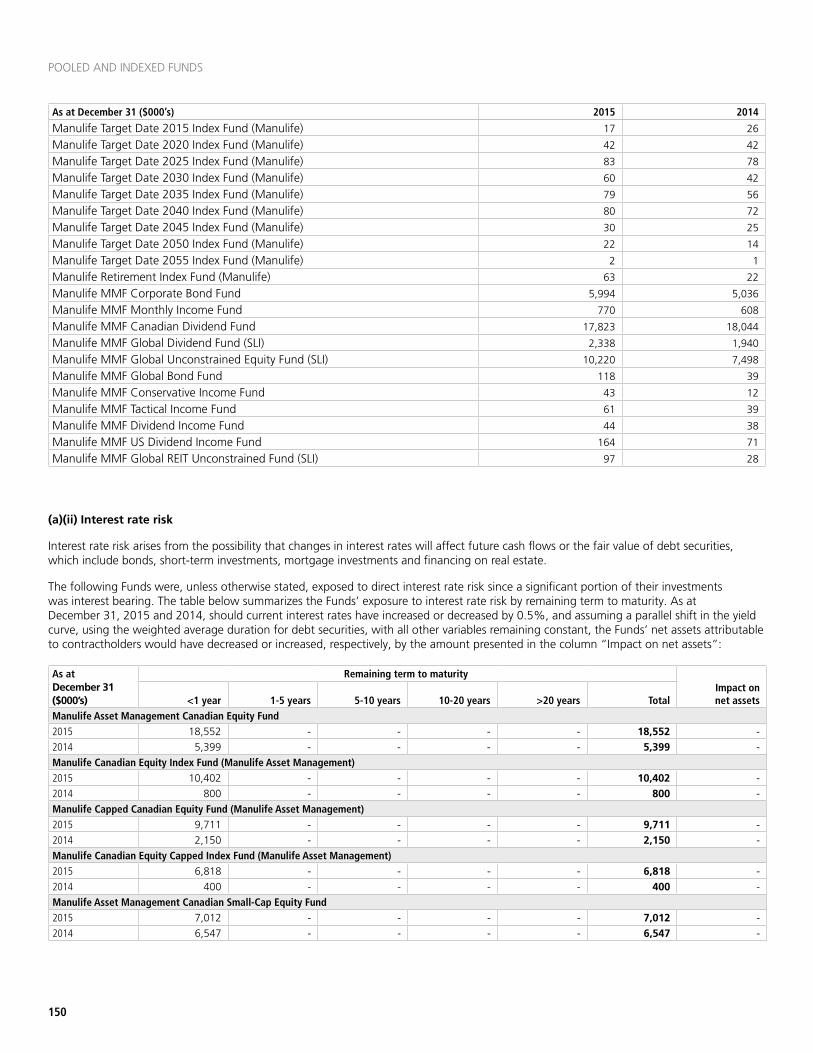
150
POOLED AND INDEXED FUNDS
Manulife Target Date 2015 Index Fund (Manulife) 17 26
Manulife Target Date 2020 Index Fund (Manulife) 42 42
Manulife Target Date 2025 Index Fund (Manulife) 83 78
Manulife Target Date 2030 Index Fund (Manulife) 60 42
Manulife Target Date 2035 Index Fund (Manulife) 79 56
Manulife Target Date 2040 Index Fund (Manulife) 80 72
Manulife Target Date 2045 Index Fund (Manulife) 30 25
Manulife Target Date 2050 Index Fund (Manulife) 22 14
Manulife Target Date 2055 Index Fund (Manulife) 2 1
Manulife Retirement Index Fund (Manulife) 63 22
Manulife MMF Corporate Bond Fund 5,994 5,036
Manulife MMF Monthly Income Fund 770 608
Manulife MMF Canadian Dividend Fund 17,823 18,044
Manulife MMF Global Dividend Fund (SLI) 2,338 1,940
Manulife MMF Global Unconstrained Equity Fund (SLI) 10,220 7,498
Manulife MMF Global Bond Fund 118 39
Manulife MMF Conservative Income Fund 43 12
Manulife MMF Tactical Income Fund 61 39
Manulife MMF Dividend Income Fund 44 38
Manulife MMF US Dividend Income Fund 164 71
Manulife MMF Global REIT Unconstrained Fund (SLI) 97 28
(a)(ii) Interest rate risk
Interest rate risk arises from the possibility that changes in interest rates will affect future cash flows or the fair value of debt securities, which include bonds, short-term investments, mortgage investments and financing on real estate.
The following Funds were, unless otherwise stated, exposed to direct interest rate risk since a significant portion of their investments was interest bearing. The table below summarizes the Funds’ exposure to interest rate risk by remaining term to maturity. As at December 31, 2015 and 2014, should current interest rates have increased or decreased by 0.5%, and assuming a parallel shift in the yield curve, using the weighted average duration for debt securities, with all other variables remaining constant, the Funds’ net assets attributable to contractholders would have decreased or increased, respectively, by the amount presented in the column “Impact on net assets”:
As at December 31 ($000’s)
Remaining term to maturityImpact on net assets<1 year 1-5 years 5-10 years 10-20 years >20 years Total
Manulife Asset Management Canadian Equity Fund2015 18,552 - - - - 18,552 - 2014 5,399 - - - - 5,399 - Manulife Canadian Equity Index Fund (Manulife Asset Management)2015 10,402 - - - - 10,402 - 2014 800 - - - - 800 - Manulife Capped Canadian Equity Fund (Manulife Asset Management)2015 9,711 - - - - 9,711 - 2014 2,150 - - - - 2,150 - Manulife Canadian Equity Capped Index Fund (Manulife Asset Management)2015 6,818 - - - - 6,818 - 2014 400 - - - - 400 - Manulife Asset Management Canadian Small-Cap Equity Fund2015 7,012 - - - - 7,012 - 2014 6,547 - - - - 6,547 -
As at December 31 ($000’s) 2015 2014
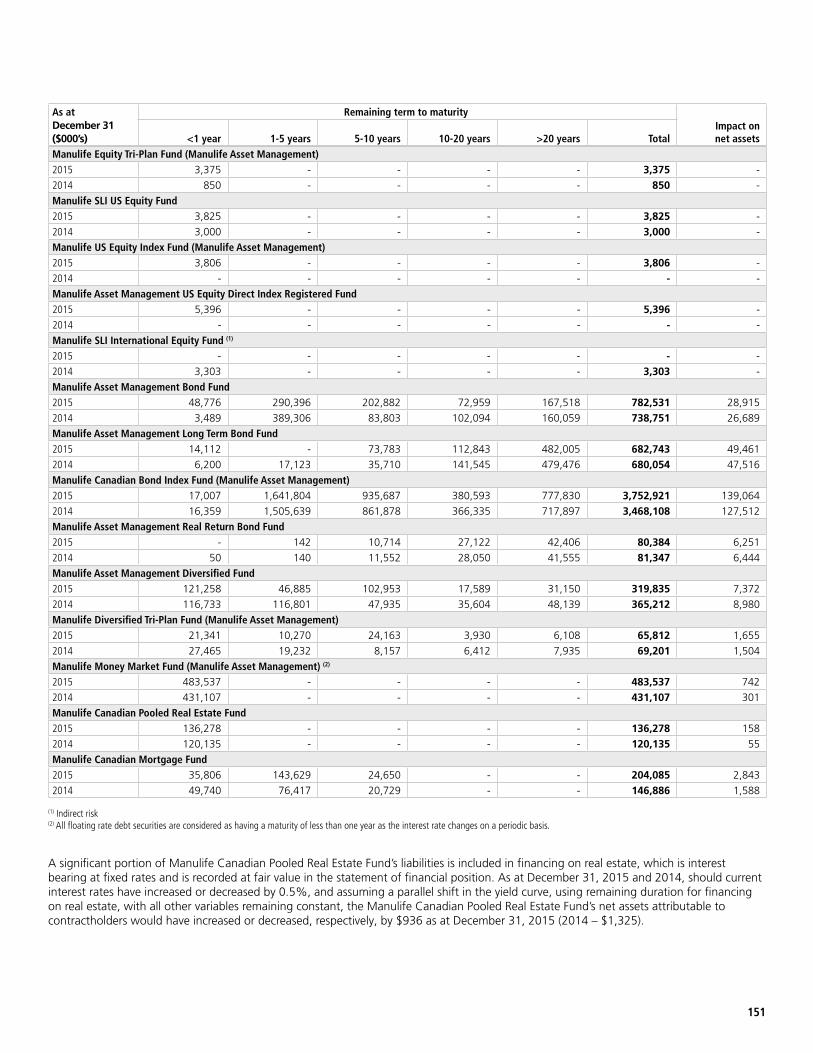
151
Manulife Equity Tri-Plan Fund (Manulife Asset Management)2015 3,375 - - - - 3,375 - 2014 850 - - - - 850 - Manulife SLI US Equity Fund2015 3,825 - - - - 3,825 - 2014 3,000 - - - - 3,000 - Manulife US Equity Index Fund (Manulife Asset Management)2015 3,806 - - - - 3,806 - 2014 - - - - - - - Manulife Asset Management US Equity Direct Index Registered Fund2015 5,396 - - - - 5,396 - 2014 - - - - - - - Manulife SLI International Equity Fund (1)
2015 - - - - - - - 2014 3,303 - - - - 3,303 - Manulife Asset Management Bond Fund2015 48,776 290,396 202,882 72,959 167,518 782,531 28,915 2014 3,489 389,306 83,803 102,094 160,059 738,751 26,689 Manulife Asset Management Long Term Bond Fund2015 14,112 - 73,783 112,843 482,005 682,743 49,461 2014 6,200 17,123 35,710 141,545 479,476 680,054 47,516 Manulife Canadian Bond Index Fund (Manulife Asset Management)2015 17,007 1,641,804 935,687 380,593 777,830 3,752,921 139,064 2014 16,359 1,505,639 861,878 366,335 717,897 3,468,108 127,512 Manulife Asset Management Real Return Bond Fund2015 - 142 10,714 27,122 42,406 80,384 6,251 2014 50 140 11,552 28,050 41,555 81,347 6,444 Manulife Asset Management Diversified Fund2015 121,258 46,885 102,953 17,589 31,150 319,835 7,372 2014 116,733 116,801 47,935 35,604 48,139 365,212 8,980 Manulife Diversified Tri-Plan Fund (Manulife Asset Management)2015 21,341 10,270 24,163 3,930 6,108 65,812 1,655 2014 27,465 19,232 8,157 6,412 7,935 69,201 1,504 Manulife Money Market Fund (Manulife Asset Management) (2)
2015 483,537 - - - - 483,537 742 2014 431,107 - - - - 431,107 301 Manulife Canadian Pooled Real Estate Fund2015 136,278 - - - - 136,278 158 2014 120,135 - - - - 120,135 55 Manulife Canadian Mortgage Fund2015 35,806 143,629 24,650 - - 204,085 2,843 2014 49,740 76,417 20,729 - - 146,886 1,588
(1) Indirect risk (2) All floating rate debt securities are considered as having a maturity of less than one year as the interest rate changes on a periodic basis.
A significant portion of Manulife Canadian Pooled Real Estate Fund’s liabilities is included in financing on real estate, which is interest bearing at fixed rates and is recorded at fair value in the statement of financial position. As at December 31, 2015 and 2014, should current interest rates have increased or decreased by 0.5%, and assuming a parallel shift in the yield curve, using remaining duration for financing on real estate, with all other variables remaining constant, the Manulife Canadian Pooled Real Estate Fund’s net assets attributable to contractholders would have increased or decreased, respectively, by $936 as at December 31, 2015 (2014 – $1,325).
As at December 31 ($000’s)
Remaining term to maturityImpact on net assets<1 year 1-5 years 5-10 years 10-20 years >20 years Total
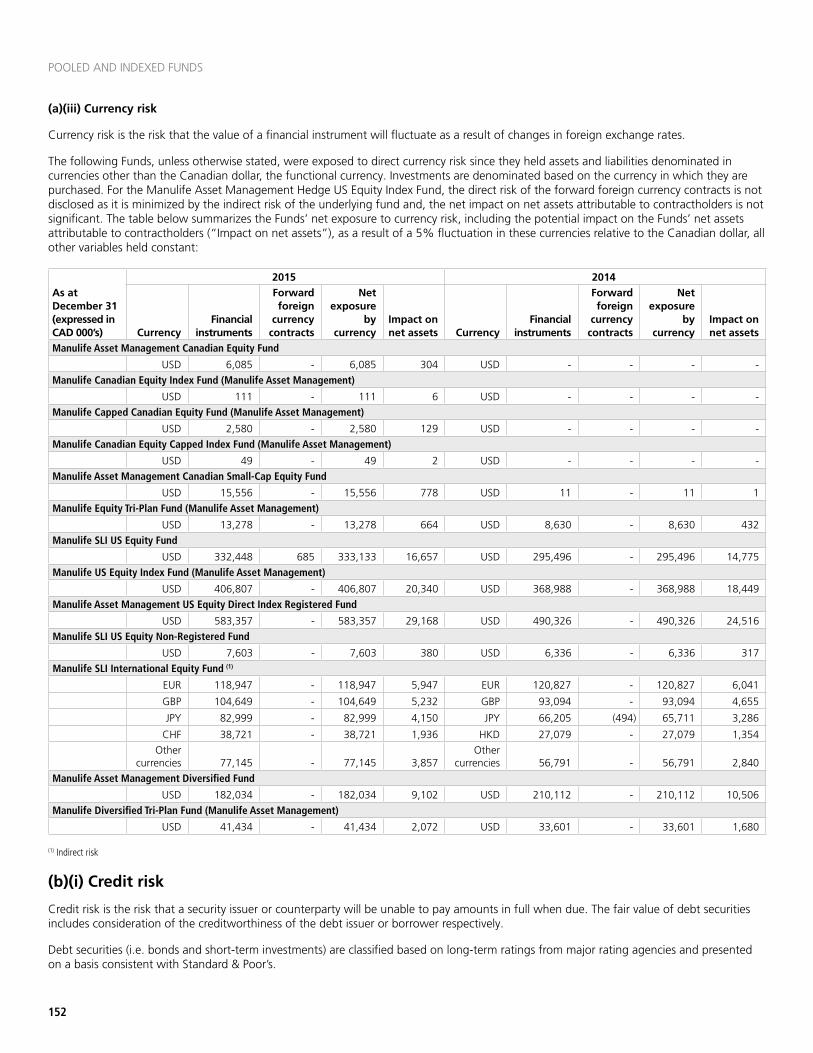
152
POOLED AND INDEXED FUNDS
(a)(iii) Currency risk
Currency risk is the risk that the value of a financial instrument will fluctuate as a result of changes in foreign exchange rates.
The following Funds, unless otherwise stated, were exposed to direct currency risk since they held assets and liabilities denominated in currencies other than the Canadian dollar, the functional currency. Investments are denominated based on the currency in which they are purchased. For the Manulife Asset Management Hedge US Equity Index Fund, the direct risk of the forward foreign currency contracts is not disclosed as it is minimized by the indirect risk of the underlying fund and, the net impact on net assets attributable to contractholders is not significant. The table below summarizes the Funds’ net exposure to currency risk, including the potential impact on the Funds’ net assets attributable to contractholders (“Impact on net assets”), as a result of a 5% fluctuation in these currencies relative to the Canadian dollar, all other variables held constant:
As at December 31 (expressed in CAD 000’s)
2015 2014
CurrencyFinancial
instruments
Forward foreign
currency contracts
Net exposure
by currency
Impact on net assets Currency
Financial instruments
Forward foreign
currency contracts
Net exposure
by currency
Impact on net assets
Manulife Asset Management Canadian Equity Fund
USD 6,085 - 6,085 304 USD - - - - Manulife Canadian Equity Index Fund (Manulife Asset Management)
USD 111 - 111 6 USD - - - - Manulife Capped Canadian Equity Fund (Manulife Asset Management)
USD 2,580 - 2,580 129 USD - - - - Manulife Canadian Equity Capped Index Fund (Manulife Asset Management)
USD 49 - 49 2 USD - - - - Manulife Asset Management Canadian Small-Cap Equity Fund
USD 15,556 - 15,556 778 USD 11 - 11 1 Manulife Equity Tri-Plan Fund (Manulife Asset Management)
USD 13,278 - 13,278 664 USD 8,630 - 8,630 432 Manulife SLI US Equity Fund
USD 332,448 685 333,133 16,657 USD 295,496 - 295,496 14,775 Manulife US Equity Index Fund (Manulife Asset Management)
USD 406,807 - 406,807 20,340 USD 368,988 - 368,988 18,449 Manulife Asset Management US Equity Direct Index Registered Fund
USD 583,357 - 583,357 29,168 USD 490,326 - 490,326 24,516 Manulife SLI US Equity Non-Registered Fund
USD 7,603 - 7,603 380 USD 6,336 - 6,336 317 Manulife SLI International Equity Fund (1)
EUR 118,947 - 118,947 5,947 EUR 120,827 - 120,827 6,041
GBP 104,649 - 104,649 5,232 GBP 93,094 - 93,094 4,655
JPY 82,999 - 82,999 4,150 JPY 66,205 (494) 65,711 3,286
CHF 38,721 - 38,721 1,936 HKD 27,079 - 27,079 1,354 Other
currencies 77,145 - 77,145 3,857 Other
currencies 56,791 - 56,791 2,840 Manulife Asset Management Diversified Fund
USD 182,034 - 182,034 9,102 USD 210,112 - 210,112 10,506 Manulife Diversified Tri-Plan Fund (Manulife Asset Management)
USD 41,434 - 41,434 2,072 USD 33,601 - 33,601 1,680
(1) Indirect risk
(b)(i) Credit risk
Credit risk is the risk that a security issuer or counterparty will be unable to pay amounts in full when due. The fair value of debt securities includes consideration of the creditworthiness of the debt issuer or borrower respectively.
Debt securities (i.e. bonds and short-term investments) are classified based on long-term ratings from major rating agencies and presented on a basis consistent with Standard & Poor’s.

153
The Funds’ credit risk exposure is derived from their holdings in debt securities, forward foreign currency contracts, mortgage investments or other assets. In all cases, the carrying amount represents the maximum exposure to credit risk.
The direct credit risk exposure of debt securities by credit rating was as follows:
Credit ratings (%) of debt securities as at December 31 AAA AA A BBB Total
Manulife Asset Management Canadian Equity Fund
2015 38 62 - - 1002014 84 8 8 - 100Manulife Canadian Equity Index Fund (Manulife Asset Management)2015 76 24 - - 1002014 - 50 50 - 100Manulife Capped Canadian Equity Fund (Manulife Asset Management)2015 49 51 - - 1002014 - 50 50 - 100Manulife Canadian Equity Capped Index Fund (Manulife Asset Management)2015 - 100 - - 1002014 - 50 50 - 100Manulife Asset Management Canadian Small-Cap Equity Fund2015 98 2 - - 1002014 70 15 15 - 100Manulife Equity Tri-Plan Fund (Manulife Asset Management)2015 - 100 - - 1002014 - 94 6 - 100Manulife SLI US Equity Fund2015 - - 100 - 1002014 - 50 50 - 100Manulife US Equity Index Fund (Manulife Asset Management)2015 100 - - - 1002014 - - - - - Manulife Asset Management US Equity Direct Index Registered Fund2015 - 100 - - 1002014 - - - - - Manulife Asset Management Bond Fund2015 25 34 21 20 1002014 25 28 28 19 100Manulife Asset Management Long Term Bond Fund2015 32 28 30 10 1002014 21 30 38 11 100Manulife Canadian Bond Index Fund (Manulife Asset Management)2015 43 25 22 10 1002014 44 24 23 9 100Manulife Asset Management Real Return Bond Fund2015 88 5 7 - 1002014 88 5 7 - 100Manulife Asset Management Diversified Fund2015 56 23 9 12 1002014 23 29 35 13 100Manulife Diversified Tri-Plan Fund (Manulife Asset Management)2015 57 22 9 12 1002014 24 37 27 12 100
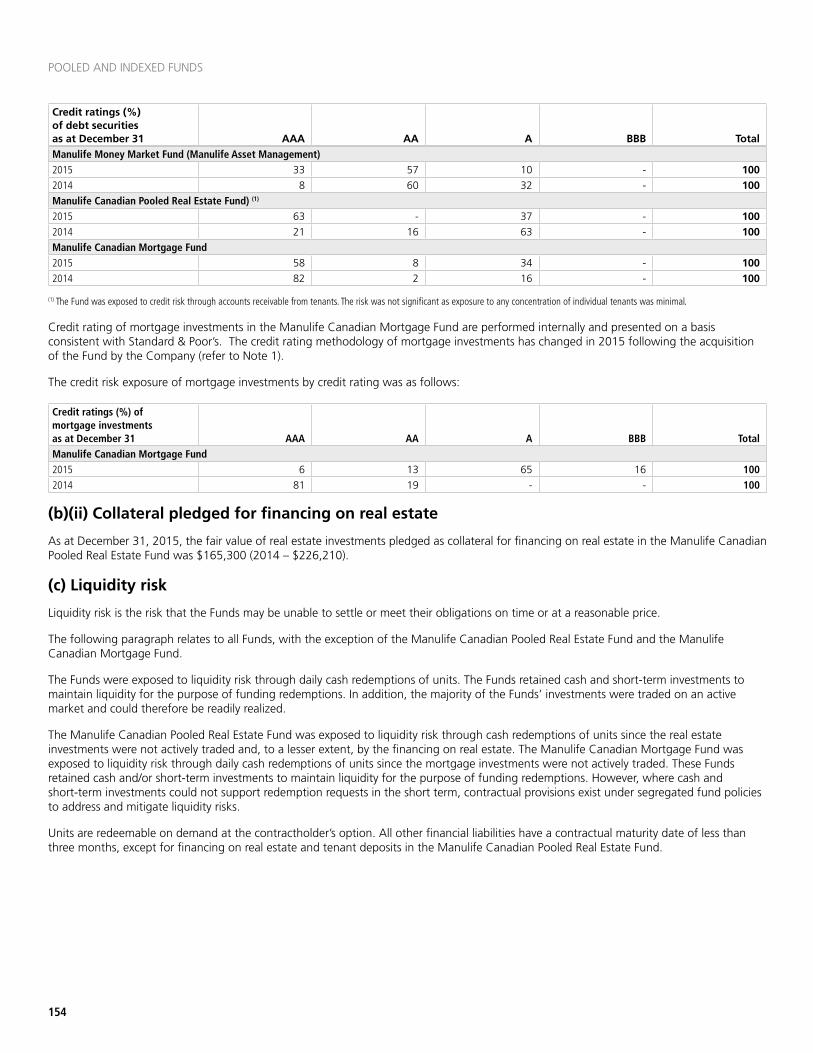
154
POOLED AND INDEXED FUNDS
Manulife Money Market Fund (Manulife Asset Management)2015 33 57 10 - 1002014 8 60 32 - 100Manulife Canadian Pooled Real Estate Fund) (1)
2015 63 - 37 - 1002014 21 16 63 - 100Manulife Canadian Mortgage Fund2015 58 8 34 - 1002014 82 2 16 - 100
(1) The Fund was exposed to credit risk through accounts receivable from tenants. The risk was not significant as exposure to any concentration of individual tenants was minimal.
Credit rating of mortgage investments in the Manulife Canadian Mortgage Fund are performed internally and presented on a basis consistent with Standard & Poor’s. The credit rating methodology of mortgage investments has changed in 2015 following the acquisition of the Fund by the Company (refer to Note 1).
The credit risk exposure of mortgage investments by credit rating was as follows:
Credit ratings (%) of mortgage investments as at December 31 AAA AA A BBB TotalManulife Canadian Mortgage Fund2015 6 13 65 16 1002014 81 19 - - 100
(b)(ii) Collateral pledged for financing on real estate
As at December 31, 2015, the fair value of real estate investments pledged as collateral for financing on real estate in the Manulife Canadian Pooled Real Estate Fund was $165,300 (2014 – $226,210).
(c) Liquidity risk
Liquidity risk is the risk that the Funds may be unable to settle or meet their obligations on time or at a reasonable price.
The following paragraph relates to all Funds, with the exception of the Manulife Canadian Pooled Real Estate Fund and the Manulife Canadian Mortgage Fund.
The Funds were exposed to liquidity risk through daily cash redemptions of units. The Funds retained cash and short-term investments to maintain liquidity for the purpose of funding redemptions. In addition, the majority of the Funds’ investments were traded on an active market and could therefore be readily realized.
The Manulife Canadian Pooled Real Estate Fund was exposed to liquidity risk through cash redemptions of units since the real estate investments were not actively traded and, to a lesser extent, by the financing on real estate. The Manulife Canadian Mortgage Fund was exposed to liquidity risk through daily cash redemptions of units since the mortgage investments were not actively traded. These Funds retained cash and/or short-term investments to maintain liquidity for the purpose of funding redemptions. However, where cash and short-term investments could not support redemption requests in the short term, contractual provisions exist under segregated fund policies to address and mitigate liquidity risks.
Units are redeemable on demand at the contractholder’s option. All other financial liabilities have a contractual maturity date of less than three months, except for financing on real estate and tenant deposits in the Manulife Canadian Pooled Real Estate Fund.
Credit ratings (%) of debt securities as at December 31 AAA AA A BBB Total
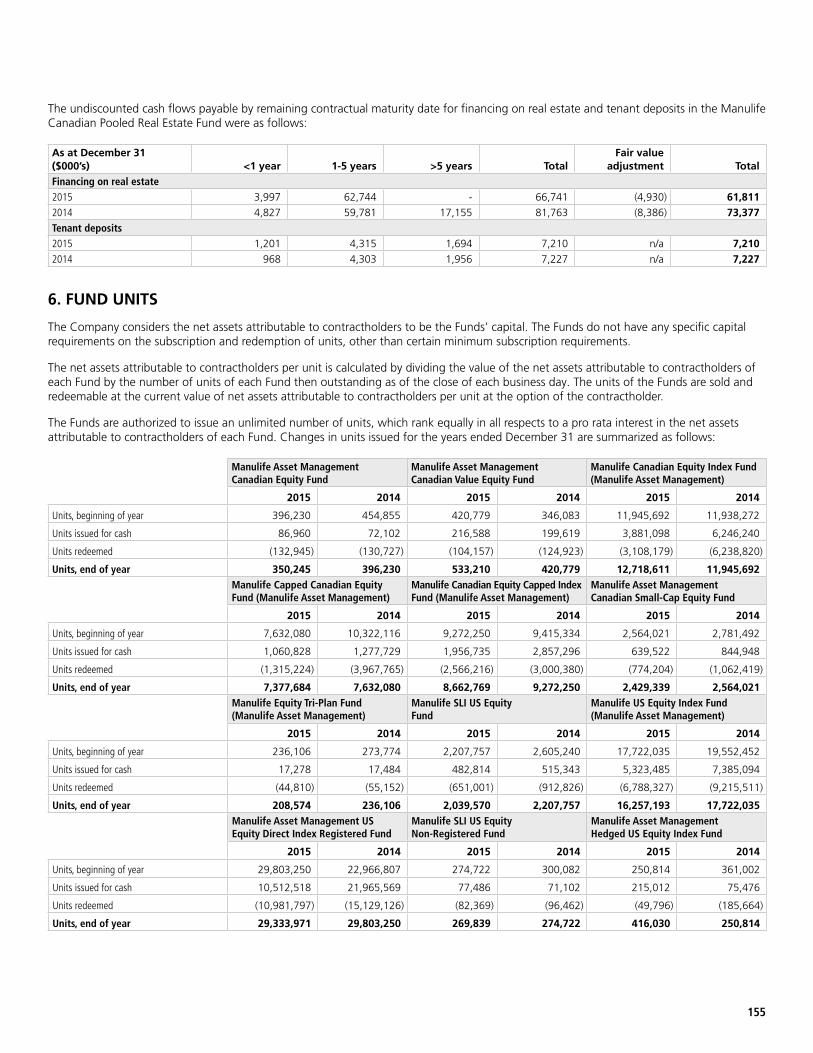
155
The undiscounted cash flows payable by remaining contractual maturity date for financing on real estate and tenant deposits in the Manulife Canadian Pooled Real Estate Fund were as follows:
As at December 31 ($000’s) <1 year 1-5 years >5 years Total
Fair value adjustment Total
Financing on real estate2015 3,997 62,744 - 66,741 (4,930) 61,8112014 4,827 59,781 17,155 81,763 (8,386) 73,377Tenant deposits2015 1,201 4,315 1,694 7,210 n/a 7,2102014 968 4,303 1,956 7,227 n/a 7,227
6. FUND UNITS
The Company considers the net assets attributable to contractholders to be the Funds’ capital. The Funds do not have any specific capital requirements on the subscription and redemption of units, other than certain minimum subscription requirements.
The net assets attributable to contractholders per unit is calculated by dividing the value of the net assets attributable to contractholders of each Fund by the number of units of each Fund then outstanding as of the close of each business day. The units of the Funds are sold and redeemable at the current value of net assets attributable to contractholders per unit at the option of the contractholder.
The Funds are authorized to issue an unlimited number of units, which rank equally in all respects to a pro rata interest in the net assets attributable to contractholders of each Fund. Changes in units issued for the years ended December 31 are summarized as follows:
Manulife Asset Management Canadian Equity Fund
Manulife Asset Management Canadian Value Equity Fund
Manulife Canadian Equity Index Fund (Manulife Asset Management)
2015 2014 2015 2014 2015 2014
Units, beginning of year 396,230 454,855 420,779 346,083 11,945,692 11,938,272
Units issued for cash 86,960 72,102 216,588 199,619 3,881,098 6,246,240
Units redeemed (132,945) (130,727) (104,157) (124,923) (3,108,179) (6,238,820)
Units, end of year 350,245 396,230 533,210 420,779 12,718,611 11,945,692 Manulife Capped Canadian Equity Fund (Manulife Asset Management)
Manulife Canadian Equity Capped Index Fund (Manulife Asset Management)
Manulife Asset Management Canadian Small-Cap Equity Fund
2015 2014 2015 2014 2015 2014
Units, beginning of year 7,632,080 10,322,116 9,272,250 9,415,334 2,564,021 2,781,492
Units issued for cash 1,060,828 1,277,729 1,956,735 2,857,296 639,522 844,948
Units redeemed (1,315,224) (3,967,765) (2,566,216) (3,000,380) (774,204) (1,062,419)
Units, end of year 7,377,684 7,632,080 8,662,769 9,272,250 2,429,339 2,564,021 Manulife Equity Tri-Plan Fund (Manulife Asset Management)
Manulife SLI US Equity Fund
Manulife US Equity Index Fund (Manulife Asset Management)
2015 2014 2015 2014 2015 2014
Units, beginning of year 236,106 273,774 2,207,757 2,605,240 17,722,035 19,552,452
Units issued for cash 17,278 17,484 482,814 515,343 5,323,485 7,385,094
Units redeemed (44,810) (55,152) (651,001) (912,826) (6,788,327) (9,215,511)
Units, end of year 208,574 236,106 2,039,570 2,207,757 16,257,193 17,722,035 Manulife Asset Management US Equity Direct Index Registered Fund
Manulife SLI US Equity Non-Registered Fund
Manulife Asset Management Hedged US Equity Index Fund
2015 2014 2015 2014 2015 2014
Units, beginning of year 29,803,250 22,966,807 274,722 300,082 250,814 361,002
Units issued for cash 10,512,518 21,965,569 77,486 71,102 215,012 75,476
Units redeemed (10,981,797) (15,129,126) (82,369) (96,462) (49,796) (185,664)
Units, end of year 29,333,971 29,803,250 269,839 274,722 416,030 250,814
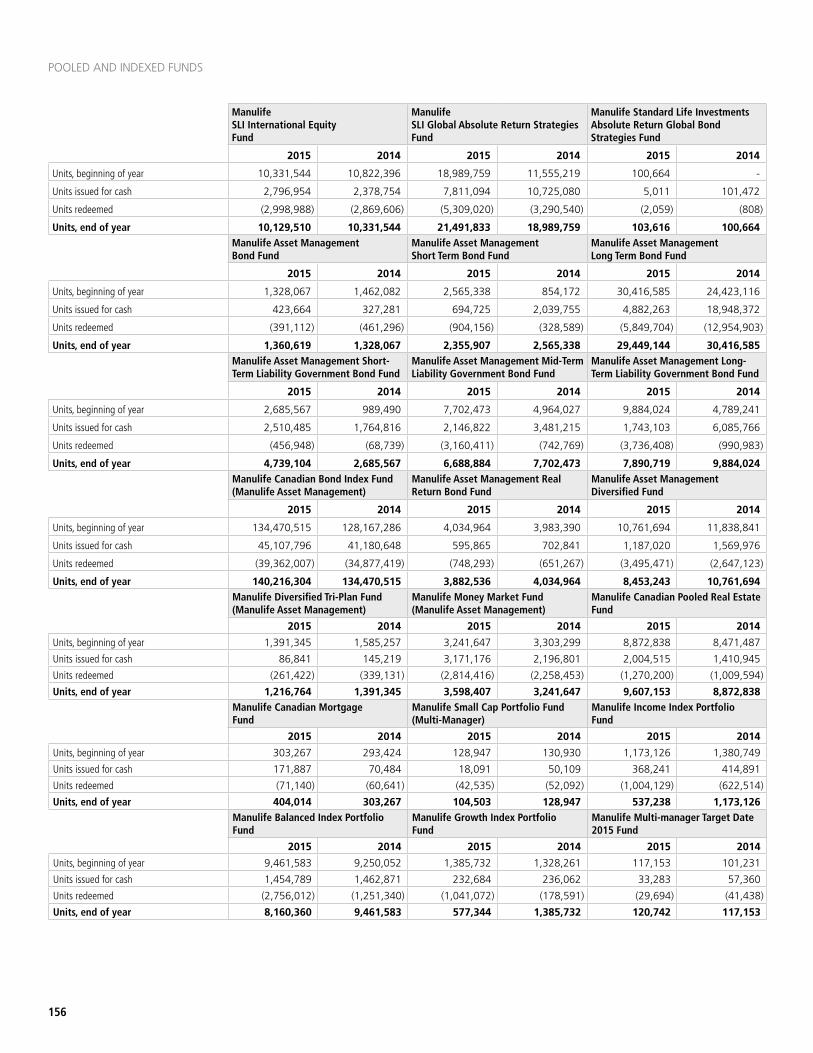
156
POOLED AND INDEXED FUNDS
Manulife SLI International Equity Fund
Manulife SLI Global Absolute Return Strategies Fund
Manulife Standard Life Investments Absolute Return Global Bond Strategies Fund
2015 2014 2015 2014 2015 2014
Units, beginning of year 10,331,544 10,822,396 18,989,759 11,555,219 100,664 -
Units issued for cash 2,796,954 2,378,754 7,811,094 10,725,080 5,011 101,472
Units redeemed (2,998,988) (2,869,606) (5,309,020) (3,290,540) (2,059) (808)
Units, end of year 10,129,510 10,331,544 21,491,833 18,989,759 103,616 100,664 Manulife Asset Management Bond Fund
Manulife Asset Management Short Term Bond Fund
Manulife Asset Management Long Term Bond Fund
2015 2014 2015 2014 2015 2014
Units, beginning of year 1,328,067 1,462,082 2,565,338 854,172 30,416,585 24,423,116
Units issued for cash 423,664 327,281 694,725 2,039,755 4,882,263 18,948,372
Units redeemed (391,112) (461,296) (904,156) (328,589) (5,849,704) (12,954,903)
Units, end of year 1,360,619 1,328,067 2,355,907 2,565,338 29,449,144 30,416,585 Manulife Asset Management Short-Term Liability Government Bond Fund
Manulife Asset Management Mid-Term Liability Government Bond Fund
Manulife Asset Management Long-Term Liability Government Bond Fund
2015 2014 2015 2014 2015 2014
Units, beginning of year 2,685,567 989,490 7,702,473 4,964,027 9,884,024 4,789,241
Units issued for cash 2,510,485 1,764,816 2,146,822 3,481,215 1,743,103 6,085,766
Units redeemed (456,948) (68,739) (3,160,411) (742,769) (3,736,408) (990,983)
Units, end of year 4,739,104 2,685,567 6,688,884 7,702,473 7,890,719 9,884,024 Manulife Canadian Bond Index Fund (Manulife Asset Management)
Manulife Asset Management Real Return Bond Fund
Manulife Asset Management Diversified Fund
2015 2014 2015 2014 2015 2014
Units, beginning of year 134,470,515 128,167,286 4,034,964 3,983,390 10,761,694 11,838,841
Units issued for cash 45,107,796 41,180,648 595,865 702,841 1,187,020 1,569,976
Units redeemed (39,362,007) (34,877,419) (748,293) (651,267) (3,495,471) (2,647,123)
Units, end of year 140,216,304 134,470,515 3,882,536 4,034,964 8,453,243 10,761,694 Manulife Diversified Tri-Plan Fund (Manulife Asset Management)
Manulife Money Market Fund (Manulife Asset Management)
Manulife Canadian Pooled Real Estate Fund
2015 2014 2015 2014 2015 2014
Units, beginning of year 1,391,345 1,585,257 3,241,647 3,303,299 8,872,838 8,471,487
Units issued for cash 86,841 145,219 3,171,176 2,196,801 2,004,515 1,410,945
Units redeemed (261,422) (339,131) (2,814,416) (2,258,453) (1,270,200) (1,009,594)
Units, end of year 1,216,764 1,391,345 3,598,407 3,241,647 9,607,153 8,872,838 Manulife Canadian Mortgage Fund
Manulife Small Cap Portfolio Fund (Multi-Manager)
Manulife Income Index Portfolio Fund
2015 2014 2015 2014 2015 2014
Units, beginning of year 303,267 293,424 128,947 130,930 1,173,126 1,380,749
Units issued for cash 171,887 70,484 18,091 50,109 368,241 414,891
Units redeemed (71,140) (60,641) (42,535) (52,092) (1,004,129) (622,514)
Units, end of year 404,014 303,267 104,503 128,947 537,238 1,173,126 Manulife Balanced Index Portfolio Fund
Manulife Growth Index Portfolio Fund
Manulife Multi-manager Target Date 2015 Fund
2015 2014 2015 2014 2015 2014
Units, beginning of year 9,461,583 9,250,052 1,385,732 1,328,261 117,153 101,231
Units issued for cash 1,454,789 1,462,871 232,684 236,062 33,283 57,360
Units redeemed (2,756,012) (1,251,340) (1,041,072) (178,591) (29,694) (41,438)
Units, end of year 8,160,360 9,461,583 577,344 1,385,732 120,742 117,153
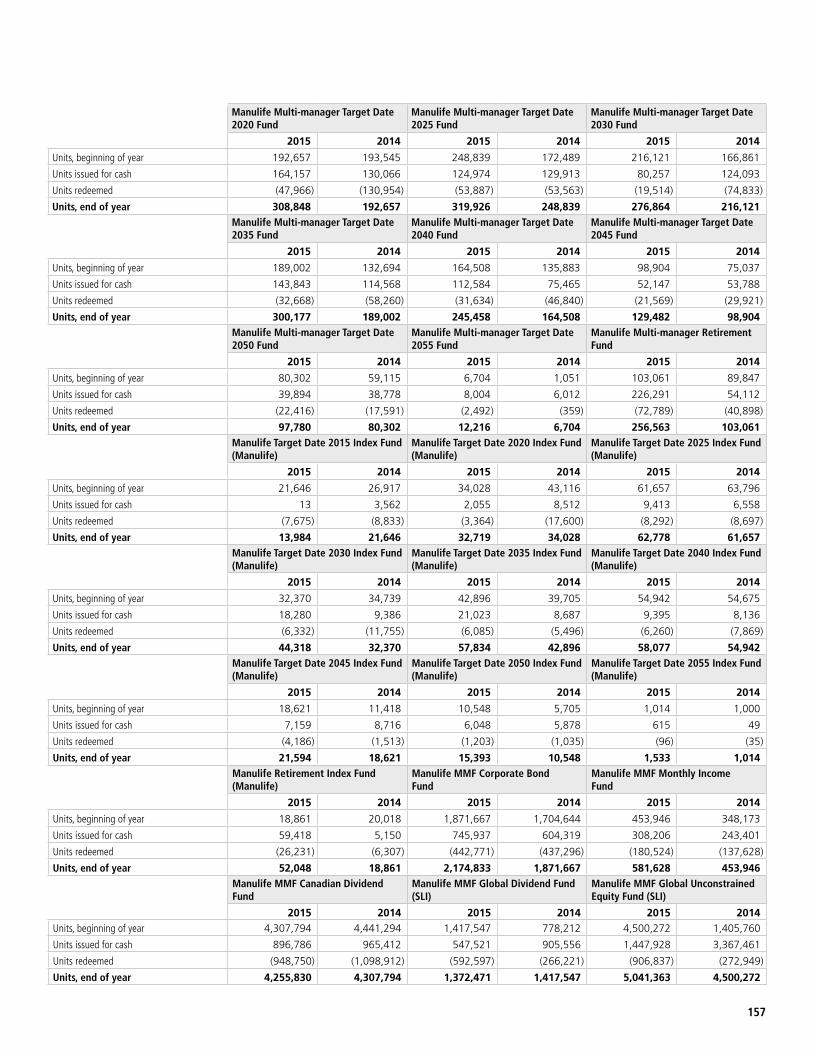
157
Manulife Multi-manager Target Date 2020 Fund
Manulife Multi-manager Target Date 2025 Fund
Manulife Multi-manager Target Date 2030 Fund
2015 2014 2015 2014 2015 2014
Units, beginning of year 192,657 193,545 248,839 172,489 216,121 166,861
Units issued for cash 164,157 130,066 124,974 129,913 80,257 124,093
Units redeemed (47,966) (130,954) (53,887) (53,563) (19,514) (74,833)
Units, end of year 308,848 192,657 319,926 248,839 276,864 216,121 Manulife Multi-manager Target Date 2035 Fund
Manulife Multi-manager Target Date 2040 Fund
Manulife Multi-manager Target Date 2045 Fund
2015 2014 2015 2014 2015 2014
Units, beginning of year 189,002 132,694 164,508 135,883 98,904 75,037
Units issued for cash 143,843 114,568 112,584 75,465 52,147 53,788
Units redeemed (32,668) (58,260) (31,634) (46,840) (21,569) (29,921)
Units, end of year 300,177 189,002 245,458 164,508 129,482 98,904 Manulife Multi-manager Target Date 2050 Fund
Manulife Multi-manager Target Date 2055 Fund
Manulife Multi-manager Retirement Fund
2015 2014 2015 2014 2015 2014
Units, beginning of year 80,302 59,115 6,704 1,051 103,061 89,847
Units issued for cash 39,894 38,778 8,004 6,012 226,291 54,112
Units redeemed (22,416) (17,591) (2,492) (359) (72,789) (40,898)
Units, end of year 97,780 80,302 12,216 6,704 256,563 103,061 Manulife Target Date 2015 Index Fund (Manulife)
Manulife Target Date 2020 Index Fund (Manulife)
Manulife Target Date 2025 Index Fund (Manulife)
2015 2014 2015 2014 2015 2014
Units, beginning of year 21,646 26,917 34,028 43,116 61,657 63,796
Units issued for cash 13 3,562 2,055 8,512 9,413 6,558
Units redeemed (7,675) (8,833) (3,364) (17,600) (8,292) (8,697)
Units, end of year 13,984 21,646 32,719 34,028 62,778 61,657 Manulife Target Date 2030 Index Fund (Manulife)
Manulife Target Date 2035 Index Fund (Manulife)
Manulife Target Date 2040 Index Fund (Manulife)
2015 2014 2015 2014 2015 2014
Units, beginning of year 32,370 34,739 42,896 39,705 54,942 54,675
Units issued for cash 18,280 9,386 21,023 8,687 9,395 8,136
Units redeemed (6,332) (11,755) (6,085) (5,496) (6,260) (7,869)
Units, end of year 44,318 32,370 57,834 42,896 58,077 54,942 Manulife Target Date 2045 Index Fund (Manulife)
Manulife Target Date 2050 Index Fund (Manulife)
Manulife Target Date 2055 Index Fund (Manulife)
2015 2014 2015 2014 2015 2014
Units, beginning of year 18,621 11,418 10,548 5,705 1,014 1,000
Units issued for cash 7,159 8,716 6,048 5,878 615 49
Units redeemed (4,186) (1,513) (1,203) (1,035) (96) (35)
Units, end of year 21,594 18,621 15,393 10,548 1,533 1,014 Manulife Retirement Index Fund (Manulife)
Manulife MMF Corporate Bond Fund
Manulife MMF Monthly Income Fund
2015 2014 2015 2014 2015 2014
Units, beginning of year 18,861 20,018 1,871,667 1,704,644 453,946 348,173
Units issued for cash 59,418 5,150 745,937 604,319 308,206 243,401
Units redeemed (26,231) (6,307) (442,771) (437,296) (180,524) (137,628)
Units, end of year 52,048 18,861 2,174,833 1,871,667 581,628 453,946 Manulife MMF Canadian Dividend Fund
Manulife MMF Global Dividend Fund (SLI)
Manulife MMF Global Unconstrained Equity Fund (SLI)
2015 2014 2015 2014 2015 2014 Units, beginning of year 4,307,794 4,441,294 1,417,547 778,212 4,500,272 1,405,760
Units issued for cash 896,786 965,412 547,521 905,556 1,447,928 3,367,461
Units redeemed (948,750) (1,098,912) (592,597) (266,221) (906,837) (272,949)
Units, end of year 4,255,830 4,307,794 1,372,471 1,417,547 5,041,363 4,500,272
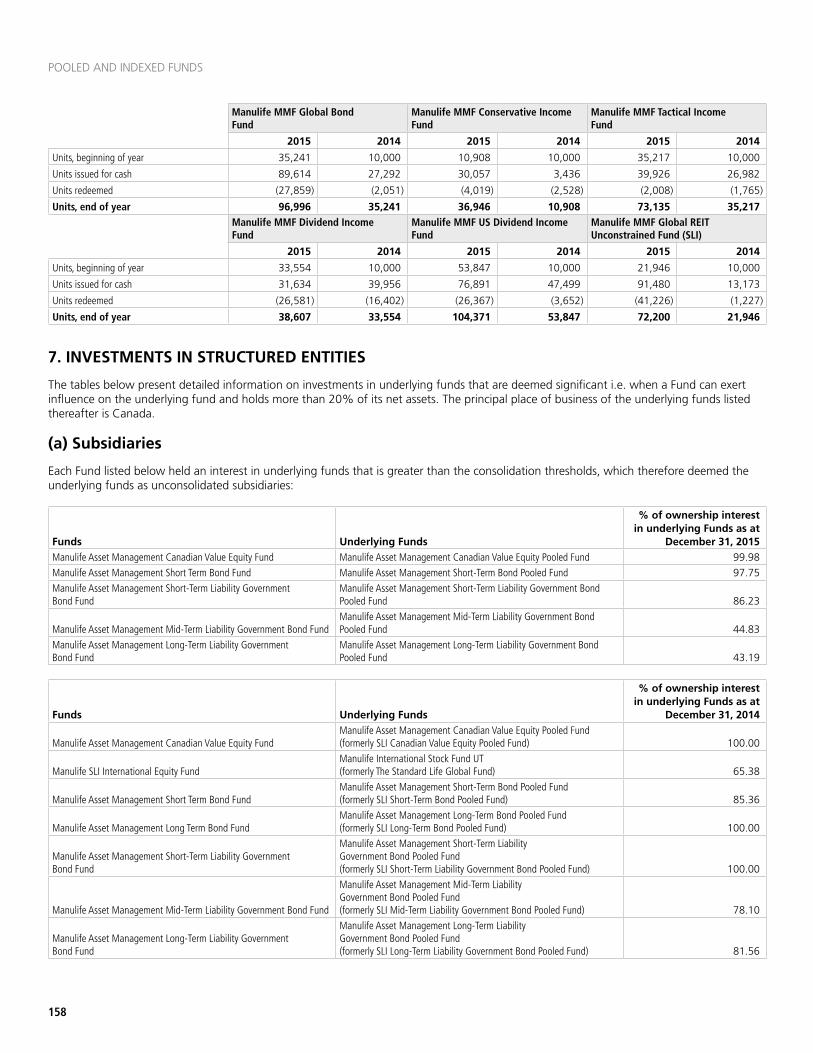
158
POOLED AND INDEXED FUNDS
Manulife MMF Global Bond Fund
Manulife MMF Conservative Income Fund
Manulife MMF Tactical Income Fund
2015 2014 2015 2014 2015 2014
Units, beginning of year 35,241 10,000 10,908 10,000 35,217 10,000
Units issued for cash 89,614 27,292 30,057 3,436 39,926 26,982
Units redeemed (27,859) (2,051) (4,019) (2,528) (2,008) (1,765)
Units, end of year 96,996 35,241 36,946 10,908 73,135 35,217 Manulife MMF Dividend Income Fund
Manulife MMF US Dividend Income Fund
Manulife MMF Global REIT Unconstrained Fund (SLI)
2015 2014 2015 2014 2015 2014
Units, beginning of year 33,554 10,000 53,847 10,000 21,946 10,000
Units issued for cash 31,634 39,956 76,891 47,499 91,480 13,173
Units redeemed (26,581) (16,402) (26,367) (3,652) (41,226) (1,227)
Units, end of year 38,607 33,554 104,371 53,847 72,200 21,946
7. INVESTMENTS IN STRUCTURED ENTITIES
The tables below present detailed information on investments in underlying funds that are deemed significant i.e. when a Fund can exert influence on the underlying fund and holds more than 20% of its net assets. The principal place of business of the underlying funds listed thereafter is Canada.
(a) Subsidiaries
Each Fund listed below held an interest in underlying funds that is greater than the consolidation thresholds, which therefore deemed the underlying funds as unconsolidated subsidiaries:
Funds Underlying Funds
% of ownership interest in underlying Funds as at
December 31, 2015Manulife Asset Management Canadian Value Equity Fund Manulife Asset Management Canadian Value Equity Pooled Fund 99.98Manulife Asset Management Short Term Bond Fund Manulife Asset Management Short-Term Bond Pooled Fund 97.75Manulife Asset Management Short-Term Liability Government Bond Fund
Manulife Asset Management Short-Term Liability Government Bond Pooled Fund 86.23
Manulife Asset Management Mid-Term Liability Government Bond FundManulife Asset Management Mid-Term Liability Government Bond Pooled Fund 44.83
Manulife Asset Management Long-Term Liability Government Bond Fund
Manulife Asset Management Long-Term Liability Government Bond Pooled Fund 43.19
Funds Underlying Funds
% of ownership interest in underlying Funds as at
December 31, 2014
Manulife Asset Management Canadian Value Equity FundManulife Asset Management Canadian Value Equity Pooled Fund (formerly SLI Canadian Value Equity Pooled Fund) 100.00
Manulife SLI International Equity FundManulife International Stock Fund UT (formerly The Standard Life Global Fund) 65.38
Manulife Asset Management Short Term Bond FundManulife Asset Management Short-Term Bond Pooled Fund (formerly SLI Short-Term Bond Pooled Fund) 85.36
Manulife Asset Management Long Term Bond FundManulife Asset Management Long-Term Bond Pooled Fund (formerly SLI Long-Term Bond Pooled Fund) 100.00
Manulife Asset Management Short-Term Liability Government Bond Fund
Manulife Asset Management Short-Term Liability Government Bond Pooled Fund (formerly SLI Short-Term Liability Government Bond Pooled Fund) 100.00
Manulife Asset Management Mid-Term Liability Government Bond Fund
Manulife Asset Management Mid-Term Liability Government Bond Pooled Fund (formerly SLI Mid-Term Liability Government Bond Pooled Fund) 78.10
Manulife Asset Management Long-Term Liability Government Bond Fund
Manulife Asset Management Long-Term Liability Government Bond Pooled Fund (formerly SLI Long-Term Liability Government Bond Pooled Fund) 81.56
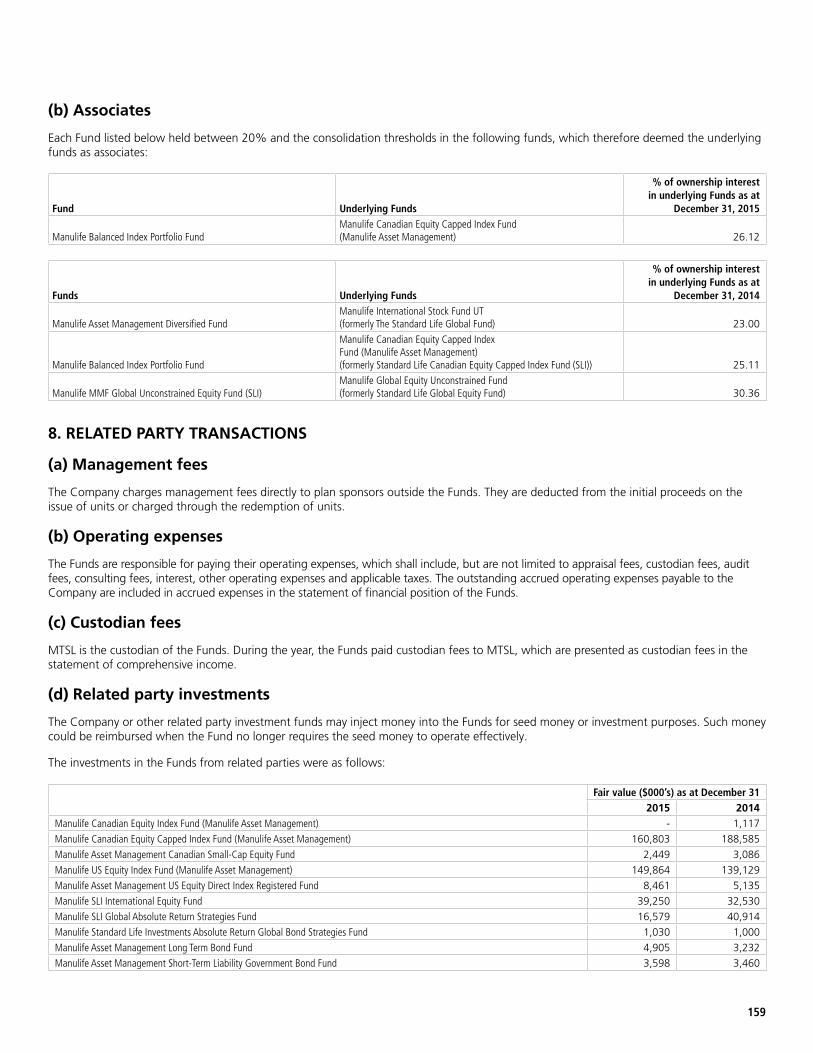
159
(b) Associates
Each Fund listed below held between 20% and the consolidation thresholds in the following funds, which therefore deemed the underlying funds as associates:
Fund Underlying Funds
% of ownership interest in underlying Funds as at
December 31, 2015
Manulife Balanced Index Portfolio FundManulife Canadian Equity Capped Index Fund (Manulife Asset Management) 26.12
Funds Underlying Funds
% of ownership interest in underlying Funds as at
December 31, 2014
Manulife Asset Management Diversified Fund Manulife International Stock Fund UT (formerly The Standard Life Global Fund) 23.00
Manulife Balanced Index Portfolio Fund
Manulife Canadian Equity Capped Index Fund (Manulife Asset Management) (formerly Standard Life Canadian Equity Capped Index Fund (SLI)) 25.11
Manulife MMF Global Unconstrained Equity Fund (SLI)Manulife Global Equity Unconstrained Fund (formerly Standard Life Global Equity Fund) 30.36
8. RELATED PARTY TRANSACTIONS
(a) Management fees
The Company charges management fees directly to plan sponsors outside the Funds. They are deducted from the initial proceeds on the issue of units or charged through the redemption of units.
(b) Operating expenses
The Funds are responsible for paying their operating expenses, which shall include, but are not limited to appraisal fees, custodian fees, audit fees, consulting fees, interest, other operating expenses and applicable taxes. The outstanding accrued operating expenses payable to the Company are included in accrued expenses in the statement of financial position of the Funds.
(c) Custodian fees
MTSL is the custodian of the Funds. During the year, the Funds paid custodian fees to MTSL, which are presented as custodian fees in the statement of comprehensive income.
(d) Related party investments
The Company or other related party investment funds may inject money into the Funds for seed money or investment purposes. Such money could be reimbursed when the Fund no longer requires the seed money to operate effectively.
The investments in the Funds from related parties were as follows:
Fair value ($000’s) as at December 312015 2014
Manulife Canadian Equity Index Fund (Manulife Asset Management) - 1,117 Manulife Canadian Equity Capped Index Fund (Manulife Asset Management) 160,803 188,585 Manulife Asset Management Canadian Small-Cap Equity Fund 2,449 3,086 Manulife US Equity Index Fund (Manulife Asset Management) 149,864 139,129 Manulife Asset Management US Equity Direct Index Registered Fund 8,461 5,135 Manulife SLI International Equity Fund 39,250 32,530 Manulife SLI Global Absolute Return Strategies Fund 16,579 40,914 Manulife Standard Life Investments Absolute Return Global Bond Strategies Fund 1,030 1,000 Manulife Asset Management Long Term Bond Fund 4,905 3,232 Manulife Asset Management Short-Term Liability Government Bond Fund 3,598 3,460
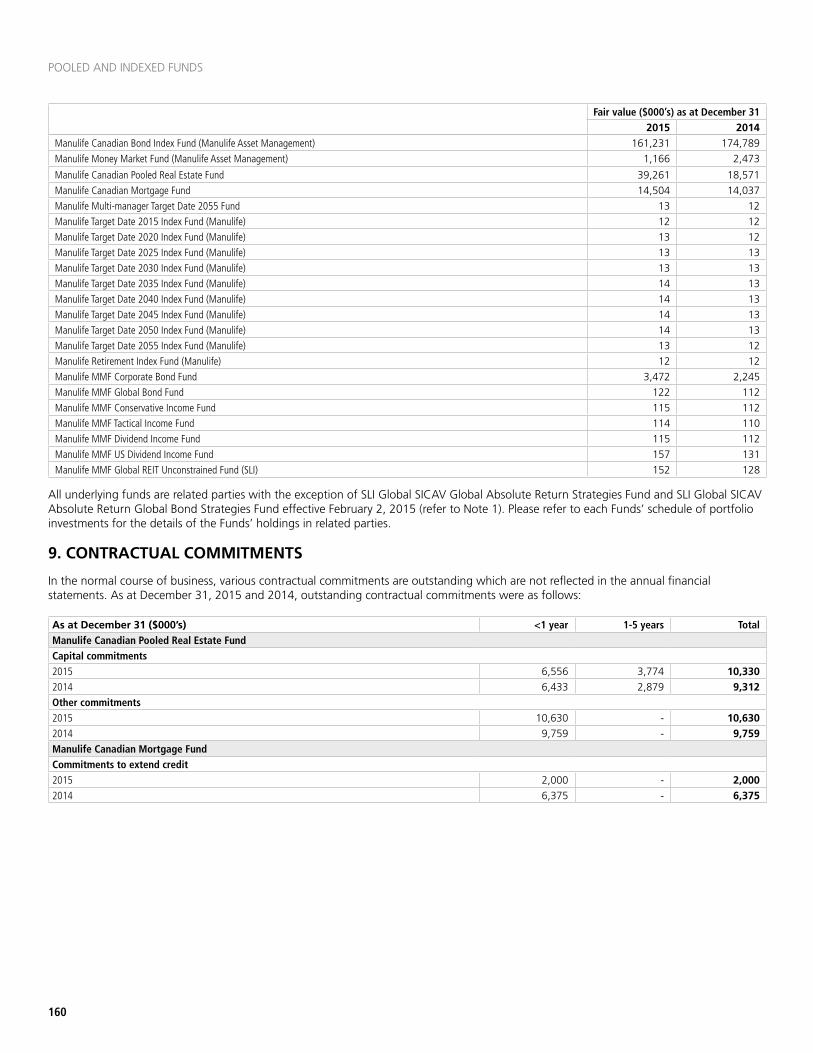
160
POOLED AND INDEXED FUNDS
Manulife Canadian Bond Index Fund (Manulife Asset Management) 161,231 174,789 Manulife Money Market Fund (Manulife Asset Management) 1,166 2,473
Manulife Canadian Pooled Real Estate Fund 39,261 18,571 Manulife Canadian Mortgage Fund 14,504 14,037 Manulife Multi-manager Target Date 2055 Fund 13 12 Manulife Target Date 2015 Index Fund (Manulife) 12 12 Manulife Target Date 2020 Index Fund (Manulife) 13 12 Manulife Target Date 2025 Index Fund (Manulife) 13 13 Manulife Target Date 2030 Index Fund (Manulife) 13 13 Manulife Target Date 2035 Index Fund (Manulife) 14 13 Manulife Target Date 2040 Index Fund (Manulife) 14 13 Manulife Target Date 2045 Index Fund (Manulife) 14 13 Manulife Target Date 2050 Index Fund (Manulife) 14 13 Manulife Target Date 2055 Index Fund (Manulife) 13 12 Manulife Retirement Index Fund (Manulife) 12 12 Manulife MMF Corporate Bond Fund 3,472 2,245 Manulife MMF Global Bond Fund 122 112 Manulife MMF Conservative Income Fund 115 112 Manulife MMF Tactical Income Fund 114 110 Manulife MMF Dividend Income Fund 115 112 Manulife MMF US Dividend Income Fund 157 131 Manulife MMF Global REIT Unconstrained Fund (SLI) 152 128
All underlying funds are related parties with the exception of SLI Global SICAV Global Absolute Return Strategies Fund and SLI Global SICAV Absolute Return Global Bond Strategies Fund effective February 2, 2015 (refer to Note 1). Please refer to each Funds’ schedule of portfolio investments for the details of the Funds’ holdings in related parties.
9. CONTRACTUAL COMMITMENTS
In the normal course of business, various contractual commitments are outstanding which are not reflected in the annual financial statements. As at December 31, 2015 and 2014, outstanding contractual commitments were as follows:
As at December 31 ($000’s) <1 year 1-5 years TotalManulife Canadian Pooled Real Estate FundCapital commitments2015 6,556 3,774 10,330 2014 6,433 2,879 9,312 Other commitments2015 10,630 - 10,630 2014 9,759 - 9,759 Manulife Canadian Mortgage FundCommitments to extend credit2015 2,000 - 2,000 2014 6,375 - 6,375
Fair value ($000’s) as at December 312015 2014
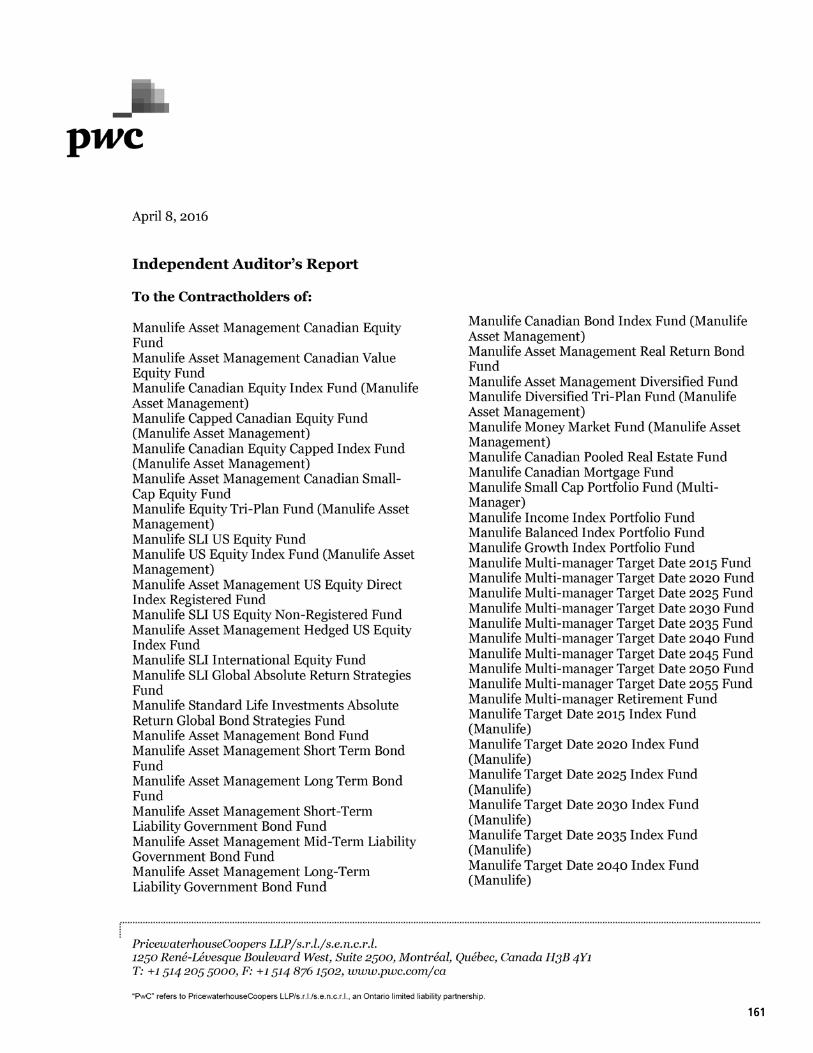
161
162
163

Manulife, Manulife Investments, the Block Design, the Four Cube Design, and Strong Reliable Trustworthy Forward-thinking are trademarks of The Manufacturers Life Insurance Company and are used by it, and by its affiliates under licence.GE10215Q GS 03/16