annual financial statements as per 31 december 2017 ... · sales of new machinery +3.7% y/y and...
TRANSCRIPT
Annual Financial Statementsas per 31 December 2017Analysts‘ Conference
Munich, 29 March 2018
Prof. Klaus Josef Lutz, CEO
Andreas Helber, CFO
29 March 2018BayWa AG Page 2
Agenda
1. Financial Year 2017
2. Performance of the Segments
3. Group Financials
4. Strategic Outlook for FY 2018
5. Operational Outlook for FY 2018
Appendix

BayWa AG
Financial Year 2017Prof. Klaus Josef Lutz
29 March 2018 Page 3
Positive earnings trend in all three core operating segments
Completion of the full refurbishment of the Group’s headquarters and relocation back to the building
Successful placement of a EUR 300 million hybrid bond
Dividend raised
Ongoing implementation of a speciality strategy through acquisitions: 100% Tracomex (Netherlands), 100% Premium Crops (UK)
Restructuring of grain trading activities in Southern and Eastern Europe completed
Expansion of Fruit: JV Al Dahra BayWa Agriculture, for cultivation of fruit and vegetables in UAE, developing according to plan; projects with investment of EUR 300 million planned (USA, Australia, Japan …)
Financial Year 2017 Highlights
BayWa AG 29 March 2018 Page 4
GROUP
AGRICULTURE
Growth path of BayWa r.e.: takeover of Australian wind project developer Future Energy (100%) and GroenLeven (70%) in Q1/18 with a 2 GW pipeline for solar projects in the Netherlands
Expansion of service and energy trading: acquisition of several international service companies as well as CLENS (Leipzig), an electricity marketing company
Developing of the Agro Innovation Lab innovation centre into Ag-tech Accelerator for start-ups
Start to developing software for a uniform data standard in agricultural equipment (AAG)
Financial Year 2017 Highlights
BayWa AG 29 March 2018 Page 5
ENERGY
INNOVATION & DIGITALISATION
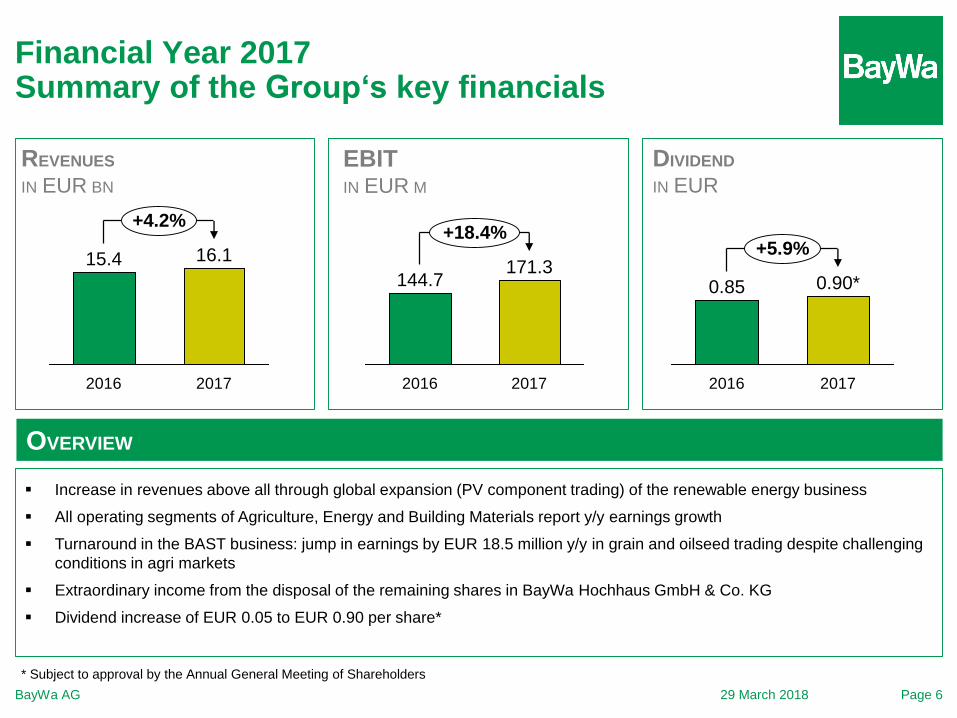
Financial Year 2017Summary of the Group‘s key financials
29 March 2018BayWa AG Page 6
+4.2%
2017
16.1
2016
15.4
2017
144.7
+18.4%
171.3
2016
+5.9%
0.85
2016
0.90*
2017
REVENUES
IN EUR BN
EBITIN EUR M
DIVIDEND
IN EUR
OVERVIEW
Increase in revenues above all through global expansion (PV component trading) of the renewable energy business
All operating segments of Agriculture, Energy and Building Materials report y/y earnings growth
Turnaround in the BAST business: jump in earnings by EUR 18.5 million y/y in grain and oilseed trading despite challenging
conditions in agri markets
Extraordinary income from the disposal of the remaining shares in BayWa Hochhaus GmbH & Co. KG
Dividend increase of EUR 0.05 to EUR 0.90 per share*
* Subject to approval by the Annual General Meeting of Shareholders
29 March 2018BayWa AG Page 7
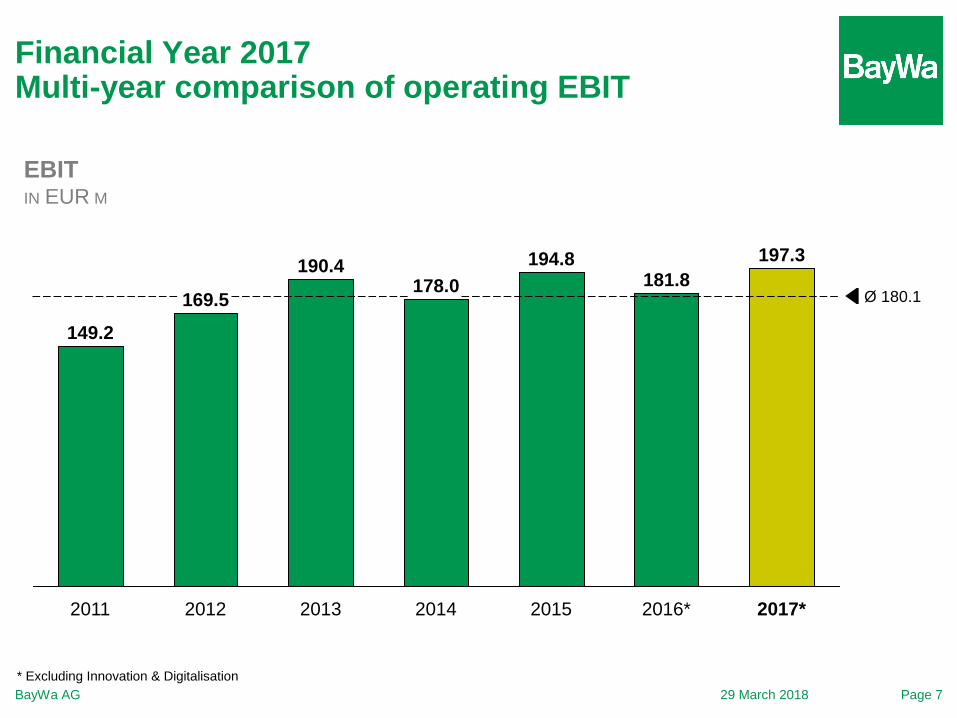
Financial Year 2017 Multi-year comparison of operating EBIT
181.8
149.2
20142012 2016*
Ø 180.1
2017*
178.0
2013
194.8
169.5
2011
197.3190.4
2015
EBITIN EUR M
* Excluding Innovation & Digitalisation
29 March 2018BayWa AG Page 8
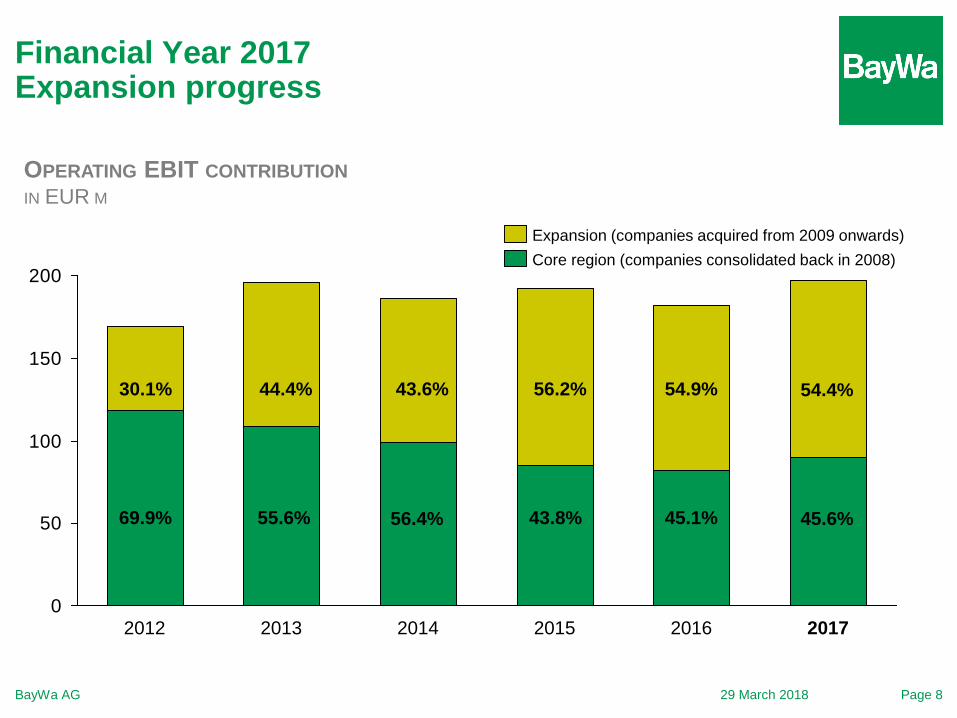
Financial Year 2017 Expansion progress
0
50
100
150
200
2012 20142013 2015 20172016
Expansion (companies acquired from 2009 onwards)
Core region (companies consolidated back in 2008)
30.1% 44.4% 43.6% 56.2% 54.9%
69.9% 55.6% 56.4% 43.8% 45.1%
OPERATING EBIT CONTRIBUTION
IN EUR M
54.4%
45.6%
BayWa AG
Performance of the SegmentsProf. Klaus Josef Lutz
29 March 2018 Page 9
Agriculture Segment 2017
GRAIN
OILSEED
SEED
FEEDSTUFF
CROP PROTECTION
FERTILISERS
FRUIT
AGRICULTURAL EQUIPMENT
Agriculture Segment 2017Market development: Products
29 March 2018BayWa AG Page 11
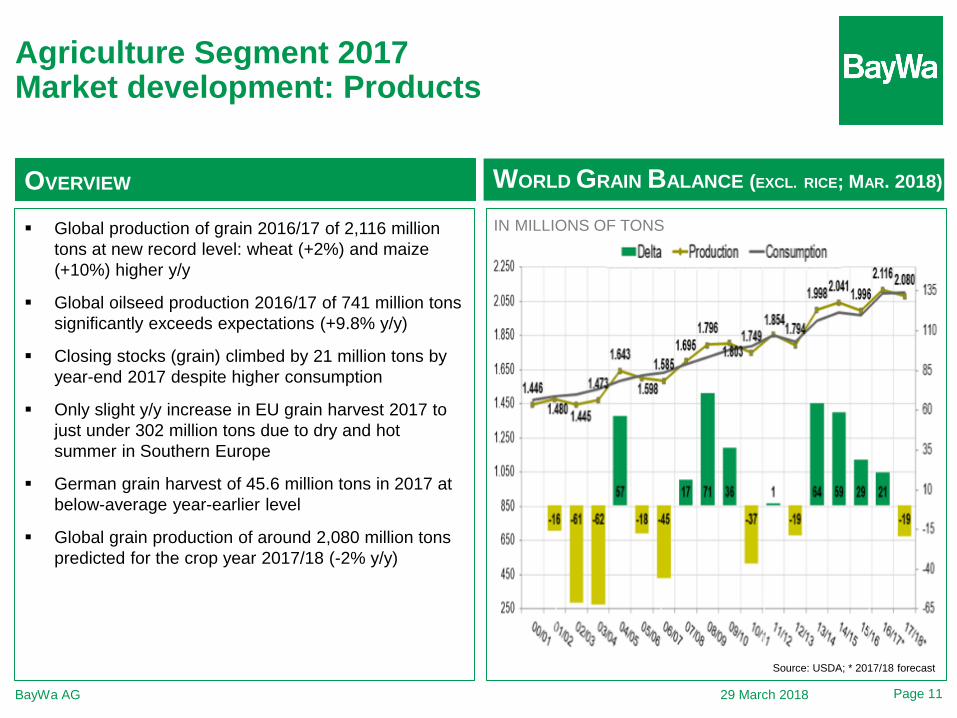
Source: USDA; * 2017/18 forecast
WORLD GRAIN BALANCE (EXCL. RICE; MAR. 2018)
IN MILLIONS OF TONS Global production of grain 2016/17 of 2,116 million
tons at new record level: wheat (+2%) and maize
(+10%) higher y/y
Global oilseed production 2016/17 of 741 million tons
significantly exceeds expectations (+9.8% y/y)
Closing stocks (grain) climbed by 21 million tons by
year-end 2017 despite higher consumption
Only slight y/y increase in EU grain harvest 2017 to
just under 302 million tons due to dry and hot
summer in Southern Europe
German grain harvest of 45.6 million tons in 2017 at
below-average year-earlier level
Global grain production of around 2,080 million tons
predicted for the crop year 2017/18 (-2% y/y)
OVERVIEW
Agriculture Segment 2017Market development: Inputs
29 March 2018BayWa AG Page 12
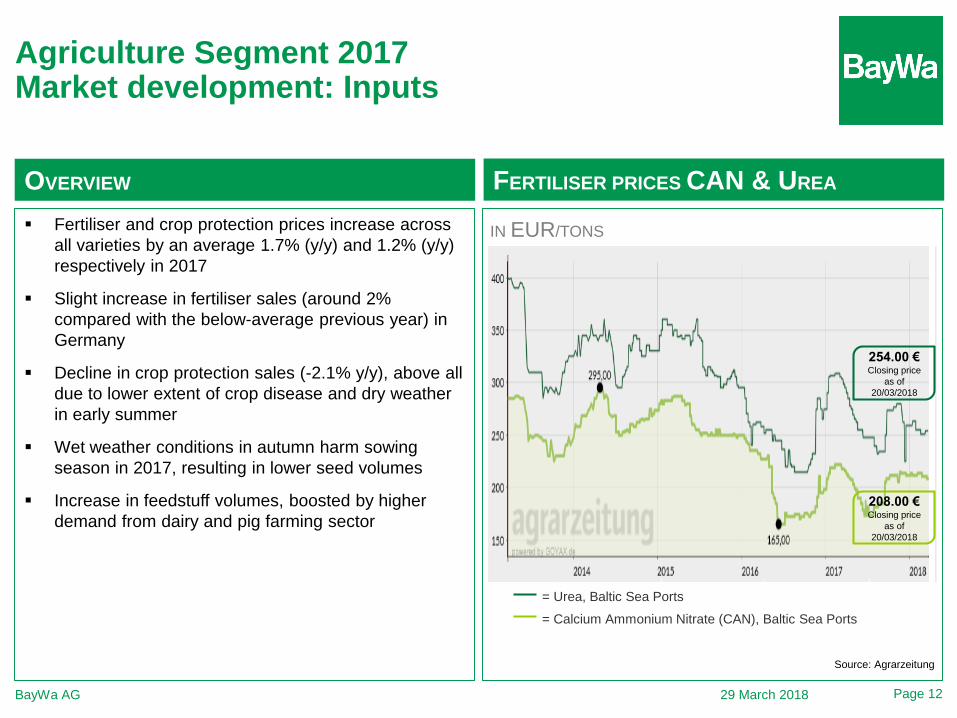
Source: Agrarzeitung
OVERVIEW FERTILISER PRICES CAN & UREA
Fertiliser and crop protection prices increase across
all varieties by an average 1.7% (y/y) and 1.2% (y/y)
respectively in 2017
Slight increase in fertiliser sales (around 2%
compared with the below-average previous year) in
Germany
Decline in crop protection sales (-2.1% y/y), above all
due to lower extent of crop disease and dry weather
in early summer
Wet weather conditions in autumn harm sowing
season in 2017, resulting in lower seed volumes
Increase in feedstuff volumes, boosted by higher
demand from dairy and pig farming sector
= Urea, Baltic Sea Ports
= Calcium Ammonium Nitrate (CAN), Baltic Sea Ports
IN EUR/TONS
254.00 €Closing price
as of
20/03/2018
208.00 €Closing price
as of
20/03/2018
Agriculture Segment 2017Market development: Agricultural Equipment
29 March 2018BayWa AG Page 13
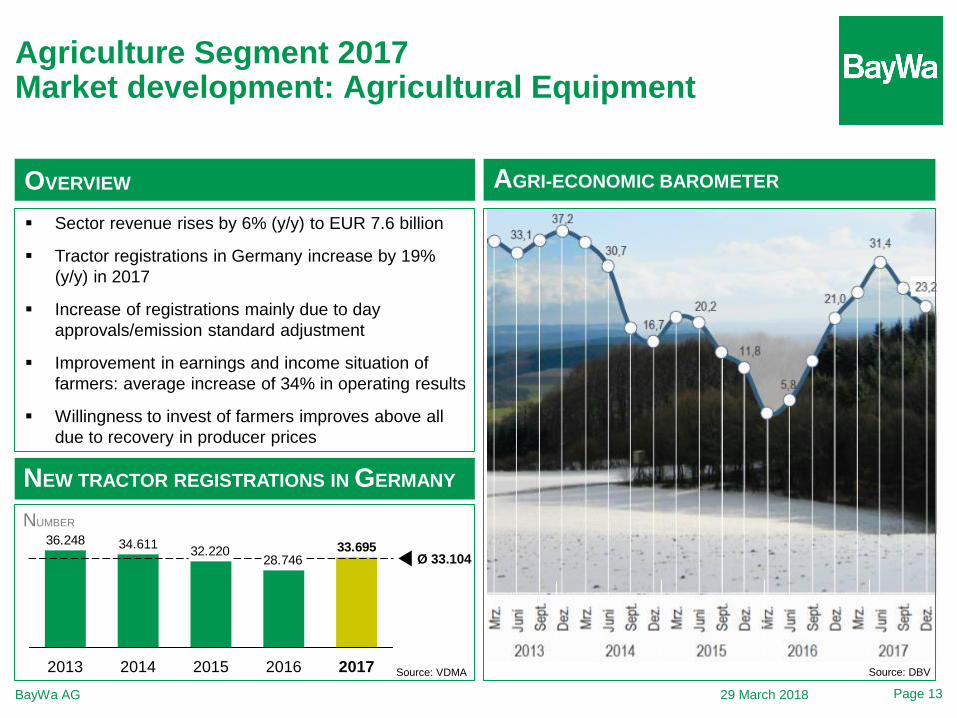
OVERVIEW
Sector revenue rises by 6% (y/y) to EUR 7.6 billion
Tractor registrations in Germany increase by 19%
(y/y) in 2017
Increase of registrations mainly due to day
approvals/emission standard adjustment
Improvement in earnings and income situation of
farmers: average increase of 34% in operating results
Willingness to invest of farmers improves above all
due to recovery in producer prices
33.69528.746
32.22034.61136.248
201520142013 2016
Ø 33.104
2017
AGRI-ECONOMIC BAROMETER
Source: VDMA
NEW TRACTOR REGISTRATIONS IN GERMANY
Source: DBV
NUMBER
Agriculture Segment 2017Market development: Fruit
29 March 2018BayWa AG Page 14
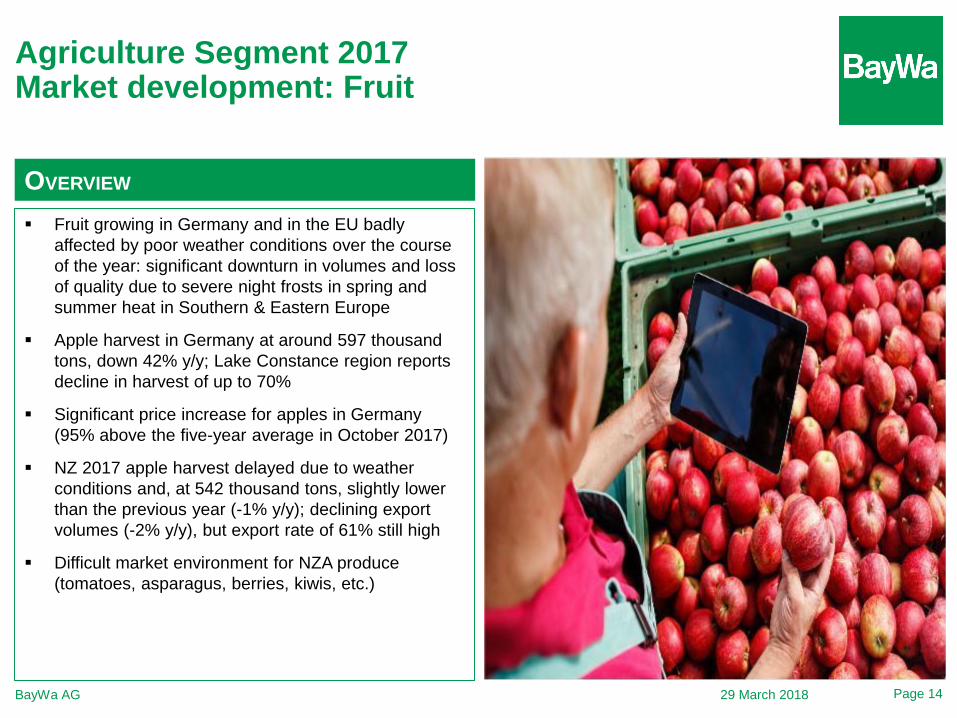
OVERVIEW
Fruit growing in Germany and in the EU badly
affected by poor weather conditions over the course
of the year: significant downturn in volumes and loss
of quality due to severe night frosts in spring and
summer heat in Southern & Eastern Europe
Apple harvest in Germany at around 597 thousand
tons, down 42% y/y; Lake Constance region reports
decline in harvest of up to 70%
Significant price increase for apples in Germany
(95% above the five-year average in October 2017)
NZ 2017 apple harvest delayed due to weather
conditions and, at 542 thousand tons, slightly lower
than the previous year (-1% y/y); declining export
volumes (-2% y/y), but export rate of 61% still high
Difficult market environment for NZA produce
(tomatoes, asparagus, berries, kiwis, etc.)
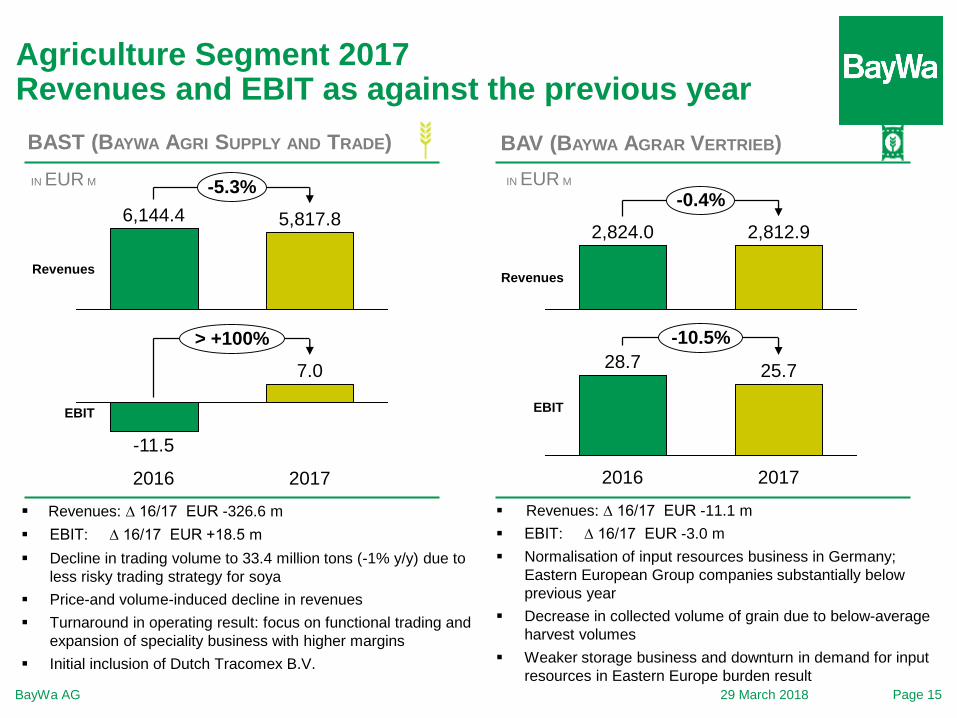
-11.5
> +100%
EBIT
2017
7.0
2016
Agriculture Segment 2017Revenues and EBIT as against the previous year
5,817.86,144.4
Revenues
-5.3%IN EUR M
Revenues: ∆ 16/17 EUR -326.6 m
EBIT: ∆ 16/17 EUR +18.5 m
Decline in trading volume to 33.4 million tons (-1% y/y) due to
less risky trading strategy for soya
Price-and volume-induced decline in revenues
Turnaround in operating result: focus on functional trading and
expansion of speciality business with higher margins
Initial inclusion of Dutch Tracomex B.V.
BayWa AG
2016
25.7
2017
EBIT
28.7
-10.5%
-0.4%
Revenues
2,824.0 2,812.9
Page 1529 March 2018
BAST (BAYWA AGRI SUPPLY AND TRADE)
Revenues: ∆ 16/17 EUR -11.1 m
EBIT: ∆ 16/17 EUR -3.0 m
Normalisation of input resources business in Germany;
Eastern European Group companies substantially below
previous year
Decrease in collected volume of grain due to below-average
harvest volumes
Weaker storage business and downturn in demand for input
resources in Eastern Europe burden result
IN EUR M
BAV (BAYWA AGRAR VERTRIEB)
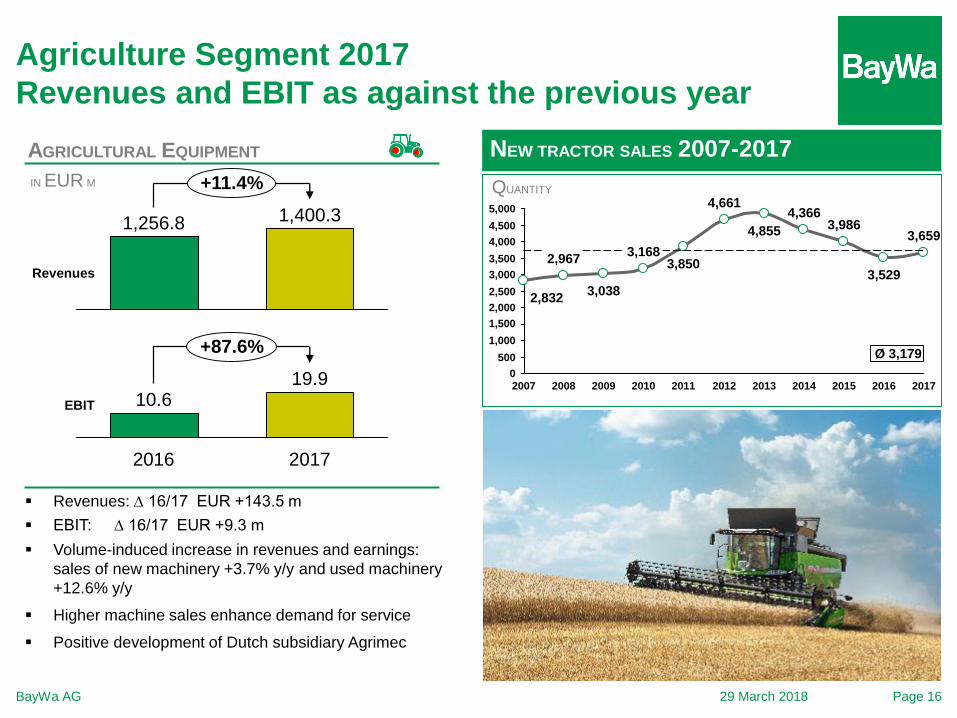
19.9
EBIT
20172016
+87.6%
10.6
Agriculture Segment 2017
Revenues and EBIT as against the previous year
Revenues
1,400.3
+11.4%
1,256.8
Revenues: ∆ 16/17 EUR +143.5 m
EBIT: ∆ 16/17 EUR +9.3 m
Volume-induced increase in revenues and earnings:
sales of new machinery +3.7% y/y and used machinery
+12.6% y/y
Higher machine sales enhance demand for service
Positive development of Dutch subsidiary Agrimec
29 March 2018BayWa AG Page 16
5,000
2,500
1,500
500
0
2,000
1,000
4,500
4,000
3,500
3,000
3,659
2016
3,529
2015
3,986
20172009 2012
3,168
2,832
2008
2,967
2007 2011
4,661
3,038
2010
4,855
4,366
2014
3,850
2013
Ø 3,179
AGRICULTURAL EQUIPMENT
IN EUR M
NEW TRACTOR SALES 2007-2017
QUANTITY
181194
236
206
256
19
22
21
25
14
45
54
59
82
58
18
18
19 19
20
0
50
100
150
200
250
300
350
400
2013 2014 2015 2016 2017
Dessert pome fruit Soft and stone fruitTropical fruits Vegetable fruits
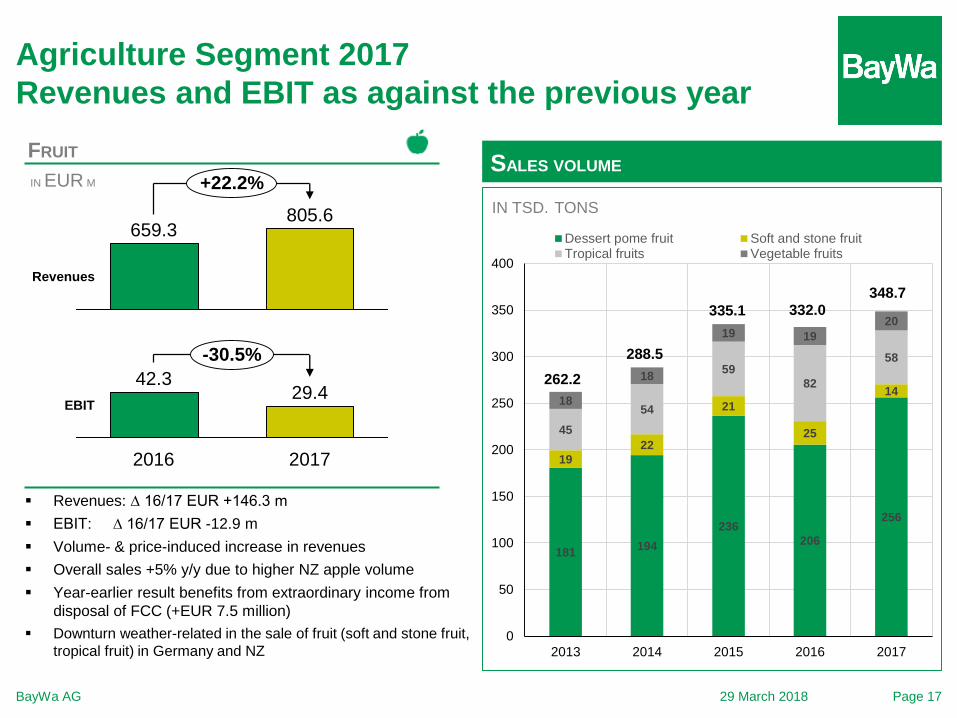
29.4
20172016
42.3
-30.5%
EBIT
Agriculture Segment 2017
Revenues and EBIT as against the previous year
+22.2%
805.6
Revenues
659.3
Revenues: ∆ 16/17 EUR +146.3 m
EBIT: ∆ 16/17 EUR -12.9 m
Volume- & price-induced increase in revenues
Overall sales +5% y/y due to higher NZ apple volume
Year-earlier result benefits from extraordinary income from
disposal of FCC (+EUR 7.5 million)
Downturn weather-related in the sale of fruit (soft and stone fruit,
tropical fruit) in Germany and NZ
29 March 2018BayWa AG Page 17
FRUIT
IN EUR M
SALES VOLUME
262.2
288.5
335.1 332.0348.7
IN TSD. TONS
Energy Segment 2017
BAYWA R.E.
HEATING OIL
LUBRICANTS
SOLID BIOFUELS
FUELS
Energy Segment 2017Market development
29 March 2018BayWa AG Page 19
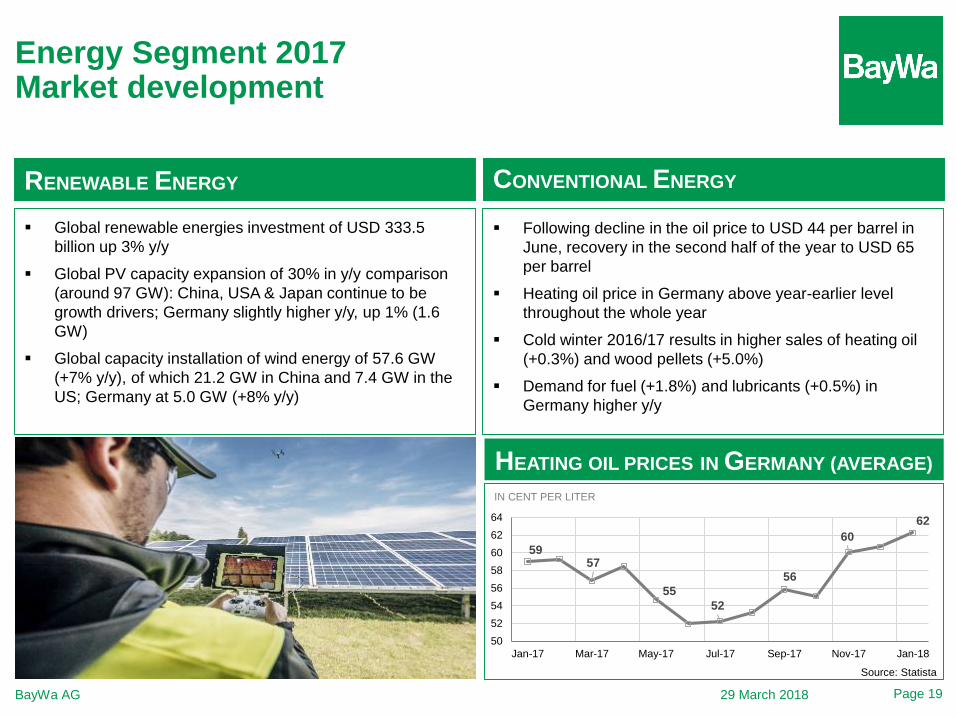
RENEWABLE ENERGY
Global renewable energies investment of USD 333.5
billion up 3% y/y
Global PV capacity expansion of 30% in y/y comparison
(around 97 GW): China, USA & Japan continue to be
growth drivers; Germany slightly higher y/y, up 1% (1.6
GW)
Global capacity installation of wind energy of 57.6 GW
(+7% y/y), of which 21.2 GW in China and 7.4 GW in the
US; Germany at 5.0 GW (+8% y/y)
CONVENTIONAL ENERGY
Following decline in the oil price to USD 44 per barrel in
June, recovery in the second half of the year to USD 65
per barrel
Heating oil price in Germany above year-earlier level
throughout the whole year
Cold winter 2016/17 results in higher sales of heating oil
(+0.3%) and wood pellets (+5.0%)
Demand for fuel (+1.8%) and lubricants (+0.5%) in
Germany higher y/y
HEATING OIL PRICES IN GERMANY (AVERAGE)
IN CENT PER LITER
5957
55
52
56
60
62
50
52
54
56
58
60
62
64
Jan-17 Mar-17 May-17 Jul-17 Sep-17 Nov-17 Jan-18
Source: Statista
39134
285 32136
260
438
92
176
215
119
14
31
45
44
252
28%
45%
68%
82%
0%
10%
20%
30%
40%
50%
60%
70%
80%
90%
0
200
400
600
800
1000
1200
1400
1994-2004 2005-2010 2011-2016 2017-2022
Wind Solar Hydropower
Others Best-case scenario % from wind and solar
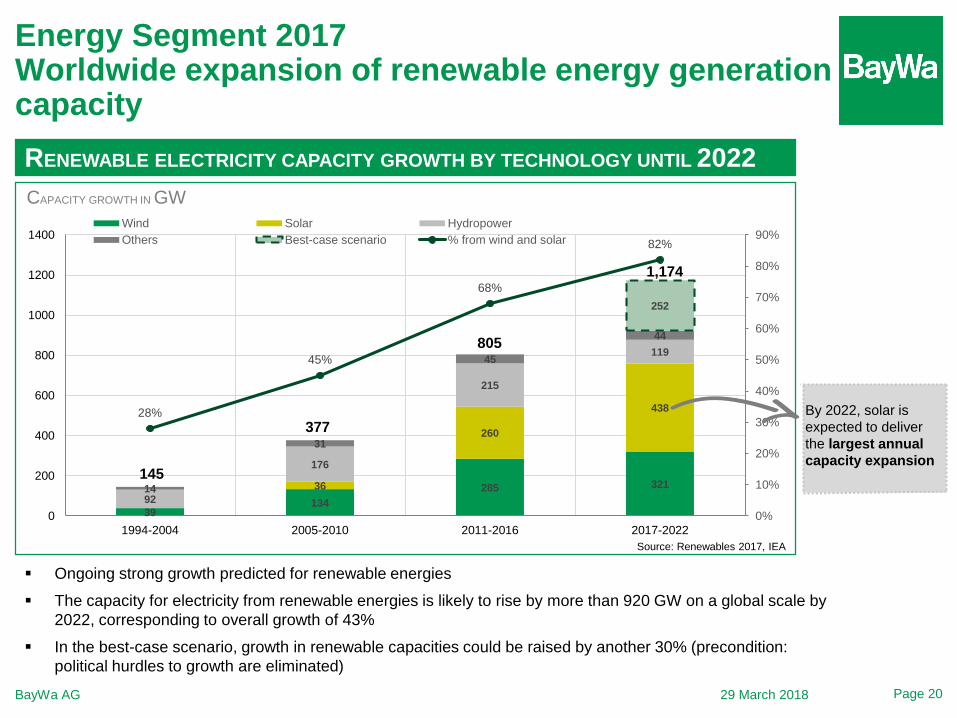
Energy Segment 2017Worldwide expansion of renewable energy generation capacity
29 March 2018BayWa AG
RENEWABLE ELECTRICITY CAPACITY GROWTH BY TECHNOLOGY UNTIL 2022
Ongoing strong growth predicted for renewable energies
The capacity for electricity from renewable energies is likely to rise by more than 920 GW on a global scale by
2022, corresponding to overall growth of 43%
In the best-case scenario, growth in renewable capacities could be raised by another 30% (precondition:
political hurdles to growth are eliminated)
Source: Renewables 2017, IEA
By 2022, solar is
expected to deliver
the largest annual
capacity expansion
1,174
805
377
145
CAPACITY GROWTH IN GW
Page 20
2016
EBIT
15.8
2017
18.5
+17.1%
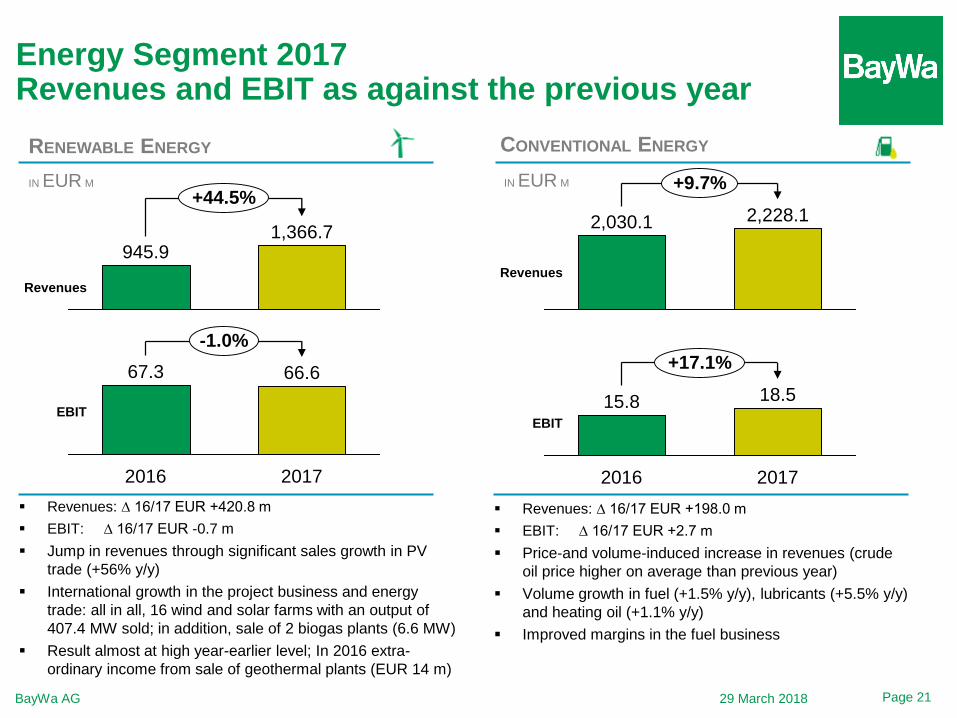
Energy Segment 2017 Revenues and EBIT as against the previous year
2,228.1
Revenues
+9.7%
2,030.1
Revenues: ∆ 16/17 EUR +198.0 m
EBIT: ∆ 16/17 EUR +2.7 m
Price-and volume-induced increase in revenues (crude
oil price higher on average than previous year)
Volume growth in fuel (+1.5% y/y), lubricants (+5.5% y/y)
and heating oil (+1.1% y/y)
Improved margins in the fuel business
67.3
EBIT
66.6
20172016
-1.0%
Revenues
+44.5%
1,366.7945.9
Revenues: ∆ 16/17 EUR +420.8 m
EBIT: ∆ 16/17 EUR -0.7 m
Jump in revenues through significant sales growth in PV
trade (+56% y/y)
International growth in the project business and energy
trade: all in all, 16 wind and solar farms with an output of
407.4 MW sold; in addition, sale of 2 biogas plants (6.6 MW)
Result almost at high year-earlier level; In 2016 extra-
ordinary income from sale of geothermal plants (EUR 14 m)
IN EUR M
CONVENTIONAL ENERGYRENEWABLE ENERGY
IN EUR M
29 March 2018 Page 21BayWa AG

Building Materials Segment 2017
BUILDING MATERIALS
Building Materials Segment 2017Market development
29 March 2018BayWa AG Page 23
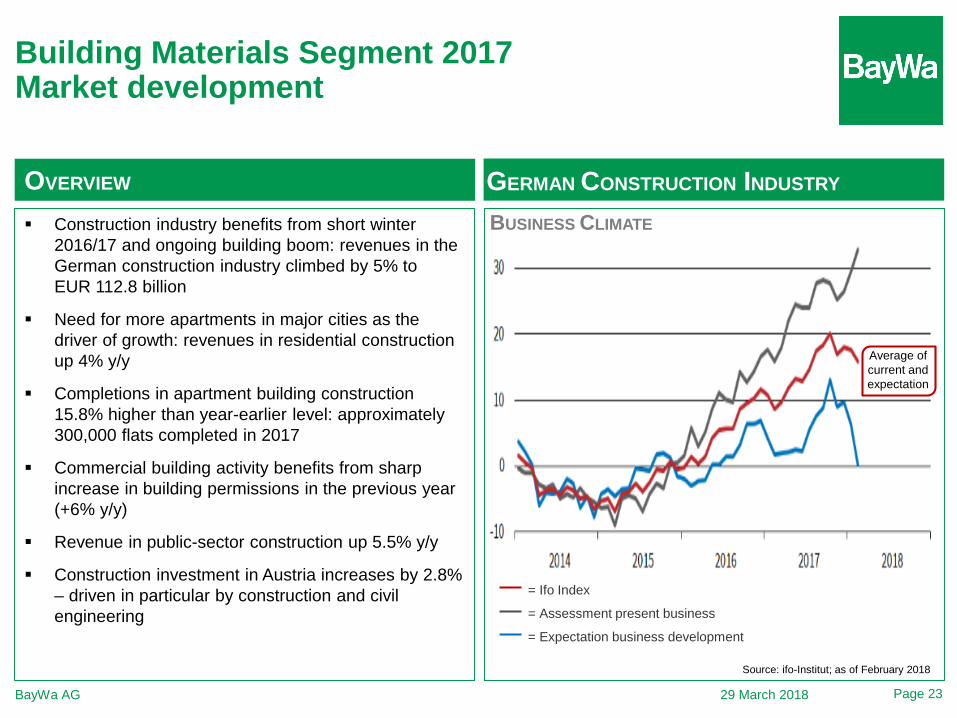
OVERVIEW GERMAN CONSTRUCTION INDUSTRY
Construction industry benefits from short winter
2016/17 and ongoing building boom: revenues in the
German construction industry climbed by 5% to
EUR 112.8 billion
Need for more apartments in major cities as the
driver of growth: revenues in residential construction
up 4% y/y
Completions in apartment building construction
15.8% higher than year-earlier level: approximately
300,000 flats completed in 2017
Commercial building activity benefits from sharp
increase in building permissions in the previous year
(+6% y/y)
Revenue in public-sector construction up 5.5% y/y
Construction investment in Austria increases by 2.8%
– driven in particular by construction and civil
engineering
Source: ifo-Institut; as of February 2018
BUSINESS CLIMATE
= Ifo Index
= Expectation business development
= Assessment present business
Average of
current and
expectation
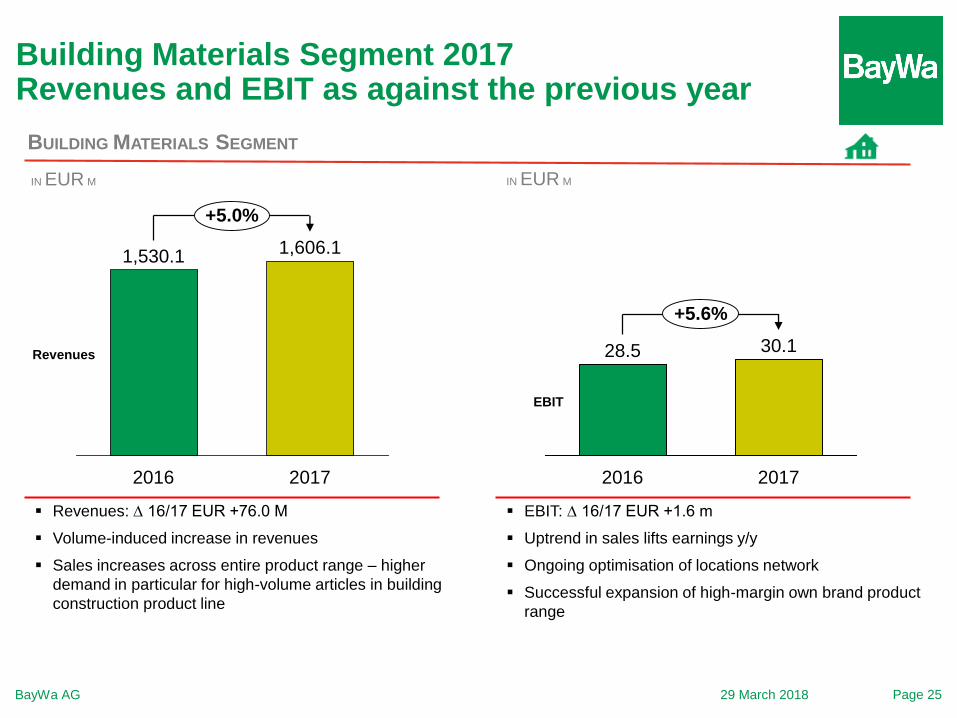
+5.0%
Revenues
2017
1,606.1
2016
1,530.1
Building Materials Segment 2017Revenues and EBIT as against the previous year
IN EUR M
Revenues: ∆ 16/17 EUR +76.0 M
Volume-induced increase in revenues
Sales increases across entire product range – higher
demand in particular for high-volume articles in building
construction product line
BayWa AG
+5.6%
EBIT
2017
30.1
2016
28.5
Page 2529 March 2018
BUILDING MATERIALS SEGMENT
EBIT: ∆ 16/17 EUR +1.6 m
Uptrend in sales lifts earnings y/y
Ongoing optimisation of locations network
Successful expansion of high-margin own brand product
range
IN EUR M

INNOVATION & DIGITALISATION
Innovation & Digitalisation Segment 2017
Innovation & Digitalisation Segment 2017Market development
BayWa AG
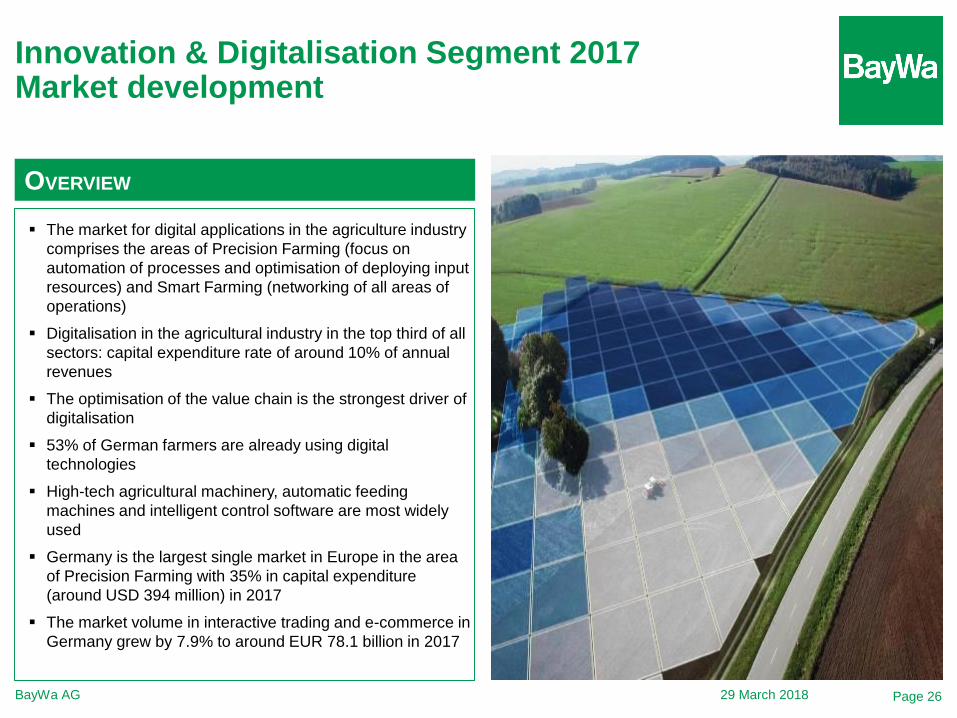
OVERVIEW
The market for digital applications in the agriculture industry
comprises the areas of Precision Farming (focus on
automation of processes and optimisation of deploying input
resources) and Smart Farming (networking of all areas of
operations)
Digitalisation in the agricultural industry in the top third of all
sectors: capital expenditure rate of around 10% of annual
revenues
The optimisation of the value chain is the strongest driver of
digitalisation
53% of German farmers are already using digital
technologies
High-tech agricultural machinery, automatic feeding
machines and intelligent control software are most widely
used
Germany is the largest single market in Europe in the area
of Precision Farming with 35% in capital expenditure
(around USD 394 million) in 2017
The market volume in interactive trading and e-commerce in
Germany grew by 7.9% to around EUR 78.1 billion in 2017
29 March 2018 Page 26
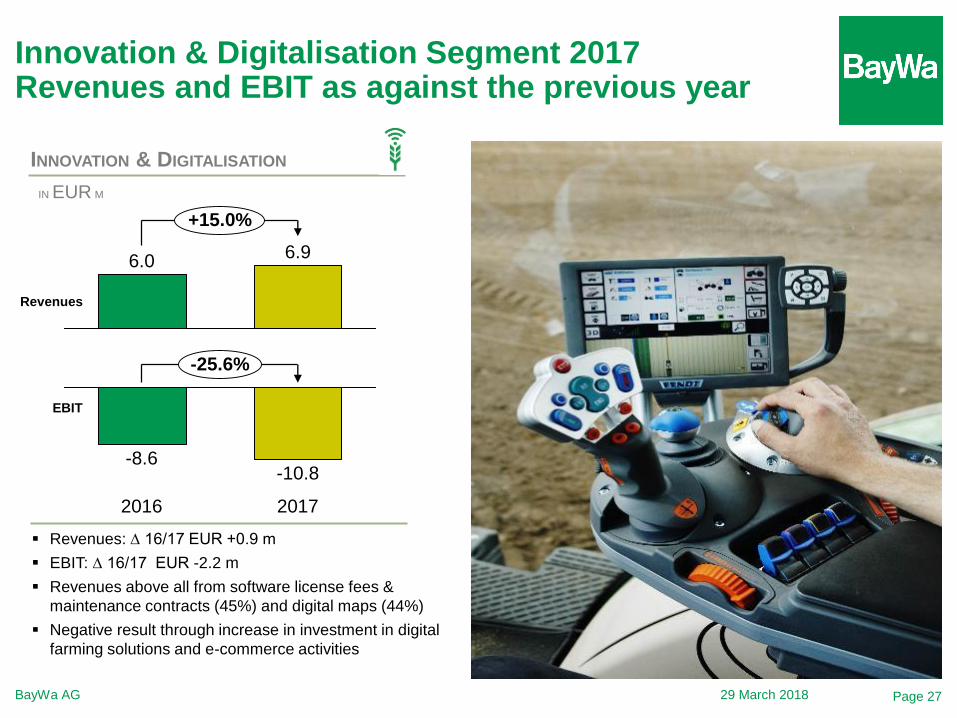
Innovation & Digitalisation Segment 2017Revenues and EBIT as against the previous year
29 March 2018BayWa AG Page 27
-25.6%
2017
EBIT
-10.8
2016
-8.6
+15.0%
6.9
Revenues
6.0
INNOVATION & DIGITALISATION
IN EUR M
Revenues: ∆ 16/17 EUR +0.9 m
EBIT: ∆ 16/17 EUR -2.2 m
Revenues above all from software license fees &
maintenance contracts (45%) and digital maps (44%)
Negative result through increase in investment in digital
farming solutions and e-commerce activities
BayWa AG
Group FinancialsAndreas Helber
29 March 2018 Page 28
Group FinancialsFinal quarter as against the previous year
29 March 2018BayWa AG
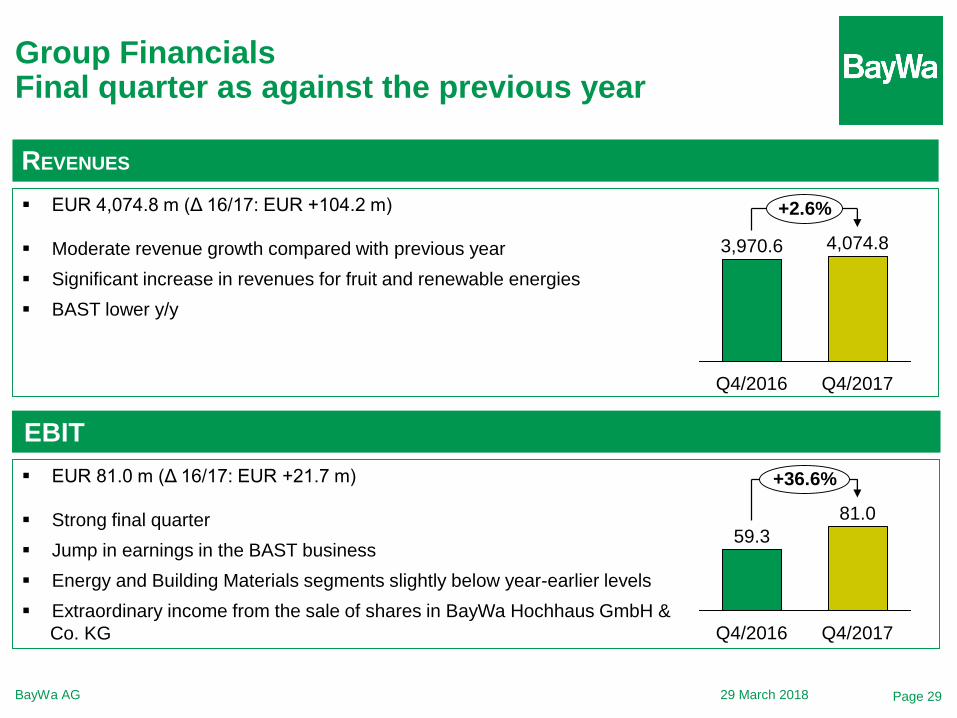
EBIT
EUR 81.0 m (Δ 16/17: EUR +21.7 m)
Strong final quarter
Jump in earnings in the BAST business
Energy and Building Materials segments slightly below year-earlier levels
Extraordinary income from the sale of shares in BayWa Hochhaus GmbH &
Co. KG
59.3
Q4/2017Q4/2016
81.0
+36.6%
EUR 4,074.8 m (Δ 16/17: EUR +104.2 m)
Moderate revenue growth compared with previous year
Significant increase in revenues for fruit and renewable energies
BAST lower y/y
+2.6%
Q4/2017Q4/2016
3,970.6 4,074.8
REVENUES
Page 29
Group FinancialsKey Financials – Income Statement
29 March 2018 Page 30BayWa AG
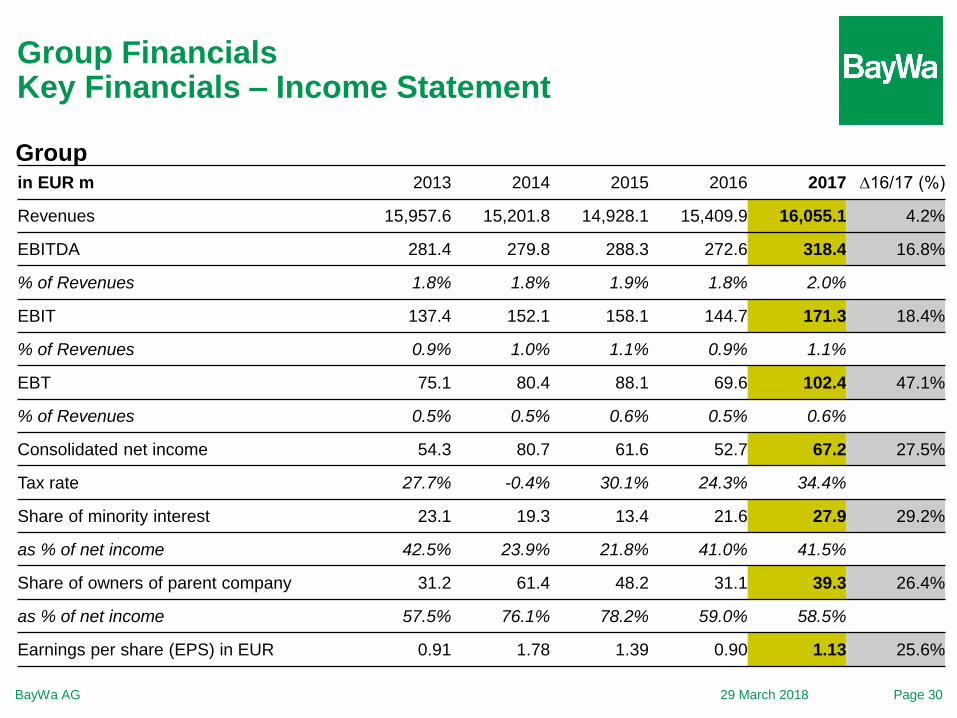
Groupin EUR m 2013 2014 2015 2016 2017 ∆16/17 (%)
Revenues 15,957.6 15,201.8 14,928.1 15,409.9 16,055.1 4.2%
EBITDA 281.4 279.8 288.3 272.6 318.4 16.8%
% of Revenues 1.8% 1.8% 1.9% 1.8% 2.0%
EBIT 137.4 152.1 158.1 144.7 171.3 18.4%
% of Revenues 0.9% 1.0% 1.1% 0.9% 1.1%
EBT 75.1 80.4 88.1 69.6 102.4 47.1%
% of Revenues 0.5% 0.5% 0.6% 0.5% 0.6%
Consolidated net income 54.3 80.7 61.6 52.7 67.2 27.5%
Tax rate 27.7% -0.4% 30.1% 24.3% 34.4%
Share of minority interest 23.1 19.3 13.4 21.6 27.9 29.2%
as % of net income 42.5% 23.9% 21.8% 41.0% 41.5%
Share of owners of parent company 31.2 61.4 48.2 31.1 39.3 26.4%
as % of net income 57.5% 76.1% 78.2% 59.0% 58.5%
Earnings per share (EPS) in EUR 0.91 1.78 1.39 0.90 1.13 25.6%
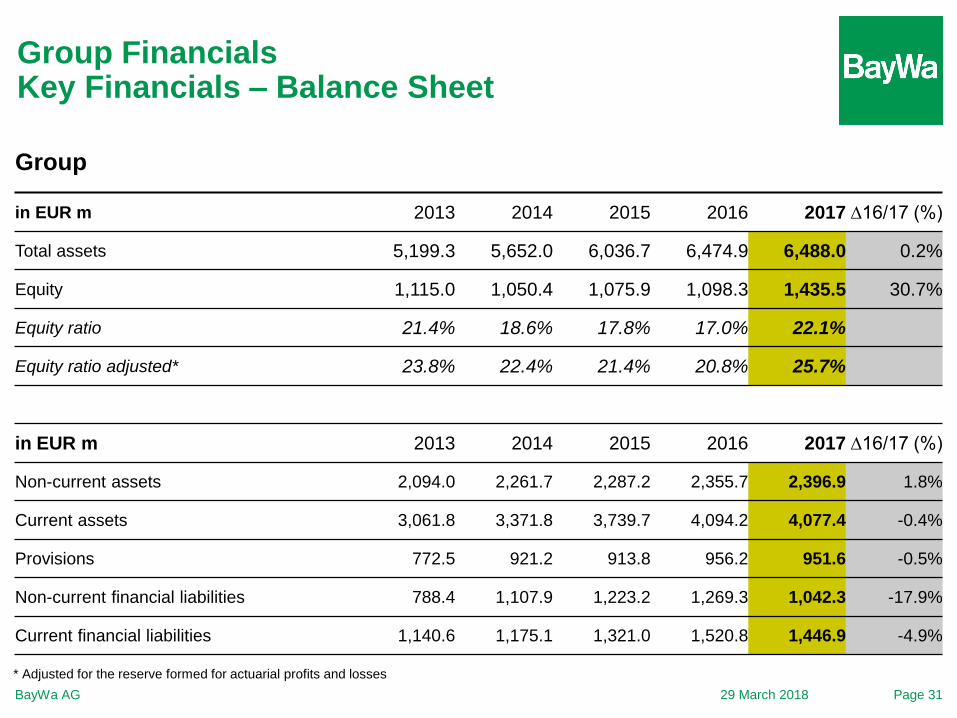
in EUR m 2013 2014 2015 2016 2017 ∆16/17 (%)
Total assets 5,199.3 5,652.0 6,036.7 6,474.9 6,488.0 0.2%
Equity 1,115.0 1,050.4 1,075.9 1,098.3 1,435.5 30.7%
Equity ratio 21.4% 18.6% 17.8% 17.0% 22.1%
Equity ratio adjusted* 23.8% 22.4% 21.4% 20.8% 25.7%
in EUR m 2013 2014 2015 2016 2017 ∆16/17 (%)
Non-current assets 2,094.0 2,261.7 2,287.2 2,355.7 2,396.9 1.8%
Current assets 3,061.8 3,371.8 3,739.7 4,094.2 4,077.4 -0.4%
Provisions 772.5 921.2 913.8 956.2 951.6 -0.5%
Non-current financial liabilities 788.4 1,107.9 1,223.2 1,269.3 1,042.3 -17.9%
Current financial liabilities 1,140.6 1,175.1 1,321.0 1,520.8 1,446.9 -4.9%
Group FinancialsKey Financials – Balance Sheet
29 March 2018 Page 31BayWa AG
* Adjusted for the reserve formed for actuarial profits and losses
Group
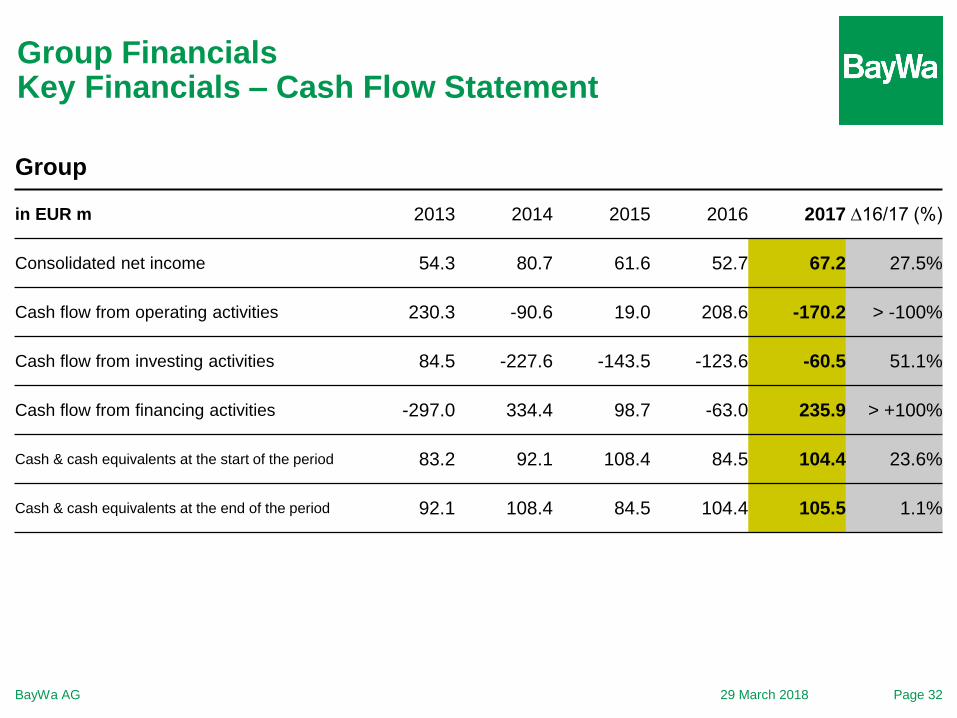
Group FinancialsKey Financials – Cash Flow Statement
29 March 2018 Page 32BayWa AG
Group
in EUR m 2013 2014 2015 2016 2017 ∆16/17 (%)
Consolidated net income 54.3 80.7 61.6 52.7 67.2 27.5%
Cash flow from operating activities 230.3 -90.6 19.0 208.6 -170.2 > -100%
Cash flow from investing activities 84.5 -227.6 -143.5 -123.6 -60.5 51.1%
Cash flow from financing activities -297.0 334.4 98.7 -63.0 235.9 > +100%
Cash & cash equivalents at the start of the period 83.2 92.1 108.4 84.5 104.4 23.6%
Cash & cash equivalents at the end of the period 92.1 108.4 84.5 104.4 105.5 1.1%
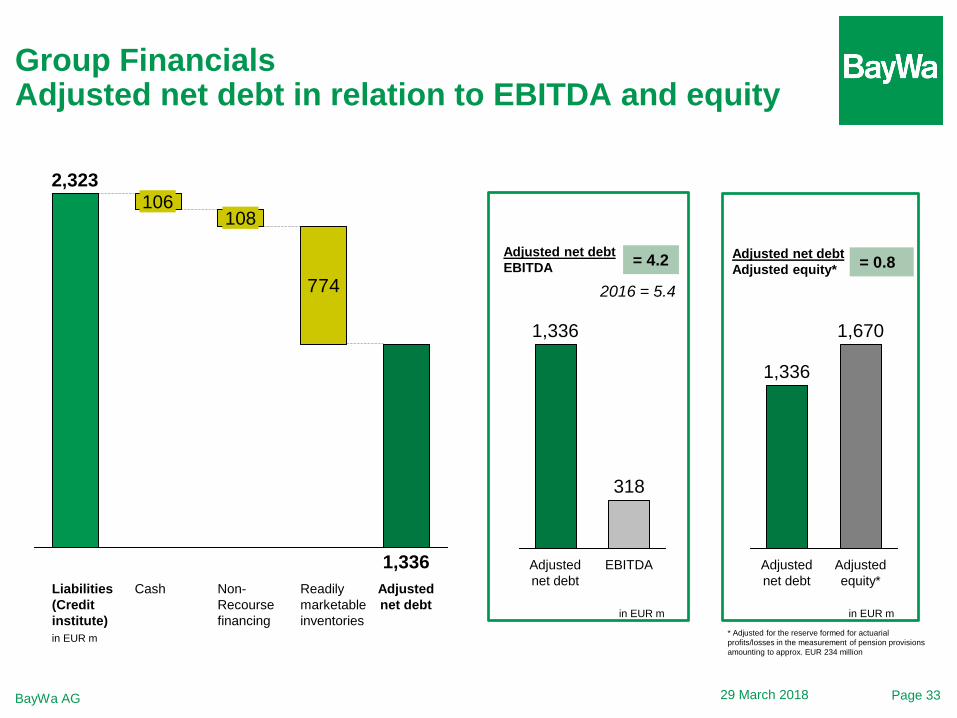
774
Readily
marketable
inventories
Non-
Recourse
financing
Adjusted
net debt
1,336
108
Cash
106
Liabilities
(Credit
institute)
2,323
in EUR m
Page 33BayWa AG 29 March 2018
318
Adjusted
net debt
EBITDA
1,336
Adjusted net debt
EBITDA = 4.2
1,670
1,336
Adjusted
net debt
Adjusted
equity*
in EUR m
Group FinancialsAdjusted net debt in relation to EBITDA and equity
= 0.8
* Adjusted for the reserve formed for actuarial
profits/losses in the measurement of pension provisions
amounting to approx. EUR 234 million
in EUR m
Adjusted net debt
Adjusted equity*
2016 = 5.4
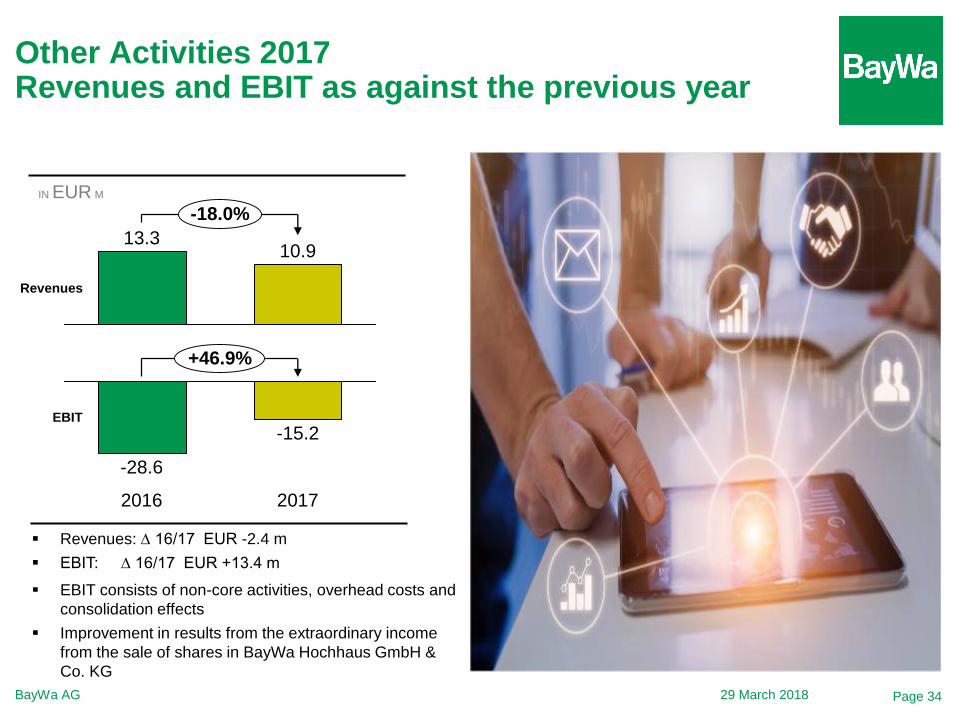
Other Activities 2017Revenues and EBIT as against the previous year
29 March 2018BayWa AG Page 34
EBIT
+46.9%
2017
-15.2
-28.6
2016
-18.0%
Revenues
10.913.3
IN EUR M
Revenues: ∆ 16/17 EUR -2.4 m
EBIT: ∆ 16/17 EUR +13.4 m
EBIT consists of non-core activities, overhead costs and
consolidation effects
Improvement in results from the extraordinary income
from the sale of shares in BayWa Hochhaus GmbH &
Co. KG

BayWa AG
Strategic Outlook for FY 2018Prof. Klaus Josef Lutz
29 March 2018 Page 35
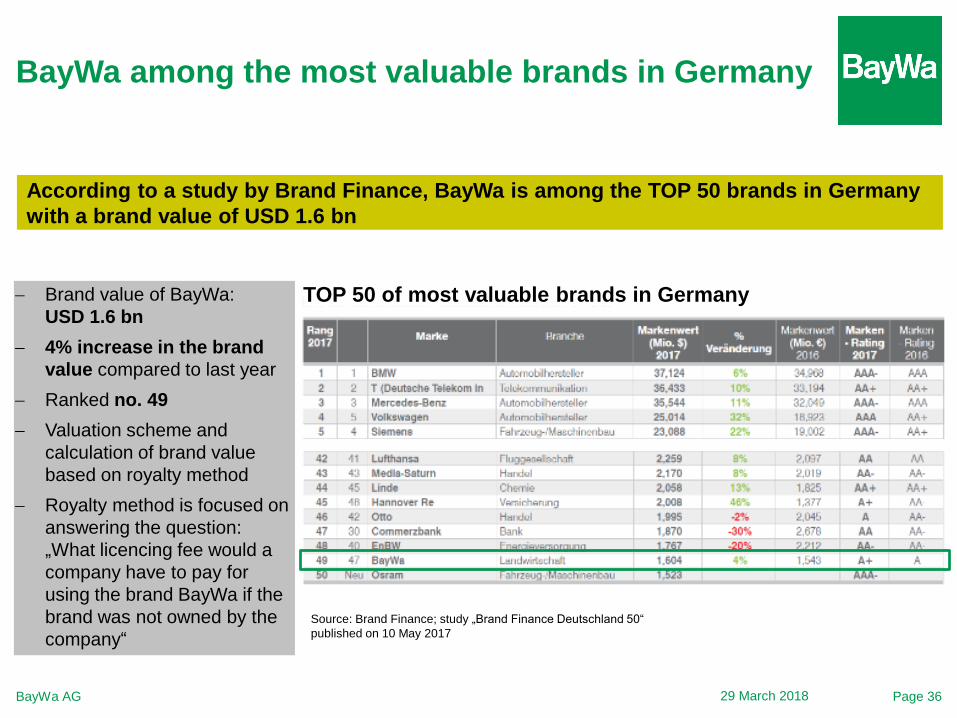
BayWa among the most valuable brands in Germany
Brand value of BayWa:
USD 1.6 bn
4% increase in the brand
value compared to last year
Ranked no. 49
Valuation scheme and
calculation of brand value
based on royalty method
Royalty method is focused on
answering the question:
„What licencing fee would a
company have to pay for
using the brand BayWa if the
brand was not owned by the
company“
Source: Brand Finance; study „Brand Finance Deutschland 50“
published on 10 May 2017
According to a study by Brand Finance, BayWa is among the TOP 50 brands in Germany
with a brand value of USD 1.6 bn
TOP 50 of most valuable brands in Germany
29 March 2018BayWa AG Page 36
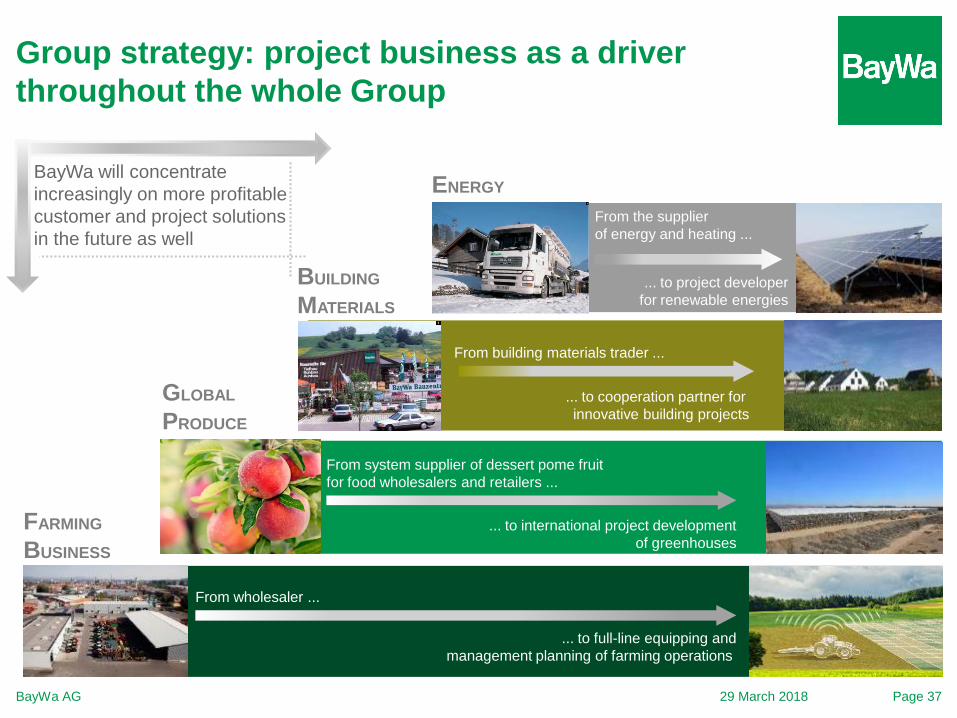
Group strategy: project business as a driver
throughout the whole Group
From system supplier of dessert pome fruit
for food wholesalers and retailers ...
... to international project development
of greenhouses
From building materials trader ...
... to cooperation partner for
innovative building projects
From the supplier
of energy and heating ...
... to project developer
for renewable energies
... to full-line equipping and
management planning of farming operations
From wholesaler ...
BayWa will concentrate
increasingly on more profitable
customer and project solutions
in the future as well
ENERGY
BUILDING
MATERIALS
GLOBAL
PRODUCE
FARMING
BUSINESS
29 March 2018BayWa AG Page 37
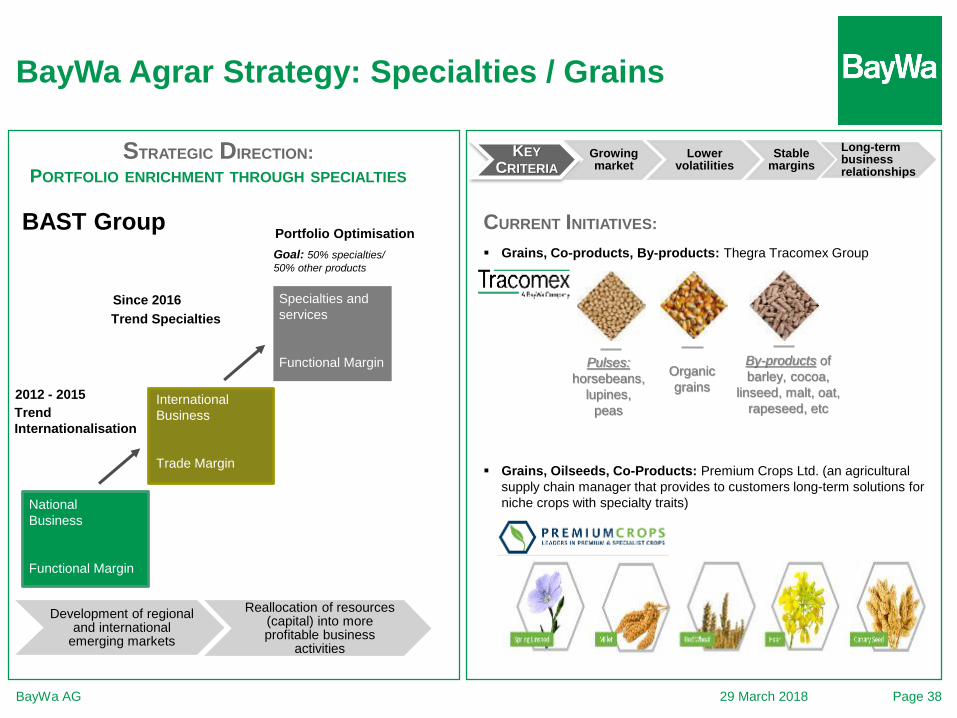
BayWa Agrar Strategy: Specialties / Grains
29 March 2018
Goal: 50% specialties/
50% other products
Trend
Internationalisation
2012 - 2015
Since 2016
STRATEGIC DIRECTION:
PORTFOLIO ENRICHMENT THROUGH SPECIALTIES
KEY
CRITERIA
Growingmarket
Lowervolatilities
Stablemargins
Long-term businessrelationships
BAST Group Grains, Co-products, By-products: Thegra Tracomex Group
Grains, Oilseeds, Co-Products: Premium Crops Ltd. (an agricultural
supply chain manager that provides to customers long-term solutions for
niche crops with specialty traits)
CURRENT INITIATIVES:
By-products of
barley, cocoa,
linseed, malt, oat,
rapeseed, etc
Organic
grains
Pulses:
horsebeans,
lupines,
peas
National
Business
Functional Margin
International
Business
Trade Margin
Specialties and
services
Functional Margin
Development of regional and international
emerging markets
Reallocation of resources(capital) into moreprofitable business
activities
Portfolio Optimisation
Trend Specialties
BayWa AG Page 38
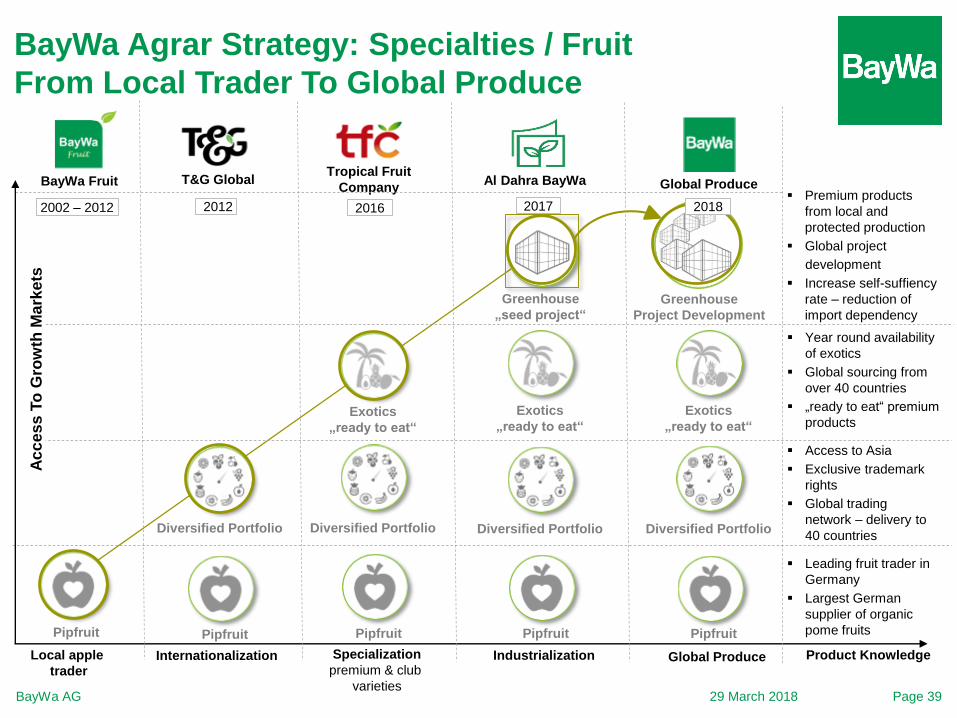
Pipfruit
Local apple
trader
BayWa Fruit T&G GlobalTropical Fruit
CompanyAl Dahra BayWa
Pipfruit
Exotics
„ready to eat“
Diversified Portfolio
Pipfruit
Diversified Portfolio
Internationalization Specialization
premium & club
varieties
Exotics
„ready to eat“
Pipfruit
Diversified Portfolio
Industrialization
Greenhouse
„seed project“
Exotics
„ready to eat“
Pipfruit
Diversified Portfolio
Greenhouse
Project Development
Global Produce
Global Produce
Product Knowledge
2002 – 2012 2012 2016 2017 2018
Leading fruit trader in
Germany
Largest German
supplier of organic
pome fruits
Access to Asia
Exclusive trademark
rights
Global trading
network – delivery to
40 countries
Year round availability
of exotics
Global sourcing from
over 40 countries
„ready to eat“ premium
products
Premium products
from local and
protected production
Global project
development
Increase self-suffiency
rate – reduction of
import dependency
Ac
ce
ss
To
Gro
wth
Ma
rke
ts
29 March 2018
BayWa Agrar Strategy: Specialties / Fruit
From Local Trader To Global Produce
BayWa AG Page 39
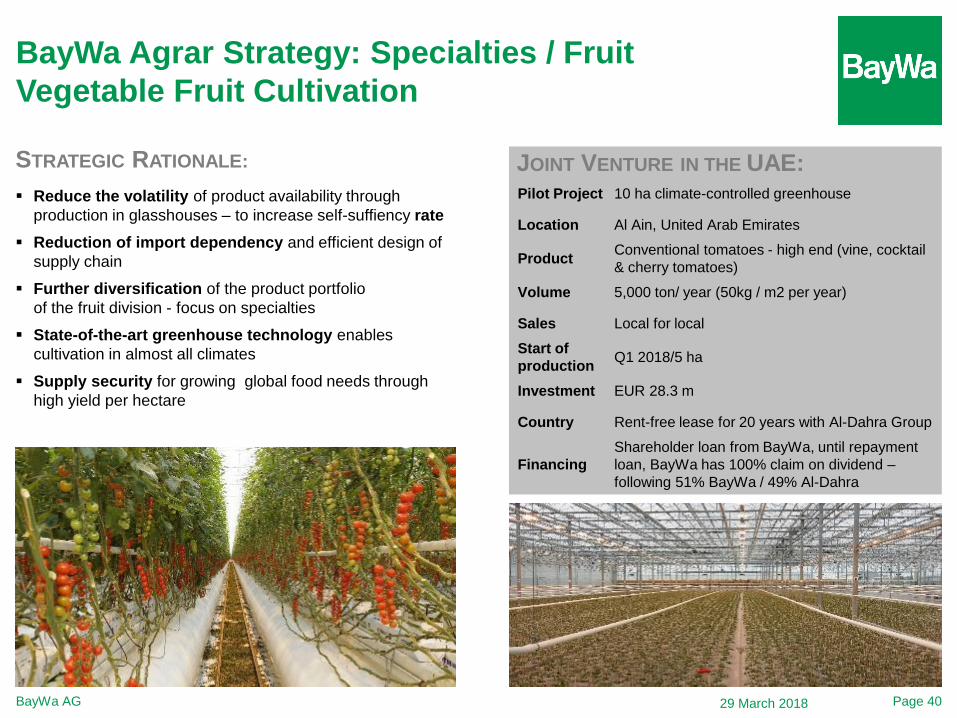
BayWa Agrar Strategy: Specialties / Fruit
Vegetable Fruit Cultivation
29 March 2018
JOINT VENTURE IN THE UAE:STRATEGIC RATIONALE:
Reduce the volatility of product availability through
production in glasshouses – to increase self-suffiency rate
Reduction of import dependency and efficient design of
supply chain
Further diversification of the product portfolio
of the fruit division - focus on specialties
State-of-the-art greenhouse technology enables
cultivation in almost all climates
Supply security for growing global food needs through
high yield per hectare
Pilot Project 10 ha climate-controlled greenhouse
Location Al Ain, United Arab Emirates
ProductConventional tomatoes - high end (vine, cocktail
& cherry tomatoes)
Volume 5,000 ton/ year (50kg / m2 per year)
Sales Local for local
Start of
productionQ1 2018/5 ha
Investment EUR 28.3 m
Country Rent-free lease for 20 years with Al-Dahra Group
Financing
Shareholder loan from BayWa, until repayment
loan, BayWa has 100% claim on dividend –
following 51% BayWa / 49% Al-Dahra
BayWa AG Page 40
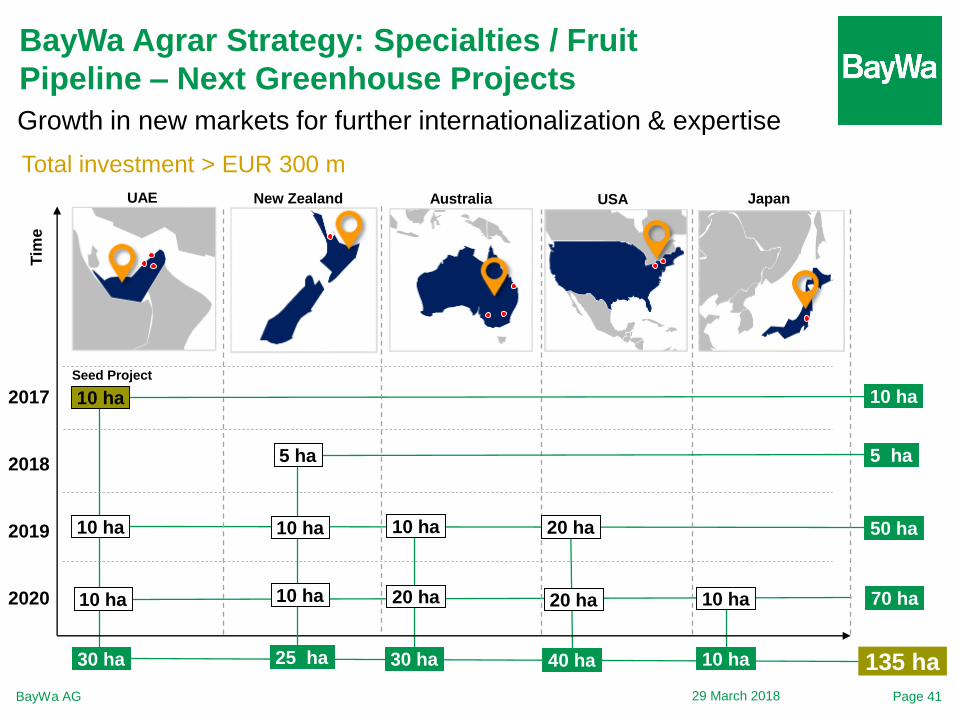
UAE JapanUSAAustralia
2017
2018
2019
2020
10 ha
10 ha
10 ha
20 ha
20 ha
10 ha
10 ha
30 ha 40 ha 30 ha 10 ha
50 ha
70 ha
5 ha
10 ha
Tim
e
135 ha
Seed Project
20 ha
New Zealand
5 ha
25 ha
10 ha
10 ha
Total investment > EUR 300 m
BayWa Agrar Strategy: Specialties / Fruit
Pipeline – Next Greenhouse Projects
Growth in new markets for further internationalization & expertise
29 March 2018BayWa AG Page 41
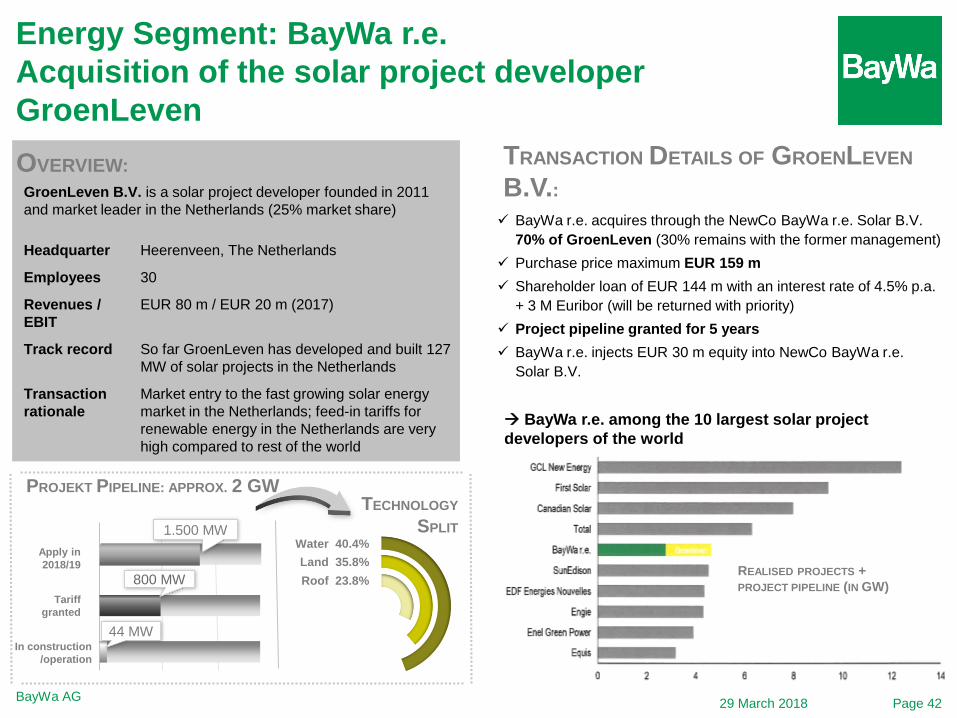
Energy Segment: BayWa r.e.
Acquisition of the solar project developer
GroenLeven
BayWa AG
OVERVIEW: TRANSACTION DETAILS OF GROENLEVEN
B.V.: BayWa r.e. acquires through the NewCo BayWa r.e. Solar B.V.
70% of GroenLeven (30% remains with the former management)
Purchase price maximum EUR 159 m
Shareholder loan of EUR 144 m with an interest rate of 4.5% p.a.
+ 3 M Euribor (will be returned with priority)
Project pipeline granted for 5 years
BayWa r.e. injects EUR 30 m equity into NewCo BayWa r.e.
Solar B.V.
Water 40.4%
Land 35.8%
Roof 23.8%
Apply in
2018/19
Tariff
granted
In construction
/operation
1.500 MW
800 MW
44 MW
GroenLeven B.V. is a solar project developer founded in 2011
and market leader in the Netherlands (25% market share)
Headquarter Heerenveen, The Netherlands
Employees 30
Revenues /
EBIT
EUR 80 m / EUR 20 m (2017)
Track record So far GroenLeven has developed and built 127
MW of solar projects in the Netherlands
Transaction
rationale
Market entry to the fast growing solar energy
market in the Netherlands; feed-in tariffs for
renewable energy in the Netherlands are very
high compared to rest of the world
BayWa r.e. among the 10 largest solar project
developers of the world
REALISED PROJECTS +
PROJECT PIPELINE (IN GW)
TECHNOLOGY
SPLIT
PROJEKT PIPELINE: APPROX. 2 GW
29 March 2018 Page 42

BayWa AG
Operational Outlook for FY 2018Prof. Klaus Josef Lutz
29 March 2018 Page 43
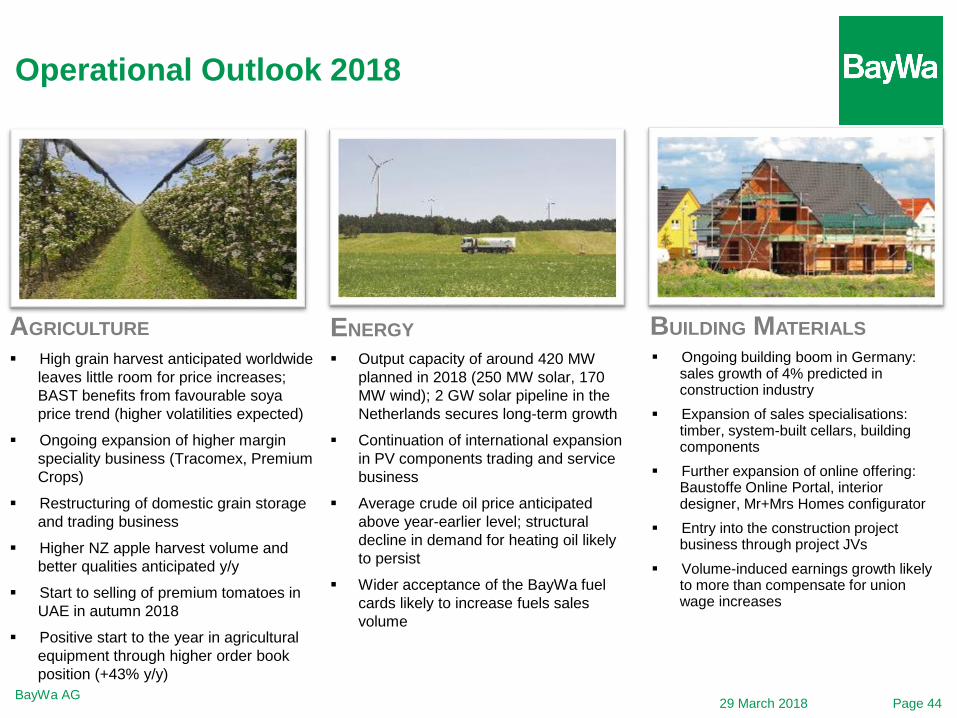
Operational Outlook 2018
BayWa AG
BUILDING MATERIALSENERGY
High grain harvest anticipated worldwide
leaves little room for price increases;
BAST benefits from favourable soya
price trend (higher volatilities expected)
Ongoing expansion of higher margin
speciality business (Tracomex, Premium
Crops)
Restructuring of domestic grain storage
and trading business
Higher NZ apple harvest volume and
better qualities anticipated y/y
Start to selling of premium tomatoes in
UAE in autumn 2018
Positive start to the year in agricultural
equipment through higher order book
position (+43% y/y)
Output capacity of around 420 MW
planned in 2018 (250 MW solar, 170
MW wind); 2 GW solar pipeline in the
Netherlands secures long-term growth
Continuation of international expansion
in PV components trading and service
business
Average crude oil price anticipated
above year-earlier level; structural
decline in demand for heating oil likely
to persist
Wider acceptance of the BayWa fuel
cards likely to increase fuels sales
volume
Ongoing building boom in Germany: sales growth of 4% predicted in construction industry
Expansion of sales specialisations: timber, system-built cellars, building components
Further expansion of online offering: Baustoffe Online Portal, interior designer, Mr+Mrs Homes configurator
Entry into the construction project business through project JVs
Volume-induced earnings growth likely to more than compensate for union wage increases
AGRICULTURE
29 March 2018 Page 44
Thank you for your attention The information in this presentation is partly made up of forward-looking statements which are based on assumptions and are subject to unforeseeable risks.In as much as the assumptions on the successful integration of acquisitions and on the internal growth of the company should prove to be inaccurate, or should other unforeseeable risks occur, the possibility of the assets, financial position and results of operations of the Group diverging negatively from the target figures cited in this presentation should not be discounted.BayWa AG can therefore undertake no guarantee that the actual development of the net worth, financial position and results of operations of the Group will concur with the target figures described in this presentation.

Appendix
29 March 2018 Page 47BayWa AG
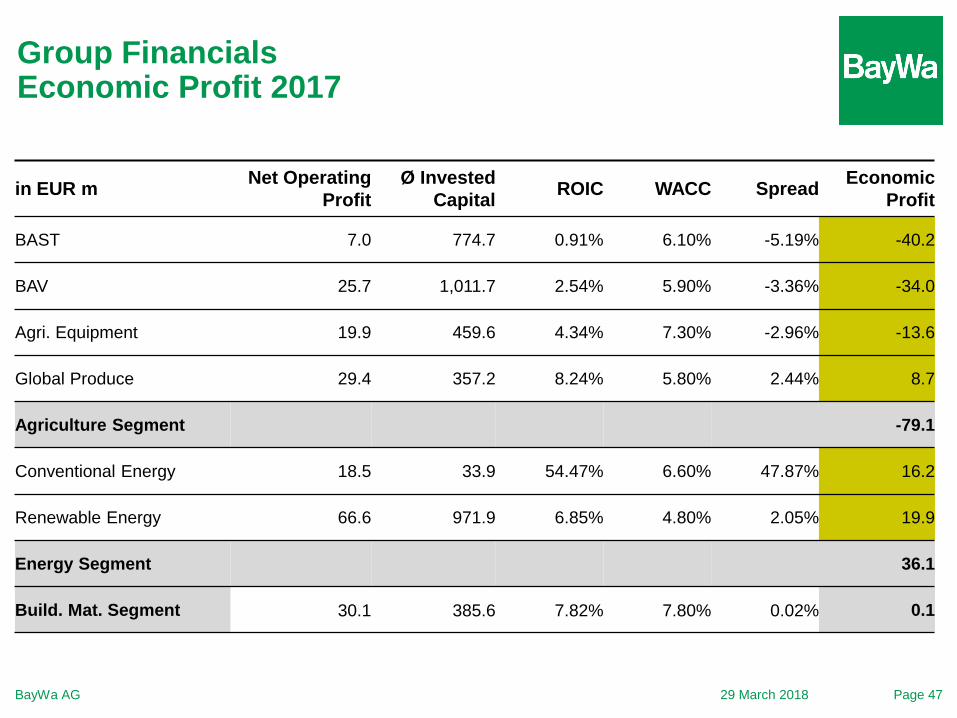
in EUR mNet Operating
Profit
Ø Invested
CapitalROIC WACC Spread
Economic
Profit
BAST 7.0 774.7 0.91% 6.10% -5.19% -40.2
BAV 25.7 1,011.7 2.54% 5.90% -3.36% -34.0
Agri. Equipment 19.9 459.6 4.34% 7.30% -2.96% -13.6
Global Produce 29.4 357.2 8.24% 5.80% 2.44% 8.7
Agriculture Segment -79.1
Conventional Energy 18.5 33.9 54.47% 6.60% 47.87% 16.2
Renewable Energy 66.6 971.9 6.85% 4.80% 2.05% 19.9
Energy Segment 36.1
Build. Mat. Segment 30.1 385.6 7.82% 7.80% 0.02% 0.1
Group FinancialsEconomic Profit 2017
Financials Agriculture SegmentIncome Statement
29 March 2018 Page 48BayWa AG
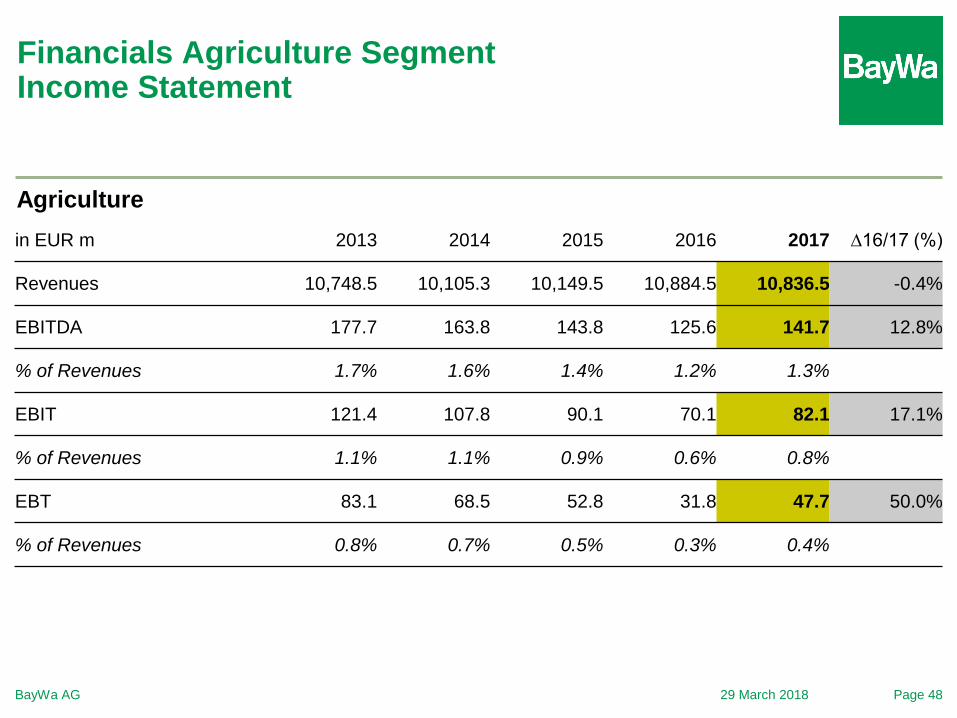
Agriculture
in EUR m 2013 2014 2015 2016 2017 ∆16/17 (%)
Revenues 10,748.5 10,105.3 10,149.5 10,884.5 10,836.5 -0.4%
EBITDA 177.7 163.8 143.8 125.6 141.7 12.8%
% of Revenues 1.7% 1.6% 1.4% 1.2% 1.3%
EBIT 121.4 107.8 90.1 70.1 82.1 17.1%
% of Revenues 1.1% 1.1% 0.9% 0.6% 0.8%
EBT 83.1 68.5 52.8 31.8 47.7 50.0%
% of Revenues 0.8% 0.7% 0.5% 0.3% 0.4%
Financials Energy SegmentIncome Statement
29 March 2018 Page 49BayWa AG
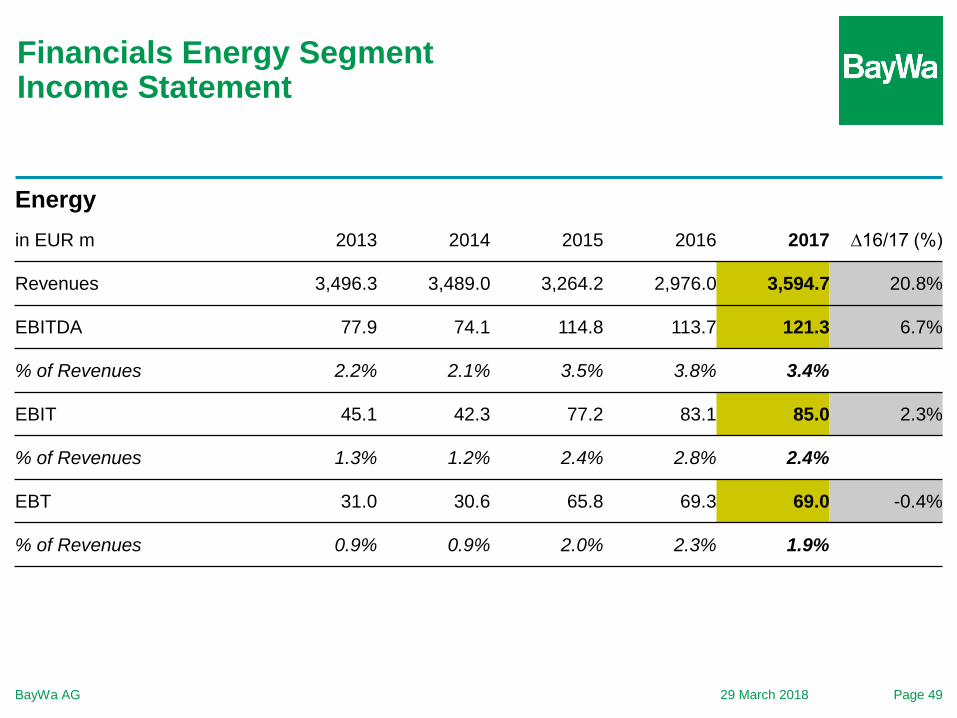
Energy
in EUR m 2013 2014 2015 2016 2017 ∆16/17 (%)
Revenues 3,496.3 3,489.0 3,264.2 2,976.0 3,594.7 20.8%
EBITDA 77.9 74.1 114.8 113.7 121.3 6.7%
% of Revenues 2.2% 2.1% 3.5% 3.8% 3.4%
EBIT 45.1 42.3 77.2 83.1 85.0 2.3%
% of Revenues 1.3% 1.2% 2.4% 2.8% 2.4%
EBT 31.0 30.6 65.8 69.3 69.0 -0.4%
% of Revenues 0.9% 0.9% 2.0% 2.3% 1.9%
Financials Building Materials SegmentIncome Statement
29 March 2018 Page 50BayWa AG
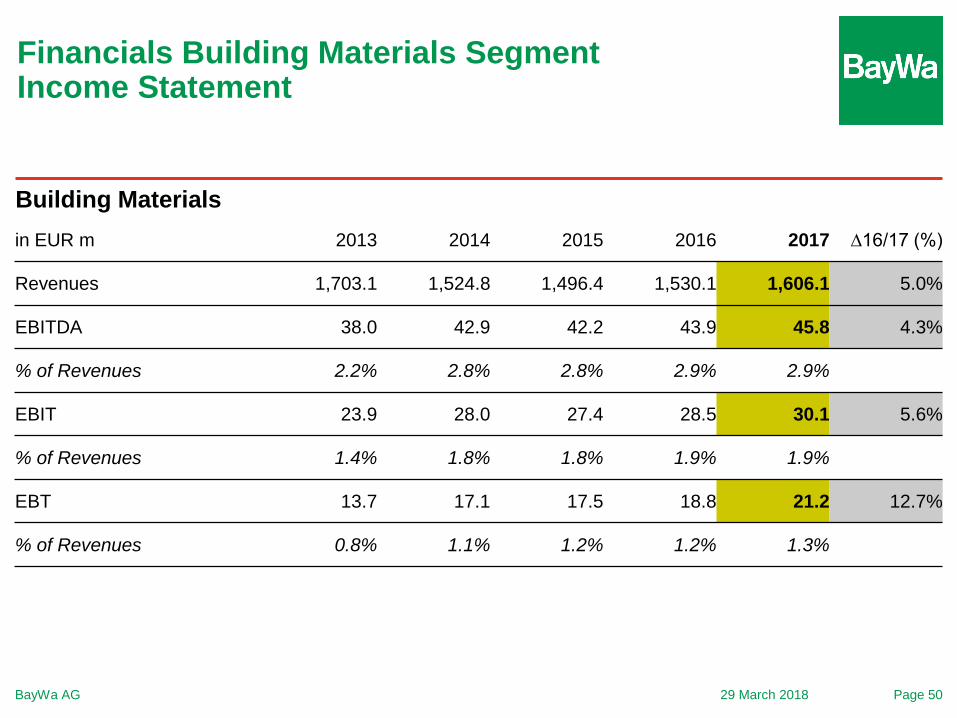
Building Materials
in EUR m 2013 2014 2015 2016 2017 ∆16/17 (%)
Revenues 1,703.1 1,524.8 1,496.4 1,530.1 1,606.1 5.0%
EBITDA 38.0 42.9 42.2 43.9 45.8 4.3%
% of Revenues 2.2% 2.8% 2.8% 2.9% 2.9%
EBIT 23.9 28.0 27.4 28.5 30.1 5.6%
% of Revenues 1.4% 1.8% 1.8% 1.9% 1.9%
EBT 13.7 17.1 17.5 18.8 21.2 12.7%
% of Revenues 0.8% 1.1% 1.2% 1.2% 1.3%
BayWa AG
BayWa Share 2017
29 March 2018 Page 51
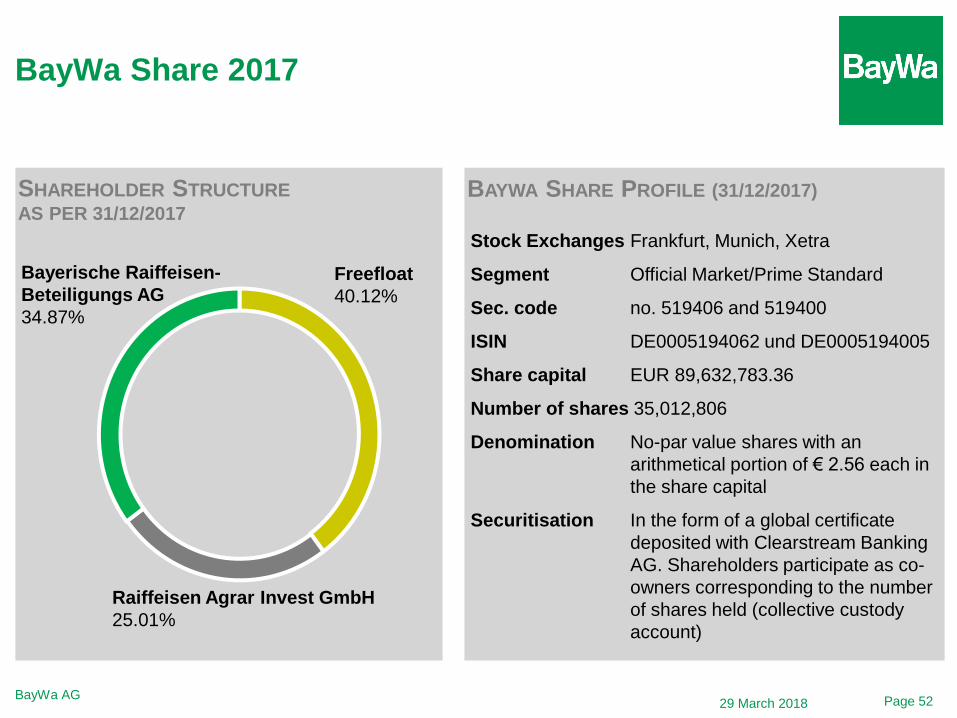
BayWa Share 2017
SHAREHOLDER STRUCTURE
AS PER 31/12/2017
Stock Exchanges Frankfurt, Munich, Xetra
Segment Official Market/Prime Standard
Sec. code no. 519406 and 519400
ISIN DE0005194062 und DE0005194005
Share capital EUR 89,632,783.36
Number of shares 35,012,806
Denomination No-par value shares with an
arithmetical portion of € 2.56 each in
the share capital
Securitisation In the form of a global certificate
deposited with Clearstream Banking
AG. Shareholders participate as co-
owners corresponding to the number
of shares held (collective custody
account)
BAYWA SHARE PROFILE (31/12/2017)
Freefloat
40.12%
Raiffeisen Agrar Invest GmbH
25.01%
Bayerische Raiffeisen-
Beteiligungs AG
34.87%
BayWa AG29 March 2018 Page 52
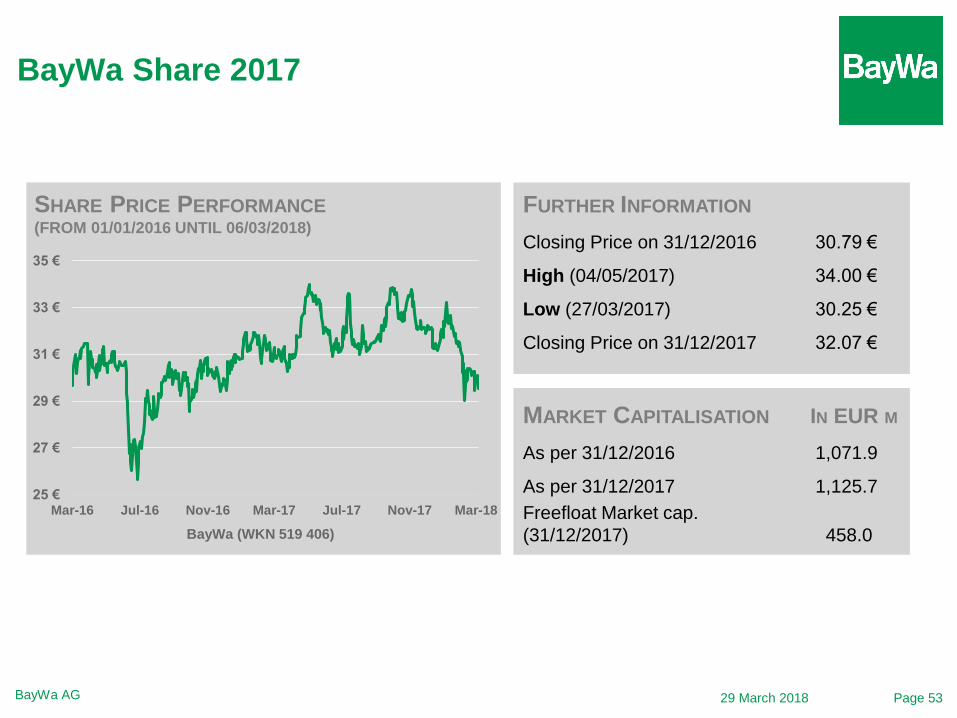
BayWa Share 2017
FURTHER INFORMATION
Closing Price on 31/12/2016 30.79 €
High (04/05/2017) 34.00 €
Low (27/03/2017) 30.25 €
Closing Price on 31/12/2017 32.07 €
MARKET CAPITALISATION IN EUR M
As per 31/12/2016 1,071.9
As per 31/12/2017 1,125.7
Freefloat Market cap.
(31/12/2017) 458.0
SHARE PRICE PERFORMANCE(FROM 01/01/2016 UNTIL 06/03/2018)
BayWa AG
25 €
27 €
29 €
31 €
33 €
35 €
Mar-16 Jul-16 Nov-16 Mar-17 Jul-17 Nov-17 Mar-18
BayWa (WKN 519 406)
29 March 2018 Page 53

Investor Relations Contact
JOSKO
RADELJIC
JULIUS
BLERSCH
Head of Investor Relations
Telefon +49 (089) 92 22 3887
Mobil +49 162 2828671
RAPHAELA
DA COSTA VON GEHLEN
Investor Relations Manager
Telefon +49 (089) 92 22 3151
Mobil +49 162 2828410
Junior Investor Relations Manager
Telefon +49 (089) 92 22 2873
Mobil +49 151 44024858
BAYWA AG
Arabellastraße 4
81925 Munich, Germany
Homepage: www.baywa.com
Financial Calendar 2018MARCH 2018
29/03 Analysts‘ Conference, BayWa AG in Munich
MAY 2018
09/05 Analysts‘ Conference Call Q1
JUNE 2018
05/06 Annual General Meeting, ICM Munich
RENATE
LORENZ
Assistant
Telefon +49 (089) 92 22 3881