annual financial statements – as at december 31, 2014ivari.ca/files/2014_bpi_legacy_afs.pdf · we...
TRANSCRIPT

Annual Financial Statements – a s a t D e c e m b e r 3 1 , 2 0 1 4
Legacy Segregated Funds

Overview .......................................................................................................................... 1
Independent Auditor’s Report ...................................................................................... 2
Equity Funds
Cambridge American Equity Segregated Fund ..................................................................... 3
CI American Small Companies Segregated Fund ................................................................. 11
CI Global Segregated Fund ................................................................................................... 19
CI International Segregated Fund ......................................................................................... 28
Signature Canadian Segregated Fund .................................................................................. 38
Signature Select Canadian Segregated Fund .................................................................... 46
Balanced Fund
Signature Canadian Balanced Segregated Fund ................................................................ 54
Income Funds
CI Money Market Segregated Fund ...................................................................................... 63
Signature Canadian Bond Segregated Fund ......................................................................... 71
Signature Dividend Income Segregated Fund ...................................................................... 79
Signature High Income B Segregated Fund ......................................................................... 88
Signature High Income Segregated Fund .......................................................................... 96
Notes to the Financial Statements ............................................................................... 104
Legal Notice .................................................................................................................... 108
A look inside

– 1 –
Enclosed are the Financial Statements for your segregated funds for
the year ended December 31, 2014. Inside is important information
about each fund, including its financial statements for the year and a
list of the top portfolio holdings of the underlying fund as of the end
of the year.
Additional information about your funds can be found on our website,
www.ci.com.
If you have any questions about your investments, please contact your
financial advisor. CI is proud to partner with advisors across Canada.
We believe investors are most successful when they follow an investment
plan developed with the assistance of a qualified advisor.
You may also contact CI Client Services at 1-800-792-9355.
Thank you for investing with us.
CANADA’S INVESTMENT COMPANY
CI has been investing on behalf of Canadians since 1965 and has
grown to become one of Canada’s largest investment fund companies.
We manage over $103 billion on behalf of two million Canadians.
CI is a subsidiary of CI Financial Corp., a TSX-listed financial services
firm with $132.6 billion in assets at December 31, 2014.
CI provides one of the industry’s widest selections of investment
products and services and a strong lineup of leading portfolio
management teams. Our portfolio management expertise is offered
through several platforms, including mutual funds, tax-efficient funds,
guaranteed solutions, alternative investments and managed solutions.
2 Queen Street East, Twentieth FloorToronto, Ontario M5C 3G7www.ci.com
Telephone: 416-364-1145Toll Free: 1-800-268-9374Facsimile: 416-364-6299

– 2 –Annual Financial Statements as at December 31, 2014
Legacy Segregated FundsIndependent Auditors’ Report
To the Contractholders of:
Cambridge American Equity Segregated Fund
CI American Small Companies Segregated Fund
CI Global Segregated Fund
CI International Segregated Fund
CI Money Market Segregated Fund
Signature Canadian Balanced Segregated Fund
Signature Canadian Bond Segregated Fund
Signature Canadian Segregated Fund
Signature Dividend Income Segregated Fund
Signature High Income B Segregated Fund
Signature High Income Segregated Fund
Signature Select Canadian Segregated Fund
(collectively, the “Funds”)
We have audited the accompanying financial statements of the Funds, which comprise the statements
of financial position as at December 31, 2014 and 2013, and January 1, 2013, and the statements
of comprehensive income, changes in net assets attributable to contractholders and cash flows for
the years ended December 31, 2014 and 2013, which comprise a summary of significant accounting
policies and other explanatory information.
Management’s Responsibility for the Financial Statements
Management is responsible for the preparation and fair presentation of these financial statements
in accordance with International Financial Reporting Standards, and for such internal control as
management determines is necessary to enable the preparation of financial statements that are free
from material misstatement, whether due to fraud or error.
Auditors’ Responsibility
Our responsibility is to express an opinion on these financial statements based on our audits.
We conducted our audits in accordance with Canadian generally accepted auditing standards. Those
standards require that we comply with ethical requirements and plan and perform the audit to obtain
reasonable assurance about whether the financial statements are free from material misstatement.
An audit involves performing procedures to obtain audit evidence about the amounts and disclosures
in the financial statements. The procedures selected depend on the auditors’ judgment, including the
assessment of the risks of material misstatement of the financial statements, whether due to fraud or
error. In making those risk assessments, the auditors consider internal control relevant to the entity’s
preparation and fair presentation of the financial statements in order to design audit procedures
that are appropriate in the circumstances, but not for the purpose of expressing an opinion on the
effectiveness of the entity’s internal control. An audit also includes evaluating the appropriateness
of accounting policies used and the reasonableness of accounting estimates made by management,
as well as evaluating the overall presentation of the financial statements.
We believe that the audit evidence we have obtained in our audits is sufficient and appropriate to
provide a basis for our audit opinion.
Opinion
In our opinion, the financial statements present fairly, in all material respects, the financial position
of the Funds as at December 31, 2014 and 2013, and January 1, 2013, and their financial performance
and their cash flows for the years ended December 31, 2014 and 2013 in accordance with International
Financial Reporting Standards.
Toronto, Canada
May 11, 2015

– 3 –Annual Financial Statements as at December 31, 2014
Cambridge American Equity Segregated Fund
2014 2013
- - - - - - (19) (102)
185 482
- - 24 22 190 402
37 35 2 3 - - 2 2 41 40 - - 149 362
2.07 3.92 1.48 3.39
as at as at as at Dec. 31, 2014 Dec. 31, 2013 Jan. 1, 2013
1,226 1,147 914 - 1 1 - - - - - - - - - - - - - - 1 1,226 1,148 916
- - - - - - - - - - - - - - - - - - - - - 1,226 1,148 916
14.99 12.96 9.01 13.14 11.60 8.24
For inception date of the Fund, please refer to Note 1 in the Notes to the Financial Statements.The accompanying notes are an integral part of these financial statements.
Financial Statements (audited)
CIG - 134
Statements of Financial Position (in $000’s except for per unit amounts)
Statements of Comprehensive Income for the years ended December 31(in $000’s except for per unit amounts)
Assets Current assets Investments Cash Fees rebate receivable Dividends receivable Interest receivable Receivable for investments sold Receivable for unit subscriptions
Liabilities Current liabilities Bank overdraft Payable for investments purchased Payable for unit redemptions Management fees payable Administration fees payable Insurance fees payable
Net assets attributable to contractholders
Net assets attributable to contractholders per unit: Class IClass II
Income Net gain (loss) on investments Dividends Income distributions from investments Capital gain distributions from investments Net realized gain (loss) on sale of investments Change in unrealized appreciation (depreciation) in value of
investments Other income Interest Fees rebate (Note 7)
Expenses (Note 7)Management fees Administration fees Insurance fees Harmonized sales tax
Expenses absorbed by the manager Increase (decrease) in net assets from operations attributable to contractholders
Increase (decrease) in net assets from operations attributable to contractholders per unit: Class I Class II

– 4 –Annual Financial Statements as at December 31, 2014
Cambridge American Equity Segregated Fund
The accompanying notes are an integral part of these financial statements.
Financial Statements (audited)
2014 2013
1,148 916
149 362
314 86 (385) (216) (71) (130)
1,226 1,148
Net assets attributable to contractholders at the beginning of year Increase (decrease) in net assets from operations attributable to contractholders Unit transactions Proceeds from issuance of units Amounts paid on redemption of units
Net assets attributable to contractholders at the end of year
Statements of Changes in Net Assets Attributable to Contractholders for the years ended December 31 (in $000’s)
2014 2013
149 362
19 102
(185) (482) 264 165 (177) (18) - - - - - - - - - - - - 70 129
314 87 (385) (216) (71) (129)
(1) - 1 1 - 1
- - - - - - - -
Statements of Cash Flows for the years ended December 31 (in $000’s)
Cash flows from (used in) operating activities Increase (decrease) in net assets from operations attributable to contractholders Adjustments for: Net realized (gain) loss on sale of investments Change in unrealized (appreciation) depreciation in value of
investments Proceeds from sale of investments Purchase of investments (Increase) decrease in dividends receivable (Increase) decrease in interest receivable Increase (decrease) in management fees payable Increase (decrease) in administration fees payable Increase (decrease) in insurance fees payable (Increase) decrease in fees rebate receivable Net cash from (used in) operating activities
Cash flows from (used in) financing activities Proceeds from issuances of unitsAmounts paid on redemption of unitsNet cash from (used in) financing activities
Net increase (decrease) in cashCash (bank overdraft), beginning of yearCash (bank overdraft), end of year
Supplementary Information: Dividends received, net of withholding taxInterest receivedInterest paidIncome taxes paid

– 5 –Annual Financial Statements as at December 31, 2014
Cambridge American Equity Segregated Fund
Schedule of Investment Portfolio as at December 31, 2014 (audited)
No. of Average Fair Units/Shares Investment Cost ($) Value ($)
112,195 Cambridge American Equity Fund (Class A)† 1,180,971 1,226,291 Total Investments (100.0%) 1,180,971 1,226,291 Other Net Assets (Liabilities) (0.0%) 178 Net Assets Attributable to Contractholders (100.0%) 1,226,469
Top 25 Holdings of Underlying Fund (unaudited)
No. of Average Fair Units/Shares Investment Cost ($) Value ($)
Cash & Equivalents 34,771,008 180,000 Avis Budget Group Inc. 12,110,697 13,869,476 75,000 Signature Bank 9,686,315 10,974,165 85,000 Norfolk Southern Corp. 10,197,567 10,822,975 120,000 Walgreens Boots Alliance Inc. 9,611,501 10,622,183 175,000 First Republic Bank 10,261,228 10,595,465 120,000 Viacom Inc., Class B 10,241,982 10,489,754 202,200 Thomson Reuters Corp. 9,152,713 9,475,336 15,000 Google Inc., Class A 9,108,640 9,246,666 200,000 CGI Group Inc. (USD) 7,703,533 8,865,759 6,500 Priceline.com Inc. 8,146,113 8,609,457 57,000 Core Laboratories N.V. 8,218,053 7,968,240 65,000 EOG Resources Inc. 6,184,288 6,951,989 170,000 Allison Transmission Holdings Inc. 6,644,037 6,694,624 75,000 Cerner Corp. 4,944,388 5,633,451 95,000 Crown Holdings Inc. 5,395,178 5,617,188 20,000 Precision Castparts Corp. 5,412,905 5,596,394 265,000 Viper Energy Partners L.P. 4,901,227 5,581,118 105,000 US Bancorp 5,320,698 5,482,726 22,000 McKesson Corp. 5,015,552 5,305,004 40,000 Anheuser-Busch InBev N.V., ADR 5,139,916 5,219,088 50,000 Expedia Inc. 5,112,806 4,957,948 100,000 SunTrust Banks Inc. 4,187,322 4,867,339 115,600 H&R Block Inc. 4,308,665 4,522,801 50,000 Cullen/Frost Bankers Inc. 4,138,324 4,102,969
† The Underlying Fund is also managed by CI Investments Inc., the Manager of the Fund. Percentages shown in brackets in the Schedule of Investment Portfolio relate investments at fair value to net assets attributable to contractholders of the Fund. The accompanying notes are an integral part of these financial statements.

– 6 –Annual Financial Statements as at December 31, 2014
Cambridge American Equity Segregated Fund
The accompanying notes are an integral part of these financial statements.
Fund Specific Notes to Financial Statements (audited)
Interest in Underlying Fund (Note 3)
The following tables present the Fund’s interest in the Underlying Fund.
as at December 31, 2014 Fair Value of Fair Value of the Fund’s Investment Ownership in the the Underlying Fund in the Underlying Fund Underlying FundUnderlying Fund (in $000’s) (in $000’s) (%) 271,064 1,226 0.5
as at December 31, 2013 Fair Value of Fair Value of the Fund’s Investment Ownership in the the Underlying Fund in the Underlying Fund Underlying FundUnderlying Fund (in $000’s) (in $000’s) (%) 204,358 1,147 0.6
as at January 1, 2013 Fair Value of Fair Value of the Fund’s Investment Ownership in the the Underlying Fund in the Underlying Fund Underlying FundUnderlying Fund (in $000’s) (in $000’s) (%) 59,758 914 1.5
Cambridge American Equity Fund
Cambridge American Equity Fund
Cambridge American Equity Fund

– 7 –Annual Financial Statements as at December 31, 2014
Cambridge American Equity Segregated Fund
Unit Transactions (Note 6)for the years ended December 31
Number of units at the beginning of yearUnits issued for cashUnits redeemed Number of units at the end of year
For inception date of the Fund, please refer to Note 1 in the Notes to the Financial Statements.The accompanying notes are an integral part of these financial statements.
Class I Class II 2014 2013 2014 2013 41,750 46,679 52,343 60,094 17,894 5,781 4,840 1,894 (15,294) (10,710) (14,429) (9,645) 44,350 41,750 42,754 52,343
Reconciliation of Equity as previously reported under Canadian GAAP to IFRS (Note 10) (in $000’s)
EquityEquity as reported under Canadian GAAPRevaluation of investments at FVTPLNet assets attributable to contractholders
as at as at Dec. 31, 2013 Jan. 1, 2013
1,148 916 - - 1,148 916
Reconciliation of Comprehensive Income as previously reported under Canadian GAAP to IFRS (Note 10) (in $000’s)
Comprehensive IncomeComprehensive income as reported under Canadian GAAPRevaluation of investments at FVTPLIncrease (decrease) in net assets from operations attributable to contractholders
for the year ended Dec. 31, 2013
362 - 362
Fund Specific Notes to Financial Statements (audited)

– 8 –Annual Financial Statements as at December 31, 2014
Cambridge American Equity Segregated Fund
For inception date of the Fund, please refer to Note 1 in the Notes to the Financial Statements.The accompanying notes are an integral part of these financial statements.
Financial Information (for the years ended December 31) (unaudited)
(1) This information is provided as at December 31, of the years shown.(2) The Fund’s portfolio turnover rate indicates how actively the Fund’s portfolio advisor manages its portfolio investments. A portfolio turnover rate of 100% is equivalent to the Fund buying and selling all of the securities in its portfolio once in the
course of the year. The higher a fund’s portfolio turnover rate in a year, the greater the trading costs payable by the fund in the year, and the greater the chance of an contractholder receiving taxable capital gains in the year. There is not necessarily
a relationship between a high turnover rate and the performance of a fund.(3) Management expense information is calculated based on expenses charged directly to the Fund plus, if applicable, expenses of the underlying fund, excluding commissions and brokerage fees, calculated on a weighted average basis on the percentage
weighting of the underlying fund and is expressed as an annualized percentage of average net asset value for the years shown. As of July 1, 2010, Ontario combined the federal goods and services tax (“GST” - 5%) with the provincial retail sales tax
(“PST” - 8%). The combination resulted in a Harmonized sales tax (“HST”) rate of 13%. The Effective HST tax rate is calculated using the attribution percentage for each province based on contractholders residency and can be different from 13%. For any
particular year, the rate shown will be prorated based on the different rates in effect during that year. For the year ended December 31, 2010 the rate applied is 5% for the period January 1, 2010 to June 30, 2010 and the Fund’s Effective HST rate for the period
starting July 1, 2010. The rate shown for the year ended December 31, 2010 is the time weighted average of these rates.(4) For financial years before January 1, 2013, the financial highlights are derived from the financial statements prepared in accordance with Canadian GAAP applicable to public enterprises. For financial years beginning on or after January 1, 2013,
the financial highlights are derived from the financial statements prepared in accordance with IFRS.
Financial HighlightsThe following tables show selected key financial information about the Fund and are intended to help you understand the Fund’s financial performance for the past five years, as applicable.
The Fund’s Net Asset Value per UnitNet assets value per unit at December 31, of the year shown ($) (1)
Ratios and Supplemental Data Net assets attributable to contractholders ($000’s) (1)
Number of units outstanding (1)
Portfolio turnover rate (%) (2)
Management Expense Ratio Management expense ratio before taxes (%) (3)
Harmonized sales tax/Goods and services tax (%) (3)
Management expense ratio after taxes (%) (3)
Management expense ratio before waivers or absorptions (%) (3)
Effective HST/GST rate for the year (%) (3)
Class I 2014 2013 2012 2011 2010 2009(4)
14.99 12.96 9.01 8.28 9.35
665 540 421 431 688 44,350 41,750 46,679 52,135 73,512 Data found for 16.23 1.73 0.65 0.59 2.73
2.66 2.66 2.65 2.59 2.61 0.27 0.28 0.26 0.26 0.21 2.93 2.94 2.91 2.85 2.82 2.93 2.94 2.91 2.85 2.82 9.37 10.03 9.40 9.95 7.46
Class II 2014 2013 2012 2011 2010 2009(4)
13.14 11.60 8.24 7.72 8.91
561 608 495 573 921 42,754 52,343 60,094 74,145 103,333 No Data found fo 16.23 1.73 0.65 0.59 2.73
4.56 4.56 4.55 4.49 4.51 0.47 0.48 0.47 0.48 0.34 5.03 5.04 5.02 4.97 4.85 5.03 5.04 5.02 4.97 4.85 10.17 10.44 10.71 11.00 8.27

– 9 –Annual Financial Statements as at December 31, 2014
Cambridge American Equity Segregated Fund
The accompanying notes are an integral part of these financial statements.
Other Price Risk (cont’d)As at December 31, 2014, had the U.S. markets increased or decreased by 10% (December 31, 2013 and January 1, 2013 - 10%), with all other variables held constant, net assets attributable to contractholders of the Fund would have increased or decreased, respectively, by approximately $123,000 (December 31, 2013 - $115,000 and January 1, 2013 - $91,000). In practice, actual results may differ from this analysis and the difference may be material.
Currency RiskThe Fund indirectly bears the currency risk exposure of the Underlying Fund. As at December 31, 2014, December 31, 2013 and January 1, 2013, the Underlying Fund was exposed to currency risk as it invested predominantly in stocks that were denominated in U.S. dollars, whereas, the Canadian dollar is the functional currency of the Fund and the Underlying Fund. As a result, the Fund was affected by fluctuations in the value of such currencies relative to the Canadian dollar.
The tables below summarize the Underlying Fund’s exposure to currency risk.
as at December 31, 2014Currency Net Assets (%)US Dollar 58.6 Total 58.6
as at December 31, 2013 Currency Net Assets (%)US Dollar 67.9Total 67.9
as at January 1, 2013 Currency Net Assets (%)US Dollar 85.8Total 85.8
As at December 31, 2014, had the Canadian dollar strengthened or weakened by 10% (December 31, 2013 and January 1, 2013 - 10%) in relation to all other foreign currencies held in the Underlying Fund, with all other variables held constant, net assets attributable to contractholders of the Fund would have decreased or increased, respectively, by approximately $72,000 (December 31, 2013 - $78,000 and January 1, 2013 - $78,000). In practice, the actual results may differ from this analysis and the difference may be material.
Interest Rate RiskThe Fund indirectly bears the interest rate risk exposure of the Underlying Fund. As at December 31, 2014, December 31, 2013 and January 1, 2013, the Underlying Fund had insignificant exposure to interest rate risk as substantially all of its assets were invested in stocks.
Fair Value Hierarchy (Note 9)
The tables below summarize the inputs used by the Fund in valuing the Fund’s investments carried at fair value.
Long Positions at fair value as at December 31, 2014 Level 1 Level 2 Level 3 Total (in $000’s) (in $000’s) (in $000’s) (in $000’s)Underlying Fund 1,226 - - 1,226 Total 1,226 - - 1,226
Concentration RiskThe Cambridge American Equity Fund’s financial instruments were concentrated in the following segments:
as at December 31, 2014Categories Net Assets (%)Consumer Discretionary 22.5Industrials 17.5Financials 15.6Cash & Equivalents 12.8Information Technology 10.7Energy 8.6Consumer Staples 5.8Health Care 4.0Materials 2.1Utilities 1.0Other Net Assets (Liabilities) (0.1)Foreign Currency Forward Contracts (0.5)
as at December 31, 2013 Categories Net Assets (%)Industrials 23.9Health Care 23.2Financials 11.0Consumer Discretionary 10.6Information Technology 10.4Energy 7.7Cash & Equivalents 6.3Materials 4.0Consumer Staples 1.9Other Net Assets (Liabilities) 1.0
as at January 1, 2013 Categories Net Assets (%)Industrials 20.7Health Care 20.6Information Technology 17.3Consumer Discretionary 12.7Financials 10.0Materials 8.3Consumer Staples 5.3Energy 3.4Cash & Equivalents 1.5Other Net Assets (Liabilities) 0.2
Credit RiskThe Fund was predominantly invested in equities; however some of the Fund’s assets were invested in derivative instruments. As at December 31, 2014, December 31, 2013 and January 1, 2013, the Fund’s exposure to credit risk through derivative instruments was insignificant.
Other Price Risk The Fund indirectly bears the other price risk exposure of the Underlying Fund. As at December 31, 2014, December 31, 2013 and January 1, 2013, the Underlying Fund was exposed to other price risk as its holdings were sensitive to changes in general economic conditions in the United States. The Underlying Fund was invested in U.S. stocks.
Fund Specific Notes to Financial Statements (audited)
Financial Instruments Risks (Note 9)

– 10 –Annual Financial Statements as at December 31, 2014
Cambridge American Equity Segregated Fund
The accompanying notes are an integral part of these financial statements.
Fair Value Hierarchy (Note 9) (cont’d)
Long Positions at fair value as at December 31, 2013 Level 1 Level 2 Level 3 Total (in $000’s) (in $000’s) (in $000’s) (in $000’s)Underlying Fund 1,147 - - 1,147 Total 1,147 - - 1,147
There were no transfers between Level 1 and Level 2 during the years ended December 31, 2014 and 2013.
Long Positions at fair value as at January 1, 2013 Level 1 Level 2 Level 3 Total (in $000’s) (in $000’s) (in $000’s) (in $000’s)Underlying Fund 914 - - 914 Total 914 - - 914
Fund Specific Notes to Financial Statements (audited)

– 11 –Annual Financial Statements as at December 31, 2014
CI American Small Companies Segregated Fund
2014 2013
- - - - - - 69 8
(29) 129
- - 7 8 47 145
11 12 1 1 - - - - 12 13 - -
35 132
1.56 4.33 1.31 3.54
as at as at as at Dec. 31, 2014 Dec. 31, 2013 Jan. 1, 2013
267 421 319 1 1 1 - - - - - - - - - - - - - - - 268 422 320
- - - - - - - - - 1 1 - - - - - - - 1 1 - 267 421 320
16.15 14.13 9.81 13.68 12.30 8.77
For inception date of the Fund, please refer to Note 1 in the Notes to the Financial Statements.The accompanying notes are an integral part of these financial statements.
Financial Statements (audited)
CIG - 133
Statements of Financial Position (in $000’s except for per unit amounts)
Statements of Comprehensive Income for the years ended December 31(in $000’s except for per unit amounts)
Assets Current assets Investments Cash Fees rebate receivable Dividends receivable Interest receivable Receivable for investments sold Receivable for unit subscriptions
Liabilities Current liabilities Bank overdraft Payable for investments purchased Payable for unit redemptions Management fees payable Administration fees payable Insurance fees payable
Net assets attributable to contractholders
Net assets attributable to contractholders per unit: Class IClass II
Income Net gain (loss) on investments Dividends Income distributions from investments Capital gain distributions from investments Net realized gain (loss) on sale of investments Change in unrealized appreciation (depreciation) in value of
investments Other income Interest Fees rebate (Note 7)
Expenses (Note 7)Management fees Administration fees Insurance fees Harmonized sales tax
Expenses absorbed by the manager Increase (decrease) in net assets from operations attributable to contractholders
Increase (decrease) in net assets from operations attributable to contractholders per unit: Class I Class II

– 12 –Annual Financial Statements as at December 31, 2014
CI American Small Companies Segregated Fund
The accompanying notes are an integral part of these financial statements.
Financial Statements (audited)
2014 2013
421 320
35 132
153 56 (342) (87) (189) (31)
267 421
Net assets attributable to contractholders at the beginning of year Increase (decrease) in net assets from operations attributable to contractholders Unit transactions Proceeds from issuance of units Amounts paid on redemption of units
Net assets attributable to contractholders at the end of year
Statements of Changes in Net Assets Attributable to Contractholders for the years ended December 31 (in $000’s)
2014 2013
35 132
(69) (8)
29 (129) 200 35 (6) - - - - - - 1 - - - - - - 189 31
153 56 (342) (87) (189) (31)
- - 1 1 1 1
- - - - - - - -
Statements of Cash Flows for the years ended December 31 (in $000’s)
Cash flows from (used in) operating activities Increase (decrease) in net assets from operations attributable to contractholders Adjustments for: Net realized (gain) loss on sale of investments Change in unrealized (appreciation) depreciation in value of
investments Proceeds from sale of investments Purchase of investments (Increase) decrease in dividends receivable (Increase) decrease in interest receivable Increase (decrease) in management fees payable Increase (decrease) in administration fees payable Increase (decrease) in insurance fees payable (Increase) decrease in fees rebate receivable Net cash from (used in) operating activities
Cash flows from (used in) financing activities Proceeds from issuances of unitsAmounts paid on redemption of unitsNet cash from (used in) financing activities
Net increase (decrease) in cashCash (bank overdraft), beginning of yearCash (bank overdraft), end of year
Supplementary Information: Dividends received, net of withholding taxInterest receivedInterest paidIncome taxes paid

– 13 –Annual Financial Statements as at December 31, 2014
CI American Small Companies Segregated Fund
Schedule of Investment Portfolio as at December 31, 2014 (audited)
No. of Average Fair Units/Shares Investment Cost ($) Value ($)
5,559 CI American Small Companies Fund (Class A)† 155,933 266,509 Total Investments (99.7%) 155,933 266,509 Other Net Assets (Liabilities) (0.3%) 733 Net Assets Attributable to Contractholders (100%) 267,242
Top 25 Holdings of Underlying Fund (unaudited)
No. of Average Fair Units/Shares Investment Cost ($) Value ($)
24,185 Wabtec Corp. 647,279 2,441,144 21,030 WellCare Health Plans Inc. 1,218,961 2,004,695 29,141 Alkermes PLC 450,092 1,982,363 56,825 Bankunited Inc. 1,661,947 1,912,342 29,504 Integra LifeSciences Holdings Corp. 1,090,240 1,858,652 139,384 Investors Bancorp Inc. 963,952 1,817,510 44,085 Mueller Industries Inc. 698,916 1,748,364 27,470 Catamaran Corp. (USD) 1,349,811 1,651,378 24,090 Brinker International Inc. 986,038 1,642,398 26,930 Armstrong World Industries Inc. 1,238,293 1,599,207 95,720 Cypress Semiconductor Corp. 1,060,919 1,587,846 39,505 Total System Services Inc. 815,424 1,558,466 22,570 Bank of Hawaii Corp. 1,182,106 1,555,024 57,440 Service Corp. International 729,731 1,514,669 38,151 Allison Transmission Holdings Inc. 1,025,853 1,502,392 22,510 Life Time Fitness Inc. 1,063,202 1,480,549 25,625 Woodward Inc. 757,242 1,465,451 26,690 Arthur J. Gallagher & Co. 751,006 1,459,697 29,060 Hexcel Corp. 841,803 1,400,608 47,685 Masco Corp. 723,795 1,395,918 42,210 Great Plains Energy Inc. 941,289 1,393,042 52,640 EVERTEC Inc. 1,344,313 1,353,240 38,775 B&G Foods Inc. 1,238,428 1,346,792 22,165 CommVault Systems Inc. 1,198,212 1,330,920 18,640 Rock-Tenn Co., Class A 660,629 1,320,416
† The Underlying Fund is also managed by CI Investments Inc., the Manager of the Fund. Percentages shown in brackets in the Schedule of Investment Portfolio relate investments at fair value to net assets attributable to contractholders of the Fund. The accompanying notes are an integral part of these financial statements.

– 14 –Annual Financial Statements as at December 31, 2014
CI American Small Companies Segregated Fund
The accompanying notes are an integral part of these financial statements.
Fund Specific Notes to Financial Statements (audited)
Interest in Underlying Fund (Note 3)
The following tables present the Fund’s interest in the Underlying Fund.
as at December 31, 2014 Fair Value of Fair Value of the Fund’s Investment Ownership in the the Underlying Fund in the Underlying Fund Underlying FundUnderlying Fund (in $000’s) (in $000’s) (%) 91,780 267 0.3
as at December 31, 2013 Fair Value of Fair Value of the Fund’s Investment Ownership in the the Underlying Fund in the Underlying Fund Underlying FundUnderlying Fund (in $000’s) (in $000’s) (%) 81,420 421 0.5
as at January 1, 2013 Fair Value of Fair Value of the Fund’s Investment Ownership in the the Underlying Fund in the Underlying Fund Underlying FundUnderlying Fund (in $000’s) (in $000’s) (%) 50,925 319 0.6
CI American Small Companies Fund
CI American Small Companies Fund
CI American Small Companies Fund

– 15 –Annual Financial Statements as at December 31, 2014
CI American Small Companies Segregated Fund
Unit Transactions (Note 6)for the years ended December 31
Number of units at the beginning of yearUnits issued for cashUnits redeemed Number of units at the end of year
For inception date of the Fund, please refer to Note 1 in the Notes to the Financial Statements.The accompanying notes are an integral part of these financial statements.
Class I Class II 2014 2013 2014 2013 20,752 22,819 10,402 11,001 10,850 4,051 - - (21,662) (6,118) (2,604) (599) 9,940 20,752 7,798 10,402
Reconciliation of Equity as previously reported under Canadian GAAP to IFRS (Note 10) (in $000’s)
EquityEquity as reported under Canadian GAAPRevaluation of investments at FVTPLNet assets attributable to contractholders
as at as at Dec. 31, 2013 Jan. 1, 2013
421 320 - - 421 320
Reconciliation of Comprehensive Income as previously reported under Canadian GAAP to IFRS (Note 10) (in $000’s)
Comprehensive IncomeComprehensive income as reported under Canadian GAAPRevaluation of investments at FVTPLIncrease (decrease) in net assets from operations attributable to contractholders
for the year ended Dec. 31, 2013
132 - 132
Fund Specific Notes to Financial Statements (audited)

– 16 –Annual Financial Statements as at December 31, 2014
CI American Small Companies Segregated Fund
For inception date of the Fund, please refer to Note 1 in the Notes to the Financial Statements.The accompanying notes are an integral part of these financial statements.
Financial Information (for the years ended December 31) (unaudited)
(1) This information is provided as at December 31, of the years shown.(2) The Fund’s portfolio turnover rate indicates how actively the Fund’s portfolio advisor manages its portfolio investments. A portfolio turnover rate of 100% is equivalent to the Fund buying and selling all of the securities in its portfolio once in the
course of the year. The higher a fund’s portfolio turnover rate in a year, the greater the trading costs payable by the fund in the year, and the greater the chance of an contractholder receiving taxable capital gains in the year. There is not necessarily
a relationship between a high turnover rate and the performance of a fund.(3) Management expense information is calculated based on expenses charged directly to the Fund plus, if applicable, expenses of the underlying fund, excluding commissions and brokerage fees, calculated on a weighted average basis on the percentage
weighting of the underlying fund and is expressed as an annualized percentage of average net asset value for the years shown. As of July 1, 2010, Ontario combined the federal goods and services tax (“GST” - 5%) with the provincial retail sales tax
(“PST” - 8%). The combination resulted in a Harmonized sales tax (“HST”) rate of 13%. The Effective HST tax rate is calculated using the attribution percentage for each province based on contractholders residency and can be different from 13%. For any
particular year, the rate shown will be prorated based on the different rates in effect during that year. For the year ended December 31, 2010 the rate applied is 5% for the period January 1, 2010 to June 30, 2010 and the Fund’s Effective HST rate for the period
starting July 1, 2010. The rate shown for the year ended December 31, 2010 is the time weighted average of these rates.(4) For financial years before January 1, 2013, the financial highlights are derived from the financial statements prepared in accordance with Canadian GAAP applicable to public enterprises. For financial years beginning on or after January 1, 2013,
the financial highlights are derived from the financial statements prepared in accordance with IFRS.
Financial HighlightsThe following tables show selected key financial information about the Fund and are intended to help you understand the Fund’s financial performance for the past five years, as applicable.
The Fund’s Net Asset Value per UnitNet assets value per unit at December 31, of the year shown ($) (1)
Ratios and Supplemental Data Net assets attributable to contractholders ($000’s) (1)
Number of units outstanding (1)
Portfolio turnover rate (%) (2)
Management Expense Ratio Management expense ratio before taxes (%) (3)
Harmonized sales tax/Goods and services tax (%) (3)
Management expense ratio after taxes (%) (3)
Management expense ratio before waivers or absorptions (%) (3)
Effective HST/GST rate for the year (%) (3)
The Fund’s Net Asset Value per UnitNet assets value per unit at December 31, of the year shown ($) (1)
Ratios and Supplemental Data Net assets attributable to contractholders ($000’s) (1)
Number of units outstanding (1)
Portfolio turnover rate (%) (2)
Management Expense Ratio Management expense ratio before taxes (%) (3)
Harmonized sales tax/Goods and services tax (%) (3)
Management expense ratio after taxes (%) (3)
Management expense ratio before waivers or absorptions (%) (3)
Effective HST/GST rate for the year (%) (3)
Class I 2014 2013 2012 2011 2010 2009(4)
16.15 14.13 9.81 9.05 9.05
160 293 223 232 175 9,940 20,752 22,819 25,721 19,263 1.72 - 0.06 22.32 -
2.65 2.66 2.64 2.65 2.65 0.26 0.26 0.26 0.27 0.22 2.91 2.92 2.90 2.92 2.87 2.91 2.92 2.90 2.92 2.87 7.73 8.16 8.25 8.85 6.22
Class II 2014 2013 2012 2011 2010 2009(4)
13.68 12.30 8.77 8.31 8.55
107 128 97 100 132 7,798 10,402 11,001 11,982 15,481 1.72 - 0.06 22.32 -
5.05 5.06 5.04 5.05 5.05 0.57 0.56 0.56 0.57 0.40 5.62 5.62 5.60 5.62 5.45 5.62 5.62 5.60 5.62 5.45 11.97 12.00 11.95 11.79 8.47

– 17 –Annual Financial Statements as at December 31, 2014
CI American Small Companies Segregated Fund
The accompanying notes are an integral part of these financial statements.
Credit RiskThe Fund indirectly bears the credit risk exposure of the Underlying Fund. As at December 31, 2014, December 31, 2013 and January 1, 2013, the Underlying Fund had insignificant exposure to credit risk as it invested predominantly in stocks.
Other Price Risk The Fund indirectly bears the other price risk exposure of the Underlying Fund. As at December 31, 2014, December 31, 2013 and January 1, 2013, the Underlying Fund was exposed to other price risk as its holdings were sensitive to changes in general economic conditions in the United States. The Underlying Fund was invested in U.S. stocks.
As at December 31, 2014, had the U.S. markets increased or decreased by 10% (December 31, 2013 and January 1, 2013 - 10%), with all other variables held constant, net assets attributable to contractholders of the Fund would have increased or decreased, respectively, by approximately $27,000 (December 31, 2013 - $42,000 and January 1, 2013 - $32,000). In practice, actual results may differ from this analysis and the difference may be material.
Currency RiskThe Fund indirectly bears the currency risk exposure of the Underlying Fund. As at December 31, 2014, December 31, 2013 and January 1, 2013, the Underlying Fund was exposed to currency risk as it invested predominantly in stocks that were denominated in U.S. dollars, whereas, the Canadian dollar is the functional currency of the Fund and the Underlying Fund. As a result, the Fund was affected by fluctuations in the value of such currencies relative to the Canadian dollar.
The tables below summarize the Underlying Fund’s exposure to currency risk.
as at December 31, 2014Currency Net Assets (%)US Dollar 99.8 Total 99.8
as at December 31, 2013 Currency Net Assets (%)US Dollar 98.4Total 98.4
as at January 1, 2013 Currency Net Assets (%)US Dollar 96.3Total 96.3
As at December 31, 2014, had the Canadian dollar strengthened or weakened by 10% (December 31, 2013 and January 1, 2013 - 10%) in relation to all other foreign currencies held in the Underlying Fund, with all other variables held constant, net assets attributable to contractholders of the Fund would have decreased or increased, respectively, by approximately $27,000 (December 31, 2013 - $41,000 and January 1, 2013 - $31,000). In practice, the actual results may differ from this analysis and the difference may be material.
Interest Rate RiskThe Fund indirectly bears the interest rate risk exposure of the Underlying Fund. As at December 31, 2014, December 31, 2013 and January 1, 2013, the Underlying Fund had insignificant exposure to interest rate risk as substantially all of its assets were invested in stocks.
Concentration RiskThe CI American Small Companies Fund’s financial instruments were concentrated in the following segments:
as at December 31, 2014Categories Net Assets (%)Financials 23.3Industrials 20.8Health Care 15.0Information Technology 13.6Consumer Discretionary 12.3Materials 6.3Utilities 4.2Energy 1.5Consumer Staples 1.5Other Net Assets (Liabilities) 1.0Telecommunication Services 0.3Cash & Equivalents 0.2
as at December 31, 2013 Categories Net Assets (%)Industrials 23.6Financials 18.4Health Care 15.6Consumer Discretionary 14.6Information Technology 9.0Materials 7.3Utilities 5.6Consumer Staples 2.5Cash & Equivalents 1.7Energy 1.4Telecommunication Services 0.4Other Net Assets (Liabilities) (0.1)
as at January 1, 2013 Categories Net Assets (%)Industrials 21.3Health Care 16.2Consumer Discretionary 15.3Financials 12.8Information Technology 8.9Materials 6.7Utilities 6.3Cash & Equivalents 4.8Consumer Staples 3.2Telecommunication Services 2.4Energy 1.4Exchange-Traded Funds 1.0Other Net Assets (Liabilities) (0.3)
Fund Specific Notes to Financial Statements (audited)
Financial Instruments Risks (Note 9)

– 18 –Annual Financial Statements as at December 31, 2014
CI American Small Companies Segregated Fund
The accompanying notes are an integral part of these financial statements.
Fair Value Hierarchy (Note 9)
The tables below summarize the inputs used by the Fund in valuing the Fund’s investments carried at fair value.
Long Positions at fair value as at December 31, 2014 Level 1 Level 2 Level 3 Total (in $000’s) (in $000’s) (in $000’s) (in $000’s)Underlying Fund 267 - - 267 Total 267 - - 267
Long Positions at fair value as at December 31, 2013 Level 1 Level 2 Level 3 Total (in $000’s) (in $000’s) (in $000’s) (in $000’s)Underlying Fund 421 - - 421Total 421 - - 421
There were no transfers between Level 1 and Level 2 during the years ended December 31, 2014 and 2013.
Long Positions at fair value as at January 1, 2013 Level 1 Level 2 Level 3 Total (in $000’s) (in $000’s) (in $000’s) (in $000’s)Underlying Fund 319 - - 319 Total 319 - - 319
Fund Specific Notes to Financial Statements (audited)

– 19 –Annual Financial Statements as at December 31, 2014
CI Global Segregated Fund
2014 2013
- - - - - - 86 (4)
73 355
- - 29 36 188 387
44 54 3 4 - - 2 2 49 60 - - 139 327
1.16 1.83 0.86 1.49
as at as at as at Dec. 31, 2014 Dec. 31, 2013 Jan. 1, 2013
1,162 1,563 1,604 5 6 6 - - - - - - - - - - - - - - 7 1,167 1,569 1,617
- - - - - - - - 8 - - - - - - - - - - - 8 1,167 1,569 1,609
10.72 9.57 7.74 9.42 8.58 7.09
For inception date of the Fund, please refer to Note 1 in the Notes to the Financial Statements.The accompanying notes are an integral part of these financial statements.
Financial Statements (audited)
CIG - 135
Statements of Financial Position (in $000’s except for per unit amounts)
Statements of Comprehensive Income for the years ended December 31(in $000’s except for per unit amounts)
Assets Current assets Investments Cash Fees rebate receivable Dividends receivable Interest receivable Receivable for investments sold Receivable for unit subscriptions
Liabilities Current liabilities Bank overdraft Payable for investments purchased Payable for unit redemptions Management fees payable Administration fees payable Insurance fees payable
Net assets attributable to contractholders
Net assets attributable to contractholders per unit: Class IClass II
Income Net gain (loss) on investments Dividends Income distributions from investments Capital gain distributions from investments Net realized gain (loss) on sale of investments Change in unrealized appreciation (depreciation) in value of
investments Other income Interest Fees rebate (Note 7)
Expenses (Note 7)Management fees Administration fees Insurance fees Harmonized sales tax
Expenses absorbed by the manager Increase (decrease) in net assets from operations attributable to contractholders
Increase (decrease) in net assets from operations attributable to contractholders per unit: Class I Class II

– 20 –Annual Financial Statements as at December 31, 2014
CI Global Segregated Fund
The accompanying notes are an integral part of these financial statements.
Financial Statements (audited)
2014 2013
1,569 1,609
139 327
20 113 (561) (480) (541) (367)
1,167 1,569
Net assets attributable to contractholders at the beginning of year Increase (decrease) in net assets from operations attributable to contractholders Unit transactions Proceeds from issuance of units Amounts paid on redemption of units
Net assets attributable to contractholders at the end of year
Statements of Changes in Net Assets Attributable to Contractholders for the years ended December 31 (in $000’s)
2014 2013
139 327
(86) 4
(73) (355) 561 397 (1) (5) - - - - - - - - - - - - 540 368
20 120 (561) (488) (541) (368)
(1) - 6 6 5 6
- - - - - - - -
Statements of Cash Flows for the years ended December 31 (in $000’s)
Cash flows from (used in) operating activities Increase (decrease) in net assets from operations attributable to contractholders Adjustments for: Net realized (gain) loss on sale of investments Change in unrealized (appreciation) depreciation in value of
investments Proceeds from sale of investments Purchase of investments (Increase) decrease in dividends receivable (Increase) decrease in interest receivable Increase (decrease) in management fees payable Increase (decrease) in administration fees payable Increase (decrease) in insurance fees payable (Increase) decrease in fees rebate receivable Net cash from (used in) operating activities
Cash flows from (used in) financing activities Proceeds from issuances of unitsAmounts paid on redemption of unitsNet cash from (used in) financing activities
Net increase (decrease) in cashCash (bank overdraft), beginning of yearCash (bank overdraft), end of year
Supplementary Information: Dividends received, net of withholding taxInterest receivedInterest paidIncome taxes paid

– 21 –Annual Financial Statements as at December 31, 2014
CI Global Segregated Fund
Schedule of Investment Portfolio as at December 31, 2014 (audited)
No. of Average Fair Units/Shares Investment Cost ($) Value ($)
74,743 CI Global Fund (Class A)† 920,429 1,161,502 Total Investments (99.6%) 920,429 1,161,502 Other Net Assets (Liabilities) (0.4%) 5,094 Net Assets Attributable to Contractholders (100.0%) 1,166,596
Top 25 Holdings of Underlying Fund (unaudited)
No. of Average Fair Units/Shares Investment Cost ($) Value ($)
Cash & Equivalents 38,399,452 339,200 JPMorgan Chase & Co., Warrants (28Oct18) 5,064,111 8,195,902 404,300 UBS Group AG 7,793,536 8,072,019 112,900 Citigroup Inc. 4,724,560 7,096,579 55,900 Alibaba Group Holding Ltd. 5,125,998 6,749,507 231,750 PNC Financial Services Group Inc., Warrants (31Dec18) 2,912,729 6,716,884 246,010 Wells Fargo & Co., Warrants (28Oct18) 2,895,466 6,104,240 181,580 Forest City Enterprises Inc., Class A 3,728,655 4,492,884 44,600 NXP Semiconductor N.V. 2,282,533 3,958,273 45,650 QUALCOMM Inc. 2,471,312 3,941,690 12,350 Roche Holding AG 2,505,140 3,894,092 32,700 Novartis AG, Registered Shares 2,291,798 3,527,939 2,410 Samsung Electronics Co., Ltd. 2,052,832 3,396,748 597,600 Telstra Corp., Ltd. 1,899,762 3,383,925 80,000 Intel Corp. 1,789,570 3,372,520 22,000 Thermo Fisher Scientific Inc. 2,995,669 3,201,966 28,557 PepsiCo Inc. 1,935,682 3,136,878 116,984 BHP Billiton PLC 3,816,362 2,941,228 22,000 Apple Inc. 1,826,126 2,820,919 32,300 Nestle S.A., Registered Shares 2,079,281 2,752,734 33,400 Eaton Corp PLC 2,206,136 2,636,801 100,978 Taiwan Semiconductor Manufacturing Co., Ltd., ADR 1,064,440 2,625,212 19,900 Chevron Corp. 2,244,444 2,593,260 34,500 Toyota Motor Corp. 2,109,773 2,529,144 170,600 Telefonaktiebolaget LM Ericsson, Class B 2,203,201 2,398,520
† The Underlying Fund is also managed by CI Investments Inc., the Manager of the Fund. Percentages shown in brackets in the Schedule of Investment Portfolio relate investments at fair value to net assets attributable to contractholders of the Fund. The accompanying notes are an integral part of these financial statements.

– 22 –Annual Financial Statements as at December 31, 2014
CI Global Segregated Fund
The accompanying notes are an integral part of these financial statements.
Fund Specific Notes to Financial Statements (audited)
Interest in Underlying Fund (Note 3)
The following tables present the Fund’s interest in the Underlying Fund.
as at December 31, 2014 Fair Value of Fair Value of the Fund’s Investment Ownership in the the Underlying Fund in the Underlying Fund Underlying FundUnderlying Fund (in $000’s) (in $000’s) (%) 264,916 1,162 0.4
as at December 31, 2013 Fair Value of Fair Value of the Fund’s Investment Ownership in the the Underlying Fund in the Underlying Fund Underlying FundUnderlying Fund (in $000’s) (in $000’s) (%) 263,050 1,563 0.6
as at January 1, 2013 Fair Value of Fair Value of the Fund’s Investment Ownership in the the Underlying Fund in the Underlying Fund Underlying FundUnderlying Fund (in $000’s) (in $000’s) (%) 241,285 1,604 0.7
CI Global Fund
CI Global Fund
CI Global Fund

– 23 –Annual Financial Statements as at December 31, 2014
CI Global Segregated Fund
Unit Transactions (Note 6)for the years ended December 31
Number of units at the beginning of yearUnits issued for cashUnits redeemed Number of units at the end of year
For inception date of the Fund, please refer to Note 1 in the Notes to the Financial Statements.The accompanying notes are an integral part of these financial statements.
Class I Class II 2014 2013 2014 2013 80,530 100,788 93,097 116,870 1,240 2,962 797 10,663 (31,871) (23,220) (26,876) (34,436) 49,899 80,530 67,018 93,097
Reconciliation of Equity as previously reported under Canadian GAAP to IFRS (Note 10) (in $000’s)
EquityEquity as reported under Canadian GAAPRevaluation of investments at FVTPLNet assets attributable to contractholders
as at as at Dec. 31, 2013 Jan. 1, 2013
1,569 1,609 - - 1,569 1,609
Reconciliation of Comprehensive Income as previously reported under Canadian GAAP to IFRS (Note 10) (in $000’s)
Comprehensive IncomeComprehensive income as reported under Canadian GAAPRevaluation of investments at FVTPLIncrease (decrease) in net assets from operations attributable to contractholders
for the year ended Dec. 31, 2013
327 - 327
Fund Specific Notes to Financial Statements (audited)

– 24 –Annual Financial Statements as at December 31, 2014
CI Global Segregated Fund
For inception date of the Fund, please refer to Note 1 in the Notes to the Financial Statements.The accompanying notes are an integral part of these financial statements.
Financial Information (for the years ended December 31) (unaudited)
(1) This information is provided as at December 31, of the years shown.(2) The Fund’s portfolio turnover rate indicates how actively the Fund’s portfolio advisor manages its portfolio investments. A portfolio turnover rate of 100% is equivalent to the Fund buying and selling all of the securities in its portfolio once in the
course of the year. The higher a fund’s portfolio turnover rate in a year, the greater the trading costs payable by the fund in the year, and the greater the chance of an contractholder receiving taxable capital gains in the year. There is not necessarily
a relationship between a high turnover rate and the performance of a fund.(3) Management expense information is calculated based on expenses charged directly to the Fund plus, if applicable, expenses of the underlying fund, excluding commissions and brokerage fees, calculated on a weighted average basis on the percentage
weighting of the underlying fund and is expressed as an annualized percentage of average net asset value for the years shown. As of July 1, 2010, Ontario combined the federal goods and services tax (“GST” - 5%) with the provincial retail sales tax
(“PST” - 8%). The combination resulted in a Harmonized sales tax (“HST”) rate of 13%. The Effective HST tax rate is calculated using the attribution percentage for each province based on contractholders residency and can be different from 13%. For any
particular year, the rate shown will be prorated based on the different rates in effect during that year. For the year ended December 31, 2010 the rate applied is 5% for the period January 1, 2010 to June 30, 2010 and the Fund’s Effective HST rate for the period
starting July 1, 2010. The rate shown for the year ended December 31, 2010 is the time weighted average of these rates.(4) For financial years before January 1, 2013, the financial highlights are derived from the financial statements prepared in accordance with Canadian GAAP applicable to public enterprises. For financial years beginning on or after January 1, 2013,
the financial highlights are derived from the financial statements prepared in accordance with IFRS.
Financial HighlightsThe following tables show selected key financial information about the Fund and are intended to help you understand the Fund’s financial performance for the past five years, as applicable.
The Fund’s Net Asset Value per UnitNet assets value per unit at December 31, of the year shown ($) (1)
Ratios and Supplemental Data Net assets attributable to contractholders ($000’s) (1)
Number of units outstanding (1)
Portfolio turnover rate (%) (2)
Management Expense Ratio Management expense ratio before taxes (%) (3)
Harmonized sales tax/Goods and services tax (%) (3)
Management expense ratio after taxes (%) (3)
Management expense ratio before waivers or absorptions (%) (3)
Effective HST/GST rate for the year (%) (3)
The Fund’s Net Asset Value per UnitNet assets value per unit at December 31, of the year shown ($) (1)
Ratios and Supplemental Data Net assets attributable to contractholders ($000’s) (1)
Number of units outstanding (1)
Portfolio turnover rate (%) (2)
Management Expense Ratio Management expense ratio before taxes (%) (3)
Harmonized sales tax/Goods and services tax (%) (3)
Management expense ratio after taxes (%) (3)
Management expense ratio before waivers or absorptions (%) (3)
Effective HST/GST rate for the year (%) (3)
Class I 2014 2013 2012 2011 2010 2009(4)
10.72 9.57 7.74 6.83 7.43
535 770 781 807 1,188 49,899 80,530 100,788 118,219 159,846 0.08 0.30 0.23 0.73 1.83
2.61 2.61 2.60 2.62 2.61 0.26 0.26 0.27 0.27 0.22 2.87 2.87 2.87 2.89 2.83 2.87 2.87 2.87 2.89 2.83 9.04 9.80 9.86 10.13 7.55
Class II 2014 2013 2012 2011 2010 2009(4)
9.42 8.58 7.09 6.38 7.08
632 799 828 916 1,482 67,018 93,097 116,870 143,654 209,263 0.08 0.30 0.23 0.73 1.83
4.46 4.46 4.45 4.47 4.46 0.43 0.44 0.47 0.47 0.34 4.89 4.90 4.92 4.94 4.80 4.89 4.90 4.92 4.94 4.80 9.34 9.66 10.60 10.77 8.05

– 25 –Annual Financial Statements as at December 31, 2014
CI Global Segregated Fund
The accompanying notes are an integral part of these financial statements.
Concentration Risk (cont’d)
as at December 31, 2013 Categories Net Assets (%)U.S.A. 38.1Cash & Equivalents 11.6Switzerland 8.8U.K. 7.4France 4.6Japan 4.5Netherlands 3.5Germany 2.9Belgium 2.6Australia 2.1Canada 2.0South Korea 1.8Thailand 1.5Mexico 1.0Sweden 1.0China 0.9Taiwan 0.8Ireland 0.7Hong Kong 0.7Russia 0.6Cayman Islands 0.6Bermuda 0.6Netherlands Antilles 0.6Indonesia 0.6Brazil 0.6South Africa 0.3Other Net Assets (Liabilities) 0.1Foreign Currency Forward Contracts (0.5)
Concentration RiskThe CI Global Fund’s financial instruments were concentrated in the following segments:
as at December 31, 2014Categories Net Assets (%)Long Positions:U.S.A. 40.6Cash & Equivalents 14.5Switzerland 7.3Japan 5.6U.K. 5.2France 3.7Cayman Islands 2.5Germany 2.5Netherlands 1.9South Korea 1.9Ireland 1.6Sweden 1.5Belgium 1.5Australia 1.3Jersey Island 1.2Foreign Currency Forward Contracts 1.2China 1.0Taiwan 1.0Canada 0.9Chile 0.8Spain 0.7Other Net Assets (Liabilities) 0.6Italy 0.5Indonesia 0.5India 0.5Mexico 0.4Bermuda 0.3Thailand 0.3Hong Kong 0.3Portugal 0.2Total Long Positions 102.0
Short Positions:U.S.A. (2.0)Total Short Positions (2.0)
Fund Specific Notes to Financial Statements (audited)
Financial Instruments Risks (Note 9)

– 26 –Annual Financial Statements as at December 31, 2014
CI Global Segregated Fund
The accompanying notes are an integral part of these financial statements.
Other Price Risk (cont’d)As at December 31, 2014, had the global markets increased or decreased by 10% (December 31, 2013 and January 1, 2013 - 10%), with all other variables held constant, net assets attributable to contractholders of the Fund would have increased or decreased, respectively, by approximately $116,000 (December 31, 2013 - $156,000 and January 1, 2013 - $160,000). In practice, actual results may differ from this analysis and the difference may be material.
Currency RiskThe Fund indirectly bears the currency risk exposure of the Underlying Fund. As at December 31, 2014, December 31, 2013 and January 1, 2013, the Underlying Fund was exposed to currency risk as it invested predominantly in stocks that were denominated in currencies other than Canadian dollars, the functional currency of the Fund and the Underlying Fund. As a result, the Fund was affected by fluctuations in the value of such currencies relative to the Canadian dollar.
The tables below summarize the Underlying Fund’s exposure to currency risk.
as at December 31, 2014Currency Net Assets (%)US Dollar 82.9 British Pound 2.7 Euro 2.3 Japanese Yen 2.2 Swiss Franc 1.9 Swedish Krona 1.5 Hong Kong Dollar 1.3 Australian Dollar 1.0 Korean Won 0.9 Indonesian Rupiah 0.5 Indian Rupee 0.5 Chilean Peso 0.4 Thai Baht 0.3 Brazilian Real 0.1 Total 98.5
as at December 31, 2013 Currency Net Assets (%)US Dollar 56.0 British Pound 5.3 Swiss Franc 4.3 Euro 4.0 Japanese Yen 2.3 Australian Dollar 2.1 Korean Won 1.8 Hong Kong Dollar 1.7 Thai Baht 1.5 Swedish Krona 1.0 Indonesian Rupiah 0.6 Brazilian Real 0.4 Mexican Peso 0.4 Indian Rupee 0.4 South Africa Rand 0.3 Taiwan Dollar 0.2 Total 82.3
Concentration Risk (cont’d)
as at January 1, 2013 Categories Net Assets (%)U.S.A. 42.4U.K. 7.8Switzerland 6.7Cash & Equivalents 5.6Australia 4.8Japan 4.1Canada 2.8France 2.8Mexico 2.5Belgium 2.1Brazil 2.0Netherlands 1.9Germany 1.9South Korea 1.8Thailand 1.7Hong Kong 1.3China 1.0Denmark 0.9Taiwan 0.8Cayman Islands 0.8Indonesia 0.8Bermuda 0.8Russia 0.6Netherlands Antilles 0.5Israel 0.4Italy 0.4Ireland 0.3Chile 0.3Jersey Island 0.3Sweden 0.2Foreign Currency Forward Contracts (0.3)
Credit RiskThe Fund indirectly bears the credit risk exposure of the Underlying Fund. As at December 31, 2014, December 31, 2013 and January 1, 2013, the Underlying Fund had insignificant exposure to credit risk as it invested predominantly in stocks.
The Underlying Fund was invested in fixed income securities, preferred securities and derivative instruments, if any, with the following credit ratings, as per the table below.
as at December 31, 2014Credit Rating^ Net Assets (%)AAA/Aaa/A++ 0.1 AA/Aa/A+ 1.2 Total 1.3 ^ Credit ratings are obtained from Standard & Poor’s, where available, otherwise ratings are obtained from: Moody’s
Investors Service or Dominion Bond Rating Services, respectively.
Other Price Risk The Fund indirectly bears the other price risk exposure of the Underlying Fund. As at December 31, 2014, December 31, 2013 and January 1, 2013, the Underlying Fund was exposed to other price risk as its holdings were sensitive to changes in general economic conditions across the world. The Underlying Fund was invested in foreign stocks.
Fund Specific Notes to Financial Statements (audited)

– 27 –Annual Financial Statements as at December 31, 2014
CI Global Segregated Fund
The accompanying notes are an integral part of these financial statements.
Fair Value Hierarchy (Note 9) (cont’d)
Long Positions at fair value as at January 1, 2013 Level 1 Level 2 Level 3 Total (in $000’s) (in $000’s) (in $000’s) (in $000’s)Underlying Fund 1,604 - - 1,604 Total 1,604 - - 1,604
Currency Risk (cont’d)
as at January 1, 2013 Currency Net Assets (%)US Dollar 51.8 Swiss Franc 6.8 Euro 4.5 Japanese Yen 4.1 British Pound 3.7 Hong Kong Dollar 2.9 Brazilian Real 2.8 Australian Dollar 2.3 Korean Won 1.8 Thai Baht 1.7 Mexican Peso 1.1 Danish Krone 0.9 Indonesian Rupiah 0.8 Taiwan Dollar 0.4 Israeli Shekel 0.4 Indian Rupee 0.4 Swedish Krona 0.2Total 86.6
As at December 31, 2014, had the Canadian dollar strengthened or weakened by 10% (December 31, 2013 and January 1, 2013 - 10%) in relation to all other foreign currencies held in the Underlying Fund, with all other variables held constant, net assets attributable to contractholders of the Fund would have decreased or increased, respectively, by approximately $115,000 (December 31, 2013 - $129,000 and January 1, 2013 - $139,000). In practice, the actual results may differ from this analysis and the difference may be material.
Interest Rate RiskThe Fund indirectly bears the interest rate risk exposure of the Underlying Fund. As at December 31, 2014, December 31, 2013 and January 1, 2013, the Underlying Fund had insignificant exposure to interest rate risk as substantially all of its assets were invested in stocks.
Fair Value Hierarchy (Note 9)
The tables below summarize the inputs used by the Fund in valuing the Fund’s investments carried at fair value.
Long Positions at fair value as at December 31, 2014 Level 1 Level 2 Level 3 Total (in $000’s) (in $000’s) (in $000’s) (in $000’s)Underlying Fund 1,162 - - 1,162 Total 1,162 - - 1,162
Long Positions at fair value as at December 31, 2013 Level 1 Level 2 Level 3 Total (in $000’s) (in $000’s) (in $000’s) (in $000’s)Underlying Fund 1,563 - - 1,563Total 1,563 - - 1,563
There were no transfers between Level 1 and Level 2 during the years ended December 31, 2014 and 2013.
Fund Specific Notes to Financial Statements (audited)

– 28 –Annual Financial Statements as at December 31, 2014
CI International Segregated Fund
2014 2013
- - - - - - 8 (14)
38 133
- - 13 18 59 137
16 22 1 2 - - 1 1 18 25 - - 41 112
0.79 1.37 0.39 1.04
as at as at as at Dec. 31, 2014 Dec. 31, 2013 Jan. 1, 2013
461 735 722 2 - 2 - - - - - - - - - - - - - - - 463 735 724
- - - - - - - - - - - 1 - - - - - - - - 1 463 735 723
10.20 9.54 8.16 8.88 8.49 7.42
For inception date of the Fund, please refer to Note 1 in the Notes to the Financial Statements.The accompanying notes are an integral part of these financial statements.
Financial Statements (audited)
CIG - 136
Statements of Financial Position (in $000’s except for per unit amounts)
Statements of Comprehensive Income for the years ended December 31(in $000’s except for per unit amounts)
Assets Current assets Investments Cash Fees rebate receivable Dividends receivable Interest receivable Receivable for investments sold Receivable for unit subscriptions
Liabilities Current liabilities Bank overdraft Payable for investments purchased Payable for unit redemptions Management fees payable Administration fees payable Insurance fees payable
Net assets attributable to contractholders
Net assets attributable to contractholders per unit: Class IClass II
Income Net gain (loss) on investments Dividends Income distributions from investments Capital gain distributions from investments Net realized gain (loss) on sale of investments Change in unrealized appreciation (depreciation) in value of
investments Other income Interest Fees rebate (Note 7)
Expenses (Note 7)Management fees Administration fees Insurance fees Harmonized sales tax
Expenses absorbed by the manager Increase (decrease) in net assets from operations attributable to contractholders
Increase (decrease) in net assets from operations attributable to contractholders per unit: Class I Class II

– 29 –Annual Financial Statements as at December 31, 2014
CI International Segregated Fund
The accompanying notes are an integral part of these financial statements.
Financial Statements (audited)
2014 2013
735 723
41 112
146 20 (459) (120) (313) (100)
463 735
Net assets attributable to contractholders at the beginning of year Increase (decrease) in net assets from operations attributable to contractholders Unit transactions Proceeds from issuance of units Amounts paid on redemption of units
Net assets attributable to contractholders at the end of year
Statements of Changes in Net Assets Attributable to Contractholders for the years ended December 31 (in $000’s)
2014 2013
41 112
(8) 14
(38) (133) 338 125 (18) (19) - - - - - (1) - - - - - - 315 98
146 20 (459) (120) (313) (100)
2 (2) - 2 2 -
- - - - - - - -
Statements of Cash Flows for the years ended December 31 (in $000’s)
Cash flows from (used in) operating activities Increase (decrease) in net assets from operations attributable to contractholders Adjustments for: Net realized (gain) loss on sale of investments Change in unrealized (appreciation) depreciation in value of
investments Proceeds from sale of investments Purchase of investments (Increase) decrease in dividends receivable (Increase) decrease in interest receivable Increase (decrease) in management fees payable Increase (decrease) in administration fees payable Increase (decrease) in insurance fees payable (Increase) decrease in fees rebate receivable Net cash from (used in) operating activities
Cash flows from (used in) financing activities Proceeds from issuances of unitsAmounts paid on redemption of unitsNet cash from (used in) financing activities
Net increase (decrease) in cashCash (bank overdraft), beginning of yearCash (bank overdraft), end of year
Supplementary Information: Dividends received, net of withholding taxInterest receivedInterest paidIncome taxes paid

– 30 –Annual Financial Statements as at December 31, 2014
CI International Segregated Fund
Schedule of Investment Portfolio as at December 31, 2014 (audited)
No. of Average Fair Units/Shares Investment Cost ($) Value ($)
26,562 Signature International Fund (Class A)† 439,574 460,847 Total Investments (99.6%) 439,574 460,847 Other Net Assets (Liabilities) (0.4%) 1,877 Net Assets Attributable to Contractholders (100.0%) 462,724
Top 25 Holdings of Underlying Fund (unaudited)
No. of Average Fair Units/Shares Investment Cost ($) Value ($)
Cash & Equivalents 10,680,311 101,500 UBS Group AG 1,966,612 2,026,490 15,450 Novartis AG, Registered Shares 1,149,305 1,666,870 5,200 Roche Holding AG 1,173,365 1,639,618 13,400 Alibaba Group Holding Ltd. 1,231,943 1,617,950 16,350 Nestle S.A., Registered Shares 1,135,316 1,393,412 910 Samsung Electronics Co., Ltd. 866,439 1,282,590 14,600 Toyota Motor Corp. 898,020 1,070,305 11,600 NXP Semiconductor N.V. 609,663 1,029,506 978,750 Bank Mandiri Persero Tbk PT 788,868 989,169 28,300 Honda Motor Co., Ltd. 1,094,808 967,869 24,450 Royal Dutch Shell PLC, Class A 850,950 953,411 157,900 Telstra Corp., Ltd. 612,037 894,113 9,600 QUALCOMM Inc. 579,020 828,921 32,261 BHP Billiton PLC 1,061,281 811,111 14,800 Societe Generale S.A. 781,427 727,893 27,218 Taiwan Semiconductor Manufacturing Co., Ltd., ADR 374,577 707,610 4,450 Bayer AG 384,550 706,806 112,200 Kingfisher PLC 621,094 691,777 98,219 Turkiye Halk Bankasi AS 655,258 678,770 10,129 Wolseley PLC 415,294 676,049 49,288 EFG International 590,785 667,937 10,800 ASSA ABLOY AB, Class B 616,117 667,552 46,600 Telefonaktiebolaget LM Ericsson, Class B 606,135 655,164 6,153 Sanofi 648,704 654,357
† The Underlying Fund is also managed by CI Investments Inc., the Manager of the Fund. Percentages shown in brackets in the Schedule of Investment Portfolio relate investments at fair value to net assets attributable to contractholders of the Fund. The accompanying notes are an integral part of these financial statements.
– 31 –Annual Financial Statements as at December 31, 2014
CI International Segregated Fund
The accompanying notes are an integral part of these financial statements.
Fund Specific Notes to Financial Statements (audited)
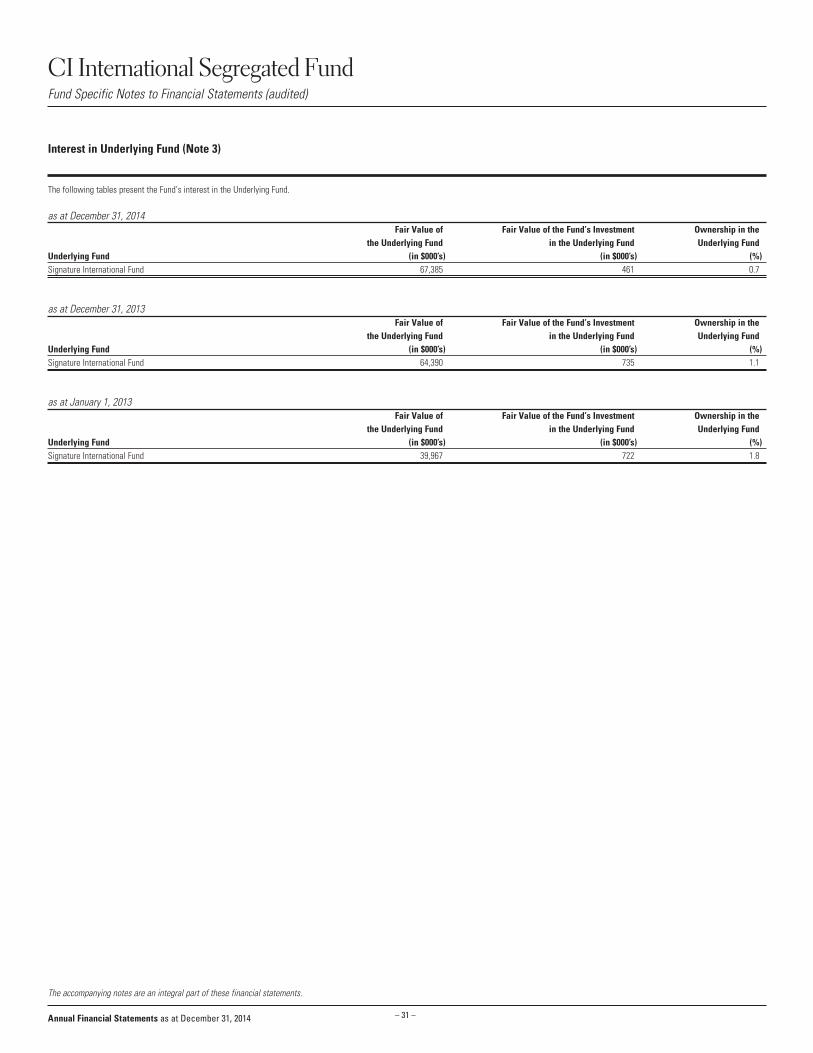
Interest in Underlying Fund (Note 3)
The following tables present the Fund’s interest in the Underlying Fund.
as at December 31, 2014 Fair Value of Fair Value of the Fund’s Investment Ownership in the the Underlying Fund in the Underlying Fund Underlying FundUnderlying Fund (in $000’s) (in $000’s) (%) 67,385 461 0.7
as at December 31, 2013 Fair Value of Fair Value of the Fund’s Investment Ownership in the the Underlying Fund in the Underlying Fund Underlying FundUnderlying Fund (in $000’s) (in $000’s) (%) 64,390 735 1.1
as at January 1, 2013 Fair Value of Fair Value of the Fund’s Investment Ownership in the the Underlying Fund in the Underlying Fund Underlying FundUnderlying Fund (in $000’s) (in $000’s) (%) 39,967 722 1.8
Signature International Fund
Signature International Fund
Signature International Fund

– 32 –Annual Financial Statements as at December 31, 2014
CI International Segregated Fund
Unit Transactions (Note 6)for the years ended December 31
Number of units at the beginning of yearUnits issued for cashUnits redeemed Number of units at the end of year
For inception date of the Fund, please refer to Note 1 in the Notes to the Financial Statements.The accompanying notes are an integral part of these financial statements.
Class I Class II 2014 2013 2014 2013 59,812 70,033 19,317 20,484 12,007 95 3,021 2,419 (41,805) (10,316) (4,720) (3,586) 30,014 59,812 17,618 19,317
Reconciliation of Equity as previously reported under Canadian GAAP to IFRS (Note 10) (in $000’s)
EquityEquity as reported under Canadian GAAPRevaluation of investments at FVTPLNet assets attributable to contractholders
as at as at Dec. 31, 2013 Jan. 1, 2013
735 723 - - 735 723
Reconciliation of Comprehensive Income as previously reported under Canadian GAAP to IFRS (Note 10) (in $000’s)
Comprehensive IncomeComprehensive income as reported under Canadian GAAPRevaluation of investments at FVTPLIncrease (decrease) in net assets from operations attributable to contractholders
for the year ended Dec. 31, 2013
112 - 112
Fund Specific Notes to Financial Statements (audited)

– 33 –Annual Financial Statements as at December 31, 2014
CI International Segregated Fund
For inception date of the Fund, please refer to Note 1 in the Notes to the Financial Statements.The accompanying notes are an integral part of these financial statements.
Financial Information (for the years ended December 31) (unaudited)
(1) This information is provided as at December 31, of the years shown.(2) The Fund’s portfolio turnover rate indicates how actively the Fund’s portfolio advisor manages its portfolio investments. A portfolio turnover rate of 100% is equivalent to the Fund buying and selling all of the securities in its portfolio once in the
course of the year. The higher a fund’s portfolio turnover rate in a year, the greater the trading costs payable by the fund in the year, and the greater the chance of an contractholder receiving taxable capital gains in the year. There is not necessarily
a relationship between a high turnover rate and the performance of a fund.(3) Management expense information is calculated based on expenses charged directly to the Fund plus, if applicable, expenses of the underlying fund, excluding commissions and brokerage fees, calculated on a weighted average basis on the percentage
weighting of the underlying fund and is expressed as an annualized percentage of average net asset value for the years shown. As of July 1, 2010, Ontario combined the federal goods and services tax (“GST” - 5%) with the provincial retail sales tax
(“PST” - 8%). The combination resulted in a Harmonized sales tax (“HST”) rate of 13%. The Effective HST tax rate is calculated using the attribution percentage for each province based on contractholders residency and can be different from 13%. For any
particular year, the rate shown will be prorated based on the different rates in effect during that year. For the year ended December 31, 2010 the rate applied is 5% for the period January 1, 2010 to June 30, 2010 and the Fund’s Effective HST rate for the period
starting July 1, 2010. The rate shown for the year ended December 31, 2010 is the time weighted average of these rates.(4) For financial years before January 1, 2013, the financial highlights are derived from the financial statements prepared in accordance with Canadian GAAP applicable to public enterprises. For financial years beginning on or after January 1, 2013,
the financial highlights are derived from the financial statements prepared in accordance with IFRS.
Financial HighlightsThe following tables show selected key financial information about the Fund and are intended to help you understand the Fund’s financial performance for the past five years, as applicable.
The Fund’s Net Asset Value per UnitNet assets value per unit at December 31, of the year shown ($) (1)
Ratios and Supplemental Data Net assets attributable to contractholders ($000’s) (1)
Number of units outstanding (1)
Portfolio turnover rate (%) (2)
Management Expense Ratio Management expense ratio before taxes (%) (3)
Harmonized sales tax/Goods and services tax (%) (3)
Management expense ratio after taxes (%) (3)
Management expense ratio before waivers or absorptions (%) (3)
Effective HST/GST rate for the year (%) (3)
The Fund’s Net Asset Value per UnitNet assets value per unit at December 31, of the year shown ($) (1)
Ratios and Supplemental Data Net assets attributable to contractholders ($000’s) (1)
Number of units outstanding (1)
Portfolio turnover rate (%) (2)
Management Expense Ratio Management expense ratio before taxes (%) (3)
Harmonized sales tax/Goods and services tax (%) (3)
Management expense ratio after taxes (%) (3)
Management expense ratio before waivers or absorptions (%) (3)
Effective HST/GST rate for the year (%) (3)
Class I 2014 2013 2012 2011 2010 2009(4)
10.20 9.54 8.16 7.04 7.90
306 571 571 572 814 30,014 59,812 70,033 81,266 102,990 3.06 2.54 0.10 5.87 4.27
2.61 2.61 2.61 2.63 2.61 0.27 0.27 0.27 0.27 0.22 2.88 2.88 2.88 2.90 2.83 2.88 2.88 2.88 2.90 2.83 7.88 8.49 10.35 10.65 7.64
Class II 2014 2013 2012 2011 2010 2009(4)
8.88 8.49 7.42 6.55 7.51
157 164 152 230 397 17,618 19,317 20,484 35,194 52,888 3.06 2.54 0.10 5.87 4.27
4.56 4.56 4.56 4.58 4.56 0.52 0.52 0.49 0.49 0.35 5.08 5.08 5.05 5.07 4.91 5.08 5.08 5.05 5.07 4.91 11.94 11.76 11.12 11.05 8.14

– 34 –Annual Financial Statements as at December 31, 2014
CI International Segregated Fund
The accompanying notes are an integral part of these financial statements.
Concentration Risk (cont’d)
as at December 31, 2013 Categories Net Assets (%)Cash & Equivalents 15.5Switzerland 14.2U.K. 11.9Japan 8.3France 6.6Germany 6.1Netherlands 4.5Belgium 3.5South Korea 3.0Thailand 3.0Australia 2.4Sweden 2.3Hong Kong 2.0Netherlands Antilles 1.7Cayman Islands 1.7China 1.5Brazil 1.5U.S.A. 1.5Russia 1.3Mexico 1.3Jersey Island 1.1Indonesia 1.1Austria 1.0Taiwan 0.9Bermuda 0.7Norway 0.7Turkey 0.6South Africa 0.5India 0.3Other Net Assets (Liabilities) 0.1Foreign Currency Forward Contracts (0.8)
Concentration RiskThe Signature International Fund’s financial instruments were concentrated in the following segments:
as at December 31, 2014Categories Net Assets (%)Cash & Equivalents 15.8Switzerland 11.7U.K. 9.5Japan 9.2France 6.1Germany 4.9Cayman Islands 3.9Netherlands 3.4Sweden 2.9U.S.A. 2.9Australia 2.6South Korea 2.5Belgium 2.3China 2.2Foreign Currency Forward Contracts 2.1Italy 1.8Indonesia 1.5Chile 1.5Thailand 1.5Jersey Island 1.4Spain 1.3Taiwan 1.1Turkey 1.0Mexico 0.9India 0.8Bermuda 0.8Luxembourg 0.7Panama 0.7Brazil 0.6Hong Kong 0.6Ireland 0.5Philippines 0.5Singapore 0.4Norway 0.3Russia 0.2Greece 0.2Portugal 0.2Other Net Assets (Liabilities) (0.5)
Fund Specific Notes to Financial Statements (audited)
Financial Instruments Risks (Note 9)

– 35 –Annual Financial Statements as at December 31, 2014
CI International Segregated Fund
The accompanying notes are an integral part of these financial statements.
Credit Risk (cont’d)
as at December 31, 2013 Credit Rating^ Net Assets (%)AA/Aa/A+ 0.2 Not Rated 0.6Total 0.8
as at January 1, 2013 Credit Rating^ Net Assets (%)AA/Aa/A+ 0.1 Not Rated 0.8 Total 0.9
^ Credit ratings are obtained from Standard & Poor’s, where available, otherwise ratings are obtained from: Moody’s
Investors Service or Dominion Bond Rating Services, respectively.
Other Price Risk The Fund indirectly bears the other price risk exposure of the Underlying Fund. As at December 31, 2014, December 31, 2013 and January 1, 2013, the Underlying Fund was exposed to other price risk as its holdings were sensitive to changes in general economic conditions across the world. The Underlying Fund was invested in international stocks.
As at December 31, 2014, had the foreign markets increased or decreased by 10% (December 31, 2013 and January 1, 2013 - 10%), with all other variables held constant, net assets attributable to contractholders of the Fund would have increased or decreased, respectively, by approximately $46,000 (December 31, 2013 - $74,000 and January 1, 2013 - $72,000). In practice, actual results may differ from this analysis and the difference may be material.
Currency RiskThe Fund indirectly bears the currency risk exposure of the Underlying Fund. As at December 31, 2014, December 31, 2013 and January 1, 2013, the Underlying Fund was exposed to currency risk as it invested predominantly in stocks that were denominated in currencies other than Canadian dollars, the functional currency of the Fund and the Underlying Fund. As a result, the Fund was affected by fluctuations in the value of such currencies relative to the Canadian dollar.
Concentration Risk (cont’d)
as at January 1, 2013 Categories Net Assets (%)U.K. 13.1Switzerland 10.4Japan 9.2U.S.A. 6.9Australia 5.4Cash & Equivalents 5.3Netherlands 5.1Hong Kong 4.0France 3.8South Korea 3.7Germany 3.7Brazil 3.2Thailand 2.8Mexico 2.3Belgium 2.3China 2.3Indonesia 1.7Netherlands Antilles 1.6Singapore 1.5Sweden 1.5Jersey Island 1.4Other Net Assets (Liabilities) 1.3Russia 1.2Bermuda 1.1Denmark 0.9Taiwan 0.8Norway 0.7Cayman Islands 0.6Italy 0.6Spain 0.5Israel 0.4Turkey 0.3Poland 0.2Austria 0.2Chile 0.2Czech Republic 0.2Foreign Currency Forward Contracts (0.4)
Credit RiskThe Fund indirectly bears the credit risk exposure of the Underlying Fund. As at December 31, 2014, December 31, 2013 and January 1, 2013, the Underlying Fund had insignificant exposure to credit risk as it invested predominantly in stocks.
The Underlying Fund was invested in fixed income securities, preferred securities and derivative instruments, if any, with the following credit ratings, as per the tables below.
as at December 31, 2014Credit Rating^ Net Assets (%)AAA/Aaa/A++ 0.2 AA/Aa/A+ 2.2 Total 2.4
Fund Specific Notes to Financial Statements (audited)

– 36 –Annual Financial Statements as at December 31, 2014
CI International Segregated Fund
The accompanying notes are an integral part of these financial statements.
Currency Risk (cont’d)
as at January 1, 2013 Currency Net Assets (%)US Dollar 14.2 Swiss Franc 10.3 Japanese Yen 8.9 British Pound 7.5 Euro 7.3 Hong Kong Dollar 7.1 Korean Won 3.7 Brazilian Real 3.4 Thai Baht 2.8 Australian Dollar 2.6 Indonesian Rupiah 1.7 Taiwan Dollar 1.6 Swedish Krona 1.5 Singapore Dollar 1.5 Mexican Peso 1.0 Danish Krone 0.9 Norwegian Krone 0.7 Indian Rupee 0.5 Israeli Shekel 0.4 Turkish Lira 0.3 Polish Zloty 0.2 Czech Koruna 0.2Total 78.3
As at December 31, 2014, had the Canadian dollar strengthened or weakened by 10% (December 31, 2013 and January 1, 2013 - 10%) in relation to all other foreign currencies held in the Underlying Fund, with all other variables held constant, net assets attributable to contractholders of the Fund would have decreased or increased, respectively, by approximately $46,000 (December 31, 2013 - $52,000 and January 1, 2013 - $57,000). In practice, the actual results may differ from this analysis and the difference may be material.
Interest Rate RiskThe Fund indirectly bears the interest rate risk exposure of the Underlying Fund. As at December 31, 2014, December 31, 2013 and January 1, 2013, the Underlying Fund had insignificant exposure to interest rate risk as substantially all of its assets were invested in stocks.
Fair Value Hierarchy (Note 9)
The tables below summarize the inputs used by the Fund in valuing the Fund’s investments carried at fair value.
Long Positions at fair value as at December 31, 2014 Level 1 Level 2 Level 3 Total (in $000’s) (in $000’s) (in $000’s) (in $000’s)Underlying Fund 461 - - 461 Total 461 - - 461
Long Positions at fair value as at December 31, 2013 Level 1 Level 2 Level 3 Total (in $000’s) (in $000’s) (in $000’s) (in $000’s)Underlying Fund 735 - - 735 Total 735 - - 735
There were no transfers between Level 1 and Level 2 during the years ended December 31, 2014 and 2013.
Currency Risk (cont’d)The tables below summarize the Underlying Fund’s exposure to currency risk.
as at December 31, 2014Currency Net Assets (%)US Dollar 62.3 British Pound 5.4 Hong Kong Dollar 5.4 Euro 4.9 Japanese Yen 3.6 Swedish Krona 2.9 Swiss Franc 2.8 Australian Dollar 1.9 Indonesian Rupiah 1.5 Thai Baht 1.4 Korean Won 1.2 Indian Rupee 1.1 Turkish Lira 1.0 Brazilian Real 0.6 Chilean Peso 0.6 Taiwan Dollar 0.5 Philippine Peso 0.5 Singapore Dollar 0.4 Mexican Peso 0.4 Norwegian Krone 0.3 Total 98.7
as at December 31, 2013 Currency Net Assets (%)US Dollar 21.0 British Pound 9.5 Swiss Franc 7.4 Euro 6.4 Hong Kong Dollar 5.0 Japanese Yen 4.3 Korean Won 3.0 Thai Baht 3.0 Australian Dollar 2.4 Swedish Krona 2.3 Brazilian Real 1.1 Indonesian Rupiah 1.1 Norwegian Krone 0.7 Indian Rupee 0.7 Mexican Peso 0.6 Turkish Lira 0.6 South Africa Rand 0.5 Taiwan Dollar 0.5Total 70.1
Fund Specific Notes to Financial Statements (audited)

– 37 –Annual Financial Statements as at December 31, 2014
CI International Segregated Fund
The accompanying notes are an integral part of these financial statements.
Fair Value Hierarchy (Note 9) (cont’d)
Long Positions at fair value as at January 1, 2013 Level 1 Level 2 Level 3 Total (in $000’s) (in $000’s) (in $000’s) (in $000’s)Underlying Fund 722 - - 722Total 722 - - 722
Fund Specific Notes to Financial Statements (audited)

– 38 –Annual Financial Statements as at December 31, 2014
Signature Canadian Segregated Fund
2014 2013
- - 3 - 96 - 214 54
(59) 392
- - 50 56 304 502
67 76 6 6 - - 2 3 75 85 - -
229 417
2.17 2.99 1.55 2.31
as at as at as at Dec. 31, 2014 Dec. 31, 2013 Jan. 1, 2013
2,048 2,581 2,454 9 5 - - - - - - - - - - - - - - - - 2,057 2,586 2,454
- - - - - - - - - - 1 - - - - - - - - 1 - 2,057 2,585 2,454
21.28 19.14 16.12 18.30 16.86 14.53
For inception date of the Fund, please refer to Note 1 in the Notes to the Financial Statements.The accompanying notes are an integral part of these financial statements.
Financial Statements (audited)
CIG - 131
Statements of Financial Position (in $000’s except for per unit amounts)
Statements of Comprehensive Income for the years ended December 31(in $000’s except for per unit amounts)
Assets Current assets Investments Cash Fees rebate receivable Dividends receivable Interest receivable Receivable for investments sold Receivable for unit subscriptions
Liabilities Current liabilities Bank overdraft Payable for investments purchased Payable for unit redemptions Management fees payable Administration fees payable Insurance fees payable
Net assets attributable to contractholders
Net assets attributable to contractholders per unit: Class IClass II
Income Net gain (loss) on investments Dividends Income distributions from investments Capital gain distributions from investments Net realized gain (loss) on sale of investments Change in unrealized appreciation (depreciation) in value of
investments Other income Interest Fees rebate (Note 7)
Expenses (Note 7)Management fees Administration fees Insurance fees Harmonized sales tax
Expenses absorbed by the manager Increase (decrease) in net assets from operations attributable to contractholders
Increase (decrease) in net assets from operations attributable to contractholders per unit: Class I Class II

– 39 –Annual Financial Statements as at December 31, 2014
Signature Canadian Segregated Fund
The accompanying notes are an integral part of these financial statements.
Financial Statements (audited)
2014 2013
2,585 2,454
229 417
138 9 (895) (295) (757) (286)
2,057 2,585
Net assets attributable to contractholders at the beginning of year Increase (decrease) in net assets from operations attributable to contractholders Unit transactions Proceeds from issuance of units Amounts paid on redemption of units
Net assets attributable to contractholders at the end of year
Statements of Changes in Net Assets Attributable to Contractholders for the years ended December 31 (in $000’s)
2014 2013
229 417
(214) (54)
59 (392) 797 325 (109) (6) - - - - (1) 1 - - - - - - 761 291
138 9 (895) (295) (757) (286)
4 5 5 - 9 5
- - - - - - - -
Statements of Cash Flows for the years ended December 31 (in $000’s)
Cash flows from (used in) operating activities Increase (decrease) in net assets from operations attributable to contractholders Adjustments for: Net realized (gain) loss on sale of investments Change in unrealized (appreciation) depreciation in value of
investments Proceeds from sale of investments Purchase of investments (Increase) decrease in dividends receivable (Increase) decrease in interest receivable Increase (decrease) in management fees payable Increase (decrease) in administration fees payable Increase (decrease) in insurance fees payable (Increase) decrease in fees rebate receivable Net cash from (used in) operating activities
Cash flows from (used in) financing activities Proceeds from issuances of unitsAmounts paid on redemption of unitsNet cash from (used in) financing activities
Net increase (decrease) in cashCash (bank overdraft), beginning of yearCash (bank overdraft), end of year
Supplementary Information: Dividends received, net of withholding taxInterest receivedInterest paidIncome taxes paid

– 40 –Annual Financial Statements as at December 31, 2014
Signature Canadian Segregated Fund
Schedule of Investment Portfolio as at December 31, 2014 (audited)
No. of Average Fair Units/Shares Investment Cost ($) Value ($)
86,377 Signature Select Canadian Fund (Class A)† 1,519,185 2,048,003 Total Investments (99.6%) 1,519,185 2,048,003 Other Net Assets (Liabilities) (0.4%) 8,873 Net Assets Attributable to Contractholders (100.0%) 2,056,876
Top 25 Holdings of Underlying Fund (unaudited)
No. of Average Fair Units/Shares Investment Cost ($) Value ($)
Cash & Equivalents 273,248,458 2,753,566 Toronto-Dominion Bank 104,375,981 152,850,449 2,258,900 The Bank of Nova Scotia 134,944,985 149,787,659 1,852,000 Royal Bank of Canada 122,527,324 148,604,480 8,610,691 Signature Cash Management Fund (Class C) 86,106,910 86,106,910 1,037,900 Canadian National Railway Co. 36,916,376 83,052,758 2,523,674 JPMorgan Chase & Co., Warrants (28Oct18) 34,230,035 60,978,137 2,342,000 UBS Group AG 45,571,656 46,759,013 759,610 Brookfield Asset Management Inc., Class A 19,373,983 44,224,494 807,180 Alimentation Couche-Tard Inc., Class B 7,987,395 39,301,594 619,600 Citigroup Inc. 28,455,621 38,946,327 421,600 NXP Semiconductor N.V. 21,470,089 37,417,220 594,350 Enbridge Inc. 29,394,857 35,506,469 267,700 Apple Inc. 22,289,988 34,325,457 302,300 Novartis AG, Registered Shares 17,849,733 32,614,553 1,259,109 BHP Billiton PLC 41,192,829 31,656,699 100,100 Roche Holding AG 20,755,150 31,562,642 873,000 Canadian Natural Resources Ltd. 30,446,303 31,358,160 965,040 Power Corp. of Canada 29,093,658 30,649,670 724,950 Intel Corp. 16,593,956 30,561,353 1,131,277 Cenovus Energy Inc. 36,183,876 27,116,710 172,500 Thermo Fisher Scientific Inc. 23,417,050 25,106,321 399,700 Loblaw Co., Ltd. 14,463,663 24,849,349 1,493,850 EnCana Corp. 30,611,483 24,155,555 293,500 KLA-Tencor Corp. 14,868,723 23,975,326
† The Underlying Fund is also managed by CI Investments Inc., the Manager of the Fund. Percentages shown in brackets in the Schedule of Investment Portfolio relate investments at fair value to net assets attributable to contractholders of the Fund. The accompanying notes are an integral part of these financial statements.
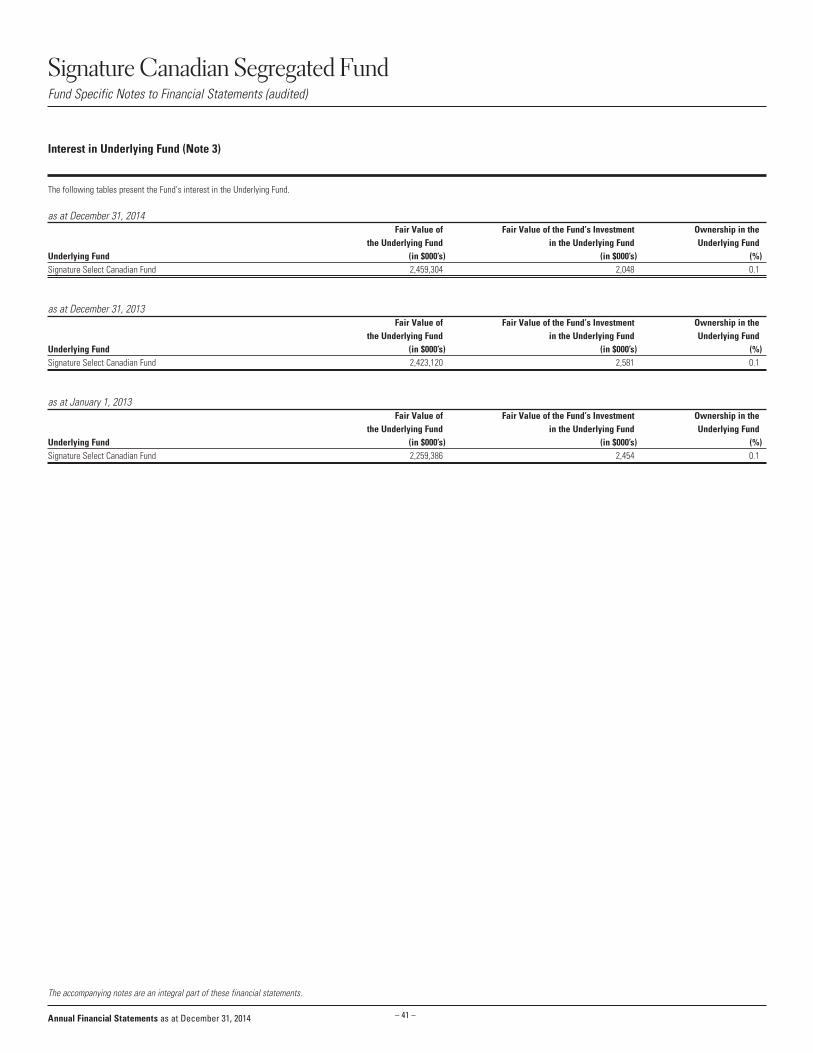
– 41 –Annual Financial Statements as at December 31, 2014
Signature Canadian Segregated Fund
The accompanying notes are an integral part of these financial statements.
Fund Specific Notes to Financial Statements (audited)
Interest in Underlying Fund (Note 3)
The following tables present the Fund’s interest in the Underlying Fund.
as at December 31, 2014 Fair Value of Fair Value of the Fund’s Investment Ownership in the the Underlying Fund in the Underlying Fund Underlying FundUnderlying Fund (in $000’s) (in $000’s) (%) 2,459,304 2,048 0.1
as at December 31, 2013 Fair Value of Fair Value of the Fund’s Investment Ownership in the the Underlying Fund in the Underlying Fund Underlying FundUnderlying Fund (in $000’s) (in $000’s) (%) 2,423,120 2,581 0.1
as at January 1, 2013 Fair Value of Fair Value of the Fund’s Investment Ownership in the the Underlying Fund in the Underlying Fund Underlying FundUnderlying Fund (in $000’s) (in $000’s) (%) 2,259,386 2,454 0.1
Signature Select Canadian Fund
Signature Select Canadian Fund
Signature Select Canadian Fund

– 42 –Annual Financial Statements as at December 31, 2014
Signature Canadian Segregated Fund
Unit Transactions (Note 6)for the years ended December 31
Number of units at the beginning of yearUnits issued for cashUnits redeemed Number of units at the end of year
For inception date of the Fund, please refer to Note 1 in the Notes to the Financial Statements.The accompanying notes are an integral part of these financial statements.
Class I Class II 2014 2013 2014 2013 87,738 98,269 53,735 59,924 6,606 276 266 282 (27,570) (10,807) (19,257) (6,471) 66,774 87,738 34,744 53,735
Reconciliation of Equity as previously reported under Canadian GAAP to IFRS (Note 10) (in $000’s)
EquityEquity as reported under Canadian GAAPRevaluation of investments at FVTPLNet assets attributable to contractholders
as at as at Dec. 31, 2013 Jan. 1, 2013
2,585 2,454 - - 2,585 2,454
Reconciliation of Comprehensive Income as previously reported under Canadian GAAP to IFRS (Note 10) (in $000’s)
Comprehensive IncomeComprehensive income as reported under Canadian GAAPRevaluation of investments at FVTPLIncrease (decrease) in net assets from operations attributable to contractholders
for the year ended Dec. 31, 2013
417 - 417
Fund Specific Notes to Financial Statements (audited)

– 43 –Annual Financial Statements as at December 31, 2014
Signature Canadian Segregated Fund
For inception date of the Fund, please refer to Note 1 in the Notes to the Financial Statements.The accompanying notes are an integral part of these financial statements.
Financial Information (for the years ended December 31) (unaudited)
(1) This information is provided as at December 31, of the years shown.(2) The Fund’s portfolio turnover rate indicates how actively the Fund’s portfolio advisor manages its portfolio investments. A portfolio turnover rate of 100% is equivalent to the Fund buying and selling all of the securities in its portfolio once in the
course of the year. The higher a fund’s portfolio turnover rate in a year, the greater the trading costs payable by the fund in the year, and the greater the chance of an contractholder receiving taxable capital gains in the year. There is not necessarily
a relationship between a high turnover rate and the performance of a fund.(3) Management expense information is calculated based on expenses charged directly to the Fund plus, if applicable, expenses of the underlying fund, excluding commissions and brokerage fees, calculated on a weighted average basis on the percentage
weighting of the underlying fund and is expressed as an annualized percentage of average net asset value for the years shown. As of July 1, 2010, Ontario combined the federal goods and services tax (“GST” - 5%) with the provincial retail sales tax
(“PST” - 8%). The combination resulted in a Harmonized sales tax (“HST”) rate of 13%. The Effective HST tax rate is calculated using the attribution percentage for each province based on contractholders residency and can be different from 13%. For any
particular year, the rate shown will be prorated based on the different rates in effect during that year. For the year ended December 31, 2010 the rate applied is 5% for the period January 1, 2010 to June 30, 2010 and the Fund’s Effective HST rate for the period
starting July 1, 2010. The rate shown for the year ended December 31, 2010 is the time weighted average of these rates.(4) For financial years before January 1, 2013, the financial highlights are derived from the financial statements prepared in accordance with Canadian GAAP applicable to public enterprises. For financial years beginning on or after January 1, 2013,
the financial highlights are derived from the financial statements prepared in accordance with IFRS.
Financial HighlightsThe following tables show selected key financial information about the Fund and are intended to help you understand the Fund’s financial performance for the past five years, as applicable.
The Fund’s Net Asset Value per UnitNet assets value per unit at December 31, of the year shown ($) (1)
Ratios and Supplemental Data Net assets attributable to contractholders ($000’s) (1)
Number of units outstanding (1)
Portfolio turnover rate (%) (2)
Management Expense Ratio Management expense ratio before taxes (%) (3)
Harmonized sales tax/Goods and services tax (%) (3)
Management expense ratio after taxes (%) (3)
Management expense ratio before waivers or absorptions (%) (3)
Effective HST/GST rate for the year (%) (3)
The Fund’s Net Asset Value per UnitNet assets value per unit at December 31, of the year shown ($) (1)
Ratios and Supplemental Data Net assets attributable to contractholders ($000’s) (1)
Number of units outstanding (1)
Portfolio turnover rate (%) (2)
Management Expense Ratio Management expense ratio before taxes (%) (3)
Harmonized sales tax/Goods and services tax (%) (3)
Management expense ratio after taxes (%) (3)
Management expense ratio before waivers or absorptions (%) (3)
Effective HST/GST rate for the year (%) (3)
Class I 2014 2013 2012 2011 2010 2009(4)
21.28 19.14 16.12 14.95 16.40
1,421 1,679 1,583 1,707 2,115 66,774 87,738 98,269 114,180 128,987 4.80 0.25 0.47 4.66 3.43
2.49 2.50 2.49 2.49 2.49 0.27 0.27 0.26 0.26 0.21 2.76 2.77 2.75 2.75 2.70 2.76 2.77 2.75 2.75 2.70 8.93 9.55 10.36 9.88 7.32
Class II 2014 2013 2012 2011 2010 2009(4)
18.30 16.86 14.53 13.80 15.49
636 906 871 895 1,317 34,744 53,735 59,924 64,858 85,009 4.80 0.25 0.47 4.66 3.43
4.59 4.60 4.59 4.59 4.59 0.52 0.51 0.50 0.50 0.37 5.11 5.11 5.09 5.09 4.96 5.11 5.11 5.09 5.09 4.96 11.49 11.48 11.03 11.18 8.16

– 44 –Annual Financial Statements as at December 31, 2014
Signature Canadian Segregated Fund
The accompanying notes are an integral part of these financial statements.
Concentration Risk (cont’d)
as at January 1, 2013 Categories Net Assets (%)Long Positions:Financials 27.8Energy 16.6Materials 10.0Consumer Staples 9.9Health Care 7.1Information Technology 5.4Industrials 5.4Exchange-Traded Funds 5.4Consumer Discretionary 3.9Short-Term Investments 3.9Telecommunication Services 2.2Cash & Equivalents 1.5Utilities 1.3Private Placements 0.2Other Net Assets (Liabilities) 0.2Foreign Currency Forward Contracts (0.2)Total Long Positions 100.6
Short Positions:Health Care (0.6)Total Short Positions (0.6)
Credit RiskThe Fund indirectly bears the credit risk exposure of the Underlying Fund. As at December 31, 2014, December 31, 2013 and January 1, 2013, the Underlying Fund had insignificant exposure to credit risk as it invested predominantly in stocks.
The Underlying Fund was invested in fixed income securities, preferred securities and derivative instruments, if any, with the following credit ratings, as per the tables below.
as at December 31, 2013 Credit Rating^ Net Assets (%) Not Rated 0.4Total 0.4
as at January 1, 2013 Credit Rating^ Net Assets (%)AA/Aa/A+ 3.5 Not Rated 1.0 Total 4.5
^ Credit ratings are obtained from Standard & Poor’s, where available, otherwise ratings are obtained from: Moody’s
Investors Service or Dominion Bond Rating Services, respectively.
Concentration RiskThe Signature Select Canadian Fund’s financial instruments were concentrated in the following segments:
as at December 31, 2014Categories Net Assets (%)Long Positions:Financials 28.6Cash & Equivalents 11.1Industrials 9.5Information Technology 8.8Consumer Staples 8.4Energy 7.8Consumer Discretionary 6.6Health Care 5.9Funds 3.5Warrants 3.4Materials 3.1Telecommunication Services 1.6Utilities 1.4Private Placements 0.8Foreign Currency Forward Contracts 0.2Total Long Positions 100.7
Short Positions:Financials (0.7)Total Short Positions (0.7)
as at December 31, 2013 Categories Net Assets (%)Financials 25.2Energy 15.1Health Care 10.8Consumer Staples 10.7Industrials 8.9Information Technology 6.4Funds 5.2Cash & Equivalents 5.1Materials 3.8Consumer Discretionary 3.5Warrants 3.0Utilities 1.9Telecommunication Services 0.7Private Placements 0.3Other Net Assets (Liabilities) (0.2)Foreign Currency Forward Contracts (0.4)
Fund Specific Notes to Financial Statements (audited)
Financial Instruments Risks (Note 9)

– 45 –Annual Financial Statements as at December 31, 2014
Signature Canadian Segregated Fund
The accompanying notes are an integral part of these financial statements.
Currency Risk (cont’d)
as at January 1, 2013 Currency Net Assets (%)US Dollar 22.7 Swiss Franc 3.3 Brazilian Real 0.8 Thai Baht 0.8 Euro 0.7 Japanese Yen 0.6 British Pound 0.6 Hong Kong Dollar 0.6 Mexican Peso 0.5 Swedish Krona 0.2 Australian Dollar 0.1 Indonesian Rupiah 0.1Total 31.0
As at December 31, 2014, had the Canadian dollar strengthened or weakened by 10% (December 31, 2013 and January 1, 2013 - 10%) in relation to all other foreign currencies held in the Underlying Fund, with all other variables held constant, net assets attributable to contractholders of the Fund would have decreased or increased, respectively, by approximately $93,000 (December 31, 2013 - $88,000 and January 1, 2013 - $76,000). In practice, the actual results may differ from this analysis and the difference may be material.
Interest Rate RiskThe Fund indirectly bears the interest rate risk exposure of the Underlying Fund. As at December 31, 2014, December 31, 2013 and January 1, 2013, the Underlying Fund had insignificant exposure to interest rate risk as substantially all of its assets were invested in stocks.
Fair Value Hierarchy (Note 9)
The tables below summarize the inputs used by the Fund in valuing the Fund’s investments carried at fair value.
Long Positions at fair value as at December 31, 2014 Level 1 Level 2 Level 3 Total (in $000’s) (in $000’s) (in $000’s) (in $000’s)Underlying Fund 2,048 - - 2,048 Total 2,048 - - 2,048
Long Positions at fair value as at December 31, 2013 Level 1 Level 2 Level 3 Total (in $000’s) (in $000’s) (in $000’s) (in $000’s)Underlying Fund 2,581 - - 2,581Total 2,581 - - 2,581
There were no transfers between Level 1 and Level 2 during the years ended December 31, 2014 and 2013.
Long Positions at fair value as at January 1, 2013 Level 1 Level 2 Level 3 Total (in $000’s) (in $000’s) (in $000’s) (in $000’s)Underlying Fund 2,454 - - 2,454 Total 2,454 - - 2,454
Other Price Risk The Fund indirectly bears the other price risk exposure of the Underlying Fund. As at December 31, 2014, December 31, 2013 and January 1, 2013, the Underlying Fund was exposed to other price risk as its holdings were sensitive to changes in general economic conditions in Canada. The Underlying Fund was invested in Canadian stocks.
As at December 31, 2014, had the Canadian markets increased or decreased by 10% (December 31, 2013 and January 1, 2013 - 10%), with all other variables held constant, net assets attributable to contractholders of the Fund would have increased or decreased, respectively, by approximately $205,000 (December 31, 2013 - $258,000 and January 1, 2013 - $245,000). In practice, actual results may differ from this analysis and the difference may be material.
Currency RiskThe Fund indirectly bears the currency risk exposure of the Underlying Fund. As at December 31, 2014, December 31, 2013 and January 1, 2013, the Underlying Fund was exposed to currency risk, as some of its investments were denominated in currencies other than Canadian dollars, the functional currency of the Fund and the Underlying Fund. As a result, the Fund was affected by fluctuations in the value of such currencies relative to the Canadian dollar.
The tables below summarize the Underlying Fund’s exposure to currency risk.
as at December 31, 2014Currency Net Assets (%)US Dollar 38.3 Japanese Yen 2.1 British Pound 1.5 Swiss Franc 1.3 Euro 1.0 Swedish Krona 1.0 Korean Won 0.2 Hong Kong Dollar 0.1 Total 45.5
as at December 31, 2013 Currency Net Assets (%)US Dollar 24.2 Swiss Franc 2.7 Japanese Yen 1.5 British Pound 1.5 Euro 1.0 Swedish Krona 0.8 Hong Kong Dollar 0.6 Thai Baht 0.5 Brazilian Real 0.4 Mexican Peso 0.4 Korean Won 0.2 South Africa Rand 0.2 Total 34.0
Fund Specific Notes to Financial Statements (audited)

– 46 –Annual Financial Statements as at December 31, 2014
Signature Select Canadian Segregated Fund
2014 2013
- - 4 - 152 - 526 110
(293) 673
- - 79 98 468 881
117 154 8 11 - - 5 7 130 172 - - 338 709
3.96 5.55 2.64 4.31
as at as at as at Dec. 31, 2014 Dec. 31, 2013 Jan. 1, 2013
3,229 4,582 4,407 - 6 11 - - - - - - - - - - 1 2 - - - 3,229 4,589 4,420
5 - - - - - - - - - - 1 - - - - - - 5 - 1 3,224 4,589 4,419
39.24 35.31 29.75 34.06 31.36 27.02
For inception date of the Fund, please refer to Note 1 in the Notes to the Financial Statements.The accompanying notes are an integral part of these financial statements.
Financial Statements (audited)
CIG - 132
Statements of Financial Position (in $000’s except for per unit amounts)
Statements of Comprehensive Income for the years ended December 31(in $000’s except for per unit amounts)
Assets Current assets Investments Cash Fees rebate receivable Dividends receivable Interest receivable Receivable for investments sold Receivable for unit subscriptions
Liabilities Current liabilities Bank overdraft Payable for investments purchased Payable for unit redemptions Management fees payable Administration fees payable Insurance fees payable
Net assets attributable to contractholders
Net assets attributable to contractholders per unit: Class IClass II
Income Net gain (loss) on investments Dividends Income distributions from investments Capital gain distributions from investments Net realized gain (loss) on sale of investments Change in unrealized appreciation (depreciation) in value of
investments Other income Interest Fees rebate (Note 7)
Expenses (Note 7)Management fees Administration fees Insurance fees Harmonized sales tax
Expenses absorbed by the manager Increase (decrease) in net assets from operations attributable to contractholders
Increase (decrease) in net assets from operations attributable to contractholders per unit: Class I Class II

– 47 –Annual Financial Statements as at December 31, 2014
Signature Select Canadian Segregated Fund
The accompanying notes are an integral part of these financial statements.
Financial Statements (audited)
2014 2013
4,589 4,419
338 709
126 43 (1,829) (582) (1,703) (539)
3,224 4,589
Net assets attributable to contractholders at the beginning of year Increase (decrease) in net assets from operations attributable to contractholders Unit transactions Proceeds from issuance of units Amounts paid on redemption of units
Net assets attributable to contractholders at the end of year
Statements of Changes in Net Assets Attributable to Contractholders for the years ended December 31 (in $000’s)
2014 2013
338 709
(526) (110)
293 (673) 1,866 614 (279) (5) - - - - - (1) - - - - - - 1,692 534
126 43 (1,829) (582) (1,703) (539)
(11) (5) 6 11 (5) 6
- - - - - - - -
Statements of Cash Flows for the years ended December 31 (in $000’s)
Cash flows from (used in) operating activities Increase (decrease) in net assets from operations attributable to contractholders Adjustments for: Net realized (gain) loss on sale of investments Change in unrealized (appreciation) depreciation in value of
investments Proceeds from sale of investments Purchase of investments (Increase) decrease in dividends receivable (Increase) decrease in interest receivable Increase (decrease) in management fees payable Increase (decrease) in administration fees payable Increase (decrease) in insurance fees payable (Increase) decrease in fees rebate receivable Net cash from (used in) operating activities
Cash flows from (used in) financing activities Proceeds from issuances of unitsAmounts paid on redemption of unitsNet cash from (used in) financing activities
Net increase (decrease) in cashCash (bank overdraft), beginning of yearCash (bank overdraft), end of year
Supplementary Information: Dividends received, net of withholding taxInterest receivedInterest paidIncome taxes paid

– 48 –Annual Financial Statements as at December 31, 2014
Signature Select Canadian Segregated Fund
Schedule of Investment Portfolio as at December 31, 2014 (audited)
No. of Average Fair Units/Shares Investment Cost ($) Value ($)
136,196 Signature Select Canadian Fund (Class A)† 2,351,071 3,229,215 Total Investments (100.2%) 2,351,071 3,229,215 Other Net Assets (Liabilities) (-0.2%) (5,442) Net Assets Attributable to Contractholders (100.0%) 3,223,773
Top 25 Holdings of Underlying Fund (unaudited)
No. of Average Fair Units/Shares Investment Cost ($) Value ($)
Cash & Equivalents 273,248,458 2,753,566 Toronto-Dominion Bank 104,375,981 152,850,449 2,258,900 The Bank of Nova Scotia 134,944,985 149,787,659 1,852,000 Royal Bank of Canada 122,527,324 148,604,480 8,610,691 Signature Cash Management Fund (Class C) 86,106,910 86,106,910 1,037,900 Canadian National Railway Co. 36,916,376 83,052,758 2,523,674 JPMorgan Chase & Co., Warrants (28Oct18) 34,230,035 60,978,137 2,342,000 UBS Group AG 45,571,656 46,759,013 759,610 Brookfield Asset Management Inc., Class A 19,373,983 44,224,494 807,180 Alimentation Couche-Tard Inc., Class B 7,987,395 39,301,594 619,600 Citigroup Inc. 28,455,621 38,946,327 421,600 NXP Semiconductor N.V. 21,470,089 37,417,220 594,350 Enbridge Inc. 29,394,857 35,506,469 267,700 Apple Inc. 22,289,988 34,325,457 302,300 Novartis AG, Registered Shares 17,849,733 32,614,553 1,259,109 BHP Billiton PLC 41,192,829 31,656,699 100,100 Roche Holding AG 20,755,150 31,562,642 873,000 Canadian Natural Resources Ltd. 30,446,303 31,358,160 965,040 Power Corp. of Canada 29,093,658 30,649,670 724,950 Intel Corp. 16,593,956 30,561,353 1,131,277 Cenovus Energy Inc. 36,183,876 27,116,710 172,500 Thermo Fisher Scientific Inc. 23,417,050 25,106,321 399,700 Loblaw Co., Ltd. 14,463,663 24,849,349 1,493,850 EnCana Corp. 30,611,483 24,155,555 293,500 KLA-Tencor Corp. 14,868,723 23,975,326
† The Underlying Fund is also managed by CI Investments Inc., the Manager of the Fund. Percentages shown in brackets in the Schedule of Investment Portfolio relate investments at fair value to net assets attributable to contractholders of the Fund. The accompanying notes are an integral part of these financial statements.

– 49 –Annual Financial Statements as at December 31, 2014
Signature Select Canadian Segregated Fund
The accompanying notes are an integral part of these financial statements.
Fund Specific Notes to Financial Statements (audited)
Interest in Underlying Fund (Note 3)
The following tables present the Fund’s interest in the Underlying Fund.
as at December 31, 2014 Fair Value of Fair Value of the Fund’s Investment Ownership in the the Underlying Fund in the Underlying Fund Underlying FundUnderlying Fund (in $000’s) (in $000’s) (%) 2,459,304 3,229 0.1
as at December 31, 2013 Fair Value of Fair Value of the Fund’s Investment Ownership in the the Underlying Fund in the Underlying Fund Underlying FundUnderlying Fund (in $000’s) (in $000’s) (%) 2,423,120 4,582 0.2
as at January 1, 2013 Fair Value of Fair Value of the Fund’s Investment Ownership in the the Underlying Fund in the Underlying Fund Underlying FundUnderlying Fund (in $000’s) (in $000’s) (%) 2,259,386 4,407 0.2
Signature Select Canadian Fund
Signature Select Canadian Fund
Signature Select Canadian Fund

– 50 –Annual Financial Statements as at December 31, 2014
Signature Select Canadian Segregated Fund
Unit Transactions (Note 6)for the years ended December 31
Number of units at the beginning of yearUnits issued for cashUnits redeemed Number of units at the end of year
For inception date of the Fund, please refer to Note 1 in the Notes to the Financial Statements.The accompanying notes are an integral part of these financial statements.
Class I Class II 2014 2013 2014 2013 57,761 63,421 81,305 93,712 3,154 1,100 58 256 (14,404) (6,760) (40,286) (12,663) 46,511 57,761 41,077 81,305
Reconciliation of Equity as previously reported under Canadian GAAP to IFRS (Note 10) (in $000’s)
EquityEquity as reported under Canadian GAAPRevaluation of investments at FVTPLNet assets attributable to contractholders
as at as at Dec. 31, 2013 Jan. 1, 2013
4,589 4,419 - - 4,589 4,419
Reconciliation of Comprehensive Income as previously reported under Canadian GAAP to IFRS (Note 10) (in $000’s)
Comprehensive IncomeComprehensive income as reported under Canadian GAAPRevaluation of investments at FVTPLIncrease (decrease) in net assets from operations attributable to contractholders
for the year ended Dec. 31, 2013
709 - 709
Fund Specific Notes to Financial Statements (audited)

– 51 –Annual Financial Statements as at December 31, 2014
Signature Select Canadian Segregated Fund
For inception date of the Fund, please refer to Note 1 in the Notes to the Financial Statements.The accompanying notes are an integral part of these financial statements.
Financial Information (for the years ended December 31) (unaudited)
(1) This information is provided as at December 31, of the years shown.(2) The Fund’s portfolio turnover rate indicates how actively the Fund’s portfolio advisor manages its portfolio investments. A portfolio turnover rate of 100% is equivalent to the Fund buying and selling all of the securities in its portfolio once in the
course of the year. The higher a fund’s portfolio turnover rate in a year, the greater the trading costs payable by the fund in the year, and the greater the chance of an contractholder receiving taxable capital gains in the year. There is not necessarily
a relationship between a high turnover rate and the performance of a fund.(3) Management expense information is calculated based on expenses charged directly to the Fund plus, if applicable, expenses of the underlying fund, excluding commissions and brokerage fees, calculated on a weighted average basis on the percentage
weighting of the underlying fund and is expressed as an annualized percentage of average net asset value for the years shown. As of July 1, 2010, Ontario combined the federal goods and services tax (“GST” - 5%) with the provincial retail sales tax
(“PST” - 8%). The combination resulted in a Harmonized sales tax (“HST”) rate of 13%. The Effective HST tax rate is calculated using the attribution percentage for each province based on contractholders residency and can be different from 13%. For any
particular year, the rate shown will be prorated based on the different rates in effect during that year. For the year ended December 31, 2010 the rate applied is 5% for the period January 1, 2010 to June 30, 2010 and the Fund’s Effective HST rate for the period
starting July 1, 2010. The rate shown for the year ended December 31, 2010 is the time weighted average of these rates.(4) For financial years before January 1, 2013, the financial highlights are derived from the financial statements prepared in accordance with Canadian GAAP applicable to public enterprises. For financial years beginning on or after January 1, 2013,
the financial highlights are derived from the financial statements prepared in accordance with IFRS.
Financial HighlightsThe following tables show selected key financial information about the Fund and are intended to help you understand the Fund’s financial performance for the past five years, as applicable.
The Fund’s Net Asset Value per UnitNet assets value per unit at December 31, of the year shown ($) (1)
Ratios and Supplemental Data Net assets attributable to contractholders ($000’s) (1)
Number of units outstanding (1)
Portfolio turnover rate (%) (2)
Management Expense Ratio Management expense ratio before taxes (%) (3)
Harmonized sales tax/Goods and services tax (%) (3)
Management expense ratio after taxes (%) (3)
Management expense ratio before waivers or absorptions (%) (3)
Effective HST/GST rate for the year (%) (3)
The Fund’s Net Asset Value per UnitNet assets value per unit at December 31, of the year shown ($) (1)
Ratios and Supplemental Data Net assets attributable to contractholders ($000’s) (1)
Number of units outstanding (1)
Portfolio turnover rate (%) (2)
Management Expense Ratio Management expense ratio before taxes (%) (3)
Harmonized sales tax/Goods and services tax (%) (3)
Management expense ratio after taxes (%) (3)
Management expense ratio before waivers or absorptions (%) (3)
Effective HST/GST rate for the year (%) (3)
Class I 2014 2013 2012 2011 2010 2009(4)
39.24 35.31 29.75 27.61 30.29
1,825 2,040 1,887 1,872 2,658 46,511 57,761 63,421 67,806 87,750 7.76 0.12 1.67 0.33 4.93
2.54 2.55 2.53 2.54 2.54 0.28 0.28 0.27 0.27 0.22 2.82 2.83 2.80 2.81 2.76 2.82 2.83 2.80 2.81 2.76 11.26 11.07 11.45 11.84 8.50
Class II 2014 2013 2012 2011 2010 2009(4)
34.06 31.36 27.02 25.66 28.79
1,399 2,549 2,532 3,010 4,429 41,077 81,305 93,712 117,326 153,824 7.76 0.12 1.67 0.33 4.93
4.59 4.60 4.58 4.59 4.59 0.48 0.49 0.49 0.50 0.37 5.07 5.09 5.07 5.09 4.96 5.07 5.09 5.07 5.09 4.96 10.19 10.60 10.87 11.10 8.03

– 52 –Annual Financial Statements as at December 31, 2014
Signature Select Canadian Segregated Fund
The accompanying notes are an integral part of these financial statements.
Concentration Risk (cont’d)
as at January 1, 2013 Categories Net Assets (%)Long Positions:Financials 27.8Energy 16.6Materials 10.0Consumer Staples 9.9Health Care 7.1Information Technology 5.4Industrials 5.4Exchange-Traded Funds 5.4Consumer Discretionary 3.9Short-Term Investments 3.9Telecommunication Services 2.2Cash & Equivalents 1.5Utilities 1.3Private Placements 0.2Other Net Assets (Liabilities) 0.2Foreign Currency Forward Contracts (0.2)Total Long Positions 100.6
Short Positions:Health Care (0.6)Total Short Positions (0.6)
Credit RiskThe Fund indirectly bears the credit risk exposure of the Underlying Fund. As at December 31, 2014, December 31, 2013 and January 1, 2013, the Underlying Fund was exposed to credit risk as some of its assets were invested in fixed income securities.
The Underlying Fund was invested in fixed income securities, preferred securities and derivative instruments, if any, with the following credit ratings, as per the tables below.
as at December 31, 2013 Credit Rating^ Net Assets (%) Not Rated 0.4Total 0.4
as at January 1, 2013 Credit Rating^ Net Assets (%)AA/Aa/A+ 3.5 Not Rated 1.0 Total 4.5
^ Credit ratings are obtained from Standard & Poor’s, where available, otherwise ratings are obtained from: Moody’s
Investors Service or Dominion Bond Rating Services, respectively.
Concentration RiskThe Signature Select Canadian Fund’s financial instruments were concentrated in the following segments:
as at December 31, 2014Categories Net Assets (%)Long Positions:Financials 28.6Cash & Equivalents 11.1Industrials 9.5Information Technology 8.8Consumer Staples 8.4Energy 7.8Consumer Discretionary 6.6Health Care 5.9Funds 3.5Warrants 3.4Materials 3.1Telecommunication Services 1.6Utilities 1.4Private Placements 0.8Foreign Currency Forward Contracts 0.2Total Long Positions 100.7
Short Positions:Financials (0.7)Total Short Positions (0.7)
as at December 31, 2013 Categories Net Assets (%)Financials 25.2Energy 15.1Health Care 10.8Consumer Staples 10.7Industrials 8.9Information Technology 6.4Funds 5.2Cash & Equivalents 5.1Materials 3.8Consumer Discretionary 3.5Warrants 3.0Utilities 1.9Telecommunication Services 0.7Private Placements 0.3Other Net Assets (Liabilities) (0.2)Foreign Currency Forward Contracts (0.4)
Fund Specific Notes to Financial Statements (audited)
Financial Instruments Risks (Note 9)

– 53 –Annual Financial Statements as at December 31, 2014
Signature Select Canadian Segregated Fund
The accompanying notes are an integral part of these financial statements.
Currency Risk (cont’d)
as at January 1, 2013 Currency Net Assets (%)US Dollar 22.7 Swiss Franc 3.3 Brazilian Real 0.8 Thai Baht 0.8 Euro 0.7 Japanese Yen 0.6 British Pound 0.6 Hong Kong Dollar 0.6 Mexican Peso 0.5 Swedish Krona 0.2 Australian Dollar 0.1 Indonesian Rupiah 0.1 Total 31.0
As at December 31, 2014, had the Canadian dollar strengthened or weakened by 10% (December 31, 2013 and January 1, 2013 - 10%) in relation to all other foreign currencies held in the Underlying Fund, with all other variables held constant, net assets attributable to contractholders of the Fund would have decreased or increased, respectively, by approximately $147,000 (December 31, 2013 - $156,000 and January 1, 2013 - $137,000). In practice, the actual results may differ from this analysis and the difference may be material.
Interest Rate RiskThe Fund indirectly bears the interest rate risk exposure of the Underlying Fund. As at December 31, 2014, December 31, 2013 and January 1, 2013, the Underlying Fund had insignificant exposure to interest rate risk as substantially all of its assets were invested in stocks.
Fair Value Hierarchy (Note 9)
The tables below summarize the inputs used by the Fund in valuing the Fund’s investments carried at fair value.
Long Positions at fair value as at December 31, 2014 Level 1 Level 2 Level 3 Total (in $000’s) (in $000’s) (in $000’s) (in $000’s)Underlying Fund 3,229 - - 3,229 Total 3,229 - - 3,229
Long Positions at fair value as at December 31, 2013 Level 1 Level 2 Level 3 Total (in $000’s) (in $000’s) (in $000’s) (in $000’s)Underlying Fund 4,582 - - 4,582Total 4,582 - - 4,582
There were no transfers between Level 1 and Level 2 during the years ended December 31, 2014 and 2013.
Long Positions at fair value as at January 1, 2013 Level 1 Level 2 Level 3 Total (in $000’s) (in $000’s) (in $000’s) (in $000’s)Underlying Fund 4,407 - - 4,407 Total 4,407 - - 4,407
Other Price Risk The Fund indirectly bears the other price risk exposure of the Underlying Fund. As at December 31, 2014, December 31, 2013 and January 1, 2013, the Underlying Fund’s holdings were sensitive to changes in general economic conditions in Canada. The Underlying Fund’s portfolio consisted of Canadian stocks and fixed income securities, thus an overall downturn in the Canadian economy may lead to a widening in credit spreads and a decrease in equity prices which would then lead to a decrease in the value of the Underlying Fund’s holdings.
As at December 31, 2014, had the Canadian markets increased or decreased by 10% (December 31, 2013 and January 1, 2013 - 10%), with all other variables held constant, net assets attributable to contractholders of the Fund would have increased or decreased, respectively, by approximately $323,000 (December 31, 2013 - $458,000 and January 1, 2013 - $441,000). In practice, actual results may differ from this analysis and the difference may be material.
Currency RiskThe Fund indirectly bears the currency risk exposure of the Underlying Fund. As at December 31, 2014, December 31, 2013 and January 1, 2013, the Underlying Fund was exposed to currency risk, as some of its investments were denominated in currencies other than Canadian dollars, the functional currency of the Fund and the Underlying Fund. As a result, the Fund was affected by fluctuations in the value of such currencies relative to the Canadian dollar.
The tables below summarize the Underlying Fund’s exposure to currency risk.
as at December 31, 2014Currency Net Assets (%)US Dollar 38.3 Japanese Yen 2.1 British Pound 1.5 Swiss Franc 1.3 Euro 1.0 Swedish Krona 1.0 Korean Won 0.2 Hong Kong Dollar 0.1 Total 45.5
as at December 31, 2013 Currency Net Assets (%)US Dollar 24.2 Swiss Franc 2.7 Japanese Yen 1.5 British Pound 1.5 Euro 1.0 Swedish Krona 0.8 Hong Kong Dollar 0.6 Thai Baht 0.5 Brazilian Real 0.4 Mexican Peso 0.4 Korean Won 0.2 South Africa Rand 0.2 Total 34.0
Fund Specific Notes to Financial Statements (audited)

– 54 –Annual Financial Statements as at December 31, 2014
Signature Canadian Balanced Segregated Fund
2014 2013
- - 94 70 452 199 498 200
(90) 644
- - 206 212 1,160 1,325
257 266 22 23 - - 8 8 287 297 - -
873 1,028
2.31 2.34 1.70 1.77
as at as at as at Dec. 31, 2014 Dec. 31, 2013 Jan. 1, 2013
8,318 9,647 9,892 38 28 26 - - - - - - - - - - 4 - - - - 8,356 9,679 9,918
- - - - - - - - 1 - - - - - - - - - - - 1 8,356 9,679 9,917
24.19 21.90 19.56 21.53 19.84 18.06
For inception date of the Fund, please refer to Note 1 in the Notes to the Financial Statements.The accompanying notes are an integral part of these financial statements.
Financial Statements (audited)
CIG - 137
Statements of Financial Position (in $000’s except for per unit amounts)
Statements of Comprehensive Income for the years ended December 31(in $000’s except for per unit amounts)
Assets Current assets Investments Cash Fees rebate receivable Dividends receivable Interest receivable Receivable for investments sold Receivable for unit subscriptions
Liabilities Current liabilities Bank overdraft Payable for investments purchased Payable for unit redemptions Management fees payable Administration fees payable Insurance fees payable
Net assets attributable to contractholders
Net assets attributable to contractholders per unit: Class IClass II
Income Net gain (loss) on investments Dividends Income distributions from investments Capital gain distributions from investments Net realized gain (loss) on sale of investments Change in unrealized appreciation (depreciation) in value of
investments Other income Interest Fees rebate (Note 7)
Expenses (Note 7) Management fees Administration fees Insurance fees Harmonized sales tax
Expenses absorbed by the manager Increase (decrease) in net assets from operations attributable to contractholders
Increase (decrease) in net assets from operations attributable to contractholders per unit: Class I Class II

– 55 –Annual Financial Statements as at December 31, 2014
Signature Canadian Balanced Segregated Fund
The accompanying notes are an integral part of these financial statements.
Financial Statements (audited)
2014 2013
9,679 9,917
873 1,028
228 349 (2,424) (1,615) (2,196) (1,266)
8,356 9,679
Net assets attributable to contractholders at the beginning of year Increase (decrease) in net assets from operations attributable to contractholders Unit transactions Proceeds from issuance of units Amounts paid on redemption of units
Net assets attributable to contractholders at the end of year
Statements of Changes in Net Assets Attributable to Contractholders for the years ended December 31 (in $000’s)
2014 2013
873 1,028
(498) (200)
90 (644) 2,383 1,499 (642) (414) - - - - - - - - - - - - 2,206 1,269
228 349 (2,424) (1,616) (2,196) (1,267)
10 2 28 26 38 28
- - - - - - - -
Statements of Cash Flows for the years ended December 31 (in $000’s)
Cash flows from (used in) operating activities Increase (decrease) in net assets from operations attributable to contractholders Adjustments for: Net realized (gain) loss on sale of investments Change in unrealized (appreciation) depreciation in value of
investments Proceeds from sale of investments Purchase of investments (Increase) decrease in dividends receivable (Increase) decrease in interest receivable Increase (decrease) in management fees payable Increase (decrease) in administration fees payable Increase (decrease) in insurance fees payable (Increase) decrease in fees rebate receivable Net cash from (used in) operating activities
Cash flows from (used in) financing activities Proceeds from issuances of unitsAmounts paid on redemption of unitsNet cash from (used in) financing activities
Net increase (decrease) in cashCash (bank overdraft), beginning of yearCash (bank overdraft), end of year
Supplementary Information: Dividends received, net of withholding taxInterest receivedInterest paidIncome taxes paid

– 56 –Annual Financial Statements as at December 31, 2014
Signature Canadian Balanced Segregated Fund
Schedule of Investment Portfolio as at December 31, 2014 (audited)
No. of Average Fair Units/Shares Investment Cost ($) Value ($)
484,992 Signature Canadian Balanced Fund (Class A)† 6,862,137 8,317,619 Total Investments (99.5%) 6,862,137 8,317,619 Other Net Assets (Liabilities) (0.5%) 38,276 Net Assets Attributable to Contractholders (100.0%) 8,355,895
Top 25 Holdings of Underlying Fund (unaudited)
No. of Average Fair Units/Shares Investment Cost ($) Value ($)
Cash & Equivalents 228,065,474 1,392,742 Toronto-Dominion Bank 55,505,754 77,311,108 1,142,260 The Bank of Nova Scotia 68,472,261 75,743,261 936,700 Royal Bank of Canada 62,655,509 75,160,808 5,957,748 Signature Cash Management Fund (Class C) 59,577,478 59,577,478 1,464,731 JPMorgan Chase & Co., Warrants (28Oct18) 19,278,735 35,391,484 431,400 Canadian National Railway Co. 19,154,686 34,520,628 27,161,000 Government of Canada 1.5% 02/01/2017 27,420,609 27,432,780 24,355,000 Province of Ontario 4.2% 06/02/2020 27,023,686 27,201,392 1,182,200 UBS Group AG 23,056,469 23,603,119 419,660 Alimentation Couche-Tard Inc., Class B 5,309,438 20,433,245 157,100 Apple Inc. 12,674,561 20,143,927 343,550 Brookfield Asset Management Inc., Class A 9,630,709 20,001,481 223,000 NXP Semiconductor N.V. 11,467,122 19,791,367 313,400 Citigroup Inc. 14,613,164 19,699,449 18,485,000 Province of Ontario 2.1% 09/08/2018 18,715,142 18,851,462 442,250 Intel Corp. 10,320,295 18,643,711 299,950 Enbridge Inc. 14,911,429 17,919,013 14,584,000 Province of Quebec 4.25% 12/01/2021 16,105,994 16,475,500 148,350 Novartis AG, Registered Shares 9,293,374 16,005,190 621,900 BHP Billiton PLC 20,678,679 15,635,899 487,220 Power Corp. of Canada 14,685,479 15,474,107 14,185,000 Province of Ontario 4.2% 03/08/2018 15,527,541 15,383,783 13,482,000 Province of Quebec 4.5% 12/01/2019 15,094,151 15,172,367 185,050 KLA-Tencor Corp. 9,596,661 15,116,300
† The Underlying Fund is also managed by CI Investments Inc., the Manager of the Fund. Percentages shown in brackets in the Schedule of Investment Portfolio relate investments at fair value to net assets attributable to contractholders of the Fund. The accompanying notes are an integral part of these financial statements.

– 57 –Annual Financial Statements as at December 31, 2014
Signature Canadian Balanced Segregated Fund
The accompanying notes are an integral part of these financial statements.
Fund Specific Notes to Financial Statements (audited)
Interest in Underlying Fund (Note 3)
The following tables present the Fund’s interest in the Underlying Fund.
as at December 31, 2014 Fair Value of Fair Value of the Fund’s Investment Ownership in the the Underlying Fund in the Underlying Fund Underlying FundUnderlying Fund (in $000’s) (in $000’s) (%) 1,945,615 8,318 0.4
as at December 31, 2013 Fair Value of Fair Value of the Fund’s Investment Ownership in the the Underlying Fund in the Underlying Fund Underlying FundUnderlying Fund (in $000’s) (in $000’s) (%) 1,919,928 9,647 0.5
as at January 1, 2013 Fair Value of Fair Value of the Fund’s Investment Ownership in the the Underlying Fund in the Underlying Fund Underlying FundUnderlying Fund (in $000’s) (in $000’s) (%) 1,924,068 9,892 0.5
Signature Canadian Balanced Fund
Signature Canadian Balanced Fund
Signature Canadian Balanced Fund

– 58 –Annual Financial Statements as at December 31, 2014
Signature Canadian Balanced Segregated Fund
Unit Transactions (Note 6)for the years ended December 31
Number of units at the beginning of yearUnits issued for cashUnits redeemed Number of units at the end of year
For inception date of the Fund, please refer to Note 1 in the Notes to the Financial Statements.The accompanying notes are an integral part of these financial statements.
Class I Class II 2014 2013 2014 2013 285,884 325,526 172,273 196,516 7,684 14,235 2,255 2,713 (79,433) (53,877) (27,001) (26,956) 214,135 285,884 147,527 172,273
Reconciliation of Equity as previously reported under Canadian GAAP to IFRS (Note 10) (in $000’s)
EquityEquity as reported under Canadian GAAPRevaluation of investments at FVTPLNet assets attributable to contractholders
as at as at Dec. 31, 2013 Jan. 1, 2013
9,679 9,917 - - 9,679 9,917
Reconciliation of Comprehensive Income as previously reported under Canadian GAAP to IFRS (Note 10) (in $000’s)
Comprehensive IncomeComprehensive income as reported under Canadian GAAPRevaluation of investments at FVTPLIncrease (decrease) in net assets from operations attributable to contractholders
for the year ended Dec. 31, 2013
1,028 - 1,028
Fund Specific Notes to Financial Statements (audited)

– 59 –Annual Financial Statements as at December 31, 2014
Signature Canadian Balanced Segregated Fund
For inception date of the Fund, please refer to Note 1 in the Notes to the Financial Statements.The accompanying notes are an integral part of these financial statements.
Financial Information (for the years ended December 31) (unaudited)
(1) This information is provided as at December 31, of the years shown.(2) The Fund’s portfolio turnover rate indicates how actively the Fund’s portfolio advisor manages its portfolio investments. A portfolio turnover rate of 100% is equivalent to the Fund buying and selling all of the securities in its portfolio once in the
course of the year. The higher a fund’s portfolio turnover rate in a year, the greater the trading costs payable by the fund in the year, and the greater the chance of an contractholder receiving taxable capital gains in the year. There is not necessarily
a relationship between a high turnover rate and the performance of a fund.(3) Management expense information is calculated based on expenses charged directly to the Fund plus, if applicable, expenses of the underlying fund, excluding commissions and brokerage fees, calculated on a weighted average basis on the percentage
weighting of the underlying fund and is expressed as an annualized percentage of average net asset value for the years shown. As of July 1, 2010, Ontario combined the federal goods and services tax (“GST” - 5%) with the provincial retail sales tax
(“PST” - 8%). The combination resulted in a Harmonized sales tax (“HST”) rate of 13%. The Effective HST tax rate is calculated using the attribution percentage for each province based on contractholders residency and can be different from 13%. For any
particular year, the rate shown will be prorated based on the different rates in effect during that year. For the year ended December 31, 2010 the rate applied is 5% for the period January 1, 2010 to June 30, 2010 and the Fund’s Effective HST rate for the period
starting July 1, 2010. The rate shown for the year ended December 31, 2010 is the time weighted average of these rates.(4) For financial years before January 1, 2013, the financial highlights are derived from the financial statements prepared in accordance with Canadian GAAP applicable to public enterprises. For financial years beginning on or after January 1, 2013,
the financial highlights are derived from the financial statements prepared in accordance with IFRS.
Financial HighlightsThe following tables show selected key financial information about the Fund and are intended to help you understand the Fund’s financial performance for the past five years, as applicable.
The Fund’s Net Asset Value per UnitNet assets value per unit at December 31, of the year shown ($) (1)
Ratios and Supplemental Data Net assets attributable to contractholders ($000’s) (1)
Number of units outstanding (1)
Portfolio turnover rate (%) (2)
Management Expense Ratio Management expense ratio before taxes (%) (3)
Harmonized sales tax/Goods and services tax (%) (3)
Management expense ratio after taxes (%) (3)
Management expense ratio before waivers or absorptions (%) (3)
Effective HST/GST rate for the year (%) (3)
The Fund’s Net Asset Value per UnitNet assets value per unit at December 31, of the year shown ($) (1)
Ratios and Supplemental Data Net assets attributable to contractholders ($000’s) (1)
Number of units outstanding (1)
Portfolio turnover rate (%) (2)
Management Expense Ratio Management expense ratio before taxes (%) (3)
Harmonized sales tax/Goods and services tax (%) (3)
Management expense ratio after taxes (%) (3)
Management expense ratio before waivers or absorptions (%) (3)
Effective HST/GST rate for the year (%) (3)
Class I 2014 2013 2012 2011 2010 2009(4)
24.19 21.90 19.56 18.42 19.14
5,180 6,260 6,368 6,573 8,600 214,135 285,884 325,526 356,791 449,322 6.87 4.30 2.05 4.85 9.44
2.39 2.39 2.38 2.39 2.39 0.25 0.25 0.24 0.24 0.20 2.64 2.64 2.62 2.63 2.59 2.64 2.64 2.62 2.63 2.59 10.55 10.77 11.15 10.98 7.96
Class II 2014 2013 2012 2011 2010 2009(4)
21.53 19.84 18.06 17.32 18.33
3,176 3,419 3,549 4,107 5,267 147,527 172,273 196,516 237,157 287,324 6.87 4.30 2.05 4.85 9.44
4.04 4.04 4.03 4.04 4.04 0.43 0.44 0.43 0.42 0.33 4.47 4.48 4.46 4.46 4.37 4.47 4.48 4.46 4.46 4.37 10.72 11.14 11.13 10.93 8.04

– 60 –Annual Financial Statements as at December 31, 2014
Signature Canadian Balanced Segregated Fund
The accompanying notes are an integral part of these financial statements.
Concentration Risk (cont’d)
as at January 1, 2013 Categories Net Assets (%)Long Positions:Financials 18.9Corporate Bonds 15.8Energy 10.6Canadian Government Bonds 7.6Materials 7.0Consumer Staples 6.9Provincial Bonds 6.8Health Care 4.7Information Technology 4.0Industrials 3.6Exchange-Traded Funds 3.6Consumer Discretionary 2.7Foreign Government Bonds 2.5Telecommunication Services 1.4Cash & Equivalents 1.1Short-Term Investments 0.9Municipal Bonds 0.9Utilities 0.9Asset Backed Securities 0.4Other Net Assets (Liabilities) 0.2Private Placements 0.1Foreign Currency Forward Contracts (0.2)Total Long Positions 100.4
Short Positions:Health Care (0.4)Total Short Positions (0.4)
Credit RiskThe Fund indirectly bears the credit risk exposure of the Underlying Fund. As at December 31, 2014, December 31, 2013 and January 1, 2013, the Underlying Fund was exposed to credit risk as some of its assets were invested in fixed income securities.
The Underlying Fund was invested in fixed income securities, preferred securities and derivative instruments, if any, with the following credit ratings, as per the tables below.
as at December 31, 2014Credit Rating^ Net Assets (%)AAA/Aaa/A++ 8.2 AA/Aa/A+ 6.3 A 8.4 BBB/Baa/B++ 7.5 BB/Ba/B+ 0.7 Not Rated 0.3 Total 31.4
Concentration RiskThe Signature Canadian Balanced Fund’s financial instruments were concentrated in the following segments:
as at December 31, 2014Categories Net Assets (%)Long Positions:Financials 18.5Corporate Bonds 13.7Cash & Equivalents 11.7Provincial Bonds 10.2Industrials 5.8Information Technology 5.7Consumer Staples 5.5Canadian Government Bonds 5.5Consumer Discretionary 4.2Energy 4.2Health Care 3.8Funds 3.1Warrants 2.4Materials 2.0Telecommunication Services 1.0Utilities 0.9Foreign Government Bonds 0.6Municipal Bonds 0.6Private Placements 0.5Asset Backed Securities 0.3Other Net Assets (Liabilities) 0.2Foreign Currency Forward Contracts 0.1Total Long Positions 100.5
Short Positions:Financials (0.5)Total Short Positions (0.5)
as at December 31, 2013 Categories Net Assets (%)Financials 17.7Corporate Bonds 14.4Energy 9.1Health Care 8.2Consumer Staples 8.1Canadian Government Bonds 6.6Industrials 6.0Provincial Bonds 6.0Cash & Equivalents 5.1Information Technology 4.5Funds 3.2Materials 2.7Consumer Discretionary 2.6Warrants 2.1Utilities 1.3Foreign Government Bonds 1.3Municipal Bonds 0.5Telecommunication Services 0.5Asset Backed Securities 0.3Private Placements 0.2Other Net Assets (Liabilities) (0.1)Foreign Currency Forward Contracts (0.3)
Fund Specific Notes to Financial Statements (audited)
Financial Instruments Risks (Note 9)

– 61 –Annual Financial Statements as at December 31, 2014
Signature Canadian Balanced Segregated Fund
The accompanying notes are an integral part of these financial statements.
Currency Risk (cont’d)
The tables below summarize the Underlying Fund’s exposure to currency risk.
as at December 31, 2014Currency Net Assets (%)US Dollar 29.6 Japanese Yen 1.3 British Pound 0.9 Swiss Franc 0.9 Swedish Krona 0.7 Euro 0.6 Hong Kong Dollar 0.1 Korean Won 0.1 New Zealand Dollar 0.1 Total 34.3
as at December 31, 2013 Currency Net Assets (%)US Dollar 18.8 Swiss Franc 2.3 Japanese Yen 1.2 British Pound 1.1 Euro 0.7 Swedish Krona 0.6 Hong Kong Dollar 0.4 Mexican Peso 0.4 Thai Baht 0.4 Brazilian Real 0.3 Korean Won 0.2 South Africa Rand 0.1 New Zealand Dollar 0.1 Total 26.6
as at January 1, 2013 Currency Net Assets (%)US Dollar 16.5 Swiss Franc 2.3 Euro 0.6 Brazilian Real 0.5 Thai Baht 0.5 Japanese Yen 0.4 British Pound 0.4 Hong Kong Dollar 0.4 Mexican Peso 0.4 Australian Dollar 0.1 Swedish Krona 0.1 New Zealand Dollar 0.1 Indonesian Rupiah 0.1Total 22.4
Credit Risk (cont’d)
as at December 31, 2013 Credit Rating^ Net Assets (%)AAA/Aaa/A++ 9.1 AA/Aa/A+ 4.4 A 6.6 BBB/Baa/B++ 7.2 BB/Ba/B+ 0.9 B 0.1 CCC/Caa/C++ 0.1 Not Rated 1.2 Total 29.6
as at January 1, 2013 Credit Rating^ Net Assets (%)AAA/Aaa/A++ 10.4 AA/Aa/A+ 4.7 A 8.8 BBB/Baa/B++ 8.4 BB/Ba/B+ 0.8 Not Rated 2.2Total 35.3
^ Credit ratings are obtained from Standard & Poor’s, where available, otherwise ratings are obtained from: Moody’s
Investors Service or Dominion Bond Rating Services, respectively.
Other Price Risk The Fund indirectly bears the other price risk exposure of the Underlying Fund. As at December 31, 2014, December 31, 2013 and January 1, 2013, the Underlying Fund’s holdings were sensitive to changes in general economic conditions in Canada. The Underlying Fund’s portfolio consisted of Canadian stocks and fixed income securities, thus an overall downturn in the Canadian economy may lead to a widening in credit spreads and a decrease in equity prices which would then lead to a decrease in the value of the Underlying Fund’s holdings.
As at December 31, 2014, had the Canadian markets increased or decreased by 10% (December 31, 2013 and January 1, 2013 - 10%), with all other variables held constant, net assets attributable to contractholders of the Fund would have increased or decreased, respectively, by approximately $478,000 (December 31, 2013 - $635,000 and January 1, 2013 - $634,000). In practice, actual results may differ from this analysis and the difference may be material.
Currency RiskThe Fund indirectly bears the currency risk exposure of the Underlying Fund. As at December 31, 2014, December 31, 2013 and January 1, 2013, the Underlying Fund was exposed to currency risk, as some of its investments were denominated in currencies other than Canadian dollars, the functional currency of the Fund and the Underlying Fund. As a result, the Fund was affected by fluctuations in the value of such currencies relative to the Canadian dollar.
Fund Specific Notes to Financial Statements (audited)
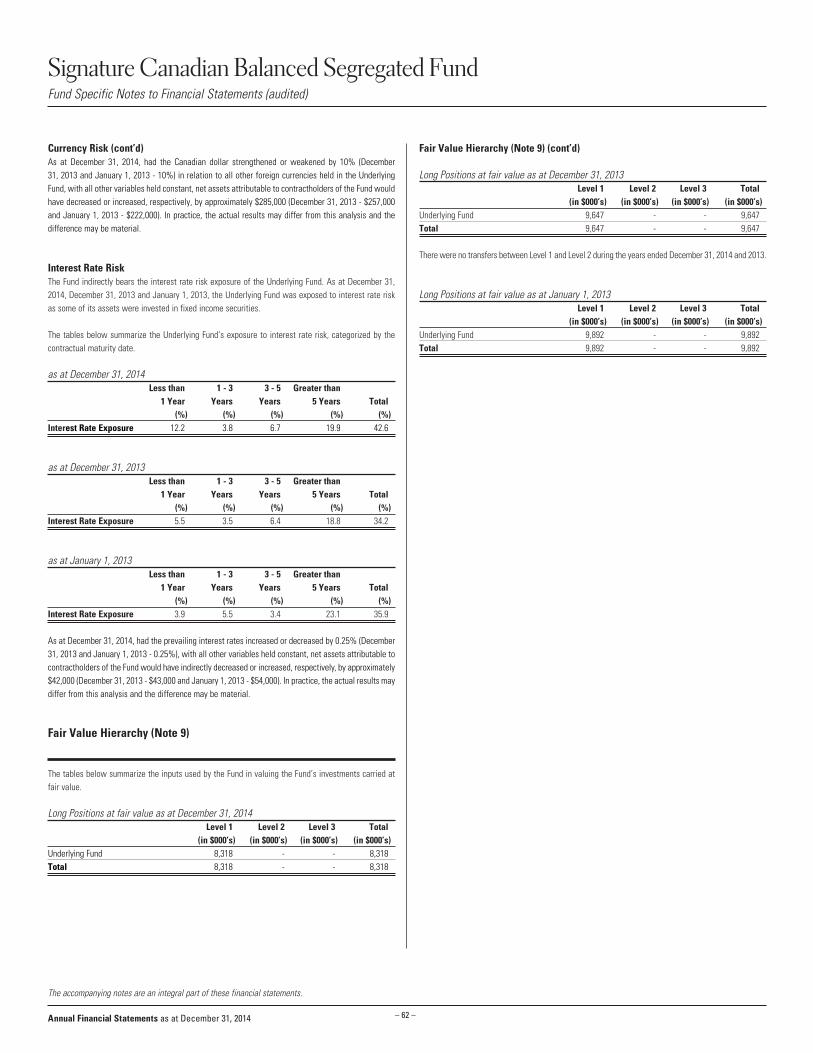
– 62 –Annual Financial Statements as at December 31, 2014
Signature Canadian Balanced Segregated Fund
The accompanying notes are an integral part of these financial statements.
Fair Value Hierarchy (Note 9) (cont’d)
Long Positions at fair value as at December 31, 2013 Level 1 Level 2 Level 3 Total (in $000’s) (in $000’s) (in $000’s) (in $000’s)Underlying Fund 9,647 - - 9,647Total 9,647 - - 9,647
There were no transfers between Level 1 and Level 2 during the years ended December 31, 2014 and 2013.
Long Positions at fair value as at January 1, 2013 Level 1 Level 2 Level 3 Total (in $000’s) (in $000’s) (in $000’s) (in $000’s)Underlying Fund 9,892 - - 9,892 Total 9,892 - - 9,892
Currency Risk (cont’d)As at December 31, 2014, had the Canadian dollar strengthened or weakened by 10% (December 31, 2013 and January 1, 2013 - 10%) in relation to all other foreign currencies held in the Underlying Fund, with all other variables held constant, net assets attributable to contractholders of the Fund would have decreased or increased, respectively, by approximately $285,000 (December 31, 2013 - $257,000 and January 1, 2013 - $222,000). In practice, the actual results may differ from this analysis and the difference may be material.
Interest Rate RiskThe Fund indirectly bears the interest rate risk exposure of the Underlying Fund. As at December 31, 2014, December 31, 2013 and January 1, 2013, the Underlying Fund was exposed to interest rate risk as some of its assets were invested in fixed income securities.
The tables below summarize the Underlying Fund’s exposure to interest rate risk, categorized by the contractual maturity date.
as at December 31, 2014 Less than 1 - 3 3 - 5 Greater than 1 Year Years Years 5 Years Total (%) (%) (%) (%) (%)Interest Rate Exposure 12.2 3.8 6.7 19.9 42.6
as at December 31, 2013 Less than 1 - 3 3 - 5 Greater than 1 Year Years Years 5 Years Total (%) (%) (%) (%) (%)Interest Rate Exposure 5.5 3.5 6.4 18.8 34.2
as at January 1, 2013 Less than 1 - 3 3 - 5 Greater than 1 Year Years Years 5 Years Total (%) (%) (%) (%) (%)Interest Rate Exposure 3.9 5.5 3.4 23.1 35.9
As at December 31, 2014, had the prevailing interest rates increased or decreased by 0.25% (December 31, 2013 and January 1, 2013 - 0.25%), with all other variables held constant, net assets attributable to contractholders of the Fund would have indirectly decreased or increased, respectively, by approximately $42,000 (December 31, 2013 - $43,000 and January 1, 2013 - $54,000). In practice, the actual results may differ from this analysis and the difference may be material.
Fair Value Hierarchy (Note 9)
The tables below summarize the inputs used by the Fund in valuing the Fund’s investments carried at fair value.
Long Positions at fair value as at December 31, 2014 Level 1 Level 2 Level 3 Total (in $000’s) (in $000’s) (in $000’s) (in $000’s)Underlying Fund 8,318 - - 8,318 Total 8,318 - - 8,318
Fund Specific Notes to Financial Statements (audited)

– 63 –Annual Financial Statements as at December 31, 2014
CI Money Market Segregated Fund
2014 2013
- - 10 14 - - - -
- -
1 1 16 17 27 32
17 20 1 1 6 9 1 1 25 31 - -
2 1
0.04 0.05 (0.03) (0.03)
as at as at as at Dec. 31, 2014 Dec. 31, 2013 Jan. 1, 2013
1,816 2,483 2,416 2 7 3 - - - - - - - 2 2 - - - - - 8 1,818 2,492 2,429
- - - - 2 2 - - 8 - - - - - - - - - - 2 10 1,818 2,490 2,419
13.10 13.06 13.01 12.57 12.59 12.63
For inception date of the Fund, please refer to Note 1 in the Notes to the Financial Statements.The accompanying notes are an integral part of these financial statements.
Financial Statements (audited)
CIG - 142
Statements of Financial Position (in $000’s except for per unit amounts)
Statements of Comprehensive Income for the years ended December 31(in $000’s except for per unit amounts)
Assets Current assets Investments Cash Fees rebate receivable Dividends receivable Interest receivable Receivable for investments sold Receivable for unit subscriptions
Liabilities Current liabilities Bank overdraft Payable for investments purchased Payable for unit redemptions Management fees payable Administration fees payable Insurance fees payable
Net assets attributable to contractholders
Net assets attributable to contractholders per unit: Class IClass II
Income Net gain (loss) on investments Dividends Income distributions from investments Capital gain distributions from investments Net realized gain (loss) on sale of investments Change in unrealized appreciation (depreciation) in value of
investments Other income Interest Fees rebate (Note 7)
Expenses (Note 7)Management fees Administration fees Insurance fees Harmonized sales tax
Expenses absorbed by the manager Increase (decrease) in net assets from operations attributable to contractholders
Increase (decrease) in net assets from operations attributable to contractholders per unit: Class I Class II

– 64 –Annual Financial Statements as at December 31, 2014
CI Money Market Segregated Fund
The accompanying notes are an integral part of these financial statements.
Financial Statements (audited)
2014 2013
2,490 2,419
2 1
4,504 2,577 (5,178) (2,507) (674) 70
1,818 2,490
Net assets attributable to contractholders at the beginning of year Increase (decrease) in net assets from operations attributable to contractholders Unit transactions Proceeds from issuance of units Amounts paid on redemption of units
Net assets attributable to contractholders at the end of year
Statements of Changes in Net Assets Attributable to Contractholders for the years ended December 31 (in $000’s)
2014 2013
2 1
- -
- - 4,775 2,295 (4,110) (2,362) - - 2 - - - - - - - - - 669 (66)
4,504 2,585 (5,178) (2,515) (674) 70
(5) 4 7 3 2 7
- - 1 1 - - - -
Statements of Cash Flows for the years ended December 31 (in $000’s)
Cash flows from (used in) operating activities Increase (decrease) in net assets from operations attributable to contractholders Adjustments for: Net realized (gain) loss on sale of investments Change in unrealized (appreciation) depreciation in value of
investments Proceeds from sale of investments Purchase of investments (Increase) decrease in dividends receivable (Increase) decrease in interest receivable Increase (decrease) in management fees payable Increase (decrease) in administration fees payable Increase (decrease) in insurance fees payable (Increase) decrease in fees rebate receivable Net cash from (used in) operating activities
Cash flows from (used in) financing activities Proceeds from issuances of unitsAmounts paid on redemption of unitsNet cash from (used in) financing activities
Net increase (decrease) in cashCash (bank overdraft), beginning of yearCash (bank overdraft), end of year
Supplementary Information: Dividends received, net of withholding taxInterest receivedInterest paidIncome taxes paid

– 65 –Annual Financial Statements as at December 31, 2014
CI Money Market Segregated Fund
Schedule of Investment Portfolio as at December 31, 2014 (audited)
No. of Average Fair Units/Shares Investment Cost ($) Value ($)
181,635 CI Money Market Fund (Class A)† 1,816,351 1,816,351 Total Investments (99.9%) 1,816,351 1,816,351 Other Net Assets (Liabilities) (0.1%) 1,773 Net Assets Attributable to Contractholders (100.0%) 1,818,124
Top 25 Holdings of Underlying Fund (unaudited)
No. of Average Fair Units/Shares Investment Cost ($) Value ($)
Cash & Equivalents 127,740,767 45,000,000 Province of Ontario 0.97841% 02/18/2015 44,896,500 44,943,200 40,580,000 Hydro-Quebec, FRN, 1.389% 02/11/2015 40,674,146 40,591,561 40,393,000 Laurentian Bank of Canada 1.00134% 01/06/2015 40,385,200 40,388,600 32,370,000 Province of New Brunswick, FRN, 1.32% 02/22/2016 32,456,104 32,429,098 28,700,000 National Bank of Canada 1.54% 06/23/2016 28,704,754 28,703,809 27,960,000 Toronto-Dominion Bank 1.473% 04/21/2016 27,960,000 27,960,000 24,005,000 Royal Bank of Canada 3.18% 03/16/2015 24,250,185 24,096,948 24,107,000 HSBC Bank Canada 1.22021% 03/02/2015 24,037,100 24,059,500 24,064,000 Province of Quebec 0.98783% 02/06/2015 24,020,400 24,041,200 20,705,000 Canadian Treasury Bill 0.91112% 04/09/2015 20,641,200 20,655,500 20,290,000 The Bank of Nova Scotia 2.25% 05/08/2015 20,456,936 20,349,909 20,089,000 Canadian Treasury Bill 0.89014% 03/12/2015 20,039,200 20,054,800 20,038,000 Canadian Treasury Bill 0.92363% 01/08/2015 20,026,800 20,034,800 19,900,000 Canadian Imperial Bank of Commerce 3.1% 03/02/2015 20,182,955 19,958,190 18,510,000 HSBC Bank Canada 3.86% 05/21/2015 18,955,867 18,677,533 16,230,000 Bank of Montreal 3.93% 04/27/2015 16,636,870 16,356,605 16,230,000 Enbridge Inc., FRN, 2.28% 08/19/2015 16,299,468 16,247,462 16,045,000 Royal Bank of Canada 1.19008% 01/26/2015 16,014,200 16,032,400 16,009,000 Bank of Montreal 1.18748% 01/12/2015 15,992,400 16,003,800 16,000,000 Province of Alberta 0.96802% 01/27/2015 15,965,300 15,989,400 15,925,000 Bank of Montreal 1.89% 10/05/2015 15,999,688 15,980,370 14,400,000 The Bank of Nova Scotia, FRN, 1.64% 09/18/2015 14,432,251 14,414,924 13,993,000 Province of Saskatchewan 0.97118% 02/12/2015 13,969,200 13,977,800 13,070,000 Province of Manitoba, FRN, 1.508% 05/04/2015 13,102,675 13,090,885
† The Underlying Fund is also managed by CI Investments Inc., the Manager of the Fund. Percentages shown in brackets in the Schedule of Investment Portfolio relate investments at fair value to net assets attributable to contractholders of the Fund. The accompanying notes are an integral part of these financial statements.

– 66 –Annual Financial Statements as at December 31, 2014
CI Money Market Segregated Fund
The accompanying notes are an integral part of these financial statements.
Fund Specific Notes to Financial Statements (audited)
Interest in Underlying Fund (Note 3)
The following tables present the Fund’s interest in the Underlying Fund.
as at December 31, 2014 Fair Value of Fair Value of the Fund’s Investment Ownership in the the Underlying Fund in the Underlying Fund Underlying FundUnderlying Fund (in $000’s) (in $000’s) (%) 850,084 1,816 0.2
as at December 31, 2013 Fair Value of Fair Value of the Fund’s Investment Ownership in the the Underlying Fund in the Underlying Fund Underlying FundUnderlying Fund (in $000’s) (in $000’s) (%) 925,189 2,483 0.3
as at January 1, 2013 Fair Value of Fair Value of the Fund’s Investment Ownership in the the Underlying Fund in the Underlying Fund Underlying FundUnderlying Fund (in $000’s) (in $000’s) (%) 1,080,025 2,416 0.2
CI Money Market Fund
CI Money Market Fund
CI Money Market Fund

– 67 –Annual Financial Statements as at December 31, 2014
CI Money Market Segregated Fund
Unit Transactions (Note 6)for the years ended December 31
Number of units at the beginning of yearUnits issued for cashUnits redeemed Number of units at the end of year
For inception date of the Fund, please refer to Note 1 in the Notes to the Financial Statements.The accompanying notes are an integral part of these financial statements.
Class I Class II 2014 2013 2014 2013 106,719 81,960 87,014 107,080 215,039 128,582 134,392 71,410 (248,503) (103,823) (153,090) (91,476) 73,255 106,719 68,316 87,014
Reconciliation of Equity as previously reported under Canadian GAAP to IFRS (Note 10) (in $000’s)
EquityEquity as reported under Canadian GAAPRevaluation of investments at FVTPLNet assets attributable to contractholders
as at as at Dec. 31, 2013 Jan. 1, 2013
2,490 2,419 - - 2,490 2,419
Reconciliation of Comprehensive Income as previously reported under Canadian GAAP to IFRS (Note 10) (in $000’s)
Comprehensive IncomeComprehensive income as reported under Canadian GAAPRevaluation of investments at FVTPLIncrease (decrease) in net assets from operations attributable to contractholders
for the year ended Dec. 31, 2013
1 - 1
Fund Specific Notes to Financial Statements (audited)

– 68 –Annual Financial Statements as at December 31, 2014
CI Money Market Segregated Fund
For inception date of the Fund, please refer to Note 1 in the Notes to the Financial Statements.The accompanying notes are an integral part of these financial statements.
Financial Information (for the years ended December 31) (unaudited)
(1) This information is provided as at December 31, of the years shown.(2) The Fund’s portfolio turnover rate indicates how actively the Fund’s portfolio advisor manages its portfolio investments. A portfolio turnover rate of 100% is equivalent to the Fund buying and selling all of the securities in its portfolio once in the
course of the year. The higher a fund’s portfolio turnover rate in a year, the greater the trading costs payable by the fund in the year, and the greater the chance of an contractholder receiving taxable capital gains in the year. There is not necessarily
a relationship between a high turnover rate and the performance of a fund.(3) Management expense information is calculated based on expenses charged directly to the Fund plus, if applicable, expenses of the underlying fund, excluding commissions and brokerage fees, calculated on a weighted average basis on the percentage
weighting of the underlying fund and is expressed as an annualized percentage of average net asset value for the years shown. As of July 1, 2010, Ontario combined the federal goods and services tax (“GST” - 5%) with the provincial retail sales tax
(“PST” - 8%). The combination resulted in a Harmonized sales tax (“HST”) rate of 13%. The Effective HST tax rate is calculated using the attribution percentage for each province based on contractholders residency and can be different from 13%. For any
particular year, the rate shown will be prorated based on the different rates in effect during that year. For the year ended December 31, 2010 the rate applied is 5% for the period January 1, 2010 to June 30, 2010 and the Fund’s Effective HST rate for the period
starting July 1, 2010. The rate shown for the year ended December 31, 2010 is the time weighted average of these rates.(4) For financial years before January 1, 2013, the financial highlights are derived from the financial statements prepared in accordance with Canadian GAAP applicable to public enterprises. For financial years beginning on or after January 1, 2013,
the financial highlights are derived from the financial statements prepared in accordance with IFRS.
Financial HighlightsThe following tables show selected key financial information about the Fund and are intended to help you understand the Fund’s financial performance for the past five years, as applicable.
The Fund’s Net Asset Value per UnitNet assets value per unit at December 31, of the year shown ($) (1)
Ratios and Supplemental Data Net assets attributable to contractholders ($000’s) (1)
Number of units outstanding (1)
Portfolio turnover rate (%) (2)
Management Expense Ratio Management expense ratio before taxes (%) (3)
Harmonized sales tax/Goods and services tax (%) (3)
Management expense ratio after taxes (%) (3)
Management expense ratio before waivers or absorptions (%) (3)
Effective HST/GST rate for the year (%) (3)
The Fund’s Net Asset Value per UnitNet assets value per unit at December 31, of the year shown ($) (1)
Ratios and Supplemental Data Net assets attributable to contractholders ($000’s) (1)
Number of units outstanding (1)
Portfolio turnover rate (%) (2)
Management Expense Ratio Management expense ratio before taxes (%) (3)
Harmonized sales tax/Goods and services tax (%) (3)
Management expense ratio after taxes (%) (3)
Management expense ratio before waivers or absorptions (%) (3)
Effective HST/GST rate for the year (%) (3)
Class I 2014 2013 2012 2011 2010 2009(4)
13.10 13.06 13.01 12.94 12.86
960 1,394 1,066 1,590 1,923 73,255 106,719 81,960 122,928 149,458 191.55 90.74 87.37 107.13 2.17
0.89 0.89 0.89 0.89 0.89 0.09 0.10 0.09 0.09 0.07 0.98 0.99 0.98 0.98 0.96 0.98 0.99 0.98 0.98 0.96 11.60 11.52 10.29 10.42 7.60
Class II 2014 2013 2012 2011 2010 2009(4)
12.57 12.59 12.63 12.64 12.65
858 1,096 1,353 2,086 2,504 68,316 87,014 107,080 165,030 197,988 191.55 90.74 87.37 107.13 2.17
1.37 1.48 1.48 1.48 1.48 0.15 0.16 0.15 0.15 0.12 1.52 1.64 1.63 1.63 1.60 1.52 1.64 1.63 1.63 1.60 11.24 10.58 10.75 10.69 7.98
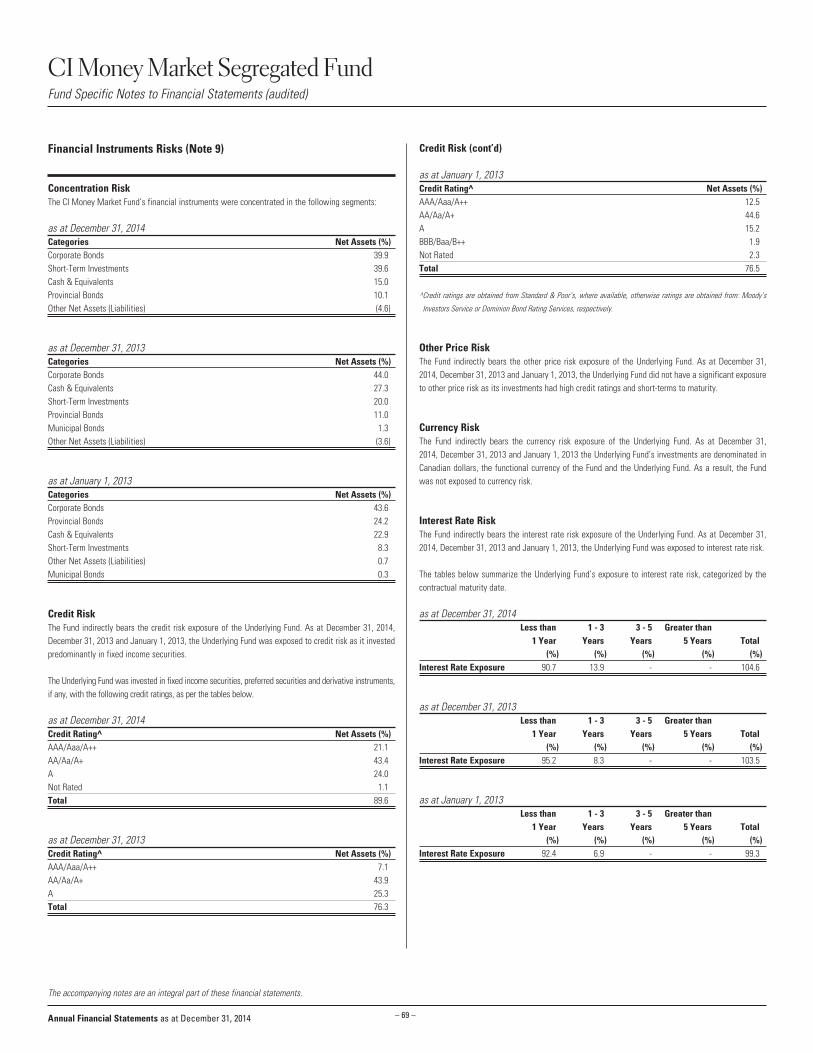
– 69 –Annual Financial Statements as at December 31, 2014
CI Money Market Segregated Fund
The accompanying notes are an integral part of these financial statements.
Credit Risk (cont’d)
as at January 1, 2013 Credit Rating^ Net Assets (%)AAA/Aaa/A++ 12.5 AA/Aa/A+ 44.6 A 15.2 BBB/Baa/B++ 1.9 Not Rated 2.3Total 76.5
^ Credit ratings are obtained from Standard & Poor’s, where available, otherwise ratings are obtained from: Moody’s
Investors Service or Dominion Bond Rating Services, respectively.
Other Price Risk The Fund indirectly bears the other price risk exposure of the Underlying Fund. As at December 31, 2014, December 31, 2013 and January 1, 2013, the Underlying Fund did not have a significant exposure to other price risk as its investments had high credit ratings and short-terms to maturity.
Currency RiskThe Fund indirectly bears the currency risk exposure of the Underlying Fund. As at December 31, 2014, December 31, 2013 and January 1, 2013 the Underlying Fund’s investments are denominated in Canadian dollars, the functional currency of the Fund and the Underlying Fund. As a result, the Fund was not exposed to currency risk.
Interest Rate RiskThe Fund indirectly bears the interest rate risk exposure of the Underlying Fund. As at December 31, 2014, December 31, 2013 and January 1, 2013, the Underlying Fund was exposed to interest rate risk.
The tables below summarize the Underlying Fund’s exposure to interest rate risk, categorized by the contractual maturity date.
as at December 31, 2014 Less than 1 - 3 3 - 5 Greater than 1 Year Years Years 5 Years Total (%) (%) (%) (%) (%)Interest Rate Exposure 90.7 13.9 - - 104.6
as at December 31, 2013 Less than 1 - 3 3 - 5 Greater than 1 Year Years Years 5 Years Total (%) (%) (%) (%) (%)Interest Rate Exposure 95.2 8.3 - - 103.5
as at January 1, 2013 Less than 1 - 3 3 - 5 Greater than 1 Year Years Years 5 Years Total (%) (%) (%) (%) (%)Interest Rate Exposure 92.4 6.9 - - 99.3
Concentration RiskThe CI Money Market Fund’s financial instruments were concentrated in the following segments:
as at December 31, 2014Categories Net Assets (%)Corporate Bonds 39.9Short-Term Investments 39.6Cash & Equivalents 15.0Provincial Bonds 10.1Other Net Assets (Liabilities) (4.6)
as at December 31, 2013 Categories Net Assets (%)Corporate Bonds 44.0Cash & Equivalents 27.3Short-Term Investments 20.0Provincial Bonds 11.0Municipal Bonds 1.3Other Net Assets (Liabilities) (3.6)
as at January 1, 2013 Categories Net Assets (%)Corporate Bonds 43.6Provincial Bonds 24.2Cash & Equivalents 22.9Short-Term Investments 8.3Other Net Assets (Liabilities) 0.7Municipal Bonds 0.3
Credit RiskThe Fund indirectly bears the credit risk exposure of the Underlying Fund. As at December 31, 2014, December 31, 2013 and January 1, 2013, the Underlying Fund was exposed to credit risk as it invested predominantly in fixed income securities.
The Underlying Fund was invested in fixed income securities, preferred securities and derivative instruments, if any, with the following credit ratings, as per the tables below.
as at December 31, 2014Credit Rating^ Net Assets (%)AAA/Aaa/A++ 21.1 AA/Aa/A+ 43.4 A 24.0 Not Rated 1.1 Total 89.6
as at December 31, 2013 Credit Rating^ Net Assets (%)AAA/Aaa/A++ 7.1 AA/Aa/A+ 43.9 A 25.3Total 76.3
Fund Specific Notes to Financial Statements (audited)
Financial Instruments Risks (Note 9)

– 70 –Annual Financial Statements as at December 31, 2014
CI Money Market Segregated Fund
The accompanying notes are an integral part of these financial statements.
Fair Value Hierarchy (Note 9)
The tables below summarize the inputs used by the Fund in valuing the Fund’s investments carried at fair value.
Long Positions at fair value as at December 31, 2014 Level 1 Level 2 Level 3 Total (in $000’s) (in $000’s) (in $000’s) (in $000’s)Underlying Fund 1,816 - - 1,816 Total 1,816 - - 1,816
Long Positions at fair value as at December 31, 2013 Level 1 Level 2 Level 3 Total (in $000’s) (in $000’s) (in $000’s) (in $000’s)Underlying Fund 2,483 - - 2,483Total 2,483 - - 2,483
There were no transfers between Level 1 and Level 2 during the years ended December 31, 2014 and 2013.
Long Positions at fair value as at January 1, 2013 Level 1 Level 2 Level 3 Total (in $000’s) (in $000’s) (in $000’s) (in $000’s)Underlying Fund 2,416 - - 2,416 Total 2,416 - - 2,416
Fund Specific Notes to Financial Statements (audited)

– 71 –Annual Financial Statements as at December 31, 2014
Signature Canadian Bond Segregated Fund
2014 2013
- - 19 31 2 1 10 6
42 (63)
- - 14 21 87 (4)
18 27 2 4 - - 1 1 21 32 - - 66 (36)
1.35 (0.38) 1.05 (0.49)
as at as at as at Dec. 31, 2014 Dec. 31, 2013 Jan. 1, 2013
797 1,177 1,555 4 5 7 - - - - - - - - - - - - - - - 801 1,182 1,562
- - - - - - - - - - - - - - - - - - - - - 801 1,182 1,562
18.13 16.87 17.25 16.91 15.92 16.46
For inception date of the Fund, please refer to Note 1 in the Notes to the Financial Statements.The accompanying notes are an integral part of these financial statements.
Financial Statements (audited)
CIG - 140
Statements of Financial Position (in $000’s except for per unit amounts)
Statements of Comprehensive Income for the years ended December 31(in $000’s except for per unit amounts)
Assets Current assets Investments Cash Fees rebate receivable Dividends receivable Interest receivable Receivable for investments sold Receivable for unit subscriptions
Liabilities Current liabilities Bank overdraft Payable for investments purchased Payable for unit redemptions Management fees payable Administration fees payable Insurance fees payable
Net assets attributable to contractholders
Net assets attributable to contractholders per unit: Class IClass II
Income Net gain (loss) on investments Dividends Income distributions from investments Capital gain distributions from investments Net realized gain (loss) on sale of investments Change in unrealized appreciation (depreciation) in value of
investments Other income Interest Fees rebate (Note 7)
Expenses (Note 7)Management fees Administration fees Insurance fees Harmonized sales tax
Expenses absorbed by the manager Increase (decrease) in net assets from operations attributable to contractholders
Increase (decrease) in net assets from operations attributable to contractholders per unit: Class I Class II

– 72 –Annual Financial Statements as at December 31, 2014
Signature Canadian Bond Segregated Fund
The accompanying notes are an integral part of these financial statements.
Financial Statements (audited)
2014 2013
1,182 1,562
66 (36)
92 88 (539) (432) (447) (344)
801 1,182
Net assets attributable to contractholders at the beginning of year Increase (decrease) in net assets from operations attributable to contractholders Unit transactions Proceeds from issuance of units Amounts paid on redemption of units
Net assets attributable to contractholders at the end of year
Statements of Changes in Net Assets Attributable to Contractholders for the years ended December 31 (in $000’s)
2014 2013
66 (36)
(10) (6)
(42) 63 460 390 (28) (69) - - - - - - - - - - - - 446 342
92 88 (539) (432) (447) (344)
(1) (2) 5 7 4 5
- - - - - - - -
Statements of Cash Flows for the years ended December 31 (in $000’s)
Cash flows from (used in) operating activities Increase (decrease) in net assets from operations attributable to contractholders Adjustments for: Net realized (gain) loss on sale of investments Change in unrealized (appreciation) depreciation in value of
investments Proceeds from sale of investments Purchase of investments (Increase) decrease in dividends receivable (Increase) decrease in interest receivable Increase (decrease) in management fees payable Increase (decrease) in administration fees payable Increase (decrease) in insurance fees payable (Increase) decrease in fees rebate receivable Net cash from (used in) operating activities
Cash flows from (used in) financing activities Proceeds from issuances of unitsAmounts paid on redemption of unitsNet cash from (used in) financing activities
Net increase (decrease) in cashCash (bank overdraft), beginning of yearCash (bank overdraft), end of year
Supplementary Information: Dividends received, net of withholding taxInterest receivedInterest paidIncome taxes paid

– 73 –Annual Financial Statements as at December 31, 2014
Signature Canadian Bond Segregated Fund
Schedule of Investment Portfolio as at December 31, 2014 (audited)
No. of Average Fair Units/Shares Investment Cost ($) Value ($)
135,761 Signature Canadian Bond Fund (Class A)† 763,319 796,919 Total Investments (99.5%) 763,319 796,919 Other Net Assets (Liabilities) (0.5%) 3,764 Net Assets Attributable to Contractholders (100.0%) 800,683
Top 25 Holdings of Underlying Fund (unaudited)
No. of Average Fair Units/Shares Investment Cost ($) Value ($)
99,120,000 Province of Ontario 4.2% 06/02/2020 110,009,504 110,704,251 59,995,000 Government of Canada 5% 06/01/2037 82,652,848 88,124,590 73,845,000 Province of Quebec 4.5% 12/01/2019 82,739,587 83,103,651 81,112,000 Province of Ontario 2.1% 09/08/2018 82,051,479 82,720,033 69,841,000 Province of Quebec 4.25% 12/01/2021 76,758,765 78,899,163 77,086,000 Government of Canada 1.5% 02/01/2017 77,821,311 77,857,342 74,710,000 Government of Canada 1.75% 09/01/2019 75,599,272 76,088,400 63,615,000 Province of Ontario 4.2% 03/08/2018 69,823,729 68,991,144 62,040,000 Canada Housing Trust No.1, 1.95% 06/15/2019 62,098,930 63,034,331 Cash & Equivalents 61,049,245 43,730,000 Province of Quebec 6% 10/01/2029 53,301,185 58,858,214 55,928,000 Province of British Columbia 3.2% 06/18/2044 52,520,761 56,433,299 49,055,000 Province of Quebec 3.75% 09/01/2024 51,978,842 53,510,305 47,057,000 Government of Canada 2.5% 06/01/2024 49,203,407 49,942,939 31,756,000 Province of British Columbia 6.35% 06/18/2031 44,302,237 45,683,236 39,565,000 Canada Housing Trust No.1, 1.75% 06/15/2018 39,394,993 39,998,317 25,925,000 55 Ontario School Board Trust 5.9% 06/02/2033 29,428,239 34,333,352 31,830,000 The Royal Bank of Scotland PLC, Callable 5.37% 11/29/2049 27,808,122 30,835,313 21,960,000 Province of Nova Scotia 4.7% 06/01/2041 26,734,522 27,208,828 24,573,000 Government of Canada 2.75% 06/01/2022 25,943,251 26,529,902 20,144,000 Federal Republic of Austria 5.375% 12/01/2034 22,998,800 25,223,667 22,951,000 Province of Quebec 3.5% 12/01/2045 21,803,356 23,639,276 19,432,000 Province of British Columbia 3.7% 12/18/2020 20,755,867 21,395,351 19,640,000 Province of Ontario 3.5% 06/02/2024 20,310,322 21,096,101 2,004,931 Signature Cash Management Fund (Class C) 20,049,311 20,049,311
† The Underlying Fund is also managed by CI Investments Inc., the Manager of the Fund. Percentages shown in brackets in the Schedule of Investment Portfolio relate investments at fair value to net assets attributable to contractholders of the Fund. The accompanying notes are an integral part of these financial statements.

– 74 –Annual Financial Statements as at December 31, 2014
Signature Canadian Bond Segregated Fund
The accompanying notes are an integral part of these financial statements.
Fund Specific Notes to Financial Statements (audited)
Interest in Underlying Fund (Note 3)
The following tables present the Fund’s interest in the Underlying Fund.
as at December 31, 2014 Fair Value of Fair Value of the Fund’s Investment Ownership in the the Underlying Fund in the Underlying Fund Underlying FundUnderlying Fund (in $000’s) (in $000’s) (%) 2,688,658 797 -
as at December 31, 2013 Fair Value of Fair Value of the Fund’s Investment Ownership in the the Underlying Fund in the Underlying Fund Underlying FundUnderlying Fund (in $000’s) (in $000’s) (%) 2,576,922 1,177 -
as at January 1, 2013 Fair Value of Fair Value of the Fund’s Investment Ownership in the the Underlying Fund in the Underlying Fund Underlying FundUnderlying Fund (in $000’s) (in $000’s) (%) 3,130,298 1,555 -
Signature Canadian Bond Fund
Signature Canadian Bond Fund
Signature Canadian Bond Fund

– 75 –Annual Financial Statements as at December 31, 2014
Signature Canadian Bond Segregated Fund
Unit Transactions (Note 6)for the years ended December 31
Number of units at the beginning of yearUnits issued for cashUnits redeemed Number of units at the end of year
For inception date of the Fund, please refer to Note 1 in the Notes to the Financial Statements.The accompanying notes are an integral part of these financial statements.
Class I Class II 2014 2013 2014 2013 41,974 54,731 29,785 37,562 5,070 3,524 178 1,771 (23,391) (16,281) (7,975) (9,548) 23,653 41,974 21,988 29,785
Reconciliation of Equity as previously reported under Canadian GAAP to IFRS (Note 10) (in $000’s)
EquityEquity as reported under Canadian GAAPRevaluation of investments at FVTPLNet assets attributable to contractholders
as at as at Dec. 31, 2013 Jan. 1, 2013
1,182 1,562 - - 1,182 1,562
Reconciliation of Comprehensive Income as previously reported under Canadian GAAP to IFRS (Note 10) (in $000’s)
Comprehensive IncomeComprehensive income as reported under Canadian GAAPRevaluation of investments at FVTPLIncrease (decrease) in net assets from operations attributable to contractholders
for the year ended as at Dec. 31, 2013 Jun. 30, 2013
(36) - (36)
Fund Specific Notes to Financial Statements (audited)

– 76 –Annual Financial Statements as at December 31, 2014
Signature Canadian Bond Segregated Fund
For inception date of the Fund, please refer to Note 1 in the Notes to the Financial Statements.The accompanying notes are an integral part of these financial statements.
Financial Information (for the years ended December 31) (unaudited)
(1) This information is provided as at December 31, of the years shown.(2) The Fund’s portfolio turnover rate indicates how actively the Fund’s portfolio advisor manages its portfolio investments. A portfolio turnover rate of 100% is equivalent to the Fund buying and selling all of the securities in its portfolio once in the
course of the year. The higher a fund’s portfolio turnover rate in a year, the greater the trading costs payable by the fund in the year, and the greater the chance of an contractholder receiving taxable capital gains in the year. There is not necessarily
a relationship between a high turnover rate and the performance of a fund.(3) Management expense information is calculated based on expenses charged directly to the Fund plus, if applicable, expenses of the underlying fund, excluding commissions and brokerage fees, calculated on a weighted average basis on the percentage
weighting of the underlying fund and is expressed as an annualized percentage of average net asset value for the years shown. As of July 1, 2010, Ontario combined the federal goods and services tax (“GST” - 5%) with the provincial retail sales tax
(“PST” - 8%). The combination resulted in a Harmonized sales tax (“HST”) rate of 13%. The Effective HST tax rate is calculated using the attribution percentage for each province based on contractholders residency and can be different from 13%. For any
particular year, the rate shown will be prorated based on the different rates in effect during that year. For the year ended December 31, 2010 the rate applied is 5% for the period January 1, 2010 to June 30, 2010 and the Fund’s Effective HST rate for the period
starting July 1, 2010. The rate shown for the year ended December 31, 2010 is the time weighted average of these rates.(4) For financial years before January 1, 2013, the financial highlights are derived from the financial statements prepared in accordance with Canadian GAAP applicable to public enterprises. For financial years beginning on or after January 1, 2013,
the financial highlights are derived from the financial statements prepared in accordance with IFRS.
Financial HighlightsThe following tables show selected key financial information about the Fund and are intended to help you understand the Fund’s financial performance for the past five years, as applicable.
The Fund’s Net Asset Value per UnitNet assets value per unit at December 31, of the year shown ($) (1)
Ratios and Supplemental Data Net assets attributable to contractholders ($000’s) (1)
Number of units outstanding (1)
Portfolio turnover rate (%) (2)
Management Expense Ratio Management expense ratio before taxes (%) (3)
Harmonized sales tax/Goods and services tax (%) (3)
Management expense ratio after taxes (%) (3)
Management expense ratio before waivers or absorptions (%) (3)
Effective HST/GST rate for the year (%) (3)
The Fund’s Net Asset Value per UnitNet assets value per unit at December 31, of the year shown ($) (1)
Ratios and Supplemental Data Net assets attributable to contractholders ($000’s) (1)
Number of units outstanding (1)
Portfolio turnover rate (%) (2)
Management Expense Ratio Management expense ratio before taxes (%) (3)
Harmonized sales tax/Goods and services tax (%) (3)
Management expense ratio after taxes (%) (3)
Management expense ratio before waivers or absorptions (%) (3)
Effective HST/GST rate for the year (%) (3)
Class I 2014 2013 2012 2011 2010 2009(4)
18.13 16.87 17.25 16.71 15.64
429 708 944 990 909 23,653 41,974 54,731 59,202 58,163 3.05 4.94 9.21 15.82 18.72
1.70 1.70 1.70 1.71 1.71 0.19 0.19 0.17 0.17 0.14 1.89 1.89 1.87 1.88 1.85 1.89 1.89 1.87 1.88 1.85 9.40 10.03 10.97 10.71 7.87
Class II 2014 2013 2012 2011 2010 2009(4)
16.91 15.92 16.46 16.12 15.25
372 474 618 630 655 21,988 29,785 37,562 39,107 42,951 3.05 4.94 9.21 15.82 18.72
2.70 2.70 2.70 2.71 2.71 0.28 0.30 0.27 0.27 0.22 2.98 3.00 2.97 2.98 2.93 2.98 3.00 2.97 2.98 2.93 9.38 10.62 10.47 10.48 7.81

– 77 –Annual Financial Statements as at December 31, 2014
Signature Canadian Bond Segregated Fund
The accompanying notes are an integral part of these financial statements.
Credit Risk (cont’d)The Underlying Fund was invested in fixed income securities, preferred securities and derivative instruments, if any, with the following credit ratings, as per the tables below.
as at December 31, 2014Credit Rating^ Net Assets (%)AAA/Aaa/A++ 26.6 AA/Aa/A+ 21.7 A 27.5 BBB/Baa/B++ 17.4 BB/Ba/B+ 2.7 Not Rated 0.5 Total 96.4
as at December 31, 2013 Credit Rating^ Net Assets (%)AAA/Aaa/A++ 36.3 AA/Aa/A+ 15.5 A 21.0 BBB/Baa/B++ 17.8 BB/Ba/B+ 3.2 B 0.2 CCC/Caa/C++ 0.1 Not Rated 3.3Total 97.4
as at January 1, 2013 Credit Rating^ Net Assets (%)AAA/Aaa/A++ 33.1 AA/Aa/A+ 14.0 A 27.2 BBB/Baa/B++ 16.4 BB/Ba/B+ 2.3 Not Rated 5.8Total 98.8
^ Credit ratings are obtained from Standard & Poor’s, where available, otherwise ratings are obtained from: Moody’s
Investors Service or Dominion Bond Rating Services, respectively.
Other Price Risk The Fund indirectly bears the other price risk exposure of the Underlying Fund. As at December 31, 2014, December 31, 2013 and January 1, 2013, the Underlying Fund did not have a significant exposure to other price risk as the Underlying Fund was invested in fixed income securities.
Currency RiskThe Fund indirectly bears the currency risk exposure of the Underlying Fund. As at December 31, 2014, December 31, 2013 and January 1, 2013, the Underlying Fund was exposed to currency risk, as some of its investments were denominated in currencies other than Canadian dollars, the functional currency of the Fund and the Underlying Fund. As a result, the Fund was affected by fluctuations in the value of such currencies relative to the Canadian dollar.
Concentration RiskThe Signature Canadian Bond Fund’s financial instruments were concentrated in the following segments:
as at December 31, 2014Categories Net Assets (%)Corporate Bonds 40.5Provincial Bonds 33.0Canadian Government Bonds 17.6Foreign Government Bonds 2.3Cash & Equivalents 2.3Municipal Bonds 2.1Asset Backed Securities 0.9Funds 0.7Other Net Assets (Liabilities) 0.5Consumer Discretionary 0.1
as at December 31, 2013 Categories Net Assets (%)Corporate Bonds 42.5Canadian Government Bonds 27.3Provincial Bonds 20.3Foreign Government Bonds 4.5Municipal Bonds 1.8Cash & Equivalents 1.6Asset Backed Securities 1.0Other Net Assets (Liabilities) 0.9Consumer Discretionary 0.1
as at January 1, 2013 Categories Net Assets (%)Corporate Bonds 40.3Canadian Government Bonds 25.6Provincial Bonds 20.8Foreign Government Bonds 7.2Municipal Bonds 2.2Short-Term Investments 1.7Asset Backed Securities 1.1Cash & Equivalents 0.9Other Net Assets (Liabilities) 0.3Foreign Currency Forward Contracts (0.1)
Credit RiskThe Fund indirectly bears the credit risk exposure of the Underlying Fund. As at December 31, 2014, December 31, 2013 and January 1, 2013, the Underlying Fund was exposed to credit risk as it invested in fixed income securities.
Fund Specific Notes to Financial Statements (audited)
Financial Instruments Risks (Note 9)

– 78 –Annual Financial Statements as at December 31, 2014
Signature Canadian Bond Segregated Fund
The accompanying notes are an integral part of these financial statements.
Interest Rate Risk (cont’d)
as at January 1, 2013 Less than 1 - 3 3 - 5 Greater than 1 Year Years Years 5 Years Total (%) (%) (%) (%) (%)Interest Rate Exposure 6.7 15.6 14.6 62.7 99.6
As at December 31, 2014, had the prevailing interest rates increased or decreased by 0.25% (December 31, 2013 and January 1, 2013 - 0.25%), with all other variables held constant, net assets attributable to contractholders of the Fund would have indirectly decreased or increased, respectively, by approximately $14,000 (December 31, 2013 - $19,000 and January 1, 2013 - $25,000). In practice, the actual results may differ from this analysis and the difference may be material.
Fair Value Hierarchy (Note 9)
The tables below summarize the inputs used by the Fund in valuing the Fund’s investments carried at fair value.
Long Positions at fair value as at December 31, 2014 Level 1 Level 2 Level 3 Total (in $000’s) (in $000’s) (in $000’s) (in $000’s)Underlying Fund 797 - - 797 Total 797 - - 797
Long Positions at fair value as at December 31, 2013 Level 1 Level 2 Level 3 Total (in $000’s) (in $000’s) (in $000’s) (in $000’s)Underlying Fund 1,177 - - 1,177 Total 1,177 - - 1,177
There were no transfers between Level 1 and Level 2 during the years ended December 31, 2014 and 2013.
Long Positions at fair value as at January 1, 2013 Level 1 Level 2 Level 3 Total (in $000’s) (in $000’s) (in $000’s) (in $000’s)Underlying Fund 1,555 - - 1,555Total 1,555 - - 1,555
Currency Risk (cont’d)
The tables below summarize the Underlying Fund’s exposure to currency risk.
as at December 31, 2014Currency Net Assets (%)US Dollar 0.7 New Zealand Dollar 0.2 British Pound 0.1 Total 1.0
as at December 31, 2013 Currency Net Assets (%)US Dollar 2.3 New Zealand Dollar 0.4 British Pound 0.1 Total 2.8
as at January 1, 2013 Currency Net Assets (%)US Dollar 1.7 New Zealand Dollar 0.3 Euro 0.1 British Pound 0.1Total 2.2
As at December 31, 2014, had the Canadian dollar strengthened or weakened by 10% (December 31, 2013 and January 1, 2013 - 10%) in relation to all other foreign currencies held in the Underlying Fund, with all other variables held constant, net assets attributable to contractholders of the Fund would have decreased or increased, respectively, by approximately $1,000 (December 31, 2013 - $3,000 and January 1, 2013 - $3,000). In practice, the actual results may differ from this analysis and the difference may be material.
Interest Rate RiskThe Fund indirectly bears the interest rate risk exposure of the Underlying Fund. As at December 31, 2014, December 31, 2013 and January 1, 2013, the Underlying Fund was exposed to interest rate risk as it invested in fixed income securities.
The tables below summarize the Underlying Fund’s exposure to interest rate risk, categorized by the contractual maturity date.
as at December 31, 2014 Less than 1 - 3 3 - 5 Greater than 1 Year Years Years 5 Years Total (%) (%) (%) (%) (%)Interest Rate Exposure 3.6 11.0 24.0 60.1 98.7
as at December 31, 2013 Less than 1 - 3 3 - 5 Greater than 1 Year Years Years 5 Years Total (%) (%) (%) (%) (%)Interest Rate Exposure 2.4 10.5 26.9 59.1 98.9
Fund Specific Notes to Financial Statements (audited)

– 79 –Annual Financial Statements as at December 31, 2014
Signature Dividend Income Segregated Fund
2014 2013
- - 222 253 228 - 381 395
541 1,181
- - 144 147 1,516 1,976
184 193 29 29 - - 7 8 220 230 - - 1,296 1,746
3.07 3.54 2.46 2.98
as at as at as at Dec. 31, 2014 Dec. 31, 2013 Jan. 1, 2013
11,830 11,921 12,363 17 53 45 - - - - - - - - - 1 7 1 - - - 11,848 11,981 12,409
- - - - - - - 1 - - - 1 - - - - - - - 1 1 11,848 11,980 12,408
28.93 25.86 22.31 26.38 23.92 20.94
For inception date of the Fund, please refer to Note 1 in the Notes to the Financial Statements.The accompanying notes are an integral part of these financial statements.
Financial Statements (audited)
CIG - 139
Statements of Financial Position (in $000’s except for per unit amounts)
Statements of Comprehensive Income for the years ended December 31(in $000’s except for per unit amounts)
Assets Current assets Investments Cash Fees rebate receivable Dividends receivable Interest receivable Receivable for investments sold Receivable for unit subscriptions
Liabilities Current liabilities Bank overdraft Payable for investments purchased Payable for unit redemptions Management fees payable Administration fees payable Insurance fees payable
Net assets attributable to contractholders
Net assets attributable to contractholders per unit: Class IClass II
Income Net gain (loss) on investments Dividends Income distributions from investments Capital gain distributions from investments Net realized gain (loss) on sale of investments Change in unrealized appreciation (depreciation) in value of
investments Other income Interest Fees rebate (Note 7)
Expenses (Note 7)Management fees Administration fees Insurance fees Harmonized sales tax
Expenses absorbed by the manager Increase (decrease) in net assets from operations attributable to contractholders
Increase (decrease) in net assets from operations attributable to contractholders per unit: Class I Class II

– 80 –Annual Financial Statements as at December 31, 2014
Signature Dividend Income Segregated Fund
The accompanying notes are an integral part of these financial statements.
Financial Statements (audited)
2014 2013
11,980 12,408
1,296 1,746
136 90 (1,564) (2,264) (1,428) (2,174)
11,848 11,980
Net assets attributable to contractholders at the beginning of year Increase (decrease) in net assets from operations attributable to contractholders Unit transactions Proceeds from issuance of units Amounts paid on redemption of units
Net assets attributable to contractholders at the end of year
Statements of Changes in Net Assets Attributable to Contractholders for the years ended December 31 (in $000’s)
2014 2013
1,296 1,746
(381) (395)
(541) (1,181) 1,469 2,264 (450) (252) - - - - - (1) - - - - - - 1,393 2,181
136 90 (1,565) (2,263) (1,429) (2,173)
(36) 8 53 45 17 53
- - - - - - - -
Statements of Cash Flows for the years ended December 31 (in $000’s)
Cash flows from (used in) operating activities Increase (decrease) in net assets from operations attributable to contractholders Adjustments for: Net realized (gain) loss on sale of investments Change in unrealized (appreciation) depreciation in value of
investments Proceeds from sale of investments Purchase of investments (Increase) decrease in dividends receivable (Increase) decrease in interest receivable Increase (decrease) in management fees payable Increase (decrease) in administration fees payable Increase (decrease) in insurance fees payable (Increase) decrease in fees rebate receivable Net cash from (used in) operating activities
Cash flows from (used in) financing activities Proceeds from issuances of unitsAmounts paid on redemption of unitsNet cash from (used in) financing activities
Net increase (decrease) in cashCash (bank overdraft), beginning of yearCash (bank overdraft), end of year
Supplementary Information: Dividends received, net of withholding taxInterest receivedInterest paidIncome taxes paid

– 81 –Annual Financial Statements as at December 31, 2014
Signature Dividend Income Segregated Fund
Schedule of Investment Portfolio as at December 31, 2014 (audited)
No. of Average Fair Units/Shares Investment Cost ($) Value ($)
946,427 Signature Dividend Fund (Class X)† 8,521,514 11,830,337 Total Investments (99.8%) 8,521,514 11,830,337 Other Net Assets (Liabilities) (0.2%) 17,233 Net Assets Attributable to Contractholders (100.0%) 11,847,570
Top 25 Holdings of Underlying Fund (unaudited)
No. of Average Fair Units/Shares Investment Cost ($) Value ($)
Cash & Equivalents 122,733,223 964,200 Toronto-Dominion Bank 39,517,841 53,522,742 793,700 The Bank of Nova Scotia 48,628,577 52,630,247 647,100 Royal Bank of Canada 44,797,792 51,923,304 630,300 Enbridge Inc. 33,502,813 37,654,122 1,488,400 JPMorgan Chase & Co., Warrants (28Oct18) 21,039,647 35,963,385 990,313 PNC Financial Services Group Inc., Warrants (31Dec18) 10,189,449 28,702,557 365,300 Citigroup Inc. 16,926,557 22,961,739 906,084 Wells Fargo & Co., Warrants (28Oct18) 9,030,453 22,482,638 275,200 Canadian National Railway Co. 14,285,822 22,021,504 690,410 Power Corp. of Canada 20,537,446 21,927,422 915,300 UBS Group AG 18,280,581 18,274,349 266,400 Loblaw Co., Ltd. 10,213,907 16,562,088 724,950 BCE Inc., Preferred, Series AB 18,868,880 15,347,192 723,300 BCE Inc., Preferred 4.4%, Series AF 16 18,205,959 14,769,786 691,550 BCE Inc., Preferred, Series AJ 17,975,084 14,522,550 526,700 Husky Energy Inc. 15,292,079 14,484,250 169,350 Nestle S.A., Registered Shares 9,420,258 14,432,677 44,000 Roche Holding AG 9,409,733 13,873,689 131,050 Procter & Gamble Co. 9,436,072 13,867,089 518,050 Fortis Inc., Preferred 4.9%, Series E, Callable/Convertible 13,000,637 13,339,788 122,600 Novartis AG, Registered Shares 7,870,203 13,227,073 244,650 Microsoft Corp. 7,439,906 13,201,051 282,800 Rogers Communications Inc., Class B 13,227,871 12,774,076 454,100 HSBC Bank Canada, Preferred 5.1%, Series 5 11,344,034 11,452,402
† The Underlying Fund is also managed by CI Investments Inc., the Manager of the Fund. Percentages shown in brackets in the Schedule of Investment Portfolio relate investments at fair value to net assets attributable to contractholders of the Fund. The accompanying notes are an integral part of these financial statements.

– 82 –Annual Financial Statements as at December 31, 2014
Signature Dividend Income Segregated Fund
The accompanying notes are an integral part of these financial statements.
Fund Specific Notes to Financial Statements (audited)
Interest in Underlying Fund (Note 3)
The following tables present the Fund’s interest in the Underlying Fund.
as at December 31, 2014 Fair Value of Fair Value of the Fund’s Investment Ownership in the the Underlying Fund in the Underlying Fund Underlying FundUnderlying Fund (in $000’s) (in $000’s) (%) 1,436,241 11,830 0.8
as at December 31, 2013 Fair Value of Fair Value of the Fund’s Investment Ownership in the the Underlying Fund in the Underlying Fund Underlying FundUnderlying Fund (in $000’s) (in $000’s) (%) 1,345,215 11,921 0.9
as at January 1, 2013 Fair Value of Fair Value of the Fund’s Investment Ownership in the the Underlying Fund in the Underlying Fund Underlying FundUnderlying Fund (in $000’s) (in $000’s) (%) 1,181,500 12,363 1.0
Signature Dividend Fund
Signature Dividend Fund
Signature Dividend Fund

– 83 –Annual Financial Statements as at December 31, 2014
Signature Dividend Income Segregated Fund
Unit Transactions (Note 6)for the years ended December 31
Number of units at the beginning of yearUnits issued for cashUnits redeemed Number of units at the end of year
For inception date of the Fund, please refer to Note 1 in the Notes to the Financial Statements.The accompanying notes are an integral part of these financial statements.
Class I Class II 2014 2013 2014 2013 326,542 366,987 147,862 201,534 2,485 2,709 2,591 1,061 (40,102) (43,154) (18,234) (54,733) 288,925 326,542 132,219 147,862
Reconciliation of Equity as previously reported under Canadian GAAP to IFRS (Note 10) (in $000’s)
EquityEquity as reported under Canadian GAAPRevaluation of investments at FVTPLNet assets attributable to contractholders
as at as at Dec. 31, 2013 Jan. 1, 2013
11,980 12,408 - - 11,980 12,408
Reconciliation of Comprehensive Income as previously reported under Canadian GAAP to IFRS (Note 10) (in $000’s)
Comprehensive IncomeComprehensive income as reported under Canadian GAAPRevaluation of investments at FVTPLIncrease (decrease) in net assets from operations attributable to contractholders
for the year ended Dec. 31, 2013
1,746 - 1,746
Fund Specific Notes to Financial Statements (audited)

– 84 –Annual Financial Statements as at December 31, 2014
Signature Dividend Income Segregated Fund
For inception date of the Fund, please refer to Note 1 in the Notes to the Financial Statements.The accompanying notes are an integral part of these financial statements.
Financial Information (for the years ended December 31) (unaudited)
(1) This information is provided as at December 31, of the years shown.(2) The Fund’s portfolio turnover rate indicates how actively the Fund’s portfolio advisor manages its portfolio investments. A portfolio turnover rate of 100% is equivalent to the Fund buying and selling all of the securities in its portfolio once in the
course of the year. The higher a fund’s portfolio turnover rate in a year, the greater the trading costs payable by the fund in the year, and the greater the chance of an contractholder receiving taxable capital gains in the year. There is not necessarily
a relationship between a high turnover rate and the performance of a fund.(3) Management expense information is calculated based on expenses charged directly to the Fund plus, if applicable, expenses of the underlying fund, excluding commissions and brokerage fees, calculated on a weighted average basis on the percentage
weighting of the underlying fund and is expressed as an annualized percentage of average net asset value for the years shown. As of July 1, 2010, Ontario combined the federal goods and services tax (“GST” - 5%) with the provincial retail sales tax
(“PST” - 8%). The combination resulted in a Harmonized sales tax (“HST”) rate of 13%. The Effective HST tax rate is calculated using the attribution percentage for each province based on contractholders residency and can be different from 13%. For any
particular year, the rate shown will be prorated based on the different rates in effect during that year. For the year ended December 31, 2010 the rate applied is 5% for the period January 1, 2010 to June 30, 2010 and the Fund’s Effective HST rate for the period
starting July 1, 2010. The rate shown for the year ended December 31, 2010 is the time weighted average of these rates.(4) For financial years before January 1, 2013, the financial highlights are derived from the financial statements prepared in accordance with Canadian GAAP applicable to public enterprises. For financial years beginning on or after January 1, 2013,
the financial highlights are derived from the financial statements prepared in accordance with IFRS.
Financial HighlightsThe following tables show selected key financial information about the Fund and are intended to help you understand the Fund’s financial performance for the past five years, as applicable.
The Fund’s Net Asset Value per UnitNet assets value per unit at December 31, of the year shown ($) (1)
Ratios and Supplemental Data Net assets attributable to contractholders ($000’s) (1)
Number of units outstanding (1)
Portfolio turnover rate (%) (2)
Management Expense Ratio Management expense ratio before taxes (%) (3)
Harmonized sales tax/Goods and services tax (%) (3)
Management expense ratio after taxes (%) (3)
Management expense ratio before waivers or absorptions (%) (3)
Effective HST/GST rate for the year (%) (3)
The Fund’s Net Asset Value per UnitNet assets value per unit at December 31, of the year shown ($) (1)
Ratios and Supplemental Data Net assets attributable to contractholders ($000’s) (1)
Number of units outstanding (1)
Portfolio turnover rate (%) (2)
Management Expense Ratio Management expense ratio before taxes (%) (3)
Harmonized sales tax/Goods and services tax (%) (3)
Management expense ratio after taxes (%) (3)
Management expense ratio before waivers or absorptions (%) (3)
Effective HST/GST rate for the year (%) (3)
Class I 2014 2013 2012 2011 2010 2009(4)
28.93 25.86 22.31 20.23 20.34
8,360 8,443 8,188 8,828 10,727 288,925 326,542 366,987 436,468 527,272 3.76 2.06 1.95 2.28 2.82
1.39 1.38 1.39 1.39 1.39 0.14 0.14 0.15 0.15 0.12 1.53 1.52 1.54 1.54 1.51 1.53 1.52 1.54 1.54 1.51 11.13 11.54 11.99 12.00 8.47
Class II 2014 2013 2012 2011 2010 2009(4)
26.38 23.92 20.94 19.26 19.65
3,488 3,537 4,220 5,128 6,361 132,219 147,862 201,534 266,263 323,670 3.76 2.06 1.95 2.28 2.82
2.69 2.68 2.69 2.69 2.69 0.28 0.27 0.29 0.29 0.22 2.97 2.95 2.98 2.98 2.91 2.97 2.95 2.98 2.98 2.91 10.64 10.24 10.88 11.01 8.06

– 85 –Annual Financial Statements as at December 31, 2014
Signature Dividend Income Segregated Fund
The accompanying notes are an integral part of these financial statements.
Concentration Risk (cont’d)
as at January 1, 2013 Categories Net Assets (%)Financials 51.2Consumer Staples 8.6Telecommunication Services 8.5Health Care 6.4Energy 6.1Materials 5.0Utilities 3.9Industrials 3.2Consumer Discretionary 3.0Short-Term Investments 2.0Information Technology 0.7Corporate Bonds 0.7Exchange-Traded Funds 0.5Other Net Assets (Liabilities) 0.3Cash & Equivalents 0.2Private Placements 0.1Foreign Currency Forward Contracts (0.4)
Credit RiskThe Fund indirectly bears the credit risk exposure of the Underlying Fund. As at December 31, 2014, December 31, 2013 and January 1, 2013, the Underlying Fund was exposed to credit risk as some of its assets were invested in fixed income securities and preferred securities.
The Underlying Fund was invested in fixed income securities, preferred securities and derivative instruments, if any, with the following credit ratings, as per the tables below.
as at December 31, 2014Credit Rating^ Net Assets (%)AAA/Aaa/A++ 0.1 AA/Aa/A+ 0.2 A 5.6 BBB/Baa/B++ 17.7 BB/Ba/B+ 2.9 B 0.1 Not Rated 0.4 Total 27.0
as at December 31, 2013 Credit Rating^ Net Assets (%)AA/Aa/A+ 0.9 A 11.6 BBB/Baa/B++ 14.0 BB/Ba/B+ 3.1 B 0.1 Not Rated 0.6 Total 30.3
Concentration RiskThe Signature Dividend Fund’s financial instruments were concentrated in the following segments:
as at December 31, 2014Categories Net Assets (%)Long Positions:Financials 39.7Energy 9.0Cash & Equivalents 8.5Telecommunication Services 7.8Consumer Staples 7.7Warrants 6.1Health Care 5.6Industrials 5.3Utilities 4.3Information Technology 3.0Consumer Discretionary 2.5Materials 1.2Corporate Bonds 0.3Foreign Currency Forward Contracts 0.2Private Placements 0.1Total Long Positions 101.3
Short Positions:Financials (1.3)Total Short Positions (1.3)
as at December 31, 2013 Categories Net Assets (%)Financials 41.1Energy 11.3Consumer Staples 9.6Telecommunication Services 7.7Health Care 5.8Warrants 5.8Industrials 5.7Utilities 3.7Information Technology 3.2Consumer Discretionary 2.7Materials 1.9Cash & Equivalents 1.0Corporate Bonds 0.8Private Placements 0.2Foreign Currency Forward Contracts (0.5)
Fund Specific Notes to Financial Statements (audited)
Financial Instruments Risks (Note 9)

– 86 –Annual Financial Statements as at December 31, 2014
Signature Dividend Income Segregated Fund
The accompanying notes are an integral part of these financial statements.
Currency Risk (cont’d)
as at December 31, 2013 Currency Net Assets (%)US Dollar 19.5 British Pound 2.0 Swiss Franc 2.0 Euro 1.4 Swedish Krona 0.7 Thai Baht 0.7 Japanese Yen 0.6 Singapore Dollar 0.6 Australian Dollar 0.4 Hong Kong Dollar 0.4 Brazilian Real 0.3 Indonesian Rupiah 0.3 South Africa Rand 0.1 Total 29.0
as at January 1, 2013 Currency Net Assets (%)US Dollar 9.6 Swiss Franc 3.2 Euro 1.6 Japanese Yen 1.2 British Pound 0.8 Brazilian Real 0.5 Danish Krone 0.5 Thai Baht 0.5 Australian Dollar 0.3 Indonesian Rupiah 0.2 Swedish Krona 0.1 Hong Kong Dollar (0.1)Total 18.4
As at December 31, 2014, had the Canadian dollar strengthened or weakened by 10% (December 31, 2013 and January 1, 2013 - 10%) in relation to all other foreign currencies held in the Underlying Fund, with all other variables held constant, net assets attributable to contractholders of the Fund would have decreased or increased, respectively, by approximately $447,000 (December 31, 2013 - $346,000 and January 1, 2013 - $228,000). In practice, the actual results may differ from this analysis and the difference may be material.
Interest Rate RiskThe Fund indirectly bears the interest rate risk exposure of the Underlying Fund. As at December 31, 2014, December 31, 2013 and January 1, 2013, the Underlying Fund was exposed to interest rate risk as some of its assets were invested in fixed income securities.
The tables below summarize the Underlying Fund’s exposure to interest rate risk, categorized by the contractual maturity date.
as at December 31, 2014 Less than 1 - 3 3 - 5 Greater than 1 Year Years Years 5 Years Total (%) (%) (%) (%) (%)Interest Rate Exposure 8.5 - - 0.3 8.8
Credit Risk (cont’d)
as at January 1, 2013 Credit Rating^ Net Assets (%)AAA/Aaa/A++ 1.8 AA/Aa/A+ 1.0 A 13.2 BBB/Baa/B++ 17.9 BB/Ba/B+ 4.0 B 0.1 Not Rated 1.7 Total 39.7
^ Credit ratings are obtained from Standard & Poor’s, where available, otherwise ratings are obtained from: Moody’s
Investors Service or Dominion Bond Rating Services, respectively.
Other Price Risk The Fund indirectly bears the other price risk exposure of the Underlying Fund. As at December 31, 2014, December 31, 2013 and January 1, 2013, the Underlying Fund’s holdings were sensitive to changes in general economic conditions in Canada. The Underlying Fund’s portfolio consisted of Canadian stocks, preferred shares and fixed income securities, thus an overall downturn in the Canadian economy may lead to a widening in credit spreads and a decrease in equity prices which would then lead to a decrease in the value of the Underlying Fund’s holdings.
As at December 31, 2014, had the Canadian markets increased or decreased by 10% (December 31, 2013 and January 1, 2013 - 10%), with all other variables held constant, net assets attributable to contractholders of the Fund would have increased or decreased, respectively, by approximately $1,079,000 (December 31, 2013 - $1,171,000 and January 1, 2013 - $1,199,000). In practice, actual results may differ from this analysis and the difference may be material.
Currency RiskThe Fund indirectly bears the currency risk exposure of the Underlying Fund. As at December 31, 2014, December 31, 2013 and January 1, 2013, the Underlying Fund was exposed to currency risk, as some of its investments were denominated in currencies other than Canadian dollars, the functional currency of the Fund and the Underlying Fund. As a result, the Fund was affected by fluctuations in the value of such currencies relative to the Canadian dollar.
The tables below summarize the Underlying Fund’s exposure to currency risk.
as at December 31, 2014Currency Net Assets (%)US Dollar 30.3 Euro 1.5 British Pound 1.4 Swiss Franc 1.2 Japanese Yen 0.9 Hong Kong Dollar 0.7 Swedish Krona 0.5 Singapore Dollar 0.5 Australian Dollar 0.2 Brazilian Real 0.2 Thai Baht 0.2 Indonesian Rupiah 0.2 Total 37.8
Fund Specific Notes to Financial Statements (audited)

– 87 –Annual Financial Statements as at December 31, 2014
Signature Dividend Income Segregated Fund
The accompanying notes are an integral part of these financial statements.
Interest Rate Risk (cont’d)
as at December 31, 2013 Less than 1 - 3 3 - 5 Greater than 1 Year Years Years 5 Years Total (%) (%) (%) (%) (%)Interest Rate Exposure 1.0 - - 0.8 1.8
as at January 1, 2013 Less than 1 - 3 3 - 5 Greater than 1 Year Years Years 5 Years Total (%) (%) (%) (%) (%)Interest Rate Exposure 2.3 - - 0.7 3.0
As at December 31, 2014, had the prevailing interest rates increased or decreased by 0.25% (December 31, 2013 and January 1, 2013 - 0.25%), with all other variables held constant, net assets attributable to contractholders of the Fund would have indirectly decreased or increased, respectively, by a nominal amount (December 31, 2013 - $1,000 and January 1, 2013 - $1,000). In practice, the actual results may differ from this analysis and the difference may be material.
Fair Value Hierarchy (Note 9)
The tables below summarize the inputs used by the Fund in valuing the Fund’s investments carried at fair value.
Long Positions at fair value as at December 31, 2014 Level 1 Level 2 Level 3 Total (in $000’s) (in $000’s) (in $000’s) (in $000’s)Underlying Fund 11,830 - - 11,830 Total 11,830 - - 11,830
Long Positions at fair value as at December 31, 2013 Level 1 Level 2 Level 3 Total (in $000’s) (in $000’s) (in $000’s) (in $000’s)Underlying Fund 11,921 - - 11,921 Total 11,921 - - 11,921
There were no transfers between Level 1 and Level 2 during the years ended December 31, 2014 and 2013.
Long Positions at fair value as at January 1, 2013 Level 1 Level 2 Level 3 Total (in $000’s) (in $000’s) (in $000’s) (in $000’s)Underlying Fund 12,363 - - 12,363Total 12,363 - - 12,363
Fund Specific Notes to Financial Statements (audited)

– 88 –Annual Financial Statements as at December 31, 2014
Signature High Income B Segregated Fund
2014 2013
- - 30 41 - - 35 11
15 27
- - 14 14 94 93
18 18 3 2 - - 1 1 22 21 - -
72 72
2.63 2.37 2.01 1.86
as at as at as at Dec. 31, 2014 Dec. 31, 2013 Jan. 1, 2013
891 962 964 4 - 2 - - - - - - - - - - - - - - - 895 962 966
- - - - - - - - - - - - - - - - - - - - - 895 962 966
33.57 31.01 28.62 30.93 28.99 27.15
For inception date of the Fund, please refer to Note 1 in the Notes to the Financial Statements.The accompanying notes are an integral part of these financial statements.
Financial Statements (audited)
CIG - 141
Statements of Financial Position (in $000’s except for per unit amounts)
Statements of Comprehensive Income for the years ended December 31(in $000’s except for per unit amounts)
Assets Current assets Investments Cash Fees rebate receivable Dividends receivable Interest receivable Receivable for investments sold Receivable for unit subscriptions
Liabilities Current liabilities Bank overdraft Payable for investments purchased Payable for unit redemptions Management fees payable Administration fees payable Insurance fees payable
Net assets attributable to contractholders
Net assets attributable to contractholders per unit: Class IClass II
Income Net gain (loss) on investments Dividends Income distributions from investments Capital gain distributions from investments Net realized gain (loss) on sale of investments Change in unrealized appreciation (depreciation) in value of
investments Other income Interest Fees rebate (Note 7)
Expenses (Note 7)Management fees Administration fees Insurance fees Harmonized sales tax
Expenses absorbed by the manager Increase (decrease) in net assets from operations attributable to contractholders
Increase (decrease) in net assets from operations attributable to contractholders per unit: Class I Class II

– 89 –Annual Financial Statements as at December 31, 2014
Signature High Income B Segregated Fund
The accompanying notes are an integral part of these financial statements.
Financial Statements (audited)
2014 2013
962 966
72 72
54 - (193) (76) (139) (76)
895 962
Net assets attributable to contractholders at the beginning of year Increase (decrease) in net assets from operations attributable to contractholders Unit transactions Proceeds from issuance of units Amounts paid on redemption of units
Net assets attributable to contractholders at the end of year
Statements of Changes in Net Assets Attributable to Contractholders for the years ended December 31 (in $000’s)
2014 2013
72 72
(35) (11)
(15) (27) 205 82 (84) (42) - - - - - - - - - - - - 143 74
54 - (193) (76) (139) (76)
4 (2) - 2 4 -
- - - - - - - -
Statements of Cash Flows for the years ended December 31 (in $000’s)
Cash flows from (used in) operating activities Increase (decrease) in net assets from operations attributable to contractholders Adjustments for: Net realized (gain) loss on sale of investments Change in unrealized (appreciation) depreciation in value of
investments Proceeds from sale of investments Purchase of investments (Increase) decrease in dividends receivable (Increase) decrease in interest receivable Increase (decrease) in management fees payable Increase (decrease) in administration fees payable Increase (decrease) in insurance fees payable (Increase) decrease in fees rebate receivable Net cash from (used in) operating activities
Cash flows from (used in) financing activities Proceeds from issuances of unitsAmounts paid on redemption of unitsNet cash from (used in) financing activities
Net increase (decrease) in cashCash (bank overdraft), beginning of yearCash (bank overdraft), end of year
Supplementary Information: Dividends received, net of withholding taxInterest receivedInterest paidIncome taxes paid

– 90 –Annual Financial Statements as at December 31, 2014
Signature High Income B Segregated Fund
Schedule of Investment Portfolio as at December 31, 2014 (audited)
No. of Average Fair Units/Shares Investment Cost ($) Value ($)
59,663 Signature High Income Fund (Class A)† 728,090 890,774 Total Investments (99.5%) 728,090 890,774 Other Net Assets (Liabilities) (0.5%) 4,179 Net Assets Attributable to Contractholders (100.0%) 894,953
Top 25 Holdings of Underlying Fund (unaudited)
No. of Average Fair Units/Shares Investment Cost ($) Value ($)
66,401,445 Signature Cash Management Fund (Class C) 664,014,450 664,014,450 Cash & Equivalents 403,986,438 6,359,920 Inter Pipeline Ltd. 71,404,879 228,575,525 169,224,000 United States Treasury Note/Bond 2.375% 08/15/2024 186,178,965 200,220,748 168,624,000 United States Treasury Note/Bond 1.625% 08/31/2019 186,545,146 196,096,604 55,894,900 Singapore Telecommunications Ltd. 144,470,630 191,160,705 8,098,700 UBS Group AG 171,473,397 161,693,945 8,186,860 Veresen Inc. 108,821,193 150,310,750 15,033,160 Algonquin Power & Utilities Corp. 116,082,564 144,919,662 3,163,270 Canadian REIT 79,137,532 144,846,133 2,303,800 Citigroup Inc. 123,515,972 144,810,439 16,882,424 Transurban Group 93,133,356 137,390,874 3,436,175 Allied Properties REIT 56,656,275 128,650,392 2,566,320 Kinder Morgan Inc. 92,208,837 126,133,775 1,556,400 JPMorgan Chase & Co. 96,989,774 113,144,733 1,870,600 Enbridge Inc. 89,756,229 111,749,644 4,193,242 Brookfield Office Properties Inc. (USD) 65,259,961 111,402,171 84,812,000 United States Treasury Note/Bond 3.125% 08/15/2044 92,950,912 106,065,246 12,713,740 Frontier Communications Corp. 58,350,453 98,509,184 2,400,100 AT&T Inc. 89,247,875 93,651,967 1,039,100 Canadian National Railway Co. 36,668,198 83,148,782 3,410,295 Abertis Infraestructuras S.A. 55,917,021 78,757,375 13,717,400 Telstra Corp., Ltd. 40,902,768 77,675,119 1,714,586 AltaGas Ltd. 46,529,493 74,310,157 16,623,788 Syndey Airport 37,710,764 74,265,429
† The Underlying Fund is also managed by CI Investments Inc., the Manager of the Fund. Percentages shown in brackets in the Schedule of Investment Portfolio relate investments at fair value to net assets attributable to contractholders of the Fund. The accompanying notes are an integral part of these financial statements.

– 91 –Annual Financial Statements as at December 31, 2014
Signature High Income B Segregated Fund
The accompanying notes are an integral part of these financial statements.
Fund Specific Notes to Financial Statements (audited)
Interest in Underlying Fund (Note 3)
The following tables present the Fund’s interest in the Underlying Fund.
as at December 31, 2014 Fair Value of Fair Value of the Fund’s Investment Ownership in the the Underlying Fund in the Underlying Fund Underlying FundUnderlying Fund (in $000’s) (in $000’s) (%) 10,020,583 891 -
as at December 31, 2013 Fair Value of Fair Value of the Fund’s Investment Ownership in the the Underlying Fund in the Underlying Fund Underlying FundUnderlying Fund (in $000’s) (in $000’s) (%) 8,994,373 962 -
as at January 1, 2013 Fair Value of Fair Value of the Fund’s Investment Ownership in the the Underlying Fund in the Underlying Fund Underlying FundUnderlying Fund (in $000’s) (in $000’s) (%) 7,988,951 964 -
Signature High Income Fund
Signature High Income Fund
Signature High Income Fund

– 92 –Annual Financial Statements as at December 31, 2014
Signature High Income B Segregated Fund
Unit Transactions (Note 6)for the years ended December 31
Number of units at the beginning of yearUnits issued for cashUnits redeemed Number of units at the end of year
For inception date of the Fund, please refer to Note 1 in the Notes to the Financial Statements.The accompanying notes are an integral part of these financial statements.
Class I Class II 2014 2013 2014 2013 20,476 21,349 11,297 13,080 299 - 1,446 - (2,551) (873) (3,585) (1,783) 18,224 20,476 9,158 11,297
Reconciliation of Equity as previously reported under Canadian GAAP to IFRS (Note 10) (in $000’s)
EquityEquity as reported under Canadian GAAPRevaluation of investments at FVTPLNet assets attributable to contractholders
as at as at Dec. 31, 2013 Jan. 1, 2013
962 966 - - 962 966
Reconciliation of Comprehensive Income as previously reported under Canadian GAAP to IFRS (Note 10) (in $000’s)
Comprehensive IncomeComprehensive income as reported under Canadian GAAPRevaluation of investments at FVTPLIncrease (decrease) in net assets from operations attributable to contractholders
for the year ended Dec. 31, 2013
72 - 72
Fund Specific Notes to Financial Statements (audited)

– 93 –Annual Financial Statements as at December 31, 2014
Signature High Income B Segregated Fund
For inception date of the Fund, please refer to Note 1 in the Notes to the Financial Statements.The accompanying notes are an integral part of these financial statements.
Financial Information (for the years ended December 31) (unaudited)
(1) This information is provided as at December 31, of the years shown.(2) The Fund’s portfolio turnover rate indicates how actively the Fund’s portfolio advisor manages its portfolio investments. A portfolio turnover rate of 100% is equivalent to the Fund buying and selling all of the securities in its portfolio once in the
course of the year. The higher a fund’s portfolio turnover rate in a year, the greater the trading costs payable by the fund in the year, and the greater the chance of an contractholder receiving taxable capital gains in the year. There is not necessarily
a relationship between a high turnover rate and the performance of a fund.(3) Management expense information is calculated based on expenses charged directly to the Fund plus, if applicable, expenses of the underlying fund, excluding commissions and brokerage fees, calculated on a weighted average basis on the percentage
weighting of the underlying fund and is expressed as an annualized percentage of average net asset value for the years shown. As of July 1, 2010, Ontario combined the federal goods and services tax (“GST” - 5%) with the provincial retail sales tax
(“PST” - 8%). The combination resulted in a Harmonized sales tax (“HST”) rate of 13%. The Effective HST tax rate is calculated using the attribution percentage for each province based on contractholders residency and can be different from 13%. For any
particular year, the rate shown will be prorated based on the different rates in effect during that year. For the year ended December 31, 2010 the rate applied is 5% for the period January 1, 2010 to June 30, 2010 and the Fund’s Effective HST rate for the period
starting July 1, 2010. The rate shown for the year ended December 31, 2010 is the time weighted average of these rates.(4) For financial years before January 1, 2013, the financial highlights are derived from the financial statements prepared in accordance with Canadian GAAP applicable to public enterprises. For financial years beginning on or after January 1, 2013,
the financial highlights are derived from the financial statements prepared in accordance with IFRS.
Financial HighlightsThe following tables show selected key financial information about the Fund and are intended to help you understand the Fund’s financial performance for the past five years, as applicable.
The Fund’s Net Asset Value per UnitNet assets value per unit at December 31, of the year shown ($) (1)
Ratios and Supplemental Data Net assets attributable to contractholders ($000’s) (1)
Number of units outstanding (1)
Portfolio turnover rate (%) (2)
Management Expense Ratio Management expense ratio before taxes (%) (3)
Harmonized sales tax/Goods and services tax (%) (3)
Management expense ratio after taxes (%) (3)
Management expense ratio before waivers or absorptions (%) (3)
Effective HST/GST rate for the year (%) (3)
The Fund’s Net Asset Value per UnitNet assets value per unit at December 31, of the year shown ($) (1)
Ratios and Supplemental Data Net assets attributable to contractholders ($000’s) (1)
Number of units outstanding (1)
Portfolio turnover rate (%) (2)
Management Expense Ratio Management expense ratio before taxes (%) (3)
Harmonized sales tax/Goods and services tax (%) (3)
Management expense ratio after taxes (%) (3)
Management expense ratio before waivers or absorptions (%) (3)
Effective HST/GST rate for the year (%) (3)
Class I 2014 2013 2012 2011 2010 2009(4)
33.57 31.01 28.62 25.73 24.61
612 634 611 569 753 18,224 20,476 21,349 22,119 30,613 8.77 4.37 3.99 6.62 18.47
1.68 1.69 1.69 1.69 1.69 0.17 0.18 0.18 0.18 0.14 1.85 1.87 1.87 1.87 1.83 1.85 1.87 1.87 1.87 1.83 11.00 10.97 10.85 10.73 7.84
Class II 2014 2013 2012 2011 2010 2009(4)
30.93 28.99 27.15 24.76 24.04
283 328 355 321 464 9,158 11,297 13,080 12,951 19,303 8.77 4.37 3.99 6.62 18.47
2.98 2.99 2.99 2.99 2.99 0.33 0.33 0.32 0.31 0.23 3.31 3.32 3.31 3.30 3.22 3.31 3.32 3.31 3.30 3.22 12.37 11.66 10.74 10.23 7.58
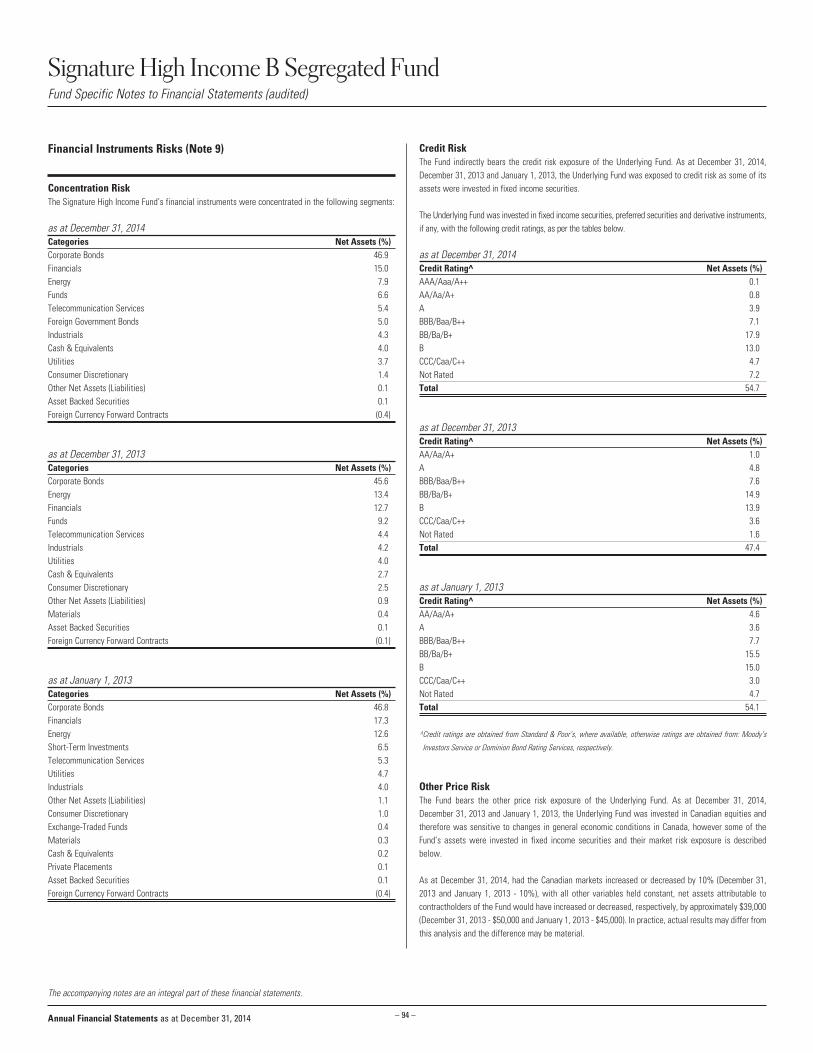
– 94 –Annual Financial Statements as at December 31, 2014
Signature High Income B Segregated Fund
The accompanying notes are an integral part of these financial statements.
Credit RiskThe Fund indirectly bears the credit risk exposure of the Underlying Fund. As at December 31, 2014, December 31, 2013 and January 1, 2013, the Underlying Fund was exposed to credit risk as some of its assets were invested in fixed income securities.
The Underlying Fund was invested in fixed income securities, preferred securities and derivative instruments, if any, with the following credit ratings, as per the tables below.
as at December 31, 2014Credit Rating^ Net Assets (%)AAA/Aaa/A++ 0.1 AA/Aa/A+ 0.8 A 3.9 BBB/Baa/B++ 7.1 BB/Ba/B+ 17.9 B 13.0 CCC/Caa/C++ 4.7 Not Rated 7.2 Total 54.7
as at December 31, 2013 Credit Rating^ Net Assets (%)AA/Aa/A+ 1.0 A 4.8 BBB/Baa/B++ 7.6 BB/Ba/B+ 14.9 B 13.9 CCC/Caa/C++ 3.6 Not Rated 1.6 Total 47.4
as at January 1, 2013 Credit Rating^ Net Assets (%)AA/Aa/A+ 4.6 A 3.6 BBB/Baa/B++ 7.7 BB/Ba/B+ 15.5 B 15.0 CCC/Caa/C++ 3.0 Not Rated 4.7Total 54.1
^ Credit ratings are obtained from Standard & Poor’s, where available, otherwise ratings are obtained from: Moody’s
Investors Service or Dominion Bond Rating Services, respectively.
Other Price Risk The Fund bears the other price risk exposure of the Underlying Fund. As at December 31, 2014, December 31, 2013 and January 1, 2013, the Underlying Fund was invested in Canadian equities and therefore was sensitive to changes in general economic conditions in Canada, however some of the Fund’s assets were invested in fixed income securities and their market risk exposure is described below.
As at December 31, 2014, had the Canadian markets increased or decreased by 10% (December 31, 2013 and January 1, 2013 - 10%), with all other variables held constant, net assets attributable to contractholders of the Fund would have increased or decreased, respectively, by approximately $39,000 (December 31, 2013 - $50,000 and January 1, 2013 - $45,000). In practice, actual results may differ from this analysis and the difference may be material.
Concentration RiskThe Signature High Income Fund’s financial instruments were concentrated in the following segments:
as at December 31, 2014Categories Net Assets (%)Corporate Bonds 46.9Financials 15.0Energy 7.9Funds 6.6Telecommunication Services 5.4Foreign Government Bonds 5.0Industrials 4.3Cash & Equivalents 4.0Utilities 3.7Consumer Discretionary 1.4Other Net Assets (Liabilities) 0.1Asset Backed Securities 0.1Foreign Currency Forward Contracts (0.4)
as at December 31, 2013 Categories Net Assets (%)Corporate Bonds 45.6Energy 13.4Financials 12.7Funds 9.2Telecommunication Services 4.4Industrials 4.2Utilities 4.0Cash & Equivalents 2.7Consumer Discretionary 2.5Other Net Assets (Liabilities) 0.9Materials 0.4Asset Backed Securities 0.1Foreign Currency Forward Contracts (0.1)
as at January 1, 2013 Categories Net Assets (%)Corporate Bonds 46.8Financials 17.3Energy 12.6Short-Term Investments 6.5Telecommunication Services 5.3Utilities 4.7Industrials 4.0Other Net Assets (Liabilities) 1.1Consumer Discretionary 1.0Exchange-Traded Funds 0.4Materials 0.3Cash & Equivalents 0.2Private Placements 0.1Asset Backed Securities 0.1Foreign Currency Forward Contracts (0.4)
Fund Specific Notes to Financial Statements (audited)
Financial Instruments Risks (Note 9)

– 95 –Annual Financial Statements as at December 31, 2014
Signature High Income B Segregated Fund
The accompanying notes are an integral part of these financial statements.
Interest Rate Risk (cont’d)The tables below summarize the Underlying Fund’s exposure to interest rate risk, categorized by the contractual maturity date.
as at December 31, 2014 Less than 1 - 3 3 - 5 Greater than 1 Year Years Years 5 Years Total (%) (%) (%) (%) (%)Interest Rate Exposure 7.0 3.6 11.1 34.3 56.0
as at December 31, 2013 Less than 1 - 3 3 - 5 Greater than 1 Year Years Years 5 Years Total (%) (%) (%) (%) (%)Interest Rate Exposure 7.4 2.6 8.4 30.0 48.4
as at January 1, 2013 Less than 1 - 3 3 - 5 Greater than 1 Year Years Years 5 Years Total (%) (%) (%) (%) (%)Interest Rate Exposure 7.8 3.1 8.3 34.3 53.5
As at December 31, 2014, had the prevailing interest rates increased or decreased by 0.25% (December 31, 2013 and January 1, 2013 - 0.25%), with all other variables held constant, net assets attributable to contractholders of the Fund would have indirectly decreased or increased, respectively, by approximately $4,000 (December 31, 2013 - $3,000 and January 1, 2013 - $4,000). In practice, the actual results may differ from this analysis and the difference may be material.
Fair Value Hierarchy (Note 9)
The tables below summarize the inputs used by the Fund in valuing the Fund’s investments carried at fair value.
Long Positions at fair value as at December 31, 2014 Level 1 Level 2 Level 3 Total (in $000’s) (in $000’s) (in $000’s) (in $000’s)Underlying Fund 891 - - 891 Total 891 - - 891
Long Positions at fair value as at December 31, 2013 Level 1 Level 2 Level 3 Total (in $000’s) (in $000’s) (in $000’s) (in $000’s)Underlying Fund 962 - - 962 Total 962 - - 962
There were no transfers between Level 1 and Level 2 during the years ended December 31, 2014 and 2013.
Long Positions at fair value as at January 1, 2013 Level 1 Level 2 Level 3 Total (in $000’s) (in $000’s) (in $000’s) (in $000’s)Underlying Fund 964 - - 964 Total 964 - - 964
Currency RiskThe Fund indirectly bears the currency risk exposure of the Underlying Fund. As at December 31, 2014, December 31, 2013 and January 1, 2013, the Underlying Fund was exposed to currency risk, as some of its investments were denominated in currencies other than Canadian dollars, the functional currency of the Fund and the Underlying Fund. As a result, the Fund was affected by fluctuations in the value of such currencies relative to the Canadian dollar.
The tables below summarize the Underlying Fund’s exposure to currency risk.
as at December 31, 2014Currency Net Assets (%)US Dollar 17.5 Swiss Franc 1.6 Singapore Dollar 1.1 Swedish Krona 1.0 Australian Dollar 0.7 Euro 0.2 British Pound 0.2 Hong Kong Dollar 0.1 Total 22.4
as at December 31, 2013 Currency Net Assets (%)US Dollar 12.6 Singapore Dollar 1.3 Euro 0.8 Australian Dollar 0.7 British Pound 0.6 Hong Kong Dollar 0.1 Brazilian Real 0.1 Total 16.2
as at January 1, 2013 Currency Net Assets (%)US Dollar 11.3 Singapore Dollar 2.4 Australian Dollar 1.3 Euro 0.8 British Pound 0.6 Brazilian Real 0.1Total 16.5
As at December 31, 2014, had the Canadian dollar strengthened or weakened by 10% (December 31, 2013 and January 1, 2013 - 10%) in relation to all other foreign currencies held in the Underlying Fund, with all other variables held constant, net assets attributable to contractholders of the Fund would have decreased or increased, respectively, by approximately $20,000 (December 31, 2013 - $16,000 and January 1, 2013 - $16,000). In practice, the actual results may differ from this analysis and the difference may be material.
Interest Rate RiskThe Fund indirectly bears the interest rate risk exposure of the Underlying Fund. As at December 31, 2014, December 31, 2013 and January 1, 2013, the Underlying Fund was exposed to interest rate risk as some of its assets were invested in fixed income securities.
Fund Specific Notes to Financial Statements (audited)

– 96 –Annual Financial Statements as at December 31, 2014
Signature High Income Segregated Fund
2014 2013
- - 204 304 - - 276 231
53 39
- - 93 101 626 675
122 132 15 17 - - 5 5 142 154 - - 484 521
2.92 2.60 2.16 2.07
as at as at as at Dec. 31, 2014 Dec. 31, 2013 Jan. 1, 2013
6,114 6,617 7,420 - 1 35 - - - - - - - - - 5 2 2 - - - 6,119 6,620 7,457
1 - - - - 1 - - - - - - - - - - - - 1 - 1 6,118 6,620 7,456
37.26 34.42 31.77 33.99 31.85 29.83
For inception date of the Fund, please refer to Note 1 in the Notes to the Financial Statements.The accompanying notes are an integral part of these financial statements.
Financial Statements (audited)
CIG - 138
Statements of Financial Position (in $000’s except for per unit amounts)
Statements of Comprehensive Income for the years ended December 31(in $000’s except for per unit amounts)
Assets Current assets Investments Cash Fees rebate receivable Dividends receivable Interest receivable Receivable for investments sold Receivable for unit subscriptions
Liabilities Current liabilities Bank overdraft Payable for investments purchased Payable for unit redemptions Management fees payable Administration fees payable Insurance fees payable
Net assets attributable to contractholders
Net assets attributable to contractholders per unit: Class IClass II
Income Net gain (loss) on investments Dividends Income distributions from investments Capital gain distributions from investments Net realized gain (loss) on sale of investments Change in unrealized appreciation (depreciation) in value of
investments Other income Interest Fees rebate (Note 7)
Expenses (Note 7)Management fees Administration fees Insurance fees Harmonized sales tax
Expenses absorbed by the manager Increase (decrease) in net assets from operations attributable to contractholders
Increase (decrease) in net assets from operations attributable to contractholders per unit: Class I Class II

– 97 –Annual Financial Statements as at December 31, 2014
Signature High Income Segregated Fund
The accompanying notes are an integral part of these financial statements.
Financial Statements (audited)
2014 2013
6,620 7,456
484 521
592 255 (1,578) (1,612) (986) (1,357)
6,118 6,620
Net assets attributable to contractholders at the beginning of year Increase (decrease) in net assets from operations attributable to contractholders Unit transactions Proceeds from issuance of units Amounts paid on redemption of units
Net assets attributable to contractholders at the end of year
Statements of Changes in Net Assets Attributable to Contractholders for the years ended December 31 (in $000’s)
2014 2013
484 521
(276) (231)
(53) (39) 1,385 1,418 (556) (346) - - - - - - - - - - - - 984 1,323
592 255 (1,578) (1,612) (986) (1,357)
(2) (34) 1 35 (1) 1
- - - - - - - -
Statements of Cash Flows for the years ended December 31 (in $000’s)
Cash flows from (used in) operating activities Increase (decrease) in net assets from operations attributable to contractholders Adjustments for: Net realized (gain) loss on sale of investments Change in unrealized (appreciation) depreciation in value of
investments Proceeds from sale of investments Purchase of investments (Increase) decrease in dividends receivable (Increase) decrease in interest receivable Increase (decrease) in management fees payable Increase (decrease) in administration fees payable Increase (decrease) in insurance fees payable (Increase) decrease in fees rebate receivable Net cash from (used in) operating activities
Cash flows from (used in) financing activities Proceeds from issuances of unitsAmounts paid on redemption of unitsNet cash from (used in) financing activities
Net increase (decrease) in cashCash (bank overdraft), beginning of yearCash (bank overdraft), end of year
Supplementary Information: Dividends received, net of withholding taxInterest receivedInterest paidIncome taxes paid

– 98 –Annual Financial Statements as at December 31, 2014
Signature High Income Segregated Fund
Schedule of Investment Portfolio as at December 31, 2014 (audited)
No. of Average Fair Units/Shares Investment Cost ($) Value ($)
409,499 Signature High Income Fund (Class A)† 4,848,298 6,113,818 Total Investments (99.9%) 4,848,298 6,113,818 Other Net Assets (Liabilities) (0.1%) 4,491 Net Assets Attributable to Contractholders (100.0%) 6,118,309
Top 25 Holdings of Underlying Fund (unaudited)
No. of Average Fair Units/Shares Investment Cost ($) Value ($)
66,401,445 Signature Cash Management Fund (Class C) 664,014,450 664,014,450 Cash & Equivalents 403,986,438 6,359,920 Inter Pipeline Ltd. 71,404,879 228,575,525 169,224,000 United States Treasury Note/Bond 2.375% 08/15/2024 186,178,965 200,220,748 168,624,000 United States Treasury Note/Bond 1.625% 08/31/2019 186,545,146 196,096,604 55,894,900 Singapore Telecommunications Ltd. 144,470,630 191,160,705 8,098,700 UBS Group AG 171,473,397 161,693,945 8,186,860 Veresen Inc. 108,821,193 150,310,750 15,033,160 Algonquin Power & Utilities Corp. 116,082,564 144,919,662 3,163,270 Canadian REIT 79,137,532 144,846,133 2,303,800 Citigroup Inc. 123,515,972 144,810,439 16,882,424 Transurban Group 93,133,356 137,390,874 3,436,175 Allied Properties REIT 56,656,275 128,650,392 2,566,320 Kinder Morgan Inc. 92,208,837 126,133,775 1,556,400 JPMorgan Chase & Co. 96,989,774 113,144,733 1,870,600 Enbridge Inc. 89,756,229 111,749,644 4,193,242 Brookfield Office Properties Inc. (USD) 65,259,961 111,402,171 84,812,000 United States Treasury Note/Bond 3.125% 08/15/2044 92,950,912 106,065,246 12,713,740 Frontier Communications Corp. 58,350,453 98,509,184 2,400,100 AT&T Inc. 89,247,875 93,651,967 1,039,100 Canadian National Railway Co. 36,668,198 83,148,782 3,410,295 Abertis Infraestructuras S.A. 55,917,021 78,757,375 13,717,400 Telstra Corp., Ltd. 40,902,768 77,675,119 1,714,586 AltaGas Ltd. 46,529,493 74,310,157 16,623,788 Syndey Airport 37,710,764 74,265,429
† The Underlying Fund is also managed by CI Investments Inc., the Manager of the Fund. Percentages shown in brackets in the Schedule of Investment Portfolio relate investments at fair value to net assets attributable to contractholders of the Fund. The accompanying notes are an integral part of these financial statements.

– 99 –Annual Financial Statements as at December 31, 2014
Signature High Income Segregated Fund
The accompanying notes are an integral part of these financial statements.
Fund Specific Notes to Financial Statements (audited)
Interest in Underlying Fund (Note 3)
The following tables present the Fund’s interest in the Underlying Fund.
as at December 31, 2014 Fair Value of Fair Value of the Fund’s Investment Ownership in the the Underlying Fund in the Underlying Fund Underlying FundUnderlying Fund (in $000’s) (in $000’s) (%) 10,020,583 6,114 0.1
as at December 31, 2013 Fair Value of Fair Value of the Fund’s Investment Ownership in the the Underlying Fund in the Underlying Fund Underlying FundUnderlying Fund (in $000’s) (in $000’s) (%) 8,994,373 6,617 0.1
as at January 1, 2013 Fair Value of Fair Value of the Fund’s Investment Ownership in the the Underlying Fund in the Underlying Fund Underlying FundUnderlying Fund (in $000’s) (in $000’s) (%) 7,988,951 7,420 0.1
Signature High Income Fund
Signature High Income Fund
Signature High Income Fund
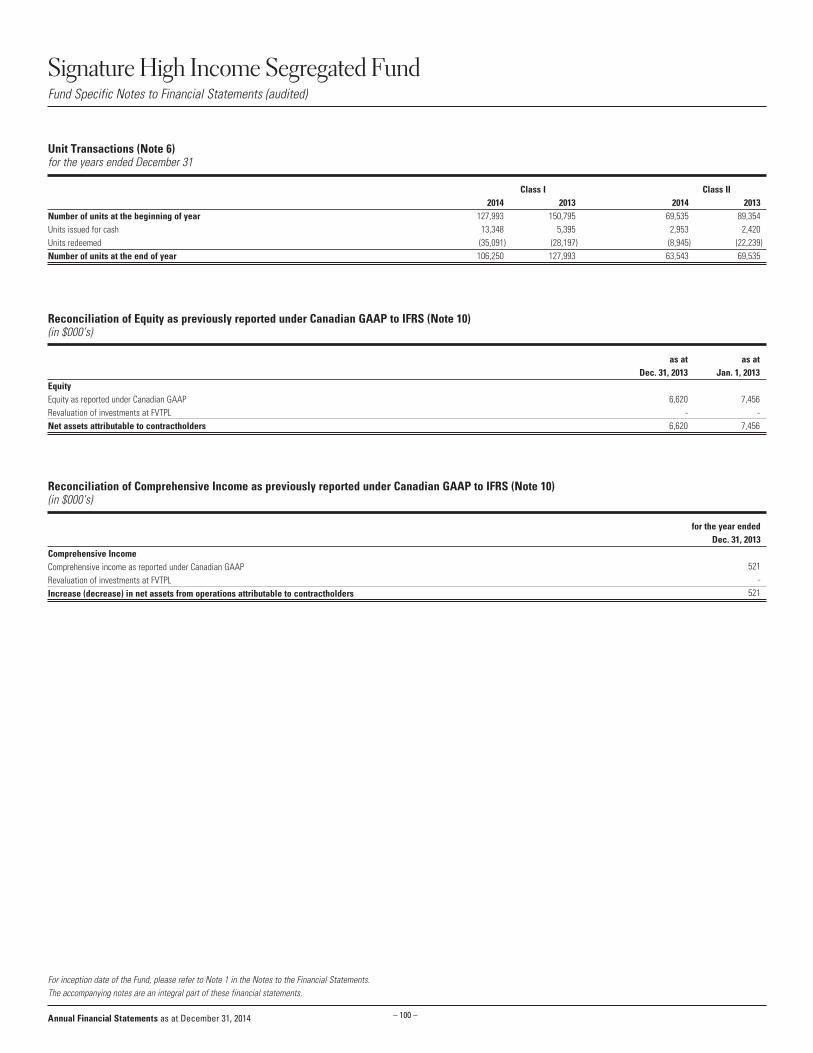
– 100 –Annual Financial Statements as at December 31, 2014
Signature High Income Segregated Fund
Unit Transactions (Note 6)for the years ended December 31
Number of units at the beginning of yearUnits issued for cashUnits redeemed Number of units at the end of year
For inception date of the Fund, please refer to Note 1 in the Notes to the Financial Statements.The accompanying notes are an integral part of these financial statements.
Class I Class II 2014 2013 2014 2013 127,993 150,795 69,535 89,354 13,348 5,395 2,953 2,420 (35,091) (28,197) (8,945) (22,239) 106,250 127,993 63,543 69,535
Reconciliation of Equity as previously reported under Canadian GAAP to IFRS (Note 10) (in $000’s)
EquityEquity as reported under Canadian GAAPRevaluation of investments at FVTPLNet assets attributable to contractholders
as at as at Dec. 31, 2013 Jan. 1, 2013
6,620 7,456 - - 6,620 7,456
Reconciliation of Comprehensive Income as previously reported under Canadian GAAP to IFRS (Note 10) (in $000’s)
Comprehensive IncomeComprehensive income as reported under Canadian GAAPRevaluation of investments at FVTPLIncrease (decrease) in net assets from operations attributable to contractholders
for the year ended Dec. 31, 2013
521 - 521
Fund Specific Notes to Financial Statements (audited)

– 101 –Annual Financial Statements as at December 31, 2014
Signature High Income Segregated Fund
For inception date of the Fund, please refer to Note 1 in the Notes to the Financial Statements.The accompanying notes are an integral part of these financial statements.
Financial Information (for the years ended December 31) (unaudited)
(1) This information is provided as at December 31, of the years shown.(2) The Fund’s portfolio turnover rate indicates how actively the Fund’s portfolio advisor manages its portfolio investments. A portfolio turnover rate of 100% is equivalent to the Fund buying and selling all of the securities in its portfolio once in the
course of the year. The higher a fund’s portfolio turnover rate in a year, the greater the trading costs payable by the fund in the year, and the greater the chance of an contractholder receiving taxable capital gains in the year. There is not necessarily
a relationship between a high turnover rate and the performance of a fund.(3) Management expense information is calculated based on expenses charged directly to the Fund plus, if applicable, expenses of the underlying fund, excluding commissions and brokerage fees, calculated on a weighted average basis on the percentage
weighting of the underlying fund and is expressed as an annualized percentage of average net asset value for the years shown. As of July 1, 2010, Ontario combined the federal goods and services tax (“GST” - 5%) with the provincial retail sales tax
(“PST” - 8%). The combination resulted in a Harmonized sales tax (“HST”) rate of 13%. The Effective HST tax rate is calculated using the attribution percentage for each province based on contractholders residency and can be different from 13%. For any
particular year, the rate shown will be prorated based on the different rates in effect during that year. For the year ended December 31, 2010 the rate applied is 5% for the period January 1, 2010 to June 30, 2010 and the Fund’s Effective HST rate for the period
starting July 1, 2010. The rate shown for the year ended December 31, 2010 is the time weighted average of these rates.(4) For financial years before January 1, 2013, the financial highlights are derived from the financial statements prepared in accordance with Canadian GAAP applicable to public enterprises. For financial years beginning on or after January 1, 2013,
the financial highlights are derived from the financial statements prepared in accordance with IFRS.
Financial HighlightsThe following tables show selected key financial information about the Fund and are intended to help you understand the Fund’s financial performance for the past five years, as applicable.
The Fund’s Net Asset Value per UnitNet assets value per unit at December 31, of the year shown ($) (1)
Ratios and Supplemental Data Net assets attributable to contractholders ($000’s) (1)
Number of units outstanding (1)
Portfolio turnover rate (%) (2)
Management Expense Ratio Management expense ratio before taxes (%) (3)
Harmonized sales tax/Goods and services tax (%) (3)
Management expense ratio after taxes (%) (3)
Management expense ratio before waivers or absorptions (%) (3)
Effective HST/GST rate for the year (%) (3)
The Fund’s Net Asset Value per UnitNet assets value per unit at December 31, of the year shown ($) (1)
Ratios and Supplemental Data Net assets attributable to contractholders ($000’s) (1)
Number of units outstanding (1)
Portfolio turnover rate (%) (2)
Management Expense Ratio Management expense ratio before taxes (%) (3)
Harmonized sales tax/Goods and services tax (%) (3)
Management expense ratio after taxes (%) (3)
Management expense ratio before waivers or absorptions (%) (3)
Effective HST/GST rate for the year (%) (3)
Class I 2014 2013 2012 2011 2010 2009(4)
37.26 34.42 31.77 28.56 27.33
3,958 4,405 4,791 4,922 5,255 106,250 127,993 150,795 172,328 192,265 8.64 4.97 11.63 11.96 10.52
1.69 1.69 1.68 1.69 1.69 0.18 0.18 0.18 0.18 0.14 1.87 1.87 1.86 1.87 1.83 1.87 1.87 1.86 1.87 1.83 10.77 11.11 12.08 11.87 8.44
Class II 2014 2013 2012 2011 2010 2009(4)
33.99 31.85 29.83 27.20 26.41
2,160 2,215 2,665 2,911 3,452 63,543 69,535 89,354 107,037 130,718 8.64 4.97 11.63 11.96 10.52
2.99 2.99 2.98 2.99 2.99 0.31 0.32 0.33 0.32 0.24 3.30 3.31 3.31 3.31 3.23 3.30 3.31 3.31 3.31 3.23 10.14 10.97 11.44 11.03 8.19

– 102 –Annual Financial Statements as at December 31, 2014
Signature High Income Segregated Fund
The accompanying notes are an integral part of these financial statements.
Credit RiskThe Fund indirectly bears the credit risk exposure of the Underlying Fund. As at December 31, 2014, December 31, 2013 and January 1, 2013, the Underlying Fund was exposed to credit risk as some of its assets were invested in fixed income securities.
The Underlying Fund was invested in fixed income securities, preferred securities and derivative instruments, if any, with the following credit ratings, as per the tables below.
as at December 31, 2014Credit Rating^ Net Assets (%)AAA/Aaa/A++ 0.1 AA/Aa/A+ 0.8 A 3.9 BBB/Baa/B++ 7.1 BB/Ba/B+ 17.9 B 13.0 CCC/Caa/C++ 4.7 Not Rated 7.2 Total 54.7
as at December 31, 2013 Credit Rating^ Net Assets (%)AA/Aa/A+ 1.0 A 4.8 BBB/Baa/B++ 7.6 BB/Ba/B+ 14.9 B 13.9 CCC/Caa/C++ 3.6 Not Rated 1.6 Total 47.4
as at January 1, 2013 Credit Rating^ Net Assets (%)AA/Aa/A+ 4.6 A 3.6 BBB/Baa/B++ 7.7 BB/Ba/B+ 15.5 B 15.0 CCC/Caa/C++ 3.0 Not Rated 4.7Total 54.1
^ Credit ratings are obtained from Standard & Poor’s, where available, otherwise ratings are obtained from: Moody’s
Investors Service or Dominion Bond Rating Services, respectively.
Other Price Risk The Fund indirectly bears the other price risk exposure of the Underlying Fund. As at December 31, 2014, December 31, 2013 and January 1, 2013, the Underlying Fund’s holdings were sensitive to changes in general economic conditions in Canada. The Underlying Fund’s portfolio consisted of Canadian stocks and fixed income securities, thus an overall downturn in the Canadian economy may lead to a widening in credit spreads and a decrease in equity prices which would then lead to a decrease in the value of the Underlying Fund’s holdings.
As at December 31, 2014, had the Canadian markets increased or decreased by 10% (December 31, 2013 and January 1, 2013 - 10%), with all other variables held constant, net assets attributable to contractholders of the Fund would have increased or decreased, respectively, by approximately $269,000 (December 31, 2013 - $341,000 and January 1, 2013 - $345,000). In practice, actual results may differ from this analysis and the difference may be material.
Concentration RiskThe Signature High Income Fund’s financial instruments were concentrated in the following segments:
as at December 31, 2014Categories Net Assets (%)Corporate Bonds 46.9Financials 15.0Energy 7.9Funds 6.6Telecommunication Services 5.4Foreign Government Bonds 5.0Industrials 4.3Cash & Equivalents 4.0Utilities 3.7Consumer Discretionary 1.4Other Net Assets (Liabilities) 0.1Asset Backed Securities 0.1Foreign Currency Forward Contracts (0.4)
as at December 31, 2013 Categories Net Assets (%)Corporate Bonds 45.6Energy 13.4Financials 12.7Funds 9.2Telecommunication Services 4.4Industrials 4.2Utilities 4.0Cash & Equivalents 2.7Consumer Discretionary 2.5Other Net Assets (Liabilities) 0.9Materials 0.4Asset Backed Securities 0.1Foreign Currency Forward Contracts (0.1)
as at January 1, 2013 Categories Net Assets (%)Corporate Bonds 46.8Financials 17.3Energy 12.6Short-Term Investments 6.5Telecommunication Services 5.3Utilities 4.7Industrials 4.0Other Net Assets (Liabilities) 1.1Consumer Discretionary 1.0Exchange-Traded Funds 0.4Materials 0.3Cash & Equivalents 0.2Private Placements 0.1Asset Backed Securities 0.1Foreign Currency Forward Contracts (0.4)
Fund Specific Notes to Financial Statements (audited)
Financial Instruments Risks (Note 9)

– 103 –Annual Financial Statements as at December 31, 2014
Signature High Income Segregated Fund
The accompanying notes are an integral part of these financial statements.
Interest Rate Risk (cont’d)
The tables below summarize the Underlying Fund’s exposure to interest rate risk, categorized by the contractual maturity date.
as at December 31, 2014 Less than 1 - 3 3 - 5 Greater than 1 Year Years Years 5 Years Total (%) (%) (%) (%) (%)Interest Rate Exposure 7.0 3.6 11.1 34.3 56.0
as at December 31, 2013 Less than 1 - 3 3 - 5 Greater than 1 Year Years Years 5 Years Total (%) (%) (%) (%) (%)Interest Rate Exposure 7.4 2.6 8.4 30.0 48.4
as at January 1, 2013 Less than 1 - 3 3 - 5 Greater than 1 Year Years Years 5 Years Total (%) (%) (%) (%) (%)Interest Rate Exposure 7.8 3.1 8.3 34.3 53.5
As at December 31, 2014, had the prevailing interest rates increased or decreased by 0.25% (December 31, 2013 and January 1, 2013 - 0.25%), with all other variables held constant, net assets attributable to contractholders of the Fund would have indirectly decreased or increased, respectively, by approximately $28,000 (December 31, 2013 - $21,000 and January 1, 2013 - $32,000). In practice, the actual results may differ from this analysis and the difference may be material.
Fair Value Hierarchy (Note 9)
The tables below summarize the inputs used by the Fund in valuing the Fund’s investments carried at fair value.
Long Positions at fair value as at December 31, 2014 Level 1 Level 2 Level 3 Total (in $000’s) (in $000’s) (in $000’s) (in $000’s)Underlying Fund 6,114 - - 6,114 Total 6,114 - - 6,114
Long Positions at fair value as at December 31, 2013 Level 1 Level 2 Level 3 Total (in $000’s) (in $000’s) (in $000’s) (in $000’s)Underlying Fund 6,617 - - 6,617Total 6,617 - - 6,617
There were no transfers between Level 1 and Level 2 during the years ended December 31, 2014 and 2013.
Long Positions at fair value as at January 1, 2013 Level 1 Level 2 Level 3 Total (in $000’s) (in $000’s) (in $000’s) (in $000’s)Underlying Fund 7,420 - - 7,420Total 7,420 - - 7,420
Currency RiskThe Fund indirectly bears the currency risk exposure of the Underlying Fund. As at December 31, 2014, December 31, 2013 and January 1, 2013, the Underlying Fund was exposed to currency risk, as some of its investments were denominated in currencies other than Canadian dollars, the functional currency of the Fund and the Underlying Fund. As a result, the Fund was affected by fluctuations in the value of such currencies relative to the Canadian dollar.
The tables below summarize the Underlying Fund’s exposure to currency risk.
as at December 31, 2014Currency Net Assets (%)US Dollar 17.5 Swiss Franc 1.6 Singapore Dollar 1.1 Swedish Krona 1.0 Australian Dollar 0.7 Euro 0.2 British Pound 0.2 Hong Kong Dollar 0.1 Total 22.4
as at December 31, 2013 Currency Net Assets (%)US Dollar 12.6 Singapore Dollar 1.3 Euro 0.8 Australian Dollar 0.7 British Pound 0.6 Hong Kong Dollar 0.1 Brazilian Real 0.1 Total 16.2
as at January 1, 2013 Currency Net Assets (%)US Dollar 11.3 Singapore Dollar 2.4 Australian Dollar 1.3 Euro 0.8 British Pound 0.6 Brazilian Real 0.1Total 16.5
As at December 31, 2014, had the Canadian dollar strengthened or weakened by 10% (December 31, 2013 and January 1, 2013 - 10%) in relation to all other foreign currencies held in the Underlying Fund, with all other variables held constant, net assets attributable to contractholders of the Fund would have decreased or increased, respectively, by approximately $137,000 (December 31, 2013 - $107,000 and January 1, 2013 - $122,000). In practice, the actual results may differ from this analysis and the difference may be material.
Interest Rate RiskThe Fund indirectly bears the interest rate risk exposure of the Underlying Fund. As at December 31, 2014, December 31, 2013 and January 1, 2013, the Underlying Fund was exposed to interest rate risk as some of its assets were invested in fixed income securities.
Fund Specific Notes to Financial Statements (audited)

– 104 –Annual Financial Statements as at December 31, 2014
Legacy Segregated Funds
1. THE FUNDS
The following Legacy Segregated Funds were created by a board resolution of Transamerica Life
Canada (“Transamerica”):
Funds Dated
Cambridge American Equity Segregated Fund December 29, 1997
CI American Small Companies Segregated Fund December 29, 1997
CI Global Segregated Fund December 29, 1997
CI International Segregated Fund December 29, 1997
CI Money Market Segregated Fund December 29, 1997
Signature Canadian Balanced Segregated Fund December 29, 1997
Signature Canadian Bond Segregated Fund December 29, 1997
Signature Canadian Segregated Fund December 29, 1997
Signature Dividend Income Segregated Fund December 29, 1997
Signature High Income B Segregated Fund February 1, 1999
Signature High Income Segregated Fund December 29, 1997
Signature Select Canadian Segregated Fund February 1, 1999
(the “Fund” or collectively “the Funds”)
Transamerica is the sole issuer of the variable annuity contract providing for investment in each Fund.
The assets of the Funds are owned by Transamerica and are segregated from Transamerica’s other
assets. The Funds are not separate legal entities.
Transamerica has appointed CI Investments Inc. (the “Manager”) to perform certain administrative
and management services on its behalf in relation to the Funds and the contracts. The head office of
CI Investments Inc. is located at 2 Queen Street East, Toronto, Ontario, M5C 3G7. CI Investments Inc.
is a subsidiary of CI Financial Corp.
Each Fund invests all of its net assets in a CI mutual fund (the “Underlying Fund”).
There are two classes of units of the Funds, I and II. Class I units were offered to investors on the date
of the formation of the Funds. Class II units were offered to investors on February 1, 1999. Both classes
represent a 100/100 Guarantee option.
The financial statements are presented in Canadian dollars.
These financial statements were authorized for issue by the Manager on April 30, 2015.
2. BASIS OF PREPARATION AND ADOPTION OF IFRS
These financial statements have been prepared in accordance with International Financial Reporting
Standards (“IFRS”) applicable to the preparation of annual financial statements. The Funds adopted
this basis of accounting on January 1, 2014 as required by Canadian securities legislation and the
Canadian Accounting Standards Board. Previously, the Funds prepared their financial statements in
accordance with Canadian generally accepted accounting principles as defined in the Part V of the
CPA Canada Handbook - Accounting (“Canadian GAAP”). The Funds have consistently applied the
accounting policies used in the preparation of their opening IFRS statement of financial position at
January 1, 2013 and throughout all periods presented, as if these policies had always been in effect.
Note 10 discloses the impact of the transition to IFRS on the Funds’ reported financial position,
financial performance and cash flows, including the nature and effect of significant changes in
accounting policies from those used in the Funds’ financial statements for the year ended December 31,
2013 prepared under Canadian GAAP.
The policies applied in these annual financial statements are based on IFRS requirements applicable
as of December 31, 2014.
The Statements of Financial Position are as at December 31, 2014, December 31, 2013 and January 1,
2013. The Statements of Comprehensive Income, Statements of Changes in Net Assets Attributable to
Contractholders and Statements of Cash Flows are for the years ended December 31, 2014 and 2013.
Schedule of Investment Portfolio is as at December 31, 2014. The Fund Specific Notes to Financial
Statements for each Fund consist of Interest in Underlying Fund as at December 31, 2014, December
31, 2013 and January 1, 2013, Unit Transactions as at December 31, 2014 and 2013, Reconciliation of
Equity as previously reported under Canadian GAAP to IFRS as at December 31, 2013 and January 1,
2013, Reconciliation of Comprehensive Income as previously reported under Canadian GAAP to IFRS
for the year ended December 31, 2013 and Financial Instruments Risks as at December 31, 2014,
December 31, 2013 and January 1, 2013, as applicable.
3. SIGNIFICANT ACCOUNTING POLICIES
The following is a summary of the significant accounting policies of the Funds:
a. Classification and recognition of financial instruments
The Funds recognize financial instruments at fair value upon initial recognition, inclusive of transaction
costs in the case of financial instruments measured at amortized cost. Purchases and sales of
financial assets are recognized at their trade date. The Funds’ investments are measured at fair value
through profit or loss (“FVTPL”). The Funds’ obligations for net assets attributable to contractholders
are presented at the redemption amount. All other financial assets and liabilities are measured at
amortized cost. Under this method, financial assets and liabilities reflect the amount required to
be received or paid, discounted, when appropriate, at the effective interest rate. There were no
differences between the net asset value (“NAV”) used for transactions with contractholders and the
net assets attributable to contractholders used for reporting purposes under IFRS.
b. Fair value of financial investments
At the financial reporting date, listed securities are valued based on the last traded market price
for financial assets and financial liabilities where the last traded price falls within the day’s bid-ask
spread. In circumstances where the last traded price is not within the bid-ask spread, the Manager
determines the point within the bid-ask spread that is most representative of fair value based on the
existing marked conditions. Unlisted securities are valued based on price quotations from recognized
investment dealers, or failing that, their fair value is determined by the Manager on the basis of the
latest reported information available. Underlying Funds are valued on each business day at their net
asset value as reported by the Underlying Funds’ manager.
c. Financial assets at fair value
The Funds classify their investments in Underlying Funds as financial assets at fair value through
profit or loss.
This category has two sub-categories: financial assets held for trading; and those designated at fair
value through profit or loss at inception.
Financial assets held for trading
A financial asset is classified as held for trading (“HFT”) if it is acquired or incurred principally
for the purpose of selling or repurchasing in the near term or if on initial recognition is part
of a portfolio of identifiable financial investments that are managed together and for which
there is evidence of a recent actual pattern of short-term profit taking. As at December 31,
2014, December 31, 2013 and January 1, 2013, the Funds did not hold any financial assets
categorized as HFT.
Notes to the Financial Statements (audited)

– 105 –Annual Financial Statements as at December 31, 2014
Legacy Segregated Funds
Financial assets designated at fair value through profit or loss at inception
Financial assets designated at fair value through profit or loss at inception, are financial
instruments that are not classified as HFT but are managed, and their performance is evaluated
on a fair value basis in accordance with the Funds’ documented investment strategy. As at
December 31, 2014, December 31, 2013 and January 1, 2013, all investments held by the Funds
were designated as FVTPL.
d. Foreign exchange
The Funds subscriptions and redemptions are denominated in Canadian dollars, which is also the
Funds’ functional and presentation currency.
e. Cost of investments
Cost of investments represents the amount paid for each security, and is determined on an average
cost basis.
f. Investment transactions
Investment transactions are accounted for on the trade date. Realized gains and losses on sales of
investments and unrealized appreciation or depreciation in value of investments are calculated on an
average cost basis.
g. Income recognition
Distributions from investments are recorded on the ex-distribution date and interest income is accrued
on a daily basis.
Distributions received from investment fund holdings are recognized by the Funds in the same form in
which they were received from the Underlying Funds.
h. Consolidated financial statements
Under IFRS 10, Consolidated Financial Statements, a Fund is required to provide consolidated financial
statements if it has control over the entities it invests in. In October 2013, the IASB issued an
“Investment Entity” amendment to IFRS 10, which provides an exception to consolidation for an entity
that meets the definition of Investment Entity. The Manager has determined that all Funds satisfy the
criteria of an Investment Entity.
i. Investments in associates, joint ventures, subsidiaries and structure entities
Subsidiaries are entities, including investments in other investment entities, over which the Fund
has control. A Fund controls an entity when it is exposed to, or has rights to, variable returns from
its involvement with the entity, and has the ability to affect those returns through its power over the
entity. Associates and joint ventures are investments over which a Fund has significant influence or
joint control. Conversely, structured entities are entities that have been designed such that voting
or similar rights are not the dominant factors in determining control over the entity, such as when
voting rights relate to administrative tasks only and the relevant activities are directed by means of
contractual arrangements.
For all Funds that invest in Underlying Funds, the Manager has determined that the bottom investee
funds meet the definition of a structured entity to the top (investing) funds.
The Fund invests in redeemable units or shares of other investment funds (“Underlying Funds”) to gain
exposure to the investment objectives and strategies of the Underlying Funds. Each Underlying Fund is
generally financed through the capital invested by the Fund, along with other investors, which entitles
unitholders or shareholders to a proportionate share of the Underlying Fund’s net assets. The Fund
does not provide additional financial or other support to the Underlying Funds. All Underlying Funds
were established in and carry out their operations in Canada. The Fund’s interests in Underlying Funds
are reported at fair value in “Investments” in its Statements of Financial Position and in its Schedule
of Investments, which represents the Fund’s maximum exposure to financial loss.
Information related to Funds’ interest in Underlying Funds for each Fund appears under the Fund
Specific Notes to Financial Statements.
j. Net asset value per unit
Net asset value per unit for each class is calculated at the end of each day on which the Toronto Stock
Exchange is open for business by dividing the total net asset value of each class by its outstanding
units.
The total net asset value of each class is computed by calculating the value of that class’ proportionate
share of the Fund’s assets less that class’ proportionate share of the Fund’s common liabilities and
class specific liabilities. Expenses directly attributable to a class are charged to that class. Income
and other expenses are allocated to each class proportionately based upon the relative total net asset
value of each class to the total net asset value of the Fund.
k. Cash
Cash is comprised of cash on deposit.
l. Increase (decrease) in net assets from operations attributable to contractholders per unit
Increase (decrease) in net assets from operations attributable to contractholders per unit of each
class is calculated by dividing the increase (decrease) in net assets from operations attributable to
contractholders of each class of a Fund by the weighted average number of units outstanding of that
class during the year.
m. Non-zero amounts
Some of the balances reported in the financial statements include amounts that are rounded to zero.
4. USE OF ACCOUNTING JUDGMENTS AND ESTIMATES
The preparation of financial statements in accordance with IFRS requires management to make
judgments, estimates and assumptions that affect the application of accounting policies and
reported amounts of assets and liabilities at the reporting date and the reported amounts of income
and expenses during the reporting period. The following discusses the most significant accounting
judgments and estimates that the Funds have made in preparing the financial statements:
Classification and measurement of investments and application of the fair value option
In classifying and measuring financial instruments held by the Funds, the Manager is required
to make significant judgments about whether or not the business of the Funds is to invest on a
total return basis for the purpose of applying the fair value option for the financial assets under
IAS39, Financial instruments – Recognition and Measurement. The most significant judgment
made includes the determination that certain investments are held-for-trading and that the fair
value option can be applied to those which are not.
5. INCOME TAXES
Each Fund is deemed to be an inter-vivos trust under the provisions of the Income Tax Act (Canada)
and is deemed to have allocated its taxable income to the policyholders. Each Fund’s net capital gains
(losses) are deemed to be those of the beneficiaries. Accordingly, each Fund is not subject to income
tax on its net income, including net realized capital gains for the year.
Notes to the Financial Statements (audited) (cont’d)

– 106 –Annual Financial Statements as at December 31, 2014
Legacy Segregated Funds
A Fund may elect each year to realize capital gains/(losses) for the taxation year, to optimize the
allocation of capital gains/(losses) between redeeming and continuing beneficiaries.
6. CONTRACTHOLDERS UNITS
There are two classes of units of the Funds, I and II. Class I units were offered to investors on the date
of the formation of the Funds. Class II units were offered to investors on February 1, 1999. Both classes
represent a 100/100 Guarantee option.
Unit Transactions information for each Fund appears under the Fund Specific Notes to Financial
Statements.
7. MANAGEMENT FEES AND EXPENSE RATIO
Transamerica charges each Fund an annual management fee. The Fund’s Manager charges an annual
management fee to each underlying fund for the provision of its services pursuant to the management
agreement.
The daily management fee applicable to each Fund and payable to Transamerica is calculated on each
valuation date and is equal to the product of the net asset value of each Fund on such date and the
number of days elapsed since the last valuation date, multiplied by Transamerica’s daily management
fee applicable to each Fund.
In addition to the management fee payable, each Fund and each underlying fund is charged an annual
administration fee. In return for an annual administration fee the Manager bears all of the operating
expenses of the each Fund and each underlying fund (other than certain taxes, borrowing costs, certain
new governmental fees and costs and expenses of reports and information folders required to comply
with laws and regulatory guidelines regulating the issuance or sale of variable annuity contracts).
The management fees and the fees rebate reported in the Statements of Comprehensive Income of
each Fund are each presented on a gross basis.
Management Expense Ratios (MER) information appears under the Financial Highlights section of the
Fund Specific Notes to Financial Statements.
The Funds pay an insurance fee to Transamerica. The insurance fee of the Fund Class is charged by
Transamerica for the applicable Guarantee Option in respect of that Fund Class. The insurance fees
payable at year-end are included in the “Insurance fees payable” in the Statements of Financial
Position, while insurance fees expense for the year are included in the “Insurance fees” in the
Statements of Comprehensive Income.
8. RELATED PARTY TRANSACTIONS
The Funds invest in an Underlying Fund that is also managed by CI Investments Inc., the Manager of
the Funds.
9. FINANCIAL INSTRUMENTS RISK
Risk management
The Funds invest in units of Underlying Funds and are exposed to a variety of financial instruments
risks: credit risk, liquidity risk and market risk (including other price risk, currency risk and interest rate
risk). The level of risk to which each Fund is exposed depends on the investment objective and the
type of investments held by the Underlying Funds. The value of investments within an Underlying Fund
portfolio can fluctuate daily as a result of changes in prevailing interest rates, economic and market
conditions and company specific news related to investments held by the Underlying Fund and this will
affect the value of each of the Funds. The Manager of the Underlying Funds may minimize potential
adverse effects of these risks by, but not limited to, regular monitoring of the Underlying Funds’
positions and market events, diversification of the investment portfolio by asset type, country, sector,
term to maturity within the constraints of the stated objectives, and through the usage of derivatives
to hedge certain risk exposures.
Details of individual Funds’ exposure to financial instruments risks are available in the Financial
Instruments Risk section of the Fund Specific Notes to Financial Statements.
Concentration risk
Concentration risk arises as a result of the concentration of exposures within the same category,
whether it is a geographical allocation, asset type, industry sector or counterparty. For top holdings of
the Underlying Funds refer to Fund Specific Notes to Financial Statements.
Credit risk
Credit risk is the risk that a security issuer or counterparty to a financial instrument will fail to meet
its financial obligations. The fair value of a debt instrument includes consideration of the credit
worthiness of the debt issuer. Credit risk exposure for derivative instruments is based on each
Underlying Fund’s unrealized gain on the contractual obligations with the counterparty as at the
reporting date. The credit risk exposure of the Funds’ other assets are represented by their carrying
amount as disclosed in the Statements of Financial Position.
Liquidity risk
Liquidity risk is the risk that a Fund may not be able to settle or meet its obligations, on time or at
a reasonable price. The Funds are exposed to daily cash redemption of redeemable units. The Funds
invest all of their assets in Underlying Funds which can be readily disposed of.
Market risk
The Funds’ investments are subject to market risk which is the risk that the fair value of future cash
flows of a financial instrument will fluctuate due to changes in market conditions.
i. Other Price Risk
Other price risk is the risk that the value of financial instruments will fluctuate as a result of
changes in market prices (other than those arising from interest rate risk or currency risk). The
value of each investment is influenced by the outlook of the issuer and by general economic and
political conditions, as well as industry and market trends. All securities present a risk of loss of
capital.
Other assets and liabilities are monetary items that are short-term in nature and therefore are not
subject to other price risk.
ii. Currency Risk
Currency risk arises from financial instruments that are denominated in a currency other than,
Canadian dollars, the functional currency of the Funds and the Underlying Funds. As a result, the
Underlying Funds may be exposed to the risk that the value of securities denominated in other
currencies will fluctuate due to changes in exchange rates. Equities traded in foreign markets are
also exposed to currency risk as the prices denominated in foreign currencies are converted to
Underlying Funds’ functional currency to determine their fair value.
Notes to the Financial Statements (audited) (cont’d)

– 107 –Annual Financial Statements as at December 31, 2014
Legacy Segregated Funds
iii. Interest Rate Risk
Interest rate risk is the risk that the fair value of interest-bearing investments will fluctuate due
to changes in prevailing levels of market interest rates. As a result, the value of the Underlying
Funds that invest in debt securities and/or income trusts will be affected by changes in applicable
interest rates. If interest rates fall, the fair value of existing debt securities may increase due to the
increase in yield. Alternatively, if interest rates rise, the yield of existing debt securities decrease
which may then lead to a decrease in their fair value. The magnitude of the decline will generally
be greater for long-term debt securities than for short-term debt securities.
Interest rate risk also applies to convertible securities. The fair value of these securities varies
inversely with interest rates, similar to other debt securities. However, since they may be
converted into common shares, convertible securities are generally less affected by interest rate
fluctuations than other debt securities.
Fair value hierarchy
The Funds are required to classify financial instruments measured at fair value using a fair value
hierarchy. Investments whose values are based on quoted market prices in active markets are
classified as Level 1. This level includes publicly traded equities, exchange traded and retail mutual
funds, exchange traded warrants, futures contracts and traded options.
Financial instruments that trade in markets that are not considered to be active but are valued based
on quoted market prices, dealer quotations or alternative pricing sources supported by observable
inputs are classified as Level 2. These include, fixed income securities, mortgage backed securities
(“MBS”), short-term instruments, non-traded warrants, over-the-counter options, structured notes of
indexed securities, if applicable, foreign currency forward contracts and swap instruments.
Investments classified as Level 3 have significant unobservable inputs. Level 3 instruments include
private equities, private term loans, private equity funds and certain derivatives. As observable prices
are not available for these securities, the Funds may use a variety of valuation techniques to derive
the fair value.
The Funds invest only in other investment funds and these investments are classified as Level 1.
10. TRANSITION TO IFRS
The effects of the Funds’ transition to IFRS are as follows:
Transition elections
The only voluntary exemption adopted by the Funds’ upon transition was the ability to designate a
financial asset or financial liability at fair value through profit and loss. All financial assets designated
at FVTPL upon transition were previously carried at fair value under Canadian GAAP as required by
Accounting Guideline 18, Investment Companies.
Statement of cash flows
Under Canadian GAAP, the Funds were exempt from providing a statement of cash flows. IAS 1,
Presentation of Financial Statements, requires that a complete set of financial statements include a
statement of cash flows for the current and comparative years.
Classification of units issued by the Funds
Under Canadian GAAP, the Funds accounted for their units as equity. Under IFRS, IAS 32, Financial
Instruments: Presentation, requires that units of an entity which include a contractual obligation
for the Issuer to repurchase or redeem the units for cash or another financial asset be classified as
financial liability. The Funds units have been reclassified as financial liabilities on transition to IFRS.
Revaluation of investments at FVTPL
Under Canadian GAAP, the Funds measured the fair values of their investments in accordance with
Section 3855, Financial Instruments – Recognition and Measurement, which required the use of bid
prices for long positions and ask prices for short positions; to the extent such prices are available.
Under IFRS, the Funds measure the fair values of their investments using the guidance in IFRS 13, Fair
Value Measurement, which requires that if an asset or a liability has a bid price and an ask price,
then its fair value is to be based on a price within the bid-ask spread that is most representative of
fair value. As the Funds’ invest only in the Underlying Funds which are valued at net asset value as
reported by the Underlying Funds’ manager under Canadian GAAP as well as IFRS no adjustments
were recognized upon Funds’ transition to IFRS.
Details of the revaluation of investments at FVTPL for each of the Funds are available in the Fund
Specific Notes to Financial Statements of each Fund.
Reclassification adjustments
The Funds did not have any reclassified amounts to their financial statements presentation upon
transition to IFRS.
Notes to the Financial Statements (audited) (cont’d)

– 108 –Annual Financial Statements as at December 31, 2014
NOTICE: Should you require additional copies of these Annual Financial Statements or have received
more than one copy, please contact CI Investments Inc. or your adviser.
Transamerica Life Canada is the sole issuer of the individual variable annuity contract providing for
investment in Legacy Segregated Funds. A description of the key features of the applicable individual
variable annuity contract is contained in the Legacy Funds Information Folder. ANY AMOUNT THAT
IS ALLOCATED TO A SEGREGATED FUND IS INVESTED AT THE RISK OF THE OWNER AND
MAY INCREASE OR DECREASE IN VALUE.
®CI Investments and the CI Investments design are trademarks of CI Investments Inc. ®TRANSAMERICA and the pyramid design are registered trademarks of Transamerica Corporation.
Transamerica Life Canada is licensed to use such marks.
INFORMATION FOLDER: CI Investments Inc. would be pleased to provide, without charge, the most
recent Information Folder upon request to its Toronto office.
Legacy Segregated FundsLegal Notice

LEGACY_AR_XX/15E
2 Queen Street East, Twentieth Floor, Toronto, Ontario M5C 3G7 I www.ci.comHead Office / Toronto416-364-1145 1-800-268-9374
Calgary 403-205-43961-800-776-9027
Montreal 514-875-0090 1-800-268-1602
Vancouver 604-681-3346 1-800-665-6994
Client Services English: 1-800-792-9355 French: 1-800-668-3528
Transamerica Life Canada
5000 Yonge StreetToronto, Ontario, M2N 7J8