annual financial report management report responsibility
TRANSCRIPT
NESTLÉ HOLDINGS, INC.AND SUBSIDIARIES
Annual Financial Report
Management Report
Responsibility Statement
Consolidated Financial Statements
December 31, 2015 and 2014
(With Independent Auditors’ Report Thereon)
NESTLÉ HOLDINGS, INC.AND SUBSIDIARIES
Table of Contents
Page
Management Report 3
Responsibility Statement 8
Independent Auditors’ Report 9
Consolidated Financial Statements
Consolidated Balance Sheet 10
Consolidated Income Statement 11
Consolidated Statement of Comprehensive Income 12
Consolidated Statement of Changes in Equity 13
Consolidated Statement of Cash Flows 14
Notes to Consolidated Financial Statements
151922232326283738394449545455565759606163
(1) Accounting Policies(2) Analyses by Segment(3) Trade and Other Receivables, net(4) Inventories, net(5) Derivative Assets and Liabilities(6) Property, Plant and Equipment, net(7) Employee Benefits(8) Investments in Joint Ventures and Associated Companies(9) Deferred Taxes(10) Goodwill and Intangible Assets(11) Financial Instruments(12) Financial Risks(13) Assets Held for Sale(14) Accruals(15) Provisions and Contingencies(16) Net Financial Income/(Expense)(17) Net Other Trading and Operating Income/(Expenses)(18) Income Tax Expense(19) Lease Commitments(20) Acquisitions and Disposals of Businesses(21) Events after the Balance Sheet Date(22) Transactions with Related Parties 64
NESTLÉ HOLDINGS, INC.AND SUBSIDIARIES
December 31, 2015 and 2014
Management Report
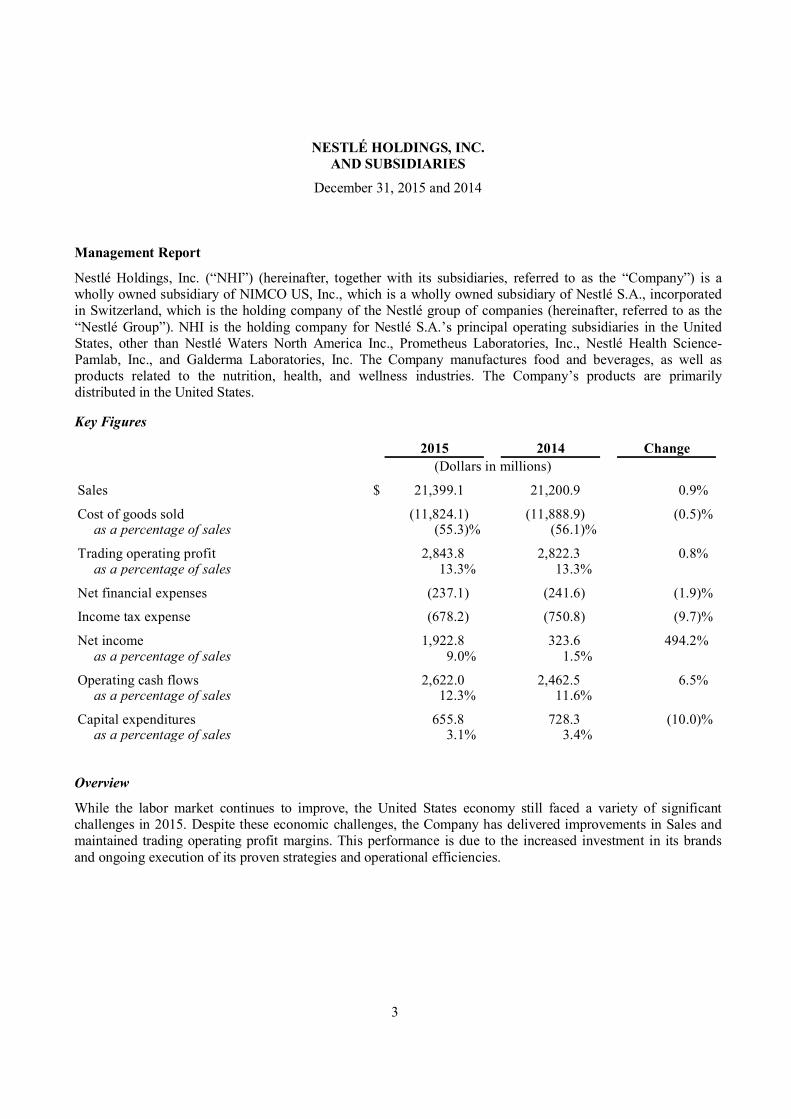
Nestlé Holdings, Inc. (“NHI”) (hereinafter, together with its subsidiaries, referred to as the “Company”) is awholly owned subsidiary of NIMCO US, Inc., which is a wholly owned subsidiary of Nestlé S.A., incorporatedin Switzerland, which is the holding company of the Nestlé group of companies (hereinafter, referred to as the“Nestlé Group”). NHI is the holding company for Nestlé S.A.’s principal operating subsidiaries in the UnitedStates, other than Nestlé Waters North America Inc., Prometheus Laboratories, Inc., Nestlé Health Science-Pamlab, Inc., and Galderma Laboratories, Inc. The Company manufactures food and beverages, as well asproducts related to the nutrition, health, and wellness industries. The Company’s products are primarilydistributed in the United States.
Key Figures
2015 2014 Change(Dollars in millions)
Sales $ 21,399.1 21,200.9 0.9%
Cost of goods sold (11,824.1) (11,888.9) (0.5)%as a percentage of sales (55.3)% (56.1)%
Trading operating profit 2,843.8 2,822.3 0.8%as a percentage of sales 13.3% 13.3%
Net financial expenses (237.1) (241.6) (1.9)%
Income tax expense (678.2) (750.8) (9.7)%
Net income 1,922.8 323.6 494.2%as a percentage of sales 9.0% 1.5%
Operating cash flows 2,622.0 2,462.5 6.5%as a percentage of sales 12.3% 11.6%
Capital expenditures 655.8 728.3 (10.0)%as a percentage of sales 3.1% 3.4%
Overview
While the labor market continues to improve, the United States economy still faced a variety of significantchallenges in 2015. Despite these economic challenges, the Company has delivered improvements in Sales andmaintained trading operating profit margins. This performance is due to the increased investment in its brandsand ongoing execution of its proven strategies and operational efficiencies.
3
NESTLÉ HOLDINGS, INC.AND SUBSIDIARIES
December 31, 2015 and 2014
Sales
For the years ended December 31, 2015 and 2014, consolidated sales totaled $21.4 and $21.2 billion,respectively. The main factors per segment are as follows:
Nestlé USA Brands sales were $9.8 billion for each of the years ended December 31, 2015 and 2014.While growth accelerated, it was offset by the Juicy Juice, fruit drinks, divestiture in 2014. In the frozenmeals business, sales of the new ranges of Lean Cuisine and Stouffer’s were strong, supported by positiveconsumption trends. Pizza’s positive momentum also accelerated, driven by innovation. In ice cream,Häagen-Dazs and snacks continued to drive growth with new product launches. Coffee-mate maintained itsgood momentum through constant innovation and renovation of flavors and packaging as well as newdistribution. Some prominent brands in this segment include Coffee-mate, Nescafé, Nesquik, Stouffer’s,DiGiorno, Lean Cuisine, Hot Pockets, Nestlé Crunch, Butterfinger, Nestlé Toll House and Dreyer’s/Edy’s.
Nestlé Purina PetCare sales were $7.3 and $7.1 billion for the years ended December 31, 2015 and 2014,respectively. Sales in PetCare continued to grow with strong sales performances from Fancy Feast, PurinaOne and cat litter. Increased brand support is helping the recovery of Beneful. Some notable brands in thissegment include Beneful, Alpo, Purina ONE, Purina Dog Chow, Pro Plan, Fancy Feast, Friskies, PurinaCat Chow and Tidys Cats Litter.
Nutrition sales were $2.0 billion for each of the years ended December 31, 2015 and 2014. Sales in thissegment remained unchanged from 2014. Infant cereals performed well, while the infant formula andmeals and drinks category softened. There was growth in the juvenile life insurance business. A notablebrand in this segment is Gerber.
Other businesses sales were $2.4 and $2.3 billion for the years ended December 31, 2015 and 2014,respectively. The Nestlé Health Science business reported good growth, driven by strong performances inBoost and Carnation Breakfast Essentials in the consumer care category. Nespresso delivered solid growthand continued to build momentum. Sales of the recently launched VertuoLine system machines acceleratedon the back of the new varieties of machines and Grands Crus coffee and the new communicationcampaign.
Profitability
Trading operating profit was $2.8 billion for each of the years ended December 31, 2015 and 2014, whichequaled approximately 13.3% of sales. The percentage of sales was flat primarily due to increases in marketing,general and administrative expenses, which offset the increase in sales.
Cost of goods sold was $11.8 and $11.9 billion for the years ended December 31, 2015 and 2014, which equaled55.3% and 56.1% of sales, respectively. The decrease was primarily due to lower commodity prices.
Distribution expenses were $1.9 billion for each of the years ended December 31, 2015 and 2014, which equaled9.0% and 9.1% of sales, respectively. The decrease as a percentage of sales was due to fuel costs savings indelivery expenses, partially offset by increases in other networking expenses.
Marketing, general and administrative expenses were $3.6 and $3.3 billion for the years ended December 31,2015 and 2014, respectively. The increase in expenses as a percentage of sales from 15.6% in 2014 to 16.7% in2015 is primarily due to increases in media communication and other general expenses.
4

NESTLÉ HOLDINGS, INC.AND SUBSIDIARIES
December 31, 2015 and 2014
Net other trading expenses were $45.4 and $76.8 million for the years ended December 31, 2015 and 2014,respectively. The decrease was primarily due to decreases in impairment of property, plant and equipment andintangible assets, deferred compensation costs, restructuring costs, and litigation and onerous contracts partiallyoffset by the decrease in the return on company-owned life insurance.
Net Profit Margin – Other Items of Interest
Net financial expenses decreased by $4.5 million in 2015 primarily due to a reduction in net financing costoffset by increased net interest expense on defined benefit plans.
The Company’s income tax expense decreased by $72.6 million in 2015, primarily as a result of adjustments toprior years’ taxes and the decreases in the amortization of goodwill and other intangible assets, offset by anincrease in income from continuing operations before income taxes.
Cash Flow
Operating cash flow increased from $2.5 billion in 2014 to $2.6 billion in 2015. The change is primarily due tothe effect of higher net income, partially offset by the increase in cash used for working capital.
Principal Risks and Uncertainties
Risk Management
At the Nestlé S.A. level, the Nestlé Group Enterprise Risk Management Framework (“ERM”) is designed toidentify, communicate, and mitigate risks in order to minimize their potential impact on the Nestlé Group,including the Company. The Nestlé Group has adopted a dual approach in identifying and assessing risks. Atop-down assessment is performed annually at the Nestlé Group level to create a good understanding of theGroup’s mega-risks, to allocate ownership to drive specific actions around them and take any relevant steps toaddress them. A bottom-up assessment occurs in parallel and focuses on the global risk portfolio in thebusinesses/corporate functions. It involves the aggregation of individual assessments by the Zones, GloballyManaged Businesses and all markets of the Nestlé Group. It is intended to provide a high-level risk mapping ofCompany risk and allows Company management to make sound decisions on the future operations of theCompany and ensure that any risk growing in importance within the organization is captured and addressed inNestlé’s ERM agenda.
Risk assessments are the responsibility of line management; this applies equally to a business or a function, andany mitigating actions identified in the assessments are the responsibility of the individual line management. IfNestlé S.A. intervention is required, responsibility for mitigating actions will generally be determined by theNestlé Group Executive Board. The results of the ERM are presented annually to the Nestlé Group ExecutiveBoard and to the Audit Committee of Nestlé S.A., and conclusions are reported to the Board of Directors ofNestlé S.A.
Factors Affecting Results
The Company’s reputation is based on consumers’ trust. Any major event triggered by a serious food safety orother compliance issue could have a negative effect on the Company’s reputation or brand image. The Companyhas policies, processes, controls and regular monitoring (dedicated dashboard with relevant KPIs) in place toprevent such events.
5

NESTLÉ HOLDINGS, INC.AND SUBSIDIARIES
December 31, 2015 and 2014
The success of the Company depends on its ability to anticipate consumer preferences and to offer high-quality,appealing products. The Company’s businesses are subject to some seasonality, and adverse weather conditionsmay impact sales.
The food industry as a whole is faced with the global challenge of increasing obesity. The Company makes itsproducts available in a range of sizes and varieties designed to meet all needs and all occasions.
The Company is dependent on the sustainable supply of a number of raw materials, packaging materials, andservices/utilities. Any major event triggered by natural hazards (drought, flood, etc.), change in macroeconomicenvironment (shift in production patterns, biofuels, excessive trading, etc.), resulting in input price volatilitiesand/or capacity constraints, could potentially impact the Company’s financial results. The Company has policies,processes, controls and regular monitoring in place to (if ever possible) anticipate such events and adequatelymitigate against them.
In particular, the Company manages risks and opportunities related to climate change and water resourcesproactively given the impact it may have on agriculture and food production systems.
The Company’s liquidities/liabilities (currency fluctuation, interest rate, derivatives and/or hedging, pensionfunding obligations/retirement benefits, banking/commercial credit, and cost of capital, etc.) could be impactedby any major event in the financial markets. The Company, along with its parent company, Nestlé S.A., has theappropriate risk mitigation measures in place.
The Company is dependent on the sustainable manufacturing/supply of finished goods for all product categories.A major event in one of the Company’s key plants, at a key supplier, contract manufacturers, co-packer, and/orwarehouse facility could potentially lead to a supply disruption and impact upon the Company’s financial results.Business continuity plans are established and regularly maintained in order to mitigate against such an event.
The Company depends on accurate, timely information and numerical data from key software applications,without disruption, to enable day-to-day decision making.
The Company is subject to environmental regimes and has put controls in place to comply with legislationconcerning the protection of the environment, including the use of natural resources, release of air emissions andwaste-water, and the generation, storage, handling, transportation, treatment, and disposal of waste materials.
The Company is subject to health and safety regimes and has procedures in place to comply with legislationconcerning the protection of the health and welfare of employees and contractors.
The Company is party to a variety of legal proceedings arising out of the normal course of business. TheCompany believes that there are valid defenses for the claims and intends to defend any such litigation.
Security, political stability, legal and regulatory, fiscal, macroeconomic, foreign trade, labor, and/orinfrastructure risks could potentially impact the Company’s ability to do business. Events such as infectiousdisease could also impact upon the Company’s ability to operate. Any of these events could potentially lead to asupply disruption and impact the Company’s financial results. Regular monitoring and ad hoc business continuityplans are established in order to mitigate against such events.
6
NESTLÉ HOLDINGS, INC.AND SUBSIDIARIES
December 31, 2015 and 2014
Outlook
Although the economic outlook remains challenging, there are opportunities to leverage the Company’scompetitive advantages, deliver on growth opportunities, and benefit from the drive for continuous improvement.The Company is committed to supporting the Nestlé Group in achieving its financial objectives including organicgrowth in line with 2015, with improvements in margins and underlying earnings per share in constantcurrencies, and capital efficiency.
7

NESTLÉ HOLDINGS, INC.AND SUBSIDIARIES
December 31, 2015 and 2014
Responsibility Statement
Steve Presley, Chief Financial Officer, confirms that to the best of his knowledge:
(a) the financial statements, prepared in accordance with IFRS, give a true and fair view of the assets,liabilities, financial position and profit or loss of NHI, and the undertakings included in the consolidationtaken as a whole; and
(b) the management report includes a fair review of the development and performance of the business and theposition of NHI and the undertakings included in the consolidation taken as a whole, together with adescription of the principal risks and uncertainties that they face.
March 23, 2016
8
KPMG LLPSuite 180021700 Oxnard StreetWoodland Hills, CA 91367-3642
KPMG LLP is a Delaware limited liability partnership,the U.S. member firm of KPMG International Cooperative(�KPMG International�), a Swiss entity.
The Board of DirectorsNestlé Holdings, Inc.:
We have audited the accompanying consolidated financial statements of Nestlé Holdings, Inc. (an indirectly andwholly owned subsidiary of Nestlé S.A.) and subsidiaries, which comprise the consolidated balance sheets as ofDecember 31, 2015 and 2014, and the related consolidated income statements and statements of comprehensiveincome, changes in equity, and cash flows for the years then ended, and the related notes to the consolidatedfinancial statements.
s Responsibility for the Financial StatementsManagement is responsible for the preparation and fair presentation of these consolidated financial statements inaccordance with International Financial Reporting Standards as issued by the International Accounting StandardsBoard; this includes the design, implementation, and maintenance of internal control relevant to the preparationand fair presentation of consolidated financial statements that are free from material misstatement, whether due tofraud or error.
Auditors ResponsibilityOur responsibility is to express an opinion on these consolidated financial statements based on our audits. Weconducted our audits in accordance with auditing standards generally accepted in the United States of America andInternational Standards on Auditing. Those standards require that we plan and perform the audit to obtainreasonable assurance about whether the consolidated financial statements are free from material misstatement.
An audit involves performing procedures to obtain audit evidence about the amounts and disclosures in theconsolidated financial statements. The procedures selected depend on the auditors judgment, including theassessment of the risks of material misstatement of the consolidated financial statements, whether due to fraud orerror. In making those risk assessments, the auditor considers internal control s preparationand fair presentation of the consolidated financial statements in order to design audit procedures that are appropriatein the circumstances, but not for the purpose of expressing an opinion on s internalcontrol. Accordingly, we express no such opinion. An audit also includes evaluating the appropriateness ofaccounting policies used and the reasonableness of significant accounting estimates made by management, as wellas evaluating the overall presentation of the consolidated financial statements.
We believe that the audit evidence we have obtained is sufficient and appropriate to provide a basis for our opinion.
OpinionIn our opinion, the consolidated financial statements referred to above present fairly, in all material respects, thefinancial position of Nestlé Holdings, Inc. and subsidiaries as of December 31, 2015 and 2014, and the results oftheir operations and their cash flows for the years then ended, in accordance with International Financial ReportingStandards as issued by the International Accounting Standards Board.
Woodland Hills, CaliforniaMarch 23, 2016
10
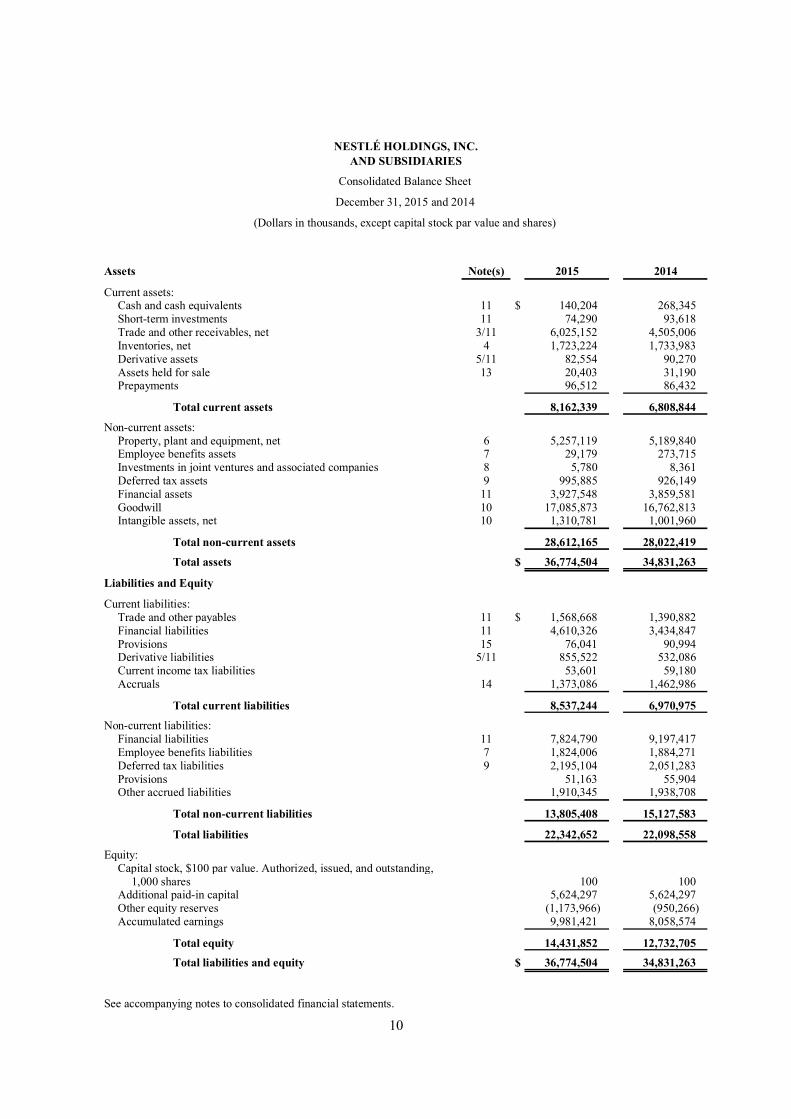
NESTLÉ HOLDINGS, INC.AND SUBSIDIARIES
Consolidated Balance Sheet
December 31, 2015 and 2014
(Dollars in thousands, except capital stock par value and shares)
Assets Note(s) 2015 2014
Current assets:Cash and cash equivalents 11 $ 140,204 268,345Short-term investments 11 74,290 93,618Trade and other receivables, net 3/11 6,025,152 4,505,006Inventories, net 4 1,723,224 1,733,983Derivative assets 5/11 82,554 90,270Assets held for sale 13 20,403 31,190Prepayments 96,512 86,432
Total current assets 8,162,339 6,808,844
Non-current assets:Property, plant and equipment, net 6 5,257,119 5,189,840Employee benefits assets 7 29,179 273,715Investments in joint ventures and associated companies 8 5,780 8,361Deferred tax assets 9 995,885 926,149Financial assets 11 3,927,548 3,859,581Goodwill 10 17,085,873 16,762,813Intangible assets, net 10 1,310,781 1,001,960
Total non-current assets 28,612,165 28,022,419
Total assets $ 36,774,504 34,831,263
Liabilities and Equity
Current liabilities:Trade and other payables 11 $ 1,568,668 1,390,882Financial liabilities 11 4,610,326 3,434,847Provisions 15 76,041 90,994Derivative liabilities 5/11 855,522 532,086Current income tax liabilities 53,601 59,180Accruals 14 1,373,086 1,462,986
Total current liabilities 8,537,244 6,970,975
Non-current liabilities:Financial liabilities 11 7,824,790 9,197,417Employee benefits liabilities 7 1,824,006 1,884,271Deferred tax liabilities 9 2,195,104 2,051,283Provisions 51,163 55,904Other accrued liabilities 1,910,345 1,938,708
Total non-current liabilities 13,805,408 15,127,583
Total liabilities 22,342,652 22,098,558
Equity:Capital stock, $100 par value. Authorized, issued, and outstanding,
1,000 shares 100 100Additional paid-in capital 5,624,297 5,624,297Other equity reserves (1,173,966) (950,266)Accumulated earnings 9,981,421 8,058,574
Total equity 14,431,852 12,732,705Total liabilities and equity $ 36,774,504 34,831,263
See accompanying notes to consolidated financial statements.

11
NESTLÉ HOLDINGS, INC.AND SUBSIDIARIES
Consolidated Income Statement
Years ended December 31, 2015 and 2014
(Dollars in thousands)
Note 2015 2014
Sales 2 $ 21,399,111 21,200,874Cost of goods sold (11,824,068) (11,888,862)Distribution expenses (1,932,695) (1,927,749)Marketing, general and administrative expenses (3,572,784) (3,308,593)Royalties to affiliated company (1,180,428) (1,176,607)Net other trading expenses 17 (45,354) (76,759)
Trading operating profit 2,843,782 2,822,304
Net other operating expenses 17 (9,968) (1,515,471)
Operating profit 2,833,814 1,306,833
16 (237,073) (241,635)Net financial expensesShare of results from joint venture and associated companies 4,152 6,968
Income from continuing operations before income taxes 2,600,893 1,072,166
Income tax expense 18 (678,205) (750,809)
Income from continuing operations 1,922,688 321,357
Income from discontinued operations, net of taxes 159 2,283
Net income $ 1,922,847 323,640
See accompanying notes to consolidated financial statements.

12
NESTLÉ HOLDINGS, INC.AND SUBSIDIARIES
Consolidated Statement of Comprehensive Income
Years ended December 31, 2015 and 2014
(Dollars in thousands)
Note 2015 2014
Net income $ 1,922,847 323,640
Other comprehensive income (loss):Fair value adjustments on available-for-sale financial instruments:
Recognized in fair value reserve * (134,903) 105,142Reclassified from fair value reserve to income statement * (56,818) 15,676
Fair value adjustments on cash flow hedges:Recognized in hedging reserve * (77,176) (87,227)Reclassified from hedging reserve * 55,066 53,692
Income taxes on fair value adjustments on available-for-sale financialinstruments and cash flow hedges 18 74,263 (30,036)
Total items that are or may be reclassified subsequentlyto the income statement (139,568) 57,247
Remeasurement of defined benefit plans 7 (137,911) (350,226)Income taxes on remeasurement of defined benefit plans 18 53,779 136,575
Total items that will never be reclassified to the income statement (84,132) (213,651)
Other comprehensive losses (223,700) (156,404)
Total comprehensive income $ 1,699,147 167,236
* Included in other equity reserves.
See accompanying notes to consolidated financial statements.
13
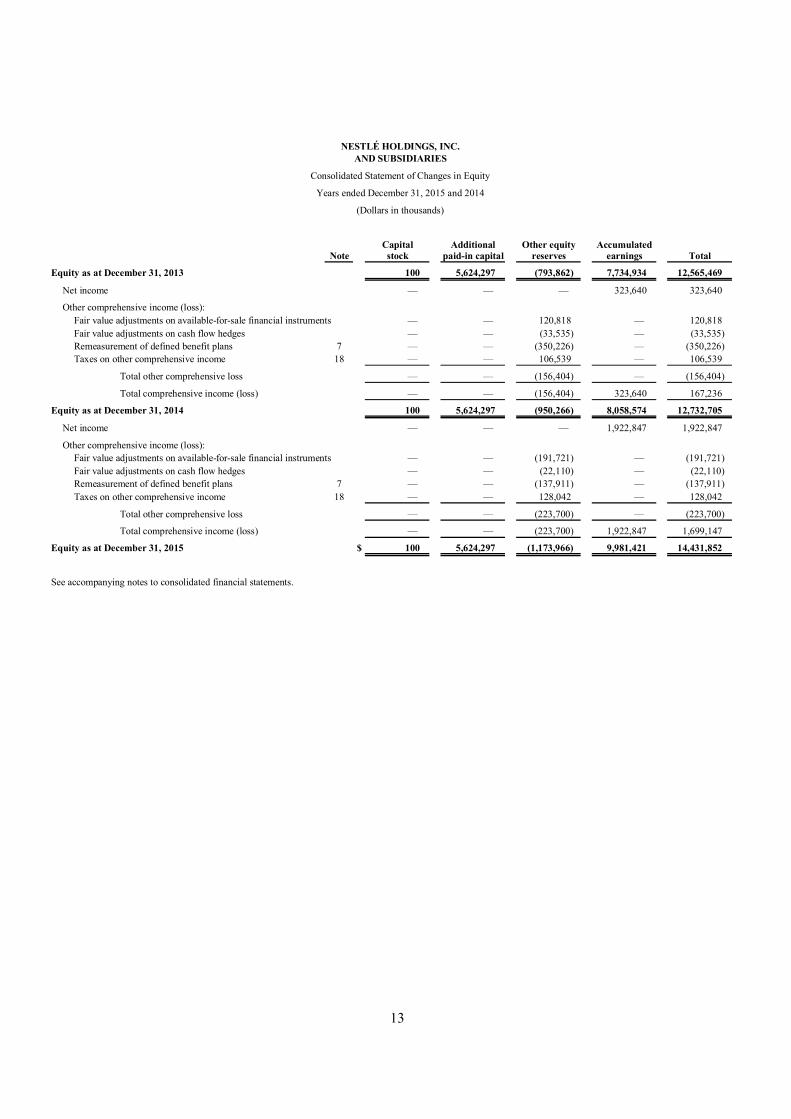
NESTLÉ HOLDINGS, INC.AND SUBSIDIARIES
Consolidated Statement of Changes in Equity
Years ended December 31, 2015 and 2014
(Dollars in thousands)
Capital Additional Other equity AccumulatedNote stock paid-in capital reserves earnings Total
Equity as at December 31, 2013 100 5,624,297 (793,862) 7,734,934 12,565,469
Net income — — — 323,640 323,640
Other comprehensive income (loss):Fair value adjustments on available-for-sale financial instruments — — 120,818 — 120,818Fair value adjustments on cash flow hedges — — (33,535) — (33,535)Remeasurement of defined benefit plans 7 — — (350,226) — (350,226)Taxes on other comprehensive income 18 — — 106,539 — 106,539
Total other comprehensive loss — — (156,404) — (156,404)
Total comprehensive income (loss) — — (156,404) 323,640 167,236
Equity as at December 31, 2014 100 5,624,297 (950,266) 8,058,574 12,732,705
Net income — — — 1,922,847 1,922,847
Other comprehensive income (loss):Fair value adjustments on available-for-sale financial instruments — — (191,721) — (191,721)Fair value adjustments on cash flow hedges — — (22,110) — (22,110)Remeasurement of defined benefit plans 7 — — (137,911) — (137,911)Taxes on other comprehensive income 18 — — 128,042 — 128,042
Total other comprehensive loss — — (223,700) — (223,700)
Total comprehensive income (loss) — — (223,700) 1,922,847 1,699,147
Equity as at December 31, 2015 $ 100 5,624,297 (1,173,966) 9,981,421 14,431,852
See accompanying notes to consolidated financial statements.
14
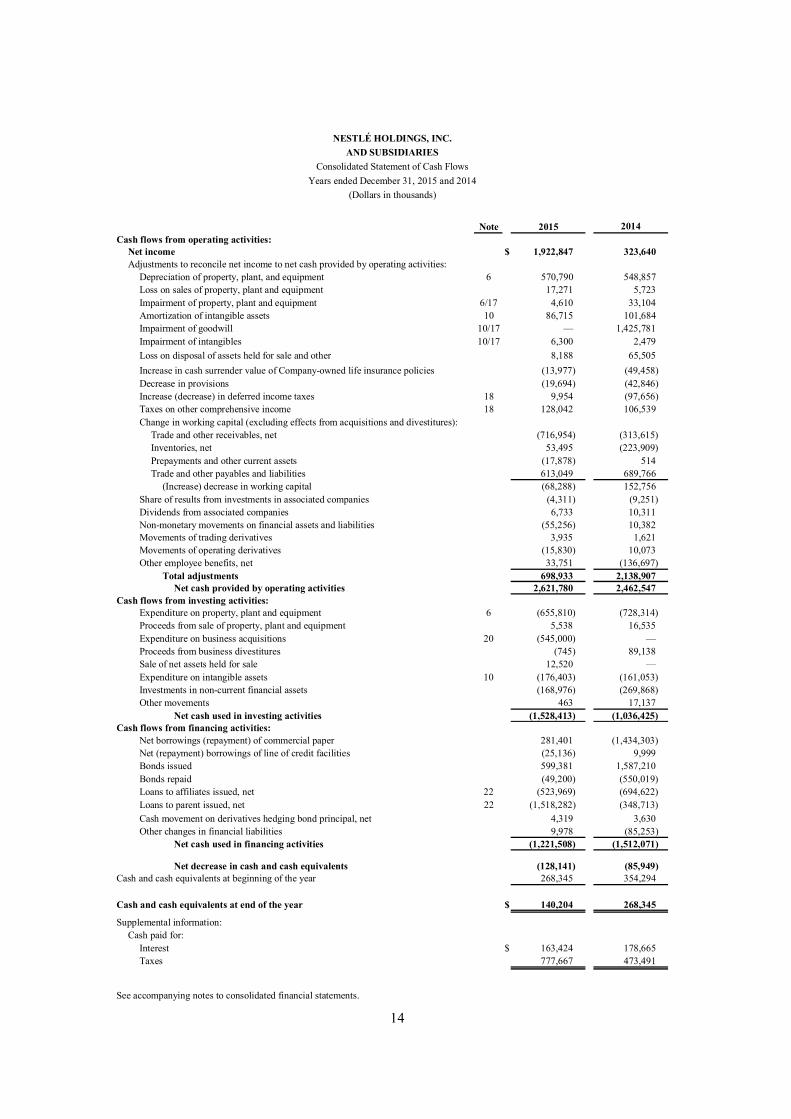
Note 2015 2014Cash flows from operating activities:
Net income $ 1,922,847 323,640Adjustments to reconcile net income to net cash provided by operating activities:
Depreciation of property, plant, and equipment 6 570,790 548,857Loss on sales of property, plant and equipment 17,271 5,723Impairment of property, plant and equipment 6/17 4,610 33,104Amortization of intangible assets 10 86,715 101,684Impairment of goodwill 10/17 — 1,425,781Impairment of intangibles 10/17 6,300 2,479Loss on disposal of assets held for sale and other 8,188 65,505Increase in cash surrender value of Company-owned life insurance policies (13,977) (49,458)Decrease in provisions (19,694) (42,846)Increase (decrease) in deferred income taxes 18 9,954 (97,656)Taxes on other comprehensive income 18 128,042 106,539Change in working capital (excluding effects from acquisitions and divestitures):
Trade and other receivables, net (716,954) (313,615)Inventories, net 53,495 (223,909)Prepayments and other current assets (17,878) 514Trade and other payables and liabilities 613,049 689,766
(Increase) decrease in working capital (68,288) 152,756Share of results from investments in associated companies (4,311) (9,251)Dividends from associated companies 6,733 10,311Non-monetary movements on financial assets and liabilities (55,256) 10,382Movements of trading derivatives 3,935 1,621Movements of operating derivatives (15,830) 10,073Other employee benefits, net 33,751 (136,697)
Total adjustments 698,933 2,138,907Net cash provided by operating activities 2,621,780 2,462,547
Cash flows from investing activities:Expenditure on property, plant and equipment 6 (655,810) (728,314)Proceeds from sale of property, plant and equipment 5,538 16,535Expenditure on business acquisitions 20 (545,000) —Proceeds from business divestitures (745) 89,138Sale of net assets held for sale 12,520 —Expenditure on intangible assets 10 (176,403) (161,053)Investments in non-current financial assets (168,976) (269,868)Other movements 463 17,137
Net cash used in investing activities (1,528,413) (1,036,425)Cash flows from financing activities:
Net borrowings (repayment) of commercial paper 281,401 (1,434,303)Net (repayment) borrowings of line of credit facilities (25,136) 9,999Bonds issued 599,381 1,587,210Bonds repaid (49,200) (550,019)Loans to affiliates issued, net 22 (523,969) (694,622)Loans to parent issued, net 22 (1,518,282) (348,713)Cash movement on derivatives hedging bond principal, net 4,319 3,630Other changes in financial liabilities 9,978 (85,253)
Net cash used in financing activities (1,221,508) (1,512,071)
Net decrease in cash and cash equivalents (128,141) (85,949)Cash and cash equivalents at beginning of the year 268,345 354,294
Cash and cash equivalents at end of the year $ 140,204 268,345
Supplemental information:Cash paid for:
Interest $ 163,424 178,665Taxes 777,667 473,491
See accompanying notes to consolidated financial statements.
NESTLÉ HOLDINGS, INC.AND SUBSIDIARIES
Consolidated Statement of Cash FlowsYears ended December 31, 2015 and 2014
(Dollars in thousands)

NESTLÉ HOLDINGS, INC.AND SUBSIDIARIES
Notes to Consolidated Financial Statements
December 31, 2015 and 2014
(Dollars in thousands)
(1) Accounting Policies
Nestlé Holdings, Inc. (“NHI”) (hereinafter, together with its subsidiaries, referred to as the “Company”) isa wholly owned subsidiary of NIMCO US, Inc., which is a wholly owned subsidiary of Nestlé S.A.,incorporated in Switzerland, which is the holding company of the Nestlé group of companies (hereinafter,referred to as the Nestlé Group). NHI is the holding company for Nestlé S.A.’s principal operatingsubsidiaries in the United States, other than Nestlé Waters North America Inc., Prometheus Laboratories,Inc., Nestlé Health Science-Pamlab, Inc., and Galderma Laboratories, Inc. NHI was incorporated in theState of Delaware in 1983 under registration number 833330118. NHI is a corporation and has unlimitedduration. The address of the registered office of NHI is 1209 Orange Street, Wilmington, Delaware 19801.
The Company manufactures food and beverages, as well as products related to the nutrition, health, andwellness industries. Its products are primarily distributed in the United States. Such products includesoluble coffee, chocolate-based drinks, dairy products, infant nutrition, healthcare nutrition, ice cream,frozen and chilled food, culinary aids, and chocolate and confectionary. Other business activities includepet care products and juvenile life insurance.
The consolidated financial statements were authorized for issue by NHI’s directors on March 23, 2016.
(a) Significant Accounting Policies
Basis of Preparation
The consolidated financial statements of the Company have been prepared in accordance withInternational Financial Reporting Standards (IFRS) as issued by the International AccountingStandards Board (IASB).
The consolidated financial statements have been prepared on an accrual basis and under thehistorical cost convention, unless stated otherwise. All significant consolidated companies, jointarrangements and associates have a December 31 accounting year-end.
Accounting policies are included in the relevant notes to the consolidated financial statements. Theaccounting policies below are applied throughout the financial statements.
The preparation of the consolidated financial statements requires Company management to exercisejudgment and to make estimates and assumptions that affect the application of policies; the reportedamounts of revenues, expenses, assets, and liabilities; and disclosures. These estimates andassociated assumptions are based on historical experience and various other factors that are believedto be reasonable under the circumstances. Actual results could differ from these estimates.
The estimates and underlying assumptions are reviewed on an ongoing basis. Revisions toaccounting estimates are recognized in the period in which the estimate is revised if the revisionaffects only that period or in the period of the revision and future periods if the revision affects bothcurrent and future periods. Those areas affected are mainly provisions and contingencies (Note 15),goodwill and intangible assets with indefinite useful life impairment tests (Note 10), property, plant
15 (Continued)

NESTLÉ HOLDINGS, INC.AND SUBSIDIARIES
Notes to Consolidated Financial Statements
December 31, 2015 and 2014
(Dollars in thousands)
and equipment (Note 6), employee benefits (Note 7), allowance for doubtful receivables (Note 3),and income taxes (Note 18).
Scope of Consolidation
The consolidated financial statements comprise the financial statements of NHI and its subsidiaries.All material intercompany profits, transactions, and balances have been eliminated. The subsidiarycompanies, which are wholly and directly owned by NHI and incorporated in the United States, areas follows:
Gerber Products CompanyJC Holdings, Inc.Nespresso USA, Inc.Nestlé Capital CorporationNestlé HealthCare Nutrition, Inc.Nestlé Insurance Holdings, Inc.Nestlé Purina PetCare Company
Nestlé USA, Inc.TSC Holdings, Inc.
Newly acquired companies are consolidated from the effective date of control using the acquisitionmethod.
Foreign Currency
For the Company, transactions in currencies other than the Company’s functional currency(U.S. dollars) are recorded at the rate of exchange at the transaction date. Monetary assets andliabilities that are denominated in foreign currencies are remeasured at the year-end rates. Anyresulting exchange differences are recorded in the consolidated income statement, except whendeferred in other comprehensive income as qualifying cash flow hedges.
On consolidation, assets and liabilities of the Company reported in their functional currencies aretranslated into U.S. dollars, the Company’s presentation currency, at year-end exchange rates.Income and expense items are translated into U.S. dollars at the annual weighted average rate ofexchange or at the rate on the date of the transaction for significant items.
Differences arising from the retranslation of opening net assets of the Company, together withdifferences arising from the restatement of the net results for the year of the Company from averageor actual rates to year-end rates, are recognized in other comprehensive income or loss.
Sales
Sales represent amounts received and receivable from third parties for goods supplied to customersand for services rendered. Revenue from sales of goods is recognized in the consolidated incomestatement at the moment when the significant risks and rewards of ownership of the goods have been
16 (Continued)

NESTLÉ HOLDINGS, INC.AND SUBSIDIARIES
Notes to Consolidated Financial Statements
December 31, 2015 and 2014
(Dollars in thousands)
transferred to the buyer, which is mainly upon shipment. It is measured at the list price applicable toa given distribution channel after deduction of returns, sales taxes, pricing allowances, other tradediscounts, and couponing and price promotions to consumers. Payments made to the customers forcommercial services received are expensed as incurred.
Expenses
Cost of goods sold is determined on the basis of the cost of production or of purchase, adjusted forthe variation of inventories. All other expenses, including those in respect of advertising andpromotions, are recognized when the Company receives the risks and rewards of ownership of thegoods or when it receives the services. Additional details of specific expenses are provided in therespective notes.
Changes in Presentation – Analyses by Segment
The amount of segment assets is no longer disclosed. Segment assets are not included in themeasures used for allocating resources and assessing segment performance. The Company discloseson a voluntary basis the invested capital (Note 2) as well as goodwill and intangible assets bysegment for consistency with long-standing practice. Goodwill and intangible assets are not includedin the invested capital since the amounts recognized are not comparable between segments due todifferences in the intensity of acquisition activity and changes in accounting standards, which wereapplicable at various points in time when the Company undertook significant acquisitions.
Other Changes in Presentation
Notes to the Consolidated Financial Statements have been restructured, with the accounting policygenerally being placed immediately before the respective Note.
(b) Changes in Accounting Policies
A number of standards have been modified on miscellaneous points with effect from January 1,2015. Such changes include Defined Benefit Plans: Employee Contributions (Amendments to IAS19), as well as the Annual Improvements to IFRS 2010-2012 Cycle and the Annual Improvements toIFRS 2011-2013 Cycle. None of these amendments had a material effect on the Company’sconsolidated financial statements.
Changes in IFRS that may affect the Company after December 31, 2015
The following new standards, interpretations and amendments to existing standards have beenpublished and are mandatory for the accounting period beginning on January 1, 2016 or later. TheCompany has not early adopted them.
IFRS 9 – Financial Instruments
This standard addresses the accounting principles for the financial reporting of financial assets andfinancial liabilities, including classification, measurement, impairment, derecognition and hedgeaccounting. The standard will affect the Company’s accounting for its available-for-sale financial
17 (Continued)

NESTLÉ HOLDINGS, INC.AND SUBSIDIARIES
Notes to Consolidated Financial Statements
December 31, 2015 and 2014
(Dollars in thousands)
assets, as IFRS 9 only permits the recognition of fair value gains and losses in other comprehensiveincome under some circumstances and gains and losses on certain instruments with specific cashflow characteristics are never reclassified to the consolidated income statement at a later date. Thereis no expected impact on the Company’s accounting for financial liabilities, as the new requirementsonly affect the accounting for financial liabilities that are designated at fair value through profit orloss, and the Company does not have any such liabilities. The Company is currently assessing theimpact of the new impairment and hedge accounting requirements. In particular, it is expected thatthe new component hedge model may bring improved alignment between the risk managementstrategies and their accounting treatment. This standard is mandatory for the accounting periodbeginning on January 1, 2018.
IFRS 15 – Revenue from Contract with Customers
This standard combines, enhances and replaces specific guidance on recognizing revenue with asingle standard. It defines a new five-step model to recognize revenue from customer contracts. TheCompany is currently assessing the potential impact of this new standard. This standard is mandatoryfor the accounting period beginning on January 1, 2018.
IFRS 16 – Leases
This standard will replace IAS 17 and sets out the principles for the recognition, measurement,presentation and disclosure of leases. The main effect on the Company is that IFRS 16 introduces asingle lessee accounting model and requires a lessee to recognize assets and liabilities for almost allleases and will therefore result in an increase of total assets and total liabilities. All things beingequal, under the new standard higher trading operating profit would be partially or entirely offset byhigher interest expenses. The company is currently assessing the precise impact of this new standard.This standard is mandatory for the accounting period beginning on January 1, 2019.
Improvements and Other Amendments to IFRS/IAS
A number of standards have been modified on miscellaneous points. None of these amendments areexpected to have a material effect on the Company’s consolidated financial statements.
18 (Continued)
NESTLÉ HOLDINGS, INC.AND SUBSIDIARIES
Notes to Consolidated Financial Statements
December 31, 2015 and 2014
(Dollars in thousands)
(2) Analyses by Segment
Segment Reporting
Operating segments reflect the Company’s management structure and the way financial information isregularly reviewed by the chief operating decision maker (“CODM”). The CODM has been defined as abody comprising the members of the Nestlé Group Executive Board to whom the various operatingsegments report, since this is the level at which resources are allocated and results are assessed.
The Company’s management structure is aligned with the Nestlé Group management structure and isorganized around products.
The Nestlé USA Brands segment forms part of the Nestlé Group Zone Americas segment. It consistsprimarily of beverages, confections, snacks, frozen prepared foods, pizza, ice cream, and other foodproducts.
The PetCare segment also forms part of the Nestlé Group Zone Americas segment, and sellsproducts and services for domestic pets.
The Nutrition segment is part of the Nestlé Nutrition Globally Managed Business (“GMB”) segmentand consists primarily of infant and baby food products.
The Other businesses segment category comprises other operating segments that do not meet thecriteria for separate reporting, such as Nestlé Professional (forming part of the Nestlé ProfessionalGMB), which sells products for the food services industry, Nestlé Health Science which providespioneering science-based nutritional solutions to deliver improved personalized health care forpeople with medical conditions, and the Nespresso business unit. Nestlé Professional, Nespresso,and Nestlé Health Science form part of the Nestlé Group Other businesses segment.
Depreciation and amortization includes depreciation of property, plant and equipment and amortization ofintangible assets.
No segment assets and liabilities are regularly provided to the CODM to assess segment performance or toallocate resources and therefore segment assets and liabilities are not disclosed. However, the Companydiscloses the invested capital and goodwill and intangible assets by segment on a voluntary basis.
Invested capital comprises property, plant and equipment, trade and other receivables, assets held for sale,inventories, prepayments and accrued income as well as specific financial assets associated to thesegments, less trade and other payables, liabilities directly associated with assets held for sale, non-currentother payables as well as accruals and deferred income.
Goodwill and intangible assets are not included in invested capital since the amounts recognized are notcomparable between segments due to differences in the intensity of acquisition activity and changes inaccounting standards which were applicable at various points in time when the Company undertooksignificant acquisitions. Nevertheless, an allocation of goodwill and intangible assets by segment andproduct and the related impairment expenses are provided.
19 (Continued)

NESTLÉ HOLDINGS, INC.AND SUBSIDIARIES
Notes to Consolidated Financial Statements
December 31, 2015 and 2014
(Dollars in thousands)
Inter-segment eliminations represent inter-company balances between the different segments.
Invested capital and goodwill and intangible assets by segment represent the situation at the end of theyear.
Capital additions represent the total cost incurred to acquire property, plant and equipment, intangibleassets and goodwill, including those arising from business combinations. Capital expenditure representsthe investment in property, plant and equipment only.
Unallocated items represent items whose allocation to a segment would be arbitrary. They mainly comprisecorporate expenses and related assets.
The Company generates substantially all of its sales within the United States.
Revenue and Results
2015 Brands (a) PetCare Nutrition (a) Other (a) TotalSales 9,815,803 7,268,675 1,963,300 2,351,333 21,399,111Trading operating profit (b) 1,085,564 1,350,149 242,316 155,577 2,833,606Net other trading expenses (c) (31,151) (3,737) (5,512) (6,515) (46,915)
Of which impairment of property,plant and equipment (3,499) (766) - (345) (4,610)
Of which restructuring costs (4,123) - (933) (1,395) (6,451)Depreciation and amortization (281,751) (171,061) (98,255) (106,438) (657,505)
2014 Brands (a) PetCare Nutrition (a) Other (a) TotalSales 9,830,903 7,098,926 1,996,924 2,274,121 21,200,874Trading operating profit (b) 1,072,678 1,286,454 298,887 150,447 2,808,466Net other trading expenses (c) (54,334) (5,788) (6,750) (10,695) (77,567)
Of which impairment of property,plant and equipment (32,914) (223) - 33 (33,104)
Of which restructuring costs (10,387) (341) (723) (3,594) (15,045)Depreciation and amortization (285,408) (187,275) (103,235) (74,623) (650,541)
(a) Nestlé USA Brands primarily consists of beverage, prepared foods, ice cream, confections and snacks, and other food products.Nutrition primarily consists of infant and baby food products. Other primarily consists of Nestlé Professional, Nespresso andNestlé Health Science, which do not meet the criteria for separate disclosure.
(b) The Company determines trading operating profit by allocating corporate expenses to its operating segments based onactivity-based cost drivers.
(c) Included in Trading operating profit.
20 (Continued)
NESTLÉ HOLDINGS, INC.AND SUBSIDIARIES
Notes to Consolidated Financial Statements
December 31, 2015 and 2014
(Dollars in thousands)
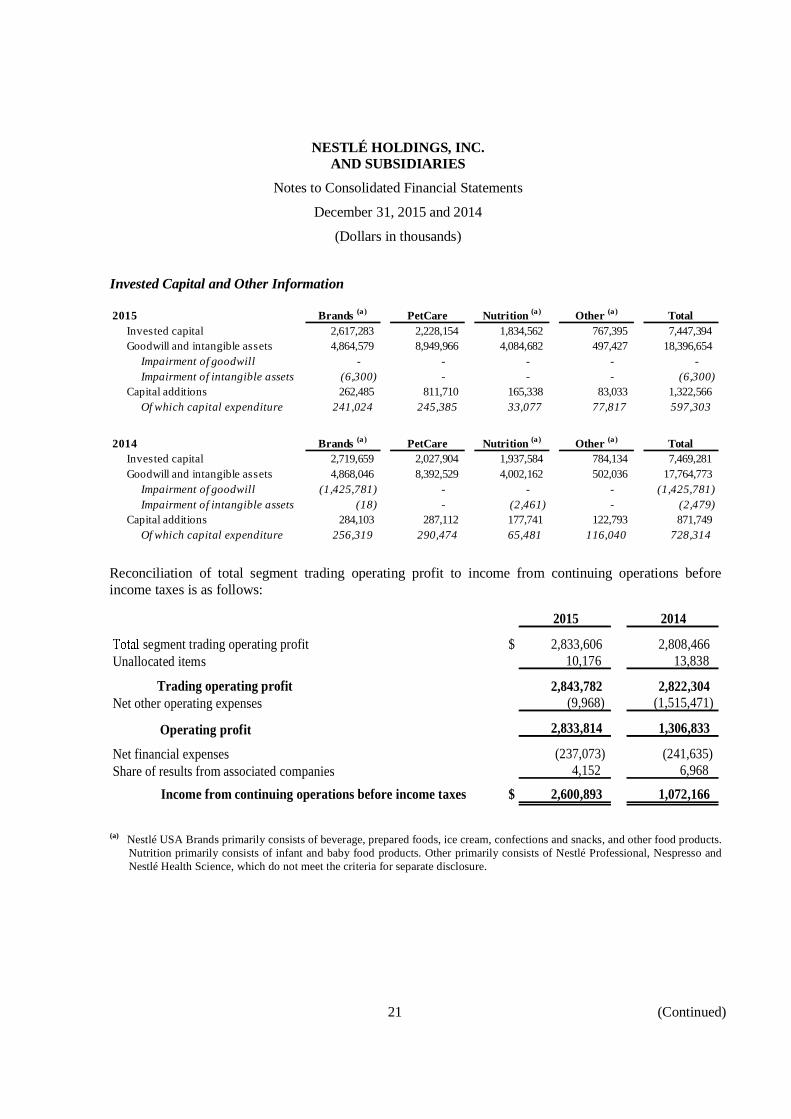
Invested Capital and Other Information
2015 Brands (a) PetCare Nutrition (a) Other (a) TotalInvested capital 2,617,283 2,228,154 1,834,562 767,395 7,447,394Goodwill and intangible assets 4,864,579 8,949,966 4,084,682 497,427 18,396,654
Impairment of goodwill - - - - -Impairment of intangible assets (6,300) - - - (6,300)
Capital additions 262,485 811,710 165,338 83,033 1,322,566Of which capital expenditure 241,024 245,385 33,077 77,817 597,303
2014 Brands (a) PetCare Nutrition (a) Other (a) TotalInvested capital 2,719,659 2,027,904 1,937,584 784,134 7,469,281Goodwill and intangible assets 4,868,046 8,392,529 4,002,162 502,036 17,764,773
Impairment of goodwill (1,425,781) - - - (1,425,781)Impairment of intangible assets (18) - (2,461) - (2,479)
Capital additions 284,103 287,112 177,741 122,793 871,749Of which capital expenditure 256,319 290,474 65,481 116,040 728,314
Reconciliation of total segment trading operating profit to income from continuing operations beforeincome taxes is as follows:
2015 2014
$ 2,833,606 2,808,466segment trading operating profitUnallocated items 10,176 13,838
2,843,782 2,822,304Trading operating profitNet other operating expenses (9,968) (1,515,471)
Operating profit 2,833,814 1,306,833
(237,073) (241,635)Net financial expensesShare of results from associated companies 4,152 6,968
Income from continuing operations before income taxes $ 2,600,893 1,072,166
(a) Nestlé USA Brands primarily consists of beverage, prepared foods, ice cream, confections and snacks, and other food products.Nutrition primarily consists of infant and baby food products. Other primarily consists of Nestlé Professional, Nespresso andNestlé Health Science, which do not meet the criteria for separate disclosure.
21 (Continued)
NESTLÉ HOLDINGS, INC.AND SUBSIDIARIES
Notes to Consolidated Financial Statements
December 31, 2015 and 2014
(Dollars in thousands)
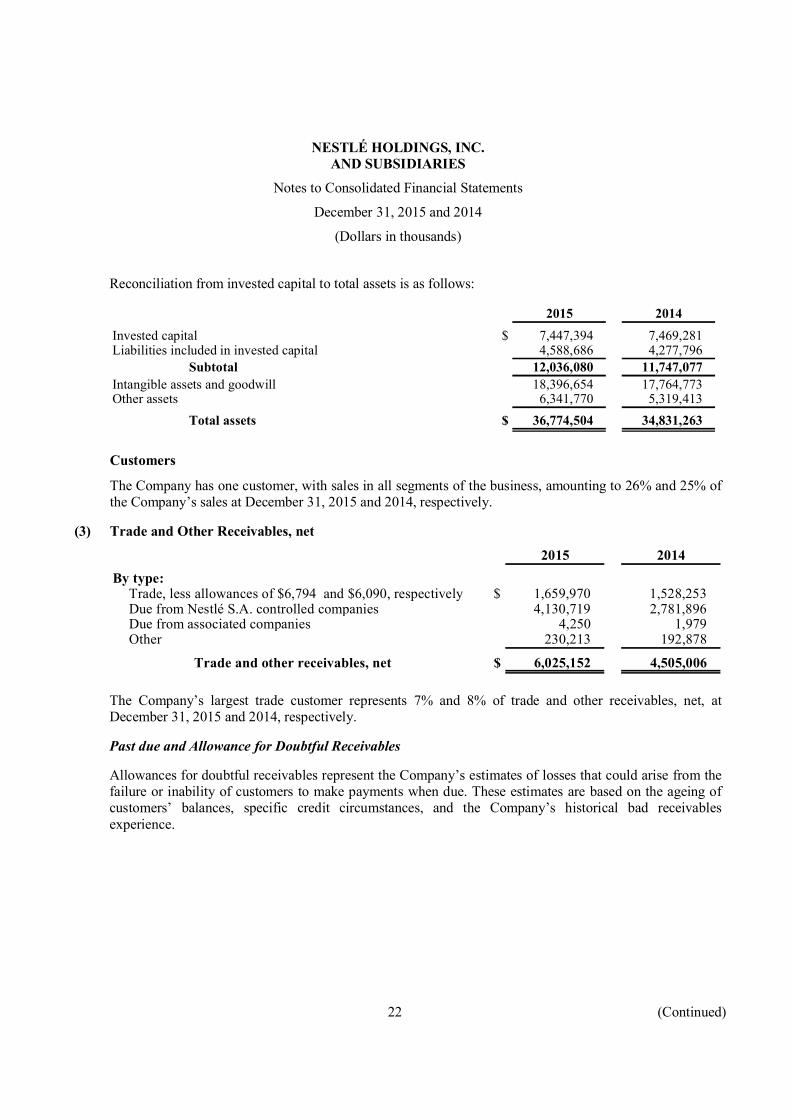
Reconciliation from invested capital to total assets is as follows:
2015 2014$ 7,447,394 7,469,281Invested capital
Liabilities included in invested capital 4,588,686 4,277,796Subtotal 12,036,080 11,747,077
18,396,654 17,764,773Intangible assets and goodwillOther assets 6,341,770 5,319,413
Total assets $ 36,774,504 34,831,263
Customers
The Company has one customer, with sales in all segments of the business, amounting to 26% and 25% ofthe Company’s sales at December 31, 2015 and 2014, respectively.
(3) Trade and Other Receivables, net
2015 2014By type:
Trade, less allowances of $6,794 and $6,090, respectively $ 1,659,970 1,528,253Due from Nestlé S.A. controlled companies 4,130,719 2,781,896Due from associated companies 4,250 1,979Other 230,213 192,878
Trade and other receivables, net $ 6,025,152 4,505,006
The Company’s largest trade customer represents 7% and 8% of trade and other receivables, net, atDecember 31, 2015 and 2014, respectively.
Past due and Allowance for Doubtful Receivables
Allowances for doubtful receivables represent the Company’s estimates of losses that could arise from thefailure or inability of customers to make payments when due. These estimates are based on the ageing ofcustomers’ balances, specific credit circumstances, and the Company’s historical bad receivablesexperience.
22 (Continued)

NESTLÉ HOLDINGS, INC.AND SUBSIDIARIES
Notes to Consolidated Financial Statements
December 31, 2015 and 2014
(Dollars in thousands)
2015 2014By payment status:
Not past due $ 5,973,646 4,493,547Past due 1-30 days 38,142 39,289Past due 31-60 days 6,127 4,699Past due 61-90 days 2,827 1,708Past due 91-120 days 1,582 780Past due more than 120 days 9,622 3,215Unapplied credit memos — (32,142)Allowance for doubtful receivables (6,794) (6,090)
Trade and other receivables, net $ 6,025,152 4,505,006
Based on the historic trends and the expected performance of the customers, the Company believes that theabove allowance for doubtful receivables sufficiently covers for the risk of default.
The carrying value of trade receivables, net of allowance for doubtful receivables, approximates fair value.
(4) Inventories, net
Raw materials and purchased finished goods are valued at the lower of purchase cost calculated using theFIFO (first-in, first-out) method and net realizable value. Work in progress, sundry supplies andmanufactured finished goods are valued at the lower of their weighted average cost and net realizablevalue. The cost of inventories includes the gains/losses on qualified cash flow hedges for the purchase ofraw materials and finished goods.
2015 2014$ 514,795 485,396
1,272,520 1,323,554Raw materials and work in progressFinished goodsAllowance for write-down to net realizable value (64,091) (74,967)
Inventories, net $ 1,723,224 1,733,983
(5) Derivative Assets and Liabilities and Hedge Accounting
Derivative Financial Instruments
The Company’s derivatives mainly consist of currency forwards and swaps; commodity futures andoptions; and interest rate forwards and swaps. Derivatives are mainly used to manage exposures to foreignexchange, interest rate, and commodity price risk as described in the Market Risk section in FinancialRisks (Note 12).
Derivatives are initially recognized at fair value. They are subsequently remeasured at fair value on aregular basis and at each reporting date as a minimum, with all their gains and losses, realized andunrealized, recognized in the consolidated income statement unless they are in a qualifying hedgingrelationship.
23 (Continued)
NESTLÉ HOLDINGS, INC.AND SUBSIDIARIES
Notes to Consolidated Financial Statements
December 31, 2015 and 2014
(Dollars in thousands)
Hedge Accounting
The Company designates and documents certain derivatives and other financial assets or financialliabilities as hedging instruments against changes in fair values of recognized assets and liabilities (fairvalue hedges) and highly probable forecast transactions (cash flow hedges). The effectiveness of suchhedges is assessed at inception and verified on a quarterly basis, using prospective and retrospectivetesting.
Fair Value Hedges
The Company uses fair value hedges to mitigate foreign currency and interest rate risks of its recognizedassets and liabilities.
Changes in fair values of hedging instruments designated as fair value hedges and the adjustments for therisks being hedged in the carrying amounts of the underlying transactions are recognized in theconsolidated income statement.
Cash Flow Hedges
The Company uses cash flow hedges to mitigate a particular risk associated with a recognized asset orliability or highly probable forecast transactions, such as purchases of raw materials, finished goods andequipment, as well as the variability of expected interest payments and receipts.
The effective part of the changes in fair value of hedging instruments are recognized in othercomprehensive income or loss, while any ineffective part is recognized immediately in the consolidatedincome statement. When the hedged item results in the recognition of a non-financial asset or liability, thegains or losses previously recognized in other comprehensive income are included in the measurement costof the asset or the liability. Otherwise, the gains or losses previously recognized in other comprehensiveincome are removed and recognized in the consolidated income statement at the same time as the hedgedtransaction.
Undesignated Derivatives
Derivatives which are not designated in a hedging relationship are classified as undesignated derivatives.They are acquired in the frame of approved risk management policies even though hedge accounting is notapplied.
24 (Continued)
NESTLÉ HOLDINGS, INC.AND SUBSIDIARIES
Notes to Consolidated Financial Statements
December 31, 2015 and 2014
(Dollars in thousands)
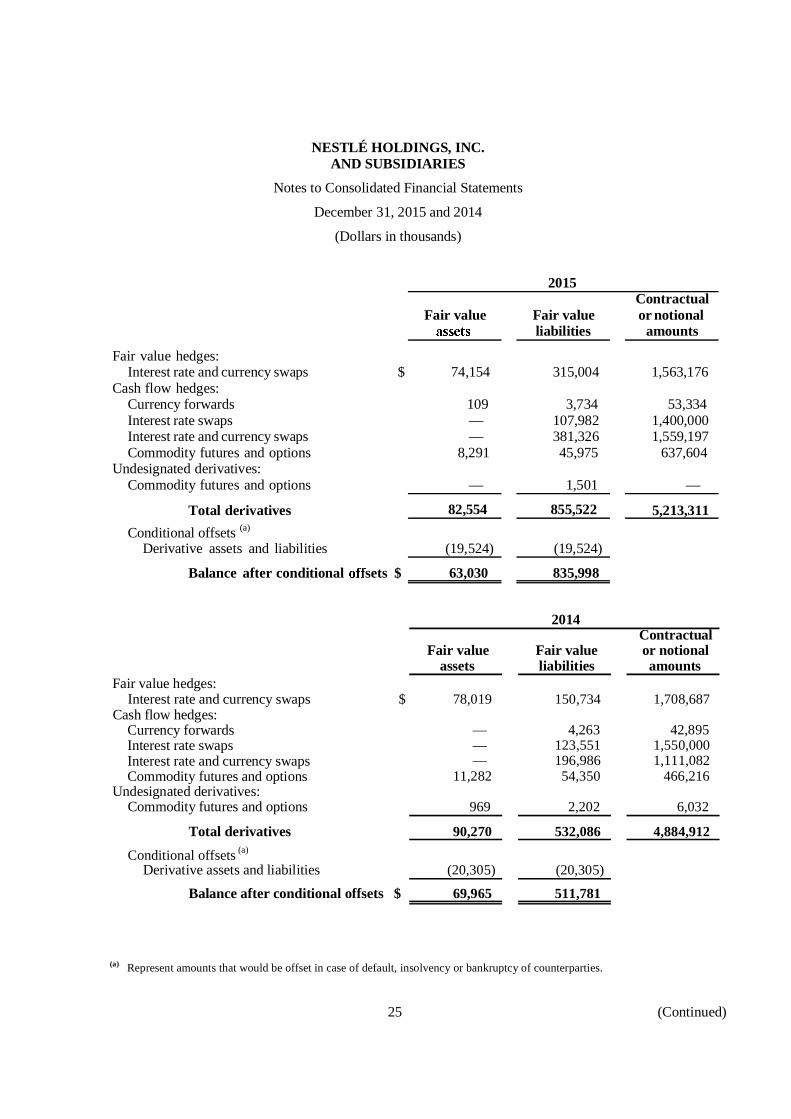
2015Contractual
Fair value Fair value or notionalliabilities amounts
Fair value hedges:$ 74,154 315,004 1,563,176Interest rate and currency swaps
Cash flow hedges:109 3,734 53,334— 107,982 1,400,000— 381,326 1,559,197
Currency forwardsInterest rate swapsInterest rate and currency swapsCommodity futures and options 8,291 45,975 637,604
Undesignated derivatives:Commodity futures and options — 1,501 —
Total de ivatives 82,554 855,522 5,213,311Conditional offsets (a)
Derivative assets and liabilities (19,524) (19,524)
Balance after conditional sets $ 63,030 835,998
2014Contractual
Fair value Fair value or notionalassets liabilities amounts
Fair value hedges:$ 78,019 150,734 1,708,687Interest rate and currency swaps
Cash flow hedges:— 4,263 42,895— 123,551 1,550,000— 196,986 1,111,082
Currency forwardsInterest rate swapsInterest rate and currency swapsCommodity futures and options 11,282 54,350 466,216
Undesignated derivatives:Commodity futures and options 969 2,202 6,032
Total derivatives 90,270 532,086 4,884,912
Conditional offsets (a)
Derivative assets and liabilities (20,305) (20,305)
Balance after conditional offsets $ 69,965 511,781
(a) Represent amounts that would be offset in case of default, insolvency or bankruptcy of counterparties.
25 (Continued)
NESTLÉ HOLDINGS, INC.AND SUBSIDIARIES
Notes to Consolidated Financial Statements
December 31, 2015 and 2014
(Dollars in thousands)
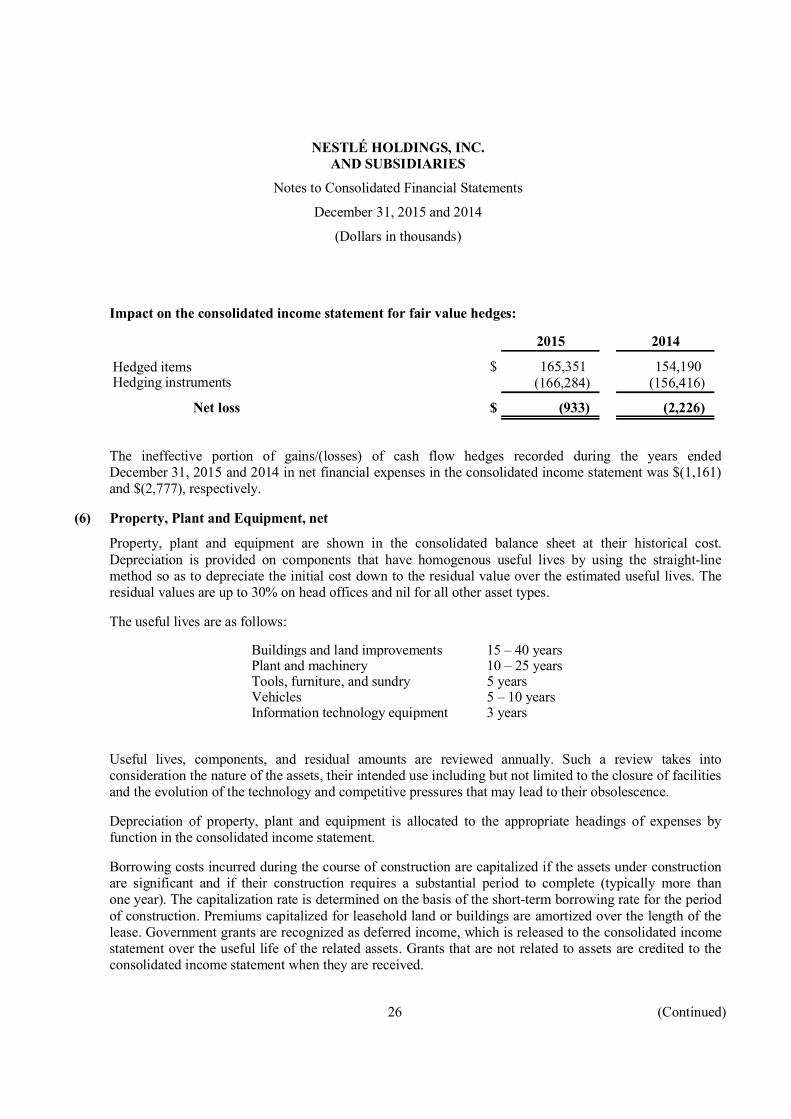
Impact on the consolidated income statement for fair value hedges:
2015 2014
$ 165,351 154,190Hedged itemsHedging instruments (166,284) (156,416)
Net loss $ (933) (2,226)
The ineffective portion of gains/(losses) of cash flow hedges recorded during the years endedDecember 31, 2015 and 2014 in net financial expenses in the consolidated income statement was $(1,161)and $(2,777), respectively.
(6) Property, Plant and Equipment, net
Property, plant and equipment are shown in the consolidated balance sheet at their historical cost.Depreciation is provided on components that have homogenous useful lives by using the straight-linemethod so as to depreciate the initial cost down to the residual value over the estimated useful lives. Theresidual values are up to 30% on head offices and nil for all other asset types.
The useful lives are as follows:
Buildings and land improvements 15 – 40 yearsPlant and machinery 10 – 25 yearsTools, furniture, and sundry 5 yearsVehicles 5 – 10 yearsInformation technology equipment 3 years
Useful lives, components, and residual amounts are reviewed annually. Such a review takes intoconsideration the nature of the assets, their intended use including but not limited to the closure of facilitiesand the evolution of the technology and competitive pressures that may lead to their obsolescence.
Depreciation of property, plant and equipment is allocated to the appropriate headings of expenses byfunction in the consolidated income statement.
Borrowing costs incurred during the course of construction are capitalized if the assets under constructionare significant and if their construction requires a substantial period to complete (typically more thanone year). The capitalization rate is determined on the basis of the short-term borrowing rate for the periodof construction. Premiums capitalized for leasehold land or buildings are amortized over the length of thelease. Government grants are recognized as deferred income, which is released to the consolidated incomestatement over the useful life of the related assets. Grants that are not related to assets are credited to theconsolidated income statement when they are received.
26 (Continued)
NESTLÉ HOLDINGS, INC.AND SUBSIDIARIES
Notes to Consolidated Financial Statements
December 31, 2015 and 2014
(Dollars in thousands)
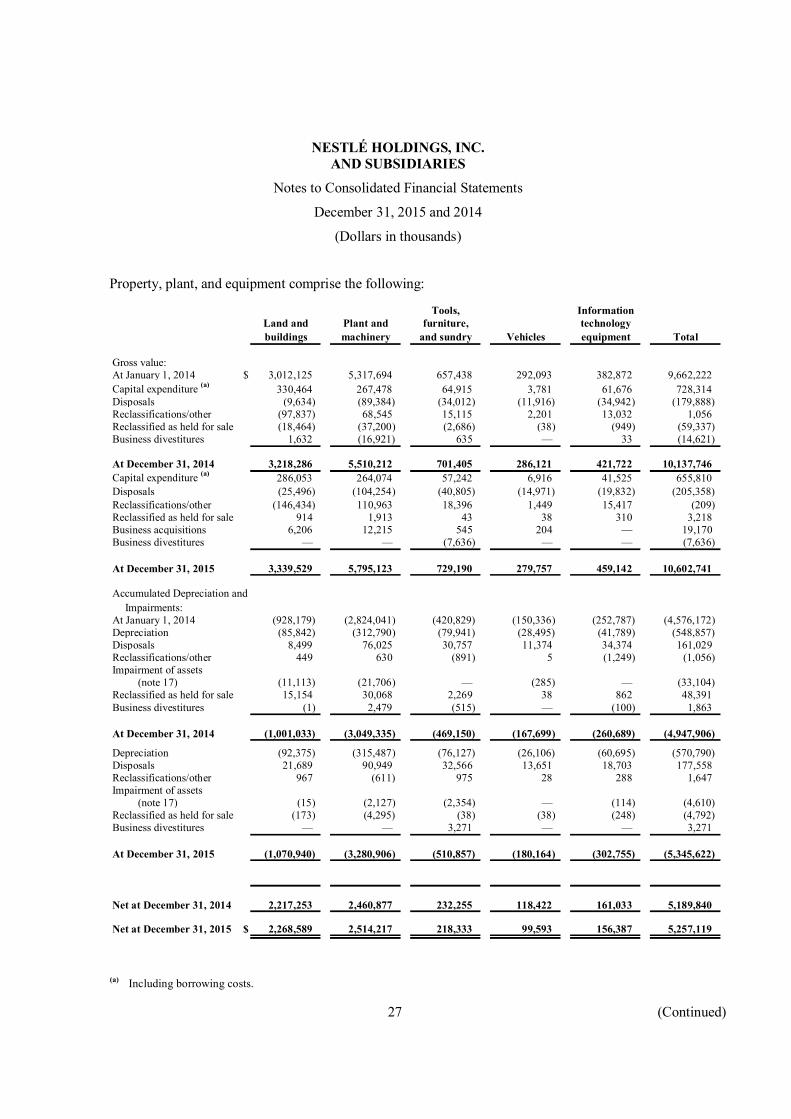
Property, plant, and equipment comprise the following:
Tools, InformationLand and Plant and furniture, technologybuildings machinery and sundry Vehicles equipment Total
Gross value:At January 1, 2014 $ 3,012,125 5,317,694 657,438 292,093 382,872 9,662,222Capital expenditure (a) 330,464 267,478 64,915 3,781 61,676 728,314Disposals (9,634) (89,384) (34,012) (11,916) (34,942) (179,888)Reclassifications/other (97,837) 68,545 15,115 2,201 13,032 1,056Reclassified as held for sale (18,464) (37,200) (2,686) (38) (949) (59,337)Business divestitures 1,632 (16,921) 635 — 33 (14,621)
At December 31, 2014 3,218,286 5,510,212 701,405 286,121 421,722 10,137,746Capital expenditure (a) 286,053 264,074 57,242 6,916 41,525 655,810Disposals (25,496) (104,254) (40,805) (14,971) (19,832) (205,358)Reclassifications/other (146,434) 110,963 18,396 1,449 15,417 (209)Reclassified as held for sale 914 1,913 43 38 310 3,218Business acquisitions 6,206 12,215 545 204 — 19,170Business divestitures — — (7,636) — — (7,636)
At December 31, 2015 3,339,529 5,795,123 729,190 279,757 459,142 10,602,741
Accumulated Depreciation andImpairments:
At January 1, 2014 (928,179) (2,824,041) (420,829) (150,336) (252,787) (4,576,172)Depreciation (85,842) (312,790) (79,941) (28,495) (41,789) (548,857)Disposals 8,499 76,025 30,757 11,374 34,374 161,029Reclassifications/other 449 630 (891) 5 (1,249) (1,056)Impairment of assets
(note 17) (11,113) (21,706) — (285) — (33,104)Reclassified as held for sale 15,154 30,068 2,269 38 862 48,391Business divestitures (1) 2,479 (515) — (100) 1,863
At December 31, 2014 (1,001,033) (3,049,335) (469,150) (167,699) (260,689) (4,947,906)
Depreciation (92,375) (315,487) (76,127) (26,106) (60,695) (570,790)Disposals 21,689 90,949 32,566 13,651 18,703 177,558Reclassifications/other 967 (611) 975 28 288 1,647Impairment of assets
(note 17) (15) (2,127) (2,354) — (114) (4,610)Reclassified as held for sale (173) (4,295) (38) (38) (248) (4,792)Business divestitures — — 3,271 — — 3,271
At December 31, 2015 (1,070,940) (3,280,906) (510,857) (180,164) (302,755) (5,345,622)
Net at December 31, 2014 2,217,253 2,460,877 232,255 118,422 161,033 5,189,840
Net at December 31, 2015 $ 2,268,589 2,514,217 218,333 99,593 156,387 5,257,119
(a) Including borrowing costs.
27 (Continued)
NESTLÉ HOLDINGS, INC.AND SUBSIDIARIES
Notes to Consolidated Financial Statements
December 31, 2015 and 2014
(Dollars in thousands)
Additions to property, plant and equipment include $1,865 and $6,782 of finance leases in 2015 and 2014,respectively. The net book value of assets held under finance leases included in property, plant andequipment at December 31, 2015 and 2014 was $25,304 and $30,252, respectively.
At December 31, 2015 and 2014, property, plant and equipment included $42,224 and $315,058,respectively, of assets under construction. There were $59,299 and $82,513 in commitments for futurecapital expenditures as of December 31, 2015 and 2014, respectively.
Impairment of Property, Plant and Equipment
Consideration is given at each balance sheet date to determine whether there is any indication ofimpairment of the carrying amounts of the Company’s property, plant and equipment. Indication could beunfavorable development of a business under competitive pressures or severe economic slowdown in agiven market, as well as reorganization of the operations to leverage their scale.
In assessing value in use, the estimated future cash flows are discounted to their present value, based on thetime value of money and any risks specific to the assets location. The risks specific to the asset areincluded in the determination of the cash flows.
Impairment of property, plant and equipment arises mainly from plans to optimize industrialmanufacturing capacities within inefficient production facilities. The 2015 impairments were attributableto the declines in production at the facilities in Solon, Ohio; and Little Chute, Wisconsin, which are part ofthe Brands segment.
(7) Employee Benefits
Post-employment Benefits
The liabilities of the Company arising from defined benefit obligations, and the related current servicecost, are determined using the projected unit credit method. The Company’s external actuaries performvaluations on an annual basis. Such plans are either externally funded, with the plan assets held separatelyfrom those of the Company in independently administered funds, or unfunded. The deficit or excess of thefair value of plan assets over the present value of the defined benefit obligation is recognized as a liabilityor an asset on the consolidated balance sheet.
Pension cost charged to the consolidated income statement consists of service cost (current and pastservice cost, gains and losses arising from settlement) and administration costs (other than costs ofmanaging plan assets), which are allocated to the appropriate heading by function, and net interest expenseor income, which is presented as part of net financial income/(expense). The actual return less interestincome on plan assets, changes in actuarial assumptions, and differences between actuarial assumptionsand what has actually occurred are reported in other comprehensive income or loss.
The Company also provides for benefits under defined contribution plans. Contributions to these plans arecharged to the consolidated income statement as incurred.
28 (Continued)

NESTLÉ HOLDINGS, INC.AND SUBSIDIARIES
Notes to Consolidated Financial Statements
December 31, 2015 and 2014
(Dollars in thousands)
Pensions and Retirement Benefits
Nestlé’s primary pension plan is non-contributory for the employees. The plan is a pension equity design,under which members earn pension credits each year based on a schedule related to the sum of their ageand service with Nestlé. A member’s benefit is the sum of the annual pension credits earned multiplied byan average earning, payable as a lump sum. However, in lieu of the lump sum, members have the option ofconverting the benefit to a monthly pension annuity. The plan does not provide for automatic pensionincreases.
Post-employment Medical Benefits and Other Employee Benefits
The Company maintains medical benefit plans, classified as defined benefit plans under IAS 19, whichcover eligible retired employees. The Company’s obligations for other employee benefits consist mainly ofend of service indemnities, which do not have the character of pensions.
Risks related to Defined Benefit Plans
The main risks to which the Company is exposed in relation to operating defined benefit plans are:
mortality risk: the assumptions adopted by the Company make allowance for future improvements inlife expectancy. However, if life expectancy improves at a faster rate than assumed, this would resultin greater payments from the plans and consequently increases in the plans’ liabilities. In order tominimize this risk, mortality assumptions are reviewed on a regular basis.
market and liquidity risks: these are the risks that the investments do not meet the expected returnsover the medium to long term. This also encompasses the mismatch between assets and liabilities. Inorder to minimize these risks, the structure of the portfolios is reviewed and asset-liability matchinganalyses are performed on a regular basis.
Plan Amendments and Restructuring Events
During the year, there were minor plan amendments and restructuring events, which have been recognizedas past service costs.
Asset-liability Management and Funding Arrangement
Plan trustees or General Assemblies are responsible for determining the mix of asset classes and targetallocations of the Nestlé’s plans with the support of investment advisors. Periodical reviews of the assetmix are made by mandating external consultants to perform asset-liability matching analyses. Suchanalyses aim at comparing dynamically the fair value of assets and the liabilities in order to determine themost adequate strategic asset allocation.
The overall investment policy and strategy for the Company’s funded defined benefit plans is guided bythe objective of achieving an investment return which, together with the contributions paid, is sufficient tomaintain reasonable control over the various funding risks of the plans. As those risks evolve with thedevelopment of capital markets and asset management activities, the Company addresses the assessmentand control process of the major investment pension risks. In order to protect the Company’s defined
29 (Continued)

NESTLÉ HOLDINGS, INC.AND SUBSIDIARIES
Notes to Consolidated Financial Statements
December 31, 2015 and 2014
(Dollars in thousands)
benefit plans funding ratio and to mitigate the financial risks, protective measures on the investmentstrategies are in force. To the extent possible, the risks are shared equally amongst the differentstakeholders.
Reconciliation of assets and liabilities recognized in the consolidated balance sheet is as follows:
2015 2014Defined Post- Defined Post-benefit employment benefit employment
retirement medical retirement medicalplans benefits Total plans benefits Total
Present value of funded obligations $ 3,923,249 — 3,923,249 4,087,144 — 4,087,144Fair value of plan assets (3,943,041) — (3,943,041) (4,379,219) — (4,379,219)
Excess of assets overfunded obligations (19,792) — (19,792) (292,075) — (292,075)
Present value of unfunded obligations 524,425 589,528 1,113,953 545,939 638,643 1,184,582Unrecognized assets and minimum
funding requirements 16,782 — 16,782 18,360 — 18,360Net Defined Benefit
Liabilities $ 521,415 589,528 1,110,943 272,224 638,643 910,867
Liabilities from cash-settled share-basedtransactions 59,020 55,024
Liabilities from non-current deferredcompensation and other 624,864 644,665
Net Liabilities $ 1,794,827 $ 1,610,556Reflected in the balance sheet as follows:
Employee benefit assets $ (29,179) $ (273,715)Employee benefit liabilities 1,824,006 1,884,271
Net Liabilities $ 1,794,827 $ 1,610,556
30 (Continued)

NESTLÉ HOLDINGS, INC.AND SUBSIDIARIES
Notes to Consolidated Financial Statements
December 31, 2015 and 2014
(Dollars in thousands)
The movement in the present value of defined benefit obligations is reflected as follows:
2015 2014Defined Post- Defined Post-benefit employment benefit employment
retirement medical retirement medicalplans benefits Total plans benefits Total
At January 1 $ 4,633,083 638,643 5,271,726 4,040,302 650,602 4,690,904of which funded defined
benefit plans 4,087,144 — 4,087,144 3,543,684 — 3,543,684of which unfunded defined
benefit plans 545,939 638,643 1,184,582 496,618 650,602 1,147,220Service cost 166,899 21,555 188,454 143,900 (46,754) 97,146
of which current service cost 166,286 21,555 187,841 147,312 24,007 171,319of which past service cost 613 — 613 (3,412) (70,761) (74,173)
Interest expense 174,878 21,400 196,278 180,341 25,561 205,902Actuarial (gains)/losses (31,813) (63,717) (95,530) 591,522 37,734 629,256Benefits paid on funded
defined benefit plans (451,013) — (451,013) (275,041) — (275,041)Benefits paid on unfunded
defined benefit plans (44,360) (28,353) (72,713) (47,941) (28,500) (76,441)
At December 31 $ 4,447,674 589,528 5,037,202 4,633,083 638,643 5,271,726of which funded defined
benefit plans $ 3,923,249 — 3,923,249 4,087,144 — 4,087,144of which unfunded defined
benefit plans 524,425 589,528 1,113,953 545,939 638,643 1,184,582
The movement in the fair value of defined benefit assets is reflected as follows:
2015 2014Defined Post- Defined Post-benefit employment benefit employment
retirement medical retirement medicalplans benefits Total plans benefits Total
At January 1 $ (4,379,219) — (4,379,219) (4,043,723) — (4,043,723)
Interest income (171,104) — (171,104) (190,475) — (190,475)Actual return on plan assets,
excluding interest income 235,019 — 235,019 (275,806) — (275,806)Employer contributions (78,750) — (78,750) (144,256) (144,256)Benefits paid on funded
defined benefit plans 451,013 — 451,013 275,041 — 275,041
At December 31 $ (3,943,041) — (3,943,041) (4,379,219) — (4,379,219)
31 (Continued)

NESTLÉ HOLDINGS, INC.AND SUBSIDIARIES
Notes to Consolidated Financial Statements
December 31, 2015 and 2014
(Dollars in thousands)
The major categories of plan assets as a percentage of total plan assets are as follows:
2015 2014December 31:
13.54% 13.20%EquitiesDebts 49.30 51.20
of which government debts 23.58 24.6425.72 26.56of which corporate debts
Alternative investments 37.16 35.60Total 100.00% 100.00%
Equity, government debts, and commodities represent 37% and 38% of the plan assets in 2015 and 2014,respectively. Almost all of them are quoted in an active market. Corporate debts, real estate, hedge fundsand private equities represent 63% and 62% of the plan assets in 2015 and 2014, respectively. Almost allof them are not quoted in an active market.
The movement in unrecognized assets and minimum funding requirements is as follows:
2015 2014Defined Post- Defined Post-benefit employment benefit employment
retirement medical retirement medicalplans benefits Total plans benefits Total
At January 1 $ 18,360 — 18,360 21,584 — 21,584Limitation of interest income 636 — 636 856 — 856Changes due to asset ceiling (2,214) — (2,214) (4,080) — (4,080)
At December 31 $ 16,782 — 16,782 18,360 — 18,360
Expenses recognized in the consolidated income statement are as follows:
2015 2014Post- Post-
Defined employment Defined employmentbenefit medical benefit medical
retirement benefits and retirement benefits andplans other benefits Total plans other benefits Total
Service cost $ 159,985 20,702 180,687 137,566 (47,169) 90,397Net Interest expense/(income) 6,921 20,739 27,660 (5,042) 24,808 19,766Administration expenses 9,672 — 9,672 10,215 — 10,215
Defined benefit expenses 176,578 41,441 218,019 142,739 (22,361) 120,378
Defined contribution expenses 90,422 — 90,422 86,568 — 86,568
Total expenses $ 267,000 41,441 308,441 229,307 (22,361) 206,946
32 (Continued)
NESTLÉ HOLDINGS, INC.AND SUBSIDIARIES
Notes to Consolidated Financial Statements
December 31, 2015 and 2014
(Dollars in thousands)
The expenses for defined benefit and defined contribution plans are allocated to the appropriate headingsof expenses by function.
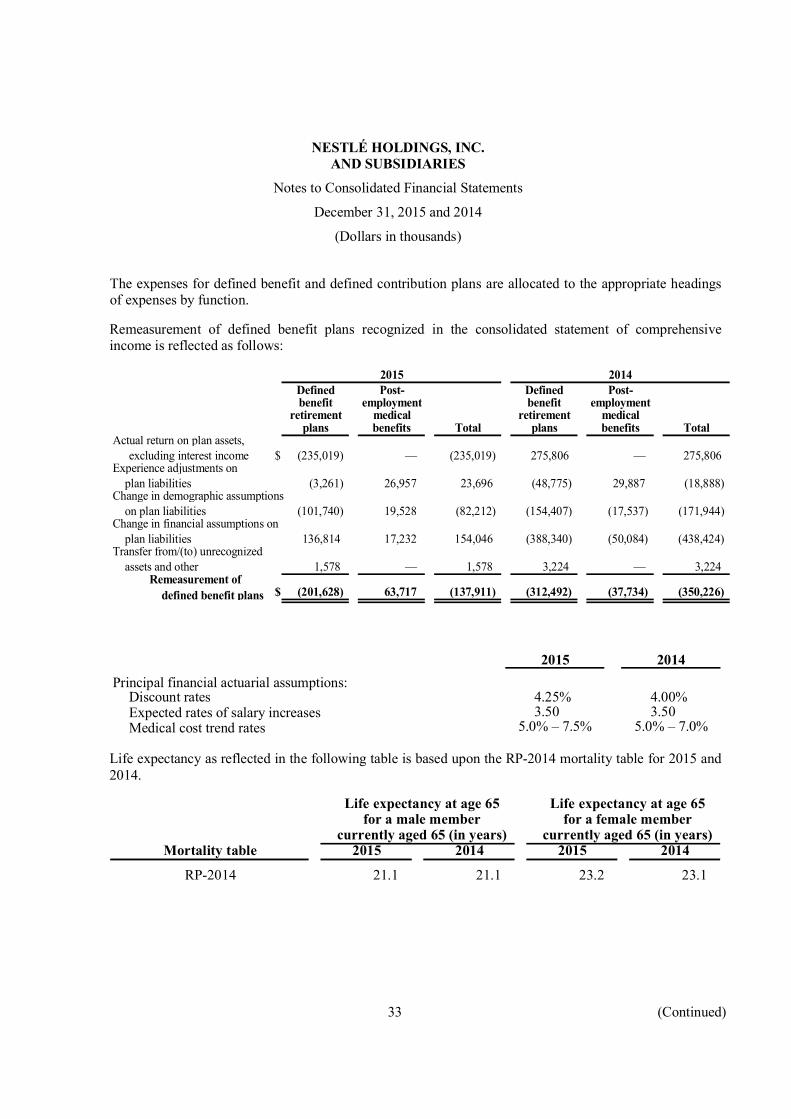
Remeasurement of defined benefit plans recognized in the consolidated statement of comprehensiveincome is reflected as follows:
2015 2014Defined Post- Defined Post-benefit employment benefit employment
retirement medical retirement medicalplans benefits Total plans benefits Total
Actual return on plan assets,excluding interest income $ (235,019) — (235,019) 275,806 — 275,806
Experience adjustments onplan liabilities (3,261) 26,957 23,696 (48,775) 29,887 (18,888)
Change in demographic assumptionson plan liabilities (101,740) 19,528 (82,212) (154,407) (17,537) (171,944)
Change in financial assumptions onplan liabilities 136,814 17,232 154,046 (388,340) (50,084) (438,424)
Transfer from/(to) unrecognizedassets and other 1,578 — 1,578 3,224 — 3,224
Remeasurement ofdefined benefit plans $ (201,628) 63,717 (137,911) (312,492) (37,734) (350,226)
2015 2014Principal financial actuarial assumptions:
4.25% 4.00%3.50 3.50
Discount ratesExpected rates of salary increasesMedical cost trend rates 5.0% – 7.5% 5.0% – 7.0%
Life expectancy as reflected in the following table is based upon the RP-2014 mortality table for 2015 and2014.
Life expectancy at age 65for a male member
currently aged 65 (in years)
Life expectancy at age 65for a female member
currently aged 65 (in years)Mortality table 2015 2014 2015 2014
RP-2014 21.1 21.1 23.2 23.1
33 (Continued)
NESTLÉ HOLDINGS, INC.AND SUBSIDIARIES
Notes to Consolidated Financial Statements
December 31, 2015 and 2014
(Dollars in thousands)
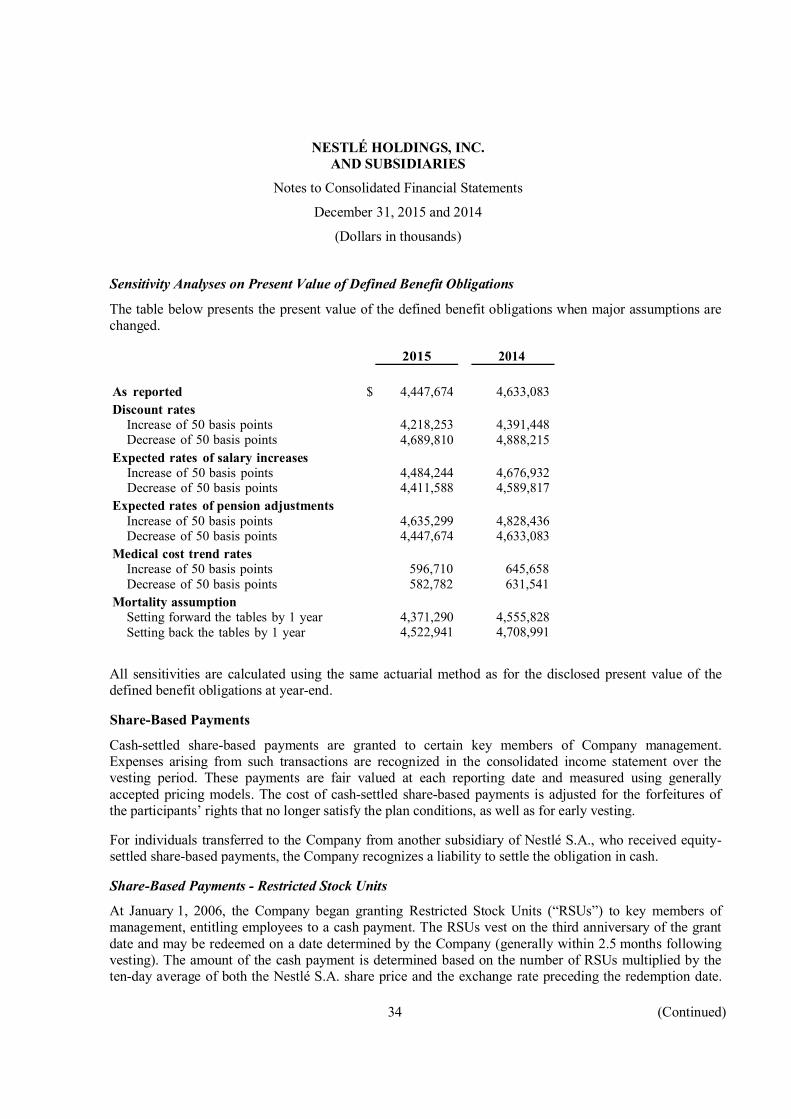
Sensitivity Analyses on Present Value of Defined Benefit Obligations
The table below presents the present value of the defined benefit obligations when major assumptions arechanged.
2015 2014
As reported $ 4,447,674 4,633,083Discount rates
4,218,253 4,391,448Increase of 50 basis pointsDecrease of 50 basis points 4,689,810 4,888,215
Expected rates of salary increases4,484,244 4,676,932Increase of 50 basis points
Decrease of 50 basis points 4,411,588 4,589,817Expected rates of pension adjustments
4,635,299 4,828,436Increase of 50 basis pointsDecrease of 50 basis points 4,447,674 4,633,083
Medical cost trend rates596,710 645,658Increase of 50 basis points
Decrease of 50 basis points 582,782 631,541Mortality assumption
4,371,290 4,555,828Setting forward the tables by 1 yearSetting back the tables by 1 year 4,522,941 4,708,991
All sensitivities are calculated using the same actuarial method as for the disclosed present value of thedefined benefit obligations at year-end.
Share-Based Payments
Cash-settled share-based payments are granted to certain key members of Company management.Expenses arising from such transactions are recognized in the consolidated income statement over thevesting period. These payments are fair valued at each reporting date and measured using generallyaccepted pricing models. The cost of cash-settled share-based payments is adjusted for the forfeitures ofthe participants’ rights that no longer satisfy the plan conditions, as well as for early vesting.
For individuals transferred to the Company from another subsidiary of Nestlé S.A., who received equity-settled share-based payments, the Company recognizes a liability to settle the obligation in cash.
Share-Based Payments - Restricted Stock Units
At January 1, 2006, the Company began granting Restricted Stock Units (“RSUs”) to key members ofmanagement, entitling employees to a cash payment. The RSUs vest on the third anniversary of the grantdate and may be redeemed on a date determined by the Company (generally within 2.5 months followingvesting). The amount of the cash payment is determined based on the number of RSUs multiplied by theten-day average of both the Nestlé S.A. share price and the exchange rate preceding the redemption date.
34 (Continued)
NESTLÉ HOLDINGS, INC.AND SUBSIDIARIES
Notes to Consolidated Financial Statements
December 31, 2015 and 2014
(Dollars in thousands)
Upon voluntary resignation or termination of employment for cause, all RSUs granted and outstandingbecome null and void without any compensation. However, upon termination of employment, as a result ofdeath, redundancy, disability, retirement, termination without cause, or divestiture, all RSUs granted andoutstanding will continue to vest and become vested on the third anniversary of the grant date and will beredeemed on a date determined by the Company. Effective January 1, 2015, RSUs will no longer begranted.
Share-Based Payments - Performance Stock Units
At January 1, 2015, the Company began granting Performance Stock Units (“PSUs”) to key members ofmanagement, entitling employees to a cash payment. The PSUs vest on the third anniversary of the grantdate and may be redeemed on a date determined by the Company (generally within 2.5 months followingvesting). Upon vesting, the number of shares delivered ranges from 0% to 200% of the initial grant and isdetermined by the degree by which the performance measures of the PSUs have been met. These measuresare the relative Total Shareholder Return of the Nestlé S.A. share in relation to the STOXX Europe 600Food & Beverage Net Return Index (as from 2014 the STOXX Global 1800 Food & Beverage Net ReturnIndex); and the growth of the underlying earnings per share in constant currencies. Each of the twomeasures has equal weighting in determining the vesting level of the initial PSUs award. The amount ofthe cash payment is determined based on the number of vested PSUs multiplied by the ten-day average ofboth the Nestlé S.A. share price and the exchange rate preceding the redemption date. Upon voluntaryresignation or termination of employment for cause, all PSUs granted and outstanding become null andvoid without any compensation. However, upon termination of employment, as a result of death,redundancy, disability, retirement, termination without cause or divestiture, all PSUs granted andoutstanding will continue to vest and become vested on the third anniversary of the grant date and will beredeemed on a date determined by the Company.
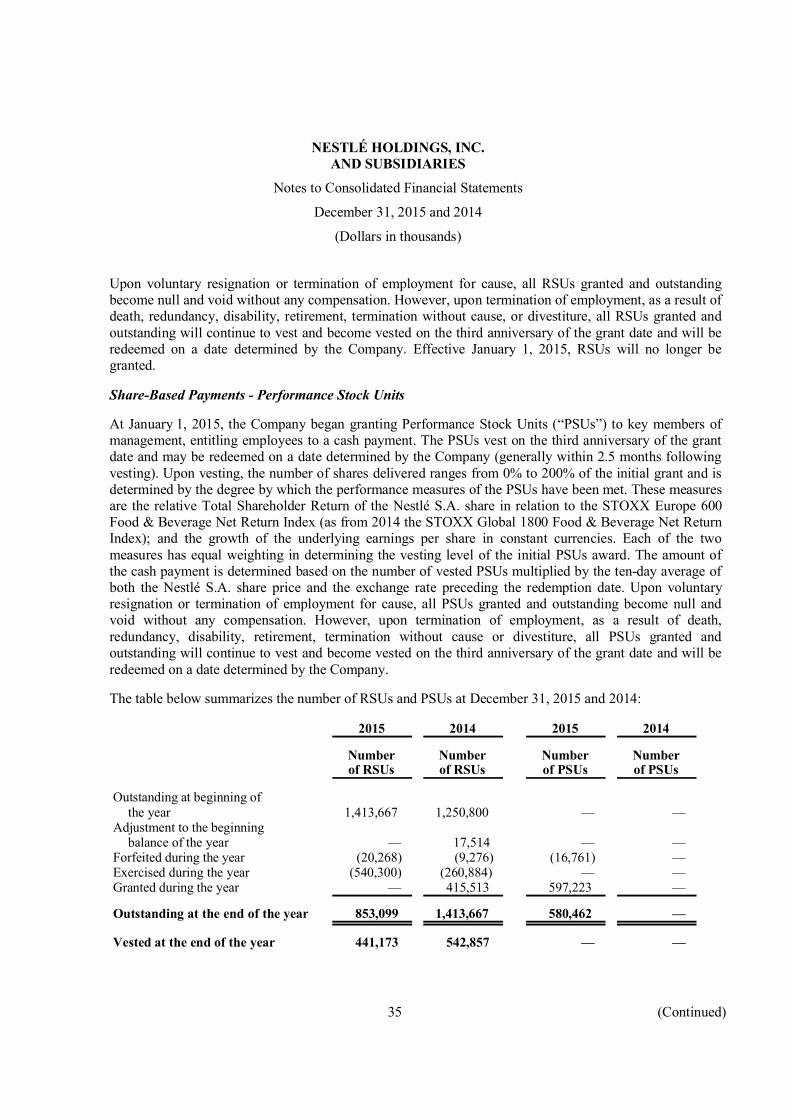
The table below summarizes the number of RSUs and PSUs at December 31, 2015 and 2014:
2015 2014 2015 2014
Number Number Number Numberof RSUs of RSUs of PSUs of PSUs
Outstanding at beginning of1,413,667 1,250,800 — —the year
Adjustment to the beginning— 17,514 — —
(20,268) (9,276) (16,761) —(540,300) (260,884) — —
balance of the yearForfeited during the yearExercised during the yearGranted during the year — 415,513 597,223 —
Outstanding at the end of the year 853,099 1,413,667 580,462 —
Vested at the end of the year 441,173 542,857 — —
35 (Continued)

NESTLÉ HOLDINGS, INC.AND SUBSIDIARIES
Notes to Consolidated Financial Statements
December 31, 2015 and 2014
(Dollars in thousands)
The average fair value of RSUs at December 31, 2015 is $68.66 (2014: $64.00). The average fair value ofPSUs at December 31, 2015 is $73.44.
Share-Based Payments - Group-issued Restricted Stock Units
Members of management of the Nestlé Group are awarded Group Restricted Stock Units (“GRSUs”) thatentitle participants to receive freely disposable Nestlé S.A. shares or an equivalent amount in cash at theend of a three-year restriction period. For individuals who participate in this plan and are transferred to theCompany from another subsidiary of Nestlé S.A., the Company recognizes a liability to settle theobligation in cash. The amount of the cash payment is determined based on the number of GRSUsmultiplied by the ten-day average of both the share price of Nestlé S.A. share price and the exchange ratepreceding the redemption date. There were no GRSUs granted in 2014 and 2015.
The table below summarizes the number of GRSUs at December 31, 2015 and 2014:
2015 2014
Number Numberof GRSUs of GRSUs
Outstanding at beginning of92,124 146,729the year
Transferred (to)/from another21,906 (10,162)
(54,314) (44,443)affiliate/Others
Exercised during the yearForfeited during the year (2,280) —
Outstanding at the end of the year 57,436 92,124
Vested at the end of the year 57,436 56,827
The fair value of the GRSUs corresponds to the market price of Nestlé S.A. shares when granted,recognized over the three-year vesting period and remeasured for subsequent changes in the market price.The average fair value of GRSUs at December 31, 2015 is $68.81 (2014: $62.74).
Share-Based Payments - Group-issued Performance Share Units
From 2014, members of Group Management are awarded Group Performance Share Units (“GPSUs”) thatentitle participants to receive freely disposable Nestlé S.A. shares or an equivalent amount in cash(accounted for as cash-settled share-based payment transactions) at the end of a three-year restrictionperiod. For individuals transferred to the Company from another subsidiary of Nestlé S.A., the Companyrecognizes a liability to settle the obligation in cash. Upon vesting, the number of shares delivered rangesfrom 0% to 200% of the initial grant and is determined by the degree by which the performance measuresof the GPSUs have been met. These measures are the relative Total Shareholder Return of the Nestlé S.A.share in relation to the STOXX Europe 600 Food & Beverage Net Return Index (as from 2014 the STOXXGlobal 1800 Food & Beverage Net Return Index); and the growth of the underlying earnings per share inconstant currencies. Each of the two measures has equal weighting in determining the vesting level of the
36 (Continued)
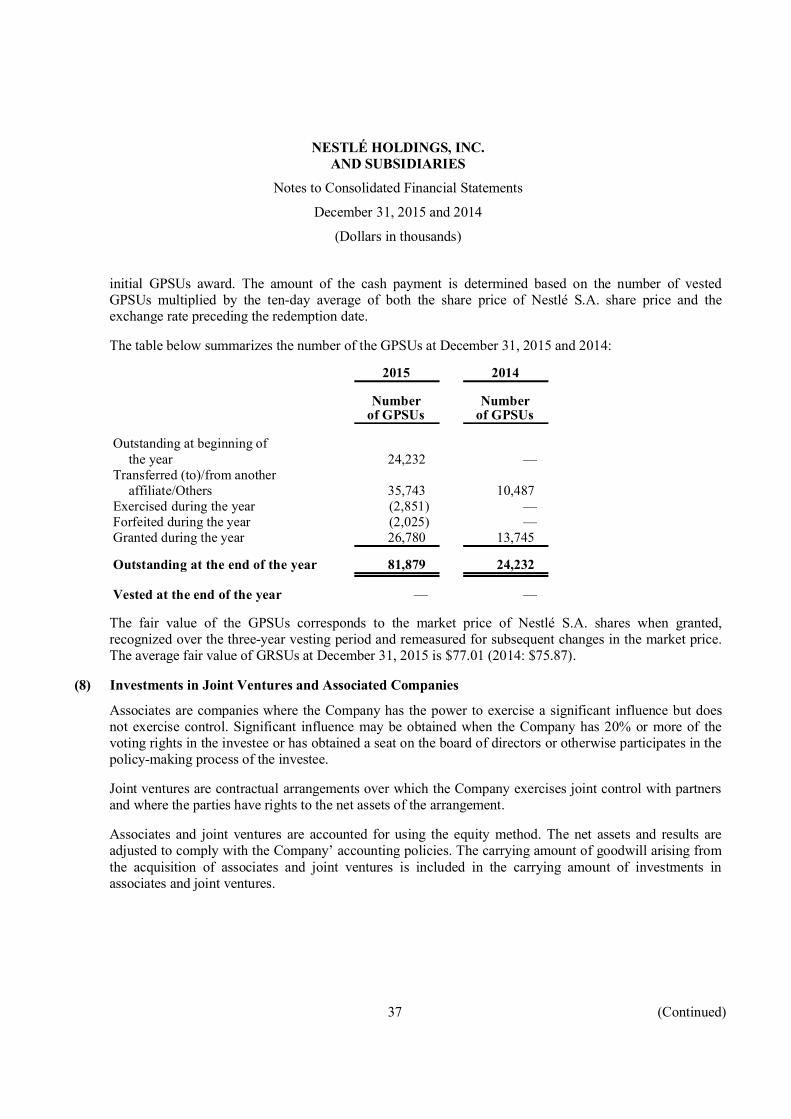
NESTLÉ HOLDINGS, INC.AND SUBSIDIARIES
Notes to Consolidated Financial Statements
December 31, 2015 and 2014
(Dollars in thousands)
initial GPSUs award. The amount of the cash payment is determined based on the number of vestedGPSUs multiplied by the ten-day average of both the share price of Nestlé S.A. share price and theexchange rate preceding the redemption date.
The table below summarizes the number of the GPSUs at December 31, 2015 and 2014:
2015 2014
Number Numberof GPSUs of GPSUs
Outstanding at beginning of24,232 —the year
Transferred (to)/from another35,743 10,487(2,851) —(2,025) —
affiliate/OthersExercised during the yearForfeited during the yearGranted during the year 26,780 13,745
Outstanding at the end of the year 81,879 24,232
Vested at the end of the year — —
The fair value of the GPSUs corresponds to the market price of Nestlé S.A. shares when granted,recognized over the three-year vesting period and remeasured for subsequent changes in the market price.The average fair value of GRSUs at December 31, 2015 is $77.01 (2014: $75.87).
(8) Investments in Joint Ventures and Associated Companies
Associates are companies where the Company has the power to exercise a significant influence but doesnot exercise control. Significant influence may be obtained when the Company has 20% or more of thevoting rights in the investee or has obtained a seat on the board of directors or otherwise participates in thepolicy-making process of the investee.
Joint ventures are contractual arrangements over which the Company exercises joint control with partnersand where the parties have rights to the net assets of the arrangement.
Associates and joint ventures are accounted for using the equity method. The net assets and results areadjusted to comply with the Company’ accounting policies. The carrying amount of goodwill arising fromthe acquisition of associates and joint ventures is included in the carrying amount of investments inassociates and joint ventures.
37 (Continued)

NESTLÉ HOLDINGS, INC.AND SUBSIDIARIES
Notes to Consolidated Financial Statements
December 31, 2015 and 2014
(Dollars in thousands)
The Company has the following investments in joint ventures and associated companies:
Ownership interest Net book value2015 2014 2015 2014
45% 45% $ 4,224 3,664Williams Inland Distributors, LLCBeverage Partners North America 50 50 1,556 4,697
Total investments in joint venturesand associated companies $ 5,780 8,361
(9) Deferred Taxes
Deferred taxation is the tax attributable to the temporary differences that arise when taxation authoritiesrecognize and measure assets and liabilities with rules that differ from the principles of the consolidatedfinancial statements. It also arises from temporary differences stemming from tax losses carried forward.
Deferred taxes are calculated under the liability method at the rates of tax expected to prevail when thetemporary differences reverse, subject to such rates being substantially enacted at the balance sheet date.Any changes of tax rates are recognized in the consolidated income statement unless related to itemsdirectly recognized in other comprehensive income. Deferred tax liabilities are recognized on all taxabletemporary differences excluding non-deductible goodwill. Deferred tax assets are recognized on alldeductible temporary differences provided that it is probable that future taxable income will be available.
Deferred tax assets by types of temporary differences are as follows:
2015 2014$ 718,095 680,254
196,860 196,90756,525 34,09913,559 1,719
Employee benefitsInventories, receivables, payables, accruals, and provisionsFinancial instrumentsNet operating lossesOthers 10,846 13,170
995,885 926,149Total deferred tax assets $
Deferred tax liabilities by types of temporary differences are as follows:
2015 2014$ 791,917 725,828
— 29,9071,134,850 984,115
— 56,261
Tangible fixed assetsEmployee benefitsGoodwill and other intangible assetsFinancial instrumentsOthers 268,337 255,172
Total deferred tax liabilities $ 2,195,104 2,051,283
38 (Continued)
NESTLÉ HOLDINGS, INC.AND SUBSIDIARIES
Notes to Consolidated Financial Statements
December 31, 2015 and 2014
(Dollars in thousands)
At December 31, 2015 and 2014, deferred taxes were recognized for all temporary differences, unless anexception from the general principal applied. Additionally, the Company had net operating losses and taxcredits, which can be carried forward to the extent taxable income will be generated. In earlier years, aportion of the net operating losses and tax credits that the Company does not expect to realize weretransferred to unrecognized deferred tax assets. These unrecognized deferred tax assets total $21,690, all ofwhich expire in more than five years. Excluding the unrecognized deferred tax assets, a benefit has beenfully recognized based on the Company’s expectation of probable taxable profits before the unused taxlosses expire.
(10) Goodwill and Intangible Assets
Goodwill
Goodwill is initially recognized during a business combination (Note 20). Subsequently it is measured atcost less impairment.
Intangible Assets
This heading includes intangible assets that are internally generated or acquired, either separately or in abusiness combination, when they are identifiable and can be reliably measured. Internally generatedintangible assets (essentially management information system software) are capitalized provided that thereis an identifiable asset that will be useful in generating future benefits in terms of savings, economies ofscale, etc.
Indefinite life intangible assets are those assets for which there is no foreseeable limit to their usefuleconomic life as they arise from contractual or other legal rights that can be renewed without significantcost and are the subject of continuous marketing support. They are not amortized but tested for impairmentannually or more frequently if an impairment indicator is triggered. The assessment of the classification ofintangible assets as indefinite is reviewed annually.
Finite life intangible assets are amortized over the shorter of their contractual or useful economic lives.They mainly comprise management information systems and rights and customer lists. Finite lifeintangible assets are amortized on a straight-line basis assuming a zero residual value: managementinformation systems over a period ranging from 3 to 5 years; and other finite life intangible assets over 5 to20 years or longer, depending on specific circumstances. Useful lives and residual values are reviewedannually. Amortization of intangible assets is allocated to the appropriate headings of expenses by functionin the consolidated income statement.
39 (Continued)
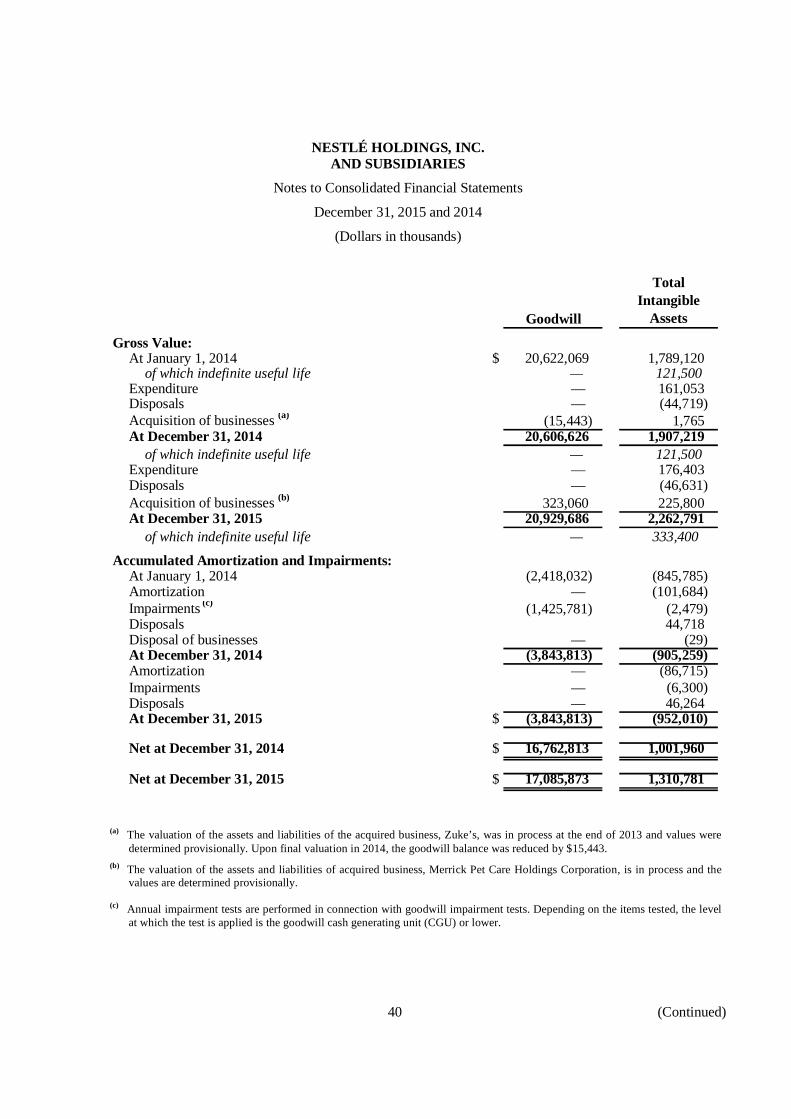
NESTLÉ HOLDINGS, INC.AND SUBSIDIARIES
Notes to Consolidated Financial Statements
December 31, 2015 and 2014
(Dollars in thousands)
Goodwill
TotalIntangible
Assets
Gross Value:At January 1, 2014 $ 20,622,069 1,789,120
of which indefinite useful life — 121,500Expenditure — 161,053Disposals — (44,719)Acquisition of businesses (a) (15,443) 1,765At December 31, 2014 20,606,626 1,907,219
of which indefinite useful life — 121,500Expenditure — 176,403Disposals — (46,631)Acquisition of businesses (b) 323,060 225,800At December 31, 2015 20,929,686 2,262,791
of which indefinite useful life — 333,400
Accumulated Amortization and Impairments:At January 1, 2014 (2,418,032) (845,785)Amortization — (101,684)Impairments (c) (1,425,781) (2,479)Disposals 44,718Disposal of businesses — (29)At December 31, 2014 (3,843,813) (905,259)Amortization — (86,715)Impairments — (6,300)Disposals — 46,264At December 31, 2015 $ (3,843,813) (952,010)
Net at December 31, 2014 $ 16,762,813 1,001,960
Net at December 31, 2015 $ 17,085,873 1,310,781
(a) The valuation of the assets and liabilities of the acquired business, Zuke’s, was in process at the end of 2013 and values weredetermined provisionally. Upon final valuation in 2014, the goodwill balance was reduced by $15,443.
(b) The valuation of the assets and liabilities of acquired business, Merrick Pet Care Holdings Corporation, is in process and thevalues are determined provisionally.
(c) Annual impairment tests are performed in connection with goodwill impairment tests. Depending on the items tested, the levelat which the test is applied is the goodwill cash generating unit (CGU) or lower.
40 (Continued)

NESTLÉ HOLDINGS, INC.AND SUBSIDIARIES
Notes to Consolidated Financial Statements
December 31, 2015 and 2014
(Dollars in thousands)
Impairment of Goodwill and Intangible Assets
Goodwill and indefinite life intangible assets are tested for impairment at least annually and upon theoccurrence of an indication of impairment. Finite life intangible assets are tested when there is anindication of impairment.
The annual impairment tests are performed at the same time each year and at the cash generating unit(“CGU”) level. The Company defines its CGU for goodwill impairment testing based on the way that itmonitors and derives economic benefits from the acquired goodwill. For indefinite life intangible assets,the Company defines its CGU as the smallest identifiable group of assets that generates cash inflows thatare largely independent of the cash inflows from other assets or groups of assets. The impairment tests areperformed by comparing the carrying value of the assets of the CGU with their recoverable amount basedon their value in use, which corresponds to their future projected cash flows discounted at an appropriatepre-tax rate of return. Usually, the cash flows correspond to estimates made by management in financialplans and business strategies covering a period of five years after making adjustments to consider theassets in their current condition. They are then projected to perpetuity using a multiple which correspondsto a steady or declining growth rate. The Company assesses the uncertainty of these estimates byperforming sensitivity analysis. The discount rate reflects the current assessment of the time value ofmoney and the risks specific to the CGU (essentially country risk). The business risk is included in thedetermination of the cash flows. Both the cash flows and the discount rates include inflation. Animpairment loss in respect of goodwill is never subsequently reversed.
Impairment Charge
There was no goodwill impairment in 2015.
In 2014, an impairment of goodwill of $1,425,781 was recorded with regards of the Direct Store Deliverysystem (DSD) CGU for Frozen Pizza and Ice Cream.
Annual Impairment Tests
Impairment reviews have been conducted for goodwill and intangible assets with indefinite useful lifeitems allocated to five cash generating units (CGU).
The following three CGUs have been considered as significant either with regard to the total goodwill or tothe total intangible assets with indefinite useful life for which detailed results are presented: PetCare, InfantNutrition, and Direct Store Delivery system (DSD) for Frozen Pizza and Ice Cream.
41 (Continued)
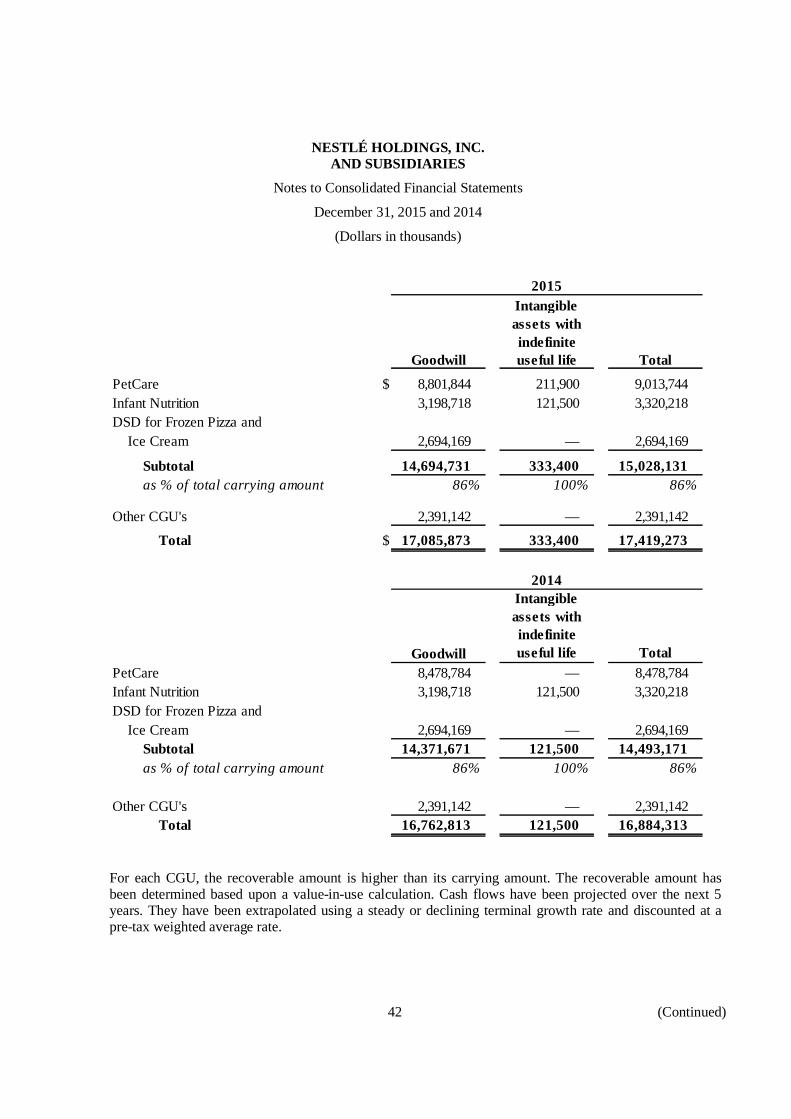
NESTLÉ HOLDINGS, INC.AND SUBSIDIARIES
Notes to Consolidated Financial Statements
December 31, 2015 and 2014
(Dollars in thousands)
Goodwill
Intangibleassets withindefiniteuseful life Total
PetCare $ 8,801,844 211,900 9,013,744Infant Nutrition 3,198,718 121,500 3,320,218DSD for Frozen Pizza and
Ice Cream 2,694,169 — 2,694,169
Subtotal 14,694,731 333,400 15,028,131as % of total carrying amount 86% 100% 86%
Other CGU's 2,391,142 — 2,391,142
Total $ 17,085,873 333,400 17,419,273
Goodwill
Intangibleassets withindefiniteuseful life Total
PetCare 8,478,784 — 8,478,784Infant Nutrition 3,198,718 121,500 3,320,218DSD for Frozen Pizza and
Ice Cream 2,694,169 — 2,694,169Subtotal 14,371,671 121,500 14,493,171as % of total carrying amount 86% 100% 86%
Other CGU's 2,391,142 — 2,391,142Total 16,762,813 121,500 16,884,313
2015
2014
For each CGU, the recoverable amount is higher than its carrying amount. The recoverable amount hasbeen determined based upon a value-in-use calculation. Cash flows have been projected over the next 5years. They have been extrapolated using a steady or declining terminal growth rate and discounted at apre-tax weighted average rate.
42 (Continued)

NESTLÉ HOLDINGS, INC.AND SUBSIDIARIES
Notes to Consolidated Financial Statements
December 31, 2015 and 2014
(Dollars in thousands)
The following table summarizes the key assumptions for each significant CGU:
Period ofCash FlowProjections
Annual SalesGrowth
AnnualMargin
EvolutionTerminal
Growth Rate
Pre-TaxDiscount
RatePetCare 5 years 3% to 3.4% Stable 2.0% 7.2%Infant Nutrition 5 years 2.3% to 5.6% Improvement 2.0% 7.4%DSD for Frozen Pizza and
Ice Cream 5 years 0.1% to 1% Improvement 1.5% 7.7%
Period ofCash FlowProjections
Annual SalesGrowth
AnnualMargin
EvolutionTerminal
Growth Rate
Pre-TaxDiscount
RatePetCare 5 years 4% to 6% Stable 2.0% 7.6%Infant Nutrition 5 years 0% to 8% Improvement 1.0% 7.7%DSD for Frozen Pizza and
Ice Cream 5 years -2% to 1% Improvement 1.5% 7.6%
2015
2014
The pre-tax discount rate has been computed based on external sources of information.
The cash flows for the first 5 years were based upon financial plans approved by Nestlé GroupManagement which are consistent with the Nestlé Group’s approved strategy for this period. Theyare based on past performance and current initiatives.
The terminal growth rates have been determined to reflect the long term view of the nominalevolution of the business.
Management believes that no reasonably possible change in any of the above key assumptions would causethe CGU’s recoverable amount to fall below the carrying value of the CGUs except for the CGU DSD forFrozen Pizza and Ice Cream. For this CGU, the following changes in the material assumptions lead to asituation where the value in use equals the carrying amount.
43 (Continued)
NESTLÉ HOLDINGS, INC.AND SUBSIDIARIES
Notes to Consolidated Financial Statements
December 31, 2015 and 2014
(Dollars in thousands)
(11) Financial Instruments
Financial Assets
Financial assets are initially recognized at fair value plus directly attributable transaction costs. However,when a financial asset at fair value through the income statement is recognized, the transaction costs areexpensed immediately. Subsequent remeasurement of financial assets is determined by their categorizationwhich is revisited at each reporting date.
At each balance sheet date, the Company assesses whether its financial assets are to be impaired.Impairment losses are recognized in the consolidated income statement where there is objective evidenceof impairment, such as where the issuer is in bankruptcy, default, or other significant financial difficulty.
Financial assets are derecognized (in full or partly) when substantially all of Company’s rights to cashflows from the respective assets have expired or have been transferred and the Company has neitherexposure to substantially all the risks inherent in those assets nor entitlement to rewards from them.
Classes and Categories of Financial Instruments
The Company classifies its financial instruments into the following categories: loans and receivables,financial assets designated at fair value through income statement, held-for-trading, available-for-saleassets and financial liabilities at amortized cost.
Loans and Receivables
Loans and receivables are non-derivative financial assets with fixed or determinable payments that are notquoted in an active market. This category includes the following classes of financial assets: loans, trade,and other receivables and cash at bank and cash in hand.
Subsequent to initial measurement, loans and receivables are carried at amortized cost using the effectiveinterest rate method less appropriate allowances for doubtful receivables, see Trade and Other Receivables,net (Note 3).
Financial Assets Designated at Fair Value through Income Statement
Certain investments are designated at fair value through the income statement because this reduces anaccounting mismatch, which would otherwise arise due to the remeasurement of certain liabilities usingcurrent market prices as inputs. Company-owned life insurance policies are categorized as financial assetsat fair value through profit and loss. They are reported at their cash surrender value with any changes incash surrender value being recognized in the consolidated income statement.
Held-for-Trading Assets and Liabilities
Held-for-trading assets and liabilities are derivative financial instruments. Subsequent to initialmeasurement, items classified as held-for-trading are carried at fair value and all their gains and losses,realized and unrealized, are recognized in the consolidated income statement unless they are part of ahedging relationship (see Derivative Assets and Liabilities and Hedge Accounting, Note 5).
44 (Continued)
NESTLÉ HOLDINGS, INC.AND SUBSIDIARIES
Notes to Consolidated Financial Statements
December 31, 2015 and 2014
(Dollars in thousands)
Available-for-Sale Assets
Available-for-sale assets are those non-derivative financial assets that are either designated as such uponinitial recognition or are not classified in any of the other categories of financial assets. This categoryincludes the following classes of financial assets: bonds and bond funds, equities and equity funds,commercial paper, time deposits, and other investments.
Subsequent to initial measurement, available-for-sale assets are stated at fair value with all unrealized gainsor losses recognized in other comprehensive income until their disposal at which time such gains or lossesare recognized in the consolidated income statement.
Interest and dividends from available-for-sale assets are recognized in the consolidated income statement.
Financial Liabilities at Amortized Cost
Financial liabilities are initially recognized at the fair value of consideration received less directlyattributable transaction costs.
Subsequent to initial measurement, financial liabilities are recognized at amortized cost. The differencebetween the initial carrying amount of the financial liabilities and their redemption value is recognized inthe consolidated income statement over the contractual terms using the effective interest rate method. Thiscategory includes the following classes of financial liabilities: trade and other payables, commercial paper,bonds, and other financial liabilities.
Financial liabilities at amortized cost are further classified as current and non-current depending whetherthese will fall due within twelve months after the balance sheet date or beyond.
Financial liabilities are derecognized (in full or partly) when the Company is discharged from itsobligation, when they expire, and when they are canceled or replaced by a new liability with substantiallymodified terms.
45 (Continued)
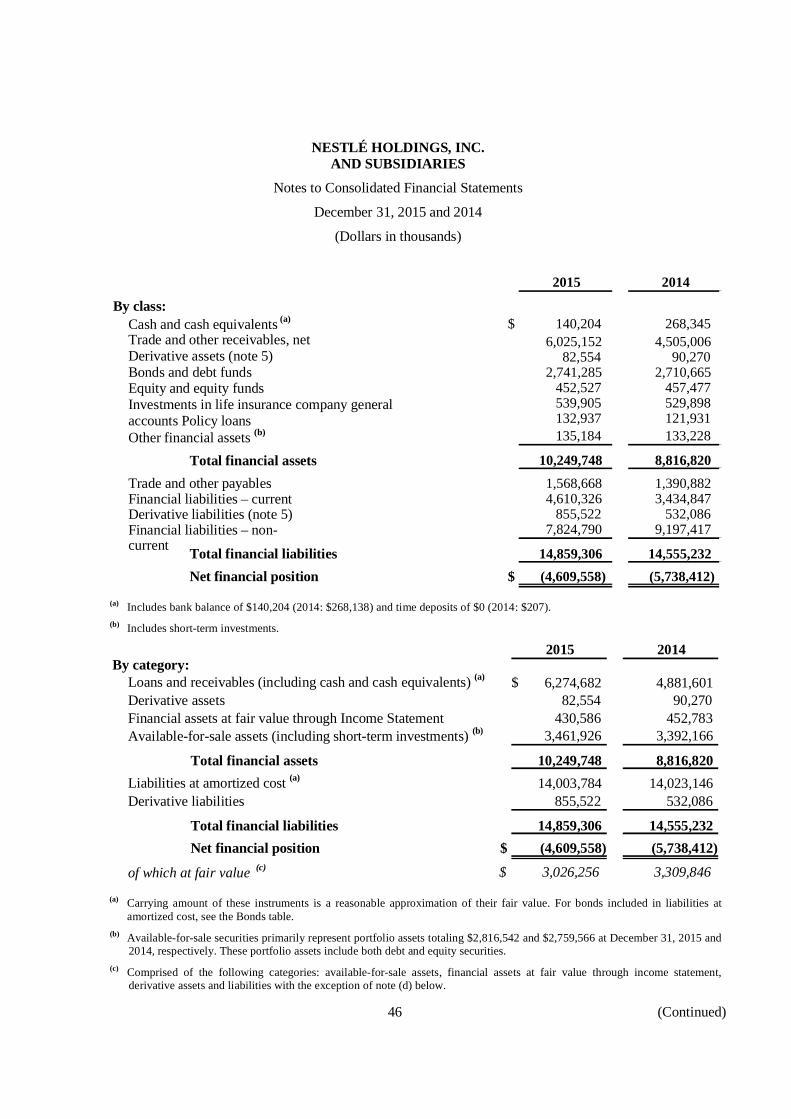
NESTLÉ HOLDINGS, INC.AND SUBSIDIARIES
Notes to Consolidated Financial Statements
December 31, 2015 and 2014
(Dollars in thousands)
2015 2014
By class:$ 140,204 268,345
6,025,152 4,505,00682,554 90,270
2,741,285 2,710,665452,527 457,477539,905 529,898132,937 121,931
Cash and cash equivalents (a)
Trade and other receivables, netDerivative assets (note 5)Bonds and debt fundsEquity and equity fundsInvestments in life insurance company generalaccounts Policy loansOther financial assets (b) 135,184 133,228
Total financial assets 10,249,748 8,816,8201,568,668 1,390,8824,610,326 3,434,847
855,522 532,086
Trade and other payablesFinancial liabilities – currentDerivative liabilities (note 5)Financial liabilities – non-current
7,824,790 9,197,417
Total financial liabilities 14,859,306 14,555,232Net financial position $ (4,609,558) (5,738,412)
(a) Includes bank balance of $140,204 (2014: $268,138) and time deposits of $0 (2014: $207).(b) Includes short-term investments.
2015 2014By category:
6,274,682 4,881,60182,554 90,270
430,586 452,783
Loans and receivables (including cash and cash equivalents) (a) $Derivative assetsFinancial assets at fair value through Income StatementAvailable-for-sale assets (including short-term investments) (b) 3,461,926 3,392,166
Total financial assets 10,249,748 8,816,82014,003,784 14,023,146Liabilities at amortized cost (a)
Derivative liabilities 855,522 532,086
Total financial liabilities 14,859,306 14,555,232Net financial position $ (4,609,558) (5,738,412)
of which at fair value (c) $ 3,026,256 3,309,846
(a) Carrying amount of these instruments is a reasonable approximation of their fair value. For bonds included in liabilities atamortized cost, see the Bonds table.
(b) Available-for-sale securities primarily represent portfolio assets totaling $2,816,542 and $2,759,566 at December 31, 2015 and2014, respectively. These portfolio assets include both debt and equity securities.
(c) Comprised of the following categories: available-for-sale assets, financial assets at fair value through income statement,derivative assets and liabilities with the exception of note (d) below.
46 (Continued)
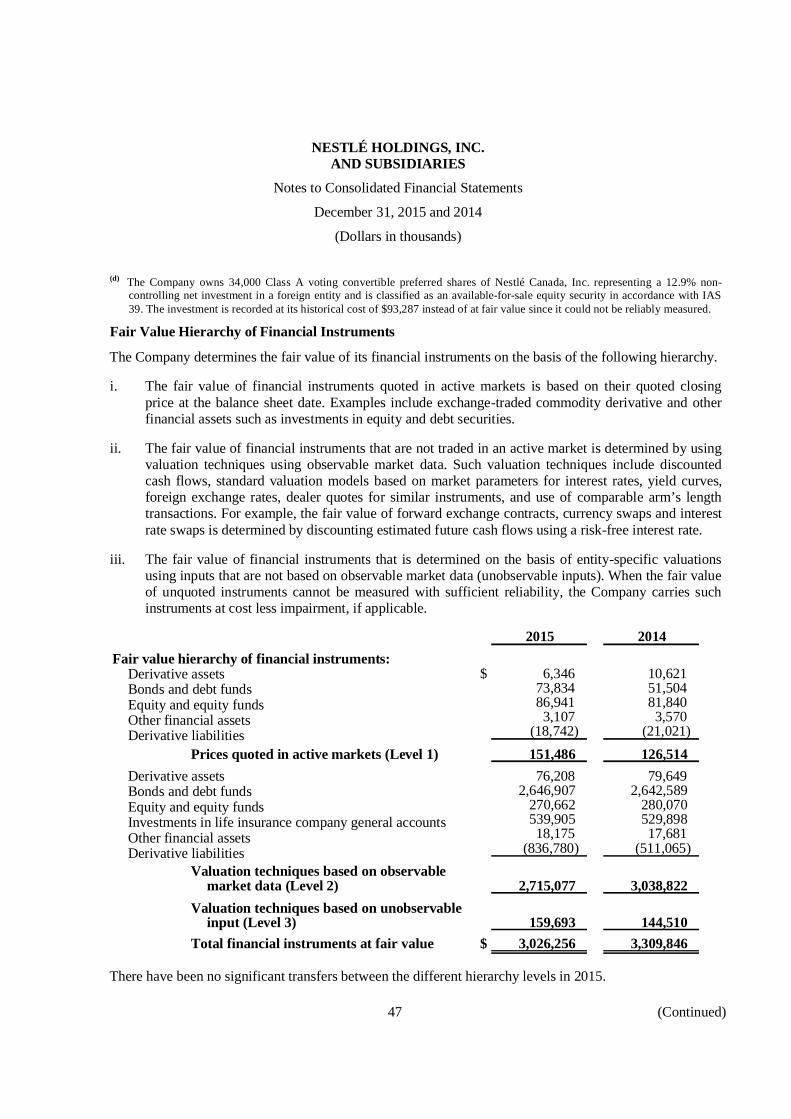
NESTLÉ HOLDINGS, INC.AND SUBSIDIARIES
Notes to Consolidated Financial Statements
December 31, 2015 and 2014
(Dollars in thousands)
(d) The Company owns 34,000 Class A voting convertible preferred shares of Nestlé Canada, Inc. representing a 12.9% non-controlling net investment in a foreign entity and is classified as an available-for-sale equity security in accordance with IAS39. The investment is recorded at its historical cost of $93,287 instead of at fair value since it could not be reliably measured.
Fair Value Hierarchy of Financial Instruments
The Company determines the fair value of its financial instruments on the basis of the following hierarchy.
i. The fair value of financial instruments quoted in active markets is based on their quoted closingprice at the balance sheet date. Examples include exchange-traded commodity derivative and otherfinancial assets such as investments in equity and debt securities.
ii. The fair value of financial instruments that are not traded in an active market is determined by usingvaluation techniques using observable market data. Such valuation techniques include discountedcash flows, standard valuation models based on market parameters for interest rates, yield curves,foreign exchange rates, dealer quotes for similar instruments, and use of comparable arm’s lengthtransactions. For example, the fair value of forward exchange contracts, currency swaps and interestrate swaps is determined by discounting estimated future cash flows using a risk-free interest rate.
iii. The fair value of financial instruments that is determined on the basis of entity-specific valuationsusing inputs that are not based on observable market data (unobservable inputs). When the fair valueof unquoted instruments cannot be measured with sufficient reliability, the Company carries suchinstruments at cost less impairment, if applicable.
2015 2014Fair value hierarchy of financial instruments:
$ 6,346 10,62173,834 51,50486,941 81,8403,107 3,570
Derivative assetsBonds and debt fundsEquity and equity fundsOther financial assetsDerivative liabilities (18,742) (21,021)
Prices quoted in active markets (Level 1) 151,486 126,51476,208 79,649
2,646,907 2,642,589270,662 280,070539,905 529,89818,175 17,681
Derivative assetsBonds and debt fundsEquity and equity fundsInvestments in life insurance company general accountsOther financial assetsDerivative liabilities (836,780) (511,065)
Valuation techniques based on observablemarket data (Level 2) 2,715,077 3,038,822
Valuation techniques based on unobservableinput (Level 3) 159,693 144,510
Total financial instruments at fair value $ 3,026,256 3,309,846
There have been no significant transfers between the different hierarchy levels in 2015.
47 (Continued)

NESTLÉ HOLDINGS, INC.AND SUBSIDIARIES
Notes to Consolidated Financial Statements
December 31, 2015 and 2014
(Dollars in thousands)
BondsEffective Year of issue/
Comments Coupon interest rate maturity 2015 2014
AUD 275,000 (b) 5.50% 5.69% 2011-2016 $ 204,763 234,069NOK 1,000,000 (b) 3.38 3.59 2011-2016 115,856 138,892USD 200,000 (c) 2.00 2.06 2011-2016 199,901 199,794USD 900,000 (c) 1.38 1.46 2012-2017 898,934 898,222NOK 3,000,000 (a) 2.50 2.66 2012-2017 339,668 401,683AUD 200,000 (a) 4.00 4.11 2012-2017 145,778 163,141NOK 1,000,000 (a) 2.25 2.31 2012-2017 113,406 134,219GBP 250,000 (b) 1.63 1.71 2013-2017 369,117 388,747CHF 250,000 (b) 2.63 2.66 2007-2018 270,022 273,439USD 500,000 (c) 1.25 1.32 2012-2018 499,337 499,019AUD 175,000 (b) 3.75 3.84 2013-2018 130,244 146,498USD 400,000 (c) 1.38 1.50 2013-2018 398,717 398,230AUD 200,000 (a) 3.88 4.08 2013-2018 145,133 162,322AUD 300,000 (a) 4.13 4.33 2013-2018 217,748 243,624AUD 100,000 (b) 4.13 4.34 2013-2018 75,787 85,298USD 500,000 (c) 2.00 2.17 2013-2019 496,740 495,957USD 500,000 (c) 2.25 2.41 2013-2019 497,496 496,753USD 400,000 (c) 2.00 2.06 2014-2019 399,144 398,926AUD 250,000 (b) 4.25 4.43 2014-2020 192,711 217,269NOK 1,000,000 (b) 2.75 2.85 2014-2020 119,342 140,921USD 650,000 (c) 2.13 2.27 2014-2020 646,257 645,382AUD 175,000 (b) 3.63 3.77 2014-2020 133,338 149,213GBP 400,000 (a) 1.75 1.82 2015-2020 591,166 –
Other bonds issued by Nestlé PurinaPetCare Company:
USD 47,680 (c) 7.75 6.25 1995-2015 — 48,195USD 63,210 (c) 9.30 6.46 1991-2021 71,361 72,605USD 78,963 (c) 8.63 6.46 1992-2022 87,683 88,812USD 43,927 (c) 8.13 6.47 1993-2023 47,994 48,436USD 51,164 (c) 7.88 6.45 1995-2025 55,877 56,231Other Bonds 1,841 3,377
Total carrying amount (*) $ 7,465,361 7,229,274of which due within one year 520,522 49,723of which due after one year 6,944,839 7,179,551
Fair value (*) of bonds, based on prices quoted (level 2) 7,556,661 7,367,516
(*) Carrying amount and fair value of bonds exclude accrued interest.
Several bonds are hedged by currency and/or interest derivatives. The fair value of these derivatives isshown under derivative assets of $74,154 (2014: $78,019) and under derivative liabilities of $696,330 and(2014:$ 347,720).(a) Subject to an interest rate and currency swap that creates a U.S. dollar liability at fixed rates.(b) Subject to an interest rate and currency swap that creates a U.S. dollar liability at floating rates.(c) Not subject to an interest rate or currency swap.
48 (Continued)
NESTLÉ HOLDINGS, INC.AND SUBSIDIARIES
Notes to Consolidated Financial Statements
December 31, 2015 and 2014
(Dollars in thousands)
(12) Financial Risks
In the course of its business, the Company is exposed to a number of financial risks: credit risk, liquidityrisk, market risk (including foreign currency risk and interest rate risk, commodity price risk, and equityprice risk). This note presents the Company’s objectives, policies, and processes for managing its financialrisk and capital.
Financial risk management is an integral part of the way the Company is managed. The Board of Directorsof Nestlé S.A. determines the financial control principles as well as the principles of financial planning.The Chief Executive Officer organizes, manages, and monitors all financial risks, including asset andliability matters.
A Nestlé S.A. Asset and Liability Management Committee (“ALMC”), under the supervision of the ChiefFinancial Officer of Nestlé S.A., is the governing body for the establishment and subsequent execution ofNestlé S.A.’s Financial Asset and Liability Management Policy. It ensures implementation of strategiesand achievement of objectives of Nestlé S.A.’s Financial Asset and Liabilities Management Policy, whichare executed by the Centre Treasury, the Regional Treasury Centres, and in specific local circumstances,by the affiliated companies. The activities of the Centre Treasury and of the Regional Treasury Centres aresupervised by an independent Middle Office, which verifies the compliance of the strategies proposedand/or operations executed within the approved guidelines and limits set by the ALMC. ApprovedTreasury Management Guidelines define and classify risks as well as determine, by category oftransaction, specific approval, execution, and monitoring procedures. In accordance with theaforementioned policies, the Company only enters into derivative transactions relating to assets, liabilities,or anticipated future transactions.
Credit Risk
Credit Risk Management
Credit risk refers to the risk that a counterparty will default on its contractual obligations resulting infinancial loss to the Company. Credit risk arises on liquid assets, non-current financial assets, derivativeassets, trade and other receivables.
The Company aims to minimize its financial credit risk through the application of risk managementpolicies. Credit limits are set based on a counterparty value and a probability of default. The methodologyused to set the list of counterparty limits includes Enterprise Value (“EV”), counterparty Credit Ratings(“CR”), and Credit Default Swaps (“CDS”). Evolution of counterparties is monitored regularly, taking intoconsideration EV, CR, and CDS evolution by Nestlé S.A. As a result of this review, changes on creditlimits and risk allocation are carried out.
The Company avoids the concentration of credit risk on its liquid assets by spreading them over severalinstitutions and sectors.
Trade receivables are subject to credit limits, control, and approval procedures in all the affiliatedcompanies. Due to its large geographic base and number of customers, the Company is not exposed tomaterial concentrations of credit risk on its Trade and Other Receivables, net (Note 3). Nevertheless,
49 (Continued)
NESTLÉ HOLDINGS, INC.AND SUBSIDIARIES
Notes to Consolidated Financial Statements
December 31, 2015 and 2014
(Dollars in thousands)
global commercial counterparties are constantly monitored following the similar methodology used forfinancial counterparties.
The maximum exposure to credit risk resulting from financial activities, without considering nettingagreements and without taking into account any collateral held or other credit enhancements, is equal to thecarrying amount of the Company’s financial assets.
Credit rating of financial assets (excluding receivables and inter-group loans):
2015 2014
Investment grade (A- and above) $ 2,726,252 3,051,229Investment grade (BBB+, BBB and BBB-) 991,688 751,965Non-investment grade (BB+ and below) 65,329 80,175Not rated (a) 428,705 428,445
Total financial assets (excluding receivablesand inter-group loans) $ 4,211,974 4,311,814
(a) Mainly equity securities and other investments for which no credit rating is available.
The source of the credit ratings is Standard & Poor’s; if not available, the Company uses other credit ratingequivalents. The Company deals mainly with financial institutions located in Switzerland, the EuropeanUnion, and North America.
Liquidity Risk
Liquidity Risk Management
Liquidity risk is the risk that a company may encounter difficulties in meeting its obligations associatedwith financial liabilities that are settled by delivering cash or other financial assets. Such risk may resultfrom inadequate market depth, disruption, or refinancing problems. The Company’s objective is to managethis risk by limiting exposures in financial instruments that may be affected by liquidity problems and bymaintaining sufficient back-up facilities.
50 (Continued)

NESTLÉ HOLDINGS, INC.AND SUBSIDIARIES
Notes to Consolidated Financial Statements
December 31, 2015 and 2014
(Dollars in thousands)
Contractual maturities of certain financial assets and financial liabilities and derivatives (includinginterest)
2015Interest and
3rd to 5th After the 5th Contractual Impact of Carrying1st year 2nd year year year amount Discounting amount
Trade and other payables $ 1,568,668 — — — 1,568,668 — 1,568,668Commercial paper 3,212,400 — — — 3,212,400 (844) 3,211,556Bonds 699,068 2,036,972 5,066,254 279,871 8,082,165 (616,804) 7,465,361Other financial debt 879,061 861,424 15,991 3,931 1,760,407 (2,208) 1,758,199
Total financial debt 4,790,529 2,898,396 5,082,245 283,802 13,054,972 (619,856) 12,435,116Financial liabilities
(excluding derivatives) 6,359,197 2,898,396 5,082,245 283,802 14,623,640 (619,856) 14,003,784
Non-currency derivative assets 8,291 — — — 8,291 — 8,291Non-currency derivative liabilities (83,480) (27,127) (45,620) (2,362) (158,589) 3,131 (155,458)Gross amount receivable from
currency derivatives 453,949 1,049,381 1,943,364 — 3,446,694 (145,554) 3,301,140Gross amount payable from
currency derivatives (543,799) (1,341,734) (2,192,185) — (4,077,718) 150,777 (3,926,941)Net derivatives (165,039) (319,480) (294,441) (2,362) (781,322) 8,354 (772,968)
of which derivatives undercash flow hedges (a) $ (66,995) (292,876) (172,001) (2,362) (534,234) 3,617 (530,617)
2014Interest and
3rd to 5th After the 5th Contractual Impact of Carrying1st year 2nd year year year amount Discounting amount
Trade and other payables $ 1,390,882 — — — 1,390,882 — 1,390,882Commercial paper 2,932,280 — — — 2,932,280 (2,125) 2,930,155Bonds 230,967 743,587 5,546,529 1,464,080 7,985,163 (755,889) 7,229,274Other financial liabilities 837,577 760,635 871,027 6,635 2,475,874 (3,039) 2,472,835
Total financial debt 4,000,824 1,504,222 6,417,556 1,470,715 13,393,317 (761,053) 12,632,264Financial liabilities
(excluding derivatives) 5,391,706 1,504,222 6,417,556 1,470,715 14,784,199 (761,053) 14,023,146
Non-currency derivative assets 12,251 — — — 12,251 — 12,251Non-currency derivative liabilities (104,560) (29,678) (42,262) (6,969) (183,469) 3,366 (180,103)Gross amount receivable from
currency derivatives 135,267 451,999 2,120,269 499,997 3,207,532 (177,501) 3,030,031Gross amount payable from
currency derivatives (74,490) (487,473) (2,335,927) (555,812) (3,453,702) 149,707 (3,303,995)Net derivatives (31,532) (65,152) (257,920) (62,784) (417,388) (24,428) (441,816)
of which derivatives undercash flow hedges (a) $ (76,957) (11,884) (258,482) (6,969) (354,292) (13,576) (367,868)
(a) The periods when the cash flow hedges affect the consolidated income statement do not differ significantly from the maturitiesdisclosed above.
51 (Continued)
NESTLÉ HOLDINGS, INC.AND SUBSIDIARIES
Notes to Consolidated Financial Statements
December 31, 2015 and 2014
(Dollars in thousands)
Market Risk
The Company is exposed to risk from movements in foreign currency exchange rates, interest rates, andmarket prices that affect its assets, liabilities, and future transactions.
Foreign Currency Risk
The Company is exposed to foreign currency risk from transactions and translation. Transactionalexposures arise from transactions in foreign currency. They are managed within a prudent and systematichedging policy in accordance with the Company’s specific business requirements through the use ofcurrency forwards and swaps.
Interest Rate Risk
Interest rate risk on financial debt is managed based on duration and interest management targets set by theALMC through the use of fixed rate debt and interest rate swaps.
Taking into account the impact of interest derivatives, the proportion of financial debt subject to fixedinterest rates for a period longer than one year represents 65% (2014: 66%).
Price Risk
Commodity Price Risk
Commodity price risk arises from transactions on the world commodity markets for securing the suppliesof green coffee, cocoa beans, and other commodities necessary for the manufacture of some of theCompany’s products.
The Company’s objective is to minimize the impact of commodity price fluctuations and this exposure ishedged in accordance with the policies set by the Company’s management and the Nestlé Group policy oncommodity price risk management.
The regional Commodity Purchasing Competence Centre is responsible for managing commodity pricerisks on the basis of internal directives and centrally determined limits, generally through the use ofexchange-traded commodity derivatives.
The commodity price risk exposure of future purchases is primarily managed using a combination ofderivatives (mainly futures and options) and executory contracts.
As a result of the short product business cycle of the Company, the majority of the anticipated future rawmaterial transactions outstanding at the balance sheet date are expected to occur in the next year.
Equity Price Risk
The Company is exposed to equity price risk on investments. To manage the price risk arising from theseinvestments, the Company diversifies its portfolios in accordance with the guidelines set by the Board ofDirectors of Nestlé S.A.
52 (Continued)
NESTLÉ HOLDINGS, INC.AND SUBSIDIARIES
Notes to Consolidated Financial Statements
December 31, 2015 and 2014
(Dollars in thousands)
Value at Risk (“VaR”)
Description of the Method
The VaR is a single measure to assess market risk. The VaR estimates the size of losses given currentpositions and possible changes in financial markets. The Company uses simulation to calculate VaR basedon the historic data for a 250-day period.
The VaR calculation is based on a 95% confidence level and accordingly, does not take into account lossesthat might occur beyond this level of confidence.
The VaR is calculated on the basis of unhedged exposures outstanding at the close of business and does notnecessarily reflect intra-day exposures.
Objective of the Method
The Company uses the described VaR analysis to estimate the potential one-day loss in the fair value of itsfinancial and commodity instruments.
The Company cannot predict the actual future movements in market rates and prices, therefore, the belowVaR numbers neither represent actual losses nor consider the effects of favorable movements in underlyingvariables. Accordingly, these VaR numbers may only be considered indicative of future movements to theextent the historic market patterns repeat in the future.
VaR Figures
The VaR computation includes the Company’s financial assets and liabilities that are subject to foreigncurrency, interest rate, and price risk.
The estimated potential one-day loss from the Company’s foreign currency, interest rate, and equity pricerisk sensitive instruments, as calculated using the above-described historic VaR model, is $(600) and$(128) for the years ended December 31, 2015 and 2014, respectively.
The estimated potential one-day loss from the Company’s commodity price risk sensitive instruments, ascalculated using the above described historic VaR model, is not significant.
Capital Risk Management
The Company’s capital risk management strategy is to maintain a sound capital base to support thecontinued development of the Company’s operations, utilizing various funding sources available to it.Substantially all of the Company’s debt is guaranteed by Nestlé S.A., which allows the Company toborrow from third parties at lower interest rates. In order to ensure that the return on invested capital isoptimized, the Company establishes strict limits on annual additions of property, plant and equipment.
53 (Continued)
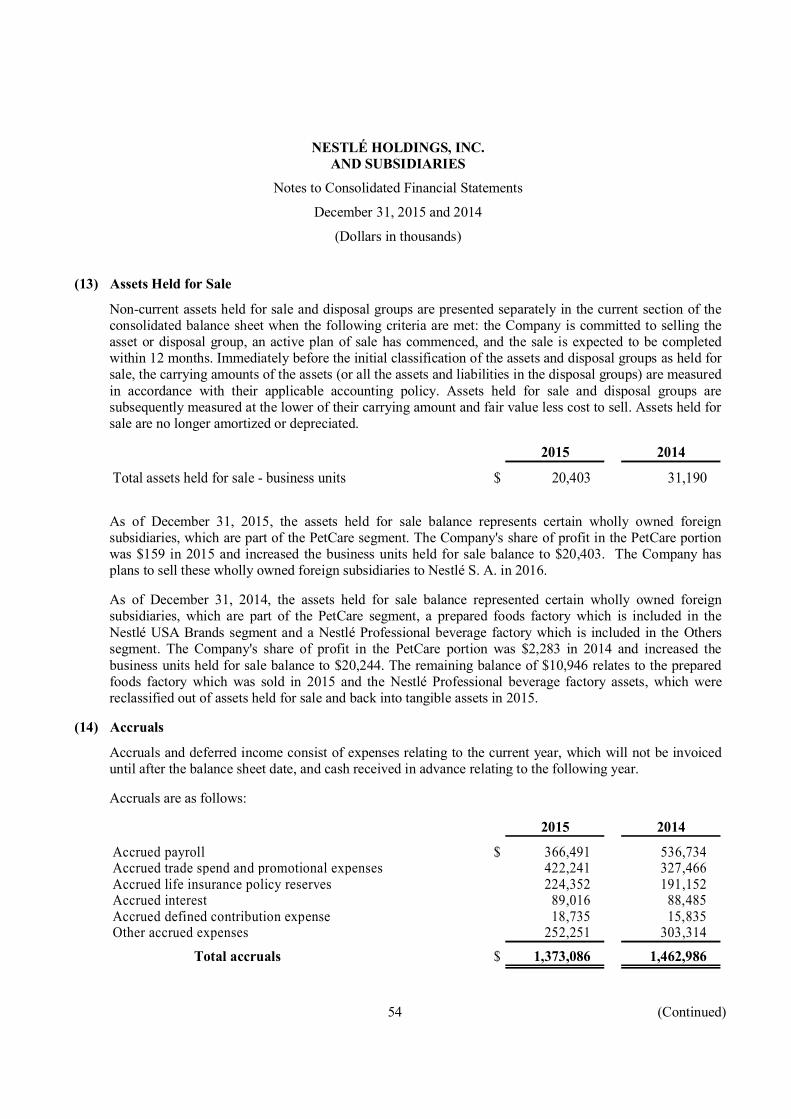
NESTLÉ HOLDINGS, INC.AND SUBSIDIARIES
Notes to Consolidated Financial Statements
December 31, 2015 and 2014
(Dollars in thousands)
(13) Assets Held for Sale
Non-current assets held for sale and disposal groups are presented separately in the current section of theconsolidated balance sheet when the following criteria are met: the Company is committed to selling theasset or disposal group, an active plan of sale has commenced, and the sale is expected to be completedwithin 12 months. Immediately before the initial classification of the assets and disposal groups as held forsale, the carrying amounts of the assets (or all the assets and liabilities in the disposal groups) are measuredin accordance with their applicable accounting policy. Assets held for sale and disposal groups aresubsequently measured at the lower of their carrying amount and fair value less cost to sell. Assets held forsale are no longer amortized or depreciated.
2015 2014
Total assets held for sale - business units $ 20,403 31,190
As of December 31, 2015, the assets held for sale balance represents certain wholly owned foreignsubsidiaries, which are part of the PetCare segment. The Company's share of profit in the PetCare portionwas $159 in 2015 and increased the business units held for sale balance to $20,403. The Company hasplans to sell these wholly owned foreign subsidiaries to Nestlé S. A. in 2016.
As of December 31, 2014, the assets held for sale balance represented certain wholly owned foreignsubsidiaries, which are part of the PetCare segment, a prepared foods factory which is included in theNestlé USA Brands segment and a Nestlé Professional beverage factory which is included in the Otherssegment. The Company's share of profit in the PetCare portion was $2,283 in 2014 and increased thebusiness units held for sale balance to $20,244. The remaining balance of $10,946 relates to the preparedfoods factory which was sold in 2015 and the Nestlé Professional beverage factory assets, which werereclassified out of assets held for sale and back into tangible assets in 2015.
(14) Accruals
Accruals and deferred income consist of expenses relating to the current year, which will not be invoiceduntil after the balance sheet date, and cash received in advance relating to the following year.
Accruals are as follows:
2015 2014
Accrued payroll $ 366,491 536,734Accrued trade spend and promotional expenses 422,241 327,466Accrued life insurance policy reserves 224,352 191,152Accrued interest 89,016 88,485Accrued defined contribution expense 18,735 15,835Other accrued expenses 252,251 303,314
Total accruals $ 1,373,086 1,462,986
54 (Continued)
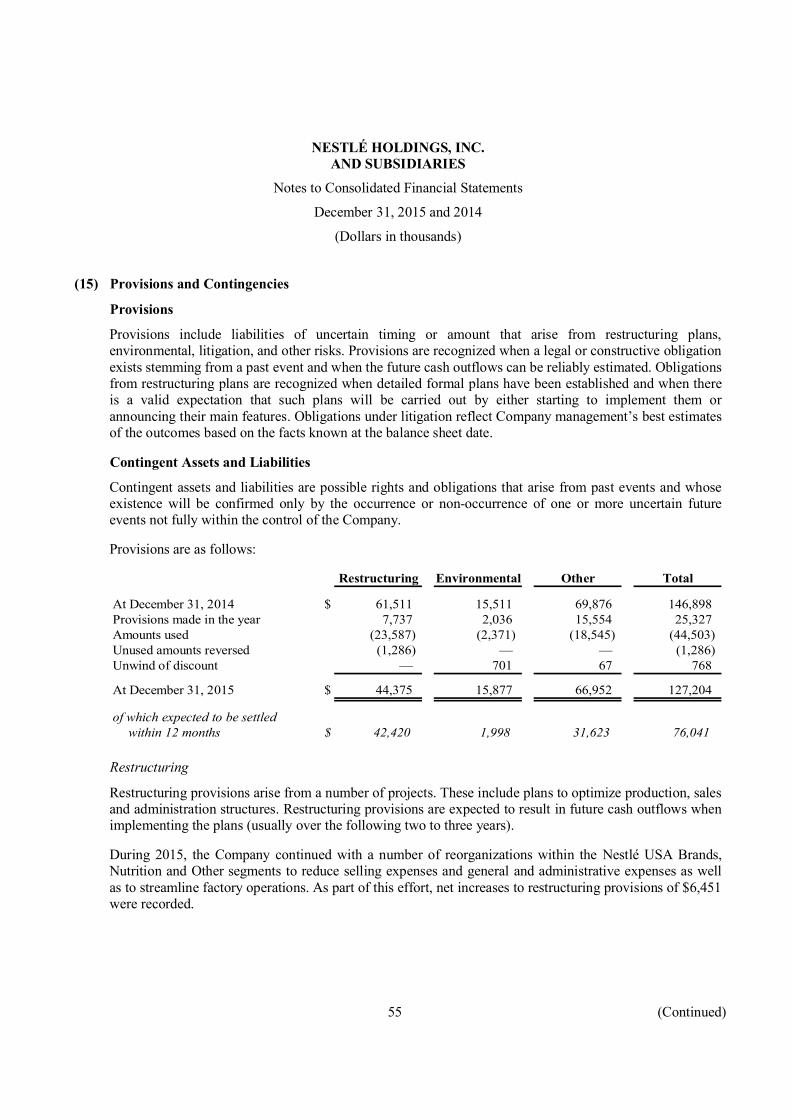
NESTLÉ HOLDINGS, INC.AND SUBSIDIARIES
Notes to Consolidated Financial Statements
December 31, 2015 and 2014
(Dollars in thousands)
(15) Provisions and Contingencies
Provisions
Provisions include liabilities of uncertain timing or amount that arise from restructuring plans,environmental, litigation, and other risks. Provisions are recognized when a legal or constructive obligationexists stemming from a past event and when the future cash outflows can be reliably estimated. Obligationsfrom restructuring plans are recognized when detailed formal plans have been established and when thereis a valid expectation that such plans will be carried out by either starting to implement them orannouncing their main features. Obligations under litigation reflect Company management’s best estimatesof the outcomes based on the facts known at the balance sheet date.
Contingent Assets and Liabilities
Contingent assets and liabilities are possible rights and obligations that arise from past events and whoseexistence will be confirmed only by the occurrence or non-occurrence of one or more uncertain futureevents not fully within the control of the Company.
Provisions are as follows:
Restructuring Environmental Other Total
At December 31, 2014 $ 61,511 15,511 69,876 146,898Provisions made in the year 7,737 2,036 15,554 25,327Amounts used (23,587) (2,371) (18,545) (44,503)Unused amounts reversed (1,286) — — (1,286)Unwind of discount — 701 67 768
At December 31, 2015 $ 44,375 15,877 66,952 127,204
of which expected to be settledwithin 12 months $ 42,420 1,998 31,623 76,041
Restructuring
Restructuring provisions arise from a number of projects. These include plans to optimize production, salesand administration structures. Restructuring provisions are expected to result in future cash outflows whenimplementing the plans (usually over the following two to three years).
During 2015, the Company continued with a number of reorganizations within the Nestlé USA Brands,Nutrition and Other segments to reduce selling expenses and general and administrative expenses as wellas to streamline factory operations. As part of this effort, net increases to restructuring provisions of $6,451were recorded.
55 (Continued)
NESTLÉ HOLDINGS, INC.AND SUBSIDIARIES
Notes to Consolidated Financial Statements
December 31, 2015 and 2014
(Dollars in thousands)
Environmental
Situations where the Company is found liable for remediation or cleanup efforts by the U.S. environmentalProtection Agency (“EPA”) or other governmental agencies on specific sites represent known liabilities. Inthese instances, it is the Company’s policy to accrue for environmental cleanup costs when they areassessed. As assessments and cleanups proceed, these liabilities are reviewed and adjusted as additionalinformation becomes available regarding the nature and extent of contamination, methods of remediationrequired, other actions by governmental agencies or private parties, and the amount, if any, of availablecoverage by the Company’s insurance carriers.
Other Provisions
In 2015, the Company recorded provisions concerning non-cancelable leases, service agreements andlitigation.
Contingencies
(a) Litigation
The Company is exposed to a number of asserted claims and unasserted potential claims encounteredin the normal course of business. In the opinion of Company management, the resolution of thesematters will not have a material impact on the Company’s consolidated financial position.
(b) Exposure for Environmental Matters
The Company has contingent liabilities related to environmental matters where the Company hasreceived “Notices of Potential Liability” from, or has been identified as a “Potentially ResponsibleParty” by, the EPA or other government agencies regarding the alleged disposal of hazardousmaterial at various sites around the country that allegedly require environmental cleanup.
These proceedings are being vigorously defended or resolutions are being negotiated. Although theoutcome of these proceedings is unknown, Company management does not believe that any resultingliability would be material to the consolidated financial position of the Company.
(16) Net Financial Income/(Expense)
Net financial income/(expense) includes net financing cost and net interest income/(expense) on definedbenefit plans.
Net financing cost comprises the interest income earned on cash and cash equivalents, and short-terminvestments, as well as the interest expense on financial debt (collectively termed “net debt”). Theseheadings also include other income and expense such as exchange differences on net debt and results onrelated foreign currency and interest rate hedging instruments. Certain borrowing costs are capitalized asexplained under the section “Property, Plant and Equipment”.
56 (Continued)
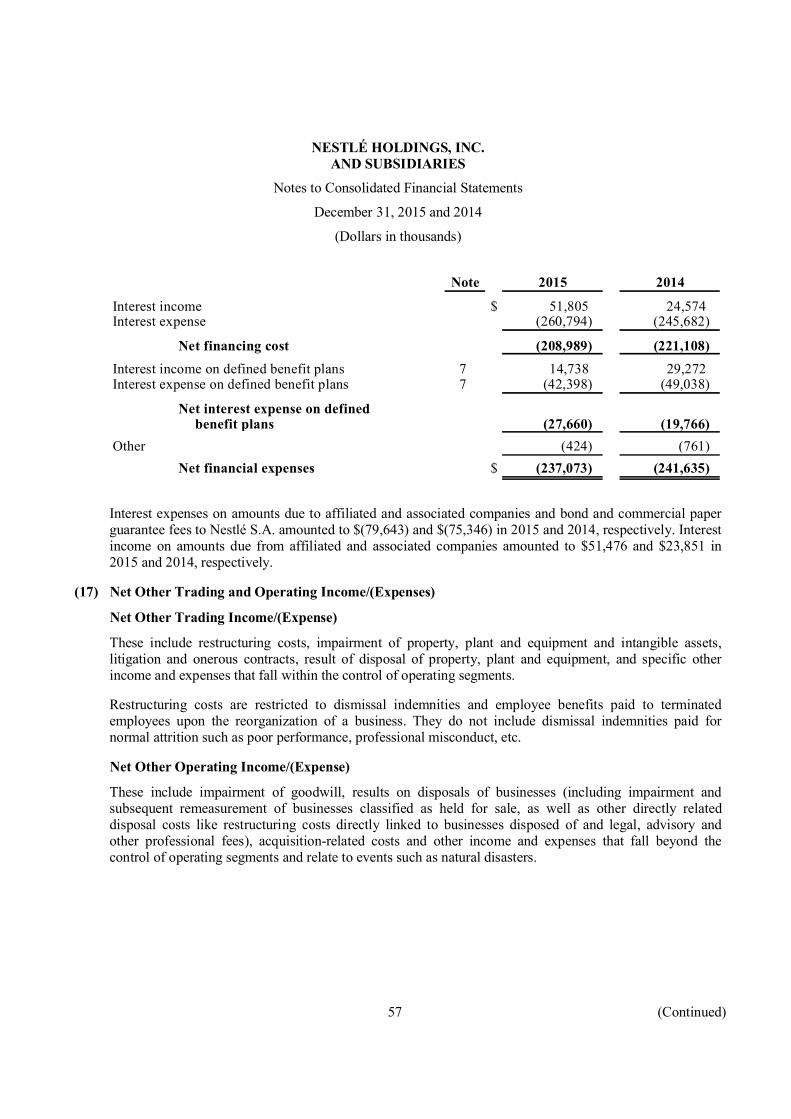
NESTLÉ HOLDINGS, INC.AND SUBSIDIARIES
Notes to Consolidated Financial Statements
December 31, 2015 and 2014
(Dollars in thousands)
Note 2015 2014
Interest income $ 51,805 24,574Interest expense (260,794) (245,682)
Net financing cost (208,989) (221,108)Interest income on defined benefit plans 7 14,738 29,272Interest expense on defined benefit plans 7 (42,398) (49,038)
Net interest expense on definedbenefit plans (27,660) (19,766)
Other (424) (761)Net financial expenses $ (237,073) (241,635)
Interest expenses on amounts due to affiliated and associated companies and bond and commercial paperguarantee fees to Nestlé S.A. amounted to $(79,643) and $(75,346) in 2015 and 2014, respectively. Interestincome on amounts due from affiliated and associated companies amounted to $51,476 and $23,851 in2015 and 2014, respectively.
(17) Net Other Trading and Operating Income/(Expenses)
Net Other Trading Income/(Expense)
These include restructuring costs, impairment of property, plant and equipment and intangible assets,litigation and onerous contracts, result of disposal of property, plant and equipment, and specific otherincome and expenses that fall within the control of operating segments.
Restructuring costs are restricted to dismissal indemnities and employee benefits paid to terminatedemployees upon the reorganization of a business. They do not include dismissal indemnities paid fornormal attrition such as poor performance, professional misconduct, etc.
Net Other Operating Income/(Expense)
These include impairment of goodwill, results on disposals of businesses (including impairment andsubsequent remeasurement of businesses classified as held for sale, as well as other directly relateddisposal costs like restructuring costs directly linked to businesses disposed of and legal, advisory andother professional fees), acquisition-related costs and other income and expenses that fall beyond thecontrol of operating segments and relate to events such as natural disasters.
57 (Continued)
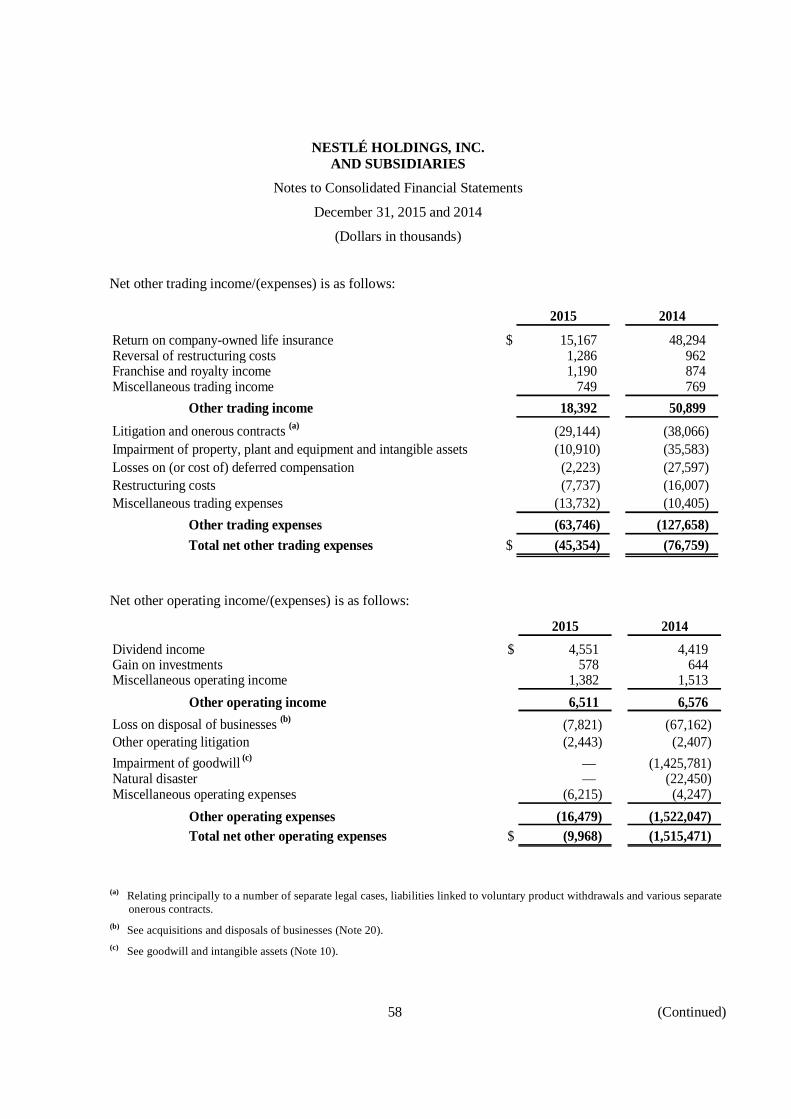
NESTLÉ HOLDINGS, INC.AND SUBSIDIARIES
Notes to Consolidated Financial Statements
December 31, 2015 and 2014
(Dollars in thousands)
Net other trading income/(expenses) is as follows:
2015 2014
Return on company-owned life insurance $ 15,167 48,294Reversal of restructuring costs 1,286 962Franchise and royalty income 1,190 874Miscellaneous trading income 749 769
Other trading income 18,392 50,899Litigation and onerous contracts (a) (29,144) (38,066)Impairment of property, plant and equipment and intangible assets (10,910) (35,583)Losses on (or cost of) deferred compensation (2,223) (27,597)Restructuring costs (7,737) (16,007)Miscellaneous trading expenses (13,732) (10,405)
Other trading expenses (63,746) (127,658)Total net other trading expenses $ (45,354) (76,759)
Net other operating income/(expenses) is as follows:
2015 2014Dividend income $ 4,551 4,419Gain on investments 578 644Miscellaneous operating income 1,382 1,513
Other operating income 6,511 6,576Loss on disposal of businesses (b) (7,821) (67,162)Other operating litigation (2,443) (2,407)Impairment of goodwill (c) — (1,425,781)Natural disaster — (22,450)Miscellaneous operating expenses (6,215) (4,247)
Other operating expenses (16,479) (1,522,047)Total net other operating expenses $ (9,968) (1,515,471)
(a) Relating principally to a number of separate legal cases, liabilities linked to voluntary product withdrawals and various separateonerous contracts.
(b) See acquisitions and disposals of businesses (Note 20).(c) See goodwill and intangible assets (Note 10).
58 (Continued)
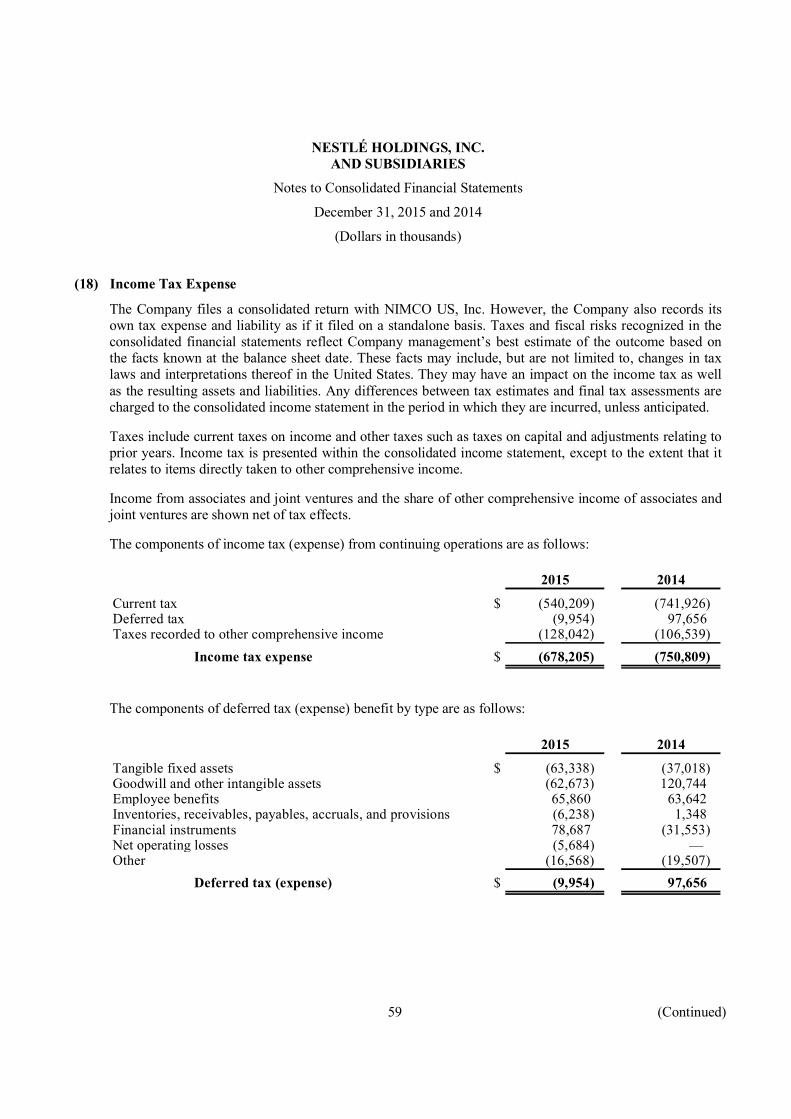
NESTLÉ HOLDINGS, INC.AND SUBSIDIARIES
Notes to Consolidated Financial Statements
December 31, 2015 and 2014
(Dollars in thousands)
(18) Income Tax Expense
The Company files a consolidated return with NIMCO US, Inc. However, the Company also records itsown tax expense and liability as if it filed on a standalone basis. Taxes and fiscal risks recognized in theconsolidated financial statements reflect Company management’s best estimate of the outcome based onthe facts known at the balance sheet date. These facts may include, but are not limited to, changes in taxlaws and interpretations thereof in the United States. They may have an impact on the income tax as wellas the resulting assets and liabilities. Any differences between tax estimates and final tax assessments arecharged to the consolidated income statement in the period in which they are incurred, unless anticipated.
Taxes include current taxes on income and other taxes such as taxes on capital and adjustments relating toprior years. Income tax is presented within the consolidated income statement, except to the extent that itrelates to items directly taken to other comprehensive income.
Income from associates and joint ventures and the share of other comprehensive income of associates andjoint ventures are shown net of tax effects.
The components of income tax (expense) from continuing operations are as follows:
2015 2014
Current tax $ (540,209) (741,926)Deferred tax (9,954) 97,656Taxes recorded to other comprehensive income (128,042) (106,539)
Income tax expense $ (678,205) (750,809)
The components of deferred tax (expense) benefit by type are as follows:
2015 2014
Tangible fixed assets $ (63,338) (37,018)Goodwill and other intangible assets (62,673) 120,744Employee benefits 65,860 63,642Inventories, receivables, payables, accruals, and provisions (6,238) 1,348Financial instruments 78,687 (31,553)Net operating losses (5,684) —Other (16,568) (19,507)
Deferred tax (expense) $ (9,954) 97,656
59 (Continued)

NESTLÉ HOLDINGS, INC.AND SUBSIDIARIES
Notes to Consolidated Financial Statements
December 31, 2015 and 2014
(Dollars in thousands)
Taxes recognized in other comprehensive income:
2015 2014
Tax effect relating to:Fair value adjustments on cash flow hedges $ (8,623) (13,080)Fair value of available-for-sale assets (65,640) 43,116Defined benefit plan actuarial gains (53,779) (136,575)
Total taxes recognized $ (128,042) (106,539)
Reconciliation of income from continuing operations before income taxes multiplied by the applicable taxrate to income tax (expense) is as follows:
2015 2014
(410,673)Tax at theoretical rateTax effect on non-deductible amortization of goodwill
$ (1,006,443)
(116) (310,870)and other intangible assetsPermanent differences on company-owned life insurance
9,497 24,44650,302 49,581
274,121 (96,002)
policiesTax effect of non-deductible or non-taxable itemsPrior years’ taxesOther taxes (5,566) (7,291)
Income tax expense $ (678,205) (750,809)
Effective tax rate 26% 70%
(19) Lease Commitments
Leasing agreements that transfer to the Company substantially all the rewards and risks of ownership of anasset are treated as finance leases. All other leases are classified as operating leases.
Assets acquired under finance leases are capitalized and depreciated in accordance with the Company’spolicy on property, plant and equipment unless the lease term is shorter. The associated finance leaseobligations are included under financial debt. Leasehold improvements are amortized over their useful lifeor the lease term, whichever is shorter.
Rentals under operating leases are charged to the consolidated income statement on a straight-line basisover the period of the lease.
The Company is obligated under various operating and finance leases primarily for buildings, distributionfacilities, equipment, railroad, and agricultural properties as follows:
60 (Continued)
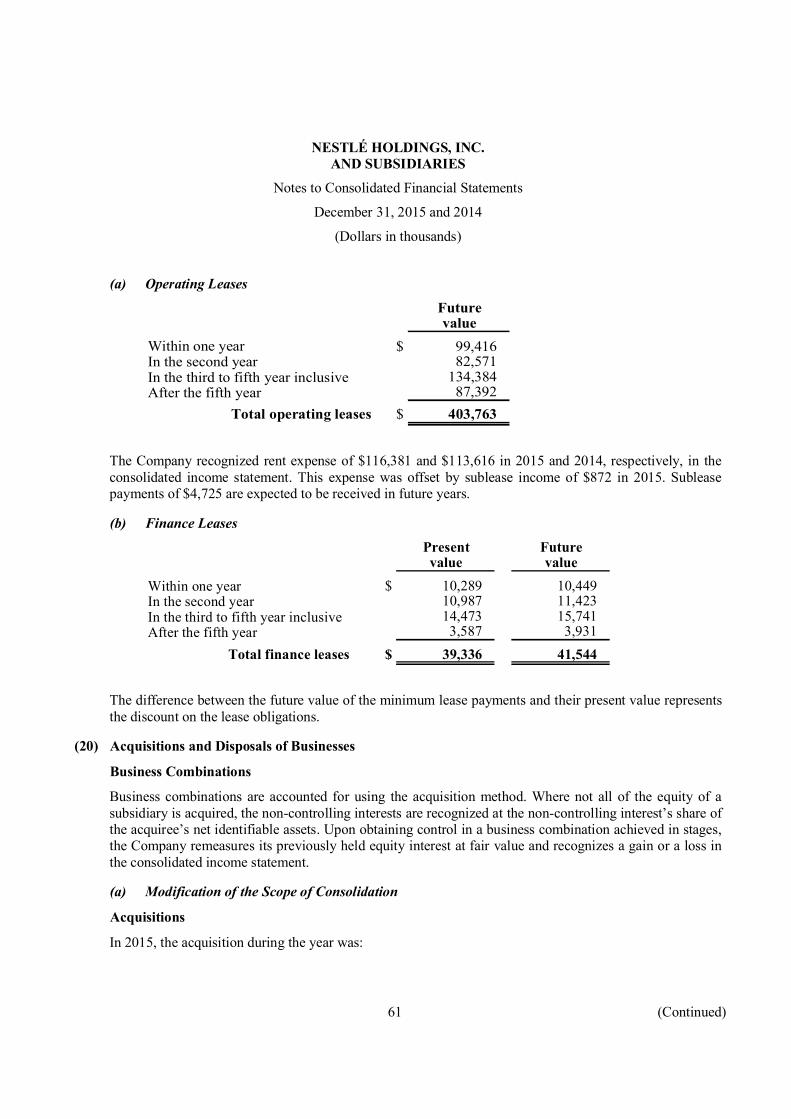
NESTLÉ HOLDINGS, INC.AND SUBSIDIARIES
Notes to Consolidated Financial Statements
December 31, 2015 and 2014
(Dollars in thousands)
(a) Operating Leases
Futurevalue
$ 99,41682,571
134,384
Within one yearIn the second yearIn the third to fifth year inclusiveAfter the fifth year 87,392
Total operating leases $ 403,763
The Company recognized rent expense of $116,381 and $113,616 in 2015 and 2014, respectively, in theconsolidated income statement. This expense was offset by sublease income of $872 in 2015. Subleasepayments of $4,725 are expected to be received in future years.
(b) Finance Leases
Present Futurevalue value
$ 10,289 10,44910,987 11,42314,473 15,741
Within one yearIn the second yearIn the third to fifth year inclusiveAfter the fifth year 3,587 3,931
Total finance leases $ 39,336 41,544
The difference between the future value of the minimum lease payments and their present value representsthe discount on the lease obligations.
(20) Acquisitions and Disposals of Businesses
Business Combinations
Business combinations are accounted for using the acquisition method. Where not all of the equity of asubsidiary is acquired, the non-controlling interests are recognized at the non-controlling interest’s share ofthe acquiree’s net identifiable assets. Upon obtaining control in a business combination achieved in stages,the Company remeasures its previously held equity interest at fair value and recognizes a gain or a loss inthe consolidated income statement.
(a) Modification of the Scope of Consolidation
Acquisitions
In 2015, the acquisition during the year was:
61 (Continued)

NESTLÉ HOLDINGS, INC.AND SUBSIDIARIES
Notes to Consolidated Financial Statements
December 31, 2015 and 2014
(Dollars in thousands)
Merrick Pet Care Holdings Corporation, USA, natural and organic pet food products (PetCare), 100%,September.
There were no acquisitions in 2014.
Disposals
In 2015, the main disposal during the year was:
COMPAT pumps (Other), 100%, (June).
In 2014, the main disposals were:
Juicy Juice, fruit drinks (Nestlé USA Brands), 100% (June); and Powerbar (Nutrition), 100% (September).
(b) Acquisitions of Businesses
On September 1, 2015, the Company acquired Merrick Pet Care Holdings Corporation, one of the fastest-growing natural and organic pet food companies in the United States. The business includes three leadingbrands such as Merrick, Castor and Pollux, and Whole Earth Farms. This acquisition is included in thePetCare segment and will enhance the Company’s pet care product portfolio in the United States where theCompany has already established a leadership in the pet foods product categories. The goodwill arisingfrom this acquisition represents a strong natural and organic pet foods presence and is not expected to bedeductible for tax purposes.
The major classes of assets acquired and liabilities assumed at the acquisition date were:
2015Total
$ 19,170225,80066,218
77
Property, plant and equipmentIntangible assetsInventories and other assetsFinancial assetsEmployee benefits, deferred taxes,
(64,595)and provisionsOther liabilities (24,730)
Fair value of identifiablenet assets $ 221,940
Since the valuation of the assets and liabilities of the recently acquired business is in process, the values aredetermined provisionally.
62 (Continued)

NESTLÉ HOLDINGS, INC.AND SUBSIDIARIES
Notes to Consolidated Financial Statements
December 31, 2015 and 2014
(Dollars in thousands)
The goodwill arising on acquisition and the cash outflow were:
2015Total
$ 545,000Fair value of consideration transferredFair value of identifiable net assets (221,940)
Goodwill $ 323,060
545,000Fair value of consideration transferredCash and cash equivalents acquired —
Cash outflow on acquisitions $ 545,000
Acquisition-related costs, which mostly relate to the acquisitions of Merrick Pet Care HoldingsCorporation, were recognized under net operating expenses in the consolidated income statement (Note 17)for an amount of $1,213.
There were no acquisitions in 2014.
(c) Disposals of Businesses
The loss on disposals of businesses $7,821 (Note 17) is due to the derecognition of net assets from theconsolidated balance sheet primarily for Compat Pump (Other).
(21) Events after the Balance Sheet Date
The values of assets and liabilities at the balance sheet date are adjusted if there is evidence that subsequentadjusting events warrant a modification of these values. These adjustments are made up to the date ofauthorization of the 2015 consolidated financial statements. Other non-adjusting events are disclosed in thenotes to the consolidated financial statements.
Other than the following, the Company was not aware of specific events or transactions occurring afterDecember 31, 2015, and up to March 23, 2016 that would have a material impact on the accounting orpresentation of the accompanying consolidated financial statements.
On January 31, 2016, the Company sold 100% of the acquired intellectual property of Merrick Pet CareHoldings Corporation to other companies controlled by Nestlé S.A.
63 (Continued)
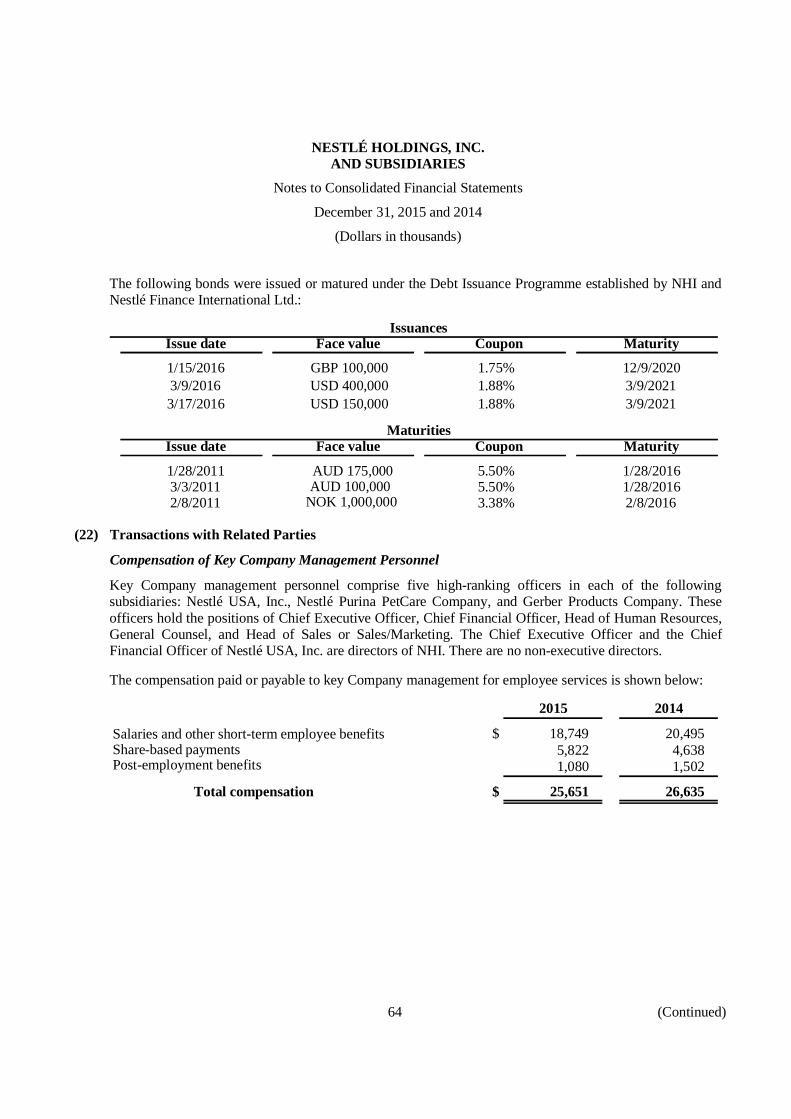
NESTLÉ HOLDINGS, INC.AND SUBSIDIARIES
Notes to Consolidated Financial Statements
December 31, 2015 and 2014
(Dollars in thousands)
The following bonds were issued or matured under the Debt Issuance Programme established by NHI andNestlé Finance International Ltd.:
IssuancesIssue date Face value Coupon Maturity
1/15/2016 GBP 100,000 1.75% 12/9/20203/9/2016 USD 400,000 1.88% 3/9/20213/17/2016 USD 150,000 1.88% 3/9/2021
MaturitiesIssue date Face value Coupon Maturity
1/28/2011 5.50% 1/28/20163/3/2011 5.50% 1/28/20162/8/2011
AUD 175,000AUD 100,000
NOK 1,000,000 3.38% 2/8/2016
(22) Transactions with Related Parties
Compensation of Key Company Management Personnel
Key Company management personnel comprise five high-ranking officers in each of the followingsubsidiaries: Nestlé USA, Inc., Nestlé Purina PetCare Company, and Gerber Products Company. Theseofficers hold the positions of Chief Executive Officer, Chief Financial Officer, Head of Human Resources,General Counsel, and Head of Sales or Sales/Marketing. The Chief Executive Officer and the ChiefFinancial Officer of Nestlé USA, Inc. are directors of NHI. There are no non-executive directors.
The compensation paid or payable to key Company management for employee services is shown below:
2015 2014
$ 18,749 20,4955,822 4,638
Salaries and other short-term employee benefitsShare-based paymentsPost-employment benefits 1,080 1,502
Total compensation $ 25,651 26,635
64 (Continued)

NESTLÉ HOLDINGS, INC.AND SUBSIDIARIES
Notes to Consolidated Financial Statements
December 31, 2015 and 2014
(Dollars in thousands)
Loans with Related Parties
2015 2014
Loans from Nestlé S.A.:$ 1,600,083 1,850,083At January 1
Loan repayments — (250,000)
At December 31 $ 1,600,083 1,600,083
Loans to NIMCO US, Inc. (Parent):916,990 568,277At January 1
Loans granted during year 1,518,282 348,713
At December 31 $ 2,435,272 916,990
Loans from affiliates:$ 320,553 346,673
20,612 3,958At January 1Loans received during yearLoan repayments (317,034) (30,078)
At December 31 $ 24,131 320,553
Loans to affiliates:$ 1,324,607 906,105
273,043 519,197At January 1Loans granted during yearLoan repayments (45,496) (100,695)
At December 31 $ 1,552,154 1,324,607
The above loans with related parties are in the trade and other receivables, trade and other payables, andcurrent and non-current financial liabilities balances of the consolidated balance sheet.
65