annual financial report - city of port aransas, texas 2006-2007.pdf · annual financial report ......
TRANSCRIPT
ANNUAL FINANCIAL REPORT
FOR THE YEAR ENDED SEPTEMBER 30, 2007


CITY OF PORT ARANSAS, TEXASANNUAL FINANCIAL REPORT
FOR THE YEAR ENDED SEPTEMBER 30, 2007
TABLE OF CONTENTS
PageFINANCIAL SECTION:
Independent Auditors' Report 1
Management’s Discussion and Analysis 2
Basic Financial Statements:
Government-Wide Financial Statements:
Statement of Net Assets 15
Statement of Activities 16
Fund Financial Statements:
Balance Sheet – Governmental Funds 18
Statement of Revenues, Expenditures and Changes in Fund Balance – Governmental Funds 20
Reconciliation of the Governmental Funds Balance Sheet to the Statement of Net Assets 22
Reconciliation of the Governmental Funds Balance Sheet to the Statement of Revenues,
Expenditures and Changes in Fund Balance 23
Notes to the Financial Statements 24
Required Supplementary Information
Statement of Revenues, Expenditures and Changes in Fund Balance -Budget (GAAP Basis) and Actual – Major Governmental Funds:
General Fund 40Advertising Fund 41Beach Fund 42
Recreational Development Fund 43Port Aransas Recreational Development Corporation 44
SUPPLEMENTAL SECTION:COMBINING AND INDIVIDUAL FUND FINANCIAL STATEMENTS AND SCHEDULES:
GENERAL FUND:Comparative Balance Sheets 46Statement of Revenues, Expenditures and Changes in Fund Balance - Budget (GAAP Basis) and Actual 47Schedule of Revenues Compared to Budget (GAAP Basis) 48Schedule of Expenditures by Category 49
SPECIAL REVENUE FUNDS:
Municipal Airport Fund:Comparative Balance Sheets 50Statement of Revenues, Expenditures and Changes in Fund Balance - Budget (GAAP Basis) and Actual 51
Advertising Fund:Comparative Balance Sheets 52Statement of Revenues, Expenditures and Changes in Fund Balance - Budget (GAAP Basis) and Actual 53

TABLE OF CONTENTS - CONTINUED
Page
Beach Fund:Comparative Balance Sheets 54Statement of Revenues, Expenditures and Changes in Fund Balance - Budget (GAAP Basis) and Actual 55
Recreational Development Fund:Comparative Balance Sheets 56Statement of Revenues, Expenditures and Changes in Fund Balance - Budget (GAAP Basis) and Actual 57
Port Aransas Recreational Development Corporation:Comparative Balance Sheets 58Statement of Revenues, Expenditures and Changes in Fund Balance - Budget (GAAP Basis) and Actual 59
Port Aransas Library:Comparative Balance Sheets 60Comparative Statements of Revenues, Expenditures and Changes in Fund Balance 60
CAPITAL PROJECTS FUNDS:Combining Balance Sheet 61Combining Statement of Revenues, Expenditures and Changes in Fund Balances 62
OTHER SCHEDULES:Historical Statement of General Revenues 64Property Tax Collections 66Analysis of Ad Valorem Taxes Receivable by Year of Levy 68

FINANCIAL SECTION
INDEPENDENT AUDITORS’ REPORTMANAGEMENT’S DISCUSSION AND ANALYSIS
BASIC FINANCIAL STATEMENTSREQUIRED SUPPLEMENTARY INFORMATION

This Page Left Blank Intentionally
1
KOSAREK, DAVENPORT & CUDDCERTIFIED PUBLIC ACCOUNTANTS
A PROFESSIONAL LIMITED LIABILITY COMPANY5151 FLYNN PARKWAY - SUITE 604
CORPUS CHRISTI, TEXAS 78411-4394
WILLIE J. KOSAREK, CPA TELEPHONE 361-852-8223GARY R. DAVENPORT, CPA FAX 361-852-8688MARLEANA CUDD, CPA EMAIL [email protected]
INDEPENDENT AUDITORS’ REPORT
To the Honorable Mayor andMembers of the City Council
City of Port Aransas, Texas
We have audited the accompanying financial statements of the governmental activities, business-type activities, major funds and remaining fund information of the City of Port Aransas, Texas as of and for the year ended September 30, 2007, which collectively compromise the City's basic financial statements as listed in the table of contents. These financial statements are the responsibility of the City’s management. Our responsibility is to express opinions on these financial statements based on our audit.We conducted our audit in accordance with auditing standards generally accepted in the United States of America. Those standards require that we plan and perform the audit to obtain reasonable assurance about whether the financial statements are free of material misstatement. An audit includes examining, on a test basis, evidence supporting the amounts and disclosures in the financial statements. An audit also includes assessing the accounting principles used and significant estimates made by management, as well as evaluating the overall financial statement presentation. We believe that our audit provides a reasonable basis for our opinion.
In our opinion, the financial statements referred to above present fairly, in all material respects, therespective financial position of the governmental activities, the business-type activities, each major fund and the aggregate remaining fund information for the City of Port Aransas, Texas as of September 30, 2007, and the respective changes in financial position of those activities and funds for the year then ended in conformity with accounting principles generally accepted in the United States of America. The Management’s Discussion and Analysis and the other required supplementary information on pages 2 through 14 and pages 40 through 44 are not a required part of the basic financial statements but are supplementary information required by the Governmental Accounting Standards Board. We have applied certain limited procedures, which consisted principally of inquiries of management regarding the methods of measurement and presentation of the supplementary information. However, we did not audit the information and express no opinion on it.Our audit was conducted for the purpose of forming an opinion on the basic financial statements taken as a whole. The combining and individual fund financial statements and schedules listed in the table of contents are presented for purposes of additional analysis and are not a required part of the basic financial statements of the City of Port Aransas, Texas. This information has been subjected to the auditing procedures applied in the audit of the basic financial statements and, in our opinion, is fairlypresented in all material respects in relation to the basic financial statements taken as a whole.
Kosarek, Davenport & Cudd CPAs, PLLCApril 18, 2008

2
MANAGEMENT’S DISCUSSION AND ANALYSIS
This section of City of Port Aransas’ (City) annual financial report presents an overview, through management’s discussion and analysis (MD&A), of the City’s financial activities and performance during the fiscal year ended September 30, 2007. Please read it in conjunction with the independent auditors’ report and the City’s financial statements and disclosures, which follow this section.
FINANCIAL HIGHLIGHTS• The City’s total combined net assets were $23,829,053 and $22,899,789 as of September 30, 2007 and 2006,
respectively .• During the fiscal year ended September 30, 2007, the City’s net assets increased (decreased) by $1,779,115 for
governmental activities and by ($849,852) for business-type activities as compared to $1,143,409 and $358,231, respectively for the previous year ended September 30, 2006.
• Total expenditures in the City’s General Fund increased by $1,692 and $778,121 from 2006 and 2005, respectively.• Fund balances at September 30, 2007 and 2006, respectively are as follows: $2,365,065 & $3,186,478 - General
Fund; $781,702 & $560,432 - Beach Cleaning Fund; $446,474 & $1,258,549 - Recreational Development Fund and $206,072 & $267,359 - Port Aransas Recreational Development Corporation
• The City issued certificates of obligation in the amount of $2,250,000 during the year ended September 30, 2004. The proceeds are being used to construct a nature preserve. At September 30, 2007 and 2006, the City has unexpended funds for this project totaling $1,811,457 and $1,773,132 respectively.
• The City issued general obligation bonds in the amount of $2,685,000 during the year ended September 30, 2007 for various street and drainage projects. The bond proceeds are accounted for in the Streets & Land Acquisition Fund. Along with transfers from other funds, the unexpended funds for these projects $5,847,876 and $890,277 at September 30, 2007 and 2006, respectively.
• The City has no authorized and unissued debt at September 30, 2007.
OVERVIEW OF THE FINANCIAL STATEMENTS
This annual report consists of three parts—management’s discussion and analysis (this section), the basic financial statements, and required supplementary information. Under GASB 34, basic financial statements include two kinds of statements that present different views of the City. Figure A-1 shows how the required parts of this annual report are arranged and related to one another. The remaining overview section of management’s discussion and analysis explains the structure and contents of each of the statements.
The first two statements are government-wide financial statements that provide both long-term and short-term information about the City’s overall financial status. The Statement of Net Assets and the Statement of Activities, which are the government-wide statements, report information about the City as a whole, and about its activities in a way that provides information helpful in determining whether the City’s financial condition has improved or deteriorated as a result of the current year’s activities.
The remaining statements are fund financial statements that focus on individual parts of the government, reporting the City’s operations in more detail than the government-wide statements. The funds are classified into three groups: Governmental Funds, Proprietary Funds and Fiduciary Funds.
• The Governmental Funds statements tell how general government services were financed in the short term as well as what remains for future spending.
• Proprietary and Fiduciary funds are not applicable to the City. The gas utility, sanitation and the marina are business-type activities. However, they are accounted for in the City’s general fund.
The notes to the financial statements explain some of the information in the financial statements and provide more detailed data that are necessary for a full understanding of the financial statements.
The statements and notes are followed by a section of required supplementary information that includes budgetary comparisons of the City’s major funds, as defined by GASB 34.
Figure A-1, Required Components ofthe City’s Annual Financial Report

3
Government-wide StatementsThe government-wide statements report information about the City as a whole using accounting methods similar to those used by private-sector companies. The statement of net assets includes all of the City’s assets and liabilities. All of the current year’s revenues and expenses are accounted for in the statement of activities regardless of when cash is received or paid.
The two government-wide statements report the City’s net assets and how they have changed. Net assets—the difference between the City’s assets and liabilities—is one way to measure the City’s financial health or position.
• Over time, increases or decreases in the City’s net assets are an indicator of whether its financial health is improving or deteriorating, respectively.
• To assess the overall health of the City, you need to consider additional nonfinancial factors such as changes in the City’s tax base, which has increased significantly over the past several years.
The government-wide financial statements of the City include all Governmental and business-type activities. All of the City’s services are included here. These activities are financed primarily by taxes and user fees charged to customers.
Fund Financial StatementsThe fund financial statements provide more detailed information about the City’s most significant funds—not the City as a whole. Funds are accounting devices that the City uses to keep track of specific sources of funding and spending for particular purposes. Because most of the City’s funds qualify as major funds, all funds are presented as if they are major funds. Actual major funds, as defined by GASB 34, include: General Fund, Advertising Fund, Beach Fund, Recreational Development Fund, Nature Preserve Capital Projects Fund and Streets & Land Acquisition Capital Projects Fund. The remaining funds, though not “Major” funds by definition, include the Municipal Airport Fund, Port Aransas Recreational Development Corporation and the Port Aransas Library Fund.
• Some funds are required by State law and by covenants of bonds/certificates of obligation.
• The City Council establishes other funds to control and manage money for particular purposes or to show that it is properly using certain taxes, fees and grants.
The City has only one of the three categories of funds mentioned below.
• Governmental funds—All of the City’s services are included in governmental funds, which focus on (1) how cash and other financial assets that can readily be converted to cash flow in and out and (2) the balances left at year-end that are available for spending. Consequently, the governmental fund statements provide a detailed short-term view that helps one determine whether there are more or fewer financial resources that can be spent in the near future to finance the City’s services. Because this information does not encompass the additional long-term focus of the government-wide statements, we provide additional information at the bottom of the governmental funds statement, or on the subsequent page, that explains the relationship (or differences) between them.
• Proprietary Funds – Although some of the City’s operations are similar to those ordinarily accounted for in Proprietary Funds, the City has chosen to report the harbor and utility funds’ operations in the General Fund.
• Fiduciary Funds—The City has no Fiduciary Funds.

4
GOVERNMENT-WIDE FINANCIAL ANALYSISAssets, Liabilities and Net assets as of September 30, 2007 and 2006 are summarized in Table A-1. Changes in the City’s net assets and the net cost of functional expenses are reported in Table A-2.
Table A-1Summary Statement of Net Assets
September 30, 2007 and 2006Governmental Act ivit ies Busines s-Type Act ivi ties To tal
2007 2006 2007 2006 2007 2006ASSETS:Current and o ther assets 12 ,096,685$ 7,300 ,821$ 653,413$ 1,518,251$ 12 ,750,097$ 8,819,072$Cap ital Assets - Net 14 ,427,604 14,338 ,251 2,347,504 2,340,268 16 ,775,108 16,678,519
T otal Assets 26 ,524,289$ 21,639 ,072$ 3,000,917$ 3,858,519$ 29 ,525,206$ 25,497,591$LIABI LITIES:Current liabili ties 1 ,201,290$ 608 ,768$ 162,132$ 167,291$ 1 ,363,421$ 776,059$Long-term liab ilities 4 ,350,478 1,821 ,742 - - 4 ,350,478 1,821,742
T otal Liabil ities 5 ,551,768 2,430 ,510 162,132$ 167,291$ 5 ,713,899 2,597,801NET ASSETS:Invested in capital assets - Net 13 ,743,652 14,130 ,107 2,347,504 2,340,268 16 ,091,156 16,470,375Restricted 1 ,605,571 2,284 ,584 - - 1 ,605,571 2,284,584Unrest ricted 5 ,638,454 2,793 ,870 493,872 1,350,960 6 ,132,326 4,144,830
Total Net Assets 20 ,987,677$ 19,208 ,561$ 2,841,376$ 3,691,228$ 23 ,829,053$ 22,899,789$
Changes in net assets are presented in Table A-2.Table A-2
Changes in Net AssetsF or The Years Ended September 30, 2007 and 2006
Governmental Activities
Business-Type Activities Total
% of Total Revenue FYE 2006
Increase (Decrease)
Progra m Revenues:Charges for Services 1,385,506$ 1,977,918$ 3,363,424$ 29.1 6% 3,076,023$ 287,401$
Operat ing Grants and Contributions 389,788 - 389,788 3.3 8% 530,283 (140,496)Capital Grants and Contributions 283,193 - 283,193 2.4 6% 590,790 (307,597)
Total Program Revenues 2,058,487 1,977,918 4,036,405 35.0 0% 4,197,097 (160,692)
General Rev enues & Transfers:Property Taxes 3,009,120 - 3,009,120 26.0 9% 2,876,317 -Other taxes 3,810,343 - 3,810,343 33.0 4% 3,521,899 288,444State shared revenues 103,159 - 103,159 0.8 9% 98,489 4,670Gain (losss ) sale of assets - - - 0.0 0% 183,018 (183,018)Investment Earnings 529,778 45,411 575,188 4.9 9% 328,074 247,114Transfers 1,200,000 (1,200,000) - 0.0 0% - -
Total General Revenues & Transfers 8,652,400 (1,154,589) 7,497,811 65.0 0% 7,007,798 357,210
Total Revenues & Transfers 10,710,887 823,329 11,534,215 100.0 0% 11,204,895 196,518$ 2007
Expenses: Net Cost
General government 3,098,257 - 3,098,257 26.8 6% 3,142,744 (44,486)$ (3 ,017,334)$ Police, Fire & EMS 1,860,630 - 1,860,630 16.1 3% 1,735,456 125,174 (1 ,513,155) Inspect ions 297,512 - 297,512 2.5 8% 261,413 36,099 117,749 Public Works & St reets 1,584,035 - 1,584,035 13.7 3% 1,166,886 417,149 (1 ,584,035) Parks and recreation 1,173,382 - 1,173,382 10.1 7% 970,592 202,790 (266,089) Library 185,156 - 185,156 1.6 1% 156,879 28,277 (166,265) Public Bui ldings 441,520 - 441,520 3.8 3% 355,737 85,783 (407,426) Public transportation 152,198 - 152,198 1.3 2% 120,097 32,101 102,351 Interest on long-term debt 139,080 - 139,080 1.2 1% 77,388 61,692 (139,080) Gas util ity & sanitation - 1,342,678 1,342,678 11.6 4% 1,336,531 6,147 168,426 Marina - 330,503 330,503 2.8 7% 379,533 (49,030) 136,311
T otal Expenses 8,931,772 1,673,181 10,604,953 91.9 4% 9,703,255 901,697 (6 ,568,548)$
Increase (Decrease) in Net Assets 1,779,115$ (849,852)$ 929,263$ 8.0 6% 1,501,640$ (705,179)$
5
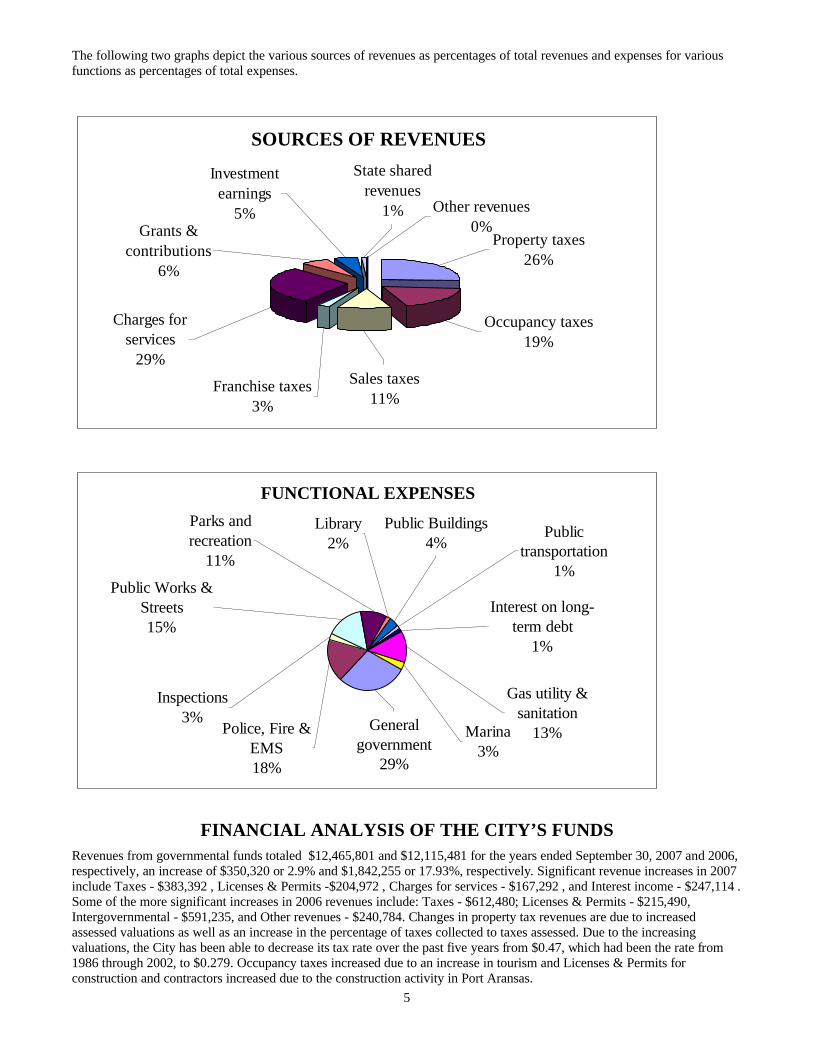
The following two graphs depict the various sources of revenues as percentages of total revenues and expenses for various functions as percentages of total expenses.
SOURCES OF REVENUES
Investment earnings
5%Property taxes
26%
Occupancy taxes19%
Sales taxes11%
Franchise taxes3%
Charges for services
29%
Other revenues0%
State shared revenues
1%Grants &
contributions6%
FUNCTIONAL EXPENSES
Interest on long-term debt
1%
Marina3%
Public transportation
1%
Gas utility & sanitation
13%
Public Buildings4%
Library2%
Parks and recreation
11%
Public Works & Streets15%
Inspections3%
Police, Fire & EMS18%
General government
29%
FINANCIAL ANALYSIS OF THE CITY’S FUNDSRevenues from governmental funds totaled $12,465,801 and $12,115,481 for the years ended September 30, 2007 and 2006, respectively, an increase of $350,320 or 2.9% and $1,842,255 or 17.93%, respectively. Significant revenue increases in 2007include Taxes - $383,392 , Licenses & Permits -$204,972 , Charges for services - $167,292 , and Interest income - $247,114 . Some of the more significant increases in 2006 revenues include: Taxes - $612,480; Licenses & Permits - $215,490, Intergovernmental - $591,235, and Other revenues - $240,784. Changes in property tax revenues are due to increased assessed valuations as well as an increase in the percentage of taxes collected to taxes assessed. Due to the increasing valuations, the City has been able to decrease its tax rate over the past five years from $0.47, which had been the rate from 1986 through 2002, to $0.279. Occupancy taxes increased due to an increase in tourism and Licenses & Permits for construction and contractors increased due to the construction activity in Port Aransas.

6
General Fund Budgetary HighlightsOver the course of the year, the City revised its budget twice increasing expenditures and transfers by $27,500 in the General Fund and $9,500 in the Recreational Development Fund. Budget variances are “Favorable” if actual revenues exceed budgeted amounts and if actual expenditures are under budgeted amounts. Variances are “Unfavorable” if actual revenues are under budgeted amounts and if actual expenditures are over budgeted amounts. Favorable variances are indicated by showing amounts without brackets and unfavorable variances are indicated by bracketed amounts. The only departmental unfavorable variance is for the Public Works department where costs exceeded the budget by $1,014.
FY 2007 revenues were budgeted to increase by $125,485 or 1.48% and expenditures were budgeted to increase $1,431,864or 18.82%. Budget variances for the current year are as follows: Revenues - $33,762 and Expenditures - $1,430,172. The actual budget comparison is presented on page 40 and a more detailed comparison of revenues is presented on page 48. Also, graphs, which are presented at the end of this discussion and analysis, provide additional information regarding actual increases and decreases in various sources of revenues for all of the City’s funds.
CAPITAL ASSETS AND DEBT ADMINISTRATIONCapital Assets
At September 30, 2007 and 2006, the City had invested $16,775,108 and $16,678,519 , net of depreciation, in a broad range of capital assets, including land, buildings, infrastructure, machinery & equipment, and vehicles. In 2007, the City acquired assets totaling $950,550 for use in governmental activities and acquired assets totaling 138,692 for use in its business type activities. In 2006, the City acquired land totaling $765,424, other capital assets used in governmental activities totaling $1,148,843 and assets used in business-type activities totaling $84,065. More detailed information about the City’s capital assets is presented in the notes to the basic financial statements.
Long Term DebtPrincipal payments on the Certificates of Obligation of $125,000 and $120,000 were recorded in 2007 and 2006, respectively. The capitalized lease obligation decreased $54,721 and $32,458 in 2007 and 2006, respectively. Net increases in compensated absences for 2007 and 2006 were $17,999 and $4,416, respectively.
Bond Ratings - Standard & Poor’s assigned rating is “A-".
GRAPHS OF SELECTED DATA
Selected data from the Governmental funds are represented by the following charts and graphs. The time-lines presented in the accompanying charts and graphs present the most current year on the left-hand side of the graph and each preceding year is to the right. This presentation is necessary because this is the order that all of the City’s financial information is presented in the financial statements and other schedules.
7
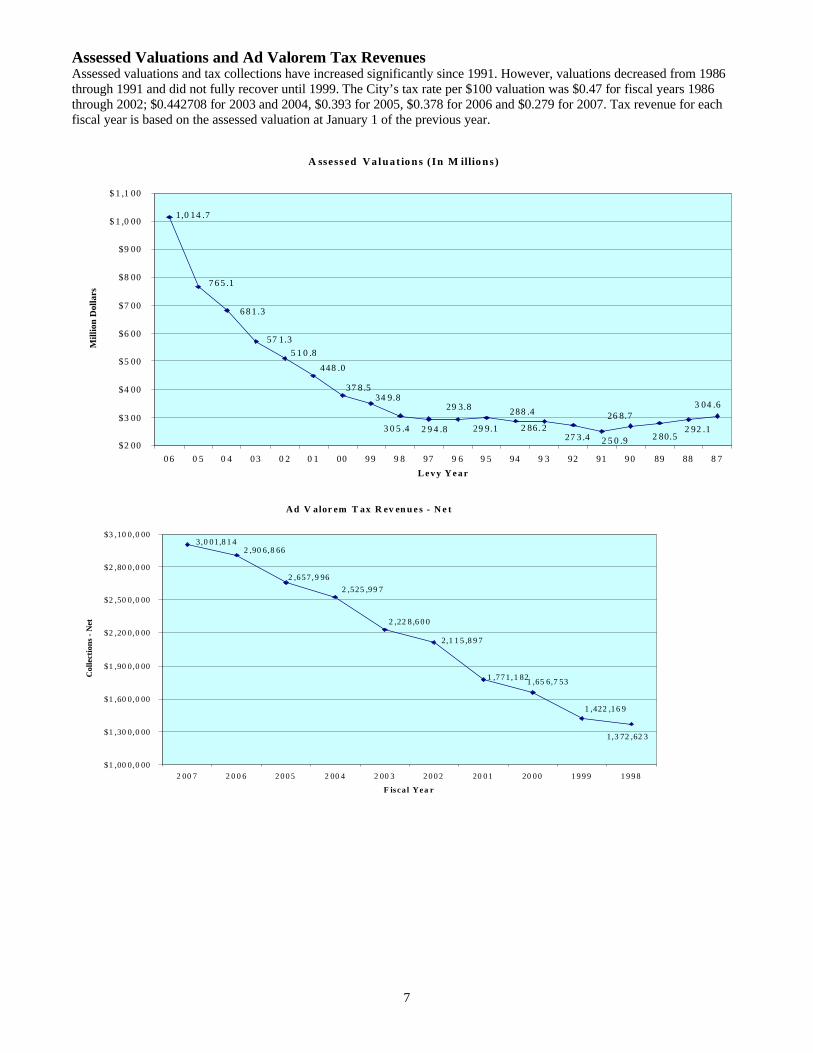
Assessed Valuations and Ad Valorem Tax RevenuesAssessed valuations and tax collections have increased significantly since 1991. However, valuations decreased from 1986through 1991 and did not fully recover until 1999. The City’s tax rate per $100 valuation was $0.47 for fiscal years 1986through 2002; $0.442708 for 2003 and 2004, $0.393 for 2005, $0.378 for 2006 and $0.279 for 2007. Tax revenue for each fiscal year is based on the assessed valuation at January 1 of the previous year.
A ssessed V a l u a t io n s (In M illio n s )
2 92 .129 9.1
288 .429 3.8
2 86. 227 3 .4 2 5 0 .9
26 8.7
2 80.53 0 5 .4
34 9.8
1,0 14 .7
57 1.3
2 9 4 .8
37 8 .5
448 .05 1 0 .8
6 8 1 .3
7 6 5 .1
3 04 .6
$2 00
$3 00
$4 00
$5 00
$6 00
$7 00
$8 00
$9 00
$ 1 ,0 00
$ 1 ,1 00
0 6 0 5 0 4 0 3 0 2 0 1 00 9 9 9 8 97 9 6 9 5 94 9 3 92 91 9 0 89 88 8 7L e v y Y e a r
Mill
ion
Dol
lars
Ad V alor em T ax R ev en u e s - N e t
2 ,22 8 ,6 0 0
2,1 1 5 ,8 9 7
2 ,90 6,8 66
1,3 72 ,62 3
1 ,422 ,16 9
1 ,65 6,7 531 ,771 ,1 82
2 ,525 ,99 72 ,657 ,9 96
3,0 01,8 1 4
$1 ,00 0,0 00
$1 ,30 0,0 00
$1 ,60 0,0 00
$1 ,90 0,0 00
$2 ,20 0,0 00
$2 ,50 0,0 00
$2 ,80 0,0 00
$3 ,10 0,0 00
2 00 7 2 0 0 6 2 0 0 5 2 00 4 2 00 3 2 0 0 2 20 01 20 00 1 9 9 9 1 9 9 8
F isca l Yea r
Col
lect
ions
- N
et

8
Various Taxes as a Percentage of Total TaxesThe make up of the various taxes as a % of total tax revenues each fiscal year have not changed significantly. The make up of tax collections has been approximately as follows: Ad valorem 40%; Sales 20%,Occupancy 30% & Franchise 10%.
Sales Tax RevenuesSales tax revenues have increased each year except for fiscal years 1998 and 2003. TheCity increased its sales tax rate from 1% to 1½% in 1996. The additional 1/2% sales tax has been recorded in the Port Aransas Recreational Development Corporation and is restricted to economic development.
Franchise Tax RevenuesThe primary franchise tax comes from the electric utility company. The increase in 2001 is due primarily to a one-time settlement with the electric utility company totaling $56,313. Franchise taxes from electric utilities have decreased from 2001 through 2005. The decreases are most likely due to the deregulation of the utility industry allowing customers to choose their utility providers. None of the other utility providers have submitted Franchise Tax reports or remitted any Franchise Tax payments. Franchise taxes from cable TV, telephoneand BFI/others have generally increased over the years.
0%
10%
20%
30%
40%
50%
60%
70%
80%
90%
100%
2007 2006 2005 2004 2003 2002 2001 2000 1999 1998Fiscal Year
Percentages of Tax Revenues
Franchise TaxOccupancyCity Sales Ad valorem - Net
Sales Tax Revenues
1,070,234
818,553
916,334
674,355 611,687
967,883963,823
1,261,977
1,245,245
1,096,962
$500,000
$600,000
$700,000
$800,000
$900,000
$1,000,000
$1,100,000
$1,200,000
$1,300,000
$1,400,000
2007 2006 2005 2004 2003 2002 2001 2000 1999 1998Fiscal Year
Franchise Tax Revenue
358,881
374,905
390,781
361,100
389,591
389,621
454,150
310,751265,377
292,544
$200,000
$250,000
$300,000
$350,000
$400,000
$450,000
$500,000
2007 2006 2005 2004 2003 2002 2001 2000 1999 1998
Fiscal Year

9
Franchise Tax - Electricity
200,000
225,000
250,000
275,000
300,000
325,000
350,000
375,000
400,000
2007 2006 2005 2004 2003 2002 2001 2000 1999 1998
Fiscal Year
Franchise Tax - Other Than Electricity
$-
$10,000
$20,000
$30,000
$40,000
$50,000
$60,000
$70,000
$80,000
2007 2006 2005 2004 2003 2002 2001 2000 1999 1998FISCAL YEAR
BFI &OtherPhoneCable TV
Hotel-Motel Occupancy Tax Revenues
Occupancy taxes continue to increase due to the growth in tourism. The rate was increased from 6% to 7% effective 1/1/99.
Occupancy Tax Revenues
1,702,446
1,369,3271,390,289
1,901,749
2,157,586
1,416,879
1,533,239
1,310,703
1,126,194
856,035
$500,000
$1,000,000
$1,500,000
$2,000,000
$2,500,000
2007 2006 2005 2004 2003 2002 2001 2000 1999 1998Fiscal Year
Construction PermitsAlthough there are a few years with decreases, revenues have steadily increased over the ten-year period.There have been significant increases since 2003 reflecting theincreased construction activity in Port Aransas.
Construction Permits & Contractor Licenses
161,090
409,810
276,132
181,159
252,396
133,067
151,423
130,368 94,714 127,462
$50,000
$100,000
$150,000
$200,000
$250,000
$300,000
$350,000
$400,000
$450,000
2007 2006 2005 2004 2003 2002 2001 2000 1999 1998Fiscal Year

10
Food and Beverage PermitsPermit fees are as follows: Food -$3.50; Beer & Wine (on premise) -$87.50 and mixed beverage -$375.00. At these rates, there has to be substantial growth or decline to significantly affect total income. Fluctuations are more likely due to the fact that the mixed beverage permit is a multiyear permit and some years have more of these permits due than others.
Food & Beverage Permits
7,242
5,412
6,439
7,880
6,9966,535
11,374
7,027 6,974
8,554
$5,000
$6,000
$7,000
$8,000
$9,000
$10,000
$11,000
$12,000
2007 2006 2005 2004 2003 2002 2001 2000 1999 1998
Fiscal Year
Beach Parking PermitsPermit sales fluctuate based not only on the level of tourism on the island; but also, due to the level of enforcement of the parking permitrules. Sales increased to over $200,000 from 1999 through 2002. In 2003, the City entered into an agreement with the City of Corpus Christi and Nueces County to sell beach parking permits that would be valid on all beaches governed by the three entities. This agreement benefited the many visitors to Port Aransas, Mustang Island and North Padre Island. Revenues have fluctuated up and down each year since the agreement was approved. The agreement provided that the City would be reimbursed for any loss of revenue in 2003. The reimbursement was not determined
or received until 2004.
Beach Parking Permits
271,403
159,543
214,123
418,245
351,790
138,601
217,467 219,814
172,473215,046
$130,000
$180,000
$230,000
$280,000
$330,000
$380,000
$430,000
2007 2006 2005 2004 2003 2002 2001 2000 1999 1998
Fiscal Year

11
Intergovernmental Revenues
Regular intergovernmental revenues are made up of the following: Federal Emergency Management Assistance, Texas Beach Cleaning Grant, State Shared Beverage Tax and various grants and reimbursements from county and local governmental agencies. The most significant grants and reimbursements received during the ten-year period include: 1998 - Park Grant from the Texas Parks & Wildlife - $472,969; First Phase of the Coastal Erosion Project - $491,982 in 2001 and $795,665 in 2002. The first phase of the Coastal Erosion Project was completed in 2002 at a total cost of $1,329,258. This project was financed by the Texas General Land Office (GLO) ($998,147), Port of Corpus Christi Authority ($124,500), Nueces County WC&ID #4 ($165,000) and the City ($41,611). The second phase of the Coastal Erosion Project, which cost $883,639, was completed in 2003. This project was financed by the Texas General Land Office ($551,835), Port of Corpus Christi Authority ($150,000), and the City ($181,804). In 2003, the City also received a $427,100 block grant from the Texas Department of Transportation for renovation to the Port Aransas Municipal Airport. The renovations were completed in 2003. FY’s 2004 through 2006 include grants from the Texas General Land Office for land acquisition in Charlie’s Pasture, which will be used for the nature preserve. FY 2006 also includes $200,000 from the Port of Corpus Christi (Bulkhead); $151,117 for Equipment, $18,163 for the Airport; $15,755 for the Hike & Bike Trail.
Inter gove rnm enta l Re venue s
1 ,23 7,4 46
7 7 3 ,98 4
5 5 1 ,27 7
1,1 42 ,51 2
6 3 2 ,76 6
1,5 01,346
331,027
863,022
310,592
7 8 5 ,99 1
$100 ,0 00
$300 ,0 00
$500 ,0 00
$700 ,0 00
$900 ,0 00
$1 ,10 0,0 00
$1 ,30 0,0 00
$1 ,50 0,0 00
$1 ,70 0,0 00
20 07 200 6 200 5 2 0 0 4 2 0 0 3 20 02 20 01 20 00 19 99 19 98
F iscal Year
Sanitation RevenuesSanitation revenues include regular trash pick-up and fees charged at the collection station. Except for 2003 and 2001, revenues have generally increased. Collection Station fees have been as follows:2006-07 - $43,0152005-06 - $36,7062004-05 - $31,6562003-04 - $32,4632002-03 - $42,8812001-02 - $57,3722000-01 - $28,1081999-00 - $71,025The decreases in revenues have been due to the decreases in the Collection Station revenues.
Sanitation Revenues
336,252
297,891286,640
400,695
480,773
319,552
285,362
251,284
271,821
237,853
$200,000
$250,000
$300,000
$350,000
$400,000
$450,000
$500,000
2007 2006 2005 2004 2003 2002 2001 2000 1999 1998
Fiscal Year
12
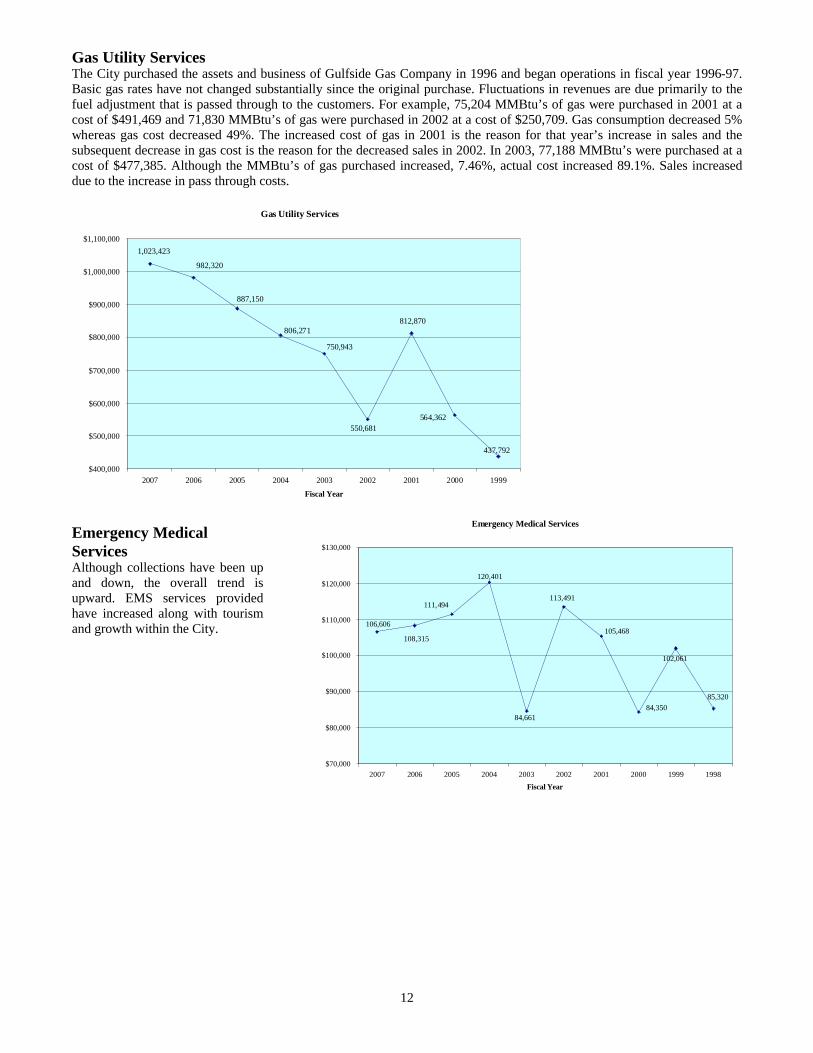
Gas Utility ServicesThe City purchased the assets and business of Gulfside Gas Company in 1996 and began operations in fiscal year 1996-97. Basic gas rates have not changed substantially since the original purchase. Fluctuations in revenues are due primarily to the fuel adjustment that is passed through to the customers. For example, 75,204 MMBtu’s of gas were purchased in 2001 at a cost of $491,469 and 71,830 MMBtu’s of gas were purchased in 2002 at a cost of $250,709. Gas consumption decreased 5% whereas gas cost decreased 49%. The increased cost of gas in 2001 is the reason for that year’s increase in sales and the subsequent decrease in gas cost is the reason for the decreased sales in 2002. In 2003, 77,188 MMBtu’s were purchased at a cost of $477,385. Although the MMBtu’s of gas purchased increased, 7.46%, actual cost increased 89.1%. Sales increased due to the increase in pass through costs.
Gas Utility Services
437,792
564,362
1,023,423
550,681
812,870
982,320
750,943
806,271
887,150
$400,000
$500,000
$600,000
$700,000
$800,000
$900,000
$1,000,000
$1,100,000
2007 2006 2005 2004 2003 2002 2001 2000 1999
Fiscal Year
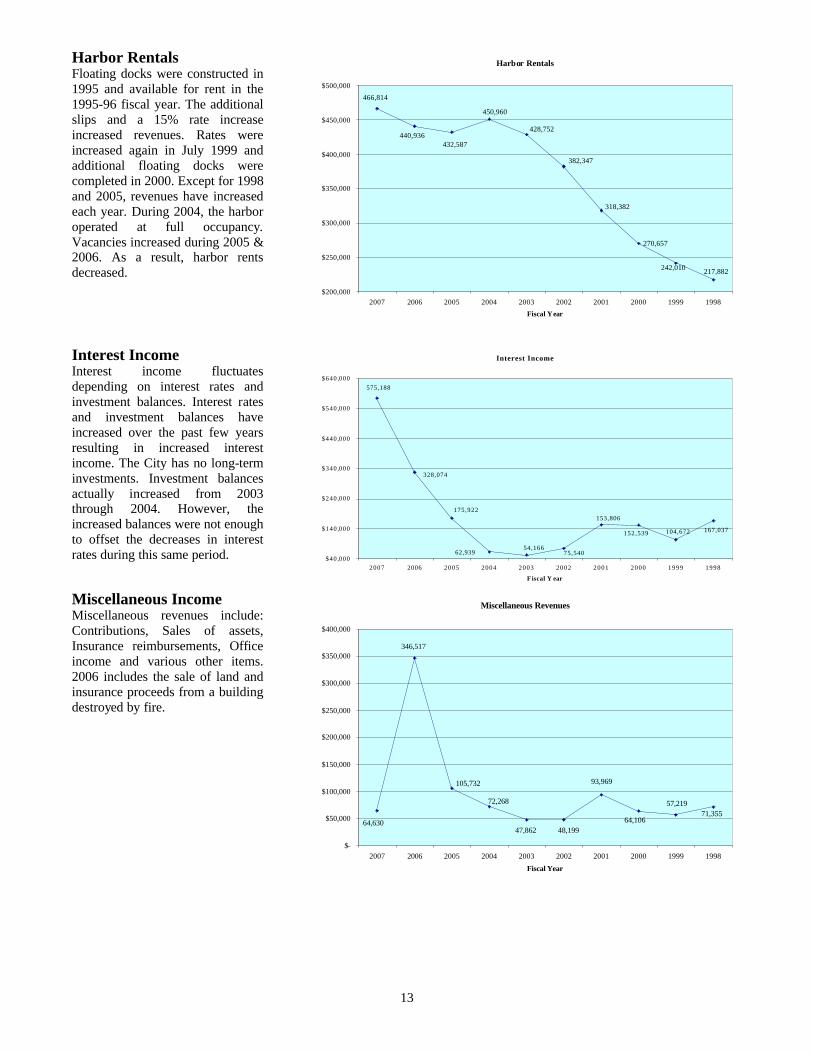
Emergency Medical ServicesAlthough collections have been up and down, the overall trend is upward. EMS services provided have increased along with tourism and growth within the City.
Emergency Medical Services
102,061
108,315
106,606105,468
84,350
111,494
120,401
84,661
113,491
85,320
$70,000
$80,000
$90,000
$100,000
$110,000
$120,000
$130,000
2007 2006 2005 2004 2003 2002 2001 2000 1999 1998Fiscal Year
13
Harbor RentalsFloating docks were constructed in 1995 and available for rent in the 1995-96 fiscal year. The additional slips and a 15% rate increaseincreased revenues. Rates were increased again in July 1999 and additional floating docks were completed in 2000. Except for 1998and 2005, revenues have increasedeach year. During 2004, the harbor operated at full occupancy. Vacancies increased during 2005 & 2006. As a result, harbor rents decreased.
Harbor Rentals
466,814
440,936432,587
428,752
382,347
450,960
318,382
242,010
270,657
217,882
$200,000
$250,000
$300,000
$350,000
$400,000
$450,000
$500,000
2007 2006 2005 2004 2003 2002 2001 2000 1999 1998Fiscal Year
Interest IncomeInterest income fluctuates depending on interest rates and investment balances. Interest ratesand investment balances have increased over the past few years resulting in increased interest income. The City has no long-term investments. Investment balances actually increased from 2003 through 2004. However, the increased balances were not enough to offset the decreases in interest rates during this same period.
Interest Income
175,922
328,074
54,166
153,806
152,539
75,540
575,188
62,939
167,037104,672
$40 ,000
$140,000
$240,000
$340,000
$440,000
$540,000
$640,000
2007 2006 2005 2004 2003 2002 2001 2000 1999 1998
F iscal Y ear
Miscellaneous IncomeMiscellaneous revenues include: Contributions, Sales of assets, Insurance reimbursements, Office income and various other items. 2006 includes the sale of land and insurance proceeds from a building destroyed by fire.
Miscellaneous Revenues
346,517
72,268
47,86264,630
105,732
48,199
93,969
64,106
57,21971,355
$-
$50,000
$100,000
$150,000
$200,000
$250,000
$300,000
$350,000
$400,000
2007 2006 2005 2004 2003 2002 2001 2000 1999 1998Fiscal Year

14
CONTACTING THE CITY’S FINANCIAL MANAGEMENTThis financial report is designed to provide our citizens, taxpayers, customers, and investors and creditors with a general overview of the City’s finances and to demonstrate the City’s accountability for the money it receives. If you have questions about this report or need additional financial information, contact the City’s Business Office, at 710 West Avenue A, Port Aransas, Texas 78373 or call 1-361-749-4111. Some additional information is also available on the City’s web-site @www.cityofportaransas.org
15
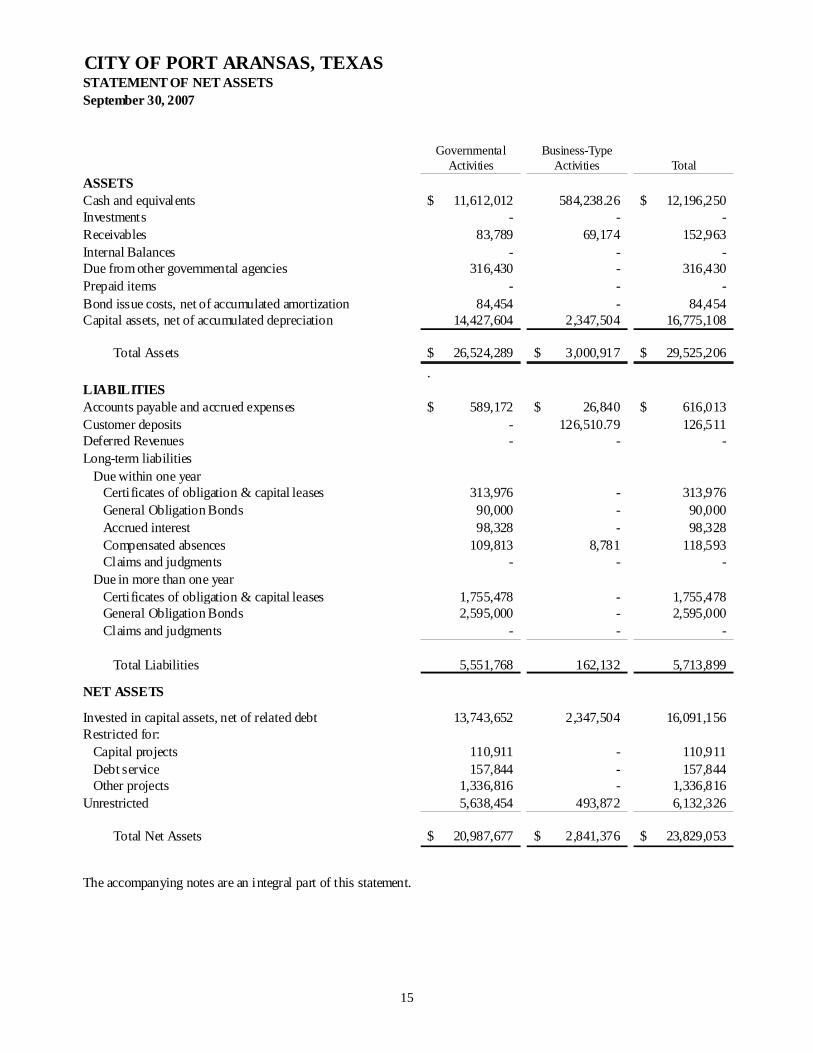
CITY OF PORT ARANSAS, TEXASSTATEMENT OF NET ASSETSSeptember 30, 2007
Governmental Activities
Business-Type Activities Total
ASSETSCash and equivalents 11,612,012$ 584,238.26 12,196,250$ Investments - - - Receivables 83,789 69,174 152,963 Internal Balances - - - Due from other governmental agencies 316,430 - 316,430 Prepaid items - - - Bond issue costs, net of accumulated amortization 84,454 - 84,454 Capital assets, net of accumulated depreciation 14,427,604 2,347,504 16,775,108
Total Assets 26,524,289$ 3,000,917$ 29,525,206$ .
LIABILITIESAccounts payable and accrued expenses 589,172$ 26,840$ 616,013$ Customer deposits - 126,510.79 126,511 Deferred Revenues - - - Long-term liabilities
Due within one yearCertificates of obligation & capital leases 313,976 - 313,976 General Obligation Bonds 90,000 - 90,000 Accrued interest 98,328 - 98,328 Compensated absences 109,813 8,781 118,593 Claims and judgments - - -
Due in more than one yearCertificates of obligation & capital leases 1,755,478 - 1,755,478 General Obligation Bonds 2,595,000 - 2,595,000 Claims and judgments - - -
Total Liabilities 5,551,768 162,132 5,713,899
NET ASSETS
Invested in capital assets, net of related debt 13,743,652 2,347,504 16,091,156 Restricted for:
Capital projects 110,911 - 110,911 Debt service 157,844 - 157,844 Other projects 1,336,816 - 1,336,816
Unrestricted 5,638,454 493,872 6,132,326
Total Net Assets 20,987,677$ 2,841,376$ 23,829,053$
The accompanying notes are an integral part of this statement.

16
CITY OF PORT ARANSAS, TEXASSTATEMENT OF ACTIVITIESFor the Year Ended September 30, 2007
Functions/Programs ExpensesCharges for
ServicesOperating Grants & Contributions
Capital Grants & Contributions
Primary governmentGovernmental Activities
General government 3,098,257$ 74,465$ 6,459$ -$ Police 1,259,178 217,388 23,481 - Fire 157,246 - - - Emergency medical services 444,207 106,606 - - Inspections 297,512 415,261 - - Public works & streets 1,584,035 - - - Parks and recreation 1,173,382 520,519 103,581 283,193 Library 185,156 17,174 1,717 - Public buildings 441,520 34,094 - - Public transportation 152,198 - 254,550 - Interest on long-term debt 139,080 - - -
Total governmental activities 8,931,772 1,385,506 389,788 283,193
Business-type activitiesGas utility & sanitation 1,342,678 1,511,103 - - Harbor 330,503 466,814 - -
Total business-type activities 1,673,181 1,977,918 - -
Total primary government 10,604,953$ 3,363,424$ 389,788$ 283,193$
General revenues:Taxes:
Property taxes, levied for general purposesProperty taxes, levied for debt serviceFranchise taxesOccupancy taxesSales & use taxesState shared beverage tax
Unrestricted investment earningsMiscellaneous
Transfers
Total general revenues, special items, and transfers
Change in net assets
Net assets - beginning
Net assets - ending
The accompanying notes are an integral part of this statement.
Program Revenue
17
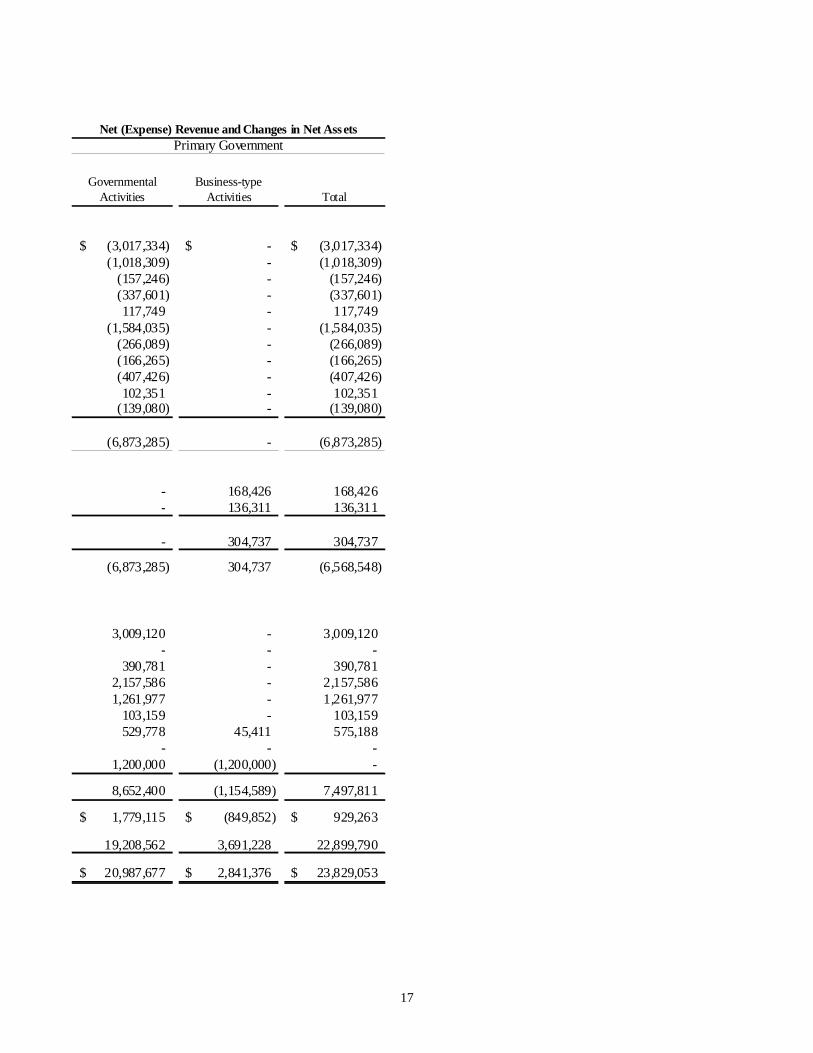
Governmental Activities
Business-type Activities Total
(3,017,334)$ -$ (3,017,334)$ (1,018,309) - (1,018,309)
(157,246) - (157,246) (337,601) - (337,601) 117,749 - 117,749
(1,584,035) - (1,584,035) (266,089) - (266,089) (166,265) - (166,265) (407,426) - (407,426) 102,351 - 102,351
(139,080) - (139,080)
(6,873,285) - (6,873,285)
- 168,426 168,426 - 136,311 136,311
- 304,737 304,737
(6,873,285) 304,737 (6,568,548)
3,009,120 - 3,009,120 - - -
390,781 - 390,781 2,157,586 - 2,157,586 1,261,977 - 1,261,977
103,159 - 103,159 529,778 45,411 575,188
- - - 1,200,000 (1,200,000) -
8,652,400 (1,154,589) 7,497,811
1,779,115$ (849,852)$ 929,263$
19,208,562 3,691,228 22,899,790
20,987,677$ 2,841,376$ 23,829,053$
Net (Expense) Revenue and Changes in Net AssetsPrimary Government

18
CITY OF PORT ARANSAS, TEXASBALANCE SHEETGOVERNMENTAL FUNDSSeptember 30, 2007
BeachGeneral Airport Advertising Cleaning
ASSETSCash and Temporary Investments $ 2,387,600 $ (7,542) $ 125,897 $ 733,150 Receivables - Net of Allowances:
Accounts 68,474 485 - - Governmental Units 191,478 33,193 - 48,552 Ad Valorem Taxes - Net 76,281 - - - Other 7,611 - - -
Prepaid Expenses - - - -
Total Assets $ 2,731,444 $ 26,136 $ 125,897 $ 781,702
LIABILITIESAccounts Payable $ 126,035 $ 737 $ - $ - Accrued Liabilities 37,553 - - - Matured Bonds & Interst Payable - - - - Customer Deposits 126,511 - - - Deferred Revenues 76,281 - - -
Total Liabilities 366,380 737 - -
FUND BALANCESReserved For:
Approved Projects - - - - Unreserved:
Designated For Harbor 205,345 - - - Designated For Gas Utility 294,716 - - - Designated For Specific Projects - - - Undesignated 1,865,003 25,399 125,897 781,702
Total Fund Equity 2,365,065 25,399 125,897 781,702
Total Liabilities And Fund Equity $ 2,731,444 $ 26,136 $ 125,897 $ 781,702
The accompanying notes are an integral part of this statement.

19
Port AransasRecreational Streets Total
Recreational Development Nature & Land GovernmentalDevelopment Corporation Library Preserve Acquisition Funds
$ 604,221 $ 172,767 $ 79,054 $ 1,811,457 $ 6,289,647 $ 12,196,250
- - - - - 68,960 - 43,208 - - - 316,430 - - - - - 76,281
111 - - - - 7,723 - - - - - -
$ 604,332 $ 215,975 $ 79,054 $ 1,811,457 $ 6,289,647 $ 12,665,643
$ 14 $ 7,838 $ - $ - $ 441,771 $ 576,394 - 2,065 - - - 39,618
157,844 - - - - 157,844 - - - - - 126,511 - - - - - 76,281
157,858 9,903 - - 441,771 976,648
- - - - 1,679,677 1,679,677
- - - - - 205,345 - - - - - 294,716 - - - 1,811,457 - 1,811,457
446,474 206,072 79,054 - 4,168,199 7,697,800
446,474 206,072 79,054 1,811,457 5,847,876 11,688,995
$ 604,332 $ 215,975 $ 79,054 $ 1,811,457 $ 6,289,647 $ 12,665,643

20
CITY OF PORT ARANSAS, TEXASSTATEMENT OF REVENUES, EXPENDITURES AND CHANGES IN FUND BALANCEGOVERNMENTAL FUNDSFor The Year Ended September 30, 2007
BeachGeneral Airport Advertising Cleaning
REVENUES:Taxes $ 4,233,912 $ - $ 924,680 $ 616,453 Licenses and Permits 421,183 - - 418,245 Intergovernmental 393,686 33,193 - 97,104 Charges For Services 2,580,704 85,808 - - Fines and Penalties 232,993 - - - Rentals 500,908 - - - Interest Income 217,378 1,593 10,148 28,359 Other 56,539 - - -
Total Revenues 8,637,304 120,594 934,827 1,160,161EXPENDITURES:Current:
Central Operating 822,619 - - - Mayor and Council 176,911 - 968,830 - CityCourt 72,942 - - - CityAttorney 78,286 - - - CityManager 229,991 - - - CitySecretary 175,949 - - - Finance 154,403 - - - Parks and Recreation 405,021 125,211 - 938,891 Police 1,244,202 - - - Fire 117,169 - - - Emergency Medical Services 428,496 - - - Public Works 960,837 - - - Building Codes & Planning 296,068 - - - Library 185,182 - - - Public Buildings 370,368 - - - Harbor 270,677 - - - Public Transportation 151,782 - - - Gas Utility & Sanitation 1,403,591 - - -
Capital Projects - - - - Debt Service 67,388 - - -
Total Expenditures 7,611,883 125,211 968,830 938,891 Excess of Revenues
Over (Under) Expenditures 1,025,421 (4,617) (34,003) 221,270
OTHER FINANCING SOURCES (USES):Proceeds From Sale of Bonds - - - - Transfers From (To) Other Funds (1,846,834) - - -
Fund Balances - October 1 3,186,478 30,016 159,900 560,432
Fund Balances - September 30 $ 2,365,065 $ 25,399 $ 125,897 $ 781,702 The accompanying notes are an integral part of this statement.

21
Port AransasRecreational Streets Total
Recreational Development Nature & Land GovernmentalDevelopment Corporation Library Preserve Acquisition Funds
$ 616,453 $ 420,659 $ - $ - $ - $ 6,812,157 - - - - - 839,429 - - - - 250,000 773,984 - - - - - 2,666,513 - - - - - 232,993 - - - - - 500,908
62,099 10,135 2,701 91,779 150,997 575,188 - - 8,091 - - 64,630
678,552 430,794 10,792 91,779 400,997 12,465,801$
- - - - - 822,619 - - - - - 1,145,741 - - - - - 72,942 - - - - - 78,286 - - - - - 229,991 - - - - - 175,949 - - - - - 154,403 - 492,081 - - - 1,961,205 - - - - - 1,244,202 - - - - - 117,169 - - - - - 428,496 - - - - - 960,837 - - - - - 296,068 - - 1,417 - - 186,598
49,884 - - - - 420,252 - - - - - 270,677 - - - - - 151,782 - - - - - 1,403,591 - - - 53,455 1,177,888 1,231,342
191,088 - - - 47,000 305,475 240,971 492,081 1,417 53,455 1,224,888 11,657,627
437,580 (61,287) 9,376 38,325 (823,891) 808,174
- - - - 2,685,000 2,685,000 (1,249,656) - - - 3,096,490 - 1,258,549 267,359 69,678 1,773,132 890,277 8,195,821
$ 446,474 $ 206,072 $ 79,054 $ 1,811,457 $ 5,847,876 $ 11,688,995

22
CITY OF PORT ARANSAS, TEXASRECONCILIATION OF THE GOVERNMENTAL FUNDS BALANCE SHEETTO THE STATEMENT OF NET ASSETSSeptember 30, 2007
Total Fund Balance - Governmental Funds 11,688,995$
Amounts reported in the governmental activities in the statement of net assets are different because:
1 - Capital assets used in governmental activities are not current financial resources and therefore are not reported in the governmental funds. The cost of the assets is $28,494,935 and the accumulated depreciation is $11,719,827 16,775,108
2 - Other long-term assets, including delinquent taxes receivable, net of allowance are not available for current period expenditures and are, therefore, deferred in the funds. 76,281
3 - Some liabilities are not due and payable in the current period and therefore are not reported in funds. A detail of these liabilities follows:
Compensated absences (118,593)$ Capitalized lease obligations (159,454) General Obligation Bonds (2,685,000) Certificates of obligation (1,785,000) (4,748,048)
4 - Various other reclassifications and eliminations are necessary to convert from the modified accrual of accounting to the accrual basis of accounting. These include recording bond issue cost net of amortization of $84,454 as an asset and accrued interest of $65,485 as a liability. The net effect of these reclassifications and recognitions is to increase (decrease) net assets. 18,969
Net Assets of Governmental Activities 23,829,053$

23
CITY OF PORT ARANSAS, TEXASRECONCILIATION OF THE GOVERNMENTAL FUNDS STATEMENT OF REVENUES, EXPENDITURESAND CHANGES IN FUND BALANCE TO THE STATEMENT OF ACTIVITIESFor The Year Ended September 30, 2007
Change in Fund Balance - Governmental Funds 3,493,174$
Amounts reported in the governmental activities in the statement of activities are different because:
1 - Governmental funds report capital outlays as expenditures. However, in the statement of activities the cost of capital assets is allocated over their estimated useful lives and reported as depreciation expense. Capital outlays and depreciation expense for the current period are as follows:
Capital outlays 1,089,242$ Depreciation expense (1,141,602) (52,360)
2 - Revenues in the statement of activities that do not provided current financial resources are not reported as revenues in funds. Adjustment necessary to report property tax revenues on the accrual basis. 7,306
3 - Debt proceeds provide current financial resources to governmental funds, but issuing debt increases long-term liabilities in the statement of net assets. Repayment of debt principal is an expenditure in the governmental funds, but the repayment reduces long-term liabilities in the statement of net assets. This is the amount by which proceeds exceeded repayment.
Compensated absences (253)$ Capitalized lease obligations 55,721 General Obligation Bonds Issued (2,685,000) Certificates of obligation paid 125,000 (2,504,532)
4 - Various other reclassifications and eliminations are necessary to convert from the modified accrual of accounting to the accrual basis of accounting. These include reclassifying bond issue costs, recording amortization of bond issue cost, writing off net book value of assest sold or disposed and adjusting accrued interest on long-term debt. The net effect of these reclassifications and recognitions is to increase (decrease) net assets.
Amortization of bond issue costs (4,309)$ Bond issue costs 47,000 Decrease (Increase) - Accrued interest on long-termdebt (57,017)
(14,326)
Change in Net Assets of Governmental Activities 929,263$

24
CITY OF PORT ARANSAS, TEXASNOTES TO THE FINANCIAL STATEMENTSFOR THE YEAR ENDED SEPTEMBER 30, 2007
A. SUMMARY OF SIGNIFICANT ACCOUNTING POLICIES: The City of Port Aransas, Texas (the "City") was incorporated as a general law city in November 1955. In August 1978 the City adopted the Mayor-Council-Manager form of government. The principal services accounted for as general governmental functions include public safety, health, streets, sanitation, park and recreation, planning, zoning and general administrative services. The financial statements of the City have been prepared in accordance with accounting principles generally accepted in the United States of America (GAAP) as applied to governmental units. The Governmental Accounting Standards Board (GASB) is the standard setting body for governmental accounting and financial reporting. The GASB periodically updates its codification of the existing Governmental Accounting and Financial Reporting Standards, which along with subsequent GASB pronouncements (Statements and Interpretations), constitutes GAAP for governmental units.The more significant accounting principles and practices are discussed in subsequent sections of these Notes.
REPORTING ENTITY:The financial statements of the reporting entity include those of the City (the primary government) and its component units, entities for which the City is considered financially accountable. In evaluating how to define the City, for financial reporting purposes, management has considered all potential component units. The City is financially accountable if it appoints a voting majority of the organization’s governing board and it is able to impose its will on the organization, or there is a potential for the organization to provide specific financial benefits to or burdens on the City. Additionally, the City is required to consider other organizations for which the nature and significance of their relationship with the City are such that exclusion would cause the City’s financial statements to be misleading or incomplete. Blended component units, although legally separate entities are, in substance, part of the City operations and so data from these units are combined with data of the City. If applicable, each discretely presented component unit is reported in a separate column in the government-wide financial statements to emphasize it is legally separate from the City.
Blended Component Units:The Port Aransas Recreational Development Corporation (PARDC) was chartered on November 27, 1995. The public purposes for which the Corporation is organized and for which it may issue bonds are as follows: construction, development, expansion, maintenance, operation and promotion of recreational and sports fields and stadiums, swimming pool, sports complexes, and related facilities and improvements. The Board of Directors consisting of seven members is appointed by the City Council. PARDC's main source of revenue is the additional one-half cent sales tax approved by voters.Discretely Presented Component Units - There are no component units requiring discrete presentation.
Related Organizations and Jointly Governed Organizations that are administered by separate boards or commissions provide services within the City. However, the City is not financially accountable for these organizations. Therefore, they are not component units of the City, even if the City Council could appoint a voting majority of the organizations' board. Consequently, financial information for the Coastal Bend Council of Governments, the Regional Transit Authority and the Port Aransas Chamber of Commerce are not included in these financial statements.

NOTES TO THE FINANCIAL STATEMENTS CONTINUED…
25
The PARDC is audited in conjunction with the audit of the City’s general-purpose financial statements. PARDC does not issue separate stand-alone financial statements.
Basic Financial Statements:The basic financial statements include both government-wide (based on the City as a whole) and fund financial statements. While the previous model emphasized fund types (the total of all funds of a particular type), in the new reporting model the focus is on either the City as a whole or major individual funds (within the fund financial statements). Both the government-wide and fund financial statements categorize activities as either governmental activities or business-type activities. In the government-wide statement of net assets, both the governmental and business-type activities columns are presented on a consolidated basis by column and reflected on a full accrual, economic resource basis, which incorporates long-term assets and receivables as well as long-term debt and obligations.The government-wide statement of activities reflects both the gross and net cost per functional category (police, fire, operations, etc.) which are otherwise being supported by general government revenues (e.g., property taxes, sales taxes and certain intergovernmental revenues). The statement of activities reduces gross expenses, including depreciation, by related program revenues, operating and capital grants. The program revenues must be directly associated with the function or a business-type activity. Program revenues include revenues form charges for services, franchise fees, fines and penalties, licenses and permit fees and service assessments. The operating grants include operating-specific and discretionary (either operating or capital) grants while the capital grants column reflects capital-specific grants.
The net costs (by government or business-type activity) are normally covered by general revenue. Historically, the previous model did not summarize or present net cost by function or activity. This government-wide presentation focuses more on the substantiality of the City as an entity and the changes in aggregate financial position resulting from the activities of the fiscal period.
The fund financial statements are similar to the financial statements presented in the previous model. Emphasis here is on the major funds in either the governmental or business type categories. Non-major funds (by category) or fund type are summarized into a single column.The governmental funds major fund statements in the fund financial statements are presented on a current financial resource and modified accrual basis of accounting. This is the manner in which these funds are normally budgeted. This presentation demonstrates: legal and covenant compliance, source and use of liquid resources and how the City’s actual experience conforms to the budget or fiscal plan. Since the governmental fund statements are presented on a different measurement focus and basis of accounting than the government-wide statements, reconciliations are presented following the statementsthat briefly explain the adjustments necessary to transform the fund based financial statements into the government-wide statements.
Basis of Presentation:The City’s financial transactions are recorded in individual funds, each of which is considered a separate accounting entity. The operations of each fund are accounted for with a separate set of self-balancing accounts that comprise its assets, liabilities, fund equity, revenues and expenditures. Resources are allocated to and accounted for in individual funds based upon the purposes for which they are to be spent and the means by which spending activities are controlled. GASB 34 establishes criteria(percentage of the assets, liabilities, revenues or expenditures/expenses of either fund category or the governmental and enterprise combined) for the determination of major funds. The nonmajor funds can be combined in a single column in the fund financial statements. However, management determined that reporting all funds in the basis financial statements as if they were major funds would provide a more simple and meaningful presentation. Actual major funds, as defined by GASB 34, for the year ended

NOTES TO THE FINANCIAL STATEMENTS CONTINUED…
26
September 30, 2007 are as follows: General Fund (always a major fund), Recreational Development Fund, Nature Preserve Capital Project Fund and the Streets & Land Acquisition Capital Projects Fund. Funds not meeting the definition but reported as major funds on the balance sheet and statements of revenues, expenditures and changes in fund balance include: Municipal Airport Fund, Advertising Fund, Beach Fund, Port Aransas Recreational Development Corporation and the Library Fund.
The General Fund (GF) accounts for all financial resources except those required to be accounted for in another fund. The Advertising Fund accounts for the portion of Occupancy taxes that are required to be spent for advertising and promoting the City. The Beach Fundaccounts for the portion of Occupancy taxes required to provide beach cleaning and safety. The Recreational Development Fund accounts for the portion of Occupancy taxes that the Council requires to be set aside for recreational development. The Nature Preserve Capital Projects Fund was established to account for the proceeds of the Certificates of Obligation that were issued during the year ended September 30, 2004. Certificates of Obligation will be used to provide a nature preserve. The Streets and Land Acquisition Fund accounts for bond proceeds, grants from other governmental agencies and transfers from the General Fund that are used for streets, miscellaneous projects and land acquisitions other than for the nature preserve.
GASB 34 eliminates the presentation of account groups, but provides for these records to be maintained and incorporates the information into the Governmental column in the government-wide statement of net assets.
Basis of Accounting: Basis of accounting refers to the point at which revenues or expenditures/expenses are recognized in the accounts and reported in the financial statements. It relates to the timing of the measurements made, regardless of the measurement focus applied. The government-wide statements are presented on accrual basis of accounting. The governmental funds in the fund financial statements are presented on a modified accrual basis. Accrual means that revenues are recognized when earned and expenditures/expense are recognized when incurred. All governmental funds use the modified accrualbasis of accounting. Under this basis of accounting, revenues are recognized when susceptible to accrual (i.e., when they become both measurable and available). "Measurable" means the amount of the transaction can be determined and "available" means collectible within the current period or soon enough thereafter to be used to pay liabilities of the current period. The City considers property taxes and franchise taxes as available if they are collected within 60 days after year-end. A one-year availability period is used for revenue recognition for all other governmental fund revenues. Expenditures are recorded when the related fund liability is incurred. Principal and interest on general long-term debt are recorded as fund liabilities when due or when amounts have been accumulated in therequired fund for payments to be made early in the following year.
Revenues susceptible to accrual are property taxes, franchise taxes, grants earned, interest revenue, harbor rentals and charges for sanitation and gas utility services. Receivable amounts are reported net of allowances for uncollectibles where appropriate. As of September 30, 2007, the City recorded allowances of $23,000 for utilities and $19,070 for ad valorem taxes in the General Fund. No other allowances are considered necessary. Sales taxes collected and held by the state at year-end on behalf of the City also are recognized as revenue. Occupancy taxes, fines, permits, and miscellaneous revenues are not susceptible to accrual because generally they are not measurable until received in cash.In applying the “susceptible to accrual” concept to intergovernmental revenues pursuant to GASB No. 33 “Accounting and Financial Reporting for Nonexchange Transactions”, the revenue provider recognizes liabilities and expenses and the revenue recipient recognizes receivables and revenue when

NOTES TO THE FINANCIAL STATEMENTS CONTINUED…
27
the applicable eligibility requirements, including time requirements, are met. Resources transmitted before the eligibility requirements are met are reported as advances by the provider and as deferred revenue by the recipient/Encumbrances are supported by purchase orders or contracts and represent commitments related to unperformed contracts for goods or services. Under Texas law, appropriations lapse at year-end and encumbrances outstanding at that time are to be canceled or appropriately provided for in the subsequent year’s budget. The only significant encumbrances outstanding at September 30, 2007 totaled $1,679.677 for contracts in process for the 2007 street and drainage program.
Cash and cash equivalents of all City funds, except for the Library and Seized Drug money, are pooled and each fund has equity in the pooled amount. Cash and cash equivalents include currency on hand, demand deposits with banks, amounts included in pooled cash and liquid investments with a maturity of three months or less when purchased. City funds are deposited and invested under the terms of a depository contract. The depository bank deposits for safekeeping and trust with a third-party bankapproved pledged securities as authorized by Chapter 2257 Collateral for Public Funds of the Government Code in an amount sufficient to protect City funds on a day-to-day basis during the period of the contract. The pledge of such securities is waived only to the extent of the depository bank's dollar amount of Federal Deposit Insurance Corporation ("FDIC") Insurance. Texas statutes authorize the City to invest in 1) obligations of the U.S. Treasury or its agencies and instrumentalities; 2) direct obligations of the State of Texas or its agencies; 3) other obligations, the principal of and interest on which are unconditionally guaranteed or insured by the State of Texas or the United States; 4) obligations of states, agencies, counties or cities rated A or better by a national investment rating firm; 5) certificates of deposit that are insured by the Federal Deposit Insurance Corporation or secured by obligations having a market value of at least the principal amount of the certificates; and 6) fully collateralized direct repurchase agreements. The City’s investments are stated at fair value, which is determined using selected bases. Short-term investments are reported at cost, which approximates fair value. Securities traded on a national or international exchange are valued at the last reported sales price at current exchange rates. Cash deposits are reported at carrying amount, which reasonably estimates fair value. The net change in fair value of investments is recognized and reported as investment income in the financial statements. Accrued interest, if material, is shown under the caption accrued interest receivable. Other wise it is included with the value of the investment. Additional cash and investment information and fair values are presented in Note C. Interest earned on pooled cash is allocated to each fund based on the funds’ participation in that investment. Aside from accounts clearly identified as belonging to a specific fund, any unrealized gain/loss resulting from the valuation is allocated to each fund based on the fund’s participation in that investment.
Receivables and Payables – Amounts reported as interfund receivables and payables are eliminated in the government-wide statement of net assets. All trade and property tax receivables are shown net of an allowance for uncollectibles. Trade accounts receivable in excess of 120 days comprise the trade accounts receivable allowance for uncollectibles. The property tax receivable allowance is equal to 20% of outstanding property taxes at the end of the fiscal year. Utility revenue is recorded when billed at the end of the month. The estimated value of services provided but unbilled is not considered significant because meters are read near the end of the month. As such, no unbilled services are included in the accompanying financial statements. Net property tax receivable of $76,281 is fully deferred at year-end because delinquent collections received within the following sixty days are not considered significant. Inventories are not considered significant and are not reported in the accompanying financial statements. As a result, costs of inventories are recorded as expenditures when purchased.Capital Assets - All capital assets, including public domain ("infrastructure") general fixed assets, purchased or constructed are valued at historical cost or estimated historical cost if actual historical cost

NOTES TO THE FINANCIAL STATEMENTS CONTINUED…
28
is not available. Donated assets are valued at their estimated market value on the date donated. Maintenance repairs and renewals, which neither materially add to the value of the property nor appreciably prolong its life, are charged to expense as incurred. Leases that meet the criteria of a capital lease, as defined by Statement of Financial Accounting Standards No. 13, are capitalized. Depreciation on capital assets is calculated on the straight-line basis over the following estimated useful lives: Gas pipelines – 50 years; Infrastructure - 30 to 50 years, Runways and related improvements - 15 to 20 years; Buildings - 30 to 40 years; Improvements other than buildings 10 to 20 years; Vehicles – 5 years; Machinery and equipment - 5 to 15 years and Office furniture – 7 years. Interest is capitalized on assets, other than infrastructure assets, acquired with tax-exempt debt. The amount of interest capitalized is the net interest expense incurred (interest expense less interest income) from the date of the borrowing until completion of the project. Restricted Assets – When an expense is incurred for purposes for which both restricted and unrestricted net assets are available, it is the city’s policy to apply restricted net assets first.Accumulated Unpaid Compensated Absences - The City allows employees to accumulate up to a maximum of 130 days of unused sick leave. However sick days do not vest, and accordingly, employees can be paid sick leave only when sick. Since an employee's right to receive compensation for future absences is contingent upon the absences being caused by future illnesses and since amounts cannot be reasonably estimated, a liability for unused sick leave is not recorded in the financial statements. Earned vacation time generally must be used within one year of accrual. Up to 10 days of accumulated earned vacation will be paid to an employee upon termination. Accumulated unpaid vacation pay is reported in the government-wide statement of net assets. Expenditures are recorded in the governmental funds as employees resign or retire. The amount expected to be paid from current resources is not considered to be significant. Long-Term Obligations – In the government-wide financial statements, long-term debt and other long-term obligations are reported as liabilities in the applicable governmental activities and business-type activities. Bond premiums and discounts, as well as issuance costs, are deferred and amortized over the life of the bonds using the effective interest method. Bonds payable are reported net of the applicable bond premium or discount. Bond issuance costs incurred on the issuance of the Certificates of Obligation are reported as assets, net of amortization on the Statement of Net Assets. In the fund financial statements, governmental funds recognize bond premiums and discounts, as well as bond issuance costs, during the current period. The face amount of debt issued is reported as other financing sources. Premiums received on debt issuances are reported as other financing sources while discounts on debt issuances are reported as other financing uses. Issuance costs, whether or not withheld from the actual debt proceeds received, are reported as debt service expenditures in the governmental funds, bond discounts and issuance costs are treated as period costs in the year issued. Interfund Transactions - During the course of normal operations, the City has numerous transactions between funds including expenditures and transfers of resources to provide services. The accompanying fund financial statements generally reflect such transactions as operating transfers, which are included in the results of operations of the individual funds. Nonrecurring transfers of equity between funds are treated as residual equity transfers and are reported as additions or deductions to the fund balance of the individual funds. The General Fund charges the Beach Fund for vehicles and equipment used to provide beach safety, police patrols and cleaning. The General Fund also charges other funds for services as provided. Since these charges are considered "Quasi External" transactions, they are recorded as revenues by the General Fund and expenditures by the other funds. During the year ended September 30, 2007 the General Fund charged the Beach Fund $938,891. Charges in excess of a fund’s available resources are not recorded as due from that fund because it can not be determined if that fund will receive sufficient resources to enable repayment of the excess amounts. If sufficient funds become

NOTES TO THE FINANCIAL STATEMENTS CONTINUED…
29
available in future years, a reimbursement may be made. In years prior to 2007, charges to the Beach Fund exceeded the resources in that fund by $32,584. Reimbursements have not been made to the General Fund for these prior year charges. The “Quasi External” transactions are eliminated for the government-wide statements.
Fund Equity - In the fund financial statements, governmental funds report reservations of fund balance for amounts that are not available for appropriation or are legally restricted by outside parties for use for a specific purpose. Designations represent tentative management plans that are subject to change.Use of Estimates – The preparation of financial statements in conformity with generally accepted accounting principles requires management to make estimates and assumptions that affect certainreported amounts and disclosures. Accordingly, actual results could differ from those estimates.
B. BUDGETS AND BUDGETARY ACCOUNTING:The City Charter requires adoption of an annual budget. This budget is prepared in accordance with the basis of accounting utilized by the various funds. The Capital Projects Funds adopt project-length budgets. The City Manager is authorized to transfer budgeted amounts within departments; however, any revisions that alter the total expenditures of a department must be approved by the City Council. The following procedures are used by the City in establishing the budgetary data reflected in the financial statements: 1) Prior to October 1, the beginning of the fiscal year, the City Manager submits a proposed budget to the City Council. This budget includes proposed expenditures and the means of financing them; 2) Advertised public hearings are conducted; 3) Budget and tax levy are enacted through the passage of ordinances; 4) Budget is amended as considered necessary. Both original and amended budgets for the General and major Special Revenue Funds are presented in the required supplementary information following these notes. All unencumbered budget appropriations except project budgets, lapse at the end of each fiscal year.
C. Cash and Temporary Investments:Cash in Depository Banks - At September 30, 2007, the carrying amount of the City's deposits at its depository banks totaled $64,294 at American bank, $91,987 at Value bank and $21,084 at Herndon, Plant, Oakley LTD and the banks’ balances totaled $173,482, $91,987 and $21,084, respectively. All deposits were entirely covered by FDIC insurance and by pledged collateral held by a third party bank in the City's name. The City's cash deposits during the year ended September 30, 2007 were entirely covered by FDIC insurance and by pledged collateral held by the City's agent bank in the City's name.Custodial credit risk is the risk that in the event of a bank failure, the City’s deposits may not be returned or the City may not be able to recover collateral securities in the possession of an outside party. The City’s policy requires all invested funds to be fully collateralized or insured consistent with federal and state law and the current bank depository contract. Also, all securities pledged as collateral shall be deposited in trust with the Federal Reserve Bank or an independent investment institution under an appropriate legal contract. The amount of securities pledged shall be determined by their market value.
Temporary Investments - The City maintains accounts at TexPool, which is duly chartered and administrated by the State Treasurer's Office and its portfolio consists of U.S. Treasury bills and notes, collateralized certificates of deposit and repurchase agreements. The objective of TexPool is to maintain a stable $1.00 price of the fund. All securities owned by TexPool are marked to market daily and if the ratio of the market value of the portfolio divided by its book value is less than 0.995 or greater than 1.005, TexPool will sell portfolio holdings as required to maintain the ratio between 0.995 and 1.005. However, the $1.00 price is not guaranteed or insured by the State of Texas or the Treasury. Accounts at Herndon Plant Oakley are used to invest primarily in securities of the U.S. or its agencies.

NOTES TO THE FINANCIAL STATEMENTS CONTINUED…
30
Investments - Credit risk is the risk that an issuer or other counterparty to an investment will not fulfill its obligations. Investments that are represented by specific identifiable investment securities are classified as to credit risk by three categories described as follows: 1) insured or registered, or securities held by the City or its agent in the City's name; 2) uninsured and unregistered, with securities held by the counterparty's trust department or agent in the City's name; 3) uninsured and unregistered, with securities held by the counterparty, or by its trust department or agent but not in the City's name. Investments held in mutual funds are not assigned risk categories since the City has not been issued securities, but rather owns an undivided beneficial interest in the investments. All of the City’s investments, other than investments in mutual funds, are in category 1. During the year ended September 30, 2005, the City changed its investment strategy from investing solely in TexPool to investing in a variety of temporary investments such as US Treasuries, quasi governmental agencies, mutual funds, certificates of deposits and money market accounts. During the year ended September 30, 2007, the City changed its investment strategy back to investing primarily at TexPool. The City reports certain investments at fair value in the balance sheet and recognizes the corresponding change in the fair value of investments in the year in which the change occurred. Fair value fluctuates with interest rates and increasing rates could cause fair value to decline below original cost. Fair values of the City’s investments are equal to their respective carrying amounts. City management believes the liquidity of the portfolio is more than adequate to meet cash flow requirements and to preclude the City from having to sell investments below original cost for that purpose. Interest rate risk is the risk that changes in interest rates will adversely affect the fair value of an investment. Investments held for longer periods are subject to increased risk of adverse interest rate changes. The City’s investment policy provides the guideline that maturity of securities should not exceed more than five years and that pooled funds’ average dollar-weighted maturity allowed based on the stated maturity date for the portfolio is one year. Investments are diversified to minimize the risk of loss resulting from over-concentrations of assets in a specific maturity period. The net increase (decrease) in the fair value of investments held during the year ended September 30, 2007 was $23,786. This amount takes into account all changes in fair value, including purchases and sales that occurred during the year. The City has no unrealized loss at September 30, 2007. Investments and temporary investments held by the City at September 30, 2007 are as follows:
CarryingAmounts
Tempora ry Inv estments - Substantia lly al l mature within 1 year:Investments in U. S. Agencies -$
Tempora ry Inv estments not catego rized (Mutual Funds)Thornburg LTD Term US Govt-A - TexPo ol 12,017,062
Total Temp orary Inv estments not categorized (Mutual Funds) 12,017,062
Certificates of Deposits and Money Ma rket AccountsMM - Tamarack Inv es tment Funds 21,084 Certi ficates of Depos it - ValueBank 64,618
To tal Cert ificates o f D ep osit and Money Market Acco unts 85,702
Tota l Inv estments, Mutual Funds, Certificatesof D epost a nd Money Market Accounts 12,102,764$
D. Property Taxes:Property Taxes attach as an enforceable lien on property as of January 1. Property taxes are levied on October 1 based on 100% of appraised value of property as determined on the previous January 1. Appraised values are determined by the Nueces County Appraisal District; approved by the Nueces

NOTES TO THE FINANCIAL STATEMENTS CONTINUED…
31
County Appraisal Review Board; and certified by the Chief Appraiser. Property taxes are due upon receipt of the tax bill and are delinquent if not paid before February of the year following the year in which imposed. The City offers discounts of 3%, 2% and 1% on payments received in October, November and December, respectively. The City's taxes are billed and collected by the Nueces County Tax Office. Ad valorem taxes of $3,057,037 were assessed on property values totaling $1,014,716,436using a tax rate of $0.297 per $100 assessed valuation.
E. CAPITAL ASSETS:Changes in Capital Assets are as follows: Balances @ Decreases & Balances @
10/1/06 Additions Transfers (In) Out 9/30/07GovernmentalActivities:Capital assets not being depreciated:
Land 3,440,036$ -$ -$ 3,440,036$ Construction in Progress - - - -
Total notbeing depreciated 3,440,036 - - 3,440,036
Capital assets being depreciated:Buildings 3,091,017 3,705 (21,377) 3,116,099 Infrastructure 11,173,738 779,063 - 11,952,801 Machinery & Equipment 2,723,230 91,036 80,848 2,733,418 Vehicles 1,882,093 76,746 (119,781) 2,078,620
Total depreciable assets 18,870,078 950,550 (60,310) 19,880,938
Less accumulated depreciationBuildings 1,508,276 83,133 - 1,591,409 Infrastructure 3,432,850 580,074 - 4,012,923 Machinery & Equipment 1,842,388 183,401 59,471 1,966,318 Vehicles 1,188,350 163,539 29,168 1,322,720
Total Accumulated Depreciation 7,971,863 1,010,146 88,639 8,893,370
Total Depreciable Assets - Net 10,898,215 (59,596) (148,949) 10,987,568
Governmental activities capital assets - Net 14,338,251$ (59,596)$ (148,949)$ 14,427,604$
Balances @ Decreases & Balances @10/1/06 Additions Transfers 9/30/07
Business-Type ActivitiesCapital assets not being depreciated:
Land -$ -$ -$ -$ Construction in Progress - - - -
Total notbeing depreciated - - - -
Capital assets being depreciated:Buildings 47,328 27,760 - 75,087 Infrastructure 4,696,653 73,540 - 4,770,192 Machinery & Equipment 177,206 24,158 - 201,364 Vehicles 114,083 13,235 - 127,318
Total depreciable assets 5,035,269 138,692 - 5,173,961
Less accumulated depreciationBuildings 7,443 672 - 8,115 Infrastructure 2,521,203 111,231 - 2,632,434 Machinery & Equipment 96,115 11,673 - 107,788 Vehicles 70,240 7,880 - 78,120
Total Accumulated Depreciation 2,695,001 131,456 - 2,826,457
Total Depreciable Assets - Net 2,340,268 7,236 - 2,347,504
Business-type activities capital assets - Net 2,340,268$ 7,236$ -$ 2,347,504$
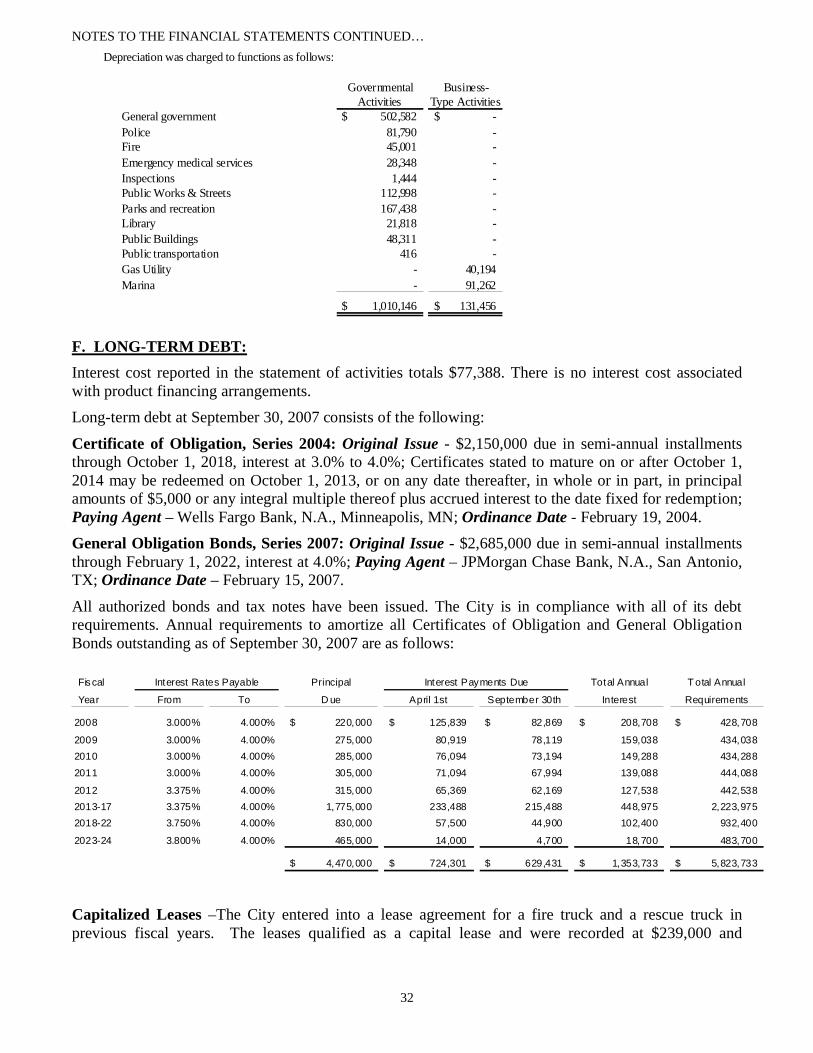
NOTES TO THE FINANCIAL STATEMENTS CONTINUED…
32
Depreciation was charged to functions as follows:
Governmental Activities
Business-Type Activities
General government 502,582$ -$ Police 81,790 - Fire 45,001 - Emergency medical services 28,348 - Inspections 1,444 - Public Works & Streets 112,998 - Parks and recreation 167,438 - Library 21,818 - Public Buildings 48,311 - Public transportation 416 - Gas Utility - 40,194 Marina - 91,262
1,010,146$ 131,456$
F. LONG-TERM DEBT:Interest cost reported in the statement of activities totals $77,388. There is no interest cost associated with product financing arrangements.Long-term debt at September 30, 2007 consists of the following:
Certificate of Obligation, Series 2004: Original Issue - $2,150,000 due in semi-annual installments through October 1, 2018, interest at 3.0% to 4.0%; Certificates stated to mature on or after October 1, 2014 may be redeemed on October 1, 2013, or on any date thereafter, in whole or in part, in principal amounts of $5,000 or any integral multiple thereof plus accrued interest to the date fixed for redemption; Paying Agent – Wells Fargo Bank, N.A., Minneapolis, MN; Ordinance Date - February 19, 2004.General Obligation Bonds, Series 2007: Original Issue - $2,685,000 due in semi-annual installments through February 1, 2022, interest at 4.0%; Paying Agent – JPMorgan Chase Bank, N.A., San Antonio, TX; Ordinance Date – February 15, 2007.
All authorized bonds and tax notes have been issued. The City is in compliance with all of its debt requirements. Annual requirements to amortize all Certificates of Obligation and General Obligation Bonds outstanding as of September 30, 2007 are as follows:
Fiscal Interest Rates Payable Principal Interest Payments Due Total Annual T otal Annual
Year From To D ue April 1st September 30th Interest Requirements
2008 3.000% 4.000% 220,000$ 125,839$ 82,869$ 208,708$ 428,708$
2009 3.000% 4.000% 275,000 80,919 78,119 159,038 434,038 2010 3.000% 4.000% 285,000 76,094 73,194 149,288 434,288 2011 3.000% 4.000% 305,000 71,094 67,994 139,088 444,088
2012 3.375% 4.000% 315,000 65,369 62,169 127,538 442,538 2013-17 3.375% 4.000% 1,775,000 233,488 215,488 448,975 2,223,975 2018-22 3.750% 4.000% 830,000 57,500 44,900 102,400 932,400
2023-24 3.800% 4.000% 465,000 14,000 4,700 18,700 483,700
4,470,000$ 724,301$ 629,431$ 1,353,733$ 5,823,733$
Capitalized Leases –The City entered into a lease agreement for a fire truck and a rescue truck in previous fiscal years. The leases qualified as a capital lease and were recorded at $239,000 and

NOTES TO THE FINANCIAL STATEMENTS CONTINUED…
33
$170,073, respectively, which were the present values of the future minimum lease payments at the leases’ inception. The following is a schedule of future minimum payments together with the present value of the net minimum lease payments as of September 30, 2007:
Fiscal Year2008 67,388$ 2009 28,297 2010 28,296 2011 28,297 2012 28,296
Total Minimum Lease Payments 180,574 Less Amounts Representing Interest 21,120 Present Value of Net Minimum
Lease Payments 159,454$
Changes in general long-term debt are summarized as follows:
Balance Balance Due Within10/1/06 Increase Decrease 9/30/07 One Year
Certificates of Obligation - 2004 1,910,000$ -$ 125,000$ 1,785,000$ 130,000$ Matured Certificate of Obligation - 125,000 125,000 125,000 CapitalizedLeases 215,175 - 55,721 159,454 58,976 General Obligation Bonds - 2007 - 2,685,000 - 2,685,000 90,000 Compensated Absences 100,594 17,999 - 118,593 118,593
2,225,769$ 2,827,999$ 180,721$ 4,873,048$ 522,570$
The General Fund is responsible for the Certificates of Obligation, Capitalized Leases and Compensated Absences. However, a portion of the Occupancy taxes has been designated to pay the principal and interest on the Certificates of Obligation. The City anticipates that sufficient Occupancy taxes will be available to retire this debt and that no funds will be required from the General Fund. In prior years, the PARDC paid the debt related to the Series 1997 tax notes and the Debt Service Fund paid all other bonded debt. The Debt Service Fund was closed upon the complete liquidation of the bonded debt.However, the issuance of the General Obligation Bonds – Series 2007 will require the City to re-establish the Debt Service Fund and to set a debt service tax rate beginning in the 2007-08 fiscal year.All long-term debt is for governmental activities. The City had no long-term debt for business-type activities during the year ended September 30, 2007.
G. COMMITMENTS UNDER NONCAPITALIZED LEASES:Operating Leases - The City leases some office equipment. Most of the leases are cancelable. The City entered into a surface lease with the Texas General Land Office for 1,089.88 acres in an area known as Charlie’s Pasture. The initial lease term is for 30 years. The lease is payable in 30 annual payments of $5,500 beginning in 2002 and is renewable at the City’s option for an additional 20 year period at a mutually agreeable annual amount. Use of the leased premises is restricted solely for a public park. Minimum lease commitment for each of the next five fiscal years beginning October 1, 2007 is $5,500.Minimum lease commitment for the each of the subsequent five-year periods ending in fiscal year September 30, 2031 is $27,500. Land lease payments for the year ended September 30, 2007 totaled $5,500.
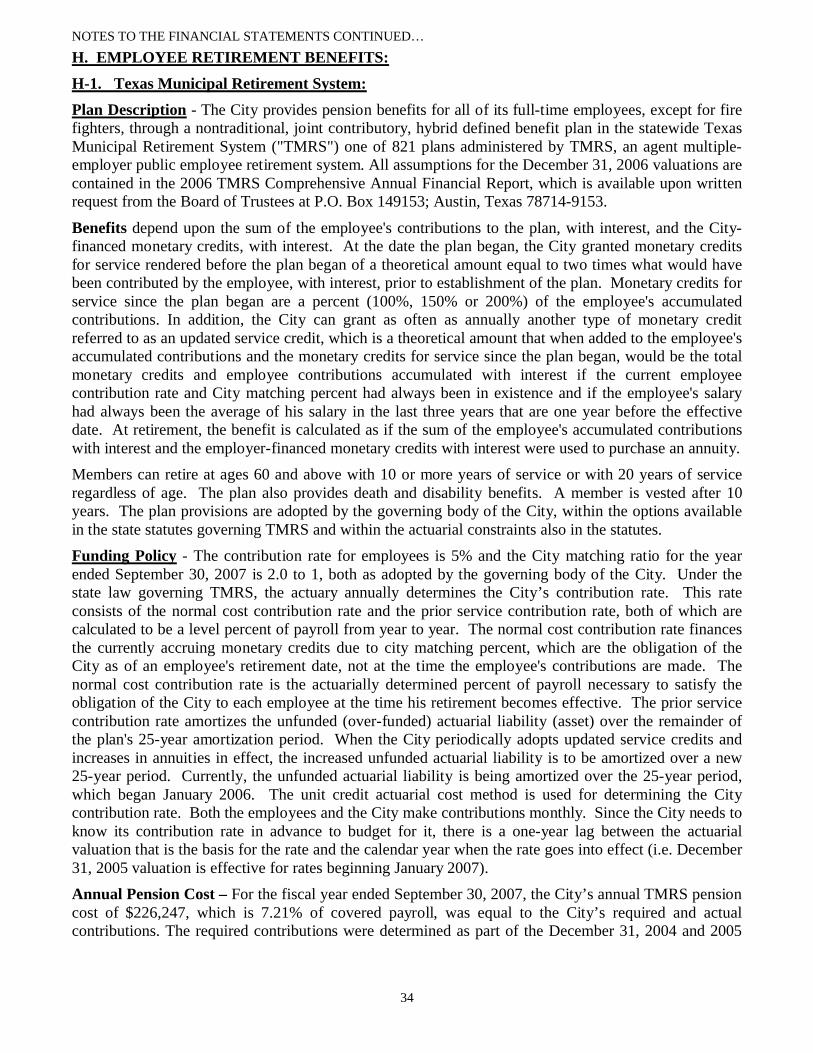
NOTES TO THE FINANCIAL STATEMENTS CONTINUED…
34
H. EMPLOYEE RETIREMENT BENEFITS:H-1. Texas Municipal Retirement System:Plan Description - The City provides pension benefits for all of its full-time employees, except for fire fighters, through a nontraditional, joint contributory, hybrid defined benefit plan in the statewide Texas Municipal Retirement System ("TMRS") one of 821 plans administered by TMRS, an agent multiple-employer public employee retirement system. All assumptions for the December 31, 2006 valuations are contained in the 2006 TMRS Comprehensive Annual Financial Report, which is available upon written request from the Board of Trustees at P.O. Box 149153; Austin, Texas 78714-9153.
Benefits depend upon the sum of the employee's contributions to the plan, with interest, and the City-financed monetary credits, with interest. At the date the plan began, the City granted monetary credits for service rendered before the plan began of a theoretical amount equal to two times what would have been contributed by the employee, with interest, prior to establishment of the plan. Monetary credits for service since the plan began are a percent (100%, 150% or 200%) of the employee's accumulated contributions. In addition, the City can grant as often as annually another type of monetary credit referred to as an updated service credit, which is a theoretical amount that when added to the employee's accumulated contributions and the monetary credits for service since the plan began, would be the total monetary credits and employee contributions accumulated with interest if the current employee contribution rate and City matching percent had always been in existence and if the employee's salary had always been the average of his salary in the last three years that are one year before the effective date. At retirement, the benefit is calculated as if the sum of the employee's accumulated contributions with interest and the employer-financed monetary credits with interest were used to purchase an annuity.Members can retire at ages 60 and above with 10 or more years of service or with 20 years of service regardless of age. The plan also provides death and disability benefits. A member is vested after 10years. The plan provisions are adopted by the governing body of the City, within the options available in the state statutes governing TMRS and within the actuarial constraints also in the statutes.Funding Policy - The contribution rate for employees is 5% and the City matching ratio for the year ended September 30, 2007 is 2.0 to 1, both as adopted by the governing body of the City. Under the state law governing TMRS, the actuary annually determines the City’s contribution rate. This rate consists of the normal cost contribution rate and the prior service contribution rate, both of which are calculated to be a level percent of payroll from year to year. The normal cost contribution rate finances the currently accruing monetary credits due to city matching percent, which are the obligation of the City as of an employee's retirement date, not at the time the employee's contributions are made. The normal cost contribution rate is the actuarially determined percent of payroll necessary to satisfy the obligation of the City to each employee at the time his retirement becomes effective. The prior service contribution rate amortizes the unfunded (over-funded) actuarial liability (asset) over the remainder of the plan's 25-year amortization period. When the City periodically adopts updated service credits and increases in annuities in effect, the increased unfunded actuarial liability is to be amortized over a new 25-year period. Currently, the unfunded actuarial liability is being amortized over the 25-year period, which began January 2006. The unit credit actuarial cost method is used for determining the City contribution rate. Both the employees and the City make contributions monthly. Since the City needs to know its contribution rate in advance to budget for it, there is a one-year lag between the actuarial valuation that is the basis for the rate and the calendar year when the rate goes into effect (i.e. December 31, 2005 valuation is effective for rates beginning January 2007).Annual Pension Cost – For the fiscal year ended September 30, 2007, the City’s annual TMRS pension cost of $226,247, which is 7.21% of covered payroll, was equal to the City’s required and actual contributions. The required contributions were determined as part of the December 31, 2004 and 2005

NOTES TO THE FINANCIAL STATEMENTS CONTINUED…
35
actuarial valuations. In addition, the City paid $8,159 for supplemental death benefits.
H-2. Texas Emergency Services Retirement System (“TESRS”): Plan Description & Benefits- The City provides pension benefits for all of its fire fighters through a defined benefit plan in the TESRS (the “Pension System”). The Fire Fighters' Pension Commission is the administrator of the TESRS, a cost-sharing multiple employer pension system established and administered by the State of Texas to provide pension benefits for emergency services personnel who serve without significant monetary remuneration. TESRS does not issue a stand alone financial report but is considered a component unit of the State of Texas financial reporting entity and is included in the State's financial reports as a pension trust fund. A report may be obtained by contacting the State Comptroller at P.O. Box 13528, Capitol Station, Austin, Texas 78711. At August 31, 2006, there were181 member fire or emergency services departments participating in TESRS. TESRS was created by Senate Bill 411, 65th Legislature, Regular Session (1977), and most recently revised in the 79th
Legislature, Regular Session (2005), which recodified the provisions and gave the TESRS Board of Trustees authority to establish vesting requirements, contribution levels, benefit formulas and eligibility requirements by board rule. The system’s provisions include retirement benefits as well as death and disability benefits. Eligible members include emergency services personnel who provide services related to fire, rescue and emergency medical services and who serve without significant remuneration while members in good standing of a participating department. In addition, eligible members include auxiliaryemployees who receive limited compensation from a political subdivision of Texas and who are certified by the political subdivision as being regularly engaged in the performance of duties for a participating department. Members are vested beginning with the fifth year of service, at 5% per year of service for the first ten years and 10% for each of the next five years of service. Upon reaching age 55, a vested member may retire and receive a monthly pension equal to his vested percentage multiplied by six times the governing body's average monthly contribution over the member’s years of qualified service. For years of service in excess of 15 years, this monthly benefit is increased at the rate of 6.2% compounded annually. On and off-duty death benefits and on-duty disability benefits are dependent on whether or not the member was engaged in the performance of duties at the time of death or disability. Death benefits include a lump-sum amount and continuing monthly payments to a member's surviving spouse anddependent children.Funding Policy - Contribution requirements were established by S.B. 411, 65th Legislature, Regular Session (1977) and were amended by board rule in 2006. No contributions are required by individual members of participating departments. The governing bodies of participating department are required to contribute at least the minimum prescribed amount per month for each active member and may contribute more. Additional contributions may be made by a governing body to pay for granting credit for service before the department began participating in TESRS (prior Service) The State may also be required to make a limited amount of annual contributions to make the fund actuarially sound.
Annual Required Contributions - The contribution requirement per active emergency services personnel member per month is not actuarially determined. Rather, the minimum contribution provisions were set by board rule. For the fiscal year ending August 31, 2006 total contributions (dues and prior service) of $2,077,728 were paid into TESRS by the political subdivisions served by the member volunteer emergency services personnel. In addition, the state appropriated $675,307 for the fiscal year ending August 31, 2006. Total contributions made were equal to the contributions required by the state stature and were equal to the contributions required based on the revised August 31, 2004 actuarial valuation.
The purpose of the biennial actuarial valuation is to test the adequacy of the financing arrangement to determine if it is adequate to pay the benefits that are promised. The actuarial valuation as of August 31,

NOTES TO THE FINANCIAL STATEMENTS CONTINUED…
36
2006 revealed the adequacy of the expected contributions from the political subdivisions (dues and prior service contributions) together with the actual state appropriations for the fiscal year ending August 31, 2007 ($709,613 as the maximum state contribution according to state law plus approximately $400,000 to help pay for the System’s administrative expenses) and with the assumed continuation of legislative appropriations of (1) the maximum state contribution amount in future years for up to 30 years as is necessary for the System to have a 30-year amortization period and (2) approximately $400,000 each year to help pay for the System’s administrative expenses. Expected contributions for the fiscal year ending August 31, 2007 are equal to the contributions required. The City’s expense for the year ended September 30, 2007 is $3,680. Actuarial valuations for the three most current valuations are summarized as follows:
Actuarial Valuation Information: Texas Municipal Retirement System Volunteer Fire Fighter's Retirement FundActuarial valuation date 12/31/04 12/31/05 12/31/06 08/31/02 08/31/04 08/31/06Actuarial cost method Unit Credit Unit Credit Unit Credit Entry Age NormalAmortization method Level percentage of payroll, open Level Dollar, openAmortization period in years 25 25 25 Infinity Infinity 30
Asset valuation method Amortized cost for bonds; no equities
Net Pension Obligation (NPO) -$ -$ -$ -$ -$ -$ Assumptions:
Investment return - Net 7.00% 7.00% 7.00% 8.00% 8.00% 8.00%Projected salary increases None None None N/A N/A N/AInflation 3.50% 3.50% 3.50% 4.00% 4.00% 3.75%Cost-of-livingadjustments None None None None None None
Market value s moothed by 5-Yr deferred recognit ion method with a 90 %-110% corridor on mark et value
Schedule of Funding Information: Texas Municipal Retirement System Volunteer Fire Fighter's Retirement FundActuarial valuation date 12/31/04 12/31/05 12/31/06 08/31/02 08/31/04 08/31/06Actuarial value of assets $2,710,862 $2,883,700 $3,108,840 $32,797,262 $38,140,501 $42,268,305Actuarial accrued liability (AAL) 3,413,235 3,743,965 4,064,719 45,976,387 51,567,426 58,082,828Unfunded actuarial accrued
liability (UAAL) (702,373) (860,265) (955,879) 13,179,125 13,426,925 15,814,523Funded ratio 79.42% 77.02% 76.48% 71.3% 74.0% 72.8%Annual covered payroll (actuarial) 2,827,658 2,602,580 2,752,879 N/A N/A N/AUAAL as % of covered payroll -24.84% -33.05% -34.72% N/A N/A N/A
Trend Information: Texas Municipal Retirement System Volunteer Fire Fighter's Retirement Fund
Fiscal Year Ending
Annual Pension Cost
(APC)
Percentage of APC
ContributedFiscal Year
Ending
Annual Pension Cost
(APC)
Percentage of APC
Contributed9/30/98 53,678$ 100.00% 9/30/98 3,654$ 100.00%9/30/99 69,624$ 100.00% 9/30/99 2,341$ 100.00%9/30/00 69,080$ 100.00% 9/30/00 3,791$ 100.00%9/30/01 80,415$ 100.00% 9/30/01 2,747$ 100.00%9/30/02 92,360$ 100.00% 9/30/02 2,197$ 100.00%9/30/03 100,426$ 100.00% 9/30/03 4,801$ 100.00%9/30/04 117,372$ 100.00% 9/30/04 4,176$ 100.00%9/30/05 185,191$ 100.00% 9/30/05 684$ 100.00%9/30/06 202,548$ 100.00% 9/30/06 2,804$ 100.00%9/30/07 226,247$ 100.00% 9/30/07 3,680$ 100.00%
I. 457 DEFERRED COMPENSATION PLAN:The City offers its employees a deferred compensation plan (Plan) created in accordance with Internal Revenue Code Section 457. The Plan, available to all City employees, permits them to defer a portion of their salary until future years. Amounts of compensation deferred under the Plan are not available to employees until their termination, retirement, death or an unforeseeable emergency occurs. The City funds all amounts of compensation deferred under the Plan, at the direction of the covered employee.

NOTES TO THE FINANCIAL STATEMENTS CONTINUED…
37
The International City Manager Association (ICMA) Retirement Corporation has been appointed as thePlan administrator. The City's fiduciary responsibility under the Plan is to remit employee contributions to ICMA on a regular basis. All amounts of compensation deferred under the Plan, all property and rights purchased with those amounts, and all income attributable to those amounts, property, or rights are (until paid or made available to the employee or other beneficiary) solely the property and rights of the qualified trust, custodial account or annuity contract for the benefit of participants or their beneficiaries. As such, none of the plan's assets are included in these financial statements.
J. POST EMPLOYMENT HEALTH CARE BENEFITS - COBRA:Under the Consolidated Omnibus Budget Reconciliation Act (COBRA), the City provides health care benefits to eligible former employees and eligible dependents. Certain requirements are outlined by the federal government for this coverage. Although. premiums are paid in full by the insured for the actual months covered, the City pays a fee for the administration of the COBRA plan. This program is offered for a period of 18 months after the termination date.
K. RISK MANAGEMENT:The City is exposed to various risks of loss related to torts; theft of, damage to, and destruction of assets; errors and omissions; injuries to employees and others; and natural disasters. The City's program for managing risks include: 1) participation in a public entity risk pool (Texas Municipal League) to cover liability claims such as workers compensation, life, and general liability claims; 2) purchasing commercial property insurance for protection from damages due to windstorms, hurricanes, hail storms and floods; 3) providing employees with various safety programs. Except for minimal deductibles, the City has transferred risk of losses to the public entity risk pool and to commercial insurers. There has been no significant reduction in insurance coverage. Settlement amounts have not exceeded insurance coverage for the year ended September 30, 2007 or the three prior years.
L. COMMITMENTS AND CONTINGENCIES:Litigation - Various claims and lawsuits are pending against the City. Although an estimate of the ultimate loss can not be made, the City's management believes potential losses resulting from these claims and lawsuits will not have a material effect on the City's financial statements.Grant Audit - The City receives various grants for specific purposes that are subject to review and audit by grantor agencies. Such audits could result in a request for reimbursement for expenditures disallowed under the terms and conditions of the appropriate agency. In the opinion of City management, such disallowance, if any, will not be significant.Overpaid Franchise Taxes – AEP Texas (AEP) notified the City that it had overpaid its franchise taxes over the past several years by $90,845. The City agreed to allow AEP to reduce its future monthly franchise tax payments by $3,785 for 24 months beginning October 2006 and ending September 2008.
M. ROUNDING IN THE FINANCIAL STATEMENTS:Although all amounts reported in the financial statements are shown or displayed as rounded to the nearest dollar, the individual amounts actually include the pennies. In some cases, this may cause some series of numbers to appear as if they do not add properly. However, this is just the result of rounding. The totals and subtotals presented in these financial statements represent the correctly rounded results of the individual amounts, which include pennies, making up the totals or subtotals.

38
This Page Left Blank Intentionally

39
REQUIRED SUPPLEMENTARY INFORMATION
BUDGETARY COMPARISONS - MAJOR GOVERNMENTAL FUNDS

40
CITY OF PORT ARANSAS, TEXASGENERAL FUNDStatement of Revenues, Expenditures and Changes in Fund Balance - Budget (GAAP Basis) and ActualFor The Year Ended September 30, 2007
With Comparative Actual Amounts For The Year Ended September 30, 2006
2007 2006Variance -
Original Amended FavorableBudget Budget Actual (Unfavorable) Actual
REVENUES:Taxes $ 4,104,040 $ 4,104,040 $ 4,233,912 $ 129,872 $ 4,112,603Licenses and Permits 354,794 364,794 421,183 56,389 282,667 Intergovernmental 340,871 348,871 393,686 44,815 468,092 Charges For Services 2,731,478 2,731,478 2,580,704 (150,774) 2,403,029Fines and Penalties 300,984 300,984 232,993 (67,991) 267,985 Rentals 457,375 466,875 500,908 34,033 467,950 Interest Income 112,500 112,500 217,378 104,878 189,345 Other 174,000 174,000 56,539 (117,461) 286,385 Total Revenues 8,576,042 8,603,542 8,637,304 33,762 8,478,057
EXPENDITURES:Current:
Central Operating 1,005,633 1,005,633 822,619 183,014 842,524 Mayor and Council 733,500 733,500 176,911 556,589 170,025 City Court 100,007 100,007 72,942 27,065 72,883 City Attorney 80,750 80,750 78,286 2,464 56,380 City Manager 267,837 267,837 229,991 37,846 218,738 City Secretary 222,584 222,584 175,949 46,635 171,414 Finance 171,847 171,847 154,403 17,444 136,177 Parks and Recreation 479,589 479,589 405,021 74,568 380,764 Police 1,347,899 1,355,899 1,244,202 111,697 1,118,269Fire 160,943 160,943 117,169 43,774 136,396 Emergency Medical Services 487,606 487,606 428,496 59,110 483,984 Public Works 996,223 996,223 960,837 35,386 1,297,633Building Codes & Planning 296,258 306,258 296,068 10,190 259,561 Library 191,158 191,158 185,182 5,976 152,314 Public Buildings 391,698 401,198 370,368 30,830 302,255 Harbor 344,039 344,039 270,677 73,362 299,774 Public Transportation 192,626 192,626 151,782 40,844 119,444 Gas Utility & Sanitation 1,563,467 1,563,467 1,403,591 159,876 1,352,564
Debt Service 77,687 77,687 67,388 10,299 39,091
Total Expenditures 9,111,351 9,138,851 7,611,883 1,526,968 7,610,191Excess of Revenues
Over (Under) Expenditures (535,309) (535,309) 1,025,421 1,560,730 867,866 OTHER FINANCING SOURCES (USES):Transfers From (To) Other Funds (1,946,334) (1,946,334) (1,846,834) 99,500 (788,159) Fund Balances - October 1 2,595,009 2,595,009 3,186,478 591,469 3,106,771
Fund Balances - September 30 $ 113,366 $ 113,366 $ 2,365,065 $ 2,251,699 $ 3,186,478

41
CITY OF PORT ARANSAS, TEXASADVERTISING FUNDStatement of Revenues, Expenditures and Changes in Fund Balance - Budget (GAAP Basis) and ActualFor The Year Ended September 30, 2007
With Comparative Actual Amounts For The Year Ended September 30, 2006
2007 2006Variance -
Original Amended FavorableBudget Budget Actual (Unfavorable) Actual
REVENUES:Occupancy Tax $ 814,285 $ 814,285 $ 924,680 $ 110,395 $ 814,952 Interest 3,500 3,500 10,148 6,648 7,159
Total Revenues 817,785 817,785 934,827 117,042 822,111
EXPENDITURES:Current:
Mayor and Council:Advertising Services & Brochures 1,068,830 1,068,830 968,830 100,000 923,143
Total Expenditures 1,068,830 1,068,830 968,830 100,000 923,143
Excess of Revenues Over (Under) Expenditures (251,045) (251,045) (34,003) 217,042 (101,032)
Fund Balances - October 1 251,044 251,044 159,900 (91,144) 260,932
Fund Balances - September 30 $ (1) $ (1) $ 125,897 $ 125,898 $ 159,900

42
CITY OF PORT ARANSAS, TEXASBEACH FUNDStatement of Revenues, Expenditures and Changes in Fund Balance - Budget (GAAP Basis) and ActualFor The Year Ended September 30, 2007
With Comparative Actual Amounts For The Year Ended September 30, 2006
2007 2006Variance -
Original Amended FavorableBudget Budget Actual (Unfavorable) Actual
REVENUES:Occupancy Tax $ 542,857 $ 542,857 $ 616,453 $ 73,596 $ 815,098 Beach Parking Permits 288,866 288,866 418,245 129,379 351,790 Intergovernmental:
State Grants & Reimbursements 85,000 85,000 97,104 12,104 88,634 Interest - - 28,359 28,359 6,214
Total Revenues 916,723 916,723 1,160,161 243,438 1,261,735
EXPENDITURES:Current:
Parks and Recreation:
Supplies and Services 1,166,960 1,166,960 938,891 228,069 836,431 Capital Outlay - - - - -
Total Expenditures 1,166,960 1,166,960 938,891 228,069 836,431
Excess of Revenues Over (Under) Expenditures (250,237) (250,237) 221,270 471,507 425,304
Fund Balances - October 1 250,237 250,237 560,432 310,195 135,128
Fund Balances - September 30 $ - $ - $ 781,702 $ 781,702 $ 560,432

43
CITY OF PORT ARANSAS, TEXASRECREATIONAL DEVELOPMENT FUNDStatement of Revenues, Expenditures and Changes in Fund Balance - Budget (GAAP Basis) and ActualFor The Year Ended September 30, 2007
With Comparative Actual Amounts For The Year Ended September 30, 2006
2007 2006Variance -
Original Amended FavorableBudget Budget Actual (Unfavorable) Actual
REVENUES:Occupancy Tax $ 542,858 $ 552,358 $ 616,453 $ 64,095 $ 271,699 Interest 25,000 25,000 62,099 37,099 42,429
Total Revenues 567,858 577,358 678,552 101,194 314,129
EXPENDITURES:Current
Public Buildings 271,429 271,429 49,884 221,545 - Capital Projects - - - - - Debt Service 290,688 290,688 191,088 99,601 189,688
Total Expenditures 562,117 562,117 240,971 321,146 189,688
Excess of Revenues Over (Under) Expenditures 5,741 15,241 437,580 422,339 124,441
Fund Balances - October 1 1,234,415 1,234,415 1,258,549 24,134 1,134,108
Fund Balances - September 30 $ - $ - $ 446,474 $ 446,474 $ 1,258,549

44
CITY OF PORT ARANSAS, TEXASPORT ARANSAS RECREATIONAL DEVELOPMENT CORPORATIONStatement of Revenues, Expenditures and Changes in Fund Balance - Budget (GAAP Basis) and ActualFor The Year Ended September 30, 2007
With Comparative Actual Amounts For The Year Ended September 30, 2006
2007 2006Variance -
Original Amended FavorableBudget Budget Actual (Unfavorable) Actual
REVENUES:Sales Tax $ 430,000 $ 430,000 $ 420,659 $ (9,341) $ 414,413 Interest 2,500 2,500 10,135 7,635 8,211
Total Revenues 432,500 432,500 430,794 (1,706) 422,624
EXPENDITURES:Current:
Parks and Recreation:Personnel Cost 309,298 309,298 284,539 24,759 225,607 Supplies & Services 203,572 203,572 196,740 6,832 103,378 Capital Outlay 14,060 14,060 10,802 3,258 73,969
Debt Service - - - - -
Total Expenditures 526,930 526,930 492,081 34,849 402,954
Excess of Revenues Over (Under) Expenditures (94,430) (94,430) (61,287) 33,143 19,670
Fund Balances - October 1 250,574 250,574 267,359 16,785 247,689
Fund Balances - September 30 $ 156,144 $ 156,144 $ 206,072 $ 49,928 $ 267,359

45
SUPPLEMENTAL SECTION
COMBINING FINANCIAL STATEMENTS ANDINDIVIDUAL FUND FINANCIAL STATEMENTS AND SCHEDULES

46
CITY OF PORT ARANSAS, TEXASGENERAL FUNDComparative Balance SheetsSeptember 30, 2007 and 2006
2007 2006ASSETS:Cash and Temporary Investments 2,387,600$ 3,231,643$ Receivables and Allowances:
Accounts:Sanitation and Gas Utilities 91,474 115,258 Allowance for Uncollectible Accounts (23,000) (11,000)
Other 7,611 81,223 Governmental Units:
Federal - - State of Texas 175,003 120,449 Nueces County 16,475 7,882 Other Governmental Units - 11,070
Ad Valorem Taxes 95,351 86,219 Allowance for Uncollectible Taxes (19,070) (17,244)
Prepaid Expenses - -
Total Assets 2,731,444$ 3,625,500$
LIABILITIES:Accounts Payable 126,035$ 221,373$ Accrued Liabilities 37,553 25,303 Customer Deposits 126,511 123,372 Deferred Taxes - Ad Valorem Taxes 76,281 68,975
Total Liabilities 366,380 439,022
FUND BALANCES:Reserved For Prepaid Expenses - - Reserved For Approved Projects - 21,750 Unreserved:
Designated For Harbor 205,345 764,587 Designated For Gas/Sanitation Utility 294,716 564,623 Undesignated 1,865,003 1,835,517
Total Fund Balances 2,365,065 3,186,478 Total Liabilities and Fund Balances 2,731,444$ 3,625,500$

47
CITY OF PORT ARANSAS, TEXASGENERAL FUNDStatement of Revenues, Expenditures and Changes in Fund Balance - Budget (GAAP Basis) and ActualFor The Year Ended September 30, 2007
With Comparative Actual Amounts For The Year Ended September 30, 2006
2007 2006Variance -
Original Amended FavorableBudget Budget Actual (Unfavorable) Actual
REVENUES:Taxes $ 4,104,040 $ 4,104,040 $ 4,233,912 $ 129,872 $ 4,112,603Licenses and Permits 354,794 364,794 421,183 56,389 282,667 Intergovernmental 340,871 348,871 393,686 44,815 468,092 Charges For Services 2,731,478 2,731,478 2,580,704 (150,774) 2,403,029Fines and Penalties 300,984 300,984 232,993 (67,991) 267,985 Rentals 457,375 466,875 500,908 34,033 467,950 Interest Income 112,500 112,500 217,378 104,878 189,345 Other 174,000 174,000 56,539 (117,461) 286,385 Total Revenues 8,576,042 8,603,542 8,637,304 33,762 8,478,057
EXPENDITURES:Current:
Central Operating 1,005,633 1,005,633 822,619 183,014 842,524 Mayor and Council 733,500 733,500 176,911 556,589 170,025 City Court 100,007 100,007 72,942 27,065 72,883 City Attorney 80,750 80,750 78,286 2,464 56,380 City Manager 267,837 267,837 229,991 37,846 218,738 City Secretary 222,584 222,584 175,949 46,635 171,414 Finance 171,847 171,847 154,403 17,444 136,177 Parks and Recreation 479,589 479,589 405,021 74,568 380,764 Police 1,347,899 1,355,899 1,244,202 111,697 1,118,269Fire 160,943 160,943 117,169 43,774 136,396 Emergency Medical Services 487,606 487,606 428,496 59,110 483,984 Public Works 996,223 996,223 960,837 35,386 1,297,633Building Codes & Planning 296,258 306,258 296,068 10,190 259,561 Library 191,158 191,158 185,182 5,976 152,314 Public Buildings 391,698 401,198 370,368 30,830 302,255 Harbor 344,039 344,039 270,677 73,362 299,774 Public Transportation 192,626 192,626 151,782 40,844 119,444 Gas Utility & Sanitation 1,563,467 1,563,467 1,403,591 159,876 1,352,564
Debt Service 77,687 77,687 67,388 10,299 39,091
Total Expenditures 9,111,351 9,138,851 7,611,883 1,526,968 7,610,191Excess of Revenues
Over (Under) Expenditures (535,309) (535,309) 1,025,421 1,560,730 867,866 OTHER FINANCING SOURCES (USES):Transfers From (To) Other Funds (1,946,334) (1,946,334) (1,846,834) 99,500 (788,159) Fund Balances - October 1 2,595,009 2,595,009 3,186,478 591,469 3,106,771
Fund Balances - September 30 $ 113,366 $ 113,366 $ 2,365,065 $ 2,251,699 $ 3,186,478

48
CITY OF PORT ARANSAS, TEXASGENERAL FUNDSchedule of Revenues Compared To Budget (GAAP Basis)For The Year Ended September 30, 2007
With Comparative Actual Amounts For The Year Ended September 30, 20062007 2006
Variance -Original Amended FavorableBudget Budget Actual (Unfavorable) Actual
Taxes:Ad valorem $ 2,896,095 $ 2,896,095 $ 3,001,814 $ 105,719 $ 2,906,866City Sales (1%) 860,000 860,000 841,317 (18,683) 830,832 Franchise 347,945 347,945 390,781 42,836 374,905
4,104,040 4,104,040 4,233,912 129,872 4,112,603Licenses and permits:
Construction permits 332,694 342,694 384,852 42,158 263,175 Contractor licenses 11,600 11,600 24,958 13,358 12,957 Food, beverage and other permits 10,500 10,500 11,374 874 6,535
354,794 364,794 421,183 56,389 282,667 Intergovernmental:
Federal Grants 15,578 23,578 14,442 (9,136) 33,159 State Grants & Reimbursements 96,667 96,667 111,645 14,978 272,872 Nueces County & RTA 228,626 228,626 267,599 38,973 161,107 Other Local Governments - - - - 955
340,871 348,871 393,686 44,815 468,092 Charges for services:
Sanitation 405,950 405,950 480,773 74,823 400,695 Gas Utility 1,082,366 1,082,366 1,023,423 (58,943) 982,320 Emergency medical service 113,194 113,194 106,606 (6,588) 108,315 Swimming pool fees 27,007 27,007 16,466 (10,542) 24,047 Other - - 14,546 14,546 51,222 Provided to Other Funds 1,102,961 1,102,961 938,891 (164,070) 836,431
2,731,478 2,731,478 2,580,704 (150,774) 2,403,029
Fines and penalties 300,984 300,984 232,993 (67,991) 267,985 Rentals:
Rents and fees - Harbor 428,000 428,000 466,814 38,814 440,936 Rents and fees - Other Facili ties 29,375 38,875 34,094 (4,781) 27,015
457,375 466,875 500,908 34,033 467,950 Interest 112,500 112,500 217,378 104,878 189,345 Other:
Contributions - - 1,086 1,086 25,000 Sale of assets/Insurance recovery 119,000 119,000 6,907 (112,093) 226,625 Miscellaneous 55,000 55,000 48,545 (6,455) 34,759
174,000 174,000 56,539 (117,461) 286,385
Total Revenues $ 8,576,042 $ 8,603,542 $ 8,637,304 $ 33,762 $ 8,478,057

49
CITY OF PORT ARANSAS, TEXASGENERAL FUNDSCHEDULE OF EXPENDITURES BY CATEGORYFor The Year Ended September 30, 2007
SCHEDULE OF CURRENT EXPENDITURES:
Personnel Supplies & Capital TotalCosts Services Outlay Expenditures
Central Operating $ - $ 822,619 $ - $ 822,619 Mayor and Council - 176,911 - 176,911 City Court 63,760 9,182 - 72,942 City Attorney - 78,286 - 78,286 City Manager 189,054 17,357 23,580 229,991 City Secretary 128,427 44,936 2,586 175,949 Finance 141,660 10,817 1,925 154,403 Parks and Recreation 303,908 92,482 8,630 405,021 Police 1,074,341 84,994 84,868 1,244,202Fire 69,807 42,338 5,024 117,169 Emergency Medical Service 376,253 39,605 12,638 428,496 Public Works 841,015 111,897 7,925 960,837 Building Codes & Planning 257,041 38,882 144 296,068 Library 148,429 10,445 26,308 185,182 Public Buildings 234,615 106,947 28,805 370,368 Harbor 131,665 124,227 14,786 270,677 Public Transportation 148,030 3,752 - 151,782 Gas Utility & Sanitation 243,822 1,052,662 107,108 1,403,591
Total Current Expenditures $ 4,351,830 $ 2,868,340 $ 324,325 7,544,495
SCHEDULE OF DEBT SERVICE:Lease Payment - Rescue Truck $ 28,296 Lease Payment - Ladder Truck & Rescue Truck 39,091
Total Debt Service 67,388
TOTAL EXPENDITURES $ 7,611,883

50
CITY OF PORT ARANSAS, TEXASMUNICIPAL AIRPORT FUNDComparative Balance SheetsSeptember 30, 2007 and 2006
2007 2006ASSETS:Cash and Temporary Investments $ (7,542) $ 30,281 Receivables:
Accounts Receivable 485 430 Governmental Units 33,193 -
Prepaid Expense - -
Total Assets $ 26,136 $ 30,710
LIABILITIES AND FUND BALANCES:
Liabilities:Accounts Payable $ 737 $ 694 Accrued Liabilities - -
Total Liabilities 737 694
Fund Balances:Unreserved:Undesignated 25,399 30,016
Total Liabilities and Fund Balances $ 26,136 $ 30,710

51
CITY OF PORT ARANSAS, TEXASMUNICIPAL AIRPORT FUNDStatement of Revenues, Expenditures and Changes in Fund Balance - Budget (GAAP Basis) and ActualFor The Year Ended September 30, 2007
With Comparative Actual Amounts For The Year Ended September 30, 2006
2007 2006Variance -
Original Amended FavorableBudget Budget Actual (Unfavorable) Actual
REVENUES:Intergovernmental:
State Grants & Reimbursements $ 31,170 $ 31,170 $ 33,193 $ 2,023 $ 18,163 Charges for services:
Airport Fees 85,000 85,000 85,808 808 96,191 Interest 1,000 1,000 1,593 593 1,050
Total Revenues 117,170 117,170 120,594 3,424 115,404
EXPENDITURES:Current:
Airport Operations 152,471 152,471 125,211 27,260 85,388 Capital Projects - - - - -
Total Expenditures 152,471 152,471 125,211 27,260 85,388
Excess of Revenues Over (Under) Expenditures (35,301) (35,301) (4,617) 30,684 30,016
Transfers From (To) Other Funds - - - - -
Fund Balances - October 1 35,301 35,301 30,016 5,285 -
Fund Balances - September 30 $ - $ - $ 25,399 $ 35,968 $ 30,016

52
CITY OF PORT ARANSAS, TEXASADVERTISING FUNDComparative Balance SheetsSeptember 30, 2007 and 2006
2007 2006ASSETS:Cash and Temporary Investments $ 125,897 $ 291,525 Accounts Receivable - -
Total Assets $ 125,897 $ 291,525
LIABILITIES AND FUND BALANCES:Liabilities:Accounts Payable $ - $ 131,625 Accrued Liabilities - -
Total Liabilities - 131,625 Fund Balances:Undesignated 125,897 159,900
Total Liabilities and Fund Balances $ 125,897 $ 291,525
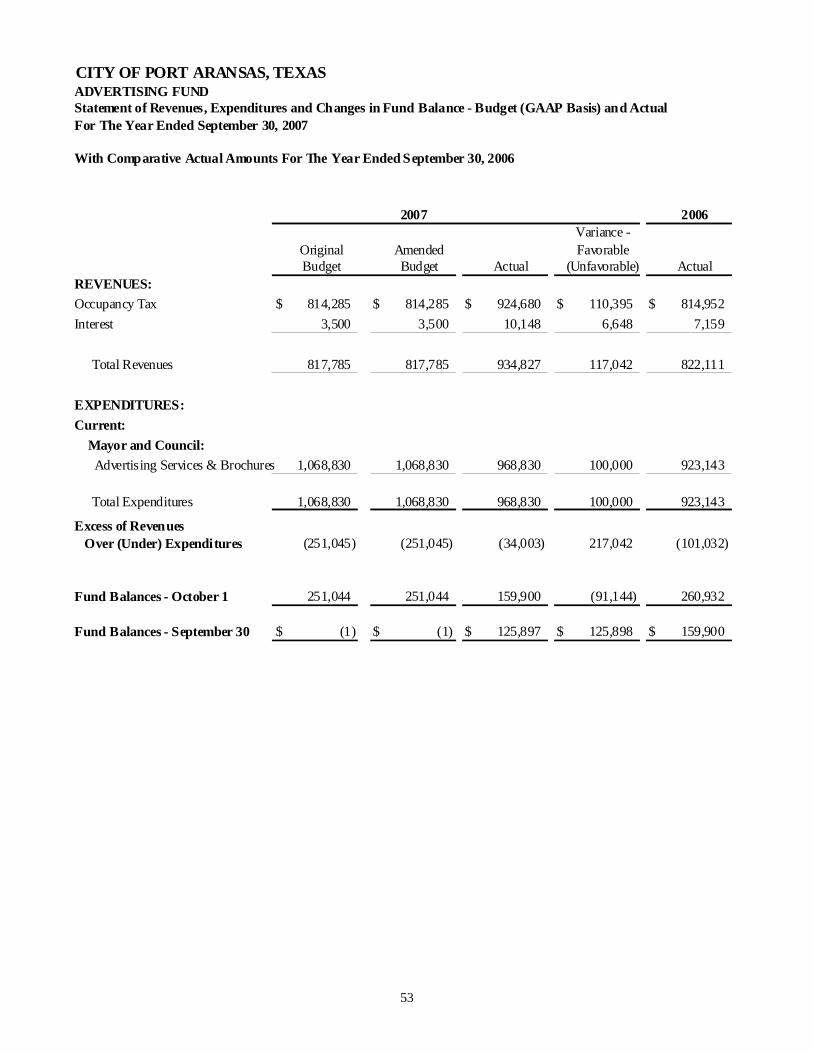
53
CITY OF PORT ARANSAS, TEXASADVERTISING FUNDStatement of Revenues, Expenditures and Changes in Fund Balance - Budget (GAAP Basis) and ActualFor The Year Ended September 30, 2007
With Comparative Actual Amounts For The Year Ended September 30, 2006
2007 2006Variance -
Original Amended FavorableBudget Budget Actual (Unfavorable) Actual
REVENUES:Occupancy Tax $ 814,285 $ 814,285 $ 924,680 $ 110,395 $ 814,952 Interest 3,500 3,500 10,148 6,648 7,159
Total Revenues 817,785 817,785 934,827 117,042 822,111
EXPENDITURES:Current:
Mayor and Council:Advertising Services & Brochures 1,068,830 1,068,830 968,830 100,000 923,143
Total Expenditures 1,068,830 1,068,830 968,830 100,000 923,143
Excess of Revenues Over (Under) Expenditures (251,045) (251,045) (34,003) 217,042 (101,032)
Fund Balances - October 1 251,044 251,044 159,900 (91,144) 260,932
Fund Balances - September 30 $ (1) $ (1) $ 125,897 $ 125,898 $ 159,900

54
CITY OF PORT ARANSAS, TEXASBEACH FUNDComparative Balance SheetsSeptember 30, 2007 and 2006
2007 2006ASSETS:Cash and Temporary Investments $ 733,150 $ 473,179 Receivables - Other Governments 48,552 87,253
Total Assets $ 781,702 $ 560,432
LIABILITIES AND FUND BALANCES:Liabilities:Accounts Payable $ - $ -
Total Liabilities - -
Fund Balances:Undesignated 781,702 560,432
Total Liabilities and Fund Balances $ 781,702 $ 560,432

55
CITY OF PORT ARANSAS, TEXASBEACH FUNDStatement of Revenues, Expenditures and Changes in Fund Balance - Budget (GAAP Basis) and ActualFor The Year Ended September 30, 2007
With Comparative Actual Amounts For The Year Ended September 30, 2006
2007 2006Variance -
Original Amended FavorableBudget Budget Actual (Unfavorable) Actual
REVENUES:Occupancy Tax $ 542,857 $ 542,857 $ 616,453 $ 73,596 $ 815,098 Beach Parking Permits 288,866 288,866 418,245 129,379 351,790 Intergovernmental:
State Grants & Reimbursements 85,000 85,000 97,104 12,104 88,634 Interest - - 28,359 28,359 6,214
Total Revenues 916,723 916,723 1,160,161 243,438 1,261,735
EXPENDITURES:Current:
Parks and Recreation:
Supplies and Services 1,166,960 1,166,960 938,891 228,069 836,431 Capital Outlay - - - - -
Total Expenditures 1,166,960 1,166,960 938,891 228,069 836,431
Excess of Revenues Over (Under) Expenditures (250,237) (250,237) 221,270 471,507 425,304
Fund Balances - October 1 250,237 250,237 560,432 310,195 135,128
Fund Balances - September 30 $ - $ - $ 781,702 $ 781,702 $ 560,432

56
CITY OF PORT ARANSAS, TEXASRECREATIONAL DEVELOPMENT FUNDComparative Balance SheetsSeptember 30, 2007 and 2006
2007 2006ASSETS:Cash and Temporary Investments $ 604,221 $ 1,258,549Receivables - -
Other 111 -
Total Assets $ 604,332 $ 1,258,549
LIABILITIES AND FUND BALANCES:Liabilities:Accounts Payable $ 14 $ - Accrued Liabilities - - Matured Bonds & Interest 157,844 -
Total Liabilities 157,858 -
Fund Balances:
Reserved for Debt Service 157,844 - Undesignated 288,630 1,258,549
Total Fund Balances 446,474 1,258,549Total Liabilities and Fund Balances $ 604,332 $ 1,258,549

57
CITY OF PORT ARANSAS, TEXASRECREATIONAL DEVELOPMENT FUNDStatement of Revenues, Expenditures and Changes in Fund Balance - Budget (GAAP Basis) and ActualFor The Year Ended September 30, 2007
With Comparative Actual Amounts For The Year Ended September 30, 2006
2007 2006Variance -
Original Amended FavorableBudget Budget Actual (Unfavorable) Actual
REVENUES:Occupancy Tax $ 542,858 $ 552,358 $ 616,453 $ 64,095 $ 271,699 Interest 25,000 25,000 62,099 37,099 42,429
Total Revenues 567,858 577,358 678,552 101,194 314,129
EXPENDITURES:Current
Public Buildings 271,429 271,429 49,884 221,545 - Capital Projects - - - - - Debt Service 290,688 290,688 191,088 99,601 189,688
Total Expenditures 562,117 562,117 240,971 321,146 189,688
Excess of Revenues Over (Under) Expenditures 5,741 15,241 437,580 422,339 124,441
Fund Balances - October 1 1,234,415 1,234,415 1,258,549 24,134 1,134,108
Fund Balances - September 30 $ - $ - $ 446,474 $ 446,474 $ 1,258,549

58
CITY OF PORT ARANSAS, TEXASPORT ARANSAS RECREATIONAL DEVELOPMENT CORPORATIONComparative Balance SheetsSeptember 30, 2007 and 2006
2007 2006ASSETS:Cash and Temporary Investments $ 172,767 $ 226,780 Receivables - Other Governments 43,208 47,476
Total Assets $ 215,975 $ 274,255
LIABILITIES AND FUND BALANCES:Liabilities:Accounts payable $ 7,838 $ 6,003 Accrued Liabilities 2,065 893
Total Liabilities 9,903 6,896 Fund Balances:Reserved - Development & Debt Service - - Undesignated 206,072 267,359
Total Liabilities and Fund Balances $ 215,975 $ 274,255
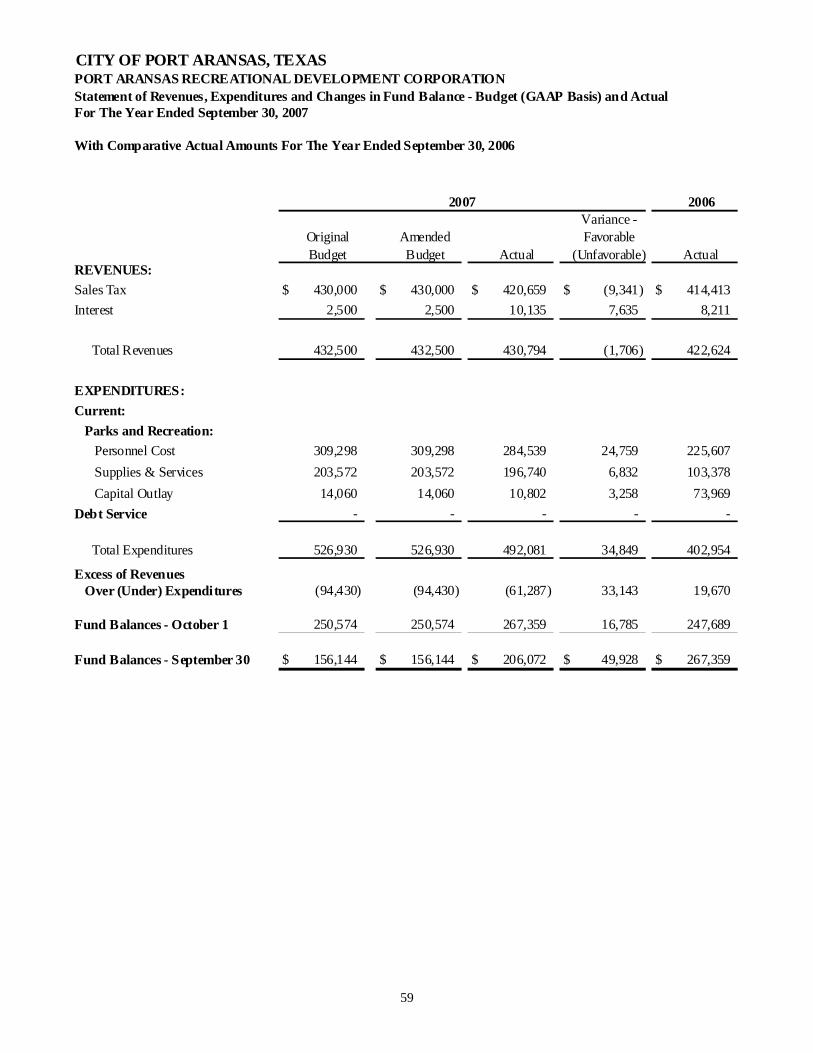
59
CITY OF PORT ARANSAS, TEXASPORT ARANSAS RECREATIONAL DEVELOPMENT CORPORATIONStatement of Revenues, Expenditures and Changes in Fund Balance - Budget (GAAP Basis) and ActualFor The Year Ended September 30, 2007
With Comparative Actual Amounts For The Year Ended September 30, 2006
2007 2006Variance -
Original Amended FavorableBudget Budget Actual (Unfavorable) Actual
REVENUES:Sales Tax $ 430,000 $ 430,000 $ 420,659 $ (9,341) $ 414,413 Interest 2,500 2,500 10,135 7,635 8,211
Total Revenues 432,500 432,500 430,794 (1,706) 422,624
EXPENDITURES:Current:
Parks and Recreation:Personnel Cost 309,298 309,298 284,539 24,759 225,607 Supplies & Services 203,572 203,572 196,740 6,832 103,378 Capital Outlay 14,060 14,060 10,802 3,258 73,969
Debt Service - - - - -
Total Expenditures 526,930 526,930 492,081 34,849 402,954
Excess of Revenues Over (Under) Expenditures (94,430) (94,430) (61,287) 33,143 19,670
Fund Balances - October 1 250,574 250,574 267,359 16,785 247,689
Fund Balances - September 30 $ 156,144 $ 156,144 $ 206,072 $ 49,928 $ 267,359

60
CITY OF PORT ARANSAS, TEXASLIBRARY TRUST FUNDComparative Balance SheetsSeptember 30, 2007 and 2006
2007 2006ASSETS:Cash in bank $ 79,054 $ 69,678
FUND BALANCES:Undesignated $ 79,054 $ 69,678
CITY OF PORT ARANSAS, TEXASLIBRARY TRUST FUNDComparative Statements of Revenues, Expenditures and Changes in Fund BalanceFor The Years Ended September 30, 2007 and 2006
2007 2006REVENUES:Interest $ 2,701 $ 1,187 Contributions 1,070 882 Book sale 7,021 7,200
Total Revenues 10,792 9,269
EXPENDITURES:Current:
Programs and supplies 1,417 989 Capital Outlay - -
Total Expenditures 1,417 989 Excess of Revenues
Over (Under) Expenditures 9,376 8,281
Fund Balances - October 1 69,678 61,398
Fund Balances - September 30 $ 79,054 $ 69,678

61
CITY OF PORT ARANSAS, TEXASCAPITAL PROJECTS FUNDSCOMBINING BALANCE SHEETSSeptember 30, 2007
Streets& Land Nature
Acquisition Preserve Totals
ASSETS:
Cash and Temporary Investments 6,289,647$ 1,811,457$ 8,101,104$
Accounts Receivable - - -
Governmental Units:
Federal - - -
State of Texas - General Land Office - - -
Nueces County - - -
Interfund Account - - -
Prepaid Expenses - - -
Total Assets 6,289,647$ 1,811,457$ 8,101,104$
LIABILITIES AND FUND BALANCES:
Liabilities:
Accounts payable 441,771$ -$ 441,771$
Accrued Liabilities - - -
Deferred Revenues - - -
Total Liabilities 441,771 - 441,771
Fund Balances:
Reserved for:
Approved Projects 1,679,677 - 1,679,677
Unreserved:
Designated for Specific Projects - 1,811,457 1,811,457
Undesignated 4,168,199 - 4,168,199
Total Fund Balances 5,847,876 1,811,457 7,659,333
Total Liabilities and Fund Balances 6,289,647$ 1,811,457$ 8,101,104$
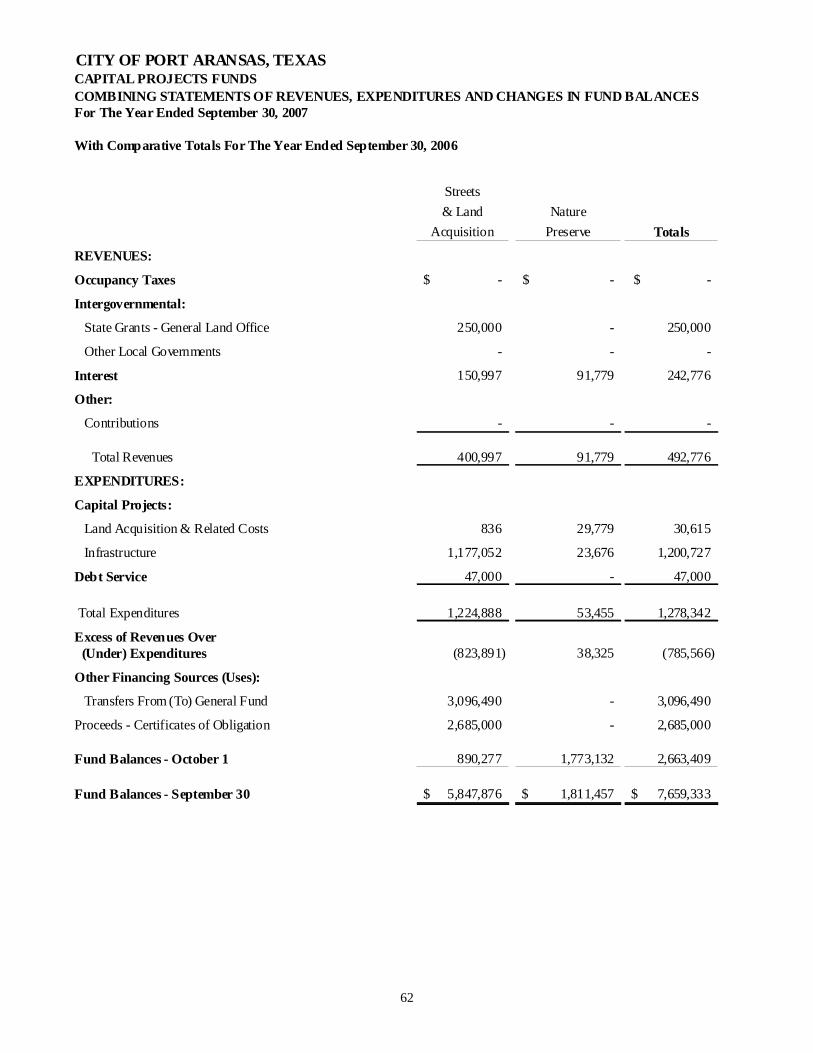
62
CITY OF PORT ARANSAS, TEXASCAPITAL PROJECTS FUNDSCOMBINING STATEMENTS OF REVENUES, EXPENDITURES AND CHANGES IN FUND BALANCESFor The Year Ended September 30, 2007
With Comparative Totals For The Year Ended September 30, 2006
Streets& Land Nature
Acquisition Preserve Totals
REVENUES:
Occupancy Taxes -$ -$ -$
Intergovernmental:
State Grants - General Land Office 250,000 - 250,000
Other Local Governments - - -
Interest 150,997 91,779 242,776
Other:
Contributions - - -
Total Revenues 400,997 91,779 492,776
EXPENDITURES:
Capital Projects:
Land Acquisition & Related Costs 836 29,779 30,615
Infrastructure 1,177,052 23,676 1,200,727
Debt Service 47,000 - 47,000
Total Expenditures 1,224,888 53,455 1,278,342
Excess of Revenues Over (Under) Expenditures (823,891) 38,325 (785,566)
Other Financing Sources (Uses):
Transfers From (To) General Fund 3,096,490 - 3,096,490
Proceeds - Certificates of Obligation 2,685,000 - 2,685,000
Fund Balances - October 1 890,277 1,773,132 2,663,409
Fund Balances - September 30 5,847,876$ 1,811,457$ 7,659,333$

63
OTHER SCHEDULES
The Historical Statement of General Revenues includes revenues from all Governmental Fund Types including the Port Aransas Recreational Development Corporation (a Blended Component Unit). All interfund transactions have been eliminated for purposes of these schedules.

64
CITY OF PORT ARANSAS, TEXASHISTORICAL STATEMENT OF GEN ERAL REVENUESYEARS EN DED SEPTEMBER 30,
2007 2006 2005 2004 2003Taxes:Advalorem - Net 3,001,814$ 2,906,866$ 2,657,996$ 2,525,997$ 2,228,600$ Occupancy 2,157,586 1,901,749 1,702,446 1,533,239 1,416,879 City Sales 1,261,977 1,245,245 1,096,962 1,070,234 963,823 Franchise 390,781 374,905 358,881 361,100 389,621
6,812,157 6,428,766 5,816,285 5,490,570 4,998,923 Licenses & Permits:Construction 384,852 263,175 239,571 160,844 112,817 Contractors 24,958 12,957 12,825 20,315 20,250 Food & Other 11,374 6,535 7,027 8,554 6,974 Beach Parking 418,245 351,790 159,543 271,403 138,601
839,429 634,456 418,966 461,116 278,641 Intergovernmental:Federal:FEMA & Miscellaneous 14,442 33,159 123,431 19,528 9,450 State:
Beverage Tax 103,159 98,489 80,525 72,714 68,491 Beach Cleaning 97,104 88,634 83,102 85,000 77,357 Coastal Erosion - - - - 989,737 Land Acquisition & Miscellaneous 291,679 560,169 110,583 293,199 51,141
County & Local:Coastal Erosion & Other Reimb. - 200,955 630 - 150,000 Nueces County 13,049 5,108 6,842 8,001 7,329 Regional Transit Authority 254,550 155,999 146,165 154,324 147,842
773,984 1,142,512 551,277 632,766 1,501,346 Charges for Services:Sanitation 480,773 400,695 336,252 319,552 285,362 Gas Utility 1,023,423 982,320 887,150 806,271 750,943 Emergency Medical Services 106,606 108,315 111,494 120,401 84,661 Swimming Pool 16,466 24,047 28,607 24,762 23,431 Airport Fees 85,808 96,191 89,107 73,238 17,492 Other 14,546 51,222 25,106 36,612 25,588
1,727,621 1,662,790 1,477,716 1,380,835 1,187,477
Fines & Penalties 232,993 267,985 360,768 285,183 212,117 Rentals:Harbor Rentals 466,814 440,936 432,587 450,960 428,752 Facility Rentals 34,094 27,015 21,962 25,986 20,903
500,908 467,950 454,549 476,947 449,655 Interest 575,188 328,074 175,922 62,939 54,166 Other:Contributions 2,156 77,932 32,358 15,805 15,037 Sale of Assets/Insurance Recovery 6,907 226,625 2,130 - - Miscellaneous 55,566 41,959 71,245 56,463 32,825
64,630 346,517 105,732 72,268 47,862
Total 11,526,910$ 11,279,051$ 9,361,217$ 8,862,623$ 8,730,187$

65
2002 2001 2000 1999 1998
2,115,897$ 1,771,182$ 1,656,753$ 1,422,169$ 1,372,623$ 1,390,289 1,369,327 1,310,703 1,126,194 856,035
967,883 916,334 818,553 674,355 611,687 389,591 454,150 310,751 292,544 265,377
4,863,661 4,510,994 4,096,761 3,515,261 3,105,722
131,803 141,655 113,313 80,994 114,372 19,620 19,435 17,055 13,720 13,090
6,996 7,242 7,880 6,439 5,412 217,467 219,814 214,123 215,046 172,473 375,886 388,145 352,371 316,199 305,347
6,853 6,853 19,176 6,853 6,853
65,115 59,262 52,536 45,118 39,690 89,083 94,628 96,584 99,037 90,896
697,753 300,394 - - - 127,891 67,665 30,317 18,207 476,926
97,912 191,588 - - 25,000 9,364 8,413 8,110 20,711 22,944
143,475 134,218 124,305 120,667 123,682 1,237,446 863,022 331,027 310,592 785,991
297,891 251,284 286,640 271,821 237,853 550,681 812,870 564,362 437,792 433,372 113,491 105,468 84,350 102,061 85,320 24,114 26,323 27,165 17,290 - 10,519 12,839 11,204 10,584 5,945 12,606 9,073 9,882 10,210 90
1,009,301 1,217,856 983,602 849,757 762,580 190,478 183,221 144,046 123,962 118,854
382,347 318,382 270,657 242,010 217,882 21,423 19,132 13,855 18,058 14,972
403,770 337,513 284,512 260,067 232,855 75,540 153,806 152,539 104,672 167,037
19,139 33,412 36,615 27,542 37,947 - - 5,500 - -
29,060 60,556 21,991 29,677 33,408 48,199 93,969 64,106 57,219 71,355
8,204,281$ 7,748,527$ 6,408,964$ 5,537,729$ 5,549,741$

66
CITY OF PORT ARANSAS, TEXASOTHER SCHEDULESFISCAL YEARS 1998 - 2007
PROPERTY TAX COLLECTIONS:
Fiscal Current Collections Delinquent CollectionsYear Current Year Discounts Prior Year Penalty & Total
Ended Tax Levy Tax Levy Allowed Tax Levy Interest Collections
9/30/98 1,385,455$ 1,342,062$ (27,199)$ 33,557$ 24,203$ 1,372,623$
9/30/99 1,435,478 1,404,321 (27,130) 22,418 22,560 1,422,169
9/30/00 1,644,131 1,610,121 (30,159) 38,153 38,638 1,656,753
9/30/01 1,778,828 1,740,500 (34,407) 35,871 29,219 1,771,183
9/30/02 2,102,841 2,051,591 (39,074) 50,837 52,542 2,115,896
9/30/03 2,285,000 2,209,329 (41,576) 27,932 32,915 2,228,600
9/30/04 2,529,210 2,490,346 (48,124) 46,585 37,189 2,525,996
9/30/05 2,693,565 2,634,705 (50,141) 34,915 38,516 2,657,996
9/30/06 2,890,633 2,851,003 (56,576) 58,312 57,732 2,910,472
9/30/07 3,057,037 2,964,649 (56,576) 36,008 57,732 3,001,814

67
Ratio to LevyNet Current Delinquent Total
Fees Collections Collections Collections Collections
(5,668)$ 1,366,954$ 94.905% 4.169% 99.07%
(6,238) 1,415,931 95.940% 3.133% 99.07%
(6,346) 1,650,407 96.097% 4.671% 100.77%
(7,143) 1,764,040 95.911% 3.659% 99.57%
(6,619) 2,109,277 95.705% 4.916% 100.62%
(6,944) 2,221,656 94.869% 2.663% 97.53%
(8,074) 2,517,922 96.561% 3.312% 99.87%
(7,580) 2,650,416 95.953% 2.726% 98.68%
(7,580) 2,902,892 96.672% 4.015% 100.69%
(7,580) 2,994,234 95.127% 3.066% 98.19%

68
CITY OF PORT ARANSAS, TEXASOTHER SCHEDULESFor The Year Ended September 30, 2007
ANALYSIS OF AD VALOREM TAXES RECEIVABLE BY YEAR OF LEVY:
HISTORICAL INFORMATION
Tax RatesAssessed Debt
Levy Year Value General Service Total
1998 & Prior 294,777,583$ 0.443322$ 0.026678$ 0.470000$
1999 305,420,851 0.470000 N/A 0.470000
2000 349,814,971 0.470000 N/A 0.470000
2001 378,473,998 0.470000 N/A 0.470000
2002 447,978,266 0.470000 N/A 0.470000
2003 510,777,731 0.442708 N/A 0.442708
2004 571,304,237 0.442708 N/A 0.442708
2005 681,323,506 0.393000 N/A 0.393000
2006 765,080,430 0.378000 N/A 0.378000
2007 1,014,716,436 0.297000 N/A 0.297000
Allowance for Uncollectible Taxes
Penalties & Interest Collected
Discounts Allowed
Adjustments to Tax Roll
(Increase) Decrease - Allowance for Uncollectible Taxes
Ad Valorem Tax Revenue:
Modified Accrual Basis
Accrual Basis

69
TAX LEVY, COLLECTIONS, ADJUSTMENTS, COLLECTIONS & RECEIVABLES FYE 9/30/07
Beginning Current Adjustments EndingBalance Year's Levy Collections To Tax Roll Balance
15,068$ -$ 1,540$ (1,697)$ 11,831$
2,659 - 233 (3) 2,423
2,860 - 234 (3) 2,623
5,324 - 2,155 (3) 3,166
8,801 - 4,188 (89) 4,524
8,745 - 4,721 (84) 3,940
8,057 - 3,698 (147) 4,212
9,285 - 5,125 (127) 4,033
25,419 - 14,114 (19) 11,286
- 3,057,037 2,964,649 (45,075) 47,313
86,219 3,057,037 3,000,658 (47,247) 95,351
(17,244) - - (1,826) (19,070)
68,975$ 3,057,037 3,000,658 (49,073)$ 76,281$
57,732 57,732
(56,576) (56,576)
(47,247) -
(1,826) -
3,001,814$
3,009,120$

70
END OF REPORT