annual eport r and financial statements...6 annual report and financial statements for the year...
TRANSCRIPT

Annual Report and Financial Statements
For the year ended 31 MARCH 2 0 1 9

2 Annual Report and Financial Statements for the year ended 31 MARCH 2019
Our vision is that
It’s a bold statement but one everyone across our business is passionate about

3
Contents
Strategic Report
Chairmanʼs Statement 5Our Business Model 8Group Structure 9Our Market 10Chief Executiveʼs Statement 12Operational Review 13Financial Review 22Value for Money - Our Strategic Approach 26Value for Money - 2018 / 19 Performance 28Risk Management 34Principal Risks and Uncertainties 35Corporate and Social Responsibility 39
Corporate Governance
Corporate Governance Introduction 43Corporate Governance Report 44Board of Directors 62Directorsʼ Remuneration Report 68Report of the Board 78Statement of Directorsʼ Responsibilities 79
Financial Statements
Financial Statements Introduction 81Independent Auditor’s Report to the members of Aster Group Limited 82Consolidated Statement of Comprehensive Income 90Consolidated Statement of Financial Position 91Consolidated Statement of Changes in Reserves 92Consolidated Statement of Cash Flows 93Notes to the Consolidated Financial Statements 94Association’s Statement of Comprehensive Income 172Association’s Statement of Changes in Reserves 172Association’s Statement of Financial Position 173Notes to the Association’s Financial Statements 174Entity Legal Status 190Legal and Administrative Details 192

4 Annual Report and Financial Statements for the year ended 31 MARCH 2019
Our strengths are our people and ethical approach

5
Our purpose is to improve people’s lives. We provide safety and security through our reliable landlord services and we supply a wide range of housing options in response to the housing crisis. Our strengths are our people and ethical approach.
Chairmanʼs Statement
Strategic Report

6 Annual Report and Financial Statements for the year ended 31 MARCH 2019
We run our business with a commercial mind-set but one that has a social heart and doesn’t create dividends for shareholders. Instead, we reinvest our profits back into building new homes and ensuring we provide a good service to our customers. This approach has seen us have another successful year, continuing to build on our financial strength.
We were proud to complete the development of 1,156 new homes last year. Of the new homes, more than 90% were affordable housing - 444 for affordable rent, 156 for social rent and 453 for affordable homeownership options like shared ownership. These add to our current portfolio of circa 30,000 homes across the south of England.
Almost 100 of the homes built in 2018/19 were via joint ventures with a further 80 from our land-led programme with 28 homes delivered via community land trusts. We expanded our geographical footprint, exchanging contracts on new schemes in Surrey and West Sussex – the first time we have built homes in these counties. These included our third joint venture with Galliford Try Homes Limited, which is delivering a 130-home development in Horsham. There was an investment of over £177 million in new and existing schemes during the 2018/19 year.
Meanwhile, our role as a leading housing association that is committed to providing more affordable homes was underlined by Inside Housing’s analysis of the 2018/19 financial year, which showed Aster is one of the UK’s top 10 providers based on completions.
We continue to be at the forefront of the UK’s growing shared ownership sector. We published our second report ‘Another Way Part Two: Helping Shared Ownership Thrive’, in September of last year and we were subsequently invited to present our recommendations to parliament at the All Party Parliamentary Group for Housing and Planning.
As a member of the MORhomes initiative, a new sector borrowing platform formed and owned by a group of over 60 housing associations, we were a borrower in its inaugural £250 million bond issue supporting our continuing commitment to the development of affordable homes, borrowing £40 million, repayable in 2028.
We also tapped our £250 million 2043 bond, originally issued in 2013, for a further £200 million in May 2018. £50 million was issued in May 2018 with a further £20 million in November 2018. Of the total £450 million bond at nominal value, £320 million has been issued at year end, with £130 million retained. Subsequent to the year end, £20 million has been issued.
At the end of the year, we had sufficient loan facilities in place to fund our development programme until September 2020. Since year end the group has successfully issued £20 million of the above retained bonds that will further enhance the group’s ability to deliver its development programme.
Other highlights from the results for the year include headline revenue reaching £211.9 million (2018: £204.7 million) with operating profit before impairment, interest and taxation at £76.9 million (2018: £75.4 million). Net profit after tax was a record £55.4 million (2018: £49.7 million).
We continue to place the highest priority on the health, safety and wellbeing of our colleagues, customers and contractors. We are proud to say that one hundred per cent of our homes achieve the Government’s ‘Decent Homes Standard’ and we are working towards every one of our homes receiving an Energy Performance Certificate (EPC) rating of ‘C’ or above by 2025. We invested over £37.5 million on repairing and maintaining our stock of more than
30,000 homes to the highest industry regulatory standards. We have also restructured our safety and sustainability team and have created new roles that look specifically at landlord and employee health and safety as well as training and systems and compliance. Safety remains our number one priority, and there is an absolute commitment to responding to any concerns or potential hazards as quickly as possible to prevent the risk of an accident or harm.
We have made a series of board and committee appointments to strengthen our governance arrangements with senior figures from a variety of backgrounds. Our A+ rating has been affirmed again by Standard and Poor’s, which has recognised our strong fundamentals and experienced management team, and our robust governance evidenced in the maintenance of our G1 governance and V1 viability ratings by the Regulator of Social Housing.
The future
To continue our success and deliver on key business priorities we will invest in our business and go above and beyond compliance. We recognise that investment in maintaining and improving our homes, our workforce and customer experience is equally as important as playing our part in delivering the variety and volume of homes the UK needs. This will see us invest almost £2.5 million in the maintenance and regeneration of our properties, including £1.3 million on health and safety works, plus nearly £0.5 million to bolster our frontline staff. This investment in health and safety beyond our statutory compliance will have an impact on profitability.
BREXIT continues to be one of the main factors which results in a prevailing uncertainty in the future economy of the UK. Against this background we operate a prudent, diversified business structure that generates revenue from multiple sources. Our strategy and model are regularly reviewed and stress-tested by our leadership team
Chairmanʼs Statement

7
Strategic Report Corporate Governance Financial Statements
and overseen by our independent risk and compliance committee, which comprises four experienced non-executive members.
For our colleagues, we know that if we feel part of a team and understand how our contribution makes a difference, our services to customers will be as good as they can be. We’re on an exciting transformation journey and what sets us apart is The Aster Way. This is a shared understanding of the way we work – creating a fair, diverse and inclusive culture. We will also develop a pipeline of talent that will keep our business at the forefront of new ideas, technology, innovation and delivery of our vision for many years to come.
We will continue to address our gender pay gap which has already seen a year on year reduction. We recognise there is still much to do to build an inclusive and diverse culture and making sure areas like recruitment are reflective of the communities we serve. This work is ongoing, and we still have much progress to make, but it is something to which we are wholeheartedly committed.
For our customers, we continue to ensure their voices, ideas and interests are reflected in everything we do. Our involved Customer Groups which include; our Customer and Community Network, Customer Overview Group, Designated Complaints Panel and Customer Scrutiny Group, have a strong voice in our business, they help to shape the services we provide. With their involvement, we recently published our Service Promises which outline our service standards across all areas of the landlord functions.
We will also continue our collaborative approach to working with the Department for Work and Pensions (DWP) which allows us to provide the DWP with key information about the impact of Universal Credit on our customers. It also gives us a platform to influence national decision making and to ensure up to date and regular information is fed back down to the teams that need it.
The Aster Foundation will invest in activities which empower people in our communities to improve their own lives; to sustain tenancies and improve life chances, enable independence, sustain the workforce of the future and create a lasting legacy by building thriving communities. We’re excited about the potential for the Foundation which also continues to support colleague volunteering and match-funding.
We believe that we can be an agent for change, as part of this we will continue our work on a regeneration project in Melcombe Regis; a ward in the Weymouth and Portland area of Dorset. The community suffers from a highly transient population
and a number of societal issues. We recognise that we cannot address all of the physical and social problems associated with communities of this type by ourselves, so we are proud to be part of a multi-agency project board that comprises key regional decision makers (The Local Authority, Police and Crime Commissioner, local NHS trust) alongside key community groups. Together we are looking at a range of initiatives to improve the physical and social fabric of the area.
On a personal note, this will be my last year as Group Chairman. I’m immensely proud to have been a part of Aster’s evolution over the past eight years. The business is well placed to rise to the challenges and grasp the opportunities which lie ahead and I know I leave the business in strong hands.
Andrew Jackson Group Chairman
6 August 2019

8 Annual Report and Financial Statements for the year ended 31 MARCH 2019
Development of affordable housing
Revenue Maintenance
(Increase in asset value)
Everyone has a home
Other activities
Development of homes for open market sale
Our Business Model
Everyone has a home
The group’s activities are categorised into four areas: 1. Provision of housing through its Registered Providers - Aster Communities, Synergy Housing Limited and Aster 3 Limited; 2. Care and support services through Aster Living; 3. Property management and maintenance through Aster Property Limited;4. Development of housing for rent and sale through Aster Homes Limited and joint ventures with Galliford Try Homes Limited (White Rock Land LLP, Boorley Green LLP and Kilnwood Vale LLP).The group primarily generates revenues from rent and service charges associated with the provision of housing, and from the sale of houses built for shared ownership and open market sale. Profits after financing (servicing of debt) and tax are reinvested and used to build additional homes (usually through supporting additional borrowing capacity).The group finances additional development through traditional bank funding, capital markets (bonds), the European Investment Bank (EIB), Affordable Housing Finance (AHF) bond, part of the Affordable Homes Guarantee Programme, and more recently the sector borrowing vehicle MORhomes PLC of which the group is also a member.
External funding
Profit

9
Strategic Report Corporate Governance Financial Statements
Group Structure
The main activity of each of the companies in the group is:
Aster Group Limited Acts as holding company for the group and provides support services for each of the subsidiaries.
Aster Communities Registered Provider, with properties primarily in Hampshire, Wiltshire, Somerset and Devon and Cornwall.
Synergy Housing Limited Registered Provider, with properties primarily in Dorset, Hampshire and Wiltshire.
Aster 3 Limited Registered Provider, to provide additional development capacity to the group.
Aster Living Provision of care and support services to vulnerable people in specialist housing or their own homes.
Aster Property Limited Management and maintenance of housing stock and related areas.Aster Homes Limited Development of homes for affordable and market sale and rent.Aster Options Plus Limited Ceased trading in 2018/19.
Aster Treasury Plc Special purpose vehicle for raising bond finance on behalf of other group entities.
Silbury Housing Holdings Limited and Silbury Housing Limited
Special purpose vehicles for the delivery of homes in Wiltshire as part of a service concession arrangement.
Zebra Property Solutions Limited Ceased trading in 2018/19.
Aster Solar Limited Special purpose vehicle for investment in photovoltaic panels on behalf of other group entities.
White Rock Land LLP, Boorley Green LLP and Kilnwood Vale LLP
Limited Liability Partnerships jointly owned by Aster Homes Limited and Galliford Try Homes Limited to develop properties.
The structure of the group is:
Zebra Property Solutions Limited
Silbury Housing Holdings Limited
Silbury Housing Limited
Aster Living
Aster Homes Limited
Aster Options
Plus Limited
Aster Communities
Synergy Housing Limited
Aster Solar Limited
Aster 3 Limited
Aster Treasury
PLC
Aster Property Limited
White Rock Land LLP
Kilnwood Vale LLP
Boorley Green LLP
Aster Group Limited
Charitable Community Benefit Society
Non Charitable Company
Joint Venture
External Joint Venture
Not shown: 7 Dormant Companies -information is available on request
Key to entity type:

10 Annual Report and Financial Statements for the year ended 31 MARCH 2019
4+22+17+25+32+AHomes owned and / or managed - 2019
73+1+20+3+3+AGroup revenue split - 2019
Aster Group owns and manages over 30,000 properties and provides services to more than 69,000 customers across central, southern and south west England, with the largest number of homes in Dorset and Wiltshire.
5%
22%
16%
24%
33%Devon & Cornwall
Hampshire
Somerset
Wiltshire
Dorset
Provision of affordable housing
Outright sales
First tranche shared ownershipCare and support income
Other income
Our Market
Total units owned and / or managed 30,791
3%3%
1%
The group was formed by six large scale voluntary transfers (LSVTs). The main source of revenue for the group is through the provision of affordable housing services. Shared ownership sales also play an important part in generating revenue for the business, further supported by care and support services and outright sales. The revenue generated by the group is used to provide a good, reliable landlord service for the group’s customers and to invest into the provision of more homes.
73%
20%
Total revenue £212 million

11
Strategic Report Corporate Governance Financial Statements
4+22+17+25+32+AFollowing the Chancellor’s 2015 Autumn Statement, 2018/19 marked the penultimate year of the four year 1% annual rent reduction that will continue until the end of April 2020.
In October 2017, the government announced that increases to social housing rents will return to the Consumer Price Index (CPI) plus 1% for five years from April 2020. This will give social tenants, councils and housing associations the security and certainty they need.
In order to gain greater control over the group’s delivery of housing, the business has increased its land-led programme and in addition will use profits generated from open market sale activity, primarily delivered through joint venture opportunities, to subsidise its affordable homes programme going forward. The business will also continue to seek larger opportunities for development (i.e. exceeding 20 homes) to capture economies of scale and further drive efficiencies.
Coupled with this, the group will look to identify land for new development within its existing stock through a review of underperforming assets, increasing stock density and replacing stock which is no longer fit for purpose.
This year the group continued into the second year of its void disposals programme (‘VDP’), a programme designed to sell under-performing void properties on the open market that no longer meet the standard the group requires. Properties identified for sale are assessed against a number of criteria and where the relevant thresholds are not met are approved by an independent panel for sale. Capital generated from these sales funds the group’s ambitious development pipeline to spend £2 billion building 10,800 new homes over seven years. On average for every property sold under the VDP programme the business builds two or more homes, often within five miles from where the property was sold.
The group continues to benefit from its development of homes for open market sale with profits generated used to enable the delivery of more affordable homes. The group’s open market sale programme is primarily delivered with its joint venture partners allowing the group to take advantage of the expertise that the partners bring as well as sharing the risk and investment.

12 Annual Report and Financial Statements for the year ended 31 MARCH 2019
This fiscal year marks the penultimate year of four years of 1% rent reduction, but despite this revenue stream suffering the group has had a successful financial year. Turnover has grown to £211.9 million (2018: £204.7 million) – driven primarily by first tranche shared ownership sales which increased by £5.9 million to £42.2 million this year. Rental income has increased in the year by £3.3 million to £143.9 million (2018: £140.6 million), the fall in rental income from the 1% rent reduction more than offset by rental income generated from the new homes delivered from the group’s development programme.
Operating expenditure increased by £8.8 million to £152.6 million (2018: £143.8 million) primarily related to the increase in shared ownership cost of sales (£4.1 million) and planned maintenance and major works costs (£5.3 million).
Profit on disposal of property, plant and equipment increased by £3.0 million to £17.6 million, which reflects the second year of the void disposal programme and the group’s commitment to selling those assets which meet the group’s disposal criteria. The proceeds arising from these sales are reinvested by the group in future developments. Profit before interest and taxation increased by £6.0 million to £79.5 million (2018: £73.5 million).
Net interest and financing costs of £24.5 million (2018: £23.8 million) were in line with expectations for the year. Interest receivable increased by £415,000 with interest on the total loans to the joint ventures up on the previous year. Interest payable increased by £915,000 driven by new borrowing in the year. The group’s weighted average interest cost reduced from 3.46% last year to 3.41% in 2019.
Chief Executiveʼs Statement
In June 2018 the group tapped into its existing bond for a further £200 million, issuing £70 million during the year and bringing the total of Aster’s bonds in issue to £320 million. This leaves £130 million of retained bonds deferred for future issue. The group welcomed the addition of a new borrowing vehicle to the sector, MORhomes PLC, formed and owned by a group of housing associations, including Aster. In February 2019 the group drew down £40 million through MORhomes’ inaugural medium term notes programme.
The group delivered 1,156 homes in the year, up 23% from 2017/18. This included 1,053 affordable homes for rent and sale, up from 839 in the previous financial year. The cost of delivering these affordable homes was £171 million (2018: £158 million). The group also delivered 96 homes through the Boorley Green LLP and White Rock Land LLP joint ventures with Galliford Try Homes Limited.
A key driver for the group is to increase the number of homes delivered on land it owns or acquires. This will give the group greater control over the quality and timing of delivery. This year the group acquired land that is expected to deliver circa 238 homes over the next few years. In addition, projects delivered in partnership with private developers via Section 106 of the Town and Country Planning Act, which is designed to make development possible where it otherwise would not be, remain a crucial part of Aster’s future development programme. This year 980 homes were delivered through the Section 106 route. The business will also continue to work strategically with developer partners where it can balance its return on investment and deliver good quality homes.
The group will continue to invest in joint ventures to deliver homes for open market sale, and in June 2018 Aster Homes Limited entered into Kilnwood Vale LLP with Galliford Try Homes Limited. This allows the group to access the supply chain and expertise of a developer partner and ensures that the business can maximise profit. Aster Homes Limited will also deliver homes for open market sale on its own land when it can meet its agreed hurdle rates. To support this strategy, Aster Homes Limited partnered with two developers. E. G. Carter & Co Limited and Galliford Try Homes Limited to enable optimum delivery and control of its building programme.
All homes within the group were compliant with the government’s Decent Homes standard at 31 March 2019. Throughout 2018/19, £37.5 million was spent on making improvements to tenants’ homes. More than 700 residents received new kitchens, almost 500 had new bathrooms fitted and more than 1,300 new heating systems were installed.
The performance of each of the group’s main operating divisions is set out in the Operational Review.
Bjorn HowardGroup Chief Executive
6 August 2019

13
Strategic Report Corporate Governance Financial Statements
Total revenue £138 million
Aster Communities
Income streams:
Aster Communities’ principal activity is to provide affordable homes and associated services as a Registered Provider. Aster Communities owns and manages approximately 22,000 homes for more than 47,000 customers and is a developer of new affordable housing.
Turnover increased by £8.3 million to £138.3 million. Lettings income remained consistent, falling by £0.4 million to £99.6 million. First tranche shared ownership income increased by £7.3 million to £31.4 million during the year and open market sales income increased by £1.3 million to £2.2 million.
Provision of affordable housing
First tranche shared ownership
Other income 74+23+3+A74%
23%
3%
Operational Review
2018 / 19 Target
2018 / 19 Actual
2017 / 18 Actual
% rent lost through vacant properties 0.8% 0.8% 1.0%Average number of days to re-let - General Needs 14 17 14
Average number of days to re-let - Housing for Older People (HOPS) 24 30 34% arrears (General Needs and HOPS) 3.0% 2.1% 1.8%% repairs completed on time 90.0% 81.6% 87.7%% of tenants found the repair process easy 80.0% 82.9% 86.8%New homes completed 682 700 614
Operating costs prior to impairment increased by £12.4 million to £103.1 million. This was mainly due to a £7.0 million increase in cost of first tranche and open market sales reflecting the related increase in revenue, a £2.8 million increase in major repairs work and an additional £1.0 million of non-capitalised development costs related to first tranche marketing spend.
Operating profit prior to impairment fell from £51.3 million to £47.1 million.
The association made a charitable cash donation to Aster Group Limited of £10 million to further the charitable aims of the group and a £6.7 million donation of assets to Aster 3 Limited.
Targets for Aster Communities are set at the beginning of each year as part of the business planning process, and regular reports are drawn from each of the key operating systems to monitor performance. Measures for Aster Communities are outlined in the table below.

14 Annual Report and Financial Statements for the year ended 31 MARCH 2019
Aster Communities (continued)
Key highlights are as follows:
• Rent lost through properties being empty is low at 0.8% of total rental income and an improvement from last year (2018: 1.0%);
• Average re-let times for both general needs and housing for older people remained good, although slightly behind target. Re-let times for housing for older people improved by four days due to working closely with local authorities to find suitable nominees for void properties. Re-let times for general needs properties slipped from last year mainly due to slippage on void repairs in the earlier part of the year. This is being managed closely through a workstream approach to improve performance going forward;
• Income collection remains strong with the arrears’ percentage at 2.1% (2018: 1.8%) despite the gradual roll out of Universal Credit. Universal Credit claimants have increased during 2018/19 from 1,441 to 2,811 and there is a continued strong focus on managing the impact of welfare reform and the roll out of Universal Credit, through the internal Strategy and Practitioners Groups;
Operational Review
• The percentage of repairs completed on time fell by six percentage points and was below target. This is because the figure now incorporates performance of all management and maintenance work, not just general repairs, to allow better monitoring of all round performance. An improvement plan is in place to improve and stabilise performance;
• Aster Communities completed 693 affordable and seven open market (2018: 614) new homes for rental or sale against a target of 682;
• The association continues to improve its approach to recovering service charges with tighter controls and more efficient systems for recording expenditure and charging customers. Aster Communities recovered 68% of its service chargeable costs;
• Aster Communities invested £180,000 on neighbourhood enhancements, to ensure communal areas remain desirable and safe; and
• There have been 58 void disposal programme (VDP) sales (2018: 30), 40 stock option appraisal programme (SOAP) sales (2018: 19), and 4 land sales (2018: 9).

Strategic Report Corporate Governance Financial Statements
15
2018 / 19 Target
2018 / 19 Actual
2017 / 18 Actual
% rent lost through vacant properties 0.8% 0.7% 0.4%Average number of days to re-let - General Needs 14 15 14
Average number of days to re-let - Housing for Older People (HOPS) 24 30 19% arrears (General Needs and HOPS) 3.0% 2.3% 2.2%% repairs completed on time 90.0% 82.9% 96.4%% of tenants found the repair process easy 80.0% 76.2% 83.5%New homes completed 345 360 225
Synergy Housing Limited
Income streams:
Total revenue £67 million
Provision of affordable housing
First tranche shared ownership
Other income
Synergy Housing Limited’s principal activity is to provide affordable homes and associated services as a Registered Provider. Synergy Housing Limited owns and manages approximately 11,000 homes for more than 22,000 customers and is a developer of new affordable housing.
Turnover increased by £1.0 million to £67.1 million. Lettings income increased by £1.5 million to £53.7 million. First tranche shared ownership income reduced by £1.4 million to £10.8 million during the year, with more shared ownership homes being sold
through Aster Communities this year. A compensation payment of £920,000 was received from National Grid in relation to a large number of properties affected by their apparatus and the potential future development impact.
Operating costs fell by £1.4 million to £45.0 million. This is due to a £1.4 million reduction in cost of first tranche sales reflecting the related fall in revenue.
Operating profit increased from £22.4 million to £27.9 million including an increase of £3.1 million related to
the sale of housing property, plant and equipment, driven mainly through the group’s void disposal programme.
The association made a £2.7 million donation of assets to Aster 3 Limited.
Targets for Synergy Housing Limited are set at the beginning of each year as part of the business planning process and regular reports are drawn from each of the key operating systems to monitor performance. Measures for the association are highlighted in the table below.
80+16+4+A80%
16%
4%

16 Annual Report and Financial Statements for the year ended 31 MARCH 2019
Operational Review
Synergy Housing Limited (continued)
Key highlights are as follows:
• Rent lost through properties being empty is 0.7% of total rental income (2018: 0.4%) compared to a target of 0.8%;
• The average number of re-let days remains good. The re-let times for general needs properties is in line with last year and target, although for housing for older people, stock suffered a fall of 11 days from last year due to a focus on desirable properties which are easier to re-let and an asset review of less desirable hard to let properties;
• Income collection remains strong with the arrears’ percentage at 2.3% (2018: 2.2%) despite the gradual roll out of Universal Credit. Universal Credit claimants have increased during 2018/19 from 348 to 1223 and there is a continued strong focus on managing the impacts of welfare reform and the roll out of Universal Credit, through the internal Strategy and Practitioners Groups;
• The association’s repairs completion was slightly behind target and last year. This is because the figure now incorporates performance of all management and maintenance work, not just general repairs, to allow better monitoring of all round performance. An improvement plan is in place to improve and stabilise performance;
• Synergy Housing Limited completed 360 (2018: 225) new homes for rental or sale against a target of 345;
• The association continues to improve its approach to recovering service charges with tighter controls and more efficient systems for recording expenditure and charging customers. This year the company recovered 83% of its service chargeable costs;
• The association invested £62,000 on neighbourhood enhancements, to ensure communal areas remain desirable and safe; and
• There have been 31 void disposal programme sales (VDP) (2018: 10), 12 stock option appraisal programme (SOAP) sales (2018: 1) and 4 land sales (2018: nil).

17
Strategic Report Corporate Governance Financial Statements
Aster 3 Limited
2018 / 19 Target
2018 / 19 Actual
2017 / 18 Actual
% rent lost through vacant properties 0.8% 0.4% -Average number of days to re-let - General Needs 14 30 -% arrears (General Needs) 3.0% 2.2% -% repairs completed on time 90.0% 86.9% -% of tenants found the repair process easy 80.0% 85.7% -New homes completed - - -
Aster 3 Limited’s principal activity is to provide affordable homes and associated services as a Registered Provider. Aster 3 Limited owns and manages 243 homes.
This year is the first year of trading for Aster 3 Limited, with the organisation receiving donations of assets with a value of £9.4 million from Aster Communities and Synergy Housing Limited in May 2018 to enable it to have a base from which to grow.
Aster 3 Limited has the advantage of having no bank debt and as such is not constrained by restrictive bank covenants.
Turnover was £1,108,000 with £1,076,000 of lettings income and £32,000 from garage lettings.
Operating costs were £831,000. Of these £816,000 relate to lettings.
Operating profit was £277,000.
The association has Key Performance Indicators with targets set at the beginning of each year as part of the business planning process. Regular reports are drawn from each of the key operating systems to monitor performance. Measures for Aster 3 Limited are highlighted below:
Key highlights are as follows:
• 243 properties were transferred into the association from Aster Communities and Synergy Housing Limited in May 2018 as general needs housing;
• Rental, service charge and other related income was earned from the properties from the date of transfer (for an 11 month period);
• Rent lost through void properties is good at 0.4% of total rental income compared to a target of 0.8%;
• Average re-let days were disappointing at 30 days and this area will remain an area of focus for improvement in 2019/20 through a workstream approach; and
• Income collection is strong with the arrears’ percentage at 2.2% despite the gradual roll out of Universal Credit. There were 46 Universal Credit claimants during 2018/19 and there is a continued focus on managing the impacts of welfare reform and the roll out of Universal Credit, through the internal Strategy and Practitioners Groups.
18 Annual Report and Financial Statements for the year ended 31 MARCH 2019
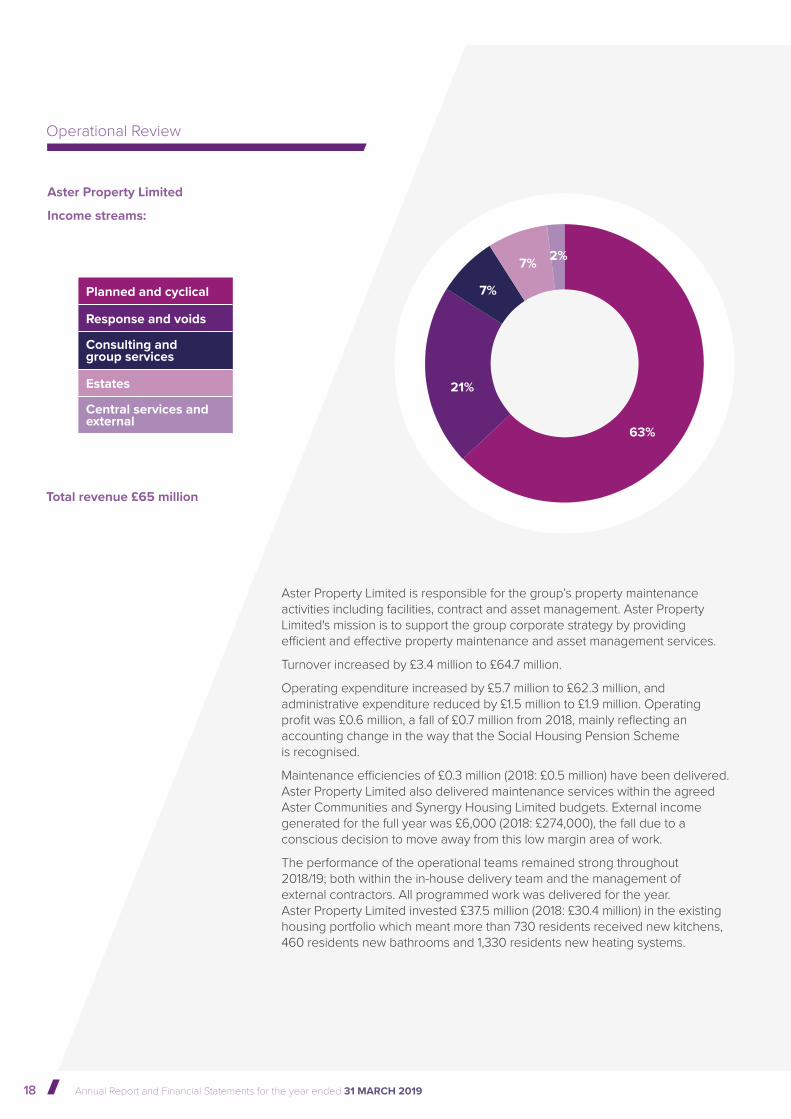
63+21+7+7+2+A7%
2%
21%
7%
63%
Total revenue £65 million
Aster Property Limited is responsible for the group’s property maintenance activities including facilities, contract and asset management. Aster Property Limited's mission is to support the group corporate strategy by providing efficient and effective property maintenance and asset management services.
Turnover increased by £3.4 million to £64.7 million.
Operating expenditure increased by £5.7 million to £62.3 million, and administrative expenditure reduced by £1.5 million to £1.9 million. Operating profit was £0.6 million, a fall of £0.7 million from 2018, mainly reflecting an accounting change in the way that the Social Housing Pension Scheme is recognised.
Maintenance efficiencies of £0.3 million (2018: £0.5 million) have been delivered. Aster Property Limited also delivered maintenance services within the agreed Aster Communities and Synergy Housing Limited budgets. External income generated for the full year was £6,000 (2018: £274,000), the fall due to a conscious decision to move away from this low margin area of work.
The performance of the operational teams remained strong throughout 2018/19; both within the in-house delivery team and the management of external contractors. All programmed work was delivered for the year. Aster Property Limited invested £37.5 million (2018: £30.4 million) in the existing housing portfolio which meant more than 730 residents received new kitchens, 460 residents new bathrooms and 1,330 residents new heating systems.
Aster Property Limited
Income streams:
Planned and cyclical
Response and voids
Consulting and group services
Estates
Central services and external
Operational Review

19
Strategic Report Corporate Governance Financial Statements
Aster Homes Limited provides design and build services for developing affordable homes for the Aster Group. It is also a commercial development company building new homes for direct sale.
Turnover fell by £10.8 million to £86.8 million. This included £85.8 million (2018: £96.4 million) of design and build fee income from services provided to Aster Communities, Synergy Housing Limited and Aster 3 Limited. Despite an increase in development activity, the decrease in turnover reflects a number of schemes being at an early stage of the development cycle.
Operating expenses fell by £9.8 million to a total of £84.2 million. This reflects the lower design and build income with cost of sales reducing by £9.8 million to £80.0 million.
Resulting operating profit of £2.6 million was £1.0 million less than in 2018.
The number of homes completed is set out in the table below:
Total units developed 1,156
Homes completed 2018 / 19 Target
2018 / 19Actual
2017 / 18Actual
Homes completed for Aster Communities 815 693 614Homes completed for Synergy Housing Limited 212 360 225Homes completed for Aster 3 Limited - - -Total affordable homes built 1,027 1,053 839Private sales completed* 114 103 100Total 1,141 1,156 939
Aster Homes Limited
Unit development:
10+40+50+A600
453
103
Open market sales (including through JVs)
Shared ownership
Affordable rent
* Includes 96 units (2018: 93 units) completed through joint ventures.

20 Annual Report and Financial Statements for the year ended 31 MARCH 2019
Joint venture performance
Private sale development projects were delivered through joint venture arrangements with Galliford Try Homes Limited. White Rock Land LLP saw 55 private sale completions and 16 affordable homes in 2018/19 and is forecast to build and sell a further 366 private homes and 110 affordable homes over the next five years. Boorley Green LLP sold 41 private homes and 19 affordable homes in the year and will deliver a further 227 private homes and 121 affordable homes over the next six years.
Aster Homes Limited's 50% share of the commercial trading activity through White Rock Land LLP and Boorley Green LLP is estimated to generate £115 million of sales income and £16 million of profit over the next six years. The joint ventures have contributed £1.2 million of profit for the 2018/19 year. Aster Homes Limited’s share is consolidated at group level and not reflected in Aster Homes Limited’s results.
Turnover for White Rock Land LLP was £7.5 million (2018: £8.7 million) and profits for the year were £486,000 (2018: £561,000). Boorley Green LLP made a profit of £937,000 (2018: £534,000). Aster Homes Limited received dividend income of £18,000 from White Rock Land LLP for the Okehampton scheme which has been completed with all homes sold. Kilnwood Vale LLP was established in 2018/19 and is due to deliver 97 private homes and 33 affordable homes over the duration of the project’s life cycle.
Operational Review
Aster Living’s principal activity is to provide care and support services to help vulnerable people keep their independence.
Aster Living generated a loss before tax of £56,000 (2018: loss of £214,000). Following management decisions all care and support, handihelp and home improvement services have ended during the year. The remaining services offered by Aster Living are for independent living and the provision of Telecare. For the year to 31 March 2019, independent living made an operating profit of £14,000 (2018: £9,000) and Telecare an operating profit of £208,000 (2018: £110,000).
Aster Living
Aster Solar LimitedAster Solar Limited’s main activity is to provide green electricity to the group’s customers through the installation of photovoltaic panels on existing properties. The company benefits from the resale of unused electricity generated through the government agreed feed-in tariff.
Aster Communities and Synergy Housing Limited have invested in Aster Solar Limited to further their charitable objectives. The alleviation of fuel poverty amongst their tenants is a key objective for both, together with the ability to generate profits that can be re-invested into charitable activities.
Turnover for the year reduced by £1,000 to £298,000. The company generated a profit before tax of £82,000 (2018: £94,000).
Aster Treasury Plc
Aster Treasury Plc’s principal activity is to raise external debt to finance the growth and development activities of the group and its subsidiaries. For the year ended 31 March 2019 £70 million of additional debt was raised. The company also paid interest on its current debt and received interest on its on-lending to group companies.
For the year ended 31 March 2019 there was no profit or loss (2018: £nil) with interest paid on the bond fully recovered from group companies.
Silbury Housing Limited
Silbury Housing Limited’s principal activity is to deliver a 22 year service concession arrangement with Wiltshire Council to develop, manage and maintain 242 affordable homes.
Profit before tax increased by £16,000 to £269,000 in the year.

21
Strategic Report Corporate Governance Financial Statements
22 Annual Report and Financial Statements for the year ended 31 MARCH 2019
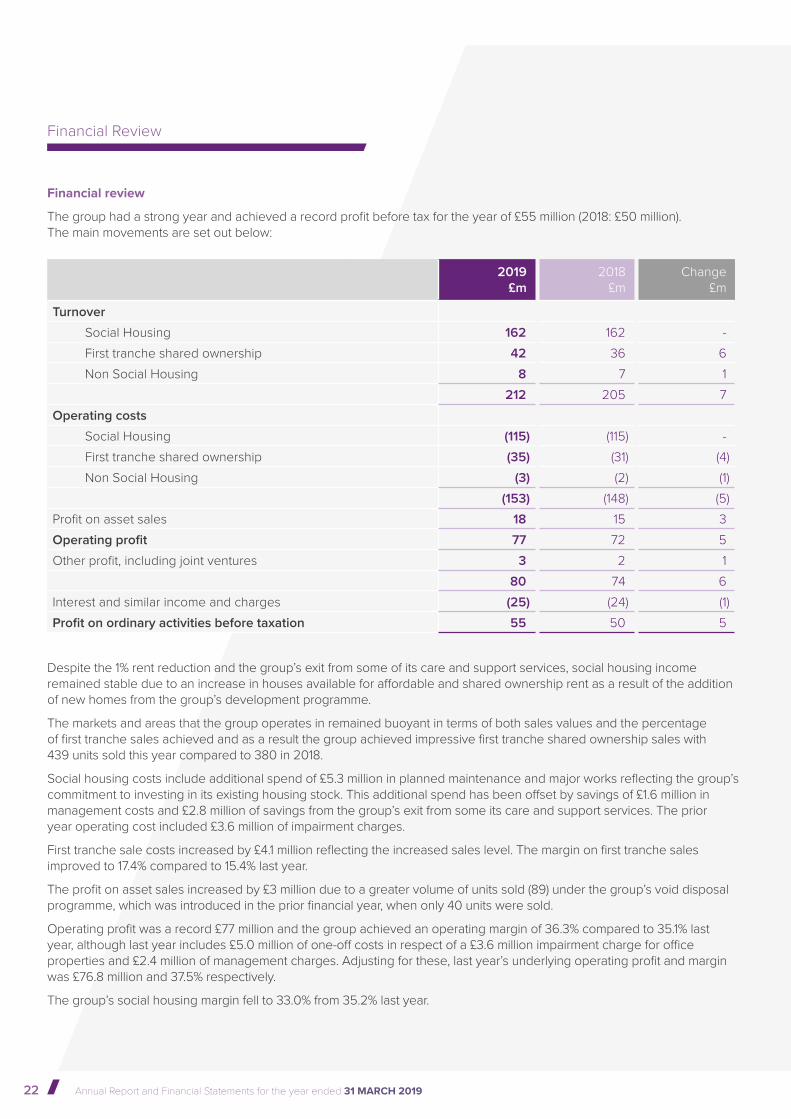
Financial review
The group had a strong year and achieved a record profit before tax for the year of £55 million (2018: £50 million). The main movements are set out below:
2019£m
2018£m
Change£m
Turnover
Social Housing 162 162 - First tranche shared ownership 42 36 6 Non Social Housing 8 7 1
212 205 7 Operating costs
Social Housing (115) (115) - First tranche shared ownership (35) (31) (4)Non Social Housing (3) (2) (1)
(153) (148) (5)Profit on asset sales 18 15 3 Operating profit 77 72 5 Other profit, including joint ventures 3 2 1
80 74 6 Interest and similar income and charges (25) (24) (1)Profit on ordinary activities before taxation 55 50 5
Financial Review
Despite the 1% rent reduction and the group’s exit from some of its care and support services, social housing income remained stable due to an increase in houses available for affordable and shared ownership rent as a result of the addition of new homes from the group’s development programme.
The markets and areas that the group operates in remained buoyant in terms of both sales values and the percentage of first tranche sales achieved and as a result the group achieved impressive first tranche shared ownership sales with 439 units sold this year compared to 380 in 2018.
Social housing costs include additional spend of £5.3 million in planned maintenance and major works reflecting the group’s commitment to investing in its existing housing stock. This additional spend has been offset by savings of £1.6 million in management costs and £2.8 million of savings from the group’s exit from some its care and support services. The prior year operating cost included £3.6 million of impairment charges.
First tranche sale costs increased by £4.1 million reflecting the increased sales level. The margin on first tranche sales improved to 17.4% compared to 15.4% last year.
The profit on asset sales increased by £3 million due to a greater volume of units sold (89) under the group’s void disposal programme, which was introduced in the prior financial year, when only 40 units were sold.
Operating profit was a record £77 million and the group achieved an operating margin of 36.3% compared to 35.1% last year, although last year includes £5.0 million of one-off costs in respect of a £3.6 million impairment charge for office properties and £2.4 million of management charges. Adjusting for these, last year’s underlying operating profit and margin was £76.8 million and 37.5% respectively.
The group’s social housing margin fell to 33.0% from 35.2% last year.

23
Strategic Report Corporate Governance Financial Statements
Cash inflows and outflows
The detailed cash flow for the group is set out on page 93. In summary the main cash flows for the group were:
2019£m
2018£m
Net cash generated from operating activities 152 152 Less net interest paid (34) (28)
118 124 Investment in new properties (178) (180)Social housing grant received 3 3 Purchase of other fixed assets (2) (2)
(59) (55)Drawdown of loans 125 50 Loans to joint ventures (5) (2)Repayment of borrowings (30) (1)Increase / (decrease) in cash holdings 31 (8)
The group held £132 million (2018: £101 million) of cash and cash equivalents at year end and had £960 million (2018: £867 million) of bank loans and bonds.
Net cash flows from operating activities remained strong and in line with last year. The group’s cash conversion ratio fell from 304% to 276%.
Cash invested in new properties was £2 million less than 2018 at £178 million, driven by a lower direct spend on open market sale units, offset by increased investment in joint venture led spend. Investment in new affordable homes remained level with last year at £178 million. The group developed 1,156 homes in the year, 217 more than in 2018. The £180 million spend in 2018 included spend attributable to units that were delivered in 2019 in line with the development cycle.
There were two main sources of finance for the group in the year:
• Issuance of £70 million nominal value of bond, following the group’s bond tap in May 2018 and November 2018 which were issued at a premium resulting in the group receiving £83.9 million; and
• The receipt of £40 million from MORhomes PLC, the new sector borrowing vehicle, medium term notes programme.
The repayments of borrowings include £28.5 million payment of excess cash into the group’s revolving credit facilities, which can be drawn down again at a later date, and scheduled capital repayments in Aster Communities as some of the group’s facilities mature. There were also scheduled capital repayments made by Silbury Housing Holdings Limited.

24 Annual Report and Financial Statements for the year ended 31 MARCH 2019
Statement of Financial Position
• Property, plant and equipment - This mainly includes the group’s social and affordable rented housing properties and components. The increase is driven by the properties developed in the year and component replacements offset by depreciation.
• Debtors - This primarily includes the group’s debtors falling due after one year as well as trade debtors and rent arrears. Debtors have increased due to increases in the loans to joint ventures (£6.9 million), reflecting the investment in the new Kilnwood Vale LLP joint venture as well as further investment in Boorley Green LLP in line with its expected spend profile; an increase in service charge debtors (£3.6 million) offset by an increase in service charge creditors (below); and an increase in prepayments and accrued income of £3.1 million.
• Shared ownership properties held for resale - This includes the first tranche element of the group’s
These movements in the Statement of Financial Position are explained below:
Financial Review
2019£m
2018£m
Movement£m
Fixed assetsProperty, plant and equipment 1,610 1,498 112 Investment properties 17 16 1
1,627 1,514 113 Current assetsInventory 2 2 -Debtors 112 100 12 Shared ownership properties held for resale 30 23 7 Properties held for open market sale - 2 (2) Cash and cash equivalents 132 101 31
275 228 48 Creditors: amounts falling due within one year (74) (63) (11)
1,829 1,679 150
Creditors: amounts falling due after more than one year (995) (903) (92)Pension liability (45) (33) (12)Other provisions (1) (2) 1 Net assets 788 741 47
shared ownership properties completed, but yet to be sold. The increase relates to a greater number of shared ownership units under construction compared to last year (£1.9 million) coupled with more unsold completed units than last year due to the volume of build increasing (£4.4 million).
• Cash - Increased by £30.9 million due to net new borrowings (see cash flow above) offset by development spend.
• Creditors: amounts falling due within one year - This primarily includes accruals and deferred income, trade creditors, rent paid in advance, service charge over recovery and the element of loans repayable within one year. The increase is due to increases in accruals and deferred income (£8.6 million) driven by development scheme and management cost accruals and an
increased service charge creditor offsetting in part the increase in the service charge debtor above (£2.7 million).
• Creditors: amounts falling due after more than one year - This includes the group’s long-term debt. The net increase of £92 million is due to net movement in loans of £95.4 million (see cash flow above) offset by a reduction in the Social Housing Pension Scheme recovery plan liability (£4.9 million).
• Pension liability - This includes the pension deficits from the group’s four local government pension schemes and the Social Housing Pension Scheme (SHPS). The increase is mainly due to a new accounting treatment which resulted in the SHPS being treated as a defined benefit scheme, and as a result the group recognising its share of the SHPS liability of £14.8 million.

25
Strategic Report Corporate Governance Financial Statements

26 Annual Report and Financial Statements for the year ended 31 MARCH 2019
Value for Money - Our Strategic Approach
As a group Aster have made it clear that value for money (VFM) is fully integrated in the group-wide corporate strategy and objectives setting, and this approach has helped to deliver VFM across customers, financial strength, growth, operations, development and culture in equal measure.
VFM has always formed a central part of the group’s business and organisational culture. This is encapsulated in the strategy and delivered through the corporate objectives.
VFM is about being effective in planning, managing and operating the business. It means making the best use of resources to provide quality homes backed by high quality services. The group’s commitment to VFM is woven throughout the governance, business planning and operational teams.
Aster has a commitment to:
• Reinvest all the profits made into new and existing homes and providing good services. Everything done begins with our social purpose;
• Combine a social heart with a commercial mindset to create homes and communities current and future customers can be proud of;
• Make investment decisions on a long-term commercial basis, that provide not just short-term gains, but long-term benefits to the group and customers;
• Investing in technology over the next five years to deliver improved efficiency and better customer service, determined to drive value in services by minimising customer effort in processes;
• To create a network of strategic partnerships to tackle the housing crisis;
• Deliver social and economic value - in 2018/19 for every £1 spent on developing new homes, over £60 was generated of additional economic value to local communities and over £30 of social value; and
• Aster’s business model, financial strength, robust governance, investor confidence and commitment to a range of tenures, enables the group to keep building, even during economic downturns and unfavourable market conditions.

27
Strategic Report Corporate Governance Financial Statements
VFM in Aster’s Corporate Strategy:
“Providing customer-focused, easily accessible, good and safe landlord services” - As is evidenced by the social housing cost per unit performance, the business looks to strike the right balance between investment and value for money for customers. Investment in stock provides safe services and will generate efficiencies through the group’s digital transformation programme that will make services accessible and cost-effective. Working with the supply chain will maximise value from operational contracts and ensure that the procurement framework maximises value for customers.
“ Being an agent for change through the activities we choose to do through the Aster Foundation” - VFM is not just about pounds and pence, and through the work of the Aster Foundation the group looks to further drive social value across all landlord services. The main aim of the Foundation Strategy is to maximise tenancy sustainment. This is good value for the business, but also good for customers who get to stay in their Aster homes for as long as possible. Targeting investment at the places which can make the most impact will deliver social value to customers and will ensure further investment can be made in the future.
“ Building as many homes as we can, offering a range of housing options” - The development programme is targeted at making the biggest difference Aster can to the housing shortage, by building as many homes as possible. What this doesn’t mean is sacrificing quality. Aster’s performance shows we are in the upper quartile for generating new supply and this remains the goal. VFM for customers means providing quality, affordable homes in the places they want to live.
“ Ensuring we are ready for the future” - Aster’s digital transformation journey will allow customers to access services in more ways than ever before. Investment in our colleagues to ensure that a culture is created in the business that ensures maximum outcomes for customers. VFM is not always about cutting costs, it’s about return on investment, and this is the aim with digital and colleague transformation.
“ Delivering our Corporate Strategy quicker and better through growth” - Growth will never be pursued that has a detrimental impact on the offer to customers and colleagues. All growth options are assessed thoroughly in relation to additional resulting growth or from efficiencies that can be generated. Aster is not looking to become bigger for the sake of it, any growth must benefit customers and colleagues and add to the group’s vision and purpose.

28 Annual Report and Financial Statements for the year ended 31 MARCH 2019
Sets out the number of new social housing units, excluding those homes delivered through the group’s joint ventures, that have been acquired or developed as a proportion of total social housing units owned at the year end.
New supply delivered - social housing
3.5 % 2.8 %2018 / 19 2017 / 18
2.5 %2016 / 17 Median Quartile 3
UpperQuartile
Scorecard 2018 Target 2019 / 20
--
The group’s performance in 2018/19 provides strong evidence of the commitments set out in the approach to VFM.
Set out below is the group's Sector Scorecard comparison showing the median (average) and quartile 3 (top 25%) positions.
Value for Money - 2018 / 19 Performance
Performance against the VFM key metrics
Sets out the number of new non social housing units, including those homes delivered through the group’s joint ventures, that have been acquired or developed as a proportion of total non social housing units owned at the year end.
New supply delivered - non social housing
84.0 %2017 / 18
89.1 %2016 / 17 Median Quartile 3
UpperQuartile
Scorecard 2018 Target 2019 / 20
--81.4%
2018 / 19
Reflects the investment in social housing properties (existing stock and new supply) as a percentage of the total value of social housing properties held (Aster measure the total value of social housing properties at deemed cost ¹).
Reinvestment
14.1 % 15.8 %2018 / 19 2017 / 18 Median Quartile 3
UpperQuartile
5.8 % 8.5 %Scorecard 2018 Target 2019 / 20
2016 / 17
12.3 %

29
Strategic Report Corporate Governance Financial Statements
Assesses the headline social housing cost per unit as defined by the regulator. Costs include management costs, service charges, maintenance, major repairs, other social housing costs and other operating costs on housing lettings, but excludes depreciation.
Headline social housing cost per unit (CPU)
£ 3 , 391 £ 3 , 4552018 / 19 2017 / 18
£ 3 , 1552016 / 17 Median Quartile 3 Median
Scorecard 2018 Target 2019 / 20
£ 2,982£ 3,450
Strategic Report Corporate Governance Financial Statements
Calculated as net debt (loans less cash) as a proportion of social housing assets. Shows how much of the social housing assets are made up of debt, and the degree of dependence on debt finance. It also sets out the potential capacity for further borrowing which can be used to fund the future development of new housing.
Gearing
52.2 % 52.0 %2018 / 19 2017 / 18
52.2 %2016 / 17 Median Quartile 3 Median
Scorecard 2018 Target 2019 / 20
35.1% 48.8 %
Seeks to measure the level of surplus generated compared to interest payable. It is a key indicator for liquidity and investment capacity.
EBITDA MRI ² interest cover
223.2 %2017 / 18
262.4 %2016 / 17 Median Quartile 3 Median
Scorecard 2018 Target 2019 / 20222.8%
2018 / 19231.6% 323.3 %
Sets out the total number of new housing units, including those homes delivered through the group’s joint ventures, that have been acquired or developed as a proportion of total housing units owned at the year end.
New supply delivered - combined
3.7 % 3.0 %2018 / 19 2017 / 18
2.7 %2016 / 17 Median Quartile 3
UpperQuartile
Scorecard 2018 Target 2019 / 20
2.3%1.0 %

30 Annual Report and Financial Statements for the year ended 31 MARCH 2019
Demonstrates the profitability of operating assets before exceptional expenses. Defined as operating profit, excluding surplus on sale of property, plant and equipment, as a percentage of total turnover or social housing turnover as appropriate.
¹ Deemed cost assets consist of social housing assets held at an EUV-SH valuation up to 31 March 2014 and subsequent additions at cost.² EBITDA MRI is Earning before interest, tax, depreciation, amortisation, excluding profit on disposal of property, plant and equipment, but including the cost of capitalised major repairs (major repairs included). Interest includes the group’s interest payable plus interest capitalised during the year but excluding interest on the net pension liabilities.³ Operating profit includes the group’s operating profit inclusive of profit from disposal of property, plant and equipment, and the share of profit in joint ventures.
Compares the operating profit ³ to total assets less current liabilities.
Return on capital employed (ROCE)
4.4 %2017 / 18
39.9 %
4.3%
2016 / 17
2016 / 17
Median
Median
Quartile 3
Quartile 3
Median
Median
Scorecard 2018
Scorecard 2018
Target 2019 / 20
Target 2019 / 20
Demonstrates the profitability of operating assets before exceptional expenses. Defined as operating profit, excluding surplus on sale of property, plant and equipment, as a percentage of total turnover or social housing turnover as appropriate.
Median Quartile 3 Median
Scorecard 2018 Scorecard 2018 Target 2019 / 20
27.9%
30.4%
3.7%
33.5 %
36.0%
5.0%4.3%
2018 / 19
Operating margin - overall
28.0 % 28.0 % 33.8%
2018 / 19 2017 / 18 2016 / 172016 / 17
Operating margin - social housing only
33.0 % 35.2 %2018 / 19 2017 / 18
Value for Money - 2018 / 19 Performance
Performance against the VFM key metrics (continued)

31
Strategic Report Corporate Governance Financial Statements
32 Annual Report and Financial Statements for the year ended 31 MARCH 2019
2018 / 19 Performance
Aster is one of the sector leaders in reinvestment and the overall sector leader in new supply delivered. Aster’s combined new supply delivered measure of 3.7% is 0.2% higher than the next best performing housing association. The group’s business model is worked hard to develop as many new homes as possible within the group’s financial capacity and in 2018/19 Aster built 1,156 total homes, 217 more than in 2017/18 (1,053 of which were affordable homes) closing the year with 30,508 homes owned (30,388 of which were affordable homes).
The reinvestment spend metric is measured as a proportion of the value of the group’s properties. The fall in reinvestment is due to an increase in the value of the group’s social housing assets from £1.5 billion in 2017/18 to £1.6 billion in 2018/19, not a fall in the level of reinvestment spend. Total investment spend on properties increased from £212 million last year to £224 million.
Aster recognises that the greatest role to play in tackling the housing crisis is “building as many new homes as we can”, this is a key component of the corporate strategy, and Aster’s performance in the upper quartile of both the reinvestment and new supply delivered metrics against the sector overall highlights this.
The group’s ambition is also highlighted by the level of gearing which pushes the business hard and is viewed as a positive, remaining in the upper quartile. The small increase in the group’s gearing ratio reflects the increase in net debt of £63 million to £828 million being proportionally greater than the increase in the total value of social housing assets held.
EBITDA MRI interest cover has reduced marginally. The group’s EBITDA MRI increased by £5.0 million compared to last year, but the £2.3 million increase in the cost of finance increased by a greater proportion. This is partly due to a small increase in the cost of debt, but also due to the timing of when finance for the group’s ambitious development program is put in place - being at least 12 months before it is required and hence resultant returns from this future development falling into future financial years.
Aster has performed close to the median for the sector against both the gearing and EBITDA MRI interest cover metrics, highlighting the group’s ambition of “delivering our Corporate Strategy quicker and better through growth” but not at the cost of increasing the group’s risk and exposure.
The social housing cost per unit position has improved from 2017/18 through to this financial year. Additional costs for increased investment in planned maintenance and major works of £78 per unit have been more than offset by management cost savings of £81 per unit and the winding down of the group’s direct delivery of care and support having further savings of £61 per unit. Aster has performed slightly ahead of the median for the sector. Excluding £199 per unit costs related to extra care services such as the supporting people contract, domiciliary care and Telecare, the social housing cost per unit directly related to social housing lettings reduced to £3,192 which is closer to the upper quartile of the sector and gives a better indication of where Aster sits in comparison to other housing associations without the diverse range of Aster’s services.
Significant investment is planned for 2019/20 in existing housing stock to take the group’s health and safety beyond compliance, as such it is anticipated that the overall costs will rise next year. Aster’s approach to VFM is not to be the cheapest, but to provide customers with good, safe homes and with good, reliable services and the group’s investment plans in the coming year reflect this.
Operating margins, although a good measure of overall profitability, should be viewed in the context of the diversity of activities the sector, and Aster in particular, is now engaged in. Overall margin has remained consistent with 2017/18 and is in line with the sector median. There has been some reduction in the social housing operating margin resulting from additional maintenance and improvements costs of £5.7 million emphasising the group’s commitment to providing customers with good, safe homes and with good, reliable services. Despite this, the social housing margin is ahead of the sector median.
Whilst overall return on capital employed (ROCE) gives an indication of how well the group makes a financial return on the assets it owns, Aster’s asset management plans focus on improving how the asset base can perform better as well as improving the group’s homes. ROCE has remained in line with the prior year figure. An increase in operating surplus is proportionally matched by the increase in the group’s asset base reflecting not just the reinvestment and new supply delivered but the group’s commitment to “ensuring Aster is ready for the future” through investment in digital and colleague transformation.
Value for Money - 2018 / 19 Performance
33
Strategic Report Corporate Governance Financial Statements
Aster's 2019 / 20 targets
To ensure that resources are directed towards achieving Aster’s ambitions, the group continues to be committed to finding efficiencies and getting the most out of the money spent. These efficiencies have been built into the group’s budgetary process.
As evidenced by the target positions set out in the table above, Aster wants to continue to lead the way in building more new homes, and harnessing the group’s financial strength to deliver more new supply. This needs to be balanced with ensuring investment in existing stock, whilst still providing VFM to customers in the rents offered and the services provided.
Aster remains committed to delivering VFM across the group strategy but recognises that VFM is not just pounds and pence, but also in the value of services to customers, the social value added to communities now and into the future, and the value that can be added to solving the housing crisis.
In addition to Value for Money being central to the Aster corporate strategy, there are also a number of operational targets that are set out across business areas and are managed and monitored through our operational governance panels.
These include:
• Generating efficiencies across our customer facing services that improves quality, but reduces inefficacy of people and resource;
• Using our assets effectively through a robust and proactive management of our Void Disposals Programme;
• Making good investment decisions and investing for both social and financial return on investment; and
• Build close to 1,000 new homes and continue to lead the way in the delivery of new supply.
34 Annual Report and Financial Statements for the year ended 31 MARCH 2019
Managing risk is fundamental if the group is to protect its viability and deliver its strategic ambitions. It has embedded a risk management culture that identifies and mitigates current and emerging risks whilst exploring potential opportunities arising from new events.
Risk governance
Risk oversight is the board’s responsibility, with the Group Risk and Compliance Committee undertaking a more detailed review of risks that might adversely affect the business’ strategy, operations and legislative compliance. The Group Treasury Committee ensures that risks to the financial viability of the group are managed in accordance with the Treasury Management Policy.
The group recognises that known and understood risk can and should be taken to achieve its objectives, provided that it is justified and actively managed. While the board accepts operational risk is inevitable and that perfect risk avoidance is neither possible nor necessarily desirable, risks related to health and safety, financial viability and reputation must be actively managed and mitigated.
Risk framework and risk appetite
The group’s Framework for Opportunity and Risk Management sets out how it identifies, assesses and grades significant risks. Risks are recorded on a risk register, together with existing mitigation control, potential control improvements and assurances relating to the effectiveness of controls.
In July 2018 the Aster Group Limited board reconsidered and approved the group’s updated risk appetite.
The Group Risk and Compliance Committee, the executive board and the leadership team considered the key risks to the group at every meeting and received information about any change in risk profile.
Risk Management
Scenario testing
The group has undertaken multi-variate scenario testing to analyse the effects of realistic economic and risk scenarios. It has modelled those identified scenarios and assessed the impact on the group’s financial covenants and viability. To ensure the group can recover from the impact of the scenarios, mitigation strategies have been developed for each scenario. Testing complies with the Regulator of Social Housing regulatory guidance.
BREXIT
In 2018/19 BREXIT continued to provide uncertainty in the market place in which the group operates, in particular, pressures on house selling prices and the performance of the housing market, available labour supply in relation to building, as well as inflationary and interest rate pressures in the economy.
Aster has taken a proactive approach to evaluating the impact of BREXIT and the group has focused its approach on those areas deemed the highest risk as a result of BREXIT. In summary:
• Changes to the housing market - The sector as a whole is more exposed to market fluctuations, and with this in mind, the group has conducted rigorous stress testing for a variety of market scenarios. Included within this were scenarios that forecast a steeper and more severe market downturn;
• Slowdown in s106 agreements - The sector is beginning to see signs of a slowdown in s106 agreements and whilst this is not necessarily a symptom of BREXIT, it is related to wider market conditions. The group’s development programme is geared towards the majority of output coming from s106 agreements. However, in 2018/19 this ratio was increasingly offset through land led development and the group has a vision to be running a 50/50 split programme within five years;
• Building the workforce of the future - One of the few tangible outcomes from BREXIT so far has been the drop in availability of labour across the construction sector. Whilst this has been more acute in London, the group is not immune to the impact. 2018/19 was a record year for the group’s apprenticeship programme, and there is a clear commitment to be the master of its own destiny with a local workforce primed for the future; and
• Suppliers - The group undertook a detailed analysis of its suppliers to understand how they and the group may be impacted by a no deal BREXIT. The group is not overly exposed to supply chain issues, but this is something that has been discussed and will continue to be reported to the boards to ensure it can be effectively managed.
The group’s board regularly discusses and debates BREXIT and are well informed on the issues and kept up to date on the implications for the group.
The group financial plan for 2019/20 has assumed a neutral impact from BREXIT with no impact on the business from these risks although the group’s stress testing scenarios very much cover the group’s ability to weather the associated financial impact from these risks should they occur.

35
Strategic Report Corporate Governance Financial Statements
Risk
External factors
Potential impact Aster’s response
Global and economic operating environment (inc. BREXIT)
Any changes which may affect the operating environment in the UK, could negatively impact profitability.
The impact would depend on the event, however a key consideration following any significant world event for instance is the impact it might have on the group’s funders and key stakeholders directly, the labour market available to the group or the view of the sector by investors, stakeholders, employees and customers.
A living business plan is produced on a quarterly basis that uses prudent assumptions in the long term, with stress testing, scenario analysis and contingency planning.
Horizon scanning is completed.
A treasury management plan including detailed financial risk appetite and acceptable tolerances, is reported monthly to the executive board.
Sales risk
The property market experiences a slowdown in sales and a reduction in property prices, impacting on the ability to sustain a viable development programme across all tenures.
A delay (e.g. sales taking longer than planned) or reduction (e.g. a fall in sales price) to the projected cash flow may result in additional costs to fund the liquidity shortfall, may result in a covenant breach due to on-lending and could impact on the development capacity of the group.
A fall in sales price would result in reduced income and therefore profit, impacting on the funding of further development.
Transactional sales data is monitored weekly.
Performance and expected performance is reported against the development strategy and a suite of KPIs with agreed tolerances and trigger points.
Sales pipeline risk monitoring housing market intelligence reports are reviewed regularly.
Construction pace is monitored to consider speeding up or slowing down development and build rate.
Principal risks
During 2018/19, the board regularly reviewed the risks which they believed could adversely impact the business and also focussed on the opportunities that could be realised to deliver the strategy. The following list provides an overview of the principal risks to the group at the end of March 2019. The list is not exhaustive or set out in order of priority and is continually subject to change:
Principal Risks and Uncertainties

36 Annual Report and Financial Statements for the year ended 31 MARCH 2019
Principal Risks and Uncertainties
Risk
Technical and operational issues
Potential impact Aster’s response
Liquidity and security
Inability to access financing options and maintain sufficient loan security would have an adverse effect on the funding of future development programmes and therefore the future growth of the group.
Liquidity problems would cause the group to slow down or stop its development programme.
The group’s inability to charge housing assets as security for current and future funding requirements restricts the level of future borrowing and could result in an increased cost of borrowing and hence could restrict the level of housing development. In the case of existing borrowing, a delay in security charging could result in a loan covenant breach.
Key financial metrics are monitored monthly, including cashflow.
A security utilisation model is embedded into the business plan.
Property charging, and utilisation is monitored by the Group Investment Panel and Group Treasury Committee.
The group has specific resources dedicated to ensuring a ‘charging pack ready’ approach is followed with monthly monitoring of the security available to be charged KPI.
Health and safety
Serious breach of health and safety regulations leads to serious injury or death.
Any impact would be dependent on the severity of the breach, however could ultimately result in a negative financial impact and detrimental impact with key stakeholders, e.g. regulators, funders and customers.
A monthly board report is produced detailing performance relating to gas, electrical, lifts and water hygiene servicing and fire risk assessment and actions.
Operational management scrutinise and oversee live performance data.
The group applies the three lines of defence assurance model in all areas of safety monitoring.
The group has in place policies and operational procedures, including estate inspections.
Reputational risk
Reputational damage due to significant or sustained high-level crisis events.
The group relies on its reputation to help secure new development opportunities, attract new customers, employees and partner organisations, trade with funders and suppliers and support its position with regulators.
Damage to the group’s reputation could have a detrimental impact on any or all of the above resulting in a negative impact on profits and the future provision of housing.
The group is proactive in communicating regional and national communication of positive news stories, celebrating the difference safe and secure homes make to our communities.
The group has robust and tested incident management plans to support effective response to incidents.
Principal risks (continued)

37
Strategic Report Corporate Governance Financial Statements
Risk
Technical and operational issues
Potential impact Aster’s response
Cyber security
An IT security breachcausing data loss and / or system failure.
Interruption to normal business operations could result in (the short-term) key frontline services not being delivered to customers, and in (the long-term) regulatory intervention.
Cyber-attacks can result in financial loss, disruption of service or damage to reputation.
The group undertakes disaster recovery planning and testing with external specialist annual penetration testing.
The group has in place network security, malware protection, email scanning, web filtering, wireless access control and phishing protection which is monitored regularly and updated as required.
The group has put in place user education and awareness training alongside policy and procedure.
Welfare reform
The impact of welfare reform (inc. Universal Credit) could be significantly different to that envisaged and prepared for resulting in increased rent arrears and decreased income.
Government policy, particularly around benefits paid to the group’s customers such as housing benefit or the housing element of Universal Credit, can have a negative impact on the income streams of the group.
The group has a welfare reform strategy group in place to monitor strategic change and operational impact.
The group is also a member of the Department of Work & Pensions national strategic landlords group with Trusted Partner status.
The group has strong referral and triage processes in place to capture customers at risk of Universal Credit arrears.
The group is also engaged in strategic peer discussions to ensure understanding of best practice.

38 Annual Report and Financial Statements for the year ended 31 MARCH 2019
Treasury policy
The group operates a centralised treasury management function, the primary purpose of which is to manage liquidity, funding, investment and the group’s financial risk, including risk from volatility in interest rates and liquidity. The Group Treasury Committee reviews and recommends the Group Treasury Management Policy before it is approved by the Overlap Boards.
Interest rate risk
The group’s exposure to interest rate fluctuations on its borrowings is managed by using fixed rate loans and interest rate swaps. It is the group’s policy to manage interest rate risk by having at least 50% of debt and no more than 90% of debt subject to fixed rates for the medium to long term. As at 31 March 2019, 88% of debt was fixed (2018: 86%). The group finances its operations by a mixture of retained surpluses, borrowing from the capital markets, government grants and bank loans.
Liquidity risk
Liquidity risk is managed by ensuring the group can meet at least six months of net committed expenditure from cash and having at least twelve months sufficient cash and committed loan facilities capable of immediate draw down to cover the next twelve months forecast cash requirement at all times leaving the group with cash to cover six month net committed expenditure. The group has sufficient undrawn committed and secured facilities and cash available to fund the group, at its full committed and generic development programme level, until 30 September 2020, leaving the group with the cash required to cover six months worth of net committed expenditure. Further financing is not required for another 18 months. This is above the RSH’s requirement for funding which expects finance to be agreed and in place 12 months before it is required.
Cash held at 31 March 2019 was £132.0 million (2018: £101.1 million) which is considerably more than the six months committed capital expenditure required by the Group Treasury Management policy of £58.3 million (2018: £34 million). This cash will be used to help fund the development programme over the next two years.
At 31 March 2019, undrawn committed loan facilities and overdraft facilities amounted to £173.2 million (2018: £118.7 million), all of which is committed and £135.7 million (2018: £118.7 million) available for immediate drawdown.
The drawdown of loan facilities is closely linked to investment in new homes. At the end of the year the group had not committed to any investment that would take it beyond the level of facilities available.
In order to maintain flexibility in the management of liquidity, the group’s policy is to ensure that no more than 15% of debt matures in any 12 months’ period and no more than 35% over the next five years where no replacement finance has been arranged. Of the group debt, £130.5 million (13% of the current facility) is repayable within five years.
Principal Risks and Uncertainties
Financial instruments

39
Strategic Report Corporate Governance Financial Statements
Employee wellbeing During 2018/19 the Aster Group moved forward considerably with its mental health campaign aimed at changing the conversation around mental health in the workplace and put in place training and support for its managers and colleagues. The group has now trained 164 Mental Health First Aiders, one for every eight members of the workforce, with waiting lists for all the future courses.The group recognise that its trade operatives, like many construction industry workers, are particularly vulnerable to mental health issues, so has developed awareness sessions to help these colleagues spot the warning signs in themselves and their workmates. There are now 80 operatives trained with more awareness session planned across the regions for the coming year. The group has also launched a ‘Menopause at Work’ campaign. This initiative will focus on three key areas:• Provide support and information
for women going through the menopause;
• Raise awareness and make it an inclusive topic for the whole group; and
• Educate line managers to be aware of the signs and symptoms of the menopause and their role in supporting colleagues so they can deliver their role successfully.
Giving backSince the group started the match funding initiative nearly three years ago, colleagues have raised over £91,000 for charities with the group contributing over £50,000. During 2018/19 the group has match funded £10,000 to a wide range of different causes, from large team efforts for Alzheimer Society’s Trek 26 marathon walk around Stonehenge and MIND Charity’s RED January, to group-wide charity support and fundraising for Children in Need and Save the Children.
Corporate and Social Responsibility
In addition, as part of the group’s broader commitment to give something back, it has also chosen Cancer Research UK as its ‘Charity of the Year’.
This year the group’s volunteering scheme has seen colleagues dedicate 112 days to activities in local communities and was awarded the Community Award for Volunteering by Dorset Volunteer Centre.
Through the Aster Foundation, the group’s initiative for delivering support to non-core activities of value to its customers, the group has provided one work placement for a member of its local communities, as well as one apprenticeship and six volunteering opportunities.
Employee voice
The Aster Group is on an exciting transformation journey. The group wants to ensure that it is known and trusted, and its people are connected.
As part of this objective the group held Innovation Cafés across all regions in May 2018, where colleagues shared the ways in which they would like to be able to use their voice. The outputs from these sessions have helped inform a review of the group’s internal communication channels and a new approach to employee voice developed, with a focus on empowering colleagues to proactively use their voice to make change happen for themselves. The new intranet platform, Asternet which was launched in February 2019 has provided a collaborative channel for colleagues to easily share their ideas, thoughts and feedback.
The group’s Transformation Network has continued to grow over the past 12 months and continues to act as a channel for communications up and down the group. All colleague groups such as Change Agents, Wellbeing Champions and Employee Consultative Forum members have been brought into the Transformation Network, which has ensured a joined-up approach to cultural change.
In November 2018, all Networkers came together to attend an event where they were given a suite of tools to help them fulfil their role as cultural ambassadors. To ensure focus and provide Networkers with the support needed, Transformation Network Specialisms have been created, and all Networkers have selected which Specialism they will work on over the next year.In response to feedback received following the large scale ‘This is Aster’ event which took place in June 2018, a pilot ‘Quarterly This is Aster’ day was hosted in January 2019. The event was open to all colleagues and provided the chance for attendees to take part in two-way conversations with their peers and members of Executive Board about The Aster Way and the group’s corporate strategy. Feedback from attendees indicates this is an effective way of engaging colleagues and sharing employee voice, and plans are underway to rotate these events around the regions over the coming year. Particular focus has been placed on ensuring remote workers contribute to Employee Voice. The group’s trade teams were invited to away days in October and November 2018, where they were encouraged to share their thoughts on improvements that could be made to support the group’s transformation. A new approach to trades’ team meetings has also been agreed, to create more engaging meetings where colleagues feel able to share their voice and hear updates on what is happening in response to the feedback they have provided. Formal channels to capture Employee Voice and measure the group’s transformation journey have been further developed, with quarterly pulse surveys introduced in June 2018 to provide real time temperature checks. All colleagues were invited to share their thoughts on how the group is performing against each of The Aster Way themes via the annual colleague survey in February 2019.

40 Annual Report and Financial Statements for the year ended 31 MARCH 2019
Equality and diversity
The Aster Group remains committed to creating a fair and inclusive culture and have embedded this aim throughout The Aster Way – our values and behaviours proposition.
This includes reviewing the group’s approach to creating a more diverse and inclusive workforce, which will seek to address a number of key areas through a targeted action plan, working with members of the Transformation Network.
The group reported a reduction in its gender pay gap from last year with reportable figures for the year being 9% (2018: 18%) for Aster Group and 14% for Aster Property Limited (2018: 17%). The group are already working on a range of actions which will seek to further reduce this gap and has set some short, medium and long-term targets which have been published internally and externally.
In addition, the group remain proud to be a Disability Confident Committed employer and are working to achieve the next level of registration.
Environmental impact and mitigation
The group continues to maintain its externally certified environmental management system to the latest version of the ISO14001 standard and no non-conformities were raised at the most recent external audit (January 2019) as undertaken by our environmental auditors BSI Ltd.
More broadly, the group continues to deliver environmental sustainability commitments and key headlines show that our business mileage has reduced by 30% (or 830,000 miles) over the last five years exceeding the target. The corporate building energy consumption has also reduced by 21% and 99% of our office waste is now recycled.
During 2018/19 the group successfully secured green electricity contracts for its corporate real estate and communal domestic portfolio. This is a first for the group.
And as part of the group’s ongoing commitment to ensure all its homes have an energy performance rating of C by 2025 it has successfully secured £1.3 million of funding from the Warm Homes Fund with additional match funding of £657,000 from Southern Gas Networks to bring new efficient gas heating systems to 800 homes.
By order of the board
Bjorn HowardGroup Chief Executive
6 August 2019
Corporate and Social Responsibility

41
Strategic Report Corporate Governance Financial Statements

The group board are responsible for ensuring the sound running of the group
42 Annual Report and Financial Statements for the year ended 31 MARCH 2019

This section of the annual report describes the group’s corporate governance structures and processes and how they have been applied throughout the year.
Corporate Governance Introduction
Corporate Governance
The board of Aster Group Limited (group board) is responsible for ensuring the sound running of the group. This can only be achieved if supported by appropriate and well managed governance processes. The key elements which are believed to be essential for this are described below and discussed in more detail throughout this section of the report.
The group operates an “Overlap Boards” structure, meaning that with the exception of Aster Communities, the same people sit on the boards of Aster Group Limited, Aster Homes Limited, Aster 3 Limited, Aster Living, Aster Property Limited and Synergy Housing Limited. In addition to those members sitting on the Overlap Boards, Aster Communities’ board includes two local council nominees. The meetings of the Overlap Boards clearly indicate the entity for which decisions are being considered to enable board members of the registered societies and directors of the group’s companies to fulfil their duties to act in the best interest of the individual entities. The group’s other operating subsidiaries have their own boards that are appointed by the group board.
43
44 Annual Report and Financial Statements for the year ended 31 MARCH 2019
The UK Corporate Governance Code
The UK Corporate Governance Code (the Code) was published by the Financial Reporting Council (FRC) in May 2010 and revised in September 2012, together with a revised version of its Guidance on Audit Committees. It was revised again in September 2014, the revision focused on the provision by companies of information about the risks which affect longer term viability. A further revision in September 2016 implemented the European Union’s Audit Regulations and applied to the group from 1 April 2017. In July 2018 the Code moved to an updated set of principles that emphasise the importance of strong corporate governance to long-term sustainable success. The group has adopted the 2018 Code from 1 April 2019 and will report against the 2018 Code in its 2019/20 annual report.
The 2016 Code contains broad principles and specific provisions which set out standards of good practice in relation to leadership and effectiveness, remuneration, accountability and relations with shareholders. This Corporate Governance Report is structured to report against each of these key areas. Together with the Group Remunerations and Nomination Committee Report and the Group Audit Committee Report, it describes how the group has complied with the provisions of the Code and applied its main principles during the year.
Corporate Governance Report

45
Strategic Report Corporate Governance Financial Statements
Compliance with the Code of Governance
Except as referred to below, Aster Group Limited and its subsidiaries (the group) have complied with all relevant provisions of the Code throughout the year. The board of Aster Group Limited (group board) sets the standard of governance across the group and ensures compliance with the Code.
During 2018/19 an external evaluation of the effectiveness of the boards and committees was undertaken by Altair Limited, a specialist housing consultancy, appointed by the Group Remuneration and Nominations Committee as its independent advisors. Initial feedback from Altair Limited was considered by the Group Remuneration and Nominations Committee (GRNC) in January 2019 and Altair Limited commented that its findings should be considered in context of there being no real areas of concern.
The board believes that the approach taken to evaluation is consistent with the relevant main principle of the Code (B.6) which requires the board to undertake a formal and rigorous annual evaluation. The board’s intention remains to undertake an externally facilitated evaluation process at least every three years and that in the intervening years the review will be led by the Chairman, Senior Independent Director and the Company Secretary.
Corporate Governance Report
Governance arrangements
The group’s governance structure comprises:
Aster Group Limited Board Responsible for the overall direction of the group, formulating strategies and plans and monitoring the work of the committees.
Subsidiary Boards Contribute to the overall direction and strategy and formulate the strategy and plans for the subsidiaries in line with the overall group.
Customer and Community Network Oversees service delivery to all of Aster Group’s customers and the work it does in communities. Its focus is Aster Group’s social purpose and social impact while being mindful of the economic and regulatory environment that Aster Group operates in.
Group Remuneration and Nominations Committee
Considers matters relating to the recruitment and development of board members, independent members and executive directors. This includes remuneration policy and frameworks, remuneration implementation, nominations to boards and committees and board effectiveness assessments.
Group Audit Committee Oversees the appointment of internal and external auditors and the scope of their work. It also reports to the board on the operation of the internal control arrangements and scrutinises the statutory accounts.
Group Treasury Committee Oversees the group’s treasury management activities and makes recommendations to the boards on those activities.
Group Risk and Compliance Committee
Oversees the management of risk including the development of an effective risk management framework and oversees compliance with statutory regulatory requirements.
Group Executive Board Responsible for implementing the group’s strategy ensuring that financial and other resources are in place to deliver the group strategy.

46 Annual Report and Financial Statements for the year ended 31 MARCH 2019
The code states that at least half the board should be independent non-executive directors. Aster Group Limited and all subsidiaries covered by the group’s “Overlap Boards” structure comply fully with this area of the code, however, the group operates a business model that allows maximum flexibility within the spirit of the code and this model allows the remaining, specialist subsidiaries in the group the flexibility to maximise value to the group as a whole and to not fully comply with the Code as follows:
• The board of Aster Treasury Plc (AT) is composed of three executives and reflects the specialist nature of this vehicle. The group board is confident that the operation of AT is under the close scrutiny of the Group Treasury Committee that consists of non-executive and independent members only;
• Silbury Housing Limited and Silbury Housing Holdings Limited delivered and now monitor the PFI contract for 242 properties in Wiltshire. The group board feels that the mainly executive directors have the appropriate skills and experience to manage this complex project and close scrutiny is provided by the group’s leadership team, executive board and the group’s committees. The boards have one non-executive director;
• Zebra Property Solutions Limited previously delivered the development of properties for resale and rental on the open market prior to it ceasing trading on 1 April 2018. The group board is confident that the three executive board directors have the right balance of skills and experience;
Compliance with the Code of Governance (continued)
Corporate Governance Report
• Aster Solar Limited is a joint venture between Aster Communities and Synergy Housing Limited to deliver solar panels to Aster properties. The four executive board members of Aster Solar Limited give this operationally focused company the scrutiny required by the group board;
• White Rock Land LLP, Kilnwood Vale LLP and Boorley Green LLP are joint ventures between Aster Homes Limited and Galliford Try Homes Limited to deliver properties for sale on the open market to help Aster deliver more affordable housing. There are six partner representatives consisting of executives from the partner organisations. The Aster Homes Limited board, with the support of the executive board, closely monitors the projects and is confident that the joint ventures are prudently managed; and
• The group board is confident that the evaluation of the individual directors sitting on these specialist boards through day to day monitoring of performance by the overlap boards, executive board and the group leadership team ensures they are fit for purpose and an evaluation of these boards was included in the board evaluation which concluded with a report to the group board in September 2017.
Key activities
During the year the Group Remuneration and Nominations Committee supported the group board to re-appoint the Chair. The re-appointment of the Chair was led by the Senior Independent Director and was informed by the appraisal of the Chair and the evaluation of the group board. The Group Remuneration and Nominations Committee also supported the group to recruit a successor to the Chair who will complete his third and final year as Chair.
The committee continuously monitors its succession plan and during the year supported the board with the recruitment of three non-executive members and a co-optee to the overlap boards. These appointments were open to internal and external candidates. One appointment was made from external candidates, the others from existing independent committee members in keeping with the group’s succession policy.
Two appointments were due to expiration of terms of office, and one due to resignation arising from time commitments as a member of the House of Lords. The co-optee appointment was made from an independent member of the Group Treasury Committee.
The externally recruited director was appointed to the Group Risk and Compliance Committee and Group Remuneration and Nominations Committee. One internal candidate appointed to the overlap boards retired from the Group Audit Committee and was appointed Chair of the Group Risk and Compliance Committee and as member of the Group Treasury Committee. The second internal candidate was and continues to be the Chair of the Customer and Community Network, strengthening the customer voice on the boards.
47
Strategic Report Corporate Governance Financial Statements
LeadershipThe role of the boardThe board’s role is to provide leadership of the group and direction for management. It is collectively responsible for the long-term success of the group and for ensuring the group is appropriately managed and operates responsibly as it pursues its objectives. The board reviews the performance of management and the operating and financial performance of the group as a whole. It is responsible for ensuring that the necessary resources are provided for Aster to meet its objectives. In particular, the board is responsible for the key areas of setting strategy and determining risk appetite, ensuring good governance, decision making, promoting good behaviour and succession.Operation of the boardIn order to carry out its work, the board has a planned programme of agendas to ensure all necessary matters are covered and to allow sufficient time for debate and challenge, particularly on areas such as strategy and risk, including risk appetite.The board also takes time to review past decisions where necessary. At board meetings the board receives and considers papers and presentations from management on relevant topics. Effective scrutiny and decision making are supported by providing the board with high quality, accurate, clear and timely information including input from experts and independent advisers where necessary. The board seeks to work in the best interests of Aster Group and its stakeholders.
The division of responsibilities between the Chairman and the Chief ExecutiveThere is a clear division of responsibilities between the running of the board and the executive responsibility for the running of the business and no single individual has unfettered powers of decision. The Chairman’s and Chief Executive’s roles are separate and the division of responsibilities between these roles is clearly established in the standing orders. A periodic review of standing orders and financial regulations during the year confirmed the division of responsibilities as fit for purpose. The role of the ChairmanAndrew Jackson, the Group Chairman, leads the board. He is responsible for ensuring an effective board and effective contributions from individual directors, particularly non-executive directors, based on a culture of mutual respect, openness, debate and constructive challenge. To achieve this, he seeks to facilitate and encourage open communication and constructive working relations between the executive and non-executive directors. He also seeks to ensure that the executive directors are responsive to constructive challenge on their proposals by the non-executive directors. As Chairman, Andrew sets the board’s agenda and ensures that there is adequate time to discuss all agenda items. Each year the board agrees an annual agenda plan designed to ensure that it has the right amount of time throughout the year to discuss all necessary matters. In particular, the board has sought to ensure there is sufficient time to discuss strategy so that the non-executive directors have a good opportunity to challenge and help develop strategy proposals. In addition, the Chairman monitors, with assistance from the Company Secretary, the information distributed to the board to ensure it is of high quality, accurate, clear and timely.
During the year the committee supported the appointment of the Senior Independent Director (SID) due to the term of office expiration of the existing SID. The appointment was made following an internal recruitment campaign.
The appointment of the SID necessitated a change of Chair of the Group Audit Committee and the Co-optee was appointed into this role.
Two new independent members were appointed during the year using external advertising. One appointee was appointed to both the Group Remuneration and Nominations Committee and Group Risk and Compliance Committee and the second to the Customer and Community Network.
All new and retiring members were included in the Altair Limited evaluation.

48 Annual Report and Financial Statements for the year ended 31 MARCH 2019
Corporate Governance Report
The role of the Non-Executive Directors
The role of the non-executive directors is to scrutinise management’s performance in meeting agreed goals and objectives and to monitor how that performance is reported. They must also be satisfied with the integrity of the group’s financial information and with the robustness and defensibility of financial and non-financial controls and risk management systems.
As members of the board, the non-executive directors have a key role in constructively challenging in all areas. This is vital to the independence and objectivity of the board’s deliberations and decision making and is particularly important in helping develop proposals on strategy.
The Chief Executive and the other executive directors welcome, and are responsive to, constructive challenge by the non-executive directors on their proposals. The non-executive directors’ role is then to support the decisions that have been taken and to support the executive team in their delivery. Non-executive directors also play an important part in supporting the Chairman and the executive directors in embracing and representing the company’s culture, values and standards within the board and throughout Aster.
The non-executive directors are responsible for determining appropriate levels of remuneration for the executive directors and have a prime role in appointing and where necessary removing executive directors, and in succession planning.
The role of the Senior Independent Director
During the year Phillip Owens, Senior Independent Director since September 2014, retired at the end of his term of office. Mike Biles was appointed as Senior Independent Director in September 2018. As Senior Independent Director, Mike’s role is to provide a sounding board for Andrew Jackson, to act, when necessary, as a focal point and intermediary for the concerns of the other non-executive directors and to ensure that any key issues that are not being addressed by the Chairman or the executive management are taken up. Andrew has a regular dialogue with Mike regarding current issues. While no such issues have arisen in the year, should any significant issues arise which threaten the stability of Aster or its board, it is recognised that the Senior Independent Director may be required to work with the Chairman or others or to intervene to resolve them. Mike ensures a strong independent link between the board and Aster’s customers and sits on the Customer and Community Network.
The Senior Independent Director is available to shareholders should they have concerns which have not been resolved from contact through the normal channels of Chairman, Chief Executive or other executive directors or if the normal channels may be inappropriate. The Senior Independent Director is responsible for leading the annual appraisal of the Chairman’s performance. The Senior Independent Director plays an important role by ensuring there is an orderly succession process for succession to the chairmanship of Aster Group.
The role of the Chief Executive
The Chief Executive, Bjorn Howard, has day to day management responsibility for running the group’s operations, for applying group policies and for implementing the group’s strategy and policies agreed by the board. He has the broad authority from the board to run the group and he is accountable for, and reports to the board on, how it is performing. Bjorn also has a key role in the process for the setting and review of strategy. More broadly, he promotes the company’s culture and standards throughout Aster, including those on governance.
The role of the Executive Directors
The executive directors have specific responsibilities relating to the areas of the business they oversee. However their duties extend beyond their own businesses to include the whole of the group’s operations and activities.

49
Strategic Report Corporate Governance Financial Statements
The role of the Company Secretary
David Betteridge has been the group’s Company Secretary since February 2018.
David Betteridge is secretary to the board and its committees. David reports to the Group Chairman on board governance matters and, together with him, he keeps the efficacy of the company’s and the board’s governance processes under review and considers improvements. He is also responsible to the board for compliance with board procedures. He is responsible, through the Group Chairman, for advising and keeping the board up to date on all legislative, regulatory and governance matters and developments. David’s responsibilities include ensuring good information flows within the board and its committees and between senior management and non-executive directors. He also facilitates induction and assists with professional development as required. The Company Secretary's advice, services and support are available to each director, independent member and co-optee.
Board meetings
The board meets regularly throughout the year in order to effectively discharge its duties, during 2018 it has met 12 times and there is frequent contact between meetings.
Board committees
The board ensures that its committees are provided with sufficient resources to undertake their duties, including access to the services of the Company Secretary as required. Each committee has the authority to seek any information that it requires from any officer or employee of the company or its subsidiaries. Each committee is also authorised by the board to take independent advice (including legal or other professional advice), at the company’s expense, as it considers necessary. Specific independent consultancy is available to the Group Remuneration and Nominations Committee and the Group Treasury Committee and the details are contained in the respective committee reports.
Group Treasury Committee
The Group Treasury Committee met five times during the year. The committee provides strong technical and strategic scrutiny of the group’s treasury functions. The committee is chaired by Andrew Kluth (non-executive director) and consists of three other members, Andrew Jackson (non-executive), Clive Barnett (non-executive - co-optee) and Caroline Wehrle (non-executive) who joined the committee during the year. The committee ensures affordable capital is available to support the ambitious development programme while ensuring the group operates within the financial covenants agreed with lenders. The committee regularly reviews the treasury risks included on the group’s strategic risk map.
As well as receiving regular and comprehensive key performance reports and scrutinising risks associated with treasury management during the year the Group Treasury Committee:
• Supervised the successful tap of Aster’s Bond;
• Approved changes to designated hedging documentation;
• Approved the group’s securities dealing policy;
• Provided scrutiny of the availability of security;
• Supervised investment in and borrowing through the sector vehicle MORhomes PLC;
• Recommending intra-group lending to support the Bargates housing development;
• Supervised the management of existing credit swap arrangements;
• Considered options to hedge the retained bonds;
• Received an internal audit on the Treasury Management Function;
• Monitored the opportunities/risk around the re-financing of Aster’s PFI borrowing;
• Recommended the Treasury Management Policy;
• Approved additional bank lending;
• Received assurance relating to Aster’s credit rating;
• Monitored and considered the implications of BREXIT; and
• Received training on the process and challenges of property security.
50 Annual Report and Financial Statements for the year ended 31 MARCH 2019
Group Remuneration and Nominations Committee
The Group Remuneration and Nominations Committee is chaired by Stephen Trusler (non-executive) and consists of four other members, Andrew Jackson (non-executive Chairman), Mike McCullen (non-executive), Tracey Peters (non-executive) and Julie Kortens (independent member). During the year Phillip Owens and Sally Higham left the committee at the end of their terms of office. The committee met five times during the year. The committee’s role and work on remuneration is set out in the Remuneration Report and details of their work in relation to appointments is set out above within the review of compliance with the UK Code.
Group Audit Committee
The Group Audit Committee oversees the group’s financial reporting, audit, control processes and recommends the annual accounts to entity boards. The Group Audit Committee is chaired by Clive Barnett (non-executive - co-optee) and consists of three other members, David Finch (independent member) and Mike Biles plus one vacancy which was filled in July 2019. Phillip Owens (non-executive) retired during the year from the end of September 2018 and Caroline Wehrle (non-executive) was appointed to other committees from October 2018.
The committee met five times during the year including one joint meeting with the Group Risk and Compliance Committee and, in addition to recommending the approval of the statutory accounts and reports thereon, considered the following matters:
• Approved and monitored progress against the Internal Audit programme;
• Approved the external auditors work programme;
• Monitored completion of audit recommendations;
• Recommended the statement of internal control;
• Received any reports under the group’s speak up and fraud processes;
• Supervised and received reports from the Group’s external auditors;
• Approved the non-audit fee policy;
• Reviewed all internal audit reports; and
• Reviewed the group’s financial regulations and standing orders.
Group Risk and Compliance Committee
The Group Risk and Compliance Committee helps to ensure that Aster has an effective framework and process to identify, assess and manage risk and compliance across its business. The Group Risk and Compliance Committee is chaired by Caroline Wehrle (non-executive) and consists of three other members, Mike Biles (non-executive), Julie Kortens (independent member) and Mike McCullen (non-executive). Sally Higham (non-executive) retired during the year and Mary Watkins (non-executive), resigned due to time commitments elsewhere.
The committee met six times during the year including one joint meeting with the Group Audit Committee, as well as receiving regular reports to assist its supervision of risk and compliance across Aster, also:
• Carried out a “deep-dive” into areas of interest including:
• Customer complaints;
• Digital transformation;
• Opportunities for local authority partnership working;
• Emerging changes to insurance liability; and
• The future of IT automation.
Corporate Governance Report

51
Strategic Report Corporate Governance Financial Statements
• Approved the Data Protection, Privacy and Confidentiality Policy;
• Received reassurance regarding IT disaster recovery;
• Supported the board to closely monitor serious health and safety incidents;
• Considered the regulator’s sector risk profile;
• Reviewed the group’s insurance arrangements and claims;
• Approved the Framework for Opportunity and Risk Management including the Risk Management Policy and instigated an independent review of its effectiveness;
• Revisited and recommended the group’s risk appetites and tolerances; and
• Received assurance regarding the management of health and safety.
Customer and Community Network
The Customer and Community Network oversees service delivery to all of Aster’s customers and the work it does for its communities. The Customer and Community Network is chaired by Tracey Peters (non-executive) and consists of ten other members, Tony Brooks (independent member), Tracy Aarons (independent member), Debbie Cattell (independent member), Mark Skellon (independent member), Chris Bain (independent member), Mike Biles (non-executive), Stephanie Taylor (co-optee), Bjorn Howard (executive), Rachel Credidio (executive), and Jean Dalziel (executive). Phillip Owens (non-executive), Peter Kingsbury (co-optee) and Nigel Woollcombe-Adams (independent member) retired during the year at the expiry of their terms of office.
The network met four times during the year and as well as receiving regular customer related performance, compliance and risk management reports also:
• Received regular updates from and fed back to the overlap boards and the executive board;
• Considered Aster’s approach and experience in tenancy related court matters;
• Received an update on the repairs service;
• Considered customer service pledges;
• Input into Aster’s customer related strategies;
• Monitored the development of the Aster Foundation;
• Approved the following customer related policies:
• Aids and Adaptations;
• Recoverable Service Charge Policy;
• Leasehold Major Works Repayment Policy;
• Anti-social Behaviour Policy; and
• Compensation Policy.
• Received regular reports from the Customer Overview Group and the Customer Scrutiny Panel; and
• Revisited its forward plan.
Board Committee Membership
Each independent non-executive director is a member of at least one board committee. When deciding the chairmanship and membership of board committees, the board takes into account the value of ensuring that committee membership is refreshed and seeks to ensure that undue reliance is not placed on particular individuals.

52 Annual Report and Financial Statements for the year ended 31 MARCH 2019
Attendance at board and committee meetings
Set out below is the board and committee members attendance at the group’s meetings. Attendance may be lower than the number of possible meetings due to the director or committee member only holding office for part of the year. Where this is the case the percentage in the table reflects the percentage of the possible attendance.
¹ Phillip Owens, Senior Independent Director and member of the Group Audit Committee, Group Remuneration and Nominations Committee and the Customer and Community Network retired on the 30 September 2018 after being involved with Aster Group and its predecessor organisations since 2009 and reaching the end of his term of office.
² Mary Watkins, non-executive director and member of the Group Risk and Compliance Committee resigned on the 31 July 2018 due to work commitments at the House of Lords.
³ Sally Higham non-executive director, Chair of the Group Risk and Compliance Committee and member of the Group Remuneration and Nominations Committee retired on the 30 September 2018 at the expiry of her term of office, having been involved with Aster Group and its predecessor organisations since 2009.
Group board and committees
Aster Group
Limited
Group Executive
Board
Customer and
Community Network
Group Audit
Committee
Group Remuneration
and Nominations Committee
Group Risk and
Compliance Committee
Group Treasury
Committee
Number of possible meetings 12 12 4 5 5 6 5
Clive Barnett ⁸ 5 (100%) 3 (100%) 5 (100%)
Mike Biles ⁴ 10 (83%) 2 (50%) 4 (80%) 4 (67%)
Sally Higham ³ 6 (86%) 2 (67%) 2 (100%)
Bjorn Howard 12 (100%) 12 (100%) 4 (100%)
Andrew Jackson 10 (83%) 5 (100%) 4 (80%)
Andrew Kluth 11 (92%) 5 (100%)
Mike McCullen ⁷ 5 (100%) 2 (100%) 4 (100%)
Phillip Owens ¹ 7 (100%) 2 (100%) 2 (100%) 3 (100%)
Tracey Peters ⁶ 5 (100%) 4 (100%) 4 (80%)
Michael Reece 12 (100%) 11 (92%)
Stephen Trusler 10 (83%) 5 (100%)
Mary Watkins ² 4 (80%) 0 (0%)
Caroline Wehrle ⁵ 6 (86%) 2 (100%) 6 (100%) 2 (67%)
Amanda Williams 11 (92%) 10 (83%)
Chris Benn 12 (100%)
Rachel Credidio 11 (92%) 2 (50%)
Dawn Fowler-Stevens 12 (100%)
Graeme Stanley 7 (58%)
Tracy Aarons ¹⁰ 2 (67%)
Chris Bain 4 (100%)
Tony Brooks 2 (50%)
Debbie Cattell 3 (75%)
Jean Dalziel 4 (100%)
Peter Kingsbury 1 (100%)
Mark Skellon 4 (100%)
Stephanie Taylor 1 (25%)
Nigel Woollcombe-Adams 1 (100%)
David Finch 5 (100%) Julie Kortens ⁹ 1 (50%) 4 (100%)
Corporate Governance Report

53
Strategic Report Corporate Governance Financial Statements
The Board Committees’ terms of reference
Each board committee has written terms of reference which have been approved by the board and are reviewed periodically to ensure that they comply with the latest legal and regulatory requirements and reflect developments in best practice. The committees formally report to the board on their proceedings after each meeting and generally on all matters and activities for which they are responsible via committee minutes.
Effectiveness
The composition of the board
The composition and size of the board and its committees are reviewed regularly by the Group Remuneration and Nominations Committee to ensure they have the appropriate balance of skills, experience, independence and knowledge of the group to enable them to discharge their respective duties and responsibilities effectively.
Having previously adopted the National Housing Federation (‘NHF’) Excellence in Governance Code which allowed a nine-year term of office for board directors, in 2016 the board agreed transitional arrangements that allowed non-executive directors serving at the time of the transition to serve a
maximum of nine years. Non-executive directors appointed since 2016 are appointed for three years and may serve a maximum of two terms.
Appointment to the board and its committees
The board, through the Group Remuneration and Nominations Committee, follows a formal, rigorous and transparent procedure to select and appoint new board directors. The processes are similar for the appointment of executive and non-executive directors. The committee leads the process and makes recommendations to the board.
In considering board composition, the committee assesses the range and balance of skills, experience, knowledge and independence on the board, identifies any gaps or issues and considers any need to refresh the board. If, after this evaluation, the committee feels that it is necessary to appoint a new director, it then prepares a description of the role and of the capabilities required for the appointment and sets objective selection criteria accordingly. The benefits of diversity on the board, including gender diversity, are carefully considered.
The committee considers any proposed recruitment in the context of the group’s strategic priorities, plans and objectives, as well as the prevailing business environment. It also takes into account succession plans in place and this is discussed further under ‘Succession Planning’ below. It seeks prospective non-executive directors who can make positive contributions to the board and its committees and who have the capability to challenge on strategic and other matters.
Aster Group’s business is diverse in scope and carries strategic, commercial and financial risks. Accordingly, attention is paid to the composition and balance of the board to ensure that it has wide experience of the industry and regulatory environment in which Aster Group operates, and appropriate financial, operational and risk management skills. In each board appointment, whether executive or non-executive, objectivity and integrity, as well as skills, experience, ability and diversity, assist the board in its key functions, and are prerequisites for appointment. This also applies to senior management appointments below board level.
⁴ Mike Biles was appointed as Senior Independent Director on the 1 October 2018 for three years. ⁵ Caroline Wehrle was co-opted to the overlap boards on the 1 August 2018 and subsequently appointed as non-executive
on the 1 October 2018 for three years. Caroline was simultaneously appointed as Chair of the Group Risk and Compliance Committee and member of the Group Treasury Committee.
⁶ Tracey Peters was appointed as non-executive director on the 1 October 2018 and continues to be the Chair of the Customer and Community Network and a member of the Group Remuneration and Nominations Committee.
⁷ Mike McCullen was appointed as non-executive director on the 1 October 2018 for three years and simultaneously appointed to the Group Remuneration and Nominations Committee and Group Risk and Compliance Committee.
⁸ Clive Barnett was appointed as co-optee to the overlap boards on the 1 October 2018 for one year and at the same time, was appointed as Chair of the Group Audit Committee.
⁹ Julie Kortens was appointed as an independent member of the Group Risk and Compliance Committee and Group Remuneration and Nominations Committee on the 1 October 2018 for three years.
¹⁰ Tracy Aarons was appointed as independent member of the Customer and Community Network on the 1 September 2018 for three years.

54 Annual Report and Financial Statements for the year ended 31 MARCH 2019
Corporate Governance Report
Board evaluation
The board agreed that the 2018 board evaluation review should be carried out by external consultants and Altair Limited were appointed to carry out this independent review.
The board requires that the annual evaluation of the boards is carried out by external consultants once every three years. During 2018 Altair interviewed all non-executive directors and independent committee members including new and retiring members and attended a meeting of the overlap boards and each committee.
The outcomes from this review were considered by the Group Remuneration and Nominations Committee at its January 2019 meeting and the committee will be further considering this report and make recommendations as to any actions required at its April 2019 meeting.
Board induction and training
An induction programme tailored to meet the needs of individual directors is provided for each new director. Overall, the aim of the induction programme is to introduce new directors to the group’s business, its operations and its governance arrangements. Individual induction requirements are monitored by the Chairman, with the support of the Company Secretary, to ensure that new and recently appointed directors gain sufficient knowledge about the group to enable them to contribute to the board’s deliberations as swiftly as possible.
During the year the Group Remuneration and Nominations Committee approved an improved development plan to support directors and independent members, including executive directors, and their respective governing bodies from appointment through to their cessation as a member.
The board receives on-going training through sessions before board meetings (based on strategic requirements and issues identified during evaluation processes), attendance at conferences, ad-hoc courses and opportunities to work with managers. In addition, the board and its committees undertake deep-dive reviews of specific areas of business activity throughout the year to enhance knowledge of a broad range of operational areas.
Appointment to the board and its committees (continued)
The group considers that the board’s collective experiences equip it to direct the group’s strategy and meet its business needs as they evolve over time. The succession plan ensures the board remains mindful that an appropriate balance between directors who can bring a new perspective and those who provide continuity is essential for a business-like Aster Group.
Directors’ conflicts of interest
The Companies Act 2006 provides that directors must avoid a situation where they have, or can have, a direct or indirect interest that conflicts, or possibly may conflict, with the company’s interests. The board has established procedures for the disclosure by directors of any such conflicts and for the consideration and authorisation of these conflicts by the board. In accordance with the Act, the board considered and authorised each director’s reported potential conflicts of interest during the year. Whenever a director takes on additional external responsibilities, the board considers any potential conflicts that may arise and whether the director continues to have enough time to fulfil his or her role as a director. The board continues to monitor and review potential conflicts of interest on a regular basis and during the year confirmed its code of conduct policy as fit for purpose.

55
Strategic Report Corporate Governance Financial Statements
Information and support
The board has processes in place to ensure that it receives the right information in the right form and at the right time to enable it to effectively discharge its duties. The Group Chairman, through the Company Secretary and with the support of the executive directors and management, ensures that this information is of high quality in terms of its accuracy, clarity, appropriateness, comprehensiveness and currency. Directors can seek clarification or amplification from management where necessary. The directors have access to independent external professional advice at the company’s expense where they judge this necessary to discharge their responsibilities as directors.
Diversity
The board considers that it is the background and experience brought to the board by each individual that best secures and demonstrates its diversity.
No fixed quota is applied to decisions regarding recruitment, rather the Group Remuneration and Nominations Committee considers capability and capacity to commit the necessary time to the role in its recommendations to the board. The intention is the appointment of the most suitably-qualified candidate to complement and balance the skills, knowledge and experience of the board, seeking to appoint those who will be best able to help lead the group in its long-term strategy.
The board is well-placed by the mixture of skills, experience and knowledge of its directors to act in the best interests of the group. The Group Remuneration and Nominations Committee is supporting the group to ensure compliance with The Equality Act 2010 (Gender Pay Gap Information) Regulations 2017.
Succession planning
The board recognises that effective succession planning is not only a fundamental component of board effectiveness but is also integral to the delivery of Aster’s strategic plans. It is essential in ensuring a continuous level of quality in management, in promoting diversity and in avoiding instability by helping to mitigate the risks which may be associated with any unforeseen events, such as the departure of a key individual.
The board has endorsed a succession policy and the Group Remuneration and Nominations Committee routinely reviews the plan for the overlap boards and the committees to facilitate future recruitment in a timely manner. The committee works to ensure a continuous flow of talent is available through developing existing directors and independent members and identifying suitable external candidates to ensure a refreshing of talent and ideas and the on-going maintenance of skills.
Time commitment of the Chairman and the Non-Executive Directors
The board recognises that it is vital that all directors should be able to dedicate enough time to Aster Group to effectively discharge their responsibilities. The time commitment required by Aster is considered by the board and by individual directors on appointment.
The letters of appointment of the Chairman and of each non-executive director set out the expected minimum time commitment for their roles. Each undertake that they will have sufficient time to meet what is expected of them for the proper performance of their duties and acknowledge that there may, on occasion, be a need to devote additional time.
The other significant commitments of the Chairman and of each non-executive director are disclosed to the board before appointment, with an indication of the time involved.
Dialogue with shareholders
The board welcomes the opportunity to openly engage with shareholders as it recognises the importance of a continuing effective dialogue. The board takes responsibility for ensuring that such dialogue takes place.
Aster Communities and Synergy Housing Limited continued their ongoing engagement with shareholders during the year including regular briefing notes and informal shareholder gatherings attended by board directors and senior employees.
The shareholders of the remaining group entities are non-executive directors and entities within the group and engagement with shareholders is through the day to day reporting structure.

56 Annual Report and Financial Statements for the year ended 31 MARCH 2019
Corporate Governance Report
Annual statement on internal control
Introduction
The Aster Group Limited board is responsible for the group’s internal control system and for regularly reviewing its effectiveness. The group has in place integrated governance, risk and compliance frameworks, which play a critical role in setting out how it manages and assures itself that the risks relating to the achievement of its corporate vision, strategy and objectives are effectively controlled. This system of internal control is in accordance with the UK Corporate Governance Code and is designed to manage rather than eliminate the risk of failure to achieve business objectives and can only provide reasonable but not absolute assurance against material misstatement or loss.
The Group Audit Committee provides oversight on behalf of the board regarding the system of internal control and regularly reviews its effectiveness.
1. Operational management
During 2018/19, the executive directors were supported by the leadership team. The business plan and budgets are prepared annually to help ensure the group delivers its strategy and are presented to each entity board and the Aster Group Limited board for approval. To help monitor and ensure that the group’s financial plan remains viable and does not put any undue pressure on its resources, a quarterly update is prepared and considered, this is known as a “living” business plan.
2. Internal audit
The group’s internal audit function is led by the director of audit. There is also an outsource arrangement with appropriate specialist organisations to provide internal audit support where there is an identified resource need or specialist input.
The internal audit plan for 2018/19 was risk-based and informed by the strategic plan, risk register, compliance framework and management requests.
3. Risk management
Risk
Managing risk is fundamental if the group is to protect its viability and deliver its strategic ambitions. It has embedded a risk management culture that identifies and mitigates current and emerging risks whilst exploring potential opportunities arising from new events.
Risk governance
Risk oversight is the board’s responsibility, with the Group Risk and Compliance Committee undertaking a more detailed review of risks that might adversely affect the business’s strategy, operations and legislative compliance. The Group Treasury Committee ensures that risks to the financial viability of the group are managed in accordance with the treasury management policy.
The group recognises that known and understood risk can and should be taken to achieve its objectives, provided that it is justified and actively managed. While the board accepts operational risk is inevitable and that perfect risk avoidance is neither possible nor necessarily desirable, risks related to Health and Safety, financial viability and reputation must be actively managed and mitigated.
Risk framework and risk appetite
The group’s Framework for Opportunity and Risk Management sets out how it identifies, assesses and grades significant risks. Risks are recorded on a risk register, together with existing mitigation controls, potential control improvements and assurances relating to the effectiveness of controls.
In July 2018, the Aster Group Limited board reconsidered and approved the group’s updated risk appetite.
The Group Risk and Compliance Committee, the executive board and the leadership team considered the key risks to the group at every meeting and received information about any change in risk profile.
Scenario testing
The group has undertaken multi-variate scenario testing to analyse the effects of realistic economic and risk scenarios. It has modelled those identified scenarios and assessed the impact on its financial covenants and viability. To ensure the group can recover from the impact of the scenarios, mitigation strategies have been developed for each one. Testing complies with the Regulator of Social Housing’s regulatory guidance.

57
Strategic Report Corporate Governance Financial Statements
4. Regulator of Social Housing - Regulatory Standards
As a registered provider, the group’s primary regulatory framework is the Regulator of Social Housing’s Regulatory Framework for Social Housing in England.
Self-assessment against the required outcomes and specific expectations of each regulatory standard is held centrally in the compliance obligations register, creating a continuous record of how the group delivers against the regulatory expectations and assurance of effective compliance controls.
Actions have been identified which will further strengthen the group’s offer to tenants and other customers and its strong approach to governance and financial planning. Progress will be monitored by responsible lead directors and the Group Risk and Compliance Committee.
Based on these assessments and mapped assurances, it is considered that the group is compliant with all regulatory standards.
5. Compliance
The Governance and Financial Viability Standard sets an expectation for all registered provider boards to take reasonable measures to assure themselves of compliance with all relevant law. The group also recognises that complying with law and taking an ethical approach to business management is critical to ensuring the continued trust of stakeholders.
The group’s approach to regulatory and legislative compliance assurance, through its compliance framework, includes the maintenance of a compliance requirements register. This register identifies all relevant areas of regulation, legislation and industry standards and ensures that accountability for compliance is clearly identified.
The primary items of legislation and regulation are analysed in detail within the compliance obligations register which:
• contains detailed assessments, including how an obligation affects the group, the controls in place to ensure compliance or prevent non-compliance and the assurance available from the three ‘lines of defence’ (see below);
• directs focus on the highest compliance risks and critical processes;
• provides exception reporting to the Group Risk and Compliance Committee; and
• provide a continuous process of compliance assurance to the entity boards, Group Risk and Compliance, Group Audit Committee and executive board.
6. Assurance
The group utilises the ‘three lines of defence’ approach to assurance: day-to-day, assurance is gained at the operational and management level; routinely, through overview by specialist functions and the governing bodies; and, on occasion, independent assurance is gained through internal or external audits or accreditation. Independent assurance is also the group’s fourth cornerstone in its approach to strong governance and assurance.
Assurance across these three lines is regularly evidenced in relation to all identified risks and primary compliance obligations.
The group’s internal auditors have submitted their annual report that includes reference to the standard of control that has been achieved throughout the year and generally
shows a strong compliance with controls. The standards of control have been reported to the Group Audit Committee in regular internal audit reports.
There has been one audit report graded with weak assurance during the year. This audit reviewed controls associated with the ‘grey fleet’ (the use of personal vehicles for business journeys) and identified weaknesses and inconsistency in the guidance and direction provided to colleagues and a lack of a risk assessment and consideration of the relevant “Driving for Work” guidance. The audit recommendations have been agreed and are being progressed.
In addition to controls detailed elsewhere in this statement, the directors derived assurance from the following internal and external controls during 2018/19:
• business and financial reporting, including business critical Key Performance Indicators (KPIs) reported monthly;
• implementation of policies and procedures for key business activities;
• delegations of authority for all financial transactions and other key technical and commercial decisions;
• segregation of duties where appropriate and cost-effective;
• operational management team scrutiny and challenge;
• independent third-party reviews; and
• the skills and experience of all employees.

58 Annual Report and Financial Statements for the year ended 31 MARCH 2019
Annual statement on internal control (continued)
Corporate Governance Report
7. Fraud and dishonest behaviours
The group values its reputation and is committed to maintaining the highest possible ethical standards in all its business activities, including a commitment to reducing the risk of dishonest behaviour within the business to an absolute minimum and keeping it at that level, to ensure that its resources are used to deliver its vital services to its tenants and other customers.
The group has a dishonesty policy, which covers fraud, theft and bribery and also provides a framework for responding to suspicions of dishonest behaviour, which includes tenancy fraud.
In addition, the group has a speak up policy that encourages employees and others to express any serious concerns regarding suspected misconduct or malpractice within the business or by third parties with which it works.
The Group Audit Committee receives regular updates in relation to fraud or attempted fraud and any speak up reports received.
The group also has a designated money laundering reporting officer and has, over 2018/19, continued to review the robustness of revised processes and training introduced following the change in legislation in 2017. This has included an internal audit of the anti-money laundering framework, which received good assurance.
8. Regulatory interaction
In January 2019, Orona Limited (the appointed lift contractor) and Synergy Housing Limited were sentenced for Health and Safety breaches linked to an accident which tragically resulted in a fatality in one of its homes. The accident happened in August 2015 and involved a through floor lift. Synergy Housing Limited was fined £1 million in line with the Sentencing Guidelines and this has been paid in full. Aster Property Limited pleaded not guilty to a similar charge and this has been left to lie on file. Our solicitors have advised that, in practice, this charge can no longer be pursued.
The Regulator of Social Housing (RSH) has confirmed its view that Aster had not breached its regulatory standards. The RSH concluded that Aster’s contribution to the events that led to the accident in August 2015 were not indicative of wider systemic failings whereby other customers were put at risk. In view of this no regulatory action is to be taken.
During 2018/19, the group communicated with the Environment Agency (EA) in relation to incidents as required. The group received correspondence on eight occasions as a result of samples taken by the EA at the group’s sewage treatment plants that contaminants were above permitted levels. The group also self-reported seven internal samples which were above permitted levels. In each case the EA was satisfied with either the explanation as to the findings of the sample reading or Aster’s plans to address any deficiencies in how the plant was operating at that time.
Finally, in 2017/18, the group submitted 14 RIDDOR (Reporting of Injuries, Diseases and Dangerous Occurrences Regulations) reports to the HSE, as required by the Regulations. None of the reports resulted in any request for further information.
Conclusion
I, Bjorn Howard, CEO of the Aster Group, am satisfied that there is sufficient evidence to confirm that adequate systems of internal control existed and operated throughout the year 2018/19, and that those systems were aligned to an ongoing process for management of the significant risks facing the group.
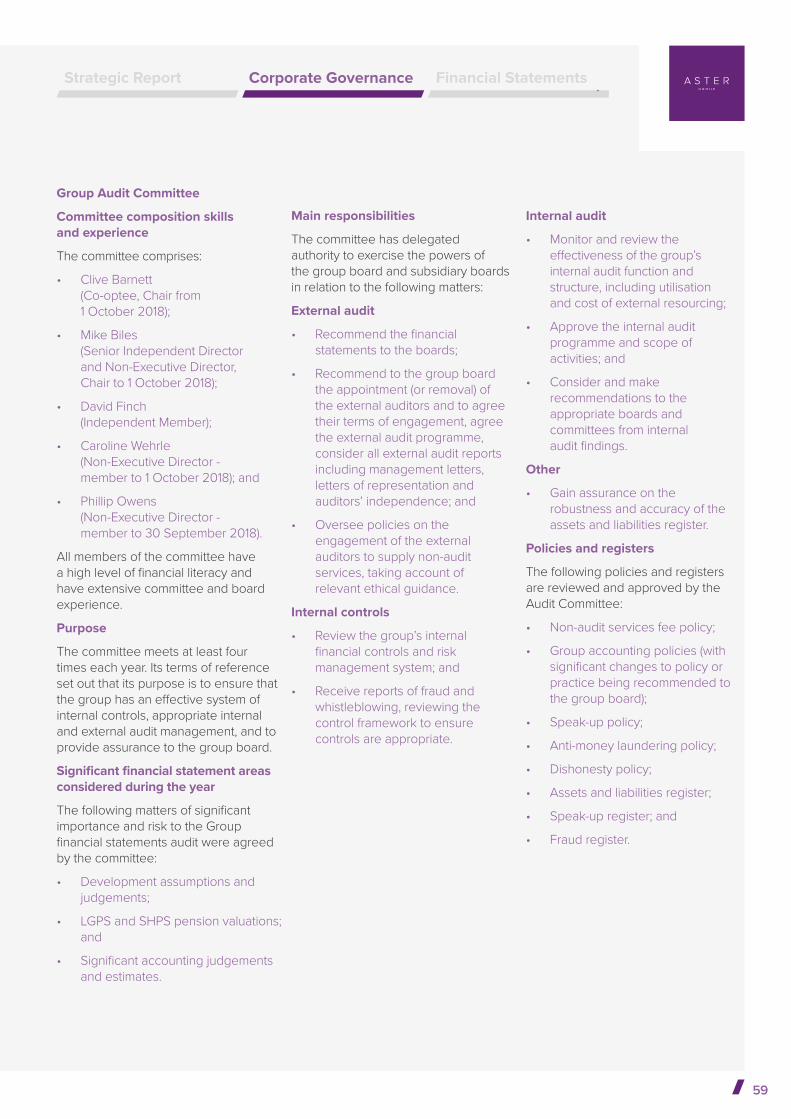
59
Strategic Report Corporate Governance Financial Statements
Group Audit Committee
Committee composition skills and experience
The committee comprises:
• Clive Barnett (Co-optee, Chair from 1 October 2018);
• Mike Biles (Senior Independent Director and Non-Executive Director, Chair to 1 October 2018);
• David Finch (Independent Member);
• Caroline Wehrle (Non-Executive Director - member to 1 October 2018); and
• Phillip Owens (Non-Executive Director - member to 30 September 2018).
All members of the committee have a high level of financial literacy and have extensive committee and board experience.
Purpose
The committee meets at least four times each year. Its terms of reference set out that its purpose is to ensure that the group has an effective system of internal controls, appropriate internal and external audit management, and to provide assurance to the group board.
Significant financial statement areas considered during the year
The following matters of significant importance and risk to the Group financial statements audit were agreed by the committee:
• Development assumptions and judgements;
• LGPS and SHPS pension valuations; and
• Significant accounting judgements and estimates.
Main responsibilities
The committee has delegated authority to exercise the powers of the group board and subsidiary boards in relation to the following matters:
External audit
• Recommend the financial statements to the boards;
• Recommend to the group board the appointment (or removal) of the external auditors and to agree their terms of engagement, agree the external audit programme, consider all external audit reports including management letters, letters of representation and auditors’ independence; and
• Oversee policies on the engagement of the external auditors to supply non-audit services, taking account of relevant ethical guidance.
Internal controls
• Review the group’s internal financial controls and risk management system; and
• Receive reports of fraud and whistleblowing, reviewing the control framework to ensure controls are appropriate.
Internal audit
• Monitor and review the effectiveness of the group’s internal audit function and structure, including utilisation and cost of external resourcing;
• Approve the internal audit programme and scope of activities; and
• Consider and make recommendations to the appropriate boards and committees from internal audit findings.
Other
• Gain assurance on the robustness and accuracy of the assets and liabilities register.
Policies and registers
The following policies and registers are reviewed and approved by the Audit Committee:
• Non-audit services fee policy;
• Group accounting policies (with significant changes to policy or practice being recommended to the group board);
• Speak-up policy;
• Anti-money laundering policy;
• Dishonesty policy;
• Assets and liabilities register;
• Speak-up register; and
• Fraud register.

60 Annual Report and Financial Statements for the year ended 31 MARCH 2019
Corporate Governance Report
Group Audit Committee (continued)
Activity during the year
The director of audit is satisfied that the group complies with the audit provisions of the Code. A number of activities were undertaken during the year which support the ongoing work of the committee over and above its core responsibilities outlined above. Those activities include:
• A private meeting held by the members of the committee and the external auditors at the July 2018 meeting of the committee; and
• A joint meeting between members of the Group Audit Committee and the Group Risk and Compliance Committee held in the year which resulted in an action plan for cross–committee reporting.
Viability statement
In accordance with provision C.2.2 of the 2016 Corporate Governance Code, the directors have assessed the viability of the group and have selected a period of seven years for the assessment. The group has a property development programme that runs for a rolling seven-year period. This programme forms the basis of the group’s financial plan that covers the seven year period and is then extrapolated over a further 23 years, resulting in a 30 year plan. For these reasons the group uses a seven-year strategic planning cycle and the directors have determined that seven years is also an appropriate period over which to provide its viability statement.
The financial plan considers the group’s future financial stability, property development strategy and the viability of future expense reduction programmes by measuring the operating margin, exposure to the property market, asset cover, interest cover and net worth ratios over the seven-year period.
The interest cover and net worth ratios are the prominent covenants the group has in its bank loan agreements. These ratios are used as the basis for a full suite of multi-variate stress testing over the life of the plan on a number of realistic, market relevant scenarios.
The stress testing considers the principal risks assessed to have the greatest impact. The group’s focus for stress testing in the 2019 financial plan is on exposure to the property market, the impact of further changes to the rent regime and BREXIT.
These scenarios are designed to stress and, in some cases, breach the group’s lenders covenants. The group applies mitigating items from its established mitigations toolbox to recover these scenarios back to a compliant level. These mitigations include reducing investment in the development programme, issuing emergency liquidity and a number of expenditure freezes.
Based on the results of this analysis, the directors confirm that they have a reasonable expectation that the group will be able to continue in operation and meet its liabilities as they fall due over the next seven years.

61
Strategic Report Corporate Governance Financial Statements

62 Annual Report and Financial Statements for the year ended 31 MARCH 2019
Board of Directors
Members of the board: The directors of the company who were in office during the year and up to the date of signing the financial statements, unless otherwise indicated, are set out below.
Non-executive directors:
Andrew Jackson Chairman
Phillip Owens Retired 30 September 2018
Sally Higham Retired 30 September 2018
Mary Watkins Retired 31 July 2018
Stephen Trusler
Mike Biles Senior Independent Director
Andrew Kluth
Mike McCullen Appointed 1 October 2018
Tracey Peters Appointed 1 October 2018
Caroline Wehrle Appointed 1 October 2018
Executive directors:
Bjorn Howard Group Chief Executive
Michael Reece Group Operations Director
Amanda Williams Group Development Director
Co-Optee:
Clive Barnett Appointed 1 October 2018
Executive Board: Bjorn Howard Group Chief Executive
John Brace Group Resources Director and Deputy Group Chief Executive - redundant 30 April 2018
Rachel Credidio Group People and Transformation Director
Michael Reece Group Operations Director
Graeme Stanley Group Strategy and Implementation Director
Amanda Williams Group Development Director
Dawn Fowler-Stevens Group Growth and Assurance Director
Chris Benn Group Finance Director
Company Secretary: David Betteridge

63
Strategic Report Corporate Governance Financial Statements
Andrew brings an extensive knowledge of financial affairs, risk management, internal control structures and performance monitoring to the role of chairman. He has served on the Aster Group Board and chaired the Group Audit and Group Risk Committees. Andrew has been Group Chairman since 1 October 2015.
A chartered accountant, Andrew has held executive and non-executive directorships in a number of industries including energy and construction working with the UK Atomic Energy Authority and Sir Alfred McAlpine.
He has previously served on Aster Group’s property maintenance and asset management division board.
Committee Membership:
Group Treasury Committee
Group Remuneration and Nominations Committee
Andrew JacksonGroup Chairman
Mike has a doctorate in law and was housing ombudsman for England for 13 years until 2014. This role has given him an extensive understanding of all aspects of rented housing from complaint handling and dispute resolution to customer service, support and building good relations between providers and customers.
Mike has taught Land Law, Landlord and Tenant Law and Housing Law extensively. He has also published articles in this field and has chaired and spoken at numerous industry-related conferences.
Mike is a visiting professor in law at Southampton Business School where he has also held the post of Head of the School of Law. He has been
a lawyer member of the Leasehold Valuation Tribunal and a member of the management committee of a registered social provider.
Mike is an honorary member of the Chartered Institute of Housing and was a member of the Chartered Institute of Arbitrators and a fellow of the Royal Society of Arts.
Committee Membership:
Group Audit Committee
Group Risk and Compliance Committee
Customer and Communities Network
Mike BilesNon-executive director and Senior Independent Director

64 Annual Report and Financial Statements for the year ended 31 MARCH 2019
Board of Directors
Mike is an accomplished CEO, Chairman and technology entrepreneur with over 30-years’ leadership experience in private, public and venture backed businesses specialising in technology for the built environment.
Mike was a co-founder and Managing Director of Asta Development plc, one of the UK’s most successful project management software businesses for the construction industry, which he grew and led to exit in 2006. He is a former Group Board Director of an AIM listed technology business and was CEO of its international construction software and services business for over eight years.
He has extensive overseas experience having led construction technology businesses in Sweden and Germany and established international distribution in Australia, Europe and the USA. He has completed a number of international acquisitions.
Mike started his own consultancy practice in 2015 working as an independent director and consultant advising private equity firms on technology investments and VC-backed technology start-ups. He is currently Director of Pre-contract Solutions at Causeway Technologies.
He holds a Computer Science degree (Manchester) and an MBA (Warwick).
Committee Membership:
Group Risk and Compliance Committee
Group Remuneration and Nominations Committee
Clive recently retired from RBS/NatWest having been head of the bank’s housing finance team for many years. He worked within the social housing finance market for over 20 years and was recognised as a leading figure in that sector. Clive represented RBS within Government circles, including RSH, DCLG and CML Housing Committee.
In addition to his role with Aster, Clive also holds other non-executive positions and was also a consultant director with one of the sector’s leading treasury advisers for a short while.
Committee Membership:
Chair Group Audit Committee
Group Treasury Committee
Mike McCullenNon-executive director
Clive BarnettCo-optee

65
Strategic Report Corporate Governance Financial Statements
Tracey is an accomplished human resources professional. She has worked as an executive board HR professional in many industry sectors including retail, manufacturing and electronic banking and has fifteen years of non-executive director experience with organisations such as Spectrum Housing Association, Dorset County Hospital FT and Lighthouse Poole.
Tracey runs a consulting business specialising in organisational and personal development which offers executive coaching and counselling. She is also a non-executive director and trustee of Active Dorset, which
Andrew is a career finance professional specialising in the Treasury arena. He has held a number of senior roles, primarily in the debt finance function within British Gas, Vodafone and National Grid and is currently Head of Treasury at UK Power Networks.
In his early career Andrew helped finance Eurotunnel before working on the demerger of Centrica from British Gas and the separation of the Gas Distribution Networks from Lattice Group. Andrew has worked on several large acquisitions globally including Mannesmann at Vodafone and Keyspan Corp at National Grid.
Andrew has held a number of other non-executive posts including as a director of Aerion Fund Management and roles relating to his work as a trustee for various pension schemes.
Committee Membership:
Chair Group Treasury Committee
Andrew KluthNon-executive director
Tracey Peters Non-executive director
engages with many stakeholders in the South West encouraging people to include physical activity in their everyday lives.
Tracey also works as a volunteer with Relate working in schools with children who are suffering emotional difficulties.
Committee Membership:
Chair Customer and Community Network
Group Remuneration and Nominations Committee

66 Annual Report and Financial Statements for the year ended 31 MARCH 201966
Board of Directors
Annual Report and Financial Statements for the year ended 31 MARCH 2018
Stephen is the Residential Sector Leader at Laing OʼRourke where he is responsible for leading strategic growth in the residential business.Stephen has previously held senior roles with large housing companies: Wates Living Space; Alfred McAlpine; and Lovell.With over 30 years’ experience in the housing industry Stephen has an extensive track record in successfully growing major businesses. He is committed to ensuring that housing supply and affordability remains high on the Government’s political agenda and
a passionate supporter of driving innovation across the construction industry.Stephen is a fellow of the Royal Institute of Chartered Surveyors and a distinguished member of the Chartered Institute of Housing.
Committee Membership:Chair Group Remuneration and Nominations Committee
Caroline has spent more than 20 years working in the fields of risk management, internal controls and, more recently, compliance and ethics. The first 8 years of Caroline’s career were spent working in the engineering sector for WS Atkins, providing technical and quantitative risk management services to public and private sector clients, largely in the rail industry. This included 4 years spent working in Hong Kong, China and Singapore. Caroline has over 16 years’ of experience with Diageo’s internal audit function where she undertook a number of senior finance positions, culminating in her role as Global Risk and Compliance Director leading an integrated global risk, control, compliance and ethics function. Caroline is passionate about doing business the right way.
Caroline has a BA Honours degree in Risk Management from Glasgow Caledonian University, an MBA from Cass University, and is a member of the Institute of Risk Management.
Committee Membership:Chair Group Risk and Compliance CommitteeGroup Treasury Committee
Stephen TruslerNon-executive director
Caroline WehrleNon-executive director

67
Strategic Report Corporate Governance Financial Statements
Bjorn became Aster Group’s CEO in 2009 and has been instrumental in driving growth, including leading Aster’s successful merger with Synergy Housing Limited in 2012. Since then, the group’s housing business has grown to more than 30,000 homes.
Bjorn has worked in the housing, care and support industry for 30 years and has extensive board-level experience in both executive and non-executive roles. He has served as a non-executive director for an NHS Trust, educational
organisations, regeneration boards and as a government appointee to a housing association.
Bjorn holds a master’s degree in management and is a fellow of the Chartered Institute of Housing and Chartered Management Institute. He is also a member of the Institute of Directors.
Committee Membership:
Customer and Community Network
Michael is responsible for all group housing, asset management and maintenance activities.
Michael joined Aster Group in 2008 as managing director of Aster Property Management where he progressed to group operations director.
He has spent over 30 years in the maintenance sector working in a variety of contractor, consultant, local authority and housing association senior roles.
Michael has extensive operations experience including improving, restructuring and merging property maintenance functions and direct labour organisations.
He has quantity surveying qualifications, a law degree and an MBA.
Amanda has over 25 years’ experience in development, marketing and asset management for registered social landlords, joining Aster Group in 2012. She was previously director of business development at Synergy Housing Limited, prior to the merger with Aster and drove the strategic direction of the association’s new-build development activity, including becoming an independent preferred investment partner.
Before Aster, Amanda was head of development for Sanctuary Housing Group for London and the South East, and an associate director of Adams Integra, a consultancy specialising in housing development and planning. She was also director of development services for Apex Housing (now A2Dominion) for nine years where she was responsible for growing a mixed development programme from scratch to over 1,000 units per year.
Amanda is a Board Director of Silva Homes.
Michael ReeceGroup operations directorExecutive director
Bjorn HowardGroup CEOExecutive director
Amanda WilliamsGroup development directorExecutive director
67

68 Annual Report and Financial Statements for the year ended 31 MARCH 2019
MembersStephen Trusler Committee member and Chair since 1 September 2014.
Philip Owens Committee member since 1 September 2014. Retired 30 September 2018.
Sally Higham Committee member since 1 September 2014. Retired 30 September 2018.
Andrew Jackson Committee member since 14 March 2017.
Tracey Peters Committee member since 14 March 2017.
Mike McCullen Committee member since 1 October 2018.
Julie Kortens Independent Committee member since 1 October 2018.
Other attendees at committee meetings include the Group CEO, Group People and Transformation Director, Group Growth and Assurance Director, Governance and Risk Director, Transformation Director - People, Transformation Director - Communications and Talent Lead. The committee met five times during 2018/19.
The work of the committee is supported by the group’s governance and assurance team and the Group Growth and Assurance Director who assist the Committee Chairman in planning the committee’s work and ensuring that the committee receives accurate and timely information.
Remuneration and Nominations Committee Overview
The directors’ remuneration report for the year ended 31 March 2019 sets out the remuneration policy and remuneration details for the executive and non-executive directors of the group.
It has been prepared in accordance with the Accounting Direction 2015 and elements of Schedule 8 of The Large and Medium-sized Companies and Groups (Accounts and Reports) Regulations 2008 as amended in August 2013. The report is split into three main areas: the annual report on remuneration, committee overview and the policy report.
The committee will continue to focus on the linking of reward to business and individual performance and the strengthening of the group’s values.
The committee’s responsibility is to determine and oversee remuneration policy that seeks to retain and motivate talented individuals, align with the group’s values and principles, and comply with best practice and regulatory requirements.
The committee reviews the on-going appropriateness and relevance of remuneration policy and takes into account many factors including the need for remuneration to be structured so as to link rewards to business and individual performance.
This report details the existing remuneration policy that is in place for the executive board of Aster. As part of the ongoing approach to excellence and best practice, the group has been completing a review of this policy during 2018/19 to ensure that it is fit for purpose in the future. The results of this review are due to be implemented during 2019/20.
The composition of the Group Remuneration and Nominations Committee (GRNC) comprises four non-executive directors and one independent member. During the year the membership of the committee was as follows:
Directorsʼ Remuneration Report

69
Strategic Report Corporate Governance Financial Statements
Committeeʼs role and responsibilities
The committee’s responsibilities include:
• Reviewing the structure, size and composition (including the skills, knowledge, experience and diversity) of the board and making recommendations to the board with regard to any proposed changes;
• Nominating, for the approval of the board, appropriate individuals to fill board vacancies as and when they arise having considered candidates with relevant experience from a wide range of backgrounds;
• Succession planning, taking into account the challenges and opportunities facing the company and the background, skills and expertise that will be required on the board in the future and reviewing annually management succession planning processes in relation to the company’s senior executives;
• Determining and recommending to the board the framework and policy for the remuneration of the Chairman, non-executive directors and independent members; and
• Determining and recommending to the board the framework and policy for the remuneration of the CEO and executive directors.
Committee activities during 2018/19
The committee receives a regular report on trends in remuneration in the sector and beyond presented by Altair Limited, the committee’s advisors. The committee regularly reviews the structure, size and composition (including the skills, knowledge and experience) required of the board and makes recommendations to the board as appropriate. The board has satisfied itself that the committee has in place appropriate plans for orderly succession to the board and senior management positions as well as procedures to ensure an appropriate balance of skills within the group and on the board and its committees.
In considering board composition, the committee assesses the range and balance of skills, experience, knowledge and independence on the board, identifies any gaps or issues and considers any need to refresh the board. If, after this evaluation, the committee feels that it is necessary to appoint a new director, it then prepares a description of the role and of the capabilities required for the appointment and sets objective selection criteria accordingly. The benefits of diversity on the board are carefully considered.
The committee considers any proposed recruitment in the context of the group’s strategic priorities, plans and objectives, as well as the prevailing business environment. It seeks prospective non-executive directors who can make positive contributions to the board and its committees and who have the capability to challenge on strategic and other matters. This is balanced with the desire to maintain board cohesiveness.
During the year the committee also considered the following matters:
• Considered a report on gender pay gap reporting;
• Carried out a review of executive remuneration and approach to bonus payments;
• Reviewed its terms of reference to ensure it remained fit for purpose;
• Reviewed the Board Succession Policy;
• Recommended the appointment of a new Senior Independent Director on the retirement of the post holder; and
• Recommended the appointment of new Non-Executive Directors and an Independent Member following a comprehensive external recruitment programme.
The board through the committee will continue to focus during the coming year in particular on succession planning, including for the planned appointment of a new board chair upon the retirement of the current chair.

70 Annual Report and Financial Statements for the year ended 31 MARCH 2019
Remuneration policy
The remuneration strategy for Aster Group’s Executive Board positions is based on the following five key priorities:
1. Retention of executive board members
Remuneration should be sufficient to help Aster retain current executive directors. This will provide Aster with stable leadership and ensure that the organisation is best placed to deliver future change and growth activities.
2. Transparency Remuneration of executive directors should be transparent and sufficiently robust to stand up to any external scrutiny.
This includes positioning of the remuneration package against the market and ensuring a robust and demonstrable link between performance and bonus awards.
3. Simplicity Any executive board remuneration arrangements that Aster has in place will remain simple and easy to understand. This includes the breadth of the remuneration package, as well as areas such as performance objectives. This will help to support the ‘Transparency’ objective above, but will also ensure that the overall scheme remains efficient to manage.
4. Reward success Basic salaries will be set at a level sufficient to attract and retain high calibre staff, and the bonus scheme will be used as a mechanism to reward exceptional performance.
5. Fairness and market based remuneration
Executive directors will be paid fairly in relation to the market with basic salaries set within the median position found for the post through external benchmarking.
Aster Group’s executive reward package has a focus on fixed remuneration, but with a small variable element available to reward exceptional performance.
The approach has been designed to enable Aster Group to recruit and retain high calibre individuals, provide a mechanism to motivate and reward high levels of performance, reflect sector practices and maintains a focus on value for money.
Directorsʼ Remuneration Report

71
Strategic Report Corporate Governance Financial Statements
Details on each element of reward included in the remuneration package for Executive Board positions are provided in the table below.
Type Element of reward
Description Purpose Value
Fixed Basic salary A fixed basic salary, set in line with the chosen benchmark position.
To provide competitive fixed elements of reward which can attract and retain high calibre individuals to deliver Aster’s strategy.
Spot salary aligned to the market.
Pension Access to a defined benefit pension, operated by the Social Housing Pension Scheme. (Reviewed in 2018/19 and due to come into effect 1 April 2020)
Employer contributions dependent upon scheme membership.
Other An annual health assessment is provided to members of the executive board. Other benefits are in line with wider package of benefits provided to all staff.
In line with wider staff provision.
Variable Bonus A variable element of the package determined on an annual basis with reference to performance against agreed objectives.
To motivate and reward exceptional levels of performance.
Maximum award is 10% of the basic salary for each post, awarded on an annual basis as a non-consolidated bonus.
Bonus payments are discretionary and non-pensionable.
To develop collaborative working across the Executive Board.

72 Annual Report and Financial Statements for the year ended 31 MARCH 2019
Details on each variable element of reward included in the remuneration package for Executive Board positions are provided in the table below.
Remuneration policy (continued)
Setting performance objectivesPerformance objectives The performance metrics used as part of the bonus scheme will include
a mix of:
• Corporate – linked directly to Aster’s corporate strategy and applied consistently to all members of the Executive Board
• Individual – specific to each individual
To achieve the aim of ‘Simplicity’, as a guide there should in total be no more than eight objectives.
The targets must be SMART (Specific, Measurable, Achievable, Realistic and Timely) and the GRNC must ensure that the objectives which are set are stretching.
Monitoring performance Performance against the objectives should be pro-actively monitored by the GRNC and Chief Executive for Executive Directors throughout the year.
In exceptional circumstances and to ensure that they remain appropriate, the GRNC has discretion to approve the adjustment of the objectives.
Reviewing performance At the end of the financial year the Chief Executive will consider performance against the previously agreed objectives and determine an appropriate level of bonus award (Group Chair for Chief Executive, see below for further comments on linking performance with bonus awards). All awards to be approved by the GRNC.
The purpose of the executive bonus scheme is to:
• Motivate and reward exceptional levels of performance;
• Develop collaborative working across the executive board;
• Ensure key elements of Aster’s strategy are delivered successfully;
• Provide the potential to earn a maximum award of 10% of basic salary; and
• Reward performance on an annual basis.
Details on how the bonus scheme is operated are provided below.
Directorsʼ Remuneration Report

73
Strategic Report Corporate Governance Financial Statements
Linking performance to bonus awards
There is the opportunity to make bonus awards on a sliding scale of up to 10% of basic salary. The table below provides some guidance on the link between level of performance and the value of the bonus awards.
Level of performance Value of bonus awardedPoor / satisfactory – The majority of the set targets have not been met or there has been significant underperformance in one or two areas to warrant the withholding of any bonus payment.
0%
Above average – the majority of the targets have been met or exceeded. A minority of targets have not been met, predominantly due to circumstances outside of the individual’s control.
1% to 3%
Good performance – all set targets have been met. 3% to 7%
Excellent performance – all set targets have been met and the majority have been exceeded. 7% to 10%
The information above is for guidance only and the GRNC has absolute discretion for determining the level of bonuses awarded. This includes either withholding or enhancing the level of award made having considered all relevant circumstances related to performance.
Withholding of bonus awards
The GRNC has the absolute discretion on approving the level of bonus awards. In certain circumstances the GRNC may also decide to withhold approval of the award of a bonus payment. Examples of circumstances where the GRNC may withhold bonuses (even when targets are met):
• When other environmental factors (external or internal) would deem the award of a bonus to the executive board as inappropriate;
• If performance of the organisation in core areas drops below required standards;
• If an individual is no longer in employment or is under notice of termination (either resignation or dismissal); and
• If an individual is subject to a disciplinary investigation. If the investigation is subsequently found to have no foundation, the entitlement will be re-instated if there are no other mitigating circumstances as defined by the GRNC.
Advisors to the Committee
Altair Limited acted as independent advisors to the committee throughout the year. The committee is satisfied that the advice it receives on executive directors’ remuneration is independent and objective.
Chairman and Non-Executive Directors
The Chairman and each of the non-executive directors have letters of appointment and terms of service. These set out their duties and responsibilities, the time commitment expected by the company, and the basis on which their fees will be paid. These letters of appointment can be terminated with immediate effect by either the director concerned or the group. There are no provisions for compensation payable on termination of appointment.
None of the non-executive directors nor the Chairman is entitled to a bonus or pension contributions. The non-executive directors’ letters of appointment are available for inspection, on request, at the group’s registered office.

74 Annual Report and Financial Statements for the year ended 31 MARCH 2019
Directors’ emoluments
The information provided in this part of the Directors’ Remuneration Report is subject to audit.
Members of the executive board
Name Position Salary, allowances
and fees£
Benefits in kind
£
Bonus
£
Employersʼ pension
contribution£
Loss of office
£
Total
£
Bjorn Howard 1 Group Chief Executive2019 228,062 868 20,526 21,438 - 270,8942018 216,618 784 17,573 20,362 - 255,337
John Brace Group Resources Director and Deputy Group Chief ExecutiveRedundant 30 April 2018
2019 - - - - - -2018 167,504 2,170 14,688 15,745 193,172 393,279
Michael Reece 1 Group Operations Director
2019 166,050 1,142 14,114 15,609 - 196,9152018 151,830 1,100 12,974 12,974 - 178,878
Graeme Stanley 2 Group Strategy and Implementation Director
2019 82,761 - - - - 82,7612018 80,564 - - - - 80,564
Amanda Williams 1 Group Development Director
2019 166,050 - 14,945 16,605 - 197,6002018 143,916 - 12,036 13,011 - 168,963
Brian Whittaker Group Human Resources DirectorRedundant 4 August 2017
2019 - - - - - -2018 52,479 873 500 4,933 210,891 269,676
Rachel Credidio Group People and Transformation Director
2019 132,369 868 11,251 12,443 - 156,9312018 121,140 784 8,412 11,387 - 141,723
Dawn Fowler-Stevens
Group Growth and Assurance Director Appointed 27 July 2017
2019 125,690 868 11,928 8,430 - 146,9162018 69,795 460 - 6,437 - 76,692
Chris Benn Group Finance Director Appointed 27 July 2017
2019 167,369 955 13,679 6,027 - 188,0302018 91,667 460 - 4,652 - 96,779
Total 2019 1,068,351 4,701 86,443 80,552 - 1,240,047 Total 2018 1,095,513 6,631 66,183 89,501 404,063 1,661,891
Directorsʼ Remuneration Report

75
Strategic Report Corporate Governance Financial Statements
Set out below is the remuneration of the group and its subsidiariesʼ non-executive directors and committee members.
Non-executive directors - Aster Group Board
Name Position 2019 Total
£
2018Total
£
Clive Barnett Co-optee from 1 October 2018 5,562 -Mike Biles 17,822 13,158 Sally Higham Retired 30 September 2018 8,712 13,071 Andrew Jackson 28,700 26,664 Andrew Kluth 17,425 13,071 Mike McCullen Appointed 1 October 2018 6,163 - Phillip Owens Retired 30 September 2018 9,110 17,776 Tracey Peters Appointed 1 October 2018 7,036 -Stephen Trusler 17,425 13,071 Mary Watkins Retired 31 July 2018 4,109 13,039 Caroline Wehrle Co-optee from 1 August 2018,
Appointed 1 October 2018 9,321 - 131,385 109,850
Non-executive directors - Subsidiary companies
Name Position 2019 Total
£
2018Total
£
Richard Clewer 1,286 1,255 Clare Crawford 4,823 4,125 Nigel Woollcombe-Adams 3 3,277 5,960
9,386 11,340
All employed members of the executive board are ordinary members of the Social Housing Pension Scheme (SHPs). Three, including Bjorn Howard, are members of the final salary 1/60th structure, one is a member of the Career Average of Earnings (CARE) 1/60th structure, one is a member of the CARE 1/120th structure and one is a member of the SHPs defined contribution structure. No enhanced or special terms apply and there are no additional pension arrangements in place.
During the previous year the group’s Executive Team was restructured. John Brace and Brian Whittaker were made redundant and Dawn Fowler-Stevens and Chris Benn joined the team. Their remuneration is shown above from the date they left or joined the team. John Brace received a loss of office payment of £193,172 redundancy payment. Brian Whittaker received loss of office payments consisting of £69,762 payment in lieu of notice and £141,129 redundancy payment totalling £210,891.1 Bjorn Howard, Michael Reece and Amanda Williams are also Group Board Directors. 2 Graeme Stanley is employed as a consultant.
3 Nigel Woollcombe-Adams is also a member of the Customer and Community Network until 31 August 2018.
Expenses for all boards of £7,626 (2018: £6,793) were reimbursed during the year.

76 Annual Report and Financial Statements for the year ended 31 MARCH 2019
4 Caroline Wehrle is chair of the Group Risk and Compliance Committee and is a member of one other committee. She was co-opted to Aster Group Board from 1 August 2018 and appointed as a non-executive director on 1 October 2018. Her salary for 2019 has been apportioned on a time basis between committee members and non-executive directors - Aster Group Board.
5 Clive Barnett is chair of the Group Audit Committee and is a member of one other committee. He was co-opted to Aster Group Board from 1 October 2018. His salary for 2019 has been apportioned on a time basis between committee members and non-executive directors - Aster Group Board.
6 Tracey Peters is chair of the Customer and Community Network and is a member of one other committee. She was also appointed to Aster Group Board from 1 October 2018. Her salary for 2019 has been apportioned on a time basis between committee members and non-executive directors - Aster Group Board.
All Aster Group Board non-executive directors are also members of at least one of the group’s committees. Remuneration for this work is reflected in the non-executive directors remuneration shown in the table on the previous page.
Committee members
Name Position 2019 Total
£
2018Total
£
Caroline Wehrle 4 4,661 8,108 David Finch 4,823 4,706 Clive Barnett 5 5,562 4,705 Julie Kortens Appointed 1 October 2018 4,823 -
Tracey Peters 6 7,036 10,646Malcolm Curtis Retired 5 June 2017 - 1,274
26,905 29,439
Customer and Community Network members
Directors’ emoluments (continued)
Directorsʼ Remuneration Report
The Customer and Community Network has seven (2018: seven) members who do not serve on any other committees. Five members who served for a full year were each paid an annual salary of £4,823 (2018: £4,705). One member was appointed to the Network on 1 September 2018 serving for seven months and was paid a salary of £2,813. One member retired on 7 September 2018 serving for five months and was paid a salary of £4,207 (2018: £9,411). The total remuneration paid to the members was £31,134 (2018: £32,297).
Expenses for all committees and networks of £2,361 (2018: £2,453) were reimbursed during the year.
The Remuneration Report was approved by the Board of Directors on and signed on its behalf by:
Stephen TruslerChairman of the Remuneration Committee
6 August 2019

77
Strategic Report Corporate Governance Financial Statements

78 Annual Report and Financial Statements for the year ended 31 MARCH 2019
Report of the Board
The board presents its report and the audited consolidated financial statements for the year ended 31 March 2019.The board's report comprises page 78 of this report. Some of the matters required by legislation have been included in the Strategic Report (pages 5 to 41) as the board considers them to be of strategic importance. In particular these are:• future business developments;• principal risks; and• corporate and social responsibility (including diversity).Principal activities The Aster Group’s principal activities are to provide affordable homes and associated services through its Registered Providers and other member companies. It also provides care and support services to the elderly and vulnerable, maintains its properties and develops new homes for rent and sale.Group results for the yearThe group's consolidated profit for the year was £55.4 million (2018: £49.7 million). Profit before tax was £55.0 million (2018: £49.6 million).The BoardThe members of the board are listed in the Board of Directors details on page 62 of this report.Capital structureThe group contains entities in different forms (Charitable Community Benefit Societies with charitable rules, companies limited by shares and a public limited company). The group finances its operations by a combination of government grants, loans from commercial banks, publicly listed bond finance and retained surpluses. Directorsʼ indemnitiesThe group has made qualifying third party indemnity provisions for the benefits of its directors and officers (which extend to the performance of any duties as a director or officer of an associated company or subsidiary). The provisions have been in place throughout the year and remain in force at the date of this report. Going concernThe group’s business activities, together with factors likely to affect its future development and position, are set out in the Strategic Report on pages 5 to 41. A member of the group is party to deeds of contribution with its partner company in joint ventures. These deeds cover the jointly controlled entities’ obligations in connection with their development sites. The group has in place long-term debt facilities which provide adequate resources to finance committed reinvestment and development programmes and generate operational cash flows sufficient to finance the group’s day-to-day operations. The group also has a long-term business plan which shows that it is able to service its debt facilities whilst continuing to comply with lenders’ covenants. On this basis, the Board have a reasonable expectation that the group has adequate resources to continue in operational existence for the foreseeable future as outlined in the viability statement on page 60. The group therefore continues to adopt the going concern basis in preparing its consolidated financial statements.Disclosure of information to auditorsSo far as the board is aware, there is no relevant information of which the group’s auditors are unaware. The board has taken all reasonable steps that ought to have been taken to make itself aware of any relevant audit information, and to establish that the association’s auditors are aware of that information.By order of the board
David Betteridge Company Secretary6 August 2019

79
Strategic Report Corporate Governance Financial Statements
Statement of Directorsʼ Responsibilities
Statement of Board’s responsibilities in respect of the Annual Report and the financial statements The board is responsible for preparing the Annual Report and the financial statements in accordance with applicable law and regulations. Co-operative and Community Benefit Society law requires the board to prepare financial statements for each financial year. Under those regulations the board have elected to prepare the financial statements in accordance with UK Accounting Standards, including FRS 102 The Financial Reporting Standard applicable in the UK and Republic of Ireland. The financial statements are required by law to give a true and fair view of the state of affairs of the group and the association and of the income and expenditure of the group and the association for that period. In preparing these financial statements, the board is required to: • select suitable accounting policies and then apply them consistently; • make judgements and estimates that are reasonable and prudent; • state whether applicable UK Accounting Standards and the Statement of Recommended Practice
have been followed, subject to any material departures disclosed and explained in the financial statements;
• assess the group and the association’s ability to continue as a going concern, disclosing, as applicable, matters related to going concern; and
• use the going concern basis of accounting unless it either intends to liquidate the group or the association or to cease operations or has no realistic alternative but to do so.
The board is responsible for keeping proper books of account that disclose with reasonable accuracy at any time the financial position of the association and enable them to ensure that its financial statements comply with the Co-operative and Community Benefit Societies Act 2014, the Housing and Regeneration Act 2008 and the Accounting Direction for Private Registered Providers of Social Housing 2015. It is responsible for such internal control as it determines is necessary to enable the preparation of financial statements that are free from material misstatement, whether due to fraud or error, and has general responsibility for taking such steps as are reasonably open to it to safeguard the assets of the association and to prevent and detect fraud and other irregularities. The board is responsible for the maintenance and integrity of the corporate and financial information included on the association’s website. Legislation in the UK governing the preparation and dissemination of financial statements may differ from legislation in other jurisdictions.Responsibility statement of the directors in respect of the annual financial reportWe confirm that to the best of our knowledge: • the financial statements, prepared in accordance with the applicable set of accounting standards,
give a true and fair view of the assets, liabilities, financial position and profit or loss of the company; and
• the strategic report includes a fair review of the development and performance of the business and the position of the issuer, together with a description of the principal risks and uncertainties that they face.
We consider the annual report and accounts, taken as a whole, is fair, balanced and understandable and provides the information necessary for shareholders to assess the group’s position and performance, business model and strategy.By order of the board
Bjorn HowardGroup Chief Executive6 August 2019

We have fulfilled our ethical responsibilities
80 Annual Report and Financial Statements for the year ended 31 MARCH 2019

Introduction to financial statements
Financial Statements
This section of the annual report provides the Independent auditor’s full report to the members of Aster Group Limited, for and on behalf of KPMG LLP, Statutory Auditor.Following is a full and detailed annual account of the financial statements for the year ended 31 MARCH 2019.
81

1. Our opinion is unmodified
We have audited the financial statements of Aster Group Limited (“the Association”) for the year ended 31st March 2019 which comprise the Consolidated Statement of Comprehensive Income, the Consolidated Statement of Financial Position, Consolidated Statement of Changes in Reserves, Consolidated Statement of Cash Flows and the related notes to the Consolidated Financial Statements and the Association’s Statement of Comprehensive Income, Association’s Statement of Changes in Reserves, Association’s Statement of Financial Position and the related notes to the Association’s Financial Statements, including the accounting policies in note 4 to the Consolidated Statements and note 3 to the Association’s Financial Statements.
In our opinion the financial statements:
•give a true and fair view of the state of theGroup’s and of the parent Association’s affairs as at31 March 2019 and of the Group’s and parentAssociation’s income and expenditure for the yearthen ended;
•the group financial statements have been properlyprepared in accordance with UK accountingstandards, including FRS 102 The FinancialReporting Standard applicable in the UK andRepublic of Ireland;
•comply with the requirements of the Co-operativeand Community Benefit Societies Act 2014; and
•have been prepared in accordance with theHousing and Regeneration Act 2008 and theAccounting Direction for Registered Providers ofSocial Housing 2015.
Basis for opinion
We conducted our audit in accordance with International Standards on Auditing (UK) (“ISAs (UK)”) and applicable law. Our responsibilities are described below. We have fulfilled our ethical responsibilities under, and are independent of the Group in accordance with, UK ethical requirements including the FRC Ethical Standard. We believe that the audit evidence we have obtained is a sufficient and appropriate basis for our opinion.
Independent auditor’s reportto the members of Aster Group Ltd
Overview
Materiality: group financial statements as a whole
£4m (2018:£4m)
1.9% (2018: 2%) of Revenue
Coverage 99.6% (2018: 99.7%) of Revenue
Risks of material misstatement vs 2018
Recurring risks
New risks
Revised risks
Development Spend ◄►
LGPS Pension Liability Valuation
◄►
New: SHPS Pension Liability Valuation
New: The impact of uncertainties due to the UK exiting the European Union
Revised: Aster Group Limited -Completeness and Accuracy of Expenses Incurred
2. Key audit matters: our assessment of risks of material misstatement
Key audit matters are those matters that, in our professional judgment, were of most significance in the audit of the financialstatements and include the most significant assessed risks of material misstatement (whether or not due to fraud) identified byus, including those which had the greatest effect on: the overall audit strategy; the allocation of resources in the audit; anddirecting the efforts of the engagement team. These matters were addressed in the context of our audit of the financialstatements as a whole, and in forming our audit opinion thereon, as we do not provide a separate opinion on these matters. Inarriving at our audit opinion above, the key audit matters, in decreasing order of significance, were as follows:
The risk Our response
Development Spend
(£1,585.7 million; 2018: £1,473.8m)
Refer to page 9 (KPMG Audit Committee Report), page 99 (accounting policy) and page 123 (financial disclosures).
Significant development programme
The Group has a significant development programme. This includes mixed tenure schemes as well as a significant number of open market developments.
The accounting for these schemes contains a number of assumptions and judgements relating to the recoverability of work in progress and capitalised costs.
This also includes the consideration of impairment on significant developments due to time delays, increases in construction costs and/or budget overruns.
There is a risk that the appropriate valuation and accounting treatment is not applied to development transactions.
Our procedures included:
— Reviewing judgements: Reviewing the judgements applied to amounts capitalised to ensure compliance with the SORP and FRS 102 specifically on areas such as capitalised interest and development administration costs;
— Assess accounting treatment: Review of property additions and disposals in the year and ensuring the correct accounting treatment is adopted. Review of accounting treatment for transactions and verification of costs back to source documentation focusing on balance sheet capitalisation;
— Review of classification: Review the appropriateness of the classification of current asset stock and WIP balances, and their recoverability, and the surplus achieved on the sale of units;
— Consideration of impairment: Review of the consideration of impairment triggers on significant developments.
82

2. Key audit matters: our assessment of risks of material misstatement
Key audit matters are those matters that, in our professional judgment, were of most significance in the audit of the financialstatements and include the most significant assessed risks of material misstatement (whether or not due to fraud) identified byus, including those which had the greatest effect on: the overall audit strategy; the allocation of resources in the audit; anddirecting the efforts of the engagement team. These matters were addressed in the context of our audit of the financialstatements as a whole, and in forming our audit opinion thereon, as we do not provide a separate opinion on these matters. Inarriving at our audit opinion above, the key audit matters, in decreasing order of significance, were as follows:
The risk Our response
Development Spend
(£1,585.7 million; 2018: £1,473.8m)
Refer to page 9 (KPMG Audit Committee Report), page 99 (accounting policy) and page 123 (financial disclosures).
Significant development programme
The Group has a significant development programme. This includes mixed tenure schemes as well as a significant number of open market developments.
The accounting for these schemes contains a number of assumptions and judgements relating to the recoverability of work in progress and capitalised costs.
This also includes the consideration of impairment on significant developments due to time delays, increases in construction costs and/or budget overruns.
There is a risk that the appropriate valuation and accounting treatment is not applied to development transactions.
Our procedures included:
— Reviewing judgements: Reviewing the judgements applied to amounts capitalised to ensure compliance with the SORP and FRS 102 specifically on areas such as capitalised interest and development administration costs;
— Assess accounting treatment: Review of property additions and disposals in the year and ensuring the correct accounting treatment is adopted. Review of accounting treatment for transactions and verification of costs back to source documentation focusing on balance sheet capitalisation;
— Review of classification: Review the appropriateness of the classification of current asset stock and WIP balances, and their recoverability, and the surplus achieved on the sale of units;
— Consideration of impairment: Review of the consideration of impairment triggers on significant developments.
83

2. Key audit matters: our assessment of risks of material misstatement (cont.)
The risk Our response
LGPS Pension Liability-Valuation
(£30.3 million; 2018: £33.2m)
Refer to page 10 (KPMG Audit Committee Report), page 101 (accounting policy) and page 141 (financial disclosures).
Actuarial assumptions
The Group participates in seven pension schemes. There are four Local Government Pension Schemes (LGPS) including Dorset County Council, Hampshire County Council, Somerset County Council and Wiltshire Council. The valuation of such Local Government Pension Schemes relies on a number of actuarial assumptions.
The different actuarial firms involved in valuing pension liabilities in the sector adopt a range of assumptions. It is therefore critical that the assumptions appropriately reflect the profile of the Group’s employees, and are based on the most recent actuarial valuation. It is also important that assumptions are derived on a consistent basis year to year, or updated to reflect the Group’s current position.
Our procedures included:
— Use of Pension specialists: We have engaged KPMG actuarial specialists to assess the reasonableness of standing membership data;
— Analytical review of data: Using substantive analytical procedures to assess the completeness and accuracy of standing membership data;
— Assessing underlying inputs: We have assessed the inputs from source data from management into the actuaries’ reporting. The data is input directly from the source system and we have tied this through to payslips and contribution rates. The triennial valuation has been used to evaluate the active members proportion of gross retirement benefit.
SHPS Pension Liability-Valuation
(£14.8 million; 2018: N/a)
Refer to page 11 (KPMG Audit Committee Report), page 102 (accounting policy) and page 158 (financial disclosures).
Actuarial assumptions
The Group participates in seven pension schemes. There are three schemes within the Social Housing Pension Schemes, two defined benefit and one defined contribution. The accounting treatment for the SHPS Defined Benefit schemes has changed this year as a result of the level of information that is now available.
Previously, employers have effectively only accounted for contributions paid in the year and the net present value of the deficit recovery plan within their accounts, since sufficient information to calculate the full actuarial liability was not available. This information is now available, and this change will mean that the employer’s full share of the assets and liabilities will be brought onto the balance sheet. The Group’s share of these assets and liabilities has been calculated by the scheme actuaries.
Our procedures included:
— Use of Pension specialists: We have engaged KPMG actuarial specialists to review the key assumptions used and the methodology of the scheme Actuary;
— Review of Assets and Liabilities: We have reviewed the methodology for valuation of the Group’s share of scheme assets and liabilities;
— Review of accounting treatment: We have reviewed the accounting treatment and entries applied by the Group to confirm that information is accurately disclosed in the financial statements.
2. Key audit matters: our assessment of risks of material misstatement (cont.)
The risk Our response
The impact of uncertainties due to the UK exiting the European Union
Refer to page 16-17 (KPMG Audit Committee Report) and page 34 (financial disclosures).
Unprecedented levels of uncertainty:
All audits assess and challenge the reasonableness of estimates, in particular as described in Development Spend, Pension Liability valuations and the appropriateness of the going concern basis of preparation of the financial statements. All of these depend on assessments of the future economic environment and the Group’s future prospects and performance.
In addition, we are required to consider the other information presented in the Annual Report including the principal risks disclosure and the viability statement and to consider the directors’ statement that the annual report and financial statements taken as a whole is fair, balanced and understandable and provides the information necessary for shareholders to assess the Group’s position and performance, business model and strategy .
Brexit is one of the most significant economic events for the UK and at the date of this report its effects are subject to unprecedented levels of uncertainty of outcomes, with the full range of possible effects unknown.
We developed a standardised firm-wideapproach to the consideration of theuncertainties arising from Brexit in planning andperforming our audits. Our procedures included:
— Our Brexit Knowledge: We considered management’s and the executives’ assessment of Brexit-related sources of risk for the group’s business and financial resources compared with our own understanding of the risk. We considered the plans to take action to mitigate the risks;
— Assessing transparency: As well as assessing individual disclosures as part of our procedures on Development Spend, Pension Liability valuations and the appropriateness of the going concern basis of preparation of the financial statements we considered all of the Brexit related disclosures together, including those in the strategic report, comparing the overall picture against our understanding of the risks.
Aster Group Limited -Completeness and accuracy of expenses incurred
(£21.9 million; 2018: £20.3m)
Refer to page 15 (KPMG Audit Committee Report), page 174 (accounting policy) and page 175 (financial disclosures).
Provision of support services
Aster Group Ltd is the holding company for the group and provides central support services to each of its subsidiary entities.
As such, the entity will incur external expenditure in line with budgets and recharge these to other group companies.
This results in the majority of the balance sheet items being driven by amounts owing/ due to group companies and the income statement is driven by costs incurred on behalf of the group and related income.
Expenditure is seen to be the only external transactions going through the group company and therefore are considered to be the area where we would focus our audit testing.
Our procedures included:
— Review of costs incurred: We have reviewed the nature of expenditure and tested a sample to third party evidence;
— Assessment of classification: We have assessed the classification of expenditure and ensured that the expenses are classified in correct areas through assessment of consistency between years.
— Review of cut-off: We have assessed the cut off of expenditure through a search for unrecorded liabilities and testing transactions around the year end.
84
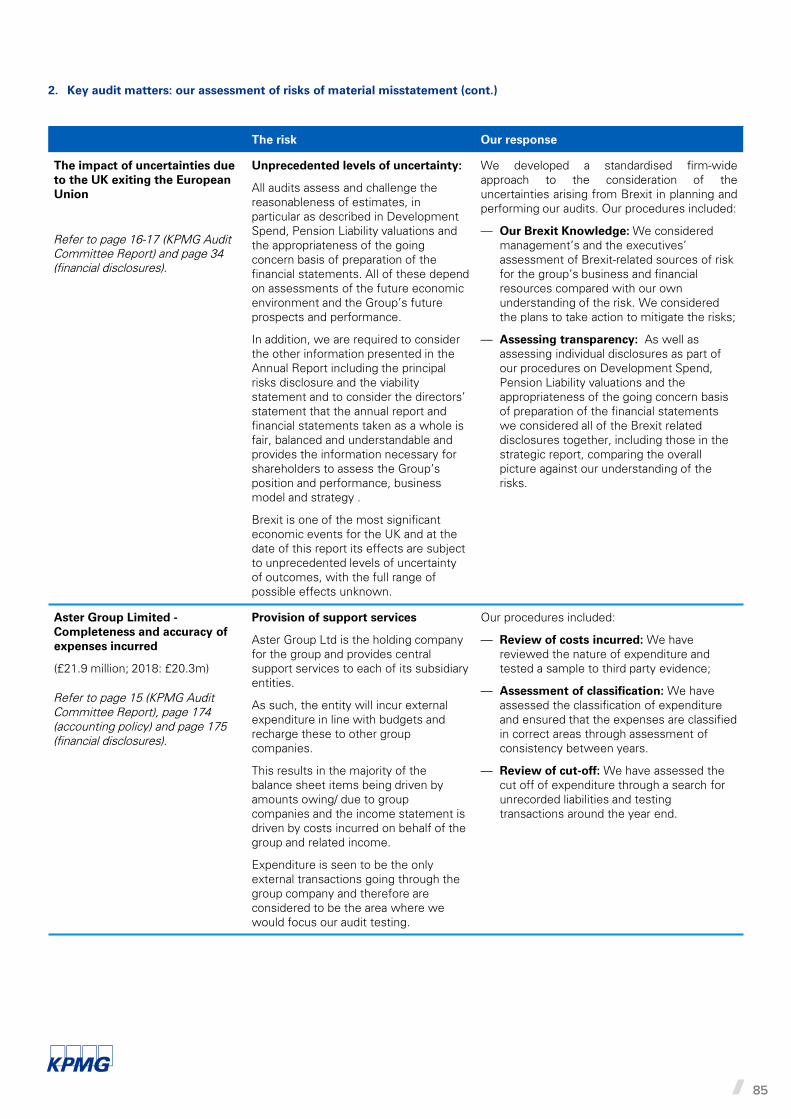
2. Key audit matters: our assessment of risks of material misstatement (cont.)
The risk Our response
The impact of uncertainties due to the UK exiting the European Union
Refer to page 16-17 (KPMG Audit Committee Report) and page 34 (financial disclosures).
Unprecedented levels of uncertainty:
All audits assess and challenge the reasonableness of estimates, in particular as described in Development Spend, Pension Liability valuations and the appropriateness of the going concern basis of preparation of the financial statements. All of these depend on assessments of the future economic environment and the Group’s future prospects and performance.
In addition, we are required to consider the other information presented in the Annual Report including the principal risks disclosure and the viability statement and to consider the directors’ statement that the annual report and financial statements taken as a whole is fair, balanced and understandable and provides the information necessary for shareholders to assess the Group’s position and performance, business model and strategy .
Brexit is one of the most significant economic events for the UK and at the date of this report its effects are subject to unprecedented levels of uncertainty of outcomes, with the full range of possible effects unknown.
We developed a standardised firm-wideapproach to the consideration of theuncertainties arising from Brexit in planning andperforming our audits. Our procedures included:
— Our Brexit Knowledge: We considered management’s and the executives’ assessment of Brexit-related sources of risk for the group’s business and financial resources compared with our own understanding of the risk. We considered the plans to take action to mitigate the risks;
— Assessing transparency: As well as assessing individual disclosures as part of our procedures on Development Spend, Pension Liability valuations and the appropriateness of the going concern basis of preparation of the financial statements we considered all of the Brexit related disclosures together, including those in the strategic report, comparing the overall picture against our understanding of the risks.
Aster Group Limited -Completeness and accuracy of expenses incurred
(£21.9 million; 2018: £20.3m)
Refer to page 15 (KPMG Audit Committee Report), page 174 (accounting policy) and page 175 (financial disclosures).
Provision of support services
Aster Group Ltd is the holding company for the group and provides central support services to each of its subsidiary entities.
As such, the entity will incur external expenditure in line with budgets and recharge these to other group companies.
This results in the majority of the balance sheet items being driven by amounts owing/ due to group companies and the income statement is driven by costs incurred on behalf of the group and related income.
Expenditure is seen to be the only external transactions going through the group company and therefore are considered to be the area where we would focus our audit testing.
Our procedures included:
— Review of costs incurred: We have reviewed the nature of expenditure and tested a sample to third party evidence;
— Assessment of classification: We have assessed the classification of expenditure and ensured that the expenses are classified in correct areas through assessment of consistency between years.
— Review of cut-off: We have assessed the cut off of expenditure through a search for unrecorded liabilities and testing transactions around the year end.
85

3. Our application of materiality and anoverview of the scope of our audit
Materiality for the group financial statements as a whole was set at £4m, determined with reference to a benchmark of revenue, of which it represents 1.9% (2018: 2.0%).
Materiality for the parent company financial statements as a whole was set at £0.43m (2018:£0.4m), determined with reference to abenchmark of expenditure, of which itrepresents 2.0% (2018: 1.9%).
We agreed to report to the Audit Committee anycorrected or uncorrected identifiedmisstatements exceeding £0.2m, in addition toother identified misstatements that warrantedreporting on qualitative grounds.
Of the group’s 16 (2018: 14) reportingcomponents, we subjected 6 (2018: 6) to fullscope audits for group purposes and 2 (2018: 2)to specified risk-focused audit procedures. Thelatter were not individually financially significantenough to require a full scope audit for grouppurposes, but did present specific individualrisks that needed to be addressed. Thecomponents within the scope of our workaccounted for the percentages illustratedopposite.
The remaining 0.2% of total group revenue,0.0% of group surplus before tax and 0.8% oftotal group assets is represented by 8 reportingcomponents, none of which individuallyrepresented more than 0.8% of total grouprevenue, group profit before tax or total groupassets. For these residual components, we performed an analysis at an aggregated grouplevel to re-examine our assessment that therewere no significant risks of materialmisstatement within these.
The Group team instructed component auditorsas to the significant areas to be covered,including the relevant risks detailed above andthe information to be reported back. The Groupteam approved the component materialities,which ranged from £3m to £1m, having regardto the mix of size and risk profile of the Groupacross the components. The work on all of thein-scope components (2018: All) was performedby component auditors and the registeredproviders and the audit of the parent company,was performed by the Group team.
Group revenue£211.9m (2018: £204.7m)
Group materiality£4m (2018: £4m)
£4mWhole financialstatements materiality(2018: £4m)
£2mRange of materiality at 8 components (£3m-£1m) (2018 £2m)
£0.2mMisstatements reported to the audit committee (2018: £0.2m)
Group RevenueGroup materiality
96.9
2.9
Group revenue Group surplus before tax
Group net assets
99.8%(2018 99.7%)
Group gross assets
98.6
1.4
100%(2018 97.1)
97
2.6
99.6%(2018: 99.3%)
99.4
-0.2
99.2%(2018: 99.2%)
Key: Full scope for group audit purposes 2019
Specified risk-focused audit procedures 2019
Residual components
4. We have nothing to report on going concern2
We are required to report to you if we have anythingmaterial to add or draw attention to in relation to thedirectors’ statement in note 4 to the consolidate and note 3to the association's financial statements on the use of thegoing concern basis of accounting with no materialuncertainties that may cast significant doubt over the Groupand Company’s use of that basis for a period of at leasttwelve months from the date of approval of the financialstatements. We have nothing to report in these respects.
5. We have nothing to report on the other information inthe Annual Report4
The directors are responsible for the other informationpresented in the Annual Report together with the financialstatements. Our opinion on the financial statements doesnot cover the other information and, accordingly, we do notexpress an audit opinion or, except as explicitly statedbelow, any form of assurance conclusion thereon.
Our responsibility is to read the other information and, in doing so, consider whether, based on our financial statements audit work, the information therein is materially misstated or inconsistent with the financial statements or our audit knowledge. Based solely on that work we have not identified material misstatements in the other information.
Strategic report
Based solely on our work on the other information:
— we have not identified material misstatements in the strategic report and the directors’ report;
— in our opinion the information given in those reports for the financial year is consistent with the financial statements; and
— in our opinion those reports have been prepared in accordance with the requirements of the Housing and Regeneration Act 2008 and the Accounting Direction for Registered Providers of Social Housing 2015.
Disclosures of principal risks and longer-term viability
Based on the knowledge we acquired during our financial statements audit, we have nothing material to add or draw attention to in relation to:
— the directors’ confirmation within the viability statement page 60 that they have carried out a robust assessment of the principal risks facing the Group, including those that would threaten its business model, future performance, solvency and liquidity;
— the Principal Risks and Uncertainties disclosures describing these risks and explaining how they are being managed and mitigated; and
— the directors’ explanation in the viability statement of how they have assessed the prospects of the Group, over what period they have done so and why they considered that period to be appropriate, and their statement as to whether they have a reasonable expectation that the Group will be able to continue in operation and meet its liabilities as they fall due over the period of their assessment, including any related disclosures drawing attention to any necessary qualifications or assumptions.
Corporate governance disclosures
We are required to report to you if:7
— we have identified material inconsistencies between the knowledge we acquired during our financial statements audit and the directors’ statement that they consider that the annual report and financial statements taken as a whole is fair, balanced and understandable and provides the information necessary for shareholders to assess the Group’s position and performance, business model and strategy; or
— the section of the annual report describing the work of the Audit Committee does not appropriately address matters communicated by us to the Audit Committee.
We have nothing to report in these respects.
6. We have nothing to report on the other matters onwhich we are required to report by exception
Under the Cooperative and Community Benefit Society Act2014, we are required to report to you if, in our opinion:
— adequate accounting records have not been kept by theparent Company, or returns adequate for our audit have not been received from branches not visited by us; or
— the parent Company financial statements are not in agreement with the accounting records and returns; or
— certain disclosures of directors’ remuneration specified by law are not made; or
— we have not received all the information and explanations we require for our audit.
We have nothing to report in these respects.
7. Respective responsibilities
Directors’ responsibilities
As explained more fully in their statement set out on page79, the Directors are responsible for: the preparation of thefinancial statements including being satisfied that they givea true and fair view; such internal control as they determineis necessary to enable the preparation of financialstatements that are free from material misstatement,whether due to fraud or error; assessing the Group andparent Association’s ability to continue as a going concern,disclosing, as applicable, matters related to going concern;and using the going concern basis of accounting unlessthey either intend to liquidate the Group or the parentAssociation or to cease operations, or have no realisticalternative but to do so.
Auditor’s responsibilities
Our objectives are to obtain reasonable assurance about whether the financial statements as a whole are free from material misstatement, whether due to fraud or error, and to issue our opinion in an auditor’s report. Reasonable assurance is a high level of assurance, but does not guarantee that an audit conducted in accordance with ISAs (UK) will always detect a material misstatement when it exists. Misstatements can arise from fraud or error and are considered material if, individually or in aggregate, they could reasonably be expected to influence the economic decisions of users taken on the basis of the financial statements.
A fuller description of our responsibilities is provided on the FRC’s website at www.frc.org.uk/auditorsresponsibilities.
86
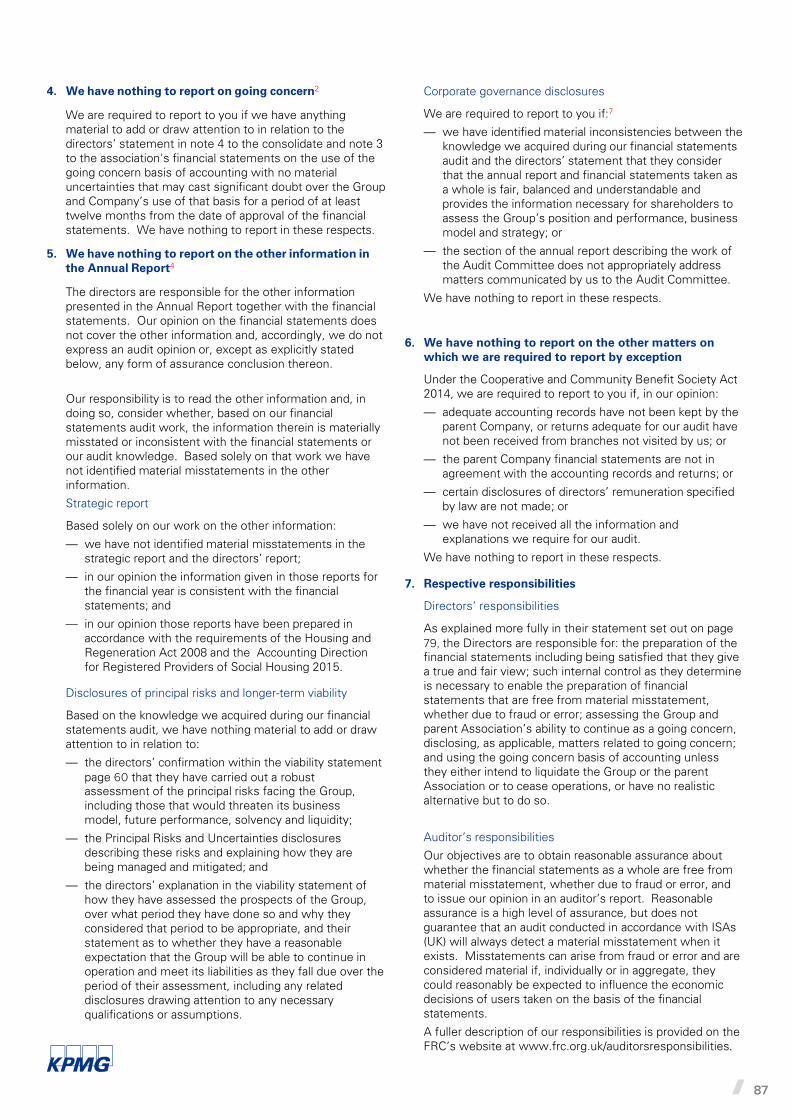
4. We have nothing to report on going concern2
We are required to report to you if we have anythingmaterial to add or draw attention to in relation to thedirectors’ statement in note 4 to the consolidate and note 3to the association's financial statements on the use of thegoing concern basis of accounting with no materialuncertainties that may cast significant doubt over the Groupand Company’s use of that basis for a period of at leasttwelve months from the date of approval of the financialstatements. We have nothing to report in these respects.
5. We have nothing to report on the other information inthe Annual Report4
The directors are responsible for the other informationpresented in the Annual Report together with the financialstatements. Our opinion on the financial statements doesnot cover the other information and, accordingly, we do notexpress an audit opinion or, except as explicitly statedbelow, any form of assurance conclusion thereon.
Our responsibility is to read the other information and, in doing so, consider whether, based on our financial statements audit work, the information therein is materially misstated or inconsistent with the financial statements or our audit knowledge. Based solely on that work we have not identified material misstatements in the other information.
Strategic report
Based solely on our work on the other information:
— we have not identified material misstatements in the strategic report and the directors’ report;
— in our opinion the information given in those reports for the financial year is consistent with the financial statements; and
— in our opinion those reports have been prepared in accordance with the requirements of the Housing and Regeneration Act 2008 and the Accounting Direction for Registered Providers of Social Housing 2015.
Disclosures of principal risks and longer-term viability
Based on the knowledge we acquired during our financial statements audit, we have nothing material to add or draw attention to in relation to:
— the directors’ confirmation within the viability statement page 60 that they have carried out a robust assessment of the principal risks facing the Group, including those that would threaten its business model, future performance, solvency and liquidity;
— the Principal Risks and Uncertainties disclosures describing these risks and explaining how they are being managed and mitigated; and
— the directors’ explanation in the viability statement of how they have assessed the prospects of the Group, over what period they have done so and why they considered that period to be appropriate, and their statement as to whether they have a reasonable expectation that the Group will be able to continue in operation and meet its liabilities as they fall due over the period of their assessment, including any related disclosures drawing attention to any necessary qualifications or assumptions.
Corporate governance disclosures
We are required to report to you if:7
— we have identified material inconsistencies between the knowledge we acquired during our financial statements audit and the directors’ statement that they consider that the annual report and financial statements taken as a whole is fair, balanced and understandable and provides the information necessary for shareholders to assess the Group’s position and performance, business model and strategy; or
— the section of the annual report describing the work of the Audit Committee does not appropriately address matters communicated by us to the Audit Committee.
We have nothing to report in these respects.
6. We have nothing to report on the other matters onwhich we are required to report by exception
Under the Cooperative and Community Benefit Society Act2014, we are required to report to you if, in our opinion:
— adequate accounting records have not been kept by theparent Company, or returns adequate for our audit have not been received from branches not visited by us; or
— the parent Company financial statements are not in agreement with the accounting records and returns; or
— certain disclosures of directors’ remuneration specified by law are not made; or
— we have not received all the information and explanations we require for our audit.
We have nothing to report in these respects.
7. Respective responsibilities
Directors’ responsibilities
As explained more fully in their statement set out on page79, the Directors are responsible for: the preparation of thefinancial statements including being satisfied that they givea true and fair view; such internal control as they determineis necessary to enable the preparation of financialstatements that are free from material misstatement,whether due to fraud or error; assessing the Group andparent Association’s ability to continue as a going concern,disclosing, as applicable, matters related to going concern;and using the going concern basis of accounting unlessthey either intend to liquidate the Group or the parentAssociation or to cease operations, or have no realisticalternative but to do so.
Auditor’s responsibilities
Our objectives are to obtain reasonable assurance about whether the financial statements as a whole are free from material misstatement, whether due to fraud or error, and to issue our opinion in an auditor’s report. Reasonable assurance is a high level of assurance, but does not guarantee that an audit conducted in accordance with ISAs (UK) will always detect a material misstatement when it exists. Misstatements can arise from fraud or error and are considered material if, individually or in aggregate, they could reasonably be expected to influence the economic decisions of users taken on the basis of the financial statements.
A fuller description of our responsibilities is provided on the FRC’s website at www.frc.org.uk/auditorsresponsibilities.
87

8. The purpose of our audit work and to whom we oweour responsibilities
This report is made solely to the Association in accordance with section 87 of the Co-operative and Community Benefit Societies Act 2014 and section 128 of the Housing and Regeneration Act 2008. Our audit work has been undertaken so that we might state to the Association those matters we are required to state to them in an auditor’s report and for no other purpose. To the fullest extent permitted by law, we do not accept or assume responsibility to anyone other than the Association, as a body, for our audit work, for this report, or for the opinions we have formed.
Harry Mears
for and on behalf of KPMG LLP, Statutory Auditor
Chartered Accountants
Gateway House
Tollgate
Eastleigh
SO53 3TG
12 August 2019
88

89
Strategic Report Corporate Governance Financial Statements
89
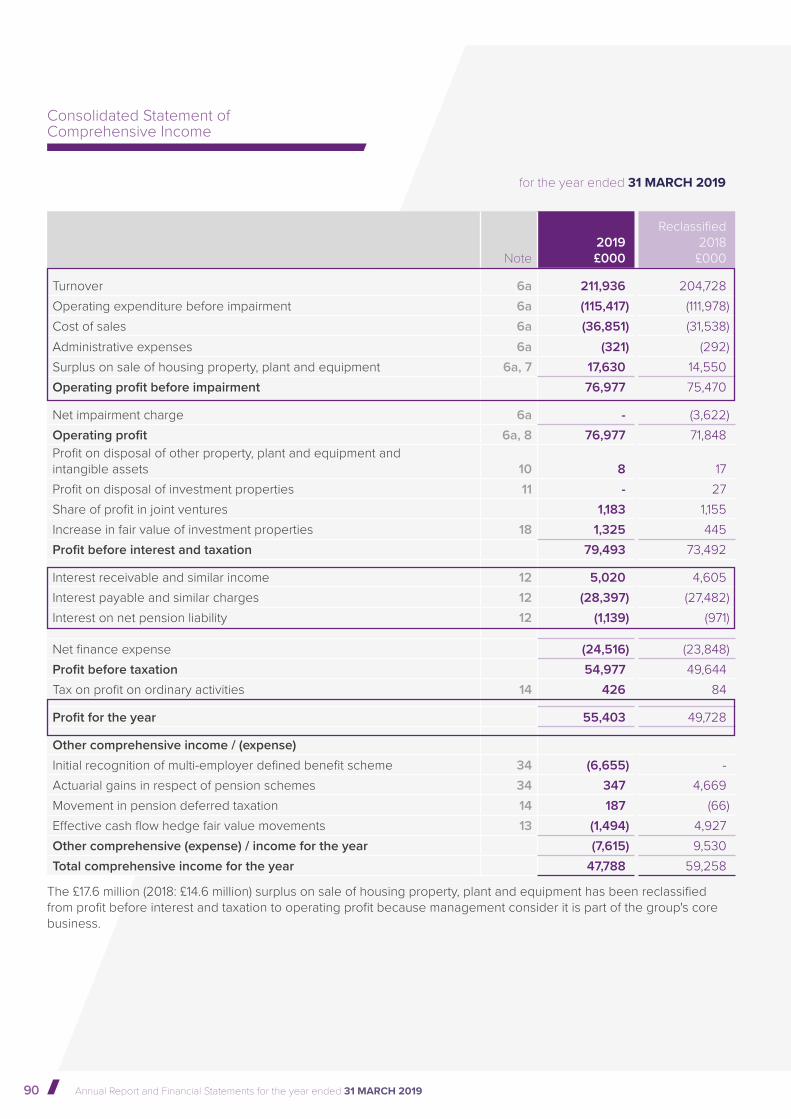
90 Annual Report and Financial Statements for the year ended 31 MARCH 2019
for the year ended 31 MARCH 2019
Consolidated Statement of Comprehensive Income
Note2019£000
Reclassified2018
£000
Turnover 6a 211,936 204,728 Operating expenditure before impairment 6a (115,417) (111,978)Cost of sales 6a (36,851) (31,538)Administrative expenses 6a (321) (292)Surplus on sale of housing property, plant and equipment 6a, 7 17,630 14,550 Operating profit before impairment 76,977 75,470
Net impairment charge 6a - (3,622)Operating profit 6a, 8 76,977 71,848 Profit on disposal of other property, plant and equipment and intangible assets 10 8 17 Profit on disposal of investment properties 11 - 27 Share of profit in joint ventures 1,183 1,155 Increase in fair value of investment properties 18 1,325 445 Profit before interest and taxation 79,493 73,492
Interest receivable and similar income 12 5,020 4,605 Interest payable and similar charges 12 (28,397) (27,482)Interest on net pension liability 12 (1,139) (971)
Net finance expense (24,516) (23,848)Profit before taxation 54,977 49,644 Tax on profit on ordinary activities 14 426 84
Profit for the year 55,403 49,728
Other comprehensive income / (expense) Initial recognition of multi-employer defined benefit scheme 34 (6,655) - Actuarial gains in respect of pension schemes 34 347 4,669 Movement in pension deferred taxation 14 187 (66)Effective cash flow hedge fair value movements 13 (1,494) 4,927 Other comprehensive (expense) / income for the year (7,615) 9,530 Total comprehensive income for the year 47,788 59,258
The £17.6 million (2018: £14.6 million) surplus on sale of housing property, plant and equipment has been reclassified from profit before interest and taxation to operating profit because management consider it is part of the group's core business.

91
Strategic Report Corporate Governance Financial Statements
Note2019£000
2018£000
Fixed assetsIntangible assets 15 2,214 2,627 Property, plant and equipment (social housing) 16 1,585,672 1,473,779 Property, plant and equipment (other assets) 17 16,003 16,707 Investment properties 18 16,984 15,766 HomeBuy loans receivable 19 3,966 4,216 Investments in joint ventures 20 2,360 1,195 Other investments 21 230 20
1,627,429 1,514,310 Non-current assetsDebtors: amounts falling due after one year 22 82,360 81,435 Current assetsInventories 23 2,323 1,948 Debtors: amounts falling due within one year 24 29,375 18,416 Shared ownership properties held for sale 25 29,608 23,256 Properties held for open market sale 26 - 1,570 Cash and cash equivalents 27 131,986 101,075
193,292 146,265 Creditors: amounts falling due within one year 28 (73,918) (62,736)Net current assets 119,374 83,529 Total assets less current liabilities 1,829,163 1,679,274 Non current liabilitiesCreditors: amounts falling due after more than one year 29 (995,193) (903,068)Pension liability - Local Government Pension Scheme 34 (30,260) (33,202)Pension liability - Social Housing Pension Scheme 34 (14,755) - Other provisions 35 (691) (2,528)Net assets 788,264 740,476 Capital and reservesCalled up share capital 36 - - Profit and loss reserve 407,899 353,566 Revaluation reserve 37 399,582 404,633 Restricted reserve 37 208 208 Cash flow hedge reserve 37 (19,425) (17,931)Total reserves 788,264 740,476
as at 31 MARCH 2019
The financial statements on pages 90 to 170 were approved and authorised for issue by the board on 6 August 2019 and were signed on its behalf by:
Andrew JacksonChairman
Bjorn HowardGroup Chief Executive
David BetteridgeCompany Secretary
Consolidated Statement of Financial Position

92 Annual Report and Financial Statements for the year ended 31 MARCH 2019
2019
Profit and loss
reserve £000
Revaluationreserve
£000
Restrictedreserve
£000
Cash flowhedge
reserve£000
Total reserves
£000
Balance at 1 April 2018 353,566 404,633 208 (17,931) 740,476 Profit for the year 55,403 - - - 55,403
Other comprehensive expense for the year (6,121) - - (1,494) (7,615)
Transfer from revaluation reserve to income and expenditure reserve 5,051 (5,051) - - -
Deferred tax timing differences - - - - -
Balance at 31 March 2019 407,899 399,582 208 (19,425) 788,264
2018
Profit and loss
reserve £000
Revaluationreserve
£000
Restrictedreserve
£000
Cash flowhedge
reserve£000
Total reserves
£000Balance at 1 April 2017 294,654 409,214 208 (22,858) 681,218 Profit for the year 49,728 - - - 49,728 Other comprehensive income for the year 4,603 - - 4,927 9,530
Transfer from revaluation reserve to income and expenditure reserve 4,581 (4,581) - - - Deferred tax timing differences - - - - - Balance at 31 March 2018 353,566 404,633 208 (17,931) 740,476
for the year ended 31 MARCH 2019
Consolidated Statement of Changes in Reserves
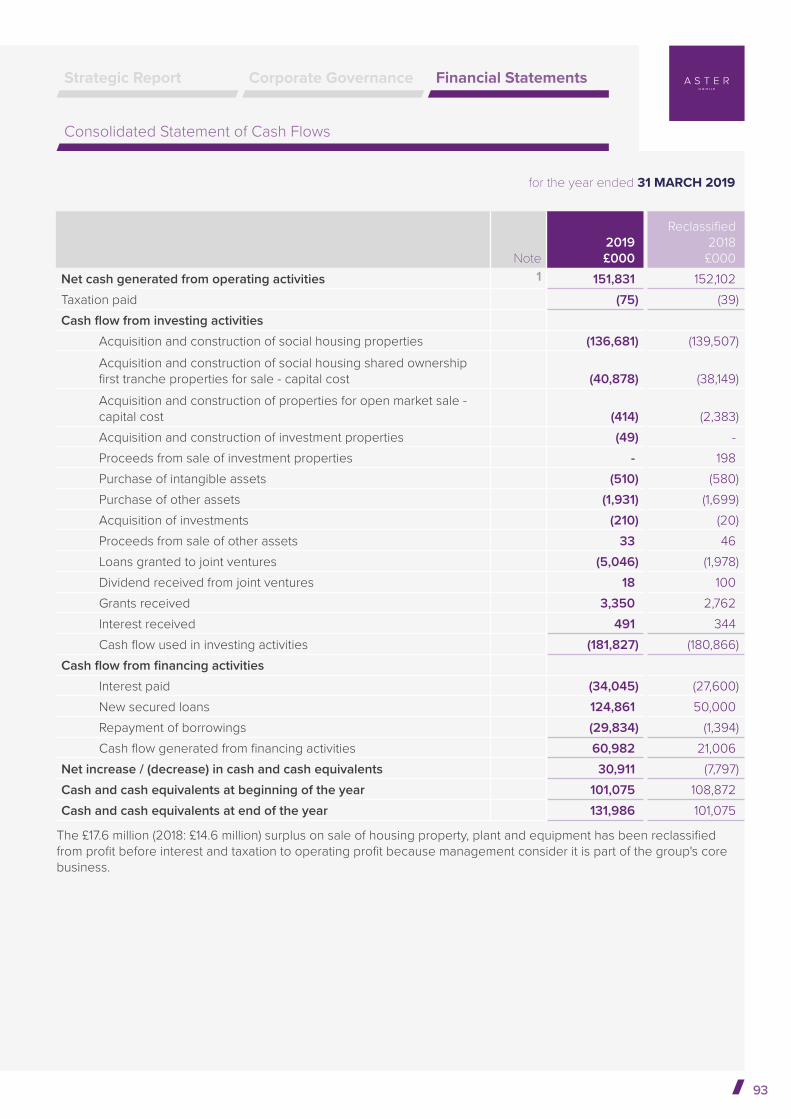
93
Strategic Report Corporate Governance Financial Statements
Note2019£000
Reclassified2018
£000Net cash generated from operating activities 1 151,831 152,102 Taxation paid (75) (39)Cash flow from investing activities
Acquisition and construction of social housing properties (136,681) (139,507)Acquisition and construction of social housing shared ownership first tranche properties for sale - capital cost (40,878) (38,149)Acquisition and construction of properties for open market sale - capital cost (414) (2,383)Acquisition and construction of investment properties (49) - Proceeds from sale of investment properties - 198 Purchase of intangible assets (510) (580)Purchase of other assets (1,931) (1,699)Acquisition of investments (210) (20)Proceeds from sale of other assets 33 46 Loans granted to joint ventures (5,046) (1,978)Dividend received from joint ventures 18 100 Grants received 3,350 2,762 Interest received 491 344 Cash flow used in investing activities (181,827) (180,866)
Cash flow from financing activities
Interest paid (34,045) (27,600)New secured loans 124,861 50,000 Repayment of borrowings (29,834) (1,394)Cash flow generated from financing activities 60,982 21,006
Net increase / (decrease) in cash and cash equivalents 30,911 (7,797)Cash and cash equivalents at beginning of the year 101,075 108,872 Cash and cash equivalents at end of the year 131,986 101,075
for the year ended 31 MARCH 2019
Consolidated Statement of Cash Flows
The £17.6 million (2018: £14.6 million) surplus on sale of housing property, plant and equipment has been reclassified from profit before interest and taxation to operating profit because management consider it is part of the group's core business.

94 Annual Report and Financial Statements for the year ended 31 MARCH 2019
1 Note to the consolidated statement of cash flows
Cash flow from operating activities2019£000
Reclassified2018
£000Profit for the year 55,403 49,728 Adjustments for non-cash items
Amortisation of intangible assets 911 1,288 Depreciation of property, plant and equipment 25,597 24,723 Charge to impairment of property, plant and equipment - 3,134 Investment property fair value adjustments (1,325) (445) Accelerated depreciation of components 813 1,032 Increase in inventories (375) (473) Increase in debtors (3,242) (1,947) Increase in creditors 3,715 4,288 (Decrease) / increase in provisions (1,837) 2,350 Movement in shared ownership properties held for sale less capital cost 34,526 32,552 Movement in open market properties held for sale less capital cost 1,984 813 Pension cost less contributions payable (1,599) (920)Carrying amount of housing property 12,275 11,549 Carrying amount of property, plant and equipment 25 29 Carrying amount of investment properties - 171
71,468 78,144 Adjustments for investing or financing activities
Proceeds from the sale of property, plant and equipment (33) (46) Proceeds from the sale of investment properties - (198) Government grants recycled / (utilised) in the year 477 626 Interest payable 29,536 28,453 Interest receivable (5,020) (4,605)
24,960 24,230 Net cash generated from operating activities 151,831 152,102
Notes to the Consolidated Financial Statements
The disposal of housing properties has been reclassified as part of operating profit because management consider it is part of the group's core business.

95
Strategic Report Corporate Governance Financial Statements
2 Legal status
Aster Group is registered under the Cooperative and Community Benefit Society Act 2014, and is registered with the Regulator of Social Housing (‘RSH’) as a Registered Provider as defined by the Housing Act 2004.
3 Basis of preparation
The financial statements of the group and association have been prepared in accordance with applicable United Kingdom accounting standards, including Financial Reporting Standard 102 - ‘The Financial Reporting Standard applicable in the United Kingdom and Republic of Ireland’ (FRS102), the Housing SORP 2014: Statement of Recommended Practice for Registered Social Housing Providers, and comply with the Accounting Direction for Private Registered Providers of Social Housing 2015. The group is classified as a Public Benefit Entity under FRS102.
The financial statements are presented in Sterling (£).
Application of accounting policies
The group’s accounting policies have been applied consistently throughout the year with one exception, the accounting for the SHPS defined benefit pension scheme.
Prior to 1 April 2018 the scheme was accounted for under FRS 102 2015 paragraphs 28.11 and 28.11A as a multi-employer pension plan with employer costs being recognised in profit and loss and the present value of the contributions to the scheme’s deficit recovery plan recognised as a creditor.
From 1 April 2018 sufficient information has been available to attribute the scheme’s assets and liabilities to its member employers. The scheme has subsequently been accounted for as a defined benefit plan as outlined in FRS 102 2015 paragraphs 28.14 to 28.28.
The resulting expense from this transition has been recognised in Other Comprehensive Income as required by FRED 71, the early adoption of FRS 102 2018 paragraphs 28.11B and 28.11C.
Group consolidation
The group is required to prepare consolidated financial statements under the Co-operative and Community Benefit Societies Act 2014 incorporating the financial statements of the association and its subsidiaries. Intra-group transactions have been eliminated on consolidation.
Basis of consolidation
SubsidiariesSubsidiaries that are not the ultimate parent do not produce consolidated financial statements under the exemption included in section 9.3 of FRS 102.
Joint venturesJoint ventures are contractual arrangements between two or more parties which enter into an activity that they jointly control. The group has two types of joint venture.
i. Jointly controlled entities – these are separate organisations in which each party has an interest. In the group’s consolidated financial statements they are accounted for using the equity method. In the association’s financial statements the investment in the joint venture is recognised at cost.
ii. Jointly controlled operations – each party uses their own resources rather than establishing a separate organisation. The jointly controlled operation agreement lays out how revenues from the activity are shared. For these operations the group recognises:
• The assets it controls and the liabilities it incurs; and
• The expenses it incurs and its share of the income from the operation.
4 Summary of significant accounting policies
Going concern
The group’s business activities, together with factors likely to affect its future development and position, are
set out in the Strategic Report of the Board on pages 5 to 41. A member of the group is party to deeds of contribution with its partner company in joint ventures. These deeds cover the jointly controlled entities’ obligations in connection with their development sites.
The group has in place long-term debt facilities which provide adequate resources to finance committed reinvestment and development programmes and generate operational cash flows sufficient to finance the group’s day-to-day operations. The group also has a long-term business plan which shows that it is able to service its debt facilities whilst continuing to comply with lenders’ covenants.
On this basis, the Board have a reasonable expectation that the group has adequate resources to continue in operational existence for the foreseeable future as outlined in the viability statement on page 60. The group therefore continues to adopt the going concern basis in preparing its consolidated financial statements.
Operating profit
The group has chosen to show operating profit on the face of the Consolidated Statement of Comprehensive Income. This figure represents income, less the costs and expenses incurred to generate it, from the group’s principal activities that are not investing or financing activities.
Turnover
Turnover represents:Rental, service charge income and garage lettings - recognised from the point at which the properties under development reach practical completion or otherwise become available for letting.
Service charge income - an amalgamation of the budgeted charge for the year and the under or over recovery from the pre-previous year.

96 Annual Report and Financial Statements for the year ended 31 MARCH 2019
Turnover (continued)
Revenue fees and grants from local authorities and the RSH - recognised over the period the related costs are incurred.
Asset related fees and grants from local authorities and the RSH - recognised over the life of the related asset. For grants relating to completed properties the grant is amortised through turnover over the effective useful life of the property’s structure.
Income from first tranche sales of New Build HomeBuy and housing properties developed for sale - recognised at the legal completion of the sale.
Helpline and Telecare revenue - relates to providing personal monitoring systems to vulnerable customers. The charges are raised and recognised weekly from the installation of the equipment for as long as the customer requires it.
Finance debtor revenue - relates to the income received in relation to the group’s Service Concession Arrangement. It is made up of a monthly charge for each property with a certificate of availability and an annual dwelling charge payable by the grantor of the arrangement (Wiltshire County Council). Revenue is recognised from the date each property is certificated as available.
Green electricity - amounts received or receivable from the feed in tariff receivable for green electricity produced by the photovoltaic panels the company owns. Turnover is recognised as the energy is produced. Additional kilowatts of energy generated are sold to the National Grid.
Other income, such as domiciliary care, home improvements, design and build fees and sewerage services - recognised when the performance of a service is completed, or when the requirements of an agreement with a third party or other group subsidiary are met.
4 Summary of significant accounting policies (continued)
Property managed by agents
The group has a small number of properties that it owns but are managed by agents on its behalf. Where the group carries the financial risk on property managed by agents, all the income and expenditure arising from the property is included in the Consolidated Statement of Comprehensive Income for the year. Where the agency carries the financial risk, the profit or loss for the year includes only that income and expenditure which relates solely to the group.
Value added tax (VAT)
The group is registered for VAT and, while turnover is stated excluding VAT, a large portion of its income, including its rents, is exempt for VAT purposes. The majority of its expenditure is subject to VAT which cannot be reclaimed and therefore expenditure is shown inclusive of irrecoverable VAT. The balance of VAT payable or recoverable at the year-end is included as a current liability or asset.
Right to buy
The gain or loss on disposal of housing properties under the right to buy arrangement is calculated as being the difference between the proceeds of sale of a property and the carrying value of that property. The gain or loss on disposal is recognised in the Consolidated Statement of Comprehensive Income for the year at the date of transfer after adjusting for any local authority claw back agreement in operation. The relevant local authority claw back is recognised as a liability until it is repaid to the authority.
Right to acquire
The gain or loss on the disposal of housing properties under the right to acquire arrangement is calculated as being the difference between the proceeds of sale of a property and the carrying value of that property. Any gain or loss on disposal is recognised in the Consolidated Statement of Comprehensive Income for the year at the date of transfer.
New Build HomeBuy (Shared ownership)
The cost of developing New Build HomeBuy properties is split between current assets for that part of the property which is expected to be sold by way of a first tranche sale and property, plant and equipment for the remaining part of the property which is expected to be retained.
First tranche sales on New Build HomeBuy properties are recognised in turnover, with an appropriate proportion of development build costs being expensed through cost of sales.
Subsequent tranches sold (staircasing) are reflected in the Statement of Comprehensive Income on sale of property, plant and equipment. Such staircasing sales may result in social housing grant being deferred or abated until it can be recycled or repaid. Cost includes the acquisition of land and buildings, the cost of developing properties, plus expenditure incurred in respect of improvements.
Taxation
The group consists of some subsidiaries which have adopted charitable rules and benefit from various exemptions from taxation afforded by tax legislation and are therefore not liable to corporation tax on income or gains falling within those exemptions. The group also has some subsidiaries which are subject to taxation. These taxable subsidiaries are able to gift aid some or all of their taxable profits to their parent entity and in doing so reduce or eliminate their tax liability.
Notes to the Consolidated Financial Statements

97
Strategic Report Corporate Governance Financial Statements
Component UELStructure (see below) 30 - 100 yearsRoof 60 yearsHeating Distribution Systems 30 yearsBoiler 15 yearsBathroom 30 years Windows / Doors 30 years Kitchen 20 yearsElectrical wiring 30 years
Impairment reviews are carried out at each reporting date. If impairment is present the asset’s carrying value is reduced to its depreciated replacement cost, as outlined in the impairment policy, unless it is being demolished or remodelled when the carrying value is reduced to that of the remaining components. Social housing properties held on long leases are depreciated in the same manner as freehold properties, except where the unexpired lease term is shorter than the longest component life envisaged, in which case the unexpired term of the lease is adopted as the useful economic life of the relevant component category.New Build HomeBuy properties are split proportionately between property, plant and equipment and current assets based on the proportion of the share of equity sold in the first tranche. The element of a property anticipated to be sold
Structure UEL
Pre-fabricated reinforced concrete construction (PRC) 30 yearsBedsits 30 yearsAll other social housing properties 100 years
UELComputer software 3 yearsMain computer systems software 10 years
Freehold land is not depreciated.The Aster Group elected to take the transitional exemption laid out in paragraph 35.10(d) of FRS 102 and use the 31 March 2014 valuation as the deemed cost of social housing properties at that date. All social housing properties completed after that date are recognised at cost.
Social housing properties and depreciation
Properties rented for social benefit are classified as property, plant and equipment and referred to as social housing. These properties are rented at below market rate to people put forward by the relevant local authorities from their housing lists. Social housing properties under construction are stated at cost and are not depreciated. These are reclassified as social housing properties on practical completion of construction with cost apportioned by key components.
Freehold land is not depreciated. Freehold properties are depreciated by component on a straight line basis over the estimated useful economic lives of the component categories.
Investments
The group holds investments in companies outside the group. These are recognised at cost less impairment.
Intangible assets and amortisation - computer software
Intangible assets are identifiable non-monetary assets without physical substance such as computer software. Intangible assets are stated at cost less accumulated amortisation. Cost includes the original purchase price of the asset and any directly attributable costs of preparing the asset for its intended use. Amortisation is charged on a straight line basis over the expected remaining useful economic lives (‘UEL’) of the assets as follows:
as a first tranche sale is recognised as a current asset, whereas the element relating to second and subsequent tranche sales is treated as property, plant and equipment. If the profit on sale of the first tranche is expected to exceed the total overall profit on sale of all tranches of that property the proportionate value of the first tranche current asset is increased to limit the profit earned to the overall profit. Depreciation on freehold properties and long leasehold social housing properties is provided to write off the cost less the estimated residual value of social housing properties by equal instalments over their remaining estimated useful economic life (‘UEL’). Any additions and improvements are depreciated over the remaining life of the premises. The useful economic lives used are:
Social housing properties are split between the structure and those major components which require periodic replacement. Capitalised major components are depreciated over the following useful economic lives (‘UEL’):

98 Annual Report and Financial Statements for the year ended 31 MARCH 2019
Donated land and social housing properties
Land donated by local authorities and others is added to the cost of the development scheme at the market value of the land at the time of the donation. If the land is donated by a local authority the market value is recognised as a government grant and accounted for using the accruals method. If the land is donated by a non-government party the market value is recognised as turnover in the Statement of Comprehensive Income for the year.
Where social housing properties are donated by one group member to another the transfer is made at the properties net book value with the resulting expense or income being recognised as a donation.
UELFreehold offices 50 yearsPhotovoltaic panels 25 yearsMotor vehicles 4 – 5 yearsOffice, estate equipment and furniture 3 – 15 years
Capitalisation of internal staff costs
a) Housing development schemes Internal staff costs that are directly related to the development of housing assets are capitalised to the schemes under construction where the outcome of the scheme is certain. Where the outcome of the scheme is uncertain or aborted, the direct development administration costs are charged to the Consolidated Statement of Comprehensive Income for the year.
b) Development of internally created assets Internal staffing costs relating to internally created other tangible or intangible assets are capitalised to the extent that they are additional costs incurred due to the development of the asset.
An internally generated intangible asset is only recognised if all the following conditions are met:
• The asset created can be identified (such as software or a website);
• It is expected that the asset created will generate future economic benefits; and
• The development cost of the asset can be measured reliably.
Internally generated intangible assets are recognised at cost and amortised on a straight line basis over the useful lives from the date the asset becomes usable.
Property, plant and equipment, is stated at cost less accumulated depreciation. Cost includes the original purchase price of the asset and the costs incurred in bringing the asset to the location and condition necessary for it to be capable of operating in the manner intended. Subsequent expenditure is capitalised where it increases the value of the asset or extends its life. Completed social housing properties are covered by a separate policy. Depreciation is charged on a straight line basis over the expected remaining useful economic lives of the assets as follows:
Freehold premises (non-social housing properties) depreciation is provided to write off the cost less estimated residual value over the useful economic life
Interest receivable and payable
Interest is recognised on an accruals basis, using the effective interest rate method recognised in the Consolidated Statement of Comprehensive Income over the life of the financial instrument.
Capitalisation of interest costs
Interest costs relating to the construction and acquisition of housing assets are charged to the cost of the development scheme, over the period of its development. The amount capitalised represents either:
• Interest costs incurred specifically for financing the development programme after the deduction of social housing grant in advance; or
• Interest costs of the group as a whole after the deduction of interest on social housing grant in advance to the extent that they are funding the development programme.
Other interest costs are recognised in the Consolidated Statement of Comprehensive Income for the year to which they relate.Leased assets Where assets are financed by leasing agreements that transfers substantially all the risks and rewards of ownership, they are treated as if they had been purchased outright. The amount capitalised is the lower of the present value of the minimum lease payments payable during the lease term or the fair value of the leased asset. The corresponding leasing commitments are shown as the present value of the obligations to the lessor. Lease payments are treated as consisting of a finance charge and a reduction in the liability. The finance charge is charged to the Consolidated Statement of Comprehensive Income for the year using the effective interest method.Rentals paid under operating leases are charged to the Consolidated Statement of Comprehensive Income for the year on a straight line basis over the period of the lease.
Property, plant and equipment and depreciation, non-social housing
4 Summary of significant accounting policies (continued)
of the property. Any additions and improvements are depreciated over the remaining life of the premises.
Assets under construction are stated at cost (as defined above). They are presented separately in the note to the financial statements and not depreciated until they are completed and brought into use. The useful economic lives of all property, plant and equipment is reviewed annually.
Notes to the Consolidated Financial Statements

99
Strategic Report Corporate Governance Financial Statements
Investment properties
Investment properties are properties held for capital appreciation, rented at a market rate where there are no restrictions on who can be a tenant, or both.
Investment properties are re-valued each year to their fair or market value. Any changes in value are recognised in the Consolidated Statement of Comprehensive Income for the year when they occur.
HomeBuy scheme
The group operates the HomeBuy Scheme lending up to 25% of the cost of a property purchase to tenants who wish to own their own home. This loan is secured on the title of the property. On subsequent sale of the property by the purchaser the group receives a proportion of the sale proceeds equal to the original percentage lent.
The loans are financed by Social Housing Grant (‘SHG’) from the Regulator of Social Housing (‘RSH’). On subsequent sale by the purchaser, the SHG is recycled and the group keeps any profit. In the event of a loss, the SHG is written off and expensed through operating expenditure.
The loan to the purchaser is treated as a fixed asset investment made by the group and the grant from the RSH is recognised separately as a loan to the group. The investment is carried on the Consolidated Statement of Financial Position at transaction cost and monitored for signs of impairment.
Inventories
a) General inventories Inventories are valued at the lower of cost and net realisable value, after making allowances for any obsolete and/or slow moving items. Net realisable value is the price which inventories can be sold for in the normal course of business after allowing for the costs of realisation. Inventories are valued using a first-in-first-out methodology.
b) Properties developed for market sale Properties that have been developed for market sale are recognised at the lower of cost and net realisable value (selling price less cost to sell). Cost comprises materials, direct labour, direct development overheads and attributable interest. Sales proceeds are included in turnover.
c) Work in process Speculative housing land, stock plots and work in progress, is recognised at the lower of cost and net realisable value (selling price less cost to sell). Cost comprises materials, direct labour, direct development overheads and attributable interest.
Impairment
a) Inventories At the end of each reporting period inventories are reviewed for impairment. If any inventory is found to be impaired the carrying value is reduced to the selling price less costs to complete and sell.
b) Other tangible and intangible assets Other tangible and intangible assets are reviewed for impairment if there is an indication that impairment may have occurred. Where there is evidence of impairment, the affected assets are written down to the recoverable amount. Any such write down is charged to the Consolidated Statement of Comprehensive Income for the year.
c) Social housing Social housing properties are subject to impairment trigger reviews on completion and then annually thereafter. If there is a trigger and evidence of impairment is found the carrying value of the property is compared to its depreciated replacement cost. This represents the amount it would cost the group to replace the property. For properties built or acquired prior to 1 April 2014 this replacement cost is depreciated from 1 April 2014. For properties built or acquired after 1 April 2014 depreciation starts from the build or acquisition date. If the property’s carrying value is higher than its depreciated replacement cost the carrying value must be reduced to the depreciated replacement cost, the write down is charged to the Consolidated Statement of Comprehensive Income for the year.
The group has some pre-fabricated reinforced concrete construction properties and bedsits. Where an impairment review indicates that their useful economic life is likely to be less than the standard policy they have been re-lifed to 10 years.
d) Unsold first tranche HomeBuy current assets On practical completion HomeBuy property assets are spilt between current assets for the unsold first tranche portion and property, plant and equipment for the rental portion.
First tranche current assets are reviewed for impairment if there are indications that the market value of the property has dropped below that included in the investment appraisal. If any current assets are found to be impaired the carrying value is reduced to the selling price less costs to complete and sell.
The rental portion is treated as social housing for impairment purposes.

100 Annual Report and Financial Statements for the year ended 31 MARCH 2019
4 Summary of significant accounting policies (continued)
Impairment (continued)e) Open market properties held
for sale Open market properties held for sale are classified as current assets and are reviewed for impairment if there are indications that the market value of the property has dropped below its carrying value. If any current assets are found to be impaired the carrying value is reduced to the selling price less costs to complete and sell.
Accrued income When, as a result of performing a service or otherwise meeting the requirements of an agreement with a third party, income falls due but has not been invoiced in the year, an accrual is made for this income.Deferred income Where payment has been received for goods or services not yet delivered, the amount is initially recorded as a liability in the Consolidated Statement of Financial Position and recognised as turnover once the delivery has been made.Service Concession Arrangements The group has a Service Concession Arrangement, previously known as a Private Finance Initiative scheme, with Wiltshire Council which was entered into before 1 April 2014. The group is taking advantage of the transitional arrangement outlined in section 35.10 (I) of FRS 102 and will continue accounting for the scheme using the accounting policies in place prior to that date.Costs incurred on the Private Finance Initiative scheme in respect of development, design, construction and finance costs during the period prior to availability of the social housing properties are accumulated within stocks as amounts recoverable on long term contracts. Once completed housing units are made available for occupation, the accumulated amounts recoverable on long term contracts are transferred to finance debtors receivable and
recovered over the contract period on an annuity basis.Service charge sinking fundsThe group owns a number of schemes which require it to manage sinking funds in order to maintain the upkeep of the properties and may only be used for the benefit of the relevant schemes. These funds are held in creditors on the Consolidated Statement of Financial Position.Financial instruments Section 11 Basic Financial Instruments of FRS 102 permits an accounting policy choice for financial instruments. The group has chosen to adopt sections 11 and 12 of FRS 102 as permitted by this section. a) Rent arrears and other debts
Rent arrears, other amounts due from tenants and other miscellaneous debts are recognised and carried at original amount of the charge, less provision for impairment. A provision is made and charged to the Consolidated Statement of Comprehensive Income for the year when there is objective evidence that the group will not be able to collect all amounts due in accordance to the original terms.
Any tenants or miscellaneous debtors who have a payment arrangement to pay their debts over a period of longer than the normal terms of business are treated as having a financing transaction. These transactions are recognised at their present value rather than transaction value. The discount rate used for the present value calculation is based upon an estimate of the rate the debtor could obtain in their own right.
b) Cash and cash equivalents Cash and cash equivalents includes cash, short-term deposits and other short-term highly liquid investments with an original maturity of twelve months or less.
For the purpose of the Consolidated Statement of Cash Flows, cash and cash equivalents are as defined
above, net of outstanding bank overdrafts.
c) Derivatives - Financial assets Financial assets are recognised at fair value. They represent some of the financial instruments that have been designated as hedging instruments. Hedging is further explained below in the derivative note.
d) Derivatives - Financial liabilitiesi) Financial liabilities are recognised at
fair value. They represent some of the financial instruments that have been designated as hedging instruments. Hedging is further explained below in the derivative note.
ii) Bonds are classified as other financial liabilities under section 11 of FRS 102 and held at amortised cost using the effective interest rate method to allocate costs of issue (including the discount on issue).
iii) Accrued interest payable on the bonds is also classified as other financial liabilities and held at amortised cost.
e) Offsetting financial instruments Financial assets and liabilities are offset and the net amount reported in the Consolidated Statement of Financial Position when there is a legally enforceable right to offset the recognised amounts and there is an intention to settle on a net basis or realise the asset and settle the liability simultaneously.
f) Trade creditors Trade creditors are not interest- bearing and are stated at their transaction value.
g) Trade debtors Trade debtors are recognised at amortised cost.
h) Committed borrowings and bank overdrafts Interest-bearing loans and overdrafts are recorded at the amounts received, net of direct issue costs, using the effective interest method. Direct issue costs are amortised over the period of the loans and
Notes to the Consolidated Financial Statements

101
Strategic Report Corporate Governance Financial Statements
overdrafts to which they relate. Finance charges, including premiums payable on settlement or redemption, are charged to the profit or loss for the period as incurred using the effective interest rate method and are added to the carrying value of the borrowings or overdraft to the extent they are not settled in the period in which they arise.When a loan facility agreement is entered into, any associated costs are capitalised, discounted at the prevailing market rate of interest amortised over the life of the related loans.
i) Derivative financial instruments Various derivative financial instruments are used to manage exposure to interest rate risks, including interest rate swaps and options or a combination of these. All derivative instruments are recorded in the Consolidated Statement of Financial Position at fair value. The recognition of gains or losses on derivative instruments depends on whether or not the instrument is designated as a hedging instrument. Derivatives are designated as either:
(I) A standalone derivative recognised at fair value through the Consolidated Statement of Comprehensive Income; or
(II) A cash flow hedging instrument. The full fair value of a hedging
derivative is classified as a non- current asset or liability when the derivative matures in more than twelve months, and as a current asset or liability when the derivative matures in less than twelve months.
j) Cash flow hedges The effective portion of gains or losses on derivatives that are designated and qualify as cash flow hedges are recognised in other comprehensive income within the Consolidated Statement of Comprehensive Income and subsequently in the cash flow hedge reserve. The ineffective portion of such gains and losses is recognised in the Consolidated Statement of Comprehensive Income for the period immediately.
Amounts accumulated in the cash flow hedge reserve are reclassified to the Consolidated Statement of Comprehensive Income in the periods when the hedged item is recognised in the Statement of Comprehensive Income.
When a hedging instrument expires or is sold, or when a hedge no longer meets the criteria for hedge accounting, any cumulative gain or loss existing in the cash flow reserve at that time is recognised in the Consolidated Statement of Comprehensive Income for the period.
k) Interest rate exposure Interest rate swaps are used to manage the group’s exposure to fluctuations in interest rates on its floating rate borrowings. The maturity profile of these swaps is matched with the underlying debt. Hedging policy is to fix no more than 90% of term debt but also leave no more than 50% of borrowings on a floating rate. The expected future debt profile is based on estimates of the timings and size of future housing developments funding demands offset by an estimate of cash generated by operating activities.
l) Convertible financial instruments Convertible financial instruments can be converted into third-party equity under certain circumstances. They do not meet the criteria for basic financial instruments under section 11 of FRS 102 and are recognised at their fair value, which is measured at the end of each reporting year with any changes being recognised in profit or loss.
Social housing and other grants Social housing grant (‘SHG’) is receivable from the Regulator of Social Housing (‘RSH’). It is accounted for under section 24 of FRS 102 ‘Government Grants’ using the accrual model. Once properties have been completed the grant is classified as a long-term creditor and amortised to the Consolidated Statement of Comprehensive Income for the year over the life of the properties’
structure. Where grants are paid in advance, they are included in creditors until performance is completed. If a property which received a grant is subsequently sold, or another relevant event takes place the SHG appears as a creditor. It can be recycled for use in a project approved by the RSH or repaid to the RSH if it is not used within the agreed timescale. Prior to transition to FRS 102 Aster Group held its social housing properties at valuation. On transition this became the deemed cost. All SHG received prior to transition on 1 April 2014 was transferred to the profit and loss reserve. It is recycled from this reserve if a relevant event occurs.Government grants received after 1 April 2014 are recognised in income over periods in which the related costs are recognised for which the grant is intended to compensate, over the useful economic life of the property’s structure.Other government grants received are also accounted for under section 24 of FRS 102 using the accrual model.When part of the government grant is deferred, it is recognised as deferred income within creditors and allocated between due within one year and due after more than one year as appropriate.Pension costs The cost of providing retirement pensions and related benefits is accounted for in accordance with Section 28 of FRS 102 ‘Employee Benefits’.The group participates in eight pension schemes. There are four Local Government Pension Schemes (‘LGPS’) which are the Dorset County Council Pension Fund, the Hampshire County Council Pension Scheme, the Somerset County Council Pension Scheme and the Wiltshire Council Pension Scheme. There are three separate schemes with the Social Housing Pension Scheme (‘SHPS’), and one defined contribution (‘stakeholder’) scheme with Friends Provident. The accounting treatment for each scheme is described below.

102 Annual Report and Financial Statements for the year ended 31 MARCH 2019
Pension costs (continued)The LGPSs are accounted for as defined benefit schemes. The assets for these schemes are held separately from those of the group in independently administered funds. Pension scheme assets are measured in accordance with the FRS 102 fair value hierarchy. Pension scheme liabilities are measured using the projected unit actuarial method and are discounted at the current rate of return on a high quality corporate bond of equivalent terms and currency to the liability.The increase in the present value of the liabilities of the group’s defined benefit pension schemes expected to arise from employee service in the year is charged to operating profit. The expected return on the schemes’ assets and the increase during the year in the present value of the schemes’ liabilities arising from the passage of time are included in operating expenditure. Pension schemes’ surpluses, to the extent that they are considered recoverable, or deficits, are recognised in full and presented on the face of the Consolidated Statement of Financial Position net of the related deferred tax. Actuarial gains and losses which arise from the difference between actual and expected performance of the scheme are recognised in Other Comprehensive Income. All LGPS schemes are closed to new starters.There are three separate SHPS schemes.The SHPS defined benefit scheme based on final salary was closed to new starters with effect from October 2010. Employees currently have a choice of joining the SHPS defined benefit scheme based on a career average of earnings (CARE), or a SHPS defined contributions (stakeholder) scheme. The CARE scheme will be closed to new starters from June 2019.Defined contribution scheme costs are charged to the Consolidated Statement of Comprehensive Income as they fall due.
4 Summary of significant accounting policies (continued)
Prior to 1 April 2018 SHPS were unable to provide sufficient information for the defined benefits schemes to calculate the group’s share of assets and liabilities and the scheme was accounted for as a defined contribution scheme. The SHPS scheme was in deficit and the group had agreed to participate in a deficit funding arrangement which was recognised as a liability. The amount recognised was the present value of the contributions payable under the deficit funding arrangement.From 1 April 2018 SHPS has been able to provide sufficient information to calculate the group’s share of the scheme’s assets and liabilities. The scheme is now accounted for as a defined benefit scheme as described for the LGPSs above.The movements resulting from the transition have been recognised in Other Comprehensive Income, see “Pension obligations” note 34 for further details. All SHPS defined benefit schemes will be closed to new starters from June 2019.Employees joining Flourish Homes (now part of Aster Communities) between September 2003 and September 2010 were only offered entrance to a defined contribution (‘stakeholder’) scheme with Friends Provident. Since October 2010 new employees have been offered entrance to the SHPS defined benefits career average scheme or the SHPS defined contribution scheme. All payments for both schemes are charged as an expense in the Consolidated Statement of Comprehensive Income.
Provisions
a) General provisions A provision is recognised in the Consolidated Statement of Financial Position where the group has an obligation as a result of a past event, and it is probable that economic benefits will be required to settle the obligation. The amount of provision is
re-assessed each year in the light of estimated future income and costs as appropriate.
b) Termination benefits Termination benefits are only recognised once a formal plan has been approved by the group’s senior management.
Deferred taxation
Deferred taxation is provided in accordance with Section 29 of FRS 102 ‘Income Tax’. It is recognised in respect of all timing differences at the reporting date where transactions or events have occurred at that date that will result in either an obligation to pay more tax in the future or a right to pay less tax in the future.
A net deferred tax asset is recognised as recoverable and therefore recognised only when, on the basis of all available evidence, it can be regarded as probable that there will be suitable taxable profits against which to recover carried forward tax losses and from which the future reversal of underlying timing differences can be deducted.Deferred tax is measured on an undiscounted basis at the average tax rates that are expected to apply in the periods in which the timing differences are expected to reverse based on tax rates and laws that have been enacted or substantively enacted at the reporting date.
Restricted reserve
Reserves which arise from the sale of some properties where the transfer agreement with the local council requires the association to retain a portion of the sale proceeds. The reserve can only be used to fund investment in properties in the Mendip area, in agreement with Mendip District Council.
Notes to the Consolidated Financial Statements

103
Strategic Report Corporate Governance Financial Statements

104 Annual Report and Financial Statements for the year ended 31 MARCH 2019
Multi-employer defined benefit pension scheme
The group participates in two multi-employer defined benefit pension plans. One based on final salary and one based on a career average of earnings, both provided by the Social Housing Pension Scheme.
In the judgement of the directors prior to 1 April 2018 there was not sufficient information available to be able to reliably account for the group’s share of the SHPS defined benefit scheme obligation and assets. Therefore, the scheme was accounted for as a defined contribution scheme. From 1 April 2018 there was sufficient information to attribute the scheme’s assets and liabilities and the scheme’s accounting changed to defined benefit. The movements resulting from the transition have been recognised in Other Comprehensive Income which the directors judge to be appropriate. See the ‘Pension obligations’ note 34 for further details.
Fair value
The directors have made the following judgements regarding fair value:
• If land is donated at below market cost it is recognised at its fair value. The directors judge this to be its market value at the time of the donation.
• Investment properties are recognised each year at their fair value. The directors judge this to be their market value at the end of the reporting year.
• Convertible financial instruments are recognised at their fair value. The directors judge this to be the face value of the third-party equity they could be converted into at the end of the reporting period.
Derivative financial instruments are used to manage interest rate risk. These financial instruments are recognised each year at their fair or mark to market (‘MTM’) value. This is determined by measuring the future discounted cash flows generated by the financial instrument against the implied interest yield curve at that point in time for the same nominal amount. The difference between these two figures is the financial instrument’s fair or mark to market value. The directors judge this to be an appropriate method of determining their fair value.
Cash generating units
When reviewing social housing properties for impairment the directors are required to consider the level of cash generating unit. For impairment purposes, the directors consider that each individual property constitutes a cash generating unit as it generates cash flows that are largely independent of the cash flows generated by other assets.
Impairment triggers for housing properties
On completion each development scheme is reviewed for impairment triggers using the group's Property Impairment Flow Chart. If it is judged that there is evidence that the scheme has activated one of the triggers in the flow chart an impairment review is undertaken. Where impairment is found the carrying value of the properties in the scheme is reduced to their depreciated replacement cost. This process is also applied to completed properties annually.
Useful lives of social housing property assets
Social housing property assets are split into their component parts, with each component being depreciated over a separate estimated useful economic life. The annual depreciation charge for social housing property assets in total is sensitive to changes in these estimated useful economic lives. The useful economic lives of individual components are re-assessed as part of a rolling stock condition survey, examining 20% of the stock annually, and amended where necessary. See note 4 for the useful economic lives for each class of component.
5 Critical accounting judgements and estimation uncertainty
Preparation of the financial statements requires management to make significant judgements and estimates, which are shown below.
Estimates and judgements are continually evaluated and are based on historical experience and other factors, including expectations of future events that are believed to be reasonable under the circumstances. Critical judgements in applying the group’s accounting policies
Notes to the Consolidated Financial Statements

105
Strategic Report Corporate Governance Financial Statements
Rebalancing surpluses from HomeBuy first tranche sales
Where social housing development schemes consist of social rental and HomeBuy properties the cost of development is split between the individual properties by property classification. As these costs cannot be accurately assigned to individual properties management assumes that they are evenly spread by floor area.
The HomeBuy property costs are then further split between the percentage of the property to remain as property, plant and equipment and the current asset based on the percentage to be sold as the first tranche sale.
The exception to this treatment is where the overall surplus of the HomeBuy element of a scheme is less than the surplus to be recognised for the first tranche sale. The surplus for the HomeBuy element of a scheme is calculated by taking the present value of the net cash flows expected to be generated by this element of the scheme over a period of 30 years, away from the cost of this element of the scheme. If the resulting surplus is smaller than the surplus on the first tranche sales alone the first tranche surplus must be restricted to that of HomeBuy element of the scheme. This is achieved by transferring costs from property, plant and equipment to the current asset until the excess surplus is removed.
Change in accounting policy for multi-employer defined benefit pension plans
Prior to 1 April 2018 multi-employer defined benefit pension plans were accounted for as defined contribution schemes. Contributions to a plan’s deficit recovery plan were recognised at the present value of the contributions discounted at the current rate of return on a high-quality corporate bond of equivalent terms and currency to the liability, provided by the scheme’s actuaries. From 1 April 2018 these plans are accounted for as a defined
benefit scheme. The cost of these benefits and the present value of the obligation depend on a number of estimates, including life expectancy, salary increases, asset valuations and the discount rate on corporate bonds. These estimates are provided by the scheme’s actuaries. The directors are satisfied these estimates are reasonable. See the ‘Pension obligations’ note 34 for further details.
Critical judgements in applying the group’s accounting policies
Critical accounting estimates and assumptions

106 Annual Report and Financial Statements for the year ended 31 MARCH 2019
Note
2019 2018Turnover
£000
Operatingexpenditure /cost of sales
£000
Operatingprofit /
(loss)£000
Turnover
£000
Operatingexpenditure /cost of sales
£000
Operatingprofit /
(loss)£000
Income and expenditure from lettingsHousing accommodation before impairment 6b 154,319 (103,467) 50,852 152,142 (98,643) 53,499 Other income and expenditure Social HousingHousing services provided to third parties 704 (790) (86) 2,085 (2,189) (104)Supporting People contract 2,485 (2,471) 14 1,069 (976) 93 Properties managed by agents 319 (71) 248 289 - 289 Community involvement 18 (736) (718) 49 (648) (599)Domiciliary care 911 (1,225) (314) 3,577 (4,010) (433)Helpline / Telecare 1,680 (1,472) 208 1,818 (1,847) (29)Home improvements 975 (939) 36 1,063 (908) 155 Development costs not capitalised - (2,904) (2,904) - (1,792) (1,792)Other 113 - 113 52 84 136
7,205 (10,608) (3,403) 10,002 (12,286) (2,284)Non Social HousingGarage lettings 3,378 (594) 2,784 3,387 (309) 3,078 Sewerage services 133 (328) (195) 159 (170) (11)Market rented property rental 843 (239) 604 848 (257) 591 Other 1,614 (181) 1,433 921 (313) 608
5,968 (1,342) 4,626 5,315 (1,049) 4,266 Total income and expenditure 167,492 (115,417) 52,075 167,459 (111,978) 55,481 Other income and cost of sales Social HousingFirst tranche shared ownership 42,237 (34,867) 7,370 36,334 (30,742) 5,592 Non Social HousingOpen market property sales 2,207 (1,984) 223 935 (796) 139 Total other income and cost of sales 44,444 (36,851) 7,593 37,269 (31,538) 5,731 Total 211,936 (152,268) 59,668 204,728 (143,516) 61,212 Administrative expenses (321) (292)Surplus on sale of housing property, plant and equipment 7 17,630 14,550 Operating profit before impairment 76,977 75,470 Impairment of social housing 6b - (488)Impairment of office premises 6b - (3,134)Operating profit 76,977 71,848
6 Turnover, operating expenditure and profit6a Turnover, operating expenditure and profit
Notes to the Consolidated Financial Statements

107
Strategic Report Corporate Governance Financial Statements

108 Annual Report and Financial Statements for the year ended 31 MARCH 2019
6 Turnover, operating expenditure and profit6b Income and expenditure from lettings
2019
Generalneeds
housing£000
Supported housing
£000
Sharedownership
£000
Other
£000
Total
£000
Income
Rents 119,200 16,971 6,984 760 143,915
Service charges 3,110 4,620 736 1,224 9,690
Amortisation of government grants 118 64 39 - 221
Other revenue grants 381 84 26 2 493
Total net rents from lettings 122,809 21,739 7,785 1,986 154,319
Expenditure
Management (27,867) (133) (7) (46) (28,053)
Services (2,424) (5,087) (4,842) (166) (12,519)
Routine maintenance (12,576) (784) (25) (2) (13,387)
Planned maintenance (8,252) (39) - - (8,291)
Major improvements and repairs (15,854) - - - (15,854)
Bad debts (789) (120) - (21) (930)
Depreciation of housing properties (19,859) (2,686) (1,063) (12) (23,620)
Accelerated depreciation of components (765) (43) - (5) (813)
Operating expenditure on housing lettings (88,386) (8,892) (5,937) (252) (103,467)
Operating profit on lettings activities 34,423 12,847 1,848 1,734 50,852
Rental income is stated net of void losses as set out below:Void losses 926 412 24 27 1,389
Notes to the Consolidated Financial Statements

109
Strategic Report Corporate Governance Financial Statements
2018
General needs
housing £000
Supported housing
£000
Shared ownership
£000
Other
£000
Total
£000
Income
Rents 117,310 17,215 5,465 567 140,557 Service charges 3,613 3,945 680 2,555 10,793 Amortisation of government grants 109 64 35 - 208 Other revenue grants 442 101 39 2 584 Total net rents from lettings 121,474 21,325 6,219 3,124 152,142 ExpenditureManagement (29,459) (136) (5) (52) (29,652)Services (8,471) (2,860) (700) (38) (12,069)Routine maintenance (12,145) (793) (56) (46) (13,040)Planned maintenance (6,808) (191) - - (6,999)Major improvements and repairs (11,844) - - - (11,844)Bad debts (1,475) (132) - (20) (1,627)Depreciation of housing properties (18,880) (2,682) (812) - (22,374)Accelerated depreciation of components (916) (122) - - (1,038)Operating expenditure on housing lettings (89,998) (6,916) (1,573) (156) (98,643)Operating profit on lettings activities before impairment 31,476 14,409 4,646 2,968 53,499 Impairment of housing properties (488) - - - (488)Impairment of office premises (3,134) - - - (3,134)Operating profit on lettings activities 27,854 14,409 4,646 2,968 49,877 Rental income is stated net of void losses as set out below:Void losses 908 401 - 44 1,353
The impairment of housing assets was triggered by the sale of a block of flats where the carrying value was shown to be greater than its depreciated replacement cost.
The impairment of office premises followed a review of all office premises where it was observed that the carrying value of an office block was greater than market value.

110 Annual Report and Financial Statements for the year ended 31 MARCH 2019
Turnover 2019
Net rental
income
£000
Care and
support income
£000
Repairs and maintenance income
£000
Design and build and
management services fees
£000
First tranche and open
market property sales
£000
Other
£000
Total
£000
Aster Communities 102,345 - - 2,099 33,598 304 138,346
Synergy Housing Ltd 54,243 - - 15 10,846 2,036 67,140
Aster 3 Ltd 1,108 - - - - - 1,108
Aster Living - 3,686 975 - - - 4,661
Aster Property Ltd - - 64,728 - - - 64,728
Aster Homes Ltd - - - 85,817 976 - 86,793
Zebra Property Solutions Ltd - - - - - - -
Aster Group Ltd - - - 21,336 - - 21,336
Aster Treasury Plc - - - - - - -
Silbury Housing and Holdings Ltd - - - - - 1,593 1,593
Aster Options Plus Ltd - - - - - - - Aster Solar Ltd - - - - - 298 298
Eliminations - - (64,722) (108,369) (976) - (174,067)
Total turnover 157,696 3,686 981 898 44,444 4,231 211,936
6c Segmental analysis
The group has determined the Group Executive Board to be the chief operating decision maker. The Group Executive Board reports to the Group Overlap Boards and has operational responsibility for all aspects of the group’s business. It has the power to make operational decisions and
allocate resources. The Group Executive Board have determined that the group’s operating segments are represented by the group’s individual subsidiaries. The tables below are a summary of the management information received by the Group Executive Board for decision making
purposes. Segments are reported on by expenditure and income. Segmental assets and liabilities have not been disclosed because they are not regularly provided to the Group Executive Board for decision making.
Notes to the Consolidated Financial Statements

111
Strategic Report Corporate Governance Financial Statements
Profit / (Loss) 2019
Turnover
£000
Cost of sales
£000
Operating expenditure
£000
Disposal of housing properties
£000
Depreciation
£000
Impairment
£000
Operating profit / (loss)
£000
Aster Communities 138,346 (28,969) (57,687) 11,918 (16,468) - 47,140
Synergy Housing Ltd 67,140 (8,853) (27,373) 5,712 (8,756) - 27,870
Aster 3 Ltd 1,108 - (612) - (219) - 277
Aster Living 4,661 - (4,602) - (115) - (56)
Aster Property Ltd 64,728 - (63,520) - (621) - 587
Aster Homes Ltd 86,793 (79,984) (4,178) - - - 2,631
Zebra Property Solutions Ltd - - (7) - - - (7)
Aster Group Ltd 21,336 - (20,888) - (1,006) - (558)
Aster Treasury Plc - - - - - - -
Silbury Housing and Holdings Ltd 1,593 - (927) - - - 666
Aster Solar Ltd 298 - (80) - (136) - 82
Eliminations (174,067) 80,955 91,457 - - - (1,655)
211,936 (36,851) (88,417) 17,630 (27,321) - 76,977
Net interest (24,516)
Surplus on disposal of other property, plant and equipment and intangible assets 8
Share of joint venture profit 1,183
Fair value adjustment of investment properties 1,325
Profit before taxation 54,977

112 Annual Report and Financial Statements for the year ended 31 MARCH 2019
Turnover 2018
Net rental
income
£000
Care and
support income
£000
Repairs and maintenance income
£000
Design and build and
management services fees
£000
First tranche and open
market property sales
£000
Other
£000
Total
£000Aster Communities 102,781 - - 2,068 25,005 217 130,071 Synergy Housing Ltd 52,748 - - 17 12,264 1,070 66,099 Aster 3 Ltd - - - - - - - Aster Living - 6,488 1,063 - - - 7,551 Aster Property Ltd - - 61,294 - - - 61,294 Aster Homes Ltd - - - 96,861 727 30 97,618 Zebra Property Solutions Ltd - - - - - 76 76 Aster Group Ltd - - - 19,493 - - 19,493 Aster Treasury Plc - - - - - - - Silbury Housing and Holdings Ltd - - - - - 1,560 1,560 Aster Options Plus Ltd - - - - - 230 230 Aster Solar Ltd - - - - - 299 299 Eliminations - (24) (61,021) (117,759) (727) (32) (179,563)Total turnover 155,529 6,464 1,336 680 37,269 3,450 204,728
6c Segmental analysis (continued)
Notes to the Consolidated Financial Statements

113
Strategic Report Corporate Governance Financial Statements
Profit / (Loss) 2018
Turnover
£000
Cost of sales
£000
Operating expenditure
£000
Disposal of housing properties
£000
Depreciation
£000
Impairment
£000
Operating profit /
(loss)£000
Aster Communities 130,071 (21,945) (52,617) 11,916 (16,129) (3,622) 47,674 Synergy Housing Ltd 66,099 (10,308) (27,678) 2,634 (8,352) - 22,395 Aster 3 Ltd - - - - - - -Aster Living 7,551 - (7,572) - (193) - (214)Aster Property Ltd 61,294 - (59,243) - (780) - 1,271 Aster Homes Ltd 97,618 (89,871) (4,127) - - - 3,620 Zebra Property Solutions Ltd 76 17 (29) - - - 64 Aster Group Ltd 19,493 - (19,054) - (1,258) - (819)Aster Treasury Plc - - - - - - - Silbury Housing and Holdings Ltd 1,560 - (880) - - - 680 Aster Options Plus Ltd 230 - (225) - - - 5 Aster Solar Ltd 299 - (69) - (136) - 94 Eliminations (179,563) 90,569 86,099 - - - (2,895)
204,728 (31,538) (85,395) 14,550 (26,848) (3,622) 71,875 Net interest (23,848)Surplus on disposal of other property, plant and equipment and intangible assets 17 Share of joint venture profit 1,155 Fair value adjustment of investment properties 445 Profit before taxation 49,644
The surplus on sale of housing property, plant and equipment has been reclassified from profit before interest and taxation to operating profit for £17.6 million (2018: £14.6 million) because management consider it is part of the group's core business.

114 Annual Report and Financial Statements for the year ended 31 MARCH 2019
7 Profit / (loss) on disposal of housing property, plant and equipment
8 Operating profit
2019£000
2018£000
Operating profit is stated after charging / (crediting):
Auditors’ remuneration (excluding irrecoverable VAT) In their capacity as auditors:
Financial statements audit 147 120 In respect of other services:
Service charge review 2 2 Other non-aduit services 55 1
Depreciation:Property, plant and equipment - (social housing) 23,620 22,374 Accelerated depreciation of components 813 1,038 Property, plant and equipment - (other assets) 1,977 2,349
Amortisation of intangible assets 911 1,288 Impairment:
Housing properties - (charge) / net reversal - 488 Office premises - 3,134
Profit on shared ownership properties, first tranche (7,370) (5,592)Inventory recognised as an expense 7,863 7,261 Operating lease payments:
Land and buildings 59 67 Office premises 292 252 Office equipment 10 -
2019 2018
Proceeds
£000
Cost of disposal
£000
Profit /(loss)£000
Proceeds
£000
Cost of disposal
£000
Profit /(loss)£000
Right to buy 3,433 (3,670) (237) 4,148 (4,581) (433)Right to acquire 802 (233) 569 855 (218) 637 Shared ownership staircasing 5,653 (3,434) 2,219 6,084 (3,605) 2,479 Disposal of void properties 19,846 (4,938) 14,908 14,612 (3,128) 11,484 Others 171 - 171 400 (17) 383 Total social housing 29,905 (12,275) 17,630 26,099 (11,549) 14,550
The disposal of housing properties has been reclassified as part of operating profit because management consider it is part of the group's core business.
Local authority clawback payments, legal and other related costs are included in the cost of disposal.
Notes to the Consolidated Financial Statements

115
Strategic Report Corporate Governance Financial Statements
Staff costs: 2019£000
2018£000
Wages and salaries 38,357 39,163 Social security costs 3,791 3,902 Other pension costs 3,090 2,574
45,238 45,639
9 Employee information 2019
No.2018
No.
The average number of persons employed during the year (full time equivalents ‘FTE’) based on 37 hours per week 1,144 1,210
FTE by salary bands: 2019
No.
Restated2018
No.£59,999 or less 1,061 1,131 £60,000 to £69,999 38 34 £70,000 to £79,999 13 13 £80,000 to £89,999 5 8 £90,000 to £99,999 12 10 £100,000 to £109,999 6 5 £110,000 to £119,999 2 2 £120,000 to £129,999 1 - £130,000 to £139,999 - 1 £140,000 to £149,999 1 2 £150,000 to £159,999 1 - £160,000 to £169,999 - 1 £170,000 to £179,999 - 1 £180,000 to £189,999 1 - £190,000 to £199,999 2 - £200,000 to £209,999 - 1 £250,000 to £259,999 - 1 £270,000 to £279,999 1 -
1,144 1,210
Salary includes salary, car allowance, any acting up allowances, bonuses and pension contributions made by the group. The prior year figures have been restated to reflect the inclusion of bonuses and pension contributions.
None of the above employees received any enhanced pension payments during the year (2018: nil).
The disposal of housing properties has been reclassified as part of operating profit because management consider it is part of the group's core business.
Local authority clawback payments, legal and other related costs are included in the cost of disposal.

116 Annual Report and Financial Statements for the year ended 31 MARCH 2019
10 Profit on disposal of other property, plant and equipment and intangible assets
11 Profit on disposal of investment properties
2019 2018
Proceeds
£000
Cost of disposal
£000
Profit / (loss)
£000
Proceeds
£000
Cost of disposal
£000
Profit / (loss)
£000
Motor vehicles 28 - 28 28 (10) 18 Computer equipment - (1) (1) - - - Computer software - (12) (12) - - - Solar panels 5 (12) (7) 18 (19) (1)Total 33 (25) 8 46 (29) 17
2019 2018
Proceeds
£000
Cost of disposal
£000
Profit
£000
Proceeds
£000
Cost of disposal
£000
Profit
£000Investment properties - - - 198 (171) 27
Legal and other related costs are included in cost of disposal.
Notes to the Consolidated Financial Statements

117
Strategic Report Corporate Governance Financial Statements
12 Finance income and expense
Note2019£000
2018£000
Interest receivable and similar income
Interest on short term deposits 491 344 Finance debtor interest receivable 2,459 2,517 Other interest receivable 1,752 1,481 Total interest income on financial assets not measured at fair value through profit or loss 4,702 4,342 Unwinding of trade debtor discounting 318 263
5,020 4,605 Interest payable and similar charges
Guaranteed fixed rate secured bond (13,190) (11,194)Fixed rated loans (12,939) (14,000)Interest rate swaps (3,071) (3,690)Floating rated loans (3,632) (1,647)Less interest capitalised 5,375 3,943
(27,457) (26,588)Disposal proceeds fund interest (1) (1)Recycled capital grant fund interest (16) (13)Interest charged on amounts due under right to buy sharing agreement (2) (6)Amortisation of arrangement fees (40) (43)Administration charge (250) (259)Amortisation of issue costs (54) (36)Total interest income on financial liabilities not measured at fair value through profit or loss (27,820) (26,946)Movement in SHPS recovery plan liability discounting - (85)Trade debtor discounting (577) (451)
(28,397) (27,482)Interest on net pension liability
Local government pension schemes 34 (1,139) (971)Net finance expense (24,516) (23,848)
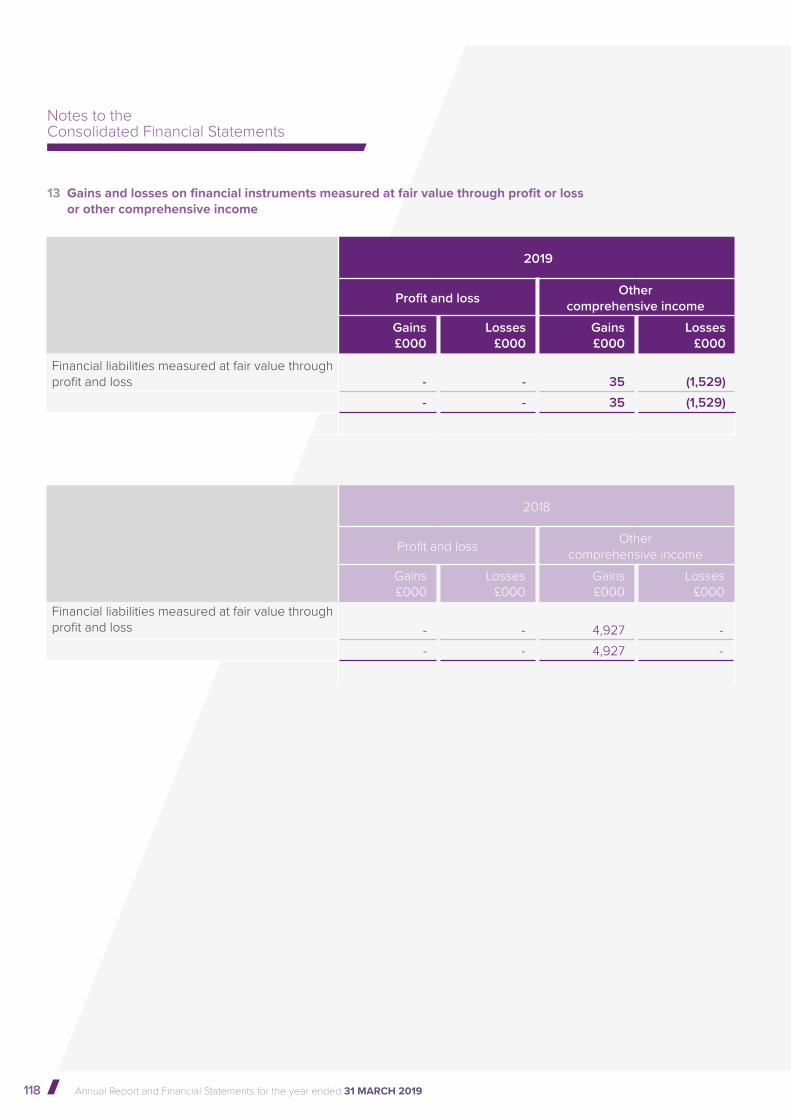
118 Annual Report and Financial Statements for the year ended 31 MARCH 2019
13 Gains and losses on financial instruments measured at fair value through profit or loss or other comprehensive income
2019
Profit and loss Other comprehensive income
Gains £000
Losses £000
Gains £000
Losses £000
Financial liabilities measured at fair value through profit and loss - - 35 (1,529)
- - 35 (1,529)
2018
Profit and loss Other comprehensive income
Gains £000
Losses £000
Gains £000
Losses £000
Financial liabilities measured at fair value through profit and loss - - 4,927 -
- - 4,927 -
Notes to the Consolidated Financial Statements

119
Strategic Report Corporate Governance Financial Statements

120 Annual Report and Financial Statements for the year ended 31 MARCH 2019
14 Tax on profit on ordinary activities
2019£000
2018£000
(a) Tax expense included in profit or loss The tax (credit) / charge on the profit on ordinary activities was as follows:
Current tax
UK corporation tax expense - 75 Under provision in previous years - (1)Total current tax - 74 Deferred tax
Origination and reversal of timing differences (264) (177)Adjustment for prior year (190) - Changes in tax rate or laws 28 19 Total deferred tax (426) (158)Tax on profit on ordinary activities (426) (84)
2019£000
2018£000
(b) Tax credit included in other comprehensive income / (expense)
Deferred tax
Origination and reversal of timing differences (187) 66 Adjustment for prior years - - Impact of change in tax rate - -
(187) 66
Notes to the Consolidated Financial Statements

121
Strategic Report Corporate Governance Financial Statements
2019£000
2018£000
(c) Factors affecting tax charge / (credit) for the year
Profit on ordinary activities before taxation: 54,977 49,644 Profit on ordinary activities multiplied by standard rate of Corporation Tax in the UK of 19% (2018: 19%) 10,446 9,432 Effects of:
Profit from charitable activities (10,710) (9,496)Expenses not deductible - 2 Effects of tax rate changes 28 18 Utilisation of losses - - Joint venture profit share - - Items not allowable for tax purposes - - Deferred tax asset transferred to another group entity - - Items charged to other comprehensive income - - Adjustments for prior year (190) (40)Other timing differences - -
(426) (84)
2019£000
2018£000
(d) Deferred tax
Asset at start of year (501) (409)Deferred tax (credit) / charge to income statement for the year (426) (158)Deferred tax (credit) / charge in other comprehensive income for the year (187) 66 Asset at end of year (1,114) (501)
(e) Tax rate changesThe Finance Act 2015 was substantively enacted on 26 October 2015 and reduced the main rate of corporation tax to 19% with effect from 1 April 2017. The Finance Act 2016 was substantively enacted on 15 September 2016 and reduced the main rate of corporation tax to 17% from 1 April 2020. Closing deferred tax balances have therefore been valued at 17% or 19% (2018: 17% or 19%) depending on the date they are expected to fully unwind.
The tax assessed for the year differs from the standard rate of corporation tax in the UK as explained below.
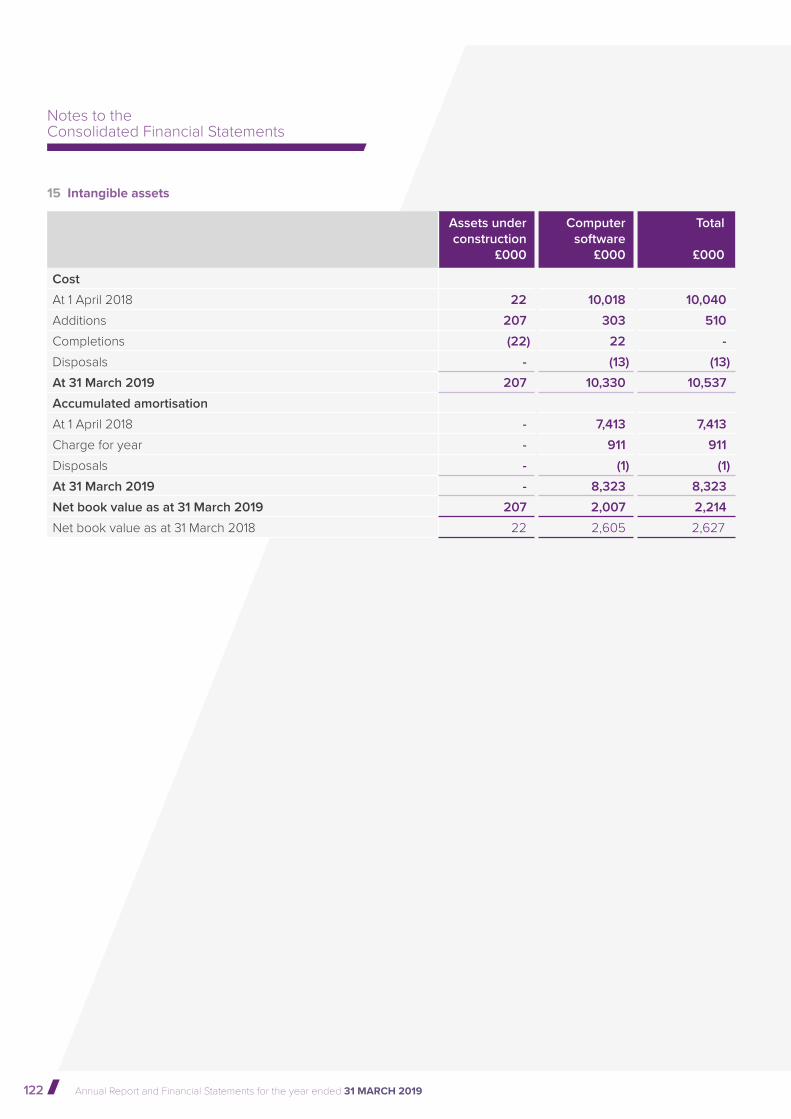
122 Annual Report and Financial Statements for the year ended 31 MARCH 2019
15 Intangible assets
Assets under construction
£000
Computer software
£000
Total
£000
Cost
At 1 April 2018 22 10,018 10,040
Additions 207 303 510
Completions (22) 22 -
Disposals - (13) (13)
At 31 March 2019 207 10,330 10,537
Accumulated amortisation
At 1 April 2018 - 7,413 7,413
Charge for year - 911 911
Disposals - (1) (1)
At 31 March 2019 - 8,323 8,323
Net book value as at 31 March 2019 207 2,007 2,214
Net book value as at 31 March 2018 22 2,605 2,627
Notes to the Consolidated Financial Statements

123
Strategic Report Corporate Governance Financial Statements
16 Property, plant and equipment (social housing)
On transition to FRS 102 Aster Group has elected to take the transitional exemption laid out in paragraph 35.10(d) of FRS 102 and is using the 31 March 2014 valuation as the deemed cost of social housing properties held at that date. All social housing properties completed or acquired after that date are recognised at cost.
Housing properties under
construction£000
Completed housing
properties£000
Shared ownership under
construction £000
Shared ownership completed
£000
Total
£000
Cost
At 1 April 2018 48,664 1,345,461 25,724 126,474 1,546,323
Additions 76,554 - 53,885 - 130,439
Components - 15,039 - - 15,039
Disposal of components - (3,689) - - (3,689)
Completions (74,870) 74,870 (52,194) 52,194 -
Disposals - (7,170) - (3,054) (10,224)
At 31 March 2019 50,348 1,424,511 27,415 175,614 1,677,888
Accumulated depreciation
At 1 April 2018 - 70,285 - 2,259 72,544
Charge for year - 22,582 - 1,038 23,620
Disposal of components - (2,876) - - (2,876)
Disposals - (974) - (98) (1,072)
At 31 March 2019 - 89,017 - 3,199 92,216
Net book value at 31 March 2019 50,348 1,335,494 27,415 172,415 1,585,672
Net book value at 31 March 2018 48,664 1,275,176 25,724 124,215 1,473,779
Net book value of property, plant and equipment - social housing by tenure
2019£000
2018£000
Freehold 582,406 539,666 Long leasehold 1,003,266 934,113 Net book value 1,585,672 1,473,779
The cost of completed properties during the year includes £5.4 million (2018: £3.9 million) of capitalised borrowing costs at an average cost of borrowing of 2.6% (2018: 2.23%).

124 Annual Report and Financial Statements for the year ended 31 MARCH 2019
16 Property, plant and equipment (social housing) (continued)
Current value of completed social housing properties
Housing properties under
construction£000
Completed housing
properties£000
Shared ownership under
construction £000
Shared ownership completed
£000
Total
£000
The below valuation was carried out by Jones Lang LaSalle Limited Chartered Surveyors on 31 March 2019, on the basis of Existing Use Value - Social Housing. The valuations were carried out in accordance with RICS Appraisal and Valuation Manual effective from 1 January 1996 (as amended).
Notes to the Consolidated Financial Statements
Existing Use Valuation - Social Housing Valuation at 31 March 2019 - 1,419,630 - 156,790 1,576,420 Valuation at 31 March 2018 - 1,256,570 - 120,940 1,377,510

125
Strategic Report Corporate Governance Financial Statements
Office premises
£000
Leasehold office
improvements
£000
Assets under
construction
£000
Motor vehicles
£000
Office and estate equipment
and furniture£000
Computer equipment
£000
Total
£000
Cost
At 1 April 2018 15,373 879 24 6,510 10,598 5,586 38,970
Additions 270 - - 584 425 496 1,775
Completions - - (8) - - 8 -
Disposals (439) - - (377) (846) (1) (1,663)
At 31 March 2019 15,204 879 16 6,717 10,177 6,089 39,082
Accumulated depreciation
At 1 April 2018 6,756 162 - 4,770 5,946 4,629 22,263
Charge for year 266 19 - 609 479 604 1,977
Disposals - - - (347) (814) - (1,161)
At 31 March 2019 7,022 181 - 5,032 5,611 5,233 23,079
Net book value at 31 March 2019 8,182 698 16 1,685 4,566 856 16,003
Net book value at 31 March 2018 8,617 717 24 1,740 4,652 957 16,707
17 Property, plant and equipment (other assets)

126 Annual Report and Financial Statements for the year ended 31 MARCH 2019
18 Investment properties
Market rented properties
£000
Freehold
£000
Total investment properties
£000
Fair value
At 1 April 2018 15,708 58 15,766
Replacement components 49 - 49
Cost adjustment (156) - (156)
Fair value adjustments 312 1,013 1,325
At 31 March 2019 15,913 1,071 16,984
Notes to the Consolidated Financial Statements
The above valuation was carried out by Jones Lang LaSalle Limited Chartered Surveyors, as at 31 March 2019, on the basis of market value using the comparison method. Market value is defined by the Royal Institution of Chartered Surveyors (RICS) as ‘The estimated amount for which an asset or liability should exchange on the valuation date between a willing buyer and a willing seller in an arm’s length transaction after proper marketing and where the parties had each acted knowledgeably, prudently and without compulsion’. The valuations were carried out in accordance with RICS Appraisal and Valuation Manual effective from 1 January 1996 (as amended).
The freehold fair value adjustment is the recognition of the present value of the ground rents for the group’s leasehold properties, discounted at 5% in accordance with RICS guidance.

127
Strategic Report Corporate Governance Financial Statements
19 HomeBuy loans receivable
The group operates the HomeBuy Scheme, lending up to 25% of the cost of a property purchase to tenants who wish to own their own home. This loan is secured on the title of the property. On subsequent sale of the property by the purchaser, the group receives a proportion of the sale proceeds equal to the original percentage lent.
2019£000
2018£000
At 1 April 4,216 4,495 Proceeds received from sales (363) (378)Profit taken to profit and loss 113 99 At 31 March 3,966 4,216
2019£000
Group’s share(50%) £000
2018£000
Group’s share (50%) £000
Current assets - White Rock Land LLP 47,508 23,754 48,612 24,306 Current assets - Boorley Green LLP 51,596 25,798 54,240 27,120 Current assets - Kilnwood Vale LLP 14,874 7,437 - - Total current assets 113,978 56,989 102,852 51,426 Current liabilities - White Rock Land LLP (44,058) (22,029) (46,096) (23,048)Current liabilities - Boorley Green LLP (49,848) (24,924) (54,366) (27,183)Current liabilities - Kilnwood Vale LLP (15,352) (7,676) - - Total current liabilities (109,258) (54,629) (100,462) (50,231)Net assets 4,720 2,360 2,390 1,195
20 Investments in joint ventures
Aster Homes Limited has set up three limited liability partnership jointly controlled entities, White Rock Land LLP; Boorley Green LLP and from 29 June 2018, Kilnwood Vale LLP, with Galliford Try Homes Limited to develop and sell properties for social and private housing. For the year to 31 March 2019 White Rock Land LLP made a profit after distributions of £1.0 million (2018: profit £1.0 million); Boorley Green LLP made a profit of £1.9 million (2018: profit £1.0 million) and Kilnwood Vale LLP made a loss of £0.5 million (2018: £nil). During the year White Rock Land LLP made a distribution to shareholders of £36,000 (2018: £200,000) and Boorley Green LLP and Kilnwood Vale LLP made no distribution to shareholders (2018: £nil). The balance sheets of White Rock Land LLP, Boorley Green LLP, Kilnwood Vale LLP and the group’s share (50%) are as follows:

128 Annual Report and Financial Statements for the year ended 31 MARCH 2019
Aster Homes Limited holds one £1 share in White Rock Land LLP; one £1 share in Boorley Green LLP and one £1 share in Kilnwood Vale LLP. These entities are jointly controlled with Galliford Try Homes Limited, with the group holding 50%. The shares are fully paid.
The group holds 440,000 10 pence shared in MORhomes PLC, a social housing funding vehicle.
22 Debtors: amounts falling due after one year
2019£000
2018£000
Finance debtor 38,951 40,201 Loan to joint ventures 39,888 38,172 European Investment Bank liquidity reserve funds 3,061 3,062 MORhomes convertible financial instruments 460 -
82,360 81,435
21 Other investments
2019£000
2018£000
White Rock Land LLP - - Boorley Green LLP - - Kilnwood Vale LLP - - MORhomes PLC 230 20
230 20
A condition of the European Investment Bank (EIB) loans is that Aster Group holds an amount of at least twelve months interest payments in liquidity reserve funds as security against default on interest payments. These funds are controlled by the EIB and the Aster Group can only access the funds when the principal of the loans are repaid.
MORhomes PLC fixed rate unsecured convertible financial instruments (‘CoCo Loan Notes’) under certain circumstances can be converted to equity.
Notes to the Consolidated Financial Statements

129
Strategic Report Corporate Governance Financial Statements
24 Debtors: amounts falling due within one year
2019£000
2018£000
Trade debtors 1,807 2,286 Rent arrears 11,124 10,995 Service charge under-recovery 5,616 2,015 Less discounting of debts payable over more than 12 months (1,173) (914)Less provision for bad debts - rent arrears and service charges (4,654) (4,432)
12,720 9,950 Finance debtor 3,077 3,073 Loan to joint ventures 5,082 - Other debtors 503 257 Less provision for bad debts - other debtors (28) (25)Deferred tax 1,114 501 VAT recoverable 181 278 Other capital grants receivable 226 953 Prepayments and accrued income 6,500 3,429
29,375 18,416
23 Inventories
2019£000
2018£000
Trade consumables 316 332 Work in progress 2,007 1,616
2,323 1,948
Trade consumables relate to small items carried on the group’s repair vehicles to be used in minor repairs. Work in progress comprises uninvoiced design and build fees and the initial costs of a development scheme for which the tenure mix is yet to be decided.
Group deferred tax liabilities have been netted from the group’s deferred tax asset as all deferred tax relates to the same authority.

130 Annual Report and Financial Statements for the year ended 31 MARCH 2019
26 Properties held for open market sale
25 Shared ownership properties held for sale
Under construction
£000
Completed
£000
Total
£000
At 1 April 2018 17,092 6,164 23,256
Additions 40,878 - 40,878
Completions (38,948) 38,948 -
Disposals - (34,526) (34,526)
At 31 March 2019 19,022 10,586 29,608
Under construction
£000
Completed
£000
Total
£000
At 1 April 2018 1,570 - 1,570
Additions 414 - 414
Completions (1,984) 1,984 -
Disposals - (1,984) (1,984)
At 31 March 2019 - - -
27 Cash and cash equivalents 2019
£0002018
£000
Short term deposits 38,036 35,109Cash at bank and in hand 93,950 65,966
131,986 101,075
Notes to the Consolidated Financial Statements

131
Strategic Report Corporate Governance Financial Statements
Note2019£000
2018£000
Trade creditors 4,906 3,694 Taxation and social security payable 978 980 Pension contributions 509 503 Social Housing Pension scheme recovery plan liability 34 - 1,111 VAT 321 574 Rent paid in advance 4,293 3,812 Service charge over-recovery 4,484 1,758 Amounts due under right to buy sharing agreement 1,846 2,871 Corporation tax - 75 Capital grant received in advance 92 100 Social Housing Grant 30 4,263 2,758 Recycled Capital Grant Fund 31 1,458 473 Disposal Proceeds Fund 32 469 199 Accrued holiday pay 55 71 Other creditors 2,958 3,109 Accruals and deferred income 34,344 25,794 Loan repayable by instalment (within 1 year) 12,942 14,854
73,918 62,736
28 Creditors: amounts falling due within one year
29 Creditors: amounts falling due after more than one year
Note2019£000
2018£000
Loans repayableIn less than five years 113,626 103,672 In five years or more 818,674 746,149 Less unamortised issue fees (2,520) (1,822)Less unamortised discount issue fees (2,812) (2,873)Less deferred arrangement fees (487) (527)Plus unamortised premium on issue 21,043 7,551
947,524 852,150 Social Housing Grant 30 22,289 20,770 Recycled Capital Grant Fund 31 1,986 2,783 Disposal Proceeds Fund 32 3 365 Financial liabilities - interest rate swaps 19,425 17,930 HomeBuy Grant 3,966 4,216 Social Housing Pension scheme recovery plan liability 34 - 4,854
995,193 903,068
Interest is payable on housing loans at varying commercial rates. Loans are secured by fixed charges on individual properties. Interest rates ranged from 1.5% to 6.3% (2018: 1.5% to 6.3%) for fixed/hedged loans and 0.7% to 1.3% (2018: 0.7% to 1.0%) for variable loans.
At 31 March 2019, the group had undrawn loan facilities of £173.2 million (2018: £118.7 million) to finance future operating cash flows and investments.

132 Annual Report and Financial Statements for the year ended 31 MARCH 2019
Government Grants received 2019£000
2018£000
Social Housing Grant 253,356 250,005 HomeBuy Grant 3,966 4,216
257,322 254,221
2019£000
2018£000
Profit and loss reserve 226,804 226,477 Creditors: amounts falling due within one year 4,263 2,758 Creditors: amounts falling due after more than one year 26,255 24,986
257,322 254,221
Set out above is the cumulative amount of grant received by the group in relation to properties owned at the Consolidated Statement of Financial Position date. This grant is recognised in:
30 Social Housing Grant
2019£000
2018£000
Balance as at 1 April 23,528 21,098 Additions 3,350 2,762 Amortised within Consolidated Statement of Comprehensive Income (218) (208)Disposals (108) (124)Balance as at 31 March 26,552 23,528
2019£000
2018£000
Recognised in:Creditors: amounts falling due within one year 4,263 2,758 Creditors: amounts falling due after one year 22,289 20,770
26,552 23,528
Social housing grant (‘SHG’) is receivable from the Regulator of Social Housing (‘RSH’). Grant received for properties under construction is classified as a creditor due in less than one year. Once properties have been completed the grant is classified as a long-term creditor and amortised to the profit or loss for the period over the life of the properties’ structure.
Notes to the Consolidated Financial Statements
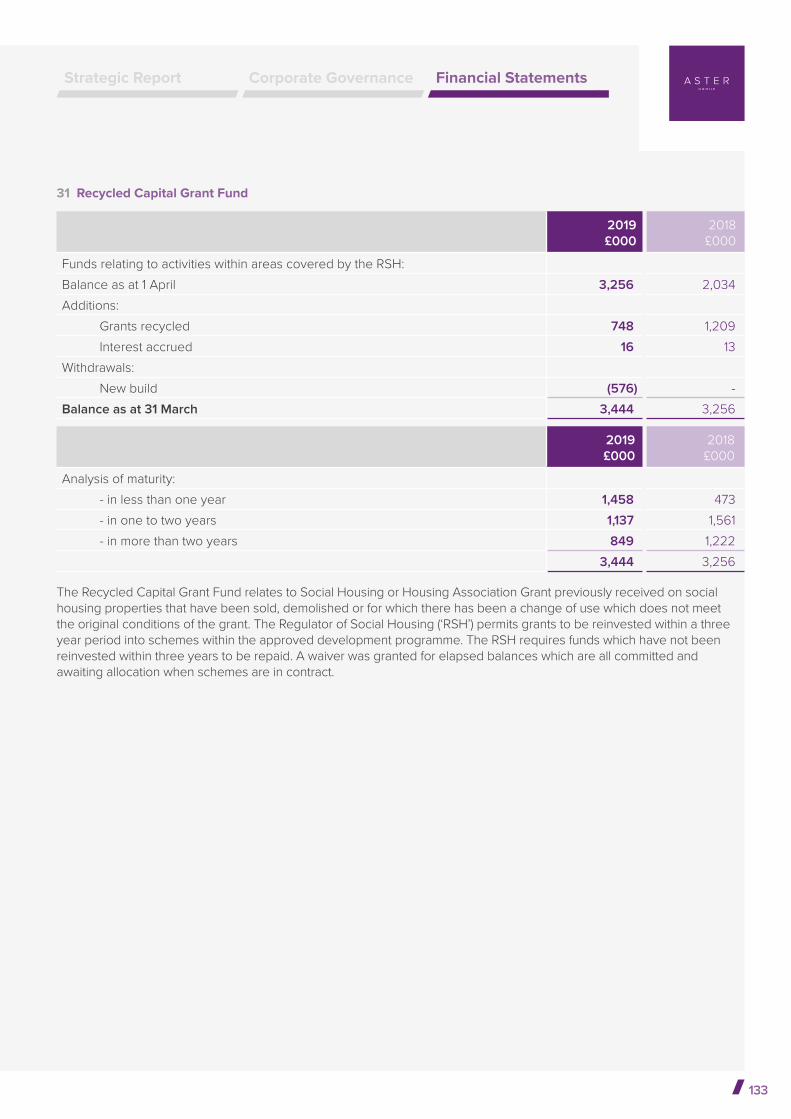
133
Strategic Report Corporate Governance Financial Statements
31 Recycled Capital Grant Fund
2019£000
2018£000
Funds relating to activities within areas covered by the RSH:Balance as at 1 April 3,256 2,034 Additions:
Grants recycled 748 1,209 Interest accrued 16 13
Withdrawals:New build (576) -
Balance as at 31 March 3,444 3,256
2019£000
2018£000
Analysis of maturity:- in less than one year 1,458 473 - in one to two years 1,137 1,561 - in more than two years 849 1,222
3,444 3,256
The Recycled Capital Grant Fund relates to Social Housing or Housing Association Grant previously received on social housing properties that have been sold, demolished or for which there has been a change of use which does not meet the original conditions of the grant. The Regulator of Social Housing (‘RSH’) permits grants to be reinvested within a three year period into schemes within the approved development programme. The RSH requires funds which have not been reinvested within three years to be repaid. A waiver was granted for elapsed balances which are all committed and awaiting allocation when schemes are in contract.

134 Annual Report and Financial Statements for the year ended 31 MARCH 2019
32 Disposal Proceeds Fund
2019£000
2018£000
Funds relating to activities within areas covered by the RSH:Balance as at 1 April 564 562 Additions:
Funds recycled 1 1 Interest 1 1
Withdrawals:New build (94) -
Balance as at 31 March 472 564
2019£000
2018£000
Analysis of maturity:- in less than one year 469 199 - in one to two years 2 365 - in more than two years 1 -
472 564
Following the deregulation changes made to the Housing and Planning Act 2016, which came into force on 6 April 2017, the requirement to recycle grant into the Disposal Proceeds Fund was removed. The Disposal Proceeds Fund will continue to have interest added and withdrawals made to fund new builds until the fund is exhausted or until the wind down period ends on 6 April 2020. After this date any unused funds will be repaid to the Regulator of Social Housing (‘RSH’). A waiver was granted for elapsed balances which are all committed and awaiting allocation when schemes are in contract.
Notes to the Consolidated Financial Statements

135
Strategic Report Corporate Governance Financial Statements
33 Financial instruments
33a Financial instruments’ descriptions
The group holds several different types of financial instrument which it uses to fund its activities and manage its interest rate risk. The characteristics of the main classes of financial instrument held are given below:
Interest rate swaps
An interest rate swap is an agreement between two parties to exchange interest rate types. Floating rate interest is exchanged for fixed rated interest and vice-versa. During the year the group managed its interest rate risk and reduced interest rate volatility through five interest rate swaps, exchanging floating rated interest for fixed rated interest.
The value of the group’s interest rate swaps is measured at each year end at the instruments fair value using a mark-to-market valuation. Where an instrument has a positive mark-to-market valuation it is treated as an asset and conversely where the mark-to-market value is negative it is treated as a liability. Any changes in the mark-to-market fair value are recognised in profit or loss unless the interest rate swap is designated as a hedging instrument and used in a hedging relationship for hedge accounting. Hedge accounting is outlined below.
At the 31 March 2019 the group held £19.4 million (2018: £17.9 million) of interest rate swap financial liabilities.
Guaranteed fixed rate secured bonds
The group has issued £320 million of guaranteed fixed rated secured bonds. They are listed on the London Stock Exchange with a maturity date of 18 December 2043. They are denominated in sterling and the interest or coupon rate is 4.5% payable half-yearly in arrears.
The bonds were issued in five tranches, four tranches at a premium and one
at a discount so the amount of funds received were not the same as the principal amount. Issue costs were also deducted from the amount received. The carrying value of these bonds in the group’s financial statements is calculated using the effective interest rate method. This spreads the premium or discount and the issue fees over the life of the bond. The interest charge to profit or loss is the effective interest and not the amount actually paid.
Fixed rate loans
The group’s fixed rate loans have a base fixed interest rate plus a margin that varies over the life of the borrowing. Due to this variation these loans are recognised using the effective interest method which averages the interest rate over the life of the loan. As with the group’s bonds the interest charged to profit or loss is the effective interest and not the amount actually paid. During the year the effective interest charged to the Consolidated Statement of Comprehensive Income was £634,000 (2018: £505,000).
At the end of the year the group had drawn £327.9 million (2018: £347.5 million) of fixed rated loans which incurred an effective interest charge during the year of between 1.5% and 6.3% (2018: 1.5% and 6.3%). These loans have a carrying value of £328.6 million (2018: £348.3 million) giving a cumulative effective interest adjustment of £700,000 (2018: £800,000).
Floating rate loans
The interest on these loans varies or floats as the London Inter-Bank Offered Rate (LIBOR) changes. In addition to LIBOR a margin is also charged which makes up the total interest rate. Within the total amount the group can borrow from its lenders there is a set amount designated as floating loans, once this limit is
reached the group cannot draw down any more floating rated loans. At the end of the year the group had drawn £258.6 million (2018: £268.4 million) of floating rated loans and was charged interest rates of between 0.7% and 1.3% (2018: 0.7% and 1.0%).
Disposal Proceeds Fund
Following the deregulation changes made to the Housing and Planning Act 2016, which came into force on 6 April 2017, the requirement to recycle grant into the Disposal Proceeds Fund was removed. The Disposal Proceeds Fund continue to have interest added and withdrawals made to fund new builds until the fund is exhausted or until the wind down period ends on 6 April 2020. The balance on the fund is £472,000 (2018: £564,000).
Convertible financial instruments
Convertible financial instruments can be converted into third-party equity under certain circumstances. These instruments are recognised at the face value of the third-party equity they could be converted into at the end of each reporting year. Any changes in value are taken through profit or loss.
At 31 March 2019 the group held £460,000 (2018:£nil) of convertible financial instruments with £nil (2108: £nil) fair value movement being recognised in profit or loss.
Recycled Capital Grant Fund
The group receives Social Housing Grant from the Regulator of Social Housing (‘RSH’) to build social housing. When the tenant of a New Build HomeBuy property purchases a further tranche of the property, if there are sufficient sales proceeds, the associated grant will be recycled via the Recycled Capital Grant Fund. Like the Disposal Proceeds Fund a notional amount of interest is added to the fund each year depending on the value of the fund. The balance in the group’s Recycled Capital Grant

136 Annual Report and Financial Statements for the year ended 31 MARCH 2019
33 Financial instruments (continued)
33b Financial instruments’ classifications
33a Financial instruments’ descriptions (continued)
Recycled Capital Grant Fund (continued)
Fund at the end of the year was £3,444,000 (2018: £3,256,000), this includes £16,000 (2018: £13,000) of interest added during the year.
Loan commitments measured at cost less impairment
The group has various borrowing facilities available to it. The undrawn committed facilities are valued at cost less impairment. The amount of undrawn borrowings at 31 March 2019 was £173.2 million (2018: £118.7 million), the cost of the undrawn facility is £227,000 (2018: £201,000).
Hedge accounting
The group has five interest rate swaps that meet the requirements under FRS 102 section 12: ‘Other financial instruments’, for hedge accounting. The group uses hedge accounting to manage the volatility of the fair value movements of its interest rate swaps. The hedging relationship is between an interest rate swap, the hedging instrument, and a loan, the hedged item. The relationship allows the fair value movements in the hedging instrument that are equal to the fair value movements in the hedged item, the effective part, to be recognised through Other Comprehensive Income in the cash flow hedge reserve rather than profit or loss. The parts of the movement that do not match, the ineffective part, are recognised in profit or loss.
For the year ended 31 March 2019 the group recognised £1,494,000 losses (2018: £4,927,000 gains) of net effective cash flow hedge movements in Other Comprehensive (Expense)/Income and movement of £nil (2018: £nil) of ineffective cash flow hedge movements in profit or loss.
Amortised cost
Basic financial instruments such as loans are measured at amortised cost. This is calculated using the effective interest rate method. For floating rated loans and fixed rate loans with no interest rate changes the effective interest will equal the amount of interest paid. For fixed rated loans which have changes in interest rate over the life of the loan the effective interest rate will average the different interest rates over the life of the loan. The effective interest is the amount that is recognised in Consolidated Statement of Comprehensive Income.
Fair value through profit or loss
Complex financial instruments, such as derivatives are recognised at fair value through profit or loss. At the end of each financial period their value is calculated by looking at an active market of similar instruments and establishing what their value would be if they were traded on that market, their fair value. Any changes in the fair value are recognised in the Consolidated Statement of Comprehensive Income.
Equity
Equity is the difference between an entity’s total assets and total liabilities. Where a company has joint or a controlling interest in another company its share of the equity in that company is recognised in its financial statements.
Notes to the Consolidated Financial Statements

137
Strategic Report Corporate Governance Financial Statements
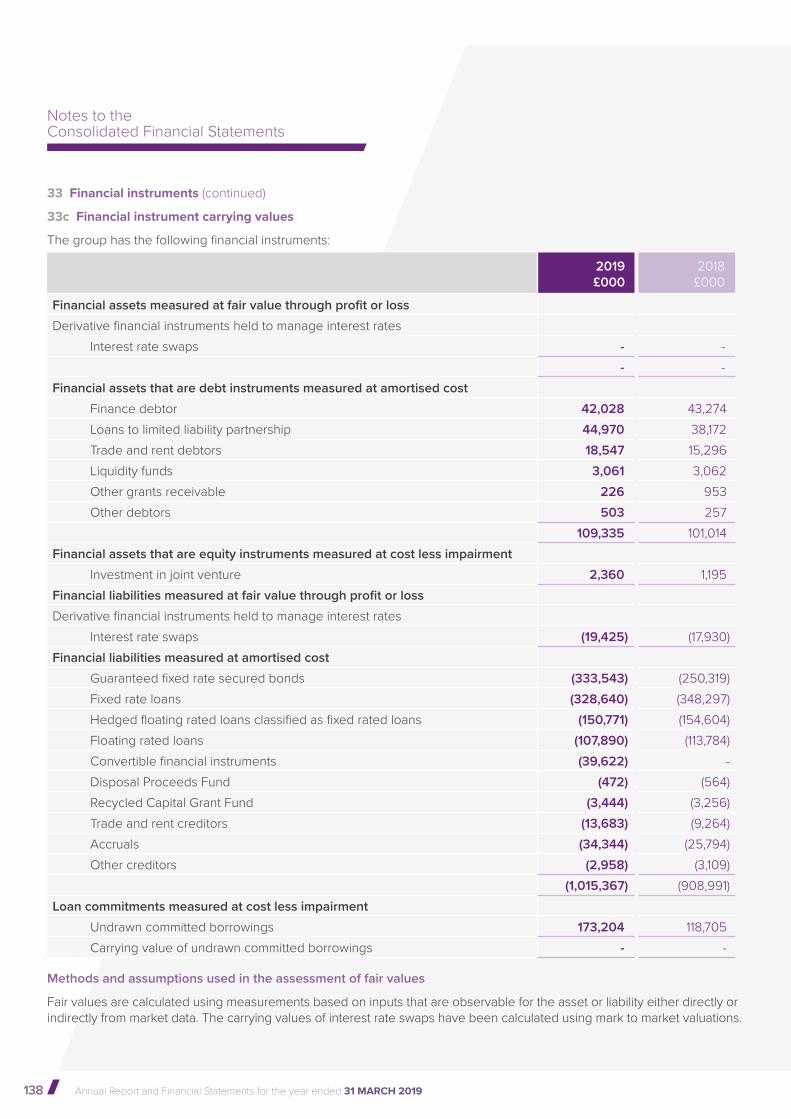
138 Annual Report and Financial Statements for the year ended 31 MARCH 2019
33 Financial instruments (continued)
33c Financial instrument carrying values
The group has the following financial instruments:
2019£000
2018£000
Financial assets measured at fair value through profit or loss
Derivative financial instruments held to manage interest ratesInterest rate swaps - -
- -Financial assets that are debt instruments measured at amortised cost
Finance debtor 42,028 43,274 Loans to limited liability partnership 44,970 38,172 Trade and rent debtors 18,547 15,296 Liquidity funds 3,061 3,062 Other grants receivable 226 953 Other debtors 503 257
109,335 101,014 Financial assets that are equity instruments measured at cost less impairment
Investment in joint venture 2,360 1,195 Financial liabilities measured at fair value through profit or loss
Derivative financial instruments held to manage interest ratesInterest rate swaps (19,425) (17,930)
Financial liabilities measured at amortised cost
Guaranteed fixed rate secured bonds (333,543) (250,319)Fixed rate loans (328,640) (348,297)Hedged floating rated loans classified as fixed rated loans (150,771) (154,604)Floating rated loans (107,890) (113,784)Convertible financial instruments (39,622) - Disposal Proceeds Fund (472) (564)Recycled Capital Grant Fund (3,444) (3,256)Trade and rent creditors (13,683) (9,264)Accruals (34,344) (25,794)Other creditors (2,958) (3,109)
(1,015,367) (908,991)Loan commitments measured at cost less impairment
Undrawn committed borrowings 173,204 118,705 Carrying value of undrawn committed borrowings - -
Methods and assumptions used in the assessment of fair values
Fair values are calculated using measurements based on inputs that are observable for the asset or liability either directly or indirectly from market data. The carrying values of interest rate swaps have been calculated using mark to market valuations.
Notes to the Consolidated Financial Statements

139
Strategic Report Corporate Governance Financial Statements
33e Maturity of borrowings
The maturity profile of the principal value of the group’s loans, shown in note 33d, is:
2019£000
2018£000
Group borrowings comprise
Guaranteed fixed rate secured bonds 320,000 250,000 MORhomes convertible financial instruments 40,000 - Affordable Housing Finance Fixed rated loans 150,000 150,000 Fixed rated loans 177,886 197,511 Hedged floating rate loans classified as fixed rate loans 150,771 154,604 Floating rated loans 107,890 113,784 Disposal Proceeds Fund 472 564 Recycled Capital Grant Fund 3,444 3,256
950,463 869,719
2019 2018Weighted
average interest rate
%
Weighted average period for which
rate is fixedYears
Weighted average
interest rate %
Weighted average period for which
rate is fixedYears
At 31 MarchGuaranteed fixed rate secured bonds 4.50 24.70 4.50 25.70Convertible financial instruments 3.70 18.90 - -Fixed rated loans 3.27 14.31 3.36 12.40
2019 2018Repayment Repayment
By instalments
£000
Not by instalments
£000
Total
£000
By instalments
£000
Not by instalments
£000
Total
£000
0 - 1 years 12,942 1,927 14,869 14,854 1,606 16,460 1 - 2 years 16,989 1,139 18,128 12,942 990 13,932 2 - 5 years 96,638 851 97,489 90,730 1,224 91,954 Over 5 years 387,015 432,962 819,977 424,411 322,962 747,373
513,584 436,879 950,463 542,937 326,782 869,719
33d Interest rate profile of borrowings
The repayment profile is based on loan documentation and considering the impact of undrawn facilities.
The above borrowings are secured against the group’s social housing properties. The value of the secured properties is £1,257.9 million (2018: £1,214.6 million). At 31 March 2019 properties valuing £281.3 million (2018: £229.4 million) were unsecured and available to be secured.
The above values are the loan principal repayable not the loans’ carrying value. When floating rate loans have been hedged they are classified in the above table as fixed rate.

140 Annual Report and Financial Statements for the year ended 31 MARCH 2019
Cash flow hedges 2019
Hedging instrument
Principal
£000
Interest rate
payable
%
Maturity Cash flows
Fair value
£000
Charge /(credit) to other comprehensive
income£000
Credit to profit or
loss
£000
Barclays swaps 39,666 3.08 2034 Monthly (6,361) 586 -
Credit Suisse swap 32,500 2.97 2031 Monthly (3,695) 75 -
Credit Suisse swap 50,000 2.26 2022 Monthly (2,101) (35) -
Notting Hill swap 8,000 2.96 2038 Half yearly (1,990) 217 -
Notting Hill swap 22,000 2.85 2037 Quarterly (5,278) 651 -
152,166 (19,425) 1,494 -
Cash flow hedges 2018
Hedging instrument
Principal
£000
Interest rate
payable
%
Maturity Cash flows
Fair value
£000
(Credit) / charge to other comprehensive
income £000
Credit to profit or
loss
£000
Barclays swaps 39,666 3.08 2034 Monthly (5,775) (1,625) - Credit Suisse swap 35,000 2.97 2031 Monthly (3,620) (1,296) - Credit Suisse swap 50,000 2.26 2022 Monthly (2,136) (1,675) - Notting Hill swap 8,000 2.96 2038 Half yearly (1,773) (101) - Notting Hill swap 22,000 2.85 2037 Quarterly (4,626) (230) -
154,666 (17,930) (4,927) -
33 Financial instruments (continued)
33f Hedge accounting
The objective of the hedge is to use an interest rate swap to eliminate the variability of cash flows associated with the interest payments on an associated portion of a floating loan.
The cash flows on both the hedged loans and interest rate swaps relating to the Barclay’s and Credit Suisse hedging arrangements are paid monthly and affect the Consolidated Statement of Comprehensive Income with the same frequency. The cash flows of the loans hedged by the Notting Hill interest rate swaps occur monthly and are recognised in profit or loss with this frequency. The Notting Hill interest swap cash flows occur half yearly and quarterly. They affect the Consolidated Statement of Comprehensive Income with this frequency. Interest accruals are used to match the frequencies until the cash flows occur.
Notes to the Consolidated Financial Statements

141
Strategic Report Corporate Governance Financial Statements
34 Pension obligations
Group pension schemes
• Hampshire County Council Pension Scheme (closed to new members);
• Somerset County Council Pension Scheme (closed to new members);
• Dorset County Council Pension Scheme (closed to new members);
• Social Housing Pension Scheme (SHPS) final salary defined benefit scheme (closed to new members); and
• SHPS career average of earnings (CARE), (closed to new members from June 2019).
• and two defined contribution (stakeholder) schemes:
• SHPS defined contribution scheme; and• Friends Provident defined contribution
scheme (closed to new members).The accounting treatments for each of the schemes are described below:
The cost of providing retirement pensions and related benefits is accounted for in accordance with FRS 102 section 28 – ‘Employee Benefits’. The group participates in eight pension schemes.• There are six defined benefit
schemes:• Wiltshire Pension Scheme
(closed to new members);
Aster Group consolidated
Note
2019
Total cost by
scheme £000
Total interest on net pension liability
by scheme £000
Actuarial gains / (losses) in
pension scheme £000
Pension liability
£000County pension schemes:
Wiltshire 34a 217 71 (160) (3,019)Wiltshire asset ceiling 34a - - (45) (45)Hampshire - funded 34b 40 100 780 (2,890)Hampshire - unfunded 34c - 10 - (430)Somerset 34d 198 250 588 (9,482)Dorset 34e 530 387 1,539 (14,394)
985 818 2,702 (30,260)SHPS
Defined benefit 1,153 321 (2,355) (14,755)Initial recognition of multi-employer defined benefit scheme - - (6,655) - Defined contribution 938 - - -
Friends Provident 14 - - - 3,090 1,139 (6,308) (45,015)
Aster Group consolidated
Note
2018
Total cost by
scheme £000
Total interest on net pension liability
by scheme £000
Actuarial gains / (losses) in
pension scheme £000
Pension liability
£000County pension schemes:
Wiltshire 34a 260 119 1,755 (3,168)Wiltshire asset ceiling 34a - - 4 4 Hampshire - funded 34b 40 110 (80) (4,250)Hampshire - unfunded 34c - 10 - (440)Somerset 34d 248 276 621 (9,953)Dorset 34e 609 456 2,369 (15,395)
1,157 971 4,669 (33,202)SHPS 1,402 - - - Friends Provident 15 - - -
2,574 971 4,669 (33,202)
Summary of movements and balances in funding
The pension cost to the group for the year ended 31 March 2019 was £3.1 million (2018: £2.6 million) in respect of 1,077 (2018: 1,170) active members of all schemes.

142 Annual Report and Financial Statements for the year ended 31 MARCH 2019
34 Pension obligations (continued)
Local government pension schemes
In October 2018 the High Court published its judgement on the case of Lloyds Banking Group and the equalisation of Guaranteed Minimum Pensions (‘GMP’).
The association has reviewed the impact of GMP Equalisation in respect of its Local Government Pension Scheme and identified that a range of approaches has been adopted by the scheme actuaries. These approaches range from a detailed assessment of the impact of the requirements in 2019 through to limited recognition of the impact as the scheme actuaries wait for guidance from the Government on the methodology to be applied in calculating the full liability. No further adjustments have been made to the present value of obligations as the effect is not considered material.
In December 2018 the Court of Appeal ruled that ‘transitional arrangements’ protection in respect of benefit changes to the Judicial and Fire Fighter Pension scheme amounted to unlawful discrimination (‘McCloud case’). Due to similar pension reforms to the LGPS in benefits the judgement is expected to be applicable to the LGPS. Whilst the judgement might be appealed by the Government in the Supreme Court it is generally considered unlikely that this will be successful.
The directors have considered the potential impact of the McCloud case on the group and associations defined benefit liability as at 31 March 2019. No additional liability has been recognised given the profile of the scheme members and assuming a very cautious outcome on the LGPS scheme liability (gross obligation: £111.3 million) the directors are satisfied that when fully accounted in the financial statements the impact will not be material to the group or association Financial Statements as at 31 March 2019.
34a Wiltshire Pension Fund
The figures from Wiltshire Council are the consolidated figures in respect of Aster Communities, Aster Living, Aster Property Limited, and direct employees of Aster Group Limited (the Association).
The group participates in the above fund as an admitted body under the Local Government Superannuation Regulations 1995, funded jointly by employer and employee contributions. The fund is a defined benefit final salary multi-employer scheme.
As at the balance sheet date there were 15 (2018: 18) active members of the scheme employed across the whole group. The annual pensionable payroll in respect of these members was £530,000 (2018: £619,000) for the whole group.
The fund is subject to an actuarial valuation of the scheme every three years. The main purpose of the valuation is to determine the financial position of the scheme in order to address the level of future contributions required so that the scheme can meet its pension obligations as they fall due.
The scheme actuary has prepared an actuarial report that provides an approximate update on the funding position of the scheme as at 31 March 2019. The principal assumptions used by the independent qualified actuaries in updating the latest valuation in order to provide the disclosures required by Financial Reporting Standard No. 102 section 28 – Employee Benefits are stated below. The actuary has used the projected unit credit method of valuation.
The last triennial valuation was performed on 31 March 2016 and the results have been incorporated into the financial statements for 2019.
The next triennial valuation will be carried out on 31 March 2019 and the results for this will be incorporated into the financial statements for 2020.
The information in the statement relating to the valuation of the pensions scheme’s assets and liabilities has been prepared by the scheme’s actuaries, Hymans Robertson LLP.
During 2018 Aster Living ceased being a member of the Wiltshire County Council Pension Scheme, and its net assets in the scheme were transferred to Aster Group Limited. At that time the obligation transfer was adjusted by £49,000 relating to additional changes in financial assumptions.
Notes to the Consolidated Financial Statements

143
Strategic Report Corporate Governance Financial Statements
Financial assumptions 2019%p.a.
2018%p.a.
Pension increases 2.5 2.4 Salary increases 2.8 2.7 Discount rate 2.4 2.7
Mortality 2019 years
2018years
Current pensioners Females 24.9 24.9 Males 22.5 22.5 Future pensioners Females 26.7 26.7 Males 24.1 24.1
Fair value of employer assets 2019£000
2018£000
Equities 17,970 16,238 Bonds 3,544 3,479 Property 3,290 3,015 Cash 506 464
25,310 23,196 Asset ceiling adjustment (289) 4
25,021 23,200
Total cost recognised as expense 2019£000
2018£000
Current service cost 217 260 Interest costs 687 665 Expected return on assets employed (616) (546)Total 288 379
Return on plan assets 1,962 1,823

144 Annual Report and Financial Statements for the year ended 31 MARCH 2019
34 Pension obligations (continued)
34a Wiltshire Pension Fund (continued)
Reconciliation of defined benefit obligation 2019£000
2018£000
Opening defined benefit obligation 26,364 26,604 Current service cost 217 260 Interest cost 687 665 Contributions by members 37 45 Actuarial losses / (gains) 1,506 (478)Estimated unfunded benefits paid (9) (9)Estimated benefits paid (717) (723)Closing defined benefit obligation 28,085 26,364
Reconciliation of fair value of employer assets 2019£000
2018£000
Opening fair value of employer assets 23,200 21,442 Expected return on assets 616 546 Contributions by members 37 45 Contributions by employers 584 609 Unfunded contributions 9 9 Actuarial gains 1,346 1,277 Unfunded benefits paid (9) (9)Benefits paid (717) (723)Closing fair value of employer assets 25,066 23,196 Asset ceiling adjustment (45) 4 Closing fair value of scheme assets recognised in financial statements 25,021 23,200 Pension liability 3,064 3,164
Projected pension expense for the year to 31 MARCH 2020
2020£000
Projected current service cost 235 Expected return on plan assets (606)Interest on obligation 669 Total 298
Notes to the Consolidated Financial Statements

145
Strategic Report Corporate Governance Financial Statements

146 Annual Report and Financial Statements for the year ended 31 MARCH 2019
34 Pension obligations (continued)
34b Hampshire County Council Pension Fund
The group participates in the above fund as an admitted body under the Local Government Superannuation Regulations 1995, funded jointly by employer and employee contributions. The fund is a defined benefit final salary multi-employer scheme.
At the balance sheet date there were 3 (2018: 4) active members of the scheme employed by Aster Communities. The annual pensionable payroll in respect of these members was £122,000 (2018: £129,905).
The fund is subject to an actuarial valuation of the scheme every three years. The main purpose of the valuation is to determine the financial position of the scheme in order to address the level of future contributions required so that the scheme can meet its pension obligations as they fall due.
Notes to the Consolidated Financial Statements
The scheme actuary has prepared an actuarial report that provides an approximate update on the funding position of the scheme as at 31 March 2019. The principal assumptions used by the independent qualified actuaries in updating the latest valuation in order to provide the disclosures required by Financial Reporting Standard No. 102 section 28 ‘Employee Benefits’ are stated below. The actuary has used projected unit credit method of valuation.
The last triennial valuation was performed on 31 March 2016 and the results have been incorporated into the financial statements for 2019.
The next triennial valuation will be carried out on 31 March 2019 and the results for this will be incorporated into the financial statements for 2020. This includes the unfunded element of the scheme.
The information in the statement relating to the valuation of the pensions scheme’s assets and liabilities has been prepared by the scheme’s actuaries, Hewitt Associates Limited.
Hampshire County Council also provides a unfunded pension scheme. This relates to unfunded pension arrangements provided by the group. These are termination benefits made on a discretionary basis upon early retirement in respect of members of the LGPS.

147
Strategic Report Corporate Governance Financial Statements
Financial assumptions 2019%p.a.
2018%p.a.
Price increases - RPI 3.3 3.2 Price increases - CPI 2.2 2.1 Pension increases 2.2 2.1 Salary increases 3.7 3.6 Discount rate 2.4 2.6
Mortality 2019 years
2018years
Current pensioners Females 26.1 27.2 Males 23.3 24.1 Future pensioners Females 27.8 29.4 Males 24.9 26.2
Fair value of employer assets 2019£000
2018£000
Equities 8,422 7,581 Gilts 3,074 375 Bonds 704 2,991 Property 1,029 848 Cash 311 315
13,540 12,110
Total cost recognised as expense 2019£000
2018£000
Current service cost 40 40 Interest costs 420 400 Expected return on assets employed (320) (290)Total 140 150
Return on plan assets 1,190 350

148 Annual Report and Financial Statements for the year ended 31 MARCH 2019
34 Pension obligations (continued)
34b Hampshire County Council Pension Fund (continued)
Reconciliation of defined benefit obligation 2019£000
2018£000
Opening defined benefit obligation 16,360 16,350 Current service cost 40 40 Interest cost 420 400 Contributions by members 10 10 Actuarial losses 90 140 Estimated benefits paid (490) (580)Closing defined benefit obligation 16,430 16,360
Reconciliation of fair value of employer assets 2019£000
2018£000
Opening fair value of employer assets 12,110 11,630 Expected return on assets 320 290 Contributions by members 10 10 Contributions by employers 720 700 Actuarial gains 870 60 Benefits paid (490) (580)Closing fair value of employer assets 13,540 12,110 Pension liability 2,890 4,250
Notes to the Consolidated Financial Statements

149
Strategic Report Corporate Governance Financial Statements
Recognition in the Statement of Comprehensive income 2019£000
2018£000
Interest costs 10 10
Reconciliation of unfunded liabilities 2019£000
2018£000
Opening defined benefit obligation 440 450 Actuarial losses - - Interest cost 10 10 Estimated benefits paid (20) (20)Closing defined benefit obligation 430 440
Projected pension expense for the year to 31 MARCH 2020
2020£000
Funded benefits
Projected current service cost 40 Interest on obligation 60 Total 100 Unfunded benefits
Interest on obligation 10 Total 10
34c Unfunded Scheme
Financial assumptions 2019%p.a.
2018%p.a.
Price increases - RPI 3.3 3.2Price increases - CPI 2.2 2.1Discount rate 2.4 2.6
Mortality 2019 years
2018years
Current pensioners Females 26.1 27.2 Males 23.3 24.1

150 Annual Report and Financial Statements for the year ended 31 MARCH 2019
34 Pension obligations (continued)
34d Somerset County Council Pension Fund
The group participates in this fund as an admitted body under the Local Government Superannuation Regulations 1995, funded jointly by employer and employee contributions. The fund is a defined benefit final salary multi-employer scheme.
As at the balance sheet date there were 14 (2018: 17) active members of the scheme employed by Aster Communities. The annual pensionable payroll in respect of these members was £436,000 (2018: £560,000).
The fund is subject to an actuarial valuation of the scheme every three years. The main purpose of the valuation is to determine the financial position of the scheme in order to address the level of future contributions required so that the scheme can meet its pension obligations as they fall due.
The scheme actuary has prepared an actuarial report that provides an approximate update on the funding position of the scheme as at 31 March 2019. The principal assumptions used by the independent qualified actuaries in updating the latest valuation in order to provide the disclosures required by Financial Reporting Standard No. 102 section 28 – Employee Benefits are stated below. The actuary has used the projected unit credit method of valuation.
The last triennial valuation was performed on 31 March 2016 and the results have been incorporated into the financial statements for 2019.
The next triennial valuation will be carried out on 31 March 2019 and the results for this will be incorporated into the financial statements for 2020.
The information in the statement relating to the valuation of the pensions scheme’s assets and liabilities has been prepared by the scheme’s actuaries, Barnett Waddingham.
Notes to the Consolidated Financial Statements

151
Strategic Report Corporate Governance Financial Statements
Financial assumptions 2019%p.a.
2018%p.a.
Pension increases 2.5 2.3 CPI increases 2.5 2.3 Salary increases 4.0 3.8 Discount rate 2.4 2.5
Mortality 2019 years
2018years
Current pensioners Females 24.0 25.2 Males 22.9 24.0 Future pensioners Females 25.8 27.5 Males 24.6 26.2
Fair value of employer assets 2019£000
2018£000
Equities 8,180 8,231 Gilts 665 624 Bonds 1,069 1,080 Property 1,019 1,095 Cash 771 501
11,704 11,531
Total cost recognised as expense 2019£000
2018£000
Current service cost 191 242 Interest costs 539 575 Expected return on assets employed (289) (299)Administration expenses 7 6 Total 448 524
Actual return on plan assets 596 542

152 Annual Report and Financial Statements for the year ended 31 MARCH 2019
34 Pension obligations (continued)
34d Somerset County Council Pension Fund (continued)
Reconciliation of defined benefit obligation 2019£000
2018£000
Opening defined benefit obligation 21,484 21,546 Current service cost 172 242 Past service cost 19 - Interest cost 539 575 Contributions by members 29 40 Actuarial gains (281) (378)Estimated benefits paid (776) (541)Closing defined benefit obligation 21,186 21,484
Reconciliation of fair value of employer assets 2019£000
2018£000
Opening fair value of employer assets 11,531 11,155 Expected return on assets 289 299 Contributions by members 29 40 Contributions by employers 331 341 Administration expenses (7) (6)Return on assets less interest 307 243 Benefits paid (776) (541)Closing fair value of employer assets 11,704 11,531 Pension liability 9,482 9,953
Projected pension expense for the year to 31 MARCH 2020
2020£000
Projected current service cost 172 Interest on obligation 224 Administration expenses 7 Total 403
Notes to the Consolidated Financial Statements

153
Strategic Report Corporate Governance Financial Statements
154 Annual Report and Financial Statements for the year ended 31 MARCH 2019
34 Pension obligations (continued)
34e Dorset County Council Pension Fund
The group participates in the above fund as an admitted body under the Local Government Superannuation Regulations 1995, funded jointly by employer and employee contributions. The fund is a defined benefit final salary multi-employer scheme.
As at the balance sheet date there were 41 (2018: 46) active members of the scheme employed by Synergy Housing Limited. The annual pensionable payroll in respect of these members was £1.3 million (2018: £1.5 million).
The fund is subject to an actuarial valuation of the scheme every three years. The main purpose of the valuation is to determine the financial position of the scheme in order to address the level of future contributions required so that the scheme can meet its pension obligations as they fall due.
The scheme actuary has prepared an actuarial report that provides an approximate update on the funding position of the scheme as at 31 March 2019. The principal assumptions used by the independent qualified actuaries in updating the latest valuation in order to provide the disclosures required by Financial Reporting Standard No. 102 section 28 – Employee Benefits are stated below. The actuary has used the projected unit credit method of valuation.
The last triennial valuation was performed on 31 March 2016 and the results have been incorporated into the financial statements for 2019.
The next triennial valuation will be carried out on 31 March 2019 and the results for this will be incorporated into the financial statements for 2020.
The information in the statement relating to the valuation of the pensions scheme’s assets and liabilities has been prepared by the scheme’s actuaries, Barnett Waddingham.
Notes to the Consolidated Financial Statements

155
Strategic Report Corporate Governance Financial Statements
Financial assumptions 2019%p.a.
2018%p.a.
Price increases - CPI 2.4 2.6Pension increases 2.4 2.4Salary increases 3.9 3.9Discount rate 2.4 2.6
Mortality 2019 years
2018years
Current pensioners Females 24.8 26.1 Males 22.9 24.0Future pensioners Females 26.6 28.4 Males 24.6 26.2
Fair value of employer assets 2019£000
2018£000
Equities 15,596 16,263 Bonds 3,988 3,940 Debt Instruments 1,413 1,086 Alternative Assets 1,456 1,416 Other Bonds 2,179 2,109 Absolute Return Portfolio 1,827 1,819 Property 3,355 3,033 Cash 923 423
30,737 30,089
Total cost recognised as expense 2019£000
2018£000
Current service cost 506 588 Interest costs 1,146 1,238 Expected return on assets employed (759) (782)Administration expenses 24 21 Total 917 1,065
Return on plan assets 1,349 1,468

156 Annual Report and Financial Statements for the year ended 31 MARCH 2019
34 Pension obligations (continued)
34e Dorset County Council Pension Fund (continued)
Reconciliation of defined benefit obligation 2019£000
2018£000
Opening defined benefit obligation 45,484 46,400 Current service cost 506 588 Interest cost 1,146 1,238 Contributions by members 85 94 Actuarial gains (949) (1,683)Estimated unfunded benefits paid (7) (7)Estimated benefits paid (1,134) (1,146)Closing defined benefit obligation 45,131 45,484
Reconciliation of fair value of employer assets 2019£000
2018£000
Opening fair value of employer assets 30,089 29,303 Expected return on assets 759 782 Contributions by members 85 94 Contributions by employers 379 398 Administration expenses (24) (21)Return on assets less interest 590 686 Benefits paid (1,141) (1,153)Closing fair value of employer assets 30,737 30,089 Pension liability 14,394 15,395
Projected pension expense for the year to 31 MARCH 2020
2020£000
Projected current service cost 497 Interest on obligation 341 Administration expenses 25 Total 863
Notes to the Consolidated Financial Statements

157
Strategic Report Corporate Governance Financial Statements

158 Annual Report and Financial Statements for the year ended 31 MARCH 2019
34 Pension obligations (continued)
The Social Housing Pension Scheme
The group participates in the Social Housing Pension Scheme (“the Scheme”). The Scheme is funded by both contributing parties.
SHPS is a multi-employer defined benefit scheme. Employer participation in the Scheme is subject to adherence with the employer responsibilities and obligations as set out in the ‘SHPS House Policies and Rules Employer Guide’.
The Scheme operated a single benefit structure, final salary with a 1/60th accrual rate until 31 March 2007. From April 2007 three defined benefit structures have been available, namely:
• Final salary with a 1/60th accrual rate – closed to new members;
• Final salary with a 1/70th accrual rate – not available to employees of Aster Group; and
• Career average revalued earnings (CARE) with a 1/60th accrual rate – closed to new members.
Notes to the Consolidated Financial Statements
From April 2010 a further two defined benefit structures have been available, namely:
• Final salary with a 1/80th accrual rate – not available to employees of Aster Group; and
• Career average revalued earnings (CARE) with a 1/80th accrual rate – not available to employees of Aster Group.
A defined contribution benefit structure was made available from 1 October 2010.
An employer can elect to operate different benefit structures for their active members and their new entrants. An employer can only operate one open defined benefit structure at any one time. An open benefit structure is one which new entrants are able to join.
Aster Group currently operates a final salary with a 1/60th accrual rate (closed to new members), a career average revalued earnings (CARE) with a 1/60th accrual rate (closed to new members), a career average revalued earnings (CARE) with a 1/120th accrual rate and a defined contribution scheme for active members offering variable levels of contribution.
In February 2014, Aster Group introduced a career average revalued earnings (CARE) with a 1/120th accrual rate which closes to new starters in June 2019.
SHPS defined benefit scheme
Aster Group participates in the scheme, a multi-employer scheme which provides benefits to some 500 non-associated employers. The scheme is a defined benefit scheme in the UK.
The scheme is subject to the funding legislation outlined in the Pensions Act 2004 which came into force on 30 December 2005. This, together with documents issued by the Pensions Regulator and Technical Actuarial Standards issued by the Financial Reporting Council, set out the framework for funding defined benefit occupational pension schemes in the UK.
The scheme is classified as a ‘last-man standing arrangement’. Therefore the company is potentially liable for other participating employers’ obligations if those employers are unable to meet their share of the scheme deficit following withdrawal from the scheme. Participating employers are legally required to meet their share of the scheme deficit on an annuity purchase basis on withdrawal from the scheme.
A full actuarial valuation for the scheme was carried out with an effective date of 30 September 2017. This showed assets of £4,553 million, liabilities of £6,075 million and a deficit of £1,522 million. To eliminate this funding shortfall, the trustees and the participating employers have agreed that additional contributions will be paid, in combination from all employers, to the scheme.

159
Strategic Report Corporate Governance Financial Statements
SHPS is a multi-employer scheme which provides benefits to non-associated employers. The scheme is classified as a defined benefit scheme. At 31 March 2018 it was not possible for the Association to obtain sufficient information to account for the liability on a full FRS 102 valuation basis so it was accounted for as a defined contribution scheme where the net present value of the deficit contributions were recognised in the accounts as creditors falling within and more than one year.
As a result of additional information, SHPS are now able to split the pension liability by employer which has resulted in the scheme liability being accounted for adopting a full FRS 102 valuation at 31 March 2019. In accordance with FRED 71, no restatement of prior year figures has been made in these accounts. A reconciliation between the closing liability at 31 March 2018 and the opening provision at 1 April 2018 is shown below.
SHPS defined benefit pension plan – change of accounting policy
Reconciliation of opening and closing Social Housing Pension Scheme recovery plan liability
2019£000
2018£000
At 1 April 5,965 7,020 Derecognition of Social Housing Pension Scheme recovery plan liability (5,965) - Unwinding of the discount factor - 85 Deficit contribution paid - (1,065)Remeasurements - changes in assumptions - (75)At 31 March - 5,965 Recognised in: Creditors: amounts falling due within one year - 1,111 Creditors: amounts falling due after one year - 4,854
- 5,965
Social Housing Pension Scheme recovery plan liability profit and loss impact
2019£000
2018£000
Recognised in operating profit Remeasurements - changes in assumptions - (75)
- (75)Recognised in total finance income and expense Interest expense - 85
£000
SHPS recovery plan liability - 31 March 2018 5,965 Derecognition of SHPS recovery plan liability via other comprehensive income (5,965)Recognition of SHPS net pension liability via other comprehensive income 12,620 SHPS net pension liability – 1 April 2018 12,620
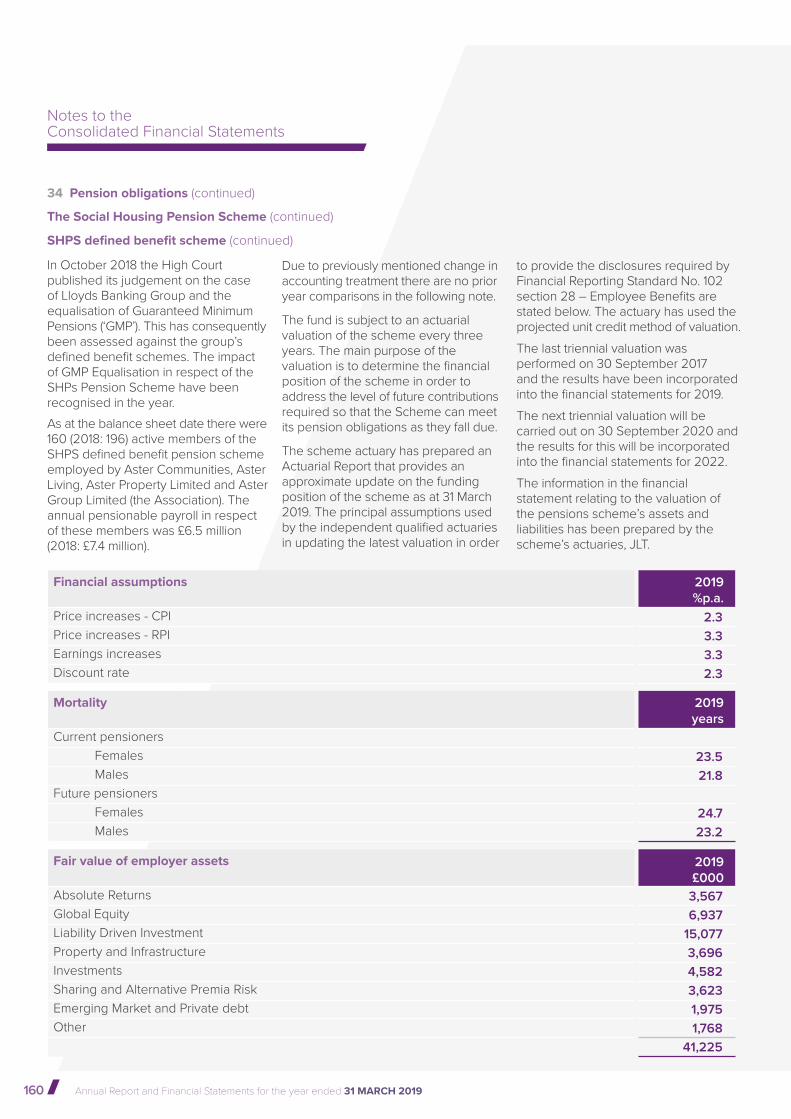
160 Annual Report and Financial Statements for the year ended 31 MARCH 2019
Financial assumptions 2019%p.a.
Price increases - CPI 2.3Price increases - RPI 3.3Earnings increases 3.3Discount rate 2.3
Mortality 2019 years
Current pensioners Females 23.5 Males 21.8 Future pensioners Females 24.7 Males 23.2
Fair value of employer assets 2019£000
Absolute Returns 3,567 Global Equity 6,937 Liability Driven Investment 15,077 Property and Infrastructure 3,696 Investments 4,582 Sharing and Alternative Premia Risk 3,623 Emerging Market and Private debt 1,975 Other 1,768
41,225
34 Pension obligations (continued)
The Social Housing Pension Scheme (continued)
In October 2018 the High Court published its judgement on the case of Lloyds Banking Group and the equalisation of Guaranteed Minimum Pensions (‘GMP’). This has consequently been assessed against the group’s defined benefit schemes. The impact of GMP Equalisation in respect of the SHPs Pension Scheme have been recognised in the year.As at the balance sheet date there were 160 (2018: 196) active members of the SHPS defined benefit pension scheme employed by Aster Communities, Aster Living, Aster Property Limited and Aster Group Limited (the Association). The annual pensionable payroll in respect of these members was £6.5 million (2018: £7.4 million).
Notes to the Consolidated Financial Statements
SHPS defined benefit scheme (continued)
Due to previously mentioned change in accounting treatment there are no prior year comparisons in the following note.
The fund is subject to an actuarial valuation of the scheme every three years. The main purpose of the valuation is to determine the financial position of the scheme in order to address the level of future contributions required so that the Scheme can meet its pension obligations as they fall due.
The scheme actuary has prepared an Actuarial Report that provides an approximate update on the funding position of the scheme as at 31 March 2019. The principal assumptions used by the independent qualified actuaries in updating the latest valuation in order
to provide the disclosures required by Financial Reporting Standard No. 102 section 28 – Employee Benefits are stated below. The actuary has used the projected unit credit method of valuation.The last triennial valuation was performed on 30 September 2017 and the results have been incorporated into the financial statements for 2019.The next triennial valuation will be carried out on 30 September 2020 and the results for this will be incorporated into the financial statements for 2022.The information in the financial statement relating to the valuation of the pensions scheme’s assets and liabilities has been prepared by the scheme’s actuaries, JLT.

161
Strategic Report Corporate Governance Financial Statements
Total cost recognised in profit for the year 2019£000
Current service cost 1,100 Expenses 53 Net interest cost 321 Total 1,474
Return on plan assets 2,360
Reconciliation of defined benefit obligation 2019£000
Opening defined benefit obligation 50,232 Current service cost 1,100 Contributions by scheme participants 676 Expenses 53 Interest expense 1,314 Actuarial losses 3,722 Benefits paid and expenses (1,117)Closing defined benefit obligation 55,980
Reconciliation of fair value of scheme assets 2019£000
Opening fair value of scheme assets 37,612 Interest income 993 Actuarial gain 1,367 Contributions by the employer 1,694 Contributions by scheme participants 676 Benefits paid and expenses (1,117)Closing fair value of scheme assets 41,225 Net pension liability 14,755
The scheme is administered by the Pensions Trust. It is open to all members of staff and is the pension scheme for auto-enrolment. The association paid contributions between 2.5% and 10% (2018: 2% and 10%) and employees paid contributions from 2.5% (2018: from 2%). On retirement, funds or units earned can be converted into a pension with the Trust, or used to secure a pension with another provider. At 31 March 2019 there were 838 (2018: 881) active members of the scheme.
The Social Housing Pension Scheme defined contribution scheme

162 Annual Report and Financial Statements for the year ended 31 MARCH 2019
35 Other provisions
36 Called up share capital
2019
Redundancy£000
Other£000
Total £000
At 1 April 678 1,850 2,528
Additions during the year 6 304 310
Amounts utilised during the year (647) (1,500) (2,147)
At 31 March 37 654 691
2018
Redundancy£000
Other£000
Total £000
At 1 April 38 140 178 Additions during the year 647 1,850 2,497 Amounts utilised during the year (7) (140) (147)At 31 March 678 1,850 2,528
Other provisions relates to a provision for unused office space rented by the group under an operating lease and other matters.
2019£
2018£
Ordinary shares allotted, issued and fully paid of £1 each
At 1 April 7 7 Issued during the year 3 - Cancelled during the year (3) - At 31 March 7 7
Notes to the Consolidated Financial Statements

163
Strategic Report Corporate Governance Financial Statements
37 Other reserves
2019
Revaluation reserve
£000
Restricted reserve
£000
Cash flow hedge reserve
£000
Total
£000
At 1 April 404,633 208 (17,931) 386,910
Revaluation surplus realised on disposals (5,051) - - (5,051)
Effective cash flow hedge fair value movements - - (1,494) (1,494)
At 31 March 399,582 208 (19,425) 380,365
2018
Revaluation reserve
£000
Restricted reserve
£000
Cash flow hedge reserve
£000
Total
£000At 1 April 409,214 208 (22,858) 386,564 Revaluation surplus realised on disposals (4,581) - - (4,581)Effective cash flow hedge fair value movements - - 4,927 4,927 At 31 March 404,633 208 (17,931) 386,910
Revaluation reserve
Prior to transition to FRS 102, on 1 April 2014, the group’s social housing properties were revalued each year. The revaluation reserve represents the increases in value of properties held at this date. On transition to FRS 102 the group moved to recognising its social housing at deemed cost and no longer records increases in social housing property valuation.
Restricted reserve
The restricted reserve consists of the sales proceeds of some properties where the local council required the group to retain a portion of the proceeds. The reserve can only be used to fund investments in properties in the Mendip area, in agreement with Mendip District Council.
Cash flow hedge reserve
The cash flow hedge reserve is used to record the effective transactions from the group’s cash flow hedging arrangements.
Other reserves consist of the following amounts:
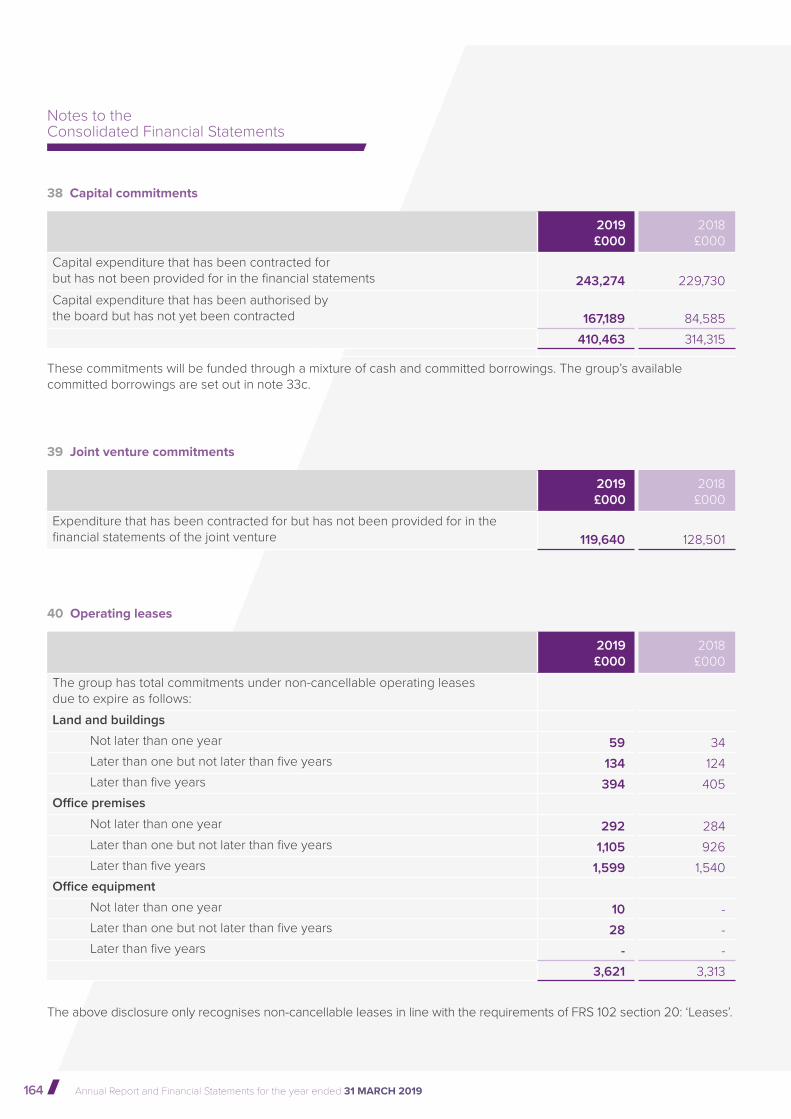
164 Annual Report and Financial Statements for the year ended 31 MARCH 2019
38 Capital commitments
39 Joint venture commitments
40 Operating leases
These commitments will be funded through a mixture of cash and committed borrowings. The group’s available committed borrowings are set out in note 33c.
2019£000
2018£000
Capital expenditure that has been contracted for but has not been provided for in the financial statements 243,274 229,730 Capital expenditure that has been authorised by the board but has not yet been contracted 167,189 84,585
410,463 314,315
2019£000
2018£000
Expenditure that has been contracted for but has not been provided for in the financial statements of the joint venture 119,640 128,501
2019£000
2018£000
The group has total commitments under non-cancellable operating leases due to expire as follows:Land and buildings
Not later than one year 59 34 Later than one but not later than five years 134 124 Later than five years 394 405
Office premises
Not later than one year 292 284 Later than one but not later than five years 1,105 926 Later than five years 1,599 1,540
Office equipment
Not later than one year 10 - Later than one but not later than five years 28 - Later than five years - -
3,621 3,313
The above disclosure only recognises non-cancellable leases in line with the requirements of FRS 102 section 20: ‘Leases’.
Notes to the Consolidated Financial Statements

165
Strategic Report Corporate Governance Financial Statements
41 Homes and bed spaces in management and in development
2019No.
2018No.
Under development at end of year:Housing accommodation 1,061 1,143 Shared ownership 739 778 Open market sale 25 7
1,825 1,928 Under management at end of year:Owned and managed by the Group:
Housing accommodationSocial rent 19,281 19,270 Affordable rent 3,250 2,818
Supported housingSocial rent 3,575 3,604 Affordable rent 70 70
Shared ownership 2,505 2,094 Market rented 95 94 Leasehold 1,491 1,469 Temporary social housing 147 122
30,414 29,541 Not owned but managed by the Group:
Housing accommodationSocial rent 248 249
Leasehold 2 3 Temporary social housing 33 32
283 284 Owned but managed by others at the end of the year:
Supported housingSocial rent 69 62
Care homes 25 25 Market rented - -
94 87 30,791 29,912
The above table consists of:
2019No.
2018No.
Homes 30,768 29,889 Bed spaces 23 23
30,791 29,912

166 Annual Report and Financial Statements for the year ended 31 MARCH 2019
42 Contingent liabilities 43 Related party transactions
Aster Communities
Aster Communities has entered into a service concession arrangement contract (previously known as a private finance initiative contract) with Wiltshire Council. The 242 properties covered by the contract are available for occupation and the costs of construction have been transferred to a finance debtor that is recovered over the contract period on an annuity basis.
Wiltshire Council holds an option to purchase the properties at the end of the contract period in 2034 at price equal to the existing use valuation – social housing (EUV-SH) of the properties less 40% of the ‘authority residual value overage share’ (ARVOS).ARVOS is the difference between the EUV-SH and the terminal debt, £12.9 million, providing EUV-SH is greater than the terminal debt. If EUV-SH is less than the terminal debt there is no ARVOS. If Wiltshire Council does not take up this option Aster Communities can purchase the properties. If this happens Aster Communities will repay the terminal debt balance of £12.9 million. Aster Communities will then pay Wiltshire Council 40% of ARVOS, providing the properties EUV-SH is greater than the terminal debt. As it is unknown whether or not Wiltshire Council will opt to purchase the properties at the end of the contract the group has not recorded a related liability for this transaction at 31 March 2019 or 31 March 2018.
Aster Homes Limited
At the time of entering into contracts, the vendors of the three large joint venture development sites with deferred payment terms required a parent company guarantee, that would only be applicable in the event of the JV defaulting on payment. Galliford Try Homes Limited, a joint venture partner of Aster Homes Limited, have provided the guarantee. Aster Homes Limited agreed, through a deed of contribution entered into at site acquisition, to honour their 50% share of this guarantee. At 31 March 2019, this contingent liability was £3.3 million (2018: £2.7 million) for Aster Homes Limited; £nil (2018: £22,000) relating to White Rock LLP; £3.3 million (2018: £2.7 million) relating to Boorley Green LLP; and £nil (2018: £nil) relating to Kilnwood Vale LLP.
Aster Group Limited provides management and other services to all group companies under the terms of documented service level agreements. The group has taken advantage of the exemption allowed under Section 33 Related Party Disclosures of FRS 102 not to disclose related party transactions with wholly owned subsidiaries within the group. These have been eliminated on consolidation in the group’s financial statements. Set out below are other transactions that require disclosure under FRS 102:
a) Bjorn Howard, who is an executive director of Aster Group Limited and member of the executive board, has a related parties working within the group; the party related to Mr Howard is a member of the executive board. This related party operates independently from Mr Howard and does not directly report to him. He has no direct influence over the related parties’ remuneration package, which is in line with other staff in similar positions within the group. All transactions between the related party and the group are included within these financial statements.
b) The group provided services to English Rural Housing Association (ERHA) and East Boro Housing Trust (EBHT). During the year ended 31 March 2019 ERHA received £11,657 (2018: £7,100) of consultancy and internal audit services and had a closing debtor balance of £5,176 (2018: £2,600). EBHT received £5,325 (2018: £3,700) of out of hours response repair work, covering emergency property repairs and had an outstanding balance of £nil (2018: £260) with the group.
Notes to the Consolidated Financial Statements

167
Strategic Report Corporate Governance Financial Statements
c) Aster Homes Limited is party to limited liability partnerships, White Rock Land LLP; Boorley Green LLP and Kilnwood Vale LLP, with Galliford Try Homes Limited. These LLPs develop and sell properties for social and private housing. Aster Homes Limited entered into the following transactions during the year with the LLP partnerships:
During the year, loans were made to the LLPs to fund each of the developments it was engaged in. The details of the loans at year end are as follows:
Scheme 2019 Interest
received£000
2018 Interest
received £000
2019 Loan value£000
2018 Loan value
£000Interest rate
%Latest repayment
date
White Rock 1,211 1,053 3,871 4,690 3.5 plus base* 31 March 2020Tithe Barn 2,820 2,262 11,636 12,398 4.0 plus base* 31 December 2021Boorley Green 1,828 1,029 15,962 16,340 4.0 plus base* 1 July 2026Kilnwood Vale 237 - 7,405 - 3.5 plus base* 1 July 2026
6,096 4,344 38,874 33,428
* base rate was 0.5-0.75% for the year (2018: 0.25-0.5%).
The loans made to White Rock Land LLP; Boorley Green LLP and Kilnwood Vale LLP are secured against the land and properties being developed.
During the year ended 31 March 2019 £718,000 (2018: £794,000) of loan interest and a dividend of £18,000 (2018: £100,000) was recognised in profit and loss from White Rock Land LLP. At the end of the year ended 31 March 2019 White Rock Land LLP had an outstanding loan balance of £19.5 million (2018: £20.4 million).
During the year ended 31 March 2019 £807,000 (2018: £687,000) of loan interest was recognised in profit and loss from Boorley Green LLP. At the end of the year ended 31 March 2019 Boorley Green LLP had an outstanding loan balance of £17.8 million (2018: £17.4 million).
During the year ended 31 March 2019 £237,000 (2018: £nil) of loan interest was recognised in profit and loss from Kilnwood Vale LLP. At the end of the year ended 31 March 2019 Kilnwood Vale LLP had an outstanding loan balance of £7.6 million (2018: £nil).
The Aster Group recognised £1.2 million (2018: £1.2 million) of profit from its joint venture activities during 2018/19. White Rock Land LLP’s income during the year was £15.1 million (2018: £17.5 million) and its expenditure was £14.1 million (2018: £16.3 million) making a profit of £1.0 million (2018: £1.2 million). The group’s 50% share of this profit was £0.5 million (2018: £0.6 million).
Boorley Green LLP had £21.6 million (2018: £15.3 million) of income during 2018/19 and had expenditure of £19.7 million (2018: £14.3 million) making a profit of £1.9 million (2018: £1.1 million). The group’s share 50% of this profit was £0.9 million (2018: £535,000).
Kilnwood Vale LLP had £nil (2018: £nil) of income during 2018/19 and had expenditure of £0.5 million (2018: £nil) making a loss of £0.5 million (2018: £nil). The group’s share 50% of this loss was £239,000 (2018: £nil).
White Rock Land LLP’s; Boorley Green LLP’s and Kilnwood Vale LLP’s principal place of business are: Cowley Business Park Cowley Uxbridge Middlesex UB8 2AL
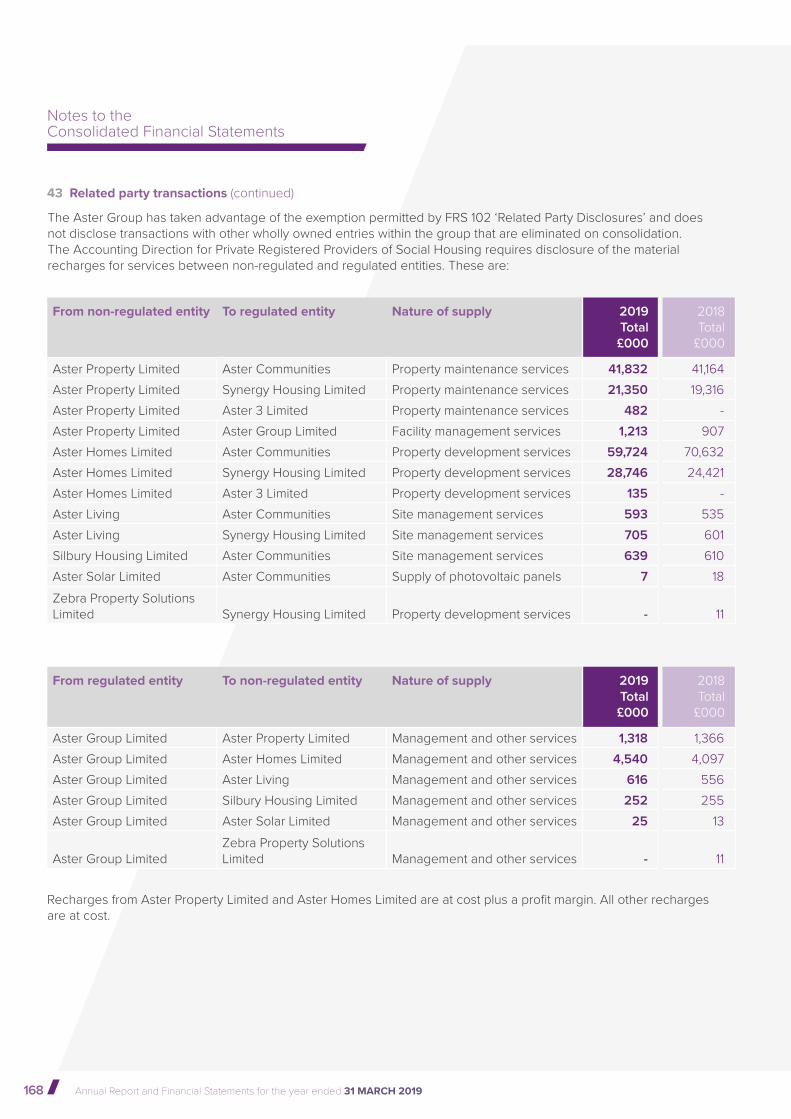
168 Annual Report and Financial Statements for the year ended 31 MARCH 2019
43 Related party transactions (continued)
The Aster Group has taken advantage of the exemption permitted by FRS 102 ‘Related Party Disclosures’ and does not disclose transactions with other wholly owned entries within the group that are eliminated on consolidation. The Accounting Direction for Private Registered Providers of Social Housing requires disclosure of the material recharges for services between non-regulated and regulated entities. These are:
Recharges from Aster Property Limited and Aster Homes Limited are at cost plus a profit margin. All other recharges are at cost.
From non-regulated entity To regulated entity Nature of supply 2019Total£000
2018Total
£000
Aster Property Limited Aster Communities Property maintenance services 41,832 41,164 Aster Property Limited Synergy Housing Limited Property maintenance services 21,350 19,316 Aster Property Limited Aster 3 Limited Property maintenance services 482 -Aster Property Limited Aster Group Limited Facility management services 1,213 907 Aster Homes Limited Aster Communities Property development services 59,724 70,632 Aster Homes Limited Synergy Housing Limited Property development services 28,746 24,421 Aster Homes Limited Aster 3 Limited Property development services 135 -Aster Living Aster Communities Site management services 593 535 Aster Living Synergy Housing Limited Site management services 705 601 Silbury Housing Limited Aster Communities Site management services 639 610 Aster Solar Limited Aster Communities Supply of photovoltaic panels 7 18 Zebra Property Solutions Limited Synergy Housing Limited Property development services - 11
From regulated entity To non-regulated entity Nature of supply 2019Total£000
2018Total
£000
Aster Group Limited Aster Property Limited Management and other services 1,318 1,366 Aster Group Limited Aster Homes Limited Management and other services 4,540 4,097 Aster Group Limited Aster Living Management and other services 616 556 Aster Group Limited Silbury Housing Limited Management and other services 252 255 Aster Group Limited Aster Solar Limited Management and other services 25 13
Aster Group LimitedZebra Property Solutions Limited Management and other services - 11
Notes to the Consolidated Financial Statements

169
Strategic Report Corporate Governance Financial Statements

170 Annual Report and Financial Statements for the year ended 31 MARCH 2019
45 Key management compensation
2019£000
2018 £000
Salaries and short-term benefits 1,159 1,169 Non-executive directorsʼ fees 199 183 Post-employment benefits 81 89 Compensation for loss of office - 404
1,439 1,845 Of which:
Executive directors - Group Overlap Boards 665 996 Non-Executive directors - Group Overlap Boards 131 110 Non-Executive directors - Subsidiaries, members of committees and the Customer and Community Network 68 73 Executive board members 575 666
1,439 1,845
44 Post balance sheet events
On the 8 May 2019 the directors issued £20 million nominal value of retained bonds. The proceeds were on-lent within the group.
Notes to the Consolidated Financial Statements
Details of the remuneration of directors and executive board members is given in the Directorsʼ Remuneration Report.
The value of the executive directorsʼ and boardʼs benefits in kind have been included in the salaries and short-term benefits figure.

171
Strategic Report Corporate Governance Financial Statements

172 Annual Report and Financial Statements for the year ended 31 MARCH 2019
Note2019£000
2018£000
Turnover 5 21,336 19,493 Operating expenditure 5 (21,894) (20,312)Operating loss 5,6 (558) (819) Charitable donations received 9 10,000 10,000 Gift aid 10 4,661 1,183 Loss on disposal of other assets 11 (13) - Profit before interest and taxation 14,090 10,364
Interest receivable and similar income 12 1,329 27 Interest payable and similar charges 12 (1,022) (25)Interest on net pension liability 12 (105) (27)
Total finance income and expense 202 (25) Profit before tax 14,292 10,339 Tax on profit on ordinary activities 13 - -
Profit for the financial year 14,292 10,339
Other comprehensive income
Initial recognition of multi-employer defined benefit scheme 23 (2,358) - Actuarial (losses) / gains in respect of pension schemes 23 (762) 468 Other comprehensive (expense) / income for the year (3,120) 468 Total comprehensive income for the year 11,172 10,807
Statement of Changes in Reserves 2019£000
2018£000
Retained earnings as at 1 April 27,212 16,405 Profit for the financial year 14,292 10,339 Other comprehensive (expense) / income for the year (3,120) 468 Retained earnings as at 31 March 38,384 27,212
Company number 29573R
Association’s Statement of Changes in Reserves
for the year ended 31 MARCH 2019
Association’s Statement of Comprehensive Income
for the year ended 31 MARCH 2019

173
Strategic Report Corporate Governance Financial Statements
as at 31 MARCH 2019
Note2019£000
2018£000
Fixed assets
Intangible assets 14 827 738 Property, plant and equipment (other assets) 15 835 937 Investments in subsidiaries 16 8,050 8,050 Other investments 17 30 20
9,742 9,745 Non-current assets
Debtors: amounts falling due after more than one year 18 33,000 - Current assets
Debtors: amounts falling due within one year 19 5,804 15,976 Cash and cash equivalents 20 22,963 5,527
28,767 21,503 Creditors: amounts falling due within one year 21 (5,368) (2,509)Net current assets 23,399 18,994 Total assets less current liabilities 66,141 28,739 Non current liabilities
Creditors: amounts falling due after more than one year 22 (23,000) (1,427)Pension liability - Local Government Pension Scheme 23 (23) (69)Pension liability - Social Housing Pension Scheme 23 (4,697) - Other provisions 24 (37) (31)Net current assets 38,384 27,212 Capital and Reserves
Called up shared capital 25 - - Retained earnings 38,384 27,212 Total reserves 38,384 27,212
Company number 29573R
Andrew JacksonChairman
Bjorn HowardGroup Chief Executive
David BetteridgeCompany Secretary
The financial statements on pages 172 to 190 were approved by the board on 6 August 2019 and were signed on its behalf by:
Association’s Statement of Financial Position
174 Annual Report and Financial Statements for the year ended 31 MARCH 2019
1 Legal statusAster Group Limited is registered under the Cooperative and Community Benefit Society Act 2014, and is registered with the Regulator for Social Housing (RSH) as a Registered Provider as defined by the Housing Act 2004.2 Basis of preparationThe financial statements of the association have been prepared in accordance with applicable United Kingdom accounting standards, including Financial Reporting Standard 102 - ‘The Financial Reporting Standard applicable in the United Kingdom and Republic of Ireland’ (FRS102), the Housing SORP 2014: Statement of Recommended Practice for Registered Social Housing Providers, and comply with the Accounting Direction for Private Registered Providers of Social Housing 2015. The association is classified as a Public Benefit Entity under FRS102.The financial statements are presented in Sterling (£).Application of accounting policies The association's accounting policies have been applied consistently throughout the year with one exception, the accounting for the SHPS defined benefit pension scheme.Prior to 1 April 2018 the scheme was accounted for under FRS 102 2015 paragraphs 28.11 and 28.11A as a multi-employer pension plan with employer costs being recognised in profit and loss and the present value of the contributions to the scheme’s deficit recovery plan recognised as a creditor. From 1 April 2018 sufficient information has been available to attribute the scheme’s assets and liabilities to its member employers. The scheme has subsequently been accounted for as a defined benefit plan as outlined in FRS 102 2015 paragraphs 28.14 to 28.28. The resulting loss from this transition has been recognised in Other Comprehensive Income as required
Notes to the Association’s Financial Statements
by FRED 71, the early adoption of FRS 102 2018 paragraphs 28.11B and 28.11C.Going concern The majority of Aster Group Limited’s income comes from other group members. The association receives management, property and other services from other group members. The association is party to three group guarantees, with other group members. One giving a parental guarantee covering the timely payment of interest and principal for the on-lending of bond funds, a second covering a cross guarantee with other borrowers under the bond structure the timely payment of interest and principal of third-party funding and a third receiving a guarantee covering its defined benefit pension scheme net liability under Section 75 of the Pensions Act. Given this, the association’s net asset position and that of the group members it is reliant on, the directors are satisfied that the association, and the Aster Group as a whole, have adequate resources to continue in operational existence of the foreseeable future. For this reason, these financial statements are prepared on the going concern basis, under the historical cost convention. PresentationThe association has elected not to produce a statement of cash flows, detailed disclosures of financial instruments and disclosure relating to key management compensation within the individual subsidiary financial statements in line with exemptions available within FRS 102 and the Housing SORP 2014. These disclosures are included in the group’s consolidated financial statements.
3 Summary of significant accounting policies
The group's accounting policies are detailed in note 4 of the consolidated financial statements. In addition to these policies the association applies
the following:
TurnoverTurnover represents:Intra group service income - management and other services provided to other group entities recognised over the period the services are delivered.Third party service income - administration fees charged on re-sale or staircasing transactions for shared ownership properties. Gift aidCommercial companies can donate any excess profits in the form of gift aid to charitable group members. These donations can only be made if the commercial company has distributable reserves for the financial year in question. Gift aid is recognised where irreversible shareholders' resolutions have been made and where cash has been paid. Taxation The company is liable to taxation on its profit. Current tax is provided at amounts expected to be paid (or recovered) using the tax rates and laws that have been enacted or substantively enacted by the statement of financial position date.Investments Aster Group Limited holds investments in other group companies. These are recognised at cost less impairment. 4 Critical accounting judgements and estimation uncertaintyEstimates and judgements are continually evaluated and are based on historical experience and other factors, including expectations of future events that are believed to be reasonable under the circumstances.Those applied by the Aster Group can be found in the ‘Critical accounting judgements and estimation uncertainty’ note in the consolidated financial statements. The association has no additional critical accounting judgements and estimation uncertainties.

175
Strategic Report Corporate Governance Financial Statements
5 Turnover and operating expenditure
6 Operating loss
7 Directors’ emoluments
See Directors’ remuneration report on pages 68 to 76.
2019 2018Turnover
£000
Operating expenditure
£000
Operating loss
£000
Turnover
£000
Operating expenditure
£000
Operating loss
£000Services provided to subsidiaries - registered providers 15,313 (15,713) (400) 13,787 (14,367) (580)Services provided to subsidiaries - other 5,849 (6,002) (153) 5,606 (5,841) (235)Services provided to third party organisations 174 (179) (5) 100 (104) (4)
21,336 (21,894) (558) 19,493 (20,312) (819)
2019£000
2018 £000
Operating loss is stated after charging Auditors’ remuneration (excluding irrecoverable VAT):In their capacity as auditor: 14 14 Depreciation - Property, plant and equipment (other assets) 597 662 Amortisation of intangible assets 409 596 Loss on disposal of property, plant and equipment (other assets) 13 -
8 Employee information 2019
No.2018
No.The average number of persons employed during the year (full time equivalents ‘FTE’) based on 37 hours per week 215 193
FTE by salary bands: 2019No.
Restated 2018No.
£59,999 and less 166 145 £60,000 to £69,999 19 18 £70,000 to £79,999 9 9 £80,000 to £89,999 3 4 £90,000 to £99,999 7 6 £100,000 to £109,999 4 3 £110,000 to £119,999 1 2 £120,000 to £129,999 1 1 £140,000 to £149,999 1 2 £150,000 to £159,999 1 1 £180,000 to £189,999 1 - £190,000 to £199,999 1 - £200,000 to £209,999 - 1 £270,000 to £279,999 1 1
215 193
None of the above employees received any enhanced pension payments during the year (2018: nil).
Salary includes salary, car allowance, any acting up allowances, bonuses and pension contributions made by the group. The prior year figures have been restated to reflect this.

176 Annual Report and Financial Statements for the year ended 31 MARCH 2019
Gift aid receivable from subsidiaries: 2019£000
2018£000
Aster Homes Limited 3,427 - Aster Property Limited 1,177 1,182 Zebra Property Solutions Limited 53 - Aster Options Plus Limited 2 1 Aster Solar Limited 2 -
4,661 1,183
12 Finance income and expense
9 Charitable donations received
Staff costs: 2019£000
2018£000
Wages and salaries 9,583 8,783 Social security costs 1,057 954 Other pension costs 684 435
11,324 10,172
2019£000
2018£000
Aster Communities 10,000 10,000
2019£000
2018£000
Interest receivable and similar incomeInterest on short term deposits 66 27 Interest receivable from other group companies 1,263 -
1,329 27 Interest payable and similar chargesMovement in SHPS recovery plan liability discounting - (25)Interest payable to other group companies (1,022) -
(1,022) (25)Interest on net pension liabilityLocal government pension schemes - (27)Social Housing Pension schemes (105) -
(105) (27)Net finance income / (expense) 202 (25)
8 Employee information (continued)
11 Loss on disposal of assets
10 Gift aid
Aster Communities made a charitable donation to Aster Group Limited during the year to further the groupʼs principal activities.
2019 2018Proceeds
£000
Cost of Sales£000
Loss
£000
Proceeds
£000
Cost of Sales£000
Loss
£000Computer software - (12) (12) - - - Computer equipment - (1) (1) - - - Loss on disposal - (13) (13) - - -
Notes to the Association’s Financial Statements

177
Strategic Report Corporate Governance Financial Statements
13 Tax on profit on ordinary activities
2019£000
2018£000
(a) Tax expense included in profit or loss:The tax charge on the profit on ordinary activities was as followsCurrent tax UK corporation tax expense - - Under provision in previous years - - Total current tax - - Deferred taxOrigination and reversal of timing differences - - Adjustment for prior year - - Changes in tax rate or laws - - Total deferred tax - - Tax on profit on ordinary activities - -
2019£000
2018£000
(b) Tax expense included in other comprehensive incomeDeferred taxOrigination and reversal of timing differences - - Impact of change in tax rate - -
- -
2019£000
2018£000
(c) Factors affecting tax charge for the yearProfit on ordinary activities before taxation 14,292 10,339 Profit on ordinary activities multiplied by standard rate of Corporation Tax in the UK of 17% (2018: 17%) 2,430 1,759 Effects of:
Surplus from charitable activities - - Expenses not deductible - - Utilisation of losses - - Tax at marginal rates - - Items not allowable for tax purposes (2,430) (1,759)Capital allowances less than depreciation - - Items charged to other comprehensive income - - Other timing differences - -
Total tax charge - -
The tax assessed for the year differs from the standard rate of corporation tax in the UK as explained below.
8 Employee information (continued)
11 Loss on disposal of assets
(d) Tax rate changes The Finance Act 2015 was substantively enacted on 26 October 2015 and reduced the main rate of corporation tax to 19% with effect from 1 April 2017. The Finance Act 2016 was substantively enacted on 15 September 2016 and reduced the main rate of corporation tax to 17% from 1 April 2020. Closing deferred tax balances have therefore been valued at 17% or 19% (2018: 17% or 19%) depending on the date they are expected to fully unwind.
Aster Communities made a charitable donation to Aster Group Limited during the year to further the groupʼs principal activities.
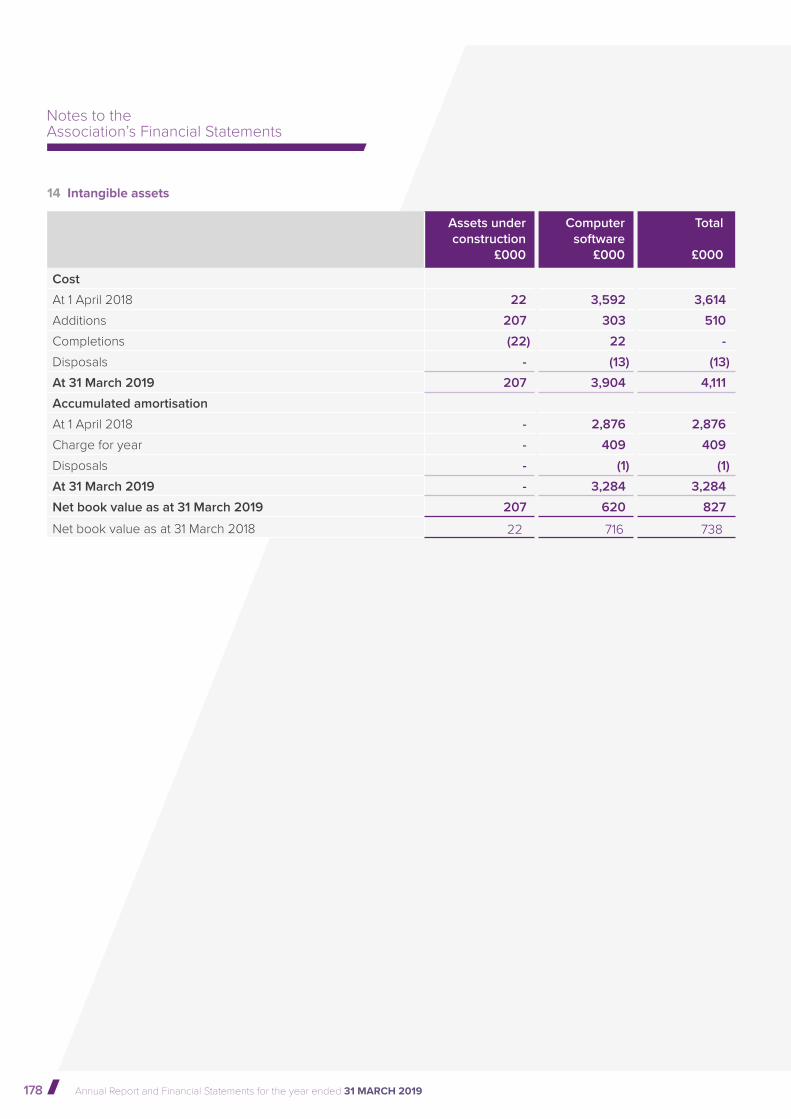
178 Annual Report and Financial Statements for the year ended 31 MARCH 2019
14 Intangible assets
Assets under construction
£000
Computer software
£000
Total
£000
Cost
At 1 April 2018 22 3,592 3,614
Additions 207 303 510
Completions (22) 22 -
Disposals - (13) (13)
At 31 March 2019 207 3,904 4,111
Accumulated amortisation
At 1 April 2018 - 2,876 2,876
Charge for year - 409 409
Disposals - (1) (1)
At 31 March 2019 - 3,284 3,284
Net book value as at 31 March 2019 207 620 827
Net book value as at 31 March 2018 22 716 738
Notes to the Association’s Financial Statements

179
Strategic Report Corporate Governance Financial Statements
15 Property, plant and equipment (other assets)
Assets under construction
£000
Furniture and equipment
£000
Computer equipment
£000
Total
£000
Cost
At 1 April 2018 24 321 4,073 4,418
Additions - - 496 496
Completions (8) - 8 -
Disposals - - (1) (1)
At 31 March 2019 16 321 4,576 4,913
Accumulated depreciation
At 1 April 2018 - 304 3,177 3,481
Charge for year - 14 583 597
At 31 March 2019 - 318 3,760 4,078 Net book value as at 31 March 2019 16 3 816 835 Net book value as at 31 March 2018 24 17 896 937
16 Investments in subsidiaries
2019£000
2018£000
Aster Treasury Plc - 50,000 £1 shares 50 50 Aster Communities - 1 £1 share - - Synergy Housing Limited - 1 £1 share - - Aster 3 Limited - 1 £1 share - - Aster Living - 1 £1 share - - Aster Property Limited - 1 £1 share and 1 £1 share with a £3 million premium 3,000 3,000 Aster Homes Limited - 96 £1 shares and 1 £1 share with a £5 million premium 5,000 5,000 Aster Options Plus Limited - 94 £1 shares - -
8,050 8,050

180 Annual Report and Financial Statements for the year ended 31 MARCH 2019
2019£000
2018£000
Trade debtors 252 183 Less provision for bad debts (10) -
242 183 Amounts owed by group undertakings 3,953 14,726 Other debtors 12 21 Prepayments and accrued income 1,597 1,046
5,804 15,976
2019£000
2018£000
MORhomes PLC shares 30 20
20 Cash and cash equivalents
18 Debtors: amounts falling due after more than one year
2019£000
2018£000
Short term deposits 4,000 - Cash at bank and in hand 18,963 5,527
22,963 5,527
2019£000
2018£000
Amounts owing by group undertakings 33,000 -
2019£000
2018£000
Trade creditors 369 345 Taxation and social security 286 260 Pension contributions 136 128 VAT 16 61 Amounts owed to group undertakings 2,374 405 Accrued holiday pay 14 11 Other creditors 25 29 Accruals and deferred income 2,148 935 Social Housing Pension Scheme recovery plan liability - 335
5,368 2,509
19 Debtors: amounts falling due within one year
17 Other investments
Aster Group Limited holds 20,000 fully paid 10 pence shares with a premium of 90 pence and 20,000 10 pence shares with a premium of 40 pence in MORhomes PLC, which is a social housing funding vehicle.
21 Creditors: amounts falling due within one year
Notes to the Association’s Financial Statements

181
Strategic Report Corporate Governance Financial Statements
2018
Total cost by scheme
£000
Total interest on net pension
liability by scheme £000
Actuarial gain in pension scheme
£000
Pension deficit
£000
Wiltshire Pension Scheme 60 (27) 419 (69)Wiltshire Pension Scheme - actuarial asset adjustment - - 49 - SHPS 375 - - -
435 (27) 468 (69)
2019£000
2018£000
Amounts owed to group undertakings 23,000 - Social Housing Pension Scheme recovery plan - 1,427
23,000 1,427
23 Pension obligations
The cost of providing retirement pensions and related benefits is accounted for in accordance with FRS 102 section 28 ‘Employee Benefits’. The association participates in four pension schemes.
2019
Total cost by scheme
£000
Total interest on net pension
liability by scheme £000
Actuarial loss in pension scheme
£000
Pension deficit
£000
Wiltshire Pension Scheme 47 - (137) (23)SHPS
Defined benefit schemes 375 (105) (625) (4,697)Initial recognition of multi-employer defined benefit scheme - - (2,358) - Defined contribution scheme 262 - - -
684 (105) (3,120) (4,720)
The pension cost to the association for the year ended 31 March 2019 was £684,000 (2018: £435,000) in respect of 247 employees (2018: 220).
During 2018 Aster Living closed its Wiltshire County Council Pension Scheme. The net assets were transferred to Aster Group Limited. The obligation transfer was adjusted by £49,000 relating to additional changes in financial assumptions.
22 Creditors: amounts falling due after more than one year
Summary of movements and balances in pension funding
There are three defined benefit schemes:
• Wiltshire Pension Scheme (closed to new members);
• Social Housing Pension Scheme (SHPS) final salary defined benefit scheme (closed to new members); and
• SHPS career average of earnings (CARE).
and one defined contribution (stakeholder) scheme.
• SHPS defined contribution scheme.
The accounting treatments for each of the schemes are described below.
182 Annual Report and Financial Statements for the year ended 31 MARCH 2019
23 Pension obligations (continued)
Local government pension schemes Wiltshire Pension Scheme
In October 2018 the High Court published its judgement on the case of Lloyds Banking Group and the equalisation of Guaranteed Minimum Pensions (‘GMP’).
The association has reviewed the impact of GMP Equalisation in respect of its Local Government Pension Scheme and identified that a range of approaches has been adopted by the scheme actuaries. These approaches range from a detailed assessment of the impact of the requirements in 2019 through to limited recognition of the impact as the scheme actuaries wait for guidance from the Government on the methodology to be applied in calculating the full liability. No further adjustments have been made to the present value of obligations as the effect is not considered material.
In December 2018 the Court of Appeal ruled that ‘transitional arrangements’ protection in respect of benefit changes to the Judicial and Fire Fighter Pension scheme amounted to unlawful discrimination (‘McCloud case’). Due to similar pension reforms to the LGPS in benefits the judgement is expected to be applicable to the LGPS. Whilst the judgement might be appealed by the Government in the Supreme Court it is generally considered unlikely that this will be successful.
The directors have considered the potential impact of the McCloud case on the group and associations defined benefit liability as at 31 March 2019. No additional liability has been recognised given the profile of the scheme members and assuming a very cautious outcome on the LGPS scheme liability (gross obligation: £9.2 million) the directors are satisfied that when fully accounted in the financial statements the impact will not be material to the group or association Financial Statements as at 31 March 2019.
Aster Group Limited participates in the above fund as an admitted body under the Local Government Superannuation Regulations 1995, funded jointly by employer and employee contributions. The fund is a defined benefit final salary multi-employer scheme and is contracted out.
As at the balance sheet date there were 3 (2018: 3) active members of the Scheme employed by Aster Group Limited. The annual pensionable payroll in respect of these members was £116,000 (2018: £140,000).
The fund is subject to an actuarial valuation of the scheme every three years. The main purpose of the valuation is to determine the financial position of the scheme in order to address the level of future contributions required so the scheme can meet its pension obligations as they fall due.
The scheme actuary has prepared an actuarial report that provides an
approximate update on the funding position of the scheme as at 31 March 2019. The principal assumptions used by the independent qualified actuaries in updating the latest valuation in order to provide the disclosures required by Financial Reporting Standard 102, section 28 ‘Employee Benefits’ are stated below. The actuary has used the projected unit credit method of valuation.
The last triennial valuation was performed on 31 March 2016 and the results have been incorporated into the financial statements for 2019.
The next triennial valuation will be carried out on 31 March 2019 and the results for this will be incorporated into the financial statements for 2020.
The information in the statement relating to the valuation of the pensions scheme’s assets and liabilities has been prepared by the scheme’s actuaries, Hymans Robertson LLP.
Notes to the Association’s Financial Statements

183
Strategic Report Corporate Governance Financial Statements
Wiltshire Pension Scheme
Financial assumptions 2019%p.a.
2018%p.a.
Price increases 2.5 2.4Pension increases 2.5 2.4Salary increases 2.8 2.7Expected return on assets 2.4 2.7Discount rate 2.4 2.7
Mortality 2019 years
2018years
Current pensioners Females 24.9 24.9 Males 22.5 22.5 Future pensioners Females 26.7 26.7 Males 24.1 24.1
Fair value of employer assets 2019£000
2018£000
Equities 6,501 5,876 Bonds 1,282 1,259 Property 1,190 1,091 Cash 183 168
9,156 8,394
Total cost recognised as expense 2019£000
2018£000
Current service cost 47 60 Interest costs 227 149 Expected return on assets employed (227) (122)Total 47 87
Return on plan assets 707 393

184 Annual Report and Financial Statements for the year ended 31 MARCH 2019
Reconciliation of defined benefit obligation 2019£000
2018£000
Opening defined benefit obligation 8,463 5,775 Current service cost 47 60 Interest cost 227 149 Contributions by members 8 11 Actuarial losses / (gains) 617 (148)Estimated benefits paid (183) (163)Transferred from Aster Living - 2,828 Actuarial asset adjustment - (49)Closing defined benefit obligation 9,179 8,463
Reconciliation of fair value of employer assets 2019£000
2018£000
Opening fair value of employer assets 8,394 4,653 Expected return on assets 227 122 Contributions by members 8 11 Contributions by employers 230 240 Actuarial gains 480 271 Benefits paid (183) (163)Transferred from Aster Living - 3,260 Closing fair value of employer assets 9,156 8,394
Projected pension expense for the year to 31 MARCH 2020
2020£000
Projected current service cost 51 Interest on obligation 219 Expected return on plan assets (220)Total 50
23 Pension obligations (continued)
Wiltshire Pension Scheme (continued)
Notes to the Association’s Financial Statements

185
Strategic Report Corporate Governance Financial Statements
The Social Housing Pension Scheme
Aster Group Limited participates in the Social Housing Pension Scheme (the Scheme). The Scheme is funded and is contracted-out of the State Pension scheme.
The Scheme is a multi-employer defined benefit scheme. Employer participation in the Scheme is subject to adherence with the employer responsibilities and obligations as set out in the ‘SHPS House Policies and
Rules Employer Guide’. Full details of the Scheme and its operation can be found in note 34 of the Consolidated Financial Statements.
Reconciliation of opening and closing Social Housing Pension Scheme recovery plan liability
2019£000
2018£000
At 1 April 1,762 2,080 Unwinding of the discount factor - 25 Deficit contribution paid - (321)Remeasurements - changes in assumptions - (22)Derecognition of Social Housing Pension Scheme recovery plan liability (1,762) - At 31 March - 1,762 Recognised in: Creditors: amounts falling due within one year - 335 Creditors: amounts falling due after one year - 1,427
- 1,762
Social Housing Pension Scheme recovery plan liability profit and loss impact
2019£000
2018£000
Recognised in operating profit Remeasurements - changes in assumptions - (22) Remeasurements - contribution schedule - -
- (22)Recognised in total finance income and expense Interest expense - 25
SHPS defined benefit pension plan – change of accounting policy
SHPS is a multi-employer scheme which provides benefits to non-associated employers. The scheme is classified as a defined benefit scheme. At 31 March 2018 it was not possible for the Association to obtain sufficient information to account for the liability on a full FRS 102 valuation basis so it was accounted for as a defined contribution scheme where the net present value of the deficit contributions were recognised in the accounts as creditors falling within and more than one year.
As a result of additional information, SHPS are now able to split the pension liability by employer which has resulted in the scheme liability being accounted for adopting a full FRS 102 valuation at 31 March 2019. In accordance with FRED 71, no restatement of prior year figures has been made in these accounts. A reconciliation between the closing liability at 31 March 2018 and the opening provision at 1 April 2018 is shown below:
£000
SHPS recovery plan liability - 31 March 2018 1,762 Derecognition of SHPS recovery plan liability via other comprehensive income (1,762)Recognition of SHPS net pension liability via other comprehensive income 4,120 SHPS net pension liability – 1 April 2018 4,120

186 Annual Report and Financial Statements for the year ended 31 MARCH 2019
In October 2018 the High Court published its judgement on the case of Lloyds Banking Group and the equalisation of Guaranteed Minimum Pensions (‘GMP’). This has consequently been assessed against the group’s defined benefit schemes. The impact of GMP Equalisation in respect of the SHPs Pension Scheme have been recognised in the year. As at the balance sheet date there were 39 (2018: 40) active members of the Scheme employed by Aster Group Limited (the Association). The annual pensionable payroll in respect of these members was £2.4 million (2018: £2.5 million). Due to previously mentioned change in accounting treatment there are no prior year comparisons in the following note.
Financial assumptions 2019%p.a.
Price increases - CPI 2.2Price increases - RPI 3.2Earnings increases 3.2Discount rate 2.4
Mortality 2019 years
Current pensioners Females 23.5 Males 21.8 Future pensioners Females 24.7 Males 23.2
Fair value of employer assets 2019£000
Absolute Returns 1,099 Global Equity 2,138 Liability Driven Investment 4,646 Property and Infrastructure 1,139 Investments 1,412 Sharing and Alternative Premia Risk 1,117 Emerging Market and Private debt 609 Other 545
12,705
23 Pension obligations (continued)
The Social Housing Pension Scheme (continued)
Notes to the Association’s Financial Statements
The fund is subject to an actuarial valuation of the Scheme every three years. The main purpose of the valuation is to determine the financial position of the Scheme in order to address the level of future contributions required so that the Scheme can meet its pension obligations as they fall due.
The Scheme Actuary has prepared an Actuarial Report that provides an approximate update on the funding position of the Scheme as at 31 March 2019. The principal assumptions used by the independent qualified actuaries in updating the latest valuation in order to provide the disclosures required by Financial Reporting Standard No. 102 section 28 – Employee Benefits are stated below. The actuary has used the projected unit credit method of valuation.
The last triennial valuation was performed on 30 September 2017 and the results have been incorporated into the financial statements for 2019.
The next triennial valuation will be carried out on 30 September 2020 and the results for this will be incorporated into the financial statements for 2022.
The information in the financial statement relating to the valuation of the pensions scheme’s assets and liabilities has been prepared by the scheme’s actuaries, JLT.

187
Strategic Report Corporate Governance Financial Statements
Total cost recognised in profit for the year 2019£000
Current service cost 365 Expenses 10 Net interest cost 105 Total 480
Return on plan assets 811
Reconciliation of defined benefit obligation 2019£000
Opening defined benefit obligation 15,603 Current service cost 365 Contributions by scheme participants 235 Expenses 10 Interest expense 409 Actuarial losses 1,132 Benefits paid and expenses (352)Closing defined benefit obligation 17,402
Reconciliation of fair value of scheme assets 2019£000
Opening fair value of scheme assets 11,483 Interest income 304 Actuarial gain 507 Contributions by the employer 528 Contributions by scheme participants 235 Benefits paid and expenses (352)Closing fair value of scheme assets 12,705 Net pension liability 4,697
The Social Housing Pension Scheme defined contribution scheme
The scheme is administered by the Pensions Trust. It is open to all members of staff and is the pension scheme for auto-enrolment. The association paid contributions between 2.5% and 10% (2018: 2% and 10%) and employees paid contributions from 2.5% to 7% (2018: from 2% to 7%). On retirement, funds or units earned can be converted into a pension with the Trust, or used to secure a pension with another provider. At 31 March 2019 there were 172 (2018: 143) active members of the scheme.

188 Annual Report and Financial Statements for the year ended 31 MARCH 2019
24 Other provisions
2019Redundancy
£000
2018Redundancy
£000
At 1 April 31 31 Additions during the year 6 - Amounts utilised during the year - - At 31 March 37 31
2019£
2018£
Ordinary shares allotted, issued and fully paid
At 1 April 7 7 Issued during the year 3 - Cancelled during the year (3) - At 31 March 7 7
2019£000
2018£000
Office equipment
Not later than one year 10 - Later than one year but not later than five years 28 - Later than five years - -
38 -
25 Called up share capital
26 Operating leases
27 Related party transactions
Aster Group Limited provides management and other services to all group companies under the terms of documented service level agreements. Overheads are apportioned on the basis of the amount of time spent and the affordability to the subsidiary. The amount of turnover relating to registered provider and other subsidiaries is shown in note 5.
Aster Group Limited has taken advantage of the exemption allowed under FRS 102 Section 33 'Related Party Disclosures' not to disclose related party transactions within the group. This exemption is available providing the transactions are entered into between two or more members of a group, so long as any subsidiary which is party to the transaction is wholly owned.
Aster Group Limited has total commitments under non-cancellable operating leases due to expire as follows:
Notes to the Association’s Financial Statements

189
Strategic Report Corporate Governance Financial Statements

190 Annual Report and Financial Statements for the year ended 31 MARCH 2019
28 Status
Aster Group Limited is the ultimate parent and ultimate controlling party within the Aster Group, which comprises:
• Aster Communities, a wholly owned subsidiary which is a registered provider and Charitable Community Benefit Society, registered with the Regulator of Social Housing (RSH);
• Aster Living, a wholly owned subsidiary whose activities include providing care and support services. Aster Living is a Charitable Community Benefit Society;
• Aster Property Limited, a wholly owned subsidiary of Aster Group Limited whose activities include property maintenance services to group members. Aster Property Limited is incorporated under the Companies Act 2006;
• Aster Homes Limited, a subsidiary of Aster Group Limited which provides property based development services to group members. Aster Homes Limited is incorporated under the Companies Act 2006;
• Synergy Housing Limited, a wholly owned subsidiary which is a registered provider and Charitable Community Benefit Society, registered with the Regulator of Social Housing (RSH);
• Zebra Property Solutions Limited, a wholly owned subsidiary of Synergy Housing Limited which ceased trading on 1 April 2018. Zebra Property Solutions Limited is incorporated under the Companies Act 2006;
• Silbury Housing Holdings Limited, which is a wholly owned subsidiary of Aster Communities and has a subsidiary, Silbury Housing Limited, which provides a service concession arrangement for Wiltshire Council. Both companies are incorporated under the Companies Act 2006;
• Aster Treasury Plc, a wholly owned subsidiary of Aster Group Limited, providing long term finance under a finance bond to group members. Aster Treasury Plc is incorporated as a public limited company under the Companies Act 2006;
• Aster Options Plus Limited, a cost sharing vehicle, ceased trading on 1 April 2018. Aster Options Plus Limited is incorporated under the Companies Act 2006;
• Aster Solar Limited, a subsidiary jointly owned by Aster Communities and Synergy Housing Limited, provides investment in photo voltaic panels on behalf of the group. Aster Solar Limited is incorporated under the Companies Act 2006;
• Aster 3 Limited, a wholly owned subsidiary which is a registered provider and Charitable Community Benefit Society, registered with the Regulator of Social Housing (RSH).
Aster Group Limited is party to the below jointly controlled entities:
• White Rock Land LLP, a 50% owned Limited Liability Partnership between Aster Homes Limited and Galliford Try Homes Limited, established to develop sites in the South-West of England;
• Boorley Green LLP, a 50% owned Limited Liability Partnership between Aster Homes Limited and Galliford Try Homes Limited, established to develop sites in Hampshire;
• Kilnwood Vale LLP, a 50% owned Limited Liability Partnership between Aster Homes Limited and Galliford Try Homes Limited, established to develop sites in West Sussex.
Printed copies of the financial statements are available from the following address:
The Company Secretary, Sarsen Court, Horton Avenue, Cannings Hill, Devizes, Wiltshire, SN10 2AZ.
Sarsen Court is the registered office of all but two of the group’s subsidiaries. The registered office of Synergy Housing Limited and Zebra Property Solutions Limited is Link House, First Floor, West Street, Poole, Dorset, BH15 1LD.
Entity Legal Status

191
Strategic Report Corporate Governance Financial Statements
192 Annual Report and Financial Statements for the year ended 31 MARCH 2019
Registered office:
Sarsen Court, Horton Avenue, Cannings Hill, Devizes, Wiltshire, SN10 2AZ
Legal status:
Aster Group Limited is incorporated under the Co-operative and Community Benefit Societies Act 2014 number 29573R
Registered with the Regulator of Social Housing (RSH)
Independent Auditor:
KPMG LLP Chartered Accountants and Statutory Auditor Gateway House, Tollgate, Chandlerʼs Ford, Eastleigh, SO53 3TG
Principal Banker: Barclays Bank Plc Business Banking 3rd Floor, Windsor Court, 3 Windsor Place, Cardiff, CF10 3ZL
Principal Solicitor: Trowers and Hamlins 3 Bunhill Row, London, EC1Y 8YZ
Funders: The Royal Bank of Scotland, Facility agent 1st Floor, 280 Bishopsgate, London, EC2M 3RB
Abbey National Treasury Services Plc 2 Triton Square, Regents Place, London, NW1 3AN
Lloyds Bank Plc Corporate Banking Level 7 Bishopsgate Exchange, 155 Bishopsgate, London, EC2M 3YB
MORhomes PLC 71 Queen Victoria Street, London, EC4V 4AY
Legal and Administrative Details

193
Strategic Report Corporate Governance Financial Statements
Principal Banker: Barclays Bank Plc Business Banking 3rd Floor, Windsor Court, 3 Windsor Place, Cardiff, CF10 3ZL
Principal Solicitor: Trowers and Hamlins 3 Bunhill Row, London, EC1Y 8YZ
Funders: The Royal Bank of Scotland, Facility agent 1st Floor, 280 Bishopsgate, London, EC2M 3RB
Abbey National Treasury Services Plc 2 Triton Square, Regents Place, London, NW1 3AN
Lloyds Bank Plc Corporate Banking Level 7 Bishopsgate Exchange, 155 Bishopsgate, London, EC2M 3YB
MORhomes PLC 71 Queen Victoria Street, London, EC4V 4AY
Funders (continued): Dexia (Public Finance Bank) Shackleton House, 4 Battle Bridge Road, London, SE1 2RB
Barclays Bank Plc Business Banking 3rd Floor, Windsor Court, 3 Windsor Place, Cardiff, CF10 3ZL
Affordable Housing Finance Plc 4th Floor Cannon Street, London, EC4N 5AF
Security Trustee: Prudential Trustee Company Limited Laurence Pountney Hill, London, EC4R 0HH
Valuer: Jones Lang LaSalle Limited 45 Church Street, Birmingham, B3 2RT
Financial Adviser: J.C. Rathbone Associates Limited 12 St. James Square, London, SW1Y 4LB

194 Annual Report and Financial Statements for the year ended 31 MARCH 2019
195

Sarsen Court, Horton Avenue, Cannings Hill, Devizes, Wiltshire. SN10 2AZT: 0333 400 8222 @AsterGroupUK AsterGroupUK www.aster.co.uk
1906012