annual education statistics 2009
TRANSCRIPT

AnnuAl EducAtion StAtiSticS
�
ANNUAL EDUCATION STATISTICS, 2009
Policy and Planning DivisionMinistry of Education
Royal Government of Bhutan

Published by:
Policy and Planning DivisionMinistry of EducationRoyal Government of Bhutan
Telephone: +975-2-327387, 334307Fax: +975-2-325183
Email: [email protected] sangaychoden@education,gov,bt Website: www.education.gov.bt
Copyright © 2009 Policy and Planning Division, Ministry of Education
All rights reserved. No part of this publication may be reproduced in any form without prior permission from the Policy and Planning Division, Ministry of Education.
Printed @ KUENSEL Corporation Ltd.
First Edition: 1999Eleventh Edition: 2009
AnnuAl EducAtion StAtiSticS
��

ACKNOWLEDGEMENT
the Annual Education Statistics provides basic information on Pre-school, Primary and Secondary education in Bhutan, and therefore is an important source of information for decision making. the Principals and teachers of the schools are the main contributors who supplied the required school data. the dzongkhag Education Officers, in their respective domains, helped to ensure that the data provided are accurate and timely.
in academic year 2009, the AES report 2009 has more added features and information both in terms of contents and presentation as compared to the previous publication. Most of the information is presented in the graphic form as to make it more user-friendly and understandable. Most of these old tables have been replaced by maps, charts, pie-charts and graphs etc. We would like to thank Hon’ble Madam Secretary and the Management committee of the MoE for their valuable inputs in improving the AES report.
The calculation of the enrollment ratio (NER and GER) and completion rate is based on revised figure of Population and Housing census, 2005 and dzongkhag Population Projection, 2006-2015, published by national Statistics Bureau. our assumption is that the international migration is negligible. Some of the dzongkhags boundaries were re-demarcated, this change in boundaries has affected the population of the affected Dzongkhags, Therefore NSB has revised the 2005 Dzongkhag figures as to accommodate with the changes made within the dzongkhag boundaries. the Policy and Planning division, MoE is greatly indebted to the national Statistics Bureau, MolHR, MoF, RuB, dratshang lhentshog and also the departments and divisions within the Ministry, for their support in bringing out this report. this support has enabled the publication of increasingly more relevant, accurate and timely information on education in Bhutan. lastly we hope that this report provides the policy makers, planners, development partners, and other stake holders’ valuable information for both macro and micro-level planning and program implementation. We also solicit our readers’ valuable comments and suggestions that will help improve our AES in future.
Policy and Planning division Ministry of Education
thimphu, Bhutan
AnnuAl EducAtion StAtiSticS
���

AnnuAl EducAtion StAtiSticS
�v

AnnuAl EducAtion StAtiSticS
v
TABLE OF CONTENTSACKNOWLEDGEMENT .......................................................................................................................III
LIST OF FIGURES ............................................................................................................................... vII
LIST OF TABLES .................................................................................................................................vIII
ACRONYMS, ABBREvIATIONS AND GLOSSARY .......................................................................... x
ANNUAL EDUCATION STATISTICS (AES) ........................................................................................ 1
The AnnuAl School cenSuS ........................................................................................................................ 2SelecTion of indicATorS ............................................................................................................................... 3
COMMON INDICATORS ........................................................................................................................ 5
1. ExECUTIvE SUMMARY............................................................................................................. 5
1.1. inTroducTion ......................................................................................................................... 51.2. educATion STrucTure ............................................................................................................ 5
1.2.1. General education structure .................................................................................. 61.2.2. Schools in General Education ............................................................................... 7
1.3 GenerAl educATion curriculum ........................................................................................... 71.4 educATion AdminiSTrATion .................................................................................................... 9
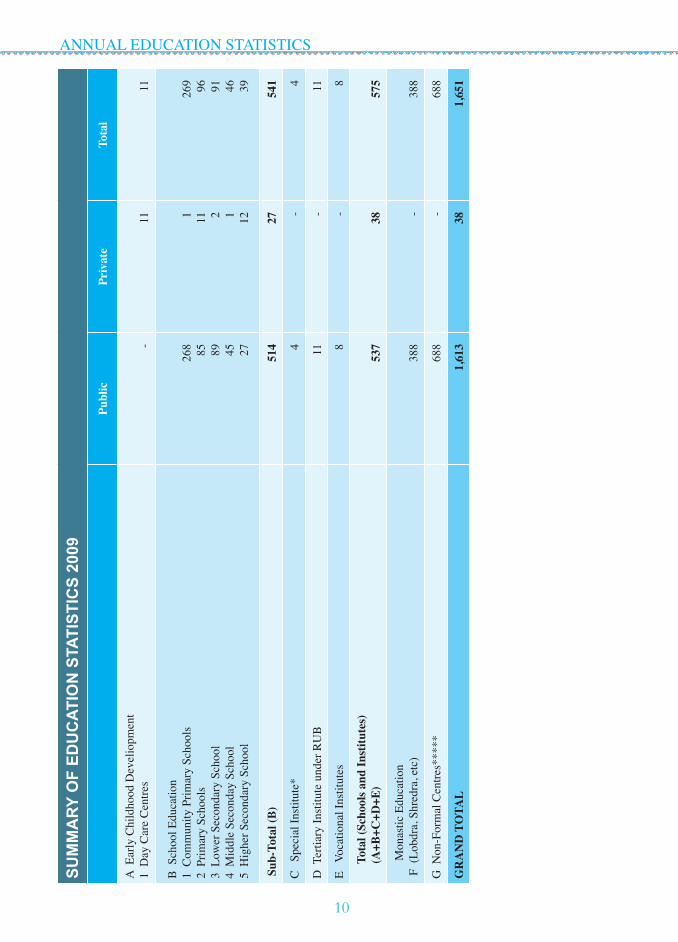
SUMMARY OF EDUCATION STATISTICS 2009 .............................................................................. 10
2. STATUS OF EDUCATION IN 2009 ........................................................................................... 13
2.1. enrolmenT, SchoolS And TeAcherS AT The nATionAl level .............................................. 132.1.1. Enrolment ............................................................................................................. 13
2.2. TrendS in PrimAry educATion 2006-2009 .......................................................................... 152.3. Schools and Institutes ......................................................................................................... 17
2.3.1. Extended Classroom ............................................................................................. 172.3.2. Early Childhood Care and Development ............................................................. 182.3.3 Community Primary Schools ................................................................................ 18
2.4 Schools and Enrolment by Location .................................................................................... 182.5. Non Formal Education ........................................................................................................ 202.6. Continuing Education Programme ...................................................................................... 202.7. Teachers ............................................................................................................................... 202.8 educATion fAciliTieS, enrolmenT And TeAcherS in The dzonGkhAGS ................................... 212.8.1. Provision of schools per Dzongkhag ................................................................................... 212.8.2. Teachers in the Dzongkhags ................................................................................................ 222.9 School Feeding, WFP ..........................................................................................................23
3. ENROLMENT IN THE GENERAL EDUCATION PROGRAM ............................................ 24
3.0. PrimAry educATion (clASSeS PP-vi) .................................................................................. 243.2 GirlS enrolmenT ................................................................................................................. 28
3.2.1. Girls’ enrolment in HSS and tertiary education ................................................... 333.3. Gender PAriTy index ............................................................................................................... 333.4. SecondAry educATion ......................................................................................................... 40
3.4.1 Lower and Middle Secondary Education (VII-X) ................................................ 403.4.2. Higher Secondary Education (XI –XII) ............................................................... 41

AnnuAl EducAtion StAtiSticS
v�
4. ExAMINATION RESULTS .........................................................................................................44
4.1.1. Class X Examinations ...........................................................................................................44
4.1.2. Class XII Examination ............................................................................................444.1.3. Class VI and Class VIII Examinations ...................................................................45
4.2 efficiency indicATorS ............................................................................................................454.2.1. Promotees, Repeaters and Drop-outs ....................................................................454.2.2 Completion rate and internal efficiency measures. ...............................................48
4.4 Class X detaited results .......................................................................................... 484.5 Repetition and dropout rates since 2003 ................................................................ 484.6(a) Primary completio rates since 2006 ..................................................................... 494.6(b) Basic completion rates since 2006 ........................................................................ 49
5. TEACHERS ..................................................................................................................................52
5.1 TeAcher STrenGTh .................................................................................................................525.1.1 Proportion of Non-Bhutanese Teachers .................................................................52
5.2 TeAcher educATion ...............................................................................................................545.2.1 Pre-service training ................................................................................................545.2.2 In-Service training ..................................................................................................54
5.3 AcAdemic Profile of TeAcherS ..............................................................................................55
6. QUALITY INDICATORS .............................................................................................................56
6.1 TeAcher-PuPil rATio ..............................................................................................................566.2 clASS Size ..............................................................................................................................58
7. EDUCATION FACILITIES .........................................................................................................61
7.1 The WATer SiTuATion in SchoolS ..........................................................................................617.2 ProviSion of clASSroomS, lAborATorieS And comPuTerS in SchoolS .....................................627.2.1. Laboratories in schools.........................................................................................................637.2.2. Computers in schools ............................................................................................................637.3 elecTriciTy, TelePhone And inTerneT connecTiviTy ..............................................................647.4 Road accesibility ...................................................................................................................66
8. NON-FORMAL, CONTINUING AND SPECIAL EDUCATION ............................................69
8.1 non formAl educATion ........................................................................................................698.2 conTinuinG educATion ..........................................................................................................698.3 SPeciAl educATion ................................................................................................................698.4 SAnSkriT PAThShAlAS ............................................................................................................70
9. TERTIARY, vOCATIONAL, INTERNATIONAL AND MONASTIC EDUCATION ..........71
9.1 TerTiAry educATion ...............................................................................................................729.2 vocATionAl educATion ..........................................................................................................729.3 STudenTS AbroAd ..................................................................................................................72 Primary and secondary education ........................................................................................72 Tertiary education .................................................................................................................729.4 monASTic educATion .............................................................................................................73

AnnuAl EducAtion StAtiSticS
v��
10. FINANCING OF EDUCATION ...................................................................................................74
10.1 free ServiceS And ShArinG of coSTS .....................................................................................7410.2 AnnuAl budGeT .....................................................................................................................7410.3 Per heAd coSTS .....................................................................................................................80
LIST OF FIGURES
Figure 1.1 Growth in the number of Schools and institutes ............................................................... 5Figure 1.2 Growth in the number of enrolments in Schools and institutes ........................................ 6Figure 1.3 General education structure............................................................................................... 7Figure 1.4 General Education curriculum PP-Xii .............................................................................. 8Figure 2.0 Survival to the grade 5 and grade 10 ............................................................................... 15Figure 2.1 Primary enrolment, nER ................................................................................................. 16Figure 2.2 trend on survival to 5 and grade 10 ................................................................................ 16Figure 2.3 net enrolment ratios since 1998 ...................................................................................... 17Figure 2.4 Enrolment per dzongkhag by level of school ................................................................. 21Figure 2.5 Primary enrolment (PP-Vi) by dzongkhag..................................................................... 22Figure 2.6 econdary enrolment (class Vii –Xii) by dzongkhag ..................................................... 22Figure 2.7 teachers per school type ................................................................................................. 23Figure 3.0. Pre-primary enrolments by age ....................................................................................... 24Figure 3.1. division of primary aged children (6-12 yrs)................................................................. 27Figure 3.2. Girls participation in the Secondary Education since 2002 ............................................ 28Figure 3.3(a) Gender Parity index by dzongkhag (nPER) .................................................................. 34Figure 3.3(b) Gender Parity index by dzongkhag (GPER) .................................................................. 36Figure 3.4(a-b) Repetition and Promotion and rate by class gender ........................................................ 36Figure 3.5(a) divisions of streams in the Public ................................................................................... 36 Higher Secondary School ................................................................................................ 41Figure 3.5(b) divisions of streams in the Private Higher Secondary School ....................................... 41Figure 3.6 Enrolment trend in class Xi and Xii since 2002 ............................................................. 42Figure 4.0 class X passed trend since 2002 ..................................................................................... 44Figure 4.1 class Xii passed trend since 2002 .................................................................................. 45Figure 4.2 Repetition and dropout rate for class PP-X since 2002................................................... 46Figure 4.3 Primary enrolments (PP-iii) ............................................................................................ 46Figure 5.0 Proportion of bhutanese and non-Bhutanese teachers(1997 - 2009) .............................. 53Figure 6.0 teacher Pupil ratio by dzongkhag below and above the mean ...................................... 56Figure 6.1 teacher pupil ratios with mean and standard deviation. ................................................. 57Figure 6.2 division of teacher pupil ratio......................................................................................... 57Figure 6.3 teacher pupil ratio since 2002 by level of school ........................................................... 59Figure 7.0 total Student per class .................................................................................................... 62
LIST OF TABLEStable 2.0 Estimated enrolment per school level & type, March 2009 .................................................. 13table 2.1 Enrolment Ratios 2009, 2008, 2007 and 2006 ...................................................................... 14table 2.2 School and enrolment by categorization, 2009 ..................................................................... 19table 2.3 changes in teacher numbers per school 2002-2009 .............................................................. 21

AnnuAl EducAtion StAtiSticS
v���
table 2.4 School feeding in 2009, WFP-support and Government stipend .......................................... 23table 3.0 Gross or Apparent intake Ratio (AiR) 2004-2009 ................................................................ 25table 3.1 new admissions in PP 2002-2009 ........................................................................................ 25table 3.2: Enrolment in Primary Education, 2002-2009........................................................................ 26table 3.3 Primary Enrolment by age ..................................................................................................... 26table 3.4 nPER and GPER 2005-2009 ................................................................................................ 27Table 3.5 Girls’ enrolment by type/level of school, March 2009 .......................................................... 29Table 3.6 Percentage wise girls’ enrolment per level and type of school, March 2009 ........................ 30Table 3.7 Girl’s enrolment per location per Dzongkhag, March 2009 .................................................. 31Table 3.8 Girls’ enrolment in class X and class XI public and private schools 03- 09. ........................ 33table 3.9 distribution (in %) by dzongkhag of the 6-12 years old not in school, March 2009 ........... 39table 4.0 details on drop-outs and repeaters 2008-2009 ...................................................................... 47table 4.1 Survivors to the grade 2004-2008 (both sexes, boys, girls) .................................................. 51table 5.0 teacher strength March 2009 ................................................................................................ 52table 5.1 teacher strength 2007-2009 .................................................................................................. 53table 5.2 in-service Workshops ............................................................................................................ 54table 5.3 distance education 2003-2008 .............................................................................................. 54table 5.4 number of trained teachers by degree, March 2008 ............................................................. 55table 6.0 teacher-pupil ratio in schools per location March 2009 ....................................................... 56table 6.1 target t: P ratio reached per dzongkhag, March 2009 ......................................................... 58table 6.2 class size per location per school, March 2009 .................................................................... 59table 6.3 class size Maximum per dzongkhag, March 2009 .............................................................. 60table 7.0 Water situation in the schools, March 2009 .......................................................................... 61table 7.1: Student-tap stand ratio by dzongkhag for schools with tap stands, March 2009 ................ 62table 7.2 laboratory by level of school, public schools, March 2008 ................................................. 63table 7.3 computers in the schools, March 2009 ................................................................................. 64table 7.4: Electricity connectivity, per level, March 2009 .................................................................... 65table 7.5: Schools with working landline phone, per category, March 2009 ........................................ 65table 7.6: internet connectivity per level, March 2009 ......................................................................... 66table 7.7 Accessibility by road for public schools by dzongkhag, March 2009 ................................. 67table 7.8 distance of school from the nearest road head by level of school ........................................ 68table 8.0 Enrolment in continuing Education since 2006.................................................................... 69table 8.1: Enrolment and teaching Strength in nid 2002-2008 ........................................................... 70table 9.0 Staff and Students in the Royal university of Bhutan academic year 2008 ......................... 71table 9.1 Staff and students in Vocational training institutes academic year 2008 ............................. 72table 9.2 Bhutanese undergraduate students abroad with RGoB Scholarships, 2009 ........................ 72table 9.3 Bhutanese privately funded tertiary Education students abroad, 2009 ................................ 73table 9.4 Enrolment in monastic schools administered by the central monastic body, 2008 ............... 73table 10.1 Annual Budget Education Sectors 2008 – 2009 (in Million nu.) ......................................... 75table 10.2(a). Education revised budget and expenditure (FY 07-08) by dzongkhag (nu. in Million) .................................................................................................. 76table 10.2(b). top 5 utilizers of Budget .................................................................................................... 79table 10.2(c). top 5 under utilizers of Budget .......................................................................................... 79table 10.3 Estimated cost per student, May 2009................................................................................... 80
STATICAL TABLES
table 1.1 Enrolment of students per dzongkhag per type of School 2009 ........................................... 82table 1.2 Public and Private Schools per dzongkhag 2009 ................................................................. 83table 1.3 Enrolment of students per dzongkhag by level 2007-2009 .................................................. 84

AnnuAl EducAtion StAtiSticS
�x
table 1.4 teachers in Bhutan in 2009 per school type per dzongkhag ................................................ 85table 1.5 Summary of Enrolment and teaching Staff in Schools, institutes, nFE centres and day care centres, 2009 ............................................................................. 86table 1.6 nER & GER Primary and the Gender Parity index per dzongkhag, 2009 .......................... 88table 1.7 indicative nER and GER Primary per dzongkhag, 2008-2009 ........................................... 89table 1.8: Enrolment in class Xi and Xii per stream, March 2009...................................................... 90table 1.9 Enrolment in public and private higher secondary schools since 2002 ................................ 90table 2.0 class X results, 1997-2008 .................................................................................................... 90table 2.1 class Xii results 1997-2008 .................................................................................................. 91table 2.2 Enrolments, Repetition Rate & dropout Rate (PP-X) 2002-2009 ........................................ 91table 2.3 drop-out rate and numbers 2002-2009 ................................................................................. 91table 2.4 Repetition rate and numbers 2003-2009 ............................................................................... 92table 2.5 Primary and Basic education completion rates, 2006-2009 .................................................. 92Table 2.6 Measures of Internal Efficiency 2008 (Both Sexes) .............................................................. 93table 2.7 Proportion of non-Bhutanese teachers 1997-2009 ............................................................... 94table 2.8 teacher graduates from pre-service training 2002-2008 ....................................................... 94table 2.9 Enrolment in the colleges of Education 2003-2009 ............................................................. 94Table 3.0 Number of teachers who have upgraded their qualifications ................................................ 95Table 3.1 Teachers’ academic qualification by nationality & type of school, March 2009 .................. 95table 3.2 teacher-Pupil ratio per dzongkhag per type of school March 2009 ..................................... 96table 3.3: teacher Pupil ratio in Schools per dzongkhag per type of school 2007-2009 ..................... 97table 3.4 teacher-pupil ratio per school, divided by ratio 2009 ........................................................... 98table 3.5 teacher-Pupil ratio 1999-2009 .............................................................................................. 98table 3.6 class Size per school type per dzongkhag 2008 and 2009 ................................................... 98table 3.7 classroom student ratio by dzongkhag................................................................................. 99table 3.8 nFE- centers, teachers, and learners (Blc, Plc) per dzongkhag ..................................... 100table 3.9 Remarks on water supply by status of schools, March 2009 .............................................. 100table 4.0: Electricity, landline and internet per dzongkhag, March 2009 ......................................... 101table 4.1: distance of school from the nearest road head by dzongkhag ........................................... 102table 4.2: distance of school from the nearest road head by class ..................................................... 103table 4.3 division of number of 6-16 years old not in PP-X, 2009.................................................... 103table 4.4 nER & GER basic and the Gender Parity index per dzongkhag, 2009 ............................. 104
AnnEXuRE
Annex 1. neW And uPGrAded SchoolS in bhuTAn in 2009 .................................................................. 106Annex 2. comPArATive enrolmenT ....................................................................................................... 108Annex 3. comPArATive enrolmenT ....................................................................................................... 110Annex 4. orGAnizATion of The moe heAdquArTerS ............................................................................111Annex 5. WfP-SuPPorT ........................................................................................................................ 113

AnnuAl EducAtion StAtiSticS
x
ACRONYMS, ABBREVIATIONS AND GLOSSARY
Acronyms
AES Annual Education Statistics
AFD Administrative and Finance Division
AIR Apparent Intake Ratio
ASCF Annual School Census Form
BBE Bhutan Board of Examinations
BCSE BhutanCertificateforSecondaryEducation
B.Ed Bachelor of Education
B.Ed (D) Bachelor of Education (Dzongkha)
B.Ed(p) BachelorofEducation(Primary)
BHSEC BhutanHigherSecondaryEducationCertificate
BLC Basic Learning course
CAPSD Curriculum and Professional Services Division
CE Continuing Education
CECD Counseling Division
CoE College of Education
CPS CommunityPrimarySchool
DAHE Department of Adult and Higher Education
DDA DzongkhaDevelopmentAuthority
DEO DzongkhagEducationOfficer
DPP Dzongkhag Population Projection 2006-2015
DSE Department of School Education
DYS Department of Youth and Sports
ECCD EarlyChildhoodDevelopmentDivision
ECR Extended Classroom
EFA Education For All
EM Education Media
EMSSD Education Monitoring & Support Service Division
FYP Five Year Plan
GBER Gross Basic Enrolment Rate
GER Gross Enrolment Rate
GES Geog Education Services
GoI Government of India
GPER GrossPrimaryEnrolmentRate
GPER GrossPrimaryEnrolmentRate
GPI GenderParityIndex
GSD Games and Sports Division
HRD Human Resource Division
HSS HigherSecondarySchool

AnnuAl EducAtion StAtiSticS
x�
IA Internal Auditor
ICSE IndianCertificateforSecondaryEducation
ISE IndianSecondaryExaminationCertificate
LSS LowerSecondarySchool
MDG Millennium Development Goal
M.Ed Masters in Education
MoE MinistryofEducation
MoF MinistryofFinance
MoLHR MinistryofLabourandHumanResource
MSS MiddleSecondarySchool
NBER Net Basic Enrolment Rate
NER Net Enrolment Rate
NFCED Non Formal and Continuing Education Division
NFE Non-Formal Education
NGO Non-governmental Organization
NID NationalInstituteforDisabled
NIZC National Institute of Zorig Chusum
NIR Net Enrolment Rate
NPER NetPrimaryEnrolmentRate
NSB National Statistics Bureau
NWAB National Women’s Association of Bhutan
PCR PrimaryCompletionRate
PGCE PostGraduateCertificateinEducation
PGDE Post Graduate Diploma in Education
PHCB Population and Housing Census of Bhutan
PLC Post Learning Course
PP Pre-Primary
PPD PolicyandPlanningDivision
PS PrimarySchool
PTC PrimaryTeachingCertificate
PTR Pupil Teacher Ratio
RCS Resource Centre Services
RGoB RoyalGovernmentofBhutan
RUB RoyalUniversityofBhutan
SCD Scouts and Culture Division
SD Scholarship Division
SDG SAARC Development Goals
SLC School Liaison and Coordination Unit
SLD SchoolLibraryDevelopment
SPBD School Planning and Building Division
SPS School Procurement Services

AnnuAl EducAtion StAtiSticS
x��
TIZC TrashiyangtseInstituteofZorigChusum
UPE UniversalPrimaryEducation
VTI Vocational Training Institute
WFP World Food Programme
YC Youth Center
YIC Youth Information Centre
ZDS Zhungkha Development Services
ZLT Zhungkha Language Teachers
ZTC ZhungkhaTeachingCertificate
Abbreviation
Ave Average
Bht Bhutanese
Mgt Management
N/Bht Non-Bhutanese
Nu. Ngultrum
Pvt Private
Std Student
T:P Teacher Pupil Ratio
Voc. Vocational
Glossary
Dzongkhag District
Dratshang Monkbody
Lhakhang Temple
Dungkhag Sub-District
Dzongdag Head of District Administration
Geog Block

AnnuAl EducAtion StAtiSticS
�
ANNUAL EDUCATION STATISTICS (AES)
the Annual Education Statistics (AES) is a collection of basic statistical information on schools in Bhutan. this report is prepared based on the data collected in March 2009. it focuses on Pre-School, Primary and Secondary education and includes information on students, staff, other school facilities, community participation and finance in their respective variables, characteristics and disaggregates. the Education indicators section presents information on selected indicators of quantity, quality, efficiency, equity, etc that are commonly used in measuring developments in the education system.
Education Statistics and indicators 2009, is primarily intended for use by Education administrators and managers at the school, dzongkhag and Ministerial levels of the Ministry of Education. Professionals including teachers, educators and allied personnel in related institutions
The Annual School Census
and organizations including the community will find this book useful and informative. Researchers in education and associated fields may also find this book valuable as a primary source of administrative data on education in Bhutan. overall the AES provides a sound basis for policy analysis and planning and also serves as a pointer to a whole spectrum of studies and surveys in the Bhutanese educational context.
the Policy and Planning division uses the “Annual School census Forms” - (AScF) - to collect the data for preparing this report. the forms are distributed to all the schools annually through the Dzongkhag Education Offices. The School Principals take the responsibility for filling the forms and the Dzongkhag Education Offices for collecting, checking and returning the forms to PPd.
the data compiled in this report has been captured through a national census of schools in Bhutan. the School census Process, which incorporates aspects of data collection, data validation and auditing, data analysis and reporting to stakeholders, has been carried out according to the steps illustrated in the following diagram:the process is repeated every year to ensure all
education sector stakeholders to have access to good quality information about the education sector, and sector programs can be monitored for impact and positive outcomes. the 2009 School census has been highly successful data collection exercise, which produced a wealth of data for planning, policy making, budgeting, monitoring and evaluation.

AnnuAl EducAtion StAtiSticS
�
Selection of Indicators
Within the context of planning, monitoring and evaluating the educational objectives and targets set by the Ministry, statistical indicators presented in the book are selected from the array of standard education indicators used internationally to measure the educational development. these indicators are also important in the global focus on the national monitoring, assessment and development of national Millenium development Goals (MdG) and SAARc development goals (SdG) relating to education.
copies of the AES report are distributed to the departments and divisions under the Ministry and the Dzongkhag Education Offices (DEOs) in all dzongkhags and to all the schools in the country for their planning, monitoring and evaluation purposes. copies are also sent to the Government Ministries, departments, development partners and other organizations including nGos, media, etc. Further additional information is also disseminated to ministries, organizations and individuals as determined by the needs on a “selective” basis.

AnnuAl EducAtion StAtiSticS
�
COMMON INDICATORS
Net Primary Enrolment Rate Total enrolment in a specific level of education (PP-VI) of the official age-group (6-12years) expressed as a percentage of the corresponding population (6-12 years) in a given school year. in Bhutan Primary education extends from PP-Vi corresponding to 6-12 years old.
Gross Primary Enrolment RateTotal enrolment in a specific level of education (PP-VI), regardless of age, expressed as a percentage of the official school-age population (6-12 years) corresponding to the same level of education in a given school-year.
Apparent Intake rateTotal number of new entrants in the first grade of primary education, regardless of age, expressed as a percentage of the population at the official primary school-entrance age (6years)
Net Intake RateNew entrants in the first grade of primary education who are of the official primary school-entrance age (6 years), expressed as a percentage of the population of the same age.
Transition RateThe number of pupils (or students) admitted to the first grade of a higher level of education, in a given year, expressed as a percentage of the number of pupils (or students) enrolled in the final grade of the lower level of education in the previous year.
Repetition Rate by gradethe number of repeaters in the given grade in a given year, expressed as a percentage of the total enrolment in the same grade in the previous year.
Survival rates by GradePercentage of a cohort of pupils (or students), enrolled in the first grade of a given level or cycle of education in a given school-year, who are expected to reach successive grades.
Coefficient of Efficiencythe ideal (optimal) number of pupil-years required (i.e. in the absence of repetition and drop-out) to produce a number of graduates from a given school-cohort for a cycle or level of education expressed as a percentage of the actual number of pupil-years spent to produce the same number of graduates. input-output ratio, which is the reciprocal of the coefficient of efficiency, is often used as an alternative. One school-year spent in a grade by a pupil is counted as one pupil-year.
Percentage of Repeaters in primary educationnumber of repeaters, in the primary education in a given year, expressed as a percentage of the total enrolment at the same level, in the same year.
Teacher Pupil ratioAverage number of pupils per teacher at a specific level of education, in a given school-year. Teachers are defined as persons whose professional activity involves the transmitting of knowledge, attitudes and skills that are stipulated in a formal curriculum programme to students enrolled in a formal educational institution

AnnuAl EducAtion StAtiSticS
�
Percentage of Private EnrolmentEnrolment in private educational institutions at a given level of education, expressed as a percentage of total enrolment at the same level. Here ‘Private’ means, all educational institutions not operated by a public authority, whether or not they receive financial support from such authorities.
Percentage of teaching Staff in Private Educational Institutionthe number of teachers in private educational institutions at a given level of education, expressed as a percentage of the total teaching staff in all types of institutions at the same level of education. Here ‘Private’ means, all educational institutions not operated by a public authority, whether or not they receive financial support from such authorities.

AnnuAl EducAtion StAtiSticS
�
1.2. Education Structure
the education system in Bhutan has three main elements: general education, monastic education and non-formal and continuing education. the first type of education is by far the biggest and is commonly seen as the only educational structure. Monastic education is the oldest form of education in Bhutan and was the only education available in the country until the introduction of formal school-based education in the late 1950’s. Students enroll in monastic education at different stages in their life.
While monastic education continues to be an important part of the national culture, western education has been promoted and expanded since first Five Year Plan in 1961 to address the basic educational needs, and develop human resources required for the socio-economic development of the country. Within a period of four decades, the government has been able to expand the modern education system from about 11 schools prior to the first Five Year Plan in 1961 to 556 schools and institutes in 2009, spanning from community primary schools to tertiary institutes. Fig. 1.1 shows the progressive growth of the number of schools and institutes since the first Five year Plan.
1. EXECUTIVE SUMMARY
1.1. Introduction
the Annual Education Statistics report provides a quantitative overview of the current state of the education system, summarizing information on general school-based, monastic, non-formal, continuing, vocational, tertiary and monastic education within Bhutan and to some extent information on Bhutanese students studying outside Bhutan. in addition to information on the academic year 2009, some historical comparisons are included.
chapter one provides a general background on the education system in Bhutan, while chapter 2 contains an overview of the status of education in 2009. chapters 3 to 8 present more detailed information on the elements of the education system that are under the jurisdiction of the Ministry of Education. the chapters focus, respectively, on enrolment, exam results, teachers, quality indicators, facilities in the schools and non-formal, continuing and special education. chapter 9 presents some basic information on education outside the jurisdiction of the Ministry of Education, viz. monastic, vocational, tertiary, and students studying outside the country. chapter 10 provides some financial information pertaining to the Education Sector. the chapter 11 contains all the Statistical tables. the appendices contain detailed information on enrolment, teachers and the school feeding programme.
Figure 1.1 Growth in the number of Schools and Institutes
6005004003002001000
series 1 11 98 119 268 408 556 1961 1971 1981 1992 2002 2009

AnnuAl EducAtion StAtiSticS
�
At the same time the expansion of education system has been accompanied by a rapid growth in the enrolment of students as a result of the government’s commitment to education. From about 400 students in the early 60’s ( beginning of the first plan), total enrolment has increased in all levels of formal education and tertiary institutes in Bhutan to 1,69,313 as of March 2009, reflecting a growth of about 5% over the previous academic
year 2008. Among the factors responsible for the increasing enrolment are, increased awareness about the value of education among the parents and the government’s policy of ensuring that all children be able to complete primary education within their geogs. Fig. 1.2 shows the progressive increase in enrolment in schools and institutes since the 1st Five Year Plan
For those who could not attend or complete general or monastic education, basic literacy courses are offered all over the country in non-formal education centers. Since 2006, the Ministry of Education in collaboration with private higher secondary schools, has initiated a continuing education programme, to allow school drop outs the opportunity to upgrade their qualifications.
1.2.1. General education structure
the school-based education structure in Bhutan starts with 11 years of free basic education from classes PP to X. the 11 years of basic education are divided into 7 years of primary education (PP-Vi), which starts at the age of 6, and 4 years of Secondary Education (Vii-X). At the end of the cycle (class X) there is a national board examination, Bhutan Certificate for Secondary Education (BcSE).
Beyond class X, students continue their general education in classes Xi and Xii in Higher Secondary Schools either join the vocational training institutes
or enter the labour market based on the students’ performance in the board examinations (BcSE). Students, who are not qualified for the government funded education attends private higher secondary schools in Bhutan or abroad and vocational courses organized by private training institutes. the duration of vocational training in both government and private institutes vary depending upon the type of course.
After completing class Xii (public and private), graduates continue their studies in the tertiary level or either enroll in the Vti or enter job market. Some graduates from the Vocational training institutes are selected to continue education at the tertiary level. Students join one of the institutes under Royal university of Bhutan (RuB) for a diploma or a bachelor’s degree or join an institute abroad. Selection for the RuB is based upon BHSEc results. A limited number of students are eligible for government scholarships for professional studies abroad, while others fund themselves to tertiary education institutes abroad.
series 1 400 11610 37682 57370 126379 169313 series 1 1961 1971 1981 1992 2002 2009
Figure 1.2 Growth in the number of enrolments in Schools and Institutes
200000
150000
100000
50000
0 1961 1971 1981 1992 2002 2009
Enrolment 400 11610 37682 57370 126379 169313

AnnuAl EducAtion StAtiSticS
�
1.2.2. Schools in General Education
At the primary education level a school is either called a primary school or a community primary school. Both schools offer, in principle, seven years of education, from PP to Vi.
At the secondary level, the classification of a school depends on the final class that is taught. Schools that have Class VIII as their final class, is called lower Secondary, while schools that have class X or Xii as their terminal classes are called Middle Secondary and Higher Secondary Schools respectively.
1.3 General Education Curriculum
the objective of primary education in Bhutan is to impart basic literacy and numeracy skills, to provide knowledge of the country’s history,
Figure 1.3 gives a schematic overview of the general education structure in Bhutan.
General Education Structure in Bhutan
level Age (in years)
class labourMarketSchool/ Tertiary Education System Voc. Edu.
SystemnFE
Public Private continuingEducation
tertiarylevel
22212019
4th yr3rd yr2nd yr1st yr
Higher Sec. 1817
XiiXi
Secondarylevel
16151413
XiXViiiVii
Primarylevel
1211109876
ViViViiiiiiPP
Pre -School(Eccd)
54 day care3
210
geography, culture and traditions and to teach the fundamentals of agriculture, health & hygiene, and population education. Moral and value education are given special attention. Activity-based learning is used uniformly across the country to teach these skills and knowledge.
class iX students can choose between Economics, commercial Studies and computer Applications while in higher secondary education students have to choose between Arts , commerce and Science
the Bhutan Board of Examinations (BBE) conducts the national examinations for Bhutanese schools at classes X and Xii. the examinations for classes Vi and Viii have been decentralized to the schools, although the questions, model answers and marking schemes are provided by the BBE.
curriculum reforms of English, dzongkha and

AnnuAl EducAtion StAtiSticS
�
Mathematics were initiated in the 9th FYP and will continue in the 10th plan, especially for dzongkha
and Mathematics. Figure 1.4 provides an overview of the curriculum up to class Xii.
Figure 1.4 General Education curriculum PP-XII
AreaPrimary Education LSS MSS HSS
Subjects PP i ii iii iV V Vi Vii Viii iX X Xi Xii
language
dzongkha
Rigzhung
English
English literature
Mathe-matics
Mathematics
Business Mathematics
Science and
technology
Science
Physics
chemistry
Biology
computer application
computer Science
HumanSociety
andEnvironment
Environmental Studies
Social Studies
History
Geography
commercial Studies
commerce
Accounting
Economics
creative &Pratical Arts
Visual Arts and craft
Songs, dances, Music
Health, Physical Edu.
& Personaldevelopment
Health and Population Studies
Games and Sports
Moral and Value Education
Scouts
Socially use-ful & Produc-
tive Work
Agriculture and Social Forestry
SuPW
Basic Vocational Skills
Learing areas with specific subjects and periods set in the time table
learing areas addressed in co-curricular programmes, school organisation or integrated in the subjects areas

AnnuAl EducAtion StAtiSticS
�
1.4 Education Administration
the responsibility for the administration of education in Bhutan is shared amongst the Ministry of Education (MoE), the Ministry of labour and Human Resources (MolHR), the Royal university of Bhutan (RuB), the dzongkhags and the Geogs. Monastic education is the responsibility of the central monastic body and privately managed independent monasteries. the MoE is responsible for policy planning, curriculum development and administration of Basic (Primary up to Middle secondary), Higher Secondary, non Formal and continuing Education. it is also responsible for ex-country tertiary level scholarships, and the design and implementation of Higher Education Policy. this includes liaising with institutions at that level, such as the RuB. the organizational structure of the MoE is presented in the appendices. (Annex 3.1)
the dzongkhag Administration are entrusted with a range of responsibilities in the education sector, both formal and non formal education, school construction and maintenance, supply of teaching learning materials , deployment of teachers within the dzongkhag and implementation of national policies. these responsibilities are carried out by Dzongkhag Education Officers (DEOs), and Assistant dEos, all of whom report both to the dzongdag and the Ministry of Education. the MolHR is responsible for vocational training after class X and the Royal university of Bhutan (RuB) is responsible for planning, curriculum development and administration of the eleven tertiary institutions responsible for the provision of public education after class Xii. Bhutan faces many challenges in achieving the MdG of which the most potent one is the decade long insurgency; it is difficult to determine the exact number of school aged children who have been denied access to schooling, especially in those very remote and difficult parts of the country and also those physically disadvantaged children. the recent establishments of Extended classroom
(EcRs) are effort towards further improving access for every school going aged children ensuring that the schools are within an hour’s walking distance. in places where it is not feasible to establish a cPS, the Ministry has started the establishment of extended classrooms (EcRs) to make education accessible to remote and scattered population.
the primary education level is now placing enormous pressure at the secondary schools, thus resulting in overcrowded classrooms. therefore another key challenge will be to provide space at the secondary level for students moving up from the primary level
the other and the more critical concern is the quality of education. the critical role of education in a nation’s development and progress, particularly in the context of a knowledge society, is universally accepted, and in recent times, the quality of education has increasingly become a subject of public discussion. it is felt that the quality of education has not kept pace with the both expansion of the education system or the times. therefore, improving the quality of education is a critical challenge for the education sector in the 10th FYP. to address the quality of education in the 10th FYP, the Ministry of Education will be focusing efforts to reform the curriculum, strengthen and improve both pre-service and in-service teacher education, encouraging in-service teachers to further specialize in specific subject areas and grade levels such as for early childhood and elementary system to monitor the quality education at classes X and Xii, establish a programme of national Education Assessment to monitor the quality of education at the various levels of schooling and across subjects, enhance equitable distribution of experienced and qualified teachers across all schools in the country, strengthen and improve the education management system at all levels, with particular emphasis on the school level management and review and reform the monitoring and professional support services system making it more efficient and effective, inter alia, towards improving the quality of education.
2. STATUS OF EDUCATION IN
AnnuAl EducAtion StAtiSticS
�0
2009
SU
MM
AR
Y O
F E
DU
CA
TIO
N S
TAT
IST
ICS
200
9
Publ
icPr
ivat
e To
tal
A E
arly
chi
ldho
od d
evel
iopm
ent
1 d
ay c
are
cen
tres
-11
11
B S
choo
l Edu
catio
n1
com
mun
ity P
rimar
y Sc
hool
s2
Prim
ary
Scho
ols
3 l
ower
Sec
onda
ry S
choo
l4
Mid
dle
Seco
nday
Sch
ool
5 H
ighe
r Sec
onda
ry S
choo
l
268 85 89 45 27
1 11 2 1 12
269 96 91 46 39
Sub-
Tota
l (B)
514
2754
1
c
Spec
ial i
nstit
ute*
4-
4
d t
ertia
ry in
stitu
te u
nder
Ru
B11
-11
E V
ocat
iona
l ins
titut
es8
-8
T
otal
(Sch
ools
and
Inst
itute
s)
(A
+B+C
+D+E
) 53
738
575
Mon
astic
Edu
catio
n F
(lo
bdra
, Shr
edra
, etc
)38
8-
388
G n
on-F
orm
al c
entre
s***
**68
8-
688
GR
AN
D T
OTA
L1,
613
381,
651

AnnuAl EducAtion StAtiSticS
��
SU
MM
AR
Y O
F S
TU
DE
NT
S, L
EA
RN
ER
S, T
RA
INE
ES
& N
OV
ITIA
TE
S
Gov
ernm
ent
Pri
vate
T
otal
A
Ear
ly c
hild
hood
dev
elop
men
t M
ale
Fem
ale
Mal
e F
emal
e M
ale
Fem
ale
tot
al
1
day
car
e c
entre
s 0
0
1
95
168
1
95
168
3
63
B
Sch
ool E
duca
tion
1
com
mun
ity P
rimar
y Sc
hool
s 1
5,75
3 1
5,33
7 4
1 2
3 1
5,79
4 1
5,36
0 3
1,15
4
2
Prim
ary
Scho
ols
11,
802
11,
763
796
8
03
12,
598
12,
566
25,
164
4
low
er S
econ
dary
Sch
ools
2
3,83
7 2
4,31
6 3
38
321
2
4,17
5 2
4,63
7 4
8,81
2
5
Mid
dle
Seco
ndar
y Sc
hool
s 1
7,24
1 1
6,65
0 1
98
165
1
7,43
9 1
6,81
5 3
4,25
4
6
Hig
her S
econ
dary
Sch
ools
9
,783
9
,097
3
,005
2
,993
1
2,78
8 1
2,09
0 2
4,87
8
Sub
-Tot
al
78,
416
77,
163
4,3
78
4,3
05
82,
794
81,
468
164
,262
B
Bhu
tane
se st
uden
ts in
indi
a &
abr
oad*
* 1
88
104
1
88
104
2
92
Sub
-tot
al (B
[i]+
[i])
78,
416
77,
163
4,5
66
4,4
09
82,
982
81,
572
164
,554
c
Spe
cial
inst
itute
s*
80
36
80
36
116
d
ter
tiary
Edu
catio
n
1
ter
tiary
inst
itute
s und
er R
uB
3
,296
1
,755
3
,296
1
,755
5
,051
2
ter
tiary
Stu
dent
s in
indi
a***
7
8 2
3 1
,844
1
,392
1
,922
1
,415
3
,337
5
ter
tiary
Stu
dent
s abr
oad*
**
321
7
1 1
3 1
3 3
34
84
418
Sub
-Tot
al (D
) 3
,695
1
,849
1
,857
1
,405
5
,552
3
,254
8
,806
E
Voc
atio
nal i
nstit
utes
8
25
397
8
25
397
1
,222
Tot
al (S
choo
ls an
d In
stitu
tes)
8
3,01
6 7
9,44
5 6
,618
5
,982
8
9,63
4 8
5,42
7 1
75,0
61
F
Mon
astic
Edu
catio
n
(lob
dra,
Shr
edra
,etc
)***
* 4
,395
6
7 5
,149
-
9,5
44
67
9,6
11
G
non
-For
mal
cen
tres*
****
3
,999
9
,161
3
,999
9
,161
1
3,16
0
GR
AN
D T
OTA
L 9
1,41
0 8
8,67
3 1
1,76
7 5
,982
1
03,1
77
94,
655
197
,832

AnnuAl EducAtion StAtiSticS
��
SU
MM
AR
Y O
F T
EA
CH
ER
S, L
EC
TU
RE
RS
, IN
ST
RU
CT
OR
S, T
RA
INE
R &
CA
RE
GIV
ER
S
Gov
ernm
ent
Priv
ate
Tota
l
AEa
rly c
hild
hood
dev
elop
men
tM
ale
Fem
ale
Mal
eFe
mal
eM
ale
Fem
ale
tota
l
1d
ay c
are
cen
tres
--
136
136
37
BSc
hool
Edu
catio
n
1c
omm
unity
Prim
ary
scho
ols
991
290
52
996
292
1,28
8
2Pr
imar
y Sc
hool
s50
043
136
8653
651
71,
053
3lo
wer
Sec
onda
ry S
choo
ls90
488
118
3292
291
31,
835
4M
iddl
e Se
cond
ary
Scho
ols
734
540
1215
746
551,
301
5H
ighe
r Sec
onda
ry S
choo
ls59
831
420
277
800
391
1,19
1
Sub-
tota
l (B)
3,72
72,
456
273
212
4,00
02,
668
6,66
8
cSp
ecia
l ins
titut
es*
1720
--
1720
37
dte
rtiar
y in
stitu
tes u
nder
Ru
B62
516
8-
-62
516
879
3
EVo
catio
nal i
nstit
utes
110
1711
017
127
tota
l (Sc
hool
s and
inst
itute
s)
GN
on-F
orm
al C
entr
es**
***
315
441
315
441
756
GR
AN
D T
OTA
L4,
794
3,10
227
424
85,
068
3,35
08,
418
*
Nat
iona
l ins
titut
e fo
r the
Dis
able
d, th
e Sa
nskr
it Pa
tsha
la a
nd D
rugy
el L
SS a
nd C
hang
angk
ha L
SS a
re in
clud
ed u
nder
Spe
cial
Inst
itute
s
*
*
Bhut
anes
e st
uden
ts in
PP-
XII s
tudy
ing
in D
arje
elin
g an
d K
alim
pong
**
* S
tude
nts w
ho a
re o
n RG
OB
Scho
lars
hip
abro
ad h
ave
been
list
ed u
nder
pub
lic st
uden
ts a
nd o
ther
stud
ents
stud
ying
abr
aod
unde
r pri
vate
****
The
mon
astic
enr
olm
ent r
eflec
ted
unde
r pub
lic is
from
200
9, th
e en
rolm
ent r
eflec
ted
unde
r pri
vate
is fr
om 2
004

AnnuAl EducAtion StAtiSticS
��
2.1.1. Enrolment
2.1. Enrolment, Schools and Teachers at the National Level
The total enrolment figures for Bhutan in March 2009 are presented in table 2.0. this includes enrolment in all Bhutanese educational institutes as well as Bhutanese students studying outside Bhutan. Although, the data on monastic enrolment
and students studying outside the country is not comprehensive, this gives a good indicative overview. in total there are about 198,000 students and learners.
1Table 2.0 Estimated enrolment per school level & type, March 2009
� *TheinformationontheSchoolstudentsabroadisbaseduponinformationgivenbytheDzongkhaLopensinDarjeelingandKalimpong.Sincesizeableamountofstudentsareenrolledintheseplaces.WedonotcollectschoolchildreninotherpartsofIndia**ThespecialinstitutesaretheSanskritPatshalaandtheNationalInstitutefortheDisabled.StudentsenrolledintheDeafUnit in Drukgyel LSS and Changangkha LSS are reflected under the general students since these students participate in regulareducation^The figures for tertiary students abroad are based upon administration information with the scholarship divisions, DAHE, for students on scholarship and tertiary Education Division for the tertiary students upon the membership of the Bhutanese Students Association in India and abroad. As the information on students studying abroad without government support is basedonasecondarysourceofdata.Itisnotcomprehensiveorcomplete^^ Information on Vocational institutes and the Royal University is from the 2008/2009 academic year, which runs from July08toJune09~ The information on the NFE learners has been collected by the NFE division of the MoE.~~ Information about the Monastic education has been collected by the Central Monastic Body. The enrolment reflected under public is data collected in 2007. The enrolment reflected under private monasteries is from 2004
Table 2.0 Enrolment per school level & type, March 2009
Public Private Total
day care centre Students - 363 363
Primary Students(PP-Vi) 106,056 2,786 108,842
lower & Middle Secondary Students (Vii-X) 43,339 266 43,605
Higher Secondary Students (Xi-Xii) 6,184 5,631 11,815
School Students Abroad * - 292 292
Special institute Students** 116 - 116
tertiary Students 5,051 - 5,051
tertiary Students Abroad ^ 493 3,262 3,755
Vocational Students ^^ 1,222 - 1,222
nFE learners~ 13,160 - 13,160
Monastic Students ~~ 4,462 5,149 9,611
Total 180,083 17,749 197,832
2. STATUS OF EDUCATION 2009

AnnuAl EducAtion StAtiSticS
��
table 2.1 below presents the key education indicators for access to education, Gross Primary Enrolment Ratio (GPER) and net Primary Enrolment Ratio (nPER). these are calculated based on the Projection of Population and Housing
census 2005. Both Gross and net, are based on the number of pupils formally registered, usually surveyed at the date close to the beginning of the school year. in Bhutan we do not collect attendance information.
Table 2.1 Enrolment Ratios 2009, 2008, 2007 and 2006
Indicator 2006 2007 2008 2009
NER primary education (PP-vI) 79% 84% 88.0% 91.82%
GER primary education (PP-vI) 102.0% 106.0% 112.0% 115.73%
NER Basic education (PP-x) 75.0% 78.0% 85.0% 88.36%
GER Basic education (PP-x) 85.0% 88.0% 96.0% 100.30%
the following box 2.01 gives a brief analysis on the nER and GER as per the EFA Goal Monitoring Report 2003/4.
Box: 2.0 a closer look: analysis of Primary enrolment
no single statistics is adequate for the task of monitoring progress towards uPE. Historically the GER had been used since 1980 (the year of the Addis Ababa plan) as a leading indicator of progress. More recently, however, as countries progress towards UPE, more and more of them have GERs exceeding 100%, their values being inflated by the number of early and late entrants and repeaters in school.
The NER also has drawbacks. Thus, where the official entrance age is different from the usual entrance age, an underestimation of actual school participation results, by including only children of primary school age. the nER does not take into account other children who will eventually complete primary education. thus, both indicators need to be examined in relation to each other and together with other parameters, such as percentage of overall pupils, the percentage of repeaters, and the survival and completion rates. Each of these tells important and complementary parts of the story
the biggest increases are observed for the primary net enrolment ratios. the primary net enrolment ratios increased from 79 in 2006 to 91.8 percent in 2009; almost equal number of boys and girls are enrolled at the official school age.
Between 2006 and 2009, the primary nER increased from 79 to 91.8 percent. the primary nER of girls grew by 14 percentage points over the three-year period, compared to 11 percentage points for boys, indicating increased girls’ enrolment. As a result, the gap between the male and female primary NER had dropped.
The recent statistics shows that fewer boys than girls enroll in school at the official school age.
� EFA Global Monitoring and Report 2003/4, UNESCO
AnnuAl EducAtion StAtiSticS
��
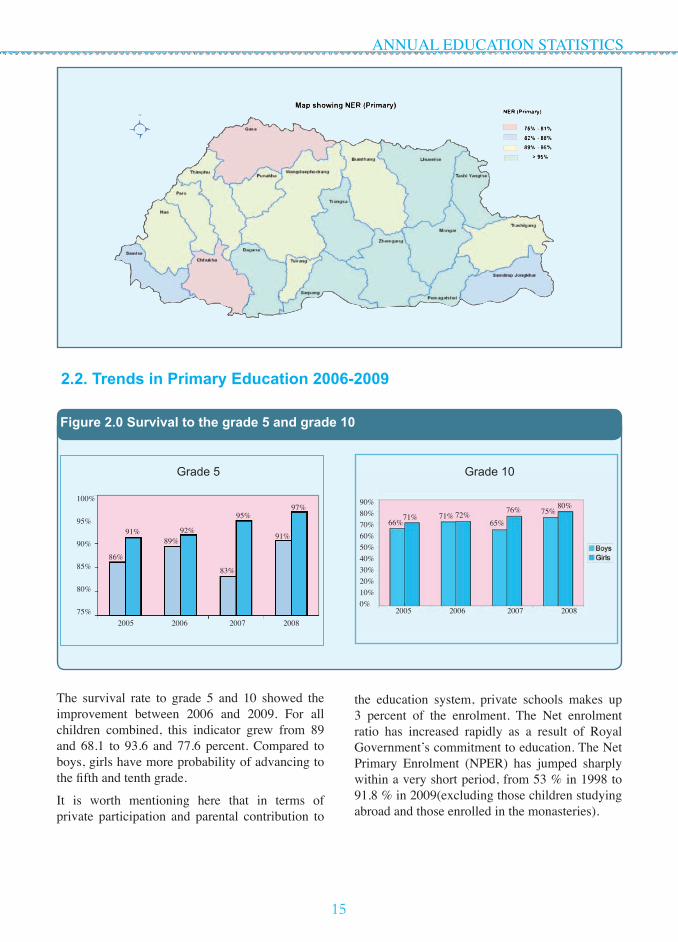
the survival rate to grade 5 and 10 showed the improvement between 2006 and 2009. For all children combined, this indicator grew from 89 and 68.1 to 93.6 and 77.6 percent. compared to boys, girls have more probability of advancing to the fifth and tenth grade.
it is worth mentioning here that in terms of private participation and parental contribution to
the education system, private schools makes up 3 percent of the enrolment. the net enrolment ratio has increased rapidly as a result of Royal Government’s commitment to education. The Net Primary Enrolment (nPER) has jumped sharply within a very short period, from 53 % in 1998 to 91.8 % in 2009(excluding those children studying abroad and those enrolled in the monasteries).
2.2. Trends in Primary Education 2006-2009
Figure 2.0 Survival to the grade 5 and grade 10
100%
95%
90%
85%
80%
75%
86%
91%89%
92%
83%
95%
91%
97%
2005 2006 2007 2008
90%80%70%60%50%40%30%20%10%0%
66%71% 71% 72%
65%76% 75%
80%
2005 2006 2007 2008
Grade 5 Grade 10

AnnuAl EducAtion StAtiSticS
��
the increasing enrolment and primary school completion rates indicate that Bhutan is on the track to achieving the MdG goals. However the last mile will be hardest to achieve. currently, it is estimated that 4-5% of the primary aged population are out of school. While a few of these are pursuing education in monasteries (2%) and abroad (1%), they also include children in remote and hard to reach areas, children of nomadic and migrant populations and children with learning disabilities whose special learning needs are currently not catered for. these children have different needs from the majority of the students,
and the key challenge is to put in place innovative and cost effective strategies to provide access and quality education.
According to the PHcB 2005, it has shown that about 1% of primary aged children are studying outside Bhutan, and about 2% are enrolled in the monasteries. Assuming that these ratios still holds true, then over 95.82% (91.82% nER, 1% abroad, and 2% in the Monasteries, 1% enrolled in Secondary level in 2009) of our Primary aged children access education. chapter 3 provides a more thorough analysis.
Figure 2.2 Trend on survival to 5 and grade 10
Figure 2.1 Primary enrolment, NER
95%
90%
85%
80%
75%
70%2006 2007 2008 2009
80% 79%
84% 84%
87%89%
91%93%
94%93%92%91%90%89%88%87%86%
2005 2006 2007 2008
80%78%76%74%72%70%68%66%64%62% 2005 2006 2007 2008
Grade 5 Grade 10

AnnuAl EducAtion StAtiSticS
��
Given the recent progress of the net Enrolment Ratio (nER) in Primary education, it seems likely that Bhutan will achieve the target of universal Primary Education by 2015.
overall the nER has increased from 53% in 1998 to 91.8% in 2009 according to our annual school census data. the improvement in the enrolment ratios for girls was much better than for the boys. in terms of enrolment, there are no gender disparities between boys and girls, with girls sometimes doing better than boys at the national level. However in Gasa and S/Jongkhar there are significantly more boys enrolled, and in Punakha and Wangdue, there are more girls enrolled
2.3. Schools and Institutes
At the moment the total number of schools under the general education system in Bhutan consists of 269 community Primary Schools, 1 Private community Primary School, 85 Primary Schools, 11 private Primary Schools, 89 lower Secondary Schools, 2 private lower Secondary Schools, 45 Middle Secondary Schools, 1 private Middle Secondary Schools, 27 Higher Secondary Schools, 12 Private Higher Secondary Schools and 11 private day care centers. the 4 special institutes are the national institute for the disabled, deaf unit in drugyel lSS, changangkha lSS and the Sanskrit Patshala. there are 688 non-Formal Education centers in the country.
the RuB has 11 colleges located across the country. under the MolHR there are 8 vocational training institutes. there are 391 monastic schools under the central monastic body. the number of private monasteries remains unaccounted for. that makes a total of 1737 educational institutions in the country.
in 2009, 13 community Primary Schools, 1 Private community Primary School, 1 lower Secondary School, 1 Private Higher Secondary Schools and 34 Extended classrooms were opened while 3 schools were upgraded to lower Secondary, 1 to Middle Secondary and 1 to Higher Secondary. in addition, 1 private lower Secondary School was upgraded to Middle secondary schools and 2 private primary school to higher secondary school.
in the appendices a detailed list of the new and upgraded schools in 2009 is presented (see annex 1)
2.3.1. Extended Classroom
The tenth five year plan emphasizes the universalization of Primary education to equip citizens with knowledge and skills to lead better life. The tenth five year plan envisages NER of 100% in primary, 90% in basic education, 70% in the 15+ age group. to achieve this target Ministry of education is committed to improving the efficiency of the education system, increasing access to primary and secondary education.
Figure 2.3 Net enrolment ratios since 1998
120%
100%
80%
60%
40%
20%
0%1998 2005 2006 2007 2008 2009 2015

AnnuAl EducAtion StAtiSticS
��
the recent establishments of Extended classroom (EcRs) are effort towards further improving access for every school going aged children, especially from remote rural areas and those scattered villages where students had to walk a long distance to school. A significant number of these children are out of school.
Almost 1000 students are reported to have enrolled in EcR this year. Most of these students are from a very remote area.
these initiatives have enabled RGoB to improve the net Primary Enrolment Ratio (nPER) from 79% in 2006 to 91.8% in 2009.
2.3.2. Early Childhood Care and Development
the Ministry of Education has approved the establishment of two day-care centres in Gomtu and Samtse, and is in the process of developing a national policy on Early childhood care and development (Eccd).
2.3.3 Community Primary Schools
over the years, the Ministry of Education has been able to enhance access to education for population groups living in the rural and remote parts of the country through the establishment of community primary schools. A community primary school is a primary school that caters to a specific community, which can be a village or a cluster of defined villages. All the households in the community contribute labour towards the construction and maintenance of the school. the government provides support in the form of payment for skilled labour, and construction materials that are not locally available as well as textbooks, stationery and teachers.
the average enrolment in a community Primary School (cPS) is 115 students. there are 270 such community primary schools. over the years several cPSs have been upgraded to lower Middle and Higher Secondary Schools.
2.4 Schools and Enrolment by Location
the Ministry of Education categorizes every school according to its location. this categorization is used for teacher appointments and other policies. At the moment the Ministry uses the following seven categories: urban (grade 1 and grade 2), Semi-urban, Semi-remote, Remote, Very remote, Difficult2. table 2.2 gives the details for this year.
Around 64 percent of the total enrolment is concentrated in the urban and semi-urban areas, while only 36 percent of schools are in these areas. this can be attributed to the scattered nature of our population settlements in the rural and remote areas and explains the relatively high cost of providing education services.
it is also apparent from the table above that most of the cPSs are in remoter areas of the country, generally lacking communication and access facilities, while most Secondary Schools are in larger and better connected areas. over 29% of primary school students are currently enrolled in cPSs - a little over 50% of these students – around 15,657 students - are enrolled in 163 schools classified as remote, very remote or difficult. These students would otherwise have had to either walk long distances or be enrolled in boarding schools to access education.
3 The categorization of schools is planned to be changed. The new categorization was not yet finalized when this report was finished. The last time schools were officially categorized was in 2004.

AnnuAl EducAtion StAtiSticS
��
Tab
le 2
.2:
Sch
oo
ls &
En
rolm
ent
by
Lo
cati
on
, 200
9
urb
anSe
mi-u
rban
Sem
i-Rem
ote
Rem
ote
Very
Rem
ote
Diffi
cult
tota
l
no.
Enro
l.n
o.En
rol.
no.
Enro
l.n
o.En
rol.
no.
Enro
l.n
o.En
rol.
no.
Enro
l.
CPS
4
931
2
7 4
,580
7
5 9
,986
1
01
9,5
17
59
5,9
10
3
230
2
69
31,
154
0.7%
0.6%
5.0%
2.8%
13.9
%6.
1%18
.7%
5.8%
10.9
%3.
6%0.
6%0.
1%49
.7%
19.0
%
PS 2
1 1
0,66
7 1
2 3
,398
2
1 4
,299
1
8 2
,918
2
4 3
,882
-
- 9
6 2
5,16
4
3.9%
6.5%
2.2%
2.1%
3.9%
2.6%
3.3%
1.8%
4.4%
2.4%
0.0%
0.0%
17.7
%15
.3%
LSS
27
24,
323
19
8,4
82
30
10,
840
9
3,4
08
6
1,7
59
- -
91
48,
812
5.0%
14.8
%3.
5%5.
2%5.
5%6.
6%1.
7%2.
1%1.
1%1.
1%0.
0%0.
0%16
.8%
29.7
%
MSS
19
16,
212
17
12,
184
7
4,1
25
3
1,7
33
- -
- -
46
34,
254
3.5%
9.9%
3.1%
7.4%
1.3%
2.5%
0.6%
1.1%
0.0%
0.0%
0.0%
0.0%
8.5%
20.9
%
HSS
30
21,
257
9
3,6
21
- -
- -
- -
- -
39
24,
878
5.5%
12.9
%1.
7%2.
2%0.
0%0.
0%0.
0%0.
0%0.
0%0.
0%0.
0%0.
0%7.
2%15
.1%
Tota
l 1
01
73,
390
84
32,
265
133
2
9,25
0 1
31
17,
576
89
11,
551
3
230
5
41
164
,262
18.7
%44
.7%
15.5
%19
.6%
24.6
%17
.8%
24.2
%10
.7%
16.5
%7.
0%0.
6%0.
1%10
0.0%
100.
0%

AnnuAl EducAtion StAtiSticS
�0
2.5. Non Formal Education
the number of nFE centres has increased tremendously from 6 in 1992 with 300 learners to 688 with 13,160 learners and 756 instructors in 2009, Recognizing the important role of the nFE instructors, and in a bid to boost this important sub-sector, the Royal Government has raised their salary from nu.4500 to nu.6000 per month. the number of centres and enrolment had decreased as compared to last year. learners attend a basic literacy course followed by a post literacy course.
the non-Formal Education (nFE) Programme has contributed greatly to increasing the literacy rate of our population. From a negligible adult literacy level in 1961, the Population and Housing census of Bhutan (PHcB) 2005 report the adult literacy rate at 53%. While national baseline data on literacy is still lacking and will need to be developed, the PHcB 2005 nevertheless indicates that despite successes in this area, Bhutan still has a low level of literacy by both international and regional standards. therefore the Royal Government has set an ambitious challenge of raising the adult literacy rate to 70% by 2013.
An impact study of the nFE programme was conducted in 2008 jointly with unicEF. this is the first comprehensive study of the NFE sector since its inception almost two decades ago. the study highlighted a number of achievements and identified areas for improvement and change. The Ministry of Education has already started taking action on the recommendations, specifically
to incorporate English and Mathematics as additions.
2.6. Continuing Education Programme
the cE programme offers adults who could not complete their school education with the opportunity to upgrade their academic qualification. In order to provide more people with the same opportunity, beyond thimphu, the programme was extended to Paro and chukha dzongkhags.
the number of people enrolled in the programme grew from around 300 in 2007 to over 860 in 2009. Possibilities are also being explored to further expand cE programme to other dzongkhags through selected public schools for better outreach.
2.7. Teachers
there were 8418 teachers and instructors excluding monastic teachers as of March 2009. this includes 350 teachers recruited under the light druk-Yul project and 53 expatriate teachers, in March 2009, who were sent to the dzongkhags.
table 2.3 shows the steady increase in the teaching cadre over the last six years for both public and private schools. the growth in teacher numbers across all levels of schools in 2009, shows the even spread of new establishments and upgrading across all levels.

AnnuAl EducAtion StAtiSticS
��
Table 2.3 Changes in teacher cadre per school type 2002-2009
CPS PS LSS MSS HSS Total
teachers % gr teach
ers % gr teachers % gr teach
ers % gr teachers % gr teach
ers % gr
2009 1835 84% 1301 41% 1191 -30% 6668 467% 37 -96% 11032 92%
2008 1000 12% 922 2% 1691 4% 1177 8% 955 12% 5745 7%
2007 892 5% 905 15% 1627 -1% 1093 46% 854 43% 5371 16%
2006 852 8% 790 3% 1643 11% 748 4% 596 8% 4629 8%
2005 786 11% 767 2% 1477 1% 721 -1% 551 25% 4302 5%
2004 707 19% 752 7% 1461 5% 729 17% 440 -6% 4089 9%
2003 592 12% 701 -7% 1388 20% 623 -7% 466 35% 3770 9%
2002 529 755 1153 670 346 3453
2.8 Education facilities, enrolment and teachers in the Dzongkhags
2.8.1. Provision of schools per Dzongkhag
Every dzongkhag provides basic education for its children. At the secondary level, students who
Most dzongkhags have middle and higher secondary schools with boarding facilities to provide education at these levels to students who do not have access to Secondary Schools within their own locality. However urban Dzongkhags/Dungkhags like Thimphu, Samtse and Phuentsholing do not have boarding schools at the higher secondary level.
do not have access to schools within their own locality are boarded in the nearest boarding school. (Boarding is also offered in some selected primary schools).
Pvt. HSS
HSS
Pvt. MSS
MSS
Pvt. LSS
LSS
Pvt. PS
PS
CPS
Figure 2.4 Enrolment per Dzongkhag by level of school
Bum
than
g
Chu
kha
Dag
ana
Gas
a
Haa
Lhu
ents
e
Mon
gar
Paro
p/G
atsh
el
Puna
kha
S/Jo
ngkh
ar
Sam
tse
Sarp
ang
Thi
mph
u
T/g
ang
T/y
angt
se
Tro
ngsa
Tsir
ang
Wan
gdue
Zhe
mga
ng
30000
25000
20000
15000
10000
5000
0
Pvt. HSS
HSS
Pvt. MSS
MSS
Pvt. LSS
LSS
Pvt. PS
CPS

AnnuAl EducAtion StAtiSticS
��
The above figure gives an overview of enrolment in primary education (PP-Vi) of each dzongkhag. thimphu has the highest, with 14,340 students enrolled in class PP-Vi- about 13% of total
primary enrolment, followed by chukha and Samtse with 11,011 and 10,616 students enrolled in PP-Vi respectively, making about 10% of the primary enrolment.
As can be seen from the figure above, Secondary enrolment by dzongkhag, thimphu has the highest
followed by the chukha and Samtse as usual, by the fact that these are the most populous dzongkhag.
Figure 2.6 Secondary enrolment (Class VII –XII) by Dzongkhag
Bum
than
g
Chu
kha
Dag
ana
Gas
a
Haa
Lhu
ents
e
Mon
gar
Paro
p/G
atsh
el
Puna
kha
S/Jo
ngkh
ar
Sam
tse
Sarp
ang
Thi
mph
u
T/g
ang
T/y
angt
se
Tro
ngsa
Tsir
ang
Wan
gdue
Zhe
mga
ng
12000
10000
8000
6000
4000
2000
0
2.8.2. Teachers in the Dzongkhags
the table below shows the teachers per school type per dzongkhag in Bhutan. details are discussed in the chapters about teachers and quality indicators.
Bum
than
g
Chu
kha
Dag
ana
Gas
a
Haa
Lhu
ents
e
Mon
gar
Paro
p/G
atsh
el
Puna
kha
S/Jo
ngkh
ar
Sam
tse
Sarp
ang
Thi
mph
u
T/g
ang
T/y
angt
se
Tro
ngsa
Tsir
ang
Wan
gdue
Zhe
mga
ng
16000
14000
12000
10000
8000
6000
4000
2000
0
Figure 2.5 Primary enrolment (PP-VI) by Dzongkhag

AnnuAl EducAtion StAtiSticS
��
2.9 School Feeding, WFP
the policy of the Ministry of Education and the regional agencies is to provide primary schooling within easy walking distance, in order to allow children to attend school near their homes. However, given the mountainous terrain, the dispersed settlement patterns of the population and resource constraints, some children have to enroll in primary schools more distant from their homes as day scholars, or as boarders.
this is made possible, largely due to the provision of meals through the school feeding program. Approximately 6,000 primary level students, who have to board, are provided with two meals a day through the World Food Program (WFP). these two meals for boarding students are supplemented
by a government stipend to cover the third meal. For a limited number of informal boarders in community and primary schools the third meal is provided by the family of the children. Moreover, for approximately 18,700 primary level day students, WFP provides two meals per day. this means that about 17% of the primary level students in Bhutan receive school feeding.
the WFP further provides 2 meals a day for all boarders in public secondary schools up to class X. the government supplements this with a stipend scheme which covers the cost of 1 meal per boarder. Around 20% of all class Vii to class X students in Bhutan is entitled to this support. in addition, about 12% of day scholars in classes Vii-X also receive 2 meals a day through the WFP school feeding programme.
Figure 2.7 Teachers per school type
Bum
than
g
Chu
kha
Dag
ana
Gas
a
Haa
Lhu
ents
e
Mon
gar
Paro
p/G
atsh
el
Puna
kha
S/Jo
ngkh
ar
Sam
tse
Sarp
ang
Thi
mph
u
T/g
ang
T/y
angt
se
Tro
ngsa
Tsir
ang
Wan
gdue
Zhe
mga
ng
1200
1000
800
600
400
200
0
Table 2.4 School feeding in 2009, WFP-support and Government stipend
Primary Students Receiving WFP & Stipend
Primary Students Receiving WFP
class Vii-X Students receiv-ing WFP and Stipend
dayBoarders
no % no % no %
0 0.0% 14,904 14% 5,035 12%
6,071 6% 3,859 4% 3,859 9%
6,071 6% 18,763 17% 8,894 20%
in the appendix an overview of the WFP-supported schools per dzongkhag is given. (Annex 5)

AnnuAl EducAtion StAtiSticS
��
3. ENROLMENT IN THE GENERAL EDUCATION PROGRAM
3.0. Primary Education (Classes PP-VI)
the number of new entrants in primary education as of March 2009 was 16,250. About 7% increase from last year. two important indicators to monitor the level of access to education in Bhutan are the Apparent (Gross) intake Ratio (AiR) and the net intake Ratio (niR)3.
the box 3.0 4gives the brief explanation on the two indicators (niR and GiR)
Box 3.0: Access to primary education
Universal enrolment of children in school cannot be achieved unless a first-grade intake approximates 100% of the starting age range. Accordingly gross and net intake rates provide useful indicators of one aspects of progress towards EFA
In many developing countries the official entrance age means little. The high proportion of late entrants in sub-Saharan Africa and latin America and the caribbean implies that the niR often underestimates the actual access. For example in 1996 in Chile, where the official entrance age is 6, the NIR for 6 year olds was 38%, as against 60% for 7 year olds. In Lesotho (1996) the values were respectively 30% for official entrance age and 35% for one year older, in other countries the proportion of underage enrollees may be significant. On the other hand when there are many early or late entrants the GiR may be effectively, over estimates access. thus the two indicators have to be interpreted with care.
table 3.0 gives the AiR for the last 6 years. Both private and public students (excluding those 6-12 years old children enrolled in the monastery and abroad). As shown in the table, the AiR has exceeded 100% for the last 6 years and continues to increase.
4 AIR = total number of new entrants/total population of correct age (6 years old) NIR = total number of correct age entrants (6 years old)/total population of correct age (6 years old)5 EFA Global Monitoring and Report 2003/4, UNESCO
Figure 3.0. Pre-primary enrolments by age

AnnuAl EducAtion StAtiSticS
��
the net intake Ratio for 2009 is estimated at around 53%. this is 2.7% higher than last year when it was estimated at 50%. in 2006 it was estimated at 44%. the estimate is based upon the assumption that all 6 year olds in PP are new entrants since the age of the repeaters is unknown. Since the Apparent intake Ratio has been more than 100% over the last years and this year it is
around 120.5% showing, that a lot of children go to school for the first time when they are older than 6, almost 52% of the PP enrolment are more than 6 years old, 7% are 5 years and below. in 2009 , it is estimated that around 41% of the new entrants are 6 years (right age). Since several children are younger than 6 in PP the niR is an estimate.
3.4. Secondary Education
Table 3.0 Gross or Apparent Intake Ratio (AIR) 2004-2009
Class Year Enrolment Repeaters New Entrants
Pop. 6 yrs old AIR
PP 2009 17305 1055 16250 13485 120.5%
PP 2008 16434 1192 15242 13343 114.2%
PP 2007 16392 1127 15265 13347 114.4%
PP 2006 16842 1257 15585 13907 111.1%
PP 2005 15518 1507 14011 12887 108.1%
PP 2004 16636 1761 14875 14143 104.2%
table 3.1 below shows the new admissions in PP for the last 8 years. the enrolment has increased over the years from only 13,491 in 2002 to 16,250 students in 2009, about 20% increase since 2002.
Table 3.1 New admissions in PP 2002-2008
YearPP Enrolment Growth
Boys Girls Total # %age
2009 8145 8105 16250 1008 6.6%
2008 7612 7630 15242 -23 -0.2%
2007 7751 7514 15265 -320 -2.1%
2006 7967 7618 15585 1574 11.2%
2005 7187 6824 14011 -864 -5.8%
2004 7565 7310 14875 891 6.4%
2003 7052 6932 13984 493 3.7%
2002 6967 6524 13491 614 4.8%
Average annual growth rate 3.1%
table 3.2 below shows that the total enrolment in primary education has increased by 2,742 students in 2009 almost twice the last year’s primary enrolment growth. The enrolment growth rate had increase by about 1% from last year. there had been a notable increase in the primary enrolment with an average annual increase of 2.7% for the last 8 years.

AnnuAl EducAtion StAtiSticS
��
Table 3.3 Primary enrolment by age
Class Right age(in years)
Right age enrolment
Overageunderagewithin 6-
12years >12 years T. overage
PP 6 41.0% 50.9% 0.7% 51.6% 7.5%
I 7 31.7% 59.6% 1.1% 60.7% 7.6%
II 8 29.0% 59.8% 2.2% 62.0% 9.0%
III 9 25.8% 57.3% 8.1% 65.4% 8.8%
Iv 10 21.5% 49.4% 20.8% 70.2% 8.3%
v 11 19.9% 27.8% 44.3% 72.1% 8.0%
vI 12 19.8% 0.0% 72.7% 72.7% 7.5%
Average 27.0% 43.5% 21.4% 64.9% 8.1%
this increase in primary enrolment has also been accompanied with the enrolment of many underage and overage children in the education system (see table 3.3 for details)
As can be seen from the above tables, there are also children who starts their schooling at the age more than 12 years.
table 3.4 shows the Gross primary enrolment ratio and the net primary enrolment ratio from 2005 to 2009.
5
6 As mentioned in footnote 8, chapter 2, the denominator for 2005 to 2007 ratios was based on the PHCB05 data with 0% international migration and 0% mortality for the concerned age group. The 2008 and 2009 ratios used the Dzongkhag population projection 2006-20�5 published by NSB in June 2008.
Table 3.2: Enrolment in Primary Education, 2002-2009
YearsStudents Annual Growth
Boys Girls Total %
2009 54705 54137 108842 2742 2.6%
2008 53571 52529 106100 1633 1.6%
2007 53260 51207 104467 2275 2.2%
2006 52187 50005 102192 2318 2.3%
2005 51218 48656 99874 2025 2.1%
2004 50443 47406 97849 3875 4.1%
2003 48921 45053 93974 3030 3.3%
2002 48006 42938 90944 2752 3.1%
Average annual growth rate 2.7%

AnnuAl EducAtion StAtiSticS
��
the number of out of school primary age children not in PP-Vi is around 3,852 i.e. almost 4%. However, these children do not necessarily have to be out-of-school. Analyzing current data allows for the following assumptions and estimates of the whereabouts of these children to be made:
Box 3.1: assumption of the primary aged children not in school
• A large proportion of these children are 6 years old and not yet in school. Since the niR is estimated to be around 52.7%, while the AIR is around 120.5%, more than 50% of the children entering school for the first time are older than 6 years old, while some 7%) be younger, especially in the private schools. Based on the available data, around 19% of the primary enrolment are over the age of 12 and 7% of the primary enrolment are 5 years and below. this big difference between niR and AiR has also occurred in previous years. it is estimated that around 5% of the 6-12 year old children are 6 years old and not yet enrolled. Given the limited spaces in urban areas and the difficult walking distances in remote areas, it is very likely that most of them will be enrolled next year or the year thereafter.
• A small group of these primary school age children who are not in the primary levels is actually enrolled in class Vii or higher. the net Primary Enrolment does not include these children. Based on the available data, around 1% of the children aged between 6 to 12 years old are enrolled in secondary education in Bhutan.
• Based on the PHCB results, an estimate of the number of primary age children staying/studying abroad and the number of primary age children studying/staying in monastic schools can be made. In 2005 around 1% of the 6-12 year old children were reported to be temporarily abroad. it is assumed that they were enrolled in school. in 2005 around 2% of the 6-12 years old children were assumed to be enrolled in traditional, monastic education. if we assume that the proportion of children abroad and in the monastery as a proportion of the total out-of-school population remains the same, it is estimated that around 1% of the 6-12 year old children are studying abroad and around 2% of the 6-12 year old are in the monastery.
• the last group are the children 7 years and older who are currently out of school. they will have dropped out or never gone to school. looking at the current age of entrants in PP some might still enroll or return to school while some will not. Since the age of the drop-outs is unknown, it is not possible to estimate how many of these children have actually dropped out and how many never went to school.
• Some of the out of school children mentioned above would also include disabled children. in order to achieve universal primary education it would be necessary to make provisions also for the education of all disabled children and this includes also finding how many children in Bhutan are disabled, how many of these children are already in school and what kind of special needs these children have in order to receive quality education
Table 3.4 NPER and GPER 2005-2009
Gross Primary Enrolment
Net Primary Enrolment
2009 115.73% 91.82%
2008 112% 88%
2007 106% 84%
2006 102% 79%
2005 97% 73%
Figure 3.1. Division of primary aged Children (6-12 yrs)

AnnuAl EducAtion StAtiSticS
��
3.2 Girls Enrolment
Girls’ enrolment over the last 6 years shows a slow but steady increase. With the exception of higher secondary level, the girls’ enrolment as a percentage of the total school enrolment is about 50%, at every level of general education. However, even at the higher secondary level, the enrolment of girls has been increasing steadily over the years. The girl’s enrolment in the Secondary education had increased from 45 in 2002 to 49.6 percent in 2009 with the increase of 4.6% since 2002.
the box 3.26 shows brief backgrounds on the importance of education girls published by unicEF.
Box 3.2: Importance of educating girl.
it is extremely important that girls have access to an education. For every additional year girls go to school, they receive 20 percent higher wages and suffer 10 percent fewer child deaths. Women with some formal education are more likely to seek medical care, ensure their children are immunized, be better informed about their children’s nutritional requirements, and adopt improved sanitation practices. As a result, their infants and children have higher survival rates and tend to be healthier and better nourished. According to the international center for Research on Women, the education that a girl receives is the strongest predictor of the age she will marry and is a critical factor in reducing the prevalence of child marriage. the World Bank estimates that an additional year of schooling for 1,000 women helps prevent two maternal deaths. Also, each additional year of formal education that a mother completes translates to her children staying in school an additional one-third to one-half of a year.
in terms of private participation and contribution to the education system, Private Secondary enrolments make up 11 percent of the total enrolment compared to 8% in 2006.
6 Progress for Children (A Report card on Gender Parity and primary education.), UNICEF.
Figure 3.2. Girls participation in the Secondary Education since 2002
30000
25000
20000
15000
10000
5000
02002 2003 2004 2005 2006 2007 2008 2009

AnnuAl EducAtion StAtiSticS
��
in 2000, the international community committed to achieving Millennium development Goals (MDGs) by the year 2015, two specifically related to education: MdG 2 focuses on universal primary education and MdG 3 aims to reduce the gender gap in education. Bhutan has achieved an impressive girl’s Primary Net Enrolment Ratio of 92.55 to that of 89.94 percent for boys with the boys/girls ratio to be 99.8 boys to that of 100 girls (which means there are more girls enrolled than boys at the official age group) .
While notable progress has been made in the category of enrolment; much progress is still needed, especially in addressing quality of education that addresses socio-economic needs.Furthermore the Gross Enrolment Ratio has increased to 115.73% in 2009 with 99 boys for every 100 girls enrolled in Primary schools irrespective of age. the national survival rate of girls in primary school is 94.8 to that of 85.5% for boys.
From table 3.5 you can see clearly at the higher level education, girls’ enrolment is lower than boys. In the upper secondary school, girls are seen to reduce in numbers as they proceed to higher classes especially after class X. About 86 girls to that of 100 boys enroll in class Xi and Xii, while 102 girls out of every 100 boys enrolled in Xi and Xii, are of right age (17-18years). this means that more girls are enrolled at the official age in the Higher Secondary School. table 3.7 gives a regional picture of the number and percentage of girls enrolled under the different categories of schools by dzongkhag. this ratio is a crude indicator, since it does not take into account differences in overall population, which could make significant differences, especially in scantily populated areas where a 50-50 gender division is not always realistic.
on average, girls make up 50% of the enrolment in Bhutanese schools and in several dzongkhags it is above 50%. Since enrolment and population figures are so small, these are all indicative figures. It is difficult to draw valid conclusions without knowing the actual population in the Dzongkhags and regional categories.
Table 3.5 Percentage wise girls’ enrolment per level and type of school, March 2009
Class Pvt CPS PS LSS MSS HSS ALL
PP-vI 49.1% 49.3% 49.9% 50.2% 49.3% 51.9% 49.7%
vII-vIII 43.2% 0.0% 0.0% 51.4% 51.5% 51.7% 51.4%
Ix-x 32.7% 0.0% 0.0% 0.0% 46.6% 51.8% 49.1%
xI-xII 50.3% 0.0% 0.0% 0.0% 0.0% 40.7% 45.3%
PP-xII 49.6% 49.3% 49.9% 50.5% 49.1% 48.2% 49.6%

AnnuAl EducAtion StAtiSticS
�0
Tab
le 3
.6 G
irls
’ en
rolm
ent
by
typ
e/le
vel o
f sc
ho
ol,
Mar
ch 2
009
Cla
ssPr
ivat
e
Scho
ols
Com
. Pri
mar
y
Scho
ols
Prim
ary
Scho
ols
Low
er S
ec.
Scho
ols
Mid
dle
Sec.
Sc
hool
sH
ighe
r Sec
. Sc
hool
sTo
tal
GT
GT
GT
GT
GT
GT
GT
PP 4
90
1,0
20
2,8
44
5,7
34
1,7
03
3,4
52
2,4
41
4,8
45
1,0
23
2,0
57
98
197
8
,599
1
7,30
5
I 2
20
457
2
,583
5
,186
1
,786
3
,531
2
,426
4
,902
1
,116
2
,240
8
8 1
73
8,2
19
16,
489
II 1
88
393
2
,396
5
,002
1
,729
3
,518
2
,414
4
,880
1
,040
2
,128
1
03
181
7
,870
1
6,10
2
III
169
3
24
2,3
23
4,8
37
1,6
77
3,4
04
2,5
43
5,1
92
1,0
30
2,1
43
74
135
7
,816
1
6,03
5
Iv 1
27
261
1
,980
4
,028
1
,679
3
,433
2
,548
5
,192
1
,071
2
,280
6
6 1
28
7,4
71
15,
322
v 8
1 1
74
1,7
78
3,4
82
1,6
59
3,2
61
2,6
79
5,1
01
1,1
88
2,3
44
75
177
7
,460
1
4,53
9
vI
92
157
1
,433
2
,821
1
,530
2
,966
2
,486
4
,856
1
,072
2
,099
8
9 1
51
6,7
02
13,
050
Sub-
Tota
l1,
367
2,78
6 1
5,33
7 3
1,09
0 1
1,76
3 2
3,56
5 1
7,53
7 3
4,96
8 7
,540
1
5,29
1 5
93
1,1
42
54,
137
108,
842
vII
40
101
0
0
0
0
3
,739
7
,299
2
,433
4
,743
3
91
707
6
,603
1
2,85
0
vII
I 3
0 6
1 0
0
0
0
3
,040
5
,886
2
,274
4
,402
5
42
1,0
98
5,8
86
11,
447
Sub-
Tota
l 7
0 1
62
0
0
0
0
6,7
79
13,
185
4,7
07
9,1
45
933
1
,805
1
2,48
9 2
4,29
7
Ix 1
4 4
6 0
0
0
0
0
0
2
,544
5
,389
2
,669
5
,116
5
,227
1
0,55
1
x 2
0 5
8 0
0
0
0
0
0
1
,859
4
,066
2
,383
4
,633
4
,262
8
,757
Sub-
Tota
l 3
4 1
04
0
0
0
0
0
0
4,4
03
9,4
55
5,0
52
9,7
49
9,4
89
19,
308
xI
1356
2719
--
--
--
-1,
361
3,27
12,
717
5,99
0
xII
1,47
8 2
,912
-
- -
- -
- -
- 1
,158
2
,913
2
,636
5
,825
Sub-
Tota
l2,
834
5,6
31
0
0
0
0
0
0
0
0
2,5
19
6,1
84
5,3
53
11,
815
Tota
l4,
305
8,68
3 1
5,33
7 3
1,09
0 1
1,76
3 2
3,56
5 2
4,31
6 4
8,15
3 1
6,65
0 3
3,89
1 9
,097
1
8,88
0 8
1,46
8 16
4,26
2

AnnuAl EducAtion StAtiSticS
��
Tab
le 3
.7 G
irl’s
en
rolm
ent
per
loca
tio
n p
er D
zon
gkh
ag, M
arch
200
9
Dzo
ngkh
agU
rban
Sem
i-Urb
anSe
mi-R
emot
eR
emot
eve
ry R
emot
eD
ifficu
ltTo
tal
Enro
l%
Enro
l%
Enro
l%
Enro
l%
Enro
l%
Enro
l%
Enro
l%
Bhut
an36
961
50%
1551
848
%14
730
50%
8539
49%
5623
49%
9742
%81
468
50%
Bum
than
g11
6551
%46
850
%44
752
%56
48%
00%
00%
2136
51%
chu
kha
4643
50%
1351
50%
1048
49%
214
47%
926
48%
00%
8182
50%
dag
ana
00%
1392
48%
973
48%
478
49%
222
51%
00%
3065
48%
Gas
a0
0%0
0%19
453
%61
56%
00%
6438
%31
950
%
Haa
681
52%
710
48%
00%
8755
%47
55%
00%
1525
50%
lhue
ntse
417
46%
443
50%
413
49%
532
48%
128
50%
00%
1933
48%
Mon
gar
1322
48%
1072
47%
458
48%
1108
50%
605
45%
00%
4565
48%
Paro
3639
51%
1021
50%
464
53%
124
51%
00%
00%
5248
51%
Pem
agat
shel
566
42%
514
48%
595
47%
789
48%
470
51%
00%
2934
47%
Puna
kha
1248
50%
465
52%
2038
55%
9549
%0
0%0
0%38
4653
%
Sam
tse
2106
50%
2743
48%
457
49%
586
47%
710
46%
00%
6602
48%
Sarp
ang
3134
51%
660
49%
1095
49%
290
49%
3048
%0
0%52
0950
%
thim
phu
1132
152
%70
347
%30
852
%48
49%
00%
3353
%12
413
52%
tras
higa
ng13
0151
%16
6646
%19
1448
%58
547
%57
148
%0
0%60
3748
%
tras
hiya
ngts
e66
049
%34
246
%96
550
%49
451
%14
949
%0
0%26
1049
%
tron
gsa
679
47%
341
53%
478
50%
198
51%
6846
%0
0%17
6449
%
tsira
ng93
547
%52
350
%33
149
%64
748
%0
0%0
0%24
3648
%
Wan
gdue
1388
51%
167
51%
1656
54%
467
54%
177
56%
00%
3855
53%
Zhem
gang
622
48%
611
45%
278
51%
195
47%
962
52%
00%
2668
49%

AnnuAl EducAtion StAtiSticS
��

AnnuAl EducAtion StAtiSticS
��
3.2.1. Girls’ enrolment in HSS and Tertiary education
As mentioned earlier, the comparative enrolment of girls in public Higher Secondary Schools is lower than in the earlier stages of the general education system. In table 3.8 the girls’ enrolment in class X and class Xi is compared over the years.
Table 3.8 Girls’ enrolment in class X and class XI public and private schools 03- 09.
level x xI public xI private
Year G T % G G T % G G T % G
2009 4262 8757 49% 1361 3271 42% 1356 2719 50%
2008 3883 7909 49% 1116 2885 39% 1320 2541 52%
2007 3675 7691 48% 1096 2667 41% 942 1914 49%
2006 3275 6856 48% 944 2525 37% 865 1709 51%
2005 3038 6427 47% 770 1539 33% 851 1688 50%
2004 2842 6246 46% 656 2031 32% 774 1579 49%
2003 2361 5264 45% 571 1751 33% 613 1240 49%
In 2009 the relative percentage of girls’ enrolment in class Xi in Public Higher Secondary Schools had increased by 3% compared to last year. in the publicly financed tertiary education system, both in and ex-country enrolment of girls is still much lower than that of boys.
only 37% of the students studying in the RuB colleges and institutes are girls, girls makes up about 19% of the students that receive scholarship to study abroad and about 3% of the students studying abroad without government’s financial assistance.
overall enrolment of girls in the tertiary education is much lesser than that of boys with only 3 girls out every 5 boys enrolled in the tertiary level, while the “gender gap” in the primary education has narrowed over the years; the relative disadvantage still keeps girls from enrolment in secondary and tertiary education.
3.3. Gender Parity Index
the Gender Parity index (GPi) is a socioeconomic index usually designed to measure the relative access to education of males and females. in its simplest form, it is calculated as the quotient of the number of females by the number of males enrolled in a given stage of education (primary, secondary, etc.). it is used by international organizations, particularly in measuring the progress of developing countries. the institute for Statistics of UNESCO also uses a more general definition of GPI: for any development indicator one can define the GPi relative to this indicator by dividing its value for females by its value for males.
The following figures 3.3(a) shows the indicative Gender Parity index (nER) in 2009. if this index is between 0.97 and 1.03, it is considered to be parity or equal representation of both sexes. A GPi of less than 1 indicates that there are fewer females, in proportion to the appropriate school-age population, than males in the formal education system however, if it is higher or lower, one of the two sexes is underrepresented.

AnnuAl EducAtion StAtiSticS
��
Gender inequities continue to exist in society. in many cultures and traditions, girl children are discouraged from pursuing an education. not only do girls experience barriers to accessing education, but girls attending school face certain barriers to education that are not shared by their male classmates.
In Bhutan, girls – by and large – don’t experience
Figure 3.3(a) Gender Parity Index by Dzongkhag (NPER)
discrimination with regards to access to education, as is commonly seen in some parts of the world.
this year, the national GPi is 1.02. this indicates that on the whole, the correct proportions of females in relation to males are enrolled in the education system. However the gender equity remains the biggest challenge in the Bhutanese education system.
some parts of the world.
This year, the national GPI is 1.02. Thisindicates that on the whole, the correctproportions of females in relation to males are enrolledintheeducationsystem.Howeverthegenderequityremains thebiggestchallengeintheBhutaneseeducationsystem.
Box 3.31presentsadifferencebetweengenderparityandgenderequality.
� EFA Global Monitoring and Report 2003/4, UNESCO
1.40
1.20
1.00
0.80
0.60
0.40
0.20
0.00

AnnuAl EducAtion StAtiSticS
��
Box 3.37 presents a difference between gender parity and gender equality.
Box 3.3: Parity and Equality
Gender parity and gender equality in education mean different things; the first is a purely numerical concept. Reaching gender parity in education implies that the same proportion of boys and girls – relative to their respective age groups-would enter the education system and participate in its different cycles.
Gender equality, on the other hand, means that boys and girls would experience the same advantages or disadvantages in educational access, treatment and outcomes. in so far as it goes beyond questions of numerical balance, equality is more difficult to define and measure than parity.
The achievement of full gender equality in education would imply:
• Equality of opportunities, in the sense that girls and boys are offered the same chances to access school, i.e. parents, teachers and society at large have no gender-biased attitudes in this respect:
• Quality in learning process, i.e. girls and boys receive the same treatment and attention, follow the same curricula, enjoy teaching methods and teaching tools free of stereotypes and gender bias, are offered academic orientation and counseling not affected by gender biases, profit from the same quantity and quality of appropriate educational infrastructures;
• Equality of outcomes: i.e. learning achievements, length of school careers, academic qualifications and diplomas would not differ by gender;
• Equality of external results, i.e. job opportunities, the time needed to find a job after leaving full time education, the earning of men and women with similar qualification and experience, would all be equal
the enrolment ratios for 2009 are based upon PHcB 2005, which also account for the changes made in the boundaries of the dzongkhags.
this year also the girls seem to have overtaken the boys in terms of correct age enrolment. However the difference is too small to draw any conclusions.
7 EFA Global Monitoring and Report 2003/4, UNESCO
the dzongkhag with the highest GPi is chukha at 1.21 followed by Punakha, Bumthang and thimphu at 1.20, 1.17 and 1.14 respectively and the lowest
GPi is seen in Pemagatshel and Samdrupjongkhar at 0.88. the majority of the dzongkhags showed a GPi of slightly under or over 1.00.

AnnuAl EducAtion StAtiSticS
��
the highest improvement in GPi is seen in chukha, with 1.21 from 0.99 since last year.
Generally there are more females participating at primary school level than males, this pattern shifts
at a secondary school level as there are more males than female learners at this phase. this indicates that fewer females than males are passing over from primary school phase into secondary school phase. It may also reflect that more females than
males are inclined to drop-out of secondary school as you can see in the figure 3.4(a), 3.4(b) and 3.4(c), the dropout rate for girls’ remains lesser
than boys until class Viii. this pattern shifts when they reach class iX and X, after class Viii more girls are likely to repeat and drop out.
Figure 3.4(a-b) Repetition & Promotion and rate by class by gender
Figure 3.3(b) Gender Parity Index by Dzongkhag (GPER)
1.40
1.20
1.00
0.80
0.60
0.40
0.20
0.00
Repetition Promotion

AnnuAl EducAtion StAtiSticS
��
Although discrimination does not pose a huge problem for females in terms of access to school, it is important to bear in mind that girls participating in the schooling system may experience various forms of gender-based discrimination. We cant say anything since no comprehensive study has been done in this field.
the nER and GER by dzongkhag are calculated using the dzongkhag Population Projection 2006-2015 published by NSB on June 2008, where they projects the population of Bhutan by age gender and areas upto 2015. it has used the exponential growth model together with the ratio type methods. the age-sex distribution was estimated as the ratio of the population in each age group of national population. the adjustment of the data as per new administrative boundaries of the dzongkhags was necessitated to ensure the comparability of population data over time. the population of thimphu is projected to reach 116,012 in 2015, an increase of 25% from 2005 with an average growth of 2.2 percent, which is
the highest among the dzongkhags. Pemagatshel has the least average growth rate of 1.2 percent and its population is projected at 25,180 in 2015 from 22,287 in 2005. Gasa is expected to have an additional population of about 600 persons by 2015 making its population of 3,692 persons, thus remaining the least populated dzongkhag8.
As per the population projection from the PHcB 2005 by the nSB, Pema Gatshel, Sarpang and trashiyangtse have 3,071, 5,360 and 2630, 6-12 years old children respectively. in 2009, 3,153 5,417 and 2,875 students aged 6-12years are enrolled in these dzongkhag respectively.
8 Dzongkhag Population Projection 2006-20�5, June 2008
PP i ii iii iV V Vi Vii Viii iX X
Figure 3.4(c) Dropout rate by class by gender

AnnuAl EducAtion StAtiSticS
��

AnnuAl EducAtion StAtiSticS
��
table 3.9 shows an estimated distribution of out of school primary age children among the dzongkhags. the biggest number of out of school primary aged children is in chukha with 31%. A big proportion can also be found in the other populous dzongkhags like thimphu, Samtse and Samdrupjongkhar. For thimphu dzongkhag, it can be assumed that a significant number of the children not in PP-Vi are either studying abroad or enrolled in the monastery.
As can be seen, the highest increase in drop out is found in chukha from 13 in 2008 (See General Statistics 2008) to 31 percent this year.
A comparison of the changes in enrolment between 2009 and 2008 at the dzongkhag level shows a general increase in both net and Gross enrolment ratios. in the map, the dzongkhags that have a change of more than 5% in the nPER since last year have been highlighted(See page 40).
the increase in nER has been accompanied by uneven progress among the dzongkhag, the nER in the chukha dzongkhag is 20% lower than the highest dzongkhag i.e. trashiyangtse, Pemagatshel and Sarpang with 100% enrolment. Gasa has the lowest NER; however Gasa’s Population is too small to draw any conclusion. the only dzongkhag where the primary nER decreased significantly is Paro and Chukha. The primary enrolment aged 6-12 years in chukha has increased only by 1% while the population aged 6-12years in Chukha has increased significantly by about 8.4% since last year.
the primary right aged enrolment in Paro has decreased and on other hand the population 6-12 years has increased remarkably by about 8% compared to last year according to the dzongkhag Population Projection 2006-2015.
9the accuracy of any projection is conditional on the reliability of the base population estimates, the component data, and the degree to which the underlying assumptions correspond to the future trends. Projections are not predictions;
9 Dzongkhag Population Projection 2006-20�5, June2008
Table 3.9 Distribution (in %) by Dzongkhag of the 6-12 years old not in school, March 2009chukha 31% Bumthang 2%
thimphu 16% dagana 1%
Samtse 14% Haa 2%
Samdrupjongkhar 9% Gasa 1%
Paro 9% trongsa 1%
trashigang 6% lhuentse 0%
Wangdue 5% Zhemgang 0%
Punakha 5% Pema Gatshel 0%
tsirang 3% Sarpang 0%
Mongar 2% trashiyangtse 0%
they instead an effort to create plausible scenarios based on assumptions regarding the components of population growth, which are themselves subject to uncertainty. Accordingly, it cannot be claimed that the value observed in the coming years will always remain within the range implied by the projection exercises.
Whether or not this will be a trend will be seen next year. Sarpang shows a remarkable increase in nER about 17% increase since last year followed by tsirang, Samtse and dagana with, 13% and 11% respectively, the population tends to have decreased for these dzongkhags compared to last year.
the over all primary nER has increased by about 4%. the continued improvement and increase in enrolment is very encouraging. Figures indicates that increasing the net intake Ratio to ensure that more and more children enroll at the age of 6 and strategies focused on increasing enrolment in highly populous dzongkhags like Samtse, chukha, Paro Samdrupjongkhar and Samtse are required for achieving universal primary enrolment.

AnnuAl EducAtion StAtiSticS
�0
Table 3.10 Enrolment in Class VII-X 2002-2009
Year Enrolment in Class vII-x Annual Growth
2009 21627 21978 43605 2750 6.7%
2008 20353 20502 40855 1944 5.0%
2007 19664 19247 38911 2714 6.5%
2006 18315 17882 36197 2367 7.0%
2005 17258 16572 33830 2382 7.6%
2004 16256 15192 31448 2565 8.9%
2003 15131 13752 28883 1472 5.4%
2002 14647 12764 27411 1544 6.0%
Average annual growth rate 6.6%
3.4. Secondary Education
3.4.1 Lower and Middle Secondary Education (VII-X)
table 3.10 gives the enrolment for the classes Vii to X since 2002. Since private schools hardly offer these levels there is no distinction made between private and public students. the annual growth at this level has been high since 1995, especially compared with the growth in primary education.
the girls have overtaken boys in terms of cor-rect age enrolment both in Primary and secondary education. However, the participation of girls are much lower in the secondary school, with GPi of only 0.91 in Higher education(Xi-Xii) i.e. only 6
girls out of every 7 boys continue with their High-er Education.
there is a remarkable increase in the secondary enrolment with the annual increase of 6.6% for the

AnnuAl EducAtion StAtiSticS
��
past 8 years, though the rate is low in terms of cor-rect age enrolment i.e. 45.8% nER (Vii-X), with again more girls enrolled at the correct age, but the overall gross enrolment ratio (Vii-X) stands at 75.2%. As of recent statistics, transition Rate from prima-ry to secondary education is 85.8%, the percentage
The following box 3.4 a brief definitions and purpose of the Transition Rates
of children enrolled in the last grade of primary school who continue their education at the second-ary level is known as the transition rate from pri-mary to secondary education. 86% of children in the last grade of primary school go on to attend secondary school.
Box 3.4 Purpose of Transition Rate
this indicator conveys information on the degree of access or transition from one cycle or level of edu-cation to a higher one. Viewed from the lower cycle or level of education, it is considered as an output indicator, viewed from the higher educational cycle or level, it constitutes an indicator of access. it can also help in assessing the relative selectivity of an education system, which can be due to pedagogical or financial requirements
the difference between male and female transition rates is negligible, girls are more likely to transfer to secondary school; the transition rate is 86.6% for girls and 85.1 % for boys. More girls are be-ing transferred to the secondary level. not only do they have very high primary school enrollment ratios, they are also more likely to continue their education at the secondary level.
3.4.2. Higher Secondary Education (XI –XII)
the top 40% of Students who graduate from class X are admitted in public Higher Secondary Schools based on their performance in the BcSE. those students, who do not qualify, continue their education in Private Higher Secondary schools or either join Vti or enter the labour force.
Students choose among three different streams, Science, Arts and Commerce. figure 3.5(a) and 3.5(b) shows the distribution of enrolment among the streams by public and private schools. only a few private schools offer Science. the majority of the students in government schools opt for Sci-ence. the main reason for the increase in Science enrolment this year could be attributed to the in-
crease in number of Science seats in government schools. commerce appears to be the most popular stream among the private school students.
on the whole, the number of higher secondary stu-dents this year has grown at a higher rate than in the last two years, mainly because 3, private pri-mary school has upgraded to higher secondary lev-el. this indicates the importance of Private HSS role in the general education system.
From 2002 onwards, the enrolment in both private and public schools is shown. overall, the enrol-ment has increased tremendously in the last 12
Figure 3.5(a) Divisions of streams in the Public Higher Secondary School
Figure 3.5(b) Divisions of streams in the Private Higher Secondary School

AnnuAl EducAtion StAtiSticS
��
years, with an annual increase of about 21%. With the government policy of enrolling
Approximately 40% of class X graduates in gov-ernment HSSs, this growth will continue for quite some time. the nER in the higher education is only 14%, while the enrolment are less in terms of correct age, the overall enrolment in class Xi and
Xii is 36%(GER) i.e. 1 out of every 3 population are enrolled in class Xi and Xii irrespective of their age.
the national GPi of 1.02 in the primary level, hav-ing more girls than boys in the primary education, but the gender gap widens at the Secondary level with only 47% of girls and 54% of boys in school.
Figure 3.6 Enrolment trend in class XI and XII since 2002
1400012000100008000600040002000
02002 2003 2004 2005 2006 2007 2008 2009

AnnuAl EducAtion StAtiSticS
��

AnnuAl EducAtion StAtiSticS
��
4.1.1. Class X Examinations
the national level examinations at the end of Pri-mary Education were instituted in 1972 with the aim of ensuring uniformity in the standard of edu-cation among the different schools across the coun-try. it was also used as a touchstone for screening the candidates for entry into the next level of gen-eral education. With the upgrading of the basic ed-ucation level to class X, the class X examinations have now replaced the end of primary education examinations as the major touchstone.
4. EXAMINATION RESULTS
For many students the class X examinations marks the end of their general education. Students who fail are only allowed to re-appear the examinations as private candidates and cannot attend regular classes in the government schools. However, these conditions may not apply to cases where students were sick or have valid reasons for not sitting the examinations. The figures below reflect only the results of the regular candidates. the annual increase in the number of students appearing for exams has been very steady. in
2008 more than 1,000 students appeared. Given the increased enrolment in primary and secondary education, the annual number of class X graduates is likely to keep increasing.
4.1.2. Class xII Examination
in 2006 the Bhutan Board of Examinations took over the conduct of the class Xii exams from the
ciScE. With regard to repetition and examinations in class Xii, the same rules apply as in class X. the number of students appearing for the class Xii examinations has slightly increased compared to last year. the pass percentage was very low, with one reason cited as the new curriculum in English and Business Mathematics.
Figure 4.0 Class X passed trend since 2002
9 7 %
9 6 %
9 5 %
9 4 %
9 3 %
9 2 %
9 1 %
9 0 %
8 9 %2002 2003 2004 2005 2006 2007 2008

AnnuAl EducAtion StAtiSticS
��
4.1.3. Class VI and Class VIII Examinations
the class Vi examinations were decentralized in 1999 and the class Viii examinations in 2006. the decentralization of examinations gives schools the responsibility for administration and marking of the examinations. However, for purposes of uni-formity in standards, the papers for both examina-tions are still set by the Bhutan Board of Examina-tions (BBE).
4.2 Efficiency indicators
4.2.1. Promotees, Repeaters and Drop-outs
The efficiency of the Education System can be monitored by indicators such as repetition rate, dropout rate, promotion rate and survival rate at various levels of education. these are known as Efficiency Indicators. The lower the repetition and dropout rates, and the higher the number of pro-motees and the survival rate, the better the system is said to be doing. the net and Gross enrolment (nER and GER) and intake ratios (AiR) indicate access to education. The efficiency indicators and the access indicators together give quantitative in-formation on the quality of the system. if children come to school, remain in school and do not repeat
too much, it gives an indication of the accessibility and the efficiency of the system.the box 4.0 talks about the effect of repetition
Box 4.0: Repetition in Primary education
High levels of access and enrolment do not themselves guarantee that the achievement of goal 2 is at hand. in order for “all children” to have “access to and com-plete free and compulsory primary education of good quality...” it is necessary that people proceed through the educational ladder as smoothly and efficiently as possible. All countries particularly those with very low levels of primary participation, are concerned that their limited resource are well utilized. While time spent by pupils repeating grade is not necessar-ily wasted. it is undeniable that the efforts to reduce rates of repetition and drop outs are crucial parts of any uPE strategy.
in countries where resources are limited, school places occupied by repeaters may keep others out of school.
The figures show that the repetition rate has gone down considerably. From 2006 onwards the class X school leavers who do not continue onto class XI are no longer defined as drop-outs therefore the drop-out rate is lower after 2005.
Figure 4.1 Class XII passed trend since 2002
9 7 %
9 6 %
9 5 %
9 4 %
9 3 %
9 2 %
9 1 %
9 0 %
8 9 %2002 2003 2004 2005 2006 2007 2008

AnnuAl EducAtion StAtiSticS
��
The internal efficiency of the education system needs to be enhanced by reducing the repetition and dropout rates. Particularly grade iV. there are many over age and underage children in primary schools, Most of the underage children who should be in early childhood development centers are in grade 1 i.e. almost 1%. the main reason for low promotion rate in grade iV may include those un-
Figure 4.3 Primary enrolments (PP-III)
derage (8%) and overage (60%) children in class PP-III (see figure 4.3), high repetition rate, and frequent drop outs, since many student start school as late as 12 years and above and as young as 5 years old and below, these students are likely to repeat and drop out. these are just an assumption; a comprehensive study in this field in future may bridge this assumption.
Figure 4.2 Repetition and dropout rate for class PP-X since 2002
2002 2003 2004 2005 2006 2007 2008 2009
14.0%
12.0%
10.0%
8 . 0 %
6 . 0 %
2 . 0 %
0 . 0 %
Repetition ratedropout

AnnuAl EducAtion StAtiSticS
��
the box 4.1 shows the study done in Senegal on the effects of repetitions on dropout
Box 4.1: Study in Senegal on Repetition
the study done in Senegal revealed that such widespread practice of repetition is very expensive, since all the costs of schooling increase with schooling duration, and each repeating child needs to be enrolled one more year to achieve a given grade. they also found that Grade repetition has an impact on the schooling decisions.First, grade repetition modifies the acquisition of knowledge at a given date, and the parent’s beliefs about the future acquisition of knowledge may be a determinant of dropouts. in fact, when a child repeats a grade, he may consoli-date the skills corresponding to his grade. However, it is unclear whether it compensates for the fact that he does not acquire the skills corresponding to the next grade. that is why the net effect of grade repetition on the acquisition of knowledge is ambiguous. Second, grade repetition acts for the parents as a signal for ability. if the parents observe theirchild’s ability noisily, then grade repetition decreases their beliefs on ability. As a result, gradeRepetition possibly causes school dropouts.Finally, grade repetition may increase the cost of schooling. it increases the time needed to reach a given grade. For a given last grade attended, the opportunity costs increase by one year when a child has to repeat once, and the job market benefits of schooling are postponed by one year. Then, grade repetition would cause school dropouts because it increases the costs of schooling. overall, the sign of the effect of these three mechanisms is ambiguous.
Table 4.0 Details on drop-outs and repeaters 2008-2009
ClassEnrolement Repeaters Promotees Dropouts Percentage
2008 2009 2009 Imputed Imputed Promotees Repeaters Dropouts
PP 16,434 17,305 1,055 15,446 0 94.0% 6.4% 0.0%
I 16,097 16,489 1,043 14,862 192 92.3% 6.5% 1.2%
II 16,542 16,102 1,240 15,091 211 91.2% 7.5% 1.3%
III 14,996 16,035 944 13,906 146 92.7% 6.3% 1.0%
Iv 15,512 15,322 1,416 13,652 444 88.0% 9.1% 2.9%
v 13,815 14,539 887 12,451 477 90.1% 6.4% 3.5%
vI 12,704 13,050 599 11,878 227 93.5% 4.7% 1.8%
Sub-Total 106,100 108,842 7,184 97,286 1,630 91.7% 6.8% 1.5%
vII 12,328 12,850 972 10,832 524 87.9% 7.9% 4.3%
vIII 10,919 11,447 615 10,031 273 91.9% 5.6% 2.5%
Sub-Total 23,247 24,297 1,587 20,863 797 89.7% 6.8% 3.4%
Ix 9,699 10,551 520 8,705 474 89.8% 5.4% 4.9%
x* 7,909 8,757 52 5,923 0 74.9% 0.7% 0.0%
Sub-Total 17,608 19,308 572 14,628 474 83.1% 3.2% 2.7%
Total 146,955 152,447 9,343 132,777 2,901 90.4% 6.4% 2.0%
* The students who leave school after Class x are Graduates and school leavers and not drop-outs

AnnuAl EducAtion StAtiSticS
��
the above table gives the details per level of re-peaters, promotees and drop-outs for 2008-2009. the drop-out rate in PP was 1.3 last year, however this year the dropout rate is 0 showing zero drop-out in PP.
the repetition rate in grade iV remains the highest, and the highest drop out in grade Vii, indicating that the primary students may have difficulties in coping with the increased learning demand placed on them by the expanded/changed curriculum, fur-ther compounded by the change in schools. After completing their primary schooling, many stu-dents continue their education in lSS nearby or sometime even far away from home as boarders. this may be a factor contributing to the increased repetition and drop out rates. However a compre-hensive study may bridge the knowledge gap in this area.
The figures for Class X require some extra ex-planation. Every student who passed class X is a class X graduate. in 2008, 7,526 students passed their class X exams. of those who failed or did not appear in the exam, 53 are repeaters and the rest are school leavers without a certificate. These school leavers might decide to do the exam again as private candidates. the graduates who cannot continue in class Xi may choose to join a voca-tional training institute, attend a school abroad, or enter the job market.
Figure 4.4 gives a more detailed overview of what happens with the class X students of 2008 in 2009.
this year the drop-out rate in class iX decreased. class iX and class Vii show a high drop-out rate,
Figure 4.4 Class X detailed results
Figure 4.5 Repetition and drop out rates
since 2003
though it is much lower compared to last year. it is interesting to note that the drop out rate in class Vii and iX has dropped compared to last year for about 2 to 3% decrease in both the level. the num-ber of drop-outs in PP had also dropped. While this may be a statistical error, it is quite impressive to see 100% retention in PP. the total number of drop-outs is lower than last year.
A drop out rate of 0% until class iV is essential in order to achieve the goal of 100% nER. Moreover, it is also known at a minimum of 5 years of education is required to ensure literacy and numeracy. it is estimated that within the 9th FYP period, around 10,000 children have left the education system as illiterates. of course they might have enrolled again, either in monasteries or abroad.
compared to 2003 the repetition rate has gone down significantly, although it has remained stable for the last 3 to 4 years.
it is interesting to note is that once again grade iV has the highest repetition rate this year. Grade Vii has over the years, has had one of the highest repetition and drop-out rates. this is not surpris-ing, given the change students undergo when they progress from primary to secondary education.
4.2.2 Completion rate and internal efficiency measures.
the completion rate for either primary or basic
2003 2004 2005 2006 2007 2008 2009
14%12%10%8%6%4%2%0%
Repetition ratedropout

AnnuAl EducAtion StAtiSticS
��
education indicates how many children actually complete education. the Gross intake Ratio for the last grade of the education cycle is used. table 4.3 gives the completion rates for 2006 to 2009 for primary and basic education. compared to last year for both cycles the completion rate has
the current statistics shows that almost about 90% of children complete the primary education. i.e. 8 out of every 9 children enrolled completes the pri-mary education. And about 3 out of every 5 com-plete the basic education (PP-X).
By looking at the current trend, Bhutan is on the
track of achieving the MdG and to achieve 100% enrolment by 2015 will just be a linear progres-sion, However it is very difficult to determine the exact number of school aged children who have been denied access to schooling, especially in the very remote areas, and those disadvantaged chil-dren.
gone up significantly. The number of new entrants has increased (enrolment went up), and most importantly the number of 12 and 16 years old has decreased (denominator went down). According to the nSB projection there are almost 300, 12 and 16 year old less in Bhutan than last year.
Figure 4.6(b) Basic completion rates since 2006
80.0%60.0%40.0%20.0%0.0%
2006 2007 2008 2009
Figure 4.6(a) Primary completion rates since 2006
9 5 . 0 %9 0 . 0 %8 5 . 0 %8 0 . 0 %7 5 . 0 %7 0 . 0 %6 5 . 0 %
2006 2007 2008 2009
Box 4.2 gives the overview of the factors affecting the PCR
Box 4.2: Factors affecting the Primary Completion Rate
Education creates choices and opportunities for people, helps to reduce poverty and gender bias, lowers birth rates, and stimulates a better understanding of diseases. For countries, it creates a more dynamic workforce and well-informed citizens able to compete and cooperate globally - opening doors to economic and social prosperity. universal primary education (measured through primary completion rate) is the second MdG. information provided on actual completion captures one of the most critical issues in the education sector.
Various factors may lead to poor performance on the PcR indicator, including low quality of schooling, discouragement resulting from poor performance, the direct and indirect costs of schooling, and the demands of farm work which keep children out of school for extended periods. Students’ progress to higher grades may also be limited by the availability of teachers, classrooms, and educational materials. However, this indicator is the most direct measure of national progress toward universal primary education and it captures the final outcome of the primary education system. But these factors take some time to change. therefore, improvements (or declines) in response to policy change will only register slowly
However, unESco and others note that the primary completion rate has limitations as an indicator of quality of an education system. it does not capture any measure of actual student learning, or estimate how many graduating students master a minimum set of cognitive skills

AnnuAl EducAtion StAtiSticS
�0
The coefficient of internal efficiency for Basic education shows the internal efficiency of the Bhutanese education system. The coefficient has increased by about 8% since 2004. Both boys and girls drop out significantly more in the secondary education grades. class iX is the only level where the drop-out rate of girls is higher than that of boys.
the survival rate to the last grade of primary school is an official indicator to track progress toward the second un Millennium development Goal (MdG), which calls for universal primary educa-tion by the year 2015. the survival rate to the last grade is the percentage of a cohort of students who enter the first grade of primary education and who are expected to reach the last grade, regardless of repetition
Table 4.1 compares the indicator ‘survivors to the grade’ for the last 4 years. Since 2005 gender de-segregated data is available. unlike in 2006, the girls performed much better than the boys in 2007. on average 2005 was a weak year, and it is fair to say that for the last 4 years, 65 to 73% of all
the children starting PP will eventually graduate. Some more years of gender disaggregated data is required to analyze the gender differences. Since Bhutan has such a small education system indi-vidual incidences have a great impact, while quite often they are not indicators of a trend.
Although 90% of children enrolled in grade 1 has reached grade 6 in 2009, a 4% jump since 2004, A significant number of children continue to drop out of school before completing the primary edu-cation cycle, there are no major gender disparities between boys and girls, with sometimes girls do-ing better than boys in terms of enrolment. in fact girls have been doing much better then boys for the past 5 years. Although there is room to improve the data quality for this indicator, the general trend in the last five years is that more children who start primary are reaching grade 6.
the recent statistics shows a remarkable increase in the basic graduate at 72%, an increase of about 5% since last year. indicating that 72% of children, who enter the school system finally completes the basic education. (class X graduates)

AnnuAl EducAtion StAtiSticS
��
Tab
le 4
.1 S
urv
ivo
rs t
o t
he
gra
de
2004
-200
8 (b
oth
sex
es, b
oys
, gir
ls)
PP1
23
45
67
89
10G
radu
ates
Both
Sex
es
Surv
ivor
s to
the
grad
e 20
0810
0010
0098
797
496
493
389
988
284
181
977
772
1
Surv
ivor
s to
the
grad
e 20
071,
000
986
967
943
924
887
854
839
787
757
701
670
Surv
ivor
s to
the
grad
e 20
061,
000
997
988
962
954
911
874
856
808
786
720
673
Surv
ivor
s to
the
grad
e 20
051,
000
1,00
098
094
793
288
684
481
575
072
068
263
1
Surv
ivor
s to
the
grad
e 20
041,
000
997
985
960
942
898
859
845
793
775
718
671
Boys
Surv
ivor
s to
the
grad
e 20
081,
000
997
981
960
939
902
851
832
788
780
753
721
Surv
ivor
s to
the
grad
e 20
071,
000
979
950
919
882
831
790
767
717
684
645
618
Surv
ivor
s to
the
grad
e 20
061,
000
1,00
098
895
994
889
484
481
578
176
271
368
2
Surv
ivor
s to
the
grad
e 20
051,
000
999
979
937
913
862
811
775
710
681
657
617
Gir
ls
Surv
ivor
s to
the
grad
e 20
081,
000
1,00
099
198
698
696
294
593
089
485
679
771
5
Surv
ivor
s to
the
grad
e 20
071,
000
993
985
968
968
946
922
916
861
837
760
724
Surv
ivor
s to
the
grad
e 20
061,
000
982
976
953
948
918
895
887
824
800
717
652
Surv
ivor
s to
the
grad
e 20
051,
000
1,00
098
095
795
091
187
785
779
376
370
764
3

AnnuAl EducAtion StAtiSticS
��
5.1 Teacher strength
the total number of teachers as of March 2009 is 8418. this includes all government schools, private schools, institutes and non Formal centers. the
number of teachers in regular government schools is 6705. table 5.0 shows the teacher strength in Bhutan at the moment.
in table 5.1 the number of teachers for 2007, 2008 and 2009 per type of school and gender are reported.
in remote areas and cPS, the number of male teachers is much higher than that of female teachers. the proportion of female teachers in the public Higher Secondary Schools is around 34%, a bit less than the proportion of girls in these schools.
5. TEACHERS
Table 5.0 Teacher strength March 2009
Public Private Total A Early Childhood Male Female Male Female Male Female Total
1 day care centres - - 1 36 1 36 3 7
B School Education
1 community Primary Schools 991 290 5 2 996 292 1,288
2 Primary Schools 500 431 36 86 536 517 1,053
4 lower Secondary Schools 904 881 18 32 922 913 1,835
5 Middle Secondary Schools 734 540 12 15 746 555 1,301
6 Higher Secondary Schools 598 314 202 77 800 391 1,191
Sub-Total 3,727 2,456 731 212 4,000 2,668 6,668
C Tertiary Education
1 tertiary institutes 625 168 0 0 625 168 793
D vocational institutes 110 17 0 0 110 17 127
E Special Institutes 17 20 0 0 17 20 37
Total (Schools and Institutes) 4,479 2,661 274 248 4,752 2,906 7,662
G Non-Formal Centres 315 441 0 0 315 441 756
GRAND TOTAL 4,801 3,75 274 248 5,068 3,350 8,418

AnnuAl EducAtion StAtiSticS
��
5.1.1 Proportion of Non-Bhutanese TeachersFrom an almost total dependence on expatriate teachers in the 1960s, the Bhutanese education system has moved towards self-sufficiency. However, dependence on expatriate teachers continues at the secondary levels and private schools recruit a comparatively large number of ex-pat teachers. At present around 10% of the total teaching force is expatriate. A comparison between 1997 and 2009 shows an impressively high increase in the proportion and absolute number of Bhutanese teachers over the years.
Table 5.1 Teacher strength 2007-2009
Type of School2006 2007 2008 2009
M F Tot M F Tot M F Tot M F Tot
community Primary 665 187 852 703 193 896 775 225 1,000 991 290 1,281
Pvt community Pri-mary School 0 0 0 0 0 0 0 0 0 5 2 7
Primary Schools 427 363 790 416 335 751 425 374 799 500 431 931
Pvt Primary Schools 52 112 164 46 107 153 39 84 123 36 86 122
lower Secondary Schools 857 786 1,643 860 744 1,604 836 791 1,627 904 881 1,785
Pvt lower Secondary Schools 0 0 0 12 11 23 27 37 64 18 32 50
Middle Secondary Schools 440 308 748 622 471 1,093 697 480 1,177 734 540 1,274
Pvt Middle Secondary School 0 0 0 0 0 0 0 0 0 12 15 27
Higher Secondary Schools 413 183 596 467 216 683 523 231 754 598 314 912
Pvt Higher Secondary schools 136 34 170 131 38 169 154 47 201 202 77 279
Total 2,990 1,973 4,963 3,257 2,115 5,372 3,476 2,269 5,745 4,000 2,668 6,668
Approximately 10 percent of the teachers in the School system are expatriates, with the majority teaching in the higher secondary and middle sec-ondary levels. At the higher secondary level, 27 percent of the teachers are expatriates and at the middle secondary level, 14 percent are expatriates. 27 percent of private school teachers are expatri-ates, with the majority being employed in the pri-vate higher secondary levels.
Similarly, approximately 12 percent of the lectur-ers in the institutes under the Royal university of Bhutan are expatriates, with the maximum in Sherubtse college, where 28 percent of the teach-ing staff are expatriates.
Figure 5.0 Proportion of Bhutanese and non Bhutanese teachers (1997-2009)
70000600050004000300020001000
01997 2002 2007 2008 2009
Bht
nBht

AnnuAl EducAtion StAtiSticS
��
However, the vocational institutes under the Ministry of labour and Human Resources (MolHR), and the special institutes and day care centers under the Ministry of Education are fully staffed by Bhutanese nationals.
5.2 Teacher education5.2.1 Pre-service training
Pre-service teacher education is provided at the colleges of Education (coE) in Samtse and Paro, the former established in 1968 and the latter in 1975. there are two pre-service programs offered, a Bachelor of Education (B.Ed) and a Post Gradu-ate Certificate in Education (PGCE). The four-year B.Ed. programme caters for both primary and sec-ondary teaching and is provided in both the coEs, whereas the one year PGcE programme caters for secondary teaching and is provided in the institute at Samtse only.
Entry into the PGcE programme requires a 1st degree, while the B.Ed programme requires a class XII or equivalent certificate. Currently, the B.Ed degree includes 1 year of field attachment as apprentice teachers at the beginning of the pro-gramme. in 2008, 325 students were sent as ap-prentice teachers.
From 2009 onwards the apprenticeship programme at the beginning will be discontinued and students will undergo the apprenticeship during the 3rd year of the programme. the B.Ed programme, which used to be only in English, has now been expanded to include dzong-kha.
the enrolment in the 2 teacher colleges has in-creased to about 2028 students i.e 60% increase since last year. the proportion of girls choosing to become teachers is hovering around 36%. this is not surprising given the lower proportion of girls enrolled in higher secondary schools. the propor-tion of girls enrolled in the teacher colleges has been declining since 2004. considering the overall enrolment in the RuB-colleges, the proportion of girls studying in the teacher colleges is higher than the average.
5.2.2 In-Service training
Although many factors combine to make a suc-
cessful school, therefore a successful education system, many people agree that quality teachers are among the most important requirements for suc-cess, especially when success of school is defined by an ability of the school to raise the achievement of its students. teachers are crucial given their daily contact with students in the classroomteach-ers are regularly updated on new developments in curriculum and other educational issues through in-service training and workshops organized at national, dzongkhag and school level as well as through fellowships outside the country. the table below shows the number of in-service workshops organized at the national level from 2002 - 2008.
Since 1995, the Ministry has provided opportunities for in-service teachers to upgrade their qualifications by sitting for the national level examinations as private candidates. in december 2008, 150 will avail this opportunity.
Table 5.2 In-service Workshops
YearNational Level
Courses Participants2002 31 2,0332003 27 1,3582004 22 8512005 10 5602006 20 2,3452007 16 1,800total 126 8,947
Table 5.3 Distance education 2003-2008
Year of graduation B.Ed (P) M.Ed
2003 45 -
2004 32 -
2005 44 17
2006 44 17
2007(2007-2008) 40 23
2008(2008-2009) 41 20
total 246 77

AnnuAl EducAtion StAtiSticS
��
Since 2000, in-service teachers have had the opportunity to upgrade themselves to Bachelors of Education (B.Ed) in primary education via a distance education programme. in 2002, a Masters of Education programme was also started at the Paro college of Education using the same mode. table 5.4 shows the number of graduates so far.
Table 5.4 Number of trained teachers by degree, March 2008
Academic degreeTrained as teacher not trained as teacher Total Teachers
# % # % # %
Masters degree 390 6% 109 2% 499 8%
Bachelors degree 2,809 42% 510 8% 3,319 50%
Higher Secondary/ 1,611 24% 151 2% 1,762 27%
under Matriculation 11 0% 3 0% 14 0.2%
ZltS 865 13% 191 3% 1,056 16%
Total 5,686 86% 964 15% 6,650 100%
this programme is in great demand, especially af-ter a first degree became an official requirement for advancing in one’s career. The Distance B.Ed is being facilitated from Samtse college of Edu-cation, and the distance M.Ed from Paro college of Education. teachers participating are offered classes during winter break and offered remote education during the academic year. in that sense, both programmes are mixed mode degrees rather than distance education.
5.3 Academic profile of teachers
out of a total of 6650 teachers, 86% are trained in the teaching profession. Around 84% of our teach-ers have at least a Class X certificate. In addition, about 16% of the teachers are Zhungkha language teachers (Zlts). less than 0.2% of the teachers do not have a class X certificate.
A comparatively low percentage of the teachers with a Masters and Bachelors degree, most of whom are expatriate teachers, do not have a teach-ing certificate.

AnnuAl EducAtion StAtiSticS
��
Some of the major quality indicators that the Min-istry of Education uses are the teacher-pupil ratio, or the number of teachers per school and the class size. this chapter focuses on these indicators.
6.1 Teacher-pupil ratio
The student/teacher ratio measures the number of students per teacher. It reflects teacher workload and the availability of teachers’ services to their students. The lower the student/teacher ratio, the higher the availability of teacher services to stu-dents. The student/teacher ratio has implications not only for the cost of education, but also for the quality. The student/teacher ratio is not the same
6. QUALITY INDICATORS
as class size, however. the relationship between these two measures of teacher workload is affect-ed by a variety of factors, including the number of classes for which a teacher is responsible and the number of classes taken by students.
table 6.0 gives the teacher-pupil ratio for different school levels by location. it shows that, on aver-age, the highest ratios are found in the remote and very remote schools. the table includes private schools which are mainly in the urban category. it is interesting to note that the ratio in the cPSs has dropped since last year. that is because so many teachers were deployed to the remote areas, and most of cPSs are in the remote areas
Table 6.0 Teacher-pupil ratio in schools per location March 2009
Level of Schools Urban Semi-Urban
Semi-Remote Remote very
Remote Difficult Total
community primary 23 25 25 23 25 16 24
Primary 26 23 24 26 28 0 25
lower Secondary 27 26 26 33 28 0 27
Middle Seconday 25 28 27 37 0 0 27
Higher Seconday 21 20 0 0 0 0 21
Total 25 26 25 26 26 16 25
Figure 6.0 Teacher Pupil ratio by Dzongkhag below and above the mean
35
30
25
20
15
10
5
0

AnnuAl EducAtion StAtiSticS
��
nationwide, the teacher pupil ratio is now 25 students per teacher on average. the decrease in teacher pupil ratio has been accompanied by un-even progress among the category of school and dzongkhags, with a standard deviation 4.362 and mean 24 at the dzongkhag level. on average the ratio has improved in all dzongkhag. Also aver-ages of more than 50 for a certain type of school in a dzongkhag no longer occurs as was the case in previous years. The figure 6.0 shows the ratios by dzongkhag.
Standard deviation is a measure of the variability
or dispersion of a population, a data set, or a prob-ability distribution. A low standard deviation indi-cates that the data points tend to be very close to the same value (the mean), i.e. evenly or uniformly distributed, while a high standard deviation indi-cates that the data are “spread out” over a large range of values ( data is not evenly distributed).
though the national teacher pupil ratio is low and impressive, but it has been accompanied by un-even distribution among the schools, regions and dzongkhags with some having very high ratios and some very low.
the teacher pupil ratio in trongsa is 19 (apart from Gasa, lowest ratio) while it is 32 (highest ratio) in Samdrup Jongkhar, the variation is very high at the school level. We focus on school rather then dzongkhag because the latter would miss the potentially large differences among schools within dzongkhag in terms of teacher distribution. the standard deviation among the school is 11.841 typically ranging from 5 to 106; which means that some remote schools have ratios as less as 5 while some has as high as 106.
About 48% of the schools have a pupil-teacher ratio between 20 and 32. A signifi-cant number of cPSs also have a low ratio. this is also understandable since cPSs fo-
Figure 6.1 Teacher pupil ratios with mean and standard deviation.
0 20 40 60 80 100 120
140
120
100
80
60
40
20
0
Histrogram
Freq
uenc
y
Figure 6.2 Division of teacher pupil ratio
1%
2%17%
48%
32%

AnnuAl EducAtion StAtiSticS
��
cus on small communities, with multi grade situa-tions. if we leave out the cPSs, 50 public schools have a pupil-teacher ratio of less than 20, while more than 150 have a pupil-teacher ratio of over 30, and 17 schools i.e. 1% have a pupil-teacher ra-tio of more than 50.
table 6.1 shows the number of schools per dzong-khag that have a teacher: Pupil ratio lower than or equal to 32 and schools that have a teacher: Pu-pil ratio higher than 32. in Bumthang, Gasa, Haa
and trongsa all schools have a teacher: Pupil in line with the government target, while lhuentse, Paro, Punakha, thimphu, and trashi Yangtse are getting there. trashigang has the highest number of schools that have reached the target. dagana, Samdrup Jongkhar, Sarpang and Samtse have comparatively high number of school that still has to reach the target. in terms of absolute numbers Samdrup Jongkhar, Chukha and Mongar have the highest number of schools that still have to reach the target.
Table 6.1 Target T: P ratio reached
Dzongkhag T.P<32 T.P>32 %TP<32Bumthang 19 0 100%chukhaa 26 13 67%dagana 12 11 52%Gasa 5 0 100%Haa 11 0 100%lhuentse 25 2 93%Mongar 37 13 74%Paro 20 2 91%P/Gatshel 33 4 89%Punakha 20 1 95%s/jongkhar 12 16 43%Samtse 15 10 60%Sarpang 13 9 59%thimphu 39 2 95%trashigang 58 8 88%T/Yangtse 27 3 90%trongsa 24 0 100%tsirang 8 6 57%Wangdue 24 5 83%Zhemgang 27 5 84%
in March 2009, 21 schools and 11 Extended class-room reported they had only 1 teacher. of these, 9 schools and 11 Extended classroom reported to have an enrolment of more than 25 students. the policy is to have a maximum of 25 students in a MG situation. 4 schools and 11 Extended class-room each with 1 teacher and an enrolment of more than 25 opened this year.
The figure 6.3 gives the changes in teacher-pupil ratio over the years. it shows a steady decline in the (community) primary and lower secondary schools, with the rate of decrease slowing down the last 3 to 4 years. the ratio in the middle & higher secondary schools has been stable over the last few years.
6.2 Class size
next to number of students per teacher another indicator that can be used is the number of students per class or student: section ratio. teacher pupil ratio and class size are not same (see box 2.1 ) this assumes that every section in a school is a different class. table 6.2 shows the class size per section per school. it shows that in urban and semi-urban areas the classes are crowded. it also shows that the classes in the lower Secondary, Middle Secondary and Higher Secondary Schools are more crowded than in the Primary and community Primary Schools. the cPSs have on average the smallest class sizes, and in these schools multi-grade is more common.
Box 6.0: Difference between Class Size and Teacher Pupil Ratio
class Size – the number of students for whom a teacher is primarily responsibleduring a school year
Pupil-teacher Ratio (PtR) – is the number of students in a school or dzongkhag compared to the number of teaching professionals. in some venues all educators are included, including counselors, dance teachers, etc.

AnnuAl EducAtion StAtiSticS
��
the assumption in standard classroom construction is that the maximum number of students in a classroom is 40. therefore on average our classes have less than 40 students.
Table 6.2 Class size per location per school, March 2009
CategoryUrban Semi-
UrbanSemi-
Remote Remote very-Remote Difficult Average
levels of schools
CPS 30 26 20 17 16 9 20
PS 33 27 25 23 23 27
LSS 37 34 32 33 30 33
MSS 34 37 37 39 37
HSS 36 35 35
Average 34 32 29 28 23 9 26
the differences between the regions and school types are considerable. the dzongkhag with large class sizes last year have all improved a bit, despite increases in enrolment. the average class size in all dzongkhags is 40 or less. the average class size for Bhutan has reduced to 26 indicating that the school system has been able to accommodate the increasing enrolment.
But, as the school improvement ideas go, reducing class sizes is costlier than many others and more complicated than it appears on first blush.
With many communities already facing shortages of qualified teachers, one concern is that the press for quantity will come at the expense of quality, forcing schools and dzongkhag to hire under qualified or unprepared teachers.
the table 6.3 shows by dzongkhag, how many schools have a class size that is smaller than or equal to 40, and how many schools have more than 40 per class in most dzongkhags a majority of the schools have been able to keep the average
Figure 6.3 Teacher pupil ratio since 2002 by level of school
45
40
35
30
25
20
15
10
5
0
Middle & HigherSecondary
Primary PrivatelowerSecondary
communityPrimary

AnnuAl EducAtion StAtiSticS
�0
class size below 40. the exception is Sarpang, where the class rooms are overcrowded in about 41% of the schools.
The box 6.1 presents some of the research findings on the benefits of smaller classrooms
Box 6.1: Research findings on benefits of smaller class
Research, for the most part, tends to support the belief in the benefits of small classes. Compelling evidence demonstrates that reducing class size, particularly for younger children, has a positive effect on student achievement overall and an especially significant impact on the education of disadvantaged children.large gains in both math and reading stem from more effective teaching and more focused learning. More teacher-student interaction allows teachers to recognize the needs of individual students and customize instruction and assignments. teachers know the students better and can recognize problems and special needs early. For their part, students are more likely to be on task and less likely to talk amongst themselves. they create fewer discipline problems and engage in more pro-social behavior, allowing teachers to devote more time to instruction and less to controlling the class. Smaller classrooms are more pleasant and have fewer distractions.Researchers have found long-term effects of small classes in the early years. Students with two or more years of small classes in elementary school score higher on tests in middle and high school
Table 6.3 Class size Maximum per Dzongkhag, March 2009
DzongkhagClass =< 40 Class > 40 % Class =< 40
2008 2009 2008 2009 2008 2009
Bhutan 413 528 52 48 89% 92%
Bumthang 15 18 1 1 94% 95%
chhukha 29 34 5 6 85% 85%
dagana 12 19 7 7 63% 73%
Gasa 2 5 0 0 100% 100%
Haa 7 11 0 0 100% 100%
lhuentse 23 27 0 0 100% 100%
Mongar 44 49 2 1 96% 98%
Paro 16 19 4 3 80% 86%
Pema Gatshel 27 36 1 1 96% 97%
Punakha 16 21 2 0 89% 100%
Samdrupjongkhar 19 24 4 4 83% 86%
Samtse 5 24 9 8 36% 75%
Sarpang 8 13 6 9 57% 59%
thimphu 34 39 2 2 94% 95%
trashigang 57 66 1 0 98% 100%
trashiyangtse 27 30 0 0 100% 100%
trongsa 20 24 0 0 100% 100%
tsirang 5 10 3 4 63% 71%
Wangduephodrang 21 28 4 1 84% 97%
Zhemgang 26 31 1 1 96% 97%

AnnuAl EducAtion StAtiSticS
��
to provide quality education it is important that facilities in the school are up to date. in this chap-ter the status of some of these facilities viz. water provision, electricity, telephone connection, labo-ratories, computers and classrooms, as reported
7. EDUCATION FACILITIES
by the schools is reflected. A study in Tennessee has found a statistically significant relationship be-tween school facilities and the Student behaviours and performance (see box 7.0).
the chapter ends with an overview of the accessibility of the schools.
Box 7.0: Correlation between school facility and student behaviors and performance
there is growing evidence of a correlation between the adequacy of a school facility and student behavior and per-formance. The study done in Tennessee, have found a statistically significant relationship between the condition of a school, or classroom, and student achievement. in general, students attending school in newer, better facilities score five to seventeen points higher on standardized tests than those attending in substandard buildings
Building a school infrastructure is different from building an office infrastructure. The school infrastructure not only has to be functional and economical, it has to give a sense of self-worth to the student. it has to show the communi-ty’s commitment to education. Indeed, schools send an important message: we value our children. The building can either say to students: “Tough it out and get by—we’re not completely committed to your education;” or it can say: “You are a vital part of our community. We want you to feel safe, comfortable, challenged, inspired, and proud— we believe in you and your future.” the message that the school building sends is not lost on teachers, students, or the community at large.
School facilities also seem to symbolize something to the community. An attractive school is a source of pride and generates good will for public education. For students, it inspires good conduct, increases academic achievement, and reduces vandalism
7.1 The Water Situation in Schools
Based on the reports of the schools as to the number of tap stands in a school and the sufficiency of water supply, an analysis has been made of the water situation in our schools as shown by table 7.0.
Table 7.0 Water situation in the schools, March 2009
Statusno tapstand 1 or more tapstands
no informationSufficient Water supply
Insufficient Water Supply
Sufficient Water supply
Insufficient Water Supply
Public day 11 40 189 155 27
Public 2 13 54 54 0
Private 0 0 18 0 0
total 13 53 261 209 27
About 51% of the schools reported to have sufficient water supply, the same percentage for day school and

AnnuAl EducAtion StAtiSticS
��
46% as for boarding schools. Around 67 boarding schools reported to have insufficient water supply, while 13 of these boarding schools have no tap stands for their students.
When analyzing the water supply situation for day schools without tap stands, it was found that around half of them have a source or stream, espe-cially the remote schools.
As shown earlier, around 46% of the boarding schools state they have sufficient water supply. Some of these still choose to make a remark with regard to their water supply, therefore 48% is shown as having sufficient water supply. Most of the water problems in schools are to do with their source.
the table 7.1 shows the average number of tap stands available for students by dzongkhag.
Table 7.1: Student-tap stand ratio by Dzong-khag for schools with tap stands, March 2009
Dzongkhag No Tapstand
Schools with tapstand
No. of school
Student:Tapstand ratio
Bumthang 1 13 211
chukhaa 8 26 434
dagana 3 22 226
Gasa 2 2 236
Haa 1 8 283
lhuentse 5 21 116
Mongar 4 40 215
Paro 0 18 454
P/Gatshel 3 27 213
Punakha 4 15 315
s/jongkhar 1 22 264
Samtse 9 9 694
Sarpang 4 14 682
thimphu 5 29 582
trashigang 6 53 214
T/Yangtse 0 27 167
trongsa 3 17 148
tsirang 3 9 302
Wangdue 1 23 256
Zhemgang 4 22 157
7.2 Provision of classrooms, labo-ratories and computers in schools
the number of classrooms available in a school is another facility that influences the quality of education. Some schools face shortage of classrooms and have to introduce shift system.
Figure 7.0 shows the class room situation. collecting information on classrooms was more difficult than collecting information on enrolment. A significant amount of schools did not give adequate information on their classrooms . it is also unknown whether the classrooms reported in the statistics forms are permanent classrooms or temporary structures.
Analysis of the information, as in figure 7.0, indicates that most of the schools that gave information have enough classrooms. only 10% of schools reported to have more than 40 students per class.
Figure 7.0 Total Student per class

AnnuAl EducAtion StAtiSticS
��
7.2.1. Laboratories in schools
Another facility that is required in the schools is laboratories. classes Vii and Viii require a general science laboratory, while classes iX and above re-quire separate laboratories for physics, chemistry, and biology. A computer laboratory is also required for class iX and above.
table 7.2 shows the current provision of laboratories
in the schools. A word of caution is required with regard to data-collection. it is unclear what the using existing classrooms in the absence of dedicated laboratories, reported. the 3rd column refers to schools that have all 5 laboratories. in case a school has a General Science laboratory and a chemistry laboratory, but does not have any other laboratories it is calculated under the 2nd column.
From the above we can see only 6 higher second-ary schools have fully equipped general science laboratories as well as physics, chemistry, biology and computer laboratories. 29 schools still have to construct 3 laboratories. Four Higher Secondary School and three Middle secondary schools do not have a laboratory at all as they have only recent-ly been upgraded. the same is true for the lower secondary schools. due to admission pressure so many schools were upgraded before putting in ad-equate facilities. this is one of the main challenges for the 10th FYP.
7.2.2. Computers in schools
one of the goals of the 9th FYP was to equip all Higher and most of the Middle Secondary Schools with computers. it literacy is seen as an invalu-able asset for a future career. therefore computer
Table 7.2 Laboratory by level of school, public schools, March 2008
No Laboratory General Science Laboratory
General Science with other Laboratory* No information
CPS 246 23 0 0
PS 70 23 0 3
LSS 36 52 3 0
MSS 3 31 11 1
HSS 4 29 6 0
*Chemistry, Biology, Physics and computer laboratory
Science and computer Applications are offered, it teachers continue to be trained, and schools are provided with computer laboratories and computer laboratory assistants, along with both hardware and software for it education. table 7.3 shows the results of this project.All Higher Secondary Schools have computers, with an average of 21 per school. of the 46 Middle Secondary Schools, 39 have computers, with an average of 19 computers per school.
At the (c) PS and lSS level the number of com-puters is less. on average, the schools that have computers, have just a few and these are probably used by the office staff. Quite a surprising number of community Primary Schools have computers, given the fact that a lot of them are in remote plac-es, and some do not have access to electricity.

AnnuAl EducAtion StAtiSticS
��
7.3 Electricity, telephone and in-ternet connectivity
the priority after the provision of basic facilities like water and classrooms is to ensure that schools have access to electricity, a working telephone-line and a working internet connection. this paragraph describes the current situation with regard to these facilities.
For the schools at level Vii and higher being con-nected is very important and computers and labo-ratories need electricity.
Almost 50% of the cPSs have electricity. While it is not clear whether the question of access to electricity may have been interpreted as including access to solar power, the data shows that a lot of areas in Bhutan are not yet electrified.
telephone access is another important facility which is necessary for ensuring communication between parents and the school, between the school and the dzongkhag and central administration etc. This can also benefit the larger community in case of remote schools.
Table 7.3 Computers in the schools, March 2009
Level
With ComputerWithout
computer No informationNo. school No of computers Average Computer
per school
Public
cPS 122 340 3 141 5
PS 55 197 4 28 2
lSS 72 343 5 11 6
MSS 38 555 15 3 4
HSS 26 538 21 0 1
Total 313 1973 6 183 18
Private
cPS 0 0 0 0 1
PS 9 47 5 1 1
lSS 2 34 17 0 0
MSS 1 23 23 0 0
HSS 10 289 29 0 2
Total 22 393 18 1 4
Grand Total 335 2366 24 184 22

AnnuAl EducAtion StAtiSticS
��
Table 7.4: Electricity connectivity, per level, March 2009
LevelSchools with electricity connectivity
Yes No % Yes No Total
Public
CPS 121 134 48% 13 268PS 54 27 67% 4 85LSS 66 14 83% 8 88MSS 37 5 88% 3 45HSS 26 0 100% 1 27Total 304 180 63% 29 514
Private
CPS 0 0 0% 1 1PS 9 1 90% 1 11LSS 2 0 100% 0 2MSS 1 0 100% 0 1HSS 11 0 100% 1 12Total 23 1 96% 3 27Grand Total 327 181 64% 32 541
72% of the public schools in Bhutan report that they have a working landline phone. Even in the more remote areas around 60% of the schools can be contacted via the telephone.
internet facilities are now increasingly being intro-duced in our schools. Most schools with internet are connected via dial-up. However, this is not ad-
equate for schools and a few Middle and Higher Secondary Schools are now moving from dial-up to lease-lines.
Further it facilities in schools are being enhanced with training of it laboratory assistants in set-ting up and maintenance of local Area networks (lAn).
Table 7.5: Schools with working landline phone, per category, March 2009
CategoryWorking Landline Phone
Yes No % Yes No Information Total
Public
Urban 75 6 93% 5 86
Semi-Urban 63 11 85% 2 76
remote 66 58 53% 5 129
Semi-remote 94 34 73% 6 134
very remote 52 27 66% 6 85
difficult 3 1 75% 4
Total 353 137 72% 24 514
Private
Urban 17 0 100% 1 18
Semi-Urban 7 0 100% 2 9
Total 24 0 100% 3 27

AnnuAl EducAtion StAtiSticS
��
From the above table we could see that 87% of private schools are connected to the internet while only 25% of the public schools have that access. However 81% of Public HSS have access to internet while only 8 to 25% of c (PS) has the access
7.4 Road accessibility
Accessibility by road is another very important indicator. While it has less to do with the quality of educa-tion, it enables supply of goods and materials and facilitates the movement of teachers and students. About 56% of our schools have access to road.
Road access per Dzongkhag is reflected in table 7.9. 89% of schools in Thimphu have road access, followed by Bumthang with 88%. 3 out of every 5 schools in Mongar and 3 out of every 7 schools in Pemagatshel have road access.
table 7.8 shows the distance of school from the nearest road head by level of school. We see that most of our schools are located near the road head, most of them within the walking distance of less than 20 minutes. Almost all the HSS are less than 20 minutes walking distance from the road. While many of the remoter CPS’s are far away from the road, a walking distance as far as more than three days from the road head.
Table 7.6: Internet connectivity per level, March 2009
LevelWorking Internet Connection
Yes No % Yes No Information Total
Public
CPS 21 231 8% 16 268PS 20 60 25% 6 86LSS 38 43 47% 7 88MSS 20 21 49% 4 45HSS 21 5 81% 2 28Total 120 360 25% 35 514
Private
CPS 0 0 0% 1 1PS 8 1 89% 2 11LSS 2 0 100% 0 2MSS 1 0 100% 0 1HSS 9 2 82% 1 12Total 20 3 87% 4 27

AnnuAl EducAtion StAtiSticS
��
Table 7.7 Accessibility by road for public schools by Dzongkhag, March 2009
OwnershipRoad acessibility
Yes No % Yes No Information
Public
Bumthang 15 2 88% 2
chukhaa 20 17 54% 2
dagana 11 12 48%
Gasa 1 3 25%
Haa 6 4 60%
lhuentse 13 14 48%
Mongar 17 29 37% 4
Paro 15 3 83% 4
P/Gatshel 10 24 29% 3
Punakha 17 3 85% 1
s/jongkhar 11 14 44% 1
Samtse 11 8 58%
Sarpang 12 8 60% 1
thimphu 24 3 89%
trashigang 33 30 52%
T/Yangtse 11 19 37%
trongsa 14 9 61%
tsirang 6 7 46%
Wangdue 19 8 70%
Zhemgang 8 21 28%
PrivateBumthang 1 100%
chukhaa 1 100%
Mongar 1 100%
Paro 4 100%
Punakha 1 100%
s/jongkhar 1 100%
Sarpang 2 100%
thimphu 12 100%
Zhemgang 1 100%
table 7.8 shows the distance of school from the nearest road head by level of school. We see that most of our schools are located near the road head, most of them within the walking distance of less than 20 minutes. Almost all the HSS are less than
20 minutes walking distance from the road. While many of the remoter CPS’s are far away from the road, a walking distance as far as more than three days from the road head.

AnnuAl EducAtion StAtiSticS
��
Tab
le 7
.8 D
ista
nce
of
sch
oo
l fro
m t
he
nea
rest
ro
ad h
ead
by
leve
l of
sch
oo
l
Ow
ners
hip
Dist
ance
to sc
hool
from
nea
rest
road
hea
d
Less
than
20
min
utes
<1 h
r<
2hr
< 3h
r<
one
day
< tw
o da
ys<
thre
e da
ys
> th
ree
days
No
Info
rmat
ion
Publ
ic
cPS
8216
1223
2935
1820
32
PS40
01
69
88
410
lSS
573
24
57
02
8
MSS
381
00
01
00
5
HSS
240
10
00
00
3
tota
l24
222
1737
4455
2710
5
Priv
ate
cPS
00
1
PS10
00
1
lSS
20
0
MSS
10
0
HSS
73
11
tota
l20
31

AnnuAl EducAtion StAtiSticS
��
8.1 Non Formal Education
the joint efforts of the dzongkha development Authority (DDA) and the National Women’s Asso-ciation of Bhutan (nWAB) gave birth to the non-Formal Education (nFE) in 1992. the Ministry of Education formally took over nFE programme in 1994, now called the non-Formal and continuing Education division (nFcEd).
there has been a tremendous growth in the number of nFE centers from 6 in 1992 with 300 learners to 688 centers with 13160 learners and 737 instruc-tors in 2009. learners can attend a basic literacy course followed by a post literacy course. there are fewer instructors than centers since courses in some centers are taught by regular teachers who are not reflected in this table.it is interesting to note that participation of women in the nFE programme is high, both as instructors and learners. Participation in Samtse is the highest in absolute numbers while participation in dagana is comparatively high.
8.2 Continuing Education
in 2006 the Ministry of Education started a pilot continuing Education Programme at Kelki Private HSS, to offer adults who had to leave school be-fore finishing their secondary education the oppor-tunity to upgrade their qualifications. Presently the programme offers 2 year courses for completion of classes X and Xii. Since most of the participants are in-service people, the classes are conducted in the evenings and on the weekends.
8. NON-FORMAL, CONTINUING AND SPECIAL EDUCATION
Table 8.0 Enrolment in Continuing Educa-tion since 2006
Male Female Total
2009 391 475 866
2008 266 311 577
2007 177 216 393
2006 78 70 148
in 2008 and 2009 the programme expanded to more schools in Paro, Bumthang, Sarpang and chhukha. the programme has been found to be very popular, especially at classes Xi and Xii. this enrolment is not yet counted in the summary table since the cE programme is still in its pilot phase.
8.3 Special Education
the national institute for the disabled (nid) in Khaling caters to visually impaired children. As of 2009, there are 48 students and 13 teachers in the institute. two other schools also cater to special needs education, contributing toward the ‘Educa-
tion for All’ goals. Drukgyel LSS in Paro has a deaf education resource unit, while changangkha lSS in thimphu has facilities to teach both physi-cally and mentally challenged children. these two schools are part of the RGoB’s effort to make schools as inclusive as possible and integrate spe-cial education into mainstream education.

AnnuAl EducAtion StAtiSticS
�0
the enrolment in the nid has decreased this year, though it has showed a slow increase over the last few years, especially compared to the spectacular enrolment increase in the regular education. one of the challenges for the education sector is to en-sure that all children with special needs receive suitable education so they can become full mem-bers of society.
8.4 Sanskrit Pathshalas
there is presently 1 school in Sarpang catering to the study of Sanskrit for young children. there are 18 children in this school.
Table 8.1: Enrolment and Teaching Strength in NID 2002-2008
Students Teachers
B G BG M F MF
2009 30 18 48 10 3 13
2008 30 20 50 13 0 13
2007 34 15 49 11 1 12
2006 23 18 41 11 1 12
2005 33 9 42 9 1 10
2004 27 11 38 9 1 10
2003 26 9 35 7 1 8
2002 28 9 37 7 1 8

AnnuAl EducAtion StAtiSticS
��
9.1 Tertiary education
All publicly financed tertiary education in Bhutan is under the umbrella of the Royal university of Bhutan. At the moment 11 different institutes con-
stitute the Royal university of Bhutan. For more specific details the RUB can be consulted The girl’s enrolment is seen to be lesser than boys in the RuB, with male female ratio of 65:35.
9. TERTIARY, VOCATIONAL, INTERNA-TIONAL AND MONASTIC
EDUCATION
Table 9.0 Staff and Students in the Royal University of Bhutan academic year 2008
Sl. Level of schoolsStudents Teachers Others
B G BG Bht N/Bht Tot Bht N/Bht Tot
Institutions:
1 college of natural Resources, lobesa 121 26 147 70 2 72 15 0 15
2 college of Science and technology, Rinchhending 213 79 292 66 15 81 19 0 19
3 institute of language and culture Studies, Semtokha 215 124 339 46 1 47 10 0 10
4 Jigme Namgyel Polytechnic, dewathang 268 77 345 59 2 61 13 0 13
5 national institute of traditional Medicine, thimphu 31 9 40 15 - 15 3 0 3
6 Paro college of Education, Paro 719 343 1,062 82 1 83 17 0 17
7 Royal institute of Health Sciences, thimphu 131 126 257 41 - 41 9 0 9
8 Royal institute of Management, Semtokha 193 143 336 76 3 79 31 0 31
9 Samtse college of Education, Samtse 580 386 966 81 8 89 23 0 23
10 Sherubtse college, Kanglung 510 262 772 112 44 156 21 0 21
11 Gaeddug college of 315 180 495 52 17 69 16 0 16
Total 3,296 1,755 5,051 700 93 793 177 0 177

AnnuAl EducAtion StAtiSticS
��
9.3 Students Abroad
Primary and secondary educationA significant number of Bhutanese children are studying in primary and secondary schools abroad. Many Parents also send their children to schools in towns like Kalimpong, darjeeling and chennai in india. these children are funded privately.
9.2 Vocational education
Provision of vocational education is the responsibility of the Ministry of labour and Human
Resources. At the moment there are 8 Vocational Training institutes. For more specific details the Ministry of labour and Human Resources can be contacted.
Table 9.1 Staff and students in Vocational Training Institutes academic year 2008
Dzong-khag
Name of the institute
Students Teaching Non-Teaching
Male Female Total male female Total Male female Total
Bumthang chumey Vti 147 91 238 15 6 21 5 2 7
Punakha Khuruthang Vti 116 50 166 10 5 15 10 5 15
Sarpang Serzhong Vti 79 54 133 10 1 11 3 1 4
thimphu national institute for Zorig chusum 216 125 341 26 3 29 6 6 12
thimphu institute of automobile 21 4 25 9 1 10 1 1 2
tashigang Rangjung Vti 109 48 157 16 1 17 10 1 11
tashiyang-tse
tashiyangtse insti-tute of Zorig chu-sum
42 15 57 12 0 12 5 0 5
Wangdue Samthang 95 10 105 12 0 12 6 0 6
Total 825 397 1222 110 17 127 46 16 62
Tertiary educationEvery year, the RGoB provides scholarships for class Xii graduates to study various professions abroad. these slots are limited and merit based. Several other funding agencies like the Government of india also provide undergraduate scholarships. table 9.2 gives the number of undergraduate
Table 9.2 Bhutanese Undergraduate students abroad with RGOB Scholarships, 2008
Year of pass-ing out
India, RGOB India, GOI Other, RGOB India,MoA Total
M F MF M F MF M F MF M F MF M F MF
2009 38 9 47 32 5 37 15 2 17 0 0 0 85 16 101
2010 11 3 14 49 6 55 10 2 11 4 4 8 74 15 88
2011 23 11 34 38 10 48 16 8 23 13 4 17 90 33 122
2012 6 0 6 50 5 55 12 3 14 11 5 16 79 13 91
2013 0 0 0 9 0 9 15 9 24 0 0 0 24 9 33
2014 0 0 0 4 0 4 17 3 20 0 0 0 21 3 24
2015 0 0 0 0 0 0 26 5 31 0 0 0 26 5 31
Total 78 23 101 182 26 208 111 32 140 28 13 41 399 94 490

AnnuAl EducAtion StAtiSticS
��
students with scholarships abroad. A significant number of students also study abroad through private funding. table 9.3 gives the students studying privately in india and in other countries.
the private student numbers are based upon the membership figures of the Bhutanese Student Associations in the different towns and countries.
the number of girls receiving scholarships and those under private funding is much lower than the number of boys. i.e. only 19 and 43 percent respec-tively.. it remains one of the challenges to ensure that participation of girls stay at the same level as in class X.
9.4 Monastic Education
Monastic education is the oldest form of education in Bhutan. today it continues to play an impor-tant role in the Bhutanese Education system. Most monastic schools are administered by the central Monastic Body. For these schools enrolment data has been collected. table 9.4 gives an overview of
the enrolment in these schools. the Monastic body has reported that there are 4642 students in 388 monastic schools and 3 nunneries over Bhutan. this enrolment is significantly lower than the one reported for 2006 and 2007, which was 9287 and 7005.
information on monas-teries not administered by the central monastic body is not available in detail. the central mo-nastic body has reported that in 2004, there were 5,149 learners enrolled in these monasteries. it is obvious that more boys than girls are en-rolled in these schools.
Table 9.3 Bhutanese privately funded Tertiary Education students abroad, 2008
Country Male Female Total
india 1844 1392 3236
thailand 4 3 7
nepal 1 0 1
Phillipines 4 3 7
uSA 0 2 2
Bangladesh 4 5 9
Total 1857 1405 3262
Table 9.4 Enrolment in monastic schools administered by the central monastic body, 2008
Dzongkhag Monastic schools Male Female Total
Bhutan 388 4395 67 4642
chhukha 25 119 119
dagana 11 122 122
Gasa 9 83 83
Haa 18 112 112
lhuentse 10 177 177
Mongar 27 202 202
Paro 43 243 30 273
Pemagatshel 5 96 17 113
Punakha/Thimphu 71 1890 20 2090
Samdrup Jongkhar 2 86 86
Samtse 9 181 181
trashiyangtse 6 103 103
trashigang 30 171 171
Trongsa/Bumthang 70 288 288
tsirang 5 83 83
Wangdiphodrang 30 205 205
Zhemgang 8 129 129
Sarpang 9 105 105
AnnuAl EducAtion StAtiSticS
��
10.1 Free services and sharing of costs
the Bhutanese education system is built upon the concept of free services from primary to tertiary level. Students are not only given free tuition but also provided with many facilities viz. stationary, textbooks, sports-items and boarding facilities and
10. FINANCING OF EDUCATION
food based on need. the policy trend during the last few years is, however, to work towards cost-sharing with parents, especially amongst those populations that are in a position to do so. Accord-ingly students studying in the urban areas have had to buy their own stationeries since 1993.
in general, all students are required to contribute to a School development Fund at the following rates:
‹ Community Primary and Primary Schools Nu 30/- per student per annum‹ Lower Secondary Schools Nu 100/- per student per annum‹ Middle and Higher Secondary Schools Nu 200/- per student per annum
10.2 Annual budget
The total budget provision for financial year 2007-2008 amounts to over Nu.3700 million, with more than half the provision for the programmes administered by the dzongkhags.

AnnuAl EducAtion StAtiSticS
��
Table 10.1 Annual Budget Education Sectors 2008 -2009 (in Million Nu.)
SI.No. Itmes Current Capital Total
1 national direction and educational Services 198.41 964.41 1,162.81
2 nid, Khaling 5.26 11.30 16.56
3 non Formal Education centres* 0.00 0.00 0.00
4 community Primary and Primary Schools 599.48 324.22 923.70
5 lower, Middle & Higher Secondary Schools 1,159.40 356.65 1,516.04
6 School Procurement Services 134.20 0.00 134.20
7 Resource centre Services 0.90 0.33 1.23
8 Gewog Education Services 0.00 1.23 1.23
Total 2,.97.65 1,658.13 3,755.77
Institutes & Colleges under RUB
1 ilcS, Semtokha 26.91 85.14 112.05
2 Paro college of Education 50.24 10.98 61.22
3 Samtse college of Education 40.27 30.04 70.31
4 college of national Resource, lobesa 25.26 9.16 34.42
5 college of Science & technology, Richending 27.73 49.39 77.12
6 Jigme Namgyel Polytechnic, Dewathang 23.68 17.53 41.21
7 Sherubtse college, Kanglung 56.54 26.81 83.35
8 Gedu college of Business Studies 30.50 11.90 42.40
9 national institute of traditional Medicine 6.24 8.58 14.82
10 Royal institute of Health Sciences 18.39 12.73 31.12
Total 305.75 262.26 568.00
Institutes under the MOLHR
1 institute for Zorig chusum, tashiyangtse 8.73 4.85 13.58
2 national institute for Zorig chusum, thimphu 18.50 3.87 22.37
3 Vocational training institute - Khuruthang 11.00 8.41 19.41
4 Vocational training institute - Samthang 9.76 2.31 12.08
5 Vocational training institute - Sarpang 8.17 5.98 14.16
6 Vocational training institute - chumey 8.92 2.34 11.25
7 Vocational training institute - Rangjung 10.48 19.07 29.55
8 Vocational training institute - thimphu 7.967 0.69 8.66
9 institute of Automobile Engineering, thimphu 4.15 0.18 4.33
Total 87.67 47.70 138.37
*Budget for NFEC clubbed under Primary Education Services

AnnuAl EducAtion StAtiSticS
��
Tab
le 1
0.2(
a) E
du
cati
on
Rev
ised
Bu
dg
et &
Exp
end
itu
re (
FY
07-
08)
by
Dzo
ng
khag
(
Nu
. In
Mill
ion
)
Sl.
No
Dzo
ngkh
ag
Pri
mar
y S
econ
dary
S
LD
SPS
R
CS
DEO
’s O
ffice
T
OTA
L
Cur
. C
ap.
Tot
. C
ur.
Cap
. T
ot.
Cur
. C
ap.
Tot
. C
ur.
Cap
. T
ot.
Cur
. C
ap.
Tot
. C
ur. C
ap.
Tot.
Cur
. C
ap.
Tot
.
1 Bu
mth
ang
Bud
. 1
6.45
4
.73
21.
18
30.
80
11.
29
42.
01
1.1
0 -
1.1
0 4
.07
- 4
.07
0.0
7 -
0.0
7 5
2.49
1
6.03
6
8.52
Exp
e.
15.
65
4.6
1 2
0.26
2
7.63
1
0.36
3
7.98
0
.96
- 0
.96
4.0
5 -
4.0
5 0
.01
- 0
.01
48.
30
14.
97
63.
27
%95
%97
%96
%90
%92
%90
%88
%88
%10
0%10
0%13
%13
%92
%93
%92
%
2 C
hukh
a
Bud
. 3
2.35
1
1.76
4
4.11
1
01.3
8 2
3.24
1
24.6
2 4
.21
- 4
.21
14.
02
- 1
4.02
0
.12
- 0
.12
152
.07
35.
00
187
.07
Exp
e.
15.
11
5.7
1 2
0.82
4
6.74
1
8.22
6
4.96
4
.02
- 4
.02
12.
87
- 1
2.87
0
.09
- 0
.09
78.
82
23.
93
102
.75
%47
%49
%47
%46
%78
%52
%95
%0%
95%
92%
0%92
%75
%0%
75%
52%
68%
55%
3 D
agan
a
Bud
. 2
1.36
6
.42
27.
79
19.
26
4.1
2 2
3.38
1
.20
- 1
.20
4 -
4.0
0 0
.07
- 0
.07
45.
89
10.
55
56.
44
Exp
e.
20.
81
4.9
0 2
5.71
2
0.41
4
.20
24.
61
1.2
4 -
1.2
4 4
.00
- 4
.00
0.0
8 -
0.0
8 4
6.53
9
.10
55.
63
%19
7%10
3%12
9%10
6%10
2%10
5%10
3%10
3%10
0%10
0%10
9%10
9%10
1%86
%99
%
4 G
asa
Bud
. 6
.37
1.0
9 7
.45
9.3
3 2
0.41
2
9.74
0
.15
0.1
5 0
.02
0.3
4 0
.36
15.
86
21.
84
37.
70
Exp
e.
5.5
5 1
.05
6.6
1 7
.33
13.
09
20.
43
0.1
3 0
.13
0.0
2 0
.27
0.2
9 1
3.03
1
4.41
2
7.45
%87
%97
%89
%79
%64
%69
%87
%87
%92
%79
%79
%82
%66
%73
%
5 H
aa
Bud
. 1
1.94
2
.54
14.
48
24.
13
0.8
7 2
5.00
0
.75
- 0
.75
2.5
0 -
2.5
0 3
9.32
3
.41
42.
73
Exp
e.
10.
98
1.9
5 1
2.92
2
3.15
0
.85
24.
00
0.6
3 -
0.6
3 2
.50
- 2
.50
37.
25
2.8
0 4
0.05
%92
%77
%89
%96
%98
%96
%83
%83
%10
0%10
0%95
%82
%94
%
6 Lh
unts
he
Bud
. 2
4.44
4
.85
29.
29
19.
27
4.0
5 2
3.33
1
.10
- 1
.10
6.2
9 -
6.2
9 0
.02
- 0
.02
51.
12
8.9
0 6
0.02
Exp
e.
24.
24
4.7
4 2
8.98
1
9.39
4
.05
23.
44
1.0
1 1
.01
6.2
9 -
6.2
9 0
.01
- 0
.01
51.
02
8.7
9 5
9.81
%99
%98
%99
%10
1%10
0%10
1%10
0%10
0%10
0%10
0%47
%47
%10
0%99
%10
0%
7 M
onga
r
Bud
. 4
4.76
1
2.22
5
6.98
4
9.45
3
.12
52.
57
2.5
5 -
2.5
5 9
.39
- 9
.39
0.0
3 -
0.0
3 1
06.1
8 1
5.33
1
21.5
2
Exp
e.
44.
60
9.8
4 5
4.45
4
9.18
3
.07
52.
25
2.3
9 -
2.3
9 9
.39
- 9
.39
0.0
3 -
0.0
3 1
05.5
8 1
2.91
1
18.5
0
%10
0%81
%96
%99
%99
%99
%94
%94
%10
0%10
0%93
%93
%99
%84
%98
%
8 Pa
ro
Bud
. 1
6.63
2
.56
19.
19
78.
39
5.8
6 8
4.25
2
.30
- 2
.30
6.0
6 -
6.0
6 1
03.3
8 8
.42
111
.80
Exp
e.
14.
10
2.5
6 1
6.66
7
4.39
5
.01
79.
40
1.6
2 -
1.6
2 5
.02
- 5
.02
95.
13
7.5
7 1
02.7
0
%85
%10
0%87
%95
%86
%94
%71
%71
%83
%83
%92
%90
%92
%

AnnuAl EducAtion StAtiSticS
��
Sl.
No
Dzo
ngkh
ag
Pri
mar
y S
econ
dary
S
LD
SPS
R
CS
DEO
’s O
ffice
T
OTA
L
Cur
. C
ap.
Tot
. C
ur.
Cap
. T
ot.
Cur
. C
ap.
Tot
. C
ur.
Cap
. T
ot.
Cur
. C
ap.
Tot
. C
ur. C
ap.
Tot.
Cur
. C
ap.
Tot
.
9 P/
Gat
shel
Bud
. 2
4.34
5
.55
29.
89
55.
12
25.
65
80.
77
0.7
5 -
0.7
5 0
.03
- 0
.03
80.
24
31.
20
111
.44
Exp
e.
23.
59
3.8
6 2
7.45
5
2.08
2
4.09
7
6.17
0
.75
- 0
.75
0.2
0 -
0.2
0 7
6.62
2
7.95
1
04.5
8
%97
%70
%92
%95
%94
%94
%10
0%10
0%66
7%66
7%96
%90
%94
%
10
Puna
kha
Bud
. 1
7.77
1
.66
19.
43
43.
44
49.
47
92.
91
1.2
8 0
1.2
8 0
.05
- 0
.05
62.
54
51.
13
113
.67
Exp
e.
18.
33
1.7
0 2
0.03
4
1.31
4
6.14
8
7.45
1
.28
- 1
.28
0.0
5 -
0.0
5 6
0.97
4
7.84
1
08.8
1
%10
3%10
2%10
3%95
%93
%94
%10
0%10
0%10
0%10
0%98
%94
%96
%
11
S/Jo
ngkh
ar
Bud
. 2
0.13
1
9.94
4
0.07
4
1.78
1
00.0
6 1
41.8
5 0
.87
- 0
.87
8.4
1 -
8.4
1 0
.04
- 0
.04
71.
23
120
.00
191
.24
1
9.07
1
7.75
3
6.81
4
0.36
4
1.42
8
1.78
0
.87
- 0
.87
8.5
0 -
8.5
0 0
.04
- 0
.04
68.
83
59.
16
127
.99
%95
%89
%92
%97
%41
%58
%10
0%10
0%10
1%10
1%95
%95
%97
%49
%67
%
12
Sam
tse
Bud
. 3
2.68
7
.35
40.
03
48.
87
11.
19
60.
06
1.3
6 -
1.3
6 8
.81
- 8
.81
0.0
5 -
0.0
5 9
1.76
1
8.54
1
10.3
0
3
1.54
3
.49
35.
03
48.
04
9.1
6 5
7.20
1
.35
- 1
.35
8.8
1 -
8.8
1 0
.05
- 0
.05
89.
78
12.
65
102
.43
%97
%14
3%18
7%98
%82
%95
%99
%99
%10
0%10
0%10
0%10
0%98
%68
%93
%
13
Sarp
ang
Bud
. 2
5.81
3
.90
29.
71
36.
82
1.1
0 3
7.92
2
.07
- 2
.07
4.8
7 -
4.8
7 0
.06
- 0
.06
69.
62
5.0
0 7
4.62
2
6.18
3
.15
29.
32
37.
08
0.7
8 3
7.86
1
.37
- 1
.37
3.6
5 -
3.6
5 0
.01
- 0
.01
68.
28
3.9
3 7
2.21
%10
1%81
%99
%10
1%70
%10
0%66
%66
%75
%75
%26
%26
%98
%79
%97
%
14
Thim
phu
Bud
. 4
8.16
8
.03
56.
19
130
.64
40.
28
170
.92
4.6
6 -
4.6
6 0
.05
- 0
.05
-
1
99.0
0 4
8.31
2
47.3
1
3
6.22
4
.69
40.
91
92.
62
28.
48
121
.01
4.2
1 -
4.2
1 0
.01
- 0
.01
-
1
48.5
6 3
3.17
1
81.7
2
%75
%58
%73
%10
8%71
%10
7%90
%0%
90%
16%
16%
75%
69%
74%
15
Tras
higa
ng
Bud
. 6
1.25
1
5.91
7
7.16
8
4.35
1
3.12
9
7.07
3
.43
- 3
.43
9.1
5 -
9.1
5 0
.06
- 0
.06
158
.23
29.
04
186
.87
5
4.52
1
4.07
6
8.58
8
2.23
1
1.40
9
3.28
3
.02
- 3
.02
9.1
5 -
9.1
5 0
.06
- 0
.06
148
.97
25.
46
174
.09
%89
%88
%89
%18
3%87
%96
%88
%0%
88%
100%
0%10
0%98
%98
%94
%88
%93
%

AnnuAl EducAtion StAtiSticS
��
Sl.
No
Dzo
ngkh
ag
Pri
mar
y S
econ
dary
S
LD
SPS
R
CS
DEO
’s O
ffice
T
OTA
L
Cur
. C
ap.
Tot
. C
ur.
Cap
. T
ot.
Cur
. C
ap.
Tot
. C
ur.
Cap
. T
ot.
Cur
. C
ap.
Tot
. C
ur. C
ap.
Tot.
Cur
. C
ap.
Tot
.
16
T/Ya
ngts
e
Bud
. 2
0.44
8
.00
28.
44
35.
36
3.5
1 3
8.88
1
.42
1.4
2 3
.10
- 3
.10
0.0
5 0
.05
60.
37
11.
51
71.
88
1
9.73
7
.62
27.
35
32.
04
3.4
4 3
5.48
1
.36
1.3
6 2
.32
- 2
.32
0.0
1 0
.01
55.
46
11.
05
66.
51
%97
%95
%96
%91
%98
%91
%95
%95
%75
%0%
75%
31%
31%
92%
96%
93%
17
Tron
gsa
Bud
. 2
0.01
4
.18
24.
19
24.
35
10.
97
35.
32
0.3
0 -
0.3
0 8
.37
- 8
.37
0.0
7 -
0.0
7 5
3.01
1
5.15
6
8.25
1
9.91
3
.94
23.
85
23.
98
7.6
3 3
1.61
1
.03
- 1
.03
8.3
7 -
8.3
7 0
.06
- 0
.06
53.
35
11.
57
64.
92
%10
0%94
%99
%99
%70
%90
%34
8%34
8%10
0%10
0%81
%81
%10
1%76
%95
%
18
Tsir
ang
Bud
. 1
0.81
6
.68
17.
48
28.
53
3.7
0 3
2.23
0
.57
- 0
.57
3.7
7 -
3.7
7 0
.04
- 0
.04
43.
72
10.
38
54.
10
9
.05
0.6
9 9
.74
12.
82
2.1
7 1
5.00
0
.57
- 0
.57
3.3
3 -
3.3
3 0
.03
- 0
.03
25.
81
2.8
6 2
8.67
%84
%10
%56
%45
%59
%47
%10
0%0%
100%
88%
88%
67%
67%
59%
28%
53%
19
W/P
ho-
dran
g
Bud
. 2
7.81
2
.36
30.
17
41.
28
19.
70
60.
98
1.8
4 -
1.8
4 1
0.42
-
10.
42
0.0
1 0
.01
81.
37
22.
06
103
.43
2
8.29
0
.65
28.
94
55.
22
12.
07
67.
29
1.6
1 -
1.6
1 9
.32
- 9
.32
0.0
0 0
.00
94.
45
12.
72
107
.17
%10
2%28
%96
%13
4%61
%11
0%88
%0%
88%
89%
89%
13%
13%
116%
58%
104%
20
Zhem
gang
Bud
. 3
4.71
1
4.22
4
8.93
3
2.00
1
.63
33.
63
1.2
8 -
1.2
8 6
7.99
1
5.85
8
3.84
3
4.62
7
.32
41.
94
31.
94
0.7
0 3
2.64
1
.21
- 1
.21
67.
77
8.0
2 7
5.78
%10
0%52
%86
%10
0%43
%97
%94
%0%
94%
100%
51%
90%

AnnuAl EducAtion StAtiSticS
��
Table 10.2 b Top Utilizer of Budget
Sl. No Dzongkhag TOTAL
Cur. Cap. Tot.
1 W/Phodrang
Bud. 81.37 22.06 103.43
Expe. 94.45 12.72 107.17
% 116% 58% 104%
2 lhuntshe
Bud. 51.12 8.90 60.02
Expe. 51.02 8.79 59.81
% 100% 99% 100%
3 dagana
Bud. 45.89 10.55 56.44
Expe. 46.53 9.10 55.63
% 101% 86% 99%
4 Mongar
Bud. 106.18 15.33 121.52
Expe. 105.58 12.91 118.50
% 99% 84% 98%
5 Sarpang
Bud. 69.62 5.00 74.62
Expe. 68.28 3.93 72.21
% 98% 79% 97%
Table 10.2c Top five under utilizer of budget
Sl. No Dzongkhag TOTAL
Cur. Cap. Tot.
1 tsirang
Bud. 43.72 10.38 54.10
Expe. 25.81 2.86 28.67
% 59% 28% 53%
2 chukha
Bud. 152.07 35.00 187.07
Expe. 78.82 23.93 102.75
% 52% 68% 55%
3 S/Jongkhar
Bud. 71.23 120.00 191.24
Expe. 68.83 59.16 127.99
% 97% 49% 67%
4 Gasa
Bud. 15.86 21.84 37.70
Expe. 13.03 14.41 27.45
% 82% 66% 73%
5 thimphu thromdey
Bud. 199.00 48.31 247.31
Expe. 148.56 33.17 181.72
% 75% 69% 74%

AnnuAl EducAtion StAtiSticS
80
10.3 Perheadcosts
the estimated per head cost by school levels as given in table 10.3
Table10.3Estimatedcostperstudent,May2008
Schools & Institute under the Ministry of Education Cost per student per annum (in Nu)
Primary Schools* 8,623
a) day Scolars 8,305
b) Boarders 12,929
lower Secondary Schools 11,768
a) day Scolars 10.410
b) Boarders 14,947
Middle Secondary Schools* 13,970
a) day Scolars 11,910
b) Boarders 16,447
Higher Secondary Schools* 16,566
a) day Scolars 15,120
b) Boarders 19,567
National Institute for the Disabled* 104,356
Institute & College under Royal University of Bhutan** 57,082
ilcS, Semtokha 48,546
Paro college of Education, Paro 41,697
Samtse college of Education, Samtse 42,447
college of natural Resources, lobesa 147,284
college of Science & technology, Rinchending 74,875
Jigme namgyel Polytechnic, dewathang 60,908
Sherubtse college, Kangkung 65,965
Jigme Singye Wangchuck college of Business Studies no student in 2007
Institute under Ministry of Labour and Human Resources** 69,845
institute for Zoring chusum, tashiyangtse 120,982
national institute for Zoring chusum, thimphu 82,906
Vocational training institute - Khuruthang 54,524
Vocational training institute - Samthang 66,549
Vocational training institute - Rangjung 63,798
construction trainingcenter - thimphu 45,859
Vocational training institute - Sarpang 44,008
Vocational training institute - chumey 34,571* This is based on 2006 - 07 expenditure
** This is based on 2007 - 08 expenditure

AnnuAl EducAtion StAtiSticS
��
STATISTICAL TABLES

AnnuAl EducAtion StAtiSticS
��
Tab
le 1
.1 E
nro
lmen
t o
f st
ud
ents
per
Dzo
ng
khag
per
typ
e o
f S
cho
ol 2
009
Dzo
ngkh
agC
PSPS
Pvt.
PSLS
SPv
t. LS
SM
SSPv
t MSS
HSS
Pvt.
HSS
Tota
l
#%
#%
#%
#%
#%
#%
#%
#%
#%
#%
Bum
than
g11
173.
6%31
91.
4%0
0.0%
1059
2.2%
00.
0%10
433.
1%0
0.0%
450
2.4%
202
3.4%
4190
2.6%
chu
kha
2582
8.3%
932
4.0%
00.
0%51
6810
.7%
229
34.7
%38
0611
.2%
00.
0%32
0617
.0%
529
8.8%
1645
210
.0%
dag
ana
2609
8.4%
134
0.6%
00.
0%19
714.
1%0
0.0%
1235
3.6%
00.
0%41
22.
2%0
0.0%
6361
3.9%
Gas
a16
80.
5%10
90.
5%0
0.0%
00.
0%0
0.0%
364
1.1%
00.
0%0
0.0%
00.
0%64
10.
4%
Haa
168
0.5%
670
2.8%
00.
0%15
243.
2%0
0.0%
00.
0%0
0.0%
684
3.6%
00.
0%30
461.
9%
lhue
ntse
908
2.9%
1522
6.5%
00.
0%54
31.
1%0
0.0%
456
1.3%
00.
0%57
53.
1%0
0.0%
4004
2.4%
Mon
gar
2803
9.0%
920
3.9%
00.
0%29
996.
2%0
0.0%
1180
3.5%
00.
0%15
228.
1%11
11.
9%95
355.
8%
Paro
246
0.8%
1419
6.0%
603.
8%45
359.
4%0
0.0%
1207
3.6%
00.
0%15
558.
2%13
8023
.0%
1040
26.
3%
Pem
agat
shel
1712
5.5%
455
1.9%
00.
0%24
245.
0%0
0.0%
1036
3.1%
00.
0%61
53.
3%0
0.0%
6242
3.8%
Puna
kha
983
3.2%
986
4.2%
00.
0%19
114.
0%0
0.0%
1899
5.6%
00.
0%66
63.
5%86
914
.5%
7314
4.5%
Sam
drup
jong
khar
1459
4.7%
2015
8.6%
120
7.5%
2216
4.6%
00.
0%27
428.
1%0
0.0%
00.
0%0
0.0%
8552
5.2%
Sam
tse
2993
9.6%
1498
6.4%
00.
0%13
902.
9%0
0.0%
7189
21.2
%0
0.0%
658
3.5%
00.
0%13
728
8.4%
Sarp
ang
2301
7.4%
00.
0%31
1.9%
4033
8.4%
00.
0%24
597.
3%0
0.0%
1060
5.6%
552
9.2%
1043
66.
4%
thim
phu
913
2.9%
4855
20.6
%13
8886
.8%
6999
14.5
%43
065
.3%
4121
12.2
%36
310
0.0%
2601
13.8
%22
3737
.3%
2354
414
.3%
tras
higa
ng32
6510
.5%
2362
10.0
%0
0.0%
3346
6.9%
00.
0%18
285.
4%0
0.0%
1775
9.4%
00.
0%12
576
7.7%
tras
hiya
ngts
e17
055.
5%34
01.
4%0
0.0%
2094
4.3%
00.
0%67
42.
0%0
0.0%
504
2.7%
00.
0%53
173.
2%
tron
gsa
1194
3.8%
844
3.6%
00.
0%70
31.
5%0
0.0%
379
1.1%
00.
0%46
82.
5%0
0.0%
3588
2.2%
tsira
ng10
373.
3%59
92.
5%0
0.0%
1904
4.0%
00.
0%95
82.
8%0
0.0%
580
3.1%
00.
0%50
783.
1%
Wan
gdue
1769
5.7%
2102
8.9%
00.
0%21
174.
4%0
0.0%
515
1.5%
00.
0%83
04.
4%0
0.0%
7333
4.5%
Zhem
gang
1158
3.7%
1484
6.3%
00.
0%12
172.
5%0
0.0%
800
2.4%
00.
0%71
93.
8%11
82.
0%54
963.
3%
Tota
l31
090
100.
0%23
565
100%
1599
100%
4815
310
0%65
910
0%33
891
100%
363
100%
1888
010
0%59
9810
0%16
4262
100%

AnnuAl EducAtion StAtiSticS
��
Tab
le 1
.2 P
ub
lic a
nd
Pri
vate
Sch
oo
ls p
er D
zon
gkh
ag 2
009
Dzo
ng-
khag
ECR
CPS
PSPv
t. PS
LSS
Pvt.
LSS
MSS
Pvt M
SSH
SSPv
t. H
SSTo
tal
#%
#%
#%
#%
#%
#%
#%
#%
#%
#%
#%
Bum
than
g0
0.0%
124.
5%1
1.2%
00.
0%2
2.2%
00.
0%2
4.4%
00.
0%1
3.7%
18.
3%19
3.3%
chu
kha
12.
9%19
7.1%
44.
7%0
0.0%
77.
9%1
50.0
%4
8.9%
00.
0%3
11.1
%1
8.3%
407.
0%
dag
ana
38.
8%14
5.2%
11.
2%0
0.0%
55.
6%0
0.0%
24.
4%0
0.0%
13.
7%0
0.0%
264.
5%
Gas
a1
2.9%
20.
7%1
1.2%
00.
0%0
0.0%
00.
0%1
2.2%
00.
0%0
0.0%
00.
0%5
0.9%
Haa
12.
9%3
1.1%
33.
5%0
0.0%
33.
4%0
0.0%
00.
0%0
0.0%
13.
7%0
0.0%
111.
9%
lhue
ntse
00.
0%14
5.2%
910
.5%
00.
0%2
2.2%
00.
0%1
2.2%
00.
0%1
3.7%
00.
0%27
4.7%
Mon
gar
00.
0%31
11.5
%6
7.0%
00.
0%8
9.0%
00.
0%2
4.4%
00.
0%2
7.4%
18.
3%50
8.7%
Paro
00.
0%3
1.1%
33.
5%1
89.
0%0
0.0%
24.
4%0
0.0%
27.
4%3
25.0
%22
3.8%
Pem
aga
tshe
l6
17.6
%18
6.7%
44.
7%0
0.0%
66.
7%0
0.0%
24.
4%0
0.0%
13.
7%0
0.0%
376.
4%
Puna
kha
00.
0%9
3.3%
33.
5%0
0.0%
44.
5%0
0.0%
36.
7%0
0.0%
13.
7%1
8.3%
213.
7%
Sam
drup
jong
khar
25.
9%10
3.7%
55.
8%1
55.
6%0
0.0%
511
.1%
00.
0%0
0.0%
00.
0%28
4.9%
Sam
tse
1235
.3%
93.
3%3
3.5%
00.
0%1
1.1%
00.
0%5
11.1
%0
0.0%
13.
7%0
0.0%
315.
4%
Sarp
ang
12.
9%11
4.1%
00.
0%1
44.
5%0
0.0%
24.
4%0
0.0%
27.
4%1
8.3%
223.
8%
thim
phu
12.
9%7
2.6%
67.
0%7
910
.1%
150
.0%
48.
9%1
100.
0%2
7.4%
325
.0%
417.
1%
tras
hi-
38.
8%35
13.0
%12
14.0
%0
0.0%
910
.1%
00.
0%4
8.9%
00.
0%3
11.1
%0
0.0%
6611
.5%
tras
hi-
yang
tse
00.
0%20
7.4%
33.
5%0
0.0%
55.
6%0
0.0%
12.
2%0
0.0%
13.
7%0
0.0%
305.
2%
tron
gsa
00.
0%15
5.6%
44.
7%0
0.0%
33.
4%0
0.0%
12.
2%0
0.0%
13.
7%0
0.0%
244.
2%
tsira
ng1
2.9%
72.
6%2
2.3%
00.
0%2
2.2%
00.
0%1
2.2%
00.
0%1
3.7%
00.
0%14
2.4%
Wan
gdue
25.
9%15
5.6%
67.
0%0
0.0%
33.
4%0
0.0%
12.
2%0
0.0%
27.
4%0
0.0%
295.
0%
Zhem
gang
00.
0%15
5.6%
1011
.6%
00.
0%3
3.4%
00.
0%2
4.4%
00.
0%1
3.7%
18.
3%32
5.6%
Tota
l34
100.
0%26
986
100%
1010
0%89
100%
210
0%45
100%
110
0.0%
2710
0%12
100%
575
100%

AnnuAl EducAtion StAtiSticS
��
Tab
le 1
.3 E
nro
lmen
t o
f st
ud
ents
per
Dzo
ng
khag
by
leve
l 200
7-20
09
Dzo
ngkh
agPP
-vI
vII
-vII
IIx
-xx
I-x
II
2007
2008
2009
2007
2008
2009
2007
2008
2009
2007
2008
2009
Bum
than
g26
1325
8325
2367
667
768
258
959
259
331
636
739
2
chu
kha
1051
010
890
1101
121
4623
2424
541,
882
1,90
918
9886
094
710
89
dag
ana
3978
4709
4961
518
743
833
424
427
512
00
55
Gas
a40
540
743
987
105
9732
8010
50
00
Haa
1878
1854
1946
493
527
500
464
410
450
112
110
150
lhue
ntse
2834
2836
2803
525
552
636
394
391
416
131
144
149
Mon
gar
6245
6399
6467
1375
1389
1346
1,01
499
411
4335
042
357
9
Paro
5678
5836
5864
1556
1481
1514
1,15
11,
186
1401
829
1216
1623
Pem
agat
shel
4123
3993
3913
980
1069
1100
1,10
897
790
131
232
332
8
Puna
kha
3093
4101
4170
682
1048
1072
699
971
912
891
1055
1160
Sam
drup
jong
khar
6036
6073
6200
1277
1327
1401
276
590
951
00
0
Sam
tse
9093
9418
1061
613
8615
3218
0177
294
111
6812
414
314
3
Sarp
ang
6609
6462
6961
1354
1448
1497
980
1,05
311
6811
040
081
0
thim
phu
1460
213
893
1434
035
6632
3334
052,
827
2,71
129
6129
9631
7232
65
tras
higa
ng85
0283
9882
1619
2219
2819
101,
489
1,57
316
9358
066
075
7
tras
hiya
ngts
e35
7536
5336
9565
570
277
048
953
853
631
030
931
6
tron
gsa
2584
2473
2439
504
591
577
376
365
437
128
121
135
tsira
ng30
7031
9035
1757
870
174
143
248
656
327
026
325
7
Wan
gdue
5361
5250
5194
1057
1031
1058
784
786
824
216
246
257
Zhem
gang
3678
3682
3567
767
839
903
625
628
676
281
258
350
Tota
l10
4467
1061
0010
8842
2210
423
247
2429
716
,807
17,6
0819
308
8816
1015
711
815

AnnuAl EducAtion StAtiSticS
��
Tab
le 1
.4 T
each
ers
in B
hu
tan
in 2
009
per
sch
oo
l typ
e p
er D
zon
gkh
ag
Dzo
ngkh
agC
PSPS
LSS
MSS
HSS
T:P
Publ
ic
scho
ols
Pvt
Tota
lT:
P A
ll sc
hool
sTe
ache
rs
Teac
hers
Te
ache
rs
Teac
hers
Te
ache
rs
Teac
hers
Te
ache
rs
%
Bum
than
g63
1040
4226
22.0
919
03%
22.1
chu
kha
8537
178
147
141
26.7
4162
99%
26.2
dag
ana
777
6335
2031
.50
202
3%31
.5
Gas
a9
80
200
17.3
037
1%17
.3
Haa
1035
650
3421
.20
144
2%21
.2
lhue
ntse
5064
2422
2621
.50
186
3%21
.5
Mon
gar
108
3211
249
7325
.213
387
6%24
.6
Paro
1656
183
5965
23.6
7745
67%
22.8
Pem
agat
sel
8921
8744
2223
.70
263
4%23
.7
Puna
kha
4941
7877
4222
.538
325
5%22
.5
S/Jo
nkha
r44
6262
970
31.8
827
34%
31.3
Sam
tse
8746
4919
829
33.6
040
96%
33.6
Sarp
ang
700
117
8167
29.4
2736
25%
28.8
thim
phu
4719
629
518
712
323
.026
611
1417
%21
.5
T/ga
ng16
087
135
8081
23.2
054
38%
23.2
T/ya
ngts
e85
1972
2527
23.3
022
83%
23.3
tong
sa70
4641
1823
18.1
019
83%
18.1
tsira
ng33
1959
3131
29.4
017
33%
29.4
Wan
gdue
7883
7626
5623
.00
319
5%23
.0
Zhem
gang
5162
4936
2624
.06
230
3%23
.9
Tota
l12
8193
117
8512
7491
225
.248
566
6824
.6

AnnuAl EducAtion StAtiSticS
��
Tab
le 1
.5 S
um
mar
y o
f E
nro
lmen
t an
d T
each
ing
Sta
ff in
Sch
oo
ls, I
nst
itu
tes,
NF
E c
entr
es a
nd
Day
Car
e C
entr
es, 2
009
Sl.
No.
Leve
ls/Ty
pes o
f Sch
ools,
Cen
tres
& In
stitu
tes
No.
sSe
c.s
Enro
lmen
tTe
ache
rs
Mal
eFe
mal
eTo
tal
Bht
N/B
htTo
tal
AEa
rly
Chi
ldho
od C
are
(Day
Car
e C
entr
es)
11
195
168
363
37 -
37
BSc
hool
Edu
catio
n
1c
omm
unity
Prim
ary
Scho
ols
268
1,6
59
15,
753
15,
337
31,
090
1,2
78
3
1,2
81
2Pv
t com
mun
ity P
rimar
y sc
hool
1 4
4
1 2
3 6
4 7
0
7
3Pr
imar
y Sc
hool
s85
819
11
802
1176
3 2
3,56
5 9
24
7
931
4Pv
t. P
rimar
y Sc
hool
s 1
1 9
2 7
96
803
1
,599
1
09
13
122
5lo
wer
Sec
onda
ry S
choo
ls 8
9 1
,381
2
3,83
7 2
4,31
6 4
8,15
3 1
,696
8
9 1
,785
6Pv
t. lo
wer
Sec
onda
ry S
choo
ls 2
3
0 3
38
321
6
59
40
10
50
7M
iddl
e Se
cond
ary
Scho
ols
45
951
1
7,24
1 1
6,65
0 3
3,89
1 1
,096
1
78
1,2
74
8Pv
t Mid
dle
Seco
ndar
y Sc
hool
1
15
198
1
65
363
2
2 5
2
7
9H
ighe
r Sec
onda
ry S
choo
ls 2
7 5
16
9,7
83
9,0
97
18,
880
666
2
46
912
10Pv
t. H
ighe
r Sec
onda
ry S
choo
ls
12
312
3
,005
2
,993
5
,998
1
77
102
2
79
Sub-
Tota
l 5
41
5,7
79
82,
794
81,
468
6,0
15
653
6
,668
CTe
rtia
ry E
duca
tion
Insit
utes
(RU
B)
1c
olle
ge o
f nat
ural
Res
ourc
es, l
obes
a 1
1
21
26
147
702
72
2c
olle
ge o
f Sci
ence
and
tec
hnol
ogy,
Rin
chen
ding
1
213
7929
2 6
6 1
5 81
3in
stitu
tes o
f lan
guag
e an
d c
ultu
re S
tudi
es,
1
215
1
24
339
46
1
47
4Ji
gme
Nam
gyel
Pol
ytec
hnic
, Dew
atha
ng 1
2
68
77
345
59
2
61
5n
atio
nal i
nstit
ute
of t
radi
tiona
l med
icin
e,
thim
phu
1
31
9
40 1
5 -
15
6Pa
ro c
olle
ge o
f Edu
catio
n, P
aro
1
719
3
43
1062
82
1
83
7R
oyal
inst
itute
for H
ealth
Sci
ence
s, th
imph
u 1
1
31
126
25
7 4
1 -
41
8R
oyal
inst
itute
of M
anag
emen
t, Se
mto
kha
1
193
1
43
336
76
3
79
9Sa
mts
e c
olle
ge o
f Edu
catio
n, S
amts
e 1
5
80
386
96
6 8
1 8
89

AnnuAl EducAtion StAtiSticS
��
10Sh
erub
tse
col
lege
, K
angl
ung
1
510
2
62
772
112
4
4 15
6
11G
eddu
g c
olle
ge o
f Bus
ines
s Stu
dies
1
315
1
80
495
52
17
69
Sub-
Tota
l 1
1 3
,296
1
,755
5
,051
70
093
793
Dvo
catio
nal I
nstit
utes
0
1Vo
catio
nal t
rain
ing
inst
itute
, chu
mey
1
147
9123
821
- 21
2Vo
catio
nal t
rain
ing
inst
itute
, Khu
ruth
ang
1
116
5016
615
- 15
3Vo
catio
nal t
rain
ing
insi
tute
, She
rsho
ng,S
arpa
ng 1
79
5413
311
- 11
4n
atio
nal i
nstit
ute
for Z
orig
chu
sum
, thi
mph
u 1
21
612
534
129
- 29
5in
stitu
te o
f Aut
omob
ile E
ngin
eerin
g, t
him
phu
1
214
2510
- 10
6Vo
catio
nal t
rain
ing
inst
itute
, Ran
gjun
g 1
10
948
157
17 -
17
7tr
ashi
yang
tse
inst
itute
ofr
Zor
ig c
husu
m 1
42
1557
12 -
12
8Vo
catio
nal t
rain
ing
inst
itute
, Sam
than
g 1
95
1010
512
- 12
Sub-
Tota
l 8
8
25
397
1
,222
1
27
0
127
ESp
ecia
l Ins
titut
es0
1n
atio
nal i
nstit
ute
of d
isab
led
1
30
18
48 1
3 -
13
2Ji
gmec
holin
g Sa
nskr
it Pa
thsh
ala
1
18
- 18
1
- 1
Sub-
Tota
l 2
4
8 1
8 6
6 1
4 0
14
FN
on-F
orm
al E
duca
tion
Prog
ram
me
688
0
0
0
756
-75
6
Tota
l 1
,261
5
,779
8
6,96
3 8
3,63
8 1
70,6
01
8,9
00
746
9,
646

AnnuAl EducAtion StAtiSticS
��
Tab
le 1
.6 N
ER
& G
ER
Pri
mar
y an
d t
he
Gen
der
Par
ity
Ind
ex p
er D
zon
gkh
ag, 2
009
NER
GER
BG
BGG
PIB
GBG
GPI
Bhut
an91
%93
%91
.82%
1.02
115%
116%
116%
1.01
Bum
than
g86
%99
%92
%1.
1598
%11
4%10
6%1.
16
Chu
kha
72%
90%
80%
1.24
92%
110%
100%
1.19
Dag
ana
99%
97%
98%
0.98
142%
140%
141%
0.99
Gas
a83
%80
%81
%0.
9699
%92
%95
%0.
93
Haa
92%
95%
94%
1.03
112%
115%
113%
1.03
Lhue
ntse
104%
93%
98%
0.89
128%
119%
123%
0.93
Mon
gar
101%
93%
97%
0.92
124%
112%
118%
0.91
Paro
86%
90%
88%
1.04
106%
112%
109%
1.05
Pem
agat
shel
108%
98%
103%
0.91
132%
123%
127%
0.93
Puna
kha
86%
100%
91%
1.17
104%
118%
111%
1.14
Sam
drup
jong
khar
92%
84%
88%
0.91
124%
112%
118%
0.91
Sam
tse
89%
88%
89%
0.99
124%
115%
119%
0.93
Sarp
ang
102%
100%
101%
0.98
133%
127%
130%
0.96
Thim
phu
86%
94%
90%
1.01
102%
111%
106%
1.09
Tras
higa
ng96
%90
%93
%0.
9411
9%11
0%11
4%0.
92
Tras
hiya
ngts
e11
4%10
5%10
9%0.
9214
7%13
5%14
1%0.
92
Tron
gsa
99%
93%
96%
0.94
127%
119%
123%
0.94
Tsir
ang
96%
88%
92%
0.91
134%
121%
127%
0.90
Wan
gdue
90%
95%
93%
1.06
108%
117%
112%
1.09
Zhem
gang
101%
97%
99%
0.97
132%
127%
129%
0.97

AnnuAl EducAtion StAtiSticS
��
Tab
le 1
.7 In
dic
ativ
e N
ER
an
d G
ER
Pri
mar
y p
er D
zon
gkh
ag, 2
008-
2009
NER
GER
2008
2009
2008
2009
2008
2009
2008
2009
2008
2009
2008
2009
BB
GG
BGBG
BB
GG
BGBG
Bhut
an87
%91
%89
%93
%88
%91
.82%
112%
115%
112%
116%
106%
116%
Bum
than
g89
%86
%96
%99
%92
%92
.1%
110%
98%
116%
114%
115%
106%
Chu
kha
86%
72%
86%
90%
86%
80.0
%11
1%92
%10
4%11
0%99
%10
0%
Dag
ana
82%
99%
92%
97%
87%
98.3
%11
8%14
2%12
2%14
0%11
9%14
1%
Gas
a90
%83
%63
%80
%76
%81
.3%
105%
99%
76%
92%
82%
95%
Haa
85%
92%
95%
95%
90%
93.7
%10
4%11
2%11
2%11
5%10
8%11
3%
Lhue
ntse
89%
104%
88%
93%
89%
98.1
%11
4%12
8%11
4%11
9%10
4%12
3%
Mon
gar
90%
101%
91%
93%
90%
96.6
%10
8%12
4%11
0%11
2%10
3%11
8%
Paro
96%
86%
97%
90%
97%
87.9
%11
7%10
6%11
8%11
2%10
7%10
9%
P/G
atsh
el94
%10
8%92
%98
%93
%10
2.7%
120%
132%
120%
123%
118%
127%
Puna
kha
90%
86%
96%
100%
93%
90.8
%11
0%10
4%12
0%11
8%11
0%11
1%
S/jo
ngkh
ar85
%92
%80
%84
%82
%87
.9%
113%
124%
109%
112%
109%
118%
Sam
tse
74%
89%
78%
88%
76%
88.5
%10
3%12
4%10
3%11
5%96
%11
9%
Sarp
ang
83%
102%
85%
100%
84%
101.
1%11
1%13
3%11
1%12
7%97
%13
0%
Thim
phu
94%
86%
95%
94%
95%
89.9
%11
5%10
2%11
3%11
1%10
9%10
6%
Tras
higa
ng88
%96
%87
%90
%88
%93
.0%
109%
119%
107%
110%
104%
114%
Tras
hiya
ngts
e98
%11
4%98
%10
5%98
%10
9.3%
126%
147%
125%
135%
116%
141%
Tron
gsa
92%
99%
96%
93%
94%
96.2
%11
5%12
7%12
0%11
9%11
9%12
3%
Tsir
ang
78%
96%
79%
88%
79%
91.5
%11
5%13
4%11
3%12
1%10
5%12
7%
Wan
gdue
87%
90%
91%
95%
89%
92.5
%10
6%10
8%11
4%11
7%10
6%11
2%
Zhem
gang
91%
101%
95%
97%
93%
98.9
%12
0%13
2%12
3%12
7%11
9%12
9%

AnnuAl EducAtion StAtiSticS
�0
Table 1.8: Enrolment in Class XI and XII per stream, March 2009
Public Schools Private Schools Total
# % # % # %
Class x
I
Arts 304 9% 888 33% 1192 20%
commerce 1028 31% 1667 61% 2695 45%
Science 1939 59% 164 6% 2103 35%
Sub-total 3271 100% 2719 100% 5990 100%
Class x
II
Arts 311 11% 961 33% 1272 22%
commerce 895 31% 1669 57% 2564 44%
Science 1707 59% 282 10% 1989 34%
Sub-total 2913 100% 2912 100% 5825 100%
Table 1.9 Enrolment in public and private higher secondary schools since 2002
YearPublic Private Total Annual growth
Boys Girls Total Boys Girls Total Boys Girls Total %age
2009 3665 2519 6184 2797 2834 5631 6462 5353 11815 1658 16.3%
2008 3326 2181 5507 2277 2373 4650 5603 4554 10157 1341 15.2%
2007 3142 2023 5165 1845 1806 3651 4987 3829 8816 714 8.8%
2006 3069 1695 4764 1665 1673 3338 4734 3368 8102 418 5.4%
2005 2900 1432 4332 1698 1654 3352 4598 3086 7684 993 14.8%
2004 2546 1213 3759 1514 1418 2932 4060 2631 6691 887 15.3%
2003 2261 1092 3353 1255 1196 2451 3516 2288 5804 1327 29.6%
2002 1795 844 2639 982 856 1838 2777 1700 4477 1673 59.7%
Average annual growth rate 20.7%
Table 2.0 Class X results, 1997-2008
Year 1997 1998 1999 2000 2001 2002 2003 2004 2005 2006 2007 2008
No. of students appeared 1,476 1,796 2,389 3,159 4,596 4,791 5,298 6,057 6,392 6,893 7,924 7,982
No. of students passed 1,285 1,379 2,114 2,519 4,215 4,411 5,110 5,822 5,945 6,338 7,573 7,526
No. of students failed 191 417 275 640 381 380 188 235 447 555 351 456
Pass % 87% 77% 89% 80% 92% 92% 97% 96% 93% 92% 96% 94%
*Regular Candidates

AnnuAl EducAtion StAtiSticS
��
Table 2.1 Class XII results 1997-2008
Year 1997 1998 1999 2000 2001 2002 2003 2004 2005 2006 2007 2008
No. of students appeared 252 444 469 529 1206 1703 2997 3170 3871 3969 5027 5510
No. of students passed 250 372 443 469 1115 1582 2688 2904 3494 3737 4263 4768
No. of studentsfailed 2 72 26 60 91 121 309 266 377 232 764 533
Pass % 99% 84% 95% 89% 93% 93% 90% 92% 90% 94% 85% 87%
*Regular Candidates
Table 2.2 Enrolments, Repetition Rate & Dropout Rate (PP-X) 2002-20092002 2003 2004 2005 2006 2007 2008 2009
Enrolment 118,355 122,857 128,771 133,288 138,422 143,378 146,955 152,447
Promotees 92,883 98,218 105,384 113,948 118,262 134,545 127,606 132,777
Repeaters 14,767 13,604 12,206 9,266 8,743 8,833 8,833 9,343
Rep. Rate 12.9% 11.5% 9.9% 7.2% 6.6% 6.4% 6.0% 6.1%
dropouts 6,421 6,533 5,267 5,557 4,055 4,989 4,064 2,901
Dropout Rate 5.4% 5.3% 4.1% 4.2% 3.0% 3.6% 2.8% 1.9%
Table 2.3 Drop-out rate and numbers 2002-2009
Class
2002-2003 2003-2004 2004-2005 2005-2006 2006-2007 2007-2008 2008-2009 Total
Ave %Dropouts Dropouts Dropouts Dropouts Dropouts Dropouts Dropouts
#` % #` % #` % #` % #` % #` % #` %
PP -62 -0% 44 0% 33 0% -5 0% 21 0% 216 1% -67 -0% -36 0%
I 381 3% 275 2% 168 1% 302 2% 127 1% 310 2% 192 1% 1445 2%
II 526 4% 267 2% 355 2% 481 3% 389 2% 361 2% 211 1% 2229 2%
III 420 3% 314 2% 234 2% 223 2% 118 1% 239 2% 146 1% 1455 2%
Iv 754 6% 492 4% 584 4% 611 4% 600 4% 530 4% 444 3% 3485 4%
v 554 5% 566 5% 49 4% 570 5% 479 4% 457 3% 477 4% 2695 4%
vI 423 5% 532 5% 154 2% 366 3% 242 2% 178 2% 227 2% 1944 3%
vII 789 9% 822 9% 565 6% 766 7% 581 5% 673 6% 524 4% 4047 7%
vIII 470 7% 164 2% 169 2% 343 4% 237 3% 409 4% 273 3% 1656 3%
Ix 518 8% 169 2% 507 7% 388 5% 257 3% 691 8% 474 5% 2313 5%
After class x school leaver continue in class xI or in vocational training or join the labor market

AnnuAl EducAtion StAtiSticS
��
Table 2.4 Repetition rate and numbers 2003-2009
Class
2002-2003 2003-2004 2004-2005 2005-2006 2006-2007 2007-2008 2008-2009 Ave %Repeaters Repeaters Repeaters Repeaters Repeaters Repeaters Repeaters
# % # % # % # % # % # % # %
PP 1,993 13% 1,761 11% 1,507 9% 1,257 8% 1131 7% 1,192 7% 1,055 6.4% 8.8%
I 1,896 13% 1,739 11% 1,359 9% 1,280 8% 1173 8% 1,113 7% 1,043 6.5% 8.7%
II 1,762 12% 1,526 11% 1,235 8% 1,236 8% 1299 8% 1,100 7% 1,240 7.5% 8.8%
III 1,378 11% 1,223 9% 924 7% 856 6% 961 7% 920 6% 944 6.3% 7.3%
Iv 1,790 14% 1,726 13% 1,265 9% 1,255 9% 1208 8% 1,285 9% 1,416 9.1% 10.3%
v 1,223 12% 1,035 9% 679 6% 734 6% 665 5% 731 5% 887 6.4% 7.1%
vI 1,096 12% 805 8% 465 4% 389 4% 464 4% 442 4% 599 4.7% 5.7%
vII 1,189 13% 1,100 12% 828 8% 917 9% 873 8% 1,010 9% 972 7.9% 9.5%
vIII 304 4% 344 5% 318 4% 275 3% 457 5% 715 7% 615 5.6% 4.8%
Ix 886 13% 867 12% 636 8% 516 7% 542 6% 606 7% 520 5.4% 8.4%
x 87 2% 80 2% 50 1% 28 0% 72 0% 90 1% 52 0.7% 0.9%
Table 2.5 Primary and Basic education completion rates, 2006-2009New Entrants Correct Age Completion rate
vI x 12 16 Primary Basic
2009 12,451 8,705 13,798 14,274 90.2% 61.0%
2008 12,246 7,870 14,127 14,577 86.7% 54.0%
2007 11,474 7,619 15,131 15,404 75.8% 49.5%
2006 11,331 6,828 14,789 16,039 76.6% 42.6%

AnnuAl EducAtion StAtiSticS
��
Tab
le 2
.6 M
easu
res
of
Inte
rnal
Effi
cien
cy 2
008
(Bo
th S
exes
)Bo
th S
exes
PP1
23
45
67
89
10G
radu
ates
Prom
otio
n ra
te94
.0%
92.3
%91
.2%
92.7
%88
.0%
90.1
%93
.5%
87.9
%91
.9%
89.8
%92
.2%
Rep
etiti
on ra
te6.
4%6.
5%7.
5%6.
3%9.
1%6.
4%4.
7%7.
9%5.
6%5.
4%0.
7%
dro
pout
rate
-0.4
%1.
2%1.
3%1.
0%2.
9%3.
5%1.
8%4.
3%2.
5%4.
9%7.
2%
Adj
uste
d pr
omot
ion
rate
93.6
%92
.3%
91.2
%92
.7%
88.0
%90
.1%
93.5
%87
.9%
91.9
%89
.8%
92.2
%
Surv
ivor
s to
the
Gra
de10
00.0
1000
.098
7.2
973.
696
3.5
933.
289
8.7
881.
984
1.2
818.
977
6.6
720.
6
Aver
age
stud
y tim
e at
Gra
de1.
11.
11.
11.
11.
11.
11.
11.
11.
11.
11.
011
.7
Pupi
l-yea
rs in
vest
ed p
er G
radu
ate
14.9
Coe
ffici
ent o
f Int
erna
l Effi
cien
cy73
.8%
Boys
PP1
23
45
67
89
10G
radu
ates
Prom
otio
n ra
te93
.0%
91.3
%89
.5%
90.9
%85
.6%
87.7
%92
.7%
87.3
%93
.6%
91.6
%95
.0%
Rep
etiti
on ra
te6.
8%7.
2%8.
5%7.
0%10
.9%
7.0%
5.2%
7.8%
5.4%
5.1%
0.8%
dro
pout
rate
0.2%
1.5%
2.0%
2.0%
3.5%
5.3%
2.1%
4.9%
1.0%
3.3%
4.2%
Adj
uste
d pr
omot
ion
rate
93.0
%91
.3%
89.5
%90
.9%
85.6
%87
.7%
92.7
%87
.3%
93.6
%91
.6%
95.0
%
Surv
ivor
s to
the
Gra
de10
00.0
997.
498
1.1
959.
793
8.9
901.
985
0.9
832.
078
7.9
779.
675
2.6
720.
5
Aver
age
stud
y tim
e at
Gra
de1.
11.
11.
11.
11.
11.
11.
11.
11.
11.
11.
011
.8
Pupi
l-yea
rs in
vest
ed p
er G
radu
ate
14.6
Coe
ffici
ent o
f Int
erna
l Effi
cien
cy75
.6%
Gir
ls
PP1
23
45
67
89
10G
radu
ates
Prom
otio
n ra
te95
.0%
93.4
%93
.1%
94.6
%90
.4%
92.5
%94
.3%
88.4
%90
.2%
87.9
%89
.3%
Rep
etiti
on ra
te6.
0%5.
7%6.
4%5.
5%7.
4%5.
8%4.
2%8.
0%5.
8%5.
6%0.
5%
dro
pout
rate
-1.1
%0.
9%0.
5%-0
.1%
2.2%
1.7%
1.5%
3.6%
4.0%
6.5%
10.2
%
Adj
uste
d pr
omot
ion
rate
94.0
%93
.4%
93.1
%94
.5%
90.4
%92
.5%
94.3
%88
.4%
90.2
%87
.9%
89.3
%
Surv
ivor
s to
the
Gra
de10
00.0
1000
.099
1.0
985.
798
5.7
962.
194
5.0
930.
489
3.6
855.
879
6.8
714.
9
Aver
age
stud
y tim
e at
Gra
de1.
11.
11.
11.
11.
11.
11.
01.
11.
11.
11.
011
.7
Pupi
l-yea
rs in
vest
ed p
er G
radu
ate
15.3
Coe
ffici
ent o
f Int
erna
l Effi
cien
cy71
.7%

AnnuAl EducAtion StAtiSticS
��
Table 2.7 Proportion of Non-Bhutanese teachers 1997-2009
1997 2002 2007 2008 2009
Bht N/Bt Tot. Bht N/Bt Tot. Bht N/Bt Tot. Bht N/Bt Tot. Bht N/Bt Tot.
CPS 246 3 249 527 2 529 889 3 892 998 2 1,000 1278 3 1281
PS 110 212 322 724 31 755 745 6 751 792 7 799 924 7 931
LSS 368 105 473 948 205 1,153 1,501 103 1,604 1,537 90 1,627 1696 89 1785
M & HSS 208 108 316 657 359 1,016 1,365 411 1,776 1,492 439 1,931 1762 424 2186
Pvt. S 66 5 71 144 71 215 257 91 348 279 109 388 355 130 485
NID 8 8 7 1 8 11 1 12 13 0 13 13 0 13
Total 1,006 433 1,439 3,007 669 3,676 4,757 614 5,371 5,111 647 5,758 6028 653 6681
% 70% 30% 82% 18% 89% 11% 89% 11% 90% 10%
Table 2.8 Teacher graduates from pre-service training 2002-20082002 2003 2004 2005 2006 2007 2008 Total
PGCE 49 48 46 48 62 43 106 402
B.Ed 101 136 177 371 429 377 375 1966
PTC* 150 170 0 0 0 0 0 320
ZTC* 37 32 37 0 0 0 0 106
337 386 260 419 491 420 481 2794
These programmes have been phased out. PTC had its last graduates in 2003, ZTC in 2004
Table 2.9 Enrolment in the Colleges of Education 2003-2009
YearCoE, Samtse COE, Paro Grand Total
%FM F Total M F Total M F Total
2003 224 120 344 337 319 656 561 439 1,000 44%
2004 327 162 489 355 282 637 682 444 1,126 39%
2005 321 166 487 462 317 779 783 483 1,266 38%
2006 320 163 483 419 325 744 739 488 1,227 40%
2007 359 187 546 428 275 703 787 462 1,249 37%
2008 352 188 540 430 294 724 782 482 1,264 38%
2009 580 386 966 719 343 1,062 1,299 729 2,028 36%
Diff. Between 2009 & 2003
356 266 196 382 24 68 738 290 1,02839%
159% 222% 57% 113% 8% 10% 132% 66% 103%

AnnuAl EducAtion StAtiSticS
��
Table 3.0 Number of teachers who have upgraded their qualifications
Year ISC ILCS ICSE Total Remarks
2009 110 40 0 150 Enrolled for examination
2008 330 116 1 447 Enrolled for examination
2007 203 40 1 244 Appeared for examination
2006 267 36 303 Enrolled for examination
2005 190 54 1 225 Enrolled for examination
2004 91 10 1 102 Appeared for examination
2003 103 14 2 119 Appeared for examination
Table 3.1 Teachers’ academic qualification by nationality & type of school, March 2009
Academic Qualifi-cation
Public Private Total
Bht
Non-Bht
All
Bht
Non-Bht
All
Bht
% Bht
Non-Bht
% N
on-Bht
All
Masters degree 141 253 394 21 84 105 162 33% 337 68% 499
Bachelors degree 2,881 258 3,139 144 36 180 3,025 91% 294 9% 3,319
Higher Secondary/Matriculation
1,637 10 1,647 106 9 115 1,743 99% 19 1% 1,762
under Matriculation 13 0 13 1 0 1 14 100% 0 0% 14
ZltS 979 0 979 77 0 77 1,056 100% 0 0% 1,056
Total 5,651 521 6,172 349 129 478 6,000 90% 650 10% 6,650
*Dance teachers not included

AnnuAl EducAtion StAtiSticS
��
Table 3.2 Teacher-Pupil ratio per Dzongkhag per type of school March 2009
CPS PS LSS MSS HSS Ave Pvt Pvt. Pvt. Pvt Pvt. Total
Bhutan 23 25 27 27 21 25 9 11 13 13 22 25
Bumthang 18 32 27 25 17 24 22 22
Chukha 30 25 29 26 23 27 11 25 26
Dagana 0 19 31 35 21 21 31
Gasa 19 14 18 17 17
Haa 17 19 23 20 20 21
Lhuentse 18 24 23 21 22 22 22
Mongar 26 29 27 24 21 25 9 25
Paro 15 25 25 21 24 22 9 20 23
Pemagatshel 19 22 28 24 28 24 24
Punakha 20 24 25 25 16 22 23 23
Samdrupjongkhar 33 33 36 28 32 15 31
Samtse 34 33 28 36 23 31 34
Sarpang 22 35 30 16 26 10 23 29
Thimphu 19 25 24 22 21 22 9 13 14 13 23 22
Trashigang 20 27 25 23 22 23 23
Trashiyangtse 20 18 29 27 19 23 23
Trongsa 17 18 17 21 20 19 18
Tsirang 31 32 32 31 19 29 29
Wangdue 23 25 30 20 15 23 23
Zhemgang 23 24 25 22 28 24 20 25

AnnuAl EducAtion StAtiSticS
��
Tab
le 3
.3:
Tea
cher
Pu
pil
rati
o in
Sch
oo
ls p
er D
zon
gkh
ag p
er t
ype
of
sch
oo
l 200
7-20
09
CPS
PSLS
SM
SSH
SSPu
blic
2007
2008
2009
2007
2008
2009
2007
2008
2009
2007
2008
2009
2007
2008
2009
2007
2008
2009
Bhut
an32
3023
3129
2530
3027
2727
2722
2121
2928
25
Bum
than
g25
2218
2625
2723
2725
2120
1724
2424
chu
kha
3230
3028
3025
3334
2930
2526
2322
2330
2827
dag
ana
5449
033
5019
4342
3123
2635
4039
21
Gas
a21
1919
914
1216
1818
1515
17
Haa
2421
1726
2119
2423
2323
2320
2422
20
lhue
ntse
3127
1832
3424
2624
2323
2721
2021
2228
2722
Mon
gar
3132
2637
3729
3133
2727
2724
2322
2129
3025
Paro
2622
1529
2525
2626
2523
2121
2222
2425
2322
Pem
agat
shel
2727
1922
2322
3033
2830
2824
2626
2828
2924
Puna
kha
2220
2028
2524
2526
2529
2425
2117
1625
2222
Sam
drup
jong
khar
4642
3352
4033
4141
3626
2828
3737
32
Sam
tse
5547
3456
4233
3830
2838
4136
1917
2340
3731
Sarp
ang
4236
2233
4239
3528
3730
2021
1636
3326
thim
phu
2819
1930
2725
2826
2424
2122
2221
2126
2322
tras
higa
ng27
2420
3026
2728
2825
2327
2324
2422
2726
23
tras
hiya
ngts
e33
3020
2726
1831
3429
2425
2722
2219
2928
23
tron
gsa
2624
1724
2418
2321
1718
2321
1923
2023
2319
tsira
ng49
4431
4340
3233
3332
3637
3126
2119
3533
29
Wan
gdue
3026
2332
2725
3031
3021
2320
1517
1527
2623
Zhem
gang
6228
2327
2624
3430
2523
2222
2828
2836
2724

AnnuAl EducAtion StAtiSticS
��
Table 3.4 Teacher-pupil ratio per school, divided by ratio 2009
Level CPS PS LSS MSS HSS ECRTotal
Ratio Public Private Public Private Public Private Public Private Public Private Public
greater than 80 1 1 1 3
50-80 8 2 2 1 13
32-50 54 15 17 5 5 96
20-32 96 41 1 63 35 17 8 10 271
0-20 109 1 28 9 7 2 4 1 10 3 8 182
268 1 86 10 89 2 45 1 28 11 24 565
Table 3.5 Teacher-Pupil ratio 1999-2009Level 1999 2000 2001 2002 2003 2004 2005 2006 2007 2008 2009
Community Pri-mary 50 47 43 40 38 35 34 28 32 30 23
Primary 43 44 42 38 37 35 34 33 31 29 25
Lower Secondary 41 39 40 36 34 33 33 31 30 30 27
Middle & Higher Secondary 27 28 28 27 26 27 27 27 25 24 24
Private 22 23 19 18 20 18 19 16 18 17 15
Table 3.6 Classroom student ratio by DzongkhagClass:student ratio
less than 20 20-40 More than 40
chukhaa 14 19 7
dagana 4 20 2
Gasa 4 1 0
Haa 3 7 1
lhuentse 13 12 2
Mongar 27 19 3
Paro 5 14 2
P/Gatshel 22 12 3
Punakha 9 11 1
s/jongkhar 6 15 6
Samtse 9 11 9
Sarpang 3 14 5
thimphu 12 24 5
trashigang 36 25 4
T/Yangtse 15 12 3
trongsa 15 9 0
tsirang 2 12 0
Wangdue 9 17 1
Zhemgang 20 11 1
239 272 56

AnnuAl EducAtion StAtiSticS
��
Tab
le 3
.7 C
lass
Siz
e p
er s
cho
ol t
ype
per
Dzo
ng
khag
200
8 an
d 2
009
Dzo
ngkh
agC
PSPS
LSS
MSS
HSS
Pvt C
PSPv
t PS
Pvt L
SSPv
t MSS
Pvt H
SSTo
tal
2008
2009
2008
2009
2008
2009
2008
2009
2008
2009
2008
2009
2008
2009
2008
2009
2008
2009
2008
2009
2008
2009
Bhut
an19
030
2935
3537
3636
3616
1917
2222
2436
3430
29
Bum
than
g17
1546
3130
3231
3132
3234
2424
chu
kha
2121
3128
4039
3831
4239
2521
3835
3436
dag
ana
3534
3219
4437
3641
3837
36
Gas
a11
1116
1625
2817
18
Haa
1615
2323
3131
3331
2827
lhue
ntse
1312
2525
2827
3333
3138
2122
Mon
gar
1615
2222
3333
3434
3839
2224
24
Paro
1312
3134
3632
3534
3839
1910
4433
3432
Pem
agat
sel
1613
1618
3632
3535
3938
2522
Puna
kha
1818
3329
3231
3836
3837
3335
3130
S/Jo
nkha
r23
2240
4236
3539
3815
1734
33
Sam
tse
3836
3733
4539
4642
2935
4239
Sarp
ang
3532
4343
3940
3534
2710
2733
3837
thim
phu
2121
3737
3839
3333
3638
1619
1822
2324
3737
3333
T/ga
ng16
1525
2533
3137
3339
3825
24
T/ya
ngts
e16
1418
1626
3233
3237
3622
22
tong
sa14
1326
2215
2330
2733
3119
19
tsira
ng37
3746
3745
4339
3731
3240
39
Wan
gdue
1919
3331
4015
3530
3232
3028
Zhem
gang
1615
1921
3530
3436
4034
3025
23

AnnuAl EducAtion StAtiSticS
�00
Tab
le 3
.8 N
FE
- ce
nte
rs, t
each
ers,
an
d le
arn
ers
(BL
C, P
LC
) p
er D
zon
gkh
ag
Dzo
ngkh
agC
entr
esIn
stru
ctor
sBL
C le
arne
rPL
C L
earn
ers
BLC
+PLC
MF
MF
MF
MF
MF
MF
MF
MF
Bhut
an68
831
544
175
62,
882
6,43
99,
321
1,11
72,
722
3,83
93,
999
9,16
113
,160
Bum
than
g18
814
220
6565
812
112
98
186
194
Chu
kha
3624
1943
193
492
685
1617
719
320
966
987
8
Dag
ana
8423
3558
344
407
751
218
307
525
562
714
1,27
6
Gas
a2
11
29
1019
1211
2321
2142
Haa
112
1416
4987
136
1846
6467
133
200
Lhue
ntse
3718
1937
7522
530
013
935
549
421
458
079
4
Mon
gar
6132
3870
239
537
776
7816
524
331
770
21,
019
Paro
156
915
4323
627
911
2334
5425
931
3
Pem
agat
shel
3721
2344
7644
251
835
163
198
111
605
716
Puna
kha
249
1625
3859
9736
158
194
7421
729
1
S/Jo
ngkh
ar30
2117
3811
529
440
941
105
146
156
399
555
Sam
tse
6130
4575
753
861
1,61
410
616
126
785
91,
022
1,88
1
Sarp
ang
3714
2741
164
392
556
126
260
386
290
652
942
Thim
phu
3823
4265
3250
353
59
124
133
4162
766
8
T/G
ang
6622
4668
337
801
1,13
894
198
292
431
999
1,43
0
T/Ya
ngts
e17
1013
2346
139
185
3573
108
8121
229
3
Tron
gsa
225
1520
5212
417
653
7312
610
519
730
2
Tsir
ang
3916
1531
123
257
380
4034
7416
329
145
4
Wan
gdue
3517
2441
9529
238
739
142
181
134
434
568
Zhem
gang
1813
922
9921
631
53
2629
102
242
344
Tab
le 3
.9 R
emar
ks o
n w
ater
su
pp
ly b
y st
atu
s o
f sc
ho
ols
, Mar
ch 2
009
Stat
ussc
arc-
city
of
sour
ce
poor
qu
ality
co
nnec
-
insu
f-fic
ient
Shar
e w
ith
publ
ic
sprin
g so
urce
no
wat
er
supp
ly
tem
po-
rary
co
nnec
-
suffi
-ci
ent
no re
-se
rver
ta
nk
no
com
-m
ents
need
s to
be re
no-
vate
d
unde
r pr
oces
s
drie
s up
durin
g w
inte
r
insu
f-fic
ient
bu
dget
new
ly
con-
stru
cted
need
to
be
re-
no
in-
form
a-tio
n
day
5213
1625
220
420
115
164
87
12
127
Boa
rder
316
36
14
159
34
00
31
01
0

AnnuAl EducAtion StAtiSticS
�0�
Tab
le 4
.0:
Ele
ctri
city
, Lan
dlin
e an
d In
tern
et p
er D
zon
gkh
ag, M
arch
200
9
Dzo
ngkh
ag
Elec
tric
ityW
orki
ng L
andl
ine
Phon
eW
orki
ng In
tern
et C
onne
ctio
n
Yes
% Y
esN
o In
form
atio
nYe
sYe
s %N
o in
form
a-tio
nYe
sYe
s %N
o in
form
atio
n
Bum
than
g8
50%
312
71%
23
19%
3
chu
khaa
2976
%1
2668
%1
1334
%1
dag
ana
730
%14
61%
313
%
Gas
a3
75%
267
%1
133
%1
Haa
889
%1
667
%1
556
%1
lhue
ntse
1350
%1
1350
%1
14%
1
Mon
gar
2553
%3
3063
%2
1225
%2
Paro
2110
0%1
1781
%1
1257
%1
P/G
atsh
el18
60%
122
76%
27
24%
2
Puna
kha
2095
%15
75%
18
40%
1
s/jo
ngkh
ar14
58%
216
67%
26
25%
2
Sam
tse
1263
%16
84%
421
%
Sarp
ang
1583
%3
1895
%2
635
%4
thim
phu
3595
%3
3492
%3
2465
%3
tras
higa
ng48
80%
348
79%
215
25%
4
T/Ya
ngts
e21
70%
2170
%7
23%
tron
gsa
629
%3
1886
%3
314
%3
tsira
ng4
31%
969
%2
15%
Wan
gdue
1558
%1
2077
%1
519
%1
Zhem
gang
724
%3
2071
%4
311
%4
Tota
l32
964
%29
377
73%
2914
028
%34

AnnuAl EducAtion StAtiSticS
�0�
Tab
le 4
.1:
Dis
tan
ce o
f sc
ho
ol f
rom
th
e n
eare
st r
oad
hea
d b
y D
zon
gkh
ag
Ow
ners
hip
Dist
ance
from
the
near
est r
oad
head
Tota
lle
ss th
an 2
0 m
ins
<1 h
r<2
hr<4
hr<o
ne d
ay<t
wo
days
<thr
ee d
ays
>thr
ee d
ays
Public
Bum
than
g12
02
00
01
318
Chu
khaa
173
30
14
38
39
Dag
ana
100
11
45
05
26
Gas
a1
00
00
11
25
Haa
61
00
00
04
11
Lhue
ntse
122
21
62
02
27
Mon
gar
152
07
36
313
49
Paro
141
00
10
02
18
P/G
atsh
el8
11
26
65
837
Puna
kha
132
01
00
04
20
s/jon
gkha
r11
01
04
40
727
Sam
tse
110
03
22
210
30
Sarp
ang
120
00
22
13
20
Thim
phu
241
00
00
03
28
Tras
higa
ng28
42
105
62
966
T/Ya
ngts
e11
01
72
70
230
Tron
gsa
121
11
24
03
24
tsir
ang
62
11
12
01
14
Wan
gdue
122
02
42
07
29
Zhem
gang
70
21
12
99
31
Private
Bum
than
g0
01
1
Chu
khaa
10
01
Mon
gar
10
01
Paro
22
04
Puna
kha
10
01
s/jon
gkha
r1
00
1
Sarp
ang
20
02
Thim
phu
120
013
Zhem
gang
01
01

AnnuAl EducAtion StAtiSticS
�0�
Table 4.2: Distance of school from the nearest road head by Class
Class size
Distance from the nearest road head
totalless than 20
<1 hr <2hr <4hr <one day
<two days
<three days
>three days
Public Private
less than 20 54 12 5 23 19 32 16 61 222
20-40 146 9 10 13 20 19 9 37 263
40-60 37 1 2 0 5 1 0 5 51
60-120 1 0 0 0 0 2 1 1 5
238 22 17 36 44 54 26 104 541
less than 20 14 1 1 16
20-40 6 2 1 9
Table 4.3 Division of number of 6-16 years old not in PP-X, 2009
chukha 24% lhuentse 2%
thimphu 17% Haa 2%
Samtse 12% trongsa 2%
trashigang 8% Zhemgang 1%
Mongar 6% Sarpang 1%
Wangdue 6% tsirang 1%
Samdrupjongkhar 6% Gasa 1%
Paro 5% dagana 1%
Punakha 4% trashiyangtse -0%
Bumthang 3% Pema Gatshel 0%

AnnuAl EducAtion StAtiSticS
�0�
Table 4.4 NER & GER basic and the Gender Parity Index per Dzongkhag, 2009
NER GER
B G BG GPI B G BG GPI
Bhutan 86% 90% 88.36% 1.05 99% 102% 100% 1.02
Bumthang 83% 95% 89% 1.15 91% 107% 99% 1.17
Chukha 69% 86% 77% 1.24 79% 96% 87% 1.21
Dagana 96% 96% 96% 1.00 112% 108% 110% 0.96
Gasa 72% 75% 74% 1.04 85% 87% 86% 1.02
Haa 86% 94% 90% 1.09 99% 111% 104% 1.12
Lhuentse 95% 90% 92% 0.95 110% 100% 105% 0.91
Mongar 92% 84% 88% 0.92 107% 95% 101% 0.89
Paro 83% 94% 89% 1.13 96% 106% 101% 1.11
Pemagatshel 104% 95% 99% 0.91 123% 109% 116% 0.88
Punakha 80% 100% 88% 1.25 92% 110% 101% 1.20
Samdrupjongkhar 92% 85% 88% 0.92 110% 97% 103% 0.88
Samtse 87% 84% 86% 0.96 98% 91% 95% 0.93
Sarpang 98% 97% 98% 0.99 114% 110% 112% 0.96
Thimphu 80% 92% 86% 1.16 89% 101% 95% 1.14
Trashigang 91% 85% 88% 0.94 105% 98% 102% 0.93
Trashiyangtse 106% 98% 102% 0.93 122% 114% 118% 0.93
Trongsa 93% 90% 91% 0.97 109% 106% 108% 0.97
Tsirang 96% 92% 94% 0.96 113% 104% 108% 0.92
Wangdue 80% 91% 86% 1.14 89% 100% 95% 1.12
Zhemgang 99% 97% 98% 0.98 120% 112% 116% 0.94
Table 4.5 Class X detailed results 2008-2009
% number
Graduates continuing class Xi 76% 5,923
Graduates not continuing class Xi 20% 1,603
Repeaters 1% 53
School-leavers without certificate 3% 264
Total 7,843

AnnuAl EducAtion StAtiSticS
�0�
ANNEXURE

106
AnnEXuRE
Schools established in 2009SL.No Dzongkhag School/location Level Remarks
1 chukha1 tashilakha cPS dayschool
2 Pachu* cPS dayschool
2 dagana3 Karmaling cPS dayschool
4 Gumla cPS dayschool
3 lhuentse 5 chagzam cPS dayschool
4 Samtse7 Panabari* cPS dayschool
8 Phuensum cPS dayschool
5 Sarpang
9 lharing*- cPS dayschool
10 Pangkhey* cPS dayschool
11 Maugaon** cPS dayschool
12 Gong** cPS dayschool
6 trashigang14 dungtse MSS Boarding
15 Bartsham MSS Boarding
7 trongsa 16 Samcholing lSS dayschool
8 tsirang17 Phuentenchu* cPS dayschool
18 tsholingkhar cPS dayschool
9 Zhemgang 19 Sonamthang MSS Boarding
Private Schools
1 Mongar 6 Sherub Reldri HSS Boarding
2 thimphu 13 Yum thuje charity School cPS dayschool
Annex 1. New and Upgraded schools in Bhutan in 2009
Schools Upgraded in 2009Sl. No Dzongkhag School/location From To
1 chukha 1 Gedu MSS HSS
2 dagana
2 daga MSS HSS
3 dagapela lSS MSS
4 daga PS lSS
5 namchalla cPS lSS
3 Wangdue6 Gaselo MSS HSS
7 tshangkha cPS lSS
Private Schools
1 Paro1 Yoezerling PS HSS
2 tenzin PS HSS
2 thimphu 3 druk lSS MSS

107
AnnEXuRE
Extended Classroom established in 2009
SL.No Dzongkhag Name Level Parent School
1 chukha 1 Agaon EcR tashilakha cPS
2 dagana
2 Bichgoan EcR lhamoizingkha lSS
3 devitar EcR lhamoizingkha lSS
4 Pangserpo EcR Pangna cPS
3 Gasa 5 lungo EcR laya cPS
4 Haa 6 Sektena EcR Jyenkhana PS
5 Pema Gatshel
7 Yoomzore EcR chonshing cPS
8 Kheri EcR Khenzore cPS
9 Pangthang EcR Yelchen cPS
10 ngangshing(Mann) EcR Resinang cPS
11 EcR Gonpasingma lSS
12 Gashari EcR norbugang cPS
6 Samdrup Jongkhar13 Philuma EcR orong lSS
14 nainatal EcR Pemathang lSS
7 Samtse
15 dzongsar EcR tendu MSS
16 dumshidara EcR Gomtu MSS
17 Malbasey EcR Samtse lSS
18 nangladang EcR chengmari PS
19 Jaringay EcR Mindruling cPS
20 Baseni EcR denchhukha PS
21 Pungta EcR denchhukha PS
22 Kirney EcR chengmari PS
23 lamitar EcR Ghunauney MSS
24 Sanglung EcR Sengdhyen PS
25 Garigaon EcR taba dramtoe cPS
26 tading EcR taba dramtoe cPS
8 Sarpang 27 Kharpaney EcR lharing cPS
9 thimphu 28 Soe EcR lingzhi cPS
10 trashigang
29 durung EcR Gongthung cPS
30 Muktangkhar EcR Bartsham PS
31 Kheri EcR Wamrong lSS
11 tsirang 32 nimazor EcR Mendrelgang MSS
12 Wangdue33 Matalungchu EcR Wangdi lSS
34 Gogona EcR Phobjikha PS

108
AnnEXuRE
Comparative Enrolment in Different Levels of Schools 08-09
ClassPrivate Schools Com. Primary Schools Primary Schools Lower & Middle Sec. Schools Higher Secondary Schools Total
2008 2009 +or- %* 2008 2009 +or- %* 2008 2009 +or- %* 2008 2009 +or- %* 2008 2009 +or- %* 2008 2009 +or- %*
PP 946 1,020 74 7.8% 5,111 5,734 623 12.2% 3,339 3,452 113 3.4% 7,019 6,902 (117) -1.7% 197 16,415 17108 693 4.2%
I 488 457 (31) -6.4% 5,130 5,186 56 1.1% 3,366 3,531 165 4.9% 7,115 7,142 27 0.4% 173 16,099 16,316 217 1.3%
II 399 393 (6) -1.5% 5,152 5,002 (150) -2.9% 3,498 3,518 20 0.6% 7,497 7,008 (489) -6.5% 181 16,546 15,921 (625) -3.8%
III 286 324 38 13.3% 4,180 4,837 657 15.7% 3,279 3,404 125 3.8% 7,249 7,335 86 1.2% 135 14,994 15,900 906 6.0%
Iv 205 261 56 27.3% 4,035 4,028 (7) -0.2% 3,438 3,433 (5) -0.1% 7,789 7,472 (317) -4.1% 128 15,467 15,194 (273) -1.8%
v 171 174 3 1.8% 3,323 3,482 159 4.8% 3,163 3,261 98 3.1% 7,136 7,445 309 4.3% 177 13,793 14,362 569 4.1%
vI 155 157 2 1.3% 2,771 2,821 50 1.8% 2,730 2,966 236 8.6% 7,029 6,955 (74) -1.1% 151 12,685 12,899 214 1.7%
Sub-Total 2,650 2,786 136 5.1% 29,702 31,090 1,388 4.7% 22,813 23,565 752 3.3% 50,834 50,259 (575) -1.1% - 1,142 0 0 105,999 107,700 1,701 1.6%
vII 52 101 49 94.2% 11,669 12,042 373 3.2% 584 707 123 21.1% 12,305 12,850 545 4.4%
vIII 29 61 32 9,843 10,288 445 4.5% 1,047 1,098 51 4.9% 10,919 11,447 528 4.8%
Sub-Total 81 162 81 21,512 22,330 818 3.8% 1,631 1,805 174 10.7% 23,224 24,297 1,073 4.6%
Ix 19 46 27 142.1% 5,125 5,389 264 5.2% 4,612 5,116 504 10.9% 9,756 10,551 795 8.1%
x 29 58 29 100.0% 3,527 4,066 539 15.3% 4,405 4,633 228 5.2% 7,961 8,757 796 10.0%
Sub-Total 48 104 56 116.7% - 0 0 - 0 0 0 8,652 9,455 803 9.3% 9,017 9,749 732 8.1% 17,717 19,308 1,591 9.0%
xI 2,541 2,719 178 7.0% 2,885 3,271 386 13.4% 5,426 5,990 564 10.4%
xII 2,109 2,912 803 38.1% 2,622 2,913 291 11.1% 4,731 5,825 1,094 23.1%
Sub-Total 4,650 5,631 981 21.1% - 0 0 - 0 0 0 - 0 5,507 6,184 677 12.3% 10,157 11,815 1,658 16.3%
Total 7,429 8,683 1,254 16.9% 29,702 31,090 1,388 4.7% 22,813 23,565 752 0 80,998 82,044 1,046 1.3% 16,155 18,880 1,583 9.8% 157,112 164,262 6,023 3.8%
Annex 2. Comparative enrolment

109
AnnEXuRE
Comparative Enrolment in Different Levels of Schools 08-09
ClassPrivate Schools Com. Primary Schools Primary Schools Lower & Middle Sec. Schools Higher Secondary Schools Total
2008 2009 +or- %* 2008 2009 +or- %* 2008 2009 +or- %* 2008 2009 +or- %* 2008 2009 +or- %* 2008 2009 +or- %*
PP 946 1,020 74 7.8% 5,111 5,734 623 12.2% 3,339 3,452 113 3.4% 7,019 6,902 (117) -1.7% 197 16,415 17108 693 4.2%
I 488 457 (31) -6.4% 5,130 5,186 56 1.1% 3,366 3,531 165 4.9% 7,115 7,142 27 0.4% 173 16,099 16,316 217 1.3%
II 399 393 (6) -1.5% 5,152 5,002 (150) -2.9% 3,498 3,518 20 0.6% 7,497 7,008 (489) -6.5% 181 16,546 15,921 (625) -3.8%
III 286 324 38 13.3% 4,180 4,837 657 15.7% 3,279 3,404 125 3.8% 7,249 7,335 86 1.2% 135 14,994 15,900 906 6.0%
Iv 205 261 56 27.3% 4,035 4,028 (7) -0.2% 3,438 3,433 (5) -0.1% 7,789 7,472 (317) -4.1% 128 15,467 15,194 (273) -1.8%
v 171 174 3 1.8% 3,323 3,482 159 4.8% 3,163 3,261 98 3.1% 7,136 7,445 309 4.3% 177 13,793 14,362 569 4.1%
vI 155 157 2 1.3% 2,771 2,821 50 1.8% 2,730 2,966 236 8.6% 7,029 6,955 (74) -1.1% 151 12,685 12,899 214 1.7%
Sub-Total 2,650 2,786 136 5.1% 29,702 31,090 1,388 4.7% 22,813 23,565 752 3.3% 50,834 50,259 (575) -1.1% - 1,142 0 0 105,999 107,700 1,701 1.6%
vII 52 101 49 94.2% 11,669 12,042 373 3.2% 584 707 123 21.1% 12,305 12,850 545 4.4%
vIII 29 61 32 9,843 10,288 445 4.5% 1,047 1,098 51 4.9% 10,919 11,447 528 4.8%
Sub-Total 81 162 81 21,512 22,330 818 3.8% 1,631 1,805 174 10.7% 23,224 24,297 1,073 4.6%
Ix 19 46 27 142.1% 5,125 5,389 264 5.2% 4,612 5,116 504 10.9% 9,756 10,551 795 8.1%
x 29 58 29 100.0% 3,527 4,066 539 15.3% 4,405 4,633 228 5.2% 7,961 8,757 796 10.0%
Sub-Total 48 104 56 116.7% - 0 0 - 0 0 0 8,652 9,455 803 9.3% 9,017 9,749 732 8.1% 17,717 19,308 1,591 9.0%
xI 2,541 2,719 178 7.0% 2,885 3,271 386 13.4% 5,426 5,990 564 10.4%
xII 2,109 2,912 803 38.1% 2,622 2,913 291 11.1% 4,731 5,825 1,094 23.1%
Sub-Total 4,650 5,631 981 21.1% - 0 0 - 0 0 0 - 0 5,507 6,184 677 12.3% 10,157 11,815 1,658 16.3%
Total 7,429 8,683 1,254 16.9% 29,702 31,090 1,388 4.7% 22,813 23,565 752 0 80,998 82,044 1,046 1.3% 16,155 18,880 1,583 9.8% 157,112 164,262 6,023 3.8%
Annex 2. Comparative enrolment

110
AnnEXuREA
nn
ex 3
. Co
mp
arat
ive
dri
po
uts
an
d r
epea
ters
Det
ails
on
dro
po
uts
an
d r
epea
ters
by
gen
der
by
clas
s 20
08-2
009
Cla
ss
Enro
lmen
tR
epea
ters
Prom
otee
s Im
pute
dD
ropo
uts
impu
ted
Perc
enta
ge
2008
2009
2009
Prom
otee
sR
epea
ters
Dro
pout
s
Mal
eFe
mal
eM
ale
Fem
ale
Mal
e Fe
mal
eM
ale
F
e-M
ale
Fe-
Mal
eFe
mal
eM
ale
Fem
ale
Mal
eFe
mal
e
PP8,
260
8,17
48,
706
8,59
956
149
47,
679
7,76
720
-87
93.0
%95
.0%
6.8%
6.0%
0.2%
-1.1
%
i8,
217
7,88
08.
270
8,21
959
145
27,
501
7,36
112
567
91.3
%92
.4%
7.2%
5.7%
1.5%
0.9%
ii8,
578
7,96
48,
232
7,87
073
150
97,
676
7,41
517
140
89.5
%93
.1%
8.5%
6.4%
2.0%
0.5%
iii
7,71
07,
286
8,21
97,
816
543
401
7,01
26,
894
155
-990
.9%
94.6
%7.
0%5.
5%2.
0%-0
.1%
iV7,
707
7,80
57,
851
7,47
183
957
76,
597
7,05
527
117
385
.6%
90.4
%10
.9%
7.4%
3.5%
2.2v
V6,
864
6,95
17,
079
7,46
048
240
56,
012
6,43
036
111
687
.7%
92.5
%7.
0%5.
8%5.
3%1.
7%
Vi
6,23
56,
469
6,34
86,
702
327
272
5,77
76,
101
131
9692
.7%
94.3
%5.
2%4.
2%2.
1%1.
5%
Sub-
Tota
l53
,571
52,5
2954
,705
54,1
374,
074
3,11
048
,263
49,0
231,
234
396
90.1
%93
.3%
7.6%
5.9%
2.3%
0.8%
Vii
6,03
16,
297
6.24
76,
603
470
502
5,26
65.
566
295
229
87.3
%88
.4%
7.8%
8.0%
4.9%
3.6%
Vii
i5,
425
5,49
45,
561
5,88
629
532
05,
076
4,95
554
219
93.6
%90
.2%
5.4%
5.8%
1.0%
4.0%
Sub-
Tota
l11
,456
11,7
9111
,808
12,4
8976
582
210
,342
10,5
2134
944
890
.3%
89.2
%6.
7%7.
0%3.
0%3.
8%
iX4,
871
4,82
85,
324
5,22
724
827
24,
463
4,24
216
031
491
.6%
87.9
%5.
1%5.
6%3.
3%6.
5%
X4,
026
3,88
34,
495
4,26
232
203,
233
2,70
476
11,
159
80.3
%69
.6%
0.8%
0.5%
18.9
%29
.8%
Sub-
Tota
l8,
897
8,71
19,
819
9,48
928
029
27,
696
6,94
692
11,
473
86.5
%79
.7%
3.1%
3.4%
10.4
%16
.9%
Tota
l14
6,95
514
6,95
514
6,95
576
,115
5,11
94,
224
66,3
0166
,490
2,50
42,
317
45.1
%45
.2%
3.5%
2.9%
1.7%
1.6%
*the
stud
ents
who
leav
e af
ter c
lass
X a
re G
radu
ates
and
scho
ol le
aver
s and
not
dro
p-ou
ts

111
AnnEXuRE
Annex 4. Organization of the MoE Headquarters
The National Assembly elects the Minister for a term of 5 years. The Minister is supported by the Ministry Secretariat, which is headed by a Secretary. The Secretariat is organized into the Policy and Planning Division (PPD), which also includes the IT-unit, the Administrative and Finance Division (AFD) and Human Resource Division (HRD). The Bhutan Board of Examinations (BBE) and the National Commission for UNESCO are also a part of the Secretariat, and are directly accountable to the Secretary. The Internal Audit Unit (IA) headed by a Chief Internal Auditor reports directly to the Minister.
There are three Departments under the Ministry of Education; the Department of School Education (DSE), the Department of Adult and Higher Education (DAHE) and the Department of Youth and Sports (DYS). Each Department is headed by a Director, who is responsible for the implementation of the plans and policies of the department. Each Director is supported by Chief Programme Officers who head the various divisions under the department.
The Department of School Education is organized into 4 Divisions and the School Liaison and Coor-dination Unit (SLC) which supports the Department. The 4 divisions are the Curriculum and Profes-sional Services Division (CAPSD), the Education Monitoring & Support Service Division (EMSSD), the Programme Division (PD) and the School Planning and Building Division (SPBD. The Programme Division administers the following programmes: School Information Technology (IT), Special Edu-cation (SE), Early Childhood and Care Development (ECCD), School Agriculture, School Nutrition and Feeding and Private Schools development. CAPSD has a very close relation with the Paro Col-lege of Education (CoE). CAPSD-officers teach at the College in order to keep close contact with the teaching practice. The CoE is part of the Royal University of Bhutan.
The Department of Adult and Higher Education is organized into the Scholarship Division (SD), the Tertiary Division and the Non Formal and Continuing Education Division (NFECED). This depart-ment is also responsible for liaison with the Royal University of Bhutan.
The Department of Youth, Sports and Culture is organized into the Career Education and Counsel-ing Division (CECD), Games and Sports Division (GSD), Scouts and Culture Division (SCD) and Education Media (EM). The Games and Sports Division also has the support of the National Sports Federations. The Department is further supported by the Youth Information Centre (YIC) for advo-cacy of information related to youth and the Youth Centre for organizing youth programmes.
The next page shows the organizational structure of the ministry.

112
AnnEXuRE
Annex 4.1 Organizational Structure, Ministry of Education
Thefollowingfiguregivesthenumberofstaffworkingfortheministryofeducation
Table 3.2 Staff strength of the Ministry of Education, 2008
Office Officers Support Pool Staff (Drivers, Messen- Total
M F MF M F MF M F MF M F MF
1.00 Office of the Minister
Sub-total 1 1 3 4 1 5
2.00 Secretariat
2.01 Office of the Secretary 1 1 1 1 1 1 2 2 2 4
2.02 internal Audit 2 2 0 0 2 0 2
2.03 Policy and Planning division 7 4 11 1 2 3 1 1 9 6 15
2.04 Administration and Finance division 3 3 6 4 7 11 4 2 6 11 12 23
2.05 Bhutan Board of Examinations 5 3 8 3 3 6 1 1 9 6 15
2.06 Human Resource Management division 4 3 7 2 6 8 3 1 4 9 10 19
2.07 national commission of unesco 1 1 2 1 1 1 1 2 2 4
Sub-total 22 15 37 11 19 30 11 4 15 44 38 82
3.00 Directorates
3.01 department of School Education 46 8 54 12 9 21 12 4 16 70 21 91
3.02 departement of Adult & Higher Education 7 1 8 2 7 9 2 2 4 11 10 21
3.03 dpartment of Youth & Sports 16 8 24 8 7 15 5 3 8 29 18 47
Sub-total 69 17 86 22 23 45 19 9 28 110 49 159
Grand total 91 32 123 34 43 75 33 13 43 158 88 246

113
AnnEXuRE
Annex 5. WFP-support
2009 WFP Beneficiaries
School Name2009 WFP BENEFICIARIES
Total WFP Beneficiaries
WFP Day Students WFP Boarders
Day Boarders Total Girls Boys Total Girls Boys Total
1 BUMTHANG 1 cHHuMEY MSS 0 114 114 0 0 0 61 53 114
2 tAnG lSS 0 81 81 0 0 0 41 40 81
3 uRA MSS 0 74 74 0 0 0 34 40 74
SUB TOTAL 0 269 269 0 0 0 136 133 2692 CHHUKHA 1 cHAPcHA MSS 7 121 128 3 4 7 62 59 121
2 RincHEnlinG cPS 45 0 45 21 24 45 0 0 0
3 cHHuKHA HSS 0 308 308 0 0 0 133 175 308
4 GEtAnA cPS 105 0 105 43 62 105 0 0 0
5 BAiKunZA cPS 115 0 115 46 69 115 0 0 0
6 BonGo PS 27 48 75 14 13 27 24 24 48
7 cHunGKHA lSS 86 314 400 44 42 86 140 174 314
8 KEtoKHA cPS 76 0 76 36 40 76 0 0 0
9 KAMJI LSS 44 443 487 13 31 44 208 235 443
10 dunGnA lSS 65 260 325 28 37 65 119 141 260
11 MEtAKHA cPS 106 0 106 58 48 106 0 0 0
12 SincHulA PS 328 0 328 144 184 328 0 0 0
13 cHonGAYKHA cPS 293 0 293 153 140 293 0 0 0
14 cHiMunA PS 235 0 235 110 125 235 0 0 0
15 loKcHinA lSS 304 0 304 132 172 304 0 0 0
16 KEZARi cPS 97 0 97 62 35 97 0 0 0
SUB TOTAL 1933 1494 3427 907 1026 1933 686 808 14943 DAGANA 1 dAGA MSS 0 111 111 0 0 0 60 51 111
2 SAMEY cPS 125 9 134 68 57 125 2 7 9
3 PHEKoMA cPS 215 0 215 103 112 215 0 0 0
4 DRUJEYGANG MSS 0 231 231 0 0 0 113 118 231
5 PHuEnSuMGAnG cPS 155 0 155 86 69 155 0 0 0
6 GESARlinG lSS 96 275 371 55 41 96 117 158 275
7 ZincHElA cPS 159 0 159 81 78 159 0 0 0
8 niMtolA cPS 183 0 183 87 96 183 0 0 0
9 lunGtEnGAnG cPS 122 0 122 62 60 122 0 0 0
10 tSHAnGKHA lSS 282 0 282 133 149 282 0 0 0
SUB TOTAL 1337 626 1963 675 662 1337 292 334 626

114
AnnEXuRE
School Name2009 WFP BENEFICIARIES
Total WFP Beneficiaries
WFP Day Students WFP Boarders
Day Boarders Total Girls Boys Total Girls Boys Total
4 GASA
1 BJISHONG MSS 87 167 254 45 42 87 93 74 167
2 GASA PS 111 0 111 62 49 111 0 0 0
3 lAYA cPS 27 75 102 16 11 27 19 56 75
4 lunAnA cPS 0 71 71 0 0 0 18 53 71
SUB TOTAL 225 313 538 123 102 225 130 183 313
5 HAA
1 JYENSA PS 205 0 205 102 103 205 0 0 0
2 JYENKHANA PS 0 261 261 0 0 0 138 123 261
3 UGYEN DORJI HSS 0 78 78 0 0 0 36 42 78
4 SoMBEKHA PS 75 0 75 37 38 75 0 0 0
5 RAnGtSE cPS 98 0 98 55 43 98 0 0 0
SUB TOTAL 378 339 717 194 184 378 174 165 339
6 LHUNTSE
1 nEY cPS 39 0 39 16 23 39 0 0 0
2 PHuYuM HSS 0 120 120 0 0 0 58 62 120
3 tHiMYul lSS 249 0 249 122 127 249 0 0 0
4 KHoMA lSS 70 205 275 32 38 70 103 102 205
5 tSHocHHEn cPS 120 0 120 52 68 120 0 0 0
6 WAMBuR cPS 71 58 129 37 34 71 25 33 58
7 tAnGMAcHHu MSS 0 231 231 0 0 0 114 117 231
8 lAdRonG cPS 125 0 125 70 55 125 0 0 0
9 ZAnGKHAR cPS 26 108 134 15 11 26 46 62 108
10 GoRtSuM cPS 183 0 183 88 95 183 0 0 0
11 dunGKAR PS 85 101 186 42 43 85 52 49 101
12 ZHAM cPS 61 0 61 32 29 61 0 0 0
SUB TOTAL 1029 823 1852 506 523 1029 398 425 823
7 MONGAR
1 GYElPoZHinG HSS 0 515 515 0 0 0 246 269 515
2 tSAKAlinG PS 98 32 130 45 53 98 17 15 32
3 tSAMAnG PS 8 132 140 6 2 8 66 66 132
4 YAdi MSS 0 112 112 0 0 0 51 61 112
5 tHAnGRonG PS 85 123 208 45 40 85 62 61 123
6 BAlAM cPS 217 0 217 109 108 217 0 0 0
7 dRAMEtSE MSS 0 123 123 0 0 0 50 73 123
8 KEnGKHAR lSS 169 145 314 69 100 169 53 92 145

115
AnnEXuRE
School Name2009 WFP BENEFICIARIES
Total WFP Beneficiaries
WFP Day Students WFP Boarders
Day Boarders Total Girls Boys Total Girls Boys Total
9 udARic cPS 105 0 105 49 56 105 0 0 0
10 nAGoR lSS 146 112 258 65 81 146 46 66 112
11 PAnGtHAnG cPS 70 0 70 35 35 70 0 0 0
12 SilAMBi cPS 61 0 61 29 32 61 0 0 0
13 WAMA cPS 41 0 41 25 16 41 0 0 0
14 dAKSA cPS 108 0 108 50 58 108 0 0 0
15 YAnGBARi cPS 86 0 86 41 45 86 0 0 0
16 JURMEY PS 229 0 229 116 113 229 0 0 0
17 SERZonG lSS 123 114 237 65 58 123 54 60 114
18 ZunGlEn PS 81 0 81 41 40 81 0 0 0
19 linGKHAR cPS 68 0 68 32 36 68 0 0 0
20 YARAGlA cPS 43 0 43 21 22 43 0 0 0
21 WAicHuR cPS 85 0 85 37 48 85 0 0 0
22 nARAnG cPS 192 0 192 89 103 192 0 0 0
SUB TOTAL 2015 1408 3423 969 1046 2015 645 763 1408
8 PARO
1 dRuKGYEl HSS 0 444 444 0 0 0 230 214 444
2 dAWAKHA lSS 0 180 180 0 0 0 87 93 180
3 BitEKHA lSS 0 165 165 0 0 0 79 86 165
4 GonEYtSAWA cPS 26 69 95 12 14 26 38 31 69
SUB TOTAL 26 858 884 12 14 26 434 424 858
9 PEMAGATSHEL
1 tSEBAR lSS 131 141 272 61 70 131 74 67 141
2 GonPASinGMA lSS 136 199 335 67 69 136 90 109 199
3 YuRunG lSS 103 187 290 57 46 103 83 104 187
4 dunGMin cPS 21 41 62 12 9 21 21 20 41
5 MiKuRi cPS 78 58 136 47 31 78 25 33 58
6 cHiMonG PS 59 26 85 23 36 59 15 11 26
7 dEcHHElinG lSS 262 112 374 135 127 262 55 57 112
8 nGAnGlAM lSS 0 117 117 0 0 0 59 58 117
9 nGAnGlAM MSS 0 202 202 0 0 0 86 116 202
10 noRBuGAnG cPS 144 0 144 55 89 144 0 0 0
11 tSHAtSi PS 83 86 169 43 40 83 39 47 86
12 KHAnGMA cPS 87 0 87 44 43 87 0 0 0
13 REZiMo cPS 72 0 72 42 30 72 0 0 0
14 dAGoR cPS 52 0 52 22 30 52 0 0 0

116
AnnEXuRE
School Name2009 WFP BENEFICIARIES
Total WFP Beneficiaries
WFP Day Students WFP Boarders
Day Boarders Total Girls Boys Total Girls Boys Total
15 tHonGSA cPS 80 0 80 32 48 80 0 0 0
16 WoonGcHilo cPS 103 0 103 47 56 103 0 0 0
17 KERonG cPS 43 0 43 20 23 43 0 0 0
18 cHoEKHoRlinG cPS 70 0 70 33 37 70 0 0 0
SUB TOTAL 1524 1169 2693 740 784 1524 547 622 1169
10 PUNAKHA
1 tASHidinGKHA MSS 0 268 268 0 0 0 142 126 268
2 PunAKHA HSS 0 185 185 0 0 0 100 85 185
3 tHinlEYGAnG PS 0 142 142 0 0 0 74 68 142
4 tHinlEYGAnG MSS 0 150 150 0 0 0 88 62 150
5 GoEn SHARi cPS 138 0 138 69 69 138 0 0 0
SUB TOTAL 138 745 883 69 69 138 404 341 745
11 S/JONGKHAR
1 GoMdAR lSS 165 193 358 75 90 165 88 105 193
2 lAuRi PS 156 194 350 86 70 156 84 110 194
3 MARtSHAlA MSS 38 109 147 17 21 38 38 71 109
4 MARtSHAlA PS 87 242 329 34 53 87 118 124 242
5 MINJIWOONG LSS 106 203 309 49 57 106 110 93 203
6 oRonG lSS 124 248 372 75 49 124 112 136 248
7 YARPHu cPS 150 0 150 73 77 150 0 0 0
8 ZAMtARi cPS 121 0 121 63 58 121 0 0 0
9 BARZoR cPS 144 0 144 60 84 144 0 0 0
10 SARJUNG CPS 140 0 140 56 84 140 0 0 0
11 tSHotSAlo cPS 65 0 65 30 35 65 0 0 0
12 dunGMAnBA cPS 106 0 106 48 58 106 0 0 0
13 ZAnGtEY cPS 156 0 156 99 57 156 0 0 0
SUB TOTAL 1558 1189 2747 765 793 1558 550 639 1189
12 SAMTSE
doRoKHA MSS 0 280 280 0 0 0 115 165 280
SEnGdHYEn cPS 105 312 417 42 63 105 131 181 312
dEncHHuKHA cPS 335 0 335 158 177 335 0 0 0
MindulinG cPS 297 0 297 142 155 297 0 0 0
tABA dAMtoE PS 284 0 284 128 156 284 0 0 0
BARA cPS 496 0 496 248 248 496 0 0 0
nAMGAYcHolinG 370 0 370 175 195 370 0 0 0
SUB TOTAL 1887 592 2479 893 994 1887 246 346 592

117
AnnEXuRE
School Name2009 WFP BENEFICIARIES
Total WFP Beneficiaries
WFP Day Students WFP Boarders
Day Boarders Total Girls Boys Total Girls Boys Total
13 SARPANG
1 uMlinG cPS 353 0 353 162 191 353 0 0 0
2 SARPAnG HSS 0 202 202 0 0 0 99 103 202
3 noRBulinG MSS 0 175 175 0 0 0 80 95 175
SUB TOTAL 353 377 730 162 191 353 179 198 377
14 THIMPHU
1 GEnEKHA lSS 132 168 300 72 60 132 84 84 168
2 linGZHi cPS 0 69 69 0 0 0 33 36 69
3 cHAMGAnG lSS 287 0 287 151 136 287 0 0 0
SUB TOTAL 419 237 656 223 196 419 117 120 237
15 TRASHIGANG
1 tHonGRonG cPS 85 0 85 39 46 85 0 0 0
2 toKSHinGMAnG cPS 0 162 162 0 0 0 66 96 162
3 KAnGPARA lSS 99 188 287 43 56 99 79 109 188
4 BiKHAR PS 216 36 252 104 112 216 25 11 36
5 uZoRonG lSS 76 280 356 40 36 76 143 137 280
6 BidunG lSS 0 251 251 0 0 0 130 121 251
7 JOENKHAR CPS 68 0 68 28 40 68 0 0 0
8 SAKtEnG PS 244 0 244 86 158 244 0 0 0
9 BREKHA cPS 105 0 105 51 54 105 0 0 0
10 J.SHERUBLING HSS 0 273 273 0 0 0 108 165 273
11 nid KHAlinG 0 48 48 0 0 0 19 29 48
12 luMAnG PS 13 98 111 4 9 13 52 46 98
13 tHREPHu cPS 24 0 24 14 10 24 0 0 0
14 WAMRonG lSS 101 222 323 44 57 101 103 119 222
15 tASHitSE HSS 0 342 342 0 0 0 159 183 342
16 tHunGKHAR lSS 156 101 257 67 89 156 47 54 101
17 PASAPHu PS 60 0 60 36 24 60 0 0 0
18 MERAK PS 226 0 226 101 125 226 0 0 0
19 PHonGMEY PS 158 0 158 74 84 158 0 0 0
20 tHRiMSHinG cPS 62 0 62 31 31 62 0 0 0
21 JERELIMI CPS 95 0 95 47 48 95 0 0 0
22 KuRicHilo cPS 135 0 135 47 88 135 0 0 0
23 BERdunGMA cPS 55 0 55 22 33 55 0 0 0
24 dAliPHAnGMA cPS 67 0 67 31 36 67 0 0 0
25 cHiYA cPS 84 0 84 48 36 84 0 0 0

118
AnnEXuRE
School Name2009 WFP BENEFICIARIES
Total WFP Beneficiaries
WFP Day Students WFP Boarders
Day Boarders Total Girls Boys Total Girls Boys Total
26 BEnSHinGMo cPS 85 0 85 38 47 85 0 0 0
27 KAnGlunG MSS 0 34 34 0 0 0 18 16 34
28 tARPHEl cPS 115 0 115 49 66 115 0 0 0
29 WoMAnAnG cPS 78 0 78 38 40 78 0 0 0
30 toKAPHu cPS 82 0 82 46 36 82 0 0 0
31 TONGMIJANGSA LSS 114 156 270 55 59 114 82 74 156
32 tSEnKHARlA MSS 194 367 561 92 102 194 153 214 367
33 JANGPHUTSE CPS 86 0 86 47 39 86 0 0 0
34 KHEni lSS 34 202 236 15 19 34 107 95 202
35 MElonGKHAR cPS 85 0 85 49 36 85 0 0 0
36 tHRAGoM cPS 18 80 98 8 10 18 36 44 80
37 YAlAnG cPS 88 0 88 52 36 88 0 0 0
38 dAliKHER cPS 44 0 44 20 24 44 0 0 0
39 BuMdElinG lSS 0 66 66 0 0 0 34 32 66
40 duKti cPS 35 0 35 20 15 35 0 0 0
41 SHonGRinG cPS 74 0 74 28 46 74 0 0 0
SUB TOTAL 3261 2906 6167 1514 1747 3261 1361 1545 2906
17 TRONGSA
1 BEMJI PS 50 20 70 28 22 50 6 14 20
2 tAKtSE MSS 0 86 86 0 0 0 38 48 86
3 KElA cPS 42 0 42 24 18 42 0 0 0
4 tSHAnGKHA lSS 111 73 184 59 52 111 34 39 73
5 JANGBI CPS 59 0 59 32 27 59 0 0 0
6 lAnGtHEl lSS 263 79 342 147 116 263 38 41 79
7 KoRPHu PS 66 0 66 27 39 66 0 0 0
8 NABJI CPS 78 0 78 39 39 78 0 0 0
9 niMSHonG cPS 90 0 90 41 49 90 0 0 0
10 KARSHonG cPS 61 0 61 34 27 61 0 0 0
SUB TOTAL 820 258 1078 431 389 820 116 142 258
18 TSIRANG
1 PAtAlEY cPS 278 0 278 128 150 278 0 0 0
2 MEndRElGAnG MSS 0 169 169 0 0 0 87 82 169
3 tSiRAnGtoE lSS 318 0 318 136 182 318 0 0 0
SUB TOTAL 596 169 765 264 332 596 87 82 169
19 W/PHODRANG
1 SAMtEnGAnG MSS 0 215 215 0 0 0 131 84 215

119
AnnEXuRE
School Name2009 WFP BENEFICIARIES
Total WFP Beneficiaries
WFP Day Students WFP Boarders
Day Boarders Total Girls Boys Total Girls Boys Total
2 KHotAKHA cPS 193 0 193 104 89 193 0 0 0
3 JALA CPS 74 0 74 34 40 74 0 0 0
4 SAMtEnGAnG PS 154 0 154 79 75 154 0 0 0
5 AdA cPS 30 70 100 15 15 30 36 34 70
6 nAHi PS 54 90 144 30 24 54 51 39 90
7 SHA tASHA PS 56 163 219 36 20 56 88 75 163
8 GASElo lSS 0 242 242 0 0 0 131 111 242
9 dAnGcHHu cPS 112 0 112 77 35 112 0 0 0
10 noBdinG lSS 0 145 145 0 0 0 71 74 145
11 SEPHu cPS 125 0 125 60 65 125 0 0 0
12 RAMEYcHEn cPS 180 0 180 103 77 180 0 0 0
SUB TOTAL 978 925 1903 538 440 978 508 417 925
20 ZHEMGANG
1 BARdoH cPS 22 66 88 12 10 22 29 37 66
2 KHoMSHAR cPS 126 74 200 72 54 126 41 33 74
3 lAnGduRBi cPS 89 22 111 48 41 89 9 13 22
4 BJOKA-DOGAR CPS 69 61 130 26 43 69 38 23 61
5 tSHAidAnG cPS 92 0 92 51 41 92 0 0 0
6 GoMPHu lSS 67 117 184 38 29 67 54 63 117
7 KAKtonG cPS 124 0 124 53 71 124 0 0 0
8 YEBilAPtSA MSS 0 342 342 0 0 0 153 189 342
9 ZHEMGAnG HSS 0 183 183 0 0 0 93 90 183
10 BudASHi cPS 101 0 101 63 38 101 0 0 0
11 SonAMtHAnG MSS 31 249 280 15 16 31 99 150 249
12 PAnBAnG cPS 156 62 218 70 86 156 20 42 62
13 PAntAnG cPS 44 120 164 19 25 44 55 65 120
14 tASHiBi cPS 110 0 110 58 52 110 0 0 0
15 niMZHonG cPS 47 0 47 22 25 47 0 0 0
16 SHinGKHAR cPS 23 139 162 13 10 23 77 62 139
17 GoSHinG cPS 103 89 192 61 42 103 44 45 89
18 TRADIJONG CPS 64 0 64 31 33 64 0 0 0
19 dunMAnG cPS 62 0 62 39 23 62 0 0 0
20 dEGElA cPS 63 0 63 34 29 63 0 0 0
21 BARPonG cPS 69 0 69 35 34 69 0 0 0
SUB TOTAL 1462 1524 2986 760 702 1462 712 812 1524
GRAND TOTAL 19939 16221 36160 9745 10194 19939 7722 8499 16221

120
AnnEXuRE
School LevelTypeType
Sec.PP I II III IV V VI VII VIII IX X XI XII Total Bht
NBht Total T:PG T G T G T S G T G T G T G T G T G T G T G T G T G T B G T ZLT Oth.
1 Bumthang
1 Jakar HSS U 14 0 0 0 0 0 0 0 0 0 0 0 0 0 0 0 0 0 0 0 76 128 70 132 37 90 43 100 224 226 450 5 18 3 26
2 Chumey MSS U 19 14 22 19 36 20 31 1 14 27 16 34 14 31 8 24 60 101 51 101 38 95 55 105 0 0 0 0 298 309 607 5 18 1 24
3 Ura MSS SU 15 15 32 16 31 10 24 1 7 20 12 21 11 23 15 30 32 69 29 53 48 93 15 40 0 0 0 0 226 210 436 2 14 2 18
4 Wangdicholing LSS U 24 35 78 45 90 40 78 2 46 88 41 104 58 100 51 87 87 159 50 107 0 0 0 0 0 0 0 0 438 453 891 6 22 0 28
5 Tang LSS SR 11 10 18 6 11 1 6 1 4 7 4 8 4 13 4 13 27 50 20 42 0 0 0 0 0 0 0 0 88 80 168 3 9 0 12
6Gangrithang (Jalikhar)
PS U 7 27 46 26 48 27 43 1 25 46 30 53 26 50 16 33 0 0 0 0 0 0 0 0 0 0 0 0 142 177 319 2 8 0 10 32
7 Zangtherpo CPS SU 7 16 32 11 23 14 33 1 16 29 16 34 13 29 13 19 0 0 0 0 0 0 0 0 0 0 0 0 100 99 199 2 7 0 9
8 Zungnye CPS SU 7 5 9 8 14 16 24 1 9 16 9 22 8 14 5 10 0 0 0 0 0 0 0 0 0 0 0 0 49 60 109 2 5 0 7
9 Shingnyer CPS SR 5 5 10 8 15 0 0 0 5 11 3 10 4 7 0 0 0 0 0 0 0 0 0 0 0 0 0 0 28 25 53 1 2 0 3
10 Tangsibi CPS SR 6 0 0 5 11 8 11 1 3 7 5 10 6 13 2 4 0 0 0 0 0 0 0 0 0 0 0 0 27 29 56 1 2 0 3
11 Khangrab CPS SR 7 17 27 5 11 7 12 1 6 12 13 22 13 25 6 15 0 0 0 0 0 0 0 0 0 0 0 0 57 67 124 2 5 0 7
12 Gaytsa CPS SR 7 8 19 13 25 12 20 1 8 25 27 34 10 22 10 26 0 0 0 0 0 0 0 0 0 0 0 0 83 88 171 2 7 0 9
13 Kharsat CPS SR 7 8 13 3 5 5 11 1 3 5 14 20 11 14 6 10 0 0 0 0 0 0 0 0 0 0 0 0 28 50 78 2 3 0 5
14 Dhur CPS SR 7 11 22 9 16 5 12 1 7 11 4 12 9 13 4 8 0 0 0 0 0 0 0 0 0 0 0 0 45 49 94 1 4 0 5
15 Shingkhar CPS SR 5 0 0 7 10 0 0 0 2 7 2 7 3 6 4 7 0 0 0 0 0 0 0 0 0 0 0 0 19 18 37 1 2 0 3
16 Jigmiling CPS SR 7 5 10 6 12 5 10 1 5 13 10 13 5 11 5 11 0 0 0 0 0 0 0 0 0 0 0 0 39 41 80 1 3 0 4
17 Chhokhor Toe CPS R 7 4 10 5 13 12 18 1 4 14 1 6 5 15 7 7 0 0 0 0 0 0 0 0 0 0 0 0 45 38 83 2 3 0 5
18 Chungphel CPS R 5 6 9 0 0 4 9 1 0 0 2 6 3 3 3 6 0 0 0 0 0 0 0 0 0 0 0 0 15 18 33 2 1 0 3
Total 167 186 357 192 371 186 342 16 164 338 209 416 203 389 159 310 206 379 150 303 162 316 140 277 37 90 43 100 1951 2037 3988 42 133 6 181 22
1Sonam Kuenphen (Pvt)
HSS SU 6 0 0 0 0 0 0 0 0 0 0 0 0 0 0 0 0 0 0 0 0 0 0 0 30 57 69 145 103 99 202 1 3 5 9 22
Total 6 0 0 0 0 0 0 0 0 0 0 0 0 0 0 0 0 0 0 0 0 0 0 0 30 57 69 145 103 99 202 1 3 5 9 22
G.Total 173 186 357 192 371 186 342 16 164 338 209 416 203 389 159 310 206 379 150 303 162 316 140 277 67 147 112 245 2054 2136 4190 43 136 11 190 22
2 Chukha
1 Chukha HSS U 19 0 0 0 0 0 0 0 0 0 0 0 0 0 0 0 0 0 0 0 110 275 115 231 74 166 53 121 441 352 793 4 22 12 38
2 Phuentsholing HSS U 31 53 104 45 80 45 80 2 32 54 31 52 23 55 25 46 59 112 45 86 104 202 92 171 63 123 61 103 590 678 1268 8 26 17 51
3 Gedu HSS U 32 45 93 43 93 58 101 3 42 81 35 76 52 122 64 105 69 118 73 140 35 76 47 93 18 47 0 0 564 581 1145 9 36 7 52
4 Darla MSS U 30 42 79 70 139 55 109 3 46 98 31 68 45 128 51 107 60 126 61 115 57 107 28 72 0 0 0 0 602 546 1148 5 30 6 41
5 Phuentsholing MSS U 52 46 83 119 246 15 42 1 42 89 36 84 49 86 44 75 38 92 80 141 109 194 65 111 0 0 0 0 600 643 1243 7 20 14 41
6 Chapcha MSS SU 10 0 0 0 0 0 0 0 0 0 0 0 0 0 0 0 39 68 40 82 63 121 49 95 0 0 0 0 175 191 366 3 13 4 20
7 Wangchu MSS SU 30 30 59 40 83 59 119 3 47 101 56 112 61 122 49 102 48 83 51 118 38 75 37 75 0 0 0 0 533 516 1049 6 28 11 45
8 Pasakha LSS U 25 76 147 132 254 82 159 3 63 142 48 117 72 134 43 89 52 100 36 62 0 0 0 0 0 0 0 0 600 604 1204 4 14 4 22
9 Phuentsholing LSS U 44 105 216 0 0 135 276 8 134 269 98 181 138 248 110 231 104 174 34 67 0 0 0 0 0 0 0 0 804 858 1662 7 65 6 78
10 Tsimalakha LSS SU 20 40 78 40 86 39 72 2 43 80 25 56 29 60 39 74 58 108 57 112 0 0 0 0 0 0 0 0 356 370 726 4 22 3 29
11 Chungkha LSS SR 11 12 26 15 30 12 23 1 11 21 14 29 19 44 25 54 41 99 33 74 0 0 0 0 0 0 0 0 218 182 400 1 8 0 9
12 Kamji LSS SR 13 25 37 16 31 11 23 1 14 31 23 39 29 53 20 47 62 172 57 103 0 0 0 0 0 0 0 0 279 257 536 2 15 2 19
13 Logchina LSS VR 9 26 45 21 45 19 41 1 21 48 16 37 14 24 9 29 9 26 7 21 0 0 0 0 0 0 0 0 174 142 316 2 10 0 12
14 Dungna LSS VR 10 24 38 20 38 31 68 2 10 40 16 34 12 41 8 26 15 22 10 17 0 0 0 0 0 0 0 0 178 146 324 1 8 0 9
15 Arekha PS SU 12 24 53 38 76 35 69 2 21 48 28 62 26 58 15 35 0 0 0 0 0 0 0 0 0 0 0 0 214 187 401 2 11 1 14

121
AnnEXuRE
School LevelTypeType
Sec.PP I II III IV V VI VII VIII IX X XI XII Total Bht
NBht Total T:PG T G T G T S G T G T G T G T G T G T G T G T G T G T B G T ZLT Oth.
1 Bumthang
1 Jakar HSS U 14 0 0 0 0 0 0 0 0 0 0 0 0 0 0 0 0 0 0 0 76 128 70 132 37 90 43 100 224 226 450 5 18 3 26
2 Chumey MSS U 19 14 22 19 36 20 31 1 14 27 16 34 14 31 8 24 60 101 51 101 38 95 55 105 0 0 0 0 298 309 607 5 18 1 24
3 Ura MSS SU 15 15 32 16 31 10 24 1 7 20 12 21 11 23 15 30 32 69 29 53 48 93 15 40 0 0 0 0 226 210 436 2 14 2 18
4 Wangdicholing LSS U 24 35 78 45 90 40 78 2 46 88 41 104 58 100 51 87 87 159 50 107 0 0 0 0 0 0 0 0 438 453 891 6 22 0 28
5 Tang LSS SR 11 10 18 6 11 1 6 1 4 7 4 8 4 13 4 13 27 50 20 42 0 0 0 0 0 0 0 0 88 80 168 3 9 0 12
6Gangrithang (Jalikhar)
PS U 7 27 46 26 48 27 43 1 25 46 30 53 26 50 16 33 0 0 0 0 0 0 0 0 0 0 0 0 142 177 319 2 8 0 10 32
7 Zangtherpo CPS SU 7 16 32 11 23 14 33 1 16 29 16 34 13 29 13 19 0 0 0 0 0 0 0 0 0 0 0 0 100 99 199 2 7 0 9
8 Zungnye CPS SU 7 5 9 8 14 16 24 1 9 16 9 22 8 14 5 10 0 0 0 0 0 0 0 0 0 0 0 0 49 60 109 2 5 0 7
9 Shingnyer CPS SR 5 5 10 8 15 0 0 0 5 11 3 10 4 7 0 0 0 0 0 0 0 0 0 0 0 0 0 0 28 25 53 1 2 0 3
10 Tangsibi CPS SR 6 0 0 5 11 8 11 1 3 7 5 10 6 13 2 4 0 0 0 0 0 0 0 0 0 0 0 0 27 29 56 1 2 0 3
11 Khangrab CPS SR 7 17 27 5 11 7 12 1 6 12 13 22 13 25 6 15 0 0 0 0 0 0 0 0 0 0 0 0 57 67 124 2 5 0 7
12 Gaytsa CPS SR 7 8 19 13 25 12 20 1 8 25 27 34 10 22 10 26 0 0 0 0 0 0 0 0 0 0 0 0 83 88 171 2 7 0 9
13 Kharsat CPS SR 7 8 13 3 5 5 11 1 3 5 14 20 11 14 6 10 0 0 0 0 0 0 0 0 0 0 0 0 28 50 78 2 3 0 5
14 Dhur CPS SR 7 11 22 9 16 5 12 1 7 11 4 12 9 13 4 8 0 0 0 0 0 0 0 0 0 0 0 0 45 49 94 1 4 0 5
15 Shingkhar CPS SR 5 0 0 7 10 0 0 0 2 7 2 7 3 6 4 7 0 0 0 0 0 0 0 0 0 0 0 0 19 18 37 1 2 0 3
16 Jigmiling CPS SR 7 5 10 6 12 5 10 1 5 13 10 13 5 11 5 11 0 0 0 0 0 0 0 0 0 0 0 0 39 41 80 1 3 0 4
17 Chhokhor Toe CPS R 7 4 10 5 13 12 18 1 4 14 1 6 5 15 7 7 0 0 0 0 0 0 0 0 0 0 0 0 45 38 83 2 3 0 5
18 Chungphel CPS R 5 6 9 0 0 4 9 1 0 0 2 6 3 3 3 6 0 0 0 0 0 0 0 0 0 0 0 0 15 18 33 2 1 0 3
Total 167 186 357 192 371 186 342 16 164 338 209 416 203 389 159 310 206 379 150 303 162 316 140 277 37 90 43 100 1951 2037 3988 42 133 6 181 22
1Sonam Kuenphen (Pvt)
HSS SU 6 0 0 0 0 0 0 0 0 0 0 0 0 0 0 0 0 0 0 0 0 0 0 0 30 57 69 145 103 99 202 1 3 5 9 22
Total 6 0 0 0 0 0 0 0 0 0 0 0 0 0 0 0 0 0 0 0 0 0 0 0 30 57 69 145 103 99 202 1 3 5 9 22
G.Total 173 186 357 192 371 186 342 16 164 338 209 416 203 389 159 310 206 379 150 303 162 316 140 277 67 147 112 245 2054 2136 4190 43 136 11 190 22
2 Chukha
1 Chukha HSS U 19 0 0 0 0 0 0 0 0 0 0 0 0 0 0 0 0 0 0 0 110 275 115 231 74 166 53 121 441 352 793 4 22 12 38
2 Phuentsholing HSS U 31 53 104 45 80 45 80 2 32 54 31 52 23 55 25 46 59 112 45 86 104 202 92 171 63 123 61 103 590 678 1268 8 26 17 51
3 Gedu HSS U 32 45 93 43 93 58 101 3 42 81 35 76 52 122 64 105 69 118 73 140 35 76 47 93 18 47 0 0 564 581 1145 9 36 7 52
4 Darla MSS U 30 42 79 70 139 55 109 3 46 98 31 68 45 128 51 107 60 126 61 115 57 107 28 72 0 0 0 0 602 546 1148 5 30 6 41
5 Phuentsholing MSS U 52 46 83 119 246 15 42 1 42 89 36 84 49 86 44 75 38 92 80 141 109 194 65 111 0 0 0 0 600 643 1243 7 20 14 41
6 Chapcha MSS SU 10 0 0 0 0 0 0 0 0 0 0 0 0 0 0 0 39 68 40 82 63 121 49 95 0 0 0 0 175 191 366 3 13 4 20
7 Wangchu MSS SU 30 30 59 40 83 59 119 3 47 101 56 112 61 122 49 102 48 83 51 118 38 75 37 75 0 0 0 0 533 516 1049 6 28 11 45
8 Pasakha LSS U 25 76 147 132 254 82 159 3 63 142 48 117 72 134 43 89 52 100 36 62 0 0 0 0 0 0 0 0 600 604 1204 4 14 4 22
9 Phuentsholing LSS U 44 105 216 0 0 135 276 8 134 269 98 181 138 248 110 231 104 174 34 67 0 0 0 0 0 0 0 0 804 858 1662 7 65 6 78
10 Tsimalakha LSS SU 20 40 78 40 86 39 72 2 43 80 25 56 29 60 39 74 58 108 57 112 0 0 0 0 0 0 0 0 356 370 726 4 22 3 29
11 Chungkha LSS SR 11 12 26 15 30 12 23 1 11 21 14 29 19 44 25 54 41 99 33 74 0 0 0 0 0 0 0 0 218 182 400 1 8 0 9
12 Kamji LSS SR 13 25 37 16 31 11 23 1 14 31 23 39 29 53 20 47 62 172 57 103 0 0 0 0 0 0 0 0 279 257 536 2 15 2 19
13 Logchina LSS VR 9 26 45 21 45 19 41 1 21 48 16 37 14 24 9 29 9 26 7 21 0 0 0 0 0 0 0 0 174 142 316 2 10 0 12
14 Dungna LSS VR 10 24 38 20 38 31 68 2 10 40 16 34 12 41 8 26 15 22 10 17 0 0 0 0 0 0 0 0 178 146 324 1 8 0 9
15 Arekha PS SU 12 24 53 38 76 35 69 2 21 48 28 62 26 58 15 35 0 0 0 0 0 0 0 0 0 0 0 0 214 187 401 2 11 1 14

122
AnnEXuRE
School LevelTypeType
Sec.PP I II III IV V VI VII VIII IX X XI XII Total Bht
NBht Total T:PG T G T G T S G T G T G T G T G T G T G T G T G T G T B G T ZLT Oth.
16 Chapcha PS SU 7 13 19 10 23 6 21 1 10 17 8 16 11 19 7 13 0 0 0 0 0 0 0 0 0 0 0 0 63 65 128 2 7 0 9
17 Sinchula PS R 7 19 39 20 47 18 46 1 19 43 34 69 22 46 12 38 0 0 0 0 0 0 0 0 0 0 0 0 184 144 328 1 7 0 8
18 Bongo PS VR 7 4 9 7 17 5 11 1 5 11 2 7 9 11 6 9 0 0 0 0 0 0 0 0 0 0 0 0 37 38 75 1 5 0 6
19 Tashilakha CPS SU 1 22 38 0 0 0 0 0 0 0 0 0 0 0 0 0 0 0 0 0 0 0 0 0 0 0 0 0 16 22 38 0 1 0 1
20 Mebesa CPS SR 8 29 58 22 32 22 36 1 16 30 16 31 16 23 20 31 0 0 0 0 0 0 0 0 0 0 0 0 100 141 241 1 7 0 8
21 Shemagangkha CPS SR 7 4 9 6 14 5 10 1 8 15 6 9 6 8 7 11 0 0 0 0 0 0 0 0 0 0 0 0 34 42 76 1 4 0 5
22 Lobneykha CPS SR 7 3 11 6 10 6 10 1 5 8 5 9 3 6 4 7 0 0 0 0 0 0 0 0 0 0 0 0 29 32 61 1 1 0 2
23 Paga CPS SR 7 7 10 3 7 2 8 1 5 7 6 10 5 7 4 6 0 0 0 0 0 0 0 0 0 0 0 0 23 32 55 0 3 0 3
24 Wangdigatshel CPS SR 11 38 75 39 78 42 76 2 32 66 24 44 10 30 4 14 0 0 0 0 0 0 0 0 0 0 0 0 194 189 383 1 10 0 11
25 Rinchenling CPS SR 6 2 5 1 8 2 7 1 0 0 5 9 7 12 4 4 0 0 0 0 0 0 0 0 0 0 0 0 24 21 45 0 2 0 2
26 Meretsemo CPS SR 7 7 17 5 8 9 15 1 14 20 8 16 6 13 12 17 0 0 0 0 0 0 0 0 0 0 0 0 45 61 106 1 5 0 6
27 Alaykha CPS SR 6 7 14 11 26 9 23 1 10 18 10 25 9 15 0 0 0 0 0 0 0 0 0 0 0 0 0 0 65 56 121 0 5 0 5
28 Kezari CPS SR 3 14 35 21 62 0 0 0 0 0 0 0 0 0 0 0 0 0 0 0 0 0 0 0 0 0 0 0 62 35 97 0 2 0 2
29 Totogom CPS R 4 1 3 3 8 5 6 1 4 8 0 0 0 0 0 0 0 0 0 0 0 0 0 0 0 0 0 0 12 13 25 0 2 0 2
30 Pachu CPS R 3 21 36 36 70 0 0 0 0 0 0 0 0 0 0 0 0 0 0 0 0 0 0 0 0 0 0 0 49 57 106 0 1 0 1
31 Tsimakha CPS VR 7 12 33 19 44 30 45 1 16 34 22 41 21 43 27 44 0 0 0 0 0 0 0 0 0 0 0 0 137 147 284 1 8 0 9
32 Metakha CPS VR 7 10 14 15 27 5 16 1 8 16 9 13 8 15 3 5 0 0 0 0 0 0 0 0 0 0 0 0 48 58 106 0 3 0 3
33 Ketokha CPS VR 7 9 16 3 7 4 11 1 4 10 3 8 9 16 4 8 0 0 0 0 0 0 0 0 0 0 0 0 40 36 76 0 3 0 3
34 Chongaykha CPS VR 8 25 45 26 52 26 45 1 14 41 14 30 18 31 31 50 0 0 0 0 0 0 0 0 0 0 0 0 140 154 294 0 7 0 7
35 Baikunza CPS VR 7 3 12 6 13 9 30 1 9 14 4 12 7 21 8 13 0 0 0 0 0 0 0 0 0 0 0 0 69 46 115 0 3 0 3
36 Getana CPS VR 7 10 22 12 20 3 14 1 4 14 5 9 5 12 5 15 0 0 0 0 0 0 0 0 0 0 0 0 62 44 106 0 6 0 6
37 Chimuna CPS VR 7 14 26 25 48 21 45 1 22 44 14 31 7 20 7 21 0 0 0 0 0 0 0 0 0 0 0 0 125 110 235 0 6 0 6
Total 489 822 1604 895 1822 825 1657 52 731 1518 652 1336 748 1523 667 1326 654 1300 584 1138 516 1050 433 848 155 336 114 224 7886 7796 15682 75 426 87 588 27
1 Reldri (Pvt) HSS U 15 0 0 0 0 0 0 0 0 0 0 0 0 0 0 0 0 0 0 0 0 0 0 0 121 235 153 294 255 274 529 4 10 7 21
Total 15 0 0 0 0 0 0 0 0 0 0 0 0 0 0 0 0 0 0 0 0 0 0 0 121 235 153 294 255 274 529 4 10 7 21 25
1 Phajoding (Pvt) LSS U 11 45 100 9 32 16 25 1 12 17 8 15 8 17 1 7 5 12 3 4 0 0 0 0 0 0 0 0 122 107 229 5 9 6 20
Total 11 45 100 9 32 16 25 1 12 17 8 15 8 17 1 7 5 12 3 4 0 0 0 0 0 0 0 0 122 107 229 5 9 6 20 11
1 Yagaon (Tashilakha ECR VR 1 5 12 0 0 0 0 0 0 0 0 0 0 0 0 0 0 0 0 0 0 0 0 0 0 0 0 0 7 5 12 0 0 0 0
Total 1 5 12 0 0 0 0 0 0 0 0 0 0 0 0 0 0 0 0 0 0 0 0 0 0 0 0 0 7 5 12 0 0 0 0
G.Total 516 872 1716 904 1854 841 1682 53 743 1535 660 1351 756 1540 668 1333 659 1312 587 1142 516 1050 433 848 276 571 267 518 8270 8182 16452 84 445 100 629 26
3 Dagana
1 Tashiding CPS SU 6 22 37 20 37 14 37 1 26 41 15 39 25 43 0 0 0 0 0 0 0 0 0 0 0 0 0 0 112 122 234 0 6 0 6
2 Dogak CPS SR 7 9 14 15 24 12 29 1 21 35 21 37 20 37 21 52 0 0 0 0 0 0 0 0 0 0 0 0 109 119 228 0 8 0 8
3 Karmaling CPS SR 2 41 83 0 0 0 0 0 0 0 0 0 0 0 0 0 0 0 0 0 0 0 0 0 0 0 0 0 42 41 83 0 2 0 2
4 Pangna CPS SR 10 30 72 26 50 26 55 1 41 92 28 50 37 70 16 37 0 0 0 0 0 0 0 0 0 0 0 0 222 204 426 2 8 1 11
5 Lhaling CPS SR 7 9 20 16 34 22 36 1 20 40 22 45 16 37 11 19 0 0 0 0 0 0 0 0 0 0 0 0 115 116 231 1 7 0 8
6 Daleythang CPS SR 6 11 26 22 49 19 41 1 20 42 27 49 21 43 0 0 0 0 0 0 0 0 0 0 0 0 0 0 130 120 250 1 5 0 6
7 Phekoma CPS R 7 20 36 21 37 17 38 1 11 31 13 26 17 30 16 30 0 0 0 0 0 0 0 0 0 0 0 0 113 115 228 1 6 0 7
8 Nimtola CPS R 4 15 34 18 35 15 45 1 38 68 0 0 0 0 0 0 0 0 0 0 0 0 0 0 0 0 0 0 96 86 182 1 3 0 4

123
AnnEXuRE
School LevelTypeType
Sec.PP I II III IV V VI VII VIII IX X XI XII Total Bht
NBht Total T:PG T G T G T S G T G T G T G T G T G T G T G T G T G T B G T ZLT Oth.
16 Chapcha PS SU 7 13 19 10 23 6 21 1 10 17 8 16 11 19 7 13 0 0 0 0 0 0 0 0 0 0 0 0 63 65 128 2 7 0 9
17 Sinchula PS R 7 19 39 20 47 18 46 1 19 43 34 69 22 46 12 38 0 0 0 0 0 0 0 0 0 0 0 0 184 144 328 1 7 0 8
18 Bongo PS VR 7 4 9 7 17 5 11 1 5 11 2 7 9 11 6 9 0 0 0 0 0 0 0 0 0 0 0 0 37 38 75 1 5 0 6
19 Tashilakha CPS SU 1 22 38 0 0 0 0 0 0 0 0 0 0 0 0 0 0 0 0 0 0 0 0 0 0 0 0 0 16 22 38 0 1 0 1
20 Mebesa CPS SR 8 29 58 22 32 22 36 1 16 30 16 31 16 23 20 31 0 0 0 0 0 0 0 0 0 0 0 0 100 141 241 1 7 0 8
21 Shemagangkha CPS SR 7 4 9 6 14 5 10 1 8 15 6 9 6 8 7 11 0 0 0 0 0 0 0 0 0 0 0 0 34 42 76 1 4 0 5
22 Lobneykha CPS SR 7 3 11 6 10 6 10 1 5 8 5 9 3 6 4 7 0 0 0 0 0 0 0 0 0 0 0 0 29 32 61 1 1 0 2
23 Paga CPS SR 7 7 10 3 7 2 8 1 5 7 6 10 5 7 4 6 0 0 0 0 0 0 0 0 0 0 0 0 23 32 55 0 3 0 3
24 Wangdigatshel CPS SR 11 38 75 39 78 42 76 2 32 66 24 44 10 30 4 14 0 0 0 0 0 0 0 0 0 0 0 0 194 189 383 1 10 0 11
25 Rinchenling CPS SR 6 2 5 1 8 2 7 1 0 0 5 9 7 12 4 4 0 0 0 0 0 0 0 0 0 0 0 0 24 21 45 0 2 0 2
26 Meretsemo CPS SR 7 7 17 5 8 9 15 1 14 20 8 16 6 13 12 17 0 0 0 0 0 0 0 0 0 0 0 0 45 61 106 1 5 0 6
27 Alaykha CPS SR 6 7 14 11 26 9 23 1 10 18 10 25 9 15 0 0 0 0 0 0 0 0 0 0 0 0 0 0 65 56 121 0 5 0 5
28 Kezari CPS SR 3 14 35 21 62 0 0 0 0 0 0 0 0 0 0 0 0 0 0 0 0 0 0 0 0 0 0 0 62 35 97 0 2 0 2
29 Totogom CPS R 4 1 3 3 8 5 6 1 4 8 0 0 0 0 0 0 0 0 0 0 0 0 0 0 0 0 0 0 12 13 25 0 2 0 2
30 Pachu CPS R 3 21 36 36 70 0 0 0 0 0 0 0 0 0 0 0 0 0 0 0 0 0 0 0 0 0 0 0 49 57 106 0 1 0 1
31 Tsimakha CPS VR 7 12 33 19 44 30 45 1 16 34 22 41 21 43 27 44 0 0 0 0 0 0 0 0 0 0 0 0 137 147 284 1 8 0 9
32 Metakha CPS VR 7 10 14 15 27 5 16 1 8 16 9 13 8 15 3 5 0 0 0 0 0 0 0 0 0 0 0 0 48 58 106 0 3 0 3
33 Ketokha CPS VR 7 9 16 3 7 4 11 1 4 10 3 8 9 16 4 8 0 0 0 0 0 0 0 0 0 0 0 0 40 36 76 0 3 0 3
34 Chongaykha CPS VR 8 25 45 26 52 26 45 1 14 41 14 30 18 31 31 50 0 0 0 0 0 0 0 0 0 0 0 0 140 154 294 0 7 0 7
35 Baikunza CPS VR 7 3 12 6 13 9 30 1 9 14 4 12 7 21 8 13 0 0 0 0 0 0 0 0 0 0 0 0 69 46 115 0 3 0 3
36 Getana CPS VR 7 10 22 12 20 3 14 1 4 14 5 9 5 12 5 15 0 0 0 0 0 0 0 0 0 0 0 0 62 44 106 0 6 0 6
37 Chimuna CPS VR 7 14 26 25 48 21 45 1 22 44 14 31 7 20 7 21 0 0 0 0 0 0 0 0 0 0 0 0 125 110 235 0 6 0 6
Total 489 822 1604 895 1822 825 1657 52 731 1518 652 1336 748 1523 667 1326 654 1300 584 1138 516 1050 433 848 155 336 114 224 7886 7796 15682 75 426 87 588 27
1 Reldri (Pvt) HSS U 15 0 0 0 0 0 0 0 0 0 0 0 0 0 0 0 0 0 0 0 0 0 0 0 121 235 153 294 255 274 529 4 10 7 21
Total 15 0 0 0 0 0 0 0 0 0 0 0 0 0 0 0 0 0 0 0 0 0 0 0 121 235 153 294 255 274 529 4 10 7 21 25
1 Phajoding (Pvt) LSS U 11 45 100 9 32 16 25 1 12 17 8 15 8 17 1 7 5 12 3 4 0 0 0 0 0 0 0 0 122 107 229 5 9 6 20
Total 11 45 100 9 32 16 25 1 12 17 8 15 8 17 1 7 5 12 3 4 0 0 0 0 0 0 0 0 122 107 229 5 9 6 20 11
1 Yagaon (Tashilakha ECR VR 1 5 12 0 0 0 0 0 0 0 0 0 0 0 0 0 0 0 0 0 0 0 0 0 0 0 0 0 7 5 12 0 0 0 0
Total 1 5 12 0 0 0 0 0 0 0 0 0 0 0 0 0 0 0 0 0 0 0 0 0 0 0 0 0 7 5 12 0 0 0 0
G.Total 516 872 1716 904 1854 841 1682 53 743 1535 660 1351 756 1540 668 1333 659 1312 587 1142 516 1050 433 848 276 571 267 518 8270 8182 16452 84 445 100 629 26
3 Dagana
1 Tashiding CPS SU 6 22 37 20 37 14 37 1 26 41 15 39 25 43 0 0 0 0 0 0 0 0 0 0 0 0 0 0 112 122 234 0 6 0 6
2 Dogak CPS SR 7 9 14 15 24 12 29 1 21 35 21 37 20 37 21 52 0 0 0 0 0 0 0 0 0 0 0 0 109 119 228 0 8 0 8
3 Karmaling CPS SR 2 41 83 0 0 0 0 0 0 0 0 0 0 0 0 0 0 0 0 0 0 0 0 0 0 0 0 0 42 41 83 0 2 0 2
4 Pangna CPS SR 10 30 72 26 50 26 55 1 41 92 28 50 37 70 16 37 0 0 0 0 0 0 0 0 0 0 0 0 222 204 426 2 8 1 11
5 Lhaling CPS SR 7 9 20 16 34 22 36 1 20 40 22 45 16 37 11 19 0 0 0 0 0 0 0 0 0 0 0 0 115 116 231 1 7 0 8
6 Daleythang CPS SR 6 11 26 22 49 19 41 1 20 42 27 49 21 43 0 0 0 0 0 0 0 0 0 0 0 0 0 0 130 120 250 1 5 0 6
7 Phekoma CPS R 7 20 36 21 37 17 38 1 11 31 13 26 17 30 16 30 0 0 0 0 0 0 0 0 0 0 0 0 113 115 228 1 6 0 7
8 Nimtola CPS R 4 15 34 18 35 15 45 1 38 68 0 0 0 0 0 0 0 0 0 0 0 0 0 0 0 0 0 0 96 86 182 1 3 0 4

124
AnnEXuRE
School LevelTypeType
Sec.PP I II III IV V VI VII VIII IX X XI XII Total Bht
NBht Total T:PG T G T G T S G T G T G T G T G T G T G T G T G T G T B G T ZLT Oth.
9 Lungtengang CPS R 7 8 13 6 16 5 12 1 14 25 9 21 12 17 8 18 0 0 0 0 0 0 0 0 0 0 0 0 60 62 122 1 3 0 4
10 Balaygang CPS R 4 10 24 15 25 20 42 1 17 37 0 0 0 0 0 0 0 0 0 0 0 0 0 0 0 0 0 0 66 62 128 2 2 0 4
11 Zinchella CPS R 4 17 39 26 43 20 38 1 18 39 0 0 0 0 0 0 0 0 0 0 0 0 0 0 0 0 0 0 78 81 159 0 5 0 5
12 Gangzor CPS R 4 15 34 19 41 29 64 2 0 0 0 0 0 0 0 0 0 0 0 0 0 0 0 0 0 0 0 0 76 63 139 1 3 0 4
13 Gumla CPS R 1 9 27 0 0 0 0 0 0 0 0 0 0 0 0 0 0 0 0 0 0 0 0 0 0 0 0 0 18 9 27 0 1 0 1
14 Phuensumgang CPS VR 7 7 19 12 16 11 24 1 11 18 20 32 14 21 12 25 0 0 0 0 0 0 0 0 0 0 0 0 68 87 155 1 6 0 7
15 Samey PS SR 7 11 18 10 20 11 24 1 8 12 13 23 8 16 9 21 0 0 0 0 0 0 0 0 0 0 0 0 64 70 134 2 5 0 7
16 Daga LSS SU 10 19 45 22 46 19 41 1 18 42 25 48 20 45 22 51 30 59 17 31 0 0 0 0 0 0 0 0 216 192 408 3 9 0 12
17 Lhamoy Zingkha LSS SU 17 8 30 37 77 30 63 2 37 73 35 92 41 79 35 63 26 70 17 42 0 0 0 0 0 0 0 0 323 266 589 3 15 4 22
18 Geserling LSS SR 9 17 43 26 44 20 43 1 25 43 19 50 15 43 24 46 15 39 12 26 0 0 0 0 0 0 0 0 204 173 377 2 9 0 11
19 Namchala LSS SR 8 19 37 11 33 15 31 1 9 24 14 30 22 38 18 40 13 32 0 0 0 0 0 0 0 0 0 0 144 121 265 3 6 0 9
20 Tshangkha LSS VR 8 9 27 21 38 15 31 1 26 49 18 44 18 40 15 30 13 23 0 0 0 0 0 0 0 0 0 0 147 135 282 2 7 0 9
21 Drujeygang MSS SU 13 0 0 0 0 0 0 0 0 0 0 0 0 0 0 0 64 138 58 121 42 104 42 98 0 0 0 0 255 206 461 1 13 3 17
22 Dagapela MSS SU 17 26 58 25 58 40 74 2 47 96 55 110 49 97 40 76 36 89 40 71 22 45 0 0 0 0 0 0 394 380 774 3 15 0 18
23 Daga HSS SU 11 0 0 0 0 0 0 0 0 0 0 0 0 0 0 0 0 0 51 92 75 162 52 103 19 55 0 0 215 197 412 3 11 6 20
Total 176 332 736 368 723 360 768 22 407 807 334 696 335 656 247 508 197 450 195 383 139 311 94 201 19 55 0 0 3267 3027 6294 33 155 14 202 31
1Bichgaon (Lhamoiz-ingkha LSS)
ECR SU 1 13 26 0 0 0 0 0 0 0 0 0 0 0 0 0 0 0 0 0 0 0 0 0 0 0 0 0 13 13 26 0 0 0 0
2Pangserpo (Pangna CPS)
ECR SR 1 9 17 0 0 0 0 0 0 0 0 0 0 0 0 0 0 0 0 0 0 0 0 0 0 0 0 0 8 9 17 0 0 0 0
3Devitar (Lhamoizing-kha LSS)
ECR SU 1 16 24 0 0 0 0 0 0 0 0 0 0 0 0 0 0 0 0 0 0 0 0 0 0 0 0 0 8 16 24 0 0 0 0
Total 3 38 67 0 0 0 0 0 0 0 0 0 0 0 0 0 0 0 0 0 0 0 0 0 0 0 0 0 29 38 67 0 0 0 0
G.Total 179 370 803 368 723 360 768 22 407 807 334 696 335 656 247 508 197 450 195 383 139 311 94 201 19 55 0 0 3296 3065 6361 33 155 14 202 32
4 Gasa
1 Bjishong MSS SR 13 13 21 14 25 6 13 1 15 34 13 22 14 29 9 18 28 52 27 45 32 71 23 34 0 0 0 0 170 194 364 4 16 0 20
2 Gasa PS R 7 14 26 9 15 4 10 1 4 9 4 9 8 15 18 25 0 0 0 0 0 0 0 0 0 0 0 0 48 61 109 1 7 0 8
3 Laya CPS D 7 3 4 2 10 6 14 1 3 16 6 14 1 12 1 4 0 0 0 0 0 0 0 0 0 0 0 0 52 22 74 1 5 0 6
4 Luanana CPS D 7 7 17 2 5 2 8 1 4 10 3 7 4 12 2 6 0 0 0 0 0 0 0 0 0 0 0 0 41 24 65 0 2 0 2
Total 34 37 68 27 55 18 45 4 26 69 26 52 27 68 30 53 28 52 27 45 32 71 23 34 0 0 0 0 311 301 612 6 30 0 36 17
1 Lungo(Laya CPS) ECR D 1 18 29 0 0 0 0 0 0 0 0 0 0 0 0 0 0 0 0 0 0 0 0 0 0 0 0 0 11 18 29 0 1 0 1
Total 1 18 29 0 0 0 0 0 0 0 0 0 0 0 0 0 0 0 0 0 0 0 0 0 0 0 0 0 11 18 29 0 1 0 1 29
G.Total 35 55 97 27 55 18 45 4 26 69 26 52 27 68 30 53 28 52 27 45 32 71 23 34 0 0 0 0 322 319 641 6 31 0 37 17
5 Haa
1 Ugyen Dorji HSS U 22 0 0 0 0 0 0 0 0 0 0 0 0 0 0 0 0 0 40 84 163 268 103 182 35 89 20 61 323 361 684 4 24 6 34
2 Katsho LSS U 20 34 75 29 65 32 62 2 37 87 24 60 41 70 28 55 52 93 43 70 0 0 0 0 0 0 0 0 317 320 637 5 20 1 26
3 Tshaphel LSS SU 14 17 33 14 26 22 44 2 16 35 26 41 11 27 18 39 52 113 20 47 0 0 0 0 0 0 0 0 209 196 405 4 15 0 19
4 Damthang LSS SU 16 37 83 27 56 27 59 2 26 53 23 60 17 30 18 48 27 51 21 42 0 0 0 0 0 0 0 0 259 223 482 5 15 0 20
5 Gyensa PS SU 7 9 21 19 29 13 35 1 16 30 11 24 15 25 12 27 0 0 0 0 0 0 0 0 0 0 0 0 96 95 191 2 7 0 9
6 Jyenkhana PS SU 14 26 53 29 68 22 46 2 36 63 22 43 20 41 32 58 0 0 0 0 0 0 0 0 0 0 0 0 185 187 372 3 17 0 20
7 Sombaykha PS VR 7 8 19 8 20 7 11 1 2 8 3 6 4 4 6 7 0 0 0 0 0 0 0 0 0 0 0 0 37 38 75 1 4 0 5

125
AnnEXuRE
School LevelTypeType
Sec.PP I II III IV V VI VII VIII IX X XI XII Total Bht
NBht Total T:PG T G T G T S G T G T G T G T G T G T G T G T G T G T B G T ZLT Oth.
9 Lungtengang CPS R 7 8 13 6 16 5 12 1 14 25 9 21 12 17 8 18 0 0 0 0 0 0 0 0 0 0 0 0 60 62 122 1 3 0 4
10 Balaygang CPS R 4 10 24 15 25 20 42 1 17 37 0 0 0 0 0 0 0 0 0 0 0 0 0 0 0 0 0 0 66 62 128 2 2 0 4
11 Zinchella CPS R 4 17 39 26 43 20 38 1 18 39 0 0 0 0 0 0 0 0 0 0 0 0 0 0 0 0 0 0 78 81 159 0 5 0 5
12 Gangzor CPS R 4 15 34 19 41 29 64 2 0 0 0 0 0 0 0 0 0 0 0 0 0 0 0 0 0 0 0 0 76 63 139 1 3 0 4
13 Gumla CPS R 1 9 27 0 0 0 0 0 0 0 0 0 0 0 0 0 0 0 0 0 0 0 0 0 0 0 0 0 18 9 27 0 1 0 1
14 Phuensumgang CPS VR 7 7 19 12 16 11 24 1 11 18 20 32 14 21 12 25 0 0 0 0 0 0 0 0 0 0 0 0 68 87 155 1 6 0 7
15 Samey PS SR 7 11 18 10 20 11 24 1 8 12 13 23 8 16 9 21 0 0 0 0 0 0 0 0 0 0 0 0 64 70 134 2 5 0 7
16 Daga LSS SU 10 19 45 22 46 19 41 1 18 42 25 48 20 45 22 51 30 59 17 31 0 0 0 0 0 0 0 0 216 192 408 3 9 0 12
17 Lhamoy Zingkha LSS SU 17 8 30 37 77 30 63 2 37 73 35 92 41 79 35 63 26 70 17 42 0 0 0 0 0 0 0 0 323 266 589 3 15 4 22
18 Geserling LSS SR 9 17 43 26 44 20 43 1 25 43 19 50 15 43 24 46 15 39 12 26 0 0 0 0 0 0 0 0 204 173 377 2 9 0 11
19 Namchala LSS SR 8 19 37 11 33 15 31 1 9 24 14 30 22 38 18 40 13 32 0 0 0 0 0 0 0 0 0 0 144 121 265 3 6 0 9
20 Tshangkha LSS VR 8 9 27 21 38 15 31 1 26 49 18 44 18 40 15 30 13 23 0 0 0 0 0 0 0 0 0 0 147 135 282 2 7 0 9
21 Drujeygang MSS SU 13 0 0 0 0 0 0 0 0 0 0 0 0 0 0 0 64 138 58 121 42 104 42 98 0 0 0 0 255 206 461 1 13 3 17
22 Dagapela MSS SU 17 26 58 25 58 40 74 2 47 96 55 110 49 97 40 76 36 89 40 71 22 45 0 0 0 0 0 0 394 380 774 3 15 0 18
23 Daga HSS SU 11 0 0 0 0 0 0 0 0 0 0 0 0 0 0 0 0 0 51 92 75 162 52 103 19 55 0 0 215 197 412 3 11 6 20
Total 176 332 736 368 723 360 768 22 407 807 334 696 335 656 247 508 197 450 195 383 139 311 94 201 19 55 0 0 3267 3027 6294 33 155 14 202 31
1Bichgaon (Lhamoiz-ingkha LSS)
ECR SU 1 13 26 0 0 0 0 0 0 0 0 0 0 0 0 0 0 0 0 0 0 0 0 0 0 0 0 0 13 13 26 0 0 0 0
2Pangserpo (Pangna CPS)
ECR SR 1 9 17 0 0 0 0 0 0 0 0 0 0 0 0 0 0 0 0 0 0 0 0 0 0 0 0 0 8 9 17 0 0 0 0
3Devitar (Lhamoizing-kha LSS)
ECR SU 1 16 24 0 0 0 0 0 0 0 0 0 0 0 0 0 0 0 0 0 0 0 0 0 0 0 0 0 8 16 24 0 0 0 0
Total 3 38 67 0 0 0 0 0 0 0 0 0 0 0 0 0 0 0 0 0 0 0 0 0 0 0 0 0 29 38 67 0 0 0 0
G.Total 179 370 803 368 723 360 768 22 407 807 334 696 335 656 247 508 197 450 195 383 139 311 94 201 19 55 0 0 3296 3065 6361 33 155 14 202 32
4 Gasa
1 Bjishong MSS SR 13 13 21 14 25 6 13 1 15 34 13 22 14 29 9 18 28 52 27 45 32 71 23 34 0 0 0 0 170 194 364 4 16 0 20
2 Gasa PS R 7 14 26 9 15 4 10 1 4 9 4 9 8 15 18 25 0 0 0 0 0 0 0 0 0 0 0 0 48 61 109 1 7 0 8
3 Laya CPS D 7 3 4 2 10 6 14 1 3 16 6 14 1 12 1 4 0 0 0 0 0 0 0 0 0 0 0 0 52 22 74 1 5 0 6
4 Luanana CPS D 7 7 17 2 5 2 8 1 4 10 3 7 4 12 2 6 0 0 0 0 0 0 0 0 0 0 0 0 41 24 65 0 2 0 2
Total 34 37 68 27 55 18 45 4 26 69 26 52 27 68 30 53 28 52 27 45 32 71 23 34 0 0 0 0 311 301 612 6 30 0 36 17
1 Lungo(Laya CPS) ECR D 1 18 29 0 0 0 0 0 0 0 0 0 0 0 0 0 0 0 0 0 0 0 0 0 0 0 0 0 11 18 29 0 1 0 1
Total 1 18 29 0 0 0 0 0 0 0 0 0 0 0 0 0 0 0 0 0 0 0 0 0 0 0 0 0 11 18 29 0 1 0 1 29
G.Total 35 55 97 27 55 18 45 4 26 69 26 52 27 68 30 53 28 52 27 45 32 71 23 34 0 0 0 0 322 319 641 6 31 0 37 17
5 Haa
1 Ugyen Dorji HSS U 22 0 0 0 0 0 0 0 0 0 0 0 0 0 0 0 0 0 40 84 163 268 103 182 35 89 20 61 323 361 684 4 24 6 34
2 Katsho LSS U 20 34 75 29 65 32 62 2 37 87 24 60 41 70 28 55 52 93 43 70 0 0 0 0 0 0 0 0 317 320 637 5 20 1 26
3 Tshaphel LSS SU 14 17 33 14 26 22 44 2 16 35 26 41 11 27 18 39 52 113 20 47 0 0 0 0 0 0 0 0 209 196 405 4 15 0 19
4 Damthang LSS SU 16 37 83 27 56 27 59 2 26 53 23 60 17 30 18 48 27 51 21 42 0 0 0 0 0 0 0 0 259 223 482 5 15 0 20
5 Gyensa PS SU 7 9 21 19 29 13 35 1 16 30 11 24 15 25 12 27 0 0 0 0 0 0 0 0 0 0 0 0 96 95 191 2 7 0 9
6 Jyenkhana PS SU 14 26 53 29 68 22 46 2 36 63 22 43 20 41 32 58 0 0 0 0 0 0 0 0 0 0 0 0 185 187 372 3 17 0 20
7 Sombaykha PS VR 7 8 19 8 20 7 11 1 2 8 3 6 4 4 6 7 0 0 0 0 0 0 0 0 0 0 0 0 37 38 75 1 4 0 5

126
AnnEXuRE
School LevelTypeType
Sec.PP I II III IV V VI VII VIII IX X XI XII Total Bht
NBht Total T:PG T G T G T S G T G T G T G T G T G T G T G T G T G T B G T ZLT Oth.
8 Shari CPS R 4 6 10 4 11 7 17 1 15 22 0 0 0 0 0 0 0 0 0 0 0 0 0 0 0 0 0 0 28 32 60 0 4 0 4
9 Rangtse CPS R 4 17 33 21 34 8 14 1 9 17 0 0 0 0 0 0 0 0 0 0 0 0 0 0 0 0 0 0 43 55 98 0 4 0 4
10 Mochu CPS VR 3 3 3 0 0 4 5 1 2 2 0 0 0 0 0 0 0 0 0 0 0 0 0 0 0 0 0 0 1 9 10 0 2 0 2
Total 111 157 330 151 309 142 293 13 159 317 109 234 108 197 114 234 131 257 124 243 163 268 103 182 35 89 20 61 1498 1516 3014 24 112 7 143 21
1Sektena (Jyenkhana PS)
ECR SU 1 9 32 0 0 0 0 0 0 0 0 0 0 0 0 0 0 0 0 0 0 0 0 0 0 0 0 0 23 9 32 0 1 0 1 32
Total 1 9 32 0 0 0 0 0 0 0 0 0 0 0 0 0 0 0 0 0 0 0 0 0 0 0 0 0 23 9 32 0 1 0 1 32
G.Total 112 166 362 151 309 142 293 13 159 317 109 234 108 197 114 234 131 257 124 243 163 268 103 182 35 89 20 61 1521 1525 3046 24 113 7 144 21
6 Lhuentse
1 Phuyum HSS U 15 0 0 0 0 0 0 0 0 0 0 0 0 0 0 0 57 101 45 94 58 113 54 118 12 57 17 92 332 243 575 4 15 7 26
2 Tangmachu MSS SU 14 0 0 0 0 0 0 0 0 0 0 0 0 0 0 0 86 158 53 113 47 114 21 71 0 0 0 0 249 207 456 3 16 3 22
3 Khoma LSS SR 11 6 13 7 16 13 24 1 12 32 18 32 13 24 14 23 38 72 19 47 0 0 0 0 0 0 0 0 143 140 283 3 10 0 13
4 Thimyul LSS SR 9 11 27 22 36 12 29 1 18 29 14 39 17 32 8 17 15 29 10 22 0 0 0 0 0 0 0 0 133 127 260 2 8 1 11
5 Lhuentse PS U 10 24 51 16 32 34 65 2 27 50 27 56 26 42 20 36 0 0 0 0 0 0 0 0 0 0 0 0 158 174 332 2 11 0 13
6 Tangmachu PS SU 7 28 49 19 46 30 47 1 17 29 18 31 18 30 20 39 0 0 0 0 0 0 0 0 0 0 0 0 121 150 271 2 5 0 7
7 Minjey PS SR 7 12 32 9 16 9 17 1 7 16 10 18 16 25 7 13 0 0 0 0 0 0 0 0 0 0 0 0 67 70 137 1 6 0 7
8 Zangkhar PS R 7 9 17 6 10 2 17 1 8 15 9 19 16 25 11 31 0 0 0 0 0 0 0 0 0 0 0 0 73 61 134 1 7 0 8
9 Wambur PS R 7 10 16 7 18 10 22 1 7 19 15 22 8 23 5 9 0 0 0 0 0 0 0 0 0 0 0 0 67 62 129 0 6 0 6
10 Gortsum PS R 7 15 28 12 28 15 32 1 11 23 16 28 12 29 8 16 0 0 0 0 0 0 0 0 0 0 0 0 95 89 184 1 6 0 7
11 Ladrong PS R 7 8 17 19 27 12 18 1 9 15 8 17 8 18 6 13 0 0 0 0 0 0 0 0 0 0 0 0 55 70 125 2 5 0 7
12 Dungkhar PS VR 7 7 15 7 10 5 12 1 12 31 25 51 21 38 15 28 0 0 0 0 0 0 0 0 0 0 0 0 93 92 185 2 5 0 7
13 Chagzom PS VR 2 7 13 8 12 0 0 0 0 0 0 0 0 0 0 0 0 0 0 0 0 0 0 0 0 0 0 0 10 15 25 1 1 0 2
14 Autsho CPS SU 7 17 29 13 31 8 18 1 9 17 16 33 6 15 17 23 0 0 0 0 0 0 0 0 0 0 0 0 80 86 166 2 5 0 7
15 Zhamling CPS SR 4 3 3 2 4 1 6 1 3 5 0 0 0 0 0 0 0 0 0 0 0 0 0 0 0 0 0 0 9 9 18 1 1 0 2
16 Kupinyesa CPS SR 7 1 3 1 6 2 5 1 5 8 6 13 5 13 5 13 0 0 0 0 0 0 0 0 0 0 0 0 36 25 61 2 1 0 3
17 Domkhar CPS SR 7 7 14 2 8 4 12 1 7 13 8 16 5 11 9 17 0 0 0 0 0 0 0 0 0 0 0 0 49 42 91 1 3 0 4
18 Tshochen CPS R 7 4 18 7 10 12 25 1 4 18 5 18 15 22 5 12 0 0 0 0 0 0 0 0 0 0 0 0 71 52 123 1 6 0 7
19 Shawa CPS R 4 0 4 6 11 4 7 1 4 15 0 0 0 0 0 0 0 0 0 0 0 0 0 0 0 0 0 0 23 14 37 0 2 0 2
20 Dangling CPS R 7 4 15 3 10 11 15 1 11 20 8 18 13 23 20 24 0 0 0 0 0 0 0 0 0 0 0 0 55 70 125 1 4 0 5
21 Ganglakhema CPS R 7 6 10 7 15 5 10 1 5 17 3 10 5 14 5 10 0 0 0 0 0 0 0 0 0 0 0 0 50 36 86 1 4 0 5
22 Pangkhar CPS R 4 5 8 3 5 4 9 1 9 12 0 0 0 0 0 0 0 0 0 0 0 0 0 0 0 0 0 0 13 21 34 0 2 0 2
23 Zham CPS R 7 6 11 4 9 3 6 1 4 8 7 10 2 6 6 11 0 0 0 0 0 0 0 0 0 0 0 0 29 32 61 1 3 0 4
24 Baptong CPS R 2 1 3 7 15 0 0 0 0 0 0 0 0 0 0 0 0 0 0 0 0 0 0 0 0 0 0 0 10 8 18 0 2 0 2
25 Ney CPS R 6 3 5 0 0 4 8 1 0 5 2 6 4 10 4 9 0 0 0 0 0 0 0 0 0 0 0 0 26 17 43 1 2 0 3
26 Ongar CPS VR 3 0 0 0 0 6 9 1 3 8 8 11 0 0 0 0 0 0 0 0 0 0 0 0 0 0 0 0 11 17 28 1 1 0 2
27 Thuenpey CPS VR 3 1 5 2 8 1 4 1 0 0 0 0 0 0 0 0 0 0 0 0 0 0 0 0 0 0 0 0 13 4 17 1 1 0 2
Total 185 195 406 189 383 207 417 24 192 405 223 448 210 400 185 344 196 360 127 276 105 227 75 189 12 57 17 92 2071 1933 4004 37 138 11 186 22
7 Mongar
1 Gyelpozhing HSS U 20 0 0 0 0 0 0 0 0 0 0 0 0 0 0 0 75 139 69 159 75 146 70 160 30 118 29 117 491 348 839 4 23 8 35
2 Mongar HSS U 19 0 0 0 0 0 0 0 0 0 0 0 0 0 0 0 0 0 0 0 140 255 93 195 43 121 53 112 354 329 683 5 25 8 38
3 Drametse MSS SU 16 11 31 20 41 14 39 1 15 39 10 30 12 28 17 36 26 75 36 78 47 113 12 48 0 0 0 0 338 220 558 4 14 3 21
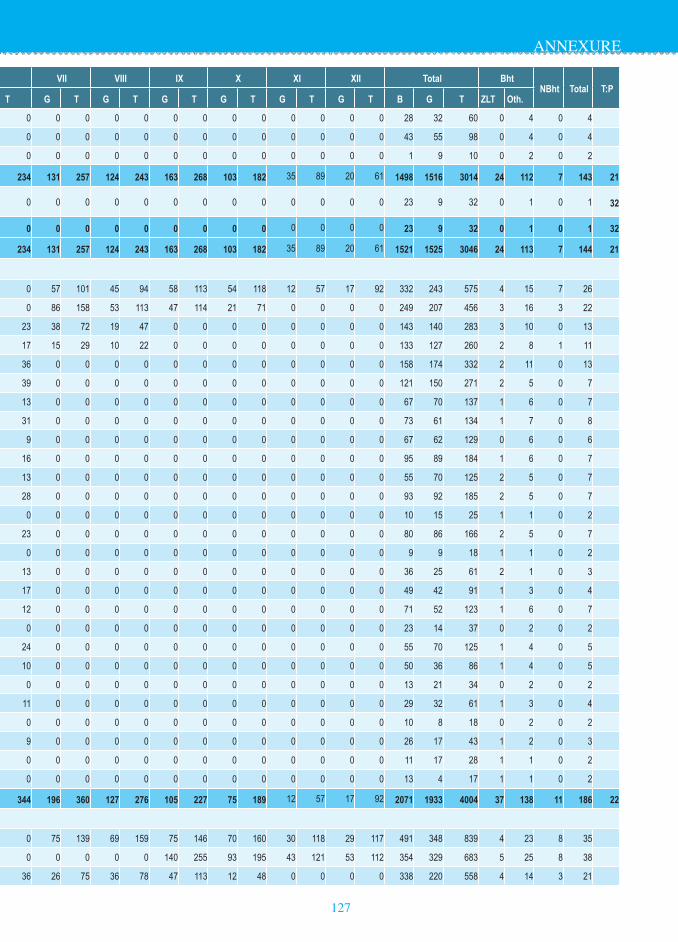
127
AnnEXuRE
School LevelTypeType
Sec.PP I II III IV V VI VII VIII IX X XI XII Total Bht
NBht Total T:PG T G T G T S G T G T G T G T G T G T G T G T G T G T B G T ZLT Oth.
8 Shari CPS R 4 6 10 4 11 7 17 1 15 22 0 0 0 0 0 0 0 0 0 0 0 0 0 0 0 0 0 0 28 32 60 0 4 0 4
9 Rangtse CPS R 4 17 33 21 34 8 14 1 9 17 0 0 0 0 0 0 0 0 0 0 0 0 0 0 0 0 0 0 43 55 98 0 4 0 4
10 Mochu CPS VR 3 3 3 0 0 4 5 1 2 2 0 0 0 0 0 0 0 0 0 0 0 0 0 0 0 0 0 0 1 9 10 0 2 0 2
Total 111 157 330 151 309 142 293 13 159 317 109 234 108 197 114 234 131 257 124 243 163 268 103 182 35 89 20 61 1498 1516 3014 24 112 7 143 21
1Sektena (Jyenkhana PS)
ECR SU 1 9 32 0 0 0 0 0 0 0 0 0 0 0 0 0 0 0 0 0 0 0 0 0 0 0 0 0 23 9 32 0 1 0 1 32
Total 1 9 32 0 0 0 0 0 0 0 0 0 0 0 0 0 0 0 0 0 0 0 0 0 0 0 0 0 23 9 32 0 1 0 1 32
G.Total 112 166 362 151 309 142 293 13 159 317 109 234 108 197 114 234 131 257 124 243 163 268 103 182 35 89 20 61 1521 1525 3046 24 113 7 144 21
6 Lhuentse
1 Phuyum HSS U 15 0 0 0 0 0 0 0 0 0 0 0 0 0 0 0 57 101 45 94 58 113 54 118 12 57 17 92 332 243 575 4 15 7 26
2 Tangmachu MSS SU 14 0 0 0 0 0 0 0 0 0 0 0 0 0 0 0 86 158 53 113 47 114 21 71 0 0 0 0 249 207 456 3 16 3 22
3 Khoma LSS SR 11 6 13 7 16 13 24 1 12 32 18 32 13 24 14 23 38 72 19 47 0 0 0 0 0 0 0 0 143 140 283 3 10 0 13
4 Thimyul LSS SR 9 11 27 22 36 12 29 1 18 29 14 39 17 32 8 17 15 29 10 22 0 0 0 0 0 0 0 0 133 127 260 2 8 1 11
5 Lhuentse PS U 10 24 51 16 32 34 65 2 27 50 27 56 26 42 20 36 0 0 0 0 0 0 0 0 0 0 0 0 158 174 332 2 11 0 13
6 Tangmachu PS SU 7 28 49 19 46 30 47 1 17 29 18 31 18 30 20 39 0 0 0 0 0 0 0 0 0 0 0 0 121 150 271 2 5 0 7
7 Minjey PS SR 7 12 32 9 16 9 17 1 7 16 10 18 16 25 7 13 0 0 0 0 0 0 0 0 0 0 0 0 67 70 137 1 6 0 7
8 Zangkhar PS R 7 9 17 6 10 2 17 1 8 15 9 19 16 25 11 31 0 0 0 0 0 0 0 0 0 0 0 0 73 61 134 1 7 0 8
9 Wambur PS R 7 10 16 7 18 10 22 1 7 19 15 22 8 23 5 9 0 0 0 0 0 0 0 0 0 0 0 0 67 62 129 0 6 0 6
10 Gortsum PS R 7 15 28 12 28 15 32 1 11 23 16 28 12 29 8 16 0 0 0 0 0 0 0 0 0 0 0 0 95 89 184 1 6 0 7
11 Ladrong PS R 7 8 17 19 27 12 18 1 9 15 8 17 8 18 6 13 0 0 0 0 0 0 0 0 0 0 0 0 55 70 125 2 5 0 7
12 Dungkhar PS VR 7 7 15 7 10 5 12 1 12 31 25 51 21 38 15 28 0 0 0 0 0 0 0 0 0 0 0 0 93 92 185 2 5 0 7
13 Chagzom PS VR 2 7 13 8 12 0 0 0 0 0 0 0 0 0 0 0 0 0 0 0 0 0 0 0 0 0 0 0 10 15 25 1 1 0 2
14 Autsho CPS SU 7 17 29 13 31 8 18 1 9 17 16 33 6 15 17 23 0 0 0 0 0 0 0 0 0 0 0 0 80 86 166 2 5 0 7
15 Zhamling CPS SR 4 3 3 2 4 1 6 1 3 5 0 0 0 0 0 0 0 0 0 0 0 0 0 0 0 0 0 0 9 9 18 1 1 0 2
16 Kupinyesa CPS SR 7 1 3 1 6 2 5 1 5 8 6 13 5 13 5 13 0 0 0 0 0 0 0 0 0 0 0 0 36 25 61 2 1 0 3
17 Domkhar CPS SR 7 7 14 2 8 4 12 1 7 13 8 16 5 11 9 17 0 0 0 0 0 0 0 0 0 0 0 0 49 42 91 1 3 0 4
18 Tshochen CPS R 7 4 18 7 10 12 25 1 4 18 5 18 15 22 5 12 0 0 0 0 0 0 0 0 0 0 0 0 71 52 123 1 6 0 7
19 Shawa CPS R 4 0 4 6 11 4 7 1 4 15 0 0 0 0 0 0 0 0 0 0 0 0 0 0 0 0 0 0 23 14 37 0 2 0 2
20 Dangling CPS R 7 4 15 3 10 11 15 1 11 20 8 18 13 23 20 24 0 0 0 0 0 0 0 0 0 0 0 0 55 70 125 1 4 0 5
21 Ganglakhema CPS R 7 6 10 7 15 5 10 1 5 17 3 10 5 14 5 10 0 0 0 0 0 0 0 0 0 0 0 0 50 36 86 1 4 0 5
22 Pangkhar CPS R 4 5 8 3 5 4 9 1 9 12 0 0 0 0 0 0 0 0 0 0 0 0 0 0 0 0 0 0 13 21 34 0 2 0 2
23 Zham CPS R 7 6 11 4 9 3 6 1 4 8 7 10 2 6 6 11 0 0 0 0 0 0 0 0 0 0 0 0 29 32 61 1 3 0 4
24 Baptong CPS R 2 1 3 7 15 0 0 0 0 0 0 0 0 0 0 0 0 0 0 0 0 0 0 0 0 0 0 0 10 8 18 0 2 0 2
25 Ney CPS R 6 3 5 0 0 4 8 1 0 5 2 6 4 10 4 9 0 0 0 0 0 0 0 0 0 0 0 0 26 17 43 1 2 0 3
26 Ongar CPS VR 3 0 0 0 0 6 9 1 3 8 8 11 0 0 0 0 0 0 0 0 0 0 0 0 0 0 0 0 11 17 28 1 1 0 2
27 Thuenpey CPS VR 3 1 5 2 8 1 4 1 0 0 0 0 0 0 0 0 0 0 0 0 0 0 0 0 0 0 0 0 13 4 17 1 1 0 2
Total 185 195 406 189 383 207 417 24 192 405 223 448 210 400 185 344 196 360 127 276 105 227 75 189 12 57 17 92 2071 1933 4004 37 138 11 186 22
7 Mongar
1 Gyelpozhing HSS U 20 0 0 0 0 0 0 0 0 0 0 0 0 0 0 0 75 139 69 159 75 146 70 160 30 118 29 117 491 348 839 4 23 8 35
2 Mongar HSS U 19 0 0 0 0 0 0 0 0 0 0 0 0 0 0 0 0 0 0 0 140 255 93 195 43 121 53 112 354 329 683 5 25 8 38
3 Drametse MSS SU 16 11 31 20 41 14 39 1 15 39 10 30 12 28 17 36 26 75 36 78 47 113 12 48 0 0 0 0 338 220 558 4 14 3 21

128
AnnEXuRE
School LevelTypeType
Sec.PP I II III IV V VI VII VIII IX X XI XII Total Bht
NBht Total T:PG T G T G T S G T G T G T G T G T G T G T G T G T G T B G T ZLT Oth.
4 Yadi MSS SU 19 19 28 22 38 10 20 1 10 20 13 27 22 42 17 36 46 95 36 90 68 124 40 102 0 0 0 0 319 303 622 5 23 0 28
5 Mongar LSS U 21 65 103 47 88 44 86 2 45 78 31 64 48 83 33 71 51 96 54 97 0 0 0 0 0 0 0 0 348 418 766 5 22 0 27
6 Kurichhu LSS U 12 15 39 33 79 23 47 1 32 63 29 52 29 49 23 52 25 45 18 26 0 0 0 0 0 0 0 0 225 227 452 3 12 2 17
7 Kidheykhar (Kilikhar) LSS SU 10 14 27 19 33 13 25 1 26 47 17 48 25 41 23 42 22 36 20 38 0 0 0 0 0 0 0 0 158 179 337 3 11 0 14
8 Chaskhar LSS SR 9 12 30 17 32 17 45 1 17 39 20 42 23 35 19 36 20 38 14 33 0 0 0 0 0 0 0 0 171 159 330 3 9 0 12
9 Chali LSS SR 9 12 28 15 46 24 37 1 13 27 23 44 14 33 15 24 13 29 15 26 0 0 0 0 0 0 0 0 150 144 294 2 10 0 12
10 Serzhong LSS R 9 15 31 9 20 16 26 1 12 25 13 24 17 29 16 31 16 37 11 22 0 0 0 0 0 0 0 0 120 125 245 3 8 0 11
11 Nagor LSS VR 10 14 27 7 13 14 27 1 13 37 13 27 0 0 12 25 19 51 19 51 0 0 0 0 0 0 0 0 147 111 258 2 8 0 10
12 Kengkhar LSS VR 10 11 32 27 52 16 39 1 6 28 12 26 13 28 12 27 21 40 10 45 0 0 0 0 0 0 0 0 189 128 317 2 7 0 9
13 Bumpazor PS SR 7 7 16 14 23 7 17 1 7 15 7 16 9 17 6 11 0 0 0 0 0 0 0 0 0 0 0 0 58 57 115 2 4 0 6
14 Tsamang PS R 7 12 20 19 33 9 13 1 7 18 14 22 3 12 8 22 0 0 0 0 0 0 0 0 0 0 0 0 68 72 140 1 5 0 6
15 Tsakaling PS R 7 10 25 5 13 6 18 1 7 15 13 20 9 24 15 20 0 0 0 0 0 0 0 0 0 0 0 0 70 65 135 1 4 0 5
16 Zunglen PS R 7 11 15 4 15 7 13 1 2 7 8 16 4 6 5 9 0 0 0 0 0 0 0 0 0 0 0 0 40 41 81 1 2 0 3
17 Thangrong PS R 7 15 38 21 42 18 35 1 20 36 17 27 10 22 10 20 0 0 0 0 0 0 0 0 0 0 0 0 109 111 220 1 6 0 7
18 Jurmey PS VR 7 25 38 24 40 12 29 1 16 33 14 36 13 26 12 27 0 0 0 0 0 0 0 0 0 0 0 0 113 116 229 1 4 0 5
19 Ngatshang CPS SU 7 7 14 8 21 9 21 1 11 22 18 24 13 20 13 21 0 0 0 0 0 0 0 0 0 0 0 0 64 79 143 1 6 0 7
20 Ridaza CPS SU 7 23 39 12 26 15 42 1 15 35 28 40 17 33 14 28 0 0 0 0 0 0 0 0 0 0 0 0 119 124 243 2 8 0 10
21 Lingmithang CPS SU 7 14 36 15 34 16 36 1 24 39 12 37 12 24 27 50 0 0 0 0 0 0 0 0 0 0 0 0 136 120 256 1 5 0 6
22 Sengor CPS SR 7 4 11 8 14 5 7 1 4 11 2 7 4 6 7 9 0 0 0 0 0 0 0 0 0 0 0 0 31 34 65 1 2 0 3
23 Chaskhar Pam CPS SR 7 5 8 10 18 7 24 1 7 20 3 14 6 13 1 10 0 0 0 0 0 0 0 0 0 0 0 0 68 39 107 1 2 0 3
24 Wama CPS SR 4 10 14 5 8 6 13 1 4 7 0 0 0 0 0 0 0 0 0 0 0 0 0 0 0 0 0 0 17 25 42 0 2 0 2
25 Muhung CPS R 5 6 12 0 0 6 12 1 7 13 4 9 0 0 4 14 0 0 0 0 0 0 0 0 0 0 0 0 33 27 60 1 2 0 3
26 Baging CPS R 7 12 26 12 22 14 26 1 4 11 16 27 8 12 4 6 0 0 0 0 0 0 0 0 0 0 0 0 60 70 130 1 4 0 5
27 Konbar CPS R 7 11 17 3 6 3 16 1 3 9 12 17 5 6 3 7 0 0 0 0 0 0 0 0 0 0 0 0 38 40 78 1 3 0 4
28 Balam CPS R 7 18 43 18 35 15 27 1 25 36 18 38 6 20 9 18 0 0 0 0 0 0 0 0 0 0 0 0 108 109 217 1 5 0 6
29 Ganglapong CPS R 7 9 16 5 11 8 13 1 5 11 5 9 3 8 3 8 0 0 0 0 0 0 0 0 0 0 0 0 38 38 76 1 2 0 3
30 Banjar CPS R 6 2 6 5 7 4 6 1 3 6 7 12 3 8 5 7 0 0 0 0 0 0 0 0 0 0 0 0 23 29 52 0 2 0 2
31 Soenakhar CPS R 5 8 14 7 15 7 21 1 8 21 7 8 0 0 0 0 0 0 0 0 0 0 0 0 0 0 0 0 42 37 79 1 2 0 3
32 Resa CPS R 5 6 10 0 0 1 5 1 0 0 6 13 4 6 1 6 0 0 0 0 0 0 0 0 0 0 0 0 22 18 40 0 3 0 3
33 Thridangbi CPS R 7 15 27 5 13 7 15 1 11 20 8 14 8 14 7 15 0 0 0 0 0 0 0 0 0 0 0 0 57 61 118 1 4 0 5
34 Sherub Choling CPS R 5 2 7 2 7 6 11 1 12 15 2 4 0 0 0 0 0 0 0 0 0 0 0 0 0 0 0 0 20 24 44 1 2 0 3
35 Jaibab CPS R 4 4 10 4 8 5 12 1 8 14 0 0 0 0 0 0 0 0 0 0 0 0 0 0 0 0 0 0 23 21 44 0 2 0 2
36 Lingkhar CPS R 4 7 13 1 6 11 19 1 13 30 0 0 0 0 0 0 0 0 0 0 0 0 0 0 0 0 0 0 36 32 68 0 2 0 2
37 Narang CPS R 7 16 30 17 38 11 29 1 11 27 13 23 12 24 9 21 0 0 0 0 0 0 0 0 0 0 0 0 103 89 192 1 3 0 4
38 Waichur CPS R 6 4 10 5 12 7 17 1 7 18 10 17 4 11 0 0 0 0 0 0 0 0 0 0 0 0 0 0 48 37 85 1 1 0 2
39 Takhambi CPS R 7 6 11 1 7 0 2 1 1 4 4 9 5 10 1 5 0 0 0 0 0 0 0 0 0 0 0 0 30 18 48 1 2 0 3
40 Saling CPS R 6 5 11 3 7 0 0 0 6 11 7 7 2 5 3 11 0 0 0 0 0 0 0 0 0 0 0 0 26 26 52 1 2 0 3
41 Kalapang CPS R 3 5 11 0 0 3 6 1 10 17 0 0 0 0 0 0 0 0 0 0 0 0 0 0 0 0 0 0 16 18 34 0 2 0 2
42 Dagsa CPS VR 7 10 17 6 10 5 18 1 15 24 7 21 3 9 4 11 0 0 0 0 0 0 0 0 0 0 0 0 60 50 110 1 2 0 3
43 Yangbari CPS VR 6 2 11 6 15 0 0 0 10 23 6 14 13 18 6 11 0 0 0 0 0 0 0 0 0 0 0 0 49 43 92 1 2 0 3
44 Yaragla CPS VR 6 5 8 6 8 0 0 0 1 3 4 7 1 7 4 10 0 0 0 0 0 0 0 0 0 0 0 0 22 21 43 1 2 0 3

129
AnnEXuRE
School LevelTypeType
Sec.PP I II III IV V VI VII VIII IX X XI XII Total Bht
NBht Total T:PG T G T G T S G T G T G T G T G T G T G T G T G T G T B G T ZLT Oth.
4 Yadi MSS SU 19 19 28 22 38 10 20 1 10 20 13 27 22 42 17 36 46 95 36 90 68 124 40 102 0 0 0 0 319 303 622 5 23 0 28
5 Mongar LSS U 21 65 103 47 88 44 86 2 45 78 31 64 48 83 33 71 51 96 54 97 0 0 0 0 0 0 0 0 348 418 766 5 22 0 27
6 Kurichhu LSS U 12 15 39 33 79 23 47 1 32 63 29 52 29 49 23 52 25 45 18 26 0 0 0 0 0 0 0 0 225 227 452 3 12 2 17
7 Kidheykhar (Kilikhar) LSS SU 10 14 27 19 33 13 25 1 26 47 17 48 25 41 23 42 22 36 20 38 0 0 0 0 0 0 0 0 158 179 337 3 11 0 14
8 Chaskhar LSS SR 9 12 30 17 32 17 45 1 17 39 20 42 23 35 19 36 20 38 14 33 0 0 0 0 0 0 0 0 171 159 330 3 9 0 12
9 Chali LSS SR 9 12 28 15 46 24 37 1 13 27 23 44 14 33 15 24 13 29 15 26 0 0 0 0 0 0 0 0 150 144 294 2 10 0 12
10 Serzhong LSS R 9 15 31 9 20 16 26 1 12 25 13 24 17 29 16 31 16 37 11 22 0 0 0 0 0 0 0 0 120 125 245 3 8 0 11
11 Nagor LSS VR 10 14 27 7 13 14 27 1 13 37 13 27 0 0 12 25 19 51 19 51 0 0 0 0 0 0 0 0 147 111 258 2 8 0 10
12 Kengkhar LSS VR 10 11 32 27 52 16 39 1 6 28 12 26 13 28 12 27 21 40 10 45 0 0 0 0 0 0 0 0 189 128 317 2 7 0 9
13 Bumpazor PS SR 7 7 16 14 23 7 17 1 7 15 7 16 9 17 6 11 0 0 0 0 0 0 0 0 0 0 0 0 58 57 115 2 4 0 6
14 Tsamang PS R 7 12 20 19 33 9 13 1 7 18 14 22 3 12 8 22 0 0 0 0 0 0 0 0 0 0 0 0 68 72 140 1 5 0 6
15 Tsakaling PS R 7 10 25 5 13 6 18 1 7 15 13 20 9 24 15 20 0 0 0 0 0 0 0 0 0 0 0 0 70 65 135 1 4 0 5
16 Zunglen PS R 7 11 15 4 15 7 13 1 2 7 8 16 4 6 5 9 0 0 0 0 0 0 0 0 0 0 0 0 40 41 81 1 2 0 3
17 Thangrong PS R 7 15 38 21 42 18 35 1 20 36 17 27 10 22 10 20 0 0 0 0 0 0 0 0 0 0 0 0 109 111 220 1 6 0 7
18 Jurmey PS VR 7 25 38 24 40 12 29 1 16 33 14 36 13 26 12 27 0 0 0 0 0 0 0 0 0 0 0 0 113 116 229 1 4 0 5
19 Ngatshang CPS SU 7 7 14 8 21 9 21 1 11 22 18 24 13 20 13 21 0 0 0 0 0 0 0 0 0 0 0 0 64 79 143 1 6 0 7
20 Ridaza CPS SU 7 23 39 12 26 15 42 1 15 35 28 40 17 33 14 28 0 0 0 0 0 0 0 0 0 0 0 0 119 124 243 2 8 0 10
21 Lingmithang CPS SU 7 14 36 15 34 16 36 1 24 39 12 37 12 24 27 50 0 0 0 0 0 0 0 0 0 0 0 0 136 120 256 1 5 0 6
22 Sengor CPS SR 7 4 11 8 14 5 7 1 4 11 2 7 4 6 7 9 0 0 0 0 0 0 0 0 0 0 0 0 31 34 65 1 2 0 3
23 Chaskhar Pam CPS SR 7 5 8 10 18 7 24 1 7 20 3 14 6 13 1 10 0 0 0 0 0 0 0 0 0 0 0 0 68 39 107 1 2 0 3
24 Wama CPS SR 4 10 14 5 8 6 13 1 4 7 0 0 0 0 0 0 0 0 0 0 0 0 0 0 0 0 0 0 17 25 42 0 2 0 2
25 Muhung CPS R 5 6 12 0 0 6 12 1 7 13 4 9 0 0 4 14 0 0 0 0 0 0 0 0 0 0 0 0 33 27 60 1 2 0 3
26 Baging CPS R 7 12 26 12 22 14 26 1 4 11 16 27 8 12 4 6 0 0 0 0 0 0 0 0 0 0 0 0 60 70 130 1 4 0 5
27 Konbar CPS R 7 11 17 3 6 3 16 1 3 9 12 17 5 6 3 7 0 0 0 0 0 0 0 0 0 0 0 0 38 40 78 1 3 0 4
28 Balam CPS R 7 18 43 18 35 15 27 1 25 36 18 38 6 20 9 18 0 0 0 0 0 0 0 0 0 0 0 0 108 109 217 1 5 0 6
29 Ganglapong CPS R 7 9 16 5 11 8 13 1 5 11 5 9 3 8 3 8 0 0 0 0 0 0 0 0 0 0 0 0 38 38 76 1 2 0 3
30 Banjar CPS R 6 2 6 5 7 4 6 1 3 6 7 12 3 8 5 7 0 0 0 0 0 0 0 0 0 0 0 0 23 29 52 0 2 0 2
31 Soenakhar CPS R 5 8 14 7 15 7 21 1 8 21 7 8 0 0 0 0 0 0 0 0 0 0 0 0 0 0 0 0 42 37 79 1 2 0 3
32 Resa CPS R 5 6 10 0 0 1 5 1 0 0 6 13 4 6 1 6 0 0 0 0 0 0 0 0 0 0 0 0 22 18 40 0 3 0 3
33 Thridangbi CPS R 7 15 27 5 13 7 15 1 11 20 8 14 8 14 7 15 0 0 0 0 0 0 0 0 0 0 0 0 57 61 118 1 4 0 5
34 Sherub Choling CPS R 5 2 7 2 7 6 11 1 12 15 2 4 0 0 0 0 0 0 0 0 0 0 0 0 0 0 0 0 20 24 44 1 2 0 3
35 Jaibab CPS R 4 4 10 4 8 5 12 1 8 14 0 0 0 0 0 0 0 0 0 0 0 0 0 0 0 0 0 0 23 21 44 0 2 0 2
36 Lingkhar CPS R 4 7 13 1 6 11 19 1 13 30 0 0 0 0 0 0 0 0 0 0 0 0 0 0 0 0 0 0 36 32 68 0 2 0 2
37 Narang CPS R 7 16 30 17 38 11 29 1 11 27 13 23 12 24 9 21 0 0 0 0 0 0 0 0 0 0 0 0 103 89 192 1 3 0 4
38 Waichur CPS R 6 4 10 5 12 7 17 1 7 18 10 17 4 11 0 0 0 0 0 0 0 0 0 0 0 0 0 0 48 37 85 1 1 0 2
39 Takhambi CPS R 7 6 11 1 7 0 2 1 1 4 4 9 5 10 1 5 0 0 0 0 0 0 0 0 0 0 0 0 30 18 48 1 2 0 3
40 Saling CPS R 6 5 11 3 7 0 0 0 6 11 7 7 2 5 3 11 0 0 0 0 0 0 0 0 0 0 0 0 26 26 52 1 2 0 3
41 Kalapang CPS R 3 5 11 0 0 3 6 1 10 17 0 0 0 0 0 0 0 0 0 0 0 0 0 0 0 0 0 0 16 18 34 0 2 0 2
42 Dagsa CPS VR 7 10 17 6 10 5 18 1 15 24 7 21 3 9 4 11 0 0 0 0 0 0 0 0 0 0 0 0 60 50 110 1 2 0 3
43 Yangbari CPS VR 6 2 11 6 15 0 0 0 10 23 6 14 13 18 6 11 0 0 0 0 0 0 0 0 0 0 0 0 49 43 92 1 2 0 3
44 Yaragla CPS VR 6 5 8 6 8 0 0 0 1 3 4 7 1 7 4 10 0 0 0 0 0 0 0 0 0 0 0 0 22 21 43 1 2 0 3

130
AnnEXuRE
School LevelTypeType
Sec.PP I II III IV V VI VII VIII IX X XI XII Total Bht
NBht Total T:PG T G T G T S G T G T G T G T G T G T G T G T G T G T B G T ZLT Oth.
45 Pangthang CPS VR 7 6 9 2 7 11 16 1 5 12 4 9 1 9 6 8 0 0 0 0 0 0 0 0 0 0 0 0 35 35 70 1 3 0 4
46 Silambi CPS VR 6 6 12 6 11 5 8 1 7 15 3 10 3 6 0 0 0 0 0 0 0 0 0 0 0 0 0 0 32 30 62 1 1 0 2
47 Bakla CPS VR 3 1 2 3 7 0 0 0 6 10 0 0 0 0 0 0 0 0 0 0 0 0 0 0 0 0 0 0 9 10 19 0 2 0 2
48 Broksar CPS VR 5 4 8 3 5 2 5 1 1 5 2 7 0 0 0 0 0 0 0 0 0 0 0 0 0 0 0 0 18 12 30 0 1 0 1
49 Udaric CPS VR 7 13 17 10 24 5 16 1 10 17 5 12 2 6 4 12 0 0 0 0 0 0 0 0 0 0 0 0 55 49 104 1 3 0 4
50 Sherub Reldri (Pvt) HSS SU 5 0 0 0 0 0 0 0 0 0 0 0 0 0 0 0 0 0 0 0 0 0 0 0 47 111 0 0 64 47 111 2 2 9 13
Total 395 514 1008 491 1010 444 959 44 502 1033 467 930 386 750 378 777 334 681 302 665 330 638 215 505 120 350 82 229 4970 4565 9535 74 283 30 387 25
8 Paro
1 Drukgyel HSS U 22 0 0 0 0 0 0 0 0 0 0 0 0 0 0 0 0 0 0 0 191 346 189 339 56 161 84 176 502 520 1022 7 17 11 35
2 Shari HSS SU 18 0 0 0 0 0 0 0 0 0 0 0 0 0 0 0 39 68 31 65 106 181 49 90 40 73 32 56 236 297 533 4 19 7 30
3 Shaba MSS U 14 0 0 0 0 0 0 0 0 0 0 0 0 0 0 0 50 100 48 94 72 159 84 144 0 0 0 0 243 254 497 4 17 4 25
4 Khangkhu MSS U 22 14 38 18 36 20 47 2 30 54 37 64 45 77 34 64 60 109 54 100 29 65 27 56 0 0 0 0 342 368 710 6 26 2 34
5 Gaupey LSS U 22 34 70 39 69 29 71 2 47 96 46 96 48 92 57 95 27 50 18 42 0 0 0 0 0 0 0 0 336 345 681 7 25 0 32
6 Drukgyel LSS U 18 41 77 29 61 36 80 2 43 75 35 65 36 57 33 69 42 74 43 79 0 0 0 0 0 0 0 0 299 338 637 5 28 1 34
7 Doteng LSS U 10 17 30 24 44 21 45 1 16 42 22 47 19 31 34 56 23 42 24 43 0 0 0 0 0 0 0 0 180 200 380 3 12 0 15
8 Lango LSS U 39 43 94 38 77 38 89 2 49 89 50 102 56 110 50 91 53 98 61 90 0 0 0 0 0 0 0 0 402 438 840 6 21 2 29
9 Woochu LSS U 25 36 83 33 74 51 92 3 47 98 58 115 42 92 45 81 61 106 39 64 0 0 0 0 0 0 0 0 393 412 805 7 28 0 35
10 Wanakha LSS SU 9 24 43 34 57 18 38 1 26 46 26 34 16 27 17 29 11 16 7 18 0 0 0 0 0 0 0 0 129 179 308 2 7 0 9
11 Bitekha LSS SR 10 25 51 27 54 19 48 1 19 44 24 50 31 56 32 54 41 81 32 54 0 0 0 0 0 0 0 0 242 250 492 3 12 0 15
12 Dawakha LSS SR 10 18 24 22 42 27 44 1 17 29 15 38 29 45 26 49 31 70 29 51 0 0 0 0 0 0 0 0 178 214 392 2 11 1 14
13 Shaba PS U 22 58 130 54 124 64 131 3 63 115 67 132 49 104 64 115 0 0 0 0 0 0 0 0 0 0 0 0 432 419 851 5 25 0 30
14 Taju PS SU 13 30 70 32 84 27 60 2 32 78 32 74 30 70 19 37 0 0 0 0 0 0 0 0 0 0 0 0 271 202 473 4 16 0 20
15 Gonyetsawa PS R 7 12 19 5 15 7 17 1 5 9 1 10 8 15 9 10 0 0 0 0 0 0 0 0 0 0 0 0 48 47 95 1 5 0 6
16 Issuna CPS SU 7 17 27 8 12 8 13 1 6 13 6 13 4 12 4 9 0 0 0 0 0 0 0 0 0 0 0 0 46 53 99 1 3 0 4
17 Ramechetsekha CPS R 7 9 16 9 18 10 20 1 8 22 14 24 11 21 4 8 0 0 0 0 0 0 0 0 0 0 0 0 64 65 129 2 8 0 10
18 Nabesa CPS R 6 4 6 0 0 1 1 1 2 3 3 4 2 4 0 0 0 0 0 0 0 0 0 0 0 0 0 0 6 12 18 1 1 0 2
19 Yoezerling Pvt. U 14 63 137 14 23 11 26 1 9 16 0 0 0 0 0 0 0 0 0 0 0 0 0 0 37 77 0 0 145 134 279 5 9 6 20
20 K. Gangri Pvt. U 6 22 44 1 4 3 9 1 1 3 0 0 0 0 0 0 0 0 0 0 0 0 0 0 0 0 0 0 33 27 60 0 7 0 7
21 Tenzin Pvt. U 11 0 0 0 0 0 0 0 0 0 0 0 0 0 0 0 0 0 0 0 0 0 0 0 112 261 72 189 266 184 450 3 8 7 18
22 Kuenga Pvt. SU 17 0 0 0 0 0 0 0 0 0 0 0 0 0 0 0 0 0 0 0 0 0 6 21 90 184 194 446 361 290 651 5 13 14 32
Total 329 467 959 387 794 390 831 26 420 832 436 868 426 813 428 767 438 814 386 700 398 751 355 650 335 756 382 867 5154 5248 10402 83 318 55 456 23
9 P/Gatshel
1 Nangkhor HSS U 16 0 0 0 0 0 0 0 0 0 0 0 0 0 0 0 0 0 0 0 63 149 71 138 51 163 53 165 377 238 615 4 13 5 22
2 Pemagatshel MSS U 21 24 45 17 45 17 43 1 14 37 20 44 21 39 19 32 45 77 27 60 71 177 53 143 0 0 0 0 414 328 742 5 21 4 30
3 Nganglam MSS SU 9 0 0 0 0 0 0 0 0 0 0 0 0 0 0 0 0 0 0 0 77 163 49 131 0 0 0 0 168 126 294 2 9 3 14
4 Nganglam LSS SU 17 47 97 40 89 28 58 1 29 57 39 64 41 84 38 58 73 148 53 118 0 0 0 0 0 0 0 0 385 388 773 2 22 1 25
5 Shumar LSS SR 10 14 33 16 35 20 49 2 18 37 19 31 14 31 19 26 19 43 16 35 0 0 0 0 0 0 0 0 165 155 320 2 10 1 13
6 Gongpasingma LSS SR 12 7 17 8 14 6 11 1 10 14 10 25 17 24 8 27 52 118 39 85 0 0 0 0 0 0 0 0 178 157 335 2 11 1 14
7 Yurung LSS R 11 8 18 13 17 10 21 1 9 19 6 15 16 25 10 19 34 81 34 75 0 0 0 0 0 0 0 0 150 140 290 2 9 0 11
8 Tsebar LSS R 11 9 17 13 26 7 17 1 13 23 7 20 11 17 18 29 41 78 32 69 0 0 0 0 0 0 0 0 145 151 296 1 11 0 12
9 Dechenling LSS R 12 17 33 15 37 19 35 1 16 32 36 67 18 30 18 30 30 56 23 57 0 0 0 0 0 0 0 0 185 192 377 3 8 0 11

131
AnnEXuRE
School LevelTypeType
Sec.PP I II III IV V VI VII VIII IX X XI XII Total Bht
NBht Total T:PG T G T G T S G T G T G T G T G T G T G T G T G T G T B G T ZLT Oth.
45 Pangthang CPS VR 7 6 9 2 7 11 16 1 5 12 4 9 1 9 6 8 0 0 0 0 0 0 0 0 0 0 0 0 35 35 70 1 3 0 4
46 Silambi CPS VR 6 6 12 6 11 5 8 1 7 15 3 10 3 6 0 0 0 0 0 0 0 0 0 0 0 0 0 0 32 30 62 1 1 0 2
47 Bakla CPS VR 3 1 2 3 7 0 0 0 6 10 0 0 0 0 0 0 0 0 0 0 0 0 0 0 0 0 0 0 9 10 19 0 2 0 2
48 Broksar CPS VR 5 4 8 3 5 2 5 1 1 5 2 7 0 0 0 0 0 0 0 0 0 0 0 0 0 0 0 0 18 12 30 0 1 0 1
49 Udaric CPS VR 7 13 17 10 24 5 16 1 10 17 5 12 2 6 4 12 0 0 0 0 0 0 0 0 0 0 0 0 55 49 104 1 3 0 4
50 Sherub Reldri (Pvt) HSS SU 5 0 0 0 0 0 0 0 0 0 0 0 0 0 0 0 0 0 0 0 0 0 0 0 47 111 0 0 64 47 111 2 2 9 13
Total 395 514 1008 491 1010 444 959 44 502 1033 467 930 386 750 378 777 334 681 302 665 330 638 215 505 120 350 82 229 4970 4565 9535 74 283 30 387 25
8 Paro
1 Drukgyel HSS U 22 0 0 0 0 0 0 0 0 0 0 0 0 0 0 0 0 0 0 0 191 346 189 339 56 161 84 176 502 520 1022 7 17 11 35
2 Shari HSS SU 18 0 0 0 0 0 0 0 0 0 0 0 0 0 0 0 39 68 31 65 106 181 49 90 40 73 32 56 236 297 533 4 19 7 30
3 Shaba MSS U 14 0 0 0 0 0 0 0 0 0 0 0 0 0 0 0 50 100 48 94 72 159 84 144 0 0 0 0 243 254 497 4 17 4 25
4 Khangkhu MSS U 22 14 38 18 36 20 47 2 30 54 37 64 45 77 34 64 60 109 54 100 29 65 27 56 0 0 0 0 342 368 710 6 26 2 34
5 Gaupey LSS U 22 34 70 39 69 29 71 2 47 96 46 96 48 92 57 95 27 50 18 42 0 0 0 0 0 0 0 0 336 345 681 7 25 0 32
6 Drukgyel LSS U 18 41 77 29 61 36 80 2 43 75 35 65 36 57 33 69 42 74 43 79 0 0 0 0 0 0 0 0 299 338 637 5 28 1 34
7 Doteng LSS U 10 17 30 24 44 21 45 1 16 42 22 47 19 31 34 56 23 42 24 43 0 0 0 0 0 0 0 0 180 200 380 3 12 0 15
8 Lango LSS U 39 43 94 38 77 38 89 2 49 89 50 102 56 110 50 91 53 98 61 90 0 0 0 0 0 0 0 0 402 438 840 6 21 2 29
9 Woochu LSS U 25 36 83 33 74 51 92 3 47 98 58 115 42 92 45 81 61 106 39 64 0 0 0 0 0 0 0 0 393 412 805 7 28 0 35
10 Wanakha LSS SU 9 24 43 34 57 18 38 1 26 46 26 34 16 27 17 29 11 16 7 18 0 0 0 0 0 0 0 0 129 179 308 2 7 0 9
11 Bitekha LSS SR 10 25 51 27 54 19 48 1 19 44 24 50 31 56 32 54 41 81 32 54 0 0 0 0 0 0 0 0 242 250 492 3 12 0 15
12 Dawakha LSS SR 10 18 24 22 42 27 44 1 17 29 15 38 29 45 26 49 31 70 29 51 0 0 0 0 0 0 0 0 178 214 392 2 11 1 14
13 Shaba PS U 22 58 130 54 124 64 131 3 63 115 67 132 49 104 64 115 0 0 0 0 0 0 0 0 0 0 0 0 432 419 851 5 25 0 30
14 Taju PS SU 13 30 70 32 84 27 60 2 32 78 32 74 30 70 19 37 0 0 0 0 0 0 0 0 0 0 0 0 271 202 473 4 16 0 20
15 Gonyetsawa PS R 7 12 19 5 15 7 17 1 5 9 1 10 8 15 9 10 0 0 0 0 0 0 0 0 0 0 0 0 48 47 95 1 5 0 6
16 Issuna CPS SU 7 17 27 8 12 8 13 1 6 13 6 13 4 12 4 9 0 0 0 0 0 0 0 0 0 0 0 0 46 53 99 1 3 0 4
17 Ramechetsekha CPS R 7 9 16 9 18 10 20 1 8 22 14 24 11 21 4 8 0 0 0 0 0 0 0 0 0 0 0 0 64 65 129 2 8 0 10
18 Nabesa CPS R 6 4 6 0 0 1 1 1 2 3 3 4 2 4 0 0 0 0 0 0 0 0 0 0 0 0 0 0 6 12 18 1 1 0 2
19 Yoezerling Pvt. U 14 63 137 14 23 11 26 1 9 16 0 0 0 0 0 0 0 0 0 0 0 0 0 0 37 77 0 0 145 134 279 5 9 6 20
20 K. Gangri Pvt. U 6 22 44 1 4 3 9 1 1 3 0 0 0 0 0 0 0 0 0 0 0 0 0 0 0 0 0 0 33 27 60 0 7 0 7
21 Tenzin Pvt. U 11 0 0 0 0 0 0 0 0 0 0 0 0 0 0 0 0 0 0 0 0 0 0 0 112 261 72 189 266 184 450 3 8 7 18
22 Kuenga Pvt. SU 17 0 0 0 0 0 0 0 0 0 0 0 0 0 0 0 0 0 0 0 0 0 6 21 90 184 194 446 361 290 651 5 13 14 32
Total 329 467 959 387 794 390 831 26 420 832 436 868 426 813 428 767 438 814 386 700 398 751 355 650 335 756 382 867 5154 5248 10402 83 318 55 456 23
9 P/Gatshel
1 Nangkhor HSS U 16 0 0 0 0 0 0 0 0 0 0 0 0 0 0 0 0 0 0 0 63 149 71 138 51 163 53 165 377 238 615 4 13 5 22
2 Pemagatshel MSS U 21 24 45 17 45 17 43 1 14 37 20 44 21 39 19 32 45 77 27 60 71 177 53 143 0 0 0 0 414 328 742 5 21 4 30
3 Nganglam MSS SU 9 0 0 0 0 0 0 0 0 0 0 0 0 0 0 0 0 0 0 0 77 163 49 131 0 0 0 0 168 126 294 2 9 3 14
4 Nganglam LSS SU 17 47 97 40 89 28 58 1 29 57 39 64 41 84 38 58 73 148 53 118 0 0 0 0 0 0 0 0 385 388 773 2 22 1 25
5 Shumar LSS SR 10 14 33 16 35 20 49 2 18 37 19 31 14 31 19 26 19 43 16 35 0 0 0 0 0 0 0 0 165 155 320 2 10 1 13
6 Gongpasingma LSS SR 12 7 17 8 14 6 11 1 10 14 10 25 17 24 8 27 52 118 39 85 0 0 0 0 0 0 0 0 178 157 335 2 11 1 14
7 Yurung LSS R 11 8 18 13 17 10 21 1 9 19 6 15 16 25 10 19 34 81 34 75 0 0 0 0 0 0 0 0 150 140 290 2 9 0 11
8 Tsebar LSS R 11 9 17 13 26 7 17 1 13 23 7 20 11 17 18 29 41 78 32 69 0 0 0 0 0 0 0 0 145 151 296 1 11 0 12
9 Dechenling LSS R 12 17 33 15 37 19 35 1 16 32 36 67 18 30 18 30 30 56 23 57 0 0 0 0 0 0 0 0 185 192 377 3 8 0 11

132
AnnEXuRE
School LevelTypeType
Sec.PP I II III IV V VI VII VIII IX X XI XII Total Bht
NBht Total T:PG T G T G T S G T G T G T G T G T G T G T G T G T G T B G T ZLT Oth.
10 Chimong PS VR 6 4 8 6 17 6 14 1 0 0 11 22 6 11 7 13 0 0 0 0 0 0 0 0 0 0 0 0 45 40 85 1 4 0 5
11 Mikuri PS VR 7 8 19 10 25 15 20 1 16 24 11 21 5 15 7 12 0 0 0 0 0 0 0 0 0 0 0 0 64 72 136 2 5 0 7
12 Dungmin PS VR 6 7 11 0 0 6 11 1 4 9 3 9 6 10 9 15 0 0 0 0 0 0 0 0 0 0 0 0 30 35 65 1 2 0 3
13 Tshatsi PS VR 7 13 23 12 26 22 38 1 4 12 10 24 11 23 10 23 0 0 0 0 0 0 0 0 0 0 0 0 87 82 169 0 6 0 6
14 Khar CPS SR 7 4 15 17 25 8 20 1 14 27 12 22 11 20 12 22 0 0 0 0 0 0 0 0 0 0 0 0 73 78 151 1 6 0 7
15 Khothakpa CPS SR 7 18 32 17 36 15 34 1 17 39 14 27 18 34 12 25 0 0 0 0 0 0 0 0 0 0 0 0 116 111 227 0 5 1 6
16 Thongsa CPS SR 7 8 15 4 10 4 10 1 5 10 3 10 6 20 5 12 0 0 0 0 0 0 0 0 0 0 0 0 52 35 87 1 4 0 5
17 Woongchilo CPS SR 7 4 14 7 21 12 19 1 6 13 6 14 9 12 3 10 0 0 0 0 0 0 0 0 0 0 0 0 56 47 103 1 5 0 6
18 Dagor CPS R 6 2 6 6 10 4 11 1 0 0 4 8 3 10 3 8 0 0 0 0 0 0 0 0 0 0 0 0 31 22 53 0 5 0 5
19 Khangma CPS R 7 8 19 7 10 4 11 1 7 11 8 11 6 9 6 18 0 0 0 0 0 0 0 0 0 0 0 0 43 46 89 1 4 0 5
20 Shali CPS R 7 8 19 10 23 8 21 1 16 27 8 21 13 22 8 16 0 0 0 0 0 0 0 0 0 0 0 0 78 71 149 1 5 0 6
21 Khenrigonpa CPS R 6 4 9 0 0 4 12 1 3 14 8 13 6 15 12 16 0 0 0 0 0 0 0 0 0 0 0 0 42 37 79 1 4 0 5
22 Choekhorling CPS R 5 0 0 3 9 5 9 1 0 0 6 14 7 12 7 10 0 0 0 0 0 0 0 0 0 0 0 0 26 28 54 1 4 0 5
23 Kerong CPS R 6 6 9 0 0 1 9 1 5 6 2 4 3 8 3 7 0 0 0 0 0 0 0 0 0 0 0 0 23 20 43 0 3 0 3
24 Norbugang CPS R 7 6 16 9 17 7 11 1 4 24 12 32 12 26 8 25 0 0 0 0 0 0 0 0 0 0 0 0 93 58 151 1 6 0 7
25 Rezimo CPS VR 7 3 6 4 7 8 12 1 9 12 6 15 3 9 7 11 0 0 0 0 0 0 0 0 0 0 0 0 32 40 72 0 3 0 3
26 Nyaskhar CPS VR 4 3 5 1 3 3 8 1 0 0 2 4 0 0 0 0 0 0 0 0 0 0 0 0 0 0 0 0 11 9 20 0 1 0 1
27 Khenzore CPS VR 6 2 7 2 8 11 20 1 13 18 11 17 4 13 0 0 0 0 0 0 0 0 0 0 0 0 0 0 40 43 83 1 3 0 4
28 Laniri CPS VR 5 0 0 4 7 3 12 1 0 0 6 14 8 9 7 9 0 0 0 0 0 0 0 0 0 0 0 0 23 28 51 0 3 0 3
29 Chongshing CPS VR 5 3 5 5 9 6 10 1 0 0 2 7 7 13 0 0 0 0 0 0 0 0 0 0 0 0 0 0 21 23 44 1 3 0 4
30 Resinang CPS VR 6 1 3 1 3 2 7 1 1 3 2 8 5 8 0 0 0 0 0 0 0 0 0 0 0 0 0 0 20 12 32 0 2 0 2
31 Yelchen CPS VR 7 10 17 8 20 3 9 1 4 9 13 20 6 15 7 11 0 0 0 0 0 0 0 0 0 0 0 0 50 51 101 1 5 0 6
Total 257 248 518 255 549 264 562 30 237 477 297 603 293 564 263 484 294 601 224 499 211 489 173 412 51 163 53 165 3223 2863 6086 38 202 16 256 24
1 Pangthang( Yelchen) ECR VR 4 4 10 5 6 1 8 1 3 5 0 0 0 0 0 0 0 0 0 0 0 0 0 0 0 0 0 0 16 13 29 0 2 0 2
2 Ngangshing (Gonpas- ECR VR 4 9 15 3 5 1 4 1 2 8 0 0 0 0 0 0 0 0 0 0 0 0 0 0 0 0 0 0 17 15 32 0 1 0 1
3 Yumzor (Chongshing ECR VR 3 3 6 3 4 1 1 1 0 0 0 0 0 0 0 0 0 0 0 0 0 0 0 0 0 0 0 0 4 7 11 0 1 0 1
4 Gashari (Norbugang ECR R 4 6 10 6 11 3 11 1 2 5 0 0 0 0 0 0 0 0 0 0 0 0 0 0 0 0 0 0 20 17 37 0 1 0 1
5 Kheri (Khenrigonpa ECR R 3 2 8 3 4 0 0 0 2 2 0 0 0 0 0 0 0 0 0 0 0 0 0 0 0 0 0 0 7 7 14 0 1 0 1
6 Ngamalang (Gonpas- ECR SR 4 5 11 2 6 3 11 1 2 5 0 0 0 0 0 0 0 0 0 0 0 0 0 0 0 0 0 0 21 12 33 0 1 0 1
Total 22 29 60 22 36 9 35 5 11 25 0 0 0 0 0 0 0 0 0 0 0 0 0 0 0 0 0 0 85 71 156 0 7 0 7 22
G.Total 279 277 578 277 585 273 597 35 248 502 297 603 293 564 263 484 294 601 224 499 211 489 173 412 51 163 53 165 3308 2934 6242 38 209 16 263 24
10 Punakha
1 Punakha HSS U 18 0 0 0 0 0 0 0 0 0 0 0 0 0 0 0 0 0 0 0 39 82 99 195 90 211 76 178 362 304 666 6 25 11 42
2 Khuruthang MSS U 27 39 98 48 99 52 87 2 44 81 42 90 51 87 44 83 74 133 57 109 28 64 31 51 0 0 0 0 472 510 982 6 29 6 41
3 Thinleygang MSS SU 12 0 0 0 0 0 0 0 0 0 0 0 0 0 0 0 55 82 60 116 52 92 56 103 0 0 0 0 170 223 393 3 10 3 16
4 Trashhidingkha MSS SR 14 0 0 0 0 0 0 0 0 0 0 0 0 0 0 0 63 117 79 152 94 168 54 87 0 0 0 0 234 290 524 4 14 2 20
5 Bjijokha LSS SR 10 18 39 24 38 23 42 1 25 38 26 49 18 39 13 21 13 26 15 25 0 0 0 0 0 0 0 0 142 175 317 4 11 1 16
6 Kabesa LSS SR 17 37 65 40 78 38 71 2 32 70 46 72 38 62 29 47 33 50 52 65 0 0 0 0 0 0 0 0 235 345 580 6 13 1 20
7 Shengana LSS SR 9 11 24 13 27 11 21 1 10 20 16 32 7 26 11 23 11 23 8 15 0 0 0 0 0 0 0 0 113 98 211 3 9 1 13
8 Lobesa LSS SR 26 51 95 57 105 65 121 3 47 92 42 80 71 110 50 69 53 80 37 51 0 0 0 0 0 0 0 0 330 473 803 6 22 1 29

133
AnnEXuRE
School LevelTypeType
Sec.PP I II III IV V VI VII VIII IX X XI XII Total Bht
NBht Total T:PG T G T G T S G T G T G T G T G T G T G T G T G T G T B G T ZLT Oth.
10 Chimong PS VR 6 4 8 6 17 6 14 1 0 0 11 22 6 11 7 13 0 0 0 0 0 0 0 0 0 0 0 0 45 40 85 1 4 0 5
11 Mikuri PS VR 7 8 19 10 25 15 20 1 16 24 11 21 5 15 7 12 0 0 0 0 0 0 0 0 0 0 0 0 64 72 136 2 5 0 7
12 Dungmin PS VR 6 7 11 0 0 6 11 1 4 9 3 9 6 10 9 15 0 0 0 0 0 0 0 0 0 0 0 0 30 35 65 1 2 0 3
13 Tshatsi PS VR 7 13 23 12 26 22 38 1 4 12 10 24 11 23 10 23 0 0 0 0 0 0 0 0 0 0 0 0 87 82 169 0 6 0 6
14 Khar CPS SR 7 4 15 17 25 8 20 1 14 27 12 22 11 20 12 22 0 0 0 0 0 0 0 0 0 0 0 0 73 78 151 1 6 0 7
15 Khothakpa CPS SR 7 18 32 17 36 15 34 1 17 39 14 27 18 34 12 25 0 0 0 0 0 0 0 0 0 0 0 0 116 111 227 0 5 1 6
16 Thongsa CPS SR 7 8 15 4 10 4 10 1 5 10 3 10 6 20 5 12 0 0 0 0 0 0 0 0 0 0 0 0 52 35 87 1 4 0 5
17 Woongchilo CPS SR 7 4 14 7 21 12 19 1 6 13 6 14 9 12 3 10 0 0 0 0 0 0 0 0 0 0 0 0 56 47 103 1 5 0 6
18 Dagor CPS R 6 2 6 6 10 4 11 1 0 0 4 8 3 10 3 8 0 0 0 0 0 0 0 0 0 0 0 0 31 22 53 0 5 0 5
19 Khangma CPS R 7 8 19 7 10 4 11 1 7 11 8 11 6 9 6 18 0 0 0 0 0 0 0 0 0 0 0 0 43 46 89 1 4 0 5
20 Shali CPS R 7 8 19 10 23 8 21 1 16 27 8 21 13 22 8 16 0 0 0 0 0 0 0 0 0 0 0 0 78 71 149 1 5 0 6
21 Khenrigonpa CPS R 6 4 9 0 0 4 12 1 3 14 8 13 6 15 12 16 0 0 0 0 0 0 0 0 0 0 0 0 42 37 79 1 4 0 5
22 Choekhorling CPS R 5 0 0 3 9 5 9 1 0 0 6 14 7 12 7 10 0 0 0 0 0 0 0 0 0 0 0 0 26 28 54 1 4 0 5
23 Kerong CPS R 6 6 9 0 0 1 9 1 5 6 2 4 3 8 3 7 0 0 0 0 0 0 0 0 0 0 0 0 23 20 43 0 3 0 3
24 Norbugang CPS R 7 6 16 9 17 7 11 1 4 24 12 32 12 26 8 25 0 0 0 0 0 0 0 0 0 0 0 0 93 58 151 1 6 0 7
25 Rezimo CPS VR 7 3 6 4 7 8 12 1 9 12 6 15 3 9 7 11 0 0 0 0 0 0 0 0 0 0 0 0 32 40 72 0 3 0 3
26 Nyaskhar CPS VR 4 3 5 1 3 3 8 1 0 0 2 4 0 0 0 0 0 0 0 0 0 0 0 0 0 0 0 0 11 9 20 0 1 0 1
27 Khenzore CPS VR 6 2 7 2 8 11 20 1 13 18 11 17 4 13 0 0 0 0 0 0 0 0 0 0 0 0 0 0 40 43 83 1 3 0 4
28 Laniri CPS VR 5 0 0 4 7 3 12 1 0 0 6 14 8 9 7 9 0 0 0 0 0 0 0 0 0 0 0 0 23 28 51 0 3 0 3
29 Chongshing CPS VR 5 3 5 5 9 6 10 1 0 0 2 7 7 13 0 0 0 0 0 0 0 0 0 0 0 0 0 0 21 23 44 1 3 0 4
30 Resinang CPS VR 6 1 3 1 3 2 7 1 1 3 2 8 5 8 0 0 0 0 0 0 0 0 0 0 0 0 0 0 20 12 32 0 2 0 2
31 Yelchen CPS VR 7 10 17 8 20 3 9 1 4 9 13 20 6 15 7 11 0 0 0 0 0 0 0 0 0 0 0 0 50 51 101 1 5 0 6
Total 257 248 518 255 549 264 562 30 237 477 297 603 293 564 263 484 294 601 224 499 211 489 173 412 51 163 53 165 3223 2863 6086 38 202 16 256 24
1 Pangthang( Yelchen) ECR VR 4 4 10 5 6 1 8 1 3 5 0 0 0 0 0 0 0 0 0 0 0 0 0 0 0 0 0 0 16 13 29 0 2 0 2
2 Ngangshing (Gonpas- ECR VR 4 9 15 3 5 1 4 1 2 8 0 0 0 0 0 0 0 0 0 0 0 0 0 0 0 0 0 0 17 15 32 0 1 0 1
3 Yumzor (Chongshing ECR VR 3 3 6 3 4 1 1 1 0 0 0 0 0 0 0 0 0 0 0 0 0 0 0 0 0 0 0 0 4 7 11 0 1 0 1
4 Gashari (Norbugang ECR R 4 6 10 6 11 3 11 1 2 5 0 0 0 0 0 0 0 0 0 0 0 0 0 0 0 0 0 0 20 17 37 0 1 0 1
5 Kheri (Khenrigonpa ECR R 3 2 8 3 4 0 0 0 2 2 0 0 0 0 0 0 0 0 0 0 0 0 0 0 0 0 0 0 7 7 14 0 1 0 1
6 Ngamalang (Gonpas- ECR SR 4 5 11 2 6 3 11 1 2 5 0 0 0 0 0 0 0 0 0 0 0 0 0 0 0 0 0 0 21 12 33 0 1 0 1
Total 22 29 60 22 36 9 35 5 11 25 0 0 0 0 0 0 0 0 0 0 0 0 0 0 0 0 0 0 85 71 156 0 7 0 7 22
G.Total 279 277 578 277 585 273 597 35 248 502 297 603 293 564 263 484 294 601 224 499 211 489 173 412 51 163 53 165 3308 2934 6242 38 209 16 263 24
10 Punakha
1 Punakha HSS U 18 0 0 0 0 0 0 0 0 0 0 0 0 0 0 0 0 0 0 0 39 82 99 195 90 211 76 178 362 304 666 6 25 11 42
2 Khuruthang MSS U 27 39 98 48 99 52 87 2 44 81 42 90 51 87 44 83 74 133 57 109 28 64 31 51 0 0 0 0 472 510 982 6 29 6 41
3 Thinleygang MSS SU 12 0 0 0 0 0 0 0 0 0 0 0 0 0 0 0 55 82 60 116 52 92 56 103 0 0 0 0 170 223 393 3 10 3 16
4 Trashhidingkha MSS SR 14 0 0 0 0 0 0 0 0 0 0 0 0 0 0 0 63 117 79 152 94 168 54 87 0 0 0 0 234 290 524 4 14 2 20
5 Bjijokha LSS SR 10 18 39 24 38 23 42 1 25 38 26 49 18 39 13 21 13 26 15 25 0 0 0 0 0 0 0 0 142 175 317 4 11 1 16
6 Kabesa LSS SR 17 37 65 40 78 38 71 2 32 70 46 72 38 62 29 47 33 50 52 65 0 0 0 0 0 0 0 0 235 345 580 6 13 1 20
7 Shengana LSS SR 9 11 24 13 27 11 21 1 10 20 16 32 7 26 11 23 11 23 8 15 0 0 0 0 0 0 0 0 113 98 211 3 9 1 13
8 Lobesa LSS SR 26 51 95 57 105 65 121 3 47 92 42 80 71 110 50 69 53 80 37 51 0 0 0 0 0 0 0 0 330 473 803 6 22 1 29

134
AnnEXuRE
School LevelTypeType
Sec.PP I II III IV V VI VII VIII IX X XI XII Total Bht
NBht Total T:PG T G T G T S G T G T G T G T G T G T G T G T G T G T B G T ZLT Oth.
9 Thinleygang PS SU 9 14 31 14 36 15 31 1 24 41 24 60 21 38 27 55 0 0 0 0 0 0 0 0 0 0 0 0 153 139 292 3 9 0 12
10 Tshochasa PS SR 7 6 13 10 21 9 20 1 8 15 6 15 8 12 9 14 0 0 0 0 0 0 0 0 0 0 0 0 54 56 110 2 6 0 8
11 Logodama PS SR 18 37 86 57 103 36 70 2 50 91 51 91 43 72 38 71 0 0 0 0 0 0 0 0 0 0 0 0 272 312 584 4 17 0 21
12 Mendhagang CPS SU 7 10 26 22 43 14 32 1 16 29 12 24 14 26 15 27 0 0 0 0 0 0 0 0 0 0 0 0 104 103 207 1 8 0 9
13 Goenshari CPS SR 7 11 25 9 24 10 17 1 13 24 13 22 10 19 4 8 0 0 0 0 0 0 0 0 0 0 0 0 69 70 139 2 5 0 7
14 Laptsakha CPS SR 7 7 26 10 21 15 29 1 13 24 13 27 15 29 9 25 0 0 0 0 0 0 0 0 0 0 0 0 99 82 181 2 6 0 8
15 Nobgang CPS SR 7 5 12 3 10 4 9 1 5 11 5 7 5 7 6 11 0 0 0 0 0 0 0 0 0 0 0 0 34 33 67 1 4 0 5
16 Tahogang CPS SR 7 11 15 5 11 4 8 1 7 11 5 10 6 9 9 9 0 0 0 0 0 0 0 0 0 0 0 0 26 47 73 1 3 0 4
17 Phulusu CPS SR 4 7 14 0 4 3 10 1 5 9 0 0 0 0 0 0 0 0 0 0 0 0 0 0 0 0 0 0 22 15 37 0 2 0 2
18 Lakhu CPS SR 5 14 30 11 21 6 10 1 7 12 4 12 0 0 0 0 0 0 0 0 0 0 0 0 0 0 0 0 43 42 85 0 4 0 4
19 Wolathang CPS R 7 13 22 7 21 5 12 1 8 15 5 7 0 7 5 11 0 0 0 0 0 0 0 0 0 0 0 0 52 43 95 1 4 0 5
20 Nawakha CPS R 5 8 19 13 20 14 23 1 10 21 7 16 0 0 0 0 0 0 0 0 0 0 0 0 0 0 0 0 47 52 99 1 4 0 5
Total 223 299 640 343 682 324 613 22 324 604 317 614 307 543 269 474 302 511 308 533 213 406 240 436 90 211 76 178 3033 3412 6445 56 205 26 287 23
1Ugyen Academy (Pvt)
HSS U 25 0 0 0 0 0 0 0 0 0 0 0 0 0 0 0 6 12 7 16 9 33 14 37 156 316 242 455 435 434 869 7 23 8 38 23
Total 25 0 0 0 0 0 0 0 0 0 0 0 0 0 0 0 6 12 7 16 9 33 14 37 156 316 242 455 435 434 869 7 23 8 38 23
G.Total 248 299 640 343 682 324 613 22 324 604 317 614 307 543 269 474 308 523 315 549 222 439 254 473 246 527 318 633 3468 3846 7314 63 228 34 325 23
11 S/Jongkhar
1 Samdrupjongkhar MSS U 20 0 0 0 0 0 0 0 0 0 53 104 50 98 56 113 65 105 57 107 27 72 27 65 0 0 0 0 329 335 664 4 14 9 27
2 Garpawoong MSS MSS U 9 0 0 0 0 0 0 0 0 0 0 0 0 0 0 0 46 78 44 66 37 90 27 55 0 0 0 0 135 154 289 2 10 6 18
3 Phuntshothang MSS SR 22 63 120 42 93 70 149 3 40 98 43 107 56 98 48 96 61 112 43 100 26 63 16 44 0 0 0 0 572 508 1080 3 20 3 26
4 Martshalla MSS R 8 0 0 0 0 0 0 0 0 0 0 0 0 0 0 0 28 84 26 63 29 70 11 54 0 0 0 0 177 94 271 2 8 0 10
5 Orong MSS R 13 0 0 0 0 0 0 0 0 0 0 0 0 0 0 0 0 0 0 0 97 243 70 195 0 0 0 0 271 167 438 3 10 3 16
6 Jomotshangkha LSS SU 15 39 77 26 48 24 62 2 31 63 26 46 26 54 22 53 36 60 17 33 0 0 0 0 0 0 0 0 249 247 496 2 10 4 16
7 Pemathang LSS R 11 27 53 19 37 28 49 1 30 59 28 60 41 69 14 41 20 39 15 31 0 0 0 0 0 0 0 0 216 222 438 2 7 0 9
8 Gomdar LSS R 11 18 40 21 39 19 44 1 24 48 20 42 20 43 20 43 35 69 32 63 0 0 0 0 0 0 0 0 222 209 431 2 8 2 12
9 Minjiwoong LSS R 12 0 0 4 14 7 17 1 9 16 11 19 8 14 7 15 67 125 46 89 0 0 0 0 0 0 0 0 150 159 309 2 6 1 9
10 Orong LSS R 12 19 27 19 42 21 33 1 26 48 26 53 18 49 32 59 42 84 47 93 0 0 0 0 0 0 0 0 238 250 488 2 9 3 14
11 Samdrupjongkhar PS U 15 46 103 71 131 68 134 4 64 134 0 0 0 0 0 0 0 0 0 0 0 0 0 0 0 0 0 0 253 249 502 1 18 0 19
12 Deothang PS U 18 68 125 44 105 35 82 2 38 86 54 88 49 93 54 100 0 0 0 0 0 0 0 0 0 0 0 0 337 342 679 3 17 2 22
13 Yarphu PS R 7 7 12 8 17 9 19 1 9 17 14 34 11 23 15 27 0 0 0 0 0 0 0 0 0 0 0 0 76 73 149 0 5 0 5
14 Martshala PS R 7 19 44 29 49 23 47 1 20 53 23 51 21 47 22 44 0 0 0 0 0 0 0 0 0 0 0 0 178 157 335 1 6 0 7
15 Lauri PS VR 1 16 38 24 49 35 73 0 24 50 26 47 18 45 27 48 0 0 0 0 0 0 0 0 0 0 0 0 180 170 350 0 9 0 9
16 Rikhey CPS SU 7 12 22 14 27 11 27 1 8 24 13 29 13 21 8 21 0 0 0 0 0 0 0 0 0 0 0 0 92 79 171 1 7 0 8
17 Wooling CPS SR 7 11 22 6 16 20 44 1 18 34 22 50 19 45 14 30 0 0 0 0 0 0 0 0 0 0 0 0 131 110 241 1 4 0 5
18 Barzor CPS R 5 11 20 13 26 9 31 1 19 43 10 26 0 0 0 0 0 0 0 0 0 0 0 0 0 0 0 0 84 62 146 0 3 0 3
19 Wangphu CPS R 5 34 64 22 37 3 9 1 5 9 0 0 0 0 0 0 0 0 0 0 0 0 0 0 0 0 0 0 55 64 119 0 3 0 3
20 Zamtari CPS VR 7 5 14 3 6 7 17 1 15 22 19 36 8 16 6 10 0 0 0 0 0 0 0 0 0 0 0 0 58 63 121 1 2 0 3
21 Monmola CPS VR 7 8 24 13 23 14 34 1 12 22 13 21 16 38 16 30 0 0 0 0 0 0 0 0 0 0 0 0 100 92 192 1 5 0 6
22 Tshotsalo CPS VR 7 3 8 1 7 8 14 1 7 12 3 6 7 13 3 7 0 0 0 0 0 0 0 0 0 0 0 0 35 32 67 0 2 0 2

135
AnnEXuRE
School LevelTypeType
Sec.PP I II III IV V VI VII VIII IX X XI XII Total Bht
NBht Total T:PG T G T G T S G T G T G T G T G T G T G T G T G T G T B G T ZLT Oth.
9 Thinleygang PS SU 9 14 31 14 36 15 31 1 24 41 24 60 21 38 27 55 0 0 0 0 0 0 0 0 0 0 0 0 153 139 292 3 9 0 12
10 Tshochasa PS SR 7 6 13 10 21 9 20 1 8 15 6 15 8 12 9 14 0 0 0 0 0 0 0 0 0 0 0 0 54 56 110 2 6 0 8
11 Logodama PS SR 18 37 86 57 103 36 70 2 50 91 51 91 43 72 38 71 0 0 0 0 0 0 0 0 0 0 0 0 272 312 584 4 17 0 21
12 Mendhagang CPS SU 7 10 26 22 43 14 32 1 16 29 12 24 14 26 15 27 0 0 0 0 0 0 0 0 0 0 0 0 104 103 207 1 8 0 9
13 Goenshari CPS SR 7 11 25 9 24 10 17 1 13 24 13 22 10 19 4 8 0 0 0 0 0 0 0 0 0 0 0 0 69 70 139 2 5 0 7
14 Laptsakha CPS SR 7 7 26 10 21 15 29 1 13 24 13 27 15 29 9 25 0 0 0 0 0 0 0 0 0 0 0 0 99 82 181 2 6 0 8
15 Nobgang CPS SR 7 5 12 3 10 4 9 1 5 11 5 7 5 7 6 11 0 0 0 0 0 0 0 0 0 0 0 0 34 33 67 1 4 0 5
16 Tahogang CPS SR 7 11 15 5 11 4 8 1 7 11 5 10 6 9 9 9 0 0 0 0 0 0 0 0 0 0 0 0 26 47 73 1 3 0 4
17 Phulusu CPS SR 4 7 14 0 4 3 10 1 5 9 0 0 0 0 0 0 0 0 0 0 0 0 0 0 0 0 0 0 22 15 37 0 2 0 2
18 Lakhu CPS SR 5 14 30 11 21 6 10 1 7 12 4 12 0 0 0 0 0 0 0 0 0 0 0 0 0 0 0 0 43 42 85 0 4 0 4
19 Wolathang CPS R 7 13 22 7 21 5 12 1 8 15 5 7 0 7 5 11 0 0 0 0 0 0 0 0 0 0 0 0 52 43 95 1 4 0 5
20 Nawakha CPS R 5 8 19 13 20 14 23 1 10 21 7 16 0 0 0 0 0 0 0 0 0 0 0 0 0 0 0 0 47 52 99 1 4 0 5
Total 223 299 640 343 682 324 613 22 324 604 317 614 307 543 269 474 302 511 308 533 213 406 240 436 90 211 76 178 3033 3412 6445 56 205 26 287 23
1Ugyen Academy (Pvt)
HSS U 25 0 0 0 0 0 0 0 0 0 0 0 0 0 0 0 6 12 7 16 9 33 14 37 156 316 242 455 435 434 869 7 23 8 38 23
Total 25 0 0 0 0 0 0 0 0 0 0 0 0 0 0 0 6 12 7 16 9 33 14 37 156 316 242 455 435 434 869 7 23 8 38 23
G.Total 248 299 640 343 682 324 613 22 324 604 317 614 307 543 269 474 308 523 315 549 222 439 254 473 246 527 318 633 3468 3846 7314 63 228 34 325 23
11 S/Jongkhar
1 Samdrupjongkhar MSS U 20 0 0 0 0 0 0 0 0 0 53 104 50 98 56 113 65 105 57 107 27 72 27 65 0 0 0 0 329 335 664 4 14 9 27
2 Garpawoong MSS MSS U 9 0 0 0 0 0 0 0 0 0 0 0 0 0 0 0 46 78 44 66 37 90 27 55 0 0 0 0 135 154 289 2 10 6 18
3 Phuntshothang MSS SR 22 63 120 42 93 70 149 3 40 98 43 107 56 98 48 96 61 112 43 100 26 63 16 44 0 0 0 0 572 508 1080 3 20 3 26
4 Martshalla MSS R 8 0 0 0 0 0 0 0 0 0 0 0 0 0 0 0 28 84 26 63 29 70 11 54 0 0 0 0 177 94 271 2 8 0 10
5 Orong MSS R 13 0 0 0 0 0 0 0 0 0 0 0 0 0 0 0 0 0 0 0 97 243 70 195 0 0 0 0 271 167 438 3 10 3 16
6 Jomotshangkha LSS SU 15 39 77 26 48 24 62 2 31 63 26 46 26 54 22 53 36 60 17 33 0 0 0 0 0 0 0 0 249 247 496 2 10 4 16
7 Pemathang LSS R 11 27 53 19 37 28 49 1 30 59 28 60 41 69 14 41 20 39 15 31 0 0 0 0 0 0 0 0 216 222 438 2 7 0 9
8 Gomdar LSS R 11 18 40 21 39 19 44 1 24 48 20 42 20 43 20 43 35 69 32 63 0 0 0 0 0 0 0 0 222 209 431 2 8 2 12
9 Minjiwoong LSS R 12 0 0 4 14 7 17 1 9 16 11 19 8 14 7 15 67 125 46 89 0 0 0 0 0 0 0 0 150 159 309 2 6 1 9
10 Orong LSS R 12 19 27 19 42 21 33 1 26 48 26 53 18 49 32 59 42 84 47 93 0 0 0 0 0 0 0 0 238 250 488 2 9 3 14
11 Samdrupjongkhar PS U 15 46 103 71 131 68 134 4 64 134 0 0 0 0 0 0 0 0 0 0 0 0 0 0 0 0 0 0 253 249 502 1 18 0 19
12 Deothang PS U 18 68 125 44 105 35 82 2 38 86 54 88 49 93 54 100 0 0 0 0 0 0 0 0 0 0 0 0 337 342 679 3 17 2 22
13 Yarphu PS R 7 7 12 8 17 9 19 1 9 17 14 34 11 23 15 27 0 0 0 0 0 0 0 0 0 0 0 0 76 73 149 0 5 0 5
14 Martshala PS R 7 19 44 29 49 23 47 1 20 53 23 51 21 47 22 44 0 0 0 0 0 0 0 0 0 0 0 0 178 157 335 1 6 0 7
15 Lauri PS VR 1 16 38 24 49 35 73 0 24 50 26 47 18 45 27 48 0 0 0 0 0 0 0 0 0 0 0 0 180 170 350 0 9 0 9
16 Rikhey CPS SU 7 12 22 14 27 11 27 1 8 24 13 29 13 21 8 21 0 0 0 0 0 0 0 0 0 0 0 0 92 79 171 1 7 0 8
17 Wooling CPS SR 7 11 22 6 16 20 44 1 18 34 22 50 19 45 14 30 0 0 0 0 0 0 0 0 0 0 0 0 131 110 241 1 4 0 5
18 Barzor CPS R 5 11 20 13 26 9 31 1 19 43 10 26 0 0 0 0 0 0 0 0 0 0 0 0 0 0 0 0 84 62 146 0 3 0 3
19 Wangphu CPS R 5 34 64 22 37 3 9 1 5 9 0 0 0 0 0 0 0 0 0 0 0 0 0 0 0 0 0 0 55 64 119 0 3 0 3
20 Zamtari CPS VR 7 5 14 3 6 7 17 1 15 22 19 36 8 16 6 10 0 0 0 0 0 0 0 0 0 0 0 0 58 63 121 1 2 0 3
21 Monmola CPS VR 7 8 24 13 23 14 34 1 12 22 13 21 16 38 16 30 0 0 0 0 0 0 0 0 0 0 0 0 100 92 192 1 5 0 6
22 Tshotsalo CPS VR 7 3 8 1 7 8 14 1 7 12 3 6 7 13 3 7 0 0 0 0 0 0 0 0 0 0 0 0 35 32 67 0 2 0 2

136
AnnEXuRE
23 Zangthey CPS VR 7 5 5 16 24 15 22 1 11 22 6 18 26 34 18 31 0 0 0 0 0 0 0 0 0 0 0 0 59 97 156 1 5 0 6
24 Dungmanma CPS VR 6 9 22 5 11 10 20 1 11 26 0 0 8 14 5 13 0 0 0 0 0 0 0 0 0 0 0 0 58 48 106 1 2 0 3
School LevelTypeType
Sec.PP I II III IV V VI VII VIII IX X XI XII Total Bht
NBht Total T:PG T G T G T S G T G T G T G T G T G T G T G T G T G T B G T ZLT Oth.
25 Sarjung CPS VR 7 9 32 16 28 10 23 1 3 14 4 17 8 13 6 13 0 0 0 0 0 0 0 0 0 0 0 0 84 56 140 1 4 0 5
26 Dechen Pvt. U 7 39 84 5 15 5 11 1 5 10 0 0 0 0 0 0 0 0 0 0 0 0 0 0 0 0 0 0 66 54 120 2 4 2 8
Total 253 468 956 421 844 451 961 28 429 910 414 854 423 827 393 794 400 756 327 645 216 538 151 413 0 0 0 0 4405 4093 8498 38 198 35 271 31
1 Philuma (Orong LSS) ECR R 1 13 25 0 0 0 0 0 0 0 0 0 0 0 0 0 0 0 0 0 0 0 0 0 0 0 0 0 12 13 25 1 0 0 1
2 Nainital (Pemathang ECR R 2 11 19 4 10 0 0 0 0 0 0 0 0 0 0 0 0 0 0 0 0 0 0 0 0 0 0 0 14 15 29 0 1 0 1
Total 3 24 44 4 10 0 0 0 0 0 0 0 0 0 0 0 0 0 0 0 0 0 0 0 0 0 0 0 26 28 54 1 1 0 2 27
G.Total 256 492 1000 425 854 451 961 28 429 910 414 854 423 827 393 794 400 756 327 645 216 538 151 413 0 0 0 0 4431 4121 8552 39 199 35 273 31
12 Samtse
1 Samtse HSS U 19 0 0 0 0 0 0 0 0 0 0 0 0 0 0 0 0 0 103 203 88 171 64 141 33 64 38 79 332 326 658 4 14 11 29
2 Gomtu MSS U 40 101 201 119 223 115 225 4 94 202 82 193 79 165 71 160 72 130 64 128 39 85 31 68 0 0 0 0 913 867 1780 8 26 14 48
3 Peljorling MSS SU 41 77 174 60 127 82 186 4 96 204 95 209 120 219 73 143 92 191 80 146 70 131 38 79 0 0 0 0 926 883 1809 8 43 5 56
4Yoeseltse(Ghumauney)
MSS SU 29 47 87 46 89 54 106 3 48 106 51 104 50 94 56 100 52 104 34 96 37 91 27 64 0 0 0 0 539 502 1041 7 24 6 37 28
5 Tendu MSS SU 33 49 107 87 174 88 180 4 65 148 68 146 74 172 40 90 63 132 51 95 46 83 25 57 0 0 0 0 728 656 1384 7 24 4 35
6 Dorokha MSS R 24 30 52 30 57 35 68 2 34 70 30 62 60 104 61 108 73 162 59 143 36 91 34 107 0 0 0 0 542 482 1024 2 19 0 21
7 Samtse LSS U 35 92 178 101 191 68 132 3 81 172 75 143 74 149 68 124 131 271 0 0 0 0 0 0 0 0 0 0 670 690 1360 4 42 2 48
8 Chengmari PS SU 17 36 82 38 74 36 71 2 45 90 52 109 44 86 23 62 0 0 0 0 0 0 0 0 0 0 0 0 300 274 574 2 23 0 25
9 Denchukha PS VR 10 18 43 19 32 20 38 1 26 61 25 54 25 58 25 49 0 0 0 0 0 0 0 0 0 0 0 0 177 158 335 2 8 0 10
10 Sengdhyen PS VR 12 34 67 25 47 26 60 2 29 62 16 53 29 92 14 36 0 0 0 0 0 0 0 0 0 0 0 0 244 173 417 1 8 0 9
11 Mechetar CPS U 11 25 42 34 64 32 63 2 19 41 23 47 26 58 31 63 0 0 0 0 0 0 0 0 0 0 0 0 188 190 378 1 15 0 16
12 Chargharey CPS SU 13 34 83 42 75 16 42 1 39 77 21 60 26 68 25 52 0 0 0 0 0 0 0 0 0 0 0 0 254 203 457 0 12 0 12
13 Ugentse (Nainital) CPS SU 8 20 38 30 68 11 31 1 29 67 15 37 21 48 15 31 0 0 0 0 0 0 0 0 0 0 0 0 179 141 320 1 8 0 9
14 Bara CPS SR 13 53 114 29 53 57 102 2 31 68 26 66 30 65 22 28 0 0 0 0 0 0 0 0 0 0 0 0 248 248 496 3 9 0 12
15 Namgaycholing CPS SR 10 38 76 42 88 75 164 4 23 50 0 0 0 0 0 0 0 0 0 0 0 0 0 0 0 0 0 0 200 178 378 2 9 0 11
16 Phensum CPS SR 2 31 62 0 0 0 0 0 0 0 0 0 0 0 0 0 0 0 0 0 0 0 0 0 0 0 0 0 31 31 62 1 2 0 3
17 Panbari CPS R 7 40 81 64 139 0 0 0 0 0 0 0 0 0 0 0 0 0 0 0 0 0 0 0 0 0 0 0 116 104 220 1 7 0 8
18 Mindruling CPS VR 7 17 45 18 44 27 49 1 28 50 16 36 14 34 22 39 0 0 0 0 0 0 0 0 0 0 0 0 155 142 297 1 5 0 6
19 Taba Dramtoe CPS VR 8 23 48 25 45 28 59 2 42 102 10 30 0 0 0 0 0 0 0 0 0 0 0 0 0 0 0 0 156 128 284 2 7 0 9
Total 339 765 1580 809 1590 770 1576 38 729 1570 605 1349 672 1412 546 1085 483 990 391 811 316 652 219 516 33 64 38 79 6898 6376 13274 57 305 42 404 33
1 Jaringay (Mindruling ECR VR 2 10 26 10 20 0 0 0 0 0 0 0 0 0 0 0 0 0 0 0 0 0 0 0 0 0 0 0 26 20 46 0 1 0 1
2 Pungtha (Denchukha ECR VR 2 0 7 13 22 0 0 0 0 0 0 0 0 0 0 0 0 0 0 0 0 0 0 0 0 0 0 0 16 13 29 0 0 0 0
3 Baseni (Denchukha ECR VR 2 11 14 25 43 0 0 0 0 0 0 0 0 0 0 0 0 0 0 0 0 0 0 0 0 0 0 0 21 36 57 0 0 0 0
4 Dzongsar (Tendu ECR SU 1 21 44 0 0 0 0 0 0 0 0 0 0 0 0 0 0 0 0 0 0 0 0 0 0 0 0 0 23 21 44 0 0 0 0
5 Nangladang (Cheng- ECR SU 1 16 26 0 0 0 0 0 0 0 0 0 0 0 0 0 0 0 0 0 0 0 0 0 0 0 0 0 10 16 26 0 1 0 1
6 Kirney (Chengmari ECR SU 1 14 33 0 0 0 0 0 0 0 0 0 0 0 0 0 0 0 0 0 0 0 0 0 0 0 0 0 19 14 33 0 1 0 1
7 Malbasey (Samtse ECR U 1 12 30 0 0 0 0 0 0 0 0 0 0 0 0 0 0 0 0 0 0 0 0 0 0 0 0 0 18 12 30 0 1 0 1
8 Sanglung (Sengdhyen ECR VR 1 14 27 0 0 0 0 0 0 0 0 0 0 0 0 0 0 0 0 0 0 0 0 0 0 0 0 0 13 14 27 0 0 0 0
9 Dumshidara (Gomtu ECR U 1 21 42 0 0 0 0 0 0 0 0 0 0 0 0 0 0 0 0 0 0 0 0 0 0 0 0 0 21 21 42 0 0 0 0
10 Tading (Taba Dramtoe ECR VR 1 9 21 0 0 0 0 0 0 0 0 0 0 0 0 0 0 0 0 0 0 0 0 0 0 0 0 0 12 9 21 0 0 0 0

137
AnnEXuRE
23 Zangthey CPS VR 7 5 5 16 24 15 22 1 11 22 6 18 26 34 18 31 0 0 0 0 0 0 0 0 0 0 0 0 59 97 156 1 5 0 6
24 Dungmanma CPS VR 6 9 22 5 11 10 20 1 11 26 0 0 8 14 5 13 0 0 0 0 0 0 0 0 0 0 0 0 58 48 106 1 2 0 3
School LevelTypeType
Sec.PP I II III IV V VI VII VIII IX X XI XII Total Bht
NBht Total T:PG T G T G T S G T G T G T G T G T G T G T G T G T G T B G T ZLT Oth.
25 Sarjung CPS VR 7 9 32 16 28 10 23 1 3 14 4 17 8 13 6 13 0 0 0 0 0 0 0 0 0 0 0 0 84 56 140 1 4 0 5
26 Dechen Pvt. U 7 39 84 5 15 5 11 1 5 10 0 0 0 0 0 0 0 0 0 0 0 0 0 0 0 0 0 0 66 54 120 2 4 2 8
Total 253 468 956 421 844 451 961 28 429 910 414 854 423 827 393 794 400 756 327 645 216 538 151 413 0 0 0 0 4405 4093 8498 38 198 35 271 31
1 Philuma (Orong LSS) ECR R 1 13 25 0 0 0 0 0 0 0 0 0 0 0 0 0 0 0 0 0 0 0 0 0 0 0 0 0 12 13 25 1 0 0 1
2 Nainital (Pemathang ECR R 2 11 19 4 10 0 0 0 0 0 0 0 0 0 0 0 0 0 0 0 0 0 0 0 0 0 0 0 14 15 29 0 1 0 1
Total 3 24 44 4 10 0 0 0 0 0 0 0 0 0 0 0 0 0 0 0 0 0 0 0 0 0 0 0 26 28 54 1 1 0 2 27
G.Total 256 492 1000 425 854 451 961 28 429 910 414 854 423 827 393 794 400 756 327 645 216 538 151 413 0 0 0 0 4431 4121 8552 39 199 35 273 31
12 Samtse
1 Samtse HSS U 19 0 0 0 0 0 0 0 0 0 0 0 0 0 0 0 0 0 103 203 88 171 64 141 33 64 38 79 332 326 658 4 14 11 29
2 Gomtu MSS U 40 101 201 119 223 115 225 4 94 202 82 193 79 165 71 160 72 130 64 128 39 85 31 68 0 0 0 0 913 867 1780 8 26 14 48
3 Peljorling MSS SU 41 77 174 60 127 82 186 4 96 204 95 209 120 219 73 143 92 191 80 146 70 131 38 79 0 0 0 0 926 883 1809 8 43 5 56
4Yoeseltse(Ghumauney)
MSS SU 29 47 87 46 89 54 106 3 48 106 51 104 50 94 56 100 52 104 34 96 37 91 27 64 0 0 0 0 539 502 1041 7 24 6 37 28
5 Tendu MSS SU 33 49 107 87 174 88 180 4 65 148 68 146 74 172 40 90 63 132 51 95 46 83 25 57 0 0 0 0 728 656 1384 7 24 4 35
6 Dorokha MSS R 24 30 52 30 57 35 68 2 34 70 30 62 60 104 61 108 73 162 59 143 36 91 34 107 0 0 0 0 542 482 1024 2 19 0 21
7 Samtse LSS U 35 92 178 101 191 68 132 3 81 172 75 143 74 149 68 124 131 271 0 0 0 0 0 0 0 0 0 0 670 690 1360 4 42 2 48
8 Chengmari PS SU 17 36 82 38 74 36 71 2 45 90 52 109 44 86 23 62 0 0 0 0 0 0 0 0 0 0 0 0 300 274 574 2 23 0 25
9 Denchukha PS VR 10 18 43 19 32 20 38 1 26 61 25 54 25 58 25 49 0 0 0 0 0 0 0 0 0 0 0 0 177 158 335 2 8 0 10
10 Sengdhyen PS VR 12 34 67 25 47 26 60 2 29 62 16 53 29 92 14 36 0 0 0 0 0 0 0 0 0 0 0 0 244 173 417 1 8 0 9
11 Mechetar CPS U 11 25 42 34 64 32 63 2 19 41 23 47 26 58 31 63 0 0 0 0 0 0 0 0 0 0 0 0 188 190 378 1 15 0 16
12 Chargharey CPS SU 13 34 83 42 75 16 42 1 39 77 21 60 26 68 25 52 0 0 0 0 0 0 0 0 0 0 0 0 254 203 457 0 12 0 12
13 Ugentse (Nainital) CPS SU 8 20 38 30 68 11 31 1 29 67 15 37 21 48 15 31 0 0 0 0 0 0 0 0 0 0 0 0 179 141 320 1 8 0 9
14 Bara CPS SR 13 53 114 29 53 57 102 2 31 68 26 66 30 65 22 28 0 0 0 0 0 0 0 0 0 0 0 0 248 248 496 3 9 0 12
15 Namgaycholing CPS SR 10 38 76 42 88 75 164 4 23 50 0 0 0 0 0 0 0 0 0 0 0 0 0 0 0 0 0 0 200 178 378 2 9 0 11
16 Phensum CPS SR 2 31 62 0 0 0 0 0 0 0 0 0 0 0 0 0 0 0 0 0 0 0 0 0 0 0 0 0 31 31 62 1 2 0 3
17 Panbari CPS R 7 40 81 64 139 0 0 0 0 0 0 0 0 0 0 0 0 0 0 0 0 0 0 0 0 0 0 0 116 104 220 1 7 0 8
18 Mindruling CPS VR 7 17 45 18 44 27 49 1 28 50 16 36 14 34 22 39 0 0 0 0 0 0 0 0 0 0 0 0 155 142 297 1 5 0 6
19 Taba Dramtoe CPS VR 8 23 48 25 45 28 59 2 42 102 10 30 0 0 0 0 0 0 0 0 0 0 0 0 0 0 0 0 156 128 284 2 7 0 9
Total 339 765 1580 809 1590 770 1576 38 729 1570 605 1349 672 1412 546 1085 483 990 391 811 316 652 219 516 33 64 38 79 6898 6376 13274 57 305 42 404 33
1 Jaringay (Mindruling ECR VR 2 10 26 10 20 0 0 0 0 0 0 0 0 0 0 0 0 0 0 0 0 0 0 0 0 0 0 0 26 20 46 0 1 0 1
2 Pungtha (Denchukha ECR VR 2 0 7 13 22 0 0 0 0 0 0 0 0 0 0 0 0 0 0 0 0 0 0 0 0 0 0 0 16 13 29 0 0 0 0
3 Baseni (Denchukha ECR VR 2 11 14 25 43 0 0 0 0 0 0 0 0 0 0 0 0 0 0 0 0 0 0 0 0 0 0 0 21 36 57 0 0 0 0
4 Dzongsar (Tendu ECR SU 1 21 44 0 0 0 0 0 0 0 0 0 0 0 0 0 0 0 0 0 0 0 0 0 0 0 0 0 23 21 44 0 0 0 0
5 Nangladang (Cheng- ECR SU 1 16 26 0 0 0 0 0 0 0 0 0 0 0 0 0 0 0 0 0 0 0 0 0 0 0 0 0 10 16 26 0 1 0 1
6 Kirney (Chengmari ECR SU 1 14 33 0 0 0 0 0 0 0 0 0 0 0 0 0 0 0 0 0 0 0 0 0 0 0 0 0 19 14 33 0 1 0 1
7 Malbasey (Samtse ECR U 1 12 30 0 0 0 0 0 0 0 0 0 0 0 0 0 0 0 0 0 0 0 0 0 0 0 0 0 18 12 30 0 1 0 1
8 Sanglung (Sengdhyen ECR VR 1 14 27 0 0 0 0 0 0 0 0 0 0 0 0 0 0 0 0 0 0 0 0 0 0 0 0 0 13 14 27 0 0 0 0
9 Dumshidara (Gomtu ECR U 1 21 42 0 0 0 0 0 0 0 0 0 0 0 0 0 0 0 0 0 0 0 0 0 0 0 0 0 21 21 42 0 0 0 0
10 Tading (Taba Dramtoe ECR VR 1 9 21 0 0 0 0 0 0 0 0 0 0 0 0 0 0 0 0 0 0 0 0 0 0 0 0 0 12 9 21 0 0 0 0

138
AnnEXuRE
11 Garigaon ( Taba ECR VR 1 17 34 0 0 0 0 0 0 0 0 0 0 0 0 0 0 0 0 0 0 0 0 0 0 0 0 0 17 17 34 0 0 0 0
12 Jumsa (Tendu MSS) ECR SU 1 21 44 0 0 0 0 0 0 0 0 0 0 0 0 0 0 0 0 0 0 0 0 0 0 0 0 0 23 21 44 0 0 0 0
School LevelTypeType
Sec.PP I II III IV V VI VII VIII IX X XI XII Total Bht
NBht Total T:PG T G T G T S G T G T G T G T G T G T G T G T G T G T B G T ZLT Oth.
13 Lamitar (Gumauney ECR SU 1 12 21 0 0 0 0 0 0 0 0 0 0 0 0 0 0 0 0 0 0 0 0 0 0 0 0 0 9 12 21 0 1 0 1
Total 16 178 369 48 85 0 0 0 0 0 0 0 0 0 0 0 0 0 0 0 0 0 0 0 0 0 0 0 228 226 454 0 5 0 5 91
G.Total 355 943 1949 857 1675 770 1576 38 729 1570 605 1349 672 1412 546 1085 483 990 391 811 316 652 219 516 33 64 38 79 7126 6602 13728 57 310 42 409 34
13 Sarpang
1 Gelephu HSS U 12 0 0 0 0 0 0 0 0 0 0 0 0 0 0 0 0 0 0 0 98 191 85 167 49 82 21 66 253 253 506 4 19 9 32
2 Sarpang HSS U 19 0 0 0 0 0 0 0 0 0 0 0 0 0 0 0 0 0 0 0 104 220 81 178 44 111 13 45 312 242 554 5 18 12 35
3 Peltrithang MSS U 36 65 132 85 172 72 142 3 71 147 70 169 77 142 68 135 71 150 86 138 45 107 29 59 0 0 0 0 754 739 1493 9 39 2 50
4 Norbuling MSS SR 26 22 36 22 43 20 43 1 28 50 31 56 20 43 35 62 104 191 92 196 73 162 26 84 0 0 0 0 493 473 966 4 26 1 31
5 Gelephu LSS U 42 98 195 118 216 103 195 4 91 185 101 193 116 227 114 214 107 194 124 224 0 0 0 0 0 0 0 0 871 972 1843 8 40 6 54
6 Sarpang LSS U 30 102 179 69 143 60 118 3 82 153 60 144 83 142 61 116 69 120 50 109 0 0 0 0 0 0 0 0 588 636 1224 7 27 0 34
7 Dekiling LSS SU 13 22 50 25 51 30 55 1 26 62 35 69 28 75 35 72 22 52 19 43 0 0 0 0 0 0 0 0 287 242 529 2 15 0 17
8 Jigmiling LSS SU 10 25 46 27 59 22 45 1 26 52 27 51 29 53 31 51 21 43 20 37 0 0 0 0 0 0 0 0 209 228 437 1 11 0 12
9 Dechen Pelri (Jarwa) CPS SU 7 19 33 18 29 15 28 1 9 20 8 17 7 16 12 22 0 0 0 0 0 0 0 0 0 0 0 0 77 88 165 2 6 0 8
10 Serzhong CPS SU 7 14 34 14 30 17 35 1 19 34 10 25 12 39 16 32 0 0 0 0 0 0 0 0 0 0 0 0 127 102 229 1 7 0 8
11 Chuzagang CPS SR 8 18 30 29 63 29 48 1 26 56 18 42 36 52 18 33 0 0 0 0 0 0 0 0 0 0 0 0 150 174 324 1 9 0 10
12 Jigmecholing CPS SR 14 53 94 45 96 30 61 2 32 59 36 91 57 105 40 75 0 0 0 0 0 0 0 0 0 0 0 0 288 293 581 3 12 0 15
13 Umling CPS SR 9 15 35 20 46 17 48 1 22 59 29 55 25 57 27 50 0 0 0 0 0 0 0 0 0 0 0 0 195 155 350 1 10 0 11
14 Bhur CPS R 5 25 50 18 37 19 38 1 15 36 0 0 0 0 0 0 0 0 0 0 0 0 0 0 0 0 0 0 84 77 161 1 5 0 6
15 Lharing CPS R 4 16 36 19 37 14 33 1 14 32 0 0 0 0 0 0 0 0 0 0 0 0 0 0 0 0 0 0 75 63 138 0 3 0 3
16 Pangkhey CPS R 6 30 64 31 59 5 13 1 10 23 0 0 0 0 0 0 0 0 0 0 0 0 0 0 0 0 0 0 83 76 159 0 3 0 3
17 Maugaon CPS R 1 23 46 0 0 0 0 0 0 0 0 0 0 0 0 0 0 0 0 0 0 0 0 0 0 0 0 0 23 23 46 0 1 0 1
18 Gong CPS R 2 39 63 0 0 0 0 0 0 0 0 0 0 0 0 0 0 0 0 0 0 0 0 0 0 0 0 0 24 39 63 0 1 0 1
19 Retey CPS VR 7 4 10 4 6 4 8 1 6 16 6 8 4 8 2 7 0 0 0 0 0 0 0 0 0 0 0 0 33 30 63 0 3 0 3
Total 258 590 1133 544 1087 457 910 23 477 984 431 920 494 959 459 869 394 750 391 747 320 680 221 488 93 193 34 111 4926 4905 9831 49 255 30 334 29
18 Kuendrup (Pvt) HSS U 17 10 26 5 12 4 5 1 1 3 0 0 0 0 0 0 0 0 0 0 0 0 0 0 134 252 122 254 276 276 552 4 9 11 24
19 Samphel (Pvt) PS U 3 12 22 0 0 0 4 1 0 0 4 5 0 0 0 0 0 0 0 0 0 0 0 0 0 0 0 0 15 16 31 0 3 0 3
Total 20 22 48 5 12 4 9 2 1 3 4 5 0 0 0 0 0 0 0 0 0 0 0 0 134 252 122 254 291 292 583 4 12 11 27 22
1 Kharpaney (Lharing ECR R 1 12 22 0 0 0 0 0 0 0 0 0 0 0 0 0 0 0 0 0 0 0 0 0 0 0 0 0 10 12 22 0 1 0 1
Total 1 12 22 0 0 0 0 0 0 0 0 0 0 0 0 0 0 0 0 0 0 0 0 0 0 0 0 0 10 12 22 0 1 0 1 22
G.Total 279 624 1203 549 1099 461 919 25 478 987 435 925 494 959 459 869 394 750 391 747 320 680 221 488 227 445 156 365 5227 5209 10436 53 268 41 362 29
14 Thimphu
1 Yangchenphug HSS U 37 0 0 0 0 0 0 0 0 0 0 0 0 0 0 0 0 0 0 0 234 411 219 366 216 359 178 316 605 847 1452 9 25 28 62
2 Motithang HSS U 31 0 0 0 0 0 0 0 0 0 0 0 0 0 0 0 0 0 0 0 223 415 213 381 106 188 83 165 524 625 1149 8 35 18 61
3 Dechencholing MSS U 49 56 124 88 168 79 166 4 88 171 97 188 85 180 78 154 87 156 107 187 75 144 68 131 0 0 0 0 861 908 1769 12 54 10 76
4 Lungtenzampa MSS U 33 0 0 0 0 0 0 0 0 0 0 0 0 0 0 0 110 204 92 141 203 350 179 335 0 0 0 0 446 584 1030 6 32 13 51
5 Khasadrapchu MSS U 28 37 74 33 66 37 70 2 49 90 39 77 44 86 46 96 52 91 41 91 28 56 27 52 0 0 0 0 416 433 849 8 20 9 37
6 Babesa MSS U 14 0 0 0 0 0 0 0 0 0 0 0 0 0 0 0 55 102 34 64 74 171 55 136 0 0 0 0 255 218 473 4 15 4 23
7 Changangkha LSS U 26 16 40 42 85 35 56 1 39 86 75 129 52 105 58 112 122 227 93 166 0 0 0 0 0 0 0 0 474 532 1006 5 33 5 43

139
AnnEXuRE
11 Garigaon ( Taba ECR VR 1 17 34 0 0 0 0 0 0 0 0 0 0 0 0 0 0 0 0 0 0 0 0 0 0 0 0 0 17 17 34 0 0 0 0
12 Jumsa (Tendu MSS) ECR SU 1 21 44 0 0 0 0 0 0 0 0 0 0 0 0 0 0 0 0 0 0 0 0 0 0 0 0 0 23 21 44 0 0 0 0
School LevelTypeType
Sec.PP I II III IV V VI VII VIII IX X XI XII Total Bht
NBht Total T:PG T G T G T S G T G T G T G T G T G T G T G T G T G T B G T ZLT Oth.
13 Lamitar (Gumauney ECR SU 1 12 21 0 0 0 0 0 0 0 0 0 0 0 0 0 0 0 0 0 0 0 0 0 0 0 0 0 9 12 21 0 1 0 1
Total 16 178 369 48 85 0 0 0 0 0 0 0 0 0 0 0 0 0 0 0 0 0 0 0 0 0 0 0 228 226 454 0 5 0 5 91
G.Total 355 943 1949 857 1675 770 1576 38 729 1570 605 1349 672 1412 546 1085 483 990 391 811 316 652 219 516 33 64 38 79 7126 6602 13728 57 310 42 409 34
13 Sarpang
1 Gelephu HSS U 12 0 0 0 0 0 0 0 0 0 0 0 0 0 0 0 0 0 0 0 98 191 85 167 49 82 21 66 253 253 506 4 19 9 32
2 Sarpang HSS U 19 0 0 0 0 0 0 0 0 0 0 0 0 0 0 0 0 0 0 0 104 220 81 178 44 111 13 45 312 242 554 5 18 12 35
3 Peltrithang MSS U 36 65 132 85 172 72 142 3 71 147 70 169 77 142 68 135 71 150 86 138 45 107 29 59 0 0 0 0 754 739 1493 9 39 2 50
4 Norbuling MSS SR 26 22 36 22 43 20 43 1 28 50 31 56 20 43 35 62 104 191 92 196 73 162 26 84 0 0 0 0 493 473 966 4 26 1 31
5 Gelephu LSS U 42 98 195 118 216 103 195 4 91 185 101 193 116 227 114 214 107 194 124 224 0 0 0 0 0 0 0 0 871 972 1843 8 40 6 54
6 Sarpang LSS U 30 102 179 69 143 60 118 3 82 153 60 144 83 142 61 116 69 120 50 109 0 0 0 0 0 0 0 0 588 636 1224 7 27 0 34
7 Dekiling LSS SU 13 22 50 25 51 30 55 1 26 62 35 69 28 75 35 72 22 52 19 43 0 0 0 0 0 0 0 0 287 242 529 2 15 0 17
8 Jigmiling LSS SU 10 25 46 27 59 22 45 1 26 52 27 51 29 53 31 51 21 43 20 37 0 0 0 0 0 0 0 0 209 228 437 1 11 0 12
9 Dechen Pelri (Jarwa) CPS SU 7 19 33 18 29 15 28 1 9 20 8 17 7 16 12 22 0 0 0 0 0 0 0 0 0 0 0 0 77 88 165 2 6 0 8
10 Serzhong CPS SU 7 14 34 14 30 17 35 1 19 34 10 25 12 39 16 32 0 0 0 0 0 0 0 0 0 0 0 0 127 102 229 1 7 0 8
11 Chuzagang CPS SR 8 18 30 29 63 29 48 1 26 56 18 42 36 52 18 33 0 0 0 0 0 0 0 0 0 0 0 0 150 174 324 1 9 0 10
12 Jigmecholing CPS SR 14 53 94 45 96 30 61 2 32 59 36 91 57 105 40 75 0 0 0 0 0 0 0 0 0 0 0 0 288 293 581 3 12 0 15
13 Umling CPS SR 9 15 35 20 46 17 48 1 22 59 29 55 25 57 27 50 0 0 0 0 0 0 0 0 0 0 0 0 195 155 350 1 10 0 11
14 Bhur CPS R 5 25 50 18 37 19 38 1 15 36 0 0 0 0 0 0 0 0 0 0 0 0 0 0 0 0 0 0 84 77 161 1 5 0 6
15 Lharing CPS R 4 16 36 19 37 14 33 1 14 32 0 0 0 0 0 0 0 0 0 0 0 0 0 0 0 0 0 0 75 63 138 0 3 0 3
16 Pangkhey CPS R 6 30 64 31 59 5 13 1 10 23 0 0 0 0 0 0 0 0 0 0 0 0 0 0 0 0 0 0 83 76 159 0 3 0 3
17 Maugaon CPS R 1 23 46 0 0 0 0 0 0 0 0 0 0 0 0 0 0 0 0 0 0 0 0 0 0 0 0 0 23 23 46 0 1 0 1
18 Gong CPS R 2 39 63 0 0 0 0 0 0 0 0 0 0 0 0 0 0 0 0 0 0 0 0 0 0 0 0 0 24 39 63 0 1 0 1
19 Retey CPS VR 7 4 10 4 6 4 8 1 6 16 6 8 4 8 2 7 0 0 0 0 0 0 0 0 0 0 0 0 33 30 63 0 3 0 3
Total 258 590 1133 544 1087 457 910 23 477 984 431 920 494 959 459 869 394 750 391 747 320 680 221 488 93 193 34 111 4926 4905 9831 49 255 30 334 29
18 Kuendrup (Pvt) HSS U 17 10 26 5 12 4 5 1 1 3 0 0 0 0 0 0 0 0 0 0 0 0 0 0 134 252 122 254 276 276 552 4 9 11 24
19 Samphel (Pvt) PS U 3 12 22 0 0 0 4 1 0 0 4 5 0 0 0 0 0 0 0 0 0 0 0 0 0 0 0 0 15 16 31 0 3 0 3
Total 20 22 48 5 12 4 9 2 1 3 4 5 0 0 0 0 0 0 0 0 0 0 0 0 134 252 122 254 291 292 583 4 12 11 27 22
1 Kharpaney (Lharing ECR R 1 12 22 0 0 0 0 0 0 0 0 0 0 0 0 0 0 0 0 0 0 0 0 0 0 0 0 0 10 12 22 0 1 0 1
Total 1 12 22 0 0 0 0 0 0 0 0 0 0 0 0 0 0 0 0 0 0 0 0 0 0 0 0 0 10 12 22 0 1 0 1 22
G.Total 279 624 1203 549 1099 461 919 25 478 987 435 925 494 959 459 869 394 750 391 747 320 680 221 488 227 445 156 365 5227 5209 10436 53 268 41 362 29
14 Thimphu
1 Yangchenphug HSS U 37 0 0 0 0 0 0 0 0 0 0 0 0 0 0 0 0 0 0 0 234 411 219 366 216 359 178 316 605 847 1452 9 25 28 62
2 Motithang HSS U 31 0 0 0 0 0 0 0 0 0 0 0 0 0 0 0 0 0 0 0 223 415 213 381 106 188 83 165 524 625 1149 8 35 18 61
3 Dechencholing MSS U 49 56 124 88 168 79 166 4 88 171 97 188 85 180 78 154 87 156 107 187 75 144 68 131 0 0 0 0 861 908 1769 12 54 10 76
4 Lungtenzampa MSS U 33 0 0 0 0 0 0 0 0 0 0 0 0 0 0 0 110 204 92 141 203 350 179 335 0 0 0 0 446 584 1030 6 32 13 51
5 Khasadrapchu MSS U 28 37 74 33 66 37 70 2 49 90 39 77 44 86 46 96 52 91 41 91 28 56 27 52 0 0 0 0 416 433 849 8 20 9 37
6 Babesa MSS U 14 0 0 0 0 0 0 0 0 0 0 0 0 0 0 0 55 102 34 64 74 171 55 136 0 0 0 0 255 218 473 4 15 4 23
7 Changangkha LSS U 26 16 40 42 85 35 56 1 39 86 75 129 52 105 58 112 122 227 93 166 0 0 0 0 0 0 0 0 474 532 1006 5 33 5 43

140
AnnEXuRE
8 Choden LSS U 8 0 0 0 0 0 0 0 0 0 0 0 0 0 0 0 74 134 65 131 0 0 0 0 0 0 0 0 126 139 265 2 9 2 13
9 Jigme Namgyel LSS U 34 66 121 60 121 57 100 3 60 135 53 124 56 109 72 125 106 184 127 240 0 0 0 0 0 0 0 0 602 657 1259 8 48 1 57
School LevelTypeType
Sec.PP I II III IV V VI VII VIII IX X XI XII Total Bht
NBht Total T:PG T G T G T S G T G T G T G T G T G T G T G T G T G T B G T ZLT Oth.
10 Zilukha LSS U 26 40 91 60 108 47 101 3 47 96 49 117 48 91 56 114 57 108 46 98 0 0 0 0 0 0 0 0 474 450 924 4 34 0 38
11 Changzamtog LSS U 31 51 92 43 105 48 103 2 56 130 88 169 68 152 60 128 146 275 153 280 0 0 0 0 0 0 0 0 721 713 1434 7 41 4 52
12 Loselling LSS U 19 23 60 55 119 63 117 2 61 106 56 96 66 109 47 90 40 92 67 123 0 0 0 0 0 0 0 0 434 478 912 5 32 2 39
13 Chang Rigphel LSS SU 17 38 77 45 111 37 77 2 35 72 34 78 35 68 21 59 33 67 0 0 0 0 0 0 0 0 0 0 331 278 609 3 21 0 24
14 Genekha LSS SR 10 12 23 12 25 11 24 1 18 30 18 43 18 33 23 36 31 56 13 33 0 0 0 0 0 0 0 0 147 156 303 3 11 1 15
15 Chamgang LSS SR 9 19 33 15 31 23 52 1 25 48 19 35 18 29 16 22 12 20 5 17 0 0 0 0 0 0 0 0 135 152 287 3 11 0 14
16 Jigme Losel PS U 21 58 109 62 120 67 118 3 73 140 39 99 76 131 60 108 0 0 0 0 0 0 0 0 0 0 0 0 390 435 825 5 27 0 32
17 Lungtenphu PS U 30 79 168 112 207 90 169 4 72 160 74 152 97 178 70 128 0 0 0 0 0 0 0 0 0 0 0 0 568 594 1162 6 31 1 38
18 Rinchen Kuenphen PS U 21 57 100 54 81 51 123 3 57 109 62 121 77 133 60 105 0 0 0 0 0 0 0 0 0 0 0 0 354 418 772 4 31 0 35
19 Changbangdu PS U 17 41 85 48 81 47 101 3 47 94 30 75 19 52 34 61 0 0 0 0 0 0 0 0 0 0 0 0 283 266 549 3 23 0 26
20 Zilnon Namgyeling PS U 19 38 64 39 77 52 108 2 76 143 50 118 52 101 43 101 0 0 0 0 0 0 0 0 0 0 0 0 362 350 712 4 32 0 36
21 Babesa PS U 22 61 120 65 119 75 150 4 63 120 55 110 59 119 49 97 0 0 0 0 0 0 0 0 0 0 0 0 408 427 835 7 21 1 29
22 Kuzshugchen CPS U 9 30 43 16 48 20 38 1 12 35 11 31 17 28 9 18 0 0 0 0 0 0 0 0 0 0 0 0 126 115 241 2 10 0 12
23 Hongtsho CPS U 7 14 31 12 30 13 27 1 16 27 13 28 14 25 6 17 0 0 0 0 0 0 0 0 0 0 0 0 97 88 185 1 7 0 8
24 Jemina CPS SU 5 12 37 16 45 17 41 1 15 22 12 23 0 0 0 0 0 0 0 0 0 0 0 0 0 0 0 0 96 72 168 2 5 0 7
25 Sisina CPS SU 7 21 35 16 27 18 32 1 10 18 6 17 11 19 4 10 0 0 0 0 0 0 0 0 0 0 0 0 72 86 158 1 8 0 9
26 Tshaluna CPS R 7 8 18 6 15 7 11 1 7 11 6 19 6 12 8 13 0 0 0 0 0 0 0 0 0 0 0 0 51 48 99 0 6 0 6
27 Lingzhi CPS D 7 6 14 6 8 3 6 1 6 9 1 8 2 4 2 3 0 0 0 0 0 0 0 0 0 0 0 0 26 26 52 1 3 0 4
Total 544 783 1559 905 1797 897 1790 46 932 1852 887 1857 920 1764 822 1597 925 1716 843 1571 837 1547 761 1401 322 547 261 481 9384 10095 19479 123 625 99 847 23
1 Rinchen (Pvt) HSS U 20 0 0 0 0 0 0 0 0 0 0 0 0 0 0 0 0 0 0 0 0 0 0 0 208 398 218 386 358 426 784 6 15 10 31
2 Nima (Pvt) HSS U 21 0 0 0 0 0 0 0 0 0 0 0 0 0 0 0 0 0 0 0 0 0 0 0 194 382 185 341 344 379 723 5 21 8 34
3 Kelki (Pvt) HSS U 20 0 0 0 0 0 0 0 0 0 0 0 0 0 0 0 0 0 0 0 0 0 0 0 195 377 203 353 332 398 730 6 14 13 33
Total 61 0 0 0 0 0 0 0 0 0 0 0 0 0 0 0 0 0 0 0 0 0 0 0 597 1157 606 1080 1034 1203 2237 17 50 31 98 23
1 Druk (Pvt) MSS U 15 14 25 23 54 21 54 2 28 52 28 51 8 25 15 34 14 37 9 18 5 13 0 0 0 0 0 0 198 165 363 4 18 5 27
Total 15 14 25 23 54 21 54 2 28 52 28 51 8 25 15 34 14 37 9 18 5 13 0 0 0 0 0 0 198 165 363 4 18 5 27 13
1 Dr. Tobgyel (Pvt) LSS U 19 23 50 27 48 33 72 3 27 54 36 67 16 40 26 36 15 40 11 23 0 0 0 0 0 0 0 0 216 214 430 5 21 4 30
Total 19 23 50 27 48 33 72 3 27 54 36 67 16 40 26 36 15 40 11 23 0 0 0 0 0 0 0 0 216 214 430 5 21 4 30 14
1 Sunshine (Pvt) PS U 8 27 50 20 47 16 29 1 13 19 6 17 11 15 14 23 0 0 0 0 0 0 0 0 0 0 0 0 93 107 200 2 10 1 13
2 Early Learning Centre PS U 19 36 69 32 60 37 61 3 22 53 20 47 18 38 21 35 0 0 0 0 0 0 0 0 0 0 0 0 177 186 363 6 17 4 27
3 Little Dragon (Pvt) PS U 13 39 75 27 45 11 23 2 17 27 10 21 7 10 5 8 0 0 0 0 0 0 0 0 0 0 0 0 93 116 209 3 14 0 17
4 Etho Metho (Rigsar) PS SU 15 88 176 20 41 7 26 1 7 16 3 6 1 4 4 6 0 0 0 0 0 0 0 0 0 0 0 0 145 130 275 3 13 2 18
5 Rigpey Jungney (Pvt) PS SU 3 6 18 3 6 1 2 1 0 0 0 0 0 0 0 0 0 0 0 0 0 0 0 0 0 0 0 0 16 10 26 1 2 0 3
6 Thimphu (Pvt) PS SU 10 20 42 22 40 18 36 2 25 39 7 20 12 21 0 0 0 0 0 0 0 0 0 0 0 0 0 0 94 104 198 1 11 4 16
7 Phuensum (Pvt) PS U 8 25 46 10 22 5 10 1 2 15 5 12 0 4 6 8 0 0 0 0 0 0 0 0 0 0 0 0 64 53 117 3 7 0 10
Total 76 241 476 134 261 95 187 11 86 169 51 123 49 92 50 80 0 0 0 0 0 0 0 0 0 0 0 0 682 706 1388 19 74 11 104 13
1 Yum Thuje Zam Char- CPS SU 4 21 56 2 8 0 0 0 0 0 0 0 0 0 0 0 0 0 0 0 0 0 0 0 0 0 0 0 41 23 64 1 6 0 7
Total 4 21 56 2 8 0 0 0 0 0 0 0 0 0 0 0 0 0 0 0 0 0 0 0 0 0 0 0 41 23 64 1 6 0 7 9
1 Soe ECR (Lingzhi ECR D 1 7 10 0 0 0 0 0 0 0 0 0 0 0 0 0 0 0 0 0 0 0 0 0 0 0 0 0 3 7 10 0 1 0 1

141
AnnEXuRE
8 Choden LSS U 8 0 0 0 0 0 0 0 0 0 0 0 0 0 0 0 74 134 65 131 0 0 0 0 0 0 0 0 126 139 265 2 9 2 13
9 Jigme Namgyel LSS U 34 66 121 60 121 57 100 3 60 135 53 124 56 109 72 125 106 184 127 240 0 0 0 0 0 0 0 0 602 657 1259 8 48 1 57
School LevelTypeType
Sec.PP I II III IV V VI VII VIII IX X XI XII Total Bht
NBht Total T:PG T G T G T S G T G T G T G T G T G T G T G T G T G T B G T ZLT Oth.
10 Zilukha LSS U 26 40 91 60 108 47 101 3 47 96 49 117 48 91 56 114 57 108 46 98 0 0 0 0 0 0 0 0 474 450 924 4 34 0 38
11 Changzamtog LSS U 31 51 92 43 105 48 103 2 56 130 88 169 68 152 60 128 146 275 153 280 0 0 0 0 0 0 0 0 721 713 1434 7 41 4 52
12 Loselling LSS U 19 23 60 55 119 63 117 2 61 106 56 96 66 109 47 90 40 92 67 123 0 0 0 0 0 0 0 0 434 478 912 5 32 2 39
13 Chang Rigphel LSS SU 17 38 77 45 111 37 77 2 35 72 34 78 35 68 21 59 33 67 0 0 0 0 0 0 0 0 0 0 331 278 609 3 21 0 24
14 Genekha LSS SR 10 12 23 12 25 11 24 1 18 30 18 43 18 33 23 36 31 56 13 33 0 0 0 0 0 0 0 0 147 156 303 3 11 1 15
15 Chamgang LSS SR 9 19 33 15 31 23 52 1 25 48 19 35 18 29 16 22 12 20 5 17 0 0 0 0 0 0 0 0 135 152 287 3 11 0 14
16 Jigme Losel PS U 21 58 109 62 120 67 118 3 73 140 39 99 76 131 60 108 0 0 0 0 0 0 0 0 0 0 0 0 390 435 825 5 27 0 32
17 Lungtenphu PS U 30 79 168 112 207 90 169 4 72 160 74 152 97 178 70 128 0 0 0 0 0 0 0 0 0 0 0 0 568 594 1162 6 31 1 38
18 Rinchen Kuenphen PS U 21 57 100 54 81 51 123 3 57 109 62 121 77 133 60 105 0 0 0 0 0 0 0 0 0 0 0 0 354 418 772 4 31 0 35
19 Changbangdu PS U 17 41 85 48 81 47 101 3 47 94 30 75 19 52 34 61 0 0 0 0 0 0 0 0 0 0 0 0 283 266 549 3 23 0 26
20 Zilnon Namgyeling PS U 19 38 64 39 77 52 108 2 76 143 50 118 52 101 43 101 0 0 0 0 0 0 0 0 0 0 0 0 362 350 712 4 32 0 36
21 Babesa PS U 22 61 120 65 119 75 150 4 63 120 55 110 59 119 49 97 0 0 0 0 0 0 0 0 0 0 0 0 408 427 835 7 21 1 29
22 Kuzshugchen CPS U 9 30 43 16 48 20 38 1 12 35 11 31 17 28 9 18 0 0 0 0 0 0 0 0 0 0 0 0 126 115 241 2 10 0 12
23 Hongtsho CPS U 7 14 31 12 30 13 27 1 16 27 13 28 14 25 6 17 0 0 0 0 0 0 0 0 0 0 0 0 97 88 185 1 7 0 8
24 Jemina CPS SU 5 12 37 16 45 17 41 1 15 22 12 23 0 0 0 0 0 0 0 0 0 0 0 0 0 0 0 0 96 72 168 2 5 0 7
25 Sisina CPS SU 7 21 35 16 27 18 32 1 10 18 6 17 11 19 4 10 0 0 0 0 0 0 0 0 0 0 0 0 72 86 158 1 8 0 9
26 Tshaluna CPS R 7 8 18 6 15 7 11 1 7 11 6 19 6 12 8 13 0 0 0 0 0 0 0 0 0 0 0 0 51 48 99 0 6 0 6
27 Lingzhi CPS D 7 6 14 6 8 3 6 1 6 9 1 8 2 4 2 3 0 0 0 0 0 0 0 0 0 0 0 0 26 26 52 1 3 0 4
Total 544 783 1559 905 1797 897 1790 46 932 1852 887 1857 920 1764 822 1597 925 1716 843 1571 837 1547 761 1401 322 547 261 481 9384 10095 19479 123 625 99 847 23
1 Rinchen (Pvt) HSS U 20 0 0 0 0 0 0 0 0 0 0 0 0 0 0 0 0 0 0 0 0 0 0 0 208 398 218 386 358 426 784 6 15 10 31
2 Nima (Pvt) HSS U 21 0 0 0 0 0 0 0 0 0 0 0 0 0 0 0 0 0 0 0 0 0 0 0 194 382 185 341 344 379 723 5 21 8 34
3 Kelki (Pvt) HSS U 20 0 0 0 0 0 0 0 0 0 0 0 0 0 0 0 0 0 0 0 0 0 0 0 195 377 203 353 332 398 730 6 14 13 33
Total 61 0 0 0 0 0 0 0 0 0 0 0 0 0 0 0 0 0 0 0 0 0 0 0 597 1157 606 1080 1034 1203 2237 17 50 31 98 23
1 Druk (Pvt) MSS U 15 14 25 23 54 21 54 2 28 52 28 51 8 25 15 34 14 37 9 18 5 13 0 0 0 0 0 0 198 165 363 4 18 5 27
Total 15 14 25 23 54 21 54 2 28 52 28 51 8 25 15 34 14 37 9 18 5 13 0 0 0 0 0 0 198 165 363 4 18 5 27 13
1 Dr. Tobgyel (Pvt) LSS U 19 23 50 27 48 33 72 3 27 54 36 67 16 40 26 36 15 40 11 23 0 0 0 0 0 0 0 0 216 214 430 5 21 4 30
Total 19 23 50 27 48 33 72 3 27 54 36 67 16 40 26 36 15 40 11 23 0 0 0 0 0 0 0 0 216 214 430 5 21 4 30 14
1 Sunshine (Pvt) PS U 8 27 50 20 47 16 29 1 13 19 6 17 11 15 14 23 0 0 0 0 0 0 0 0 0 0 0 0 93 107 200 2 10 1 13
2 Early Learning Centre PS U 19 36 69 32 60 37 61 3 22 53 20 47 18 38 21 35 0 0 0 0 0 0 0 0 0 0 0 0 177 186 363 6 17 4 27
3 Little Dragon (Pvt) PS U 13 39 75 27 45 11 23 2 17 27 10 21 7 10 5 8 0 0 0 0 0 0 0 0 0 0 0 0 93 116 209 3 14 0 17
4 Etho Metho (Rigsar) PS SU 15 88 176 20 41 7 26 1 7 16 3 6 1 4 4 6 0 0 0 0 0 0 0 0 0 0 0 0 145 130 275 3 13 2 18
5 Rigpey Jungney (Pvt) PS SU 3 6 18 3 6 1 2 1 0 0 0 0 0 0 0 0 0 0 0 0 0 0 0 0 0 0 0 0 16 10 26 1 2 0 3
6 Thimphu (Pvt) PS SU 10 20 42 22 40 18 36 2 25 39 7 20 12 21 0 0 0 0 0 0 0 0 0 0 0 0 0 0 94 104 198 1 11 4 16
7 Phuensum (Pvt) PS U 8 25 46 10 22 5 10 1 2 15 5 12 0 4 6 8 0 0 0 0 0 0 0 0 0 0 0 0 64 53 117 3 7 0 10
Total 76 241 476 134 261 95 187 11 86 169 51 123 49 92 50 80 0 0 0 0 0 0 0 0 0 0 0 0 682 706 1388 19 74 11 104 13
1 Yum Thuje Zam Char- CPS SU 4 21 56 2 8 0 0 0 0 0 0 0 0 0 0 0 0 0 0 0 0 0 0 0 0 0 0 0 41 23 64 1 6 0 7
Total 4 21 56 2 8 0 0 0 0 0 0 0 0 0 0 0 0 0 0 0 0 0 0 0 0 0 0 0 41 23 64 1 6 0 7 9
1 Soe ECR (Lingzhi ECR D 1 7 10 0 0 0 0 0 0 0 0 0 0 0 0 0 0 0 0 0 0 0 0 0 0 0 0 0 3 7 10 0 1 0 1

142
AnnEXuRE
Total 1 7 10 0 0 0 0 0 0 0 0 0 0 0 0 0 0 0 0 0 0 0 0 0 0 0 0 0 3 7 10 0 1 0 1 10
G.Total 720 1089 2176 1091 2168 1046 2103 62 1073 2127 1002 2098 993 1921 913 1747 954 1793 863 1612 842 1560 761 1401 919 1704 867 1561 11558 12413 23971 169 795 150 1114 22
School LevelTypeType
Sec.PP I II III IV V VI VII VIII IX X XI XII Total Bht
NBht Total T:PG T G T G T S G T G T G T G T G T G T G T G T G T G T B G T ZLT Oth.
15 T/gang
1 Ranjung HSS U 14 0 0 0 0 0 0 0 0 0 0 0 0 0 0 0 0 0 0 0 70 135 73 141 30 114 44 120 293 217 510 3 13 8 24
2 Jigmesherubling HSS SU 17 0 0 0 0 0 0 0 0 0 0 0 0 0 0 0 0 0 0 0 68 161 80 188 64 157 75 172 391 287 678 4 16 11 31
3 Tashitse HSS SU 16 0 0 0 0 0 0 0 0 0 0 0 0 0 0 0 0 0 0 0 90 188 93 205 37 111 7 83 360 227 587 4 14 8 26
4 Trashigang MSS U 23 50 80 40 77 33 68 2 41 67 29 58 29 52 37 68 36 76 32 64 33 62 57 98 0 0 0 0 353 417 770 5 23 6 34
5 Kanglung MSS U 12 0 0 0 0 0 0 0 0 0 0 0 0 0 0 0 29 68 41 68 56 92 71 154 0 0 0 0 185 197 382 3 13 1 17
6 Dungtse MSS SR 10 0 0 0 0 0 0 0 0 0 0 0 0 0 0 0 54 110 66 120 50 119 0 0 0 0 0 0 179 170 349 3 12 1 16
7 Bartsham MSS SR 10 0 0 0 0 0 0 0 0 0 0 0 0 0 0 0 76 129 30 48 66 150 0 0 0 0 0 0 155 172 327 2 11 0 13
8 Ranjung LSS U 10 21 35 18 30 28 47 1 24 47 24 40 29 47 14 36 25 57 23 41 0 0 0 0 0 0 0 0 174 206 380 2 12 0 14
9 Khaling LSS SU 14 17 41 21 40 25 47 2 24 42 25 52 22 36 18 41 21 48 24 57 0 0 0 0 0 0 0 0 207 197 404 3 12 2 17
10 Yongphula LSS SU 10 13 35 15 32 26 42 1 29 58 14 38 18 32 19 36 16 43 8 23 0 0 0 0 0 0 0 0 181 158 339 2 13 1 16
11 Radhi LSS SU 9 19 34 16 38 18 31 1 16 41 15 28 17 29 14 31 19 33 19 36 0 0 0 0 0 0 0 0 148 153 301 2 12 1 15
12 Wamrong LSS SU 16 17 27 10 26 10 34 1 27 48 21 48 21 44 14 35 64 131 59 123 0 0 0 0 0 0 0 0 273 243 516 3 10 4 17
13 Bidung LSS SR 13 9 23 14 21 8 18 1 10 21 13 31 23 32 24 37 59 112 52 107 0 0 0 0 0 0 0 0 190 212 402 2 11 4 17
14 Uzorong LSS SR 11 19 27 25 56 19 37 1 16 29 17 34 11 21 19 32 50 102 47 93 0 0 0 0 0 0 0 0 208 223 431 2 13 0 15
15 Kangpara LSS SR 10 9 24 12 23 8 18 1 15 30 12 32 18 36 12 31 16 38 22 59 0 0 0 0 0 0 0 0 167 124 291 1 10 0 11
16 Thungkhar LSS VR 11 9 16 7 21 13 23 1 11 16 12 25 3 18 4 19 35 73 21 51 0 0 0 0 0 0 0 0 147 115 262 2 11 0 13
17 Kanglung PS U 14 35 70 42 75 31 68 2 29 73 46 86 40 85 41 62 0 0 0 0 0 0 0 0 0 0 0 0 255 264 519 3 14 0 17
18 Galing PS SR 7 11 17 6 14 6 15 1 6 14 8 23 13 19 12 19 0 0 0 0 0 0 0 0 0 0 0 0 59 62 121 1 5 1 7
19 Phongmey PS SR 7 13 22 12 18 4 16 1 18 29 6 23 9 21 13 29 0 0 0 0 0 0 0 0 0 0 0 0 83 75 158 1 5 0 6
20 Bikhar PS SR 7 27 43 18 37 15 32 1 15 42 12 24 14 38 28 36 0 0 0 0 0 0 0 0 0 0 0 0 123 129 252 1 6 0 7
21 Chaling PS SR 7 13 25 12 24 14 35 1 13 28 21 37 11 25 10 22 0 0 0 0 0 0 0 0 0 0 0 0 102 94 196 1 6 0 7
22 Changmey PS SR 7 8 15 10 21 8 13 1 11 20 6 18 8 16 15 20 0 0 0 0 0 0 0 0 0 0 0 0 57 66 123 1 6 0 7
23 Bartsham PS SR 7 13 32 11 25 7 18 1 13 29 15 25 26 42 16 30 0 0 0 0 0 0 0 0 0 0 0 0 100 101 201 2 6 0 8
24 Merak PS SR 7 11 28 28 58 19 38 1 18 42 12 20 9 24 8 30 0 0 0 0 0 0 0 0 0 0 0 0 135 105 240 0 7 0 7
25 Lumang PS R 7 7 17 11 18 6 13 1 11 21 9 17 2 9 11 17 0 0 0 0 0 0 0 0 0 0 0 0 55 57 112 1 4 0 5
26 Tsangpo PS R 7 1 8 4 10 11 22 1 6 11 5 16 5 12 6 13 0 0 0 0 0 0 0 0 0 0 0 0 54 38 92 1 3 0 4
27 Pasaphu PS VR 6 0 0 6 8 2 5 1 4 8 7 12 6 12 10 15 0 0 0 0 0 0 0 0 0 0 0 0 25 35 60 1 3 0 4
28 Sakteng PS VR 7 27 52 21 44 18 43 1 12 42 16 35 9 26 5 22 0 0 0 0 0 0 0 0 0 0 0 0 156 108 264 1 6 0 7
29 Yangneer CPS SU 7 10 23 17 33 13 32 1 16 23 22 35 18 37 11 18 0 0 0 0 0 0 0 0 0 0 0 0 94 107 201 1 6 0 7
30 Gongthung CPS SU 7 7 22 20 31 23 34 1 10 16 13 25 8 22 8 19 0 0 0 0 0 0 0 0 0 0 0 0 80 89 169 1 7 0 8
31 Moshi CPS SU 7 16 30 11 21 10 32 1 12 22 13 28 10 20 6 21 0 0 0 0 0 0 0 0 0 0 0 0 96 78 174 0 5 0 5
32 Pam CPS SU 7 20 26 7 11 10 15 1 10 14 5 14 8 17 8 16 0 0 0 0 0 0 0 0 0 0 0 0 45 68 113 0 5 0 5
33 Barshong CPS SU 7 3 9 4 9 8 18 1 4 9 9 23 4 9 7 11 0 0 0 0 0 0 0 0 0 0 0 0 49 39 88 1 5 0 6
34 Rangshikhar CPS SR 6 1 6 6 9 8 11 1 0 0 4 10 3 5 4 10 0 0 0 0 0 0 0 0 0 0 0 0 25 26 51 1 3 0 4
35 Phegpari CPS SR 7 6 16 6 14 3 13 1 4 10 10 21 8 14 5 16 0 0 0 0 0 0 0 0 0 0 0 0 62 42 104 1 5 0 6
36 Saling CPS SR 7 4 14 7 15 8 12 1 8 13 6 18 12 19 4 12 0 0 0 0 0 0 0 0 0 0 0 0 54 49 103 1 6 0 7
37 Pakaling CPS SR 7 8 15 6 13 7 20 1 12 27 5 11 8 18 7 13 0 0 0 0 0 0 0 0 0 0 0 0 64 53 117 1 5 0 6

143
AnnEXuRE
Total 1 7 10 0 0 0 0 0 0 0 0 0 0 0 0 0 0 0 0 0 0 0 0 0 0 0 0 0 3 7 10 0 1 0 1 10
G.Total 720 1089 2176 1091 2168 1046 2103 62 1073 2127 1002 2098 993 1921 913 1747 954 1793 863 1612 842 1560 761 1401 919 1704 867 1561 11558 12413 23971 169 795 150 1114 22
School LevelTypeType
Sec.PP I II III IV V VI VII VIII IX X XI XII Total Bht
NBht Total T:PG T G T G T S G T G T G T G T G T G T G T G T G T G T B G T ZLT Oth.
15 T/gang
1 Ranjung HSS U 14 0 0 0 0 0 0 0 0 0 0 0 0 0 0 0 0 0 0 0 70 135 73 141 30 114 44 120 293 217 510 3 13 8 24
2 Jigmesherubling HSS SU 17 0 0 0 0 0 0 0 0 0 0 0 0 0 0 0 0 0 0 0 68 161 80 188 64 157 75 172 391 287 678 4 16 11 31
3 Tashitse HSS SU 16 0 0 0 0 0 0 0 0 0 0 0 0 0 0 0 0 0 0 0 90 188 93 205 37 111 7 83 360 227 587 4 14 8 26
4 Trashigang MSS U 23 50 80 40 77 33 68 2 41 67 29 58 29 52 37 68 36 76 32 64 33 62 57 98 0 0 0 0 353 417 770 5 23 6 34
5 Kanglung MSS U 12 0 0 0 0 0 0 0 0 0 0 0 0 0 0 0 29 68 41 68 56 92 71 154 0 0 0 0 185 197 382 3 13 1 17
6 Dungtse MSS SR 10 0 0 0 0 0 0 0 0 0 0 0 0 0 0 0 54 110 66 120 50 119 0 0 0 0 0 0 179 170 349 3 12 1 16
7 Bartsham MSS SR 10 0 0 0 0 0 0 0 0 0 0 0 0 0 0 0 76 129 30 48 66 150 0 0 0 0 0 0 155 172 327 2 11 0 13
8 Ranjung LSS U 10 21 35 18 30 28 47 1 24 47 24 40 29 47 14 36 25 57 23 41 0 0 0 0 0 0 0 0 174 206 380 2 12 0 14
9 Khaling LSS SU 14 17 41 21 40 25 47 2 24 42 25 52 22 36 18 41 21 48 24 57 0 0 0 0 0 0 0 0 207 197 404 3 12 2 17
10 Yongphula LSS SU 10 13 35 15 32 26 42 1 29 58 14 38 18 32 19 36 16 43 8 23 0 0 0 0 0 0 0 0 181 158 339 2 13 1 16
11 Radhi LSS SU 9 19 34 16 38 18 31 1 16 41 15 28 17 29 14 31 19 33 19 36 0 0 0 0 0 0 0 0 148 153 301 2 12 1 15
12 Wamrong LSS SU 16 17 27 10 26 10 34 1 27 48 21 48 21 44 14 35 64 131 59 123 0 0 0 0 0 0 0 0 273 243 516 3 10 4 17
13 Bidung LSS SR 13 9 23 14 21 8 18 1 10 21 13 31 23 32 24 37 59 112 52 107 0 0 0 0 0 0 0 0 190 212 402 2 11 4 17
14 Uzorong LSS SR 11 19 27 25 56 19 37 1 16 29 17 34 11 21 19 32 50 102 47 93 0 0 0 0 0 0 0 0 208 223 431 2 13 0 15
15 Kangpara LSS SR 10 9 24 12 23 8 18 1 15 30 12 32 18 36 12 31 16 38 22 59 0 0 0 0 0 0 0 0 167 124 291 1 10 0 11
16 Thungkhar LSS VR 11 9 16 7 21 13 23 1 11 16 12 25 3 18 4 19 35 73 21 51 0 0 0 0 0 0 0 0 147 115 262 2 11 0 13
17 Kanglung PS U 14 35 70 42 75 31 68 2 29 73 46 86 40 85 41 62 0 0 0 0 0 0 0 0 0 0 0 0 255 264 519 3 14 0 17
18 Galing PS SR 7 11 17 6 14 6 15 1 6 14 8 23 13 19 12 19 0 0 0 0 0 0 0 0 0 0 0 0 59 62 121 1 5 1 7
19 Phongmey PS SR 7 13 22 12 18 4 16 1 18 29 6 23 9 21 13 29 0 0 0 0 0 0 0 0 0 0 0 0 83 75 158 1 5 0 6
20 Bikhar PS SR 7 27 43 18 37 15 32 1 15 42 12 24 14 38 28 36 0 0 0 0 0 0 0 0 0 0 0 0 123 129 252 1 6 0 7
21 Chaling PS SR 7 13 25 12 24 14 35 1 13 28 21 37 11 25 10 22 0 0 0 0 0 0 0 0 0 0 0 0 102 94 196 1 6 0 7
22 Changmey PS SR 7 8 15 10 21 8 13 1 11 20 6 18 8 16 15 20 0 0 0 0 0 0 0 0 0 0 0 0 57 66 123 1 6 0 7
23 Bartsham PS SR 7 13 32 11 25 7 18 1 13 29 15 25 26 42 16 30 0 0 0 0 0 0 0 0 0 0 0 0 100 101 201 2 6 0 8
24 Merak PS SR 7 11 28 28 58 19 38 1 18 42 12 20 9 24 8 30 0 0 0 0 0 0 0 0 0 0 0 0 135 105 240 0 7 0 7
25 Lumang PS R 7 7 17 11 18 6 13 1 11 21 9 17 2 9 11 17 0 0 0 0 0 0 0 0 0 0 0 0 55 57 112 1 4 0 5
26 Tsangpo PS R 7 1 8 4 10 11 22 1 6 11 5 16 5 12 6 13 0 0 0 0 0 0 0 0 0 0 0 0 54 38 92 1 3 0 4
27 Pasaphu PS VR 6 0 0 6 8 2 5 1 4 8 7 12 6 12 10 15 0 0 0 0 0 0 0 0 0 0 0 0 25 35 60 1 3 0 4
28 Sakteng PS VR 7 27 52 21 44 18 43 1 12 42 16 35 9 26 5 22 0 0 0 0 0 0 0 0 0 0 0 0 156 108 264 1 6 0 7
29 Yangneer CPS SU 7 10 23 17 33 13 32 1 16 23 22 35 18 37 11 18 0 0 0 0 0 0 0 0 0 0 0 0 94 107 201 1 6 0 7
30 Gongthung CPS SU 7 7 22 20 31 23 34 1 10 16 13 25 8 22 8 19 0 0 0 0 0 0 0 0 0 0 0 0 80 89 169 1 7 0 8
31 Moshi CPS SU 7 16 30 11 21 10 32 1 12 22 13 28 10 20 6 21 0 0 0 0 0 0 0 0 0 0 0 0 96 78 174 0 5 0 5
32 Pam CPS SU 7 20 26 7 11 10 15 1 10 14 5 14 8 17 8 16 0 0 0 0 0 0 0 0 0 0 0 0 45 68 113 0 5 0 5
33 Barshong CPS SU 7 3 9 4 9 8 18 1 4 9 9 23 4 9 7 11 0 0 0 0 0 0 0 0 0 0 0 0 49 39 88 1 5 0 6
34 Rangshikhar CPS SR 6 1 6 6 9 8 11 1 0 0 4 10 3 5 4 10 0 0 0 0 0 0 0 0 0 0 0 0 25 26 51 1 3 0 4
35 Phegpari CPS SR 7 6 16 6 14 3 13 1 4 10 10 21 8 14 5 16 0 0 0 0 0 0 0 0 0 0 0 0 62 42 104 1 5 0 6
36 Saling CPS SR 7 4 14 7 15 8 12 1 8 13 6 18 12 19 4 12 0 0 0 0 0 0 0 0 0 0 0 0 54 49 103 1 6 0 7
37 Pakaling CPS SR 7 8 15 6 13 7 20 1 12 27 5 11 8 18 7 13 0 0 0 0 0 0 0 0 0 0 0 0 64 53 117 1 5 0 6

144
AnnEXuRE
38 Tokshingmang CPS SR 7 16 36 13 26 9 22 1 10 41 27 53 20 44 8 25 0 0 0 0 0 0 0 0 0 0 0 0 144 103 247 1 6 0 7
39 Rongthung CPS SR 7 5 16 10 24 9 14 1 11 25 8 31 16 28 9 26 0 0 0 0 0 0 0 0 0 0 0 0 96 68 164 1 5 1 7
40 Tongling CPS SR 7 3 7 3 5 2 5 1 2 7 2 5 1 5 4 11 0 0 0 0 0 0 0 0 0 0 0 0 28 17 45 0 3 0 3
School LevelTypeType
Sec.PP I II III IV V VI VII VIII IX X XI XII Total Bht
NBht Total T:PG T G T G T S G T G T G T G T G T G T G T G T G T G T B G T ZLT Oth.
41 Thrakthrik CPS SR 3 3 8 3 4 3 14 1 0 0 0 0 0 0 0 0 0 0 0 0 0 0 0 0 0 0 0 0 17 9 26 0 2 0 2
42 Tshogonpa CPS R 7 6 18 9 12 5 11 1 6 13 9 14 1 6 5 16 0 0 0 0 0 0 0 0 0 0 0 0 49 41 90 1 4 0 5
43 Thrimshing CPS R 7 5 11 7 10 6 11 1 3 9 1 7 5 7 5 9 0 0 0 0 0 0 0 0 0 0 0 0 32 32 64 1 3 0 4
44 Ying Gom CPS R 5 9 12 5 8 5 9 1 9 15 7 11 0 0 0 0 0 0 0 0 0 0 0 0 0 0 0 0 20 35 55 1 2 0 3
45 Brekha CPS R 7 9 21 6 11 10 20 1 6 13 6 11 9 20 6 9 0 0 0 0 0 0 0 0 0 0 0 0 53 52 105 1 4 0 5
46 Yobinang CPS R 6 10 11 0 0 4 6 1 4 8 8 8 6 12 2 6 0 0 0 0 0 0 0 0 0 0 0 0 17 34 51 0 2 0 2
47 Kurichilo CPS R 7 6 12 8 17 6 22 1 4 22 12 24 7 24 4 14 0 0 0 0 0 0 0 0 0 0 0 0 88 47 135 1 6 0 7
48 Jangsheri CPS R 6 4 9 4 7 1 6 1 5 12 7 12 7 9 0 0 0 0 0 0 0 0 0 0 0 0 0 0 27 28 55 0 3 0 3
49 Samkhar CPS R 4 1 11 0 0 4 8 1 0 0 1 5 0 0 2 5 0 0 0 0 0 0 0 0 0 0 0 0 21 8 29 0 2 0 2
50 Joenkhar CPS R 6 8 14 0 0 4 10 1 3 9 3 13 5 11 6 13 0 0 0 0 0 0 0 0 0 0 0 0 41 29 70 0 5 0 5
51 Jomtshang CPS R 7 6 11 6 11 4 11 1 2 5 4 6 3 10 7 11 0 0 0 0 0 0 0 0 0 0 0 0 33 32 65 0 4 0 4
52 Chiya CPS R 7 8 15 12 17 11 14 1 2 12 6 15 3 10 1 6 0 0 0 0 0 0 0 0 0 0 0 0 46 43 89 0 5 0 5
53 Benshingmo CPS R 7 4 12 2 12 6 13 1 6 13 7 10 8 15 5 10 0 0 0 0 0 0 0 0 0 0 0 0 47 38 85 1 4 0 5
54 Jerelemi CPS R 7 8 15 9 17 8 15 1 10 20 1 5 7 14 4 10 0 0 0 0 0 0 0 0 0 0 0 0 49 47 96 1 4 0 5
55Zordung (Threphu-woong)
CPS R 4 4 6 6 15 6 15 1 8 19 0 0 0 0 0 0 0 0 0 0 0 0 0 0 0 0 0 0 31 24 55 0 2 0 2 28
56 Bepam CPS VR 7 4 13 7 10 10 16 1 10 15 6 10 3 9 5 10 0 0 0 0 0 0 0 0 0 0 0 0 38 45 83 1 4 0 5
57 Dungmanba CPS VR 7 10 16 14 22 6 13 1 5 12 7 8 5 8 7 11 0 0 0 0 0 0 0 0 0 0 0 0 36 54 90 1 3 0 4
58 Yabrang CPS VR 7 4 10 10 20 11 21 1 5 14 12 23 8 15 12 16 0 0 0 0 0 0 0 0 0 0 0 0 57 62 119 1 6 0 7
59 Thongrong CPS VR 7 9 12 3 16 3 9 1 9 15 7 11 5 9 5 16 0 0 0 0 0 0 0 0 0 0 0 0 47 41 88 1 4 0 5
60 Berdungma CPS VR 7 6 10 5 11 6 14 1 1 6 1 3 4 7 1 6 0 0 0 0 0 0 0 0 0 0 0 0 33 24 57 1 2 0 3
61 Threphu CPS VR 4 5 9 4 6 3 4 1 2 5 0 0 0 0 0 0 0 0 0 0 0 0 0 0 0 0 0 0 10 14 24 1 1 0 2
62 Ritsangdung CPS VR 3 21 31 9 18 11 23 1 0 0 0 0 0 0 0 0 0 0 0 0 0 0 0 0 0 0 0 0 31 41 72 0 2 0 2
63 Daliphangma CPS VR 4 7 14 9 15 9 22 1 7 17 0 0 0 0 0 0 0 0 0 0 0 0 0 0 0 0 0 0 36 32 68 0 2 0 2
Total 515 605 1192 607 1186 581 1218 60 575 1219 574 1192 545 1100 508 1047 500 1020 444 890 433 907 374 786 131 382 126 375 6511 6003 12514 79 414 49 542 23
1 Kheri (Wamrong LSS) ECR SU 3 7 9 3 9 0 2 1 0 0 0 0 0 0 0 0 0 0 0 0 0 0 0 0 0 0 0 0 10 10 20 0 0 0 0
2 Muktangkhar (Bart- ECR SR 3 5 12 2 4 7 8 1 0 0 0 0 0 0 0 0 0 0 0 0 0 0 0 0 0 0 0 0 10 14 24 0 1 0 1
3 Durung (Gongthung ECR SU 4 4 8 2 3 3 5 1 1 2 0 0 0 0 0 0 0 0 0 0 0 0 0 0 0 0 0 0 8 10 18 0 0 0 0
Total 10 16 29 7 16 10 15 3 1 2 0 0 0 0 0 0 0 0 0 0 0 0 0 0 0 0 0 0 28 34 62 0 1 0 1 62
G.Total 525 621 1221 614 1202 591 1233 63 576 1221 574 1192 545 1100 508 1047 500 1020 444 890 433 907 374 786 131 382 126 375 6539 6037 12576 79 415 49 543 23
16 T/Yangtse
1 Bayling HSS U 14 0 0 0 0 0 0 0 0 0 0 0 0 0 0 0 0 0 0 0 65 97 49 91 49 155 47 161 294 210 504 4 14 9 27
2 Tsenkarla MSS SU 21 16 35 17 34 10 30 1 10 21 17 34 10 21 18 29 28 61 32 61 74 182 72 166 0 0 0 0 370 304 674 4 20 1 25
3 Trashiyangtse LSS U 22 70 117 40 80 40 96 2 37 76 57 115 52 94 64 110 55 92 35 71 0 0 0 0 0 0 0 0 401 450 851 4 22 1 27
4 Kheni LSS SR 14 13 28 10 20 16 30 1 16 29 15 32 15 32 13 26 59 120 65 115 0 0 0 0 0 0 0 0 210 222 432 3 12 0 15
5 Tongmijangsa LSS SR 11 8 17 15 22 7 16 1 11 24 6 16 17 33 9 21 30 60 34 61 0 0 0 0 0 0 0 0 133 137 270 2 10 0 12
6 Ramjar LSS SR 9 15 27 13 31 12 31 1 17 36 16 38 18 30 11 30 12 26 15 27 0 0 0 0 0 0 0 0 147 129 276 1 9 0 10
7 Bumdeling LSS SR 9 14 32 18 39 12 26 1 10 24 11 29 4 21 10 18 20 42 20 34 0 0 0 0 0 0 0 0 146 119 265 1 7 0 8

145
AnnEXuRE
38 Tokshingmang CPS SR 7 16 36 13 26 9 22 1 10 41 27 53 20 44 8 25 0 0 0 0 0 0 0 0 0 0 0 0 144 103 247 1 6 0 7
39 Rongthung CPS SR 7 5 16 10 24 9 14 1 11 25 8 31 16 28 9 26 0 0 0 0 0 0 0 0 0 0 0 0 96 68 164 1 5 1 7
40 Tongling CPS SR 7 3 7 3 5 2 5 1 2 7 2 5 1 5 4 11 0 0 0 0 0 0 0 0 0 0 0 0 28 17 45 0 3 0 3
School LevelTypeType
Sec.PP I II III IV V VI VII VIII IX X XI XII Total Bht
NBht Total T:PG T G T G T S G T G T G T G T G T G T G T G T G T G T B G T ZLT Oth.
41 Thrakthrik CPS SR 3 3 8 3 4 3 14 1 0 0 0 0 0 0 0 0 0 0 0 0 0 0 0 0 0 0 0 0 17 9 26 0 2 0 2
42 Tshogonpa CPS R 7 6 18 9 12 5 11 1 6 13 9 14 1 6 5 16 0 0 0 0 0 0 0 0 0 0 0 0 49 41 90 1 4 0 5
43 Thrimshing CPS R 7 5 11 7 10 6 11 1 3 9 1 7 5 7 5 9 0 0 0 0 0 0 0 0 0 0 0 0 32 32 64 1 3 0 4
44 Ying Gom CPS R 5 9 12 5 8 5 9 1 9 15 7 11 0 0 0 0 0 0 0 0 0 0 0 0 0 0 0 0 20 35 55 1 2 0 3
45 Brekha CPS R 7 9 21 6 11 10 20 1 6 13 6 11 9 20 6 9 0 0 0 0 0 0 0 0 0 0 0 0 53 52 105 1 4 0 5
46 Yobinang CPS R 6 10 11 0 0 4 6 1 4 8 8 8 6 12 2 6 0 0 0 0 0 0 0 0 0 0 0 0 17 34 51 0 2 0 2
47 Kurichilo CPS R 7 6 12 8 17 6 22 1 4 22 12 24 7 24 4 14 0 0 0 0 0 0 0 0 0 0 0 0 88 47 135 1 6 0 7
48 Jangsheri CPS R 6 4 9 4 7 1 6 1 5 12 7 12 7 9 0 0 0 0 0 0 0 0 0 0 0 0 0 0 27 28 55 0 3 0 3
49 Samkhar CPS R 4 1 11 0 0 4 8 1 0 0 1 5 0 0 2 5 0 0 0 0 0 0 0 0 0 0 0 0 21 8 29 0 2 0 2
50 Joenkhar CPS R 6 8 14 0 0 4 10 1 3 9 3 13 5 11 6 13 0 0 0 0 0 0 0 0 0 0 0 0 41 29 70 0 5 0 5
51 Jomtshang CPS R 7 6 11 6 11 4 11 1 2 5 4 6 3 10 7 11 0 0 0 0 0 0 0 0 0 0 0 0 33 32 65 0 4 0 4
52 Chiya CPS R 7 8 15 12 17 11 14 1 2 12 6 15 3 10 1 6 0 0 0 0 0 0 0 0 0 0 0 0 46 43 89 0 5 0 5
53 Benshingmo CPS R 7 4 12 2 12 6 13 1 6 13 7 10 8 15 5 10 0 0 0 0 0 0 0 0 0 0 0 0 47 38 85 1 4 0 5
54 Jerelemi CPS R 7 8 15 9 17 8 15 1 10 20 1 5 7 14 4 10 0 0 0 0 0 0 0 0 0 0 0 0 49 47 96 1 4 0 5
55Zordung (Threphu-woong)
CPS R 4 4 6 6 15 6 15 1 8 19 0 0 0 0 0 0 0 0 0 0 0 0 0 0 0 0 0 0 31 24 55 0 2 0 2 28
56 Bepam CPS VR 7 4 13 7 10 10 16 1 10 15 6 10 3 9 5 10 0 0 0 0 0 0 0 0 0 0 0 0 38 45 83 1 4 0 5
57 Dungmanba CPS VR 7 10 16 14 22 6 13 1 5 12 7 8 5 8 7 11 0 0 0 0 0 0 0 0 0 0 0 0 36 54 90 1 3 0 4
58 Yabrang CPS VR 7 4 10 10 20 11 21 1 5 14 12 23 8 15 12 16 0 0 0 0 0 0 0 0 0 0 0 0 57 62 119 1 6 0 7
59 Thongrong CPS VR 7 9 12 3 16 3 9 1 9 15 7 11 5 9 5 16 0 0 0 0 0 0 0 0 0 0 0 0 47 41 88 1 4 0 5
60 Berdungma CPS VR 7 6 10 5 11 6 14 1 1 6 1 3 4 7 1 6 0 0 0 0 0 0 0 0 0 0 0 0 33 24 57 1 2 0 3
61 Threphu CPS VR 4 5 9 4 6 3 4 1 2 5 0 0 0 0 0 0 0 0 0 0 0 0 0 0 0 0 0 0 10 14 24 1 1 0 2
62 Ritsangdung CPS VR 3 21 31 9 18 11 23 1 0 0 0 0 0 0 0 0 0 0 0 0 0 0 0 0 0 0 0 0 31 41 72 0 2 0 2
63 Daliphangma CPS VR 4 7 14 9 15 9 22 1 7 17 0 0 0 0 0 0 0 0 0 0 0 0 0 0 0 0 0 0 36 32 68 0 2 0 2
Total 515 605 1192 607 1186 581 1218 60 575 1219 574 1192 545 1100 508 1047 500 1020 444 890 433 907 374 786 131 382 126 375 6511 6003 12514 79 414 49 542 23
1 Kheri (Wamrong LSS) ECR SU 3 7 9 3 9 0 2 1 0 0 0 0 0 0 0 0 0 0 0 0 0 0 0 0 0 0 0 0 10 10 20 0 0 0 0
2 Muktangkhar (Bart- ECR SR 3 5 12 2 4 7 8 1 0 0 0 0 0 0 0 0 0 0 0 0 0 0 0 0 0 0 0 0 10 14 24 0 1 0 1
3 Durung (Gongthung ECR SU 4 4 8 2 3 3 5 1 1 2 0 0 0 0 0 0 0 0 0 0 0 0 0 0 0 0 0 0 8 10 18 0 0 0 0
Total 10 16 29 7 16 10 15 3 1 2 0 0 0 0 0 0 0 0 0 0 0 0 0 0 0 0 0 0 28 34 62 0 1 0 1 62
G.Total 525 621 1221 614 1202 591 1233 63 576 1221 574 1192 545 1100 508 1047 500 1020 444 890 433 907 374 786 131 382 126 375 6539 6037 12576 79 415 49 543 23
16 T/Yangtse
1 Bayling HSS U 14 0 0 0 0 0 0 0 0 0 0 0 0 0 0 0 0 0 0 0 65 97 49 91 49 155 47 161 294 210 504 4 14 9 27
2 Tsenkarla MSS SU 21 16 35 17 34 10 30 1 10 21 17 34 10 21 18 29 28 61 32 61 74 182 72 166 0 0 0 0 370 304 674 4 20 1 25
3 Trashiyangtse LSS U 22 70 117 40 80 40 96 2 37 76 57 115 52 94 64 110 55 92 35 71 0 0 0 0 0 0 0 0 401 450 851 4 22 1 27
4 Kheni LSS SR 14 13 28 10 20 16 30 1 16 29 15 32 15 32 13 26 59 120 65 115 0 0 0 0 0 0 0 0 210 222 432 3 12 0 15
5 Tongmijangsa LSS SR 11 8 17 15 22 7 16 1 11 24 6 16 17 33 9 21 30 60 34 61 0 0 0 0 0 0 0 0 133 137 270 2 10 0 12
6 Ramjar LSS SR 9 15 27 13 31 12 31 1 17 36 16 38 18 30 11 30 12 26 15 27 0 0 0 0 0 0 0 0 147 129 276 1 9 0 10
7 Bumdeling LSS SR 9 14 32 18 39 12 26 1 10 24 11 29 4 21 10 18 20 42 20 34 0 0 0 0 0 0 0 0 146 119 265 1 7 0 8
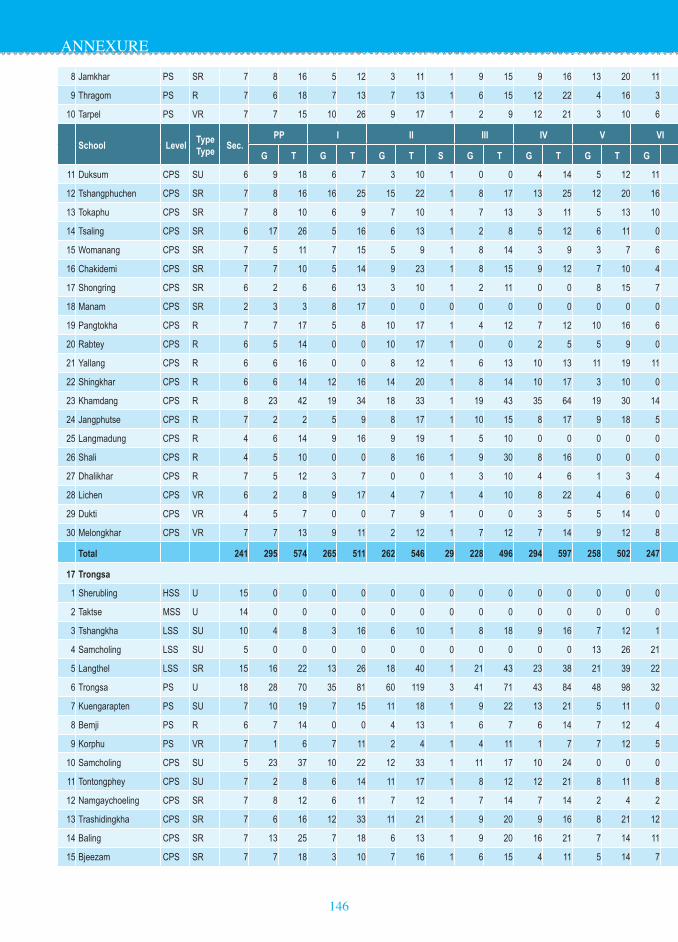
146
AnnEXuRE
8 Jamkhar PS SR 7 8 16 5 12 3 11 1 9 15 9 16 13 20 11 26 0 0 0 0 0 0 0 0 0 0 0 0 58 58 116 1 6 0 7
9 Thragom PS R 7 6 18 7 13 7 13 1 6 15 12 22 4 16 3 12 0 0 0 0 0 0 0 0 0 0 0 0 64 45 109 1 5 0 6
10 Tarpel PS VR 7 7 15 10 26 9 17 1 2 9 12 21 3 10 6 17 0 0 0 0 0 0 0 0 0 0 0 0 66 49 115 1 5 0 6
School LevelTypeType
Sec.PP I II III IV V VI VII VIII IX X XI XII Total Bht
NBht Total T:PG T G T G T S G T G T G T G T G T G T G T G T G T G T B G T ZLT Oth.
11 Duksum CPS SU 6 9 18 6 7 3 10 1 0 0 4 14 5 12 11 17 0 0 0 0 0 0 0 0 0 0 0 0 40 38 78 1 3 0 4
12 Tshangphuchen CPS SR 7 8 16 16 25 15 22 1 8 17 13 25 12 20 16 26 0 0 0 0 0 0 0 0 0 0 0 0 63 88 151 1 4 0 5
13 Tokaphu CPS SR 7 8 10 6 9 7 10 1 7 13 3 11 5 13 10 16 0 0 0 0 0 0 0 0 0 0 0 0 36 46 82 1 4 0 5
14 Tsaling CPS SR 6 17 26 5 16 6 13 1 2 8 5 12 6 11 0 0 0 0 0 0 0 0 0 0 0 0 0 0 45 41 86 1 4 0 5
15 Womanang CPS SR 7 5 11 7 15 5 9 1 8 14 3 9 3 7 6 13 0 0 0 0 0 0 0 0 0 0 0 0 41 37 78 1 4 0 5
16 Chakidemi CPS SR 7 7 10 5 14 9 23 1 8 15 9 12 7 10 4 10 0 0 0 0 0 0 0 0 0 0 0 0 45 49 94 1 4 0 5
17 Shongring CPS SR 6 2 6 6 13 3 10 1 2 11 0 0 8 15 7 19 0 0 0 0 0 0 0 0 0 0 0 0 46 28 74 1 3 0 4
18 Manam CPS SR 2 3 3 8 17 0 0 0 0 0 0 0 0 0 0 0 0 0 0 0 0 0 0 0 0 0 0 0 9 11 20 0 2 0 2
19 Pangtokha CPS R 7 7 17 5 8 10 17 1 4 12 7 12 10 16 6 12 0 0 0 0 0 0 0 0 0 0 0 0 45 49 94 1 4 0 5
20 Rabtey CPS R 6 5 14 0 0 10 17 1 0 0 2 5 5 9 0 0 0 0 0 0 0 0 0 0 0 0 0 0 23 22 45 1 1 0 2
21 Yallang CPS R 6 6 16 0 0 8 12 1 6 13 10 13 11 19 11 15 0 0 0 0 0 0 0 0 0 0 0 0 36 52 88 0 2 0 2
22 Shingkhar CPS R 6 6 14 12 16 14 20 1 8 14 10 17 3 10 0 0 0 0 0 0 0 0 0 0 0 0 0 0 38 53 91 0 4 0 4
23 Khamdang CPS R 8 23 42 19 34 18 33 1 19 43 35 64 19 30 14 27 0 0 0 0 0 0 0 0 0 0 0 0 126 147 273 1 8 0 9
24 Jangphutse CPS R 7 2 2 5 9 8 17 1 10 15 8 17 9 18 5 8 0 0 0 0 0 0 0 0 0 0 0 0 39 47 86 1 4 0 5
25 Langmadung CPS R 4 6 14 9 16 9 19 1 5 10 0 0 0 0 0 0 0 0 0 0 0 0 0 0 0 0 0 0 30 29 59 0 3 0 3
26 Shali CPS R 4 5 10 0 0 8 16 1 9 30 8 16 0 0 0 0 0 0 0 0 0 0 0 0 0 0 0 0 42 30 72 1 3 0 4
27 Dhalikhar CPS R 7 5 12 3 7 0 0 1 3 10 4 6 1 3 4 6 0 0 0 0 0 0 0 0 0 0 0 0 24 20 44 1 4 0 5
28 Lichen CPS VR 6 2 8 9 17 4 7 1 4 10 8 22 4 6 0 0 0 0 0 0 0 0 0 0 0 0 0 0 39 31 70 0 3 0 3
29 Dukti CPS VR 4 5 7 0 0 7 9 1 0 0 3 5 5 14 0 0 0 0 0 0 0 0 0 0 0 0 0 0 15 20 35 1 2 0 3
30 Melongkhar CPS VR 7 7 13 9 11 2 12 1 7 12 7 14 9 12 8 11 0 0 0 0 0 0 0 0 0 0 0 0 36 49 85 1 4 0 5
Total 241 295 574 265 511 262 546 29 228 496 294 597 258 502 247 469 204 401 201 369 139 279 121 257 49 155 47 161 2707 2610 5317 37 180 11 228 23
17 Trongsa
1 Sherubling HSS U 15 0 0 0 0 0 0 0 0 0 0 0 0 0 0 0 37 65 36 73 68 121 40 74 31 74 11 61 245 223 468 4 15 4 23
2 Taktse MSS U 14 0 0 0 0 0 0 0 0 0 0 0 0 0 0 0 27 55 35 82 63 140 44 102 0 0 0 0 210 169 379 4 14 0 18
3 Tshangkha LSS SU 10 4 8 3 16 6 10 1 8 18 9 16 7 12 1 6 33 56 22 42 0 0 0 0 0 0 0 0 91 93 184 3 10 0 13
4 Samcholing LSS SU 5 0 0 0 0 0 0 0 0 0 0 0 13 26 21 38 25 44 13 20 0 0 0 0 0 0 0 0 56 72 128 1 8 0 9
5 Langthel LSS SR 15 16 22 13 26 18 40 1 21 43 23 38 21 39 22 43 51 91 28 49 0 0 0 0 0 0 0 0 178 213 391 3 15 1 19
6 Trongsa PS U 18 28 70 35 81 60 119 3 41 71 43 84 48 98 32 79 0 0 0 0 0 0 0 0 0 0 0 0 315 287 602 4 23 0 27
7 Kuengarapten PS SU 7 10 19 7 15 11 18 1 9 22 13 21 5 11 0 0 0 0 0 0 0 0 0 0 0 0 0 0 51 55 106 1 8 1 10
8 Bemji PS R 6 7 14 0 0 4 13 1 6 7 6 14 7 12 4 10 0 0 0 0 0 0 0 0 0 0 0 0 36 34 70 1 3 0 4
9 Korphu PS VR 7 1 6 7 11 2 4 1 4 11 1 7 7 12 5 15 0 0 0 0 0 0 0 0 0 0 0 0 39 27 66 2 3 0 5
10 Samcholing CPS SU 5 23 37 10 22 12 33 1 11 17 10 24 0 0 0 0 0 0 0 0 0 0 0 0 0 0 0 0 67 66 133 1 4 0 5
11 Tontongphey CPS SU 7 2 8 6 14 11 17 1 8 12 12 21 8 11 8 12 0 0 0 0 0 0 0 0 0 0 0 0 40 55 95 1 7 0 8
12 Namgaychoeling CPS SR 7 8 12 6 11 7 12 1 7 14 7 14 2 4 2 7 0 0 0 0 0 0 0 0 0 0 0 0 35 39 74 1 4 0 5
13 Trashidingkha CPS SR 7 6 16 12 33 11 21 1 9 20 9 16 8 21 12 26 0 0 0 0 0 0 0 0 0 0 0 0 86 67 153 2 5 0 7
14 Baling CPS SR 7 13 25 7 18 6 13 1 9 20 16 21 7 14 11 15 0 0 0 0 0 0 0 0 0 0 0 0 57 69 126 1 4 0 5
15 Bjeezam CPS SR 7 7 18 3 10 7 16 1 6 15 4 11 5 14 7 17 0 0 0 0 0 0 0 0 0 0 0 0 62 39 101 2 6 0 8

147
AnnEXuRE
8 Jamkhar PS SR 7 8 16 5 12 3 11 1 9 15 9 16 13 20 11 26 0 0 0 0 0 0 0 0 0 0 0 0 58 58 116 1 6 0 7
9 Thragom PS R 7 6 18 7 13 7 13 1 6 15 12 22 4 16 3 12 0 0 0 0 0 0 0 0 0 0 0 0 64 45 109 1 5 0 6
10 Tarpel PS VR 7 7 15 10 26 9 17 1 2 9 12 21 3 10 6 17 0 0 0 0 0 0 0 0 0 0 0 0 66 49 115 1 5 0 6
School LevelTypeType
Sec.PP I II III IV V VI VII VIII IX X XI XII Total Bht
NBht Total T:PG T G T G T S G T G T G T G T G T G T G T G T G T G T B G T ZLT Oth.
11 Duksum CPS SU 6 9 18 6 7 3 10 1 0 0 4 14 5 12 11 17 0 0 0 0 0 0 0 0 0 0 0 0 40 38 78 1 3 0 4
12 Tshangphuchen CPS SR 7 8 16 16 25 15 22 1 8 17 13 25 12 20 16 26 0 0 0 0 0 0 0 0 0 0 0 0 63 88 151 1 4 0 5
13 Tokaphu CPS SR 7 8 10 6 9 7 10 1 7 13 3 11 5 13 10 16 0 0 0 0 0 0 0 0 0 0 0 0 36 46 82 1 4 0 5
14 Tsaling CPS SR 6 17 26 5 16 6 13 1 2 8 5 12 6 11 0 0 0 0 0 0 0 0 0 0 0 0 0 0 45 41 86 1 4 0 5
15 Womanang CPS SR 7 5 11 7 15 5 9 1 8 14 3 9 3 7 6 13 0 0 0 0 0 0 0 0 0 0 0 0 41 37 78 1 4 0 5
16 Chakidemi CPS SR 7 7 10 5 14 9 23 1 8 15 9 12 7 10 4 10 0 0 0 0 0 0 0 0 0 0 0 0 45 49 94 1 4 0 5
17 Shongring CPS SR 6 2 6 6 13 3 10 1 2 11 0 0 8 15 7 19 0 0 0 0 0 0 0 0 0 0 0 0 46 28 74 1 3 0 4
18 Manam CPS SR 2 3 3 8 17 0 0 0 0 0 0 0 0 0 0 0 0 0 0 0 0 0 0 0 0 0 0 0 9 11 20 0 2 0 2
19 Pangtokha CPS R 7 7 17 5 8 10 17 1 4 12 7 12 10 16 6 12 0 0 0 0 0 0 0 0 0 0 0 0 45 49 94 1 4 0 5
20 Rabtey CPS R 6 5 14 0 0 10 17 1 0 0 2 5 5 9 0 0 0 0 0 0 0 0 0 0 0 0 0 0 23 22 45 1 1 0 2
21 Yallang CPS R 6 6 16 0 0 8 12 1 6 13 10 13 11 19 11 15 0 0 0 0 0 0 0 0 0 0 0 0 36 52 88 0 2 0 2
22 Shingkhar CPS R 6 6 14 12 16 14 20 1 8 14 10 17 3 10 0 0 0 0 0 0 0 0 0 0 0 0 0 0 38 53 91 0 4 0 4
23 Khamdang CPS R 8 23 42 19 34 18 33 1 19 43 35 64 19 30 14 27 0 0 0 0 0 0 0 0 0 0 0 0 126 147 273 1 8 0 9
24 Jangphutse CPS R 7 2 2 5 9 8 17 1 10 15 8 17 9 18 5 8 0 0 0 0 0 0 0 0 0 0 0 0 39 47 86 1 4 0 5
25 Langmadung CPS R 4 6 14 9 16 9 19 1 5 10 0 0 0 0 0 0 0 0 0 0 0 0 0 0 0 0 0 0 30 29 59 0 3 0 3
26 Shali CPS R 4 5 10 0 0 8 16 1 9 30 8 16 0 0 0 0 0 0 0 0 0 0 0 0 0 0 0 0 42 30 72 1 3 0 4
27 Dhalikhar CPS R 7 5 12 3 7 0 0 1 3 10 4 6 1 3 4 6 0 0 0 0 0 0 0 0 0 0 0 0 24 20 44 1 4 0 5
28 Lichen CPS VR 6 2 8 9 17 4 7 1 4 10 8 22 4 6 0 0 0 0 0 0 0 0 0 0 0 0 0 0 39 31 70 0 3 0 3
29 Dukti CPS VR 4 5 7 0 0 7 9 1 0 0 3 5 5 14 0 0 0 0 0 0 0 0 0 0 0 0 0 0 15 20 35 1 2 0 3
30 Melongkhar CPS VR 7 7 13 9 11 2 12 1 7 12 7 14 9 12 8 11 0 0 0 0 0 0 0 0 0 0 0 0 36 49 85 1 4 0 5
Total 241 295 574 265 511 262 546 29 228 496 294 597 258 502 247 469 204 401 201 369 139 279 121 257 49 155 47 161 2707 2610 5317 37 180 11 228 23
17 Trongsa
1 Sherubling HSS U 15 0 0 0 0 0 0 0 0 0 0 0 0 0 0 0 37 65 36 73 68 121 40 74 31 74 11 61 245 223 468 4 15 4 23
2 Taktse MSS U 14 0 0 0 0 0 0 0 0 0 0 0 0 0 0 0 27 55 35 82 63 140 44 102 0 0 0 0 210 169 379 4 14 0 18
3 Tshangkha LSS SU 10 4 8 3 16 6 10 1 8 18 9 16 7 12 1 6 33 56 22 42 0 0 0 0 0 0 0 0 91 93 184 3 10 0 13
4 Samcholing LSS SU 5 0 0 0 0 0 0 0 0 0 0 0 13 26 21 38 25 44 13 20 0 0 0 0 0 0 0 0 56 72 128 1 8 0 9
5 Langthel LSS SR 15 16 22 13 26 18 40 1 21 43 23 38 21 39 22 43 51 91 28 49 0 0 0 0 0 0 0 0 178 213 391 3 15 1 19
6 Trongsa PS U 18 28 70 35 81 60 119 3 41 71 43 84 48 98 32 79 0 0 0 0 0 0 0 0 0 0 0 0 315 287 602 4 23 0 27
7 Kuengarapten PS SU 7 10 19 7 15 11 18 1 9 22 13 21 5 11 0 0 0 0 0 0 0 0 0 0 0 0 0 0 51 55 106 1 8 1 10
8 Bemji PS R 6 7 14 0 0 4 13 1 6 7 6 14 7 12 4 10 0 0 0 0 0 0 0 0 0 0 0 0 36 34 70 1 3 0 4
9 Korphu PS VR 7 1 6 7 11 2 4 1 4 11 1 7 7 12 5 15 0 0 0 0 0 0 0 0 0 0 0 0 39 27 66 2 3 0 5
10 Samcholing CPS SU 5 23 37 10 22 12 33 1 11 17 10 24 0 0 0 0 0 0 0 0 0 0 0 0 0 0 0 0 67 66 133 1 4 0 5
11 Tontongphey CPS SU 7 2 8 6 14 11 17 1 8 12 12 21 8 11 8 12 0 0 0 0 0 0 0 0 0 0 0 0 40 55 95 1 7 0 8
12 Namgaychoeling CPS SR 7 8 12 6 11 7 12 1 7 14 7 14 2 4 2 7 0 0 0 0 0 0 0 0 0 0 0 0 35 39 74 1 4 0 5
13 Trashidingkha CPS SR 7 6 16 12 33 11 21 1 9 20 9 16 8 21 12 26 0 0 0 0 0 0 0 0 0 0 0 0 86 67 153 2 5 0 7
14 Baling CPS SR 7 13 25 7 18 6 13 1 9 20 16 21 7 14 11 15 0 0 0 0 0 0 0 0 0 0 0 0 57 69 126 1 4 0 5
15 Bjeezam CPS SR 7 7 18 3 10 7 16 1 6 15 4 11 5 14 7 17 0 0 0 0 0 0 0 0 0 0 0 0 62 39 101 2 6 0 8
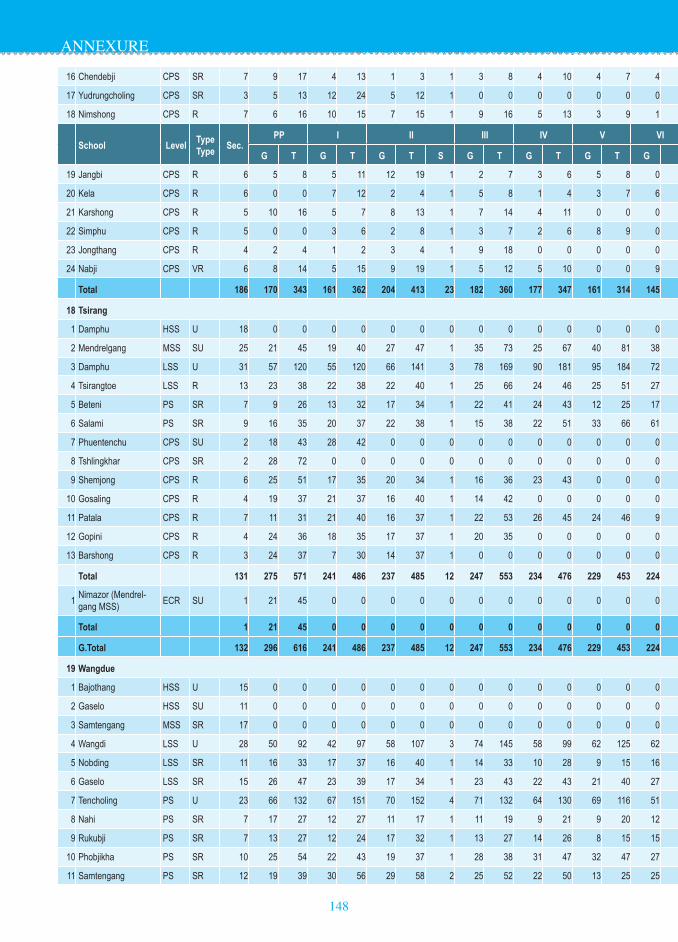
148
AnnEXuRE
16 Chendebji CPS SR 7 9 17 4 13 1 3 1 3 8 4 10 4 7 4 8 0 0 0 0 0 0 0 0 0 0 0 0 37 29 66 1 4 0 5
17 Yudrungcholing CPS SR 3 5 13 12 24 5 12 1 0 0 0 0 0 0 0 0 0 0 0 0 0 0 0 0 0 0 0 0 27 22 49 0 2 0 2
18 Nimshong CPS R 7 6 16 10 15 7 15 1 9 16 5 13 3 9 1 6 0 0 0 0 0 0 0 0 0 0 0 0 49 41 90 1 5 0 6
School LevelTypeType
Sec.PP I II III IV V VI VII VIII IX X XI XII Total Bht
NBht Total T:PG T G T G T S G T G T G T G T G T G T G T G T G T G T B G T ZLT Oth.
19 Jangbi CPS R 6 5 8 5 11 12 19 1 2 7 3 6 5 8 0 0 0 0 0 0 0 0 0 0 0 0 0 0 27 32 59 1 2 0 3
20 Kela CPS R 6 0 0 7 12 2 4 1 5 8 1 4 3 7 6 7 0 0 0 0 0 0 0 0 0 0 0 0 18 24 42 1 2 0 3
21 Karshong CPS R 5 10 16 5 7 8 13 1 7 14 4 11 0 0 0 0 0 0 0 0 0 0 0 0 0 0 0 0 27 34 61 0 2 0 2
22 Simphu CPS R 5 0 0 3 6 2 8 1 3 7 2 6 8 9 0 0 0 0 0 0 0 0 0 0 0 0 0 0 18 18 36 0 3 0 3
23 Jongthang CPS R 4 2 4 1 2 3 4 1 9 18 0 0 0 0 0 0 0 0 0 0 0 0 0 0 0 0 0 0 13 15 28 0 2 0 2
24 Nabji CPS VR 6 8 14 5 15 9 19 1 5 12 5 10 0 0 9 11 0 0 0 0 0 0 0 0 0 0 0 0 40 41 81 1 5 0 6
Total 186 170 343 161 362 204 413 23 182 360 177 347 161 314 145 300 173 311 134 266 131 261 84 176 31 74 11 61 1824 1764 3588 36 156 6 198 18
18 Tsirang
1 Damphu HSS U 18 0 0 0 0 0 0 0 0 0 0 0 0 0 0 0 0 0 0 0 84 174 68 149 42 126 43 131 343 237 580 5 19 7 31
2 Mendrelgang MSS SU 25 21 45 19 40 27 47 1 35 73 25 67 40 81 38 62 83 154 55 104 66 146 47 94 0 0 0 0 457 456 913 6 24 0 30
3 Damphu LSS U 31 57 120 55 120 66 141 3 78 169 90 181 95 184 72 159 75 153 110 197 0 0 0 0 0 0 0 0 726 698 1424 8 37 0 45
4 Tsirangtoe LSS R 13 23 38 22 38 22 40 1 25 66 24 46 25 51 27 68 32 79 23 54 0 0 0 0 0 0 0 0 257 223 480 2 12 0 14
5 Beteni PS SR 7 9 26 13 32 17 34 1 22 41 24 43 12 25 17 32 0 0 0 0 0 0 0 0 0 0 0 0 119 114 233 2 6 0 8
6 Salami PS SR 9 16 35 20 37 22 38 1 15 38 22 51 33 66 61 101 0 0 0 0 0 0 0 0 0 0 0 0 177 189 366 2 9 0 11
7 Phuentenchu CPS SU 2 18 43 28 42 0 0 0 0 0 0 0 0 0 0 0 0 0 0 0 0 0 0 0 0 0 0 0 39 46 85 1 1 0 2
8 Tshlingkhar CPS SR 2 28 72 0 0 0 0 0 0 0 0 0 0 0 0 0 0 0 0 0 0 0 0 0 0 0 0 0 44 28 72 1 2 0 3
9 Shemjong CPS R 6 25 51 17 35 20 34 1 16 36 23 43 0 0 0 0 0 0 0 0 0 0 0 0 0 0 0 0 98 101 199 2 5 0 7
10 Gosaling CPS R 4 19 37 21 37 16 40 1 14 42 0 0 0 0 0 0 0 0 0 0 0 0 0 0 0 0 0 0 86 70 156 1 4 0 5
11 Patala CPS R 7 11 31 21 40 16 37 1 22 53 26 45 24 46 9 26 0 0 0 0 0 0 0 0 0 0 0 0 149 129 278 1 7 0 8
12 Gopini CPS R 4 24 36 18 35 17 37 1 20 35 0 0 0 0 0 0 0 0 0 0 0 0 0 0 0 0 0 0 64 79 143 0 5 0 5
13 Barshong CPS R 3 24 37 7 30 14 37 1 0 0 0 0 0 0 0 0 0 0 0 0 0 0 0 0 0 0 0 0 59 45 104 1 2 0 3
Total 131 275 571 241 486 237 485 12 247 553 234 476 229 453 224 448 190 386 188 355 150 320 115 243 42 126 43 131 2618 2415 5033 32 133 7 172 29
1Nimazor (Mendrel-gang MSS)
ECR SU 1 21 45 0 0 0 0 0 0 0 0 0 0 0 0 0 0 0 0 0 0 0 0 0 0 0 0 0 24 21 45 0 1 0 1 45
Total 1 21 45 0 0 0 0 0 0 0 0 0 0 0 0 0 0 0 0 0 0 0 0 0 0 0 0 0 24 21 45 0 1 0 1 45
G.Total 132 296 616 241 486 237 485 12 247 553 234 476 229 453 224 448 190 386 188 355 150 320 115 243 42 126 43 131 2642 2436 5078 32 134 7 173 29
19 Wangdue
1 Bajothang HSS U 15 0 0 0 0 0 0 0 0 0 0 0 0 0 0 0 0 0 0 0 74 138 77 142 37 103 44 118 269 232 501 6 26 4 36
2 Gaselo HSS SU 11 0 0 0 0 0 0 0 0 0 0 0 0 0 0 0 0 0 0 0 88 163 65 130 14 36 0 0 162 167 329 3 13 4 20
3 Samtengang MSS SR 17 0 0 0 0 0 0 0 0 0 0 0 0 0 0 0 62 102 100 162 67 124 66 127 0 0 0 0 220 295 515 5 19 2 26
4 Wangdi LSS U 28 50 92 42 97 58 107 3 74 145 58 99 62 125 62 122 120 222 98 167 0 0 0 0 0 0 0 0 552 624 1176 6 32 2 40
5 Nobding LSS SR 11 16 33 17 37 16 40 1 14 33 10 28 9 15 16 24 55 103 36 70 0 0 0 0 0 0 0 0 194 189 383 4 10 0 14
6 Gaselo LSS SR 15 26 47 23 39 17 34 1 23 43 22 43 21 40 27 50 56 114 65 118 0 0 0 0 0 0 0 0 248 280 528 3 15 3 21
7 Tencholing PS U 23 66 132 67 151 70 152 4 71 132 64 130 69 116 51 95 0 0 0 0 0 0 0 0 0 0 0 0 450 458 908 7 26 0 33
8 Nahi PS SR 7 17 27 12 27 11 17 1 11 19 9 21 9 20 12 14 0 0 0 0 0 0 0 0 0 0 0 0 64 81 145 3 7 0 10
9 Rukubji PS SR 7 13 27 12 24 17 32 1 13 27 14 26 8 15 15 23 0 0 0 0 0 0 0 0 0 0 0 0 82 92 174 2 6 0 8
10 Phobjikha PS SR 10 25 54 22 43 19 37 1 28 38 31 47 32 47 27 46 0 0 0 0 0 0 0 0 0 0 0 0 128 184 312 3 8 0 11
11 Samtengang PS SR 12 19 39 30 56 29 58 2 25 52 22 50 13 25 25 44 0 0 0 0 0 0 0 0 0 0 0 0 161 163 324 3 11 0 14

149
AnnEXuRE
16 Chendebji CPS SR 7 9 17 4 13 1 3 1 3 8 4 10 4 7 4 8 0 0 0 0 0 0 0 0 0 0 0 0 37 29 66 1 4 0 5
17 Yudrungcholing CPS SR 3 5 13 12 24 5 12 1 0 0 0 0 0 0 0 0 0 0 0 0 0 0 0 0 0 0 0 0 27 22 49 0 2 0 2
18 Nimshong CPS R 7 6 16 10 15 7 15 1 9 16 5 13 3 9 1 6 0 0 0 0 0 0 0 0 0 0 0 0 49 41 90 1 5 0 6
School LevelTypeType
Sec.PP I II III IV V VI VII VIII IX X XI XII Total Bht
NBht Total T:PG T G T G T S G T G T G T G T G T G T G T G T G T G T B G T ZLT Oth.
19 Jangbi CPS R 6 5 8 5 11 12 19 1 2 7 3 6 5 8 0 0 0 0 0 0 0 0 0 0 0 0 0 0 27 32 59 1 2 0 3
20 Kela CPS R 6 0 0 7 12 2 4 1 5 8 1 4 3 7 6 7 0 0 0 0 0 0 0 0 0 0 0 0 18 24 42 1 2 0 3
21 Karshong CPS R 5 10 16 5 7 8 13 1 7 14 4 11 0 0 0 0 0 0 0 0 0 0 0 0 0 0 0 0 27 34 61 0 2 0 2
22 Simphu CPS R 5 0 0 3 6 2 8 1 3 7 2 6 8 9 0 0 0 0 0 0 0 0 0 0 0 0 0 0 18 18 36 0 3 0 3
23 Jongthang CPS R 4 2 4 1 2 3 4 1 9 18 0 0 0 0 0 0 0 0 0 0 0 0 0 0 0 0 0 0 13 15 28 0 2 0 2
24 Nabji CPS VR 6 8 14 5 15 9 19 1 5 12 5 10 0 0 9 11 0 0 0 0 0 0 0 0 0 0 0 0 40 41 81 1 5 0 6
Total 186 170 343 161 362 204 413 23 182 360 177 347 161 314 145 300 173 311 134 266 131 261 84 176 31 74 11 61 1824 1764 3588 36 156 6 198 18
18 Tsirang
1 Damphu HSS U 18 0 0 0 0 0 0 0 0 0 0 0 0 0 0 0 0 0 0 0 84 174 68 149 42 126 43 131 343 237 580 5 19 7 31
2 Mendrelgang MSS SU 25 21 45 19 40 27 47 1 35 73 25 67 40 81 38 62 83 154 55 104 66 146 47 94 0 0 0 0 457 456 913 6 24 0 30
3 Damphu LSS U 31 57 120 55 120 66 141 3 78 169 90 181 95 184 72 159 75 153 110 197 0 0 0 0 0 0 0 0 726 698 1424 8 37 0 45
4 Tsirangtoe LSS R 13 23 38 22 38 22 40 1 25 66 24 46 25 51 27 68 32 79 23 54 0 0 0 0 0 0 0 0 257 223 480 2 12 0 14
5 Beteni PS SR 7 9 26 13 32 17 34 1 22 41 24 43 12 25 17 32 0 0 0 0 0 0 0 0 0 0 0 0 119 114 233 2 6 0 8
6 Salami PS SR 9 16 35 20 37 22 38 1 15 38 22 51 33 66 61 101 0 0 0 0 0 0 0 0 0 0 0 0 177 189 366 2 9 0 11
7 Phuentenchu CPS SU 2 18 43 28 42 0 0 0 0 0 0 0 0 0 0 0 0 0 0 0 0 0 0 0 0 0 0 0 39 46 85 1 1 0 2
8 Tshlingkhar CPS SR 2 28 72 0 0 0 0 0 0 0 0 0 0 0 0 0 0 0 0 0 0 0 0 0 0 0 0 0 44 28 72 1 2 0 3
9 Shemjong CPS R 6 25 51 17 35 20 34 1 16 36 23 43 0 0 0 0 0 0 0 0 0 0 0 0 0 0 0 0 98 101 199 2 5 0 7
10 Gosaling CPS R 4 19 37 21 37 16 40 1 14 42 0 0 0 0 0 0 0 0 0 0 0 0 0 0 0 0 0 0 86 70 156 1 4 0 5
11 Patala CPS R 7 11 31 21 40 16 37 1 22 53 26 45 24 46 9 26 0 0 0 0 0 0 0 0 0 0 0 0 149 129 278 1 7 0 8
12 Gopini CPS R 4 24 36 18 35 17 37 1 20 35 0 0 0 0 0 0 0 0 0 0 0 0 0 0 0 0 0 0 64 79 143 0 5 0 5
13 Barshong CPS R 3 24 37 7 30 14 37 1 0 0 0 0 0 0 0 0 0 0 0 0 0 0 0 0 0 0 0 0 59 45 104 1 2 0 3
Total 131 275 571 241 486 237 485 12 247 553 234 476 229 453 224 448 190 386 188 355 150 320 115 243 42 126 43 131 2618 2415 5033 32 133 7 172 29
1Nimazor (Mendrel-gang MSS)
ECR SU 1 21 45 0 0 0 0 0 0 0 0 0 0 0 0 0 0 0 0 0 0 0 0 0 0 0 0 0 24 21 45 0 1 0 1 45
Total 1 21 45 0 0 0 0 0 0 0 0 0 0 0 0 0 0 0 0 0 0 0 0 0 0 0 0 0 24 21 45 0 1 0 1 45
G.Total 132 296 616 241 486 237 485 12 247 553 234 476 229 453 224 448 190 386 188 355 150 320 115 243 42 126 43 131 2642 2436 5078 32 134 7 173 29
19 Wangdue
1 Bajothang HSS U 15 0 0 0 0 0 0 0 0 0 0 0 0 0 0 0 0 0 0 0 74 138 77 142 37 103 44 118 269 232 501 6 26 4 36
2 Gaselo HSS SU 11 0 0 0 0 0 0 0 0 0 0 0 0 0 0 0 0 0 0 0 88 163 65 130 14 36 0 0 162 167 329 3 13 4 20
3 Samtengang MSS SR 17 0 0 0 0 0 0 0 0 0 0 0 0 0 0 0 62 102 100 162 67 124 66 127 0 0 0 0 220 295 515 5 19 2 26
4 Wangdi LSS U 28 50 92 42 97 58 107 3 74 145 58 99 62 125 62 122 120 222 98 167 0 0 0 0 0 0 0 0 552 624 1176 6 32 2 40
5 Nobding LSS SR 11 16 33 17 37 16 40 1 14 33 10 28 9 15 16 24 55 103 36 70 0 0 0 0 0 0 0 0 194 189 383 4 10 0 14
6 Gaselo LSS SR 15 26 47 23 39 17 34 1 23 43 22 43 21 40 27 50 56 114 65 118 0 0 0 0 0 0 0 0 248 280 528 3 15 3 21
7 Tencholing PS U 23 66 132 67 151 70 152 4 71 132 64 130 69 116 51 95 0 0 0 0 0 0 0 0 0 0 0 0 450 458 908 7 26 0 33
8 Nahi PS SR 7 17 27 12 27 11 17 1 11 19 9 21 9 20 12 14 0 0 0 0 0 0 0 0 0 0 0 0 64 81 145 3 7 0 10
9 Rukubji PS SR 7 13 27 12 24 17 32 1 13 27 14 26 8 15 15 23 0 0 0 0 0 0 0 0 0 0 0 0 82 92 174 2 6 0 8
10 Phobjikha PS SR 10 25 54 22 43 19 37 1 28 38 31 47 32 47 27 46 0 0 0 0 0 0 0 0 0 0 0 0 128 184 312 3 8 0 11
11 Samtengang PS SR 12 19 39 30 56 29 58 2 25 52 22 50 13 25 25 44 0 0 0 0 0 0 0 0 0 0 0 0 161 163 324 3 11 0 14

150
AnnEXuRE
12 Sha Tasha PS VR 7 11 22 20 32 22 42 1 12 27 24 40 24 31 13 25 0 0 0 0 0 0 0 0 0 0 0 0 93 126 219 1 5 0 6
13 Rinchengang CPS U 4 18 27 16 45 12 24 1 15 31 0 0 0 0 0 0 0 0 0 0 0 0 0 0 0 0 0 0 66 61 127 1 4 0 5
14 Sephu CPS SR 7 9 13 7 20 6 18 1 9 21 13 21 9 12 7 20 0 0 0 0 0 0 0 0 0 0 0 0 65 60 125 1 5 0 6
School LevelTypeType
Sec.PP I II III IV V VI VII VIII IX X XI XII Total Bht
NBht Total T:PG T G T G T S G T G T G T G T G T G T G T G T G T G T B G T ZLT Oth.
15 Bjena CPS SR 6 10 14 8 16 8 17 1 7 16 10 15 8 11 0 0 0 0 0 0 0 0 0 0 0 0 0 0 38 51 89 1 4 0 5
16 Rubesa CPS SR 6 10 15 11 18 6 13 1 4 11 12 21 14 21 0 0 0 0 0 0 0 0 0 0 0 0 0 0 42 57 99 1 5 0 6
17 Hebesa CPS SR 7 20 37 11 19 10 19 1 11 22 6 14 7 9 5 11 0 0 0 0 0 0 0 0 0 0 0 0 61 70 131 1 5 0 6
18 Bayta CPS SR 6 15 27 18 36 14 27 1 16 26 21 40 10 20 0 0 0 0 0 0 0 0 0 0 0 0 0 0 82 94 176 1 4 0 5
19 Migtana CPS SR 2 14 25 16 35 0 0 0 0 0 0 0 0 0 0 0 0 0 0 0 0 0 0 0 0 0 0 0 30 30 60 0 2 0 2
20 Kazhi CPS R 7 12 30 12 28 9 18 1 9 22 8 16 9 14 7 8 0 0 0 0 0 0 0 0 0 0 0 0 70 66 136 2 5 0 7
21 Khothaka CPS R 7 8 22 17 33 13 31 1 23 39 21 37 14 15 9 18 0 0 0 0 0 0 0 0 0 0 0 0 90 105 195 2 5 0 7
22 Dangchu CPS R 7 18 25 15 26 11 17 1 8 12 7 9 10 15 8 8 0 0 0 0 0 0 0 0 0 0 0 0 35 77 112 1 5 0 6
23 Phuensum Deki CPS R 6 6 12 5 12 8 17 1 8 17 10 13 9 12 0 0 0 0 0 0 0 0 0 0 0 0 0 0 37 46 83 1 4 0 5
24 Rameychen CPS R 7 13 25 17 22 16 28 1 13 19 14 31 16 31 14 24 0 0 0 0 0 0 0 0 0 0 0 0 77 103 180 2 3 0 5
25 Jala CPS R 7 8 16 5 13 7 13 1 6 15 3 8 3 6 2 3 0 0 0 0 0 0 0 0 0 0 0 0 40 34 74 0 5 0 5
26 Uma CPS R 7 7 15 4 9 8 17 1 5 14 4 12 5 6 3 9 0 0 0 0 0 0 0 0 0 0 0 0 46 36 82 1 3 0 4
27 Ada CPS VR 7 5 13 2 4 4 7 1 10 19 10 21 10 18 10 18 0 0 0 0 0 0 0 0 0 0 0 0 49 51 100 1 3 0 4
Total 256 416 789 409 842 391 785 29 415 800 393 742 371 624 313 562 293 541 299 517 229 425 208 399 51 139 44 118 3451 3832 7283 62 240 15 317 23
1 Matalungchu (Wangdi ECR U 2 9 24 4 6 0 0 0 0 0 0 0 0 0 0 0 0 0 0 0 0 0 0 0 0 0 0 0 17 13 30 0 1 0 1
2 Gogona (Phobjikha ECR SR 2 8 16 2 4 0 0 0 0 0 0 0 0 0 0 0 0 0 0 0 0 0 0 0 0 0 0 0 10 10 20 0 1 0 1
Total 4 17 40 6 10 0 0 0 0 0 0 0 0 0 0 0 0 0 0 0 0 0 0 0 0 0 0 0 27 23 50 0 2 0 2 25
G.Total 260 433 829 415 852 391 785 29 415 800 393 742 371 624 313 562 293 541 299 517 229 425 208 399 51 139 44 118 3478 3855 7333 62 242 15 319 23
20 Zhemgang
1 Zhemgang HSS U 21 0 0 0 0 0 0 0 0 0 0 0 0 0 0 0 55 104 49 102 80 148 72 133 41 117 33 115 389 330 719 2 19 5 26
2 Yebilepcha MSS SU 13 0 0 0 0 0 0 0 0 0 0 0 0 0 0 0 31 60 38 65 69 143 71 174 0 0 0 0 233 209 442 3 13 6 22
3 Sonamthang MSS SU 9 0 0 0 0 0 0 0 0 0 0 0 0 0 0 0 66 172 48 108 24 78 0 0 0 0 0 0 220 138 358 2 11 1 14
4 Zhemgang LSS U 18 35 78 34 62 32 72 2 29 72 37 67 29 64 33 67 33 59 30 50 0 0 0 0 0 0 0 0 299 292 591 3 16 1 20
5 Tingtibi LSS SU 14 20 38 24 56 23 49 1 24 45 22 56 26 47 23 43 19 45 31 62 0 0 0 0 0 0 0 0 229 212 441 4 13 2 19
6 Gomphu LSS SR 9 3 13 15 27 0 0 1 8 13 12 19 12 21 10 16 17 33 15 43 0 0 0 0 0 0 0 0 93 92 185 2 8 0 10
7 Tshaidang PS SR 7 9 20 4 10 10 17 1 4 13 4 8 6 12 4 12 0 0 0 0 0 0 0 0 0 0 0 0 51 41 92 1 4 0 5
8 Buli PS SR 7 5 9 9 19 12 18 1 9 17 16 24 10 18 9 17 0 0 0 0 0 0 0 0 0 0 0 0 52 70 122 1 6 0 7
9 Panbang PS R 9 29 51 20 43 25 53 1 14 44 37 69 29 56 23 55 0 0 0 0 0 0 0 0 0 0 0 0 194 177 371 2 9 0 11
10 Shingkhar PS VR 7 12 23 8 17 19 25 1 8 20 14 29 11 25 18 22 0 0 0 0 0 0 0 0 0 0 0 0 71 90 161 1 6 0 7
11 Goshing PS VR 7 12 21 10 20 12 28 1 17 31 14 29 27 39 15 29 0 0 0 0 0 0 0 0 0 0 0 0 90 107 197 1 6 0 7
12 Nimshong PS VR 6 2 5 6 9 0 5 1 7 11 0 0 3 10 4 7 0 0 0 0 0 0 0 0 0 0 0 0 25 22 47 0 2 0 2
13 Pantang PS VR 7 8 14 9 14 9 15 1 5 12 14 37 22 48 8 25 0 0 0 0 0 0 0 0 0 0 0 0 90 75 165 0 5 0 5
14 Langdurbi PS VR 7 7 8 6 14 12 20 1 12 21 3 10 10 20 7 18 0 0 0 0 0 0 0 0 0 0 0 0 54 57 111 0 7 0 7
15 Bardo PS VR 7 6 15 7 14 6 15 1 7 12 5 12 6 10 4 10 0 0 0 0 0 0 0 0 0 0 0 0 47 41 88 1 3 0 4
16 Bjoka PS VR 7 5 7 13 18 8 15 1 12 18 11 26 10 20 5 26 0 0 0 0 0 0 0 0 0 0 0 0 66 64 130 1 6 0 7
17 Goling CPS SR 7 7 14 7 10 8 15 1 8 13 4 10 6 13 1 6 0 0 0 0 0 0 0 0 0 0 0 0 40 41 81 1 3 0 4
18 Tshanglajong CPS SR 7 5 13 2 3 8 12 1 2 6 7 8 9 14 1 7 0 0 0 0 0 0 0 0 0 0 0 0 29 34 63 0 3 0 3

151
AnnEXuRE
12 Sha Tasha PS VR 7 11 22 20 32 22 42 1 12 27 24 40 24 31 13 25 0 0 0 0 0 0 0 0 0 0 0 0 93 126 219 1 5 0 6
13 Rinchengang CPS U 4 18 27 16 45 12 24 1 15 31 0 0 0 0 0 0 0 0 0 0 0 0 0 0 0 0 0 0 66 61 127 1 4 0 5
14 Sephu CPS SR 7 9 13 7 20 6 18 1 9 21 13 21 9 12 7 20 0 0 0 0 0 0 0 0 0 0 0 0 65 60 125 1 5 0 6
School LevelTypeType
Sec.PP I II III IV V VI VII VIII IX X XI XII Total Bht
NBht Total T:PG T G T G T S G T G T G T G T G T G T G T G T G T G T B G T ZLT Oth.
15 Bjena CPS SR 6 10 14 8 16 8 17 1 7 16 10 15 8 11 0 0 0 0 0 0 0 0 0 0 0 0 0 0 38 51 89 1 4 0 5
16 Rubesa CPS SR 6 10 15 11 18 6 13 1 4 11 12 21 14 21 0 0 0 0 0 0 0 0 0 0 0 0 0 0 42 57 99 1 5 0 6
17 Hebesa CPS SR 7 20 37 11 19 10 19 1 11 22 6 14 7 9 5 11 0 0 0 0 0 0 0 0 0 0 0 0 61 70 131 1 5 0 6
18 Bayta CPS SR 6 15 27 18 36 14 27 1 16 26 21 40 10 20 0 0 0 0 0 0 0 0 0 0 0 0 0 0 82 94 176 1 4 0 5
19 Migtana CPS SR 2 14 25 16 35 0 0 0 0 0 0 0 0 0 0 0 0 0 0 0 0 0 0 0 0 0 0 0 30 30 60 0 2 0 2
20 Kazhi CPS R 7 12 30 12 28 9 18 1 9 22 8 16 9 14 7 8 0 0 0 0 0 0 0 0 0 0 0 0 70 66 136 2 5 0 7
21 Khothaka CPS R 7 8 22 17 33 13 31 1 23 39 21 37 14 15 9 18 0 0 0 0 0 0 0 0 0 0 0 0 90 105 195 2 5 0 7
22 Dangchu CPS R 7 18 25 15 26 11 17 1 8 12 7 9 10 15 8 8 0 0 0 0 0 0 0 0 0 0 0 0 35 77 112 1 5 0 6
23 Phuensum Deki CPS R 6 6 12 5 12 8 17 1 8 17 10 13 9 12 0 0 0 0 0 0 0 0 0 0 0 0 0 0 37 46 83 1 4 0 5
24 Rameychen CPS R 7 13 25 17 22 16 28 1 13 19 14 31 16 31 14 24 0 0 0 0 0 0 0 0 0 0 0 0 77 103 180 2 3 0 5
25 Jala CPS R 7 8 16 5 13 7 13 1 6 15 3 8 3 6 2 3 0 0 0 0 0 0 0 0 0 0 0 0 40 34 74 0 5 0 5
26 Uma CPS R 7 7 15 4 9 8 17 1 5 14 4 12 5 6 3 9 0 0 0 0 0 0 0 0 0 0 0 0 46 36 82 1 3 0 4
27 Ada CPS VR 7 5 13 2 4 4 7 1 10 19 10 21 10 18 10 18 0 0 0 0 0 0 0 0 0 0 0 0 49 51 100 1 3 0 4
Total 256 416 789 409 842 391 785 29 415 800 393 742 371 624 313 562 293 541 299 517 229 425 208 399 51 139 44 118 3451 3832 7283 62 240 15 317 23
1 Matalungchu (Wangdi ECR U 2 9 24 4 6 0 0 0 0 0 0 0 0 0 0 0 0 0 0 0 0 0 0 0 0 0 0 0 17 13 30 0 1 0 1
2 Gogona (Phobjikha ECR SR 2 8 16 2 4 0 0 0 0 0 0 0 0 0 0 0 0 0 0 0 0 0 0 0 0 0 0 0 10 10 20 0 1 0 1
Total 4 17 40 6 10 0 0 0 0 0 0 0 0 0 0 0 0 0 0 0 0 0 0 0 0 0 0 0 27 23 50 0 2 0 2 25
G.Total 260 433 829 415 852 391 785 29 415 800 393 742 371 624 313 562 293 541 299 517 229 425 208 399 51 139 44 118 3478 3855 7333 62 242 15 319 23
20 Zhemgang
1 Zhemgang HSS U 21 0 0 0 0 0 0 0 0 0 0 0 0 0 0 0 55 104 49 102 80 148 72 133 41 117 33 115 389 330 719 2 19 5 26
2 Yebilepcha MSS SU 13 0 0 0 0 0 0 0 0 0 0 0 0 0 0 0 31 60 38 65 69 143 71 174 0 0 0 0 233 209 442 3 13 6 22
3 Sonamthang MSS SU 9 0 0 0 0 0 0 0 0 0 0 0 0 0 0 0 66 172 48 108 24 78 0 0 0 0 0 0 220 138 358 2 11 1 14
4 Zhemgang LSS U 18 35 78 34 62 32 72 2 29 72 37 67 29 64 33 67 33 59 30 50 0 0 0 0 0 0 0 0 299 292 591 3 16 1 20
5 Tingtibi LSS SU 14 20 38 24 56 23 49 1 24 45 22 56 26 47 23 43 19 45 31 62 0 0 0 0 0 0 0 0 229 212 441 4 13 2 19
6 Gomphu LSS SR 9 3 13 15 27 0 0 1 8 13 12 19 12 21 10 16 17 33 15 43 0 0 0 0 0 0 0 0 93 92 185 2 8 0 10
7 Tshaidang PS SR 7 9 20 4 10 10 17 1 4 13 4 8 6 12 4 12 0 0 0 0 0 0 0 0 0 0 0 0 51 41 92 1 4 0 5
8 Buli PS SR 7 5 9 9 19 12 18 1 9 17 16 24 10 18 9 17 0 0 0 0 0 0 0 0 0 0 0 0 52 70 122 1 6 0 7
9 Panbang PS R 9 29 51 20 43 25 53 1 14 44 37 69 29 56 23 55 0 0 0 0 0 0 0 0 0 0 0 0 194 177 371 2 9 0 11
10 Shingkhar PS VR 7 12 23 8 17 19 25 1 8 20 14 29 11 25 18 22 0 0 0 0 0 0 0 0 0 0 0 0 71 90 161 1 6 0 7
11 Goshing PS VR 7 12 21 10 20 12 28 1 17 31 14 29 27 39 15 29 0 0 0 0 0 0 0 0 0 0 0 0 90 107 197 1 6 0 7
12 Nimshong PS VR 6 2 5 6 9 0 5 1 7 11 0 0 3 10 4 7 0 0 0 0 0 0 0 0 0 0 0 0 25 22 47 0 2 0 2
13 Pantang PS VR 7 8 14 9 14 9 15 1 5 12 14 37 22 48 8 25 0 0 0 0 0 0 0 0 0 0 0 0 90 75 165 0 5 0 5
14 Langdurbi PS VR 7 7 8 6 14 12 20 1 12 21 3 10 10 20 7 18 0 0 0 0 0 0 0 0 0 0 0 0 54 57 111 0 7 0 7
15 Bardo PS VR 7 6 15 7 14 6 15 1 7 12 5 12 6 10 4 10 0 0 0 0 0 0 0 0 0 0 0 0 47 41 88 1 3 0 4
16 Bjoka PS VR 7 5 7 13 18 8 15 1 12 18 11 26 10 20 5 26 0 0 0 0 0 0 0 0 0 0 0 0 66 64 130 1 6 0 7
17 Goling CPS SR 7 7 14 7 10 8 15 1 8 13 4 10 6 13 1 6 0 0 0 0 0 0 0 0 0 0 0 0 40 41 81 1 3 0 4
18 Tshanglajong CPS SR 7 5 13 2 3 8 12 1 2 6 7 8 9 14 1 7 0 0 0 0 0 0 0 0 0 0 0 0 29 34 63 0 3 0 3

152
AnnEXuRE
19 Repati CPS R 2 3 3 2 16 0 0 0 0 0 0 0 0 0 0 0 0 0 0 0 0 0 0 0 0 0 0 0 14 5 19 0 1 0 1
20 Kikhar CPS R 2 3 12 10 15 0 0 0 0 0 0 0 0 0 0 0 0 0 0 0 0 0 0 0 0 0 0 0 14 13 27 0 1 0 1
21 Digala CPS VR 4 0 0 4 7 5 7 1 10 21 15 28 0 0 0 0 0 0 0 0 0 0 0 0 0 0 0 0 29 34 63 0 2 0 2
School LevelTypeType
Sec.PP I II III IV V VI VII VIII IX X XI XII Total Bht
NBht Total T:PG T G T G T S G T G T G T G T G T G T G T G T G T G T B G T ZLT Oth.
22 Tradijong CPS VR 7 3 10 3 6 5 9 1 8 13 2 8 6 12 4 6 0 0 0 0 0 0 0 0 0 0 0 0 33 31 64 0 3 0 3
23 Thrisa CPS VR 7 4 9 4 9 7 13 1 4 15 4 12 9 16 10 15 0 0 0 0 0 0 0 0 0 0 0 0 47 42 89 0 7 0 7
24 Tashibi CPS VR 7 8 16 8 11 10 24 1 7 14 7 15 11 15 7 15 0 0 0 0 0 0 0 0 0 0 0 0 52 58 110 0 6 0 6
25 Tali CPS VR 7 7 14 4 11 5 8 1 8 16 4 10 0 2 7 12 0 0 0 0 0 0 0 0 0 0 0 0 38 35 73 1 2 0 3
26 Kaktong CPS VR 7 7 13 8 17 7 15 1 8 21 12 26 7 15 5 18 0 0 0 0 0 0 0 0 0 0 0 0 71 54 125 1 5 0 6
27 Dali CPS VR 2 0 0 3 6 3 6 1 0 0 0 0 0 0 0 0 0 0 0 0 0 0 0 0 0 0 0 0 6 6 12 1 1 0 2
28 Dunmang CPS VR 4 6 9 8 13 7 13 1 18 27 0 0 0 0 0 0 0 0 0 0 0 0 0 0 0 0 0 0 23 39 62 0 3 0 3
29 Barpong CPS VR 4 6 8 4 5 11 24 1 13 32 0 0 0 0 0 0 0 0 0 0 0 0 0 0 0 0 0 0 35 34 69 0 2 0 2
30 Budhasi CPS VR 4 9 21 16 25 15 25 1 20 30 0 0 0 0 0 0 0 0 0 0 0 0 0 0 0 0 0 0 41 60 101 0 3 0 3
31 Khomshar CPS VR 7 14 24 24 37 13 31 1 12 32 21 27 14 30 15 19 0 0 0 0 0 0 0 0 0 0 0 0 87 113 200 1 4 0 5
32 Prince Namgay HSS SU 4 0 0 0 0 0 0 0 0 0 0 0 0 0 0 0 0 0 0 0 0 0 0 0 32 69 20 49 66 52 118 1 1 4 6
Total 237 235 468 272 514 272 534 27 274 569 265 530 263 507 213 445 221 473 211 430 173 369 143 307 73 186 53 164 2828 2668 5496 30 181 19 230 24
Grand Total 5642 8599 17305 8219 16489 7870 16102 595 7816 16035 7471 15322 7460 14539 6702 13050 6603 12850 5886 11447 5227 10551 4262 8757 2717 5990 2636 5825 82794 81468 164262 1079 4936 653 6668 25

153
AnnEXuRE
19 Repati CPS R 2 3 3 2 16 0 0 0 0 0 0 0 0 0 0 0 0 0 0 0 0 0 0 0 0 0 0 0 14 5 19 0 1 0 1
20 Kikhar CPS R 2 3 12 10 15 0 0 0 0 0 0 0 0 0 0 0 0 0 0 0 0 0 0 0 0 0 0 0 14 13 27 0 1 0 1
21 Digala CPS VR 4 0 0 4 7 5 7 1 10 21 15 28 0 0 0 0 0 0 0 0 0 0 0 0 0 0 0 0 29 34 63 0 2 0 2
School LevelTypeType
Sec.PP I II III IV V VI VII VIII IX X XI XII Total Bht
NBht Total T:PG T G T G T S G T G T G T G T G T G T G T G T G T G T B G T ZLT Oth.
22 Tradijong CPS VR 7 3 10 3 6 5 9 1 8 13 2 8 6 12 4 6 0 0 0 0 0 0 0 0 0 0 0 0 33 31 64 0 3 0 3
23 Thrisa CPS VR 7 4 9 4 9 7 13 1 4 15 4 12 9 16 10 15 0 0 0 0 0 0 0 0 0 0 0 0 47 42 89 0 7 0 7
24 Tashibi CPS VR 7 8 16 8 11 10 24 1 7 14 7 15 11 15 7 15 0 0 0 0 0 0 0 0 0 0 0 0 52 58 110 0 6 0 6
25 Tali CPS VR 7 7 14 4 11 5 8 1 8 16 4 10 0 2 7 12 0 0 0 0 0 0 0 0 0 0 0 0 38 35 73 1 2 0 3
26 Kaktong CPS VR 7 7 13 8 17 7 15 1 8 21 12 26 7 15 5 18 0 0 0 0 0 0 0 0 0 0 0 0 71 54 125 1 5 0 6
27 Dali CPS VR 2 0 0 3 6 3 6 1 0 0 0 0 0 0 0 0 0 0 0 0 0 0 0 0 0 0 0 0 6 6 12 1 1 0 2
28 Dunmang CPS VR 4 6 9 8 13 7 13 1 18 27 0 0 0 0 0 0 0 0 0 0 0 0 0 0 0 0 0 0 23 39 62 0 3 0 3
29 Barpong CPS VR 4 6 8 4 5 11 24 1 13 32 0 0 0 0 0 0 0 0 0 0 0 0 0 0 0 0 0 0 35 34 69 0 2 0 2
30 Budhasi CPS VR 4 9 21 16 25 15 25 1 20 30 0 0 0 0 0 0 0 0 0 0 0 0 0 0 0 0 0 0 41 60 101 0 3 0 3
31 Khomshar CPS VR 7 14 24 24 37 13 31 1 12 32 21 27 14 30 15 19 0 0 0 0 0 0 0 0 0 0 0 0 87 113 200 1 4 0 5
32 Prince Namgay HSS SU 4 0 0 0 0 0 0 0 0 0 0 0 0 0 0 0 0 0 0 0 0 0 0 0 32 69 20 49 66 52 118 1 1 4 6
Total 237 235 468 272 514 272 534 27 274 569 265 530 263 507 213 445 221 473 211 430 173 369 143 307 73 186 53 164 2828 2668 5496 30 181 19 230 24
Grand Total 5642 8599 17305 8219 16489 7870 16102 595 7816 16035 7471 15322 7460 14539 6702 13050 6603 12850 5886 11447 5227 10551 4262 8757 2717 5990 2636 5825 82794 81468 164262 1079 4936 653 6668 25