annual data
DESCRIPTION
annual data of the company L&TTRANSCRIPT

70th Annual Report2014-2015
GLOBAL BENCHMARKS
L&T AR 2015 Cover.indd 1-3 30/07/15 1:11 pm

L&T AR 2015 Cover.indd 4-6 30/07/15 1:13 pm

1
Dear Shareholders,
A year after a new political dispensation came to power, I believe
the Government has achieved creditable success on multiple
fronts in rebooting the economy, despite the constraints and
complexities involved. A number of macro-level decisions taken
in the last year have resulted in improved economic indicators.
These measures include a steady cutback in subsidies, higher
allocation of budgetary resources towards infrastructure, steps
to rein in high levels of inflation, reduction in the backlog of
environmental clearances for infrastructure projects and a
transparent allocation of telecom and coal resources at market-
determined prices. The economy has also benefitted from the
fortuitous decrease in international crude oil prices. This has
helped reduce the oil subsidy burden and has had a salutary effect
on the Current Account. GDP growth has meanwhile moved up
to 7.3% from 6.9% a year ago and the prevailing low inflation
levels are conducive to reduction in interest rates. It is now up
to the Government to add pace to reform measures and build
further on the foundations laid so far.
Your Company’s capability profile is convergent with the needs
of the nation. The Government’s recent emphasis on developing
infrastructure, creating Smart Cities and the ‘Make in India’ thrust
opens up an exciting canvas of opportunity for L&T’s businesses.
Our engagement with key national projects gives a topical
resonance to the Company’s slogan, ‘We Make the Things That
Make India Proud’.
A. M. NaikGroup Executive Chairman
2
Performance Overview
Notwithstanding the uncertainties of the economic environment
and the execution blips encountered from time to time, your
Company has turned in a laudable performance on most key
performance parameters for 2014-15.
Order Inflows, which are the lifeblood of your Company’s
integrated Engineering Procurement & Construction (EPC)
business model, clocked in at v 155,367 crores at the Group level,
which represents a strong growth of 22% over the corresponding
inflows of the Previous Year. The unexecuted Order Book stood at
an all-time high of v 232,649 crores and represents a 28% growth
over the Order Book at the end of the Previous Year. Considering
that several execution challenges were encountered, such as
‘Right of Way’, land availability and other issues, Group Revenues
for the year, which stood at v 92,762 crores, grew by 8% over
the Previous Year. Profit after Tax at the Group level stood at v
4,765 crores and represents a decline of 2.8%, caused by losses
incurred in some challenging Hydrocarbon projects in the Middle
East as well as under-recoveries in the investment-constrained
segments of Power, Metallurgical & Material Handling and Heavy
Engineering.
It gives me pleasure to announce that your Company has
recommended a Dividend of v 16.25 per equity share on a face
value of v 2 per share for the year. The corresponding dividend
during the previous fiscal was at v 14.25 per equity share.
Internationalisation
Your company views internationalisation as more than merely
extending domestic operations overseas, to actually building
a multi-cultural leadership team and workforce drawn from
the local milieu. The Company is already seeing the positive
outcomes of earlier internalisation efforts, primarily in the Middle
East. The unexecuted international Order Book stood at over
v 60,000 crores at the end of 2014-15. This largely comprises
orders from diverse infrastructure areas such as metro rail, power
transmission & distribution, road & expressways and hydrocarbon
sectors.
If the expected growth in the domestic market happens, this may
result in a marginal decline in the share of international business
for the Company over the next few years. We intend to retain our
geographical diversification as a bulwark against single-country
dependency and to enable cross-learning of best practices in
international project execution.
Talent Management
The businesses that your Company engages in are primarily
people-driven. Accordingly, our HR policies are centred around
the creation of an environment that attracts, nurtures and rewards
high-calibre talent. Young engineers also gain the opportunity
to operate on the frontlines of technology and associate with
projects of unprecedented scale and complexity. A structured
seven-stage leadership development programme, conducted in
collaboration with the world’s finest management institutes, has
helped to build a robust talent pipeline at all levels.
Our HR organisation is well-geared towards attraction and
retention of engineering talent in an ecosystem that provides
long-cycle professional development opportunities in almost all
forms of engineering disciplines and caters to career building
aspirations of talent at all levels.
Sustainable Development
At the heart of your Company’s approach to business is a
sustainable model of development. It is built on the pillars of
inclusive growth and a commitment to environment conservation,
where expediency does not compromise long-term interests. Our
apex level CSR committee, comprising Board Members, has decided
to focus on a unifying theme - ‘Building Social Infrastructure’. This
covers water conservation, education, skill-building and healthcare.
The total spends on CSR initiatives in 2014-15 by your Company
amounted to v 76.54 crores under eligible items as defined in the
Companies Act and another v 20.92 crores in CSR activities not
specifically covered under the Companies Act.
Outlook
While private sector investments in industrial capex are yet to
take off, spends by the public sector in core infrastructure have
been improving. Funding from increased budgetary allocation by
the Central Government, increased level of ordering by healthy
public sector undertakings and a steady inflow of soft loans
from external multilateral lending agencies have contributed to a
perceptible rise in the core infrastructure investment momentum.
This has considerably enhanced potential business opportunities
for your Company.
Segments that hold promise in FY16 include:
1) Infrastructure
a) Roads: This segment has seen a shift from the earlier
focus on the PPP (Public Private Partnership) model to EPC
contracts in FY15. It is likely that this trend will continue and
we expect significant construction contracts to be awarded
3
by the National Highways Authority of India. This
opportunity basket is likely to be augmented by orders
for tunnels and special bridges as well as orders from state
governments for expressways. We will continue to
selectively target road construction prospects in the Middle
East, where we have an impressive track record.
b) Railways: In FY15, your Company has won some significant
contracts for segments of the Dedicated Freight Corridor.
Substantial ordering of more jobs under this program is
expected in FY16 and provides good prospects. FY16 is also
likely to see the commencement of awards for new railway
lines in the Middle East, where L&T intends to participate.
c) Metro Rail: Your Company has successfully executed
metro rail projects in multiple cities across the country, since
most State-level urban development authorities view metro
rail as the most viable solution for urban traffic
decongestion. Continuing spends are likely in this segment,
providing robust business potential for your Company
Execution of two large metro rail projects in the Middle East
won in FY14 is progressing satisfactorily
d) Urban Infrastructure: This segment encompasses multiple
areas such as residential buildings, IT & office complexes,
hospitals, educational institutions and shopping malls.
Collectively, they represent substantial opportunities
for L&T.
e) Smart Cities and Communication Infrastructure: This is
a new segment that has opened up over the last year, and
includes city surveillance systems, basic infrastructure for
proposed smart cities and telecom infrastructure. The
segment holds good business potential.
f) Water infrastructure: Falling water tables across the
country, coupled with the new Government’s drive towards
sanitation, Ganga Action Plan and irrigation programs, will
result in increased business prospects for your Company.
Opportunities targeted by this business segment
include bulk transmission & treatment of water, waste water
treatment, effluent treatment plants and lift irrigation
programmes.
2) Thermal Power Generation
The sector has been hampered by a number of constraints
including fuel shortages, tardy environment clearances, intense
competition from power equipment manufacturers, paucity of
long-term funding, and slow progress in raising end-user tariffs in
line with power production costs. Some of these constraints have
been mitigated in the last one year, and thermal power investment
programmes saw a much needed improvement in FY15. Your
Company bagged some significantly large orders in the last fiscal
arising from the larger opportunity base. The increased investment
momentum, driven by Central and State Power Generation
Utilities, continues to gather pace and your Company expects to
garner business arising from such investments. In the meantime,
L&T continues to focus on cost-competitiveness through cost
reduction and operational efficiency measures.
3) Power Transmission & Distribution
This sector has seen increasing investment trends and your
Company has benefited from such investments by way of
sustained and increased Order Inflows. The momentum is likely
to continue by way of grid augmentation by Central and State
Transmission Utilities.
We continue to be a significant player in this space in the Gulf
Region. Increased T&D investments in countries like Saudi Arabia,
Qatar, Oman, UAE and Kuwait continue to offer good business
potential. We are also targeting business in select African
countries in FY16.
4) Hydrocarbon
On the domestic front, reduced prices of crude oil in the
international markets has relieved domestic oil producers
and retailers from the onerous subsidy burden that they have
traditionally been saddled with. Coupled with the hike in the
administered price of gas as well as the introduction of the
new urea investment policy, the investment momentum of
hydrocarbon investments in the country is likely to increase and
your Company is ideally poised to tap this growth.
In Middle East markets, the drop in oil prices has led to a reduction
in Upstream capex. However, Mid and Downstream investments,
for the time-being, are not affected and your Company proposes
to bid for such opportunities as and when they enter the tendering
stage.
5) Defence Sector
Over the years, the Company has built significant capabilities in
the manufacture of defence equipment, primarily for the Indian
Navy and the Army. These capabilities have been built internally
as well as in combination with foreign technology providers.
The Company’s new shipbuilding facility at Kattupalli, built
primarily for defence warships has, however, seen significant

4
under-utilisation due to non-involvement of the private sector
in defence equipment manufacturing in any meaningful manner.
The new Government has taken substantial steps to involve the
private sector in defence equipment manufacturing and this is
at the heart of its ‘Make in India’ initiative. Your Company now
sees opportunities in this sector that it can tap. The bids for some
major naval craft and artillery guns have been submitted.
6) Heavy Engineering
This segment has been adversely affected by the global shrinkage
in ordering of Hydrocarbon equipment, arising out of a decline
in oil prices as well as the contraction of investments in Coal
Gasifiers and Nuclear Power plants. The new steel-making and
heavy forgings facility at Hazira (Gujarat) remains heavily under-
utilised. We are, however, seeing a revival in the building of new
nuclear power plants over the next year or so.
7) Metallurgical & Material Handling
Investments in the metals space in India have been severely
affected by the Supreme Court ban on iron ore mining in the
States of Karnataka, Goa and Odisha over the last few years.
This had led to a significant depletion of the Order Book of
this segment. Lifting of the ban in some select areas and for
captive steel producers has now led to an uptick in investments
for capacity addition in the ferrous metals sector. The business
has recently bagged a few orders which is expected to improve
revenue streams in FY16.
The Material Handling business has also been adversely affected
by lacklustre Industrial capex for a prolonged period. Outlook
for this business is expected to improve once Industrial capex
picks up.
8) Electrical & Automation (E&A)
The Electrical and Automation business continues to maintain its
leadership position in LV switchgear. During the course of 2014-
15, E&A has increased its operating margin and also improved
its market share in the domestic market. Product Development
in both LV and MV switchgear continues to forge ahead and the
business continues to be at the forefront of technology through
the launch of its in-house designed products. With the slowdown
in the Oil & Gas market, the Business has enhanced its focus
towards the Infrastructure sector by increasing the offering of
dedicated products specifically designed to meet the needs of the
Infrastructure sector market.
9) Realty
This business, which was recently started by L&T, continues to
grow in terms of revenue and profits. The business develops
and sells real estate, either by developing its own land parcels
or through Joint Ventures with select real estate developers.
The business is likely to further expand in Mumbai as well as in
Chennai and Bengaluru during 2015-16. During 2014-15, the
Group level revenues of this business stood at v 1,929 crores,
which represents an increase of 45% over the revenues of the
Previous Year. EBITDA for FY15 at v 1,065 crores registered an
increase of 41% over the EBITDA of the Previous Year, thus making
a meaningful contribution to the Company’s overall business.
10) Information Technology and Technology Services (IT&TS)
The IT&TS business has been growing steadily and revenues
clocked in at v 7,659 crores in FY15, representing a 19% growth
over the Previous Year. The business is focusing on increasing its
presence in the Americas, Europe, Gulf countries and the Far East.
We intend to unlock the value of the Business. We are evaluating
various options, subject to various factors, to discover the value
of this business.
11) Financial Services
This business was listed in 2011 and continues to expand. It had
a loan book of over v 47,000 crores at the end of FY15 and its
Assets Under Management have grown to over v 21,000 crores.
The business has successfully integrated its earlier acquisitions in
the Mutual Funds and Housing Finance areas and has a positive
growth outlook for FY16
12) Developmental Projects
During FY15, L&T IDPL, an intermediate holding company with
step-down subsidiaries (Special Purpose Vehicles) primarily
developing transportation infrastructure, received a v 1,000 crores
capital infusion from a large Canadian Pension Fund and the
second tranche of equal amount is expected to be received
in December 2015. The Developmental Projects business has
profitably monetized its stake in Dhamra Port. Such value
monetisation initiatives have reduced the dependency on your
Company’s balance sheet. The construction of the Hyderabad
Metro is progressing in full swing and the project is expected to
become a showcased ‘Transit Oriented Development’ model when
operational. The slowdown in the economy in the past few years
has adversely affected revenues and profitability of several PPP
infrastructure projects in the country and your Company has been
making concerted efforts to find solutions to the challenges faced
in this space. It will continue to monetize mature assets from

5
time-to-time and may selectively bid for value-accretive projects
in the roads and transmission line businesses.
Nabha Power Limited which houses investments in a 2x700
MW coal fired power plant in Rajpura, Punjab is also part of
the business portfolio and the plant went fully operational in
FY15. The operations are expected to stabilise in FY16 and your
Company will look for selective value monetisation as and when
the opportunity arises.
In conclusion, I would like to thank my fellow Board Members,
L&T-ites, customers, vendors and other stakeholders who have
collectively enabled sustainable and profitable growth in business
year after year.
Thank You
A. M. Naik
Group Executive Chairman

6
Contents
Company Information 7
Organisation Structure 8 - 9
Leadership Team 10
L&T Nationwide Network & Global Presence 12 - 13
Corporate Social Responsibility 14 - 17
Annual Business Responsibility Report (ABRR) 2014-15 18 - 35
Standalone Financials - 10 Year Highlights 36
Consolidated Financials - 10 Year Highlights 37
Graphs 38 - 39
Directors’ Report 40 - 108
Management Discussion & Analysis 109 - 184
Auditors’ Report 185 - 187
Balance Sheet 188
Statement of Profit and Loss 189
Cash Flow Statement 190 - 191
Notes forming part of Accounts 192 - 265
Auditors’ Report on Consolidated Financial Statements 266 - 271
Consolidated Balance Sheet 272
Consolidated Statement of Profit and Loss 273
Consolidated Cash Flow Statement 274
Notes forming part of Consolidated Accounts 275 - 341
Information regarding Subsidiary Companies 342 - 350
Shareholder’s Satisfaction Survey Form – 2015 353 - 354
Route Map to the AGM Venue 355

7
MR. A. M. NAIK Group Executive Chairman
MR. K. VENKATARAMANAN Chief Executive Officer & Managing Director
MR. M. V. KOTWAL Whole-time Director & President (Heavy Engineering)
MR. S. N. SUBRAHMANYAN Whole-time Director & Senior Executive Vice President
(Infrastructure & Construction)
MR. R. SHANKAR RAMAN Whole-time Director & Chief Financial Officer
MR. SHAILENDRA ROY Whole-time Director & Senior Executive Vice President
(Power, Minerals & Metals)
MR. M. M. CHITALE Independent Director
MR. SUBODH BHARGAVA Independent Director
MR. M. DAMODARAN Independent Director
MR. VIKRAM SINGH MEHTA Independent Director
MR. SUSHOBHAN SARKER Nominee of Life Insurance Corporation of India
MR. ADIL SIRAJ ZAINULBHAI Independent Director
MR. AKHILESH KRISHNA GUPTA Independent Director
MR. BAHRAM N. VAKIL Independent Director
MR. SWAPAN DASGUPTA Nominee of the Administrator of the SUUTI
MRS. SUNITA SHARMA Nominee of Life Insurance Corporation of India
MR. THOMAS MATHEW T. Independent Director
MR. AJAY SHANKAR Independent Director
70th ANNUAL GENERAL MEETING AT BIRLA MATUSHRI SABHAGAR, 19, MARINE LINES, MUMBAI - 400 020 ON WEDNESDAY, SEPTEMBER 9, 2015 AT 3.00 P.M.
Company Information
Company Secretary Mr. N. Hariharan
Registered Office L&T House, Ballard Estate, Mumbai - 400 001
Auditors M/s. Sharp & Tannan
Solicitors M/s. Manilal Kher Ambalal & Co.
Registrar & Share Transfer Agents Sharepro Services (India) Private Limited
Board of Directors

8

9

10
A. M. Naik
Group Executive Chairman
S. N. Roy
Sr. Executive Vice President
(Power, Minerals & Metals)
R. Shankar Raman
Chief Financial Offi cer
S. N. Subrahmanyan
Sr. Executive Vice President
(Infrastructure & Construction)
M. V. Kotwal
President
(Heavy Engineering)
S. C. Bhargava
Sr. Vice President
(Electrical & Automation)
K. Venkataramanan
CEO & Managing Director
Leadership Team

11
MILESTONES TO A MORE
VIBRANT INDIA
L&T is building the prestigious ‘Statue of Unity’ near
Vadodara – a magnifi cent, 182 metre tribute to the
Man of Iron, Sardar Vallabhai Patel. When complete,
it will be the tallest statute in the world.

12
Nationwide Network

13
Global Presence

1414
Building India’s Social InfrastructureCorporate Social Responsibility, no matter how well
intentioned, runs the risk of diffusion – of trying to run
too many programmes, do too many things, too soon.
We have therefore narrowed our focus to a single theme:
Building India’s Social Infrastructure. Based on key criteria,
a few villages have been selected in water-stressed districts
around the country, and more are being identified.
Through our Integrated Community Development
programmes, we partner with the community and address
issues of water and sanitation, education, health and
skill-building. Active participation from the community is
sought every step of the way, breaking down illusionary
differences between ‘us’ and ‘them’, between ‘experts’
and ‘dependent’ villagers awaiting relief.
Communities pledged their support through ‘Shram
Daan’ or voluntary service. They agreed to partner L&T
in implementing projects, and most importantly, assume
ownership of the plan. This would ensure that the
programmes are sustained all the way to success.
Beyond the clear, realistic targets and the measurable progress achieved by our CSR team, is a less quantifiable but deeply fulfilling goal -
spreading smiles.
Corporate Social Responsibility
1515
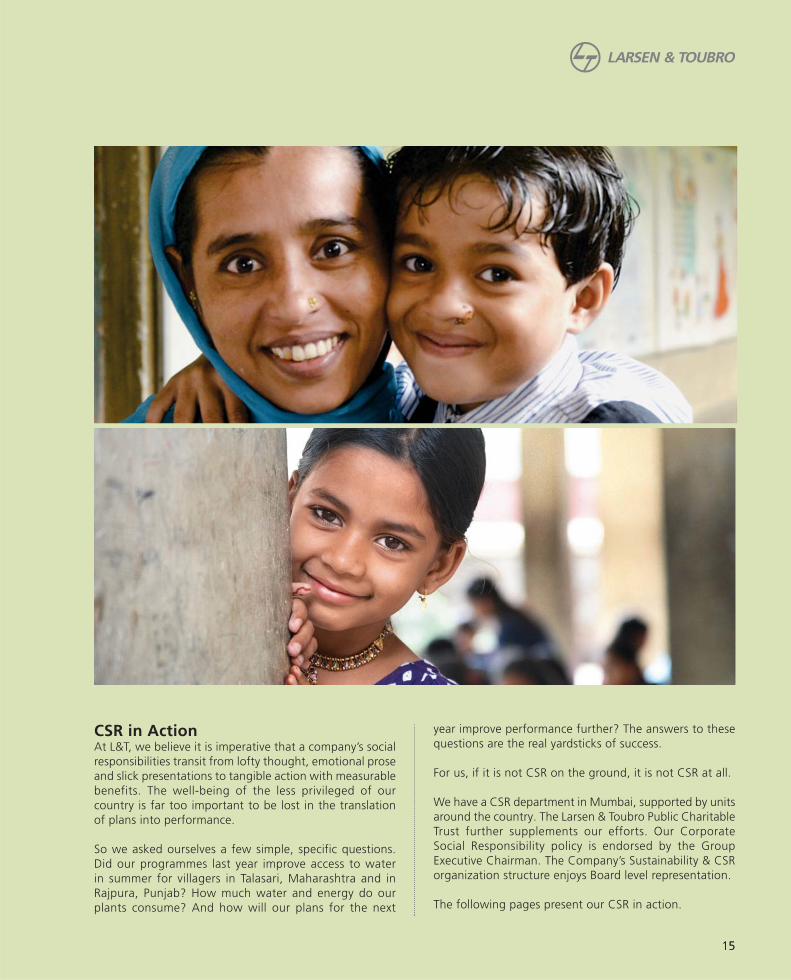
CSR in ActionAt L&T, we believe it is imperative that a company’s social
responsibilities transit from lofty thought, emotional prose
and slick presentations to tangible action with measurable
benefits. The well-being of the less privileged of our
country is far too important to be lost in the translation
of plans into performance.
So we asked ourselves a few simple, specific questions.
Did our programmes last year improve access to water
in summer for villagers in Talasari, Maharashtra and in
Rajpura, Punjab? How much water and energy do our
plants consume? And how will our plans for the next
year improve performance further? The answers to these
questions are the real yardsticks of success.
For us, if it is not CSR on the ground, it is not CSR at all.
We have a CSR department in Mumbai, supported by units
around the country. The Larsen & Toubro Public Charitable
Trust further supplements our efforts. Our Corporate
Social Responsibility policy is endorsed by the Group
Executive Chairman. The Company’s Sustainability & CSR
organization structure enjoys Board level representation.
The following pages present our CSR in action.
16
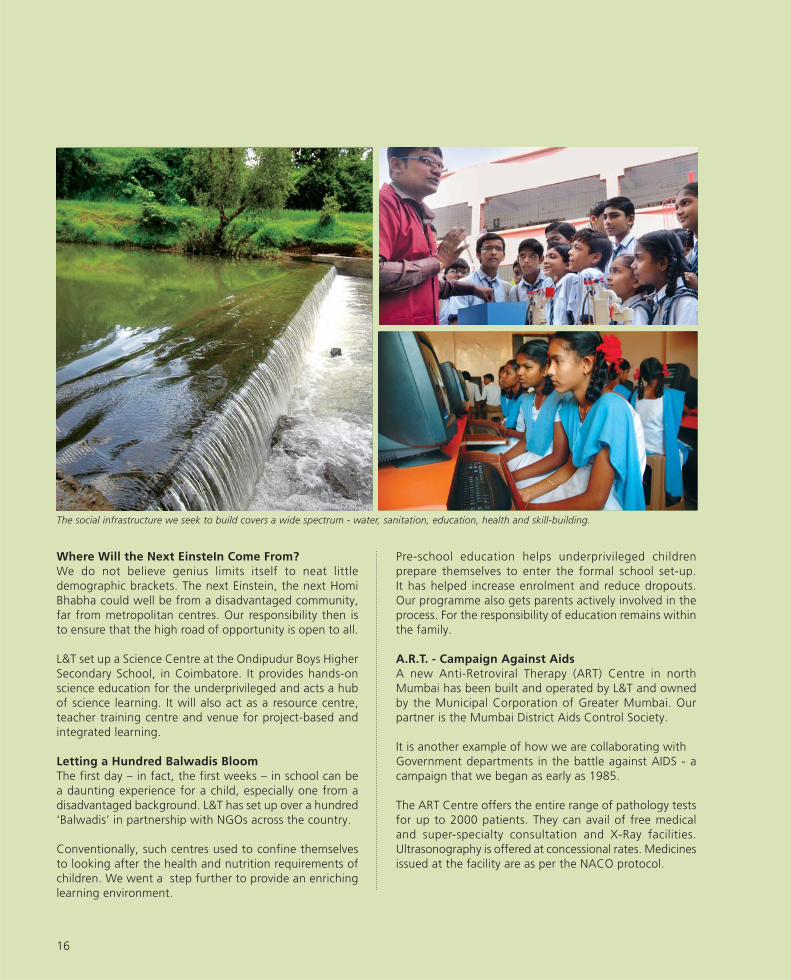
Where Will the Next EinsteIn Come From?
We do not believe genius limits itself to neat little
demographic brackets. The next Einstein, the next Homi
Bhabha could well be from a disadvantaged community,
far from metropolitan centres. Our responsibility then is
to ensure that the high road of opportunity is open to all.
L&T set up a Science Centre at the Ondipudur Boys Higher
Secondary School, in Coimbatore. It provides hands-on
science education for the underprivileged and acts a hub
of science learning. It will also act as a resource centre,
teacher training centre and venue for project-based and
integrated learning.
Letting a Hundred Balwadis Bloom
The first day – in fact, the first weeks – in school can be
a daunting experience for a child, especially one from a
disadvantaged background. L&T has set up over a hundred
‘Balwadis’ in partnership with NGOs across the country.
Conventionally, such centres used to confine themselves
to looking after the health and nutrition requirements of
children. We went a step further to provide an enriching
learning environment.
Pre-school education helps underprivileged children
prepare themselves to enter the formal school set-up.
It has helped increase enrolment and reduce dropouts.
Our programme also gets parents actively involved in the
process. For the responsibility of education remains within
the family.
A.R.T. - Campaign Against Aids
A new Anti-Retroviral Therapy (ART) Centre in north
Mumbai has been built and operated by L&T and owned
by the Municipal Corporation of Greater Mumbai. Our
partner is the Mumbai District Aids Control Society.
It is another example of how we are collaborating with
Government departments in the battle against AIDS - a
campaign that we began as early as 1985.
The ART Centre offers the entire range of pathology tests
for up to 2000 patients. They can avail of free medical
and super-specialty consultation and X-Ray facilities.
Ultrasonography is offered at concessional rates. Medicines
issued at the facility are as per the NACO protocol.
The social infrastructure we seek to build covers a wide spectrum - water, sanitation, education, health and skill-building.

1717
The Power Plant that also Provides Water
For the villagers around L&T’s supercritical power station
at Rajpura, Punjab, the plant is a many-sided benefactor.
In addition to lighting up their lives with thermal power,
it is also helping to quench the thirst of many. Rajpura
receives an average annual rainfall of 677 mm – not quite
enough for year-long needs of the farmers.
L&T engineers constructed a multi-tiered water
conservation system. This includes two storage tanks
(Capacity: 7694 cubic metres), a filtration chamber and
a recharge-well for harvesting rainwater and facilitating
artificial recharge.
It has led to a rise in the water table and more water for
the community.
L&T-eers Are More than Volunteers
Volunteers offer their services for good causes. L&T-eers do
more. They are passionate champions of the causes they
espouse. They are conscious of the company’s long history
of responding to social needs. And they carry this tradition
further. From teaching at municipal schools to donating
blood, running marathons for a cause to mobilizing
funds for supporting a number of community initiatives,
L&T-eering has become a way of life.
The employees also assist in tree plantation drives,
participate in company-wide programmes for energy
conservation and recycling of material. All this is carried
out in the personal time of the employees, well beyond
office hours
As we said, they are more than volunteers. The only way to
describe them is - L&T-eers.
Reduce, Reuse...Rethink
To the traditional three ‘Rs’ of sustainability, viz. Reduce,
Reuse and Recycle, L&T added a fourth - Rethink. At L&T’s
Hazira unit, our innovative engineers are using a Vapour
Absorption Machine that taps into the exhaust duct
from the forge reheating furnace. Thus, no natural gas is
needed when the furnace is in operation. It has minimised
natural gas consumption and led to an annual saving of
approximately 192,000 cubic metres of natural gas.
Yes, reducing and re-thinking has its rewards!
We believe education, skill-building and vocational training are powerful weapons in society’s war against deprivation.
18
Annual Business Responsibility Report (ABRR) 2014-15
This Business Responsibility Report (BRR) format conforms
to the Securities & Exchange Board of India (SEBI) listing
requirement. It covers the National Voluntary Guidelines
(NVG) based on Social, Environmental & Economic
Responsibilities of Business released by the Ministry of
Corporate Affairs, India.
The Company has also been publishing a Sustainability
Report every year since 2008 as per the Global Reporting
Initiative (GRI) G3 guidelines. All the Sustainability Reports
are externally assured and are ‘GRI Checked Application
Level A+’, signifying the highest level of disclosure in the
public domain. The 2014-15 report is being prepared as per
the latest Global Reporting Initiative (GRI) G4 guidelines.
The reports can be accessed at www.Lntsustainability.com.
The Company is the first engineering & construction
company in India to report on its Corporate Sustainability
performance, and among the earliest to state its
conformance with the eight missions of the National
Action Plan on Climate Change (NAPCC), India.
1. Corporate Identity Number (CIN) of the Company: L99999MH1946PLC004768
2. Name of the Company: Larsen & Toubro Limited
3. Registered address: L&T House, Ballard Estate, Mumbai: 400 001, India
4. Website: www.Larsentoubro.com
5. E-mail id: [email protected]
6. Financial Year reported: 1st April, 2014 - 31st March, 2015
7. Sector(s) that the Company is engaged in (industrial activity code-wise):
Section A: General Information about the Company
Group Class Sub-Class Description
271 2710 Manufacture of electric motors, generators, transformers and electricity distribution and control apparatus
282 2824 28246 Manufacture of parts and accessories for machinery / equipment used by construction and mining industries
301 3011 30111 Building of commercial vessels, passenger vessels, ferry boats, cargo ships, tankers, tugs, hovercraft (except
recreation type hovercraft), etc.
30112 Building of warships and scientifi c investigation ships, etc.
30114 Construction of fl oating or submersible drilling platforms
410 4100 41001 Construction of buildings carried out on own-account basis or on a fee or contract basis
421 4210 42101 Construction and maintenance of motorways, streets, roads, other vehicular and pedestrian ways, highways,
bridges, tunnels and subways
42102 Construction and maintenance of railways and rail-bridges
422 4220 42201 Construction and maintenance of power plants
42202 Construction / erection and maintenance of power, telecommunication and transmission lines
42901 Construction and maintenance of industrial facilities such as refi neries, chemical plants, etc.
465 4659 46594 Wholesale of construction and civil engineering machinery and equipment
681 6810 68100 Real estate activities with own or leased property
711 7110 71100 Architectural and engineering activities and related technical consultancy

19
8. List three key products/services that the Company manufactures/provides (as in the balance sheet)
1. Construction and project related activity
2. Manufacturing and trading activity
3. Engineering service
9. Total number of locations where business activity is undertaken by the Company
i. Number of International Locations: 35
ii. Number of National Locations: 100
10. Markets served by the Company – Local/State/National/International/: All
1. Paid up Capital (INR): ` 185.91 crore
2. Total Turnover (INR): ` 57558 crore
3. Total profit after taxes (INR): ` 5056 crore
4. Total Spending on Corporate Social Responsibility (CSR) as percentage of profit after tax: 2.1%
5. List of activities in which expenditure in point 4 (above) has been incurred:-
Community and social engagements broadly covering;
A. Water & Sanitation
B. Education
C. Health
D. Skill Building
E. Environment protection
1. Does the Company have any Subsidiary Company/ Companies?
Yes
2. Do the Subsidiary Company/Companies participate in the BR Initiatives of the parent company? If yes, then indicate
the number of such subsidiary company(s):
Yes. The Business Responsibility (BR) initiatives of the company are extended to the Subsidiary/Associate
Companies and these are encouraged to participate in various related activities of BR.
3. Do any other entity/entities (e.g. suppliers, distributors etc.) that the Company does business with; participate in the
BR initiatives of the Company? If yes, then indicate the percentage of such entity/entities? [Less than 30%, 30-60%,
More than 60%]:
Yes. The Company promotes BR initiatives in its value chain. At present, less than 30% of its suppliers/
distributors participate in BR initiatives.
1. Details of Director/Directors responsible for BR
a) Details of the Director/Directors responsible for implementation of the BR policy/policies
• DIN Number: 00001744
• Name: Mr. M. V. Kotwal
• Designation: Whole time Director & President (Heavy Engineering)
Section B: Financial Details of the Company
Section C: Other Details
Section D: BR Information

20
b) Details of the BR head
S. No Particulars Details
1. DIN Number (If applicable) Not Applicable
2. Name Major General Gautam Kar (Retd.)
3. Designation Head - Corporate Infrastructure & Administrative Services
4. Telephone Number +91-22-67052447
5. Email ID [email protected]
2. Principle-wise (as per NVGs) BR Policy/policies (Reply in Y/N)
Name of principles:
P1 – Businesses should conduct and govern themselves with Ethics, Transparency and Accountability
P2 – Businesses should provide goods and services that are safe and contribute to sustainability throughout
their life cycle
P3 – Businesses should promote the well-being of all employees
P4 – Businesses should respect the interests of, and be responsive towards all stakeholders, especially those who are
disadvantaged, vulnerable and marginalized
P5 – Businesses should respect and promote human rights
P6 – Businesses should respect, protect, and make efforts to restore the environment
P7 – Businesses, when engaged in influencing public and regulatory policy, should do so in a responsible manner
P8 – Businesses should support inclusive growth and equitable development
P9 – Businesses should engage with and provide value to their customers and consumers in a responsible manner
S. No. Questions P1 P2 P3 P4 P5 P6 P7 P8 P9
1. Do you have a policy/policies for Y Y Y Y Y Y Y Y Y
2. Has the policy being formulated in consultation with the relevant
stakeholders?
Y Y Y Y Y Y Y Y Y
3. Does the policy conform to any national /international standards?
If yes, Please specify? (50 words)
Yes. The policies are aligned with NVG guidelines
and applicable international standards of ISO
9001, ISO 14001, OHSAS 18001 and ILO principles.
4. Has the policy being approved by the Board?
Yes.
If yes, has it been signed by MD/owner/CEO/appropriate Board Director?
Signed by the Group Executive Chairman
Y Y Y Y Y Y Y Y Y
5. Does the company have a specifi ed committee of the Board/ Directors/
Offi cials to oversee the implementation of the policy?
Yes.
Y Y Y Y Y Y Y Y Y
6. Indicate the link for the policy to be viewed online? www.Lntsustainability.com
7. Has the policy been formally communicated to all relevant internal and
external stakeholders?
Y Y Y Y Y Y Y Y Y
8. Does the company have an in-house structure to implement the policy/
policies?
Y Y Y Y Y Y Y Y Y

21
2a. If answer to S.No. 1 against any principle, is ‘No’, please explain why: (Tick up to 2 options)
3. Governance related to BR
• Indicate the frequency with which the Board of Directors, Committee of the Board or CEO to assess the BR
performance of the Company. Within 3 months, 3-6 months, Annually, More than 1 year
o Annually
• Does the Company publish a BR or a Sustainability Report? What is the hyperlink for viewing this report? How
frequently it is published?
Yes, the Company has been publishing its Sustainability Report annually as per the framework
of Global Reporting Initiative (GRI) G3 since 2008. The sustainability reports are externally
assured and are ‘GRI Checked Application Level A+’, signifying the highest level of disclosure. The
report can be accessed at www.Lntsustainability.com
S. No. Questions P1 P2 P3 P4 P5 P6 P7 P8 P9
9. Does the Company have a grievance redressal mechanism related to the
policy/policies to address stakeholders’ grievances related to the policy/
policies?
Y Y Y Y Y Y Y Y Y
10. Has the company carried out independent audit/evaluation of the work-
ing of this policy by an internal or external agency?
Y Y Y Y Y Y Y Y Y
S. No. Questions P1 P2 P3 P4 P5 P6 P7 P8 P9
1. The company has not understood the Principles -----
2. The company is not at a stage where it fi nds itself in a position to
formulate and implement the policies on specifi ed principles
-----
3. The company does not have fi nancial or manpower resources available
for the task
-----
4. It is planned to be done within next 6 months -----
5. It is planned to be done within the next 1 year -----
6. Any other reason (please specify) -----
Principle 1: Businesses should conduct and govern themselves with Ethics, Transparency and Accountability
The Company’s governance framework enjoins the
highest standards of ethical and responsible conduct of
business on the part of all concerned to create value for
all stakeholders. The cornerstones of our governance
philosophy are ethics, transparency and accountability.
The Company’s Vision Statement as well as the policies
on Sustainability, Corporate Social Responsibility (CSR),
Corporate Human Resource and Corporate Environment,
Health and Safety (EHS) articulates the commitment to
these values. These policies extend to the operations of
all subsidiaries and associate companies.
L&T’s Board and senior management abide by the
Company’s ‘Code of Conduct’. The CEO & Managing
Section E:

22
Director provides an annual declaration regarding
compliance by the Company. The Code of Conduct is
featured on the Company’s website – www.Larsentoubro.
com. Sound systems and policies are in place (e.g. Whistle
Blower Policy) to promote the Company’s principles of
ethics and fair practices covering all group companies.
The Company’s Executive Management Committee
(EMC) ensures effective formulation and implementation
of a sustainability strategy, and draws up policies. In
addition, at the corporate level, sustainability initiatives
and performance are periodically reviewed by a nominated
member of the EMC.
Further, we have revised the Environmental & Social Code
of Conduct for suppliers this year and strengthened
processes to include specific clauses on ethics and
transparency. Many of Company’s suppliers are signatories
to this code.
The non-financial performance of the Company is
disclosed in the public domain, encapsulated in the
Company’s annual Sustainability Reports. These reports are
available as printed copies or accessible on the Company’s
website. This report is third-party verified and conforms to
the world-wide accepted framework of Global Reporting
Initiative (GRI).
Details relating to stakeholder complaints are included in
the Directors’ Report Section of this Annual Report.
Principle 2: Businesses should provide goods and services that are safe and contribute to sustainability throughout their life-cycle
L&T serves the core sector of the economy and builds
infrastructure critical to industries, businesses and public
well-being. We recognize the far reaching impact of
our products and projects, and ensure that safety and
sustainability are integrated into engineering and design.
While designing products to meet the specific needs of
customers, we ensure minimal environmental impact in
the course of production. Societal good, environmental
impact and economic value are taken into account in the
development process of all products.
The Company advocates energy efficiency in the course
of production, and thereby reduces its carbon footprint.
A comprehensive review of health and safety impact
of products, projects and services is carried out. All the
products and projects are accompanied with adequate
labels and signage systems, operation & maintenance
manuals. L&T offers comprehensive training to customer
personnel.
The Company’s expanding green products and services
portfolio helps the customers ‘Go Green’ by conserving
natural resources reducing energy consumption and
associated GHG emissions. The Company’s area of
expertise encompasses Green Buildings, Mass Rapid
Transit Systems like metro and mono rail, solar power
plants built on EPC basis, fuel switch projects, coal
Codified policies publicly affirm the organisation’s commitment,
governs actions and provides clarity of direction.

23
Energy efficient products and systems from the Electrical
& Automation business cover low-watt loss fuses, Power
Management Systems, AC drives, smart metering systems,
etc.
Within the scope of its activities, the Company aims to
conserve resources during construction and manufacturing
by practicing material optimization, using eco-friendly
raw materials and adopting energy efficient processes.
To enhance health and safety aspects at manufacturing
facilities and project sites, multiple initiatives have been
introduced and on-going interventions strengthened.
Sustainability Practices in the Value Chain
Assessing the lifecycle impacts of the Company’s products
is critical to achieving overall reductions in environmental
impact across the value chain, while growing our business.
gasifiers, super-critical thermal power plant & equipment,
power transmission & distribution systems, energy saving
electrical & automation solutions, etc.
Coal gasifiers manufactured by the Heavy Engineering
business conserve energy and are environment friendly.
Green Building at Talegaon. This is one of many eco-friendly buildings
that form part of L&T’s campuses.

24
Lifecycle Assessment (LCA) is one of the techniques
adopted to understand the environmental impact of
products. This year, we have revised the Environment and
Social Code of Conduct for suppliers which advocates
environment-friendly, occupational health & safety and
socially-responsible business practices. Many suppliers are
committed to practicing it in letter and spirit.
The Company conducted an environmental and social
assessment of select suppliers to help them identify
energy, water and resource-saving opportunities. The
Company also conducts capacity-building programs for
vendors and sub-contractors, and provides training and
technical expertise to improve operational efficiency. Local
sourcing enhances logistics and provides a fillip to the local
economy. Around 80% of the Company’s requirements are
met by local suppliers. Across L&T we have had ongoing
supplier engagement programs.
The Company continually promotes material recycling and
use of alternate materials. However, as the products are
‘engineered to order’ based on customer requirement,
the scope for direct material recycling is limited. Alternate
materials such as fly ash in place of cement, crushed
sand instead of natural sand, blast furnace slag in road
construction in place of natural aggregate etc. help to
conserve precious natural resources. Other examples
include recycling of steel scrap from steel centres of
construction business and zinc waste for plating operations.
The Company also engages with its value chain through
an established stakeholder engagement framework.
Feedback is valuable in formulating and implementing the
sustainability roadmap for inclusive growth.
Principle 3: Business should promote well-being of employees
L&T believes that it is employees who shape the
organisation’s character and drive its performance. The
Company succeeds if, and only if, employees recognise
that the corporate goals are aligned to their individual
aspirations. A nurturing environment and a climate
conducive to personal well-being and professional growth
are intrinsic to the L&T culture.
The Company’s Corporate Human Resource Policy has a
robust framework which inspires innovation and creativity.
Total workforce
L&T employees
(Standalone)
Refer “Standalone Financials
– 10 Year Highlights” section
of the Annual Report
Number of permanent
women employees
2,295
Contract workmen 4,11,604
The Company directly employs 94 persons with disabilities.
The value chain also employs 25 persons with disabilities.
The Company believes in an inclusive approach to
employment. No discrimination is made on the basis
of caste, religion, region, gender or physical disability.
The company complies with the principles of the United
Nations Global Compact. Contracts entered into with
vendors and partners include Human Rights clauses.
Air Traffic Control Tower, Mumbai Airport - built by L&T. It combines
aesthetics with engineering.

25
The Company recognizes employee unions and associations
affiliated with different trade unions at its manufacturing
facilities. 7.4% of permanent employees are covered
under this category.
Safety is a thrust area for the Company. The Corporate
Environment, Health & Safety (EHS) Policy enlists the
commitment towards embedding a safety culture in all
business operations and providing a safe and healthy
workplace to all employees. The safety performance of
the Company is reviewed by the Board of the Company
in each quarter.
Regular safety training, tool box talks, mock drills and
specific safety interventions are undertaken to build a safe
work culture within the organization. Further, a wide range
of technical, functional as well as managerial training is
imparted to the employees to nurture their competencies.
New employees are also given compulsory training on
multiple disciplines including health, safety & environment,
human rights, climate change and sustainable development
along-with orientation towards the Company businesses
and functions of various departments. All contract workmen
receive mandatory safety training before commencing
work. A total of over 3.7 million man – hours of training
was provided in FY 2014-15 to the permanent employees.
The Company’s policy on ‘Protection of Women’s Rights at
Workplace’ has been drawn up, and widely disseminated.
There were no cases of sexual harassment received in the
Company during 2014-15.
No complaints relating to child labour, forced labour or
involuntary labour were received in the FY 2014-15.
In addition to workplace safety management, efforts
are also made towards employee wellness through the
‘Working on Wellness’ initiative. This focuses on stress
management and essential healthcare to enhance overall
employee well-being and promote work-life balance.
Special programs are conducted for families of employees
on home safety, career guidance and hobbies.
Principle 4: Businesses should respect the interests of, and be responsive towards all stakeholders, especially those who are disadvantaged, vulnerable and marginalized
As one of India’s most widely held companies with diverse
and transparent shareholding, we recognize that our
stakeholders form a vast and heterogeneous community.
We are conscious of the increased responsibility to ensure
that diverse and sometimes contrary interests are met
with fairness and equity. The Company engages with
its identified stakeholders on an ongoing basis through
a structured stakeholder engagement programs. The
company continues to improve the value proposition it
offers customers, shareholders, employees, suppliers and
other stakeholders and develop the communities around
its areas of operation.
The Leadership Development Academy at Lonavala near Mumbai
is one of the only institutions of its kind in India. It provides the
springboard for Team L&T to attain the next level of professional
growth.
Safety techniques need to be scientifically disseminated. L&T has set
up a one-of-a-kind Safety Innovation School in Hazira.
26
The Company uses multiple communication platforms,
including formal and informal channels of communication,
in its dialogue with stakeholders. The Company’s
engagement framework is based on objectives like
proactive response, transparency, inclusiveness and
trust. Based on feedback, the framework is remodeled to
enable the company to customize its communication and
undertake engagement initiatives for internal and external
stakeholders. Informed interaction helps in strategy
formulation, superior decision-making and accountability.
The Company recognizes the opportunity to create
positive social impact through engagements with the
community. The CSR programs run by the Company are
focused primarily on sections of the local communities,
which are disadvantaged, vulnerable and marginalized.
Open communication channels ensure that the expressed
needs of the community are reflected in the development
initiatives we design.
Our CSR program is focused on ‘Building India’s Social
Infrastructure’. After a detailed need assessment, the
focus areas of work are identified in the operational
communities. The Company partners the communities not
only in identifying their needs but also in implementing and
tracking the progress of work done towards addressing
their issues. The programs are focused on:
• Water & Sanitation
• Education
• Health
• Skill Development
Further details of the CSR program & approach are listed
in Principle 8.
The Company has a dedicated Corporate Brand
Management & Communications department which
facilitates an on-going dialogue between the organization
and its stakeholders. Existing communication channels
include:
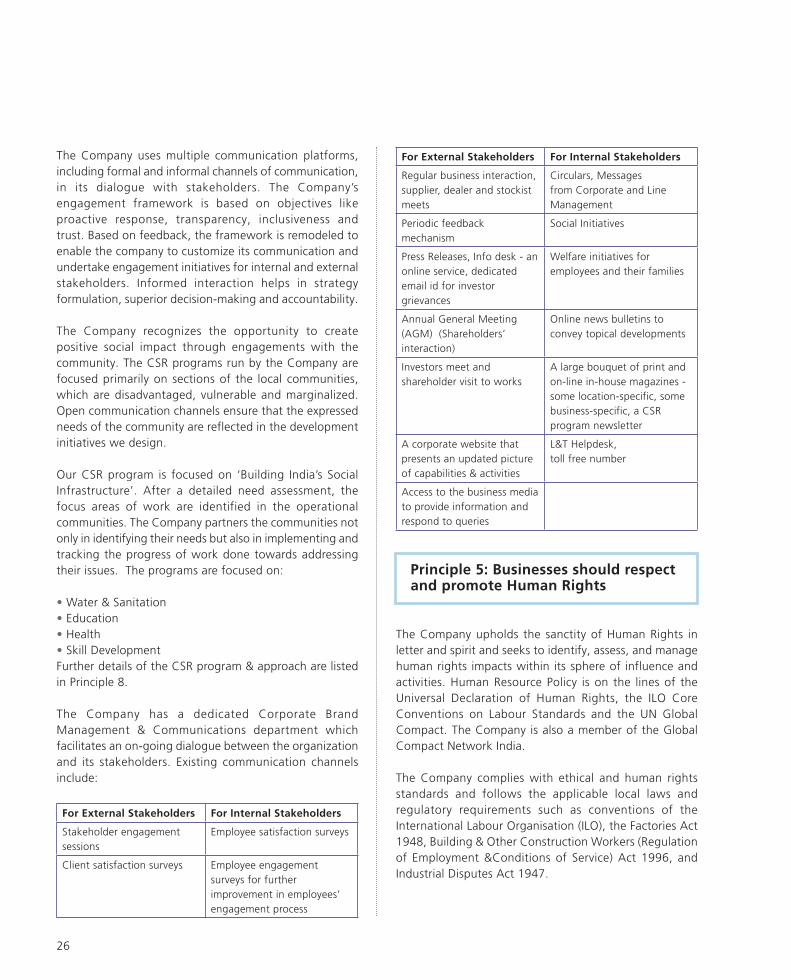
For External Stakeholders For Internal Stakeholders
Stakeholder engagement
sessions
Employee satisfaction surveys
Client satisfaction surveys Employee engagement
surveys for further
improvement in employees’
engagement process
For External Stakeholders For Internal Stakeholders
Regular business interaction,
supplier, dealer and stockist
meets
Circulars, Messages
from Corporate and Line
Management
Periodic feedback
mechanism
Social Initiatives
Press Releases, Info desk - an
online service, dedicated
email id for investor
grievances
Welfare initiatives for
employees and their families
Annual General Meeting
(AGM) (Shareholders’
interaction)
Online news bulletins to
convey topical developments
Investors meet and
shareholder visit to works
A large bouquet of print and
on-line in-house magazines -
some location-specific, some
business-specific, a CSR
program newsletter
A corporate website that
presents an updated picture
of capabilities & activities
L&T Helpdesk,
toll free number
Access to the business media
to provide information and
respond to queries
Principle 5: Businesses should respect and promote Human Rights
The Company upholds the sanctity of Human Rights in
letter and spirit and seeks to identify, assess, and manage
human rights impacts within its sphere of influence and
activities. Human Resource Policy is on the lines of the
Universal Declaration of Human Rights, the ILO Core
Conventions on Labour Standards and the UN Global
Compact. The Company is also a member of the Global
Compact Network India.
The Company complies with ethical and human rights
standards and follows the applicable local laws and
regulatory requirements such as conventions of the
International Labour Organisation (ILO), the Factories Act
1948, Building & Other Construction Workers (Regulation
of Employment &Conditions of Service) Act 1996, and
Industrial Disputes Act 1947.

27
Companies. Key suppliers are also encouraged to follow
such practices.
We remain committed to the eight missions of the National
Action Plan on Climate Change (NAPCC) instituted
by the Government of India. Progressively, we have
been investing in products and processes that promote
sustainable growth - enhancing energy security, developing
low-carbon technologies for building infrastructure,
spreading sustainability knowledge and increasing green
cover. Numerous initiatives have been undertaken for
reduction of energy and Greenhouse Gas (GHG) Emission
intensity, increased use of renewable energy, promotion
of green building construction, and enhancement of green
cover, provision of solar & renewable energy solutions to
customers and building of capacity for environmental
management. Carbon emissions are annually disclosed to
the Carbon Disclosure Project. Our energy auditors and
energy managers have been trained at units certified by
Bureau of Energy Efficiency (BEE).
The Company adheres to all pollution control standards set
by the regulatory bodies like Central and State pollution
control boards. Environmental regulatory approvals are
sought prior to commencement of operations at units and
project sites. Regular checks are conducted by internal
We ensure that human rights clauses (including those
that deal with child or forced labour) are part of contract
documents entered into with sub-contractors, and are
strictly adhered to within our premises and sites, while also
being extended to Subsidiary and Associate companies.
Employees are sensitized on human rights through
induction training programs, interactive sessions, intranet,
policy manuals and posters.
The Company’s recruitment rules, procedures and general
conditions of service stipulate equal opportunities for
all its employees at the time of recruitment as well as
during the course of employment irrespective of gender,
ethnicity, nationality, sexual orientation, political or
religious affiliation.
We propagate our values across the supply chain by
prescribing a ‘Code of Conduct’ for our suppliers. Apart
from the internal stakeholders the policy extends to our
Suppliers, Contractors and NGOs. We have initiated
environmental and social screening and assessment of
select suppliers based on their impact on the environment
and type of operations. Many of our suppliers are
signatories to this code and are committed to practice
it in letter and spirit. Essential environment-friendly and
socially-responsible business practices propagated by the
Code include energy efficiency, water conservation, waste
reduction, occupational health & safety, prevention of
corruption and respect for human rights.
There were no reported complaints related to human
rights violations during the FY 2014-15.
Principle 6: Business should respect, protect, and make efforts to restore the environment
L&T is committed to environmental sustainability in all areas
of its operations. We have revised our sustainability policy
this year which is in synch with current environmental
concerns.
A system is in place to identify and assess potential
environmental risks and opportunities in its operations.
The Company’s environment conservation programs and
initiatives are propagated to its Subsidiary and Associate
Sustainability begins at home. ‘Unnati’ - L&T’s new facility in Navi
Mumbai has achieved LEED (Leadership in Energy and Environmental
Design) Gold Certification.
28
and independent auditors/assessors, to ensure compliance
with relevant environmental regulations and compliance
reports are submitted to Central Pollution Control Board
(CPCB) / State Pollution Control Boards (SPCB) where ever
applicable. The Company’s Board of Directors has complete
access to the information within the organization. This
includes reports on any material effluent or pollution
problems. All manufacturing units and service sites are
encouraged to develop and maintain a management
system based on ISO 14001 & OHSAS 18001. During the
financial year, there were no pending or unresolved show
cause/legal notices from CPCB/SPCB.
As a part of Company-wide effort to protect the
environment, and in accordance with the circular issued
by the Ministry of Corporate Affairs, Government of India,
shareholders have been given the option of receiving
documents related to general meetings (including AGM),
Audited Financial Statements, etc., through e-mail instead
of printed copies.
Salient features of the Company’s green initiatives include:
Using Renewable Energy
A Power Purchase Agreement is in place since 2003 with
a renewable energy power producer for various campuses
to draw renewable energy as a substitute to fossil fuel
generated electricity.
Reducing Carbon Footprint
Lifecycle assessment - from cradle to gate - has been
conducted of a product manufactured by the Heavy
Engineering business. Results show that 40% of the
total carbon footprint is generated during the in-house
fabrication process. The rest is caused by activities outside
Company premises. Initiatives taken at the Powai campus
include: investments in renewable energy, reduction in
material consumption and enhancing the product’s energy
efficiency. The Company plans to conduct similar studies
for other products. In addition to reducing its own carbon
footprint, it offers customers a bouquet of green products
and services. Revenue from green products & services are
contributing an increasingly larger share in the Company’s
total revenue.
Conserving Water
L&T’s water consumption intensity and treated wastewater
discharge have declined steadily over the years. Various
water management initiatives like water auditing, rainwater
harvesting and Industrial and domestic wastewater
treatment and reuse are in place across all manufacturing
locations. Five L&T campuses have been certified as ‘Water
Positive’ by an independent assurance provider. All 28
major units are zero waste-water discharge.
The Larsen & Toubro Public Charitable Trust (LTPCT)
supplements the Company’s efforts in water conservation
efforts by focusing on water management projects in
tribal and drought-prone regions of Maharashtra. Over
200 check dams were constructed in Dahanu and Talasari
blocks of Maharashtra, in collaboration with voluntary
organizations.
Promoting Biodiversity
Carbon sequestration studies were conducted in six
campuses. Studies show that the Powai campus has:
around 101 wild plant species; 169 cultivated plant
species, 23 bird species, 19 butterfly species, 6 species
of mammals and 9 species of reptiles. Several initiatives
have been taken to protect biodiversity in the area and to
grow native species.
Principle 7: Responsible Public Advocacy
L&T articulates the larger interests of industry, professional
disciplines and the community at industrial forums and
professional bodies. Our senior executives provide the
benefits of their experience and insights while participating
in the formulation of public policies. Institutes and
industrial forums where the Company participates include:
• Association of Business Communicators of India
• Associated Chambers of Commerce and Industry of
India (ASSOCHAM)
• Bombay Chamber of Commerce & Industry (BCCI)
• Bureau of Indian Standards (BIS)
• Construction Industry Development Council (CIDC)
• Confederation of Indian Industry (CII), Centre of
Excellence for Sustainable Development (CESD)
• CII – Green Business Centre (GBC)
• Federation of Indian Chambers of Commerce and
Industry (FICCI)
• Indian Electrical and Electronics Manufacturers
Association (IEEMA)

29
The company has identified the following thrust areas:
• Water & Sanitation
• Education
• Healthcare
• Skill Development
A snapshot of the work is as follows-:
Water & Sanitation
Severe water-stressed areas in the country have been
identified. We will focus on creating sustainable sources
of water for drinking, sanitation and irrigation. Replicable
and indigenous methods for augmenting water supply will
be adopted, such as building check dams, field bunds, and
soil and water conservation. The program will also help
the community to build and utilize sanitation facilities.
Other initiatives in these identified areas will include
support to local schools, skill development training and
access to medical facilities.
Education
We focus on providing primary education, developing
infrastructure and enhancing the learning experience in
schools in the vicinity of our units across India.
Innovative learning methods are used in subjects like
mathematics and science, which many children find
challenging. Our ‘Science on Wheels’ van visits schools and
provides a hands-on opportunity to perform experiments.
Other initiatives include, support to pre-schools,
infrastructure development, setting up computer labs,
providing teaching aids and uniforms to the needy,
capacity building of teachers, organizing summer camps,
• Indian Institute of Chemical Engineers (IIChE)
• National Safety Council (NSC)
• National Fire Protection Institution (NFPI)
The Company’s senior executives interact with CII - CESD
on a focused program of sustainable development and
integrated reporting. They are part of the working
teams on Environment, Health & Safety (EHS), energy
conservation and Corporate Social Responsibility (CSR).
Principle 8: Support Inclusive Growth
Inclusive growth is at the heart of Company’s social
engagement strategy. Last year, L&T revisited CSR thrust
areas and developed a new theme: ‘Building India’s Social
Infrastructure’. All the Company’s CSR activities are
centered on holistic and integrated social development
programs at locations identified as being most needy. A
new Corporate Social Responsibility (CSR) policy has been
formulated.
The Company has the following structure for
implementation of CSR programs: The Apex SCSR Team
at the corporate level and SCSR team at the business level
and unit level -
• CSR projects are identified and implemented by a unit
level SCSR team, area/branch offices and project based
team with guidance from the Apex and Business level
SCSR team
• Ladies Clubs formed by women employees and spouses
of L&T employees participate in implementation of CSR
projects
• Employee volunteers - known as ‘L&Teers’ focus on
health and education programs
The Company works with NGOs, and the society at large
in a collaborative approach to identify the requirements
of the local community through need assessment
before initiating any social program. Periodic-impact
assessment is done to monitor the benefits received by
the community and augment the CSR project if required.
The community development programs are either fully-
adopted or supported by the company as per the need
on a case-to-case basis. Capacity-building programs for
local administrations are also conducted to successfully
run the programs.
‘Science on Wheels’ - L&T joins hands with an NGO to promote
science in schools. This is part of L&T’s broad spectrum of community
initiatives.
30
sports activities and upgrading school libraries. Currently,
L&T is supporting over 250 schools across India and
reaching out to over 2 lakh underprivileged children - in
addition to undertaking interventions in over 100 balwadis
and anganwadis.
Health
L&T participates in building a healthy community through
ongoing initiatives in several areas of healthcare with a
focus on mother and child care, including several other
facets of well-being.
Around its establishments, across India, L&T has set
up health centres with a focus on reproductive health
and conducted diagnostic and clinical health camps to
support maternal and child health care, immunization
and health education. Health camps are conducted by a
combination of teams and mobile clinics that reaches out
to the underprivileged. Our HIV/AIDS prevention initiatives
include conducting awareness camps in the community,
Anti-Retroviral Therapy (ART), Integrated Counseling and
Testing at the Company’s health centre in Mumbai.
The first health centre for the community was set up by L&T
in Andheri, Mumbai in 1967. Today, nine community health
centres in towns with L&T campuses – Mumbai (2), Thane,
Ahmednagar, Surat, Kansbahal, Coimbatore, Chennai and
Vadodara provide health care for the community as well
as employees and their family members. L&T has also
set up Artificial Kidney Dialysis centres for benefit of the
underprivileged at Mumbai, Thane, Vadodara and Chennai
community health centres. Our community health centres
reach out to over 3 lakh beneficiaries anually and at 13
locations, we cater to their needs through mobile health
vans.
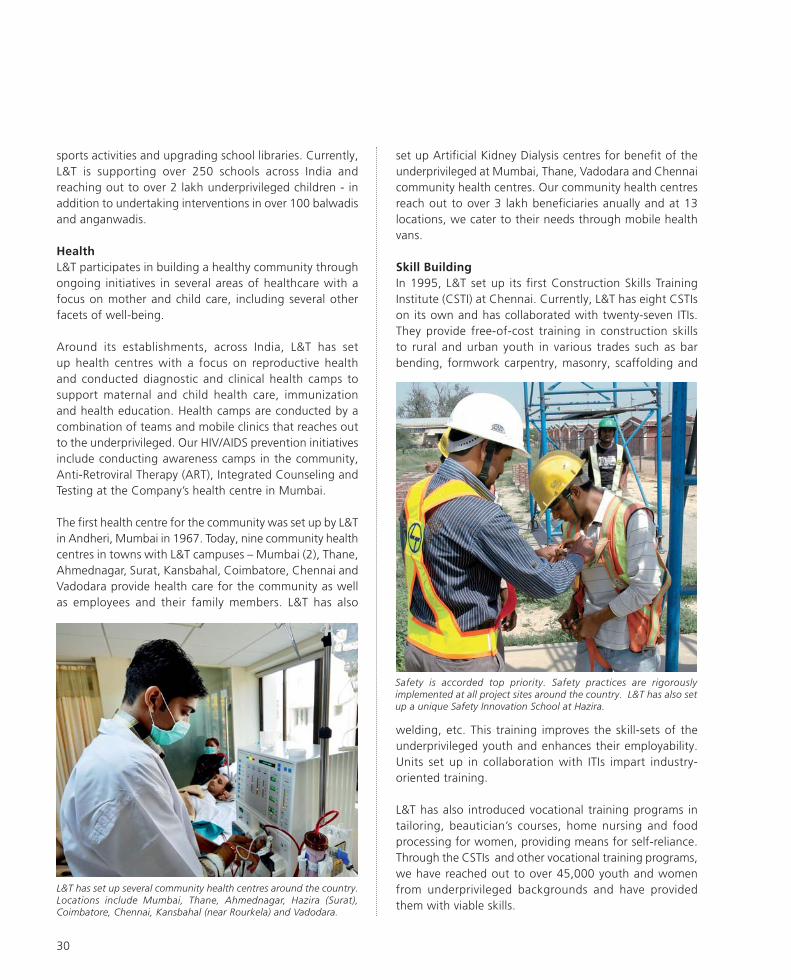
Skill Building
In 1995, L&T set up its first Construction Skills Training
Institute (CSTI) at Chennai. Currently, L&T has eight CSTIs
on its own and has collaborated with twenty-seven ITIs.
They provide free-of-cost training in construction skills
to rural and urban youth in various trades such as bar
bending, formwork carpentry, masonry, scaffolding and
welding, etc. This training improves the skill-sets of the
underprivileged youth and enhances their employability.
Units set up in collaboration with ITIs impart industry-
oriented training.
L&T has also introduced vocational training programs in
tailoring, beautician’s courses, home nursing and food
processing for women, providing means for self-reliance.
Through the CSTIs and other vocational training programs,
we have reached out to over 45,000 youth and women
from underprivileged backgrounds and have provided
them with viable skills.
Safety is accorded top priority. Safety practices are rigorously
implemented at all project sites around the country. L&T has also set
up a unique Safety Innovation School at Hazira.
L&T has set up several community health centres around the country.
Locations include Mumbai, Thane, Ahmednagar, Hazira (Surat),
Coimbatore, Chennai, Kansbahal (near Rourkela) and Vadodara.
31
The Company has reached out to over 1.3 million
beneficiaries through various CSR programs and initiatives.
The Larsen & Toubro Public Charitable Trust (LTPCT)
conducts vocational training program for women, giving
them the opportunity to earn their livelihood. The program
conducts beautician courses and imparts skills related to
tailoring, home-nursing, food processing, etc.
This year, with the construction of additional check dams
in the Dahanu Taluka of Maharashtra, the total number
has reached 200. Check dams are eco-friendly structures
that help irrigation and ground water recharge.
Please refer to the ‘Social Performance’ section of
Sustainability Reports for further details on various social
engagement and community development programs.
The Company contributed Rs. 105.68 crores in 2014-15
towards social development.
Principle 9: Engage with and provide value to customers
We believe our leadership position in most of our major
businesses rests on our ability to consistently improve the
value we offer customers. We engage with our clients
to understand requirements, and anticipate needs. We
invest in R&D, design facilities, superior manufacturing
and testing processes, and set up training centres for our
own and customer personnel.
Health & Safety concerns are integrated at the product
design stage. Our products carry suitable labeling and are
accompanied by operation and maintenance manuals in
line with relevant codes and specifications. Similar clarity
is maintained across all our projects through signage
systems. Products are tested and benchmarked against
stringent national and international standards such as
Bureau of Indian Standards, International Organization
for Standardization and International Electro technical
Commission.
An established system of addressing customer complaints,
comments and suggestions ensures regular personal
interaction with clients. The system consists of regular
customer meets, customer satisfaction surveys, training
programs for customer representatives and market
based research. All our channel partners, i.e., Stockists
and Dealers are briefed about new product features and
components. The high percentage of repeat orders is a
reliable indication of customer satisfaction and confidence
in L&T’s products, projects and services.
All norms, standards and voluntary codes and guidelines
related to marketing communication are adhered to.
The brand management guidelines institutionalized by
L&T’s Corporate Brand Management & Communications
(CBMC) department authenticate communications and
help customers identify and distinguish the Company’s
products.
Regarding unfair trade practices, irresponsible advertising
and or anti-competitive behaviour, no stakeholder has
filled a case against the Company in last five years and
there are no pending cases as on 31st March, 2015.
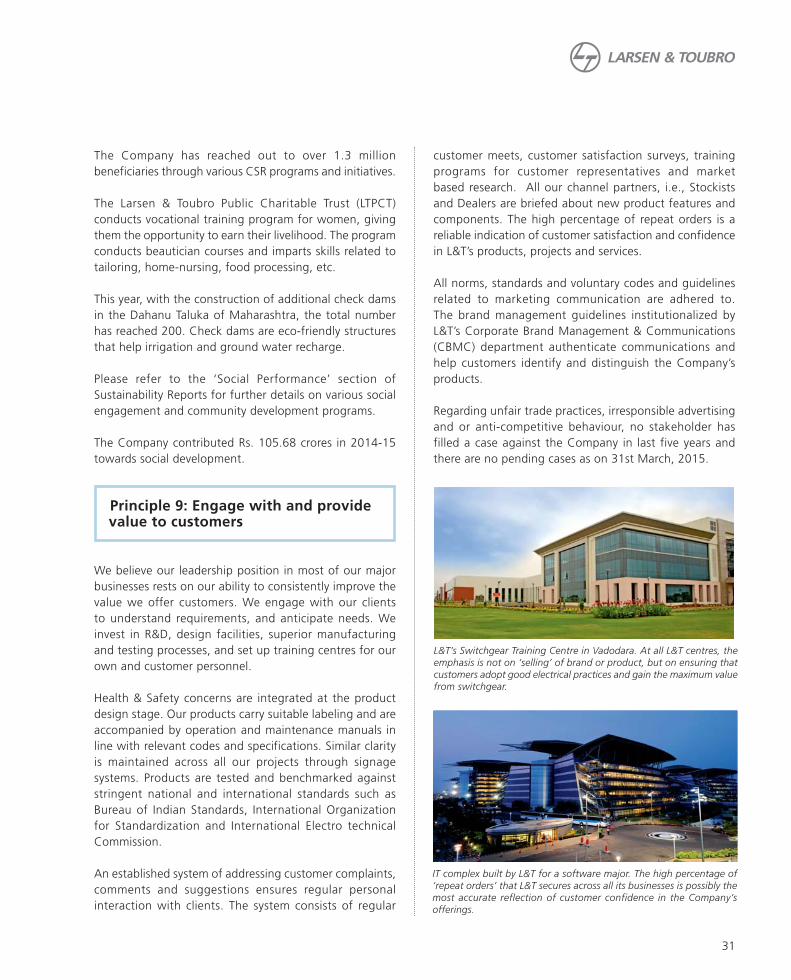
L&T’s Switchgear Training Centre in Vadodara. At all L&T centres, the
emphasis is not on ‘selling’ of brand or product, but on ensuring that
customers adopt good electrical practices and gain the maximum value
from switchgear.
IT complex built by L&T for a software major. The high percentage of
‘repeat orders’ that L&T secures across all its businesses is possibly the
most accurate reflection of customer confidence in the Company’s
offerings.

32
Annexure: Mapping to the SEBI framework
QuestionReference
Section Page Number
Section A : General Information about the Company
1. Corporate Identity Number (CIN) of the Company
2. Name of the Company
3. Registered Address
4. Website
5. Email id
6. Financial Year Reported
7. Sector(s) that the Company is engaged in (industrial activity code-wise)
AR Page 18
AR Page 18
AR Page 18
AR Page 18
AR Pages 18-19
8. List three key products/services that the Company manufactures/provides (as in bal-
ance sheet)
9. Total number of locations where business activity is undertaken by the Company
AR Page 19
i. Number of International Locations (Provide details of major 5 AR Page 19
ii. Number of National Locations AR Page 19
10. Markets served by the Company – Local/State/National/International AR Page 19
Section B: Financial Details of the Company
1. Paid up Capital (INR) AR Page 19
2. Total Turnover (INR)
3. Total profi t after taxes (INR)
AR Page 19
4. Total spending on Corporate Social Responsibility (CSR) as percentage of profi t
after tax (%)
AR Page 19
5. List of activities in which expenditure in 4 above has been incurred: - AR Page 19
Section C : Other Details
1. Does the Company have any Subsidiary Company/ Companies? AR Page 19
2. Do the Subsidiary Company/Companies participate in the BR Initiatives of the par-
ent company? If yes, then indicate the number of such subsidiary company(s)
3. Do any other entity/entities (e.g. suppliers, distributors etc.) that the Company
does business with, participate in the BR initiatives of the Company? If yes, then
indicate the percentage of such entity/entities?
[Less than 30%, 30-60%, More than 60%]
AR Page 19
Section D: BR Information
1. Details of Director/Directors responsible for BR
a) Details of the Director/Director the BR policy/policies
• DIN Number
• Name
• Designation
b) Details of the BR head
• DIN Number (if applicable)
• Name
• Designation
• Telephone number
• e-mail ID
AR Page 19-20
3. Governance Related to BR
Indicate the frequency with which the Board of Directors, Committee of the Board or
CEO to assess the BR performance of the Company. Within 3 months, 3-6 months, An-
nually, More than 1 year
AR Page 21

33
QuestionReference
Section Page Number
Does the Company publish a BR or a Sustainability Report? What is the Hyperlink for
viewing this report? How frequently it is published?
AR Page 21
Section E : Principle-wise Performance
Principle1: Ethics, Transparency and Accountability
Does the policy relating to ethics, bribery and corruption cover only the company?
Does it extend to the Group/Joint Ventures/ Suppliers/Contractors/NGOs /Others?
AR Page 21-22
How many stakeholder complaints have been received in the past fi nancial year and
what percentage was satisfactorily resolved by the management?
The details related to
stakeholder complaints
are included in the
Directors’ Report
Section of this Annual
Report.
Page 22
Principle 2 : Sustainable Products and Services
List up to 3 of your products or services whose design has incorporated social or envi-
ronmental concerns, risks and/or opportunities.
AR Page 22-24
For each such product, provide the following details in respect of resource use (energy,
water, raw material etc.) per unit of product (optional):
AR Page 22-24
Does the company have procedures in place for sustainable sourcing (including transpor-
tation)?
AR Page 22-24
Has the company taken any steps to procure goods and services from local & small
producers, including communities surrounding their place of work?
AR Page 22-24
If yes, what steps have been taken to improve their capacity and capability of local and
small vendors?
Does the company have a mechanism to recycle products and waste? If yes what is the
percentage of recycling of products and waste (separately as <5%, 5-10%, >10%).
Also, provide details thereof, in about 50 words or so.
Green buildings
constructed by the
Company’s Construc-
tion Business help
customers to reduce
energy and water
consumption, utilize
recycled material and
locally source most of
construction mate-
rial. The Company is
a leading EPC solution
provider for Solar
Photo Voltaic (PV)
based power plants
helping customers save
on the energy bills and
contribute to reduc-
tion of GHG emissions
from consumption of
indirect energy.
Page 22-24

34
QuestionReference
Section Page Number
Principle 3: Employee Well Being
Total number of employees.
Total number of employees hired on temporary/contractual/casual basis.
Number of permanent women employees.
Number of permanent employees with disabilities
Do you have an employee association that is recognized by management?
What percentage of your permanent employees is members of this recognized employee
association?
Page 24
Please indicate the Number of complaints relating to child labour, forced labour, invol-
untary labour, sexual harassment in the last fi nancial year and pending, as on the end of
the fi nancial year.
Page 25
What percentage of your under mentioned employees were given safety and skill up
gradation training in the last year?
Page 25
Principle 4: Valuing Marginalized Stakeholders
Has the company mapped its internal and external stakeholders? Page 25
Out of the above, has the company identifi ed the disadvantaged, vulnerable & marginal-
ized stakeholders?
Are there any special initiatives taken by the company to engage with the disadvan-
taged, vulnerable and marginalized stakeholders.
Page 26
Principle 5: Human Rights
Does the policy of the company on human rights cover only the company or extend to
the Group/Joint Ventures/Suppliers/Contractors/NGOs/Others?
Page 26
How many stakeholder complaints have been received in the past fi nancial year and
what percent was satisfactorily resolved by the management?
Page 27
Principle 6: Environment
Does the policy related to Principle 6 cover only the company or extends to the Group/
Joint Ventures/Suppliers/Contractors/NGOs/others.
Page 27
Does the company have strategies/ initiatives to address global environmental issues
such as climate change, global warming, etc?
Page 27
Does the company identify and assess potential environmental risks? Page 27-28
Does the company have any project related to Clean Development
Mechanism?
Page 27-28
Has the company undertaken any other initiatives on – clean technology, energy ef-
fi ciency, renewable energy, etc. Y/N.
Page 27-28

35
QuestionReference
Section Page Number
Are the Emissions/Waste generated by the company within the permissible limits given
by CPCB/SPCB for the fi nancial year being reported?
Number of show cause/ legal notices received from CPCB/SPCB which are pending (i.e.,
not resolved to satisfaction) as on end of Financial Year.
Page 28
Principle 7: Policy Advocacy
Is your company a member of any trade and chamber or association? If Yes, Name only
those major ones that your business deals with:
Have you advocated/lobbied through above associations for the advancement or im-
provement of public good?
Page 28-29
Principle 8: Inclusive Growth
Does the company have specifi ed programs/initiatives/projects in
pursuit of the policy related to Principle 8?
Page 29
Are the programs/projects undertaken through in-house team/own foundation/external
NGO/government structures/any other organisation?
Page 29-30
Have you done any impact assessment of your initiative? Page 29-30
What is your company’s direct contribution to community development projects -
Amount in INR and the details of the projects undertaken. Page 31
Have you taken steps to ensure that this community development initiative is success-
fully adopted by the community?
Page 29-31
Principle 9: Customer Welfare
What percentage of customer complaints/consumer cases are pending as on the end of
fi nancial year.
The details related to
stakeholder complaints
are included in the
Directors’ Report
Section of this Annual
Report.
Does the company display product information on the product label, over and above
what is mandated as per local laws?
Page 31
Is there any case fi led by any stakeholder against the company regarding unfair trade
practices, irresponsible advertising and/or anti-competitive behaviour during the last fi ve
years and pending as of end of fi nancial year
Did your company carry out any consumer survey/ consumer satisfaction trends?
Page 31
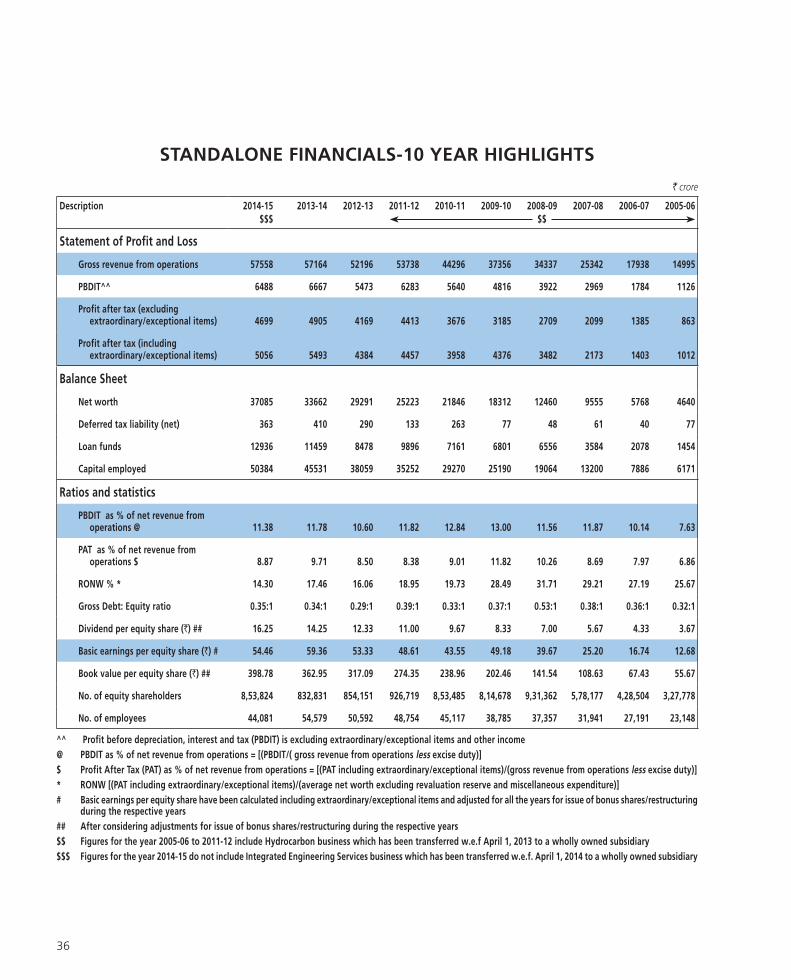
36
STANDALONE FINANCIALS-10 YEAR HIGHLIGHTS
` crore
Description 2014-15 2013-14 2012-13 2011-12 2010-11 2009-10 2008-09 2007-08 2006-07 2005-06
$$$ $$
Statement of Profit and Loss
Gross revenue from operations 57558 57164 52196 53738 44296 37356 34337 25342 17938 14995
PBDIT^^ 6488 6667 5473 6283 5640 4816 3922 2969 1784 1126
Profit after tax (excluding extraordinary/exceptional items) 4699 4905 4169 4413 3676 3185 2709 2099 1385 863
Profit after tax (including extraordinary/exceptional items) 5056 5493 4384 4457 3958 4376 3482 2173 1403 1012
Balance Sheet
Net worth 37085 33662 29291 25223 21846 18312 12460 9555 5768 4640
Deferred tax liability (net) 363 410 290 133 263 77 48 61 40 77
Loan funds 12936 11459 8478 9896 7161 6801 6556 3584 2078 1454
Capital employed 50384 45531 38059 35252 29270 25190 19064 13200 7886 6171
Ratios and statistics
PBDIT as % of net revenue from operations @ 11.38 11.78 10.60 11.82 12.84 13.00 11.56 11.87 10.14 7.63
PAT as % of net revenue from operations $ 8.87 9.71 8.50 8.38 9.01 11.82 10.26 8.69 7.97 6.86
RONW % * 14.30 17.46 16.06 18.95 19.73 28.49 31.71 29.21 27.19 25.67
Gross Debt: Equity ratio 0.35:1 0.34:1 0.29:1 0.39:1 0.33:1 0.37:1 0.53:1 0.38:1 0.36:1 0.32:1
Dividend per equity share (`) ## 16.25 14.25 12.33 11.00 9.67 8.33 7.00 5.67 4.33 3.67
Basic earnings per equity share (`) # 54.46 59.36 53.33 48.61 43.55 49.18 39.67 25.20 16.74 12.68
Book value per equity share (`) ## 398.78 362.95 317.09 274.35 238.96 202.46 141.54 108.63 67.43 55.67
No. of equity shareholders 8,53,824 832,831 854,151 926,719 8,53,485 8,14,678 9,31,362 5,78,177 4,28,504 3,27,778
No. of employees 44,081 54,579 50,592 48,754 45,117 38,785 37,357 31,941 27,191 23,148
^^ Profit before depreciation, interest and tax (PBDIT) is excluding extraordinary/exceptional items and other income
@ PBDIT as % of net revenue from operations = [(PBDIT/( gross revenue from operations less excise duty)]
$ Profit After Tax (PAT) as % of net revenue from operations = [(PAT including extraordinary/exceptional items)/(gross revenue from operations less excise duty)]
* RONW [(PAT including extraordinary/exceptional items)/(average net worth excluding revaluation reserve and miscellaneous expenditure)]
# Basic earnings per equity share have been calculated including extraordinary/exceptional items and adjusted for all the years for issue of bonus shares/restructuring during the respective years
## After considering adjustments for issue of bonus shares/restructuring during the respective years
$$ Figures for the year 2005-06 to 2011-12 include Hydrocarbon business which has been transferred w.e.f April 1, 2013 to a wholly owned subsidiary
$$$ Figures for the year 2014-15 do not include Integrated Engineering Services business which has been transferred w.e.f. April 1, 2014 to a wholly owned subsidiary

37
CONSOLIDATED FINANCIALS-10 YEAR HIGHLIGHTS
` crore
Description 2014-15 2013-14 2012-13 2011-12 2010-11 2009-10 2008-09 2007-08 2006-07 2005-06
Statement of Profit and Loss
Gross revenue from operation 92762 85889 75195 64960 52470 44310 40932 29819 20877 16809
PBDIT^^ 11336 10730 9929 8884 7677 6423 5024 3706 2615 1585
Profit attributable to shareholders of Parent Company (excluding extraordinary/exceptional items)
4470 4547 4911 4649 4238 3796 3007 2304 1810 1051
Profit attributable to shareholders of Parent Company (including extraordinary/exceptional items)
4765 4902 5206 4694 4456 5451 3789 2325 2240 1317
Balance Sheet
Net worth 40909 37712 33860 29387 25051 20991 13988 10831 6922 4964
Minority Interest 4999 3179 2653 1753 1026 1087 1059 923 646 107
Deferred tax liability (net) (185) 337 184 82 311 153 131 122 107 127
Loan funds 90571 80330 62672 47150 32798 22656 18400 12120 6200 3499
Deferred payment liability 3032 3482 3954 4418 4512 1951 1970 196 232 –
Capital employed 139326 125040 103323 82790 63698 46838 35548 24192 14107 8697
Ratios and statistics
PBDIT as % of net revenue from operations @ 12.32 12.60 13.33 13.81 14.75 14.61 12.40 12.58 12.75 9.57
PAT as % of net revenue from operations $ 5.18 5.76 6.99 7.30 8.56 12.40 9.35 7.89 10.92 7.95
RONW % ** 12.13 13.71 16.47 17.26 19.38 31.23 30.64 26.92 38.01 32.30
Gross debt:equity ratio 2.21:1 2.13:1 1.85:1 1.61:1 1.31:1 1.08:1 1.32:1 1.12:1 0.9:1 0.71:1
Basic earnings per equity share (`) # 51.33 52.97 56.53 51.21 49.04 61.27 43.17 26.96 26.73 16.50
Book value per equity share (`) ## 439.93 406.65 366.59 319.64 273.97 232.04 158.84 122.87 80.92 59.57
Dividend per equity share (`) ## 16.25 14.25 12.33 11.00 9.67 8.33 7.00 5.67 4.33 3.67
^^ Profit before depreciation, interest and tax [PBDIT] is excluding extraordinary/exceptional items and other income.
@ PBDIT as % of net revenue from operation =[(PBDIT/(gross revenue from operation less excise duty)].
$ PAT as % of net revenue from operation = [(PAT including extraordinary/exceptional items)/(gross revenue from operation less excise duty)].
** RONW [(profit available for appropriation including extraordinary/exceptional items)/(average net worth excluding revaluation reserve and miscellaneous expenditure)].
# Basic earnings per equity share has been calculated including extraordinary/exceptional items and adjusted for all the years for issue of bonus shares/ restructing during the respective years.
## After considering issue of bonus shares/restructuring during the respective years.

38
L&T CONSOLIDATED - SEGMENT-WISE REVENUE 2014-15
L&T CONSOLIDATED - ORDER INFLOW L&T CONSOLIDATED - GROSS REVENUE FROM OPERATIONS AND PAT
L&T CONSOLIDATED - PBDIT AS % OF NET REVENUE FROM OPERATIONS
L&T CONSOLIDATED - ORDER BOOK
L&T CONSOLIDATED - SEGMENT-WISE ORDER INFLOW 2014-15

39
L&T CONSOLIDATED - SEGMENT-WISE ORDER BOOK AS AT MARCH 31, 2015
L&T CONSOLIDATED - SEGMENT-WISE EBIDTA MARGINS* L&T CONSOLIDATED - SEGMENT-WISE CAPITAL EMPLOYED
L&T CONSOLIDATED - SEGMENT-WISE RESULT 2014-15
L&T STANDALONE - GROSS REVENUE FROM OPERATIONS AND PAT

40
Directors’ Report
Dear Members,
The Directors have pleasure in presenting their Annual
Report and Audited Financial Statements for the year ended
March 31, 2015.
FINANCIAL RESULTS
2014-15` crore
2013-14` crore
Profit before depreciation, exceptional and extraordinary items and tax 7352.21 7471.83
Less: Depreciation, amortisation, impairment and obsolescence 1009.74 793.36
6342.47 6678.47
Add: Transfer from Revaluation Reserve 1.59 0.94
Profit before exceptional and extraordinary items and tax 6344.06 6679.41
Add: Exceptional items 357.16 588.50
Profit before tax 6701.22 7267.91
Less: Provision for tax 1645.04 1774.78
Profit for the period carried to Balance Sheet 5056.18 5493.13
Add: Balance brought forward from previous year 333.45 285.75
Less: Dividend paid for the previous year (including dividend distribution tax) 2.20 2.78
Less: Depreciation charged against retained earnings 86.28 –
Add: Reversal of deferred tax on depreciation charged against retained earnings 29.33 –
Balance available for disposal (which the directors appropriate as follows):
5330.48 5776.10
Debenture Redemption Reserve 256.50 44.00
Proposed Dividend 1510.54 1320.85
Dividend Tax 134.33 77.80
General Reserve – 4000.00
1901.37 5442.65
Balance to be carried forward 3429.11 333.45
Dividend 1510.54 1320.85
The Directors recommend payment of final dividend of ` 16.25 per equity share of ` 2/- each on 92,95,62,061 shares.
CAPITAL & FINANCE
During the year under review, the Company allotted
26,49,403 equity shares upon exercise of stock options by
the eligible employees under the Employee Stock Option
Scheme.
The Company tied up long term foreign currency loans of
approximately ` 1,093.75 crore and issued Non-Convertible
Debentures (NCDs) worth ` 1,150 crore. In addition, the
Company also refinanced USD 200 million foreign currency
loan through a Foreign Currency Convertible Bond (FCCB)
issuance to reduce its interest cost. Apart from this, the
Company also repaid a part of its long term foreign currency
debt of USD 5.83 million.
CAPITAL EXPENDITURE
As at March 31, 2015, the gross fixed and intangible assets,
including leased assets, stood at ` 12,784 crore and the
net fixed and intangible assets, including leased assets, at
` 7,981 crore. Capital expenditure during the year amounted
to ` 953 crore.
DEPOSITS
There were no deposits which were due for repayment on
or before March 31, 2015. All unclaimed deposits were
transferred to Investor Education & Protection Fund during
the year.
DEPOSITORY SYSTEM
As the members are aware, the Company’s shares are
compulsorily tradable in electronic form. As on March
31, 2015, 97.77% of the Company’s total paid-up capital
representing 90,87,91,211 shares are in dematerialized
form. In view of the numerous advantages offered by the
Depository system, members holding shares in physical mode
are advised to avail of the facility of dematerialization from
either of the depositories.
TRANSFER TO INVESTOR EDUCATION AND
PROTECTION FUND
The Company sends letters to all shareholders, whose
dividends are unclaimed so as to ensure that they receive
their rightful dues. Efforts are also made in co-ordination
with the Registrar to locate the shareholders who have not
claimed their dues.
During the year the Company has transferred a sum of
` 1,47,21,816 to Investor Education & Protection Fund, the
amount which was due & payable and remained unclaimed
and unpaid for a period of seven years as provided in Section
205C(2) of the Companies Act, 1956. Despite the reminder
letters sent to each shareholder, this amount remained
unclaimed and hence was transferred. Cumulatively, the
amount transferred to the said fund was ` 13,05,29,159 as
on March 31, 2015.
SUBSIDIARY / ASSOCIATE / JOINT VENTURE
COMPANIES
During the year under review, the Company subscribed /
acquired equity / preference shares in various subsidiary /

41
associate / joint venture companies. These subsidiaries include
companies in general insurance, real estate, infrastructure,
engineering services and manufacturing sectors. The details
of investments in subsidiary companies during the year are
as under:
A) Shares acquired during the year:
Name of the company Type of Shares No. of shares
L&T General Insurance Company Limited Equity 12,50,00,000
L&T Infrastructure Engineering Limited (See Note 1)
Equity 18,00,000
L&T Metro Rail (Hyderabad) Limited Equity 82,60,000
L&T Seawoods Limited Equity 49,35,50,000
L&T Seawoods Limited Preference 1,03,60,00,000
L&T Technology Services Limited Equity 19,75,00,000
L&T Technology Services Limited Preference 35,00,00,000
L&T Valves Limited Equity (Bonus) 2,36,740
L&T-MHPS Turbine Generators Private Limited
Equity 16,83,00,000
L&T Shipbuilding Limited Preference 5,00,00,000
B) Equity shares sold/transferred during the year:
Name of the company Number of shares
L&T Finance Holdings Limited (See Note 2) 6,16,53,599
Note:
1. During the year, the Company acquired 50% stake
in L&T Infrastructure Engineering Limited (formerly
known as L&T-Ramboll Consulting Engineers Limited)
from the Joint Venture partner, with this acquisition,
L&T Infrastructure Engineering Limited is now a wholly
owned subsidiary of the Company.
2. To comply with, inter-alia the minimum public
shareholding requirement in L&T Finance Holdings
Limited by August 2014, the Company has sold shares
of L&T Finance Holdings Limited.
The Company has formulated a policy on the identification of
material subsidiaries and the same is placed on the website at
http://investors.larsentoubro.com/Listing-Compliance.aspx.
C) Performance and Financial Position of each
subsidiary/associate/joint venture companies:
A statement containing the salient features of the financial
statement of subsidiary/associate/joint venture companies is
provided on pages 342 to 350 of this Annual Report.
PARTICULARS OF LOANS GIVEN, INVESTMENTS
MADE, GUARANTEES GIVEN OR SECURITY PROVIDED
BY THE COMPANY
The Company has disclosed the full particulars of the loans
given, investments made or guarantees given or security
provided on pages 222 to 224 of this Annual Report.
PARTICULARS OF CONTRACTS OR ARRANGEMENTS
WITH RELATED PARTIES
The Audit Committee and the Board of Directors have
approved the Related Party Transactions Policy and the
same has been uploaded on the Company’s website
http://investors.larsentoubro.com/Listing-Compliance.aspx.
The Company has a process in place to periodically review
and monitor Related Party Transactions.
All the related party transactions were in the ordinary course
of business and at arm’s length. The Audit Committee has
approved all related party transactions for FY 2014-15 and
estimated transactions for FY 2015-16.
There were no material transactions with the related parties
during the year.
YEAR IN RETROSPECT
The gross sales and other income for the financial year under
review were ` 59,841 crore as against ` 59,045 crore for
the previous financial year registering an increase of 1.35%.
The profit before tax from continuing operations including
extraordinary and exceptional items was ` 6,701 crore for
the financial year under review as against ` 7,268 crore for
the previous financial year, registering a decrease of 7.8%.
The profit after tax from continuing operations including
extraordinary and exceptional items of ` 5,056 crore for
the financial year under review as against ` 5,493 crore for
the previous financial year, registering a decrease of 7.96%.
AMOUNT CARRIED TO RESERVE
The Company has not transferred any amount to the reserves
during the current financial year.
DIVIDEND
The Directors recommend payment of dividend of ` 16.25
per equity share of ` 2/- each on the share capital.
MATERIAL CHANGES AND COMMITMENTS AFFECTING
THE FINANCIAL POSITION OF THE COMPANY
BETWEEN THE END OF THE FINANCIAL YEAR AND THE
DATE OF THE REPORT
There are no material changes and commitments affecting
the financial position of the Company between the end of
the financial year and the date of this Report.

42
CONSERVATION OF ENERGY, TECHNOLOGY ABSORPTION,
FOREIGN EXCHANGE EARNINGS AND OUTGO
Information as required to be given under Section 134(3)(m)
read with Rule 8(3) of the Companies (Accounts) Rules, 2014
is provided in Annexure ‘A’ forming part of this Report.
RISK MANAGEMENT POLICY
The Company has constituted a Risk Management Committee
comprising of Mr. A. M. Naik, Mr. K. Venkataramanan and
Mr. R. Shankar Raman and concerned heads of Independent
Companies as members. Mr. A. M. Naik is the Chairman of
the Committee.
The Company has formulated a risk management policy and
has in place a mechanism to inform the Board Members
about risk assessment and minimization procedures and
periodical review to ensure that executive management
controls risk by means of a properly designed framework.
A detailed note on risk management is given under financial
review section of the Management Discussion and Analysis
on pages 182 to 183 of this Annual Report.
CORPORATE SOCIAL RESPONSIBILITY
The Company has constituted a Corporate Social
Responsibility Committee comprising of Mr. Vikram Singh
Mehta, Mr. M. V. Kotwal and Mr. R. Shankar Raman as the
Members. Mr. Vikram Singh Mehta is the Chairman of the
Committee.
The details of the various projects and programs
to be undertaken by the Company as a part of its
CSR policy framework is available on its website
http://investors.larsentoubro.com/Listing-Compliance.aspx.
The disclosures required to be given under Section 135 of the
Companies Act, 2013 read with Rule 8(1) of the Companies
(Corporate Social Responsibility Policy) Rules, 2014 are given
in Annexure ‘D’ forming part of this Report.
DETAILS OF DIRECTORS AND KEY MANAGERIAL
PERSONNEL APPOINTED/RESIGNED/RETIRED DURING
THE YEAR
Mr. S. Rajgopal and Mr. S. N. Talwar, Independent Directors,
retired at the conclusion of the Annual General Meeting
(AGM) held on August 22, 2014.
Mr. A. K. Jain, Nominee Director representing Administrator
of the ‘Specified Undertaking of Unit Trust of India’ (SUUTI)
resigned with effect from February 10, 2015, consequent to
the withdrawal of his nomination.
The Board places on record its appreciation of the immense
contribution made by Mr. S. Rajgopal, Mr. S. N. Talwar and
Mr. A. K. Jain to the Company.
The Board has appointed Mr. Akhilesh Krishna Gupta as
an Independent Director of the Company from September
9, 2014 to September 8, 2019, subject to the approval
of the shareholders. Mr. Akhilesh Gupta, appointed as an
Additional Director, will hold office till the ensuing AGM and
is eligible for appointment.
The Board has appointed Mr. Bahram Navroz Vakil as an
Independent Director of the Company from March 16,
2015 to March 15, 2020, subject to the approval of the
shareholders. Mr. Vakil, appointed as an Additional Director,
will hold office till the ensuing AGM and is eligible for
appointment.
The Board has appointed Mr. Swapan Dasgupta as a Director
in the casual vacancy caused by the resignation of Mr. A.
K. Jain as a Director representing SUUTI, with effect from
April 1, 2015.
The Board has appointed Mrs. Sunita Sharma as a Director in
the casual vacancy caused by the resignation of Mr. N. Mohan
Raj as a Director representing ‘Life Insurance Corporation of
India’, with effect from April 1, 2015.
The Board has appointed Mr. Thomas Mathew T. as an
Independent Director of the Company from April 3, 2015
to April 2, 2020, subject to the approval of the shareholders.
Mr. Mathew, appointed as an Additional Director, will hold
office till the ensuing AGM and is eligible for appointment.
The Board has appointed Mr. Ajay Shankar as an Independent
Director of the Company from May 30, 2015 to May 29,
2020, subject to the approval of the shareholders. Mr. Ajay
Shankar, appointed as an Additional Director, will hold office
till the ensuing AGM and is eligible for appointment.
Mr. Sushobhan Sarker, Mr. Shailendra Roy and Mr. R. Shankar
Raman retire from the Board by rotation and are eligible for
re-appointment at the forthcoming AGM.
The notice convening the AGM includes the proposal for
appointment / re-appointment of Directors.
The terms and conditions of appointment of the Independent
Directors are placed on the website of the Company
http://investors.larsentoubro.com/Listing-Compliance.aspx.
The Company has also disclosed the Directors’
fami l ia r i zat ion programme on i t s webs i te
http://investors.larsentoubro.com/Listing-Compliance.aspx.
NUMBER OF MEETINGS OF THE BOARD OF DIRECTORS
This information is given in Annexure ‘C’ - Report on
Corporate Governance forming part of this Report. Members
are requested to refer to page 57 of this Annual Report.

43
AUDIT COMMITTEE
The Company has in place an Audit Committee in terms of
the requirements of the Companies Act, 2013 read with
the rules made thereunder and Clause 49 of the Listing
Agreement. The details relating to the same are given in
Annexure ‘C’ - Report on Corporate Governance forming
part of this Report. Members are requested to refer to pages
59 to 61 of this Annual Report.
COMPANY POLICY ON DIRECTOR APPOINTMENT AND
REMUNERATION
The Company has in place a Nomination & Remuneration
Committee in accordance with the requirements of the
Companies Act, 2013 read with the rules made thereunder
and Clause 49 of the Listing Agreement. The details relating
to the same are given in Annexure ‘C’ - Report on Corporate
Governance forming part of this Report. Members are
requested to refer to pages 61 to 63 of this Annual Report.
The Committee has formulated a policy on Director’s
appointment and remuneration including recommendation
of remuneration of the key managerial personnel and other
employees, board diversity, composition and the criteria
for determining qualifications, positive attributes and
independence of a Director.
DECLARATION OF INDEPENDENCE
The Company has received Declarations of Independence
as stipulated under Section 149(7) of the Companies
Act, 2013 and Clause 49 of the Listing Agreement
from Independent Directors confirming that he is not
disqualified from appointing/continuing as an Independent
Director. The same are also displayed on its website
http://investors.larsentoubro.com/Listing-Compliance.aspx.
EXTRACT OF ANNUAL RETURN
As per the provisions of Section 92(3) of the Companies
Act, 2013, an extract of the Annual Return in Form MGT-9
is attached as Annexure ‘G’ to this Report.
DIRECTORS RESPONSIBILITY STATEMENT
The Board of Directors of the Company confirms that:
a) In the preparation of Annual Accounts, the applicable
accounting standards have been followed along with
proper explanation relating to material departures;
b) The Directors have selected such accounting policies
and applied them consistently and made judgments
and estimates that are reasonable and prudent so as
to give a true and fair view of the state of affairs of the
Company at the end of the financial year and of the
profit of the Company for that period;
c) The Directors have taken proper and sufficient care
for the maintenance of adequate accounting records
in accordance with the provisions of the Companies
Act, 2013 for safeguarding the assets of the Company
and for preventing and detecting fraud and other
irregularities;
d) The Directors have prepared the Annual Accounts on a
going concern basis;
e) The Directors have laid down an adequate system of
internal financial control to be followed by the Company
and that such internal financial controls are adequate
and were operating efficiently; and
f) The Directors have devised proper systems to ensure
compliance with the provisions of all applicable laws
and that such systems were adequate and operating
effectively.
ADEQUACY OF INTERNAL FINANCIAL CONTROL
The Company has designed and implemented a process
driven framework for Internal Financial Controls (“IFC”)
within the meaning of the explanation to Section 134(5)(e)
of the Companies Act, 2013. For the year ended March
31, 2015, the Board is of the opinion that the Company
has sound IFC commensurate with the nature and size of
its business operations and operating effectively and no
material weakness exist. The Company has a process in place
to continuously monitor the same and identify gaps, if any,
and implement new and/or improved controls wherever the
effect of such gaps would have a material effect on the
Company’s operations.
PERFORMANCE EVALUATION OF THE BOARD, ITS
COMMITTEES AND DIRECTORS
The Nomination & Remuneration Committee and the
Board have laid down the manner in which formal annual
evaluation of the performance of the Board, Committees
and individual Directors has to be made.
It includes circulation of questionnaires to all Directors
for evaluation of the Board and its Committees, Board
composition and its structure, its culture, its effectiveness,
its functioning, information availability, etc. These
questionnaires also cover specific criteria and the grounds
on which all Directors in their individual capacity will be
evaluated.
The Individual Directors responses on the questionnaire on
the performance of the Board, Committee(s), Directors and
Chairman were analyzed to arrive at unbiased conclusions.
The inputs given by all the directors were discussed in the
meeting of the Independent Directors held on March 23,
2015, as per Schedule IV of the Companies Act, 2013.

44
The performance evaluation of the Board, Committees
and Directors was also reviewed by the Nomination &
Remuneration Committee.
DISCLOSURE OF REMUNERATION
The details of remuneration as required to be disclosed under
the Companies Act, 2013 and the rules made thereunder is
given in Annexure ‘H’ forming part of this Report.
The Board of Directors wishes to express their appreciation
to all the employees for their outstanding contribution to
the operations of the Company during the year. The details
of employees receiving remuneration exceeding ` 5 lakh per
month or ` 60 lakh per annum is provided in Annexure ‘E’
forming part of this Report. In terms of Section 136(1) of the
Act and the rules made thereunder, the Report and Accounts
are being sent to the shareholders excluding the aforesaid
Annexure. Any Shareholder interested in obtaining a copy
of the same may write to the Company Secretary. None of
the employees listed in the said Annexure is related to any
Director of the Company.
RECEIPT OF REMUNERATION BY MANAGING
DIRECTOR FROM SUBSIDIARY COMPANY
Mr. K. Venkataramanan, Chief Executive Officer and
Managing Director of the Company, is also the Managing
Director of a wholly owned subsidiary, L&T Hydrocarbon
Engineering Limited. During the year 2014-15, part of the
remuneration received by Mr. Venkataramanan was debited
to L&T Hydrocarbon Engineering Limited. Kindly refer to
page 242 of this Annual Report for details.
OTHER DISCLOSURES
The disclosures relating to Employee Stock Options required
to be made under the provisions of the Companies Act,
2013 and the rules made thereunder and the SEBI (Employee
Stock Option Scheme and Employee Stock Purchase Scheme)
Guidelines, 1999 together with a certificate obtained from
the Statutory Auditors, confirming compliance, is provided
in Annexure ‘B’ forming part of this Report.
Pursuant to Clause 49 of the Listing Agreement entered
into with the Stock Exchanges, a Report on Corporate
Governance and a certificate obtained from the Statutory
Auditors confirming compliance, is provided in Annexure ‘C’
forming part of this Report.
VIGIL MECHANISM
As per the provisions of Section 177(9) of the Companies
Act, 2013, the Company is required to establish an effective
Vigil Mechanism for Directors and employees to report
genuine concerns.
The Company has a Whistle-blower Policy in place since
2004 to report concerns about unethical behaviour,
actual/ suspected frauds and violation of Company’s Code
of Conduct or Ethics Policy. The Policy has been suitably
modified to meet the requirements of Vigil Mechanism under
the Companies Act, 2013. The policy provides for adequate
safeguards against victimisation of persons who avail the
same and provides for direct access to the Chairperson of
the Audit Committee. The Audit Committee of the Company
oversees the implementation of the Whistle-Blower Policy.
The Company has disclosed information about the
establishment of the Whistle Blower Policy on its website
http://investors.larsentoubro.com/corporategovernance.aspx.
BUSINESS RESPONSIBILITY REPORTING
The Company has been one of the first engineering and
construction companies in India to publish its report on
Corporate Sustainability.
As per Clause 55 of the Listing Agreement with the Stock
Exchanges, a separate section on Business Responsibility
Reporting forms a part of this Annual Report (refer pages
18 to 35).
The detai led Corporate Sustainabi l i ty Report
is also avai lable on the Company’s website
http://www.larsentoubro.com/corporate/sustainability.
DETAILS OF SIGNIFICANT AND MATERIAL ORDERS
PASSED BY THE REGULATORS OR COURTS OR
TRIBUNALS
During the year under review, there were no material
and significant orders passed by the regulators or courts
or tribunals impacting the going concern status and the
Company’s operations in future.
CONSOLIDATED FINANCIAL STATEMENTS:
Your Directors have pleasure in attaching the Consolidated
Financial Statements pursuant to Section 129(3) of the
Companies Act, 2013 and Clause 32 of the Listing Agreement
entered into with the Stock Exchanges and prepared in
accordance with the Accounting Standards prescribed by the
Institute of Chartered Accountants of India, in this regard.
The Auditors report to the shareholders does not contain any
qualification, observation or adverse comment.
SECRETARIAL AUDIT REPORT
The Secretarial Audit Report issued by M/s. S. N.
Ananthasubramanian & Co., Practicing Company Secretaries
is attached as Annexure ‘F’ to this Report.

45
The Secretarial Auditor’s report to the shareholders does not
contain any qualification.
REPORTING OF FRAUD
The Auditors of the Company have not reported any fraud
as specified under the second proviso of Section 143(12) of
the Companies Act, 2013.
AUDITORS
The Company’s auditors M/s. Sharp & Tannan, (firm
registration number 109982W) have already completed
more than ten years as Statutory Auditors of the Company.
In accordance with provisions of Section 139 of the
Companies Act, 2013 and the Companies (Audit and
Auditors) Rules, 2014, they can continue as Auditors for a
further period of two years i.e up to March 31, 2017. It is
proposed to appoint them from conclusion of 70th Annual
General Meeting till the conclusion of 72nd Annual General
Meeting.
In view of the mandatory rotation of auditor requirement
and to ensure smooth transition during this period, it is also
proposed to appoint M/s. Deloitte Haskins & Sells LLP as
Statutory Auditors for a period of 5 continuous years i.e.,
from the conclusion of 70th Annual General Meeting till the
conclusion of 75th Annual General Meeting of the Company.
Both the Auditors will be jointly and severally responsible
during the first two financial years 2015-16 and 2016-17.
Sharp & Tannan and Deloitte Haskins & Sells LLP, have
informed the Company vide letters dated May 30, 2015 &
May 26, 2015 respectively, that their appointment if made
would be within the limits prescribed under section 141 of
the Companies Act, 2013.
Sharp & Tannan and Deloitte Haskins & Sells LLP, have
confirmed that they have subjected themselves to the peer
review process of Institute of Chartered Accountants of India
(ICAI) and hold valid certificate issued by the Peer Review
Board of the ICAI.
Sharp & Tannan and Deloitte Haskins & Sells LLP, have also
furnished a declaration confirming their independence as
well as their arm’s length relationship with the Company
and declared that they have not taken up any prohibited
non-audit assignments for the Company.
COST AUDITORS
Pursuant to the provisions of Section 148(3) of the
Companies Act, 2013 the Board of Directors had appointed
M/s R. Nanabhoy & Co., Cost Accountants, as Cost Auditors
of the Company, for conducting the audit of cost records
for the financial year ended March 31, 2015. The audit is in
progress and report will be filed with Ministry of Corporate
Affairs within the prescribed period.
The Board, on the recommendation of the Audit Committee,
at its meeting held on May 30, 2015, has approved the
appointment of M/s R. Nanabhoy & Co., Cost Accountants
as the Cost Auditors of the Company, for conducting audit
of cost records for the financial year ending March 31, 2016.
There is an additional coverage of products under audit
during the year.
A proposal for ratification of remuneration of the Cost
Auditors for FY 2014-15 as well as FY 2015-16 is placed
before the shareholders.
ACKNOWLEDGEMENT
Your Directors take this opportunity to thank the customers,
supply chain partners, employees, Financial Institutions,
Banks, Central and State Government authorities,
Regulatory authorities, Stock Exchanges and all the various
stakeholders for their continued co-operation and support
to the Company. Your Directors also wish to record their
appreciation for the continued co-operation and support
received from the Joint Venture partners / Associates.
For and on behalf of the Board
A. M. Naik
Group Executive Chairman
(DIN: 00001514)
Mumbai, May 30, 2015

46
Annexure ‘A’ to the Directors’ Report
Information as required to be given under Section 134(3)(m)
read with Rule 8(3) of the Companies (Accounts) Rules,
2014.
[A] CONSERVATION OF ENERGY:
(i) Steps taken or impact on conservation of energy:
Replacement of existing aged inefficient Split AC
units with energy efficient units.
Retrofitting of LED tube in place of FTL.
Utilization of Chiller for HVAC System – Campus
FMD initiated and controls the chiller running
hour for HVAC need during holidays and extended
working hours.
Close monitoring of lighting system by providing
dedicated team to avoid unwanted lighting power.
Replacement of LED tubes and lamps in place of FTL
and Metal Halide lamps at TLT factories.
Use of Automatic Power Factor Correction Unit to
maintain Power factor above 0.98 at TLT factories.
Close monitoring of lighting system by providing
Automatic On/Off Timers in Outdoor Lighting at
TLT factories.
Automation in Galvanizing Furnace in order
to maintain constant Air-Fuel Ratio & maintain
working Temperature.
Providing Magnetic Resonators for increasing the
combustion Efficiency of Fuel (LPG).
Installation of Energy Efficient Ceiling Fans in
canteen at TLT Pithampur.
Synchronized switching operation for Automatic
Lighting for Paint Booth.
Installation of Occupancy Sensor in Admin Building
& Shop floor office at Piping centre.
Replacement of Metal Halide lamp with LED lamp
for LMS Shop Overhead lighting and CNC machines
lighting.
Use of LED lighting in confined space and job
lighting.
Installation of magnetic resonators in PFS and HFS1
Furnace to reduce NG consumption.
Use of astronomical Timers for Street Lighting and
yard/shop lighting to conserve energy.
Introduction of VFDs for boom & turntables.
Retrofitting of SKODA & Pegard indexing table with
CNC & energy efficient servo motor & drive.
Conversion of shop wagons from petrol engine to
electric motor.
Introduction of magnetic resonators in furnaces.
Special Chemical treatment using Scacil / Bionil for
Condenser water of EPC AC plant.
Upgrading and qualifying Hot Air Oven (50 kW) in
place of Horizontal Autoclave (450 kW) for curing
of components.
Optimized operation of Centralized Chiller for
offices and DFEs.
Use of transparent PE based false ceiling / roof
sheets in workshops / assembly sheds to utilize
day light.
Installation of APGC (auto power generated &
conserved) urinal flushing system and wash basin
taps.
Utilization of natural water source from ISF instead
of MIDC potable water for irrigation of green belt
at SSC.
Use of light pipes to utilize the day light in canteen
& blasting bay resulted into annual saving of
4200Kwh.
Automatic Water Filling system which trips the
pump if the designated level is reached and reduces
the power consumption for water overflow.
Implementation of Smart metering system to
monitor shop wise energy consumption in Talegaon.
Use of VFD drives on 132 kW Compressors leading
to power factor improvement from 0.8 to 0.98.
70% use of Inverter based Welding Machines for
project construction.
Optimized operation of Centralized Chiller for
offices and VRF type Centralized Air condition.
Use of infra-red motion sensor for lighting control
in toilet blocks.
Installation of 90 kW VFD drive on Wheelabrator
motors of Plate treatment line, thereby improving
power factor from 0.8 to 0.98.

47
Use of Solar tubes on rooftop and transparent PE
sheets on doors of marine coating workshop.
Conversion of 25 kW hydro test pump motor from
delta connection to star connection, when being
used in interceptor Boat thereby reducing power
consumption by 10 kW.
Disconnection of Tube Light fixtures in unused area.
Installation of presence sensors at various locations.
Optimum use of AC & FDVS (Forced draft ventilation
system) at various locations.
Reduction in machining time of CK310-0801-1
part.
Installation of VFD (Variable Frequency Drive) for
air compressor.
Provision of Auto shut off in 63T & 40T Presses in
case of idling.
Thyristors introduced in Heat Treatment for
reducing Energy Consumption by 8%.
Power & LPG consumption reduced by 9% by
optimizing usage of Thermal reclamation plant.
Production increased during Non-peak hours.
Utilization of Demand effectively without exceeding
90% of MD.
Replacement of 60HP furnace cooling water
circulation by 20HP pump.
Installation of programmable auto switching timer
to switch off Shop floor overhead lights during
breaks & Sundays at Kansbahal.
Modification of conventional machines lubrication
pump for intermittent operation as per requirement.
Identification of and arresting compressed air
leakage points thus reducing compressed air
consumption.
Observation of ‘Walk-to-Work’ day on 2nd Saturday
of every month at Kansbahal works.
Provision of LED Light fittings at EWL, Kancheepuram
works.
Planning production during night hours thus
availing 5% rebate.
Installation of harmonic filters to reduce the level
of harmonics to improve power quality as per the
requirement of the TNEB thus avoiding penalty of
2% in the overall TNEB Billing.
(ii) Steps taken by the Company for utilizing
alternate sources of energy:
Power generation through Solar Roof top PV
installation. All buildings in L&T Construction
campus at Chennai have Solar PV roof top
installations.
Installation of Solar Powered Street Light with 36W
LED Fittings at TLT, Pondicherry.
Installation of 113.9 kWp Solar Photovoltaic (PV)
system consisting of Crystalline and CIGS modules
with fixed tilt, single-axis and dual-axis tracking
systems installed at Construction Skills & Training
Institute (CSTI) at Jadcherla, Telangana. This system
shall generate approximately over 2 lakh units of
clean energy per annum and which will prevent
approximately 136 tons of CO2 emission.
Successful surveillance audit for Management
of Energy through ISO 50001:2011 (Energy
Management System) methodology.
Purchase of Green Power from third party wind
farm to reduce the carbon footprint.
Installation of 10kW solar PV panels with grid
connectivity.
Use of high velocity burners in place of low velocity
burners.
Development of PTAW process for stellite hard
facing.
Elimination of Welding/plasma cutting by use of
forming/ joggling operation.
Establishment of Baseline data for Energy Intensive
Processes / Equipment.
Provision in operation control Panel for switching
off hydraulic Power pack during idling conditions.
Installation of wind turbine roof top ventilators at
Workshops, Electric Substation & Canteen instead
of exhaust fans.
Provision of switch on Operator Console to reduce
idle runtime and for efficient control of 75 kW DC
fan motor in CNC machines.
Installation of Solar Street light replacing
conventional Metal Halide lighting.
Optimum utilization of windmill power in the place
of State Electricity Board.

48
(iii) Capital investment on energy conservation
equipments:
Conversion of VAM based air-conditioning plant to
water cooled screw chiller in SBU block.
100 kVA UPS for furnace to reduce diesel
consumption of DG set during power cuts.
Installation of lighting transformer for shop & area
lighting at Heavy Engineering at Hazira.
BOT (Build Operate Transfer) projects with ESCOs
(Energy Saving Companies) for energy conservation
in Peripheral Lighting by migrating from HPSV to
LED light.
Initiation of additional investment & proposal for
replacement of existing MHL 250W shop lights
with LED or induction lights.
Introduction of power factor incentive by WESCO
to help maintain power factor to unity resulting in
saving in monthly electricity bill by approximately
`1.5 Lakhs per month.
Trial run of impactor / crusher to be carried out
by AC VDF drive replacing conventional Start-delta
starter to save energy.
Installation of dedicated portable compressor at
undercarriage shop & detachment of air connection
from central compressor to save air consumption.
[B] TECHNOLOGY ABSORPTION:
(i) Efforts made towards technology absorption:
Elimination of 5 Position rotary switches in HMT
Radial Drilling Machine and replacing with a speed
control drive which is used for controlling speed
according to requirement and elimination of
separate 2 speed motor.
Replacement of the starter of fuel gas blower
used for galvanizing with drive control (Delta
VFD) so as to adjust motor speed according to the
requirements.
Completed Airworthiness Qualification of
Integrated Life Support System - On-board Oxygen
Generation System for fighter aircrafts.
Development and Qualification of Oxygen System
for Military Helicopters.
Technology absorption & adaptation for
development of Combat Vehicles & Artillery
Systems.
Entering into technology transfer agreement with
a leading Global technology provider for Titanium
Clad equipment.
Indigenous development of fully automatic T-ring
welding station using GMAW.
Process development for automatic welding and
helium leak testing in manufacturing of various
assemblies of ITER Cryostat.
Development of in-situ system for automatic
buttering on shell surface using MIG / FCAW / TIG
process.
Indigenous development of 3-point contact
expansion process for tube positioning prior to
tube to tube-sheet welding in Reactors and Heat
Exchangers.
Indigenous design and manufacturing technology
of Fast Interceptor Boats for Indian Coast Guard.
Up streaming of production processes and
modularizing parts of ships to attain built period
reduction and optimization of resources and cost
of ships.
Development of RT quality GMAW/FCAW with
ceramic backing (single side full penetration
welding without chip back) for steel as well as
aluminum alloy first time in L&T.
Development of semiautomatic FCAW for pipe
flange joints instead of SMAW/GTAW.
Manufacturing of critical components of Heavy Lift
Cranes in house.
Development of Panel welding (3 wires SAW)
station, Single side single pass full penetration
square butt welding up to plate thickness of 16 mm,
development of RT quality welds though different
mock up, procedure & welder developments and
development of semiautomatic GMAW for welding
of High strength low alloy steel through different
mock up, procedure & welder developments.
Self-shielded FCAW to eliminate usage of shielding
gas.
Design and development of Side Launch of large
vessels.
In-house expertise to commission major equipment
of Interceptor boats.
In-house expertise to choke fast major machineries
on ships.

49
Introduction of new low voltage drives, different
variants of MCCBs, 4000 H2 ACB (Air Circuit
Breaker) for hazardous condition & a new range
of smart Busbar trunking solution for aluminum
application.
Development of new, cost-optimized meter
platforms offering better features.
Development and integration of modules to
facilitate remote communication of meter data
over Radio / GSM.
Development of Pre-Paid Meters, Smart Meters,
Protective Relays and Panel Meters.
Introduction of new single phase meter “Alpha” &
“Alpha Plus”, Single Phase Meter with ZigBee radio
used in AMR (Automatic Meter reading) system,
Cl.1 Whole current Meter with IR (Infra-Red)
communication port & MC 61C-nx : Over current
& Earth fault relay with RS-485 port.
Localization of VCB mechanism, 36 kV VCB
(Vacuum Circuit Breaker) and GIS (Gas Insulated
Switchgear) tank manufacturing.
Manufacturing of RMU (Ring Main Units) at
Ahmednagar works.
Introduction of Enersys M main distribution boards.
Introduction of India’s 1st indigenous protection
relay (FCOM) complying with IEC61850 Edn2
standard for interoperability.
Development of 11T Wheel Loader, 9T Asphalt
Compactor and 11T Soil Compactor.
Indigenization of various components by Rubber
Processing Machinery business (RPM) by designing,
developing specifications and adapting to
International conditions.
Use of T-pot ladle used to improve Yield in
production of Hubs by Foundry Business Unit (FBU).
Use of ATAS software by FBU to identify alternate
pig iron as a substitute for Sorel metal which is
costlier and in demand.
Pouring small SG Iron castings consistently without
adding innoculants.
Introduction of Flaskless mould by FBU for small
items to enhance productivity and reduction of
investment on mould boxes.
Use of Thermocol pattern for development of large
casting to reduce lead time.
Modification of running system modified in a large
casting to enhance productivity and yield.
Various models of semi-mobile skid mounted
crushing unit have been developed to meet specific
applications for mining.
Adaptation of crushing technology for various
applications.
(ii) Benefits derived like product improvement,
cost reduction, product development or import
substitution:
Structural floors with light weight concrete can
reduce the dead load of the concrete structures.
Pre-packed grout, dry mortar and high flow
grout are value added products with improved
performance for building structures.
Sandwich structural wall panels improve the
thermal comforts in buildings.
CGBM is a cost effective and durable solution to
many pavement related issues like rutting, pot
holes, cracking etc.
Emulsion based cold mixes with Reclaimed Asphalt
Pavement materials give environmental friendly
economical green technology over conventional
bituminous mixes.
The rugged tablet PC and the 3D image capturing
gadget would drastically simplify capturing and
analysing data at the construction sites.
Results of CFD analysis were also verified with the
physical hydraulic model testing. Appreciable saving
in excavation and structural concrete, resulting in
cost and time effective construction solution.
Alternate solution for rock toe requires substantially
less material, is easy to construct and environment
friendly.
The design (thickness) of the crotch plate was
optimized in order to reduce the structural stress
developed by the fluid flow within the allowable
limit and considering the economic feasibility.
Automation in creep test.
A full fledged Microgrid system installed at L&T
Construction, Chennai campus, which consists
of 117kWp Solar power, 2.4kWp (3 Nos.) Micro

50
wind turbine, 1010 kVA (2 Nos.) DG sets and
grid connection. The system seamlessly integrates
renewable energy sources with conventional
energy sources and regulates the connected load
for optimum system performance.
Battery Energy Storage System (BESS) using 32 kWh
advanced Lithium-ion battery technology (project
under execution) at car park of Chennai campus.
The BESS system can be used for energy time shift
and frequency regulation applications.
Developed and deployed Seasonal-Tilt module
mounting structure for enhancing power
generation from Photovoltaic Solar Power Plants.
Developed and deployed Ground-Following module
mounting structure (Contour Following Structure
–CFS) for minimizing impacts of land profile on the
design of a solar power plant.
Signed MoUs with European technology providers
for acquiring solar thermal solutions in the field
of power generation, desalination and industrial
process heating.
Initiated a pilot smart city model in L&T
Construction’s Chennai campus. The system would
integrate features like surveillance, access control
systems, video analytics and emergency response
systems.
Utilization of LiDAR for topographic survey for
highway projects.
Automation Tool/Application developed using
AutoLisp involving Automatic taking of input data
from LOP/pegging plan to standard Bill of Materials,
Automatic generation of CSDs for open route and
yards and Automatic generation of SEDs for open
route and yards resulting in savings of 136 days as
compared to manual procedure per person.
Project foundation construction of Hyderabad Metro
using CSLM (Controlled low-strength material)
which is a self-compacted, cementitious material
used primarily as backfill in lieu of compacted fill
resulting in decreased labor requirements, faster
construction speed and potentially lower in-place
cost.
Indigenisation (import substitution) & development
of products and automatic welding process for
critical components for Indian Defence & Aerospace
sector.
Indigenisation (import substitution) & development
of HLT processes in ITER Cryostat manufacturing.
Product improvement.
Technology transfer to cover development of
manufacturing techniques for fabricating over-
sized titanium clad equipment.
Broaden product portfolio for future PTA projects/
revamps.
Increase in know-how within the country.
Improved productivity and quality.
Cost reduction by in-house design and development.
Foreign exchange saving by import substitution.
Requirement of IMS based CWA Sensors for Indian
Defence.
Increased self-reliance and savings in Foreign
Exchange.
Application of niche technologies to the Defence &
Aerospace segment.
Indigenisation (import substitution) & development
of equipment and machinery of Interceptor
Boats, which was earlier imported and critical
commissioning process (by Indian partner) where
services were rendered by equipment manufacturer
(Foreign) in past.
Continuous product development in the switchgear
business at its various Department of Scientific
& Industrial Research, Ministry of Science &
Technology accredited R&D facilities in India and
filing 152 Patent, 14 Trademark, 5 Design and
5 Copyright applications in India and 6 foreign
applications.
Expansion of switchgear product range and
offerings to the infrastructure sector.
Product development has helped in competing with
international manufacturers in the construction
& mining equipment and rubber processing
machinery business.
Wider range of products to meet specific application
requirement for crushing.
Development of higher capacity of Rotary Breaker.

51
(iii) Information regarding technology imported
during the last 3 years:
S.
No.
Technology
Imported
Year of
Import
Status of absorption
& reasons for non-
absorption, if any
a) Dry Sand Making
S y s t e m s , A i r
Screens, Vertical
Shaft Impactors
(VSI ) and Jaw
Crushers (STJ) from
KEMCO, Japan.
2013-14 Under absorption -
Testing of raw material
(crushed rock) and
interpretation of test
result for predicting
its suitability for sand
manufacturing and
cost of manufacturing
are yet to be absorbed
fully. Test plant is
planned to be set up
at Kansbahal works
for this purpose.
(iv) Expenditure incurred on Research & Development:
` crore
2014-15
Capital 64.12
Recurring 139.44
Total 203.56
Total R&D expenditure as a percentage
of total turnover
0.35%
[C] FOREIGN EXCHANGE EARNINGS AND OUTGO:
` crore
2014-15
Foreign Exchange earned 9440.72
Foreign Exchange saved/deemed exports 1202.88
Total 10643.60
Foreign Exchange used 9673.31
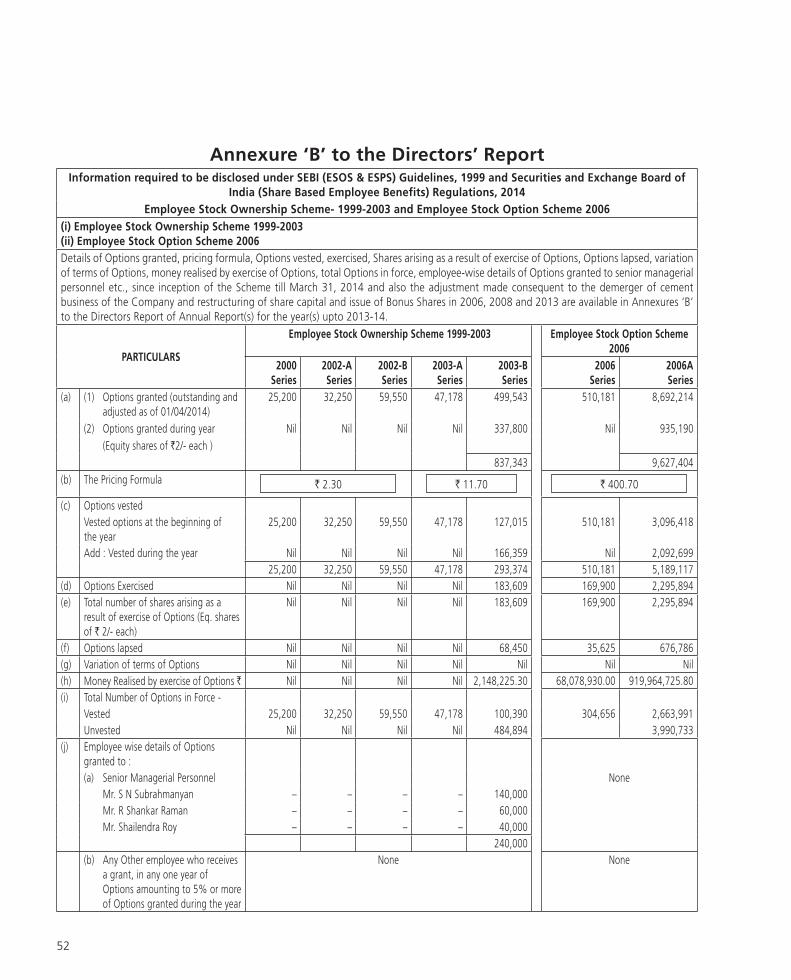
52
Annexure ‘B’ to the Directors’ ReportInformation required to be disclosed under SEBI (ESOS & ESPS) Guidelines, 1999 and Securities and Exchange Board of
India (Share Based Employee Benefits) Regulations, 2014
Employee Stock Ownership Scheme- 1999-2003 and Employee Stock Option Scheme 2006
(i) Employee Stock Ownership Scheme 1999-2003
(ii) Employee Stock Option Scheme 2006
Details of Options granted, pricing formula, Options vested, exercised, Shares arising as a result of exercise of Options, Options lapsed, variation
of terms of Options, money realised by exercise of Options, total Options in force, employee-wise details of Options granted to senior managerial
personnel etc., since inception of the Scheme till March 31, 2014 and also the adjustment made consequent to the demerger of cement
business of the Company and restructuring of share capital and issue of Bonus Shares in 2006, 2008 and 2013 are available in Annexures ‘B’
to the Directors Report of Annual Report(s) for the year(s) upto 2013-14.
PARTICULARS
Employee Stock Ownership Scheme 1999-2003 Employee Stock Option Scheme
2006
2000
Series
2002-A
Series
2002-B
Series
2003-A
Series
2003-B
Series
2006
Series
2006A
Series
(a) (1) Options granted (outstanding and
adjusted as of 01/04/2014)
25,200 32,250 59,550 47,178 499,543 510,181 8,692,214
(2) Options granted during year Nil Nil Nil Nil 337,800 Nil 935,190
(Equity shares of `2/- each )
837,343 9,627,404
(b) The Pricing Formula ` 2.30 ` 11.70 ` 400.70
(c) Options vested
Vested options at the beginning of
the year
25,200 32,250 59,550 47,178 127,015 510,181 3,096,418
Add : Vested during the year Nil Nil Nil Nil 166,359 Nil 2,092,699
25,200 32,250 59,550 47,178 293,374 510,181 5,189,117
(d) Options Exercised Nil Nil Nil Nil 183,609 169,900 2,295,894
(e) Total number of shares arising as a
result of exercise of Options (Eq. shares
of ` 2/- each)
Nil Nil Nil Nil 183,609 169,900 2,295,894
(f) Options lapsed Nil Nil Nil Nil 68,450 35,625 676,786
(g) Variation of terms of Options Nil Nil Nil Nil Nil Nil Nil
(h) Money Realised by exercise of Options ` Nil Nil Nil Nil 2,148,225.30 68,078,930.00 919,964,725.80
(i) Total Number of Options in Force -
Vested 25,200 32,250 59,550 47,178 100,390 304,656 2,663,991
Unvested Nil Nil Nil Nil 484,894 3,990,733
(j) Employee wise details of Options
granted to :
(a) Senior Managerial Personnel None
Mr. S N Subrahmanyan – – – – 140,000
Mr. R Shankar Raman – – – – 60,000
Mr. Shailendra Roy – – – – 40,000
240,000
(b) Any Other employee who receives
a grant, in any one year of
Options amounting to 5% or more
of Options granted during the year
None None
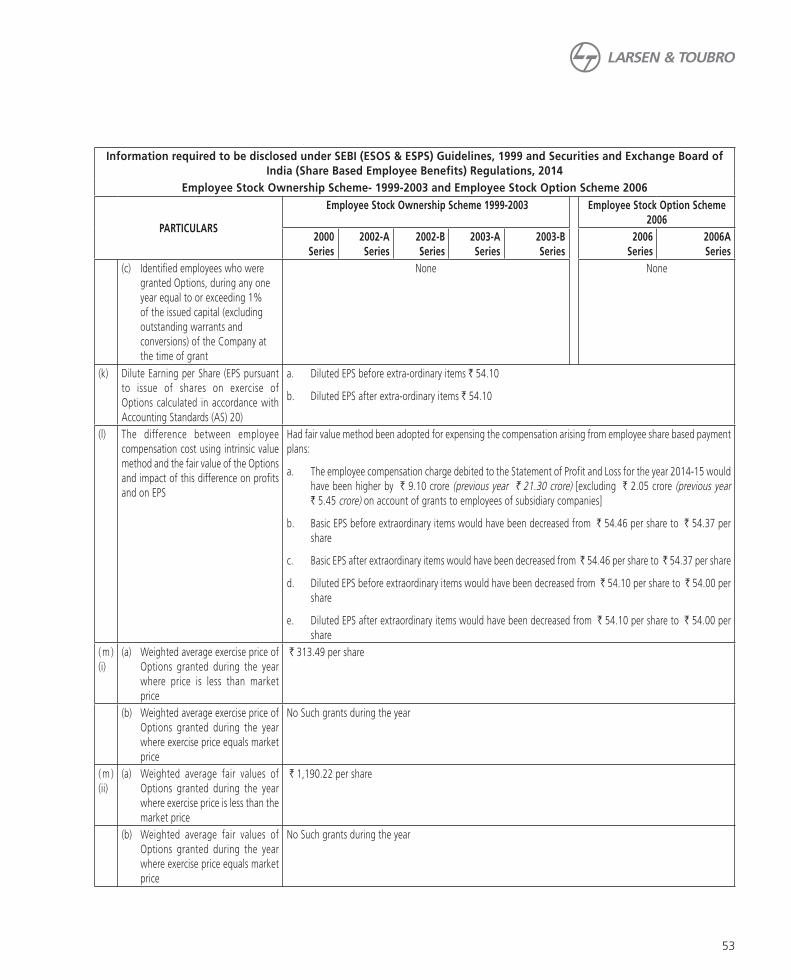
53
PARTICULARS
Employee Stock Ownership Scheme 1999-2003 Employee Stock Option Scheme
2006
2000
Series
2002-A
Series
2002-B
Series
2003-A
Series
2003-B
Series
2006
Series
2006A
Series
(c) Identified employees who were
granted Options, during any one
year equal to or exceeding 1%
of the issued capital (excluding
outstanding warrants and
conversions) of the Company at
the time of grant
None None
(k) Dilute Earning per Share (EPS pursuant
to issue of shares on exercise of
Options calculated in accordance with
Accounting Standards (AS) 20)
a. Diluted EPS before extra-ordinary items ` 54.10
b. Diluted EPS after extra-ordinary items ` 54.10
(l) The difference between employee
compensation cost using intrinsic value
method and the fair value of the Options
and impact of this difference on profits
and on EPS
Had fair value method been adopted for expensing the compensation arising from employee share based payment
plans:
a. The employee compensation charge debited to the Statement of Profit and Loss for the year 2014-15 would
have been higher by ` 9.10 crore (previous year ` 21.30 crore) [excluding ` 2.05 crore (previous year
` 5.45 crore) on account of grants to employees of subsidiary companies]
b. Basic EPS before extraordinary items would have been decreased from ` 54.46 per share to ` 54.37 per
share
c. Basic EPS after extraordinary items would have been decreased from ̀ 54.46 per share to ` 54.37 per share
d. Diluted EPS before extraordinary items would have been decreased from ` 54.10 per share to ` 54.00 per
share
e. Diluted EPS after extraordinary items would have been decreased from ` 54.10 per share to ` 54.00 per
share
( m )
(i)
(a) Weighted average exercise price of
Options granted during the year
where price is less than market
price
` 313.49 per share
(b) Weighted average exercise price of
Options granted during the year
where exercise price equals market
price
No Such grants during the year
( m )
(ii)
(a) Weighted average fair values of
Options granted during the year
where exercise price is less than the
market price
` 1,190.22 per share
(b) Weighted average fair values of
Options granted during the year
where exercise price equals market
price
No Such grants during the year
Information required to be disclosed under SEBI (ESOS & ESPS) Guidelines, 1999 and Securities and Exchange Board of
India (Share Based Employee Benefits) Regulations, 2014
Employee Stock Ownership Scheme- 1999-2003 and Employee Stock Option Scheme 2006

54
(n) Method and significant assumptions
used to estimate the fair value of
Options granted during the year
(a) Method Black-Sholes Options Pricing Model
(b) Significant Assumptions
(i) Weighted average risk free
interest rate
8.57%
(ii) Weighted average expected
life of Options
4.01 years
(iii) Weighted average expected
volatility
33.92%
(iv) Weighted average expected
dividends
` 57.18 per option
(v) Weighted average market
price
` 1,444.51 per option
AUDITORS’ CERTIFICATE ON EMPLOYEE STOCK OPTION SCHEMES
We have examined the books of account and other relevant records and based on the information and explanations given to us, certify
that in our opinion, the Company has implemented the Employees Stock Option Schemes in accordance with SEBI (Employee Stock
Option Schemes and Employee Stock Purchase Scheme) Guidelines, 1999 and the resolutions of the Company in general meetings
held on 26 August 1999, 22 August 2003 and 25 August 2006.
SHARP & TANNANChartered Accountants
Firm’s Registration No.109982Wby the hand of
MILIND P. PHADKEPartner
Mumbai, May 30, 2015 Membership No.33013
Information required to be disclosed under SEBI (ESOS & ESPS) Guidelines, 1999 and Securities and Exchange Board of
India (Share Based Employee Benefits) Regulations, 2014
Employee Stock Ownership Scheme- 1999-2003 and Employee Stock Option Scheme 2006
PARTICULARS
Employee Stock Ownership Scheme 1999-2003 Employee Stock Option Scheme
2006
2000
Series
2002-A
Series
2002-B
Series
2003-A
Series
2003-B
Series
2006
Series
2006A
Series

55
Annexure ‘C’ to the Directors’ Report
A. CORPORATE GOVERNANCE
Corporate Governance is a set of principles, processes and systems which govern a company. The elements of Corporate
Governance are independence, transparency, accountability, responsibility, compliance, ethics, values and trust.
Corporate Governance enables an organization to perform efficiently and ethically generate long term wealth and
create value for all its stakeholders.
The Company believes that sound Corporate Governance is critical for enhancing and retaining investor trust and
your Company always seeks to ensure that its performance goals are met accordingly. The Company has established
systems and procedures to ensure that its Board of Directors is well informed and well equipped to fulfill its overall
responsibilities and to provide management with the strategic direction needed to create long term shareholders value.
The Company has adopted many ethical and transparent governance practices even before they were mandated by
law. The Company has always worked towards building trust with shareholders, employees, customers, suppliers and
other stakeholders based on the principles of good corporate governance.
B. COMPANY’S CORPORATE GOVERNANCE PHILOSOPHY
The Company’s essential character revolves around values based on transparency, integrity, professionalism and
accountability. At the highest level, the Company continuously endeavors to improve upon these aspects on an ongoing
basis and adopts innovative approaches for leveraging resources, converting opportunities into achievements through
proper empowerment and motivation, fostering a healthy growth and development of human resources to take the
Company forward.
C. THE GOVERNANCE STRUCTURE
The Company has four tiers of Corporate Governance structure, viz.:
(i) Strategic Supervision – by the Board of Directors comprising the Executive Directors, Non-Executive Directors
and Independent Directors.
(ii) Executive Management – by the Corporate Management comprising of the Executive Directors and one Senior
Managerial Personnel and one Advisor to the Chairman.
(iii) Strategy & Operational Management – by the Independent Company Boards of each Independent Company (IC)
comprising of representatives from the Company Board, Senior Executives from the IC and independent members.
(iv) Operational Management – by the Business Unit (BU) Heads.
The four-tier governance structure, besides ensuring greater management accountability and credibility, facilitates
increased autonomy to businesses, performance discipline and development of business leaders, leading to increased
public confidence.
D. ROLES OF VARIOUS CONSTITUENTS OF CORPORATE GOVERNANCE IN THE COMPANY
a. Board of Directors (the Board):
The Directors of the Company are in a fiduciary position, empowered to oversee the management functions with
a view to ensuring its effectiveness and enhancement of shareholder value. The Board also reviews and approves
management’s strategic plan & business objectives and monitors the Company’s strategic direction.
b. Executive Management Committee (EMC):
The EMC plays an important role in maintaining the linkage between IC’s and the Company’s Board as well as in
realizing inter-IC synergies and benefits across ICs. The key responsibilities of the EMC include approval of policies
cutting across ICs and also at Corporate level, covering capital investments, expansions, customer and supplier
synergy, Corporate Social Responsibility (CSR) and reviewing the consolidated financials and budgets before they
are presented to the Company Board.

56
c. Group Executive Chairman (GEC):
The GEC is the Chairman of the Board and the Executive Management Committee. His primary role is to provide
leadership to the Board and the Corporate Management for realizing the approved strategic plan and business
objectives. He presides over the Board and the Shareholders’ meetings. The GEC provides leadership and devotes
his full attention to certain core actions which include, inter alia, focus on restructuring, mentoring of senior
executives, succession planning and corporate governance. He is the interface for critical Government entities
and major customers of the Company and Group Companies. He also provides support to the Company and its
Group Companies, wherever necessary.
d. Chief Executive Officer and Managing Director (CEO & MD):
The CEO & MD is fully accountable to the Board for the Company’s business development, operational excellence,
business results, people development and other related responsibilities.
e. Executive Directors (ED) / Senior Management Personnel:
The Executive Directors, as members of the Board, along with the Senior Management Personnel in the Executive
Management Committee, contribute to the strategic management of the Company’s businesses within Board
approved direction and framework. They assume overall responsibility for strategic management of business and
corporate functions including its governance processes and top management effectiveness.
f. Non-Executive Directors (NED) / Independent Directors:
The Non-Executive Directors / Independent directors play a critical role in enhancing balance to the Board processes
with their independent judgment on issues of strategy, performance, resources, standards of conduct, etc., besides
providing the Board with valuable inputs.
g. Independent Company Board (IC Board):
As a part of Lakshya 2016, the Company developed an Organisation Structure to include Hybrid Holding Company.
Accordingly, 12 Independent Companies (ICs) (not legal entities) were created. These ICs are managed by their
internal “Board” comprising of Senior Executives, 1 Non-Executive Director/ Independent Director of the Company’s
Board and 2-3 Independent external Members. This structure has enabled the Company to empower people and
achieve substantial growth in the business.
Looking to the opportunities in International market, especially in Gulf Cooperation Council (GCC) countries, the
Company took an additional initiative of developing the structure, processes and leadership specifically in GCC
countries.
E. BOARD OF DIRECTORS
a. Composition of the Board:
The Company’s policy is to have an appropriate mix of Executive, Non-Executive & Independent Directors. As on
March 31, 2015, the Board comprises of the Group Executive Chairman, the Chief Executive Officer and Managing
Director, 4 Executive Directors, 1 Non-Executive Director (representing financial institutions) and 7 Independent
Directors. The composition of the Board, as on 31st March, 2015, is in conformity with the provisions of the
Companies Act, 2013 and Clause 49 of the Listing Agreement in this respect.
b. Meetings of the Board:
The Meetings of the Board are generally held at the Registered Office of the Company at L&T House, Ballard
Estate, Mumbai 400 001 and also if necessary, in locations, where the Company operates. The Meetings of the
Board have been held at regular intervals with a time gap of not more than 120 days between two consecutive
Meetings. During the year under review, 9 meetings were held on April 4, 2014, April 5, 2014, April 28, 2014,
May 30, 2014, July 28, 2014, August 21, 2014, November 7, 2014, February 9, 2015 and March 23, 2015.
A meeting of the Independent Directors was held on March 23, 2015.
The Company Secretary prepares the agenda and the explanatory notes, in consultation with the Group Executive
Chairman and CEO & Managing Director and circulates the same in advance to the Directors. Every Director is free
to suggest inclusion of items on the agenda. The Board meets at least once every quarter, inter alia, to review the

57
quarterly results. Additional Meetings are held, when necessary. Presentations are made on business operations
to the Board by Independent Company / Business Units. Senior management personnel are invited to provide
additional inputs for the items being discussed by the Board of Directors as and when necessary. The Minutes of
the proceedings of the Meetings of the Board of Directors are noted and the draft minutes are circulated amongst
the Members of the Board for their perusal. Comments, if any, received from the Directors are also incorporated
in the Minutes, in consultation with the Group Executive Chairman. Thereafter the minutes are signed by the
Chairman of the Board at the next meeting.
The following composition of the Board of Directors is as on March 31, 2015. Their attendance at the Meetings
during the year and at the last Annual General Meeting is as under:
Name of Director Category Meetings held
during the year
No of Board
Meetings
attended
Attendance at
last AGM
Mr. A. M. Naik GEC 9 8 YES
Mr. K. Venkataramanan CEO & MD 9 9 YES
Mr. M. V. Kotwal ED 9 9 YES
Mr. S. N. Subrahmanyan ED 9 9 YES
Mr. R. Shankar Raman ED 9 9 YES
Mr. Shailendra Roy ED 9 9 YES
Mr. S. Rajgopal @ ID 6 6 YES
Mr. S. N. Talwar @ ID 6 6 YES
Mr. M. M. Chitale ID 9 9 YES
Mr. Subodh Bhargava ID 9 9 YES
Mr. A. K. Jain (Note 2)# NED 8 8 YES
Mr. M. Damodaran ID 9 8 YES
Mr. Vikram Singh Mehta ID 9 8 NO
Mr. Sushobhan Sarker (Note 1) NED 9 8 YES
Mr. Adil Zainulbhai $ ID 5 5 YES
Mr. Akhilesh Gupta % ID 3 3 NA
Mr. Bahram Vakil ^ ID 1 – NA
Meetings held during the year are expressed as number of meetings eligible to attend.
Note: 1. Representing equity interest of LIC
2. Representing equity interest of SUUTI
@ ceased to be a director w.e.f. 22.08.2014. # ceased to be a director w.e.f. 10.02.2015
$ appointed as a Director w.e.f. 30.05.2014 % appointed as a Director w.e.f. 09.09.2014
^ appointed as a Director w.e.f. 16.03.2015
GEC – Group Executive Chairman ED – Executive Director
CEO & MD – Chief Executive Officer and Managing Director NED – Non-Executive Director
ID – Independent Director
1. None of the above Directors are related inter-se.
2. None of the Directors hold the office of director in more than the permissible number of companies under
the Companies Act, 2013 or Clause 49 of the Listing Agreement.

58
As on March 31, 2015, the number of other Directorships & Memberships / Chairmanships of Committees of the
Board of Directors are as follows:
Name of Director No of other company
Directorships
No. of Committee
Membership
No. of Committee
Chairmanship
Mr. A. M. Naik 3 – 1
Mr. K. Venkataramanan 1 – –
Mr. M. V. Kotwal 1 – –
Mr. S. N. Subrahmanyan 3 1 –
Mr. R. Shankar Raman 9 8 1
Mr. Shailendra Roy 9 2 –
Mr. M. M. Chitale 10 4 4
Mr. Subodh Bhargava 8 3 1
Mr. M. Damodaran 9 5 3
Mr. Vikram Singh Mehta 10 2 –
Mr. Sushobhan Sarker 3 1 1
Mr. Adil Zainulbhai 6 3 2
Mr. Akhilesh Gupta 5 2 –
Mr. Bahram Vakil 14 3 –
Committee memberships include memberships of Audit Committee and Stakeholders’ Relationship Committee
in all public limited companies (whether listed or not) and excludes private limited companies, foreign
companies and Section 8 companies.
The Committee Chairmanships / Memberships are within the limits laid down in Clause 49 of the Listing
Agreement.
c. Information to the Board:
The Board of Directors has complete access to the information within the Company, which inter alia includes -
Annual revenue budgets and capital expenditure plans
Quarterly results and results of operations of Independent Company and business segments
Financing plans of the Company
Minutes of meeting of Board of Directors, Audit Committee, Nomination & Remuneration Committee and
Corporate Social Responsibility Committee
Details of any joint venture, acquisitions of companies or collaboration agreement
Quarterly report on fatal or serious accidents or dangerous occurrences, any material effluent or pollution
problems
Any materially relevant default, if any, in financial obligations to and by the Company or substantial non-
payment for goods sold or services rendered, if any
Any issue, which involves possible public or product liability claims of substantial nature, including any
Judgment or Order, if any, which may have strictures on the conduct of the Company
Developments in respect of human resources
Compliance or Non-compliance of any regulatory, statutory nature or listing requirements and investor service
such as non-payment of dividend, delay in share transfer, etc., if any
d. Post-meeting internal communication system:
The important decisions taken at the Board / Committee meetings are communicated to the concerned departments /
Independent Company promptly.

59
F. BOARD COMMITTEES
The Board currently has 5 Committees: 1) Audit
Committee, 2) Nomination & Remuneration Committee,
3) Stakeholders’ Relationship Committee, 4) Corporate
Social Responsibility Committee and 5) Risk Management
Committee. The terms of reference of the Board
Committees are determined by the Board from time to
time. The Board is responsible for constituting, assigning
and co-opting the members of the Committees. The
meetings of each Board Committee are convened
by the respective Committee Chairman. The role
and composition of these Committees, including the
number of meetings held during the financial year and
the related attendance are provided below.
1) Audit Committee (AC)
i) Terms of reference:
The role of the Audit Committee includes the
following:
Oversight of the company’s financial
reporting process and the disclosure of its
financial information to ensure that the
financial statement is correct, sufficient
and credible.
Recommending to the Board, the
appointment, re-appointment and, if
required, the replacement or removal of
the statutory auditor and the fixation of
audit fees.
Approval of payment to statutory auditors
for any other services rendered by the
statutory auditors.
Reviewing, with the management, the
annual financial statements before
submission to the board for approval,
with particular reference to:
1. Matters required to be included in the
Directors’ Responsibility Statement
to be included in the Board’s report
in terms of Section 134(3)(c) of the
Companies Act, 2013.
2. Changes, if any, in accounting
policies and practices and reasons
for the same.
3. Major accounting entries involving
estimates based on the exercise of
judgment by management.
4. Significant adjustments made in the
financial statements arising out of
audit findings.
5. Compliance with listing and other
legal requirements relating to
financial statements.
6. Disclosure of any related party
transactions.
7. Qualifications in the draft audit
report.
Reviewing, with the management, the
quarterly financial statements before
submission to the board for approval.
Reviewing, with the management,
the statement of uses / application of
funds raised through an issue (public
issue, rights issue, preferential issue,
etc.), the statement of funds utilized for
purposes other than those stated in the
offer document/prospectus/notice and
the report submitted by the monitoring
agency monitoring the utilisation of
proceeds of public or rights issue, and
making appropriate recommendations to
the Board to take up steps in this matter.
Reviewing, with the management,
performance of statutory and internal
auditors, and adequacy of the internal
control systems.
Reviewing the adequacy of internal audit
function, if any, including the structure
of the internal audit department, staffing
and seniority of the official heading the
department, reporting structure coverage
and frequency of internal audit.
Discussion with internal auditors on any
significant findings and follow up thereon.
Reviewing the findings of any internal
investigations by the internal auditors into
matters where there is suspected fraud or
irregularity or a failure of internal control
systems of a material nature and reporting
the matter to the board.
Discussion with statutory auditors before
the audit commences, about the nature

60
and scope of audit as well as post-audit
discussion to ascertain any area of
concern.
To look into the reasons for substantial
defaults in the payment to the depositors,
debenture holders, shareholders (in case
of non-payment of declared dividends)
and creditors.
To review the functioning of the Whistle
Blower mechanism.
Approval of appointment of CFO (i.e.,
the whole-time Finance Director or any
other person heading the finance function
or discharging that function) after
assessing the qualifications, experience &
background, etc. of the candidate.
Carrying out any other function as is
mentioned in the terms of reference of
the Audit Committee.
The recommendation for appointment,
remuneration and terms of appointment
of auditors of the company.
Review and monitor the auditors’
independence and performance, and
effectiveness of audit process.
Examination of the financial statement
and the auditors’ report thereon.
Review the management discussion and
analysis of financial condition and results
of operations.
Approval or any subsequent modification
of transactions of the company with
related parties.
Scrutiny of inter-corporate loans and
investments.
Valuation of undertakings or assets of the
company, wherever it is necessary.
Evaluation of internal financial controls
and risk management systems.
Monitoring the end use of funds raised
through public offers and related matters.
ii) Composition:
The Audit Committee of the Board of Directors
was formed in 1986 and as on March 31, 2015
comprised three Independent Directors.
iii) Meetings:
During the year ended March 31, 2015, 13
meetings of the Audit Committee were held
on April 16, 2014, May 15, 2014, May 29,
2014, July 15, 2014, July 28, 2014, August
23, 2014, September 18, 2014, November
6, 2014, November 14, 2014, December 11,
2014, January 11, 2015, January 12, 2015 and
February 7, 2015.
In addition to the above, the members of
the Audit Committee also meet without the
presence of management.
The attendance of Members at the Meetings
was as follows:
Name Status No. of meetings
during the year
No. of Meetings Attended
Mr. M. M. Chitale Chairman 13 13
Mr. A. K. Jain # Member 13 13
Mr. M. Damodaran Member 13 12
Mr. Akhilesh Gupta % Member 5 3
Meetings held during the year are expressed
as number of meetings eligible to attend.
# ceased to be a member w.e.f. 10.02.2015
% appointed as a member w.e.f. 07.11.2014
All the members of the Audit Committee are
financially literate and have accounting or
related financial management expertise.
The CEO & MD, the Chief Financial Officer &
Whole-time Director and Internal Auditor are
permanent invitees to the Meetings of the
Audit Committee. The Company Secretary is
the Secretary to the Committee.
iv) Internal Audit:
The Company has an internal corporate audit
team consisting of Chartered Accountants,
Cost Accountants and Engineers. Over
a period of time, the Corporate Audit
department has acquired in-depth knowledge
about the Company, its businesses, its systems

61
& procedures, which knowledge is now
institutionalized. The Company’s Internal Audit
function is ISO 9001:2008 certified. The Head
of Corporate Audit Services is responsible to
the Audit Committee. The staff of Corporate
Audit department is rotated periodically.
From time to time, the Company’s systems
of internal controls covering financial,
operational, compliance, IT applications, etc.
are reviewed by external experts. Presentations
are made to the Audit Committee on the
findings of such reviews. The minutes of the
Audit Committee are circulated to the Board
and discussed at Board meetings.
The Company’s Audit Committee, inter
alia, reviews the adequacy of internal audit
function, reviews the internal audit reports
including those related to internal control
weaknesses and reviews the performance of
the Corporate Audit Department. The Audit
Committee is provided necessary assistance
and information to carry out their function
effectively.
2) Nomination & Remuneration Committee (N&R)
i) Terms of reference:
Identify persons who are qualified to
become directors and who may be
appointed in senior management in
accordance with the criteria laid down by
the Committee.
Recommend to the Board appointment
and removal of such persons.
Formulate criteria for determining
qualifications, positive attributes and
independence of a director.
Devise a policy on Board diversity.
Formulation of criteria for evaluation of
directors and the Board.
Carry out evaluation of the Board and
directors.
Recommend to the Board a policy, relating
to remuneration for the directors, key
managerial personnel (KMP) and other
employees.
Administration of Employee Stock Option
Scheme (ESOS).
ii) Composition:
The Committee has been in place since
1999. As at March 31, 2015, the Committee
comprised of 3 persons viz. 2 Independent
Directors and the Group Executive Chairman. It
presently comprises of 3 Independent Directors
and the Group Executive Chairman.
iii) Meetings:
During the year ended March 31, 2015, 7
meetings of the N&R Committee were held on
April 4, 2014, May 22, 2014, May 30, 2014,
July 28, 2014, August 21, 2014, November 7,
2014 and February 9, 2015.
The attendance of Members at the Meetings
was as follows:
Name Status No. of
meetings
during
the year
No. of
Meetings
Attended
Mr. S. Rajgopal @ Chairman 5 5
Mr. S. N. Talwar @ Member 5 5
Mr. Subodh Bhargava# Chairman 7 7
Mr. A. M. Naik Member 7 6
Mr. Adil Zainulbhai $ Member 2 1
Meetings held during the year are expressed
as number of meetings eligible to attend.
@ ceased to be a Chairman / member w.e.f.
21.08.2014
$ appointed as a member w.e.f. 21.08.2014
# appointed as Chairman w.e.f. 21.08.2014
iv) Board Membership Criteria:
While screening, selecting and recommending
to the Board new members, the Committee
ensures that the Board is objective, there
is absence of conflict of interest, ensures
availability of diverse perspectives, business
experience, legal, financial & other expertise,
integrity, managerial qualities, practical
wisdom, ability to read & understand financial
statements, commitment to ethical standards
and values of the Company and ensure healthy
debates & sound decisions.
While evaluating the suitability of a Director for
re-appointment, besides the above criteria, the
Committee considers the past performance,

62
attendance & participation in and contribution
to the activities of the Board by the Director.
The Independent Directors comply with the
definition of Independent Director as given
under Section 149(6) of the Companies
Act, 2013 and Clause 49 of the Listing
Agreement. While appointing / re-appointing
any Independent Directors on the Board, the
Committee considers the criteria as laid down
in the Companies Act, 2013 and Clause 49 of
the Listing Agreement.
All the Independent Directors give a certificate
confirming that they meet the “independence
criteria” as mentioned in Section 149(6) of the
Companies Act, 2013 and Clause 49 of the
Listing Agreement.
These certificates have been placed on the
website of the Company.
v) Remuneration Policy
The remuneration of the Board members
is based on the Company’s size & global
presence, its economic & financial position,
industrial trends, compensation paid by the
peer companies, etc. Compensation reflects
each Board member’s responsibility and
performance. The level of compensation
to Executive Directors is designed to be
competitive in the market for highly qualified
executives.
The Company pays remuneration to Executive
Directors by way of salary, perquisites &
retirement benefits (fixed components) &
commission (variable component), based
on recommendation of the Committee,
approval of the Board and the shareholders.
The commission payable is based on the
performance of the business / function as
well as qualitative factors. The commission
is calculated with reference to net profits of
the Company in the financial year subject to
overall ceilings stipulated under Section 197 of
the Companies Act, 2013.
The Non-Executive Directors (NEDs) are paid
remuneration by way of commission & sitting
fees. The Company pays sitting fees of `
50,000 per meeting of the Board and ̀ 25,000
per meeting of the Committee to the NEDs
for attending the meetings of the Board &
Committees. The commission is paid subject
to a limit not exceeding 1% p.a. of the profits
of the Company as approved by shareholders
(computed in accordance with Section 197 of
the Companies Act, 2013).
The commission to NEDs is distributed broadly
on the basis of their attendance, contribution
at the Board meetings, the Committee
meetings, Chairmanship of Committees and
participation in IC meetings.
In the case of nominees of Financial Institutions,
the commission is paid to the Financial
Institutions.
As required by the provisions of Clause 49 of
the Listing Agreement, the criteria for payment
to Non-Executive Directors is made available
on the investor page of our corporate website
www.larsentoubro.com
vi) Details of remuneration paid / payable
to Directors for the year ended March 31,
2015:
(a) Executive Directors:
The details of remuneration paid / payable
to the Executive Directors is as follows:
` crore
Names Salary Perquisites Retirement Benefits
Commission
Mr. A. M. Naik 3.12 0.25 5.75 18.19
Mr. K. Venkataramanan 2.02 1.64 2.54 7.39
Mr. M. V. Kotwal 1.47 1.15 1.72 4.91
Mr. S. N. Subrahmanyan 1.23 0.18 2.69 8.73
Mr. R. Shankar Raman 1.11 0.18 2.17 6.91
Mr. Shailendra N. Roy 0.96 0.99 1.47 4.48
Notice period for termination of
appointment of Group Executive
Chairman, Chief Executive Officer &
Managing Director and other Whole-time
Directors is six months on either side.
No severance pay is payable on termination
of appointment.
Details of Options granted under
Employee Stock Option Schemes are given
in Annexure ‘B’ to the Directors’ Report.
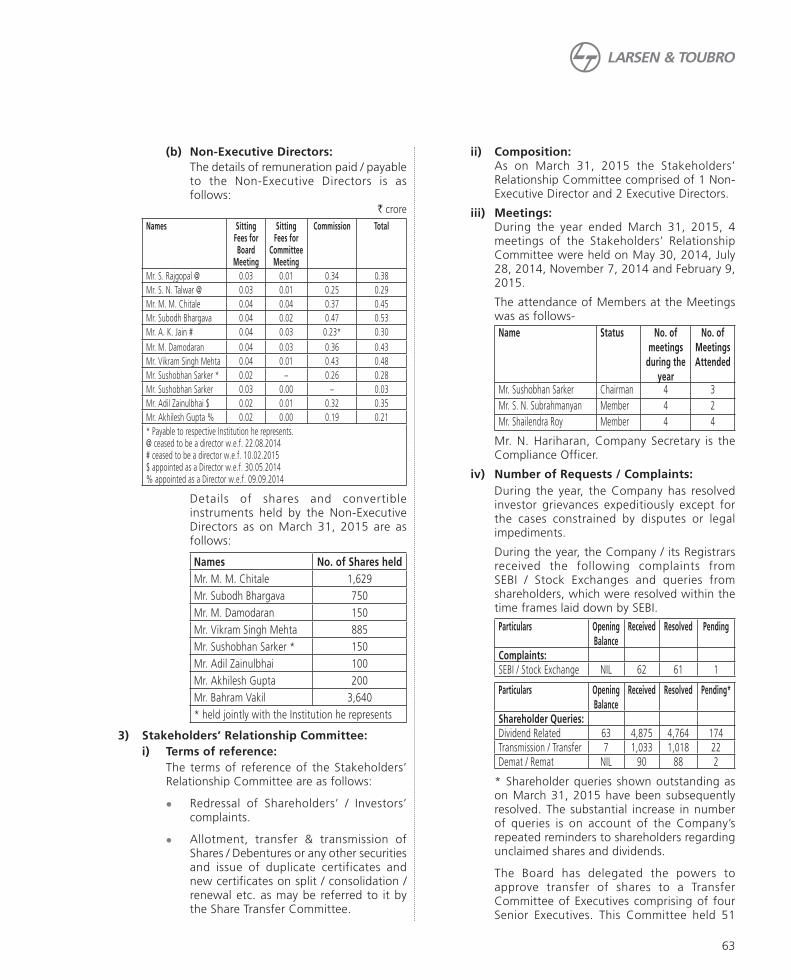
63
(b) Non-Executive Directors:
The details of remuneration paid / payable to the Non-Executive Directors is as follows:
` crore
Names Sitting Fees for Board
Meeting
Sitting Fees for
Committee Meeting
Commission Total
Mr. S. Rajgopal @ 0.03 0.01 0.34 0.38
Mr. S. N. Talwar @ 0.03 0.01 0.25 0.29
Mr. M. M. Chitale 0.04 0.04 0.37 0.45
Mr. Subodh Bhargava 0.04 0.02 0.47 0.53
Mr. A. K. Jain # 0.04 0.03 0.23* 0.30
Mr. M. Damodaran 0.04 0.03 0.36 0.43
Mr. Vikram Singh Mehta 0.04 0.01 0.43 0.48
Mr. Sushobhan Sarker * 0.02 – 0.26 0.28
Mr. Sushobhan Sarker 0.03 0.00 – 0.03
Mr. Adil Zainulbhai $ 0.02 0.01 0.32 0.35
Mr. Akhilesh Gupta % 0.02 0.00 0.19 0.21
* Payable to respective Institution he represents.@ ceased to be a director w.e.f. 22.08.2014# ceased to be a director w.e.f. 10.02.2015$ appointed as a Director w.e.f. 30.05.2014% appointed as a Director w.e.f. 09.09.2014
Details of shares and convertible instruments held by the Non-Executive Directors as on March 31, 2015 are as follows:
Names No. of Shares held
Mr. M. M. Chitale 1,629
Mr. Subodh Bhargava 750
Mr. M. Damodaran 150
Mr. Vikram Singh Mehta 885
Mr. Sushobhan Sarker * 150
Mr. Adil Zainulbhai 100
Mr. Akhilesh Gupta 200
Mr. Bahram Vakil 3,640
* held jointly with the Institution he represents
3) Stakeholders’ Relationship Committee:
i) Terms of reference:
The terms of reference of the Stakeholders’ Relationship Committee are as follows:
Redressal of Shareholders’ / Investors’ complaints.
Allotment, transfer & transmission of Shares / Debentures or any other securities and issue of duplicate certificates and new certificates on split / consolidation / renewal etc. as may be referred to it by the Share Transfer Committee.
ii) Composition: As on March 31, 2015 the Stakeholders’
Relationship Committee comprised of 1 Non-Executive Director and 2 Executive Directors.
iii) Meetings: During the year ended March 31, 2015, 4
meetings of the Stakeholders’ Relationship Committee were held on May 30, 2014, July 28, 2014, November 7, 2014 and February 9, 2015.
The attendance of Members at the Meetings was as follows-
Name Status No. of
meetings
during the
year
No. of
Meetings
Attended
Mr. Sushobhan Sarker Chairman 4 3
Mr. S. N. Subrahmanyan Member 4 2
Mr. Shailendra Roy Member 4 4
Mr. N. Hariharan, Company Secretary is the Compliance Officer.
iv) Number of Requests / Complaints:
During the year, the Company has resolved investor grievances expeditiously except for the cases constrained by disputes or legal impediments.
During the year, the Company / its Registrars received the following complaints from SEBI / Stock Exchanges and queries from shareholders, which were resolved within the time frames laid down by SEBI.
Particulars Opening
Balance
Received Resolved Pending
Complaints:SEBI / Stock Exchange NIL 62 61 1
Particulars Opening
Balance
Received Resolved Pending*
Shareholder Queries:Dividend Related 63 4,875 4,764 174Transmission / Transfer 7 1,033 1,018 22Demat / Remat NIL 90 88 2
* Shareholder queries shown outstanding as on March 31, 2015 have been subsequently resolved. The substantial increase in number of queries is on account of the Company’s repeated reminders to shareholders regarding unclaimed shares and dividends.
The Board has delegated the powers to approve transfer of shares to a Transfer Committee of Executives comprising of four Senior Executives. This Committee held 51

64
meetings during the year and approved the transfer of shares lodged with the Company.
4) Corporate Social Responsibility Committee (CSR):
i) Terms of reference:
The terms of reference of the CSR Committee are as follows:
formulate and recommend to the Board, a Corporate Social Responsibility Policy which shall indicate the activities to be undertaken by the Company;
recommend the amount of expenditure to be incurred on the activities referred to in above; and
monitor the Corporate Social Responsibility Policy of the Company from time to time.
ii) Composition:
As on March 31, 2015 the CSR Committee comprised of 1 Independent Director and 2 Executive Directors.
iii) Meetings:
During the year ended March 31, 2015, 6 meetings of the CSR Committee were held on April 2, 2014, July 14, 2014, September 2, 2014, October 8, 2014, October 30, 2014 and January 16, 2015.
The attendance of Members at the Meetings was as follows-
Name Status No. of
meetings
during the
year
No. of
Meetings
Attended
Mr. Vikram Singh Mehta Chairman 6 6
Mr. M. V. Kotwal Member 6 5
Mr. R. Shankar Raman Member 6 6
G. OTHER INFORMATION
a) Directors’ Familiarisation Programme:
All our directors are aware and are also updated as and when required, of their role, responsibilities & liabilities.
The Company holds Board meetings at its registered office and also if necessary, in locations, where it operates. Site / factory visits are organized at various locations for the Directors.
b) Information to directors:
The Board of Directors has complete access to the information within the Company, which inter alia, includes items as mentioned on Page 58 in Annexure ‘C’ to this Directors’ Report.
Presentations are made regularly to the Board / N&R / AC (minutes of AC & N&R are circulated to the Board), where Directors get an opportunity to interact with senior managers. Presentations, inter alia, cover business strategies, management structure, HR policy, management development and succession planning, quarterly and annual results, budgets, treasury policy, review of Internal Audit, risk management framework, operations of subsidiaries and associates, etc.
Independent Directors have the freedom to interact with the Company’s management. Interactions happen during Board / Committee meetings, when senior company personnel are asked to make presentations about performance of their Independent Company / Business Unit, to the Board. Such interactions also happen when these Directors meet senior management in IC meetings and informal gatherings.
c) Risk Management Framework:
The Company has in place mechanisms to inform Board Members about the risk assessment and minimization procedures and periodical review to ensure that executive management controls risk by means of a properly defined framework.
A detailed note on risk management is given in the Financial Review section of Management’s Discussion and Analysis report elsewhere in this Report.
d) Statutory Auditors:
Please refer to Page 45 of the Directors’ Report.
e) Code of Conduct:
The Company has laid down a Code of Conduct for all Board members and senior management personnel. The Code of Conduct is available on the website of the Company www.larsentourbo.com. The declaration of CEO & Managing Director is given below:
To the Shareholders of Larsen & Toubro Limited
Sub: Compliance with Code of Conduct
I hereby declare that all the Board Members and Senior Management Personnel have affirmed compliance with the Code of Conduct as adopted by the Board of Directors.
K. Venkataramanan Chief Executive Officer & Managing Director
Date: May 30, 2015
Place: Mumbai

65
f) General Body Meetings:
The last three Annual General Meetings of the
Company were held at Birla Matushri Sabhagar,
Mumbai as under:
Financial Year Date Time
2013-2014 August 22, 2014 3.00 p.m.
2012-2013 August 22, 2013 3.00 p.m.
2011-2012 August 24, 2012 3.00 p.m.
The following Special Resolutions were passed by
the members during the past 3 Annual General
Meetings:
Annual General Meeting held on August 22, 2014:
No special resolutions were listed in the
agenda for the meeting.
Annual General Meeting held on August 22, 2013:
To approve raising of capital through QIPs
by issue of shares / convertible debentures /
securities upto an amount of USD 600 million
or ` 3200 crore.
To approve appointment of Statutory Auditors
and remuneration payable to them.
Annual General Meeting held on August 24, 2012:
To approve appointment of Mr. A. M. Naik as
the Executive Chairman of the Company.
To approve raising of capital through QIPs
by issue of shares / convertible debentures /
securities upto an amount of USD 600 million
or ` 3200 crore.
To approve appointment of Statutory Auditors
and remuneration payable to them.
g) Approval of Members through Postal Ballot:
The Company received approval of the members on
14th July 2014, for passing Special Resolutions under
Section 110 of the Companies Act, 2013 read with
the Companies (Management and Administration)
Rules, 2014, for the following businesses:
Resolution
No.
Details of the resolution
1 To create charge on the total assets of the
Company to secure its borrowings.
2 Authorizing the Board of Directors to raise
funds through issue of Equity Shares through
Qualified Institutional Placement (QIP),
Convertible Bonds, Equity Shares through
Depository receipts of an amount not
exceeding ` 3,600 crore or USD 600 million,
whichever is higher.
Resolution
No.
Details of the resolution
3 Authorizing the Board of Directors to
raise funds through private placement of
non-convertible debentures not exceeding
` 6,000 crore.
4 Alteration of the Articles of Association of the
Company.
Mr. S. N. Ananthasubramanian, Practicing Company
Secretary, was appointed as the Scrutinizer for
conducting the Postal Ballot process. The details
of the voting pattern are as under:
Resolution No.1
Particulars No. of votes cast % of total
votes castPhysical E-Voting Total
In favour of
the resolution
37,68,21,687 6,56,18,076 44,24,39,763 87.84
Against the
resolution
3,67,77,271 2,44,99,548 6,12,76,819 12.16
TOTAL 41,35,98,958 9,01,17,624 50,37,16,582 100.00
Number of Invalid Ballots / E-votes (unsigned /
unticked / incomplete / incorrect voting) was 269.
Resolution No.2
Particulars No. of votes cast % of total
votes castPhysical E-Voting Total
In favour of the resolution
41,28,63,654 9,00,43,441 50,29,07,095 99.67
Against the resolution
15,28,444 1,38,041 16,66,485 0.33
TOTAL 41,43,92,098 9,01,81,482 50,45,73,580 100.00
Number of Invalid Ballots / E-votes (unsigned /
unticked / incomplete / incorrect voting) was 293.
Resolution No.3
Particulars No. of votes cast % of total
votes castPhysical E-Voting Total
In favour of the resolution
41,17,06,969 9,00,06,050 50,17,13,019 99.44
Against the resolution
26,73,206 1,43,385 28,16,591 0.56
TOTAL 41,43,80,175 9,01,49,435 50,45,29,610 100.00
Number of Invalid Ballots / E-votes (unsigned /
unticked / incomplete / incorrect voting) was 324.

66
Resolution No.4
Particulars No. of votes cast % of total
votes castPhysical E-Voting Total
In favour of the resolution
41,39,50,348 8,99,84,884 50,39,35,232 99.93
Against the
resolution
2,37,586 99,606 3,37,192 0.07
TOTAL 41,41,87,934 9,00,84,490 50,42,72,424 100.00
Number of Invalid Ballots / E-votes (unsigned /
unticked / incomplete / incorrect voting) was 314.
Procedure for Postal Ballot:
After receiving the approval of the Board of
Directors, Notice of the Postal Ballot, text of the
Resolution and Explanatory Statement, relevant
documents, Postal Ballot Form and self-addressed
postage envelopes are sent to the shareholders to
enable them to consider and vote for and against
the proposal within a period of 30 days from the
date of dispatch. E-voting facility is made available
to all the shareholders and instructions for the
same are specified under instructions for voting
in the Postal Ballot Notice. E-mails are sent to
shareholders whose e-mail ids are available with
the depositories and the Company alongwith
Postal Ballot Notice and Ballot Form.The calendar
of events containing the activity chart is filed with
the Registrar of Companies within 7 days of the
passing of the Resolution by the Board of Directors.
After the last day for receipt of ballots (physical
/ e-voting), the Scrutinizer, after due verification,
submits the results to the Chairman. Thereafter,
the Chairman declares the result of the Postal
Ballot. The same is published in the Newspapers
and displayed on the Company Website and Notice
Board and submitted to Stock Exchanges.
Proposal for Postal Ballot:
At present there is no proposal for Postal Ballot.
h) Disclosures:
1. During the year, there were no transactions
of material nature with the Directors or the
Management or relatives or the subsidiaries
that had potential conflict with the interests
of the Company.
2. Details of all related party transactions form a
part of the accounts as required under AS 18
and the same are given on pages 233 to 244
of the Annual Report.
3. The Company has followed all relevant
Accounting Standards notified by the
Companies (Accounting Standards) Rules,
2006 while preparing the Financial Statements.
4. The Company makes presentations to
Institutional Investors & Equity Analysts on the
Company’s performance on a quarterly basis.
5. There were no instances of non-compliance
on any matter related to the capital markets,
during the last three years.
i) Means of communication:
Financial Results
Quarterly & Annual Results are published in prominent daily newspapers viz. The Financial Express, The Hindu Business Line & Loksatta. The results are also posted on the Company’s website: www.larsentoubro.com.
News Releases Official news releases are sent to stock exchanges as well as displayed on the Company’s website: www.larsentoubro.com.
Website The Company’s corporate webs i te www.larsentoubro.com provides comprehensive information about its portfolio of businesses. Section on “Investors” serves to inform and service the Shareholders allowing them to access information at their convenience. Presentations made to Institutional Investors on a quarterly basis and the quarterly shareholding pattern of the Company is also displayed on the website. The entire Annual Report and Accounts of the Company and subsidiaries are available in downloadable formats. It will also be made available on the websites of the Stock Exchanges.
Filing with Stock Exchanges
Information to Stock Exchanges is now being also filed online on NEAPS for NSE and BSE Online for BSE.
Annual Report Annual Report is circulated to all the members and all others like auditors, equity analysts, etc.
Management Discussion & Analysis
This forms a part of the Annual Report which is mailed to the shareholders of the Company.
H. UNCLAIMED SHARES
As required under Clause 5A of the Listing Agreement,
the Company had sent reminders to the shareholders
to collect their share certificates which were lying
unclaimed / undelivered with the Company. The
Company received substantial number of requests to
claim these share certificates, which were released after
a thorough due diligence. As on today, the Company
has share certificates of only 1.95% of the total

67
shareholders lying unclaimed / undelivered. These will
be transferred to the Unclaimed Suspense Account as
required under the Listing Agreement. The Company
has already opened the “Unclaimed Suspense Account”
and is in the process of completing the formalities for
transferring the shares.
I. GENERAL SHAREHOLDERS’ INFORMATION
a) Annual General Meeting:
The Annual General Meeting of the Company has
been convened on Wednesday, September 9, 2015
at Birla Matushri Sabhagar, Marine Lines, Mumbai
– 400 020 at 3.00 p.m.
b) Financial calendar:
1. Annual Results of 2014-15 May 30, 2015
2. Mailing of Annual Reports Second week of August, 2015
3. First Quarter Results During the last week of July 2015 *
4. Annual General Meeting September 9, 2015
5. Payment of Dividend September 11, 2015
6. Second Quarter results During last week of October, 2015 *
7. Third Quarter results During last week of January, 2016 *
* Tentative
c) Book Closure:
The dates of Book Closure are from Thursday,
September 3, 2015 to Wednesday, September
9, 2015 (both days inclusive) to determine the
members entitled to the dividend for FY 2014-2015.
d) Listing of equity shares / shares underlying
GDRs on Stock Exchanges:
The shares of the Company are listed on BSE
Limited (BSE) and the National Stock Exchange of
India Limited (NSE).
GDRs are listed on Luxembourg Stock Exchange
and London Stock Exchange.
e) Listing Fees to Stock Exchanges:
The Company has paid the Listing Fees for the year
2015-2016 to the above Stock Exchanges.
f) Custodial Fees to Depositories:
Annual custodial fees for the year 2015-2016 to
National Securities Depository Limited (NSDL) and
Central Depository Services (India) Limited (CDSL)
will be paid by the Company on receipt of invoices
from them.
g) Stock Code / Symbol:
The Company’s equity shares / GDRs are listed on
the following Stock Exchanges and admitted for
trading in London Stock Exchange:
Bombay Stock Exchange (BSE) : Scrip Code - 500510
National Stock Exchange (NSE) : Scrip Code - LT
ISIN : INE018A01030
Reuters RIC : LART.BO
Luxembourg Exchange Stock Code : 005428157
London Exchange Stock Code : LTOD
The Company’s shares constitute a part of BSE 30
Index of the BSE Limited as well as NIFTY Index of
the National Stock Exchange of India Limited.
h) Stock market data for the year 2014-2015:
Month L&T BSE Price (`) BSE SENSEX
High Low Month Close
High Low Month Close
2014
April 1,387.85 1,242.45 1,295.55 22,939.31 22,197.51 22,417.80
May 1,622.70 1,251.60 1,548.90 25,375.63 22,277.04 24,217.34
June 1,774.70 1,603.00 1,701.60 25,725.12 24,270.20 25,413.78
July 1,763.00 1,501.00 1,504.10 26,300.17 24,892.00 25,894.97
August 1,556.00 1,439.20 1,526.90 26,674.38 25,232.82 26,638.11
September 1,629.95 1,435.35 1,457.45 27,354.99 26,220.49 26,630.51
October 1,659.95 1,400.00 1,654.85 27,894.32 25,910.77 27,865.83
November 1,692.60 1,593.65 1,640.10 28,822.37 27,739.56 28,693.99
December 1,654.90 1,451.65 1,496.50 28,809.64 26,469.42 27,499.42
2015
January 1,749.50 1,486.55 1,700.10 29,844.16 26,776.12 29,182.95
February 1,800.00 1,532.00 1,766.90 29,560.32 28,044.49 29,361.50
March 1,892.95 1,616.35 1,719.00 30,024.74 27,248.45 27,957.49
20001900180017001600150014001300120011001000900800700600
320003100030000290002800027000260002500024000230002200021000
BSE
SEN
SEX
L&T-
BSE
(V)
Apr14
May14
Jun14
Jul14
Aug14
Sep14
Daily Closing Price
Stock Performance
Oct14
Nov14
Dec14
Jan15
Feb15
Mar15
L&T BSE (v) BSE SENSEX

68
Month L&T NSE Price ( `) NIFTY
High Low Month Close
High Low Month Close
2014
April 1,388.50 1,242.00 1,294.10 6,869.85 6,650.40 6,696.40
May 1,627.35 1,251.20 1,545.50 7,563.50 6,638.55 7,229.95
June 1,776.60 1,539.00 1,701.70 7,700.05 7,239.50 7,611.35
July 1,765.90 1,499.30 1,502.90 7,840.95 7,422.15 7,721.30
August 1,557.90 1,440.00 1,526.50 7,968.25 7,540.10 7,954.35
September 1,632.70 1,431.65 1,458.25 8,180.20 7,841.80 7,964.80
October 1,663.50 1,401.00 1,655.45 8,330.75 7,723.85 8,322.20
November 1,692.90 1,593.50 1,639.35 8,617.00 8,290.25 8,588.25
December 1,655.00 1,450.20 1,494.65 8,626.95 7,961.35 8,282.70
2015
January 1,750.00 1,485.55 1,700.55 8,996.60 8,065.45 8,808.90
February 1,799.90 1,532.15 1,768.10 8,941.10 8,470.50 8,901.85
March 1,893.80 1,613.45 1,719.65 9,119.20 8,269.15 8,491.00
2000
1900
1800
1700
1600
1500
1400
1300
1200
1100
9500
9000
8500
8000
7500
7000
6500
6000
NSE
NIF
TY
L&T-
NSE
(V)
Apr14
May14
Jun14
Jul14
Aug14
Sep14
Daily Closing Price
Stock Performance
Oct14
Nov14
Dec14
Jan15
Feb15
Mar15
L&T NSE (v) NSE NIFTY
i) Registrar and Share Transfer Agents (RTA):
Sharepro Services (India) Private Limited,
Unit : Larsen & Toubro Limited
Samhita Warehousing Complex,
Bldg. No.13 A B, 2nd Floor
Off Sakinaka Telephone Exchange Lane,
Andheri – Kurla Road, Sakinaka
Mumbai – 400 072.
j) Share Transfer System:
The share transfer activities under physical mode
are carried out by the RTA. Shares in physical mode
which are lodged for transfer are processed and
returned within the stipulated time. The share
related information is available online.
Physical shares received for dematerialization are
processed and completed within a period of 21
days from the date of receipt. Bad deliveries are
promptly returned to Depository Participants (DPs)
under advice to the shareholders.
As required under Clause 47C of the Listing
Agreement, a certificate on half yearly basis
confirming due compliance of share transfer
formalities by the Company from Practicing
Company Secretary has been submitted to Stock
Exchanges within stipulated time.
k) Distribution of Shareholding as on March 31,
2015:
No. of Shares Shareholders Shareholding
Number % Number %
Upto 500 7,81,280 91.51 6,58,86,346 7.09
501 – 1000 39,256 4.60 2,78,31,827 2.99
1001 – 2000 18,171 2.13 2,55,51,969 2.75
2001 – 3000 5,663 0.66 1,40,84,226 1.51
3001 – 4000 2,425 0.28 84,38,946 0.91
4001 – 5000 1,511 0.18 68,17,391 0.73
5001 – 10000 2,836 0.33 1,96,83,512 2.12
10001 & ABOVE 2,682 0.31 76,12,67,844 81.90
TOTAL 8,53,824 100.00 92,95,62,061 100.00
l) Categories of Shareholders is as under:
Category
31.03.2015 31.03.2014
No. of Shares
% No. of Shares
%
Financial Institutions 28,00,34,611 30.12 28,57,74,435 30.83
Foreign Institutional Investors
15,61,72,982 16.80 17,12,25,959 18.47
Shares underlying GDRs
2,12,66,473 2.29 2,47,96,796 2.68
Mutual Funds 5,44,05,173 5.85 5,26,61,895 5.68
Bodies Corporate 7,29,24,831 7.85 6,41,75,878 6.92
Directors & Relatives 25,11,947 0.27 34,43,552 0.37
L&T Employees Welfare Foundation
11,16,06,174 12.01 11,16,06,174 12.04
General Public 23,06,39,870 24.81 21,32,27,969 23.00
TOTAL 92,95,62,061 100.00 92,69,12,658 100.00

69
m) Dematerialization of shares:
The Company’s Shares are required to be compulsorily traded in the Stock Exchanges in dematerialized form. The Company had sent letters to shareholders holding shares in physical form emphasizing the benefits of dematerialization.
The number of shares held in dematerialized and physical mode is as under:
No. of shares % of total capital issued
Held in dematerialized form in NSDL
87,11,72,247 93.72
Held in dematerialized form in
CDSL
3,76,18,964 4.05
Physical 2,07,70,850 2.23
Total 92,95,62,061 100.00
n) Outstanding GDRs / ADRs / Warrants or any Convertible Instruments, conversion date and likely impact on equity:
The outstanding GDRs are backed up by underlying equity shares which are part of the existing paid-up capital.
The Company has the following Foreign Currency Convertible Bonds outstanding as on March 31, 2015:
0.675% USD 200 million Foreign Currency Convertible Bonds due 2019
(i) Principal Value of the Bonds issued USD 200 million
(ii) Principal Value of Bonds converted to GDRs since issue.
NIL
(iii) Principal Value of Bonds outstanding as at March 31, 2015
USD 200 million
(iv) Underlying Equity Shares / GDRs issued pursuant to conversion as per (ii) above
NIL
(v) Underlying Equity Shares / GDRs that may be issued pursuant to conversion notices in respect of (iii) above
63,46,986 shares
These Convertible Bonds are listed on the Singapore Exchange Securities Trading Limited.
o) Investor Education & Protection Fund (IEPF):
Pursuant to the provisions of Investor Education & Protection Fund (uploading of information regarding unpaid and unclaimed amounts lying with Companies) Rules, 2012, the Company has uploaded the details of unpaid and unclaimed amounts lying with Company as on August 22, 2014 (date of last AGM) on the Company’s website (www.larsentoubro.com) and on the website of MCA.
p) Listing of Debt Securities:
The redeemable Non-Convertible debentures issued by the Company are listed on the Wholesale Debt Market (WDM) of National Stock Exchange of India Limited (NSE) and / or BSE Limited (BSE).
q) Debenture Trustees (for privately placed debentures)
IDBI Trusteeship Services Limited Ground Floor, Asian Building, 17, R. Kamani Marg Ballard Estate, Mumbai – 400 001
r) Plant Locations:
The L&T Group’s facilities for design, engineering, manufacture, modular fabrication and production are based at multiple locations within India including Ahmednagar, Bengaluru, Chennai, Coimbatore, Faridabad, Hazira (Surat), Kattupalli (near Chennai), Kanchipuram, Mumbai, Navi Mumbai, Mysore, Pithampur, Puducherry, Rajpura, Kansbahal (Rourkela), Talegaon and Vadodara. L&T’s international manufacturing footprint covers the Gulf (Oman, Saudi Arabia, U.A.E.), South East Asia (Malaysia, Indonesia), Australia and the U.K. The L&T Group also has an extensive network of offices in India and around the globe.
s) Address for correspondence:
Larsen & Toubro Limited, L&T House, Ballard Estate, Mumbai 400 001. Tel. No. (022) 67525 656, Fax No. (022) 67525 893
Shareholder correspondence may be directed to the Company’s Registrar and Share Transfer Agent, whose address is given below:
1. Sharepro Services (India) Private Limited Unit : Larsen & Toubro Limited Samhita Warehousing Complex, Bldg. No.13 A B, 2nd Floor Off Sakinaka Telephone Exchange Lane, Andheri – Kurla Road, Sakinaka Mumbai – 400 072. Tel No. : (022) 6772 0300 / 6772 0400 Fax No. (022) 2859 1568 / 2850 8927 E-Mail : [email protected]; [email protected]
70
2. Sharepro Services (India) Private Limited Unit : Larsen & Toubro Limited 912, Raheja Centre, Free Press Journal Road, Nariman Point, Mumbai 400 021. Tel : (022) 6613 4700 Fax : (022) 2282 5484
t) Investor Grievances:
The Company has designated an exclusive e-mail id viz. [email protected] to enable investors to register their complaints, if any. The Company strives to reply to the complaints within a period of 3 working days.
u) Securities Dealing Code:
Pursuant to the SEBI (Prohibition of Insider Trading) Regulations 1992, a Securities Dealing Code for prevention of insider trading is in place. The objective of the Code is to prevent purchase and / or sale of shares of the Company by an Insider on the basis of unpublished price sensitive information. Under this Code, Designated Persons (Directors, Advisors, Officers and other concerned employees / persons) are prevented from dealing in the Company’s shares during the closure of Trading Window. To deal in securities beyond specified limit, permission of Compliance Officer is also required. All the Designated Employees are also required to disclose related information periodically as defined in the Code. Directors and designated employees who buy and sell shares of the Company are prohibited from entering into an opposite transaction i.e sell or buy any shares of the Company during the next six months following the prior transactions. Directors are also prohibited from taking positions in the derivatives segment of the Company’s shares.
Mr. N. Hariharan, Company Secretary has been designated as the Compliance Officer.
Pursuant to the SEBI (Prohibition of Insider Trading) Regulations 2015, the Company has made amendments to the L&T Securities Dealing Code and the same is effective from May 15, 2015.
The Company has appointed Mr. Arnob Mondal, Vice President (Corporate Accounts & Investor Relations), as Chief Investor Relations Officer. The Company also formulated Code of Practices and Procedures for Fair Disclosure of Unpublished Price Sensitive Information which is available on Company’s Website.
v) Awareness Sessions/ Workshops on Governance practices:
Employees across the Company as well as the group are being sensitized about the various policies and governance practices of the Company. The Company has designed in-house training workshops on Corporate Governance with the help of an external faculty covering basics of Corporate Governance as well as internal policies and compliances under Code of Conduct, Whistle Blower Policy, Sexual Harassment of Women at Workplace (Prevention, Prohibition & Redressal) Act, 2013, SEBI Insider Trading Regulations, etc. Workshops were conducted in India as well as abroad to create a batch of trainers across various businesses. These trainers have in turn conducted around 100 training / awareness sessions within their business and covered more than 24,000 employees in supervisory and above cadre. A similar session on Compliance & Governance was also conducted for senior management by external experts.
The Company will continue to conduct such workshops / sessions on a regular basis.
w) ISO 9001:2008 Certification:
The Company’s Secretarial Department which provides secretarial services and investor services for the Company and its Subsidiary and Associate Companies, is ISO 9001:2008 certified.
x) Secretarial Audit as per SEBI requirements:
As stipulated by SEBI, a Qualified Practising Company Secretary carries out Reconciliation of Share Capital Audit to reconcile the total admitted capital with National Securities Depository Limited (NSDL) and Central Depository Services (India) Limited (CDSL) and the total issued and listed capital. This audit is carried out every quarter and the report thereon is submitted to the Stock Exchanges. The Audit confirms that the total Listed and Paid-up capital is in agreement with the aggregate of the total number of shares in dematerialized form and in physical form.
The secretarial department of the Company at Mumbai is manned by competent and experienced professionals. The Company has a system to review and audit its secretarial and other statutory compliances by competent professionals, who are employees of the Company. Appropriate actions are taken to continuously improve the quality of compliance.
The Company also has adequate software and systems to monitor compliance.

71
Chief Executive Officer (CEO) and Chief Financial Officer (CFO) Certification
To the Board of Directors of Larsen & Toubro Limited
Dear Sirs,
Sub: CEO / CFO Certificate(Issue in accordance with provisions of Clause 49 of the Listing Agreement)
We have reviewed the financial statements, read with the cash flow statement of Larsen & Toubro Limited for the year ended March 31, 2015 and that to the best of our knowledge and belief, we state that;
(a) (i) These statements do not contain any materially untrue statement or omit any material fact or contain statements that may be misleading;
(ii) These statements present a true and fair view of the Company’s affairs and are in compliance with current accounting standards, applicable laws and regulations.
(b) There are, to the best of our knowledge and belief, no transactions entered into by the Company during the year which are fraudulent, illegal or in violation of the Company’s code of conduct.
(c) We accept responsibility for establishing and maintaining internal controls for financial reporting. We have evaluated the effectiveness of internal control systems of the Company and have disclosed to the Auditors and the Audit Committee, deficiencies in the design or operation of internal controls, if any, and steps taken or propose to be taken for rectifying these deficiencies.
(d) We have indicated to the Auditors and the Audit Committee:
(i) Significant changes in accounting policies made during the year ended 31st March 2015 and that the same have been disclosed suitably in the notes to the financial statements; and
(ii) that there were no instances of significant fraud of which we have become aware.
Yours sincerely,
R. Shankar Raman K. Venkataramanan A. M. NaikChief Financial Officer Chief Executive Officer &
Managing Director
Group Executive Chairman
Place: Mumbai
Date: May 30, 2015
Auditors Certificate on Compliance of Conditions of Corporate Governance To the members of Larsen & Toubro Limited
We have examined the compliance of conditions of corporate governance by Larsen & Toubro Limited for the year ended 31st March 2015 as stipulated in clause 49 of the Listing Agreement entered into by the Company with the stock exchanges.
The compliance of conditions of corporate governance is the responsibility of the management. Our examination was limited to procedures and implementation thereof, adopted by the Company for ensuring the compliance of the conditions of corporate governance. It is neither an audit nor an expression of opinion on the financial statements of the Company.
In our opinion and to the best of our information and according to the explanation given to us, we certify that the Company has complied in all material respects with the conditions of corporate governance as stipulated in the above mentioned Listing Agreement.
We state that such compliance is neither an assurance as to the future viability of the Company nor the efficiency or effectiveness with which the management has conducted the affairs of the Company.
SHARP AND TANNAN Chartered Accountants Firm’s Registration No. 109982W
by the hand of
MILIND P. PHADKEPartner
Mumbai, May 30, 2015 Membership No. 33013
72
Annexure ‘D’ to the Directors’ Report
CSR ACTIVITIES FOR 2014-15
1. A brief outline of the Company’s CSR policy,
including overview of projects or programs
proposed to be undertaken and a reference to
the web-link to the CSR policy and projects or
programs.
The Company’s CSR Policy framework details the
mechanisms for undertaking various programs in
accordance with Section 135 of the Companies Act,
2013 (the Act) for the benefit of the community.
The Company will primarily focus on ‘Building India’s
Social Infrastructure’ as part of its CSR programme
which will include, amongst others, the following areas,
viz.
Water & Sanitation – may include but not limited
to program making clean drinking water available,
conservation and purification of water or for
improving conditions related to sanitation.
Education - may include but not limited to
education infrastructure support to educational
Institutions, educational programs & nurturing
talent at various levels.
Health - may include but not limited to community
health centres, mobile medical vans, dialysis
centres, general and specialized health camps
and outreach programs, support to HIV / AIDS,
Tuberculosis control programs.
Skill Development - may include but not limited to
vocational training such as skill building, computer
training, women empowerment, support to ITIs,
support to specially abled (infrastructure support
& vocational training), Construction Skills Training
Centres and providing employability skills to
women and youth.
Governance, Technology and Innovation would be the
key enabling factors across all these verticals.
The detailed CSR Policy Framework is given in the
Governance section on the website of the Company
http://investors.larsentoubro.com/Listing-Compliance.aspx
2. Composition of the CSR Committee.
The CSR Committee of the Board was constituted on
January 22, 2014. It comprises of one Independent
Director and two Executive Directors. The Company
Secretary acts as Secretary to the Committee.
The present Committee comprises of Mr. Vikram Singh
Mehta as Chairman, Mr. M. V. Kotwal and Mr. R.
Shankar Raman as members and Mr. N. Hariharan as
the Secretary of the Committee.
3. Average net profit of the Company for the last
three financial years.
The average net profit of the Company for the last three
financial years is ` 5,310.29 crore.
4. Prescribed CSR expenditure (two percent of the
amount as in item 3 above).
The Company is required to spend an amount of
` 106.21 crore as CSR expenditure during the financial
year 2014-15.
5. Details of CSR spent during the financial year:
a. Total amount to be spent for the financial year
The Company is required to spend ` 106.21 crore
during the financial year 2014-15.
b. Amount unspent, if any
The Company has not spent ` 29.67 crore during
the financial year 2014-15.
c. Manner in which the amount was spent in the
financial year is detailed below:
As per table enclosed
6. Reasons for not spending the amount during the
financial year.
The Company has spent ` 76.54 crore on CSR activities
/ projects as defined by schedule VII of the Act.
The Company has always taken up social and community
development initiatives at its establishments and project
sites and has been contributing to the welfare of
underprivileged over the last four decades in the areas
of health, education and skill building.
Hence, in addition to ` 76.54 crore, the Company also
spent ` 20.92 crore towards other CSR activities which
are however not covered in Schedule VII of the Act.
Also as a commitment for various social development
programs, the Company has contributed ` 8.22 crore
to Larsen & Toubro Public Charitable Trust.
The Company, while continuing to support its ongoing
projects, also intends to expand the CSR initiatives in a
systematic manner to achieve maximum impact in the
most needy locations.

73
Integrated community development projects under the
theme ‘Building India’s Social Infrastructure’ having
a span of 4-5 years have been launched during the
current financial year and the spend on such projects
will increase considerably in the subsequent years.
Towards this, in addition to the amounts mentioned
above, the Company has committed and deposited `
2.88 crore for execution cost in an escrow account.
The Company envisages an increased CSR spend in a
planned manner in the future for which the long term
projects have been identified.
7. CSR Committee Responsibility Statement:
The CSR Committee hereby affirms that:
The Company has duly formulated a CSR Policy
Framework which includes formulation of a CSR
Theme, CSR budget and roles and responsibilities
of the Committee as well as the various internal
committees formed for implementation of the CSR
policy;
The Company has constituted a mechanism to
monitor and report on the progress of the CSR
programs;
The activities undertaken by the Company as well
as the implementation and monitoring mechanisms
are in compliance with its CSR objectives and CSR
policy.
K. VENKATARAMANAN VIKRAM SINGH MEHTA
Chief Executive Officer
& Managing Director
(DIN: 0001647)
Chairman – CSR
Committee
(DIN: 00041197)

74
S. No. CSR Project or activity identified Sector in which the project is covered
Projects or Programs 1. Local Area or other2. Specify the state and district
where projects or program was undertaken
Amount outlay
(budget) project or
programme wise (` In
Lakh)
Direct expenses
(` In Lakh)
Overhead(` In Lakh)
Cumulative expenditure
upto the reporting
period(` In Lakh)
Amount spent: direct
or through implementing
agency
1 School support programme-Enhancing the quality of education and learning levels in government schools/ schools running for children from underprivileged backgrounds (teachers training, play way methods, support for English and Mathematics, capacity building, promoting extra curricular activities)
Education Maharashtra (Mumbai, Ahmednagar, Pune), Tamil Nadu (Coimbatore, Kancheepuram), West Bengal (Kolkata), NCR (Faridabad), Gujarat (Vadodara, Hazira)
195.65 188.25 19.68 207.93 Implementing agencies
2 Community based program-Study Centres/ balwadis/anganwadis run for developing pre-school foundation, promoting healthy and hygienic environment for education, developing the learning levels of children at par with their mainstream grades and providing nutritional supplements
Education Maharashtra (Mumbai), Gujarat (Ahmedabad, Hazira, Vadodara), Orissa (Kansbahal), Tamil Nadu (Villupuram), Delhi
463.00 485.57 50.75 536.33 Implementing agencies
3 Providing infrastructure support for education (drinking water and sanitation facilities, renovation of classrooms, water proofing of school buildings, providing furniture and light fittings, donation of computers, upgradation of libraries, playground development, distribution of solar lamps)
Education Gujarat (Hazira, Ahmedabad, Kakrapar), Maharashtra (Talegaon, Mumbai, Ahmednagar, Tarapur), Tamil Nadu (Kalpakkam, Coimbatore, Chennai, Puducherry, Kancheepuram), Karnataka (Mysore, Bangalore),Andhra Pradesh (Vishakhapatnam, Hyderabad), Arunachal Pradesh (Subansiri), Uttarakhand, Delhi, Kerala (Kochi, Kollam), Jharkhand (Jamshedpur), Chhattisgarh (Bhillai, Raipur), Orissa (Puri), Bihar (Patna), Rajasthan (Jaipur, Jodhpur), Punjab (Mohali), NCR (Noida, Faridabad), Uttar Pradesh (Noida, Jaunpur, Barabanki), West Bengal (Raiganj), Haryana (Gurgaon)
791.48 615.67 63.42 679.09 Direct
4 Providing educational aids to children- books,stationary, sports equipment, uniforms, school bags, shoes, woollen clothes, raincoats, etc.
Education Maharashtra (Talegaon, Tarapur, Ahmednagar, Nagpur, Mumbai), Andhra Pradesh (Vishakapatnam, Hyderabad), New Delhi, Gujarat (Bharuch, Kakrapar, Ahmedabad, Vadodara, Sanand), Tamil Nadu (Kalpakkam, Chennai, Pallavaram, Navallur, Kancheepuram), Uttarakhand, West Bengal (Kolkata), Kerala (Kochi), Andhra Pradesh (Hyderabad), Punjab (Chandigarh), Madhya Pradesh (Bhopal), Orissa (Bhubaneshwar, Kansbahal, Sambhalpur), Rajasthan (Jaipur), Uttar Pradesh (Lucknow), Karnataka (Bangalore), Bihar (Patna)
253.35 144.94 15.15 160.09 Direct
5 Awareness programs (health and hygiene, road safety, career guidance, personality development)
Education Gujarat (Hazira, Mahan, Mundra), Maharashtra (Talegaon, Tiroda), Arunachal Pradesh (Subansiri), Karnataka (Mysore, Bangalore), Rajasthan (Chabra-Baran), Madhya Pradesh (Khandwa, Nigree), Uttar Pradesh (Anpara), Tamil Nadu (Kancheepuram)
106.45 98.45 10.29 108.74 Implementing agencies

75
S. No. CSR Project or activity identified Sector in which the project is covered
Projects or Programs 1. Local Area or other2. Specify the state and district
where projects or program was undertaken
Amount outlay
(budget) project or
programme wise (` In
Lakh)
Direct expenses
(` In Lakh)
Overhead(` In Lakh)
Cumulative expenditure
upto the reporting
period(` In Lakh)
Amount spent: direct
or through implementing
agency
6 Community Health Centres(running multi-specialty centre offering diagnostic services including family planning, gynaecological, paediatric, immunization, chest & TB, ophthalmic consultation, dialysis services, HIV/AIDS awareness, detection, treatment, counselling services at free / nominal cost to the community)
Health Maharashtra (Mumbai, Thane, Ahmednagar), Gujarat (Surat)
296.20 246.69 25.78 272.47 Direct
7 Health Camps(general, eye, dental, vaccinations) and health awareness
Health Maharashtra (Mumbai, Ahmednagar),Andhra Pradesh (Vizag), Gujarat(Bharuch), Tamil Nadu (Coimbatore)
30.10 17.65 1.84 19.49 Direct
8 Health Camps(general, eye, dental, vaccinations) and health awareness
Health Gujarat (Hazira, Ahmedabad, Vadodara Bharuch, Kakrapar, Jamnagar, Kandla, Mudra, Mahan, Khandwa), Andhra Pradesh (Vizag, Hyderabad), Arunachal Pradesh (Subhanseri), Punjab (Chandigarh, Mohali), Chhattisgarh (Korba), Jharkhand (Jamshedpur), Karnataka (Bangalore), Kerala (Kochi), Madhya Pradesh (Bhopal, Satna, Nigree), Maharashtra (Tarapur, Pune, Mumbai, Nashik, Amravati, Tiroda), New Delhi, Orissa (Bhubaneshwar, Kansbahal), Tamil Nadu (Puducherry, Kalpakkam, Chennai, Shizhinganallur, Katupalli, Kancheepuram), Rajasthan(Jaipur, Jodhpur, Chabra-Baran), Uttar Pradesh (Lucknow, Anpara, Bara), Uttarakhand, West Bengal (Kolkata)
316.72 201.79 21.09 222.88 Implementing agencies
9 Blood donation camps Health Gujarat (Hazira, Vadodara, Ahmedabad), Andhra Pradesh (Vizag, Hyderabad), Punjab (Chandigarh), Chhattisgarh (Korba), Haryana (Gurgaon), Jharkhand (Jamshedpur), Karnataka (Bangalore), Kerala (Kochi), Madhya Pradesh (Bhopal), Maharashtra (Talegaon, Pune, Mumbai, Nagpur), New Delhi, Orissa (Bhubaneshwar), Tamil Nadu (Coimbatore, Chennai), Uttar Pradesh (Lucknow, Ghaziabad), West Bengal(Kolkata)
49.37 28.86 3.02 31.88 Implementing agencies
10 Infrastructure support to medical centres
Health Maharashtra (Mumbai), Uttar Pradesh (Ghaziabad, Noida), Tamil Nadu (Kalpakkam, Manapakkam, Pudhupakkam), Rajasthan (Pokhran)
26.80 6.24 0.65 6.89 Direct
11 Construction Skill Training Institute - CSTI
Skill Building Maharashtra (Panvel), Orissa (Cuttack), West Bangal (Kona), Delhi (Pilkhuwa), Andhra Pradesh (Hyderabad), Karnataka (Bangalore), Tamil Nadu (Kanchipuram, Kattupalli)
3677.53 3402.19 645.00 4047.19 Direct
12 Computer training for youth Skill Building Gujarat (Hazira, Vadodara) 18.85 13.22 1.38 14.60 Implementing agencies

76
S. No. CSR Project or activity identified Sector in which the project is covered
Projects or Programs 1. Local Area or other2. Specify the state and district
where projects or program was undertaken
Amount outlay
(budget) project or
programme wise (` In
Lakh)
Direct expenses
(` In Lakh)
Overhead(` In Lakh)
Cumulative expenditure
upto the reporting
period(` In Lakh)
Amount spent: direct
or through implementing
agency
13 Vocational Training Skill Building Gujarat (Ahmedabad, Ankleshwar, Baroda & Hazira), Delhi (Faridabad), Karnataka (Bangalore), Maharashtra (Pune), Uttar Pradesh (Lucknow), Andhra Pradesh (Vizag)
122.70 55.00 5.75 60.75 Implementing agencies
14 Women empowerment through vocational training
Skill Building Gujarat (Hazira), Maharashtra (Nagpur), Tamil Nadu (Chennai), Delhi (Delhi, Faridabad), Orissa (Kansbahal), Rajasthan (Jaipur), Jharkhand (Jamshedpur)
53.65 40.54 4.24 44.78 Implementing agencies
15 Skill building for differently abled (Project Neev)
Skill Building Gujarat (Hazira, Ahmedabad), Andhra Pradesh (Vizag), Karnataka (Bangalore, Bellary), Tamil Nadu (Chennai, Coimbatore, Kanchipuram), Maharashtra, (Pune, Nagpur), West Bengal (Kolkata), Jharkhand (Jamshedpur), Kerala (Kochi), Uttar Pradesh (Lucknow), Orissa (Bhubaneswar, Kansbahal), Rajasthan (Jaipur, Chabra-Baran), Madhya Pradesh (Khandwa)
92.13 82.22 8.59 90.81 Implementing agencies
16 Basic infrastructure support in the community (Water, Health, Sanitation, Solar lights, roads etc.)
Community Development
Orissa (Rayagada), Gujarat (Kakarapara), Andhra Pradesh (Vizag), Tamil Nadu (Kalpakkam, Chennai, Kattupalli, Siruseri), Maharashtra (Tarapur), Arunachal Pradesh (Subansiri), West Bengal (Kolkata), Delhi, Haryana (Gurgaon), Jharkhand (Jamshedpur), Rajasthan (Jaipur), Madhya Pradesh (Khandwa)
361.81 304.55 31.83 336.38 Direct
17 ** Integrated Community Development Programme
Water& Sanitation, Health, Education, Skill Building
Rajasthan (Rajsamand, Udaipur), Gujarat (Dahod), Maharashtra (Ahmednagar), Tamil Nadu (Coimbatore)
500.00 20.88 2.18 23.06 Implementing agencies
18 Development of gardens and maintenance of public spaces
Environment Maharashtra (Mumbai, Talegaon, Ahmednagar), Gujarat (Hazira, Vadodara), Madhya Pradesh (Bhopal), Rajasthan (Chabra-Baran), Tamil Nadu (Kancheepuram), NCR (Faridabad)
272.60 261.92 27.38 289.29 Direct
19 Tree plantation and environment protection
Environment Andhra Pradesh (Vishakapatnam, Hyderabad), Arunachal Pradesh (Subhansiri), Bihar (Patna), Punjab (Chandigarh, Ludhiana), Chhattisgarh, Gujarat (Bharuch, Ahmedabad, Jamnagar, Mahan, Kandla, Mudra), Jammu & Kashmir (Jammu), Jharkhand (Jamshedpur), Karnataka (Bangalore), Kerala (Kochi), Madhya Pradesh (Satna, Gwalior, Khandwa, Nigree), Maharashtra (Talegaon, Tarapur, Pune, Mumbai, Nashik, Amravati, Tiroda), Delhi, Orissa (Bhubaneshwar), Rajasthan (Jaipur, Chabra-Baran), Tamil Nadu (Kalpakkam, Chennai, Coimbatore, Navallur, Neyveli, Kancheepuram, Uttar Pradesh (Lucknow, Ghaziabad, Meerut), Uttarakhand, West Bengal (Kolkata)
105.08 52.70 5.51 58.21 Direct

77
S. No. CSR Project or activity identified Sector in which the project is covered
Projects or Programs 1. Local Area or other2. Specify the state and district
where projects or program was undertaken
Amount outlay
(budget) project or
programme wise (` In
Lakh)
Direct expenses
(` In Lakh)
Overhead(` In Lakh)
Cumulative expenditure
upto the reporting
period(` In Lakh)
Amount spent: direct
or through implementing
agency
20 Awareness programs- environment, energy conservation, road safety
Environment Delhi, Jharkhand (Jamshedpur), Maharashtra (Nagpur, Ahmednagar), Andhra Pradesh (Hyderabad), Tamil Nadu (Tuticorin)
18.50 11.90 1.24 13.14 Implementing agencies
21 Employee Volunteering Employee volunteering
PAN India 85.00 63.55 6.64 70.19 Direct
22 Donation to Prime Minister’s Relief Fund
PAN India – 360.00 – 360.00 Direct
Total 7836.97 6702.78 951.42 7654.20
**Notes: ` 288.3 lakhs has been committed and deposited towards execution cost of first year, of this project in an ESCROW account.

78
Annexure ‘E’ to the Directors’ Report
A) Ratio of the remuneration of each director to the median remuneration of the employees of the company
for the financial year 2014-15, the percentage increase in remuneration of each Director & Company
Secretary during the financial year 2014-15 and comparison of the remuneration of each of the Key
Managerial Personnel against the performance of the company
` croreName of the Director/KMP
2014-15Designation Total
RemunerationRatio of
remuneration of director to
the median remuneration $
Percentage increase in
Remuneration
Comparison of the Remuneration of the KMP against the performance of the Company
A M Naik Group Executive Chairman 27.32 453.75 (3.84)
Profit before tax decreased by 7.8% and Profit after tax decreased by 8.0% in the financial year 2014-15
K Venkataramanan Chief Executive Officer & Managing Director
13.58 225.62 2.42
M V Kotwal Whole-time Director & President (Heavy Engineering)
9.25 153.62 1.16
S N Subrahmanyan Whole-time Director & Senior Executive Vice President (Infrastructure & Construction)
12.83 213.19 (3.26)
R Shankar Raman Whole-time Director & Chief Financial Officer
10.37 172.17 (3.89)
Shailendra N Roy Whole-time Director & Senior Executive Vice President (Power, Minerals & Metals)
7.90 131.18 3.12
S Rajgopal Non-Executive Director 0.38 16.10 * The siting fees for Board and Committee meetings were increased from ` 20,000/- per meeting to ` 50,000/- for Board meetings and ` 25,000/- for Committee meetings during the year. The remuneration policy is given in Annexure ‘C’ of this Board Report. Please refer to page 62 of the Annual Report.
S N Talwar Non-Executive Director 0.29 12.10 ** M M Chitale Independent Director 0.45 7.47 7.02 Subhodh Bhargava Independent Director 0.53 8.76 16.19 A K Jain Non-Executive Director 0.30 5.71 *** M Damodaran Independent Director 0.43 7.14 7.93 Vikram Singh Mehta Independent Director 0.48 8.03 74.79 Sushobhan Sarker^ Nominee of Life Insurance
Corporation of India 0.31 5.14 8.56
Adil Zainulbhai Independent Director 0.35 8.56 # Akhilesh Gupta Independent Director 0.21 6.37 ##
N Hariharan Company Secretary 0.89 NA 12.98
* Details not given as S Rajgopal was a director for only part of the financial year 2014-15 i.e., upto August 22, 2014.
** Details not given as S N Talwar was a director for only part of the financial year 2014-15 i.e., upto August 22, 2014.
*** Details not given as A K Jain was a director for only part of the financial year 2014-15 i.e., upto February 10, 2015;
# Details not given as Adil Zainulbhai was a director for only part of the financial year 2014-15 i.e., w.e.f. May 30, 2014.
## Details not given as Akhilesh Gupta was a director for only part of the financial year 2014-15 i.e., w.e.f. September 9, 2014.
$ Ratio of remuneration of director to the median remuneration is calculated on pro-rata basis for those directors who served for only part of the financial year 2014-15.
^ Part of the remuneration has been paid to the financial institution he represents.
B) Percentage increase in the median remuneration of all employees in the financial year 2014-15:
The median remuneration of employees of the Company during the financial year was ` 6.02 lakh. In the financial year, there was an increase of 12.1% in the median remuneration of employees;
C) Number of permanent employees on the rolls of Company as on 31st March 2015
There were 44081 permanent employees on the rolls of Company as on March 31, 2015;
79
D) Explanation on the relationship between average increase in remuneration and company performance
The average increase in remuneration per employee was 9.8%.The Profit after Tax for the year 2014-15 decreased by 8.0%.The average increase in remuneration per employee is in line with normal pay revisions and variable component forming integral part of remuneration which is linked to individual performance apart from Company’s performance.
E) Comparison of the remuneration of the Key Managerial Personnel against the performance of the Company
The remuneration of Key Managerial Personnel for the year declined by 1.55% and the Profit after Tax decreased by 8.0%.The remuneration to Key Managerial Personnel is designed to be competitive in the market for highly qualified executives.
F) Variations in the market capitalisation of the company, price earnings ratio as at the closing date of the current financial year and previous financial year and percentage increase over decrease in the market quotations of the shares of the company in comparison to the rate at which the company came out with the last public offer in case of listed companies
The market capitalisation as on 31st March, 2015 was ` 159791 crore (` 117964 crore as on 31st March, 2014). The price earnings ratio of the Company was 31.56 as at 31st March, 2015 and was 21.44 as at 31st March, 2014.
The Company had made a public issue of fully convertible debentures in November 1989 @ ` 300 per debenture. These debentures were fully converted into 5 equity share of ` 10 each in tranches in 1992. Taking into consideration the adjustments for the demerger of the cement business in June 2004, bonus issues in 1:1 ratio in October 2006 and October 2008 and bonus issue in 1:2 ratio in July 2013, the closing share price of the Company at BSE Limited on 31st March 2015, at ` 1719.00 per equity share of face value ` 2 each is 342 times the price of the share issued in 1992.
G) Average percentile increase already made in the salaries of the employees other than the managerial personnel in the last financial year and its comparison with the percentile increase in the managerial remuneration and justification thereof and point out if there are any exceptional circumstances for increase in managerial remuneration
Average percentage increase made in the salaries of employees other than the managerial personnel for the year 2014-15 was 10.1% whereas there is decline in the managerial remuneration by 1.55% because a substantial portion of managerial remuneration is linked to Company performance during the financial year 2014-15. As stated above, the Profit after Tax for the year 2014-15 decreased by 8.0% directly impacting the variable component of managerial remuneration.
H) The key parameters for any variable component of remuneration availed by the directors
The key parameters for the variable component of remuneration availed by the Key Management Personnel are (a) profit after tax of the Company and (b) profit after tax of the respective business divisions (including subsidiary and associate companies of those business divisions) and (c) leadership initiatives undertaken during the year. These parameters are approved by the Board of Directors based on the recommendations of the Nomination & Remuneration Committee and resolution passed by Annual General Meeting as per the Remuneration Policy for Key Management Personnel. The variable component of remuneration of Key Management Personnel is subject to maximum limit approved by the shareholders in the Annual General Meeting.
The non-executive directors are paid remuneration by way of commission & sitting fees. The Company pays sitting fees of ` 50,000 per meeting of the Board and ` 25,000 per meeting of the Committee to the non-executive directors for attending the meetings of the Board & Committees. The commission is paid as per limits approved by shareholders, subject to a limit not exceeding 1% p.a. of the profits of the Company (computed in accordance with Section 198 of the Companies Act, 2013). The commission to non-executive directors is distributed broadly on the basis of their attendance, contribution at the Board, the Committee meetings,Chairmanship of Committees and participation in meetings of the business divisions. In the case of nominees of Financial Institutions,the commission is paid to the Financial Institutions.

80
Annexure ‘F’ to the Directors’ Report
To,
The Members,
Larsen & Toubro Limited
CIN L9999MH1946PLC004768
L&T House,
Ballard Estate,
Mumbai – 400001
Our Secretarial Audit Report of even date is to be read along with this letter.
Management’s Responsibility
1. It is the responsibility of the management of the Company to maintain secretarial records, devise proper systems to
ensure compliance with the provisions of all applicable laws and regulations and to ensure that the systems are adequate
and operate effectively.
Auditor’s Responsibility
2. Our responsibility is to express an opinion on these secretarial records, standards and procedures followed by the
Company with respect to secretarial compliances.
3. We believe that audit evidence and information obtained from the Company’s management is adequate and appropriate
for us to provide a basis for our opinion.
4. Wherever required, we have obtained the management’s representation about the compliance of laws, rules and
regulations and happening of events etc.
Disclaimer
5. The Secretarial Audit Report is neither an assurance as to the future viability of the Company nor of the efficacy or
effectiveness with which the management has conducted the affairs of the Company.
For S. N. ANANTHASUBRAMANIAN & CO.
S N Ananthasubramanian
Place: Thane
Date : May 20, 2015
81
To,
The Members,
Larsen & Toubro Limited
CIN L9999MH1946PLC004768
L&T House, Ballard Estate,
Mumbai – 400 001
We have conducted the Secretarial Audit of the compliance
of applicable statutory provisions and the adherence to
good corporate practices by Larsen & Toubro Limited
(hereinafter called the Company). Secretarial Audit was
conducted in a manner that provided us a reasonable basis
for evaluating the corporate conducts/statutory compliances
and expressing our opinion thereon.
Based on our verification of the Company’s books, papers,
minute books, forms and returns filed and other records
maintained by the Company and also the information
provided by the Company, its officers, agents and authorized
representatives during the conduct of secretarial audit, we
hereby report that in our opinion, the Company has, during
the audit period covering the financial year ended on 31st
March 2015, complied with the statutory provisions listed
hereunder and also that the Company has proper Board-
processes and compliance-mechanism in place to the extent,
in the manner and subject to the reporting made hereinafter:
We have examined the books, papers, minute books, forms
and returns filed and other records maintained by the
Company for the financial year ended on 31st March, 2015
according to the provisions of:
i. The Companies Act, 1956 and Companies Act, 2013
(the Act) and the rules made thereunder;
ii. The Securities Contracts (Regulation) Act, 1956 (‘SCRA’)
and the rules made thereunder;
iii. The Depositories Act, 1996 and the Regulations and
Bye-laws framed thereunder;
iv. Foreign Exchange Management Act, 1999 and the
rules and regulations made thereunder to the extent of
Foreign Direct Investment, Overseas Direct Investment
and External Commercial Borrowings;
v. The following Regulations and Guidelines prescribed
under the Securities and Exchange Board of India Act,
1992 (‘SEBI Act’): -
a. The Securities and Exchange Board of India
(Substantial Acquisition of Shares and Takeovers)
Regulations, 2011;
b. The Securities and Exchange Board of India
(Prohibition of Insider Trading) Regulations, 1992;
c. The Securities and Exchange Board of India (Issue of
Capital and Disclosure Requirements) Regulations,
2009 - Not Applicable as the Company has not
issued further capital during the financial year
under review;
d. The Securities and Exchange Board of India
(Employee Stock Option Scheme and Employee
Stock Purchase Scheme) Guidelines, 1999 /
Securities and Exchange Board of India (Share Based
Employee Benefits) Regulations, 2014 (effective
28th October 2014);
e. The Securities and Exchange Board of India (Issue
and Listing of Debt Securities) Regulations, 2008;
f. The Securities and Exchange Board of India
(Registrars to an Issue and Share Transfer Agents)
Regulations, 1993 regarding the Companies Act
and dealing with client - Not Applicable as the
Company is not registered as Registrar to Issue
and Share Transfer Agent during the financial
year under review;
g. The Securities and Exchange Board of India
(Delisting of Equity Shares) Regulations, 2009 - Not
applicable as the Company has not delisted/
propose to delist its equity shares from any
stock exchange during the financial year under
review;
h. The Securities and Exchange Board of India
(Buyback of Securities) Regulations, 1998 - Not
applicable as the Company has not bought
Form No. MR-3
SECRETARIAL AUDIT REPORT
FOR THE FINANCIAL YEAR ENDED 31ST MARCH 2015
[Pursuant to section 204(1) of the Companies Act, 2013 and rule No.9 of the Companies (Appointment and Remuneration
Personnel) Rules, 2014]
82
back/propose to buy-back any of its securities
during the financial year under review.
vi. The Company has informed that there are no laws,
which are specifically applicable to the Company.
We have also examined compliance with the applicable
clauses of the following:
(i) Secretarial Standards issued by The Institute of Company
Secretaries of India (not applicable as not notified
during the period under review).
(ii) The Listing Agreements entered into by the Company
with BSE Limited and National Stock Exchange of India
Limited and;
During the period under review the Company has complied
with the provisions of the Act, Rules, Regulations, Guidelines,
Standards, etc. mentioned above.
We further report that: -
The Board of Directors of the Company is duly
constituted with proper balance of Executive Directors,
Non-Executive Directors and Independent Directors. The
changes in the composition of the Board of Directors
that took place during the period under review were
carried out in compliance with the provisions of the Act.
Adequate notice is given to all Directors to schedule
the Board Meetings, agenda and detailed notes on
agenda were sent sufficiently in advance, and a system
exists for seeking and obtaining further information and
clarifications on the agenda items before the meeting
and for meaningful participation at the meeting.
Unanimous decision is carried through hence there
are no dissenting members’ views to be captured and
recorded as part of the minutes.
We further report that based on review of compliance
mechanism established by the Company and on the basis
of the Compliance Certificate(s) issued by the Company
Secretary and taken on record by the Board of Directors
at their meeting(s), we are of the opinion that there are
adequate systems and processes in place in the Company
which is commensurate with the size and operations of the
Company to monitor and ensure compliance with applicable
laws, rules, regulations and guidelines: -
As informed, the Company has responded to notices
for demands, claims, penalties etc., levied by various
statutory /regulatory authorities and initiated actions for
corrective measures, wherever found necessary.
We further report that during the audit period:
The Company has on October 21, 2014 raised USD
200 million by issuing and allotting Foreign Currency
Convertible Bonds.
The members have inter alia passed Special Resolutions
by way of Postal Ballot on 14th July 2014:
i. accorded the consent to the creation by the Board
of Directors of such mortgages, charges and
hypothecations as may be necessary on such of the
assets of the Company, both present and future,
in favour of financial institutions, investment
institutions and their subsidiaries, banks, mutual
funds, trusts, other bodies corporate or any other
entities and Trustees for the holders of debentures
/ bonds and / or other instruments which may be
issued on private placement basis or otherwise, to
secure loans, debentures, bonds, working capital
facilities and other instruments in any currency of
an outstanding aggregate value not exceeding the
total assets of the Company;
ii. amended the Articles of Association of the
Company.
For S. N. ANANTHASUBRAMANIAN & CO
S N Ananthasubramanian
FCS No.4206
C P No. 1774
Place: Thane
Date: May 20, 2015
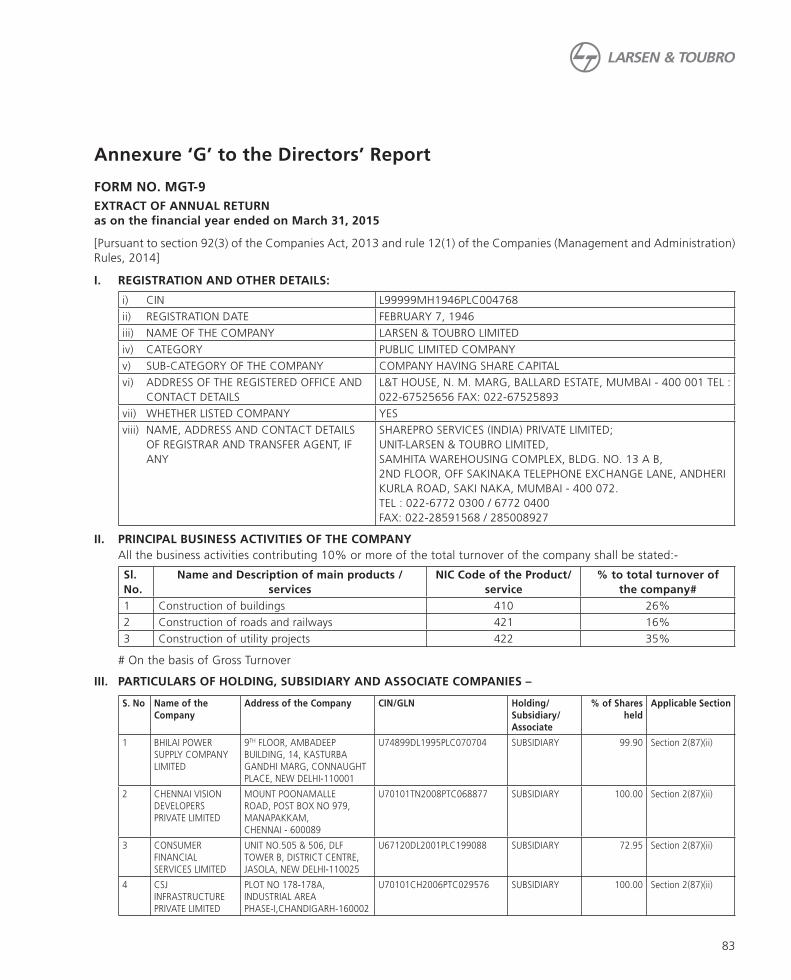
83
Annexure ‘G’ to the Directors’ Report
FORM NO. MGT-9
EXTRACT OF ANNUAL RETURN
as on the financial year ended on March 31, 2015
[Pursuant to section 92(3) of the Companies Act, 2013 and rule 12(1) of the Companies (Management and Administration)
Rules, 2014]
I. REGISTRATION AND OTHER DETAILS:
i) CIN L99999MH1946PLC004768
ii) REGISTRATION DATE FEBRUARY 7, 1946
iii) NAME OF THE COMPANY LARSEN & TOUBRO LIMITED
iv) CATEGORY PUBLIC LIMITED COMPANY
v) SUB-CATEGORY OF THE COMPANY COMPANY HAVING SHARE CAPITAL
vi) ADDRESS OF THE REGISTERED OFFICE AND
CONTACT DETAILS
L&T HOUSE, N. M. MARG, BALLARD ESTATE, MUMBAI - 400 001 TEL :
022-67525656 FAX: 022-67525893
vii) WHETHER LISTED COMPANY YES
viii) NAME, ADDRESS AND CONTACT DETAILS
OF REGISTRAR AND TRANSFER AGENT, IF
ANY
SHAREPRO SERVICES (INDIA) PRIVATE LIMITED;
UNIT-LARSEN & TOUBRO LIMITED,
SAMHITA WAREHOUSING COMPLEX, BLDG. NO. 13 A B,
2ND FLOOR, OFF SAKINAKA TELEPHONE EXCHANGE LANE, ANDHERI
KURLA ROAD, SAKI NAKA, MUMBAI - 400 072.
TEL : 022-6772 0300 / 6772 0400
FAX: 022-28591568 / 285008927
II. PRINCIPAL BUSINESS ACTIVITIES OF THE COMPANY
All the business activities contributing 10% or more of the total turnover of the company shall be stated:-
Sl.
No.
Name and Description of main products /
services
NIC Code of the Product/
service
% to total turnover of
the company#
1 Construction of buildings 410 26%
2 Construction of roads and railways 421 16%
3 Construction of utility projects 422 35%
# On the basis of Gross Turnover
III. PARTICULARS OF HOLDING, SUBSIDIARY AND ASSOCIATE COMPANIES –
S. No Name of the
Company
Address of the Company CIN/GLN Holding/
Subsidiary/
Associate
% of Shares
held
Applicable Section
1 BHILAI POWER
SUPPLY COMPANY
LIMITED
9TH FLOOR, AMBADEEP
BUILDING, 14, KASTURBA
GANDHI MARG, CONNAUGHT
PLACE, NEW DELHI-110001
U74899DL1995PLC070704 SUBSIDIARY 99.90 Section 2(87)(ii)
2 CHENNAI VISION
DEVELOPERS
PRIVATE LIMITED
MOUNT POONAMALLE
ROAD, POST BOX NO 979,
MANAPAKKAM,
CHENNAI - 600089
U70101TN2008PTC068877 SUBSIDIARY 100.00 Section 2(87)(ii)
3 CONSUMER
FINANCIAL
SERVICES LIMITED
UNIT NO.505 & 506, DLF
TOWER B, DISTRICT CENTRE,
JASOLA, NEW DELHI-110025
U67120DL2001PLC199088 SUBSIDIARY 72.95 Section 2(87)(ii)
4 CSJ
INFRASTRUCTURE
PRIVATE LIMITED
PLOT NO 178-178A,
INDUSTRIAL AREA
PHASE-I,CHANDIGARH-160002
U70101CH2006PTC029576 SUBSIDIARY 100.00 Section 2(87)(ii)

84
S. No Name of the
Company
Address of the Company CIN/GLN Holding/
Subsidiary/
Associate
% of Shares
held
Applicable Section
5 EWAC ALLOYS
LIMITED
L&T HOUSE, N M MARG,
BALLARD ESTATE,
MUMBAI- 400001
U74999MH1962PLC012315 SUBSIDIARY 100.00 Section 2(87)(ii)
6 FAMILY CREDIT
LIMITED
TECHNOPOLIS, 7TH FLOOR,
A- WING, PLOT NO. - 4, BLOCK
- BP, SECTOR - V, SALT LAKE,
KOLKATA-700091
U65910WB1993FLC060810 SUBSIDIARY 72.95 Section 2(87)(ii)
7 GDA
TECHNOLOGIES
LIMITED
NO.9-A, CHINTHAMANI
NAGAR, K.K. PUDUR,
COIMBATORE-641038
U72200TZ1997PLC008145 SUBSIDIARY 100.00 Section 2(87)(ii)
8 HENIKWON
CORPORATION SDN.
BHD
2A-03-2, LORONG BATU
NILAM 4A, BANDAR BUKIT
TINGGI, 41200, KLANG,
SELANGOR, MALAYSIA
NA SUBSIDIARY 100.00 Section 2(87)(ii)
9 HI-TECH ROCK
PRODUCTS &
AGGREGATE
LIMITED
MOUNT POONAMALLE
ROAD, POST BOX NO 979,
MANAPAKKAM, CHENNAI
- 600089
U14290TN2008PLC065900 SUBSIDIARY 100.00 Section 2(87)(ii)
10 HYDERABAD
INTERNATIONAL
TRADE EXPOSITIONS
LIMITED
HITEX EXHIBITION CENTRE,
N A C, IZZAT NAGAR,
HYDERBAD-500032
U52520TG2001PLC037105 SUBSIDIARY 51.72 Section 2(87)(ii)
11 INFORMATION
SYSTEMS RESOURCE
CENTRE PRIVATE
LIMITED
L&T HOUSE, N M MARG,
BALLARD ESTATE,
MUMBAI-400001
U72200MH1996PTC100517 SUBSIDIARY 100.00 Section 2(87)(ii)
12 KANA CONTROLS
GENERAL TRADING
& CONTRACTING
COMPANY WLL
OFFICE NO. 14, 5TH FLOOR,
AL-FARWANIYA, BLOCK NO.
44, BLDG. NO. 6, GHASHAM
FAHED AL-BASMAN, KUWAIT
NA SUBSIDIARY 49.00 Section 2(87)(i)
13 KESUN IRON AND
STEEL COMPANY
PRIVATE LIMITED
L&T ENERGY CENTRE, NEAR
CHHANI JAKAT NAKA,
VADODARA-390002
U27100GJ2009PTC055901 SUBSIDIARY 95.00 Section 2(87)(ii)
14 KUDGI
TRANSMISSION
LIMITED
MOUNT POONAMALLE
ROAD, POST BOX NO 979,
MANAPAKKAM,
CHENNAI - 600089
U40106DL2012GOI245339 SUBSIDIARY 97.45 Section 2(87)(ii)
15 L&T - GULF PRIVATE
LIMITED
L&T HOUSE, N M MARG,
BALLARD ESTATE,
MUMBAI-400001
U74140MH2008PTC177765 SUBSIDIARY 50.0002 Section 2(87)(ii)
16 L&T ACCESS
DISTRIBUTION
SERVICES LIMITED
MOUNT POONAMALLE
ROAD, POST BOX NO 979,
MANAPAKKAM,
CHENNAI - 600089
U65100TN2011PLC083348 SUBSIDIARY 72.95 Section 2(87)(ii)
17 L&T AHMEDABAD-
MALIYA TOLLWAY
LIMITED
MOUNT POONAMALLE
ROAD, POST BOX NO 979,
MANAPAKKAM,
CHENNAI - 600089
U45203TN2008PLC069211 SUBSIDIARY 97.45 Section 2(87)(ii)
18 L&T ARUNACHAL
HYDROPOWER
LIMITED
L&T HOUSE, N M MARG,
BALLARD ESTATE,
MUMBAI-400001
U40300MH2010PLC204778 SUBSIDIARY 100.00 Section 2(87)(ii)
19 L&T AVIATION
SERVICES PRIVATE
LIMITED
L&T HOUSE, N M MARG,
BALLARD ESTATE,
MUMBAI-400001
U62100MH2009PTC196917 SUBSIDIARY 100.00 Section 2(87)(ii)
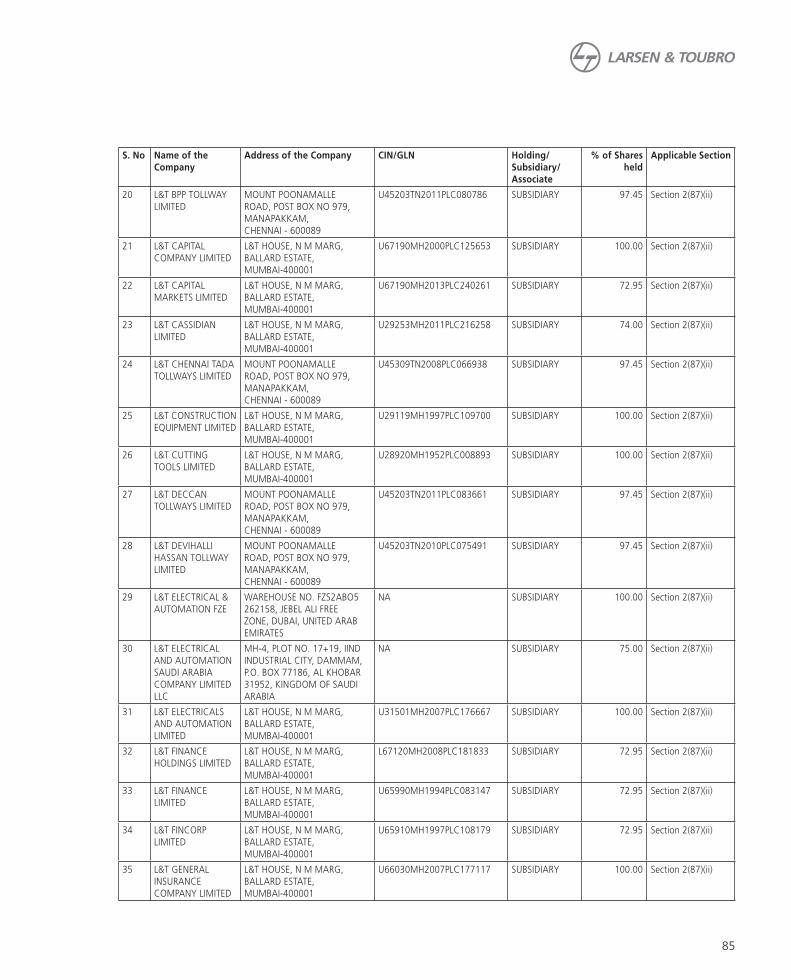
85
S. No Name of the
Company
Address of the Company CIN/GLN Holding/
Subsidiary/
Associate
% of Shares
held
Applicable Section
20 L&T BPP TOLLWAY
LIMITED
MOUNT POONAMALLE
ROAD, POST BOX NO 979,
MANAPAKKAM,
CHENNAI - 600089
U45203TN2011PLC080786 SUBSIDIARY 97.45 Section 2(87)(ii)
21 L&T CAPITAL
COMPANY LIMITED
L&T HOUSE, N M MARG,
BALLARD ESTATE,
MUMBAI-400001
U67190MH2000PLC125653 SUBSIDIARY 100.00 Section 2(87)(ii)
22 L&T CAPITAL
MARKETS LIMITED
L&T HOUSE, N M MARG,
BALLARD ESTATE,
MUMBAI-400001
U67190MH2013PLC240261 SUBSIDIARY 72.95 Section 2(87)(ii)
23 L&T CASSIDIAN
LIMITED
L&T HOUSE, N M MARG,
BALLARD ESTATE,
MUMBAI-400001
U29253MH2011PLC216258 SUBSIDIARY 74.00 Section 2(87)(ii)
24 L&T CHENNAI TADA
TOLLWAYS LIMITED
MOUNT POONAMALLE
ROAD, POST BOX NO 979,
MANAPAKKAM,
CHENNAI - 600089
U45309TN2008PLC066938 SUBSIDIARY 97.45 Section 2(87)(ii)
25 L&T CONSTRUCTION
EQUIPMENT LIMITED
L&T HOUSE, N M MARG,
BALLARD ESTATE,
MUMBAI-400001
U29119MH1997PLC109700 SUBSIDIARY 100.00 Section 2(87)(ii)
26 L&T CUTTING
TOOLS LIMITED
L&T HOUSE, N M MARG,
BALLARD ESTATE,
MUMBAI-400001
U28920MH1952PLC008893 SUBSIDIARY 100.00 Section 2(87)(ii)
27 L&T DECCAN
TOLLWAYS LIMITED
MOUNT POONAMALLE
ROAD, POST BOX NO 979,
MANAPAKKAM,
CHENNAI - 600089
U45203TN2011PLC083661 SUBSIDIARY 97.45 Section 2(87)(ii)
28 L&T DEVIHALLI
HASSAN TOLLWAY
LIMITED
MOUNT POONAMALLE
ROAD, POST BOX NO 979,
MANAPAKKAM,
CHENNAI - 600089
U45203TN2010PLC075491 SUBSIDIARY 97.45 Section 2(87)(ii)
29 L&T ELECTRICAL &
AUTOMATION FZE
WAREHOUSE NO. FZS2ABO5
262158, JEBEL ALI FREE
ZONE, DUBAI, UNITED ARAB
EMIRATES
NA SUBSIDIARY 100.00 Section 2(87)(ii)
30 L&T ELECTRICAL
AND AUTOMATION
SAUDI ARABIA
COMPANY LIMITED
LLC
MH-4, PLOT NO. 17+19, IIND
INDUSTRIAL CITY, DAMMAM,
P.O. BOX 77186, AL KHOBAR
31952, KINGDOM OF SAUDI
ARABIA
NA SUBSIDIARY 75.00 Section 2(87)(ii)
31 L&T ELECTRICALS
AND AUTOMATION
LIMITED
L&T HOUSE, N M MARG,
BALLARD ESTATE,
MUMBAI-400001
U31501MH2007PLC176667 SUBSIDIARY 100.00 Section 2(87)(ii)
32 L&T FINANCE
HOLDINGS LIMITED
L&T HOUSE, N M MARG,
BALLARD ESTATE,
MUMBAI-400001
L67120MH2008PLC181833 SUBSIDIARY 72.95 Section 2(87)(ii)
33 L&T FINANCE
LIMITED
L&T HOUSE, N M MARG,
BALLARD ESTATE,
MUMBAI-400001
U65990MH1994PLC083147 SUBSIDIARY 72.95 Section 2(87)(ii)
34 L&T FINCORP
LIMITED
L&T HOUSE, N M MARG,
BALLARD ESTATE,
MUMBAI-400001
U65910MH1997PLC108179 SUBSIDIARY 72.95 Section 2(87)(ii)
35 L&T GENERAL
INSURANCE
COMPANY LIMITED
L&T HOUSE, N M MARG,
BALLARD ESTATE,
MUMBAI-400001
U66030MH2007PLC177117 SUBSIDIARY 100.00 Section 2(87)(ii)

86
S. No Name of the
Company
Address of the Company CIN/GLN Holding/
Subsidiary/
Associate
% of Shares
held
Applicable Section
36 L&T HALOL-
SHAMLAJI TOLLWAY
LIMITED
MOUNT POONAMALLE
ROAD, POST BOX NO 979,
MANAPAKKAM,
CHENNAI - 600089
U45203TN2008PLC069210 SUBSIDIARY 97.45 Section 2(87)(ii)
37 L&T HIMACHAL
HYDROPOWER
LIMITED
RAMA COTTAGE, KANLOG,
SHIMLA-171001
U40102HP2010PLC031697 SUBSIDIARY 100.00 Section 2(87)(ii)
38 L&T HITECH CITY
LIMITED
AQ4-A1, CYBER TOWER,
HITEC CITY, MADHAPUR,
HYDERABAD-500081
U70102TG2007PLC053938 SUBSIDIARY 65.86 Section 2(87)(ii)
39 L&T HOUSING
FINANCE LIMITED
UNIT NO.505 & 506, DLF
TOWER B, DISTRICT CENTRE,
JASOLA, NEW DELHI-110025
U45200DL1994PLC198639 SUBSIDIARY 72.95 Section 2(87)(ii)
40 L&T HOWDEN
PRIVATE LIMITED
L&T HOUSE, N M MARG,
BALLARD ESTATE,
MUMBAI-400001
U31401MH2010PTC204403 SUBSIDIARY 50.10 Section 2(87)(ii)
41 L&T HYDROCARBON
ENGINEERING
LIMITED
L&T HOUSE, N M MARG,
BALLARD ESTATE,
MUMBAI-400001
U11200MH2009PLC191426 SUBSIDIARY 100.00 Section 2(87)(ii)
42 L&T IDPL TRUSTEE
MANAGER PTE. LTD.
8 CROSS STREET, #10-00, PWC
BUILDING,
SINGAPORE (048424)
NA SUBSIDIARY 97.45 Section 2(87)(ii)
43 L&T INFOCITY
LIMITED
1-Q4-A1, CYBER
TOWER, HITEC CITY,
MADHAPUR, HYDERABAD,
TELANGANA-500081
U72200TG1997PLC026885 SUBSIDIARY 89.00 Section 2(87)(ii)
44 L&T INFORMATION
TECHNOLOGY
SERVICES
(SHANGHAI) CO.,
LTD.
ROOM 1100, BUILDING 2,
NO.1388, XINGXIAN ROAD,
JIADING DISTRICT, SHANGHAI
NA SUBSIDIARY 100.00 Section 2(87)(ii)
45 L&T INFOTECH
FINANCIAL
SERVICES
TECHNOLOGIES INC
2810, MATHESON BLVD EAST
SUITE 500, MISSISSAUGA,
ONL4W 4X7 CANADA
NA SUBSIDIARY 100.00 Section 2(87)(ii)
46 L&T INFRA DEBT
FUND LIMITED
3B, LAXMI TOWERS, C - 25,
‘G’ BLOCK, BANDRA - KURLA
COMPLEX, BANDRA (EAST),
MUMBAI-400051
U67100MH2013PLC241104 SUBSIDIARY 72.95 Section 2(87)(ii)
47 L&T INFRA
INVESTMENT
PARTNERS
ADVISORY PRIVATE
LIMITED
3B, LAXMI TOWERS, C - 25,
‘G’ BLOCK, BANDRA - KURLA
COMPLEX, BANDRA (EAST),
MUMBAI-400051
U67190MH2011PTC218046 SUBSIDIARY 72.95 Section 2(87)(ii)
48 L&T INFRA
INVESTMENT
PARTNERS TRUSTEE
PRIVATE LIMITED
3B, LAXMI TOWERS, C - 25,
‘G’ BLOCK, BANDRA - KURLA
COMPLEX, BANDRA (EAST),
MUMBAI-400051
U65900MH2011PTC220896 SUBSIDIARY 72.95 Section 2(87)(ii)
49 L&T
INFRASTRUCTURE
DEVELOPMENT
PROJECTS LANKA
(PRIVATE) LIMITED
NO.5 – 4/1, 19TH LANE,
COLOMBO - 03, SRI LANKA
NA SUBSIDIARY 93.44 Section 2(87)(ii)
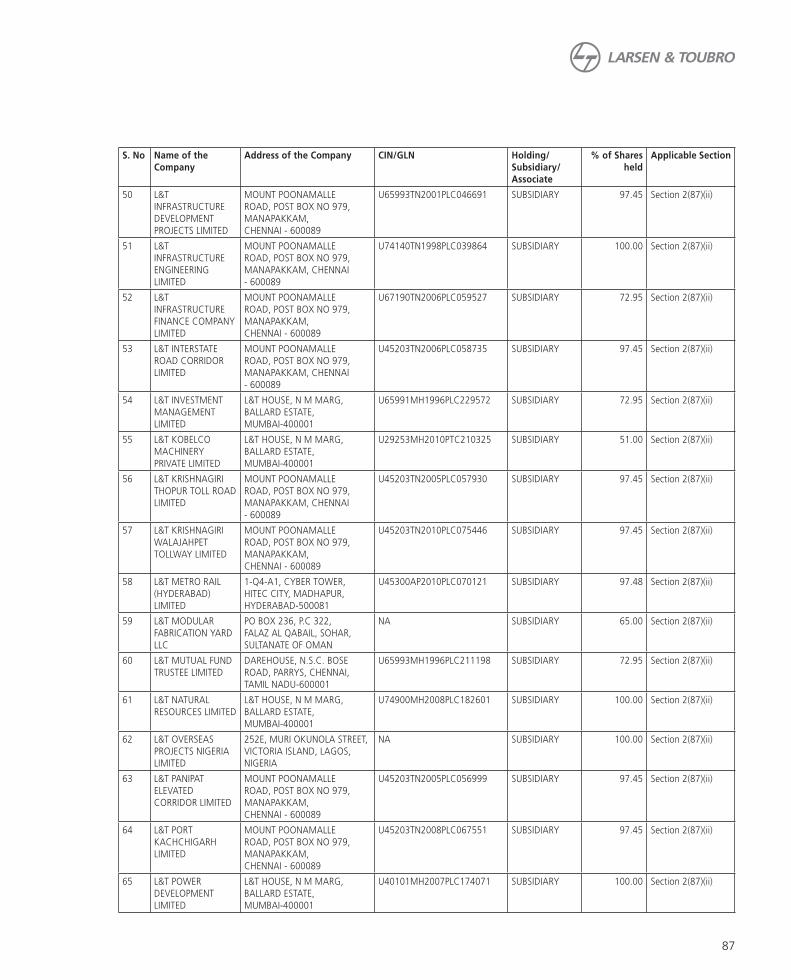
87
S. No Name of the
Company
Address of the Company CIN/GLN Holding/
Subsidiary/
Associate
% of Shares
held
Applicable Section
50 L&T
INFRASTRUCTURE
DEVELOPMENT
PROJECTS LIMITED
MOUNT POONAMALLE
ROAD, POST BOX NO 979,
MANAPAKKAM,
CHENNAI - 600089
U65993TN2001PLC046691 SUBSIDIARY 97.45 Section 2(87)(ii)
51 L&T
INFRASTRUCTURE
ENGINEERING
LIMITED
MOUNT POONAMALLE
ROAD, POST BOX NO 979,
MANAPAKKAM, CHENNAI
- 600089
U74140TN1998PLC039864 SUBSIDIARY 100.00 Section 2(87)(ii)
52 L&T
INFRASTRUCTURE
FINANCE COMPANY
LIMITED
MOUNT POONAMALLE
ROAD, POST BOX NO 979,
MANAPAKKAM,
CHENNAI - 600089
U67190TN2006PLC059527 SUBSIDIARY 72.95 Section 2(87)(ii)
53 L&T INTERSTATE
ROAD CORRIDOR
LIMITED
MOUNT POONAMALLE
ROAD, POST BOX NO 979,
MANAPAKKAM, CHENNAI
- 600089
U45203TN2006PLC058735 SUBSIDIARY 97.45 Section 2(87)(ii)
54 L&T INVESTMENT
MANAGEMENT
LIMITED
L&T HOUSE, N M MARG,
BALLARD ESTATE,
MUMBAI-400001
U65991MH1996PLC229572 SUBSIDIARY 72.95 Section 2(87)(ii)
55 L&T KOBELCO
MACHINERY
PRIVATE LIMITED
L&T HOUSE, N M MARG,
BALLARD ESTATE,
MUMBAI-400001
U29253MH2010PTC210325 SUBSIDIARY 51.00 Section 2(87)(ii)
56 L&T KRISHNAGIRI
THOPUR TOLL ROAD
LIMITED
MOUNT POONAMALLE
ROAD, POST BOX NO 979,
MANAPAKKAM, CHENNAI
- 600089
U45203TN2005PLC057930 SUBSIDIARY 97.45 Section 2(87)(ii)
57 L&T KRISHNAGIRI
WALAJAHPET
TOLLWAY LIMITED
MOUNT POONAMALLE
ROAD, POST BOX NO 979,
MANAPAKKAM,
CHENNAI - 600089
U45203TN2010PLC075446 SUBSIDIARY 97.45 Section 2(87)(ii)
58 L&T METRO RAIL
(HYDERABAD)
LIMITED
1-Q4-A1, CYBER TOWER,
HITEC CITY, MADHAPUR,
HYDERABAD-500081
U45300AP2010PLC070121 SUBSIDIARY 97.48 Section 2(87)(ii)
59 L&T MODULAR
FABRICATION YARD
LLC
PO BOX 236, P.C 322,
FALAZ AL QABAIL, SOHAR,
SULTANATE OF OMAN
NA SUBSIDIARY 65.00 Section 2(87)(ii)
60 L&T MUTUAL FUND
TRUSTEE LIMITED
DAREHOUSE, N.S.C. BOSE
ROAD, PARRYS, CHENNAI,
TAMIL NADU-600001
U65993MH1996PLC211198 SUBSIDIARY 72.95 Section 2(87)(ii)
61 L&T NATURAL
RESOURCES LIMITED
L&T HOUSE, N M MARG,
BALLARD ESTATE,
MUMBAI-400001
U74900MH2008PLC182601 SUBSIDIARY 100.00 Section 2(87)(ii)
62 L&T OVERSEAS
PROJECTS NIGERIA
LIMITED
252E, MURI OKUNOLA STREET,
VICTORIA ISLAND, LAGOS,
NIGERIA
NA SUBSIDIARY 100.00 Section 2(87)(ii)
63 L&T PANIPAT
ELEVATED
CORRIDOR LIMITED
MOUNT POONAMALLE
ROAD, POST BOX NO 979,
MANAPAKKAM,
CHENNAI - 600089
U45203TN2005PLC056999 SUBSIDIARY 97.45 Section 2(87)(ii)
64 L&T PORT
KACHCHIGARH
LIMITED
MOUNT POONAMALLE
ROAD, POST BOX NO 979,
MANAPAKKAM,
CHENNAI - 600089
U45203TN2008PLC067551 SUBSIDIARY 97.45 Section 2(87)(ii)
65 L&T POWER
DEVELOPMENT
LIMITED
L&T HOUSE, N M MARG,
BALLARD ESTATE,
MUMBAI-400001
U40101MH2007PLC174071 SUBSIDIARY 100.00 Section 2(87)(ii)

88
S. No Name of the
Company
Address of the Company CIN/GLN Holding/
Subsidiary/
Associate
% of Shares
held
Applicable Section
66 L&T POWER LIMITED L&T HOUSE, N M MARG,
BALLARD ESTATE,
MUMBAI-400001
U40100MH2006PLC160413 SUBSIDIARY 100.00 Section 2(87)(ii)
67 L&T POWERGEN
LIMITED
L&T HOUSE, N M MARG,
BALLARD ESTATE,
MUMBAI-400001
U40103MH2010PLC209313 SUBSIDIARY 100.00 Section 2(87)(ii)
68 L&T RAJKOT-
VADINAR TOLLWAY
LIMITED
MOUNT POONAMALLE
ROAD, POST BOX NO 979,
MANAPAKKAM,
CHENNAI - 600089
U45203TN2008PLC069184 SUBSIDIARY 97.45 Section 2(87)(ii)
69 L&T REALTY FZE EXECUTIVE SUITE, P.O.BOX
121576, SAIF ZONE,SHARJAH,
U.A.E.
NA SUBSIDIARY 100.00 Section 2(87)(ii)
70 L&T REALTY LIMITED L&T HOUSE, N M MARG,
BALLARD ESTATE,
MUMBAI-400001
U74200MH2007PLC176358 SUBSIDIARY 100.00 Section 2(87)(ii)
71 L&T SAMAKHIALI
GANDHIDHAM
TOLLWAY LIMITED
MOUNT POONAMALLE
ROAD, POST BOX NO 979,
MANAPAKKAM, CHENNAI
- 600089
U45203TN2010PLC074501 SUBSIDIARY 97.45 Section 2(87)(ii)
72 L&T SAMBALPUR
- ROURKELA
TOLLWAY LIMITED
MOUNT POONAMALLE
ROAD, POST BOX NO 979,
MANAPAKKAM,
CHENNAI - 600089
U45206TN2013PLC093395 SUBSIDIARY 97.45 Section 2(87)(ii)
73 L&T SAPURA
OFFSHORE PRIVATE
LIMITED
MOUNT POONAMALLE
ROAD, POST BOX NO 979,
MANAPAKKAM, CHENNAI
- 600089
U11200TN2010PTC077214 SUBSIDIARY 60.00 Section 2(87)(ii)
74 L&T SAPURA
SHIPPING PRIVATE
LIMITED
MOUNT POONAMALLE
ROAD, POST BOX NO 979,
MANAPAKKAM,
CHENNAI - 600089
U61100TN2010PTC077217 SUBSIDIARY 60.00 Section 2(87)(ii)
75 L&T SEAWOODS
LIMITED
L&T HOUSE, N M MARG,
BALLARD ESTATE,
MUMBAI-400001
U45203MH2008PLC180029 SUBSIDIARY 100.00 Section 2(87)(ii)
76 L&T SHIPBUILDING
LIMITED
GROUND FLOOR, TC-1
BUILDING, L&T CONSTRUCTION
CAMPUS, MOUNT
POONAMALLE ROAD, POST
BOX NO 979, MANAPAKKAM,
CHENNAI - 600089
U74900TN2007PLC065356 SUBSIDIARY 97.00 Section 2(87)(ii)
77 L&T SOLAR LIMITED L&T HOUSE, N M MARG,
BALLARD ESTATE,
MUMBAI-400001
U40109MH2010PLC205058 SUBSIDIARY 100.00 Section 2(87)(ii)
78 L&T SOUTH CITY
PROJECTS LIMITED
MOUNT POONAMALLE
ROAD, POST BOX NO 979,
MANAPAKKAM,
CHENNAI - 600089
U70101TN2006PLC058866 SUBSIDIARY 51.00 Section 2(87)(ii)
79 L&T SPECIAL
STEELS AND HEAVY
FORGINGS PRIVATE
LIMITED
L&T HOUSE, N M MARG,
BALLARD ESTATE,
MUMBAI-400001
U27109MH2009PTC193699 SUBSIDIARY 74.00 Section 2(87)(ii)
80 L&T TECHNOLOGY
SERVICES LIMITED
L&T HOUSE, N M MARG,
BALLARD ESTATE,
MUMBAI-400001
U72900MH2012PLC232169 SUBSIDIARY 100.00 Section 2(87)(ii)

89
S. No Name of the
Company
Address of the Company CIN/GLN Holding/
Subsidiary/
Associate
% of Shares
held
Applicable Section
81 L&T TECHNOLOGY
SERVICES LLC
200, WEST ADAMS STREET,
CHICAGO, ILLINOIS-60606
NA SUBSIDIARY 100.00 Section 2(87)(ii)
82 L&T THALES
TECHNOLOGY
SERVICES PRIVATE
LIMITED
RR V TOWER, 6TH FLOOR, 33A,
DEVELOPED PLOTS, SIDCO
INDUSTRIAL ESTATE, GUINDY,
CHENNAI-600032
U72200TN2006PTC059421 SUBSIDIARY 74.00 Section 2(87)(ii)
83 L&T
TRANSPORTATION
INFRASTRUCTURE
LIMITED
MOUNT POONAMALLE
ROAD, POST BOX NO 979,
MANAPAKKAM,
CHENNAI - 600089
U45203TN1997PLC039102 SUBSIDIARY 98.12 Section 2(87)(ii)
84 L&T TRUSTEE
COMPANY PRIVATE
LIMITED
L&T HOUSE, N M MARG,
BALLARD ESTATE,
MUMBAI-400001
U74990MH2009PTC193936 SUBSIDIARY 100.00 Section 2(87)(ii)
85 L&T UTTARANCHAL
HYDROPOWER
LIMITED
6, GAVNI VILLAGE,
NEXT TO JALAGAM
OFFICE, CHANDRAPURI,
UTTARKHAND-246425
U31401UR2006PLC032329 SUBSIDIARY 100.00 Section 2(87)(ii)
86 L&T VADODARA
BHARUCH
TOLLWAYS LIMITED
MOUNT POONAMALLE
ROAD, POST BOX NO 979,
MANAPAKKAM,
CHENNAI - 600089
U45203TN2005PLC058417 SUBSIDIARY 97.45 Section 2(87)(ii)
87 L&T VALVES LIMITED L&T HOUSE, N M MARG,
BALLARD ESTATE,
MUMBAI-400001
U74999MH1961PLC012188 SUBSIDIARY 100.00 Section 2(87)(ii)
88 L&T VISION
VENTURES LIMITED
MOUNT POONAMALLE
ROAD, POST BOX NO 979,
MANAPAKKAM, CHENNAI
- 600089
U74210TN2006PLC061845 SUBSIDIARY 68.00 Section 2(87)(ii)
89 L&T VRINDAVAN
PROPERTIES LIMITED
MOUNT POONAMALLE
ROAD, POST BOX NO 979,
MANAPAKKAM,
CHENNAI - 600089
U70200TN2011PLC081100 SUBSIDIARY 72.95 Section 2(87)(ii)
90 L&T WESTERN
ANDHRA TOLLWAYS
LIMITED
MOUNT POONAMALLE
ROAD, POST BOX NO 979,
MANAPAKKAM, CHENNAI
- 600089
U45203TN2005PLC057931 SUBSIDIARY 97.45 Section 2(87)(ii)
91 L&T WESTERN
INDIA TOLLBRIDGE
LIMITED
MOUNT POONAMALLE
ROAD, POST BOX NO 979,
MANAPAKKAM,
CHENNAI - 600089
U45203TN1999PLC042518 SUBSIDIARY 97.45 Section 2(87)(ii)
92 L&T-MHPS BOILERS
PRIVATE LIMITED
L&T HOUSE, N M MARG,
BALLARD ESTATE,
MUMBAI-400001
U29119MH2006PTC165102 SUBSIDIARY 51.00 Section 2(87)(ii)
93 L&T-MHPS TURBINE
GENERATORS
PRIVATE LIMITED
L&T HOUSE, N M MARG,
BALLARD ESTATE,
MUMBAI-400001
U31101MH2006PTC166541 SUBSIDIARY 51.00 Section 2(87)(ii)
94 L&T-SARGENT &
LUNDY LIMITED
L&T HOUSE, N M MARG,
BALLARD ESTATE,
MUMBAI-400001
U74210MH1995PLC088099 SUBSIDIARY 50.0001 Section 2(87)(ii)
95 L&T-VALDEL
ENGINEERING
LIMITED
NO 19, PRIMROSE ROAD,
BANGALORE-560025
U74210KA2004PLC035094 SUBSIDIARY 100.00 Section 2(87)(ii)
96 LARSEN & TOUBRO
(EAST ASIA) SDN.
BHD
SUITE 702, 7TH FLOOR, WISMA
HANGSAM, JALAN HANG
LEKIR, 50000 KUALA LUMPUR,
MALAYSIA
NA SUBSIDIARY 30.00 Section 2(87)(i)
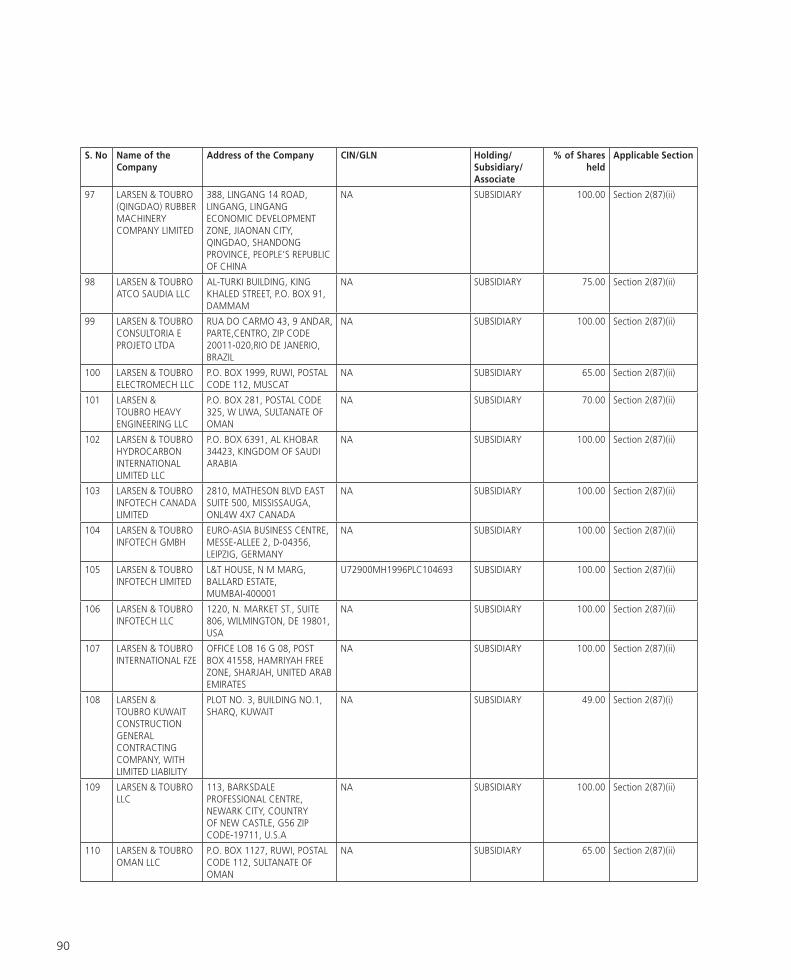
90
S. No Name of the
Company
Address of the Company CIN/GLN Holding/
Subsidiary/
Associate
% of Shares
held
Applicable Section
97 LARSEN & TOUBRO
(QINGDAO) RUBBER
MACHINERY
COMPANY LIMITED
388, LINGANG 14 ROAD,
LINGANG, LINGANG
ECONOMIC DEVELOPMENT
ZONE, JIAONAN CITY,
QINGDAO, SHANDONG
PROVINCE, PEOPLE’S REPUBLIC
OF CHINA
NA SUBSIDIARY 100.00 Section 2(87)(ii)
98 LARSEN & TOUBRO
ATCO SAUDIA LLC
AL-TURKI BUILDING, KING
KHALED STREET, P.O. BOX 91,
DAMMAM
NA SUBSIDIARY 75.00 Section 2(87)(ii)
99 LARSEN & TOUBRO
CONSULTORIA E
PROJETO LTDA
RUA DO CARMO 43, 9 ANDAR,
PARTE,CENTRO, ZIP CODE
20011-020,RIO DE JANERIO,
BRAZIL
NA SUBSIDIARY 100.00 Section 2(87)(ii)
100 LARSEN & TOUBRO
ELECTROMECH LLC
P.O. BOX 1999, RUWI, POSTAL
CODE 112, MUSCAT
NA SUBSIDIARY 65.00 Section 2(87)(ii)
101 LARSEN &
TOUBRO HEAVY
ENGINEERING LLC
P.O. BOX 281, POSTAL CODE
325, W LIWA, SULTANATE OF
OMAN
NA SUBSIDIARY 70.00 Section 2(87)(ii)
102 LARSEN & TOUBRO
HYDROCARBON
INTERNATIONAL
LIMITED LLC
P.O. BOX 6391, AL KHOBAR
34423, KINGDOM OF SAUDI
ARABIA
NA SUBSIDIARY 100.00 Section 2(87)(ii)
103 LARSEN & TOUBRO
INFOTECH CANADA
LIMITED
2810, MATHESON BLVD EAST
SUITE 500, MISSISSAUGA,
ONL4W 4X7 CANADA
NA SUBSIDIARY 100.00 Section 2(87)(ii)
104 LARSEN & TOUBRO
INFOTECH GMBH
EURO-ASIA BUSINESS CENTRE,
MESSE-ALLEE 2, D-04356,
LEIPZIG, GERMANY
NA SUBSIDIARY 100.00 Section 2(87)(ii)
105 LARSEN & TOUBRO
INFOTECH LIMITED
L&T HOUSE, N M MARG,
BALLARD ESTATE,
MUMBAI-400001
U72900MH1996PLC104693 SUBSIDIARY 100.00 Section 2(87)(ii)
106 LARSEN & TOUBRO
INFOTECH LLC
1220, N. MARKET ST., SUITE
806, WILMINGTON, DE 19801,
USA
NA SUBSIDIARY 100.00 Section 2(87)(ii)
107 LARSEN & TOUBRO
INTERNATIONAL FZE
OFFICE LOB 16 G 08, POST
BOX 41558, HAMRIYAH FREE
ZONE, SHARJAH, UNITED ARAB
EMIRATES
NA SUBSIDIARY 100.00 Section 2(87)(ii)
108 LARSEN &
TOUBRO KUWAIT
CONSTRUCTION
GENERAL
CONTRACTING
COMPANY, WITH
LIMITED LIABILITY
PLOT NO. 3, BUILDING NO.1,
SHARQ, KUWAIT
NA SUBSIDIARY 49.00 Section 2(87)(i)
109 LARSEN & TOUBRO
LLC
113, BARKSDALE
PROFESSIONAL CENTRE,
NEWARK CITY, COUNTRY
OF NEW CASTLE, G56 ZIP
CODE-19711, U.S.A
NA SUBSIDIARY 100.00 Section 2(87)(ii)
110 LARSEN & TOUBRO
OMAN LLC
P.O. BOX 1127, RUWI, POSTAL
CODE 112, SULTANATE OF
OMAN
NA SUBSIDIARY 65.00 Section 2(87)(ii)

91
S. No Name of the
Company
Address of the Company CIN/GLN Holding/
Subsidiary/
Associate
% of Shares
held
Applicable Section
111 LARSEN & TOUBRO
QATAR LLC
P.O. BOX 24399, SH.
THAMOUR BLDG., MEZZANINE
FLOOR, AL-HANDASA AREA,
NEAR JAIDAH FLYOVER, B RING
ROAD, DOHA, QATAR
NA SUBSIDIARY 49.00 Section 2(87)(i)
112 LARSEN & TOUBRO
READYMIX AND
ASPHALT CONCRETE
INDUSTRIES LLC
JEBEL ALI INDUSTRIAL AREA,
JEBEL ALI, DUBAI
NA SUBSIDIARY 49.00 Section 2(87)(i)
113 LARSEN & TOUBRO
SAUDI ARABIA LLC
P.O. BOX NO.20, RIYADH
11351, KINGDOM OF SAUDI
ARABIA 11351
NA SUBSIDIARY 100.00 Section 2(87)(ii)
114 LARSEN & TOUBRO
TANDD SA (PTY)
LIMITED
2ND FLOOR, 4 PENCARROW
CRESCENT, LA LUCIA RIDGE
OFFICE ESTATE, SOUTH AFRICA
4019
NA SUBSIDIARY 72.50 Section 2(87)(ii)
115 LARSEN AND
TOUBRO INFOTECH
SOUTH AFRICA
(PTY) LIMITED
6TH FLOOR, 119 HERTZOG
BOULEVARD, FORESHORE,
CAPETOWN, SOUTH AFRICA
8001
NA SUBSIDIARY 74.90 Section 2(87)(ii)
116 LARSEN TOUBRO
ARABIA LLC
ALMADA TOWER, PRINCE
TURKI STREET, AL KHOBAR,
SAUDI ARABIA
NA SUBSIDIARY 75.00 Section 2(87)(ii)
117 MUDIT CEMENT
PRIVATE LIMITED
UNIT NO.505 & 506, DLF
TOWER B, DISTRICT CENTRE,
JASOLA, NEW DELHI-110025
U26942DL1990PTC041941 SUBSIDIARY 72.95 Section 2(87)(ii)
118 NABHA POWER
LIMITED
PO BOX NO-28, NEAR VILLAGE
NALASH, RAJPURA-140401
U40102PB2007PLC031039 SUBSIDIARY 100.00 Section 2(87)(ii)
119 PNG TOLLWAY
LIMITED
MOUNT POONAMALLE
ROAD, POST BOX NO 979,
MANAPAKKAM, CHENNAI
- 600089
U45203TN2009PLC070741 SUBSIDIARY 72.77 Section 2(87)(ii)
120 PT TAMCO
INDONESIA
JALAN RAYA PASAR SERANG,
NO. 15, KANDANG RODA,
CIKARANG BEKASI 17330,
INDONESIA
NA SUBSIDIARY 100.00 Section 2(87)(ii)
121 PT. LARSEN
& TOUBRO
HYDROCARBON
ENGINEERING
INDONESIA
THE CITY TOWER, 12TH FLOOR,
UNIT 1-N, J1.MH., THAMRIN
NO.81, CENTRAL JAKARTA,
INDONESIA 10310
NA SUBSIDIARY 95.00 Section 2(87)(ii)
122 RAYKAL
ALUMINIUM
COMPANY PRIVATE
LIMITED
ANNAPURNA COMPLEX, 559,
LEWIS ROAD, BHUBANESWAR,
ODIHSA-751014
U13203OR1999PTC005673 SUBSIDIARY 75.50 Section 2(87)(ii)
123 SERVOWATCH
SYSTEMS LIMITED
THE WOODROPE BUILDING,
WOODROLFE ROAD,
TOLLESBURY, MALDONESSEX
CM9 8SE, UNITED KINGDOM
NA SUBSIDIARY 100.00 Section 2(87)(ii)
124 SPECTRUM
INFOTECH PRIVATE
LIMITED
LANDT HOUSE, 38, CUBBON
ROAD, BANGALORE-560001
U72200KA1995PTC018112 SUBSIDIARY 100.00 Section 2(87)(ii)
125 TAMCO ELECTRICAL
INDUSTRIES
AUSTRALIA PTY LTD
31, KITCHEN ROAD,
DANDENONG, VICTORIA 3175,
AUSTRALIA
NA SUBSIDIARY 100.00 Section 2(87)(ii)

92
S. No Name of the
Company
Address of the Company CIN/GLN Holding/
Subsidiary/
Associate
% of Shares
held
Applicable Section
126 TAMCO
SWITCHGEAR
(MALAYSIA) SDN
BHD
UNIT C508, BLOCK C,
KELANA SQUARE, JALAN
SS7/26, KELANA JAYA 47301,
PETALING JAYA SELANGOR
DAR UL EHSAN, MALAYSIA
NA SUBSIDIARY 100.00 Section 2(87)(ii)
127 THALEST LIMITED ENDEAVOUR HOUSE,
BENTALLS INDUSTRIAL ESTATE,
HOLLOWAY ROAD, MALDON,
ESSEX, C9 4ER, UNITED
KINGDOM
NA SUBSIDIARY 100.00 Section 2(87)(ii)
128 FEEDBACK INFRA
PRIVATE LIMITED
311, 3rd Floor,Vardhaman
Plaza, Pocket 7, Plot No. 6,
Sector 12, Dwarka , New Delhi
-110078
U74899DL1990PTC040630 ASSOCIATE 16.89 Section 2(6)
129 GUJARAT LEATHER
INDUSTRIES LIMITED
NO 3001, GIDC INDUSTRIAL
ESTATE, ANKLESHWAR,
GUJARAT
U18104GJ1978SGC003134 ASSOCIATE 50.00 Section 2(6)
130 INDIRAN
ENGINEERING
PROJECTS AND
SYSTEMS KISH PJSC
POST BOX 1267, NEHA
APARTMENT, BAZAAR-E-
DANOOS, KISH ISLAND, IRAN
NA ASSOCIATE 50.00 Section 2(6)
131 INTERNATIONAL
SEAPORTS (HALDIA)
PRIVATE LIMITED
FLAT NO. 27, 5TH FLOOR,
KOHINOOR BUILDING, 105,
PARK STREET, KOLKATA
700016
U45205WB1999PTC090733 ASSOCIATE 21.74 Section 2(6)
132 JSK ELECTRICALS
PRIVATE LIMITED
B-31, BASEMENT, VISHAL
ENCLAVE, NEW DELHI 110027
U31908DL2008PTC182292 ASSOCIATE 26.00 Section 2(6)
133 L&T CAMP
FACILITIES LLC
P. O. BOX 44357, DUBAI,
UNITED ARAB EMIRATES
NA ASSOCIATE 49.00 Section 2(6)
134 L&T-CHIYODA
LIMITED
L&T HOUSE, N M MARG,
BALLARD ESTATE,
MUMBAI-400001
U28920MH1994PLC083035 ASSOCIATE 50.00 Section 2(6)
135 LARSEN & TOUBRO
QATAR & HBK
CONTRACTING LLC
P. O. BOX 1362, DOHA, QATAR NA ASSOCIATE 24.50 Section 2(6)
136 MAGTORQ PRIVATE
LIMITED
NO. 58-C, SIPCOT INDUSTRIAL
COMPLEX, HOSUR-635126
U02520TZ1989PTC002458 ASSOCIATE 42.85 Section 2(6)
137 RISHI CONSFAB
PRIVATE LIMITED
611, VEENA KILLEDAR
INDUSTRIAL ESTATE, 10-14,
PAIS STREET, BYCULLA (WEST),
MUMBAI 400011
U28112MH2008PTC178448 ASSOCIATE 26.00 Section 2(6)
138 SALZER
ELECTRONICS
LIMITED
SAMICHETTI PALAYAM,
JOTHIPURAM POST,
COIMBATORE 641047
L03210TZ1985PLC001535 ASSOCIATE 26.06 Section 2(6)
139 VIZAG IT PARK
LIMITED
GANDHI PLACE,
VUDA COMPOUND,
SIRIPURAM JUNCTION,
VISHAKHAPATTANAM,
ANDHRA PRADESH 530003
U45200AP2003PLC041374 ASSOCIATE 23.14 Section 2(6)
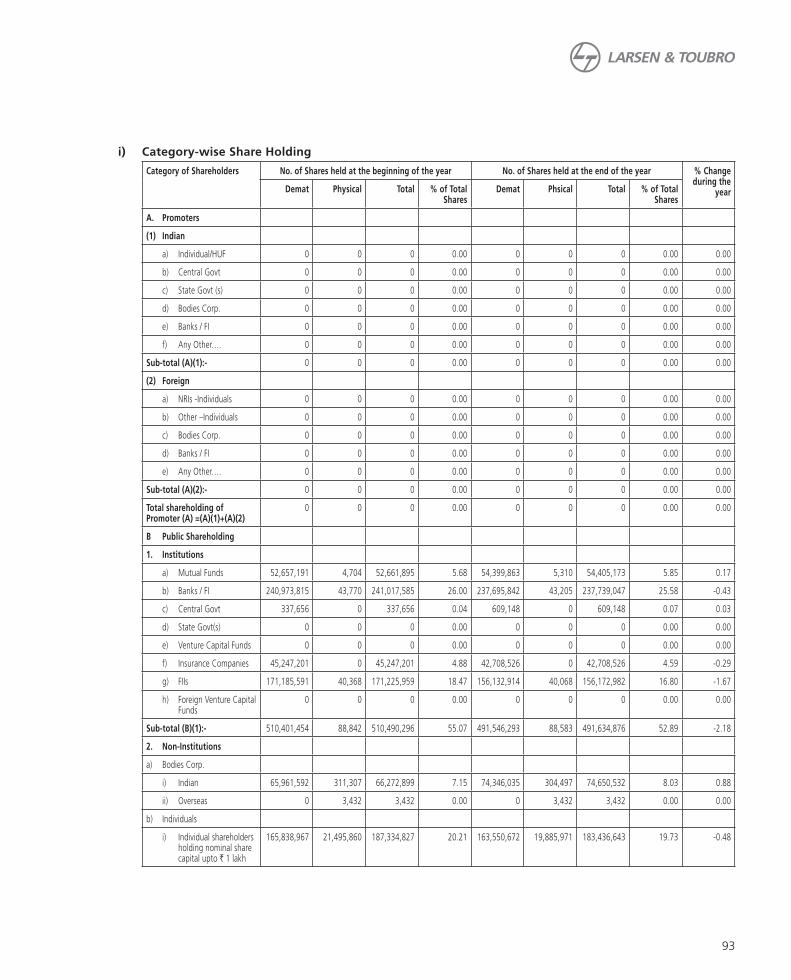
93
i) Category-wise Share Holding
Category of Shareholders No. of Shares held at the beginning of the year No. of Shares held at the end of the year % Change during the
yearDemat Physical Total % of Total Shares
Demat Phsical Total % of Total Shares
A. Promoters
(1) Indian
a) Individual/HUF 0 0 0 0.00 0 0 0 0.00 0.00
b) Central Govt 0 0 0 0.00 0 0 0 0.00 0.00
c) State Govt (s) 0 0 0 0.00 0 0 0 0.00 0.00
d) Bodies Corp. 0 0 0 0.00 0 0 0 0.00 0.00
e) Banks / FI 0 0 0 0.00 0 0 0 0.00 0.00
f) Any Other…. 0 0 0 0.00 0 0 0 0.00 0.00
Sub-total (A)(1):- 0 0 0 0.00 0 0 0 0.00 0.00
(2) Foreign
a) NRIs -Individuals 0 0 0 0.00 0 0 0 0.00 0.00
b) Other –Individuals 0 0 0 0.00 0 0 0 0.00 0.00
c) Bodies Corp. 0 0 0 0.00 0 0 0 0.00 0.00
d) Banks / FI 0 0 0 0.00 0 0 0 0.00 0.00
e) Any Other…. 0 0 0 0.00 0 0 0 0.00 0.00
Sub-total (A)(2):- 0 0 0 0.00 0 0 0 0.00 0.00
Total shareholding of Promoter (A) =(A)(1)+(A)(2)
0 0 0 0.00 0 0 0 0.00 0.00
B Public Shareholding
1. Institutions
a) Mutual Funds 52,657,191 4,704 52,661,895 5.68 54,399,863 5,310 54,405,173 5.85 0.17
b) Banks / FI 240,973,815 43,770 241,017,585 26.00 237,695,842 43,205 237,739,047 25.58 -0.43
c) Central Govt 337,656 0 337,656 0.04 609,148 0 609,148 0.07 0.03
d) State Govt(s) 0 0 0 0.00 0 0 0 0.00 0.00
e) Venture Capital Funds 0 0 0 0.00 0 0 0 0.00 0.00
f) Insurance Companies 45,247,201 0 45,247,201 4.88 42,708,526 0 42,708,526 4.59 -0.29
g) FIIs 171,185,591 40,368 171,225,959 18.47 156,132,914 40,068 156,172,982 16.80 -1.67
h) Foreign Venture Capital Funds
0 0 0 0.00 0 0 0 0.00 0.00
Sub-total (B)(1):- 510,401,454 88,842 510,490,296 55.07 491,546,293 88,583 491,634,876 52.89 -2.18
2. Non-Institutions
a) Bodies Corp.
i) Indian 65,961,592 311,307 66,272,899 7.15 74,346,035 304,497 74,650,532 8.03 0.88
ii) Overseas 0 3,432 3,432 0.00 0 3,432 3,432 0.00 0.00
b) Individuals
i) Individual shareholders holding nominal share capital upto ` 1 lakh
165,838,967 21,495,860 187,334,827 20.21 163,550,672 19,885,971 183,436,643 19.73 -0.48
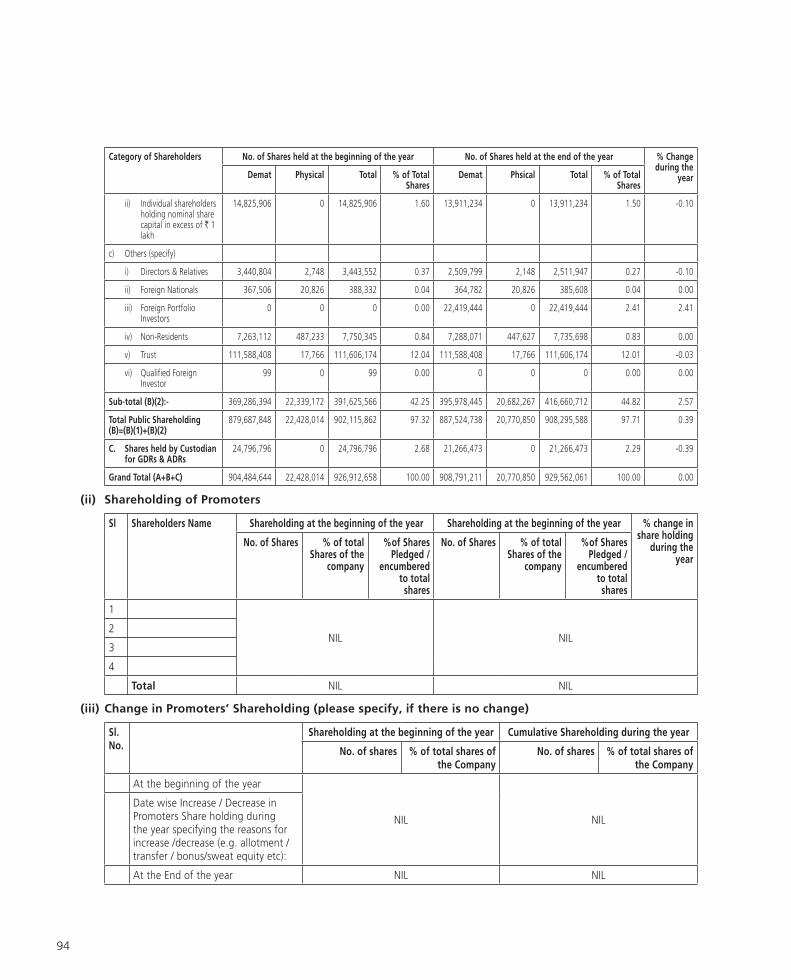
94
Category of Shareholders No. of Shares held at the beginning of the year No. of Shares held at the end of the year % Change during the
yearDemat Physical Total % of Total Shares
Demat Phsical Total % of Total Shares
ii) Individual shareholders holding nominal share capital in excess of ` 1 lakh
14,825,906 0 14,825,906 1.60 13,911,234 0 13,911,234 1.50 -0.10
c) Others (specify)
i) Directors & Relatives 3,440,804 2,748 3,443,552 0.37 2,509,799 2,148 2,511,947 0.27 -0.10
ii) Foreign Nationals 367,506 20,826 388,332 0.04 364,782 20,826 385,608 0.04 0.00
iii) Foreign Portfolio Investors
0 0 0 0.00 22,419,444 0 22,419,444 2.41 2.41
iv) Non-Residents 7,263,112 487,233 7,750,345 0.84 7,288,071 447,627 7,735,698 0.83 0.00
v) Trust 111,588,408 17,766 111,606,174 12.04 111,588,408 17,766 111,606,174 12.01 -0.03
vi) Qualified Foreign Investor
99 0 99 0.00 0 0 0 0.00 0.00
Sub-total (B)(2):- 369,286,394 22,339,172 391,625,566 42.25 395,978,445 20,682,267 416,660,712 44.82 2.57
Total Public Shareholding (B)=(B)(1)+(B)(2)
879,687,848 22,428,014 902,115,862 97.32 887,524,738 20,770,850 908,295,588 97.71 0.39
C. Shares held by Custodian for GDRs & ADRs
24,796,796 0 24,796,796 2.68 21,266,473 0 21,266,473 2.29 -0.39
Grand Total (A+B+C) 904,484,644 22,428,014 926,912,658 100.00 908,791,211 20,770,850 929,562,061 100.00 0.00
(ii) Shareholding of Promoters
Sl Shareholders Name Shareholding at the beginning of the year Shareholding at the beginning of the year % change in share holding
during the year
No. of Shares % of total Shares of the
company
%of Shares Pledged /
encumbered to total shares
No. of Shares % of total Shares of the
company
%of Shares Pledged /
encumbered to total shares
1
NIL NIL2
3
4
Total NIL NIL
(iii) Change in Promoters’ Shareholding (please specify, if there is no change)
Sl. No.
Shareholding at the beginning of the year Cumulative Shareholding during the year
No. of shares % of total shares of the Company
No. of shares % of total shares of the Company
At the beginning of the year
NIL NIL
Date wise Increase / Decrease in Promoters Share holding during the year specifying the reasons for increase /decrease (e.g. allotment / transfer / bonus/sweat equity etc):
At the End of the year NIL NIL

95
(iv) Shareholding Pattern of top ten Shareholders (other than Directors, Promoters and Holders of GDRs
and ADRs):
Sl. No.
Shareholding at the beginning of the year
Cumulative Shareholding during the year
For Each of the top 10 shareholders
No. of shares % of total Shares of the
Company
No. of shares % of total Shares of the
Company
1 LIFE INSURANCE CORPORATION OF INDIA
At the beginning of the year
157,556,923 17.00
Date wise Increase / Decrease in Share holding during the
year specifying the reasons for increase /decrease
(e.g. allotment / transfer / bonus / sweat equity etc):
13.02.2015 (110,000) (0.01) 157,446,923 16.94
20.02.2015 (160,846) (0.02) 157,286,077 16.92
27.02.2015 (234,648) (0.03) 157,051,429 16.90
6.03.2015 (397,091) (0.04) 156,654,338 16.85
13.03.2015 (218,167) (0.02) 156,436,171 16.83
20.03.2015 (119,393) (0.01) 156,316,778 16.82
27.03.2015 (544,493) (0.06) 155,772,285 16.76
31.03.2015 (250,000) (0.03) 155,522,285 16.73
At the End of the year
155,522,285 16.73
2 L&T EMPLOYEES WELFARE FOUNDATION
At the beginning of the year
111,606,174 12.04
At the End of the year
111,606,174 12.01
3 ADMINISTRATOR OF THE SPECIFIED UNDERTAKING OF THE UNIT TRUST OF INDIA
At the beginning of the year
75,925,962 8.19
At the End of the year
75,925,962 8.17
4 HDFC TRUSTEE COMPANY LIMITED-HDFC EQUITY FUND
At the beginning of the year
12,151,009 1.31 0.00
Date wise Increase / Decrease in Share holding during the
year specifying the reasons for increase /decrease
(e.g. allotment / transfer / bonus / sweat equity etc):
11.04.2014 (98,140) (0.01) 12,052,869 1.30
18.04.2014 358 0.00 12,053,227 1.30
25.04.2014 (273) (0.00) 12,052,954 1.30
02.05.2014 80,627 0.01 12,133,581 1.31
09.05.2014 210,789 0.02 12,344,370 1.33
16.05.2014 81,140 0.01 12,425,510 1.34
23.05.2014 14,283 0.00 12,439,793 1.34
30.05.2014 110,565 0.01 12,550,358 1.35
06.06.2014 370,563 0.04 12,920,921 1.39
13.06.2014 92,534 0.01 13,013,455 1.40
20.06.2014 253,011 0.03 13,266,466 1.43
30.06.2014 153,449 0.02 13,419,915 1.45
04.07.2014 21,575 0.00 13,441,490 1.45
11.07.2014 31,572 0.00 13,473,062 1.45
18.07.2014 119,634 0.01 13,592,696 1.47
01.08.2014 (227,250) (0.02) 13,365,446 1.44
08.08.2014 275,122 0.03 13,640,568 1.47
15.08.2014 (30,000) (0.00) 13,610,568 1.47
22.08.2014 2,875 0.00 13,613,443 1.47

96
Sl. No.
Shareholding at the beginning of the year
Cumulative Shareholding during the year
For Each of the top 10 shareholders
No. of shares % of total Shares of the
Company
No. of shares % of total Shares of the
Company
Date wise Increase / Decrease in Share holding during the
year specifying the reasons for increase /decrease
(e.g. allotment / transfer / bonus / sweat equity etc):
29.08.2014 436,661 0.05 14,050,104 1.51
05.09.2014 42 0.00 14,050,146 1.51
12.09.2014 99,097 0.01 14,149,243 1.52
30.09.2014 349,728 0.04 14,498,971 1.56
17.10.2014 202,580 0.02 14,701,551 1.58
31.10.2014 914 0.00 14,702,465 1.58
07.11.2014 (314) (0.00) 14,702,151 1.58
14.11.2014 100,000 0.01 14,802,151 1.59
21.11.2014 257,000 0.03 15,059,151 1.62
28.11.2014 521,362 0.06 15,580,513 1.68
05.12.2014 500,000 0.05 16,080,513 1.73
12.12.2014 326,677 0.04 16,407,190 1.77
19.12.2014 615,805 0.07 17,022,995 1.83
31.12.2014 256,062 0.03 17,279,057 1.86
02.01.2015 (28,609) (0.00) 17,250,448 1.86
09.01.2015 875 0.00 17,251,323 1.86
16.01.2015 1,517 0.00 17,252,840 1.86
23.01.2015 435,718 0.05 17,688,558 1.90
30.01.2015 84,155 0.01 17,772,713 1.91
06.02.2015 307,000 0.03 18,079,713 1.95
13.02.2015 648,308 0.07 18,728,021 2.01
20.02.2015 15,352 0.00 18,743,373 2.02
27.02.2015 59,836 0.01 18,803,209 2.02
6.03.2015 99,188 0.01 18,902,397 2.03
13.03.2015 49,633 0.01 18,952,030 2.04
27.03.2015 (874) (0.00) 18,951,156 2.04
31.03.2015 300,014 0.03 19,251,170 2.07
At the End of the year
19,251,170 2.07
5 GENERAL INSURANCE CORPORATION OF INDIA
At the beginning of the year
18,485,000 1.99 0.00
Date wise Increase / Decrease in Share holding during the
year specifying the reasons for increase /decrease
(e.g. allotment / transfer / bonus / sweat equity etc):
11.04.2014 (20,000) (0.00) 18,465,000 1.99
18.04.2014 (30,000) (0.00) 18,435,000 1.99
02.05.2014 (38,397) (0.00) 18,396,603 1.98
16.05.2014 (11,603) (0.00) 18,385,000 1.98
23.05.2014 (96,000) (0.01) 18,289,000 1.97
06.06.2014 (75,000) (0.01) 18,214,000 1.96
13.06.2014 (25,000) (0.00) 18,189,000 1.96
30.06.2014 (40,000) (0.00) 18,149,000 1.96
04.07.2014 (47,814) (0.01) 18,101,186 1.95
05.12.2014 (75,000) (0.01) 18,026,186 1.94
12.12.2014 (15,000) (0.00) 18,011,186 1.94
23.01.2015 (75,000) (0.01) 17,936,186 1.93
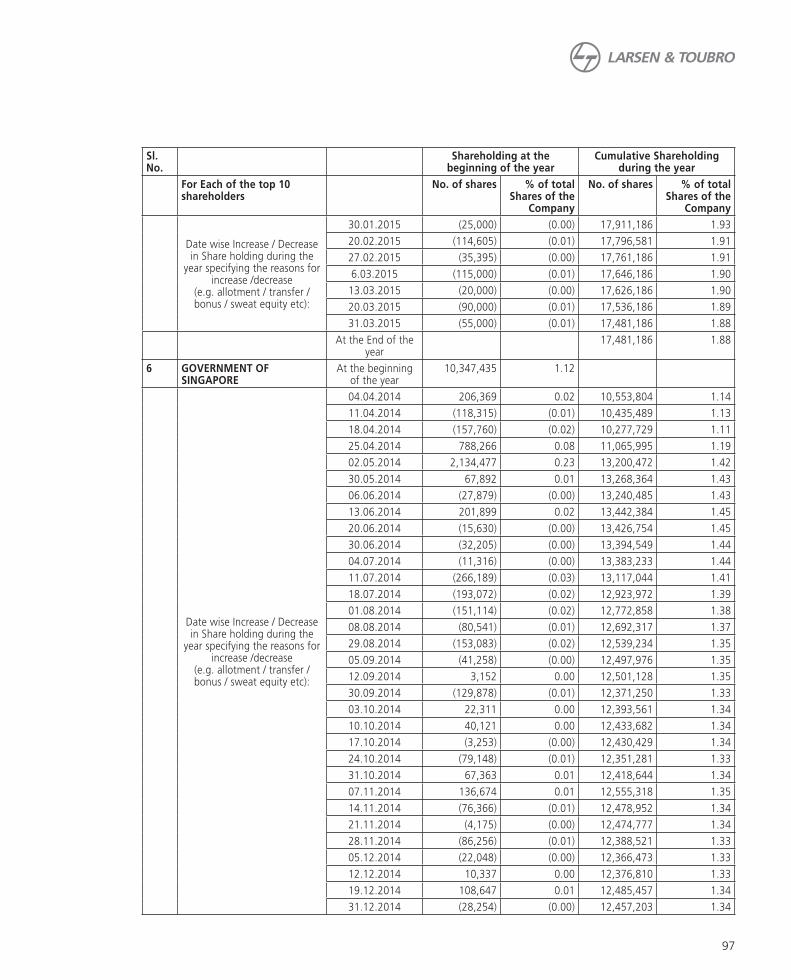
97
Sl. No.
Shareholding at the beginning of the year
Cumulative Shareholding during the year
For Each of the top 10 shareholders
No. of shares % of total Shares of the
Company
No. of shares % of total Shares of the
Company
Date wise Increase / Decrease in Share holding during the
year specifying the reasons for increase /decrease
(e.g. allotment / transfer / bonus / sweat equity etc):
30.01.2015 (25,000) (0.00) 17,911,186 1.93
20.02.2015 (114,605) (0.01) 17,796,581 1.91
27.02.2015 (35,395) (0.00) 17,761,186 1.91
6.03.2015 (115,000) (0.01) 17,646,186 1.90
13.03.2015 (20,000) (0.00) 17,626,186 1.90
20.03.2015 (90,000) (0.01) 17,536,186 1.89
31.03.2015 (55,000) (0.01) 17,481,186 1.88
At the End of the year
17,481,186 1.88
6 GOVERNMENT OF SINGAPORE
At the beginning of the year
10,347,435 1.12
Date wise Increase / Decrease in Share holding during the
year specifying the reasons for increase /decrease
(e.g. allotment / transfer / bonus / sweat equity etc):
04.04.2014 206,369 0.02 10,553,804 1.14
11.04.2014 (118,315) (0.01) 10,435,489 1.13
18.04.2014 (157,760) (0.02) 10,277,729 1.11
25.04.2014 788,266 0.08 11,065,995 1.19
02.05.2014 2,134,477 0.23 13,200,472 1.42
30.05.2014 67,892 0.01 13,268,364 1.43
06.06.2014 (27,879) (0.00) 13,240,485 1.43
13.06.2014 201,899 0.02 13,442,384 1.45
20.06.2014 (15,630) (0.00) 13,426,754 1.45
30.06.2014 (32,205) (0.00) 13,394,549 1.44
04.07.2014 (11,316) (0.00) 13,383,233 1.44
11.07.2014 (266,189) (0.03) 13,117,044 1.41
18.07.2014 (193,072) (0.02) 12,923,972 1.39
01.08.2014 (151,114) (0.02) 12,772,858 1.38
08.08.2014 (80,541) (0.01) 12,692,317 1.37
29.08.2014 (153,083) (0.02) 12,539,234 1.35
05.09.2014 (41,258) (0.00) 12,497,976 1.35
12.09.2014 3,152 0.00 12,501,128 1.35
30.09.2014 (129,878) (0.01) 12,371,250 1.33
03.10.2014 22,311 0.00 12,393,561 1.34
10.10.2014 40,121 0.00 12,433,682 1.34
17.10.2014 (3,253) (0.00) 12,430,429 1.34
24.10.2014 (79,148) (0.01) 12,351,281 1.33
31.10.2014 67,363 0.01 12,418,644 1.34
07.11.2014 136,674 0.01 12,555,318 1.35
14.11.2014 (76,366) (0.01) 12,478,952 1.34
21.11.2014 (4,175) (0.00) 12,474,777 1.34
28.11.2014 (86,256) (0.01) 12,388,521 1.33
05.12.2014 (22,048) (0.00) 12,366,473 1.33
12.12.2014 10,337 0.00 12,376,810 1.33
19.12.2014 108,647 0.01 12,485,457 1.34
31.12.2014 (28,254) (0.00) 12,457,203 1.34

98
Sl. No.
Shareholding at the beginning of the year
Cumulative Shareholding during the year
For Each of the top 10 shareholders
No. of shares % of total Shares of the
Company
No. of shares % of total Shares of the
Company
Date wise Increase / Decrease in Share holding during the
year specifying the reasons for increase /decrease
(e.g. allotment / transfer / bonus / sweat equity etc):
16.01.2015 97,444 0.01 12,554,647 1.35
23.01.2015 53,231 0.01 12,607,878 1.36
13.02.2015 89,158 0.01 12,697,036 1.37
20.02.2015 224,222 0.02 12,921,258 1.39
6.03.2015 6,304 0.00 12,927,562 1.39
27.03.2015 23,481 0.00 12,951,043 1.39
At the End of the year
12,951,043 1.39
7 ICICI PRUDENTIAL LIFE INSURANCE COMPANY LTD
At the beginning of the year
8,747,810 0.94
Date wise Increase / Decrease in Share holding during the
year specifying the reasons for increase /decrease
(e.g. allotment / transfer / bonus / sweat equity etc):
04.04.2014 37,994 0.00 8,785,804 0.95
11.04.2014 (588,541) (0.06) 8,197,263 0.88
18.04.2014 (7,691) (0.00) 8,189,572 0.88
25.04.2014 (528,081) (0.06) 7,661,491 0.83
02.05.2014 (35,586) (0.00) 7,625,905 0.82
09.05.2014 240,055 0.03 7,865,960 0.85
16.05.2014 488,700 0.05 8,354,660 0.90
23.05.2014 248,781 0.03 8,603,441 0.93
30.05.2014 (170,355) (0.02) 8,433,086 0.91
06.06.2014 (483,865) (0.05) 7,949,221 0.86
13.06.2014 (325,645) (0.04) 7,623,576 0.82
20.06.2014 (31,716) (0.00) 7,591,860 0.82
30.06.2014 22,932 0.00 7,614,792 0.82
04.07.2014 92,712 0.01 7,707,504 0.83
11.07.2014 133,478 0.01 7,840,982 0.85
18.07.2014 (14,735) (0.00) 7,826,247 0.84
25.07.2014 119,526 0.01 7,945,773 0.86
01.08.2014 (93,930) (0.01) 7,851,843 0.85
08.08.2014 111,262 0.01 7,963,105 0.86
15.08.2014 146,992 0.02 8,110,097 0.87
22.08.2014 936,472 0.10 9,046,569 0.97
29.08.2014 687,167 0.07 9,733,736 1.05
05.09.2014 601,545 0.06 10,335,281 1.11
12.09.2014 305,049 0.03 10,640,330 1.15
19.09.2014 222,865 0.02 10,863,195 1.17
30.09.2014 183,758 0.02 11,046,953 1.19
03.10.2014 (3,747) (0.00) 11,043,206 1.19
10.10.2014 (51,588) (0.01) 10,991,618 1.18
17.10.2014 296,604 0.03 11,288,222 1.22
24.10.2014 193,727 0.02 11,481,949 1.24
31.10.2014 229,215 0.02 11,711,164 1.26
07.11.2014 (47,700) (0.01) 11,663,464 1.26
14.11.2014 (325,438) (0.04) 11,338,026 1.22

99
Sl. No.
Shareholding at the beginning of the year
Cumulative Shareholding during the year
For Each of the top 10 shareholders
No. of shares % of total Shares of the
Company
No. of shares % of total Shares of the
Company
Date wise Increase / Decrease in Share holding during the
year specifying the reasons for increase /decrease
(e.g. allotment / transfer / bonus / sweat equity etc):
21.11.2014 6,572 0.00 11,344,598 1.22
28.11.2014 (125,642) (0.01) 11,218,956 1.21
05.12.2014 (20,690) (0.00) 11,198,266 1.21
12.12.2014 (18,420) (0.00) 11,179,846 1.20
19.12.2014 388,093 0.04 11,567,939 1.25
31.12.2014 79,688 0.01 11,647,627 1.25
02.01.2015 19,935 0.00 11,667,562 1.26
09.01.2015 188,674 0.02 11,856,236 1.28
16.01.2015 64,608 0.01 11,920,844 1.28
23.01.2015 53,409 0.01 11,974,253 1.29
30.01.2015 (5,084) (0.00) 11,969,169 1.29
06.02.2015 15,487 0.00 11,984,656 1.29
13.02.2015 191,323 0.02 12,175,979 1.31
20.02.2015 (14,570) (0.00) 12,161,409 1.31
27.02.2015 (15,395) (0.00) 12,146,014 1.31
6.03.2015 (76,951) (0.01) 12,069,063 1.30
13.03.2015 (144,221) (0.02) 11,924,842 1.28
20.03.2015 (100,257) (0.01) 11,824,585 1.27
27.03.2015 302,225 0.03 12,126,810 1.30
31.03.2015 233,485 0.03 12,360,295 1.33
At the End of the year
12,360,295 1.33
8 ABU DHABI INVESTMENT AUTHORITY - BEHAVE
At the beginning of the year
10,124,574 1.09
Date wise Increase / Decrease in Share holding during the
year specifying the reasons for increase /decrease
(e.g. allotment / transfer / bonus / sweat equity etc):
04.04.2014 (68,869) (0.01) 10,055,705 1.08
02.05.2014 (34,107) (0.00) 10,021,598 1.08
09.05.2014 (83,500) (0.01) 9,938,098 1.07
23.05.2014 181,352 0.02 10,119,450 1.09
30.05.2014 (71,500) (0.01) 10,047,950 1.08
06.06.2014 369,940 0.04 10,417,890 1.12
13.06.2014 21,485 0.00 10,439,375 1.13
20.06.2014 236,211 0.03 10,675,586 1.15
30.06.2014 176,947 0.02 10,852,533 1.17
04.07.2014 40,453 0.00 10,892,986 1.17
11.07.2014 105,484 0.01 10,998,470 1.19
18.07.2014 34,157 0.00 11,032,627 1.19
25.07.2014 (135,658) (0.01) 10,896,969 1.17
29.08.2014 40,275 0.00 10,937,244 1.18
05.09.2014 61,687 0.01 10,998,931 1.18
19.09.2014 20,307 0.00 11,019,238 1.19
30.09.2014 11,127 0.00 11,030,365 1.19
17.10.2014 (100,461) (0.01) 10,929,904 1.18
14.11.2014 (42,398) (0.00) 10,887,506 1.17

100
Sl. No.
Shareholding at the beginning of the year
Cumulative Shareholding during the year
For Each of the top 10 shareholders
No. of shares % of total Shares of the
Company
No. of shares % of total Shares of the
Company
Date wise Increase / Decrease in Share holding during the
year specifying the reasons for increase /decrease
(e.g. allotment / transfer / bonus / sweat equity etc):
21.11.2014 13,644 0.00 10,901,150 1.17
28.11.2014 (88,687) (0.01) 10,812,463 1.16
05.12.2014 95,000 0.01 10,907,463 1.17
12.12.2014 29,390 0.00 10,936,853 1.18
19.12.2014 (195,000) (0.02) 10,741,853 1.16
23.01.2015 (191,999) (0.02) 10,549,854 1.14
30.01.2015 (150,000) (0.02) 10,399,854 1.12
06.02.2015 (3,292) (0.00) 10,396,562 1.12
13.02.2015 (153,032) (0.02) 10,243,530 1.10
27.02.2015 (16,116) (0.00) 10,227,414 1.10
6.03.2015 (134,276) (0.01) 10,093,138 1.09
20.03.2015 88,500 0.01 10,181,638 1.10
At the End of the year
10,181,638 1.10
9 THE NEW INDIA ASSURANCE COMPANY LIMITED
At the beginning of the year
9,647,590 1.04
Date wise Increase / Decrease in Share holding during the
year specifying the reasons for increase /decrease
(e.g. allotment / transfer / bonus / sweat equity etc):
11.04.2014 (17,500) (0.00) 9,630,090 1.04
18.04.2014 (15,000) (0.00) 9,615,090 1.04
25.04.2014 (31,000) (0.00) 9,584,090 1.03
02.05.2014 (10,000) (0.00) 9,574,090 1.03
09.05.2014 (35,000) (0.00) 9,539,090 1.03
16.05.2014 (48,500) (0.01) 9,490,590 1.02
23.05.2014 (43,000) (0.00) 9,447,590 1.02
30.05.2014 (35,180) (0.00) 9,412,410 1.01
06.06.2014 (7,500) (0.00) 9,404,910 1.01
13.06.2014 (57,000) (0.01) 9,347,910 1.01
20.06.2014 (10,000) (0.00) 9,337,910 1.01
30.06.2014 (38,223) (0.00) 9,299,687 1.00
04.07.2014 (25,000) (0.00) 9,274,687 1.00
11.07.2014 (10,000) (0.00) 9,264,687 1.00
12.09.2014 (35,000) (0.00) 9,229,687 0.99
07.11.2014 (5,000) (0.00) 9,224,687 0.99
14.11.2014 (2,500) (0.00) 9,222,187 0.99
21.11.2014 (10,392) (0.00) 9,211,795 0.99
28.11.2014 (50,317) (0.01) 9,161,478 0.99
05.12.2014 (21,233) (0.00) 9,140,245 0.98
12.12.2014 (5,000) (0.00) 9,135,245 0.98
06.02.2015 (17,500) (0.00) 9,117,745 0.98
13.02.2015 (7,500) (0.00) 9,110,245 0.98
20.02.2015 (15,429) (0.00) 9,094,816 0.98
27.02.2015 (22,500) (0.00) 9,072,316 0.98
6.03.2015 (55,000) (0.01) 9,017,316 0.97
13.03.2015 (5,000) (0.00) 9,012,316 0.97
At the End of the year
9,012,316 0.97

101
Sl. No.
Shareholding at the beginning of the year
Cumulative Shareholding during the year
For Each of the top 10 shareholders
No. of shares % of total Shares of the
Company
No. of shares % of total Shares of the
Company
10 HDFC STANDARD LIFE INSURANCE COMPANY LIMITED
At the beginning of the year
7,451,563 0.80
Date wise Increase / Decrease in Share holding during the
year specifying the reasons for increase /decrease
(e.g. allotment / transfer / bonus / sweat equity etc):
04.04.2014 92,182 0.01 7,543,745 0.81
11.04.2014 11,183 0.00 7,554,928 0.81
18.04.2014 36,425 0.00 7,591,353 0.82
25.04.2014 (269,327) (0.03) 7,322,026 0.79
02.05.2014 (50,000) (0.01) 7,272,026 0.78
09.05.2014 190,023 0.02 7,462,049 0.80
16.05.2014 (5,462) (0.00) 7,456,587 0.80
23.05.2014 (20,939) (0.00) 7,435,648 0.80
06.06.2014 26,860 0.00 7,462,508 0.80
13.06.2014 30,000 0.00 7,492,508 0.81
20.06.2014 49,750 0.01 7,542,258 0.81
30.06.2014 (113,143) (0.01) 7,429,115 0.80
04.07.2014 67,915 0.01 7,497,030 0.81
11.07.2014 (69,142) (0.01) 7,427,888 0.80
18.07.2014 283,000 0.03 7,710,888 0.83
25.07.2014 63,251 0.01 7,774,139 0.84
01.08.2014 (17,731) (0.00) 7,756,408 0.84
08.08.2014 65,000 0.01 7,821,408 0.84
15.08.2014 1,727 0.00 7,823,135 0.84
22.08.2014 6,476 0.00 7,829,611 0.84
29.08.2014 24,408 0.00 7,854,019 0.85
05.09.2014 (1,540) (0.00) 7,852,479 0.85
12.09.2014 33,842 0.00 7,886,321 0.85
19.09.2014 39,075 0.00 7,925,396 0.85
30.09.2014 7,506 0.00 7,932,902 0.85
10.10.2014 3,654 0.00 7,936,556 0.86
24.10.2014 7,355 0.00 7,943,911 0.86
31.10.2014 (12,230) (0.00) 7,931,681 0.85
07.11.2014 (17,331) (0.00) 7,914,350 0.85
14.11.2014 (7,414) (0.00) 7,906,936 0.85
21.11.2014 25,433 0.00 7,932,369 0.85
28.11.2014 25,036 0.00 7,957,405 0.86
05.12.2014 88,729 0.01 8,046,134 0.87
12.12.2014 36 0.00 8,046,170 0.87
19.12.2014 (132,555) (0.01) 7,913,615 0.85
31.12.2014 35,528 0.00 7,949,143 0.86
02.01.2015 3,492 0.00 7,952,635 0.86
09.01.2015 1,613 0.00 7,954,248 0.86
16.01.2015 80 0.00 7,954,328 0.86
23.01.2015 28,838 0.00 7,983,166 0.86

102
Sl. No.
Shareholding at the beginning of the year
Cumulative Shareholding during the year
For Each of the top 10 shareholders
No. of shares % of total Shares of the
Company
No. of shares % of total Shares of the
Company
Date wise Increase / Decrease in Share holding during the
year specifying the reasons for increase /decrease
(e.g. allotment / transfer / bonus / sweat equity etc):
30.01.2015 23,102 0.00 8,006,268 0.86
06.02.2015 150,500 0.02 8,156,768 0.88
13.02.2015 645 0.00 8,157,413 0.88
20.02.2015 23,046 0.00 8,180,459 0.88
27.02.2015 (121,780) (0.01) 8,058,679 0.87
6.03.2015 55,509 0.01 8,114,188 0.87
13.03.2015 (223,093) (0.02) 7,891,095 0.85
20.03.2015 (22,000) (0.00) 7,869,095 0.85
27.03.2015 63,680 0.01 7,932,775 0.85
31.03.2015 (94,393) (0.01) 7,838,382 0.84
At the End of the year
7,838,382 0.84
11 SBI LIFE INSURANCE COMPANY LIMITED
At the beginning of the year
8,811,922 0.95
Date wise Increase / Decrease in Share holding during the
year specifying the reasons for increase /decrease
(e.g. allotment / transfer / bonus / sweat equity etc):
04.04.2014 384,645 0.04 9,196,567 0.99
11.04.2014 (92,699) (0.01) 9,103,868 0.98
18.04.2014 (173,450) (0.02) 8,930,418 0.96
25.04.2014 (61,013) (0.01) 8,869,405 0.96
02.05.2014 (72,308) (0.01) 8,797,097 0.95
09.05.2014 (36,189) (0.00) 8,760,908 0.94
16.05.2014 (50,312) (0.01) 8,710,596 0.94
23.05.2014 137,295 0.01 8,847,891 0.95
30.05.2014 (295,993) (0.03) 8,551,898 0.92
06.06.2014 (130,978) (0.01) 8,420,920 0.91
13.06.2014 (195,557) (0.02) 8,225,363 0.89
20.06.2014 (19,924) (0.00) 8,205,439 0.88
30.06.2014 (30,543) (0.00) 8,174,896 0.88
04.07.2014 (24,066) (0.00) 8,150,830 0.88
11.07.2014 (134,265) (0.01) 8,016,565 0.86
18.07.2014 (139,741) (0.02) 7,876,824 0.85
25.07.2014 (38,044) (0.00) 7,838,780 0.84
01.08.2014 (118,144) (0.01) 7,720,636 0.83
08.08.2014 132,083 0.01 7,852,719 0.85
15.08.2014 40,014 0.00 7,892,733 0.85
22.08.2014 98,729 0.01 7,991,462 0.86
29.08.2014 (704) (0.00) 7,990,758 0.86
05.09.2014 (16,953) (0.00) 7,973,805 0.86
12.09.2014 (76,244) (0.01) 7,897,561 0.85
19.09.2014 (81,186) (0.01) 7,816,375 0.84
30.09.2014 (319,912) (0.03) 7,496,463 0.81
03.10.2014 (49,500) (0.01) 7,446,963 0.80
10.10.2014 (61,735) (0.01) 7,385,228 0.80
17.10.2014 10,499 0.00 7,395,727 0.80
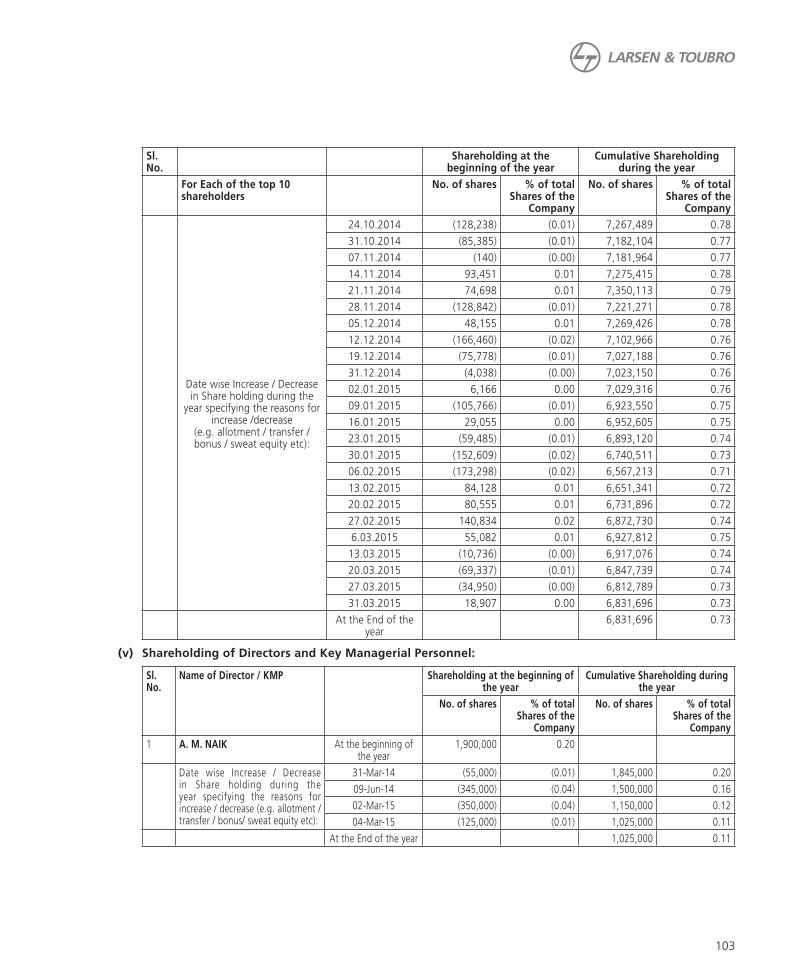
103
Sl. No.
Shareholding at the beginning of the year
Cumulative Shareholding during the year
For Each of the top 10 shareholders
No. of shares % of total Shares of the
Company
No. of shares % of total Shares of the
Company
Date wise Increase / Decrease in Share holding during the
year specifying the reasons for increase /decrease
(e.g. allotment / transfer / bonus / sweat equity etc):
24.10.2014 (128,238) (0.01) 7,267,489 0.78
31.10.2014 (85,385) (0.01) 7,182,104 0.77
07.11.2014 (140) (0.00) 7,181,964 0.77
14.11.2014 93,451 0.01 7,275,415 0.78
21.11.2014 74,698 0.01 7,350,113 0.79
28.11.2014 (128,842) (0.01) 7,221,271 0.78
05.12.2014 48,155 0.01 7,269,426 0.78
12.12.2014 (166,460) (0.02) 7,102,966 0.76
19.12.2014 (75,778) (0.01) 7,027,188 0.76
31.12.2014 (4,038) (0.00) 7,023,150 0.76
02.01.2015 6,166 0.00 7,029,316 0.76
09.01.2015 (105,766) (0.01) 6,923,550 0.75
16.01.2015 29,055 0.00 6,952,605 0.75
23.01.2015 (59,485) (0.01) 6,893,120 0.74
30.01.2015 (152,609) (0.02) 6,740,511 0.73
06.02.2015 (173,298) (0.02) 6,567,213 0.71
13.02.2015 84,128 0.01 6,651,341 0.72
20.02.2015 80,555 0.01 6,731,896 0.72
27.02.2015 140,834 0.02 6,872,730 0.74
6.03.2015 55,082 0.01 6,927,812 0.75
13.03.2015 (10,736) (0.00) 6,917,076 0.74
20.03.2015 (69,337) (0.01) 6,847,739 0.74
27.03.2015 (34,950) (0.00) 6,812,789 0.73
31.03.2015 18,907 0.00 6,831,696 0.73
At the End of the year
6,831,696 0.73
(v) Shareholding of Directors and Key Managerial Personnel:
Sl. No.
Name of Director / KMP Shareholding at the beginning of the year
Cumulative Shareholding during the year
No. of shares % of total Shares of the
Company
No. of shares % of total Shares of the
Company
1 A. M. NAIK At the beginning of the year
1,900,000 0.20
Date wise Increase / Decrease in Share holding during the year specifying the reasons for increase / decrease (e.g. allotment / transfer / bonus/ sweat equity etc):
31-Mar-14 (55,000) (0.01) 1,845,000 0.20
09-Jun-14 (345,000) (0.04) 1,500,000 0.16
02-Mar-15 (350,000) (0.04) 1,150,000 0.12
04-Mar-15 (125,000) (0.01) 1,025,000 0.11
At the End of the year 1,025,000 0.11
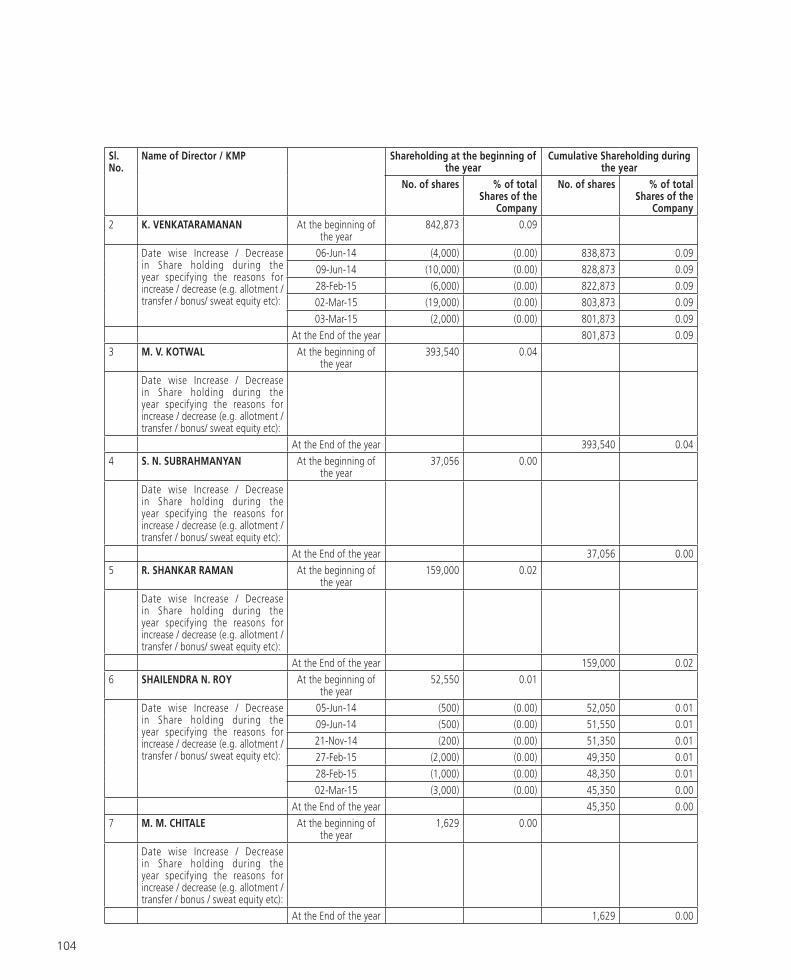
104
Sl. No.
Name of Director / KMP Shareholding at the beginning of the year
Cumulative Shareholding during the year
No. of shares % of total Shares of the
Company
No. of shares % of total Shares of the
Company
2 K. VENKATARAMANAN At the beginning of the year
842,873 0.09
Date wise Increase / Decrease in Share holding during the year specifying the reasons for increase / decrease (e.g. allotment / transfer / bonus/ sweat equity etc):
06-Jun-14 (4,000) (0.00) 838,873 0.09
09-Jun-14 (10,000) (0.00) 828,873 0.09
28-Feb-15 (6,000) (0.00) 822,873 0.09
02-Mar-15 (19,000) (0.00) 803,873 0.09
03-Mar-15 (2,000) (0.00) 801,873 0.09
At the End of the year 801,873 0.09
3 M. V. KOTWAL At the beginning of the year
393,540 0.04
Date wise Increase / Decrease in Share holding during the year specifying the reasons for increase / decrease (e.g. allotment / transfer / bonus/ sweat equity etc):
At the End of the year 393,540 0.04
4 S. N. SUBRAHMANYAN At the beginning of the year
37,056 0.00
Date wise Increase / Decrease in Share holding during the year specifying the reasons for increase / decrease (e.g. allotment / transfer / bonus/ sweat equity etc):
At the End of the year 37,056 0.00
5 R. SHANKAR RAMAN At the beginning of the year
159,000 0.02
Date wise Increase / Decrease in Share holding during the year specifying the reasons for increase / decrease (e.g. allotment / transfer / bonus/ sweat equity etc):
At the End of the year 159,000 0.02
6 SHAILENDRA N. ROY At the beginning of the year
52,550 0.01
Date wise Increase / Decrease in Share holding during the year specifying the reasons for increase / decrease (e.g. allotment / transfer / bonus/ sweat equity etc):
05-Jun-14 (500) (0.00) 52,050 0.01
09-Jun-14 (500) (0.00) 51,550 0.01
21-Nov-14 (200) (0.00) 51,350 0.01
27-Feb-15 (2,000) (0.00) 49,350 0.01
28-Feb-15 (1,000) (0.00) 48,350 0.01
02-Mar-15 (3,000) (0.00) 45,350 0.00
At the End of the year 45,350 0.00
7 M. M. CHITALE At the beginning of the year
1,629 0.00
Date wise Increase / Decrease in Share holding during the year specifying the reasons for increase / decrease (e.g. allotment / transfer / bonus / sweat equity etc):
At the End of the year 1,629 0.00

105
Sl. No.
Name of Director / KMP Shareholding at the beginning of the year
Cumulative Shareholding during the year
No. of shares % of total Shares of the
Company
No. of shares % of total Shares of the
Company
8 SUBODH BHARGAVA At the beginning of the year
750 0.00
Date wise Increase / Decrease in Share holding during the year specifying the reasons for increase / decrease (e.g. allotment / transfer / bonus/ sweat equity etc):
At the End of the year 750 0.00
9 M. DAMODARAN At the beginning of the year
150 0.00
Date wise Increase / Decrease in Share holding during the year specifying the reasons for increase / decrease (e.g. allotment / transfer / bonus/ sweat equity etc):
At the End of the year 150 0.00
10 VIKRAM SINGH MEHTA At the beginning of the year
885 0.00
Date wise Increase / Decrease in Share holding during the year specifying the reasons for increase / decrease (e.g. allotment / transfer / bonus/ sweat equity etc):
At the End of the year 885 0.00
11 SUSHOBHAN SARKER At the beginning of the year
150 0.00
Date wise Increase / Decrease in Share holding during the year specifying the reasons for increase / decrease (e.g. allotment / transfer / bonus/ sweat equity etc):
At the End of the year 150 0.00
12 ADIL ZAINULBHAI At the beginning of the year
– 0.00
Date wise Increase / Decrease in Share holding during the year specifying the reasons for increase / decrease (e.g. allotment / transfer / bonus/ sweat equity etc):
25-Jul-14 100 100
At the End of the year 100 0.00
13 AKHILESH GUPTA At the beginning of the year
– 0.00
Date wise Increase / Decrease in Share holding during the year specifying the reasons for increase / decrease (e.g. allotment / transfer / bonus/ sweat equity etc):
03-Oct-14 200 200
At the End of the year 200 0.00

106
Sl. No.
Name of Director / KMP Shareholding at the beginning of the year
Cumulative Shareholding during the year
No. of shares % of total Shares of the
Company
No. of shares % of total Shares of the
Company
14 BAHRAM VAKIL At the beginning of the year
– –
Date wise Increase / Decrease in Share holding during the year specifying the reasons for increase / decrease (e.g. allotment / transfer / bonus/ sweat equity etc):
(Share holding on the date of appointment
- 16-Mar-15)
3640 0.00 3640 0.00
At the End of the year 3,640 0.00
15 N. HARIHARAN At the beginning of the year
23,140 0.00
Date wise Increase / Decrease in Share holding during the year specifying the reasons for increase / decrease (e.g. allotment / transfer / bonus/ sweat equity etc):
At the End of the year 23,140 0.00
V. INDEBTEDNESS
Indebtedness of the Company including interest outstanding/accrued but not due for payment
All amounts in ` crore
Secured Loans excluding
deposits
Unsecured Loans Deposits Total Indebtedness
Indebtedness at the beginning of the financial year
i) Principal Amount 1307.23 10151.69 – 11458.92
ii) Interest due but not paid – – – –
iii) Interest accrued but not due 9.51 114.35 – 123.86
Total (i+ii+iii) 1316.74 10266.04 – 11582.78
Change in Indebtedness during the financial year
Addition 137288.77 9496.88 – 146785.65
Reduction (137933.35) (7591.94) – (145525.29)
Exchange gain/(loss) 0.50 251.03 – 251.53
Net Change (644.08) 2155.97 – 1511.89
Indebtedness at the end of the financial year
i) Principal Amount
ii) Interest due but not paid
iii) Interest accrued but not due
664.04
–
8.62
12272.55
–
149.46
–
–
–
12936.59
–
158.08
Total (i+ii+iii) 672.66 12422.01 – 13094.67

107
VI. REMUNERATION OF DIRECTORS AND KEY MANAGERIAL PERSONNEL
All amounts in ` crore
A. REMUNERATION TO MANAGING DIRECTOR, WHOLE-TIME DIRECTORS AND / OR MANAGER:
Sl. no.
Particulars of Remuneration Name of MD/WTD/ Manager Total Amount
A M NAIK K VENKATARAMANAN
M V KOTWAL S N SUBRAHMANYAN
R SHANKAR RAMAN
SHAILENDRA ROY
1 Gross salary
(a) Salary as per provisions contained in section 17(1) of the Income-tax Act, 1961
3.35 2.19 1.59 1.40 1.28 1.07 10.88
(b) Value of perquisites u/s 17(2) Income-tax Act, 1961
0.03 1.46 1.02 0.01 0.02 0.89 3.43
(c) Profits in lieu of salary under section 17(3) Income tax Act, 1961
0.00 0.00 0.00 0.00 0.00 0.00 0.00
2 Stock Option 0.00 0.00 0.00 0.00 0.00 0.00 0.00
3 Sweat Equity 0.00 0.00 0.00 0.00 0.00 0.00 0.00
4 Commission- as % of profit- others, specify…
18.19 7.39 4.91 8.73 6.91 4.48 50.61
5 Others (Contribution to Provident Fund & Superannuation Fund)
5.75 2.54 1.73 2.69 2.16 1.46 16.33
Total (A) 27.32 13.58 9.25 12.83 10.37 7.90 81.25
Ceiling as per the Act 643.75
B. REMUNERATION TO OTHER DIRECTORS
Sl. no. Particulars of Remuneration
Name of Directors Total AmountS RAJGOPAL @ S N TALWAR @ M M CHITALE SUBODH
BHARGAVAA K JAIN # M
DAMODARANVIKRAM
SINGH MEHTASUSHOBHAN
SARKERADIL
ZAINULBHAIAKHILESH
GUPTA
1 Independent Directors
Fee for attending board / committee meetings
0.04 0.04 0.08 0.06 0.07 0.05 0.03 0.02 0.39
Commission 0.34 0.25 0.37 0.47 0.36 0.43 0.32 0.19 2.73
Others, please specify
0.00
Total (1) 0.38 0.29 0.45 0.53 0.00 0.43 0.48 0.00 0.35 0.21 3.12
2 Other Non-Executive Directors
Fee for attending board / committee meetings
0.07 0.05 0.12
Commission * 0.23 0.26 0.49
Others, please specify
0.00
Total (2) 0.00 0.00 0.00 0.00 0.30 0.00 0.00 0.31 0.00 0.00 0.61
Total (B)=(1+2) 0.38 0.29 0.45 0.53 0.30 0.43 0.48 0.31 0.35 0.21 3.73
Total ManagerialRemuneration (A) + (B)
84.98
Overall Ceiling as per the Act 708.13
@ Ceased to be Director w.e.f. 22.08.2014 # Ceased to be Director w.e.f. 10.02.2015 * Commission is payable to the respective Institutions they represent

108
C. REMUNERATION TO KEY MANAGERIAL PERSONNEL OTHER THAN MD / MANAGER / WTD
All amounts in ` crore
Sl. no.
Particulars of Remuneration Key Managerial Personnel
CEO Company Secretary
(N. Hariharan)
CFO Total
1 Gross salary
(a) Salary as per provisions contained in section 17(1) of the Income-tax Act, 1961
Not Applicable
0.83
Not Applicable
(b) Value of perquisites u/s 17(2) Income-tax Act, 1961
0.00
(c) Profits in lieu of salary under section 17(3) Income tax Act, 1961
0.00
2 Stock Option 0.00
3 Sweat Equity
4 Commission- as % of profit- others, specify…
0.00
5 Others (Contribution to Provident Fund & Superannuation Fund)
0.06
Total 0.89
VII. PENALTIES / PUNISHMENT/ COMPOUNDING OF OFFENCES:
Type Section of the Companies Act
Brief Description
Details of Penalty / Punishment/ Compounding fees imposed
Authority [RD / NCLT / COURT]
Appeal made, if any (give
Details)
A. COMPANY
Penalty
NIL Punishment
Compounding
B. DIRECTORS
Penalty
NIL Punishment
Compounding
C. OTHER OFFICERS IN DEFAULT
Penalty
NIL Punishment
Compounding

109
The global economy is expected to grow 3.5% in 2015 with
improved economic indicators in US. However, fragility
may continue in Euro zone and the pace of development
is expected to slow down in China in 2015. Although new
investments in Oil & Gas Sector in the Middle East may
get impacted due to low crude oil prices, infrastructure
development would remain in focus. Successful demand
recovery process in the key emerging market economies
and a staggered roll back of the accommodative monetary
policies of the advanced economies hold the key for a
more stable and growth oriented outlook for the global
economy.
Overview of Indian Economy:
The investment climate remained sluggish throughout
the year 2014-15. The GDP growth of Indian economy
was 7.3% in the year 2014-15 via-a-vis 6.9% recorded in
2013-14 based on the new series. The new government in
the centre, assumed the office with the high expectations.
In order to improve macroeconomic parameters, the
government has taken certain policy initiatives such as
enhancing limits of FDI in defence, insurance, real estate,
reduction of subsidies, decontrol of petroleum pricing,
transparent mechanism for allocation of telecom and
natural resources etc. The government has also significantly
stepped up budgetary allocation for infrastructure
development with several new initiatives like development
of Smart cities, Digital India, High Speed Rail Corridors,
new Industrial Clusters and has announced ambitious
projects such as linking of rivers and Clean Ganga along
with the measures for revival of power sector.
Investment climate, however, remained subdued during
2014-15, as the reform process would take some more
time to gain ground. Industrial demand was weak and
capacity utilisation remained low across the sectors. Tight
liquidity position prevailed throughout the year with
elevated interest rates.
The government is addressing policy hurdles by fast-
tracking decision-making and is putting in place some
crucial building blocks for enhancing the ease of doing
business. Going forward, sectors like Roads, Railways,
Security Systems, Communication, and Water offer
good opportunities in short to the medium term.
With its significant capabilities in defence equipment
manufacturing, the Company sees opening up of
significant opportunities in the defence sector under
‘Make in India Program’ in the medium term. Lower oil
prices, higher FDI inflows and the reform initiatives of the
new government at the centre, along with its commitment
to sound fiscal management and consolidation augur well
for the growth prospects and the overall macroeconomic
situation.
Business Scenario:
The Company has sustained the growth momentum in the
order inflows amidst a difficult business environment over
the last 2-3 years on the back of its diversified portfolio,
timely mapping of emerging opportunities and proven
capabilities. The year 2014-15 witnessed sluggish demand
and sectoral bottlenecks, impacting the revenue and
margins of certain core businesses of the Company. Cost
overruns and close-out costs of international jobs pulled
down the overall expected consolidated profits during
2014-15. Increasing levels of net working capital and
limited fresh cash flows exerted pressure on availability
of surplus funds.
The Company has identified certain key thrust areas and
strategies for leveraging on the capabilities in order to
benefit from the emerging growth opportunities. Major
thrust areas and growth strategies are enumerated below.
Growth Strategies and Thrust Areas:
• Focus on Quality of new orders: The businesses are
selective in order intake and are focusing on robust
due diligence of prospects, especially in International
markets, as a part of risk management process so that
the execution and other risks are mitigated.
• Profitable and efficient execution: Efficient contract
management, sound execution strategies, cost
competitiveness and improved operational efficiency
are pre-requisites for achieving profitable growth in the
competitive business environment. Close monitoring,
timely deployment of resources, efficient sourcing
strategies, reduction in the fixed costs and rigorous
negotiation of service contracts are some of the major
initiatives that are pursued to enhance the execution
efficiencies.
Management Discussion & Analysis 2014-15

110
• Working Capital: To address the increasing levels of
working capital, the Company has embarked upon
tightening of capital allocation to various businesses.
Regular focus on day-to-day cash management,
monitoring of exposures to customers and maximization
of vendor credits are being pursued to bring down the
funds deployed in working capital. Specific measures
for liquidation of sticky receivables, accelerating
invoicing of work completed and liquidation of surplus
/ unserviceable inventories are also being pursued.
• Manpower: People are the key enablers in translating
growth aspirations into reality. Manpower resource
planning is accordingly being focussed on building
up and retention of talent with the requisite skill sets
and managerial / leadership bandwidth. Given the
challenging business environment and increasingly
demanding customers, the focus is on strengthening
the performance-oriented culture and identification of
redundancies.
The Company with its healthy balance sheet, diversified
presence and proven capabilities is well placed to benefit
early as sustainable growth opportunities emerge over the
next few years.
In this background, the Company’s various businesses
present their operations review for the year 2014-15 as
follows:
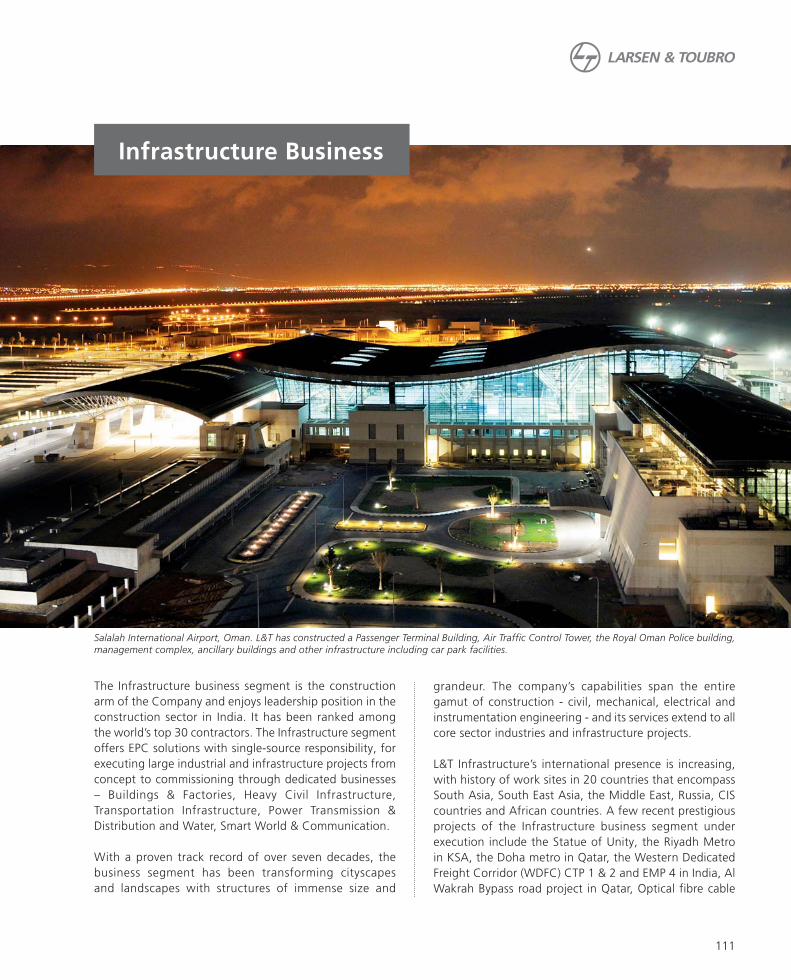
111
Infrastructure Business
Salalah International Airport, Oman. L&T has constructed a Passenger Terminal Building, Air Traffic Control Tower, the Royal Oman Police building,
management complex, ancillary buildings and other infrastructure including car park facilities.
The Infrastructure business segment is the construction
arm of the Company and enjoys leadership position in the
construction sector in India. It has been ranked among
the world’s top 30 contractors. The Infrastructure segment
offers EPC solutions with single-source responsibility, for
executing large industrial and infrastructure projects from
concept to commissioning through dedicated businesses
– Buildings & Factories, Heavy Civil Infrastructure,
Transportation Infrastructure, Power Transmission &
Distribution and Water, Smart World & Communication.
With a proven track record of over seven decades, the
business segment has been transforming cityscapes
and landscapes with structures of immense size and
grandeur. The company’s capabilities span the entire
gamut of construction - civil, mechanical, electrical and
instrumentation engineering - and its services extend to all
core sector industries and infrastructure projects.
L&T Infrastructure’s international presence is increasing,
with history of work sites in 20 countries that encompass
South Asia, South East Asia, the Middle East, Russia, CIS
countries and African countries. A few recent prestigious
projects of the Infrastructure business segment under
execution include the Statue of Unity, the Riyadh Metro
in KSA, the Doha metro in Qatar, the Western Dedicated
Freight Corridor (WDFC) CTP 1 & 2 and EMP 4 in India, Al
Wakrah Bypass road project in Qatar, Optical fibre cable

112
network for BSNL, Kahramaa Phase XI substations in Qatar
and Mumbai city surveillance project.
Infrastructure Business Scenario
India
India remains rich with potential. With a stable government
in place coupled with improving business sentiments and
a rapidly emerging environment that is conducive for
policy making, the future looks promising especially for
the Infrastructure and Construction sector.
The total order announcements/ awards have marginally
improved during 2014-15 and the trend is expected to
strengthen during 2015-16.
As regards the competitive landscape, many prominent
players continue to reel under high debt and some are
under Corporate Debt Restructuring (CDR) which is
evident from the recent financial results published by
them. An increasing number of PPP and real estate assets
are up for sale in a ‘buyers’ market. Such companies with
stressed balance sheets will take time to recoup. To fill the
gap, a number of foreign players have come in making
competition more robust.
Going forward, there is a good possibility of the CAPEX
cycle recovering within 2-3 quarters. Only players with
strong delivery capabilities and a stable balance sheet will
be better placed to leverage this upturn.
Middle East
The Middle East also poses a challenging scenario and
growth rates have been conservatively pegged lower
primarily because of the steep fall in crude oil prices
though analysts believe that these prices will settle in
2015. There is a strong likelihood that the GCC countries
will be able to tide over these testing times thanks to the
huge surplus funds that they have at their disposal.
Opportunities will still be available in the Middle East
though it would be prudent to seek growth from other
new geographies like Africa and South East Asia that have
remained largely insulated from the slowdown.
Global
Available results reveal a modest showing by the global
construction industry in 2014 though there has been an
aggressive adoption of ‘big ticket’ infrastructure projects
in the Middle East and the release of pent up demand in
the US. While the Euro zone failed to rev up, the sharp
decline in oil prices has led oil majors to announce CAPEX
reductions. Most global contractors are therefore focusing
on select, growing overseas markets resulting in increased
competition.
Orders were improving from the Middle East for a major
portion of 2014, though there has been a perceptible
slowing down in the later part of the year both in on-going
projects and new announcements. The real estate markets
of Dubai and Abu Dhabi are also seeing some correction.
Going forward, although falling crude oil prices could
be a dampener, there is a widespread feeling that the
Middle East construction sector will hold its own and
drive demand albeit at extremely competitive levels. Risk
evaluation and proactive mitigation will remain the focus.
Buildings and Factories
Overview:
Buildings & Factories (B&F) is a business vertical that is
equipped with the domain knowledge, expertise and
wide-ranging experience to undertake Engineering,
Procurement and Construction (EPC) of Airports, IT Parks,
Office buildings, Institutional spaces, Hospitals, Stadiums,
Hotels, Elite residential buildings, High rise structures,
Mass housing complexes, Factory structures, Cement
plants and Industrial warehouses. B&F is a pioneer in
offering ’Total engineering solutions’ right from “concept
to commissioning” across all the business lines cited above.
B&F’s competitive advantages include dedicated
engineering design centers, competency cells, advanced
formwork systems, mechanized projects execution and a
rich talent pool of employees.
Business Environment:
The previous calendar year was a tough one for the
Indian economy. Almost all customers deferred their
projects / investments during first half of the year due
to the parliamentary elections. The federal bank’s cues
to end quantitative easing led to foreign investors
panicking and impulsively pulling out their investments
from all emerging markets including India. This drastically
reduced liquidity in the capital market in turn affecting
the progress of ongoing projects. However, the formation
of a strong central government in the second quarter of
the financial year revived positivity amongst the investors.

113
All India Institute of Medical Sciences Hospital, Bhubaneswar - one of
the many healthcare institutions built by L&T in India and the Gulf.
The new government is keen on bolstering infrastructure
development by announcing projects like SMART cities,
Industrial Corridors, etc.
Against all odds, B&F has registered steady growth and
continued to maintain its leadership position in the
industry. B&F also expanded its footprint in the Middle
East countries to diversify business portfolio.
Significant Initiatives:
B&F implemented operational excellence initiatives across
all levels to enhance profitability, like the introduction of
value engineering techniques to cut down cost and improve
productivity. Project cycle times were brought down by
embracing technology and mechanized execution. Safety
is imbibed as a ’way of culture‘ and the concept of ‘Golden
Rule‘ was implemented across all projects to educate and
sensitize everyone on hazardous project activities and the
corresponding preventive measures.
A team of experts was formed to study futuristic businesses
potential and formulate suitable strategies to evolve a
competitive edge.
Key moves have been taken to strengthen the international
organization and follow a focused approach towards
projects that complement the strengths of B&F.
The projects executed by B&F continued to bag various
awards & recognitions during 2014-15. Two Projects
bagged Awards from The Royal Society for Prevention
of Accidents (RoSPA). Six Projects bagged Awards from
British Safety Council. Twelve Projects bagged Awards
from National Safety Council, India. Four Projects bagged
Awards from Indian Concrete Institute. Three Projects
bagged Awards for Quality Excellence from CII and
Construction Week.
The prestigious ’Statue of Unity‘ project has been won
which will be a global iconic structure. This re-affirms
B&F’s capabilities of executing challenging and technically
complex projects.
B&F has maintained its leadership in the construction
of super-specialty hospitals and medical colleges in the
country. Major hospital projects have been secured in the
eastern and northern parts of India.
Terminal 2, Mumbai International Airport. L&T successfully overcame
the challenges of modernizing and expanding a brownfield airport on
turnkey basis in this busy metropolis without disrupting air schedules.
L&T is helping cities soar skywards by building a wide range of
residential projects, from elite towers to mass-housing complexes.

114
Repeat orders were received from loyal customers in the
IT and residential business lines. Kannur and Cochin green
field airports were secured during the year emphasizing its
expertise in building aviation infrastructure.
Major orders were secured from esteemed customers like
Bombay Realty, Omkar developers, Oberoi and DLF group
for the construction of elite high rise residential towers in
western and northern India. In southern India, prestigious
orders were received from Prestige, Provident and Skylark
group for the construction of residential towers.
Some of the key projects commissioned by B&F this year
are Commercial complexes for IT giants like Cognizant,
TCS, HCL and iGate, Boeing MRO facility at Nagpur, High
rise residential towers for DLF, Godrej, IREO and Olympia
clients, Cement plants for Rajashree & Century Cements
and Factory establishments for JCB, Maruti Suzuki, North
Central Railway & VSF Grasim.
Outlook:
B&F is upbeat about the Indian business scenario and is
well positioned to capture the momentum. The realty
sector will stimulate growth in view of easing out of
interest rates, relaxation in FDI norms and revived investor
sentiments. Rapid urbanization and the rising middle
class are driving huge demands for affordable houses.
The ‘Make in India’ initiative is expected to bolster the
manufacturing industry. Raising quality and awareness in
healthcare is expected to generate more investments.
Modernization of Tier 1 & 2 city airports and the kick start
of Navi Mumbai green field airport will drive growth in
domestic aviation sector. Strong IT & BPM industry growth
will drive commercial space requirement.
In the international arena, though falling oil prices may
have some impact on the Middle East economy, there is
hope that infrastructure spending will continue strongly
in view of Expo 2020 (UAE) & FIFA 2022 (Qatar) and good
business prospects are envisaged for Stadiums, Metro Rail
and Healthcare related projects.
B&F is poised for sustained growth in the forthcoming
years against the backdrop of a reviving economy and
an improving business climate. B&F is also placed
advantageously with respect to a healthy order book, wide
customer network, strong organizational setup, efficient
supply chain management, requisite resources and skilled
workforce.
L&T has built over 150 IT parks and commercial complexes in India
and neighbouring countries.
A large residential complex in Ahmedabad. L&T builds residential
projects for all segments of society.
A mall in Kolkata
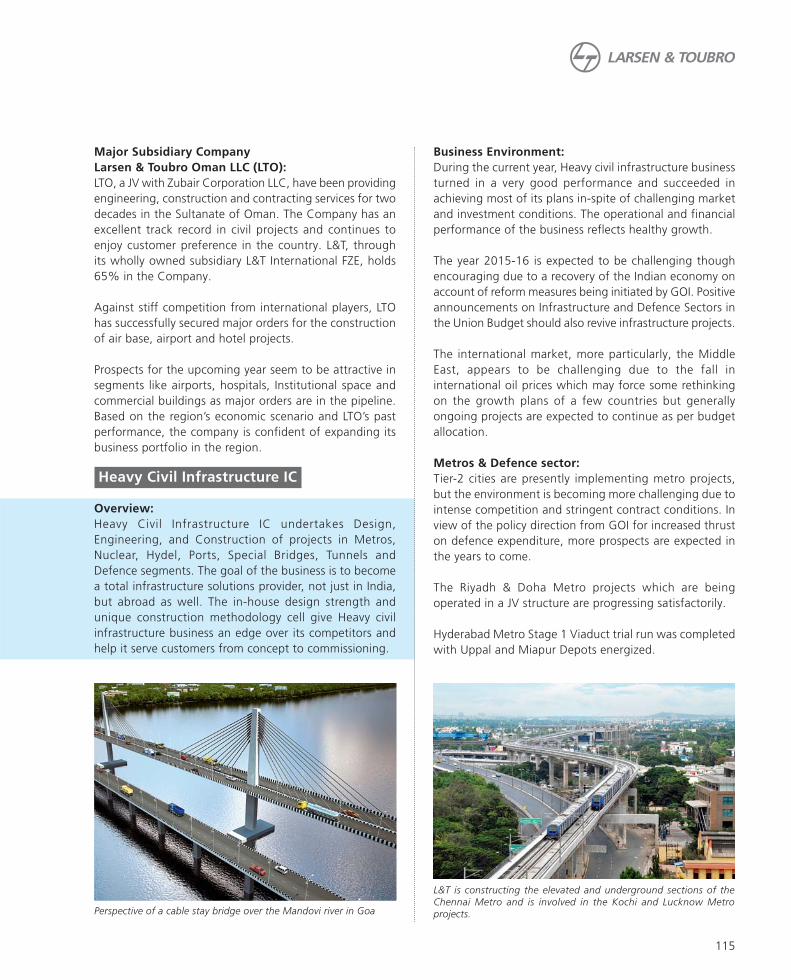
115
Major Subsidiary Company
Larsen & Toubro Oman LLC (LTO):
LTO, a JV with Zubair Corporation LLC, have been providing
engineering, construction and contracting services for two
decades in the Sultanate of Oman. The Company has an
excellent track record in civil projects and continues to
enjoy customer preference in the country. L&T, through
its wholly owned subsidiary L&T International FZE, holds
65% in the Company.
Against stiff competition from international players, LTO
has successfully secured major orders for the construction
of air base, airport and hotel projects.
Prospects for the upcoming year seem to be attractive in
segments like airports, hospitals, Institutional space and
commercial buildings as major orders are in the pipeline.
Based on the region’s economic scenario and LTO’s past
performance, the company is confident of expanding its
business portfolio in the region.
Heavy Civil Infrastructure IC
Overview:
Heavy Civil Infrastructure IC undertakes Design,
Engineering, and Construction of projects in Metros,
Nuclear, Hydel, Ports, Special Bridges, Tunnels and
Defence segments. The goal of the business is to become
a total infrastructure solutions provider, not just in India,
but abroad as well. The in-house design strength and
unique construction methodology cell give Heavy civil
infrastructure business an edge over its competitors and
help it serve customers from concept to commissioning.
Business Environment:
During the current year, Heavy civil infrastructure business
turned in a very good performance and succeeded in
achieving most of its plans in-spite of challenging market
and investment conditions. The operational and financial
performance of the business reflects healthy growth.
The year 2015-16 is expected to be challenging though
encouraging due to a recovery of the Indian economy on
account of reform measures being initiated by GOI. Positive
announcements on Infrastructure and Defence Sectors in
the Union Budget should also revive infrastructure projects.
The international market, more particularly, the Middle
East, appears to be challenging due to the fall in
international oil prices which may force some rethinking
on the growth plans of a few countries but generally
ongoing projects are expected to continue as per budget
allocation.
Metros & Defence sector:
Tier-2 cities are presently implementing metro projects,
but the environment is becoming more challenging due to
intense competition and stringent contract conditions. In
view of the policy direction from GOI for increased thrust
on defence expenditure, more prospects are expected in
the years to come.
The Riyadh & Doha Metro projects which are being
operated in a JV structure are progressing satisfactorily.
Hyderabad Metro Stage 1 Viaduct trial run was completed
with Uppal and Miapur Depots energized.
Perspective of a cable stay bridge over the Mandovi river in Goa
L&T is constructing the elevated and underground sections of the
Chennai Metro and is involved in the Kochi and Lucknow Metro
projects.

116
Hydel, Ports & Tunnels sector:
GOI has initiated the development of Hydro projects in
Nepal and signed 2 Power Development Agreements (PDA)
with the Nepal Government, while continuing Hydro-
power developments in Bhutan. GOI plans to expedite the
water linking projects across the country and have already
identified priority links to be taken up immediately. GOI
is also focusing on developing strategic and all weather
tunnels. Opportunities in these areas are also emerging in
Middle East region
Nuclear & Special Bridges sector:
The nuclear segment is promising with the development/
expansion of projects in existing locations like Kudankulam
3 & 4, Tarapur and Kalpakkam. Many new bridge projects
in Western and Northern India, a few more special bridge
packages from DFCC and High Speed Rail network are
expected in India.
In the Year 2014-15, the business bagged a major order in
the Defence segment which helped to maintain its growth
in Order Inflow. The business also tasted success in various
other segments like Special Bridges and Metros. Some of
the orders booked include Mandovi Cable-stay Bridge,
Barapulla Extradosed Bridge, Lucknow Metro, CC-77 etc.
Hydel and Ports segments saw only limited tenders mainly
due to environmental clearance issues for various projects
in the country.
Three packages of the Delhi Metro, an elevated package
of the Chennai Metro and a few defence projects were
completed during the course of the year.
Significant Initiatives:
During the year, certain initiatives were implemented to
improve the operational efficiency of the business.
Environment, Health and Safety (EHS): With Heavy Civil
Infrastructure business expanding operations beyond
boundaries, the aim was to improve safety standards to
world class level. A framework called L&T LIFE is being
implemented for safety management with a vision of ‘Zero
Harm’ throughout global operations.
Hydroelectric power plant at the foothills of the Himalayas
Construction of a critical structure in progress at Kakrapar Nuclear Power Project in Gujarat

117
Many EHS awards and honors have been won at different
levels and categories. The Kakrapar Atomic Power Project
bagged the prestigious Golden Shield Award from the
National Safety Council for the third consecutive year. 7
British Safety Council awards were won apart from the
ROSPA gold for KAPP, DMRC CC-06, HMRL projects and
ROSPA Silver for CMRL UG, DMRC CC-27 projects. 2 IEI
Safety Innovation Awards were bagged for CC-28 & KAPP.
Further, three sites have achieved more than 10 million
safe hours (KAPP, CC06 and Singoli Bhatwari HEP).
Risk Management Committee: With several international
and domestic mega projects having long gestation periods
and entering into more Joint Ventures, risk assessment and
mitigation become crucial functions to safe guard interests
during the execution of such projects. There is now a Risk
Management Committee at the business level integrated
with the central Contracts Management team.
HR Training: The Training team conducted 309 programs
(5,986 staff and 30,133 man-days) during the year.
Training Man Days grew by 39% as compared to the last
year.
Workman Management Centre (WMC): The business
employs about 32,000 workmen across various projects for
its operations. Through WMCs at Chennai and Hyderabad,
the business has been able to streamline the process of
subcontractor and labour movement, conducting training
programs for workmen at site level and standardizing
welfare arrangements.
Increase Frontline Supervisors: Frontline supervisors are
the backbone for project sites and the plan is to increase
their numbers that are proportional to the project size as
it directly affects productivity.
Outlook:
More international jobs are being targeted and the business
is confident of achieving a higher share of revenues from
the international operations.
On the domestic front, the business sees bright prospects
in Tunnels/Ports/Bridges segment which are being actively
pursued. The business will continue to be selective in Hydro
projects and will focus more on private Hydro projects
with equitable contracts. In the coming year, the Defence
and Nuclear sectors have some very interesting prospects
which will continue to be key areas.
There are bright prospects for Metros domestically and
some in the Gulf region.
Recently, the business signed an MOU with the French
firm Areva for cooperation to maximize localization for the
9000 MW Jaitapur Nuclear Plant in Maharashtra.
The strength of Heavy Civil Infrastructure business is its
team which is presently 3956 with an increase of ~ 375
people compared to last year. More training programmes
focusing on technical, leadership and soft skills will be
introduced to develop more future leaders.
With the commissioning of Kudankulam Atomic Power
project Unit I & II, prospects for further units are looking
bright. Heavy Civil infrastructure business is expected to
have a healthy year on the domestic front. With a healthy
order book backed by a strong team spread geographically,
the Heavy civil infrastructure business is confident of
achieving the revenue targets for 2015-16.
Perspective of the bridge over the Narmada, Gujarat - one of the
longest of its kind to be built in India.
Major international metro systems being built by L&T include the
Riyadh Metro (above) and the Doha Metro.

118
Major Subsidiary Company
L&T Geostructure LLP (LTGS):
L&T GeoStructure LLP (LTGS) is a subsidiary entity - a
Joint Venture with Transworld Infraprojects Private
Limited. LTGS has a strong and a professional, foundation
specialist team with the knowledge of design, equipment
and methods to execute and supervise sophisticated
works. The company was formed with focus on marine
foundations, deep foundation-supported bridges, mining
shafts and other ground-related businesses. LTGS also has
expertise in the areas of large diameter piling, diaphragm
walls, cut-off walls, secant pile walls, sheet piles, intake
structures, ground improvement, hard-rock boring and
water retaining structures.
Major orders secured in 2014-15 by LTGS include Intake
well works for CW system and makeup water system civil
works in Nabinagar power project from NTPC, Bridges for
MBL Infrastructure at Kolkata and Sheet pile wall for RIL
and coffer dam at Hazira
LTGS achieved 3.39 million safe man hours during
2014-15. LTGS also completed 12000 nos. of piling in
BPCL Kochi refinery, well within the contract period.
Ground improvement work - stone column 3500 nos. was
completed in World Trade Centre, Noida for SpireTech
Transportation Infrastructure
Overview:
Transportation Infrastructure business comprises Roads,
Runways (Airside Infrastructure) & Elevated Corridors
(RREC), Railways Construction, Railways Systems &
International Infrastructure. It has sustained growth over
the years in the past by securing prestigious orders in Roads
& Railways despite sluggish domestic economic growth.
The business team has vast experience in Project
Management, Engineering Design & Construction
Management which gives it a competitive edge over
competitors. The business has a pan-India presence and is
also in GCC countries with multiple projects. Engineering
Research & Design Centers in Mumbai, Faridabad and
Chennai and an Offshore Engineering Centre in Mumbai
caters to the requirements of international projects besides
Area Offices in India/GCC countries.
Business Environment:
RREC has been successful in expanding its customer base
during the year by securing an order for the construction
of an Expressway from Lucknow to Unnao measuring
63 km for v 1630 crore from Uttar Pradesh Expressway
Industrial Development Authority.
Further, RREC has been successful in adding new clients
for bidding projects under PPP mode - namely TRIL Roads
Private Limited & Uniquest Infra Ventures Private Limited
and is expect to bag some major projects in 2015-16.
The international jobs which the business bagged in the
roads sector in the recent past are also progressing well.
The Railway business has been awarded a major order by
DFCCIL (Dedicated Freight Corridor Corporation of India
Limited) for the Electrification of 914 Rkms from Rewari
to Vadodara for v 3097 crore (Package EMP 4), which is
the largest ever electrification contract in the history of
the Indian Railways. In the Railway construction business,
a new customer has been added by way of securing a
The Sheikh Khalifa Interchange linking Abu Dhabi and Dubai. One
of the many infrastructure projects constructed by L&T in the GCC
region.
Automated track-laying machine deployed at the prestigious
Dedicated Freight Corridor project.

119
project for construction of Railway line & Water pipeline
from the thermal power station to Manoharpur Coal mines
for Odisha Power Generation Corporation Limited for
v 1090 crore through EPC mode.
The other major orders secured during the year on the
domestic front include Rewa-Katni-Jabalpur Road Projects
in Madhya Pradesh from NHAI - 4 packages, Bijapur
Gulbarga Homnabad Road Project in Karnataka from
NHAI.
On the international front, the major orders secured
during the year include Doha Industrial Package 6 (LRDP)
in Qatar and Advanced People Mover Tunnel from Abu
Dhabi Airports Company in UAE.
The projects completed during the year were Beawar Pali
Pindwara Road Project (244 kms in Rajasthan), Samkhiali
Gandhidham Road Project (56 km, Gujarat) and VIP Flyover
in Kolkata
During the year, Transportation Infrastructure business
bagged 14 International Safety awards i.e., 4 RoSPA (Royal
Society for the Prevention of Accidents) Gold, 1 RoSPA
Bronze & 9 British Safety Council awards along with 7
prestigious safety awards from National Safety Council
(NSC), India & 1 Safety Innovation Award.
Significant Initiatives:
There was continuous thrust on operational excellence
through efficient supply chain management, resource
utilization and cost optimization by adopting improved
engineering models i.e., Mechanized Pavement Design,
use of Reclaimed Asphalt Pavement, integral design for
flyovers and flexible wire rope safety barriers.
On the International front, Transportation Infrastructure
business has undertaken special initiatives towards
organization building in Oman, UAE, Qatar & Saudi
Arabia. More emphasis is being given for the recruitment
of expatriates as Country Heads, Business Development
Leaders and Project Directors.
Special focus is being given for the selection of international
Joint Venture partners to get pre-qualified in high value/
advanced technical projects in the GCC countries.
Various strategic initiatives have been undertaken in the
international business to strengthen procurement / asset
management / cost control teams to provide immediate
onshore support to project teams.
Outlook:
The government has ambitious plans of awarding around
9000 Kms of road projects in both EPC and PPP modes
amounting to around v 75000 crore in the year 2015-16.
In addition, the near term outlook for the sector looks highly
promising in terms of massive business opportunities, as
the government is keeping ready around 500 Projects
worth v 3 Lakh crore to bid out in the next 2- 3 years to
achieve the ambitious target of construction of 30kms of
road/day set by the Ministry of Road Transport & Highways
(MORTH).
In PPP mode, government is working on the Model
Concession Agreement (MCA) to bring in changes to the
existing contract clauses which will make PPP projects
more attractive. Besides, the Ministry is in discussion with
the RBI / Financial institutions to ease out the lending
norms to the sector.
Apart from NHAI projects, the Government’s ‘Make in
India’ initiative will demand the development of industrial
corridors, which requires huge investment for basic
infrastructure such as Roads, Bridges and Flyovers. Further,
the Ministry of Defence (MOD) is proposing to award road
projects along the borders of India, which would provide
good business opportunities for the road business.
The future for the Railways SBG continues to be promising
with the Western Dedicated Freight Corridor being the
mainstay for growth. The Balance Civil and Track packages
valuing around v 5500 crore are expected to be awarded
in the year 2015-16 by DFCCIL on the Western Dedicated
Freight Corridor. The remaining Civil and Track works
The 72 km, 3 line, Hyderabad Metro Rail Project is the world’s largest
public-private-partnership project in the urban transportation sector.

120
worth v 3900 crore are expected to be awarded in the
year 2015-16 in the Eastern Dedicated Freight Corridor
with World Bank funding.
Rapid urbanization and traffic congestion have fueled the
demand for Mass Rapid Transit Systems (MRTS). Cities like
Mumbai (Line-3), Lucknow, Ahmedabad, Noida/Greater
Noida, Nagpur, and Bangalore (Phase-2) have announced
metro projects. Some of these projects are expected to be
tendered during the current fiscal.
Monorail projects announced in Delhi, Kozhikode &
Trivandrum are likely to add more business opportunities
to the Railway business in the coming years.
The GCC Railway network valuing in excess of USD 15 Bn.
cutting across Saudi Arabia, Qatar, UAE and Oman is an
important infrastructure investment in the Middle East.
These projects offer huge opportunities for the Railway
business in the international market.
The World Expo 2020 in Dubai and the FIFA World Cup
-2022 in Qatar together with Saudi Arabia’s ongoing
expansion and diversification plans are likely to be the key
business opportunities for the infrastructure sector in the
coming years. The Expo related infrastructure development
and operations alone are expected to cost approximately
over USD 9 Bn in UAE.
The Kingdom of Saudi Arabia has been investing heavily
in infrastructure, development of new economic zones,
airports, ports and rail-road infrastructure and adopting
the latest technologies for sustainable development to
meet the growing demands of the expanding economy.
Power Transmission & Distribution
Overview
L&T’s Power Transmission and Distribution business is
a leading EPC player in the field of Power Transmission
and Distribution offering integrated solutions and end-
to-end services ranging from Design, Manufacturing,
Supply, Installation and Commissioning of Transmission
Lines, Underground Cable Networks (both Power &
Control), Substations, Distribution Networks, Electrical &
Instrumentation works for Power, Process & Infrastructure
Projects, in both the domestic and international markets.
Extra High Voltage Substation Systems & Power Distribution
Business Unit focuses on providing turnkey solutions for
Extra High Voltage Air Insulated / Gas Insulated Substations
for Utilities & Power Plants, EHV Cable Networks, Utility
Power Distribution & Power Quality Improvement works,
complete Electrical, Instrumentation & Communication
(EI&C) solutions for large Thermal & Nuclear Power Plants
and various industrial & infrastructure projects such as
Metallurgical Plants, Hydrocarbon & Pipeline Projects, IT
Parks, Airports, Sea Ports, Metros, OFC networks, etc.
Transmission Line Business Unit offers turnkey EPC solutions
in overhead lines for power evacuation and transmission,
bolstered by its state-of-the-art tower manufacturing
units at Puducherry and Pithampur supplying over
1.3 lakh tonnes of tower components annually. The
Design & Testing center at Kanchipuram accredited by
National Accreditation Board for Testing and Calibration
Laboratories (NABL) is one of the largest in ASIA and also
amongst the renowned testing centers in the world. Solar
Business Unit provides single point EPC turnkey solutions
for solar related projects (both solar PV & concentrated
solar thermal). Experience spans across all terrains (sandy,
Rigid Overhead Contact System of Delhi Metro Rail Corporation
765 kV DC transmission lines at Kudgi, Karnataka

121
rocky, etc.), all technologies (Thin Film Frameless and
Framed, Crystalline, Tracker, etc.) and various Contract
Structures including Turnkey EPC and BoS Contracts. The
business unit provides Optimized Power Plant design and
is the Channel Partner of Ministry of New & Renewable
Energy (MNRE) with highest rating in the System Integrator
and RESCO categories.
PT&D’s International Business Units offer complete solutions
in the field of power transmission and distribution including
High Voltage Substations, Power Transmission Lines, Extra
High Voltage Cabling and Electrical, Instrumentation and
Controls (EI&C) works for infrastructure projects such as
Airports, Oil & Gas Industries etc. in countries like UAE,
Qatar, Kuwait, Oman, Saudi Arabia, Bahrain, Algeria and
Kenya.
Business Environment:
For FY 2014-15, the power transmission and distribution
sector in India saw the distribution sector maintaining the
momentum it had gained during the year 2013-14 backed
by significant investments.
Against the backdrop of several governmental initiatives
in the distribution sector, endorsed by central funding
agencies, state utilities have laid emphasis on strengthening
their respective distribution networks for better efficiency,
accountability and management. PT&D has positioned
itself to capitalize on these emerging opportunities and
was successful in bagging major orders. In addressed
markets, Extra High Voltage (EHV) Sub-station Systems
& Power Distribution Business Unit enjoys considerable
market share and is the clear numero-uno in terms of
volume.
The opportunities in the transmission sector were steady
as central and select state utilities concentrated on Power
System Strengthening Schemes to meet their demands.
Policy issues and a general lull continued in the power
and industry segment. Steel, Cement & Power generation
continue to see adverse impact with little expansion
400 kV Bab Asab - Habshan Transmission Line in Abu Dhabi. L&T is one of the industry leaders in turnkey construction of power transmission and
distribution systems in the Middle East.

122
announced and ongoing Greenfield projects moving at
a slow pace.
Transmission Line projects are spread across the Indian sub-
continent and encompass varied and composite terrains.
The contours of the Transmission Line business have
changed from PGCIL & Utilities to Tariff-based competitive
bidding (TBCB) process. Several players are planning to
enter TBCB projects. Strengthening of networks is going
to take place. Land acquisition for the same is in the step
of re-promulgation by the Union Cabinet and will have
an impact on the Right of Way clearances in transmission
line projects.
Projects have been executed for Central Transmission
Utilities like PGCIL, NHPC, etc. and for various State
Transmission Utilities like those in Maharashtra, Gujarat,
Chhattisgarh, West Bengal, Punjab, Tamil Nadu, etc. EPC
projects have also been undertaken for various Independent
Power Producers pan India. The business has dedicated,
experienced construction teams to take up projects at
various voltage levels and are presently executing various
projects at 765kV AC, 400kV AC & 800kV High Voltage
Direct Current (HVDC) levels in various parts of the country.
In the Solar Business, the year witnessed reduced
capacity addition due to delays in policy implementation.
Nevertheless, the new government has shown deep
interest in developing solar power plants across India and
has initiated plans to achieve its target of 100 GW by
2022.
On the International front, during the year 2014-15,
PT&D Business in Middle East had mixed fortunes in the
prevailing economic and political scenario. The political
scenario was optimistic in general. The positive investment
climate was aided by FIFA 2022 related investments in
Qatar, Expo 2020 related plans in UAE and continued T&D
investment plans of Kuwait & Oman. Key focus on Saudi
Arabia has resulted in substantial growth for the T&D
Business as their central power utility has gone ahead with
its vast expansion plans so as to meet its demand forecast.
Though the overall scenario looks optimistic, there were
concerns in the Middle East region on account of the
recent developments in the neighboring countries of Iraq,
Syria & Yemen. Further, the drop in oil prices during the
latter part of the year also contributed to some anxiety in
terms of the investments/ developments planned in the
region with a little slowdown witnessed in Brown field/
Green field Industrial Electrical works related to the Oil &
Gas market.
The untapped African market is steadily opening up
in the Comolec and Sub Saharan regions providing a
breakthrough for the T&D business in Algeria & Kenya.
Fronts are also opening up for increased power generation
and evacuation aided by specific funding agencies in place.
Major orders secured in the domestic market included
400 kV Gas Insulated Substations at Lahal for Himachal
Pradesh Power Transmission Corporation Limited
(HPPTCL), Pandiabil, Baripada and Parbati for Power
Grid Corporation of India Limited (PGCIL); 765kV Gas
Insulated Substations at Hyderabad and Nizamabad for
Power Grid Corporation of India Limited (PGCIL) and
400 kV Air Insulated Substation at Karamadai for Tamil
Nadu Transmission Corporation Limited (TANTRANSCO).
Other Orders were bagged in Power Distribution & Quality
improvement works under the Restructured Accelerated
Power Development and Reforms Program (RAPDRP), Rajiv
Gandhi Grameen Vidyutikaran Yojana (RGGVY) & Rural
Electrification schemes for various DISCOMs in the states
of Uttar Pradesh, West Bengal and Odisha. Opportunities
are growing in the Odisha DISCOM segment.
Further, a breakthrough was made in telecom cabling
infrastructure segment with the bagging of an order for
a mega network worth v 2442 crore from BSNL (project
implementation agency for Ministry of Defence) for
Optical Fiber Cable Laying Works (OFC). This will form
the backbone optical highway infrastructure and serve as
dedicated communication media for the defence sector in
lieu of vacating spectrum.
In the Transmission Line business, prospects from PGCIL
increased by nearly 40% and PT&D was one of the highest
Electrical installations at a gas-based industrial substation in Doha

123
market-share holders by securing v 1500 crore orders for
the construction of 765kV / 400kV & 220kV lines across
India. Orders were won from the state utilities of Bihar,
Tamil Nadu & Uttar Pradesh. The Business also entered
tariff bidding by bagging 2 projects with Sterlite, one each
in Rajasthan and Madhya Pradesh.
The Solar Business secured orders to the tune of 85 MW
with key clients being Sun Edison, Aditya Birla Group, Alkyl
Amines Chemicals Ltd. and GRT Jewellers.
The Middle East business bagged a major order in Qatar for
turnkey construction of 6 EHV GIS substations for Qatar
General Electricity & Water Corporation (KAHRAMAA).
The business also successfully bagged a breakthrough
order in Oman for the 400 kV GIS Substations from Oman
Electricity & Transmission Company (OETC). One more
EHV GIS substation was bagged from the same customer
resulting in a premium position for the Company with
the customer. The Business has also bagged substantial
volume of 115 kV Transmission Line projects in Saudi
Arabia from Saudi Electricity Company (SEC). Prestigious
orders to execute Power Development of Electrical facilities
were bagged in Saudi Arabia. EHV GIS substation orders
from private customers were also secured in UAE.
Further, the year marks a noteworthy achievement in
PT&D’s Africa initiative. The business received a major
transmission Line order in the East African market for
constructing a 500kV Transmission line from Isiolo to
Marsabit in Kenya as part of the Ethiopia – Kenya Link for
regional interconnection & creating transmission capacity
needed in interchange of Electric Power between Ethiopia
and Kenya in the long run. The business also secured a
repeat order in Algeria for building a 220kV Substation
from SONELGAZ, a federal utility in Algeria.
The key projects commissioned during the year include
major EHV substations viz. 765 kV GIS at Pune; 765 kV
AIS at Dharamjaygarh; Bhiwani & Jind; Jabalpur, Bina &
Indore - for PGCIL and 765 kV AIS at Phagi for RRVPNL;
400 kV GIS at Bokaro and Nagapattinam for PGCIL; 400
kV AIS at Tutucorin for PGCIL; 400 kV AIS at Thiuvalam
& Kayathar for TANTRANSCO. 765 kV GIS at Pune is the
first 765 kV GIS to be commissioned in India. Further,
in the process of executing 4 more 765 kV GIS projects,
the business ensured market leadership in the EHV Gas
Insulated Substation business in India. More than 14000
villages were electrified across India as part of ’Electricity
for All’ Program. Further, 7 Units of 660 to 800 MW Super
Critical Power Plants were commissioned and commenced
commercial operations.
In the Transmission Line business, a series of corridors
were executed, primarily the 800kV HVDC line from
Nidhura to Agra (130kM), 765kV D/C line from Raipur to
Wardha of PGCIL (126kM), 765kV D/C line from Wardha
to Aurangabad of PGCIL (100kM), 400kV D/C line from
Pugalur : Pandiyankuppam of TANTRANSCO (150kM) and
400kV D/C line from Mettur : Thiruvalam of TANTRANSCO
(102kM). The tallest tower in Asia (472 mtrs) was executed
by Transmission line business unit and successfully handed
over to the Indian Navy.
The Solar business commissioned around 82 MWp which
is the highest by any pure play EPC player in India. L&T
commissioned its first i-LSTK based solar PV project
capacity of 11 MWp in Warangal district, Telangana. The
65 MWp Solar PV was also commissioned for Sun Edison
under NSM Phase 2 batch 1 located in Rajasthan (39 MWp)
and Madhya Pradesh (26 MWp ) respectively. Also recently
successfully commissioned was the first solar PV project
(6 MWp) under Tamil Nadu state policy for GRT Jewellers.
In the International market, the Middle East business
commissioned two 220 kV Substations at Doha Industrial
Super & Duhail in Qatar for KAHRAMAA, 16 Nos. 132 kV
GIS Substations across the countries of operation, 110
KM of 220 kV Cabling works in Qatar for KAHRAMAA,
292 KMs of 380 kV OHL in Saudi Arabia for SEC, 234
KMs of 220 kV OHL in UAE for Abu Dhabi Transmission &
Despatch Company.
India’s first 1200 kV substation at Bina, Madhya Pradesh. L&T
offers complete solutions in high–voltage substations and power
transmission lines.

124
Significant Initiatives:
In view of PT&D’s growing exposure to Utility Distribution
Segment, innovative Project Management techniques
suited to the specific needs of such projects are being
developed and implemented for effective control &
monitoring such as :
• Innovative Project management software to monitor the
Progress of Transmission Line projects has been taken
up. Dedicated software to track real time project key
cost elements / major deliverables is being developed.
The software will be capable of working across Mobile/
Tablet/ Computer platforms and across all operating
systems.
• Real time monitoring of progress/ workmen deployment
through camera at sites and monitoring at centralized
location is being implemented on trial basis for projects
in Qatar.
Operational excellence initiatives in the areas of on-time
delivery, profitability enhancement, cost reduction
and process implementation at project sites are being
undertaken to have control over effective contracts and
efficient working capital management.
Committed Business Development teams have been
formed to tap the business potential across Domestic and
International markets. A strategy to expand into African
and ASEAN market is being vigorously pursued as a key
initiative.
PT&D has been certified ISO in Quality Management,
OHSAS, Environment and Energy Management.
Awards and recognitions won during the year include:
• Suraksha Puraskar and Sahabhagyatha award from M/s.
PGCIL.
• Plaque of Honor Award from M/S BAPL for rerouting
WBSETCL lines.
• ROSPA Safety Awards for 5 Projects.
• Appreciation from British Safety Council for 8 Projects.
As part of PT&D’s internationalization strategy to expand
into key African economies, it has strengthened its talent
base to vigorously pursue emerging potential, create
corporate brand awareness & preference.
As part of Powering Africa initiative, PT&D participated in
key events & conferences in Tanzania, Ethiopia, Kenya, and
South Africa for brand building in the East African region.
Outlook:
The emphasis placed by the incumbent government
on providing thrust to domestic manufacturing would
necessitate manifold increase in power requirements. With
its experience and core competencies, the EHV Substation
& Power Distribution business is in an optimal position to
exploit the opportunities accruing as a result.
For the year 2015-16, the EHV substation segment is
expecting a high capital expenditure from central utility for
Substations with emphasis on 765/400 kV GIS. The Central
Government has launched Deen Dayal Upadhyaya Gram
Jyoti Yojana (DDUGJY) and Integrated Power Development
Scheme (IPDS) with investment laid as per the Planning
Commission. These schemes aim to continue the reforms
in Power Distribution sector over the next 5 years. This
will provide a great opportunity every year in the DISCOM
(Utility) segment. Further, with the start of coal block
auctions in Feb’15, stalled Power, Steel & Cement Projects
are expected to take off in the year 2015-16.
In the Transmission Business, while the state and central
utilities will continue to attract the routine packages for
grid strengthening, Major Transmission Packages will also
come in through the Tariff Based competitive bidding.
In the Solar business, while the first half of 2014 was
very uncertain due to the elections, the second half was
promising, and laid a good foundation for a vastly better
2015. The Ministry of New and Renewable Energy (MNRE)
started the process for allocating 3 GW of solar projects
under the state specific programme. Several Central Public
Sector Undertakings and government organizations are
also in the process of setting up solar power plants.
Three southern states – Karnataka, Andhra Pradesh and
World’s largest single rooftop (7.5 MWp) solar power plant in Punjab

125
the newly carved Telangana – allotted 500 MW of solar
projects each, and if all goes well, a majority of these
projects will be commissioned by end of 2015/early 2016.
Apart from these, several public sector tenders are coming
up to meet the India’s energy requirement. Around
1500 MW tenders have been released and there are plans
to install 5000 MW in the coming 3 years.
After two years of sluggishness, annual solar installations
are expected to cross 2 GW in 2015, and another 3-4 GW
is likely to be allotted this year. More clarity will emerge
during the year as to how exactly the 100 GW target will
be achieved. The domestic PV manufacturing industry will
benefit once the demand increases. Financing cost, which
has been one of the major challenges for setting up solar
projects, is also expected to gradually reduce as a result
of the easing of inflation. Overall, 2015 promises to be
a good year for the Indian solar sector and the start of
a potential era for solar, considering the fructification of
Government policies.
The Middle East Business expects a stable political
environment across the GCC countries. Also Infrastructure,
Transmission & Distribution spends are expected to
continue to be aided by the major events like FIFA 2022,
Expo 2020 and other ambitious events being hosted across
the region. In UAE, there is a shift towards investment
opportunities in the Dubai region. Also opportunities on
Enhancement & Refurbishment of Electrical Network are
expected across the GCC countries.
With cautious decision making/ relook on non-priority
investments, fast track delivery of projects is expected to
meet needs and deadlines. With criticism from watchdog
agencies, stress on Labor reforms and Human rights are
on the raise resulting in various macro changes in the
operational structure.
Further, Africa is experiencing an unprecedented
economic boom and is being seen as the next investment
destination. There has been an increased focus on
better macroeconomic management by the govt. bodies
& good policies to attract investments from foreign
companies. There has been a huge inflow of investments
in the infrastructure and Oil & Gas sectors. Africa’s Power
Infrastructure deficit may serve as an impediment to the
continent’s economic growth, but it represents a major
opportunity. Regional integration in terms of power
pools and promotion of renewable generation are game
changers that could shape the energy landscape in sub-
Saharan Africa. The Power infrastructure is being ramped
up. T&D is concentrated on key economies such as Algeria,
Morocco, Tunisia, Kenya, Tanzania, Ethiopia, Zambia,
Uganda, Mozambique & Malawi. These countries have a
clear road map to build Substations & Transmission lines to
meet their ever increasing demand for electricity.
The overall outlook of PT&D sector given the above
domestic and international scenario looks promising.
PT&D needs to look forward to strengthen its position to
tap these opportunities by ramping up and leveraging the
synergies across geographies to improve its growth levels
both on top line as well as on bottom line.
Major Subsidiary Company:
Larsen & Toubro Oman LLC (LTO):
LTO is a Joint Venture with Muscat Trading Company
(Zubair Corporation Group), providing engineering,
construction and contracting services in the Sultanate
of Oman. LTO made its maiden venture into Oman in
1994 and has completed 21 years emerging as one of
the leading EPC construction companies. During the past
year, the Company has won breakthrough orders for 400
kV GIS Substations. 4 Nos 132 kV S/S were commissioned
during the year.
LTO expects a stable political/ economic scenario in Oman
with growing opportunities in the T&D segment.
Larsen & Toubro Saudi Arabia LLC (LTSA):
LTSA is a wholly owned subsidiary providing engineering,
construction and contracting services in the sphere of
Asia’s largest (125 MWe) solar thermal power plant in Rajasthan,
based on high efficiency, CSP technology. L&T is the country’s largest
player in the field of solar plant construction.

126
T&D in the Kingdom of Saudi Arabia. During the past
year, the company had taken on a significant volume of
Transmission line jobs with Saudi Electricity Company (SEC)
and orders for Power development/ data center with Saudi
Aramco. The company had commissioned more than 500
KMs of Transmission Line works (380 kV & 220 kV) during
the past year.
With a stable political environment, huge surplus/
reserves, and the need for increased Power Transmission
& Distribution network, LTSA is well poised to reap the
growth and increased volumes in the coming year.
Water, Smart World & Communication
Water & Effluent Treatment
Overview:
On a global scale, the demand for fresh water is rising
owing to increased population, urbanization and rapid
industrialization. There is a rising awareness on the
importance and urgency of optimum management of
scarce water resources.
The Water & Effluent Treatment Business caters to
turnkey infrastructure projects including water supply
& distribution, desalination plants, water management
system, waste water networks, water & waste water
treatment plants, industrial water systems, lift irrigation
systems and canal rehabilitation.
Business Environment:
The Water & Effluent Treatment business has
commissioned several important water projects in the year
2014-15. These include (a) Melur and Attur Combined
Water Supply Schemes for Tamil Nadu Water Supply &
Drainage Board, which shall provide drinking water to
more than 2700 rural habitations in Madurai and Salem
districts of Tamil Nadu (b) Water Supply Project for over
100 habitations of Puttaparthy, Andhra Pradesh (c) 25
MGD Dahej Water Supply Project for Gujarat Industrial
Development Corporation (d) Rajanahalli and Shiggaon
Lift Irrigation Schemes for Karnataka Neeravari Nigam
Limited (Government of Karnataka) and (e) Botad Branch
Canal Lift Irrigation Project for Narmada Water Resources,
Water Supply & Kalpsar Department (Govt. of Gujarat).
The business has also been successful in securing orders
from various business domains like lift irrigation, drinking
water supply, plant water systems, common effluent
treatment plants and municipal waste water collection &
treatment. Some of these include:
a) Lift Irrigation Schemes in various districts of Odisha
and Madhya Pradesh for their respective State Water
Resources Departments
b) Plant Water Systems for NMDC, Chhattisgarh and
Bakreshwar Thermal Power Plant (WBPDCL), West
Bengal
c) Agra Water Supply Project and Allahabad Waste Water
Scheme for UP Jal Nigam
d) Dindigul Water Supply Scheme for Tamil Nadu Water
Supply & Drainage Board and
e) Ranchi Water Supply Scheme for Public Health &
Engineering Department, Jharkhand.
On the International front, the Business has received fresh
orders in Qatar and Oman including
172 MLD Lift Water Supply Project, Rajasthan. L&T has designed and
constructed numerous water reservoirs, pipelines and distribution
systems.
180 MLD waste-water treatment plant at Doha, Qatar - one of
multiple projects that affirm L&T’s broad spectrum of capabilities in
the water sector.

127
a) Waste Water Treatment Plant at Al Shamal, Qatar based
on Sequential Batch Reactor (SBR) & Ultrafiltration (UF)
technologies for ASHGHAL
b) Water Infrastructure Works at Sumail and Salalah, Oman
for Public Establishment of Industrial Estates and Salalah
Free Zone Company respectively.
Significant Initiatives:
With huge opportunities in the water and effluent treatment
space, significant initiatives have been taken to ensure that
the business continues to be ahead of competition, both
in terms of market share and profitability. Some of these
initiatives are:-
• Participation in water management tenders, which
include reduction in unaccounted-for water and water
metering.
• Strategic tie-ups with technology partners for upcoming
desalination projects and for large-scale waste water
treatment plants.
• Focus on prospective segments such as water re-use and
canal modernization.
Outlook:
Large investments have been proposed by multi-lateral
funding agencies for water & waste water schemes in
India. Nearly 500 cities and towns are expected to be
covered under the Atal Mission for Rejuvenation and
Urban Transformation (AMRUT) for development of urban
infrastructure. Coming to irrigation, mega projects have
been proposed across major states along with proposals to
connect rivers with 15000 km of canals. The government
has already set in motion an integrated Ganga conservation
plan - ‘Namami Gange’ which envisages investments for
sewage infrastructure across several urban habitations
along the river. Stringent implementation of pollution
norms are in place to encourage setting up of common
effluent treatment plants.
In the International market, opportunities have been
identified for desalination and sewage treatment
plants in GCC. FIFA 2022 is an important driver for
water infrastructure prospects in Qatar. Similar water
infrastructure prospects are visible in Oman, UAE and KSA.
Smart World & Communication
Overview:
The world is seeking smarter, secure and intelligent
solutions to enhance quality of life, which has led to
the rise of smart cities, advanced security solutions
and communication infrastructure in several advanced
economies. India is also rapidly gearing up to create
smart infrastructure that will soon be the backbone of
the economy.
The Smart World & Communication Business provides
EPC services in the areas of city surveillance, intelligent
traffic management systems, transport & logistics, border
security, communication networks, telecom infrastructure,
building management systems, smart grids and smart city
development.
Business Environment:
The Smart World & Communication Business has recently
signed a contract with the Home Department, Government
of Maharashtra for a CCTV-based Surveillance Project in
Mumbai city. This project is the largest of its kind in India,
which involves design, development, implementation and
maintenance of CCTV cameras, data centers, command &
control centers, viewing centers and network connectivity
across multiple locations of strategic importance in
Mumbai city.
The Business has recently commissioned a City Surveillance
and Intelligent Traffic Management Project for Home
Department, Government of Gujarat, which covers three
key cities of Gujarat namely Ahmedabad, Gandhinagar
and Vadodara. A unique project facilitating better
surveillance and management of critical infrastructure at
Sabarmati Jail, Ahmedabad has also been completed in
the year 2014-15.
Significant Initiatives:
The Smart World & Communication Business has been
formed to exclusively cater to security solutions, smart
cities, communication network and telecom Infrastructure.
Water pre-treatment plant at Sagardighi, West Bengal

128
The Business will channelize internal resources to
effectively tap the specific requirements of a wide range
of customers including central and state governments,
railways, airports, seaports, transport & logistics providers,
telecommunication service providers, IT companies and
residential building/city developers in a focused manner
as a Master Systems Integrator (MSI).
Outlook:
Several tenders for city surveillance, intelligent traffic
management systems and emergency response systems
have been floated by various state governments, especially
in cities and at certain places of pilgrimage. Security and
management of critical infrastructure set-ups like airports,
ports and jails are also gaining importance. The business
expects finalization of other active infrastructure packages
of NFS (Network for Spectrum) for implementation of optical
fiber communication network and last mile connectivity
for defence establishments. Other government initiatives
viz., Digital India, National Optical Fiber Network and
E-Governance provide opportunities for development of
broadband telecom infrastructure as a platform for smart
services and utilities. As far as smart cities are concerned,
the Central Government has announced the development
of 100 smart cities in India. Countries like USA, Japan
and France will, most probably, provide investments and
technology support for the development of many of
these smart cities across India. Some of the smart city
packages which are in advanced stages include Naya
Raipur-Chhattisgarh, Bandra-Kurla Complex-Mumbai,
Dholera-Gujarat and Ujjain-Madhya Pradesh.
L&T offers integrated capabilities drawn from L&T Construction, L&T Electrical & Automation, L&T Infotech and L&T Technology Services

129
Power Business
Overview:
Power business undertakes construction of coal and
gas-based power plants on a lump sum turnkey basis.
It provides an integrated concept–to-commissioning
solutions to its customers.
The business has world class in-house manufacturing
facilities in Hazira for supercritical Boilers, Turbines &
Generators, Pressure Piping, Axial Fans, Air-Preheaters and
Electrostatic Precipitators. It has rich experience in Project
Management, Engineering & Construction Management
which gives it an edge over its competitors. It has project
management offices at Vadodara, Faridabad and Chennai
and project sites across India. Further, the business has
strengthened its international presence by securing
the second EPC order for a Gas based power project in
Bangladesh.
Power business continued to demonstrate its unmatchable
execution capabilities in super critical technology for its
projects. This was proven by commencement of commercial
operations of 3420 MW of new power generation capacity
during the year that was built by the business.
Business Environment:
Business Environment continued to be challenging for
the power sector. During the year, projects of a meagre
7540 MW in the supercritical space were awarded against
the domestic supercritical manufacturing capacity of about
24000 MW. The excess manufacturing capacity built-up
is leading to aggressive competition with players bidding
all-time low prices coupled with extremely tight completion
schedule to bag awards in the shrunk market. However,
with the political stability, improved consumer confidence,
expectations of a modest recovery in growth and decline
in inflation expectations, the business environment has
shown the signs of improvement. Kick-start of stalled
projects demonstrates such positive environment.
On the policy front, Government’s thrust for economic
growth through ‘Make in India’ campaign, transparency in
coal block allocation/auction and impetus on distribution
2x800 MW supercritical thermal power plant, Krishnapatnam, Andhra Pradesh. L&T provides EPC solutions for coal and gas-based power plants

130
reforms will lead to revival of Indian Power sector in the
coming years. It is expected that in line with its ‘Make in
India’ philosophy, the government would extend ‘Phased
Manufacturing Program’ beyond October 2015 and
retain Mandatory Domestic Sourcing clause for critical
equipment in the revised Standard Bidding Documents
(SBD) for UMPPs to ensure optimum utilization of domestic
manufacturing facilities for Power equipment.
For the year 2015-16, the market scenario is likely to
improve with multiple Central as well as State Government
utilities coming up with new tenders. A few UMPPs are also
expected to be tendered with revised SBDs giving impetus
to thermal power sector. Opportunities are also expected
in Nuclear Power generation segment after durable risk
mitigation solutions (Insurance Pool) are made available.
In view of the uncertain gas supply situation in the
country, the Power business continued its endeavour to
tap export markets for gas-based power projects and has
been successful in securing two EPC orders in Bangladesh.
The business will continue to explore gas-based power
project opportunities in Bangladesh and the Middle East.
During the year 2014-15, the Power business secured its
first full EPC order from NTPC for 2x660 MW Khargone
TPP in Madhya Pradesh. The business will supply Ultra-
Supercritical technology for the first time is India for the
Khargone project. Further, Steam Generator order was
also received from NTPC for 2x660 MW Tanda II TPP in
Uttar Pradesh.
The business also got an EPC order from MPPGCL for full
EPC package of 2x660 MW SSTPP – II (Malwa) in Madhya
Pradesh. It had successfully executed BoP EPC package for
2x600 MW SSTPP – I (Malwa).
The business strengthened its presence in Bangladesh
by securing an EPC order for BPDB 225 MW Sikalbaha
CCPP. In the previous year, it bagged an order for NWPGCL
360 MW Bheramara CCPP in Bangladesh. The business is
also pursuing other prospects in that country.
The business secured fresh orders worth over v 15,000 crore
in the year 2014-15.
Significant Initiatives:
The business, in order to counter pressure on price and
project completion schedule, took several measures during
the year to improve its cost competitiveness and operational
excellence. It received award for Excellence in Power
Project Execution from the Central Board of Irrigation and
Power (CBIP). The citation lauds the execution of Nabha
Power’s 2x700 MW supercritical thermal power plant at
Rajpura, Punjab, by the business in record time. Securing
two full EPC coal power projects and one Boiler Island job
during the year proves business efforts in this direction.
During the year, the business undertook re-organization
of its business structure with the help of a leading
consultancy agency to achieve operational excellence
and optimal staffing in the business. Innovative IT tools
have been deployed for effective project management.
The business continued its focus on high quality safety
standards and practices resulting in receiving accolades
not only in domestic but also from international clients.
The focus on exports and international markets was further
sharpened during the year. The business has strengthened
its presence in Bangladesh. Various businesses such as
piping, boiler, turbine and engineering were successful in
bagging several prestigious export orders which are being
executed to the complete satisfaction of the clients.
Outlook:
The Indian power sector is undergoing important changes
that are redefining the industry outlook.
The business sentiment has improved. As economic
growth rate improves, it will drive power demand in
India. Several tenders from central and state utilities are
in pipeline and are expected to be awarded during the
coming years. The Government of India’s focus to attain
‘Power For All’ has accelerated capacity addition in the
country. At the same time, the competitive intensity is
increasing on market side as well as supply side - fuel,
logistics, finances and manpower. The financial health of
power distribution companies remains a concern. This, in
turn, is impacting financial health of power generating
companies and further investment from private sector.
In order to achieve power generation target for the year
2015-16, Government has taken various initiatives which
focus on maximization of capacity utilization of existing
as well as stranded power generating assets, controlling
input costs, optimization of fuel mix, technology upgrades
and utilization of non-conventional energy sources.
Stringent environment norms will call for cutting edge
super critical technology and new product innovations
and the business will be in fore-front to take advantage
of these opportunities.
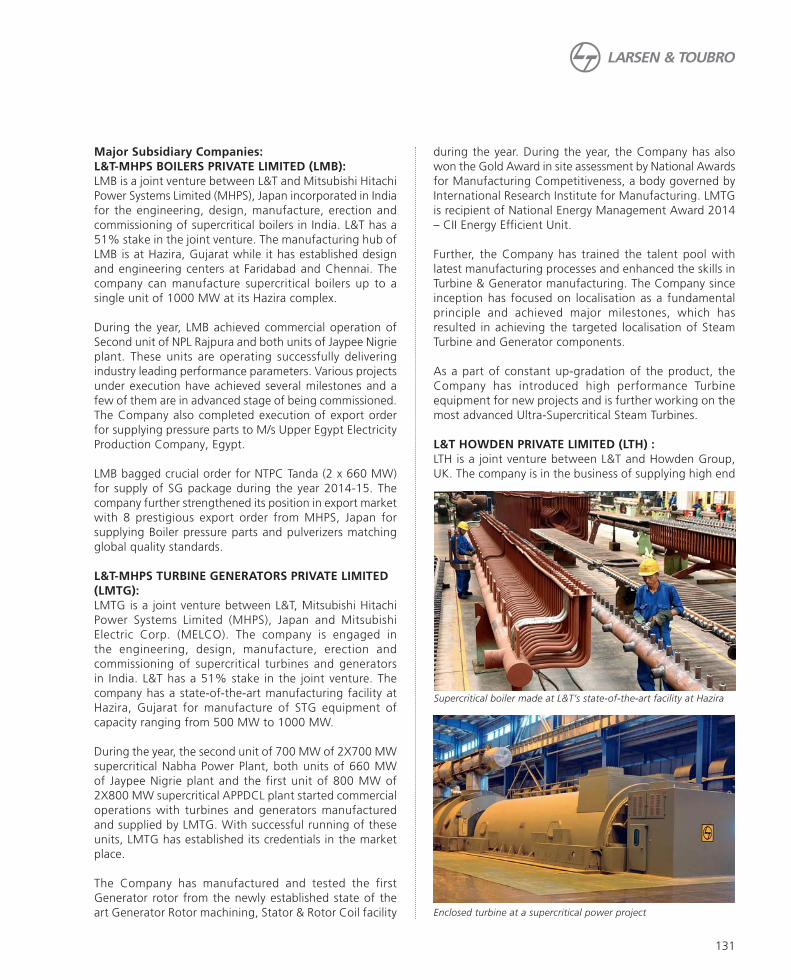
131
Supercritical boiler made at L&T’s state-of-the-art facility at Hazira
Enclosed turbine at a supercritical power project
Major Subsidiary Companies:
L&T-MHPS BOILERS PRIVATE LIMITED (LMB):
LMB is a joint venture between L&T and Mitsubishi Hitachi
Power Systems Limited (MHPS), Japan incorporated in India
for the engineering, design, manufacture, erection and
commissioning of supercritical boilers in India. L&T has a
51% stake in the joint venture. The manufacturing hub of
LMB is at Hazira, Gujarat while it has established design
and engineering centers at Faridabad and Chennai. The
company can manufacture supercritical boilers up to a
single unit of 1000 MW at its Hazira complex.
During the year, LMB achieved commercial operation of
Second unit of NPL Rajpura and both units of Jaypee Nigrie
plant. These units are operating successfully delivering
industry leading performance parameters. Various projects
under execution have achieved several milestones and a
few of them are in advanced stage of being commissioned.
The Company also completed execution of export order
for supplying pressure parts to M/s Upper Egypt Electricity
Production Company, Egypt.
LMB bagged crucial order for NTPC Tanda (2 x 660 MW)
for supply of SG package during the year 2014-15. The
company further strengthened its position in export market
with 8 prestigious export order from MHPS, Japan for
supplying Boiler pressure parts and pulverizers matching
global quality standards.
L&T-MHPS TURBINE GENERATORS PRIVATE LIMITED
(LMTG):
LMTG is a joint venture between L&T, Mitsubishi Hitachi
Power Systems Limited (MHPS), Japan and Mitsubishi
Electric Corp. (MELCO). The company is engaged in
the engineering, design, manufacture, erection and
commissioning of supercritical turbines and generators
in India. L&T has a 51% stake in the joint venture. The
company has a state-of-the-art manufacturing facility at
Hazira, Gujarat for manufacture of STG equipment of
capacity ranging from 500 MW to 1000 MW.
During the year, the second unit of 700 MW of 2X700 MW
supercritical Nabha Power Plant, both units of 660 MW
of Jaypee Nigrie plant and the first unit of 800 MW of
2X800 MW supercritical APPDCL plant started commercial
operations with turbines and generators manufactured
and supplied by LMTG. With successful running of these
units, LMTG has established its credentials in the market
place.
The Company has manufactured and tested the first
Generator rotor from the newly established state of the
art Generator Rotor machining, Stator & Rotor Coil facility
during the year. During the year, the Company has also
won the Gold Award in site assessment by National Awards
for Manufacturing Competitiveness, a body governed by
International Research Institute for Manufacturing. LMTG
is recipient of National Energy Management Award 2014
– CII Energy Efficient Unit.
Further, the Company has trained the talent pool with
latest manufacturing processes and enhanced the skills in
Turbine & Generator manufacturing. The Company since
inception has focused on localisation as a fundamental
principle and achieved major milestones, which has
resulted in achieving the targeted localisation of Steam
Turbine and Generator components.
As a part of constant up-gradation of the product, the
Company has introduced high performance Turbine
equipment for new projects and is further working on the
most advanced Ultra-Supercritical Steam Turbines.
L&T HOWDEN PRIVATE LIMITED (LTH) :
LTH is a joint venture between L&T and Howden Group,
UK. The company is in the business of supplying high end

132
fans and air pre-heaters for supercritical power plants.
L&T has a stake of 50.10% in the joint venture. The
company has a state-of-the-art manufacturing facility for
manufacture of fans and air pre-heaters at Hazira, Gujarat
along with a fan testing facility. It also has a design and
engineering center at Faridabad near New Delhi.
Howden’s acquisition of Flaktwood’s GII division globally
and TLT Babcock (in USA and India) has significantly
increased the probability of the Company securing new
equipment orders. It has also increased the market
potential for the after-market spares and services. The
company can now cater to the spares of Flaktwood design
and TLT design in India apart from its VARIAX fan spares.
The company has secured a breakthrough order for supply
of element baskets to BWE towards NTPC’s upcoming
Meja 2 x 660 MW STPP in 2015. The company is currently
executing various projects for Boiler and FGD OEMs.
The company has successfully type tested the ID and the
PA fans at its manufacturing works at Hazira for the NTPC
Kudgi 3 x 800 MW STPP for which it received the contract
from M/s Doosan Power Systems India earlier.
L&T-SARGENT & LUNDY LIMITED (LTSL) :
LTSL, established in 1995, is a premier engineering &
consultancy firm in the power sector, born out of shared
vision of two renowned companies - Larsen & Toubro
Limited (L&T) and Sargent & Lundy LLC, USA (S&L), a
global consulting firm in power industry since 1891. L&T
has a stake of just over 50% in the joint venture.
LTSL’s main Design Centre is located in Vadodara and
Faridabad. LTSL has a present strength of around 650
experienced professionals.
LTSL offers complete gamut of power plant engineering
& consultancy services - from concept to commissioning.
Its experience list includes overseas projects in USA, Saudi
Arabia, Oman, UAE, Jordan, China, Thailand, Malaysia,
Sri Lanka, Bangladesh, Nigeria, Panama, Kuwait, Morocco
and Kenya. Besides having considerable expertise in gas
based and subcritical coal based power projects, LTSL is
also involved in engineering of supercritical coal based
projects and forms the engineering base for L&T’s thrust
into turnkey execution of supercritical technology. As of
now, it has engineered around 20000 MW of generation
capacity of gas-turbine based power plants and around
21000 MW of generation capacity of coal-based power
plants across the globe.
During the year, LTSL added new customers to its client
list. This year’s addition included a major EPC contractor
in South Korea, one of the world’s largest IPP based in
France, a Malaysian Power Player and a Saudi Arabia based
EPC player. LTSL also received breakthrough orders in new
areas of business in Transmission & Distribution, Substation
Engineering and Renewables (Solar) and R&M Segments. It
also received the Golden Peacock National Quality Award
for excellence in Quality Systems and Processes, conferred
by Institute of Directors, India
For the year 2015-16, LTSL will continue to focus on
addressing clients’ need for cost optimized engineering
services within a tight execution schedule.
2x700 MW supercritical thermal power plant, Rajpura, Punjab. L&T provides EPC solutions for thermal power projects

133
Metallurgical & Material Handling Business
Overview:
Metallurgical and Material Handling (MMH) business
provides EPC (Engineering, Procurement & Construction)
solutions for ferrous (iron & steel making), non-ferrous
(aluminium, copper, lead and zinc) as well as bulk material
handling systems in the power, port, steel and mining
sectors. MMH business also offers Ash Handling Plant
(AHP) solutions to the power plants sector. MMH business
has comprehensive and robust design and engineering
capabilities to cater to the EPC needs across all disciplines.
It also has in-house facilities to manufacture high-end
equipment for the metallurgical and material handling
industries involving heavy fabrication, precision machining,
critical assemblies, etc. These manufacturing facilities are
located at Kansbahal (Odisha) and Kanchipuram (Tamil
Nadu).
Business Environment:
Business environment in India continues to remain sluggish
as industry debt is at all-time high, stressed margins in
spite of low raw material price and steel & power industries
continue to face multiple sectoral issues. All these factors
have impacted investments in new projects. The year
2014-15 was very challenging for power industry with
no major power plant expansions announced by private
players.
Government initiatives and commitment to bring
transparency is, however, expected to boost mining sector.
Coal Ministry plans to boost Coal India’s annual production
to the level of 1 billion MT by 2019. Thrust on Ultra Mega
Power Projects (UMPPs) 12000-16000 MW ordering is
expected in the year 2015-16.
Plants commissioned across various business units during
the year 2014-15 are:-
Material Handling package for Adani at Vizag,
Electric Arc Furnace for JSIS at Oman,
EMAL Aluminium Smelter expansion at Abu Dhabi,
Aditya Aluminium Smelter expansion at Lapanga,
Sinter Plant at Bhilai. L&T offers a single, dependable source from engineering to commissioning for every phase of steel making

134
Pulverized Coal Injection for HBF Tata Steel at Jamshedpur,
Coke Oven for Bhushan Steel at Angul, Pickling Line and
Tandem Cold Mill at Tata Steel Jamshedpur, and Drywall
Gypsum Board plant for Zawawi Minerals at Oman.
Material Handling Business Units of MMH business
continues to support the major power producers and
some of the projects either completed or in the advanced
stages of commissioning in the year 2014-15 include Coal
Handling Plants (CHP) for Jaypee Nigrie, DB Power, NTPL
Tuticorin and GMR Energy.
MMH business has secured two large EPC orders in
the GCC countries and is actively pursuing some other
prospects in this region.
MMH business managed to stay ahead of its competitors
in major bids in the year 2014-15 which include Hot Strip
Mill package for SAIL at Rourkela, BOF and Slab Caster for
SAIL at Bokaro, S&T Coal Washery at Dhanbad, and CHP
& AHP for NTPC at Khargone.
MMH business is currently executing major Metallurgical
projects for Tata Steel Limited at Kalinganagar, for SAIL
at Bhilai & Durgapur and for DPCL at Dolvi. Material
Handling packages for RRVUNL at Chhabra, MPPGCL
Malwa, Reliance Jamnagar, for Adani at Kandla & Mundra,
Northern & Mahanadi Coal field jobs at Nighai, Khadia and
Lingaraj and 10 other packages are concurrently under
execution for various other customers.
Mineral Beneficiation is seen as the major area of
investment in near future.
Industrial Machinery & Foundry Business Unit, Kansbahal,
has forayed into high end customised manufacturing for
steel, power, metallurgical, mining and other industrial
sectors. The primary products of Kansbahal include surface
miners, crushing systems, paper machinery, apron feeders,
sand plants and key equipment for coke oven, pellet and
steel making segment. The foundry section caters to coal
mill parts for thermal power such as grinding elements
and other cast parts.
The business is now fully equipped to manufacture high
end equipment involving heavy fabrication, intricate
castings, precision machining and critical assembly.
In the year 2014-15, Kansbahal unit supplied one large
size (1600 Tons per Hour) rotary breaker type crusher to
Rio Tinto, Mount Thorley Mines at Singleton, Australia,
custom built to suit specific site requirements. Another
prestigious international order received by the unit
included supply of 4 Nos. Apron Feeders for GRINDROD,
South Africa. Continuing the dominance in supplying
limestone crushing solutions to Indian cement Industry,
Kansbahal Unit also supplied biggest size Compound
Impactor in India with capacity of 1500 Tons per hour
this year to ACC, Jamul. It also launched its new range of
eco-friendly ‘Advanced Sand Manufacturing Solutions’ in
technical collaboration with Kemco, Japan. The 1st sand
classifier was supplied to L&T’s Western Dedicated Freight
Corridor project.
The manufacturing facility is strategically planning to
further augment and enhance its product portfolio with
new products like Grinding Track Carrier for pulverisiing
Mills and cast component for sinter plant, pallet plant and
Roll Chocks etc
The fabrication shop at Kanchipuram continues to provide
the support and strength of critical & heavy fabrication
Steel Melt Shop for a steel major in Oman 3600 TPH Stacker Reclaimer, Rajpura, Punjab. One of the many
industry-wide bulk material handling solutions provided by L&T

135
and assembly works of Material Handling Equipment like
Stackers, Reclaimers and host of other mid precision level
equipment catering to the Steel, Mining, Power and other
process plants.
Key success factors for the MMH business are customer
satisfaction, operational efficiency and consistent
performance. MMH has also established offices in the
Gulf countries to address international customer needs
and further increase its business potential.
Significant Initiatives:
MMH business has made strategic alliances with
leading global technologists as a part of its business line
diversification across various segments, which include:
• Paul Wurth - in Blast Furnace, Coke Oven, CDQ and
By-Product Plant.
• Outotec - in Sinter and Pellet plant.
• Primetals - in steel making caster and rolling
• Brass - in slurry pipe line
• METSO - in iron ore beneficiation
• DRA - in iron ore and base metals ore beneficiation
• Hatch, USA - in Iron Ore Beneficiation Plants
• Norwest and Kellogg Brown & Root - in Coal Washery
• UCC, USA - in ash and mill reject handling system
• Peninsula Alloys Inc., Canada - in Metal Matrix
Composite Casting
• ARD Crushing Ltd, UK - in Cone Crusher technology
• KEMCO, Japan - in advanced sand plant technology
• Ashton Bulk, U.K. – in high end Material Handling
Equipment
• Doppelmayr for Ropecon
As part of business augmentation drive, material handling
sector has envisaged opportunities in:
• Ash Handling including retrofit (Wet to Dry)
• EPC support for MDO (Mining, Development and
Operation)
• Rail Freight Handling System
• Operation & Maintenance for power plants.
The non-ferrous sector has started to expand its portfolio
into by-product plants for Zinc & Copper. Manufacturing
facility at Kanchipuram is exploring opportunities in Wind
Power Generation in India, wherein capacity addition
expected is at 11000 MW in next five years. Kansbahal unit
has also taken initiatives to explore business opportunities
in East & South Africa and GCC countries with a target of
15% sales through exports and is also expecting 20-25%
sales through new products.
Constant efforts are on to further strengthen the in-house
capabilities. The Material Handling unit has taken the help
of Delft University, Netherlands to enhance engineering
capability of Long Belt Conveyor (LBC), Pipe conveyor &
Shiftable Conveyors. Operational excellence initiatives
implemented across all job sites are poised to impact and
improve the profitability.
During the year, MMH business has initiated various cost
control measures like restructuring of business operations,
right sizing manpower, improve productivity through
operation excellence. Going forward, these initiatives will
benefit the organisation in a better manner.
Outlook:
Steel Sector is currently facing sectoral challenges with
global steel prices at rock bottom and high level of industry
debt across steel players. Some of the positive regulatory
interventions such as allocation of coal mines and increase
in import duty on steel have, however, started to show
signs of improvement in domestic steel sector.
The Ministry of Steel has set ambitious plan to invest in
modernization and expansion of steel plants in various
PSUs and has also taken several initiatives like setting up
of Inter-Ministerial Group and Project Monitoring Group
for effective coordination and expediting implementation
of various investment projects in the steel sector. All these
initiatives provide greater opportunities in steel sector.
Power sector has an investment potential of more than
200 billion USD in the next five years. The Ministry of
Power has set ambitious target to double production
capacity to two trillion units of energy by 2019. All these
initiatives are expected to provide lot of opportunities for
MMH business.
1600 TPH Rotary Breaker

136
Heavy Engineering Business
Overview:
The Heavy Engineering business is involved in design,
engineering, production,delivery and commissioning of
custom designed critical equipment & systems to core
sectors like Fertilizer, Refinery, Petrochemical, Chemical, Oil
& Gas, Thermal & Nuclear Power, Aerospace and Defence.
The business has a good track record in executing large,
complex projects with a high technology base on account
of its capabilities consisting of in-house engineering, R&D
centers, world class production facilities, experienced and
competent project team and safe work culture.
The Heavy Engineering business is structured into two
Strategic Business Groups (SBGs):
• Process Plant Equipment and Nuclear
• Defence and Aerospace
Process Plant Equipment and Nuclear (PP&N) SBG is
involved in manufacture of large complex equipment
such as Heat exchangers for process plants and equipment
for the Nuclear Power sector. Heavy manufacturing is
undertaken at work centers located in Mumbai, Hazira
and at Sohar in Oman. The business has also put in place
a team for capturing opportunities in Modification Revamp
& Upgrade (MRU). Ranoli near Vadodara handles precision
fabrication in Stainless Steel and titanium on process plant
side.
The business is proud to be associated with International
Thermonuclear Experimental Reactor (ITER), the world’s
largest ‘first-of-its-kind’ fusion reactor. While sections of
the 30 M diameter, 3700 MT stainless steel cryostat for
ITER project are being manufactured at the Hazira facility,
the business has setup a workshop in France for assembly
of these sections.
Defence and Aerospace (D&A) SBG is involved in
conceptualisation, design, development and production of
complex systems including Artillery systems, Land & Naval
Weapon systems, Fire Control Systems, Naval equipment
and systems, Underwater Platforms, Engineering Systems
for Land & Marine forces, C4I systems, Missile systems
Pinaka multi-barrel rocket-launcher. L&T works closely with defence research organisations to develop and manufacture weapon and missile systems
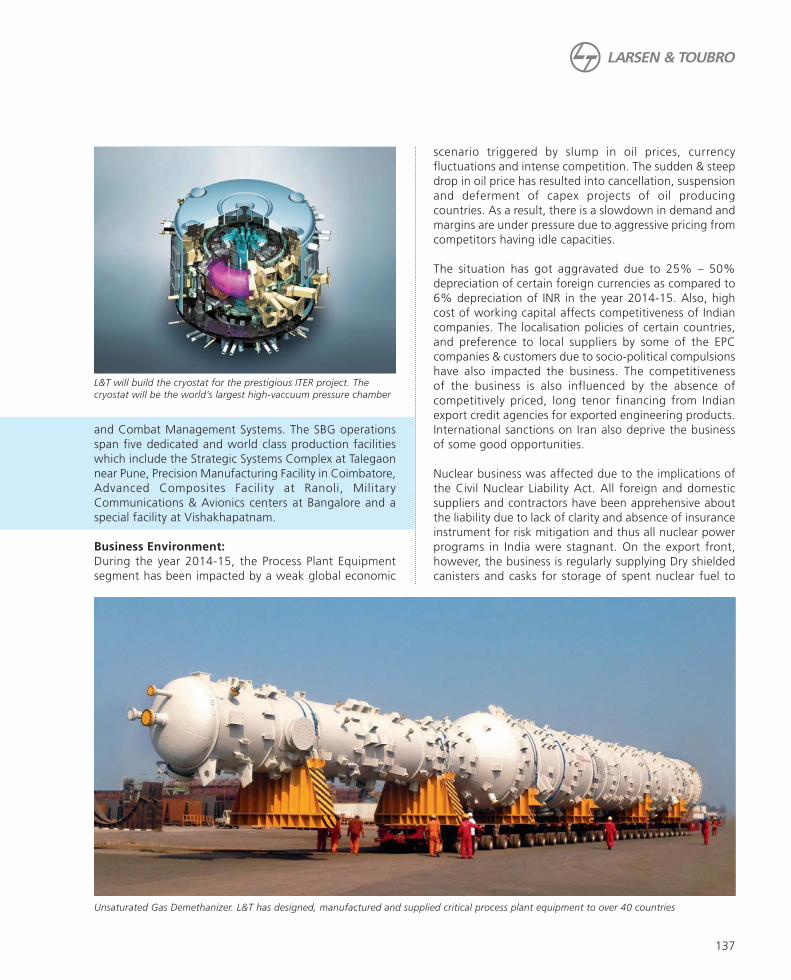
137
Unsaturated Gas Demethanizer. L&T has designed, manufactured and supplied critical process plant equipment to over 40 countries
and Combat Management Systems. The SBG operations
span five dedicated and world class production facilities
which include the Strategic Systems Complex at Talegaon
near Pune, Precision Manufacturing Facility in Coimbatore,
Advanced Composites Facility at Ranoli, Military
Communications & Avionics centers at Bangalore and a
special facility at Vishakhapatnam.
Business Environment:
During the year 2014-15, the Process Plant Equipment
segment has been impacted by a weak global economic
scenario triggered by slump in oil prices, currency
fluctuations and intense competition. The sudden & steep
drop in oil price has resulted into cancellation, suspension
and deferment of capex projects of oil producing
countries. As a result, there is a slowdown in demand and
margins are under pressure due to aggressive pricing from
competitors having idle capacities.
The situation has got aggravated due to 25% – 50%
depreciation of certain foreign currencies as compared to
6% depreciation of INR in the year 2014-15. Also, high
cost of working capital affects competitiveness of Indian
companies. The localisation policies of certain countries,
and preference to local suppliers by some of the EPC
companies & customers due to socio-political compulsions
have also impacted the business. The competitiveness
of the business is also influenced by the absence of
competitively priced, long tenor financing from Indian
export credit agencies for exported engineering products.
International sanctions on Iran also deprive the business
of some good opportunities.
Nuclear business was affected due to the implications of
the Civil Nuclear Liability Act. All foreign and domestic
suppliers and contractors have been apprehensive about
the liability due to lack of clarity and absence of insurance
instrument for risk mitigation and thus all nuclear power
programs in India were stagnant. On the export front,
however, the business is regularly supplying Dry shielded
canisters and casks for storage of spent nuclear fuel to
L&T will build the cryostat for the prestigious ITER project. The
cryostat will be the world’s largest high-vaccuum pressure chamber

138
• Innovation
• Enterprise-wide Collaboration for Alignment with
Strategy (ECAS) & Employee Engagement
• LAKSHYA (Strategy perspective planning exercise)
‘Theory of Constraints’ based ‘Critical Chain Project
Management’ targets improving execution and delivery
performance. It uses a process to identify the constraints
and to focus the organisation and prioritise actions so as
to increase the flow.
Operational excellence measures such as productivity
monitoring, knowledge management across products,
optimum inventory management are undertaken for the
products under execution. Awareness of the need to
control working capital has been percolated across all levels
in Organisation and a stringent control is being exercised.
ECAS seeks to enhance Organisational Excellence through
a strategy of promoting Customer Intimacy and a culture
of cross functional collaboration. A Cross-functional
collaboration survey was conducted across locations to
take stock of collaboration levels.
The business strives for continuous improvement for
the protection and development of health, safety and
environmental assets of its employees and stakeholders.
During the year, the business continued its thrust on the
safety cultural transformation through various initiatives
like ‘Behaviour Based Safety’. Local councils to drive
employee engagement and operational excellence
initiatives at local level, employee engagement, feedback
and ideation workshops are conducted with the objective
of creating an innovative, involved and committed work
force. Team building workshops across various businesses
were organised to build a culture of camaraderie and
strengthen employee bonding. The business continued
to engage key business development personnel and
international business heads in select geographies.
Product & Technology Development Centers focus on
new product development and development of improved
manufacturing technology. These Centers are engaged
in enhancing technologies related to process industries,
manufacturing, mechanical systems, defence electronics
& embedded software solutions and submarine designs.
These Centers provide specific emphasis on welding
& metallurgy, composite material, heat transfer,
hydrodynamics, computational fluid dynamics, stress
analysis, drives, microwave & RF, embedded systems,
high availability systems and military communication.
Significant initiatives have been taken by these Centers
to focus on new product development either through
internal development projects or through participation L&T has played a key role in various aspects of the design and
manufacture of India’s first Nuclear Powered Submarine
utilities in USA.The production centers have been audited
and approved by the US Nuclear Regulatory Commission
for this purpose.
The Defence& Aerospace segment is a technology driven
segment with a long ‘bid to award’ cycle and order inflow
has been impacted primarily due to the continuing effect
of deferment in decisions by the past government over
preceding two financial years. Major orders secured in
this segment during the year 2014-15 include production
orders for Artillery systems upgrade and land engineering
systems. The first non-offset export order received from
Philippines this year marks a significant breakthrough in
the International Market. At the same time, some repeat
orders have been deferred by the Government.
On the execution front, the year saw award-winning
process improvements leading to record production rate of
‘missile-a-day’ (Akash) output at Coimbatore, and healthy
progress in serial production of bridging systems from
Strategic System Complex, Talegaon. Revenues, and thus
PBIT in FY 2014-15 are, however, expected to be lower
due to long cycle time of orders at hand and technological
challenges. The SBG has recorded healthy collections of
v 1650 crore, which has resulted in significant improvement
of the Net Working Capital.
Significant Initiatives:
In order to maintain leadership position in the Process
Plant & Defence sector, focused team initiatives are taken
under a campaign titled “UDAAN”
Some of the initiatives under “UDAAN” are:
• Sustainability and Corporate Social Responsibility
Initiatives
• Implementation of Theory of Constraints
The photograph is for representation purposes only, and does not purport
to be a photograph of the actual nuclear-powered submarine.

139
in opportunities presented by “Make” & “Buy & Make -
Indian” programs or through collaborative programs with
National laboratories such as DRDO and ISRO.
The steering group, comprising the top management of
the business, plans, oversees & monitors all these initiatives
through regular review meetings.
Understanding its social responsibility, the business has
taken a unique environment-friendly initiative where,
instead of welcoming guests or felicitating individuals with
traditional flower-bouquets, tree plantation certificates
are used. This practice is now being increasingly adopted
across other units in the company.
Outlook:
Many of the projects deferred due to the global economic
crisis are expected to move forward in the coming years.
Middle East, Iran and South America offer good prospects
in the short to medium term. In the Process Plant Equipment
business, new investments in refineries are expected to be
low on account of low oil prices which are expected to
remain in range of $50-$80 per barrel for the coming 2-3
years. The business plans to tap business in North America
for growth in coming years. The business has recruited a
senior expat in North America to tap this market. Other
than refinery business, the business expects that around
6 thermal power plants in India and 5 more in South East
Asia would be finalised during the year 2015-16. The
business also expects 3 fertilizer plants to be launched
in the year 2015-16. Further to this, US-Iran discussion
seem to have concluded successfully and a large business
potential is seen in Iran. To start with, the business will
target the industries which do not fall under sanctions.
Generally, however, depreciated foreign currencies and
slow demand is expected to continue to exert pressure on
margins and competitiveness in the year 2015-16.
With clarifications given by Ministry of External Affairs, risk
and uncertainties of civil nuclear liability seem to have been
addressed through the proposed Indian Nuclear Insurance
Plan (INIP). This is expected to revive all Indian nuclear
programs based on domestic and foreign technologies.
In the long term, Russian, French & American plans to
setup nuclear plants in India, will generate substantial
business opportunities for both manufacturing shops and
LTSSHF. L&T has entered into strategic teaming agreement
/ MoU with the concerned foreign technology suppliers
and can look forward to a global presence in this industry.
Due to stiff competition in international markets, foreign
OEMs are looking at cost effective solutions through
plant upgrades & de-bottlenecking, and this opens up
opportunities for the business.
The ‘Make in India’ campaign has given a renewed thrust
to Indigenisation of Defence Sector with strong emphasis
on enhanced role for Private Sector. This is visible from
the pace and volume of clearance of new programs
(totaling >v 1.7 lakh crore) over the past 10 months, across
various sectors such as Naval Platforms, Artillery Systems,
Aircrafts & Helicopters. The various steps taken by the
Government, which include some increase in the Defence
budget, assurances by the top echelons towards quicker
decision making, continuing efforts towards streamlining
processes and procedures for ease of business and focus
on creation of level playing field for DPSUs, foreign
companies and Indian private industry, present a positive
outlook for business. Besides, there is also a strong focus
on defence exports through collaboration between DRDO,
DPSUs and Private Sector. Upcoming opportunities in the
defence sector in the medium term include Artillery & Air
Defence gun programs, Surface & Naval radars, Missiles
and Military communication programs. Over the years,
L&T has made strategic investments in segment-specific
infrastructure and technology, through in-house R&D &
product development, for the Defence sector. Significant
Technology & Product Development Initiatives are being
undertaken in selected fields. The business is“future
ready” to play a proactive role towards self-reliance in
strategically important areas.
The business envisages good market opportunities in
the medium to long term and is well positioned with
the necessary technology, largely home grown, state of
art manufacturing facilities, with a young and dedicated
work-force, all of this augurs well for the business to tap
upcoming business opportunities.
Major Subsidiary Companies
L&T SPECIAL STEELS AND HEAVY FORGINGS
PRIVATE LIMITED (LTSSHF):
LTSSHF is a joint venture (JV) between Larsen & Toubro (L&T)
and Nuclear Power Corporation of India Limited (NPCIL)
with L&T holding 74% equity stake. The JV Company has
set up a fully integrated manufacturing facility at Hazira,
Gujarat to produce ingots and finished forgings required
for critical equipment in nuclear power and hydrocarbon
industry, rotors in power industry, rolls in steel plants and
other heavy forgings for general engineering applications.
The setting up of LTSSHF constitutes a major strategic step
towards achieving India’s independence from imports of
heavy forgings and for ensuring timely supply of heavy
forgings for nuclear power plants. LTSSHF commenced
commercial operations from October1, 2012 with a
capacity to produce ingots weighing upto 300 MT each
and heavy finished forgings weighing up to 120 MT each.
The annual capacity for finished forgings is 40000 MT.

140
During the year, the Company has successfully produced
Special Steels in various grades, ingots weighing up to
200 MT - the largest size in the country and manufactured
heavy forgings required for critical equipment in refineries,
fertilizers, nuclear, power and other segments. A vertical
shaft furnace facility required for manufacture of rotors
has been commissioned. The company has been successful
in qualifying its facility to meet the requirement of several
customers and obtaining development orders. The
company has, however, faced fierce competition from
global established players. This is primarily due to excess
overall global capacity and a reduced demand. Focused
efforts are on for improving production processes and
manufacturing efficiencies in order to remain competitive.
Technical collaboration for a specified range, with Japan
Steel Works, world leaders in special forgings, has shown
good results. The company has undertaken additional
work involving value-addition beyond forging and is
actively exploring suitable opportunities in new areas such
as specialised & large medical equipment to tide over the
current difficult period. In the mid-term, with the imminent
release of Indian Nuclear projects and progress on the
Russian, French & American fronts for new Light Water
Reactors, LTSSHF envisages a much improved scenario
within the next 3 years
SPECTRUM INFOTECH PRIVATE LIMITED (SIPL):
SIPL is a wholly owned subsidiary of Larsen &Toubro Limited.
SIPL undertakes technology development and manufacture
of products in the highly specialised area of Avionics. Line
Replaceable Units –LRUs, for military aircraft applications
have been successfully produced and deployed. SIPL
concentrates largely on product development in embedded
solutions, control and signal processing for defence sector
and undertakes technology development and manufacture
of avionics products. SIPL is certified for such products
by Centre for Military Airworthiness and Certification
(CEMILAC), Ministry of Defence. SIPL has also obtained
AS9100 Rev C, ISO 9001 and IS0 27001 certifications.
LRUs designed and manufactured by SIPL are on-board
the Light Combat Aircraft (LCA). SIPL has also developed
technology to position and control high precision Gimbal
platform for directed energy weapon applications and is
a key player in the design, development and engineering
of Integrated Life Support System for LCA.
New programs like LCA MKII, LUH, LCH and HTT40 have
opened new business opportunities in the avionics domain.
Increased competition from smaller firms and entry of
new players coupled with volatility in foreign exchange
rates have, however, resulted in a challenging business
environment.
LARSEN & TOUBRO HEAVY ENGINEERING LLC:
Larsen & Toubro Heavy Engineering LLC is a Joint Venture
with Zubair Corporation, established in Sohar, Sultanate of
Oman. L&T, through its wholly owned subsidiary Larsen and
Toubro International FZE, holds 70% in the Company. The
heavy engineering facility was commissioned in October
2009. The Company focuses on business in the Middle East,
mainly GCC countries and supplements manufacturing
and fabrication facilities located in India. The company
seeks to leverage the geographical advantage with Oman
Government’s in-country-value requirements, Clean Fuel
projects coming up in Kuwait, Oman’s expected large
value investments in the hydrocarbon sector, and revamp
prospects in certain ageing refinery projects offer good
potential for the facility which has already established itself
by producing a variety of complex equipment.

141
Electrical & Automation Business
Overview:
The Electrical & Automation (E&A) business offers a wide
range of products and solutions for electricity distribution
and control in industries, utilities, infrastructure, buildings
and agriculture sectors. Its basket of offerings include Low
and Medium Voltage Switchgear components, Electrical
Systems, Marine Switchgear systems, Industrial & Building
Automation Solutions, Surveillance Systems, Energy
Meters and Protection Relays.
E&A business is supported by its five decades of experience
in in-house design & development that facilitates the
introduction of contemporary products and a high precision
tool manufacturing facility which is a pre-requisite for
high quality manufacturing. E&A runs six Switchgear
Training Centres across the country that impart training
and learning on good electrical practices to engineers,
consultants, contractors, technicians and electricians.
Currently, E&A business has manufacturing facilities at
Navi Mumbai (Mahape & Rabale), Ahmednagar, Vadodara,
Coimbatore and Mysuru in India as well as in Saudi Arabia,
Jebel Ali (UAE), Kuwait, Malaysia, Indonesia, Australia and
the UK.
The constituents of E&A business are two Strategic
Business Groups (SBGs) and designated subsidiaries. In
India, both the SBGs have under them two Business Units
(BUs) each. The Products SBG includes Electrical Standard
Products (ESP) and Metering & Protection System (MPS)
business units while Projects SBG comprises Electrical
Systems & Equipment (ESE) and Control & Automation
(C&A) business units respectively.
Business Environment
The year 2014-15 did not see any perceptible change at
the ground level in any segment. The Indian manufacturing
sector saw a decline from 18% to 17% of GDP according
to the new GDP data released by Government of India
and manufacturing exports remained stagnant at about
10 % of GDP.
India’s widest range of switchgear. L&T switchgear leads the way in the agricultural, industrial, building and commercial sectors

142
The economics slow-down led to a financial crunch at many
industrial sectors due to which new plants / expansions
were not announced. Also, around 40% of the prospects
got deferred to next year. With lesser opportunities in the
market, competition became fiercer and led to lower price
realisation. To further compound difficulties, factors like
irregular rainfall and deficit monsoon impacted sales in the
agricultural segment.
Even the international market remained quite calm. With
the reduction in dependence by US on oil imports, oil prices
saw a steep drop that affected the oil & gas sector, leading
to postponement of CAPEX and OPEX cycles. Infra projects
have, however, seen an upswing in view of FIFA-2022 in
Qatar and EXPO-2020 in Dubai in the current year.Lots of
activities were seen in metro and airport projects in Middle
East countries.
With Ti and T-Era range of switchboard and improved
automation solutions, E&A business is better positioned
to get its share of orders. It is currently engaged in talks
with EPC contractors and is in the process of obtaining
approvals.
During the year 2014-15, ESP witnessed two developments
–separation with Yaskawa (for Drives business) and Hager
(Branding agreement for Air Circuit Breakers) leading to
a decline in sales.
Significant Initiatives:
In spite of the tough market condition, E&A was able
to maintain its growth trend for both revenue as well as
bottom line, surpassing industry average. The contributors
to this success were best manufacturing practices,
operational improvement initiatives and introduction of
new products throughout the year.
E&A continued to devote its resources and capabilities to
the research & developmental endeavors, which is one
of its core strengths. Its in-house design & development
capabilities are rated among the best in the industry.
The facilities at Powai–Mumbai, Ahmednager, Mysuru,
Mahape and Coimbatore are approved by the Department
of Scientific & Industrial Research, Ministry of Science &
Technology. These centers network with international
labs, testing centers and academic institutions for keeping
abreast of new technology trends and introducing those
for customers in different segments.
During the year, E&A business filed as many as 152 Patent,
14 Trademark, 5 Design and 5 Copyright applications in
India, along with 6 foreign applications (all patents; 5
PCT National Phase; 1 Convention application). This was
the 8th consecutive year of filing more than 100 patent
applications. E&A won the “Top Organisations for Designs”
award from The Indian Intellectual Property Office which
confers annual National Intellectual Property (IP) Awards
on outstanding innovators, organisations and companies
in the field of patent, designs, trademarks and geographic
indications on World IP day on 26th April every year.
The year saw production ramp up inmodular devices and
MCCBs (Molded case circuit breaker) at Ahmednagar
and Vadodara facilities respectively. With the start of
manufacturing of new range of bus bar trunking system
at Coimbatore, a cost effective product was added to the
product portfolio of ESP. The year also witnessed the closure
of E&A’s 6 decades-old manufacturing facility at Powai and
shifting of the same to a world class facility in Mahape,
Navi Mumbai. There was a major thrust on extensive sales
promotion activities like seminars, technology conclaves,
road shows, mass media campaign and stockists’ shop
up-gradation etc. The training efforts of the business also
got a boost through higher participation at its six training
centers.
MPS introduced new single phase meters ‘Alpha’ & ’Alpha
Plus’, Single Phase Meter with ZigBee radio used in AMR
system,Cl.1 Whole Current Meter with IR (Infra-Red)
communication port, Over current & Earth fault Relay with
RS-485 port. During the year 2014-15, MPS received a
prestigious order from Tata Power to supply 5000 nos. 1
Phase Meter with LPR (Low Power Radio Modem), which
when completed would be India’s largest mesh network.
MPS provided the required support to Tata Power for
installation of first 500 meters.
E&A could improve its profitability despite tight market
conditions primarily because of better product mix,
subdued material prices and operation efficiencies. In spite
of best efforts to contain customer outstanding, the funds
employed by the business increased due to prevailing
liquidity situation.
During the year, E&A entered the Confederation of Indian
Industry (CII)’s list of Top 26 Most Innovative Companies
in India and was awarded during CII’s Industrial Innovation
Awards 2014. For Value Engineering (VE) efforts, E&A won
the Handa Golden Key Award instituted by Indian Value
Engineering Society (affiliated to SAVE International). E&A’s
Human Resource won 4 HR ACE Awards (Most Effective
People Development Intervention (1st Prize), Tech Champ
(1st Prize), Senior Level People Champion (1st Prize), Extra
Mile (3rd Prize)), CII National Award for HR Excellence for
PMC, Coimbatore and 2 Golden Globe Tiger Awards 2015
in the HR categories of – Best Mentoring Programme &

143
Best Change Management Initiative respectively at Kuala
Lumpur, Malaysia. MPS won as many as 24 Awards (9
Gold, 11 Silver, 4 Bronze & 1 Appreciation) at 5th Regional
QCFI (Quality Circle Forum of India) Convention 2015.
C&A won Bronze award for RAPDRP, executed for
Maharashtra State Electricity Distribution Company Ltd.
(MSEDCL), at First Maharashtra State e-Governance
Function and was also ranked as #3 System Integrator
in Global Survey of System Integrator Giants 2014 by
Control Engineering. ESP team won the 1st prize for
Six Sigma project in Lean Six Sigma Excellence Awards
2014 (LSSEA ’14) organised by Symbiosis Centre
for Management & Human Resource Development
(SCMHRD) in the Manufacturing category. ESP’s QC
Circle at Ahmednagar Switchgear Works bagged the
3rd position at CII’s Maharashtra Quality Circle (QC)
competition held at Kolhapur. ESP’s Vadodara Switchgear
Works (VSW) received ‘Certificate of Appreciation’ from
the Office of the Chief Commissioner of Central Excise,
Customs & Service Tax, and Vadodara zone during the
award ceremony that coincided with Central Excise Day
2015. ESE’s manufacturing facility at Coimbatore won
the 3rd Prize at the 5S Excellence Award ceremony in
Manufacturing – Large Scale category - organised by CII,
Southern Region.
Outlook
With the new government at the center, positive sentiments
are seen in the domestic market. Government spending is
likely to increase in the coming years. An uptrend is also
seen in orders from electrical utilities which is expected
to grow by 15% in coming years. Utilities will continue
to explore new technology and pilots for new technology
will continue into the year 2016-17. E&A business also
sees improvement in demand from agro industries,
pharma, textile, cement & steel sectors. The Government’s
announcement for transforming 100 cities into smart cities
and focusing on Tier 2 and 3 cities holds good potential
for E&A business.
In the area of renewable energy, the Government has
significantly revised the solar energy generation target
to be achieved by 2022. This is an area of opportunity
for E&A.The new Government has given clearance to
many naval as well as coast guard projects. The defense-
offset clause applicable to India’s imported vessels and
submarines increases opportunities for suppliers like
E&A’s marine switchgear which offers complete electrical
& control solutions for warships & submarines under one
roof. Money scarcity is likely to continue in the coming
year as Government auctions would absorb a lot of money
from the monetary system. With Euro weakening over
USD, the competitor cost of imports will be cheaper in
domestic market, leading to fierce price competition.
Projects are expected to be deferred or delayed in both
Middle East and Malaysia due to drop in oil prices. All major
customers have announced or indicated huge reduction
in Opex and Capex. Social infrastructure projects like
hospitals and metro are, however, expected to continue
as planned. Metro projects in GCC are expected to add to
revenue only in the year 2016-17 but ground work is being
targeted in the current year to increase E&A’s chances of
success. A special task force team has been formed to work
specifically on metro/railway projects coming up in GCC.
The key role for this team would be to create a strategic
alliance with main contactors from the bidding stage and
working with them to tap into these opportunities.
The key to success in the year 2015-16 will be effective
implementation of business verticals and re-organisation
of marketing zones and territories to focus on large
product portfolio for ESP. The key focus areas will be retail
L&T’s new range of high-tech AC Drives for varied applications Mumbai International Airport Network Operations Centre - powered
by L&T’s control and automation systems and expertise

144
and agricultural sectors in India. Another growth driver
would be venturing into new geographies like Myanmar,
Philippines, Vietnam and Cambodia where economy looks
buoyant. E&A plans to introduce array of new products
such as AU range of final distribution products, 690V
MCCBs, Vacuum contactors, pre-paid/smart meters and
launch of full range of Enersys M and Ti distribution boards
catering to infrastructure segment in domestic as well as
international market which are expected to increase the
revenue contribution coming from new products.
Major Subsidiary Companies
TAMCO GROUP OF COMPANIES:
TAMCO is the leading manufacturer of Low and Medium
Voltage switchgear in South East Asia with manufacturing
facilities in Malaysia, Indonesia and Australia. Its products
are widely used in power, oil & gas, construction and
manufacturing industries. Through extensive R&D and
advanced manufacturing technology, TAMCO has been
able to deliver high quality, safe, reliable and cost effective
products and solutions. Its strength lies in the flexibility
to develop and adapt products to meet customers’ needs
and, therefore, it has a high reference list across the globe.
The year 2014-15 was a year of mixed outcomes for
TAMCO. Though there were significant achievements like
getting recommended for the first 5 packages of Petronas
RAPID project, getting approval from ENA for supplying
to UK Utilities and developing a local BUMI partner for
quoting in TNB tenders, the performance of the group was
not satisfactory. The bottom line was significantly affected
on executing low margin orders, losses in Indonesia and
Australia subsidiaries in view of economic slowdown.
Fall in oil prices have led to a delay in oil & gas projects.
Added to this, the devaluation of the Euro has made the
European companies become more competitive. With
most manufacturers having excess capacities, there is a
price war to garner the available orders in the market.
Thus, the year 2015-16 looks to be a challenging year in
the Middle East, though prospects from utility companies
are likely to continue.
The key strategies for the year 2015-16 include reduction
in discretional costs and extensive value engineering
measure for material cost savings, improving operational
efficiency, launch of a new compact and cost effective
Gas Insulated Switchgear (GIS) & Ring Main Unit (RMU)
for various markets, getting approved by Saudi Electricity
Company and in Kuwait markets.
L&T ELECTRICAL & AUTOMATION FZE (LTEAFZE):
L&T Electrical & Automation FZE (LTEAFZE) is a 100%
subsidiary of L&T International FZE based in UAE. The
company provides Systems Integration solutions in the Oil
& Gas, Power, Water and Waste Water and Infrastructure
space like Airports, Hospitals, Stadiums and Transportation
segment like Metro and Rail. The solutions are centered
around Process Automation and Telecommunication
applications catering to customers / contractors in the
Middle East, Africa, CIS and Turkey markets. It has state-
of-the-art facility in Jebel Ali Free Zone and is accredited
with ISO 9001, 18001, 27001 and TUV for functional
safety.
The Company has had a below average year in terms of
achievements. The costs surpassed the estimation on the
projects, leading to a moderate bottom line, lower than
previous year. The plans are to be better prepared for the
variations in the costs on the project so as to maintain
sustainable performance.
The business outlook of the region presents a cautious but
optimistic approach. The slide in oil prices has resulted in
oil majors revisiting some of the investments and reducing
opex as well as cutting down on manpower to reduce
costs.
Projects on the drawing board, Front end engineering
drawing (FEED) stage have slowed down considerably.
Infrastructure projects have taken a big hit. Contractors
are delaying payments due to tightness of money supply
in the market. Oil & Gas projects will concentrate mainly
in off-shore and revamp to improve efficiency.
Projects announced in the infrastructure segment are likely
to continue, especially those that affect people at large
such as hospitals and metro projects. The key to success
would be focus on metro opportunities like Riyadh Metro,
Doha Metro, Oman Rail, technology tie ups and target
opportunities in brown field projects.
L&T ELECTRICALS AND AUTOMATION SAUDI ARABIA
COMPANY LIMITED, LLC (LTEASA):
L&T Electrical & Automation Saudi Arabia Company Limited
(LTEASA) is the result of a joint venture with Yusuf Bin
Ahmed Kanoo Group of Kingdom of Saudi Arabia (KSA).
It has set up a state-of-the-art integrated manufacturing
facility in Dammam to cater to the customers in and
around Saudi Arabia. The company offers complete range
of electrical systems and switchgear components in the
Saudi Arabia/ Middle East region in Low and Medium
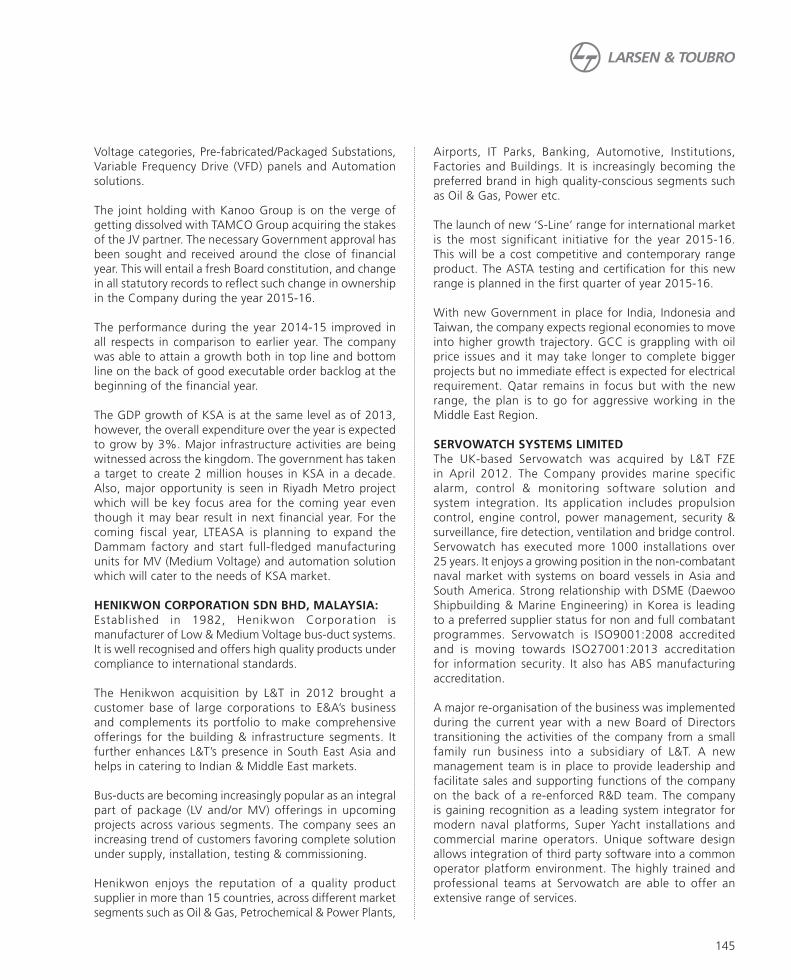
145
Voltage categories, Pre-fabricated/Packaged Substations,
Variable Frequency Drive (VFD) panels and Automation
solutions.
The joint holding with Kanoo Group is on the verge of
getting dissolved with TAMCO Group acquiring the stakes
of the JV partner. The necessary Government approval has
been sought and received around the close of financial
year. This will entail a fresh Board constitution, and change
in all statutory records to reflect such change in ownership
in the Company during the year 2015-16.
The performance during the year 2014-15 improved in
all respects in comparison to earlier year. The company
was able to attain a growth both in top line and bottom
line on the back of good executable order backlog at the
beginning of the financial year.
The GDP growth of KSA is at the same level as of 2013,
however, the overall expenditure over the year is expected
to grow by 3%. Major infrastructure activities are being
witnessed across the kingdom. The government has taken
a target to create 2 million houses in KSA in a decade.
Also, major opportunity is seen in Riyadh Metro project
which will be key focus area for the coming year even
though it may bear result in next financial year. For the
coming fiscal year, LTEASA is planning to expand the
Dammam factory and start full-fledged manufacturing
units for MV (Medium Voltage) and automation solution
which will cater to the needs of KSA market.
HENIKWON CORPORATION SDN BHD, MALAYSIA:
Established in 1982, Henikwon Corporation is
manufacturer of Low & Medium Voltage bus-duct systems.
It is well recognised and offers high quality products under
compliance to international standards.
The Henikwon acquisition by L&T in 2012 brought a
customer base of large corporations to E&A’s business
and complements its portfolio to make comprehensive
offerings for the building & infrastructure segments. It
further enhances L&T’s presence in South East Asia and
helps in catering to Indian & Middle East markets.
Bus-ducts are becoming increasingly popular as an integral
part of package (LV and/or MV) offerings in upcoming
projects across various segments. The company sees an
increasing trend of customers favoring complete solution
under supply, installation, testing & commissioning.
Henikwon enjoys the reputation of a quality product
supplier in more than 15 countries, across different market
segments such as Oil & Gas, Petrochemical & Power Plants,
Airports, IT Parks, Banking, Automotive, Institutions,
Factories and Buildings. It is increasingly becoming the
preferred brand in high quality-conscious segments such
as Oil & Gas, Power etc.
The launch of new ‘S-Line’ range for international market
is the most significant initiative for the year 2015-16.
This will be a cost competitive and contemporary range
product. The ASTA testing and certification for this new
range is planned in the first quarter of year 2015-16.
With new Government in place for India, Indonesia and
Taiwan, the company expects regional economies to move
into higher growth trajectory. GCC is grappling with oil
price issues and it may take longer to complete bigger
projects but no immediate effect is expected for electrical
requirement. Qatar remains in focus but with the new
range, the plan is to go for aggressive working in the
Middle East Region.
SERVOWATCH SYSTEMS LIMITED
The UK-based Servowatch was acquired by L&T FZE
in April 2012. The Company provides marine specific
alarm, control & monitoring software solution and
system integration. Its application includes propulsion
control, engine control, power management, security &
surveillance, fire detection, ventilation and bridge control.
Servowatch has executed more 1000 installations over
25 years. It enjoys a growing position in the non-combatant
naval market with systems on board vessels in Asia and
South America. Strong relationship with DSME (Daewoo
Shipbuilding & Marine Engineering) in Korea is leading
to a preferred supplier status for non and full combatant
programmes. Servowatch is ISO9001:2008 accredited
and is moving towards ISO27001:2013 accreditation
for information security. It also has ABS manufacturing
accreditation.
A major re-organisation of the business was implemented
during the current year with a new Board of Directors
transitioning the activities of the company from a small
family run business into a subsidiary of L&T. A new
management team is in place to provide leadership and
facilitate sales and supporting functions of the company
on the back of a re-enforced R&D team. The company
is gaining recognition as a leading system integrator for
modern naval platforms, Super Yacht installations and
commercial marine operators. Unique software design
allows integration of third party software into a common
operator platform environment. The highly trained and
professional teams at Servowatch are able to offer an
extensive range of services.

146
The company redefined the product lines to meet market
requirements with successful launch of ServoCore product
aimed at developing commercial off-the-shelf automation
system product.
Shipbuilding (especially in the Naval sector), particularly
in the Far East, remains strong and the company seeks to
take advantage of its growing reputation in this sector.
High volume commercial shipping projects also remain a
target for the company in the coming year.
KANA CONTROLS GENERAL TRADING &
CONTRACTING COMPANY WLL (Kana Controls)
LTEAFZE acquired the Kuwait-based Kana Controls General
Control & Trading Company in September 2013. Kana
Controls established in 1990, offers systems for all type of
automation including Field Instruments & Sensors, Flame
Detection & Combustion, Termination & Wiring devices,
Panel Mounted Instruments & devices, Interface devices,
Power Supplies, Panels & Enclosures.
Kana Controls is approved with most customers in Kuwait
and provides a good platform to serve the control &
automation business opportunities in Kuwait.
Switchboard installation at a power plant. L&T provides power distribution and control solutions across the value chain, from generation to end-user
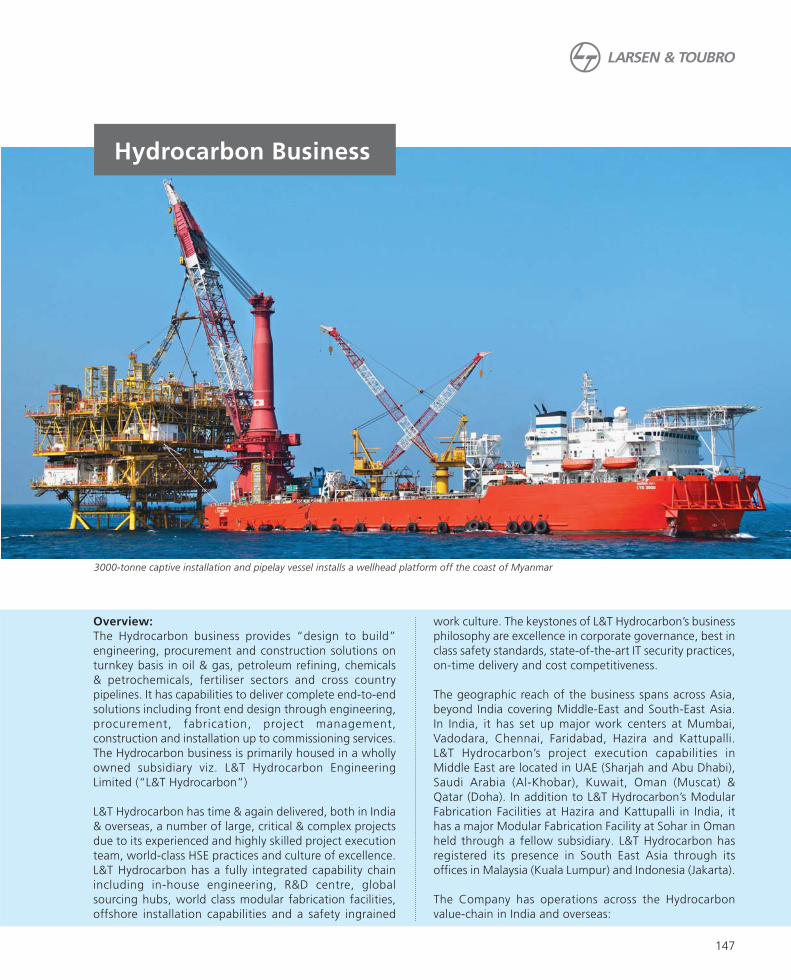
147
Overview:
The Hydrocarbon business provides “design to build”
engineering, procurement and construction solutions on
turnkey basis in oil & gas, petroleum refining, chemicals
& petrochemicals, fertiliser sectors and cross country
pipelines. It has capabilities to deliver complete end-to-end
solutions including front end design through engineering,
procurement, fabrication, project management,
construction and installation up to commissioning services.
The Hydrocarbon business is primarily housed in a wholly
owned subsidiary viz. L&T Hydrocarbon Engineering
Limited (“L&T Hydrocarbon”)
L&T Hydrocarbon has time & again delivered, both in India
& overseas, a number of large, critical & complex projects
due to its experienced and highly skilled project execution
team, world-class HSE practices and culture of excellence.
L&T Hydrocarbon has a fully integrated capability chain
including in-house engineering, R&D centre, global
sourcing hubs, world class modular fabrication facilities,
offshore installation capabilities and a safety ingrained
work culture. The keystones of L&T Hydrocarbon’s business
philosophy are excellence in corporate governance, best in
class safety standards, state-of-the-art IT security practices,
on-time delivery and cost competitiveness.
The geographic reach of the business spans across Asia,
beyond India covering Middle-East and South-East Asia.
In India, it has set up major work centers at Mumbai,
Vadodara, Chennai, Faridabad, Hazira and Kattupalli.
L&T Hydrocarbon’s project execution capabilities in
Middle East are located in UAE (Sharjah and Abu Dhabi),
Saudi Arabia (Al-Khobar), Kuwait, Oman (Muscat) &
Qatar (Doha). In addition to L&T Hydrocarbon’s Modular
Fabrication Facilities at Hazira and Kattupalli in India, it
has a major Modular Fabrication Facility at Sohar in Oman
held through a fellow subsidiary. L&T Hydrocarbon has
registered its presence in South East Asia through its
offices in Malaysia (Kuala Lumpur) and Indonesia (Jakarta).
The Company has operations across the Hydrocarbon
value-chain in India and overseas:
3000-tonne captive installation and pipelay vessel installs a wellhead platform off the coast of Myanmar
Hydrocarbon Business

148
• Hydrocarbon Upstream
• Hydrocarbon Mid & Downstream - Domestic
• Hydrocarbon Construction & Pipelines - Domestic
• Hydrocarbon Mid & Downstream including Pipelines
- International
Hydrocarbon Upstream:
The business offers turnkey solutions to the global offshore
Oil & Gas industry encompassing well-head platforms,
process platforms & modules, subsea pipelines, brown
field developments, Jack-up rig refurbishment, floating
production storage &off-loading (FPSO) topsides and
subsea projects. The business has successfully executed
large offshore platforms and pipeline projects in east and
west coast of India, Middle East, South East Asia and
Africa over two decades; for global companies such as
ONGC, GSPC, ADMA OPCO, Bunduq, Qatar Petroleum,
Maersk Oil Qatar, PTTEP, Petronas and Songas.
The business has two state-of-the-art fabrication facilities
in India at strategically important locations for offering
round the year delivery of process platforms, wellhead
platforms, modular structures, heavy jackets and oil rigs.
L&T Hydrocarbon’s Hazira Fabrication Facility, near Surat in
Gujarat, caters to business opportunities in the West Coast
of India (Mumbai High) & Kattupalli Fabrication Facility
near Chennai in Tamil Nadu caters to opportunities from
East Coast (KG Basin) and South East Asia. L&T Modular
Fabrication Yard LLC’s yard at Sohar, Oman is strategically
located to cater to opportunities in UAE, Qatar, Saudi
Arabia & North Sea. These yards have a total fabrication
capacity of about 150000 MT per year.
L&T Hydrocarbon has business development offices in
Middle East & South East Asia to provide a thrust to its
international growth plans. L&T Hydrocarbon is selectively
exploring upcoming opportunities in these regions.
L&T Hydrocarbon’s fellow subsidiaries, L&T Sapura
Shipping Private Limited own and operate a Heavy Lift
Pipe Lay Vessel, along with L&T Sapura Offshore Private
Limited provide offshore installation services. Dedicated
Engineering fellow subsidiary, L&T-Valdel Engineering
Limited, provides engineering support through
multi-locational centres at Bengaluru and Chennai.
During the year, L&T Hydrocarbon has won orders against
international competitive bidding, for engineering,
procurement, construction & installation of five wellhead
platforms at Mumbai High; two wellhead platforms,
subsea pipelines and modification of existing facilities
at Heera-Panna-Bassein block. L&T Hydrocarbon also
bagged an order for re-routing of 42” Subsea Pipeline
near Umbrahat beach. The fabrication facility at Hazira
has successfully diversified for supply of piping spools
for Reliance Industries and Kuwait National Petroleum
Company.
In international waters, L&T Hydrocarbon achieved
‘First Oil’ for its ongoing project in Abu Dhabi with Abu
Dhabi Marine Operating Company (ADMA OPCO) and
successfully completed PETRONAS Project in Myanmar.In
domestic market, L&T Hydrocarbon successfully handed
over 2 wellhead platform projects to ONGC. In recognition
of its project management excellence, L&T Hydrocarbon’s
East Coast Process Platform Project won Project
Wellhead platform commissioned off the coast of Abu Dhabi Major repair and upgradation was carried out on a jack-up rig

149
Management Institute’s (PMI) Mega Project of the Year
2014 Award.
Hydrocarbon Mid & Downstream – Domestic:
L&T Hydrocarbon provides EPC solutions for a wide range
of applications in hydrocarbon projects covering refining,
petrochemical, fertilizer (ammonia & urea complexes),
On-shore Oil & Gas processing plants, and modular
process plants.
L&T Hydrocarbon has successful track record of
simultaneous execution of multiple large value projects
on a turnkey basis supported by in-house Engineering
Resource Centers located at Mumbai, Faridabad and
Vadodara, which cater to the complete spectrum of FEED,
process and detailed engineering. L&T Hydrocarbon also
draws engineering support from L&T-Chiyoda Limited.
L&T Hydrocarbon has rich experience of project execution
with technologies from process licensors like UOP, Axens,
Haldor Topsoe, CB&I Lummus, Black & Veatch, Ortloff,
Exxon Mobil, BOC Parsons, Invista & Davy Process
Technologies. L&T Hydrocarbon has executed Lump-Sum
Turnkey(LSTK) projects in on-shore Oil & Gas Processing,
Refinery &Petrochemical applications for various Indian
oil majors like IOCL, MRPL, ONGC, OMPL, BPCL, HPCL,
Reliance Industries etc., as well as fertiliser companies like
NFL, GNFC, RCF and others.
L&T Hydrocarbon has recently made an entry into the niche
area of large scale Cryogenic Terminal projects featuring
Full Containment Cryogenic Storage Tanks. During the
year, L&T Hydrocarbon successfully completed its first
ever dome air raising activity for a Cryogenic Ethylene
Tank Project. L&T Hydrocarbon has also received an order
for EPC of a Cryogenic Ethane cum LNG Storage Tank
Project. These projects provide a good leverage for bidding
for the forthcoming LNG Terminal projects incorporating
LNG tanks and Regasification plants. L&T Hydrocarbon has
also entered into a number of strategic project specific
alliances with international EPC companies like Saipem,
Italy & Technip, France as well as Indian companies like
Engineers India Ltd, as part of its initiative in areas of LNG,
Fertilisers & Petrochemicals.
During the year, L&T Hydrocarbon has successfully
commissioned the largest single train Paraxylene complex
in India, consisting of 9 process units. In recognition of
the exemplary project management performance in an
extremely difficult terrain and weather conditions, this
project was conferred Project of the Year award in large
project category. Additionally, L&T Hydrocarbon also
received Final Acceptance Certificate (FAC) on successful
completion of Performance Guarantee tests for Additional
Gas Processing Project, two Ammonia Feedstock
Conversion Projects and Ammonia Syn Gas Generation
Project.
Hydrocarbon Construction & Pipelines – Domestic:
L&T Hydrocarbon undertakes EPC projects of cross-country
pipelines for Oil & Gas involving laying, horizontal
directional drilling (HDD), testing, pre-commissioning
3-D rendering of a petrochemical plant. The Company has dedicated centres providing engineering services for mid and downstream projects
150
& commissioning. It also renders turnkey construction
services for refineries, petrochemicals, chemical plants,
fertilizers, gas gathering stations, crude oil & gas terminals
and underground cavern storage systems for LPG.
L&T Hydrocarbon has built up major capabilities
including heavy lift competency, advanced welding
technologies and Quality systems. L&T Hydrocarbon has
also invested in strategic construction equipment, range of
Pipeline spread equipment, automatic welding machines
and other plant & machinery for Electro-mechanical
Construction Works.
L&T Hydrocarbon’s fellow subsidiary, L&T-Gulf Private
Limited, provides world class engineering capabilities for
cross-country pipeline construction.
L&T Hydrocarbon has executed projects for major private
sector customers like Cairn Energy, Reliance Industries,
HPCL Mittal Energy as well as major oil PSUs like BPCL,
IOCL, ONGC and others.
L&T Hydrocarbon is currently executing India’s first
Coal Bed Methane field development project, including
installation of Field Pipelines, Power Distribution Network,
Construction of Well Site facilities, Group Gathering
Stations and associated facilities. It is also executing
civil, mechanical, electrical & instrumentation works for
India’s largest paraxylene plant requiring more than 30000
workmen at peak execution.
Hydrocarbon Mid & Downstream International:
L&T Hydrocarbon’s international business operations are
predominantly in Middle-East, spread across United Arab
Emirates, Sultanate of Oman, Qatar, Kingdom of Saudi
Arabia and Kuwait. In South East Asia & North Africa
geographies, L&T Hydrocarbon is targeting prospects
in Indonesia & Algeria, respectively. L&T Hydrocarbon’s
network of international offices and facilities are geared
to respond to the needs of its client-base in multiple
geographies including Middle East, North Africa and South
East Asia.
L&T Hydrocarbon has built up a strong team, integrating
in-house talent with internationally experienced resources
headquartered in Sharjah and supported by regional hubs
in Al-Khobar and Kuwait. L&T Hydrocarbon is developing
an engineering center in Sharjah to co-ordinate and
consolidate engineering efforts being carried out at various
locations. A centralised proposal & estimated team is being
constituted for better control and accuracy in estimates.
L&T Hydrocarbon is also pursuing complex mega projects
through alliances with the leading global EPC companies.
Efforts have also been made during the year to strengthen
risk management including interface management and
Project Portfolio monitoring.
L&T Hydrocarbon is prequalified by major international
Oil & Gas producers such as Saudi Aramco, Kuwait Oil
Company (KOC) & Kuwait National Petroleum Company
(KNPC), Abu Dhabi Gas Industries Ltd (GASCO), Abu
Dhabi Gas Liquefaction Company Ltd (ADGAS), Abu Dhabi
Company for Onshore Oil Operations (ADCO), SOCAR,
PETRONAS, CNPC and Dragon Oil in Turkmenistan, Lukoil
in Uzbekistan and Sonatrach in Algeria.
During the year, L&T Hydrocarbon has received its largest
international order from Kuwait Oil Company to execute
Engineering, Procurement & Construction contract for
Gathering Center in North Kuwait which will process crude
oil from Raudhatain fields in a multi stage process.
During the year, L&T Hydrocarbon successfully
commissioned its gas pipeline project in UAE for Abu
Dhabi Gas Industries Ltd. It also achieved substantial
completion for Petroleum Development Oman’s Lekhwair
Gas Field Development Project in Oman. In Qatar, the two
projects being executed for Dolphin Energy have achieved
‘Ready-For-Start-Up’ (RFSU) stage.
L&T Hydrocarbon is screening local construction partners
in Algeria for tendering & execution of upcoming
opportunities. The Company is also eligible to participate
in Refinery and Fertilizer projects in Indonesia through
its Construction Service Provider Representative Office
(CSPRO).
Business Environment:
L&T Hydrocarbon achieved a major breakthrough in the
middle east during the year by securing its largest ever
contract of around USD 846 million. In India, many large
value projects were deferred during the year on account
of uncertain economic environment & volatility in crude oil
prices. Despite this, L&T Hydrocarbon received domestic
orders of around v 4000 crore.
The entire global hydrocarbon industry is passing through
a difficult phase with E&C industry leaders reporting
cost over-runs. L&T Hydrocarbon also faced over-runs in
some of the international projects bagged during 2010 to
2011 period which were first of its kind with respect to
customers, size & scale, technical complexity and affected
by unforeseen cost increases and VISA delays due to the
changed local environment.

151
All of these projects are at advanced stage of commissioning
and final settlement with customers. The Management has
restructured its international operations and steps are being
taken to build strong customer relationships, a culture
of operational excellence and greater accountability.
Contracts management, safety & quality departments are
being strengthened with experienced recruits. A process of
bid/no-bid clearance for international prospects has been
instituted to weed out unfeasible proposals at early stages.
The Management is confident that L&T Hydrocarbon will
turnaround in the year 2015-16.
Significant Initiatives:
L&T Hydrocarbon has institutionalised risk management
processes by implementing risk management policy
and guidelines, incorporating global best practices and
procedures along with quantitative tools and techniques.
The Risk management process is aimed at identification,
assessment, monitoring and mitigation of risks from pre-
bid to execution/close out of the project. Risk management
committee periodically reviews the risks and advises on the
mitigation measures.
The major challenges like tight work schedule, technical
complexities, growing competition, newer geographies,
forex variation, claims management and staffing of key
project personnel are mitigated through specific actions
like operational excellence initiatives, alliances, cost
optimisation, improved customer intimacy, compliance
with stringent HSE standards, proactive forex hedging,
strong contract & claims management and identification
of key personnel & talent at pre-bid stage.
All projects undergo a well-structured pre-bid risk review
process by risk management committee at business
and at corporate level as per well-defined authorisation
limits. The process involves a detailed assessment of risks
and deliberation on mitigation measures by the Risk
Management Committee and risk reviews of on-going
projects at regular intervals. Project managers/Project team
members also undergo certified Risk Induction Programme
conducted by ECRI (Engineering & Construction Risk
Institute) on a continuous basis to get acquainted with
Global Best Practices in Engineering & Construction Risk
Management.
L&T Hydrocarbon believes that a strong internal control
mechanism is an important pillar of corporate governance. It
has established internal control mechanism commensurate
with the size and complexity of its business. Internal control
manual provides structured framework for identification,
rectification, monitoring and reporting of internal control
weaknesses in the Company. The Company also follows
well documented Standard Operating Procedures (SOPs)
for critical business processes. The operating effectiveness
of various controls is periodically tested by external parties
and deficiencies, if any are promptly rectified.
L&T Hydrocarbon has a unique mix of experienced
professionals and young dynamic passionate individuals
working in various disciplines. HR efforts are targeted
to ensure that the right talent is sourced, selected,
trained and deployed across the organisation. A number
of in-house modules for processes like recruitment
(E-Rec) and competency management (E-Profile) have
Upgrade project executed on an EPC basis for export gas compression facilities in Qatar

152
been implemented to automate & digitise the core
processes. Special efforts are being put to identify
high potential leaders and groom them through seven
stages of leadership development to take on higher
responsibilities in the future. The Company nominates
its employees for L&T’s Corporate training programmes
like Leadership programme, Core Development Program,
EMBA programmes and special E-learning programmes
(DDI, Harvard and other certification programme) on a
regular basis. The Company continues to foster a high
performance culture by recognising good performers
and providing them with career enhancing opportunities.
Various activities and initiatives are undertaken to
increase employee motivation through initiatives like Long
Service Awards, Team Building Workshops, Town Halls,
non-monetary recognition events, etc.
As a part of its drive towards building international project
management capabilities, several senior professionals have
been recruited from leading international EPC companies.
Health, safety & environment is the cornerstone of the
Company’s business philosophy. The Company strives
for continuous improvement for the protection and
development of health, safety, and environmental assets
of its employees and stakeholders. During the year, five
crucial projects were safely commissioned without any
significant incidents. L&T Hydrocarbon has developed a
Corporate HSE Plan and refreshed various policies in line
with best practices. L&T Hydrocarbon also participated in
Global Summit on Process Safety.
During the year, several cross functional HSE audits were
initiated for offshore operations and Hazira fabrication
facility. For onshore operations, L&T Hydrocarbon
developed & implemented competency assurance &
assessment system for one of its overseas clients. A
behaviour based safety program was implemented for
developing & sustaining a positive HSE culture. Online HSE
action tracking system was made functional alongwith
online monthly HSE reports and unsafe act/incident
reporting system. Senior Management participated in site
safety surveys and employees were made part of safety
perception survey.
To spread safety awareness, various campaigns were
observed during the year. Lessons learnt during project
execution were shared throughout the organisation by
way of HSE alerts. Various HSE training programs were
held and motivational schemes were instituted.
As a responsible Corporate Citizen, L&T Hydrocarbon
believes in adopting Sustainable practices. The Company
has released Sustainability Report – “In Tune, Attune”
in January 2015 which covers various initiatives taken
across the Company and also highlights need to enhance
performance across all sustainability parameters – safety,
energy, water conservation and productivity.
As one of India’s most respected Engineering and
Construction Companies, L&T Hydrocarbon is aware of
its responsibility towards social upliftment which is an
integral part of the corporate culture. L&T Hydrocarbon
has developed a CSR framework for demonstrating its
responsibility as a corporate citizen which lays down
the principles and mechanisms for undertaking various
programs in accordance with section 135 of the Companies
Act 2013 for the community at large. L&T Hydrocarbon is
committed to developing projects that will contribute to
the quality of life, including schools, hospitals, skill training
institutes, water supply & distribution and sanitation
facilities.
During the year, L&T Hydrocarbon won several national &
international accolades from clients, some of which are as
follows:Modular Fabrication Facility (MFF), Hazira received
RoSPA Gold Award for Occupational Health & Safety,
“Visionary Project” award by IMEA, Frost & Sullivan Safety
Cultural Transformation. MFF, Kattupalli received 3 Star
Rating in CII (South India) EHS Awards 2014. Both, Hazira
& Kattupalli, also received International Safety Award
with ‘Merit’ by British Safety Council. Internationally, L&T
Hydrocarbon received “HSE Award– 2014”by PETRONAS
for exceptional HSE performance on Yetagun Project, ASSE
Gold Award 2014 for Dolphin project, Qatar and Gold
Award from American Society of Safety Engineers for
SADARA Project, Saudi.
Outlook:
The new government regime in India, has laid the policy
framework for realising strong growth in the coming
years by focusing on key pillars of Infrastructure creation
to achieve sustainable 7-8% GDP growth p.a. With China
slowing down, already certain global agencies have forecast
that India could become the fastest growing economy
in the year 2015-16. The gradual pick-up in on-ground
implementation of the above measures is expected to
result in increased opportunities for L&T Hydrocarbon in
the year 2015-16.
In Upstream sector, ONGC is expected to continue with
new project awards, notwithstanding the recent fall in

153
crude oil prices. Also, E&P companies in select geographies
like Saudi Arabia, Myanmar and Thailand are expected
to continue with their planned capex investments.
L&T Hydrocarbon is actively pursuing opportunities with
Saudi Aramco for their “Maintain Potential Facilities -
Long Term Agreement (LTA)” program which will provide
visibility of continuous projects awards in medium to long
term. L&T Hydrocarbon is also building up competencies in
Brownfield Projects to move up the value chain. As part of
de-risking strategy, L&T Hydrocarbon is actively developing
relationships with private sector customers.
In the Mid & Downstream sector, with fall in crude prices
and consequent reduction in under-recoveries, Indian
Refiners have planned expansion and clean fuel projects.
L&T Hydrocarbon is witnessing a number of exciting
opportunities in LNG Terminals, petrochemical plants &
refinery up-gradations. Fertiliser sector is also witnessing
a revival with planned investment of over v 40000 crore
in next four years.
In International markets, the current oil price scenario
has resulted in oil related projects being kept on hold.
Significant EPC awards are, however, expected in the
Gas sector in the coming year. United Arab Emirates
has planned several Gas development projects driven
by investments by state-owned companies – ADCO
and ADGAS. Oman has continued its investments and
offers good opportunities in downstream projects. Saudi
Arabia has embarked upon a program to develop its
unconventional gas reserves which will provide a number
of opportunities for L&T Hydrocarbon. Kuwait is emerging
as a stable, business- friendly destination with a fast
moving economy. With lower break even costs, Kuwait has
capacity to invest further even in this downturn and has
ambitious plans to increase oil production from 3 million
barrels per day (bpd) to 4 million bpd by 2020 which will
provide L&T Hydrocarbon with a number of opportunities
in Gathering Centres, Booster Stations, Central Gas
Utilisation Project with associated infrastructure.

154
Overview:
Information Technology business forms part of the IT
& Technology Services segment of Larsen & Toubro.
Information Technology business is housed in a wholly
owned subsidiary viz. Larsen & Toubro Infotech Limited
(“L&T Infotech”). L&T Infotech’s business is classified
under two business Clusters ‘Industrials’ and ‘Services’:
• The ‘Industrials’ Cluster leverages the parent Company’s
existing strengths and heritage to cater to manufacturing
plants, establishments including wholesale, retail sale of
products and establishments dealing with Energy and
Utilities. This cluster also houses horizontals of SAP,
Oracle, Enterprise Integration, as well as Manufacturing
Execution Systems. Horizontals are responsible to serve
clients across both Clusters.
• The ‘Services’ Cluster focuses on Banking, Financial
Services, Insurance, Media & Entertainment, Travel &
Logistics, and Healthcare. This cluster houses Testing
horizontal.
Business Environment:
Indian IT-BPM industry saw the export market at ~USD
100 billion in the year 2014-15, recording 13.1% growth
in constant currency over last year. Growth in reported
currency is estimated at 12.3%. Engineering & R&D and
product development segment is the fastest growing
at 13.2%, driven by higher value-added solutions from
existing players and expansion of the GIC landscape.
Digital solutions around SMAC (Social, Mobility, Analytics
& Cloud)– upgrading legacy systems to be SMAC enabled,
greater demand for ERP, CRM, mobility and user experience
technologies is driving growth in IT services. Infrastructure
outsourcing and software testing segment also outpaced
the industry growth rate.
The year also witnessed hyper-growth in the technology
start-up and product landscape and India is already ranked
as the 4th largest startup hub in the world with over 3100
startups in the country.
L&T Infotech’s global headquarters in Mumbai
Information Technology Business

155
Exports to US, the largest market, grew above industry
average, aided by an economic revival and higher
technology adoption. Demand from Europe remained
strong during the first half of the year, but softened during
the second half due to currency movements and economic
challenges. Manufacturing, Utilities and Retail growth
remained strong as clients increase discretionary spend
on customer experience, digital, analytics, ERP updates
and improving overall efficiency.
In the year 2015-16, NASSCOM expects the industry to
add revenues of USD 20 billion to the existing industry
revenues of USD 146 billion. Export revenues for the year
2015-16 is projected to grow by 12-14% and reach USD
110-112 billion. Domestic revenues (including ecommerce)
for the same period is likely to grow at a rate of 15-17%
percent and is expected to reach USD 55-57 billion during
the year.
Some of the key trends which are expected to drive
industry growth are as follows:
• Infrastructure Management Services (IMS): Traditional
IMS would remain, however, cloud based IMS and
Automation would bring the growth in this segment.
• Digital: Digital is the new Buzz word especially in the
Domestic market. Prime Minister’s Digital India plan,
Smart cities Initiatives are opening a lot of opportunities
for the IT industry.
• Internet of Things (IoT): IoT is the key to Digital world.
It would lead to all physical devices being connected,
which would have numerous business benefits across
industries. IDC forecasts that the worldwide market for
IoT solutions will grow from USD 1.9 Trillion in 2013 to
USD 7.1 Trillion in 2020.
• Newer Delivery models: Digital, IoT, Automation, SMAC
are not only disrupting what IT industry offers, but also
how it is offered. Newer technologies are leading to
newer delivery models. Many players are trying different
delivery models like Factory model.
• Growth from Emerging markets: US and Europe have
traditionally been the largest IT markets. In the last few
years, however, share of Emerging markets is slowly
increasing, with significant contribution in incremental
IT growth.
Business environment of IT BPM industry witnesses multiple
risks and challenges such as geography concentration,
over dependence on a few business verticals and clients.
Downturn or slower recovery in the specific geography
or business vertical or downsizing by the key clients
may have adverse impact on the prospects. The major
business being international, change in the legislations
of foreign countries, restrictions on offshore outsourcing
and stringent immigration regulations governing on-site
execution of contracts pose considerable challenges to
Indian IT companies. External unforeseen circumstances
and exchange rate risks are inherent in the business
environment. Intense competition and employee attrition
are other major risks being tackled by the IT industry. Legal
& Contractual Compliance assumes major importance in
execution. Increasing adoption of Automation technologies
for Application and Infrastructure Management services,
poses a serious threat particularly to India based players for
whom labour arbitrage will no more be a differentiating
feature with cost savings of the order of 40% to 70%
possible through automation.
Significant Initiatives:
In rapidly changing global landscape, businesses are
struggling to create sustainable advantage relative to
the competition, thereby requiring different types of
expertise, apart from technology. Solution demand is more
Industry-specific. L&T Infotech’s strategic investments in
people (talent acquisition, development & retention),
technology and domain-specific solution labs are critical
to its on-going business proposition. The company has
identified the following thrust areas to achieve its near
and medium term objectives:
• Digital: Digital Transformation is the way organizations
are changing their business models, to meet customer
expectations & achieve operational efficiency, in an
environment where the lines between the physical &
digital worlds are blurred. L&T Infotech’s digital offerings
are branded as MOSIAC. MOSAIC stands for Mobility,
Social, Analytics, Internet-of-things, and Cloud.
• A few of its Digital offerings include:
• Digital Transformation Consulting
• Digital Technologies and Architecture
• Digital Transformation Delivery and Management
• Digital Platforms and Solutions
• Infrastructure Management Services (IMS):
L&T Infotech’s Infrastructure Management Services
(IMS) offers a wide spectrum of services covering IT
Infrastructure Consulting, Design, Implementation,
Operational Support, Cloud Enablement and Hosting.
L&T Infotech leverages its unique approach of Business
First in Infrastructure Management Services to create
customized service delivery plan aligned to the business
needs of the client.
• Smart Cities: Smart Cities is a perfect fit for L&T Infotech
and L&T Group’s portfolio, as L&T is a major player in
building the Nation. India is all set to become the third
largest construction market by 2020, as per PwC report.
L&T Infotech is looking forward to partner and acquire

156
product companies in Smart Cities space to enhance its
capabilities to build the next generation Indian Cities.
Technology is at the heart of a smart city ecosystem -
from urban planning to creating healthy environment,
ensuring safety of people, smart and efficient power
distribution, ensuring 24/7 water supply, intelligent
traffic and transportation management systems
that use analytics to provide efficient solutions to
ease commuting, and automated building security
and surveillance systems requiring minimal human
intervention.
As L&T Infotech has been developing product and
solutions in the MOSIAC eco-system for global clients,
“Smart Cities” would be an opportunity to execute
leading MOSIAC products and solutions in the home
market.
• Emerging Markets: L&T Infotech has renewed its
focus on Emerging markets which includes Australia,
Singapore, Japan, South Africa, Middle East and India.
Mr. Rajat Mathur, Ex-Head of Emerging Markets at Wipro
has joined L&T-Infotech as Chief Executive – Emerging
Markets. L&T-Infotech has built a strong team in this
region to tap the growing opportunity. Especially in India
& Middle East, L&T Group has a strong presence and
have ambitious growth plans. L&T Infotech endeavors
to leverage this advantage.
• Innovation Focus: At the organization level, Research &
Development initiatives are being run by Technology &
Consulting Group and Client specific R&D functions are
being run by the respective Verticals / Service Lines. L&T
Infotech’s ongoing investments in R&D have helped build
an array of industry specific IPs such as accelerators,
frameworks, platforms, solutions etc. L&T Infotech
has an Enterprise Business Solution Lab, which tests
innovative business ideas, which adds value to the client.
It also prototypes solutions to reduce implementation.
L&T Infotech also has Thought Partnership™ structured
program to deliver IT and consulting initiatives that
lead to value-creation beyond stated objectives in the
contract. A key part of the program is about sharing
best practices and doing proof-of-value pilots wherever
required.
• New acquisitions: L&T Infotech is looking at acquisitions
that will strengthen presence in a vertical/horizontal,
geography or platform. These acquisitions would be
mainly aimed at the objective to enhance the revenue
in the next two years, leveraging on existing brand and
customers, who believe in it.
• Human Resource Strategy: L&T Infotech’s focus on
hiring, engaging and retaining key talent continued
this year. L&T Infotech continues to align talent
engagement, competency development, role and
career progression, benchmarked compensation and
benefits for its employees worldwide. This has helped
the Company to attract the best talent from across the
globe. L&T Infotech has designed a leadership program
to provide focused efforts to groom leaders as they
transition from one level to the other. These programs
are based on the leadership competency framework.
Specific programs have been designed to impart skills
and clarify attitudes for each of these competencies.
L&T Infotech believes that the next phase of growth will be
driven by large deals, IMS, Digital technology and Thought
Leadership. Therefore, L&T Infotech has formed a Digital
& Technology practice, which is mandated to nurture and
grow the Digital stack – Cloud, Social, Analytics, Mobility,
Internet of Things and so on. This again is a horizontal and
serves both industrial and service clusters.
With an eye on annuity based large deals, which calls
for references in both Application & Infrastructure
management space, L&T Infotech has decided to expand
the IMS business through an internal re-structuring to
provide the focus that it deserves. The company is also
open to grow inorganically in this space.
As on 31st March, 2015, L&T Infotech has 11 Fortune 100
clients and 34 Fortune 500 clients.
L&T Infotech’s Value Proposition: In order to make itself
competitive and strive for excellence, L&T Infotech has
adopted a three-pronged strategy to differentiate itself L&T Infotech’s facility in Chennai

157
from competitors and provide a value proposition to the
client:
(a) Business to IT connect: L&T-Infotech leverages the
domain expertise of L&T & Group companies and have
been investing heavily in building domain solutions.
The talent requirement is met through onboarding
of its SMEs and practitioners within L&T Group or
through continuous domain training followed by
globally benchmarked industry-specific certifications.
L&T Infotech offers IT Solutions driven by business
context and rooted in domain knowledge. For its
clients across the globe, this results in more impactful
industry solutions focused on gaining efficiencies,
reducing rework and improving time to market for
its clients.
(b) Execution Excellence: L&T Infotech demonstrates
Execution Excellence with its committed talent pool
of associates and effective use of proprietary tools
and processes to achieve clients’ goals on-time,
in-cost with a world-class quality. It has a proven and
established transition methodology and expertise.
This results in greater agility, transparency and
predictability of delivery for world-class programs for
its clients across the globe.
(c) Engage the Future: With a focus on future business
requirements, L&T Infotech is making itself future-
ready by building platforms and solutions based on
emerging technologies. Its 2-tier (Technology Office
at Cluster Level and Vertical/Client specific Technology
office) dedicated technology offices deliver business
benefits by harmonizing technology ecosystem and
creating differentiators using technology as the prime
mover.
L&T Infotech offers a clear understanding of social, mobile
and analytics technologies that can enable new business
capabilities and stir innovation, which results in sustained
innovation for its clients across the globe. In nutshell,
clients benefit with the skills and capabilities to deliver
next generation solutions.
Outlook:
The Business world today, is volatile, uncertain, complex
and ambiguous. Geo-political upheavals, and disruptions
in business models are driving customers to constantly
seek newer ways to run and grow their business. For
the Global technology industry, this serves as both an
opportunity and a challenge.
With sourcing services growing at 10% at a global level
and India leading with 55% market share, IT exports from
India are estimated to cross approx. USD 112 Billion in
2015-16, registering a growth of close to 14%. Industry
trends, however, will continue to play an important
role towards this. For e.g, with Oil prices at the current
levels, IT spend has been deeply impacted. While growth
opportunities would emerge from Transformation of
technological landscapes into new-age technologies
and markets outside of North America & Europe, Indian
IT players are also being challenged because of the
increasing shift from the labour-arbitrage model to that
of Automation & Robotics.
In alignment with global trends, L&T Infotech continues
to invest in Rest-of-the-world markets, where it is seeing
significant traction. South Africa and India have already
shown very positive trends while Middle East will be a
region to grow under the shadows of L&T, which has
significant presence there. L&T Infotech, besides building
competency in the Digital space, has also developed
significant capabilities in Automation and started
deploying them at clients’ landscapes. This will not only
mitigate competition risks, but will also help open doors
in both existing and new accounts.
With the right focus provided in technology, geography
and leadership, the management is confident that
L&T Infotech has gathered the right momentum for 2015-
16 and beyond.
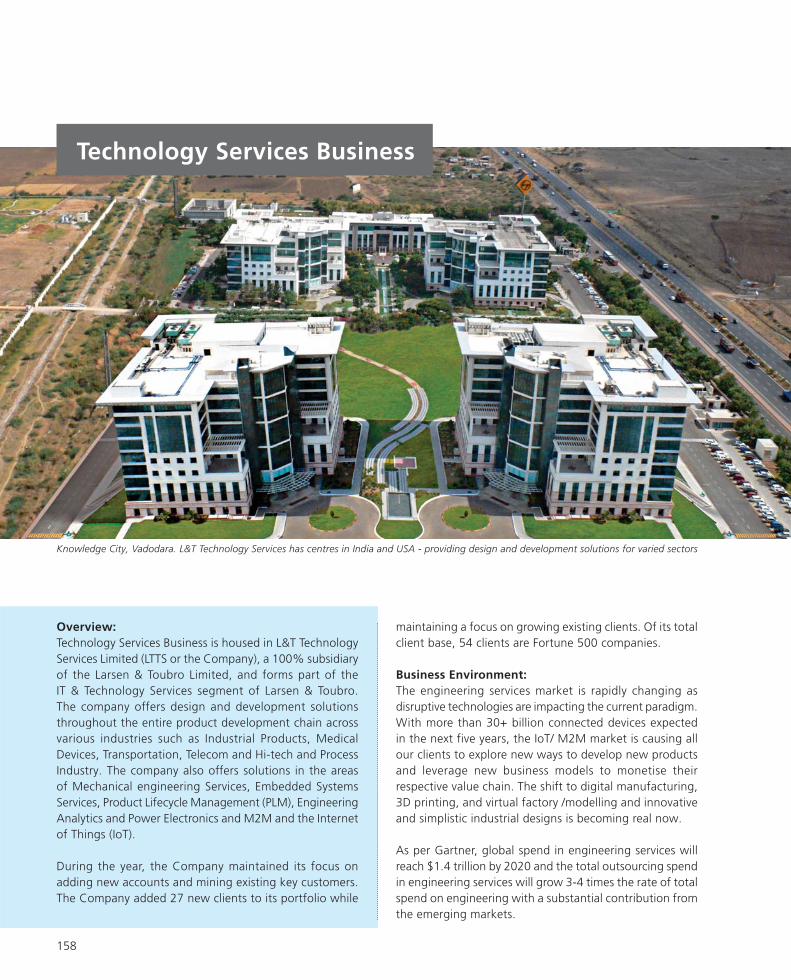
158
Technology Services Business
Overview:
Technology Services Business is housed in L&T Technology
Services Limited (LTTS or the Company), a 100% subsidiary
of the Larsen & Toubro Limited, and forms part of the
IT & Technology Services segment of Larsen & Toubro.
The company offers design and development solutions
throughout the entire product development chain across
various industries such as Industrial Products, Medical
Devices, Transportation, Telecom and Hi-tech and Process
Industry. The company also offers solutions in the areas
of Mechanical engineering Services, Embedded Systems
Services, Product Lifecycle Management (PLM), Engineering
Analytics and Power Electronics and M2M and the Internet
of Things (IoT).
During the year, the Company maintained its focus on
adding new accounts and mining existing key customers.
The Company added 27 new clients to its portfolio while
maintaining a focus on growing existing clients. Of its total
client base, 54 clients are Fortune 500 companies.
Business Environment:
The engineering services market is rapidly changing as
disruptive technologies are impacting the current paradigm.
With more than 30+ billion connected devices expected
in the next five years, the IoT/ M2M market is causing all
our clients to explore new ways to develop new products
and leverage new business models to monetise their
respective value chain. The shift to digital manufacturing,
3D printing, and virtual factory /modelling and innovative
and simplistic industrial designs is becoming real now.
As per Gartner, global spend in engineering services will
reach $1.4 trillion by 2020 and the total outsourcing spend
in engineering services will grow 3-4 times the rate of total
spend on engineering with a substantial contribution from
the emerging markets.
Knowledge City, Vadodara. L&T Technology Services has centres in India and USA - providing design and development solutions for varied sectors
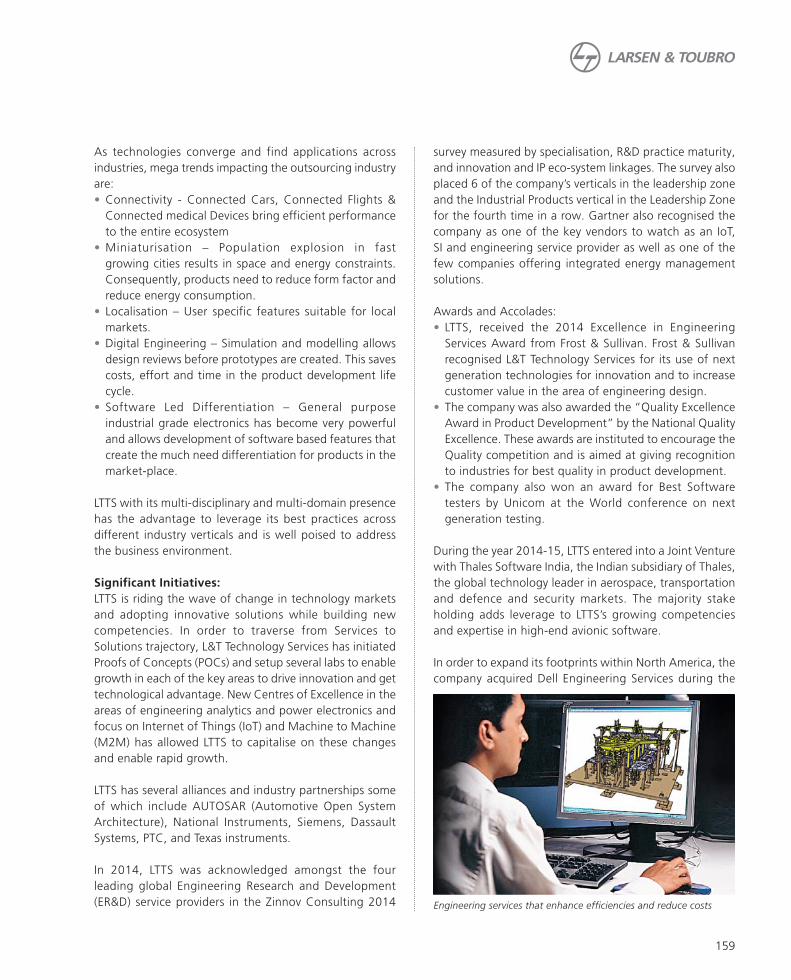
159
As technologies converge and find applications across
industries, mega trends impacting the outsourcing industry
are:
• Connectivity - Connected Cars, Connected Flights &
Connected medical Devices bring efficient performance
to the entire ecosystem
• Miniaturisation – Population explosion in fast
growing cities results in space and energy constraints.
Consequently, products need to reduce form factor and
reduce energy consumption.
• Localisation – User specific features suitable for local
markets.
• Digital Engineering – Simulation and modelling allows
design reviews before prototypes are created. This saves
costs, effort and time in the product development life
cycle.
• Software Led Differentiation – General purpose
industrial grade electronics has become very powerful
and allows development of software based features that
create the much need differentiation for products in the
market-place.
LTTS with its multi-disciplinary and multi-domain presence
has the advantage to leverage its best practices across
different industry verticals and is well poised to address
the business environment.
Significant Initiatives:
LTTS is riding the wave of change in technology markets
and adopting innovative solutions while building new
competencies. In order to traverse from Services to
Solutions trajectory, L&T Technology Services has initiated
Proofs of Concepts (POCs) and setup several labs to enable
growth in each of the key areas to drive innovation and get
technological advantage. New Centres of Excellence in the
areas of engineering analytics and power electronics and
focus on Internet of Things (IoT) and Machine to Machine
(M2M) has allowed LTTS to capitalise on these changes
and enable rapid growth.
LTTS has several alliances and industry partnerships some
of which include AUTOSAR (Automotive Open System
Architecture), National Instruments, Siemens, Dassault
Systems, PTC, and Texas instruments.
In 2014, LTTS was acknowledged amongst the four
leading global Engineering Research and Development
(ER&D) service providers in the Zinnov Consulting 2014
survey measured by specialisation, R&D practice maturity,
and innovation and IP eco-system linkages. The survey also
placed 6 of the company’s verticals in the leadership zone
and the Industrial Products vertical in the Leadership Zone
for the fourth time in a row. Gartner also recognised the
company as one of the key vendors to watch as an IoT,
SI and engineering service provider as well as one of the
few companies offering integrated energy management
solutions.
Awards and Accolades:
• LTTS, received the 2014 Excellence in Engineering
Services Award from Frost & Sullivan. Frost & Sullivan
recognised L&T Technology Services for its use of next
generation technologies for innovation and to increase
customer value in the area of engineering design.
• The company was also awarded the “Quality Excellence
Award in Product Development” by the National Quality
Excellence. These awards are instituted to encourage the
Quality competition and is aimed at giving recognition
to industries for best quality in product development.
• The company also won an award for Best Software
testers by Unicom at the World conference on next
generation testing.
During the year 2014-15, LTTS entered into a Joint Venture
with Thales Software India, the Indian subsidiary of Thales,
the global technology leader in aerospace, transportation
and defence and security markets. The majority stake
holding adds leverage to LTTS’s growing competencies
and expertise in high-end avionic software.
In order to expand its footprints within North America, the
company acquired Dell Engineering Services during the
Engineering services that enhance efficiencies and reduce costs
160
year. The strong complimentary capabilities of both the
organisations in Mechanical Design, Embedded Electronics,
and Manufacturing will add synergies while sharing a
number of relationships in multiple vertical segments
with key clients. The acquisition will also strengthen
LTTS’s global position in the USD 4 billion transportation
engineering research & development market and will help
widen its reach in with the new local delivery center in
North America.
Quality processes and projects at LTTS are benchmarked
and certified to ISO 9001, CMMI Level 5, AS 9100 C for
Aerospace projects and ISO 13485 for medical projects.
The professionals are the most important assets of the
Company. The Company believes that the quality and level
of services that these professionals deliver is highest in the
global engineering technology services industry and the
Company is committed to remain among the industry’s
leading employer. During the year, the Company added
(net) 321 employees and the closing headcount as of
March 31, 2015 was 9327.
Outlook
Though Global GDP growth in 2015-16 is expected to
be moderate, the global market for Engineering Research
& Development (ER&D) services is expected to defy the
economic downturn. Demand from sectors including
computing systems, medical devices, energy and
infrastructure is fuelling the ER&D market, and providers in
emerging economies, led by India, are poised to gain share
as multinational corporations seek to invest in innovation
and drive future growth.
Indian Engineering Service Providers (ESP) today have
embraced the global outsourcing model for better
growth prospects. With the R&D spend in various sectors
increasing in the coming years, the Indian ESPs have
good opportunities in the area of Automotive, Consumer
Software & Industrial Automation sectors. Outsourcing
is expected to increase in Consumer Electronics and
Semiconductor sectors. This opportunity along with the
strengths of the Indian ESPs like scalability of resources,
cost effectiveness, maturity in offshoring, senior leadership
engagement and design capabilities have resulted in
customers increasing responsibility and accountability of
the Indian ESPs. For Indian ESPs to move towards synergic
partnerships, these strengths coupled with the changing
business model trends like managed services and risk-
reward models will be the levers which will help grow
business.
Prospective growth for the outsourcing industry lies in
the upcoming and ever changing technology impacting
every sphere of human life. Key technology trends which
have a significant impact in the near future include mobile
internet, Internet of Things, Automation of knowledge
work, Cloud technology, Advanced robotics, Autonomous
& near-autonomous vehicles, Next-generations genomics,
Energy storage, Advanced materials, Advanced oil & gas
exploration & recovery, Renewable energy, etc.

161
The Financial Services business segment comprises retail and corporate finance, housing finance, infrastructure finance, investment and wealth management business carried through the subsidiaries of L&T Finance Holdings Limited. Financial Services business also includes general insurance which is housed in a wholly owned subsidiary viz. L&T General Insurance Company Limited.
L&T Finance Holdings
Overview:L&T Finance Holdings’ business organised under verticals structured as the Retail and Wholesale Platform, Investment Management and Wealth Management business, is carried out through its wholly owned subsidiaries. The Management’s focus is to achieve a healthy return on equity (ROE) on a sustainable basis to deliver attractive returns to all stakeholders. It is part of the Company’s vision and strategy to build a comprehensive financial services business, with certain of the products being its flagship products.
Despite the economic environment continuing to be challenging, the Company’s loan book crossed v 47000 crore, registering a healthy growth of over 17% on YOY basis. Consolidated income increased to v 6337 crore from v 5237 crore in the preceding year. Gross Non Performing Assets stood at 2.25% as compared to 3.18% in the preceding year. Net Non-Performing Assets also declined to 1.26% as compared to 2.29% in the preceding year.
Business Environment:Retail Platform – Retail, Corporate and Housing Finance BusinessBusiness of the retail platform, including retail, corporate and housing finance businesses is carried out through the company’s wholly owned subsidiaries, L&T Finance Limited, Family Credit Limited and L&T Housing Finance Limited. These comprise loans for the purchase of income generating as well as consumer assets, working capital loans for SMEs, term loans for medium and large companies, loans under micro-finance, loans for purchase of homes and loans against property.
Financial Services Business
The Financial Services business provides a range of financial solutions to rural, semi-urban and urban retail customers, as well as infrastructure
developers, SMEs and corporates

162
The product portfolio under the Retail Platform includes:
Consumer and Auto Loans
Small and Medium Enterprises
Mid and Large Corporations
Housing Finance
Microfinance
Farm equipment
Supply chain finance
Loans and Leases
Home loans Joint liability loans
Two-wheeler loans
Term loans Loan against Securities
Loan against Property
Micro individual loans
Small & Light Commercial Vehicles’ loans (S&LCV)
Warehouse Receipt Finance
Loans for Construction
Car loans Commercial Assets (CE & CV)
During the year 2014-15, while the market shrank by 13% in Farm Equipment business, the Company’s Tractor
business grew by 13% facilitating an increase in the market share by 3%. What enabled this was a strong tie-up with some notable manufacturers in the industry. Similarly, in Two-wheeler loans, while the industry volume increased by 8% during the year 2014-15, the Company grew by 17% leading to an increase in its market share. This performance was facilitated by the Company’s better penetration in existing locations and active efforts to extend the reach to new locations.
Wholesale Platform – Infrastructure and Non-infrastructure Finance BusinessThe Wholesale Platform of the Company comprises of infrastructure financing and non-infra wholesale financing through three lending entities viz. L&T Infrastructure Finance Company Limited, L&T FinCorp Limited and L&T Infra Debt Fund Limited.
The Company’s Wholesale Platform offers to customers, both fund based as well as fee based products and services that attempt to meet the requirements of infrastructure and industrial financing in India. While each segment/ company of the Wholesale Platform business has its own performance indicators and clientele, they work together to position the Wholesale Platform as a leading infrastructure, industrial and corporate solutions provider in India.
Businesses under the Wholesale Platform of the Company are organised broadly under Project Finance Group, Industrial / Corporate Finance Group and Financial Advisory Services Group (including Debt and Equity Advisory services).
Project Finance Group (PFG) appraises infrastructure projects and borrower groups, of varying complexities and provides innovative financial solutions & products to meet the requisite tenor and cash flow-based structuring requirements of customers. Over the last eight years, the Group has been able to provide financing to several large and medium-sized business groups in the country. The Group had addressed the requirements of key sectors with specific reference to Energy, Transportation, Telecommunications, Industrial Finance and others. Financing solutions are provided to projects under construction as well as refinancing solutions to operational infrastructure projects.
The Industrial/ Corporate Finance Group provides vendor finance, dealer finance, corporate debt and capital market products including loans against shares to a wide set of borrowers/ customers.
Business assets of the Wholesale Platform grew to over v 22000 crore in the year 2014-15, registering a growth of over 26% over the preceding financial year.
Our micro-finance business has uplifted and empowered over
8,00,000 rural women
Two-wheeler loans in urban and rural markets fulfil the desire for
personal mobility

163
Investment Management BusinessThe Investment Management business of the Company is carried out through L&T Investment Management Limited (L&T IM), a wholly owned subsidiary. During the period under review, average assets under management grew by 23% to v 22497 crore for the quarter ended March, 2015 versus v 18255 crore for the corresponding period in the previous year. This was achieved through a combination of several positive factors such as consistent fund
performance, three new and unique product offerings, effective cost management and strong risk management.
Equity mix for the Company increased to 38% in the quarter ended March, 2015 compared to 25% in the same quarter last year, better than industry asset mix of 32%. Average equity assets under management increased by 85% during the year 2014-15 to around v 8600 crore. Market share in gross sales more than doubled during FY 2014-15 as compared to the previous year.
Most of the Company’s funds consistently outperformed their benchmarks across one, three and five year period. In particular, nine out of ten equity oriented schemes (having a performance track record of more than one year) were in the top two quartiles with five schemes in the top quartile. In the fixed income segment, seven out of nine schemes were in the top two quartiles.
The initiatives taken during the year combined with a strong investment performance resulted in a consistent market share of 2%, an industry rank of 13 and investor folios of over 800,000 as on March 2015.
AAUM mix
25,000 –
20,000 –
15,000 –
10,000 –
5,000 –
0 –
v C
r.
Q4FY14 Q1FY15 Q2FY15 Q3FY15 Q4FY15
Equity Others
18,255
13,701
4,554
19,895
14,676
5,219
20,673
14,234
6,439
21,336
13,848
7,488
22,497
13,910
8,587
Mutual Fund investments are subject to market risk, read scheme related information carefully before investing.
Wealth Management BusinessThe Company’s Wealth Management business is carried out through L&T Capital Markets Limited -- its wholly owned subsidiary addressing the needs of Ultra High Net worth (UHNI) and High Net worth (HNI) individuals through the Company’s Private and Premier Wealth channels.
The business has grown well on the back of its business model built on the fundamental tenets of client centricity, intellectual property and execution efficiency. Average assets under service for the quarter ended March 31, 2015
L&T Infra Finance has evolved as a specialized project financier and is
a leading name in the renewable energy and road sectors
GoInvest, the first mutual fund application of its kind, allows portfolio
access and latest valuations on Facebook

164
grew to v 6966 crore, depicting an increase of 39% from v 5019 crore for the corresponding period in the previous year. The Company’s Wealth Management business has a customer base of over 3,000 and is operational in Mumbai, Delhi, Bangalore, Chennai, Hyderabad, Chandigarh, Ahmadabad, Baroda and Pune. During the period under review, the Company initiated its foray offshore and set up a representative office in Dubai in the DIFC campus.
Significant Initiatives:In the retail lending business, the major initiatives undertaken were as follows:
• Consistent focus to grow in B2C segments, through expansion in existing product lines and entry into new business
• Implementation of automated rule- driven credit evaluation for 2 wheeler loans
• Facilitation of convenient retail EMI payments for our customers through tie-ups with payment collection services
• Implementation of unified data warehouse across all retail entities and products
In the investment management business, the Company undertook many notable initiatives which included
• Introduction of 3 unique products for the investors
• The Company also launched India’s first mutual fund application on facebook called GoInvest which would allow investors to view their L&T Mutual Fund portfolios with latest valuations.
Outlook: Over the last one year, India’s new government took several steps to unshackle binding growth constraints. In particular, it cleared many infrastructure bottlenecks, sped up decision-making, fast-tracked project clearances, cut red tape and sorted out mining issues. Nevertheless, several multilateral think tanks observe that the pace of reforms will need to be stepped up to bridge the yawning infrastructure gap, unlock private investments, make Indian firms globally competitive and strengthen the balance sheets of financial intermediaries. While there has been some improvement in the economic environment, a longer timeframe is expected for the revised policies, legislation and regulation to translate into fresh capital expenditure and new projects in several sectors.
L&T General Insurance
OverviewL&T General Insurance achieved a Gross Written Premium (GWP) of v 344 crore (Previous Year v 270 crore) thereby registering a growth of 28% over the previous year.
The company made significant foray into Private Motor and Retail Health Insurance and its products have been well received in the market. Motor remains the largest contributor to the GWP with a share of 60%. Health and other Commercial lines of business (primarily Fire and Engineering) contributed 14% and 26% of the total GWP respectively. L&T General Insurance has a pan India presence with 15 branches.
Business EnvironmentGeneral insurance industry (excluding specialised insurers such as AIC and ECGC) reported a subdued growth of 10.80% in GWP from v 72853 crore in the year 2013-14 to v 80696 crore in the year 2014-15. The growth in premium for private players has slowed down to 11.3% in year 2014-15 against 15% in the previous year, whereas for the PSUs, the growth has remained constant at 10.3%. In spite of the slowdown in growth rate, which can be attributed to subdued auto sales and lack of new infrastructure projects in the year 2014-15, the private players have retained their market share of 47%.
Along with a lower top line growth, the year was marked by two major natural catastrophes - the Hudhud cyclone that hit the Andhra coast and floods in the Kashmir Valley, which negatively impacted the profitability of the industry for the year 2014-15.
Motor and Health lines of business are the fastest growing segments and account for 46% and 24% of the industry’s GWP respectively.
Significant InitiativesThe extensive use of the robust technology platform coupled with improvement in process efficiencies resulted in better productivity levels for the Company. This will further help the Company to optimize its operating costs in future.
Outlook:Insurance Laws (Amendment) Bill, 2015 was passed by both houses of the Parliament in March 2015 and a number of regulatory changes are expected from IRDAI. Low insurance penetration in terms of premium percentage to GDP, growth in urbanisation and further economic recovery is expected to improve the growth of industry in the year 2015-16. Health insurance is expected to demonstrate a strong growth due to demographics, provision for specialised players and government’s focus on health insurance and Motor insurance is expected to maintain its leading position amongst various segments. L&T General Insurance is poised to leverage the opportunities on the back of its operational efficiencies supported by its state-of-the-art technology platform.

165
Developmental Projects business segment comprises
(a) Infrastructure projects executed through L&T
Infrastructure Development Limited and its subsidiaries
and associates (L&T IDPL Group); (b) Power Development
Projects executed through L&T Power Development Limited
and its subsidiaries (L&T PDL Group) and (c) Kattupalli Port
operations of L&T Shipbuilding Limited.
The operations of developmental projects business
segment primarily involves development, operation and
maintenance of basic infrastructure projects in the Public
Private Partnership format, toll collection including annuity
based road projects, power development and power
transmission, development & operation of port facilities
and providing related advisory services. The business
model envisages calibrated churning of the portfolio to
monetise assets at an appropriate time for capital and also
for realisation of returns on the developed projects from
the perspective of shareholder value creation.
L&T IDPL Group:
Overview:
L&T Infrastructure Development Projects Limited (L&T IDPL)
is a major player in the Public-Private Partnership projects
in India with business interests across Roads and Bridges,
Ports, Metro Rail, Wind energy and emerging sectors
such as Power Transmission Lines, Water and Railways.
Incorporated in the year 2001 as L&T Holdings Limited,
then a wholly owned subsidiary of Larsen & Toubro,
L&T IDPL is currently India’s premier road developer with
a portfolio of 17 projects with 7800 kms at an estimated
project cost of v 187,000 crores. Of these, 13 projects are
under operation and 4 projects are under implementation.
L&T IDPL’s portfolio of infrastructure assets also includes
the Hyderabad metro rail project, a transmission line
project, ports and a wind energy project.
The Hyderabad Metro Rail Project - the world’s largest Public-Private-Partnership (PPP) project in the metro sector
Developmental Projects Business

166
Roads & Bridges:
No. of Projects : 17 nos.Lane Kms : 7,800 kmsEst. Project Cost : v 187 Bn
13 Operational Projects (including 1 Annuity Project)4 Implementing Projects (including 1 Hybrid Project)
Metro:
No. of Projects : 1 nos.Length of Rail Line : 71 kmsEst. Project Cost : v 170 Bn
Development of Metro Rail and Transit Oriented Development in Hyderabad
Ports:
No. of Projects : 1 no.Capacity : 3.5 MTPAProject Cost : v 1.25 Bn
One Berth in Haldia with minority stake
Transmission Line:
No. of Projects : 1 no.Capacity : 2,400 MWProject Cost : v 13.50 Bn
”Transmission System for Power evacuation“ from Kudgi TPC (3x800 MW) of NTPC Ltd. at KarnatakaScheduled COD - Dec 2015.
Total No. of Projects: 20 nos; Project Cost: v 371.24 Bn Business Environment:The Indian Infrastructure sector is likely to get major boost from the Government’s focus on development of infrastructure in India. While the recovery in the sector is likely, it would be gradual as majority of players are still burdened with highly leveraged balance sheets and stalled or slow moving projects. Furthermore, if structural constraints like uncertainty in land acquisition, delays in approvals, and inadequacy of long term funding avenues are not tackled swiftly, the project implementation on the ground may not gather momentum, thereby delaying recovery in the infrastructure sector. In addition, aggressive bidding in the past and inability or limited ability to raise equity for BOT projects have also impacted viability of infrastructure projects. Difficulty in achieving financial closure and overall weak macro-economic environment has also reduced the risk appetite of developers towards new projects. With the political stability, sharper focus on infrastructure development and improvement in economy,
new projects announcements by both the public and private sector are likely to pick-up in coming years.
During the year 2014-15, many steps have been taken to improve funding avenues to the infrastructure sector. The key policy measures include easing of FDI norms for Construction, Railways, and Defence, liberalisation of ECB policy, and providing incentives to promote InvITs. RBI has also taken multiple steps to ease funding availability to infrastructure project. Some of the key ones include providing incentives to banks in the form of exemption from CRR/SLR for long term bonds raised to lend to infrastructure sector, flexibility in refinancing norms for infrastructure projects. Besides, the Union Budget has also allocated higher funds towards public sector infrastructure projects.
In the Union Budget for 2015-16, the capital outlays for roads, and railways have been increased by v 140.3 billion and v 100.5 billion respectively which along with significantly higher road cess will enable higher public spending towards these infrastructure projects. In total, investment in infrastructure is proposed to be increased by v 700 billion in FY 2015-16 (BE) over FY 2014-15 (RE). Recognizing the need of reviving private sector participation in infrastructure projects, the Union Budget has proposed rebalancing of risks in PPP projects with Government taking up major risks, appointing an Expert Committee for analysing the possibility of and replacing multiple prior permissions with a pre-existing regulatory mechanism, and rationalizing dispute resolution mechanism.
In order to improve funding options, alternate funding sources like Infrastructure Debt Funds (IDFs) and Alternate Investment Funds (AIFs) were introduced in the past to tap into other source of savings like Insurance and Pension Funds so as to accelerate and enhance the flow of long term funds. In this regard, the recent initiative in the form of Infrastructure Investment Trusts (InvITs) may help in channelising long term funds into the sector and in releasing developers’ capital for further deployment in new projects. Moreover, InvITs could play a vital role in providing wider long-term refinance avenue thereby providing headroom for banks for new funding requirements.
To make highway projects financially viable and attract large number of bidders, the ministry of road, transport and highways has suggested a hybrid model wherein the National Highway Authority of India would finance up to 40 per cent of the total project cost. As per the model, 40 per cent of the total project cost (TPC) is to be provided by the authority (NHAI) to the concessionaire (highway developer) during the construction period in the form of ‘Construction Support’. The concessionaire would be required to bear the balance 60 per cent of the project cost through a combination of its equity contribution and

167
debt raised from the market. In the past aggressive bidding and faulty traffic projections have led to many projects becoming financially unviable. Under the proposed model, the total cost for the concessionaire (highway developer) would be only up to 60 per cent of the total project cost. NHAI has also come up with implementation of RFID technology, for automation of toll collections.
Significant Initiatives:L&T IDPL has set up internal task forces and project monitoring groups to identify, prioritise & resolve challenges faced by certain projects in the roads portfolio. L&T IDPL has also made significant strides to improve performance by help of steps such as arresting leakage of traffic on Project roads by improving awareness about reduction in travel time by usage of toll roads and partnering with local Authorities to close evading routes to Toll Plazas. L&T IDPL is working with Gujarat State Government to devise innovative solutions within ambit of Concession Agreements to improve operational performance of State Government road projects in Gujarat. Results of these initiatives are expected to bear fruit from the year 2015-16.
Road Sector overview:During the year 2012-13, the company had signed concession agreement for execution of two projects in the state of Maharashtra. Delay in land handing over, however, resulted in delay of project implementation works which in turn resulted in substantial increase of project cost. To de-risk impact of such delays, termination agreements were signed on 22nd September 2014 for L&T East West Tollway Limited and L&T Great Eastern Highway limited in the state of Maharashtra.
Recently, NHAI established a central clearing house for Electronic Toll Collection (ETC) in an effort to reduce
congestion at toll plazas and to enable seamless movement of vehicles on the countrywide national highways. L&T IDPL is among the first Concessionaires to fully exploit the new Electronic Toll Collection system across all SPVs/Projects. Now the commuter will be able to pass through L&T IDPL’s as well other concessionaires stretch without stopping at toll plazas with a single unique RFID TAG/Account.
The unique RFID TAG affixed to the vehicle windshield will be scanned by RFID reader mounted on ETC lane at toll plazas and toll will be deducted from their account automatically. The new ETC system mitigates the risk associated with toll violation, leakages and Operation & Maintenance expense
During the year, the two road subsidiaries achieved Partial COD (Commercial Operations Date) - II for Pimpalgaon Nashik Gonde (PNG) in March 2014 and Devihalli Hassan (DHTL) in December 2014. This has led to an increase in Total Revenue Collections from Road Projects. Appointed date was declared for two projects: Deccan Tollways (DTL) in April 2014 & Sambalpur Rourkela (SRTL) in June 2014. Construction work is underway in full swing in both the Projects.
Construction has been completed for Krishnagiri-Walajahpet road project and Samakhiali-Gandhidham road project and accordingly assets have been capitalised.
Major maintenance works were completed for five road projects i.e., Vadodara-Bharuch Tollway, Panipat Elevated corridor, Western Andhra Tollway (Jadcherla-Kothakota), Interstate Road Corridor (Palanpur-Swaroopganj) and Krishnagiri-Thopur Tollway. This enhances the asset quality, usability and riding quality of the roads.
The six-lane, 148.34 kms stretch of road on NH-46 from Krishnagiri to Walajahpet in Tamil Nadu

168
The total revenue from Toll Operations during the year 2014-15 aggregated to v 1177 crore as against the corresponding figure for the year 2013-14 of v 936 crore recording a growth of 25.7% over the previous year. Larsen & Toubro Limited and Canada Pension Plan Investment Board (CPPIB) have entered into a definitive investment agreement in June 2014. The agreement was made between L&T and a wholly-owned subsidiary of CPPIB, for investment into L&T Infrastructure Development Projects Limited. CPPIB, through a subsidiary, has made an initial investment of v 1000 crore in L&T IDPL on December 16, 2014 by way of subscription to compulsorily convertible preference shares.
A second tranche of v 1000 crore or such higher amount as may be agreed between L&T IDPL and CPPIB’s subsidiary, will be invested after twelve months from the date of the initial investment, subject to any required regulatory approvals at such time. This is the first direct private investment by a Canadian pension fund into an Indian infrastructure development company.
The Company had issued Commercial Papers during the year and also Letters of Credit to vendors/contractors providing goods/services for the Sambalpur-Rourkela road project, Kudgi transmission line project and major maintenance works. During the year, credit ratings for 6 projects were enhanced based on growth in toll collections.
L&T IDPL had entered into a Share Purchase Agreement on 16th May, 2014, for sale of its equity stake in M/s. Dhamra Port Company Ltd. The divestment was completed in June 2014.
Outlook:The recovery in the infrastructure sector is expected to be gradual and would be linked with on-ground impact of the policy measures as well as availability of funding.
Kudgi Power Transmission Line project, Karnataka
Unloading operations on a Cape size vessel berthed at Dhamra Port,
Odisha
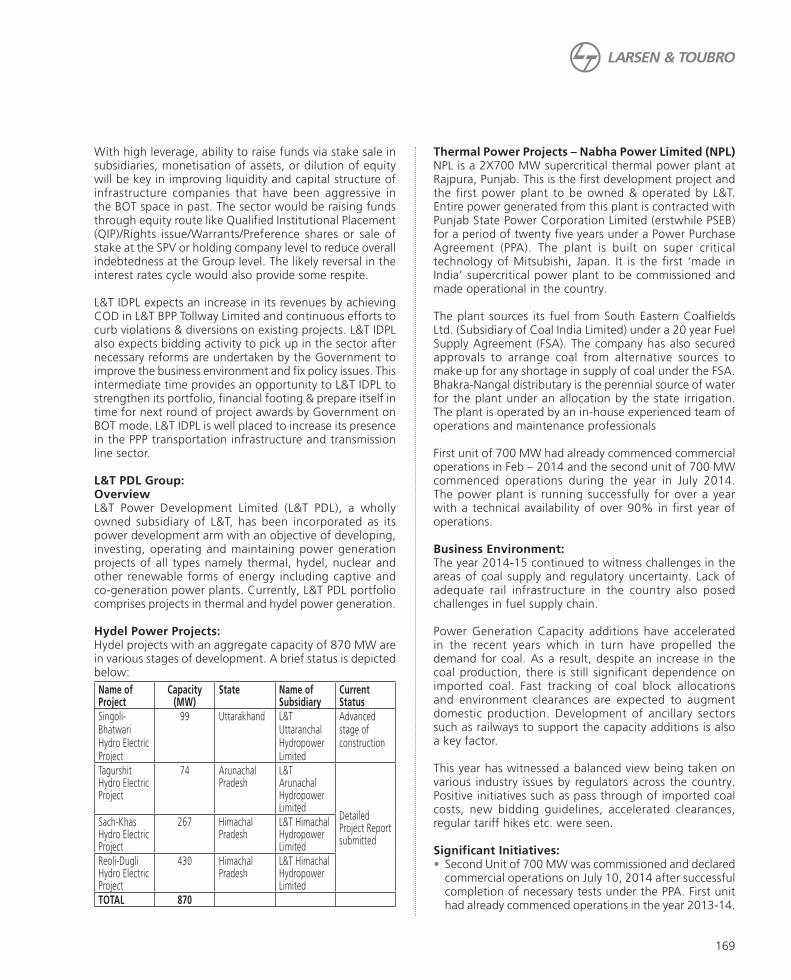
169
With high leverage, ability to raise funds via stake sale in subsidiaries, monetisation of assets, or dilution of equity will be key in improving liquidity and capital structure of infrastructure companies that have been aggressive in the BOT space in past. The sector would be raising funds through equity route like Qualified Institutional Placement (QIP)/Rights issue/Warrants/Preference shares or sale of stake at the SPV or holding company level to reduce overall indebtedness at the Group level. The likely reversal in the interest rates cycle would also provide some respite.
L&T IDPL expects an increase in its revenues by achieving COD in L&T BPP Tollway Limited and continuous efforts to curb violations & diversions on existing projects. L&T IDPL also expects bidding activity to pick up in the sector after necessary reforms are undertaken by the Government to improve the business environment and fix policy issues. This intermediate time provides an opportunity to L&T IDPL to strengthen its portfolio, financial footing & prepare itself in time for next round of project awards by Government on BOT mode. L&T IDPL is well placed to increase its presence in the PPP transportation infrastructure and transmission line sector.
L&T PDL Group: OverviewL&T Power Development Limited (L&T PDL), a wholly owned subsidiary of L&T, has been incorporated as its power development arm with an objective of developing, investing, operating and maintaining power generation projects of all types namely thermal, hydel, nuclear and other renewable forms of energy including captive and co-generation power plants. Currently, L&T PDL portfolio comprises projects in thermal and hydel power generation.
Hydel Power Projects:Hydel projects with an aggregate capacity of 870 MW are in various stages of development. A brief status is depicted below:
Name of Project
Capacity (MW)
State Name of Subsidiary
Current Status
Singoli-Bhatwari Hydro Electric Project
99 Uttarakhand L&T Uttaranchal Hydropower Limited
Advanced stage of construction
Tagurshit Hydro Electric Project
74 Arunachal Pradesh
L&T Arunachal Hydropower Limited
Detailed Project Report submitted
Sach-Khas Hydro Electric Project
267 Himachal Pradesh
L&T Himachal Hydropower Limited
Reoli-Dugli Hydro Electric Project
430 Himachal Pradesh
L&T Himachal Hydropower Limited
TOTAL 870
Thermal Power Projects – Nabha Power Limited (NPL)NPL is a 2X700 MW supercritical thermal power plant at Rajpura, Punjab. This is the first development project and the first power plant to be owned & operated by L&T. Entire power generated from this plant is contracted with Punjab State Power Corporation Limited (erstwhile PSEB) for a period of twenty five years under a Power Purchase Agreement (PPA). The plant is built on super critical technology of Mitsubishi, Japan. It is the first ‘made in India’ supercritical power plant to be commissioned and made operational in the country.
The plant sources its fuel from South Eastern Coalfields Ltd. (Subsidiary of Coal India Limited) under a 20 year Fuel Supply Agreement (FSA). The company has also secured approvals to arrange coal from alternative sources to make up for any shortage in supply of coal under the FSA. Bhakra-Nangal distributary is the perennial source of water for the plant under an allocation by the state irrigation. The plant is operated by an in-house experienced team of operations and maintenance professionals
First unit of 700 MW had already commenced commercial operations in Feb – 2014 and the second unit of 700 MW commenced operations during the year in July 2014. The power plant is running successfully for over a year with a technical availability of over 90% in first year of operations.
Business Environment:The year 2014-15 continued to witness challenges in the areas of coal supply and regulatory uncertainty. Lack of adequate rail infrastructure in the country also posed challenges in fuel supply chain.
Power Generation Capacity additions have accelerated in the recent years which in turn have propelled the demand for coal. As a result, despite an increase in the coal production, there is still significant dependence on imported coal. Fast tracking of coal block allocations and environment clearances are expected to augment domestic production. Development of ancillary sectors such as railways to support the capacity additions is also a key factor.
This year has witnessed a balanced view being taken on various industry issues by regulators across the country. Positive initiatives such as pass through of imported coal costs, new bidding guidelines, accelerated clearances, regular tariff hikes etc. were seen.
Significant Initiatives: • Second Unit of 700 MW was commissioned and declared
commercial operations on July 10, 2014 after successful completion of necessary tests under the PPA. First unit had already commenced operations in the year 2013-14.
170
• Over 90% off take of linkage coal under the Fuel supply Agreement achieved
• The company undertook significant initiatives to source coal from alternative sources to make-up for any intermediate shortfall in linkage coal with the approval of state regulator
• 100% of dry fly ash disposal achieved• Refinancing the long term debt in its existing projects
with a view to significantly reduce the interest cost• CSR initiatives in the area of development of village
infrastructure, education, skill building, enhancing gender ratio, health and environment were implemented during the year
• The company has built a committed team of professionals experienced in the field of operations and maintenance of power plants. Special emphasis is given to training and development of the workforce through various training programs. In addition to the competency building programs, the company also focusses on soft skills and leadership development.
Outlook:Increased private participation in the power sector is expected to play an important role in future capacity additions. Lower per capita consumption promises robust long term demand. On the fuel side, coal production capacity is expected to further increase by the year 2016-17.
Punjab is power surplus for 7-8 months in a year. With energy demand expected to grow and no further capacity additions being planned, the system may be deficit again in the medium term.
Maximising the plant availability, improving operational efficiency, settling the regulatory issues, ensuring adequate fuel availability, cost competitiveness and focus on construction activities for its Singoli-Bhatwari hydel project are identified as the thrust areas for the year 2015-16.
L&T Shipbuilding Limited: Kattupalli Port OperationsL&T Shipbuilding Limited is a joint venture between L&T and Tamilnadu Industrial Development and Corporation Limited (TIDCO) wherein L&T holds 97% and TIDCO holds 3% in the company to develop shipyard cum minor port complex. Both the shipyard and the port have SEZ status. Kattupalli port at Chennai has a container terminal with two container berths.
Business Environment:India has 13 major ports and about 200 non-major ports. Cargo traffic, which was 976 million metric tonnes (MMT) in 2012 is expected to reach 1758 MMT by 2017. The Indian ports and shipping industry plays a vital role in sustaining growth in the country’s trade and commerce. India currently ranks 16th among maritime countries, with a coastline of about 7517 km. Around 95 per cent of India’s trade by volume and 70 per cent by value takes place through maritime transport, according to the Ministry of Shipping.
The Indian government continues to support the ports sector. It has allowed foreign direct investment (FDI) of up to 100 per cent under the automatic route for projects regarding construction and maintenance of ports and harbors. It has also facilitated a 10-year tax holiday to enterprises engaged in developing, maintaining and operating ports, inland waterways and inland ports.
During the year, Kattupalli Port operations continued to remain affected owing to lack of export connectivity on customs side due to delays in the necessary government approvals which led to the traffic in the port remaining very subdued. The relevant export connectivity approval has since been issued in January 2015 for the EXIM trade allowing the Container Freight Station (CFS) at Kattupalli to select Kattupalli port for exports as well as imports.
Kattupalli port achieved the milestone of handling 100000 tons of Steel project cargo at the facility since it started Break Bulk Operations in April 2014.
OutlookThe shipping lines and other CFSs have now begun to seriously evaluate Kattupalli Port for EXIM trade. Given the issues of traffic congestion at Chennai port, the prospects for Kattupalli port are quite encouraging. A few shipping lines have already commenced their operations through Kattupalli Port while many more enquiries are coming in. During the year 2015-16, Kattupalli port is targeting to achieve a volume of between 3,00,000 to 4,00,000 TEUs.
There is a strong interest from Roll on Roll off (RoRo- Import/Export of cars) operators to shift to Kattupalli port. Kattupalli port has received all clearances to handle RoRo cargo in March 2015 and is targeting to achieve a volume of 6000 cars per month in the year 2015-16.

171
I. L&T CONSOLIDATED
A. PERFORMANCE REVIEW
As at March 31, 2015, L&T Group comprises of 130
subsidiaries, 11 associates and 18 joint venture companies.
Most of the group companies are strategic arms of project
and product businesses of L&T. They provide reach to different
segments in the value chain of the respective businesses
and also access to new geographies. Certain distinct service
businesses such as Information Technology, Technology
Services, Developmental Projects and Financial Services are
housed in the subsidiary and associate companies of the
Group. L&T Finance Holdings Limited is the listed subsidiary
of L&T with a number of group companies under its umbrella
operating in the financial services sector.
The Company has exercised the option as per clause 41 of
the Listing Agreement and started publishing consolidated
financial results on a quarterly basis effective April 1, 2014.
Consolidated financial reporting on a quarterly basis provides
superior quality of information of the Group’s performance
to the various stakeholders at large.
The Group garnered fresh orders totaling to v 155367 crore
for the year 2014-15 registering significant growth of
22% over the previous year, despite challenging business
environment. Increase in order inflow was driven by domestic
orders. Power Transmission and Distribution, Power,
Metallurgical & Material Handling and Heavy Engineering
businesses contributed to the order inflow growth during
the year. Infrastructure segment contributed to 55% of
the total order inflow. The Company, while focusing on
the improving domestic market, was selective in pursuing
international opportunities and this is reflected in the lower
share of international orders which stood at 25% of the total
order inflow in 2014-15 compared to 38% in the previous
year.
The Order book as at 31st March 2015 stood at v 232649 crore
providing strong revenue visibility for the next couple of
years. Building & Factories, Heavy Civil Infrastructure and
Transportation Infrastructure businesses contributed major
part of the order book. The order book registered a growth
of 28% over the previous year. The international orders
constitute 26% of the order book as at 31st March 2015.
Revenue from Operations
The consolidated revenue at v 92762 crore for the year
2014-15 registered a growth of 8% over the previous year.
Infrastructure, Information Technology & Technology Services
(IT & TS), Financial Services and Realty businesses recorded
healthy y-o-y growth. The overall revenue growth at group
level was moderated by decline in revenue recorded by
Power, Metallurgical & Material Handling, Heavy Engineering
and Hydrocarbon segments operating with a reduced Order
Book in investment constrained sectors. Lower industrial
demand impacted sales by Electrical & Automation and
Industrial Machinery businesses.
Revenue from International business constitutes 28% of
total revenue of the Group.
Operating Cost and PBDIT
Manufacturing, Construction and Operating (MCO) expenses
at v 67294 crore for the year 2014-15 increased by 7.5%
over the previous year. These expenses mainly comprise cost
of construction & other materials, subcontracting expenses,
manpower costs of IT&TS businesses and interest expenses
of Financial Services business segment. On a relative basis,
the MCO expenses reduced from 73.5% to 73.2% of net
revenue aided to an extent by benign commodity prices
during the year.
Financial Review 2014-15

172
The Staff expenses for the year 2014-15 at v 7922 crore
increased by 11% as compared to the previous year mainly
on account of pay revisions, payroll cost of new ventures and
increase in marketing staff cost of the service businesses.
The total group manpower strength as on March 31, 2015
is 97466, which includes manpower in the operation of the
IT & TS businesses at 26570. The total group manpower was
91477 as on March 31, 2014, which included manpower
strength of 24052 in operation of IT & TS.
Sales and administration expenses for the year 2014-15
at v 5453 crore increased to 5.9% of net revenue mainly
due to warranty provisions, increase in mobilization costs
for execution of new large projects in the Middle East and
statutory provisions against non-performing and standard
assets of Financial Services business.
Profit before depreciation, interest and tax (PBDIT) for the
year increased to v11336 crore, reflecting 5.6% increase
over the previous year. The EBITDA margin for the year at
12.3% is lower by 30 basis points as compared with the
previous year on the back of operating losses of Hydrocarbon
business.
Depreciation & Amortisation charge
Depreciation and amortisation charge for the year 2014-15
at v 2623 crore reflects increase of 81% over 2013-14 during
which v 664 crore was written back towards amortisation
charge. Depreciation for the year 2014-15 also includes
additional charge due to revision in useful lives of assets
as required by Schedule II of the Companies Act, 2014 and
the impairment of two road projects surrendered during the
year.
Other Income
Other income for the year 2014-15 amounted to v 1007 crore
as against v 982 crore for the previous year. This mainly
consists of profit on sale of current investments and interest
& dividend income from treasury investments.
Finance cost
The interest expense for the year 2014-15 at v 2851 crore
was lower by 9% in comparison to v 3138 crore for the
previous year due to borrowing cost capitalisation and
cessation of interest cost of a Power generating subsidiary
upon commissioning of its plant during the year. The average
borrowing cost for the year 2014-15 was maintained at
9.9% p.a. through effective refinancing and judicious mix
of short and long term borrowings.
Exceptional Item
Exceptional item in the Statement of Profit & Loss represents
gain of v 348 crore on divestment of the Company’s part-
stake in L&T Finance Holdings Limited (L&T-FHL) and sale of
a strategic investment by a subsidiary company.
Profit after Tax
The overall consolidated Profit after Tax (PAT) at v 4765 crore
for the year 2014-15 declined by 2.8% over previous year
largely due to the operating losses incurred by Hydrocarbon
business in its international jobs and also due to lower profits
earned by Power, Metallurgical & Material Handling and
Heavy Engineering businesses.
Earnings per share
Consequently, Consolidated Earnings per Share (EPS)
including exceptional and extraordinary items for the year
2014-15 at v 51.33 showed a decline of 3.1% over the
previous year.
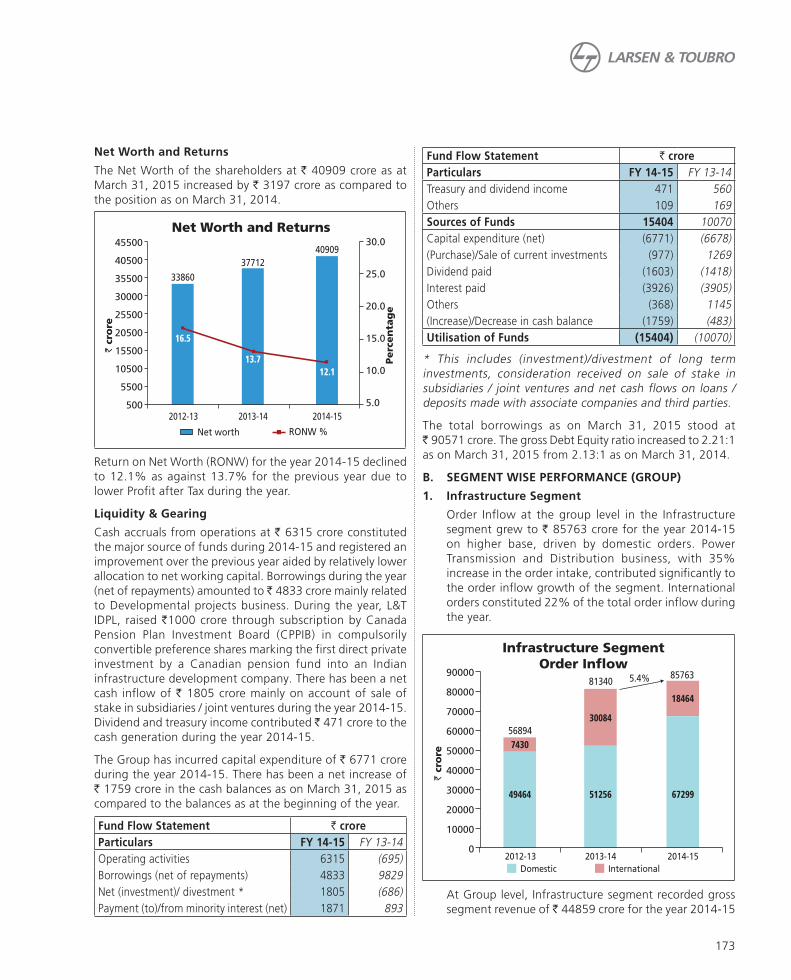
173
Net Worth and Returns
The Net Worth of the shareholders at v 40909 crore as at
March 31, 2015 increased by v 3197 crore as compared to
the position as on March 31, 2014.
Return on Net Worth (RONW) for the year 2014-15 declined
to 12.1% as against 13.7% for the previous year due to
lower Profit after Tax during the year.
Liquidity & Gearing
Cash accruals from operations at v 6315 crore constituted
the major source of funds during 2014-15 and registered an
improvement over the previous year aided by relatively lower
allocation to net working capital. Borrowings during the year
(net of repayments) amounted to v 4833 crore mainly related
to Developmental projects business. During the year, L&T
IDPL, raised v1000 crore through subscription by Canada
Pension Plan Investment Board (CPPIB) in compulsorily
convertible preference shares marking the first direct private
investment by a Canadian pension fund into an Indian
infrastructure development company. There has been a net
cash inflow of v 1805 crore mainly on account of sale of
stake in subsidiaries / joint ventures during the year 2014-15.
Dividend and treasury income contributed v 471 crore to the
cash generation during the year 2014-15.
The Group has incurred capital expenditure of v 6771 crore
during the year 2014-15. There has been a net increase of
v 1759 crore in the cash balances as on March 31, 2015 as
compared to the balances as at the beginning of the year.
Fund Flow Statement v crore
Particulars FY 14-15 FY 13-14
Operating activities 6315 (695)
Borrowings (net of repayments) 4833 9829
Net (investment)/ divestment * 1805 (686)
Payment (to)/from minority interest (net) 1871 893
Fund Flow Statement v crore
Particulars FY 14-15 FY 13-14
Treasury and dividend income 471 560
Others 109 169
Sources of Funds 15404 10070
Capital expenditure (net) (6771) (6678)
(Purchase)/Sale of current investments (977) 1269
Dividend paid (1603) (1418)
Interest paid (3926) (3905)
Others (368) 1145
(Increase)/Decrease in cash balance (1759) (483)
Utilisation of Funds (15404) (10070)
* This includes (investment)/divestment of long term
investments, consideration received on sale of stake in
subsidiaries / joint ventures and net cash flows on loans /
deposits made with associate companies and third parties.
The total borrowings as on March 31, 2015 stood at
v 90571 crore. The gross Debt Equity ratio increased to 2.21:1
as on March 31, 2015 from 2.13:1 as on March 31, 2014.
B. SEGMENT WISE PERFORMANCE (GROUP)
1. Infrastructure Segment
Order Inflow at the group level in the Infrastructure
segment grew to v 85763 crore for the year 2014-15
on higher base, driven by domestic orders. Power
Transmission and Distribution business, with 35%
increase in the order intake, contributed significantly to
the order inflow growth of the segment. International
orders constituted 22% of the total order inflow during
the year.
At Group level, Infrastructure segment recorded gross
segment revenue of v 44859 crore for the year 2014-15
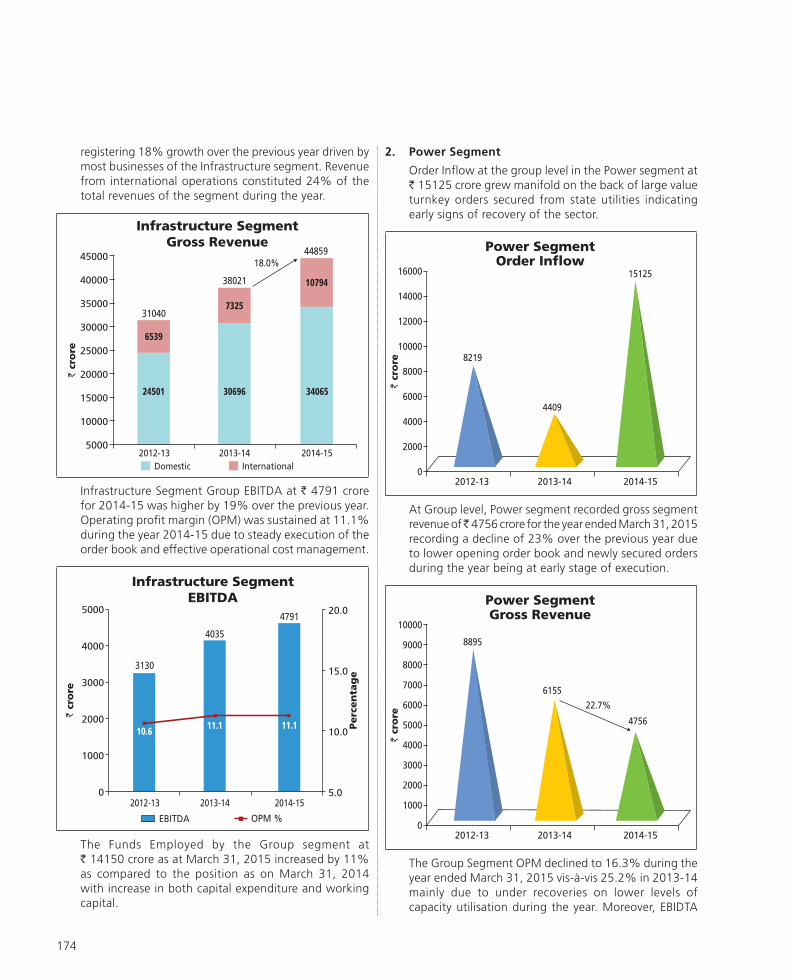
174
2. Power Segment
Order Inflow at the group level in the Power segment at
v 15125 crore grew manifold on the back of large value
turnkey orders secured from state utilities indicating
early signs of recovery of the sector.
At Group level, Power segment recorded gross segment
revenue of v 4756 crore for the year ended March 31, 2015
recording a decline of 23% over the previous year due
to lower opening order book and newly secured orders
during the year being at early stage of execution.
The Group Segment OPM declined to 16.3% during the
year ended March 31, 2015 vis-à-vis 25.2% in 2013-14
mainly due to under recoveries on lower levels of
capacity utilisation during the year. Moreover, EBIDTA
registering 18% growth over the previous year driven by
most businesses of the Infrastructure segment. Revenue
from international operations constituted 24% of the
total revenues of the segment during the year.
Infrastructure Segment Group EBITDA at v 4791 crore
for 2014-15 was higher by 19% over the previous year.
Operating profit margin (OPM) was sustained at 11.1%
during the year 2014-15 due to steady execution of the
order book and effective operational cost management.
The Funds Employed by the Group segment at
v 14150 crore as at March 31, 2015 increased by 11%
as compared to the position as on March 31, 2014
with increase in both capital expenditure and working
capital.

175
for the previous year provided a higher base effect due
to realisation of margins on jobs nearing completion.
The Funds Employed by the Group segment at
v 2049 crore as at March 31, 2015 decreased by 16% as
compared to the position as on March 31, 2014 on the
back of higher customer advances on new order wins.
3. Metallurgical and Material Handling Segment (MMH)
MMH segment recorded order Inflow of v 6136 crore
indicative of some improvement in the investment
outlook in metals & mining sector.
At Group level, MMH segment recorded gross
segment revenue of v 3426 crore for the year ended
March 31, 2015 registering a decline of 40% over the
previous year due to depleted opening order book and
delayed receipt of fresh orders during the year.
The Group Segment recorded decline in OPM at 10.6%
during the year ended March 31, 2015 vis-à-vis 16.6%
in 2013-14 due to under recoveries, delayed execution
and cost overruns in certain projects in progress.
The Funds Employed by the Group segment at
v 3228 crore as at March 31, 2015 decreased by 2%
as compared to the position as on March 31, 2014.
The segment witnessed slower pace of realisation of
receivables, as liquidity conditions remained challenging
during the year.
4. Heavy Engineering Segment
Group level order inflow in the Heavy Engineering
segment recorded significant growth of 35% to
v 4989 crore for the year ended March 31, 2015 mainly
driven by defence sector orders. International orders
constituted 29% of the total order inflow during the
year.

176
At Group level, Heavy Engineering segment recorded
gross segment revenue of v 3625 crore for the year
ended March 31, 2015 lower by 20% compared to the
previous year due to depleted opening order book and
low level of order inflows in Process Plant and Nuclear
Equipment business. Revenue from international
operations constituted 31% of the total revenues of
the segment during the year.
The Group Segment recorded OPM of 12.2% during the
year ended March 31, 2015 vis-à-vis 15.8% in 2013-14.
The decline in EBITDA margin was mainly attributable to
cost overruns in some of the jobs under execution and
under recoveries.
The Funds Employed by the Group segment at
v 4114 crore as at March 31, 2015 decreased by 4% as
compared to the position as on March 31, 2014. The
working capital level, however, increased due to higher
customer receivables and lower vendor credit.
5. Electrical & Automation Segment (E&A)
At the Group level, E&A segment recorded gross
segment revenue of v 5460 crore for the year ended
March 31, 2015 registering 6% growth over the
previous year. The revenue growth was contributed by
Electrical Standard Products and Electrical Systems &
Equipment businesses in the face of lower industrial
activity that persisted throughout the year. Revenue
from international operations constituted 32% of the
total revenues of the segment during the year.
The Group Segment recorded EBITDA of v 710 crore
during 2014-15 registering a growth of 10% over

177
previous year. The OPM of 14.8% during the year ended
March 31, 2015 reflects a growth of 60 basis points
over previous year mainly on account of decrease in
commodity prices and favourable product mix.
The Funds Employed by the Group segment at
v 2881 crore as at March 31, 2015 increased by 14%
as compared to the position as on March 31, 2014 due
to higher working capital and capital expenditure.
6. Hydrocarbon Segment
Hydrocarbon segment, at consolidated level, recorded
order inflow of v 10716 crore during 2014-15 registering
a growth of 9.6% over the previous year aided by a
large order secured by Hydrocarbon Mid & Down-stream
international business. International orders accounted
for 64% of total order inflow for 2014-15.
Hydrocarbon segment recorded gross segment revenue
of v 7432 crore for the year ended March 31, 2015
registering a decline of 27% over the previous year.
Delayed receipt of fresh orders during 2014-15 and
execution delays on projects led to lower revenue.
International revenues contributed to 51% of the total
revenues of the segment for 2014-15.
The Group Segment EBITDA at negative v 1128 crore
during the year 2014-15 recorded a sharp decline
vis-à-vis a positive EBITDA of v 298 crore in 2013-14.
The operating losses were mainly due to cost and time
overruns in international jobs and non-realisation of
estimated change orders.
The Funds Employed by the Group segment at
v 2271 crore as at March 31, 2015 decreased by 39%
as compared to the position as on March 31, 2014
on account of decline in revenues and lower working
capital.
7. IT & Technology Services (IT & TS)
IT & TS segment at consolidated level comprises L&T
Infotech group of companies and L&T Technology
Services group of companies.
IT & TS segment recorded segment gross revenue
of v 7659 crore for the year ended March 31, 2015
registering an impressive growth of 19% over the
previous year. Most of the revenues of the segment are
from international customers.
L&T Infotech group recorded total revenue of
v 5071 crore during the year ended March 31, 2015,
registering 14% growth over the previous year mainly
led by services sector and addition to clientele.
L&T Technology Services business reported growth of
28% in revenue for 2014-15 at v 2588 crore mainly due
to enhanced business from existing customers.

178
The Segment EBITDA at v 1548 crore during 2014-15
registered growth of 9.9% over previous year. However,
the OPM for the year 2014-15 at 20.4% registered a
decline of 180 basis points over previous year mainly on
account of increase in staff cost and higher proportion
of resources deployed onsite.
The Funds Employed by the Group segment at
v 3377 crore as at March 31, 2015 increased by 28%
as compared to the position as on March 31, 2014 on
account of higher working capital.
8. Financial Services (FS)
FS segment, represented by L&T Finance Holdings
Limited and its subsidiaries, continued its growth
momentum during the year ended March 31, 2015
with 24% growth in its revenue at v 6401 crore. The
segment recorded an improved Net Interest Margin
(NIM) of 5.68% as against 5.47% in the previous year.
The loan book of the segment at v 47232 crore as at
March 31, 2015, registered a growth of 18% over the
previous year due to growth in disbursement in key
focus areas in the retail and wholesale finance business.
The asset management business also registered a
growth of 15% with the assets under management as
on March 31, 2015 recorded at v 21226 crore.
The General Insurance business of the segment entered
in its fourth full year of operations and achieved a Gross
Written Premium (GWP) of v 344 crore by selling more
than 3,80,000 policies. Motor remained the largest
contributor to GWP with a share of 60%.
The FS segment disbursed fresh loans and advances
of v 32481 crore during 2014-15, recording a growth
of 25% over the previous year. Gross Non-performing
Assets (NPA) of the segment at 2.25% of loan assets as
at March 31, 2015 improved over 3.18% as on March
31, 2014, due to robust collections and sale of certain
stressed assets to Asset Reconstruction Companies.

179
9. Developmental Projects (DP)
The Group has a diversified Infrastructure development business portfolio with a mix of projects under development across various sectors such as roads, bridges, ports, metro and power development. While power development projects are developed by L&T Power Development Limited, a subsidiary company, all the developmental projects in the other sectors are developed by L&T Infrastructure Development Projects Limited. In addition, the Kattupalli Port operations are housed in L&T Shipbuilding Limited, a subsidiary company.
L&T Infrastructure Development Projects Limited (L&T-IDPL) a subsidiary company, holds majority of its investment in the transportation infrastructure and port sectors. The Group owns 20 concessions in transportation infrastructure development space under its fold comprising 17 roads and bridges projects, 1 port project, 1 transmission line project and 1 metro rail project with total estimated project cost of v 37124 crore. As on March 31, 2015, 14 projects are under operation and 6 projects are under implementation.
In the power sector, the Group has 5 projects comprising of 1 thermal project under operation and 4 Hydel projects under development. The total estimated cost of projects aggregate to v 17861 crore. The Unit 2 of the 2x700 MW super critical thermal power plant at Rajpura commenced commercial operations during the year.
DP segment recorded gross segment revenue of v 5154 crore for the year ended March 31, 2015 and grew more than 3 times over the previous year. The growth in revenues is mainly driven by operationalisation of both the units of 2x700 MW supercritical thermal power plant at Rajpura in Punjab. During the year 2014-15, the Company also monetised a part of its developmental projects portfolio at a gain of v 1350 crore which also aided the growth in revenue for the segment.
The segment recorded growth in EBITDA at v 2147 crore for the year 2014-15 vis-à-vis v 618 crore for the previous year in line with the growth in revenues.
The Funds Employed by the segment at v 27042 crore
as at March 31, 2015 increased by 3% as compared to
the position as on March 31, 2014.
10. Others Segment
Others segment at the consolidated level for L&T Group
comprises Realty, Shipbuilding, Industrial Machinery,
Construction & Mining equipment, manufacturing
and sale of Industrial Valves, Welding and Cutting
equipment businesses.
At Group level, Realty business recorded growth of 45%
in segment gross revenue of v 1929 crore for the year
2014-15 vis-à-vis v 1327 crore in the previous year aided
by progress in the two real estate development projects
at Mumbai. The Realty business recorded an EBITDA
of v 1065 crore during the year 2014-15 as against
v 753 crore during the previous year due to progress in
its projects.
At Group level, Shipbuilding business recorded growth
of 29% in segment gross revenue at v 798 crore for
the year 2014-15 vis-à-vis v 619 crore in the previous
year due to progress on jobs received for Commercial
Ships. The Shipbuilding business recorded a negative
EBITDA of v 208 crore during the year 2014-15 as
against negative EBITDA of v 497 crore during the
previous year. The losses on projects under execution
due to time and cost overruns and under recovery of
overheads due to low capacity utilisation have resulted
in negative OPM during the year. The losses during the
year were, however, lower compared to previous year.
At Group level, Industrial Machinery, Products and
Other businesses recorded growth of 9% in segment
gross revenue at v 3858 crore for the year 2014-15
vis-à-vis v 3546 crore in the previous year on the back
of revenue growth reported by the Valves business. The
EBITDA also recorded a growth of 25% at v 558 crore
for the year 2014-15 due to favourable product mix.

180
The Funds Employed by the Group segment at v 10770 crore as at March 31, 2015 increased by 13% as compared to the position as on March 31, 2014 mainly in Realty and Shipbuilding businesses in line with growth in revenues.
II. L&T STANDALONE
PERFORMANCE REVIEW
The Company registered an impressive growth in order inflow during the year 2014-15, despite challenging business environment. Revenue and EBITDA growth, however, remained modest due to slower progress on non-infrastructure projects under execution. Profit after Tax at v 5056 crore in 2014-15 was lower as compared with the corresponding previous year due to cost and time overruns in some projects and under recoveries in few of the lines of business.
The Company continued its initiative of restructuring its businesses for value creation. During the year 2014-15, Integrated Engineering Services business has been transferred to the wholly-owned subsidiary of the Company to provide the required focus and agility to this business to take advantage of growth opportunities.
The Company successfully secured new orders worth v 109738 crore during the year 2014-15, registering an increase of 41% over the previous year, led by domestic orders which grew 50%. The order intake was healthy despite delayed revival of public and private investments, policy implementation delays and aggressive competition. Buildings & Factories, Heavy Civil Infrastructure, Transportation Infrastructure, Power Transmission & Distribution and Power businesses contributed significantly to the order inflows during the year. International orders contributed to 14% of the total order inflow during 2014-15.
The Order Book as at the year-end stood at v 191252 crore providing good revenue visibility for the next couple of years. The order book registered a growth of 29% over the previous year with international orders constituting 13% of the order book.
Revenue from Operations
Gross revenue for the year 2014-15 at v 57558 crore grew by around 4% over the revenue of v 55548 crore for the previous year, after excluding the sales from transferred IES business. While businesses of the Infrastructure segment registered a strong growth of 16% over the previous year, there was a decline in the revenue of Power, Metallurgical & Material Handling and Heavy Engineering segments over previous year on account of sectoral challenges and delayed replenishment of the Order book.
International revenue at v 9258 crore grew by 22% over 2013-14 and constituted 16% of the total revenue. The international revenue was mainly contributed by Power Transmission & Distribution, Commercial Buildings & Airports, Transportation Infrastructure and Process Plants & Nuclear Equipment businesses.
Operating Cost and PBDIT
Manufacturing, Construction and Operating (MCO) expenses at v 44397 crore for the year 2014-15 increased by 3%. These expenses mainly comprise cost of construction & other materials and subcontracting expenses. The MCO expenses, however, reduced from 78.5% to 77.8% of revenue on the
back of efficient cost and contract management.

181
The Staff expenses for the year 2014-15 at v 4151 crore
increased by 11.3% due to pay revisions as compared to
the staff expenses for previous year, adjusted for transfer
of IES business for like to like comparison. The Company’s
manpower strength stood at 44081 as at March 31, 2015.
Sales and administration expenses for the year 2014-15
at v 1982 crore increased to 3.5% of net revenue due to
increase in some of the administration cost and provision for
doubtful debts and advances. The increase is also attributable
to higher reversal of warranty provisions in the previous year.
The EBITDA margin for the year at 11.4% reduced by 10
basis points as compared to the previous year. Consequently,
Profit before depreciation, interest and tax (PBDIT) stood at v
6488 crore for the year, registering a modest growth of 3%
over the adjusted PBDIT for the previous year.
Depreciation & Amortisation charge
Depreciation and amortisation charge for the year 2014-15
at v 1008 crore increased by 32% over the previous year.
Increase in the depreciation charge for the year is mainly
due to the revision in useful lives of the assets pursuant to
Schedule II of the Companies Act, 2013.
Other Income
Other income for the year 2014-15 amounted to v 2283 crore
as against v 1897 crore for the previous year. Dividends from
Group companies during the year 2014-15 amounted to
v 851 crore as against v 865 crore for the previous year. The
short term investments of temporary surpluses made in low
risk securities yielded income of v 622 crore for the year.
Finance cost
The interest expenses for the year 2014-15 at v 1419 crore
were higher vis-à-vis v 1064 crore for the previous year. The
increase in the interest expenses is mainly due to interest
on higher borrowings made during the year to finance the
rising working capital needs of the businesses. The average
borrowing cost for the year 2014-15 was contained at 9.5%
p.a., with refinancing of the loans and efficient treasury
management.
Exceptional Item
Exceptional item in the Statement of Profit & Loss represents
gain of v 357 crore on divestment of the Company’s part-
stake in L&T Finance Holdings Limited (L&T-FHL) carried out
during 2014-15. The Company had also diluted a part of its
holding in LT-FHL in the previous year, recording a gain of
v 589 crore.
Profit after Tax
Profit after Tax (PAT), including exceptional items, for the
year 2014-15 was v 5056 crore. PAT for the previous year
after adjusting for the profits of IES business which had
formed part of the standalone results stood at v 5266 crore.
The PAT for the year from normal operations excluding
exceptional gains at v 4699 crore recorded a marginal
increase of 0.5% over the comparable PAT of v 4677 crore
for the previous year.
Earnings per share
The Earnings Per Share (EPS) including exceptional items for
the year 2014-15 at v 54.46 showed a decline of 8% over
the previous year. The same, however, is not comparable
vis-à-vis the EPS for 2013-14, which included the profit
from operations of the erstwhile IES business, housed in a
subsidiary company during 2014-15.
Funds Employed and Returns
The overall Funds Employed by the Company at v 50384 crore
as at March 31, 2015 increased by v 6498 crore as compared
to the position as on March 31, 2014.
The Company incurred v 901 crore towards capital
expenditure during the year. The major expenditure was
incurred on procurement of various plant and equipment
for the businesses in Infrastructure segment.
At the business aggregate level, Net Working capital as at
March 31, 2015 at v 14130 crore increased to 24.5% of
sales as compared to v 12731 crore at 22.3% of sales as
on March 31, 2014. Tight liquidity conditions and elevated
interest rates prevailing during most part of the year
2014-15 elongated the working capital cycle. The businesses
witnessed increase in construction work in progress that has
not achieved billing milestones and delays in realisation of
customer outstandings.
During the year, investments and loans to subsidiary
and associate companies increased by v 1505 crore (net
of proceeds from divestment). Major investments have
been made in subsidiary companies operating in Power
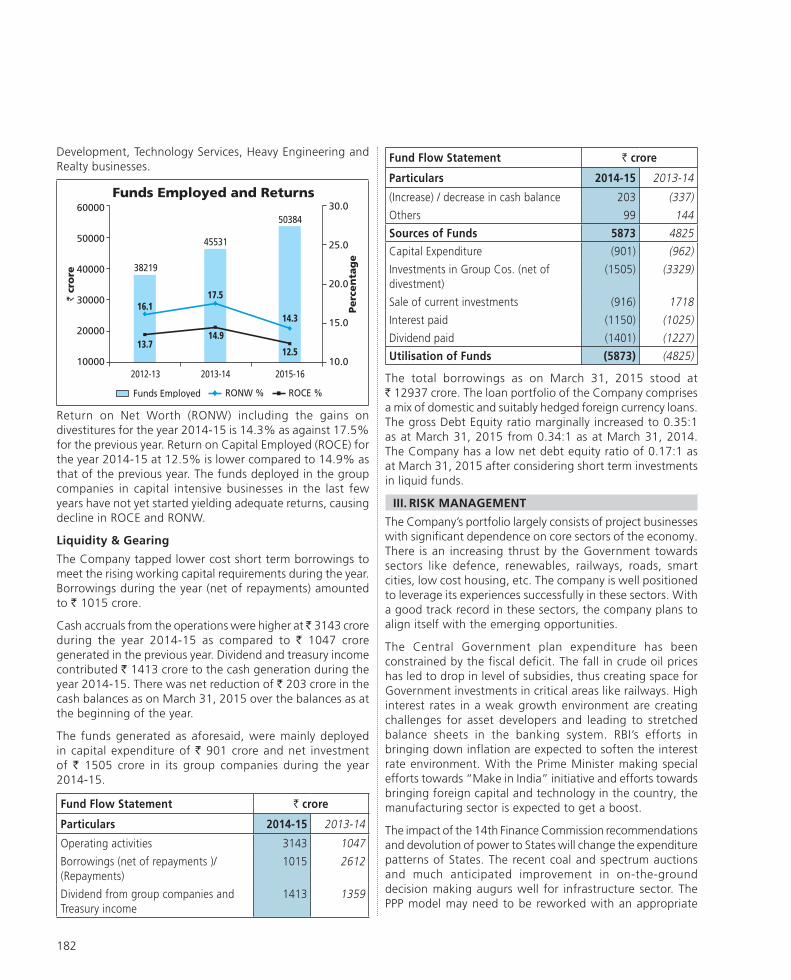
182
Development, Technology Services, Heavy Engineering and
Realty businesses.
Return on Net Worth (RONW) including the gains on
divestitures for the year 2014-15 is 14.3% as against 17.5%
for the previous year. Return on Capital Employed (ROCE) for
the year 2014-15 at 12.5% is lower compared to 14.9% as
that of the previous year. The funds deployed in the group
companies in capital intensive businesses in the last few
years have not yet started yielding adequate returns, causing
decline in ROCE and RONW.
Liquidity & Gearing
The Company tapped lower cost short term borrowings to
meet the rising working capital requirements during the year.
Borrowings during the year (net of repayments) amounted
to v 1015 crore.
Cash accruals from the operations were higher at v 3143 crore
during the year 2014-15 as compared to v 1047 crore
generated in the previous year. Dividend and treasury income
contributed v 1413 crore to the cash generation during the
year 2014-15. There was net reduction of v 203 crore in the
cash balances as on March 31, 2015 over the balances as at
the beginning of the year.
The funds generated as aforesaid, were mainly deployed
in capital expenditure of v 901 crore and net investment
of v 1505 crore in its group companies during the year
2014-15.
Fund Flow Statement v crore
Particulars 2014-15 2013-14
Operating activities 3143 1047
Borrowings (net of repayments )/
(Repayments)
1015 2612
Dividend from group companies and
Treasury income
1413 1359
Fund Flow Statement v crore
Particulars 2014-15 2013-14
(Increase) / decrease in cash balance 203 (337)
Others 99 144
Sources of Funds 5873 4825
Capital Expenditure (901) (962)
Investments in Group Cos. (net of
divestment)
(1505) (3329)
Sale of current investments (916) 1718
Interest paid (1150) (1025)
Dividend paid (1401) (1227)
Utilisation of Funds (5873) (4825)
The total borrowings as on March 31, 2015 stood at
v 12937 crore. The loan portfolio of the Company comprises
a mix of domestic and suitably hedged foreign currency loans.
The gross Debt Equity ratio marginally increased to 0.35:1
as at March 31, 2015 from 0.34:1 as at March 31, 2014.
The Company has a low net debt equity ratio of 0.17:1 as
at March 31, 2015 after considering short term investments
in liquid funds.
III. RISK MANAGEMENT
The Company’s portfolio largely consists of project businesses
with significant dependence on core sectors of the economy.
There is an increasing thrust by the Government towards
sectors like defence, renewables, railways, roads, smart
cities, low cost housing, etc. The company is well positioned
to leverage its experiences successfully in these sectors. With
a good track record in these sectors, the company plans to
align itself with the emerging opportunities.
The Central Government plan expenditure has been
constrained by the fiscal deficit. The fall in crude oil prices
has led to drop in level of subsidies, thus creating space for
Government investments in critical areas like railways. High
interest rates in a weak growth environment are creating
challenges for asset developers and leading to stretched
balance sheets in the banking system. RBI’s efforts in
bringing down inflation are expected to soften the interest
rate environment. With the Prime Minister making special
efforts towards “Make in India” initiative and efforts towards
bringing foreign capital and technology in the country, the
manufacturing sector is expected to get a boost.
The impact of the 14th Finance Commission recommendations
and devolution of power to States will change the expenditure
patterns of States. The recent coal and spectrum auctions
and much anticipated improvement in on-the-ground
decision making augurs well for infrastructure sector. The
PPP model may need to be reworked with an appropriate

183
risk-return sharing mechanism. The sharp drop in oil price
can delay the expansion plans of customers in the Middle-
East region in the hydrocarbon sector. If soft oil price sustains
over a longer term, growth in infrastructure sector could also
slowdown in the Middle-East region.
The risk management organisation has evolved over last
few years. The Company has a robust risk management
framework governed by sound risk management policies.
The Company’s existing framework provides for risk reviews
at various levels based on an authorisation structure matrix.
The Company is constantly evaluating steps to further
strengthen the Risk Management processes in the company.
The Audit Committee periodically reviews the risks facing
the company providing an opportunity for an independent
assessment.
The key processes of risk reviews include evaluation of top
risk at enterprise level, country clearance process, pre-bid risk
reviews, execution risk reviews and close-out risk reviews.
Structured presentations are made to the management
for country clearances as well as pre-bid risk reviews. For
projects under execution, periodic execution risk reviews are
held. The Company has processes to identify “Top risks that
matter” for the top Management’s review and mitigation
measures to be integrated with the business plans.
Challenges in domestic business includes worsening terms
of trade resulting in stretched working capital requirements,
slow recovery of key sectors, delays due to client obligations,
etc. Depreciating currencies of foreign competitors is a risk
which needs to be countered by improving the operational
performance and sourcing efficiencies.
The Company’s Knowledge Centre provides the value-added
research focused on the macro-economic matters, sector-
specific issues and the Company. This has enabled provision
of meaningful insights and appropriate alerts for emerging
risks. With such initiatives in place, risk management is
expected to become a strong business enabler in due course
of time.
FINANCIAL RISKS
1. Capital Structure, Liquidity and Interest Rate Risks
The Company continues its policy of maintaining a
conservative capital structure which has ensured that
it retains the highest credit rating amidst an adverse
economic environment. Low gearing levels also equip
the Company with the ability to navigate business
cycles while being able to raise growth capital on the
other. Given the demanding economic conditions in
FY 2014-15, there has been an increase in the working
capital levels of the Company. The Company has been
investing capital into subsidiaries as scheduled and in
some cases to provide for deterioration in performance
caused by the economic/business downturn, and also
to optimise overall Group interest rate risks and costs.
The Company continues to maintain adequate liquidity
on the Balance Sheet to deal effectively with business
situations.
The Company deploys its periodical surplus funds
in short term investments in line with the corporate
treasury policy. The Company constantly monitors the
liquidity levels, economic and capital market conditions
and maintains access to the lowest cost means of
sourcing liquidity through banking lines, trade finance
and capital markets. In line with above, the Company
sought to balance out the mix of short term and long
term funding sources in its working capital funding mix
this year by increasing short term funding. The Company
dynamically manages interest rate risks through a
mix of fund-raising products, investment products
and derivative products across maturity profiles and
currencies within a robust risk management framework.
2. Foreign Exchange and Commodity Price Risks
The Company’s businesses are exposed to fluctuations
in foreign exchange rates and commodity prices.
Additionally, it has exposures to foreign currency
denominated financial assets and liabilities.
While the business related financial risks, especially
involving commodity prices, by and large, are managed
contractually through variations clauses, the Company’s
loan portfolio is managed by an appropriate choice of
loan currency and appropriate treasury products, for
balancing risks and at the same time optimising the
borrowing costs.
Business related foreign exchange risks are insulated
largely through hedging actions under the framework
of a Board approved Risk Management Policy. Financial
risks in each business portfolio are measured and
managed centrally within the Company. These risks
are reviewed periodically, quantified and managed
within the acceptable thresholds as laid out in the Risk
Management Policy of the Company. The process is also
subject to an annual review by the Audit Committee.
The financial year 2014-15 was characterised by a
strong USD against most of the asset classes (currency
/ commodities). The rupee moved from 59.9 to 62.5
per US Dollar during the year. The Company was able
to deal with the volatility in markets and especially the
USD strength reasonably well given the robust financial
risk management process in place. Benign commodity
prices, a relatively stable INR against USD along with the
analytical risk management framework has benefitted
the Company.

184
IV. INTERNAL CONTROLS
The Company’s internal controls system has been founded on
values of integrity and operational excellence which explains
its pre-eminent position in all its businesses. Over the years,
formal and independent exercises for evaluation of internal
controls and initiatives for remediation of deficiencies
have resulted in a robust framework for Internal Controls,
commensurate with the size and complexity of the business.
The internal framework essentially has two elements:
(1) Structures, policies and guidelines designed to achieve
efficiency and effectiveness in operations and compliance
with laws and regulations (2) an assurance function provided
by Corporate Audit Services. The audit observations are
addressed by businesses with necessary monitoring and
facilitation by the Corporate Internal Controls department.
The entire process is reviewed periodically by the Senior
Management and the Audit Committee which oversees the
Internal Audit function.
During the year, the Company has taken steps to review
and document in a phased manner the adequacy and
operating effectiveness of internal controls in line with the
requirements of the Companies Act 2013 and the revised
SEBI Listing agreement. Employees are guided by the
Company’s ‘Code of Conduct’ policy. The ‘Whistle Blower’
policy which provides direct access to the employees to
the top management and Board members of the Company
enables the sustenance of the internal control framework in
an effective manner.
V. INFORMATION TECHNOLOGY
The Company views Information Technology (IT) as a key
enabler for improving productivity, efficiency and for
providing competitive advantage. In order to have enhanced
focus on business to IT connect, all business verticals have
their IT set-up reporting to a Divisional Chief Information
Officer (CIO) whose efforts are ultimately knitted into
Corporate IT function through well-defined governance
process.
Information Technology function runs in two modes i.e., Run
IT and Leveraging IT. Whilst function of Run IT is to enable
business with required functionality at the most optimum
cost, excellent reliability, availability, security & support,
Leveraging IT focuses on niche solutions bolted on Enterprise
Resource Planning (ERP) and Non ERP software systems to
give cutting edge/ competitive advantage to the businesses.
The Company’s own social media platform is widely used
to increase communication, collaboration and employee
engagement.
The Company’s drive towards creating Private cloud
computing has achieved maturity with deployment of
new applications and services year-on-year and increased
company-wide adoption. Almost all new business units
are consuming IT services from this platform leading to
improved speed of deployment and cost efficiencies. As
new initiatives in near future, the Company plans to work
with key vendors and examine a Hybrid cloud model to gain
additional leverage.

185
Independent Auditors’ ReportTo the Members of Larsen & Toubro Limited
Report on the standalone financial statements
We have audited the accompanying standalone financial statements of Larsen & Toubro Limited (“the Company”), which comprise the balance sheet as at 31 March 2015, the statement of profit and loss, the cash flow statement for the year then ended, and a summary of the significant accounting policies and other explanatory information.
Management’s responsibility for the standalone financial statements
The Company’s board of directors is responsible for the matters stated in section 134(5) of the Companies Act, 2013 (“the Act”) with respect to the preparation of these standalone financial statements that give a true and fair view of the financial position, financial performance and cash flows of the Company in accordance with the accounting principles generally accepted in India, including the Accounting Standards specified under section 133 of the Act, read with Rule 7 of the Companies (Accounts) Rules, 2014. This responsibility also includes maintenance of adequate accounting records in accordance with the provisions of the Act for safeguarding the assets of the Company and for preventing and detecting frauds and other irregularities; selection and application of appropriate accounting policies; making judgments and estimates that are reasonable and prudent; and design, implementation and maintenance of adequate internal financial controls, that were operating effectively for ensuring the accuracy and completeness of the accounting records, relevant to the preparation and presentation of the financial statements that give a true and fair view and are free from material misstatement, whether due to fraud or error.
Auditor’s responsibility
Our responsibility is to express an opinion on these standalone financial statements based on our audit.
We have taken into account the provisions of the Act, the accounting and auditing standards and matters which are required to be included in the audit report under the provisions of the Act and the Rules made thereunder.
We conducted our audit in accordance with the Standards on Auditing specified under section 143(10) of the Act. Those Standards require that we comply with ethical requirements and plan and perform the audit to obtain reasonable assurance about whether the financial statements are free from material misstatement.
An audit involves performing procedures to obtain audit evidence about the amounts and the disclosures in the financial statements. The procedures selected depend on the auditor’s judgment, including the assessment of the risks of material misstatement of the financial statements, whether due to fraud or error. In making those risk assessments, the auditor considers internal financial control relevant to the Company’s preparation of the financial statements that give a true and fair view in order to design audit procedures that are appropriate in the circumstances, but not for the purpose of expressing an opinion on whether the Company has in place an adequate internal financial controls system over financial reporting and the operating effectiveness of such controls. An audit also includes evaluating the appropriateness of the accounting policies used and the reasonableness of the accounting estimates made by the Company’s Directors, as well as evaluating the overall presentation of the financial statements.
We believe that the audit evidence we have obtained is sufficient and appropriate to provide a basis for our audit opinion on the standalone financial statements.
Opinion
In our opinion and to the best of our information and according to the explanations given to us, the aforesaid standalone financial statements give the information required by the Act in the manner so required and give a true and fair view in conformity with the accounting principles generally accepted in India, of the state of affairs of the Company as at 31 March 2015, and its profit and its cash flows for the year ended on that date.
Report on other legal and regulatory requirements
1 As required by the Companies (Auditor’s Report) Order, 2015 (“the Order”) issued by the central government of India in terms of sub-section (11) of section 143 of the Act, we give in the Annexure a statement on the matters specified in paragraphs 3 and 4 of the Order.
2 As required by section 143 (3) of the Act, we report that:
(a) We have sought and obtained all the information and explanations which to the best of our knowledge and belief were necessary for the purposes of our audit.
(b) In our opinion, proper books of account as required by law have been kept by the Company so far as it appears from our examination of those books.
(c) The balance sheet, the statement of profit and loss, and the cash flow statement dealt with by this report are in agreement with the books of account.
(d) In our opinion, the aforesaid standalone financial statements comply with the Accounting Standards specified under section 133 of the Act, read with rule 7 of the Companies (Accounts) Rules, 2014.
(e) On the basis of the written representations received from the directors as on 31 March 2015 taken on record by the Board of Directors, none of the directors is disqualified as on 31 March 2015 from being appointed as a director in terms of section 164 (2) of the Act.
(f) With respect to the other matters to be included in the Auditor’s Report in accordance with rule 11 of the Companies (Audit and Auditors) Rules, 2014, in our opinion and to the best of our information and according to the explanations given to us:
i. The Company has disclosed the impact of pending litigations on its financial position in its financial statements – refer notes I, note (II) in Q(16) and Q(17) to the financial statements;

186
ii. The Company has made provision, as required under the applicable law or accounting standards, for material foreseeable losses, if any, on long-term contracts including derivative contracts – refer notes C(II), D(IV) and Q(7)(a) to the financial statements; and
iii. There has been no delay in transferring amounts required to be transferred to the Investor Education and Protection Fund by the Company.
SHARP & TANNAN Chartered Accountants Firm’s Registration No.109982W by the hand of
MILIND P. PHADKE PartnerMumbai, May 30, 2015 Membership No.33013
Annexure to the Independent Auditors’ report(Referred to paragraph (1) under ‘Report on other legal and regulatory requirements’ of our report of even date)
1 (a) The Company is maintaining proper records to show full particulars including quantitative details and situation of all fixed assets.
(b) We are informed that the Company has formulated a programme of physical verification of all the fixed assets over a period of three years which, in our opinion, is reasonable having regard to the size of the Company and nature of its assets. Accordingly, the physical verification of the fixed assets has been carried out by management during the year and no material discrepancies were noticed on such verification.
2 (a) As explained to us, inventories have been physically verified by management at reasonable intervals during the year. In our opinion, the frequency of such verification is reasonable.
(b) As per the information given to us, the procedures of physical verification of inventory followed by management are, in our opinion, reasonable and adequate in relation to the size of the Company and the nature of its business.
(c) The Company is maintaining proper records of inventory. The discrepancies noticed on verification between the physical stocks and the book records were not material.
3 According to the information and explanations given to us, there are no companies, firms and other parties covered in the register maintained under section 189 of the Companies Act, 2013. Accordingly, paragraphs 3(iii)(a) and (b) of the Order are not applicable.
4 In our opinion and according to the information and explanations given to us, there are adequate internal control systems commensurate with the size of the Company and the nature of its business for the purchase of inventory and fixed assets and for the sale of goods and services. Further, on the basis of our examination of the books and records of the Company, and according to the information and explanations given to us, we have neither come across nor have been informed of any continuing failure to correct major weaknesses in the aforesaid internal control systems.
5 According to the information and explanations given to us, the Company has not accepted deposits from the public and accordingly, paragraph 3(v) of the Order is not applicable.
6 We have broadly reviewed the books of account and records maintained by the Company pursuant to the rules prescribed by the central government for the maintenance of cost records under section 148(1) of the Companies Act, 2013 in respect of all its manufacturing and construction activities and are of the opinion that prima facie the prescribed accounts and records have been made and maintained. The contents of these accounts and records have not been examined by us.
7 (a) According to the information and explanations given to us and the records of the Company examined by us, in our opinion, the Company is generally regular in depositing undisputed statutory dues including provident fund, employees state insurance, income-tax, sales-tax, wealth tax, service tax, duty of customs, duty of excise, value added tax, cess and other material statutory dues as applicable with the appropriate authorities. According to the information and explanations given to us, there were no undisputed amounts payable in respect of provident fund, employees state insurance, income-tax, sales-tax, wealth tax, service tax, duty of customs, duty of excise, cess and other statutory dues outstanding as at 31 March 2015 for a period of more than six months from the date they became payable.
(b) According to the information and explanations given to us and the records of the Company examined by us, the particulars of income-tax, sales-tax, wealth tax, service tax, duty of custom, duty of excise, value added tax or cess as at 31 March 2015 which have not been deposited on account of a dispute pending are as under:
Name of the statute
Nature of the disputed dues Amount` crore*
Period to which the amount relates Forum where disputes are pending
Central Sales Tax Act, Local Sales Tax Acts and Works Contract Tax Act
Taxability of sub-contractor turnover, rate of tax for declared goods, inter-state sales and non-submission of forms
3.20 1991-92, 1995-96, 1997-98, 1999-2000 to 2005-06
Supreme Court
Dispute regarding question of law, non-submission of forms, classification dispute, tax deducted at source at lower rate, sales in transit, high seas sales, labour turnover, local VAT, local WCT, rate of tax on declared goods and other matters
260.26 1986-87 to 2011-12 High Court
Non-submission of forms, classification disputes, disallowance of sales occasioning import, arbitrary demand raised, sub-contractors turnover disallowed, pumping and freight charges, inter-state sales turnover, tax deducted at source disallowed, rates of tax of declared goods, classification dispute, disallowance of WCT and other matters
344.55 1987-88 to 1991-92, 1994-95 to 2011-12 Sales Tax Tribunal
Forms submitted but rejected by Assessing Officer 0.78 2008-09 Commissioner (Appeals)

187
Name of the statute
Nature of the disputed dues Amount` crore*
Period to which the amount relates Forum where disputes are pending
Non-submission of forms 13.92 1995-96, 1997-98, 2001-02 to 2004-05, 2006-07 to 2012-13
Additional Commissioner (Appeals)
Non-submission of forms, disallowance of sales in transit, high seas sales, sales occasioning imports and other matters
158.19 1997-98, 1999-2000, 2001-02, 2003-04 to 2011-12
Joint Commissioner (Appeals)
Non-submission of forms, additional demands for pending forms, rate of tax dispute, disallowance of branch transfer, sub-contractors turnover, interest demand on road permit, disallowance of sales in transit, sales occasioning imports and other matters
986.17 1991-92, 1992-93, 1994-95, 1996-97, 1997-98, 1999-2000 to 2013-14
Deputy Commissioner (Appeals)
Non-submission of forms, disallowance of sales occasioning imports, rate of tax dispute and other matters
1.83 1991-92, 1992-93, 1996-97 to 2005-06 and 2008-09
Assistant Commissioner (Appeals)
Non-submission of forms and dispute related to sales in transit
1.73 1994-95 to 2014-15 Commercial Tax Officer
The Central Excise Act, 1944, Service Tax under Finance Act, 1994
Dispute of excise duty on site mix concrete and PSC grinder
0.27 1997-98 Supreme Court
Demand of excise duty on site fabricated steel structures, export rebate disallowance, valuation disputes, excise duty on concrete mix made at site, non-maintenance of separate records and other matters
565.06 1991-92, 2001-02 to 2011-12 CESTAT
Disallowance of cenvat credit, excise duty refund, short payment of service tax, excise duty on concrete mix made at site, service tax rate dispute and other matters
1.76 2006-07, 2008-09 to 2012-13 and 2014-15 Commissioner (Appeals)
Export rebate claim, service tax on commercial construction services, service tax liability against rate change and penalty imposed for wrong availment of cenvat credit
42.48 2003-04, 2005-06 and 2006-07 High Court
Demand of service tax including penalty, interest on lump-sum turnkey jobs, demand of penalty on late payment of service tax and other matters
15.24 2004-05 to 2010-11 CESTAT
Income-tax Act, 1961
Assessment under section 143(3) read with section 144C(13) and demand of tax deducted at source on bank guarantee charges and internet charges
454.90 2007-08 to 2012-13 ITAT
Dispute regarding tax deducted at source at lower rates 0.05 2005-06 Commissioner (Appeals)
*Net of pre-deposit paid in getting the stay/appeal admitted
(c) The amounts required to be transferred to the investor education and protection fund in accordance with the relevant provisions of the Companies Act, 1956 (1 of 1956) and rules made thereunder are transferred to such fund within time.
8 The Company has no accumulated losses as at 31 March 2015 and it has not incurred cash losses in the financial year ended on that date or in the immediately preceding financial year.
9 According to the records of the Company examined by us and the information and explanations given to us, the Company has not defaulted in repayment of dues to any financial institution or bank or debenture holders as at the balance sheet date.
10 In our opinion and according to the information and explanations given to us, the terms and conditions of guarantees given by the Company for loans taken by others from banks or financial institutions are prima facie not prejudicial to the interests of the Company.
11 In our opinion and according to the information and explanations given to us, on an overall basis the term loans have been applied for the purposes for which they were obtained.
12 During the course of our examination of the books and records of the Company, carried out in accordance with the generally accepted auditing practices in India, and according to the information and explanations given to us, we have neither come across any instances of material fraud on or by the Company, noticed or reported during the year, nor have we been informed of such case by management.
SHARP & TANNAN Chartered Accountants Firm’s Registration No.109982W by the hand of
MILIND P. PHADKE PartnerMumbai, May 30, 2015 Membership No.33013

188
Balance Sheet as at March 31, 2015As at 31-3-2015 As at 31-3-2014
Note ` crore ` crore ` crore ` croreEQUITY AND LIABILITIES:Shareholders’ Funds Share capital A 185.91 185.38 Reserves and surplus B 36898.67 33476.45
37084.58 33661.83Non- current liabilities Long term borrowings C(I) 8508.60 5478.14 Deferred tax liabilities (net) Q(14) 362.99 409.92 Other long term liabilities C(II) 119.62 93.57 Long term provisions C(III) 350.45 299.61
9341.66 6281.24Current liabilities Short term borrowings D(I) 3791.08 3876.04 Current maturities of long term borrowings D(II) 636.91 2104.74 Trade payables D(III) 18844.77 16345.45 Other current liabilities D(IV) 14703.88 13921.76 Short term provisions D(V) 2500.88 2113.52
40477.52 38361.51
TOTAL 86903.76 78304.58
ASSETS:Non-current assets Fixed Assets Tangible assets E(I) 7402.20 7560.81 Intangible assets E(II) 85.16 113.99 Capital work-in-progress E(I) 304.54 411.86 Intangible assets under development E(II) 189.50 150.55
7981.40 8237.21 Non-current investments F 17672.82 15168.41 Long term loans and advances G(I) 2720.83 3721.57 Cash and bank balances G(II) 75.43 9.54 Other non-current assets G(III) 52.43 53.24
Current assets Current investments H(I) 5380.08 4046.23 Inventories H(II) 2207.79 1982.53 Trade receivables H(III) 23051.11 21538.76 Cash and bank balances H(IV) 1515.80 1782.86 Short term loans and advances H(V) 7812.35 6345.65 Other current assets H(VI) 18433.72 15418.58
58400.85 51114.61
TOTAL 86903.76 78304.58
CONTINGENT LIABILITIES ICOMMITMENTS (Capital and others) JOTHER NOTES FORMING PART OF THE ACCOUNTS QSIGNIFICANT ACCOUNTING POLICIES R
A. M. NAIKGroup Executive Chairman (DIN 00001514)
As per our report attachedSHARP & TANNAN K. VENKATARAMANAN
Chief Executive Officer & Managing Director (DIN 00001647)
R. SHANKAR RAMANChief Financial Officer & Whole-time Director (DIN 00019798)
Chartered AccountantsFirm’s Registration No.109982Wby the hand of
M. M. CHITALE (DIN 00101004) SUBODH BHARGAVA (DIN 00035672)MILIND P. PHADKEPartner M. DAMODARAN (DIN 02106990) SUNITA SHARMA (DIN 02949529)Membership No.33013
SUSHOBHAN SARKER (DIN 00088276)N. HARIHARAN
Mumbai, May 30, 2015 Company Secretary Directors Mumbai, May 30, 2015
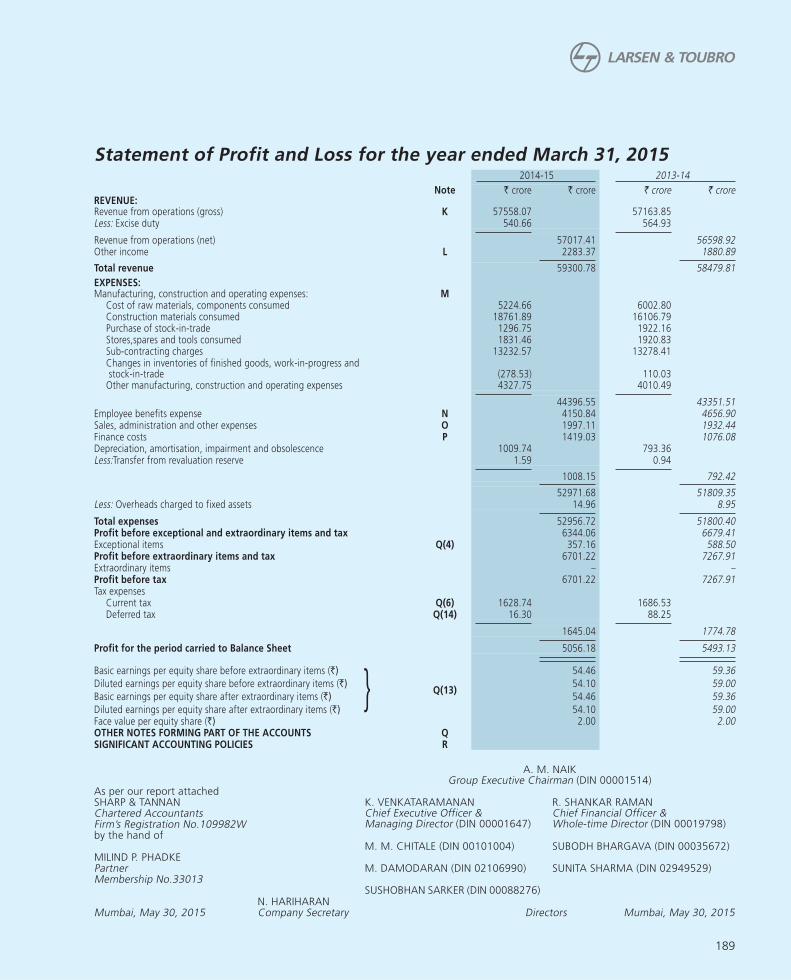
189
A. M. NAIKGroup Executive Chairman (DIN 00001514)
As per our report attachedSHARP & TANNAN K. VENKATARAMANAN
Chief Executive Officer & Managing Director (DIN 00001647)
R. SHANKAR RAMANChief Financial Officer & Whole-time Director (DIN 00019798)
Chartered AccountantsFirm’s Registration No.109982Wby the hand of
M. M. CHITALE (DIN 00101004) SUBODH BHARGAVA (DIN 00035672)MILIND P. PHADKEPartner M. DAMODARAN (DIN 02106990) SUNITA SHARMA (DIN 02949529)Membership No.33013
SUSHOBHAN SARKER (DIN 00088276)N. HARIHARAN
Mumbai, May 30, 2015 Company Secretary Directors Mumbai, May 30, 2015
Statement of Profit and Loss for the year ended March 31, 2015 2014-15 2013-14
Note ` crore ` crore ` crore ` croreREVENUE:Revenue from operations (gross) K 57558.07 57163.85Less: Excise duty 540.66 564.93
Revenue from operations (net) 57017.41 56598.92Other income L 2283.37 1880.89
Total revenue 59300.78 58479.81
EXPENSES:Manufacturing, construction and operating expenses: M Cost of raw materials, components consumed 5224.66 6002.80 Construction materials consumed 18761.89 16106.79 Purchase of stock-in-trade 1296.75 1922.16 Stores,spares and tools consumed 1831.46 1920.83 Sub-contracting charges 13232.57 13278.41 Changes in inventories of finished goods, work-in-progress and
stock-in-trade (278.53) 110.03 Other manufacturing, construction and operating expenses 4327.75 4010.49
44396.55 43351.51Employee benefits expense N 4150.84 4656.90Sales, administration and other expenses O 1997.11 1932.44Finance costs P 1419.03 1076.08Depreciation, amortisation, impairment and obsolescence 1009.74 793.36Less:Transfer from revaluation reserve 1.59 0.94
1008.15 792.42
52971.68 51809.35Less: Overheads charged to fixed assets 14.96 8.95
Total expenses 52956.72 51800.40Profit before exceptional and extraordinary items and tax 6344.06 6679.41Exceptional items Q(4) 357.16 588.50Profit before extraordinary items and tax 6701.22 7267.91Extraordinary items – –Profit before tax 6701.22 7267.91Tax expenses Current tax Q(6) 1628.74 1686.53 Deferred tax Q(14) 16.30 88.25
1645.04 1774.78
Profit for the period carried to Balance Sheet 5056.18 5493.13
Basic earnings per equity share before extraordinary items (`)
Q(13)
54.46 59.36
Diluted earnings per equity share before extraordinary items (`) 54.10 59.00
Basic earnings per equity share after extraordinary items (`) } 54.46 59.36
Diluted earnings per equity share after extraordinary items (`) 54.10 59.00Face value per equity share (`) 2.00 2.00OTHER NOTES FORMING PART OF THE ACCOUNTS QSIGNIFICANT ACCOUNTING POLICIES R
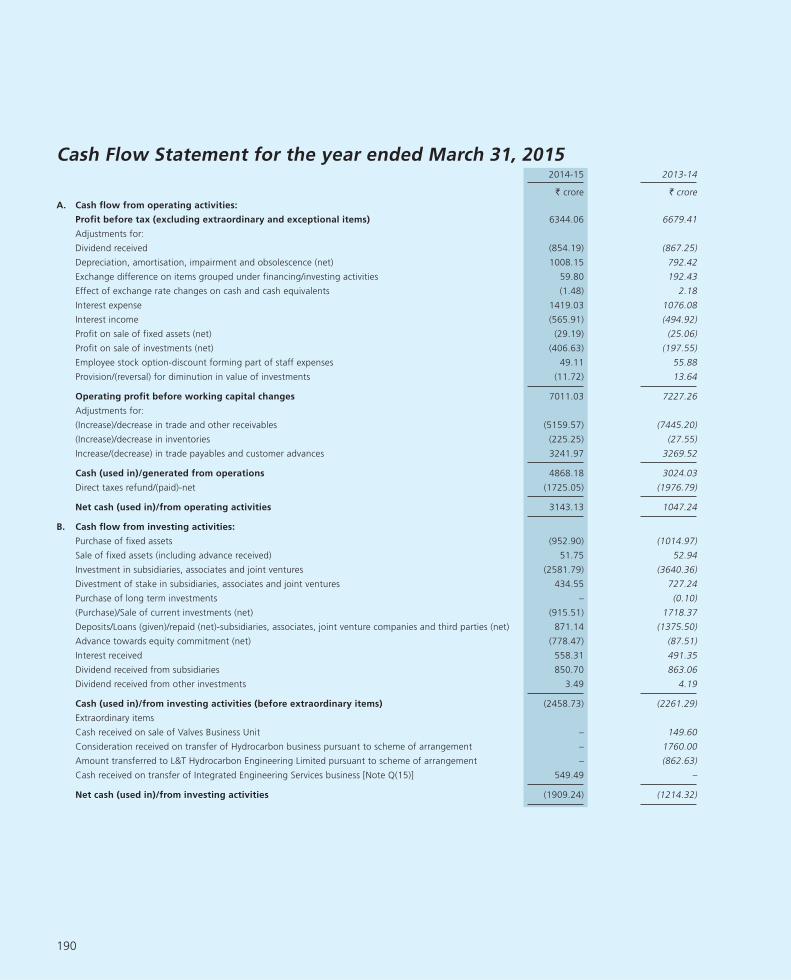
190
Cash Flow Statement for the year ended March 31, 20152014-15 2013-14
` crore ` crore
A. Cash flow from operating activities:
Profit before tax (excluding extraordinary and exceptional items) 6344.06 6679.41
Adjustments for:
Dividend received (854.19) (867.25)
Depreciation, amortisation, impairment and obsolescence (net) 1008.15 792.42
Exchange difference on items grouped under financing/investing activities 59.80 192.43
Effect of exchange rate changes on cash and cash equivalents (1.48) 2.18
Interest expense 1419.03 1076.08
Interest income (565.91) (494.92)
Profit on sale of fixed assets (net) (29.19) (25.06)
Profit on sale of investments (net) (406.63) (197.55)
Employee stock option-discount forming part of staff expenses 49.11 55.88
Provision/(reversal) for diminution in value of investments (11.72) 13.64
Operating profit before working capital changes 7011.03 7227.26
Adjustments for:
(Increase)/decrease in trade and other receivables (5159.57) (7445.20)
(Increase)/decrease in inventories (225.25) (27.55)
Increase/(decrease) in trade payables and customer advances 3241.97 3269.52
Cash (used in)/generated from operations 4868.18 3024.03
Direct taxes refund/(paid)-net (1725.05) (1976.79)
Net cash (used in)/from operating activities 3143.13 1047.24
B. Cash flow from investing activities:
Purchase of fixed assets (952.90) (1014.97)
Sale of fixed assets (including advance received) 51.75 52.94
Investment in subsidiaries, associates and joint ventures (2581.79) (3640.36)
Divestment of stake in subsidiaries, associates and joint ventures 434.55 727.24
Purchase of long term investments – (0.10)
(Purchase)/Sale of current investments (net) (915.51) 1718.37
Deposits/Loans (given)/repaid (net)-subsidiaries, associates, joint venture companies and third parties (net) 871.14 (1375.50)
Advance towards equity commitment (net) (778.47) (87.51)
Interest received 558.31 491.35
Dividend received from subsidiaries 850.70 863.06
Dividend received from other investments 3.49 4.19
Cash (used in)/from investing activities (before extraordinary items) (2458.73) (2261.29)
Extraordinary items
Cash received on sale of Valves Business Unit – 149.60
Consideration received on transfer of Hydrocarbon business pursuant to scheme of arrangement – 1760.00
Amount transferred to L&T Hydrocarbon Engineering Limited pursuant to scheme of arrangement – (862.63)
Cash received on transfer of Integrated Engineering Services business [Note Q(15)] 549.49 –
Net cash (used in)/from investing activities (1909.24) (1214.32)

191
Cash Flow Statement for the year ended March 31, 2015 (contd.)
2014-15 2013-14
` crore ` crore
C. Cash flow from financing activities:
Proceeds from fresh issue of share capital 98.89 144.05
Proceeds from long term borrowings 5109.83 4165.87
Repayment of long term borrowings (3929.44) (4981.69)
(Repayments)/Proceeds from other borrowings (net) (164.97) 3428.25
Dividends paid (1322.73) (1140.85)
Additional tax on dividend (78.12) (86.26)
Interest paid (including cash flows from interest rate swaps) (1150.01) (1025.32)
Net cash (used in)/from financing activities (1436.55) 504.05
Net (decrease)/increase in cash and cash equivalents (A + B + C) (202.66) 336.97
Cash and cash equivalents at beginning of the year 1794.12 1457.15
Cash and cash equivalents at end of the year 1591.46 1794.12
Notes:
1. Cash Flow Statement has been prepared under the indirect method as set out in the Accounting Standard (AS) 3: “Cash Flow Statements” as specified in the Companies (Accounting Standards) Rules, 2006.
2. Purchase of fixed assets includes movement of capital work-in-progress during the year.
3. For cash and cash equivalents not available for immediate use as on the Balance Sheet date, see Note G(II)(a).
4. Cash and cash equivalents included in the Cash Flow Statement comprise the following :
2014-15 2013-14
` crore ` crore
(a) Cash and cash equivalents disclosed under current assets [Note H(IV)] 1515.80 1782.86
(b) Cash and cash equivalents disclosed under non-current assets [Note G(II)] 75.43 9.54
Total Cash and cash equivalents as per Balance Sheet 1591.23 1792.40
(c) Unrealised exchange (gain)/loss on Cash and cash equivalents 0.23 1.72
Total Cash and cash equivalents as per Cash Flow Statement 1591.46 1794.12
5. Amount of corporate social responsibility related expenses spent during the year in cash ` 67.15 crore [Note Q(28)(b)].
6. Previous year’s figures have been regrouped/reclassified wherever applicable.
A. M. NAIKGroup Executive Chairman (DIN 00001514)
As per our report attachedSHARP & TANNAN K. VENKATARAMANAN
Chief Executive Officer & Managing Director (DIN 00001647)
R. SHANKAR RAMANChief Financial Officer & Whole-time Director (DIN 00019798)
Chartered AccountantsFirm’s Registration No.109982Wby the hand of
M. M. CHITALE (DIN 00101004) SUBODH BHARGAVA (DIN 00035672)MILIND P. PHADKEPartner M. DAMODARAN (DIN 02106990) SUNITA SHARMA (DIN 02949529)Membership No.33013
SUSHOBHAN SARKER (DIN 00088276)N. HARIHARAN
Mumbai, May 30, 2015 Company Secretary Directors Mumbai, May 30, 2015

192
NOTE [A]
Share capital
A(I) Share capital authorised, issued, subscribed and paid up:
Particulars
As at 31-3-2015 As at 31-3-2014
Number of shares
` crore Number of shares
` crore
Authorised:
Equity shares of ` 2 each 1,62,50,00,000 325.00 1,62,50,00,000 325.00
Issued, subscribed and fully paid up:
Equity shares of ` 2 each 92,95,62,061 185.91 92,69,12,658 185.38
A(II) Reconciliation of the number of equity shares and share capital:
Particulars
2014-15 2013-14
Number of shares
` crore Number of shares
` crore
Issued, subscribed and fully paid up equity shares outstanding at the beginning of the year 92,69,12,658 185.38 61,53,85,981 123.08
Add: Shares issued on exercise of employee stock options
during the year 26,49,403 0.53 32,32,101 0.65
Add: Shares issued as bonus on July 15, 2013 – – 30,82,94,576 61.65
Issued, subscribed and fully paid up equity shares outstanding
at the end of the year 92,95,62,061 185.91 92,69,12,658 185.38
A(III) Terms/rights attached to equity shares:
The Company has only one class of share capital, i.e., equity shares having face value of ` 2 per share. Each holder of equity share
is entitled to one vote per share.
A(IV) Shareholder holding more than 5% of equity shares as at the end of the year:
Name of the shareholder
As at 31-3-2015 As at 31-3-2014
Number of shares
Shareholding %
Number of shares
Shareholding %
Life Insurance Corporation of India 15,55,22,285 16.73 15,75,56,473 17.00
L&T Employees Welfare Foundation 11,16,06,174 12.01 11,16,04,174 12.04
Administrator of the Specified Undertaking of the Unit Trust
of India
7,59,25,962 8.17 7,59,25,962 8.19
A(V) Shares reserved for issue under options outstanding as at the end of the year on un-issued share capital:
Particulars
As at 31-3-2015 As at 31-3-2014
Number of equity shares to
be issued as fully paid
` crore(At face value)
Number of equity shares to
be issued as fully paid
` crore(At face value)
Employee stock options granted and outstanding # 77,08,842 1.54 * 98,66,116 @ 1.97 *
3.5% 5 years & 1 day US$ denominated foreign currency convertible bonds (FCCB) ## – – 73,60,864 @ 1.47 **
0.675% 5 years & 1 day US$ denominated foreign currency convertible bonds (FCCB) ## 63,46,986 1.27 ** – –
* The equity shares will be issued at a premium of ` 278.09 crore (previous year: ` 367.43 crore) ** The equity shares will be issued at a premium of ` 1215.13 crore (previous year: ` 934.93 crore) on the exercise of options by the bond holders # Note A(VIII) for terms of employee stock option schemes ## Note C(I)(b) for terms of foreign currency convertible bonds
@ The number of options have been adjusted consequent to bonus issue wherever applicable
Notes forming part of the Accounts

193
A(VI) The aggregate number of equity shares allotted as fully paid up by way of bonus shares in immediately preceding five years ended March 31,2015 are 30,82,94,576 (previous period of five years ended March 31, 2014: 30,82,94,576 shares)
A(VII) The aggregate number of equity shares issued pursuant to contract, without payment being received in cash in immediately preceding last five years ended on March 31, 2015: Nil (previous period of five years ended March 31, 2014: Nil)
A(VIII) Stock option schemes
a) Terms:
i. The grant of options to the employees under the stock option schemes is on the basis of their performance and other eligibility criteria. The options are vested equally over a period of 4 years [5 years in the case of series 2006(A)], subject to the discretion of the management and fulfillment of certain conditions.
ii. Options can be exercised anytime within a period of 7 years from the date of grant and would be settled by way of issue of equity shares. Management has discretion to modify the exercise period.
b) The details of the grants under the aforesaid schemes under various series are summarized below:
Sr. no.
Series reference2000 2002 (A) 2002 (B) 2003 (A) 2003 (B) 2006 2006 (A)
2014-15 2013-14 2014-15 2013-14 2014-15 2013-14 2014-15 2013-14 2014-15 2013-14 2014-15 2013-14 2014-15 2013-14
1 Grant price (`) 2.30 2.30 2.30 2.30 2.30 2.30 11.70 11.70 11.70 11.70 400.70 400.70 400.70 400.70
2 Grant dates 1-6-2000 19-4-2002 19-4-2002 23-5-2003 onwards 23-5-2003 onwards 1-9-2006 onwards 1-7-2007 onwards
3 Vesting commences on 1-6-2001 19-4-2003 19-4-2003 23-5-2004 onwards 23-5-2004 onwards 1-9-2007 onwards 1-7-2008 onwards
4 Options granted and outstanding at the beginning of the year 25200 16800 32250 21500 59550 39700 47178 31452 499543 435202 510181 911468 8692214 7289329
5 Options lapsed prior to bonus – – – – – – – – – 3400 – 2746 – 201054
6 Options granted prior to bonus – – – – – – – – – 4500 – – – 1115
7 Options exercised prior to bonus – – – – – – – – – 45750 – 387135 – 770285
8 Options granted and outstanding as on July 13, 2013* – 16800 – 21500 – 39700 – 31452 – 390552 – 521587 – 6319105
9 Adjusted options as on July 13, 2013* consequent to bonus issue – 25200 – 32250 – 59550 – 47178 – 585829 – 782390 – 9478918
10 Options lapsed post bonus issue – – – – – – – – 68450 10950 35625 21311 676786 530097
11 Options granted post bonus issue – – – – – – – – 337800 93300 – – 935190 1352790
12 Options exercised post bonus issue – – – – – – – – 183609 168636 169900 250898 2295894 1609397
13 Options granted and outstanding at the end of the year 25200 25200 32250 32250 59550 59550 47178 47178 585284 499543 304656 510181 6654724 8692214
Of which
Options vested 25200 25200 32250 32250 59550 59550 47178 47178 100390 127015 304656 510181 2663571 3096418
Options yet to vest – – – – – – – – 484894 372528 – – 3991153 5595796
14 Weighted average remaining contractual life of options (in years) Nil Nil Nil Nil Nil Nil Nil Nil 5.38 4.87 0.03 0.08 3.95 4.17
*Record date July 13, 2013
c) The number and weighted average exercise price of stock options for the following group of options are as follows:
Particulars
2014-15 2013-14
No. of stock options
Weighted average
exercise price (`)
No. of stock options
Weighted average
exercise price (`)
(i) Options granted and outstanding at the beginning of the year 98,66,116 374.42 87,45,451 564.54
(ii) Options granted pre bonus issue – – 5,615 133.37
(iii) Options allotted pre bonus issue – – 12,03,170 578.81
(iv) Options lapsed pre bonus issue – – 2,07,200 591.43
(v) Options granted and outstanding prior to bonus issue – – 73,40,696 561.11
(vi) Adjusted options consequent to bonus issue – – 1,10,11,315 374.10
(vii) Options granted post bonus issue 12,72,990 297.48 14,46,090 375.60
(viii) Options allotted post bonus issue 26,49,403 373.74 20,28,931 368.37
(ix) Options lapsed post bonus issue 7,80,861 366.60 5,62,358 393.13
(x) Options granted and outstanding at the end of the year 77,08,842 362.74 98,66,116 374.42
(xi) Options exercisable at the end of the year out of (x) supra 32,32,795 368.52 38,97,792 371.36
Notes forming part of the Accounts (contd.)

194
d) Weighted average share price at the date of exercise for stock options exercised during the period is ` 1554.71 (previous year:
` 1120.61) per share.
e) (i) In respect of stock options granted pursuant to the Company’s stock options schemes, the intrinsic value of the options
(excess of market price of the share over the exercise price of the option) is treated as discount and accounted as employee
compensation over the vesting period.
(ii) Expense on Employee Stock Option Schemes debited to the Statement of Profit and Loss during 2014-15 is ` 49.11 crore
(previous year: ` 55.88 crore) net of recoveries of ` 2.54 crore (previous year: ` 3.30 crore) from its group companies
towards the stock options granted to deputed employees, pursuant to the employee stock option schemes (Note N). The
entire amount pertains to equity-settled employee share-based payment plans.
f) Pursuant to the Securities and Exchange Board of India (Share Based Employee Benefits) Regulations, 2014, the Company has
adopted the guidance note on Employee Share Based Payments issued by the Institute of Chartered Accountants of India and
revised the method of computation of stock option compensation based on the number of grants that are expected to vest.
Consequently, the charge on account of employee stock option compensation for the year ended March 31, 2015 is lower and
the profit before tax is higher by ` 13.99 crore.
g) During the year, the Company has recovered ` 14.60 crore (previous year: ` 16.01 crore) from its subsidiary companies towards
the stock options granted to their employees, pursuant to the employee stock option schemes.
h) Had fair value method been adopted for expensing the compensation arising from employee share-based payment plans:
(i) The employee compensation charge debited to the Statement of Profit and Loss for the year 2014-15 would have been
higher by ` 9.10 crore (previous year: ` 21.30 crore) [excluding ` 2.05 crore (previous year: ` 5.45 crore) on account of
grants to employees of subsidiary companies]
(ii) Basic EPS before extraordinary items would have decreased from ` 54.46 per share to ` 54.37 per share
(iii) Basic EPS after extraordinary items would have decreased from ` 54.46 per share to ` 54.37 per share
(iv) Diluted EPS before extraordinary items would have decreased from ` 54.10 per share to ` 54.00 per share
(v) Diluted EPS after extraordinary items would have decreased from ` 54.10 per share to ` 54.00 per share
i) Weighted average fair values of options granted during the year is ` 1190.22 (previous year: ` 556.06) per option
j) The fair value has been calculated using the Black-Scholes Option Pricing Model and the significant assumptions and inputs to
estimate the fair value of options granted during the year are as follows:
Sr. no.
Particulars2014-15 2013-14
(i) Weighted average risk-free interest rate 8.57% 8.88%
(ii) Weighted average expected life of options 4.01 years 4.34 years
(iii) Weighted average expected volatility 33.92% 38.00%
(iv) Weighted average expected dividends over the life of the option ` 57.18 per option ` 53.42 per option
(v) Weighted average share price ` 1444.51 per option ` 834.48 per option
(vi) Weighted average exercise price ` 313.49 per share ` 379.45 per share
(vii) Method used to determine expected volatility Expected volatility is based on the historical
volatility of the Company’s share price applicable
to the total expected life of each option.
k) The balance in share option outstanding account as on March 31, 2015 is ` 252.56 crore (net) (previous year: ` 323.70 crore),
including ` 135.98 crore (previous year: ` 148.22 crore) for which the options have been vested to employees as on March 31,
2015.
A(IX) The Directors recommend payment of final dividend of ` 16.25 per equity share of ` 2 each on the number of shares outstanding as
on the record date.
Provision for final dividend has been made in the books of account for 92,95,62,061 equity shares outstanding as at March 31, 2015
amounting to ` 1510.54 crore.
Notes forming part of the Accounts (contd.)

195
Note [B]
Reserves and surplus
ParticularsAs at 31-3-2015 As at 31-3-2014
` crore ` crore ` crore ` crore
Capital reserve 10.52 10.52
Securities premium account [Note Q(6)(b)]
As per last Balance Sheet 7737.80 7512.11
Addition during the period 225.23 291.50
7963.03 7803.61
Less: Share/bond issue expenses (net of tax) 15.13 0.63
Premium on inflation linked debentures (net of tax) 2.91 3.53
Issue of Bonus shares – 61.65
7944.99 7737.80
Debenture redemption reserve:
As per last Balance Sheet 143.51 168.26
Add: Transferred from Surplus Statement of Profit and Loss 256.50 44.00
Less: Transferred to general reserve – 68.75
400.01 143.51
Revaluation reserve:
As per last Balance Sheet 19.25 20.19
Less: Transferred to Statement of Profit and Loss 1.59 0.94
Less: Transferred to general reserve 2.09 –
15.57 19.25
Share options outstanding account:
Employee stock options outstanding:
As per last Balance Sheet 459.23 585.89
Addition during the year 86.74 66.86
Transferred to general reserve 11.60 –
Deduction during the year 156.19 193.52
378.18 459.23
Deferred employee compensation expense:
As per last Balance Sheet (135.53) (191.93)
Addition during the year (86.74) (66.86)
Deduction during the year 96.65 123.26
(125.62) (135.53)
Hedging reserve (net of tax): [Note Q(14)]
As per last Balance Sheet (122.25) (332.87)
Transfer pursuant to scheme of arrangement/business transfer
agreement 79.25 148.27
Addition/(deduction) during the year (net) (155.25) 62.35
(198.25) (122.25)
General reserve:
As per last Balance Sheet 25030.47 20961.72
Add: Transferred from Surplus Statement of Profit and Loss – 4000.00
Add: Transferred from revaluation reserve 2.09 –
Add: Transferred from ESOP Outstanding 11.60 –
Add: Transferred from debenture redemption reserve – 68.75
25044.16 25030.47
Carried forward 33469.56 33143.00
Notes forming part of the Accounts (contd.)

196
ParticularsAs at 31-3-2015 As at 31-3-2014
` crore ` crore ` crore ` crore
Brought forward 33469.56 33143.00
Surplus Statement of Profit and Loss
As per last Balance Sheet 333.45 285.75
Depreciation charged against retained earnings (86.28) –
Reversal of deferred tax on depreciation charged against
retained earnings 29.33 –
Profit for the year 5056.18 5493.13
5332.68 5778.88
Less: Dividends paid for previous year 1.88 2.38
Additional tax on dividend paid for previous year 0.32 0.40
Transfer to general reserve – 4000.00
Transfer to debenture redemption reserve 256.50 44.00
Proposed dividend [Note A(IX)] 1510.54 1320.85
Additional tax on dividend 134.33 77.80
1903.57 5445.43
3429.11 333.45
36898.67 33476.45
NOTE [C(I)]
Long term borrowings
Particulars
As at 31-3-2015 As at 31-3-2014
Note Secured Unsecured Total * Secured Unsecured Total *
` crore ` crore ` crore ` crore ` crore ` crore
Redeemable non-convertible fixed rate debentures C(I)(a)(i) & (ii) 400.00 1600.00 2000.00 400.00 1050.00 1450.00
Redeemable non-convertible Inflation Linked debentures C(I)(a)(iii) – 109.76 109.76 – 105.34 105.34
0.675% Foreign currency convertible bonds C(I)(b) – 1250.00 1250.00 – – –
Term loans from banks C(I)(c) – 5148.22 5148.22 – 3921.73 3921.73
Sales tax deferment loan C(I)(d) – 0.62 0.62 – 1.07 1.07
400.00 8108.60 8508.60 400.00 5078.14 5478.14
* Loans guaranteed by directors or others ` Nil (previous year ` Nil)
C(I)(a) (i) Secured redeemable non-convertible fixed rate debentures (privately placed):
Sr. no.
Face value per
debenture (`)
Date of allotment
31-3-2015 ` crore
31-3-2014 ` crore
Interest for the year 2014-15
Terms of repayment for debentures outstanding as on 31-3-2015
1 10,00,000 January 5, 2009
400 400 9.15% p.a. payable annually
Redeemable at face value at the end of 10th year from the date of allotment.
Total 400 400
Security: The debentures are secured by way of a first charge having pari passu rights on the immovable property at certain
locations and part of a movable property of a business division, both present and future.
Notes forming part of the Accounts (contd.)NOTE [B]
Reserves and surplus (contd.)

197
(ii) Unsecured redeemable non-convertible fixed rate debentures (privately placed):
Sr. no.
Face value per
debenture (`)
Date of allotment
31-3-2015 ` crore
31-3-2014` crore
Interest for the year 2014-15
Terms of repayment for debentures outstanding as on
31-3-2015
1 10,00,000 April 10, 2012
250 250 9.75% p.a. payable annually
Redeemable at face value at the end of 10th year from the date of allotment.
2 10,00,000 May 26, 2010
300 300 8.95% p.a. payable annually
Redeemable at face value at the end of 10th year from the date of allotment.
3 10,00,000 May 11, 2010
300 300 9.15% p.a. payable annually
Redeemable at face value at the end of 10th year from the date of allotment.
4 10,00,000 April 13, 2010
200 200 8.80% p.a. payable annually
Redeemable at face value at the end of 10th year from the date of allotment.
5 10,00,000 August 22, 2014
350 – 9.15% p.a. payable annually
Redeemable at face value at the end of 2nd year from the date of allotment
6 10,00,000 August 21, 2014
200 – 9.20% p.a. payable annually
1250 Bonds redeemable at face value at the end 712th day from date of allotment & 750 bonds redeemable at face value at the end 731st day from date of allotment
7 10,00,000 December 11, 2014
300 – 8.42% p.a. payable annually
Redeemable at face value at the end of 368th day from the date of allotment.
8 10,00,000 February 2, 2015
300 – 7.80% p.a. payable annually
Redeemable at face value at the end of 366th day from the date of allotment.
Total 2200 1050
Less: 600 – Current portion of long term borrowings [Note D(II)]
1600 1050 Long term borrowings as disclosed in [Note C(I)]
(iii) Unsecured redeemable non-convertible inflation linked debentures:
Sr. no.
Face value per debenture (`)
Date of allotment
31-3-2015 ` crore
31-3-2014` crore
Interest for the year 2014-15
Terms of repayment for debentures outstanding as on 31-3-2015
1 10,00,000 May 23,2013
109.76 ^ 105.34 # 1.65% p.a. payable on
Inflation adjusted principal as
on the date of coupon payment
Redeemable at the end of 10th year from the date of allotment.
Redemption value will be calculated
as per the following formula:
[{Average reference WPI$ (on
Maturity Date)/Average reference
WPI (on Issue Date)} * Face Value]
with Floor Rate as 3% and Cap Rate
as 12%.
$ WPI here refers to Wholesale Price
Index
^ The principal amount has been calculated as [{Average reference WPI (as at 31-3-2015) / Average reference WPI (as at
23-5-2013)} * Face Value]
# The principal amount has been calculated as [{Average reference WPI (as at 31-3-2014) / Average reference WPI (as at
23-5-2013)} * Face Value]
Notes forming part of the Accounts (contd.)C(I)(a) (contd.)

198
C(I)(b) Foreign Currency Convertible Bonds:
0.675% US$ denominated 5 years & 1 day Foreign Currency Convertible Bonds (FCCB) carried at ` 1250 crore as on March 31,
2015 represent 1000 bonds of US$ 2,00,000 each .The bonds are convertible into the Company’s fully paid equity shares of ` 2
each at a conversion price of ` 1916.50 per share at the option of the bond holders at any time on and after December 1, 2014
up to October 15, 2019. The bonds are redeemable, subject to fulfillment of certain conditions, in whole but not in part, at the
option of the Company, on or at any time after October 22, 2017 but not less than seven business days prior to the maturity
date, at the principal amount together with accrued interest (calculated up to but excluding the date of redemption) on the
date fixed for redemption, unless the bonds have been previously redeemed, converted or purchased and cancelled.
C(I)(c) Details of Term Loans (Unsecured): Foreign Currency Loans:
Sr. no.
31-3-2015 ` crore
31-3-2014 ` crore
Rate of interest Terms of repayment of term loan outstanding as on 31-3-2015
1 1250.00 – USD LIBOR + Spread
Repayment due on October 21, 2019
2 625.00 – USD LIBOR + Spread
Repayable in 3 installments on (i) November 3 , 2018 (ii) November 3, 2019 (iii) November 3, 2020.
3 312.50 299.58 USD LIBOR + Spread
Repayment due on July 2, 2018
4 125.00 119.83 USD LIBOR + Spread
Repayment due on September 27, 2017
5 156.25 – USD LIBOR + Spread
Repayable on July 14, 2017
6 276.34 264.91 USD LIBOR + Spread
Repayable in 3 installments on (i) August 30, 2016 (ii) August 30, 2017 and (iii) June 28, 2018
7 381.52 365.74 USD LIBOR + Spread
Repayable in 3 installments on (i) August 30, 2016 (ii) August 30, 2017 and (iii) June 28, 2018
8 625.00 599.15 USD LIBOR + Spread
Repayable in 3 installments on (i) August 30, 2016 (ii) August 30, 2017 and (iii) June 28, 2018
9 625.00 599.15 USD LIBOR + Spread
Repayable in 3 installments on (i) August 30, 2016 (ii) August 30, 2017 and (iii) June 28, 2018
10 349.74 335.27 USD LIBOR + Spread
Repayable in 2 installments on (i) August 30, 2016 and (ii) August 30, 2017
11 312.50 – Fixed Interest Rate Repayable on August 29, 2016
12 145.83 174.75 USD LIBOR + Spread
Repayable in 5 equal installments payable annually from September 18, 2014 to September 18, 2017 with the final installment due on June 18, 2018
13 – 1198.30 USD LIBOR + Spread
14 – 864.31 JPY LIBOR + Spread
Total 5184.68 4820.99
Less: 36.46 899.26 Current portion of long term borrowings [Note D(II)]
5148.22 3921.73 Long term borrowings as disclosed in [Note C(I)]
Notes forming part of the Accounts (contd.)
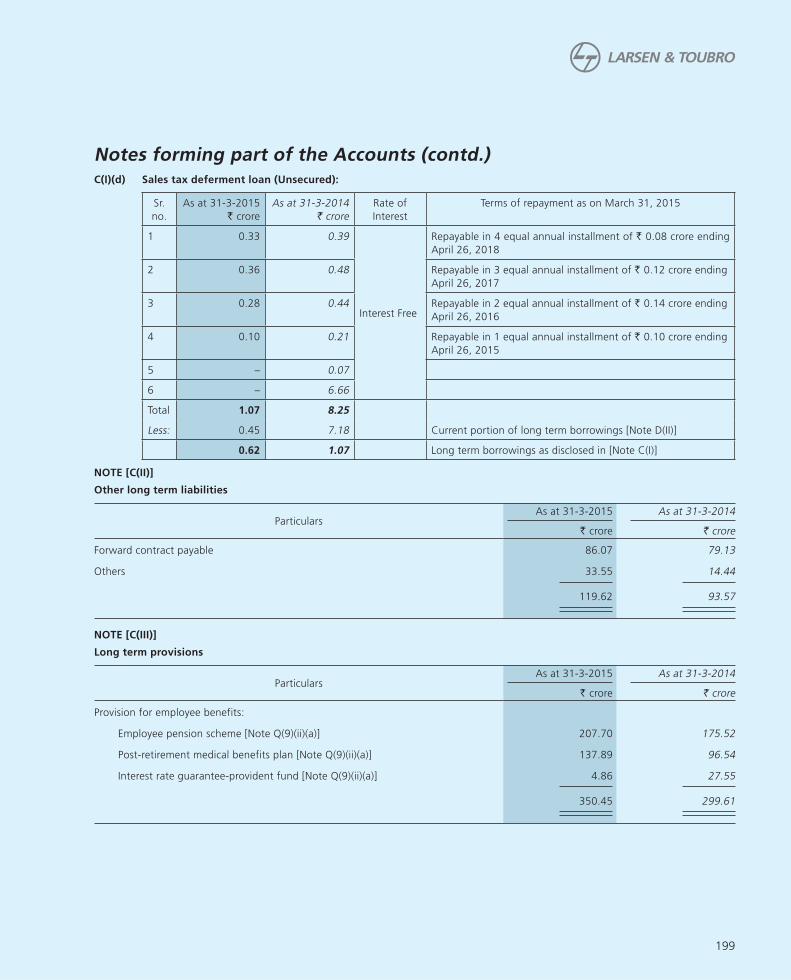
199
C(I)(d) Sales tax deferment loan (Unsecured):
Sr.
no.
As at 31-3-2015
` crore
As at 31-3-2014
` crore
Rate of
Interest
Terms of repayment as on March 31, 2015
1 0.33 0.39
Interest Free
Repayable in 4 equal annual installment of ` 0.08 crore ending
April 26, 2018
2 0.36 0.48 Repayable in 3 equal annual installment of ` 0.12 crore ending
April 26, 2017
3 0.28 0.44 Repayable in 2 equal annual installment of ` 0.14 crore ending
April 26, 2016
4 0.10 0.21 Repayable in 1 equal annual installment of ` 0.10 crore ending
April 26, 2015
5 – 0.07
6 – 6.66
Total 1.07 8.25
Less: 0.45 7.18 Current portion of long term borrowings [Note D(II)]
0.62 1.07 Long term borrowings as disclosed in [Note C(I)]
NOTE [C(II)]
Other long term liabilities
Particulars As at 31-3-2015 As at 31-3-2014
` crore ` crore
Forward contract payable 86.07 79.13
Others 33.55 14.44
119.62 93.57
NOTE [C(III)]
Long term provisions
Particulars As at 31-3-2015 As at 31-3-2014
` crore ` crore
Provision for employee benefits:
Employee pension scheme [Note Q(9)(ii)(a)] 207.70 175.52
Post-retirement medical benefits plan [Note Q(9)(ii)(a)] 137.89 96.54
Interest rate guarantee-provident fund [Note Q(9)(ii)(a)] 4.86 27.55
350.45 299.61
Notes forming part of the Accounts (contd.)

200
NOTE [D(I)]
Short term borrowings
Particulars
As at 31-3-2015 As at 31-3-2014
Secured Unsecured Total* Secured Unsecured Total*
` crore ` crore ` crore ` crore ` crore ` crore
Loans repayable on demand from banks [Note D(I)(a)] 57.79 – 57.79 104.45 81.22 185.67
Short term loans and advances from banks [Note D(I)(a)] 206.25 2484.04 2690.29 103.92 2773.79 2877.71
Short term borrowings against Government Securities – – – 698.86 – 698.86
Commercial Paper – 985.75 985.75 – – –
Loans from related parties (Subsidiary companies) – 57.25 57.25 – 113.80 113.80
264.04 3527.04 3791.08 907.23 2968.81 3876.04
* Loans guaranteed by directors or others ` Nil (previous year ` Nil)
D(I)(a) Loans repayable on demand from banks include fund based working capital facilities viz. cash credits and demand loans. The
secured portion of loans repayable on demand from banks of ` 57.79 crore (previous year: ` 104.45 crore), short term loans and
advances from the banks of ` 206.25 crore (previous year: ` 103.92 crore), working capital facilities and other non-fund based
facilities viz. bank guarantees and letters of credit, are secured by hypothecation of inventories, book debts and receivables.
NOTE [D(II)]
Current maturities of long term borrowings
Particulars As at 31-3-2015 As at 31-3-2014
` crore* ` crore*
Unsecured:
Redeemable non-convertible fixed rate debentures [Note C(I)(a)(ii)] 600.00 –
3.50% Foreign currency convertible bonds – 1198.30
Term loan from banks [Note C(I)(c)] 36.46 899.26
Sales tax deferment loan [Note C(I)(d)] 0.45 7.18
636.91 2104.74
* Loans guaranteed by directors or others ` Nil (previous year ` Nil)
NOTE [D(III)]
Trade payables
Particulars As at 31-3-2015 As at 31-3-2014
` crore ` crore
Acceptances 85.15 52.19
Due to related parties:
Subsidiary companies 1782.16 2536.29
Associate companies 22.81 19.69
Joint venture companies 81.37 61.90
Micro and small enterprises [Note Q(24)] 116.64 53.94
Due to others 16756.64 13621.44
18844.77 16345.45
Notes forming part of the Accounts (contd.)

201
NOTE [D(IV)]
Other current liabilities
Particulars As at 31-3-2015 As at 31-3-2014
` crore ` crore
Interest accrued but not due on borrowings 158.08 123.86
Unclaimed dividend 33.59 28.01
Due to customers (Construction related activity) 4008.46 4080.37
Due to customers (Property Development projects) 365.27 98.37
Advances from customers 9054.19 8207.75
Forward contract payable 347.75 645.84
Other payable (including sales tax, service tax, excise duty and others) [Note D(IV)(a)] 736.54 737.56
14703.88 13921.76
D(IV)(a) Other payable includes due to directors ` 50.61 crore (previous year : ` 52.90 crore) on account of commission.
NOTE [D(V)]
Short term provisions
Particulars As at 31-3-2015 As at 31-3-2014
` crore ` crore ` crore ` crore
Provision for employee benefits:
Gratuity [Note Q(9)(ii)(a)] 1.33 1.14
Compensated absences 486.02 425.34
Employee pension scheme [Note Q(9)(ii)(a)] 13.47 13.00
Post-retirement medical benefits plan [Note Q(9)(ii)(a)] 10.04 5.92
Bonus provision 10.35 11.24
521.21 456.64
Others:
Current tax [Net of payment made ` 1543.76 crore] 75.69 –
Proposed equity dividend 1510.54 1320.85
Additional tax on dividend 134.33 77.80
Other provisions (AS 29 Related) [Note Q(17)] 259.11 258.23
1979.67 1656.88
2500.88 2113.52
Notes forming part of the Accounts (contd.)

202
NOTE [E(I)]
Tangible assets
` crore
Class of assets
Cost/valuation Depreciation Impairment Book value
As at
1-4-2014
Transfer of
Business $ Additions Deductions
As at
31-3-2015
Up to
31-3-2014
Transfer of
Business $
For the
year* Deductions
Up to
31-3-2015
As at
31-3-2015
As at
31-3-2015
As at
31-3-2014
Land
Freehold 402.56 – 2.43 – 404.99 – – – – – – 404.99 402.56
Leashold 83.63 – 7.04 – 90.67 6.24 – 0.90 – 7.14 – 83.53 77.39
Sub total-Land 486.19 – 9.47 – 495.66 6.24 – 0.90 – 7.14 – 488.52 479.95
Buildings
Owned 2552.43 – 295.99 47.50 2800.92 394.57 – 132.50 22.30 504.77 – 2296.15 2157.86
Leased out 190.85 – – – 190.85 13.38 – 6.06 – 19.44 – 171.41 177.47
Sub total-Buildings 2743.28 – 295.99 47.50 2991.77 407.95 – 138.56 22.30 524.21 – 2467.56 2335.33
Plant and equipment
Owned 6865.89 21.05 554.56 100.82 7298.58 2735.92 7.81 678.85 82.96 3324.00 – 3974.58 4129.97
Leased out 34.22 – – – 34.22 9.28 – 2.58 – 11.86 6.93 # 15.43 18.01
Sub total-Plant & equipment 6900.11 21.05 554.56 100.82 7332.80 2745.20 7.81 681.43 82.96 3335.86 6.93 3990.01 4147.98
Computers
Owned 529.15 80.00 68.36 28.69 488.82 305.92 36.82 104.13 27.96 345.27 – 143.55 223.23
Taken on lease 0.09 – – 0.01 0.08 0.08 – 0.01 0.01 0.08 – – 0.01
Sub total-Computers 529.24 80.00 68.36 28.70 488.90 306.00 36.82 104.14 27.97 345.35 – 143.55 223.24
Office equipment
Owned 213.80 8.95 27.54 5.17 227.22 109.88 2.71 56.93 4.76 159.34 – 67.88 103.92
Sub total-Office equipment 213.80 8.95 27.54 5.17 227.22 109.88 2.71 56.93 4.76 159.34 – 67.88 103.92
Furniture and fixtures
Owned 246.91 24.62 23.81 7.40 238.70 128.10 12.25 21.50 5.12 132.23 – 106.47 118.81
Sub total-Furniture & fixture 246.91 24.62 23.81 7.40 238.70 128.10 12.25 21.50 5.12 132.23 – 106.47 118.81
Vehicles
Owned 214.26 8.31 30.64 18.23 218.36 102.95 3.14 28.12 12.83 115.10 – 103.26 111.31
Sub total-Vehicles 214.26 8.31 30.64 18.23 218.36 102.95 3.14 28.12 12.83 115.10 – 103.26 111.31
Other assets
Owned
Railway sidings 0.25 – – – 0.25 0.25 – – – 0.25 – – –
Ships 69.54 – – 1.13 68.41 26.20 – 4.96 0.77 30.39 – 38.02 43.34
Sub total-Other assets 69.79 – – 1.13 68.66 26.45 – 4.96 0.77 30.64 – 38.02 43.34
Lease Adjustment – – – – – – – – – – (3.07) (3.07)
Total 11403.58 142.93 1010.37 208.95 12062.07 3832.77 62.73 1036.54 156.71 4649.87 6.93 7402.20 7560.81
Previous year 11778.26 1164.06 960.83 171.45 11403.58 3549.61 368.94 746.25 94.15 3832.77 6.93
Add: Capital work-in-progress 304.54 411.86
7706.74 7972.67
# Impairment up to 31-03-2015 ` 6.93 crore. During the year ` NIL* Includes ` 86.28 crore transferred to opening reserve as on April 1, 2014 pursuant to Schedule II of Companies Act, 2013$ [Note Q(15)]
1. Cost/Valuation of freehold land includes ` 0.14 crore for which conveyance is yet to be completed.
2. Cost/Valuation of buildings includes ownership accommodation:
(i) (a) in various co-operative societies, shop-owners’ associations and non-trading corporations ` 88.80 crore, including 2,575
shares of ` 50 each, 232 shares of ` 100 each and 1 share of ` 250 each.
(b) in various apartments ` 11.20 crore.
Notes forming part of the Accounts (contd.)

203
NOTE [E(I)] (contd.)
(c) in various co-operative societies ` 12.88 crore for which share certificates are yet to be issued.
(d) in proposed co-operative societies ` 0.53 crore.
(ii) of ` 4.39 crore in respect of which the deed of conveyance is yet to be executed.
(iii) of ` 8.45 crore representing undivided share in properties at various locations.
3. Additions during the year and capital work-in-progress include ` 18.50 crore (previous year ` 9.87 crore) being borrowing cost
capitalised in accordance with Accounting Standard (AS)16 on “Borrowing Costs”. Asset wise break-up of borrowing costs capitalised
is as follows:
` crore
Asset class 2014-15 2013-14
Building (owned) 26.30 1.81
Plant and equipment (owned) 0.30 0.01
Office Equipment (owned) 0.02 –
Furniture and Fixtures (owned) 0.03 0.01
Capital Work-in-progress (8.15) 8.04
Total 18.50 9.87
4. Depreciation for the year include obsolescence ` 30.68 crore (previous year ` 17.09 crore).
5. Own assets given on operating lease have been presented separately in the schedule as per Accounting Standard (AS) 19.
6. Cost/valuation as at April 1, 2014 of individual assets has been reclassified wherever necessary.
7. Out of its lease hold land at Hazira, the Company has given certain portion of land for the use of its subsidiary company. The lease
deed in respect of leasehold land given to the subsidiary company is under execution.
8. With effect from April 1, 2014, depreciation has been computed and provided on the basis of useful life of fixed assets as specified in
Schedule II to the Companies Act, 2013 except in respect of assets specified in Note 9 below where the useful life was determined by
technical evaluation, considering business specific usage, the consumption pattern of the assets and the past performance of similar
assets. Consequently, the depreciation for the year ended March 31, 2015 is higher and the profit before tax lower to the extent of
` 147.41 crore.
In respect of assets where useful life specified in Schedule II has expired as on April 1, 2014, the carrying amount of ` 86.28 crore
before tax (` 56.95 crore net of tax of ` 29.33 crore) was adjusted against retained earnings as on April 1, 2014.
9. Details of assets where useful life is different from that specified in Schedule II:
Sr.
No
Category of Assets Sub-category of Assets Useful life as per
Schedule II (in years)
Useful life adopted
(in years)
1. Non-factory buildings (RCC frame
structure) 60 20-60
2. Non-factory buildings (other than
RCC frame structure) 30 10-30
3. Ownership flats Building portion-RCC frame structure 60 50
4. Office equipment Multifunctional devices 5 4
5. Air conditioning and refrigeration
equipment 15 12
6. Laboratory equipment 10 8
7. Canteen equipment 15 8
8. Motor vehicles 8 7
Notes forming part of the Accounts (contd.)
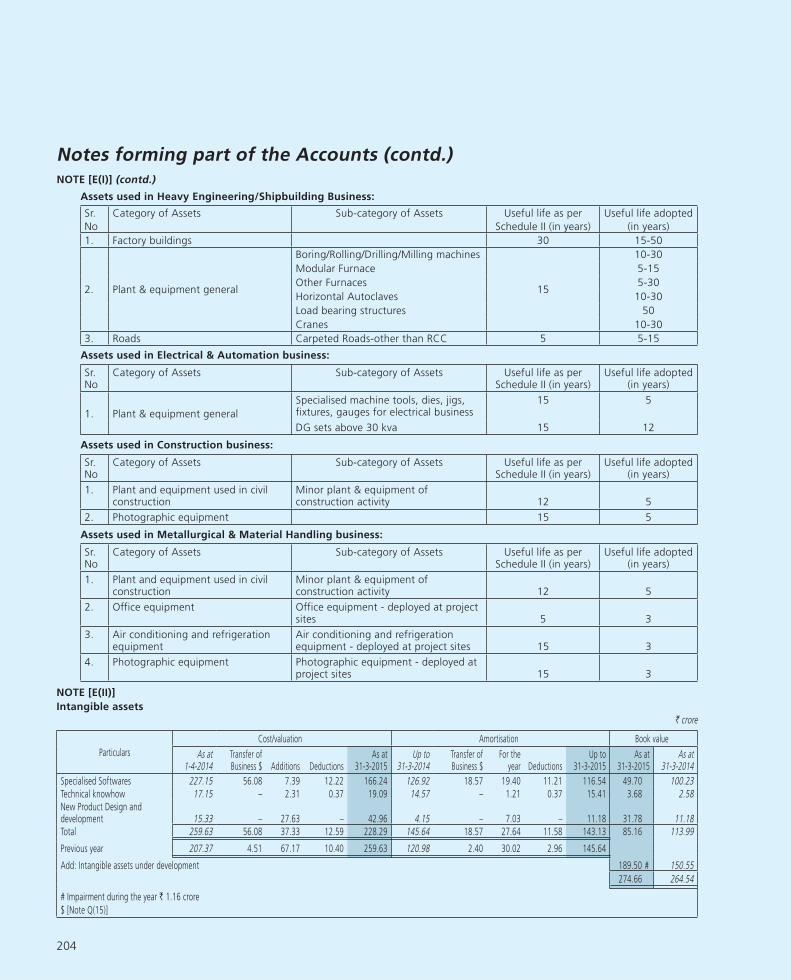
204
Assets used in Heavy Engineering/Shipbuilding Business:
Sr.
No
Category of Assets Sub-category of Assets Useful life as per
Schedule II (in years)
Useful life adopted
(in years)
1. Factory buildings 30 15-50
2. Plant & equipment general
Boring/Rolling/Drilling/Milling machines
15
10-30
Modular Furnace 5-15
Other Furnaces 5-30
Horizontal Autoclaves 10-30
Load bearing structures 50
Cranes 10-30
3. Roads Carpeted Roads-other than RCC 5 5-15
Assets used in Electrical & Automation business:
Sr. No
Category of Assets Sub-category of Assets Useful life as per Schedule II (in years)
Useful life adopted (in years)
1. Plant & equipment general
Specialised machine tools, dies, jigs, fixtures, gauges for electrical business
15 5
DG sets above 30 kva 15 12
Assets used in Construction business:
Sr. No
Category of Assets Sub-category of Assets Useful life as per Schedule II (in years)
Useful life adopted (in years)
1. Plant and equipment used in civil construction
Minor plant & equipment of construction activity 12 5
2. Photographic equipment 15 5
Assets used in Metallurgical & Material Handling business:
Sr. No
Category of Assets Sub-category of Assets Useful life as per Schedule II (in years)
Useful life adopted (in years)
1. Plant and equipment used in civil construction
Minor plant & equipment of construction activity 12 5
2. Office equipment Office equipment - deployed at project sites 5 3
3. Air conditioning and refrigeration equipment
Air conditioning and refrigeration equipment - deployed at project sites 15 3
4. Photographic equipment Photographic equipment - deployed at project sites 15 3
NOTE [E(II)]
Intangible assets
` crore
Particulars
Cost/valuation Amortisation Book value
As at 1-4-2014
Transfer of Business $ Additions Deductions
As at 31-3-2015
Up to31-3-2014
Transfer of Business $
For theyear Deductions
Up to31-3-2015
As at31-3-2015
As at31-3-2014
Specialised Softwares 227.15 56.08 7.39 12.22 166.24 126.92 18.57 19.40 11.21 116.54 49.70 100.23 Technical knowhow 17.15 – 2.31 0.37 19.09 14.57 – 1.21 0.37 15.41 3.68 2.58 New Product Design and development 15.33 – 27.63 – 42.96 4.15 – 7.03 – 11.18 31.78 11.18 Total 259.63 56.08 37.33 12.59 228.29 145.64 18.57 27.64 11.58 143.13 85.16 113.99
Previous year 207.37 4.51 67.17 10.40 259.63 120.98 2.40 30.02 2.96 145.64
Add: Intangible assets under development 189.50 # 150.55
274.66 264.54
# Impairment during the year ` 1.16 crore
$ [Note Q(15)]
Notes forming part of the Accounts (contd.)NOTE [E(I)] (contd.)

205
NOTE [F]
Non-current investments (at cost unless otherwise specified)
Particulars As at 31-3-2015 As at 31-3-2014
` crore ` crore ` crore ` crore
Long term investments
(1) Trade Investments
(A) Investment in fully paid equity/preference instruments
(a) Subsidiaries companies
(i) Fully paid equity shares 14769.69 13832.61
(ii) Fully paid preference shares 2426.00 990.00
17195.69 14822.61
(b) Associate companies
Fully paid equity shares 30.63 32.43
Less: Provision for diminution in value 0.56 0.56
30.07 31.87
(c) Other companies 43.00 43.00
Less: Provision for diminution in value 15.90 15.90
27.10 27.10
(B) Investment in integrated joint ventures 419.96 286.83
(2) Other investments
Other fully paid equity shares – –
17672.82 15168.41
Non-current Investments (at cost unless otherwise specified)
Number of units
Particulars Face value per unit
As at 31-3-2015
As at 31-3-2015
As at 31-3-2014
` ` crore ` crore
(1) Trade Investments
(A) Investments in fully paid equity / preference instruments
(a) Subsidiary companies:
(i) Fully paid equity shares
L&T Valves Limited 100 1,800,000 201.54 201.54
Bhilai Power Supply Company Limited 10 49,950 0.05 0.05
EWAC Alloys Limited 100 829,440 150.24 150.24
Hi-Tech Rock Products & Aggregates Limited 10 50,000 0.05 0.05
Kesun Iron & Steel Company Private Limited 10 9,500 0.01 0.01
Larsen & Toubro Consultoria E Projeto Ltda R$ 1 96,819 0.27 0.27
L&T-Gulf Private Limited 10 4,000,016 4.00 4.00
L&T Ahmedabad-Maliya Tollway Limited [` 1000 (previous year ` 1000)] 10 100 – –
L&T Aviation Services Private Limited 10 45,600,000 45.60 45.60
L&T Capital Company Limited (face value changed from ` 10 per share to ` 4400 per share w.e.f.22 Dec 2014)
4,400 50,000 22.00 22.00
L&T Cassidian Limited 10 37,000 0.04 0.04
L&T Finance Holdings Limited (quoted) 10 1,254,936,010 1575.15 1652.54
L&T Chennai-TADA Tollway Limited [` 1000 (previous year ` 1000)] 10 100 – –
L&T Construction Equipment Limited 10 120,000,000 84.32 84.32
L&T Devihalli Hassan Tollway Limited [` 1000 (previous year ` 1000)] 10 100 – –
Carried forward 2083.27 2160.66
Notes forming part of the Accounts (contd.)

206
Number of units
Particulars Face value per unit
As at 31-3-2015
As at 31-3-2015
As at 31-3-2014
` ` crore ` crore
(i) Fully paid equity shares (contd.)
Brought forward 2083.27 2160.66
L&T General Insurance Company Limited 10 620,000,000 620.00 495.00
L&T Halol-Shamlaji Tollway Limited [` 1000 (previous year ` 1000)] 10 100 – –
L&T Howden Private Limited 10 15,030,000 15.03 15.03
L&T Infocity Limited 10 24,030,000 16.02 16.02
L&T Metro Rail (Hyderabad) Limited 10 19,813,980 19.82 11.55
L&T Infrastructure Development Projects Limited 10 312,869,096 2696.48 2696.48
L&T Kobelco Machinery Private Limited 10 25,500,000 25.50 25.50
L&T Krishnagiri Walajahpet Tollway Limited [` 26000 (previous year ` 26000)]
10 2,600 – –
L&T-MHPS Boilers Private Limited 10 119,391,000 119.39 119.39
L&T-MHPS Turbine Generators Private Limited 10 362,406,000 362.41 194.11
L&T Natural Resources Limited 10 50,000 0.05 0.05
L&T Power Development Limited 10 2,729,300,000 2729.30 2729.30
L&T Power Limited 10 51,157 0.05 0.05
L&T Powergen Limited 10 50,000 0.05 0.05
L&T Rajkot-Vadinar Tollway Limited [` 1000 (previous year ` 1000)] 10 100 – –
L&T Realty Limited 10 47,160,700 47.16 47.16
L&T Samakhiali Gandhidham Tollway Limited 10 13,000 0.01 0.01
L&T Sapura Offshore Private Limited 10 6,000 0.01 0.01
L&T Sapura Shipping Private Limited 10 95,311,850 95.31 95.31
L&T Seawoods Limited (formerly known as L&T Seawoods Private Limited) 10 1,999,550,000 1999.55 1506.00
L&T Shipbuilding Limited 10 818,680,000 818.68 818.68
L&T Solar Limited 10 50,000 0.05 0.05
L&T Special Steels and Heavy Forgings Private Limited 10 419,284,000 419.28 419.28
L&T Electricals and Automation Limited 10 50,000 0.05 0.05
L&T Transportation Infrastructure Limited 10 10,864,000 10.86 10.86
L&T-Sargent & Lundy Limited 10 2,782,736 0.82 0.82
L&T Hydrocarbon Engineering Limited 10 1,000,050,000 1000.05 1000.05
L&T Technology Services Limited 10 300,000,000 300.00 102.50
L&T-Valdel Engineering Limited 10 1,179,000 23.89 23.89
Larsen & Toubro Infotech Limited 5 32,250,000 134.25 134.25
Larsen & Toubro International FZE AED 550500
1,829 1147.40 1147.40
Larsen Toubro Arabia LLC SAR 1000 7,500 11.08 11.08
Larsen & Toubro Hydrocarbon International Limited LLC SAR 1000 450 0.68 0.68
Larsen & Toubro LLC USD 1 50,000 0.23 0.23
PNG Tollway Limited 10 43,966,000 43.97 43.97
Raykal Aluminum Company Private Limited 10 37,750 0.04 0.04
Spectrum Infotech Private Limited 10 440,000 6.80 6.80
Carried forward 14747.54 13832.31
Notes forming part of the Accounts (contd.)NOTE [F]
Non-current investments (at cost unless otherwise specified) (contd.)

207
Number of units
Particulars Face value per unit
As at 31-3-2015
As at 31-3-2015
As at 31-3-2014
` ` crore ` crore
(i) Fully paid equity shares (contd.)
Brought forward 14747.54 13832.31
L&T Infrastructure Engineering Limited (formerly known as L&T-Ramboll Consulting Engineers Limited) [prior to September 8, 2014 Associate Company] 10 3,600,000 21.85 –
L&T Cutting Tools Limited 1,000 68,000 0.30 0.30
14769.69 13832.61
(ii) Fully paid preference shares
L&T Shipbuilding Limited -12% Non-convertible cumulative redeemable preference shares, October 23, 2028. 10 90,000,000 90.00 90.00
L&T Shipbuilding Limited -12% Non-convertible cumulative redeemable preference shares, June 26, 2029 10 50,000,000 50.00 –
L&T Technology Services Limited -10% Non-convertible Non-cumulative redeemable preference shares, February 15, 2024 10 400,000,000 400.00 400.00
L&T Technology Services Limited -10% Non-convertible Non-cumulative redeemable preference shares, September 22, 2024 10 350,000,000 350.00 –
L&T Seawoods Limited -10% Convertible non-cumulative and redeemable preference shares 2 1,036,000,000 1036.00 –
L&T Hydrocarbon Engineering Limited -10% Non-convertible Non-cumulative redeemable preference shares, February 7, 2029 10 500,000,000 500.00 500.00
2426.00 990.00
Total [1]-(A) (a) (i+ii) 17195.69 14822.61
(b) Associate companies:
Gujarat Leather Industries Limited 10 735,000 0.56 0.56
JSK Electricals Private Limited 10 2,120,040 2.12 2.12
L&T-Chiyoda Limited 10 4,500,000 4.50 4.50
L&T-Ramboll Consulting Engineers Limited (subsidiary company w.e.f. September 8, 2014)
10 – – 1.80
Magtorq Private Limited 100 9,000 4.42 4.42
Rishi Consfab Private Limited 10 2,704,000 2.70 2.70
Salzer Electronics Limited (quoted) 10 2,679,808 16.33 16.33
30.63 32.43
Less: Provision for diminution in value 0.56 0.56
Total [1]-(A) (b) 30.07 31.87
(c) Other companies:
International Seaport Dredging Limited 10,000 15,899 15.90 15.90
Tidel Park Limited 10 4,000,000 4.00 4.00
Astra Microwave Products Limited (quoted) 2 7,950,045 23.00 23.00
BBT Elevated Road Private Limited 10 100,000 0.10 0.10
43.00 43.00
Less: Provision for diminution in value 15.90 15.90
Total [1]-(A) (c) 27.10 27.10
Notes forming part of the Accounts (contd.)NOTE [F]
Non-current investments (at cost unless otherwise specified) (contd.)

208
Number of units
Particulars Face value per unit
As at 31-3-2015
As at 31-3-2015
As at 31-3-2014
` ` crore ` crore
(B) Other investments
Integrated joint venture
Desbuild-L&T Joint Venture 0.07 0.05
HCC-L&T Purulia Joint Venture 0.28 0.06
International Metro Civil Contractors Joint Venture 9.24 8.36
L&T-Eastern Joint Venture 5.21 6.13
L&T-AM Tapovan Joint Venture 107.72 91.71
L&T-Hochtief Seabird Joint Venture 23.72 23.81
L&T-Shanghai Urban Construction (Group) Corporation Joint Venture 13.27 13.16
Metro Tunneling Group 14.90 15.13
Metro Tunneling Delhi - L&T Shanghai Urban Construction (Group) Corporation Joint Venture 56.58 19.10
L&T- Shanghai Urban Construction (Group) Corporation Joint Venture CC27 Delhi 65.26 12.66
Metro Tunneling Chennai - L&T Shanghai Urban Construction (Group) Corporation Joint Venture 44.95 57.84
Laren & Toubro Limited - Shapoorji Pallonji & Co. Limited Joint Venture 21.64 38.82
Civil Works Joint Venture 57.12 –
Total [1]-(B) 419.96 286.83
Trade Investments- Total (1) 17672.82 15168.41
(2) Other Investments
Investments in fully paid equity Instruments
Other companies:
Utmal Multi purpose Service Co-operative Society Limited (B Class) [` 30,000 (previous year ` 30,000)]
100 300 0.00 0.00
Other Investments- Total (2) 0.00 0.00
Total Non current Investments (1+2) 17672.82 15168.41
Details of quoted/unquoted investments:
ParticularsAs at
31-3-2015As at
31-3-2014
` crore ` crore
(a) Aggregate amount of quoted investments and market value thereof;
Book Value 1614.48 1691.87
Market Value 8060.92 9740.38
(b) Aggregate amount of unquoted investments;
Book Value 16058.34 13476.54
(c) Aggregate provision for diminution in value of investments is ` 16.46 crore
(previous year ` 16.46 crore)
Notes forming part of the Accounts (contd.)NOTE [F]
Non-current investments (at cost unless otherwise specified) (contd.)

209
NOTE [G(I)]
Long term loans and advances
Particulars As at 31-3-2015 As at 31-3-2014
` crore ` crore
Secured considered good:
Loans against mortgage of house property 2.36 3.76
Capital advances 1.63 2.65
Inter corporate deposits including interest accrued-others 3.00 –
Other loans and advances (KMPs) 0.01 –
Unsecured considered good
Capital advances 57.46 67.41
Loans and advances to related parties:
Subsidiary Companies
Advances towards equity commitment 1986.84 1208.37
Intercorporate deposit including interest accrued
[Note Q(2)(a)]
57.51 1342.27
Joint venture company
Loans – 490.27
Other loans and advances
Security deposits 63.23 109.18
Earnest money deposits 0.46 0.74
Advances recoverable in cash or in kind 548.33 496.92
2720.83 3721.57
NOTE [G(II)]
Cash and bank balances
Particulars As at 31-3-2015 As at 31-3-2014
` crore ` crore
Cash and bank balances not available for immediate use [Note G(II)(a)]
75.43 9.54
75.43 9.54
G(II)(a) Particulars of cash and bank balances not available for immediate use
` crore
ParticularsAs at
31-3-2015
As at
31-3-2014
1 Amount deposited under credit support arrangement which is refundable only on
cessation of exposure to a bank. – 35.15
2 Amount received including interest accrued there on from customers of property
development business – to be handed over to housing society on its formation. 20.72 19.89
3 Contingency deposit (including interest accrued thereon) received from customers
of property development business towards their sales tax liability - to be refunded/
adjusted depending on the outcome of the legal case. 16.73 14.89
4 Other bank balances including interest accrued thereon not available for immediate
use being in the nature of security offered for bids submitted, loans availed,
guarantees issued by bank on behalf of the company, collaterals, earmarked grants
etc. 160.54 58.28
Total 197.99 128.21
Less: Amount reflected under Current assets [Note H(IV)] 122.56 118.67
Amount reflected under non-current assets [Note G(II)] 75.43 9.54
Notes forming part of the Accounts (contd.)

210
NOTE [G(III)]
Other non-current asset
Particulars As at 31-3-2015 As at 31-3-2014
` crore ` crore
Unamortised expenses 52.43 53.24
52.43 53.24
NOTE [H(I)]
Current Investments
Particulars As at 31-3-2015 As at 31-3-2014
` crore ` crore ` crore ` crore
Current investments
Government and trust securities 1484.77 944.28
Less: Provision for diminution in value 2.53 15.23
1482.24 929.05
Debentures and Bonds 861.26 723.93
Less: Provision for diminution in value 0.84 0.06
860.42 723.87
Mutual funds 3037.62 2118.68
Less: Provision for diminution in value 0.20 –
3037.42 2118.68
Other current investments – 274.63
Less: Provision for diminution in value – –
– 274.63
5380.08 4046.23
Other particulars in respect of current investment mentioned in H(1) are as follows:
Particulars
Number of Units
Face value per unit
As at 31-3-2015
As at 31-3-2015
As at 31-3-2014
` ` crore ` crore
Current investments:
(1) Government and trust securities:
8.28% Government of India Bonds 2032 (quoted) 100 500,000 4.91 4.91
7.16% Government of India Bond 2023 (quoted) 100 8,500,000 81.56 66.49
8.15% Government of India Bonds 2022 (quoted) 100 2,000,000 20.29 19.71
8.33% Government of India Bonds 2026 (quoted) 100 7,500,000 79.77 106.37
8.12% Government of India Bond 2020 (quoted) 100 – – 262.68
8.28% Government of India Bond 2027 (quoted) 100 10,000,000 103.75 179.98
9.20% Government of India Bond 2030 (quoted) 100 26,100,000 290.10 54.69
8.32% Government of India Bond 2032 (quoted) 100 1,500,000 15.63 13.89
7.28% Government of India Bond 2019 (quoted) 100 – – 167.47
8.24% Government of India Bond 2027 (quoted) 100 – – 66.00
9.84% Andhra Pradesh SDL 2024 (quoted) 100 – – 2.01
Carried forward 596.01 944.20
Notes forming part of the Accounts (contd.)

211
Particulars
Number of Units
Face value per unit
As at 31-3-2015
As at 31-3-2015
As at 31-3-2014
` ` crore ` crore
(1) Government and trust securities: (contd.)
Brought forward 596.01 944.20
8.90% Maharashtra SDL 2022 (quoted) 100 – – 0.08
8.83% Government of India Bond 2023 (quoted) 100 22,500,000 238.70 –
6.90% Oil Mktg Cos GOI Special Bonds 2026 (quoted) 100 1,300,000 12.04 –
9.23% Government of India Bond 2043 (quoted) 100 30,000,000 346.02 –
8.17% Government of India Bond 2044 (quoted) 100 3,000,000 31.26 –
8.27% Government of India Bond 2020 (quoted) 100 25,500,000 260.74 –
1484.77 944.28
Less: Provision for diminution in value 2.53 15.23
Government and trust securities -Total 1482.24 929.05
(2) Debentures and Bonds
(i) Subsidiary companies:
L&T Finance Limited - 10.24% Secured Redeemable Non Convertible Debenture, 17 September 2019 (quoted) 1,000 217,575 22.95 36.96
22.95 36.96
Less: Provision for diminution in value – –
Subsidiary companies-Total 22.95 36.96
(ii) Other Debentures and Bonds
6.86% IIFCL Tax Free Bonds 26 March 2023 (quoted) 1,000 250,000 25.00 25.00
7.18% IRFC Ltd. Tax Free Bonds 19 February 2023 (quoted) 1,000 3,000,000 304.28 300.00
10.75% The Tata Power Co. Ltd. NCD 21 August 2072 (quoted) 1,000,000 1,037 109.08 0.51
8.00% Indian Overseas Bank Bonds 13 Mar 2016 (quoted) 1,000,000 46 4.51 4.90
8.20% NHAI Tax Free Bonds 25 Jan 2022 (quoted) 1,000 – – 76.92
8.20% PFC Ltd. Tax Free Bonds 01 Feb 2022 (quoted) 1,000 604,355 64.89 89.22
8.46% PFC Ltd. Tax Free Bonds 30 Aug 2028 (quoted) 1,000,000 227 25.32 1.70
9.18% HDFC Ltd. NCD 22 Oct 2014 (quoted) 1,000,000 – – 14.99
9.32% NABARD Bonds 23 Feb 2015 (quoted) 1,000,000 – – 10.00
1.44% Inflation Indexed Bonds 05 Jun 2023 (quoted) 100 5,000,000 41.79 41.79
10.05% HDB Financial Services Ltd. Bonds SR-I/1/5 20 Dec 2023 (quoted) 1,000,000 260 28.04 25.99
10.20% HDB Financial Services Ltd. Bonds 09 Aug 2022 (quoted) 1,000,000 21 2.27 2.12
8.41% NTPC Ltd. Tax Free Bonds SR-1A 16 Dec 2023 (quoted) 1,000 79,162 8.54 7.92
9.80% BOI Bonds SR-XI 30 Sep 2023 (quoted) 1,000,000 – – 9.80
Citicorp Finance India Ltd. SR-515 NCD 12 Apr 2016 (quoted) 100,000 – – 26.11
ECL Finance Ltd. NCD SR-C5C401 11 Mar 2015 (quoted) 10,000,000 – – 25.00
ECL Finance Ltd. NCD SR-C5C403 19 Mar 2015 (quoted) 10,000,000 – – 25.00
8.46% REC Ltd. Tax Free Bonds SR-3B 29 Aug 2028 (quoted) 1,000,000 370 41.56 –
ECL Finance Ltd. NCD SR-J5K403 04 Nov 2015 (quoted) 10,000,000 25 25.00 –
ECL Finance Ltd. NCD SR-L5L402 15 Dec 15 (quoted) 10,000,000 25 26.28 –
Edelweiss Finance & Investments Ltd. NCD SR-A6A501 06 Jan 16 10,000,000 25 29.69 –
Edelweiss Finance & Investments Ltd. NCD SR-A6A502 08 Jan 16 10,000,000 25 29.85 –
Edelweiss Finance & Investments Ltd. NCD SR-A6A503 11 Jan 16 10,000,000 25 27.20 –
Edelweiss Finance & Investments Ltd. NCD SR-K5L401 17 Dec 15 (quoted) 10,000,000 25 26.86 –
Carried forward 820.16 686.97
Notes forming part of the Accounts (contd.)NOTE [H(I)]
Current investments (contd.)

212
Particulars
Number of Units
Face value per unit
As at 31-3-2015
As at 31-3-2015
As at 31-3-2014
` ` crore ` crore
(ii) Other Debentures and Bonds (contd.)
Brought forward 820.16 686.97
8.70% PNB Housing Finance Ltd. Bonds SR-III 24 Nov 2024 (quoted) 1,000,000 150 15.16 –
7.40% Syndicate Bank TI-2 SR-8 NCD 20 Apr 2015 (quoted) 1,000,000 30 2.99 –
838.31 686.97
Less: Provision for diminution in value 0.84 0.06
Other Debentures & Bonds -Total 837.47 686.91
Debentures & Bonds -Total 860.42 723.87
(3) Mutual funds:
DWS Short Maturity Fund - Direct Plan - Annual Bonus 10 69,269,027 118.26 105.71
Baroda Pioneer Liquid Fund - Plan A - Growth 1,000 – 50.00
JM Money Manager Fund - Super Plus Plan - Bonus -Bonus Units 10 302,625,946 360.12 330.88
L&T FMP - Series VIII - Plan J (368 Days) - Growth (quoted) 10 – 15.85
DWS Treasury Fund - Investment Plan - Direct Plan - Bonus 10 18,464,465 21.43 19.66
HDFC Liquid Fund - Growth 10 18,139,997 50.00 50.00
IDFC Cash Fund - Reg - Growth 1,000 1,177,941 200.00 50.00
JP Morgan India Treasury Fund - Direct Plan - Bonus 10 – 36.82
L&T FMP - VII (January 507D A) - Growth (quoted) 10 – 22.08
L&T FMP - VII (March 13M A) - Growth (quoted) 10 – 10.99
L&T FMP - VII (March 381D A) - Growth (quoted) 10 – 10.90
L&T FMP - Series VIII - Plan A - Growth (quoted) 10 – 21.25
L&T Floating Rate Fund Direct Plan - Growth 10 18,845,876 25.54 35.99
L&T Liquid Fund - Growth 1,000 3,033,892 581.09 600.00
Religare Invesco Liquid Fund - Growth 1,000 – – 50.00
SBI Premier Liquid Fund - Growth 1,000 455,657 100.00 150.00
Birla Sun Life Infrastructure Fund - Regular Plan - Dividend 10 – – 28.37
DSP BlackRock India Tiger Fund - Regular Plan - Dividend 10 – – 22.35
DWS Ultra Short Term Fund - Direct Plan - Annual Bonus 10 33,497,695 37.49 33.34
Franklin India Prima Fund - Dividend 10 – – 23.31
HDFC Infrastructure Fund - Dividend 10 – – 64.29
HDFC Mid-Cap Opportunities Fund - Dividend 10 – – 16.47
ICICI Prudential Discovery Fund - Regular Plan - Dividend 10 – – 24.44
ICICI Prudential Infrastructure Fund - Regular Plan-Dividend 10 – – 27.84
IDFC Sterling Equity Fund - Regular Plan - Dividend 10 – – 57.76
L&T FMP - Series X - Plan A (368 days) - Growth (quoted) 10 – – 10.22
Principal Cash Management Fund - Regular Plan - Growth 1,000 147,330 20.00 50.00
Birla Sun Life Cash Plus - Regular Plan - Growth 100 4,461,557 100.00 50.00
DWS Insta Cash Plus Fund - Super Institutional Plan - Growth 100 – – 50.00
ICICI Prudential Liquid - Regular Plan - Growth 100 – – 50.00
L&T FMP SR X - Plan D (367 Days) - Direct Plan - Growth (quoted) 10 – – 5.08
L&T FMP SR X - Plan D (367 Days) - Growth (quoted) 10 – – 5.08
Pramerica Liquid Fund - Growth 1,000 134,216 20.00 20.00
Templeton India TMA - Super IP - Growth 1,000 – – 20.00
Carried forward 1633.93 2118.68
Notes forming part of the Accounts (contd.)NOTE [H(I)]
Current investments (contd.)
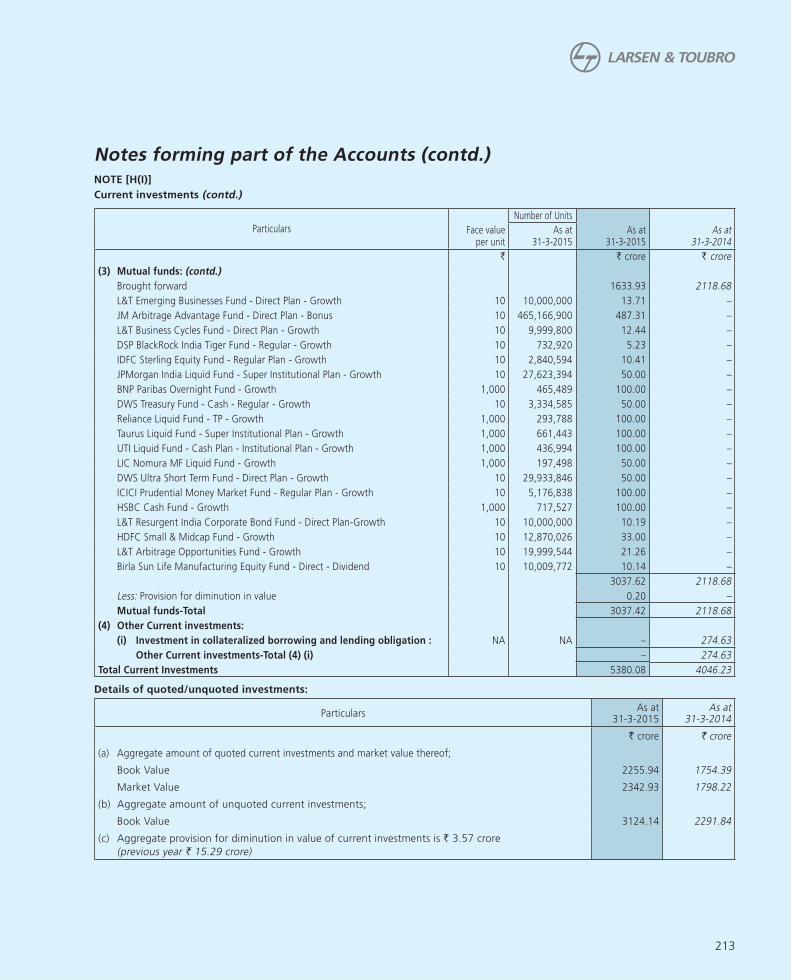
213
Particulars
Number of Units
Face value per unit
As at 31-3-2015
As at 31-3-2015
As at 31-3-2014
` ` crore ` crore
(3) Mutual funds: (contd.)
Brought forward 1633.93 2118.68
L&T Emerging Businesses Fund - Direct Plan - Growth 10 10,000,000 13.71 –
JM Arbitrage Advantage Fund - Direct Plan - Bonus 10 465,166,900 487.31 –
L&T Business Cycles Fund - Direct Plan - Growth 10 9,999,800 12.44 –
DSP BlackRock India Tiger Fund - Regular - Growth 10 732,920 5.23 –
IDFC Sterling Equity Fund - Regular Plan - Growth 10 2,840,594 10.41 –
JPMorgan India Liquid Fund - Super Institutional Plan - Growth 10 27,623,394 50.00 –
BNP Paribas Overnight Fund - Growth 1,000 465,489 100.00 –
DWS Treasury Fund - Cash - Regular - Growth 10 3,334,585 50.00 –
Reliance Liquid Fund - TP - Growth 1,000 293,788 100.00 –
Taurus Liquid Fund - Super Institutional Plan - Growth 1,000 661,443 100.00 –
UTI Liquid Fund - Cash Plan - Institutional Plan - Growth 1,000 436,994 100.00 –
LIC Nomura MF Liquid Fund - Growth 1,000 197,498 50.00 –
DWS Ultra Short Term Fund - Direct Plan - Growth 10 29,933,846 50.00 –
ICICI Prudential Money Market Fund - Regular Plan - Growth 10 5,176,838 100.00 –
HSBC Cash Fund - Growth 1,000 717,527 100.00 –
L&T Resurgent India Corporate Bond Fund - Direct Plan-Growth 10 10,000,000 10.19 –
HDFC Small & Midcap Fund - Growth 10 12,870,026 33.00 –
L&T Arbitrage Opportunities Fund - Growth 10 19,999,544 21.26 –
Birla Sun Life Manufacturing Equity Fund - Direct - Dividend 10 10,009,772 10.14 –
3037.62 2118.68
Less: Provision for diminution in value 0.20 –
Mutual funds-Total 3037.42 2118.68
(4) Other Current investments:
(i) Investment in collateralized borrowing and lending obligation : NA NA – 274.63
Other Current investments-Total (4) (i) – 274.63
Total Current Investments 5380.08 4046.23
Details of quoted/unquoted investments:
ParticularsAs at
31-3-2015As at
31-3-2014
` crore ` crore
(a) Aggregate amount of quoted current investments and market value thereof;
Book Value 2255.94 1754.39
Market Value 2342.93 1798.22
(b) Aggregate amount of unquoted current investments;
Book Value 3124.14 2291.84
(c) Aggregate provision for diminution in value of current investments is ` 3.57 crore
(previous year ` 15.29 crore)
Notes forming part of the Accounts (contd.)NOTE [H(I)]
Current investments (contd.)

214
NOTE [H(II)]
Inventories (at cost or net realisable value whichever is lower)
Particulars As at 31-3-2015 As at 31-3-2014
` crore ` crore
Raw Materials
[Includes goods-in-transit ` 21.59 crore (Previous year ` 17.17 crore)]
448.71 416.09
Components
[Includes goods-in-transit ` 17.73 crore (Previous year ` 15.38 crore)]
331.41 310.04
Construction material
[Includes goods-in-transit ` 72.87 crore (Previous year ` 85.22 crore)]
74.80 88.74
Manufacturing work-in-progress [Note Q(26)(e)] 582.78 547.59
Finished goods 261.20 203.17
Stock in trade (in respect of goods acquired for trading)
[Includes goods-in-transit ` 35.95 crore (Previous year ` 6.07 crore)]
161.13 117.21
Stores and spares
[Includes goods-in-transit ` 6.34 crore (Previous year ` 8.15 crore)]
140.07 135.09
Loose tools 6.66 5.33
Property development related work-in-progress [Note Q(7)(b)] 201.03 159.27
2207.79 1982.53
NOTE [H(III)]
Trade receivables
Particulars As at 31-3-2015 As at 31-3-2014
` crore ` crore ` crore ` crore
Secured:
Debts outstanding for more than 6 months:
Considered good 4.71 18.23
Unsecured:
Debts outstanding for more than 6 months:
Considered good 2235.07 1959.71
Considered doubtful 565.93 473.54
2801.00 2433.25
Other debts [Note H(III)(a)]
Considered good 20811.33 19560.82
Considered doubtful 0.46 0.19
23612.79 21994.26
Less: Allowance for doubtful debts 566.39 473.73
23046.40 21520.53
23051.11 21538.76
H(III)(a) Other debts includes ` 15105.86 crore (previous year: ` 14846.62 crore) contractually not due.
Notes forming part of the Accounts (contd.)

215
NOTE [H(IV)]
Cash and bank balances
Particulars As at 31-3-2015 As at 31-3-2014
` crore ` crore ` crore ` crore
Cash and cash equivalents
Balance with banks 921.66 1174.94
Cheques and drafts on hand 159.74 195.51
Cash on hand 90.52 2.31
Fixed deposits with banks (maturity less than 3 months) 175.04 250.20
1346.96 1622.96
Other bank balances
Fixed deposits with banks including interest accrued thereon 3.00 2.88
[including ` Nil of bank deposits with more than 12 months
maturity (previous year: ` Nil)]
Earmarked balances with banks-unclaimed dividend 33.59 28.01
Margin money deposits 9.69 10.34
Cash and bank balances not available for immediate use
[Note G(II)(a)] 122.56 118.67
168.84 159.90
1515.80 1782.86
NOTE [H(V)]
Short term loans and advances
Particulars As at 31-3-2015 As at 31-3-2014
` crore ` crore
Secured considered good:
Loans against mortgage of house property 0.89 1.06
Rent deposit (KMPs) – 0.01
Inter corporate deposits including interest accrued-others 70.00 100.00
Unsecured considered good:
Loans and advances to related parties:
Subsidiary Companies:
Intercorporate deposit including interest accrued
[Note Q(2)(a)] 1926.58 995.69
Others 1036.06 934.76
Associate Companies:
Advances recoverable 3.65 2.37
Joint Ventures:
Others 81.34 25.46
Carried forward 3118.52 2059.35
Notes forming part of the Accounts (contd.)
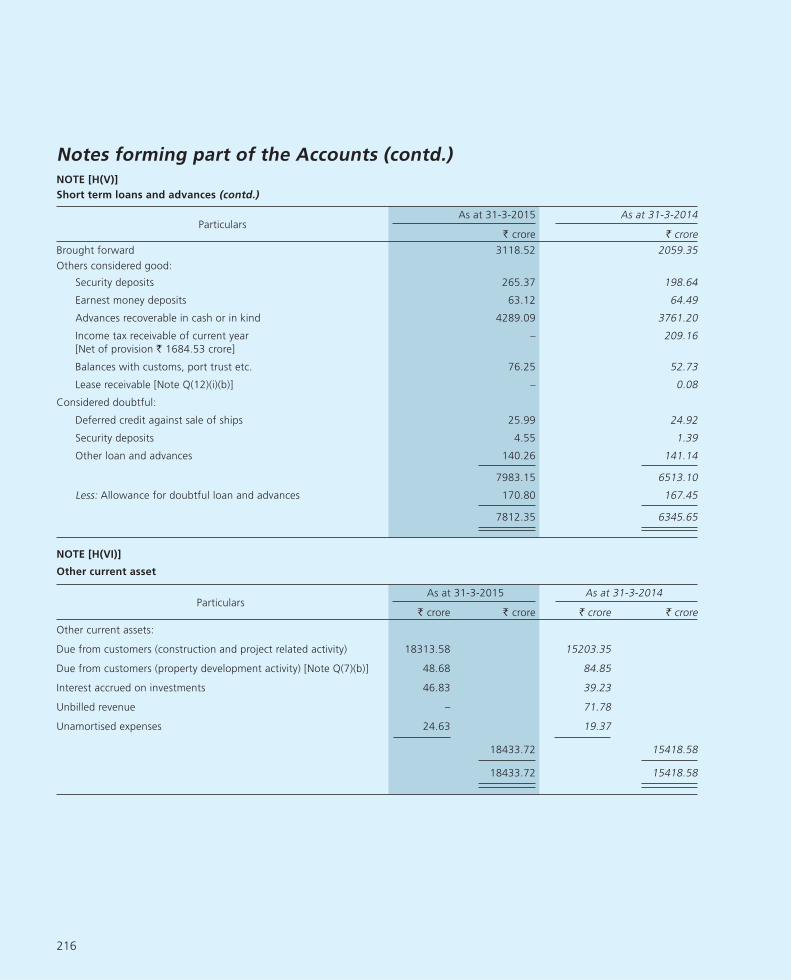
216
Particulars As at 31-3-2015 As at 31-3-2014
` crore ` crore
Brought forward 3118.52 2059.35
Others considered good:
Security deposits 265.37 198.64
Earnest money deposits 63.12 64.49
Advances recoverable in cash or in kind 4289.09 3761.20
Income tax receivable of current year
[Net of provision ` 1684.53 crore]
– 209.16
Balances with customs, port trust etc. 76.25 52.73
Lease receivable [Note Q(12)(i)(b)] – 0.08
Considered doubtful:
Deferred credit against sale of ships 25.99 24.92
Security deposits 4.55 1.39
Other loan and advances 140.26 141.14
7983.15 6513.10
Less: Allowance for doubtful loan and advances 170.80 167.45
7812.35 6345.65
NOTE [H(VI)]
Other current asset
Particulars As at 31-3-2015 As at 31-3-2014
` crore ` crore ` crore ` crore
Other current assets:
Due from customers (construction and project related activity) 18313.58 15203.35
Due from customers (property development activity) [Note Q(7)(b)] 48.68 84.85
Interest accrued on investments 46.83 39.23
Unbilled revenue – 71.78
Unamortised expenses 24.63 19.37
18433.72 15418.58
18433.72 15418.58
Notes forming part of the Accounts (contd.)NOTE [H(V)]
Short term loans and advances (contd.)

217
NOTE [I]
Contingent liabilities
Particulars As at 31-3-2015 As at 31-3-2014
` crore ` crore
(a) Claims against the Company not acknowledged as debts 883.06 184.75
(b) Sales-tax liability that may arise in respect of matters in appeal 173.96 122.11
(c) Excise duty/Service Tax liability that may arise in respect of matters in appeal/challenged by the Company in WRIT 55.41 41.80
(d) Income-tax liability (including penalty) that may arise in respect of which the Company is in appeal 826.44 463.58
(e) Corporate guarantees for debt given on behalf of Subsidiary companies 8723.55 3772.85
(f) Corporate and bank guarantees for performance given on behalf of Subsidiary companies 9201.96 5627.07
Notes:1. The Company does not expect any reimbursements in respect of the above contingent liabilities.2. It is not practicable to estimate the timing of cash outflows, if any, in respect of matters at (a) to (d) above pending resolution of the
arbitration/appellate proceedings.3. In respect of matters at (e), the cash outflows, if any, could generally occur up to twelve years, being the period over which the validity
of the guarantees extends except in a few cases where the cash outflows, if any, could occur any time during the subsistence of the borrowing to which the guarantees relate.
4. In respect of matters at (f), the cash outflows, if any, could generally occur up to four years, being the period over which the validity of the guarantees extends.
5. Contingent liability with respect to interest in joint ventures - Note Q(16)
NOTE [J]
Commitments
Particulars
As at 31-3-2015
As at 31-3-2014
` crore ` crore
(a) Estimated amount of contracts remaining to be excuted on capital account (net of advances) 294.40 404.38(b) Estimated amount of committed funding by way of equity/loans to Subsidiary companies 2738.00 4289.00
NOTE [K]
Revenue from operations
Particulars2014-15 2013-14
Note ` crore ` crore ` crore ` crore
Sales & service: Construction and project related activity Q(7)(a), Q(26)(a)(iii) 49480.38 47861.55 Manufacturing and trading activity Q26(a)(i) 5743.51 6176.82 Property development activity Q(7)(b),Q(26)(a)(ii) 946.94 447.84 Engineering and service fees Q(26)(a)(vi) 3.59 1539.86 Servicing Q(26)(a)(iv) 507.93 422.47 Commission Q(26)(a)(v) 108.78 118.64
56791.13 56567.18Other operational revenue: Income from hire of plant and equipment 33.39 61.95 Company’s share in profit of Integrated joint
ventures Q16(b) 59.78 20.86 Lease rentals 76.91 61.98 Income from services to the Group companies 240.37 89.35 Premium earned (net) on related forward
exchange contract 103.24 120.04 Miscellaneous income 253.25 242.49
766.94 596.67
57558.07 57163.85
Notes forming part of the Accounts (contd.)

218
NOTE [K(I)]
Revenue from sales & service include:
(a) ` 1443.57 crore (previous year: ̀ 1558.70 crore) for price variations net of liquidated damages in terms of contracts with the customers.
(b) Shipbuilding subsidy ` Nil (previous year: ` Nil) and reversal of shipbuilding subsidy of ` Nil (previous year: ` 31.54 crore)
NOTE [L]
Other Income
Particulars2014-15 2013-14
` crore ` crore ` crore ` crore
Interest Income
From current investments
Subsidiary companies 3.00 4.06
Others 212.44 263.01
From others
Subsidiary and associate companies 292.74 196.36
Others 57.73 31.49
565.91 494.92
Dividend income
From long term investments:
Subsidiary companies 850.70 863.06
Associate companies 0.58 2.35
Other trade investments 2.07 1.84
853.35 867.25
From current investments 0.84 –
854.19 867.25
Net gain/(loss) on sale of investment
Current investments (net) 406.63 197.55
406.63 197.55
Net gain/(loss) on sale of fixed assets (net) 29.19 25.06
Lease rental 51.57 45.94
Miscellaneous income (net of expenses) [Note L(I)] 375.88 250.17
2283.37 1880.89
NOTE [L(I)]
Miscellaneous income includes recoveries from subsidiary, joint venture and associate companies towards directly attributable expenses
incurred on employees deputed to these companies. Such expenses, the details of which given hereunder, have been netted off from
miscellaneous income.
Expenses 2014-15 2013-14
` crore ` crore
Salaries 43.78 58.37
Contribution to Provident Fund 1.53 2.31
Compensation for Employee Stock Option Plan (ESOP) 2.54 3.26
Welfare expenses 1.07 2.13
Other expenses 0.85 2.46
Total 49.77 68.53
Notes forming part of the Accounts (contd.)

219
NOTE [M]
Manufacturing, construction and operating expenses
Particulars2014-15 2013-14
` crore ` crore ` crore ` crore
Materials consumed:
Raw materials and components [Note Q(26)(b)] 5329.27 6110.42
Less: Scrap sales 104.61 107.62
5224.66 6002.80
Construction materials 18761.89 16106.79
Purchase of stock-in-trade [Note Q(26)(c)] 1296.75 2025.59
Value of stock-in-trade transferred on sale of business – (103.43)
1296.75 1922.16
Stores,spares and tools consumed 1831.46 1920.83
Sub-contracting charges 13232.57 13278.41
Changes in inventories of finished goods, work-in-progress and
stock-in-trade and property development:
Closing stock:
Finished goods 261.20 203.17
Stock-in-trade 161.13 117.21
Work-in-progress 3244.67 3068.09
3667.00 3388.47
Less: Opening stock:
Finished goods 203.17 209.11
Stock-in-trade 117.21 169.19
Work-in-progress 3068.09 3120.20
3388.47 3498.50
(278.53) 110.03
Other manufacturing, construction and operating expenses:
Excise duty 10.35 0.17
Power and fuel [Note O(I)] 631.14 593.15
Royalty and technical know-how fees 6.39 3.25
Packing and forwarding [Note O(I)] 338.41 290.07
Hire charges - plant & equipment and others 575.38 556.55
Engineering, technical and consultancy fees 499.98 485.53
Insurance [Note O(I)] 149.53 131.16
Rent [Note O(I)] 332.42 278.82
Rates and taxes [Note O(I)] 218.00 223.72
Travelling and conveyance [Note O(I)] 652.14 658.69
Repairs to plant and equipment 52.42 44.16
Repairs to buildings [Note O(I)] 7.19 8.31
General repairs and maintenance [Note O(I)] 221.89 189.79
Bank guarantee charges 106.93 99.69
Miscellaneous expenses [Note O(I)] 525.58 447.43
4327.75 4010.49
44396.55 43351.51
Notes forming part of the Accounts (contd.)

220
Notes forming part of the Accounts (contd.)NOTE [N]
Employee benefits expense
Particulars2014-15 2013-14
` crore ` crore ` crore ` crore
Salaries, wages and bonus 3375.48 3806.74
Contribution to and provision for:
Provident funds and pension fund 115.58 123.94
Superannuation/employee pension schemes 11.73 29.06
Gratuity funds [Note Q(9)(b)] 46.85 36.32
174.16 189.32
Expenses on Employee Stock Option Schemes [Note A(VIII)(e)(ii)] 49.11 55.88
Insurance expenses-Medical and others [Note O(I)] 41.43 68.23
Staff welfare expenses 510.66 536.73
4150.84 4656.90
[Note L(I) for employee benefit expenses netted off]
NOTE [O]
Sales, administration and other expenses
Particulars2014-15 2013-14
` crore ` crore ` crore ` crore
Power and fuel [Note O(I)] 54.46 63.58
Packing and forwarding [Note O(I)] 99.59 147.02
Professional fees 184.37 163.33
Audit fees [Note Q(19)] 3.80 3.63
Insurance [Note O(I)] 40.54 20.57
Rent [Note O(I)] 123.55 126.17
Rates and taxes [Note O(I)] 34.52 67.37
Travelling and conveyance [Note O(I)] 229.13 262.69
Repairs to buildings [Note O(I)] 17.68 23.47
General repairs and maintenance [Note O(I)] 205.25 218.03
Directors’ fees 0.52 0.26
Telephone, postage and telegrams 90.63 104.55
Advertising and publicity 52.60 63.50
Stationery and printing 40.33 41.86
Commission:
Distributors and agents 18.17 20.86
Others 3.09 3.04
21.26 23.90
Bank charges 52.89 32.55
Contribution to political parties [Note Q(27)] 11.00 –
Miscellaneous expenses [Note O(I)] 378.55 350.12
Carried Forward 1640.67 1712.60
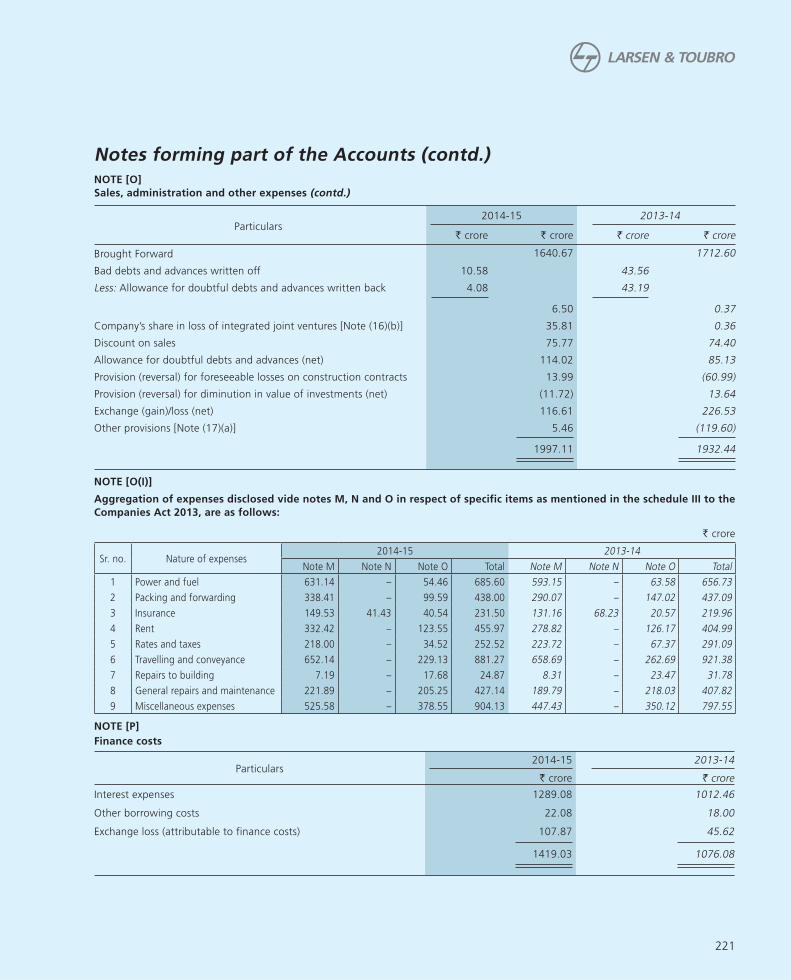
221
Notes forming part of the Accounts (contd.)
Particulars2014-15 2013-14
` crore ` crore ` crore ` crore
Brought Forward 1640.67 1712.60
Bad debts and advances written off 10.58 43.56
Less: Allowance for doubtful debts and advances written back 4.08 43.19
6.50 0.37
Company’s share in loss of integrated joint ventures [Note (16)(b)] 35.81 0.36
Discount on sales 75.77 74.40
Allowance for doubtful debts and advances (net) 114.02 85.13
Provision (reversal) for foreseeable losses on construction contracts 13.99 (60.99)
Provision (reversal) for diminution in value of investments (net) (11.72) 13.64
Exchange (gain)/loss (net) 116.61 226.53
Other provisions [Note (17)(a)] 5.46 (119.60)
1997.11 1932.44
NOTE [O(I)]
Aggregation of expenses disclosed vide notes M, N and O in respect of specific items as mentioned in the schedule III to the
Companies Act 2013, are as follows:
` crore
Sr. no. Nature of expenses2014-15 2013-14
Note M Note N Note O Total Note M Note N Note O Total
1 Power and fuel 631.14 – 54.46 685.60 593.15 – 63.58 656.73
2 Packing and forwarding 338.41 – 99.59 438.00 290.07 – 147.02 437.09
3 Insurance 149.53 41.43 40.54 231.50 131.16 68.23 20.57 219.96
4 Rent 332.42 – 123.55 455.97 278.82 – 126.17 404.99
5 Rates and taxes 218.00 – 34.52 252.52 223.72 – 67.37 291.09
6 Travelling and conveyance 652.14 – 229.13 881.27 658.69 – 262.69 921.38
7 Repairs to building 7.19 – 17.68 24.87 8.31 – 23.47 31.78
8 General repairs and maintenance 221.89 – 205.25 427.14 189.79 – 218.03 407.82
9 Miscellaneous expenses 525.58 – 378.55 904.13 447.43 – 350.12 797.55
NOTE [P]
Finance costs
Particulars2014-15 2013-14
` crore ` crore
Interest expenses 1289.08 1012.46
Other borrowing costs 22.08 18.00
Exchange loss (attributable to finance costs) 107.87 45.62
1419.03 1076.08
NOTE [O]
Sales, administration and other expenses (contd.)

222
NOTE [Q]
Q(1) The balance sheet as on March 31, 2015 and the Statement of Profit and Loss for the year ended March 31,2015 are drawn and
presented as per the format prescribed under Schedule III to the Companies Act, 2013.
Q(2) Particulars in respect of loans and advances in the nature of loans as required by the listing agreement:
` crore
Name of the Company Balance as at Maximum outstanding during
31-3-2015 31-3-2014 2014-15 2013-14
(a) Loans and advances in the nature of loans given to subsidiaries:
1 Larsen & Toubro Infotech Limited – – – 40.14
2 L&T Seawoods Limited (formerly known as L&T
Seawoods Private Limited)
– – 677.03 –
3 L&T Infrastructure Development Projects Limited – 314.54 531.69 324.55
4 L&T Realty Limited 710.03 841.20 962.11 998.52
5 L&T Chennai Projects Private Limited – – – 179.31
6 L&T Finance Holdings Limited – 200.61 201.69 200.61
7 L&T Shipbuilding Limited 386.76 – 386.76 –
8 L&T Special Steels & Heavy Forgings Private Limited 554.71 245.30 554.71 245.30
9 L&T Sapura Offshore Private Limited – – – 4.21
10 PNG Tollway Limited 57.51 52.64 57.51 52.64
11 L&T Infocity Limited – – – 36.77
12 Ewac Alloys Limited – 5.51 5.52 10.50
13 L&T Hydrocarbon Engineering Limited 150.03 603.10 1269.70 603.10
14 L&T Technology Services Limited – 15.02 108.41 15.02
15 L&T Valves Limited 15.00 60.04 61.20 60.05
16 Nabha Power Limited 110.05 – 1550.84 –
17 L&T Power Development Limited – – 42.40 –
Total 1984.09* 2337.96*
( b) Loans and advances in the nature of loans where repayment
schedule is not specified/is beyond 7 years:
1 PNG Tollway Limited 57.51 52.64 57.51 52.64
Total 57.51 52.64
(c) Loans and advances in the nature of loans where interest is
not charged or charged below prevailing yield of one year,
three year, five year or ten year government security closest
to the tenor of the Loan:
1 L&T Realty Limited – – – 200.00
Total – –
* Long term loans and advances [Note G(I)] - ` 57.51 crore (previous year: ` 1342.27 crore) and
Short term loans and advances [Note H(V)] - ` 1926.58 crore (previous year: ` 995.69 crore)
Note: Loans to employees (including directors) under various schemes of the Company (such as housing loan, furniture loan, education
loan etc.) have been considered to be outside the purview of disclosure requirements.
Notes forming part of the Accounts (contd.)
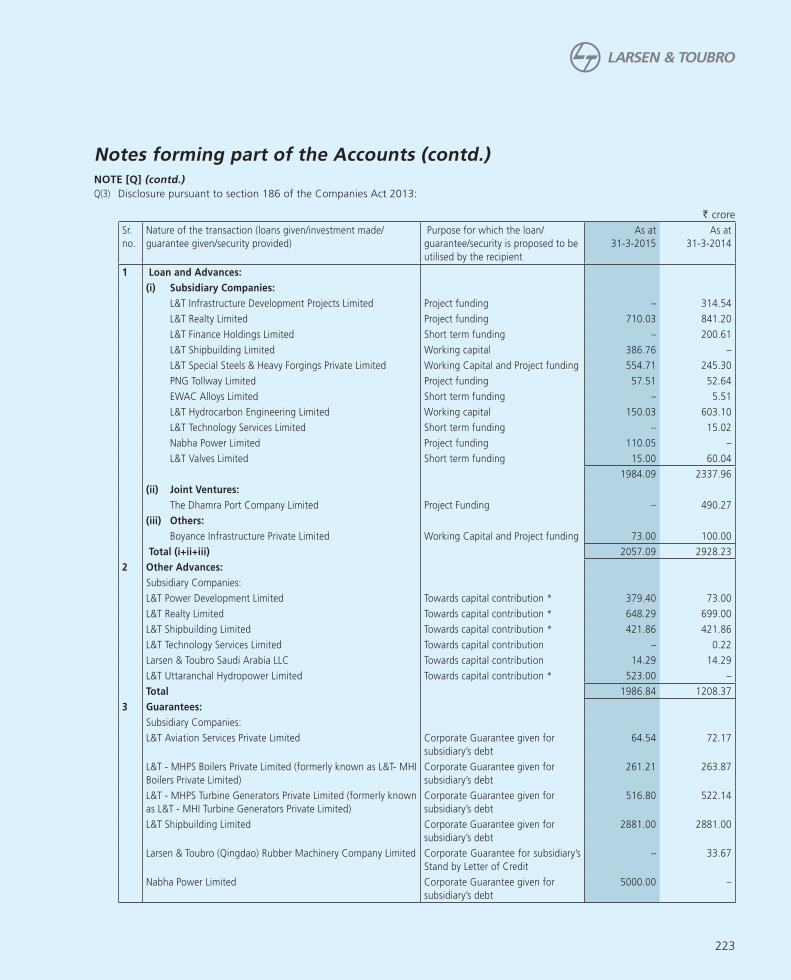
223
Q(3) Disclosure pursuant to section 186 of the Companies Act 2013:
` crore
Sr.
no.
Nature of the transaction (loans given/investment made/
guarantee given/security provided)
Purpose for which the loan/
guarantee/security is proposed to be
utilised by the recipient
As at
31-3-2015
As at
31-3-2014
1 Loan and Advances:
(i) Subsidiary Companies:
L&T Infrastructure Development Projects Limited Project funding – 314.54
L&T Realty Limited Project funding 710.03 841.20
L&T Finance Holdings Limited Short term funding – 200.61
L&T Shipbuilding Limited Working capital 386.76 –
L&T Special Steels & Heavy Forgings Private Limited Working Capital and Project funding 554.71 245.30
PNG Tollway Limited Project funding 57.51 52.64
EWAC Alloys Limited Short term funding – 5.51
L&T Hydrocarbon Engineering Limited Working capital 150.03 603.10
L&T Technology Services Limited Short term funding – 15.02
Nabha Power Limited Project funding 110.05 –
L&T Valves Limited Short term funding 15.00 60.04
1984.09 2337.96
(ii) Joint Ventures:
The Dhamra Port Company Limited Project Funding – 490.27
(iii) Others:
Boyance Infrastructure Private Limited Working Capital and Project funding 73.00 100.00
Total (i+ii+iii) 2057.09 2928.23
2 Other Advances:
Subsidiary Companies:
L&T Power Development Limited Towards capital contribution * 379.40 73.00
L&T Realty Limited Towards capital contribution * 648.29 699.00
L&T Shipbuilding Limited Towards capital contribution * 421.86 421.86
L&T Technology Services Limited Towards capital contribution – 0.22
Larsen & Toubro Saudi Arabia LLC Towards capital contribution 14.29 14.29
L&T Uttaranchal Hydropower Limited Towards capital contribution * 523.00 –
Total 1986.84 1208.37
3 Guarantees:
Subsidiary Companies:
L&T Aviation Services Private Limited Corporate Guarantee given for
subsidiary’s debt
64.54 72.17
L&T - MHPS Boilers Private Limited (formerly known as L&T- MHI
Boilers Private Limited)
Corporate Guarantee given for
subsidiary’s debt
261.21 263.87
L&T - MHPS Turbine Generators Private Limited (formerly known
as L&T - MHI Turbine Generators Private Limited)
Corporate Guarantee given for
subsidiary’s debt
516.80 522.14
L&T Shipbuilding Limited Corporate Guarantee given for
subsidiary’s debt
2881.00 2881.00
Larsen & Toubro (Qingdao) Rubber Machinery Company Limited Corporate Guarantee for subsidiary’s
Stand by Letter of Credit
– 33.67
Nabha Power Limited Corporate Guarantee given for
subsidiary’s debt
5000.00 –
Notes forming part of the Accounts (contd.)NOTE [Q] (contd.)
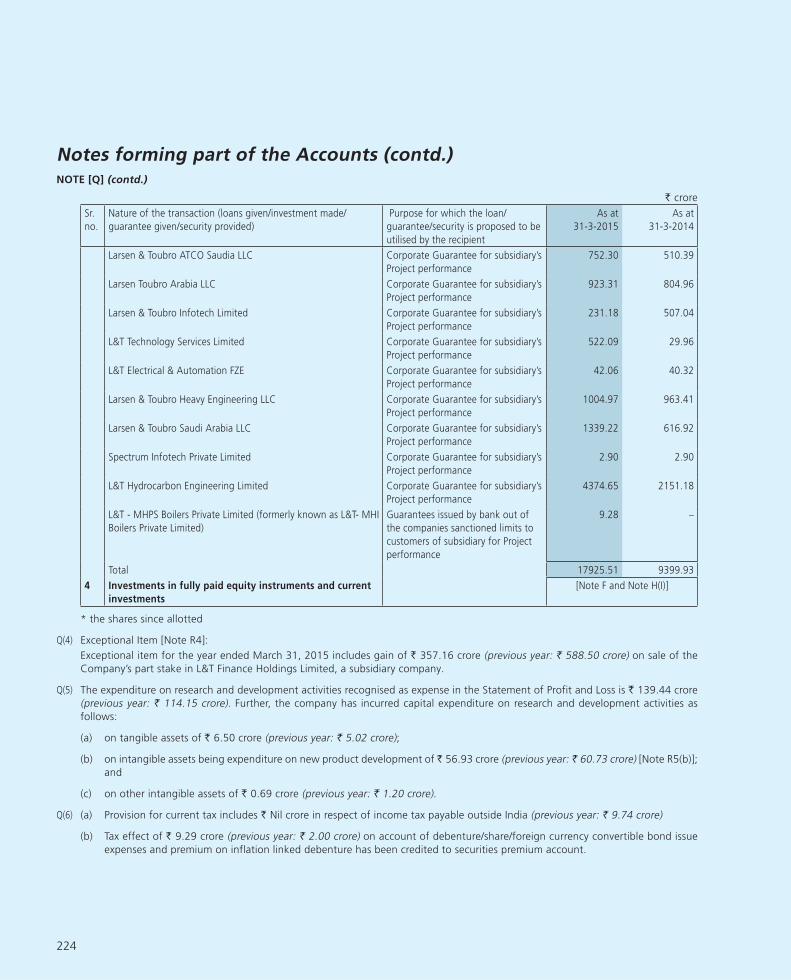
224
` crore
Sr.
no.
Nature of the transaction (loans given/investment made/
guarantee given/security provided)
Purpose for which the loan/
guarantee/security is proposed to be
utilised by the recipient
As at
31-3-2015
As at
31-3-2014
Larsen & Toubro ATCO Saudia LLC Corporate Guarantee for subsidiary’s
Project performance
752.30 510.39
Larsen Toubro Arabia LLC Corporate Guarantee for subsidiary’s
Project performance
923.31 804.96
Larsen & Toubro Infotech Limited Corporate Guarantee for subsidiary’s
Project performance
231.18 507.04
L&T Technology Services Limited Corporate Guarantee for subsidiary’s
Project performance
522.09 29.96
L&T Electrical & Automation FZE Corporate Guarantee for subsidiary’s
Project performance
42.06 40.32
Larsen & Toubro Heavy Engineering LLC Corporate Guarantee for subsidiary’s
Project performance
1004.97 963.41
Larsen & Toubro Saudi Arabia LLC Corporate Guarantee for subsidiary’s
Project performance
1339.22 616.92
Spectrum Infotech Private Limited Corporate Guarantee for subsidiary’s
Project performance
2.90 2.90
L&T Hydrocarbon Engineering Limited Corporate Guarantee for subsidiary’s
Project performance
4374.65 2151.18
L&T - MHPS Boilers Private Limited (formerly known as L&T- MHI
Boilers Private Limited)
Guarantees issued by bank out of
the companies sanctioned limits to
customers of subsidiary for Project
performance
9.28 –
Total 17925.51 9399.93
4 Investments in fully paid equity instruments and current
investments
[Note F and Note H(I)]
* the shares since allotted
Q(4) Exceptional Item [Note R4]:
Exceptional item for the year ended March 31, 2015 includes gain of ` 357.16 crore (previous year: ` 588.50 crore) on sale of the
Company’s part stake in L&T Finance Holdings Limited, a subsidiary company.
Q(5) The expenditure on research and development activities recognised as expense in the Statement of Profit and Loss is ` 139.44 crore
(previous year: ` 114.15 crore). Further, the company has incurred capital expenditure on research and development activities as
follows:
(a) on tangible assets of ` 6.50 crore (previous year: ` 5.02 crore);
(b) on intangible assets being expenditure on new product development of ` 56.93 crore (previous year: ` 60.73 crore) [Note R5(b)];
and
(c) on other intangible assets of ` 0.69 crore (previous year: ` 1.20 crore).
Q(6) (a) Provision for current tax includes ` Nil crore in respect of income tax payable outside India (previous year: ` 9.74 crore)
(b) Tax effect of ` 9.29 crore (previous year: ` 2.00 crore) on account of debenture/share/foreign currency convertible bond issue
expenses and premium on inflation linked debenture has been credited to securities premium account.
Notes forming part of the Accounts (contd.)NOTE [Q] (contd.)

225
Q(7) (a) Disclosures pursuant to Accounting Standard (AS) 7 (Revised) “Construction Contracts”: ` crore
Particulars 2014-15 2013-14
i) Contract revenue recognised for the financial year [Note (K)] 49480.38 47861.55
ii) Aggregate amount of contract costs incurred and recognised profits (less recognised
losses) as at end of the financial year for all contracts in progress as at that date 180575.53 * 156833.52 *
iii) Amount of customer advances outstanding for contracts in progress as at end of the
financial year 8338.91 7695.87
iv) Retention amounts by customers for contracts in progress as at end of the financial year 5761.50 6736.98
* includes provision for foreseeable loss: ` 117.64 crore (previous year: ` 103.65 crore)
b) Disclosures pursuant to Guidance Note on Accounting for Real Estate Transactions (Revised 2012) issued by the Institute of
Chartered Accountants of India
` crore
Particulars 2014-15 2013-14
i) Amount of project revenue recognised for the financial year [Note (K)] 946.94 447.84
ii) Aggregate amount of costs incurred and profits recognised as at the end of the financial
year 1464.96 518.02
iii) Amount of advances received 31.40 39.65
iv) Amount of work-in-progress and the value of inventories [Note H(II)] 201.03 159.27
v) Excess of revenue recognised over actual bills raised (unbilled revenue) [Note H(VI)] 48.68 84.85
Q(8) Disclosures pursuant to Accounting Standard (AS) 13 “Accounting for Investments”
1. The Company has given, inter alia, the following undertakings in respect of its investments:
a. Jointly with L&T Infrastructure Development Projects Limited (a subsidiary of the Company), to the term lenders of its
subsidiary companies L&T Transportation Infrastructure Limited (LTTIL):
i. not to reduce their joint shareholding in LTTIL below 51% until the financial assistance received from the term lenders
is repaid in full by LTTIL and
ii. to jointly meet the shortfall in the working capital requirements of LTTIL until the financial assistance received from
the term lenders is repaid in full by LTTIL.
b. To the lenders of L&T Krishnagiri Thopur Toll Road Limited (KTTL), not to dilute Company’s shareholding in L&T Infrastructure
Development Projects Limited below 51% until the borrowings received from the lenders is repaid in full by KTTL.
c. To Gujarat State Road Development Corporation Limited:
i. to hold in L&T Ahmedabad-Maliya Tollway Limited, L&T Halol-Shamlaji Tollway Limited and L&T Rajkot-Vadinar Tollway
Limited alongwith L&T Infrastructure Development Projects Limited:
100% stake during the construction period;
51% stake for 5 years from the date of commercial operation or end of construction of the project, whichever is
later; and
51% stake during operational period.
ii. not to divest the stake in L&T Infrastructure Development Projects Limited until the aforesaid undertakings are valid.
d. To National Highway Authority of India, to hold along with its associates minimum 51% stake in L&T Samakhiali Gandhidham
Tollway Limited for a period of 2 years after the construction period.
e. To National Highway Authority of India, to hold minimum 26% stake in PNG Tollway Limited till the commercial operations
date.
f. To National Highway Authority of India, to hold together with its associates in L&T Devihalli Hassan Tollway Limited, minimum
51% equity stake for a period of 2 years after construction period.
Notes forming part of the Accounts (contd.)NOTE [Q] (contd.)
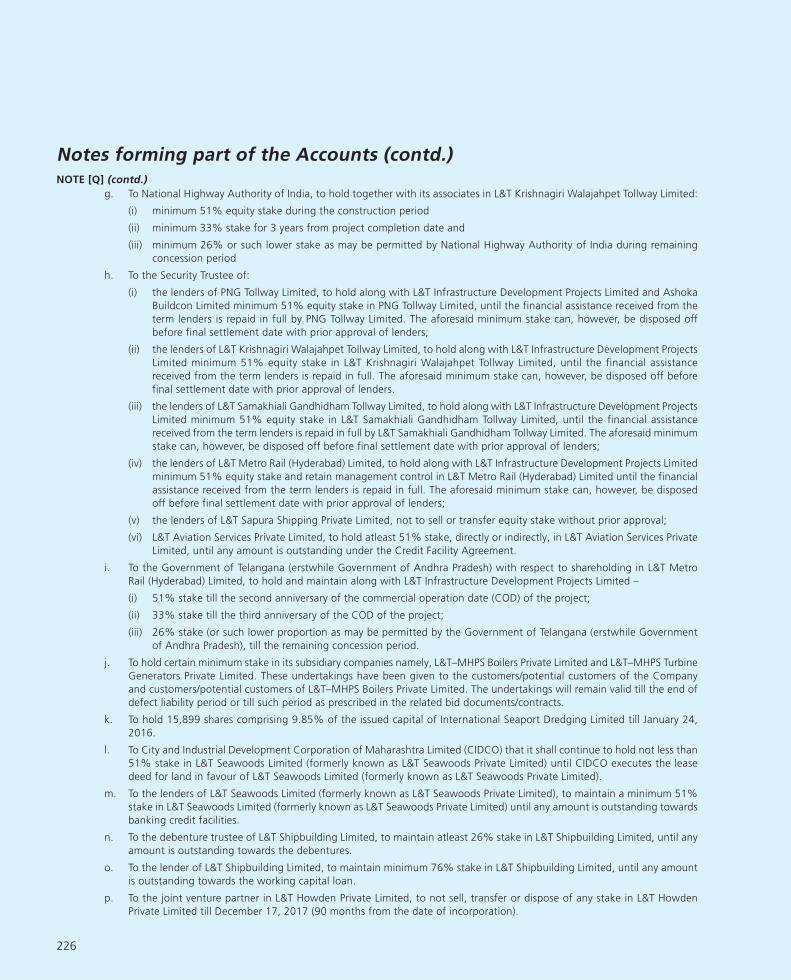
226
g. To National Highway Authority of India, to hold together with its associates in L&T Krishnagiri Walajahpet Tollway Limited:
(i) minimum 51% equity stake during the construction period
(ii) minimum 33% stake for 3 years from project completion date and
(iii) minimum 26% or such lower stake as may be permitted by National Highway Authority of India during remaining
concession period
h. To the Security Trustee of:
(i) the lenders of PNG Tollway Limited, to hold along with L&T Infrastructure Development Projects Limited and Ashoka
Buildcon Limited minimum 51% equity stake in PNG Tollway Limited, until the financial assistance received from the
term lenders is repaid in full by PNG Tollway Limited. The aforesaid minimum stake can, however, be disposed off
before final settlement date with prior approval of lenders;
(ii) the lenders of L&T Krishnagiri Walajahpet Tollway Limited, to hold along with L&T Infrastructure Development Projects
Limited minimum 51% equity stake in L&T Krishnagiri Walajahpet Tollway Limited, until the financial assistance
received from the term lenders is repaid in full. The aforesaid minimum stake can, however, be disposed off before
final settlement date with prior approval of lenders.
(iii) the lenders of L&T Samakhiali Gandhidham Tollway Limited, to hold along with L&T Infrastructure Development Projects
Limited minimum 51% equity stake in L&T Samakhiali Gandhidham Tollway Limited, until the financial assistance
received from the term lenders is repaid in full by L&T Samakhiali Gandhidham Tollway Limited. The aforesaid minimum
stake can, however, be disposed off before final settlement date with prior approval of lenders;
(iv) the lenders of L&T Metro Rail (Hyderabad) Limited, to hold along with L&T Infrastructure Development Projects Limited
minimum 51% equity stake and retain management control in L&T Metro Rail (Hyderabad) Limited until the financial
assistance received from the term lenders is repaid in full. The aforesaid minimum stake can, however, be disposed
off before final settlement date with prior approval of lenders;
(v) the lenders of L&T Sapura Shipping Private Limited, not to sell or transfer equity stake without prior approval;
(vi) L&T Aviation Services Private Limited, to hold atleast 51% stake, directly or indirectly, in L&T Aviation Services Private
Limited, until any amount is outstanding under the Credit Facility Agreement.
i. To the Government of Telangana (erstwhile Government of Andhra Pradesh) with respect to shareholding in L&T Metro
Rail (Hyderabad) Limited, to hold and maintain along with L&T Infrastructure Development Projects Limited –
(i) 51% stake till the second anniversary of the commercial operation date (COD) of the project;
(ii) 33% stake till the third anniversary of the COD of the project;
(iii) 26% stake (or such lower proportion as may be permitted by the Government of Telangana (erstwhile Government
of Andhra Pradesh), till the remaining concession period.
j. To hold certain minimum stake in its subsidiary companies namely, L&T–MHPS Boilers Private Limited and L&T–MHPS Turbine
Generators Private Limited. These undertakings have been given to the customers/potential customers of the Company
and customers/potential customers of L&T–MHPS Boilers Private Limited. The undertakings will remain valid till the end of
defect liability period or till such period as prescribed in the related bid documents/contracts.
k. To hold 15,899 shares comprising 9.85% of the issued capital of International Seaport Dredging Limited till January 24,
2016.
l. To City and Industrial Development Corporation of Maharashtra Limited (CIDCO) that it shall continue to hold not less than
51% stake in L&T Seawoods Limited (formerly known as L&T Seawoods Private Limited) until CIDCO executes the lease
deed for land in favour of L&T Seawoods Limited (formerly known as L&T Seawoods Private Limited).
m. To the lenders of L&T Seawoods Limited (formerly known as L&T Seawoods Private Limited), to maintain a minimum 51%
stake in L&T Seawoods Limited (formerly known as L&T Seawoods Private Limited) until any amount is outstanding towards
banking credit facilities.
n. To the debenture trustee of L&T Shipbuilding Limited, to maintain atleast 26% stake in L&T Shipbuilding Limited, until any
amount is outstanding towards the debentures.
o. To the lender of L&T Shipbuilding Limited, to maintain minimum 76% stake in L&T Shipbuilding Limited, until any amount
is outstanding towards the working capital loan.
p. To the joint venture partner in L&T Howden Private Limited, to not sell, transfer or dispose of any stake in L&T Howden
Private Limited till December 17, 2017 (90 months from the date of incorporation).
Notes forming part of the Accounts (contd.)NOTE [Q] (contd.)
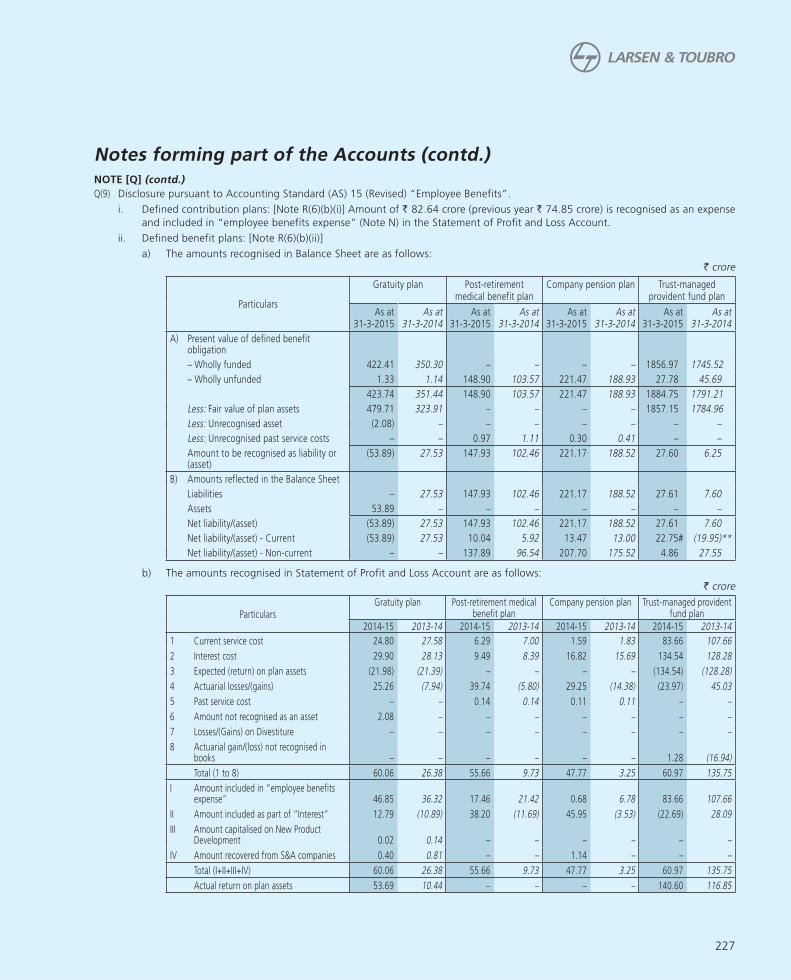
227
Q(9) Disclosure pursuant to Accounting Standard (AS) 15 (Revised) “Employee Benefits”.
i. Defined contribution plans: [Note R(6)(b)(i)] Amount of ` 82.64 crore (previous year ` 74.85 crore) is recognised as an expense
and included in “employee benefits expense” (Note N) in the Statement of Profit and Loss Account.
ii. Defined benefit plans: [Note R(6)(b)(ii)]
a) The amounts recognised in Balance Sheet are as follows:
` crore
Particulars
Gratuity plan Post-retirement medical benefit plan
Company pension plan Trust-managed provident fund plan
As at 31-3-2015
As at 31-3-2014
As at 31-3-2015
As at 31-3-2014
As at 31-3-2015
As at 31-3-2014
As at 31-3-2015
As at 31-3-2014
A) Present value of defined benefit obligation
– Wholly funded 422.41 350.30 – – – – 1856.97 1745.52
– Wholly unfunded 1.33 1.14 148.90 103.57 221.47 188.93 27.78 45.69
423.74 351.44 148.90 103.57 221.47 188.93 1884.75 1791.21
Less: Fair value of plan assets 479.71 323.91 – – – – 1857.15 1784.96
Less: Unrecognised asset (2.08) – – – – – – –
Less: Unrecognised past service costs – – 0.97 1.11 0.30 0.41 – –
Amount to be recognised as liability or (asset)
(53.89) 27.53 147.93 102.46 221.17 188.52 27.60 6.25
B) Amounts reflected in the Balance Sheet
Liabilities – 27.53 147.93 102.46 221.17 188.52 27.61 7.60
Assets 53.89 – – – – – – –
Net liability/(asset) (53.89) 27.53 147.93 102.46 221.17 188.52 27.61 7.60
Net liability/(asset) - Current (53.89) 27.53 10.04 5.92 13.47 13.00 22.75 # (19.95) **
Net liability/(asset) - Non-current – – 137.89 96.54 207.70 175.52 4.86 27.55
b) The amounts recognised in Statement of Profit and Loss Account are as follows:
` crore
ParticularsGratuity plan Post-retirement medical
benefit planCompany pension plan Trust-managed provident
fund plan
2014-15 2013-14 2014-15 2013-14 2014-15 2013-14 2014-15 2013-14
1 Current service cost 24.80 27.58 6.29 7.00 1.59 1.83 83.66 107.66
2 Interest cost 29.90 28.13 9.49 8.39 16.82 15.69 134.54 128.28
3 Expected (return) on plan assets (21.98) (21.39) – – – – (134.54) (128.28)
4 Actuarial losses/(gains) 25.26 (7.94) 39.74 (5.80) 29.25 (14.38) (23.97) 45.03
5 Past service cost – – 0.14 0.14 0.11 0.11 – –
6 Amount not recognised as an asset 2.08 – – – – – – –
7 Losses/(Gains) on Divestiture – – – – – – – –
8 Actuarial gain/(loss) not recognised in books – – – – – – 1.28 (16.94)
Total (1 to 8) 60.06 26.38 55.66 9.73 47.77 3.25 60.97 135.75
I Amount included in “employee benefits expense” 46.85 36.32 17.46 21.42 0.68 6.78 83.66 107.66
II Amount included as part of “Interest” 12.79 (10.89) 38.20 (11.69) 45.95 (3.53) (22.69) 28.09
III Amount capitalised on New Product Development 0.02 0.14 – – – – – –
IV Amount recovered from S&A companies 0.40 0.81 – – 1.14 – – –
Total (I+II+III+IV) 60.06 26.38 55.66 9.73 47.77 3.25 60.97 135.75
Actual return on plan assets 53.69 10.44 – – – – 140.60 116.85
Notes forming part of the Accounts (contd.)NOTE [Q] (contd.)

228
c) The changes in the present value of defined benefit obligation representing reconciliation of opening and closing balances
thereof are as follows:
` crore
Particulars
Gratuity plan Post-retirement medical
benefit plan
Company pension plan Trust-managed
provident fund plan
As at
31-3-2015
As at
31-3-2014
As at
31-3-2015
As at
31-3-2014
As at
31-3-2015
As at
31-3-2014
As at
31-3-2015
As at
31-3-2014
Opening balance of the present value of
defined benefit obligation 351.44 364.45 103.57 106.56 188.93 198.89 1791.21 1675.94
Add: Current service cost 24.80 27.58 6.29 7.00 1.59 1.83 83.66 107.66
Add: Interest cost 29.90 28.13 9.49 8.39 16.82 15.69 134.54 128.28
Add: Contribution by plan participants
i) Employer – – – – – – – –
ii) Employee – – – – – – 174.50 170.39
iii) Transfer-in/(out)~ (12.20) (25.11) (3.75) (7.01) – – – (154.98)
Add/(less): Actuarial losses/(gains) 56.97 (18.89) 39.74 (5.80) 29.25 (14.38) (17.91) 33.60
Less: Benefits paid (27.17) (24.72) (6.44) (5.57) (15.12) (13.10) (281.25) (169.68)
Add: Past service cost – – – – – – – –
Closing balance of the present value of
defined benefit obligation 423.74 351.44 148.90 103.57 221.47 188.93 1884.75 1791.21
d) Changes in the fair value of plan assets representing reconciliation of the opening and closing balances thereof are as
follows:
` crore
Particulars
Gratuity plan Trust-managed
provident fund plan
As at
31-3-2015
As at
31-3-2014
As at
31-3-2015
As at
31-3-2014
Opening balance of the fair value of the plan assets 323.91 311.80 1784.96 1648.23
Add: Expected Return on Plan Assets* 21.98 21.39 134.54 128.28
Add/(Less): Actuarial gains/(losses) 31.71 (10.95) 6.06 (11.43)
Add: Contribution by the employer 141.48 51.48 63.39 148.59
Add/(less): Transfer in/(out)~ (12.20) (25.11) – (154.98)
Add: Contribution by Plan participants – – 149.45 195.95
Less: Benefits paid (27.17) (24.70) (281.25) (169.68)
Closing balance of the plan assets 479.71 323.91 1857.15 1784.96
Notes: The fair value of the plan assets under the trust managed provident fund plan has been determined at amounts
based on their value at the time of redemption, assuming a constant rate of return to maturity.
* Basis used to determine the overall expected return:
The trust formed by the Company manages the investments of provident funds and gratuity funds. Expected return on plan
assets is determined based on the assessment made at the beginning of the year on the return expected on its existing
portfolio, along with the estimated increment to the plan assets and expected yield on the respective assets in the portfolio
during the year. [Note Q(9)(ii)(f)(7) infra].
The Company expects to fund ` 59.74 crore (previous year: ` 26.38 crore) towards its gratuity plan and ` 92.03 crore
(previous year: ` 86.74 crore) towards its trust-managed provident fund plan during the year 2015-16.
# Employer’s contribution due towards Provident fund
** Employer’s and employees’ contribution paid in advance
~ Amount transferred pursuant to transfer of Integrated Engineering Services Business employees to wholly owned subsidiary
L&T Technology Services Limited [Note Q(15)].
Notes forming part of the Accounts (contd.)NOTE [Q] (contd.)

229
e) The major categories of plan assets as a percentage of total plan assets are as follows:
Particulars
Gratuity plan Trust-managed provident
fund plan
As at
31-3-2015
As at
31-3-2014
As at
31-3-2015
As at
31-3-2014
Government of India securities 31% 30% 24% 24%
State government securities 11% 11% 15% 15%
Corporate bonds 30% 29% 8% 8%
Equity shares of listed companies 2% 2% – –
Fixed deposits under special deposit scheme framed by
central government for provident funds
– – 10% 12%
Insurer managed funds 1% 1% – –
Public sector unit bonds 17% 20% 42% 41%
Others 8% 7% 1% –
f) Principal actuarial assumptions at the Balance Sheet date (expressed as weighted averages):
As at
31-3-2015
As at
31-3-2014
1 Discount rate:
a) Gratuity plan 7.83% 9.19%
b) Company pension plan 7.83% 9.19%
c) Post-retirement medical benefit plan 7.83% 9.19%
2 Expected return on plan assets 7.50% 7.50%
3 Annual increase in healthcare costs (see note below) 5.00% 5.00%
4 Salary Growth rate:
a) Gratuity plan 5.00% 5.00%
b) Company pension plan 6.00% 6.00%
5 Attrition rate:
a) For post-retirement medical benefit plan & Company pension plan, the attrition rate varies from 2% to 8%
(previous year: 2% to 8%) for various age groups.
b) For gratuity plan the attrition rate varies from 1% to 6% (previous year: 1% to 6%) for various age groups.
6 The estimates of future salary increases, considered in actuarial valuation, take into account inflation, seniority,
promotion and other relevant factors, such as supply and demand in the employment market.
7 The interest payment obligation of trust-managed provident fund is assumed to be adequately covered by the interest
income on long term investments of the fund. Any shortfall in the interest income over the interest obligation is
recognised immediately in the Statement of Profit and Loss as actuarial loss.
8 The obligation of the Company under the post-retirement medical benefit plan is limited to the overall ceiling limits. At
present, healthcare cost, as indicated in the principal actuarial assumption given above, has been assumed to increase
at 5% p.a.
9 A one percentage point change in assumed healthcare cost trend rates would have the following effects on the
aggregate of the service cost and interest cost and defined benefit obligation:
` crore
ParticularsEffect of 1% increase Effect of 1% decrease
2014-15 2013-14 2014-15 2013-14
Effect on the aggregate of the service cost and
interest cost 4.01 2.89 (3.04) (2.24)
Effect on defined benefit obligation 18.35 11.70 (14.57) (9.37)
Notes forming part of the Accounts (contd.)NOTE [Q] (contd.)

230
g) The amounts pertaining to defined benefit plans are as follows:
` crore
ParticularsAs at
31-3-2015As at
31-3-2014As at
31-3-2013As at
31-3-2012As at
31-3-2011
1 Post-retirement medical benefit plan (unfunded)
Defined benefit obligation 147.93 102.46 105.31 87.01 91.31
Experience adjustment plan liabilities 13.58 14.10 1.62 (6.60) 7.91
2 Gratuity plan (funded/unfunded)
Defined benefit obligation 423.74 351.44 364.45 341.07 336.33
Plan assets 479.71 323.91 311.80 291.66 308.38
Less: Amount not recognised as an asset (2.08) – – – –
Surplus/(deficit) (53.89) (27.53) (52.65) (49.41) (27.95)
Experience adjustment plan liabilities 22.73 5.49 26.26 30.52 30.00
Experience adjustment plan assets 31.29 (8.72) 13.01 (0.45) 4.48
3 Post-retirement pension plan (unfunded)
Defined benefit obligation 221.17 188.52 198.36 184.03 162.14
Experience adjustment plan liabilities 5.13 (0.22) (2.79) 23.21 17.46
4 Trust managed provident fund plan (funded/
unfunded)
Defined benefit obligation 1884.75 1791.21 1675.94 1544.72 1396.21
Plan assets 1857.15 1784.96 1648.23 1507.47 1369.08
Surplus/(deficit) (27.60) (6.25) (27.71) (37.25) (27.13)
h) General descriptions of defined benefit plans:
1. Gratuity Plan:
The Company operates gratuity plan through a trust wherein every employee is entitled to the benefit equivalent to fifteen days salary last drawn for each completed year of service. The same is payable on termination of service or retirement whichever is earlier. The benefit vests after five years of continuous service. The company’s scheme is more favourable as compared to the obligation under Payment of Gratuity Act, 1972. A small part of the gratuity plan, which is not material, is unfunded and managed within the Company.
2. Post-retirement medical care plan:
The Post-retirement medical benefit plan provides for reimbursement of health care costs to certain categories of employees post their retirement. The reimbursement is subject to an overall ceiling sanctioned based on cadre of the employee at the time of retirement.
3. Company’s pension plan:
In addition to contribution to state-managed pension plan (EPS scheme), the Company operates a post retirement pension scheme, which is discretionary in nature for certain cadres of employees. The quantum of pension depends on the cadre of the employee at the time of retirement.
4. Trust managed provident fund plan:
The Company manages provident fund plan through a provident fund trust for its employees which is permitted under the Provident Fund and Miscellaneous Provisions Act, 1952. The plan envisages contribution by employer and employees and guarantees interest at the rate notified by the provident fund authority. The contribution by employer and employee together with interest are payable at the time of separation from service or retirement, whichever is earlier. The benefit under this plan vests immediately on rendering of service.
The interest payment obligation of trust-managed provident fund is assumed to be adequately covered by the interest income on long term investments of the fund. Any shortfall in the interest income over the interest obligation is recognised immediately in the statement of Profit and Loss as actuarial loss. Any loss/gain arising out of the investment risk and actuarial risk associated with the plan is also recognised as expense or income in the period in which such loss/gain occurs. Further, the provision of ` 27.55 crore created in 2013-14 based on actuarial valuation towards the future obligation arising out of interest rate guarantee associated with the plan, has been reversed to the extent of ` 22.69 crore in the current year, because the balance in surplus account of the fund is higher than the interest obligation of ` 27.78 crore as on March 31, 2015.
Notes forming part of the Accounts (contd.)NOTE [Q] (contd.)

231
Notes forming part of the Accounts (contd.)NOTE [Q] (contd.)
Q(10) Disclosures pursuant to Accounting Standard (AS) 17 “Segment Reporting”
a) Primary segments (business segments):
` crore
ParticularsFor the year ended 31-3-2015 For the year ended 31-3-2014
External Inter-segment Total External Inter-segment Total
Revenue - including excise duty
Infrastructure 40113.41 538.55 40651.96 34515.70 599.61 35115.31
Power 4452.23 6.72 4458.95 5131.83 8.23 5140.06
Metallurgical & Material Handling 3070.91 231.82 3302.73 5357.07 189.01 5546.08
Heavy Engineering 3254.08 45.18 3299.26 4290.63 31.14 4321.77
Electrical & Automation 3871.95 257.47 4129.42 3656.66 250.68 3907.34
Others 2795.49 32.45 2827.94 4211.96 77.96 4289.92
Elimination – (1112.19) (1112.19) – (1156.63) (1156.63)
Total 57558.07 – 57558.07 57163.85 – 57163.85
Result
Infrastructure 4442.38 3879.07
Power 201.49 518.25
Metallurgical & Material Handling 238.78 821.40
Heavy Engineering 336.11 685.67
Electrical & Automation 503.87 433.87
Others 653.36 425.48
Total 6375.99 6763.74
Inter-segment margin on capital jobs (3.04) (5.56)
6372.95 6758.18
Unallocated corporate income/(expenditure) (net) 1181.39 1090.89
Operating Profit (PBIT) 7554.34 7849.07
Interest expense (1419.03) (1076.08)
Interest income 565.91 494.92
Profit before tax (PBT) 6701.22 7267.91
Provision for current tax (1628.74) (1686.53)
Provision for deferred tax (16.30) (88.25)
Profit after tax (before extraordinary items) 5056.18 5493.13
Profit from extraordinary items – –
Profit after tax (after extraordinary items) 5056.18 5493.13
` crore
Segment assets Segment liabilities
Other information As at As at As at As at
31-3-2015 31-3-2014 31-3-2015 31-3-2014
Infrastructure 33963.23 27655.68 21010.27 16277.38
Power 6020.23 6564.38 5796.29 6273.85
Metallurgical & Material Handling 4927.07 5315.06 1723.93 2047.73
Heavy Engineering 4931.70 5311.12 2510.35 2674.95
Electrical & Automation 3081.41 2729.62 1385.19 1238.80
Others 2795.71 3466.64 1338.97 1627.66
Total 55719.35 51042.50 33765.00 30140.37
Unallocable corporate assets/liabilities 31184.41 27262.08 16054.18 14502.38
Total assets/liabilities 86903.76 78304.58 49819.18 44642.75

232
Notes forming part of the Accounts (contd.)NOTE [Q] (contd.)
` crore
Capital expenditure Depreciation, Amortisation, Impairment & Obsolescence
(included in segment expense)
Non-cash expenses other than depreciation included in
segment expense
Other Information For the year ended
For the year ended
For the year ended
For the year ended
For the year ended
For the year ended
31-3-2015 31-3-2014 31-3-2015 31-3-2014 31-3-2015 31-3-2014
Infrastructure 419.25 519.28 415.06 352.35 21.52 25.86
Power 35.13 24.16 53.88 47.92 3.95 4.54
Metallurgical & Material Handling 64.39 17.21 92.90 81.41 4.05 6.00
Heavy Engineering 80.30 70.22 124.33 83.27 3.18 5.46
Electrical & Automation 222.35 176.46 136.33 78.60 4.41 4.44
Others 31.92 128.69 61.17 79.75 2.13 8.15
b) Secondary segments (geographical segments):
` crore
Domestic Overseas Total
Particulars For the year ended
For the year ended
For the year ended
For the year ended
For the year ended
For the year ended
31-3-2015 31-3-2014 31-3-2015 31-3-2014 31-3-2015 31-3-2014
External revenue by location of customers 48300.19 48035.29 9257.88 9128.56 57558.07 57163.85
Carrying amount of segment assets by location
of assets 47894.49 44547.59 7824.87 6494.91 55719.36 51042.50
Cost incurred on acquisition of tangible and
intangible fixed assets 776.98 915.88 76.36 20.14 853.34 936.02
c) Segment reporting: segment identification, reportable segments and definition of each reportable segment:
i) Primary/secondary segment reporting format:
[a] The risk-return profile of the Company’s business is determined predominantly by the nature of its products and
services. Accordingly, the business segments constitute the primary segments for disclosure of segment information.
[b] In respect of secondary segment information, the Company has identified its geographical segments as (i) domestic
and (ii) overseas. The secondary segment information has been disclosed accordingly.
ii) Segment identification:
Business segments have been identified on the basis of the nature of products/services, the risk-return profile of individual
businesses, the organisational structure and the internal reporting system of the Company.
iii) Reportable segments:
Reportable segments have been identified as per the criteria specified in Accounting Standard (AS) 17 “Segment Reporting”.
iv) Segment composition:
• Infrastructure segment comprises engineering and construction of building and factories, transportation
infrastructure, heavy civil infrastructure, power transmission & distribution and water & renewable energy projects.
• Power segment comprises turnkey solutions for Coal-based and Gas-based thermal power plants including power
generation equipment with associated systems and/or balance-of-plant packages.
• Metallurgical & Material Handling segment comprises turnkey solutions for ferrous (iron & steel making) and
non-ferrous (aluminium, copper, lead & zinc) metal industries, bulk material & ash handling systems in power, port,
steel and mining sector including manufacture and sale of industrial machinery and equipment.
• Heavy Engineering segment comprises manufacture and supply of custom designed, engineered critical equipment
& systems to core sector industries like Fertiliser, Refinery, Petrochemical, Chemical, Oil & Gas, Thermal & Nuclear
Power, Aerospace and Defence.
• Electrical & Automation segment comprises manufacture and sale of low and medium voltage switchgear
components, custom built low and medium voltage switchboards, electronic energy meters/protection (relays) systems
and control & automation products.
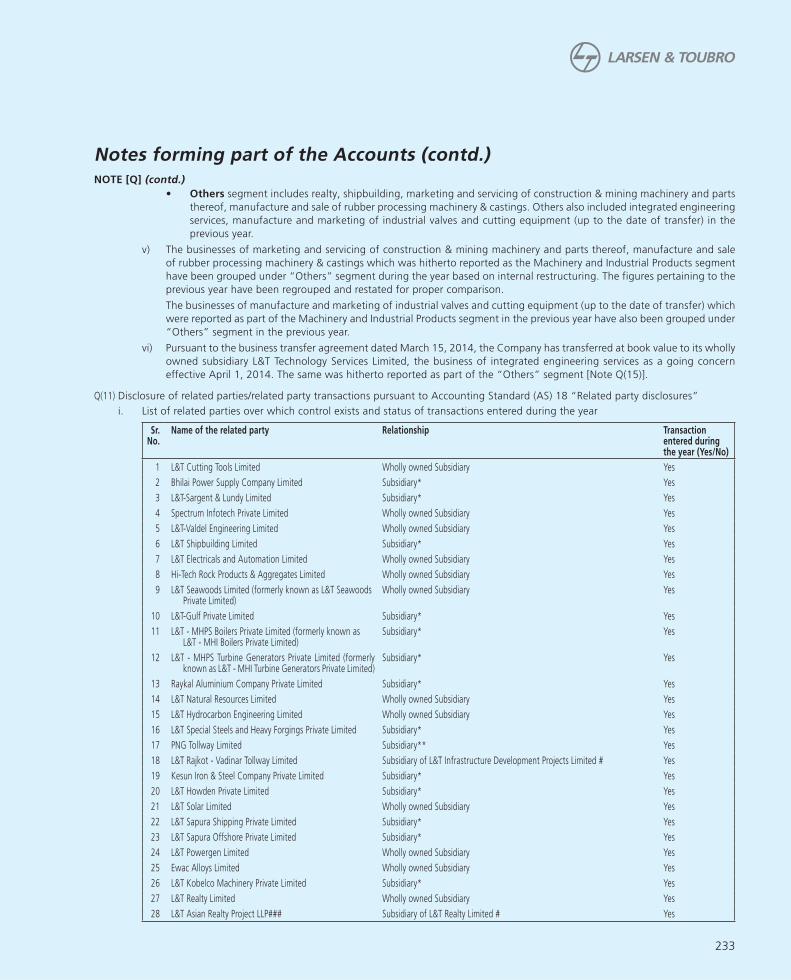
233
• Others segment includes realty, shipbuilding, marketing and servicing of construction & mining machinery and parts
thereof, manufacture and sale of rubber processing machinery & castings. Others also included integrated engineering
services, manufacture and marketing of industrial valves and cutting equipment (up to the date of transfer) in the
previous year.
v) The businesses of marketing and servicing of construction & mining machinery and parts thereof, manufacture and sale
of rubber processing machinery & castings which was hitherto reported as the Machinery and Industrial Products segment
have been grouped under “Others” segment during the year based on internal restructuring. The figures pertaining to the
previous year have been regrouped and restated for proper comparison.
The businesses of manufacture and marketing of industrial valves and cutting equipment (up to the date of transfer) which
were reported as part of the Machinery and Industrial Products segment in the previous year have also been grouped under
“Others” segment in the previous year.
vi) Pursuant to the business transfer agreement dated March 15, 2014, the Company has transferred at book value to its wholly
owned subsidiary L&T Technology Services Limited, the business of integrated engineering services as a going concern
effective April 1, 2014. The same was hitherto reported as part of the “Others” segment [Note Q(15)].
Q(11) Disclosure of related parties/related party transactions pursuant to Accounting Standard (AS) 18 “Related party disclosures”
i. List of related parties over which control exists and status of transactions entered during the year
Sr. No.
Name of the related party Relationship Transaction entered during the year (Yes/No)
1 L&T Cutting Tools Limited Wholly owned Subsidiary Yes
2 Bhilai Power Supply Company Limited Subsidiary* Yes
3 L&T-Sargent & Lundy Limited Subsidiary* Yes
4 Spectrum Infotech Private Limited Wholly owned Subsidiary Yes
5 L&T-Valdel Engineering Limited Wholly owned Subsidiary Yes
6 L&T Shipbuilding Limited Subsidiary* Yes
7 L&T Electricals and Automation Limited Wholly owned Subsidiary Yes
8 Hi-Tech Rock Products & Aggregates Limited Wholly owned Subsidiary Yes
9 L&T Seawoods Limited (formerly known as L&T Seawoods Private Limited)
Wholly owned Subsidiary Yes
10 L&T-Gulf Private Limited Subsidiary* Yes
11 L&T - MHPS Boilers Private Limited (formerly known as L&T - MHI Boilers Private Limited)
Subsidiary* Yes
12 L&T - MHPS Turbine Generators Private Limited (formerly known as L&T - MHI Turbine Generators Private Limited)
Subsidiary* Yes
13 Raykal Aluminium Company Private Limited Subsidiary* Yes
14 L&T Natural Resources Limited Wholly owned Subsidiary Yes
15 L&T Hydrocarbon Engineering Limited Wholly owned Subsidiary Yes
16 L&T Special Steels and Heavy Forgings Private Limited Subsidiary* Yes
17 PNG Tollway Limited Subsidiary** Yes
18 L&T Rajkot - Vadinar Tollway Limited Subsidiary of L&T Infrastructure Development Projects Limited # Yes
19 Kesun Iron & Steel Company Private Limited Subsidiary* Yes
20 L&T Howden Private Limited Subsidiary* Yes
21 L&T Solar Limited Wholly owned Subsidiary Yes
22 L&T Sapura Shipping Private Limited Subsidiary* Yes
23 L&T Sapura Offshore Private Limited Subsidiary* Yes
24 L&T Powergen Limited Wholly owned Subsidiary Yes
25 Ewac Alloys Limited Wholly owned Subsidiary Yes
26 L&T Kobelco Machinery Private Limited Subsidiary* Yes
27 L&T Realty Limited Wholly owned Subsidiary Yes
28 L&T Asian Realty Project LLP### Subsidiary of L&T Realty Limited # Yes
Notes forming part of the Accounts (contd.)NOTE [Q] (contd.)
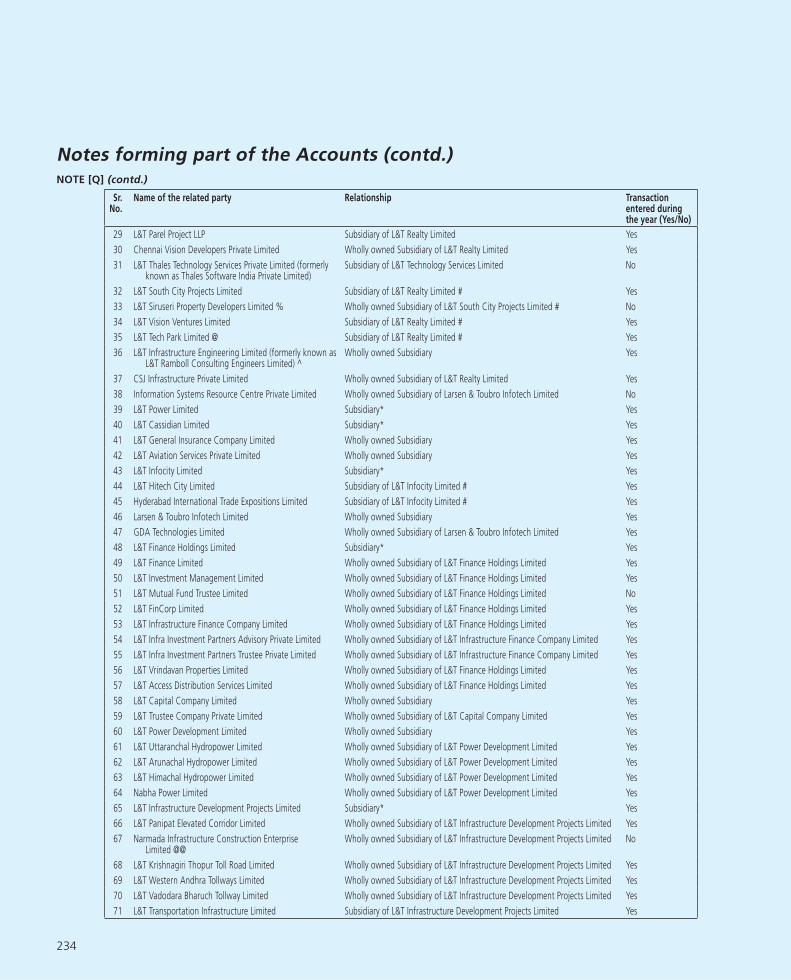
234
Sr. No.
Name of the related party Relationship Transaction entered during the year (Yes/No)
29 L&T Parel Project LLP Subsidiary of L&T Realty Limited Yes
30 Chennai Vision Developers Private Limited Wholly owned Subsidiary of L&T Realty Limited Yes
31 L&T Thales Technology Services Private Limited (formerly known as Thales Software India Private Limited)
Subsidiary of L&T Technology Services Limited No
32 L&T South City Projects Limited Subsidiary of L&T Realty Limited # Yes
33 L&T Siruseri Property Developers Limited % Wholly owned Subsidiary of L&T South City Projects Limited # No
34 L&T Vision Ventures Limited Subsidiary of L&T Realty Limited # Yes
35 L&T Tech Park Limited @ Subsidiary of L&T Realty Limited # Yes
36 L&T Infrastructure Engineering Limited (formerly known as L&T Ramboll Consulting Engineers Limited) ^
Wholly owned Subsidiary Yes
37 CSJ Infrastructure Private Limited Wholly owned Subsidiary of L&T Realty Limited Yes
38 Information Systems Resource Centre Private Limited Wholly owned Subsidiary of Larsen & Toubro Infotech Limited No
39 L&T Power Limited Subsidiary* Yes
40 L&T Cassidian Limited Subsidiary* Yes
41 L&T General Insurance Company Limited Wholly owned Subsidiary Yes
42 L&T Aviation Services Private Limited Wholly owned Subsidiary Yes
43 L&T Infocity Limited Subsidiary* Yes
44 L&T Hitech City Limited Subsidiary of L&T Infocity Limited # Yes
45 Hyderabad International Trade Expositions Limited Subsidiary of L&T Infocity Limited # Yes
46 Larsen & Toubro Infotech Limited Wholly owned Subsidiary Yes
47 GDA Technologies Limited Wholly owned Subsidiary of Larsen & Toubro Infotech Limited Yes
48 L&T Finance Holdings Limited Subsidiary* Yes
49 L&T Finance Limited Wholly owned Subsidiary of L&T Finance Holdings Limited Yes
50 L&T Investment Management Limited Wholly owned Subsidiary of L&T Finance Holdings Limited Yes
51 L&T Mutual Fund Trustee Limited Wholly owned Subsidiary of L&T Finance Holdings Limited No
52 L&T FinCorp Limited Wholly owned Subsidiary of L&T Finance Holdings Limited Yes
53 L&T Infrastructure Finance Company Limited Wholly owned Subsidiary of L&T Finance Holdings Limited Yes
54 L&T Infra Investment Partners Advisory Private Limited Wholly owned Subsidiary of L&T Infrastructure Finance Company Limited Yes
55 L&T Infra Investment Partners Trustee Private Limited Wholly owned Subsidiary of L&T Infrastructure Finance Company Limited Yes
56 L&T Vrindavan Properties Limited Wholly owned Subsidiary of L&T Finance Holdings Limited Yes
57 L&T Access Distribution Services Limited Wholly owned Subsidiary of L&T Finance Holdings Limited Yes
58 L&T Capital Company Limited Wholly owned Subsidiary Yes
59 L&T Trustee Company Private Limited Wholly owned Subsidiary of L&T Capital Company Limited Yes
60 L&T Power Development Limited Wholly owned Subsidiary Yes
61 L&T Uttaranchal Hydropower Limited Wholly owned Subsidiary of L&T Power Development Limited Yes
62 L&T Arunachal Hydropower Limited Wholly owned Subsidiary of L&T Power Development Limited Yes
63 L&T Himachal Hydropower Limited Wholly owned Subsidiary of L&T Power Development Limited Yes
64 Nabha Power Limited Wholly owned Subsidiary of L&T Power Development Limited Yes
65 L&T Infrastructure Development Projects Limited Subsidiary* Yes
66 L&T Panipat Elevated Corridor Limited Wholly owned Subsidiary of L&T Infrastructure Development Projects Limited Yes
67 Narmada Infrastructure Construction Enterprise Limited @@
Wholly owned Subsidiary of L&T Infrastructure Development Projects Limited No
68 L&T Krishnagiri Thopur Toll Road Limited Wholly owned Subsidiary of L&T Infrastructure Development Projects Limited Yes
69 L&T Western Andhra Tollways Limited Wholly owned Subsidiary of L&T Infrastructure Development Projects Limited Yes
70 L&T Vadodara Bharuch Tollway Limited Wholly owned Subsidiary of L&T Infrastructure Development Projects Limited Yes
71 L&T Transportation Infrastructure Limited Subsidiary of L&T Infrastructure Development Projects Limited Yes
Notes forming part of the Accounts (contd.)NOTE [Q] (contd.)

235
Sr. No.
Name of the related party Relationship Transaction entered during the year (Yes/No)
72 L&T Western India Tollbridge Limited Wholly owned Subsidiary of L&T Infrastructure Development Projects Limited Yes
73 L&T Interstate Road Corridor Limited Wholly owned Subsidiary of L&T Infrastructure Development Projects Limited Yes
74 International Seaports (India) Private Limited @@ Wholly owned Subsidiary of L&T Infrastructure Development Projects Limited Yes
75 L&T Port Kachchigarh Limited Wholly owned Subsidiary of L&T Infrastructure Development Projects Limited Yes
76 L&T Ahmedabad - Maliya Tollway Limited Subsidiary of L&T Infrastructure Development Projects Limited Yes
77 L&T Halol - Shamlaji Tollway Limited Subsidiary of L&T Infrastructure Development Projects Limited Yes
78 L&T Krishnagiri Walajahpet Tollway Limited Subsidiary of L&T Infrastructure Development Projects Limited Yes
79 L&T Devihalli Hassan Tollway Limited Subsidiary of L&T Infrastructure Development Projects Limited Yes
80 L&T Metro Rail (Hyderabad) Limited Subsidiary of L&T Infrastructure Development Projects Limited Yes
81 L&T Transco Private Limited @@ Wholly owned Subsidiary of L&T Infrastructure Development Projects Limited No
82 L&T Chennai – Tada Tollway Limited Subsidiary of L&T Infrastructure Development Projects Limited # Yes
83 L&T BPP Tollway Limited Wholly owned Subsidiary of L&T Infrastructure Development Projects Limited Yes
84 L&T Deccan Tollways Limited Wholly owned Subsidiary of L&T Infrastructure Development Projects Limited Yes
85 L&T Samakhiali Gandhidham Tollway Limited Subsidiary of L&T Infrastructure Development Projects Limited # Yes
86 Larsen & Toubro LLC Subsidiary* Yes
87 Larsen & Toubro Infotech, GmbH Wholly owned Subsidiary of Larsen & Toubro Infotech Limited Yes
88 Larsen & Toubro Infotech Canada Limited Wholly owned Subsidiary of Larsen & Toubro Infotech Limited Yes
89 Larsen & Toubro Infotech LLC Wholly owned Subsidiary of Larsen & Toubro Infotech Limited No
90 L&T Infotech Financial Services Technologies Inc. Wholly owned Subsidiary of Larsen & Toubro Infotech Limited Yes
91 L&T Technology Services LLC Wholly owned Subsidiary of L&T Technology Services Limited Yes
92 L&T Infrastructure Development Projects Lanka (Private) Limited
Subsidiary of L&T Infrastructure Development Projects Limited # No
93 PT Larsen & Toubro Hydrocarbon Engineering Indonesia Subsidiary* No
94 L&T IDPL Trustee Manager Pte Ltd. Wholly owned Subsidiary of L&T Infrastructure Development Projects Limited No
95 Kana Controls General Trading & Contracting Company W.L.L.
Subsidiary of L&T Electrical & Automation FZE ## No
96 L&T Diversified India Equity Fund $ Wholly owned Subsidiary of L&T Capital Company Limited No
97 L&T Information Technology Services (Shanghai) Co. Ltd. Wholly owned Subsidiary of Larsen & Toubro Infotech Limited No
98 L&T Realty FZE Wholly owned Subsidiary of L&T Realty Limited No
99 Larsen & Toubro International FZE Wholly owned Subsidiary Yes
100 Larsen & Toubro (Oman) LLC Subsidiary of Larsen & Toubro International FZE # Yes
101 Larsen & Toubro Electromech LLC Subsidiary of Larsen & Toubro International FZE # Yes
102 L&T Modular Fabrication Yard LLC Subsidiary of Larsen & Toubro International FZE # Yes
103 Larsen & Toubro (East Asia) SDN. BHD Subsidiary of Larsen & Toubro International FZE ## Yes
104 Larsen & Toubro Qatar LLC Subsidiary of Larsen & Toubro International FZE ## No
105 L&T Overseas Projects Nigeria Limited Subsidiary of Larsen & Toubro International FZE Yes
106 L&T Electricals & Automation Saudi Arabia Company Limited, LLC
Subsidiary of Larsen & Toubro International FZE # Yes
107 Larsen & Toubro Kuwait Construction General Contracting Company, W.L.L.
Subsidiary of Larsen & Toubro International FZE ## Yes
108 Larsen & Toubro (Qingdao) Rubber Machinery Company Limited @@@
Wholly owned Subsidiary of Larsen & Toubro International FZE Yes
109 Qingdao Larsen & Toubro Trading Company Limited $$ Wholly owned Subsidiary of Larsen &Toubro (Qingdao) Rubber Machinery Company Limited
No
110 Larsen & Toubro Readymix and Asphalt Concrete Industries LLC (formerly known as Larsen & Toubro Readymix Concrete Industries LLC)
Subsidiary of Larsen & Toubro International FZE ## Yes
Notes forming part of the Accounts (contd.)NOTE [Q] (contd.)

236
Notes forming part of the Accounts (contd.)NOTE [Q] (contd.)
Sr. No.
Name of the related party Relationship Transaction entered during the year (Yes/No)
111 Larsen & Toubro Saudi Arabia LLC Subsidiary of Larsen & Toubro International FZE Yes
112 Larsen & Toubro ATCO Saudia LLC Subsidiary of Larsen & Toubro International FZE Yes
113 Tamco Switchgear (Malaysia) SDN. BHD Wholly owned Subsidiary of Larsen & Toubro International FZE Yes
114 Tamco Electrical Industries Australia Pty Limited Wholly owned Subsidiary of Larsen & Toubro International FZE No
115 PT Tamco Indonesia Subsidiary of Larsen & Toubro International FZE Yes
116 Larsen & Toubro Heavy Engineering LLC Subsidiary of Larsen & Toubro International FZE # Yes
117 L&T Electrical & Automation FZE Wholly owned Subsidiary of Larsen & Toubro International FZE Yes
118 Larsen & Toubro Consultoria E Projeto Ltda Subsidiary of Larsen & Toubro International FZE No
119 Larsen & Toubro T&D SA Proprietary Limited Subsidiary of Larsen & Toubro International FZE # Yes
120 L&T East-West Tollway Limited ^^^ Wholly owned Subsidiary of L&T Infrastructure Development Projects Limited Yes
121 L&T Great Eastern Highway Limited ^^^ Wholly owned Subsidiary of L&T Infrastructure Development Projects Limited Yes
122 Servowatch System Limited Wholly owned Subsidiary of Larsen & Toubro International FZE Yes
123 L&T Geostructure LLP Subsidiary* Yes
124 Larsen Toubro Arabia LLC Subsidiary* Yes
125 Henikwon Corporation SDN. BHD Wholly owned Subsidiary of Tamco Switchgear (Malaysia) SDN. BHD Yes
126 L&T Housing Finance Limited Wholly owned Subsidiary of L&T Finance Holdings Limited Yes
127 L&T Tejomaya Limited @ Subsidiary of L&T Realty Limited # No
128 L&T Valves Limited Wholly owned Subsidiary Yes
129 L&T Technology Services Limited Wholly owned Subsidiary Yes
130 CSJ Hotels Private Limited $$$ Wholly owned Subsidiary of CSJ Infrastructure Private Limited Yes
131 L&T Consumer Finance Services Limited Wholly owned Subsidiary of L&T Housing Finance Limited Yes
132 Family Credit Limited Wholly owned Subsidiary of L&T Finance Holdings Limited Yes
133 L&T Capital Markets Limited Wholly owned Subsidiary of L&T Finance Holdings Limited Yes
134 L&T Infra Debt Fund Limited Wholly owned Subsidiary of L&T Finance Holdings Limited Yes
135 L&T Trustee Services Private Limited ^^ Wholly owned Subsidiary of L&T Mutual Fund Trustee Limited No
136 Mudit Cement Private Limited Wholly owned subsidiary of L&T Vrindavan Properties Limited Yes
137 Larsen & Toubro Infotech South Africa (PTY) Limited Subsidiary of Larsen & Toubro Infotech Limited No
138 Thalest Limited Wholly owned Subsidiary of Larsen & Toubro International FZE No
139 Larsen & Toubro Hydrocarbon International Limited LLC Subsidiary* No
140 L&T Construction Equipment Limited Wholly owned Subsidiary Yes
141 Kudgi Transmission Limited Wholly owned Subsidiary of L&T Infrastructure Development Projects Limited Yes
142 L&T Sambhalpur Rourkela Tollway limited Wholly owned Subsidiary of L&T Infrastructure Development Projects Limited Yes
* The Company holds more than one-half in nominal value of the equity share capital
** The Company, together with its subsidiaries holds more than one-half in nominal value of the equity share capital
@ The Company has sold its stake on May 22, 2014
@@ Companies merged with L&T Infrastructure Development Projects Limited pursuant to high court order with retrospective effect from April 1, 2013
@@@ The Company is in the process of being wound up
# The Company’s subsidiary/wholly owned subsidiary holds more than one-half in nominal value of the equity share capital
## The Company, together with its subsidiaries controls the composition of the Board of Directors
### The Company’s wholly owned subsidiary holds one-half of the capital and has management control
^ Associate became a wholly owned subsidiary w.e.f. September 8, 2014
^^ The company is merged with L&T Mutual Fund Trustee Limited with retrospective effect from April 1, 2013
^^^ Companies merged with L&T Infrastructure Development Projects Limited pursuant to high court order with retrospective effect from April 1, 2014
% The Company is dissolved w.e.f. April 24, 2014
$ The Company is dissolved w.e.f. August 20, 2014
$$ The Company is dissolved w.e.f. February 16, 2015
$$$ The Company is dissolved w.e.f. December 19, 2014

237
ii (a) Names of the associates and joint ventures with whom transactions were carried out during the year:
Associate companies:
1 L&T-Chiyoda Limited 2 Salzer Electronics Limited
3 Feedback Ventures Limited 4 Magtorq Private Limited
5 JSK Electricals Private Limited
Joint ventures (other than associates):
1 Metro Tunneling Group 2 L&T-Hochtief Seabird Joint Venture
3 Desbuild-L&T Joint Venture 4 Metro Tunneling Chennai - L&T Shanghai Urban Construction
(Group) Corporation Joint Venture
5 L&T-AM Tapovan Joint Venture 6 HCC-L&T Purulia Joint Venture
7 The Dhamra Port Company Limited @ 8 L&T-Shanghai Urban Construction (Group) Corporation Joint
Venture
9 L&T - Shanghai Urban Construction (Group)
Corporation Joint Venture CC27 Delhi
10 L&T-Eastern Joint Venture $
11 Laren & Toubro Limited - Shapoorji Pallonji & Co.
Limited Joint Venture
12 Metro Tunneling Delhi - L&T Shanghai Urban Construction
(Group) Corporation Joint Venture
13 International Metro Civil Contractors Joint Venture 14 Civil Works Joint Venture
15 Aktor- Larsen & Toubro-Yapi Merkezi-stfa-Al Jaber
Engineering
16 L&T-Delma Mafraq Joint Venture
17 Larsen & Toubro Limited and NCC Limited Joint Venture
@ The Company has sold its stake on June 23, 2014 $ The Joint Venture is in the process of dissolution
ii (b) Names of the Key management personnel and their relatives with whom transactions were carried out during the year:
Key management personnel & their relatives:
1 Mr. A. M. Naik (Group Executive Chairman) 2 Mr. K. Venkataramanan (CEO & Managing Director)
Mrs. Jyothi Venkataramanan (wife)
3 Mr. M. V. Kotwal (Whole-time director) 4 Mr. R. Shankar Raman (CFO & Whole-time Director)
5 Mr. S. N. Subrahmanyan (Whole-time Director) 6 Mr. S. N. Roy (Whole-time Director)
iii. Disclosure of related party transactions:
` crore
2014-15 2013-14
Sr.no.
Nature of transaction/relationship/major parties Amount Amounts for major parties
Amount Amounts for major parties
1 Purchase of goods & services (including commission paid)
Subsidiaries, including: 2340.85 3040.06
L&T - MHPS Turbine Generators Private Limited (formerly known as L&T - MHI Turbine Generators Private Limited)
484.72 782.29
L&T Valves Limited – 425.52
L&T - MHPS Boilers Private Limited (formerly known as L&T - MHI Boilers Private Limited)
1105.64 1042.90
Associates & joint ventures, including: 153.46 161.91
Salzer Electronics Limited 123.81 120.11
JSK Electricals Private Limited 24.04 26.73
Total 2494.31 3201.97
Notes forming part of the Accounts (contd.)NOTE [Q] (contd.)

238
` crore
2014-15 2013-14
Sr.no.
Nature of transaction/relationship/major parties Amount Amounts for major parties
Amount Amounts for major parties
2 Sale of goods/contract revenue & services
Subsidiaries, including: 5623.44 6355.55
L&T BPP Tollway Limited – 1072.01
L&T Metro Rail (Hyderabad) Limited 2080.94 1671.24
Nabha Power Limited 661.06 1261.76
Larsen and Toubro Saudi Arabia LLC 618.03 –
Associates & joint ventures, including: 86.91 5.07
The Dhamra Port Company Limited – 5.06
Civil Works Joint Venture 50.12 –
L&T-Shanghai Urban Construction (Group) Corporation Joint Venture CC27 Delhi 19.09 –
Metro Tunneling Chennai - L&T Shanghai Urban Construction (Group) Corporation Joint Venture 9.58 –
Total 5710.35 6360.62
3 Purchase/lease of fixed assets
Subsidiaries, including: 11.03 20.33
L&T Hydrocarbon Engineering Limited – 7.46
L&T Construction Equipment Limited 1.37 5.22
Tamco Switchgear (Malaysia) SDN. BHD 3.29 –
L&T Technology Services Limited 2.15 –
Henikwon Corporation SDN. BHD 1.55 –
Associates & joint ventures, including: 0.11 –
L&T-Chiyoda Limited 0.11 –
Total 11.14 20.33
4 Sale of fixed assets
Subsidiaries, including: 15.78 20.36
L&T Vrindavan Properties Limited – 16.01
L&T - MHPS Boilers Private Limited (formerly known as L&T - MHI Boilers Private Limited)
– 3.33
Larsen & Toubro Infotech Limited 10.34 –
Total 15.78 20.36
5 Sale of Receivables
Subsidiaries, including: 276.16 98.96
L&T Finance Limited 276.16 98.96
Total 276.16 98.96
6 Subscription to equity and preference shares (including application money paid)
Subsidiaries, including: 2428.61 4655.77
L&T Seawoods Limited (formerly known as L&T Seawoods Private Limited)
1529.55 1505.99
L&T Hydrocarbon Engineering Limited – 1500.00
L&T Power Development Limited – 930.30
L&T Technology Services Limited 547.50 502.45
Total 2428.61 4655.77
Notes forming part of the Accounts (contd.)NOTE [Q] (contd.)

239
` crore
2014-15 2013-14
Sr.no.
Nature of transaction/relationship/major parties Amount Amounts for major parties
Amount Amounts for major parties
7 Investment in Integrated Joint Ventures [Note R(21)]
Increase in Investment, including: 164.43 104.29
Metro Tunneling Chennai - L&T Shanghai Urban Construction (Group) Corporation Joint Venture – 28.95
Laren & Toubro Limited - Shapoorji Pallonji & Co. Limited Joint Venture – 33.63
Metro Tunneling Delhi - L&T Shanghai Urban Construction (Group) Corporation Joint Venture 37.48 12.78
L&T- Shanghai Urban Construction (Group) Corporation Joint Venture CC27 Delhi 52.60 12.66
Civil Works Joint Venture 57.12 –
Total 164.43 104.29
Decrease in Investment, including: 31.30 0.03
Metro Tunneling Chennai - L&T Shanghai Urban Construction (Group) Corporation Joint Venture 12.89 –
Laren & Toubro Limited - Shapoorji Pallonji & Co. Limited Joint Venture 17.18 –
International Metro Civil Contactors Joint Venture – 0.03
Total 31.30 0.03
8 Purchase of investments from
Subsidiary: 4280.66 1243.04
L&T Capital Company Limited 4280.66 1243.04
Total 4280.66 1243.04
9 Sale of investments to
Subsidiary: 4277.56 1255.10
L&T Capital Company Limited 4277.56 1242.45
Total 4277.56 1255.10
10 Charges paid for miscellaneous services
Subsidiaries, including: 89.94 80.14
Larsen & Toubro Infotech Limited 33.71 29.54
L&T Aviation Services Private Limited 27.37 27.28
Associates & joint ventures, including: 1.04 0.45
Feedback Ventures Limited 0.77 –
L&T-Chiyoda Limited 0.23 –
L&T Infrastructure Engineering Limited (formerly known as L&T Ramboll Consulting Engineers Limited)
– 0.45
Total 90.98 80.59
11 Rent paid, including lease rentals under leasing/hire purchase arrangements:
Subsidiaries, including: 1.82 4.70
L&T Construction Equipment Limited – 1.08
L&T Electrical & Automation FZE 0.98 0.50
L&T Infocity Limited 0.35 1.59
PT Tamco Indonesia 0.30 –
L&T-Sargent & Lundy Limited – 1.04
Key management personnel 0.01 0.01
Total 1.83 4.71
Notes forming part of the Accounts (contd.)NOTE [Q] (contd.)

240
` crore
2014-15 2013-14
Sr.no.
Nature of transaction/relationship/major parties Amount Amounts for major parties
Amount Amounts for major parties
12 Charges for deputation of employees to related parties
Subsidiaries, including: 69.85 67.24
L&T Power Development Limited 7.35 11.36
L&T-Valdel Engineering Limited – 12.30
L&T Parel Project LLP 24.49 15.82
Associates & joint ventures, including: 21.12 25.65
L&T-Chiyoda Limited 21.06 25.22
Total 90.97 92.89
13 Dividend received
Subsidiaries, including: 850.70 863.06
Larsen & Toubro Infotech Limited 480.52 551.48
L&T Construction Equipment Limited – 96.00
L&T Technology Services Limited 219.93 –
L&T Finance Holdings Limited 96.68 106.28
Associates & joint ventures, including: 0.58 2.35
Salzer Electronics Limited 0.40 0.32
Magtorq Private Limited 0.18 –
L&T Infrastructure Engineering Limited (formerly known as L&T Ramboll Consulting Engineers Limited)
– 1.80
Total 851.28 865.41
14 Commission received, including those under agency arrangements
Subsidiaries, including: 3.73 9.70
L&T Kobelco Machinery Private Limited 2.24 –
L&T Construction Equipment Limited 1.49 9.04
Total 3.73 9.70
15 Rent received, overheads recovered and miscellaneous income
Subsidiaries, including: 507.14 431.11
Larsen & Toubro Infotech Limited 84.71 75.18
L&T Technology Services Limited 68.64 –
L&T Geostructure LLP – 60.35
L&T Hydrocarbon Engineering Limited 105.86 129.58
Associates & joint ventures, including: 139.45 1.67
Aktor-Larsen & Toubro-Yapi Merkezi-stfa-Al Jaber Engineering Joint Venture
28.57 –
Civil Works Joint Venture 72.63 –
L&T Delma Mafraq JV 32.02 –
L&T-Chiyoda Limited – 1.66
Total 646.59 432.78
16 Guarantee charges recovered from
Subsidiaries, including: 9.12 –
Nabha Power Limited 6.36 –
Larsen and Toubro Saudi Arabia LLC 1.21 –
L&T Hydrocarbon Engineering Limited 1.06 –
Total 9.12 –
Notes forming part of the Accounts (contd.)NOTE [Q] (contd.)

241
` crore
2014-15 2013-14
Sr.no.
Nature of transaction/relationship/major parties Amount Amounts for major parties
Amount Amounts for major parties
17 Interest received from
Subsidiaries, including: 286.42 159.42
L&T Hydrocarbon Engineering Limited 76.00 –
L&T Special Steels and Heavy Forgings Private Limited 33.57 –
L&T Realty Limited 104.48 116.88
Associates & joint ventures, including: 9.32 41.00
The Dhamra Port Company Limited 9.32 41.00
Total 295.74 200.42
18 Interest paid to
Subsidiaries, including: 14.67 31.88
L&T Finance Limited – 3.49
L&T Construction Equipment Limited 4.11 4.87
L&T Infrastructure Development Projects Limited 2.35 –
L&T Realty Limited 1.54 –
Nabha Power Limited 4.76 –
L&T Cutting Tools Limited 1.72 –
Larsen and Toubro Infotech Limited – 5.34
L&T Shipbuilding Limited – 6.41
L&T Seawoods Limited (formerly known as L&T Seawoods Private Limited)
– 10.74
Total 14.67 31.88
19 Amount provided for bad debts:
Subsidiaries, including: 3.09 –
Larsen and Toubro (Qingdao) Rubber Machinery Company Limited 3.09 –
Total 3.09 –
20 Transfer of Business to
Subsidiaries, including: 549.49 1909.60
L&T Technology Services Limited 549.49 –
L&T Hydrocarbon Engineering Limited – 1760.00
L&T Valves Limited – 149.60
Total 549.49 1909.60
21 Payment of Salaries/ Perquisites (Other than commission) 16.98 15.34
(Key management personnel)
A. M. Naik 4.22 3.91
K. Venkataramanan * 4.20 4.08
M. V. Kotwal 3.01 2.49
S. N. Subrahmanyan 1.74 1.63
R. Shankar Raman 1.59 1.48
Shailendra Roy 2.22 1.75
Total 16.98 15.34
Notes forming part of the Accounts (contd.)NOTE [Q] (contd.)
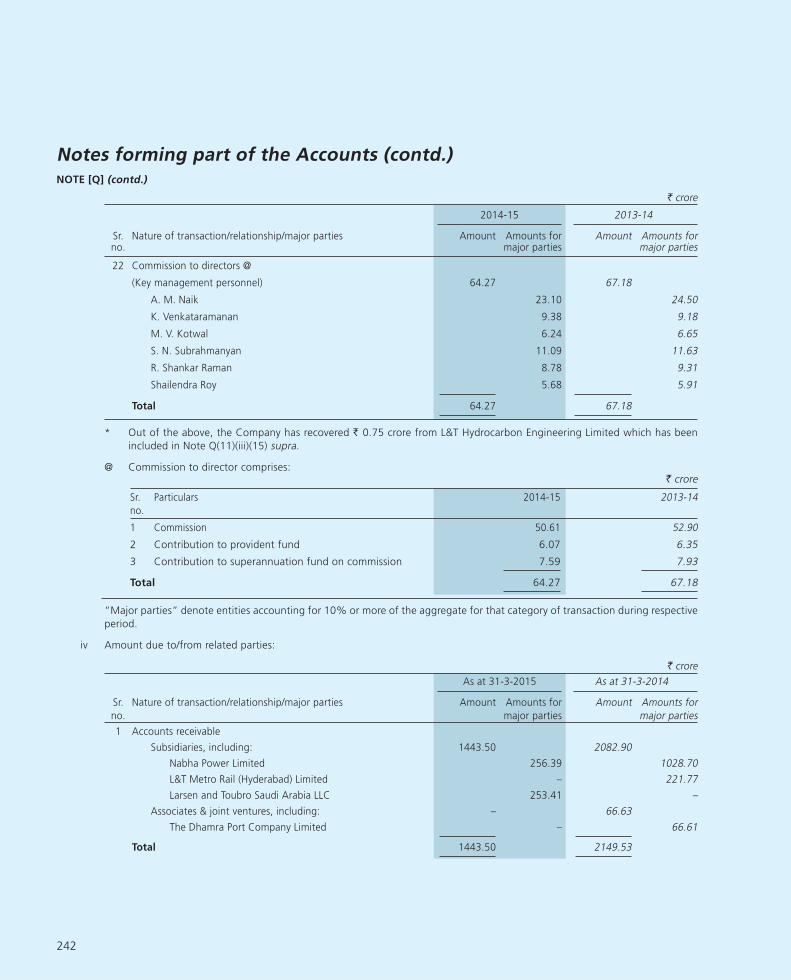
242
` crore
2014-15 2013-14
Sr.no.
Nature of transaction/relationship/major parties Amount Amounts for major parties
Amount Amounts for major parties
22 Commission to directors @
(Key management personnel) 64.27 67.18
A. M. Naik 23.10 24.50
K. Venkataramanan 9.38 9.18
M. V. Kotwal 6.24 6.65
S. N. Subrahmanyan 11.09 11.63
R. Shankar Raman 8.78 9.31
Shailendra Roy 5.68 5.91
Total 64.27 67.18
* Out of the above, the Company has recovered ` 0.75 crore from L&T Hydrocarbon Engineering Limited which has been
included in Note Q(11)(iii)(15) supra.
@ Commission to director comprises:` crore
Sr. Particulars
no.
2014-15 2013-14
1 Commission 50.61 52.90
2 Contribution to provident fund 6.07 6.35
3 Contribution to superannuation fund on commission 7.59 7.93
Total 64.27 67.18
“Major parties” denote entities accounting for 10% or more of the aggregate for that category of transaction during respective
period.
iv Amount due to/from related parties:
` crore
As at 31-3-2015 As at 31-3-2014
Sr.
no.
Nature of transaction/relationship/major parties Amount Amounts for
major parties
Amount Amounts for
major parties
1 Accounts receivable
Subsidiaries, including: 1443.50 2082.90
Nabha Power Limited 256.39 1028.70
L&T Metro Rail (Hyderabad) Limited – 221.77
Larsen and Toubro Saudi Arabia LLC 253.41 –
Associates & joint ventures, including: – 66.63
The Dhamra Port Company Limited – 66.61
Total 1443.50 2149.53
Notes forming part of the Accounts (contd.)NOTE [Q] (contd.)

243
` crore
As at 31-3-2015 As at 31-3-2014
Sr.
no.
Nature of transaction/relationship/major parties Amount Amounts for
major parties
Amount Amounts for
major parties
2 Accounts payable (including acceptance & interest accrued)
Subsidiaries, including: 1782.16 2540.89
L&T - MHPS Boilers Private Limited (formerly known as
L&T - MHI Boilers Private Limited)
830.70 1134.94
L&T - MHPS Turbine Generators Private Limited (formerly
known as L&T - MHI Turbine Generators Private Limited)
547.20 823.60
Associates & joint ventures, including: 104.19 81.59
Metro Tunneling Chennai - L&T Shanghai Urban
Construction (Group) Corporation Joint Venture 31.77 39.21
L&T- Shanghai Urban Construction (Group) Corporation
Joint Venture CC27 Delhi 18.78 16.76
Larsen & Toubro Limited and NCC Limited Joint Venture 25.20 –
Salzer Electronic Limited 18.54 13.37
Total 1886.35 2622.48
3 Investment in Debt Securities
Subsidiary: 22.95 36.96
L&T Finance Limited 22.95 36.96
Total 22.95 36.96
4 Loans & advances recoverable
Subsidiaries, including: 3021.29 3292.70
L&T Hydrocarbon Engineering Limited – 775.68
L&T - MHPS Boilers Private Limited (formerly known as
L&T - MHI Boilers Private Limited)
304.77 –
L&T Special Steels and Heavy Forgings Private Limited 564.02 –
L&T Shipbuilding Limited 400.18 –
L&T Realty Limited 710.90 841.04
Associates & joint ventures, including: 84.99 518.10
L&T - AM Tapovan Joint Venture 12.01 –
Laren & Toubro Limited - Shapoorji Pallonji & Co. Limited
Joint Venture 23.39 –
L&T- Shanghai Urban Construction (Group) Corporation
Joint Venture CC27 Delhi 27.94 –
L&T Delma Mafraq Joint Venture 14.96 –
The Dhamra Port Company Limited – 490.30
Key management personnel 0.01 0.01
Total 3106.29 3810.81
5 Advances against equity contribution
Subsidiaries, including: 1986.84 1208.37
L&T Shipbuilding Limited 421.86 421.86
L&T Realty Limited 648.29 699.00
L&T Power Development Limited 379.40 –
L&T Uttaranchal Hydropower Limited 523.00 –
Total 1986.84 1208.37
Notes forming part of the Accounts (contd.)NOTE [Q] (contd.)
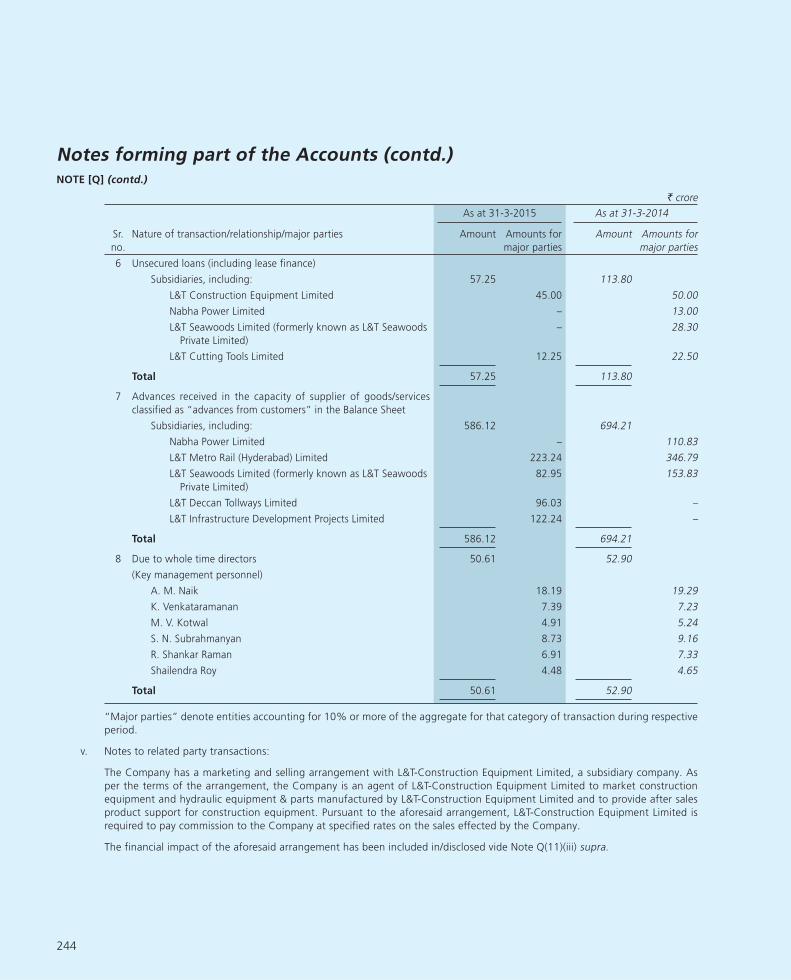
244
` crore
As at 31-3-2015 As at 31-3-2014
Sr.
no.
Nature of transaction/relationship/major parties Amount Amounts for
major parties
Amount Amounts for
major parties
6 Unsecured loans (including lease finance)
Subsidiaries, including: 57.25 113.80
L&T Construction Equipment Limited 45.00 50.00
Nabha Power Limited – 13.00
L&T Seawoods Limited (formerly known as L&T Seawoods
Private Limited)
– 28.30
L&T Cutting Tools Limited 12.25 22.50
Total 57.25 113.80
7 Advances received in the capacity of supplier of goods/services
classified as “advances from customers” in the Balance Sheet
Subsidiaries, including: 586.12 694.21
Nabha Power Limited – 110.83
L&T Metro Rail (Hyderabad) Limited 223.24 346.79
L&T Seawoods Limited (formerly known as L&T Seawoods
Private Limited)
82.95 153.83
L&T Deccan Tollways Limited 96.03 –
L&T Infrastructure Development Projects Limited 122.24 –
Total 586.12 694.21
8 Due to whole time directors 50.61 52.90
(Key management personnel)
A. M. Naik 18.19 19.29
K. Venkataramanan 7.39 7.23
M. V. Kotwal 4.91 5.24
S. N. Subrahmanyan 8.73 9.16
R. Shankar Raman 6.91 7.33
Shailendra Roy 4.48 4.65
Total 50.61 52.90
“Major parties” denote entities accounting for 10% or more of the aggregate for that category of transaction during respective
period.
v. Notes to related party transactions:
The Company has a marketing and selling arrangement with L&T-Construction Equipment Limited, a subsidiary company. As
per the terms of the arrangement, the Company is an agent of L&T-Construction Equipment Limited to market construction
equipment and hydraulic equipment & parts manufactured by L&T-Construction Equipment Limited and to provide after sales
product support for construction equipment. Pursuant to the aforesaid arrangement, L&T-Construction Equipment Limited is
required to pay commission to the Company at specified rates on the sales effected by the Company.
The financial impact of the aforesaid arrangement has been included in/disclosed vide Note Q(11)(iii) supra.
Notes forming part of the Accounts (contd.)NOTE [Q] (contd.)
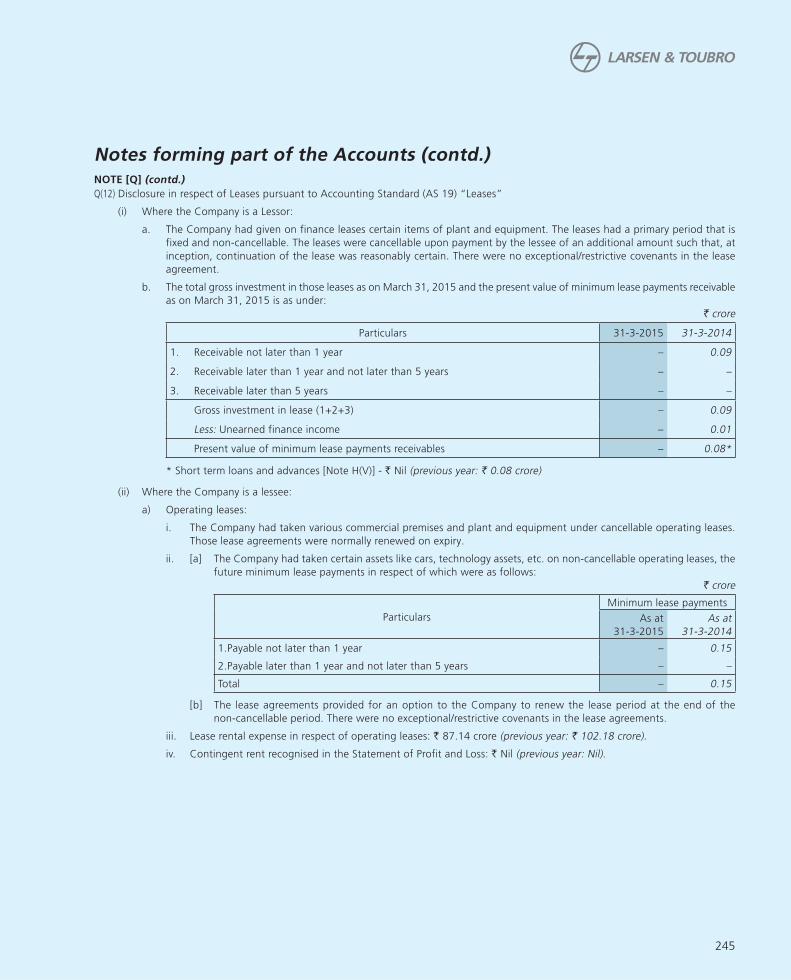
245
Q(12) Disclosure in respect of Leases pursuant to Accounting Standard (AS 19) “Leases”
(i) Where the Company is a Lessor:
a. The Company had given on finance leases certain items of plant and equipment. The leases had a primary period that is
fixed and non-cancellable. The leases were cancellable upon payment by the lessee of an additional amount such that, at
inception, continuation of the lease was reasonably certain. There were no exceptional/restrictive covenants in the lease
agreement.
b. The total gross investment in those leases as on March 31, 2015 and the present value of minimum lease payments receivable
as on March 31, 2015 is as under:
` crore
Particulars 31-3-2015 31-3-2014
1. Receivable not later than 1 year – 0.09
2. Receivable later than 1 year and not later than 5 years – –
3. Receivable later than 5 years – –
Gross investment in lease (1+2+3) – 0.09
Less: Unearned finance income – 0.01
Present value of minimum lease payments receivables – 0.08*
* Short term loans and advances [Note H(V)] - ` Nil (previous year: ` 0.08 crore)
(ii) Where the Company is a lessee:
a) Operating leases:
i. The Company had taken various commercial premises and plant and equipment under cancellable operating leases.
Those lease agreements were normally renewed on expiry.
ii. [a] The Company had taken certain assets like cars, technology assets, etc. on non-cancellable operating leases, the
future minimum lease payments in respect of which were as follows:
` crore
Particulars
Minimum lease payments
As at
31-3-2015
As at
31-3-2014
1.Payable not later than 1 year – 0.15
2.Payable later than 1 year and not later than 5 years – –
Total – 0.15
[b] The lease agreements provided for an option to the Company to renew the lease period at the end of the
non-cancellable period. There were no exceptional/restrictive covenants in the lease agreements.
iii. Lease rental expense in respect of operating leases: ` 87.14 crore (previous year: ` 102.18 crore).
iv. Contingent rent recognised in the Statement of Profit and Loss: ` Nil (previous year: Nil).
Notes forming part of the Accounts (contd.)NOTE [Q] (contd.)
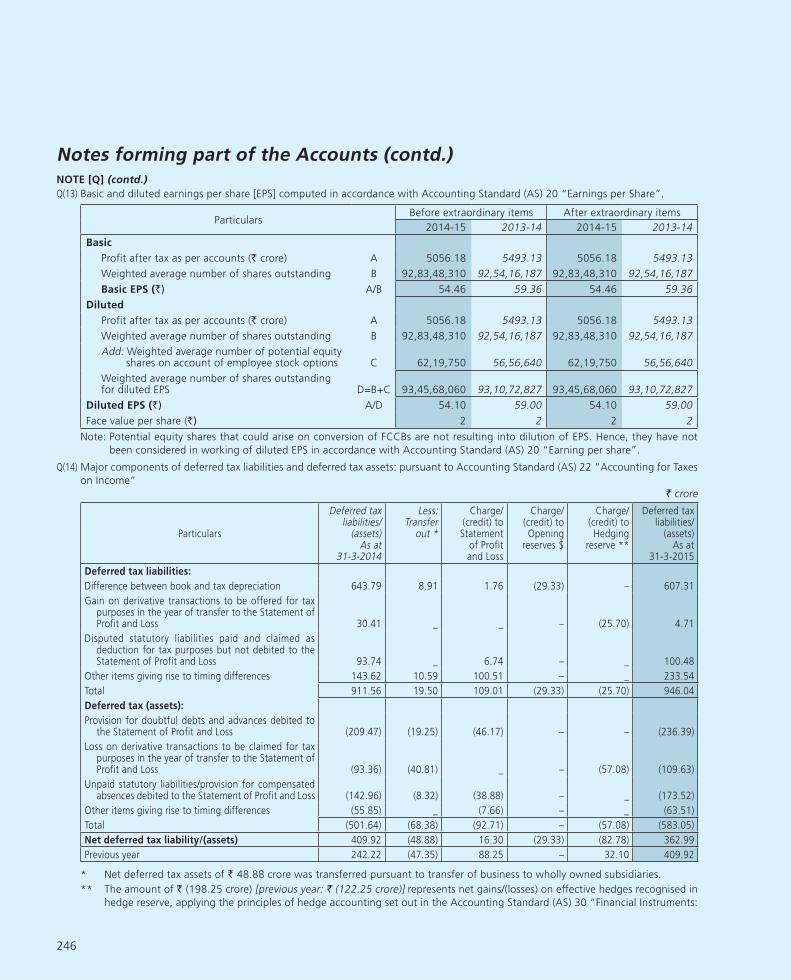
246
Q(13) Basic and diluted earnings per share [EPS] computed in accordance with Accounting Standard (AS) 20 “Earnings per Share”.
ParticularsBefore extraordinary items After extraordinary items
2014-15 2013-14 2014-15 2013-14
Basic
Profit after tax as per accounts (` crore) A 5056.18 5493.13 5056.18 5493.13
Weighted average number of shares outstanding B 92,83,48,310 92,54,16,187 92,83,48,310 92,54,16,187
Basic EPS (`) A/B 54.46 59.36 54.46 59.36
Diluted
Profit after tax as per accounts (` crore) A 5056.18 5493.13 5056.18 5493.13
Weighted average number of shares outstanding B 92,83,48,310 92,54,16,187 92,83,48,310 92,54,16,187
Add: Weighted average number of potential equity shares on account of employee stock options C 62,19,750 56,56,640 62,19,750 56,56,640
Weighted average number of shares outstanding for diluted EPS D=B+C 93,45,68,060 93,10,72,827 93,45,68,060 93,10,72,827
Diluted EPS (`) A/D 54.10 59.00 54.10 59.00
Face value per share (`) 2 2 2 2
Note: Potential equity shares that could arise on conversion of FCCBs are not resulting into dilution of EPS. Hence, they have not
been considered in working of diluted EPS in accordance with Accounting Standard (AS) 20 “Earning per share”.
Q(14) Major components of deferred tax liabilities and deferred tax assets: pursuant to Accounting Standard (AS) 22 “Accounting for Taxes
on Income”
` crore
Particulars
Deferred tax liabilities/
(assets) As at
31-3-2014
Less: Transfer
out *
Charge/(credit) to Statement
of Profit and Loss
Charge/(credit) to Opening
reserves $
Charge/(credit) to Hedging
reserve **
Deferred tax liabilities/
(assets) As at
31-3-2015
Deferred tax liabilities:
Difference between book and tax depreciation 643.79 8.91 1.76 (29.33) – 607.31
Gain on derivative transactions to be offered for tax purposes in the year of transfer to the Statement of Profit and Loss 30.41 _ _ – (25.70) 4.71
Disputed statutory liabilities paid and claimed as deduction for tax purposes but not debited to the Statement of Profit and Loss 93.74 _ 6.74 – _ 100.48
Other items giving rise to timing differences 143.62 10.59 100.51 – _ 233.54
Total 911.56 19.50 109.01 (29.33) (25.70) 946.04
Deferred tax (assets):
Provision for doubtful debts and advances debited to the Statement of Profit and Loss (209.47) (19.25) (46.17) – – (236.39)
Loss on derivative transactions to be claimed for tax purposes in the year of transfer to the Statement of Profit and Loss (93.36) (40.81) _ – (57.08) (109.63)
Unpaid statutory liabilities/provision for compensated absences debited to the Statement of Profit and Loss (142.96) (8.32) (38.88) – _ (173.52)
Other items giving rise to timing differences (55.85) _ (7.66) – _ (63.51)
Total (501.64) (68.38) (92.71) – (57.08) (583.05)
Net deferred tax liability/(assets) 409.92 (48.88) 16.30 (29.33) (82.78) 362.99
Previous year 242.22 (47.35) 88.25 – 32.10 409.92
* Net deferred tax assets of ` 48.88 crore was transferred pursuant to transfer of business to wholly owned subsidiaries.
** The amount of ` (198.25 crore) [previous year: ` (122.25 crore)] represents net gains/(losses) on effective hedges recognised in
hedge reserve, applying the principles of hedge accounting set out in the Accounting Standard (AS) 30 “Financial Instruments:
Notes forming part of the Accounts (contd.)NOTE [Q] (contd.)

247
Recognition and Measurement”. The amount is after considering the net deferred tax asset of ` 82.78 crore (previous year net
deferred tax liability: ` 32.10 crore).
$ Reversal of deferred tax on depreciation charged against opening reserves as on April 1, 2014, pursuant to Schedule II of
Companies Act 2013, ` 29.33 crore.
Q(15) Pursuant to the business transfer agreement dated March 15, 2014, the Integrated Engineering Service business of the Company has
been transferred at book value to a wholly owned subsidiary L&T Technology Services Limited as a going concern with effect from
April 1, 2014 for a lump sum consideration of ` 549.49 crore.
Q(16) Disclosures in respect of joint ventures pursuant to Accounting Standard (AS) 27 “Financial Reporting of Interests in Joint Ventures”
a) List of Joint Ventures:
Sr.
no. Name of Joint Venture Description of interest/(description of job)
Proportion of
Ownership
Interest (%)
Country
of
residence
1 L&T - Hochtief Seabird Joint Venture Jointly Controlled Entity (Construction of breakwater, Karwar)
90 India
2 International Metro Civil Contractors Joint Venture
Jointly Controlled Entity (Construction of Delhi Metro Corridor - Phase I Tunnel Project)
26 India
3 HCC - L&T Purulia Joint Venture Jointly Controlled Entity (Construction of Pumped Storage Project)
43 India
4 Desbuild - L&T Joint Venture Jointly Controlled Entity (Renovation of US Consulate, Chennai)
49 India
5 Metro Tunneling Group Jointly Controlled Entity (Construction of Delhi Metro Corridor - Phase II Tunnel Project)
26 India
6 L&T-AM Tapovan Joint Venture Jointly Controlled Entity (Construction of Head Race Tunnel for Tapovan Vishnugad Hydro Electric project at Chamoli, Uttaranchal)
65 India
7 L&T-Shanghai Urban Construction (Group) Corporation Joint Venture
Jointly Controlled Entity (Construction of Twin Tunnel between IGI Airport and Sector 21 for DMRC)
51 India
8 L&T-Eastern Joint Venture Jointly Controlled Entity (Construction and maintenance of 295 Residential Units at Dubai)
65 UAE
9 Metro Tunneling Chennai - L&T Shanghai Urban Construction (Group) Corporation Joint Venture
Jointly Controlled Entity (Construction of UG Stations at Nehru Park, KMC and Pachiyappas College and associated tunnels for CMRL).
75 India
10 Metro Tunneling Delhi - L&T Shanghai Urban Construction (Group) Corporation Joint Venture
Jointly Controlled Entity (Construction of Delhi Metro Corridor - Tunnel Project-Phase - CC5)
60 India
11 Laren & Toubro Limited - Shapoorji Pallonji & Co. Limited Joint Venture
Jointly Controlled Entity (Design & Build work for Construction of TCS SEZ at Kolkata, West Bengal)
50 India
12 L&T- Shanghai Urban Construction (Group) Corporation Joint Venture CC27 Delhi
Jointly Controlled Entity (Design and Construction of Tunnel for Delhi MRTS Project for Phase-III)
68 India
13 Civil Works Joint Venture Jointly Controlled Entity (Contract for Detail Design, Construction and Commissioning of Package 2 of The Riyadh Metro Project)
29 Saudi Arabia
14 Aktor-Larsen & Toubro –Yapi Merkezi-stfa-Al Jaber Engineering Joint Venture
Jointly Controlled Entity (Design & Build Package 3,Gold Line underground, a part of the construction of the Qatar Integrated Railway Project)
22 Qatar
15 L & T Delma Mafraq Joint Venture Jointly Controlled Entity (Improvement of Mafraq to Al Ghwaifat Border Post Highway Section No.4A)
60 UAE
16 Larsen & Toubro Limited -Scomi Engineering BHD Consortium - Residual Joint Works - Joint Venture
Jointly Controlled Entity (Implementation of residual joint works for monorail system in Mumbai)
60 India
Notes forming part of the Accounts (contd.)NOTE [Q] (contd.)

248
Sr.
no. Name of Joint Venture Description of interest/(description of job)
Proportion of
Ownership
Interest (%)
Country
of
residence
17 Larsen and Toubro Limited-Scomi Engineering BHD Consortium – O&M Joint Venture
Jointly Controlled Entity (Operation and Maintenance of monorail system)
50 India
18 Larsen & Toubro Limited and NCC Limited Joint Venture
Jointly Controlled Entity (Supply and construction of 2 parallel 2100 mm diameter steel gravity mains conduit pipes from Palra to Bhureka)
55 India
19 L&T-KBL (UJV) Hyderabad Jointly Controlled Operations (Investigation, Design, Supply and Erection of necessary lift systems with all electrical and mechanical components including surge protection systems)
– India
20 L&T - HCC Joint Venture Jointly Controlled Operations (Four laning and strengthening of exiting two lane sections from 240 km to 320 km NH-2)
– India
21 Patel-L&T Consortium Jointly Controlled Operations (Parbati Hydro Electric Project) – India
22 L&T-SVEC Joint Venture Jointly Controlled Operations (Lift Irrigation Project at Hyderabad)
– India
23 L&T-KBL-MAYTAS Joint Venture Jointly Controlled Operations (Transmission of 735 Mld treated water associated with all Civil, Electrical & Mechanical works at Hyderabad)
– India
24 Larsen & Toubro Limited & Bharat Rail Automation Pvt Ltd Joint Venture (Package 3)
Jointly Controlled Operations (Design, Supply, Erection, Testing & Commissioning of 25 KV, 50HZ, Single Phase, Traction Over-head Equipment, Switching Stations, SCADA and other associated works, in the state of Karnataka and Andhra Pradesh, India)
– India
25 Larsen & Toubro Limited & Bharat Rail Automation Pvt Ltd Joint Venture (Package 3)
Jointly Controlled Operations (Design, Supply, Erection, Testing & Commissioning of 25 KV, 50HZ, Single Phase, Traction Over-head Equipment, Switching Stations, and other associated works, in the state of Karnataka and Andhra Pradesh, India)
– India
26 L&T and Scomi Engineering BHD Joint Venture
Jointly Controlled Operations (Implementation of monorail system in Mumbai)
– India
b) Financial interest in jointly controlled entities (to the extent of the Company’s share)
` crore
Sr.
no.
Name of Integrated
joint ventures/jointly
controlled entities
Company’s share
As at March 31, 2015 For the Year 2014-15
Assets Liabilities Income Expenses Tax Net profit
(Note K)
Net loss
(Note O)
1 L&T-Hochtief Seabird Joint Venture
71.47 47.75 – 0.01 – – 0.01
(71.02) (47.21) (0.12) (0.01) (0.43) (–) (0.32)
2 International Metro Civil Contractors Joint Venture
13.06 3.82 – $ 0.11 – – 0.10
(12.21) (3.85) (–) (0.03) (–) (–) (0.03)
3 Metro Tunneling Group 22.20 7.30 1.12 – * 0.36 0.76 –
(22.37) (7.23) (1.17) (-0.47) (0.22) (0.48) (–)
4 L&T-Shanghai Urban Construction (Group) Corporation Joint Venture
18.39 5.12 0.45 0.29 0.05 0.11 –
(17.97) (4.81) (0.63) (0.02) (0.19) (0.42) (–)
5 HCC-L&T Purulia Joint Venture
2.98 2.69 0.22 – – 0.22 –
(2.98) (2.91) (–) (0.01) (–) (–) (0.01)
6 L&T-AM Tapovan Joint Venture
148.68 40.96 1.26 1.26 – – –
(146.91) (55.20) (11.32) (11.32) (–) (–) (–)
7 Desbuild - L&T Joint Venture
0.04 -0.03 – – ^ - 0.02 0.02 –
(0.34) (0.28) (–) (–) Ω (–) (–) (–) #
Notes forming part of the Accounts (contd.)NOTE [Q] (contd.)

249
` crore
Sr.
no.
Name of Integrated
joint ventures/jointly
controlled entities
Company’s share
As at March 31, 2015 For the Year 2014-15
Assets Liabilities Income Expenses Tax Net profit
(Note K)
Net loss
(Note O)
8 L&T - Eastern Joint Venture
17.79 12.57 0.23 0.54 – – 0.30
(24.72) (18.60) (0.46) (-1.61) (–) (2.07) ( –)
9 Metro Tunneling Chennai - L&T Shanghai Urban Construction (Group) Corporation Joint Venture
109.62 64.67 216.66 221.20 -0.04 – 4.14
(167.88) (110.04) (180.01) (167.47) (3.82) (8.73) (–)
10 Metro Tunneling Delhi - L&T Shanghai Urban Construction (Group) Corporation Joint Venture
128.51 71.94 140.44 141.71 – – 1.26
(118.65) (99.55) (196.00) (194.23) (0.55) (1.22) (–)
11 Laren & Toubro Limited - Shapoorji Pallonji & Co. Limited Joint Venture
75.16 53.51 82.55 96.94 – – 14.39
(104.97) (66.15) (166.22) (160.27) (1.84) (4.11) (–)
12 L&T- Shanghai Urban Construction (Group) Corporation Joint Venture CC27 Delhi
261.99 196.73 383.54 384.73 – – 1.19
(263.53) (250.88) (279.39) (273.87) (1.71) (3.81) (–)
13 Aktor-Larsen & Toubro- Yapi Merkezi-stfa-Al Jaber Engineering Joint Venture
553.11 553.11 – – – – –
(–) (–) (–) (–) (–) (–) (–)
14 Civil Works Joint Venture 1799.47 1742.36 57.12 – – 57.12 –
(–) (–) (–) (–) (–) (–) (–)
15 L&T-Delma Mafraq Joint Venture
125.92 125.92 106.78 106.78 – – –
(–) (–) (–) (–) (–) (–) (–)
16 Larsen and Toubro Limited -Scomi Engineering BHD Consortium- Residual Joint works – Joint Venture
184.85 184.85 1316.08 1313.96 0.55 1.57 –
(–) (–) (–) (–) (–) (–) (–)
17 Larsen and Toubro Limited-Scomi Engineering BHD Consortium – O&M Joint Venture
7.60 7.60 7.11 21.52 – – 14.41
(–) (–) (–) (–) (–) (–) (–)
18 Larsen & Toubro Limited and NCC Limited Joint Venture
72.10 72.10 41.35 41.35 – – –
(–) (–) (–) (–) (–) (–) (–)
Total 3612.92 3192.97 2354.91 2330.38 0.90 59.78 35.81
(953.55) (666.72) (834.16) (804.91) (8.75) (20.86) (0.36)
Share of Net Assets in Jointly Controlled Entities
419.96
(286.83)
Amounts less than ` 0.01 crore:
Current year: * ` 2634, $ ` 3352, ^ ` 8258
Previous year: Ω ` 8258, # ` 8258
Notes: i. Figures in brackets () relate to previous year.
ii. Contingent liabilities, if any, incurred in relation to interest in Joint Ventures as at March 31, 2015 : ̀ 3248.49 crore (previous year ` 505.07 crore) and share in Contingent liabilities incurred jointly with other ventures as at March 31, 2015 : ` Nil (previous year ` Nil)
iii. Share in Contingent liabilities of Joint Ventures themselves for which the company is contingently liable as on March 31, 2015: ` 80.13 crore (previous year ` 74.72 crore)
iv. Contingent liabilities in respect of liabilities of other ventures of Joint Ventures as on March 31, 2015: ̀ 10840.81 crore (previous year ̀ 402.08 crore)
v. Capital Commitments, if any, in relation to Interest in Joint Ventures as at March 31 ,2015 : ` Nil (previous year ` Nil)
vi. Share in Capital Commitments of Joint Ventures themselves for which the Company is contingent liable as at March 31 ,2015 : ` 159.34 crore (previous year ` Nil)
Notes forming part of the Accounts (contd.)NOTE [Q] (contd.)

250
Q(17) Disclosures pursuant to Accounting Standard (AS) 29 “Provisions, Contingent Liabilities and Contingent Assets”:
a) Movement in provisions:
` crore
Sr. no.
Particulars
Class of Provisions
Product warranties
Expected tax liability
in respect of indirect taxes
Litigation related
obligations
Contractual rectification
cost - construction
contracts
Total
1 Balance as at 1-4-2014 9.71 72.36 8.27 167.89 258.23
2 Additional provision during the year 3.70 41.30 – 63.29 108.29
3 Provision used/reversed during the year # (2.69) (20.24) – (84.48) (107.41)
4 Balance as at 31-3-2015 (4=1+2-3) 10.72 93.42 8.27 146.70 259.11
# includes provision used during the year ` 4.58 crore (previous year: ` 0.64 crore)
b) Nature of provisions:
i. Product warranties: The Company gives warranties on certain products and services, undertaking to repair or replace the
items that fail to perform satisfactorily during the warranty period. Provision made as at March 31, 2015 represents the
amount of the expected cost of meeting such obligations of rectification/replacement. The timing of the outflows is expected
to be within a period of five years from the date of Balance Sheet.
ii. Expected tax liability in respect of indirect taxes represents mainly the differential sales tax liability on account of non-
collection of declaration forms.
iii. Provision for litigation related obligations represents liabilities that are expected to materialise in respect of matters in
appeal.
iv. Contractual rectification cost represents the estimated cost the Company is likely to incur during defect liability period as
per the contract obligations in respect of completed construction contracts accounted under (AS) 7 (Revised) “Construction
Contracts”.
c) Disclosure in respect of contingent liabilities is given as part of Note (I) to the Balance Sheet.
Q(18) In line with the Company’s risk management policy, the various financial risks mainly relating to changes in the exchange rates, interest
rates and commodity prices are hedged by using a combination of forward contracts, swaps and other derivative contracts, besides
the natural hedges.
a) The particulars of derivative contracts entered into for hedging purposes outstanding as at March 31, 2015 are as under:
` crore
Category of Derivative Instruments
Amount of exposures hedged
As at
31-3-2015
As at
31-3-2014
i) For hedging foreign currency risks
a) Forward contracts for receivables including firm commitments and highly probable
forecasted transactions 4501.34 4727.46
b) Forward contracts for payables including firm commitments and highly probable
forecasted transactions 10825.77 8898.31
c) Currency and Interest rate Swaps 2567.35 2530.89
d) Option Contracts 204.23 160.11
ii) For hedging commodity price risks
Commodity Futures 242.52 307.01
Notes forming part of the Accounts (contd.)NOTE [Q] (contd.)

251
b) Unhedged foreign currency exposures as at March 31, 2015 are as under:
` crore
Unhedged Foreign Currency ExposuresAs at
31-3-2015
As at
31-3-2014
i) Receivables, including firm commitments and highly probable forecasted transactions 27042.70 39564.88
ii) Payables, including firm commitments and highly probable forecasted transactions 26158.82 34775.68
Note: As per the Royal Monetary Authority of Bhutan, Bhutan’s national currency is pegged to the Indian rupee at parity.
Accordingly, the unhedged foreign currency exposures reported above excludes exposures [Receivables amounting to
` 1646.07 crore (previous year: ` 345.34 crore) and payables amounting to ` 1142.08 crore (previous year ` 121.46 crore)]
with respect to currencies such as Bhutan Ngultrum (BTN).
Q(19) Auditors’ remuneration (excluding service tax):
` crore
Particulars 2014-15 2013-14
a. For Audit fees 1.25 1.08
b. For Taxation matters 0.30 0.26
c. For Other services
(i) Limited review of standalone and consolidated financial statements on a quarterly basis 1.25 1.08
(ii) Other services including certification work 0.88 0.97
d. For reimbursement of expenses 0.20 0.24
Note: The above figures include fees paid for services rendered in connection with issue of Foreign Currency Convertible Bonds (FCCB)
amounting to ` 0.08 crore (Previous year: ` Nil) charged to securities premium account during the year.
Q(20) Value of imports (on C.I.F. basis):
` crore
Particulars 2014-15 2013-14
Raw materials 1412.86 1954.36
Components and spare parts 1074.52 1701.93
Capital goods 219.69 205.37
Q(21) Expenditure in foreign currency:
` crore
Particulars 2014-15 2013-14
On overseas contracts 6133.77 4948.13
Royalty and technical know-how fees 5.67 5.59
Interest 126.97 147.40
Professional/consultation fees 187.67 183.12
Other matters 482.19 719.10
Notes forming part of the Accounts (contd.)NOTE [Q] (contd.)

252
Q(22) Dividends remitted in foreign currency:
` crore
Particulars 2014-15 2013-14
Dividend for the year ended March 31, 2014 to:
i. 11 non-resident shareholders on 20,826 shares held by them (previous year: 11 non-residents
on 20,826 shares) on 26-8-2014 0.03 0.03
ii. Custodian of global depositary receipts on 2,10,12,316 shares (previous year: 2,93,92,990
shares) on 26-8-2014 29.94 36.24
Q(23) Earnings in foreign exchange:
` crore
Particulars 2014-15 2013-14
Export of goods [including ` 672.93 crore on FOB basis (previous year: ` 942.14 crore)] 687.45 1006.72
Construction and project related activities 8431.36 6728.40
Export of services 128.71 1614.39
Commission 5.69 6.73
Interest received 0.00* 0.02
Other receipts 187.51 53.49
* ` 9652
Q(24) The Company has amounts due to suppliers under The Micro, Small and Medium Enterprises Development Act, 2006, [MSMED Act]
as at March 31, 2015. The disclosure pursuant to the said Act is as under:
` crore
Particulars 2014-15 2013-14
Principal amount due to suppliers under MSMED Act, 2006 106.94 51.49
Interest accrued, due to suppliers under MSMED Act on the above amount, and unpaid 3.76 0.11
Payment made to suppliers (other than interest) beyond the appointed day during the year 109.94 19.89
Interest paid to suppliers under MSMED Act (other than Section 16) – –
Interest paid to suppliers under MSMED Act (Section 16) 0.45 0.04
Interest due and payable towards suppliers under MSMED Act for payments already made 1.35 0.14
Interest accrued and remaining unpaid at the end of the year to suppliers under MSMED Act 3.61 0.69
Q(25) There are no amounts due and outstanding to be credited to Investor Education & Protection Fund as at March 31, 2015.
Notes forming part of the Accounts (contd.)NOTE [Q] (contd.)
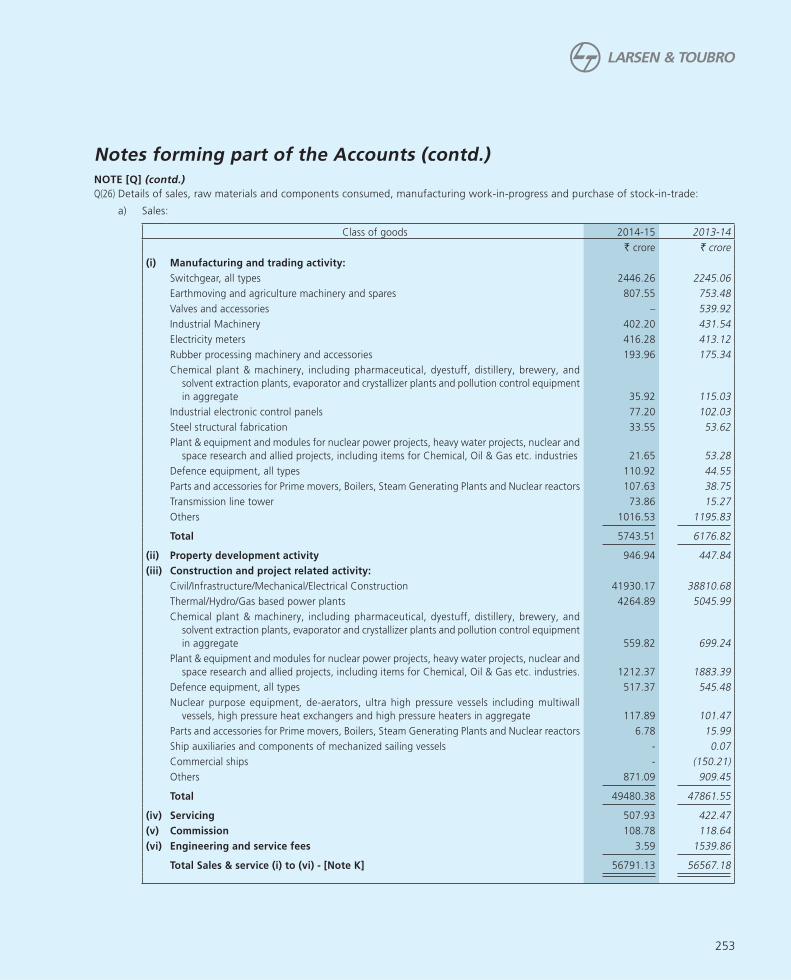
253
Q(26) Details of sales, raw materials and components consumed, manufacturing work-in-progress and purchase of stock-in-trade:
a) Sales:
Class of goods 2014-15 2013-14
` crore ` crore
(i) Manufacturing and trading activity:
Switchgear, all types 2446.26 2245.06
Earthmoving and agriculture machinery and spares 807.55 753.48
Valves and accessories – 539.92
Industrial Machinery 402.20 431.54
Electricity meters 416.28 413.12
Rubber processing machinery and accessories 193.96 175.34
Chemical plant & machinery, including pharmaceutical, dyestuff, distillery, brewery, and
solvent extraction plants, evaporator and crystallizer plants and pollution control equipment
in aggregate 35.92 115.03
Industrial electronic control panels 77.20 102.03
Steel structural fabrication 33.55 53.62
Plant & equipment and modules for nuclear power projects, heavy water projects, nuclear and
space research and allied projects, including items for Chemical, Oil & Gas etc. industries 21.65 53.28
Defence equipment, all types 110.92 44.55
Parts and accessories for Prime movers, Boilers, Steam Generating Plants and Nuclear reactors 107.63 38.75
Transmission line tower 73.86 15.27
Others 1016.53 1195.83
Total 5743.51 6176.82
(ii) Property development activity 946.94 447.84
(iii) Construction and project related activity:
Civil/Infrastructure/Mechanical/Electrical Construction 41930.17 38810.68
Thermal/Hydro/Gas based power plants 4264.89 5045.99
Chemical plant & machinery, including pharmaceutical, dyestuff, distillery, brewery, and
solvent extraction plants, evaporator and crystallizer plants and pollution control equipment
in aggregate 559.82 699.24
Plant & equipment and modules for nuclear power projects, heavy water projects, nuclear and
space research and allied projects, including items for Chemical, Oil & Gas etc. industries. 1212.37 1883.39
Defence equipment, all types 517.37 545.48
Nuclear purpose equipment, de-aerators, ultra high pressure vessels including multiwall
vessels, high pressure heat exchangers and high pressure heaters in aggregate 117.89 101.47
Parts and accessories for Prime movers, Boilers, Steam Generating Plants and Nuclear reactors 6.78 15.99
Ship auxiliaries and components of mechanized sailing vessels - 0.07
Commercial ships - (150.21)
Others 871.09 909.45
Total 49480.38 47861.55
(iv) Servicing 507.93 422.47
(v) Commission 108.78 118.64
(vi) Engineering and service fees 3.59 1539.86
Total Sales & service (i) to (vi) - [Note K] 56791.13 56567.18
Notes forming part of the Accounts (contd.)NOTE [Q] (contd.)
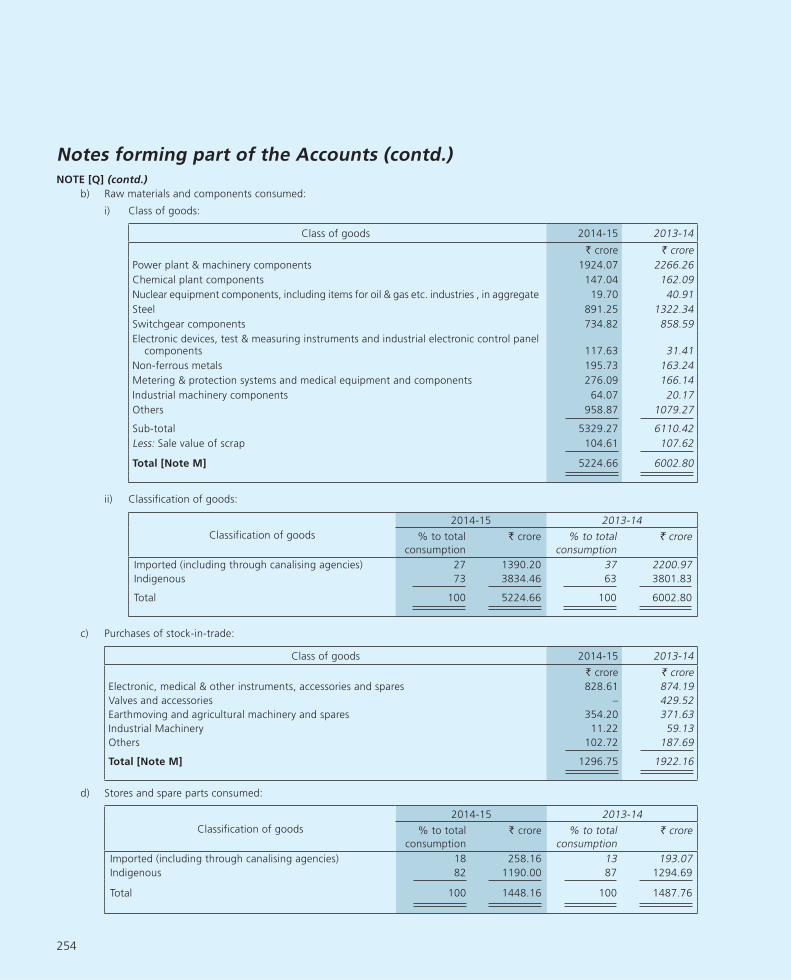
254
b) Raw materials and components consumed:
i) Class of goods:
Class of goods 2014-15 2013-14
` crore ` crore
Power plant & machinery components 1924.07 2266.26
Chemical plant components 147.04 162.09
Nuclear equipment components, including items for oil & gas etc. industries , in aggregate 19.70 40.91
Steel 891.25 1322.34
Switchgear components 734.82 858.59
Electronic devices, test & measuring instruments and industrial electronic control panel components 117.63 31.41
Non-ferrous metals 195.73 163.24
Metering & protection systems and medical equipment and components 276.09 166.14
Industrial machinery components 64.07 20.17
Others 958.87 1079.27
Sub-total 5329.27 6110.42
Less: Sale value of scrap 104.61 107.62
Total [Note M] 5224.66 6002.80
ii) Classification of goods:
Classification of goods
2014-15 2013-14
% to total
consumption
` crore % to total
consumption
` crore
Imported (including through canalising agencies) 27 1390.20 37 2200.97
Indigenous 73 3834.46 63 3801.83
Total 100 5224.66 100 6002.80
c) Purchases of stock-in-trade:
Class of goods 2014-15 2013-14
` crore ` crore
Electronic, medical & other instruments, accessories and spares 828.61 874.19
Valves and accessories – 429.52
Earthmoving and agricultural machinery and spares 354.20 371.63
Industrial Machinery 11.22 59.13
Others 102.72 187.69
Total [Note M] 1296.75 1922.16
d) Stores and spare parts consumed:
Classification of goods
2014-15 2013-14
% to total
consumption
` crore % to total
consumption
` crore
Imported (including through canalising agencies) 18 258.16 13 193.07
Indigenous 82 1190.00 87 1294.69
Total 100 1448.16 100 1487.76
Notes forming part of the Accounts (contd.)NOTE [Q] (contd.)

255
e) Details of manufacturing work-in-progress:
Class of goods 2014-15 2013-14
` crore ` crore
Industrial Machinery 43.52 44.34
Defence equipment, all types 42.96 36.47
Steel structural fabrication 34.25 27.39
Switchgear, all types 46.87 50.55
Transmission line tower 73.88 59.86
Chemical plant & machinery, including pharmaceutical, dyestuff, distillery, brewery and solvent
extraction plants, evaporator and crystallizer plants and pollution control equipment in
aggregate 6.50 11.22
Low voltage and Medium voltage switchboards and panels 100.41 71.61
Plant & equipment and modules for nuclear power projects, heavy water projects, nuclear and
space research and allied projects, including items for Chemical, Oil & Gas etc. industries. 16.62 17.66
Casting products 20.51 15.20
Rubber processing machinery and accessories 21.48 8.80
Nuclear purpose equipment, de-aerators, ultra high pressure vessels including multiwall vessels,
high pressure heat exchangers and high pressure heaters in aggregate 7.46 5.13
Ship auxiliaries and components of mechanised sailing vessels 111.41 107.46
Servicing of construction machinery 12.28 5.41
AC drives, DC drives, programmable logic controllers 2.79 1.53
Meters and protection systems 0.47 0.54
Others 41.37 84.42
Total [Note H(II)] 582.78 547.59
Q(27) Contribution to political parties include:
Contribution to political parties aggregating to ` 11.00 crore (previous year: ` Nil) made during the year as follows: Indian National
Congress: ` 5.00 crore, Bharatiya Janata Party: ` 5.00 crore and Shiv Sena ` 1.00 crore.
Q(28) a) Amount required to be spent by the Company on Corporate Social Responsibility (CSR) related activities during the year
` 106.21 crore.
b) The amount recognised as expense in the Statement of Profit & Loss on CSR related activities is ` 76.54 crore, which comprises
of:
` crore
Sr.
no.
Particulars Disclosed
under
In cash Yet to be
paid in cash
Total
i) Construction/Acquisition of assets charged to the
Statement of Profit and Loss
Note O 10.71 2.43 13.14
ii) For purposes other than (i) above Note O 40.68 6.96 47.64
Note N 15.76 – 15.76
Total 67.15 9.39 76.54
Q(29) Figures for the previous year have been regrouped/reclassified wherever necessary.
Notes forming part of the Accounts (contd.)NOTE [Q] (contd.)

256
NOTE [R] SIGNIFICANT ACCOUNTING POLICIES
1. Basis of accounting
The Company maintains its accounts on accrual basis following the historical cost convention, except for the revaluation of certain
fixed assets, in accordance with generally accepted accounting principles [“GAAP”] in compliance with the provisions of the Companies
Act, 2013 and the Accounting Standards as specified in the Companies (Accounting Standards) Rules, 2006 read with Rule 7(1) of
the Companies (Accounts) Rules, 2014 issued by the Ministry of Corporate Affairs in respect of section 133 of the Companies Act,
2013. Further, the guidance notes/announcements issued by the Institute of Chartered Accountants of India (ICAI) are also considered,
wherever applicable except to the extent where compliance with other statutory promulgations override the same requiring a different
treatment.
The preparation of financial statements in conformity with GAAP requires that the management of the Company makes estimates and
assumptions that affect the reported amounts of income and expenses of the period, the reported balances of assets and liabilities
and the disclosures relating to contingent liabilities as of the date of the financial statements. Examples of such estimates include the
useful lives of tangible and intangible fixed assets, allowance for doubtful debts/advances, future obligations in respect of retirement
benefit plans, etc. difference, if any, between the actual results and estimates is recognised in the period in which the results are
known.
2. Presentation of financial statements
The Balance Sheet and the Statement of Profit and Loss are prepared and presented in the format prescribed in the Schedule III to the
Companies Act, 2013 (“the Act”). The Cash Flow Statement has been prepared and presented as per the requirements of Accounting
Standard (AS) 3 “Cash Flow Statements”. The disclosure requirements with respect to items in the Balance Sheet and Statement of
Profit and Loss, as prescribed in the Schedule III to the Act, are presented by way of notes forming part of accounts along with the
other notes required to be disclosed under the notified Accounting Standards and the Equity Listing Agreement.
Amounts in the financial statements are presented in Indian Rupees in crore [1 crore = 10 million] rounded off to two decimal places
in line with the requirements of Schedule III. Per share data are presented in Indian Rupees to two decimals places.
3. Revenue recognition
Revenue is recognised based on nature of activity when consideration can be reasonably measured and there exists reasonable certainty
of its recovery.
A. Revenue from operations
a. Sales & Service
i. Sales and service include excise duty and adjustments made towards liquidated damages and price variation, wherever
applicable. Escalation and other claims, which are not ascertainable/acknowledged by customers, are not taken into
account.
ii. Revenue from sale of manufactured and traded goods is recognised when the substantial risks and rewards of
ownership are transferred to the buyer under the terms of the contract.
iii. Revenue from property development activity which are in substance similar to delivery of goods is recognised when all
significant risks and rewards of ownership in the land and/or building are transferred to the customer and a reasonable
expectation of collection of the sale consideration from the customer exists.
Revenue from those property development activities which have the same economic substance as that of a construction
contract is recognised based on the ‘Percentage of completion method’ (POC) when the outcome of a real estate
project can be estimated reliably upon fulfillment of all the following conditions:
a. All critical approvals necessary for commencement of the project have been obtained;
b. When the stage of completion of the project reaches a reasonable level of development i.e., contract costs for
work performed bears a reasonable proportion to the estimated total contract costs. For this purpose, a reasonable
level of development is treated as achieved only if the cost incurred (excluding cost of land/developmental rights
and borrowing cost) is atleast 25% of the total of such cost;
c. Atleast 25% of the saleable project area is secured by contracts or agreements with buyers;
Notes forming part of the Accounts (contd.)

257
d. Atleast 10 % of the total revenue as per the agreements of sale or any other legally enforceable documents are
realised at the reporting date in respect of each of the contracts and it is reasonable to expect that the parties
to such contracts will comply with the payment terms as defined in the contracts.
The costs incurred on property development activities are carried as “Inventories” till such time the outcome of the
project cannot be estimated reliably and all the aforesaid conditions are fulfilled. When the outcome of the project
can be ascertained reliably and all the aforesaid conditions are fulfilled, revenue from property development activity
is recognised at cost incurred plus proportionate margin, using percentage of completion method. Percentage of
completion is determined based on the proportion of actual cost incurred to the total estimated cost of the project.
For this purpose, actual cost includes cost of land and developmental rights but excludes borrowing cost.
Expected loss, if any, on the project is recognised as an expense in the period in which it is foreseen, irrespective of
the stage of completion of the contract.
iv. Revenue from construction/project related activity and contracts for supply/commissioning of complex plant and
equipment is recognised as follows:
a. Cost plus contracts: Contract revenue is determined by adding the aggregate cost plus proportionate margin as
agreed with the customer.
b. Fixed price contracts: Contract revenue is recognised only to the extent of cost incurred till such time the outcome
of the job cannot be ascertained reliably. When the outcome of the contract is ascertained reliably, contract
revenue is recognised at cost of work performed on the contract plus proportionate margin, using the percentage
of completion method. Percentage of completion is the proportion of cost of work performed to-date, to the
total estimated contract costs.
Government grants in the nature of subsidy related to customer contracts are recognised as revenue from
operations in the Statement of Profit and Loss, on a prudent basis, in proportion to work completed when there
is reasonable assurance that the conditions for the grant of subsidy will be fulfilled.
Expected loss, if any, on the construction/project related activity is recognised as an expense in the period in
which it is foreseen, irrespective of the stage of completion of the contract. While determining the amount of
foreseeable loss, all elements of costs and related incidental income not included in contract revenue are taken
into consideration.
v. Revenue from contracts for the rendering of engineering design services and other services which are directly related
to the construction of an asset is recognised on similar basis as stated in (iv) supra.
vi. Revenues from construction/project related activity and contracts executed in joint ventures under work-sharing
arrangement [being jointly controlled operations, in terms of Accounting Standard (AS) 27 “Financial Reporting
of Interests in Joint Ventures”], is recognised on the same basis as similar contracts independently executed by the
Company.
vii. Revenue from service related activities is recognised using the proportionate completion method.
viii. Commission income is recognised as and when the terms of the contract are fulfilled.
ix. Revenue from engineering and service fees is recognised as per the terms of the contract
x. Profit/loss on contracts executed by Integrated Joint Ventures under profit-sharing arrangement [being Jointly Controlled
Entities, in terms of Accounting Standard (AS) 27 “Financial Reporting of Interests in Joint Ventures”] is accounted
as and when the same is determined by the joint venture. Revenue from services rendered to such joint ventures is
accounted on accrual basis.
b. Other operational revenue
Other operational revenue represents income earned from the activities incidental to the business and is recognised when
the right to receive the income is established as per the terms of the contract.
Notes forming part of the Accounts (contd.)NOTE [R] SIGNIFICANT ACCOUNTING POLICIES (contd.)

258
B. Other Income
a. Interest income is accrued at applicable interest rate.
b. Dividend income is accounted in the period in which the right to receive the same is established.
c. Other Government grants, which are revenue in nature and are towards compensation for the related costs, are recognised
as income in the Statement of Profit and Loss in the period in which the matching costs are incurred.
d. Other items of income are accounted as and when the right to receive arises.
4. Extraordinary and exceptional Items
Income or expenses that arise from events or transactions that are clearly distinct from the ordinary activities of the Company are
classified as extraordinary items. Specific disclosure of such events/transactions is made in the financial statements. Similarly, any
external event beyond the control of the Company, significantly impacting income or expense, is also treated as extraordinary item
and disclosed as such.
On certain occasions, the size, type or incidence of an item of income or expense, pertaining to the ordinary activities of the Company,
is such that its disclosure improves an understanding of the performance of the Company. Such income or expense is classified as an
exceptional item and accordingly disclosed in the notes to accounts.
5. Research and development
a. Revenue expenditure on research is expensed under respective heads of account in the period in which it is incurred.
b. Development expenditure on new products is capitalised as intangible asset, if all of the following can be demonstrated:
i. The technical feasibility of completing the intangible asset so that it will be available for use or sale
ii. The Company has intention to complete the intangible asset and use or sell it
iii. The Company has ability to use or sell the intangible asset
iv. The manner in which the probable future economic benefits will be generated including the existence of a market for
output of the intangible asset or intangible asset itself or if it is to be used internally, the usefulness of intangible assets
v. The availability of adequate technical, financial and other resources to complete the development and to use or sell the
intangible asset and
vi. The Company has ability to measure the expenditure attributable to the intangible asset during its development reliably.
The development expenditure capitalised as intangible asset is amortised over its useful life.
Other development costs that do not meet above criteria are expensed in the period in which they are incurred.
6. Employee benefits
a) Short term employee benefits:
All employee benefits falling due wholly within twelve months of rendering the service are classified as short term employee
benefits. The benefits like salaries, wages, short term compensated absences etc. and the expected cost of bonus, ex-gratia. are
recognised in the period in which the employee renders the related service.
b) Post-employment benefits:
i. Defined contribution plans: The Company’s superannuation scheme, state governed provident fund scheme, employee state
insurance scheme and employee pension scheme are defined contribution plans. The contribution paid/payable under the
schemes is recognised during the period in which the employee renders the related service.
ii. Defined benefit plans: The employees’ gratuity fund schemes, post-retirement medical care scheme, pension scheme and
provident fund scheme managed by trust are the Company’s defined benefit plans. The present value of the obligation
under such defined benefit plans is determined based on actuarial valuation using the Projected Unit Credit Method.
The obligation is measured at the present value of the estimated future cash flows. The discount rate used for determining the
present value of the obligation under defined benefit plans, is based on the market yield on government securities of a maturity
period equivalent to the weighted average maturity profile of the related obligations at the Balance Sheet date.
Notes forming part of the Accounts (contd.)NOTE [R] SIGNIFICANT ACCOUNTING POLICIES (contd.)

259
NOTE [R] SIGNIFICANT ACCOUNTING POLICIES (contd.)
Actuarial gains and losses are recognised immediately in the Statement of Profit and Loss.
The interest element in the actuarial valuation of defined benefit plans, which comprises the implicit interest cost and the impact
of changes in discount rate, is classified under finance cost. The balance charge is recognised as employee benefit expenses in
the Statement of Profit and Loss.
In case of funded plans, the fair value of the plan assets is reduced from the gross obligation under the defined benefit plans
to recognise the obligation on a net basis.
Gains or losses on the curtailment or settlement of any defined benefit plan are recognised when the curtailment or settlement
occurs. Past service cost is recognised as expense on a straight line basis over the average period until the benefits become
vested.
c) Long term employee benefits:
The obligation for long term employee benefits such as long term compensated absences, long service award etc. is recognised
in the similar manner as in the case of defined benefit plans as mentioned in (b)(ii) supra.
d) Termination benefits:
Termination benefits such as compensation under Voluntary Retirement cum Pension Scheme are recognised as expense in the
period in which they are incurred.
7. Tangible fixed assets
Tangible fixed assets are stated at original cost net of tax/duty credits availed, if any, less accumulated depreciation and cumulative
impairment and those which were revalued as on October 1,1984 are stated at the values determined by the valuers less accumulated
depreciation and cumulative impairment. Assets acquired on hire purchase basis are stated at their cash values. Specific know-how
fees paid, if any, relating to plant and equipment is treated as part of cost thereof.
Administrative and other general overhead expenses that are specifically attributable to construction or acquisition of fixed assets or
bringing the fixed assets to working condition are allocated and capitalised as a part of the cost of the fixed assets.
Own manufactured assets are capitalised at cost including an appropriate share of overheads.
Tangible assets not ready for the intended use on the date of the Balance Sheet are disclosed as “capital work-in-progress”. (Also
refer to policy on leases, borrowing costs, impairment of assets and foreign currency transactions infra.)
8. Leases
The determination of whether an agreement is, or contains, a lease is based on the substance of the agreement at the date of
inception.
a. Lease transactions entered into prior to April 1, 2001:
Assets leased out are stated at original cost. Lease equalisation adjustment is the difference between capital recovery included
in the lease rentals and depreciation provided in the books.
Lease rentals in respect of assets acquired under leases are charged to Statement of Profit and Loss.
b. Lease transactions entered into on or after April 1, 2001:
Finance leases:
i. Assets acquired under leases where the Company has substantially all the risks and rewards of ownership are classified as
finance leases. Such assets are capitalised at the inception of the lease at the lower of the fair value or the present value
of minimum lease payments and a liability is created for an equivalent amount. Each lease rental paid is allocated between
the liability and the interest cost, so as to obtain a constant periodic rate of interest on the outstanding liability for each
period.
iii. Assets given under a finance lease are recognised as a receivable at an amount equal to the net investment in the lease.
Lease income is recognised over the period of the lease so as to yield a constant rate of return on the net investment in
the lease.
iv. Initial direct costs relating to assets given on finance leases are charged to Statement of Profit and Loss.
Notes forming part of the Accounts (contd.)
260
Operating leases:
i) Assets acquired on leases where a significant portion of the risks and rewards of ownership are retained by the lessor are
classified as operating leases. Lease rentals are charged to the Statement of Profit and Loss on accrual basis.
ii) Assets leased out under operating leases are capitalised. Rental income is recognised on accrual basis over the lease term.
(Also refer to policy on depreciation, infra)
9. Depreciation
a. Owned assets
i. Revalued assets:
Depreciation is provided on straight line method on the values and based at the rates given by the valuers. The difference
between depreciation provided on revalued amount and on historical cost is transferred from revaluation reserve to the
Statement of Profit and Loss.
ii. Assets carried at historical cost:
Depreciation on assets carried at historical costs is provided on straight line method on the basis of useful life as specified
in Schedule II to the Companies Act, 2013 except in respect of certain assets where the useful life was determined by
technical evaluation. The carrying amount of the assets as on April 1, 2014 is depreciated over the remaining useful life.
Where the useful life of the asset has expired, the carrying amount as on April 1, 2014 has been charged to the retained
earnings as on April 1, 2014.
iii. Depreciation for additions to/deductions from, owned assets is calculated pro rata. Extra shift depreciation is provided on
a location basis.
iv. Depreciation charge for impaired assets is adjusted in future periods in such a manner that the revised carrying amount of
the asset is allocated over its remaining useful life.
b. Leased assets:
i. Lease transactions entered into prior to April 1, 2001:
Lease charge comprising statutory depreciation and lease equalisation charge is provided for assets given on lease over the
primary period of the lease equal to recovery of net investment in the lease. Accordingly, while the statutory depreciation
on such assets is provided for on straight line method as per Schedule II to the Companies Act, 2013, the difference is
adjusted through lease equalisation and lease adjustment account.
ii. Lease transactions entered into on or after April 1, 2001:
Assets acquired under finance leases are depreciated on a straight line basis over the lease term. Where there is reasonable
certainty that the Company shall obtain ownership of the assets at the end of the lease term, such assets are depreciated
based on the useful life prescribed under Schedule II to the Companies Act, 2013 or based on the useful life adopted by
the Company for similar assets.
iii. Leasehold land
Land acquired under long term lease is classified under “tangible assets” and is depreciated over the period of lease.
10. Intangible assets and amortisation
Intangible assets are stated at original cost net of tax/duty credits availed, if any, less accumulated amortisation and cumulative
impairment. Intangible assets are recognised when it is probable that the future economic benefits that are attributable to the asset
will flow to the enterprise and the cost of the asset can be measured reliably. Intangible assets are amortised over their useful life as
follows:
a. Specialised software: over a period of six years.
b. Technical know-how: over a period of six years in case of foreign technology and three years in the case of indigenous technology.
c. Development costs for new products: over a period of five years.
NOTE [R] SIGNIFICANT ACCOUNTING POLICIES (contd.)
Notes forming part of the Accounts (contd.)

261
Administrative and other general overhead expenses that are specifically attributable to acquisition of intangible assets are allocated
and capitalised as a part of the cost of the intangible assets.
Intangible assets not ready for the intended use on the date of the Balance Sheet are disclosed as “intangible assets under development”.
Amortisation on impaired assets is provided by adjusting the amortisation charges in the remaining periods so as to allocate the asset’s
revised carrying amount over its remaining useful life.
11. Impairment of assets
As at each Balance Sheet date, the carrying amount of assets is tested for impairment so as to determine:
a. the provision for impairment loss, if any; and
b. the reversal of impairment loss recognised in previous periods, if any,
Impairment loss is recognised when the carrying amount of an asset exceeds its recoverable amount. Recoverable amount is determined:
a. in the case of an individual asset, at the higher of the net selling price and the value in use;
b. in the case of a cash generating unit (a group of assets that generates identified, independent cash flows), at the higher of the
cash generating unit’s net selling price and the value in use.
(Value in use is determined as the present value of estimated future cash flows from the continuing use of an asset and from its
disposal at the end of its useful life).
12. Investment
Trade investments comprise investments in subsidiary companies, joint ventures, associate companies and in the entities in which the
Company has strategic business interest.
Investments, which are readily realisable and are intended to be held for not more than one year from the date of acquisition, are
classified as current investments. All other investments are classified as long term investments.
Long term investments including trade investments are carried at cost, after providing for any diminution in value, if such diminution
is other than temporary in nature. Investments in integrated joint ventures are carried at cost net of adjustments for Company’s share
in profits or losses as recognised.
Current investments are carried at lower of cost and fair value. The determination of carrying amount of such investments is done
on the basis of weighted average cost of each individual investment.
Purchase and sale of investments are recognised based on the trade date accounting.
13. Inventories
Inventories are valued after providing for obsolescence, as under:
a) Raw materials, components, construction materials, stores, spares and loose tools at lower of weighted average cost or net
realisable value. However, these items are considered to be realisable at cost if the finished products in which they will be used,
are expected to be sold at or above cost.
b) Manufacturing work-in-progress at lower of weighted average cost including related overheads or net realisable value. In some
cases, Manufacturing work-in-progress are valued at lower of specifically identifiable cost or net realisable value. In the case of
qualifying assets, cost also includes applicable borrowing costs vide policy relating to borrowing costs.
c) Finished goods and stock-in-trade (in respect of goods acquired for trading) at lower of weighted average cost or net realisable
value. Cost includes related overheads and excise duty paid/payable on such goods.
d) Completed property/work-in-progress (including land) in respect of property development activity at lower of specifically
identifiable cost or net realisable value.
14. Cash and bank balances
Cash and bank balances also include fixed deposits, margin money deposits, earmarked balances with banks and other bank balances
which have restrictions on repatriation. Short term and liquid investments being not free from more than insignificant risk of change
in value, are not included as part of cash and cash equivalents.
NOTE [R] SIGNIFICANT ACCOUNTING POLICIES (contd.)
Notes forming part of the Accounts (contd.)

262
15. Securities premium account
a) Securities premium includes:
i. The difference between the market value and the consideration received in respect of shares issued pursuant to Stock
Appreciation Rights Scheme.
ii. The discount allowed, if any, in respect of shares allotted pursuant to Stock Options Scheme
b) The following expenses are written off against securities premium account:
i. Expenses incurred on issue of shares
ii. Expenses (net of tax) incurred on issue of debentures/bonds
v. Premium (net of tax) on redemption of debentures/bonds
16. Borrowing Costs
Borrowing costs include interest, commitment charges, amortisation of ancillary costs, amortisation of discounts/premium related to
borrowings, finance charges in respect of assets acquired on finance lease and exchange differences arising from foreign currency
borrowings, to the extent they are regarded as an adjustment to interest costs.
Borrowing costs that are attributable to the acquisition, construction or production of a qualifying asset are capitalised/inventorised
as part of cost of such asset till such time the asset is ready for its intended use or sale. A qualifying asset is an asset that necessarily
requires a substantial period of time to get ready for its intended use or sale. All other borrowing costs are recognised as an expense
in the period in which they are incurred.
17. Employee stock ownership schemes
In respect of stock options granted pursuant to the Company’s Stock Options Scheme, the intrinsic value of the options (excess of
market price of the share over the exercise price of the option) is treated as discount and accounted as employee compensation cost
over the vesting period. The amount recognised as expense each year is arrived at based on the number of grants expected to vest.
If a grant lapses after the vesting period, the cumulative discount recognised as expense in respect of such grant is transferred to the
general reserve.
18. Foreign currency transactions, foreign operations, forward contracts and derivatives
a) The reporting currency of the Company is Indian rupee.
b) Foreign currency transactions are recorded on initial recognition in the reporting currency, using the exchange rate at the date
of the transaction. At each Balance Sheet date, foreign currency monetary items are reported using the closing rate.
Non-monetary items, carried at historical cost denominated in a foreign currency, are reported using the exchange rate at the
date of the transaction.
Exchange differences that arise on settlement of monetary items or on reporting of monetary items at each Balance Sheet date
at the closing rate are:
i. adjusted in the cost of fixed assets specifically financed by the borrowings contracted up to March 31, 2004 to which the
exchange differences relate
ii. adjusted in the cost of fixed assets specifically financed by borrowings contracted between the period April 1, 2004 to
March 31, 2007 and to which the exchange differences relate, provided the assets are acquired from outside India
iii. recognised as income or expense in the period in which they arise, in cases other than (i) and (ii) above.
c) Financial statements of foreign operations comprising jobs contracted prior to April 1, 2004, are translated as follows:
i. Closing inventories at rates prevailing at the end of the year
ii. Fixed assets as at April 1, 1991 at rates prevailing at the end of the year in which the additions were made. Subsequent
additions are at rates prevailing on the dates of the additions. Depreciation is accounted at the same rate at which the
assets are translated.
Notes forming part of the Accounts (contd.)NOTE [R] SIGNIFICANT ACCOUNTING POLICIES (contd.)
263
iii. Other assets and liabilities at rates prevailing at the end of the year.
iv. Net revenues at the average rate for the year.
d) Financial statements of foreign operations comprising jobs contracted on or after April 1, 2004, are treated as integral operations
and translated as in the same manner as foreign currency transactions, as described above. Exchange differences arising on such
translation are recognised as income or expense of the period in which they arise.
e) Forward contracts, other than those entered into to hedge foreign currency risk on unexecuted firm commitments or highly
probable forecast transactions, are treated as foreign currency transactions and accounted accordingly as per Accounting
Standard (AS) 11 “The Effects of Changes in Foreign Exchange Rates”. Exchange differences arising on such contracts are
recognised in the period in which they arise.
Gains and losses arising on account of roll over/cancellation of such forward contracts are recognised as income/expense of the
period in which such roll over/cancellation takes place.
f) All the other derivative contracts, including forward contracts entered into to hedge foreign currency risks on unexecuted firm
commitments and highly probable forecast transactions, are recognised in the financial statements at fair value as on the Balance
Sheet date, in pursuance of the announcement of the Institute of Chartered Accountants of India (ICAI) dated March 29, 2008
on accounting of derivatives. In addition, the derivative arrangements embedded in the contracts entered in the course of
business are accounted separately if the economic characteristics and risks of the embedded derivatives are not closely related
to economic characteristics and risks of the host contract.
The Company has adopted Accounting Standard (AS) 30 “Financial Instruments: Recognition and Measurement” for accounting
of such derivative contracts, not covered under Accounting Standard (AS) 11 “The Effects of Changes in Foreign Exchange Rates”,
as mandated by the ICAI in the aforesaid announcement.
Accordingly, the resultant gains or losses on fair valuation/settlement of the derivative contracts (including embedded derivatives)
covered under Accounting Standard (AS) 30 “Financial Instruments: Recognition and Measurement” are recognised in the
Statement of Profit and Loss or Balance Sheet as the case may be after applying the test of hedge effectiveness. Where the hedge
in respect of off-balance sheet items is effective, the gains or losses are recognised in the “hedging reserve” which forms part
of “reserves and surplus” in the Balance Sheet. The amount recognised in the “hedging reserve” is transferred to the Statement
of Profit and Loss in the period in which the underlying hedged item affects the Statement of Profit and Loss. Gains or losses in
respect of ineffective hedges are recognised in the Statement of Profit and Loss in the period in which such gains or losses are
incurred.
g) The premium paid/received on a foreign currency forward contract is accounted as expense/income over the life of the contract.
19. Segment accounting
a) Segment accounting policies
Segment accounting policies are in line with the accounting policies of the Company. In addition, the following specific accounting
policies have been followed for segment reporting:
i. Segment revenue includes sales and other operational revenue directly identifiable with/allocable to the segment including
inter segment revenue.
ii. Expenses that are directly identifiable with/allocable to segments are considered for determining the segment result.
Expenses which relate to the Company as a whole and not allocable to segments are included under “unallocable corporate
expenditure“.
iii. Income which relates to the Company as a whole and not allocable to segments is included in “unallocable corporate
income”.
iv. Segment result includes margins on inter-segment capital jobs, which are reduced in arriving at the profit before tax of the
Company.
v. Segment assets and liabilities include those directly identifiable with the respective segments. Unallocable corporate assets
and liabilities represent the assets and liabilities that relate to the Company as a whole and not allocable to any segment.
Notes forming part of the Accounts (contd.)NOTE [R] SIGNIFICANT ACCOUNTING POLICIES (contd.)

264
vi. Segment non-cash expenses forming part of segment expenses includes the intrinsic value of the employee stock options
which is accounted as employee compensation cost [see Note R(17)] and is allocated to the segment.
b) Inter-segment transfer pricing
Segment revenue resulting from transactions with other business segments is accounted on the basis of transfer price agreed
between the segments. Such transfer prices are either determined to yield a desired margin or agreed on a negotiated basis.
20. Taxes on Income
Tax on income for the current period is determined on the basis of taxable income and tax credits computed in accordance with the
provisions of the Income Tax Act 1961, and based on the expected outcome of assessments/appeals.
Deferred tax is recognised on timing differences between the income accounted in financial statements and the taxable income for
the year, and quantified using the tax rates and laws enacted or substantively enacted as on the Balance Sheet date.
Deferred tax assets relating to unabsorbed depreciation/business losses/losses under the head “capital gains” are recognised and
carried forward to the extent there is virtual certainty that sufficient future taxable income will be available against which such deferred
tax assets can be realised.
Other deferred tax assets are recognised and carried forward to the extent that there is a reasonable certainty that sufficient future
taxable income will be available against which such deferred tax assets can be realised.
21. Accounting for interests in Joint Ventures
Interests in joint ventures are accounted as follows:
Type of joint venture Accounting treatment
Jointly controlled operations Company’s share of revenues, common expenses, assets and liabilities are included in revenues, expenses, assets and liabilities respectively.
Jointly controlled assets Share of the assets, according to nature of the assets, and share of the liabilities are shown as part of gross block and liabilities respectively. Share of expenses incurred on maintenance of the assets is accounted as expense. Monetary benefits, if any, from use of the assets are reflected as income.
Jointly controlled entities (a) Integrated joint ventures:
(i) Company’s share in profits or losses of integrated joint ventures is accounted on
determination of the profits or losses by the joint ventures.
(ii) Investments in integrated joint ventures are carried at cost net of Company’s share in recognised profits or losses.
(b) Incorporated jointly controlled entities:
(i) Income on investments in incorporated jointly controlled entities is recognised when the
right to receive the same is established.
(ii) Investment in such joint ventures is carried at cost after providing for any diminution in value which is other than temporary in nature.
Joint venture interests accounted as above, other than investments in incorporated jointly controlled entities, are included in the
segments to which they relate.
22. Provisions, contingent liabilities and contingent assets
Provisions are recognised for liabilities that can be measured only by using a substantial degree of estimation, if
a) the Company has a present obligation as a result of a past event
b) a probable outflow of resources is expected to settle the obligation and
c) the amount of the obligation can be reliably estimated.
Reimbursement expected in respect of expenditure required to settle a provision is recognised only when it is virtually certain that the
reimbursement will be received.
Notes forming part of the Accounts (contd.)NOTE [R] SIGNIFICANT ACCOUNTING POLICIES (contd.)
265
Contingent liability is disclosed in case of
a) a present obligation arising from past events, when it is not probable that an outflow of resources will be required to settle the
obligation
b) a present obligation arising from past events, when no reliable estimate is possible
c) a possible obligation arising from past events where the probability of outflow of resources is not remote. Contingent assets are
neither recognised, nor disclosed.
Provisions, contingent liabilities and contingent assets are reviewed at each Balance Sheet date.
23. Commitments
Commitments are future liabilities for contractual expenditure.
Commitments are classified and disclosed as follows:
a) Estimated amount of contracts remaining to be executed on capital account and not provided for
b) Uncalled liability on shares and other investments partly paid
c) Funding related commitment to subsidiary, associate and joint venture companies and
d) Other non-cancellable commitments, if any, to the extent they are considered material and relevant in the opinion of management.
Other commitments related to sales/procurements made in the normal course of business are not disclosed to avoid excessive details.
24. Operating cycle for current and non-current classification
Operating cycle for the business activities of the Company covers the duration of the specific project/contract/product line/service
including the defect liability period, wherever applicable and extends up to the realisation of receivables (including retention monies)
within the agreed credit period normally applicable to the respective lines of business.
25. Cash Flow Statement
Cash Flow Statement is prepared segregating the cash flows from operating, investing and financing activities. Cash flow from
operating activities is reported using indirect method. Under the indirect method, the net profit is adjusted for the effects of:
i. transactions of a non-cash nature
ii. any deferrals or accruals of past or future operating cash receipts or payments and
iii. items of income or expense associated with investing or financing cash flows.
Cash and cash equivalents (including bank balances) are reflected as such in the Cash Flow Statement. Those cash and cash equivalents
which are not available for general use as on the date of Balance Sheet are also included under this category with a specific disclosure.
A. M. NAIKGroup Executive Chairman (DIN 00001514)
As per our report attachedSHARP & TANNAN K. VENKATARAMANAN
Chief Executive Officer & Managing Director (DIN 00001647)
R. SHANKAR RAMANChief Financial Officer & Whole-time Director (DIN 00019798)
Chartered AccountantsFirm’s Registration No.109982Wby the hand of
M. M. CHITALE (DIN 00101004) SUBODH BHARGAVA (DIN 00035672)MILIND P. PHADKEPartner M. DAMODARAN (DIN 02106990) SUNITA SHARMA (DIN 02949529)Membership No.33013
SUSHOBHAN SARKER (DIN 00088276)N. HARIHARAN
Mumbai, May 30, 2015 Company Secretary Directors Mumbai, May 30, 2015
Notes forming part of the Accounts (contd.)NOTE [R] SIGNIFICANT ACCOUNTING POLICIES (contd.)

266
Consolidated Financial Statements 2014-15
Independent Auditors’ ReportTo the members of Larsen & Toubro Limited
Report on the consolidated financial statements
We have audited the accompanying consolidated financial statements of Larsen & Toubro Limited (hereinafter referred to as “the Holding Company”) and its subsidiaries (the Holding Company and its subsidiaries together referred to as “the Group”), its associates and jointly controlled entities, comprising of the consolidated balance sheet as at 31 March 2015, the consolidated statement of profit and loss, the consolidated cash flow statement for the year then ended and a summary of the significant accounting policies and other explanatory information (hereinafter referred to as “the consolidated financial statements”).
Management’s responsibility for the consolidated financial statements
The Holding Company’s board of directors is responsible for the preparation of these consolidated financial statements in terms of the requirements of the Companies Act, 2013 (hereinafter referred to as “the Act”) that give a true and fair view of the consolidated financial position, consolidated financial performance and consolidated cash flows of the Group including its associates and jointly controlled entities in accordance with the accounting principles generally accepted in India, including the Accounting Standards specified under section 133 of the Act, read with rule 7 of the Companies (Accounts) Rules, 2014. The respective board of directors of the companies included in the Group and of its associates and jointly controlled entities are responsible for maintenance of adequate accounting records in accordance with the provisions of the Act for safeguarding the assets of the Group and for preventing and detecting frauds and other irregularities; the selection and application of appropriate accounting policies; making judgments and estimates that are reasonable and prudent; and the design, implementation and maintenance of adequate internal financial controls, that were operating effectively for ensuring the accuracy and completeness of the accounting records, relevant to the preparation and presentation of the financial statements that give a true and fair view and are free from material misstatement, whether due to fraud or error, which have been used for the purpose of preparation of the consolidated financial statements by the directors of the Holding Company, as aforesaid.
Auditor’s responsibility
Our responsibility is to express an opinion on these consolidated financial statements based on our audit. While conducting the audit, we have taken into account the provisions of the Act, the accounting and auditing standards and matters which are required to be included in the audit report under the provisions of the Act and the rules made thereunder.
We conducted our audit in accordance with the Standards on Auditing specified under section 143(10) of the Act. Those Standards require that we comply with ethical requirements and plan and perform the audit to obtain reasonable assurance about whether the consolidated financial statements are free from material misstatement.
An audit involves performing procedures to obtain audit evidence about the amounts and the disclosures in the consolidated financial statements. The procedures selected depend on the auditor’s judgment, including the assessment of the risks of material misstatement of the consolidated financial statements, whether due to fraud or error. In making those risk assessments, the auditor considers internal financial control relevant to the Holding Company’s preparation of the consolidated financial statements that give a true and fair view in order to design audit procedures that are appropriate in the circumstances but not for the purpose of expressing an opinion on whether the Holding Company has an adequate internal financial controls system over financial reporting in place and the operating effectiveness of such controls. An audit also includes evaluating the appropriateness of the accounting policies used and the reasonableness of the accounting estimates made by the Holding Company’s board of directors, as well as evaluating the overall presentation of the consolidated financial statements.
We believe that the audit evidence obtained by us and the audit evidence obtained by the other auditors in terms of their reports referred to in sub-paragraph (a) of the other matters paragraph below, is sufficient and appropriate to provide a basis for our audit opinion on the consolidated financial statements.
Opinion
In our opinion and to the best of our information and according to the explanations given to us, the aforesaid consolidated financial statements give the information required by the Act in the manner so required and give a true and fair view in conformity with the accounting principles generally accepted in India, of the consolidated state of affairs of the Group, its associates and jointly controlled entities as at 31 March 2015, and their consolidated profit and their consolidated cash flows for the year ended on that date.
Other matters
a) We did not audit the financial statements of 70 subsidiaries and 11 jointly controlled entities, whose financial statements reflect total assets of ` 62,254.30 crores as at 31 March 2015, total revenues of ` 12,951.38 crores and net cash flows amounting to ` 1,707.67 crores for the year ended on that date, as considered in the consolidated financial statements. The consolidated financial statements also include the Group’s share of net loss of ` 1.13 crores for the year ended 31 March 2015, as considered in the consolidated financial statements, in respect of 4 associates, whose financial statements have not been audited by us. These financial statements have been audited/jointly audited by other auditors whose reports have been furnished to us by management and our opinion on the consolidated financial statements, in so far as it relates to the amounts and disclosures included in respect of these
267
subsidiaries, jointly controlled entities and associates and our report in terms of sub-sections (3) and (11) of section 143 of the Act, in so far as it relates to the aforesaid subsidiaries, jointly controlled entities and associates is based solely on the reports of the other auditors.
b) We did not audit the financial statements of 1 subsidiary and 2 jointly controlled entities, whose financial statements reflect total assets of ` 150.53 crores as at 31 March 2015, total revenues of ` 3.38 crores and net cash flows amounting to ` 1.29 crores for the year ended on that date, as considered in the consolidated financial statements. The consolidated financial statements also include the Group’s share of net profit of ` 2.96 crores for the year ended 31 March 2015, as considered in the consolidated financial statements, in respect of 5 associates, whose financial statements have not been audited by us. These financial statements are certified by management and have been furnished to us by management and our opinion on the consolidated financial statements, in so far as it relates to the amounts and disclosures included in respect of these subsidiaries, jointly controlled entities and associates and our report in terms of sub-sections (3) and (11) of section 143 of the Act, in so far as it relates to the aforesaid subsidiaries, jointly controlled entities and associates is based solely on such financial statements certified by management. In our opinion and according to the information and explanations given to us by the management, these financial statements are not material to the Group.
Our opinion on the consolidated financial statements and our report on other legal and regulatory requirements below, is not modified in respect of the above matters with respect to our reliance on the work done and the reports of the other auditors and the financial statements certified by management.
Report on other legal and regulatory requirements
1 As required by the Companies (Auditor’s Report) Order, 2015 (“the Order”), issued by the central government of India in terms of sub-section (11) of section 143 of the Act, based on the comments in the auditors’ reports of the Holding Company, subsidiary companies, associate companies and jointly controlled entities incorporated in India, we give in the Annexure a statement on the matters specified in paragraphs 3 and 4 of the Order, to the extent applicable.
2 As required by section 143(3) of the Act, we report, to the extent applicable, that:
(a) We have sought and obtained all the information and explanations which to the best of our knowledge and belief were necessary for the purposes of our audit of the aforesaid consolidated financial statements.
(b) In our opinion, proper books of account as required by law relating to preparation of the aforesaid consolidated financial statements have been kept so far as it appears from our examination of those books and the reports of the other auditors.
(c) The consolidated balance sheet, the consolidated statement of profit and loss, and the consolidated cash flow statement dealt with by this report are in agreement with the relevant books of account maintained for the purpose of preparation of the consolidated financial statements.
(d) In our opinion, the aforesaid consolidated financial statements comply with the Accounting Standards specified under section 133 of the Act, read with rule 7 of the Companies (Accounts) Rules, 2014.
(e) On the basis of the written representations received from the directors of the Holding Company as on 31 March 2015 taken on record by the board of directors of the Holding Company and the reports of the statutory auditors of its subsidiary companies and associate companies incorporated in India, none of the directors of the Group companies and its associate companies incorporated in India is disqualified as on 31 March 2015, from being appointed as a director in terms of section 164 (2) of the Act.
(f) With respect to the other matters to be included in the Auditor’s Report in accordance with rule 11 of the Companies (Audit and Auditors) Rules, 2014, in our opinion and to the best of our information and according to the explanations given to us:
i. The consolidated financial statements disclose the impact of pending litigations on the consolidated financial position of the Group, its associates and jointly controlled entities- refer notes I, Q(17)(VI), Q(18) and Q(23) to the consolidated financial statements.
ii. Provision has been made in the consolidated financial statements, as required under the applicable law or accounting standards, for material foreseeable losses, on long-term contracts including derivative contracts – refer (a) notes C(II), D(IV) and Q(9)(a) to the consolidated financial statements in respect of such items as it relates to the Group and jointly controlled companies; and (b) the Group’s share of net profit in respect of its associates.
iii. There has been no delay in transferring amounts, required to be transferred, to the Investor Education and Protection Fund by the Group, its associates and jointly controlled entities.
SHARP & TANNAN Chartered Accountants Firm’s Registration No.109982W
MILIND P. PHADKE PartnerMumbai, May 30, 2015 Membership No.33013

268
Annexure to the Auditors’ report(Referred to in ‘Other matters’ and paragraph 1 under ‘Report on other legal and regulatory requirements’ of our report of even date)
1 (a) The Group is maintaining proper records to show full particulars including quantitative details and situation of all fixed assets.
(b) We are informed that the respective companies in the Group have formulated a program of physical verification of fixed assets which, in our
opinion, is reasonable having regard to the size of the respective companies and nature of their assets. Accordingly, the physical verification
of the fixed assets has been carried out by management during the year and no material discrepancies were noticed on such verification.
2 (a) Where applicable in the Group, inventories have been physically verified by the management at reasonable intervals during the year. In our
opinion, the frequency of such verification is reasonable.
(b) The procedures of physical verification of inventory followed by the management of the Group are, in our opinion, reasonable and adequate
in relation to the size of the Group and the nature of its business.
(c) The Group is maintaining proper records of inventory. The discrepancies noticed on verification between the physical stock and book records
in certain companies in the Group were not material and have been properly dealt with in the books of account.
3 According to the information and explanations given to us, there are no companies, firms and other parties covered in the register maintained under
section 189 of the Companies Act, 2013 other than in the case of an associate company, which has granted interest bearing unsecured loans to
four entities covered under the said section. The principal amount is repayable on demand and there is no repayment schedule.
4 In our opinion and according to the information and explanations given to us, there are adequate internal control systems commensurate with the
size of the respective companies in the Group and the nature of their businesses for the purchase of inventory and fixed assets and for the sale of
goods and services. Further, on the basis of the examination of the books and records of the respective companies in the Group and according to
the information and explanations given to us, we have neither come across nor have we been informed of any continuing failure to correct major
weaknesses in the aforesaid internal control systems.
5 According to the information and explanations given to us, the Group has not accepted deposits from the public and accordingly, paragraph 3(v)
of the Order is not applicable.
6 The books of account and records maintained by certain companies in the Group pursuant to the rules prescribed by the central government for the
maintenance of cost records under section 148(1) of the Act have been broadly reviewed and we are of the opinion that prima facie the prescribed
accounts and records have been made and maintained. The contents of these accounts and records have not been examined by us.
7 (a) According to the information and explanations given and as per the records of the respective companies in the Group examined, in our opinion,
the Group is generally regular in depositing undisputed statutory dues including provident fund, employees state insurance, income-tax,
sales-tax, wealth tax, service tax, duty of customs, duty of excise, value added tax, cess and other material statutory dues, as applicable with
the appropriate authorities. According to the information and explanations given to us, there were no undisputed amounts payable in respect
of provident fund, employees state insurance, income-tax, sales-tax, wealth tax, duty of customs, duty of excise, value added tax, cess and
other statutory dues outstanding as at 31 March 2015, for a period of more than six months from the date they became payable.
(b) According to the information and explanations given to us and the records of the respective companies examined, the particulars of income-tax,
sales-tax, wealth tax, service tax, duty of custom, duty of excise, value added tax or cess as at 31 March 2015, which have not been deposited
on account of a dispute pending are as under:
Name of the statute
Nature of the disputed dues Amount` crore*
Period to which the amount relates
Forum where disputes are pending
Central Sales Tax Act, Local Sales Tax Acts and Works Contract Tax Act
Classification disputes, disallowance of input tax credit of other matters, VAT liability, taxability of sub-contractor turnover, rate of tax for declared goods, interstate sales and non submission of forms
108.44 1991-1992, 1995-1996, 1997-1998, 1999-2000 to 2013-2014
Supreme Court
Penalty on the disputed tax not covered by declaration forms, disallowance of deemed sales in course of import, taxability of sub-contractor’s turnover, local hire purchase turnover made taxable and other matter, dispute regarding question of law, non-submission of forms, classification dispute, tax deducted at source at lower rate, sales in transit, high sea sales, labour turnover, local VAT, local WCT, rate of tax on declared goods and other matters
338.95 1986-1987 to 2011-2012 High Court

269
Name of the statute
Nature of the disputed dues Amount` crore*
Period to which the amount relates
Forum where disputes are pending
Disallowance of deemed sales in course of inter state and import transactions, classification disputes, non submission of forms, disallowance of Form N 14B sale by appellate authority which was earlier allowed by assessing authority, tax on additional turnover, differential rate of tax including interest and penalty, disallowance of sales occasioning import, arbitrary demand raised, sub-contractors turnover disallowed, pumping and freight charges, TDS disallowed, rates of tax of declared goods, disallowance of works contract tax and other matters
353.52 1987-1988 to 1991-1992, 1994-1995 to 2011-2012
Sales Tax Tribunal
Classification disputes, disallowance of CST sales, non submission of forms, wrong classification of sales, disallowances of high sea sales, interest levied on short payment arising out of disallowance of input tax credit, differential tax levied for non-submission of Form-C, disallowance of exemption claimed for deemed sale in the course of inter state and import transactions, refusal of Input tax credit, disallowance of sale-in-transit, forms submitted but rejected by Assessing Officer and other matters
264.87 1995-1996, 1996-1997, 1997-1998, 1999-2000 to 2012-2013
Commissioner (Appeals) / Joint Commissioner (Appeals)
Disallowance of deemed interstate sales, non-submission of forms, disallowance of sales occasioning imports, rate of tax dispute and other matters
1.91 1991-1992, 1992-1993, 1996-1997 to 2005-2006, 2008-2009
Assistant Commissioner (Appeals)
Non submission of forms 17.50 1995-1996, 1997-1998, 2001-2002 to 2004-2005, 2006-2007 to 2012-2013
Additional Commissioner (Appeals)
Disallowance of sales in transit, deemed inter state sales, import transactions, non-submission of forms, software exports and service income revenue considered as domestic sales and other classification disputes, VAT liability, additional demand for pending forms, rate of tax dispute, disallowance of branch transfer, sub-contractors turnover, interest demand on road permit and other matters
1103.25 1989-1990, 1991-1992, 1992-1993, 1994-1995 to 2013-2014
Deputy Commissioner (Appeals)
Sales tax on scrap sales and sale of assets, non-submission of forms and dispute related to sales in transit, disallowance of exemption claimed for deemed sale in the course of inter state and import transactions
4.71 1994-1995 to 2014-2015 The Commercial Tax Officer
The Central Excise Act, 1944, Service Tax under Finance Act, 1994 and Customs Act, 1962
Dispute of excise duty on site mix concrete and PSC grinder
0.27 1997-1998 Supreme Court
Demand of interest on the cenvat credit availed on inputs removed, export rebate claim, service tax on commercial construction services, service tax liability against rate change and penalty imposed for wrong availment of cenvat credit
42.49 2003-2004 to 2006-2007 High Court
Valuation disputes, demand for excise duty on fabrication of tanks, platforms and ladders, demand for service tax on manpower recruitment and supply agency service and dispute on adjustment of excess service tax paid, demand for service tax including penalty and interest on lump-sum turnkey jobs, dispute on classification, demand for duty on sales through inter-connected units, denial of benefit of exemption under notification no. 108/95, denial
862.11 1989-1990, 1991-1992, 2001-2002 to 2013-2014
Customs, Excise and Service Tax Appellate Tribunal (CESTAT)

270
Name of the statute
Nature of the disputed dues Amount` crore*
Period to which the amount relates
Forum where disputes are pending
of service tax credit on payment of commission to sole selling agent, denial of cenvat credit on input services, service tax on reimbursement of electricity, water and diesel charges, demand of excise duty on site fabricated steel structures, export rebate disallowance, excise duty on concrete mix made at site, non maintenance of separate records, demand of service tax including penalty, demand of penalty on late payment of service tax and other matters
Demand for duty for availing cenvat credit on the basis of supplementary invoice, penalty disputed on the delayed period of payment of duty on the scrap in job worker place, dispute in classification of cobalt rod during imports, disallowance of cenvat credit, excise duty refund, short payment of service tax, service tax rate dispute, excise duty on concrete mix made at site, service tax on reimbursement of electricity, water and diesel charges and other matters
2.87 1993-1994 to 1999-2000, 2006-2007, 2008-2009 to 2012-2013, 2014-2015
Commissioner (Appeals)
Demand for service tax on manpower recruitment, dispute on software procurement, denial of excise duty exemption under Excise Notification 6 of 2006, service tax levied on receipt of interest on delayed payment
8.38 2005-2006 to 2012-2013 Commissioner
Service tax, demand for excise duty on fabrication of tanks, platforms and ladders
0.63 1989-1990 to 2011-2012 Additional Commissioner
Income-tax Act, 1961
Dispute regarding depreciation and income tax dues 0.80 2002-2003, 2004-2005 High Court
Dispute regarding tax not deducted on bank guarantee charges and interest charges, disallowance of distributorship commission, revenue expenditure, adjustment on account of arms length price of transfer pricing transaction under section 92CA(3), disallowance of exemption under section 10A, dispute regarding shortfall in tax deducted at source, income tax, interest and penalty, cenvat credit treated as income, disallowance of deduction under Section 80IA for income from BTS projects, assessment under section 143(3) read with section 144C(13)
484.16 2003-2004 to 2012-2013 Income Tax Appellate Tribunal (ITAT)
Dispute regarding tax not deducted on bank guarantee charges and interest charges
1.11 2011-2012 Chief Commissioner of Income Tax (Appeals)
Disallowance of expenses and exemption under section 10A, dispute regarding depreciation and disallowance under section 14A, disallowance under section 40(a)(ia) and computation of deduction under section 80IA, taxability of income received in advance, treatment of reimbursement of expenses as income, income tax, interest and penalty, dispute regarding applicability of tonnage tax provision, cenvat credit treated as income, hedging loss disallowed, dispute regarding tax deducted at source at lower rates
63.79 2004-2005 to 2012-2013 Commissioner of Income Tax (Appeals)
Tax, interest and penalty 19.56 2006-2007, 2009-2010, 2010-2011
Commissioner of Income Tax
Difference in rate of tax deducted at source 2.57 2007-2008, 2008-2009 Director of Income Tax (International Taxation)

271
Name of the statute
Nature of the disputed dues Amount` crore*
Period to which the amount relates
Forum where disputes are pending
Dispute regarding depreciation, disallowance under section 14A, mismatch of TDS credit, income tax dues including interest and fringe benefit tax dues
4.32 2007-2008 to 2010-2011 Assessing Officer
Dispute regarding depreciation and income tax dues 0.80 2002-2003, 2004-2005 High Court
Income tax dues 13.17 2012-2013 Assistant Commissioner of Income Tax
Tax, interest and penalty 19.56 2006-2007, 2009-2010, 2010-2011
Commissioner of Income Tax
*Net of pre-deposit paid in getting the stay/appeal admitted
Note: The above amounts do not include penalty and interest of ` 104.85 crores stayed by the Honourable Customs, Excise and Service Tax Appellate Tribunal (CESTAT) and VAT authorities.
(c) The amounts required to be transferred to the investor education and protection fund in accordance with the relevant provisions of the Companies Act 1956 (1 of 1956) and rules made thereunder are transferred to such fund within time.
8 The Group has no accumulated losses as at 31 March 2015 and it has not incurred cash losses in the financial year ended on that date or in the immediately preceding financial year.
9 According to the records of the respective companies in the Group and the information and explanations given to us, none of the companies in the Group has defaulted in repayment of dues to any financial institution or bank or debenture holder as at the balance sheet date.
10 The terms and conditions of guarantees given by certain companies in the Group for loans taken by others from banks or financial institutions are prima facie not prejudicial to the interests of the Group.
11 In our opinion and according to the information and explanations given to us, on an overall basis, we are of the opinion that the respective companies have applied term loans for the purpose for which they were obtained.
12 According to the information and explanations given to us, there were no instances of material fraud on or by the companies in the Group, noticed or reported during the year, nor have we been informed of such case by management.
SHARP & TANNAN Chartered Accountants Firm’s Registration No.109982W
MILIND P. PHADKE PartnerMumbai, May 30, 2015 Membership No.33013

272
Consolidated Balance Sheet as at March 31, 2015As at 31-3-2015 As at 31-3-2014
Note ` crore ` crore ` crore ` croreEQUITY AND LIABILITIES:Shareholders’ funds Share capital A 185.91 185.38 Reserves and surplus B 40723.16 37526.23
40909.07 37711.61 Minority interest 4998.62 3179.18 Non-current liabilities Long term borrowings C(I) 65277.98 55444.89 Deferred payment liabilities for acquisition of fixed assets Q(22) 2905.01 2966.75 Deferred tax liabilities (net) Q(15) 539.56 617.85 Other long term liabilities C(II) 1273.57 1024.11 Long term provisions C(III) 573.05 374.24
70569.17 60427.84 Current liabilities Short term borrowings D(I) 16989.24 13858.52 Current maturities of deferred payment liabilities for acquisition
of fixed assets Q(22) 127.23 515.13 Current maturities of long term borrowings D(II) 8304.16 11026.98 Trade payables D(III) 24858.99 20849.88 Other current liabilties D(IV) 23902.51 18665.83 Short term provisions D(V) 3525.11 2926.91
77707.24 67843.25
TOTAL 194184.10 169161.88
ASSETS:Non-current assets Fixed assets Tangible assets E(I) 18821.58 20855.49 Intangible assets E(II) 13701.48 9405.80 Capital work-in-progress E(I) 5420.42 4165.31 Intangible assets under development E(II) 10103.29 10013.21 Goodwill on consolidation E(III) 2215.00 2136.17
50261.77 46575.98 Non-current investments F 1646.80 1432.79 Deferred tax assets (net) Q(15) 724.20 280.39 Long term loans and advances G(I)(a) 2160.74 2461.19 Long term loans and advances towards financing activities G(I)(b) 43932.02 32939.96 Cash and bank balances G(II) 99.31 38.68 Other non-current assets G(III) 369.41 184.93 Current assets Current investments H(I) 7965.32 6676.16 Inventories H(II) 6518.19 5527.47 Trade receivables H(III) 30089.37 26384.55 Cash and bank balances H(IV) 5756.21 4096.57 Short term loans and advances H(V) 9006.35 7187.12 Short term Loans and advances towards financing activities H(V)(a) 11434.85 10911.77 Other current assets H(VI) 24219.56 24464.32
94989.85 85247.96
TOTAL 194184.10 169161.88
CONTINGENT LIABILITIES ICOMMITMENTS (capital and others) JOTHER NOTES FORMING PART OF THE ACCOUNTS QSIGNIFICANT ACCOUNTING POLICIES R
A. M. NAIKGroup Executive Chairman (DIN 00001514)
As per our report attachedSHARP & TANNAN K. VENKATARAMANAN
Chief Executive Officer & Managing Director (DIN 00001647)
R. SHANKAR RAMANChief Financial Officer & Whole-time Director (DIN 00019798)
Chartered AccountantsFirm’s Registration No.109982Wby the hand of
M. M. CHITALE (DIN 00101004) SUBODH BHARGAVA (DIN 00035672)MILIND P. PHADKEPartner M. DAMODARAN (DIN 02106990) SUNITA SHARMA (DIN 02949529)Membership No.33013
SUSHOBHAN SARKER (DIN 00088276)N. HARIHARAN
Mumbai, May 30, 2015 Company Secretary Directors Mumbai, May 30, 2015

273
Consolidated Statement of Profit and Loss for the year ended March 31, 20152014-15 2013-14
Note ` crore ` crore ` crore ` croreREVENUE:Revenue from operations (gross) K 92761.66 85889.04 Less: Excise duty 757.08 760.64
Revenue from operations (net) 92004.58 85128.40 Other income L 1007.15 981.78
Total revenue 93011.73 86110.18
EXPENSES:Manufacturing, construction and operating expenses: M Cost of raw materials, components consumed 10305.52 9574.68 Construction materials consumed 20331.39 18567.02 Purchase of stock-in-trade 1424.04 1607.22 Stores, spares and tools consumed 2501.80 2586.57 Sub-contracting charges 17404.01 16949.91 Changes in inventories of finished goods, work-in-progress and stock-in-trade (848.30) (549.16) Other manufacturing, construction and operating expenses 7935.87 7347.59 Finance cost of financial services business and finance lease activity 4158.13 3160.06 Staff expenses for software development business 4081.24 3364.77
67293.70 62608.66 Employee benefits expense N 7922.20 7135.05 Sales, administration and other expenses O 5478.03 4690.91 Finance costs P 2850.72 3138.00 Depreciation, amortisation, impairment and obsolescence 2624.09 1446.77 Less: Transfer from revaluation reserve 1.59 0.95
2622.50 1445.82
86167.15 79018.44 Less: Overheads charged to fixed assets 24.96 35.99
Total expenses 86142.19 78982.45
Profit before exceptional and extraordinary items and tax 6869.54 7127.73 Exceptional items Q(5) 347.70 361.50
Profit before extraordinary items and tax 7217.24 7489.23 Extraordinary items Q(6) - (6.25)
Profit before tax 7217.24 7482.98 Tax expense: Current tax Q(8) 2661.91 2501.64 Deferred tax (net) Q(15) (408.67) 105.94
2253.24 2607.58
Profit after tax 4964.00 4875.40 Less: Additional tax on dividend distributed/proposed by subsidiary companies 30.32 20.81
4933.68 4854.59 Add: Share in profit/(loss) (net) of associate companies 2.14 9.25
4935.82 4863.84 Add/(less): Minority interest in (income)/losses (171.00) 38.16
Net Profit after tax, minority interest and share in profit of associates 4764.82 4902.00
Basic earnings per equity share before extraordinary items (`) Q(14) 51.33 53.04 Diluted earnings per equity share before extraordinary items (`) 50.98 52.72 Basic earnings per equity share after extraordinary items (`) } 51.33 52.97 Diluted earnings per equity share after extraordinary items (`) 50.98 52.65 Face value per equity share (`) 2.00 2.00 OTHER NOTES FORMING PART OF ACCOUNTS QSIGNIFICANT ACCOUNTING POLICIES R
A. M. NAIKGroup Executive Chairman (DIN 00001514)
As per our report attachedSHARP & TANNAN K. VENKATARAMANAN
Chief Executive Officer & Managing Director (DIN 00001647)
R. SHANKAR RAMANChief Financial Officer & Whole-time Director (DIN 00019798)
Chartered AccountantsFirm’s Registration No.109982Wby the hand of
M. M. CHITALE (DIN 00101004) SUBODH BHARGAVA (DIN 00035672)MILIND P. PHADKEPartner M. DAMODARAN (DIN 02106990) SUNITA SHARMA (DIN 02949529)Membership No.33013
SUSHOBHAN SARKER (DIN 00088276)N. HARIHARAN
Mumbai, May 30, 2015 Company Secretary Directors Mumbai, May 30, 2015
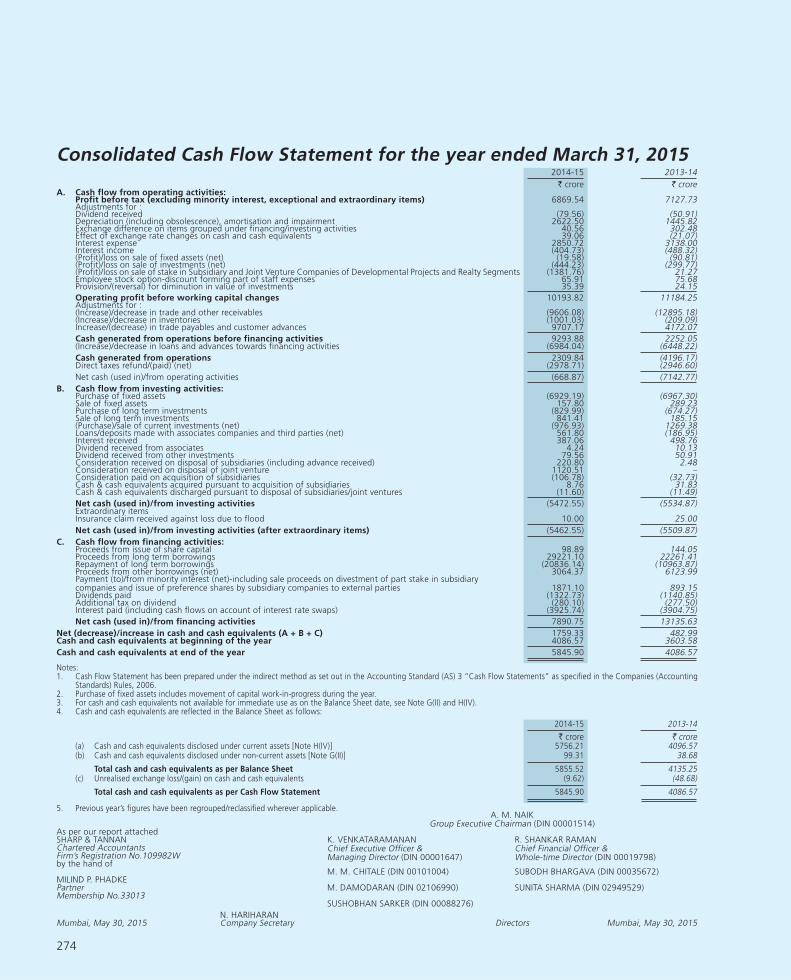
274
Consolidated Cash Flow Statement for the year ended March 31, 20152014-15 2013-14
` crore ` croreA. Cash flow from operating activities:
Profit before tax (excluding minority interest, exceptional and extraordinary items) 6869.54 7127.73 Adjustments for :Dividend received (79.56) (50.91)Depreciation (including obsolescence), amortisation and impairment 2622.50 1445.82 Exchange difference on items grouped under financing/investing activities 40.56 302.48 Effect of exchange rate changes on cash and cash equivalents 39.06 (21.07)Interest expense 2850.72 3138.00 Interest income (404.73) (488.32)(Profit)/loss on sale of fixed assets (net) (19.58) (90.81)(Profit)/loss on sale of investments (net) (444.23) (299.77)(Profit)/loss on sale of stake in Subsidiary and Joint Venture Companies of Developmental Projects and Realty Segments (1381.76) 21.27 Employee stock option-discount forming part of staff expenses 65.91 75.68 Provision/(reversal) for diminution in value of investments 35.39 24.15
Operating profit before working capital changes 10193.82 11184.25 Adjustments for :(Increase)/decrease in trade and other receivables (9606.08) (12895.18)(Increase)/decrease in inventories (1001.03) (209.09)Increase/(decrease) in trade payables and customer advances 9707.17 4172.07
Cash generated from operations before financing activities 9293.88 2252.05 (Increase)/decrease in loans and advances towards financing activities (6984.04) (6448.22)
Cash generated from operations 2309.84 (4196.17)Direct taxes refund/(paid) (net) (2978.71) (2946.60)
Net cash (used in)/from operating activities (668.87) (7142.77)
B. Cash flow from investing activities:Purchase of fixed assets (6929.19) (6967.30)Sale of fixed assets 157.80 289.23 Purchase of long term investments (829.99) (674.27)Sale of long term investments 841.41 185.15 (Purchase)/sale of current investments (net) (976.93) 1269.38 Loans/deposits made with associates companies and third parties (net) 561.80 (186.95)Interest received 387.06 498.76 Dividend received from associates 4.24 10.13 Dividend received from other investments 79.56 50.91 Consideration received on disposal of subsidiaries (including advance received) 220.80 2.48 Consideration received on disposal of joint venture 1120.51 –Consideration paid on acquisition of subsidiaries (106.78) (32.73)Cash & cash equivalents acquired pursuant to acquisition of subsidiaries 8.76 31.83 Cash & cash equivalents discharged pursuant to disposal of subsidiaries/joint ventures (11.60) (11.49)
Net cash (used in)/from investing activities (5472.55) (5534.87)Extraordinary itemsInsurance claim received against loss due to flood 10.00 25.00
Net cash (used in)/from investing activities (after extraordinary items) (5462.55) (5509.87)
C. Cash flow from financing activities:Proceeds from issue of share capital 98.89 144.05 Proceeds from long term borrowings 29221.10 22261.41 Repayment of long term borrowings (20836.14) (10963.87)Proceeds from other borrowings (net) 3064.37 6123.99 Payment (to)/from minority interest (net)-including sale proceeds on divestment of part stake in subsidiary companies and issue of preference shares by subsidiary companies to external parties 1871.10 893.15 Dividends paid (1322.73) (1140.85)Additional tax on dividend (280.10) (277.50)Interest paid (including cash flows on account of interest rate swaps) (3925.74) (3904.75)
Net cash (used in)/from financing activities 7890.75 13135.63
Net (decrease)/increase in cash and cash equivalents (A + B + C) 1759.33 482.99 Cash and cash equivalents at beginning of the year 4086.57 3603.58
Cash and cash equivalents at end of the year 5845.90 4086.57
Notes:1. Cash Flow Statement has been prepared under the indirect method as set out in the Accounting Standard (AS) 3 “Cash Flow Statements” as specified in the Companies (Accounting
Standards) Rules, 2006.2. Purchase of fixed assets includes movement of capital work-in-progress during the year.3. For cash and cash equivalents not available for immediate use as on the Balance Sheet date, see Note G(II) and H(IV).4. Cash and cash equivalents are reflected in the Balance Sheet as follows:
2014-15 2013-14
` crore ` crore(a) Cash and cash equivalents disclosed under current assets [Note H(IV)] 5756.21 4096.57 (b) Cash and cash equivalents disclosed under non-current assets [Note G(II)] 99.31 38.68
Total cash and cash equivalents as per Balance Sheet 5855.52 4135.25 (c) Unrealised exchange loss/(gain) on cash and cash equivalents (9.62) (48.68)
Total cash and cash equivalents as per Cash Flow Statement 5845.90 4086.57
5. Previous year’s figures have been regrouped/reclassified wherever applicable.A. M. NAIK
Group Executive Chairman (DIN 00001514)As per our report attachedSHARP & TANNAN K. VENKATARAMANAN
Chief Executive Officer & Managing Director (DIN 00001647)
R. SHANKAR RAMANChief Financial Officer & Whole-time Director (DIN 00019798)
Chartered AccountantsFirm’s Registration No.109982Wby the hand of
M. M. CHITALE (DIN 00101004) SUBODH BHARGAVA (DIN 00035672)MILIND P. PHADKEPartner M. DAMODARAN (DIN 02106990) SUNITA SHARMA (DIN 02949529)Membership No.33013
SUSHOBHAN SARKER (DIN 00088276)
N. HARIHARANMumbai, May 30, 2015 Company Secretary Directors Mumbai, May 30, 2015
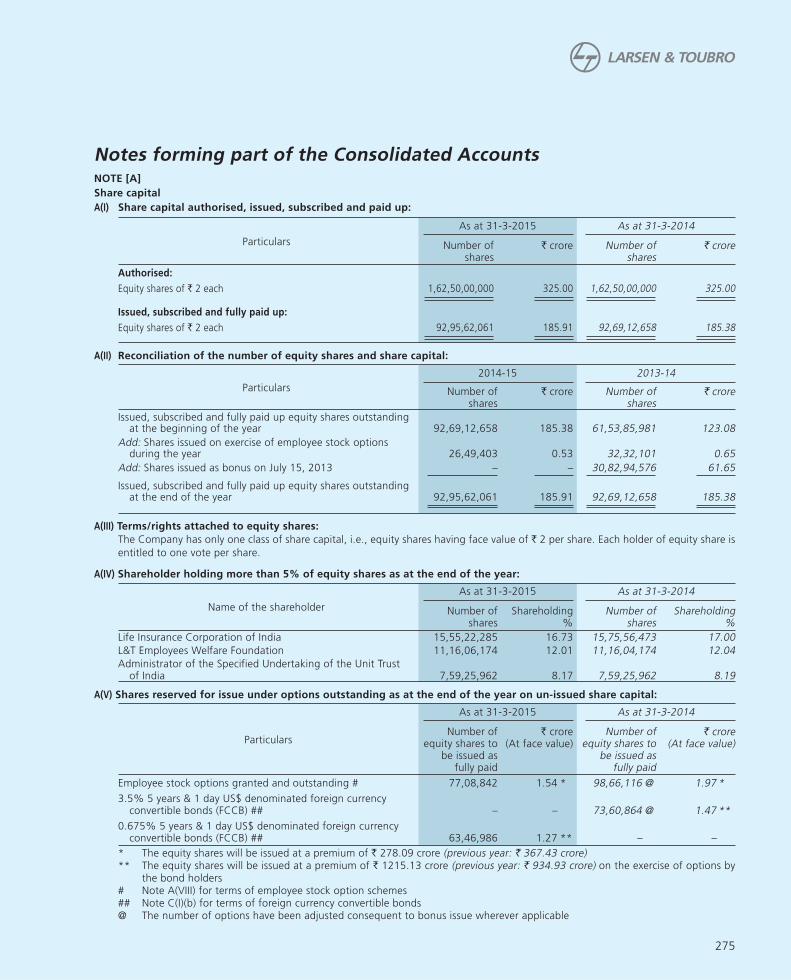
275
NOTE [A]
Share capital
A(I) Share capital authorised, issued, subscribed and paid up:
Particulars
As at 31-3-2015 As at 31-3-2014
Number of shares
` crore Number of shares
` crore
Authorised:
Equity shares of ` 2 each 1,62,50,00,000 325.00 1,62,50,00,000 325.00
Issued, subscribed and fully paid up:
Equity shares of ` 2 each 92,95,62,061 185.91 92,69,12,658 185.38
A(II) Reconciliation of the number of equity shares and share capital:
Particulars
2014-15 2013-14
Number of shares
` crore Number of shares
` crore
Issued, subscribed and fully paid up equity shares outstanding at the beginning of the year 92,69,12,658 185.38 61,53,85,981 123.08
Add: Shares issued on exercise of employee stock options during the year 26,49,403 0.53 32,32,101 0.65
Add: Shares issued as bonus on July 15, 2013 – – 30,82,94,576 61.65
Issued, subscribed and fully paid up equity shares outstanding at the end of the year 92,95,62,061 185.91 92,69,12,658 185.38
A(III) Terms/rights attached to equity shares:
The Company has only one class of share capital, i.e., equity shares having face value of ` 2 per share. Each holder of equity share is
entitled to one vote per share.
A(IV) Shareholder holding more than 5% of equity shares as at the end of the year:
Name of the shareholder
As at 31-3-2015 As at 31-3-2014
Number of shares
Shareholding %
Number of shares
Shareholding %
Life Insurance Corporation of India 15,55,22,285 16.73 15,75,56,473 17.00
L&T Employees Welfare Foundation 11,16,06,174 12.01 11,16,04,174 12.04
Administrator of the Specified Undertaking of the Unit Trust of India 7,59,25,962 8.17 7,59,25,962 8.19
A(V) Shares reserved for issue under options outstanding as at the end of the year on un-issued share capital:
Particulars
As at 31-3-2015 As at 31-3-2014
Number of equity shares to
be issued as fully paid
` crore(At face value)
Number of equity shares to
be issued as fully paid
` crore(At face value)
Employee stock options granted and outstanding # 77,08,842 1.54 * 98,66,116 @ 1.97 *
3.5% 5 years & 1 day US$ denominated foreign currency convertible bonds (FCCB) ## – – 73,60,864 @ 1.47 **
0.675% 5 years & 1 day US$ denominated foreign currency convertible bonds (FCCB) ## 63,46,986 1.27 ** – –
* The equity shares will be issued at a premium of ` 278.09 crore (previous year: ` 367.43 crore) ** The equity shares will be issued at a premium of ` 1215.13 crore (previous year: ` 934.93 crore) on the exercise of options by
the bond holders # Note A(VIII) for terms of employee stock option schemes ## Note C(I)(b) for terms of foreign currency convertible bonds @ The number of options have been adjusted consequent to bonus issue wherever applicable
Notes forming part of the Consolidated Accounts

276
A(VI) The aggregate number of equity shares allotted as fully paid up by way of bonus shares in immediately preceding five years ended
March 31,2015 are 30,82,94,576 (previous period of five years ended March 31, 2014: 30,82,94,576 shares)
A(VII) The aggregate number of equity shares issued pursuant to contract, without payment being received in cash in immediately preceding
five years ended March 31, 2015: Nil (previous period of five years ended March 31, 2014: Nil)
A(VIII) Stock option schemes
a) Terms:
i. The grant of options to the employees under the stock option schemes is on the basis of their performance and other
eligibility criteria. The options are vested equally over a period of 4 years [5 years in the case of series 2006(A)], subject to
the discretion of the management and fulfillment of certain conditions.
ii. Options can be exercised anytime within a period of 7 years from the date of grant and would be settled by way of issue
of equity shares. Management has discretion to modify the exercise period.
b) The details of the grants under the aforesaid schemes under various series are summarised below:
Sr. No.
Series reference2000 2002 (A) 2002 (B) 2003 (A) 2003 (B) 2006 2006 (A)
2014-15 2013-14 2014-15 2013-14 2014-15 2013-14 2014-15 2013-14 2014-15 2013-14 2014-15 2013-14 2014-15 2013-14
1 Grant price (`) 2.30 2.30 2.30 2.30 2.30 2.30 11.70 11.70 11.70 11.70 400.70 400.70 400.70 400.70
2 Grant dates 1-6-2000 19-4-2002 19-4-2002 23-5-2003 onwards 23-5-2003 onwards 1-9-2006 onwards 1-7-2007 onwards
3 Vesting commences on 1-6-2001 19-4-2003 19-4-2003 23-5-2004 onwards 23-5-2004 onwards 1-9-2007 onwards 1-7-2008 onwards
4 Options granted and outstanding at the beginning of the year 25200 16800 32250 21500 59550 39700 47178 31452 499543 435202 510181 911468 8692214 7289329
5 Options lapsed prior to bonus – – – – – – – – – 3400 – 2746 – 201054
6 Options granted prior to bonus – – – – – – – – – 4500 – – – 1115
7 Options exercised prior to bonus – – – – – – – – – 45750 – 387135 – 770285
8 Options granted and outstanding as on July 13, 2013* – 16800 – 21500 – 39700 – 31452 – 390552 – 521587 – 6319105
9 Adjusted options as on July 13,2013* consequent to bonus issue – 25200 – 32250 – 59550 – 47178 – 585829 – 782390 – 9478918
10 Options lapsed post bonus issue – – – – – – – – 68450 10950 35625 21311 676786 530097
11 Options granted post bonus issue – – – – – – – – 337800 93300 – – 935190 1352790
12 Options exercised post bonus issue – – – – – – – – 183609 168636 169900 250898 2295894 1609397
13 Options granted and outstanding at the end of the year 25200 25200 32250 32250 59550 59550 47178 47178 585284 499543 304656 510181 6654724 8692214
of which
14 Options vested 25200 25200 32250 32250 59550 59550 47178 47178 100390 127015 304656 510181 2663571 3096418
15 Options yet to vest – – – – – – – – 484894 372528 – – 3991153 5595796
16 Weighted average remaining contractual life of options (in years) Nil Nil Nil Nil Nil Nil Nil Nil 5.38 4.87 0.03 0.08 3.95 4.17
*Record date July 13, 2013
c) The number and weighted average exercise price of stock options for the following group of options are as follows:
Particulars
2014-15 2013-14
No. of stock options
Weighted average
exercise price (`)
No. of stock options
Weighted average
exercise price (`)
(i) Options granted and outstanding at the beginning of the year 98,66,116 374.42 87,45,451 564.54
(ii) Options granted pre bonus issue – – 5,615 133.37
(iii) Options allotted pre bonus issue – – 12,03,170 578.81
(iv) Options lapsed pre bonus issue – – 2,07,200 591.43
(v) Options granted and outstanding prior to bonus issue – – 73,40,696 561.11
(vi) Adjusted options consequent to bonus issue – – 1,10,11,315 374.10
(vii) Options granted post bonus issue 12,72,990 297.48 14,46,090 375.60
(viii) Options allotted post bonus issue 26,49,403 373.74 20,28,931 368.37
(ix) Options lapsed post bonus issue 7,80,861 366.60 5,62,358 393.13
(x) Options granted and outstanding at the end of the year 77,08,842 362.74 98,66,116 374.42
(xi) Options exercisable at the end of the year out of (x) supra 32,32,795 368.52 38,97,792 371.36
Notes forming part of the Consolidated Accounts (contd.)

277
d) Weighted average share price at the date of exercise for stock options exercised during the period is ` 1554.71 (previous year:
` 1120.61) per share.
e) (i) In respect of stock options granted pursuant to the Company’s stock options schemes, the intrinsic value of the options
(excess of market price of the share over the exercise price of the option) is treated as discount and accounted as employee
compensation over the vesting period.
(ii) Expense on Employee Stock Option Schemes debited to the Statement of Profit and Loss during 2014-15 is ` 65.91 crore
(previous year: ` 75.68 crore) (net) [Note M and N]. The entire amount pertains to equity-settled employee share-based
payment plans.
f) Pursuant to the Securities and Exchange Board of India (Share Based Employee Benefits) Regulations, 2014, the Company has
adopted the guidance note on Employee Share Based Payments issued by the Institute of Chartered Accountants of India and
revised the method of computation of stock option compensation based on the number of grants that are expected to vest.
Consequently, the charge on account of employee stock option compensation for the year ended March 31, 2015 is lower and
the profit before tax is higher by ` 17.06 crore.
g) Had fair value method been adopted for expensing the compensation arising from employee share-based payment plans:
(i) The employee compensation charge debited to the Statement of Profit and Loss for the year 2014-15 would have been
higher by ` 11.15 crore (previous year: ` 26.75 crore)
(ii) Basic EPS before extraordinary items would have decreased from ` 51.33 per share to ` 51.21 per share
(iii) Basic EPS after extraordinary items would have decreased from ` 51.33 per share to ` 51.21 per share
(iv) Diluted EPS before extraordinary items would have decreased from ` 50.98 per share to ` 50.86 per share
(v) Diluted EPS after extraordinary items would have decreased from ` 50.98 per share to ` 50.86 per share
h) Weighted average fair values of options granted during the year is ` 1190.22 (previous year: ` 556.06) per option
i) The fair value has been calculated using the Black-Scholes Option Pricing Model and the significant assumptions and inputs to
estimate the fair value of options granted during the year are as follows:
Sr. No.
Particulars2014-15 2013-14
(i) Weighted average risk-free interest rate 8.57% 8.88%
(ii) Weighted average expected life of options 4.01 years 4.34 years
(iii) Weighted average expected volatility 33.92% 38.00%
(iv) Weighted average expected dividends over the life of the option ` 57.18 per option ` 53.42 per option
(v) Weighted average share price ` 1444.51 per option ` 834.48 per option
(vi) Weighted average exercise price ` 313.49 per option ` 379.45 per option
(vii) Method used to determine expected volatility Expected volatility is based on the historical volatility of the Company’s share price applicable to the total expected life of each option.
j) The balance in share option outstanding account as on March 31, 2015 is ` 252.56 crore (net) (previous year: ` 323.70 crore),
including ` 135.98 crore (previous year: ` 148.22 crore) for which the options have been vested to employees as on March 31,
2015.
A(IX) The Directors recommend payment of final dividend of ` 16.25 per equity share of ` 2 each on the number of shares outstanding as
on the record date.
Provision for final dividend has been made in the books of account for 92,95,62,061 equity shares outstanding as at March 31, 2015
amounting to ` 1510.54 crore.
A(X) Stock ownership schemes of subsidiary companies:
1. Larsen & Toubro Infotech Limited
a) Employee Stock Ownership Scheme (‘ESOS Plan’)
Under the Employee Stock Ownership Scheme (ESOS), 22,66,470 options are outstanding as at March 31, 2015. The grant of
options to the employees under ESOS is on the basis of their performance and other eligibility criteria. Each option entitles the
holder to exercise the right to apply for and seek allotment of one equity share of ` 5 each.
Notes forming part of the Consolidated Accounts (contd.)

278
All vested options can be exercised on the First Exercise Date as may be determined by the Compensation Committee prior to
date of IPO. The details of the grants under the aforesaid scheme are summarised below:
Sr.
No. Series reference
I,II & III IV – XXI
2014-15 2013-14 2014-15 2013-14
1 Grant price (`) 25.00 10.00
2 Options granted and outstanding at the beginning of the year 3,93,003 3,93,003 18,80,484 21,55,197
3 Options granted during the year – – – –
4 Options cancelled/lapsed during the year – – 7,017 2,74,713
5 Options exercised and shares allotted during the year – – – –
6 Options granted and outstanding at the end of the year 3,93,003 3,93,003 18,73,467 18,80,484
of which
Options vested 3,93,003 3,93,003 9,70,917 9,70,917
Options yet to vest – – 9,02,550 9,09,567
b) Employees Stock Ownership Scheme – 2006 U.S. Stock Option Sub-Plan (‘Sub-Plan’)
The subsidiary had instituted the Employees Stock Ownership Scheme – 2006 U.S. Stock Option Sub-Plan (‘Sub-Plan’) for the
employees and Directors of its subsidiary, GDA Technologies, Inc, USA. The grant of options to the employees under this Sub-Plan
is on the basis of their performance and other eligibility criteria. The term of option shall be 5 years from the date of grant.
The options are vested over a period of five years, subject to fulfillment of certain conditions specified in the respective Option
agreement. Each option entitles the holder to exercise the right to apply for and seek allotment of one equity share of ` 5 each
at an exercise price of USD 12 per share. Under the said plan, options granted and outstanding as at the end of the year are
90,100 options, all vested.
Employees Stock Options granted and outstanding as at the end of the year on unissued share capital represent options 23,56,570
(previous year: 23,63,587)
2. L&T Investment Management Limited
Employee Stock Option Plan 2008 (ESOP 2008)
The Employee Stock Option Plan 2008 of the subsidiary is designed to provide stock options to employees in a specific category. All
grants under the Plan are to be issued and allotted by the Allotment Committee of the Board of the Company. The options are to
be granted to the eligible employees based on certain criteria and approval of the Allotment Committee of the Board and as per the
detailed and respective Employee Stock Option Agreements that the Company enters into with them.
The options have been granted on September 10, 2009. Options have been granted at an exercise price equal to the fair market
value of the shares as determined by an independent valuer.
The Employees shall be allotted a pre-defined number of equity shares against each option and the options will vest over a period of
five years from the date of grant at a pre-defined percentage of the total vesting, which shall each be subject to the condition that
the employees will secure specific annual performance ratings for every allotment and Company achieving certain performance target
and vesting of shares can be carried forward to maximum 2 years.
Options can be exercised anytime within a period of 5 years from the date of vesting. The employees also have the exit option which
they can exercise under certain events.
Particulars
2014-15 2013-14
No. of stock options
Weighted average
exercise price (`)
No. of stock options
Weighted average
exercise price (`)
Options granted and outstanding at the beginning of the year – – 60,000 10.50
Options granted during the year – – – –
Options forfeited/lapsed during the year – – 60,000 –
Options exercised during the year – – – –
Options granted and outstanding at the end of the year of which – – – –
Options vested – – – –
Options yet to vest – – – –
Weighted average remaining contractual life of options
(comprising the vesting period and the exercise period) (in years) Nil Nil
Since the options have been granted at an exercise price equal to the fair market value of the shares as determined by an independent
valuer, there is no charge to the Statement of Profit and Loss.
Notes forming part of the Consolidated Accounts (contd.)
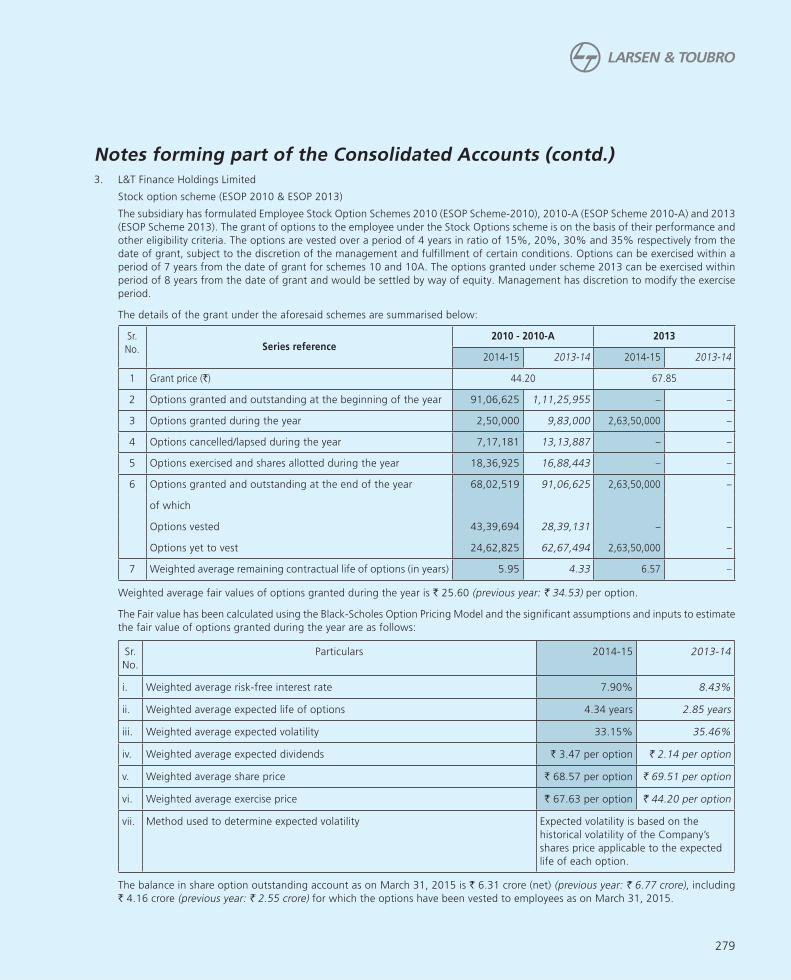
279
3. L&T Finance Holdings Limited
Stock option scheme (ESOP 2010 & ESOP 2013)
The subsidiary has formulated Employee Stock Option Schemes 2010 (ESOP Scheme-2010), 2010-A (ESOP Scheme 2010-A) and 2013
(ESOP Scheme 2013). The grant of options to the employee under the Stock Options scheme is on the basis of their performance and
other eligibility criteria. The options are vested over a period of 4 years in ratio of 15%, 20%, 30% and 35% respectively from the
date of grant, subject to the discretion of the management and fulfillment of certain conditions. Options can be exercised within a
period of 7 years from the date of grant for schemes 10 and 10A. The options granted under scheme 2013 can be exercised within
period of 8 years from the date of grant and would be settled by way of equity. Management has discretion to modify the exercise
period.
The details of the grant under the aforesaid schemes are summarised below:
Sr.
No. Series reference2010 - 2010-A 2013
2014-15 2013-14 2014-15 2013-14
1 Grant price (`) 44.20 67.85
2 Options granted and outstanding at the beginning of the year 91,06,625 1,11,25,955 – –
3 Options granted during the year 2,50,000 9,83,000 2,63,50,000 –
4 Options cancelled/lapsed during the year 7,17,181 13,13,887 – –
5 Options exercised and shares allotted during the year 18,36,925 16,88,443 – –
6 Options granted and outstanding at the end of the year 68,02,519 91,06,625 2,63,50,000 –
of which
Options vested 43,39,694 28,39,131 – –
Options yet to vest 24,62,825 62,67,494 2,63,50,000 –
7 Weighted average remaining contractual life of options (in years) 5.95 4.33 6.57 –
Weighted average fair values of options granted during the year is ` 25.60 (previous year: ` 34.53) per option.
The Fair value has been calculated using the Black-Scholes Option Pricing Model and the significant assumptions and inputs to estimate
the fair value of options granted during the year are as follows:
Sr.
No.
Particulars 2014-15 2013-14
i. Weighted average risk-free interest rate 7.90% 8.43%
ii. Weighted average expected life of options 4.34 years 2.85 years
iii. Weighted average expected volatility 33.15% 35.46%
iv. Weighted average expected dividends ` 3.47 per option ` 2.14 per option
v. Weighted average share price ` 68.57 per option ` 69.51 per option
vi. Weighted average exercise price ` 67.63 per option ` 44.20 per option
vii. Method used to determine expected volatility Expected volatility is based on the
historical volatility of the Company’s
shares price applicable to the expected
life of each option.
The balance in share option outstanding account as on March 31, 2015 is ` 6.31 crore (net) (previous year: ` 6.77 crore), including
` 4.16 crore (previous year: ` 2.55 crore) for which the options have been vested to employees as on March 31, 2015.
Notes forming part of the Consolidated Accounts (contd.)

280
NOTE [B]
Reserves and surplus
ParticularsAs at 31-3-2015 As at 31-3-2014
` crore ` crore ` crore ` crore
Capital reserve
As per last Balance Sheet 964.89 943.59
Addition during the year 2.11 21.30
967.00 964.89
Capital reserve on consolidation
As per last Balance Sheet 270.57 145.78
Addition during the year 0.06 135.06
Deduction during the year – 10.27
270.63 270.57
Capital redemption reserve
As per last Balance Sheet 3.27 3.27
3.27 3.27
Securities premium account [Note Q(8)(b)]
As per last Balance Sheet 7737.80 7512.11
Addition during the year 225.23 291.50
7963.03 7803.61
Less: Share/bond issue expenses (net of tax) 15.13 0.63
Premium on inflation linked debentures (net of tax) 2.91 3.53
Issue of bonus shares – 61.65
7944.99 7737.80
Debenture redemption reserve
As per last Balance Sheet 521.38 428.46
Less: Transferred to retained earnings – 68.75
Add: Transferred from retained earnings 354.70 161.67
876.08 521.38
Revaluation reserve
As per last Balance Sheet 19.25 20.20
Less: Transferred to Statement of Profit and Loss 1.59 0.95
Less: Transferred to retained earnings 2.09 –
15.57 19.25
Share options outstanding account
Employee share options outstanding account
As per last Balance Sheet 514.83 641.61
Addition during the year 87.77 69.20
Less: Transferred to retained earnings 11.66 –
Deduction during the year 158.40 195.98
432.54 514.83
Deferred employee compensation expense
As per last Balance Sheet (138.04) (194.69)
Addition during the year (87.77) (69.20)
Deduction during the year 98.37 125.85
(127.44) (138.04)
Carried forward 10382.64 9893.95
Notes forming part of the Consolidated Accounts (contd.)

281
ParticularsAs at 31-3-2015 As at 31-3-2014
` crore ` crore ` crore ` crore
Brought forward 10382.64 9893.95
Reserve u/s 45 IC of the Reserve Bank of India Act, 1934
As per last Balance Sheet 722.52 557.68
Add: Transferred from retained earnings 140.76 164.84
863.28 722.52
Reserve u/s 29C of National Housing Bank Act, 1987
As per last Balance Sheet 6.89 0.04
Add: Transferred from retained earnings 13.50 6.85
20.39 6.89 Tonnage tax reserve
As per last Balance Sheet 9.98 4.50 Add: Transferred from retained earnings 1.77 5.48
11.75 9.98 Foreign currency translation reserve
As per last Balance Sheet 571.42 416.99 Addition during the year (net) (81.53) 154.48 Add/(less): Transferred to Statement of Profit and Loss on divestment/dissolution of stake in subsidiaries (0.06) (0.05)
489.83 571.42
Reserve u/s 36(1)(viii) of Income Tax Act, 1961
As per last Balance Sheet 203.52 139.12
Add: Transferred from retained earnings 47.98 64.40
251.50 203.52 Hedging reserve (net of tax) [Note Q(15)]
As per last Balance Sheet (631.10) (611.70) Addition/(deduction) during the year (net) 248.83 (19.40)
(382.27) (631.10)Retained earnings As per last Balance Sheet 26749.05 23729.65 Depreciation charged against retained earnings (115.58) – Reversal of deferred tax on depreciation charged against retained earnings
38.54 –
Profit for the year 4764.82 4902.00
31436.83 28631.65 Add/(less): Transferred from/(to): Debenture redemption reserve (354.70) (92.92) Revaluation reserve 2.09 – Employee share options outstanding account 11.66 – Reserve u/s 45 IC of the Reserve Bank of India
Act, 1934 (140.76) (164.84) Reserve u/s 29C of National Housing Bank Act, 1987 (13.50) (6.85) Tonnage tax reserve (1.77) (5.48) Reserve u/s 36(1)(viii) of Income Tax Act, 1961 (47.98) (64.40) Less: Other appropriation: Dividend paid for previous year 1.88 2.38 Additional tax on dividend paid for previous year 0.32 0.40 Proposed dividend 1510.54 1320.85 Additional dividend tax [Note Q(21)] 293.09 224.48
29086.04 26749.05
40723.16 37526.23
Notes forming part of the Consolidated Accounts (contd.)NOTE [B]
Reserves and surplus (contd.)

282
NOTE [C(I)]
Long term borrowings
Particulars
As at 31-3-2015 As at 31-3-2014
Secured Unsecured Total * Secured Unsecured Total *
` crore ` crore ` crore ` crore ` crore ` crore
Redeemable non-convertible fixed rate debentures 14847.58 8540.00 23387.58 9262.56 4206.48 13469.04
Redeemable non-convertible floating rate debentures 190.00 – 190.00 410.00 – 410.00
Redeemable non-convertible inflation indexed debentures – 109.76 109.76 – 105.34 105.34
0.675% Foreign currency convertible bonds – 1250.00 1250.00 – – –
Term loans from banks 27102.97 10888.72 37991.69 31037.18 8376.00 39413.18
Term loans from others 337.25 1076.41 1413.66 337.29 631.79 969.08
Loans from financial institutions 484.39 250.00 734.39 626.71 250.00 876.71
Long term maturities of finance lease obligations – 0.28 0.28 – 0.47 0.47
Sales tax deferment loan – 0.62 0.62 – 1.07 1.07
Perpetual debts – 200.00 200.00 – 200.00 200.00
42962.19 22315.79 65277.98 41673.74 13771.15 55444.89
* Loans guaranteed by Directors or others ` Nil (previous year: ` Nil)
NOTE [C(II)]
Other long term liabilities
ParticularsAs at 31-3-2015 As at 31-3-2014
` crore ` crore
Forward contract payable 205.47 162.14
Interest accrued but not due 570.47 547.50
Others [Note C(II)(a)] 497.63 314.47
1273.57 1024.11
C(II)(a) Other long term liabilities – others include
Advance received against sale of investments represents advance of ` 14.30 crore received from M/s. Sical Logistics Limited (SLL) against
sale of 1,43,00,000 equity shares of ` 10/- each in M/s Sical Iron Ore Terminals Limited (SIOTL) at cost to SLL vide Agreement for Share
Sale and Purchase dated December 17, 2008. The sale is subject to the condition that it can be completed only after three years from the
date of commencement of commercial operations by SIOTL as per clause 18.2.2 (i) (d) of the License agreement dated September 23, 2006
between SIOTL and M/s. Ennore Port Limited (EPL). SIOTL has not been able to commence commercial operation as of March 31, 2015
due to the ban of export of iron ore from the State of Karnataka. SIOTL has sought necessary approvals from EPL and Government of
India for handling alternate commodities.
NOTE [C(III)]
Long term provisions
ParticularsAs at 31-3-2015 As at 31-3-2014
` crore ` crore
Provision for employee benefits:
Employee pension schemes [Note Q(10)(ii)(a)] 207.70 175.52
Post-retirement medical benefit plan [Note Q(10)(ii)(a)] 165.53 118.99
Interest rate guaranteed-provident fund [Note Q(10)(ii)(a)] 10.43 39.23
Others 3.34 –
Others:
Periodic major maintenance [Note Q(18)] 186.05 40.50
573.05 374.24
Notes forming part of the Consolidated Accounts (contd.)

283
NOTE [D(I)]
Short term borrowings
Particulars
As at 31-3-2015 As at 31-3-2014
Secured Unsecured Total* Secured Unsecured Total*
` crore ` crore ` crore ` crore ` crore ` crore
Loans repayable on demand:
From banks 1873.93 234.79 2108.72 1723.68 567.23 2290.91
Loans from related parties – 30.00 30.00 – 30.00 30.00
Other loans and advances:
From banks 1607.96 3716.93 5324.89 1397.14 5357.81 6754.95
Commercial paper – 8958.40 8958.40 – 3955.32 3955.32
Redeemable non-convertible fixed rate debentures – 500.00 500.00 – – –
From others – 67.23 67.23 698.86 128.48 827.34
3481.89 13507.35 16989.24 3819.68 10038.84 13858.52
* Loans guaranteed by Directors or others ` Nil (previous year: ` Nil)
NOTE [D(II)]
Current maturities of long term borrowings
Particulars
As at 31-3-2015 As at 31-3-2014
Secured Unsecured Total* Secured Unsecured Total*
` crore ` crore ` crore ` crore ` crore ` crore
Redeemable non-convertible fixed rate debentures 2318.46 600.00 2918.46 1866.60 100.00 1966.60
Redeemable non-convertible floating rate debentures – – – 250.00 – 250.00
3.50% Foreign currency convertible bonds – – – – 1198.30 1198.30
Term loans from banks 4997.52 217.48 5215.00 6575.97 985.18 7561.15
Loans from financial institutions 170.09 – 170.09 43.02 – 43.02
Finance lease obligation [Note Q(13)(ii)(a)(ii)] – 0.16 0.16 – 0.33 0.33
Sales tax deferment loan – 0.45 0.45 – 7.18 7.18
Refinance from National Housing Bank – – – 0.40 – 0.40
7486.07 818.09 8304.16 8735.99 2290.99 11026.98
* Loans guaranteed by Directors or others ` Nil (previous year: ` Nil)
NOTE [D(III)]
Trade payables
ParticularsAs at 31-3-2015 As at 31-3-2014
` crore ` crore
Acceptances 604.07 564.04
Due to related parties:
Due to others 12.41 –
Associate companies 31.87 31.86
Micro and small enterprises 148.96 94.71
Due to others 24061.68 20159.27
24858.99 20849.88
Notes forming part of the Consolidated Accounts (contd.)

284
NOTE [D(IV)]
Other current liabilities
ParticularsAs at 31-3-2015 As at 31-3-2014
` crore ` crore
Interest accrued but not due on borrowings 1303.04 769.06
Interest accrued and due on borrowings 6.93 13.87
Unclaimed dividend 33.59 28.01
Unclaimed interest on debentures 10.31 8.19
Due to customers (construction and project related activity) 4499.94 4573.54
Due to customers (property development projects) 637.70 203.21
Advances from customers 13746.91 9221.54
Forward contract payable 727.35 1135.39
Other payables (including sales tax,service tax,excise duty and others)
[Note D(IV)(a)]
2936.74 2713.02
23902.51 18665.83
D(IV)(a) Other current liabilities - other payables include
(i) Advance received against sale of investments representing advance of ` 180.00 crore from a company under an agreement dated
September 29, 2014 towards sale of stake in CSJ Infrastructure Private Limited, a wholly owned subsidiary.
(ii) Due to Directors ` 50.61 crore (previous year: ` 52.90 crore) on account of commission.
NOTE [D(V)]
Short term provisions
ParticularsAs at 31-3-2015 As at 31-3-2014
` crore ` crore ` crore ` crore
Provision for employee benefits:
Gratuity [Note Q(10)(ii)(a)] 102.93 78.63
Compensated absences 819.06 654.52
Employee pension schemes [Note Q(10)(ii)(a)] 13.47 13.00
Post-retirement medical benefit plan [Note Q(10)(ii)(a)] 14.59 6.83
Provision for interest rate guarantee 0.13 0.75
Bonus provision 22.33 22.67
972.51 776.40
Others:
Current taxes [net of payments made ` 2057.49 crore
(previous year: ` 510.95 crore)]
260.78 73.19
Proposed dividend [Note A(IX)] 1510.54 1320.85
Additional tax on dividend 148.35 104.72
Reserve for unexpired risks 155.64 105.79
Other provisions [Note Q(18)] 477.29 545.96
2552.60 2150.51
3525.11 2926.91
Notes forming part of the Consolidated Accounts (contd.)

285
NOTE [E(I)]
Tangible assets
` crore
Particulars
Cost/valuation Depreciation Impairment Book value
As at 1-4-2014
Pursuant to acquisition
of subsidiaries Additions
Foreign currency
fluctuation DeductionsAs at
31-3-2015Up to
31-3-2014
Pursuant to acquisition
of subsidiaries
For theperiod @
Foreign currency
fluctuation DeductionsUp to
31-3-2015As at
31-3-2015As at
31-3-2015As at
31-3-2014
Land
Freehold 1016.44 – 45.28 (1.01) 1.86 1058.85 – – – – – – 6.21 1052.64 1010.33
Leasehold 981.55 – 13.34 (0.71) 217.61 776.57 72.75 – 15.49 (0.44) 22.36 65.44 – 711.13 908.80
Sub total - Land 1997.99 – 58.62 (1.72) 219.47 1835.42 72.75 – 15.49 (0.44) 22.36 65.44 6.21 1763.77 1919.13
Buildings
Owned 5117.81 1.51 396.66 8.26 298.90 5225.34 688.80 1.51 237.77 3.10 62.70 868.48 – 4356.86 4429.01
Leased out 910.19 – 2.46 – 159.83 752.82 47.05 – 15.87 – 8.30 54.62 – 698.20 863.14
Sub total - Buildings 6028.00 1.51 399.12 8.26 458.73 5978.16 735.85 1.51 253.64 3.10 71.00 923.10 – 5055.06 5292.15
Plant & equipment
Owned 13255.51 12.61 987.02 35.79 765.15 13525.78 4518.00 10.37 1256.02 7.99 295.99 5496.39 – 8029.39 8737.51
Leased out 612.31 – 4.42 – 33.29 583.44 252.28 – 23.78 – 11.03 265.03 6.93 311.48 353.10
Sub total - Plant & equipment 13867.82 12.61 991.44 35.79 798.44 14109.22 4770.28 10.37 1279.80 7.99 307.02 5761.42 6.93 8340.87 9090.61
Computers
Owned 1022.90 5.25 141.61 (3.75) 69.59 1096.42 646.98 4.69 214.44 (2.80) 67.85 795.46 – 300.96 375.92
Leased out 36.65 – 0.14 – 18.52 18.27 28.32 – 8.27 – 18.52 18.07 – 0.20 8.33
Taken on lease 2.58 – – – 0.11 2.47 2.52 – 0.03 – 0.11 2.44 – 0.03 0.06
Sub total - Computers 1062.13 5.25 141.75 (3.75) 88.22 1117.16 677.82 4.69 222.74 (2.80) 86.48 815.97 – 301.19 384.31
Office equipment
Owned 472.61 4.74 56.78 0.54 18.98 515.69 263.35 4.24 108.50 0.38 17.16 359.31 0.01 156.37 209.25
Leased out 2.09 – 0.72 – 0.03 2.78 0.31 – 0.55 – 0.02 0.84 – 1.94 1.78
Sub total - Office equipment 474.70 4.74 57.50 0.54 19.01 518.47 263.66 4.24 109.05 0.38 17.18 360.15 0.01 158.31 211.03
Furniture and fixtures
Owned 588.96 1.27 65.80 2.41 20.60 637.84 282.97 0.69 66.52 0.76 15.18 335.76 – 302.08 305.99
Leased out 16.91 – 4.30 – 2.23 18.98 5.37 – 1.96 – 1.06 6.27 – 12.71 11.54
Sub total - Furniture & fixtures 605.87 1.27 70.10 2.41 22.83 656.82 288.34 0.69 68.48 0.76 16.24 342.03 – 314.79 317.53
Vehicles
Owned 466.26 0.17 76.81 8.92 34.26 517.90 249.57 0.03 66.04 3.53 22.54 296.63 – 221.27 216.69
Leased out 226.25 – 42.26 – 54.74 213.77 71.38 – 31.47 – 26.30 76.55 – 137.22 154.87
Sub total - Vehicles 692.51 0.17 119.07 8.92 89.00 731.67 320.95 0.03 97.51 3.53 48.84 373.18 – 358.49 371.56
Other assets
Owned
Railway sidings 294.40 – – – 294.15 0.25 40.56 – 5.69 – 46.00 0.25 – – 253.84
Aircraft 119.08 – – – – 119.08 19.65 – 6.67 – – 26.32 – 92.76 99.43
Ships 788.25 – – – 1.14 787.11 156.52 – 40.33 – 0.78 196.07 – 591.04 631.73
Dredged channel 2020.15 – – – 378.42 1641.73 144.40 – 69.03 – 39.85 173.58 – 1468.15 1875.75
Breakwater structures 637.72 – – – – 637.72 32.68 – 13.54 – – 46.22 – 591.50 605.04
Sub total - Other assets 3859.60 – – – 673.71 3185.89 393.81 – 135.26 – 86.63 442.44 – 2743.45 3465.79
Lease adjustment (239.36) (239.36)
Total 28588.62 25.55 1837.60 50.45 2369.41 28132.81 7523.46 21.53 2181.97 12.52 655.75 9083.73 13.15 # 18796.57 20812.75
Previous year 26873.83 251.68 1865.60 129.63 532.12 28588.62 5823.46 123.43 1739.04 54.30 216.77 7523.46 13.05
Add : Asset held for sale 25.01 42.74
18821.58 20855.49
Add : Capital work-in-progress 5420.42 4165.31
24242.00 25020.80
@ Includes ` 118.36 crore (gross of ` 3.56 crore attributable to minority ) transferred to retained earnings pursuant to Schedule II of Companies Act, 2013. # Impairment upto 31-3-2015 ` 13.15 crore, out of which ` 0.17 crore pertains to reversal of impairment loss during the year, ` 0.27 crore pertains to foreign currency translation adjustments during the year.
Notes forming part of the Consolidated Accounts (contd.)

286
NOTE [E(II)]
Intangible assets
` crore
Particulars
Cost/valuation Amortisation Impairment Book value
As at 1-4-2014
Pursuant to acquisition of
subsidiaries Additions
Foreign currency
fluctuation DeductionsAs at
31-3-2015Up to
31-3-2014
Pursuant to acquisition of
subsidiariesFor theperiod
Foreign currency
fluctuation DeductionsUp to
31-3-2015As at
31-3-2015As at
31-3-2015As at
31-3-2014
Specialised softwares 938.80 11.92 126.43 (47.99) 38.84 990.32 468.40 10.45 147.47 (12.95) 36.21 577.16 – 413.16 470.40
Technical knowhow 112.53 – 15.90 (0.22) 0.37 127.84 49.41 – 19.26 (0.22) 0.37 68.08 – 59.76 63.12
New product design and development
30.23 – 31.98 (1.08) 0.53 60.60 7.89 – 8.20 (0.27) 0.53 15.29 – 45.31 22.34
Customer contracts and relationship 112.40 – 29.69 (10.85) – 131.24 36.53 – 12.33 (4.52) – 44.34 – 86.90 75.87
Toll collection rights 9508.12 – 4547.01 – 3.96 14051.17 735.35 – 220.63 – 0.01 955.97 – 13095.20 8772.77
Utility right to use 1.53 – – – – 1.53 0.23 – 0.15 – – 0.38 – 1.15 1.30
Total 10703.61 11.92 4751.01 (60.14) 43.70 15362.70 1297.81 10.45 408.04 (17.96) 37.12 1661.22 – 13701.48 9405.80
Previous year 9098.96 7.73 1646.58 (0.44) 49.22 10703.61 1645.67 6.32 (308.04) (0.09) 46.05 1297.81 –
Add: Intangible assets under development 10103.29 # 10013.21
23804.77 19419.01
# Intangible assets under development are net of impairment of Nil upto 31-3-2015, during the year ̀ 138.77 crore, deductions in respect of assets disposed during the year ̀ 138.77 crore.
NOTE [E(III)]
Goodwill on consolidation
` crore
Particulars
Cost/valuation Amortisation Impairment Book value
As at 1-4-2014
Pursuant to acquisition of
subsidiaries Additions
Foreign currency
fluctuation DeductionsAs at
31-3-2015*Up to
31-3-2014
Pursuant to acquisition of
subsidiariesFor theperiod
Foreign currency
fluctuation DeductionsUp to
31-3-2015As at
31-3-2015As at
31-3-2015As at
31-3-2014*
Goodwill on consolidation 2184.27 – 108.56 (29.73) – 2263.10 – – – – – – 48.10 # 2215.00 2136.17
Previous year 2187.49 – 6.26 16.23 25.71 2184.27 – – – – – – 48.10 2136.17 2119.75
# Impairment upto 31-3-2015 ` 48.10 crore, during the year ` Nil.
*Goodwill represents consideration paid in excess of share in net worth of subsidiaries acquired during the year. It also includes goodwill purchased on acquisition of business of
` 39.61 crore (previous year: ` 37.03 crore).
Notes:
1 Cost/valuation of:
(i) Freehold land includes ` 0.14 crore (previous year ` 1.17 crore) for which conveyance is yet to be completed.
(ii) Leasehold land includes:
(a) ` 414.54 crore representing 1007.87 acres of land taken on lease from M/s Tamilnadu Industrial Development Corporation
Limited (TIDCO) on various dates for development of port and shipyard.
(b) ` 0.47 crore reresenting 4.728 hectares of forest land in dist. Rudryaprayag, State of Uttarakhand taken on lease for 30
years w.e.f. 10.09.2007.
(c) ` 0.77 crore reresenting 34.341 hectares of forest land in dist. Rudryaprayag, State of Uttarakhand taken on lease for 30
years w.e.f. 24.09.2009.
2. Cost/valuation of buildings includes ownership accommodation:
(i) (a) in various co-operative societies and apartments and shop-owners’ associations: ` 116.54 crore, including 2600 shares of
` 50 each, 232 shares of ` 100 each and 1 share of ` 250.
(b) in various apartments: ` 11.20 crore.
Notes forming part of the Consolidated Accounts (contd.)

287
(c) in proposed co-operative societies ` 0.53 crore.
(d) in various co-operative societies and apartments and shop-owners’ associations: ` 14.60 crore, for which share certificates
are yet to be issued.
(ii) of ` 4.39 crore in respect of which the deed of conveyance is yet to be executed.
(iii) of ` 8.48 crore representing undivided share in a property at a certain location.
3 Cost/valuation of buildings includes ` 52.09 crore for building constructed on leasehold land of 52.79 acres (out of 90.36 acres of
leasehold land, 37.57 acres have been taken back by the lessor) on a 66 years lease agreement entered with National Academy of
Construction (NAC) dated October 1, 2001, yet to be registered with appropriate authority.
4 Depreciation, amortisation, impairment and obsolescence for the year on fixed assets includes ̀ 30.27 crore (previous year: ̀ 24.64 crore)
on account of obsolescence and impairment (net of reversal) ` 138.60 crore (previous year: ` (0.41) crore).
5 Owned assets given on operating lease have been presented separately under tangible assets [Note E(I)] as per Accounting Standard
(AS) 19 “Leases”.
6 Cost/valuation as at April 1, 2014 of individual assets has been reclassified, wherever necessary.
7 With effect from April 1, 2014, depreciation has been computed and provided on the basis of useful lives of fixed assets as specified in
Schedule II to the Companies Act, 2013 except in respect of certain assets where the useful life was determined by technical evaluation,
considering business specific usage, the consumption pattern of the assets and the past performance of similar assets. Consequently,
the depreciation for the year ended March 31, 2015 is higher and the profit before tax lower to the extent of ` 178.03 crore. In
respect of assets where useful life specified in Schedule II has expired as on April 1, 2014, the carrying amount of ` 77.04 crore (net
of tax of ` 38.54 crore) was adjusted against retained earnings as on April 1, 2014.
8 Additions during the year and capital work-in-progress/intangible assets under development include ` 1374.62 crore (previous year:
` 914.00 crore) being borrowing cost capitalised in accordance with Accounting Standard (AS) 16 “Borrowing Costs” as specified
under Section 133 of the Companies Act , 2013, read with rule 7 of the Companies (Accounts) Rules, 2014. Asset wise break-up of
borowing costs capitalised is as follows:
` crore
Asset Class 2014-15 2013-14
Tangible
Dredged channel – 0.21
Building owned 26.30 2.08
Plant & equipment owned 0.30 0.15
Office equipment owned 0.02 –
Furniture and fixture owned 0.03 0.01
Intangible
Toll collection rights 3.65 94.08
Capital work-in-progress 527.48 284.71
Intangible assets under development 816.84 532.76
Total 1374.62 914.00
Notes forming part of the Consolidated Accounts (contd.)

288
NOTE [F]
Non-current investments (at cost unless otherwise specified)
Particulars As at 31-3-2015 As at 31-3-2014
` crore ` crore ` crore ` crore
Long term investments:
Trade investments:
Investments in equity instruments
Fully paid equity shares 43.00 43.00
Less: Provision for diminution in value 15.90 15.90
27.10 27.10
Investment in associates: [Note F(I)]
Fully paid equity shares of associate companies 85.05 91.17
Add/(deduct):
Accumulated share in profit/(loss) of the associate companies at the beginning of the year 74.57 218.82
Adjustment pursuant to an associate becoming subsidiary (14.43) (143.40)
Adjustment pursuant to divestment of stake in an associate 4.50 0.03
149.69 166.62
Add/(deduct):
Share in profit/(loss) (net) of associate companies-during the period 2.14 9.25
Share in depreciation, net of deferred tax, charged against accumulated profits (0.64) –
Commitment to fresh infusion of equity 2.73 2.73
Dividend received from associate companies during the period (4.24) (10.13)
Unrealised profits in respect of transactions with associate companies (1.33) (1.35)
Provision for diminution in value (0.56) (0.56)
147.79 166.56
Other investments:
Other fully paid equity shares 67.80 189.13
Less: Provision for diminution in value 28.32 10.06
39.48 179.07
Fully paid preference shares 93.75 159.00
Government and trust securities 180.00 81.57
Less: Provision for diminution in value 0.02 –
179.98 81.57
Debentures and bonds 772.72 582.67
Mutual funds 1.70 0.20
Security receipt 245.85 121.97
Investment in units of fund 138.43 114.65
1646.80 1432.79
F(I) Investments in associates include goodwill of ` 23.95 crore (previous year: ` 23.95 crore) and is further net of capital reserve of
` 0.25 crore (previous year: ` 0.25 crore).
Notes forming part of the Consolidated Accounts (contd.)

289
NOTE [G(I)(a)]
Long term loans and advances
Particulars As at 31-3-2015 As at 31-3-2014
` crore ` crore ` crore ` crore
Secured considered good:
Loans against mortgage of house property 2.37 3.77
Capital advances 30.97 32.10
Inter corporate deposits including interest accrued 3.00 –
Other loans and advances (KMPs) 0.01 –
Unsecured considered good:
Capital advances 269.23 342.08
Loans and advances to related parties:
Associate companies:
Advances recoverable – 0.01
Joint ventures:
Inter-corporate loans – 490.27
– 490.28
Other loans and advances:
Security deposits 248.72 264.15
Earnest money deposits 3.95 3.23
Advances recoverable in cash or in kind 1479.74 1277.78
Income tax receivable of current year [net of provision for tax of
` 101.80 crore (previous year: ` 128.26 crore)]
122.75 46.72
Balance with customs, port trust, etc. – 0.04
Lease receivables – 1.04
Considered doubtful:
Other loans and advances 3.01 0.45
1858.17 1593.41
Less: Allowance for doubtful loans and advances 3.01 0.45
1855.16 1592.96
2160.74 2461.19
NOTE [G(I)(b)]
Long term loans and advances towards financing activities
Particulars As at 31-3-2015 As at 31-3-2014
` crore ` crore ` crore ` crore
Secured loans:
Considered good:
Term loans 30487.13 25075.93
Finance lease 68.31 83.72
Debentures 2514.08 1812.38
Considered doubtful:
Term loans [Note G(I)(b)(i)] 386.22 335.48
33455.74 27307.51
Less: Allowance for non-performing assets 386.22 335.48
Less: Contingent provisions against standard assets 119.02 90.28
Less: Provision for standard assets 290.79 190.38
32659.71 26691.37
Carried forward 32659.71 26691.37
Notes forming part of the Consolidated Accounts (contd.)

290
Particulars As at 31-3-2015 As at 31-3-2014
` crore ` crore ` crore ` crore
Brought forward 32659.71 26691.37
Unsecured loans:
Considered good:
Term loans 1341.10 854.64
Finance lease 9645.00 5297.80
Debentures 293.22 100.00
Considered doubtful:
Term loans [Note G(I)(b)(i)] 54.34 29.19
11333.66 6281.63
Less: Allowance for non-performing assets 54.34 29.19
Less: Contingent provisions against standard assets 4.08 3.85
Less: Provision for standard assets 2.93 –
11272.31 6248.59
43932.02 32939.96
G(I)(b)(i) Loans and advances towards financing activities are classified as doubtful to the extent of provision made following prudential
norms for provisioning of assets prescribed by the Reserve Bank of India.
NOTE [G(II)]
Cash and bank balances
Particulars As at 31-3-2015 As at 31-3-2014
` crore ` crore
Cash and bank balances not available for immediate use 99.31 38.68
99.31 38.68
NOTE [G(III)]
Other non-current assets
Particulars As at 31-3-2015 As at 31-3-2014
` crore ` crore
Interest accrued on investments and others 263.56 85.19
Unamortised expenses 97.20 98.52
Others 8.65 1.22
369.41 184.93
NOTE [H(I)]
Current investments
Particulars As at 31-3-2015 As at 31-3-2014
` crore ` crore ` crore ` crore
(a) Current investments:
Fully paid equity shares 73.15 24.09
Less: Provision for diminution in value 31.60 2.64
41.55 21.45
Carried forward 41.55 21.45
Notes forming part of the Consolidated Accounts (contd.)NOTE [G(I)(b)]
Long term loans and advances towards financing activities (contd.)
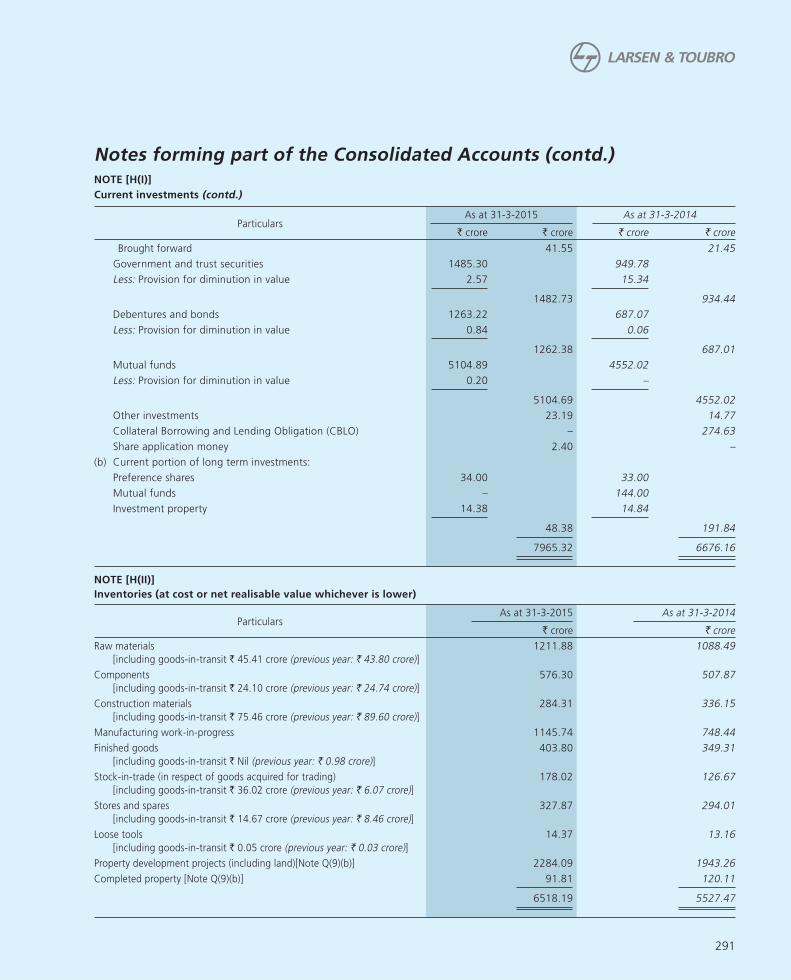
291
Particulars As at 31-3-2015 As at 31-3-2014
` crore ` crore ` crore ` crore
Brought forward 41.55 21.45
Government and trust securities 1485.30 949.78
Less: Provision for diminution in value 2.57 15.34
1482.73 934.44
Debentures and bonds 1263.22 687.07
Less: Provision for diminution in value 0.84 0.06
1262.38 687.01
Mutual funds 5104.89 4552.02
Less: Provision for diminution in value 0.20 –
5104.69 4552.02
Other investments 23.19 14.77
Collateral Borrowing and Lending Obligation (CBLO) – 274.63
Share application money 2.40 –
(b) Current portion of long term investments:
Preference shares 34.00 33.00
Mutual funds – 144.00
Investment property 14.38 14.84
48.38 191.84
7965.32 6676.16
NOTE [H(II)]
Inventories (at cost or net realisable value whichever is lower)
Particulars As at 31-3-2015 As at 31-3-2014
` crore ` crore
Raw materials
[including goods-in-transit ` 45.41 crore (previous year: ` 43.80 crore)]
1211.88 1088.49
Components
[including goods-in-transit ` 24.10 crore (previous year: ` 24.74 crore)]
576.30 507.87
Construction materials
[including goods-in-transit ` 75.46 crore (previous year: ` 89.60 crore)]
284.31 336.15
Manufacturing work-in-progress 1145.74 748.44
Finished goods
[including goods-in-transit ` Nil (previous year: ` 0.98 crore)]
403.80 349.31
Stock-in-trade (in respect of goods acquired for trading)
[including goods-in-transit ` 36.02 crore (previous year: ` 6.07 crore)]
178.02 126.67
Stores and spares
[including goods-in-transit ` 14.67 crore (previous year: ` 8.46 crore)]
327.87 294.01
Loose tools
[including goods-in-transit ` 0.05 crore (previous year: ` 0.03 crore)]
14.37 13.16
Property development projects (including land)[Note Q(9)(b)] 2284.09 1943.26
Completed property [Note Q(9)(b)] 91.81 120.11
6518.19 5527.47
Notes forming part of the Consolidated Accounts (contd.)NOTE [H(I)]
Current investments (contd.)

292
NOTE [H(III)]
Trade receivables
Particulars As at 31-3-2015 As at 31-3-2014
` crore ` crore ` crore ` crore
Trade receivables
Secured
Debts outstanding for more than 6 months
Considered good 4.71 18.23
Considered doubtful – 10.21
4.71 28.44
Other debts
Considered good 8.85 7.31
13.56 35.75
Less: Allowance for doubtful debts – 10.21
13.56 25.54
Unsecured
Debts outstanding for more than 6 months
Considered good 3508.90 3181.30
Considered doubtful 673.48 535.32
4182.38 3716.62
Other debts
Considered good 26566.91 23177.71
Considered doubtful 0.46 0.19
30749.75 26894.52
Less: Allowance for doubtful debts 673.94 535.51
30075.81 26359.01
30089.37 26384.55
NOTE [H(IV)]
Cash and bank balances
Particulars As at 31-3-2015 As at 31-3-2014
` crore ` crore ` crore ` crore
Cash and cash equivalents:
Balance with banks 3526.15 2092.19
Cheques and drafts on hand 272.27 429.83
Cash on hand 119.60 22.80
Fixed deposits with banks (maturity less than 3 months) 850.44 1057.38
4768.46 3602.20
Other bank balances:
Fixed deposits with banks including interest accured thereon
[includes ` 3.41 crore (previous year: ` 3.40 crore) of bank
deposit with more than 12 months maturity]
794.48 320.48
Earmarked balances with banks-unclaimed dividend 33.59 28.00
Earmarked balances with banks-others 10.59 8.88
Cash and bank balances not available for immediate use
including margin money deposits
149.09 137.01
987.75 494.37
5756.21 4096.57
Notes forming part of the Consolidated Accounts (contd.)
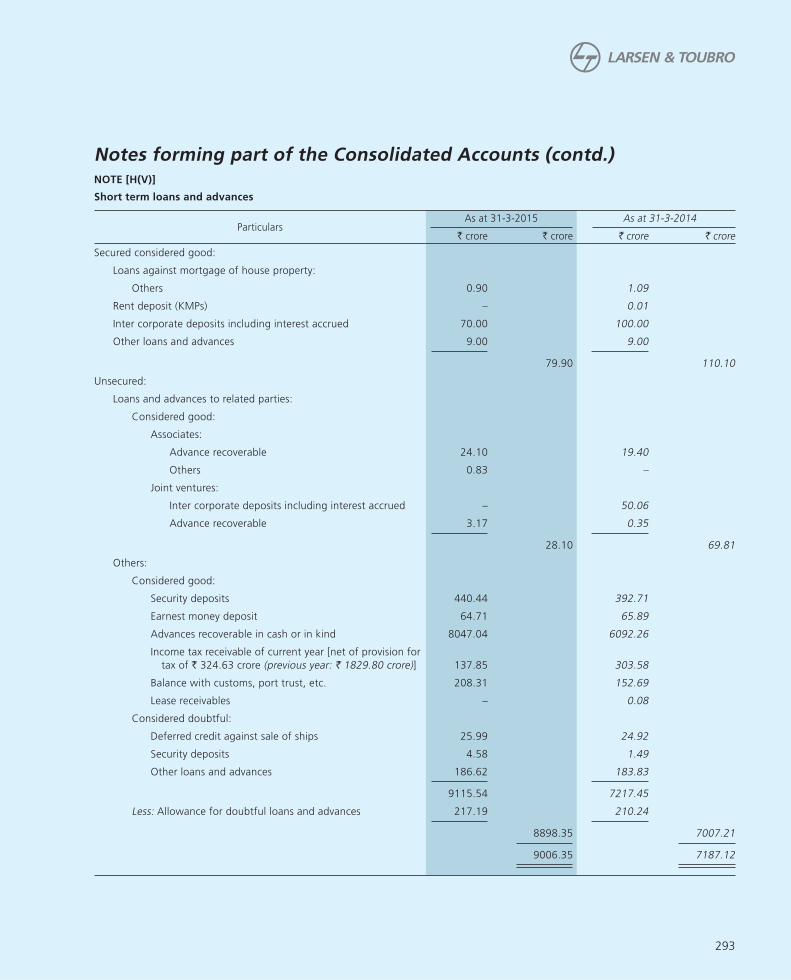
293
NOTE [H(V)]
Short term loans and advances
Particulars As at 31-3-2015 As at 31-3-2014
` crore ` crore ` crore ` crore
Secured considered good:
Loans against mortgage of house property:
Others 0.90 1.09
Rent deposit (KMPs) – 0.01
Inter corporate deposits including interest accrued 70.00 100.00
Other loans and advances 9.00 9.00
79.90 110.10
Unsecured:
Loans and advances to related parties:
Considered good:
Associates:
Advance recoverable 24.10 19.40
Others 0.83 –
Joint ventures:
Inter corporate deposits including interest accrued – 50.06
Advance recoverable 3.17 0.35
28.10 69.81
Others:
Considered good:
Security deposits 440.44 392.71
Earnest money deposit 64.71 65.89
Advances recoverable in cash or in kind 8047.04 6092.26
Income tax receivable of current year [net of provision for
tax of ` 324.63 crore (previous year: ` 1829.80 crore)] 137.85 303.58
Balance with customs, port trust, etc. 208.31 152.69
Lease receivables – 0.08
Considered doubtful:
Deferred credit against sale of ships 25.99 24.92
Security deposits 4.58 1.49
Other loans and advances 186.62 183.83
9115.54 7217.45
Less: Allowance for doubtful loans and advances 217.19 210.24
8898.35 7007.21
9006.35 7187.12
Notes forming part of the Consolidated Accounts (contd.)

294
NOTE [H(V)(a)]
Short term Loans and advances towards financing activities
Particulars As at 31-3-2015 As at 31-3-2014
` crore ` crore ` crore ` crore
Secured loans:
Considered good:
Term loans 7830.08 8362.69
Finance lease 63.66 54.59
Debentures 59.78 136.90
7953.52 8554.18
Less: Contingent provision against standard assets 32.53 26.55
7920.99 8527.63
Unsecured loans:
Considered good:
Term loans 3189.63 2278.78
Finance lease 295.75 111.87
Debentures 40.00 –
3525.38 2390.65
Less: Contingent provision against standard assets 11.52 6.51
3513.86 2384.14
11434.85 10911.77
NOTE [H(VI)]
Other current assets
Particulars As at 31-3-2015 As at 31-3-2014
` crore ` crore
Due from customers (construction and project related activity) 22730.22 23356.80
Due from customers (property development activity) [Note Q(9)(b)] 129.88 156.63
Interest accrued on investments and others 712.02 539.82
Unbilled revenue 325.75 209.93
Unamortised expenses 66.02 46.49
Accrual of fee income 2.13 2.88
Billed interest and other receivable 147.85 128.06
Others 105.69 23.71
24219.56 24464.32
Notes forming part of the Consolidated Accounts (contd.)

295
NOTE [I]
Contingent liabilities
Particulars As at 31-3-2015 As at 31-3-2014
` crore ` crore
(a) Claims against the Company not acknowledged as debts 1596.25 354.69(b) Sales-tax liability that may arise in respect of matters in appeal 217.42 163.82(c) Excise duty/Service Tax/Customs/Entry Tax/Municipal Cess liability
that may arise in respect of matters in appeal/challenged by the
Company in WRIT 226.01 209.81(d) Custom duty demands against the Group has filed appeals
before Appellate Autorities which are pending disposal 1.22 1.22(e) Income-Tax liability (including penalty) that may arise in respect
of which the Company is in appeal 1170.01 758.78(f) Corporate Guarantee for debt given on behalf of an associate
company – 3.68
Notes:
1 The Company expects reimbursements of ` 8.67 crore in respect of the above contingent liabilities.
2 It is not practicable to estimate the timing of cash outflows, if any, in respect of matters at (a) to (e) above pending resolution of the arbitration/appellate proceedings.
3 In respect of matters at (f), the cash outflows, if any, could generally occur upto one year being the period over which the validity of the guarantee exists.
4 Particulars of contingent liabilities in respect of joint ventures is given in Note Q(17).
NOTE [J]
Commitments
Particulars As at 31-3-2015 As at 31-3-2014
` crore ` crore
Estimated amount of contracts remaining to be executed on capital
account (net of advances) * 23033.22 37187.98
* Particulars of capital commitments in respect of joint ventures are given in Note Q(17).
NOTE [K]
Revenue from operations
Particulars2014-15 2013-14
` crore ` crore ` crore ` crore
Sales & service: Construction and project related activity [Note Q(9)(a)] 60702.03 61617.69 Manufacturing and trading activity 9514.43 8809.38 Engineering and service fees 2592.42 1677.42 Software development products and services 4941.83 4666.45 Income from financing activity/annuity based projects and finance
income from lease of power plant
7050.69 4994.33
Property development activity [Note Q(9)(b)] 1559.17 970.83 Toll collection and related activity 1006.41 788.31 Servicing 693.27 726.20 Commission 140.10 129.55 Income from port services 100.15 280.46 Charter hire income 169.16 176.00 Investment/portfolio management and trusteeship fees 139.17 94.82 Fees for operation and maintenance of power plant 1531.79 85.38 Premium earned (net) 206.14 173.16
90346.76 85189.98
Carried forward 90346.76 85189.98
Notes forming part of the Consolidated Accounts (contd.)

296
Particulars2014-15 2013-14
` crore ` crore ` crore ` crore
Brought forward 90346.76 85189.98
Other operational revenue: Income from hire of plant and equipment 0.45 4.64 Lease rentals 242.22 232.22 Property maintenance recoveries 14.02 17.46 Facility management income 47.86 8.68 Premium earned (net) on related forward exchange contract 262.11 89.07 Profit on sale of SPVs of developmental projects and realty business 1381.76 – Miscellaneous income 466.48 346.99
2414.90 699.06
92761.66 85889.04
K(I) Revenue from sales and service includes:
(a) ` 1324.37 crore (previous year: ` 1431.48 crore) for price variations net of liquidated damages in terms of contracts with the
customers.
(b) Reversal of shipbuilding subsidy ` Nil (previous year: ` 31.54 crore).
NOTE [L]
Other income
Particulars2014-15 2013-14
` crore ` crore ` crore ` crore
Interest income:
Interest Income on long term investments 34.88 28.45
Interest Income on current investments 212.41 268.67
Interest Income on others:
Joint venture & associate companies 10.33 48.63
Others 147.11 142.57
404.73 488.32
Dividend income:
Trade investments 2.07 1.84
Others 74.74 47.46
76.81 49.30
From current investments 2.75 1.61
79.56 50.91
Net gain/(loss) on sale of investments:
Long term investments (net) (0.47) 16.74
Current investments (net) 444.70 283.03
444.23 299.77
Net gain/(loss) on sale of fixed assets (net) 19.58 90.81
Lease rental 0.62 1.46
Miscellaneous income (net of expenses) 58.43 50.51
1007.15 981.78
Notes forming part of the Consolidated Accounts (contd.)NOTE [K]
Revenue from operations (contd.)

297
NOTE [M]
Manufacturing, construction and operating expenses
Particulars2014-15 2013-14
` crore ` crore ` crore ` crore
Materials consumed:
Raw materials and components 10451.27 9716.53
Less: Scrap sales 145.75 141.85
10305.52 9574.68
Construction materials consumed 20331.39 18567.02
Purchase of stock-in-trade 1424.04 1607.22
Stores, spares and tools consumed 2501.80 2586.57
Sub-contracting charges 17404.01 16949.91
Change in inventories of finished goods, work-in-progress and
stock-in-trade:
Closing stock:
Finished goods 403.80 349.31
Stock-in-trade 178.02 126.67
Work-in-progress 4622.97 4193.05
Cost of built up space and property development land:
Work-in-progress 1973.86 1658.63
Completed property 91.81 120.11
Property development land 310.23 284.62
7580.69 6732.39
Less: Opening stock:
Finished goods [includes ` Nil on associate becoming a
subsidiary (previous year: ` 48.61 crore)]
349.31 305.03
Stock-in-trade 126.67 189.54
Work-in-progress [includes ` Nil on associate becoming a
subsidiary (previous year: ` 43.00 crore)]
4193.05 3717.58
Cost of built up space and property development land:
Work-in-progress 1658.63 1556.78
Completed property 120.11 169.24
Property development land 284.62 245.06
6732.39 6183.23
(848.30) (549.16)
Other manufacturing, construction and operating expenses:
Excise duty 18.72 11.63
Power and fuel [Note O(I)] 968.23 1054.49
Royalty and technical know-how fees 22.14 26.12
Packing and forwarding [Note O(I)] 414.65 342.82
Hire charges-plant & equipment and others 1117.15 1104.31
Bank guarantee charges 146.47 111.31
Insurance claim incurred (net) 147.65 151.13
Engineering, professional, technical and consultancy fees 1081.46 1035.31
Carried forward 3916.47 51118.46 3837.12 48736.24
Notes forming part of the Consolidated Accounts (contd.)

298
Particulars2014-15 2013-14
` crore ` crore ` crore ` crore
Brought forward 3916.47 51118.46 3837.12 48736.24
Insurance [Note O(I)] 235.93 169.63
Rent [Note O(I)] 407.61 364.18
Rates and taxes [Note O(I)] 253.99 272.23
Travelling and conveyance [Note O(I)] 844.25 842.44
Repairs to plant & equipment 18.14 71.52
Repairs to buildings [Note O(I)] 26.15 25.09
General repairs and maintenance [Note O(I)] 351.89 331.64
Port operation expenses 41.28 121.41
Operating cost of shipping business 59.37 52.36
Miscellaneous expenses [Note O(I)] 1780.79 1259.97
7935.87 7347.59
Finance cost of financial services business and finance lease activity:
Interest and other financing charges 4158.13 3160.06
4158.13 3160.06
Staff expenses for software development business:
Salaries, wages and bonus 3839.68 3149.82
Contribution to and provision for:
Provident fund and pension fund 49.27 40.76
Superannuation/employee pension schemes 4.47 3.87
Gratuity funds [Note Q(10)(ii)(b)] 19.67 7.14
Expenses on employee stock option scheme [Note A(VIII)(e)(ii)] 4.29 0.12
Staff welfare expenses 163.86 163.06
4081.24 3364.77
67293.70 62608.66
M(I) Other manufacturing, construction and operating expenses include ̀ 527.81 crore (previous year: ̀ 2172.12 crore) towards construction
of 1400 MW power plant at Rajpura, Punjab.
Notes forming part of the Consolidated Accounts (contd.)NOTE [M]
Manufacturing, construction and operating expenses (contd.)

299
NOTE [N]
Employee benefits expense
Particulars 2014-15 2013-14
` crore ` crore ` crore ` crore
Salaries, wages and bonus 6663.11 5901.63
Contribution to and provision for:
Provident fund and pension fund 175.57 163.62
Superannuation/employee pension schemes 26.05 45.85
Gratuity funds [Note Q(10)(ii)(b)] 82.31 44.25
283.93 253.72
Expenses on employee stock option scheme [Note A(VIII)(e)(ii)] 61.62 75.56
Employee medical & other insurance premium expenses [Note O(I)] 70.64 57.36
Staff welfare expenses 842.90 846.78
7922.20 7135.05
NOTE [O]
Sales, administration and other expenses
Particulars 2014-15 2013-14
` crore ` crore ` crore ` crore
Power and fuel [Note O(I)] 106.25 103.20
Packing and forwarding [Note O(I)] 193.14 205.70
Insurance [Note O(I)] 130.60 89.27
Rent [Note O(I)] 450.98 345.02
Rates and taxes [Note O(I)] 141.63 159.05
Travelling and conveyance [Note O(I)] 582.44 557.65
Repairs to buildings [Note O(I)] 22.04 28.09
General repairs and maintenance [Note O(I)] 399.60 361.47
Professional fees 599.89 526.49
Directors’ fees 2.43 1.47
Telephone, postage and telegrams 202.47 211.75
Advertising and publicity 179.60 129.52
Stationery and printing 72.73 71.55
Commission:
Distributors and agents 119.88 75.81
Employees and others 14.96 18.13
134.84 93.94
Bank charges 121.13 84.89
Discount on sales 75.78 74.40
Miscellaneous expenses [Note O(I)] 783.74 680.38
Bad debts and advances written off 392.17 183.49
Less: Allowances for doubtful debts and advances written back 8.78 57.96
383.39 125.53
Receivable discounting charges - non-recourse 5.84 0.20
Allowances for doubtful debts,advances and non-performing assets (net) 433.97 276.95
Provision/(reversal) for foreseeable losses on construction contracts (19.34) 29.34
Provision/(reversal) for diminution in value of investments(net) 35.39 24.15
Loss on sale of SPVs of developmental projects and realty business – 21.27
Exchange (gain)/loss 135.25 357.40
Provision/(reversal) for standard assets 56.57 72.85
Other provisions [Note Q(18)(a)] 247.67 59.38
5478.03 4690.91
Notes forming part of the Consolidated Accounts (contd.)

300
NOTE [O(I)] Aggregation of expenses disclosed vide notes M, N and O in respect of specific item is as follows:
` crore
Sr.
No.Nature of expenses
2014-15 2013-14
Note M Note N Note O Total Note M Note N Note O Total
1 Power and fuel 968.23 – 106.25 1074.48 1054.49 – 103.20 1157.69
2 Packing and forwarding 414.65 – 193.14 607.79 342.82 – 205.70 548.52
3 Insurance 235.93 70.64 130.60 437.17 169.63 57.36 89.27 316.26
4 Rent 407.61 – 450.98 858.59 364.18 – 345.02 709.20
5 Rates and taxes 253.99 – 141.63 395.62 272.23 – 159.05 431.28
6 Travelling and conveyance 844.25 – 582.44 1426.69 842.44 – 557.65 1400.09
7 Repairs to buildings 26.15 – 22.04 48.19 25.09 – 28.09 53.18
8 General repairs and maintenance 351.89 – 399.60 751.49 331.64 – 361.47 693.11
9 Miscellaneous expenses 1780.79 – 783.74 2564.53 1259.97 – 680.38 1940.35
NOTE [P]
Finance costs
Particulars 2014-15 2013-14
` crore ` crore
Interest expenses 2663.71 3007.67
Other borrowing costs 25.59 26.50
Exchange loss (attributable to finance costs) 161.42 103.83
2850.72 3138.00
NOTE [Q]
Q(1) The Balance Sheet as on March 31, 2015 and the Statement of Profit and Loss for the year ended March 31, 2015 are drawn and
presented as per the format prescribed under Schedule III to the Companies Act, 2013.
Q(2) Basis of preparation
a) The Consolidated Financial Statements (CFS) are prepared in accordance with Accounting Standard (AS) 21 “Consolidated
Financial Statements”, Accounting Standard (AS) 23 “Accounting for Investments in Associates in Consolidated Financial
Statements” and Accounting Standard (AS) 27 “Financial Reporting of Interests in Joint Ventures”, as specified in the Companies
(Accounting Standards) Rules, 2006 [Note R(1)]. The CFS comprises the financial statements of Larsen & Toubro Limited (L&T),
its subsidiaries, associates and joint ventures. Reference in these notes to L&T, Company, Parent Company, Companies or Group
shall mean to include Larsen & Toubro Limited or any of its subsidiaries, associates and joint ventures, unless otherwise stated.
b) The notes including significant policies to the CFS are intended to serve as a guide for better understanding of the Group’s
position. In this respect, the Company has disclosed such notes and policies which represent the required disclosure.
Notes forming part of the Consolidated Accounts (contd.)

301
Q(3) The list of subsidiaries, associates and joint ventures included in the Consolidated Financial Statements are as under:
As at 31-3-2015 As at 31-3-2014
Sr. No.
Name of subsidiary company Country of incorporation
Proportion of ownership
interest (%)
Proportion of voting power
held (%)
Proportion of ownership
interest (%)
Proportion of voting power
held (%)
Domestic Subsidiaries
1 L&T Cutting Tools Limited India 100.00 100.00 100.00 100.00
2 Bhilai Power Supply Company Limited India 99.90 99.90 99.90 99.90
3 L&T-Sargent & Lundy Limited India 50.0001 50.0001 50.0001 50.0001
4 Spectrum Infotech Private Limited India 100.00 100.00 100.00 100.00
5 L&T-Valdel Engineering Limited India 100.00 100.00 100.00 100.00
6 L&T Shipbuilding Limited India 97.00 97.00 97.00 97.00
7 L&T Electricals and Automation Limited India 100.00 100.00 100.00 100.00
8 Hi-Tech Rock Products & Aggregates Limited India 100.00 100.00 100.00 100.00
9 L&T Seawoods Limited (formerly known as L&T Seawoods Private Limited)
India 100.00 100.00 100.00 100.00
10 L&T-Gulf Private Limited India 50.0002 50.0002 50.0002 50.0002
11 L&T-MHPS Boilers Private Limited (formerly known as L&T-MHI Boilers Private Limited )
India 51.00 51.00 51.00 51.00
12 L&T-MHPS Turbine Generators Private Limited (formerly known as L&T-MHI Turbine Generators Private Limited )
India 51.00 51.00 51.00 51.00
13 Raykal Aluminium Company Private Limited India 75.50 75.50 75.50 75.50
14 L&T Natural Resources Limited India 100.00 100.00 100.00 100.00
15 L&T Hydrocarbon Engineering Limited India 100.00 100.00 100.00 100.00
16 L&T Special Steels and Heavy Forgings Private Limited India 74.00 74.00 74.00 74.00
17 PNG Tollway Limited India 72.77 72.77 72.77 72.77
18 Kesun Iron & Steel Company Private Limited India 95.00 95.00 95.00 95.00
19 L&T Howden Private Limited India 50.10 50.10 50.10 50.10
20 L&T Solar Limited India 100.00 100.00 100.00 100.00
21 L&T Sapura Shipping Private Limited India 60.00 60.00 60.00 60.00
22 L&T Sapura Offshore Private Limited India 60.00 60.00 60.00 60.00
23 L&T PowerGen Limited India 100.00 100.00 100.00 100.00
24 Ewac Alloys Limited India 100.00 100.00 100.00 100.00
25 L&T Kobelco Machinery Private Limited India 51.00 51.00 51.00 51.00
26 L&T Geostructure LLP India 74.00 74.00 74.00 74.00
27 L&T Valves Limited India 100.00 100.00 100.00 100.00
28 L&T Realty Limited India 100.00 100.00 100.00 100.00
29 L&T Asian Realty Project LLP India 50.00 50.00 50.00 50.00
30 L&T Parel Project LLP India 100.00 100.00 100.00 100.00
31 Chennai Vision Developers Private Limited India 100.00 100.00 100.00 100.00
32 L&T South City Projects Limited India 51.00 51.00 51.00 51.00
33 L&T Siruseri Property Developers Limited * India – – 51.00 51.00
34 L&T Vision Ventures Limited India 68.00 68.00 68.00 68.00
35 L&T Tech Park Limited ** India – – 51.00 51.00
36 CSJ Infrastructure Private Limited India 100.00 100.00 82.00 82.00
37 CSJ Hotels Private Limited*** India – – 82.00 82.00
38 L&T Power Limited India 99.99 99.99 99.99 99.99
39 L&T Cassidian Limited India 74.00 74.00 74.00 74.00
40 L&T General Insurance Company Limited India 100.00 100.00 100.00 100.00
41 L&T Aviation Services Private Limited India 100.00 100.00 100.00 100.00
42 L&T Infocity Limited India 89.00 89.00 89.00 89.00
43 L&T Hitech City Limited India 65.86 65.86 65.86 65.86
44 Hyderabad International Trade Expositions Limited India 51.72 51.72 51.72 51.72
45 Larsen & Toubro Infotech Limited India 100.00 100.00 100.00 100.00
46 GDA Technologies Limited India 100.00 100.00 100.00 100.00
Notes forming part of the Consolidated Accounts (contd.)NOTE [Q] (contd.)

302
As at 31-3-2015 As at 31-3-2014
Sr. No.
Name of subsidiary company Country of incorporation
Proportion of ownership
interest (%)
Proportion of voting power
held (%)
Proportion of ownership
interest (%)
Proportion of voting power
held (%)
47 L&T Finance Holdings Limited India 72.95 72.95 76.61 76.61
48 L&T Housing Finance Limited India 72.95 72.95 76.61 76.61
49 Consumer Financial Services Limited India 72.95 72.95 76.61 76.61
50 Family Credit Limited India 72.95 72.95 76.61 76.61
51 L&T Finance Limited India 72.95 72.95 76.61 76.61
52 L&T Capital Markets Limited India 72.95 72.95 76.61 76.61
53 L&T Investment Management Limited India 72.95 72.95 76.61 76.61
54 L&T Mutual Fund Trustee Limited India 72.95 72.95 76.61 76.61
55 L&T Trustee Services Private Limited @ India – – 76.61 76.61
56 L&T FinCorp Limited India 72.95 72.95 76.61 76.61
57 L&T Infrastructure Finance Company Limited India 72.95 72.95 76.61 76.61
58 L&T Infra Debt Fund Limited India 72.95 72.95 76.61 76.61
59 L&T Infra Investment Partners Advisory Private Limited India 72.95 72.95 76.61 76.61
60 L&T infra Investment Partners Trustee Private Limited India 72.95 72.95 76.61 76.61
61 L&T Vrindavan Properties Limited India 72.95 72.95 76.61 76.61
62 L&T Access Distribution Services Limited India 72.95 72.95 76.61 76.61
63 Mudit Cement Private Limited India 72.95 72.95 76.61 76.61
64 L&T Capital Company Limited India 100.00 100.00 100.00 100.00
65 L&T Trustee Company Private Limited India 100.00 100.00 100.00 100.00
66 L&T Power Development Limited India 100.00 100.00 100.00 100.00
67 L&T Uttaranchal Hydropower Limited India 100.00 100.00 100.00 100.00
68 L&T Arunachal Hydropower Limited India 100.00 100.00 100.00 100.00
69 L&T Himachal Hydropower Limited India 100.00 100.00 100.00 100.00
70 Nabha Power Limited India 100.00 100.00 100.00 100.00
71 L&T Infrastructure Development Projects Limited India 97.45 97.45 97.45 97.45
72 L&T Panipat Elevated Corridor Limited India 97.45 97.45 97.45 97.45
73 Narmada Infrastructure Construction Enterprise Limited @@ India – – 97.45 97.45
74 L&T Krishnagiri Thopur Toll Road Limited India 97.45 97.45 97.45 97.45
75 L&T Western Andhra Tollways Limited India 97.45 97.45 97.45 97.45
76 L&T Vadodara Bharuch Tollway Limited India 97.45 97.45 97.45 97.45
77 L&T East-West Tollway Limited @@@ India – – 97.45 97.45
78 L&T Great Eastern Highway Limited @@@ India – – 97.45 97.45
79 L&T Transportation Infrastructure Limited India 98.12 98.12 98.12 98.12
80 L&T Western India Tollbridge Limited India 97.45 97.45 97.45 97.45
81 L&T Interstate Road Corridor Limited India 97.45 97.45 97.45 97.45
82 International Seaports (India) Private Limited @@ India – – 97.45 97.45
83 L&T Port Kachchigarh Limited India 97.45 97.45 97.45 97.45
84 L&T Ahmedabad-Maliya Tollway Limited India 97.45 97.45 97.45 97.45
85 L&T Halol-Shamlaji Tollway Limited India 97.45 97.45 97.45 97.45
86 L&T Krishnagiri Walajahpet Tollway Limited India 97.45 97.45 97.45 97.45
87 L&T Devihalli Hassan Tollway Limited India 97.45 97.45 97.45 97.45
88 L&T Metro Rail (Hyderabad) Limited India 97.48 97.48 97.48 97.48
89 L&T Transco Private Limited @@ India – – 97.45 97.45
90 L&T Chennai-Tada Tollway Limited India 97.45 97.45 97.45 97.45
91 L&T BPP Tollway Limited India 97.45 97.45 97.45 97.45
92 L&T Rajkot-Vadinar Tollway Limited India 97.45 97.45 97.45 97.45
93 L&T Deccan Tollways Limited India 97.45 97.45 97.45 97.45
94 L&T Samakhiali Gandhidham Tollway Limited India 97.45 97.45 97.45 97.45
95 Kudgi Transmission Limited India 97.45 97.45 97.45 97.45
96 L&T Sambalpur-Rourkela Tollway Limited India 97.45 97.45 97.45 97.45
97 L&T Technology Services Limited India 100.00 100.00 100.00 100.00
Notes forming part of the Consolidated Accounts (contd.)NOTE [Q] (contd.)

303
As at 31-3-2015 As at 31-3-2014
Sr. No.
Name of subsidiary company Country of incorporation
Proportion of ownership
interest (%)
Proportion of voting power
held (%)
Proportion of ownership
interest (%)
Proportion of voting power
held (%)
98 L&T Construction Equipment Limited India 100.00 100.00 100.00 100.00
99 L&T Tejomaya Limited ** India – – 51.09 51.09
100 L&T Infrastructure Engineering Limited ^ ( formerly known as L&T-Ramboll Consulting Engineers Limited)
India 100.00 100.00 – –
101 L&T Thales Technology Services Private Limited ^^ (formerly known as Thales Software India Private Limited)
India 74.00 74.00 – –
102 Information Systems Resource Centre Private Limited ^^^ India 100.00 100.00 – –
* The Company has been liquidated on April 23, 2014
** The Group has sold its stake on May 22, 2014
*** The company has been liquidated on December 19, 2014
@ The company is merged with L&T Mutual Fund Trustee Limited w.e.f. April 1, 2013
@@ Companies merged with L&T Infrastructure Development Projects Limited w.e.f. April 1, 2013
@@@ Companies merged with L&T Infrastructure Development Projects Limited w.e.f. April 1, 2014
^ Associate became wholly owned subsidiary w.e.f. September 8, 2014
^^ The Group acquired stake on June 26, 2014
^^^ The Group acquired stake on October 16, 2014
As at 31-3-2015 As at 31-3-2014
Sr. No.
Name of subsidiary company Country of incorporation
Proportion of ownership
interest (%)
Proportion of voting power
held (%)
Proportion of ownership
interest (%)
Proportion of voting power
held (%)
Foreign Subsidiaries
1 Larsen & Toubro LLC USA 100.00 100.00 100.00 100.00
2 Larsen & Toubro Infotech, GmbH Germany 100.00 100.00 100.00 100.00
3 Larsen & Toubro Infotech Canada Limited Canada 100.00 100.00 100.00 100.00
4 Larsen & Toubro Infotech LLC USA 100.00 100.00 100.00 100.00
5 L&T Infotech Financial Services Technologies Inc. Canada 100.00 100.00 100.00 100.00
6 Larsen & Toubro Infotech South Africa (PTY) Limited South Africa 74.90 74.90 74.90 74.90
7 L&T Information Technology Services (Shanghai) Co., Ltd. China 100.00 100.00 100.00 100.00
8 L&T Infrastructure Development Projects Lanka (Private) Limited Sri Lanka 93.44 93.44 93.44 93.44
9 L&T IDPL Trustee Manager Pte. Ltd. Singapore 97.45 97.45 97.45 97.45
10 L&T Diversified India Equity Fund * Mauritius – – 100.00 100.00
11 L&T Realty FZE UAE 100.00 100.00 100.00 100.00
12 Larsen & Toubro International FZE UAE 100.00 100.00 100.00 100.00
13 Larsen & Toubro Hydrocarbon International Limited LLC Kindgom of Saudi Arabia
100.00 100.00 100.00 100.00
14 Thalest Limited UK 100.00 100.00 100.00 100.00
15 Servowatch Systems Limited UK 100.00 100.00 100.00 100.00
16 Larsen & Toubro (Oman) LLC Sultanate of Oman 65.00 65.00 65.00 65.00
17 Larsen & Toubro Electromech LLC Sultanate of Oman 65.00 65.00 65.00 65.00
18 L&T Modular Fabrication Yard LLC Sultanate of Oman 65.00 65.00 65.00 65.00
19 Larsen & Toubro (East Asia) SDN.BHD ## Malaysia 30.00 100.00 30.00 100.00
20 Larsen & Toubro Qatar LLC ## Qatar 49.00 100.00 49.00 100.00
21 L&T Overseas Projects Nigeria Limited Nigeria 100.00 100.00 100.00 100.00
22 PT Larsen & Toubro Hydrocarbon Engineering Indonesia Indonesia 95.00 95.00 95.00 95.00
23 L&T Electricals & Automation Saudi Arabia Company LLC Kindgom of Saudi Arabia
75.00 75.00 75.00 75.00
24 Larsen & Toubro Kuwait Construction General Contracting Company, WLL ##
Kuwait 49.00 75.00 49.00 75.00
25 Larsen & Toubro (Qingdao) Rubber Machinery Company Limited @@
Peoples Republic of China
100.00 100.00 100.00 100.00
Notes forming part of the Consolidated Accounts (contd.)NOTE [Q] (contd.)
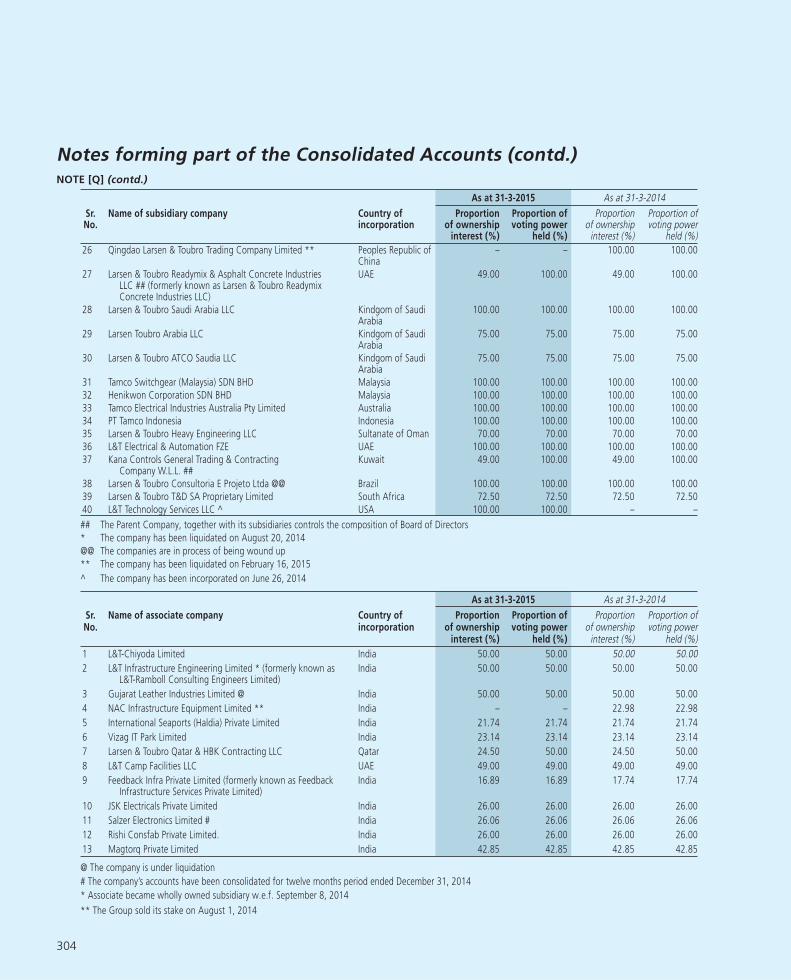
304
As at 31-3-2015 As at 31-3-2014
Sr. No.
Name of subsidiary company Country of incorporation
Proportion of ownership
interest (%)
Proportion of voting power
held (%)
Proportion of ownership
interest (%)
Proportion of voting power
held (%)
26 Qingdao Larsen & Toubro Trading Company Limited ** Peoples Republic of China
– – 100.00 100.00
27 Larsen & Toubro Readymix & Asphalt Concrete Industries LLC ## (formerly known as Larsen & Toubro Readymix Concrete Industries LLC)
UAE 49.00 100.00 49.00 100.00
28 Larsen & Toubro Saudi Arabia LLC Kindgom of Saudi Arabia
100.00 100.00 100.00 100.00
29 Larsen Toubro Arabia LLC Kindgom of Saudi Arabia
75.00 75.00 75.00 75.00
30 Larsen & Toubro ATCO Saudia LLC Kindgom of Saudi Arabia
75.00 75.00 75.00 75.00
31 Tamco Switchgear (Malaysia) SDN BHD Malaysia 100.00 100.00 100.00 100.00
32 Henikwon Corporation SDN BHD Malaysia 100.00 100.00 100.00 100.00
33 Tamco Electrical Industries Australia Pty Limited Australia 100.00 100.00 100.00 100.00
34 PT Tamco Indonesia Indonesia 100.00 100.00 100.00 100.00
35 Larsen & Toubro Heavy Engineering LLC Sultanate of Oman 70.00 70.00 70.00 70.00
36 L&T Electrical & Automation FZE UAE 100.00 100.00 100.00 100.00
37 Kana Controls General Trading & Contracting Company W.L.L. ##
Kuwait 49.00 100.00 49.00 100.00
38 Larsen & Toubro Consultoria E Projeto Ltda @@ Brazil 100.00 100.00 100.00 100.00
39 Larsen & Toubro T&D SA Proprietary Limited South Africa 72.50 72.50 72.50 72.50
40 L&T Technology Services LLC ^ USA 100.00 100.00 – –
## The Parent Company, together with its subsidiaries controls the composition of Board of Directors
* The company has been liquidated on August 20, 2014
@@ The companies are in process of being wound up
** The company has been liquidated on February 16, 2015
^ The company has been incorporated on June 26, 2014
As at 31-3-2015 As at 31-3-2014
Sr. No.
Name of associate company Country of incorporation
Proportion of ownership
interest (%)
Proportion of voting power
held (%)
Proportion of ownership
interest (%)
Proportion of voting power
held (%)
1 L&T-Chiyoda Limited India 50.00 50.00 50.00 50.00
2 L&T Infrastructure Engineering Limited * (formerly known as L&T-Ramboll Consulting Engineers Limited)
India 50.00 50.00 50.00 50.00
3 Gujarat Leather Industries Limited @ India 50.00 50.00 50.00 50.00
4 NAC Infrastructure Equipment Limited ** India – – 22.98 22.98
5 International Seaports (Haldia) Private Limited India 21.74 21.74 21.74 21.74
6 Vizag IT Park Limited India 23.14 23.14 23.14 23.14
7 Larsen & Toubro Qatar & HBK Contracting LLC Qatar 24.50 50.00 24.50 50.00
8 L&T Camp Facilities LLC UAE 49.00 49.00 49.00 49.00
9 Feedback Infra Private Limited (formerly known as Feedback Infrastructure Services Private Limited)
India 16.89 16.89 17.74 17.74
10 JSK Electricals Private Limited India 26.00 26.00 26.00 26.00
11 Salzer Electronics Limited # India 26.06 26.06 26.06 26.06
12 Rishi Consfab Private Limited. India 26.00 26.00 26.00 26.00
13 Magtorq Private Limited India 42.85 42.85 42.85 42.85
@ The company is under liquidation
# The company’s accounts have been consolidated for twelve months period ended December 31, 2014
* Associate became wholly owned subsidiary w.e.f. September 8, 2014
** The Group sold its stake on August 1, 2014
Notes forming part of the Consolidated Accounts (contd.)NOTE [Q] (contd.)
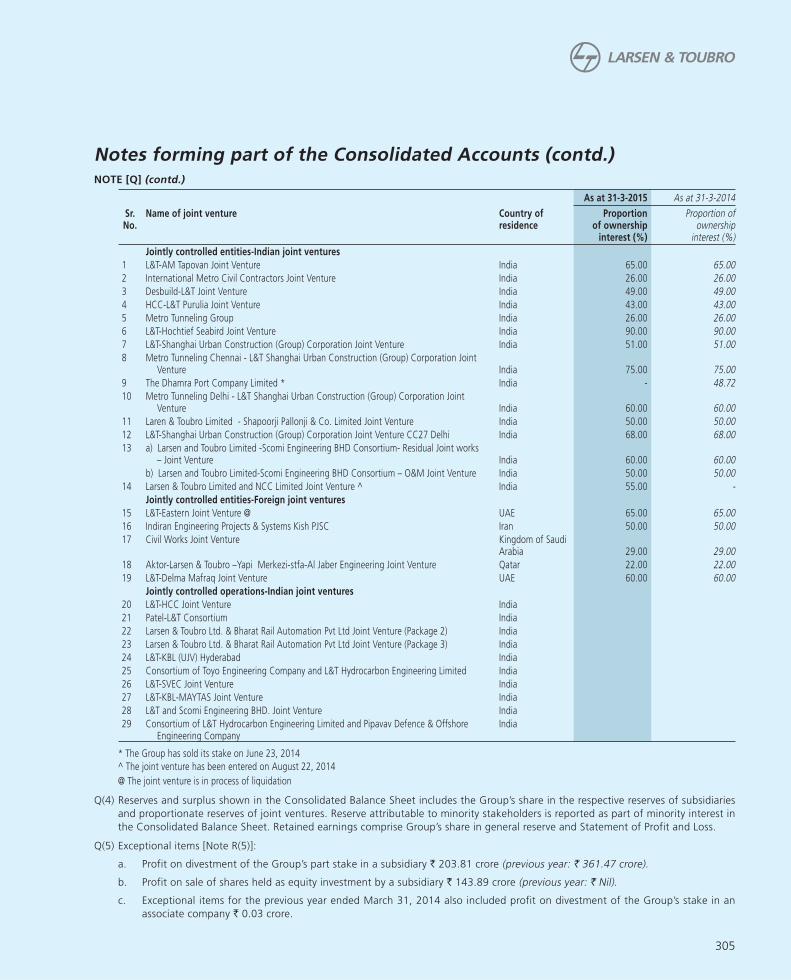
305
As at 31-3-2015 As at 31-3-2014
Sr. No.
Name of joint venture Country of residence
Proportion of ownership
interest (%)
Proportion of ownership
interest (%)
Jointly controlled entities-Indian joint ventures
1 L&T-AM Tapovan Joint Venture India 65.00 65.00
2 International Metro Civil Contractors Joint Venture India 26.00 26.00
3 Desbuild-L&T Joint Venture India 49.00 49.00
4 HCC-L&T Purulia Joint Venture India 43.00 43.00
5 Metro Tunneling Group India 26.00 26.00
6 L&T-Hochtief Seabird Joint Venture India 90.00 90.00
7 L&T-Shanghai Urban Construction (Group) Corporation Joint Venture India 51.00 51.00
8 Metro Tunneling Chennai - L&T Shanghai Urban Construction (Group) Corporation Joint Venture India 75.00 75.00
9 The Dhamra Port Company Limited * India - 48.72
10 Metro Tunneling Delhi - L&T Shanghai Urban Construction (Group) Corporation Joint Venture India 60.00 60.00
11 Laren & Toubro Limited - Shapoorji Pallonji & Co. Limited Joint Venture India 50.00 50.00
12 L&T-Shanghai Urban Construction (Group) Corporation Joint Venture CC27 Delhi India 68.00 68.00
13 a) Larsen and Toubro Limited -Scomi Engineering BHD Consortium- Residual Joint works – Joint Venture India 60.00 60.00
b) Larsen and Toubro Limited-Scomi Engineering BHD Consortium – O&M Joint Venture India 50.00 50.00
14 Larsen & Toubro Limited and NCC Limited Joint Venture ^ India 55.00 -
Jointly controlled entities-Foreign joint ventures
15 L&T-Eastern Joint Venture @ UAE 65.00 65.00
16 Indiran Engineering Projects & Systems Kish PJSC Iran 50.00 50.00
17 Civil Works Joint Venture Kingdom of Saudi Arabia 29.00 29.00
18 Aktor-Larsen & Toubro –Yapi Merkezi-stfa-Al Jaber Engineering Joint Venture Qatar 22.00 22.00
19 L&T-Delma Mafraq Joint Venture UAE 60.00 60.00
Jointly controlled operations-Indian joint ventures
20 L&T-HCC Joint Venture India
21 Patel-L&T Consortium India
22 Larsen & Toubro Ltd. & Bharat Rail Automation Pvt Ltd Joint Venture (Package 2) India
23 Larsen & Toubro Ltd. & Bharat Rail Automation Pvt Ltd Joint Venture (Package 3) India
24 L&T-KBL (UJV) Hyderabad India
25 Consortium of Toyo Engineering Company and L&T Hydrocarbon Engineering Limited India
26 L&T-SVEC Joint Venture India
27 L&T-KBL-MAYTAS Joint Venture India
28 L&T and Scomi Engineering BHD. Joint Venture India
29 Consortium of L&T Hydrocarbon Engineering Limited and Pipavav Defence & Offshore Engineering Company
India
* The Group has sold its stake on June 23, 2014
^ The joint venture has been entered on August 22, 2014
@ The joint venture is in process of liquidation
Q(4) Reserves and surplus shown in the Consolidated Balance Sheet includes the Group’s share in the respective reserves of subsidiaries
and proportionate reserves of joint ventures. Reserve attributable to minority stakeholders is reported as part of minority interest in
the Consolidated Balance Sheet. Retained earnings comprise Group’s share in general reserve and Statement of Profit and Loss.
Q(5) Exceptional items [Note R(5)]:
a. Profit on divestment of the Group’s part stake in a subsidiary ` 203.81 crore (previous year: ` 361.47 crore).
b. Profit on sale of shares held as equity investment by a subsidiary ` 143.89 crore (previous year: ` Nil).
c. Exceptional items for the previous year ended March 31, 2014 also included profit on divestment of the Group’s stake in an
associate company ` 0.03 crore.
Notes forming part of the Consolidated Accounts (contd.)NOTE [Q] (contd.)
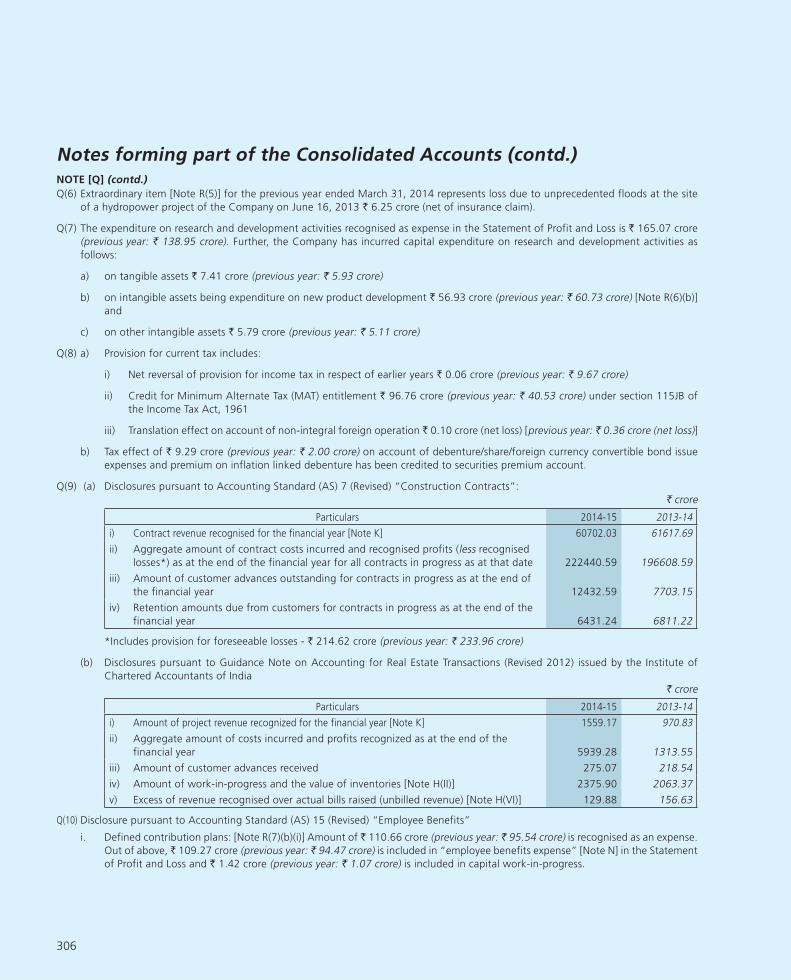
306
Q(6) Extraordinary item [Note R(5)] for the previous year ended March 31, 2014 represents loss due to unprecedented floods at the site
of a hydropower project of the Company on June 16, 2013 ` 6.25 crore (net of insurance claim).
Q(7) The expenditure on research and development activities recognised as expense in the Statement of Profit and Loss is ` 165.07 crore
(previous year: ̀ 138.95 crore). Further, the Company has incurred capital expenditure on research and development activities as
follows:
a) on tangible assets ` 7.41 crore (previous year: ` 5.93 crore)
b) on intangible assets being expenditure on new product development ` 56.93 crore (previous year: ` 60.73 crore) [Note R(6)(b)]
and
c) on other intangible assets ` 5.79 crore (previous year: ` 5.11 crore)
Q(8) a) Provision for current tax includes:
i) Net reversal of provision for income tax in respect of earlier years ` 0.06 crore (previous year: ` 9.67 crore)
ii) Credit for Minimum Alternate Tax (MAT) entitlement ` 96.76 crore (previous year: ` 40.53 crore) under section 115JB of
the Income Tax Act, 1961
iii) Translation effect on account of non-integral foreign operation ` 0.10 crore (net loss) [previous year: ` 0.36 crore (net loss)]
b) Tax effect of ` 9.29 crore (previous year: ` 2.00 crore) on account of debenture/share/foreign currency convertible bond issue
expenses and premium on inflation linked debenture has been credited to securities premium account.
Q(9) (a) Disclosures pursuant to Accounting Standard (AS) 7 (Revised) “Construction Contracts”:
` crore
Particulars 2014-15 2013-14
i) Contract revenue recognised for the financial year [Note K] 60702.03 61617.69
ii) Aggregate amount of contract costs incurred and recognised profits (less recognised
losses*) as at the end of the financial year for all contracts in progress as at that date 222440.59 196608.59
iii) Amount of customer advances outstanding for contracts in progress as at the end of
the financial year 12432.59 7703.15
iv) Retention amounts due from customers for contracts in progress as at the end of the
financial year 6431.24 6811.22
*Includes provision for foreseeable losses - ` 214.62 crore (previous year: ` 233.96 crore)
(b) Disclosures pursuant to Guidance Note on Accounting for Real Estate Transactions (Revised 2012) issued by the Institute of
Chartered Accountants of India
` crore
Particulars 2014-15 2013-14
i) Amount of project revenue recognized for the financial year [Note K] 1559.17 970.83
ii) Aggregate amount of costs incurred and profits recognized as at the end of the
financial year 5939.28 1313.55
iii) Amount of customer advances received 275.07 218.54
iv) Amount of work-in-progress and the value of inventories [Note H(II)] 2375.90 2063.37
v) Excess of revenue recognised over actual bills raised (unbilled revenue) [Note H(VI)] 129.88 156.63
Q(10) Disclosure pursuant to Accounting Standard (AS) 15 (Revised) “Employee Benefits”
i. Defined contribution plans: [Note R(7)(b)(i)] Amount of ` 110.66 crore (previous year: ` 95.54 crore) is recognised as an expense.
Out of above, ` 109.27 crore (previous year: ` 94.47 crore) is included in “employee benefits expense” [Note N] in the Statement
of Profit and Loss and ` 1.42 crore (previous year: ` 1.07 crore) is included in capital work-in-progress.
Notes forming part of the Consolidated Accounts (contd.)NOTE [Q] (contd.)

307
ii. Defined benefit plans: [Note R(7)(b)(ii)]
a) The amounts recognised in Balance Sheet are as follows:
` crore
Particulars
Gratuity plan Post-retirement medical
benefit plan
Company pension plan Trust-managed
provident fund plan
As at
31-3-2015
As at
31-3-2014
As at
31-3-2015
As at
31-3-2014
As at
31-3-2015
As at
31-3-2014
As at
31-3-2015
As at
31-3-2014
A) Present value of defined benefit obligation
Wholly funded 595.42 479.48 – – – – 2799.77 2403.95
Wholly unfunded 102.93 78.63 181.08 126.93 221.47 188.93 30.89 61.76
698.35 558.11 181.08 126.93 221.47 188.93 2830.66 2465.71
Less: Fair value of plan assets 633.60 456.76 – – – – 2811.65 2444.74
Less: Unrecognised past service costs – – 0.96 1.11 0.30 0.41 – –
Add: Amount not recognised as an asset (limit in para 59(b))
4.33 8.77 – – – – – –
Amount to be recognised as liability or (asset)
69.08 110.12 180.12 125.82 221.17 188.52 19.01 20.97
B) Amounts reflected in the Balance Sheet
Liabilities 69.08 110.12 180.12 125.82 221.17 188.52 19.01 24.09
Assets – – – – – – – –
Net liability/(asset) 69.08 110.12 180.12 125.82 221.17 188.52 19.01 24.09
Net liability/(asset) - current 69.08 110.12 14.59 6.83 13.47 13.00 8.58 (15.14) #
Net liability/(asset) - non-current – – 165.53 118.99 207.70 175.52 10.43 39.23
b) The amounts recognised in Statement of Profit and Loss Account are as follows:
` crore
Particulars
Gratuity plan Post-retirement medical benefit plan
Company pension plan Trust-managed provident fund plan
31-3-2015 31-3-2014 31-3-2015 31-3-2014 31-3-2015 31-3-2014 31-3-2015 31-3-2014
1 Current service cost 67.25 55.85 10.42 10.25 1.58 1.83 180.76 $ 160.22 $
2 Interest cost 43.95 39.36 12.20 10.35 16.83 15.69 201.44 173.42
3 Expected (return) on plan assets (33.00) (29.57) – – – – (202.50) (173.58)
4 Actuarial losses/(gains) 36.39 (26.67) 38.80 (8.35) 29.25 (14.38) (24.99) 57.08
5 Past service cost 0.53 0.07 0.14 0.14 0.11 0.11 – –
6 Effect of any curtailment or settlement – 3.32 – – – – – –
7 Adjustment for earlier years – – – – – – – –
8 Business Combination (0.89) – – – – – – –
9 Actuarial gain/(loss) not recognised in books
2.14 0.88 – – – – 0.10 (17.03)
10 Translation adjustments (0.31) (2.18) – – – – – –
11 Amount capitalized out of the above (0.60) (0.39) – – – – – –
Total (1 to 11) 115.46 40.67 61.56 12.39 47.77 3.25 154.81 200.11
I Amount included in “employee benefits expense”
82.31 44.25 23.18 24.08 1.82 6.78 88.08 131.87
II Amount included as part of “manufacturing, construction and operating expenses”
19.67 7.14 – – – – 19.00 28.35
III Amount included as part of “finance cost” 13.47 (10.86) 38.38 (11.69) 45.95 (3.53) 47.73 39.89
IV Amount capitalised on new product development
0.01 0.14 – – – – – –
Total (I+II+III+IV) 115.46 40.67 61.56 12.39 47.77 3.25 154.81 200.11
Actual return on plan assets 66.00 19.39 – – – – 210.50 165.48
Notes forming part of the Consolidated Accounts (contd.)NOTE [Q] (contd.)

308
c) The changes in the present value of defined benefit obligation representing reconciliation of opening and closing balances
thereof are as follows:
` crore
Particulars
Gratuity plan Post-retirement medical benefit plan
Company pension plan Trust-managed provident fund plan
As at
31-3-2015
As at
31-3-2014
As at
31-3-2015
As at
31-3-2014
As at
31-3-2015
As at
31-3-2014
As at
31-3-2015
As at
31-3-2014
Opening balance of the present value of defined benefit obligation 558.11 512.49 126.93 118.95 188.93 198.89 2465.71 2058.91
Add: Current service cost 67.25 55.85 10.42 10.25 1.58 1.83 180.76 $ 160.22 $
Add: Interest cost 43.95 39.36 12.19 10.35 16.82 15.69 201.44 173.42
Add: Contribution by plan participants
i) Employer – – – – – – – –
ii) Employee – – – – – – 350.52 257.70
iii) Transfer-in/(out) – – – – – – – –
Add/(less): Actuarial losses/(gains) 69.27 (36.84) 38.80 (8.35) 29.25 (14.38) (22.25) 48.98
Less: Benefits paid (42.14) (33.86) (7.12) (6.85) (15.11) (13.10) (343.40) (233.52)
Add: Past service cost 0.53 0.02 – – – – – –
Add: Liabilities assumed on transfer of employees 0.39 – (0.14) – – – (2.12) –
Add: Business combination/acquisition 0.33 15.37 – 2.58 – – – –
Add: Adjustment for earlier years – – – – – – – –
Add/(less): Translation adjustments 0.66 5.72 – – – – – –
Closing balance of the present value of defined benefit obligation 698.35 558.11 181.08 126.93 221.47 188.93 2830.66 2465.71
d) Changes in the fair value of plan assets representing reconciliation of the opening and closing balances thereof are as
follows:
` crore
Particulars
Gratuity plan Trust-managed provident fund plan
As at 31-3-2015
As at 31-3-2014
As at 31-3-2015
As at 31-3-2014
Opening balance of the fair value of the plan assets 456.76 382.83 2444.74 2027.93
Add: Expected Return on plan assets* 33.00 29.57 202.50 173.58
Add/(Less): Actuarial gains/(losses) 32.99 (10.17) 8.00 (8.10)
Add: Contribution by the employer 151.94 77.97 158.75 201.44
Add/(less): Transfer in/(out) – – – –
Add: Contribution by plan participants – – 322.15 283.41
Less: Benefits paid (42.14) (33.86) (324.49) (233.52)
Add: Business combination/disposal (net) 0.82 10.42 – –
Add: Adjustment for earlier years 0.23 – – –
Closing balance of the plan assets 633.60 456.76 2811.65 2444.74
Notes: The fair value of the plan assets under the trust managed provident fund plan has been determined at amounts
based on their value at the time of redemption, assuming a constant rate of return to maturity.
* Basis used to determine the overall expected return:
The trust formed by the Company manages the investments of provident funds and gratuity fund. Expected return on
plan assets is determined based on the assessment made at the beginning of the year on the return expected on its
existing portfolio, along with the estimated increment to the plan assets and expected yield on the respective assets
in the portfolio during the year [Note 10(ii)(f)(7)] infra.
The Company expects to fund ` 91.43 crore (previous year: ` 25.10 crore) towards its gratuity plan and ` 198.84 crore
(previous year: ` 89.45 crore) towards its trust-managed provident fund plan during the year 2014-15.
# Employer’s and employees’ contribution paid in advance.
$ Employer’s contribution to provident fund
Notes forming part of the Consolidated Accounts (contd.)NOTE [Q] (contd.)

309
e) The major categories of plan assets as a percentage of total plan assets are as follows:
Particulars
Gratuity plan Trust-managed provident
fund plan
As at
31-3-2015
As at
31-3-2014
As at
31-3-2015
As at
31-3-2014
Government of India securities 31% 30% 24% 24%
State government securities 11% 11% 15% 15%
Corporate bonds 30% 29% 8% 8%
Equity shares of listed companies 2% 2% – –
Fixed deposits under special deposit scheme framed by
Central Government for provident funds
– – 10% 12%
Insurer managed funds 1% 1% – –
Public sector unit bonds 17% 20% 42% 41%
Others 8% 7% 1% –
f) Principal actuarial assumptions at the Balance Sheet date (expressed as weighted averages):
As at
31-3-2015
As at
31-3-2014
1 Discount rate:
a) Gratuity plan 7.83% 9.19%
b) Company pension plan 7.83% 9.19%
c) Post-retirement medical benefit plan 7.83% 9.19%
2 Expected return on plan assets 7.50% 7.50%
3 Annual increase in healthcare costs (see note below) 5.00% 5.00%
4 Salary growth rate:
a) Gratuity plan 5.00% 5.00%
b) Company pension plan 6.00% 6.00%
5. Attrition rate:
a) For post-retirement medical benefit plan & company pension plan, the attrition rate varies from 2% to 8%
(previous year: 2% to 8%) for various age groups.
b) For gratuity plan the attrition rate varies from 1% to 6% (previous year: 1% to 6%) for various age groups.
6. The estimates of future salary increases, considered in actuarial valuation, take into account inflation, seniority,
promotion and other relevant factors, such as supply and demand in the employment market.
7. The interest payment obligation of trust-managed provident fund is assumed to be adequately covered by the interest
income on long term investments of the fund. Any shortfall in the interest income over the interest obligation is
recognised immediately in the Statement of Profit and Loss.
8. The obligation of the Company under the post-retirement medical benefit plan is limited to the overall ceiling limits. At
present, healthcare cost, as indicated in the principal actuarial assumption given above, has been assumed to increase
at 5% p.a.
9. One percentage point change in assumed healthcare cost trend rates would have the following effects on the aggregate
of the service cost and interest cost and defined benefit obligation:
` crore
ParticularsEffect of 1% increase Effect of 1% decrease
2014-15 2013-14 2014-15 2013-14
Effect on the aggregate of the service cost and
interest cost 5.54 3.77 (4.27) (2.90)
Effect on defined benefit obligation 23.88 14.62 (18.94) (11.64)
Notes forming part of the Consolidated Accounts (contd.)NOTE [Q] (contd.)

310
g) The amounts pertaining to defined benefit plans are as follows:
` crore
ParticularsAs at
31-3-2015As at
31-3-2014As at
31-3-2013As at
31-3-2012As at
31-3-2011
1 Post-retirement medical benefit plan (unfunded)
Defined benefit obligation 180.12 125.82 117.70 92.64 95.99
Experience adjustment plan liabilities 12.60 14.76 0.69 (6.62) 7.91
2 Gratuity plan (funded/unfunded)
Defined benefit obligation 698.35 558.11 512.49 432.29 389.90
Plan assets 633.60 456.76 382.83 322.04 327.89
Surplus/(deficit) (64.75) (101.35) (133.64) (110.39) (61.99)
Experience adjustment plan liabilities 19.88 1.42 26.18 30.18 30.37
Experience adjustment plan assets 34.41 (8.11) (13.96) (0.19) 4.38
3 Post-retirement pension plan (unfunded)
Defined benefit obligation 221.17 188.52 198.36 184.03 162.14
Experience adjustment plan liabilities 5.13 (0.22) (2.79) 23.21 17.46
4 Trust managed provident fund plan (funded)
Defined benefit obligation 2830.66 2465.71 2058.91 1833.45 1615.09
Plan assets 2811.65 2444.74 2027.93 1791.04 1583.61
Surplus/(deficit) 19.01 (20.97) (30.98) (42.41) (31.48)
h) General descriptions of defined benefit plans:
1. Gratuity plan:
The Company operates gratuity plan through a trust wherein every employee is entitled to the benefit equivalent to
fifteen days salary last drawn for each completed year of service. The same is payable on termination of service or
retirement whichever is earlier. The benefit vests after five years of continuous service. The Company’s scheme is more
favourable as compared to the obligation under Payment of Gratuity Act, 1972. A small part of the gratuity plan,
which is not material is unfunded and managed within the Company.
2. Post-retirement medical benefit plan:
The Post-retirement medical benefit plan provides for reimbursement of health care costs to certain categories of
employees post their retirement. The reimbursement is subject to an overall ceiling sanctioned based on cadre of the
employee at the time of retirement.
3. Company’s pension plan:
In addition to contribution to state-managed pension plan (EPS scheme), the Company operates a post retirement
pension scheme, which is discretionary in nature for certain cadres of employees. The quantum of pension depends
on the cadre of the employee at the time of retirement.
4. Trust managed provident fund plan:
The Company manages provident fund plan through a provident fund trust for its employees which is permitted
under the Provident Fund and Miscellaneous Provisions Act, 1952. The plan envisages contribution by employer and
employees and guarantees interest at the rate notified by the provident fund authority. The contribution by employer
and employee together with interest are payable at the time of separation from service or retirement whichever is
earlier. The benefit under this plan vests immediately on rendering of service.
The interest payment obligation of trust-managed provident fund is assumed to be adequately covered by the interest
income on long term investments of the fund. Any shortfall in the interest income over the interest obligation is
recognized immediately in the Statement of Profit and Loss as actuarial loss. Any loss/gain arising out of the investment
risk and actuarial risk associated with the plan is also recognized as expense or income in the period in which such
loss/gain occurs. Further, an amount of ` 28.80 crore (previous year: provision of ` 39.28 crore) has been reversed
based on actuarial valuation towards the future obligation arising out of interest rate guarantee associated with the
plan.
Notes forming part of the Consolidated Accounts (contd.)NOTE [Q] (contd.)

311
Q(11) Diclosure pursuant to Accounting Standard (AS) 17 “Segment Reporting”
a) Primary segments (business segments):
` crore
ParticularsFor the year ended 31-3-2015 For the year ended 31-3-2014
External Inter-segment Total External Inter-segment Total
REVENUE
Infrastructure 43426.30 1432.54 44858.84 36582.34 1439.00 38021.34
Power 4738.49 17.95 4756.44 6127.47 27.15 6154.62
Metallurgical and Material Handling 3181.77 244.69 3426.46 5523.44 208.53 5731.97
Heavy Engineering 3459.34 165.30 3624.64 4438.35 86.35 4524.70
Electrical & Automation 5060.82 398.72 5459.54 4804.89 327.82 5132.71
Hydrocarbon 7351.41 80.35 7431.76 10008.38 123.23 10131.61
IT & Technology Services 7588.63 70.32 7658.95 6353.21 96.41 6449.62
Developmental Projects 5148.03 5.61 5153.64 1533.62 9.27 1542.89
Financial Services 6393.07 7.43 6400.50 5170.87 9.99 5180.86
Others 6413.80 170.99 6584.79 5346.47 146.01 5492.48
Elimination (2593.90) (2593.90) (2473.76) (2473.76)
Total Revenue 92761.66 – 92761.66 85889.04 – 85889.04
RESULT
Infrastructure 4246.64 3696.67
Power 550.84 1375.80
Metallurgical and Material Handling 238.98 826.92
Heavy Engineering 227.00 499.62
Electrical & Automation 549.23 542.40
Hydrocarbon (1342.81) 99.54
IT & Technology Services 1316.46 1239.57
Developmental Projects 1674.34 899.44
Financial Services 1015.84 645.69
Others 1192.13 475.50
Total Segment 9668.65 10301.15
Inter segment margin on capital jobs (63.07) (97.00)
9605.58 10204.15
Unallocated corporate income/(expenditure)(net) 57.65 (65.24)
Operating Profit (PBIT) 9663.23 10138.91
Interest expenses (2850.72) (3138.00)
Interest income 404.73 488.32
Profit before tax(PBT) (before extraordinary items) 7217.24 7489.23
Profit from extra ordinary items – (6.25)
Profit before tax(PBT) (after extraordinary items) 7217.24 7482.98
Provision for current tax (2661.91) (2501.64)
Provision for deferred tax 408.67 (105.94)
Profit after tax 4964.00 4875.40
Additional tax on dividend distributed/proposed by subsidiary companies (30.32) (20.81)
Share in profit/(loss) of associates 2.14 9.25
Minority interest in (income)/losses (171.00) 38.16
Profit after tax, minority interest and share in profit of associates
4764.82 4902.00
Notes forming part of the Consolidated Accounts (contd.)NOTE [Q] (contd.)
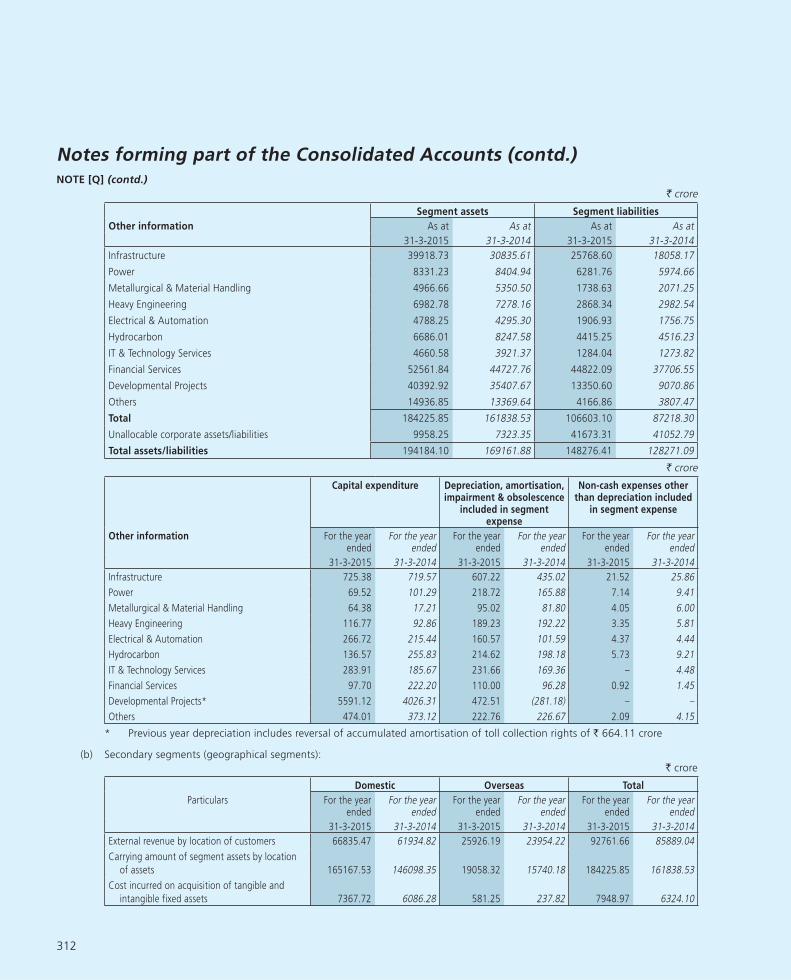
312
` crore
Segment assets Segment liabilities
Other information As at As at As at As at
31-3-2015 31-3-2014 31-3-2015 31-3-2014
Infrastructure 39918.73 30835.61 25768.60 18058.17
Power 8331.23 8404.94 6281.76 5974.66
Metallurgical & Material Handling 4966.66 5350.50 1738.63 2071.25
Heavy Engineering 6982.78 7278.16 2868.34 2982.54
Electrical & Automation 4788.25 4295.30 1906.93 1756.75
Hydrocarbon 6686.01 8247.58 4415.25 4516.23
IT & Technology Services 4660.58 3921.37 1284.04 1273.82
Financial Services 52561.84 44727.76 44822.09 37706.55
Developmental Projects 40392.92 35407.67 13350.60 9070.86
Others 14936.85 13369.64 4166.86 3807.47
Total 184225.85 161838.53 106603.10 87218.30
Unallocable corporate assets/liabilities 9958.25 7323.35 41673.31 41052.79
Total assets/liabilities 194184.10 169161.88 148276.41 128271.09
` crore
Capital expenditure Depreciation, amortisation, impairment & obsolescence
included in segment expense
Non-cash expenses other than depreciation included
in segment expense
Other information For the year ended
For the year ended
For the year ended
For the year ended
For the year ended
For the year ended
31-3-2015 31-3-2014 31-3-2015 31-3-2014 31-3-2015 31-3-2014
Infrastructure 725.38 719.57 607.22 435.02 21.52 25.86
Power 69.52 101.29 218.72 165.88 7.14 9.41
Metallurgical & Material Handling 64.38 17.21 95.02 81.80 4.05 6.00
Heavy Engineering 116.77 92.86 189.23 192.22 3.35 5.81
Electrical & Automation 266.72 215.44 160.57 101.59 4.37 4.44
Hydrocarbon 136.57 255.83 214.62 198.18 5.73 9.21
IT & Technology Services 283.91 185.67 231.66 169.36 – 4.48
Financial Services 97.70 222.20 110.00 96.28 0.92 1.45
Developmental Projects* 5591.12 4026.31 472.51 (281.18) – –
Others 474.01 373.12 222.76 226.67 2.09 4.15
* Previous year depreciation includes reversal of accumulated amortisation of toll collection rights of ` 664.11 crore
(b) Secondary segments (geographical segments):
` crore
Domestic Overseas Total
Particulars For the year ended
For the year ended
For the year ended
For the year ended
For the year ended
For the year ended
31-3-2015 31-3-2014 31-3-2015 31-3-2014 31-3-2015 31-3-2014
External revenue by location of customers 66835.47 61934.82 25926.19 23954.22 92761.66 85889.04
Carrying amount of segment assets by location
of assets 165167.53 146098.35 19058.32 15740.18 184225.85 161838.53
Cost incurred on acquisition of tangible and
intangible fixed assets 7367.72 6086.28 581.25 237.82 7948.97 6324.10
Notes forming part of the Consolidated Accounts (contd.)NOTE [Q] (contd.)
313
(c) Segment reporting: segment identification, reportable segments and definition of each reportable segment:
i) Primary/secondary segment reporting format:
a] The risk-return profile of the Company’s business is determined predominantly by the nature of its products and
services. Accordingly, the business segments constitute the primary segments for disclosure of segment information.
b] In respect of secondary segment information, the Company has identified its geographical segments as (i) domestic
and (ii) overseas. The secondary segment information has been disclosed accordingly.
ii) Segment identification
Business segments have been identified on the basis of the nature of products/services, the risk-return profile of individual
businesses, the organisational structure and the internal reporting system of the Company.
The business of manufacture and sale of industrial valves, welding and cutting equipment, manufacture, marketing and
servicing of construction equipment and parts thereof, marketing and servicing of mining machinery and parts thereof,
manufacture and sale of rubber processing machinery & castings which was hitherto reported as Machinery and Industrial
Products segment has been grouped under “Others” segment during the year ended March 31, 2015 based on internal
restructuring. The figures pertaining to the corresponding previous periods have been regrouped and restated for proper
comparison.
iii) Reportable segments
Reportable segments have been identified as per the criteria specified in Accounting Standard (AS) 17 “Segment Reporting”.
iv) Segment composition
• Infrastructure segment comprises engineering and construction of building and factories, transportation
infrastructure, heavy civil infrastructure, power transmission & distribution and water & renewable energy projects.
• Power segment comprises turnkey solutions for Coal-based and Gas-based thermal power plants including power
generation equipment with associated systems and/or balance-of-plant packages.
• Metallurgical & Material Handling segment comprises turnkey solutions for ferrous (iron & steel making) and
non-ferrous (aluminium, copper, lead & zinc) metal industries, bulk material & ash handling systems in power, port,
steel and mining sector including manufacture and sale of industrial machinery and equipment.
• Heavy Engineering segment comprises manufacture and supply of custom designed, engineered critical equipment
& systems to core sector industries like Fertiliser, Refinery, Petrochemical, Chemical, Oil & Gas, Thermal & Nuclear
Power, Aerospace and Defence.
• Electrical & Automation segment comprises manufacture and sale of low and medium voltage switchgear
components, custom built low and medium voltage switchboards, electronic energy meters/protection (relays) systems,
control & automation products.
• Hydrocarbon segment comprises complete EPC solutions for the global Oil & Gas Industry from front-end design
through detailed engineering, modular fabrication, procurement, project management, construction, installation and
commissioning.
• IT & Technology Services segment comprises information technology and integrated engineering services.
• Financial Services segment comprises retail and corporate finance, housing finance, infrastructure finance, general
insurance, asset management of mutual fund schemes and related advisory services.
• Developmental projects segment comprises development, operation and maintenance of basic infrastructure
projects, toll collection including annuity based projects, power development, development and operation of port
facilities and providing related advisory services.
• Others segment includes realty, shipbuilding, manufacture and sale of industrial valves, welding and cutting
equipment, manufacture, marketing and servicing of construction equipment and parts thereof, marketing and
servicing of mining machinery and parts thereof, manufacture and sale of rubber processing machinery & castings,
ready-mix concrete, asphalt & paving materials, mining and aviation.
Notes forming part of the Consolidated Accounts (contd.)NOTE [Q] (contd.)

314
Q(12) Disclosure of related parties/related party transactions pursuant to Accounting Standard (AS) 18 ‘’Related Party Disclosures’’:
i. Names of the related parties with whom transactions were carried out during the year and description of relationship:
Associate companies:
1 L&T-Chiyoda Limited 2 Salzer Electronics Limited
3 L&T Infrastructure Engineering Limited * (formerly
known as L&T-Ramboll Consulting Engineers Limited)
4 Magtorq Private Limited
5 JSK Electricals Private Limited 6 Vizag IT Park Limited
7 Feedback Infra Private Limited (formerly known as
Feedback Infrastructure Services Private Limited)
8 International Seaports (Haldia) Private Limited
9 Rishi Consfab Private Limited 10 L&T Camp Facilities LLC
* Associate company became wholly owned subsidiary w.e.f. September 8, 2014
Joint ventures:
1 Metro Tunneling Group 2 L&T-Hochtief Seabird Joint Venture
3 Desbuild-L&T Joint Venture 4 L&T-Shanghai Urban Construction (Group) Corporation
Joint Venture
5 L&T-AM Tapovan Joint Venture 6 HCC-L&T Purulia Joint Venture
7 The Dhamra Port Company Limited @ 8 Metro Tunneling Delhi - L&T Shanghai Urban
Construction (Group) Corporation Joint Venture
9 Metro Tunneling Chennai - L&T Shanghai Urban
Construction (Group) Corporation Joint Venture
10 L&T-Eastern Joint Venture
11 Laren & Toubro Limited - Shapoorji Pallonji & Co. Limited
Joint Venture
12 L&T-Shanghai Urban Construction (Group) Corporation
Joint Venture CC27 Delhi
13 International Metro Civil Contractors Joint Venture 14 Civil Works Group Joint Venture
15 Aktor-Larsen & Toubro–Yapi Merkezi-stfa-Al Jaber
Engineering Joint Venture
16 L&T-Delma Mafraq Joint Venture
17 Larsen & Toubro Limited and NCC Limited Joint Venture
@ The company has sold its stake on June 23, 2014.
Key management personnel & their relatives:
1 Mr. A.M. Naik (Group Executive Chairman) 2 Mr. K. Venkataramanan (CEO & Managing Director)
Mrs. Jyothi Venkataramanan (wife)
3 Mr. M. V. Kotwal (Whole-time Director) 4 Mr. R. Shankar Raman (CFO & Whole-time Director)
5 Mr. S.N.Subrahmanyan (Whole-time Director ) 6 Mr. S.N.Roy (Whole-time Director )
ii. Disclosure of related party transactions:
` crore
2014-15 2013-14
Sr. No.
Nature of transaction/relationship/major partiesAmount Amounts for
major partiesAmount Amounts for
major parties
1 Purchase of goods & services (including commission paid)
Associates & joint ventures, including: 187.56 198.55
L&T-Chiyoda Limited 23.42 34.58
JSK Electricals Private Limited 24.04 26.73
Salzer Electronics Limited 123.81 120.11
Total 187.56 198.55
Notes forming part of the Consolidated Accounts (contd.)NOTE [Q] (contd.)

315
` crore
2014-15 2013-14
Sr. No.
Nature of transaction/relationship/major partiesAmount Amounts for
major partiesAmount Amounts for
major parties
2 Sale of goods/contract revenue & services
Associates & joint ventures, including: 87.33 5.07
The Dhamra Port Company Limited – 5.06
Civil Works Joint Venture 50.12 –
Metro Tunneling Delhi - L&T Shanghai Urban Construction (Group) Corporation Joint Venture 19.09 –
Metro Tunneling Chennai - L&T Shanghai Urban Construction (Group) Corporation Joint Venture 9.58 –
Total 87.33 5.07
3 Purchase/lease of fixed assets
Associates: 0.11 –
L&T-Chiyoda Limited 0.11 –
Total 0.11 –
4 Receiving of services from related parties
Associates & joint ventures, including: 3.01 8.20
L&T-Chiyoda Limited 2.21 7.63
Feedback Infra Private Limited (formerly known as Feedback Infrastructure Services Private Limited)
0.77 –
Total 3.01 8.20
5 Rent paid
Key management personnel 0.01 0.01
Total 0.01 0.01
6 Charges for deputation of employees to related parties
Associates & joint ventures, including: 21.12 25.65
L&T-Chiyoda Limited 21.06 25.22
Total 21.12 25.65
7 Dividend received
Associates & joint ventures, including: 4.24 10.13
International Seaports (Haldia) Private Limited 1.97 5.90
Feedback Infra Private Limited (formerly known as Feedback Infrastructure Services Private Limited)
0.76 –
L&T Infrastructure Engineering Limited (formerly known as L&T-Ramboll Consulting Engineers Limited)
– 1.80
Vizag IT Park Limited 0.94 1.12
Salzer Electronics Limited 0.40 0.32
Total 4.24 10.13
8 Rent received, overheads recovered and miscellaneous income
Associates & joint ventures, including: 143.21 4.48
L&T-Chiyoda Limited 8.78 4.47
Civil Works Joint Venture 72.63 –
L&T Delma Mafraq Joint Venture 32.02 –
Aktor-Larsen & Toubro –Yapi Merkezi-stfa-Al Jaber Engineering Joint Venture 28.57 –
Total 143.21 4.48
Notes forming part of the Consolidated Accounts (contd.)NOTE [Q] (contd.)

316
` crore
2014-15 2013-14
Sr. No.
Nature of transaction/relationship/major partiesAmount Amounts for
major partiesAmount Amounts for
major parties
9 Interest Received
Associates & joint ventures, including : 15.67 54.02
The Dhamra Port Company Limited 9.32 48.63
Feedback Infra Private Limited (formerly known as Feedback Infrastructure Services Private Limited)
6.23 5.39
Total 15.67 54.02
10 Payment of salaries/perquisites (other than commission)
Key Management Personnel: 16.98 15.34
A. M. Naik 4.22 3.91
K. Venkataramanan 4.20 4.08
M. V. Kotwal 3.01 2.49
S. N. Subrahmanyan 1.74 1.63
R. Shankar Raman 1.59 1.48
S. N. Roy 2.22 1.75
Total 16.98 15.34
11 Commission to directors @
Key management personnel: 64.27 67.18
A. M. Naik 23.10 24.50
K. Venkataramanan 9.38 9.18
M. V. Kotwal 6.24 6.65
S. N. Subrahmanyan 11.09 11.63
R. Shankar Raman 8.78 9.31
S. N. Roy 5.68 5.91
Total 64.27 67.18
@ Commision to Directors comprises:
Sr.
No. Particulars 2014-15 2013-14
1 Commission 50.61 52.90
2 Contribution to provident fund 6.07 6.35
3 Contribution to superannuation fund on commission 7.59 7.93
Total 64.27 67.18
“Major parties” denote entities accounting for 10% or more of the aggregate for that category of transaction during respective period.
Notes forming part of the Consolidated Accounts (contd.)NOTE [Q] (contd.)
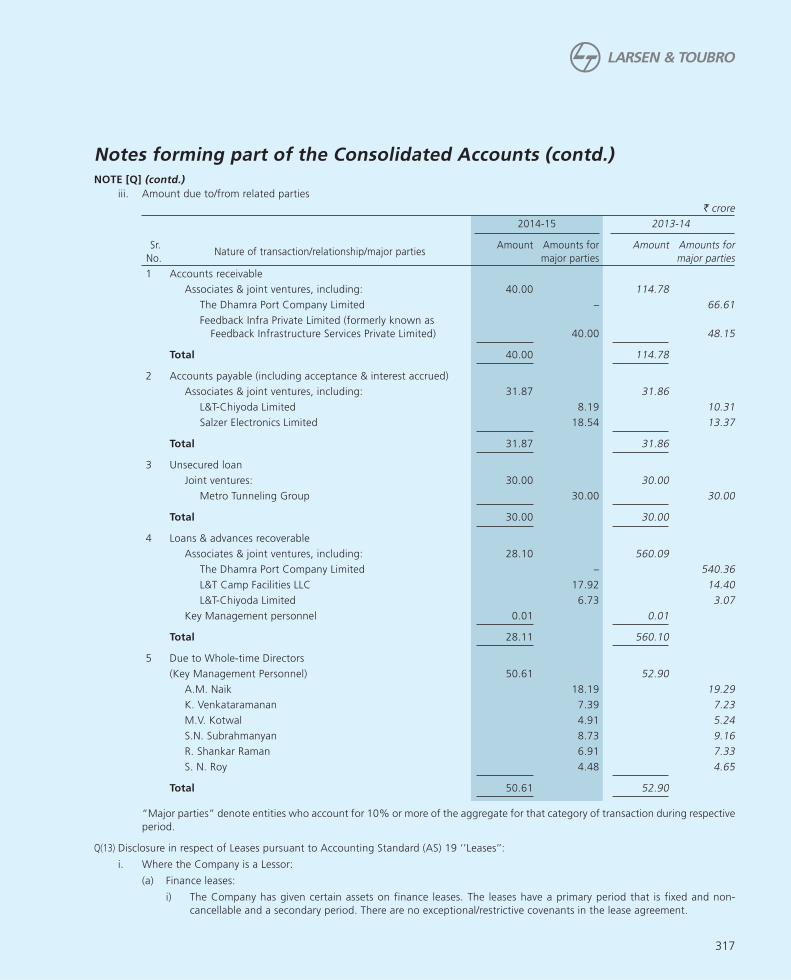
317
iii. Amount due to/from related parties
` crore
2014-15 2013-14
Sr.
No. Nature of transaction/relationship/major parties
Amount Amounts for
major parties
Amount Amounts for
major parties
1 Accounts receivable
Associates & joint ventures, including: 40.00 114.78
The Dhamra Port Company Limited – 66.61
Feedback Infra Private Limited (formerly known as
Feedback Infrastructure Services Private Limited) 40.00 48.15
Total 40.00 114.78
2 Accounts payable (including acceptance & interest accrued)
Associates & joint ventures, including: 31.87 31.86
L&T-Chiyoda Limited 8.19 10.31
Salzer Electronics Limited 18.54 13.37
Total 31.87 31.86
3 Unsecured loan
Joint ventures: 30.00 30.00
Metro Tunneling Group 30.00 30.00
Total 30.00 30.00
4 Loans & advances recoverable
Associates & joint ventures, including: 28.10 560.09
The Dhamra Port Company Limited – 540.36
L&T Camp Facilities LLC 17.92 14.40
L&T-Chiyoda Limited 6.73 3.07
Key Management personnel 0.01 0.01
Total 28.11 560.10
5 Due to Whole-time Directors
(Key Management Personnel) 50.61 52.90
A.M. Naik 18.19 19.29
K. Venkataramanan 7.39 7.23
M.V. Kotwal 4.91 5.24
S.N. Subrahmanyan 8.73 9.16
R. Shankar Raman 6.91 7.33
S. N. Roy 4.48 4.65
Total 50.61 52.90
“Major parties” denote entities who account for 10% or more of the aggregate for that category of transaction during respective
period.
Q(13) Disclosure in respect of Leases pursuant to Accounting Standard (AS) 19 ‘’Leases’’:
i. Where the Company is a Lessor:
(a) Finance leases:
i) The Company has given certain assets on finance leases. The leases have a primary period that is fixed and non-
cancellable and a secondary period. There are no exceptional/restrictive covenants in the lease agreement.
Notes forming part of the Consolidated Accounts (contd.)NOTE [Q] (contd.)

318
ii) The total gross investment in these leases as on March 31, 2015 and the present value of minimum lease payments
receivable as on March 31, 2015 is as under:
` crore
ParticularsAs at
31-3-2015
As at
31-3-2014
1. Receivable not later than 1 year 973.64 735.94
2. Receivable later than 1 year and not later than 5 years 6994.20 2992.08
3. Receivable later than 5 years 20390.00 11460.21
Gross investment in lease (1+2+3) 28357.84 15188.23
Less: Unearned finance income 19065.23 10250.99
Present value of minimum lease payments receivable 9292.61 4937.24
iii) In respect of one of the leases referred to in (a) above, the lease receivables were recorded at the inception, at the
present value of minimum lease payments, and subsequently securitized.
(b) Operating leases:
i) The Company has given assets under non-cancellable operating lease, the future minimum lease payments receivable
in respect of which, as at March 31, 2015 are as follows:
` crore
ParticularsAs at
31-3-2015
As at
31-3-2014
1. Receivable not later than 1 year 74.49 148.80
2. Receivable later than 1 year and not later than 5 years 100.53 220.10
3. Receivable later than 5 years 13.99 17.80
Total 189.01 386.70
ii. Where the Company is a Lessee:
(a) Finance leases:
i) Assets acquired on finance lease mainly comprise plant & equipment, vehicles and personal computers. The leases have
a primary period, which is fixed and non-cancellable. In the case of vehicles, the Company has an option to renew
the lease for a secondary period. The agreements provide for revision of lease rentals in the event of changes in (a)
taxes, if any, leviable on the lease rentals (b) rates of depreciation under the Income tax Act, 1961 and (c) change in
the lessor’s cost of borrowings. There are no exceptional/restrictive covenants in the lease agreements.
ii) The minimum lease rentals as at March 31, 2015 and the present value as at March 31, 2015 of minimum lease
payments in respect of assets acquired under finance leases are as follows:
` crore
Particulars
Minimum lease payments Present value of minimum
lease payments
As at
31-3-2015
As at
31-3-2014
As at
31-3-2015
As at
31-3-2014
1. Payable not later than 1 year 0.18 0.37 0.16 0.33
2. Payable later than 1 year and not later than 5 years 0.31 0.53 0.28 0.47
3. Payable later than 5 years – – – –
Total 0.49 0.90 0.44 0.80
Less: Future finance charges 0.05 0.10
Present value of minimum lease payments 0.44 0.80
iii) Contingent rent recognised/(adjusted) in the Statement of Profit and Loss in respect of finance leases: ` Nil (previous
year: ` Nil)
Notes forming part of the Consolidated Accounts (contd.)NOTE [Q] (contd.)

319
(b) Operating leases:
i) The Company has taken various commercial premises and plant & equipment under cancellable operating leases.
These lease agreements are normally renewed on expiry.
ii) [a] The Company has taken certain assets on non-cancellable operating leases, the future minimum lease payments
in respect of which, as at March 31, 2015 are as follows:
` crore
ParticularsAs at
31-3-2015
As at
31-3-2014
1. Payable not later than 1 year 73.94 70.04
2. Payable later than 1 year and not later than 5 years 168.60 212.66
3. Payable later than 5 years 115.43 180.58
Total 357.97 463.28
[b] The lease agreements provide for an option to the Company to renew the lease period at the end of the non-
cancellable period. There are no exceptional/restrictive covenants in the lease agreements.
iii) Lease rental expense in respect of operating leases: ` 173.98 crore (previous year: ` 155.40 crore)
iv) Contingent rent recognised in the Statement of Profit and Loss: ` 0.30 crore (previous year: ` 0.12)
Q(14) Basic and Diluted Earnings per share [EPS] computed in accordance with Accounting Standard (AS) 20 “Earnings per Share’’:
ParticularsBefore extraordinary items After extraordinary items
2014-15 2013-14 2014-15 2013-14
Basic
Profit after tax as per accounts (` crore) A 4764.82 4908.25 4764.82 4902.00
Weighted average number of shares outstanding B 92,83,48,310 92,54,16,187 92,83,48,310 92,54,16,187
Basic EPS (`) A/B 51.33 53.04 51.33 52.97
Diluted
Profit after tax as per accounts (` crore) A 4764.82 4908.25 4764.82 4902.00
Weighted average number of shares outstanding B 92,83,48,310 92,54,16,187 92,83,48,310 92,54,16,187
Add: Weighted average number of potential equity
shares on account of employee stock options
C 62,19,750 56,56,640 62,19,750 56,56,640
Weighted average number of shares outstanding for
diluted EPS
D=B+C 93,45,68,059 93,10,72,827 93,45,68,059 93,10,72,827
Diluted EPS (`) A/D 50.98 52.72 50.98 52.65
Face value per share (`) 2 2 2 2
Note: Potential equity shares that could arise on conversion of FCCBs are not resulting into dilution of EPS in the current year. Hence,
they have not been considered in working of diluted EPS in accordance with Accounting Standard (AS) 20 ‘’Earnings per Share’’.
Notes forming part of the Consolidated Accounts (contd.)NOTE [Q] (contd.)

320
Q(15) Major components of deferred tax liabilities and deferred tax assets pursuant to Accounting Standard (AS) 22 ‘’Accounting for Taxes
on Income‘’:
` crore
Particulars
Deferred tax
liabilities/
(assets) as at
31-3-2014
Charge/
(credit) to
Statement of
Profit and Loss
Charge/
(credit) to
opening
retained
earnings*
Effect due to
acquisition/
disposal
Charge/(credit) to reserves Deferred tax
liabilities/
(assets) as at
31-3-2015
Foreign
currency
translation
reserve
Hedging
reserve**
Deferred tax liabilities:
Difference between book and tax depreciation 1188.94 70.94 (36.74) (12.35) – – 1210.79
Gain on derivative transactions to be offered for tax
purposes in the year of transfer to Statement of
Profit and Loss 33.47 1.01 – – – 4.01 38.49
Disputed statutory liabilities paid and claimed as
deduction for tax purposes but not debited to
Statement of Profit and Loss 95.34 6.77 – – – – 102.11
Other items giving rise to timing differences 238.82 107.43 – – (0.25) – 346.00
Total 1556.57 186.15 (36.74) (12.35) (0.25) 4.01 1697.39
Deferred tax (assets):
Provision for doubtful debts, advances and
non-performing assets debited to Statement of
Profit and Loss (336.25) (175.99) – – – – (512.24)
Loss on derivative transactions to be claimed for tax
purposes in the year of transfer to Statement of
Profit and Loss (153.40) (1.14) – – – (68.87) (223.41)
Unpaid statutory liabilities/provision for
compensated absences debited to Statement of
Profit and Loss (194.34) (43.25) – (0.01) – – (237.60)
Unabsorbed depreciation/brought forward business
losses (347.97) (441.68) – 8.53 – – (781.12)
Difference between book and tax depreciation (6.87) (0.43) (2.65) (0.36) – – (10.31)
Other items giving rise to timing differences (180.28) 67.67 – (4.14) (0.60) – (117.35)
Total (1219.11) (594.82) (2.65) 4.02 (0.60) (68.87) (1882.03)
Net deferred tax liability/(assets) 337.46 (408.67) (39.39) (8.33) (0.85) (64.86) (184.64)
Previous year 183.67 105.94 – (4.94) 0.22 52.57 337.46
*Represents reversal of deferred tax on depreciation charged against opening retained earnings as on April 1, 2014, pursuant to
Schedule II of Companies Act, 2013.
**The amount of ` 382.27 crore (Previous year: ` 631.10 crore) representing net losses on effective hedges is recognised in hedge
reserve, applying the principles of hedge accounting set out in Accounting Standard (AS) 30 ‘’Financial Instruments: Recognition and
Measurement’’. The amount is after considering the net deferred tax asset of ` 64.86 crore during the year (Previous year: deferred
tax liability (net) ` 52.57 crore).
Notes forming part of the Consolidated Accounts (contd.)NOTE [Q] (contd.)

321
Q(16) The effect of acquisitions (including newly incorporated subsidiaries) and disposals during the year on the Consolidated Financial
Statements is as under:
a) Acquisitions (including newly incorporated entities):
` crore
Sr.
No.Name of company
Effect on Group profit/(loss)
after minority interest for the
year ended March 31, 2015
Net assets/
(liabilities) as at
March 31, 2015
1 L&T Infrastructure Engineering Limited 3.02 37.95
2 L&T Thales Technology Services India Private Limited 0.60 6.30
3 Information Systems Resource Centre Private Limited 2.74 83.43
4 L&T Technology Services LLC (4.79) (4.83)
Total 1.57 122.85
b) Disposals:
` crore
Sr.
No.Name of company
Effect on Group profit/(loss) after
minority interest for the year
ended March 31
Net assets as at the
date of disposal
(during 2014-15)
Net assets
as at March
31, 2014
2014-15 2013-14
1 L&T Tech Park Limited (0.01) (0.19) 13.50 13.50
2 L&T Tejomaya Limited 0.21 1.11 30.52 30.12
Total 0.20 0.92 44.02 43.62
Q(17) The Company’s share in respect of the assets, liabilities, reserves, income and expenses, related to its interests in the jointly controlled
entities, incorporated in the Consolidated Financial Statements are:
` crore
Particulars 31-3-2015 31-3-2014
I Assets Non-current assets
1 Fixed assets
(a) Tangible assets 205.25 1664.68
(b) Intangible assets – 1.74
(c) Capital work-in-progress 81.19 138.88
2 Deferred tax assets (net) 0.45 0.01
3 Long term loans and advances 27.38 40.38
4 Cash and bank balances – 2.05
5 Other non-current assets – 8.18
Current assets
1 Current investments 14.38 14.84
2 Inventories 12.44 17.12
3 Trade receivables 376.19 294.55
4 Cash and bank balances 1437.16 58.34
5 Short term loans and advances 408.43 127.81
6 Other current assets 1074.00 237.93
II Liabilities Non-current liabilities
1 Long term borrowings 4.88 1690.85
2 Other long term liabilities 1.39 113.96
Current liabilities
1 Short term borrowings 247.39 97.82
2 Current maturities of long term borrowings – 6.40
3 Trade payables 646.62 379.67
4 Other current liabilities 2316.99 173.80
5 Short term provisions 0.02 0.76
Notes forming part of the Consolidated Accounts (contd.)NOTE [Q] (contd.)

322
` crore
Particulars 31-3-2015 31-3-2014
III Reserves 1 Foreign currency translation reserve 1.10 (0.04)
2 Hedging reserve (0.25) –
3 Retained earnings 106.74 (369.84)
IV Income 1 Revenue from operations 1987.80 1216.94
2 Other income 6.78 14.67
V Expenses 1 Operating expenses 1463.90 809.23
2 Staff expenses 196.90 33.54
3 Sales administration and other expenses 106.01 72.81
4 Interest expense 53.64 211.59
5 Depreciation and amortisation 165.96 142.10
6 Provision for tax (0.88) 8.65
VI Contingent
liability
1 Contingent liabilities, if any, incurred in relation to interests in joint
ventures
3248.49 505.07
2 Share in contingent liabilities of joint ventures themselves for which
the Company is contingently liable
80.13 77.54
3 Contingent liabilities in respect of liabilities of other ventures of joint
ventures
10840.81 404.90
VII Capital
commitments
1 Share in capital commitments of joint ventures themselves for which
the Company is contingently liable
159.34 2.14
Q(18) Disclosures pursuant to Accounting Standard (AS) 29 “Provisions, Contingent Liabilities and Contingent Assets”:
a) Movement in provisions:
` crore
Sr. No.
Particulars
Class of provisions
Product warranties/ liquidated damages
Expected tax liability
in respect of indirect taxes
Litigation related
obligations
Periodic major maintenance
Contractual rectification
cost- construction
contracts
Total
1 Balance as at 01.04.2014 93.09 89.73 10.32 200.95 192.37 586.46
2 Additional provision during the year 116.36 48.46 – 166.67 101.50 432.99
3 Provision used/reversed during the year # (68.94) (26.46) – (153.90) (107.38) (356.68)
4 Translation adjustments 0.48 – 0.03 – 0.06 0.57
5 Balance as on 31.03.2015 (5=1+2-3+4) 140.99 111.73 10.35 213.72 186.55 663.34
# includes provision used during the year ` 171.36 crore (previous year: ` 41.24 crore)
b) Nature of provisions:
i. Product warranties/liquidated damages: The Company gives warranties on certain products and services, undertaking to
repair or replace the items that fail to perform satisfactorily during the warranty period. Provision made as at March 31,
2015 represents the amount of the expected cost of meeting such obligations of rectification/replacement. The timing of
the outflows is expected to be within a period of five years from the date of Balance Sheet. Liquidated damages represent
the estimated cost the Company is likely to incur due to delay in delivery as per its contract obligations and accrued on the
basis of advice from distributors/customers.
ii. Expected tax liability in respect of indirect taxes represents mainly the differential sales tax liability on account of non-
collection of declaration forms for the period prior to five years.
iii. Provision for litigation related obligations represents liabilities that are expected to materialise in respect of matters in
appeal.
iv. Periodic major maintenance represents provision made for resurfacing obligations in accordance with the terms of concession
agreement with National Highway Authority of India (NHAI).
Notes forming part of the Consolidated Accounts (contd.)NOTE [Q] (contd.)

323
v. Contractual rectification cost represents the estimated cost the Company is likely to incur during defect liability period as
per the contract obligations in respect of completed construction contracts accounted under Accounting Standard (AS) 7
(Revised) “Construction Contracts”.
c) Disclosures in respect of contingent liabilities are given as part of Note [I] to the Balance Sheet.
Q(19) In line with the Company’s risk management policy, the various financial risks mainly relating to changes in the exchange rates, interest
rates and commodity prices are hedged by using a combination of forward contracts, swaps and other derivative contracts, besides
the natural hedges.
a) The particulars of derivative contracts entered into for hedging purposes outstanding as at March 31, 2015 are as under:
` crore
Category of derivative instruments
Amount of exposures hedged
As at
31-3-2015
As at
31-3-2014
i) For hedging foreign currency risks:
a) Forward contracts for receivables including firm commitments and highly probable
forecasted transactions 16665.89 10342.23
b) Forward contracts for payables including firm commitments and highly probable
forecasted transactions 15338.11 12691.90
c) Currency swaps and interest rate swaps 3539.43 3492.62
d) Option contracts 578.48 208.11
ii) For hedging interest rate risks:
Interest rate swaps 0.47 0.51
iii) For hedging commodity price risks:
Commodity futures 289.36 464.40
b) Unhedged foreign currency exposures as at March 31, 2015 are as under:
` crore
Unhedged foreign currency exposuresAs at
31-3-2015
As at
31-3-2014
i) Receivables, including firm commitments and highly probable forecasted transactions 44653.19 57726.16
ii) Payables, including firm commitments and highly probable forecasted transactions 41099.39 51465.03
Note: As per Royal Monetary Authority of Bhutan, Bhutan’s national currency is pegged to the Indian rupee at parity. Accordingly,
the unhedged foreign currency exposures reported above excludes exposures [Receivables amounting to ` 1646.07 crore
(previous year: ` 345.34 crore) and payables amounting to ` 1142.08 crore (previous year: ` 121.46 crore)] with respect
to currencies such as Bhutan Ngultrum (BTN).
Q(20) a) The Group has undertaken various projects on Design-Build-Finance-Operate-Transfer (DBFOT)/Build-Operate-Transfer (BOT)
basis as per the concession agreements with the government authorities. Under the agreements, the concession period for toll
collection or annuity payments ranges from 15 to 35 years. At the end of the said concession period, the entire facilities are
transferred to the concerned government authorities.
b) The aggregate amount of revenues and profits before tax (net) recognised during the year in respect of construction services related
to BOT/DBFOT projects is ` 2659.37 crore (previous year: ` 3717.83 crore) and ` 324.20 crore (previous year: ` 585.47 crore)
respectively [Note R(3)(A)(a)(ix)].
c) Long term loans and advances towards financing activities include ̀ 305.05 crore (previous year: ̀ 341.10 crore) being cumulative
construction costs incurred including related margins in respect of annuity based Build-Operate-Transfer (BOT) projects.
d) Short term Loans and advances towards financing activities include ` 75.48 crore (previous year: ` 76.17 crore) being cumulative
construction costs incurred including related margins in respect of annuity based Build-Operate-Transfer (BOT) projects.
Q(21) In terms of provisions of sub-section 1A of section 115O of the Income Tax Act 1961, dividend distribution tax payable by the Parent
Company of ` 134.33 crore, is net of dividend distribution tax paid by its subsidiary companies amounting to ` 158.76 crore, relating
to dividend of ` 850.70 crore declared by them.
Notes forming part of the Consolidated Accounts (contd.)NOTE [Q] (contd.)
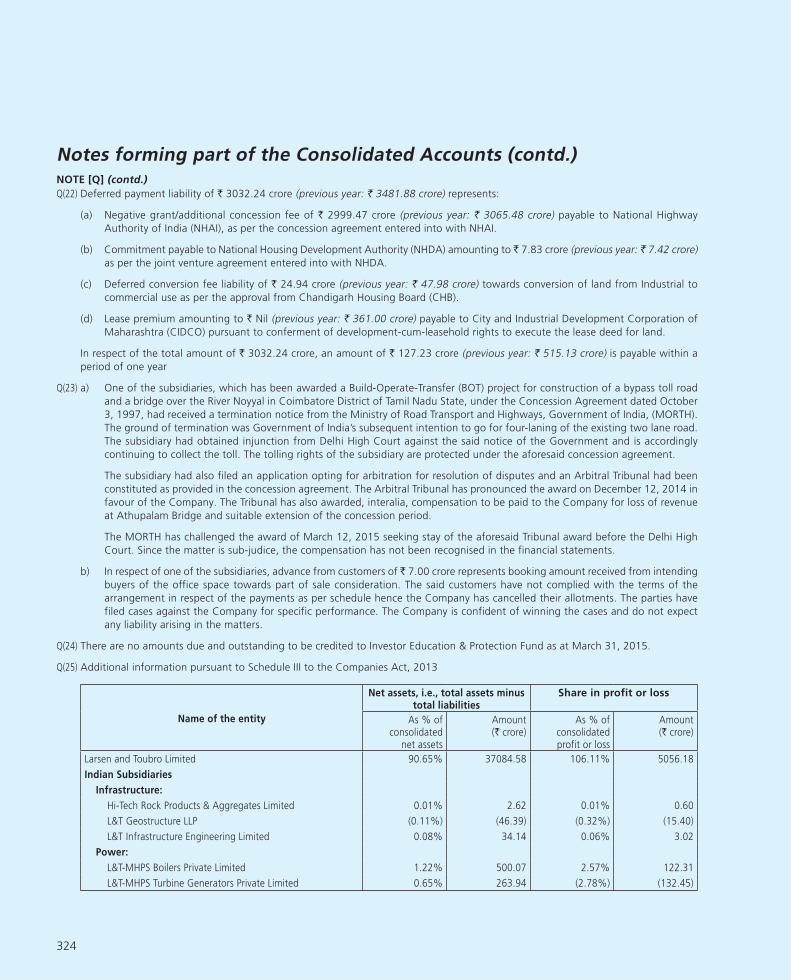
324
Q(22) Deferred payment liability of ` 3032.24 crore (previous year: ` 3481.88 crore) represents:
(a) Negative grant/additional concession fee of ` 2999.47 crore (previous year: ` 3065.48 crore) payable to National Highway
Authority of India (NHAI), as per the concession agreement entered into with NHAI.
(b) Commitment payable to National Housing Development Authority (NHDA) amounting to ̀ 7.83 crore (previous year: ̀ 7.42 crore)
as per the joint venture agreement entered into with NHDA.
(c) Deferred conversion fee liability of ` 24.94 crore (previous year: ` 47.98 crore) towards conversion of land from Industrial to
commercial use as per the approval from Chandigarh Housing Board (CHB).
(d) Lease premium amounting to ` Nil (previous year: ` 361.00 crore) payable to City and Industrial Development Corporation of
Maharashtra (CIDCO) pursuant to conferment of development-cum-leasehold rights to execute the lease deed for land.
In respect of the total amount of ` 3032.24 crore, an amount of ` 127.23 crore (previous year: ` 515.13 crore) is payable within a
period of one year
Q(23) a) One of the subsidiaries, which has been awarded a Build-Operate-Transfer (BOT) project for construction of a bypass toll road
and a bridge over the River Noyyal in Coimbatore District of Tamil Nadu State, under the Concession Agreement dated October
3, 1997, had received a termination notice from the Ministry of Road Transport and Highways, Government of India, (MORTH).
The ground of termination was Government of India’s subsequent intention to go for four-laning of the existing two lane road.
The subsidiary had obtained injunction from Delhi High Court against the said notice of the Government and is accordingly
continuing to collect the toll. The tolling rights of the subsidiary are protected under the aforesaid concession agreement.
The subsidiary had also filed an application opting for arbitration for resolution of disputes and an Arbitral Tribunal had been
constituted as provided in the concession agreement. The Arbitral Tribunal has pronounced the award on December 12, 2014 in
favour of the Company. The Tribunal has also awarded, interalia, compensation to be paid to the Company for loss of revenue
at Athupalam Bridge and suitable extension of the concession period.
The MORTH has challenged the award of March 12, 2015 seeking stay of the aforesaid Tribunal award before the Delhi High
Court. Since the matter is sub-judice, the compensation has not been recognised in the financial statements.
b) In respect of one of the subsidiaries, advance from customers of ̀ 7.00 crore represents booking amount received from intending
buyers of the office space towards part of sale consideration. The said customers have not complied with the terms of the
arrangement in respect of the payments as per schedule hence the Company has cancelled their allotments. The parties have
filed cases against the Company for specific performance. The Company is confident of winning the cases and do not expect
any liability arising in the matters.
Q(24) There are no amounts due and outstanding to be credited to Investor Education & Protection Fund as at March 31, 2015.
Q(25) Additional information pursuant to Schedule III to the Companies Act, 2013
Name of the entity
Net assets, i.e., total assets minus total liabilities
Share in profit or loss
As % of consolidated
net assets
Amount (` crore)
As % of consolidated profit or loss
Amount (` crore)
Larsen and Toubro Limited 90.65% 37084.58 106.11% 5056.18
Indian Subsidiaries
Infrastructure:
Hi-Tech Rock Products & Aggregates Limited 0.01% 2.62 0.01% 0.60
L&T Geostructure LLP (0.11%) (46.39) (0.32%) (15.40)
L&T Infrastructure Engineering Limited 0.08% 34.14 0.06% 3.02
Power:
L&T-MHPS Boilers Private Limited 1.22% 500.07 2.57% 122.31
L&T-MHPS Turbine Generators Private Limited 0.65% 263.94 (2.78%) (132.45)
Notes forming part of the Consolidated Accounts (contd.)NOTE [Q] (contd.)
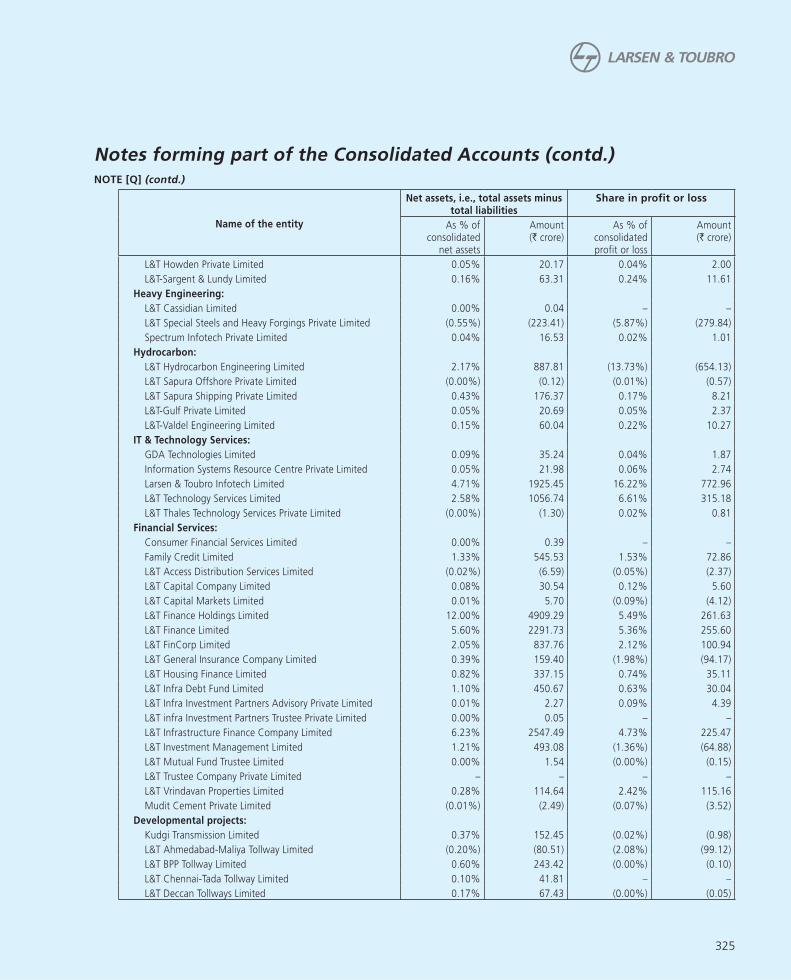
325
Name of the entity
Net assets, i.e., total assets minus total liabilities
Share in profit or loss
As % of consolidated
net assets
Amount (` crore)
As % of consolidated profit or loss
Amount (` crore)
L&T Howden Private Limited 0.05% 20.17 0.04% 2.00
L&T-Sargent & Lundy Limited 0.16% 63.31 0.24% 11.61
Heavy Engineering:
L&T Cassidian Limited 0.00% 0.04 – –
L&T Special Steels and Heavy Forgings Private Limited (0.55%) (223.41) (5.87%) (279.84)
Spectrum Infotech Private Limited 0.04% 16.53 0.02% 1.01
Hydrocarbon:
L&T Hydrocarbon Engineering Limited 2.17% 887.81 (13.73%) (654.13)
L&T Sapura Offshore Private Limited (0.00%) (0.12) (0.01%) (0.57)
L&T Sapura Shipping Private Limited 0.43% 176.37 0.17% 8.21
L&T-Gulf Private Limited 0.05% 20.69 0.05% 2.37
L&T-Valdel Engineering Limited 0.15% 60.04 0.22% 10.27
IT & Technology Services:
GDA Technologies Limited 0.09% 35.24 0.04% 1.87
Information Systems Resource Centre Private Limited 0.05% 21.98 0.06% 2.74
Larsen & Toubro Infotech Limited 4.71% 1925.45 16.22% 772.96
L&T Technology Services Limited 2.58% 1056.74 6.61% 315.18
L&T Thales Technology Services Private Limited (0.00%) (1.30) 0.02% 0.81
Financial Services:
Consumer Financial Services Limited 0.00% 0.39 – –
Family Credit Limited 1.33% 545.53 1.53% 72.86
L&T Access Distribution Services Limited (0.02%) (6.59) (0.05%) (2.37)
L&T Capital Company Limited 0.08% 30.54 0.12% 5.60
L&T Capital Markets Limited 0.01% 5.70 (0.09%) (4.12)
L&T Finance Holdings Limited 12.00% 4909.29 5.49% 261.63
L&T Finance Limited 5.60% 2291.73 5.36% 255.60
L&T FinCorp Limited 2.05% 837.76 2.12% 100.94
L&T General Insurance Company Limited 0.39% 159.40 (1.98%) (94.17)
L&T Housing Finance Limited 0.82% 337.15 0.74% 35.11
L&T Infra Debt Fund Limited 1.10% 450.67 0.63% 30.04
L&T Infra Investment Partners Advisory Private Limited 0.01% 2.27 0.09% 4.39
L&T infra Investment Partners Trustee Private Limited 0.00% 0.05 – –
L&T Infrastructure Finance Company Limited 6.23% 2547.49 4.73% 225.47
L&T Investment Management Limited 1.21% 493.08 (1.36%) (64.88)
L&T Mutual Fund Trustee Limited 0.00% 1.54 (0.00%) (0.15)
L&T Trustee Company Private Limited – – – –
L&T Vrindavan Properties Limited 0.28% 114.64 2.42% 115.16
Mudit Cement Private Limited (0.01%) (2.49) (0.07%) (3.52)
Developmental projects:
Kudgi Transmission Limited 0.37% 152.45 (0.02%) (0.98)
L&T Ahmedabad-Maliya Tollway Limited (0.20%) (80.51) (2.08%) (99.12)
L&T BPP Tollway Limited 0.60% 243.42 (0.00%) (0.10)
L&T Chennai-Tada Tollway Limited 0.10% 41.81 – –
L&T Deccan Tollways Limited 0.17% 67.43 (0.00%) (0.05)
Notes forming part of the Consolidated Accounts (contd.)NOTE [Q] (contd.)

326
Notes forming part of the Consolidated Accounts (contd.)NOTE [Q] (contd.)
Name of the entity
Net assets, i.e., total assets minus total liabilities
Share in profit or loss
As % of consolidated
net assets
Amount (` crore)
As % of consolidated profit or loss
Amount (` crore)
L&T Devihalli Hassan Tollway Limited 0.62% 253.29 (0.31%) (14.80)
L&T Halol-Shamlaji Tollway Limited (0.34%) (137.88) (2.43%) (115.72)
L&T Infrastructure Development Projects Limited 11.11% 4545.95 8.37% 399.04
L&T Interstate Road Corridor Limited 0.21% 84.70 (0.09%) (4.39)
L&T Krishnagiri Thopur Toll Road Limited (0.08%) (34.19) (0.22%) (10.61)
L&T Krishnagiri Walajahpet Tollway Limited 0.20% 83.03 (0.22%) (10.66)
L&T Metro Rail (Hyderabad) Limited 4.82% 1969.86 (0.30%) (14.11)
L&T Panipat Elevated Corridor Limited (0.47%) (190.63) (0.56%) (26.78)
L&T Port Kachchigarh Limited (0.00%) (0.40) (0.00%) (0.03)
L&T Rajkot-Vadinar Tollway Limited (0.25%) (103.14) (1.49%) (71.19)
L&T Samakhiali Gandhidham Tollway Limited 0.19% 76.95 (0.07%) (3.56)
L&T Sambalpur-Rourkela Tollway Limited 0.23% 94.99 (0.03%) (1.29)
L&T Transportation Infrastructure Limited 0.33% 136.30 0.24% 11.20
L&T Vadodara Bharuch Tollway Limited (0.72%) (293.07) 0.00% 0.07
L&T Western Andhra Tollways Limited (0.04%) (14.49) (0.26%) (12.47)
L&T Western India Tollbridge Limited 0.08% 30.84 0.03% 1.21
PNG Tollway Limited (0.14%) (55.37) (3.22%) (153.62)
Power Develoment:
L&T Arunachal Hydropower Limited 0.10% 39.34 0.00% 0.01
L&T Himachal Hydropower Limited 0.46% 189.64 0.00% 0.02
L&T Power Development Limited 7.60% 3110.91 0.01% 0.34
L&T Uttaranchal Hydropower Limited 1.67% 684.35 0.04% 1.80
Nabha Power Limited 6.75% 2763.08 4.00% 190.43
Realty:
Chennai Vision Developers Private Limited (0.00%) (0.02) – –
CSJ Hotels Private Limited – – – –
CSJ Infrastructure Private Limited 0.43% 176.75 0.35% 16.61
Hyderabad International Trade Expositions Limited 0.07% 27.84 0.07% 3.52
L&T Asian Realty Project LLP (0.00%) (1.23) (0.01%) (0.50)
L&T Hitech City Limited 0.13% 54.11 (0.04%) (2.13)
L&T Infocity Limited 0.33% 136.60 0.12% 5.94
L&T Parel Project LLP 0.37% 149.80 1.71% 81.34
L&T Realty Limited 1.14% 465.20 (0.03%) (1.49)
L&T Seawoods Limited 7.42% 3035.29 (0.03%) (1.41)
L&T Siruseri Property Developers Limited – – – –
L&T South City Projects Limited 0.31% 128.36 (0.12%) (5.61)
L&T Tech Park Limited – – – –
L&T Tejomaya Limited 0.00% 0.40 0.01% 0.40
L&T Vision Ventures Limited (0.01%) (4.59) (0.00%) (0.02)
Construction Equipment and Others
(Valves and Welding Equipment):
L&T Construction Equipment Limited 0.58% 235.08 0.46% 21.94
L&T Cutting Tools Limited 0.09% 37.56 0.47% 22.31
L&T Kobelco Machinery Private Limited 0.07% 29.50 0.06% 2.72

327
Notes forming part of the Consolidated Accounts (contd.)NOTE [Q] (contd.)
Name of the entity
Net assets, i.e., total assets minus total liabilities
Share in profit or loss
As % of consolidated
net assets
Amount (` crore)
As % of consolidated profit or loss
Amount (` crore)
L&T Valves Limited 0.94% 384.39 2.91% 138.49
Ewac Alloys Limited 0.22% 91.63 0.89% 42.58
Shipbuilding:
L&T Shipbuilding Limited (0.29%) (120.17) (14.13%) (673.48)
Others:
Bhilai Power Supply Company Limited 0.00% 0.05 – –
L&T Electricals and Automation Limited 0.00% 0.03 – –
L&T Power Limited 0.01% 4.43 0.00% 0.20
L&T PowerGen Limited 0.00% 0.04 – –
L&T Solar Limited 0.00% 0.04 – –
Kesun Iron & Steel Company Private Limited (0.00%) (0.25) – –
L&T Aviation Services Private Limited 0.11% 44.08 0.00% 0.14
L&T Natural Resources Limited (0.02%) (6.29) (0.00%) (0.01)
Raykal Aluminium Company Private Limited 0.00% 0.44 (0.00%) (0.03)
Foreign Subsidiaries
Infrastructure:
Larsen & Toubro (Oman) LLC 0.61% 248.61 (3.20%) (152.33)
Larsen & Toubro Qatar LLC 0.00% 0.58 (0.00%) (0.06)
Larsen & Toubro Saudi Arabia LLC (0.32%) (131.89) (1.02%) (48.46)
Larsen & Toubro T&D SA Proprietary Limited 0.01% 2.64 0.00% 0.16
Heavy Engineering:
Larsen & Toubro Heavy Engineering LLC (0.03%) (10.53) 0.51% 24.27
Hydrocarbon:
Larsen & Toubro Hydrocarbon International Limited LLC 0.00% 0.12 0.01% 0.40
L&T Modular Fabrication Yard LLC (0.16%) (65.95) (1.78%) (85.04)
L&T Overseas Projects Nigeria Limited 0.00% 0.05 – –
Larsen Toubro Arabia LLC (0.04%) (16.86) (0.57%) (27.18)
Larsen & Toubro ATCO Saudia LLC (0.81%) (332.99) (6.52%) (310.67)
Larsen & Toubro Electromech LLC (0.15%) (60.97) (3.56%) (169.46)
Larsen & Toubro Kuwait Construction General Contracting
Company, WLL 0.01% 3.48 (0.63%) (30.04)
PT Larsen & Toubro Hydrocarbon Engineering Indonesia – – – –
IT & Technology Services:
L&T Information Technology Services (Shanghai) Co., Ltd. (0.00%) (0.15) (0.01%) (0.49)
L&T Infotech Financial Services Technologies Inc. 0.83% 339.13 (0.37%) (17.69)
Larsen & Toubro Infotech Canada Limited 0.02% 6.96 0.02% 0.94
Larsen & Toubro Infotech LLC 0.02% 10.02 0.02% 1.15
Larsen & Toubro Infotech South Africa (PTY) Limited 0.00% 1.55 0.02% 0.76
Larsen & Toubro Infotech, GmbH 0.06% 22.50 0.07% 3.15
Larsen & Toubro LLC 0.01% 2.23 0.01% 0.25
L&T Technology Services LLC (0.01%) (4.83) (0.10%) (4.79)
Financial Services:
L&T Diversified India Equity Fund – – – –
Developmental projects:
L&T IDPL Trustee Manager Pte Ltd. 0.00% 1.59 (0.10%) (4.53)

328
Notes forming part of the Consolidated Accounts (contd.)NOTE [Q] (contd.)
Name of the entity
Net assets, i.e., total assets minus total liabilities
Share in profit or loss
As % of consolidated
net assets
Amount (` crore)
As % of consolidated profit or loss
Amount (` crore)
L&T Infrastructure Development Projects Lanka (Private)
Limited 0.18% 71.46 0.02% 1.12
Realty:
L&T Realty FZE 0.02% 9.10 0.00% 0.07
Construction Equipment and Others
(Valves and Welding Equipment):
Larsen & Toubro (Qingdao) Rubber Machinery Company
Limited
0.01% 2.05 (0.13%) (6.11)
Qingdao Larsen & Toubro Trading Company Limited – – – –
Electrical & Automation
Henikwon Corporation SDN BHD (0.03%) (12.88) 0.01% 0.33
Kana Controls General Trading & Contracting Company
W.L.L.
0.00% 0.85 (0.03%) (1.28)
L&T Electrical & Automation FZE 0.44% 179.12 0.29% 13.82
L&T Electricals & Automation Saudi Arabia Company LLC 0.07% 27.66 0.05% 2.33
PT Tamco Indonesia (0.09%) (37.91) (0.15%) (7.02)
Servowatch Systems Limited (0.02%) (7.20) (0.17%) (8.28)
Tamco Electrical Industries Australia Pty Ltd. 0.06% 23.69 (0.08%) (3.96)
Tamco Switchgear (Malaysia) SDN BHD 1.17% 477.53 0.82% 39.05
Thalest Limited 0.02% 8.16 (0.02%) (0.24)
Others:
Larsen & Toubro (East Asia) SDN.BHD 0.00% 0.64 (0.03%) (0.80)
Larsen & Toubro Consultoria E Projeto Ltda (0.00%) (0.05) 0.00% 0.09
Larsen & Toubro International FZE 2.88% 1177.85 0.56% 26.81
Larsen & Toubro Readymix & Asphalt Concrete Industries LLC (0.04%) (15.77) (0.25%) (11.96)
Total Subsidiaries 37979.39 50.62
Minority Interests in all subsidiaries (12.22%) (4998.62) (3.59%) (171.00)
Indian Associates
L&T-Chiyoda Limited 0.13% 52.48 0.05% 2.34
L&T Infrastructure Engineering Limited (0.00%) (0.00) (0.05%) (2.02)
Gujarat Leather Industries Limited – – – –
NAC Infrastructure Equipment Limited – – – –
International Seaport (Haldia) Private Limited 0.04% 17.38 0.02% 1.05
Vizag IT Park Limited 0.01% 3.12 0.02% 1.04
Feedback Infra Private Limited 0.09% 38.56 (0.03%) (1.60)
JSK Electricals Private Limited 0.01% 2.87 0.00% 0.10
Salzer Electronics Limited 0.06% 26.21 0.06% 2.69
Rishi Consfab Private Limited 0.00% 1.39 (0.02%) (0.72)
Magtorq Private Limited 0.01% 5.79 (0.01%) (0.57)
Foreign Associates
Larsen & Toubro Qatar & HBK Contracting LLC (0.00%) (0.01) – –
L&T Camp Facilities LLC (0.00%) (0.00) (0.00%) (0.17)
Total Associates 147.79 2.14
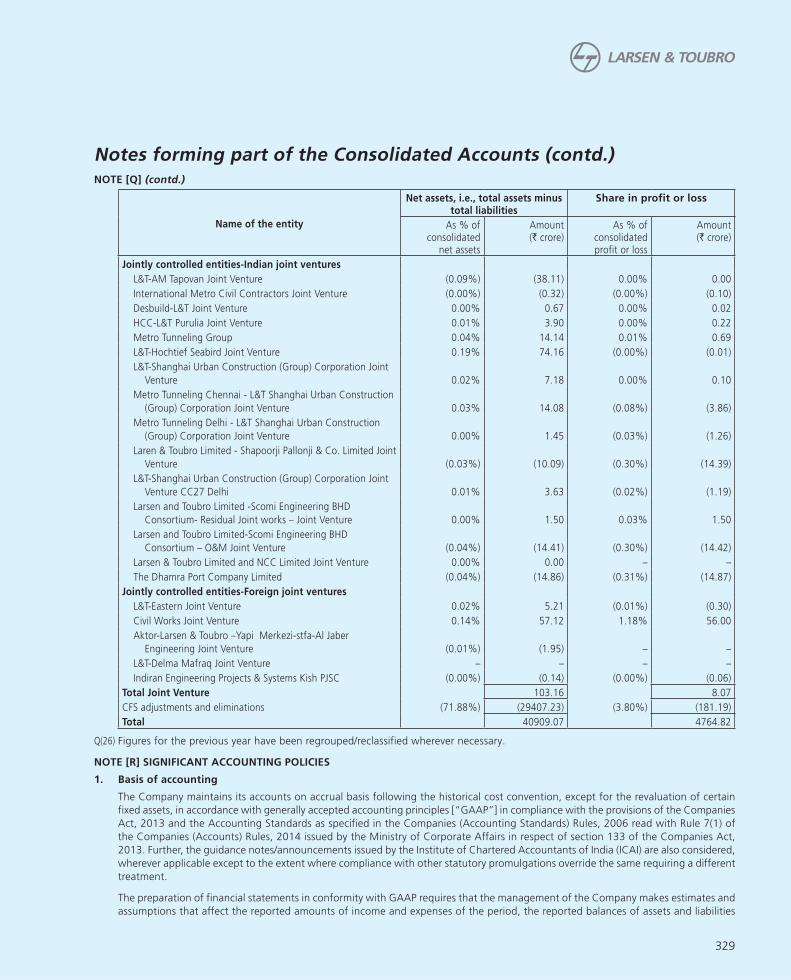
329
Notes forming part of the Consolidated Accounts (contd.)NOTE [Q] (contd.)
Name of the entity
Net assets, i.e., total assets minus total liabilities
Share in profit or loss
As % of consolidated
net assets
Amount (` crore)
As % of consolidated profit or loss
Amount (` crore)
Jointly controlled entities-Indian joint ventures
L&T-AM Tapovan Joint Venture (0.09%) (38.11) 0.00% 0.00
International Metro Civil Contractors Joint Venture (0.00%) (0.32) (0.00%) (0.10)
Desbuild-L&T Joint Venture 0.00% 0.67 0.00% 0.02
HCC-L&T Purulia Joint Venture 0.01% 3.90 0.00% 0.22
Metro Tunneling Group 0.04% 14.14 0.01% 0.69
L&T-Hochtief Seabird Joint Venture 0.19% 74.16 (0.00%) (0.01)
L&T-Shanghai Urban Construction (Group) Corporation Joint
Venture 0.02% 7.18 0.00% 0.10
Metro Tunneling Chennai - L&T Shanghai Urban Construction
(Group) Corporation Joint Venture 0.03% 14.08 (0.08%) (3.86)
Metro Tunneling Delhi - L&T Shanghai Urban Construction
(Group) Corporation Joint Venture 0.00% 1.45 (0.03%) (1.26)
Laren & Toubro Limited - Shapoorji Pallonji & Co. Limited Joint
Venture (0.03%) (10.09) (0.30%) (14.39)
L&T-Shanghai Urban Construction (Group) Corporation Joint
Venture CC27 Delhi 0.01% 3.63 (0.02%) (1.19)
Larsen and Toubro Limited -Scomi Engineering BHD
Consortium- Residual Joint works – Joint Venture 0.00% 1.50 0.03% 1.50
Larsen and Toubro Limited-Scomi Engineering BHD
Consortium – O&M Joint Venture (0.04%) (14.41) (0.30%) (14.42)
Larsen & Toubro Limited and NCC Limited Joint Venture 0.00% 0.00 – –
The Dhamra Port Company Limited (0.04%) (14.86) (0.31%) (14.87)
Jointly controlled entities-Foreign joint ventures
L&T-Eastern Joint Venture 0.02% 5.21 (0.01%) (0.30)
Civil Works Joint Venture 0.14% 57.12 1.18% 56.00
Aktor-Larsen & Toubro –Yapi Merkezi-stfa-Al Jaber
Engineering Joint Venture (0.01%) (1.95) – –
L&T-Delma Mafraq Joint Venture – – – –
Indiran Engineering Projects & Systems Kish PJSC (0.00%) (0.14) (0.00%) (0.06)
Total Joint Venture 103.16 8.07
CFS adjustments and eliminations (71.88%) (29407.23) (3.80%) (181.19)
Total 40909.07 4764.82
Q(26) Figures for the previous year have been regrouped/reclassified wherever necessary.
NOTE [R] SIGNIFICANT ACCOUNTING POLICIES
1. Basis of accounting
The Company maintains its accounts on accrual basis following the historical cost convention, except for the revaluation of certain
fixed assets, in accordance with generally accepted accounting principles [“GAAP”] in compliance with the provisions of the Companies
Act, 2013 and the Accounting Standards as specified in the Companies (Accounting Standards) Rules, 2006 read with Rule 7(1) of
the Companies (Accounts) Rules, 2014 issued by the Ministry of Corporate Affairs in respect of section 133 of the Companies Act,
2013. Further, the guidance notes/announcements issued by the Institute of Chartered Accountants of India (ICAI) are also considered,
wherever applicable except to the extent where compliance with other statutory promulgations override the same requiring a different
treatment.
The preparation of financial statements in conformity with GAAP requires that the management of the Company makes estimates and
assumptions that affect the reported amounts of income and expenses of the period, the reported balances of assets and liabilities

330
and the disclosures relating to contingent liabilities as of the date of the financial statements. Examples of such estimates include the
useful lives of tangible and intangible fixed assets, allowance for doubtful debts/advances, future obligations in respect of retirement
benefit plans, etc. Difference, if any, between the actual results and estimates is recognised in the period in which the results are
known.
The accounts of Indian subsidiaries, joint ventures and associates have been prepared in compliance with the Accounting Standards
as specified in the Companies (Accounting Standards) Rules, 2006 read with Rule 7(1) of the Companies (Accounts) Rules, 2014,
prescribed by the Central Government, and those of the foreign subsidiaries, joint ventures and associates have been prepared in
compliance with the local laws and applicable Accounting Standards. Necessary adjustments for differences in the accounting policies,
wherever applicable, have been made in the Consolidated Financial Statements.
2. Presentation of financial statements
The Balance Sheet and the Statement of Profit and Loss are prepared and presented in the format prescribed in the Schedule III to the
Companies Act, 2013 (“the Act”). The Cash Flow Statement has been prepared and presented as per the requirements of Accounting
Standard (AS) 3 “Cash Flow Statements”. The disclosure requirements with respect to items in the Balance Sheet and Statement of
Profit and Loss, as prescribed in the Schedule III to the Act, are presented by way of notes forming part of accounts along with the
other notes required to be disclosed under the notified Accounting Standards and the Equity Listing Agreement.
Amounts in the financial statements are presented in Indian Rupees in crore [1 crore = 10 million] rounded off to two decimal places
in line with the requirements of Schedule III. Per share data are presented in Indian Rupees to two decimal places.
3. Revenue recognition
Revenue is recognised based on nature of activity when consideration can be reasonably measured and there exists reasonable certainty
of its recovery.
A. Revenue from operations
a. Sales & service
i. Sales and service include excise duty and adjustments made towards liquidated damages and price variation, wherever
applicable. Escalation and other claims, which are not ascertainable/acknowledged by customers, are not taken into
account.
ii. Revenue from sale of manufactured and traded goods is recognised when the substantial risks and rewards of
ownership are transferred to the buyer under the terms of the contract.
iii. Revenue from property development activity which are in substance similar to delivery of goods, is recognised when all
significant risks and rewards of ownership in the land and/or building are transferred to the customer and a reasonable
expectation of collection of the sale consideration from the customer exists.
Revenue from those property development activities which have the same economic substance as construction contract
is recognised based on the ‘Percentage of Completion method’ (POC) when the outcome of a real estate project can
be estimated reliably upon fulfillment of all the following conditions:
a. All critical approvals necessary for commencement of the project have been obtained;
b. When the stage of completion of the project reaches a reasonable level of development i.e., contract costs for
work performed bears a reasonable proportion to the estimated total contract costs. For this purpose, a reasonable
level of development is treated as achieved only if the cost incurred (excluding cost of land/developmental rights
and borrowing cost) is atleast 25% of the total of such cost;
c. Atleast 25% of the saleable project area is secured by contracts or agreements with buyers;
d. Atleast 10% of the total revenue as per the agreements of sale or any other legally enforceable documents are
realised at the reporting date in respect of each of the contracts and it is reasonable to expect that the parties
to such contracts will comply with the payment terms as defined in the contracts.
The costs incurred on property development activities are carried as “Inventories” till such time the outcome of the
project cannot be estimated reliably and all the aforesaid conditions are fulfilled. When the outcome of the project
can be ascertained reliably and all the aforesaid conditions are fulfilled, revenue from property development activity
is recognised at cost incurred plus proportionate margin, using percentage of completion method. Percentage of
completion is determined based on the proportion of actual cost incurred to the total estimated cost of the project.
For this purpose, actual cost includes cost of land and developmental rights but excludes borrowing cost.
Notes forming part of the Consolidated Accounts (contd.)NOTE [R] SIGNIFICANT ACCOUNTING POLICIES (contd.)
331
Expected loss, if any, on the project is recognised as an expense in the period in which it is foreseen, irrespective of
the stage of completion of the contract.
iv. Revenue from construction/project related activity and contracts for supply/commissioning of complex plant and
equipment is recognised as follows:
a. Cost plus contracts: Contract revenue is determined by adding the aggregate cost plus proportionate margin as
agreed with the customer.
b. Fixed price contracts: Contract revenue is recognised only to the extent of cost incurred till such time the outcome
of the job cannot be ascertained reliably. When the outcome of the contract is ascertained reliably contract
revenue is recognised at cost of work performed on the contract plus proportionate margin, using the percentage
of completion method. Percentage of completion is the proportion of cost of work performed to-date to the
total estimated contract costs.
Government grants in the nature of subsidy related to customer contracts are recognised as revenue from operations
in the Statement of Profit and Loss, on a prudent basis, in proportion to work completed when there is reasonable
assurance that the conditions for the grant of subsidy will be fulfilled. Expected loss, if any, on the construction/project
related activity is recognised as an expense in the period in which it is foreseen, irrespective of the stage of completion
of the contract. While determining the amount of foreseeable loss, all elements of costs and related incidental income
not included in contract revenue are taken into consideration.
v. Revenue from contracts for rendering of engineering design services and other services which are directly related to
the construction of an asset is recognised on similar basis as stated in (iv) supra.
vi. Revenue from construction/project related activity and contracts executed in joint ventures under work-sharing
arrangement [being jointly controlled operations, in terms of Accounting Standard (AS) 27 “Financial Reporting
of Interests in Joint Ventures”], is recognised on the same basis as similar contracts independently executed by the
Company.
vii. Revenue from software development is recognised based on software developed or time spent in person hours or
person weeks, and billed to customers as per the terms of specific contracts. Unbilled revenue represents value of
services performed in accordance with the contract terms but not billed.
viii. Income from hire purchase and lease transactions is accounted on accrual basis, pro-rata for the period, at the rates
implicit in the transaction. Income from bill discounting, advisory and syndication services and other financing activities
is accounted on accrual basis. Income from interest-bearing assets is recognised on accrual basis over the life of the
asset based on the constant effective yield. Loan origination income i.e., processing fees and other charges collected
upfront, are recognised at the inception of the loan. Income including interest or any other charges on non-performing
asset is recognised only when realised. Any such income recognised before the asset became non-performing and
remaining unrealised is reversed.
ix. Revenue relatable to construction services rendered in connection with Build-Operate-Transfer (BOT) projects
undertaken by the Group is recognised during the period of construction using percentage of completion method.
After the completion of construction period, revenue relatable to toll collections of such projects from users of facilities
are accounted when the amount is due and recovery is certain. Licence fees for way-side amenities are accounted
on accrual basis. Revenue from annuity based projects is recognised in the Statement of Profit and Loss over the
concession period of the respective projects based on the implicit rate of return embedded in the projected cash flows.
Such income is duly adjusted for any variation in the amount and timing of the cash flows in the period in which such
variation occurs.
x. In respect of information technology (IT) and technology services, revenue from contracts awarded on time and material
basis is recognized when services are rendered and related costs are incurred. Revenue from fixed price contracts is
recognised using the proportionate completion method.
xi. Commission income is recognised as and when the terms of the contract are fulfilled.
xii. Revenue from engineering and service fees is recognised as per the terms of the contract.
xiii. Income from investment management fees is recognised in accordance with the Investment Management Agreement
and SEBI regulations based on average Assets Under Management (AUM) of mutual fund schemes over the period
of the agreement in terms of which services are performed. Portfolio management fees are recognised in accordance
with Portfolio Management Agreement entered with respective clients over the period of the agreement in terms of
Notes forming part of the Consolidated Accounts (contd.)NOTE [R] SIGNIFICANT ACCOUNTING POLICIES (contd.)
332
which the services are rendered. Trusteeship fees are accounted on an accrual basis in accordance with the Trust Deed
and are dependent on the net asset value as recorded by the respective mutual fund schemes.
xiv. Revenue from port operation services is recognised on completion of respective services.
xv. Revenue from charter hire is recognised based on the terms of the time charter agreement.
xvi Revenue from operation and maintenance services of power plant receivable under the Power Purchase Agreement
is recognised on accrual basis.
xvii. Insurance premium (net of service tax) is recognised as income over the contract period or period of risk, as appropriate,
after adjusting for unearned premium (unexpired risk) and premium deficiency, if any. Premium deficiency, if any, is
recognised if the sum of expected claim costs and related claim management costs exceed related reserve for unexpired
risk for every line of business. Reserve for unexpired risk is recognised net of reinsurance ceded and represents premium
written that is attributable and to be allocated to succeeding accounting periods for risks to be borne by the Company
under contractual obligations on a contract period basis or risk period basis, whichever is appropriate. It is calculated
on a daily pro-rata basis, written on policies during the twelve months preceding the Balance Sheet date for fire,
marine cargo and miscellaneous business (excluding project related engineering insurance contracts) and 100% for
marine hull business, on all unexpired policies at Balance Sheet date, in accordance with Section 64 V(1)(ii)(b) of the
Insurance Act, 1938. The reserve for unexpired risk is computed for project related engineering insurance contract
through the usage of Cubic Curve Method. A reserve for unexpired risks is recorded at 50% of the net premium
retro-ceded to the Company from India Motor Third Party Insurance Pool (IMTPIP) during the year. Reinsurance premium
ceded is accounted in the year in which the risk commences and over the period of risk in accordance with the treaty
arrangements with the reinsurers.
Reinsurance premium ceded on unearned premium is carried forward to the period of risk and is set off against related
unearned premium. Premium on excess of loss reinsurance cover is accounted as per the terms of the reinsurance
arrangements.
Commission on reinsurance ceded is recognised as income on ceding of reinsurance premium.
Profit commission under reinsurance treaties, wherever applicable, is recognised in the year of final determination of
the profits.
Claims incurred comprise claims paid, estimated liability for outstanding claims made following a loss occurrence
reported and estimated liability for claims Incurred But Not Reported (‘IBNR’) and claims Incurred But Not Enough
Reported (‘IBNER’). Further, claims incurred also include specific claim settlement costs such as survey/legal fees and
other directly attributable costs.
Claims (net of amounts receivable from reinsurers/co-insurers) are recognised on the date of intimation based on
estimates from surveyors/insured in the respective revenue accounts. Estimated liability for outstanding claims at
Balance Sheet date is recorded net of claims recoverable from/payable to co-insurers/reinsurers and salvage to the
extent there is certainty of realisation. Estimated liability for outstanding claims is determined by management on
the basis of ultimate amounts likely to be paid on each claim based on the past experience. These estimates are
progressively revalidated on availability of further information. IBNR represents that amount of claims that may have
been incurred during the accounting period but have not been reported or claimed. IBNR provision also includes
provision, if any, required for claims IBNER. Estimated liability for claims Incurred But Not Reported (‘IBNR’) and claims
Incurred But Not Enough Reported (‘IBNER’) is based on actuarial estimate duly certified by the appointed actuary of
the Company. IBNR/IBNER has been created on reinsurance accepted from Indian Motor Third Party Insurance Pool
(IMTPIP) based on actuarial estimates received from the IMTPIP.
b. Other operational revenue
Other operational revenue represents income earned from the activities incidental to the business and is recognised when
the right to receive the income is established as per the terms of the contract.
B. Other income
a. Interest income is accrued at applicable interest rate.
b. Dividend income is accounted in the period in which the right to receive the same is established.
Notes forming part of the Consolidated Accounts (contd.)NOTE [R] SIGNIFICANT ACCOUNTING POLICIES (contd.)

333
c. Other Government grants, which are revenue in nature and are towards compensation for the related costs, are recognised
as income in the Statement of Profit and Loss in the period in which the matching costs are incurred.
d. Other items of income are accounted as and when the right to receive arises.
4. Principles of consolidation
a. The financial statements of the Parent Company and its subsidiaries have been consolidated on a line-by-line basis by adding
together the book values of the like items of assets, liabilities, income and expenses, after eliminating intra-group balances and
the unrealised profits/losses on intra-group transactions, and are presented to the extent possible, in the same manner as the
Parent Company’s independent financial statements.
b. Investments in associate companies have been accounted for, by using equity method whereby investment is initially recorded
at cost and the carrying amount is adjusted thereafter for post-acquisition change in the Company’s share of net assets of the
associate. The carrying amount of investment in associate companies is reduced to recognise any decline which is other than
temporary in nature and such determination of decline in value, if any, is made for each investment individually. The unrealized
profits/losses on transactions with associate companies are eliminated by reducing the carrying amount of investment.
c. Goodwill on consolidation represents the difference between the Group’s share in the net worth of a subsidiary, an associate or
a joint venture, and the cost of acquisition at each point of time of making the investment in the subsidiary, the associate or the
joint venture as per Accounting Standard (AS) 21 “Consolidated Financial Statements”. For this purpose, the Group’s share of net
worth is determined on the basis of the latest financial statements, prior to the acquisition, after making necessary adjustments
for material events between the date of such financial statements and the date of respective acquisition. Capital reserve on
consolidation represents negative goodwill arising on consolidation. Goodwill arising on consolidation as per Accounting Standard
(AS) 21 ”Consolidated Financial Statements“ is not amortised, however, it is tested for impairment. In the event of cessation of
operations of a subsidiary, associate or joint venture, the unimpaired goodwill is written off fully.
d. Minority interest represents that part of the net profit or loss and net assets of subsidiaries attributable to interests which are
not owned, directly or indirectly, by the Group. Further, Preference shares issued by the subsidiaries to stakeholders outside the
Group together with dividend accruals thereon also form part of minority interest in the Consolidated Financial Statements.
e. The gains/losses in respect of part dilution of stake in subsidiary companies pursuant to issue of additional shares to minority
shareholders are recognised directly in capital reserve under reserves and surplus in the Balance Sheet. The gains/losses in respect
of part divestment of stake in subsidiary companies pursuant to sale of shares by the holding company are recognised in the
Statement of Profit and Loss.
f. The Company’s interests in joint ventures are consolidated as follows:
Type of joint venture Accounting treatment
Jointly controlled operations Company’s share of revenues, common expenses, assets and liabilities are included in revenues, expenses, assets and liabilities respectively.
Jointly controlled assets Share of the assets, according to nature of the assets, and share of the liabilities are shown as part of gross block and liabilities respectively. Share of expenses incurred on maintenance of the assets is accounted as expense. Monetary benefits, if any, from use of the assets are reflected as income.
Jointly controlled entities The Company’s interest in jointly controlled entities are proportionately consolidated on a line-by-line basis by adding together the book values of assets, liabilities, income and expenses, after eliminating the unrealised profits/losses on intra-group transactions.
Joint venture interests accounted as above are included in the segments to which they relate.
5. Extraordinary and exceptional items
Income or expenses that arise from events or transactions that are clearly distinct from the ordinary activities of the Company are
classified as extraordinary items. Specific disclosure of such events/transactions is made in the financial statements. Similarly, any
external event beyond the control of the Company, significantly impacting income or expense, is also treated as extraordinary item
and disclosed as such.
On certain occasions, the size, type or incidence of an item of income or expense, pertaining to the ordinary activities of the Company,
is such that its disclosure improves an understanding of the performance of the Company. Such income or expense is classified as an
exceptional item and accordingly disclosed in the notes to accounts.
Notes forming part of the Consolidated Accounts (contd.)NOTE [R] SIGNIFICANT ACCOUNTING POLICIES (contd.)
334
6. Research and development
a. Revenue expenditure on research is expensed under respective heads of account in the period in which it is incurred.
b. Development expenditure on new products is capitalised as intangible asset, if all of the following can be demonstrated:
i. The technical feasibility of completing the intangible asset so that it will be available for use or sale
ii. The Company has intention to complete the intangible asset and use or sell it
iii. The Company has ability to use or sell the intangible asset
iv. The manner in which the probable future economic benefits will be generated including the existence of a market for
output of the intangible asset or intangible asset itself or if it is to be used internally, the usefulness of intangible assets
v. The availability of adequate technical, financial and other resources to complete the development and to use or sell the
intangible asset and
vi. The Company has ability to measure the expenditure attributable to the intangible asset during its development reliably
The development expenditure capitalised as intangible asset is amortised over its useful life.
Other development costs that do not meet above criteria are expensed in the period in which they are incurred.
7. Employee benefits
a. Short term employee benefits:
All employee benefits falling due wholly within twelve months of rendering the service are classified as short term employee
benefits. The benefits like salaries, wages, short term compensated absences etc. and the expected cost of bonus, ex-gratia are
recognised in the period in which the employee renders the related service.
b. Post-employment benefits:
i. Defined contribution plans: The Company’s superannuation scheme, state governed provident fund scheme, employee state
insurance scheme and employee pension scheme are defined contribution plans. The contribution paid/payable under the
schemes is recognised during the period in which the employee renders the related service.
ii. Defined benefit plans: The employees’ gratuity fund schemes, post-retirement medical care scheme, pension scheme and
provident fund scheme managed by trust are the Company’s defined benefit plans. The present value of the obligation
under such defined benefit plans is determined based on actuarial valuation using the Projected Unit Credit Method.
The obligation is measured at the present value of the estimated future cash flows. The discount rate used for determining
the present value of the obligation under defined benefit plans, is based on the market yield on government securities of
a maturity period equivalent to the weighted average maturity profile of the related obligations at the Balance Sheet date.
Actuarial gains and losses are recognised immediately in the Statement of Profit and Loss.
The interest element in the actuarial valuation of defined benefit plans, which comprises the implicit interest cost and the
impact of changes in discount rate, is classified under finance cost and balance charge is recognised as employee benefit
expenses in the Statement of Profit and Loss. In case of funded plans, the fair value of the plan assets is reduced from the
gross obligation under the defined benefit plans to recognise the obligation on a net basis.
Gains or losses on the curtailment or settlement of any defined benefit plan are recognised when the curtailment or
settlement occurs. Past service cost is recognised as expense on a straight line basis over the average period until the
benefits become vested.
c. Long term employee benefits:
The obligation for long term employee benefits such as long term compensated absences, long service award etc. is recognised
in the similar manner as in the case of defined benefit plans as mentioned in (b)(ii) supra.
d. Termination benefits:
Termination benefits such as compensation under voluntary retirement cum pension scheme are recognised as expense in the
period in which they are incurred.
Notes forming part of the Consolidated Accounts (contd.)NOTE [R] SIGNIFICANT ACCOUNTING POLICIES (contd.)

335
8. Tangible fixed assets
Tangible fixed assets are stated at original cost net of tax/duty credits availed, if any, less accumulated depreciation and cumulative
impairment and those which were revalued as on October 1,1984 are stated at the values determined by the valuers less accumulated
depreciation and cumulative impairment. Assets acquired on hire purchase basis are stated at their cash values. Specific know-how
fees paid, if any, relating to plant & equipment is treated as part of cost thereof.
Administrative and other general overhead expenses that are specifically attributable to construction or acquisition of fixed assets or
bringing the fixed assets to working condition are allocated and capitalised as a part of the cost of the fixed assets.
Own manufactured assets are capitalised at cost including an appropriate share of overheads.
Tangible assets not ready for the intended use on the date of the Balance Sheet are disclosed as “capital work-in-progress”.
(Also refer to policy on leases, borrowing costs, impairment of assets and foreign currency transactions infra).
9. Leases
The determination of whether an agreement is, or contains, a lease is based on the substance of the agreement at the date of
inception.
a. Lease transactions entered into prior to April 1, 2001:
Assets leased out are stated at original cost. Lease equalisation adjustment is the difference between capital recovery included
in the lease rentals and depreciation provided in the books of account. Lease rentals in respect of assets acquired under leases
are charged to the Statement of Profit and Loss.
b. Lease transactions entered into on or after April 1, 2001:
Finance leases:
i. Assets acquired under leases where the Company has substantially all the risks and rewards of ownership are classified as
finance leases. Such assets are capitalised at the inception of the lease at the lower of the fair value or the present value
of minimum lease payments and a liability is created for an equivalent amount. Each lease rental paid is allocated between
the liability and the interest cost, so as to obtain a constant periodic rate of interest on the outstanding liability for each
period.
ii. Assets given under leases where the Company has transferred substantially all the risks and rewards of ownership to lessee,
are classified as finance leases. Where under a contract, the Company has agreed to manufacture/construct an asset and
convey, in substance, a right to the beneficiary to use the asset over a major part of its economic life, for a pre-determined
consideration, such arrangement is also accounted as finance lease.
iii. Assets given under a finance lease are recognised as a receivable at an amount equal to the net investment in the lease.
Wherever the asset is manufactured/constructed by the Company, the fair value of the asset, representing the net investment
in the lease, is recognised as sales revenue in accordance with the Company’s revenue recognition policy. Lease income is
recognised over the period of the lease so as to yield a constant rate of return on the net investment in the lease.
iv. Initial direct costs relating to assets given on finance leases are charged to the Statement of Profit and Loss.
Operating leases:
i. Assets acquired on leases where a significant portion of the risks and rewards of ownership are retained by the lessor are
classified as operating leases. Lease rentals are charged to the Statement of Profit and Loss on accrual basis.
ii. Assets leased out under operating leases are capitalised. Rental income is recognised on accrual basis over the lease term.
(Also refer to policy on depreciation infra).
10. Depreciation
A. Indian companies
a. Owned assets
i. Revalued assets:
Depreciation is provided on straight line method on the values and at the rates given by the valuers. The difference
between depreciation provided on revalued amount and on historical cost is transferred from revaluation reserve to
the Statement of Profit and Loss.
Notes forming part of the Consolidated Accounts (contd.)NOTE [R] SIGNIFICANT ACCOUNTING POLICIES (contd.)
336
ii. Assets carried at historical cost:
Depreciation on assets carried at historical cost is provided on straight line method on the basis of useful life as specified
in Schedule II to the Companies Act, 2013 except in respect of certain assets where the useful life was determined by
technical evaluation. The carrying amount of the assets as on April 1, 2014 is depreciated over the remaining useful
life. Where the useful life of the asset has expired, the carrying amount as on April 1, 2014 has been charged to the
retained earnings as on April 1, 2014.
iii. Depreciation for additions to/deductions from owned assets is calculated pro-rata. Extra shift depreciation is provided
on a location basis.
iv. Depreciation charge for impaired assets is adjusted in future periods in such a manner that the revised carrying amount
of the asset is allocated over its remaining useful life.
b. Leased assets
i. Lease transactions entered into prior to April 1, 2001:
Lease charge comprising statutory depreciation and lease equalisation charge is provided for assets given on lease
over the primary period of the lease equal to recovery of net investment in the lease. Accordingly, while the statutory
depreciation on such assets is provided for on straight line method as per Schedule II to the Companies Act, 2013,
the difference is adjusted through lease equalisation and lease adjustment account.
ii. Lease transactions entered into on or after April 1, 2001:
Assets acquired under finance leases are depreciated on a straight line basis over the lease term. Where there is
reasonable certainty that the Company shall obtain ownership of the assets at the end of the lease term, such assets
are depreciated based on the useful life prescribed under Schedule II to the Companies Act, 2013 or based on the
useful life adopted by the Company for similar assets.
iii. Leasehold land:
Land acquired under long term lease is classified under “tangible assets” and is depreciated over the period of lease.
B. Foreign companies
Depreciation has been provided on methods and at the rates required/permissible by the local laws so as to write off the assets
over their useful lives.
11. Intangible assets and amortisation
Intangible assets are stated at original cost net of tax/duty credits availed, if any, less accumulated amortisation and cumulative
impairment. Intangible assets are recognised when it is probable that the future economic benefits that are attributable to the asset
will flow to the enterprise and the cost of the asset can be measured reliably. Intangible assets are amortised as follows:
a. Specialised software: over a period of three to ten years;
b. Technical know-how: over a period of three to seven years;
c. Development costs for new products: over a period five years;
d. Customer contracts and relationships: over a period of seven to ten years;
e. Toll collection rights obtained in consideration for rendering construction services represent the right to collect toll revenue
during the concession period in respect of Build-Operate-Transfer (BOT) projects undertaken by the Group. Toll collection rights
are capitalised as intangible asset upon completion of the project at the cumulative construction costs including related margins
(refer to policy on revenue recognition supra) plus obligation towards negative grants payable to National Highway Authority
of India (NHAI), if any. Till the completion of the project, the same is recognised as intangible assets under development. The
revenue towards collection of toll/other income during the period of construction is reduced from the cost of intangible asset
under development.
Toll collection rights in respect of road projects are amortised over the period of concession using the revenue based amortisation
method prescribed under Schedule II to the Companies Act, 2013. Under the revenue based amortisation method, amortisation is
provided based on proportion of actual revenue earned till the end of the year to the total projected revenue from the intangible
assets expected to be earned over the concession period. Total projected revenue is reviewed at the end of each financial year
and is adjusted to reflect changes in earlier estimate vis-à-vis the actual revenue earned till the end of the year so that the whole
of the cost of the intangible asset is amortised over the concession period.
Notes forming part of the Consolidated Accounts (contd.)NOTE [R] SIGNIFICANT ACCOUNTING POLICIES (contd.)
337
f. Exploration and evaluation expenditure incurred for potential mineral reserves is recognised and reported as part of “intangible
assets under development” under “intangible assets” when such costs are expected to be either recouped in full through
successful exploration and development of the area of interest or alternatively, by its sale; or when exploration and evaluation
activities in the area of interest have not yet reached a stage which permits a reasonable assessment of the existence or otherwise
of economically available reserves and active and significant operations in relation to the area are continuing or are planned for
the future. Exploration assets are re-assessed on a regular basis and these costs are carried forward provided that at least one
of the conditions outlined above is met. All other exploration and evaluation expenditure is recognised as expense in the period
in which it is incurred.
g. Utility right to use costs are amortised over the period of ’agreement to use‘, but not exceeding 10 years.
Administrative and other general overhead expenses that are specifically attributable to acquisition of intangible assets are
allocated and capitalised as a part of the cost of the intangible assets.
Intangible assets not ready for the intended use on the date of the Balance Sheet are disclosed as “intangible assets under
development”.
Amortisation on impaired assets is provided by adjusting the amortisation charges in the remaining periods so as to allocate the
asset’s revised carrying amount over its remaining useful life.
12. Impairment of assets
As at each Balance Sheet date, the carrying amount of assets is tested for impairment so as to determine:
a. the provision for impairment loss, if any; and
b. the reversal of impairment loss recognised in previous periods, if any.
Impairment loss is recognised when the carrying amount of an asset exceeds its recoverable amount.
Recoverable amount is determined:
a. in the case of an individual asset, at the higher of the net selling price and the value in use;
b. in the case of a cash generating unit (a group of assets that generates identified, independent cash flows), at the higher of the
cash generating unit’s net selling price and the value in use.
(Value in use is determined as the present value of estimated future cash flows from the continuing use of an asset and from its
disposal at the end of its useful life).
13. Investments
Trade investments comprise investments in entities in which the Company has strategic business interest.
Investments, which are readily realisable and are intended to be held for not more than one year from the date of acquisition, are
classified as current investments. All other investments are classified as long term investments.
Long term investments (other than associates) including trade investments are carried at cost, after providing for any diminution in
value, if such diminution is other than temporary in nature.
Current investments are carried at lower of cost and fair value. The determination of carrying amount of such investments is done
on the basis of weighted average cost of each individual investment.
Investment in associate companies is accounted using “equity method” [Note R(4)(b)]. Purchase and sale of investments are recognised
based on the trade date accounting.
14. Inventories
Inventories are valued after providing for obsolescence, as under:
a. Raw materials, components, construction materials, stores, spares and loose tools at lower of cost or net realisable value. However,
these items are considered to be realisable at cost if the finished goods in which they will be used, are expected to be sold at
or above cost;
b. Manufacturing work-in-progress at lower of cost including related overheads or net realisable value. In some cases, manufacturing
work-in-progress is valued at lower of specifically identifiable cost or net realisable value. In the case of qualifying assets, cost
also includes applicable borrowing costs vide policy relating to borrowing costs;
Notes forming part of the Consolidated Accounts (contd.)NOTE [R] SIGNIFICANT ACCOUNTING POLICIES (contd.)

338
c. Finished goods and stock-in-trade (in respect of goods acquired for trading) at lower of cost or net realisable value. Cost includes
related overheads and excise duty paid/payable on such goods; and
d. Completed property/work-in-progress (including land) in respect of property development activity at lower of specifically
identifiable cost or net realisable value.
Cost of inventories is computed either on a weighted average or on First-in-First-out (FIFO) basis.
15. Cash and bank balances
Cash and bank balances also include fixed deposits, margin money deposits, earmarked balances with banks and other bank balances
which have restrictions on repatriation. Short term and liquid investments being not free from more than insignificant risk of change
in value, are not included as part of cash and cash equivalents.
16. Government grant of capital nature
Grants received/receivable from NHAI in the nature of “promoter contribution” are credited to “capital reserve”.
17. Securities premium account
a. Securities premium includes:
i. The difference between the market value and the consideration received in respect of shares issued pursuant to Stock
Appreciation Rights Scheme; and
ii. The discount allowed, if any, in respect of shares allotted pursuant to Stock Options Scheme.
b. The following expenses are written off against securities premium account:
i. Expenses incurred on issue of shares;
ii. Expenses (net of tax) incurred on issue of debentures/bonds; and
iii. Premium (net of tax) on redemption of debentures/bonds.
18. Borrowing costs
Borrowing costs include interest, commitment charges, amortisation of ancillary costs, amortisation of discounts/premium related to
borrowings, finance charges in respect of assets acquired on finance lease and exchange differences arising from foreign currency
borrowings, to the extent they are regarded as an adjustment to interest costs.
Borrowing costs that are attributable to the acquisition, construction or production of a qualifying asset are capitalised/inventorised
as part of cost of such asset till such time the asset is ready for its intended use or sale. A qualifying asset is an asset that necessarily
requires a substantial period of time to get ready for its intended use or sale. All other borrowing costs are recognised as an expense
in the period in which they are incurred.
19. Employee stock ownership schemes
In respect of stock options granted pursuant to the Company’s Stock Options Scheme, the intrinsic value of the options (excess of
market price of the share over the exercise price of the option) is treated as discount and accounted as employee compensation cost
over the vesting period. The amount recognised as expense each year is arrived at based on the number of grants expected to vest.
If a grant lapses after the vesting period, the cumulative discount recognized as expense in respect of such grant is transferred to the
general reserve.
20. Foreign currency transactions, foreign operations, forward contracts and derivatives
a. The reporting currency of the Company is Indian Rupee.
b. Foreign currency transactions are recorded on initial recognition in the reporting currency, using the exchange rate at the date
of the transaction. At each Balance Sheet date, foreign currency monetary items are reported using the closing rate.
Non-monetary items, carried at historical cost denominated in a foreign currency, are reported using the exchange rate at the
date of the transaction.
Exchange differences that arise on settlement of monetary items or on reporting of monetary items at each Balance Sheet date
at the closing rate are:
i. adjusted in the cost of fixed assets specifically financed by the borrowings contracted upto March 31, 2004 to which the
exchange differences relate;
Notes forming part of the Consolidated Accounts (contd.)NOTE [R] SIGNIFICANT ACCOUNTING POLICIES (contd.)

339
ii. adjusted in the cost of fixed assets specifically financed by borrowings contracted between the period April 1, 2004 to
March 31, 2007 and to which the exchange differences relate, provided the assets are acquired from outside India;
iii. recognised as income or expense in the period in which they arise, in cases other than (i) and (ii) above.
c. Financial statements of foreign operations comprising jobs contracted prior to April 1, 2004, are translated as follows:
i. Closing inventories at rates prevailing at the end of the year.
ii. Fixed assets as at April 1, 1991 at rates prevailing at the end of the year in which the additions were made. Subsequent
additions are at rates prevailing on the dates of the additions. Depreciation is accounted at the same rate at which the
assets are translated.
iii. Other assets and liabilities at rates prevailing at the end of the year.
iv. Net revenues at the average rate for the year.
d. Financial statements of foreign operations comprising jobs contracted on or after April 1, 2004, are treated as integral operations
and translated as in the same manner as foreign currency transactions, as described above. Exchange differences arising on such
translation are recognised as income or expense of the period in which they arise.
e. Financial statements of overseas non-integral operations are translated as under:
i. Assets and liabilities at the rate prevailing at the end of the year. Depreciation and amortisation is accounted at the same
rate at which assets are converted.
ii. Revenues and expenses at yearly average exchange rates prevailing during the year.
Exchange differences arising on translation of non-integral foreign operations are accumulated in the foreign currency translation
reserve until the disposal of such operations.
f. Forward contracts, other than those entered into to hedge foreign currency risk on unexecuted firm commitments or highly
probable forecasted transactions, are treated as foreign currency transactions and accounted accordingly as per Accounting
Standard (AS) 11 “The Effects of Changes in Foreign Exchange Rates”. Exchange differences arising on such contracts are
recognised in the period in which they arise.
Gains and losses arising on account of roll over/cancellation of forward contracts are recognised as income/expense of the period
in which such roll over/cancellation takes place.
g. All the other derivative contracts, including forward contracts entered into to hedge foreign currency risks on unexecuted firm
commitments and highly probable forecasted transactions, are recognised in the financial statements at fair value as on the
Balance Sheet date, in pursuance of the announcement of the ICAI dated March 29, 2008 on accounting of derivatives. In
addition, the derivative arrangements embedded in the contracts entered in the course of business are accounted separately if
the economic characteristics and risks of the embedded derivatives are not closely related to economic characteristics and risks
of the host contract.
The Company has adopted Accounting Standard (AS) 30 “Financial Instruments: Recognition and Measurement” for accounting
of such derivative contracts, not covered under Accounting Standard (AS) 11 “The Effects of Changes in Foreign Exchange Rates”,
as mandated by the ICAI in the aforesaid announcement.
Accordingly, the resultant gains or losses on fair valuation/settlement of the derivative contracts (including embedded derivatives)
covered under Accounting Standard (AS) 30 “Financial Instruments: Recognition and Measurement” are recognised in the
Statement of Profit and Loss or Balance Sheet as the case may be after applying the test of hedge effectiveness. Where the hedge
in respect of off-balance sheet items is effective, the gains or losses are recognised in the “hedging reserve” which forms part
of “reserves and surplus” in the Balance Sheet. The amount recognised in the “hedging reserve” is transferred to the Statement
of Profit and Loss in the period in which the underlying hedged item affects the Statement of Profit and Loss. Gains and losses
in respect of ineffective hedges are recognised in the Statement of Profit and Loss in the period in which such gains or losses
are incurred.
h. The premium paid/received on a foreign currency forward contract is accounted as expense/income over the life of the contract.
Notes forming part of the Consolidated Accounts (contd.)NOTE [R] SIGNIFICANT ACCOUNTING POLICIES (contd.)

340
21. Segment accounting
a. Segment accounting policies
Segment accounting policies are in line with the accounting policies of the Company. In addition, the following specific accounting
policies have been followed for segment reporting:
i. Segment revenue includes sales and other operational revenue directly identifiable with/allocable to the segment including (a)
inter segment revenue and (b) profit on sale of stake in the subsidiary and/or joint venture companies under Developmental
projects segment and Realty business grouped under “Others” segment.
ii. Expenses that are directly identifiable with/allocable to segments are considered for determining the segment result.
In respect of (a) Financial Services Segment and (b) certain projects under Developmental Projects segment viz. power
generation projects & power transmission system projects which are classified as finance lease and annuity based road
projects, the interest expenses on borrowings are accounted as segment expenses. Expenses which relate to the Company
as a whole and not allocable to segments are included under “unallocable corporate expenditure”.
iii. Income which relates to the Company as a whole and not allocable to segments is included in “unallocable corporate
income”.
iv. Segment result includes margins on inter-segment capital jobs, which are reduced in arriving at the profit before tax of the
Company.
v. Segment assets and liabilities include those directly identifiable with the respective segments. In respect of (a) financial
services segment, and (b) certain projects under developmental projects segment viz. power generation projects & power
transmission system projects which are classified as finance lease and annuity based road projects, segment liabilities include
borrowings as the interest expenses on borrowings are accounted as segment expenses in respect of the segment and
projects.
Unallocable corporate assets and liabilities represent the assets and liabilities that relate to the Company as a whole and
not allocable to any segment.
vi. Segment non-cash expenses forming part of segment expenses include the intrinsic value of the employee stock options
which is accounted as employee compensation cost [Note R(19)] and is allocated to the segment.
b. Inter-segment transfer pricing
Segment revenue resulting from transactions with other business segments is accounted on the basis of transfer price agreed
between the segments. Such transfer prices are either determined to yield a desired margin or agreed on a negotiated basis.
22. Taxes on income
a. Indian companies:
Tax on income for the current period is determined on the basis of taxable income and tax credits computed in accordance with
the provisions of the Income Tax Act, 1961 and based on the expected outcome of assessments/appeals.
Deferred tax is recognised on timing differences between the income accounted in financial statements and the taxable income
for the year, and quantified using the tax rates and laws enacted or substantively enacted as on the Balance Sheet date.
Deferred tax assets relating to unabsorbed depreciation/business losses/losses under the head “capital gains” are recognised
and carried forward to the extent there is virtual certainty that sufficient future taxable income will be available against which
such deferred tax assets can be realised.
Other deferred tax assets are recognised and carried forward to the extent that there is a reasonable certainty that sufficient
future taxable income will be available against which such deferred tax assets can be realised.
b. Foreign companies:
Foreign companies recognise tax liabilities and assets in accordance with the applicable local laws.
23. Provisions, contingent liabilities and contingent assets
Provisions are recognised for liabilities that can be measured only by using a substantial degree of estimation, if
a. the Company has a present obligation as a result of a past event
b. a probable outflow of resources is expected to settle the obligation and
c. the amount of the obligation can be reliably estimated
Notes forming part of the Consolidated Accounts (contd.)NOTE [R] SIGNIFICANT ACCOUNTING POLICIES (contd.)

341
Reimbursement expected in respect of expenditure required to settle a provision is recognised only when it is virtually certain that the
reimbursement will be received. Contingent liability is disclosed in case of
a. a present obligation arising from past events, when it is not probable that an outflow of resources will be required to settle the
obligation
b. a present obligation arising from past events, when no reliable estimate is possible
c. a possible obligation arising from past events, where the probability of outflow of resources is not remote
Contingent assets are neither recognised, nor disclosed.
Provisions, contingent liabilities and contingent assets are reviewed at each Balance Sheet date.
24. Commitments
Commitments are future liabilities for contractual expenditure.
Commitments are classified and disclosed as follows:
a. Estimated amount of contracts remaining to be executed on capital account and not provided for
b. Uncalled liability on shares and other investments partly paid
c. Funding related commitments to associate and joint venture companies and
d. Other non-cancellable commitments, if any, to the extent they are considered material and relevant in the opinion of management.
Other commitments related to sales/procurements made in the normal course of business are not disclosed to avoid excessive details.
25. Operating cycle for current and non-current classification
Operating cycle for the business activities of the Company covers the duration of the specific project/contract/product line/service
including the defect liability period, wherever applicable and extends up to the realisation of receivables (including retention monies)
within the agreed credit period normally applicable to the respective lines of business.
26. Deferred payment liabilities
The obligation towards additional concession fee payable to NHAI is recognised as deferred payment liability when the Company, in
its capacity of Concessionaire, becomes entitled to exercise the right and collect toll in accordance with the terms of the concession
agreement on Commercial Operations Date.
27. Cash flow statement
Cash flow statement is prepared segregating the cash flows from operating, investing and financing activities. Cash flow from
operating activities is reported using indirect method. Under the indirect method, the net profit is adjusted for the effects of:
a. transactions of a non-cash nature
b. any deferrals or accruals of past or future operating cash receipts or payments and
c. items of income or expense associated with investing or financing cash flows
Cash and cash equivalents (including bank balances) are reflected as such in the Cash Flow Statement. Those cash and cash equivalents
which are not available for general use as on the date of Balance Sheet are also included under this category with a specific disclosure.
A. M. NAIKGroup Executive Chairman (DIN 00001514)
As per our report attachedSHARP & TANNAN K. VENKATARAMANAN
Chief Executive Officer & Managing Director (DIN 00001647)
R. SHANKAR RAMANChief Financial Officer & Whole-time Director (DIN 00019798)
Chartered AccountantsFirm’s Registration No.109982Wby the hand of
M. M. CHITALE (DIN 00101004) SUBODH BHARGAVA (DIN 00035672)MILIND P. PHADKEPartner M. DAMODARAN (DIN 02106990) SUNITA SHARMA (DIN 02949529)Membership No.33013
SUSHOBHAN SARKER (DIN 00088276)N. HARIHARAN
Mumbai, May 30, 2015 Company Secretary Directors Mumbai, May 30, 2015
Notes forming part of the Consolidated Accounts (contd.)NOTE [R] SIGNIFICANT ACCOUNTING POLICIES (contd.)
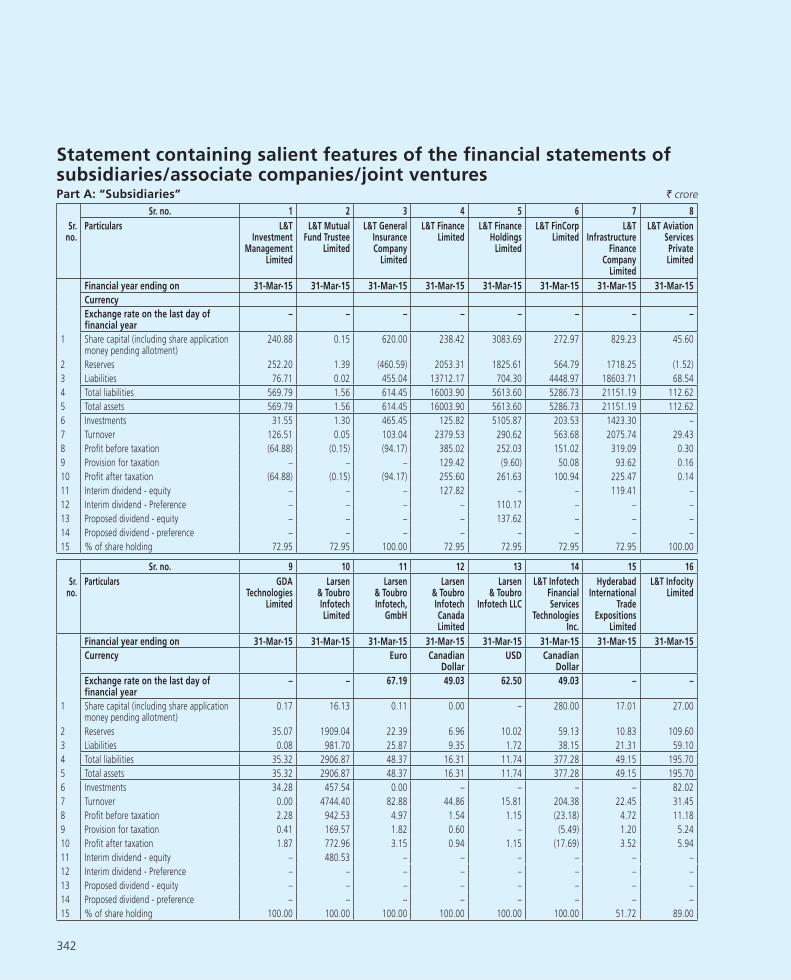
342
Statement containing salient features of the financial statements of subsidiaries/associate companies/joint venturesPart A: “Subsidiaries” ` crore
Sr. no. 1 2 3 4 5 6 7 8
Sr. no.
Particulars L&T Investment
Management Limited
L&T Mutual Fund Trustee
Limited
L&T General Insurance Company
Limited
L&T Finance Limited
L&T Finance Holdings
Limited
L&T FinCorp Limited
L&T Infrastructure
Finance Company
Limited
L&T Aviation Services Private Limited
Financial year ending on 31-Mar-15 31-Mar-15 31-Mar-15 31-Mar-15 31-Mar-15 31-Mar-15 31-Mar-15 31-Mar-15
Currency
Exchange rate on the last day of financial year
– – – – – – – –
1 Share capital (including share application money pending allotment)
240.88 0.15 620.00 238.42 3083.69 272.97 829.23 45.60
2 Reserves 252.20 1.39 (460.59) 2053.31 1825.61 564.79 1718.25 (1.52)
3 Liabilities 76.71 0.02 455.04 13712.17 704.30 4448.97 18603.71 68.54
4 Total liabilities 569.79 1.56 614.45 16003.90 5613.60 5286.73 21151.19 112.62
5 Total assets 569.79 1.56 614.45 16003.90 5613.60 5286.73 21151.19 112.62
6 Investments 31.55 1.30 465.45 125.82 5105.87 203.53 1423.30 –
7 Turnover 126.51 0.05 103.04 2379.53 290.62 563.68 2075.74 29.43
8 Profit before taxation (64.88) (0.15) (94.17) 385.02 252.03 151.02 319.09 0.30
9 Provision for taxation – – – 129.42 (9.60) 50.08 93.62 0.16
10 Profit after taxation (64.88) (0.15) (94.17) 255.60 261.63 100.94 225.47 0.14
11 Interim dividend - equity – – – 127.82 – – 119.41 –
12 Interim dividend - Preference – – – – 110.17 – – –
13 Proposed dividend - equity – – – – 137.62 – – –
14 Proposed dividend - preference – – – – – – – –
15 % of share holding 72.95 72.95 100.00 72.95 72.95 72.95 72.95 100.00
Sr. no. 9 10 11 12 13 14 15 16
Sr. no.
Particulars GDA Technologies
Limited
Larsen & Toubro Infotech Limited
Larsen & Toubro Infotech,
GmbH
Larsen & Toubro Infotech Canada Limited
Larsen & Toubro
Infotech LLC
L&T Infotech Financial Services
Technologies Inc.
Hyderabad International
Trade Expositions
Limited
L&T Infocity Limited
Financial year ending on 31-Mar-15 31-Mar-15 31-Mar-15 31-Mar-15 31-Mar-15 31-Mar-15 31-Mar-15 31-Mar-15
Currency Euro Canadian Dollar
USD Canadian Dollar
Exchange rate on the last day of financial year
– – 67.19 49.03 62.50 49.03 – –
1 Share capital (including share application money pending allotment)
0.17 16.13 0.11 0.00 – 280.00 17.01 27.00
2 Reserves 35.07 1909.04 22.39 6.96 10.02 59.13 10.83 109.60
3 Liabilities 0.08 981.70 25.87 9.35 1.72 38.15 21.31 59.10
4 Total liabilities 35.32 2906.87 48.37 16.31 11.74 377.28 49.15 195.70
5 Total assets 35.32 2906.87 48.37 16.31 11.74 377.28 49.15 195.70
6 Investments 34.28 457.54 0.00 – – – – 82.02
7 Turnover 0.00 4744.40 82.88 44.86 15.81 204.38 22.45 31.45
8 Profit before taxation 2.28 942.53 4.97 1.54 1.15 (23.18) 4.72 11.18
9 Provision for taxation 0.41 169.57 1.82 0.60 – (5.49) 1.20 5.24
10 Profit after taxation 1.87 772.96 3.15 0.94 1.15 (17.69) 3.52 5.94
11 Interim dividend - equity – 480.53 – – – – – –
12 Interim dividend - Preference – – – – – – – –
13 Proposed dividend - equity – – – – – – – –
14 Proposed dividend - preference – – – – – – – –
15 % of share holding 100.00 100.00 100.00 100.00 100.00 100.00 51.72 89.00

343
` crore
Sr. no. 17 18 19 20 21 22 23 24
Sr. no.
Particulars L&T Hitech City Limited
L&T South City Projects
Limited
CSJ Infrastructure
Private Limited
L&T Vision Ventures
Limited
L&T Chennai – Tada
Tollway Limited
L&T Samakhiali
Gandhidham Tollway Limited
L&T Infrastructure Development
Projects Limited
L&T Panipat Elevated Corridor Limited
Financial year ending on 31-Mar-15 31-Mar-15 31-Mar-15 31-Mar-15 31-Mar-15 31-Mar-15 31-Mar-15 31-Mar-15
Currency
Exchange rate on the last day of
financial year
– – – – – – – –
1 Share capital (including share application
money pending allotment)
75.00 56.48 45.89 0.05 42.00 80.54 1321.06 84.30
2 Reserves (20.89) 71.88 130.86 (4.64) (0.19) (3.59) 3224.89 (274.93)
3 Liabilities 6.83 127.67 1351.52 10.83 372.30 3402.27 1521.57 676.80
4 Total liabilities 60.94 256.03 1528.27 6.24 414.11 3479.22 6067.52 486.17
5 Total assets 60.94 256.03 1528.27 6.24 414.11 3479.22 6067.52 486.17
6 Investments – – – – 2.74 1.70 4011.01 19.48
7 Turnover 0.88 2.61 210.88 – – 8.87 1583.18 57.98
8 Profit before taxation (1.52) (5.18) 18.35 (0.02) – (3.56) 502.65 (26.78)
9 Provision for taxation 0.61 0.43 1.74 – – – 103.61 –
10 Profit after taxation (2.13) (5.61) 16.61 (0.02) – (3.56) 399.04 (26.78)
11 Interim dividend - equity – – – – – – – –
12 Interim dividend - Preference – – – – – – – –
13 Proposed dividend - equity – – – – – – – –
14 Proposed dividend - preference – – – – – – – –
15 % of share holding 65.86 51.00 100.00 68.00 97.45 97.45 97.45 97.45
Sr. no. 25 26 27 28 29 30 31 32
Sr. no.
Particulars L&T Krishnagiri Thopur Toll
Road Limited
L&T Western Andhra
Tollways Limited
L&T Vadodara Bharuch Tollway Limited
L&T Interstate Road Corridor
Limited
L&T Western India
Tollbridge Limited
L&T Transportation Infrastructure
Limited
L&T Infrastructure Development
Projects Lanka (Private) Limited
L&T Krishnagiri Walajahpet
Tollway Limited
Financial year ending on 31-Mar-15 31-Mar-15 31-Mar-15 31-Mar-15 31-Mar-15 31-Mar-15 31-Mar-15 31-Mar-15
Currency Sri Lankan Rupee
Exchange rate on the last day of financial year
– – – – – – 0.48 –
1 Share capital (including share application money pending allotment)
78.75 56.50 43.50 57.16 13.95 41.40 74.33 90.00
2 Reserves (112.94) (70.99) (336.57) 27.54 16.89 94.90 (2.88) (6.97)
3 Liabilities 626.09 276.14 1094.29 439.62 0.09 120.52 28.46 1032.29
4 Total liabilities 591.90 261.65 801.22 524.32 30.93 256.82 99.91 1115.32
5 Total assets 591.90 261.65 801.22 524.32 30.93 256.82 99.91 1115.32
6 Investments 17.41 22.39 – 88.37 20.54 147.02 – 1.62
7 Turnover 129.14 56.13 277.50 86.42 – 24.85 – 69.73
8 Profit before taxation (10.61) (12.47) 0.09 (4.39) 1.50 14.70 1.17 (10.66)
9 Provision for taxation – – 0.02 – 0.29 3.50 0.06 –
10 Profit after taxation (10.61) (12.47) 0.07 (4.39) 1.21 11.20 1.11 (10.66)
11 Interim dividend - equity – – – – – – – –
12 Interim dividend - Preference – – – – – – – –
13 Proposed dividend - equity – – – – – – – –
14 Proposed dividend - preference – – – – – – – –
15 % of share holding 97.45 97.45 97.45 97.45 97.45 98.12 93.44 97.45
Statement containing salient features of the financial statements of subsidiaries/associate companies/joint venturesPart A: “Subsidiaries” (contd.)

344
` crore
Sr. no. 33 34 35 36 37 38 39 40
Sr. no.
Particulars L&T Devihalli Hassan
Tollway Limited
L&T Metro Rail
(Hyderabad) Limited
L&T Halol - Shamlaji
Tollway Limited
L&T Ahmedabad
- Maliya Tollway Limited
L&T Port Kachchigarh
Limited
L&T Uttaranchal
Hydropower Limited
Nabha Power
Limited
L&T Power Development
Limited
Financial year ending on 31-Mar-15 31-Mar-15 31-Mar-15 31-Mar-15 31-Mar-15 31-Mar-15 31-Mar-15 31-Mar-15
Currency
Exchange rate on the last day of financial year
– – – – – – – –
1 Share capital (including share application money pending allotment)
90.00 1981.40 130.50 149.00 4.16 684.05 2688.00 3108.70
2 Reserves 163.29 (11.54) (268.38) (229.51) (4.56) 0.30 75.08 2.21
3 Liabilities 286.20 5089.92 1388.64 1507.36 0.41 26.91 8283.75 1.42
4 Total liabilities 539.49 7059.78 1250.76 1426.85 0.01 711.26 11046.83 3112.33
5 Total assets 539.49 7059.78 1250.76 1426.85 0.01 711.26 11046.83 3112.33
6 Investments – 10.01 – – – 7.24 0.13 2716.24
7 Turnover 29.80 – 68.79 119.32 – – 3174.24 11.36
8 Profit before taxation (14.80) (13.82) (115.72) (99.12) (0.03) 1.89 240.68 1.43
9 Provision for taxation – 0.29 – – – 0.09 50.25 1.09
10 Profit after taxation (14.80) (14.11) (115.72) (99.12) (0.03) 1.80 190.43 0.34
11 Interim dividend - equity – – – – – – – –
12 Interim dividend - Preference – – – – – – – –
13 Proposed dividend - equity – – – – – – – –
14 Proposed dividend - preference – – – – – – – –
15 % of share holding 97.45 97.48 97.45 97.45 97.45 100.00 100.00 100.00
Sr. no. 41 42 43 44 45 46 47 48
Sr. no.
Particulars L&T Arunachal
Hydropower Limited
L&T Himachal
Hydropower Limited
Larsen & Toubro
(Oman) LLC
Larsen & Toubro (East
Asia) SDN.BHD
Larsen & Toubro
International FZE
Larsen & Toubro Qatar
LLC
L&T Overseas
Projects Nigeria Limited
Larsen & Toubro
Electromech LLC
Financial year ending on 31-Mar-15 31-Mar-15 31-Dec-14 31-Mar-15 31-Mar-15 31-Dec-14 31-Dec-14 31-Dec-14
Currency Omani Rial Malaysian Ringgit
USD Qatari Rial Nigerian Naira
Omani Rial
Exchange rate on the last day of financial year
– – 163.73 16.88 62.50 17.31 0.35 163.73
1 Share capital (including share application money pending allotment)
39.14 175.00 23.86 0.86 1714.69 0.35 0.35 4.91
2 Reserves 0.20 (0.01) 287.98 (0.21) (540.55) 0.28 (0.29) (75.23)
3 Liabilities 0.78 16.84 1836.88 1.48 0.48 0.25 0.02 357.69
4 Total liabilities 40.12 191.83 2148.72 2.13 1174.62 0.88 0.08 287.37
5 Total assets 40.12 191.83 2148.72 2.13 1174.62 0.88 0.08 287.37
6 Investments 0.04 0.24 – – 676.49 – – –
7 Turnover – – 1898.49 2.13 0.33 – – 603.99
8 Profit before taxation 0.01 0.02 (153.72) (0.80) (25.78) (0.02) 0.01 (178.84)
9 Provision for taxation 0.00 0.00 3.63 – 0.62 – – –
10 Profit after taxation 0.01 0.02 (157.35) (0.80) (26.40) (0.02) 0.01 (178.84)
11 Interim dividend - equity – – – – – – – –
12 Interim dividend - Preference – – – – – – – –
13 Proposed dividend - equity – – – – – – – –
14 Proposed dividend - preference – – – – – – – –
15 % of share holding 100.00 100.00 65.00 30.00 100.00 49.00 100.00 65.00
Statement containing salient features of the financial statements of subsidiaries/associate companies/joint venturesPart A: “Subsidiaries” (contd.)
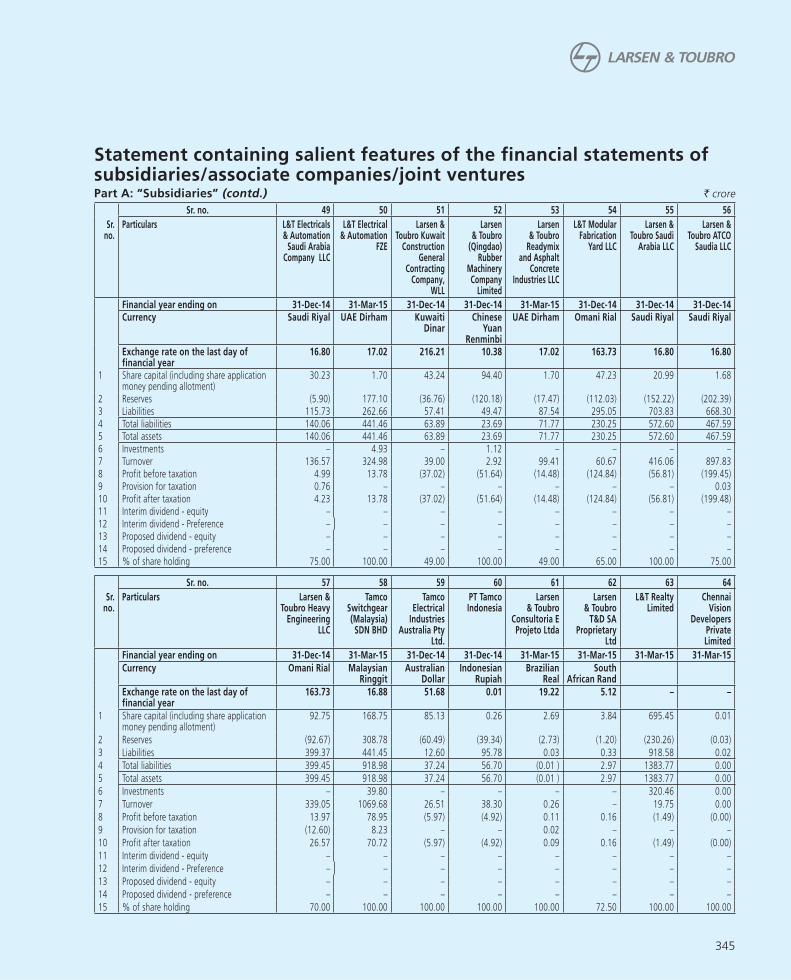
345
` crore
Sr. no. 49 50 51 52 53 54 55 56
Sr. no.
Particulars L&T Electricals & Automation
Saudi Arabia Company LLC
L&T Electrical & Automation
FZE
Larsen & Toubro Kuwait
Construction General
Contracting Company,
WLL
Larsen & Toubro
(Qingdao) Rubber
Machinery Company
Limited
Larsen & Toubro
Readymix and Asphalt
Concrete Industries LLC
L&T Modular Fabrication
Yard LLC
Larsen & Toubro Saudi
Arabia LLC
Larsen & Toubro ATCO
Saudia LLC
Financial year ending on 31-Dec-14 31-Mar-15 31-Dec-14 31-Dec-14 31-Mar-15 31-Dec-14 31-Dec-14 31-Dec-14Currency Saudi Riyal UAE Dirham Kuwaiti
Dinar Chinese
Yuan Renminbi
UAE Dirham Omani Rial Saudi Riyal Saudi Riyal
Exchange rate on the last day of financial year
16.80 17.02 216.21 10.38 17.02 163.73 16.80 16.80
1 Share capital (including share application money pending allotment)
30.23 1.70 43.24 94.40 1.70 47.23 20.99 1.68
2 Reserves (5.90) 177.10 (36.76) (120.18) (17.47) (112.03) (152.22) (202.39)3 Liabilities 115.73 262.66 57.41 49.47 87.54 295.05 703.83 668.30 4 Total liabilities 140.06 441.46 63.89 23.69 71.77 230.25 572.60 467.59 5 Total assets 140.06 441.46 63.89 23.69 71.77 230.25 572.60 467.59 6 Investments – 4.93 – 1.12 – – – – 7 Turnover 136.57 324.98 39.00 2.92 99.41 60.67 416.06 897.83 8 Profit before taxation 4.99 13.78 (37.02) (51.64) (14.48) (124.84) (56.81) (199.45)9 Provision for taxation 0.76 – – – – – – 0.0310 Profit after taxation 4.23 13.78 (37.02) (51.64) (14.48) (124.84) (56.81) (199.48)11 Interim dividend - equity – – – – – – – – 12 Interim dividend - Preference – – – – – – – – 13 Proposed dividend - equity – – – – – – – – 14 Proposed dividend - preference – – – – – – – – 15 % of share holding 75.00 100.00 49.00 100.00 49.00 65.00 100.00 75.00
Sr. no. 57 58 59 60 61 62 63 64
Sr. no.
Particulars Larsen & Toubro Heavy
Engineering LLC
Tamco Switchgear (Malaysia) SDN BHD
Tamco Electrical
Industries Australia Pty
Ltd.
PT Tamco Indonesia
Larsen & Toubro
Consultoria E Projeto Ltda
Larsen & Toubro
T&D SA Proprietary
Ltd
L&T Realty Limited
Chennai Vision
Developers Private Limited
Financial year ending on 31-Dec-14 31-Mar-15 31-Dec-14 31-Dec-14 31-Mar-15 31-Mar-15 31-Mar-15 31-Mar-15
Currency Omani Rial Malaysian Ringgit
Australian Dollar
Indonesian Rupiah
Brazilian Real
South African Rand
Exchange rate on the last day of financial year
163.73 16.88 51.68 0.01 19.22 5.12 – –
1 Share capital (including share application money pending allotment)
92.75 168.75 85.13 0.26 2.69 3.84 695.45 0.01
2 Reserves (92.67) 308.78 (60.49) (39.34) (2.73) (1.20) (230.26) (0.03)
3 Liabilities 399.37 441.45 12.60 95.78 0.03 0.33 918.58 0.02
4 Total liabilities 399.45 918.98 37.24 56.70 (0.01 ) 2.97 1383.77 0.00
5 Total assets 399.45 918.98 37.24 56.70 (0.01 ) 2.97 1383.77 0.00
6 Investments – 39.80 – – – – 320.46 0.00
7 Turnover 339.05 1069.68 26.51 38.30 0.26 – 19.75 0.00
8 Profit before taxation 13.97 78.95 (5.97) (4.92) 0.11 0.16 (1.49) (0.00)
9 Provision for taxation (12.60) 8.23 – – 0.02 – – –
10 Profit after taxation 26.57 70.72 (5.97) (4.92) 0.09 0.16 (1.49) (0.00)
11 Interim dividend - equity – – – – – – – –
12 Interim dividend - Preference – – – – – – – –
13 Proposed dividend - equity – – – – – – – –
14 Proposed dividend - preference – – – – – – – –
15 % of share holding 70.00 100.00 100.00 100.00 100.00 72.50 100.00 100.00
Statement containing salient features of the financial statements of subsidiaries/associate companies/joint venturesPart A: “Subsidiaries” (contd.)

346
` crore
Sr. no. 65 66 67 68 69 70 71 72
Sr. no.
Particulars L&T Realty FZE
L&T Power Limited
L&T-Valdel Engineering
Limited
Hi-Tech Rock Products &
Aggregates Limited
L&T Cutting Tools Limited
Bhilai Power Supply
Company Limited
L&T-Sargent & Lundy Limited
Spectrum Infotech
Private Limited
Financial year ending on 31-Dec-14 31-Mar-15 31-Mar-15 31-Mar-15 31-Mar-15 31-Mar-15 31-Mar-15 31-Mar-15
Currency UAE Dirham
Exchange rate on the last day of financial year
17.16 – – – – – – –
1 Share capital (including share application money pending allotment)
15.45 0.05 1.18 0.05 6.80 0.05 5.57 0.44
2 Reserves (6.24) 4.38 58.86 2.21 30.76 – 57.74 16.09
3 Liabilities 0.03 0.04 27.05 20.76 34.67 8.81 40.06 10.82
4 Total liabilities 9.24 4.47 87.09 23.02 72.23 8.86 103.37 27.35
5 Total assets 9.24 4.47 87.09 23.02 72.23 8.86 103.37 27.35
6 Investments – 4.45 0.33 – 0.42 – 59.05 –
7 Turnover – – 121.04 85.93 164.41 – 111.07 13.50
8 Profit before taxation 0.08 0.20 18.37 0.47 25.27 – 17.43 1.49
9 Provision for taxation – – 8.10 0.24 2.96 – 5.82 0.48
10 Profit after taxation 0.08 0.20 10.27 0.23 22.31 – 11.61 1.01
11 Interim dividend - equity – – – – 12.24 – – –
12 Interim dividend - Preference – – – – – – – –
13 Proposed dividend - equity – – – – – – 8.35 –
14 Proposed dividend - preference – – – – – – – –
15 % of share holding 100.00 99.99 100.00 100.00 100.00 99.90 50.001 100.00
Sr. no. 73 74 75 76 77 78 79 80
Sr. no.
Particulars Larsen & Toubro LLC
L&T Shipbuilding
Limited
L&T-Gulf Private Limited
L&T Electricals
and Automation
Limited
L&T Seawoods
Limited
L&T Rajkot - Vadinar
Tollway Limited
Kesun Iron & Steel
Company Private Limited
L&T Special Steels and
Heavy Forgings
Private Limited
Financial year ending on 31-Dec-14 31-Mar-15 31-Mar-15 31-Mar-15 31-Mar-15 31-Mar-15 31-Mar-15 31-Mar-15
Currency USD
Exchange rate on the last day of financial year
63.04 – – – – – – –
1 Share capital (including share application money pending allotment)
0.33 1405.86 8.00 0.05 2206.75 110.00 0.01 566.60
2 Reserves 1.78 (1526.03) 12.69 (0.02) 828.54 (213.14) (0.26) (790.01)
3 Liabilities 1.48 4902.37 7.53 0.02 230.89 1114.87 0.25 1898.12
4 Total liabilities 3.59 4782.20 28.22 0.05 3266.18 1011.73 0.00 1674.71
5 Total assets 3.59 4782.20 28.22 0.05 3266.18 1011.73 0.00 1674.71
6 Investments – 8.39 0.39 – 4.72 – – –
7 Turnover 7.66 589.38 20.03 – 107.95 85.75 – 101.97
8 Profit before taxation 0.24 (673.47) 3.72 (0.00) (1.41) (71.19) (0.00) (279.84)
9 Provision for taxation 0.05 – 1.35 0.00 – – – –
10 Profit after taxation 0.19 (673.47) 2.37 (0.00) (1.41) (71.19) (0.00) (279.84)
11 Interim dividend - equity – – – – – – – –
12 Interim dividend - Preference – – – – – – – –
13 Proposed dividend - equity – – – – – – – –
14 Proposed dividend - preference – – – – – – – –
15 % of share holding 100.00 97.00 50.002 100.00 100.00 97.45 95.00 74.00
Statement containing salient features of the financial statements of subsidiaries/associate companies/joint venturesPart A: “Subsidiaries” (contd.)
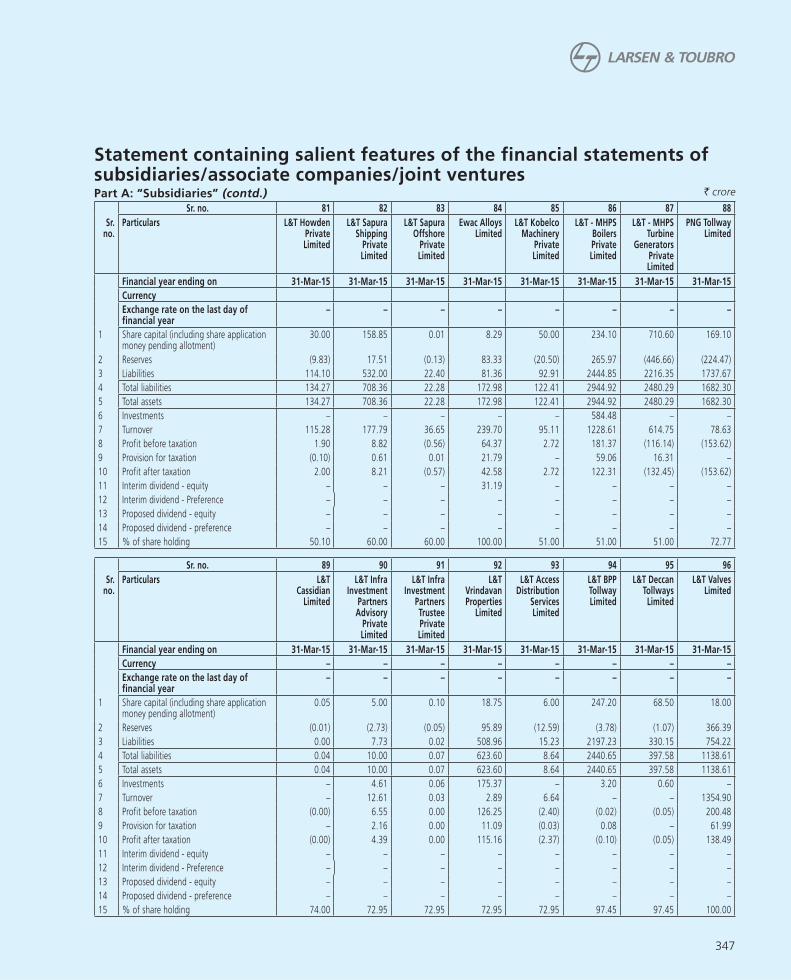
347
` crore
Sr. no. 81 82 83 84 85 86 87 88
Sr. no.
Particulars L&T Howden Private Limited
L&T Sapura Shipping
Private Limited
L&T Sapura Offshore
Private Limited
Ewac Alloys Limited
L&T Kobelco Machinery
Private Limited
L&T - MHPS Boilers Private Limited
L&T - MHPS Turbine
Generators Private Limited
PNG Tollway Limited
Financial year ending on 31-Mar-15 31-Mar-15 31-Mar-15 31-Mar-15 31-Mar-15 31-Mar-15 31-Mar-15 31-Mar-15
Currency
Exchange rate on the last day of financial year
– – – – – – – –
1 Share capital (including share application money pending allotment)
30.00 158.85 0.01 8.29 50.00 234.10 710.60 169.10
2 Reserves (9.83) 17.51 (0.13) 83.33 (20.50) 265.97 (446.66) (224.47)
3 Liabilities 114.10 532.00 22.40 81.36 92.91 2444.85 2216.35 1737.67
4 Total liabilities 134.27 708.36 22.28 172.98 122.41 2944.92 2480.29 1682.30
5 Total assets 134.27 708.36 22.28 172.98 122.41 2944.92 2480.29 1682.30
6 Investments – – – – – 584.48 – –
7 Turnover 115.28 177.79 36.65 239.70 95.11 1228.61 614.75 78.63
8 Profit before taxation 1.90 8.82 (0.56) 64.37 2.72 181.37 (116.14) (153.62)
9 Provision for taxation (0.10) 0.61 0.01 21.79 – 59.06 16.31 –
10 Profit after taxation 2.00 8.21 (0.57) 42.58 2.72 122.31 (132.45) (153.62)
11 Interim dividend - equity – – – 31.19 – – – –
12 Interim dividend - Preference – – – – – – – –
13 Proposed dividend - equity – – – – – – – –
14 Proposed dividend - preference – – – – – – – –
15 % of share holding 50.10 60.00 60.00 100.00 51.00 51.00 51.00 72.77
Sr. no. 89 90 91 92 93 94 95 96
Sr. no.
Particulars L&T Cassidian
Limited
L&T Infra Investment
Partners Advisory
Private Limited
L&T Infra Investment
Partners Trustee Private Limited
L&T Vrindavan Properties
Limited
L&T Access Distribution
Services Limited
L&T BPP Tollway Limited
L&T Deccan Tollways
Limited
L&T Valves Limited
Financial year ending on 31-Mar-15 31-Mar-15 31-Mar-15 31-Mar-15 31-Mar-15 31-Mar-15 31-Mar-15 31-Mar-15
Currency – – – – – – – –
Exchange rate on the last day of financial year
– – – – – – – –
1 Share capital (including share application money pending allotment)
0.05 5.00 0.10 18.75 6.00 247.20 68.50 18.00
2 Reserves (0.01) (2.73) (0.05) 95.89 (12.59) (3.78) (1.07) 366.39
3 Liabilities 0.00 7.73 0.02 508.96 15.23 2197.23 330.15 754.22
4 Total liabilities 0.04 10.00 0.07 623.60 8.64 2440.65 397.58 1138.61
5 Total assets 0.04 10.00 0.07 623.60 8.64 2440.65 397.58 1138.61
6 Investments – 4.61 0.06 175.37 – 3.20 0.60 –
7 Turnover – 12.61 0.03 2.89 6.64 – – 1354.90
8 Profit before taxation (0.00) 6.55 0.00 126.25 (2.40) (0.02) (0.05) 200.48
9 Provision for taxation – 2.16 0.00 11.09 (0.03) 0.08 – 61.99
10 Profit after taxation (0.00) 4.39 0.00 115.16 (2.37) (0.10) (0.05) 138.49
11 Interim dividend - equity – – – – – – – –
12 Interim dividend - Preference – – – – – – – –
13 Proposed dividend - equity – – – – – – – –
14 Proposed dividend - preference – – – – – – – –
15 % of share holding 74.00 72.95 72.95 72.95 72.95 97.45 97.45 100.00
Statement containing salient features of the financial statements of subsidiaries/associate companies/joint venturesPart A: “Subsidiaries” (contd.)

348
` crore
Sr. no. 97 98 99 100 101 102 103 104
Sr. no.
Particulars L&T Housing Finance Limited
Consumer Financial Services Limited
Family Credit Limited
L&T Capital Markets Limited
L&T Infra Debt Fund
Limited
L&T Technology
Services Limited
Larsen & Toubro Infotech
South Africa (PTY) Limited
Thalest Limited
Financial year ending on 31-Mar-15 31-Mar-15 31-Mar-15 31-Mar-15 31-Mar-15 31-Mar-15 31-Mar-15 31-Mar-15
Currency – – – – – – South African Rand
British Pound
Exchange rate on the last day of financial year
– – – – – – 5.12 92.47
1 Share capital (including share application money pending allotment)
81.42 1.00 204.31 22.75 404.30 1050.00 0.27 1.24
2 Reserves 255.72 (0.61) 341.22 (17.05) 46.37 6.74 1.28 6.92
3 Liabilities 3821.40 0.01 3249.71 6.56 477.18 650.48 21.85 –
4 Total liabilities 4158.54 0.40 3795.24 12.26 927.85 1707.22 23.40 8.16
5 Total assets 4158.54 0.40 3795.24 12.26 927.85 1707.22 23.40 8.16
6 Investments 260.91 – 176.15 4.66 203.59 6.10 – 0.46
7 Turnover 353.86 – 635.36 33.06 14.34 2560.59 76.05 –
8 Profit before taxation 53.45 0.00 101.89 (4.12) 30.04 379.10 1.12 (0.29)
9 Provision for taxation 18.34 0.00 29.03 – – 63.92 0.36 –
10 Profit after taxation 35.11 0.00 72.86 (4.12) 30.04 315.18 0.76 (0.29)
11 Interim dividend - equity – – – – – 156.82 – –
12 Interim dividend - Preference – – – – – 58.18 – –
13 Proposed dividend - equity – – – – – – – –
14 Proposed dividend - preference – – – – – – – –
15 % of share holding 72.95 72.95 72.95 72.95 72.95 100.00 74.90 100.00
Sr. no. 105 106 107 108 109 110 111 112
Sr. no.
Particulars Servowatch Systems Limited
Larsen Toubro Arabia
LLC
Henikwon Corporation
SDN BHD
L&T Infrastructure
Engineering Limited
L&T Thales Technology Services
Private Limited
Information Systems
Resource Centre Private Limited
L&T Technology
Services LLC
Mudit Cement Private Limited
Financial year ending on 31-Mar-15 31-Dec-14 31-Mar-15 31-Mar-15 31-Mar-15 31-Mar-15 31-Mar-15 31-Mar-15
Currency British Pound
Saudi Riyal Malaysian Ringgit
USD
Exchange rate on the last day of financial year
92.47 16.80 16.88 – – – 62.50 –
1 Share capital (including share application money pending allotment)
23.58 16.80 10.88 3.60 2.05 3.50 0.06 2.10
2 Reserves (30.78) (22.72) (23.77) 30.57 (3.39) 18.48 (4.89) (4.59)
3 Liabilities 56.04 315.81 25.60 14.91 13.89 5.65 80.43 34.95
4 Total liabilities 48.84 309.89 12.71 49.08 12.55 27.63 75.60 32.46
5 Total assets 48.84 309.89 12.71 49.08 12.55 27.63 75.60 32.46
6 Investments – – – 0.60 – 7.03 – –
7 Turnover 60.19 425.01 76.25 35.56 24.59 53.91 44.94 –
8 Profit before taxation (14.39) (19.05) (0.49) (1.53) 0.46 19.96 (7.62) (3.52)
9 Provision for taxation – – – (0.68) – 6.99 (2.83) –
10 Profit after taxation (14.39) (19.05) (0.49) (0.85) 0.46 12.97 (4.79) (3.52)
11 Interim dividend - equity – – – – – – – –
12 Interim dividend - Preference – – – – – – – –
13 Proposed dividend - equity – – – – – – – –
14 Proposed dividend - preference – – – – – – – –
15 % of share holding 100.00 75.00 100.00 100.00 74.00 100.00 100.00 72.95
Statement containing salient features of the financial statements of subsidiaries/associate companies/joint venturesPart A: “Subsidiaries” (contd.)

349
` crore
Sr. no. 113 114 115 116 117 118 119 120
Sr. no.
Particulars Kudgi Transmission
Limited
L&T Sambalpur
-Rourkela Tollway limited
L&T Construction
Equipment Limited
L&T Hydrocarbon Engineering
Limited
L&T Information Technology
Services (Shanghai)
Co., Ltd.
L&T IDPL Trustee
Manager Pte. Ltd.
Larsen & Toubro
Hydrocarbon International
Limited LLC
Kana Controls General
Trading & Contracting
Company W.L.L
Financial year ending on 31-Mar-15 31-Mar-15 31-Mar-15 31-Mar-15 31-Dec-14 31-Mar-15 31-Dec-14 31-Mar-15
Currency Chinese Yuan
Renminbi
Singapore Dollar
Saudi Riyal Kuwaiti Dinars
Exchange rate on the last day of financial year
– – – – 10.38 45.48 16.80 208.06
1 Share capital (including share application money pending allotment)
154.00 96.35 120.00 1500.05 0.73 5.98 0.84 2.08
2 Reserves (1.55) (1.36) 115.08 (612.24) (0.83) (4.39) (1.39) (1.23)
3 Liabilities 503.47 226.08 188.49 4522.26 1.02 0.60 35.67 10.18
4 Total liabilities 655.92 321.07 423.57 5410.07 0.92 2.19 35.12 11.03
5 Total assets 655.92 321.07 423.57 5410.07 0.92 2.19 35.12 11.03
6 Investments 1.14 6.68 – – – – – –
7 Turnover – – 389.09 5723.35 1.91 – – 30.09
8 Profit before taxation (0.95) (1.29) 33.16 (1002.36) (0.40) (4.53) (0.30) (0.53)
9 Provision for taxation 0.03 – 11.22 (348.23) – – – –
10 Profit after taxation (0.98) (1.29) 21.94 (654.13) (0.40) (4.53) (0.30) (0.53)
11 Interim dividend - equity – – – – – – – –
12 Interim dividend - Preference – – – – – – – –
13 Proposed dividend - equity – – – – – – – –
14 Proposed dividend - preference – – – – – – – –
15 % of share holding 97.45 97.45 100.00 100.00 100.00 97.45 100.00 49.00
Sr. no. 121 122 123 124 125 126
Sr. no.
Particulars L&T Capital Company
Limited
L&T Trustee Company
Private Limited
L&T Solar Limited
L&T Natural Resources
Limited
L&T PowerGen
Limited
Raykal Aluminium
Company Private Limited
Financial year ending on 31-Mar-15 31-Mar-15 31-Mar-15 31-Mar-15 31-Mar-15 31-Mar-15
Currency
Exchange rate on the last day of financial year – – – – – –
1 Share capital (including share application money pending allotment) 22.00 0.01 0.05 0.05 0.05 0.05
2 Reserves 8.54 (0.01) (0.01) (6.34) (0.01) 0.39
3 Liabilities 0.08 0.00 0.01 6.39 0.01 0.49
4 Total liabilities 30.62 0.00 0.05 0.10 0.05 0.93
5 Total assets 30.62 0.00 0.05 0.10 0.05 0.93
6 Investments 5.56 – – – – –
7 Turnover 2.46 – – – – –
8 Profit before taxation 7.18 (0.00) (0.00) (0.01) (0.00) (0.03)
9 Provision for taxation 1.58 – – – – –
10 Profit after taxation 5.60 (0.00) (0.00) (0.01) (0.00) (0.03)
11 Interim dividend - equity 2.88 – – – – –
12 Interim dividend - Preference – – – – – –
13 Proposed dividend - equity – – – – – –
14 Proposed dividend - preference – – – – – –
15 % of share holding 100.00 100.00 100.00 100.00 100.00 75.50
Statement containing salient features of the financial statements of subsidiaries/associate companies/joint venturesPart A: “Subsidiaries” (contd.)

350
Statement containing salient features of the financial statements of subsidiaries/associate companies/joint ventures
Part B: ”Associates/Joint ventures”
Sr. no. 1 2 3 4 5 6 7 8
Sr. no.
Name Of Associates / Joint ventures Feedback Infra Private
Limited
L&T- Chiyoda Limited
International Seaports (Haldia) Private Limited
L&T Infrastructure Engineering Limited
(Formerly known as L&T- Ramboll
Consulting Engineers Limited)
L&T Camp Facilities
LLC
Rishi Consfab Private Limited
Vizag IT Park Limited
JSK Electicals Private Limited
1 Latest audited Balance Sheet date 31-03-2015 31-03-2015 31-03-2014 08-09-2014 31-12-2014 31-03-2015 31-03-2015 31-03-20142 Shares of Associate/Joint Ventures held by
the company at the year endNumber 3,790,000 4,500,000 9,830,000 1,800,000 2,450 2,704,000 2,340,000 2,120,040 Amount of Investment in Associates/Joint Venture (` crore)
37.90 4.50 9.83 1.80 4.17 2.70 2.34 2.12
Total No of shares 16,361,704 9,000,000 44,058,020 3,600,000 5,000 10,400,000 9,000,000 8,154,000 Extent of Holding % 16.89% 50.00% 21.74% 50.00% 49.00% 26.00% 23.14% 26.00%
3 Description of how there is significant influence
Refer Note 1
4 Reason why the associate/joint venture is not consolidated
5 Networth attributable to Shareholding as per latest audited Balance Sheet (` crore)
12.24 51.80 17.91 15.56 (0.84) 1.39 4.55 2.57
6 Profit / Loss for the year (` crore)Considered in Consolidation 17.12 4.68 5.83 (3.87) 3.52 (2.64) 4.55 0.91 Not Considered in Consolidation
Sr. no. 9 10 11 12 13
Sr. no.
Name Of Associates / Joint ventures Larsen & Toubro Qatar & HBK
Contracting LLC
Salzer Electronics Limited
Magtorq Private Limited
Gujarat Leather Industries Limited
Indiran Engineering Projects & Systems Kish
PJSC
1 Latest audited Balance Sheet Date 31-Dec-14 31-Dec-14 31-Mar-15 31-Mar-152 Shares of Associate/Joint Ventures held by the company on the
year endNumber 100 2,679,808 9,000 735,000 875 Amount of Investment in Associates/Joint Venture (` crore) 0.17 16.33 4.42 0.56 0.39 Total No of shares 200 10,283,737 21,003 Refer Note 4 1,750 Extent of Holding % 50.00% 26.06% 42.85% 50.00% 50.00%
3 Description of how there is significant influence Refer Note 14 Reason why the associate/joint venture is not consolidated Refer Note 5 Refer Note 4 Refer Note 25 Networth attributable to Shareholding as per latest audited
Balance Sheet (` crore) (4.04) 27.12 4.49 – (0.14)
6 Profit / Loss for the year (` crore)Considered in Consolidation 0.03 10.57 (1.26) 0 (0.06)Not Considered in Consolidation
Notes:1. Significant influence is demonstrated by holding 20% or more of the voting power of the investee ( Para 4 of AS 23 - Accounting for Investments in Associates)2. The Incorporated joint venture is not required to be audited as per regulatory laws in Iran. Hence the management certified accounts have been considered for consolidation.3. The Group has sold its stake in The Dharma Port Company Limited , an incorporated joint venture and NAC Infrastructure Equipment Limited, an associate company during FY 2014-15.4. The associate company is under liquidation process and investment is fully provided in the accounts.5. The profit consolidated for FY 2014-15 is for twelve months period January 2014-December 2014, associate company being listed entity.
A. M. NAIKGroup Executive Chairman (DIN 00001514)
K. VENKATARAMANANChief Executive Officer & Managing Director (DIN 00001647)
R. SHANKAR RAMANChief Financial Officer & Whole-time Director (DIN 00019798)
M. M. CHITALE (DIN 00101004) SUBODH BHARGAVA (DIN 00035672)
M. DAMODARAN (DIN 02106990) SUNITA SHARMA (DIN 02949529)
SUSHOBHAN SARKER (DIN 00088276)N. HARIHARAN
Mumbai, May 30, 2015 Company Secretary Directors Mumbai, May 30, 2015
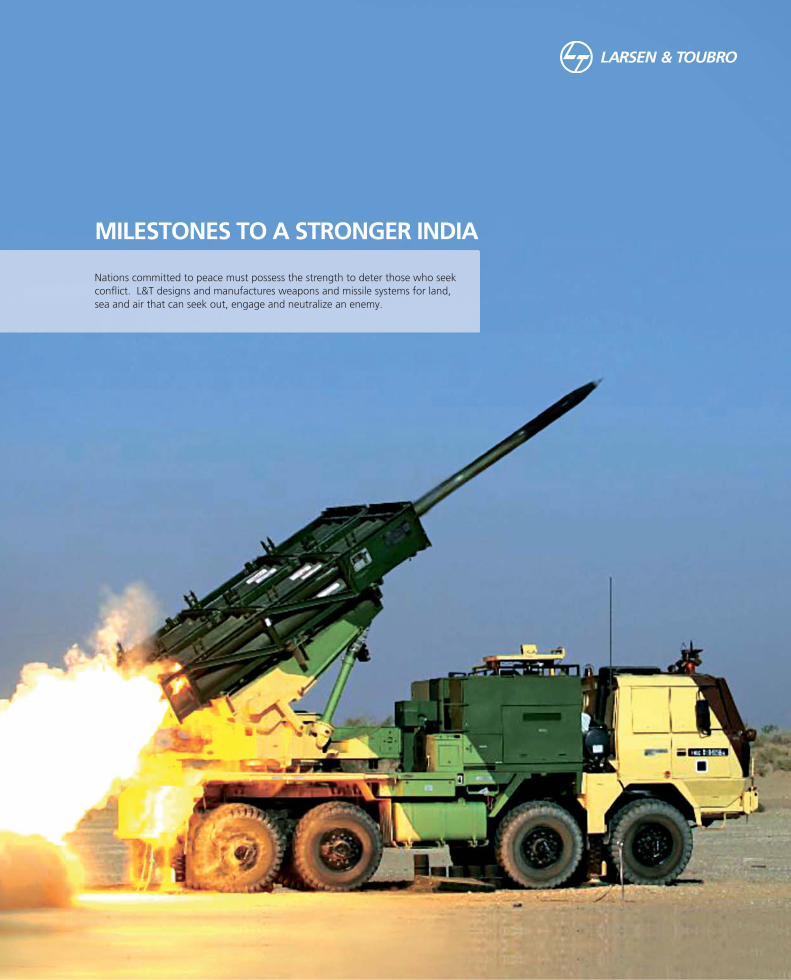
MILESTONES TO A STRONGER INDIA
Nations committed to peace must possess the strength to deter those who seek
confl ict. L&T designs and manufactures weapons and missile systems for land,
sea and air that can seek out, engage and neutralize an enemy.

352
NOTES

353
LARSEN & TOUBRO LIMITEDRegd. Office : L&T House, Ballard Estate, Mumbai 400 001.
CIN: L99999MH1946PLC004768
Shareholder’s Satisfaction Survey Form – 2015
Dear Shareholders,
It has been our constant endeavor to provide best of the services to our valuable shareholders and maintain
highest level of Corporate Governance in this Company. In order to further improve shareholder service
standards, we seek your inputs through this survey.
We would be grateful, if you could spare your valuable time to fill the questionnaire given below and send it
back to us at the Registered Office address mentioned above. Alternatively, a softcopy of the questionnaire
can be downloaded from the Investors section on our website www.Larsentoubro.com. The duly filled in
questionnaire can be sent by e-mail to [email protected].
Thank You,
N. Hariharan
Company Secretary
Name & Address of the ________________________________________________________________________
Shareholder ________________________________________________________________________
________________________________________________________________________
Folio No. / DP ID / Client ID ________________________________________________________________________
Kindly put a tick in relevant columns below.
ATTRIBUTES Please indicate your satisfaction level
Delighted Satisfi ed Dissatisfi ed
Transfer/Transmission/Demat/Remat of Shares
Issue of Duplicate Share Certifi cates
Issue of shares – on demerger/bonus – 2004,
2006, 2008 & 2013
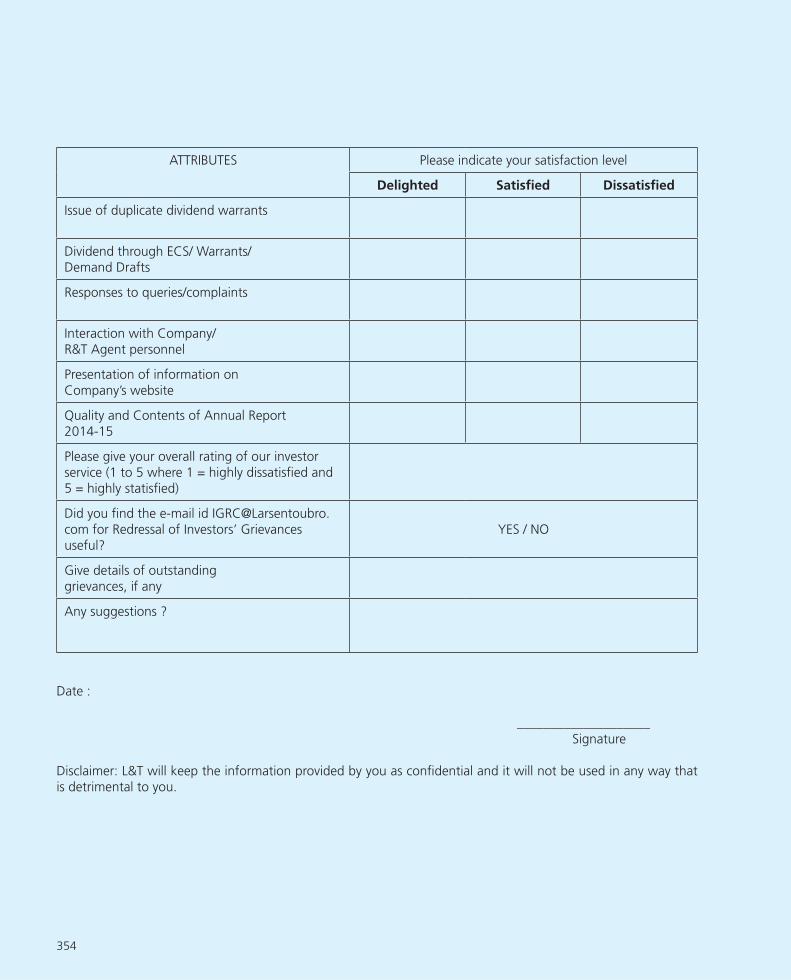
354
ATTRIBUTES Please indicate your satisfaction level
Delighted Satisfi ed Dissatisfi ed
Issue of duplicate dividend warrants
Dividend through ECS/ Warrants/
Demand Drafts
Responses to queries/complaints
Interaction with Company/
R&T Agent personnel
Presentation of information on
Company’s website
Quality and Contents of Annual Report
2014-15
Please give your overall rating of our investor
service (1 to 5 where 1 = highly dissatisfi ed and
5 = highly statisfi ed)
Did you fi nd the e-mail id IGRC@Larsentoubro.
com for Redressal of Investors’ Grievances
useful?
YES / NO
Give details of outstanding
grievances, if any
Any suggestions ?
Date :
____________________
Signature
Disclaimer: L&T will keep the information provided by you as confi dential and it will not be used in any way that
is detrimental to you.

355
Hutatma Chowk(Flora Fountain)

356
NOTES

MILESTONES TO A GREENER INDIA
Our commitment to a clean and green environment is best expressed in our
performance record. A million trees planted. All our 28 major campuses are
zero discharge, with 5 being water positive. 14 certifi ed green buildings and
one certifi ed green factory within our campuses. Around 46 million sq. ft.
of green buildings constructed.

358
NOTES
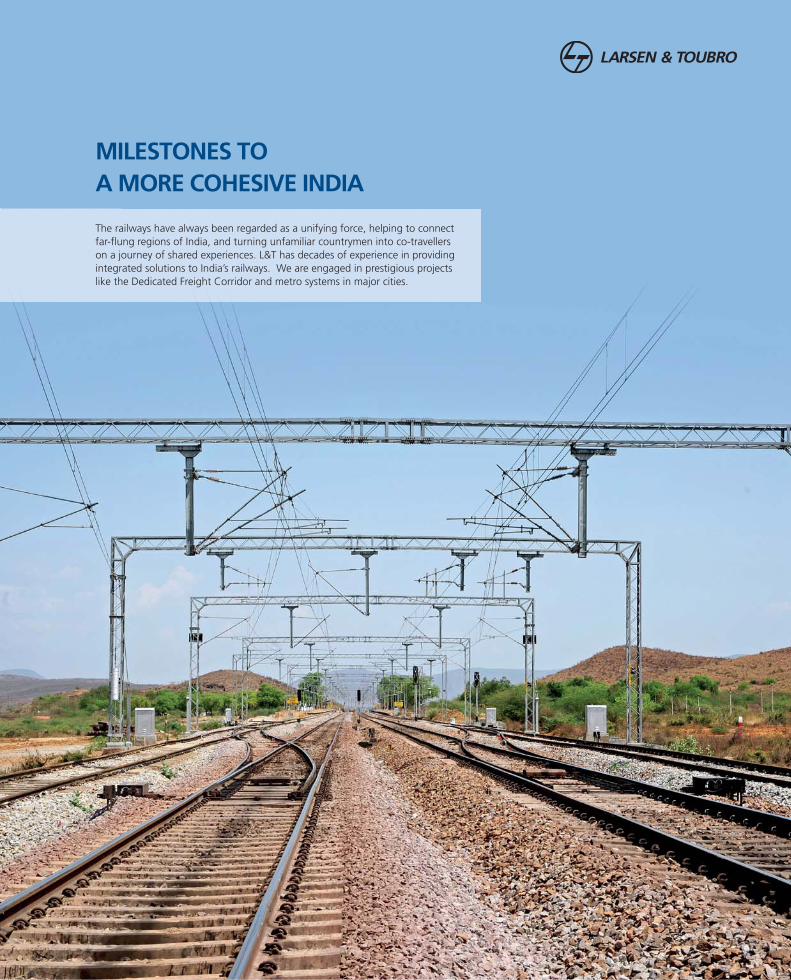
MILESTONES TO
A MORE COHESIVE INDIA
The railways have always been regarded as a unifying force, helping to connect
far-fl ung regions of India, and turning unfamiliar countrymen into co-travellers
on a journey of shared experiences. L&T has decades of experience in providing
integrated solutions to India’s railways. We are engaged in prestigious projects
like the Dedicated Freight Corridor and metro systems in major cities.

360
NOTES

AWARDS &RECOGNITION
Every year, L&T and its people receive a number of national and international
awards that acknowledge its varied accomplishments. Presented by the media,
industry associations, independent bodies and academia, they honour the
Company’s contribution in various spheres of business, technology, fi nancial
performance, growth and environmental protection.
For details of recent awards, please visit www.Larsentoubro.com
L&T AR 2015 Cover.indd 4-6 30/07/15 1:13 pm

CBMC/07/2015/DP
Printed by Burda Druck India Pvt. Ltd.
L&T AR 2015 Cover.indd 1-3 30/07/15 1:11 pm