annual · and small cap stocks did poorly. our performance* for various periods ended march 31, ......
TRANSCRIPT

TWEEDY, BROWNEGLOBAL VALUE FUND
ANNUALMARCH 31, 1999
TWEEDY, BROWNEAMERICAN VALUE FUND
Tweedy, Browne Fund Inc.
Investment Manager’s Report . . . . . . . . . . . . . . . . . . . . . . . . . . . . . . 1
Tweedy, Browne Global Value Fund:Portfolio Highlights . . . . . . . . . . . . . . . . . . . . . . . . . . . . . . . . . . . 20Perspective On Assessing Investment Results . . . . . . . . . . . . . . . 21Portfolio of Investments . . . . . . . . . . . . . . . . . . . . . . . . . . . . . . . . 23Schedule of Forward Exchange Contracts . . . . . . . . . . . . . . . . . . 32Statement of Assets and Liabilities . . . . . . . . . . . . . . . . . . . . . . . 37Statement of Operations . . . . . . . . . . . . . . . . . . . . . . . . . . . . . . . 38Statements of Changes in Net Assets . . . . . . . . . . . . . . . . . . . . . . 39Financial Highlights . . . . . . . . . . . . . . . . . . . . . . . . . . . . . . . . . . . 40Notes to Financial Statements . . . . . . . . . . . . . . . . . . . . . . . . . . . 41Report of Ernst & Young LLP, Independent Auditors . . . . . . . . . . 49Tax Information (unaudited) . . . . . . . . . . . . . . . . . . . . . . . . . . . . 50
Tweedy, Browne American Value Fund:Portfolio Highlights . . . . . . . . . . . . . . . . . . . . . . . . . . . . . . . . . . . 51Perspective On Assessing Investment Results . . . . . . . . . . . . . . . 52Portfolio of Investments . . . . . . . . . . . . . . . . . . . . . . . . . . . . . . . . 54Schedule of Forward Exchange Contracts . . . . . . . . . . . . . . . . . . 62Statement of Assets and Liabilities . . . . . . . . . . . . . . . . . . . . . . . 64Statement of Operations . . . . . . . . . . . . . . . . . . . . . . . . . . . . . . . 65Statements of Changes in Net Assets . . . . . . . . . . . . . . . . . . . . . . 66Financial Highlights . . . . . . . . . . . . . . . . . . . . . . . . . . . . . . . . . . . 67Notes to Financial Statements . . . . . . . . . . . . . . . . . . . . . . . . . . . 68Report of Ernst & Young LLP, Independent Auditors . . . . . . . . . . 75Tax Information (unaudited) . . . . . . . . . . . . . . . . . . . . . . . . . . . . 76
■ ■ ■ ■ ■ ■ ■ ■ ■ ■ ■ ■ ■ ■ ■ ■ ■ ■ ■ ■ ■ ■ ■ ■ ■ ■ ■ ■ ■
This report is for the information of the shareholders of Tweedy,Browne Fund Inc. Its use in connection with any offering of the Company’sshares is authorized only in a case of a concurrent or prior delivery of theCompany’s current prospectus. Investors should refer to the accompanyingprospectus for description of risk factors associated with investments in securities held by both Funds. Additionally, investing in foreign securitiesinvolves economic and political considerations not typically found in U.S.markets, including currency fluctuations, political uncertainty and differ-ences in financial standards. Tweedy, Browne Company LLC is a member ofthe NASD and is the Distributor of the Company.
■ ■ ■ ■ ■ ■ ■ ■ ■ ■ ■ ■ ■ ■ ■ ■ ■ ■ ■ ■ ■ ■ ■ ■ ■ ■ ■ ■ ■

To Our Shareholders:
We are pleased to present the annual report for Tweedy, Browne GlobalValue Fund and Tweedy, Browne American Value Fund for the year endedMarch 31, 1999. However, while we are pleased with the long-term invest-ment returns of both Funds since their inceptions in 1993, there is not muchto be pleased about this year concerning the building of our and our share-holders’ wealth. We think it is realistic to expect that good long-termreturns will be formed by a somewhat random pattern of good and not-so-good annual investment returns. The current Managing Directors andretired principals and their families, as well as employees of Tweedy,Browne, have more than $388.3 million in portfolios combined with or similar to client portfolios, including approximately $40.7 million in theGlobal Value Fund and $31.3 million in the American Value Fund. Withour own money and with clients’ money, we plan to stick with the valueinvestment approach that, on average (but not every year), has worked so
Investment Manager’s ReportTWEEDY, BROWNE FUND INC.
1
Chris Browne, John Spears and Will Browne (seated L to R)Bob Wyckoff and Tom Shrager (back row L to R)

well for us over the past 24 years. The underlying intrinsic value of most ofthe companies that the Funds own increased more than their share prices,laying the ground work, we believe (and hope), for good returns in thefuture. The net asset value of shares of Tweedy, Browne Global Value Fundincreased 3.03%*, after adding back the calendar year-end dividend. Thenet asset value of shares of Tweedy, Browne American Value Fund declined1.09%*, after adding back the calendar year-end dividend. It was a verystrange year in that the stocks that did well were few in number. And thosethat did well, by and large, did very well. Internet stocks and technologystocks, which we do not own, did extremely well, appearing to defy all formsof fundamental financial gravity, while large value stocks and most mid-capand small cap stocks did poorly. Our performance* for various periods ended March 31, 1999, and that of the various indices to which we compare ourselves, is set forth in the following chart:
Morningstar Morningstar
World Foreign
Tweedy, Browne MSCI EAFE(1) Stock Funds Stock Funds
Global Value US $ Hedged Average(2) Average(3)
1 Year 3.03% 6.06% 4.78% 0.15% (0.25)%
3 Years 16.95 8.47 14.90 11.62 8.70
5 Years 13.91 8.75 12.30 11.53 7.69
Since Inception(9) 15.91 9.14 11.98 12.36 9.63
Morningstar Morningstar
S&P Mid-Cap DomesticTweedy, Browne S&P Mid-Cap Russell Value Funds Stock Funds
American Value 500(4) 400(5) 2000(6) Average(7) Average(8)
1 Year (1.09)% 18.49% 0.46% (16.25)% (9.79)% 3.65%
3 Years 19.39 28.05 18.30 7.73 12.71 17.18
5 Years 20.54 26.21 18.21 11.23 14.38 17.92
Since Inception(9) 18.57 23.78 17.10 10.60 13.31 16.60
2
See page 19 for footnotes 1 through 9, which describe the indices and inception dates of the Funds.
* Past performance is not a guarantee of future results, and total return andprincipal value of investments will fluctuate with market changes. Shares,when redeemed, may be worth more or less than their original cost.

The difference between the performance of the Standard & Poor’s 500Stock Index (“S&P 500”), and the Russell 2000 Index (“Russell 2000”) at3,474 basis points (34.74%) is perhaps greater than we can ever recall. TheS&P 500 is an index of large cap stocks and the Russell 2000 is an index ofmid and smaller cap stocks. (The 1,000 largest stocks are excluded from theRussell 2000). In calendar year 1998, 15 stocks, a mere 3% of the issues inthe Index, accounted for 52% of the performance of the S&P 500. Of these15 stocks, nine were either technology or communications companies. If youowned those stocks, you had a great 1998. Most value investors did not ownthose stocks. The trailing twelve-month price/earnings ratio at the end of1998 for those stocks was 47.7 times. The projected price/earnings ratio forthe group for 1999 is 44.8 times. These are not value statistics. In the firstquarter of 1999, the stock market has gotten even narrower. Just five stocksaccounted for more than 52% of the S&P 500’s gain of 5%, and the entiregain was accounted for by only eighteen stocks. The other 482 stocks in theS&P 500 produced no net return.
In a year such as the one just past, the performance of a particular indexmay not be indicative of the performance of stocks in general. In calendaryear 1998, the performance of the average stock in the S&P 500 was lessthan one-half the performance of the Index. The same phenomenonoccurred in stock markets outside the U.S. The Morgan Stanley CapitalInternational (MSCI) Europe, Australasia and Far East Index (EAFE)gained 6.06% for the year ended March 31, 1999. For the same period,EAFE Small Cap was down 8.40%. Technology stocks are less of a factor inEurope and Asia than they are in the U.S. In Europe, telecommunicationstocks were the big movers. Anyone who has tried to order a phone systemin Europe or has paid a phone bill there will understand why there is somuch potential for growth in European telecommunication stocks.
Stock market commentators refer to this as narrowness. When marketperformance is “narrow”, a small number of stocks account for the perform-ance of an index and may not be representative of how stocks in generalhave performed. Most of the time a rising tide lifts all boats. This was notthe case in 1998. Last year was the narrowest year since the 1989-1990 peri-od when a small number of large cap consumer product companies like foodand pharmaceuticals masked what was otherwise a pretty bad year for stocks.Much of the effect stems from the fact that the popular stock market index-es are capitalization weighted. The larger the market capitalization of acompany, the greater is its contribution to the calculation of the perform-ance of an index. In the S&P 500, about 50 stocks, 10% of the issues in theIndex, generally account for approximately one-half of the Index’s weight-ing. The NASDAQ Composite Index (“NASDAQ Index”) is even moreskewed towards a handful of large companies. Out of more than 4,700 issues
3
in the NASDAQ Index, just five account for 50% of the performance calculation. While indexes in general are a reasonable barometer of stockmarket performance, capitalization weighting can distort the picture.Although the size of different stock positions within a portfolio or mutualfund can vary, generally they do not vary as much as they do in an index.For example, the market capitalization of the largest stock in the S&P 500is 1,239 times greater than the smallest. It is rare that a money managerwould build a stock portfolio with such disparities in the size of its positions.
The skewing of the indexes to large companies is further compoundedby a concentration in large technology companies. The S&P 500 was historically an index of industrial America. Today, it is increasingly concentrated in technology stocks, which for the time being are measured bya different valuation model. Potential future earnings are much more impor-tant than current earnings. The NASDAQ Index is even more skewed. Thefive largest stocks are all technology issues. Again, stock portfolios are gen-erally built around diversification, not concentration. A typical portfoliowill have stocks in many industries; it will generally not have one-half of theassets invested in one industry. This is done for the purpose of lowering risk.While a concentrated portfolio could outperform, it could also seriouslyunderperform if the area of concentration goes out of favor.
Last year, funds that were heavily invested in large capitalization growthstocks did best. Smaller stocks and “value” stocks in particular did poorly. In1998, large value stocks underperformed technology stocks, but still had positive returns. Small and mid cap value stocks posted primarily negativereturns. These negative returns were not a result of the companies them-selves doing badly. These stocks were just ignored or sold as money flowed towhere the gains were being made in technology and Internet stocks.
Internet stock valuations are particularly difficult for us to compre-hend. In our opinion, these issues are truly the cork on the champagne bottle. As a group they have little or no earnings and no near term prospectsfor earnings that could justify their sky high stock prices. We feel as thoughwe are sitting on the sidelines watching a wild party going on and wonder-ing if we are missing out on all the fun. However, we remember that, at best,these parties end with a hangover or are brought to an abrupt end when thepolice show up and cart everyone off to jail. These parties have occurred inthe past. We remember the great personal computer party of the early 1980s.The industry leaders in those days were Atari, Commodore and Tandy,names that are barely remembered today. The same happened with biotech-nology companies in 1991. True financial history buffs can recall the tulipmania of the 17th Century, the railroad mania of the late 19th Century, andthe birth of the automobile industry in the first part of this century.
4

Railroads, autos and personal computers all grew to be large, importantindustries. However, the stocks one could buy to participate in these greatgrowth industries for the most part were bad investments. A friend of ourswho also manages money told us of a report he read which showed that ifyou had invested an equal amount of money in every personal computermanufacturer in 1980, your annually compounded rate of return over thenext 18 years would have been a disappointing 4%.
Great growth industries often have the common characteristic of easeof entry with low capital requirements. Despite the fact that the auto indus-try today is a highly capital-intensive business, the opposite was the case inthe early part of this century. The same may be said for the Internet. Add tothis the fact that the pace of technological change today is so rapid, what iscutting edge technology one day can be passé the next. Ease of entry and lowcapital requirements draw competition and while competition is good forconsumers, it is bad for profits. Most Internet companies do not have anyprofits other than the profits reaped by selling stock to the public. Brandrecognition is also important for companies selling products to the consumer.To some extent, Amazon.com has brand recognition. However, when it onlytakes a point and a click to compare prices at Borders or Barnes & Noble, theonly reason to buy from one versus the others is price. The book is the same;price is the only difference and the price will be set by the company that iswilling to accept the lowest profit margin. Companies will therefore competeon price for more customers hoping that a significant market share will ulti-mately lead to profits. Unless one of the competitors has a sustainable costadvantage over the others, this is not the formula for a good business.
Although we are enthusiastic users of technology and informationtechnology in particular, we are not very good guides to what is happeningin Internet technology. When we look at a company like America Online,we cannot understand the investment model which places a value of $120billion on a company with $2.6 billion in revenues and $92 million in profits in its latest fiscal year. It may ultimately grow enough to justify itscurrent valuation, but what about a higher value from this point forward?There is nothing particularly unique about what AOL does. There are otherInternet access providers, some of which have less of the obnoxious adver-tising that keeps popping up on our computer screens. It has no patent protection and while it does have brand recognition, that alone does notguarantee its future survival. A Packard was once one of the best cars youcould buy. AOL’s current price/earnings ratio exceeds 600 times. Were it tosell at a more normal, yet rich, growth stock multiple of 35 times, its earnings must increase 17 fold. Again, it may happen, but history is full ofexamples of companies that never reached such great expectations. A port-folio of stocks with these characteristics has never been a formula for goodinvestment performance.
5

There is a lot of talk lately about a new “paradigm” for stock valuations.One needs a new paradigm to rationally justify the valuations of stocks thatsoar merely by virtue of the fact that someone has added “.com” to the endof their name. A lot of money has been made in most of these issues and alot of people are sorry they have missed out on all the fun. We even hear theoccasional complaint asking why we have not invested in these new tech-nologies. Some people may even be thinking that our time has passed, andthat we are not open to new ideas and avenues of profit in the stock market.It is true we do not go mountain biking on the weekends to train for the rig-ors of stock investing on Monday mornings. Of course we have not heardthat Warren Buffett has enrolled in karate classes either, and he seems to dookay. New ideas come and go, and it has been our experience that when theygo, a lot of money is usually lost. We do not enjoy risk and we do not enjoy losing money. If history tells us that investing in new paradigms at sky highprices eventually leads to big losses, we pass. We are perfectly happy with ourperformance over the past three years, five years and thirty years. And afterthirty years in this business doing the same thing, we are still players in thegame. We see little reason to apologize and no reason to change our stripes.
We recently participated in The Program on Investment Decisions andBehavioral Finance at the Kennedy School of Government at HarvardUniversity, as we have twice a year for the past several years. The speakersare some of the most prominent behavioral economists in the country alongwith a few investment practitioners like ourselves. We feel honored to beincluded. The economists are the theorists who perform all the empiricalstudies on people’s investment behavior. We are the lab rats who put thetheories into practice. We either come away with some new insights eachtime or feel as if we have been to a refresher course in rational behavior asit relates to investing. One insight we picked up this year was that in theinvestment world, ideas are dangerous. This may sound strange at first, butit is actually true. Most investment ideas are based on intuition or hunchesand usually lack any empirical substantiation. Most investment ideas arederived from whatever has worked well in the recent past. What else couldexplain the euphoria surrounding Internet and technology stocks?However, what has worked best most recently may not always work well forlong. As Ben Graham said, “In the short run, the stock market is a votingmachine. In the long run, it is a weighing machine.”
Meanwhile, Internet stocks continue to soar with periodic plunges.Overall, the game is still continuing. These stocks have Internet chat roomswhere all sorts of information and misinformation is exchanged by daytraders. Traders brag about how much money they made trading
6

Whatever.com, and others are suckered into the game. Stocks are boughtmerely because they have gone up and the approach becomes self-fulfilling.Little or no consideration is given to whether there is any investment valueunderlying the price that is being paid. Value does not count for anythingin the new paradigm. What is forgotten is that not everyone can get out ifand when the game ends. There will be just as many shares outstanding andsomeone will own them when the day of reckoning comes.
Perhaps as money managers, we should be smart enough to know whento jump on board these fads and when to leave. Perhaps we should be ableto determine at the beginning of each year which stocks or group of stockswill be the ones that will outperform the market over the next six monthsor year. Would we have said let’s start with the group of stocks that have noearnings and maybe no assets? Has it ever been proven that investing instocks with no earnings and no assets has been a long-term winning invest-ment strategy? Perhaps this explains why so many money managers todayare portrayed as top athletes, building stamina on the weekends for whenthe stock market opens. This may also explain why the opening bell on TheNew York Stock Exchange is covered on television as if it were the openingkick off at the Super Bowl. You need a lot of stamina to attempt to do some-thing that is not humanly possible long term. Many analysts and moneymanagers bought Internet stocks and made a lot of money. However, wethink they may be confusing luck with skill. That is often the case withinvestment fads that work for a period of time.
We view this type of investing as another form of market timing. Manypeople in our business market time, and the vast majority do not beat themarket. The behavioral psychologists and economists call this the over-con-fidence factor. We suppose that if money managers did not think they couldbeat the market, they would not try. Therefore, they believe they can beatthe market. The behavioralists have another term, “calibrated confidence”,which means knowing what you can do and what you cannot do. It requiresbeing comfortable with the knowledge of how limited your abilities reallyare. In a paper written by Brad Barber and Terrance Odean of the GraduateSchool of Management at the University of California, Davis, the authorsfound that over-confident investors trade more and make less. The greaterthe trading volume, the poorer the returns. In another study of 100,000individual stock trades, they found that the stocks investors sold “on aver-age” outperformed the stocks they bought by 3.4% after one year. It seemslogical that a money manager who turns over his portfolio at a high ratemust have confidence that all the individual investment decisions he or sheis making must be right. A lack of confidence in one’s abilities usually resultsin a lack of activity and low activity levels have been proven to produce bet-ter returns. Odean and Barber also found that investors who trade at a high
7

rate buy riskier stocks. Perhaps all those investors who are trading Internetstocks realize they are riskier than most stocks but are confident they can getout before the game is over. We wish them luck.
In the February 1, 1999 issue of Peter L. Bernstein’s newsletter,Economics and Portfolio Strategy, Jason Zweig, mutual fund columnist ofMoney Magazine, wrote an excellent piece entitled The Velocity of Learningand the Future of Active Management. In this article, Mr. Zweig comments onthe current speed of information and its influence on money management.He reports that in 1959, the turnover rate for the average mutual fund was16.4% which equates to a six-year holding period. By 1979, the turnoverrate had increased to 63.3%. Today, it exceeds 83%. And this is the average.Many funds have significantly higher turnover rates, indicating that a daytrading mentality is not solely an individual investor phenomenon. Whilethis may be great news for stockbrokers and the Internal Revenue Service,it is probably not good news for investors. Mr. Zweig points out that as theflow of data “makes the future seem closer and more knowable”, investmentmanagers make ever shorter-term bets. Pressure is exerted on money man-agers to abandon long-term investment principles in favor of short-termstrategies, which have less risk of producing performance that deviates fromwhatever benchmark is used to measure performance. This behavior isunderstandable. Money flows into funds that have had the best recent performance, and in general future performance suffers under the weight ofthese ballooning assets. This is not a problem we and most of our valuebrethren have at this time, but it is something we think about. When“value” returns to favor, we prefer a manageable inflow of money to a flood.
Performance is now measured and graded over shorter and shorter periods of time. An entire industry based on performance measurement hasgrown to the point where it influences the allocation of trillions of dollars.The yardsticks used in this industry are all based on relative performance,not absolute performance. The main yardstick is “tracking error”; e.g., howmuch did the manager’s performance deviate from the chosen benchmark.As Mr. Zweig points out, the performance measurement industry can nowtrack performance on a daily basis. We are sure that some participant in thisindustry will soon offer hourly tracking and provide this information to sub-scribers over the Internet. But is it of any value? Years ago, psychologistsperformed an experiment on kindergarten children where each child wasgiven a marshmallow. They were told the teacher would leave the room forten minutes. When the teacher returned, any child who had not eaten hisor her marshmallow would be given a second one. The majority of childrencould not resist the temptation to eat their marshmallow before the teacherreturned to the classroom. The psychologists then followed the lives of thesechildren into adulthood. They observed that the children who were able to
8

wait until the teacher returned to the classroom before eating their marsh-mallow, in general were more successful in life. These children were able tomake better long-term choices as adults.
Our investment principles have remained constant over a long periodof time and we are very pleased with the result. We think in terms of long-term absolute and relative performance, not short-term relative perform-ance. If that means that money flows away from us and into growth stockfunds in a period of relative underperformance, we have to accept that. Weknow that our method of investing has outperformed the indices over thelast 24 years, with our stocks underperforming one-third of the years andoutperforming two-thirds of the years. (Please see “Is Underperforming anIndex 30% to 40% of the Time a Normal Part of Long-Term InvestmentSuccess?” in our booklet 10 Ways to Beat an Index.) We are one-at-a-time-stock-pickers, not market forecasters. We could not have assembled at thebeginning of last year and successfully predicted that technology stocks andInternet stocks would be stellar performers over the next 12 months.
While some money managers may think they can time the stock markets or segments of the stock markets, we have a much lower opinion ofour prognosticating abilities. In fact, we readily accept the fact we cannotforecast stock markets. Sorry, but if that is what you are looking for, you haveinvested in the wrong Funds. We know one manager whose employer meas-ures his performance against the relevant benchmark weekly. Consequently,this individual is primarily concerned with whether his stocks are up at everypoint in time, and he trades in and out of stocks depending on very short-term price movements. We wonder if there is any time left for basic stockresearch. For our part, we do not even take credit for coming up with theinvestment principles that have produced rather good results over time.That credit goes foremost to Ben Graham, who in the 1930s was the first toarticulate the principles of value investing, and who such great investors asWarren Buffett and Walter Schloss credit with much of their success.
While our investment principles have remained constant over time,our methods have evolved principally through the addition of new, and webelieve valid, measurements of value criteria. In the 1960s and early 1970s,we invested mostly in stocks selling at a discount to book value, or a discount to net current assets (current assets less all liabilities). There wereplenty of those kinds of stocks in those days. At a time when manufacturingdominated the economy, book value or current assets were a significantmeasure of value. They still are. However, there is also value in consumerfranchises and businesses that have some degree of control over their mar-kets or the pricing of their products.
9

The most obvious example was in televison stations in the late 1970s.When Jim Clark joined us in 1976, he came from an investment firm thatowned television stations. Before his arrival, we never invested in compa-nies that owned televison stations because they had no tangible book value.Jim taught us that they had franchise value instead. TV stations are a semi-monopoly such as the CBS affiliate in Miami or Chicago. Moreover, stations change hands rather frequently and at fairly consistent multiples ofcash flow. It is actually easier to determine the value of a TV station than itis a manufacturing company selling at one-half of book value that is notearning a reasonable return on its capital.
One of the companies we bought at that time was Storer Broadcasting,which was selling at about one-half of 10 times cash flow, the industry standard for acquisitions. In addition, Storer had one of the lowest profitmargins in the industry, which meant that a good operator, as opposed to itsunderperforming operators, might be able to improve the bottom line. Thevalues might even be greater. (Legend has it that when Warren Buffettbought into The Washington Post Company, he explained to KatherineGraham that she owned monopolies and could therefore raise prices foradvertisements and improve earnings.) After we bought shares of Storer, weexplained the acquisition pricing of TV stations to a takeover group, andthe hidden value in Storer. We did not hear back from this group, but theyaccumulated a position in Storer and “put it in play”. To our delight, thecompany was ultimately acquired at a significant premium to our cost. Welearned the principle of appraising business values. We went on to makeother successful investments in ABC and then Capital Cities Broadcasting.In the mid-1980s, we discovered the acquisition pricing model for foodcompanies and consumer product companies, which lead to profitableinvestments in stocks such as General Foods, Rothmans Tobacco andDistillers Corporation, among others. We had expanded our universe ofcheap stocks.
We continued to buy stocks with low price/earnings (“P/E”) ratios andlow price-to-book value ratios, but had added stocks with low price-to-enter-prise value ratios. Many of our value brethren only buy a slice of the valuemenu. Some only buy low P/E stocks, which leads to a portfolio of aluminum companies, auto companies and other typically cyclical businesses. Over time this strategy has performed well. In some casesbecause of the amount of assets under management, it has been their onlyalternative. Other value managers have migrated to buying only “betterbusinesses” at reasonable prices. Our menu is more diverse. In 1998, the“better business” managers performed better. Some years, “the not-so- goodbusinesses but cheap-on-book or earnings” guys do better, but not in 1998.We are a combination of several value biases. Why else would we own
10

Johnson & Johnson, Glaxo-Wellcome, American Express and Freddie Mac?But we also own some pretty doggie companies, or at least they were whenwe bought them: ASARCO, ACX Technologies, British Mohair, EZCORP,etc. There is more than one standard for cheap. Why should we limit our-selves to just one category?
The other area where some money managers constrain themselves ismarket cap. We do not. Some managers only buy large cap stocks, whichmay be more a function of their assets under management. The more moneyone manages, the less impact a small or medium cap stock can have on yourresults because you can never own enough to make a difference. We are stillof such a size in terms of assets under management that small and mediumcap stocks can have an impact on performance. In 1998 that impact wasnegative. Usually, in our experience, the impact is positive. Money man-agers who restrict themselves to small and mid-cap stocks probably had a bad experience in 1998. Our large cap stocks, generally, carried the day last year. However, stocks that did not perform well in agiven time measurement period are not necessarily bad investments. Inmarkets when only a few segments get all the attention, perfectly goodstocks may do nothing or even decline. Our experience has been that if thevalue is there, ultimately it is recognized.
Jason Zweig speaks to this issue in the same article we mentionedabove. Along with forcing money managers to focus on the short term, theperformance measurement industry also forces money managers into “styleboxes”. Are we value, growth, large cap or small cap? Whatever you are, justbe sure you only buy stocks that fit your style. The “style police” are moreactive in the institutional money management business where changes in aportfolio can be seen daily. More often than not, institutional money man-agers are selected because they fit into some asset allocation model the clienthas adopted. This could be 1/3 large cap value, 1/3 large cap growth, 1/6small cap value and 1/6 small cap growth. Add mid cap, international, market neutral strategies, arbitrage, etc., and the permutations can be mindboggling. If you find a perfectly good stock that you think is dirt cheap, youcannot buy it if it does not also fall into your style box. We prefer to thinkout of the box while maintaining a consistent set of values. As we have said,cheap is a different number depending on the business. To judge Alcoa andJohnson & Johnson on the same P/E and price/book value criteria just doesnot make any sense. It is more important that someone have sound values,honesty and integrity, than it is the particular religion which taught themthose values. The same can be said for money managers.
We believe that the downside of our approach to investment manage-ment is underperformance, not the risk of permanent capital loss. We do not
11
own “air ball” stocks that can dissolve overnight such as what is available inthe Internet arena. We also do not invest such a great percentage of ourassets in any one issue so that if we are wrong and the company goes belly-up we have significantly impaired our net worth. Many managers who haveunderperformed their benchmark have still delivered rates of return thathave exceeded inflation and increased the wealth of their clients. In thelong run, one of the greatest risks to your net worth is not owning stocks.Bonds do not grow. They can only return their face value at maturity.Although inflation is currently at historically low levels, it still exists.Inflation is a silent, insidious tax which erodes your net worth. Within ourlifetimes, having a million dollars was considered a fortune. Also in our life-times, college cost $2,500 a year, an expensive car cost $8,000 and $100,000bought a luxurious house. Our grandparents can remember going to themovies for a nickel. One of the problems with living a long time is that yourpoint of reference for the cost of something is cheaper. Fortunately, there isan easy way to keep pace with and even beat inflation and that is equities.Historically, over time an index fund always beats inflation.
There is a great deal of talk about index funds these days, especially ina year when, according to Morgan Stanley, 86% of U.S. equity mutual fundsunderperformed the S&P 500. It is an alternative, and the S&P 500 is asgood a barometer of equities as anything out there. However, today youhave to ask what you are buying in an S&P 500 Index fund. On December31, 1998, the 12-month trailing price/earnings ratio of the S&P 500 stoodat 30.3 times. The dividend yield was barely above 1% and the price-to-book value ratio was at an historical high. These are not the fundamentalfinancial characteristics of a portfolio of stocks that we are comfortableowning. If we go back to 1982 or even 1990, these basic ratios were quitecheap. Today, they are not. Fortunately, not every stock carries the sameprice-to-book value ratio. The median P/E is 20.8 which means one-half ofthe stocks in the S&P 500 have lower P/Es. Furthermore, the S&P 500 is asmall percentage of all the stocks from which we have to choose. In termsof market cap, the 10 largest companies in the S&P 500 have an average P/Eof 40.6 times. Microsoft now has the largest market cap in the S&P 500 andits trailing P/E was a lofty 61.6 times. Five years ago, Microsoft was not evenamong the top ten. Recently, Venator Group (the old F.W. Woolworth) wasdropped from the S&P 500 and replaced with America Online which sellsat more than 600 times earnings. The days when the S&P 500 was domi-nated by the large industrial cyclical companies are gone. There has been a migration to companies that at least for the time being have higher growthrates and returns on capital, which in some measure accounts for the high-er P/E ratios. Nevertheless, P/E ratios of this magnitude do not leave muchroom for disappointment. Furthermore, historically, stocks that sell at theselevels eventually return to earth with unpleasant consequences.
12

The overall financial ratios of the S&P 500 have not gone unnoticed ininstitutional investor circles. The response of many has been to seek “alter-native investment strategies”. These alternatives run the gamut from venturecapital, to risk arbitrage and hedge funds, to leverage buyout funds. The over-all returns from these investment vehicles have not provided value added overan S&P 500 Index fund. The average performance of the managers in the topquartile has outperformed each of these types of investments. So has the topquartile of plain vanilla equity money managers. The problem with the bestalternative investment pools is getting into them. So much money has beenchasing after venture capital lately that the firms with top records will nottake your money. They don’t need it. Many will not even take all the moneytheir existing clients are willing to give them when they open a new fund.They ration investments in their funds. This has also enabled several to raisetheir fees from a 1% flat fee plus 20% of the gain to a 2% flat fee plus 30% ofthe gain. Generally, when too much money chases too few deals, the rates ofreturn decline. Much the same could be said for leverage buyout funds.
Hedge funds are a bit different. At least here you can get your moneyback sooner than 8 or 10 years. In general, investors in hedge funds can exitonce a year. In between, they may have little idea of what the hedge fundmanager is doing with their money. This became painfully apparent in thecollapse of Long Term Capital Management last September. No one,including the bankers who had lent these self-styled geniuses more than$100 billion, knew they were leveraged more than 25 to 1. Their strategywas bulletproof and they had the data and two Nobel Prize Laureates toprove it. Yet, somehow, in a matter of a few short weeks the whole thingdissolved in a cloud of smoke. Again, before the collapse, many investorswere begging them to take their money. Long Term Capital Managementhad a black box strategy, a purely quantitative way of investing that wasmuch more dependent on computers than humans. Most hedge fundsdepend on the manager and his or her ability to time markets. They go bothlong and short in their portfolios so that theoretically they will prosper irre-spective of the direction of the conventional equity markets. They have alsomoved beyond doing this with just stocks to all sorts of financial instru-ments, some of which were probably created by brokers just for them. Theycan trade in currencies, interest rate futures, commodities and foreign debt,like Russian bonds. They go in and out of things we cannot even begin tocomprehend.
13
We see several problems with hedge funds. First, the manager is basi-cally making market timing bets in a whole range of financial instruments.Conventional wisdom holds that with plain old stocks you cannot success-fully time the markets. How then can a hedge fund manager time a wholerange of markets? To our way of thinking there is a disconnect in the logic.Second, hedge funds use leverage, and in many cases the investor does notknow how much. They now have a word for this: transparency. Most hedgefunds are blind pools of capital; you cannot see what they own or how muchleverage they are employing. We are even told some will de-lever (i.e.,reduce their borrowings), as their fiscal year end approaches to give theirinvestors some comfort. We do not believe in deceiving our clients no mat-ter how much more we think we know than they do. The hedge fund man-agers claim they need this secrecy so that no one can see where they haveplaced their bets and mess up their strategies. However, you also cannot tellhow leveraged they are, as was the case with Long Term CapitalManagement. So long as a portfolio has some reasonable degree of diversi-fication, be it even just ten stocks, it is unlikely to blow up unless it is lever-aged. In our experience, when we have read about funds that crashed into awall, they were always riding on leverage. Third, and this only affects thoseof us who must pay taxes, the gains are nearly always short term, whichmeans they are taxed at the highest rates, sometimes up to 50%, dependingupon where you live. Every dollar of gain from long-term capital gains,which is taxed at 20% at the Federal level, requires $1.31 of ordinary gaintaxed at the top Federal rate of 39% to yield the same after tax profit of 80¢.For any gains in a given year that are unrealized, the amount you wouldhave had to pay in taxes can continue to compound for your benefit in sub-sequent years. The deferral of gains and continuing investment of capitalthat would otherwise be paid currently to the Internal Revenue Service canhave a very significant impact on your net worth.
Funds that invest in risk arbitrage, mergers and acquisitions, have thesame tax hurdles to overcome and the problem of too much money chasingtoo few deals, which narrows the spread or profit margin. If Company A isgoing to acquire Company B and the transaction is expected to close in threemonths, you could earn an annualized rate of return of 20% if Company B’sstock sells for 5% less than what you will be paid at closing. However, ifanother investor is willing to accept a 15% annualized rate of return, that isall you will get. The guy who is willing to accept the lowest rate of return setsthe price. The more money that flows into this type of investment, the lowerthe rate of return. Many managers who practice risk merger arbitrage werecomplaining last year that Long Term Capital Management was drivingspreads down to very narrow levels. Why would they do this? Leverage. Ifthey could leverage these investments ten-to-one and borrowed money costs
14

5%, they could make 20% on their equity with an annualized rate of returnof only 7%. On an unleveraged basis, such returns are not appealing. This isexactly what Long Term Capital Management was doing, or as one observerstated, “They were picking up dimes in front of a steam roller.” What theywere doing was ruining the game for everyone else. Now that they are gone,the risk arbs (as they are called) claim that spreads are wider and offer accept-able rates of return. This will be true only until the next guy comes alongwho is willing to settle for less profit, or leverage more to make that profit.Sooner or later, those guys always come along.
Investing is not difficult when you take the time to think about a fewbasic principles of success and stick with them. Sticking with them is some-times difficult because even the best ones do not work every year.Maintaining a long-term perspective is key. It is also easier if you invest forthe long term. Money managers who turn their portfolios over two andthree times a year must have a harder time adhering to investment princi-ples because they are attempting to beat the market in every time periodthey are measured, be it quarterly or annually. Trying to determine whichgroup of stocks will perform best in every quarter or even every year is wellbeyond our capabilities. In a study by Morgan Stanley, they found that in1998 the breadth of the stock market’s performance was narrower than inany of the past ten years, with the exception of 1990. This means that ratherthan stocks in general rising, only a very small number of stocks performedwell. We remember 1990 very well. Most value managers were down in themid to high teens, including us, despite the fact that the S&P 500 was onlydown 3.2%. That year, a small number of large consumer product compa-nies, pharmaceuticals, etc. did well, which in a weighted index was enoughto make it appear that the stock market did not have such a bad year.Financial stocks in particular were a disaster in 1990, and most value managers were heavily invested in financial stocks. Morgan Stanley furtherfound that last year, the 100 largest stocks in the S&P 500 produced 85% ofthe return. The other 80% of the stocks in the S&P 500 only produced 15%of the return. We still believe a long-term perspective works best. Look atWarren Buffett. It seems every stock he buys, he plans to hold for the rest ofhis life. He does okay without worrying about short-term performance. Lastyear the stocks that performed best for us were our larger cap holdings. Oursmall and mid-cap stocks, in which we have a significant portion of your andour assets invested, did not do much for our net worth. We also made somemistakes. We are not perfect, but we know it.
Our results with international stocks in the Tweedy, Browne GlobalValue Fund were not dissimilar from our experience with U.S. stocks. Japanwas particularly disappointing. In local currency terms, Japanese stocks weredown 8.9% in 1998. Much of what we have invested in Japan is in small and
15

medium cap stocks. Overall, the values are compelling, and a number of ourstocks were bought at discounts to net cash. We got the business for free.However, that did not prevent these stocks from getting even cheaper in1998. Lately, smaller Japanese stocks have shown some signs of life. Thisoften happens when we least expect it. Fortunately, we do not invest inemerging markets except to a tiny extent. In 1998, the Morgan StanleyCapital International Emerging Markets Free Index was down 27.5%.Generally, we do not invest in emerging markets because the financial dis-closure is often poor, the stocks are growth stocks trading at high multiples,and we cannot hedge the currency back into the dollar at any reasonablerate. The collapse of the Russian stock market last summer was especiallydramatic and acute. In the two or three years prior, the Russian stock mar-ket had increased five-fold. In a much shorter period of time, it dropped80%. During its rise, there was talk of a “new paradigm,” and many investorswere lured in as they observed the profits being made. It was a great party.However, the end came so quickly, almost like an earthquake and with sim-ilar results, that probably few were able to avoid the crash. We never prof-ited from the rise of the Russian market, but we also never had to give it allback as so many investors did.
Many investors invest internationally because they believe world mar-kets are not correlated. This means if U.S. stocks go down, maybe Europeanor Japanese stocks will go up. This is no longer completely true. In the pastseveral years, U.S. and European stocks have shown a high degree of corre-lation. Japan and the emerging markets have not. As world markets, bothstock and trade, continue on the path of globalization, correlation willincrease. It has become impossible to remain isolated. That is good. It cre-ates a discipline that makes politicians pursue economic policies that mustcompete. If something can be made cheaper in another country, it will.Trade barriers which brought on the Great Depression will no longer work.We began investing internationally for a different reason. We did it becausewe more than doubled the number of companies we could screen for invest-ment opportunities. Unlike many international investors, currency devaluations are good for us. When a country devalues its currency, its stockmarket usually goes up because its native companies have a new price advan-tage selling into world markets. By hedging the currency, we avoid the painof the devaluation and enjoy the rise in the stock market. And, to the list ofother things we know we cannot predict, we must add currency fluctuations. We invest internationally simply because it just about doublesthe number of stocks from which we can choose in our search for value. Oneexercise we perform periodically is to look at the rankings of U.S., Europeanand Japanese stocks on a price-to-book value basis and a P/E basis. Usingdata from Bloomberg, we rank all stocks in these three geographic areas withmarket capitalizations greater than $100 million into deciles. The bottom
16

decile of price-to-book in the U.S. begins at 1.07 times; Europe starts at .93times; and Japan begins at .60 times. On a P/E basis, the bottom 10% inthe U.S. starts at 10.2 times; Europe is 8 times; and Japan is at 14.3 times. Onan earnings basis, the data for Japan may be misleading for two reasons.Because Japan is in recession, corporate earnings are lower than they wouldbe in more normal economic times. In addition, many Japanese companieshold large stock and bond portfolios. If these cash items were deducted fromthe share price, the resulting P/E ratio would be much lower.
The portfolio characteristics of the Tweedy, Browne Funds as of March31, 1999 are as follows:
TWEEDY, BROWNE GLOBAL VALUE FUND
Price/Book Value 0.87 Based on 24.92% Cheaper than 94% of the 8,427 stocks in the of portfolio assets Bloomberg database with a market capitalization
above $100 million in those countries where the Global Value Fund has investments
Price/Earnings 11.82x Based on 44.7% Cheaper than 86% of the 8,427 stocks in the of portfolio assets Bloomberg database with a market capitalization
above $100 million in those countries where the Global Value Fund has investments
TWEEDY, BROWNE AMERICAN VALUE FUND
Price/Book Value 0.76 Based on 18.14% Cheaper than 97% of the 3,814 stocks in the of portfolio assets Bloomberg database with a market capitalization
above $100 million that are based in the United States
Price/Earnings 11.51x Based on 49.22% Cheaper than 84% of the 3,814 stocks in the of portfolio assets Bloomberg database with a market capitalization
above $100 million that are based in the United States
In both Funds, the balance of the assets is either cash awaiting invest-ment or is invested in companies that are mostly better businesses thatshould and often do trade at higher P/E ratios, or are stocks that have risenin price and thus P/E ratio, but are still short of our sell price targets. Overallwe are comfortable with the basic fundamental financial characteristics ofboth portfolios. We believe both portfolios have less risk than stocks in gen-eral and Internet and technology stocks in particular. We also believe ourstocks have significant potential for future gains. If only we could controlthe realization of those gains, we would not have to worry about being com-pared to the latest hot stock group. Unfortunately, stocks do not always dowhat they are told to do when they are told to do it. A stock doesn’t knowyou own it—it doesn’t care. However, it has been our experience that overtime they do respond and provide more than acceptable rates of return.
17
Little has changed at Tweedy, Browne this past year. We added oneanalyst to our staff who was formerly an investigative reporter for The WallStreet Journal. We have long believed that investment research is much likeinvestigative reporting. It requires a nose for truth and a healthy dose ofscepticism. Our goal is to stay small. We enjoy managing money, yours andours. We do not like managing people. We give people a job and leave themalone to do it. We also enjoy promoting from within, which is happeningat an increasing rate. Already, people in the firm are complaining aboutother departments “poaching” their best people. Our Managing Directors allstarted at the bottom. We believe others should have the same opportunityto advance if they have the talent.
The Year 2000. In closing, we’d like to update you on our Year 2000progress. As we mentioned in our last letter to shareholders, we engaged anoutside vendor to assist us in our applications conversion, hardware andsoftware evaluation and testing, and survey and certification of all thirdparty vendors and service providers. To date we are on target with our proj-ect plan. Testing of all hardware and software has been completed. Non-compliant hardware and software has been replaced.
We are regularly contacting all vendors and business associates to assesstheir Y2K readiness. Our critical vendors, such as the Funds’ custodian,transfer agent, and fund administration and accounting providers, are all onschedule for Y2K compliance and will be participating in industry wide test-ing through the second quarter of 1999. Although we do not believe thatwe or our mission critical vendors will have any operational difficulties onJanuary 1, 2000 or thereafter, we cannot provide any guarantees that all sys-tems effecting the funds will be free of operational difficulties. Accordingly,we are developing a contingency plan that should minimize any adverseconsequences to our or our critical vendors’ respective business processes inthe event of a temporary disruption.
Our website, which has been under construction for some time longerthan we anticipated, should be available in the latter part of June. Pleasevisit us at www.tweedy.com. In closing, let us say there has been no diminu-tion in our efforts on our common behalf. We are here, we are working andwe hope it pays off.
Sincerely,TWEEDY, BROWNE COMPANY LLC
Christopher H. BrowneWilliam H. BrowneJohn D. SpearsThomas H. ShragerRobert Q. Wyckoff, Jr.Managing Directors
18
19
Footnotes to Table on page 2(1) MSCI EAFE US $ is an unmanaged capitalization-weighted index of
companies representing the stock markets of Europe, Australasia and theFar East. MSCI EAFE Hedged consists of the results of the MSCI EAFEIndex hedged 100% back into U.S. dollars and accounts for interest ratedifferentials in forward currency exchange rates. Results for both indexesare inclusive of dividends and net of foreign withholding taxes.
(2) Morningstar World Stock Funds Average consists of the average returnsof all mutual funds in the Morningstar Universe that invest throughoutthe world while maintaining a percentage of assets (normally 25% -50%) in the U.S.
(3) Morningstar Foreign Stock Funds Average consists of the average returnsof all mutual funds in the Morningstar Universe that invest primarily inequity securities of issuers located outside the U.S.
(4) S&P 500 is an unmanaged capitalization-weighted index composed of500 widely held common stocks listed on the New York Stock Exchange,American Stock Exchange and over-the-counter market and includesthe reinvestment of dividends.
(5) S&P Mid-Cap 400 is an unmanaged capitalization-weighted index, whichassumes reinvestment of dividends and is generally considered representative of the mid-range sector of the U.S. stock market.
(6) Russell 2000 is an unmanaged capitalization-weighted index, which as-sumes reinvestment of dividends for most periods, that is comprised ofthe smallest 2000 companies in the Russell 3000 Index and is generallyconsidered representative of U.S. small capitalization stocks.
(7) Morningstar Mid-Cap Value Funds Average consists of the average returnsof all mutual funds in the Morningstar Universe classified as value fundswith median market capitalizations greater than or equal to $1 billion but less than or equal to $5 billion.
(8) Morningstar Domestic Stock Funds Average consists of the average returnsof all domestic equity mutual funds in the Morningstar Universe.
(9) Inception dates for the Global Value Fund and the American Value Fundwere June 15, 1993 and December 8, 1993, respectively. Index informa-tion is available at month end only; therefore the closest month end toinception date of the Funds, May 31, 1993 and November 30, 1993,respectively, were used except for the Morningstar Domestic Stock FundsAverage where the closest date with data available was December 31, 1993.
20
TitleTWEEDY, BROWNE GLOBAL VALUE FUND
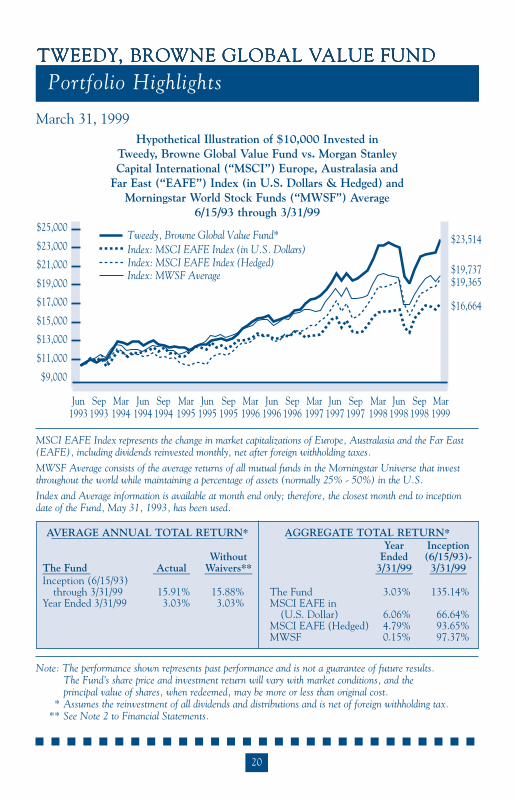
March 31, 1999Hypothetical Illustration of $10,000 Invested in
Tweedy, Browne Global Value Fund vs. Morgan Stanley Capital International (“MSCI”) Europe, Australasia and
Far East (“EAFE”) Index (in U.S. Dollars & Hedged) and Morningstar World Stock Funds (“MWSF”) Average
6/15/93 through 3/31/99
MSCI EAFE Index represents the change in market capitalizations of Europe, Australasia and the Far East(EAFE), including dividends reinvested monthly, net after foreign withholding taxes.
MWSF Average consists of the average returns of all mutual funds in the Morningstar Universe that investthroughout the world while maintaining a percentage of assets (normally 25% - 50%) in the U.S.
Index and Average information is available at month end only; therefore, the closest month end to inceptiondate of the Fund, May 31, 1993, has been used.
Note: The performance shown represents past performance and is not a guarantee of future results.The Fund’s share price and investment return will vary with market conditions, and the principal value of shares, when redeemed, may be more or less than original cost.
* Assumes the reinvestment of all dividends and distributions and is net of foreign withholding tax.** See Note 2 to Financial Statements.
TitleTWEEDY, BROWNE GLOBAL VALUE FUND
Portfolio HighlightsTWEEDY, BROWNE GLOBAL VALUE FUND
$9,000
$11,000
$13,000
$15,000
$17,000
$19,000
$21,000
$23,000
$25,000
Jun1993
Sep1993
Mar1994
Jun1994
Sep1994
Mar1995
Jun1995
Sep1995
Mar1996
Jun1996
Sep1996
Mar1997
Jun1997
Sep1997
Mar1998
Jun1998
Sep1998
Mar1999
$23,514
$19,365$19,737
$16,664
Index: MSCI EAFE Index (Hedged)Index: MSCI EAFE Index (in U.S. Dollars)
Index: MWSF Average
Tweedy, Browne Global Value Fund*
AVERAGE ANNUAL TOTAL RETURN* AGGREGATE TOTAL RETURN*____________________________________ ______________________________Year Inception
Without Ended (6/15/93)-The Fund Actual Waivers** 3/31/99 3/31/99_________ _______ _________ _______ _______Inception (6/15/93)
through 3/31/99 15.91% 15.88% The Fund 3.03% 135.14%Year Ended 3/31/99 3.03% 3.03% MSCI EAFE in
(U.S. Dollar) 6.06% 66.64%MSCI EAFE (Hedged) 4.79% 93.65%MWSF 0.15% 97.37%
TitleTWEEDY, BROWNE GLOBAL VALUE FUND
21
TitleTWEEDY, BROWNE GLOBAL VALUE FUND
March 31, 1999
In accordance with rules and guidelines set out by the Securities andExchange Commission, we have provided a comparison of the historicalinvestment results of Tweedy, Browne Global Value Fund to the historicalinvestment results of the most appropriate broad-based securities indexes,including the Morgan Stanley Capital International (MSCI) Europe,Australasia and the Far East Index (EAFE) in U.S. dollars and hedged intoU.S. dollars. However, the historical results of the MSCI Indices in largemeasure represents the investment results of stocks that we do not own. Anyportfolio which does not own exactly the same stocks in exactly the sameproportions as the index to which the particular portfolio is being comparedis not likely to have the same results as the index. The investment behav-ior of a diversified portfolio of undervalued stocks tends to be correlated tothe investment behavior of a broad index; i.e., when the index is up, prob-ably more than one-half of the stocks in the entire universe of public com-panies in all the countries that are included in the same index will be up,albeit, in greater or lesser percentages than the index. Similarly, when theindex declines, probably most of the stocks in the entire universe of publiccompanies in all countries that are included in the index will be down ingreater or lesser percentages than the index. But it is almost a mathematicaltruth that “different stocks equal different results.”
Favorable or unfavorable historical investment results in comparison toan index are not necessarily predictive of future comparative investmentresults. In Are Short-Term Performance and Value Investing MutuallyExclusive?, Eugene Shahan analyzed the investment performance of sevenmoney managers, about whom Warren Buffett wrote in his article, The SuperInvestors of Graham and Doddsville. Over long periods of time, the sevenmanagers significantly outperformed the market as measured by the DowJones Industrial Average (the “DJIA”) or the Standard & Poor’s 500 StockIndex (the “S&P 500”) by between 7.7% to 16.5% annually. (The goal ofmost institutional money managers is to outperform the market by 2% to3%.) However, for periods ranging from 13 years to 28 years, this group ofmanagers underperformed the market between 7.7% to 42% of the years.Six of the seven investment managers underperformed the market between28% to 42% of the years. In today’s environment, they would have lost manyof their clients during their periods of underperformance. Longer term, it
Perspective On Assessing Investment ResultsTWEEDY, BROWNE GLOBAL VALUE FUND

22
TitleTWEEDY, BROWNE GLOBAL VALUE FUND
would have been the wrong decision to fire any of these money managers.In examining the seven long-term investment records, unfavorable invest-ment results as compared to either index did not predict the future favor-able comparative investment results which occurred, and favorable invest-ment results in comparison to the DJIA or the S&P 500 were not always fol-lowed by future favorable comparative results. Stretches of consecutiveannual underperformance ranged from one to six years. Mr. Shahan con-cluded “Unfortunately, there is no way to distinguish between a poor three-year stretch for a manager who will do well over 15 years, from a poor three-year stretch for a manager who will continue to do poorly. Nor is there anyreason to believe that a manager who does well from the outset cannot con-tinue to do well, and consistently.”
Perspective On Assessing Investment Results

MarketValue
Shares (Note 1)COMMON STOCKS—95.5%Australia—0.0% ††
96,353 Carillon Development Ltd. . . . . . . . . . . . . . . . . . . . . . . . . . . . . . . $ 106,012
Belgium—0.1%2,726 Spadel SA . . . . . . . . . . . . . . . . . . . . . . . . . . . . . . . . . . . . . . . . . . . 3,217,898 3,252 Uco Textiles SA . . . . . . . . . . . . . . . . . . . . . . . . . . . . . . . . . . . . . . 344,703
3,562,601 Canada—1.0%
72,400 Canadian Western Bank . . . . . . . . . . . . . . . . . . . . . . . . . . . . . . . 971,249 260,700 Melcor Developments Ltd. . . . . . . . . . . . . . . . . . . . . . . . . . . . . . . 2,979,182
1,391,000 National Bank of Canada, Toronto . . . . . . . . . . . . . . . . . . . . . . . . 20,319,013 258,600 Shirmax Fashions Ltd.† . . . . . . . . . . . . . . . . . . . . . . . . . . . . . . . . . 509,662 785,883 Westfield Minerals Ltd.† . . . . . . . . . . . . . . . . . . . . . . . . . . . . . . . . 728,875
25,507,981 Denmark—0.3%
11,390 Nordvestbank . . . . . . . . . . . . . . . . . . . . . . . . . . . . . . . . . . . . . . . . 1,043,374 114,800 Unidanmark A/S, Series A . . . . . . . . . . . . . . . . . . . . . . . . . . . . . . 7,845,407
8,888,781 Finland—2.5%
568,027 Huhtamaki Group, Class I . . . . . . . . . . . . . . . . . . . . . . . . . . . . . . 20,253,865 6,200 Huhtamaki Group, Class K . . . . . . . . . . . . . . . . . . . . . . . . . . . . . . 221,070
1,036,900 Kesko Oyj . . . . . . . . . . . . . . . . . . . . . . . . . . . . . . . . . . . . . . . . . . . 15,405,101 257,555 Kone Corporation, Class B . . . . . . . . . . . . . . . . . . . . . . . . . . . . . . 27,550,543
63,430,579 France—2.7%
28,459 Bongrain SA . . . . . . . . . . . . . . . . . . . . . . . . . . . . . . . . . . . . . . . . . 10,682,538 5,229 Christian Dior SA . . . . . . . . . . . . . . . . . . . . . . . . . . . . . . . . . . . . . 671,778
128,228 Compagnie Financiere de Paribas . . . . . . . . . . . . . . . . . . . . . . . . . 14,326,114 35,044 Compagnie Fives-Lille . . . . . . . . . . . . . . . . . . . . . . . . . . . . . . . . . 2,480,161 57,700 Compagnie Lebon SA . . . . . . . . . . . . . . . . . . . . . . . . . . . . . . . . . . 2,581,078
188,692 Dollfus-Mieg & Cie SA† . . . . . . . . . . . . . . . . . . . . . . . . . . . . . . . 1,235,524 35,155 Financiere Marc de Lacharriere SA . . . . . . . . . . . . . . . . . . . . . . . . 3,608,575 57,292 Fonciere, Financiere et de Participation . . . . . . . . . . . . . . . . . . . . 3,305,676 5,229 LVMH Moet Hennessey . . . . . . . . . . . . . . . . . . . . . . . . . . . . . . . . 1,296,661
21,145 Mecelec SA . . . . . . . . . . . . . . . . . . . . . . . . . . . . . . . . . . . . . . . . . 240,581 36,372 NSC Groupe . . . . . . . . . . . . . . . . . . . . . . . . . . . . . . . . . . . . . . . . . 3,085,047 18,699 Precia† . . . . . . . . . . . . . . . . . . . . . . . . . . . . . . . . . . . . . . . . . . . . . 168,706 69,000 PSA Peugeot Citroen . . . . . . . . . . . . . . . . . . . . . . . . . . . . . . . . . . 9,930,664
994,617 Rhodia SA† . . . . . . . . . . . . . . . . . . . . . . . . . . . . . . . . . . . . . . . . . 14,938,110 9,340 Signaux Girod . . . . . . . . . . . . . . . . . . . . . . . . . . . . . . . . . . . . . . . . 200,828
68,752,041 Germany—1.1%
61,660 Kaufring AG . . . . . . . . . . . . . . . . . . . . . . . . . . . . . . . . . . . . . . . . . 1,998,710 61,140 Lindner Holding. . . . . . . . . . . . . . . . . . . . . . . . . . . . . . . . . . . . . . 1,109,838
332,075 Moebel Walther AG . . . . . . . . . . . . . . . . . . . . . . . . . . . . . . . . . . . 5,740,915 37,085 Sinn Leffers AG . . . . . . . . . . . . . . . . . . . . . . . . . . . . . . . . . . . . . . 5,609,851 15,018 Springer (Axel) Verlag AG, Class A . . . . . . . . . . . . . . . . . . . . . . . 14,441,992
28,901,306
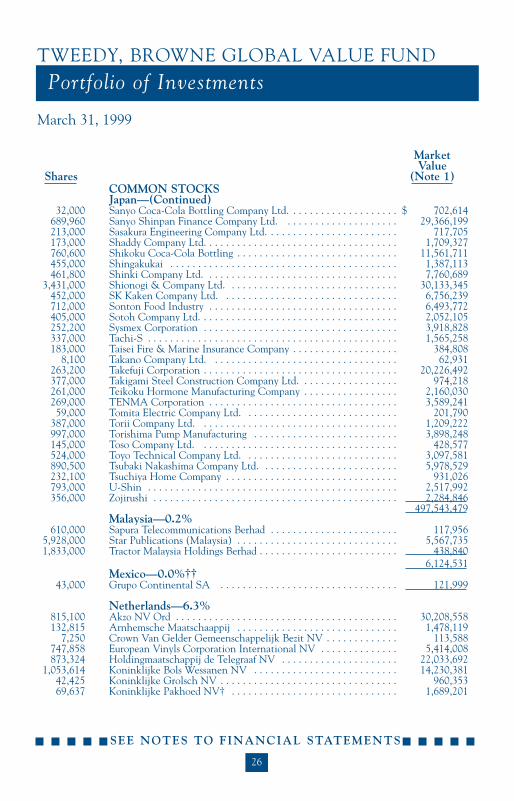
Portfolio of InvestmentsTWEEDY, BROWNE GLOBAL VALUE FUND
March 31, 1999
23
SEE NOTES TO FINANCIAL STATEMENTS

MarketValue
Shares (Note 1)COMMON STOCKSHong Kong—3.8%
15,811,309 Asean Resources Holdings Ltd.† . . . . . . . . . . . . . . . . . . . . . . . . . . $ 1,203,777 26,823,000 CDL Hotels International Ltd. . . . . . . . . . . . . . . . . . . . . . . . . . . . 8,307,013 1,236,000 Dickson Concepts International Ltd.†. . . . . . . . . . . . . . . . . . . . . . 1,004,813 1,674,000 Fountain Set Holdings . . . . . . . . . . . . . . . . . . . . . . . . . . . . . . . . . 226,815 1,004,000 Grand Hotel Holdings Ltd. . . . . . . . . . . . . . . . . . . . . . . . . . . . . . . 129,557 4,602,000 Harbour Ring International Holdings . . . . . . . . . . . . . . . . . . . . . . 172,214 5,404,000 Jardine International Motor Holdings Ltd. . . . . . . . . . . . . . . . . . . 2,074,573
13,622,500 Jardine Strategic Holdings Ltd. . . . . . . . . . . . . . . . . . . . . . . . . . . . 23,022,025 38,873,000 South China Morning Post (Holdings) Ltd. . . . . . . . . . . . . . . . . . 21,569,637 24,204,500 Swire Pacific Ltd., Class B . . . . . . . . . . . . . . . . . . . . . . . . . . . . . . . 16,553,823 9,034,500 Wing Hang Bank Ltd. . . . . . . . . . . . . . . . . . . . . . . . . . . . . . . . . . . 24,015,833
98,280,080 Ireland—1.5%
2,733,087 Crean (James) PLC . . . . . . . . . . . . . . . . . . . . . . . . . . . . . . . . . . . . 3,248,412 7,252,955 Independent Newspapers PLC . . . . . . . . . . . . . . . . . . . . . . . . . . . 32,914,649 1,105,000 Unidare PLC . . . . . . . . . . . . . . . . . . . . . . . . . . . . . . . . . . . . . . . . . 2,984,883
39,147,944 Italy—3.0%
741,850 Banco di Sardegna Risp . . . . . . . . . . . . . . . . . . . . . . . . . . . . . . . . 13,105,658 472,500 Bassetti SPA . . . . . . . . . . . . . . . . . . . . . . . . . . . . . . . . . . . . . . . . . 2,859,004
1,530,230 Burgo (Cartiere) SPA . . . . . . . . . . . . . . . . . . . . . . . . . . . . . . . . . . 10,747,193 323,000 Cementerie di Barletta . . . . . . . . . . . . . . . . . . . . . . . . . . . . . . . . . 1,165,666
1,156,450 Cristalleria Artistica . . . . . . . . . . . . . . . . . . . . . . . . . . . . . . . . . . . 3,548,707 276,925 IMI SPA . . . . . . . . . . . . . . . . . . . . . . . . . . . . . . . . . . . . . . . . . . . . 4,503,225 469,862 Industrie Zignago . . . . . . . . . . . . . . . . . . . . . . . . . . . . . . . . . . . . . 4,721,481
1,150,500 Maffei SPA . . . . . . . . . . . . . . . . . . . . . . . . . . . . . . . . . . . . . . . . . . 1,529,033 237,000 Marangoni SPA . . . . . . . . . . . . . . . . . . . . . . . . . . . . . . . . . . . . . . 806,648
1,782,500 Mondadori (Arnoldo) Editore SPA . . . . . . . . . . . . . . . . . . . . . . . . 26,674,992 8,072,735 Montefibre SPA . . . . . . . . . . . . . . . . . . . . . . . . . . . . . . . . . . . . . . 4,753,814
493,000 Vincenzo Zucchi SPA . . . . . . . . . . . . . . . . . . . . . . . . . . . . . . . . . . 3,648,904 78,064,325
Japan—19.2%220,000 Agro-Kanesho Company Ltd. . . . . . . . . . . . . . . . . . . . . . . . . . . . . 1,672,085 634,000 Aichi Electric Company Ltd. . . . . . . . . . . . . . . . . . . . . . . . . . . . . 1,017,270 582,480 Aiful Corporation . . . . . . . . . . . . . . . . . . . . . . . . . . . . . . . . . . . . 39,696,099 477,000 Amatsuji Steel Ball Manufacturing Company . . . . . . . . . . . . . . . . 4,028,206 323,000 Belluna Company Ltd. . . . . . . . . . . . . . . . . . . . . . . . . . . . . . . . . . 4,337,035 47,000 CCI Corporation . . . . . . . . . . . . . . . . . . . . . . . . . . . . . . . . . . . . . 301,651
101,000 Charle Company . . . . . . . . . . . . . . . . . . . . . . . . . . . . . . . . . . . . . . 938,226 555,500 Chiyoda Company . . . . . . . . . . . . . . . . . . . . . . . . . . . . . . . . . . . . 4,597,305 774,040 Chofu Seisakusho Company . . . . . . . . . . . . . . . . . . . . . . . . . . . . . 9,857,301 206,200 Cosel Company Ltd. . . . . . . . . . . . . . . . . . . . . . . . . . . . . . . . . . . . 2,298,560 270,000 Credia Company Ltd. . . . . . . . . . . . . . . . . . . . . . . . . . . . . . . . . . . 4,742,642 349,000 Daido Metal Company . . . . . . . . . . . . . . . . . . . . . . . . . . . . . . . . . 1,022,700
1,356,000 Danto Corporation . . . . . . . . . . . . . . . . . . . . . . . . . . . . . . . . . . . . 6,469,957 526,000 Denkyosha . . . . . . . . . . . . . . . . . . . . . . . . . . . . . . . . . . . . . . . . . . 2,332,053
24
Portfolio of InvestmentsTWEEDY, BROWNE GLOBAL VALUE FUND
March 31, 1999
SEE NOTES TO FINANCIAL STATEMENTS

MarketValue
Shares (Note 1)COMMON STOCKSJapan—(Continued)
189,000 Denyo Company Ltd. . . . . . . . . . . . . . . . . . . . . . . . . . . . . . . . . . . $ 1,236,963 1,765,000 Dowa Fire & Marine Insurance Company . . . . . . . . . . . . . . . . . . . 6,036,609
127,100 Fidelity Japan OTC & Regional Market Fund Ltd.†. . . . . . . . . . . 1,060,014 650,000 Fidelity Japanese Values Trust† . . . . . . . . . . . . . . . . . . . . . . . . . . . 512,747
1,095,000 Fuji Coca-Cola Bottling Company . . . . . . . . . . . . . . . . . . . . . . . . 13,685,766 618,000 Fuji Photo Film Ltd. . . . . . . . . . . . . . . . . . . . . . . . . . . . . . . . . . . . 23,380,822
1,664,000 Fujisawa Pharmaceutical Company . . . . . . . . . . . . . . . . . . . . . . . . 26,207,491 2,208,000 Fujitec Company Ltd. . . . . . . . . . . . . . . . . . . . . . . . . . . . . . . . . . . 17,937,727
624,000 Fukuda Denshi . . . . . . . . . . . . . . . . . . . . . . . . . . . . . . . . . . . . . . . 10,117,637 544,000 Gakken Company Ltd.† . . . . . . . . . . . . . . . . . . . . . . . . . . . . . . . . 643,162
2,431,000 Hitachi Koki Company Ltd. . . . . . . . . . . . . . . . . . . . . . . . . . . . . . 7,164,793 585,000 Hitachi Medical Corporation . . . . . . . . . . . . . . . . . . . . . . . . . . . . 6,575,476 48,000 Idec Izumi Corporation . . . . . . . . . . . . . . . . . . . . . . . . . . . . . . . . 241,591
126,000 Inaba Denkisangyo Company Ltd. . . . . . . . . . . . . . . . . . . . . . . . . 1,298,146 39,900 Kahma Company Ltd. . . . . . . . . . . . . . . . . . . . . . . . . . . . . . . . . . 240,583
1,418,000 Kansai Paint Company Ltd. . . . . . . . . . . . . . . . . . . . . . . . . . . . . . 3,760,098 185,000 Kansui Kosiado Company Ltd. . . . . . . . . . . . . . . . . . . . . . . . . . . . 1,204,535 150,000 Kato Sangyo Company Ltd. . . . . . . . . . . . . . . . . . . . . . . . . . . . . . 899,379 318,000 Katsuragawa Electric Company . . . . . . . . . . . . . . . . . . . . . . . . . . 1,799,265 193,000 Kawagishi Bridge Works . . . . . . . . . . . . . . . . . . . . . . . . . . . . . . . . 503,626
3,000 Kinki Coca-Cola Bottling Company . . . . . . . . . . . . . . . . . . . . . . . 40,713 155,100 Kita Kyushu Coca-Cola Bottling . . . . . . . . . . . . . . . . . . . . . . . . . . 6,562,099
1,591,000 Koito Manufacturing . . . . . . . . . . . . . . . . . . . . . . . . . . . . . . . . . . . 7,604,662 312,000 Kokura Enterprise Company . . . . . . . . . . . . . . . . . . . . . . . . . . . . . 1,659,925 180,000 Koyosha Inc. . . . . . . . . . . . . . . . . . . . . . . . . . . . . . . . . . . . . . . . . 585,230 764,000 Mandom Corporation . . . . . . . . . . . . . . . . . . . . . . . . . . . . . . . . . . 8,903,602 111,000 Matsumoto Yushi-Seiyaku Company . . . . . . . . . . . . . . . . . . . . . . . 2,230,967
1,941,000 Matsushita Electric Industrial Company . . . . . . . . . . . . . . . . . . . . 37,864,375 371,000 Meito Sangyo Company . . . . . . . . . . . . . . . . . . . . . . . . . . . . . . . . 3,571,676 278,000 Mitsubishi Pencil Company Ltd. . . . . . . . . . . . . . . . . . . . . . . . . . 1,922,746 495,000 Morito . . . . . . . . . . . . . . . . . . . . . . . . . . . . . . . . . . . . . . . . . . . . . . 2,215,513 385,000 Nankai Plywood Company Ltd. . . . . . . . . . . . . . . . . . . . . . . . . . . 1,648,398 342,000 Nippon Broadcasting System Inc. . . . . . . . . . . . . . . . . . . . . . . . . . 13,891,990
1,155,000 Nippon Cable System . . . . . . . . . . . . . . . . . . . . . . . . . . . . . . . . . . 8,924,756 1,060,000 Nippon Konpo Unyu Soko . . . . . . . . . . . . . . . . . . . . . . . . . . . . . . 7,474,560
90,000 Nissei Plastic Industrial Company Ltd. . . . . . . . . . . . . . . . . . . . . . 554,068 242,500 Nissin Company Ltd. . . . . . . . . . . . . . . . . . . . . . . . . . . . . . . . . . . 7,126,631 409,000 Nittetsu Mining . . . . . . . . . . . . . . . . . . . . . . . . . . . . . . . . . . . . . . 1,122,535 551,000 Nitto FC Company . . . . . . . . . . . . . . . . . . . . . . . . . . . . . . . . . . . 1,907,782 342,000 Oak . . . . . . . . . . . . . . . . . . . . . . . . . . . . . . . . . . . . . . . . . . . . . . . . 456,327 319,600 Osaka Steel Company Ltd. . . . . . . . . . . . . . . . . . . . . . . . . . . . . . . 1,171,358 287,103 Prospect Japan Fund Ltd. . . . . . . . . . . . . . . . . . . . . . . . . . . . . . . . 1,955,171 867,000 Riken Vitamin . . . . . . . . . . . . . . . . . . . . . . . . . . . . . . . . . . . . . . . 9,152,134 16,000 Rock Paint . . . . . . . . . . . . . . . . . . . . . . . . . . . . . . . . . . . . . . . . . . 92,555
452,000 Sangetsu Company Ltd. . . . . . . . . . . . . . . . . . . . . . . . . . . . . . . . . 7,252,460 232,000 Sanko Sangyo Company . . . . . . . . . . . . . . . . . . . . . . . . . . . . . . . . 1,763,290
Portfolio of InvestmentsTWEEDY, BROWNE GLOBAL VALUE FUND
March 31, 1999
25
SEE NOTES TO FINANCIAL STATEMENTS
MarketValue
Shares (Note 1)COMMON STOCKSJapan—(Continued)
32,000 Sanyo Coca-Cola Bottling Company Ltd. . . . . . . . . . . . . . . . . . . . $ 702,614 689,960 Sanyo Shinpan Finance Company Ltd. . . . . . . . . . . . . . . . . . . . . 29,366,199 213,000 Sasakura Engineering Company Ltd. . . . . . . . . . . . . . . . . . . . . . . . 717,705 173,000 Shaddy Company Ltd. . . . . . . . . . . . . . . . . . . . . . . . . . . . . . . . . . . 1,709,327 760,600 Shikoku Coca-Cola Bottling . . . . . . . . . . . . . . . . . . . . . . . . . . . . . 11,561,711455,000 Shingakukai . . . . . . . . . . . . . . . . . . . . . . . . . . . . . . . . . . . . . . . . . 1,387,113 461,800 Shinki Company Ltd. . . . . . . . . . . . . . . . . . . . . . . . . . . . . . . . . . . 7,760,689
3,431,000 Shionogi & Company Ltd. . . . . . . . . . . . . . . . . . . . . . . . . . . . . . . 30,133,345 452,000 SK Kaken Company Ltd. . . . . . . . . . . . . . . . . . . . . . . . . . . . . . . . 6,756,239 712,000 Sonton Food Industry . . . . . . . . . . . . . . . . . . . . . . . . . . . . . . . . . . 6,493,772 405,000 Sotoh Company Ltd. . . . . . . . . . . . . . . . . . . . . . . . . . . . . . . . . . . . 2,052,105 252,200 Sysmex Corporation . . . . . . . . . . . . . . . . . . . . . . . . . . . . . . . . . . . 3,918,828 337,000 Tachi-S . . . . . . . . . . . . . . . . . . . . . . . . . . . . . . . . . . . . . . . . . . . . . 1,565,258 183,000 Taisei Fire & Marine Insurance Company . . . . . . . . . . . . . . . . . . . 384,808
8,100 Takano Company Ltd. . . . . . . . . . . . . . . . . . . . . . . . . . . . . . . . . . 62,931 263,200 Takefuji Corporation . . . . . . . . . . . . . . . . . . . . . . . . . . . . . . . . . . . 20,226,492 377,000 Takigami Steel Construction Company Ltd. . . . . . . . . . . . . . . . . . 974,218 261,000 Teikoku Hormone Manufacturing Company . . . . . . . . . . . . . . . . . 2,160,030 269,000 TENMA Corporation . . . . . . . . . . . . . . . . . . . . . . . . . . . . . . . . . . 3,589,241 59,000 Tomita Electric Company Ltd. . . . . . . . . . . . . . . . . . . . . . . . . . . . 201,790
387,000 Torii Company Ltd. . . . . . . . . . . . . . . . . . . . . . . . . . . . . . . . . . . . 1,209,222 997,000 Torishima Pump Manufacturing . . . . . . . . . . . . . . . . . . . . . . . . . . 3,898,248 145,000 Toso Company Ltd. . . . . . . . . . . . . . . . . . . . . . . . . . . . . . . . . . . . 428,577 524,000 Toyo Technical Company Ltd. . . . . . . . . . . . . . . . . . . . . . . . . . . . 3,097,581 890,500 Tsubaki Nakashima Company Ltd. . . . . . . . . . . . . . . . . . . . . . . . . 5,978,529 232,100 Tsuchiya Home Company . . . . . . . . . . . . . . . . . . . . . . . . . . . . . . . 931,026 793,000 U-Shin . . . . . . . . . . . . . . . . . . . . . . . . . . . . . . . . . . . . . . . . . . . . . 2,517,992 356,000 Zojirushi . . . . . . . . . . . . . . . . . . . . . . . . . . . . . . . . . . . . . . . . . . . . 2,284,846
497,543,479 Malaysia—0.2%
610,000 Sapura Telecommunications Berhad . . . . . . . . . . . . . . . . . . . . . . . 117,956 5,928,000 Star Publications (Malaysia) . . . . . . . . . . . . . . . . . . . . . . . . . . . . . 5,567,735 1,833,000 Tractor Malaysia Holdings Berhad . . . . . . . . . . . . . . . . . . . . . . . . . 438,840
6,124,531 Mexico—0.0%††
43,000 Grupo Continental SA . . . . . . . . . . . . . . . . . . . . . . . . . . . . . . . . 121,999
Netherlands—6.3%815,100 Akzo NV Ord . . . . . . . . . . . . . . . . . . . . . . . . . . . . . . . . . . . . . . . . 30,208,558 132,815 Arnhemsche Maatschaappij . . . . . . . . . . . . . . . . . . . . . . . . . . . . . 1,478,119
7,250 Crown Van Gelder Gemeenschappelijk Bezit NV . . . . . . . . . . . . . 113,588 747,858 European Vinyls Corporation International NV . . . . . . . . . . . . . . 5,414,008 873,324 Holdingmaatschappij de Telegraaf NV . . . . . . . . . . . . . . . . . . . . . 22,033,692
1,053,614 Koninklijke Bols Wessanen NV . . . . . . . . . . . . . . . . . . . . . . . . . . 14,230,381 42,425 Koninklijke Grolsch NV . . . . . . . . . . . . . . . . . . . . . . . . . . . . . . . . 960,353 69,637 Koninklijke Pakhoed NV† . . . . . . . . . . . . . . . . . . . . . . . . . . . . . . 1,689,201
26
Portfolio of InvestmentsTWEEDY, BROWNE GLOBAL VALUE FUND
March 31, 1999
SEE NOTES TO FINANCIAL STATEMENTS
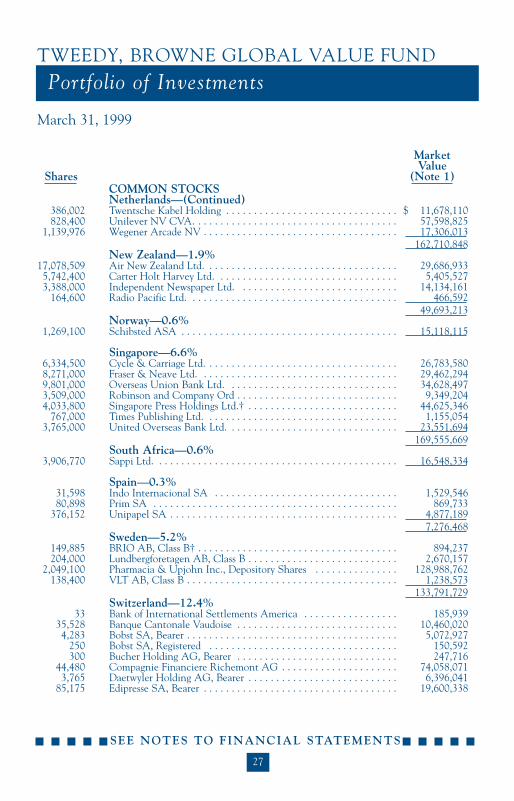
MarketValue
Shares (Note 1)COMMON STOCKSNetherlands—(Continued)
386,002 Twentsche Kabel Holding . . . . . . . . . . . . . . . . . . . . . . . . . . . . . . . $ 11,678,110 828,400 Unilever NV CVA. . . . . . . . . . . . . . . . . . . . . . . . . . . . . . . . . . . . . 57,598,825
1,139,976 Wegener Arcade NV . . . . . . . . . . . . . . . . . . . . . . . . . . . . . . . . . . . 17,306,013 162,710,848
New Zealand—1.9%17,078,509 Air New Zealand Ltd. . . . . . . . . . . . . . . . . . . . . . . . . . . . . . . . . . . 29,686,933 5,742,400 Carter Holt Harvey Ltd. . . . . . . . . . . . . . . . . . . . . . . . . . . . . . . . . 5,405,527 3,388,000 Independent Newspaper Ltd. . . . . . . . . . . . . . . . . . . . . . . . . . . . . 14,134,161
164,600 Radio Pacific Ltd. . . . . . . . . . . . . . . . . . . . . . . . . . . . . . . . . . . . . . 466,592 49,693,213
Norway—0.6%1,269,100 Schibsted ASA . . . . . . . . . . . . . . . . . . . . . . . . . . . . . . . . . . . . . . . 15,118,115
Singapore—6.6%6,334,500 Cycle & Carriage Ltd. . . . . . . . . . . . . . . . . . . . . . . . . . . . . . . . . . . 26,783,580 8,271,000 Fraser & Neave Ltd. . . . . . . . . . . . . . . . . . . . . . . . . . . . . . . . . . . . 29,462,294 9,801,000 Overseas Union Bank Ltd. . . . . . . . . . . . . . . . . . . . . . . . . . . . . . . 34,628,497 3,509,000 Robinson and Company Ord . . . . . . . . . . . . . . . . . . . . . . . . . . . . . 9,349,204 4,033,800 Singapore Press Holdings Ltd.† . . . . . . . . . . . . . . . . . . . . . . . . . . . 44,625,346
767,000 Times Publishing Ltd. . . . . . . . . . . . . . . . . . . . . . . . . . . . . . . . . . . 1,155,054 3,765,000 United Overseas Bank Ltd. . . . . . . . . . . . . . . . . . . . . . . . . . . . . . . 23,551,694
169,555,669 South Africa—0.6%
3,906,770 Sappi Ltd. . . . . . . . . . . . . . . . . . . . . . . . . . . . . . . . . . . . . . . . . . . . 16,548,334
Spain—0.3%31,598 Indo Internacional SA . . . . . . . . . . . . . . . . . . . . . . . . . . . . . . . . . 1,529,546 80,898 Prim SA . . . . . . . . . . . . . . . . . . . . . . . . . . . . . . . . . . . . . . . . . . . . 869,733
376,152 Unipapel SA . . . . . . . . . . . . . . . . . . . . . . . . . . . . . . . . . . . . . . . . . 4,877,189 7,276,468
Sweden—5.2%149,885 BRIO AB, Class B† . . . . . . . . . . . . . . . . . . . . . . . . . . . . . . . . . . . . 894,237 204,000 Lundbergforetagen AB, Class B . . . . . . . . . . . . . . . . . . . . . . . . . . . 2,670,157
2,049,100 Pharmacia & Upjohn Inc., Depository Shares . . . . . . . . . . . . . . . 128,988,762 138,400 VLT AB, Class B . . . . . . . . . . . . . . . . . . . . . . . . . . . . . . . . . . . . . . 1,238,573
133,791,729 Switzerland—12.4%
33 Bank of International Settlements America . . . . . . . . . . . . . . . . . 185,939 35,528 Banque Cantonale Vaudoise . . . . . . . . . . . . . . . . . . . . . . . . . . . . . 10,460,020 4,283 Bobst SA, Bearer . . . . . . . . . . . . . . . . . . . . . . . . . . . . . . . . . . . . . . 5,072,927
250 Bobst SA, Registered . . . . . . . . . . . . . . . . . . . . . . . . . . . . . . . . . . 150,592 300 Bucher Holding AG, Bearer . . . . . . . . . . . . . . . . . . . . . . . . . . . . . 247,716
44,480 Compagnie Financiere Richemont AG . . . . . . . . . . . . . . . . . . . . . 74,058,071 3,765 Daetwyler Holding AG, Bearer . . . . . . . . . . . . . . . . . . . . . . . . . . . 6,396,041
85,175 Edipresse SA, Bearer . . . . . . . . . . . . . . . . . . . . . . . . . . . . . . . . . . . 19,600,338
Portfolio of InvestmentsTWEEDY, BROWNE GLOBAL VALUE FUND
March 31, 1999
27
SEE NOTES TO FINANCIAL STATEMENTS
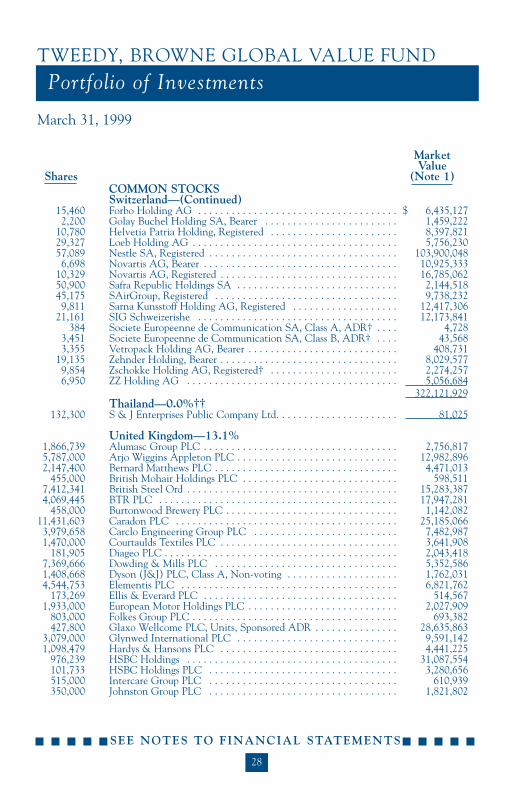
MarketValue
Shares (Note 1)COMMON STOCKSSwitzerland—(Continued)
15,460 Forbo Holding AG . . . . . . . . . . . . . . . . . . . . . . . . . . . . . . . . . . . . $ 6,435,127 2,200 Golay Buchel Holding SA, Bearer . . . . . . . . . . . . . . . . . . . . . . . . 1,459,222
10,780 Helvetia Patria Holding, Registered . . . . . . . . . . . . . . . . . . . . . . . 8,397,821 29,327 Loeb Holding AG . . . . . . . . . . . . . . . . . . . . . . . . . . . . . . . . . . . . . 5,756,230 57,089 Nestle SA, Registered . . . . . . . . . . . . . . . . . . . . . . . . . . . . . . . . . . 103,900,048 6,698 Novartis AG, Bearer . . . . . . . . . . . . . . . . . . . . . . . . . . . . . . . . . . . 10,925,333
10,329 Novartis AG, Registered . . . . . . . . . . . . . . . . . . . . . . . . . . . . . . . . 16,785,062 50,900 Safra Republic Holdings SA . . . . . . . . . . . . . . . . . . . . . . . . . . . . . 2,144,518 45,175 SAirGroup, Registered . . . . . . . . . . . . . . . . . . . . . . . . . . . . . . . . . 9,738,232 9,811 Sarna Kunsstoff Holding AG, Registered . . . . . . . . . . . . . . . . . . . 12,417,306
21,161 SIG Schweizerishe . . . . . . . . . . . . . . . . . . . . . . . . . . . . . . . . . . . . 12,173,841 384 Societe Europeenne de Communication SA, Class A, ADR† . . . . 4,728
3,451 Societe Europeenne de Communication SA, Class B, ADR† . . . . 43,568 3,355 Vetropack Holding AG, Bearer . . . . . . . . . . . . . . . . . . . . . . . . . . . 408,731
19,135 Zehnder Holding, Bearer . . . . . . . . . . . . . . . . . . . . . . . . . . . . . . . . 8,029,577 9,854 Zschokke Holding AG, Registered† . . . . . . . . . . . . . . . . . . . . . . . 2,274,257 6,950 ZZ Holding AG . . . . . . . . . . . . . . . . . . . . . . . . . . . . . . . . . . . . . . 5,056,684
322,121,929 Thailand—0.0%††
132,300 S & J Enterprises Public Company Ltd. . . . . . . . . . . . . . . . . . . . . . 81,025
United Kingdom—13.1%1,866,739 Alumasc Group PLC . . . . . . . . . . . . . . . . . . . . . . . . . . . . . . . . . . . 2,756,817 5,787,000 Arjo Wiggins Appleton PLC . . . . . . . . . . . . . . . . . . . . . . . . . . . . . 12,982,896 2,147,400 Bernard Matthews PLC . . . . . . . . . . . . . . . . . . . . . . . . . . . . . . . . . 4,471,013
455,000 British Mohair Holdings PLC . . . . . . . . . . . . . . . . . . . . . . . . . . . . 598,511 7,412,341 British Steel Ord . . . . . . . . . . . . . . . . . . . . . . . . . . . . . . . . . . . . . . 15,283,387 4,069,445 BTR PLC . . . . . . . . . . . . . . . . . . . . . . . . . . . . . . . . . . . . . . . . . . . 17,947,281
458,000 Burtonwood Brewery PLC . . . . . . . . . . . . . . . . . . . . . . . . . . . . . . . 1,142,082 11,431,603 Caradon PLC . . . . . . . . . . . . . . . . . . . . . . . . . . . . . . . . . . . . . . . . 25,185,066 3,979,658 Carclo Engineering Group PLC . . . . . . . . . . . . . . . . . . . . . . . . . . 7,482,987 1,470,000 Courtaulds Textiles PLC . . . . . . . . . . . . . . . . . . . . . . . . . . . . . . . . 3,641,908
181,905 Diageo PLC . . . . . . . . . . . . . . . . . . . . . . . . . . . . . . . . . . . . . . . . . . 2,043,418 7,369,666 Dowding & Mills PLC . . . . . . . . . . . . . . . . . . . . . . . . . . . . . . . . . 5,352,586 1,408,668 Dyson (J&J) PLC, Class A, Non-voting . . . . . . . . . . . . . . . . . . . . 1,762,031 4,544,753 Elementis PLC . . . . . . . . . . . . . . . . . . . . . . . . . . . . . . . . . . . . . . . 6,821,762
173,269 Ellis & Everard PLC . . . . . . . . . . . . . . . . . . . . . . . . . . . . . . . . . . . 514,567 1,933,000 European Motor Holdings PLC . . . . . . . . . . . . . . . . . . . . . . . . . . . 2,027,909
803,000 Folkes Group PLC . . . . . . . . . . . . . . . . . . . . . . . . . . . . . . . . . . . . . 693,382 427,800 Glaxo Wellcome PLC, Units, Sponsored ADR . . . . . . . . . . . . . . . 28,635,863
3,079,000 Glynwed International PLC . . . . . . . . . . . . . . . . . . . . . . . . . . . . . 9,591,142 1,098,479 Hardys & Hansons PLC . . . . . . . . . . . . . . . . . . . . . . . . . . . . . . . . 4,441,225
976,239 HSBC Holdings . . . . . . . . . . . . . . . . . . . . . . . . . . . . . . . . . . . . . . 31,087,554 101,733 HSBC Holdings PLC . . . . . . . . . . . . . . . . . . . . . . . . . . . . . . . . . . 3,280,656 515,000 Intercare Group PLC . . . . . . . . . . . . . . . . . . . . . . . . . . . . . . . . . . 610,939 350,000 Johnston Group PLC . . . . . . . . . . . . . . . . . . . . . . . . . . . . . . . . . . 1,821,802
28
Portfolio of InvestmentsTWEEDY, BROWNE GLOBAL VALUE FUND
March 31, 1999
SEE NOTES TO FINANCIAL STATEMENTS

MarketValue
Shares (Note 1)COMMON STOCKSUnited Kingdom—(Continued)
4,545,154 McAlpine (Alfred) PLC . . . . . . . . . . . . . . . . . . . . . . . . . . . . . . . . $ 12,470,987 6,900,000 Mirror Group PLC . . . . . . . . . . . . . . . . . . . . . . . . . . . . . . . . . . . . 23,498,214 1,777,545 Molins PLC . . . . . . . . . . . . . . . . . . . . . . . . . . . . . . . . . . . . . . . . . . 3,944,814 3,027,120 Nycomed Amersham PLC . . . . . . . . . . . . . . . . . . . . . . . . . . . . . . . 26,383,154
584,000 Partridge Fine Art Ord. . . . . . . . . . . . . . . . . . . . . . . . . . . . . . . . . . 692,793 19,107,025 Pilkington PLC . . . . . . . . . . . . . . . . . . . . . . . . . . . . . . . . . . . . . . . 25,441,946 1,947,500 Regal Hotel Group PLC . . . . . . . . . . . . . . . . . . . . . . . . . . . . . . . . 895,830 4,562,511 Rexam PLC . . . . . . . . . . . . . . . . . . . . . . . . . . . . . . . . . . . . . . . . . . 15,132,792 3,493,490 Sherwood Group PLC . . . . . . . . . . . . . . . . . . . . . . . . . . . . . . . . . . 1,409,623
277,100 SmithKline Beecham PLC, Units, ADR . . . . . . . . . . . . . . . . . . . . 19,812,650 779,500 Swan Hill Group PLC . . . . . . . . . . . . . . . . . . . . . . . . . . . . . . . . . . 754,867 153,509 Thistle Hotels PLC . . . . . . . . . . . . . . . . . . . . . . . . . . . . . . . . . . . . 415,004
3,001,672 Time Products PLC . . . . . . . . . . . . . . . . . . . . . . . . . . . . . . . . . . . . 4,190,662 1,200,000 Union PLC . . . . . . . . . . . . . . . . . . . . . . . . . . . . . . . . . . . . . . . . . . 406,728 1,537,500 Wolverhampton & Dudley Breweries PLC . . . . . . . . . . . . . . . . . . 12,134,651
37,500 Young & Company's Brewery PLC, Class A . . . . . . . . . . . . . . . . . 459,990 338,221,489
United States—13.1%221,000 American Express Company . . . . . . . . . . . . . . . . . . . . . . . . . . . . . 25,967,500 75,700 American National Insurance Company . . . . . . . . . . . . . . . . . . . . 5,048,245
333,097 Bank One Corporation . . . . . . . . . . . . . . . . . . . . . . . . . . . . . . . . . 18,341,154 514,800 Chase Manhattan Corporation . . . . . . . . . . . . . . . . . . . . . . . . . . . 41,859,675 81,500 Coca-Cola Bottling Company . . . . . . . . . . . . . . . . . . . . . . . . . . . . 4,513,063
348,300 Comerica, Inc. . . . . . . . . . . . . . . . . . . . . . . . . . . . . . . . . . . . . . . . 21,746,981 230,400 Federal Home Loan Mortgage Corporation . . . . . . . . . . . . . . . . . . 13,161,600 70,000 GATX Corporation . . . . . . . . . . . . . . . . . . . . . . . . . . . . . . . . . . . . 2,305,625
200,000 Harland (John H.) Company . . . . . . . . . . . . . . . . . . . . . . . . . . . . 2,587,500 197,100 Household International Inc. . . . . . . . . . . . . . . . . . . . . . . . . . . . . 8,992,688 454,000 MBIA Inc. . . . . . . . . . . . . . . . . . . . . . . . . . . . . . . . . . . . . . . . . . . 26,332,000 73,125 Mercantile Bancorp Inc. . . . . . . . . . . . . . . . . . . . . . . . . . . . . . . . 3,473,438 79,700 NAC Re Corporation . . . . . . . . . . . . . . . . . . . . . . . . . . . . . . . . . . 4,278,894
2,679,334 Panamerican Beverages Inc., Class A . . . . . . . . . . . . . . . . . . . . . . 47,055,803 319,600 Philip Morris Companies Inc. . . . . . . . . . . . . . . . . . . . . . . . . . . . 11,245,925 460,000 PNC Bank Corporation . . . . . . . . . . . . . . . . . . . . . . . . . . . . . . . . 25,558,750 596,000 Popular Inc. . . . . . . . . . . . . . . . . . . . . . . . . . . . . . . . . . . . . . . . . . 18,420,125 118,400 Standard Motor Products Inc. . . . . . . . . . . . . . . . . . . . . . . . . . . . 2,449,400 74,100 Syms Corporation† . . . . . . . . . . . . . . . . . . . . . . . . . . . . . . . . . . . . 551,119
294,600 Transatlantic Holdings Inc. . . . . . . . . . . . . . . . . . . . . . . . . . . . . . . 22,095,000 20,000 Tremont Corporation . . . . . . . . . . . . . . . . . . . . . . . . . . . . . . . . . . 352,500
551,000 UST Inc. . . . . . . . . . . . . . . . . . . . . . . . . . . . . . . . . . . . . . . . . . . . . 14,394,875 525,000 Wells Fargo & Company . . . . . . . . . . . . . . . . . . . . . . . . . . . . . . . . 18,407,813
339,139,673TOTAL COMMON STOCKS (Cost $2,058,323,719) . . . . . . . . . . . . . . . . . . . . . . . . . . 2,472,690,151
Portfolio of InvestmentsTWEEDY, BROWNE GLOBAL VALUE FUND
March 31, 1999
29
SEE NOTES TO FINANCIAL STATEMENTS

MarketValue
Shares (Note 1)PREFERRED STOCKS—0.8%
23,044 KSB AG . . . . . . . . . . . . . . . . . . . . . . . . . . . . . . . . . . . . . . . . . . $ 2,987,887 136,187 Moebel Walther AG . . . . . . . . . . . . . . . . . . . . . . . . . . . . . . . . . 2,339,687 160,556 Villeroy & Boch AG . . . . . . . . . . . . . . . . . . . . . . . . . . . . . . . . . 15,786,757
TOTAL PREFERRED STOCKS(Cost $26,907,456) . . . . . . . . . . . . . . . . . . . . . . . . . . . 21,114,331
FaceValue
CONVERTIBLE CORPORATE BOND—0.0%††(Cost $104,039)
JPY 9,000,000 Shikoku Coca-Cola Bottling, 2.400% due 3/29/02 . . . . . . . . . . 103,365
COMMERCIAL PAPER—1.6%(Cost $40,000,000)
$40,000,000 General Electric Capital Corporation, 5.060% due 4/1/99 . . . . 40,000,000
U.S. TREASURY BILLS—0.5%3,000,000 5.330%** due 7/22/99 . . . . . . . . . . . . . . . . . . . . . . . . . . . . . . . 2,959,110
10,000,000 4.501%** due 1/6/00 . . . . . . . . . . . . . . . . . . . . . . . . . . . . . . . . 9,656,200 . . . . . . . . . . . . . . . . . . . . . . . . . . . . . . . . . . . . . . . . . . . . . . . . .TOTAL U.S. TREASURY BILLS(Cost $12,618,764) . . . . . . . . . . . . . . . . . . . . . . . . . . . 12,615,310
REPURCHASE AGREEMENT—1.8%(Cost $47,659,000)
47,659,000 Agreement with UBS Securities Inc., 4.880% dated 3/31/99, to be repurchased at $47,665,460 on 4/1/99, collateralized by $36,933,000 U.S. Treasury Notes, 11.750% due 2/15/10(market value $48,347,605) . . . . . . . . . . . . . . . . . . . . . . . . . . . 47,659,000
TOTAL INVESTMENTS (Cost $2,185,612,978*) . . . . . . . . . 100.2% 2,594,182,157OTHER ASSETS AND LIABILITIES (Net). . . . . . . . . . . . . . (0.2) (4,608,186)NET ASSETS . . . . . . . . . . . . . . . . . . . . . . . . . . . . . . . . . . . . . 100.0% $ 2,589,573,971
* Aggregate cost for Federal tax purposes was $2,215,192,866.** Rate represents annualized yield at date of purchase (unaudited).† Non-income producing security.
†† Amount represents less than 0.1% of net assets.
Abbreviations:ADR American Depository ReceiptJPY Japanese YenOrd Ordinary Share
30
Portfolio of InvestmentsTWEEDY, BROWNE GLOBAL VALUE FUND
March 31, 1999
SEE NOTES TO FINANCIAL STATEMENTS

Percentage of Market ValueSector Diversification Net Assets (Note 1)COMMON STOCKS:Food and Beverages . . . . . . . . . . . . . . . . . . . . . . . . . . . . . . . . . 12.5% $ 324,605,165 Banking . . . . . . . . . . . . . . . . . . . . . . . . . . . . . . . . . . . . . . . . . . 12.1 313,026,481 Pharmaceuticals . . . . . . . . . . . . . . . . . . . . . . . . . . . . . . . . . . . . 11.2 290,031,690 Printing and Publishing . . . . . . . . . . . . . . . . . . . . . . . . . . . . . . 10.3 266,505,575 Financial Services . . . . . . . . . . . . . . . . . . . . . . . . . . . . . . . . . . 8.3 214,308,368 Manufacturing . . . . . . . . . . . . . . . . . . . . . . . . . . . . . . . . . . . . . 3.9 101,653,882 Tobacco . . . . . . . . . . . . . . . . . . . . . . . . . . . . . . . . . . . . . . . . . . 3.4 88,452,946 Machinery . . . . . . . . . . . . . . . . . . . . . . . . . . . . . . . . . . . . . . . . 3.0 77,237,753 Chemicals . . . . . . . . . . . . . . . . . . . . . . . . . . . . . . . . . . . . . . . . 3.0 76,907,093 Consumer Non-Durables . . . . . . . . . . . . . . . . . . . . . . . . . . . . . 2.6 66,502,427 Retail . . . . . . . . . . . . . . . . . . . . . . . . . . . . . . . . . . . . . . . . . . . . 2.5 64,878,388 Consumer Durables . . . . . . . . . . . . . . . . . . . . . . . . . . . . . . . . . 2.4 63,167,943 Autos . . . . . . . . . . . . . . . . . . . . . . . . . . . . . . . . . . . . . . . . . . . . 2.4 61,662,453 Holdings . . . . . . . . . . . . . . . . . . . . . . . . . . . . . . . . . . . . . . . . . . 2.0 52,424,851 Forest Products . . . . . . . . . . . . . . . . . . . . . . . . . . . . . . . . . . . . . 2.0 50,674,728 Engineering and Construction . . . . . . . . . . . . . . . . . . . . . . . . . 1.8 46,924,113 Transportation . . . . . . . . . . . . . . . . . . . . . . . . . . . . . . . . . . . . . 1.8 46,899,725 Insurance . . . . . . . . . . . . . . . . . . . . . . . . . . . . . . . . . . . . . . . . . 1.6 41,962,482 Building Materials . . . . . . . . . . . . . . . . . . . . . . . . . . . . . . . . . . 1.5 39,665,285 Glass Products . . . . . . . . . . . . . . . . . . . . . . . . . . . . . . . . . . . . . 1.1 29,399,384 Mining and Metal Fabrication . . . . . . . . . . . . . . . . . . . . . . . . . 0.9 22,184,606 Electronics . . . . . . . . . . . . . . . . . . . . . . . . . . . . . . . . . . . . . . . . 0.9 21,823,636 Construction Materials . . . . . . . . . . . . . . . . . . . . . . . . . . . . . . . 0.7 18,852,433 Wholesale . . . . . . . . . . . . . . . . . . . . . . . . . . . . . . . . . . . . . . . . 0.7 17,700,015 Textiles . . . . . . . . . . . . . . . . . . . . . . . . . . . . . . . . . . . . . . . . . . . 0.6 16,526,759 Radio . . . . . . . . . . . . . . . . . . . . . . . . . . . . . . . . . . . . . . . . . . . . 0.6 14,358,582 Leisure . . . . . . . . . . . . . . . . . . . . . . . . . . . . . . . . . . . . . . . . . . . 0.4 10,813,856 Health Care . . . . . . . . . . . . . . . . . . . . . . . . . . . . . . . . . . . . . . . 0.3 8,105,022 Real Estate . . . . . . . . . . . . . . . . . . . . . . . . . . . . . . . . . . . . . . . . 0.3 6,342,721 Medical Research and Supplies . . . . . . . . . . . . . . . . . . . . . . . . 0.2 5,399,500 Other . . . . . . . . . . . . . . . . . . . . . . . . . . . . . . . . . . . . . . . . . . . . 0.5 13,692,289 Total Common Stocks . . . . . . . . . . . . . . . . . . . . . . . . . . . . . . . 95.5 2,472,690,151 Preferred Stocks . . . . . . . . . . . . . . . . . . . . . . . . . . . . . . . . . . . 0.8 21,114,331 Convertible Corporate Bond . . . . . . . . . . . . . . . . . . . . . . . . . . 0.0†† 103,365Commercial Paper . . . . . . . . . . . . . . . . . . . . . . . . . . . . . . . . . . 1.6 40,000,000U.S. Treasury Bills . . . . . . . . . . . . . . . . . . . . . . . . . . . . . . . . . 0.5 12,615,310 Repurchase Agreement . . . . . . . . . . . . . . . . . . . . . . . . . . . . . . 1.8 47,659,000 Other Assets and Liabilities (Net) . . . . . . . . . . . . . . . . . . . . . (0.2) (4,608,186)Net Assets . . . . . . . . . . . . . . . . . . . . . . . . . . . . . . . . . . . . . . . . 100.0% $2,589,573,971
†† Amount represents less than 0.1% of net assets.
Portfolio of InvestmentsTWEEDY, BROWNE GLOBAL VALUE FUND
March 31, 1999
31
SEE NOTES TO FINANCIAL STATEMENTS

Contract MarketValue Value
Contracts Date (Note 1)
FORWARD EXCHANGE CONTRACTS TO BUY2,574,000 Canadian Dollar . . . . . . . . . . . . . . . . . . . . . . . . . 5/6/99 $ 1,705,395
956,410 Canadian Dollar . . . . . . . . . . . . . . . . . . . . . . . . . 7/23/99 633,923 12,300,000 Danish Krona . . . . . . . . . . . . . . . . . . . . . . . . . . . 7/2/99 1,796,293 5,069,250 Danish Krona . . . . . . . . . . . . . . . . . . . . . . . . . . . 7/23/99 741,121 4,782,375 European Economic Union Euro . . . . . . . . . . . . . 4/6/99 5,168,619
20,526,608 European Economic Union Euro . . . . . . . . . . . . . 4/12/99 22,192,531 2,039,920 European Economic Union Euro . . . . . . . . . . . . . 5/6/99 2,208,657
18,790,845 European Economic Union Euro . . . . . . . . . . . . . 6/8/99 20,383,730 89,724 Great Britain Pound Sterling . . . . . . . . . . . . . . . 4/9/99 144,803
23,991,000 Hong Kong Dollar . . . . . . . . . . . . . . . . . . . . . . . 4/12/99 3,095,064 19,833,750 Hong Kong Dollar . . . . . . . . . . . . . . . . . . . . . . . 4/23/99 2,558,059 53,127,650 Hong Kong Dollar . . . . . . . . . . . . . . . . . . . . . . . 5/6/99 6,850,078 38,947,625 Hong Kong Dollar . . . . . . . . . . . . . . . . . . . . . . . 6/1/99 5,018,886 3,354,454 New Zealand Dollar . . . . . . . . . . . . . . . . . . . . . . 5/6/99 1,794,904
15,500,000 Norwegian Krone . . . . . . . . . . . . . . . . . . . . . . . . 8/27/99 1,997,582 22,700,000 South African Rand . . . . . . . . . . . . . . . . . . . . . . 6/8/99 3,618,687 12,864,000 Singapore Dollar . . . . . . . . . . . . . . . . . . . . . . . . . 5/6/99 7,473,504 10,378,800 Singapore Dollar . . . . . . . . . . . . . . . . . . . . . . . . . 5/25/99 6,039,329 22,454,900 Singapore Dollar . . . . . . . . . . . . . . . . . . . . . . . . . 6/8/99 13,081,660 1,262,800 Singapore Dollar . . . . . . . . . . . . . . . . . . . . . . . . . 6/17/99 736,231 2,620,200 Singapore Dollar . . . . . . . . . . . . . . . . . . . . . . . . . 7/2/99 1,529,495
13,987,800 Swiss Franc . . . . . . . . . . . . . . . . . . . . . . . . . . . . . 4/12/99 9,477,825 32,754,990 Swiss Franc . . . . . . . . . . . . . . . . . . . . . . . . . . . . . 5/17/99 22,278,850 15,577,650 Swiss Franc . . . . . . . . . . . . . . . . . . . . . . . . . . . . . 6/8/99 10,620,039 38,899,350 Swiss Franc . . . . . . . . . . . . . . . . . . . . . . . . . . . . . 7/23/99 26,646,638
TOTAL FORWARD EXCHANGE CONTRACTS TO BUY(Contract Amount $187,770,563) . . . . . . . . . . . . . . . . . . . . . . . $ 177,791,903
FORWARD EXCHANGE CONTRACTS TO SELL153,971 Australian Dollar . . . . . . . . . . . . . . . . . . . . . . . . 12/23/99 $ (97,827)
2,574,000 Canadian Dollar . . . . . . . . . . . . . . . . . . . . . . . . . 5/6/99 (1,705,395)15,104,775 Canadian Dollar . . . . . . . . . . . . . . . . . . . . . . . . . 5/17/99 (10,008,066)7,920,550 Canadian Dollar . . . . . . . . . . . . . . . . . . . . . . . . . 6/1/99 (5,248,290)1,754,400 Canadian Dollar . . . . . . . . . . . . . . . . . . . . . . . . . 7/2/99 (1,162,655)
956,410 Canadian Dollar . . . . . . . . . . . . . . . . . . . . . . . . . 7/23/99 (633,923)8,267,860 Canadian Dollar . . . . . . . . . . . . . . . . . . . . . . . . . 12/23/99 (5,488,130)2,250,750 Canadian Dollar . . . . . . . . . . . . . . . . . . . . . . . . . 3/27/00 (1,495,595)4,517,400 Canadian Dollar . . . . . . . . . . . . . . . . . . . . . . . . . 3/29/00 (3,001,816)
67,890,000 Danish Krona . . . . . . . . . . . . . . . . . . . . . . . . . . . 7/2/99 (9,914,664)5,069,250 Danish Krona . . . . . . . . . . . . . . . . . . . . . . . . . . . 7/23/99 (741,121)9,366,000 Danish Krona . . . . . . . . . . . . . . . . . . . . . . . . . . . 12/23/99 (1,381,003)
9,496 European Economic Union Euro . . . . . . . . . . . . . 4/1/99 (10,261)55,781 European Economic Union Euro . . . . . . . . . . . . . 4/8/99 (60,293)
32
Schedule of Forward Exchange ContractsTWEEDY, BROWNE GLOBAL VALUE FUND
March 31, 1999
SEE NOTES TO FINANCIAL STATEMENTS

Contract MarketValue Value
Contracts Date (Note 1)
FORWARD EXCHANGE CONTRACTS TO SELL22,687 European Economic Union Euro . . . . . . . . . . . . . 4/9/99 $ (24,523)
24,672,350 European Economic Union Euro . . . . . . . . . . . . . 4/12/99 (26,674,738)10,044,334 European Economic Union Euro . . . . . . . . . . . . . 4/23/99 (10,866,801)10,250,555 European Economic Union Euro . . . . . . . . . . . . . 5/6/99 (11,098,459)19,205,407 European Economic Union Euro . . . . . . . . . . . . . 5/17/99 (20,807,169)5,360,415 European Economic Union Euro . . . . . . . . . . . . . 5/25/99 (5,810,148)
18,377,028 European Economic Union Euro . . . . . . . . . . . . . 6/1/99 (19,926,838)20,133,741 European Economic Union Euro . . . . . . . . . . . . . 6/8/99 (21,840,463)22,158,655 European Economic Union Euro . . . . . . . . . . . . . 6/17/99 (24,049,424)11,490,619 European Economic Union Euro . . . . . . . . . . . . . 7/2/99 (12,482,007)15,806,432 European Economic Union Euro . . . . . . . . . . . . . 7/15/99 (17,184,108)8,271,479 European Economic Union Euro . . . . . . . . . . . . . 8/2/99 (9,002,507)1,700,382 European Economic Union Euro . . . . . . . . . . . . . 8/13/99 (1,851,929)6,861,561 European Economic Union Euro . . . . . . . . . . . . . 8/27/99 (7,479,608)
14,005,616 European Economic Union Euro . . . . . . . . . . . . . 10/27/99 (15,327,457)23,462,883 European Economic Union Euro . . . . . . . . . . . . . 11/5/99 (25,692,808)10,029,764 European Economic Union Euro . . . . . . . . . . . . . 11/12/99 (10,988,156)4,003,750 European Economic Union Euro . . . . . . . . . . . . . 11/15/99 (4,387,210)
17,009,988 European Economic Union Euro . . . . . . . . . . . . . 11/22/99 (18,647,872)17,767,622 European Economic Union Euro . . . . . . . . . . . . . 12/10/99 (19,501,955)19,649,003 European Economic Union Euro . . . . . . . . . . . . . 12/23/99 (21,585,749)8,868,601 European Economic Union Euro . . . . . . . . . . . . . 12/31/99 (9,747,967)2,531,815 European Economic Union Euro . . . . . . . . . . . . . 1/4/00 (2,783,601)9,630,684 European Economic Union Euro . . . . . . . . . . . . . 1/18/00 (10,598,350)
21,620,687 European Economic Union Euro . . . . . . . . . . . . . 2/11/00 (23,831,200)39,268,184 European Economic Union Euro . . . . . . . . . . . . . 2/25/00 (43,323,379)19,715,028 European Economic Union Euro . . . . . . . . . . . . . 3/27/00 (21,795,903)16,197,246 European Economic Union Euro . . . . . . . . . . . . . 3/29/00 (17,909,222)
910,747 Great Britain Pound Sterling . . . . . . . . . . . . . . . 5/6/99 (1,469,458)8,098,679 Great Britain Pound Sterling . . . . . . . . . . . . . . . 5/25/99 (13,065,911)
13,083,297 Great Britain Pound Sterling . . . . . . . . . . . . . . . 6/8/99 (21,106,571)11,990,408 Great Britain Pound Sterling . . . . . . . . . . . . . . . 7/2/99 (19,341,799)24,843,949 Great Britain Pound Sterling . . . . . . . . . . . . . . . 7/23/99 (40,075,910)9,319,664 Great Britain Pound Sterling . . . . . . . . . . . . . . . 8/27/99 (15,033,592)
17,925,430 Great Britain Pound Sterling . . . . . . . . . . . . . . . 10/20/99 (28,923,471)4,866,180 Great Britain Pound Sterling . . . . . . . . . . . . . . . 11/5/99 (7,853,287)4,276,637 Great Britain Pound Sterling . . . . . . . . . . . . . . . 11/15/99 (6,902,672)3,644,094 Great Britain Pound Sterling . . . . . . . . . . . . . . . 11/22/99 (5,882,209)5,442,671 Great Britain Pound Sterling . . . . . . . . . . . . . . . 12/31/99 (8,789,494)
19,680,197 Great Britain Pound Sterling . . . . . . . . . . . . . . . 2/11/00 (31,797,833)12,503,126 Great Britain Pound Sterling . . . . . . . . . . . . . . . 2/25/00 (20,204,995)12,309,965 Great Britain Pound Sterling . . . . . . . . . . . . . . . 3/13/00 (19,896,856)12,174,337 Great Britain Pound Sterling . . . . . . . . . . . . . . . 3/27/00 (19,680,905)14,729,348 Great Britain Pound Sterling . . . . . . . . . . . . . . . 3/29/00 (23,811,878)23,991,000 Hong Kong Dollar . . . . . . . . . . . . . . . . . . . . . . . 4/12/99 (3,095,064)19,833,750 Hong Kong Dollar . . . . . . . . . . . . . . . . . . . . . . . 4/23/99 (2,558,059)53,127,650 Hong Kong Dollar . . . . . . . . . . . . . . . . . . . . . . . 5/6/99 (6,850,077)77,895,250 Hong Kong Dollar . . . . . . . . . . . . . . . . . . . . . . . 6/1/99 (10,037,772)
Schedule of Forward Exchange ContractsTWEEDY, BROWNE GLOBAL VALUE FUND
March 31, 1999
33
SEE NOTES TO FINANCIAL STATEMENTS

Contract MarketValue Value
Contracts Date (Note 1)
FORWARD EXCHANGE CONTRACTS TO SELL30,765,500 Hong Kong Dollar . . . . . . . . . . . . . . . . . . . . . . . 7/2/99 $ (3,961,548)32,712,400 Hong Kong Dollar . . . . . . . . . . . . . . . . . . . . . . . 7/23/99 (4,208,334)93,345,500 Hong Kong Dollar . . . . . . . . . . . . . . . . . . . . . . . 8/2/99 (12,003,255)35,110,757 Hong Kong Dollar . . . . . . . . . . . . . . . . . . . . . . . 9/14/99 (4,506,286)
158,880,000 Hong Kong Dollar . . . . . . . . . . . . . . . . . . . . . . . 10/20/99 (20,346,784)56,100,100 Hong Kong Dollar . . . . . . . . . . . . . . . . . . . . . . . 11/5/99 (7,176,314)
127,448,000 Hong Kong Dollar . . . . . . . . . . . . . . . . . . . . . . . 11/12/99 (16,295,091)55,548,500 Hong Kong Dollar . . . . . . . . . . . . . . . . . . . . . . . 1/18/00 (7,068,746)31,663,200 Hong Kong Dollar . . . . . . . . . . . . . . . . . . . . . . . 3/6/00 (4,015,573)94,668,000 Hong Kong Dollar . . . . . . . . . . . . . . . . . . . . . . . 3/27/00 (11,988,146)3,972,040 Japanese Yen . . . . . . . . . . . . . . . . . . . . . . . . . . . . 4/1/99 (33,543)3,633,718 Japanese Yen . . . . . . . . . . . . . . . . . . . . . . . . . . . . 4/2/99 (30,686)
45,628,893 Japanese Yen . . . . . . . . . . . . . . . . . . . . . . . . . . . . 4/5/99 (385,514)3,416,175,000 Japanese Yen . . . . . . . . . . . . . . . . . . . . . . . . . . . . 4/12/99 (28,895,014)3,714,900,000 Japanese Yen . . . . . . . . . . . . . . . . . . . . . . . . . . . . 4/23/99 (31,476,551)4,131,270,000 Japanese Yen . . . . . . . . . . . . . . . . . . . . . . . . . . . . 5/6/99 (35,069,969)3,815,400,000 Japanese Yen . . . . . . . . . . . . . . . . . . . . . . . . . . . . 5/25/99 (32,466,625)5,156,000,000 Japanese Yen . . . . . . . . . . . . . . . . . . . . . . . . . . . . 6/1/99 (43,913,134)2,475,605,000 Japanese Yen . . . . . . . . . . . . . . . . . . . . . . . . . . . . 6/8/99 (21,103,136)
379,288,000 Japanese Yen . . . . . . . . . . . . . . . . . . . . . . . . . . . . 7/2/99 (3,243,157)4,761,792,500 Japanese Yen . . . . . . . . . . . . . . . . . . . . . . . . . . . . 7/15/99 (40,790,653)2,407,984,000 Japanese Yen . . . . . . . . . . . . . . . . . . . . . . . . . . . . 8/2/99 (20,679,363)2,302,420,000 Japanese Yen . . . . . . . . . . . . . . . . . . . . . . . . . . . . 8/13/99 (19,803,179)2,235,400,000 Japanese Yen . . . . . . . . . . . . . . . . . . . . . . . . . . . . 11/12/99 (19,475,158)
466,720,000 Japanese Yen . . . . . . . . . . . . . . . . . . . . . . . . . . . . 11/15/99 (4,067,878)2,919,000,000 Japanese Yen . . . . . . . . . . . . . . . . . . . . . . . . . . . . 12/10/99 (25,532,327)
559,500,000 Japanese Yen . . . . . . . . . . . . . . . . . . . . . . . . . . . . 12/24/99 (4,903,646)329,130,000 Japanese Yen . . . . . . . . . . . . . . . . . . . . . . . . . . . . 1/4/00 (2,889,104)544,050,000 Japanese Yen . . . . . . . . . . . . . . . . . . . . . . . . . . . . 2/16/00 (4,804,735)
1,275,010,000 Japanese Yen . . . . . . . . . . . . . . . . . . . . . . . . . . . . 2/25/00 (11,274,406)7,505,550,000 Japanese Yen . . . . . . . . . . . . . . . . . . . . . . . . . . . . 3/6/00 (66,461,833)2,684,405,000 Japanese Yen . . . . . . . . . . . . . . . . . . . . . . . . . . . . 3/13/00 (23,793,818)2,810,250,000 Japanese Yen . . . . . . . . . . . . . . . . . . . . . . . . . . . . 3/29/00 (24,965,714)
3,354,454 New Zealand Dollar . . . . . . . . . . . . . . . . . . . . . . 5/6/99 (1,794,903)12,514,440 New Zealand Dollar . . . . . . . . . . . . . . . . . . . . . . 6/8/99 (6,698,677)1,829,268 New Zealand Dollar . . . . . . . . . . . . . . . . . . . . . . 7/2/99 (979,417)9,914,733 New Zealand Dollar . . . . . . . . . . . . . . . . . . . . . . 8/2/99 (5,309,959)2,067,825 New Zealand Dollar . . . . . . . . . . . . . . . . . . . . . . 8/27/99 (1,107,696)1,359,487 New Zealand Dollar . . . . . . . . . . . . . . . . . . . . . . 9/14/99 (728,370)7,517,384 New Zealand Dollar . . . . . . . . . . . . . . . . . . . . . . 10/27/99 (4,029,066)6,753,497 New Zealand Dollar . . . . . . . . . . . . . . . . . . . . . . 11/5/99 (3,619,926)9,293,680 New Zealand Dollar . . . . . . . . . . . . . . . . . . . . . . 11/12/99 (4,981,779)
28,790,787 New Zealand Dollar . . . . . . . . . . . . . . . . . . . . . . 12/23/99 (15,438,376)3,723,008 New Zealand Dollar . . . . . . . . . . . . . . . . . . . . . . 3/13/00 (1,997,749)
12,025,902 New Zealand Dollar . . . . . . . . . . . . . . . . . . . . . . 3/27/00 (6,454,592)96,660,880 Norwegian Krone . . . . . . . . . . . . . . . . . . . . . . . . 8/27/99 (12,457,294)
34
Schedule of Forward Exchange ContractsTWEEDY, BROWNE GLOBAL VALUE FUND
March 31, 1999
SEE NOTES TO FINANCIAL STATEMENTS
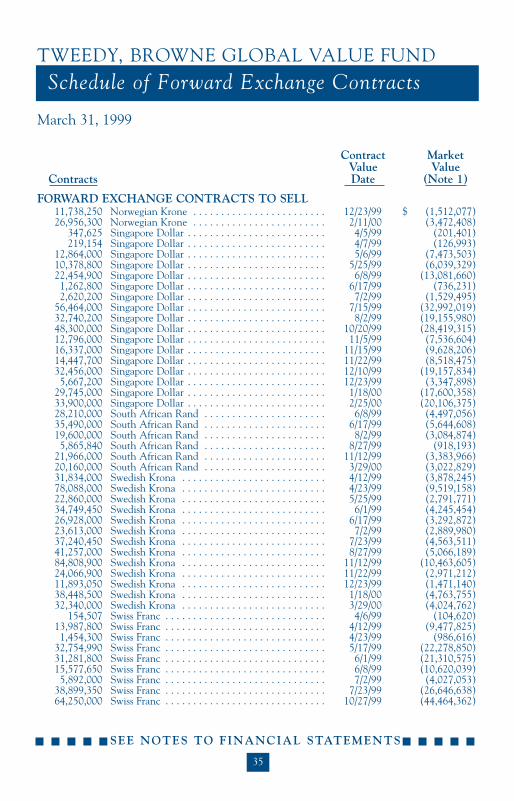
Contract MarketValue Value
Contracts Date (Note 1)
FORWARD EXCHANGE CONTRACTS TO SELL11,738,250 Norwegian Krone . . . . . . . . . . . . . . . . . . . . . . . . 12/23/99 $ (1,512,077)26,956,300 Norwegian Krone . . . . . . . . . . . . . . . . . . . . . . . . 2/11/00 (3,472,408)
347,625 Singapore Dollar . . . . . . . . . . . . . . . . . . . . . . . . . 4/5/99 (201,401)219,154 Singapore Dollar . . . . . . . . . . . . . . . . . . . . . . . . . 4/7/99 (126,993)
12,864,000 Singapore Dollar . . . . . . . . . . . . . . . . . . . . . . . . . 5/6/99 (7,473,503)10,378,800 Singapore Dollar . . . . . . . . . . . . . . . . . . . . . . . . . 5/25/99 (6,039,329)22,454,900 Singapore Dollar . . . . . . . . . . . . . . . . . . . . . . . . . 6/8/99 (13,081,660)1,262,800 Singapore Dollar . . . . . . . . . . . . . . . . . . . . . . . . . 6/17/99 (736,231)2,620,200 Singapore Dollar . . . . . . . . . . . . . . . . . . . . . . . . . 7/2/99 (1,529,495)
56,464,000 Singapore Dollar . . . . . . . . . . . . . . . . . . . . . . . . . 7/15/99 (32,992,019)32,740,200 Singapore Dollar . . . . . . . . . . . . . . . . . . . . . . . . . 8/2/99 (19,155,980)48,300,000 Singapore Dollar . . . . . . . . . . . . . . . . . . . . . . . . . 10/20/99 (28,419,315)12,796,000 Singapore Dollar . . . . . . . . . . . . . . . . . . . . . . . . . 11/5/99 (7,536,604)16,337,000 Singapore Dollar . . . . . . . . . . . . . . . . . . . . . . . . . 11/15/99 (9,628,206)14,447,700 Singapore Dollar . . . . . . . . . . . . . . . . . . . . . . . . . 11/22/99 (8,518,475)32,456,000 Singapore Dollar . . . . . . . . . . . . . . . . . . . . . . . . . 12/10/99 (19,157,834)5,667,200 Singapore Dollar . . . . . . . . . . . . . . . . . . . . . . . . . 12/23/99 (3,347,898)
29,745,000 Singapore Dollar . . . . . . . . . . . . . . . . . . . . . . . . . 1/18/00 (17,600,358)33,900,000 Singapore Dollar . . . . . . . . . . . . . . . . . . . . . . . . . 2/25/00 (20,106,375)28,210,000 South African Rand . . . . . . . . . . . . . . . . . . . . . . 6/8/99 (4,497,056)35,490,000 South African Rand . . . . . . . . . . . . . . . . . . . . . . 6/17/99 (5,644,608)19,600,000 South African Rand . . . . . . . . . . . . . . . . . . . . . . 8/2/99 (3,084,874)5,865,840 South African Rand . . . . . . . . . . . . . . . . . . . . . . 8/27/99 (918,193)
21,966,000 South African Rand . . . . . . . . . . . . . . . . . . . . . . 11/12/99 (3,383,966)20,160,000 South African Rand . . . . . . . . . . . . . . . . . . . . . . 3/29/00 (3,022,829)31,834,000 Swedish Krona . . . . . . . . . . . . . . . . . . . . . . . . . . 4/12/99 (3,878,245)78,088,000 Swedish Krona . . . . . . . . . . . . . . . . . . . . . . . . . . 4/23/99 (9,519,158)22,860,000 Swedish Krona . . . . . . . . . . . . . . . . . . . . . . . . . . 5/25/99 (2,791,771)34,749,450 Swedish Krona . . . . . . . . . . . . . . . . . . . . . . . . . . 6/1/99 (4,245,454)26,928,000 Swedish Krona . . . . . . . . . . . . . . . . . . . . . . . . . . 6/17/99 (3,292,872)23,613,000 Swedish Krona . . . . . . . . . . . . . . . . . . . . . . . . . . 7/2/99 (2,889,980)37,240,450 Swedish Krona . . . . . . . . . . . . . . . . . . . . . . . . . . 7/23/99 (4,563,511)41,257,000 Swedish Krona . . . . . . . . . . . . . . . . . . . . . . . . . . 8/27/99 (5,066,189)84,808,900 Swedish Krona . . . . . . . . . . . . . . . . . . . . . . . . . . 11/12/99 (10,463,605)24,066,900 Swedish Krona . . . . . . . . . . . . . . . . . . . . . . . . . . 11/22/99 (2,971,212)11,893,050 Swedish Krona . . . . . . . . . . . . . . . . . . . . . . . . . . 12/23/99 (1,471,140)38,448,500 Swedish Krona . . . . . . . . . . . . . . . . . . . . . . . . . . 1/18/00 (4,763,755)32,340,000 Swedish Krona . . . . . . . . . . . . . . . . . . . . . . . . . . 3/29/00 (4,024,762)
154,507 Swiss Franc . . . . . . . . . . . . . . . . . . . . . . . . . . . . . 4/6/99 (104,620)13,987,800 Swiss Franc . . . . . . . . . . . . . . . . . . . . . . . . . . . . . 4/12/99 (9,477,825)1,454,300 Swiss Franc . . . . . . . . . . . . . . . . . . . . . . . . . . . . . 4/23/99 (986,616)
32,754,990 Swiss Franc . . . . . . . . . . . . . . . . . . . . . . . . . . . . . 5/17/99 (22,278,850)31,281,800 Swiss Franc . . . . . . . . . . . . . . . . . . . . . . . . . . . . . 6/1/99 (21,310,575)15,577,650 Swiss Franc . . . . . . . . . . . . . . . . . . . . . . . . . . . . . 6/8/99 (10,620,039)5,892,000 Swiss Franc . . . . . . . . . . . . . . . . . . . . . . . . . . . . . 7/2/99 (4,027,053)
38,899,350 Swiss Franc . . . . . . . . . . . . . . . . . . . . . . . . . . . . . 7/23/99 (26,646,638)64,250,000 Swiss Franc . . . . . . . . . . . . . . . . . . . . . . . . . . . . . 10/27/99 (44,464,362)
Schedule of Forward Exchange ContractsTWEEDY, BROWNE GLOBAL VALUE FUND
March 31, 1999
35
SEE NOTES TO FINANCIAL STATEMENTS
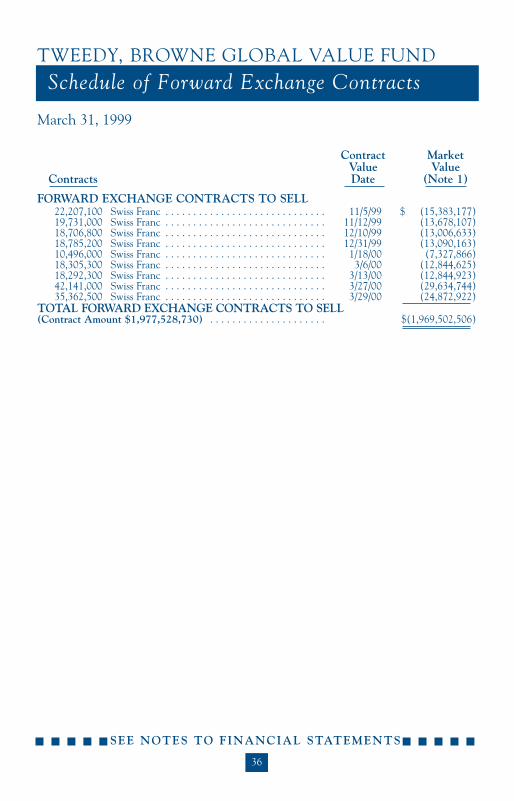
Contract MarketValue Value
Contracts Date (Note 1)
FORWARD EXCHANGE CONTRACTS TO SELL22,207,100 Swiss Franc . . . . . . . . . . . . . . . . . . . . . . . . . . . . . 11/5/99 $ (15,383,177)19,731,000 Swiss Franc . . . . . . . . . . . . . . . . . . . . . . . . . . . . . 11/12/99 (13,678,107)18,706,800 Swiss Franc . . . . . . . . . . . . . . . . . . . . . . . . . . . . . 12/10/99 (13,006,633)18,785,200 Swiss Franc . . . . . . . . . . . . . . . . . . . . . . . . . . . . . 12/31/99 (13,090,163)10,496,000 Swiss Franc . . . . . . . . . . . . . . . . . . . . . . . . . . . . . 1/18/00 (7,327,866)18,305,300 Swiss Franc . . . . . . . . . . . . . . . . . . . . . . . . . . . . . 3/6/00 (12,844,625)18,292,300 Swiss Franc . . . . . . . . . . . . . . . . . . . . . . . . . . . . . 3/13/00 (12,844,923)42,141,000 Swiss Franc . . . . . . . . . . . . . . . . . . . . . . . . . . . . . 3/27/00 (29,634,744)35,362,500 Swiss Franc . . . . . . . . . . . . . . . . . . . . . . . . . . . . . 3/29/00 (24,872,922)
TOTAL FORWARD EXCHANGE CONTRACTS TO SELL(Contract Amount $1,977,528,730) . . . . . . . . . . . . . . . . . . . . . $(1,969,502,506)
36
Schedule of Forward Exchange ContractsTWEEDY, BROWNE GLOBAL VALUE FUND
March 31, 1999
SEE NOTES TO FINANCIAL STATEMENTS

ASSETSInvestments, at value (Cost $2,185,612,978) (Note 1)
See accompanying schedule. . . . . . . . . . . . . . . . . . . . $ 2,594,182,157 Cash and foreign currency (Cost $3,336,516). . . . . . . . . . . 4,155,388 Dividends and interest receivable . . . . . . . . . . . . . . . . . . . . 8,984,646 Receivable for investment securities sold . . . . . . . . . . . . . . 4,762,849 Receivable for Fund shares sold . . . . . . . . . . . . . . . . . . . . . 4,371,980 Prepaid expenses. . . . . . . . . . . . . . . . . . . . . . . . . . . . . . . . . 18,321
Total Assets . . . . . . . . . . . . . . . . . . . . . . . . . . . . . . 2,616,475,341
LIABILITIESPayable for Fund shares redeemed. . . . . . . . . . . . . . . . . . . . $14,247,746 Payable for investment securities purchased . . . . . . . . . . . . 8,148,969Net unrealized depreciation of forward
exchange contracts (Note 1) . . . . . . . . . . . . . . . . . . . 1,952,436Investment advisory fee payable (Note 2). . . . . . . . . . . . . . 1,786,317Transfer agent fees payable (Note 2). . . . . . . . . . . . . . . . . . 137,206Custodian fees payable (Note 2). . . . . . . . . . . . . . . . . . . . . 96,500Accrued expenses and other payables . . . . . . . . . . . . . . . . . 532,196
Total Liabilities . . . . . . . . . . . . . . . . . . . . . . . . . . . 26,901,370 NET ASSETS. . . . . . . . . . . . . . . . . . . . . . . . . . . . . . . . . . . . . $ 2,589,573,971
NET ASSETS consist ofUndistributed net investment income . . . . . . . . . . . . . . . . $ 7,038,576 Accumulated net realized gain on securities, forward
exchange contracts and foreign currencies. . . . . . . . . 111,916,063 Net unrealized appreciation of securities, forward exchange
contracts, foreign currencies and net other assets . . . 406,590,505 Par value . . . . . . . . . . . . . . . . . . . . . . . . . . . . . . . . . . . . . . 14,324 Paid-in capital in excess of par value . . . . . . . . . . . . . . . . . 2,064,014,503
Total Net Assets . . . . . . . . . . . . . . . . . . . . . . . $ 2,589,573,971
NET ASSET VALUE, offering and redemption price per share ($2,589,573,971 4 143,236,350 shares of common stock outstanding) . . . . . . . . . . . . . . . . . . . . . . . . . . . . . . . $18.08
Statement of Assets and LiabilitiesTWEEDY, BROWNE GLOBAL VALUE FUND
March 31, 1999
37
SEE NOTES TO FINANCIAL STATEMENTS
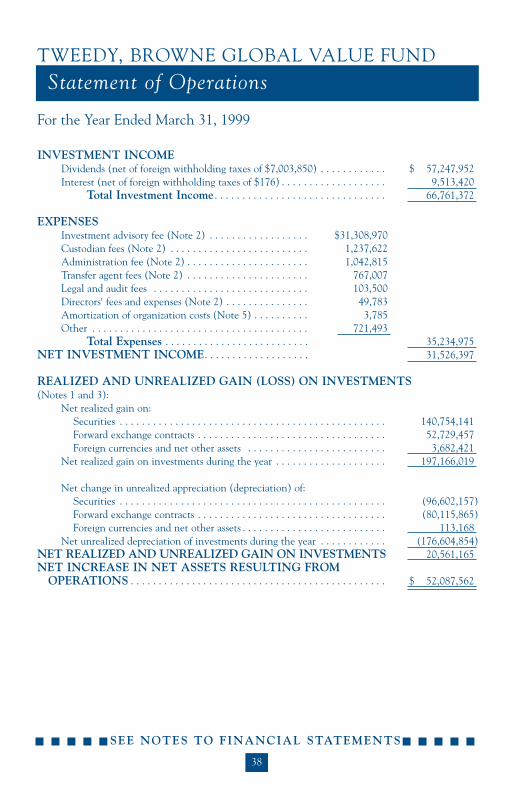
INVESTMENT INCOME Dividends (net of foreign withholding taxes of $7,003,850) . . . . . . . . . . . . $ 57,247,952 Interest (net of foreign withholding taxes of $176) . . . . . . . . . . . . . . . . . . . 9,513,420
Total Investment Income . . . . . . . . . . . . . . . . . . . . . . . . . . . . . . . 66,761,372
EXPENSES Investment advisory fee (Note 2) . . . . . . . . . . . . . . . . . . $31,308,970 Custodian fees (Note 2) . . . . . . . . . . . . . . . . . . . . . . . . . 1,237,622 Administration fee (Note 2) . . . . . . . . . . . . . . . . . . . . . . 1,042,815 Transfer agent fees (Note 2) . . . . . . . . . . . . . . . . . . . . . . 767,007 Legal and audit fees . . . . . . . . . . . . . . . . . . . . . . . . . . . . 103,500 Directors' fees and expenses (Note 2) . . . . . . . . . . . . . . . 49,783 Amortization of organization costs (Note 5) . . . . . . . . . . 3,785 Other . . . . . . . . . . . . . . . . . . . . . . . . . . . . . . . . . . . . . . . 721,493
Total Expenses . . . . . . . . . . . . . . . . . . . . . . . . . . 35,234,975 NET INVESTMENT INCOME. . . . . . . . . . . . . . . . . . . 31,526,397
REALIZED AND UNREALIZED GAIN (LOSS) ON INVESTMENTS(Notes 1 and 3):
Net realized gain on:Securities . . . . . . . . . . . . . . . . . . . . . . . . . . . . . . . . . . . . . . . . . . . . . . . . 140,754,141 Forward exchange contracts . . . . . . . . . . . . . . . . . . . . . . . . . . . . . . . . . . 52,729,457 Foreign currencies and net other assets . . . . . . . . . . . . . . . . . . . . . . . . . 3,682,421
Net realized gain on investments during the year . . . . . . . . . . . . . . . . . . . . 197,166,019
Net change in unrealized appreciation (depreciation) of:Securities . . . . . . . . . . . . . . . . . . . . . . . . . . . . . . . . . . . . . . . . . . . . . . . . (96,602,157)Forward exchange contracts . . . . . . . . . . . . . . . . . . . . . . . . . . . . . . . . . . (80,115,865)Foreign currencies and net other assets . . . . . . . . . . . . . . . . . . . . . . . . . . 113,168
Net unrealized depreciation of investments during the year . . . . . . . . . . . . (176,604,854)NET REALIZED AND UNREALIZED GAIN ON INVESTMENTS 20,561,165 NET INCREASE IN NET ASSETS RESULTING FROM
OPERATIONS . . . . . . . . . . . . . . . . . . . . . . . . . . . . . . . . . . . . . . . . . . . . . . $ 52,087,562
38
Statement of OperationsTWEEDY, BROWNE GLOBAL VALUE FUND
For the Year Ended March 31, 1999
SEE NOTES TO FINANCIAL STATEMENTS

Year YearEnded Ended
3/31/99 3/31/98Net investment income . . . . . . . . . . . . . . . . . . . . . . . . . . . . . . $ 31,526,397 $ 19,920,077 Net realized gain on securities, forward exchange contracts
and currency transactions during the year . . . . . . . . . . . . 197,166,019 182,967,157 Net unrealized appreciation (depreciation) of securities,
forward exchange contracts, foreign currencies andnet other assets during the year . . . . . . . . . . . . . . . . . . . . (176,604,854) 356,433,551
Net increase in net assets resulting from operations . . . . . . . . . 52,087,562 559,320,785 Distributions:
Dividends to shareholders from net investment income . . (51,902,775) (87,707,202)Dividends in excess of net investment income . . . . . . . . . – (8,964,368)Distributions to shareholders from net realized gain on
investments . . . . . . . . . . . . . . . . . . . . . . . . . . . . . . . (135,825,791) (54,368,991)Net increase in net assets from Fund share transactions (Note 4) 197,274,233 678,450,026 Net increase in net assets . . . . . . . . . . . . . . . . . . . . . . . . . . . . . 61,633,229 1,086,730,250 NET ASSETSBeginning of year . . . . . . . . . . . . . . . . . . . . . . . . . . . . . . . . . . . 2,527,940,742 1,441,210,492 End of year (including undistributed net investment income
of $7,038,576 and $16,475,676, respectively) . . . . . . . . . . $2,589,573,971 $2,527,940,742
Statements of Changes in Net AssetsTWEEDY, BROWNE GLOBAL VALUE FUND
39
SEE NOTES TO FINANCIAL STATEMENTS

Year Year Year Year YearEnded Ended Ended Ended Ended
3/31/99 3/31/98 3/31/97 3/31/96(a) 3/31/95Net asset value, beginning of year . . . $ 18.98 $ 15.46 $ 14.28 $ 11.52 $ 12.26 Income from investment operations:Net investment income (b) . . . . . . . . 0.23 0.26 0.12 0.15 0.10 Net realized and unrealized gain
(loss) on investments . . . . . . . . . . 0.24 4.62 2.18 2.81 (0.68)Total from investment operations. 0.47 4.88 2.30 2.96 (0.58)
Distributions:Dividends from net investment
income. . . . . . . . . . . . . . . . . . . (0.38) (0.79) (0.19) — —Dividends in excess of net
investment income. . . . . . . . . . — (0.08) (0.36) — —Distributions from net realized
gains. . . . . . . . . . . . . . . . . . . . . (0.99) (0.49) (0.57) (0.05) (0.06)Distributions in excess of net
realized gains. . . . . . . . . . . . . . . — — — (0.15) (0.10)Total distributions . . . . . . . . . . (1.37) (1.36) (1.12) (0.20) (0.16)
Net asset value, end of year . . . . . . . . $ 18.08 $ 18.98 $ 15.46 $ 14.28 $ 11.52 Total return (c) . . . . . . . . . . . . . . . . . 3.03% 33.09% 16.66% 25.88% (4.74)%
Ratios/Supplemental Data:Net assets, end of year (in 000's) . . . . $2,589,574 $2,527,941 $1,441,210 $950,911 $655,035 Ratio of operating expenses to
average net assets (d) . . . . . . . . . . . 1.41% 1.42% 1.58% 1.60% 1.65%Ratio of net investment income
to average net assets . . . . . . . . . . . 1.26% 1.05% 0.73% 1.15% 1.08%Portfolio turnover rate . . . . . . . . . . . . 23% 16% 20% 17% 16%
(a) Per share amounts have been calculated using the monthly average share method, which moreappropriately presents the per share data for the period since the use of the undistributed incomemethod does not accord with results of operations.
(b) Net investment income for a Fund share outstanding, before the waiver of fees by the administratorfor the years ended March 31, 1998 and 1997 were $0.26 and $0.11, respectively.
(c) Total return represents aggregate total return for the periods indicated.(d) Annualized expense ratio before the waiver of fees by the administrator for the years ended March
31, 1998 and 1997 were 1.43% and 1.58%, respectively.
40
Financial HighlightsTWEEDY, BROWNE GLOBAL VALUE FUND
For a Fund share outstanding throughout each year.
SEE NOTES TO FINANCIAL STATEMENTS
1. Significant Accounting Policies
Tweedy, Browne Global Value Fund (the “Fund”) is a diversifiedseries of Tweedy, Browne Fund Inc. (the “Company”). The Company is anopen-end management investment company registered with the Securitiesand Exchange Commission under the Investment Company Act of 1940,as amended. The Company was organized as a Maryland corporation onJanuary 28, 1993. The Fund commenced operations on June 15, 1993.The preparation of financial statements in accordance with generallyaccepted accounting principles requires management to make estimatesand assumptions that affect the reported amounts and disclosures in thefinancial statements. Actual results could differ from those estimates. Thefollowing is a summary of significant accounting policies consistently fol-lowed by the Fund in the preparation of its financial statements.
Portfolio Valuation Generally, the Fund’s investments are valued atmarket value or, in the absence of market value, by the Investment Adviseror, at fair value as determined by or under the direction of the Company’sBoard of Directors. Portfolio securities and other assets, listed on a U.S.national securities exchange or through any system providing for same daypublication of actual prices (and not subject to restrictions against sale bythe Fund on such exchange or system) are valued at the last quoted saleprice prior to the close of regular trading. Portfolio securities and otherassets listed on a foreign exchange or through any system providing forsame day publication of actual prices are valued at the last quoted sale priceavailable before the time when assets are valued. Portfolio securities andother assets for which there are no reported sales on the valuation date arevalued at the mean between the last asked price and the last bid price priorto the close of regular trading. When the Investment Adviser determinesthat the last sale price prior to valuation does not reflect current marketvalue, the Investment Adviser will determine the market value of thosesecurities or assets in accordance with industry practice and other factorsconsidered relevant by the Investment Adviser. All other securities andassets for which current market quotations are not readily available andthose securities which are not readily marketable due to significant legal orcontractual restrictions will be valued by the Investment Adviser or at fair
Notes to Financial StatementsTWEEDY, BROWNE GLOBAL VALUE FUND
41
value as determined by or under the direction of the Board of Directors.Debt securities with a remaining maturity of 60 days or less are valued atamortized cost, which approximates market value, or by reference to otherfactors (i.e., pricing services or dealer quotations) by the InvestmentAdviser.
Repurchase Agreements The Fund engages in repurchase agree-ment transactions. Under the terms of a typical repurchase agreement, theFund takes possession of an underlying debt obligation subject to an obli-gation of the seller to repurchase, and the Fund to resell, the obligation atan agreed-upon price and time, thereby determining the yield during theFund’s holding period. This arrangement results in a fixed rate of returnthat is not subject to market fluctuations during the Fund’s holding period.The value of the collateral is at least equal at all times to the total amountof the repurchase obligations, including interest. In the event of counter-party default, the Fund has the right to use the collateral to offset lossesincurred. There is potential loss to the Fund in the event the Fund isdelayed or prevented from exercising its rights to dispose of the collateralsecurities, including the risk of a possible decline in the value of the under-lying securities during the period while the Fund seeks to assert its rights.The Fund’s Investment Adviser, acting under the supervision of theCompany’s Board of Directors, reviews the value of the collateral and thecreditworthiness of those banks and dealers with which the Fund entersinto repurchase agreements to evaluate potential risks.
Foreign Currency The books and records of the Fund are main-tained in U.S. dollars. Foreign currencies, investments and other assetsand liabilities are translated into U.S. dollars at the exchange rates pre-vailing at the end of the period, and purchases and sales of investmentsecurities, income and expenses are translated on the respective dates ofsuch transactions. Unrealized gains and losses which result from changesin foreign currency exchange rates have been included in the unrealizedappreciation (depreciation) of currencies and net other assets. Net realizedforeign currency gains and losses resulting from changes in exchange ratesinclude foreign currency gains and losses between trade date and settlementdate on investments, securities transactions, foreign currency transactions
42
Notes to Financial StatementsTWEEDY, BROWNE GLOBAL VALUE FUND

and the difference between the amounts of interest and dividends recordedon the books of the Fund and the amount actually received. The portionof foreign currency gains and losses related to fluctuation in the exchangerates between the initial purchase trade date and subsequent sale tradedate is included in realized gains and losses on investment securities sold.
Forward Exchange Contracts The Fund has entered into forwardexchange contracts for non-trading purposes in order to reduce its expo-sure to fluctuations in foreign currency exchange on its portfolio holdings.Forward exchange contracts are valued at the forward rate and aremarked-to-market daily. The change in market value is recorded by theFund as an unrealized gain or loss. When the contract is closed, the Fundrecords a realized gain or loss equal to the difference between the value ofthe contract at the time that it was opened and the value of the contractat the time that it was closed.
The use of forward exchange contracts does not eliminate fluctua-tions in the underlying prices of the Fund’s investment securities, but itdoes establish a rate of exchange that can be achieved in the future.Although forward exchange contracts limit the risk of loss due to a declinein the value of the hedged currency, they also limit any potential gain thatmight result should the value of the currency increase. In addition, theFund could be exposed to risks if the counterparties to the contracts areunable to meet the terms of their contracts.
Securities Transactions and Investment Income Securities trans-actions are recorded as of the trade date. Realized gains and losses fromsecurities transactions are recorded on the identified cost basis. Dividendincome and distributions to shareholders are recorded on the ex-dividenddate. Interest income is recorded on the accrual basis. Dividend incomeand interest income may be subject to foreign withholding taxes. TheFund’s custodian applies for refunds where available. If the Fund meetsthe requirements of Section 853 of the Internal Revenue Code of 1986, asamended, the Fund may elect to pass through to its shareholders creditsfor foreign taxes paid.
Notes to Financial StatementsTWEEDY, BROWNE GLOBAL VALUE FUND
43
Dividends and Distributions to Shareholders Dividends from netinvestment income, if any, and distributions from realized capital gainsafter utilization of capital loss carryforwards, if any, will be declared andpaid annually. Additional distributions of net investment income andcapital gains from the Fund may be made at the discretion of the Board ofDirectors in order to avoid the application of a 4% non-deductible Federalexcise tax on certain undistributed amounts of ordinary income and capitalgains. Income distributions and capital gain distributions are determinedin accordance with income tax regulations which may differ from gener-ally accepted accounting principles. These differences are primarily dueto differing treatments of income and gains on various investment securitiesheld by the Fund, timing differences and differing characterization of distributions made by the Fund.
Federal Income Taxes The Fund intends to qualify as a regulatedinvestment company, if such qualification is in the best interest of itsshareholders, by complying with the requirements of the InternalRevenue Code of 1986, as amended, applicable to regulated investmentcompanies and by distributing substantially all of its taxable income to itsshareholders. Therefore, no Federal income tax provision is required.
Expenses Expenses directly attributable to each Fund as a diversifiedseries of the Company are charged to that Fund. Other expenses of theCompany are allocated to each Fund based on the average net assets ofeach Fund.
2. Investment Advisory Fee, Other Related Party Transactions andAdministration Fee
The Company, on behalf of the Fund, has entered into an invest-ment advisory agreement (the “Advisory Agreement”) with Tweedy,Browne Company LLC (“Tweedy, Browne”). Under the AdvisoryAgreement, the Company pays Tweedy, Browne a fee at the annual rate of1.25% of the value of its average daily net assets. The fee is payablemonthly, provided the Fund will make such interim payments as may berequested by the Investment Adviser not to exceed 75% of the amount ofthe fee then accrued on the books of the Fund and unpaid.
44
Notes to Financial StatementsTWEEDY, BROWNE GLOBAL VALUE FUND

The current and retired general partners and their families, as wellas employees of Tweedy, Browne, the Investment Adviser to the Fund,have approximately $40.7 million of their own money invested in theFund.
The Company, on behalf of the Fund, has entered into an adminis-tration agreement (the “Administration Agreement”) with First DataInvestor Services Group, Inc. (the “Administrator”), a wholly owned sub-sidiary of First Data Corporation. Under the Administration Agreement,the Company pays the Administrator an administrative fee and a fundaccounting fee computed daily and payable monthly at the followingannual rates of the value of the average daily net assets of the Fund:
Fees on AssetsBetween
Up to $500 Million and Exceeding$500 Million $1 Billion $1 Billion
Administration Fees 0.06% 0.04% 0.02%Up to Exceeding
$100 Million $100 MillionAccounting Fees 0.03% 0.01%
Under the terms of the Administration Agreement, the Companywill pay for fund administration services a minimum fee of $40,000 perannum, not to be aggregated with fees for fund accounting services. TheCompany will pay a minimum monthly fee of $4,000 for fund accountingservices for the Fund, not to be aggregated with fees for fund administra-tion services. From time to time, the Administrator may voluntarilywaive a portion of its fee otherwise payable to it. For the year endedMarch 31, 1999, the Administrator did not waive any administrative fees.
No officer, director or employee of Tweedy, Browne, theAdministrator or any parent or subsidiary of those corporations receivesany compensation from the Company for serving as a director or officer ofthe Company. The Fund pays each director who is not an officer, directoror employee of Tweedy, Browne, the Administrator or any of their affili-ates $8,000 per annum plus $500 per Regular or Special Board Meetingattended in person or by telephone, plus out-of-pocket expenses.
Notes to Financial StatementsTWEEDY, BROWNE GLOBAL VALUE FUND
45

Boston Safe Deposit and Trust Company (“Boston Safe”), an indirectwholly owned subsidiary of Mellon Trust, serves as the Fund's custodianpursuant to a custody agreement (the “Custody Agreement”). First DataInvestor Services Group, Inc. serves as the Fund’s transfer agent. Tweedy,Browne also serves as the distributor to the Fund and pays all distributionfees. No distribution fees are paid by the Fund.
3. Securities Transactions
Cost of purchases and proceeds from sales of investment securities,excluding short-term investments, for the year ended March 31, 1999,aggregated $818,186,260 and $545,726,790, respectively.
At March 31, 1999, the aggregate gross unrealized appreciation forall securities, in which there was an excess of value over tax cost, was$590,050,617 and the aggregate gross unrealized depreciation for all securities,in which there was an excess of tax cost over value, was $211,061,326.
4. Capital Stock
The Company is authorized to issue one billion shares of $0.0001par value capital stock, of which 600,000,000 of the unissued shares havebeen designated as shares of the Fund. Changes in shares outstanding forthe Fund were as follows:
Year Ended 3/31/99 Year Ended 3/31/98Shares Amount Shares Amount
Sold 68,156,263 $1,217,805,048 58,530,975 $1,007,774,368Reinvested 10,128,684 170,060,040 8,222,804 133,167,149Redeemed (68,246,032) (1,190,590,855) (26,794,022) (462,491,491)Net increase 10,038,915 $ 197,274,233 39,959,757 $ 678,450,026
5. Organization Costs
The Fund bears all costs in connection with its organization includingthe fees and expenses of registering and qualifying its shares for distributionunder Federal and state securities regulations. All such costs have beendeferred and are being amortized over a five-year period using the straight-
46
Notes to Financial StatementsTWEEDY, BROWNE GLOBAL VALUE FUND
line method from the commencement of operations of the Fund. In theevent that any of the initial shares of the Fund are redeemed during suchamortization period, the Fund will be reimbursed for any unamortizedorganization costs in the same proportion as the number of shares redeemedbears to the number of initial shares held at the time of redemption. AtMarch 31, 1999, all such costs have been fully amortized.
6. Foreign Securities
Investing in securities of foreign companies and foreign governmentsinvolves economic and political risks and considerations not typically asso-ciated with investing in U.S. companies and the U.S. Government. Theseconsiderations include changes in exchange rates and exchange rate controls(which may include suspension of the ability to transfer currency from agiven country), costs incurred in conversions between currencies, non-negotiable brokerage commissions, less publicly available information, dif-ferent accounting standards, lower trading volume, delayed settlementsand greater market volatility, the difficulty of enforcing obligations in othercountries, less securities regulation, different tax provisions (includingwithholding on dividends paid to the Fund), war, expropriation, politicaland social instability and diplomatic developments.
7. Line of Credit
Effective October 1, 1996, the Company and Mellon Trust, N.A.have entered into a Line of Credit Agreement (the “Agreement”) whichprovides the Fund and the Tweedy, Browne American Value Fund with a$50 million line of credit, primarily for temporary or emergency purposes,including the meeting of redemption requests that might otherwise requirethe untimely disposition of securities. The Fund may borrow up to one-third of its net assets; however, the total credit available to the Fund andthe Tweedy, Browne American Value Fund is $50 million. Interest ispayable at the bank’s money market rate plus 0.75% on an annualized basis.Under the Agreement, the Fund and the Tweedy, Browne American ValueFund pay a facility fee equal to 0.10% annually of the unutilized credit.The Agreement requires, among other provisions, the Fund to maintain a
Notes to Financial StatementsTWEEDY, BROWNE GLOBAL VALUE FUND
47
ratio of net assets (not including funds borrowed pursuant to theAgreement) to aggregated amount of indebtedness pursuant to theAgreement of no less than three to one. For the year ended March 31,1999, the Fund did not borrow under this Agreement.
48
Notes to Financial StatementsTWEEDY, BROWNE GLOBAL VALUE FUND

To the Shareholders and Board of Directors ofTweedy, Browne Fund Inc.:
We have audited the accompanying statement of assets and liablities,including the portfolio of investments and the schedule of forwardexchange contracts, of Tweedy, Browne Global Value Fund (the “Fund”) (aseries of Tweedy, Browne Fund Inc.) as of March 31, 1999, the relatedstatement of operations for the year then ended, the statements of changesin net assets for each of the two years in the period then ended and financialhighlights for each of the five years in the period then ended. These financial statements and financial highlights are the responsibility of theFund’s management. Our responsibility is to express an opinion on thesefinancial statements and financial highlights based on our audits.
We conducted our audits in accordance with generally accepted audit-ing standards. Those standards require that we plan and perform the audit toobtain reasonable assurance about whether the financial statements andfinancial highlights are free of material misstatement. An audit includesexamining, on a test basis, evidence supporting the amounts and disclosuresin the financial statements and financial highlights. Our procedures includ-ed confirmation of securities owned as of March 31, 1999 by correspondencewith the custodian and brokers, or by other appropriate auditing procedureswhere replies from brokers were not received. An audit also includes assessingthe accounting principles used and significant estimates made by manage-ment, as well as evaluating the overall financial statement presentation. Webelieve that our audits provide a reasonable basis for our opinion.
In our opinion, the financial statements and financial highlightsreferred to above present fairly, in all material respects, the financial posi-tion of the Tweedy, Browne Global Value Fund, a series of Tweedy, BrowneFund Inc., at March 31, 1999, the results of its operations for the year thenended, the changes in its net assets for each of the two years in the periodthen ended and financial highlights for each of the five years in the periodthen ended, in conformity with generally accepted accounting principles.
Boston, MassachusettsMay 7, 1999
Report of Ernst & Young LLP, Independent AuditorsTWEEDY, BROWNE GLOBAL VALUE FUND
49

Year Ended March 31, 1999
For the fiscal year ended March 31, 1999, the amount of long-termcapital gain designated by the Fund was $106,373,560, which is taxable asa 20% rate gain for Federal income tax purposes.
Of the ordinary income (including short-term capital gain) distribu-tions made by the Fund during the fiscal year ended March 31, 1999, 6.06%qualify for the dividend received deduction available to corporate share-holders.
50
Tax Information (unaudited)TWEEDY, BROWNE GLOBAL VALUE FUND

Portfolio HighlightsTWEEDY, BROWNE AMERICAN VALUE FUND
51
March 31, 1999Hypothetical Illustration of $10,000 Invested in
Tweedy, Browne American Value Fund vs. Standard & Poor’s 500 Stock Index (“S&P 500”) and
Morningstar Mid-Cap Value Funds (“MMCV”) Average12/8/93 through 3/31/99
The S&P 500 is an index composed of 500 widely held common stocks listed on the New York StockExchange, American Stock Exchange and over-the-counter market and includes the reinvestment of dividends.
MMCV Average consists of the average returns of all mutual funds in the Morningstar Universe classified asvalue funds with median market capitalizations greater than or equal to $1 billion but less than or equal to $5 billion.
Index and Average information is available at month end only; therefore, the closest month end to inceptiondate of the Fund, November 30, 1993, has been used.
Note: The performance shown represents past performance and is not a guarantee of future results.The Fund’s share price and investment return will vary with market conditions, and the principal value of shares, when redeemed, may be more or less than original cost.
* Assumes the reinvestment of all dividends and distributions.** See Note 2 to Financial Statements.
Dec1993
Mar1994
Jun1994
Sep1994
Mar1995
Jun1995
Sep1995
Mar1996
Jun1996
Sep1996
Mar1997
Jun1997
Sep1997
Mar1998
Jun1998
Sep1998
Mar1999
$31,214
$19,470
$24,715
Index: S&P 500*Index: MMCV Average
Tweedy, Browne American Value Fund*
$9,000$11,000$13,000$15,000$17,000$19,000$21,000$23,000$25,000$27,000$29,000$31,000$33,000
AVERAGE ANNUAL TOTAL RETURN* AGGREGATE TOTAL RETURN*____________________________________ ______________________________Year Inception
Without Ended (12/8/93)-The Fund Actual Waivers** 3/31/99 3/31/99_________ _______ _________ _______ _______Inception (12/8/93)
through 3/31/99 18.57% 18.37% The Fund (1.09)% 147.15%Year Ended 3/31/99 (1.09)% (1.11)% S&P 500 18.49% 212.14%
MMCV (9.79)% 94.70%

March 31, 1999
In accordance with rules and guidelines set out by the Securities andExchange Commission, we have provided a comparison of the historicalinvestment results of Tweedy, Browne American Value Fund to the histori-cal investment results of the most appropriate broad-based securities marketindexes, including the Standard & Poor’s 500 Stock Index (the “S&P 500”).However, the historical results of the S&P 500 in large measure representthe investment results of stocks that we do not own. Any portfolio whichdoes not own exactly the same stocks in exactly the same proportions as theindex to which the particular portfolio is being compared is not likely tohave the same results as the index. The investment behavior of a diversifiedportfolio of undervalued stocks tends to be correlated to the investmentbehavior of a broad index; i.e., when the index is up, probably more thanone-half of the stocks in the entire universe of public companies that areincluded in the same index will be up, albeit, in greater or lesser percentagesthan the index. Similarly, when the index declines, probably most of thestocks in the entire universe of public companies that are included in theindex will be down in greater or lesser percentages than the index. But it isalmost a mathematical truth that “different stocks equal different results.”
Favorable or unfavorable historical investment results in comparison toan index are not necessarily predictive of future comparative investmentresults. In Are Short-Term Performance and Value Investing MutuallyExclusive?, Eugene Shahan analyzed the investment performance of sevenmoney managers, about whom Warren Buffett wrote in his article, The SuperInvestors of Graham and Doddsville. Over long periods of time, the sevenmanagers significantly outperformed the market as measured by the DowJones Industrial Average (the “DJIA”) or the S&P 500 by between 7.7% to16.5% annually. (The goal of most institutional money managers is to out-perform the market by 2% to 3%.) However, for periods ranging from 13
52
Perspective On Assessing Investment ResultsTWEEDY, BROWNE AMERICAN VALUE FUND
years to 28 years, this group of managers underperformed the marketbetween 7.7% to 42% of the years. Six of the seven investment managersunderperformed the market between 28% to 42% of the years. In today’senvironment, they would have lost many of their clients during their peri-ods of underperformance. Longer term, it would have been the wrong deci-sion to fire any of these money managers. In examining the seven long-terminvestment records, unfavorable investment results as compared to eitherindex did not predict the future favorable comparative investment resultswhich occurred, and favorable investment results in comparison to theDJIA or the S&P 500 were not always followed by future favorable com-parative results. Stretches of consecutive annual underperformance rangedfrom one to six years. Mr. Shahan concluded “Unfortunately, there is no wayto distinguish between a poor three-year stretch for a manager who will dowell over 15 years, from a poor three-year stretch for a manager who will con-tinue to do poorly. Nor is there any reason to believe that a manager whodoes well from the outset cannot continue to do well, and consistently.”
Perspective On Assessing Investment ResultsTWEEDY, BROWNE AMERICAN VALUE FUND
53

MarketValue
Shares (Note 1)COMMON STOCKS—DOMESTIC—74.6%Advertising—0.2%
6,680 Grey Advertising Inc. . . . . . . . . . . . . . . . . . . . . . . . . . . . . . . . . . $ 2,317,543
Apparel /Textiles—0.0%††45,900 Chic by H.I.S. Inc.† . . . . . . . . . . . . . . . . . . . . . . . . . . . . . . . . . . . 109,013
Automotive Parts—1.7%739,000 Dollar Thrifty Automotive Group Inc.† . . . . . . . . . . . . . . . . . . . . 12,747,750 170,400 Standard Motor Products Inc. . . . . . . . . . . . . . . . . . . . . . . . . . . . 3,525,150 95,300 Standard Products Company . . . . . . . . . . . . . . . . . . . . . . . . . . . . . 1,548,625 5,200 Woodward Governor Company . . . . . . . . . . . . . . . . . . . . . . . . . . 129,838
17,951,363 Banking—11.8%
45,300 BancFirst Corporation . . . . . . . . . . . . . . . . . . . . . . . . . . . . . . . . . . 1,585,500 252,898 Bank One Corporation . . . . . . . . . . . . . . . . . . . . . . . . . . . . . . . . . 13,925,196 20,400 Cape Cod Bank & Trust Company . . . . . . . . . . . . . . . . . . . . . . . . 331,500
541,814 Chase Manhattan Corporation . . . . . . . . . . . . . . . . . . . . . . . . . . . 44,056,251 112,650 Comerica Inc. . . . . . . . . . . . . . . . . . . . . . . . . . . . . . . . . . . . . . . . 7,033,584
4,500 Community Financial Group—Bank of Nashville . . . . . . . . . . . . . 57,656 20,400 First Mortgage Corporation† . . . . . . . . . . . . . . . . . . . . . . . . . . . . . 89,250 50,850 Mercantile Bancorp Inc. . . . . . . . . . . . . . . . . . . . . . . . . . . . . . . . 2,415,375 43,342 Mid-America Bancorp . . . . . . . . . . . . . . . . . . . . . . . . . . . . . . . . . 1,064,588 18,000 Peoples Bank Corporation of Indianapolis . . . . . . . . . . . . . . . . . . 654,750
246,700 PNC Bank Corporation . . . . . . . . . . . . . . . . . . . . . . . . . . . . . . . . 13,707,269 802,520 Popular Inc. . . . . . . . . . . . . . . . . . . . . . . . . . . . . . . . . . . . . . . . . . 24,802,884 118,000 Republic New York Corporation . . . . . . . . . . . . . . . . . . . . . . . . . . 5,442,750 360,000 Wells Fargo & Company . . . . . . . . . . . . . . . . . . . . . . . . . . . . . . . . 12,622,500
127,789,053 Basic Industries—4.5%
298,600 ACX Technologies Inc.† . . . . . . . . . . . . . . . . . . . . . . . . . . . . . . . . 3,919,125 219,200 Alamo Group Inc. . . . . . . . . . . . . . . . . . . . . . . . . . . . . . . . . . . . . 1,726,200 141,700 Gorman-Rupp Company . . . . . . . . . . . . . . . . . . . . . . . . . . . . . . . . 2,214,063 724,000 Rayonier Inc. . . . . . . . . . . . . . . . . . . . . . . . . . . . . . . . . . . . . . . . . 29,005,250 70,200 Sequa Corporation, Class A† . . . . . . . . . . . . . . . . . . . . . . . . . . . . 3,527,550 66,000 Tecumseh Products Company, Class A . . . . . . . . . . . . . . . . . . . . . 3,339,188 66,100 Tecumseh Products Company, Class B . . . . . . . . . . . . . . . . . . . . . 3,061,256 78,000 Tremont Corporation . . . . . . . . . . . . . . . . . . . . . . . . . . . . . . . . . . 1,374,750
48,167,382 Business and Commercial Services—1.3%
716,000 Harland (John H.) Company . . . . . . . . . . . . . . . . . . . . . . . . . . . . 9,263,250 24,400 HUB Group Inc., Class A† . . . . . . . . . . . . . . . . . . . . . . . . . . . . . . 579,500 5,200 IIC Industries Inc.† . . . . . . . . . . . . . . . . . . . . . . . . . . . . . . . . . . . . 55,250
12,500 Paris Corporation . . . . . . . . . . . . . . . . . . . . . . . . . . . . . . . . . . . . . 27,734 198,000 Wallace Computer Services Inc. . . . . . . . . . . . . . . . . . . . . . . . . . 3,922,875
13,848,609
54
Portfolio Highlights
March 31, 1999
SEE NOTES TO FINANCIAL STATEMENTSSEE NOTES TO FINANCIAL STATEMENTSSEE NOTES TO FINANCIAL STATEMENTSSEE NOTES TO FINANCIAL STATEMENTS
Portfolio of InvestmentsTWEEDY, BROWNE AMERICAN VALUE FUND

Portfolio Highlights
March 31, 1999
55
SEE NOTES TO FINANCIAL STATEMENTSSEE NOTES TO FINANCIAL STATEMENTSSEE NOTES TO FINANCIAL STATEMENTSSEE NOTES TO FINANCIAL STATEMENTS
MarketValue
Shares (Note 1)COMMON STOCKS—DOMESTICChemicals—1.4%
680,700 Lilly Industries Inc., Class A . . . . . . . . . . . . . . . . . . . . . . . . . . . . . $ 10,508,306 232,900 Oil-Dri Corporation of America . . . . . . . . . . . . . . . . . . . . . . . . . . 3,391,606 77,500 Stepan Chemical Company . . . . . . . . . . . . . . . . . . . . . . . . . . . . . 1,724,375
15,624,287 Consumer Non-Durables—6.1%
142,400 Bairnco Corporation . . . . . . . . . . . . . . . . . . . . . . . . . . . . . . . . . . . 676,400 130,400 Coca-Cola Bottling Company . . . . . . . . . . . . . . . . . . . . . . . . . . . . 7,220,900 209,200 EKCO Group Inc.† . . . . . . . . . . . . . . . . . . . . . . . . . . . . . . . . . . . . 706,050 347,500 M & F Worldwide Corporation† . . . . . . . . . . . . . . . . . . . . . . . . . . 2,432,500 869,470 Philip Morris Companies Inc. . . . . . . . . . . . . . . . . . . . . . . . . . . . 30,594,476 910,900 UST Inc. . . . . . . . . . . . . . . . . . . . . . . . . . . . . . . . . . . . . . . . . . . . 23,797,263 57,200 Village Super Market Inc., Class A† . . . . . . . . . . . . . . . . . . . . . . . 818,675
66,246,264 Consumer Services—1.9%
512,900 Jones Intercable Inc., Class A† . . . . . . . . . . . . . . . . . . . . . . . . . . . 20,227,494
Electronic Equipment—0.2% 100,000 Regal Beloit . . . . . . . . . . . . . . . . . . . . . . . . . . . . . . . . . . . . . . . . . 1,806,250
Engineering and Construction—1.9%42,700 Devcon International Corporation† . . . . . . . . . . . . . . . . . . . . . . . 70,055
107,300 Harding Lawson Associates Group Inc.† . . . . . . . . . . . . . . . . . . . . 764,513 150,500 Hovnanian Enterprises Inc., Class A† . . . . . . . . . . . . . . . . . . . . . 1,128,750 22,900 Liberty Homes Inc., Class A . . . . . . . . . . . . . . . . . . . . . . . . . . . . 226,138 10,000 Liberty Homes Inc., Class B . . . . . . . . . . . . . . . . . . . . . . . . . . . . . 113,750 51,300 M/I Schottenstein Homes Inc. . . . . . . . . . . . . . . . . . . . . . . . . . . . 910,575
162,800 Oakwood Homes Corporation . . . . . . . . . . . . . . . . . . . . . . . . . . . . 2,289,375 13,700 Oriole Homes Corporation, Class A† . . . . . . . . . . . . . . . . . . . . . . 27,400 64,437 Oriole Homes Corporation, Class B † . . . . . . . . . . . . . . . . . . . . . . 118,806
269,000 RDO Equipment Company, Class A† . . . . . . . . . . . . . . . . . . . . . 2,421,000 309,621 Ryland Group Inc. . . . . . . . . . . . . . . . . . . . . . . . . . . . . . . . . . . . . 7,837,282 271,300 Standard-Pacific Corporation . . . . . . . . . . . . . . . . . . . . . . . . . . . . 3,492,988 158,000 Washington Homes Inc.† . . . . . . . . . . . . . . . . . . . . . . . . . . . . . . . 809,750
20,210,382 Financial Services—17.5%
382,230 American Express Company . . . . . . . . . . . . . . . . . . . . . . . . . . . . . 44,912,025 885,300 Credit Acceptance Corporation† . . . . . . . . . . . . . . . . . . . . . . . . . 5,062,809 789,380 Federal Home Loan Mortgage Corporation . . . . . . . . . . . . . . . . . . 45,093,333 543,500 Household International Inc. . . . . . . . . . . . . . . . . . . . . . . . . . . . . 24,797,188 41,600 Kent Financial Services Inc.† . . . . . . . . . . . . . . . . . . . . . . . . . . . . 156,000 30,000 Letchworth Independent Bancshares Corporation . . . . . . . . . . . . 406,875
632,700 MBIA Inc. . . . . . . . . . . . . . . . . . . . . . . . . . . . . . . . . . . . . . . . . . . 36,696,600 142,000 Morgan, (J.P.) & Company Inc. . . . . . . . . . . . . . . . . . . . . . . . . . . 17,519,250 756,000 Phoenix Duff & Phelps Corporation . . . . . . . . . . . . . . . . . . . . . . . 6,520,500 109,030 ReliaStar Financial Corporation . . . . . . . . . . . . . . . . . . . . . . . . . . 4,647,404 29,800 Value Line Inc. . . . . . . . . . . . . . . . . . . . . . . . . . . . . . . . . . . . . . . . 1,029,031 39,004 Whitney Holding Corporation . . . . . . . . . . . . . . . . . . . . . . . . . . . 1,439,491
188,280,506
Portfolio of InvestmentsTWEEDY, BROWNE AMERICAN VALUE FUND
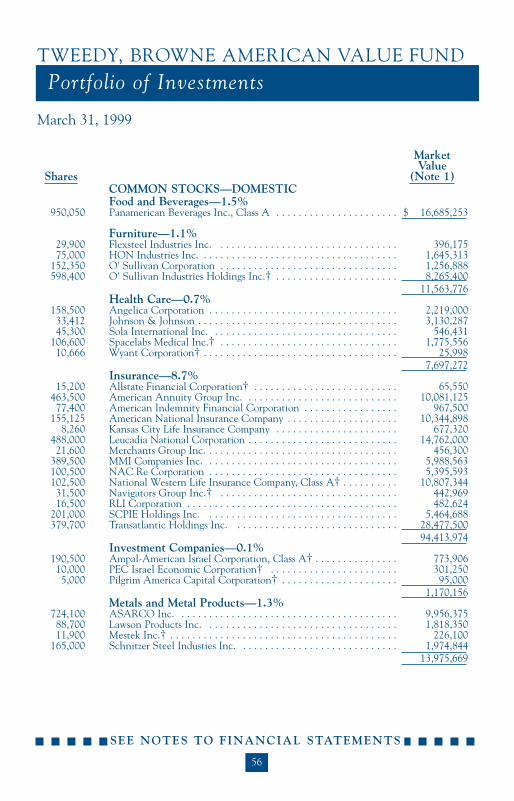
MarketValue
Shares (Note 1)COMMON STOCKS—DOMESTICFood and Beverages—1.5%
950,050 Panamerican Beverages Inc., Class A . . . . . . . . . . . . . . . . . . . . . . $ 16,685,253
Furniture—1.1%29,900 Flexsteel Industries Inc. . . . . . . . . . . . . . . . . . . . . . . . . . . . . . . . . 396,175 75,000 HON Industries Inc. . . . . . . . . . . . . . . . . . . . . . . . . . . . . . . . . . . . 1,645,313
152,350 O' Sullivan Corporation . . . . . . . . . . . . . . . . . . . . . . . . . . . . . . . . 1,256,888 598,400 O' Sullivan Industries Holdings Inc.† . . . . . . . . . . . . . . . . . . . . . . 8,265,400
11,563,776 Health Care—0.7%
158,500 Angelica Corporation . . . . . . . . . . . . . . . . . . . . . . . . . . . . . . . . . . 2,219,000 33,412 Johnson & Johnson . . . . . . . . . . . . . . . . . . . . . . . . . . . . . . . . . . . . 3,130,287 45,300 Sola International Inc. . . . . . . . . . . . . . . . . . . . . . . . . . . . . . . . . . 546,431
106,600 Spacelabs Medical Inc.† . . . . . . . . . . . . . . . . . . . . . . . . . . . . . . . . 1,775,556 10,666 Wyant Corporation† . . . . . . . . . . . . . . . . . . . . . . . . . . . . . . . . . . . 25,998
7,697,272 Insurance—8.7%
15,200 Allstate Financial Corporation† . . . . . . . . . . . . . . . . . . . . . . . . . . 65,550 463,500 American Annuity Group Inc. . . . . . . . . . . . . . . . . . . . . . . . . . . . 10,081,125 77,400 American Indemnity Financial Corporation . . . . . . . . . . . . . . . . . 967,500
155,125 American National Insurance Company . . . . . . . . . . . . . . . . . . . . 10,344,898 8,260 Kansas City Life Insurance Company . . . . . . . . . . . . . . . . . . . . . . 677,320
488,000 Leucadia National Corporation . . . . . . . . . . . . . . . . . . . . . . . . . . . 14,762,000 21,600 Merchants Group Inc. . . . . . . . . . . . . . . . . . . . . . . . . . . . . . . . . . . 456,300
389,500 MMI Companies Inc. . . . . . . . . . . . . . . . . . . . . . . . . . . . . . . . . . . 5,988,563 100,500 NAC Re Corporation . . . . . . . . . . . . . . . . . . . . . . . . . . . . . . . . . . 5,395,593 102,500 National Western Life Insurance Company, Class A† . . . . . . . . . . 10,807,344 31,500 Navigators Group Inc.† . . . . . . . . . . . . . . . . . . . . . . . . . . . . . . . . 442,969 16,500 RLI Corporation . . . . . . . . . . . . . . . . . . . . . . . . . . . . . . . . . . . . . . 482,624
201,000 SCPIE Holdings Inc. . . . . . . . . . . . . . . . . . . . . . . . . . . . . . . . . . . 5,464,688 379,700 Transatlantic Holdings Inc. . . . . . . . . . . . . . . . . . . . . . . . . . . . . . 28,477,500
94,413,974 Investment Companies—0.1%
190,500 Ampal-American Israel Corporation, Class A† . . . . . . . . . . . . . . . 773,906 10,000 PEC Israel Economic Corporation† . . . . . . . . . . . . . . . . . . . . . . . 301,250 5,000 Pilgrim America Capital Corporation† . . . . . . . . . . . . . . . . . . . . . 95,000
1,170,156 Metals and Metal Products—1.3%
724,100 ASARCO Inc. . . . . . . . . . . . . . . . . . . . . . . . . . . . . . . . . . . . . . . . 9,956,375 88,700 Lawson Products Inc. . . . . . . . . . . . . . . . . . . . . . . . . . . . . . . . . . . 1,818,350 11,900 Mestek Inc.† . . . . . . . . . . . . . . . . . . . . . . . . . . . . . . . . . . . . . . . . . 226,100
165,000 Schnitzer Steel Industies Inc. . . . . . . . . . . . . . . . . . . . . . . . . . . . . 1,974,844 13,975,669
56
Portfolio Highlights
March 31, 1999
SEE NOTES TO FINANCIAL STATEMENTSSEE NOTES TO FINANCIAL STATEMENTSSEE NOTES TO FINANCIAL STATEMENTSSEE NOTES TO FINANCIAL STATEMENTS
Portfolio of InvestmentsTWEEDY, BROWNE AMERICAN VALUE FUND
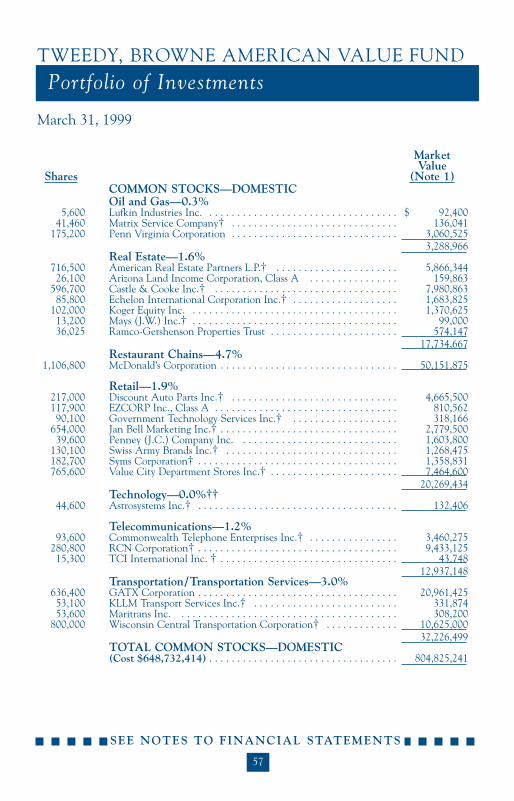
MarketValue
Shares (Note 1)COMMON STOCKS—DOMESTICOil and Gas—0.3%
5,600 Lufkin Industries Inc. . . . . . . . . . . . . . . . . . . . . . . . . . . . . . . . . . . $ 92,400 41,460 Matrix Service Company† . . . . . . . . . . . . . . . . . . . . . . . . . . . . . . 136,041
175,200 Penn Virginia Corporation . . . . . . . . . . . . . . . . . . . . . . . . . . . . . . 3,060,525 3,288,966
Real Estate—1.6%716,500 American Real Estate Partners L.P.† . . . . . . . . . . . . . . . . . . . . . . 5,866,344 26,100 Arizona Land Income Corporation, Class A . . . . . . . . . . . . . . . . 159,863
596,700 Castle & Cooke Inc.† . . . . . . . . . . . . . . . . . . . . . . . . . . . . . . . . . 7,980,863 85,800 Echelon International Corporation Inc.† . . . . . . . . . . . . . . . . . . . 1,683,825
102,000 Koger Equity Inc. . . . . . . . . . . . . . . . . . . . . . . . . . . . . . . . . . . . . . 1,370,625 13,200 Mays (J.W.) Inc.† . . . . . . . . . . . . . . . . . . . . . . . . . . . . . . . . . . . . . 99,000 36,025 Ramco-Gershenson Properties Trust . . . . . . . . . . . . . . . . . . . . . . . 574,147
17,734,667 Restaurant Chains—4.7%
1,106,800 McDonald’s Corporation . . . . . . . . . . . . . . . . . . . . . . . . . . . . . . . . 50,151,875
Retail—1.9%217,000 Discount Auto Parts Inc.† . . . . . . . . . . . . . . . . . . . . . . . . . . . . . . 4,665,500 117,900 EZCORP Inc., Class A . . . . . . . . . . . . . . . . . . . . . . . . . . . . . . . . . 810,562 90,100 Government Technology Services Inc.† . . . . . . . . . . . . . . . . . . . 318,166
654,000 Jan Bell Marketing Inc.† . . . . . . . . . . . . . . . . . . . . . . . . . . . . . . . . 2,779,500 39,600 Penney (J.C.) Company Inc. . . . . . . . . . . . . . . . . . . . . . . . . . . . . 1,603,800
130,100 Swiss Army Brands Inc.† . . . . . . . . . . . . . . . . . . . . . . . . . . . . . . . 1,268,475 182,700 Syms Corporation† . . . . . . . . . . . . . . . . . . . . . . . . . . . . . . . . . . . . 1,358,831 765,600 Value City Department Stores Inc.† . . . . . . . . . . . . . . . . . . . . . . . 7,464,600
20,269,434 Technology—0.0%††
44,600 Astrosystems Inc.† . . . . . . . . . . . . . . . . . . . . . . . . . . . . . . . . . . . . 132,406
Telecommunications—1.2%93,600 Commonwealth Telephone Enterprises Inc.† . . . . . . . . . . . . . . . . 3,460,275
280,800 RCN Corporation† . . . . . . . . . . . . . . . . . . . . . . . . . . . . . . . . . . . . 9,433,125 15,300 TCI International Inc. † . . . . . . . . . . . . . . . . . . . . . . . . . . . . . . . . 43,748
12,937,148 Transportation/Transportation Services—3.0%
636,400 GATX Corporation . . . . . . . . . . . . . . . . . . . . . . . . . . . . . . . . . . . . 20,961,425 53,100 KLLM Transport Services Inc.† . . . . . . . . . . . . . . . . . . . . . . . . . . 331,874 53,600 Maritrans Inc. . . . . . . . . . . . . . . . . . . . . . . . . . . . . . . . . . . . . . . . 308,200
800,000 Wisconsin Central Transportation Corporation† . . . . . . . . . . . . . 10,625,000 32,226,499
TOTAL COMMON STOCKS—DOMESTIC(Cost $648,732,414) . . . . . . . . . . . . . . . . . . . . . . . . . . . . . . . . . . 804,825,241
Portfolio Highlights
March 31, 1999
57
SEE NOTES TO FINANCIAL STATEMENTSSEE NOTES TO FINANCIAL STATEMENTSSEE NOTES TO FINANCIAL STATEMENTSSEE NOTES TO FINANCIAL STATEMENTS
Portfolio of InvestmentsTWEEDY, BROWNE AMERICAN VALUE FUND
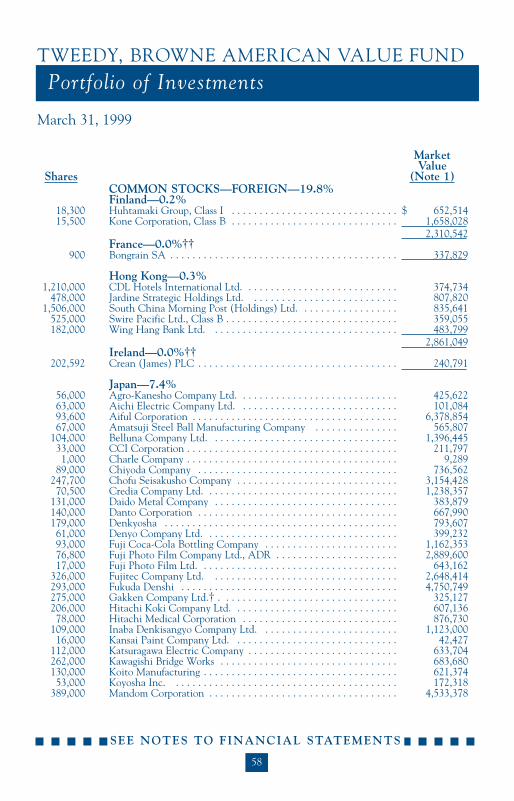
MarketValue
Shares (Note 1)COMMON STOCKS—FOREIGN—19.8%Finland—0.2%
18,300 Huhtamaki Group, Class I . . . . . . . . . . . . . . . . . . . . . . . . . . . . . . $ 652,514 15,500 Kone Corporation, Class B . . . . . . . . . . . . . . . . . . . . . . . . . . . . . . 1,658,028
2,310,542 France—0.0%††
900 Bongrain SA . . . . . . . . . . . . . . . . . . . . . . . . . . . . . . . . . . . . . . . . . 337,829
Hong Kong—0.3%1,210,000 CDL Hotels International Ltd. . . . . . . . . . . . . . . . . . . . . . . . . . . . 374,734
478,000 Jardine Strategic Holdings Ltd. . . . . . . . . . . . . . . . . . . . . . . . . . . 807,820 1,506,000 South China Morning Post (Holdings) Ltd. . . . . . . . . . . . . . . . . . 835,641
525,000 Swire Pacific Ltd., Class B . . . . . . . . . . . . . . . . . . . . . . . . . . . . . . . 359,055 182,000 Wing Hang Bank Ltd. . . . . . . . . . . . . . . . . . . . . . . . . . . . . . . . . . 483,799
2,861,049 Ireland—0.0%††
202,592 Crean (James) PLC . . . . . . . . . . . . . . . . . . . . . . . . . . . . . . . . . . . . 240,791
Japan—7.4%56,000 Agro-Kanesho Company Ltd. . . . . . . . . . . . . . . . . . . . . . . . . . . . . 425,622 63,000 Aichi Electric Company Ltd. . . . . . . . . . . . . . . . . . . . . . . . . . . . . 101,084 93,600 Aiful Corporation . . . . . . . . . . . . . . . . . . . . . . . . . . . . . . . . . . . . . 6,378,854 67,000 Amatsuji Steel Ball Manufacturing Company . . . . . . . . . . . . . . . 565,807
104,000 Belluna Company Ltd. . . . . . . . . . . . . . . . . . . . . . . . . . . . . . . . . . 1,396,445 33,000 CCI Corporation . . . . . . . . . . . . . . . . . . . . . . . . . . . . . . . . . . . . . . 211,797 1,000 Charle Company . . . . . . . . . . . . . . . . . . . . . . . . . . . . . . . . . . . . . . 9,289
89,000 Chiyoda Company . . . . . . . . . . . . . . . . . . . . . . . . . . . . . . . . . . . . 736,562 247,700 Chofu Seisakusho Company . . . . . . . . . . . . . . . . . . . . . . . . . . . . . 3,154,428 70,500 Credia Company Ltd. . . . . . . . . . . . . . . . . . . . . . . . . . . . . . . . . . . 1,238,357
131,000 Daido Metal Company . . . . . . . . . . . . . . . . . . . . . . . . . . . . . . . . . 383,879 140,000 Danto Corporation . . . . . . . . . . . . . . . . . . . . . . . . . . . . . . . . . . . . 667,990 179,000 Denkyosha . . . . . . . . . . . . . . . . . . . . . . . . . . . . . . . . . . . . . . . . . . 793,607 61,000 Denyo Company Ltd. . . . . . . . . . . . . . . . . . . . . . . . . . . . . . . . . . . 399,232 93,000 Fuji Coca-Cola Bottling Company . . . . . . . . . . . . . . . . . . . . . . . . 1,162,353 76,800 Fuji Photo Film Company Ltd., ADR . . . . . . . . . . . . . . . . . . . . . . 2,889,600 17,000 Fuji Photo Film Ltd. . . . . . . . . . . . . . . . . . . . . . . . . . . . . . . . . . . . 643,162
326,000 Fujitec Company Ltd. . . . . . . . . . . . . . . . . . . . . . . . . . . . . . . . . . 2,648,414 293,000 Fukuda Denshi . . . . . . . . . . . . . . . . . . . . . . . . . . . . . . . . . . . . . . . 4,750,749 275,000 Gakken Company Ltd.† . . . . . . . . . . . . . . . . . . . . . . . . . . . . . . . . 325,127 206,000 Hitachi Koki Company Ltd. . . . . . . . . . . . . . . . . . . . . . . . . . . . . . 607,136 78,000 Hitachi Medical Corporation . . . . . . . . . . . . . . . . . . . . . . . . . . . . 876,730
109,000 Inaba Denkisangyo Company Ltd. . . . . . . . . . . . . . . . . . . . . . . . . 1,123,000 16,000 Kansai Paint Company Ltd. . . . . . . . . . . . . . . . . . . . . . . . . . . . . . 42,427
112,000 Katsuragawa Electric Company . . . . . . . . . . . . . . . . . . . . . . . . . . . 633,704 262,000 Kawagishi Bridge Works . . . . . . . . . . . . . . . . . . . . . . . . . . . . . . . . 683,680 130,000 Koito Manufacturing . . . . . . . . . . . . . . . . . . . . . . . . . . . . . . . . . . . 621,374 53,000 Koyosha Inc. . . . . . . . . . . . . . . . . . . . . . . . . . . . . . . . . . . . . . . . . 172,318
389,000 Mandom Corporation . . . . . . . . . . . . . . . . . . . . . . . . . . . . . . . . . . 4,533,378
58
Portfolio Highlights
March 31, 1999
SEE NOTES TO FINANCIAL STATEMENTSSEE NOTES TO FINANCIAL STATEMENTSSEE NOTES TO FINANCIAL STATEMENTSSEE NOTES TO FINANCIAL STATEMENTS
Portfolio of InvestmentsTWEEDY, BROWNE AMERICAN VALUE FUND
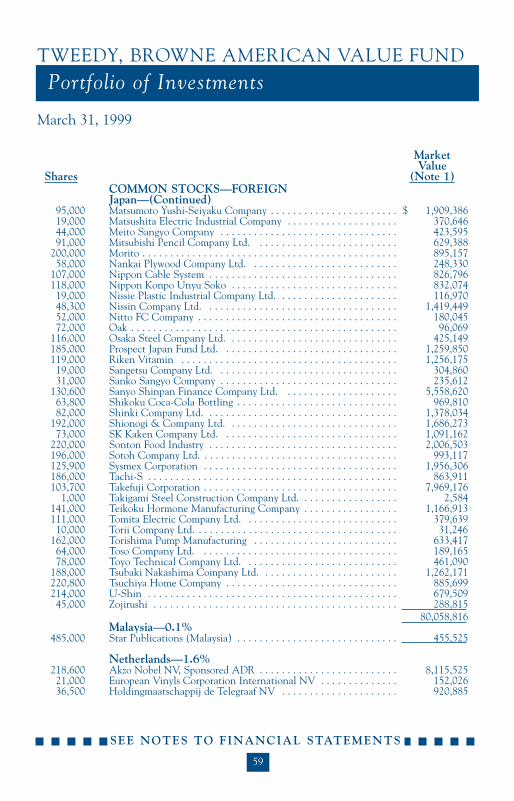
Portfolio Highlights
March 31, 1999
59
SEE NOTES TO FINANCIAL STATEMENTSSEE NOTES TO FINANCIAL STATEMENTSSEE NOTES TO FINANCIAL STATEMENTSSEE NOTES TO FINANCIAL STATEMENTS
MarketValue
Shares (Note 1)COMMON STOCKS—FOREIGNJapan—(Continued)
95,000 Matsumoto Yushi-Seiyaku Company . . . . . . . . . . . . . . . . . . . . . . . $ 1,909,386 19,000 Matsushita Electric Industrial Company . . . . . . . . . . . . . . . . . . . . 370,646 44,000 Meito Sangyo Company . . . . . . . . . . . . . . . . . . . . . . . . . . . . . . . . 423,595 91,000 Mitsubishi Pencil Company Ltd. . . . . . . . . . . . . . . . . . . . . . . . . . 629,388
200,000 Morito . . . . . . . . . . . . . . . . . . . . . . . . . . . . . . . . . . . . . . . . . . . . . . 895,157 58,000 Nankai Plywood Company Ltd. . . . . . . . . . . . . . . . . . . . . . . . . . . 248,330
107,000 Nippon Cable System . . . . . . . . . . . . . . . . . . . . . . . . . . . . . . . . . . 826,796 118,000 Nippon Konpo Unyu Soko . . . . . . . . . . . . . . . . . . . . . . . . . . . . . . 832,074 19,000 Nissie Plastic Industrial Company Ltd. . . . . . . . . . . . . . . . . . . . . . 116,970 48,300 Nissin Company Ltd. . . . . . . . . . . . . . . . . . . . . . . . . . . . . . . . . . . 1,419,449 52,000 Nitto FC Company . . . . . . . . . . . . . . . . . . . . . . . . . . . . . . . . . . . . 180,045 72,000 Oak . . . . . . . . . . . . . . . . . . . . . . . . . . . . . . . . . . . . . . . . . . . . . . . . 96,069
116,000 Osaka Steel Company Ltd. . . . . . . . . . . . . . . . . . . . . . . . . . . . . . . 425,149 185,000 Prospect Japan Fund Ltd. . . . . . . . . . . . . . . . . . . . . . . . . . . . . . . . 1,259,850 119,000 Riken Vitamin . . . . . . . . . . . . . . . . . . . . . . . . . . . . . . . . . . . . . . . 1,256,175 19,000 Sangetsu Company Ltd. . . . . . . . . . . . . . . . . . . . . . . . . . . . . . . . . 304,860 31,000 Sanko Sangyo Company . . . . . . . . . . . . . . . . . . . . . . . . . . . . . . . . 235,612
130,600 Sanyo Shinpan Finance Company Ltd. . . . . . . . . . . . . . . . . . . . . 5,558,620 63,800 Shikoku Coca-Cola Bottling . . . . . . . . . . . . . . . . . . . . . . . . . . . . . 969,810 82,000 Shinki Company Ltd. . . . . . . . . . . . . . . . . . . . . . . . . . . . . . . . . . . 1,378,034
192,000 Shionogi & Company Ltd. . . . . . . . . . . . . . . . . . . . . . . . . . . . . . . 1,686,273 73,000 SK Kaken Company Ltd. . . . . . . . . . . . . . . . . . . . . . . . . . . . . . . . 1,091,162
220,000 Sonton Food Industry . . . . . . . . . . . . . . . . . . . . . . . . . . . . . . . . . . 2,006,503 196,000 Sotoh Company Ltd. . . . . . . . . . . . . . . . . . . . . . . . . . . . . . . . . . . . 993,117 125,900 Sysmex Corporation . . . . . . . . . . . . . . . . . . . . . . . . . . . . . . . . . . . 1,956,306 186,000 Tachi-S . . . . . . . . . . . . . . . . . . . . . . . . . . . . . . . . . . . . . . . . . . . . . 863,911 103,700 Takefuji Corporation . . . . . . . . . . . . . . . . . . . . . . . . . . . . . . . . . . . 7,969,176
1,000 Takigami Steel Construction Company Ltd. . . . . . . . . . . . . . . . . . 2,584 141,000 Teikoku Hormone Manufacturing Company . . . . . . . . . . . . . . . . . 1,166,913 111,000 Tomita Electric Company Ltd. . . . . . . . . . . . . . . . . . . . . . . . . . . . 379,639 10,000 Torii Company Ltd. . . . . . . . . . . . . . . . . . . . . . . . . . . . . . . . . . . . . 31,246
162,000 Torishima Pump Manufacturing . . . . . . . . . . . . . . . . . . . . . . . . . . 633,417 64,000 Toso Company Ltd. . . . . . . . . . . . . . . . . . . . . . . . . . . . . . . . . . . . 189,165 78,000 Toyo Technical Company Ltd. . . . . . . . . . . . . . . . . . . . . . . . . . . . 461,090
188,000 Tsubaki Nakashima Company Ltd. . . . . . . . . . . . . . . . . . . . . . . . . 1,262,171 220,800 Tsuchiya Home Company . . . . . . . . . . . . . . . . . . . . . . . . . . . . . . . 885,699 214,000 U-Shin . . . . . . . . . . . . . . . . . . . . . . . . . . . . . . . . . . . . . . . . . . . . . 679,509 45,000 Zojirushi . . . . . . . . . . . . . . . . . . . . . . . . . . . . . . . . . . . . . . . . . . . . 288,815
80,058,816 Malaysia—0.1%
485,000 Star Publications (Malaysia) . . . . . . . . . . . . . . . . . . . . . . . . . . . . . 455,525
Netherlands—1.6%218,600 Akzo Nobel NV, Sponsored ADR . . . . . . . . . . . . . . . . . . . . . . . . . 8,115,525 21,000 European Vinyls Corporation International NV . . . . . . . . . . . . . . 152,026 36,500 Holdingmaatschappij de Telegraaf NV . . . . . . . . . . . . . . . . . . . . . 920,885
Portfolio of InvestmentsTWEEDY, BROWNE AMERICAN VALUE FUND

60
Portfolio Highlights
March 31, 1999
SEE NOTES TO FINANCIAL STATEMENTSSEE NOTES TO FINANCIAL STATEMENTSSEE NOTES TO FINANCIAL STATEMENTS
MarketValue
Shares (Note 1)COMMON STOCKS—FOREIGNNetherlands—(Continued)
120,800 Unilever NV, ADR . . . . . . . . . . . . . . . . . . . . . . . . . . . . . . . . . . . . $ 8,025,650 17,214,086
Singapore—0.4%518,000 Cycle & Carriage Ltd. . . . . . . . . . . . . . . . . . . . . . . . . . . . . . . . . . . 2,190,211 264,000 Fraser & Neave Ltd. . . . . . . . . . . . . . . . . . . . . . . . . . . . . . . . . . . . 940,400 266,000 Overseas Union Bank Ltd. . . . . . . . . . . . . . . . . . . . . . . . . . . . . . . 939,820 94,800 Robinson and Company Ord . . . . . . . . . . . . . . . . . . . . . . . . . . . . . 252,580
4,323,011 Spain—0.0%††
32,000 Unipapel SA . . . . . . . . . . . . . . . . . . . . . . . . . . . . . . . . . . . . . . . . . 414,912
Sweden—4.7%804,300 Pharmacia & Upjohn Inc., Depository Shares . . . . . . . . . . . . . . . . 50,629,867
Switzerland—3.0%3,650 Compagnie Financiere Richemont AG . . . . . . . . . . . . . . . . . . . . . 6,077,157 2,000 Edipresse SA, Bearer . . . . . . . . . . . . . . . . . . . . . . . . . . . . . . . . . . . 460,237
269,000 Nestle SA, Registered, ADR . . . . . . . . . . . . . . . . . . . . . . . . . . . . . 24,478,542 10,666 Novartis AG, ADR . . . . . . . . . . . . . . . . . . . . . . . . . . . . . . . . . . . . 866,635
31,882,571 United Kingdom—2.1%
875,000 British Steel Ord . . . . . . . . . . . . . . . . . . . . . . . . . . . . . . . . . . . . . . 1,804,148 315,000 Caradon PLC . . . . . . . . . . . . . . . . . . . . . . . . . . . . . . . . . . . . . . . . 693,979 274,000 Carclo Engineering Group PLC . . . . . . . . . . . . . . . . . . . . . . . . . . 515,205 445,000 Dowding & Mills PLC . . . . . . . . . . . . . . . . . . . . . . . . . . . . . . . . . 323,203 61,145 Elementis PLC . . . . . . . . . . . . . . . . . . . . . . . . . . . . . . . . . . . . . . . 91,780
163,670 Glaxo Wellcome PLC, Units, Sponsored ADR . . . . . . . . . . . . . . . 10,955,661 142,000 Hardys & Hansons PLC . . . . . . . . . . . . . . . . . . . . . . . . . . . . . . . . 574,116 41,711 HSBC Holdings . . . . . . . . . . . . . . . . . . . . . . . . . . . . . . . . . . . . . . 1,328,254
189,385 McAlpine (Alfred) PLC . . . . . . . . . . . . . . . . . . . . . . . . . . . . . . . . 519,634 50,000 Molins PLC . . . . . . . . . . . . . . . . . . . . . . . . . . . . . . . . . . . . . . . . . . 110,962
508,505 Pilkington PLC . . . . . . . . . . . . . . . . . . . . . . . . . . . . . . . . . . . . . . . 677,099 93,333 Rexam PLC . . . . . . . . . . . . . . . . . . . . . . . . . . . . . . . . . . . . . . . . . . 309,564 63,800 SmithKline Beecham PLC, Units, ADR . . . . . . . . . . . . . . . . . . . . 4,561,700
131,579 Thistle Hotels PLC . . . . . . . . . . . . . . . . . . . . . . . . . . . . . . . . . . . . 355,717 22,821,022
TOTAL COMMON STOCKS—FOREIGN(Cost $156,723,872) . . . . . . . . . . . . . . . . . . . . . . . . . . . . . . . . . . 213,550,021
SEE NOTES TO FINANCIAL STATEMENTS
Portfolio of InvestmentsTWEEDY, BROWNE AMERICAN VALUE FUND

MarketFace ValueValue (Note 1)
COMMERCIAL PAPER—1.9% (Cost $20,000,000)
$20,000,000 General Electric Capital Corporation, 5.060% due 4/1/99 . . . . $ 20,000,000
U.S. TREASURY BILL—0.1% (Cost $966,594)
1,000,000 4.501%** due 1/6/00 . . . . . . . . . . . . . . . . . . . . . . . . . . . . . . . . 965,620
REPURCHASE AGREEMENT—1.6% (Cost $17,230,000)
17,230,000 Agreement with UBS Securities Inc., 4.880% dated 3/31/99, to be repurchased at $17,232,336 on 4/1/99, collateralized by $17,209,000 U.S. Treasury Notes, 6.000% due 2/15/26(market value $17,483,268). . . . . . . . . . . . . . . . . . . . . . . . . . . 17,230,000
TOTAL INVESTMENTS (Cost $843,652,880*) . . . . . . . . 98.0% 1,056,570,882OTHER ASSETS AND LIABILITIES (Net) . . . . . . . . . . 2.0 21,643,609NET ASSETS . . . . . . . . . . . . . . . . . . . . . . . . . . . . . . . . . . . . . . 100.0% $ 1,078,214,491
* Aggregate cost for Federal tax purposes was $849,570,415.** Rate represents annualized yield at date of purchase (unaudited).† Non-income producing security.
†† Amount represents less than 0.1% of net assets.
Abbreviations:ADR American Depository ReceiptOrd Ordinary Shares
Portfolio Highlights
March 31, 1999
61
SEE NOTES TO FINANCIAL STATEMENTSSEE NOTES TO FINANCIAL STATEMENTSSEE NOTES TO FINANCIAL STATEMENTSSEE NOTES TO FINANCIAL STATEMENTS
Portfolio of InvestmentsTWEEDY, BROWNE AMERICAN VALUE FUND
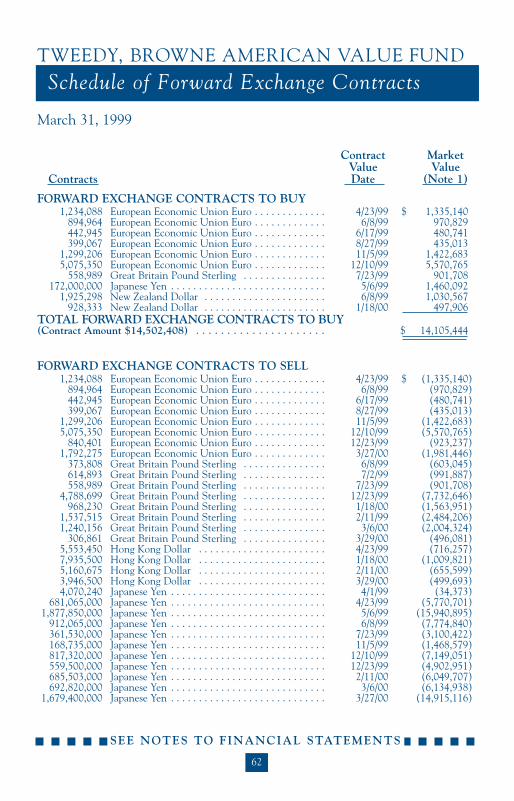
62
Portfolio Highlights
March 31, 1999
SEE NOTES TO FINANCIAL STATEMENTSSEE NOTES TO FINANCIAL STATEMENTSSEE NOTES TO FINANCIAL STATEMENTS
Contract MarketValue Value
Contracts Date (Note 1)
FORWARD EXCHANGE CONTRACTS TO BUY1,234,088 European Economic Union Euro . . . . . . . . . . . . . 4/23/99 $ 1,335,140
894,964 European Economic Union Euro . . . . . . . . . . . . . 6/8/99 970,829 442,945 European Economic Union Euro . . . . . . . . . . . . . 6/17/99 480,741 399,067 European Economic Union Euro . . . . . . . . . . . . . 8/27/99 435,013
1,299,206 European Economic Union Euro . . . . . . . . . . . . . 11/5/99 1,422,683 5,075,350 European Economic Union Euro . . . . . . . . . . . . . 12/10/99 5,570,765
558,989 Great Britain Pound Sterling . . . . . . . . . . . . . . . 7/23/99 901,708 172,000,000 Japanese Yen . . . . . . . . . . . . . . . . . . . . . . . . . . . . 5/6/99 1,460,092
1,925,298 New Zealand Dollar . . . . . . . . . . . . . . . . . . . . . . 6/8/99 1,030,567 928,333 New Zealand Dollar . . . . . . . . . . . . . . . . . . . . . . 1/18/00 497,906
TOTAL FORWARD EXCHANGE CONTRACTS TO BUY(Contract Amount $14,502,408) . . . . . . . . . . . . . . . . . . . . . $ 14,105,444
FORWARD EXCHANGE CONTRACTS TO SELL1,234,088 European Economic Union Euro . . . . . . . . . . . . . 4/23/99 $ (1,335,140)
894,964 European Economic Union Euro . . . . . . . . . . . . . 6/8/99 (970,829)442,945 European Economic Union Euro . . . . . . . . . . . . . 6/17/99 (480,741)399,067 European Economic Union Euro . . . . . . . . . . . . . 8/27/99 (435,013)
1,299,206 European Economic Union Euro . . . . . . . . . . . . . 11/5/99 (1,422,683)5,075,350 European Economic Union Euro . . . . . . . . . . . . . 12/10/99 (5,570,765)
840,401 European Economic Union Euro . . . . . . . . . . . . . 12/23/99 (923,237)1,792,275 European Economic Union Euro . . . . . . . . . . . . . 3/27/00 (1,981,446)
373,808 Great Britain Pound Sterling . . . . . . . . . . . . . . . 6/8/99 (603,045)614,893 Great Britain Pound Sterling . . . . . . . . . . . . . . . 7/2/99 (991,887)558,989 Great Britain Pound Sterling . . . . . . . . . . . . . . . 7/23/99 (901,708)
4,788,699 Great Britain Pound Sterling . . . . . . . . . . . . . . . 12/23/99 (7,732,646)968,230 Great Britain Pound Sterling . . . . . . . . . . . . . . . 1/18/00 (1,563,951)
1,537,515 Great Britain Pound Sterling . . . . . . . . . . . . . . . 2/11/99 (2,484,206)1,240,156 Great Britain Pound Sterling . . . . . . . . . . . . . . . 3/6/00 (2,004,324)
306,861 Great Britain Pound Sterling . . . . . . . . . . . . . . . 3/29/00 (496,081)5,553,450 Hong Kong Dollar . . . . . . . . . . . . . . . . . . . . . . . 4/23/99 (716,257)7,935,500 Hong Kong Dollar . . . . . . . . . . . . . . . . . . . . . . . 1/18/00 (1,009,821)5,160,675 Hong Kong Dollar . . . . . . . . . . . . . . . . . . . . . . . 2/11/00 (655,599)3,946,500 Hong Kong Dollar . . . . . . . . . . . . . . . . . . . . . . . 3/29/00 (499,693)4,070,240 Japanese Yen . . . . . . . . . . . . . . . . . . . . . . . . . . . . 4/1/99 (34,373)
681,065,000 Japanese Yen . . . . . . . . . . . . . . . . . . . . . . . . . . . . 4/23/99 (5,770,701)1,877,850,000 Japanese Yen . . . . . . . . . . . . . . . . . . . . . . . . . . . . 5/6/99 (15,940,895)
912,065,000 Japanese Yen . . . . . . . . . . . . . . . . . . . . . . . . . . . . 6/8/99 (7,774,840)361,530,000 Japanese Yen . . . . . . . . . . . . . . . . . . . . . . . . . . . . 7/23/99 (3,100,422)168,735,000 Japanese Yen . . . . . . . . . . . . . . . . . . . . . . . . . . . . 11/5/99 (1,468,579)817,320,000 Japanese Yen . . . . . . . . . . . . . . . . . . . . . . . . . . . . 12/10/99 (7,149,051)559,500,000 Japanese Yen . . . . . . . . . . . . . . . . . . . . . . . . . . . . 12/23/99 (4,902,951)685,503,000 Japanese Yen . . . . . . . . . . . . . . . . . . . . . . . . . . . . 2/11/00 (6,049,707)692,820,000 Japanese Yen . . . . . . . . . . . . . . . . . . . . . . . . . . . . 3/6/00 (6,134,938)
1,679,400,000 Japanese Yen . . . . . . . . . . . . . . . . . . . . . . . . . . . . 3/27/00 (14,915,116)
SEE NOTES TO FINANCIAL STATEMENTS
Schedule of Forward Exchange ContractsTWEEDY, BROWNE AMERICAN VALUE FUND

Contract MarketValue Value
Contracts Date (Note 1)
FORWARD EXCHANGE CONTRACTS TO SELL337,230,000 Japanese Yen . . . . . . . . . . . . . . . . . . . . . . . . . . . . 3/29/00 $ (2,995,886)
1,925,298 New Zealand Dollar . . . . . . . . . . . . . . . . . . . . . . 6/8/99 (1,030,566)928,333 New Zealand Dollar . . . . . . . . . . . . . . . . . . . . . . 1/18/00 (497,906)
1,381,840 Singapore Dollar . . . . . . . . . . . . . . . . . . . . . . . . . 6/8/99 (805,025)1,599,500 Singapore Dollar . . . . . . . . . . . . . . . . . . . . . . . . . 11/5/99 (942,075)1,622,800 Singapore Dollar . . . . . . . . . . . . . . . . . . . . . . . . . 12/10/99 (957,892)1,322,000 Singapore Dollar . . . . . . . . . . . . . . . . . . . . . . . . . 1/18/00 (782,238)
842,150 Singapore Dollar . . . . . . . . . . . . . . . . . . . . . . . . . 3/27/00 (500,386)2,376,000 Swedish Krona . . . . . . . . . . . . . . . . . . . . . . . . . . 6/17/99 (290,547)
43,579,250 Swedish Krona . . . . . . . . . . . . . . . . . . . . . . . . . . 7/23/99 (5,340,279)14,027,380 Swedish Krona . . . . . . . . . . . . . . . . . . . . . . . . . . 8/27/99 (1,722,504)32,084,000 Swedish Krona . . . . . . . . . . . . . . . . . . . . . . . . . . 12/10/99 (3,965,466)13,875,225 Swedish Krona . . . . . . . . . . . . . . . . . . . . . . . . . . 12/23/99 (1,716,330)24,133,500 Swedish Krona . . . . . . . . . . . . . . . . . . . . . . . . . . 1/4/00 (2,987,505)15,379,400 Swedish Krona . . . . . . . . . . . . . . . . . . . . . . . . . . 1/18/00 (1,905,502)27,097,350 Swedish Krona . . . . . . . . . . . . . . . . . . . . . . . . . . 2/11/00 (3,362,409)20,212,500 Swedish Krona . . . . . . . . . . . . . . . . . . . . . . . . . . 3/29/00 (2,515,476)1,745,160 Swiss Franc . . . . . . . . . . . . . . . . . . . . . . . . . . . . . 4/23/99 (1,183,939)5,381,370 Swiss Franc . . . . . . . . . . . . . . . . . . . . . . . . . . . . . 6/8/99 (3,668,742)2,201,850 Swiss Franc . . . . . . . . . . . . . . . . . . . . . . . . . . . . . 7/23/99 (1,508,300)2,672,400 Swiss Franc . . . . . . . . . . . . . . . . . . . . . . . . . . . . . 12/10/99 (1,858,090)8,050,800 Swiss Franc . . . . . . . . . . . . . . . . . . . . . . . . . . . . . 12/31/99 (5,610,070)
10,496,000 Swiss Franc . . . . . . . . . . . . . . . . . . . . . . . . . . . . . 1/18/00 (7,327,867)8,150,400 Swiss Franc . . . . . . . . . . . . . . . . . . . . . . . . . . . . . 2/11/00 (5,704,656)3,511,750 Swiss Franc . . . . . . . . . . . . . . . . . . . . . . . . . . . . . 3/27/00 (2,469,562)2,121,750 Swiss Franc . . . . . . . . . . . . . . . . . . . . . . . . . . . . . 3/29/00 (1,492,375)
TOTAL FORWARD EXCHANGE CONTRACTS TO SELL(Contract Amount $170,158,834) . . . . . . . . . . . . . . . . . . . . $ (169,162,238)
Portfolio Highlights
March 31, 1999
63
SEE NOTES TO FINANCIAL STATEMENTSSEE NOTES TO FINANCIAL STATEMENTSSEE NOTES TO FINANCIAL STATEMENTSSEE NOTES TO FINANCIAL STATEMENTS
Schedule of Forward Exchange ContractsTWEEDY, BROWNE AMERICAN VALUE FUND
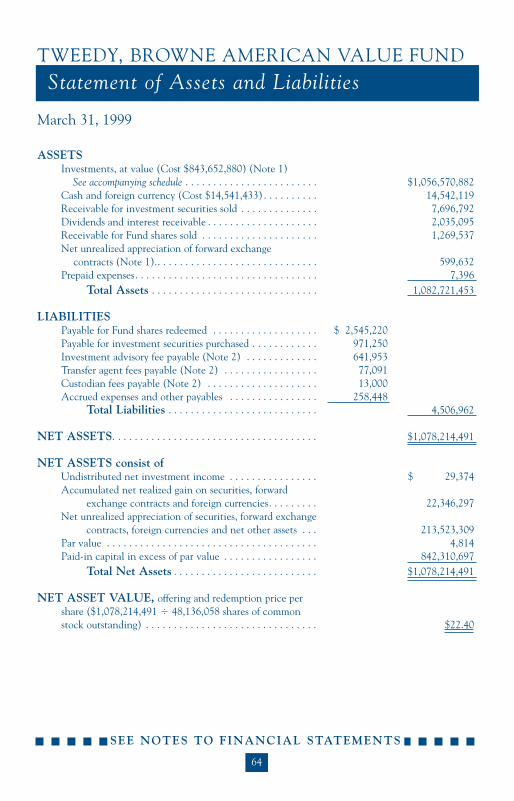
ASSETSInvestments, at value (Cost $843,652,880) (Note 1)
See accompanying schedule . . . . . . . . . . . . . . . . . . . . . . . . $1,056,570,882 Cash and foreign currency (Cost $14,541,433) . . . . . . . . . . 14,542,119 Receivable for investment securities sold . . . . . . . . . . . . . . 7,696,792 Dividends and interest receivable . . . . . . . . . . . . . . . . . . . . 2,035,095 Receivable for Fund shares sold . . . . . . . . . . . . . . . . . . . . . 1,269,537Net unrealized appreciation of forward exchange
contracts (Note 1).. . . . . . . . . . . . . . . . . . . . . . . . . . . . . 599,632Prepaid expenses. . . . . . . . . . . . . . . . . . . . . . . . . . . . . . . . . 7,396
Total Assets . . . . . . . . . . . . . . . . . . . . . . . . . . . . . . 1,082,721,453
LIABILITIESPayable for Fund shares redeemed . . . . . . . . . . . . . . . . . . . $ 2,545,220Payable for investment securities purchased . . . . . . . . . . . . 971,250Investment advisory fee payable (Note 2) . . . . . . . . . . . . . 641,953Transfer agent fees payable (Note 2) . . . . . . . . . . . . . . . . . 77,091Custodian fees payable (Note 2) . . . . . . . . . . . . . . . . . . . . 13,000Accrued expenses and other payables . . . . . . . . . . . . . . . . 258,448
Total Liabilities . . . . . . . . . . . . . . . . . . . . . . . . . . . 4,506,962
NET ASSETS. . . . . . . . . . . . . . . . . . . . . . . . . . . . . . . . . . . . . $1,078,214,491
NET ASSETS consist ofUndistributed net investment income . . . . . . . . . . . . . . . . $ 29,374 Accumulated net realized gain on securities, forward
exchange contracts and foreign currencies. . . . . . . . . 22,346,297 Net unrealized appreciation of securities, forward exchange
contracts, foreign currencies and net other assets . . . 213,523,309 Par value . . . . . . . . . . . . . . . . . . . . . . . . . . . . . . . . . . . . . . 4,814 Paid-in capital in excess of par value . . . . . . . . . . . . . . . . . 842,310,697
Total Net Assets . . . . . . . . . . . . . . . . . . . . . . . . . . $1,078,214,491
NET ASSET VALUE, offering and redemption price per share ($1,078,214,491 4 48,136,058 shares of common stock outstanding) . . . . . . . . . . . . . . . . . . . . . . . . . . . . . . . $22.40
64
Portfolio Highlights
March 31, 1999
SEE NOTES TO FINANCIAL STATEMENTSSEE NOTES TO FINANCIAL STATEMENTSSEE NOTES TO FINANCIAL STATEMENTSSEE NOTES TO FINANCIAL STATEMENTS
Statement of Assets and LiabilitiesTWEEDY, BROWNE AMERICAN VALUE FUND

INVESTMENT INCOMEDividends (net of foreign withholding taxes of $349,281) $ 16,835,642 Interest . . . . . . . . . . . . . . . . . . . . . . . . . . . . . . . . . . . . . . 4,243,339
Total Investment Income . . . . . . . . . . . . . . . . . 21,078,981
EXPENSESInvestment advisory fee (Note 2) . . . . . . . . . . . . . . . . . . $ 13,594,779 Administration fee (Note 2) . . . . . . . . . . . . . . . . . . . . . . 437,177 Transfer agent fees (Note 2) . . . . . . . . . . . . . . . . . . . . . . 466,894 Custodian fees (Note 2) . . . . . . . . . . . . . . . . . . . . . . . . . 204,656 Legal and audit fees . . . . . . . . . . . . . . . . . . . . . . . . . . . . 70,087 Directors' fees and expenses (Note 2) . . . . . . . . . . . . . . . 27,815 Amortization of organization costs (Note 5) . . . . . . . . . . 12,980 Other . . . . . . . . . . . . . . . . . . . . . . . . . . . . . . . . . . . . . . . 444,616 Waiver of fees by investment adviser (Note 2) . . . . . . . . (121,000)
Total Expenses . . . . . . . . . . . . . . . . . . . . . . . . . . 15,138,004 NET INVESTMENT INCOME . . . . . . . . . . . . . . . . . . 5,940,977
REALIZED AND UNREALIZED GAIN (LOSS) ON INVESTMENTS(Notes 1 and 3)
Net realized gain:Securities . . . . . . . . . . . . . . . . . . . . . . . . . . . . . . . . . . . . . . . . . . . . . . . . 29,526,022 Forward exchange contracts . . . . . . . . . . . . . . . . . . . . . . . . . . . . . . . . . . 1,132,217 Foreign currencies and net other assets . . . . . . . . . . . . . . . . . . . . . . . . . . 66,414
Net realized gain on investments during the year . . . . . . . . . . . . . . . . . . . . 30,724,653
Net change in unrealized appreciation (depreciation) of:Securities . . . . . . . . . . . . . . . . . . . . . . . . . . . . . . . . . . . . . . . . . . . . . . . . (50,963,605)Forward exchange contracts . . . . . . . . . . . . . . . . . . . . . . . . . . . . . . . . . . (3,506,282)Foreign currencies and net other assets . . . . . . . . . . . . . . . . . . . . . . . . . . 4,708
Net unrealized depreciation of investments during the year . . . . . . . . . . . . (54,465,179)NET REALIZED AND UNREALIZED LOSS ON INVESTMENTS . (23,740,526)NET DECREASE IN NET ASSETS RESULTING FROM OPERATIONS $(17,799,549)
Portfolio Highlights
65
SEE NOTES TO FINANCIAL STATEMENTSSEE NOTES TO FINANCIAL STATEMENTSSEE NOTES TO FINANCIAL STATEMENTSSEE NOTES TO FINANCIAL STATEMENTS
Statement of OperationsTWEEDY, BROWNE AMERICAN VALUE FUND
For the Year Ended March 31, 1999

66
Portfolio Highlights
SEE NOTES TO FINANCIAL STATEMENTSSEE NOTES TO FINANCIAL STATEMENTSSEE NOTES TO FINANCIAL STATEMENTSSEE NOTES TO FINANCIAL STATEMENTS
Statements of Changes in Net AssetsTWEEDY, BROWNE AMERICAN VALUE FUND
Year YearEnded Ended
3/31/99 3/31/98Net investment income . . . . . . . . . . . . . . . . . . . . . . . . . . . . . . $ 5,940,977 $ 4,232,973 Net realized gain on securities, forward exchange contracts
and currency transactions during the year . . . . . . . . . . . . 30,724,653 15,187,523 Net unrealized appreciation (depreciation) of securities,
forward exchange contracts, foreign currencies and net other assets during the year . . . . . . . . . . . . . . . . . . . . (54,465,179) 203,651,397
Net increase (decrease) in net assets resulting from operations . (17,799,549) 223,071,893 Distributions:
Dividends to shareholders from net investment income . . (7,030,923) (5,448,502)Distributions to shareholders from net realized gain on
investments . . . . . . . . . . . . . . . . . . . . . . . . . . . . . . . (12,518,672) (13,982,759)Net increase in net assets from Fund share transactions (Note 4) 104,325,915 465,129,709 Net increase in net assets . . . . . . . . . . . . . . . . . . . . . . . . . . . . . 66,976,771 668,770,341 NET ASSETSBeginning of year . . . . . . . . . . . . . . . . . . . . . . . . . . . . . . . . . . . 1,011,237,720 342,467,379 End of year (including undistributed net investment income
of $29,374 and $1,863,348, respectively) . . . . . . . . . . . . . . . $1,078,214,491 $1,011,237,720

Year Year Year Year YearEnded Ended Ended Ended Ended
3/31/99 3/31/98 3/31/97 3/31/96(a) 3/31/95(a)
Net asset value, beginning of year . . . $ 23.04 $ 16.22 $ 14.29 $ 10.71 $ 9.71 Income from investment operations:Net investment income (b) . . . . . . . . 0.12 0.11 0.13 0.15 0.13 Net realized and unrealized gain (loss)
on investments . . . . . . . . . . . . . . . (0.37) 7.31 2.39 3.56 0.93 Total from investment operations (0.25) 7.42 2.52 3.71 1.06
Distributions:Dividends from net investment income. (0.14) (0.17) (0.17) (0.11) (0.06)Distributions from net realized gains. (0.25) (0.43) (0.42) (0.02)
Total distributions . . . . . . . . . . (0.39) (0.60) (0.59) (0.13) (0.06)Net asset value, end of year . . . . . . . . $ 22.40 $ 23.04 $ 16.22 $ 14.29 $ 10.71 Total return (c) . . . . . . . . . . . . . . . . . (1.09)% 46.14% 17.75% 34.70% 11.02
Ratios/Supplemental Data:Net assets, end of year (in 000's). . . . . $ 1,078,214 $1,011,238 $ 342,467 $ 201,599 $ 58,856 Ratio of operating expenses to average
net assets (d) . . . . . . . . . . . . . . . . . 1.39% 1.39% 1.39% 1.39% 1.74%Ratio of net investment income to average
net assets . . . . . . . . . . . . . . . . . . . . 0.55% 0.69% 0.92% 1.13% 1.25%Portfolio turnover rate. . . . . . . . . . . . . 16% 6% 16% 9% 4%
(a) Per share amounts have been calculated using the monthly average share method, which more appropriately presents the per share data for the period since the use of the undistributed incomemethod does not accord with results of operations.
(b) Net investment income for a Fund share outstanding, before the waiver of fees by the investmentadviser and/or administrator and/or custodian for the years ended March 31, 1999, 1998, 1997, 1996and 1995 were $0.12, $0.11, $0.11, $0.12 and $0.11, respectively.
(c) Total return represents aggregate total return for the periods indicated.(d) Annualized expense ratios before the waiver of fees by the investment adviser and/or administrator
and/or custodian for the years ended March 31, 1999, 1998, 1997, 1996 and 1995 were 1.40%, 1.41%,1.52%, 1.61% and 1.94%, respectively.
Portfolio Highlights
67
SEE NOTES TO FINANCIAL STATEMENTSSEE NOTES TO FINANCIAL STATEMENTSSEE NOTES TO FINANCIAL STATEMENTSSEE NOTES TO FINANCIAL STATEMENTS
Financial HighlightsTWEEDY, BROWNE AMERICAN VALUE FUND
For a Fund share outstanding throughout each year.
%

TitleTitleTitleTitle
68
1. Significant Accounting Policies
Tweedy, Browne American Value Fund (the “Fund”) is a diversifiedseries of Tweedy, Browne Fund Inc. (the “Company”). The Company is anopen-end management investment company registered with the Securitiesand Exchange Commission under the Investment Company Act of 1940,as amended. The Company was organized as a Maryland corporation onJanuary 28, 1993. The Fund commenced operations on December 8, 1993.The preparation of financial statements in accordance with generallyaccepted accounting principles requires management to make estimatesand assumptions that affect the reported amounts and disclosures in thefinancial statements. Actual results could differ from those estimates. Thefollowing is a summary of significant accounting policies consistently followed by the Fund in the preparation of its financial statements.
Portfolio Valuation Generally, the Fund’s investments are valued atmarket value or, in the absence of market value, by the Investment Adviseror, at fair value as determined by or under the direction of the Company’sBoard of Directors. Portfolio securities and other assets, listed on a U.S.national securities exchange or through any system providing for same daypublication of actual prices (and not subject to restrictions against sale bythe Fund on such exchange or system) are valued at the last quoted saleprice prior to the close of regular trading. Portfolio securities and otherassets listed on a foreign exchange or through any system providing forsame day publication of actual prices are valued at the last quoted sale priceavailable before the time when assets are valued. Portfolio securities andother assets for which there are no reported sales on the valuation date arevalued at the mean between the last asked price and the last bid price priorto the close of regular trading. When the Investment Adviser determinesthat the last sale price prior to valuation does not reflect current marketvalue, the Investment Adviser will determine the market value of thosesecurities or assets in accordance with industry practice and other factorsconsidered relevant by the Investment Adviser. All other securities andassets for which current market quotations are not readily available andthose securities which are not readily marketable due to significant legal orcontractual restrictions will be valued by the Investment Adviser or at fair
Notes to Financial StatementsTWEEDY, BROWNE AMERICAN VALUE FUND

TitleTitleTitle
69
Title
value as determined by or under the direction of the Board of Directors.Debt securities with a remaining maturity of 60 days or less are valued atamortized cost, which approximates market value, or by reference to otherfactors (i.e., pricing services or dealer quotations) by the InvestmentAdviser.
Repurchase Agreements The Fund engages in repurchase agreementtransactions. Under the terms of a typical repurchase agreement, the Fundtakes possession of an underlying debt obligation subject to an obligationof the seller to repurchase, and the Fund to resell, the obligation at anagreed-upon price and time, thereby determining the yield during theFund’s holding period. This arrangement results in a fixed rate of returnthat is not subject to market fluctuations during the Fund’s holding period.The value of the collateral is at least equal at all times to the total amountof the repurchase obligations, including interest. In the event of counter-party default, the Fund has the right to use the collateral to offset lossesincurred. There is potential loss to the Fund in the event the Fund isdelayed or prevented from exercising its rights to dispose of the collateralsecurities, including the risk of a possible decline in the value of the under-lying securities during the period while the Fund seeks to assert its rights.The Fund’s Investment Adviser, acting under the supervision of theCompany’s Board of Directors, reviews the value of the collateral and thecreditworthiness of those banks and dealers with which the Fund entersinto repurchase agreements to evaluate potential risks.
Foreign Currency The books and records of the Fund are main-tained in U.S. dollars. Foreign currencies, investments and other assetsand liabilities are translated into U.S. dollars at the exchange rates pre-vailing at the end of the period, and purchases and sales of investmentsecurities, income and expenses are translated on the respective dates ofsuch transactions. Unrealized gains and losses which result from changesin foreign currency exchange rates have been included in the unrealizedappreciation (depreciation) of currencies and net other assets. Net realizedforeign currency gains and losses resulting from changes in exchange ratesinclude foreign currency gains and losses between trade date and settlementdate on investments, securities transactions, foreign currency transactions
Notes to Financial StatementsTWEEDY, BROWNE AMERICAN VALUE FUND

TitleTitleTitleTitle
70
and the difference between the amounts of interest and dividends recordedon the books of the Fund and the amount actually received. The portionof foreign currency gains and losses related to fluctuation in the exchangerates between the initial purchase trade date and subsequent sale trade dateis included in realized gains and losses on investment securities sold.
Forward Exchange Contracts The Fund has entered into forwardexchange contracts for non-trading purposes in order to reduce its exposureto fluctuations in foreign currency exchange on its portfolio holdings.Forward exchange contracts are valued at the forward rate and are marked-to-market daily. The change in market value is recorded by the Fund as anunrealized gain or loss. When the contract is closed, the Fund records arealized gain or loss equal to the difference between the value of the contractat the time that it was opened and the value of the contract at the timethat it was closed.
The use of forward exchange contracts does not eliminate fluctua-tions in the underlying prices of the Fund’s investment securities, but itdoes establish a rate of exchange that can be achieved in the future.Although forward exchange contracts limit the risk of loss due to a declinein the value of the hedged currency, they also limit any potential gain thatmight result should the value of the currency increase. In addition, theFund could be exposed to risks if the counterparties to the contracts areunable to meet the terms of their contracts.
Securities Transactions and Investment Income Securities trans-actions are recorded as of the trade date. Realized gains and losses fromsecurities transactions are recorded on the identified cost basis. Dividendincome and distributions to shareholders are recorded on the ex-dividenddate. Interest income is recorded on the accrual basis. Dividend incomeand interest income may be subject to foreign withholding taxes. TheFund’s custodian applies for refunds where available. If the Fund meets therequirements of Section 853 of the Internal Revenue Code of 1986, asamended, the Fund may elect to pass through to its shareholders credits forforeign taxes paid.
Notes to Financial StatementsTWEEDY, BROWNE AMERICAN VALUE FUND

TitleTitleTitle
71
Dividends and Distributions to Shareholders Dividends from netinvestment income, if any, and distributions from realized capital gainsafter utilization of capital loss carryforwards, if any, will be declared andpaid annually. Additional distributions of net investment income and capitalgains from the Fund may be made at the discretion of the Board ofDirectors in order to avoid the application of a 4% non-deductible Federalexcise tax on certain undistributed amounts of ordinary income and capitalgains. Income distributions and capital gain distributions are determinedin accordance with income tax regulations which may differ from generallyaccepted accounting principles. These differences are primarily due todiffering treatments of income and gains on various investment securitiesheld by the Fund, timing differences and differing characterization ofdistributions made by the Fund.
Federal Income Taxes The Fund intends to qualify as a regulatedinvestment company, if such qualification is in the best interest of its share-holders, by complying with the requirements of the Internal Revenue Codeof 1986, as amended, applicable to regulated investment companies and bydistributing substantially all of its taxable income to its shareholders.Therefore, no Federal income tax provision is required.
Expenses Expenses directly attributable to each Fund as a diversifiedseries of the Company are charged to that Fund. Other expenses of theCompany are allocated to each Fund based on the average net assets ofeach Fund.
2. Investment Advisory Fee, Other Related Party Transactions andAdministration Fee
The Company, on behalf of the Fund, has entered into an invest-ment advisory agreement (the “Advisory Agreement”) with Tweedy,Browne Company LLC (“Tweedy, Browne”). Under the AdvisoryAgreement, the Company pays Tweedy, Browne a fee at the annual rate of1.25% of the value of its average daily net assets. The fee is payablemonthly, provided the Fund will make such interim payments as may berequested by the Investment Adviser not to exceed 75% of the amount ofthe fee then accrued on the books of the Fund and unpaid. From time to
Notes to Financial StatementsTWEEDY, BROWNE AMERICAN VALUE FUND

TitleTitleTitle
72
time, Tweedy Browne may voluntarily waive a portion of its fee otherwisepayable to it. For the year ended March 31, 1999, Tweedy, Browne volun-tarily waived fees of $121,000.
The current and retired general partners and their families, as well asemployees of Tweedy, Browne, the Investment Adviser to the Fund, haveapproximately $31.3 million of their own money invested in the Fund.
The Company, on behalf of the Fund, has entered into an adminis-tration agreement (the “Administration Agreement”) with First DataInvestor Services Group, Inc. (the “Administrator”), a wholly owned sub-sidiary of First Data Corporation. Under the Administration Agreement,the Company pays the Administrator an administrative fee and a fundaccounting fee computed daily and payable monthly at the followingannual rates of the value of the average daily net assets of the Fund:
Fees on AssetsBetween
Up to $500 Million and Exceeding$500 Million $1 Billion $1 Billion
Administration Fees 0.06% 0.04% 0.02%Up to Exceeding
$100 Million $100 MillionAccounting Fees 0.03% 0.01%
Under the terms of the Administration Agreement, the Companywill pay for fund administration services a minimum fee of $40,000 perannum, not to be aggregated with fees for fund accounting services. TheCompany will pay a minimum monthly fee of $3,000 for fund accountingservices for the Fund, not to be aggregated with fees for fund administrationservices.
No officer, director or employee of Tweedy, Browne, theAdministrator or any parent or subsidiary of those corporations receivesany compensation from the Company for serving as a director or officer ofthe Company. The Fund pays each director who is not an officer, director
Notes to Financial StatementsTWEEDY, BROWNE AMERICAN VALUE FUND
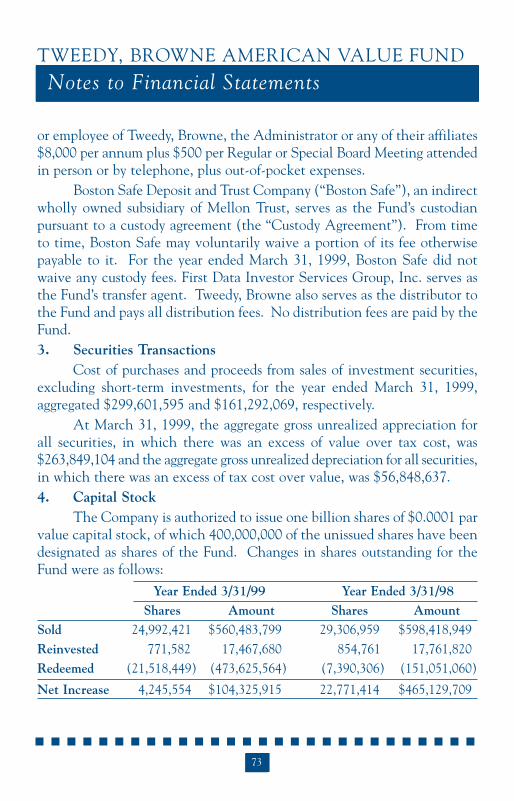
TitleTitleTitle
73
or employee of Tweedy, Browne, the Administrator or any of their affiliates$8,000 per annum plus $500 per Regular or Special Board Meeting attendedin person or by telephone, plus out-of-pocket expenses.
Boston Safe Deposit and Trust Company (“Boston Safe”), an indirectwholly owned subsidiary of Mellon Trust, serves as the Fund’s custodianpursuant to a custody agreement (the “Custody Agreement”). From timeto time, Boston Safe may voluntarily waive a portion of its fee otherwisepayable to it. For the year ended March 31, 1999, Boston Safe did notwaive any custody fees. First Data Investor Services Group, Inc. serves asthe Fund’s transfer agent. Tweedy, Browne also serves as the distributor tothe Fund and pays all distribution fees. No distribution fees are paid by theFund.3. Securities Transactions
Cost of purchases and proceeds from sales of investment securities,excluding short-term investments, for the year ended March 31, 1999,aggregated $299,601,595 and $161,292,069, respectively.
At March 31, 1999, the aggregate gross unrealized appreciation forall securities, in which there was an excess of value over tax cost, was$263,849,104 and the aggregate gross unrealized depreciation for all securities,in which there was an excess of tax cost over value, was $56,848,637.4. Capital Stock
The Company is authorized to issue one billion shares of $0.0001 parvalue capital stock, of which 400,000,000 of the unissued shares have beendesignated as shares of the Fund. Changes in shares outstanding for theFund were as follows:
Year Ended 3/31/99 Year Ended 3/31/98Shares Amount Shares Amount
Sold 24,992,421 $560,483,799 29,306,959 $598,418,949Reinvested 771,582 17,467,680 854,761 17,761,820Redeemed (21,518,449) (473,625,564) (7,390,306) (151,051,060)
Net Increase 4,245,554 $104,325,915 22,771,414 $465,129,709
Notes to Financial StatementsTWEEDY, BROWNE AMERICAN VALUE FUND

TitleTitleTitleTitle
74
5. Organization Costs
The Fund bears all costs in connection with its organization includingthe fees and expenses of registering and qualifying its shares for distributionunder Federal and state securities regulations. All such costs have beendeferred and are being amortized over a five-year period using the straight-line method from the commencement of operations of the Fund. In theevent that any of the initial shares of the Fund are redeemed during suchamortization period, the Fund will be reimbursed for any unamortizedorganization costs in the same proportion as the number of sharesredeemed bears to the number of initial shares held at the time of redemp-tion. At March 31, 1999, all such costs have been fully amortized.
6. Line of Credit
Effective October 1, 1996, the Company and Mellon Trust, N.A.have entered into a Line of Credit Agreement (the “Agreement”) whichprovides the Fund and the Tweedy, Browne Global Value Fund with a $50million line of credit, primarily for temporary or emergency purposes,including the meeting of redemption requests that might otherwise requirethe untimely disposition of securities. The Fund may borrow up to one-third of its net assets; however, the total credit available to the Fund andthe Tweedy, Browne Global Value Fund is $50 million. Interest is payableat the bank’s Money Market Rate plus 0.75% on an annualized basis.Under the Agreement, the Fund and the Tweedy, Browne Global ValueFund pay a facility fee equal to 0.10% annually of the unutilized credit.The Agreement requires, among other provisions, the Fund to maintain aratio of net assets (not including funds borrowed pursuant to theAgreement) to aggregated amount of indebtedness pursuant to theAgreement of no less than three to one. For the year ended March 31,1999, the Fund did not borrow under this Agreement.
Notes to Financial StatementsTWEEDY, BROWNE AMERICAN VALUE FUND

Title
75
To the Shareholders and Board of Directors ofTweedy, Browne Fund Inc.:
We have audited the accompanying statement of assets and liablities,including the portfolio of investments and the schedule of forwardexchange contracts, of Tweedy, Browne American Value Fund (the“Fund”) (a series of Tweedy, Browne Fund Inc.) as of March 31, 1999, therelated statement of operations for the year then ended, the statements ofchanges in net assets for each of the two years in the period then ended andfinancial highlights for each of the five years in the period then ended.These financial statements and financial highlights are the responsibility ofthe Fund’s management. Our responsibility is to express an opinion onthese financial statements and financial highlights based on our audits.
We conducted our audits in accordance with generally accepted audit-ing standards. Those standards require that we plan and perform the audit toobtain reasonable assurance about whether the financial statements andfinancial highlights are free of material misstatement. An audit includesexamining, on a test basis, evidence supporting the amounts and disclosuresin the financial statements and financial highlights. Our procedures includ-ed confirmation of securities owned as of March 31, 1999, by correspondencewith the custodian and brokers, or by other appropriate auditing procedureswhere replies from brokers were not received. An audit also includes assess-ing the accounting principles used and significant estimates made by man-agement, as well as evaluating the overall financial statement presentation.We believe that our audits provide a reasonable basis for our opinion.
In our opinion, the financial statements and financial highlightsreferred to above present fairly, in all material respects, the financial posi-tion of the Tweedy, Browne American Value Fund, a series of Tweedy,Browne Fund Inc., at March 31, 1999, the results of its operations for theyear then ended, the changes in its net assets for each of the two years inthe period then ended and financial highlights for each of the five years inthe period then ended, in conformity with generally accepted accountingprinciples.
Boston, MassachusettsMay 7, 1999
Report of Ernst & Young LLP, Independent AuditorsTWEEDY, BROWNE AMERICAN VALUE FUND
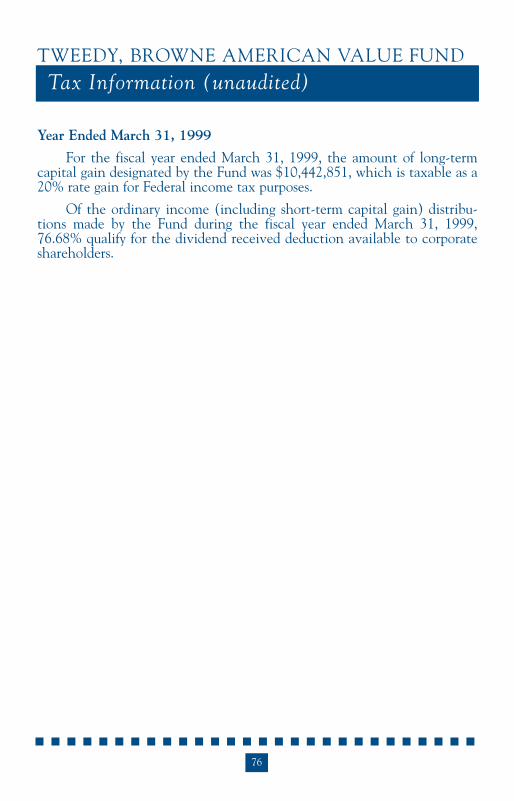
76
Title
Year Ended March 31, 1999
For the fiscal year ended March 31, 1999, the amount of long-termcapital gain designated by the Fund was $10,442,851, which is taxable as a20% rate gain for Federal income tax purposes.
Of the ordinary income (including short-term capital gain) distribu-tions made by the Fund during the fiscal year ended March 31, 1999,76.68% qualify for the dividend received deduction available to corporateshareholders.
Tax Information (unaudited)TWEEDY, BROWNE AMERICAN VALUE FUND

TWEEDY, BROWNE FUND INC.52 Vanderbilt Avenue, NY, NY 10017
800-432-4789