annrheumdis-2016-210094 revised ra-build supplementary
TRANSCRIPT

1
SUPPLEMENTARY APPENDIX
Table of Contents—online supplement
Pages 2-3: Study Investigators
Page 4: Supplementary Methods
Pages 5-6: Figure S1. Gatekeeping design for multiple comparisons
Pages 7-8: Figure S2. Secondary efficacy analyses, Weeks 0-24
Pages 9-10: Figure S3. ACR components and ESR over time
Pages 11-12: Figure S4. DAS28-ESR, CDAI, and SDAI over time
Pages 13-14: Figure S5. ACR20, ACR50, and DAS28-CRP at Week 12 in subgroups defined by concomitant csDMARD therapy
Pages 15-16: Table S1. Description of efficacy measures
Pages 17-18: Table S2. Additional baseline characteristics and disease activity
Pages 19: Table S3. Concomitant csDMARDs
Pages 20: Table S4. ACR20, ACR50, ACR70 responses, Weeks 0-24
Pages 21-22: Table S5. Adverse events during treatment, Weeks 0-24
Pages 23-25: Table S6. Serious adverse events, Weeks 0-24
Pages 26-30: Table S7. Laboratory summary, Weeks 0-12 and Weeks 0-24
Pages 31-32: Table S8. Protocol-defined serious adverse events, Weeks 0-24
Pages 33-34: Table S9. Follow-up emergent adverse events in the 28-day post-treatment evaluation period
Pages 35: References

2
Study Investigators
Argentina: Julio Hofman, Benito Velasco, Eduardo Mysler, Juan Pablo, Rodolfo Pardo, Eleonora Lucero, Jose Maldanado Cocco, Liliana del Carmen Morales, Raul Ceitilin
Australia: Paul Bird, Stephen Hall, Anna Raj, Peter Youssef, Peter Nash
Belgium: Frank Raeman, Kurt de Vlam, Filip van den Bosch, Marc Leon, Piet Guesens
Canada: Milton Baker, Andre Beaulieu, Andrew Chow, Rafat Faraawi, Clode Lessard, Timothy McCarthy, Stuart Seigel, Robert McKendry, Wojciech Olszynski, Arthur Bookman
Croatia: Dalibor Krpan, Visnja Prus, Marinko Artukovic
Czech Republic: Eva Dokoupilova, Petr Jonas, Zdenek Dvorak, Vlastimil Racek Germany: Jöm Kekow, Andrea Rubbert-Roth, Hans-Peter Tony Hungary: Edit Drescher, Tibor Balazs, Katalin Kerekes, Laszlo Hodinka India: Jyotsana Oak, Chandrashekara Srikantiah, Vineeta Shobha, Reena
Shamam, Alakendu Ghosh, Sarath Veravalli, Sarvajeet Pal, Rajiva Gupta, Sundeep Upadhyaya, D.C. Sundaresh, Surandra Kamath, Syamasis Bandyopadhyay, Jugal Kishore Kadel, Avinash Agarwal, Able Lawrence, Das Siddharth, Shailesh Udapudi, Piyush Parikh
Italy: Silvano Adami, Piercarlo Sarzi Japan: Tatsuya Atsumi, Kazuhide Tanimura, Shigeru Honjo, Masato Okada,
Wataru Hirose, Masahiro Iwamoto, Shunji Yoshida, Yoshinobu Koyama, Hiroaki Dobashi, Yuji Yamanishi
Republic of Korea: Dae-Hyun Yoo, Chul-Soo Cho, Won Park, Shin Seok Lee Mexico: Fidencio Cons-Molina, Reyna Bustamante Gonzalez, Jamie Reyes
Gonzaga, Guillermo Melendez Poland: Slawomir Jeka, Marek Krogulec, Joanna Hilt, Barbara Bazela, Zenobia
Czuszynska Portugal: José Canas da Silva, José António Costa Romania: Simona Rednic, Eugenia Mociran, Maria Suta Russia: Marina Stanislav, Elena Ilivanova, Eygenya Shmidt, Olga Ershova, Irina
Vinogradova
3
Slovakia: Livia Bruskova, Eva Ladicka, Roman Jancovic Spain: Ricardo Blanco Alonso, Jose Carlos Rosas Gomez De Salaza, Eduardo
Ucar, Jose Andres Roman Ivorra, Jaime Zubieta Tabemero Taiwan: Ko-Jen Li, Chang-Youh Tsai, Kun-Hung Chen, Chyou-Shen Lee, Chung-
Ming Huang, Cheng-Chung Wei, Ying-Chou Chen, Hung-An Chen, Hsiang-Cheng Chen
United Kingdom: Bruce Kirkham, David Walker, Hasan Tahir, Peter Prouse United States: Jeffrey Alper, Naga Bushan, Cong-Qiu Chu, Asif Cochinwala, John
Condemi, John Budd, Hisham El-Kadi, Robert Ettlinger, Ira Fenton, Rose Fife, Roy Fleischmann, Pamela Freeman, Geoffrey Gladstein, Edward Goldberger, William Gough, Maria Greenwald, Robert Griffin, Kathryn Hobbs, Bruce Hoffman, Akgun Ince, Adrian Jaffer, Theresa Karplus, Joel Kremer, Roberto Leon-Perez, Roger Lidman, James Loveless, Gary Maniloff, Angela McCain, Kimberly McIlwain Smith, Kenneth Miller, Sathish Modugu, Monika Mohan, Paul Norwood, Richard Olson, Steven Overman, Carmen Pagan Duran, Jose Pando, Carlos Pantojas, Ashok Patel, Derek Peacock, Jeffrey Poiley, Jose Rodriguez Santiago, Richard Saini, Joy Schechtman, Joel Silverfield, Chokkalingam Siva, Nehad Soloman, Oscar Soto-Raices, Prashanth Sunkureddi, William Surbeck, Ramon Toro, Alvin Wells, Debra Weinstein, Anthony Sebba, Eric Lee, Abdelnaser Elkhalili, Charles Ludivico, Suthin Songcharoen, Timothy Swartz, Jeffrey Lisse, Wendy Lee, Eric Peters, Michael Stack, Farrukh Zaidi, George Kelly, Stuart Weisman, Isam Diab

4
Supplementary Methods Patients were excluded from enrolment if they had any of the following abnormalities on screening laboratory tests:
AST or ALT >1.5 times the ULN total bilirubin ≥1.5 times the ULN neutropenia (absolute neutrophil count <1200 cells/uL) thrombocytopenia (platelets <100,000/uL) eGFR <40 mL/min/1.73m2 (estimated using the MDRD equation)
5
ACR 204 mg vs. PBO
DAS28-CRP4 mg vs. PBO
HAQ-DI4 mg vs. PBO
SDAI 3.34 mg vs. PBO
Worst Tiredness4 mg vs. PBO
MJS Severity4 mg vs. PBO
MJS Duration4 mg vs. PBO
ACR202mg vs. PBO
DAS28-CRP2mg vs. PBO
HAQ-DI2 mg vs. PBO
=0.04
Worst Pain4 mg vs. PBO
SDAI 3.32mg vs. PBO
Family 1
Primary
Family 2
Family 3
=0.01
Sub-family 2a(Hochberg procedure):
Fallback
testing
Sub-family 2b:3 hypotheses
Hochberg procedure
Hochberg procedure
Hochberg procedure
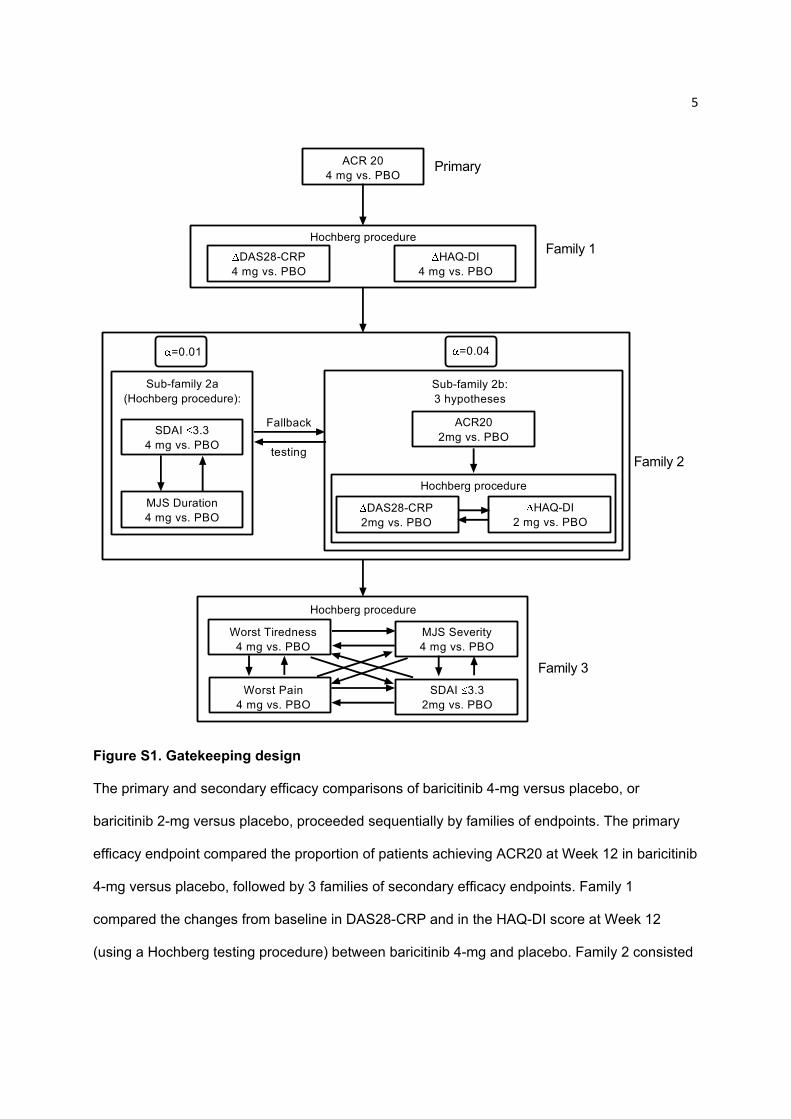
Figure S1. Gatekeeping design
The primary and secondary efficacy comparisons of baricitinib 4-mg versus placebo, or
baricitinib 2-mg versus placebo, proceeded sequentially by families of endpoints. The primary
efficacy endpoint compared the proportion of patients achieving ACR20 at Week 12 in baricitinib
4-mg versus placebo, followed by 3 families of secondary efficacy endpoints. Family 1
compared the changes from baseline in DAS28-CRP and in the HAQ-DI score at Week 12
(using a Hochberg testing procedure) between baricitinib 4-mg and placebo. Family 2 consisted
6
of 2 sub-families, one of which examined the proportion of patients achieving an SDAI score
(≤3.3) and the median duration of morning joint stiffness at Week 12 in the baricitinib 4-mg
group versus placebo (using a Hochberg testing procedure), the other sub-family examined the
percentage of patients achieving ACR20 at Week 12 in baricitinib 2-mg versus placebo,
followed by the mean change from baseline at Week 12 in DAS28-CRP and in the HAQ-DI
score (using a Hochberg testing procedure) between baricitinib 2-mg and placebo. Family 3
tested 4 hypotheses using a Hochberg testing procedure: the mean severity of morning joint
stiffness (numeric rating scale [NRS]), mean worst tiredness (NRS), mean worst joint pain
(NRS) in baricitinib 4-mg versus placebo; and the proportion of patients achieving an SDAI
score (≤3.3) in baricitinib 2-mg versus placebo at Week 12. The primary hypothesis and the 3
families of key secondary hypotheses were tested sequentially, such that testing proceeded to
the next family only when all null hypotheses in a family were rejected. Within family 2, α-levels
of 0.01 and 0.04 were allocated to the 2 sub-families. If all null hypotheses in either sub-family
were rejected, the corresponding initial α was then propagated to the other sub-family using a
fallback testing procedure. All endpoints had p≤0.001, except worst tiredness with p=0.03; thus
all endpoints were declared to be statistically significant based on the gatekeeping strategy.

7
Figure S2. Secondary efficacy analyses, Week 0-24
Week
0 1 2 4 8 12 14 16 20 24
% P
atie
nts
0
10
20
30
40
50
60
70Placebo Baricitinib 2 mg Baricitinib 4 mg
A ACR 50 Response
***
******
***
**
******
***
***
******
***
***
*****
*
Week
0 1 2 4 8 12 14 16 20 24
% P
atie
nts
0
10
20
30
40
50
60
70
Placebo Baricitinib 2 mg Baricitinib 4 mg
B ACR 70 Response
*** ******
*** ***
*** ******
******
***
***
*
*
% P
ati
ents
0
5
10
15
20
25
30
35
40
45
50
55
9
17
9
36
26
39
26***
******
***
7
21 22
11***
9***
*** ***
Week 12 Week 24
24
11
46
3133
52
***
***
***
10
4
29
1416
32***
*
***
DAS28-CRP DAS28-CRPDAS28-ESR DAS28-ESR
C
***
***
***
DAS28
Placebo Baricitinib 2 mg Baricitinib 4 mg
2
Tall bars = % patients with DAS28 ≤3.2. Lower bars = % patientswith DAS28 <2.6.
% Patients
0
5
10
15
20
25
30
35
40
45
50
55
20
33
9
35
9
** ***
21
34 35
10 9
** ***
Week 12 Week 24
29
6
48
17
52
***
***
28
4
45
15 15
52***
*
***
SDAI
4
15
SDAICDAI CDAI
*** *** ***
***
***
*** ***
***
Placebo Baricitinib 2 mg Baricitinib 4 mg
D SDAI and CDAI
1 2
Tall bars = % patients with SDAI ≤11 or CDAI ≤10. Lower bars = % patientswith SDAI ≤3.3 or CDAI ≤2.8.
% P
atie
nts
0
20
40
60
80
> 0.22 > 0.22> 0.3 > 0.3
E
Week 12 Week 24
HAQ-DI MCID
*
54
69
64
***
44
5660 *****
42
60
37
55
64
58
******
******
Placebo Baricitinib 2 mg Baricitinib 4 mg
8
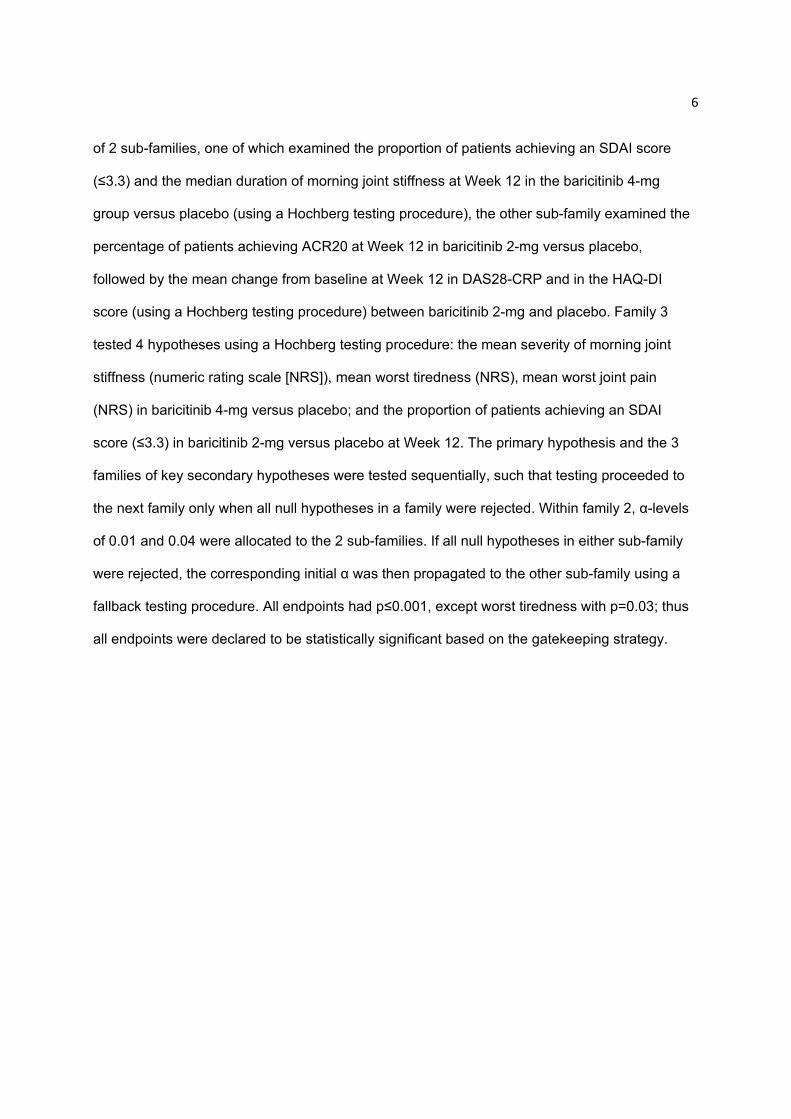
Panels A and B show the percentage of patients achieving ACR50 (A) or ACR70 (B) over time
through 24 weeks. Panel C shows the percentage of patients with DAS28-CRP and DAS28-
ESR (<2.6 or ≤3.2); Panel D shows SDAI (≤11 or ≤3.3) and CDAI (≤10 or ≤2.8); and Panel E
shows the percentage of patients achieving a HAQ-DI score improvement (≥0.22 or ≥0.3) at
Weeks 12 and 24. *p≤0.05, **p≤0.01, ***p≤0.001 versus placebo using logistic regression
without control for multiple comparisons.
9
Week
0 1 2 4 8 12 14 16 20 24
Ch
ang
e fr
om
bas
elin
e
-10
-5
0 PlaceboBaricitinib 2 mg Baricitinib 4 mg
SJC, 0-66A
*
***
***
*** ** ***
*** ***
******
***
**
****
******
Week
0 1 2 4 8 12 14 16 20 24
Ch
ang
e fr
om
bas
elin
e
-20
-15
-10
-5
0 PlaceboBaricitinib 2 mg Baricitinib 4 mg
TJC, 0-68B
*
**
*
***
**
******
***
*********
**
**
*
*
Week
0 1 2 4 8 12 14 16 20 24
Ch
ang
e fr
om
bas
elin
e
-45
-40
-35
-30
-25
-20
-15
-10
-5
0 PlaceboBaricitinib 2 mg Baricitinib 4 mg
Physician Global, 0-100 mm VASC
****** ***
*
***
***
****** ***
******
***
*** ***
***
***
***
Week
0 1 2 4 8 12 14 16 20 24
Ch
ang
e fr
om
bas
elin
e
-35
-30
-25
-20
-15
-10
-5
0 PlaceboBaricitinib 2 mg Baricitinib 4 mg
Patient Global, 0-100 mm VASD
*** ******
***
******
*** *** ***
***
******
***
******
**
Week
0 1 2 4 8 12 14 16 20 24
Ch
ang
e fr
om
bas
elin
e
-30
-25
-20
-15
-10
-5
0 PlaceboBaricitinib 2 mg Baricitinib 4 mg
Pain, 0-100 mm VASE
*****
******
******
*** ***
***
*** ***
******
****
*
Week
0 1 2 4 8 12 14 16 20 24
Ch
ang
e fr
om
bas
elin
e
-15
-10
-5
0
5
10 PlaceboBaricitinib 2 mg Baricitinib 4 mg
hsCRP, mg/LF
******
***
***
***
******
******
******
***
***
******
******
***
10
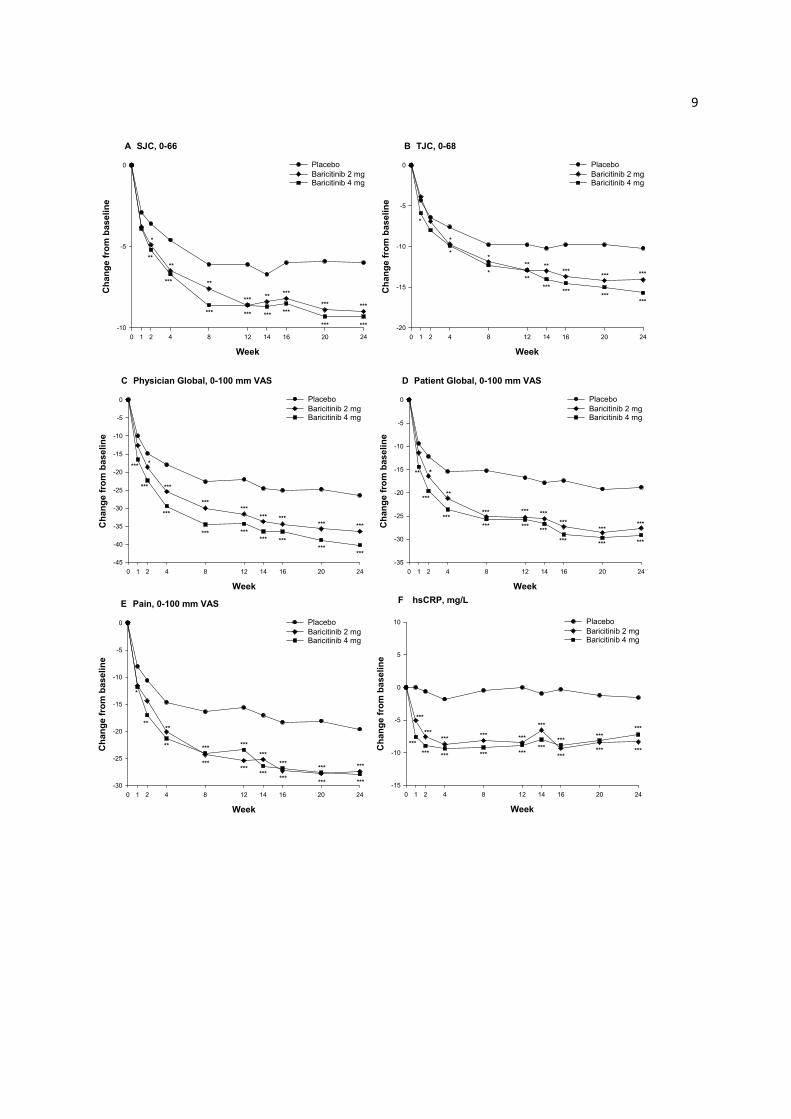
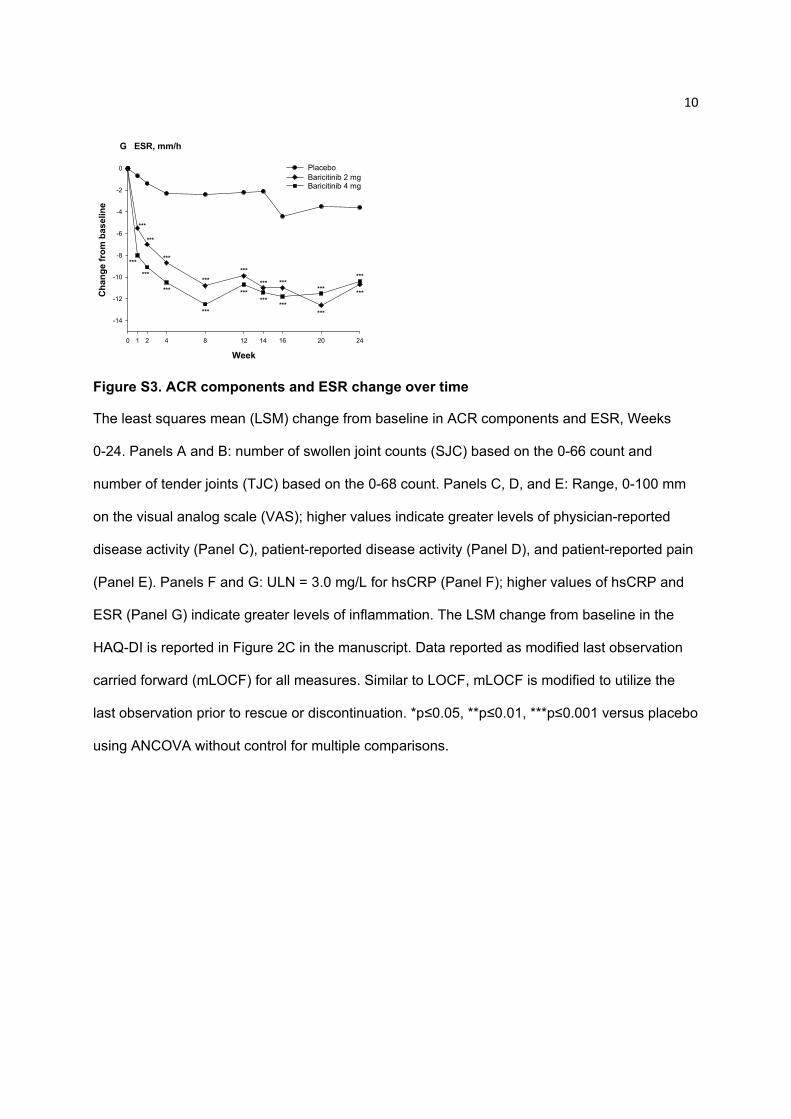
Figure S3. ACR components and ESR change over time
The least squares mean (LSM) change from baseline in ACR components and ESR, Weeks
0-24. Panels A and B: number of swollen joint counts (SJC) based on the 0-66 count and
number of tender joints (TJC) based on the 0-68 count. Panels C, D, and E: Range, 0-100 mm
on the visual analog scale (VAS); higher values indicate greater levels of physician-reported
disease activity (Panel C), patient-reported disease activity (Panel D), and patient-reported pain
(Panel E). Panels F and G: ULN = 3.0 mg/L for hsCRP (Panel F); higher values of hsCRP and
ESR (Panel G) indicate greater levels of inflammation. The LSM change from baseline in the
HAQ-DI is reported in Figure 2C in the manuscript. Data reported as modified last observation
carried forward (mLOCF) for all measures. Similar to LOCF, mLOCF is modified to utilize the
last observation prior to rescue or discontinuation. *p≤0.05, **p≤0.01, ***p≤0.001 versus placebo
using ANCOVA without control for multiple comparisons.
Week
0 1 2 4 8 12 14 16 20 24
Ch
ang
e fr
om
bas
elin
e
-14
-12
-10
-8
-6
-4
-2
0 PlaceboBaricitinib 2 mg Baricitinib 4 mg
ESR, mm/hG
***
***
***
***
***
***
***
***
***
***
***
***
***
***
***
***
***
***
11
Week
0 1 2 4 8 12 14 16 20 24
Ch
an
ge
fro
m b
as
elin
e (m
LO
CF
)
-2.5
-2.0
-1.5
-1.0
-0.5
0.0 PlaceboBaricitinib 2 mg Baricitinib 4 mg
DAS28-ESR
*
**
***
******
*** ****** ***
***
***
***
*** ***
******
*** ***
A
Week
0 1 2 4 8 12 14 16 20 24
Ch
an
ge
fro
m b
as
elin
e (m
LO
CF
)
-25
-20
-15
-10
-5
0 PlaceboBaricitinib 2 mg Baricitinib 4 mg
CDAI
*
***
***
*** *** ****** ***
***
***
***
******
*** ****** ***
B
Week
0 1 2 4 8 12 14 16 20 24
Ch
ang
e fr
om
bas
elin
e (m
LO
CF
)
-30
-25
-20
-15
-10
-5
0 PlaceboBaricitinib 2 mg Baricitinib 4 mg
SDAI Change Over Time
*
**
***
****** *** ***
*** ***
***
***
***
******
*** ****** ***
C
12
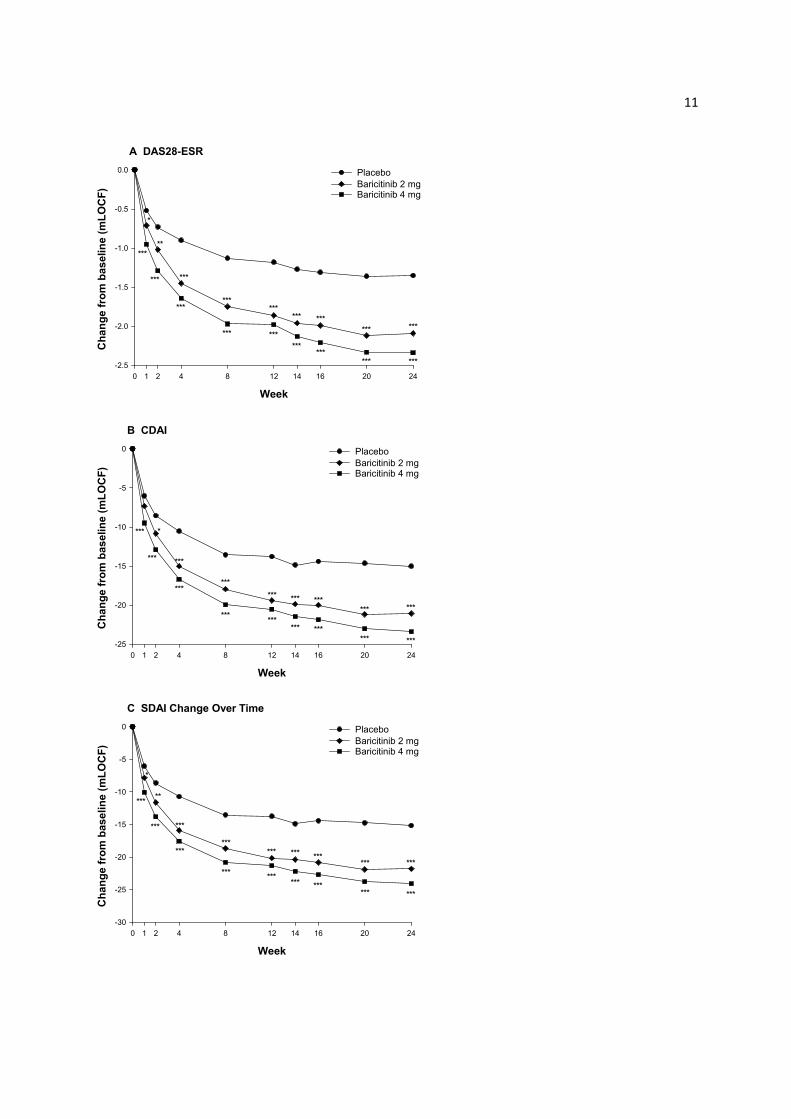
Figure S4. DAS28-ESR, CDAI, and SDAI change over time
The least squares mean (LSM) change from baseline in DAS28-ESR (Panel A), CDAI (Panel
B), and SDAI (Panel C) from Weeks 0-24. *p≤0.05, **p≤0.01, ***p≤0.001 versus placebo using
ANCOVA without control for multiple comparisons.
13
1 10 100
Overall population
PlaceboBaricitinib
2 mgBaricitinib
4 mgInteraction
p value
n/N (%)
90/228 (39) 140/227 (62)
90/228 (39) 151/229 (66)
None
2/17 (12) 7/13 (54)
2/17 (12) 11/18 (61)
MTX only
45/109 (41) 72/114 (63)
45/109 (41) 78/111 (70)
Non-MTX csDMARDs
MTX + other csDMARDs
17/44 (39) 26/43 (60)
17/44 (39) 26/41 (63)
26/58 (45) 35/57 (61)
26/58 (45) 36/59 (61)
Overall population
None
MTX only
Non-MTX csDMARDs
MTX + other csDMARDs
96/228 (42) 148/227 (65)
96/228 (42) 140/229 (61)
2/17 (12) 7/13 (54)
2/17 (12) 9/18 (50)
48/109 (44) 76/114 (67)
48/109 (44) 72/111(65)
17/44 (39) 23/43 (53)
17/44 (39) 24/41 (59)
29/58 (50) 42/57 (74)
29/58 (50) 35/59 (59)
Week 12
Background csDMARD category
None
MTX only
Non-MTX csDMARDs
MTX + other csDMARDs
Week 24
Background csDMARD category
None
MTX only
Non-MTX csDMARDs
MTX + other csDMARDs
0.271
0.533
0.367
0.498
Baricitinib 4 mg
Odds Ratio with 95% CI for baricitinib vs. placebo
Baricitinib 2 mg
A. ACR 20
0.1 1 10 100
Overall population
PlaceboBaricitinib
2 mgBaricitinib
4 mgInteraction
p value
n/N (%)
29/228 (13) 76/227 (33)
29/228 (13) 77/229 (34)
None
2/17 (12) 2/13 (15)
2/17 (12) 4/18 (22)
MTX only
14/109 (13) 42/114 (37)
14/109 (13) 40/111 (36)
Non-MTX csDMARDs
MTX + other csDMARDs
7/44 (16) 14/43 (33)
7/44 (16) 18/41 (44)
6/58 (10) 18/57 (32)
6/58 (10) 15/59 (25)
Overall population
None
MTX only
Non-MTX csDMARDs
MTX + other csDMARDs
49/228 (21) 100/227 (44)
49/228 (21) 95/229 (41)
2/17 (12) 5/13 (38)
2/17 (12) 7/18 (39)
22/109 (20) 48/114 (42)
22/109 (20) 47/111 (42)
10/44 (23) 17/43 (40)
10/44 (23) 15/41 (37)
15/58 (26) 30/57 (53)
15/58 (26) 26/59 (44)
Week 12
Background csDMARD category
None
MTX only
Non-MTX csDMARDs
MTX + other csDMARDs
Week 24
Background csDMARD category
None
MTX only
Non-MTX csDMARDs
MTX + other csDMARDs
0.910
0.727
0.789
0.891
Baricitinib 4 mg
Odds Ratio with 95% CI for baricitinib vs. placebo
Baricitinib 2 mg
B. ACR 50

14
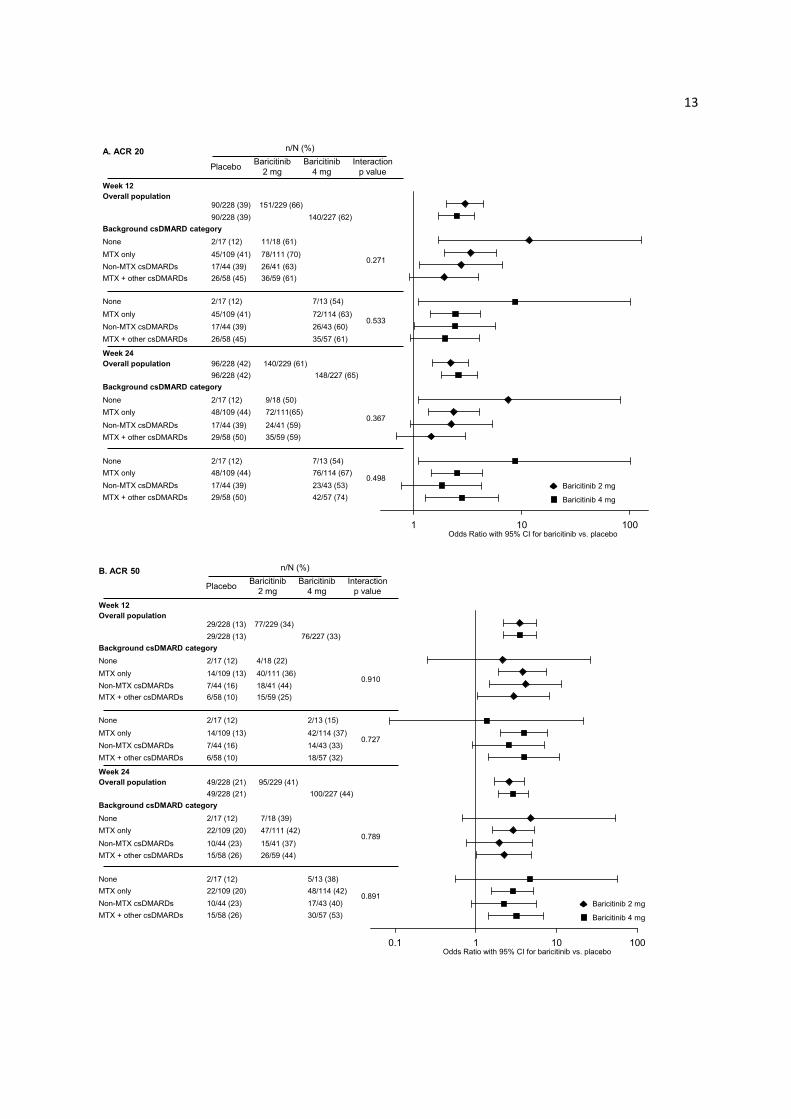
Figure S5. ACR20, ACR50, and DAS28-CRP ≤3.2 in subgroups defined by concomitant csDMARD therapy
Across the subgroups, the p-value is from the interaction test using a logistic regression model:
treatment group + subgroup + treatment-by-subgroup while the odds ratio and 95% confidence
interval (CI) are from the logistic regression model: treatment group. When logistic regression
sample size requirements (<5 responders in any category for any subgroup) are not met, the
simple odds ratio is calculated, with Fisher’s exact test substituted for the p-value and 95% CI.
For 13 of the 48 (27%) patients in the monotherapy subgroup, the only reported reason for
discontinuation of prior csDMARDs was intolerance (AE). csDMARD, conventional synthetic
disease-modifying antirheumatic drug; MTX, methotrexate; N, number of patients in the
specified subgroup; n, number of patients in the specified category.
0.1 1 10 100
Overall population
PlaceboBaricitinib
2 mgBaricitinib
4 mgInteraction
p value
n/N (%)
39/228 (17) 89/227 (39)
39/228 (17) 82/229 (36)
None
2/17 (12) 2/13 (15)
2/17 (12) 4/18 (22)
MTX only
22/109 (20) 46/114 (40)
22/109 (20) 42/111 (38)
Non-MTX csDMARDs
MTX + other csDMARDs
8/44 (18) 17/43 (40)
8/44 (18) 17/41 (41)
7/58 (12) 24/57 (42)
7/58 (12) 19/59 (32)
Overall population
None
MTX only
Non-MTX csDMARDs
MTX + other csDMARDs
54/228 (24) 117/227 (52)
54/228 (24) 106/229 (46)
2/17 (12) 8/13 (62)
2/17 (12) 7/18 (39)
28/109 (26) 59/114 (52)
28/109 (26) 56/111 (50)
12/44 (27) 19/43 (44)
12/44 (27) 17/41 (41)
12/58 (21) 31/57 (54)
12/58 (21) 26/59 (44)
Week 12
Background csDMARD category
None
MTX only
Non-MTX csDMARDs
MTX + other csDMARDs
Week 24
Background csDMARD category
None
MTX only
Non-MTX csDMARDs
MTX + other csDMARDs
0.906
0.563
0.769
0.326
Baricitinib 4 mg
Odds Ratio with 95% CI for baricitinib vs. placebo
Baricitinib 2 mg
C. DAS28-CRP ≤3.2
15
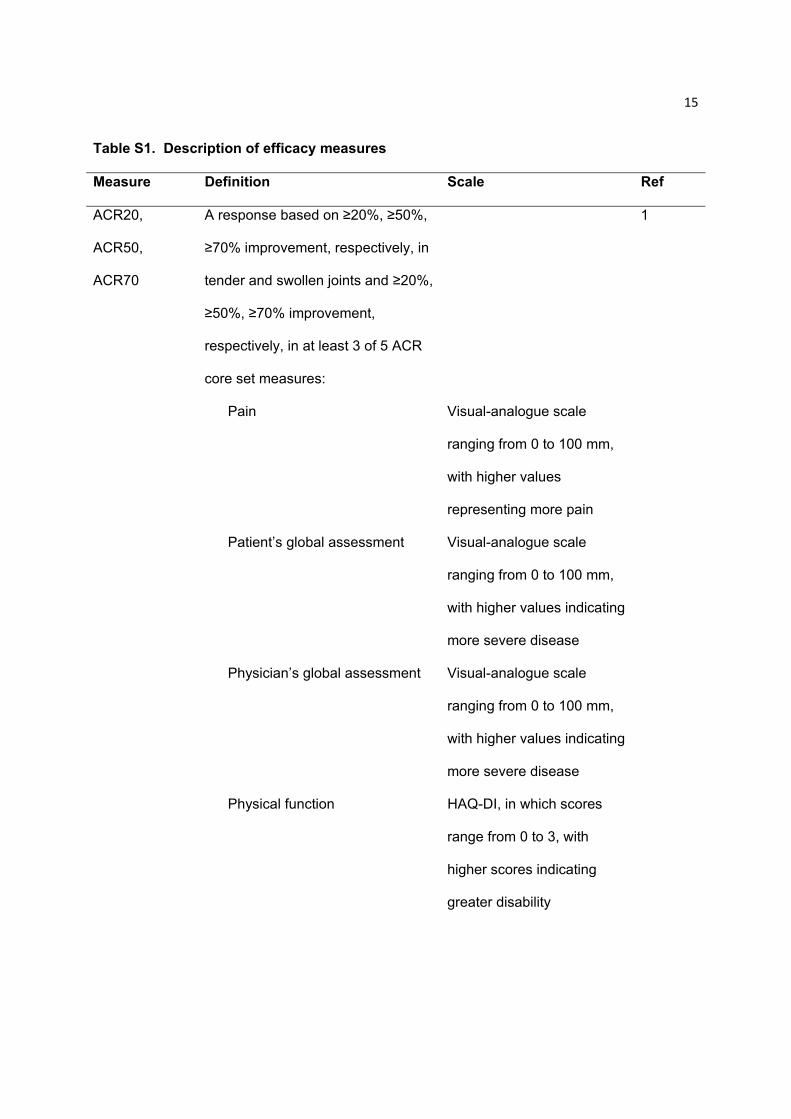
Table S1. Description of efficacy measures
Measure Definition Scale Ref
ACR20,
ACR50,
ACR70
A response based on ≥20%, ≥50%,
≥70% improvement, respectively, in
tender and swollen joints and ≥20%,
≥50%, ≥70% improvement,
respectively, in at least 3 of 5 ACR
core set measures:
1
Pain Visual-analogue scale
ranging from 0 to 100 mm,
with higher values
representing more pain
Patient’s global assessment Visual-analogue scale
ranging from 0 to 100 mm,
with higher values indicating
more severe disease
Physician’s global assessment Visual-analogue scale
ranging from 0 to 100 mm,
with higher values indicating
more severe disease
Physical function HAQ-DI, in which scores
range from 0 to 3, with
higher scores indicating
greater disability
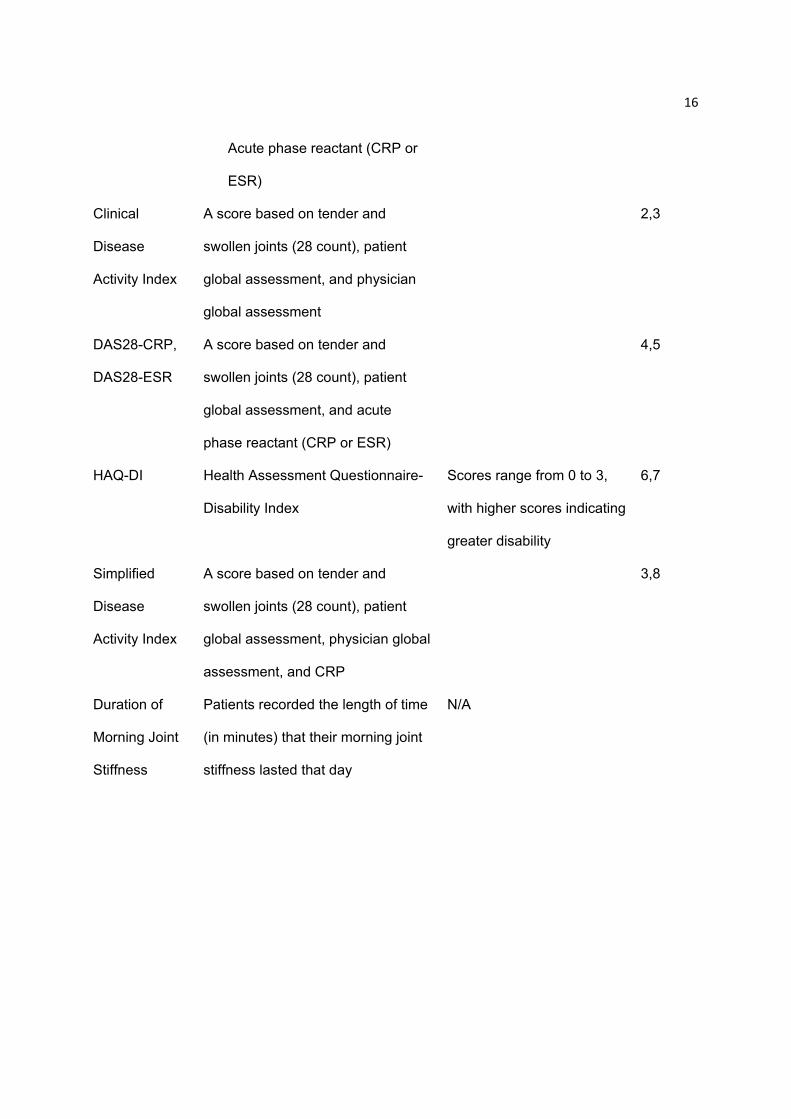
16
Acute phase reactant (CRP or
ESR)
Clinical
Disease
Activity Index
A score based on tender and
swollen joints (28 count), patient
global assessment, and physician
global assessment
2,3
DAS28-CRP,
DAS28-ESR
A score based on tender and
swollen joints (28 count), patient
global assessment, and acute
phase reactant (CRP or ESR)
4,5
HAQ-DI Health Assessment Questionnaire-
Disability Index
Scores range from 0 to 3,
with higher scores indicating
greater disability
6,7
Simplified
Disease
Activity Index
A score based on tender and
swollen joints (28 count), patient
global assessment, physician global
assessment, and CRP
3,8
Duration of
Morning Joint
Stiffness
Patients recorded the length of time
(in minutes) that their morning joint
stiffness lasted that day
N/A
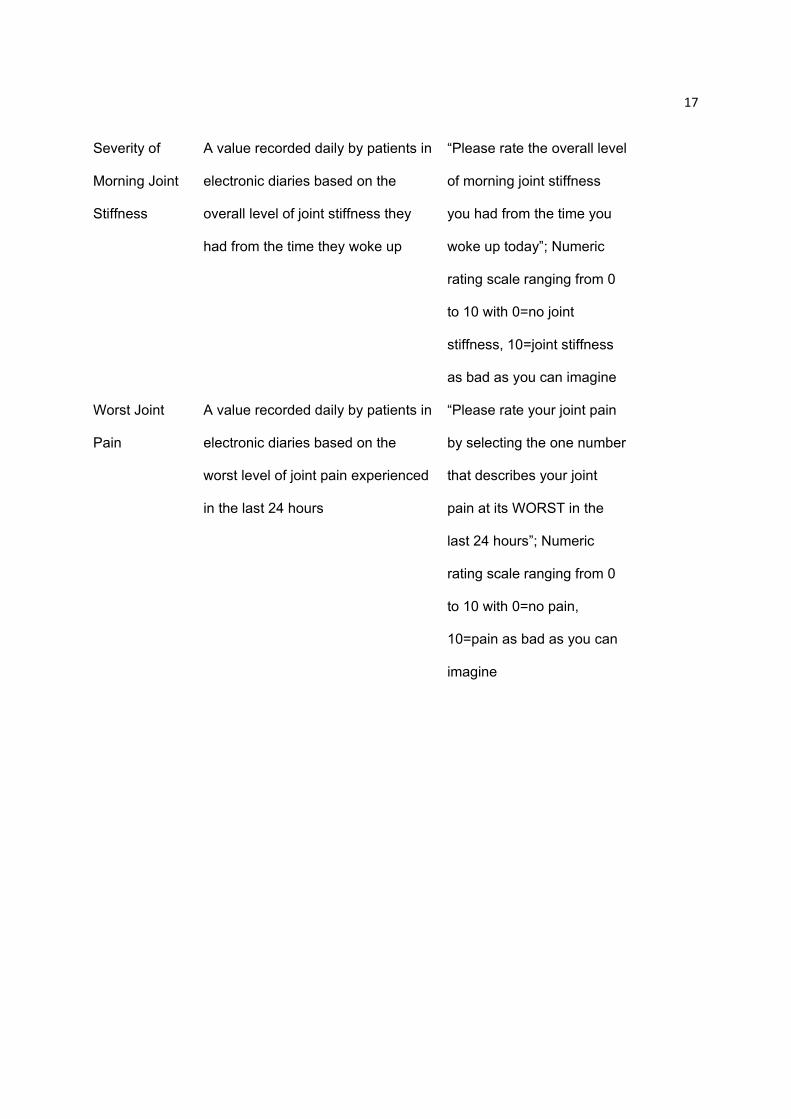
17
Severity of
Morning Joint
Stiffness
A value recorded daily by patients in
electronic diaries based on the
overall level of joint stiffness they
had from the time they woke up
“Please rate the overall level
of morning joint stiffness
you had from the time you
woke up today”; Numeric
rating scale ranging from 0
to 10 with 0=no joint
stiffness, 10=joint stiffness
as bad as you can imagine
Worst Joint
Pain
A value recorded daily by patients in
electronic diaries based on the
worst level of joint pain experienced
in the last 24 hours
“Please rate your joint pain
by selecting the one number
that describes your joint
pain at its WORST in the
last 24 hours”; Numeric
rating scale ranging from 0
to 10 with 0=no pain,
10=pain as bad as you can
imagine

18
Worst
Tiredness
A value recorded daily by patients in
electronic diaries based on the
worst level of tiredness experienced
in the last 24 hours
“Please rate your tiredness
by selecting the one number
that describes your WORST
level of tiredness during the
past 24 hours”; Numeric
rating scale ranging from 0
to 10 with 0=no tiredness,
10=as bad as you can
imagine
19
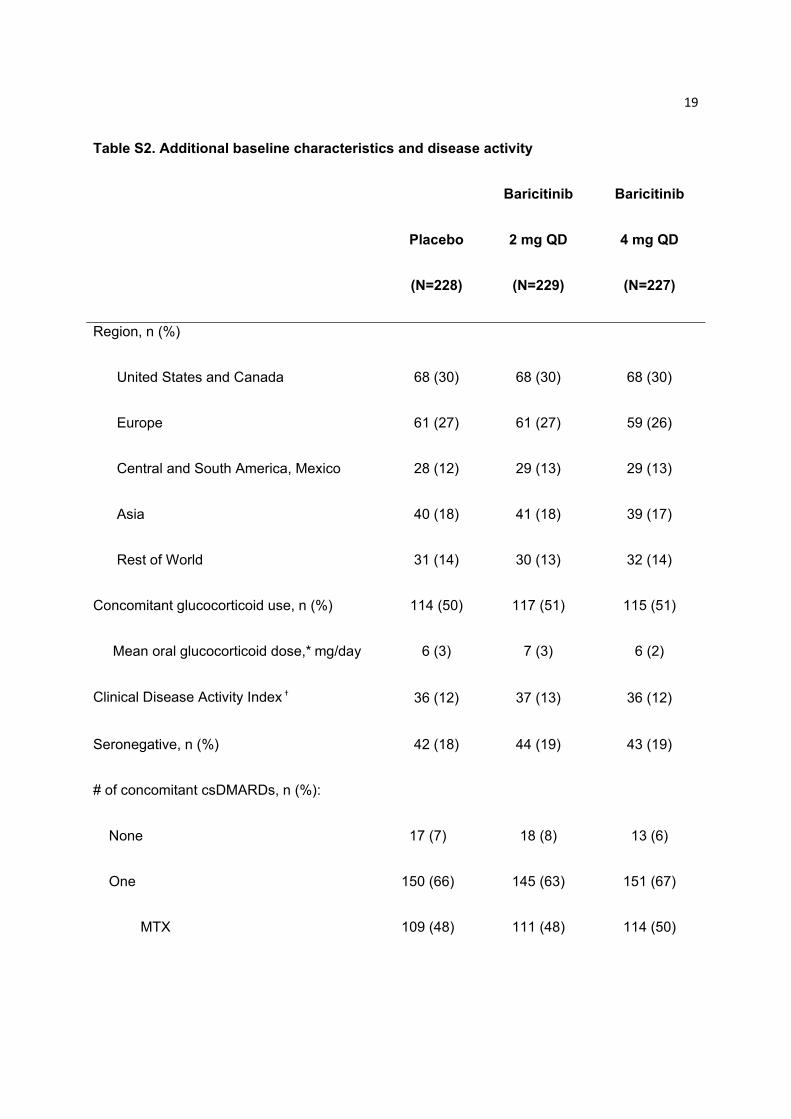
Table S2. Additional baseline characteristics and disease activity
Placebo
(N=228)
Baricitinib
2 mg QD
(N=229)
Baricitinib
4 mg QD
(N=227)
Region, n (%)
United States and Canada 68 (30) 68 (30) 68 (30)
Europe 61 (27) 61 (27) 59 (26)
Central and South America, Mexico 28 (12) 29 (13) 29 (13)
Asia 40 (18) 41 (18) 39 (17)
Rest of World 31 (14) 30 (13) 32 (14)
Concomitant glucocorticoid use, n (%) 114 (50) 117 (51) 115 (51)
Mean oral glucocorticoid dose,* mg/day 6 (3) 7 (3) 6 (2)
Clinical Disease Activity Index † 36 (12) 37 (13) 36 (12)
Seronegative, n (%) 42 (18) 44 (19) 43 (19)
# of concomitant csDMARDs, n (%):
None 17 (7) 18 (8) 13 (6)
One 150 (66) 145 (63) 151 (67)
MTX 109 (48) 111 (48) 114 (50)
20
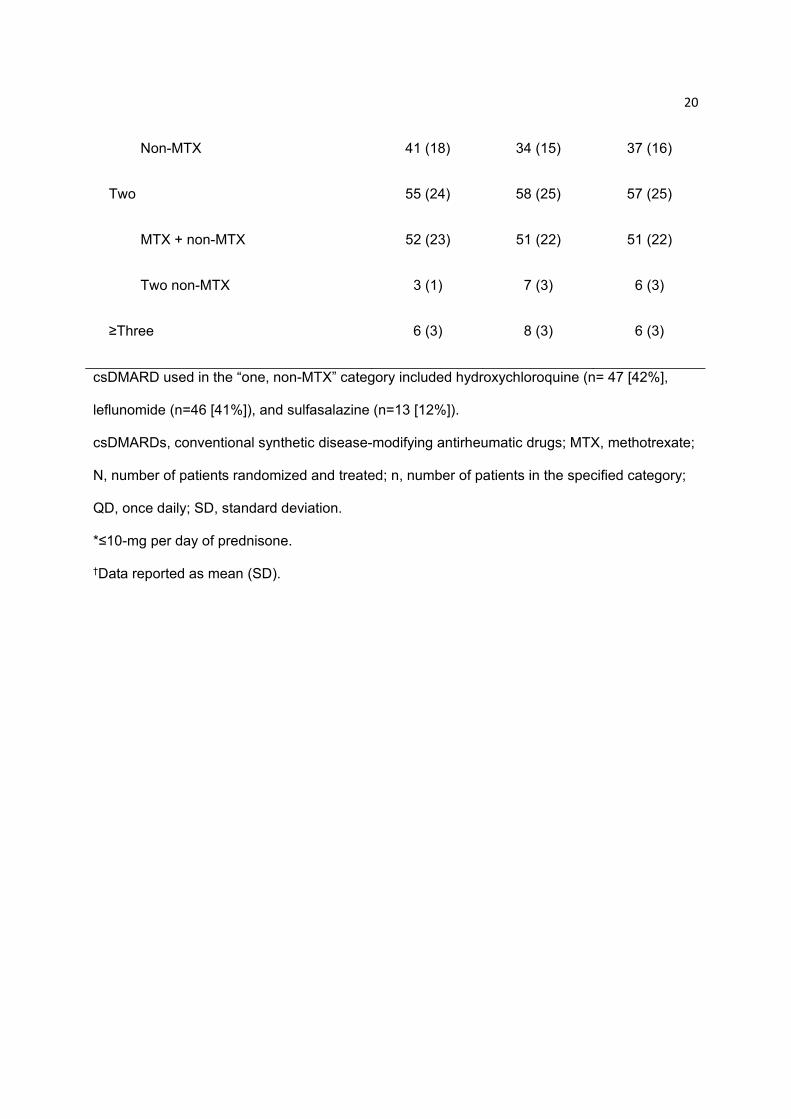
Non-MTX 41 (18) 34 (15) 37 (16)
Two 55 (24) 58 (25) 57 (25)
MTX + non-MTX 52 (23) 51 (22) 51 (22)
Two non-MTX 3 (1) 7 (3) 6 (3)
≥Three 6 (3) 8 (3) 6 (3)
csDMARD used in the “one, non-MTX” category included hydroxychloroquine (n= 47 [42%],
leflunomide (n=46 [41%]), and sulfasalazine (n=13 [12%]).
csDMARDs, conventional synthetic disease-modifying antirheumatic drugs; MTX, methotrexate;
N, number of patients randomized and treated; n, number of patients in the specified category;
QD, once daily; SD, standard deviation.
*≤10-mg per day of prednisone.
†Data reported as mean (SD).
21
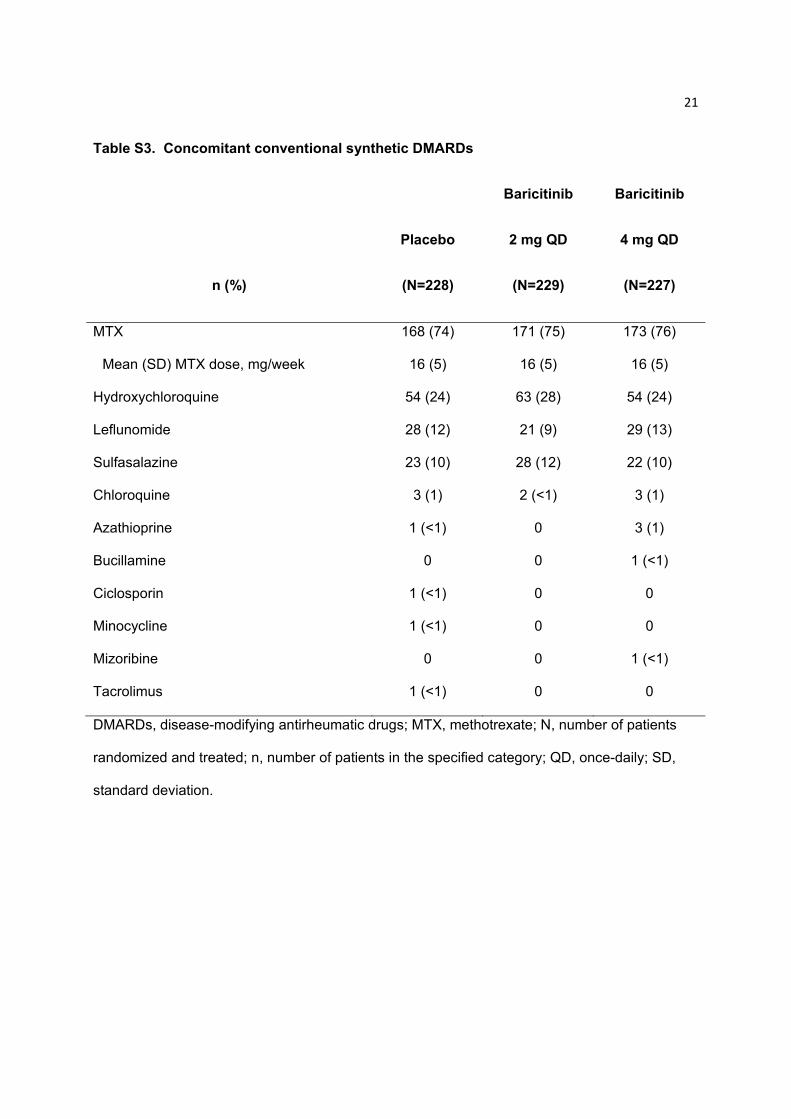
Table S3. Concomitant conventional synthetic DMARDs
n (%)
Placebo
(N=228)
Baricitinib
2 mg QD
(N=229)
Baricitinib
4 mg QD
(N=227)
MTX 168 (74) 171 (75) 173 (76)
Mean (SD) MTX dose, mg/week 16 (5) 16 (5) 16 (5)
Hydroxychloroquine 54 (24) 63 (28) 54 (24)
Leflunomide 28 (12) 21 (9) 29 (13)
Sulfasalazine 23 (10) 28 (12) 22 (10)
Chloroquine 3 (1) 2 (<1) 3 (1)
Azathioprine 1 (<1) 0 3 (1)
Bucillamine 0 0 1 (<1)
Ciclosporin 1 (<1) 0 0
Minocycline 1 (<1) 0 0
Mizoribine 0 0 1 (<1)
Tacrolimus 1 (<1) 0 0
DMARDs, disease-modifying antirheumatic drugs; MTX, methotrexate; N, number of patients
randomized and treated; n, number of patients in the specified category; QD, once-daily; SD,
standard deviation.

22
Table S4. ACR20, ACR50, ACR70 responses Weeks 0-24†
ACR20 ACR50 ACR70
Weeks
Placebo
(N=228)
Baricitinib
2 mg QD
(N=229)
Baricitinib
4 mg QD
(N=227)
Placebo
(N=228)
Baricitinib
2 mg QD
(N=229)
Baricitinib
4 mg QD
(N=227)
Placebo
(N=228)
Baricitinib
2 mg QD
(N=229)
Baricitinib
4 mg QD
(N=227)
1 32 (14) 53 (23)* 69 (30)*** 3 (1) 10 (4) 13 (6)* 1 (<1) 4 (2) 1 (<1)
2 54 (24) 79 (34)* 99 (44)*** 14 (6) 20 (9) 32 (14)** 4 (2) 4 (2) 11 (5)
4 66 (29) 119 (52)*** 122 (54)*** 17 (7) 48 (21)*** 57 (25)*** 7 (3) 21 (9)* 20 (9)*
8 92 (40) 132 (58)*** 133 (59)*** 33 (14) 60 (26)** 73 (32)*** 9 (4) 32 (14)*** 38 (17)***
12 90 (39) 151 (66)*** 140 (62)*** 29 (13) 77 (34)*** 76 (33)*** 7 (3) 41 (18)*** 41 (18)***
14 97 (43) 145 (63)*** 139 (61)*** 39 (17) 79 (34)*** 88 (39)*** 12 (5) 37 (16)*** 42 (19)***
16 98 (43) 145 (63)*** 148 (65)*** 43 (19) 86 (38)*** 96 (42)*** 20 (9) 47 (21)*** 49 (22)***
20 92 (40) 147 (64)*** 146 (64)*** 40 (18) 93 (41)*** 102 (45)*** 18 (8) 49 (21)*** 58 (26)***
23
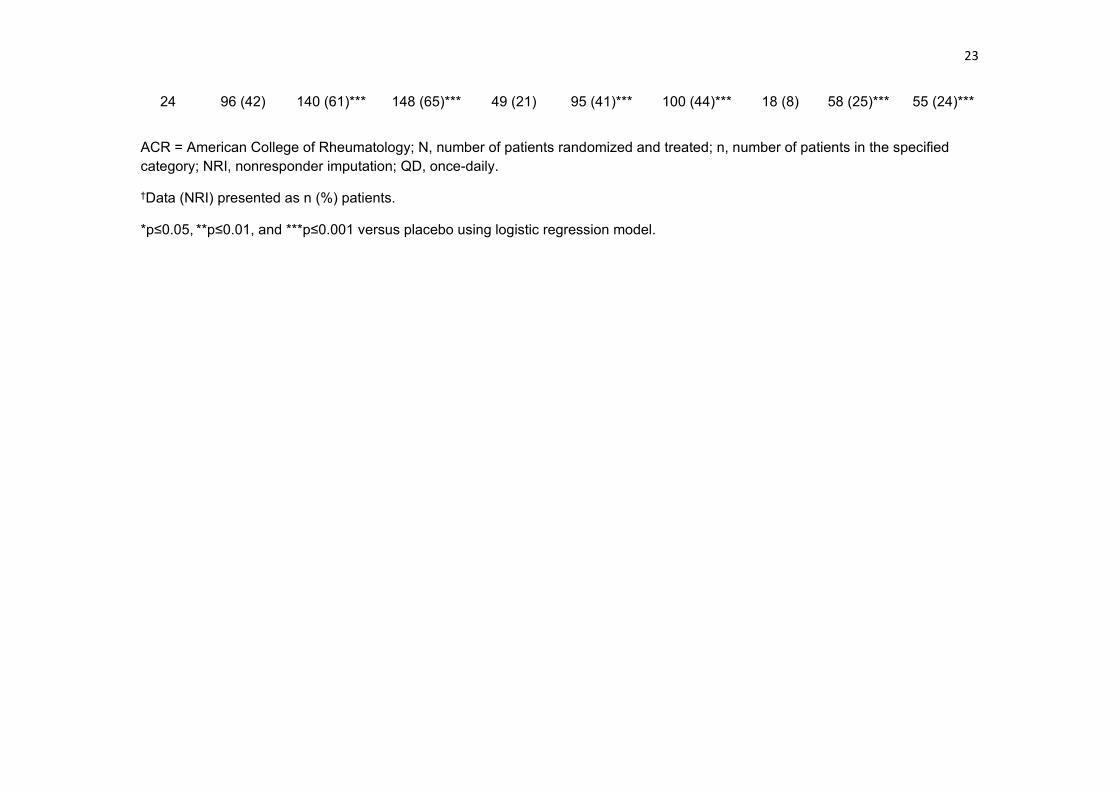
24 96 (42) 140 (61)*** 148 (65)*** 49 (21) 95 (41)*** 100 (44)*** 18 (8) 58 (25)*** 55 (24)***
ACR = American College of Rheumatology; N, number of patients randomized and treated; n, number of patients in the specified category; NRI, nonresponder imputation; QD, once-daily.
†Data (NRI) presented as n (%) patients.
*p≤0.05, **p≤0.01, and ***p≤0.001 versus placebo using logistic regression model.

24
Table S5. Adverse events during treatment, Weeks 0-24
MedDRA Preferred Term, n (%)*
Placebo
(N=228)
Baricitinib
2 mg QD
(N=229)
Baricitinib
4 mg QD
(N=227)
Patients with ≥1 adverse event during
treatment 161 (71) 154 (67) 162 (71)
Preferred terms reported in ≥2% patients in either baricitinib dose group
Upper respiratory tract infection 18 (8) 14 (6) 24 (11)
Nasopharyngitis 18 (8) 10 (4) 18 (8)
Blood CPK increased 0 8 (3) 15 (7)
Cough 3 (1) 9 (4) 9 (4)
Gastroenteritis 1 (<1) 5 (2) 9 (4)
Headache 8 (4) 15 (7) 9 (4)
Hypercholesterolemia 2 (<1) 5 (2) 9 (4)
Oropharyngeal pain 2 (<1) 4 (2) 9 (4)
Urinary tract infection 5 (2) 12 (5) 9 (4)
Pharyngitis 3 (1) 6 (3) 8 (4)
Bronchitis 12 (5) 6 (3) 7 (3)
Dizziness 4 (2) 3 (1) 7 (3)

25
Alopecia 4 (2) 1 (<1) 6 (3)
Arthralgia 3 (1) 6 (3) 6 (3)
AST increased 1 (<1) 3 (1) 6 (3)
Dyspepsia 2 (<1) 1 (<1) 6 (3)
Hyperlipidemia 2 (<1) 2 (<1) 6 (3)
Hypertension 2 (<1) 10 (4) 6 (3)
ALT increased 2 (<1) 5 (2) 5 (2)
Back pain 11 (5) 9 (4) 5 (2)
Constipation 3 (1) 7 (3) 5 (2)
Fatigue 5 (2) 2 (<1) 5 (2)
Nausea 8 (4) 7 (3) 5 (2)
Pyrexia 2 (<1) 1 (<1) 5 (2)
Abdominal pain upper 1 (<1) 5 (2) 4 (2)
Anemia 7 (3) 6 (3) 4 (2)
Diarrhea 10 (4) 10 (4) 4 (2)
Dyspnea 0 0 4 (2)
Lower respiratory tract infection 1 (<1) 1 (<1) 4 (2)
Sinus congestion 0 0 4 (2)

26
Sinusitis 6 (3) 3 (1) 4 (2)
Vomiting 4 (2) 7 (3) 4 (2)
Abdominal pain 0 5 (2) 3 (1)
Herpes zoster 0 4 (2) 3 (1)
Mouth ulceration 0 5 (2) 3 (1)
Erectile dysfunction 0 0 1 (3)†
ALT, alanine transaminase; AST, aspartate transaminase; CPK, creatine phosphokinase;
MedDRA, Medical Dictionary for Regulatory Activities; N, number of patients randomized and
treated; n, number of patients in the specified category; QD, once daily; TEAE, treatment-
emergent adverse event.
*Data represent n (%) patients who experienced a TEAE at any time during the treatment
period, up to the time of rescue.
†Denominator adjusted because event is specific to males.
27
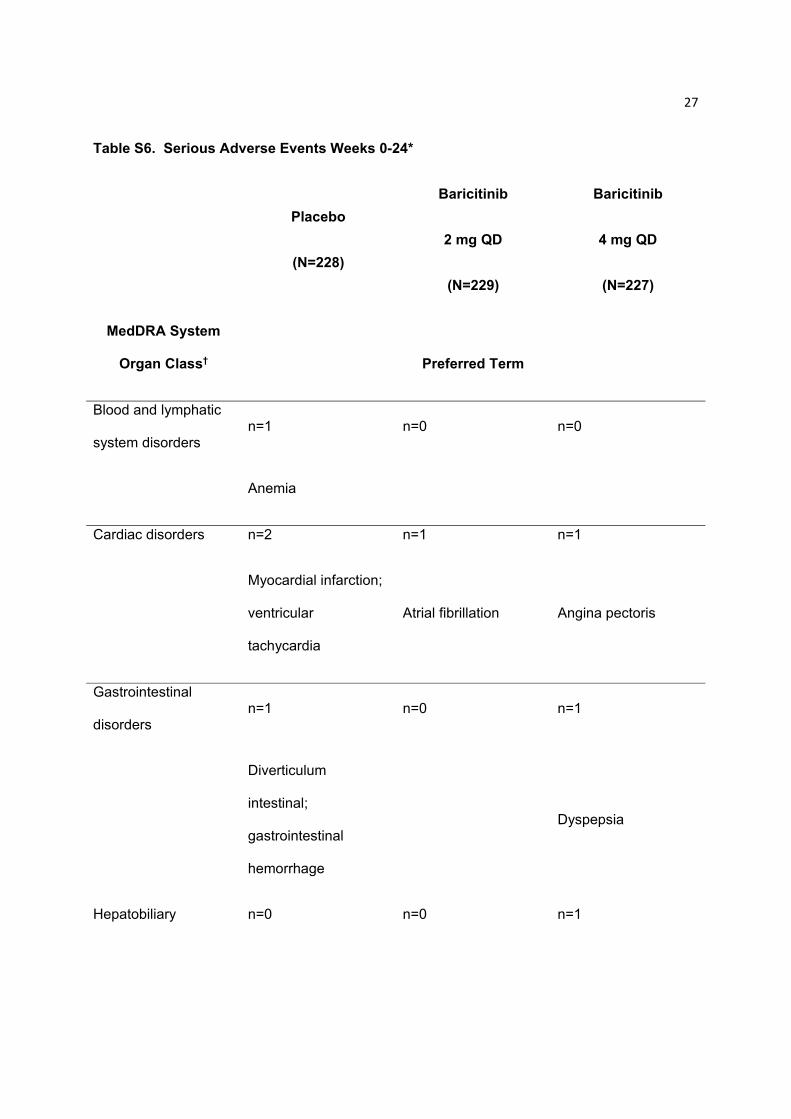
Table S6. Serious Adverse Events Weeks 0-24*
Placebo
(N=228)
Baricitinib
2 mg QD
(N=229)
Baricitinib
4 mg QD
(N=227)
MedDRA System
Organ Class† Preferred Term
Blood and lymphatic
system disorders n=1 n=0 n=0
Anemia
Cardiac disorders n=2 n=1 n=1
Myocardial infarction;
ventricular
tachycardia
Atrial fibrillation Angina pectoris
Gastrointestinal
disorders n=1 n=0 n=1
Diverticulum
intestinal;
gastrointestinal
hemorrhage
Dyspepsia
Hepatobiliary n=0 n=0 n=1
28
disorders
Cholecystitis acute
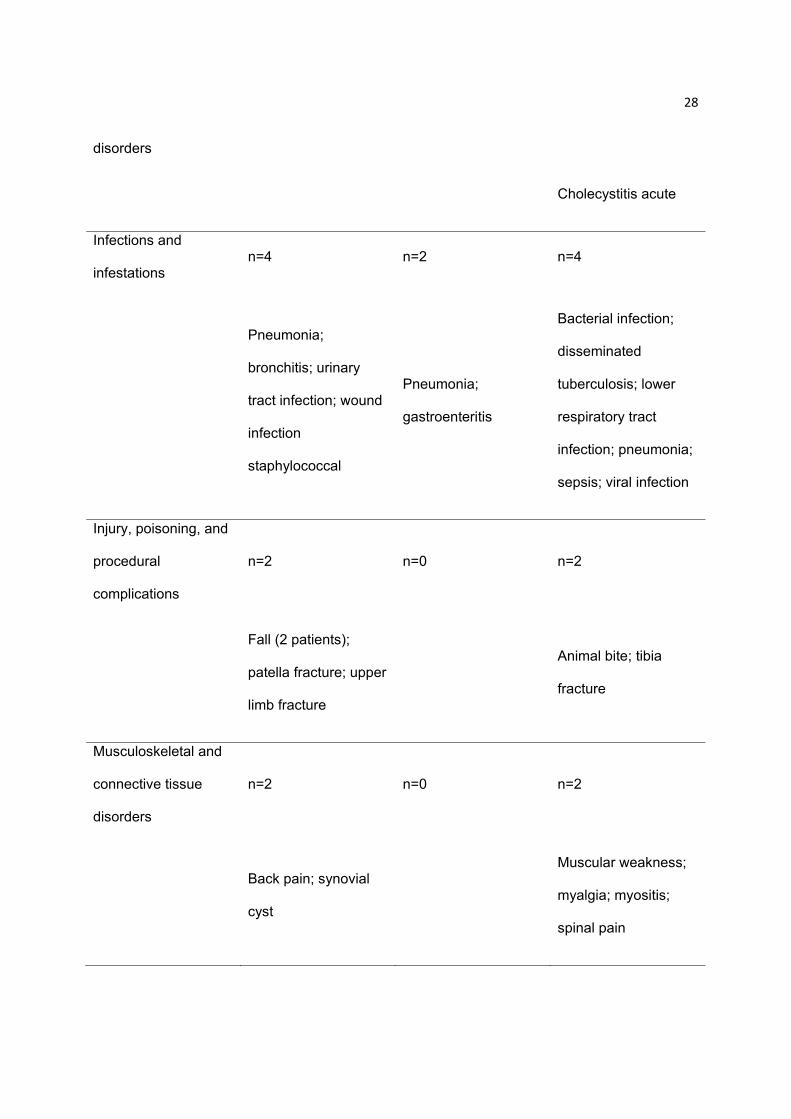
Infections and
infestations n=4 n=2 n=4
Pneumonia;
bronchitis; urinary
tract infection; wound
infection
staphylococcal
Pneumonia;
gastroenteritis
Bacterial infection;
disseminated
tuberculosis; lower
respiratory tract
infection; pneumonia;
sepsis; viral infection
Injury, poisoning, and
procedural
complications
n=2 n=0 n=2
Fall (2 patients);
patella fracture; upper
limb fracture
Animal bite; tibia
fracture
Musculoskeletal and
connective tissue
disorders
n=2 n=0 n=2
Back pain; synovial
cyst
Muscular weakness;
myalgia; myositis;
spinal pain
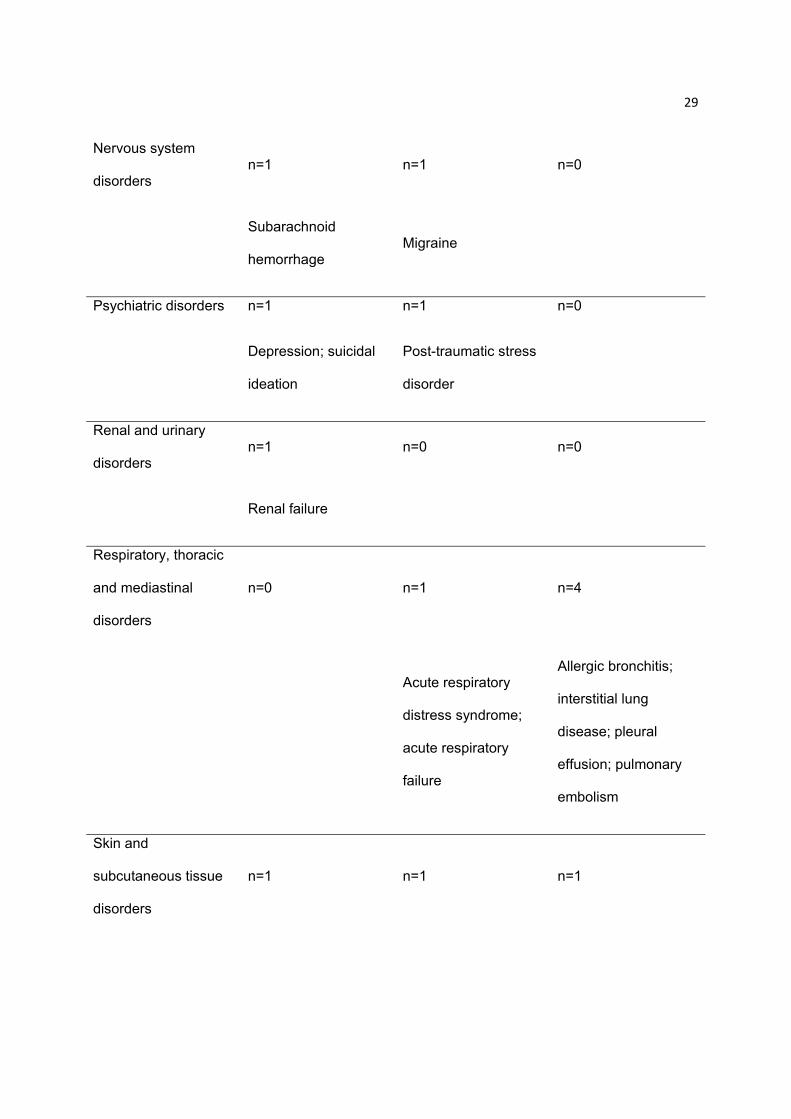
29
Nervous system
disorders n=1 n=1 n=0
Subarachnoid
hemorrhage Migraine
Psychiatric disorders n=1 n=1 n=0
Depression; suicidal
ideation
Post-traumatic stress
disorder
Renal and urinary
disorders n=1 n=0 n=0
Renal failure
Respiratory, thoracic
and mediastinal
disorders
n=0 n=1 n=4
Acute respiratory
distress syndrome;
acute respiratory
failure
Allergic bronchitis;
interstitial lung
disease; pleural
effusion; pulmonary
embolism
Skin and
subcutaneous tissue
disorders
n=1 n=1 n=1

30
Subcutaneous
emphysema Psoriasis Rash pruritic
AE, adverse event; CPK, creatine phosphokinase; MedDRA, Medical Dictionary for Regulatory
Activities; N, number of patients randomized and treated; n, number of patients in the specified
category; QD, once-daily; SAE, serious adverse event.
*SAEs reported using conventional International Conference on Harmonization definitions up to
the time of rescue. Table does not describe events that were serious for the reason of protocol
definition. The protocol required that AEs or laboratory abnormalities leading to permanent
discontinuation of study drug be designated as serious adverse events.
†Events are listed according to the system organ classes and preferred terms in MedDRA version 17.0.
31
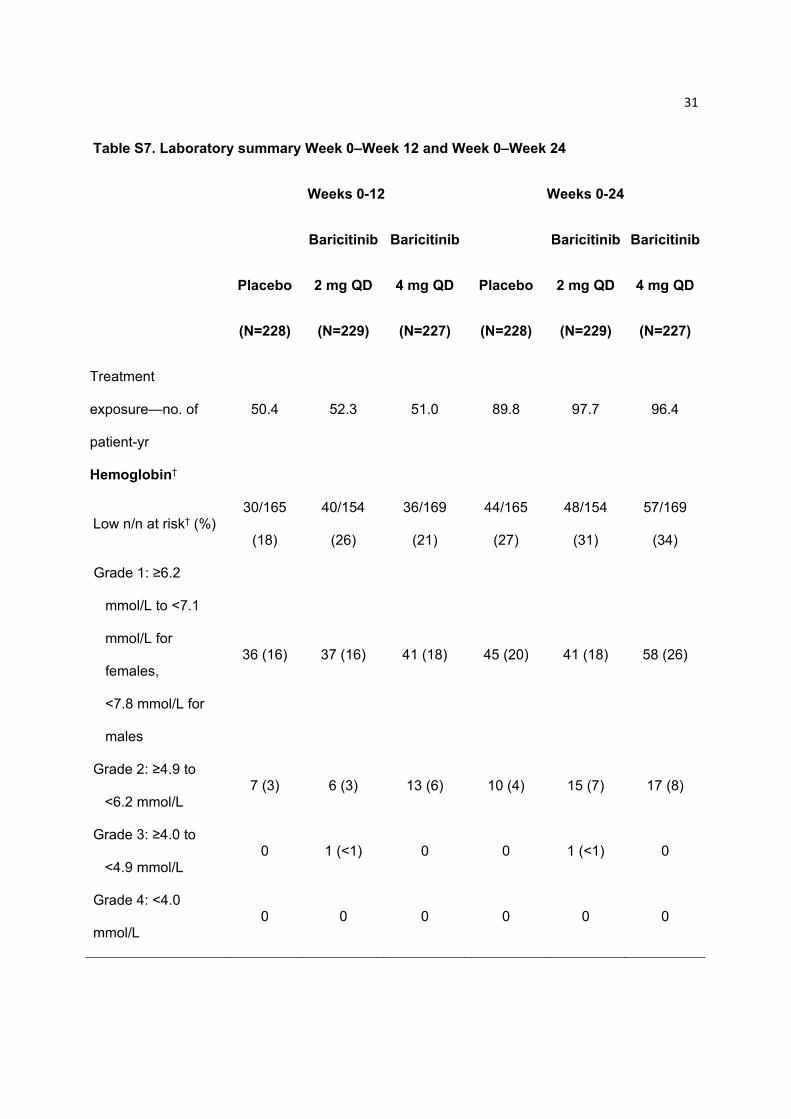
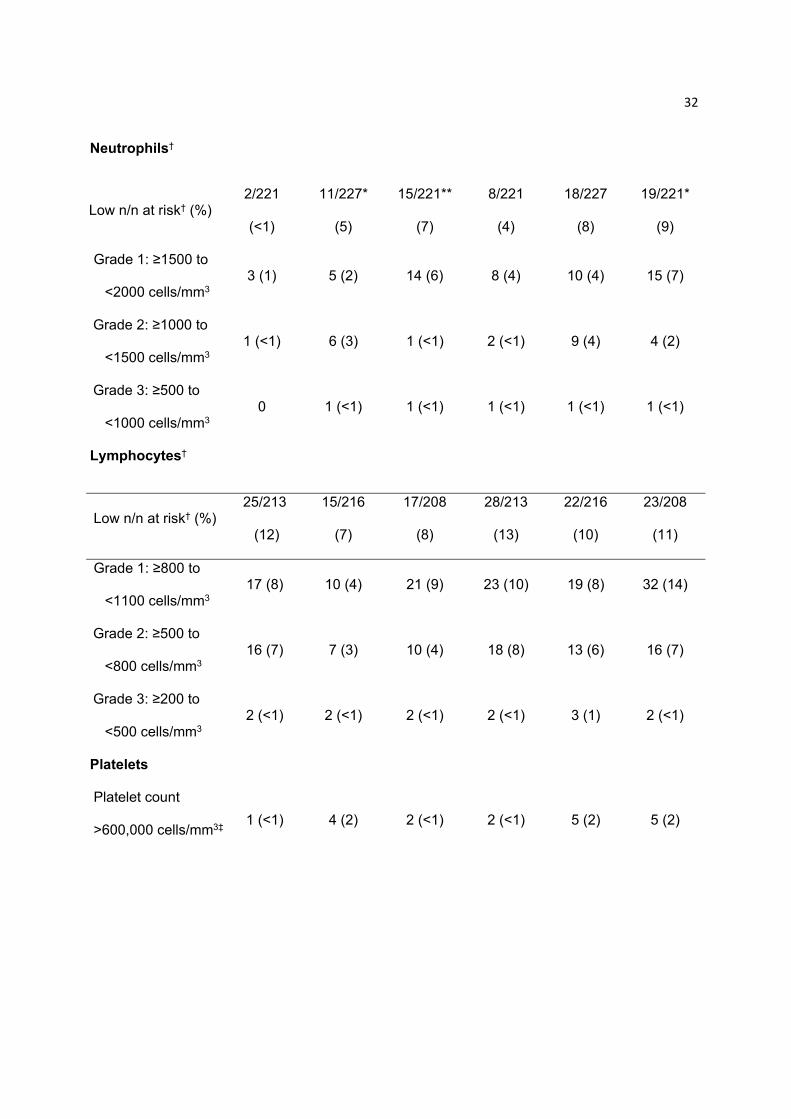
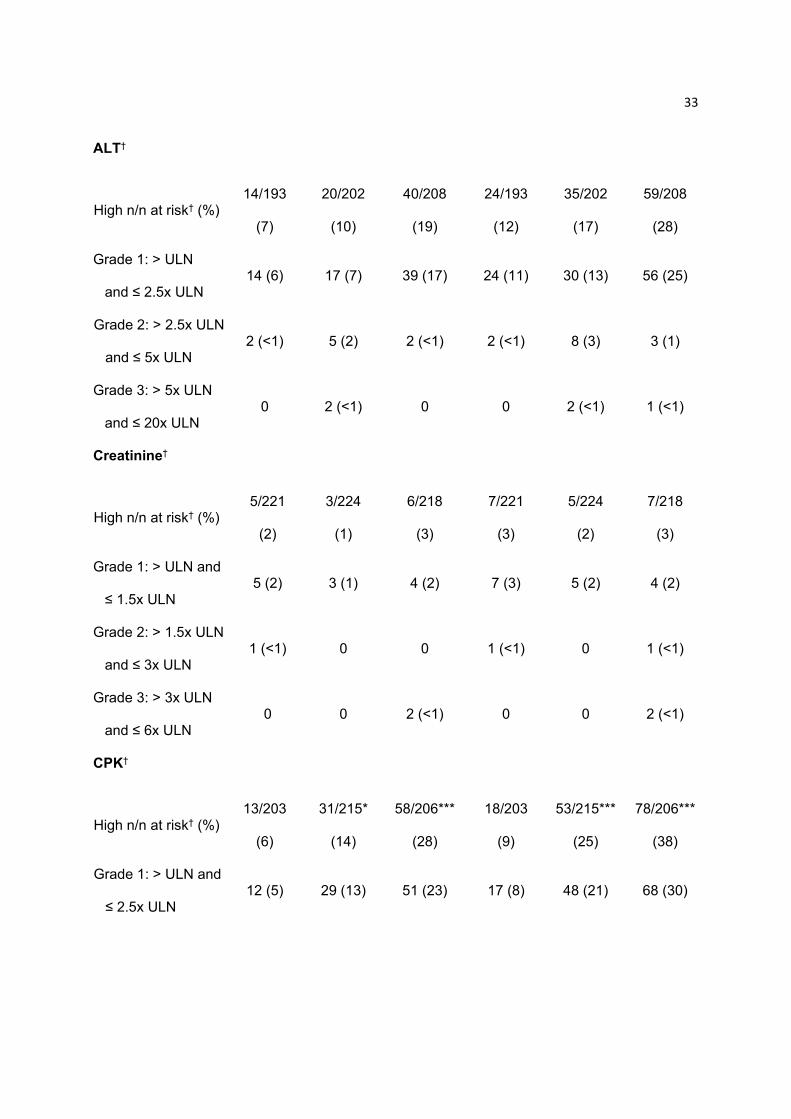
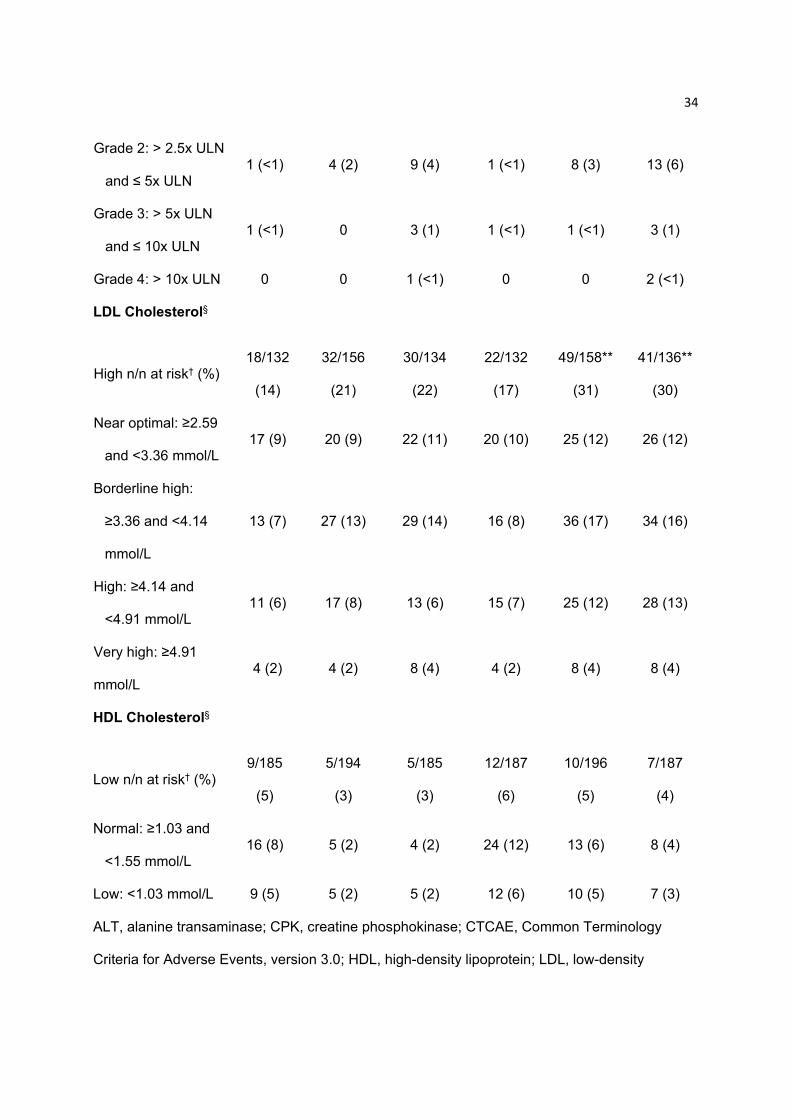
Table S7. Laboratory summary Week 0–Week 12 and Week 0–Week 24
Weeks 0-12 Weeks 0-24
Placebo
(N=228)
Baricitinib
2 mg QD
(N=229)
Baricitinib
4 mg QD
(N=227)
Placebo
(N=228)
Baricitinib
2 mg QD
(N=229)
Baricitinib
4 mg QD
(N=227)
Treatment
exposure—no. of
patient-yr
50.4 52.3 51.0 89.8 97.7 96.4
Hemoglobin†
Low n/n at risk† (%) 30/165
(18)
40/154
(26)
36/169
(21)
44/165
(27)
48/154
(31)
57/169
(34)
Grade 1: ≥6.2
mmol/L to <7.1
mmol/L for
females,
<7.8 mmol/L for
males
36 (16) 37 (16) 41 (18) 45 (20) 41 (18) 58 (26)
Grade 2: ≥4.9 to
<6.2 mmol/L 7 (3) 6 (3) 13 (6) 10 (4) 15 (7) 17 (8)
Grade 3: ≥4.0 to
<4.9 mmol/L 0 1 (<1) 0 0 1 (<1) 0
Grade 4: <4.0
mmol/L 0 0 0 0 0 0
32
Neutrophils†
Low n/n at risk† (%) 2/221
(<1)
11/227*
(5)
15/221**
(7)
8/221
(4)
18/227
(8)
19/221*
(9)
Grade 1: ≥1500 to
<2000 cells/mm3 3 (1) 5 (2) 14 (6) 8 (4) 10 (4) 15 (7)
Grade 2: ≥1000 to
<1500 cells/mm3 1 (<1) 6 (3) 1 (<1) 2 (<1) 9 (4) 4 (2)
Grade 3: ≥500 to
<1000 cells/mm3 0 1 (<1) 1 (<1) 1 (<1) 1 (<1) 1 (<1)
Lymphocytes†
Low n/n at risk† (%) 25/213
(12)
15/216
(7)
17/208
(8)
28/213
(13)
22/216
(10)
23/208
(11)
Grade 1: ≥800 to
<1100 cells/mm3 17 (8) 10 (4) 21 (9) 23 (10) 19 (8) 32 (14)
Grade 2: ≥500 to
<800 cells/mm3 16 (7) 7 (3) 10 (4) 18 (8) 13 (6) 16 (7)
Grade 3: ≥200 to
<500 cells/mm3 2 (<1) 2 (<1) 2 (<1) 2 (<1) 3 (1) 2 (<1)
Platelets
Platelet count
>600,000 cells/mm3‡ 1 (<1) 4 (2) 2 (<1) 2 (<1) 5 (2) 5 (2)
33
ALT†
High n/n at risk† (%) 14/193
(7)
20/202
(10)
40/208
(19)
24/193
(12)
35/202
(17)
59/208
(28)
Grade 1: > ULN
and ≤ 2.5x ULN 14 (6) 17 (7) 39 (17) 24 (11) 30 (13) 56 (25)
Grade 2: > 2.5x ULN
and ≤ 5x ULN 2 (<1) 5 (2) 2 (<1) 2 (<1) 8 (3) 3 (1)
Grade 3: > 5x ULN
and ≤ 20x ULN 0 2 (<1) 0 0 2 (<1) 1 (<1)
Creatinine†
High n/n at risk† (%) 5/221
(2)
3/224
(1)
6/218
(3)
7/221
(3)
5/224
(2)
7/218
(3)
Grade 1: > ULN and
≤ 1.5x ULN 5 (2) 3 (1) 4 (2) 7 (3) 5 (2) 4 (2)
Grade 2: > 1.5x ULN
and ≤ 3x ULN 1 (<1) 0 0 1 (<1) 0 1 (<1)
Grade 3: > 3x ULN
and ≤ 6x ULN 0 0 2 (<1) 0 0 2 (<1)
CPK†
High n/n at risk† (%) 13/203
(6)
31/215*
(14)
58/206***
(28)
18/203
(9)
53/215***
(25)
78/206***
(38)
Grade 1: > ULN and
≤ 2.5x ULN 12 (5) 29 (13) 51 (23) 17 (8) 48 (21) 68 (30)
34
Grade 2: > 2.5x ULN
and ≤ 5x ULN 1 (<1) 4 (2) 9 (4) 1 (<1) 8 (3) 13 (6)
Grade 3: > 5x ULN
and ≤ 10x ULN 1 (<1) 0 3 (1) 1 (<1) 1 (<1) 3 (1)
Grade 4: > 10x ULN 0 0 1 (<1) 0 0 2 (<1)
LDL Cholesterol§
High n/n at risk† (%) 18/132
(14)
32/156
(21)
30/134
(22)
22/132
(17)
49/158**
(31)
41/136**
(30)
Near optimal: ≥2.59
and <3.36 mmol/L 17 (9) 20 (9) 22 (11) 20 (10) 25 (12) 26 (12)
Borderline high:
≥3.36 and <4.14
mmol/L
13 (7) 27 (13) 29 (14) 16 (8) 36 (17) 34 (16)
High: ≥4.14 and
<4.91 mmol/L 11 (6) 17 (8) 13 (6) 15 (7) 25 (12) 28 (13)
Very high: ≥4.91
mmol/L 4 (2) 4 (2) 8 (4) 4 (2) 8 (4) 8 (4)
HDL Cholesterol§
Low n/n at risk† (%) 9/185
(5)
5/194
(3)
5/185
(3)
12/187
(6)
10/196
(5)
7/187
(4)
Normal: ≥1.03 and
<1.55 mmol/L 16 (8) 5 (2) 4 (2) 24 (12) 13 (6) 8 (4)
Low: <1.03 mmol/L 9 (5) 5 (2) 5 (2) 12 (6) 10 (5) 7 (3)
ALT, alanine transaminase; CPK, creatine phosphokinase; CTCAE, Common Terminology
Criteria for Adverse Events, version 3.0; HDL, high-density lipoprotein; LDL, low-density

35
lipoprotein; N, number of patients randomized and treated; NCEP, National Cholesterol
Education Program; QD, once-daily; ULN, upper limit of normal.
†Data represent n (%) patients and indicate the worst CTCAE grade in patients who
experienced a treatment-emergent increase in grade at any time during the treatment period, up
to the time of rescue.
§Data represent n (%) patients and indicate the worst NCEP category in patients who
experienced a treatment-emergent worsening in category at any time during the treatment
period, up to the time of rescue.
†n = number of patients with the specified abnormality in indicated direction; n at risk = number
of patients at risk for the abnormality in each treatment group. Percentages are based on the
number of patients at risk for the specific abnormality in each treatment group.
‡Incidence of protocol-defined thrombocytosis in patients with platelet counts >600,000
cells/mm3, excluding patients with a baseline value of >600,000 cells/mm3.
*p≤0.05, **p≤0.01, and ***p≤0.001 versus placebo by Fisher’s exact test.
36
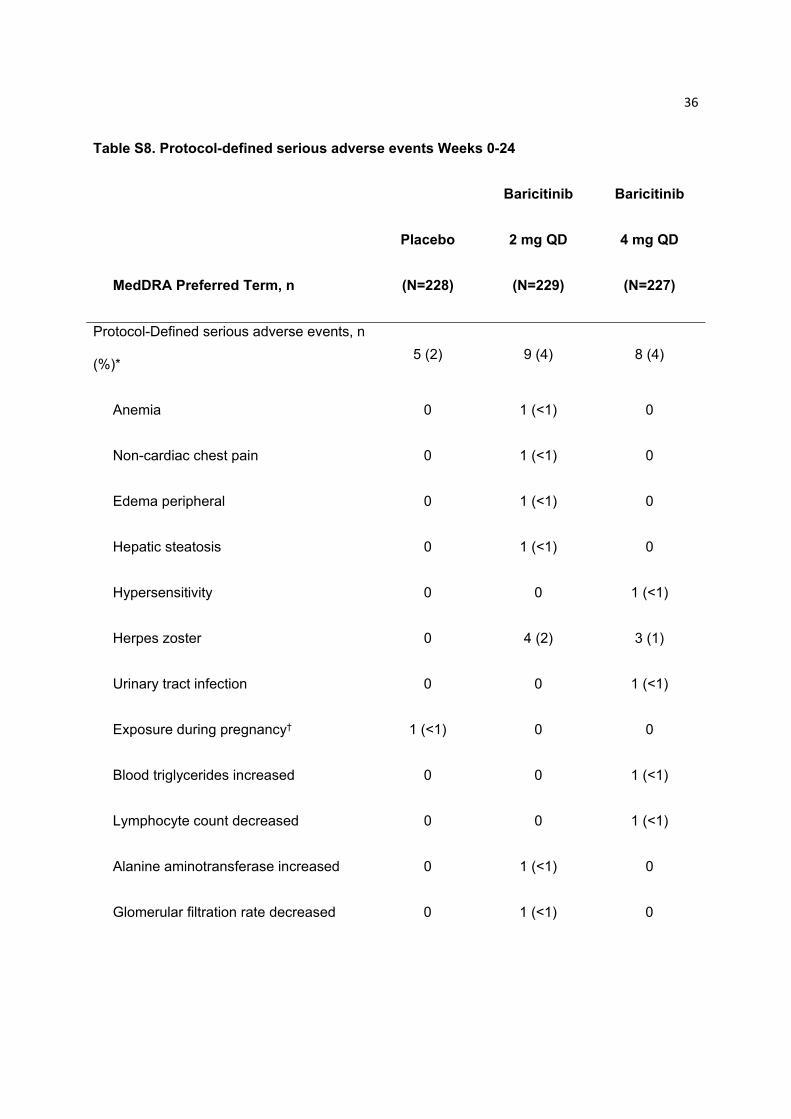
Table S8. Protocol-defined serious adverse events Weeks 0-24
MedDRA Preferred Term, n
Placebo
(N=228)
Baricitinib
2 mg QD
(N=229)
Baricitinib
4 mg QD
(N=227)
Protocol-Defined serious adverse events, n
(%)* 5 (2) 9 (4) 8 (4)
Anemia 0 1 (<1) 0
Non-cardiac chest pain 0 1 (<1) 0
Edema peripheral 0 1 (<1) 0
Hepatic steatosis 0 1 (<1) 0
Hypersensitivity 0 0 1 (<1)
Herpes zoster 0 4 (2) 3 (1)
Urinary tract infection 0 0 1 (<1)
Exposure during pregnancy† 1 (<1) 0 0
Blood triglycerides increased 0 0 1 (<1)
Lymphocyte count decreased 0 0 1 (<1)
Alanine aminotransferase increased 0 1 (<1) 0
Glomerular filtration rate decreased 0 1 (<1) 0

37
Myopathy 1 (<1) 0 0
Depression 1 (<1) 0 0
Irritability 1 (<1) 0 0
Mood altered 1 (<1) 0 0
Amenorrhea† 0 0 1 (<1)
Lung cyst 1 (<1) 0 0
MedDRA, Medical Dictionary for Regulatory Activities; N, number of patients randomized and
treated; n, number of patients in the specified category; QD, once-daily; SAEs, serious adverse
events.
*Data represent n (%) patients who experienced a protocol-defined SAE at any time during the
treatment period, up to the time of rescue. Table describes SAEs serious for the reason of
protocol definition. The protocol required that AEs or laboratory abnormalities leading to
permanent discontinuation of study drug be designated as SAEs.
†Denominator adjusted because event is specific to females.
38
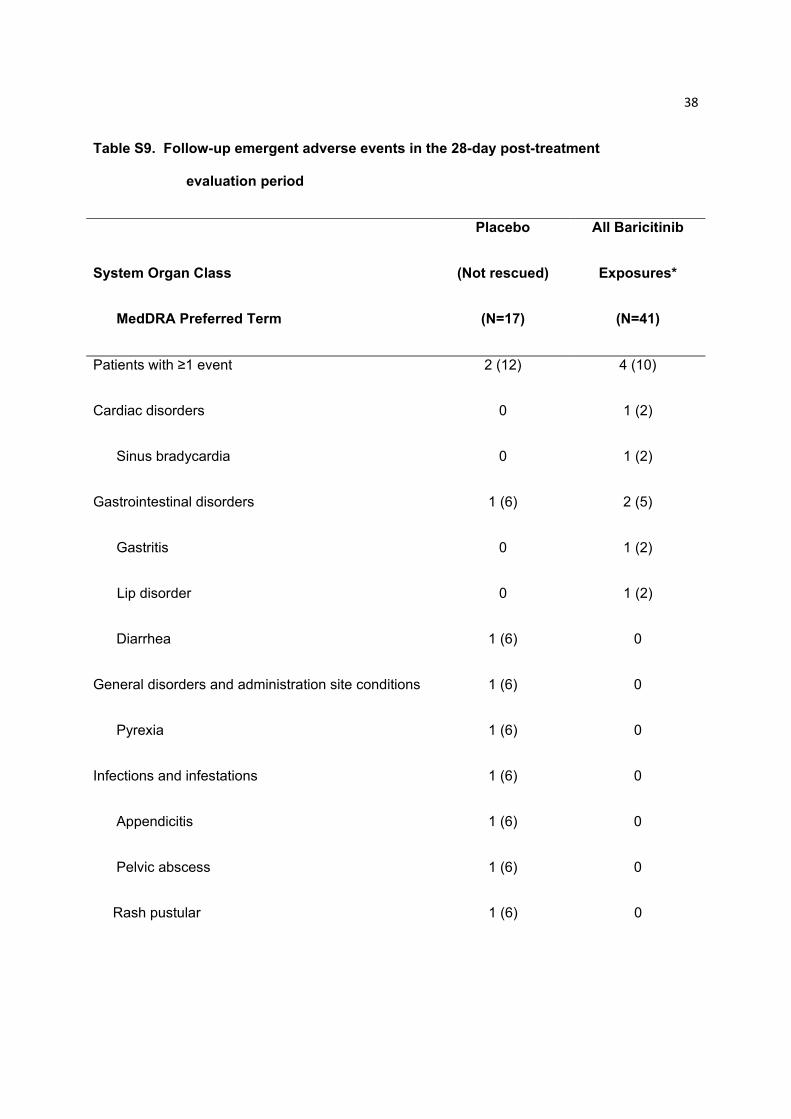
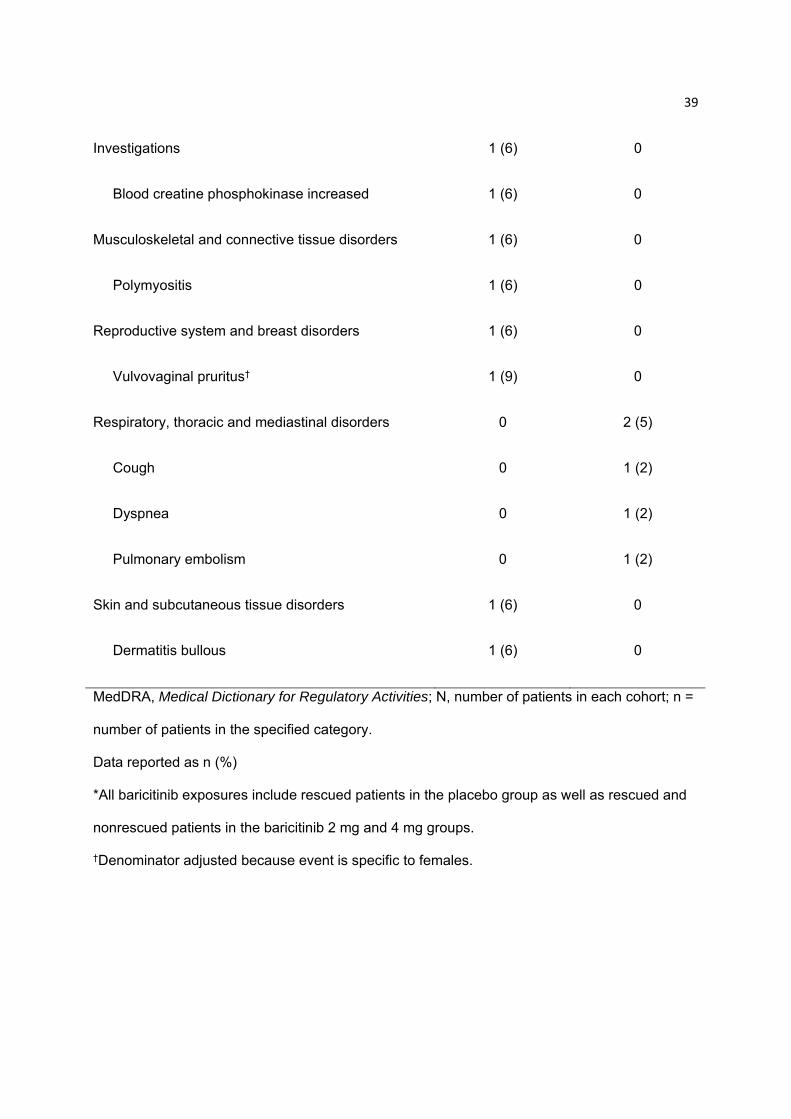
Table S9. Follow-up emergent adverse events in the 28-day post-treatment
evaluation period
System Organ Class
MedDRA Preferred Term
Placebo
(Not rescued)
(N=17)
All Baricitinib
Exposures*
(N=41)
Patients with ≥1 event 2 (12) 4 (10)
Cardiac disorders 0 1 (2)
Sinus bradycardia 0 1 (2)
Gastrointestinal disorders 1 (6) 2 (5)
Gastritis 0 1 (2)
Lip disorder 0 1 (2)
Diarrhea 1 (6) 0
General disorders and administration site conditions 1 (6) 0
Pyrexia 1 (6) 0
Infections and infestations 1 (6) 0
Appendicitis 1 (6) 0
Pelvic abscess 1 (6) 0
Rash pustular 1 (6) 0
39
Investigations 1 (6) 0
Blood creatine phosphokinase increased 1 (6) 0
Musculoskeletal and connective tissue disorders 1 (6) 0
Polymyositis 1 (6) 0
Reproductive system and breast disorders 1 (6) 0
Vulvovaginal pruritus† 1 (9) 0
Respiratory, thoracic and mediastinal disorders 0 2 (5)
Cough 0 1 (2)
Dyspnea 0 1 (2)
Pulmonary embolism 0 1 (2)
Skin and subcutaneous tissue disorders 1 (6) 0
Dermatitis bullous 1 (6) 0
MedDRA, Medical Dictionary for Regulatory Activities; N, number of patients in each cohort; n =
number of patients in the specified category.
Data reported as n (%)
*All baricitinib exposures include rescued patients in the placebo group as well as rescued and
nonrescued patients in the baricitinib 2 mg and 4 mg groups.
†Denominator adjusted because event is specific to females.
40
Supplementary References
1. Felson DT, Anderson JJ, Boers M, et al. American College of Rheumatology. Preliminary
definition of improvement in rheumatoid arthritis. Arthritis Rheum. 1995;38:727–35.
2. Aletaha D, Nell VP, Stamm T, et al. Acute phase reactants add little to composite disease
activity indices for rheumatoid arthritis: validation of a clinical activity score. Arthritis Res
Ther. 2005;7:R796–806.
3. Aletaha D, Smolen J. The Simplified Disease Activity Index (SDAI) and the Clinical Disease
Activity Index (CDAI): a review of their usefulness and validity in rheumatoid arthritis. Clin
Exp Rheumatol. 2005;23(39 Suppl):S100–8.
4. Disease Activity Score in rheumatoid arthritis. Nijmegen, the Netherlands: University Medical
Center. http://www.das-score.nl/das28/ (accessed 04/28/2016).
5. Prevoo ML, van 't Hof MA, Kuper HH, et al. Modified disease activity scores that include
twenty-eight-joint counts. Development and validation in a prospective longitudinal study of
patients with rheumatoid arthritis. Arthritis Rheum. 1995;38(1):44–8.
6. Fries JF, Spitz P, Kraines RG, et al. Measurement of patient outcome in arthritis. Arthritis
Rheum. 1980;23:137–45.
7. Fries JF, Spitz PW, Young DY. The dimensions of health outcomes: the health assessment
questionnaire, disability and pain scales. J Rheum. 1982;9:789–93.
8. Smolen JS, Breedveld FC, Schiff MH, et al. A simplified disease activity index for
rheumatoid arthritis for use in clinical practice. Rheumatology. 2003;42:244–57.