annqal report for - ncjrs.gov · adj~cent to the administr~tion and r~c@iving buildings. article...
TRANSCRIPT

•
•
•
•
•
•
. G
~ ~ .
... 'i''' .. ',"'1, .. ' . ." "
,;
r" !
AnnQal Report For
Fiscal Year 1986
~ 6 tate Of Maryland
~ rtment Of Public Safety
And Correctional Services
If you have issues viewing or accessing this file contact us at NCJRS.gov.
I. •
•
•
•
•
••
•
•
•
Ult.LIAK DONALD SCHAEFER GOVERNOR
KELVIN A. STEINBERG LT. GOVERNOR
BISHOP L. ROBINSON SECRETARY, DPSCS
DEPARTMENT OF PUBLIC SAFETY AND CORREGT!ONAL SERVICES
P.O. BOX 700 JESSUP, MARYLAND 20794-0700 (301) 799-3400
"TTY FOR THE DEAF 486-0677"
May 1. 1987
loft; 328 NORMA B. GLU~1(STE~~, ED.D.
DIRECTOR JOHN J. HURRY, M. A.
ASSOCIATE DlRECTORBEHAVIORAL SCIENCES ADMINISTRATION
ROBERT L. JOHNS, II.S.W. ASSOCIATE DIRECrORSUPERINTENDENT
FRANK EISENBERG, M.D. ASSOCIATE DIRECTORTREATMENT
The Honorable Bishop L. Robinson. Secretary Department of Public Safety and Correctional Services Suite 310. 6776 Reisterstown Road B~ltimore. Maryland ~1215-06?7
Dear Secretary Robinson:
The material enclosed represents the annual report for the Patuxent Institution for fiscal year 1986. This report also summarizes the past experience under Arti.cle 31B. which governs the operation of the Institution .
Sincerely.
Norma B. Gluckstern, Ed.D. Director
NBG: j r c
U.S. Department of Justice National Institute of Justice
106328
This document has been reproduced exactiy as received from the person or organization originating it. Points of view or opinions stated in this document are those of the authors and do not necessarily represent the official position or policies of the National Institute of Justice.
Permission to reproduce this copyrighted material has been granted by
~]and DepartJ:n~ Safety and Co~rectio~l S~Tices
to the National Criminal Justice Reference Service (NCJRS).
Further reproduction outside of the NCJRS system requires permi')· sion of the copyright owner.

•
•
•
•
•
•
•
•
•
•
•
WILLIAM DONALD SCHAEroR GOVERNOR
MELVIN A. STEINBERG LT. GOVERNOR
BISHOP L. ROBINSON SECRETARY, DPSCS
DEPARTME!NT OF PUBLIC SAFETY AND CORRECTIONAL SERVICES
Ma y 1, 1987
P.O. BOX 700 JESSUP, MARYLAND 20794-0700 (301) 799-3400
"TTY FOR THE DEAF 486-0677"
His Excellency William D. Schaefer Governor of Maryland
Dear Governor Schaefer:
NORMA B. GLUCKSTE~~. ED.D. DIRECTOR
JOHN J. MURRY, M.A. ASSOCIATE PI RECTORBEHAVIORAL SCIENCES ADMINISTRA1'ION
ROBERT 1. JOHNS. M. S .I~. ASSOCIATE DIRECTORSUPERINTENDENT
FRANK EISENBERG. N. D. ASSOCIATE DIRECTORTREATMENT
1 am pleased to present the Annual R~port of Patuxent Institution for the Fiscal Year ending June 30, 1986.
This report also sunwarizes the past exp~rlence of Patuxent Institution.
Sincerely,
Norma B. Gluckstern, Ed.D. Director
NBG: j r c
i i

•
•
•
•
•
•
•
•
•
•
•
STATE OF MARYLAND
William D. Schaefer Governor
Depar tment of Public Safety and Correctional Services
Bishop L. Robinson Secretary
Calvin A. Lightfoot Deputy Secretary
Board of Patuxent Institution
Reverend Marcus G. Wood Cha i rman
Mosa Lewis III
Robert E. Cahill, Esq.
James L. Roberts
Prof. Minor B. Crager
Fred S. Berlin, M.D.
Eugene J. Zander
Robert A. Gordon, Ph.D.
iii
Arnold J. Hopkins
Robert B. Levinson
Stella Hargett, Ph.D.
Uthman Ray, Jr., M.D.
Prof. Edward A. Tomlinson
Wi 11 i am DeVance
Richard Hamilton, M.D. (Acting)

•
•
•
•
•
•
•
•
"
PATUXENT INSTITUTION
Norma B. Gluckstern, Ed.D.
Robert L. Johns. LCSW Associate Director
Director
Frank Eisenberg, M.D. Associate Director
John J. Murry, M.A. Associate Director
INSTITUTIONAL BOARD OF REVIEW
Norma B. Gluckstern, Ed.D.
Chairwoman
Frank Eisenberg. M.D. S tel I a Ha r ge t t, Ph.D.
Robert L. Johns, LCSW Prof. Minor B. Crager
John J. Murry. M.A. Prof. Edward A. Tomlinson
Mo s e Lew is I I I, E sq.
iv

•
•
•
•
•
•
•
•
-------------~--------------- ----~------
TABLE OF CONTENTS
Table of Contents........................................ v Tables and Charts ........................................ vi Introduction .............................................. 1 Physical Plant .......................................... ·. 8 Staff ..................................................... 4 Overvieu of Patuxent Institution Operations and Procedures ....... " .......... , .......................... " 5
Inmate Reception ond Diagnosis ....................... 5 Tr0Q,tment and Review of Progress ..................... 8 Review of Status and Release from Patuxent ........... 8
Diagnostics ................................................ 10 T rea t me n t ................ 0 ................................. 11
Psychotherapy ........................................ 18 Education ............................................ 12 Volunteer Services ................................... 14
Communi ty Outreach ........................................ 15 Community Re-Elrltry Program ................................ 15 Parole ........ " ........................................... 17 Research and C()mputer System Development .................. 18 Statistical Presentation .................................. 22
, Introduction ......................................... 23 Fiscal Data .......................................... 23 F i s cal Summa r y ....................................... 28 Population anci Institution Activities Data ........... 29 Summa r y .............................................. 46
APPENDICES Appendix A: Descriptive Data on all Inmates
Evaluated in FY 1986 .................... 49
Appendix B: Descriptive data on the Inmate Population Under Treatment. FY 1986 ................................. 56
v

•
•
•
•
•
•
•
•
•
•
•
TABLES AND CHARTS
Table of Org6lnir:ation: Patuxent Institution ................ 6
Table 1: Operating Cost - FY 1986 ............••....... 24
Table 2: Inmate Population Data - FY 1986 ....•........ 30
Table 3: Comparison of Eligible and Non-Eligible Persons Diagnosed During FY 1986 ............. 34
Table 6= Board of Review Activities -FY 1918 - FY 1986 .........•...........••..... 39
Table S: Summary Statistics on Group and Individual Psychotherapy - FY 1982 - FY 1986 ..•.•..•..•. 41
Table 6: Summary Statistics on Education Acthl'ities FY 1978 -FY 1986 ............................ 42
Table 7: Activities of the Speech Pathology and Audiology Center - FY 19821 - FY 1986 •........ 43
Table 8: Summary of Volunteer Activities -FY 1984 - FY 1986 ......................•..... 44
Table 9: Summary Statistics on Community Re-Entry Program Activities -FY 1980 - FY 198,6 ..................•......... 45
CHARTS
Flowchart of Patuxent Institution Operations and Activities .................................................. 9
Chart 1 : Operating Costs - FY 1978 - FY 1986 .............. 26
Chart 2: Per Capita Costs - FY 1978 - FY 1986 ....•........ 26
Chart 3 : Average Daily Population - FY 1978 - FY 1986 ..... 27
Chart 4 : Patuxent Institution AdmiSSions and Releases -FY 1 978 - FY 1 986 ......................•......... 3 1
Chart 5 : Diagnostic Evaluations Performed - FY 1978 -FY 1986 ........................................... 32
Chart 6 : Average Age at Admission ......................... 35
Chart 7 : Me d ian I Q. . . . . . . . . . . . . . . • . . . . . . . . . . . • . . . . . . . . . . . . 3 5
Chart 8 : Average Length of Sentence ...........•........... 36
vi

I. Chart 9: Percentage of Inmates ~ith Life Sentences ........ 36
Chart 10: Murder, Rape, and Robbery Offenses -
• Eligible Persons ................................. 37
Chart 11: Murder, Rape, and Robbery Offenses -Non-Eligible Pefsons ............................. 37
Chart 12: Percentage of Whites VB. Non-Whites .............. 38
•
•
•
•
•
•
•
vii
•

•
•
•
• PATUXENT INSTITUTION
ANNUAL REPORT
• FISCAL YEAR 1986
•
•

•
•
•
•
•
•
•
•
•
•
I tQTRODUC-'T I om
Patuxent Institution's Annual Report provides information
concerning the agency's operation~ and activities during the past
year to the Office of the Secretary, ihe Governor's Office, the
legislature, and the general public. Operations and activities
include all aspects of P~tuxent Institution's budget and fiscal
resources; plant operation and maintenance; custodial. diagnostic
and treatment services; administration and research.
Patuxent Institution is situated in Jessup. Maryland,
proximately fourteen miles south of the City of Baltimore.
ap
I t
is a treatment-oriented correctional institutions maintained and
operated by the Maryland Department of Public Safety and Correc
tional Services. The Department of Public Safety and Correction
al Services is a cabinet-level Slate agency whose responsibility
includes the control and reduction of crime, maintenance of
public order, and rehabilitation of adjudicated individuals who
pose a threat to the public.
Article 31B of the Annotated Code of the General Public Laws
of Maryland (Acts of 1977) spells out Patuxent's purpose:
"(b) The purpose of the Institution is to provide efficient
and adequate programs and services for the treatment and
rehabilitation of eligible persons. This shall include a
range of program alternatives indicated by the current state
of knowledge to be appropriate and effective for the popula
tion being served. As an integral part of the program an
effective research and development effort should be estab
lished and maintained to evaluate anq recommend improvements
on an on-going basis."
"(g) 'Eligible Person' means a person who (1) has been
convicted of a crime and is serving a sentence of imprison
ment with at least three years remaining on it, (2) has an
intellectual defi~iency or emotional unbalance, (3) is
likely to respond favorably to the programs and services
1

I. •
•
•
•
•
•
•
provided at Patuxent Institution w and C4} can be better
rehabilitated throught those programs and services than by
other incarceration."
Treatment of Eligible Persons includes various forms of
group psychotherapy, numerous educational and vocational pro
grams, and medical. social. and volunteer services. It also
includes a behavioral incentive program leading to supervised and
unsupervised leaves, work release, parole, and eventual complete
rel~ase from Patuxent Institution. The Office of Research and
Computer System Development organizes information for research
purposes, implements research projects, and develops office
automation and data processing resources for Patuxent Institu
tion.
PHYSICAL PLANT
Since its opening in 1955, Patuxent Institution's physical
plant has grown to its current estimated worth of over 13.7
million dollars. Patuxent Institution is a maximum security
facility, and consists of six buildings surrounded by double
perimeter fences, protected by six guard towers. The largest
building accommodates 388 inmates, housed in 12 separate units of
individual cells. This building also includes professional
offices, group and individual psychotherapy rooms, an inmate
visiting area, an employee barber shop and dining room, and some
vocational training and maintenance activity rooms.
The Diagnostic Center is a 234-cel1 facility. It also
provides custodial and administrative offices,
and individual psychotherapy and counseling,
Institution's infirmary.
space for
and houses
group
the
During Fiscal Year 1966, in order to help relieve crowding
in the Division of Correction, an average of 83 living units in
the Diagnostic Center building were used to double-cell inmates.
An additional 42 cells house inmates in Administrative (disci
plinary) segregation.
2

•
•
•
.' •
Additional structures include an Administration Building, a
Pre-Release Center (currently unused and planned for renovation
as Q female inmate housing unit; see belo~), a vocational train
ing building devoted to skill training, and an academic building
containing ten classrooms, professional offices. a library, a
speech and hearing clinic, and an auditorium.
In Fiscal Year 1986, the status of capital projects previ
ously funded ~as as follows:
1 . Max imllm Security Treatment Facility for Women: The
design phase was completed. and supplemental funding was
requested. Completion is expected in Fiscal Year 1988.
2. T~o Ne~ Guard Towers: The work initiation conference
was held, and completion is expected in Fiscal Year
1987.
3. Phase II of Utility Renovations (plumbing, electricity,
• HVAC): The architectural and engineering study was
awarded and initiate6. Fifty percent of the construc
tion documents for this project have been submitted and
approved. ~ith the complete submission pending. Comple
tion is expected in Fiscal Year 1989.
4. Vehicular Gate and Fire Safety Smoke Door Modifications:
These two capital projects were begun prior to Fiscal
Year 1986. Modifications to the projects were
negotiated in Fiscal Year 1986, and completion of the
additional work is expected in Fiscal Year 1987.
Facility improvement
operating funds in Fiscal
projects completed
Year 1986 included
wi th
the
Maintenance
following--
replacement of the roofs on two guard towers, renovation of a
portion of the basement area in one of the buildings to serve as
a housing area for the expanding work release population. refin
ishing the gymnasium floor, replacement of the cement floor in
3
•
•
•
•
•
•
•
•
•
•
•
the kitchen loading dock area, mnd expansion of the parking area
adj~cent to the administr~tion and r~c@iving buildings.
Article 31D m~ndat0s that the Director of Patuxent Institu~
tion, the chi0~ administrative officer. be a trained and compe
tent administrator. Th@ Secretary of the Department of Public
Safety and Correctional Services apPOints the Director from a list of qualified candidates submitted by the Institution's
advisory board, the Board of Patuxent Institution. The law also
requires a minimum staff consisting of:
T~o Associate Directors, one a psychiatrist ~ith three years' experi~nce~ and one a behavioral scientist with three years' experience.
One Associate Director who serves as the custodial superintendent.
Three additional psychiatrists or clinical psychologists.
FQur social workers.
One physician.
One dentist.
Two Associate Directors have primary responsibility, under the
Director, for budgetary, personnel, and diagnostic, treatment and
community sarvices programs for the Institution. The third
Associate Director is responsible for custodial (security) and
maintenance aspects of the Institution. At the close of Fiscal
Year 1986, the Institution was authori~ed 411 positions, grouped
in the following categories:
4

•
•
•
•
•
•
•
•
•
•
•
Psychiatrists .................. 3
Psychologists .................. 11
Social Workers ................. 16
Academic Instructors ........... 9
Vocational Instructors ......... 10
Recreational Specialists ....... 5
Me d i cal Par Bon i\ a 1 • • • • • • . • • • • • . . 7
Records-Data Processing........ 3
Administrative Personnal ....... 9
Fiscal PersonneL .............. 10
Maintenance Personnel .......... 17
Food Service Personnel ......... 13
Clerical Personnel ............. 20
Correctional Personnel ......... 269
Re-Entry Program Personnel ..... 9
TOTAL .......................... 4 11
The Patuxent Institution organization chart presented on the
following page describes the various departments at Patuxent
Insti tution.
OVERVIEt1 or PAT\UIJ/:lE:r,vT OPERATIONS AND PROCEDURES
This section outlines the
Patuxent Institution, especially
operations and procedures of
as they pertain to reception,
diagnOSis, treatment. and release of inmates.
general description of staff activities and
It provides a
the chronological
order of events experienced by inmates who come to Patuxent, and
serves as an introduction to the more detailed information pre
sented in each of the following sections. The reader should
refer to the flowchart on Page 9 following.
Inmate Reception and piffiqnp~ia
Article 3iB stc~es that any person who is serving a sentence
of imprisonment following conviction for a crime, and has more
5

• •
CI) ASSISTA"T SUPERJrHEIIDEhT
CORRECTIONAL SERVICES 2nd SHIfT
CORRECTIONAl SERVICES Jrd SHIFT
• • • • •
PAT U n E "Y 1" S Y I T UTI 0 " Table of Orgonilotion
• • •
IIlOAAO Of PATUXEllT} - - - - - - - ..J L. _______
laSTITUTICIW. OOARD Of Il£VIW
RE-ami\' FACILlTf
Food MIiIln. 111
DIRECT02. DATA PROC[SSI~ RESEARCH MIl [VAlUATION
- - - - - - - - - -1I1lDICAI. S!RVICE5 ] RAINl"G COORDlHA
(Vacant) Amtn. Off. II
SUPERVISOR OF EDUCATIONAL SERVICES
ACAOE"IC SERVICES CHAIRP£RSOH UNIT I
Corr. Teocher • S.Ii!. V
VOCATIONAL SERVICES
VOL~TEER SERVICES CHAIRPERSOII 1M" IV
Co.-,---~l. Coor. S.V. V
ASSOCIATE DIRECTo. BEHAVIORAL SCIENCES
COORDINATOR Of IUOGET AND C~HITY SERVICES FlSCAlJERVICES STAff
D£V£LOPt!ENT S.II. V!
RE-ENTRY DIAGNOSTIC PROGIW1S SERVICES
STATUS BOARD Of REVIEIl JlECORDS SUPERVISIOO AII.n II I STRII TI OIC
~~.~ ., Nonna B. Gluckstern, Ed.D. 1'111 Director
•

•
•
•
•
•
•
•
•
•
•
•
than three years remaining to serve on that sentence, may be
referred to the Institution by the Commissioner of Corrections
for evaluation to determine whether the individual is an Eligible
Person.a The statute further states that the Commissioner may
refer any such individual for evaluation upon the recommendation
of the sentencing court; the State's Attorney of the county in
which the person was convicted; or upon the recommendation of the
Commissioner's staff. The Commissioner may also refer persons
who personally request such transfer and evaluation.
Inmates approved for transfer to Patuxent by the
Commissioner reside in the Patuxent Annex (a double-celled
portion of living units used for Division of Correction inmates
awaiting evaluation) until living space becomes available in
Patuxent's evaluation population. Inmates who IIdrop into"
Patuxent's evaluation population are randomly assigned to one of
four separate treatment units. and an elaborate six-month diag
nostic procedure begins.
Social workers, psychologists, psychiatrists, correctional
officers, education and medical staff e~amine and observe inmates
during the six-month evaluation. Based on formal social history
reports; psychological, psychiatric, and medical testing; an
educational evaluation; and on staff judgment of inmates' re
sponses to, and motivation for, therapeutic treatment, a panel of
clinical staff members evaluates each inmate as an Eligible
Person (EP) or Non-Eligible Person (Non-EP). Non-EP's return to
the Division of Correction. and may reapply to Patuxent Institu-
nrn practice. most inmates admitted to Patuxent for
have more than three years remaining to be served.
evaluation
This prac-
tice insures that. if accepted. Patuxent inmates will not serve
out their sentences (counting earned good time credit) before
treatment is completed.
7

•
•
•
•
•
•
•
•
•
•
•
tion after & three-year period. EP's begin participation in the
full treatment program at Patuxent Institution.
Tx@fttm@nt and 10VR@w gf PiOgE9s@ Treatment at Patuxent includes a wide
including psychotherapy. academic (remedial,
range of programs.
high school and
college-level) education. vocational training. job training and
supervision p and recreation and leisure activities. Social,
medical. and volunteer services all support and complement the
treatment activities.
A graduated tier and privilege system forms the core of the
treatment program. Staff (on a continual basis) and the Institu
tional Board of Review (on an annual basis) review each inmate's
progress in the various treatment activities. As inmates exhibit
continued socially desirable and infraction-free behavior, they
move upward in the graded tier system. from Level One with mini
mum privileges to Level Four with maximum privileges and self
government. Staff determine whether an inmate is promoted or
demoted to the various levels. and may recommend that the Board
of Review find the inmate to be a Non-EP. A finding of Non-EP by
the Board of Review returns the inmate to the Division of Correc
ti on.
R9vRew of St@iu@ and Release fyom Patuxent
Inmates TJho successfully reach Level Four prepare for
graduated release from Patuxent. beginning with either accompa
nied or unaccompanied single day leaves and progressing through
extended leaves. work or school release. parole, and eventual
complete release. Again, advancement in the release program
depends on continued responsible behavior on the part of each
inmate. and every step must be approved by the Board of Review.
At any time the Board of Review may revoke an inmate's leave
status or parole and return him to the Institution for further
treatment. or it may determine the inmate to be a Non-EP and
return him to the Division of Correction.
6

•
(C
a • • • • • • • •
FLOWCHART OF PATUXENT INSTITUTION OPERATIONS AND ACTIVITIES
COURT
r-r-
DIVISiON OF
CORRECTION
~
PATUXENT
INSTITUTION
/
NON- EP iI
NON-EP /'
TREATMENT I·· ·PSYCHOTHEFrAPV ~
C·-EDUCATION
RECREATION
r- SOCIAL SERVICES
~ l STATUS REVOKED
I
1 II NON-EP
J I GRANT STATUS
CLEAVES J
r WORKRELEASr]
[ PAROLE
•

•
•
•
•
•
•
•
•
•
When inmates sueeo5sfully c~mploto the release program, the
staff and Board of Review reconw~end them for complete release.
If an inmate's sentence has not expired by this time. Patuxent
must petition the Court to grant the inmate release from his
sentence. The Court may vacate or suspend the sentence, or deny
th~ petition, thus returning the inmate to parole status. If, at
any time during his stay at Patuxent, an inmate reaches his or
her commuted expiration date, the inmate is released from custo
dy and placed on parole with the Division of Parole and
Probation.
The remainder of this report provides detailed
concerning each of the activities discussed in
section.
DIAGNOSTICS
information
this summary
In the diagnostic process Patuxent staff determine which of
the inmate~ that undergo evaluation meet the criteria for eligi
bility (See Page 1). An evaluation team makes the determination
of eligibility in a meeting called the Diagnostic Staff Confer
ence. In the staffing procedure the evaluation team discusses
the material presented in various reports,* and votes to accept
or reject the inmate.
In Fiscal Year 1986, Patuxent staff evaluated 321 inmates
for admission. Of these, 81, or 25%, were diagnosed Eligible
Persons, and the remaining 240, 75%, were diagnosed Non-Eligible
Persons (or they left Patuxent voluntarily). In the Statistical
Summary, Charts 1 through 12 present information about those
diagnosed EP and Non-EP.
OThese reports include elaborate social histories prepared by
social workers covering criminal, drug abuse, education, family,
and medical histories, as well as detailed accounts of inter
views and testing results prepared by psychiatrists and psychol
ogists.
10

•
•
•
•
•
•
•
•
•
•
-----------~ ..
Patuxent Institution's treatment program is multifaceted and
inter-disciplinary. It provides each inmate with an integrated,
coordinat~d program consisting of group and/or individual psycho
therapy. ~n educational program geared to his needs, a vocational
~rogrQm. ffind a total therapeutic milieu of which the Unit Treat
ment Team is a major facet.
The Unit Treatment Team concept. begun in 1968. provides
four "Treatment Units," each with their own professional staff to
provide treatment services. The unit treatment system effective
ly utili~es the prison experience by providing a vehicle through
which meaningful therapeutic relationships may be established and
maintained. While each unit operates within the framework of
Institutional policy and modalities for its assigned inmates.
Th~ graded tier system o another major facet of Patuxent's
treatment program. is rooted in communications and learning
theory. Based on the hypothesis that rewarding socially desir
able behavior increases the frequency of such behavior, the
system reduces the tendency toward undesirable or antisocial
behavior. Each of the four treatment units has its own graded
tier system, consisting of four "levels" -- first, second, third,
and fourth level tiers, with first level being the "entry" tier.
The primary distinctions between the levels are the privileges
and responsibilities afforded to the residents. The inmate whose
behavior and therapeutic progress keeps pace with his or her
individualized treatment plan is promoted, by the treatment
unit. to a higher level tier. This offers increased privileges,
but also requires a higher level of acceptable behavior and
therapeutic progress on the part of the inmate. In addition to
providing incentive for improvement, the graded tier system
provides each inmate with some tangible sign of where he or she
stands within the Institution and serves as one gauge by which
both the inmate and the staff can measure progress within the
total treatment program.
11

I. •
•
•
•
•
•
•
•
•
•
PPVQ~9tha[GRV
The aim of psychotherapy is to produce changes in two impor
tant aspects of inmates' lives--personality and social behavior.
The aspects of personality disorders in which a therapist will
~ork to promote change include instability of moods, interperson
al exploitativeness. intense affect, chronic negative feelings,
and substance abuse and addiction. In the area of inmates'
social behavior, therapists work to promote change in poor school
and work performance, criminal impulsivity, and lack of remorse
or concern for others.
Formal psychotherapy begins very shortly after the inmate is
found to be an Eligible Person. Nearly all inmates participate
in group psychotherapy. Experience has ~hown that this method is
generally the most beneficial. Some inmates undergo individual
psychotherapy independently or in conjunction with group psycho
therapy and other treatment modalities, such as family therapy,
as their needs indicate. To remain eligible all committed in
mates must participate actively in some form of formal psycho
therapy. conducted by trained social workers, psychologists, and
psychiatrists. Table 5 in the Statistical Summary reviews psy
chotherapy activities at Patuxent Institution since Fiscal Year
1982.
Educatlo~
Patuxent's educational and vocational program constitutes an
equally important aspect of the treatment program. Many inmates
have not finished high school, or have never learned a trade or
held a productive job. They must be prepared for return to
SOCiety and, therefore, must have the knowledge and skills neces
sary to maintain crime-free lives in the community.
The education program offers academic instruction from the
level of illiteracy through the high school curriculum, and in
conjunction with the Community College of Baltimore, Howard
Community College, and Morgan State University, conducts a colle
giate program leading to the Associate of Arts or Baccalaureate
Degree.
12

•
•
•
•
•
•
•
•
•
•
•
Enrollment in the academic program during Fiscal Year 1986
totaled 496 individuals. Of these, 331 (65%) enrolled in the
primary and secondary school programs, and 165 (33%) attended
classes at the college level. During the year, 39 individuals
sat for the high school examination with 21 (54%) attaining their
Maryland High School Diploma. In the college program, 20 inmates
graduated with Associate of Arts Degrees and 14 with B.A. or B.S.
Degrees.
Vocational training includes carpentry, building trades,
barboring, air conditioning and refrigefation, electricity, auto
mechanics, bookbinding, drafting, weld1ng, plumbing, and sheet
metal work. These programs involve not only specific trade
oriented shops. but also include on-the job training within the
Institution. The vocational training program had an enrollment
of 365 in Fiscal Year 1986. Of these, 160 (44%) received comple
tion of training certificates.
During Fiscal Year 1986, Patuxent Institution implemented
the computer-assisted Office Automation Training Program (OATP)
for inmates based on a $56,720 grant award from the U.S. Depart
ment of JUstice, National Institute of Corrections. OATP offers
career planning instruction to all inmates preparing for work
release and parole, and offers instruction in the following areas
to inmates who enroll in the full course -- typing, office proce
dures, introduction to computers, microcomputer operations and
applications, office automation, and word processing. At the
close of Fiscal Year 1986, 34 inmates had participated in comput-
er-assisted instruction classes--24
tion component, and 10 completed
course.
completed the career educa
the full IS-week training
The Education Department will continue to offer OATP, and
will expand its course offering to other areas of computer-as
sisted instruction.
The Education Department administers the religious and
recreation programs of the Institution. These programs provide
daily gym or yard activities, intramural team activity to those
wishing to participate, regular relig10us services conducted by
Chaplains, and individual or group religious counseling.
13

•
•
•
•
•
•
•
•
•
•
•
Reintegration of the inmate with his family is another
important aspect of the treatment prooraro. In addition to the
regular visiting privilegcB sfforded the inmates, Patuxent runs
special visiting programs. During lata spring, summer, and early
fall, fourth-level inmates are allowed lawn visits. During the
Christmas holidays, fourth-level tiars conduct an "open-house,"
with visitors permitted in the housing area and dayroom for a
Christmas party, This includes a buffet luncheon, and guests may
bring approved gifts for the inmates. Activities such as these
have value in maintaining family contact and enhancing inmate
morale.
~gl"Dtftftr S@ryicqG
Volunteers are an important facet of the Patuxent program.
Under the administration of the Community Volunteer Coordinator,
the formal program of volunteer services consists of several
categories of volunteers involved in extending, supplementing, or
prQviding ancillary services to inmates. Volunteer categories
include Regular Service, Shared, and Inmate Volunteers. Regular
Service Volunteers engage in regularly scheduled activities on an
on-going basiS. Examples include the sponsors of the Alcoholics
Anonymous program, or the weekly jazzercise class. Inmate Volun
teers provide sueh services as the Reasoned Straight Program,
which is staffed by inmate and outside volunteers and meets four
or five times a year with groups of juveniles. Shared Volunteers
are members of community agencies that provide activities or
services in the Institution, such as guest speakers. Religious
volunteers conduct services or classes, and the Volunteer Chap
laincy Committee serves as a liaison body between the religious
community and the Institution.
During Fiscal Year 1986. 363 volunteers provided 81,914
hours of volunteer service at Patugent Institution. Of this
total, Regular Service Volunteers contributed 8,139 (37%) hours,
Inmate Volunteers contributed 9.855 (45%) hours. and Shared
14

I. •
•
•
•
•
•
•
•
•
Volunteers~ contributed 3.930 (18%) hours. Table 6 in the Sta-
tistical Summary presents formation concerning volunteer activi
ties in Fiscal Year 1986.
C~NITY OUTREACH
The Director and staff of Patuxent Institution perform a
vital role in educating interested parties and the general public
about the purpose and practices of Patuxent Institution. They
accomplish this through community outreach services, whereby they
speak before a variety of groups. or open the Institution's doors
for guided tours. In this manner. hundreds of persons each year
learn about Patuxent.
During Fiscal Year 1966. Patuxent staff directed tours for
juveniles participating in the Reasoned Straight program. the Wye
Institute. American University. the University of Tennessee. the
Stephanie Roper Committee, the Women's Caucus of the Maryland
House of Delegates. high school students, church groups. local
colleges, and other local and out-of-state groups.
The Director of Patuxent Institution made numerous appear
ances before such groups as the American Correctional Associa
tion, the Jewish Big Brother and Big Sister League, the Johns
Hopkins University Phipps Clinic, and the Washington Center.
CO~NITY RE-ENTRY PROGRAM
Inmates who successfully reach the Fourth Level and retain
their Eligible Person status participate in Patuxent Institu
tion's Community Re-Entry Program. The Community Re-Entry Pro-
nShared Volunteers include paid college professors (those not
paid by Patuxent Institution) who contributed shared volunteer
hours.
15
•
•
•
•
•
•
•
•
•
•
•
grom covelS various treetmant and supervision programs that
prepare inmotos for productive crime-freo lives outside of pris
on. In a manner similar to the graded tier system, inmates
progress gradually through different release programs from loaves
to work or Bchool releaso, and eventuolly to parole and complete
releaoo. The Patuxont Institution Board of Review promotes
inmates through various stages of the program based on the recom
mendations ~f the treatment staff. At any time, an inmate may be
demoted or deniod participation in any of the program's activi
ties, may be returned to Patuxent Institution for further treat
ment, or may be diagnosed a Non-Eligible Person and returned to
the Division of Correction.
Patuxent Institution operates a residential facility in
downtown Bal timoro' in connection wi th the Community Re-Entry
Program. The facility, located at 319 West Monument street,
houses 2S Inmates and is jointly managed by custodial and clini
cal staff. During Fisoal Year 1986, at anyone time approximate
ly 80 work release and 4 parole inmates resided at the Re-entry
facility. The staff of social workers and correctional officers
provide tr~atment, supervision, and social services to the Re
entry facility residents. Activities include group counseling
and psychotherapy, substance abuse self-help groups, career
planning and job readiness classes, and other special programs or
group functions.
The leave program provides for one- to five-day leaves from
the Institution for individual inmateB to enter the community to
visit their familien, friends,
pose approved by the Treatment
seek employment, or for any pur
Units and the Board of Review.
This program is the first step in the reintegration of the inmate
into the community. It is closely monitored by the Unit Treat
ment Team which supervises the individual during the course of
initial one-day leaves, and evaluates the inmate's performance
and family's reactions to subsequent leaves. Leaves may range
from a few hours during daylight hours to three to five days over
a holiday period. During the time the inmate is on leave status,
he or she remains a member of a psychotherapy group. Experiences
16
•
•
•
•
•
•
•
•
•
•
•
and feelings while on leave arc discussed in the group, to the
inmate's advantage and to the advantage of all group members.
The work release program may provide ~Bsential resources for
inmates who lack positive resources in the community. It also
serves to adapt vocational skills developed in the Institution to
the demands of the job marketplace and to reintroduce the person
to the work process. In this program, the inmate resides in the
Institution's Re-entry facility, and leaves during the day for
the purpose of full-time employment in the communi ty, returning
to the facility each evening. This program runs for at least
ninety days Cand ususlly longer), allowing the inmate to gradual
ly become accustomed to the daily routine of employment and at
the same time earn and accumulate funds to sustain him when he
returns to the community on a full-time basis. Through a similar
school release program, the Board of Review authorizes the in
mate's daily return to the community for academic or vocational
training. Every leave in both programs must be approved by the
Board of Review before it may commence.
PAROLE
Inmates whose success in pre-parole programs indicates they
have progressed sufficiently to warrant release to the community
participate in Patuxent's parole program. Parole status may be
granted in various forms, depending on individual needs and
resources. For example, those without adeq~ate funds or living
quarters are paroled initially to the Re-entry facility. Inmates
who originally came from other states may be granted parole to
their home states via an Interstate Compact. The majority of
inmates, however. are granted parole to establish an approved
independent living situation within the State.
The Re-entry Program staff provides continued professional
tr~atment services for those on parole status. Attendance at
parola clinics is mandatory for all persons residing or working
in the metropolitan area. During Fiscal Year 1986, an average of
26 persons were seen for continu~d treatment on parole each week.
17

•
•
•
•
•
•
•
•
•
•
•
In addition to the continued supervision, the Re-entry program
staff provided job ~nd fnmily counseling, parole guidance, and
social casework services to inmates and their families. The
staff worked with approximately 10 persons per week who were
significant in maintaining the inmates in the community (calle'd
collaterais). This continued treatment permits group interaction
in circumstances in the community that cannot be duplicated
within the Institution. Experience sugqests that parolees who
fail frequently do 50 during the early period of their return to
society. The need for continued treatment and support during
this critical period cannot be overemphasized.
The minimum period on parole, set by statute, is three
years, but may be longer if necessary. If, after this period,
the Board of Revie~ believes that the parolee is ready for com
plete release to the community without further supervision, the
Board may petition the sentencing court to vacate or suspend any
remaining criminal sentence. During Fiscal Year 1986, the Board
of Review petitioned the courts to release eight (8) parolees
whose adjustment warranted the petition. The court vacQted the
sentences of four (4) of the parolees, with decisions still
pending on the other four at the close of the fiscal year.
Table 9 in the Statistical Summary reviews the activi.ties of
the Community Re-Entry Program from Fiscal Year 1980 to Fiscal
Year 1986.
RESEARCH AND C~PUTER SYSTEM DEVELOPMENT
In April of 1984 the Office of Res~arch and Computer System
Deve!opment was created at Patuxent Institution as a means of
integrating both practical and theoretical research in a unified
program. Practical research has as its goal the immediate appli
cation of research findings to current InstItution operations
(planning, development, and evaluation of programs of operation
and treatment), while theoretical research concerns itself with
gains in the general body of knowledge where results may not be
immediately applicable (the testing or development of theories of
18

•
•
•
•
•
•
•
•
•
•
•
criminal behavior or appropriato models of inmata tre~ .roent).
The chiei responsibilities of ~he offica arc ~o develop and
coordinate computing resources to provide management information
and to conduct and stimulate reBear~h activities. The director
of the office reports to the Director of Patuxent Institution in
coordination with the Supervisor of Records, the Associate Direc
tors. and other supervisory personnel.
During Fiscal Year 1986, the Research Office continued its
effort to plan and develop computer resources for the Institu
tion. The Information Processing Plan for Patuxent Institution,
prepared in cooperation with the Division of Data Services,
identifies computing hardware reqUirements for Patuxent through
Fiscal Year 1992. The plan calls for the introduction of Offend
er Based State Corrections Information Systems (OBSCIS) terminals
and microcomputers for office automation in all major depart
ments.
The Research Office, again in close cooperation with the
Division of Data SerVices, maintained the Patuxent Statistical
Flotfila System (called the Flatfile). The flatfila uses OBSC!S
information and a series of data coding forms to capture
information on many inmate-related variables and events (social
and criminal histories, admission, diagnostic results, treatment
progress, work release and parole performance, release). The
Division of Data Services processes the coding forms on a monthly
basis and prepares a computer file for research and management
reporting purposes. The Flatfila became a fully operational
system in Fiscal Year 1986. At the close of the fiscal year, the
Flatiile contained 2.331 records. It is used as an integral part
of all program evaluation activities at Patuxent, and provides
data to Patuxent's administrative staff for management purposes.
Special reports and analyses have bean prepared with flotiile
data, covering such issues as inmates with special education
needs, inmate religious preferences, analysis of diagnostic
activity, military history of inmates. average length of time
spent on Levels ~ tbrough 4, and analyses of parole performance.
19

•
•
•
•
•
•
•
•
•
•
During Fiscal Year 1986, th0 Research Office installed three
Burroughs microcomputers for use in the Research, Data Process
ing, Personnel. and Accounting Departments. Eight Patuxent staff
received training on the Burroughs equipment, and an additional
six staff were trminod in-house. To date. the equipment has been
used extensively in the Research and Records departments for
office automation purposes. primarily supporting the preparation
of monthly and annual statistical reports, bi-weekly case summa
ries for the Board of Review, and general office functions.
The Research Office established the Patuxent Insti tution
Research Committee in June of 1984. This .:.ommittee, composed of
representatives from custody, the treatment professions (psychia
try, psychology, social work), education, and the Re-entry Pro
gram. oversees research activity at Patuxent and provides advice
and assistance to the Research Office. The Committee met five
times during Fiscal Year 1986. accomplishing the following:
L
2.
Continued revision of the procedures for conducting research at Pa t Ulten t Institution--the Human Subjects Rev i et1 Commit t as was established for the purpose of reviewing research proposals that involve prisoners. as research subjects.
Reviewed and approved four research proposals in the following areas:
a. A proposal to study the biological determinants of violent criminal behavior. The study did not receive the funding antiCipated and was not undertaken.
b. A study conducted by a graduate student in Clinical Psychology concerning the classification of rapists.
c. A study of parolees undertaken by one of the clinical staff.
d. A study to assess the reasons for which Patuxent inmates voluntarily leave the treatment program.
3. Reviewed the 5-year research plan prepared by the Re-
4.
:search Office.
Provided continuous assistance to the Research Office on various in-house program evaluation projects.
20

•
•
•
•
•
•
•
•
•
•
•
Research activities undertaken by the Research Office during
Fiscal Year 1986 include:
1. Preparation of cost-effectiveness and recidivism analyses fo~ the legislative hearings.
2. Refinement of data collection procedures for future cost-effectiveness and recidivism analyses.
3. Evaluation of the Sex Offender Demonstration Project.
4. Evaluation of the Office Automation Training Program.
5. Submission of a proposal for a technical assistance grant award from the National Institute of Corrections for further development and evaluation of treatment programs at Patuxent.
6. Continued the collection of data concerning the activities and decisions of the Board of Review.
The Research Director, at the request of the Office of the
Secretary, spent three months during this fiscal year working
with the Business Systems Planning Group. The Group was formed
to assess information management problems at the levels of the
Office of the Secretary and agency heads, and to recommend man
agement and information strategies for the future.
21

.~-------------------. - --- -
•
•
•
•
•
• STATiSTICAL PRESENTATION
•
•
•
•
• 22

•
••
•
•
•
•
•
•
•
•
This section presents statistical information concerning the
various departments and activities at Patuxent Institution. It
summarizes data for the past fiscal year (1986) and for trends
beginning with Fiscal Year 1978, Patuxent's first full year of
operation under the ne~ Article 31B. This section presents
fiscal data first--average annual cost per inmate and total
operating costs, and then presents statistics concerning intake,
treatment, and parole/release activities.
IAnesl-»Atm Table 1 below presents the Fiscal Year 1986 Operating Cost
and Per Capita Cost Summary. The reader should keep in mind that
the operating cost reported includes the cost of employee fringe
benefits. Fringe benefit costs were not included in the Annual
Reports for Patuxent Institution prior to Fiscal Year 1985.
Charts 1 and a below show cost trends at Patuxent with and
without fringe benefit costs.
23

•
•
•
I :.
•
•
•
•
•
•
TABLE 1
Operating Cost - Fiscal Year 1986
General Administration
custodial Care
Dietary Services
Plant Operation & Maintenance
Diagnostic, Classification, & Treatment Services
Education. Vucation. Recreation, & Religious Services
Outpatient Services
TOTAL OPERATING COST
$ 907,034
7,853,892
877,538
1, 328,596
2,549,825
1,033,754
289,813
$14,840,452
per Capita COlt Summary for Fiscal Year 1986
Par Capita COllt
814,840,452 706 $21,020
~This population figure includes inmates held at Patuxent on a temporary basis for the Division of Correction. In Fiscal Year 1986, and average of 83 Division of Correction inmates were temporarily housed at Patuxent. to help relieve crowding. These inmates are not part of Patuxent's diagnostic or treatment population. but they do account for a portion of Patuxent's operating expenses.
24

--- ----
'"
• General Fund - Balance Sheet
• ASSETS
Currqnt
Petty Cash - Working Fund 2,SOO.00
• $ 1,520.000.00
Inyentories
Supplioi & Materials 31S.S43.03
• Land ~ Improv~ments 3 343,575.30
BuildingJi 010.713,376.86
• Equipment 834,446.89 811.891,399.05
813,729,442.08
• R~iERYES AND CAPITAL SURPLUS
• Reserye for Current Atuets $ 2,500.00
Reaerye for CA1)ital Project Funds S 1,520,000.00
R~HUUY~ fgx I n:~HUll g I i ~ A S 31S,543.03 e,
QIul it fA 1 S!!l R I UJt 011 ,891,399.0S
$13,729,442.08
•
•
as
•

I. C:H.A.RT # 1
II
IJp.er·;]t1n9 CC:IStS - F"( 78 tC:1 FY' ;3.(3
• [: C) st in ~V11111Dns
•
•
•
•
•
•
•
e>
14 In c:1 udi n';] fr-i n'~~e CI):sts ......•.
o L--.. __ -L _____ -L __ --''--, _.L. __ . __ -.J. ___ .,--,-__ , __ I
1978 "1 q r,:;. '1 ...... ',,-I '>1 ,-. r;::;t..,. ' ..... ~ [..1"1 , .. ,
, .. , '--I
F" I··" I :::;(:! a ')' eo r
CH.ART .# 2 II Fl .-. "l ~. J. F'" ~~ t er Capltt] f .... :O~::.;I.::.:; -- '1''''' ,.3 .. 0 F'····· p.~"::, I '._.' ... 1
'>1 ..-~ D .i ~, QJ;t '1 '9' ;3, Ei
Cost In Th(>usond~:.~
I nc:l ud I n';! fri nl;j I::! costs , .. -.. 2(} ..... -
15
.. -.... --"""'" , .. ~--~~:~--... -... -.-.. --.---.------
---._-------_ .. _--------_.-.- --'-
D ~----~------~------~--__ --~I------~-----~-'lP7 Q
...:,1 ,I ()
F'I £: •• -, ,''''\ I ... l,.r.:. '''i t .. • J' ....... .t I ..... 1,.,.4
·1·!'"I·;::1 ,·1 .~~[) "
NOTE: The cost of employee fringe benefits were included in the operating costs for the first time in Fiscal Year 1985. The dashed line represents trends in operating costs without accounting for the change in reporting fringe costs, thou~h fringe costs were not included in operational costs in Fiscal Year 1984.
26

•
•
•
•
•
•
•
•
•
•
BOO
700
800
5.50
41=. ..... , .... l •..
. "\ .'p. t~'J ..., c P, 11 V ._ L"" .. ·
-.' ,a..DP
CJ-I.ART if 3 .. [;1(111::/ Po pu lotio n r F'y'" 7'::;.1
/ () t,] ,-', " i" .'(
1(1 '"'1'·' ..:: t;, _1' 1 f~S 1 1 tl'-"··' .. ~QL
27
1 (~.~ ~ i .(~ :.-,"!,~" i (I ['~;I' k', .. J C:1~t -J ... 1 t" .... 1 .. ,_

•
•
•
. ' •
•
•
•
•
•
•
r i fl en 1 SUm;;n!H V
During the time period from Fiscal Year 1978 to Fiscal Year
1984, Patuxent's operating costs increased at an average annual
rate of 10.2%, with the greatest increa~e (+21%) occurring from
Fiscal Year 1982 to Fiscal Year 1983. This marked increase
resulted from increased costs associated with the addition of
over 150 Division of Correction inmates to Patuxent's count, in
an effort to relieve crowding in the Division. In the most recent
year. Patuxent's operating costs increased 3.5% over last year's
figure .
The per capita cost for Patuxent, arrived at by dividing the
total operating cost by the average daily population, declined
slightly (-3%) from Fiscal Year 1978 to Fiscal Year 1984. This
cost figure rose slightly from Fiscal Year 1978 to Fiscal Year
1981, and dropped sharply from Fiscal Year 1981 to 1982 (-15%).
This drop reflects the large increase in Patuxent's average
daily population (580 in FY 81, 687 in FY 82). due to the initia
tion of double-ceIling at Patuxent. Per capita costs again rose
slightly from Fiscal Year 1982 to 1984 (+8%). In Fiscal Year
1986 per capita costs rose 9.5% reflecting a decrease in the
average daily population from Fiscal Year 1985 (see Chart 3).
Patuxent's average daily population decreased almost 6% in the
past fiscal year. from 749 to 706.
28

r. •
• I i
•
• POPULATION AND INSTITUTION ACTIVITIES DATA
•
•
•
•
B9
•

I. •
•
•
•
•
•
•
•
•
--------------------------
TABLE 2
Inmate Population Data - Fiscal Year 1966
A. Population Movement
1. Beginning of year population 2. Admissions
B. New admissions b. Return from escape c. Return from leave or work release
status d. Return from parole
(1) Investigation - no violation (a) New offense (3) Terms and Conditions (4) Pending resolution
e. Return from temporary custod¥
3. Di scharges
Il.
b. c.
Non-Eligible
(1) Staff (2) Board of Review (3) Written Request
Expiration of sentence Parole
(1) Re-entry Program (2) Community
d. Work/school release e. Escape f. Leave violation g. Other
4. End of year population
B. Population Averages
1. Average daily Institution population
4 5 6 1
£123 16 57
o 6
2. Average daily Re-entry Program population
337 o
9 17
5
296
5 6
36 o o
11
601 368
356
613
599 24
3. Average parole population 63 4. Average Division of Correction Annex population 83 S. Total average population 789
30

•
•
•
•
•
•
400
350
300
250
200
150
100
CH.ART J.t -+f.1.1
4 Admissions and Releases - FY" 7.6 to FY" 86 # of Inm(Jtes
!:J. "..-J t'T'-l <I 'C' r.:::- <""-1 t'-l 'C' .1 ~ .. J I ... _.' .. _,' ,__ ... :J
D p I p.-' a ,'-" .... c· I .... '...... ......- ..:,:. e w
1978 1979 1980 1981 1982 '198.3 Flscol 'Y'et,:tr
'1 984 '1 g821 1986
During its first full year of operation under the revised
Article 31-B. admissions exceeded releases by almost 100 inmates.
Admission exceeded releases by slight margins from Fiscal Years
1979 to 1983. and releases exceeded admissions by no more than 10
inmates from Fiscal Year 1984 to 1985. In this Fiscal Year,
admissions exceeded releases by a very slight margin. These data
do not reflect the in'mates Patuxent houses for the Division of
Correction, whose population reached 90 by the end of the Fiscal
Year.
31

•
• 60
• 40
2.0 •
I]
•
•
•
••
•
•
•
CHART # 5 Dioqnostic Evoluotions p e p~e nt.age
F'l -- Po t F'" ,-, c:! I /a_, I:) ,. LlC..'
o EF'::, II rk,n-EP:=.
'l·!:;'f'7 R '.' ,I k) 'lQQ'l .... ( .. l 'lQQ? '.' [,;i ...... '1 '~I:H! -;J;, '1 (I :H! 4 '1 ,I"'J Q k ' .. _ L .. J 'oJ ;::'1 L .. J ;:.' t .. l ... _:· '1 ('~8C:, '... .. l .. t
In Fiscal Year 1986, Patuxent admitted 81 inmates as Eligi
ble Persons (25% of the 321 inmates diagnosed). Over the years
Patuxent's evaluation team has rejected more inmates than it has
accepted as Eligible Persons (a small number of inmates voluntar-
ily leave the diagnostic program each year). In Fiscal Year 1980
the percentage of inmates accepted and rejected was almost equal.
In recent years, the gap between the percentage of inmates
accepted and rejected has widened. The 25% acceptance ratio of
this Fiscal Year is the lowest rate ever. It does not reflect a
change in admission criteria . It reflects a recent streamlining
of the diagnostic process which allows the evaluation team to
identify Non-Eligible inmates quickly.
Patuxent Institution's diagnostic procedure is a crucial
factor in the treatment pr~cess. It directly influences the
composition of the inmate population undergoing treatment at
Patuxent. through a Joint evaluation and decision process involv
ing custody. education. and clinical staff members. Table 3 and
Charts 6 through 12 below summarize the characteristics of in
mates approved (Eligible Persons or EPs) and not approved (Non
Eligible Persons or Non-EPs) for admission into Patuxent's pro-
32

•
•
•
•
•
•
•
•
•
•
•
gram. They reveal the following trends from Fiscal Year 1978 to
the present:
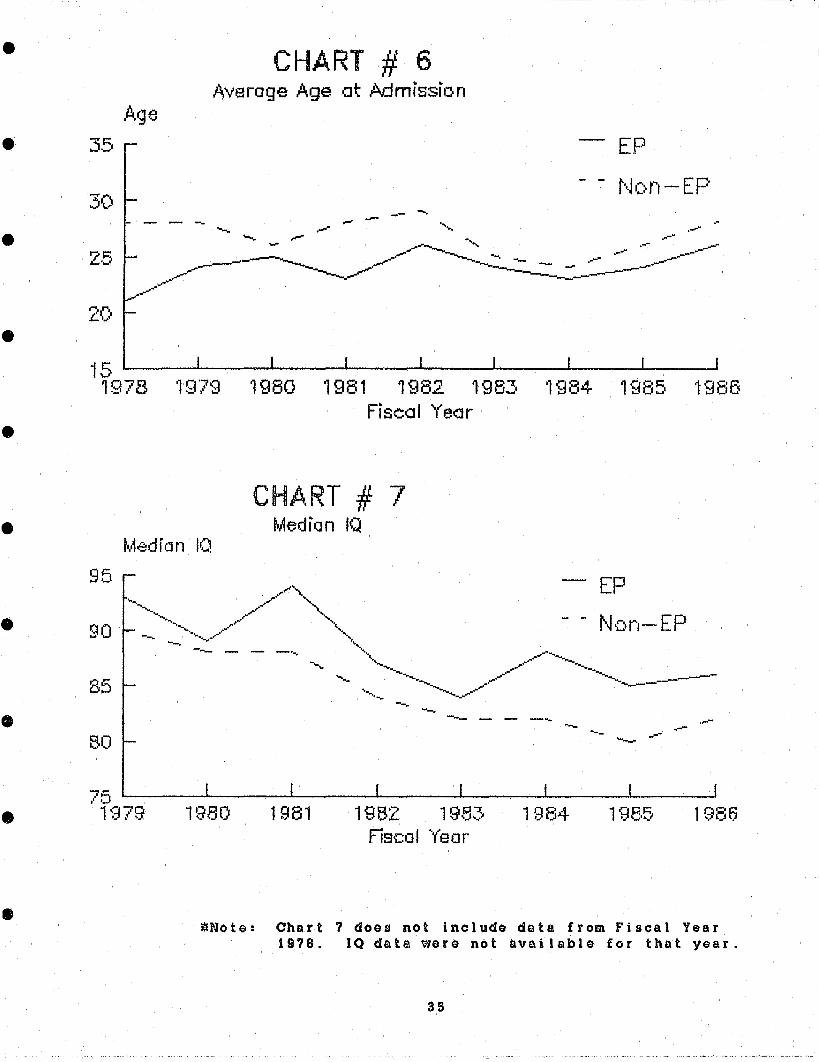
o EPa tend to be younger than Non-EPs; though this differ
ence in age has lessened over the years. Currently, EPs
are one or two years younger than Non-EPs.
o EPa tend to have higher lOs than Non-EPs; though 10
o
scores for all diagnostic inmates have lessened over the
years. Currently, the median IO score for EPs exceeds
that of Non-EPs by approximately five points.
The percentage of EPs and Non-EPs with life sentences has
fluctuated over the years, and the percentage of diagnos
tic inmates with life sentences has declined over the
years. In this fiscal year, the percentage of Non-EPs
~ith life sentences increased sharply over the past few
years.
o Not counting inmates with life sentences, the average
sentences of EPs and Non-EPs have fluctuated over the
years (from a low of 19 years for Non-EPs i~ FY 1979 to a
high of 34 years for EPs in FY 1982). Currently, the
average sentence of Non-EPa exceeds that of EPs by over
two years.
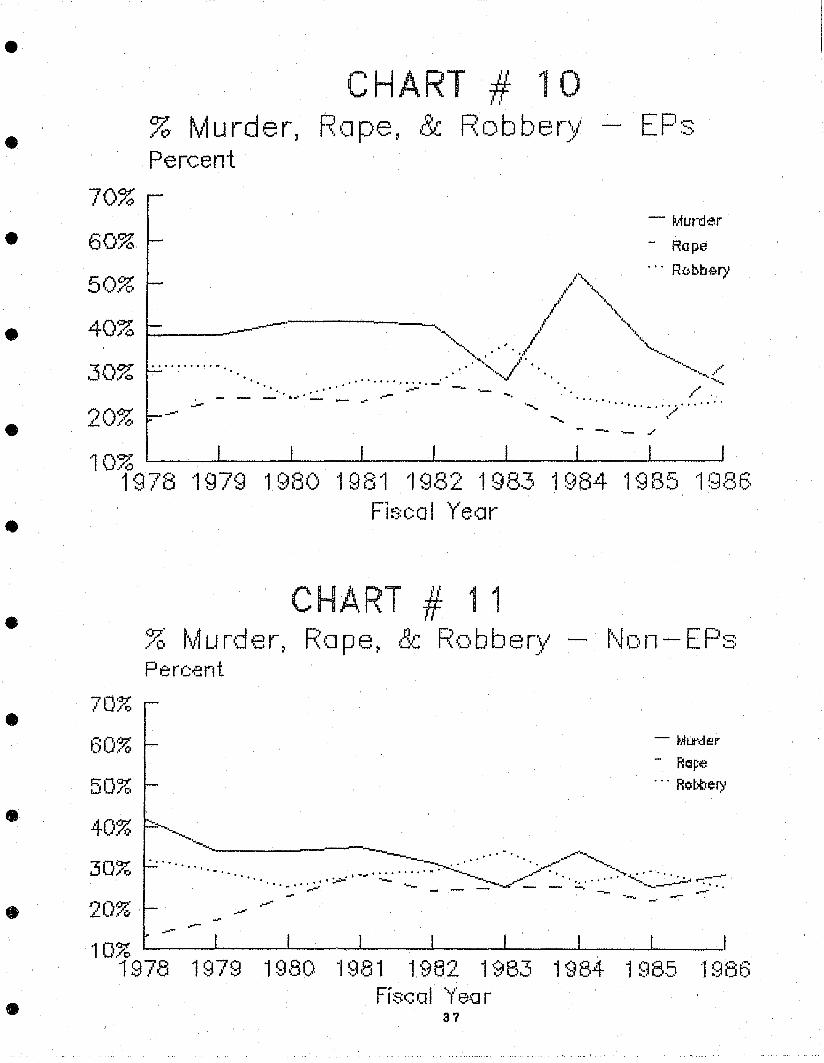
o The percentage of EPs and Non-EPs with murder, rape, or
robbery convictions remained fairly stable over the
years, with the exception of Fiscal Years 1983 (when the
percentage of EPa and Non-EPs with robbery convictions
exceeded those of EPs and Non-EPs with murder convic
tions) and 1984 (when the percentage of EPa and Non-EPs
with murder convictions increased significantly).
o Over the years a higher percentage of blacks have been
admitted into Patuxent's program, and whites have been
admitted in lower percentages.
33

•
•
•
•
•
•
•
•
•
•
•
---- --------
TAJLE 3
Compari8on of EligIble and Non-Eligible Persons
Diagnosed During Fiscal Year 1986
CliiUACTEIllISTIC
Average Length of Sentence in Years
Average Age at Admission
Median IO
Percent Murder Offenses Percent Rape OffenaeJ Percent Robbery Oifenses Percent Other Violent
Offenses Percent Drug Offenses Percent Other Nonviolent
Offenses
Percent Black Males Percent Black Females Percent White Males Percent White Females
Percent from Urbani Suburban Court Jurisdictions
Percent from Rural Court Jurisdictions
DIAGNOSIS
Eligible Person Non-Eligible Person (n=81) (n=240)
Figure
26
37
86
27% 31% 23%
15% 0%
52% 1%
44% 2%
84%
16%
5-110
16-45
66-128
Figure
29
21
89
28% 25% 25%
11% 5%
6%
67% 0%
32% 0%
90%
10%
Range
4-105
16-53
69-138
~The Median IQ for Non-Eligible Persons was calculated from a total of S5 inmates. not 240.
34
•
•
•
•
•
•
•
•
•
•
CHART # 6 Average Age at .Admission
3.5 EP
30 ~···J()n-EP·
Z.5
I"}('. L ... •
15 1978 1979 198Q 1981 1982 1982· 1984 1'~~85 '1986
Fiscal Year
CiiA.RT # 7 Median IQ
M.edf(ln IQ
95 ...... ...... .......
90 --.
85
80
75 1979
..........
EP .. ".~' .... ./ "
.,~ ......... ./ ..... ... .,.,.. \
,..... J". ..... ............ ..., --. .. .. ....... . .. ---. - - -'-. -......
1980 1981
''-.. .. ,.... .. ..... ........ ............... .....,."..- .... -..-.. ....
........ 0.1'..... .... __ -.. -...... - ,. .. .,..... .... ........ _-----'.......... -- -.
-................... ...
--- - -
1982 1983 Fiscal Year
.......
1984
.... - -_. *--..,.
.~----
1 ~~86
~Note: Chart 7 does not include data from Fiscal Year 1978. 10 data were not available for that year.
35

~~---------------------~~ ---
• CHART # 8 Average Len(~th of Sentence*
• Years
40 EP
35
30 ,.w- "
./ ------, '. _"'J-J" _--- '\\
.... \. ........... .-
\\ .. .\ _J"' .- -.._--------:..------------.
\' -,,,::.....J" __ -------'-~--
-' - ...... r····lon-EP • ''J5 L
• 20
15 ~--~----~------~-------~-----~------~----~----~ '197 B 1 9 79 1 980 198'1 1982 1983 1984 1985 1986
•
• CHART # 9 Percent of Inrn(ltes 'Nith Life Sentences
Percent
• 50%
40%
.30%
• .-, r'··lf)n -EP
.,..J'"" "1 ...
10%
-:::::;:-.______ _oJ'
- -:;-=:::.-------- ----_. -- --..... . ..... ..... -.
'. ...... 0 ..
... '-. -,.-,........ .. .. -'\.. ..-:;::,,_ .. ----...... _--=------------.... ,.. .... .. _ ..... ..-J'"
r 0% ~----~---~---~---~----~---~--~~-~
'. ..' 20%
• 1978 1979 1980 1'98'1 '1 '9-34- '1 9Ei·5 '1 qc,~:::· .... Ch_'
• nNOTE: DOGS not include life sentences.
• 36
•
•
•
•
•
•
•
•
•
•
•
60%
50%
40%
30%
'10%
----------------- ---------------~---
% ~v11 u rder, Percent
CHART 10 - EFI~
4 __ 0'
I'~ I ''' . ./ ,,.,
- Mun:ler
- Rape
, " Rc.bb£try
,1'- .... \ .. ----------..., /' "" , . ,
.......... .'. ,/ .......... .. ,..... :l. ... ......... .
•• ' ........ (I '. ................ 0'"
~v ~{ ............. -. ... ..:..' ....... :..:.... • • . ,.J- .. -- -- '- ..... /"" '. -...... . .... ........ . ......... ';,' ..
," - -- --- •. i'
1978 1979 1980 1981 1982 1983 '1 qQ4 · .... 0 '1 ~ ... ) n c::. ;:;,,0._.1
Fls:cG I Yeor
CHA,RT 1 1 )~: tv1 u njer~ F~o pe~ Be R()bbery' - r··,JDtl- EPs: Percent
700/ " /0
- Mut'cll2r
- FlCl~~
.. , Flot)c.cry
40:% -~
--.... ~ ............ ,-------_._---
...... -------- . ..... ' . . ....................... """ ... 30%
" ... "" .. . . .
' ..
t)[)o/.· .L ... .. ·v
.--
'10% 1978 1070 '.} I .:;J
. '. ... . :-:-:--.. -:...:-- :,.~:~. .............. .. ..... • • • , • :.-:_0 ....... : .. : .. : --.. ________ __ "J'"0-"" • ' •• ••• • ' "....... ...:,.:.. .. ...-_--
. .. .. ' ,..-" '-- - - - ----- -. ~...--- .: ... : .. ......
1982 1983 Ffs(::ol "'lea r
37
'-.
1984 19e.·5

•
•
•
•
•
•
•
•
•
•
101)%
80%
70%
60%
50%
·30%
0%
CHART # 12 Percentage ()f 'Whites vers us No n -'t'o'h HeEl Percent
1 q "7 Q 1 .;. ... ~ "7" .!;J ••• ..... " "'~ 1980 1981
38
11 B b::lI::k Non - EP
o 'I/Ilh ite NCI n-EP
~ BkJd-.; EP
EJ '\Vh ite EP

• • • • • • • • • • •
Table 4
Board of Review Activities - Fiscal Years 1978 to 1986
Act iyi ty 1978 1979 1980 1981 1982 1983 1984- 1985 1986
Annual Review 298 381 401 464- 542 573 554 512 497 Special Review 73 63 85 86 87 92 70 74- 105 Preliminary Parole
Revocation 21 22 33 32 21 Parole Revocation 50 42 32 46 35 32 42 35 21
(0.) Status Violation co 19 1 1 14 13 10 Non-Eligible Person 4- 17 14- 14 32 36 20 13 16 Petition for Release 13 9 17 9 5 10 2 1 8 Admin. Decision 126 138 123 152 140 171 200 187 200
Total 564 650 672 771 881 947 935 867 878
% Change +15% +3% +15% +14% + 7% -1% -7% +1.3%

I. I
•
•
•
•
•
•
•
•
•
•
Table 4 shows that in Fiscal Year 1986 the workload of the
Board of Review increased slightly by 1.3%. Annual reviews
represent a major component of Board of Review activities
(spprogimately 50% over the years). They increased annually to
Fiscal Year 1983 at an average rate of 14%, and have decreased by
approgimately 5% annually since.
Parole revocation hearings account for a small percentage of
the Board's activity (approximately 5% over the years), but take
up a larger percentage of the Board's time. Board of Review
activity in this area has fluctuated over the years, ranging from
50 cases in Fiscal Year 1978 (when all parolees were former
"Defective Delinquents") to 21 cases in this Fiscal Year (when
the parole population contained a small percentage of Eligible
Persons).
The following
various treatment
community re-entry)
tables and charts present data regarding
activities at Patuxent (therapy, education,
for Fiscal Year 1986 and previous years.
40

• • • • • • • • • • •
Table 5
Summary Statistics on Group and Individual Psychotherapy
Fiscal Years 1983 to 1986
1982 1983 1984 1985 1986
group Psychotherapy
"'" Total Hours 3,740 3.850 +3% 3,786 -3% 3.556 -6% 3,570 +4% - Total Sessions 3.511 2,560 +2% 2,531 -1% 3.395 -5% 2.395 0% Average Monthly
Attendance 392 400 +2% 378 -6% 372 -2% 359 -3.5%
Indiyidual Psychotherapy
Total Hours 1,157 1,366 +18% 614 -55% 302 -51% 150 -50% Total Sessions 1,227 1.432 +17% 646 -55% 311 -52% 163 -48% Average Monthly
Attendance 23 27 +17% 12 -56% 6 -50% 3 -50%

• • • • • • • • • • •
~ N
Table 6
SUMMARY STATISTICS ON EDUCATION ACTIVITIES - FISCAL YEARS 1978 TO 1986
.El\lROl.tLMENT .1..UJ! .1..i1.J! JJUt9.. .uuu.. till .1..i.B...3.. J.JUii. ilJ!1i. ll.U.
Pre-college 329 302 350 303 324- 381 300 305 331 College 68 96 110 120 152 160 149 146 165 Vocational (a) 294 322 241 334 365
Total 397 398 460 423 770(b) 656 696 785 861
DEGREES
G.E.D. 14 47 50 31 36 21 30 30 27 A.A. 15 11 22 17 36 30 31 32 20 BA/BS (c) 10 8 5 14 Vocational Certificate Cd) 189 199 125 170Ce) 208
Total 29 58 72 48 261 260 194 237 269
(a) The Education Department did not begin reporting enrollment data for the vocational shops until Fiscal Year 1982.
(b) Inmates may enroll in the pre-college or college programs. as well as in a vocational shop. Enrollment totals for FY 1982 to 1986 count classes enrolled in. not number of inmates enrolled.
(c) The Education Department did not begin its Bachelor's level college program until Fiscal Year 1982.
Cd) The Education Department did not report totals for vocational shop certificates of completion until Fiscal Year 1982.
(e) This figure includes 28 certificates from Howard Community College. Certificates from Howard Community college are not included in the other figures. as they were offered for the first time in Fiscal Year 1985.

• • • • • • • • • • •
Table 7
Activities of the Speech Pathology and Audiology Center
Fiscal Years 1982 to 1986
ACTIVITY .1.all J....9...U .l.JlU: ~ .1JUl§.
.". Number of Diagnostic Ct.)
Tests Performed 237 244 254 173 180
Number of Treatment Sessions 198 221 245 286 271
Average Number of Students Attending 33 32 37 34 37

•
.".
.".
• •
VOLUNTEER ACTIVITY
REGULAR VOLUNTEERS
FY 1984 FY 1985 FY 1986
INMATE VOLUNTEERS
FY 1984 FY 1985 PY 1986
SHARED VOLUNTGERS*
TOTAL
FY 1984 FY 1985 FY 1986
FY 1984 FY 1985 FY 1986
• • • • • • Table 8
SUMMARY OF VOLUNTEER ACTIVITIES - FISCAL YSi~RS 1984-1986
~OLUNTEERS
350 287 289
44 35 36
28 34 37
422 356 362
VISITS
3,580 4,609 4,771
1,504 1 ,930 1,985
m:! 1.090 i, 180
5,084 7,629 7,936
HOURS
7,030 7,944 8,129
8,928 9.690 9,855
2,558 3,855 3.930
18,154-21,489 21,914
• •
~Note: This category includes college teachers who receive wages from their respective institutions. They are counted here as Patuxent Shared Volunteers because Patuxent does not pay their wages.
*~Note: Data were not available for this category in Fiscal Year 1984.

., .. • • • •
Table 9
Summary Statistics on Community Re-Entry Program Activities
Fiscal Years 1980 to 1986
ll.M. .1JUU.. ..1J!ll ..lJ!.U.. llll ..1..1lll J.Jt.ll
Average Daity Halfway House
"'" Populations:
(JJ
Work Release 16 13 16 20 Parole 11 10 9 8 4 TOTAL 10 10 1 1 26 22 24 24
Average Number of Parolees in the Community Supervised per Week 41 39 37 30 30
Average Monthly Community Parole Population 97 98 80 73 83

•
•
•
•
•
•
•
•
•
Table 5 shows that the number of hours and sessions of
group psychotherapy pr~vided. and the average number of inmates
attendinp therapy sessions, have declined since fiscal Year 1983,
though this fiscal Year saw a slight increase in the number of
therapy hours provided. The factors contributing most
significantly to this trend include:
- Vacancies among social worker, psychologist, and psychia-
trist positions. The treatment program carried four or
five vacancies in these positions for the past few years.
- Two therapy-providing staff members work at the Re-entry
facility, and Table 6 does not count therapy provided at
that location.
Table 5 does not include data on the number of sessions and hours
of large group counseling at Patuxent (called Tier Counseling).
Inclusion of these data would nearly double the group therapy
figures in Table 5.
The amount of individual psychotherapy offered at Patuxent
has dealined sharply and steadily since fiscal Year 1983. It has
never ~een provided to more than a small percentage of the inmate
population. This trend reflects a conscious effort on the part
of Patuxent's treatment staff to reduce the use of individual
therapy and rely more on group therapy.
The Education Department operates at close to full capacity
each year, with over 300 inmates enrolled in pre-college classes,
approximately 150 in college classes. and over 300 in vocational
shops. Table 6 shows that enrollment in college classes has
increased from 68 in Fiscal Year 1978 to 16S in this fiscal Year.
a trend which produced a corresponding increase in the number of
degrees conferred, from 15 in Fiscal Year 1978 to 34 in this
Fiscal Year.
46

•
•
•
•
•
•
•
Table 7 shows that the treatment activities of the Speech
and Audiology Clinic increased steadily since Fiscal Year 1982,
with a corresponding increase in diagnostic activity.
Table 8 ShO~B that, although the number of volunteers at
Patuxent has declined slightly, volunteer activity at Patuxent
increased since Fiscal Year 1984, when volunteer data were first
tabulated.
Table 9 shows that, from Fiscal Year 1982 to fiscal Year
1985, the a~erage parole population decreased by over 20
parolees, while the work release population increased to a total
of 16. In this fiscal Year both populations increased, parolees
by approximately 10 (to an average of 83), and work release
inmates by approximately 4 (to an average of 30).
47

•
•
•
•
•
•
•
•
•
•
48
•

•
•
•
•
•
• APPENDIX A
Descriptive Data on all Inmates Evaluated in FY 1986
•
•
•
•
• 49

• CHARACTERISTICS OF TOTAL GROUP STAFFED
N=321
• Average Length of Sentence = 26.3 years
Median = 25 years Range = 4 - 110 years
• Length of Sentence N Percent
0 - 4.9 2 1% 5 - 9.9 18 6%
10 - 14.9 49 15% 15 - 1 9 . 9 48 15%
• 20 - 24.9 42 13% 25 - 29.9 34 11% 30 - 34.9 23 7% 35 - 39.9 7 2% 40 - 44.9 14 4% 45 - 49 .. 9 5 2%
• 50+ 23 7% Life 56 17% Total 321 100%
Cr ime Categories: N Percent
• 1. Murder, etc. 88 27% 2 . Rape, etc. 86 27% 3 . Assault 39 12% 4: • Robbery 80 25% 5. D.W. , D.C. , Narc. , etc. 11 3%
• 6 .. Arson, Burglary, etc. 14- 4% 7 . Larceny, etc. 3 1% Total 321 100%
Race: N Percent
• 1. Black Male 203 63% 2 . Black Female 2 1% 3 . Whi te Male 113 35% 4 . Wh i te Female 3 1% Total 321 100%
• Court Jurisdiction: N Percent
1 . Urban 127 40% 2. Suburban 157 49% 3 . Rur~l 37 12% Total 321 100%
50

• Average Age at iAdmi s s i on = 26.8 years
• Median = 24.9 years Range = 16 - 53 years
Age N Percent
• 15 - 19 37 12% ao - 24- 107 33% 2S - 29 87 27% 30 - 34 50 16% 35 - 39 18 6% 40 - 44 15 5%
• 45 - 49 5 2% SO - S4 2 1% Total 321 100%
Average I.Q. = 88.2
• Median - 82.2 Range = 66 - 138
N/A = 185 N = 136
l.Q. N Percent
• 60 69 5 4% -70 - 79 40 29% 80 - 89 34 25% 90 - 99 33 24%
100 - 109 15 11 %
• 110 - 119 6 4% 120 - 129 2 1% 130 - 139 1 1% Total 136 100%
•
•
•
• 51

•
•
•
•
•
•
•
CHARACTERISTICS OF TOTAL OROlYP STAFFED ELIOIBLE PERSONS
1\1=81
Average Length of Sentenc~ = 26.4 years
Length of Sentence
o - 4.9 5 - 9.9
10 - 14.9 15 - 19.9 20 - 24.9 25 - 29.9 30 - 34.9 3S - 39.9 40 - 44.9 45 - 49.9 50+ Life Total
Cri~e Categories:
1. Murder, etc. 2. Rape, etf.!. 3. Assault 4. Robbery
Median = 22.2 years Range = 4.5 - 110 years
1\1
1 2
15 11 11
9 6 1 2 a 9 6
81
1\1
22 25 12 19
5. D.W., D.C .• Narc .• etc. o 3 o
6. Arson, Burglary, etc. 7. Larceny, etc. Total
Race:
1. Black. Male 2. Black. Female 3. White Male 4. White Female Total
Court Jurisdiction~
1. Urban 2. Suburban 3. Rural Total
52
81
N
42 1
36 2
81
N
29 39 13 81
Percent
1% 2%
19% 21% 14% 11%
7% 1% 2% 2%
11% 7%
Percent
27% 31% 15% 23%
0% 4% 0%
Percent
52% 1%
44% 2%
Percent
36% 48% 16%

• Average Age at Admission = 26.7 years
• Median = 25 years Range = 16 - 45 years
Age N Percent
• 15 - 19 10 12% 20 - 24 25 31% 25 - 29 26 32% 30 - 34 9 11% 35 - 39 6 7% 40 - 44- 4 5%
• 45 - 49 1 1% Total 81
Average 1. o. = 88 Median = 65.5
• Range = 66 - 128
I .0. N Percent
60 - 69 4 5% 70 - 79 22 27%
• 80 - 89 22 27% 90 - 99 17 21%
100 - 109 8 10% 110 - 119 6 7% 120 - 129 2 2% Total 81 100%
•
•
•
•
53 •
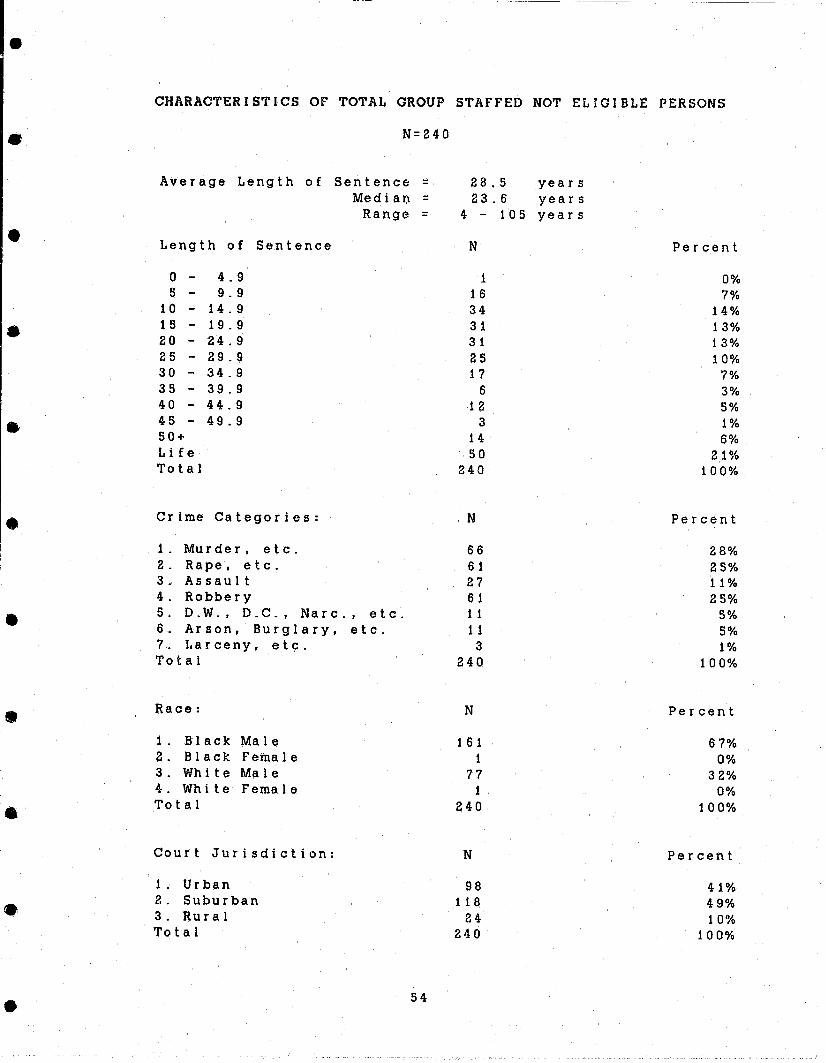
• CHARACTERISTICS OF TOTAL GROUP STAFFED NOT ELIGIBLE PERSONS
• N=240
Average Length of Sentence = 28.5 years Median = 23.6 years
Range = 4 - 105 years
• Length of Sentence N Percent
0 - 4 . 9 1 0% 5 - 9.9 1 6 7%
10 - 14.9 34 14%
• 15 - 19.9 31 13% 20 - 24.9 31 13% 25 - 29.9 25 10% 30 - 34.9 1 7 7% 35 - 39.9 6 3% 40 - 44.9 12 5%
• 45 - 49.9 3 1% 50+ 14 6% Life 50 21 % Total 240 100%
• Cr ime Categories: N Percent
1. Murder, etc. 66 28% 2 . Rape, etc. 61 25% 3. Assault 27 11 % 4 . Robbery 6 1 25%
• 5. D.W. , D.C. , Narc. , etc. 1 1 5% 6 . Arson, Burglary, etc. 1 1 5% 7 . l.a r ceny, etc. 3 1% Total 240 100%
• Race: N Percent
1 . Black Male 161 67% 2. Black Female 1 0% 3. Wh it e Male 77 32% 4. Wh it e Female 1 0%
• Total 240 100%
Court Jurisdiction: N Percent
1. Urban 98 41% 2. Suburban 118 49% .' 3. Rural 24 10% Total 240 100%
• 54

•
• Average Age at Admission = 26.9 years Median = 24. 9 years
Range = 16 - 53 years
Age N Percent
• 15 - 19 27 11%
20 - 24 82 34%
25 - 29 61 25%
30 - 34 41 17%
35 - 39 12 5%
• 40 - 44 11 5%
45 - 49 4 2%
50 - 54 2 1%
Total 240 100%
• Average I.Q. = 88.5 Median = 82.3
Range = 69 - 138 N/A = 185
N = 55
I.Q. N Percent
60 - 69 1 2% 70 - 79 18 33%
80 - 89 1 2 22% 90 - 99 16 29%
• 100 - 109 7 13% 110 - 119 0 0% 120 - 129 0 0% 130 - 139 1 2% Total 55 100%
•
•
• 55

•
•
•
•
•
•
•
•
•
•
------,
APPENDIX B
Descriptive Data on the Inmate Population Under Treatment. Fiscal Year 1986
56

•
•
•
•
•
•
•
•
•
•
•
CHARACTERISTICS OF TOTAL ELIGIBLE PERSON POPULATION
Average Length of Sentence = Median =
Range =
Length of Sentence
0 - 4.9 5 - 9 . 9
10 - 14. 9 15 - 1 9 . 9 20 - 24.9 25 - 29.9 30 - 34.9 35 - 39.9 40 - 44.9 45 - 49.9 50+ Life Total
Cr ime Categories:
1 . Murder, etc. 2 . 'Rape, etc. 3 . Assault 4. Robbery
N=467
89.0 years 28.3 years
4.5 - 110 years
N
1 5
38 68 91 44 63 13 20 10 26 88
46"1
N
178 125
36 106
5. D.W. , D.C. , Narc. , etc. 5 6 . Arson, Burglary, e t. c. 1 5 7 . Larceny, etc. 2 Total 467
N
1 . Black Male 268 2. Black Female 1 3 . White Male 195 4 . White Female 8 5 . American Indian Male 1 Total 46?
Court Jurisdiction: N
1. Urban 15? 8 . Suburban 888 3. Rural 88 Total 467
57
Percent
0% 1% 8%
15% 19%
9% 13%
3% 4% 2% 6%
19% 100%
Percent
38% 27%
8% 23%
1% 3% 0%
100%
Percent
57% 0%
42% 0% 0%
100%
Percent
34% 48% 19%
100%

----------
[.
Average Age at Admission = 24.8 years
• Median = 23.2 years Range = 15 - 49 years
Age N Percent
15 - 19 97 21%
• 20 - 24 162 35%
25 - 29 122 26% 30 - 34- 50 11% 35 - 39 19 4% 40 - 44 12 3% 45 - 49 5 1%
• Total 467 100%
Average Current Age = 28.8 years Med ian = 23.2 years
• Range = 17 - 51 years
Age N Percent
15 - 19 22 5%
20 - 24 115 25%
• 25 - 29 145 31%
30 - 34 99 21%
35 - 39 53 11%
40 - 44 20 4%
45 - 49 8 2% 50 - 54 5 1%
• Total 467 100%
Average l.Q. = 89.6 Median = 87.7
Range = 51 - 130
• I. Q. N Percent
50 - 59 3 1%
60 - 69 13 3%
70 - 79 107 23%
• 80 - 89 127 27%
90 - 99 112 24%
100 - 109 63 13%
110 - 119 30 6%
120 - 139 11 2%
130 - 139 1 0%
• Total ~67 100%
58 •