annexure vii research report - colombo stock exchange · research report as at 23rd ... of mcrp in...
TRANSCRIPT

ANNEXURE VII – Research Report

1
Melstacorp Limited
Research Report As at 23rd September 2016
Prepared By:
CT CLSA Capital (Pvt) Ltd
A CT Holdings Group and CLSA Group Company The preparer of the research report possesses the requisite expertise to prepare research report to determine business
valuations of this nature involving a company quoted under Consumer Staples Sector

2
LIST OF ABBREVIATIONS
BBH BN BPL CIL CSE CTC DCF DIST EBITDA EV Ke LBL LION LKR LTE Ltr MADU
: : : : : : : : : : : : : : : : :
Browns Beach Hotel PLC Billion Balangoda Plantations PLC Continental Insurance Lanka Limited Colombo Stock Exchange Ceylon Tobacco Company PLC Discounted Cash Flow Distilleries Company of Sri Lanka PLC Earnings before Interest, Tax, Depreciation and Amortization Enterprise Value Cost of Equity Lanka Bell Limited Lion Brewery Ceylon PLC Sri Lankan Rupees Long Term Evolution Liters Madulsima Plantations PLC
MCRP MERF MHL NATA NBT NSA PCEYL PBT PBV PER PPE PSIP ROE SLIC SOTP
: : : : : : : : : : : : : :
Melstacorp Limited Melsta Regal Finance Limited Milford Holdings (Pvt) Limited National Authority on Tobacco and Alcohol Nation Building Tax National Sales Average Periceyl (Pvt) Ltd Profit Before Tax Price to Book Value Price to Earnings Property, Plant and Equipment Pelwatte Sugar Industries PLC Group Return on Equity Sri Lanka Insurance Corporation Sum of the Parts
SPEN VAT VWASP YoY
: : : :
Aitken Spence PLC Value Added Tax Volume Weighted Average Share Price Year over Year
3
TABLE OF CONTENTS
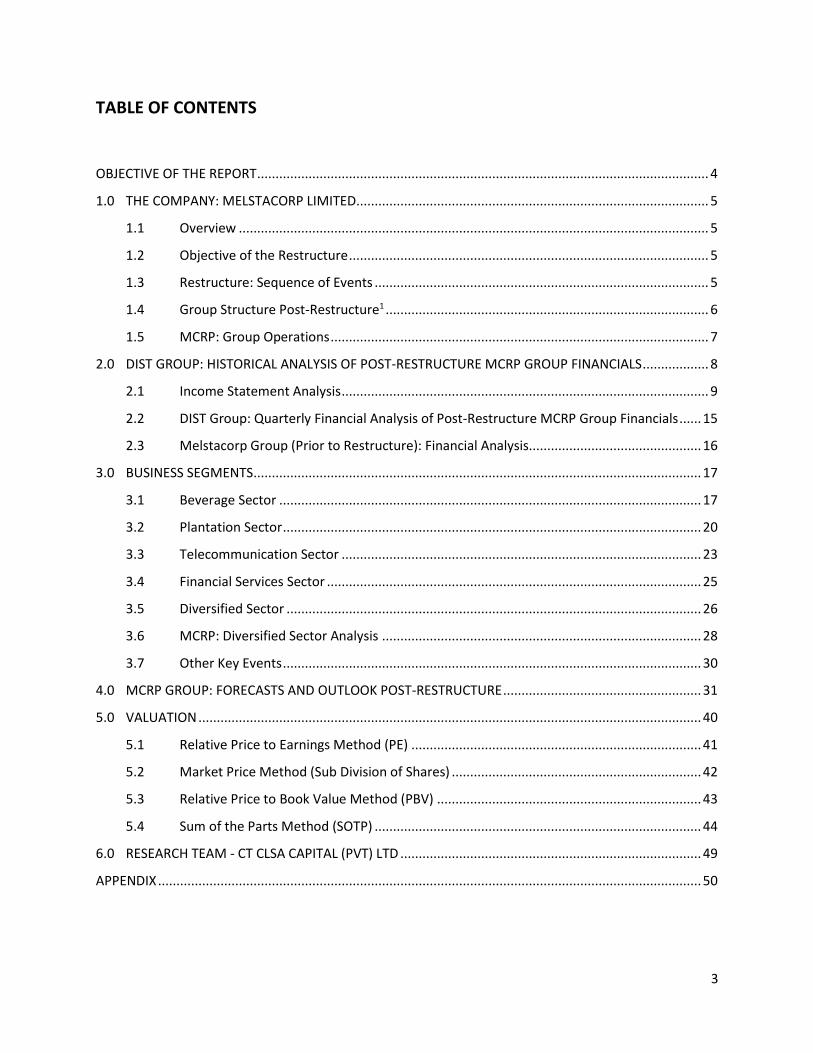
Table of Contents OBJECTIVE OF THE REPORT ........................................................................................................................... 4
1.0 THE COMPANY: MELSTACORP LIMITED................................................................................................ 5
1.1 Overview ................................................................................................................................ 5
1.2 Objective of the Restructure .................................................................................................. 5
1.3 Restructure: Sequence of Events ........................................................................................... 5
1.4 Group Structure Post-Restructure1 ........................................................................................ 6
1.5 MCRP: Group Operations ....................................................................................................... 7
2.0 DIST GROUP: HISTORICAL ANALYSIS OF POST-RESTRUCTURE MCRP GROUP FINANCIALS .................. 8
2.1 Income Statement Analysis .................................................................................................... 9
2.2 DIST Group: Quarterly Financial Analysis of Post-Restructure MCRP Group Financials ...... 15
2.3 Melstacorp Group (Prior to Restructure): Financial Analysis............................................... 16
3.0 BUSINESS SEGMENTS .......................................................................................................................... 17
3.1 Beverage Sector ................................................................................................................... 17
3.2 Plantation Sector .................................................................................................................. 20
3.3 Telecommunication Sector .................................................................................................. 23
3.4 Financial Services Sector ...................................................................................................... 25
3.5 Diversified Sector ................................................................................................................. 26
3.6 MCRP: Diversified Sector Analysis ....................................................................................... 28
3.7 Other Key Events .................................................................................................................. 30
4.0 MCRP GROUP: FORECASTS AND OUTLOOK POST-RESTRUCTURE ...................................................... 31
5.0 VALUATION ......................................................................................................................................... 40
5.1 Relative Price to Earnings Method (PE) ............................................................................... 41
5.2 Market Price Method (Sub Division of Shares) .................................................................... 42
5.3 Relative Price to Book Value Method (PBV) ........................................................................ 43
5.4 Sum of the Parts Method (SOTP) ......................................................................................... 44
6.0 RESEARCH TEAM - CT CLSA CAPITAL (PVT) LTD .................................................................................. 49
APPENDIX .................................................................................................................................................... 50

4
OBJECTIVE OF THE REPORT
The Distilleries Company of Sri Lanka PLC (DIST) made an announcement on 01st August 2016 of an Arrangement in
terms of Section X of the Companies Act No. 7 of 2007 to restructure the Group, making Melstacorp Limited (MCRP),
which is currently a 100% subsidiary of DIST, the parent company of the DIST Group. As such, DIST shares would be
suspended from trading from 30th September 2016. Shareholders of DIST Group as at 30th September 2016 will be
issued 1,200 Mn shares in MCRP in a ratio of 4:1 (4 shares of MCRP for each share in DIST) and 100% ownership of
DIST will be transferred to MCRP. Subsequently, it is proposed for MCRP to list 1,165 Mn shares on the Colombo
Stock Exchange (CSE) via an introduction. In this regard, the objective of this research report is to derive a Reference
Price for the introduction of MCRP in terms of Section 3.4.8 of the Listing Rules of the CSE.

5
1.0 THE COMPANY: MELSTACORP LIMITED
1.1 Overview
Melstacorp Limited (MCRP) is a diversified conglomerate domiciled in Sri Lanka with its business interests spanning
Beverage, Plantations, Telecommunication, Financial Services and Other Diversified Sectors. The Distilleries
Company of Sri Lanka PLC (DIST Alcohol Company), market leader in the hard alcohol segment in the country,
Balangoda Plantations PLC (BPL) and Browns Beach Hotel PLC (BBH) are subsidiaries of the MCRP Group, and are all
listed on the Colombo Stock Exchange (CSE). Furthermore, CSE listed conglomerate Aitken Spence PLC (SPEN) and
Madulsima Plantations PLC (MADU) are associate companies of MCRP. The Group employs a staff cadre of
approximately 12,700.
1.2 Objective of the Restructure
The Distilleries Company of Sri Lanka PLC (DIST Group) commenced operations as a distiller, manufacturer and
distributor of liquor products. Although it diversified its operations across a range of sectors over the years and as
such has changed its nature of business, the name of the holding company remained unchanged. With the
introduction of National Authority on Tobacco and Alcohol Act No. 27 of 2006 (NATA), using DIST as a corporate
brand name was made illegal. Branding for the Group came at a significant cost due to the need to market each
brand name independently. As a result, the DIST Group has decided to rebrand the Group under a common brand,
namely ‘MELSTA’. Furthermore, management believes that through the restructure, there would be a value
unlocking for DIST Company as a stand-alone listed entity by offering more visibility to the legacy beverage business.
1.3 Restructure: Sequence of Events
As part of the restructure process, Melstacorp Limited (MCRP), which is a fully owned subsidiary of DIST Group, will
become the ultimate parent of the Group through an Arrangement as per Part X of the Companies Act No. 7 of 2007.
As a result, DIST Alcohol Company would become a subsidiary of MCRP focusing purely on the legacy beverage
business.
The sequence of events for the Arrangement is as follows:
MCRP settling a sum of LKR 1,816,079,400 owing to DIST (out of an intercompany balance of
LKR 1,816,079,570) through the issue of 10,089,330 shares of MCRP to DIST at an issue price of LKR 180 per
share, representing the book value of MRCP at the time, which the Board of MCRP perceives is fair and
reasonable to MCRP and its sole shareholder, DIST
MCRP to issue 138,128,726 shares to DIST at an issue price of LKR 180 per share for a total consideration of
LKR 24,863,170,680. DIST to issue Promissory Notes to MCRP for the total consideration (Promissory Notes
will carry interest rate at the six months AWPLR of Licensed Commercial Banks of Sri Lanka plus 100bps)
Prior to the above, DIST held 265,450,000 shares in MCRP and post the issue of 148,218,056 shares
mentioned above, DIST would own a total of 413,668,056 shares of MCRP. These shares were consolidated
into 1,000 ordinary shares

6
100% ownership of DIST Company1 to be transferred to MCRP with shareholders of DIST as at 30th
September 2016 being issued shares in MCRP in the ratio of 04 shares of MCRP for every 01 share held in
DIST at a value of LKR 11.75 per share. On 30th September 2016, a total of 1.2 Bn shares of MCRP to be
issued for a total consideration of LKR 14.1 Bn for 300 Mn shares in DIST subsequent to which DIST would
be suspended from trading on CSE
The consolidated 1,000 ordinary shares are converted to 1,000 ordinary non-voting shares
Dissolve the Melstacorp Limited Employees Share Trust and repurchase the MCRP shares to be allotted to
the Trust through the settlement of a loan outstanding from the Trust to MCRP of LKR 1,392,132,049 as at
31st March 2016
Post-acquisition of DIST, MCRP Group would adopt a Common Control Accounting Policy for the said
Business Combination. Hence, goodwill on acquisition will not be recognized in MCRP consolidated financial
statements
MCRP to be the ultimate holding company, with a 100% stake in subsidiary DIST List MCRP on the Colombo Stock Exchange (CSE) through an Introduction of maximum of 1,165,397,072
shares at a price of LKR 69.0
DIST to recommence trading after meeting free float criteria as per the CSE (MCRP shareholders to receive
preferential allotment)
1.4 Group Structure Post-Restructure1
1 162,164 shares of DIST held by sixty four (64) deceased shareholders and three (3) shareholders who continued to hold their shares ‘in locked balance’ (which were excluded from the off-the-floor share transfer until the beneficiaries of the deceased are registered in the Register of DIST/ shares are transferred to the ‘trading balance’) are considered as held in trust for MCRP in consideration of the 648,656 MCRP shares allotted to those shareholders for the transfer of their DIST shares in terms of the ‘Arrangement’ (now held in trust).

7
1.5 MCRP: Group Operations
MCRP Group’s operations currently consist of five primary sectors (prior to restructure), namely:
Beverage (Excl. DIST Alcohol Company)
Plantations Telecommunication Financial Services Diversified
Historically, MCRP Group operations exclude the DIST Alcohol Company, which operates in the legacy alcohol
business. Prior to the restructure, MCRP Group was the only fully owned subsidiary of DIST Group, and held all other
subsidiaries. As such, DIST Group is a combination of DIST Alcohol Company and MCRP Group operations.
Under the restructuring process being carried out, MCRP will become the ultimate holding company of the former
DIST Group, following a share swap. Hence, going forward, MCRP Group will also include the performance of DIST
Alcohol Company. For consistency, this report will analyze the historical Financial Statements for DIST Group, which
is the proforma Financial Statements of MCRP Group (post-restructure).

8
2.0 DIST GROUP: HISTORICAL ANALYSIS OF POST-RESTRUCTURE MCRP
GROUP FINANCIALS
Under the restructuring process being carried out, MCRP will become the ultimate holding company of the former
DIST Group, following a share swap. Hence, going forward, MCRP Group will also include the performance of DIST
Alcohol Company. For consistency, this report will analyze the historical Financial Statements for DIST Group, which
is the proforma Financial Statements of MCRP Group (post-restructure).
The Group operates in the following segments:
Beverage: DIST Alcohol Company and Periceyl (Pvt) Ltd (PCEYL). DIST is market leader in Sri Lanka’s legal
hard alcohol segment and focuses on the manufacture of arrack. PCEYL focuses on the premium alcohol
segment and manufactures foreign liquor brands while also importing well-known premium brands
Plantations: Includes operations of subsidiary, Balangoda Plantations PLC (BPL)
Telecommunication: Focuses on the telecommunication industry through Lanka Bell Ltd, Telecom Frontier
(Pvt) Ltd, Bell Solutions (Pvt) Ltd
Financial Services: Operates in the Insurance and Financial Services businesses through subsidiaries,
Continental Insurance Lanka Ltd and Melsta Regal Finance Limited
Diversified: Includes a range of industries including tourism, hydro power, real estate and media

9
2.1 Income Statement Analysis
(LKR Bn) FY12 FY13 FY14 FY15 FY16
Net Revenue 27.0 28.8 29.0 28.9 33.8
Gross Profit 12.2 12.9 13.8 12.7 13.0
EBIT 8.3 8.0 8.5 8.5 8.4
Profit before Tax 9.0 8.1 9.5 9.7 9.0
Net Profit attributable to Equity Holders 5.5 5.1 6.1 6.6 6.0
Gross Margin 45.3% 44.7% 47.5% 43.9% 38.5%
EBIT Margin 30.7% 27.9% 29.4% 29.3% 25.0%
PBT Margin 33.3% 28.1% 32.8% 33.6% 26.6%
Net Margin 20.5% 17.9% 21.1% 22.7% 17.6%
Segmental Net Revenue Beverages 16.8 19.5 18.9 19.1 24.2
Plantations 2.7 2.8 3.2 3.0 2.4
Telecommunication 4.0 4.0 3.6 3.4 3.3
Financial Services 0.0 0.0 0.0 1.4 2.0
Diversified 3.6 2.5 3.2 2.0 1.9
Segmental Profit before Tax Beverages 6.6 6.3 8.0 8.4 8.4
Plantations 0.1 0.1 0.1 -0.1 -0.4
Telecommunication 0.1 -0.2 -0.6 -0.7 -0.6
Financial Services 0.0 0.0 0.0 0.2 0.2
Diversified 0.8 0.5 0.5 0.5 0.7
Segmental PBT Margins Beverages 39.6% 32.6% 42.4% 43.9% 34.7%
Plantations 4.4% 4.0% 4.1% -3.5% -17.8%
Telecommunication 2.4% -3.8% -17.6% -20.5% -19.5%
Financial Services n/a n/a n/a 13.0% 11.5%
Diversified 21.3% 19.1% 16.5% 28.2% 36.4%

10
2.1.1 Revenue
DIST Group reported gross revenue of LKR 88.9 Bn in FY16, increasing 33.1% YoY and at a CAGR of 8.9% over the
period FY12-16. The Beverage sector constitutes majority of the Group’s net revenues, generating 71.5% of revenue
in FY16 and an average of 66.6% over FY12-16. Telecommunication was the second largest contributor to revenue,
accounting for 9.7% (average of 11.7% over FY12-16). Plantation, Financial Services and Diversified sectors
accounted for 7.1%, 6.0% and 5.6% of revenue in FY16, respectively. Revenue growth in FY16 was largely due to
higher volumes and increased prices in the Beverage sector. Despite a slowdown during 4QFY16 due to the excise
duty led price revisions, alcohol sales volumes recorded significant growth largely owing to cracking down of the
illicit un invoiced / tax unpaid local liquor segment under the current political regime and higher consumer
disposable income.
2.1.2 Gross Profit
Group gross profit for FY16 amounted to
LKR 13.0 Bn, implying a margin of 38.5%
(vs. margin of 43.9% in the prior year). The
declining trend of gross margins since a
high of 47.5% in FY14 was due to the Value
Added Tax (VAT) and Nation Building Tax
(NBT) being consolidated with excise
duties for the Alcohol Beverage sector in
October 2014. Prior to the amendment of
the tax regulation, Group gross profit
margins ranged between 44-48%.
30%
35%
40%
45%
50%
0
4
8
12
16
FY12 FY13 FY14 FY15 FY16
LKR
Bn
Gross Profit
Gross Profit Gross Margin (%) - RHS
Source: Company Financials
62%10%
15%
0%13%
72%
7%
10%
6%6%
Revenue Composition
Beverages
Plantations
Telecommunication
Financial Services
Diversified
FY12
FY16
Source: Company Financials
-5%
0%
5%
10%
15%
20%
0
5
10
15
20
25
30
35
FY12 FY13 FY14 FY15 FY16
LKR
Bn
Revenue Growth
Total Net Revenue
Growth (%) - RHS
Source: Company Financials

11
2.1.3 Other Operating Income
Meanwhile, DIST Group recorded other income of LKR 1.2 Bn in FY16, down 16.2% YoY due to the previous year
consisting of a refund on telecommunication development charge and a gain from disposal from investments. Other
operating income consists of dividend income from financial assets, gain on disposals and rent income. Other
operating income declined at a CAGR of 8.6% over the period FY12-16, while it averaged 4.3% of net revenue during
the same period.
2.1.4 Operating Expenses
Administration Expenses for the Group declined 6.0% YoY to LKR 3.6 Bn in FY16, while it grew at a CAGR of 3.2% over
the period FY12-16. The decline in FY16 was primarily owing to the cost reduction efforts taken by management in
order to reduce the losses incurred by the Telecommunication sector. Increasing 3.0% YoY, distribution expenses
amounted to LKR 1.8 Bn for FY16 and were 5.2% of net revenue, below the 5-year average of 6.2%. Other operating
expenses of LKR 350.5 Mn in FY16 increased significantly from that of the previous year due to impairment of loans
and advances and a loss on revaluation of property, plant and equipment.
2.1.5 EBIT
LKR Bn FY12 FY13 FY14 FY15 FY16
Reported EBIT 8.3 8.0 8.5 8.5 8.4
Reported EBIT Margin 30.7% 27.9% 29.4% 29.3% 25.0%
Non-Recurring Expenses
Loss on disposal of subsidiaries
-
-
0.6
-
- Loss on disposal of equity accounted investee
-
-
0.1
-
-
Impairment of Goodwill
-
0.8
-
-
-
Recurring EBIT 8.3 8.8 9.3 8.5 8.4
Recurring EBIT Margin 30.7% 30.6% 31.9% 29.3% 25.0%
Consequently, DIST Group EBIT amounted to LKR 8.4 Bn in FY16 marginally declining from that of the prior year. EBIT
margins declined to 25.0% in FY16 from 29.3% in FY15, largely due to the impact of lower gross margins. During the
period FY12-16, DIST Group recorded non-recurring expenses such as loss on disposal of subsidiaries and associates
and impairment of goodwill in FY13-14. The disposal was related to the de-recognition of Pelwatte Sugar Industries
PLC following the enactment of Underperforming Enterprises and Underutilized Assets Bill by the Government of Sri
Lanka.
2.1.6 Net Finance Cost
Refer Section 2.1.9 Balance Sheet Analysis

12
2.1.7 Share of Profit from Equity Accounted Investees
The share of profit from equity accounted investees amounted to LKR 0.7 Bn, down 46.2% YoY. The reasons for the
decline in profits are lower profits from Aitken Spence (SPEN) (lack of contribution from the 74% owned 100MW
thermal power plant, Ace Power Embilipitiya) and the widening loss of MADU. DIST’s share of profit during the year
from SPEN amounted to LKR 0.9 Bn declining from LKR 1.5 Bn in the previous year. Furthermore, the loss from MADU
widened to LKR 0.1 Bn.
2.1.8 Net Profit
Effective tax rate of 37.0% for the
year was above the 33.5%
recorded in FY15 and also
exceeded the four year average of
33.8%. The higher effective tax
rate was owing to the higher
contribution to PBT from the
Beverage sector, which is taxed at
a higher rate.
Consequently, DIST’s net profit
attributable to equity holders of
LKR 6.0 Bn in FY16 was down 9.0%
YoY and resulted in a net margin of
17.6%, approximately 500 bps below that of FY15. This implied an earnings per share of LKR 19.88 in FY16, declining
from LKR 21.84 in the previous year.
FY12 FY13 FY14 FY15 FY16
Recurring NP Margin 20.5% 20.6% 23.6% 22.7% 17.6%
Reported NP Margin 20.5% 17.9% 21.1% 22.7% 17.6%
Meanwhile, the Group’s shareholders’ funds for FY16 were LKR 63.2 Bn, leading to a return on equity of 9.6% for the
year on a recurring basis. During FY13-16, the Group’s recurring ROE averaged 11.9%.
FY12 FY13 FY14 FY15 FY16
Recurring Net Profit Attributable to Equity Holders 5.5 5.9 6.8 6.6 6.0
Shareholders' Funds 41.6 48.0 53.6 61.0 63.2
Recurring ROE (%) 13.2% 13.5% 11.4% 9.6%
Reported Net Profit Attributable to Equity Holders 5.5 5.1 6.1 6.6 6.0
ROE (%) 11.5% 12.0% 11.4% 9.6%
Group dividend per share was LKR 3.35 in FY16, implying a dividend payout ratio of 16.9%, above a 5-year average
of 16.3%.
FY12 FY13 FY14 FY15 FY16
Dividend per Share (LKR) 3.00 3.00 3.25 3.25 3.35
Dividend Payout (%) 16.3% 17.5% 15.9% 14.9% 16.9%
0%
7%
14%
21%
28%
35%
0
2
4
6
8
10
FY13 FY14 FY15 FY16
LKR
Bn
EBIT and Net ProfitRecurring EBIT Recurring Net Profit to Equity Holders
EBIT Margin (%) - RHS Net Profit Margin (%) - RHS
Source: Company Financials

13
2.1.9 Balance Sheet Analysis
MCRP Group reported Property, Plant and
Equipment (PPE) of LKR 22.3 Bn as at 31st
March 2016, increasing from LKR 18.5 Bn in
the previous year. Intangible Assets and
Investment Property for FY16 totaled LKR 3.7
Bn increasing from LKR 3.3 Bn in FY15. Capex
of LKR 3.7 Bn was 11.0% of net revenue in
FY16, declining from 35.5% in FY15. FY15
capex included the investment in a new plant
for DIST, in order to improve efficiencies. The
new plant-related capex totaled
approximately LKR 5.0 Bn over a period of 3
years. Over the period FY12-16, capex as a
percentage of revenue averaged at 16.1%. Depreciation and Amortization for FY16 amounted to LKR 2.4 Bn
increasing from LKR 1.5 Bn in FY15.
Working Capital (Days) FY12 FY13 FY14 FY15 FY16
Inventory 143 141 106 112 105
Trade and Other Receivables 111 99 122 127 122
Trade and Other Payables 282 257 210 230 210
Working Capital Cycle -28 -17 18 10 17
The Group reported inventory of LKR 6.0 Bn, while trade receivables and payables amounted to LKR 11.3 Bn and LKR
12.0 Bn, respectively. Inventory amounted to 28.9% of cost of sales, slightly below that of the previous year.
Meanwhile, trade receivables as a percentage of revenue amounted to 33.3%, down from 34.9% in FY15. Trade and
other payables as a percentage of cost of sales amounted to 57.6%, declining from 62.9% in the previous year as the
increased excise duty resulted in higher costs.
The working capital cycle for the period ending 31st March 2016 was 17 days, increasing from 10 days in FY15. During
the years FY12-13, the Group had a negative cash cycle while on average it has maintained a cash conversion cycle
of 15 days over the period FY14-16.
FY12 FY13 FY14 FY15 FY16
Total Debt 2.6 11.2 13.4 13.8 14.5
YoY Growth (%) 322.5% 20.1% 3.3% 5.0%
Debt to Equity (x) 0.06 0.23 0.25 0.23 0.23
Finance Income 0.7 0.7 0.6 0.4
Finance Cost (0.7) (2.0) (1.2) (0.7) (0.6)
Effective Finance Cost (%) 28.5% 9.9% 5.2% 4.3%
The Group’s balance sheet strength is reflected in its relatively low gearing levels, with a low debt to equity of 0.23x
in FY16 and a 5 year average of 0.20x. Total debt for FY16 amounted to LKR 14.5 Bn, increasing 5.0% YoY. Majority
0%
8%
16%
24%
32%
40%
0
2
4
6
8
10
12
FY12 FY13 FY14 FY15 FY16
LKR
Bn
Capex and Depreciation
CapexDepreciation & Amortization (Excl. Biological Assets)Capex as a % of Net Revenue
Source: Company Financials

14
of debt for the Group is in the form of short term borrowings and bank overdrafts (80.5% of total debt in FY16).
Excluding short term debt the Group’s debt to equity ratio would be even lower averaging 0.03x over the 5 year
period FY12-16. Finance cost for FY16 amounted to LKR 0.6 Bn, declining from LKR 0.7 Bn in the previous year.
Meanwhile, finance income declined 28.9% YoY to LKR 0.4 Bn. The effective finance cost for the year of 4.3% is below
5.2% recorded in FY15.

15
2.2 DIST Group: Quarterly Financial Analysis of Post-Restructure MCRP Group Financials
Quarterly Performance (LKR Bn) 1QFY16 1QFY17 YoY Growth
Net Revenue 7.6 9.3 23.3%
Gross Profit 3.3 4.0 21.3%
EBIT 2.2 2.8 29.9%
Profit before Tax 2.4 2.8 16.3%
Net Profit Attributable to Equity Holders 1.8 1.9 9.5%
EPS (LKR) 5.85 6.41 9.5%
Gross Profit Margin (%) 43.7% 43.0%
EBIT Margin (%) 28.8% 30.3%
Net Profit Margin (%) 23.2% 20.6%
DIST Group reported net revenue of LKR 9.3 Bn in 1QFY17, recording 23.3% YoY growth (-0.5% QoQ). Revenue
growth from 1QFY16 was largely owing to growth in the Beverage sector, which remained the largest contributor to
net revenue during the quarter (74.1% of net turnover). Group gross profit also increased at a significant 21.3% YoY
to LKR 4.0 Bn (+26.6% QoQ). However, gross margins declined from 43.7% in 1QFY16 to 43.0% in 1QFY17, as the
Group was affected by higher margins being provided to retailers by the Beverage sector and low tea and rubber
prices affecting the Plantation sector.
Administration Expenses amounted to LKR 1.0 Bn in FY16 up 12.2% YoY while distribution expenses were LKR 0.5 up
4.7% YoY. Other operating expenses were LKR 0.2 Bn for the year. Total operating expenses for the quarter thus
amounted to LKR 1.5 Bn, increasing from LKR 1.3 Bn in the previous year. Operating expenses as a percentage of net
revenue was 15.8% in 1QFY17 declining from 17.7% in 1QFY16. Consequently, the Group recorded 1QFY17 EBIT of
LKR 2.8 Bn, which implies a margin of 30.3%, an expansion of 150 bps from that of 1QFY16. Net finance cost
amounted to LKR 0.1 Bn in 1QFY17 against a net finance income of LKR 0.1 Bn in the previous year’s quarter. The
Group reported total debt of LKR 12.3 Bn in 1QFY17, declining slightly from the prior year quarter and as such debt
to equity for the quarter of 0.19x was broadly in line with that reported in 1QFY16. Meanwhile, share of profit from
equity accounted investees amounted to LKR 0.1 Bn, declining from the previous year mainly due to the decline in
the tourism sector. Effective tax for the quarter increased to 36.6% from 31.5% in 1QFY16. Net profit attributable to
equity holders grew 9.5% YoY to LKR 1.9 Bn in 1QFY17, implying a net margin of 20.6%. Reported EPS was LKR 6.41.

16
2.3 Melstacorp Group (Prior to Restructure): Financial Analysis
Melstacorp as a stand-alone company is an investment holding company which generates income through rent and
investment returns through its diversified portfolio of quoted and unquoted equity investments, corporate debt
securities, sovereign debt instruments and investment property. This section of the research report analyzes the
Melstacorp Group (prior to restructure), which excludes operations of DIST Alcohol Company.
Melstacorp Group, which was historically a fully owned subsidiary of DIST Group, held stakes in the following
companies:
Periceyl (Pvt) Ltd
Balangoda Plantations PLC
Bell Solutions (Pvt) Ltd
Lanka Bell Ltd
Telecom Frontier (Pvt) Ltd
Continental Insurance Lanka Limited
Melsta Regal Finance Ltd
Melsta Logistics (Pvt) Ltd
Timpex Ltd
Bellvantage (Pvt) Ltd
Bogo Power (Pvt) Ltd
Browns Beach Hotel PLC
Milford Holdings (Pvt) Ltd
Splendor Media (Pvt) Ltd
Texpro Industries Ltd
Melsta Properties (Pvt) Ltd
Melsta Technology (Pvt) Limited
Melsta Tower (Pvt) Limited
Prior to the restructure, MCRP Group recorded total net revenue of LKR 13.0 Bn in FY16, up 3.7% YoY. The largest
contributor to net revenue in FY16 was the Telecommunication Sector followed by Beverage and Diversified sectors
contributing 25.3%, 20.5% and 19.7% to revenue, respectively. The Group reported gross profit of LKR 4.3 Bn in FY16,
below that of FY15, and as such saw its gross margins decline by 150 bps to 33.0% primarily owing to weakness in
the Plantation sector. Consequently, EBIT for the Group also declined to LKR 1.3 Bn, down 4.8% YoY. On a segmental
basis, the Diversified sector generated profit before tax of LKR 1.2 Bn in FY16 while the Beverage sector earned LKR
1.0 Bn. Both Telecommunication and Plantation sectors however, reported a loss before tax. Net profit attributable
to equity-holders declined 22.8% YoY to LKR 2.0 Bn in FY16 resulting in the net margin narrowing to 15.1% from
20.3% in the prior year.

17
3.0 BUSINESS SEGMENTS
3.1 Beverage Sector
The Beverage sector comprises operations across
two companies, DIST Alcohol Company and
Periceyl (Pvt) Ltd (PCEYL) and is the largest
revenue generating segment for the Group (71.5%
of total Group net revenue in FY16).
The origin of DIST traces back to 1913, with the commencement of distillation and manufacture of liquor products
by the Excise Department of Ceylon. The State Distilleries Corporation which was incorporated to take over the
operations was converted to a limited company, and privatized in 1992 with the acquisition by the Stassens Group
of Companies.
DIST Company markets a wide range of products including, Old Arrack, Coconut Arrack, Double Distilled Arrack,
V.S.O.A and Extra Special. Meanwhile, PCEYL’s key brands include Periceyl Black Opal, Franklin and Galerie. The price
range for several key brands of DIST Co. and PCEYL are highlighted below.
Prices of Key Brands of DIST Company and PCEYL per 750ml bottle
DIST Company Rs.* PCEYL Rs.*
Extra Special 1,200 Periceyl Lemon Arrack 1,320
Special Arrack 1,080 Flinton London Dry Gin 1,650
White Label Arrack 1,250 Franklin Brandy 1,630
Old Arrack 1,400 Petroff Vodka 1,700
V.S.O.A Premium 1,500 Balmora Rum 1,670
D.D.A 1,500 House of Tilbury Whisky 2,000
Sri Lanka Arrack 1,700 Galerie Brandy 1,950
Source: CT CLSA * w.e.f 23 Nov 2015

18
DIST Company has continued to maintain its position as market leader in the industry over the years. In terms of
Coconut and Processed Arrack, the Beverage sector accounted for 70.3% market share in 2014, while in the Total
Arrack market the sector had a market share of 71.7%.
One of the primary reasons for the decline in DIST Company market share is the increasing presence of cheap illicit
alcohol. However, the current political regime has taken a firm stance on the illicit local liquor segment in Sri Lanka,
particularly of un-invoiced and tax unpaid products, which liberally entered the market at significantly lower prices.
In FY16, the Beverage sector paid 69.4% of its gross revenue as direct turnover related taxes, up from 66.4% in the
previous year. The direct turnover related taxes for FY16 amounted to LKR 55.0 Bn, increasing from LKR 37.8 Bn in
the previous year. The industry faces another challenge due to the prohibition of advertising and promoting alcoholic
brands (NATA Act).
Meanwhile, the increasing taxes on hard alcohol over the recent years has also affected performance. The hard
liquor market continued to decline, and with it the market for DIST Alcohol Company, primarily due to the impact of
substitution, resulting from strong beer (above 5% alcohol content) being priced relatively lower. In November 2015
however, the GoSL increased the duty on strong beer, thus ending the comparative advantage of purchasing cheaper
strong beer versus more expensive hard liquor. Given these challenges, the beverage sector has continued to lose
market share from 80.5% in 2012 to 71.7% in 2014.
Tax Structure on Alcohol Beverages
Segment 2011 2012 2013 2014 2015
Jan Oct Mar Oct Jul Oct Oct* Oct Nov
Beer - Alcohol % < 5% (LKR / Ltr) 80 85 90 100 110 120 150 190 190
Beer - Alcohol % >/=5% (LKR / Ltr) 96 101 106 116 130 145 185 245 315
Molasses & Arrack (LKR / Proof Ltr) 863 923 983 1,043 1,120 1,210 1,485 1,595 1,850
Foreign Liquor (LKR / Proof Ltr) 1,003 1,063 1,123 1,183 1,250 1,370 1,700 1,860 2,030
As a result of the differing tax structure for hard liquor and malt beer (prior to the amendment in November 2015),
there has been a shift in production of liquor. The chart below indicates that production of hard liquor has continued
to decline while production of malt liquor (beer) has been on an upward trajectory. Over the period 2010-2014, hard
liquor production declined at a CAGR of 2.7%, while malt liquor production grew at a CAGR of 15.0%.
0
20
40
60
80
100
120
140
2008 2009 2010 2011 2012 2013 2014
Liquor Production
Hard Liquor (Proof Litres Mn) Malt Liquor (Beer) (Bulk Liters Mn)
Source: Excise Department
Source: Excise Department of Sri Lanka
* Consolidation of Duties

19
The segment earned net revenue of LKR 24.2
Bn in FY16, up 26.4% YoY primarily driven by
higher volumes (+11.8%) and increased
prices (+13.1%). Volume growth was largely
owing to the cracking down of the illicit local
liquor segment in Sri Lanka, while higher
disposable income also supported the
recovery. Revenue growth was however,
slightly hampered by the sharp excise duty
led price revisions. Volume growth in proof
liters declined 14.7% and 9.2% in FY14 and
FY15 against a growth in net revenue per
proof liter of 14.1% and 11.4% in the same
periods, respectively.
Despite significant revenue growth however, the
segment’s profit before tax declined marginally to
LKR 8.4 Bn in FY16 due to the adverse impact of
exchange rate movements and raw material price
increases. The average exchange rate for LKR
against the USD declined approximately 6% in
FY16, thus resulting in import of raw materials
being more expensive. Given that majority of the
sector’s ethanol requirement is imported
(approximately 70% of cost of sales), a depreciating
rupee has a negative impact on sector
performance.
Furthermore, import duties on ethanol were raised in 2015, while global sugar and ethanol prices also increased,
which also had a negative impact on sector performance. given that sugarcane is a primary raw material in the
production of ethanol, sugar prices broadly track ethanol prices.
Earnings were also impacted by the end of PCEYL’s partnership with Pernod Ricard, for distribution of imported
brands.
The sector recorded strong financial performance in 1QFY17. Net revenue from Beverages increased 30.1% YoY to
LKR 6.9 Bn during the quarter while profit before tax recorded growth of 30.3% YoY to LKR 2.8 Bn. Revenue growth
was largely due to higher volumes and product prices. PBT margins remained broadly flat during the quarter at
39.9%. On a QoQ basis, revenue growth was 1.2% while profit before tax grew 12.3%.
In FY16, DIST Alcohol Company recorded net revenue of LKR 21.5 Bn increasing 27.3% YoY driven by higher volumes
as well as prices. Gross profit for the year amounted to LKR 9.2 Bn implying a gross margin of 42.8%, decreasing from
52.2% primarily owing to the consolidation of VAT and NBT with excise duties. Margins were further hampered by
increasing competition and the resulting higher margins provided to retailers. During 1QFY17, DIST Alcohol Company
recorded net revenue of LKR 6.2 Bn increasing 31.8% YoY. Gross profit during the quarter amounted to LKR 2.9 Bn,
implying a gross margin of 46.4%, down from 47.9% in 1QFY16, given the consolidation of duties and increased
competition.
-10%
-1%
8%
17%
26%
35%
44%
0
5
10
15
20
25
FY12 FY13 FY14 FY15 FY16
LKR
Bn
Beverage - Revenue
Revenue YoY Growth (%) - RHS
0%
10%
20%
30%
40%
50%
0
2
3
5
6
8
9
FY12 FY13 FY14 FY15 FY16
LKR
Bn
Beverage - Profit before Tax
Profit before Tax PBT Margin (%) - RHS
Source: Company Financials
-20.0%
-10.0%
0.0%
10.0%
20.0%
FY14 FY15 FY16
Beverage Sector: Net Revenue per Proof Liter and Volume Growth
Volume Growth (Proof Liters) (%)
Growth in Net Revenue per Proof Liter (%)
Source: Company Financials

20
3.2 Plantation Sector
MCRP’s exposure to the Plantation sector stems from its subsidiary (effective stake of
43.2%), Balangoda Plantations PLC (BPL), which primarily focuses on the cultivation and
processing of tea and rubber. The Group is also exposed to the Plantation industry through
its associate, Madulsima Plantations PLC (MADU), of which it has an effective stake of
45.9%. The Plantation sector of the Group includes the performance of BPL, while the
performance of MADU is recorded under share of associate profits.
The Plantation sector earned net revenue of LKR
2.4 Bn in FY16 (accounted for 7.1% of Group net
revenue) declining significantly due to weak
demand for tea from export destinations such as
Russia, Ukraine, Turkey and the Middle East
combined with the impact of low prices. Revenue
from rubber plantations also declined owing to the
unfavorable weather conditions that persisted and
continued global weakness. The sector generated a
net loss before tax of LKR 0.4 Bn in FY16, increasing
from a loss of LKR 0.1 Bn in the previous year. The
Group’s Plantation sector, similar to the industry at
large, was affected by continued labour issues and trade action for wage increases. A ‘go-slow’ was launched by
estate workers in July 2015, demanding a wage hike which had an adverse impact on the sector’s performance.
Furthermore, the withdrawal of the fertilizer subsidy and the ban of certain chemicals being used have also affected
the industry at large. However, BPL continued its replanting strategy, where unproductive tea areas were diversified
into rubber, while new planting was also conducted in Balangoda and Badulla.
The sector generated revenue of LKR 0.6 Bn during 1QFY17 increasing 5.9% YoY, while the loss before tax narrowed
to LKR 35.3 Mn from LKR 102.4 Mn in the same quarter of the previous year. Improvement in sector financial
performance was largely owing to a recovery in tea prices fetched at the auctions. On a QoQ basis, revenue increased
5.2% while the loss before tax declined.
BPL was incorporated in 1992 and was listed on the CSE in 1998. The company has 06 tea estates, 12 tea cum rubber
estates and 04 rubber estates. In 2015, approximately 90% of its total crop was tea, while the remaining 10%
comprised rubber. BPL’s tea crop (primarily in Uva Medium and Low elevations) declined 6.4%, down for the second
consecutive year in 2015, while rubber crop grew 13.9% YoY.
-40%
-20%
0%
20%
0
1
2
3
4
FY12 FY13 FY14 FY15 FY16
LKR
Bn
Plantation - Revenue
Revenue YoY Growth (%) - RHS
Source: Company Financials
-20%
-15%
-10%
-5%
0%
5%
10%
-500
-400
-300
-200
-100
0
100
200
FY12 FY13 FY14 FY15 FY16
LKR
'00
0s
Plantation - Profit before TaxProfit before Tax PBT Margin (%) - RHS
Source: Company Financials

21
BPL’s National Sales Average (NSA) for tea declined 15.2% YoY while the NSA for rubber declined 16.4% YoY in FY16.
Consequently, BPL’s revenue from tea amounted to LKR 2.2 Bn, down 20.6% YoY and rubber revenue declined 4.8%
YoY to LKR 177 Mn during the year. The yield / hectare for tea declined to 867 Kg/Ha in FY16, down from 940 Kg/Ha
in the previous year. The rubber sector was adversely affected by the continued decline in global demand and large
stock piles accumulated in major consuming countries. The rubber yield / hectare however increased to 647 Kg / Ha
from 577 Kg / Ha in the previous year.
Tea Industry
Tea production continued to decline in 2015, for the second consecutive year, primarily due to supply side factors
such as unfavorable weather conditions and labour issues. The sector’s concerns were however further exacerbated
by lower demand from major export destinations owing to declining oil prices (Middle East) and geo-political
uncertainties (Russia and Ukraine). Lower demand led to the declining trend in tea prices to continue in 2015.
Production declined 2.7% YoY in 2016 continuing a downward trajectory for the second consecutive year. In 2015,
the average NSA for tea in Sri Lanka declined 11.8% YoY to LKR 387.6 per kg. However, prices started increasing
towards the end of 2015. By September 2016, prices increased to LKR 499.1 per kg, up 36.3% YoY. Sri Lanka is also
expected to benefit from the removal of economic sanctions on Iran, which is one of the country’s major export
-
50
100
150
200
250
2012 2013 2014 2015
Mn
Kg
Tea Crop Output in Sri Lanka
High Medium Low
Source: Sri Lanka Tea Board
0
100
200
300
400
500
600
2012 2013 2014 2015 2016 YTMAugust
LKR
/ K
g
National Sales Average by Elevation
Low Medium High
Source: Sri Lanka Tea Board
-
100
200
300
400
500
600
-
500
1,000
1,500
2,000
2,500
3,000
3,500
FY12 FY13 FY14 FY15 FY16
LKR
/ K
g
LKR
Mn
BPL: Tea vs. Rubber
Tea Revenue Rubber Revenue
Tea NSA - RHS Rubber NSA - RHS
Source: BPL
500
600
700
800
900
1,000
0.0
1.0
2.0
3.0
4.0
5.0
6.0
7.0
8.0
FY12 FY13 FY14 FY15 FY16
Kg
/ h
a
Mn
Kg
Cropwise BreakdownTotal Tea Crop Total Rubber Crop
Tea - Yield kg/ha Rubber - Yield kg/ha
Source: BPLL

22
destinations for tea. Although tea prices showed signs of recovery in 1QFY16, the outlook still remains relatively
bleak on the back of a global economic slowdown coupled with political unrest in the Middle East and Russia.
Rubber Industry
Natural rubber production declined 10.1% YoY to 88.6
MT ‘000s in 2015, continuing the downtrend
experienced since 2012, as smallholders slowed their
tapping operations in response to lower rubber
prices, globally. The industry was further affected by
adverse weather conditions and the high cost of
production, poor management of the fields and over
aged trees. Sri Lankan rubber prices (average of Latex
Crepe No. 1X, RSS1 and Brown Crepe 1X) was down
4.3% YoY to LKR 245.1 per Kg. Prices have continued
to decline following the trend of international rubber
price decline. The downtrend is due to the primary
substitute, synthetic rubber prices also being low due
to its positive correlation with crude oil prices.
180
270
360
450
0
40
80
120
160
2012 2013 2014 2015LK
R /
Kg
MT
'00
0s
Rubber Production and NSA in Sri Lanka
Natural Rubber Production
Average Rubber NSA
Source: Rubber Development Department of Sri Lanka

23
3.3 Telecommunication Sector
The Group’s telecommunication sector
consists of Lanka Bell (LBL), Bell Solutions
and Telecom Frontier. Lanka Bell is the
pioneer of fixed wireless telephony who
introduced CDMA technology to Sri Lanka
and currently provides a range of telecommunication services to corporate and residential customers. The Sri Lankan
telecommunication industry consists of two operators with the ability to offer mobile, fixed, data & television. LBL
has clearance to offer just one or two of the services. The Company also introduced Bell4G home broadband services
via 4G Long Term Evolution (LTE) technology. LBL has a subscriber base of approximately 0.9 Mn subscribers.
The sector generated LKR 3.3 Bn in FY16 (accounted for 9.7% of Group net revenue) while it recorded a net loss
before tax of LKR 0.6 Bn, which narrowed from a loss of LKR 0.7 Bn in the previous year. The primary reason for the
consistent net losses incurred by the sector is the significant depreciation costs, although management stated LBL is
EBITDA positive with a positive operating Cashflow. The sector recorded revenue of LKR 0.8 Bn during the quarter
declining from that of the prior year, while the loss before tax increased to LKR 0.3 Bn. On a QoQ basis, revenues
declined 2.3%.
The Sri Lankan telecommunications industry is dominated by
mobile services, which accounted for over 90% of the market,
while fixed access services accounted for less than 10%. In
2015, the number of fixed lines declined 4.0% YoY to 2.6 Mn
as a decline in wireless services offset a marginal increase in
wireline services. Cellular phone connections however, have
increased at a CAGR of 7.1% over the period 2010-2015 to
reach 24.4 Mn connections by 2015.
0
9,000
18,000
27,000
2010 2011 2012 2013 2014 2015
No
.
Fixed Services Vs. Mobile Services in Sri Lanka
Fixed Access Services ('000) Cellular Phones ('000)
Source: Central Bank of Sri Lanka
-14%
0%
14%
0
1
2
3
4
FY12 FY13 FY14 FY15 FY16
LKR
Bn
Telecommunication - Revenue
Revenue YoY Growth (%) - RHS
Source: Company Financials
-25%
-20%
-15%
-10%
-5%
0%
-800
-600
-400
-200
0
200
FY12 FY13 FY14 FY15 FY16
LKR
Mn
Telecommunication - Profit before Tax
Profit before Tax
PBT Margin (%) - RHSSource: Company Financials

24
Moreover, telephone penetration (connections per
100 persons) continued to increase in Sri Lanka
reaching 128.7 in 2015 from 117.0 in 2012 with
growth from cellular phone penetration of 116.3
more than compensating for lower penetration
levels of fixed lines of 12.4. Internet penetration in
Sri Lanka also has continued to grow reaching 19.5%
in 2015 from 6.7% in 2012. Primarily driven by higher
demand for high speed internet services in Sri Lanka,
LBL also rolled out 4G/ Long Term Evolution (LTE) to
enhance the services provided to their customers.
0 40 80 120
2012
2013
2014
2015
Telephone Penetration in Sri Lanka
Cellular Fixed
Source: Central Bank of Sri Lanka

25
3.4 Financial Services Sector
The Financial Services sector contributed 6.0% to
Group net revenue in FY16, slightly increasing
from 5.0% contribution in FY15. The Financial
Services sector consists of Continental Insurance
Lanka Limited (CIL), which operates in the general
insurance business, and Melsta Regal Finance Limited (MERF), which focuses on financing, leasing, hire purchasing
and factoring. While historically, these two business lines were segmented under Diversified Sector the Group split
the categorization of CIL and MERF as Financial Services in FY16.
CIL, which operates in the general insurance business, accounts for approximately 4% market share. The industry
has recently been intensely scrutinized by regulatory authorities and several reforms were introduced in an effort
to strengthen the framework and ensure insurance policyholders’ safety and protection. The company’s product
portfolio includes categories such as automobile, home-owners, travel, marine, general accident and property
insurances. CIL has a branch network of 40 and continues to expand its network. CIL was the first insurance company
under 5 years of operations to be rated A- (lka) by Fitch Ratings Lanka.
MERF has a rating of A+ (lka) by Fitch Ratings, and has continued to focus on penetrating the market over the last
four years of operations. The company has seven branches across the island and continues to expand its geographical
footprint. The company hopes to expand its product range to include housing loans and micro leasing products.
The sector generated revenue of LKR 2.0 Bn in FY16, increasing a significant 40.9% YoY from LKR 1.4 Bn in FY15.
Profit before Tax also grew 2.8% YoY in FY16 to LKR 0.2 Bn. Financial Services recorded revenue growth of 44.1% YoY
to reach LKR 0.7 Bn in 1QFY17, although profit before tax remained relatively flat YoY, owing to the significant claims
stemming from the recent floods. On a QoQ basis however, revenues improved 7.6% while the profit before tax
increased a significant 162.8%.
0.0
0.7
1.4
2.1
FY15 FY16
LKR
Bn
Financial Services - Revenue and Profit before Tax
Revenue Profit before Tax
Source: Company Financials

26
3.5 Diversified Sector
DIST’s Diversified sector consists of a range of industries:
Milford Holdings : 98.4% Holdings : An Investment Holding Company
Browns Beach Hotels : 53.9% Holdings : Operates in the Leisure Business
Texpro Industries : 41.8% Holdings : Dyeing and Printing Fabric
Timpex : 51.0% Holdings : An Investment Holding Company
Melsta Logistics : 100.0% Holdings : Automobile Servicing & Logistics
Splendor Media : 100.0% Holdings : Media Buying & Creative Services
Bogo Power : 99.3% Holdings : Hydro Power Generation
Bellvantage : 100.0% Holdings : BPO, KPO & Call Centre Services
Melsta Properties : 100.0% Holdings : Management of Real Estate
Melsta Towers : 100.0% Holdings : Real Estate Company
Melsta Technologies : 100.0% Holdings : Information Technology
The Diversified sector contributed 5.6% to
Group net revenue in FY16, declining from
6.7% in the previous year. The sector
generated revenue of LKR 1.9 Bn in FY16,
declining 2.5% YoY. Despite lower revenue
however, sector earnings before tax
increased 25.9% YoY to LKR 0.7 Bn in FY16
implying a PBT margin of 36.4%. Margins
expanded over 800 bps during the year.
Margin improvement was owing to higher
return on investments, an increase in rent
income and higher profits from Bogo Power.
During 1QFY17 revenue from Diversified Sector declined 3.0% YoY to LKR 0.4 Bn, while profit before tax declined
58.1% YoY to LKR 0.1 Bn. On a QoQ basis, revenues were down 32.3% while a loss before tax in the previous quarter
turned profitable. The weak performance is primarily attributable to the slowdown in equity markets.
0.0
0.5
1.0
1.5
2.0
FY15 FY16
LKR
Bn
Diversified Sector - Revenue and Profit before Tax
Revenue Profit before Tax
Source: Company Financials

27
The hydro power project, Bogo Power however, is likely to have contributed positively to the sector, due to high
rainfall levels. The Group re-launched Browns Beach Hotels PLC as Heritance Negombo in April 2016, in an effort to
capitalize on the booming tourism industry in Sri Lanka. Meanwhile, the Group’s Collision Repair Centre, Melsta
Logistics, expects to continue investing in advanced technology to enhance efficiencies as well as expand its facility.
Owing to increasing competition and lower demand for woven fabric, the Group’s textiles company, Texpro
experienced a marginal decline in revenue.
Bogo Power (Pvt) Ltd. was formed to set up a mini hydro plant in Bogowantalawa. A Power Purchase Agreement has
been entered into with the Ceylon Electricity Board for the sale of electricity generated over a period of 20 years.
The project was commissioned in December 2011, with power capacity of 4 MW and annual energy generated of
15.2 GWH. The Group’s Business Process Outsourcing Company, Bellvantage, is a leading brand in the industry.
Splendor Media meanwhile offers marketing communication solutions to its customers and is currently exploring
new opportunities in the industry.
Within the Diversified Sector, the Group also maintains a large investment portfolio which includes strategic and
non-strategic equity, the market value of which amounted to LKR 18.1 Bn, using Volume Weighted Average Share
Price from 15/08/2016 to 23/09/2016 and the shareholdings as at 30th June 2016 (no materials changes to the
shareholdings have taken place as at 23rd September 2016).
Company Shareholdings
(No.'000) WA Price*
(Rs.) Value
(Rs.'000)
ACL Cables PLC 63 62.22 3,920
Aitken Spence Hotel Holdings PLC 23 51.44 1,188
Bukit Darah PLC 72 282.00 20,360
Carson Cumberbatch PLC 29 206.35 6,067
Ceylon Hospitals PLC - Non Voting 136 81.18 11,033
Commercial Bank of Ceylon PLC 28,295 140.16 3,965,900
Commercial Bank of Ceylon PLC - Non Voting 1 117.32 78
CT Holding PLC 1,476 128.19 189,149
DFCC Bank PLC 17,043 130.61 2,226,034
Free Lanka Capital Holdings PLC 2,851 1.27 3,633
Hatton National Bank PLC 10,179 226.75 2,308,044
Haycarb PLC 74 159.07 11,752
Hemas Holdings PLC 100 100.07 10,007
The Kingsbury Hotel PLC 824 16.24 13,376
John Keells Holdings PLC 49,848 153.53 7,653,051
John Keells Holdings PLC - Warrant 2015 2,176 3.69 8,030
John Keells Hotels PLC 529 11.76 6,219
Lanka IOC PLC 30 39.38 1,181
Lanka Milk Foods (CWE) PLC 6,710 123.15 826,360
Nation Trust Bank PLC 50 81.21 4,061
National Development Bank PLC 0 165.41 0
Nestle Lanka PLC 4 2,267.73 9,064
Renuka Agri Foods PLC 6,119 3.25 19,909
SeyLan Bank PLC 10 95.01 950
Softlogic Capital PLC 40,000 6.03 241,226
Softlogic Holdings PLC 380 14.76 5,607
Textured Jersey Lanka PLC 13,512 42.57 575,137
Tokyo Cement PLC 100 55.06 5,506
Vallibal One PLC 121 21.68 2,625
Total 18,129,467

28
3.6 MCRP: Diversified Sector Analysis
The Diversified sector on the Colombo Stock Exchange comprises over 15 listed companies with a total market
capitalization of LKR 456.7 Bn as at 23rd September 2016, accounting for approximately 17% of the total market
capitalization. Sector earnings for the trailing twelve months ending 30th June 2016 amounted to LKR 27.8 Bn and
contributed 13.1% to total earnings during the period.
LKR Mn Market
Cap
Earnings FY16/
FY2016
Shareholder Funds FY16/
FY2016
John Keells Holdings 204,064 14,070 154,982
Transportation, Leisure, Property, Consumer, Financial, IT & Plantation
Hemas Holdings 60,117 2,653 21,992
FMCG, Healthcare, Leisure &Transportation
Carson Cumberbatch 37,471 2,373 41,084
Beverage, Plantation, Oils & Fats, Asset Mgmt, Real Estate, Leisure &Investment Holdings
Aitken Spence 28,298 2,027 36,646
Tourism, Maritime &Logistics, Strategic Investments & Services
C T Holdings 23,345 1,626 18,860
FMCG, Retail &Wholesale Distribution, Restaurants, Real Estate, Entertainment &Banking
Hayleys 21,375 3,004 30,855
Eco Solutions, Hand Protection, Purification, Textiles, Construction Materials, Plantations, Transportation &Logistics, Leisure, Consumer, Power &Energy, Industry Inputs
Vallibel One 22,383 4,228 38,091
Investment, Tiles and Sanitary-ware, Lifestyle & Consumer, Plantation, Banking, Tourism, Healthcare
Richard Pieris And Company 17,094 2,148 10,873
Retail, Plantations, Tyre, Plastic & Furniture, Rubber, Financial Services
Expolanka Holdings 13,293 1,113 11,854
Freight & Logistics, Investments & Services, International Trading & Manufacturing, Leisure
Softlogic Holdings 11,296 722 9,400
Retail, Healthcare, ICT, Financial Services, Automobile, Leisure
Sunshine Holdings 7,298 587 5,782
Healthcare, FMCG, Agribusiness, Power & Energy, Packaging
Browns Investments 4,836 -943 13,991
Leisure, Plantation, Renewable Energy, Construction, Real Estate, Investments
Taprobane Holdings 4,512 -1,742 3,673
Investments, Leisure, Finance, Stock &Money Brokering, Manufacturing, Property, Services
The Colombo Fort Land & Building 3,960 -321 7,611
Trading of Consumer Products & Industrial Products, Leisure, Planations
Dunamis Capital 3,186 -439 781

29
Financial Services, Manufacturing, Real Estate
F L C Holdings 1,642 -216 5,223
Plantation, Power, Leisure &Real Estate
Adam Investments 1,033 -1 1,019
Apparel, Metal, Network Communication & Automobile
Adam Capital 454 2 589
Activated Carbon, Micro Credit
Diversified Sector 456,657 30,891 413,306
* Market capitalization calculated based on 23rd September 2016 share prices

30
3.7 Other Key Events
Amount due from the Secretary to the Treasury on account of Sri Lanka Insurance Corporation (SLIC)
Shares
The Supreme Court of Sri Lanka declared and directed that the shares of SLIC purported to have been sold to
Distilleries Consortium in 2003 along with any shares purchased from employees shall be deemed to have been
held for and on behalf of the Secretary of the Treasury. Consequently, the money that was paid by the Group
subsidiary, Milford Holdings (Pvt) Limited (MHL) to purchase shares from SLIC has been returned. MHL was also
entitled to retain the profits of SLIC derived by MHL during its period of ownership. However, since the value of
profits has not been determined by MHL, no adjustments were made to the financial statements.
Pelwatte Sugar Industries PLC Group (PSIP) affected by the revival of Underperforming Enterprises
and Underutilized Assets Bill
Following the enactment of the Underperforming Enterprises and Underutilized Assets Bill in November 2011,
the state officials occupy the land leased to PSIP and are currently running its operations and related companies.
Subsequently, a compensation tribunal was formed as required by the Act. Without assuming any liability or
without any prejudice to, or impact on its rights, PSIP has submitted a claim to the tribunal. Management is
currently awaiting instructions by the Secretary to the Treasury. Financial results of PSIP up to 30 September
2011 were consolidated to the full year results ending 31 March 2012 however; consolidation has been
suspended due to non-accessibility of the information. The investment in PSIP is classified as a fully impaired
long term investment in the group.
Rights Issue of Shares for Browns Beach Hotels PLC
Browns Beach Hotel PLC (BBH) ceased its operations in March 2011 for the construction of a new resort. The
new resort commenced its operations in April 2016, under Negombo Beach Resorts (Pvt) Ltd, a fully owned
subsidiary of BBH.
The Board of Directors of BBH decided on 23rd August 2016, to issue 54,000,000 ordinary shares by way of a
rights issue subject to the approval of the CSE and shareholders of the Company. The shares are to be issued in
the ratio of 5 new ordinary shares for every 12 ordinary shares held at a consideration of LKR 25.85 per share.
The Company expects to raise approximately LKR 1,395,900,000 as equity capital to invest in its subsidiary,
Negombo Beach Resorts (Private) Limited. The subsidiary would in turn use these funds to reduce the existing
debt levels and finance the project and construction costs of the hotel in Negombo (Heritance Negombo). The
current share price of BBH as of 23rd September 2016 is Rs. 25.00 per share.

31
4.0 MCRP GROUP: FORECASTS AND OUTLOOK POST-RESTRUCTURE
Under the restructuring process being carried out, MCRP will become the ultimate holding company of the former
DIST Group with a 100% stake2, following a share swap. Hence, going forward, MCRP Group will also include the
performance of DIST Alcohol Company.
Hence, FY15 and FY16 figures in this section are of DIST Group while the forecasts are estimates for post-
restructure financials of MCRP Group, which is equivalent to the former DIST Group. Further, it is assumed DIST
Alcohol Company was a fully owned subsidiary of Melstacorp for the entire FY17E (for comparative purposes).
4.1 Revenue
Group (LKR Bn) FY15 FY16 FY17E FY18E FY19E
Gross Revenue 66.8 88.9 98.2 108.3 119.6
YoY Growth (%) 33.1% 10.5% 10.3% 10.4%
Net Revenue 28.9 33.8 37.6 41.5 45.9
YoY Growth (%) 17.0% 11.0% 10.4% 10.7%
Segmental Net Revenue Composition
Beverage 66.2% 71.5% 71.0% 70.9% 70.7%
Plantation 10.4% 7.1% 6.8% 6.8% 6.7%
Telecommunication 12.3% 10.2% 9.3% 8.8% 8.5%
Financial Services 5.0% 6.0% 6.9% 7.6% 8.4%
Diversified 6.1% 5.1% 6.0% 5.9% 5.8%
Segmental Net Revenue YoY Growth
Beverage 26.4% 10.2% 10.2% 10.2%
Plantation -19.6% 6.5% 9.5% 9.5%
Telecommunication -2.7% 0.5% 4.8% 6.6%
Financial Services 40.9% 27.4% 22.1% 21.8%
Diversified -2.2% 30.1% 8.4% 8.6%
We forecast net revenue for the Group of LKR 37.6 Bn in FY17E, up 11.0% YoY, driven by growth in Beverage,
Diversified and Financial Services sectors. Revenue growth over the forecast period is expected at a CAGR of 10.7%
during FY16-19E. On a segmental basis, we expect the Beverage sector to be the largest contributor to revenue in
FY17E, followed by the Telecommunication Sector, accounting for 71.0% and 9.3% of net revenue, respectively.
However, given the changing dynamics within the industries, we expect contribution from Telecommunication
sector to decline to 8.5% of net revenue by FY19E, while we expect the Financial Services sector to increase its
contribution to 8.4% by FY19E, from 6.9% in FY17E.
2 162,164 shares of DIST held by sixty four (64) deceased shareholders and three (3) shareholders who continued to hold their shares ‘in locked balance’ (which were excluded from the off-the-floor share transfer until the beneficiaries of the deceased are registered in the Register of DIST/ shares are transferred to the ‘trading balance’) are considered as held in trust for MCRP in consideration of the 648,656 MCRP shares allotted to those shareholders for the transfer of their DIST shares in terms of the ‘Arrangement’ (now held in trust).

32
4.2 Beverage Sector
(LKR Bn) FY15 FY16 FY17E FY18E FY19E
Net Revenue 19.1 24.2 26.7 29.4 32.4
YoY Growth (%) 1.1% 26.4% 10.2% 10.2% 10.2%
Volume Growth (Proof Liters) (%) -9.2% 11.8% 4.0% 4.0% 4.0%
Growth in Net Revenue per Proof Liter (%) 11.4% 13.1% 6.0% 6.0% 6.0%
Direct Turnover Taxes as a % of Gross Revenue 66.4% 69.4% 69.4% 69.4% 69.4%
The Beverage sector is expected to generate net revenue of LKR 26.7 Bn in FY17E, increasing 10.2% YoY. Growth in
FY17E is owing to volume growth of 4.0% and net revenue per proof liter growth of 6.0%. Revenue is expected to
reach LKR 32.4 Bn in FY19E, as it grows at a CAGR of 10.2%. We expect volume growth to continue at a moderate
level of 4.0% on average during FY17E-19E, while we assume growth in net revenue per proof liter would be at 6.0%
during the same period. We have not explicitly forecasted the increase in direct turnover related taxes, however, it
is expected that the current tax structure would continue.
The DIST Alcohol Company is expected to generate net revenue of LKR 23.7 Bn in FY17E increasing 10.2% YoY. We
expect DIST’s market share to remain at its current level of approximately 68.0% throughout the forecast period.
We expect DIST Alcohol Company to report net revenue of LKR 28.9 Bn in FY19E, growing at a CAGR of 10.2% during
the period FY16-19E.
4.3 Plantation Sector
(LKR Bn) FY15 FY16 FY17E FY18E FY19E
Net Revenue 3.0 2.4 2.6 2.8 3.1
YoY Growth (%) -19.6% 6.5% 9.5% 9.5%
Tea Revenue 2.8 2.2 2.4 2.6 2.9
Rubber Revenue 0.2 0.2 0.2 0.2 0.2
The Plantation sector recorded a significant decline in revenue of 19.6% YoY to LKR 2.4 Bn in FY16 continuing the
downward trend for the second consecutive year. We estimate revenue of LKR 2.6 Bn in FY17E an increase of 6.5%
YoY. Tea accounted for approximately 93.0% of total revenue for the sector in FY16, while the remainder was a
contribution from Rubber. In our forecasts, we assume the contribution from Tea would continue to increase while
the contribution from Rubber is expected to decline.
Revenue growth is expected to be driven by a 5.8% YoY increase in Tea to LKR 2.4 Bn in FY17E combined with a
15.8% YoY increase in Rubber to LKR 0.2 Bn. Growth in the Tea segment is owing to a potential recovery in NSA,
given the upward trend seen during the latter half of 2016. Total net revenue is estimated to grow at a CAGR of 8.5%
over the period FY16-19E with revenue from Tea and Rubber expected to record growth at a CAGR of 8.7% and 5.6%,
respectively.
33
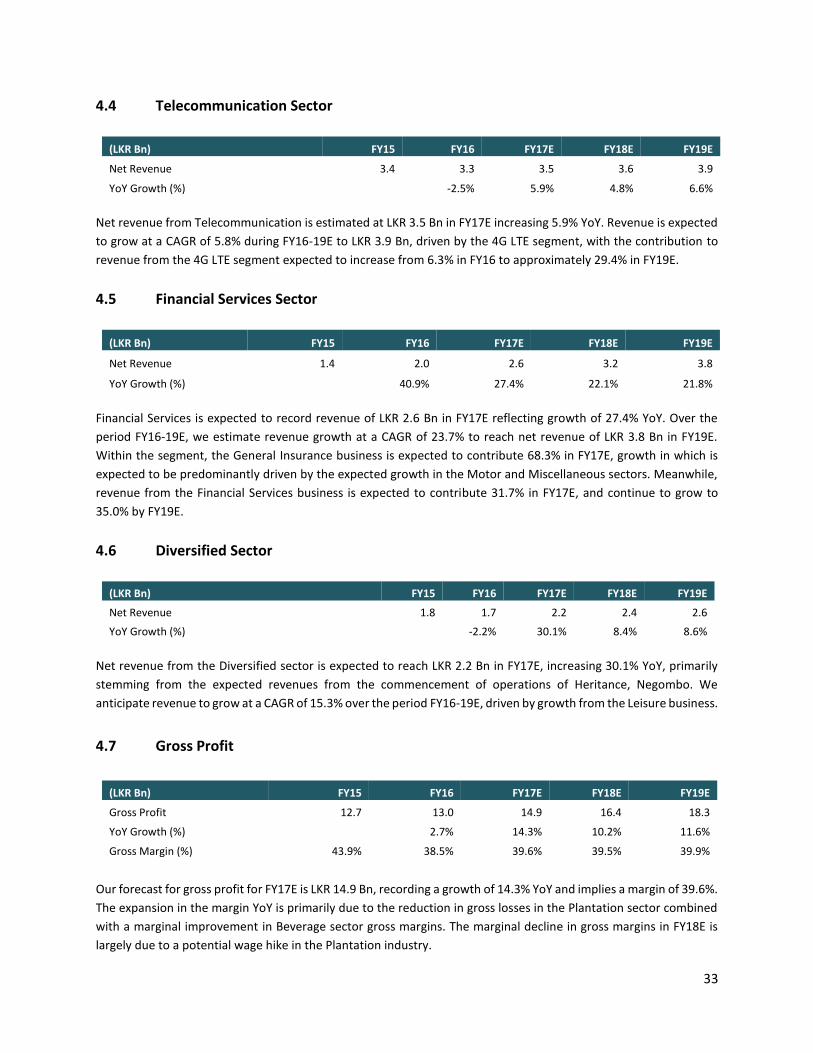
4.4 Telecommunication Sector
(LKR Bn) FY15 FY16 FY17E FY18E FY19E
Net Revenue 3.4 3.3 3.5 3.6 3.9
YoY Growth (%) -2.5% 5.9% 4.8% 6.6%
Net revenue from Telecommunication is estimated at LKR 3.5 Bn in FY17E increasing 5.9% YoY. Revenue is expected
to grow at a CAGR of 5.8% during FY16-19E to LKR 3.9 Bn, driven by the 4G LTE segment, with the contribution to
revenue from the 4G LTE segment expected to increase from 6.3% in FY16 to approximately 29.4% in FY19E.
4.5 Financial Services Sector
(LKR Bn) FY15 FY16 FY17E FY18E FY19E
Net Revenue 1.4 2.0 2.6 3.2 3.8
YoY Growth (%) 40.9% 27.4% 22.1% 21.8%
Financial Services is expected to record revenue of LKR 2.6 Bn in FY17E reflecting growth of 27.4% YoY. Over the
period FY16-19E, we estimate revenue growth at a CAGR of 23.7% to reach net revenue of LKR 3.8 Bn in FY19E.
Within the segment, the General Insurance business is expected to contribute 68.3% in FY17E, growth in which is
expected to be predominantly driven by the expected growth in the Motor and Miscellaneous sectors. Meanwhile,
revenue from the Financial Services business is expected to contribute 31.7% in FY17E, and continue to grow to
35.0% by FY19E.
4.6 Diversified Sector
(LKR Bn) FY15 FY16 FY17E FY18E FY19E
Net Revenue 1.8 1.7 2.2 2.4 2.6
YoY Growth (%) -2.2% 30.1% 8.4% 8.6%
Net revenue from the Diversified sector is expected to reach LKR 2.2 Bn in FY17E, increasing 30.1% YoY, primarily
stemming from the expected revenues from the commencement of operations of Heritance, Negombo. We
anticipate revenue to grow at a CAGR of 15.3% over the period FY16-19E, driven by growth from the Leisure business.
4.7 Gross Profit
(LKR Bn) FY15 FY16 FY17E FY18E FY19E
Gross Profit 12.7 13.0 14.9 16.4 18.3
YoY Growth (%) 2.7% 14.3% 10.2% 11.6%
Gross Margin (%) 43.9% 38.5% 39.6% 39.5% 39.9%
Our forecast for gross profit for FY17E is LKR 14.9 Bn, recording a growth of 14.3% YoY and implies a margin of 39.6%.
The expansion in the margin YoY is primarily due to the reduction in gross losses in the Plantation sector combined
with a marginal improvement in Beverage sector gross margins. The marginal decline in gross margins in FY18E is
largely due to a potential wage hike in the Plantation industry.

34
We forecast a gross margin of 42.8% for DIST Alcohol Company in FY17E, stable from that of the previous year and
improve to 43.0% by FY19E. Average gross profit growth over the forecast period for MCRP Group and DIST Alcohol
Company are 12.0% and 10.4% respectively, over the period FY17-19E. Gross margin over FY17-19E is expected to
average 39.7% for MCRP Group over the forecast period.
4.8 Other Operating Income
We have not forecasted dividend income from financial assets and gains/losses from disposal of financial assets. The
current market value of the respective financial assets has instead been considered for our Sum-of-the-Parts (SOTP)
valuation. Our forecast with the exception of the above amounts to LKR 0.4 Bn in FY17E, which is broadly in line with
that of the previous year. Other operating income is expected to remain at the same levels over the forecast period,
with operating income as a percentage of net revenue is assumed at 1.0%.
4.9 Operating Expenses
(LKR Bn) FY15 FY16 FY17E FY18E FY19E
Distribution Expenses 1.7 1.8 1.9 2.0 2.2
As a % of Net Revenue 5.9% 5.2% 4.9% 4.8% 4.7%
Administrative Expenses 3.8 3.6 4.2 4.6 4.7
YoY Growth (%) -6.0% 17.9% 7.1% 3.9%
Other Operating Expenses 0.0 0.4 0.1 0.2 0.2
As a % of Net Revenue 0.1% 1.0% 0.3% 0.4% 0.5%
Distribution costs are expected to increase 4.7% YoY to reach LKR 1.9 Bn in FY17E and expected to grow to LKR 2.2
Bn in FY19E. We assume distribution costs would average 4.8% of net revenue over the forecast period, declining
from 5.2% in FY16. Administration costs for FY17E are estimated at LKR 4.2 Bn, increasing 17.9% from the previous
year mainly due to the commencement of operations of Heritance Negombo, while it is expected to grow at a 3-year
CAGR of 9.5% to LKR 4.7 Bn in FY19E. Other Operating Expenses amounted to LKR 0.4 Bn in FY16, and we expect this
to decline to LKR 0.1 Bn in FY17E. Operating expenses as a percentage of net revenue is expected to average 0.4%
during FY17-21E.

35
4.10 EBIT
(LKR Bn) FY15 FY16 FY17E FY18E FY19E
Recurring EBIT 8.5 8.4 9.0 10.1 11.7
YoY Growth (%) -0.4% 7.0% 11.9% 15.2%
EBIT Margin (%) 29.3% 25.0% 24.1% 24.4% 25.4%
Comparable EBIT 7.7 7.7 9.0 10.1 11.7
YoY Growth (%) -0.1% 17.7% 11.9% 15.2%
EBIT Margin (%) 26.6% 22.7% 24.1% 24.4% 25.4%
Our estimate for recurring EBIT is LKR 9.0 Bn in FY17E, implying a margin of 24.1%, while we expect EBIT to grow at
a CAGR of 11.3% over the period FY16-19E. Margin decline in FY17E is owing to losses stemming from the newly
commenced hotel, Heritance Negombo. EBIT margin for the forecast period is expected to average 24.6%. Margin
expansion in FY19E is from Heritance Negombo generating profits coupled with improvement in Beverage sector
gross margins.
Comparable EBIT excludes investment income from the Group’s investment portfolio, and is expected to amount to
LKR 9.0 Bn in FY17E and increase to LKR 11.7 Bn by FY19E. Comparable EBIT margins are expected to average 24.6%
over the period FY17-19E, increasing from 22.7% in FY16.
4.11 Net Finance Costs
(LKR Bn) FY17E FY18E FY19E
Finance Income 0.3 0.5 0.7
Finance Cost (1.0) (1.3) (1.5)
Net Finance Cost (0.7) (0.7) (0.7)
Total Debt 17.8 21.0 24.2
Equity attributable to Shareholders 67.7 73.4 79.8
Debt to Equity (x) 0.25 0.28 0.29
Effective Finance Cost (%) 6.5% 6.5% 6.5%
Net finance cost for FY16 amounted to LKR 0.2 Bn, and we expect this to increase to LKR 0.7 Bn in FY17E due to
higher effective finance cost and debt. Total debt for the Group is forecasted to be LKR 17.8 Bn in FY17E, increasing
to LKR 24.2 Bn by FY19E. Net debt for the Group is estimated at LKR 11.5 Bn in FY17E declining to LKR 9.1 Bn by
FY19E, given the generation of operating cash flow. We expect the effective finance cost would remain at 6.5%
throughout the forecast period. Our forecast for debt to equity for FY17E is 0.25x, and we estimate an average debt
to equity of 0.27x over the forecast period.

36
4.12 Share of Associate Profits
We expect the share of associate profits to amount to LKR 1.1 Bn in FY17E, increasing from LKR 0.7 Bn in the previous
year, primarily driven by a renewed power purchasing agreement with the Ceylon Electricity Board for one year
through SPEN (Ace Power Embilipitiya (Pvt) Ltd). The contribution from SPEN is forecasted at LKR 1.1 Bn for the year
increasing from LKR 0.9 Bn, while we expect a negative contribution from MADU, owing to weakness in the
plantation industry. The contribution from SPEN is expected to increase to LKR 1.4 Bn by FY19E, driven by the tourism
sector. Total share of associate profits is expected to increase to LKR 1.3 Bn by FY19E.
4.13 Profit before Tax
(LKR Bn) FY15 FY16 FY17E FY18E FY19E
Share of Associate Profits 1.4 0.7 1.1 1.1 1.3
Profit Before Tax 9.7 9.0 9.4 10.5 12.3
YoY Growth (%) -7.6% 4.6% 11.7% 16.8%
PBT Margin (%) 33.6% 26.6% 25.0% 25.3% 26.8%
Comparable PBT 8.9 8.2 9.4 10.5 12.3
YoY Growth (%) -1.2% -7.9% 14.4% 11.7% 16.8%
PBT Margin (%) 30.9% 24.3% 25.0% 25.3% 26.8%
Segmental PBT (excl. associate profits)
Beverage 8.4 8.4 8.9 10.2 11.5
Plantation (0.1) (0.4) (0.2) (0.3) (0.3)
Telecommunication (0.7) (0.6) (0.8) (0.9) (0.9)
Financial Services 0.2 0.2 0.3 0.4 0.5
Diversified 0.5 0.7 0.1 0.1 0.0
The Group is forecasted to record PBT of LKR 9.4 Bn in FY17E, up 4.6% YoY. PBT is expected to grow at a CAGR of
10.9% to reach LKR 12.3 Bn in FY19E. We expect PBT margins to range from 25.0% – 26.8% during the forecast period
FY17-19E, and average 25.7%. Comparable PBT for FY17E is expected to amount to LKR 9.4 Bn increasing from LKR
8.2 Bn in the previous year, with PBT margins improving to 25.0% in FY17E from 24.3%. Growth in PBT is driven by
the leisure business turning profitable in FY19E.
On a segmental basis, the Beverage sector is expected to earn PBT of LKR 8.9 Bn in FY17E, increasing from LKR 8.4
Bn in the previous year. The Beverage sector PBT margin is expected to be 33.5% in FY17E declining from 34.7% in
the previous year as other operating income has not been forecasted. We expect Beverage sector PBT to grow at a
3-year CAGR of 11.2% during FY16-19E to reach LKR 11.5 Bn by FY19E based on improvement in gross margins which
benefited from lower depreciation and lower growth in administration expenses following the recently completed
restructure. PBT margins are expected to range between 33.5% - 35.6% over this period. The DIST Alcohol Company
is forecasted to record PBT of LKR 7.0 Bn in FY17E and increase to LKR 10.5 Bn in FY19E. The PBT margins for DIST
Alcohol Company are expected to range from 33.9% - 36.2% during FY17-19E.

37
Given the weak supply side factors, we do not expect a turnaround in the Plantations sector in the near term. As
such, we forecast a loss before tax of LKR 0.19 Bn in FY17E and expect it to record an average loss before tax of LKR
0.27 Bn over the period FY17-19E. It is expected that there would be a wage hike in FY18E, which would not be paid
in arrears, which is likely to hamper profitability further.
Despite the expectation of the Telecommunication sector recording growth in revenue, we believe the sector losses
before tax would continue to expand during the forecast period. We estimate a loss before tax of LKR 0.77 Bn in
FY17E, while a loss of LKR 0.85 Bn is expected on average over the years FY17-19E due to increasing operating and
finance costs. We do not expect the company to record a turnaround during the forecast period.
Profit before tax for Financial Services is estimated at LKR 0.3 Bn for FY17E, reflecting growth of 9.4% YoY. We expect
PBT to continue to record growth at a CAGR of 27.8% over the forecast period. The General Insurance business is
expected to contribute 57.9% to PBT in FY17E, while the financial services company is expected to contribute the
remaining. Continental Insurance is expected to record underwriting profits by FY18E. PBT margin for FY17E is
expected to be 9.9%, declining from the prior year due to the increased claims stemming from the floods which took
place in May 2016. Margins are expected to average 11.3% during FY17-19E.
The Diversified sector income consists of dividend and gains/losses on disposal of financial investments, which we
have not forecasted and instead have used the current market value for our SOTP valuations. Over our forecast
period, we expect the profit before tax to average LKR 0.06 Bn.
4.14 Net Profit attributable to Equity Holders
(LKR Bn) FY15 FY16 FY17E FY18E FY19E
Taxation 3.3 3.3 3.5 3.9 4.5
Effective Tax Rate (%) 33.5% 37.0% 37.0% 37.0% 37.0%
Recurring Net Profit attributable to Equity Holders 6.6 6.0 6.3 7.0 8.0
YoY Growth (%) -9.0% 5.3% 11.9% 14.4%
NP Margin (%) 22.7% 17.6% 16.7% 16.9% 17.5%
Comparable Profit attributable to Equity Holders 5.8 5.2 6.3 7.0 8.0
YoY Growth (%) -9.8% 20.9% 11.9% 14.4%
NP Margin (%) 19.9% 15.4% 16.7% 16.9% 17.5%
Income tax for the Group is estimated using an effective tax rate of 37.0% over the forecast period FY17-19E. We
estimate recurring net profit attributable to equity holders of LKR 6.3 Bn in FY17E, increasing from LKR 6.0 Bn in
FY16. Growth in recurring net profit attributable to equity holders is expected at a CAGR of 10.1% over FY16-19E.
Net profit margin is estimated at 16.7% in FY17E and is expected to average 16.9% during FY17-21E.
Comparable net profit attributable to shareholders excludes investment income from the Group’s investment
portfolio, which includes a range of quoted debt and equity investments. In FY16, the comparable net profit
amounted to LKR 5.2 Bn, down 9.8% YoY. We expect the comparable net profit for FY17E to amount to LKR 6.3 Bn,
increasing 20.9% YoY, while we expect the profit to grow at a CAGR of 15.3% over the period FY16-19E primarily
driven by improved performance in the Beverage sector. Comparable net margins are expected to average 16.9%
over the period FY17-19E.

38
Group FY15 FY16 FY17E FY18E FY19E
Profit for the Year 6.5 5.7 5.9 6.6 7.7
Dividend Payout Ratio (%) 15.1% 17.1% 20.0% 20.0% 20.0%
In terms of dividend payout, we expect MCRP to maintain a 20.0% payout ratio over the forecast period, increasing
from the 15.1% and 17.1% in FY15 and FY16, respectively.
4.15 Depreciation and Capex
(LKR Bn) FY17E FY18E FY19E
Property, Plant and Equipment 18.8 20.1 21.6
YoY Growth (%) 70.4% 6.9% 7.5%
Capex 3.3 3.7 4.1
Capex as a % of Net Revenue 8.8% 8.9% 8.8%
Depreciation and Amortization 2.1 2.2 2.4
Property, Plant and Equipment for the Group is expected to total LKR 18.8 Bn in FY17E. Capex for the Group is
estimated at LKR 3.3 Bn in FY17E, with capex as a percentage of revenue amounting to 8.8% of net revenue. Over
the forecast period, we expect capex as a percentage of revenue to average 8.8%. Depreciation and Amortization is
estimated at LKR 2.1 Bn in FY17E, declining from LKR 2.4 Bn in FY16. The effective depreciation rate in FY16 amounted
to 15.8% and we expected this to decline to 11.1% in FY17E.

39
4.16 Shareholders’ Funds
After incorporating the accounting entries as a result of the Arrangement to the 30th June 2016 Balance Sheet of
DIST, the proforma equity position of MCRP would be as follows:
LKR (Bn)
No of Voting Shares (Mn)
Pre-Arrangement Stated Capital 48.3 265.5
Settlement of sum owing to DIST 1.8 10.1
Promissory Notes 24.8 138.1
413,668,056 voting shares converted into 1,000 ordinary non-voting shares
New issue of shares to acquire DIST Alcohol Company 14.1 1,200.0
Buyback of shares to dissolve trust (34.6)
Proforma Stated Capital 89.1 1,165.4
The MCRP Group Stated Capital for FY17E would be LKR 89.1 Bn, with total negative retained earnings of LKR 20.6
Bn. Post-acquisition of DIST, MCRP Group would adopt a Common Control Accounting Policy for the said Business
Combination. Hence, goodwill on acquisition of DIST Alcohol Company by MCRP will not be recognized in MCRP
consolidated financial statements and would be set off against reserves. The estimated goodwill is LKR 34.3 Bn. The
total shareholders’ funds for FY17E is expected to be LKR 67.7 Bn.
Reconciliation of Shareholders' Funds for FY17E (LKR Bn) Stated Capital
Retained Earnings
Other Reserves
Shareholders’ Funds
Opening Balance 48.3 10.1 (0.8) 57.6
New Share Issue 40.8 40.8
Profit for the Year 6.2 6.2
Dividends Paid (1.2) (1.2)
Goodwill set off against Reserves (34.3) (34.3)
Share Repurchase (1.4) (1.4)
Closing Balance 89.1 (20.6) (0.8) 67.7
ROE for FY17E is estimated at 8.9% growing to 9.6% by FY19E. The average ROE for the forecast period is expected
to be 9.2%.
4.17 DIST Alcohol Company to be a Stand-alone Entity
Following the Arrangement, trading of DIST shares would be suspended on 30th September 2016 as DIST would
become a fully owned subsidiary of MCRP. DIST is expected to commence trading subsequent to meeting the free
float criteria as per the continuous listing requirements of the CSE.
However, we have not factored any dilution of stake by MCRP Group in DIST in our projections as the loss in value
via a dilution would be offset through the capital raised.

40
5.0 VALUATION
The following valuation methodologies were considered in deriving a fair value for MCRP as at 23rd September 2016:
1. Relative Price to Earnings Method (PE) 2. Relative Price to Book Value Method (PBV) 3. Market Price Method 4. Sum of the Parts Method (SOTP)
SOTP and PE are the two preferred valuation methods for a conglomerate where the value is driven as a combination of business units. Discounted Cash Flow (DCF) valuation has been used to value the Beverage sector within the SOTP method. As MCRP group has two companies in the Financial Services sector, DCF valuation is considered less applicable for MCRP overall. Managers and Financial Advisors to the Issue have established that all assumptions used in the forecasts and outlook section of this report are fair and reasonable to the best of their knowledge. All market prices used in this section are volume-weighted average prices for the period of 15th August 2016 to 23rd September 2016 assuming that all interim results for the quarter ended 30th June 2016 were released by 15th August 2016, which was the deadline for release of interim results. This is in order to avoid possible anomalies that may arise in share price movement on a single day.
Valuation Summary
A summary on the prices derived and the applicable price multiples are shown below for the four valuation methodologies used on MCRP:
Method Fair Value
per Share (LKR) Introductory Price
per Share (LKR) (Discount)/Premium
(%)
SOTP 74.94 69.00 (7.93)
Relative PER 70.62 69.00 (2.29)
Relative PBV 65.52 69.00 5.32
Market Price 68.04 69.00 1.41
Average 69.78 69.00 (1.12)
Based on the methodologies used the fair value of MCRP’s share ranges from LKR 65.52 – LKR 74.94 with an average price per share of LKR 69.78. Based on the above we recommend a share price of LKR 69.00 to be the Reference Price for the introduction of MCRP.

41
5.1 Relative Price to Earnings Method (PE)
Under the Relative PE method, MCRP share was valued using the PE multiples of comparable listed peers in the market.
𝑷 = 𝑬𝑷𝑺 × 𝑷𝑬
Where, P = Price per Share at year 0 EPS = Earnings per Share PE = Applicable Price to Earnings multiple
Comparable Listed Local Peers
Diversified Holdings Market Cap
(LKR Mn)* PER (x) **
John Keells Holdings PLC 208,726 14.6
Hemas Holdings PLC 57,295 19.5
Carson Cumberbatch PLC 40,524 37.5
Aitken Spence PLC 28,490 15.4
Vallibel One PLC 23,560 5.3
C T Holdings PLC 23,472 13.1
Hayleys PLC 21,397 7.5
Richard Pieris And Company PLC 17,442 8.1
420,905 13.4
* Using Volume Weighted Average Share Price from 15/08/2016 to 23/09/2016 **Trailing Twelve Months for the period ended 30th June 2016
MCRP Group has exposure to Beverage, Plantation, Telecommunication, Financial Services and other Diversified sectors. Given its diversified nature of operations, we have selected peers listed on the Colombo Stock Exchange (CSE) with a total market capitalization over LKR 15 Bn and operating in similar industries. However, there are no direct comparable peers for MCRP, as 71.5% of its net revenue for FY16 was generated from the beverage sector, closest peer being Carson Cumberbatch with its limited exposure to the alcohol segment (43.1% of revenue in FY16). Considering a weighted average trailing PE multiple of 13.4x for the peer group, MCRP share is valued at LKR 70.62 based on the relative PER method.
Relative PER
TTM Earnings June 2016 (LKR Mn) 6,131
Diversified Peer Multiple 13.4
Total Equity Value (LKR Mn) 82,298
Number of Shares (Mn) 1,165
Value per Share (LKR) 70.62
Source: Company Financials, CSE

42
5.2 Market Price Method (Sub Division of Shares)
Given that all the shareholders of DIST Group as at 30th September 2016 will receive four shares of MCRP for every one share held in DIST via a share swap and will own 100% of the voting shares of MCRP post share swap, this could be viewed as a 1 : 4 (approximately) subdivision of the shares of DIST.
DIST Share Price
Current Shares of DIST (Mn) 300
DIST Share Price (LKR)* 264.32
DIST Market Capitalization (LKR Mn) 79,295
SWAP Ratio 1 : 4
MCRP Total Voting Shares - Post SWAP (Mn) 1,165
MCRP Market Capitalization - Post SWAP (LKR Mn) 79,295
Post SWAP - Value per Share (LKR) 68.04
*Volume Weighted Average Share Price from 01/08/2016 to 23/09/2016
Considering a weighted average price for DIST share of LKR 264.32 since the announcement of the restructure, MCRP share is valued at LKR 68.04.

43
5.3 Relative Price to Book Value Method (PBV)
Under the Relative Price to Book Value method, MCRP share was valued using the Price to Book Value multiple of comparable listed peers in the market. 𝑷 = 𝑩𝑽𝑷𝑺 × 𝑷𝑩𝑽 where,
P = Price per Share at year t BVPS = Book Value per Share PBV = Applicable PBV multiples
Diversified Holdings Market Cap
(LKR Mn)* PBV June
(x)**
John Keels Holdings PLC 208,726 1.34
Hemas Holdings PLC 57,295 2.52
Carson Cumberbatch PLC 40,524 1.29
Aitken Spence PLC 28,490 0.78
Vallibel One PLC 23,560 0.60
C T Holdings PLC 23,472 1.21
Hayleys PLC 21,397 0.70
Richard Pieris And Company PLC 17,442 1.52
420,905 1.21
*Using Volume Weighted Average Share Price from 15/08/2016 to 23/09/2016
**Based on Shareholders’ Funds as at 30th June 2016
MCRP Group has exposure to Beverage, Plantation, Telecommunication, Financial Services and other Diversified sectors. Given its diversified nature of operations, we have selected peers listed on the Colombo Stock Exchange (CSE) with a total market capitalization over LKR 15 Bn and operating in similar industries. However, there are no direct comparable peers for MCRP, as 71.5% of its net revenue for FY16 was generated from the beverage sector, closest peer being Carson Cumberbatch with its limited exposure to the alcohol segment (43.1% of revenue in FY16).
Relative PBV
Shareholders' Funds June 2016 (LKR Mn) 62,921
Diversified Peer Multiple 1.21
Total Equity Value (LKR Mn) 76,354
Number of Shares (Mn) 1,165
Value per Share (LKR) 65.52
Considering a weighted average trailing PBV multiple of 1.21x for the peer group, MCRP share is valued at LKR 65.52 based on the relative PBV Method.

44
5.4 Sum of the Parts Method (SOTP)
The Sum-of-the-Parts (SOTP) method is a valuation methodology which is commonly used to value a Company operating in several industries. SOTP aggregates the independently valued business units of a company in order to arrive at a single total equity value. The individual business units could be valued using a range of valuation methodologies, depending on the industry it operates in. The SOTP valuation incorporates a conglomerate discount to compensate potential owners for the possible loss of focus that may arise due to expansion of operations into unrelated businesses.
Sum of the Parts (SOTP) Segment Value (LKR Mn) Beverage 80,723.1 Note 1 Telecommunications 1,461.8 Note 2 Financial Services 3,289.9 Note 3 Plantations 144.7 Note 4
Diversified 7,937.4 Note 5
Associates 13,080.9 Note 6
Market Portfolio 18,129.5 Note 7
Total Equity Value 124,767.4 Number of Shares (Mn) 1,165 Value per Share (LKR) 107.06 Applicable Discount 30% Value per Share (LKR) 74.94
* Managers and Financial Advisors to the Issue have established 30% as a fair discount to the SOTP valuation, considering the market dynamics
and future prospects and the risks associated with MCRP. Applying different valuation methodologies applicable to MCRP business segments, SOTP valuation derives a fair value per share of LKR 74.94.
Beverage (Note 1)
The Beverage sector of MCRP has been valued using the median of three methods namely, Discounted Cash Flows (DCF),
Relative Price to Earnings (PER) and Relative EV/EBITDA. The following table shows the values derived under each method:
Beverage (LKR Bn)
DCF 66.6 Note A
Relative PER 80.7 Note B
Relative EV/EBITDA 129.4 Note C
Median Equity Value 80.7

45
DCF (Note A)
DCF FY17E FY18E FY19E
Free cash flow to the firm 3,528,449 6,658,237 7,293,224
Change in Debt 1,489,472 206,261 261,515
Interest paid (1,508,512) (624,611) (642,518)
FCF to the equity holders 3,509,409 6,239,886 6,912,221
Value from Secondary Growth Phase (FY20-26E) 42,116,578
Terminal Value - - 39,760,534
Total 3,509,409 6,239,886 88,789,333
Present Value 3,131,285 4,782,447 58,454,655
NPV 66,368,387 Cash (June 2016) 278,435 Equity Value 66,646,822
Assumptions
5 Year Treasury Bond Secondary Market Rate (%)* 11.42
Equity Risk Premium (%) ** 5.00
Cost of Equity (%) 16.42
Terminal Growth Rate (%) 2.50
Medium Term Growth Rate (%) (FY20-26E) 12.38
*Source: Central Bank of Sri Lanka weekly average yield YTD till 23rd September 2016 ** Managers and Financial Advisors to the Issue have established 5.0% as a fair equity premium, considering the future prospects and the risks
associated with MCRP.

46
Relative PER and Relative EV/EBITDA
Selected Peers Market
Cap.**
PER Financial Year End
PER TTM
June***
EV/EBITDA Financial Year End
EV/EBITDA TTM
June***
Adjusted (Market Cap. weighted) PE
Adjusted (Market Cap.
weighted) EV/EBITDA
CTC* 167,765 15.78 14.94 14.42 13.36 12.65 11.31
LION 30,397 14.61 29.68 11.09 16.65 2.24 1.70
Industry 198,162 15.59 16.17 13.67 13.87 14.89 13.01
* Year ended 31st December 2015
** Using Volume Weighted Average Share Price from 15/08/2016 to 23/09/2016
***Trailing Twelve Months for the period ended 30th June 2016
For the purpose of relative valuation of the Beverage sector, we have selected Ceylon Tobacco Company PLC (CTC) and
Lion Brewery Ceylon PLC (LION) as close peers, given their focus on similar regulated industries Adjusted PER and
EV/EBITDA has been calculated for CTC using TTM June financials and year-end financials have been used for LION. The
inconsistency is due to the quarter ending 30th June 2016 for LION being an anomaly, given the recent floods and the
negative impact on its performance.
Relative PER (Note B)
Relative PER (LKR Mn)
TTM Earnings June 2016 5,422
Selected Peer Multiple (x) 14.9
Total Equity Value 80,723
Relative EV/EBITDA (Note C)
Relative EV/EBITDA (LKR Mn)
TTM EBITDA June 2016 10,112
Selected Peer Multiple (x) 13.0
Net Debt 2,122
Total Equity Value 129,429
Telecommunications (Note 2)
The Telecommunication sector of MCRP was valued on the basis of Net Book Value (NBV), assuming a multiple of 0.5x,
given that the sector is loss making. Our average fair value for the Telecommunication sector is LKR 1.5 Bn.

47
Financial Services (Note 3)
We arrive at an average fair value of LKR 3.3 Bn for the Group’s Financial Services sector, using a relative price to book
valuation. We assign the June 2016 PBV multiple of People’s Insurance PLC for Continental Insurance Lanka Limited as it
is the only listed general insurance company. Melsta Regal Finance Limited was valued using the PBV multiple for all
licensed Finance Companies listed on the CSE.
PBV June 2016 (x) *
People's Insurance PLC 1.51
Listed Licensed Finance sector 1.29
*Based on Shareholders’ Funds as at 30th June 2016
Plantations (Note 4)
The Plantations sector of the Group is valued using the average market value from 15th August 2016 to 23rd September
2016. We arrive at a value of LKR 144.7 Mn for the segment.
Balangoda Plantations PLC
WASP from 15 Aug 2016 - 23 Sep 2016 (LKR) 14.16
Shares Held by MCRP (No. Mn) 10.2
Fair Value (LKR Mn) 144.7
Diversified (Note 5)
We derive a value of LKR 7.9 Bn for the Diversified sector, using a combination of Market Value, NBV and PER. Within the
Diversified sector, we have valued Browns Beach Hotel using market value based on the weighted average prices from 15th
August 2016 to 23rd September 2016.
Browns Beach Hotel PLC
WASP from 15 Aug 2016 - 23 Sep 2016 (LKR) 26.09
Shares Held by MCRP (No. Mn) 54.3
Fair Value 1,416.2
Bogo Power has been valued based on the TTM June 2016 PER for the sector (excluding the loss making companies), as
shown below:
Power Market Cap
(LKR Mn)* PER TTM June
(x)**
Vallibel Power 6,864 8.1
Vidul Lanka 4,471 13.0
Resus Energy 1,388 9.6
Pan Asian Power PLC 1,641 14.4
Browns Hydro Power PLC 768 16.8
Industry 15,458 10.6
*Volume Weighted Average Share Price from 15/08/2016 to 23/09/2016 **Trailing Twelve Months for the period ended 30th June 2016
Apart from Bogo Power and BBH, we value the remaining companies using the NBV. The two companies owning properties
Melsta Towers and Melsta Properties are valued at current net book value, whereas the remaining companies are valued
applying a 50% discount to the NBV due to their loss making nature.
The market portfolio (refer Note 7) under the Diversified sector is valued separately.

48
Associates (Note 6)
The Associates, SPEN and MADU have been valued at LKR 13.1 Bn using the Volume Weighted Average Share Price from
15/08/2016 to 23/09/2016.
Aitken Spence Holdings PLC
WASP from 15 Aug 2016 - 23 Sep 2016 70.17
Shares Held by MCRP (No. Mn) 178.5
Fair Value 12,525.0
Madulsima Plantations PLC
WASP from 15 Aug 2016 - 23 Sep 2016 7.14
Shares Held by MCRP (No. Mn) 77.8
Fair Value 555.9
Market Portfolio (Note 7)
The Market Portfolio for the Group, which is categorized under the Diversified sector, is valued using Volume Weighted
Average Share Price from 15/08/2016 to 23/09/2016 and the shareholdings as at 30th June 2016 (no materials changes to
the shareholdings have taken place as at 23rd September 2016).
Company Shareholdings
(No.'000) WA Price*
(Rs.) Value
(Rs.'000)
ACL Cables PLC 63 62.22 3,920
Aitken Spence Hotel Holdings PLC 23 51.44 1,188
Bukit Darah PLC 72 282.00 20,360
Carson Cumberbatch PLC 29 206.35 6,067
Ceylon Hospitals PLC - Non Voting 136 81.18 11,033
Commercial Bank of Ceylon PLC 28,295 140.16 3,965,900
Commercial Bank of Ceylon PLC - Non Voting 1 117.32 78
CT Holding PLC 1,476 128.19 189,149
DFCC Bank PLC 17,043 130.61 2,226,034
Free Lanka Capital Holdings PLC 2,851 1.27 3,633
Hatton National Bank PLC 10,179 226.75 2,308,044
Haycarb PLC 74 159.07 11,752
Hemas Holdings PLC 100 100.07 10,007
The Kingsbury Hotel PLC 824 16.24 13,376
John Keells Holdings PLC 49,848 153.53 7,653,051
John Keells Holdings PLC - Warrant 2015 2,176 3.69 8,030
John Keells Hotels PLC 529 11.76 6,219
Lanka IOC PLC 30 39.38 1,181
Lanka Milk Foods (CWE) PLC 6,710 123.15 826,360
Nation Trust Bank PLC 50 81.21 4,061
National Development Bank PLC 0 165.41 0
Nestle Lanka PLC 4 2,267.73 9,064
Renuka Agri Foods PLC 6,119 3.25 19,909
Seylan Bank PLC 10 95.01 950
Softlogic Capital PLC 40,000 6.03 241,226
Softlogic Holdings PLC 380 14.76 5,607
Textured Jersey Lanka PLC 13,512 42.57 575,137
Tokyo Cement PLC 100 55.06 5,506
Vallibel One PLC 121 21.68 2,625
Total 18,129,467

49
6.0 RESEARCH TEAM - CT CLSA CAPITAL (PVT) LTD
Nichula Witharana – Assistant Vice President
Nichula counts for over five years of experience in equity research, investment management and financial analysis.
Prior to joining CT CLSA Capital, he held the position of Assistant Manager at NDB Capital Holdings Limited prior to
which he served as Assistant Manager Finance and Accounting at WNS Global Services (Pvt) Ltd.
Nichula holds a B.Sc. in Finance from the University of Sri Jayewardenepura. He is also a Chartered Financial Analyst
(CFA) and an Associate Member of the Institute of Chartered Accountants of Sri Lanka (ICASL).
Samalka Athuraliya – Senior Associate
Samalka counts for five years of experience in equity research at Copal Amba (a Moody's Analytics Company), a
leading KPO in Sri Lanka where she held the positions of Associate Analyst, Analyst and Associate Vice President prior
to joining CT CLSA Capital. She is a Chartered Financial Analyst (CFA) and an Associate Member of the Chartered
Institute of Management Accountants (CIMA) UK.
David Carvalho - Associate
David counts for over four years of experience in the field of Audit and Assurance. Prior to joining CT CLSA Capital,
he was attached to Ernst and Young Sri Lanka, a leading global firm of Chartered Accountants, where he held the
positions of Audit Junior, Audit Senior and then Senior Accountant.
Raveen Jayanetti - Analyst
Raveen counts for four years of experience in Finance and Accounting. Prior to joining CT CLSA Capital he held the
position of Senior Executive in CMA CGM SSC Lanka (Pvt) Ltd, prior to which he held the positions of Junior Executive
and Executive at WNS Global Services (Pvt) Ltd, a leading BPO in Sri Lanka.

50
APPENDIX
Forecasted Financials
MELSTACORP LIMITED
CONSOLIDATED STATEMENT OF COMPREHENSIVE INCOME (FORECAST)
FOR THE YEAR ENDING 31ST MARCH FY17E* FY17E** FY18E FY19E
Gross Revenue 58,849,125 98,226,351 108,342,342 119,609,969
Net Revenue 26,065,202 37,566,677 41,471,118 45,891,132
Cost of Sa les (15,979,963) (22,684,104) (25,072,158) (27,592,381)
Gross Profit 10,085,239 14,882,573 16,398,960 18,298,750
Other Operating Income 273,713 358,022 405,134 448,513
Dis tribution Expenses (1,611,220) (1,853,465) (1,989,039) (2,156,463)
Adminis trative Expenses (3,619,299) (4,248,759) (4,550,901) (4,728,389)
Other Operating Expenses (100,877) (100,877) (151,315) (211,841)
Results from Operating Activities 5,027,556 9,037,494 10,112,840 11,650,570
Finance Income 126,920 302,956 526,684 747,386
Finance Cost (669,471) (1,048,095) (1,258,816) (1,466,748)
Net Finance Income (542,550) (745,139) (732,132) (719,362)
Share of Profi t of Equity-Accounted Investees 1,113,478 1,113,478 1,129,336 1,348,199
Profit Before Income Tax Expense 5,598,484 9,405,833 10,510,045 12,279,408
Taxation (2,068,742) (3,475,628) (3,883,654) (4,537,466)
Profit for the Year 3,529,742 5,930,205 6,626,391 7,741,942
Profit Attributable To:
Equity Holders of the Parent 6,246,427 6,957,434 7,969,610
Non Control l ing Interest (316,222) (331,043) (227,669)
*Post arrangement Income Statement reflecting DIST alcohol company performance for 6 months in FY17E.
**Assuming DIST alcohol company was a fully owned subsidiary of Melstacorp for the entire FY17E (for comparative purposes).
The forecasted financia l s tatements are prepared based on information provided by Management of Melstacorp Limited
and other publ icly ava i lable information. The Financia l Advisors and Managers to the Introduction have establ ished that
a l l assumptions used in preparing the Forecasted Financia l Statements are fa ir and reasonable to the best of their
knowledge. The forecasts are based on current assumptions and may require adjustments i f materia l changes take
place in the company’s operating environment.

51
MELSTACORP LIMITED
CONSOLIDATED STATEMENT OF FINANCIAL POSITION (FORECAST)
AS AT 31ST MARCH FY17E FY18E FY19E
ASSETS
Non-Current Assets
Property, Plant and Equipment 18,820,618 20,124,195 21,630,604
Intangible Assets 2,102,985 1,909,046 1,738,002
Investment Property 6,070,113 6,070,113 6,070,113
Biologica l Assets 4,238,102 4,667,725 5,129,883
Investments in Subs idiaries - - -
Investment in Equity-Accounted Investees 25,888,496 26,782,879 27,856,657
Other Non-Current Financia l Investments 15,588,519 15,588,519 15,588,519
Deferred Tax Assets 704,876 704,876 704,876
Finance Lease and Hire Purchases Receivables 2,189,655 2,846,552 3,558,190
Advances and Other Loans 581,190 755,547 944,434
76,184,553 79,449,451 83,221,279
Current Assets
Inventories 6,676,459 7,370,367 8,155,905
Trade and Other Receivables 12,521,851 13,823,293 15,296,586
Finance Lease and Hire Purchases Receivables 1,248,009 1,622,412 2,028,015
Advances and Other Loans 2,465,885 3,205,651 4,007,064
Amounts due from Related Companies 684,672 755,832 836,389
Other Current Financia l Investments 2,998,527 2,998,527 2,998,527
Cash and Cash Equiva lents 6,344,893 10,671,480 15,172,953
32,940,296 40,447,562 48,495,439
Total Assets 109,124,849 119,897,013 131,716,717
EQUITY AND LIABILITIES
Share Capital and Reserves
Stated Capita l 89,100,000 89,100,000 89,100,000
Reserves (813,476) (813,476) (813,476)
Reta ined Earnings (20,556,720) (14,924,564) (8,503,342)
Equity attributable to Owners of the Company 67,729,804 73,361,960 79,783,182
Non-Control l ing Interest 3,209,454 2,878,411 2,650,742
Total Equity 70,939,258 76,240,371 82,433,924
Non-Current Liabilities
Interest bearing Loans and Borrowings 4,061,829 5,171,262 6,217,904
Deferred Tax Liabi l i ties 1,820,176 1,820,176 1,820,176
Employee Benefi ts 1,154,662 1,285,546 1,414,939
Other Deferred Liabi l i ties 246,351 243,112 241,331
7,283,019 8,520,096 9,694,350
Current Liabilities
Trade and Other Payables 13,070,689 14,446,697 15,898,862
Depos i t Liabi l i ties 1,689,904 2,196,875 2,636,250
Other Deferred Liabi l i ties 105,950 105,950 105,950
Amount due to Related Companies 530,482 585,617 648,033
Current Tax Liabi l i ties 1,737,814 1,941,827 2,268,733
Interest bearing Loans and Borrowings 11,315,764 13,152,769 15,035,311
Bank Overdrafts 2,451,970 2,706,812 2,995,306
30,902,572 35,136,547 39,588,443
Total Liabilities 38,185,591 43,656,643 49,282,793
Total Equity and Liabilities 109,124,849 119,897,013 131,716,717
- - -
*Assuming DIST alcohol company was a fully owned subsidiary of Melstacorp for the entire FY17E (for comparative purposes).

52
MELSTACORP LIMITED
CONSOLIDATED CASH FLOW (FORECAST)
FOR THE YEAR ENDING 31ST MARCH FY17E FY18E FY19E
CASH FLOWS FROM OPERATING ACTIVITIES
Operating Profit before Working Capital Changes 11,290,235 12,471,367 14,138,143
Changes in :
(Increase) / Decrease in Receivables (2,641,478) (3,246,863) (3,580,834)
(Increase) / decrease in Related Party Receivables / Payables (1,692,722) (16,025) (18,142)
(Increase) / Decrease in Inventories (662,298) (693,909) (785,538)
Increase / (Decrease) in Payables 1,284,223 1,882,979 1,891,539
Cash generated from Operations 7,577,960 10,397,549 11,645,169
Interest Pa id (1,048,095) (1,258,816) (1,466,748)
Income Tax and Super Gain Tax Paid (2,833,296) (3,679,641) (4,210,560)
Gratuity Pa id (68,660) (88,720) (98,777)
Dividends Received 222,118 234,953 274,420
Net Cash generated from / (used in) Operating Activities 3,850,026 5,605,325 6,143,504
CASH FLOWS FROM INVESTING ACTIVITIES
Acquis i tion of Property, Plant and Equipment and Intangible Assets (3,005,334) (3,317,689) (3,671,291)
Acquis i tion of Intangible Assets (22,823) (25,195) (27,880)
Interest Received 302,956 526,684 747,386
Additions to Biologica l Assets (251,650) (338,539) (359,536)
Net Cash used in Investing Activities (2,976,850) (3,154,739) (3,311,321)
CASH FLOWS FROM FINANCING ACTIVITIES
Proceeds from Long-term Interest bearing Loans and Borrowings 5,037,609 5,561,186 6,153,900
Repayments of Long-term Interest bearing Loans and Borrowings (2,649,786) (3,407,276) (4,121,894)
Net Proceeds / (Repayment) of Other Short Term Borrowings (144,054) - -
Dividend Paid (1,186,041) (1,325,278) (1,548,388)
Net Cash generated from Financing Activities 1,057,728 828,632 483,617
Net Decrease in Cash and Cash Equiva lents during the Year 1,930,903 3,279,218 3,315,800
Net Cash and Cash Equivelents recognized via Aquis i tion of Subs idiaries (3,139,976) - -
Cash and Cash Equiva lents at the beginning of the Year (2,523,328) (3,732,401) (453,183)
Cash and Cash Equivalents at the end of the Year (3,732,401) (453,183) 2,862,617
Cash at Bank 6,344,893 10,671,480 15,172,953
Other Short Term Borrowings (7,625,323) (8,417,851) (9,315,030)
Bank Overdrafts (2,451,970) (2,706,812) (2,995,306)
(3,732,401) (453,183) 2,862,617
- - -
*Assuming DIST alcohol company was a fully owned subsidiary of Melstacorp for the entire FY17E (for comparative purposes).

53
DISCLAIMER
This document (the “Document”) has been prepared by CT CLSA Capital (Pvt) Limited (CTCLSA) for the exclusive use of Melstacorp
Limited (MCRP/the Recipient). By receiving this Document from CTCLSA, the Recipient shall be deemed to have accepted all the
below mentioned provisions.
This Document is confidential and its content may not be copied, reproduced, redistributed, quoted, referred to or otherwise
disclosed, in whole or in part, directly or indirectly, to any third party, except with the prior written consent of CTCLSA, other than
for publication of this Document in the Introductory Document issued by MCRP in connection with the Listing of its shares via an
Introduction.
The information, opinions and estimates in this Document are not directed at, or intended for distribution to or use by, any person
or entity in any jurisdiction where doing so would be contrary to law or regulation or which would subject CTCLSA to any additional
registration or licensing requirement within such jurisdiction.
The information contained in the Document is being delivered for informational purposes only. Although the information
contained in the Document, or on which the Document is based, has been obtained from sources which CTCLSA believes to be
reliable, it has not been independently verified. CTCLSA does not make any representation or warranty, express or implied, as to
the accuracy or completeness of such information. As a result, the Recipient agrees that no liability of any form is, or will be,
accepted by CTCLSA, its affiliates, its shareholders or any of their directors or employees to any person or entity for any direct or
consequential loss, damage, cost, charge, expense or other liability whatsoever arising out of, or in connection with the use of,
or reliance upon, the information contained in the Document.
Nothing contained in the Document is a promise or a representation of the future or should be relied upon as being so. In
particular, no representation or warranty is given by CTCLSA as to the achievement or reasonableness of any future projections,
estimates, management targets or prospects, if any. The Recipient should make its own judgment and assessment of the
information contained in the Document. The valuations are based on current assumptions and may require adjustments after
31st of March 2017 or if material changes take place in the Company’s operating environment.
In providing this Document, CTCLSA do not undertake to provide the Recipient with access to any additional information or to
update the information contained in the Document or to correct any inaccuracies therein which may become apparent.
The following sources were used in compiling this report:-
• Public information provided by the Central Bank of Sri Lanka
• Annual Reports and Interim Financial Statements of the Companies Listed on the CSE
• Corporate Websites of Local Peers
• Audited Financials and Management Accounts of MCRP
• Information provided by MCRP and discussions held with the management
The Document does not constitute an offer or invitation to make, and is not intended to provide the basis for, any agreement or
be a substitute for the Recipient’s own analysis. Furthermore, the Recipient agrees that although this Document might contain
legal, tax, or accounting references as a means of clarifying its contents, it does not constitute legal, tax, investment or accounting
advice.
The valuations presented are valid until 31st March 2017, subject to material changes to the operations of MCRP.
CTCLSA is neither related parties nor parties acting in concert with MCRP (including but not limited to any of its promoters,
immediate parent, ultimate parent, entities in the Group etc.) and does not have any conflict of interests.