annabelle chuinard mcgill university wipc 2013 measurement of cp violation with the lhcb experiment...
TRANSCRIPT
Annabelle Chuinard
McGill University
WIPC 2013
Measurement of CP violation with the LHCb experiment at
CERN
WIPC 2013
2
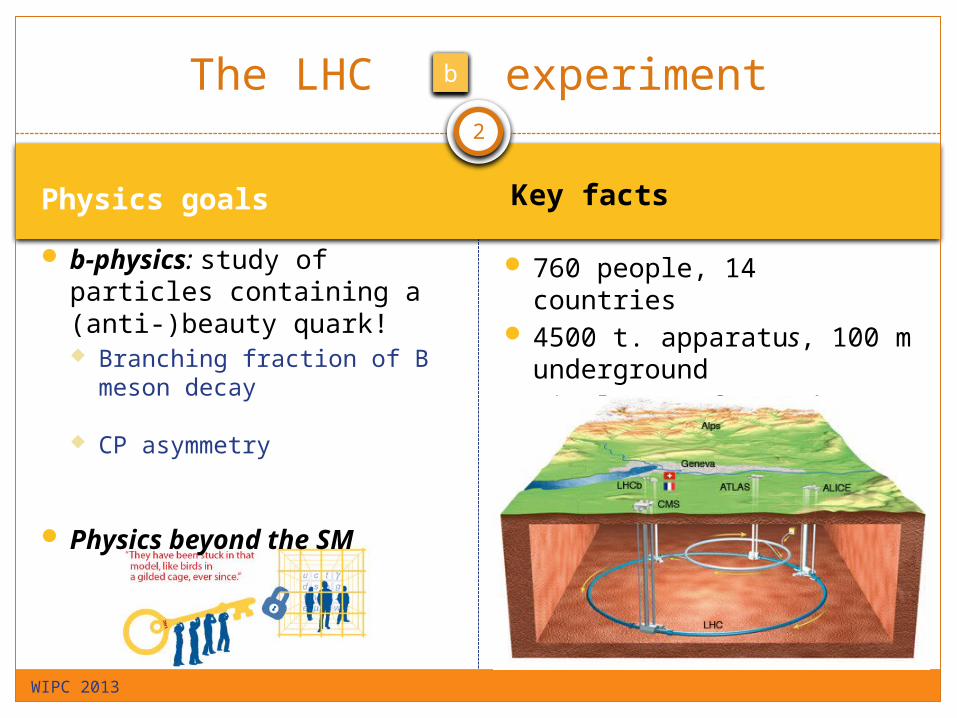
Key facts
b-physics: study of particles containing a (anti-)beauty quark! Branching fraction of B
meson decay Feynman diagram
CP asymmetry CKM matrix terms
Physics beyond the SM
The LHC experiment
WIPC 2013
b
Physics goals
b
760 people, 14 countries 4500 t. apparatus, 100 m
underground single arm forward (≠
ATLAS)
3WIPC 2013
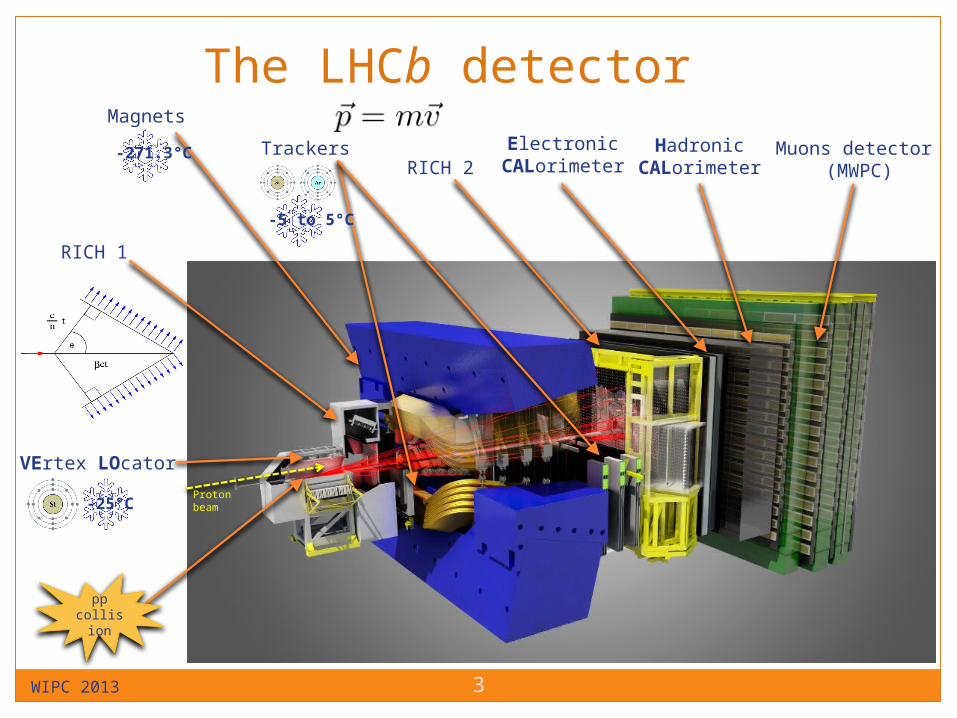
The LHCb detector
pp collisio
n
VErtex LOcator
RICH 1
Magnets
TrackersRICH 2
ElectronicCALorimeter
HadronicCALorimeter
Muons detector (MWPC)
-25°C
-5 to 5°C
-271.3°C
Proton beam

4
My job: measure CP asymmetry for
WIPC 2013
There are 2 main Feynman contributions to this decay.
Tree
Penguin (loop)
Radiative B decay :
A1
A2
Amplitudes

5
CKM terms and couplings
WIPC 2013
Cabbibo-Kobayashi-Maskawa CKM) matrix describes quark mixing in weak interactions.

6
Asymmetry
Conjugate process (CP)
WIPC 2013
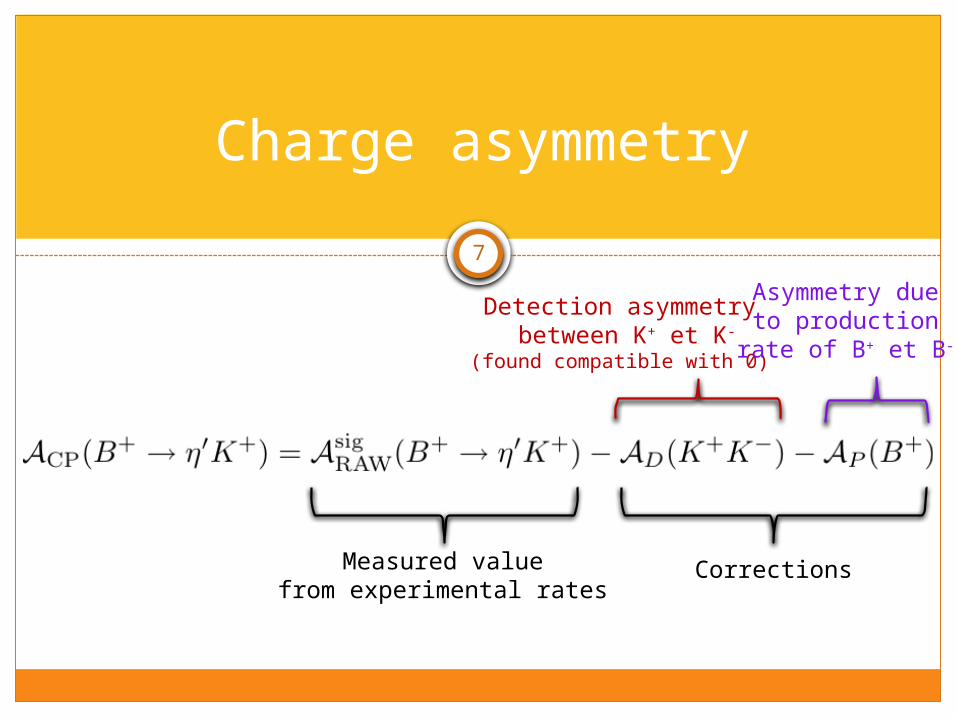
Charge asymmetry
Measured valuefrom experimental rates
Corrections
Detection asymmetry between K+ et K-
(found compatible with 0)
Asymmetry due to production rate of B+ et B-
7
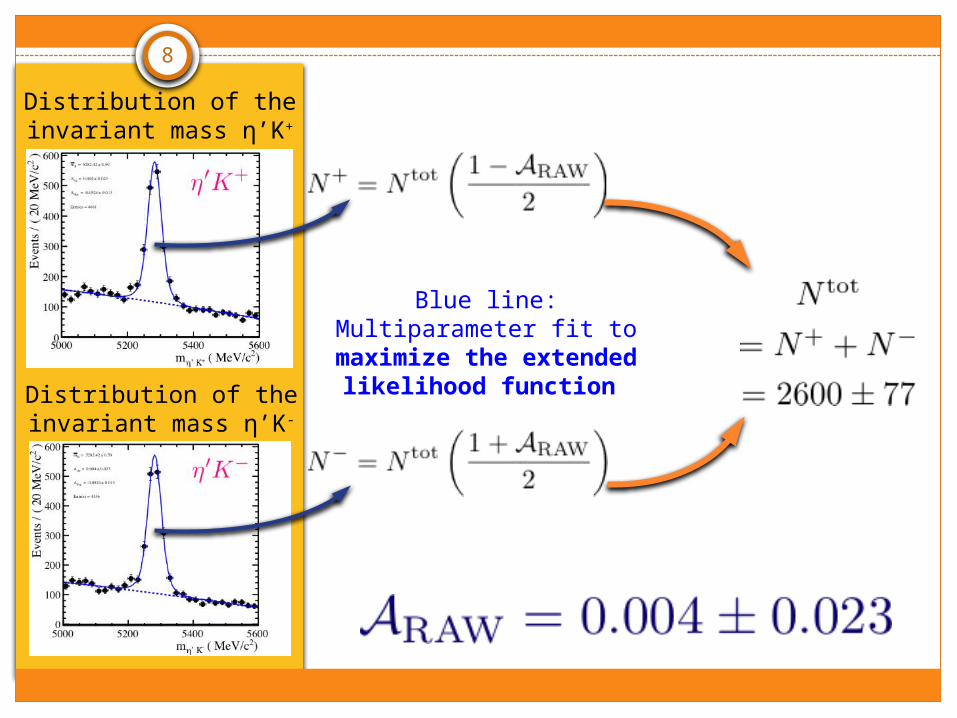
8
How to determine raw asymmetry?Distribution of the invariant mass η’K+
Blue line: Multiparameter fit to maximize the
extended likelihood function Distribution of the
invariant mass η’K-
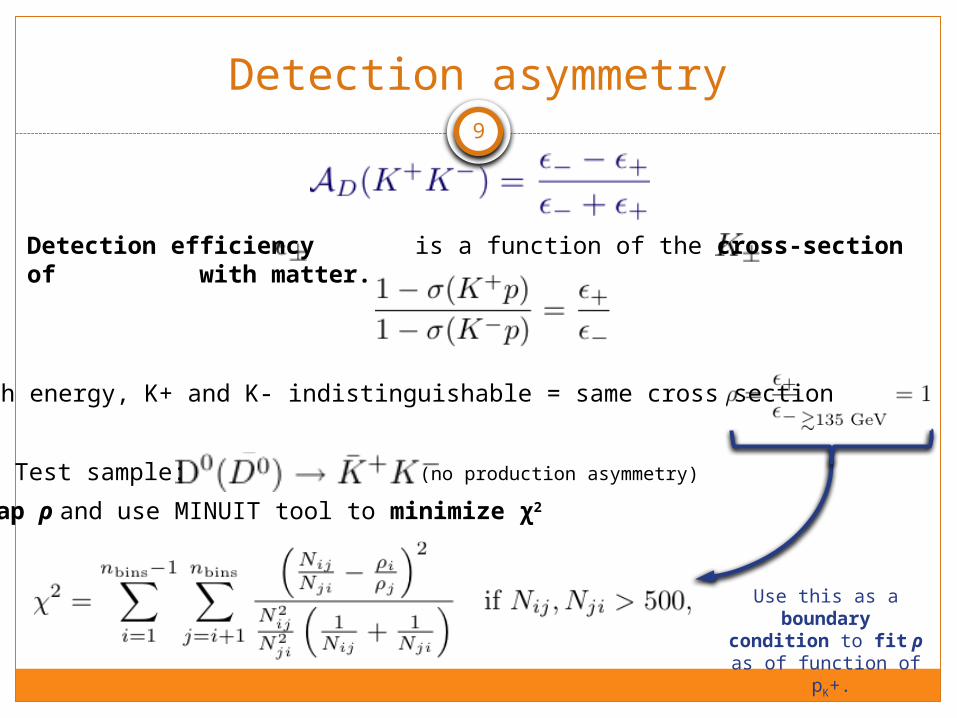
9
Detection asymmetry
Detection efficiency is a function of the cross-section of with matter.
At high energy, K+ and K- indistinguishable = same cross section
Use this as a boundary
condition to fit ρ as of function of pK+.
Map ρ and use MINUIT tool to minimize χ2
Test sample: (no production asymmetry)

10
Detection asymmetry computation
Distribution ofas a functionof the momentum
Distribution of thenumber of eventsas a function of
Distribution of thenumber of eventsas a function of
Integrate over the distribution to have number of events
11
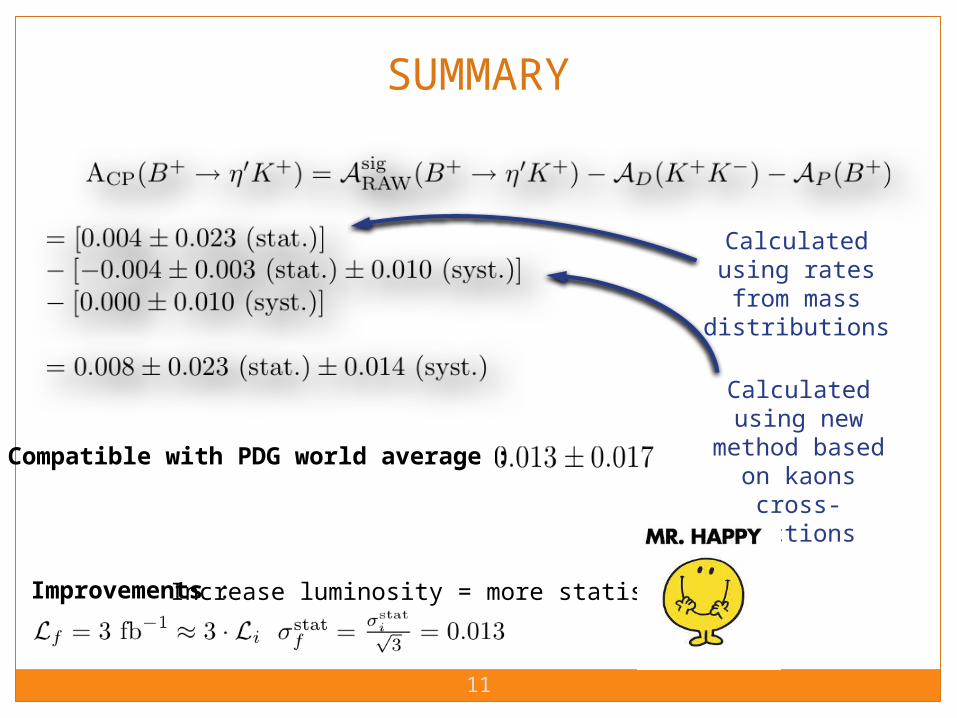
SUMMARY
Calculated using new
method based on kaons cross-
sections
Calculated using rates from mass
distributions
Compatible with PDG world average :
Improvements :Increase luminosity = more statistics

Appendix 1: 2D Likelihood fit
Poisson’s distr.
mB and mη’ are uncorrelated
Unbinned limit (either 0 or 1 event per bin)
12
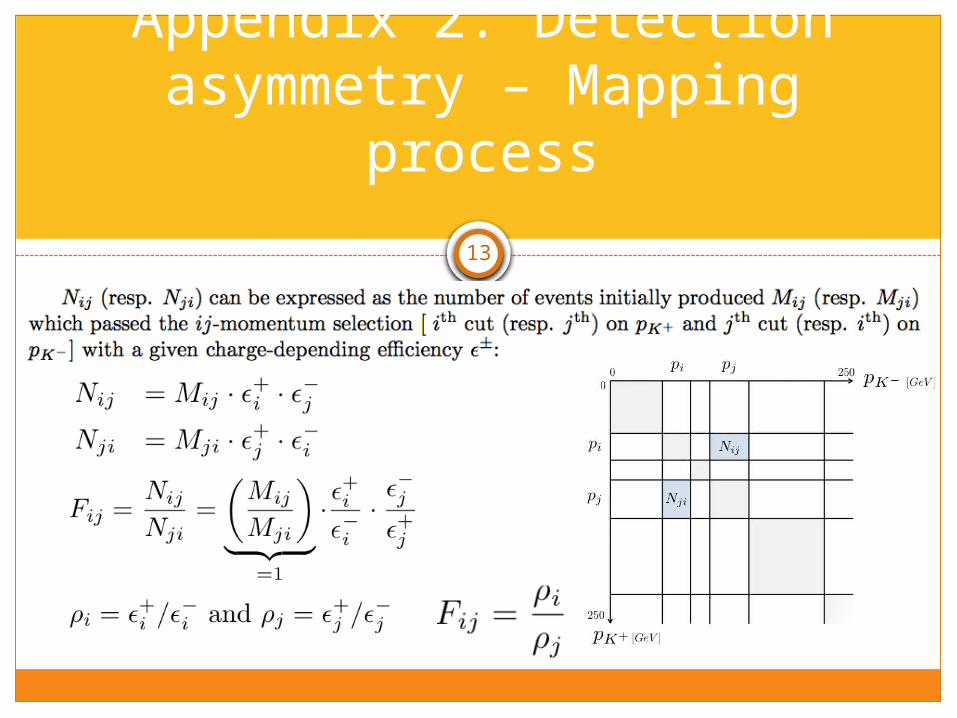
Appendix 2: Detection asymmetry – Mapping
process
13