ann04 india
TRANSCRIPT

8/6/2019 Ann04 India
http://slidepdf.com/reader/full/ann04-india 1/79
INFORMATION AND COMMUNICATION TECHNOLOGY AND DECENTWORK: STUDY OF INDIA’S EXPERIENCE
(Research Report prepared under the auspices of ILO/JILPT Networking of NationalInstitutes of Labour Studies in the Asia Pacific Region)
Uday Kumar Varma&
S.K. Sasikumar
V.V. Giri National Labour InstituteINDIA
November 2004

8/6/2019 Ann04 India
http://slidepdf.com/reader/full/ann04-india 2/79
1
INTRODUCTION
Technological change is always accompanied by realignments of the markets and
work organization. With the advent of information and communication tec hnology
revolution such realignments have undergone unprecedented changes. ‘Information-
isation’ of the society has placed work organization in the centrestage discussion on
reorganization of the economy. It benefits some and deprives others; it creates new
skills while effecting deskilling; it creates new commodities and alters relations
between human beings and the world of commodities. Information and communication
technology (ICT) enhances productivity and paves way for added employment
opportunities. Those economies, which innovated these technologies, have gained
global competitiveness and those who shied away from it lost economic opportunities
that they could have made use of. Digital globalisation has become the term of
postmodernity. Information-isation has both effective and affective dimensions; it
influences the whole social fabric by remolding the individual and inter-individual
relations in the civil space and in the family. It influences both work and leisure. ICT
heralds the days to come.
Digital globalisation cuts across the factor market barriers and ushers in possibilities
for narrowing down the gap between the developed and developing economies. Use
of ICT alters the labour processes and invents new forms of work organization. This
has paralled with the accentuated growth of globalisation and reformulations of work
organizations in most of the economic activities. The changed condition has led to
several reconsiderations of labour processes. Informationalism, which has set into all
societies, has led to several reconsiderations that affect labour flows and labour
processes. Institutions involved with the problematic of labour have begun to
reconsider their concepts and categories in a new light. Of various reconsiderations,
the question of decent work has emerged as a comprehensive term of new paradigm
during the turn of the last century. With the advent of ICT, the issue of decent work
has gained added importance because of the structural properties immanent in the
ICT sector and the anticipated impacts of it on development and labour processes.
The phrase ‘decent work’ has to be situated within this reconsideration. This phrase

8/6/2019 Ann04 India
http://slidepdf.com/reader/full/ann04-india 3/79

8/6/2019 Ann04 India
http://slidepdf.com/reader/full/ann04-india 4/79
3
activities, firm sizes and cluster characteristics. These micro indicators must be
understood in the context of the industry level characteristics of decent work.
Accordingly the report is structured in two parts. Part I of the report discusses the ICT
industry, its dominant characteristics and proliferation in India. Part II of the report
deals with the issue of decent work in the ICT industry. Part I is further subdivided in
three sections. Section 1.1 deals with the role of ICT in the development process.
Section 1.2 analyses the structure, composition and diversification of ICT industries in
India. Section 1.3 discusses the trend and pattern of growth of the industry in India.
Part II is further divided into two sections. Section 2.1 provides an overview of thedecent work in the industry on the basis of secondary literature and published
information Section 2.2 provides an analysis of the results of the primary survey of IT
industry workers. The conclusion sums up and underscores some of the important
findings and observations, and puts forward some of the possible trajectories of future
analysis.
Part I
1.1 ICT AND DEVELOPING ECONOMIES
The technological innovations in microelectronics, computing telecommunications and
opto-electronics, microprocessors, semi conductors and fibre optics have altered the
mode of assimilation, processing, storage and dissemination of Information.
Information thus, is becoming the mainstay of growth by increasing efficiency through
restructuring the organization of other factors of production, viz., capital and labour.
This ongoing process is ushering in a whole gamut of structural changes in every
sector of the economy across the globe. There are reductions in cost and increase in
growth. New entrepreneurial classes are emerging; new forms of work are replacing
the traditional forms. New Industries are mushrooming; traditional industries and
industrial structures are withering.

8/6/2019 Ann04 India
http://slidepdf.com/reader/full/ann04-india 5/79

8/6/2019 Ann04 India
http://slidepdf.com/reader/full/ann04-india 6/79
5
technology. The analysis carried out here is to search both of them as they have
presenced in Indian context.
1.2 GROWTH, STRUCTURE AND SPREAD OF ICT IN INDIA
In India, the advent of ICT has been viewed with immense optimism. ICT is being
prescribed as the panacea for a plethora of problems faced by India such as
unemployment, lack of growth, technological backwardness etc. The Ninth Five Year
Plan Document notes, “IT and allied sectors have immense potential for employment
generation. It is expected to emerge as one of the largest employers of work force in
the country, providing jobs to about 25% of the labour force in the long run. It is
expected to generate about one million additional jobs every year. It would also lead to
increased productivity in various sectors”(Planning Commission, Ninth Five Year
Plan(1997-2002) Document).
The growth of output in the ICT sector during the last two decades has been quite
impressive; the annual compound rate of growth of output was 37.4 per cent during
the twelve years between 1990-91 and 2001-02. (Chandrasekhar, 2002) The total
value has registered a significant increase from Rs.2214 crore during 1990-91 to Rs.
62134 crore by 2001-2002. (Table 1 and Chart 1).
Table 1
Estimates of Output of Indian ICT Industry (Rs. Crore)
Total Value
1990-91 2214
1991-92 2717
1992-93 3455
1993-94 4761
1994-95 6841
1995-96 9713
1996-97 13434
1997-98 18015
1998-99 23956
1999-00 33052
2000-01 54566
2001-02 62134
Source : Dataquest, Vol XIX No 13, July 15,2001,and Vol XX No 13, July 15, 2002

8/6/2019 Ann04 India
http://slidepdf.com/reader/full/ann04-india 7/79
6
Chart 1
Estimates of India's Industry output (Rs. Crore)
010000200003000040000500006000070000
1990-
91
1991-
92
1992-
93
1993-
94
1994-
95
1995-
96
1996-
97
1997-
98
1998-
99
1999-
00
2000-
01
2001-
02
The net result has been that the ratio of gross ICT output to GDP has grown from 0.38
per cent in 1991-92 to around 3 per cent by 2001-2002. This growth is impressive due
to two reasons. The first one is that this growth has been accompanied by significant
increase in exports of the sector. Growth in export of output of this sector has been
higher than the output growth. That is, the export led growth of this sector has been
advantageous to the balance of payment situation of India. Moreover, India’s share in
the world software and IT services production and export has been increasing over
time. The second reason is that, production in this sector has been effected entirely by
the private firms with institutional and policy support from the government. Both small
and large firms have more or less identical conditions for entry and sustenance. This
enables the developing countries to participate in this dynamic sector more effectively,
compared to the conventional industries. In the contemporary situation where the
State’s role in economic production is waning, this feature is quite impressive. To
comprehend this growth of the ICT sector we need to know the structure of it.
The ICT industry can be classified into three sectors for the purpose of discerning its
impact on the labour market and on decent work in particular; a) the ICT-producing
sector, which consist of the software and services, and hardware and peripherals b)
the IT-enabled Sector, and c) the ICT-Using Sector.

8/6/2019 Ann04 India
http://slidepdf.com/reader/full/ann04-india 8/79
7
1.2.1. Software Industry
The software segment dominates the ICT industry in India; more than 70 per cent of
the revenue is being generated by this segment (Table 2; Chart 2). The relative share
of all other segments, including the hardware segment, which at one time dominated
the industry, has been dwindling. The hardware segment, which accounted for 37 per
cent of total revenue in 1994-95 declined to 15 per cent by 2000-01.

8/6/2019 Ann04 India
http://slidepdf.com/reader/full/ann04-india 9/79
8
Table 2
Structure of ICT Industry in India: 1994-95- 2001-2002
(in percentages to the total value)1994-95 1997-98 1998-99 1999-00 2000-01 2001-02
Software Production 40.91 53.66 64.44 65.74 65.6 71.63Hardware Production 37.58 27.95 17.02 17.71 18.43 14.96
Peripherals Production 7.55 4.93 5.73 5.33 4.83 4.5
Training 5.24 5.23 4.99 4.61 4.2 2.36
Maintenance 6.96 4.39 3.9 3.03 2.89 2.95
Networking and others 1.76 3.84 3.92 3.58 3.9 3.6
Hardware Exports to Total IT Exports 0.85 0.61 2.78 3.9 4.4Software Exports to Total IT Exports 99.15 99.39 97.22 96.1 95.53
Domestic Share to total IT Industry 60.14 55.12 51.44 45.21 39.09
Total IT Industry (value in Rs.crores) 18016 23956 33053 54566 6213 Source : Dataquest
Chart 2
Structure of ICT Industry in India: 1994-95 to 2001-02 (Contribution of different
segements in percentages)
0
10
20
30
40
50
60
70
80
Software
Production
Hardware
Production
Peripherals
Production
Training Maintenance Networking and
others1994-95 1997-98 1998-99 1999-00 2000-01 2001-02
The software industry is predominantly an export-oriented industry, accounting for
above 70 per cent of the revenue of the software industry. The share of export
earnings in the total software revenue has been shooting up during the last decade.
The software exports from India have been growing at phenomenal rates during the
recent years (Table 3; Chart 3 & 4). In fact the boom in the ICT sector had been driven

8/6/2019 Ann04 India
http://slidepdf.com/reader/full/ann04-india 10/79
9
mainly by the export oriented growth of software industry. Indian IT software and
services exports accounted for over 18% of India's total exports during 2001-02. It is
expected that by the year 2008, Indian IT software and services industry will account
for 7% of India's GDP and 35% of India's total exports. However, India’s IT software
and services industry, at present, represents around 2% of the overall global software
market. The Government and software industry, however, have set an ambitious goal
for the software sector amounting to around $50 billion of software exports by 2008; a
share of 6% of the relevant global market (Dept. of Information Technology, 2003).
Table 3Software Exports from India
Year Software Exports(US$m)
Growth Rate ofExports
1989/90 105.4 511990/91 131.2 241991/92 173.9 331992/93 219.8 261993/94 314 431994/95 485 53
1995/96 734 51.341996/97 1085 47.821997/98 1750 61.291998/99 2650 51.431999/00 4000 50.942000/01 6300 57.52001/02 8500 43
Source : www.man.ac.uk/idpm/isiexpt.htm June 2002
Chart 3

8/6/2019 Ann04 India
http://slidepdf.com/reader/full/ann04-india 11/79
10
Exports of Indian Software Industries
0
2000
4000
6000
800010000
1 9 8 9 / 9 0
1 9 9 0 / 9 1
1 9 9 1 / 9 2
1 9 9 2 / 9 3
1 9 9 3 / 9 4
1 9 9 4 / 9 5
1 9 9 5 / 9
6 1 9 9
6 / 9 7
1 9 9 7 / 9
8 1 9 9
8 / 9 9
1 9 9 9 / 0 0
2 0 0 0 / 0 1
2 0 0 1 / 0 2
Chart 4
Growth Rates of Software Exports from India
010203040506070
1 9 8 9 / 9 0
1 9 9 0 / 9 1
1 9 9 1 / 9 2
1 9 9 2 / 9 3
1 9 9 3 / 9 4
1 9 9 4 / 9 5
1 9 9 5 / 9
6 1 9 9
6 / 9 7
1 9 9 7 / 9
8 1 9 9
8 / 9 9
1 9 9 9 / 0 0
2 0 0 0 / 0 1
2 0 0 1 / 0 2
The major destinations of software exports from India are the developed economies of
America and Europe; they together imported about 88 per cent of Indian software in
2000-01 (Table 4; Chart 5). U.S.A imported more than half of India’s export; in 1999-
00, North America accounted for 64 per cent of the exports. The demand for Indian
software exports to North America arises from different factors such as, shortage of
skilled workers in U.S., cheaper labour, lower cost of production in India and the 12
hour time gap between U.S. and India which makes it possible to have 24 hour
working days in the U.S. through networking.

8/6/2019 Ann04 India
http://slidepdf.com/reader/full/ann04-india 12/79
11
Table 4
Destination of Indian Software Exports
Destination 2000-01
USA & Canada 64.19
Europe (EU countries) 23.44Asian Region (Including Russia and CIS) 9.25
Oceanic countries 1.23
African countries 0.69
Europe (non EU countries) 1.08
Latin America 0.13
Total 100Source : Annual Report (2001), Dept. of Electronics,
Ministry of Information and Technology
Chart 5
Destination of Software Exports 2000-01
USA & Canada
Europe (EU countries)
Asian Region (Including Russia and CIS)
Oceanic countries
African countries
Europe (non EU countries)
Latin America
The majority of Indian software exports belonged to activities at the low end of the
value chain. The Indian exports mainly consisted of on-site software maintenance
work. Nevertheless, in the recent years, change in the trend towards off-site software
development. In fact, in the year 2001-02, a majority of the exports, for the first time,
were off-site (Table 5; Chart 6). The use of offshore development has helped Indian
companies to provide competitive advantage to their clients. With improving
infrastructure, such as greater bandwidth and larger number of servers, the share of
off-site work is only expected to increase.
Table 5
Locational Division of Labour in Indian Software Industry (in per cent)

8/6/2019 Ann04 India
http://slidepdf.com/reader/full/ann04-india 13/79
12
Location of work 1988 19951998-99 2000-01 2001-02
On-site 90 66 54.4 56 49
Off-site 10 33 44.4 44 51
Source : Kumar, 2001; NASSCOM CD-ROM
Chart 6
Locational Division of Labour in Indian Software
Industry (in percent)
90
6654.4 56
49
10
3344.4 44
51
0
20
40
60
80
100
1988 1995 1998-99 2000-01 2001-02
On-site
Off-site
Indian software companies have diversified their specializations in a wide range of
domains and industries. They are also able to undertake a variety of tasks. (Tables 6
& 7 ; Chart 7 & 8). Kumar (2002) observes that since the companies have diversified
their specializations, it provided scope for diversified earning potentials. For instance
the web-based revenue increased its proportion from 4.8 per cent to 16.6 per cent
over the period 1998-99 to 1999-2000. Such diversifications have also equipped the
companies to handle larger and more complex project than in the past. (Arora et.al,
2000)
Table 6
Major Domain Specialization of Indian Software Companies (1999-2000)Domains/Sector Number of Companies

8/6/2019 Ann04 India
http://slidepdf.com/reader/full/ann04-india 14/79
13
Offering Expertise Banking, Insurance, Stock Exchange, FinancialAccounting
247
Manufacturing, retail, trading & distribution 331 Transport/ airlines/ railways/ports 157 Web Applications/ Online Information Services 295 Engineering, Electronics, Design Automation/ Robotics
224
Medical & Health 163 Education, training/ entertainment 115 Telecommunications 174 Source : Kumar (2000b)
Chart 7
Major Domain Specialization of Indian Software
Companies (1999-2000)
247
331
157
295
224163
115174
050
100150200250300350
B a n k i n g ,
I n s u r a n c e ,
M
a n u f a c t u r i n g ,
r e t a i l , t r a d i n g &
T r a n s p o r t /
a i r l i n e s /
W e b
A p p l i c a t i o n s /
E n g i n e e r i n g ,
E l e c t r o n i c s ,
M e d i c a l &
H e a l t h
E d u c a t i o n ,
t r a i n i n g /
T
e l e c o m m u n i c a
t i o n s
Number of Companies Offering Expertise
Table 7
Major Areas of Specialization of Indian Software Companies
Areas Companies offeringexpertise
Web technologies/ intranet/ internet/ e-commerce 319
Euro currency solutions 132
Software product development 286
Software maintenance and migration 233RDBMS/ Data warehousing/ Datamining 215
ERP/ MRP Solutions 200
GIS/ Imaging 55
System Integration/ networking 192
Business Process Consultancy/ Reengineering 168
Source : Kumar (2000b).
Chart 8

8/6/2019 Ann04 India
http://slidepdf.com/reader/full/ann04-india 15/79
14
Major Areas of Speicialization of Indian Software Companies
319
132
286 233215 200 192
168
55
050
100150200250300350
Companies offering expertise
ICT has a tendency to cluster at specific regional locations and the relative size of the
clusters shift from one location to another. Currently, 97 per cent of the software firms
are working from Metropolitan cities and their suburbs. Although Bangalore is
considered India’s “Silicon City” today, the industry originated in Mumbai (Heeks,
1995). The business district of Nariman Point in Mumbai was the site of origin of the
Indian software industry in the late 1970s. Rise in prices and commute times led to the
industry moving to the Santa Cruz Electronics Export Processing Zone (SEEPZ) in the
city’s western suburbs.
The regional distribution of software industry is highly skewed even within the
metropolitan cities, with about 87 percent of the firms clustering in and around the
Mega cities of Delhi, Mumbai, Kolkatta, Bangalore, Chennai and Hyderabad in 2000-
01 (Table 8; Chart 9 & 10).
Clustering within a location provides cost advantages and locations outside the cluster
would engender higher transaction costs. Even at regions where this industry is in its
infancy, we can observe tendency to cluster. There are however considerable
differences among the mega cities on their relative share of software firms. While
Delhi and its suburbs had nearly a quarter of the total number of firms, Kolkatta had
only about 4 percent of firms. The southern regions of Karnataka, Tamil Nadu, Andhra
Pradesh and the western region of Maharashtra had a concentration of more than 62

8/6/2019 Ann04 India
http://slidepdf.com/reader/full/ann04-india 16/79
15
percent of all firms. This alludes to the fact that apart from high degree of clustering,
the industry itself is highly localized at certain regions.
The typical software firm is a multi-product firm. Most small software firms are
engaged in customized production. In general, the Indian software firms are involved
in different software activities, such as content development, CAD, CAM, GIS etc. But
there were considerable regional variations in the number of activities undertaken. For
example, firms in Kochi/Thiruvananthapuram undertake only 7 activities, while there
are 13 activities in Pune (Table 8). It suggests that there exist regional variations in the
capabilities and conditions of firms to diversify into diverse activities. Further, it can behypothesized that there is no one to one correspondence between the share of
different locations and the number of activities undertaken. The locations such as
Kolkatta and Pune elucidate this observation.
Table 8
Location of Software Firms 2000-01
Percentage Share of
Location
Average Number
of activityAhmedbad/Gandhinagar 2.3 10.8
Bangalore 18.1 11.2Kolkatta 3.7 11.9Chennai 10.4 11.4Delhi/Gurgaon/ Faridabad/Noida 24.3 10.7
Hyderabad 9.6 11.6Kochi/ Trivandrum 1.6 6.7Mumbai 21.2 11.1
Pune 2.2 12.9Others 6.7 11.0
All India 100.0 11.20Source : Abraham, (2003)
Chart 9

8/6/2019 Ann04 India
http://slidepdf.com/reader/full/ann04-india 17/79
16
Location of Software Firms 2000-01 (Percentage
share of Location)
Ahmedbad/Gandhinagar BangaloreCalcutta ChennaiDelhi/Gurgaon/Faridabad/Noida HyderabadKochi/ Trivandrum MumbaiPune Others
Chart 10
Location of Software Firms 2000-01 (Average number of activity)
10.8 11.2 11.9 11.4 10.7 11.6
6.7
11.112.9
11
02468
101214
A h
m e d b a d /
G
a n d h i n a g
B
a n g a l o r e
C a l c u t t a
C h e n n a i
D
e l h i / G u r g
a
o n / F a r i d a
H
y d e r a b a d
K o c h i /
T r i v a n d r u m
M u m b a i
P u n e
O t h e r s
1.2.2.Hardware Industry in India
Computer hardware comprises of data processing equipment (computers), peripherals
and networking products. There are four kinds of PC suppliers in India; they are:
Multinationals (MNCs), Indian brands, Branded assemblers and Unbranded
assemblers. There are certain specificities in the supply of hardware in India. In thetrue sense there is hardly any manufacturing of computer hardware in India. What are
supplied in India are assemblages of components imported from other countries. As
per the Manufacturing Association of Information Technology (MAIT) statistics,
unbranded assemblers carry out majority of the PC assembling. The MNCs such as
Compaq and HP procure their components from specific international vendors based
on the corporate vendor sourcing policy. (Table 9; Chart 11). The assemblers have

8/6/2019 Ann04 India
http://slidepdf.com/reader/full/ann04-india 18/79
17
been able to control the market mainly because of the import duty policy wherein the
import duty for the complete system is higher than duties for component parts. The
hardware segment has remained as an assembling segment mainly because of the
restrictions in the growth of the domestic manufacturing sector. Liberalization of
component imports and reductions in import tariffs would have encouraged all
producers to increase the share of components imported from abroad. Also, import
liberalization and the relaxation of regulations on foreign firms has increased the share
of major international players in the domestic PC market.(Chandrasekhar,2001). Many
firms, which were involved in hardware production, such as WIPRO, are moving
towards sale of imported systems as well as assembling of imported components. Theincreased dependence of the hardware sector on imported goods would mean that the
sector would have very low effect on growth and employment in the country. The
computer hardware production is more capital intensive than software production.
Probably, due to this fact, India has a comparative advantage of production of goods
requiring human skill rather than machineries. The relative importance of computer
hardware production in the ICT sector has declined over the years. This is evident
from the fact that in the past years the share of hardware segment in the total ICT
sector declined drastically to 15 per cent and 5 per cent in the peripherals (See
Table2).
Table 9
Type of Producers by Market share
Indian Brands 21%
MNC brands 22%
Branded assembled 19%
Unbranded assembled 38%Source: IT Industry Performance Mid-Year Review19 1999-2000,
Ministry of IT, New Delhi January 21, 2000.

8/6/2019 Ann04 India
http://slidepdf.com/reader/full/ann04-india 19/79
18
Chart 11
Type of Producers by Market Share
21%
22%
19%
38%
Indian Brands
MNC brands
Branded assembled
Unbranded assembled
In terms of the structure of computer systems, the Indian market has a very large
share of single user systems and it has been increasing (Table 10; Chart 12 & 13 ).
This suggests that computers are fast diffusing into smaller markets and they are
increasingly finding inroads into household and retail level activities. The MAIT Mid-
Year review for 1999-2000 revealed that PCs sold to the business segment grew by
42%, while in households it was 58% during the previous year (1998-1999). In the
small size establishments within businesses, i.e. those firms with less than 10
employees at the floor, PC consumption grew by 57% during the same period—a
significant improvement in the PC penetration into the smaller sector. The
socioeconomic class ‘B’ (the not so up-market households) has increased their
share in total purchases to 38% compared with 28%, implying that PCs are finding
their way into lesser affluent and not-so-up- market homes as well. (Gopalan, 2001).
Table 10
Structure of Sale of Computer Hardware (In Percent)
2000-01 2001-02
Hardware Units Valu Units Value
Servers 2.20 17.9 1.67 16.56
Workstations 0.60 2.85 0.53 2.72
Single-user systems 97.20 79.20 97.81 80.72
Total systems (In Numbers) 1,978,452 10,059 2,085,969 9,295
Source : Dataquest
Chart 12

8/6/2019 Ann04 India
http://slidepdf.com/reader/full/ann04-india 20/79
19
Structure of Sale of Computer Hardware Units (%)
2.2 0.6
97.2
1.67 0.53
97.81
0
20
40
60
80
100
120
Servers Workstations Single-user
systems
2000-01
2001-02
Chart 13
Structure of Sale of Computer Hardware Value (%)
17.94
2.85
79.2
2.72
80.72
16.56
0
10
20
3040
50
60
70
80
90
Servers Workstations Single-user
systems
2000-01
2001-02
1.3.3 The IT-enabled Sector
IT–enabled services is a product of the ‘digital convergence’ of information technologyand communication technology, which have facilitated a global electronic network. A
whole new gamut of services, under the generic title IT-enabled Services (ITes) have
cropped up, especially in the labour abundant developing regions of South Asia and
South–East Asia. There are four types of IT-enabled services in India, they are the
following: a) in house or captive centers, units that originally spin-offs, business

8/6/2019 Ann04 India
http://slidepdf.com/reader/full/ann04-india 21/79
20
process outsourcing units and broad based service producers who offer consulting or
IT services in addition to BPO. (Chandrasekhar, 2002)
IT-enabled services take advantage of the cheap skilled labour and also the
international time differentials. ICTs allow for the increased tradability of service
activities, particularly those that have been constrained by the geographical distance
and temporal separation between production and consumption. It has also enabled
spatial division of labour in the production of certain services such as legal databases,
remote maintenance of accounts, data processing etc. The essential difference
between IT-enabled sector and the IT-using sector is that while latter had existedbefore the advent of IT and had utilized traditional production techniques, the former
sector is the product of IT and cannot exist independent of it. In terms of sourcing of
work many large firms have their own out location units in different parts of the world.
Apart from that there are also specialized outsourcing firms which work as
independent units taking up outsourced works of other firms.
The outsourced or cross-border IT-enabled services are now receiving greater
attention as this category of ITes has a great potential for growth and contribution
towards employment opportunities in India. The spectrum of I.T-enabled services in
India is fast getting diversified into a variety of activities such as Call Centers, Medical
Transcription, Back Office Operations, Revenue Accounting, Insurance Processing,
Legal databases, Content Development, Payroll, Logistics Management etc.
The NASSCOM survey (NASSCOM, 1999) of I.T. Enabled Services estimated that
this sector employed 41,000 people in 1999 and they generated revenue of Rs. 20.30billion (Table 11). This is expected to increase to Rs. 810 billion by 2008 and the
sector is projected to employ more than 1 million people. A huge pool of English
speaking and computer literate workforce, relatively lower wages and availability of
infrastructure for setting up I.T-enabled services have provided the competitive
advantage for India to be a destination for the cross border outsourced IT-enabled
services. The proliferation of I.T-enabled services and its continuing demand-led

8/6/2019 Ann04 India
http://slidepdf.com/reader/full/ann04-india 22/79
21
growth may well open up strong opportunity for India in terms of generating
employment as well as increased export. However, the current trends are such that for
most IT-enabled service providers in India, a majority of the revenue comes from
serving clients in industries such as banking and finance, insurance, e-commerce,
software, telecom, media and entertainment, retail trade and airlines. Most of them
currently focus on a narrow portfolio of services, settling for low-end work. While most
IT- enabled service companies plan to enhance the existing skills, expertise and
established reputation with clients to grow their portfolio of services, they remain
cautious about migrating their service portfolio to high value services
(www.dqindia.com, 29
th
July, 2002)
[
Table 11
Revenues of IT-Enabled Sector (Rs.Billion)
IT Enabled Services 1999 2008(Projection)
Back Office Operation/ Revenue Accounting/ Data Entry/ Data Conversion
6.8 1900
Remote Maintenance andSupport 2.7 1350
Medical Transcription/ Insurance Claim Processing
3 110
Call Centres 1 60Data Base Services 0.7 65
Content Development 6.1 250
Total 20.3 810
Source : NASSCOM (1999), NASSCOM- Mckensey Report, New Delhi
Table 12 depicts the employment and revenues from the IT-enabled services. Both
employment and revenue have increased substantially between 1999 and 2002.
This growth has been impressive within the short span of three years. Contribution
of IT-enabled services to the total IT exports has also been on an increasing path
between 1999 and 2002; it increased from 14 per cent to 19 percent.

8/6/2019 Ann04 India
http://slidepdf.com/reader/full/ann04-india 23/79
22
1.3.ICT DIFFUSION IN INDIA
We have already observed that ICT sector has been growing in an impressive
manner. It is important to examine the extent of diffusion of ICT because to gain
international competence and to sustain the growth diffusion of it within the country
is critical. Diffusion can take place in four different ways; they are the following:
1. Through the growth of IT sector itself
2. Through the diffusion of information technology into the manufacturing sector,
which transforms production processes and increases productivity.
3. Through the utilization of IT networks by producers and consumers to undertakeonline transactions, which would reduce transaction costs and alter market
structures.
4. Through the utilization of IT network by governments, communities and individuals
to share/provide information and offer various services either for a fee or free of
cost. (Chandrashekhar, 2002)
If IT sector can get diffused in the developing economies, then the greatest attraction
of ICT is its ability to narrow down global income inequalities. Not only that ICT can
be a growth engine on its own by increasing efficiency in the production process, but
it can also be instrumental in redistribution of wealth and poverty reduction by
reaching the less privileged segments of the economy, such as the rural areas and
women. Yet, the real question is whether it is actually able to diffuse into other
sectors and enhance growth and development. Many studies have confirmed the
positive pay offs of IT in enhancing growth and development. Kraemer and Dedrick
(2001) find evidence of positive correlation between IT expenditure and growth inGDP and productivity in the Asia-Pacific region. Similarly, Jorgenson and Stiroh
(1999) and Oliner and Sichel (2000) have argued that the ongoing technological
innovations in ICT have augmented economic growth in many industrialized
economies by restructuring the organization of the primary factors of production, viz;
capital and labour, especially the latter.

8/6/2019 Ann04 India
http://slidepdf.com/reader/full/ann04-india 24/79
23
In the Indian context, however, available evidence shows that in the manufacturing
sector, there is hardly any use of IT. Prevalence of IT use was confined to
accounting and management, which accounted for 35 per cent of the total work-load
(Table 12). The utilization of networking facilities, Internet and robotics was
extremely low at 1.5 to 4 per cent. It is evident that till now the Indian manufacturing
sector have not tried, in a large scale, to utilize IT in the production process. But
there are exceptions as well; for instance in the motion pictures industry about 27
percent firms use robotics and in non-conventional energy industry 25 percent firms
use robotics and artificial intelligence.
India’s enviable growth in the ICT sector thus is not flowing into the rest of the
economy. The export-oriented growth of the software industry in India has so far
received ensured demand for abroad, but not so much from internal market. It is
essential that India develop a specific diffusion policy, especially in the
manufacturing sector to exploit this technology so as to achieve greater productivity,
redistribution and growth.
Despite all these, there have been many attempts both by the government and by
the Non-government sectors to harness the potential of the technology. New
innovations in the technology that would suit the Indian populace have been another
move in this direction. For example, the Simputer, developed from Indian Institute of
Science, Bangalore and Encore, a software company providing computing facility at
U.S.$200 compared to the P.C. at $650.00. Similarly, the corDECT of Indian Institute
of Technology, Madras provides advanced wireless access system and Midas
Communications and Analog Devices Inc. provide access with seamless integration
of voice and Internet services. The investment in the equipment, U.S.$ 45000, can
serve about 1000 customers in a radius of 10 to 25 Kms in rural areas (World
Economic Forum, 2003).
Table 12
The Use of ICT in the Manufacturing Sector of India (Percentage to total number of factories)
NIC ClassificationNo. of
FactoriesComputer for
Managerial Using Network UsingRobotics,
computer in

8/6/2019 Ann04 India
http://slidepdf.com/reader/full/ann04-india 25/79
24
(Numbers)
/accounting work Internet productionprocess
Food products 14695 13 0.8 1.4 0.9
Other food products 8109 24.2 1.4 2 1.1Beverages tobacco etc 8668 47.8 0.4 0.3 0.2
Cotton textiles 9227 22.3 0.5 1.9 1.5
Wool silk manuf. Of textiles 3989 49.3 1.3 2.3 1.9
Jute& other veg fibre textlites 503 16.7 4 3.8 2.8
Textiles prodn incl. Apparel 5409 51.3 3.2 11.3 2.7
Wood & wood products 3787 9 0.4 1 0.2
Paper& paper products 6304 38.5 1.8 3.7 4.7
Leather products 1742 37.6 1.9 7.2 0.3
Basic chemicals & products 9357 50.7 2.9 5.6 2.6
Rubber plastic & coal 7597 42.6 2.8 4 1.6Non-met. mineral products 11376 13.4 0.4 0.9 1.1
Basic metal & alloys 6915 41.9 0.9 3.7 1.7
Metal products 8243 31.7 0.9 2.9 1
Machinery & equipment 8208 44.4 2.1 5.6 2.7
Electric machinery & equipment 5743 55.8 3.5 10.9 4.9
Transport equipment 3999 47 1.6 7.2 2.6
Scientific equipment 2243 48 4 14 4
Repair of capital goods 2240 25.9 0.8 2 0.4
Electricity 3644 64.7 0.9 3.1 3.2
Gas and steam 80 75 2.5 3.8 5
Water works and supply 293 10.6 0.7 1 0.7
Non conventional energy 4 50 25 25 25
Storage& warehousing 1078 9.7 0.4 0.4 0.1
Sanitation 102 3.9 0 0 0
Motion picture etc 51 64.7 7.8 0 27.5
Laundry & others 94 18.1 0 0 0
Repair services 1966 37.6 2.6 4 1.1
Total 135666 135666 47067 2043 5046
Percentages 100 34.7 1.5 3.7 1.8Source : Annual Survey of Industries (1998-99)
India is one of the pioneers in introducing ICT in the realm of governance; to begin
with, its applications were mainly for cost optimization, decision-making, reducing
corruption, project monitoring and rural development. By the late eighties
establishments such as NICNET connected government users, EDUNET connected
educational institutions and INDONET for industrial users. (Bhatnagar, 1990) Many

8/6/2019 Ann04 India
http://slidepdf.com/reader/full/ann04-india 26/79
25
State governments introduced ICT to enhance administrative performance and e-
governance found its ways at different levels of administration. E-governance in India
tries to develop infrastructure, train human power and to initiate policy changes.
Details pertaining to some of the major E-Governance projects are provided in Table
13.
Table 13Major E-Governance projects initiated by Government Department/Agencies
at the State and District Levels
Project Implementer (s)/
Collaborators
Technology/ Innovation
Expected/ Actual
outcome
InterfaceAgency
Location Remarks
IndiaHealthCareProject
Government of India,AppleComputers,CMC Ltd.,Institute ofDesign,CDIT
Navigationbased oniconicrepresentations on amodifiedNewtonMessagepad
Reduce timespent onpaper work;increase theaccuracy ofdatasupplied,electronicstorage ofvillage levelhealth data.
RuralhealthCareWorkers(AuxiliaryNurseMidwives)
PilotProject runinRajasthan
ObsoleteTechnologyfrom AppleComputers,NewtonTechnology isno longer inproduction inApple
BHOOMI Government ofKarnataka,NICCompaq
Compressing the entireland relateddata intodigital formatand settingup touch-screenkiosks in 177talukas fromwherefarmerscould get therevenuedocument bypaying Rs.15 as userfee.Proprietarysoftware
Curbscorruption,demystifyland registryoperation;enhancetransparency, faster andmore reliabledelivery.
LandregistrationDepartment
Karnataka The system hasbeen put intooperation aftervalidation of 20million printoutsthrough villageofficials andafter distributingthem to 6.7million farmersfor theirfeedback. Atotal 700officials for 177sub- districtshave beentrained for thepropose

8/6/2019 Ann04 India
http://slidepdf.com/reader/full/ann04-india 27/79
26
incorporatingCompaq’sbio-logon
metricssystem,whichauthenticates users ofthe softwareusing theirfingerprint.Softwaresensitive tovariations in
manualrecordsacrossdistricts.
MaharashtraEmergencyEarthquakes
RehabilitationProject
Government ofMaharashtra, DFID,UNDP,Gol, World
Bank
VGF andVSATnetwork forconnectivityand GISbased
DisasterManagementInformationSystem
Betterresourcemobilization,fasterdecisionmaking, cost
reductionand efficientuse ofinformationpool.
Government officialsand NGOs
Maharashtra
Effectivenessdepends greatlyon commitmentof personnelinvolved.
WarnaWiredProject
GOM, NIC A complex ITinfrastructurewith high-speedwireless LANwith the
VSAT andMast for itsomni-directionalantenna of2Mbpsbandwidth,proxy server.
Increaseefficiencyandproductivityofcooperatives
. Createmoreemploymentopportunities.
Cooperative Societies
Maharashtra
A strongexample ofState-Civilsocietypartnership
Moderniza National Micro Disincentive Milk Gujarat Diffusion

8/6/2019 Ann04 India
http://slidepdf.com/reader/full/ann04-india 28/79
27
tion ofmilkcollection
centers
DiaryDevelopment Board
Processorbased milkcollection
systemconsisting ofmilkweighingsystem, dataprocessor,and printerto measurethe butterfatcontent ofmilk test the
quality ofmilk andmake promptpayments tofarmers.
s ofadulteration,reduced time
for payment,confidencebuilding.
Cooperatives
depends onPrivate sectorinitiatives for
massproduction.
Computerization ofPostalSystem
Government ofAndhrapradesh, CMC
Proprietaryhardwarebased onMotorola 68kprocessorwith LCD
andkeyboardcalledComputerized UniversalPostalSystem(CUPS)incorporatingregionallanguages
for interface.
Optimizationof regularworkschedules,singlewindow
operation,reduction indeliverytime.
PostOffices
AndhraPradesh
Low level ofdiffusion,thoughexclusivelydesigned forrural areas,
tested only in athree urbanpost offices.

8/6/2019 Ann04 India
http://slidepdf.com/reader/full/ann04-india 29/79
28
ComputerAided
Administration ofRegistrationDepartment
GoA, APTechnology
Services,NIC,FortuneInformaticsLtd., NIIT
Electronicdelivery of
landregistrationservicesthrough aclient-serverarchitecturesystem usingthe CARDsoftwaredevelopmentfor the
purpose,hosted byAP Statewide AreaNetwork(ASPWAN)using 2MPBoptic fibrelink.
Demystification of land
registry,enhancetransparency, faster andmore reliabledelivery,automationof indexingandaccounting,improve
citizeninterface.
LandRegistratio
nDepartment
AndhraPradesh
Huge Cost ofmaintenance,
Service chargesto be levied forcoveringestablishmentcosts.
GyanDoot GoM, ZilaPanchayat,
IIT Chennai
Pentium IIremote
accessServer andkiosks withOFC. Lowcost TDMAbased WLLindigenouslydevelopedby IITChennai toimprove
bandwidthandconnectivityproblems.
E-Governance,
E-Education,enhancement of efficiencyofgovernments, promptservicedelivery.
ITDepartmen
t, GoK,through ITMission,Kerala
Kerala Functioningonly in District
Centers. Notaccessible tovast Majority ofvillagers andthose who liveoutside the citylimits. Low userturn out.
FRIENDS Government ofKerala, C-DIT,Comtech IT
Fees andcharges fordifferentservicescould be
Eliminate thequeue andavoid longwaiting time.
ITDepartment, GoK,through ITMission,
Kerala Functioningonly in DistrictCenters. Notaccessible tovast Majority of

8/6/2019 Ann04 India
http://slidepdf.com/reader/full/ann04-india 30/79
29
Solutions paid in asinglelocation with
computerized billing. Thesoftware,which usesASP,Windows2000 andSQLRDBMS, isprogrammedto accept
paymentsdue todifferentagencies byincorporatingthe specificrules andregulationsregardingremittancespertaining to
eachagency.
Kerala. villagers andthose who liveoutside the city
limits. Low userturn out.
IT@School
GoK,Microsoft
Computersbought bythe schoolshould havepre- installedWindows9xas operatingsystem.
Moreeffectivedissemination ofcomputerknowledge inschools.
Department ofEducation,Government Schools
Kerala Criticized for itindifference touse FSF, delayin theinstallation ofequipments andpublication oftext books aswell as training
for teachers.Sevana GoK (IT
department) StateLibraryCouncil,IMK
Packagenamed‘Sevana’providesinformationon variousgovernmentschemes,programmes
Enable therural citizento have freeaccess tothe internet,enhancetransparencyandefficiency.
StateLibraryCouncil
Kerala Pilot project hasbeen started inKallara villagein Trivandrum.

8/6/2019 Ann04 India
http://slidepdf.com/reader/full/ann04-india 31/79
30
, generalinformationon local
bodies, linksto importantsites andother factsrelevant tothe ruralpopulace.
Source: Sreekumar(2002)Note: This is not an exhaustive list. Moreover, computerization projects of Government Department without theinvolvement of citizen interface are also omitted.
National information Centre of Government of India and state level educational
institutions collaborated to launch networks of fibre-optic cables, V-SATs, PCs etc.
However, E-governance has to go a long way to attain sustainable human
development and eradication of poverty.
E-governance is being experimented at various levels of administration by different
government bodies. ICTs can significantly reshape the relationship between the
government, private sector and the civil society by increased communication and
networking, which in turn would provide greater transparency and accountability.
Andhra Pradesh and Madhya Pradesh had been the two pioneer States in introducing
ICT in governance. The annual plan of each department/sector in Madhya Pradesh
Government have detailed sub-plan for IT. A distinct budgetary head of account for IT
related activities is introduced in the annual budget. An action plan is prepared to
ensure that all offices of the district Government including those at the sub-district
levels are computerized and networked by the year 2003. Another similar example is
the computerization of the Mandal Revenue Offices in the State of Andhra Pradesh.
As part of the project all the MROs (totalling 1124), the revenue divisional offices (78),
the collectorates (23), the office of the commissioner of land revenue, and the
directorate of economics and statistics at Hyderabad are getting computerized. This
involves data collection, development and implementation of appropriate databases
and development of human resources through intensive training. Storage of a wide
range of information, including documents relating to property rights in computerized

8/6/2019 Ann04 India
http://slidepdf.com/reader/full/ann04-india 32/79
31
databases and providing public access to these databases would promote
transparency that strengthens democracy, empowers people and speeds up decision-
making.
Another type of initiative emanates from the civil society, such as the M.S.
Swaminathan Foundation, which is implementing the “information village” project in
four villages of Tamil Nadu. The foundation provides villages with free technology and
information in exchange for the villages’ promise to house the computers and staff
who are operating there. The foundation extents its expertise and information on
technical matters relating to best agricultural practices, combating pest attacks; but
more importantly it provides ready access to information on market conditions,
opportunities and prices that allow small farmers to maximize incomes from their
output.
The gain in consumer surplus (the difference between the price that a consumer
actually pays and the price that the same consumer is willing to pay) depends not
merely on the total amount of IT spending but also on the composition of IT spending.
In the case of India, it is an ICT exporting country and its performance in the internal
consumption is said to be not impressive and this could be one of the reasons for
lesser gains in consumer surplus when compared to other countries such as U.S.,
U.K., Singapore, Australia and New Zealand. India is facing an adverse terms of trade
because the prices of commodities (ICT) is generally falling it is importing
commodities which are becoming more expensive. Further, the general wage hike in
the IT sector is adversely affecting (Dutch disease) the general growth of other
sectors (Joseph, 2001). In general what one can state at this juncture is that, internalconsumption of ICT products have to be promoted while maintaining the exports of
this booming sector.
There are many exercises of IT diffusion at the pilot study level, but they have not
made sufficient inroads into the economy that any claims can be made regarding its
impact on the macro economy. If ICT is to make significant impacts on the economy, it
is essential that there are greater concerted and coordinated efforts by the

8/6/2019 Ann04 India
http://slidepdf.com/reader/full/ann04-india 33/79

8/6/2019 Ann04 India
http://slidepdf.com/reader/full/ann04-india 34/79
33
Table 14
Indicators of Information Technology
Country Name
ICT Expenditure (%
of GDP)
Internet hosts
(per 10,000
people) Internet users(in thousands)
Personal computers
(per 1,000 people)
1992 1999 1999 1990@ 1999 1990 1999
Brazil 3.5 5.8 18.5 5 3500 3.1 36.3
China 1.9 4.9 0.5 N/A 8900 0.4 12.2
Finland 4.7 5.9 1117.0 70 2143 100.0 360.1
India 1.7 3.5 0.2 1 2800 0.3 3.3
Israel 4.6 7.4 187.0 5 800 63.3 245.7
Ireland 5.5 6.5 155.6 2 679 85.7 404.9
Netherlands 6.7 7.1 403.4 80 3000 93.3 359.9
United Kingdom 7.2 9.4 268.8 100 12500 107.6 302.5
United States 7.5 8.9 1479.7 3000 74100 216.8 510.5
Source : World Development Indicators,(2001), IBRD@ Internet users for Brazil, Finland, Ireland, Netherlands, U.K. and U.S.A. is in 1991 and India is1992
Chart 14
ICT Expenditure (%) in different countries
3.51.9
4.7
1.7
4.65.5
6.7 7.2 7.55.8
4.95.9
3.5
7.46.5 7.1
9.4 8.9
02468
10
B r a z i l
C h i n a
F i n l a n
d I n d i a
I s r a e l
I r e l a n d
N e t h e
r l a n d s
U n i t e d
K i n g d o
m
U n i t e d
S t a t e s
1992 1999

8/6/2019 Ann04 India
http://slidepdf.com/reader/full/ann04-india 35/79
34
Chart 15
Internet users in 1999
35008900
2143 2800 800 679 300012500
74100
01000020000300004000050000600007000080000
B r a z i l
C h i n a
F i n l a n d I n d
i a I s r a
e l I r e l a
n d
N e t h e r
l a n d s
U n i t e d
K i n g d o
m
U n i t e d
S t a t e s
Chart 16
Personal Computers in numbers (per 1000 people)
3.1 0.4
100
0.336.3
360.1
245.7
404.9
359.9
302.5
510.5
107.6
216.8
93.385.763.3
12.23.3
0
100
200
300
400
500
600
B r a z i l
C h i n a
F i n l a n d I n d
i a I s r a
e l I r e l a
n d
N e t h e
r l a n d s
U n i t e d
K i n g d o
m
U n i t e d
S t a t e s
1990 1999
It is also contended that India’s Internet users have not brought in any of the Indian
languages into the web. It is said that there may be e-zines and several entertainment
and localized information sites, but there is no focus on access to services for the
regional languages (Joyojeet Pal, 2003) unlike China’s experience.

8/6/2019 Ann04 India
http://slidepdf.com/reader/full/ann04-india 36/79
35
In the case of communication indicators too India’s records are abysmal in
comparison to developed countries as well as developing economies like China and
Brazil (Table 15). Interestingly, the average minutes per subscriber’s international
outgoing traffic has declined for both India and China during the period 1990 to 1999.
Again, in 1990 both China and India had reported same levels of telephones and
mobile phones, but by 1999 China had outpaced India by many times in both
telephone lines and mobile phones. But both countries are very much below in this
case when compared to the developed economies.
Table 15
Indicators of Communication Technology
Country Name
International
telecom, outgoing
traffic (minutes per
subscriber)
Mobile phones
(per 1,000
people)
Telephone
mainlines (per
1,000 people)
1990 1999 1990 1999 1990 1999
Brazil 17.5 23.6 0.0 89.3 65 149
China 51.1 17.9 0.0 34.1 5.9 85.8
Finland 69.7 151.1 51.6 651.0 534 557
India 29.4 17.9 0.0 1.9 5.9 26.5
Israel 72.6 279.0 3.2 472.0 343 471
Ireland 265.4 573.0 7.1 447.4 281 478
Netherlands 130.0 224.0 5.3 436.0 464 607
United Kingdom 99.6 179.7 19.3 457.0 441 567
United States 58.9 154.6 21.1 311.6 545 664Source : World Development Indicators,(2001), IBRD
Even within the country the trends in telecommunication density point towards a
regional digital divide; States like Bihar, Orissa, West Bengal and Uttar Pradesh are
having only a marginal position in the ongoing technology revolution. During the
period between 1997 and 2000, Punjab and Kerala almost doubled their Tele-density,

8/6/2019 Ann04 India
http://slidepdf.com/reader/full/ann04-india 37/79
36
and most states were able to record at least one unit rise in the Tele-density in the
same period. At the same time, West Bengal, Uttar Pradesh, Orissa and Bihar had
made slow progress. Telephone lines being an essential component of the ICT the
regional variations in the Tele-density would mean the productivity, growth and
development benefits of ICT would not reach certain geographical locations and this
result in a regional digital divide in the economy (Table 16; Chart 17).
Table 16
Tele-density Variation Across States of India
State 1997 1998 1999 2000Punjab 3.34 4.1 5.03 6.18Maharashtra 3.38 3.92 4.55 5.28Kerala 2.67 3.22 3.88 4.68Tamil Nadu 2.14 2.57 3.09 3.72Gujarat 2.44 2.79 3.19 3.64Haryana 2.00 2.36 2.8 3.31Karnataka 1.98 2.34 2.76 3.26Rajasthan 1.32 1.65 2.06 2.57Andhra Pradesh 1.35 1.59 1.87 2.2Madhya Pradesh 1.06 1.27 1.52 1.82West Bengal 0.96 1.09 1.23 1.39Uttar Pradesh 0.68 0.83 1.02 1.25Orissa 0.59 0.69 0.82 0.96Bihar 0.36 0.43 0.5 0.59Source : Department of Telecommunication,

8/6/2019 Ann04 India
http://slidepdf.com/reader/full/ann04-india 38/79
37
Chart 17
Tele-density variation across states in India
01234567
P u n j a b
M a h a r
a s h t r a K e
r a l a
T a m i l N a
d u G u j a r a t
H a r y a n
a
K a r n a t a k a
R a j a s t h a n
A n d h r a
P r a d e s h
M a d h y
a P r a d e s h
W e s t B
e n g a l
U t t a r P r
a d e s h O r i
s s a B i h a r
1997 1998 1999 2000
Development rural connectivity, E-Governance, Wired Microecomerce, IT-enabled
Artisanal Industries, Computer training, Tele-Health, research Advocacy and
Consultancy Resources etc. could allow the rural citizenry to make more informed
choices in their daily life. However, despite the economic promise of ICTs the
immediate impact of it in rural areas are far from equitable due to factors such as
differential access to capital resources, literacy and education, access to education,
agricultural technologies, etc. These inequalities are the result of socio-culturalasymmetries such as land ownership and caste discriminations.
Low level of proliferation of the basic infrastructure for the development of ICT in India
acts as a deterrent to diffusion of ICT in India. The current hype surrounding the ICT
and its impending effect on the development of the economy may well remain as
hollow promises unless adequate measures are taken to establish linkages with the
ICT sector and the rest of the economy through the construction of physical
infrastructure required to increase the use of ICT in the economy.
It is argued that government has not been able to ensure technology absorption and
development in the hardware sector and to mobilize revenue from the ICT sector. This
has led to inadequate government expenditure on infrastructure development for the
sector and this is likely to affect the sustainability of the growth rate attained by the

8/6/2019 Ann04 India
http://slidepdf.com/reader/full/ann04-india 39/79
38
sector. It is argued that government expenditure is required to reduce the widening
digital divide as well as for the growth of the industry itself. (Chandrasekhar, 2002)
Part II
2.1 Decent Work and ICT
The structure of the traditional labour market is fast changing. Permanent jobs are
becoming an anachronism. Contractual work is becoming the prevalent form of
employment. Concepts such as flexibility, informalisation and informationization are
becoming the evolving terms of the present day economic order. The ICT provides
flexibility of action, space and time for the worker. The shop floor, as the production
space is also fast losing its prominence, is becoming a constantly shifting space.
Teleworking e-lancing, and other forms of digital work forms are taking the place of the
traditional shop floor and common workspace. These and many other changes in the
production process caused by the introduction of ICT are altering the dynamics of
relation between work, worker and employer. This section examines various indicators
of decent work in the ICT sector as well as the new technology’s impact on
employment and labour.
2.1.1. Employment Opportunities and Skill Profile in ICT Sector
The classical understanding on the relationship between technological change and
employment seems to be straightforward. Either the introduction of new technologies
leads to more efficient production processes, reduces costs by saving labour, capital
materials, energy and other factors of production; or it leads more directly to the
development of new products that generate new demand. (Soete, 2001) IT industry
repudiates this understanding of technological change and employment, as this
understanding is no longer valid in the case of the new technologies, especially the
ICT. The employment creation and destruction effects of ICT are enmeshed in many
direct and indirect employment effects. The increasing tradability of service owing to
separation of production from consumption makes it more similar to the manufactured
goods while automation and outsourcing is dampening employment in the
manufacturing sector. Simply counting new jobs created or old jobs destroyed cannot

8/6/2019 Ann04 India
http://slidepdf.com/reader/full/ann04-india 40/79
39
assess whether the net balance of these direct and indirect effects will ultimately be
positive or negative.
Many studies have recorded the disintermediation effect wherein the middle level and
routine workers are replaced by computers and automated machines. Jorgenson and
Stiroh (1999) concluded that the continual decline in rental price of computers have
led to rapid substitution of this equipment for other inputs in the manufacturing sector
of USA. Tulpule and Dutta (1995) illustrate the severe labour displacing effects of
Micro electronic technologies in the Indian textile industry. Such labour displacing
effects have not been compensated by a sufficiently large increase in output in the
case of most firms.
However, in the case of service sector the possibility of codifying services and
converting services to packaged goods, mainly through the use of ICT, have
increased the possibility of production and marketing of services. This means that the
employment opportunities generated in the service sector increases the impact of the
ICT. For instance, The introduction of Automatic Teller Machines for basic banking
services would reduce the number of clerks required in the bank but can increase the
demand for technicians and managers. The use of credit and debit cards, similarly
have an indirect effect on employment. It increases greater accessibility to limited
credit, which leads to higher consumption expenditure, greater demand and, hence
higher levels of employment. There are arguments that technological progress is skill
biased which makes less skilled labour redundant. There are also arguments that
technology codifies knowledge and ‘deskill’ many of the skilled workers. The skill bias
in the technology is reflected on the wages as well. The wage rates are found to be
rising among the skilled workers, whose demand has increased, in comparison to theunskilled workers.
Autor, Katz and Krueger (1998) analyzed aggregate changes in the relative supplies,
educational levels and wages of workers from 1940 to 1996 and found strong and
persistent growth in relative demand favoring college graduates. This implies rapid
skill upgrading within the industries due to the effect of computerization. Shaw ( ),
using data on steel manufacturing in U.S, Japan and France, provides evidence to

8/6/2019 Ann04 India
http://slidepdf.com/reader/full/ann04-india 41/79
40
show that IT use leads to increased demand for skilled personal. Rather than
mechanical skills of physical dexterity, the skills needed are communication skills and
problem solving skills. In a study on the automobile industry in India (Vijayabhaskar,
2002) records polarization of skills due to the introduction of computers in the
production process. With the introduction of new technologies came new management
technique, which placed emphasis on multi -skilling. While the unskilled workers are
asked to work in other departments, the skilled workers are put to skill up gradation.
Autor, Katz and Krueger (1998) provide evidence to the argument that the use of
computer has led to higher wage levels. Using four-digit NBER productivity database,
the authors have argued that the within-industry wage differentials between computer
users and non-users have widened. But there are diverging views on the mechanism
through which ICT affects wages. The neo-classical argument is that ICT leads to a
rise in productivity, which gets reflected in wage rates. Krueger (1993) argues that
new technology causes wage disparities but this is not due to productivity. He
attributes the wage gap to ‘unobserved personal heterogeneity’. Autor, Katz and
Krueger (1998) argued that it is the initial stock of computers, rather than a change in
stock of computers that would explain the wage differentials better. Acemoglu (1998)contended that the wage differentials that existed between computer users and non-
users were the premium for the skills acquired by the computer user. Within this
framework, let us examine the emerging issues related to employment and its various
dimensions in ICT sector in India.
There is no doubt that the growth and diversification of the ICT industry in India has
had significant employment implications. However, more than the current level of
employment, what is considered crucial is the future employment generating potential
of the sector. Data pertaining to the current level of employment in the software and
IT enabled sectors are depicted in Tables17 and18 (Chart 18).

8/6/2019 Ann04 India
http://slidepdf.com/reader/full/ann04-india 42/79
41
Table 17
Key Characteristics of Employment in Software Industry
Parameters 1996 1999 2000 Software Professionals (including those in non-commercial organizations and userorganizations)
1,60,000 2,80,000 3,40,000
Of which engaged inSoftware development (%) -Marketing and relationship development (%)
70 10
67 11
63 14
Median Age (yrs) 28.4 26.2 25.7 Proportion of IT Degree holders (%) 75 n.a n.a Proportion of those having 5 yrs. Experience (%) 60 50 60 Rise in Basic Salary over previous year (%) 21 21+ESO 16+ESO*
Attrition Rate (%) 17.2 16 14 Notes : *Supplemented by Employee Stock Options. 41 companies have offered ESOs to theiremployees.Source : Kumar (2000b) based on the respective Nasscom Surveys.
Chart 18
Employment in Software Industry
0
100000
200000
300000
400000
1996 1999 2000
Software industry offers a significant number of job opportunities to the youngsters
and over time the median age of the employees is decreasing. The compound
annual growth of employment recorded at 28.5 per cent recorded over the past 3
years, though impressive from the standards of growth of jobs in the national
economy, is only half of the growth of the revenues in the industry.

8/6/2019 Ann04 India
http://slidepdf.com/reader/full/ann04-india 43/79
42
Table 18
Employment in IT-Enabled Sector
IT Enabled Services 1999 2008(Projection)
Back Office Operation/ Revenue Accounting/ Data Entry/ Data Conversion
14,000 2,60,000
Remote Maintenance andSupport
4,100 1,80,000
Medical Transcription/ Insurance Claim Processing
6,100 1,60,000
Call Centres 2,800 1,00,000
Data Base Services 1,400 1,00,000Content Development 12,600 3,00,000
Total 41,000 11,00,000
Source : NASSCOM (1999), NASSCOM- Mckinsey Report, New Delhi
NASSCOM projects that the ICT sector in India would require 2.2 million IT
professionals, 1.1 million in the IT proper and 1.1 million in the IT-enabled sector, by
the year 2008. The Report forecasts different types of the skill requirements; Of the
2.2 million, 18 per cent of them have to have web skills, 28 per cent of them have to
possess functional skills and 54 per cent of them would require technical skills.
Apart from it, there are other spillover effects like job opportunities in training and
education, informatization in traditional sectors etc, which would build a steady and
rising demand for IT skills in the near future. Ministry of Human Resource
Development have projected that the creation of new employment opportunities would
be to the tune of 7 million workers, directly or indirectly linked with the IT sector.
There is no doubt that the booming growth of ICT sector in India in the 1990s has
generated large employment opportunities for the educated, especially the technically
skilled, which is reflected in the decline in unemployment rates in this segment in the
period 1993-94 to 1999-2000 (Table19; Chart 19).

8/6/2019 Ann04 India
http://slidepdf.com/reader/full/ann04-india 44/79
43
Table 19
Unemployment According to Level of Education
Level of Education Unemployment Rates
1993-94 1999-2000
Not Literate 0.2 0.2Primary Education 0.9 1.2Middle 3.4 3.3Secondary 6.2 5.5Higher Secondary 8.7 7.8Graduate andAbove
9.3 8.8
Secondary andAbove
7.7 7.1
ALL 1.9 2.2Source: Dutt,(2002)Note: Unemployment Rates Based on UPSS
Chart 19
Unemployment According to Level of Education
0
2
4
6
8
10
N o t L i t e r a t e
P r i m a r y
E d u c a t i o n
M i d d l e
S e c o n d a r y
H i g h e r
S e c o n d a r y
G r a d u a t e
a n d A b o v e
S e c o n d a r y
a n d A b o v e
1993-
94
1999-
2000
Taking into account of the type of exports of Indian software, though India is still
having a large share of low value adding exports that require low levels of skill, we can
state that demand for skill requirement in the economy is rising rapidly. This trend is
opposed to the apprehension that the new technologies reduce skill requirements.
(Bhasker, Aranowitz and Difazic, 1994). There has been a marked decline in the ‘Body
shopping’ form of software exports, and for the first time in 2001-02 on-site form of
exports have been reported lesser than that of off-site exports. The on-site biased

8/6/2019 Ann04 India
http://slidepdf.com/reader/full/ann04-india 45/79
44
structure of exports generates a gender-based division of labour, even though the
technology is hailed to be gender neutral.
The new economy requires knowledge workers, with specific skills. The skill
requirement of this industry is very flexible and is subjected to fast rate of
obsolescence. Many firms report that they recruit new employees not on the basis of
their specific IT qualifications but on the basis of their adaptability and ‘learnability’. It
suggests that it is possible to transform work activities into repetitive routine as
proposed by the ‘degradation of work thesis’.(Aranowitz and Difazic, 1994) It is
essential that according to the rising demand for skills, adequate skills be developed inthe economy. There were 1270 colleges in the country as on 04.05.2000 with a total
intake of 205153. 1032 of these colleges offered IT courses with an intake of 66214
(37%). In addition, IITs, IIITs, IISc, Bangalore have an intake of nearly 7000.Apart
from that many students from other engineering courses also migrate into the IT
sector after completion of their courses. P.G. Review Committee indicated that in the
case of IITs more than 90 percent of the non-IT graduates migrate to IT sector (MHRD,
2000). The Task force on HRD in IT, projected that the availability of skills in the IT
sector by year 2008 would be sufficient to meet the demand projections for the year.
It should be underscored that there are certain apprehensions regarding supply of
skills, the quality of skills available and prevalence of underemployment in the IT
sector. Rothboeck et.al, (2001), based on field surveys in Bangalore and Delhi clearly
elicits high degree of functional flexibility of the worker. It is important to examine
whether such flexibility is due to the non-requirement of skill and expertise or not. The
question of underemployment has also surfaced and scholars have taken up this issue.For instance, Arora et. al., (2000) reported that most software firms recruit
engineering graduates although the skill is not utilized since a large share of the work
is non-technical.
2.1.2. Wages, Labour Cost and Productivity in ICT sector

8/6/2019 Ann04 India
http://slidepdf.com/reader/full/ann04-india 46/79
45
It is widely accepted that ICT workers earn one of the highest wages in the Indian
economy. However, lower wages of Indian software developers relative to their
counterparts in the US and Europe makes Indian software cheaper in the global
software market (Table20). The dramatic difference in the wages between US and
India explains the high demand from US. This difference in wages can be found in all
professional categories. When compared to similar outsourcing competitors like
Ireland, wages in India are estimated to be half to a three times lower.
Table 20
Salaries1 of software professionals in the United States and India, 1997
United States India2
(USD per annum) (USD per annum) Help-desk supporttechnician
25000-35500 5400-7000
Programmer 32500-39000 2200-2900 Network administrator 36000-55000 15700-19200 Programmer analyst 39000-50000 54000-7000 Systems analyst 46000-57500 8200-10700 Software developer 49000-67500 15700-19200 Database administrator 54000-67500 15700-19200 1. Figures are starting salaries for large establishments employing more than 50 software
professionals. They may be marginally lower for smaller firms. Salaries for a particulardesignation vary owing to factors such as educational and experience profile of the professional;platform of operation; nature of the assignment (contract/full-time); location of the employer; andadditional technical/professional certification.2. Converted at exchange rate of INR 41.50/USD.
Source : INFAC, Bombay quoted in OECD Information Technology Outlook, 2000
A comparison with wages for software professional of different European and other
industrially advancing countries also reveal that wages in India is substantially lower
(Table. 21).
Table 21
Comparison of Annual Wages in Software Industry Country Computer Programmer System Analyst
India 4002 100 5444 100 USA 46600 1164 61200 1124 Japan 51731 1293 64519 1185 Germany 54075 1351 65107 1196

8/6/2019 Ann04 India
http://slidepdf.com/reader/full/ann04-india 47/79
46
France 45431 1135 71163 1307 Britain 31247 781 51488 1287 Hong Kong 34615 865 63462 1166 Mexico 26078 652 35851 658 Source : Gupta (2000) quoted in K.J. Joseph (2002), “Growth ICT and Harnessing IT for
Development”, background paper prepared for the OECD-IPS Workshop on PromotingKnowledge-based Economies in Asia, Singapore 21-22 November 2002, mimeo.
Taking all costs into consideration, some estimates suggest that the cost of software
development in India is half of that in the US. Wage difference between different
professional categories is also glaring in India (Table 22; Chart 20). However such
differentials exist in other countries also. Yet the differentials are more pronounced in
India. This may have implications for the relative preference for different types of
expertise.
Table 22
Labour Cost Comparison for IT Personnel (US $ per annum) Switzer-land
USA Canada UK Ireland Greece India
ProjectLeader
74,000 54,000 39,000 39,000 43,000 24,000 23,000
Business
Analyst
74,000 38,000 36,000 37,000 36,000 28,000 21,000
SystemsAnalyst
74,000 48,000 32,000 34,000 36,000 15,000 14,000
SystemsDesigner
67,000 55,000 36,000 34,000 31,000 15,000 11,000
DevelopmentProgrammer
56,000 41,000 29,000 29,000 21,000 13,000 8,000
SupportProgrammer
56,000 37,000 26,000 25,000 21,000 15,000 8,000
NetworkAnalyst/
Designer
67,000 49,000 32,000 31,000 26,000 15,000 14,000
QualityAssuranceSpecialist
71,000 50,000 28,000 33,000 29,000 15,000 14,000
DatabaseData Analyst
67,000 50,000 32,000 22,000 29,000 24,000 17,000
Metrics/ ProcessSpecialist
74,000 48,000 29,000 31,000 Na 15,000 17,000
Documentatio 59,000 36,000 26,000 21,000 Na 15,000 8,000

8/6/2019 Ann04 India
http://slidepdf.com/reader/full/ann04-india 48/79
47
n/ TrainingStaffTest Engineer 59,000 47,000 25,000 24,000 Na 13,000 8,000Note : Figures are averages for 1995. They are likely to rise c.5-10% per annum, with rates beingslightly higher in lower-income countries.Source : Richard Heeks adapted from H.A Rubin et al. (1996) Worldwide Benchmark Project ,Rubin Systems: Pound Ridge, NY.
Chart 20
Labour Cost Comparison for IT Personnel (US $ per annum)
01000020000300004000050000
600007000080000
Switzer-land USA Canada UK Ireland Greece India
When we compare the wages earned by software professional with those working in
the conventional industries we find that wages in the software sector is higher. The
higher wages earned by the software professionals in comparison to similar skilled
employees in other industries ensure that there is a steady supply of skills in the
industry. Latif (1997) notes , “(It is clear that) The salary structure of the software
industry exceeds other sectors of the city’s economy. A software engineer in other
industries in Bangalore cannot expect to earn more than half of what he would make
in the software industry. This has meant that other businesses are losing out good
people to the software industry.”
There are wide inter-firm variations in the wage rates for similar skills. Rothboeck et.al
(2001) report that in Bangalore itself large firms producing high value added software
products paid on an average Rs. 12000 to 15000 per month as wages to the
professionals. The domestic firms and firms that were involved in IT-enabled services
paid the least to the workers; it was only around Rs. 3000- 4000 per month (Table 23).

8/6/2019 Ann04 India
http://slidepdf.com/reader/full/ann04-india 49/79
48
Table 23
Entry Level Salary in Bangalore According to Firm Type (in Rupees)
Large High end 12000-15000
Large Medium 14000
Medium High 10000-12000
Medium low End 7000
Small Medium 7000- 9000
Domestic Middle End 3500- 4000
IT enabled 3000- 4000Source: Rothboeck et. al., (2001), pp 41-42
Wages are also extremely flexible in ICTs; as the wages are closely linked to specific
projects, quantum of demand for a company’s products etc, wages paid to the same
category of job may vary due to external factors on which the firm may not have any
control. This fluctuation is also a result of its linkage with the global market. Changes
in any of the variables of the global market can influence wages in India, as this is an
export led sector. For instance the September eleventh incident catalyzed
considerable decline in the IT products from India. This had led to retrenchment of
labour as well as wage cuts. The fluctuating wages creates considerable insecurity
among the computer professionals.
Wages in the software industry had grown at over 30 percent per annum through the
1990s and attrition rates were high at 20 percent. When asked to list top 3 problems
they faced, more than half of all firms selected manpower shortage and employeeattrition as the most serious problem affecting them (Arora,et.al.,2001).
Is there any correspondence between increase in the wages and labour productivity?
This high wage rate does not reflect the productivity of the worker, rather the short
supply of certain skills in the economy. This force the producer to spent Quasi-rent to
the professional for retaining him in the firm.

8/6/2019 Ann04 India
http://slidepdf.com/reader/full/ann04-india 50/79
49
Table 24
Trends in Labour Productivity(In Rs.Lakh) 1994 1995 1996 1997 1998 1999
FullSample
6.21 5.52 5.33 4.46 4.81 4.58
LargeFirms
7.36 5.69 5.27 4.76 5.31 5.03
MediumSizedFirms
4.15 4.68 5.22 3.71 3.80 3.72
SmallFirms
10.06 9.43 7.45 6.07 4.69 4.35
Source : Kumar (2000b).
Chart 21
Trends in Labour Productivity (In Rs. Lakh)
0
2
4
6
8
10
12
1994 1995 1996 1997 1998 1999
Full Sample Large Firms Medium Sized Firms Small Firms
Table 24 & Chart 21 reveals that labour productivity has decreased over time and
since 1997 it has stabilized at a low level. At one hand, there has been a general
wage hike, but on the other hand labour productivity has decreased and remain to be
much lower than the impressive productivity of 1994-5. This trend could possibly be
due to the changes in the composition of firms of the sector. It is possible that lowproductivity activities might have been increasing relative to the high productivity
activities of early nineties. But this is an issue to be analyzed in detail. Another reason
could be the composition of labour at firm level. For instance, Lateef(1997) remarks,
“In some cases due to the lack of experienced personnel, 70 per cent of the revenue
came from 30 per cent of the staff. If wages continue to rise unabated and there is no

8/6/2019 Ann04 India
http://slidepdf.com/reader/full/ann04-india 51/79
50
commensurate increase in productivity or shift to high value added activities India
would lose out competition to other countries where wages are lower.”
What is the earning level of Indian companies, given the low productivity is a question
that needs to be probed at length. Yet, we have some comparisons between different
countries on this issue. Arora et.al., (2000) provide a comparison of three economies
that are thriving software exporters, India, Israel and Ireland. All three economies
depend to a large extent on the large supply of skilled professionals. But when it
comes to comparison of revenue generated per professional between the economies
the Indian case is abysmally low. While Israeli and Irish firms earn as high as $100000per employee, the Indian firms earn only around $15000 per employee.
2.1.3. Quality of Jobs and Employment Relations in ICT Sector
Most assignments this industry receive and take up are project tied. The skills required
to fulfill vary vastly from project to project; the duration of them also vary. Hence
employment is also mostly contractual. (Vijaybaskar,2002) The employment contracts
are, therefore, flexible and unpredictable. Work in ICT provides the employer andworker time and space flexibility. Changes in the nature and place of work,
theoretically, should offer the opportunity for a better balance between hours of work
and hours of leisure. However, the software industry being part of the global
production chain the time and space flexibility provided by the technol ogy has only
helped in increasing the work pressure on the software worker. The project tied work
makes it necessary that the worker does ‘time bound work’ and not ‘work bound time’.
Aundhkar et. al.,(2000) studying teleworking in various sectors of India reported that
employers felt that the main advantage of Teleworking is the flexibility it allows and the
greater ease of meeting deadlines. Production time has been cut down enormously.
The main disadvantage was that employee interactions are minimal. In many sectors
the superiors intervene in the process of work and provide suggestions, which is
minimal if not impossible in this form of work. In the IT-enabled sector most firms have
to work through the night as they cater to the day time zones of U.S.A. and Europe. In

8/6/2019 Ann04 India
http://slidepdf.com/reader/full/ann04-india 52/79
8/6/2019 Ann04 India
http://slidepdf.com/reader/full/ann04-india 53/79
52
Rothboeck et.al., (2001) elucidates the characteristic features of the life world of the
workers in the Indian Software industry as follows:
• There are no trade unions in the industry and conflicts are normally solved
directly between the supervisor and the employee.
• Wage setting is linked to performance and hence is highly individualized
• Given the high inter-firm and intra-firm mobility across projects in large firms
employees lack time and space for development of long term relationships
and collective mobilization of any kind.
• Training and learning are highly individualized.
• Enterprises have increasingly recognized the role of pees for recruiting and
career planning and provide lucrative financial incentives to their employees
to function as informal recruiters for the enterprise.
Venkata Ratnam(2002) notes that direct communication, direct involvement of
employees in empowered teams, voice to employees in work and work organization
and share in profits through employee stock option plans (ESOPs) are the major
feature of employee relations. It is further argued that modern human resource
management practices, creative and innovative work practices and employee
involvement and employee support programmes have contributed to sound
employer-employee relation in IT industry.
Flexible organizations and flexible employment relationships involve the breakdown of
the standard employment contract and its associated employment rights. Growing
margin of employment assignments have become short-term and involve multi-
employer relationships. In a study carried out by Samaddar (1995) shows how the
Micro Electronic Technology increased the possibility of fragmentation of the labour
process and segmentation of the workers. For instance, the management of several
newspapers in India was able to introduce new technologies in their firms despite stiff
opposition form the employees. D’Souza, Radha (1995), showed how traditional trade
unions were unable to defend the real wages of the workers in the advent of

8/6/2019 Ann04 India
http://slidepdf.com/reader/full/ann04-india 54/79
53
computerization. Trade Union leaders often accepted the blanket right of the
management to introduce new technologies, causing retrenchment, and disruption of
pattern of work.
Another aspect of the employment relations in IT sector that has been receiving
increasing attention relates to the enactment of specialized labour legislation for the
sector. It is contented that the prevalence of non-traditional, non-standard and atypical
employment patterns and practices (including contract for service than contract of
service, home work, part-time work, etc.) require different kind of regulations to govern
relationships beyond traditional employment. It is argued that the IT industries shouldbe allowed to have, among other things, flexible and longer working hours, differential
approach to leave and paid holidays etc. Having already noted that the emerging
employment scenario in the sector could accentuate certain types of labour market
insecurities, demands for specialized treatment in the realm of labour legislations need
to be handled very cautiously. This is all the more so when we consider some of the
effects of ICT expansion on gender issues.
2.1.4. ICT Sector and the Gender Question
The ICT sector is hailed to be a gender-neutral industry given its almost complete
dependence on knowledge skills rather than physical skills. Women, therefore have
been able to join this sector in much larger scale than in other traditional industries.
Women hold almost equal positions to that of men in terms of responsibilities held. But
the returns to such equitable responsibilities are inequitable.
Rothboeck’s study(2001) had found that women tended to cluster at the lower end ofthe job hierarchy leading to feminization of certain service activities. Most women and
men worked for 14 to 16 hours a day in the office and 2 to 3 hours at home every night.
There seems to be no balance between work and life in the case of women. While
men engage in jobs at work site alone, women work at work place as well as at home.
House keeping and child raring are the social responsibility of women in India. Leisure
is a mirage as far as women are concerned, as they have to engage in the house

8/6/2019 Ann04 India
http://slidepdf.com/reader/full/ann04-india 55/79
54
chores after work. Far from adjusting working needs to the needs of family life, there
can be increasing pressure to work everywhere and all the time. While teleworking
has certainly created new employment opportunities for women, the downside is that
women can be excluded from better career possibilities, and instead of finding a
balance; family responsibilities can be combined with paid work, so that women end
up acquiring new tasks on top of the old.
More than the IT proper, female intensity is much higher in the IT- enabled industry
such as call centers and Medical Transcription. Women labour is cheaper and more
flexible and this suit the industry. Women with no long-term career plans are bettersuited for contractual employment wherein the nature of job does not impart any other
marketable skills. Further, the work requires longer hours; they work at lower
remuneration; they have lesser prospects for occupational mobility and demand lesser
job security (Gayathri and Antony, 2002).
The Information economy has encouraged, more than any other sector, women to join
the workforce. But unless this is supported by deliberate policies to ensure
participation, ownership, education and ICT training for women—as well as family-
friendly policies in the information economy workplace—the old gender biases will
persist.
2.2. Results of the Primary Survey on Decent Work
In order to provide insights into the conditions of work and employment, a sample
survey, with elements of both stratified and random sampling method, was

8/6/2019 Ann04 India
http://slidepdf.com/reader/full/ann04-india 56/79
55
conducted among IT workers employed in firms at two representative clusters,
namely, Bangalore, and Trivandrum.
Methodology and Sample
Firms for the sample survey were chosen on two criteria: Size of the firm and
location of firm.
Size of the firm: Firm size measured in terms of revenue per annum represents
many capabilities of the firm including possibilities of economies of scale and scope.
In order to account for all size of firms the sample survey was stratified into three
size groups, Small size firms whose annual revenue accounted less than or equal toRs 100 million in 2003, Medium sized firms whose size was between Rs100 and Rs
500 million, and large sized firms whose size was greater than Rs. 500 million. The
survey has covered workers in all three-size classification in more or less
proportionate manner. These workers belonged to a total of 24 firms.
Regional location of the firm : Firms tend to concentrate at specific geographic
locations as a result of increasing returns to scale as the scale of production in the
region increases. Given the distribution pattern Bangalore was an obvious choice for
any study on IT firms. Then, the region with the smallest agglomeration and smallest
average number of products/services per software firm, Trivandrum was also chosen
for study. The number of activities the software firms takes up is a signal towards its
innovative capability. The study has given 3/4th weight to the sample from Bangalore,
and 1/4th from Trivandrum. Thus the survey consists of 70 workers covered from
Bangalore and 30 from Trivandrum.
The survey was conducted in two phases. Initially a pilot survey was conducted in
Bangalore using a semi structured questionnaire. In this phase informal discussions
were conducted with professionals, human resource managers, and academics.
Following discussions and pilot survey the semi structured questionnaire was refined
further and made a structured questionnaire. In the second phase responses to the

8/6/2019 Ann04 India
http://slidepdf.com/reader/full/ann04-india 57/79
56
questionnaire was collected from 100 professionals, 70 from Bangalore and 30 from
Trivandrum. These workers were selected from 24 different firms.
Employment Opportunities
ICT is one of the fastest growing sectors for both output and employment. India
draws its comparative advantage from its cost effective high quality human
resources. As per NASSCOM-McKinsey estimation India’s demand for IT skilled
labour by 2008 would rise ten fold from 280 thousand in 1998 to more than 2200
thousand workers. However the estimation is highly speculative as the methodology
for arriving at the present stock as well as the future demand is not clearly spelt out.Using the NSSO employment–unemployment survey, 1999-2000 we estimate that
only around 0.27 percent of the total workers (Usual Status) are in the IT sector
(both skilled and semi skilled). This data reveals that IT workers are concentrated
within a few states. Maharashtra alone accounted for nearly 27 percent of the
workers. (Table 25) Another 15 percent of the workers were concentrated in
Karnataka. Delhi, West Bengal, Tamil Nadu and Andhra Pradesh also had 10
percent or more of the share of the workers in IT. Gujarat, Kerala and U.P
represented another 3 percent each. It is significant that the regional distribution is
closely correlated with the presence of mega urban agglomerations. 84 percent of
the workers were concentrated in the states that had the presence of mega cities
such as Maharashtra, Delhi, Karnataka, Andhra Pradesh and West Bengal.
Employment opportunities are strongly export driven and seem to have had low
domestic linkages.
Table 25Regional Distribution of IT workers

8/6/2019 Ann04 India
http://slidepdf.com/reader/full/ann04-india 58/79
57
State Total
Andhra Pradesh 9.7
Gujarat 2.8
Karnataka 14.5
Kerala 3.6
Maharashtra 26.7
Tamil Nadu 10.3
Uttar Pradesh 3.5
West Bengal 10.3
Delhi 12.7
others 5.9
Total 100
Source: NSSO 1999-2000, Employment -Unemployment Survey, extracted from CD-ROM
Having broadly seen employment trends at the macro level we examine now the
specific micro level characteristics of the employment specially in relation to some of
the indicators of decent work
Profile of the worker
Information Technology industry is usually projected as a gender-neutral technology
with less of physical strain and more of work related to the intellect. However the
gender structure of the workforce within the IT sector does not reflect any change
form the old world work environment. This seems to reinforce the gender bias that
exists in the old world economy in the emerging sectors as well. An overwhelmingly
large proportion of the workers are male workers with female workers forming only
15 percent of the survey.
The nascent state of the industry is evident from the overwhelming presence of
young workers in the industry. Nearly 81 percent of the workers belonged to the age
group of 30 or less. This is a characteristic feature of the workforce in the IT sector.24 percent of the total surveyed workers belonged to the age group of less than or
equal to 25 years of age. A large share of the workers, 47 percent, were unmarried
young workers..
Table 26Profile of the IT worker

8/6/2019 Ann04 India
http://slidepdf.com/reader/full/ann04-india 59/79
58
DemographicCharacteristics Class/Level/Type Number Percent
Male 85 85.00
Female 15 15.00SexTotal 100 100.00
Married 53 53.00
Unmarried 47 47.00Marital Status
Total 100 100.00
Less than 25 24 24.00
25 to 30 57 57.00
30 to 35 18 18.00
Above 35 1 1.00
Age
Total 100 100
The age profile of the workforce varies across the different segment of the industry
i.e hardware segment, software segment and IT enabled Services (ITES). In the
ITES the workers in the age group of less than or equal to 25 years of age
accounted for more than 53.3 percent of the surveyed workers while only 14 percent
of the Software products & services workers belonged to that age group and only 7
percent of the workers in the hardware segment belonged to that age group.
(Table26 ) In both hardware and software segment majority of the workers, 64 and
69 percent respectively, belonged to the age group 25-30. A quarter of the hardware
workers belonged to the age group of 30 to 35. Though the age of work in the
industry seems to be low within the industry the various segments of the industry
has varied mean age of workers with the hardware segment having the highest and
the ITES reporting the lowest mean age. This worker mean age roughly corresponds
to the evolutionary path of the industry itself, with the emergence of the hardware
segment initially, followed by the software segment and finally the ITES.
Table:27
Age of Worker by Industry Segment (percent)Type of Industry Segment

8/6/2019 Ann04 India
http://slidepdf.com/reader/full/ann04-india 60/79
59
Age GroupHardware Software
IT EnabledServices Total
Less than 25 7.14 14.29 53.33 24
25 to 30 64.29 69.05 33.33 5730 to 35 25.00 16.67 13.33 18
Above 35 3.57 0.00 0.00 1
Total 100.00 100.00 100.00 100
As regards the origins of the workforce, most IT workers, prior to joining the IT
industry were natives of the urban areas within the country. In fact the entire sample
population (99 percent) belonged to urban areas, of which 27 percent were from the
six mega cities of Delhi, Mumbai, Kolkota, Chennai, Bangalore and Hyderabad, 16
percent from the metropolitan cities excluding the mega cities and 56 percent
belonging to urban areas lesser than metropolitan cities (Table 28).
Table 28
Origin of the Workforce
Mega city 27.00Metropolitan 16.00
Urban 56.00Rural 1.00Total 100
If we further disaggregate the share of workers according to the place of work nearly
60 percent of the workers surveyed in Bangalore belonged to metropolitan or mega
cities, while in Trivandrum the corresponding figure was nearly 10 percent, while the
share of other urban workers in Trivandrum was substantial at 87 percent.
Table 29Origin of the workforce across Locations
Bangalore Trivandrum Total

8/6/2019 Ann04 India
http://slidepdf.com/reader/full/ann04-india 61/79
60
Mega cities 39.13 0.00 27.00Metropolitan
cities18.84 9.68 16.00
Urban 42.03 87.10 56.00Rural 0.00 3.23 1.00Total 100 100 100.00
The migratory nature of the workers is obvious from the Table 30. Of the 69 workers
surveyed in Bangalore only 11 belonged to the parent state of Karnataka. The rest of
them had migrated from other parts of the country with 22 workers from the
neighbouring states of Kerala and Tamil Nadu. But there were also 10 workers from
Delhi. In fact almost all major states are represented in the IT workforce in
Bangalore . But in the case of Trivandrum, of the 31 workers interviewed, only 2
belonged to states outside Kerala. Thus Bangalore is clearly expressed as the
preferred choice of IT workers in comparison to Trivandrum. This is easy to
understand as the number of firms and size of firms in Bangalore are much higher
than in Trivandrum, and hence the expectation of finding employment as well as
higher wage/salary make Bangalore the preferred region for workers.
Table 30Statewise Origin of Workers
Bangalore Trivandrum Total
ANDHRA 3 0 3
BIHAR 1 0 1
DELHI 10 0 10
GUJARAT 2 0 2
J&K 2 0 2
JHARKAND 2 0 2
KARNATAKA 11 0 11
KERALA 10 29 39
MAHARASHTRA 1 0 1
ORISSA 4 0 4
PUNJAB 3 0 3
RAJASTHAN 1 0 1
TAMIL NADU 12 2 14

8/6/2019 Ann04 India
http://slidepdf.com/reader/full/ann04-india 62/79
61
U.P. 4 0 4
W.BENGAL 3 0 3
69 31 100
Patterns of Earnings in the ICT industry
IT industry is considered to be a high wage industry. The high wage rate in the
industry ensures that there is steady flow of skills to the sector and flow from other
traditional sectors. In the industry as a whole 35 percent workers received annual
salary/wages in the class Rs.200, 000 –400,000 i.e. Rs2lakh-4lakh per annum.
(Table 31) Around a quarter of the workers received earnings in the range Rs. 1-2
lakh per annum. 17 percent earned in the range Rs.4-6 lakh and 5 percent earned in
the top bracket of Rs. 6-10 lakh per annum. There are considerable variations in
earnings across the various segments of the industry. While in the software and
hardware segments the modal income bracket was Rs. 3-4 lakh, in the ITES
segment the overwhelming majority (73.3 percent) of the workers earned less than
Rs. 2 lakh a year. On the other hand 35 percent of the workers in the softwaresegment earned above Rs 4 lakh. The corresponding figure in the hardware
segment was only 20 percent. On the whole, it can be said that a larger share of
workers in the software segments earned higher wage/salary than both hardware
and ITES. The wage earning s in ITES is the least with majority of workers being in
relatively low wage class.
Table 31
Earnings of Workers across Industry Segments( per cent)
Salary per annum Hardware Software ITES Total
50000-1 lakh 0.00 10.81 36.67 18.29
1-2 lakh 13.33 18.92 36.67 24.39
2-4 lakh 66.67 35.14 20.00 35.37
4-6 lakh 20.00 27.03 3.33 17.07
6 – 10 lakh 0.00 8.11 3.33 4.88

8/6/2019 Ann04 India
http://slidepdf.com/reader/full/ann04-india 63/79
62
Total 100.00 100.00 100.00 100.00
There are considerable locational variations in wages as well (Table 32). In general
it can be said that wage differentials within the industry in Bangalore is much higher
than that of Trivandrum.
Table 32
Earnings Across Locations(percent)
Salary per Annum Bangalore Trivandrum Total50000-1 lakh 21.15 13.33 18.29
1-2 lakh 19.23 33.33 24.39
2-4 lakh 28.85 46.67 35.37
4-6 lakh 25.00 3.33 17.07
6 - 10 lakh 5.77 3.33 4.88
Total 100.00 100.00 100.00
Education and Skill Profile
Educational qualification is a key determinant of earnings received in the IT sector.
Workers with general education, i.e. who had done regular arts, science and
commerce graduation /post graduation received wages much lower than that of
technically qualified workers. More than 92 percent of the workers with general
education received wages in the bracket less than 2 lakh per annum. (Table 33) On
the other hand, 67 percent of the technically qualified workers earned more than Rs.
2 lakh per annum. This difference in earnings occur mainly due to the fact that most
general educated workers belong to the ITES segment of the industry, while the
technically qualified workers belong to the software and hardware production
segments.
Table 33

8/6/2019 Ann04 India
http://slidepdf.com/reader/full/ann04-india 64/79
63
Workers Salary per Annum by Type of Education
Salary per
Annum
Technical
Education
General Education Total
50000-1 lakh 10.14 61.54 18.29
1-2 lakh 23.19 30.77 24.39
2-4 lakh 42.03 0.00 35.37
4-6 lakh 18.84 7.69 17.07
6 - 10 lakh 5.80 0.00 4.88
Total 100.00 100.00 100.00
Enhancing Capacities for employment
Workers employability is mostly dependent on the possession of “foundation skills”
which needs regular updating and support with specific skills through training and life
long learning processes. Dual labour market theorists (Doeringer and Piore, 1971)
argue that entry to the primary labour market, characterized by relatively higher
wages, fringe benefits, good working conditions and training, promotional path etc. is
primarily determined by the type and level of education and training undergone by
the workers. Level and type of education acts as a screening method for entry into
the IT labour market. None of the workers interviewed had level of education less
than graduation. Among the workers only 14 percent of the workers had joined the
labour market after completion of general education, nearly 86 percent of the
workers have had technical education before being part of the IT labour market
(Table 34) In both hardware and software segment the concentration of technically
trained workers are very high at more than 95 percent of the workers. But in the
ITES segment the same share is at 63 percent. In the ITES segment a substantial
share of workers had undergone general education. To join the IT production sector,
namely hardware and software segments, technical education is indispensable. In
ITES sector the major skill requirements are not the engineering skills required in the
IT sector. ITES work consists of lower end outsourced tas ks of a myriad group of

8/6/2019 Ann04 India
http://slidepdf.com/reader/full/ann04-india 65/79
64
activities. The major skills required in such industries are certain basic skills such as
language and communication skills and rudimentary mathematical skills. After a
short training of two or three weeks any graduate level educated person is adept to
take up employment in the ITES sector.
Table 34
Type of Education of Workers across Industry segments( percent)
Type of Product Total
Type of
Education
Hardware Software ITES
Technical 96.43 95.24 63.33 86.00
General 3.57 4.76 36.67 14.00
Total 100 42.00 30.00 100
The IT products and services industry is a knowledge intensive sector with high
degree of skill intensity. The common qualification of workers in the sector is a
degree or diploma in Engineering. Among the technically qualified workers the
largest share of workers was with B.Tech in Electrical and Electronics Engineering
and Masters in Computer Applications (MCA), recording 26 percent each. 11
percent of the workers had qualified B.Tech in Computer Engineering (Table 35)
Nearly 16 percent had engineering degree in other trades. This shows the
knowledge intensive production process in the software production sector.
However there are considerable inter-segmental differences in skill utilisation.
In the hardware segment more than half the workers were qualified in electronics
and electrical engineering graduation and another 11 percent had post graduation in
the same trade. 33 percent in the hardware segment were engineering graduates in
other trades than computer and electronics.
In the software segment nearly half the workers (47.5 percent) were qualified
as Masters in Computer Applications (MCA).more than a quarter of the workers
were graduates in computers or electrical and electronics. In the ITES sector share
of workers who were technically qualified were comparatively less and even the
technically qualified were in the low end skills.

8/6/2019 Ann04 India
http://slidepdf.com/reader/full/ann04-india 66/79
65
Table 35
Technical Education of workers by Industry Segment
Type of Product Total
Education Hardware Software ITES
B.Tech (computer) 0.00 15.00 15.79 10.47
M.Tech Computer 0.00 5.00 0.00 2.33
B.Tech (Electrical
and Electronics)
51.85 15.00 10.53 25.58
M.Tech Electrical
and Electronics
11.11 0.00 0.00 3.49
MCA 0.00 47.50 15.79 25.58B.Tech(others) 33.33 5.00 15.79 16.28
DCS 0.00 0.00 10.53 2.33
PGDCA 3.70 7.50 15.79 8.14
others 0.00 5.00 15.79 5.81
Total 100 100 100 100
“Reskilling” in the IT sector acquires great significance due to the fact that the
industry is highly innovative and hence subjected to skill obsolescence in the short
run itself. In the case of traditional manufacturing sector innovation is a slow process
and skill obsolescence is not common, but in the new knowledge based industries
life cycle of technologies is very short. In order to retain the workers the firms have
to ‘reskill’ them. In the IT labour market workers opt for two choices of skill
acquisition, On the –Job training and Job Oriented Courses.
On-the –Job training
On-the-Job training is an important means of reskilling workers in the IT
industry. In the sample survey conducted nearly 16 percent of the workers had
received training On-The–Job which is considerably higher compared to other
traditional industries. More than 16 percent of the workers had attended Job oriented
courses prior to joining the firm. But there are considerable differences within the
various segments of the industry in the share of workers who have undergone On-
the-job training. In the hardware sector , where the industry works more like a
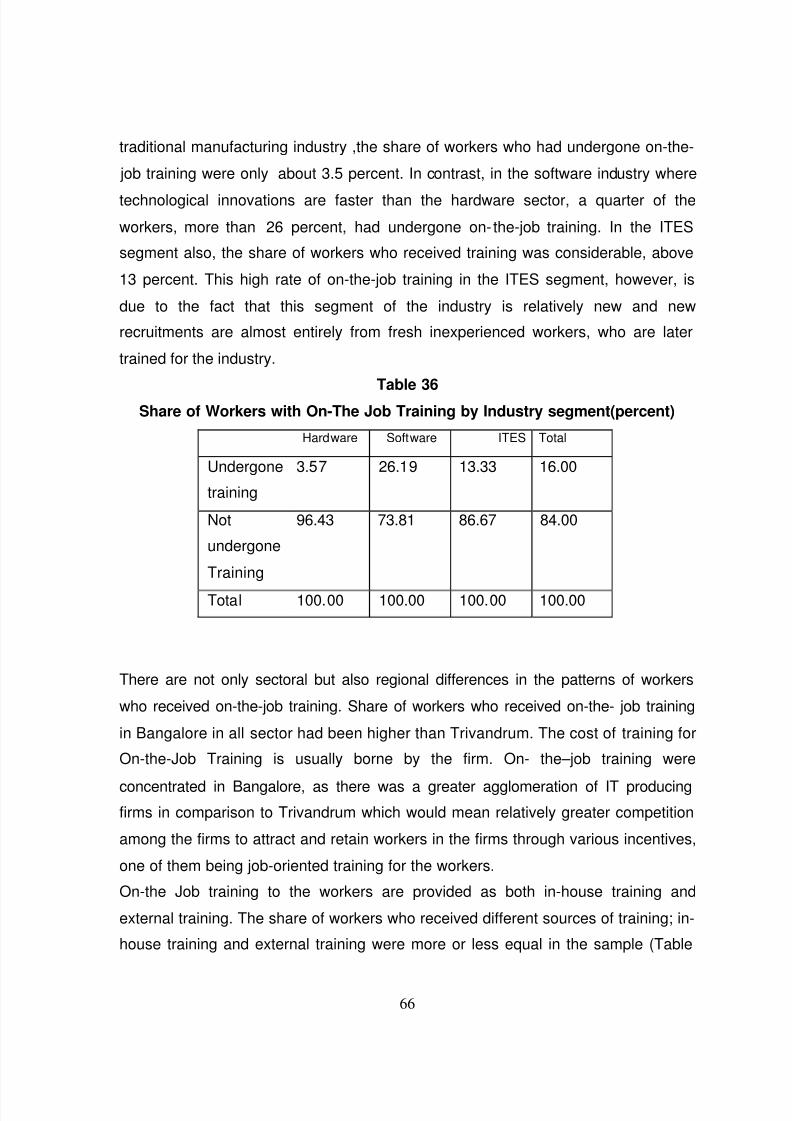
8/6/2019 Ann04 India
http://slidepdf.com/reader/full/ann04-india 67/79

8/6/2019 Ann04 India
http://slidepdf.com/reader/full/ann04-india 68/79
67
37). Generally large sized firms have their own training institutes where fresh recruits
as well as retraining are provided. Also, many large firms have arrangements with
external training institutes to provide training in specific courses.
Table 37
Type of On-the Job Training Received by Workers
Type of Training Percent
In-House Training 53.33
External Training 46.67
Total 100.00
Costs of the on-the-Job training are borne by any of the three sources; firm, the
government and worker. If a company pays for education or training and if the
employee subsequently leaves the firm then the company will have lost its
investment. In the IT industry, especially in the software segment life cycle of skills
are very short. Therefore, while training workers is in the interest of the firm funding
the training is not. Only half the workers who underwent training were funded by
their company. Nearly 40 per cent of the trained workers had to bear the training
cost themselves. Even though the training is for the firm’s production process the
workers are ready to pay for the training as the skills are in demand in other firms as
well. The government funded around 7 percent of the workers for their training.
Table 38
Source of Funding for the Training
Source of Funding Percent
Company 53.33
Self 40.00
Government 6.67
Total 100.00
Firms also have the option of recruiting from jobseekers who have undergone job
oriented courses. The cost of training is borne by the worker himself; hence there is

8/6/2019 Ann04 India
http://slidepdf.com/reader/full/ann04-india 69/79
68
no opportunity cost of losing the trained worker. Only 15 percent of the workers had
attended job-oriented courses prior to joining their current place of work. The share
of workers who had undergone job oriented course prior to joining the courses were
more or less equal with the hardware segment reporting 11 percent , software and
ITES reporting 17 percent each. A majority of those who attended such courses had
undergone long duration ( 6months and above)courses.
Workers had to pay heavy training fees for the job-oriented courses. More than 31
percent of the workers had to pay more than Rs. 40000 as course fees for the
various job oriented courses they had attended prior to joining the current job,another 31 percent of the workers had to pay between Rs. 20000 and 40000 as
course fees for training.
Firms use training facilities such as on-the –job training, with long duration to
improve productivity of the worker, and at the same time as an instrument for
retaining the worker. Long duration, fully funded On-The Job courses offered by the
firm is an incentive for the worker to join the large sized firms and remain loyal to the
firm. In the IT sector where attrition rates are reported to be high the choice of
training is one of the important methods used by the firms to retain workers. Since
the job oriented courses are not exclusive to the production process of firms, those
firms that dependent on workers who had attended job oriented courses are always
under the threat of losing their workers to other firms due to poaching and inter-firm,
interregional mobility of workers, while firms which conduct on-the-job training are
able to attract and retain workers. Thus training of workers in the software segmentis being used as one of the modes by which firms shun attrition in the industry.
Social Protection and other Promotional Benefits

8/6/2019 Ann04 India
http://slidepdf.com/reader/full/ann04-india 70/79
69
The question of social protection was the most difficult part of our survey and elicited
a variety of responses. Bulks of the allowances were seen to be part of the overall
salary packages. The workers and the firms preferred individual bargaining of the
total earnings package, the distribution of the package was left to the discretion of
the firm. The only pervasive social protective measures applied to the whole industry
was Medical insurance.( 88 percent of the workers surveyed). Benefits like Provident
fund Maternity /Paternity allowances were available to a limited number (28
percent). Neither the firms nor the workers appear interested in conventional social
security measures. None of the workers were covered under any pension schemes.
This is understandable in view of the high turnover of the firms and workers and dueto the rapid expansion of the IT sector. Most of the IT firms did not come under the
direct purview of the protective labour laws, and that may be a strong reason for the
absence of uniform conventional social security systems
Stability and Security of Work
Employment security has a very different flavour in the rapidly burgeoning IT
industry. Bulk of the employees surveyed were under unspecified employment
contracts (77 percent) with the provision for termination of contract with short ( 1
moth and less)notice period. Many workers considered this to be equal to permanent
contract. Short duration and project specific contracts were also prevalent though for
a smaller proportion especially among the ITEs employees. The varied nature of
contract without firm commitments from either parties seem to be the prevalent
mode in the current stage of IT industry. Employment contracts were not the
instruments for retaining workers nor means through which workers could lay claimto social protection. The preference for contractual employment seems to have
emerged as a response to a high degree of attrition in the industry. More than the
firms the workers in this sector are keen on moving away from one firm to the other,
searching for higher wages, better learning opportunities and improved work
environment. Thus, the average duration of a worker in a single firm is much shorter
in comparison to traditional industries. Only 20 percent of the workers had spent

8/6/2019 Ann04 India
http://slidepdf.com/reader/full/ann04-india 71/79
70
more than 24 months, i.e., 2 years in the current firm they were working. 28 percent
of the workers had spent only 1-2 years in their current firm. The majority had spent
less than a year in the current employment. However these trends are not uniform
across the various segments of the IT industry. The workers in the Hardware
segments had a much longer duration (more than 2 years) in their work place than
their counterparts in other segments.
Reasons for Preference of Employment
The choice preference of the workers exposes the modes that the firms use topersuade workers. Salary in the new firm, as expected, was the most popular reason
for the worker to shift to the new firm. More than 37 percent of the workers quoted
this as their priority reasons for shifting to the new firm, and another 20 percent
quoted this as the second preferred reason for shifting to the new firm. However this
was not the only reason for worker mobility. Another very important reason for
mobility was better learning opportunities provided by the firm. Better learning
opportunities include such aspects as learning–by–doing, peer support and learning,
on-the job training facilities etc. Approximately 33 percent of the workers chose
better learning opportunities provided in the new firms as the priority reason for
shifting to the new firm, and 26 percent chose this as the second preferred reason.
The chance to travel abroad from the new firm and popularity of the firms were seen
as the first reason for shifting to the new firm by 9 percent of the workers each.
Work Timings
In the ICT industry, most jobs are taken up by the firm on a project basis which is
time bound.. The firms are overly conscious of the reputation they build in the market,
as no IT firm has any kind of permanent production process, unlike a traditional
manufacturing firm where there are fixed clients, fixed output targets and a
permanent production chain that cyclically produces the same good. Given this
background the workers in the software segment are under tremendous work
8/6/2019 Ann04 India
http://slidepdf.com/reader/full/ann04-india 72/79
71
pressure to meet the project targets within the stipulated time frame. In fact the
higher wages/salary that is provided in the industry is partially to compensate for the
work pressure that the worker has to undergo in these firms. In the software
segment 79 percent of the workers worked for more than 8 hours of work on an
average in a day. The ITES segment also works on advantage of certain time zone
differential that India have with the U.S. and Europe. Most ITES segment firms cater
to the US industries by providing various services such as customer care,
telemarketing, data mining and storing, translation work, e-publishing etc. Most of
these works needs to be done during nighttime in India and passed on-line to the US
that has a 12-hour time gap with India that allows work to be done continuously.Thus the work in most ITES segment is to be done as night shifts. Most firms have
their night shifts starting its work schedule from 6.30 in the evening to 6.30 in the
morning, The number of hours of work in the ITES segment are accordingly longer
with 93 percent of the workers working more than 8 hours of mostly night work. The
hardware segment of the industry however functions similar to the traditional
industry with work timings also comparable to that of other traditional industries. All
the workers had reported between 7 to 8 and 8 to 9 hours of work in their firm.
The work pressures and rhythm of work were seen by majority of workers as an
important issue affecting a balanced family life. This response was the highest
among the married workers (49 percent) though even among unmarried younger
workers (below 25) this issue was reported to be a major concern (30 percent).
Social Dialogue and Collective Representation :
It is in the field of social dialogue and questions of collective representation that we
found a complete and total deficit in terms of measures of decent work. None of the
respondents (100%)mentioned any membership of any union or any previous history
of membership in a union in the industry. None of the 24 firms had any unions. The
landscape of IT industry seems to be completely union free. In addition to this all the

8/6/2019 Ann04 India
http://slidepdf.com/reader/full/ann04-india 73/79
72
respondents answered in the negative about the prospect of their joining any union
in the future too. Asked about the alternative forms of collective representations all
respondents answered in the negative. Individual representations were reported to
be alternatives to collective representations by 70 percent of the respondents. The
rest of the respondents did not mention any occasion for individual representation.
None of the respondents (100%) knew of any institution of social dialogue involving
the workers, employers and the state in their industry while 50 percent of the
workers were aware of existence of such institutions in other sectors.
CONCLUSIONS
8/6/2019 Ann04 India
http://slidepdf.com/reader/full/ann04-india 74/79
73
Some of the major conclusions of the study are as follows.
• The ICT sector has grown strongly in the last ten years in India. This has been
spurred by the growth of software exports and more recently by the expansion
of the IT enabled services sector.
.
• In terms of proliferation of ICT into other industries and services, the situation
prevailing in India is not that impressive. Industrial applications have to gain
momentum, as the infrastructure and backbone facilities are not that congenial
at present. It is also true that although there are isolated attempts to develop e-
governance its spread is yet to become prevalent.
• In terms of regional spread of ICT industries there are certain enclaves where
the ICT industry proliferates. This has led to asymmetric regional development
in terms of ICT growth performance.
• Employment is growing rapidly in the sector though there are differential
growths in different industry segments. Hardware industry employment growth
is the least impressive while both software and ITES segments have witnessed
fast growth
• The demographic profile of the workforce is predominantly urban, male and
young. The gender divide in employment patterns seen in the traditional
industries has not been bridged in the fast growing ICT sector.
• The labour pool for the industry lies in a hierarchical cluster with most from
urban metropolises and the least from rural non-urban locations. Thus the
employment growth in the industry is aggravating the already existent labour
market segmentations.• The employment in ICT sector is characterized by relatively high earnings
compared to the other manufacturing and service sector.
• There is a distinct hierarchy in average earnings in terms of the industry
segment. Software manufacturing IT sector leads in average earnings and
ITES sector is the least remunerative.

8/6/2019 Ann04 India
http://slidepdf.com/reader/full/ann04-india 75/79
74
• Earnings are strongly determined by skill and educational levels. Technical
education fetches the highest earnings.
• On the job training is preferred rather than vocational training
• The employment pattern in the industry is characterized by high labour turnover
rates and low firm loyalty. This situation is the result of rapid expansion of the
industry, short product cycles and the export orientation of most of the
segments of the industry.
• Social protection measures are atypical with absence of conventional social
security features such as pensions, provident fund and maternity benefits.
•
One of the noticeable features of employment relation of this industry is that thepredominance of ‘spot contracts’. This has facilitated employee turn over rates.
While this may be to the benefit of workers in the boom phase of the industry,
absence of employment security has the grave possibility of adversely affecting
workers during the downturns.
• The work time in the industry is marked by atypicality with relatively long
hours, prevalence of night work and project specific work schedules. This
poses problems in balancing work and family life of the workers.
• The ICT labour relation landscape is marked by complete absence of
institutions of collective representation. The industry presents at the moment a
union free scenario.
• Individual representation and individual bargaining seems to be the prevalent
alternative to collective representation. This leads to strong voice insecurity in
the employment pattern.
• Social dialogue institutions are completely absent for this industry.
• There is no vulnerability among the ICT workers in terms of safety of work.
The ICT sector is currently projected as a major growth sector of Indian economy with
tremendous employment potential and opportunity. The growth trends in the
employment pattern however seems to aggravate rather than alleviate the existing
segmentation and imbalances in the labour market. This should be major concern for

8/6/2019 Ann04 India
http://slidepdf.com/reader/full/ann04-india 76/79
75
planners and policy makers. The dominant trend in the industry is to view wages and
social security in opposition to each other. Thus relatively high wages are associated
with low social security. Absence of labour market institutions such as trade unions,
collective bargaining, social dialogue, can in situations of downturn aggravate the
vulnerabilities of the workers. Addressing these issues will be of prime importance for
both the future this industry as well as for the new economy generally.

8/6/2019 Ann04 India
http://slidepdf.com/reader/full/ann04-india 77/79
76
References
Abraham, Vinoj (2003), Regional Skill Supplies and Location of Firms: The Case of
Information Technology Industry in India, Paper presented at the StudentStipendship Programme, Sarai, 29th-30th August 2003,New Delhi.
Advait Aundhkar, Nalini Vaz, Geetha A Pillai, D L N Murthy and S S Thakar(2000),“The nature of Teleworking in Key Sectors: Case Study of Financial , Mediaand Software Sectors of Mumbai”, Economic and Political Weekly , VolumeXXXV, No 26, June 24.
Anker et al. (2002), Measuring Decent Work with Statistical Indicators , ILO, Geneva.
Autor, David, H., Lawrence F. Katz and Alan B. Krueger (1998) “Computing Inequality:
Have Computers Changed the Labour Market?” Quarterly Journal of Economics , Vol. CXIII, No.4, pp1170-1213.
Arora, A., V.S.Arunachalam, J.Asundi and Ronald Fernandes (2000), “The IndianSoftware Industry”, Research Policy , Vol.30, pp 1267-87.
Brunner, Hans-Peter (1995), Closing the Technological Gap: Technological Change in India’s Computer Industry, Sage Publications, New Delhi.
Chandrasekhar, C.P. (2001), ICT in a Developing Country Context: An India Case
Study, Background Paper for the Human Development Report, 2001, Geneva,
ILO.
Chandrasekhar, C.P. (2002); “ The Diffusion of Information Technology and TheImplications for Global Development: A Perspective Based on The IndianExperience”, Paper presented in the International Seminar on ICTs And Indian Development: Processes, Prognoses and Policies, Bangalore, 9-11 December2002, Institute of Social Studies, The Hague and Institute for HumanDevelopment, New Delhi.
D’Souza, Radha (1995), “The Introduction of Microelectronics Technology and itsImpact on Collective Bargaining in the Bombay Region”, in New Technology
and the workers response: Microelectronics, Labour and Society , edited byAmiya Kumar Bagchi, Sage Publications, New Delhi.
Department of Information Technology (2003), website dated, March 18th, 2003.
Dutt. Ruddar, (2002), “Economic Liberalization and its Implications for Employment inIndia”, in Economic Liberalisation and its Implications for Employment, in AshokMathur and P.S.Raikhy(eds.), Deep and Deep Publications Pvt. Ltd., New Delhi.

8/6/2019 Ann04 India
http://slidepdf.com/reader/full/ann04-india 78/79
77
Gayathri V. and Piush Antony (2002), “Ricocheting Gender Equations: Women and ICTCareers”, Paper presented in the International Seminar on ICTs And Indian Development: Processes, Prognoses and Policies , Bangalore, 9-11 December
2002, Institute of Social Studies, The Hague and Institute for HumanDevelopment, New Delhi.
Ghai, Dharam (2002), Decent Work: Concepts, Models and Indicators , DP 139/2002,International Institute for Labour Studies, Geneva.
Heeks R. (1995), India’s Software Industry: State Policy, Liberalization and Industrial Development, Sage Publications, New Delhi, Thousand Oaks, London.
ILO (2001), World Employment Report , 2001, ILO, Geneva.
Jorgenson, W. Dale and Kevin J.Stiroh (1999), “Information Technology and Growth”,American Economic Review , Vol 89, No.2, May.
Joseph K. J. and K. N. Harilal (2001), “Structure and Growth of India’s IT Exports:Implications of an Export Oriented Growth Strategy”, Economic and Political Weekly , Vol. 36, No. 34.
Kraemer, K.L, and Jason Dedrick,(2001), Payoffs From Investment In Information
Technology; Lessons from the Asia-Pacific Region , WP file,April.
Kumar, Nagesh (2001), “Indian Software Development- International and National
Perspective,” Economic and Political Weekly , Vol. XXXVI, No.45
Kumar, Nagesh (2002), “Developing Countries in International Division of Labour inSoftware and Service Industry: Lessons from Indian Experience”, Paperpresented in the International Seminar on ICTs And Indian Development: Processes, Prognoses and Policies , Bangalore, 9-11 December 2002, Instituteof Social Studies, The Hague and Institute for Human Development, New Delhi.
Lateef, Asma (1997), Linking Up the Global Economy: A Case Study of the Bangalore
Software Industry , New Industrial Organisation Programme, InternationalInstitute for Labour Studies, Geneva.
MAIT(2000), IT Industry Performance Mid-Year Review, 1999-2000 , New Delhi January.
Ministry of Human Resource Development, Government of India (2000), IT Manpower Challenge and Response , Interim Report of the Task Force on HRD in IT,Government of India, New Delhi
NASSCOM (1999), NASSCOM- Mckensey Report , New Delhi
NASSCOM (2002), IT Sector in India, http://nasscom.org/ , 18/02/02

8/6/2019 Ann04 India
http://slidepdf.com/reader/full/ann04-india 79/79
Oliner, D. Stephen and Daniel E. Sichel, (2000), “The Resurgence of Growth in the Late1990s: Is Information Technology the Story?”, Journal of Economic Perspectives , Vol. 14, Number 4, fall.
Pal, Joyojeet (2003), “The Developmental Promise of Information and CommunicationsTechnology in India”, Contemporary South Asia, Vol.12, No.1, March.
Rothboeck,S., M.Vijayabaskar and V. Gayathri (2001), Labour in The New Economy; The Case of The Indian Software Industry, International Labour Organization,New Delhi.
Samaddar, Ranabir (1995), “New Technology at the Shop Floor Level: The Story ofDeunionisation in Some Indian Newspapers”, in New Technology and the
workers response: Microelectronics, Labour and Society , edited by AmiyaKumar Bagchi, Sage Publications, New Delhi.
Soete, Luc (2001), “ICTs, Knowledge Work and Employment: The Challenge of Europe, International Labour Review , Volume 140, No.2.
Sood, Aditya Dev (2001), “How to Wire Rural India: Problems and Possibilities of DigitalDevelopment”, Economic and Political Weekly, October 27th.
Sreekumar T.T. (2002); “ICTs and Civil Society: Assessing the Indian Experience”,Paper presented in the International Seminar on ICTs And Indian Development: Processes, Prognoses and Policies, Bangalore, 9-11 December 2002, Instituteof Social Studies, The Hague and Institute for Human Development, New Delhi.
Tulpule, Bagaram and Ramesh C. Dutta (1995), “New Technology: Productivity,
Employment and Workers’ Response”, in New Technology and the workers response: Microelectronics, Labour and Society , edited by Amiya KumarBagchi, Sage Publications, New Delhi.
Vijayabaskar, M (2002), “ICTs and Transformation of Traditional Workplaces : The Caseof the Automobile Industry in India”, Paper presented in the International
Seminar on ICTs And Indian Development: Processes, Prognoses and Policies, Bangalore, 9-11 December 2002, Institute of Social Studies, The Hague andInstitute for Human Development, New Delhi.
Venkata Ratnam, C.S. (2002), “Human Resource Practices and Employment Relationsin ICT”, Paper presented in the International Seminar on ICTs And Indian
Development: Processes, Prognoses and Policies, Bangalore, 9-11 December2002, Institute of Social Studies, The Hague and Institute for HumanDevelopment, New Delhi.