anion exchange chromatography of acids of the citric acid ... · anion exchange chromatography of...
TRANSCRIPT

ANION EXCHANGE CHROMATOGRAPHY OF ACIDS OF THE CITRIC ACID CYCLE
BY HARRIS BUSCH,* ROBERT B. HURLBERT, AND VAN R. POTTER
(From the McArdle Memorial Laboratory, Medical School, University of Wisconsin, Madison, Wisconsin)
(Received for publication, January 7, 1952)
The demonstration of the accumulation of citrate in vivo in the presence of fluoroacetate and the specific modification of this effect produced in various organs by the injection of malonate (14) have increased the desirability of isolation and quantitative determination of the acids of the Krebs cycle and related substances. Further, proposed studies in- volving the use of radioactive tracers require the isolation of these acids in pure form. Although partition chromatography by means of silica gel columns has been used with notable success for separation of some of these acids (5-8), difficulties in the separation of certain pairs of acids, such as lactic and succinic, and limitations on the quantities of acids resolvable, led us to the use of ion exchange chromatography (9). While ion exchange resins were used for separation of the acidic group of amino acids from the neutral and basic groups (10, ll), the use of these resins for chromato- graphic separation of individual amino acids was first reported by Stein and Moore. (12, 13). Recently, Cohn has described the separation of nucleotides and purine and pyrimidine bases by ion exchange columns (14). This study is-an extension of the use of these resins to the separa- tion of acids of the Krebs cycle.
Materials and Methods
Dowex I (Formate Form)-The resin was obtained from the manufac- turer’ in the chloride form. The finer particles of the 300 to 500 mesh mixture were removed by discarding the supernatant after centrifugation of an aqueous suspension at 500 r.p.m., or by decantation of the finer particles after the resin had been suspended in water and the bulk of the coarse particles had settled. A batch of resin (600 ml. of resin bed) suf- ficient for the preparation of approximately 50 columns for analytical use was poured into a large glass column fitted with a sintered glass disk near the bottom; this disk was covered with glass wool. A solution of sodium formate (1 M) was passed through the resin bed until no further turbidity
* Postdoctoral Research Fellow of the National Cancer Institute, United States Public Health Service.
1 The Dow Chemical Company, Midland, Michigan.
717
by guest on July 1, 2017http://w
ww
.jbc.org/D
ownloaded from

718 CHROMATOGRAPHY OF CITRIC ACID CYCLE
developed in the effluent on addition of an acidic solution of silver nitrate. Approximately 1 liter of sodium formate solution was required for each 25 ml. of resin bed for conversion to the formate form. After the resin was washed with distilled water, it was stirred in a small aqueous volume to make a thick slurry, which was then poured into a storage flask.
Silica Gel-The gel was prepared by methods previously described (5, 7). For separation of malonic, citric, and isocitric acids, columns containing 1 gm. of gel were developed with 35 per cent butanol-chloroform after addition of the sample (7).
Acids-Pyruvic acid was supplied by Dr. G. A. LePage; Dr. R. H. Burris provided a sample of cis-aconitic acid; dimethylisocitric la&one was fur- nished by Dr. Alton Meister; a-ketoglutaric acid had been prepared by Dr. W. W. Ackermann; and oxalacetic acid had been prepared by Dr. Charles Heidelberger. The other acids used were commercial prepara- tions of highest purity available.
Apparatus-To obtain a uniform gradual increase in acidity in the resin bed, an apparatus was used which consisted of a reservoir of concentrated formic acid, a mixing flask, and a glass column containing the resin. Drops of eluate from the resin column were collected in large test-tubes via the Technicon automatic fraction collector,2 generally set to collect 40 drops (approximately 2.0 ml.) per tube. A controlled air inlet, equipped with a manostat3 and an air filter, admitted air to the system at a pressure suf- ficient to force fluid from the reservoir, through the mixing flask, and finally through the resin column. The reservoir was a 500 ml. filter flask contain- ing 6 N formic acid. The mixing flask was a 200 ml. round bottom flask, initially containing 200 ml. of distilled water. To insure thorough mixing of the concentrated acid entering the mixing flask and the dilute aqueous solution within, a magnetic stirring bar, encased in acid-resistant plastic, was placed within the flask and spun at a rapid rate under the influence of a rotating magnetic field.4 The resin column was prepared by adding a slurry of resin to a glass column 1 cm. in diameter, previously fitted with a removable sintered glass disk and above the glass disk a circular paper disk crimped up around the edges to prevent escape of the resin. After the resin settled, a pledget of glass wool was placed above the column. The height of the resin column was 11.5 cm. and the column contained 9.1 ml. of resin bed. After the sample and wash solution had been forced into the resin bed, 15 ml. of distilled water were added to the glass column above the resin bed and the column was then set in place in the apparat,us. The small volume of water above the resin bed provided a second volume
2 Technicon Chromatography Corporation, 215 E. 149th Street, New York, 51. 3 Moore Products Company, II and Lycoming Streets, Philadelphia, 24. 4 Arthur H. Thomas Company, Philadelphia.
by guest on July 1, 2017http://w
ww
.jbc.org/D
ownloaded from

H. BUSCH, R. B. HURLBERT, AND V. R. POTTER 719
for mixing acid with water and hence slowed the increase of acid concen- tration entering the resin bed. Eluate was collected at a rate of 10 to 12 drops per minute (14) and the usual air pressure required to produce this rate was 3 to 5 pounds per sq. in.
Concentration of Formic Acid-The concentration of formic acid in the eluate was not appreciable until five fractions had been collected. From that point, the normality rose slowly at first, reaching 0.1 N at Fraction 15, 1 N at Fraction 25, 3 N at Fraction 65, and 5 N at Fraction 140; the maxi- mum of 6 N was approached asymptotically.
Desiccation-Various individual desiccants and mixtures of desiccants were tested for their efficiency in removing formic acid and water from the fractions collected. A mixture of calcium chloride and sodium hydroxide in an approximate ratio of 2: 1 was found to remove all the water and formic acid from 50 to 75 fractions (about 150 ml.) in 6 to 10 hours. Desic- cation was effected in heated vacuum desiccators at 25 to 30 mm. of mer- cury; heat was supplied by infra-red lamps suspended above the desiccators. Inasmuch as the acids varied considerably with regard to volatility and tendency to sublimation, the vacuum utilized was not the maximum ob- tainable and for maximal recovery it was important also to remove the source of heat as soon as possible after the tubes were dry.
Preparation of Tissue Samples-Kidneys obtained from adult female rats were used in these experiments. The rats weighed 180 to 200 gm. and were purchased from the Holtzman-Rolfsmeyer Rat Company. To show the utility of the method, the effects of two inhibitors on the positions and quantities of acids emerging from the resin column were determined: (1) fluoroacetate was injected intraperitoneally (15) in a dosage of 3.5 mg. per kilo and 3 hours later the rats were decapitated and the kidneys ex- cised; (2) sodium malonate was injected subcutaneously in a dosage of 1.2 ml. of 1 M solution per 100 gm., followed 1 hour later by one-half this dose (4). 2 hours after the first injection, the rats were decapitated and the kidneys were excised. The kidneys were chilled, weighed, and ho- mogenized (16) with 1.3 ml. of 0.6 N perchloric acid per gm., wet weight, of tissue. The final concentration of perchloric acid produced, 0.33 N,
was shown to result in maximal precipitation of protein by this reagent. The homogenate was centrifuged for 10 minutes at 1500 r.p.m., and the protein precipitate was washed twice with a volume of 0.33 N perchloric acid equal to the volume of the first supernatant solution. The super- natant solutions were combined, neutralized with 2 N KOH, and cen- trifuged in the cold to precipitate the potassium perchlorate, a salt of very limited solubility in aqueous solutions. The supernatant solution was then filtered into the column. After this solution had been forced into the resin bed, the perchlorate precipitate was washed once and this
by guest on July 1, 2017http://w
ww
.jbc.org/D
ownloaded from

720 CHROMATOGRAPHY OF CITRIC ACID CYCLE
wash solution was also forced into the resin bed. The neutral effluent emerging from this initial procedure was collected separately. Water was added above the resin bed and the column was then placed in operation as described above.
Determinations-Citrate (17), lactate (18) and pyruvate and ar-keto- glutarate (19) were determined by standard methods. Solid acids were determined by titration with 0.01 N NaOH.
Results
Emergence of Acid Peaks-After the positions of the peaks of individual acids had been determined, a mixture of known acids of the Krebs cycle
ANION-EXCHANGE
0 d&ION N%BER
150
FICA 1
and the closely related amino acids, glutamic and aspartic, was subjected to the procedure. The chromatogram is illustrated in Fig. 1. The amino acids were eluted first, and in a single band. These were followed by a band of lactic acid generally emerging in two or three fractions. Succinic acid emerged several fractions after the last of the lactic acid and was followed by malic acid. Fractions 50 to 65 contained a mixture of pyruvic, malonic, citric, and isocitric acids, and the position of this group is ap- proximated by pyruvic in Fig. 1. The fumaric acid peak emerged in Frac- tions 80 to 95, followed by cr-ketoglutaric acid in Fractions 105 to 120 and finally cis-aconitic acid, which appeared as a long low peak.
To separate the acids found in Fractions 50 to 65, the tubes containing the acid eluate were each treated with 1 ml. of 2,4dinitrophenylhydrazine and then incubated for 10 minutes at 28”. After two extractions with ethyl ether, the entire procedure was repeated; the phenylhydrazone of pyruvic acid and most of the phenylhydrazine were removed by the ether.
by guest on July 1, 2017http://w
ww
.jbc.org/D
ownloaded from

H. BUSCH, R. B. HURLBERT, AND V. R. POTTER 721
These tubes, along with all others collected, were subjected to desiccation. Solid citric and malonic acids, isocitric lactone, and traces of phenylhy- drazone remained in the test-tubes after desiccation. After the acidity was titrated, excess alkali was added and the solutions were placed in a boiling water bath for 1 hour to hydrolyze the isocitric lactone. Inasmuch as isocitric lactone and malonic acid are not separated by the silica gel column under the conditions utilized, it was necessary to convert the iso-
citric la&one to isocitric acid, which was separated (Fig. 2), and quantita- tively transfer the latter to the organic phase. Quantitative transfer of the acids to the organic phase from an acidified aqueous solution6 was effected by the transfer technique of Marshall, Orten, and Smith (5). The mixture of acids, dissolved in 35 per cent butanol-chloroform, was
cn SILICA GEL l-
=4.8- -I 0
9 a > s
3 0 ‘4
w”2.4- g
h w 0
51 I I I
0 30 60 FRACTION NUMBER
FIG. 2
chromatographed on a 1 gm. silica gel column, developed with 35 per cent butanol-chloroform (7). The traces of phenylhydrazone emerged in the first fraction collected, while the malonic, citric, and isocitric acids emerged as shown in Fig. 2.
Recovery-Table I presents data on recovery of acids when added to the anion column singly or in mixtures. Recovery of acids was not signifi- cantly different when a mixture of acids was carried through the entire procedure (Table II, Experiment A). There was no change in the posi- tions or recovery of the emergent acids when a mixture was made 0.33 N
with respect to perchloric acid and the perchlorate was precipitated as the potassium salt in accordance with the procedure presented under “Prepa- ration of tissue samples” (Table II, Experiment B). Although most acids were determined by titration, lactate and pyruvate were determined colori-
6 Considerable formation of the lactone (50 to 75 per cent) was found when the salts were dried in the presence of excess HCI or when the free acid was dried after passage through a cation exchange column in the hydrogen form.
by guest on July 1, 2017http://w
ww
.jbc.org/D
ownloaded from

722 CHROMATOGRAPHY OF CITRIC ACID CYCLE
TABLE I
Recovery of Acids from Anion Exchange Resin
Acids were added to the resin column in a range of 5 to 200 MM. individually or in small groups.
I
Acid No. of experiments
Glutamic .......... Lactic. ............ Succinic ........... Malic ............. Malonic . Citric. ............ Pyruvic. .......... Isocritic. .......... Fumaric. . cu-Ketoglutaric.. cis-Aconitic.
.
I 2 5 8 7 7 6 3 5 4 4 3 / I
TABLE II
I- Average Average recovery deviation
ger cent 102 91 96 92 95 94 90 97 85 52 33
per cent
2 4 5 7 8 3 6 8 2 7
Range
per cent 98-106 89- 94 80-102 82- 98 86-111 82-111 87- 94 83-103 72-100 50- 56 23- 38
Recovery of Acids after Addition of Known Mixtures to Anion Exchange Resin
The total procedure included separation of pyruvic acid as the 2,4-dinitrophenyl- hydrazone and resolution of citric, malonic, and isocitric acids by chromatography on silica gel columns. In Experiment B, the mixture of acids was treated with perchloric acid in the same concentration as noted in “Preparation of tissue samples” and the procedure was carried on from that point.
I Experiment A Acid
Added I 2ecoverec
PM
Glutamic and aspartic. ....... Lactic ........................ 10 Succinic. ..................... 50 Malic. ....................... 100 Malonic ...................... 50 Pyruvic. ..................... 50 Citric. ....................... 100 Isocitric ...................... Fumaric ...................... 100 cr-Ketoglutaric. ............... 100 cis-Aconitic. .................
9.0 90.0 50.0 100.0 82.5 82.5 46.0 92.0 47.0 94.0 95.5 95.5
84.0 84.0 53.0 53.0
per cent
Experiment B
-- Added R ecovered RW%ly
PM PM per tent
50 49.0 98.0 10 9.2 92.0 15 14.5 96.3 20 17.3 87.0 15 12.9 86.0 10 8.9 89.0 10 9.1 91.0
8 7.6 95.0 20 20.0 100.0 30 16.8 56.0
100 38.0 38.0
metrically; in each of these cases, there was interference by the formic acid eluent or traces of formaldehyde in it, and appropriate corrections for these effects have been made in Tables I to III. Inasmuch as removal of formic acid by desiccation is practically quantitative, the blank value for titration was very low, generally less than 0.1 microequivalent of base.
by guest on July 1, 2017http://w
ww
.jbc.org/D
ownloaded from

H. BUSCH, R. B. HURLBERT, AND V. R. POTTER 723
Considerable losses of a-ketoglutaric and cis-aconitic acids were ex- perienced: calorimetric analysis of the a-ketoglutarate fraction before desic- cation revealed the same quantity of acid to be present as was found by titration. Low recoveries of cis-aconitate were obtained under the stand- ard desiccation conditions noted above, as compared with desiccation in the absence of heat; i.e., more than 90 per cent of the cis-aconitic acid was lost under the former conditions. Recoveries greater than 40 per cent have not yet been achieved. Lactic and pyruvic acids were quantitatively removed by the desiccation procedure employed. Calorimetric analyses of the formic acid eluate revealed that these acids emerged from the column quantitatively.
TABLE III
Reproducibility of Position of Emergent Acid. Peaks from Anion Exchange Resin
Summary of experiments in which known mixtures were added to the resin columns.
Acid I Fraction Nos.
Experimen 19
t1 t 1 2xperimen 23
hperimenl t1 25
Cxperiment 31
Succinic Lactic. Malic. Malonic Citric. . Pyruvic Fumaric. a-Ketoglutaric.
26 30 17 33- 36 6Q- 69
84- 93 12(f126
28-32
35-39 6672
53-61 86-91
24r 28 15- 19 30- 37
53- 63 87-100
114-134
29- 32
36- 40
6s 71
89- 99 114-129
: E
-
kperimen 34
tE kperiment 42
3&32 26- 29 IQ-20 1% 20 36-40 33- 36
6G-71 56- 63 80- 90
108-119
Identijication of Emergent Acids-Citric and lactic acids were identified by calorimetric analysis, while the identity of pyruvic and a-ketoglutaric acids was established by spectrophotometric study of the phenylhydra- zones. Melting points of the solid residue in the succinic, malic, malonic, and fumaric acid fractions were 188”, 99”, 132”, and 286” respectively, compared to 189”, 100.5”, 133”, and 290” for authentic samples. The other acids were identified by the position of the peak and the acid equiva- lence of micromoles added and micromoles recovered. Citric and iso- citric acids presented only two titratable acid groups per molecule after emergence from the anion exchange column; the latter formed a lactone which was hydrolyzed by heating in the presence of excess alkali. Re- producibility of the positions of the peaks of known acids added to the column is indicated in Table III.
Isolation of Acids from Tissues Following Injection of Inhibitors in Vivo-
by guest on July 1, 2017http://w
ww
.jbc.org/D
ownloaded from
724 CHROMATOGRAPHY OF CITRIC ACID CYCLE
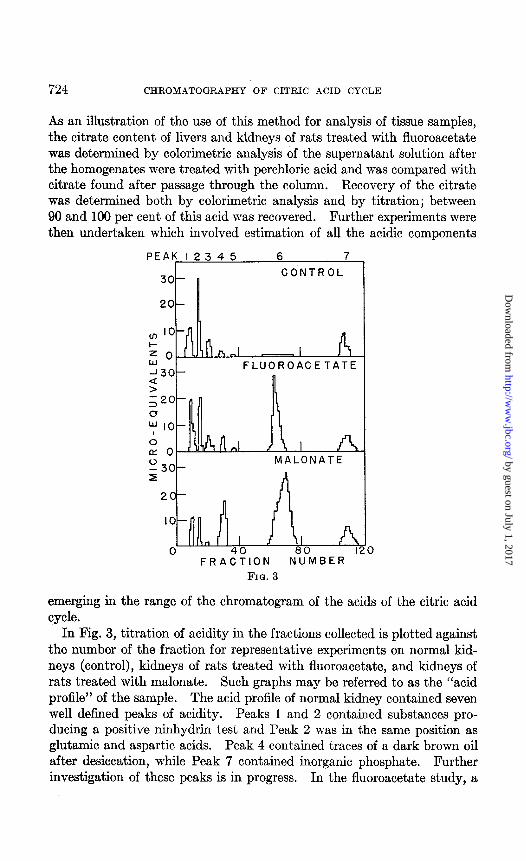
As an illustration of the use of this method for analysis of tissue samples, the citrate content of livers and kidneys of rats treated with fluoroacetate was determined by calorimetric analysis of the supernatant solution after the homogenates were treated with perchloric acid and was compared with citrate found after passage through the column. Recovery of the citrate was determined both by calorimetric analysis and by titration; between 90 and 100 per cent of this acid was recovered. Further experiments were then undertaken which involved estimation of all the acidic components
PEAK I 2 3 4 5 6 7
CONTROL
20-
I w J 30-
FLUOROACETATE
2 R
RLI / I z 30-
MALONATE
n
20-
” I I 0 40 80 I:
FRACTION NUMBER 0
FIG. 3
emerging in the range of the chromatogram of the acids of the citric acid cycle.
In Fig. 3, titration of acidity in the fractions collected is plotted against the number of the fraction for representative experiments on normal kid- neys (control), kidneys of rats treated with fluoroacetate, and kidneys of rats treated with malonate. Such graphs may be referred to as the “acid profile” of the sample. The acid profile of normal kidney contained seven well defined peaks of acidity. Peaks 1 and 2 contained substances pro- ducing a positive ninhydrin test and Peak 2 was in the same position as glutamic and aspartic acids. Peak 4 contained traces of a dark brown oil after desiccation, while Peak 7 contained inorganic phosphate. Further investigation of these peaks is in progress. In the fluoroacetate study, a
by guest on July 1, 2017http://w
ww
.jbc.org/D
ownloaded from

H. BUSCH, R. B. HURLBERT, AND V. R. POTTER 725
marked increase in titration was found in the peak which contains the citrate fraction (Peak 6), and the citrate content by titration correlated well with the citrate content as determined by calorimetric analysis. In the acid profile of the kidney of the rat treated with malonate, increased acidity was found in Peak 4, which corresponds to the succinate peak in chromatograms of known acids, as well as in Peak 6, which corresponds to the malonate peak in chromatograms of known acids. The succinate peak was contaminated by the brown oil of Peak 4, as was apparent both by gross inspection and depression of the melting point of the crystals of succinic acid from 189” to 165”. From these preliminary experiments, it was evident that the acid profile mirrored changes in a number of acid metabolites and provided a basis for further purification of the components of the peaks. Inasmuch as a number of substances could be present in any given peak of the acid profile, the use of inhibitors permitted the accumulation of a large quantity of the component acid desired, and chromatography of a small sample reduced the content of the other com- ponents to negligible quantities.
DISCUSSION
It is apparent from the data presented that the position of the acids in the eluate is dependent upon a number of factors which include the number of carboxyl groups and the ionization constant. The r81e of the number of carboxyl groups is indicated in the following examples. The ionization constant of the most active carboxyl group in pyruvic and cr-ketoglutaric acids is essentially the same; yet the former emerges some 50 fractions earlier than the latter. Moreover, the first ionization constant of malonic acid is half that of pyruvic acid and twice the first ionization constants of citric or isocitric acid; yet all emerge in the same fractions. The relative positions of the succinic, malic, and fumaric acid peaks are evidence for the r&e of the ionization in adherence of the acids to the resin; the same holds true for lactic and pyruvic acids.
Anion exchange chromatography possesses several advantages over silica gel methods in the separation of acids of the Krebs cycle. First, lactic and succinic acids were completely separated; second, the blank titrations were very low, and, in addition, valuable information was obtained by de- termination of the melting points of the crystals remaining in the tubes after desiccation. Finally, the capacity of the resin column is much greater. As much as 150 mg. of malonic acid and 25 mg. of succinic acid has been recovered from columns of the type used in this study without appreciable change in their positions, while silica gel columns of 5 times the resin bed volume used enable separation of 1 to 15 mg. of a mixture of acids of the Krebs cycle (6).
by guest on July 1, 2017http://w
ww
.jbc.org/D
ownloaded from

726 CHROMATOGRAPHY OF CITRIC ACID CYCLE
This method lends itself to various types of studies; it has been used successfully in Warburg experiments involving oxidation of labeled py- ruvate, as well as in studies on the effects of malonate on tumors and normal tissues in viva. Moreover, it is useful to have a method which can be used in conjunction with partition chromatography of organic acids, since it is very unlikely that two substances will have the same elution characteristics on both types of column.
SUMMARY
1. Formic acid, in continuously increasing concentration, eluted acids of the citric acid cycle and related acids from a Dowex 1 anion exchange resin (formate form) in the following order: glutamic and aspartic; lactic; succinic; malic; a mixture of pyruvic, malonic, citric and isocitric; fumaric; a-ketoglutaric; cis-aconitic. The components of the mixture containing pyruvic acid were separated by extraction of the latter as the 2,4-dinitro- phenylhydrazone, followed by chromatography of malonic, citric, and iso- citric acids on silica gel columns.
2. Recovery of most acids ranged from 90 to 100 per cent, but low recoveries of cr-ketoglutaric and cis-aconitic acids were found. The posi- tions of individual acid peaks on the chromatograms were consistent.
3. The method was used to demonstrate an increase in the citrate con- tent of perchloric acid extracts of kidneys of rats treated with fluoroacetate and an increase in succinate and malonate content of extracts of kidneys of rats treated with malonate.
The authors wish to express their indebtedness to Dr. G. C. Mueller and Dr. G. A. LePage for their helpful suggestions in this work.
BIBLIOGRAPHY
1. Buffa, I?., and Peters, R. A., Nature, 163, 914 (1949). 2. Buffa, P., and Peters, R. A., J. Physiol., 110, 488 (1950). 3. Potter, V. R., and Busch, H., Cancer Res., 10, 353 (1950). 4. Potter, V. R., Proc. Sot. Exp. Biol. and Med., 76, 41 (1951). 5. Marshall, L. M., Orten, J. M., and Smith, A. H., J. Biol. Chem., 179, 1127 (1949). 6. Frohman, C. E., Orten, J. M., and Smith, A. H., J. Biol. Chem., 193, 277 (1951). 7. Isherwood, F. A., Biochem. J., 40, 688 (1946). 8. Marvel, C. S., and Rands, R. D., Jr., J. Am. Chem. Sot., 72, 2642 (1950). 9. Busch, H., Hurlbert, R. B., and Potter, V. R., Federation Proc., 10, 169 (1951).
10. Cannan, R. K., J. Biol. Chem., 162, 401 (1944). 11. Consden, R., Gordon, A. H., and Martin, A. J. P., Biochem. J., 42, 443 (1948). 12. Stein, W. H., and Moore, S., Cold Spring Harbor Symposia Quant. Biol., 14, 179
(1949). 13. Moore, S., and Stein, W. H., J. Biol. Chem., 192, 663 (1951). 14. Cohn, W. E., J. Am. Chem. Sot., 72, 1471 (1950).
by guest on July 1, 2017http://w
ww
.jbc.org/D
ownloaded from

H. BUSCH, R. B. HURLBERT, AND V. R. POTTER 727
15. Potter, V. R., Busch, H., and Bothwell, J., Proc. Sot. Exp. Biol. and Med., 76, 38 (1951).
16. Potter, V. R., and Elvehjem, C. A., J. Biol. Chem., 114, 495 (1936). 17. Natelson, S., Lugovoy, J. K., and Pincus, J. B., J. Biol. Chem., 170, 597 (1947). 18. LePage, G. A., in Umbreit, W. W., Burr-is, R. H., andstauffer, J. F., Manometric
techniques and tissue metabolism, Minneapolis (1949). 19. Friedemann, T. E., and Haugen, G. E., J. Biol. Chem., 147,415 (1943).
by guest on July 1, 2017http://w
ww
.jbc.org/D
ownloaded from

PotterHarris Busch, Robert B. Hurlbert and Van R.
THE CITRIC ACID CYCLECHROMATOGRAPHY OF ACIDS OF
ANION EXCHANGE
1952, 196:717-727.J. Biol. Chem.
http://www.jbc.org/content/196/2/717.citation
Access the most updated version of this article at
Alerts:
When a correction for this article is posted•
When this article is cited•
alerts to choose from all of JBC's e-mailClick here
tml#ref-list-1
http://www.jbc.org/content/196/2/717.citation.full.haccessed free atThis article cites 0 references, 0 of which can be
by guest on July 1, 2017http://w
ww
.jbc.org/D
ownloaded from