anelasticity and spherical wave avo-modelling in · pdf fileanelasticity and spherical wave...
TRANSCRIPT

Anelasticity and spherical wave AVO
CREWES Research Report — Volume 16 (2004) 1
Anelasticity and spherical wave AVO-modelling in isotropic media
Arnim B. Haase and Charles P. Ursenbach
ABSTRACT Anelasticity modifies the AVO-response of two-layer isotropic models. When
reflection amplitude losses due to attenuation are compensated for by unit reflectivity scaling, AVO-characteristics similar to the elastic situation are found. Q-factor dependence of spherical wave AVO is found to be strongest near critical angles of Classes 1 and 2. This Q-dependence, to some degree, mimics depth dependence of elastic comparisons. Normalized spherical wave Class 3 and 4 responses show a mild Q-factor dependence for the highest attenuation levels modelled at Qp1 = 100. Wavelet stretch of converted wave AVO reflection traces is observed in addition to a phase rotation of all anelastic trace examples when compared to the elastic situation.
INTRODUCTION In previous investigations of spherical wave AVO (Haase and Ursenbach, 2004),
elasticity has been assumed. However, all rocks encountered in nature are anelastic to some degree. Anelasticity causes attenuation and velocity dispersion of seismic waves. Velocity dispersion means velocities are functions of frequency. This frequency dependence of seismic velocities can be quantified by frequency independent quality factors Q (Kjartansson, 1979). Q-factors are useful for amplitude/phase compensation and as lithology indicators, but it is well known that plane wave AVO-responses are also Q-factor dependent (see for example Carcione et al., 1998). What, then, is the spherical wave AVO-response in anelastic situations? This modeling study seeks to quantify the sensitivity of spherical wave AVO-responses (Class 1 through to 4) with respect to finite Q-factors.
THEORY A mathematical treatment of anelasticity can be found in Aki and Richards (1980).
They show that causality requires velocity dispersion and derive the following equation:
ln /( ) 1
2r e f iv v r e f Q Q
ω ωω
π
= + −
, (1)
where Q is a frequency independent quality factor.
As in the elastic case before, spherical wave displacements u are computed from the potentials Φ and Ψ :

Haase and Ursenbach
2 CREWES Research Report — Volume 16 (2004)
( )( ) ,00p i z hi tAi e R J pr e dppp
ωξωω ωξ
∞ +−Φ = ∫ (2)
1 ( )( ) ,00p i h zi tAi e R J pr e dppsi p
β ω ξ ηωω ωω α ξ
∞ +−Ψ = ∫
(3)
and
(0,0, )u = ∇Φ + ∇×∇× Ψ , (4)
where Rpp, and Rps are the particle motion reflection coefficients (from Zoeppritz’s equation).
The integrations shown in Equations (2) and (3) again proceed one frequency point at a time. However, in the anelastic situation, velocities are complex and must be recomputed for every frequency point, according to Equation 1. The P-wave quality factor for the top layer (Qp1) is assumed to be known for the computations and is listed in the displays. Qp2 (for the bottom layer) as well as S-wave quality factors Qs1 and Qs2 are calculated with the aid of empirical equations (Waters, 1978; Udias, 1999)
2
.1 / constQ P α
=
, (5)
and
24
3Q QPS
βα
=
. (6)
MODELLING The same two layer model as was utilized in the elastic situation (Haase and
Ursenbach, 2004) is also employed in this study. The layer parameters for all four AVO-Classes are repeated in Table 1:
Table 1. Layer Parameters.
Class α1/[m/s] β1/[m/s] ρ1/[kg/m3] α2/[m/s] β2/[m/s] ρ2/[kg/m3] 1 2000 879.88 2400 2933.33 1882.29 2000 2 2000 879.88 2400 2400 1540.05 2000 3 2000 879.88 2400 1963.64 1260.04 2000 4 2000 1000 2400 1598.77 654.32 2456.43
All velocities listed are taken to be reference velocities here; the reference frequency (see Equation 1) is set to 50Hz. As before, a 5/15-80/100 Ormsby wavelet is chosen as the source signature; a P-wave point source is assumed. Free surface effects are ignored.

Anelasticity and spherical wave AVO
CREWES Research Report — Volume 16 (2004) 3
Two values are assumed for the top layer P-wave quality-factor: firstly, Qp1 = 100 and, secondly, Qp1 = 387.5 . The other Q-factors are calculated from Equations (5) and (6) and are listed in Tables 2 and 3:
Table 2. Q-factors derived from Qp1=100.
Class Qp1 Qp2 Qs1 Qs2 1 100 215.1 25.8 118.1 2 100 144 25.8 79.1 3 100 96.4 25.8 52.9 4 100 63.9 33.3 14.27
Table 3. Q-factors derived from Qp1=387.5.
Class Qp1 Qp2 Qs1 Qs2 1 387.5 833.5 100 457.6 2 387.5 558 100 306 3 387.5 373.5 100 205.1 4 387.5 247.6 129.2 55.3
The appearance of the computed AVO-results depends on the scaling. Spherical spreading must be compensated for if results are to be compared to plane wave responses. Figures 1a and 1b show Class 1 spherical wave AVO magnitude responses normalized to the incident spherical P-wave. Figures 2 through 5 give Class 1 through 4 spherical wave AVO magnitude displays normalized to the response magnitude obtained when reflection coefficients R in Equations (2) and (3) are set to unity. Figures 1 through 5 are computed from trace envelopes; elastic case comparisons as well as plane wave comparisons are added for clarity. Spherical wave PS- and PP-reflection traces for AVO-Classes 1 through 4 are shown in Figures 6 through 9 . As before, these trace displays are scaled individually in order to accommodate maximum amplitudes. Clipping of maximum trace amplitudes is indicated by colour changes.
DISCUSSION AND CONCLUSIONS
The incident spherical P-wave normalization in Figures 1a and 1b highlights return path differences. The smaller the Q-factors, the larger the attenuation. The return path for converted waves is governed by Qs1, which is smaller then Qp1 (see Tables 2 and 3). Consequently, Class 1 spherical PS-wave AVO given in Figure 1a appears to be more sensitive to decreasing Q-factors than its Class 1 PP-wave comparison shown in Figure 1b. Return path attenuation is compensated for when unit R normalization is employed. Q-factor dependence appears greatly reduced for this normalization scheme, as is shown by the Class 1 examples in Figures 2a and 2b. However, converted spherical waves still seem more sensitive to increasing attenuation when compared to spherical P-waves in these examples.
Normalized Q-dependence for spherical wave AVO-Classes 1 and 2, as shown in Figures 2 and 3, to some degree mimics normalized depth dependence of the elastic

Haase and Ursenbach
4 CREWES Research Report — Volume 16 (2004)
situation (see Haase and Ursenbach, 2004). Increasing Q-factors and increasing depths move normalized spherical wave AVO closer to plane wave comparisons.
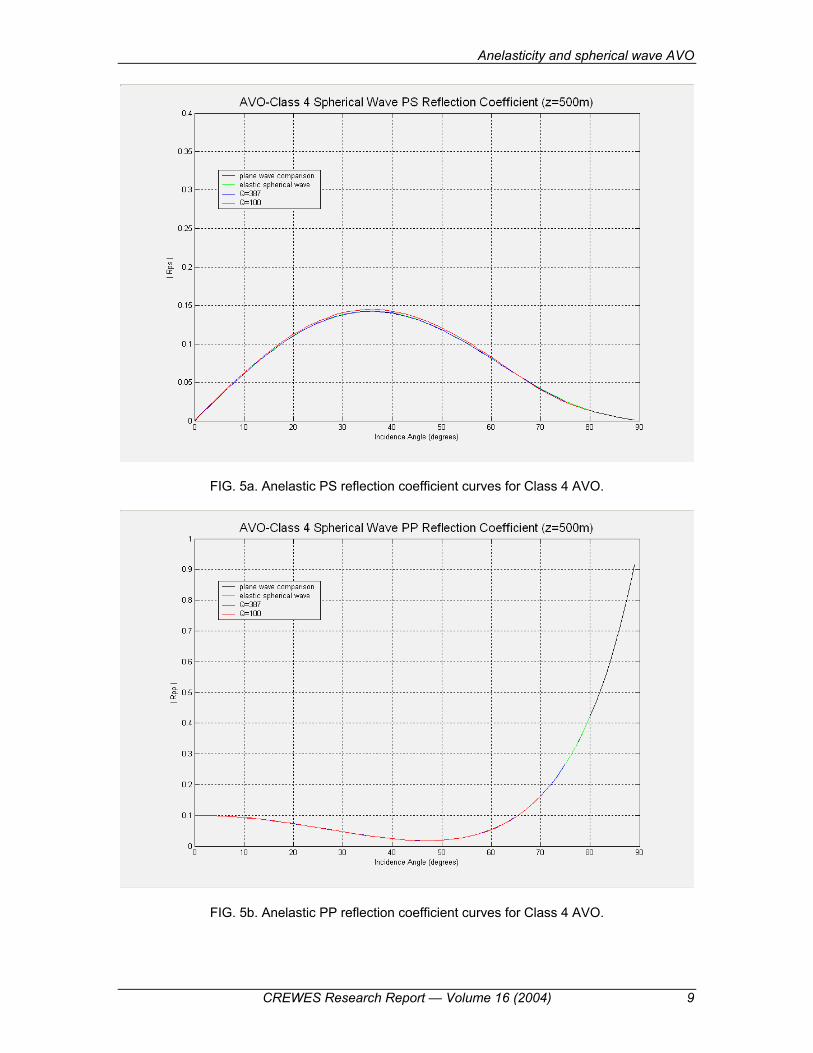
There is no Q-factor dependence following normalization of Class 3 spherical PP-wave AVO-responses (Figure 4b). The normalized Class 3 converted wave counterpart in Figure 4a shows some departure for Qp1 = 100 (the highest attenuation value considered). Note the different plotting scale for the vertical axes of Figures 4a and 5a . Figures 5a and 5b display normalized Class 4 spherical wave AVO-responses. There is similarity to spherical wave Class 3 examples in that a weak Q-factor dependence is apparent only at the largest attenuation value of converted waves.
All trace plots in Figures 6 through 9 show phase rotations when compared to the elastic situation. Note that these trace examples are all computed for a depth level of 500m and Qp1 = 100 for attenuation. Amplitude clipping is indicated by colour change: black peaks change to blue, and red troughs change to green when clipped. Also noticeable in these trace plots is the increased pulse width of anelastic converted wave reflections. This wavelet stretch is indicative of a spectral band narrowed by predominant attenuation of higher frequencies.
REFERENCES Aki, K.T., and Richards, P.G., 1980, Quantitative Seismology: Theory and Methods: Vol. 1, W.H. Freeman
and Co. Carcione, J.M., Helle, H.B., and Zhao, T., 1998, Effects of attenuation and anisotropy on reflection
amplitude versus offset: Geophysics, 63, 1652-1658. Haase, A.B., and Ursenbach, C.P., 2004, Spherical wave AVO-modelling in elastic isotropic media:
CREWES Research Report, 16. Kjartansson, E., 1979, Constant Q, wave propagation and attenuation: Journal of Geophysical Research, 84,
4737-4748. Udias, A., 1999, Principles of seismology: Cambridge University Press, page 260. Waters, K.H., 1978, Reflection Seismology: John Wiley and Sons, Inc., page 203.
ACKNOWLEDGEMENTS Thank you to Professor E. Krebes for his help with the theory. Support by the
CREWES team and its industrial sponsorship is gratefully acknowledged.

Anelasticity and spherical wave AVO
CREWES Research Report — Volume 16 (2004) 5
FIG. 1a. Incident P-wave scaling for Class 1 PS-AVO.
FIG. 1b. Incident P-wave scaling for Class 1 PP-AVO.

Haase and Ursenbach
6 CREWES Research Report — Volume 16 (2004)
FIG. 2a. Anelastic PS reflection coefficient curves for Class 1 AVO.
FIG. 2b. Anelastic PP reflection coefficient curves for Class 1 AVO.

Anelasticity and spherical wave AVO
CREWES Research Report — Volume 16 (2004) 7
FIG. 3a. Anelastic PS reflection coefficient curves for Class 2 AVO.
FIG. 3b. Anelastic PP reflection coefficient curves for Class 2 AVO.

Haase and Ursenbach
8 CREWES Research Report — Volume 16 (2004)
FIG. 4a. Anelastic PS reflection coefficient curves for Class 3 AVO.
FIG. 4b. Anelastic PP reflection coefficient curves for Class 3 AVO.
Anelasticity and spherical wave AVO
CREWES Research Report — Volume 16 (2004) 9
FIG. 5a. Anelastic PS reflection coefficient curves for Class 4 AVO.
FIG. 5b. Anelastic PP reflection coefficient curves for Class 4 AVO.

Haase and Ursenbach
10 CREWES Research Report — Volume 16 (2004)
FIG. 6a. Anelastic PS reflection traces for Class 1 AVO.
FIG. 6b. Anelastic PP reflection traces for Class 1 AVO.

Anelasticity and spherical wave AVO
CREWES Research Report — Volume 16 (2004) 11
FIG. 7a. Anelastic PS reflection traces for Class 2 AVO.
FIG. 7b. Anelastic PP reflection traces for Class 2 AVO.

Haase and Ursenbach
12 CREWES Research Report — Volume 16 (2004)
FIG. 8a. Anelastic PS reflection traces for Class 3 AVO.
FIG. 8b. Anelastic PP reflection traces for Class 3 AVO.

Anelasticity and spherical wave AVO
CREWES Research Report — Volume 16 (2004) 13
FIG. 9a. Anelastic PS reflection traces for Class 4 AVO.
FIG. 9b. Anelastic PP reflection traces for Class 4 AVO.