anderson county - community profileslmi.dew.sc.gov/lmi...
TRANSCRIPT

Anderson County
S.C. Department of Employment & Workforce
Business Intelligence Department
www.SCWorkforceInfo.com
803.737.2660
1550 Gadsden Street, PO Box 995
Columbia, SC 29202
Updated: 07/20/2018

Table Of Contents
Educational Attainment............................................................................................
Graduate Trends......................................................................................................
Educational Institutions............................................................................................
Projections by Occupation.......................................................................................
Growing Occupations.............................................................................................
Declining Occupations............................................................................................
Employment by Industry..........................................................................................
New Startup Firms..................................................................................................
Top Occupational Openings...................................................................................
New Hires by Industry............................................................................................
Turnover by Industry...........................................................................................
Average Annual Wage by Industry.......................................................................
Age of Workers by Industry....................................................................................
Projections by Industry...........................................................................................
Population.........................................................................................................
Age...............................................................................................................
Race.............................................................................................................
Gender..........................................................................................................
Change..........................................................................................................
Commuting Patterns...............................................................................................
Residents Commuting To..................................................................................
Workers Commuting From................................................................................
Employer Data......................................................................................................
Size of Establishments......................................................................................
Employment by Size of Establishment..............................................................
20 Largest Employers ......................................................................................
Annual Unemployment Rates...............................................................................
Monthly Unemployment Rates..............................................................................
Area Job Openings................................................................................................
Unemployment Insurance.....................................................................................
Demographic Data..........................................................................................
Industry Data...................................................................................................
Occupation Data.............................................................................................
Retail Sales...........................................................................................................
1
2
3
4
4
5
6
7
1. Economic Data
2. Demographic Data
8
8
9
9
10
11
12
12
13
13
13
14
3. Industry Data
15
16
17
18
19
20
21
22
23
24
25
4. Occupation Data
5. Education Data
26
27
28

Anderson CountyCommunity Profile
Annual Unemployment Rate (Unadjusted)
Trends
0
2
4
6
8
10
12
2007 2008 2009 2010 2011 2012 2013 2014 2015 2016 2017
Anderson County South Carolina United States
Un
em
plo
ym
en
t R
ate
(P
erc
en
tag
e)
United StatesAnderson County South Carolina
Year Employment Unemp Rate Employment Unemp Rate Employment Unemp Rate
2017 86,045 3,514 3.9% 2,213,894 98,757 4.3% 153,337,000 6,982,000 4.4%
2016 84,867 4,065 4.6% 2,179,521 114,145 5.0% 151,436,000 7,751,000 4.9%
2015 83,700 4,775 5.4% 2,134,244 135,095 6.0% 148,834,000 8,296,000 5.3%
2014 81,519 5,169 6.0% 2,079,565 143,413 6.5% 146,305,000 9,617,000 6.2%
2013 79,702 6,091 7.1% 2,023,642 167,326 7.6% 143,929,000 11,460,000 7.4%
2012 77,998 7,579 8.9% 1,985,618 201,260 9.2% 142,469,000 12,506,000 8.1%
2011 77,037 8,863 10.3% 1,945,900 229,623 10.6% 139,869,000 13,747,000 8.9%
2010 75,380 9,854 11.6% 1,915,045 240,623 11.2% 139,064,000 14,825,000 9.6%
2009 74,955 10,222 12.0% 1,910,670 242,075 11.2% 139,877,000 14,265,000 9.3%
2008 79,547 5,766 6.8% 1,996,409 145,823 6.8% 145,362,000 8,924,000 5.8%
2007 80,072 4,908 5.8% 2,005,686 120,205 5.7% 146,047,000 7,078,000 4.6%
Source: S.C. Department of Employment & Workforce
Page 1 of 28SC Department of Employment & Workforce

Anderson CountyCommunity Profile
Past 13 Months
Monthly Unemployment Rate (Unadjusted)
0
1
2
3
4
5
2017
-06
(Jun
)
2017
-07
(Jul)
2017
-08
(Aug
)
2017
-09
(Sep
)
2017
-10
(Oct)
2017
-11
(Nov
)
2017
-12
(Dec
)
2018
-01
(Jan
)
2018
-02
(Feb
)
2018
-03
(Mar
)
2018
-04
(Apr
)
2018
-05
(May
)
2018
-06
(Jun
)
Anderson County South Carolina United States
Un
em
plo
ym
en
t R
ate
(P
erc
en
tag
e)
Anderson CountyPeriod South Carolina United States
Jun 2018 3.5% 3.6% 4.2%
May 2018 2.7% 2.8% 3.6%
Apr 2018 2.6% 2.8% 3.7%
Mar 2018 3.8% 4.1% 4.1%
Feb 2018 4.3% 4.6% 4.4%
Jan 2018 4.7% 5.0% 4.5%
Dec 2017 3.8% 4.2% 3.9%
Nov 2017 3.6% 4.0% 3.9%
Oct 2017 3.8% 4.2% 3.9%
Sep 2017 3.9% 4.2% 4.1%
Aug 2017 4.4% 4.8% 4.5%
Jul 2017 4.3% 4.5% 4.6%
Jun 2017 4.2% 4.4% 4.5%
Source: S.C. Department of Employment & Workforce
Page 2 of 28SC Department of Employment & Workforce

Anderson CountyCommunity Profile
South CarolinaAnderson County
Area Job Openings
Period Employed Unemployed Unemp.
Rate
Job
Openings
Employed Unemployed Unemp.
Rate
Job
Openings
Jun-18 86,926 3,153 3.5% 1,412 2,226,062 87,080 3.8% 57,230
May-18 86,852 2,430 2.7% 1,382 2,225,414 92,505 4.0% 61,940
Apr-18 86,875 2,325 2.6% 1,375 2,225,655 97,929 4.2% 64,770
Mar-18 87,041 3,452 3.8% 1,346 2,225,252 102,079 4.4% 59,107
Feb-18 86,400 3,845 4.3% 1,192 2,223,397 101,415 4.4% 57,596
Jan-18 85,885 4,248 4.7% 1,307 2,221,051 100,182 4.3% 51,746
Dec-17 86,171 3,364 3.8% 1,264 2,220,845 97,879 4.2% 56,028
Nov-17 86,317 3,238 3.6% 1,510 2,221,189 97,944 4.2% 60,228
Oct-17 86,549 3,377 3.8% 1,551 2,221,475 97,934 4.2% 57,940
Sep-17 86,435 3,467 3.9% 1,557 2,220,466 97,769 4.2% 58,456
Aug-17 85,960 3,999 4.4% 1,572 2,218,539 97,377 4.2% 61,865
Jul-17 86,174 3,882 4.3% 1,570 2,216,343 96,879 4.2% 62,395
Jun-17 86,334 3,746 4.2% 1,720 2,213,831 96,674 4.2% 66,498
Source: S.C. Department of Employment & Workforce & The Conference Board's Help Wanted OnLine® data series
South Carolina Data is Seasonally Adjusted
Page 3 of 28SC Department of Employment & Workforce

Anderson CountyCommunity Profile
June 2018
Characteristics of Unemployment Insurance Claimants
Anderson County South CarolinaGender
Female 131 4,367Male 57 2,928O 5 96
0% 10% 20% 30% 40% 50% 60% 70%
Female
Male
Anderson County South Carolina
Anderson CountyRace South Carolina
ASIAN 1 22BLACK 111 4,045MULTIPLE 2 169UNKNOWN 8 252WHITE 71 2,860
0% 10% 20% 30% 40% 50% 60%
ASIAN
BLACK
HAWAIIAN
MULTIPLE
NATIVE AMERICAN
UNKNOWN
WHITE
Anderson County South CarolinaAge Group
18 - 24 9 64725 - 40 68 3,06641 - 55 74 2,28356 - 64 24 1,02965+ 18 364Less than 18 0 2
0% 5% 10% 15% 20% 25% 30% 35% 40% 45%
18 - 24
25 - 40
41 - 55
56 - 64
65+
Less than 18
Source: S.C. Department of Employment & Workforce
Anderson CountyEducation South Carolina
College Grad 91 3,283Some College 86 3,198Some High School 13 535No High School 0 33Unknown 3 342
0% 10% 20% 30% 40% 50%
College Grad
No High School
Some College
Some High School
Unknown
Page 4 of 28SC Department of Employment & Workforce

Anderson CountyCommunity Profile
Characteristics of Unemployment Insurance Claims by IndustryIndustry Groups With Largest Number of Claims
June 2018
0% 4% 8% 12% 16% 20% 24% 28%
Accommodation and Food Services
Administrative and Support and WasteManageme
Educational Services
Other Services (except Public Administration)
Retail Trade
Anderson County South Carolina
Anderson CountyIndustry South Carolina
Construction 20 880
Manufacturing 2 1,556
Wholesale Trade 8 460
Retail Trade 38 1,390
Transportation and Warehousing 6 574
Information 4 126
Finance and Insurance 2 400
Real Estate and Rental and Leasing 4 154
Professional, Scientific, and Technical Servi 8 750
Management of Companies and Enterprises 6 80
Administrative and Support and Waste Manageme 34 2,222
Educational Services 34 632
Health Care and Social Assistance 26 1,574
Arts, Entertainment, and Recreation 14 138
Accommodation and Food Services 98 1,632
Other Services (except Public Administration) 52 570
Public Administration 4 282
Unknown 26 1,280
Source: S.C. Department of Employment & Workforce
Page 5 of 28SC Department of Employment & Workforce

Anderson CountyCommunity Profile
Characteristics of Unemployment Insurance Claims by OccupationOccupation Groups With Largest Number of Claims
June 2018
0% 4% 8% 12% 16% 20% 24%
Building and Grounds Cleaning and Maintenance Occu
Educational Instruction and Library Occupations
Food Preparation and Serving Related Occupations
Management Occupations
Office and Administrative Support Occupations
South CarolinaAnderson County
Anderson CountyOccupation South Carolina
Architecture and Engineering Occupations 4 324Arts, Design, Entertainment, Sports, and Media Occ 4 130Building and Grounds Cleaning and Maintenance Occu 38 550Business and Financial Operations Occupations 10 478Community and Social Service Occupations 4 134Computer and Mathematical Occupations 2 192Construction and Extraction Occupations 16 664Educational Instruction and Library Occupations 34 918Food Preparation and Serving Related Occupations 84 1,328Healthcare Practitioners and Technical Occupations 10 372Healthcare Support Occupations 12 396Installation, Maintenance, and Repair Occupations 6 456Management Occupations 48 1,358Office and Administrative Support Occupations 34 1,882Personal Care and Service Occupations 2 140Production Occupations 8 1,460Protective Service Occupations 6 236Sales and Related Occupations 18 970Transportation and Material Moving Occupations 6 1,220Unknown 40 1,276
Source: S.C. Department of Employment & Workforce
Page 6 of 28SC Department of Employment & Workforce

Anderson CountyCommunity Profile
Retail Sales
Anderson County South Carolina
$0
$100,000,000
$200,000,000
$300,000,000
$400,000,000
$500,000,000
$600,000,000
$700,000,000
$0
$4,000,000,000
$8,000,000,000
$12,000,000,000
$16,000,000,000
$20,000,000,000
$24,000,000,000
$28,000,000,000
Apr 2
017
May
201
7
Jun
2017
Jul 2
017
Aug 2
017
Sep 2
017
Oct 2
017
Nov
201
7
Dec
201
7
Jan
2018
Feb 2
018
Mar
201
8
Apr 2
018
South CarolinaAnderson County
Source: S.C. Department of Revenue
Page 7 of 28SC Department of Employment & Workforce

Anderson CountyCommunity Profile
Population by Age
0 1 2 3 4 5 6 7 8
0-4
10-14
20-24
30-34
40-44
50-54
60-64
70-74
80-84
0-4
10-14
20-24
30-34
40-44
50-54
60-64
70-74
80-84
Anderson County South Carolina
Anderson CountyAge Range South Carolina United States
0-4 11,788 298,242 20,052,1125-9 12,371 302,111 20,409,06010-14 12,941 297,443 20,672,60915-19 12,345 321,540 21,715,07420-24 11,212 342,237 22,099,88725-29 10,662 305,167 21,243,36530-34 11,006 293,464 20,467,91235-39 11,585 291,183 19,876,16140-44 13,081 308,158 20,998,00145-49 13,738 325,660 22,109,94650-54 13,720 329,431 22,396,32255-59 12,737 309,061 20,165,89260-64 11,691 289,690 17,479,21165-69 9,169 229,251 13,189,50870-74 7,861 165,797 9,767,52275-79 5,508 117,187 7,438,75080-84 3,712 82,223 5,781,69785 and older 3,353 71,757 5,673,565
Source: U.S. Census Bureau, American Community Survey
Page 8 of 28SC Department of Employment & Workforce

Anderson CountyCommunity Profile
Population by Race
Anderson CountyRace % South Carolina % United States %
White 151,430 80.3% 3,144,146 66.0% 230,592,579 72.0%Black 30,897 16.4% 1,298,534 27.3% 39,167,010 12.2%American Indian/Alaskan Native 463 0.3% 14,732 0.3% 2,540,309 0.8%Asian 1,385 0.7% 61,097 1.3% 15,231,962 4.8%Native Hawaiian/ Other Pacific Islander 79 0.0% 2,128 0.0% 526,347 0.2%2 or more races 5,152 2.7% 169,670 3.6% 17,464,666 5.5%Other 1,650 0.9% 74,130 1.6% 14,746,054 4.6%Source: U.S. Census Bureau, American Community Survey
White 79.3%Black 16.2%American Indian/Alaskan Native 0.2%Asian 0.7%Native Hawaiian/ Other Pacific Islander 0.0%2 or more races 2.7%Other 0.9%
Total: 100.0%
Population by Gender
Anderson CountyGender South Carolina United States
Male 90,978 2,276,305 153,247,412Female 97,502 2,403,297 158,289,182
Source: U.S. Census Bureau, American Community Survey
Page 9 of 28SC Department of Employment & Workforce

Anderson CountyCommunity Profile
Historical and Projected
Population Change
South CarolinaAnderson County
0K
40K
80K
120K
160K
200K
240K
0K
1000K
2000K
3000K
4000K
5000K
6000K
1970 1980 1990 2000 2010 2020 2030
Year
South CarolinaAnderson County
Anderson CountyYear South Carolina
1970 105,474 2,590,7131980 133,235 3,121,8201990 145,177 3,486,3102000 165,740 4,012,0122010 184,990 4,549,1502020 201,730 5,020,4002030 218,520 5,488,460
Source: U.S. Census Bureau
Page 10 of 28SC Department of Employment & Workforce

Anderson CountyCommunity Profile
Commuting Patterns
In-Commuters 33.6%Out-Commuters 39.7%Work and Live in County 26.7%
Total: 100.0%
WorkersCommuting Patterns
Work and Live in County 52,413
In-Commuters 66,090
Out-Commuters 77,915
Source: U.S. Census Bureau - 2010
Page 11 of 28SC Department of Employment & Workforce

Anderson CountyCommunity Profile
Top 10 Places Residents Are Commuting To
Area Workers
Greenville County, SC 15,561Pickens County, SC 3,997Spartanburg County, SC 1,622Oconee County, SC 1,417Greenwood County, SC 463Abbeville County, SC 405Laurens County, SC 233HART COUNTY, GA 120Richland County, SC 91FRANKLIN COUNTY, GA 88
Source: U.S. Census Bureau - 2010
Top 10 Places Residents Are Commuting From
Area Workers
Pickens County, SC 4,220Greenville County, SC 3,834Oconee County, SC 1,660Abbeville County, SC 1,596HART COUNTY, GA 407Greenwood County, SC 349Laurens County, SC 229ELBERT COUNTY, GA 180Spartanburg County, SC 177Cherokee County, SC 111
Source: U.S. Census Bureau - 2010
Page 12 of 28SC Department of Employment & Workforce

Anderson CountyCommunity Profile
Employers by Size of Establishment
Anderson CountyEmployees South Carolina
0 to 4 1,909 75,6495 to 9 656 20,26310 to 19 490 14,97720 to 49 378 11,54750 to 99 131 4,562100 to 249 70 2,731250 to 499 20 866500 to 999 8 3871000 + 0 293
Source: S.C. Department of Employment & Workforce - 2017 Q3
- Indicates that the requested data is suppressed
Employment by Size of Establishment
Anderson CountyEmployees South Carolina
0 to 4 2,924 110,0575 to 9 4,337 135,03810 to 19 6,697 203,46920 to 49 11,123 352,61350 to 99 8,816 311,959100 to 249 10,380 411,508250 to 499 6,714 294,535500 to 999 5,980 262,9921000 + 0 738,384
Source: S.C. Department of Employment & Workforce - 2017 Q3
- Indicates that the requested data is suppressed
Page 13 of 28SC Department of Employment & Workforce

Anderson CountyCommunity Profile
20 Largest Employers
(Listed Alphabetically)
Corporation Name
ANDERSON AREA MEDICAL CENTER
ANDERSON COUNTY
ANDERSON COUNTY SCHOOL DISTRICT #2
ANDERSON COUNTY SCHOOL DISTRICT #5
ANDERSON COUNTY SCHOOL DISTRICT 1
ANDERSON COUNTY SCHOOL DISTRICT 4
ANDERSON UNIVERSITY
CITY OF ANDERSON
ELECTROLUX HOME PRODUCTS INC
FIRST QUALITY TISSUE SE LLC
GLEN RAVEN CUSTOM FABRICS LLC
INGLES MARKET INC
MICHELIN NORTH AMERICA INC
ONE WORLD TECHNOLOGIES INC
PLASTIC OMNIUM AUTO EXTERIORS LLC
ROBERT BOSCH CORPORATION
STAFF ONE PLUS INC
TRI COUNTY TECHNICAL EDUCATION CENT
WAL-MART ASSOCIATES INC
WALGREEN CO
Source: S.C. Department of Employment & Workforce - 2017 Q3
Page 14 of 28SC Department of Employment & Workforce

Anderson CountyCommunity Profile
Employment by Industry
7,049
2,778
71
627
2,298
6,045
958
10,507
498
167
14,420
92
1,407
1,772
2,346
547
9,257
2,058
300
2,090
Accommodation and Food Services
Administrative and Support and Waste Management andRemediation Services
Agriculture, Forestry, Fishing and Hunting
Arts, Entertainment, and Recreation
Construction
Educational Services
Finance and Insurance
Health Care and Social Assistance
Information
Management of Companies and Enterprises
Manufacturing
Mining, Quarrying, and Oil and Gas Extraction
Other Services (except Public Administration)
Professional, Scientific, and Technical Services
Public Administration
Real Estate and Rental and Leasing
Retail Trade
Transportation and Warehousing
Utilities
Wholesale Trade
Source: S.C. Department of Employment & Workforce
Quarterly Census of Employment and Wages (QCEW) - 2017 Q4
Page 15 of 28SC Department of Employment & Workforce

Anderson CountyCommunity Profile
New Startup Firms
South CarolinaAnderson County
0
400
800
1,200
1,600
2,000
2,400
0
10
20
30
40
50
60
70
2007
Q1
2007
Q3
2008
Q1
2008
Q3
2009
Q1
2009
Q3
2010
Q1
2010
Q3
2011
Q1
2011
Q3
2012
Q1
2012
Q3
2013
Q1
2013
Q3
2014
Q1
2014
Q3
2015
Q1
2015
Q3
2016
Q1
2016
Q3
2017
Q2
South CarolinaAnderson County
Anderson CountyQuarter South Carolina
2016 Q4 27 8882016 Q3 15 6792016 Q2 20 8312016 Q1 50 1,4452015 Q4 26 8892015 Q3 21 6652015 Q2 29 9052015 Q1 57 1,7462014 Q4 13 7752014 Q3 21 7412014 Q2 20 7602014 Q1 54 1,3842013 Q4 32 8482013 Q3 24 7412013 Q2 45 9822013 Q1 43 1,2402012 Q4 23 7882012 Q3 25 6722012 Q2 26 7402012 Q1 61 1,680
Note: A firm is included in the count when it does not have a UI Account Number in the previous
quarter and has a Setup Date that falls in the quarter displayed.
Source: S.C. Department of Employment & Workforce
Page 16 of 28SC Department of Employment & Workforce
Anderson CountyCommunity Profile
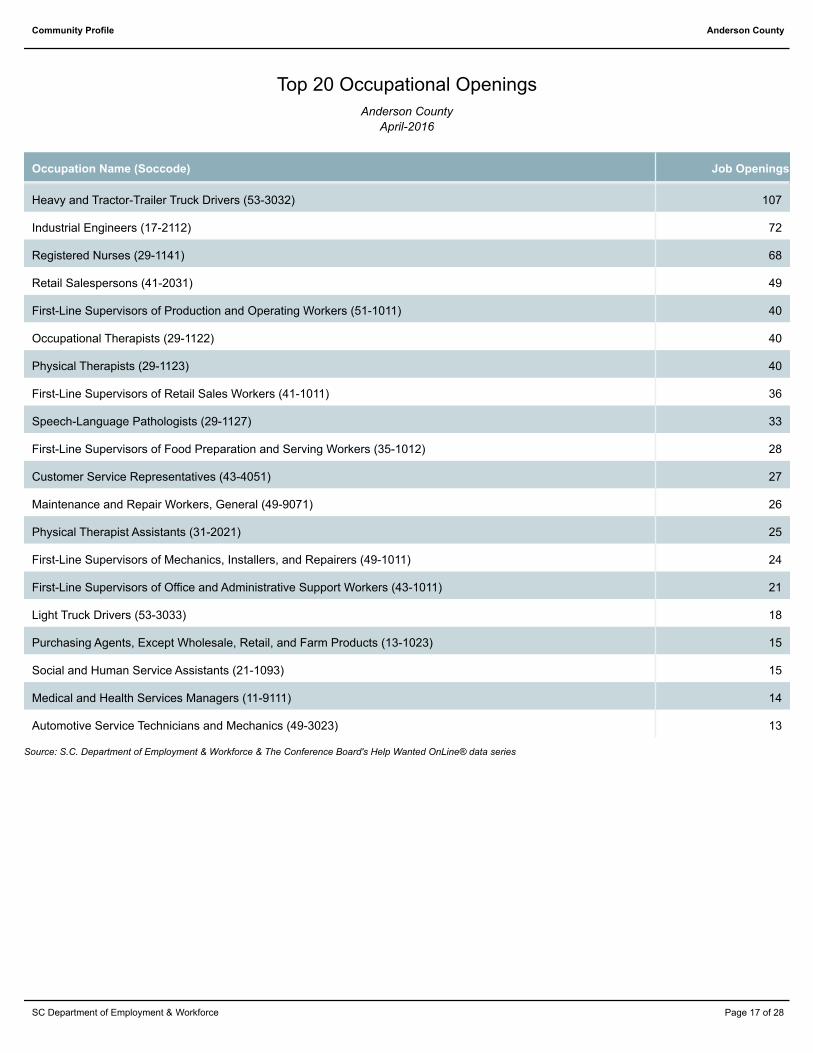
Top 20 Occupational Openings
Anderson County
April-2016
Occupation Name (Soccode) Job Openings
Heavy and Tractor-Trailer Truck Drivers (53-3032) 107
Industrial Engineers (17-2112) 72
Registered Nurses (29-1141) 68
Retail Salespersons (41-2031) 49
First-Line Supervisors of Production and Operating Workers (51-1011) 40
Occupational Therapists (29-1122) 40
Physical Therapists (29-1123) 40
First-Line Supervisors of Retail Sales Workers (41-1011) 36
Speech-Language Pathologists (29-1127) 33
First-Line Supervisors of Food Preparation and Serving Workers (35-1012) 28
Customer Service Representatives (43-4051) 27
Maintenance and Repair Workers, General (49-9071) 26
Physical Therapist Assistants (31-2021) 25
First-Line Supervisors of Mechanics, Installers, and Repairers (49-1011) 24
First-Line Supervisors of Office and Administrative Support Workers (43-1011) 21
Light Truck Drivers (53-3033) 18
Purchasing Agents, Except Wholesale, Retail, and Farm Products (13-1023) 15
Social and Human Service Assistants (21-1093) 15
Medical and Health Services Managers (11-9111) 14
Automotive Service Technicians and Mechanics (49-3023) 13
Source: S.C. Department of Employment & Workforce & The Conference Board's Help Wanted OnLine® data series
Page 17 of 28SC Department of Employment & Workforce

Anderson CountyCommunity Profile
New Hires by Industry
2,823
2,404
52
152
480
277
69
1,222
40
89
1,425
4
278
173
130
94
1,958
182
11
317
Accommodation and Food Services
Administrative and Support and Waste Managementand Remediation Services
Agriculture, Forestry, Fishing and Hunting
Arts, Entertainment, and Recreation
Construction
Educational Services
Finance and Insurance
Health Care and Social Assistance
Information
Management of Companies and Enterprises
Manufacturing
Mining, Quarrying, and Oil and Gas Extraction
Other Services (except Public Administration)
Professional, Scientific, and Technical Services
Public Administration
Real Estate and Rental and Leasing
Retail Trade
Transportation and Warehousing
Utilities
Wholesale Trade
Source: U.S. Census Bureau, Local Employment Dynamics - 2016 Q2
Page 18 of 28SC Department of Employment & Workforce

Anderson CountyCommunity Profile
Turnover by Industry
16.2%
25.8%
12.7%
12.2%
10.6%
2.5%
8.4%
6.3%
16.1%
4.2%
4.5%
18.0%
9.1%
4.1%
9.9%
11.1%
8.3%
8.6%
Accommodation and Food Services
Administrative and Support and Waste Managementand Remediation Services
Agriculture, Forestry, Fishing and Hunting
Arts, Entertainment, and Recreation
Construction
Educational Services
Finance and Insurance
Health Care and Social Assistance
Information
Management of Companies and Enterprises
Manufacturing
Other Services (except Public Administration)
Professional, Scientific, and Technical Services
Public Administration
Real Estate and Rental and Leasing
Retail Trade
Transportation and Warehousing
Wholesale Trade
Source: U.S. Census Bureau, Local Employment Dynamics - 2013 Q3
Page 19 of 28SC Department of Employment & Workforce

Anderson CountyCommunity Profile
Average Annual Wage by Industry
$15,340
$30,628
$38,428
$13,988
$51,688
$37,596
$48,256
$45,812
$44,564
$96,616
$55,848
$60,008
$35,568
$51,324
$37,908
$39,936
$28,496
$45,448
$76,908
$50,024
Accommodation and Food Services
Administrative and Support and WasteManagement and Remediation Services
Agriculture, Forestry, Fishing and Hunting
Arts, Entertainment, and Recreation
Construction
Educational Services
Finance and Insurance
Health Care and Social Assistance
Information
Management of Companies and Enterprises
Manufacturing
Mining, Quarrying, and Oil and Gas Extraction
Other Services (except Public Administration)
Professional, Scientific, and Technical Services
Public Administration
Real Estate and Rental and Leasing
Retail Trade
Transportation and Warehousing
Utilities
Wholesale Trade
Source: S.C. Department of Employment & Workforce
Quarterly Census of Employment and Wages (QCEW) - 2017 Q4
Page 20 of 28SC Department of Employment & Workforce

Anderson CountyCommunity Profile
Age of Workers by Industry
65+55-6445-5435-4425-3422-2419-2114-18Industry
Total, All Industries 1,706 3,344 4,084 13,804 14,003 14,540 10,954 3,873
Agriculture, Forestry, Fishing and Hunting 4 0 5 18 26 29 21 12
Mining, Quarrying, and Oil and Gas Extraction 0 2 0 9 11 13 8 5
Utilities 0 0 3 46 61 69 81 15
Construction 21 103 153 522 579 569 392 163
Manufacturing 21 262 578 2,471 3,147 3,647 2,718 515
Wholesale Trade 7 54 87 507 611 609 406 251
Retail Trade 400 906 817 1,941 1,529 1,536 1,226 626
Transportation and Warehousing 19 71 106 352 377 445 328 98
Information 11 16 22 97 108 128 84 40
Finance and Insurance 4 11 33 220 218 239 174 56
Real Estate and Rental and Leasing 5 8 22 99 93 113 91 27
Professional and Technical Services 14 43 77 355 294 323 232 124
Management of Companies and Enterprises 8 7 6 20 34 51 60 30
Administrative and Waste Services 45 262 338 1,067 826 740 419 191
Educational Services 5 48 215 1,159 1,455 1,696 1,339 470
Health Care and Social Assistance 39 301 610 2,494 2,780 2,567 2,088 646
Arts, Entertainment, and Recreation 55 87 77 105 79 82 78 69
Accommodation and Food Services 1,024 1,060 765 1,619 989 817 479 208
Other Services, Except Public Administration 14 70 84 311 344 382 340 146
Public Administration 10 29 84 391 444 486 389 181
Source: U.S. Census Bureau, Local Employment Dynamics - 2016 Q2
Page 21 of 28SC Department of Employment & Workforce

Anderson CountyCommunity Profile
Labor Market ProjectionsTotal Employment by Industry
(County/Metropolitan Statistical Area Data Unavailable)
Note: Projections are available by Workforce Investment Area (WIA). The data displayed is selected from the appropriate WIA.
Worklink 2014 2024
Industry Estimated
Employment
Projected
Employment
Change Percent
Change
Annual
Percent
Total Employment, All Jobs 129,166 140,756 11,590 8.97 0.86
Health care and social assistance 15,173 18,231 3,058 20.15 1.85
Educational services; state, local, and private 14,663 16,926 2,263 15.43 1.45
Administrative and support and waste management
and remediat
5,989 7,561 1,572 26.25 2.36
Accommodation and food services 12,985 14,371 1,386 10.67 1.02
Retail Trade 16,664 17,687 1,023 6.14 0.60
Construction 4,432 5,384 952 21.48 1.96
Manufacturing 24,364 25,244 880 3.61 0.36
Professional, scientific, and technical services 2,311 2,904 593 25.66 2.31
Wholesale trade 2,800 3,236 436 15.57 1.46
Transportation and Warehousing 1,734 1,992 258 14.88 1.40
Other services (except public administration) 3,845 4,100 255 6.63 0.64
Finance and insurance 2,182 2,369 187 8.57 0.83
Arts, entertainment, and recreation 1,336 1,445 109 8.16 0.79
Information 1,089 1,166 77 7.07 0.69
Real estate and rental and leasing 727 797 70 9.63 0.92
Management of companies and enterprises 323 350 27 8.36 0.81
Utilities 1,909 1,917 8 0.42 0.04
Source: S.C. Department of Employment & Workforce - Industry Projections
Page 22 of 28SC Department of Employment & Workforce

Anderson CountyCommunity Profile
Total Employment by Occupation(County/Metropolitan Statistical Area Data Unavailable)
Note: Projections are available by Workforce Investment Area (WIA). The data displayed is selected from the appropriate WIA.
Labor Market Projections
Worklink 2014 2024
Occupation Estimated
Employment
Projected
Employment
Annual
Openings
Openings
(Replace)
Openings
(Growth)
Total, all occupations 4,530 1,429 3,101 140,756 129,166
Management occupations 216 54 162 6,869 7,349
Business and financial operations occupations 98 39 59 3,105 2,722
Computer and mathematical occupations 33 15 18 1,317 1,167
Architecture and engineering occupations 78 20 58 2,380 2,191
Life, physical, and social science occupations 29 9 20 784 701
Community and social service occupations 48 19 29 1,501 1,308
Legal occupations 15 7 8 517 450
Education, training, and library occupations 343 156 187 10,430 8,867
Arts, design, entertainment, sports, and media
occupations
36 10 26 1,198 1,111
Healthcare practitioners and technical occupations 293 126 167 9,054 7,796
Healthcare support occupations 162 83 79 4,344 3,520
Protective service occupations 61 11 50 2,022 1,918
Food preparation and serving related occupations 614 151 463 14,317 12,935
Building and grounds cleaning and maintenance
occupations
148 60 88 5,064 4,465
Personal care and service occupations 134 55 79 3,921 3,385
Sales and related occupations 503 104 399 13,558 12,520
Office and administrative support occupations 472 125 347 18,149 17,185
Farming, fishing, and forestry occupations 50 0 50 1,063 1,933
Construction and extraction occupations 160 84 76 5,662 4,823
Installation, maintenance, and repair occupations 230 77 153 7,061 6,313
Production occupations 503 121 382 19,150 18,236
Transportation and material moving occupations 303 104 199 9,290 8,271
Source: S.C. Department of Employment & Workforce - Occupational Projections
Page 23 of 28SC Department of Employment & Workforce

Anderson CountyCommunity Profile
Growing Occupations
(County/Metropolitan Statistical Area Data Unavailable)
Note: Projections are available by Workforce Investment Area (WIA). The data displayed is selected from the appropriate WIA.
Labor Market Projections
Worklink 2014 2024
Occupation Estimated
Employment
Projected
Employment
Percent
Change
Replace Growth Total Average
Salary
Biomedical engineers $ 77,574 3 2 1 52 44 29
Education administrators, preschool and
childcare center/pro
$ 54,104 2 1 1 42 27 19
Home health aides $ 18,783 51 33 18 41 1,140 808
Veterinary technologists and technicians $ 26,059 3 2 1 37 92 67
Environmental scientists and specialists,
including health
$ 58,562 1 1 0 35 23 17
Nurse practitioners $ 79,110 6 4 2 35 144 107
Personal care aides $ 17,740 32 26 6 34 1,019 761
Physician assistants $ 83,664 3 2 1 33 61 46
Preschool teachers, except special education $ 22,866 15 8 7 32 324 246
Helpers--brickmasons, blockmasons,
stonemasons, and tile and
$ 24,816 4 3 1 31 123 94
Nursing instructors and teachers,
postsecondary
$ 71,310 3 2 1 30 86 66
Health specialties teachers, postsecondary $ 83,044 3 2 1 30 92 71
Self-enrichment education teachers $ 44,417 8 5 3 29 226 175
Mental health counselors $ 51,179 2 1 1 29 58 45
Diagnostic medical sonographers $ 54,915 2 1 1 29 63 49
Computer-controlled machine tool operators,
metal and plasti
$ 36,804 25 12 13 28 551 429
Brickmasons and blockmasons $ 38,407 3 2 1 28 109 85
Computer systems analysts $ 78,991 5 3 2 28 150 117
Management analysts $ 83,251 11 7 4 28 324 254
Mathematical science teachers, postsecondary $ 72,995 5 3 2 27 123 97
Occupations are sorted by highest estimated percentage growth from estimate year to projection year.
Source: S.C. Department of Employment & Workforce - Occupational Projections
Page 24 of 28SC Department of Employment & Workforce

Anderson CountyCommunity Profile
Declining Occupations(County/Metropolitan Statistical Area Data Unavailable)
Note: Projections are available by Workforce Investment Area (WIA). The data displayed is selected from the appropriate WIA.
Labor Market Projections
Worklink 2014 2024
Occupation Estimated
Employment
Projected
Employment
Percent
Change
Replace Growth Total Average
Salary
Farmworkers, farm, ranch,
and aquacultural animals
189 128 -32 5 0 5 $ 22,556
Prepress technicians and
workers
25 19 -24 0 0 0 $ 37,983
Postal service mail sorters,
processors, and processing
mach
14 11 -21 0 0 0 $ 42,738
Coin, vending, and
amusement machine
servicers and repairers
37 30 -19 0 0 0 $ 39,499
Meter readers, utilities 84 70 -17 2 0 2 $ 39,209
Postal service clerks 58 49 -16 1 0 1 $ 51,173
Postal service mail carriers 365 309 -15 7 0 7 $ 50,315
Medical transcriptionists 34 29 -15 1 0 1 $ 31,940
Heat treating equipment
setters, operators, and
tenders, met
28 24 -14 0 0 0 $ 36,538
Logging equipment
operators
79 68 -14 2 0 2 $ 28,851
Postmasters and mail
superintendents
22 19 -14 0 0 0 $ 71,612
Molding, coremaking, and
casting machine setters,
operators,
217 188 -13 3 0 3 $ 33,060
Extruding and drawing
machine setters, operators,
and tender
53 46 -13 1 0 1 $ 36,198
Cooks, fast food 933 821 -12 25 0 25 $ 17,117
Cutting, punching, and press
machine setters, operators,
and
145 128 -12 2 0 2 $ 32,047
Claims adjusters,
examiners, and investigators
27 24 -11 1 0 1 $ 62,710
Plating and coating machine
setters, operators, and
tenders,
71 64 -10 2 0 2 $ 29,859
Extruding, forming, pressing,
and compacting machine
setters
48 44 -8 2 0 2 $ 30,343
Mail clerks and mail
machine operators, except
postal servic
24 22 -8 0 0 0 $ 19,040
Print binding and finishing
workers
13 12 -8 0 0 0 $ 32,079
Occupations are sorted by highest estimated percentage decline from estimate year to projection year.
Source: S.C. Department of Employment & Workforce - Occupational Projections
Page 25 of 28SC Department of Employment & Workforce

Anderson CountyCommunity Profile
(Population 25 Years and Older)
Educational Attainment
11.72%9.77%
12.68%6.61%
31.91%
6.54%20.76%
9th to 12th No Diploma Associate's Degree Bachelor's DegreeGraduate Degree High School Graduate Less Than 9th GradeSome College
Source: U.S. Census Bureau, American Community Survey - 2013 5-Year Estimates
Page 26 of 28SC Department of Employment & Workforce

Anderson CountyCommunity Profile
(Based On Graduates From Area Schools)
Graduate Trends
0
200
400
600
800
1000
1200
20032004200520062007200820092010201120122013201420152016
Bachelor's Degree Master's Degree Doctor's Degrees
Source: Institute of Education Sciences (IES), Integrated Postsecondary Education Data System
Page 27 of 28SC Department of Employment & Workforce

Anderson CountyCommunity Profile
Educational Institutions
Anderson University
316 Boulevard
Anderson, SC 29621
864.231.2000
http://www.andersonuniversity.edu
2016 Degrees Awarded: 1,296
Arclabs
2615 Highway 153
Piedmont, SC 29673
864.236.9995
http://www.arclabs.com
2016 Degrees Awarded: 322
Forrest College
601 E River Street
Anderson, SC 29624
864.225.7653
http://www.forrestcollege.edu
2016 Degrees Awarded: 88
Kenneth Shuler School of Cosmetology-Greenville
3528-A Earl E. Morris Jr. Highway
Greenville, SC 29611
864.269.6886
http://kennethshuler.com
2016 Degrees Awarded: 124
Tri-County Technical College
7900 U.S. Hwy 76
Pendleton, SC 29670
864.646.1500
http://www.tctc.edu
2016 Degrees Awarded: 2,546
Source: Institute of Education Sciences (IES), Integrated Postsecondary Education Data System
Page 28 of 28SC Department of Employment & Workforce