and technology journal original effect adsorption vermiculite · of applied research and technology...
TRANSCRIPT

A
aiTLoamcf©t
Kf
1
tm
(
M
1C
Available online at www.sciencedirect.com
Journal of Applied Researchand Technology
www.jart.ccadet.unam.mxJournal of Applied Research and Technology 14 (2016) 325–337
Original
Effect of dispersed hydrophilic silicon dioxide nanoparticles on batchadsorption of benzoic acid from aqueous solution using modified natural
vermiculite: An equilibrium study
Ehsan Sadeghi Pouya a, Hossein Abolghasemi a,b,∗, Hooman Fatoorehchi a, Bettina Rasem c,Seyed Jalaledin Hashemi d
a Center for Separation Processes Modeling and Nano-Computations, School of Chemical Engineering, College of Engineering, University of Tehran, P.O. Box11365-4563, Tehran, Iran
b Oil and Gas Center of Excellence, University of Tehran, Tehran, Iranc Department of Chemical Engineering, Faculty of Process and Systems Engineering, Technical University of Berlin, Berlin, Germany
d Department of Chemical Engineering, Faculty of Engineering, McGill University, Montreal, Canada
Received 10 March 2016; accepted 15 August 2016Available online 11 October 2016
Dedicated to the memory of our dear colleague Prof. Seyed Jalaledin Hashemi, who passed away before the submission of this article.
bstract
The equilibrium adsorption of benzoic acid from an aqueous medium on a natural vermiculite-based adsorbent was studied in the presencend absence of hydrophilic silicon dioxide nanoparticles in batchwise mode. The adsorbent was prepared through grinding natural vermiculiten a laboratory vibratory disk mill and the surfactant modification of ground vermiculite by cetyltrimethylammonium bromide, subsequently.he equilibrium isotherm in the presence and absence of nanoparticles was experimentally obtained and the equilibrium data were fitted to theangmuir, Freundlich, Dubinin–Radushkevich and Temkin models. The results indicated that the dispersion of silicon dioxide nanoparticles atptimum concentration in the liquid phase remarkably increases the removal efficiency. Furthermore, it yields a more favorable equilibrium isothermnd changes the compatibility of equilibrium data from the Langmuir and Temkin equations to just the Langmuir equation. A quadratic polynomialodel predicting the equilibrium adsorbent capacity in the presence of nanoparticles as a function of the adsorbate and initial nanoparticle
oncentrations was successfully developed using the response surface methodology based on the rotatable central composite design. A desirabilityunction was used in order to optimize the values of all variables, independent and dependent ones, simultaneously.
2016 Universidad Nacional Autónoma de México, Centro de Ciencias Aplicadas y Desarrollo Tecnológico. This is an open access article underhe CC BY-NC-ND license (http://creativecommons.org/licenses/by-nc-nd/4.0/).
eywords: Adsorption; Benzoic acid; Vermiculite; Cetyltrimetylammonium bromide; Silicon dioxide nanoparticles; Response surface methodology; Desirabilityunction
cgutAo
. Introduction
The burgeoning trend of industrialization has contributed tohe discharge of a great deal of pollutants into our environ-
ent. Aromatic carboxylic acids (ACAs) are a sort of organic
∗ Corresponding author.E-mail addresses: [email protected], [email protected]
H. Abolghasemi).Peer Review under the responsibility of Universidad Nacional Autónoma de
éxico.
pm1aa
http://dx.doi.org/10.1016/j.jart.2016.08.005665-6423/© 2016 Universidad Nacional Autónoma de México, Centro de CienciasC BY-NC-ND license (http://creativecommons.org/licenses/by-nc-nd/4.0/).
ompounds whose occurrence in industrial waste effluents ori-inates not only from the disposal of finished products andndesirable by-products, but also from the microbial oxida-ion of hydrocarbons. Because of the poor biodegradability ofCAs arising out of the electron-withdrawing carboxyl groupn their phenyl ring, the wastewaters involved must be purifiedrior to discharge, as recommended by the European Environ-ent Agency (Huang, Wang, & Huang, 2011; Knepper et al.,
999). Benzoic acid (BA) as the simplest ACA with widespreadpplications in many industrial sectors can serve as a suit-ble model compound to make a study of eliminating ACAs
Aplicadas y Desarrollo Tecnológico. This is an open access article under the

326 E.S. Pouya et al. / Journal of Applied Resear
Nomenclature
a0, ai and aij adjustable parameters of RSM-based modelAT Temkin isotherm equilibrium constant (L/mg)bT Temkin isotherm constant (kJ/mol)C0 initial concentration of BA (mg/L)Ce equilibrium concentration of BA (mg/L)Ci initial concentration of nanoparticles (mg/L)D overall desirability functiondi individual desirability functionk number of manipulated variablesKD–R Dubinin–Radushkevich isotherm constant
(mol2/kJ2)KF Freundlich isotherm constant ((mg/g)(L/mg)1/n)KL Langmuir isotherm constant (L/mg)Li lower limitM adsorbent mass (g)N number of data pointsn number of variablesn0 number of central point replicationsnF Freundlich adsorption intensity constantp, q importance weightqD–R Dubinin–Radushkevich adsorption capacity
(mg/g)qe equilibrium adsorption capacity (mg/g)qe,cal calculated adsorption capacity at equilibrium
(mg/g)qe,exp experimental adsorption capacity at equilibrium
(mg/g)qL Langmuir adsorption capacity (mg/g)R universal gas constant (kJ/mol K)T temperature (K)Ti target valueUi upper limitV solution volume (L)Xi coded manipulated variablexi uncoded manipulated variablexi,max upper level of an uncoded manipulated variablexi,min lower level of an uncoded manipulated variableY predicted responsezi variable
f&
fd(WYcsaa
ocaB&bsocfohcf(SC2casKY2
o((rttK&BitspsTnaK&
tabonccthe adsorption efficiency whereas the two other nanoparticlesremarkably increase the adsorption efficiency. Silicon dioxide
rom aquatic media (Giannakas, Antonopoulou, Deligiannakis, Konstantinou, 2013).The conventional processes that have been thus far utilized
or removing BA from aqueous solution include photocatalyticegradation (Gandhi et al., 2011), electrochemical oxidationGarg & Prasad, 2015), microbial filtration (Zachritz, Lundie, &
ang, 1996) and adsorption (Xin et al., 2011; Yan et al., 2007;ıldız, Gönülsen, Koyuncu, & C alımlı, 2005). From the practi-
al perspective, the adsorption process is approved as a highlyelective, facile and economic in terms of design and operation
nd recyclable method for the removal of a vast array of organicnd inorganic contaminants (Qu, 2008).nr
ch and Technology 14 (2016) 325–337
Nowadays, natural clay minerals, like vermiculite, becausef being inexpensive, abundant and eco-friendly with a highapability for ion exchange, have drawn much attention eithers direct adsorbent, for example, heavy metals (Gupta &hattacharyya, 2011) and a variety of dyes (Yagub, Sen, Afroze,
Ang, 2014), or as host matrices to fabricate effective adsor-ents concerning low and high molecular weight organic acidpecies like BA (Borisover & Davis, 2015). The modificationf clay minerals by substituting their inorganic interlamellarations with quaternary ammonium cations using cationic sur-actants like cetyltrimetylammonium bromide (CTAB) is onef the most common methods to decrease the high degree ofydrophilicity and the high concentration of negative structuralharge of clay minerals, thereby improving their performanceor the adsorption of organic acids from aqueous solutionAnirudhan & Ramachandran, 2006; De Araújo Medeiros,ansiviero, Araújo, & Lago, 2009; Su, Lin, Wang, Xie, &hen, 2011; Xin et al., 2011; Yan et al., 2007; Yıldız et al.,005). There are also reports on the increase of cation exchangeapacity, porosity and surface chemical reactivity of clay miner-ls after grinding by a vibratory disk mill, which favors theirusceptibility to be modified organically (Filipovic-Petrovic,ostic-Gvozdenovic, & Eric-Antonic, 2002; Hongo, Yoshino,amazaki, Yamasaki, & Satokawa, 2012; Jiménez De Haro et al.,004).
Over the past decade, the nanotechnology revolution haspened up a promising era in numerous fields of scienceChoolaei, Rashidi, Ardjmand, Yadegari, & Soltanian, 2012)Banaei, Vojoudi, Karimi, Bahar, & Pourbasheer, 2015). In thisegard, several studies have been recently carried out to increasehe efficiency of separation processes like liquid–liquid extrac-ion (Bahmanyar, Khoobi, Mozdianfard, & Bahmanyar, 2011;hoobi et al., 2013; Raji-Asadabadi, Abolghasemi, Maragheh,
Davoodi-Nasab, 2013) and liquid chromatography (Nilsson,irnbaum, & Nilsson, 2007; Zhang, Wang, Liao, & Liu, 2006)
n the presence of dispersed nanomaterials (typically nanopar-icles). Although these studies are in their infancy, they havehown the potential of nanomaterials as multifunctional com-onents to improve the separation efficiency. All the foregoingtudies are focused on the increase of mass transfer in nanofluids.he enhanced mass transfer of several substances in water-basedanofluids in comparison with pure water has been reported by
number of scholars (Ashrafmansouri & Nasr Esfahany, 2014;rishnamurthy, Bhattacharya, Phelan, & Prasher, 2006; Veilleux
Coulombe, 2011).To our best knowledge, the present study is one of few inves-
igations on the effect that the dispersion of nanoparticles in thedsorption medium has on the removal efficiency and the adsor-ent capacity. In 2010, Jasper et al. (2010) evaluated the effectf dispersed silicon dioxide, titanium dioxide and iron(III) oxideanoparticles on the batch adsorption of trichloroethylene fromontaminated water by activated carbon. They found that sili-on dioxide nanoparticles do not have any remarkable effect on
anoparticles are one of the most common nanoparticles byeason of their low cost and commercial availability. The good

esearch and Technology 14 (2016) 325–337 327
bt&
ttbsvapaVtienTiesTadr
tfmcofDRaaa
2
2
i(chbmetTXiTai
Table 1Some characteristics of the silicon dioxide nanoparticles.
Morphology Purity Averageparticlesize
BETsurfacearea
Total porevolume
Averageporediameter
S
cnc(aTpntJnwdf
2
kga12bdaatbe
2
pEmtbcstaOr
E.S. Pouya et al. / Journal of Applied R
iocompatibility of these nanoparticles makes them applicableo processes dealing with environmental issues (Sun, Yan, Yang,
Sun, 2006; Sun et al., 2007).Today, multivariate statistical techniques are favored because
hey are time and cost efficient for experimentation and becausehey facilitate probing in the effect of inputs, alone and in com-ination, on the outputs in a multivariable system. Responseurface methodology (RSM) is one of the most useful multi-ariate statistical techniques, particularly when a few variablesre involved. This methodology is on the basis of fitting aolynomial model to a series of experimental data with theim of making statistical previsions (Bezerra, Santelli, Oliveira,illar, & Escaleira, 2008; Jain, Garg, & Kadirvelu, 2011). Since
he most successful development of an RSM-based model isntertwined with the most detailed knowledge of process, anxperimental design is essential to ascertain which experimentseed to be performed in the experimental region being studied.he central composite design is one of the most standard exper-
mental designs applied for establishing mathematical modelsstimating the first- and second-order effects in a multivariableystem (Montgomery & Runger, 2010; Murugesan et al., 2014).he application of desirability function approaches in appliednd analytical chemistry in order to find the best operating con-itions and obtain the best result has attracted much attention inecent years (Bezerra et al., 2008).
In brief, this research is aimed at: (1) optimizing the concen-ration of dispersed hydrophilic silicon dioxide nanoparticlesor the batch adsorption of BA from aqueous solution onechanically and chemically modified natural vermiculite, (2)
omparing the equilibrium isotherm in the presence and absencef nanoparticles, (3) analyzing the equilibrium data by fourrequently used isotherm models (the Langmuir, Freundlich,ubinin–Radushkevich and Temkin models), (4) developing anSM-based model to study how the initial concentrations ofdsorbate and nanoparticles influence the adsorption capacitynd, lastly, (5) finding the best local conditions using a desir-bility function optimization approach.
. Materials and methods
.1. Materials
Natural vermiculite was collected from a mineral depositn Kaleybar County (East Azerbaijan Province, Iran). BAC7H6O2) and CTAB (C19H42BrN) of analytical grade were pur-hased from Merck and Sigma–Aldrich companies. Highly pureydrophilic silicon dioxide (SiO2) nanoparticles were suppliedy TECNAN Company. The field emission scanning electronicroscopy (FE-SEM) analysis was conducted using a scanning
lectron microscope (TESCAN, MIRA3 LM) in order to inves-igate the surface morphology of silicon dioxide nanoparticles.he X-ray diffraction (XRD) analysis was performed using an-ray diffractometer (PANalytical, X’Pert Pro MPD) in order to
nvestigate the crystalline/amorphous structure of nanoparticles.he inductively coupled plasma mass spectroscopy (ICP-MS)nalysis was performed by means of a mass spectrometer (Var-an, OES-730) in order to determine the quantitative chemical
mp3i
pherical >99.9% 12.80 nm 162.9 m2/g 0.549 cm3/g 11.01 nm
omposition of impurities in the sample of silicon dioxideanoparticles. The dynamic light scattering (DLS) analysis wasonducted by means of a dynamic light scattering analyzerMicrotrac, Nanotrac Wave) in order to determine the aver-ge particle size and also the size distribution of nanoparticles.he textural characteristics (the BET surface area, the totalore volume and the average pore diameter) of silicon dioxideanoparticles were obtained by the N2 adsorption/desorptionechnique at −196 ◦C using a gas adsorption analyzer (BELapan, BELSORP-mini II). Some characteristics of the usedanoparticles are listed in Table 1. The silicon dioxide nanofluidas prepared by dispersing a desired amount of nanoparticles inistilled water using an ultrasonicator at a frequency of 20 kHzor 2 hr.
.2. Preparation of adsorbent
Initially, the natural vermiculite was reduced in size with anife mill, passed through a 120-mesh sieve, and subsequentlyround in a vibratory disk mill at 2000 rpm for 10 min. There-fter, 10 g of ground vermiculite was gently contacted with000 mL of 23 mM CTAB solution in a beaker at 60 ◦C for4 h using a heater/stirrer. Finally, the solid phase was removedy centrifugation, rinsed with enough deionized water until noetection of bromide ions by 0.1 M silver nitrate solution, driedt 60 ◦C for 48 h, activated at 120 ◦C for 1 h, pulverized in angate mortar and packed for further use. The characteristics ofhe resultant adsorbent, hereinafter designated as CTAB-V, haseen thoroughly described in our earlier works (Sadeghi Pouyat al., 2015a; Sadeghi Pouya et al., 2015b).
.3. Batch adsorption experiments
In general, the adsorption experiments were conducted bylacing an optimum amount of CTAB-V samples into 100-mLrlenmeyer flasks filled with 50 mL of BA solutions at an opti-um initial pH value and then shaking the flasks at 200 rpm at a
emperature of 30 ◦C for 12 h using a thermostatic shaking incu-ator. After attaining the equilibrium state, the suspensions wereentrifuged at 4000 rpm for 15 min and the supernatants werepectrophotometrically analyzed for the remaining BA concen-ration at a λmax of 227 nm (corresponding to the maximumbsorbance) using a Unico UV-2100 UV/vis spectrophotometer.ur preliminary experiments demonstrated that in the studied
ange of BA and nanoparticles initial concentrations, the opti-um adsorbent dosage is 0.5 g/50 mL and the initial solution
H is optimum when not adjusted (i.e. the initial solution pH of.5 ± 0.1). The upper and lower limit of BA and nanoparticlesnitial concentrations was also chosen as 100–1000 mg/L and

3 esear
1ab
E
q
wcV
2
lnttAacpwPvmwFc(&
X
wmmm
vbOJ
Y
wp
arTa
rp
2
pmdrefa&afD
D
wi
ild
d
d
d
ww
3
3
28 E.S. Pouya et al. / Journal of Applied R
–10 mg/L, respectively. The removal efficiency of BA and thedsorption capacity of CTAB-V at equilibrium were calculatedy Eqs. (1) and (2):
quilibrium removal efficiency (%) = C0 − Ce
Ce
× 100, (1)
e = (C0 − Ce)V
M, (2)
here C0 is the initial concentration of BA; Ce is the equilibriumoncentration of BA; qe is the equilibrium adsorption capacity;
is the solution volume; M is the adsorbent mass.
.4. RSM modeling approach
To explore an RSM-based correlation between the equi-ibrium adsorption capacity of CTAB-V in the presence ofanoparticles (as predicted response) and the initial concen-rations of BA and nanoparticles (as manipulated variables),he design-expert software package (v. 7.0.0) was employed.
rotatable central composite design was implemented to cre-te an experimental framework totally consisting of 13 runs, asalculated by the expression of 2n + 2n + n0 using five centraloint replications that is the software default value for a systemith two manipulated variables (Arulkumar, Sathishkumar, &alvannan, 2011; Cho & Zoh, 2007). Given that the manipulatedariables in this study were too different in scale, they were nor-alized in advance of modeling. In this regard, the upper levelas coded as +1, the center level as 0 and the lower level as −1.or any value that lies either between the lower limit and theenter level or between the center level and the upper limit, Eq.3) was used as follows (Cho & Zoh, 2007; Karnik, Gaitonde,
Davim, 2007):
i = 2xi − (xi,max + xi,min)
(xi,max − xi,min), (3)
here Xi is the coded manipulated variable; xi is the uncodedanipulated variable; xi,max is the upper level of an uncodedanipulated variable; xi,min is the lower level of an uncodedanipulated variable.The response surface was related to the coded manipulated
ariables by a full second-order polynomial equation suggestedy Box and Wilson in 1951 as follows (Bezerra et al., 2008;n the Experimental Attainment of Optimum Conditions on
STOR, n.d.):
= a0 +k∑
i=1
aiXi +k∑
i=1
k∑j=1
aijXiXj, (4)
here Y is the predicted response; a0, ai, aij is the adjustablearameters.
Regarding the experimentally obtained data, the model
djustable parameters were calculated by the multiple linearegression analysis using the least-squares optimization method.he model validity was assessed using the analysis of vari-nce (ANOVA) subroutine and by plotting internally studentizedn
t
ch and Technology 14 (2016) 325–337
esiduals versus run number and also by constructing a normalrobability plot of internally studentized residuals.
.5. Desirability function optimization approach
The desirability function optimization approach is a highlyopular optimization technique used to simultaneously deter-ine the optimum values of manipulated variables that can
etermine the optimum performance levels of one or moreesponses. During the optimization of a multivariate system,very single variable is converted into an individual desirabilityunction with a value that varies from 0 to 1, the lowest desir-bility value to the highest desirability value (Islam, Sakkas,
Albanis, 2009; Mourabet et al., 2012). The individual desir-bility functions are then combined in an overall desirabilityunction as follows (Bezerra et al., 2008; Paterakis, Korakianiti,allas, & Rekkas, 2002):
=(
n∏i=1
di
)1/n
, (5)
here D is the overall desirability; di is the individual desirabil-ty; n is the number of variables.
Depending on whether the target value of a particular variables to be maximized, minimized or located between the lowerimit and the upper limit, the individual desirability function isefined by Eqs. (6)–(8) (Bezerra et al., 2008; John, 2013):
i =
⎧⎪⎪⎪⎪⎨⎪⎪⎪⎪⎩
0 if zi ≤ Li,∣∣∣∣ zi − Li
Ti − Li
∣∣∣∣p
if Li ≤ zi ≤ Ti,
1 if zi ≥ Ti,
(6)
i =
⎧⎪⎪⎪⎪⎨⎪⎪⎪⎪⎩
1 if zi ≥ Ui,∣∣∣∣ zi − Ui
Ti − Ui
∣∣∣∣q
if Ti ≤ zi ≤ Ui,
0 if zi ≥ Ti,
(7)
i =
⎧⎪⎪⎪⎪⎪⎪⎪⎪⎪⎨⎪⎪⎪⎪⎪⎪⎪⎪⎪⎩
1 if zi ≤ Li,∣∣∣∣ zi − Li
Ti − Li
∣∣∣∣p
if Li ≤ zi ≤ Ti,∣∣∣∣ zi − Ui
Ti − Ui
∣∣∣∣q
if Ti ≤ zi ≤ Ui,
0 if zi ≥ Ui,
(8)
here zi is the variable; Li is the lower limit; p, q is the importanceeight; Ui is the upper limit; Ti is the target value.
. Results and discussion
.1. Characterization analysis of silicon dioxide
anoparticlesThe surface morphology of silicon dioxide nanoparticles atwo magnification levels (100.0 kx and 150.0 kx) is illustrated in

E.S. Pouya et al. / Journal of Applied Research and Technology 14 (2016) 325–337 329
Fig. 1. FE-SEM images of silicon dioxide nanoparticles at: (A) 100.0 kx and (B) 150.0 kx.
Fa
odsmr
scoia
paos
Fig. 3. Size distribution of silicon dioxide nanoparticles dispersed in deionizedwater.
Table 2Quantitative chemical composition of impurities in the sample of silicon dioxidenanoparticles (by weight percent).
Cu 0.0000000Zn 0.0005884Fe 0.0000000Mg 0.0000042Na 0.0000000Al 0.0000000As 0.0000000Sb 0.0000031Pb 0.0000000Hg 0.0000000
Fig. 2. XRD pattern of silicon dioxide nanoparticles.
ig. 1. As this figure shows, silicon dioxide nanoparticles have spherical and non-crystalline (or amorphous) morphology.
The XRD pattern of silicon dioxide nanoparticles in the rangef 2θ = 10–80◦ is shown in Fig. 2. The low-intensity broad peaketected around 20◦ indicates the presence of a non-crystallineilicon dioxide phase in the sample that is totally in agree-ent with the FE-SEM images. Similar observations have been
eported in previous research works (Fang et al., 2008).The size distribution of silicon dioxide nanoparticles in
emi-logarithmic coordinates is plotted in Fig. 3. This figurelearly shows that most of the nanoparticles lie in the rangef 10.0–15.0 nm in diameter. The results of the DLS analysisndicated that half of the silicon dioxide nanoparticles have anverage diameter of about 12.80 nm.
The quantitative chemical composition of impurities the sam-le of silicon dioxide nanoparticles determined by the ICP
nalysis and is listed in weight percentage in Table 2. A perusalf this table indicates that the purity of silicon dioxide in theample is higher than 99.9 wt.%.ios
Fig. 4A and B illustrates the N2 adsorption/desorptionsotherm and the pore size distribution of the sample based
n Barrett–Joyner–Halenda (BJH) model. The isotherm clearlyhows that the hysteresis loop does not form even at high
330 E.S. Pouya et al. / Journal of Applied Research and Technology 14 (2016) 325–337
Fo
rp
3
ootcrsFtofoaotdFe
Fig. 5. The effect of initial concentration of silicon dioxide nanoparticles on theequilibrium removal efficiency at different initial concentrations of BA.
Ft
tancco7tBntmfi(
ig. 4. (A) N2 adsorption/desorption isotherm and (B) BJH pore size distributionf silicon dioxide nanoparticles.
elative pressures, which suggests that the sample is not meso-orous (Naumov, 2009; Sing, 2001).
.2. Optimization of nanoparticles initial concentration
The initial concentration of silicon dioxide nanoparticles wasptimized by shaking 0.5 g of the CTAB-V samples with 50 mLf 100–1000 mg/L BA solutions at the initial pH value of 3.5 inhe presence of various concentrations of dispersed nanoparti-les (1, 2, 3, 5, 7.5 and 10 mg/L). Fig. 5 shows the equilibriumemoval efficiency as a function of the initial concentration ofilicon dioxide nanoparticles and BA. It can be observed fromig. 5 that the equilibrium removal efficiency peaks at a cer-
ain initial concentration of nanoparticles and completely levelsff afterwards. The initial concentration of nanoparticles wasound to be optimum at 5 mg/L when the initial concentrationf BA ranges between 100 and 400 mg/L and to be optimumt 7.5 mg/L when the initial concentration of BA in the rangef 400–1000 mg/L. Accordingly, the nanofluid of 7.5 mg/L ofhe initial concentration was used in order to equalize the con-
itions for the equilibrium adsorption isotherm experiments.ig. 6 shows the equilibrium removal efficiency in the pres-nce and absence of nanoparticles. As it displayed in Fig. 6,tam
ig. 6. The equilibrium removal efficiency of BA adsorption onto CTAB-V inhe presence of 7.5 mg/L silicon dioxide nanoparticles and in their absence.
he equilibrium removal efficiency increases in the range ofbout 9–31.5% in the presence of 7.5 mg/L silicon dioxideanoparticles in comparison with their absence when the initialoncentration of BA varies from 100 to 1000 mg/L. Since theolloidal stability of nanofluid has an extremely important effectn the performance of nanoparticles, the relative stability of.5 mg/L nanofluid was investigated as a function of the elapsedime using the UV/vis spectrophotometer method, as stated byahmanyar et al. (2011). For this purpose, the absorbency ofanofluid with an initial concentration of 7.5 mg/L was con-inually determined at a λmax of 325 nm (corresponding to the
aximum absorbance) over 12 h that is the required contact timeor the equilibrium establishment. As the results are illustratedn Fig. 7, the relative concentration of suspended nanoparticlesthe concentration at time t divided by the initial concentra-ion) reduces less than 7% within 12 h, which is indicative of
n adequate stability of nanofluid during the adsorption experi-ents.
E.S. Pouya et al. / Journal of Applied Research and Technology 14 (2016) 325–337 331
Fig. 7. The relative concentration of suspended silicon dioxide nanoparticlesversus elapsed time.
Fr
cthrtrirdt(baihccut
F ◦io
oK
3
Tm(
q
q
qCe
ig. 8. The effect of 7.5 mg/L silicon dioxide nanoparticles on the equilibriumemoval efficiency in the absence of CTAB-V.
The first probable explanation for the enhanced removal effi-iency in the presence of silicon dioxide nanoparticles washe adsorption of BA by the mentioned nanoparticles. But thisypothesis was rejected because our additional experimentsevealed that the dispersed hydrophilic silicon dioxide nanopar-icles at the aforementioned concentrations do not have anyemarkable affinity toward BA without introducing CTAB-Vnto the adsorption system. As shown in Fig. 8, the equilibriumemoval efficiency of 100–1000 mg BA/L in a 7.5 mg/L siliconioxide nanofluid in the absence of CTAB-V was found to be upo a maximum of approximately 4.7%. In contrast, Jasper et al.2010) have found from their adsorbent-free experiments thatoth titanium dioxide and iron(III) oxide nanoparticles alone acts adsorption sites for up to 60% of trichloroethylene. Hence,t was concluded that the presence of nanoparticles certainlyas a positive side effect on the adsorptive behavior of BA. Itan be proposed that the increase in BA removal efficiency may
orrespond to the increase in BA mass diffusion rate in the liq-id phase arising from the Brownian motion of nanoparticleshat creates micro/nanoscale convection through the intersticesq
ig. 9. The equilibrium isotherm of BA adsorption onto CTAB-V at 30 C: (A)n the presence of 7.5 mg/L silicon dioxide nanoparticles and (B) in the absencef nanoparticles.
f adsorbent particles (Ashrafmansouri & Nasr Esfahany, 2014;rishnamurthy et al., 2006).
.3. Equilibrium adsorption isotherm
The Langmuir, Freundlich, Dubinin–Radushkevich andemkin models were used to analyze the equilibrium data. Theathematical expression of these models is given in Eqs. (5)–(8)
Foo & Hameed, 2010; Ho, Porter, & McKay, 2002):
e = qLKLCe
1 + KLCe
, (5)
e = KFC1/nFe , (6)
e = qD−R exp
(−KD−R
[RT ln
(1 + 1
)]2)
, (7)
e = RT
bT
ln(AT Ce), (8)

332 E.S. Pouya et al. / Journal of Applied Research and Technology 14 (2016) 325–337
nd (B
wmntDgc
dtva(
A
wta
tCiaLcnoofim
Fig. 10. (A) The internally studentized residuals versus run number a
here qL is the Langmuir adsorption capacity; KL is the Lang-uir isotherm constant; KF is the Freundlich isotherm constant;
F is the Freundlich adsorption intensity constant; qD–R ishe Dubinin–Radushkevich adsorption capacity; KD–R is theubinin–Radushkevich isotherm constant; R is the Universalas constant; T is the temperature; bT is the Temkin isothermonstant; AT is the Temkin isotherm equilibrium constant.
The adjustable parameters together with the coefficient ofetermination for each isotherm model was calculated usinghe MATLAB nonlinear least-squares optimization routine. Thealues of qe from the experiments and from the models werelso compared based on the average absolute relative deviationAARD) defined as follows (Foo & Hameed, 2010):
ARD (%) = 100
N
N∑i=1
∣∣∣∣qe,exp − qe,cal
qe,exp
∣∣∣∣ , (9)Lwfi
) the normally probability plot of the internally studentized residuals.
here N is the number of data points; qe,exp is the experimen-al adsorption capacity at equilibrium; qe,cal is the calculateddsorption capacity at equilibrium.
Fig. 9A and B shows the experimental equilibrium data andhe predicted equilibrium isotherms for BA adsorption ontoTAB-V in the presence and absence of nanoparticles. Accord-
ng to Alberti, Amendola, Pesavento, and Biesuz (2012), it ispparent that the shape of experimental isotherm alters from theangmuir type (without strict plateau) in the absence of sili-on dioxide nanoparticles to the high affinity type in the case ofanoparticles presence. This in turn manifests that the adsorptionf BA onto CTAB-V takes place more favorably in the presencef nanoparticles (Kyzas & Matis, 2015). Table 3 tabulates thetting results together with the AARD values for each isothermodel. As can be seen, the equilibrium data are better fitted to the
angmuir and Temkin models in the absence of nanoparticleshereas in the presence of nanoparticles, they are satisfactorilytted by just the Langmuir model.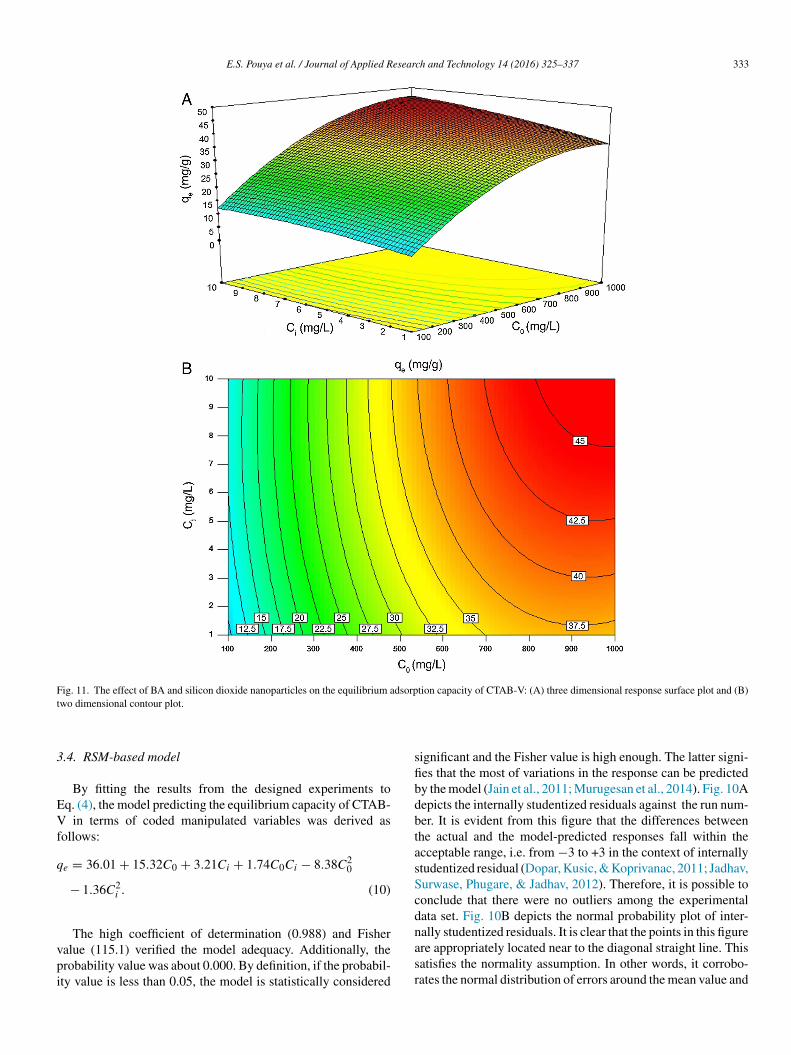
E.S. Pouya et al. / Journal of Applied Research and Technology 14 (2016) 325–337 333
Fig. 11. The effect of BA and silicon dioxide nanoparticles on the equilibrium adsorption capacity of CTAB-V: (A) three dimensional response surface plot and (B)t
3
EVf
q
vpi
sfibdbtasScdn
wo dimensional contour plot.
.4. RSM-based model
By fitting the results from the designed experiments toq. (4), the model predicting the equilibrium capacity of CTAB-
in terms of coded manipulated variables was derived asollows:
e = 36.01 + 15.32C0 + 3.21Ci + 1.74C0Ci − 8.38C20
− 1.36C2i . (10)
The high coefficient of determination (0.988) and Fisheralue (115.1) verified the model adequacy. Additionally, therobability value was about 0.000. By definition, if the probabil-ty value is less than 0.05, the model is statistically considered
asr
ignificant and the Fisher value is high enough. The latter signi-es that the most of variations in the response can be predictedy the model (Jain et al., 2011; Murugesan et al., 2014). Fig. 10Aepicts the internally studentized residuals against the run num-er. It is evident from this figure that the differences betweenhe actual and the model-predicted responses fall within thecceptable range, i.e. from −3 to +3 in the context of internallytudentized residual (Dopar, Kusic, & Koprivanac, 2011; Jadhav,urwase, Phugare, & Jadhav, 2012). Therefore, it is possible toonclude that there were no outliers among the experimentalata set. Fig. 10B depicts the normal probability plot of inter-ally studentized residuals. It is clear that the points in this figure
re appropriately located near to the diagonal straight line. Thisatisfies the normality assumption. In other words, it corrobo-ates the normal distribution of errors around the mean value and
334 E.S. Pouya et al. / Journal of Applied Research and Technology 14 (2016) 325–337
Table 3Isotherm model parameters, coefficients of determination and AARD valuesfor BA adsorption onto CTAB-V in the presence of 7.5 mg/L silicon dioxidenanoparticles and in their absence.
Isotherm model Isotherm parameters
Presence ofnanoparticles
Absence ofnanoparticles
Langmuir qL = 47.32 qL = 42.18KL = 0.036 KL = 0.012R2 = 0.952 R2 = 0.991AARD(%) = 7.021
AARD(%) = 6.051
Freundlich KF = 10.90 KF = 3.818n = 4.237 n = 2.844R2 = 0.788 R2 = 0.920AARD(%) = 22.03
AARD(%) = 12.34
Dubinin–Radushkevich qD–R = 43.02 qD–R = 29.9KD–R = 93.68 KD–R = 280.6R2 = 0.891 R2 = 0.791AARD(%) = 16.14
AARD(%) = 20.72
Temkin AT = 0.754 AT = 0.112bT = 0.318 bT = 0.303R2 = 0.885 R2 = 0.984AARD(%) = 11.72
AARD(%) = 5.232
0.00
Combined
qe (mg/g)
Ci (mg/L)
C0 (mg/L) 0.965
0.999
0.825
0.916
0.25 0.50 0.75 1.00
Fig. 12. The individual desirability value of each variable and their combination.
tedrtt&o
itictoca
Fig. 14. Effect of BA and silicon dioxide nanoparticles in
Fig. 13. Desirability value ramps for optimization of variables.
heir independency from each other (Dopar et al., 2011; Jadhavt al., 2012). The mean and variance values of the internally stu-entized residuals in this study were found to be 0.044 and 1.342,espectively. Statistically, as the mean value of a group of dataends to zero and their variance value tends to unity, the distribu-ion of those data is taken to be standard normal (Montgomery
Runger, 2010). Fig. 10A and B further confirms the validityf the suggested model.
Fig. 11A and B illustrates the individual and cumulativempacts of the initial concentrations of BA and nanoparticles onhe equilibrium adsorption capacity in the choice of test rangen three-dimensional response surface plot and two-dimensionalontour plot, respectively. The plots represent that the adsorp-ion capacity increases by increasing the initial concentrations
f both BA and nanoparticles. Fig. 11A shows that the initialoncentration of BA has a more profound effect on the responsemplitude than the initial concentration of nanoparticles. Theitial concentration on combined desirability value.

esear
cdctmatt&
3
oimtoboi3snvvvo
4
targcc
(
C
A
mTehYme
R
A
A
A
A
B
E.S. Pouya et al. / Journal of Applied R
urvature of contour lines denotes to what extent the indepen-ent variables have communal interactions. If the shape of theontour lines is more elliptical rather than circular, the interac-ive effect of independent variables on the predicted response isore significant. As it illustrated in Fig. 11B, the contour lines
re of elliptical type in this study, which means that the interac-ions between C0 and Ci are likely to be of great significance tohe equilibrium adsorption capacity (Jadhav et al., 2012; Zhong
Wang, 2010).
.5. Desirability function optimization
A maximum level of BA initial concentration, minimum levelf silicon dioxide nanoparticles initial concentration and max-mum level of CTAB-V adsorption capacity were set for the
aximum desirability. By seeking from 30 points per optimiza-ions that is the software default and considering the importancef each variable the highest value that can vary from 1 to 5, theest local conditions were found to be the initial concentrationf BA at 969.2 mg/L, the initial concentration of silicon diox-de nanoparticles at 1 mg/L and the adsorbent capacity at about6.83 mg/g. Fig. 12 shows the optimum values for all variablesuggested by the software. The effect of BA and silicon dioxideanoparticles initial concentration on the combined desirabilityalues is h shown in Fig. 13. Fig. 14 also shows the values of indi-idual desirability values as well as the combined desirabilityalue that was found to be 0.916, which indicates the reliabilityf the optimizations process.
. Conclusions
To sum up, the batch adsorption of BA from aqueous solu-ion onto CTAB-V at equilibrium was compared in the presencend absence of hydrophilic silicon dioxide nanoparticles in thisesearch. An RSM-based model was also developed for investi-ating the equilibrium adsorption capacity by varying the initialoncentrations of BA and nanoparticles. The main conclusionsan be summarized as below:
(I) A 5 and 7.5 mg/L initial concentration of nanoparticlesoptimizes the equilibrium efficiency of BA adsorptiononto CTAB-V when the initial concentration of BA is100–400 and 400–1000 mg/L, respectively.
(II) The equilibrium removal efficiency of BA in the presenceof 7.5 mg/L nanoparticles increases by between about9.0% and 31.5% when the initial concentration of BAvaries from 100 to 1000 mg/L.
(III) The equilibrium adsorption isotherm changes from theLangmuir type (without strict plateau) in the absence ofnanoparticles to the high affinity type in the presence ofnanoparticles, which implies the more favorable adsorp-tive behavior of CTAB-V when the nanoparticles arepresent.
(IV) In the presence of nanoparticles, the equilibrium dataare better fitted to the Langmuir model compared to theFreundlich, Dubinin–Radushkevich and Temkin models.In the absence of nanoparticles, the equilibrium data are
B
ch and Technology 14 (2016) 325–337 335
better fitted to the Langmuir and Temkin models com-pared to the two other models.
(V) The RSM-based model reliability was confirmed by thehigh coefficient of determination and Fisher value as wellas the probability value of less than 0.05. The range ofinternally studentized residuals was acceptable (between−3 and +3) and they were normally distributed owingto their mean and variance values very close to zero andunity, respectively.
(VI) The interactive effect of the initial concentrations of BAand nanoparticles on the equilibrium adsorption capacitywas found to be noticeable resulting from the ellipticalform of contours. Individually, it was observed that the ini-tial concentration of BA has a larger effect on the responsethan the initial concentration of nanoparticles.
VII) The desirability function optimization approach showedthat the best local conditions are to be the initial concen-tration of BA at 969.2 mg/L, the initial concentration ofsilicon dioxide nanoparticles at 1 mg/L and the adsorbentcapacity at about 36.83 mg/g.
onflict of interest
The authors have no conflicts of interest to declare.
cknowledgements
The authors are sincerely grateful to the editors and anony-ous reviewers of the Journal of Applied Research andechnology for their insightful comments and suggestions on anarlier draft of this article. The authors would also like to whole-eartedly acknowledge Prof. Parissa Khadiv-Parsi, Mr. Amiradegari, Mr. Amir Rouhi, Ms. Maryam Nedaei and Dr. Moham-ad Foroughi-dahr for their unwavering scientific support and
ncouragement.
eferences
lberti, G., Amendola, V., Pesavento, M., & Biesuz, R. (2012). Beyondthe synthesis of novel solid phases: Review on modelling of sorp-tion phenomena. Coordination Chemistry Reviews, 256(1–2), 28–45.http://dx.doi.org/10.1016/j.ccr.2011.08.022
nirudhan, T. S., & Ramachandran, M. (2006). Adsorptive removal oftannin from aqueous solutions by cationic surfactant-modified ben-tonite clay. Journal of Colloid and Interface Science, 299(1), 116–124.http://dx.doi.org/10.1016/j.jcis.2006.01.056
rulkumar, M., Sathishkumar, P., & Palvannan, T. (2011). Optimization ofOrange G dye adsorption by activated carbon of Thespesia populnea podsusing response surface methodology. Journal of Hazardous Materials,186(1), 827–834. http://dx.doi.org/10.1016/j.jhazmat.2010.11.067
shrafmansouri, S.-S., & Nasr Esfahany, M. (2014). Mass transfer in nanoflu-ids: A review. International Journal of Thermal Sciences, 82, 84–99.http://dx.doi.org/10.1016/j.ijthermalsci.2014.03.017
ahmanyar, A., Khoobi, N., Mozdianfard, M. R., & Bahmanyar, H. (2011). Theinfluence of nanoparticles on hydrodynamic characteristics and mass transferperformance in a pulsed liquid–liquid extraction column. Chemical Engi-
neering and Processing: Process Intensification, 50(11–12), 1198–1206.http://dx.doi.org/10.1016/j.cep.2011.08.008anaei, A., Vojoudi, H., Karimi, S., Bahar, S., & Pourbasheer, E. (2015).Synthesis and characterization of new modified silica coated magnetite

3 esear
B
B
C
C
D
D
F
F
F
G
G
G
G
H
H
H
I
J
J
J
J
J
K
K
K
K
K
M
M
M
NN
36 E.S. Pouya et al. / Journal of Applied R
nanoparticles with bisaldehyde as selective adsorbents of Ag(I) from aqueoussamples. RSC Advances, 5. http://dx.doi.org/10.1039/c5ra11765h
ezerra, M. A., Santelli, R. E., Oliveira, E. P., Villar, L. S., &Escaleira, L. A. (2008). Response surface methodology (RSM) as atool for optimization in analytical chemistry. Talanta, 76(5), 965–977.http://dx.doi.org/10.1016/j.talanta.2008.05.019
orisover, M., & Davis, J. A. (2015). Natural and engineeredclay barriers. Developments in clay science (Vol. 6) Elsevier.http://dx.doi.org/10.1016/B978-0-08-100027-4.00002-4
ho, I.-H., & Zoh, K.-D. (2007). Photocatalytic degradation of azodye (Reactive Red 120) in TiO2/UV system: Optimization andmodeling using a response surface methodology (RSM) based onthe central composite design. Dyes and Pigments, 75(3), 533–543.http://dx.doi.org/10.1016/j.dyepig.2006.06.041
hoolaei, M., Rashidi, A. M., Ardjmand, M., Yadegari, A., & Solta-nian, H. (2012). The effect of nanosilica on the physical properties ofoil well cement. Materials Science and Engineering A, 538, 288–294.http://dx.doi.org/10.1016/j.msea.2012.01.045
e Araújo Medeiros, M., Sansiviero, M. T. C., Araújo, M. H., & Lago, R. M.(2009). Modification of vermiculite by polymerization and carbonization ofglycerol to produce highly efficient materials for oil removal. Applied ClayScience, 45(4), 213–219. http://dx.doi.org/10.1016/j.clay.2009.06.008
opar, M., Kusic, H., & Koprivanac, N. (2011). Treatment of simulated indus-trial wastewater by photo-Fenton process. Part I: The optimization of processparameters using design of experiments (DOE). Chemical Engineering Jour-nal, 173(2), 267–279. http://dx.doi.org/10.1016/j.cej.2010.09.070
ang, J., Shan, X., Wen, B., Lin, J., Lu, X., Liu, X., et al. (2008). Sorp-tion and desorption of phenanthrene onto iron, copper, and silicon dioxidenanoparticles. Langmuir: The ACS Journal of Surfaces and Colloids, 24(6),10929–10935. http://dx.doi.org/10.1021/la801459s
ilipovic-Petrovic, L. M., Kostic-Gvozdenovic, L., & Eric-Antonic, S. C.(2002). The effects of fine grinding on the physicochemical proper-ties and thermal behavior of bentonite clay. Journal of the SerbianChemical Society, 67(11), 753–760. Retrieved from http://www.doiserbia.nb.rs/Article.aspx?ID=0352-51390211753F&AspxAutoDetectCookieSupport=1#.VfW1aJcqFUE
oo, K. Y., & Hameed, B. H. (2010). Insights into the modeling of adsorp-tion isotherm systems. Chemical Engineering Journal, 156(1), 2–10.http://dx.doi.org/10.1016/j.cej.2009.09.013
andhi, V. G., Mishra, M. K., Rao, M. S., Kumar, A. A., Joshi, P., & Shah,D. O. (2011). Comparative study on nano-crystalline titanium dioxide cat-alyzed photocatalytic degradation of aromatic carboxylic acids in aqueousmedium. Journal of Industrial and Engineering Chemistry, 17(2), 331–339.http://dx.doi.org/10.1016/j.jiec.2011.02.035
arg, K. K., & Prasad, B. (2015). Electrochemical treatment of benzoic acid(BA) from aqueous solution and optimization of parameters by responsesurface methodology (RSM). Journal of the Taiwan Institute of ChemicalEngineers, 56, 122–130. http://dx.doi.org/10.1016/j.jtice.2015.04.005
iannakas, A. E., Antonopoulou, M., Deligiannakis, Y., & Konstantinou,I. (2013). Preparation, characterization of N–I co-doped TiO2 and cat-alytic performance toward simultaneous Cr(VI) reduction and benzoicacid oxidation. Applied Catalysis B: Environmental, 140–141, 636–645.http://dx.doi.org/10.1016/j.apcatb.2013.04.052
upta, S., & Bhattacharyya, K. G. (2011). Kinetics of adsorption of metal ionson inorganic materials: A review. Advances in Colloid and Interface Science,162(1–2), 39–58. http://dx.doi.org/10.1016/j.cis.2010.12.004
o, Y. S., Porter, J. F., & McKay, G. (2002). Equilibrium isotherm studiesfor the sorption of divalent metal ions onto peat: Copper, nickel and leadsingle component systems. Water, Air, and Soil Pollution, 141(1–4), 1–33.http://dx.doi.org/10.1023/A:1021304828010
ongo, T., Yoshino, S., Yamazaki, A., Yamasaki, A., & Satokawa, S. (2012).Mechanochemical treatment of vermiculite in vibration milling and itseffect on lead(II) adsorption ability. Applied Clay Science, 70, 74–78.http://dx.doi.org/10.1016/j.clay.2012.09.016
uang, J., Wang, G., & Huang, K. (2011). Enhanced adsorption ofsalicylic acid onto a �-naphthol-modified hyper-cross-linked poly(styrene-co-divinylbenzene) resin from aqueous solution. Chemical EngineeringJournal, 168(2), 715–721. http://dx.doi.org/10.1016/j.cej.2011.01.065
O
ch and Technology 14 (2016) 325–337
slam, M. A., Sakkas, V., & Albanis, T. A. (2009). Application ofstatistical design of experiment with desirability function for theremoval of organophosphorus pesticide from aqueous solution bylow-cost material. Journal of Hazardous Materials, 170(1), 230–238.http://dx.doi.org/10.1016/j.jhazmat.2009.04.106
adhav, S. B., Surwase, S. N., Phugare, S. S., & Jadhav, J. P. (2012).Response surface methodology mediated optimization of Remazol Orangedecolorization in plain distilled water by Pseudomonas aeruginosa BCH.International Journal of Environmental Science and Technology, 10(1),181–190. http://dx.doi.org/10.1007/s13762-012-0088-9
ain, M., Garg, V. K., & Kadirvelu, K. (2011). Investigation of Cr(VI)adsorption onto chemically treated Helianthus annuus: Optimization usingresponse surface methodology. Bioresource Technology, 102(2), 600–605.http://dx.doi.org/10.1016/j.biortech.2010.08.001
asper, A., Salih, H. H., Sorial, G. A., Sinha, R., Krishnan, R., & Patterson,C. L. (2010). Impact of nanoparticles and natural organic matter on theremoval of organic pollutants by activated carbon adsorption. Environmen-tal Engineering Science, 27(1), 85–93. http://dx.doi.org/10.1089/ees.2009.0234
iménez De Haro, M., Martınez Blanes, J., Poyato, J., Pérez-Maqueda,L., Lerf, A., & Pérez-Rodrıguez, J. (2004). Effects of mechanicaltreatment and exchanged cation on the microporosity of vermicu-lite. Journal of Physics and Chemistry of Solids, 65(2–3), 435–439.http://dx.doi.org/10.1016/j.jpcs.2003.08.033
ohn, B. (2013). Application of desirability function for optimizingthe performance characteristics of carbonitrided bushes. Interna-tional Journal of Industrial Engineering Computations, 4(3), 305–314.http://dx.doi.org/10.5267/j.ijiec.2013.04.003
arnik, S. R., Gaitonde, V. N., & Davim, J. P. (2007). A comparative study of theANN and RSM modeling approaches for predicting burr size in drilling. TheInternational Journal of Advanced Manufacturing Technology, 38(9–10),868–883. http://dx.doi.org/10.1007/s00170-007-1140-7
hoobi, N., Bahmanyar, A., Molavi, H., Bastani, D., Mozdianfard, M.R., & Bahmanyar, H. (2013). Study of droplet behaviour along apulsed liquid–liquid extraction column in the presence of nanoparti-cles. The Canadian Journal of Chemical Engineering, 91(3), 506–515.http://dx.doi.org/10.1002/cjce.21679
nepper, T., Sacher, F., Lange, F., Brauch, H., Karrenbrock, F., Roer-den, O., et al. (1999). Detection of polar organic substancesrelevant for drinking water. Waste Management, 19(2), 77–99.http://dx.doi.org/10.1016/S0956-053X(99)00003-3
rishnamurthy, S., Bhattacharya, P., Phelan, P. E., & Prasher, R. S. (2006).Enhanced mass transport in nanofluids. Nano Letters, 6(3), 419–423.http://dx.doi.org/10.1021/nl0522532
yzas, G. Z., & Matis, K. A. (2015). Nanoadsorbents for pollutantsremoval: A review. Journal of Molecular Liquids, 203, 159–168.http://dx.doi.org/10.1016/j.molliq.2015.01.004
ontgomery, D. C., & Runger, G. C. (2010). Applied statistics andprobability for engineers. John Wiley & Sons. Retrieved fromhttps://books.google.com/books?id= f4KrEcNAfEC&pgis=1
ourabet, M., El Rhilassi, A., El Boujaady, H., Bennani-Ziatni, M., El Hamri,R., & Taitai, A. (2012). Removal of fluoride from aqueous solution byadsorption on Apatitic tricalcium phosphate using Box–Behnken designand desirability function. Applied Surface Science, 258(10), 4402–4410.http://dx.doi.org/10.1016/j.apsusc.2011.12.125
urugesan, A., Vidhyadevi, T., Kalaivani, S. S., Thiruvengadaravi, K. V.,Ravikumar, L., Anuradha, C. D., et al. (2014). Modelling of lead(II) ionadsorption onto poly(thiourea imine) functionalized chelating resin usingresponse surface methodology (RSM). Journal of Water Process Engineer-ing, 3, 132–143. http://dx.doi.org/10.1016/j.jwpe.2014.06.004
aumov, S. (2009). Hysteresis phenomena in mesoporous materials. pp. 95.ilsson, C., Birnbaum, S., & Nilsson, S. (2007). Use of nanoparticles in capil-
lary and microchip electrochromatography. Journal of Chromatography A,1168(1–2), 212–224. http://dx.doi.org/10.1016/j.chroma.2007.07.018, dis-
cussion 211n the Experimental Attainment of Optimum Conditions on JSTOR(n.d.). Retrieved from http://www.jstor.org/stable/2983966?seq=1#pagescan tab contents.

esear
P
Q
R
S
S
S
S
S
S
V
X
Y
Y
Y
Z
Z
Zhong, K., & Wang, Q. (2010). Optimization of ultrasonic extraction ofpolysaccharides from dried longan pulp using response surface method-
E.S. Pouya et al. / Journal of Applied R
aterakis, P. G., Korakianiti, E. S., Dallas, P. P., & Rekkas, D.M. (2002). Evaluation and simultaneous optimization of some pel-lets characteristics using a 33 factorial design and the desirabilityfunction. International Journal of Pharmaceutics, 248(1–2), 51–60.http://dx.doi.org/10.1016/S0378-5173(02)00341-1
u, J. (2008). Research progress of novel adsorption processes in waterpurification: A review. Journal of Environmental Sciences, 20(1), 1–13.http://dx.doi.org/10.1016/S1001-0742(08)60001-7
aji-Asadabadi, M., Abolghasemi, H., Maragheh, M. G., & Davoodi-Nasab, P.(2013). On the mean drop size of toluene/water dispersion in the presenceof silica nanoparticles. Chemical Engineering Research and Design, 91(9),1739–1747. http://dx.doi.org/10.1016/j.cherd.2013.03.011
adeghi Pouya, E., Abolghasemi, H., Assar, M., Hashemi, S. J., Salehpour,A., & Foroughi-dahr, M. (2015a). Theoretical and experimental stud-ies of benzoic acid batch adsorption dynamics using vermiculite-basedadsorbent. Chemical Engineering Research and Design, 93, 800–811.http://dx.doi.org/10.1016/j.cherd.2014.07.016
adeghi Pouya, E., Abolghasemi, H., Esmaieli, M., Fatoorehchi, H., Hashemi, S.J., & Salehpour, A. (2015b). Batch adsorptive removal of benzoic acid fromaqueous solution onto modified natural vermiculite: Kinetic, isotherm andthermodynamic studies. Journal of Industrial and Engineering Chemistry,31, 199–215. http://dx.doi.org/10.1016/j.jiec.2015.06.024
ing, K. (2001). The use of nitrogen adsorption for the characterisation of porousmaterials. Colloids and Surfaces A: Physicochemical and EngineeringAspects, 187–188, 3–9. http://dx.doi.org/10.1016/S0927-7757(01)00612-4
u, J., Lin, H., Wang, Q.-P., Xie, Z.-M., & Chen, Z. (2011). Adsorption of phenolfrom aqueous solutions by organomontmorillonite. Desalination, 269(1–3),163–169. http://dx.doi.org/10.1016/j.desal.2010.10.056
un, Y., Yan, F., Yang, W., & Sun, C. (2006). Multilayered construc-tion of glucose oxidase and silica nanoparticles on Au electrodes based
on layer-by-layer covalent attachment. Biomaterials, 27(21), 4042–4049.http://dx.doi.org/10.1016/j.biomaterials.2006.03.014un, Y., Yan, F., Yang, W., Zhao, S., Yang, W., & Sun, C. (2007). Effectof silica nanoparticles with different sizes on the catalytic activity of
ch and Technology 14 (2016) 325–337 337
glucose oxidase. Analytical and Bioanalytical Chemistry, 387(4),1565–1572. http://dx.doi.org/10.1007/s00216-006-1013-1
eilleux, J., & Coulombe, S. (2011). A dispersion model of enhanced massdiffusion in nanofluids. Chemical Engineering Science, 66(11), 2377–2384.http://dx.doi.org/10.1016/j.ces.2011.02.053
in, X., Si, W., Yao, Z., Feng, R., Du, B., Yan, L., et al. (2011). Adsorp-tion of benzoic acid from aqueous solution by three kinds of modifiedbentonites. Journal of Colloid and Interface Science, 359(2), 499–504.http://dx.doi.org/10.1016/j.jcis.2011.04.044
agub, M. T., Sen, T. K., Afroze, S., & Ang, H. M. (2014). Dye andits removal from aqueous solution by adsorption: A review. Advancesin Colloid and Interface Science, 209, 172–184. http://dx.doi.org/10.1016/j.cis.2014.04.002
an, L.-G., Wang, J., Yu, H.-Q., Wei, Q., Du, B., & Shan, X.-Q. (2007).Adsorption of benzoic acid by CTAB exchanged montmorillonite. AppliedClay Science, 37(3–4), 226–230. http://dx.doi.org/10.1016/j.clay.2006.12.014
ıldız, N., Gönülsen, R., Koyuncu, H., & C alımlı, A. (2005). Adsorption ofbenzoic acid and hydroquinone by organically modified bentonites. Col-loids and Surfaces A: Physicochemical and Engineering Aspects, 260(1–3),87–94. http://dx.doi.org/10.1016/j.colsurfa.2005.03.006
achritz, W. H., Lundie, L. L., & Wang, H. (1996). Benzoic acid degradation bysmall, pilot-scale artificial wetlands filter (AWF) systems. Ecological Engi-neering, 7(2), 105–116. http://dx.doi.org/10.1016/0925-8574(96)00003-1
hang, Z., Wang, Z., Liao, Y., & Liu, H. (2006). Applications of nanoma-terials in liquid chromatography: Opportunities for separation with highefficiency and selectivity. Journal of Separation Science, 29(12), 1872–1878.http://dx.doi.org/10.1002/jssc.200600154
ology. Carbohydrate Polymers, 80(1), 19–25. http://dx.doi.org/10.1016/j.carbpol.2009.10.066