and other creep - sandia national laboratoriesinfoserve.sandia.gov/sand_doc/1998/982276.pdf ·...
TRANSCRIPT

SAND98--2276Unlimited ReleasePrinted October 1998
and Other Creep
Darrell E. Munson
Prepared bySandia National LaboratoriesAlbuquerque, New Mexico 87185 and Liverrnore, California 94550
Sandia is a rnultiprogram laboratory operated by Sandia Corporation,a Lockheed Martin Company, for the United States Department ofEnergy under Contract DE-AC04-94AL85000.
Approved for pubiic reiease; further dissemination unlimited.
Sandia National laboratories

Issued by Sandia National Laboratories, operated for the United StatesDepartment of Energy by San&a Corporation.
NOTICE: This report was prepared as an account of work sponsored by anagency of the United States Government. Neither the United States Govern-ment nor any agency thereof, nor any of their employees, nor any of theircontractors, subcontractors, or their employees, makes any warrant y,express or implied, or assumes any legal liability or responsibility for theaccuracy, completeness, or usefulness of any information, apparatus, prod-uct, or process disclosed, or represents that its use would not infringe pri-vately owned rights. Reference herein to any specific commercial product,process, or service by trade name, trademark, manufacturer, or otherwise,does not necessarily constitute or imply its endorsement, recommendation,or favoring by the United States Government, any agency thereof, or any oftheir contractors or subcontractors. The views and opinions expressedherein do not necessarily state or reflect those of the United States Govern-ment, any agency thereof, or any of their contractors.
Printed in the United States of America. This report has been reproduceddirectly from the best available copy.
Available to DOE and DOE contractors fromOffice of Scientific and Technical InformationP.O. Box 62Oak Ridge, TN 37831
Prices available from (615) 576-8401, FTS 626-8401
Available to the public fromNational Technical Information ServiceU.S. Department of Commerce5285 Port Royal RdSpringfield, VA 22161
NTIS price codesPrinted copy: A04Microfiche copy: AO1
!

SAND98-2276Unlimited Release
Printed October 1998
ANALYSIS OF MULTISTAGE AND OTHERCREEP DATA FOR DOMAL SALTS
Darrell E. MunsonUnderground Storage Technology Department
Sandia National LaboratoriesP.O. Box 5800
Albuquerque, NM 87185-0706
ABSTRACT
There have existed for some time relatively sparse creep databases for a number ofdomal salts. Although all of these data were analyzed at the time they were reported, todate there has not been a comprehensive, overall evaluation within the same analysisframework. Such an evaluation may prove of value. The analysis methodology isbased on the Multimechanism Deformation (M-D) description of salt creep and thecorresponding model parameters determined from conventional creep tests. Theconstitutive model of creep was formulated through application of principles involvedin micromechanical modeling. It was possible, at minimum, to obtain the steady stateparameters of the creep model from the data on the domal salts. When this was done,the creep of the domal salts, as compared to the well-defined Waste Isolation PilotPlant (WIPP) bedded clean salt, was either essentially identical to, or significantlyharder (more creep resistant) than WIPP salt. Interestingly, the domal salts form twodistinct groups, either soft or hard, where the difference is roughly a factor of ten increep rate between the two groups. As might be expected, this classificationcorresponds quite well to the differences in magnitude of effective creep volume lossesof the Strategic Petroleum Reserve (SPR) caverns as determined by the CAVEMANcavern pressure history analysis, depending upon the specific dome or region within thedome. Creep response should also correlate to interior cavern conditions that producesalt falls. While, in general, the caverns in hard salt have a noticeably greaterpropensity for salt falls, a smaller number of similar events are exhibited even in thecaverns in soil salt.
3

Acknowledgments
The author would like to acknowledge the continued support of Bob Myers, DOE SPR/PMOwho initiated the study of hanging string damage and the behavior of cavern salt materials.Also, the support of Jim Linn, who leads the SPR program at Sandia National Laboratories, ishighly valued. Reviews by Arlo Fossum and Nancy Brodsky were greatly appreciated, as werethe remarks by Brian Ehgartner.
4
Abstract . . . . . ...00.... . . . ...0..0...0...........0.0 . . . . . . . . . . . . . . . . . . . . . . . . . . . . . . . . . . . . . . . . . . . . . . . . . . . . . . . . .3
Acknowledgments .. . . . . . . . . . . . . . . . . . . . . . . . . .. . . . . . . . . . . . . . . . . . . . . ...*.... . . . . . . . . . . . . . . . ..... . . . . . . . . .*. 4
Contents . . .. . . ...00... . . . . . . . . . . . . . . . . . . . . . . . . . . . . . . . . . . . . ...*.. . . . . . . . . . . . . . . . . . . . . . ...*... . . . . . . . . . . . . . . .5
Figures . . ..... ...00.. . . . . . . ...*.... . . . . . . . . . . . . . . . . . . . . . . . . . . . . . . . . . . . . . . . . . . . . . . . . . . . . . . . . . . . . . ...0.0..0 . . . .6
Tablles. 000 . . 00 . 0 . . . . . . . . . . . . . . . . . . ● . . 00 .0.....00 . ..0.....0.0...0.........0.0 . . . . . . . . . . . . . . ● 0 . . . 0...00..0 ● 0..6
1.0
2.0
3.0
4.0
5.0
Introduction ● . . . 00 ...00... ● . . . . . . . . . . . . . . . . . . . . . . . . . . . ● . . . . ...0.0... ● 00 . . . . . . . . . . . . . . . . . . . . . . . . . . . . . .7
Creep Testing . . . . . . . . . . . . . . . . . . . . . . . . . . . . . . . . . . . . . . . . . . . . . . . . . . . . . . . . . . . . . . . . . . ...0 . . . . . 0 . . .00....009
Analysis Strategy . . . . 000 . . . . . . . . . . . . . . . . . . . . . . 0.......00.0...0.00...0.0.. . . . . . . . . . . . . . . . . . . . . . . . . . .13
Domal Salt Database ● . . . . . . . . ...00● . . . . . . . . . . . .. . . . . . . . . . . . . . . . . . . . . . . . . . . . . . . . . . . ...0.... . ...**..17
Analysis of Creep Data . . . . ...0..0......00......0.0 . . .00. . . . . .00.. . . . . ..00....0 ● . . . . . . . . . . . . . .0 ..023
5.15.2!5.3!5.4!5.5:5.65.7:5.8
Weeks Island (WI).: . . . . . . . . . . . . . . . . . . . . . . . . . . . . . . . . . . . . . . . . . . . . . . . . . . . . . . . . . . . . . . . . . . . . . . . . . ...23
Avery Island (AI) . . . . . . . . . . . . . . . . . . . . . . . . . . . . . . . . . . . . . . . . . . . . . . . . . . . . . . . . . . . . . . . . . . . . . . . . . . . . . . 29
Big Hill (III-I) 33. . . . . . . . . . . . . . . . . . . . . . . . . . . . . . . . . . . . . . . . . . . . . . . . . . . . . . . . . . . . . . . . . . . . . . . . . . . . . . . . . ..West Hackberry (WI-I) . . . . . . . . . . . . . . . . . . . . . . . . . . . . . . . . . . . . . . . . . . . . . . . . . . . . . . . . . . . . . . . . . . . . . . . . 36
Moss Bluff (MB) 40... . . . . . . . . . .. . . . . . . . . .. .. . . . . . . . . . . . . . . . . . . . . . . . . . . . . .. . . . . . . . . . . . . . . . . . . . ..Bryan Mound (BM) 40... . . . . . . . . . .. . . . . . . . . . . . . . . . . . . . . . . . . . . . . . . . . . . . . . . . . . . . . . . . . . . . . . . . . . . . . .Bayou Chotiaw @C) . . . . . . . . . . . . . . . . . . . . . . . . . . . . . . . . . . . . . . . . . . . . . . . . . . . . . . . . . ..""" ""."" 49Jennings Dome (JD) . . . . . . . . . . . . . . . . . . . . . . . . . . . . . . . . . . . . . . . . . . . . . . . . . . . . . . . . . . . . . . . . . . . . . . . . . . . 49
6.0 Discussion . . . . . . . . . . . . . . . . . . . . . . . . . . . . . . . . . . . . . . . . . . . . . . . . . . . . . . . . . . . . . . . . . . . . . . . . . . .. . . . . . . . . . . . . . .. 51
7.0 Conclusions ● . . . . . . . . . . . . . . . . . . . . . . . . . . . . . . . . . . . . . . . . . . . . . . . . . . . . . . . ● . . . . . . . . . . . . . . . . . . ...0..... ● . ... 55
Refierences. . . . . .. . . . . . . . . . . . . . . . . . . . . . . . . . . . . . . . . . . . . . . . . .. . . . . . . . . . . . . . . . . . . . . . . . . . . . . . . . . . . . . . . . . . . . . ...57
Distribution . . . . . . . . . . . . . . . . . . . . . . . . . . . . . . . . . . . . . . . . . . . . . . . . . . . . . . . . . . . . . . . . . . . . . . . . . . . . . . . . . . . . . . . . . . . . ...61
5

Figures
Figure 1.Figure 2.Figure 3.
Figure 4.
Figure 5.
Figure 6.
Figure 7.Figure 8.Figure 9.
Raw Creep Data for a Weeks Island Specimen [Mellegard and Pfeifle, 1996] . . . . 10Axial Strain Rate Asymptote to Steady State [Mellegard and Pfeifle, 1996] . . . . . . 11Transient Creep Curves for Various Applied Stresses
[Munson and Dawson, 1982] . . . . . . . . . . . . . . . . . . . . . . . . . . . . . . . . . . . . . . . . . . . . . . . . . 12Steady State Response of Weeks Island and WIPP Salt
Munson and Ehgartner, 1997] . . . . . . . . . . . . . . . . . . . . . . . . . . . . . . . . . . . . . . . . . . . . . . 25Transient Strain Limit for Weeks Island and WIPP Salt
[Munson and Ehgartner, 1997] . . . . . . . . . . . . . . . . . . . . . . . . . . . . . . . . . . . . . . . . . . . ...27Workhardening Response of Weeks Island and WIPP Salt
[Munson and Ehgartner, 1997] . . . . . . . . . . . . . . . . . . . . . . . . . . . . . . . . . . . . . . . . . . . . . . 28Steady State Response of Avery Island Domal Salt [Data of DeVries, 1988] . . . ...32Transient Strain Limit of Avery Island Domal Salt [Data of DeVries, 1988] .. . . . . 34Delta Values of Avery Island Domal Salt [Data of DeVries, 1988] . . . . . . . . . . . . . . . . . 35
Figure 10. Steady State Creep Rates of Big Hill Domal Salt Data of Wawersik, 1985] . . . .. 37Figure 11. Conventional Test Steady State Creep Rates for West Hackberry
[Data of Wawersik. etal.. 1980b] . . . . . . . . . . . . . . . . . . . . . . . . . . . . . . . . . . . . . . . . ...38Figure 12. Incremental Test Creep Rates for West Hackberry
Data of Wawersik and Zeuch, 1984] . . . . . . . . . . . . . . . . . . . . . . . . . . . . . . . . . . . . ... 39Figure 13. Incremental Test Creep Rates for West Hackberry, Stress Drops Removed
[Data of Wawersikand Zeuch, 1984] . . . . . . . . . . . . . . . . . . . . . . . . . . . . . . . . . . . . ...41Figure 14. Incremental Test Creep Rates for Moss Bluff [Data of Wawersik, 1992] . . . ... . ...42Figure 15. Conventional Test Steady State Creep Rates for Bryan Mound
[Data of Wawersik, et al, 1980a] . . . . . . . . . . . . . . . . . . . . . . . . . . . . . . . . . . . . . . . . . . .. 43Figure 16. Incremental Test Creep Rates for Bryan Mound
[Data of Wawersik and Zeuch, 1984] . . . . . . . . . . . . . . . . . . . . . . . . . . . . . . . . . . . . ... 45Figure 17. Incremental Test Creep Rates for Bvan Mound
[Data of Wawersik and Zeuch, 1984] . . . . . . . . . . . . . . . . . . . . . . . . . . . . . . . . . . . . ... 46Figure 18. Incremental Test Creep Rates for Bayou Choctaw
Data of Wawersik and Zeuch, 1984] . . . . . . .... . . . . . . . . . . . . . . . . . . . . . . . . . . . . . 47Figure 19. Incremental Test Creep Rates for Jennings Dome
Figure 20
Table I.Table II.Table III.Table IV.Table V.
6
[Data of Wawersik and Zimmerer, 1994] . . . . . . . . . . . . ... . . . . . . . . . . . . . . . . . ...48Caveman Calculated Volume Creep Rates for SPR Caverns [Linn, 1997] . . . . . . ...54
Tables
Summary of Creep Tests on Domal Sahs.. . . . . . . . . . . . . . . . . . . . . . . . . . . . . . . . . . . . . . . . . . . . . . . 17Creep Data from Tests on Domal Salts . . . . . . . . . . . . . . . . . . . . . . . . . . . . . . . . . . . . . . . . . . . . . . . . . ..l8Avery Island Creep Database [Decries, 1988] . . . . . . . . . . . . . . . . . . . . . . . . . . . . . . . . . . . . . . . . ..3OStructure Factor Multiplication Factor from WIPP 25°C Pure Salt Baseline.......51Suggested Parameter Values forthe M-D Model . . . . . . . . . . . . . . . . . . . . . . . . . . . . . . . . . . . . ....53

1.0 INTRODUCTION
Although it has been some time since the initial creep tests of the domal salts of the StrategicPetroleum Reserve (SPR) storage sites were reported and analyzed by the initial investigators,there has been no subsequent comprehensive, overall analysis of the collective database, as yet.It seems that some attempt to do such a comprehensive evaluation is warranted. For thisevaluation, it is necessary to apply a fundamental analysis framework uniformly to thedatdbases. As a result, we will analyze these data in terms of the methods developed for theWaste Isolation Pilot Plant (WIPP) Program Munson, et al., 1989]. The WIPP analysisdetermines parameters based on data from standard creep tests. In general, these methods havebeen applied to determine parameter sets for the salt materials obtained from bedded salt layersof the WIPP facility. When combined with the appropriately framed constitutive model andnumerical codes, results of this analysis method have provided parameter sets that weresuccessful in predicting underground salt mine structural response [Munson, 1997].
The SPR sites are located in the Weeks Island, Bayou Choctaw, and West Hackberry domes inLouisiana and the Bryan Mound and Big Hill domes in Texas. In the late 1970’s and early1980’s, a relatively small number of core samples became available from the SPR sites eitherfrom core drilling of the solutioning wells or from special purpose boreholes. Specimensprepared from these cores were tested according to acceptable creep testing methods of thattime. Often, this involved multistage testing methods with numerous changes of stress andtemperature during the creep deformation of an individual specimen. Even though multistagetests differ significantly from standard creep tests, most of these multistage creep-testingmethods are not incompatible with the WIPP standard creep testing methods and we can stilldevelop some necessary information on creep parameters from these tests. Early creep testswere performed by Wawersik, et al. [1980a] on material from the Bryan Mound site and byWawersik, et al. [1980b] on material from the West Hackberry site. Later, Wawersik andZeuch [1984] performed multistage tests on specimens from Bryan Mound, West Hackberry,and Bayou Choctaw domes. Recently, using conventional test procedures compatible with theWIPP creep methodology, creep tests were performed on specimens obtained from boreholecores of the Weeks Island salt dome [Mellegard and Pfeifle, 1996], which contains anunderground mine used for SPR storage. Creep results have been repotied for domal saltsiiom other sites as well, specifically from the Avery Island [DeVries, 1988], Moss Bluff~awersik, 1992] and Jennings [Wawersik and Zimmerer, 1994] domes. Although theseresults in their entirety form a significant database, they are not necessarily sufficient for acomplete parameter evaluation according to the WIPP analysis methodology. Nevertheless,various degrees of partial parameter evaluations are possible.
In preparing for the analysis of the creep dat~ it is necessary to have a detailed understandingof the influence of various testing methods used for creep studies. These testing methods arepresented first. Then, the analysis itself requires a theoretical framework or model of materialresponse that permits all of the data to be placed in the proper context and that provides rulesfor the analysis. In this context, all of the available data are presented for each individualdome material and then analyzed according to the established rules. Partial parameter sets foreach individual dome material are determined from the data and from comparisons with thecomplete parameter set from the WIPP clean salt database. From these comparisons, two

different salt creep responses are evident. C)ne group of domal salts has a steady state creepbehavior essentially the same as WIPP clean salt, while the other group of domal salts creepmuch slower than the WIPP salt, This difference between domal salt response has beensuggested previously because of the low steady-state creep rates of Bryan Mound salt[Wawersik, et al., 1980a] compared to other domal salts, but the effect was not quantified tothe extent possible here. The results of the analyses are compared to the volume creep rate ofthe SPR caverns as measured by the CAVEMAN analysis [Ehgartner, et al., 1995] of thehistorical pressurization data. This comparison suggests the steady state creep rate and thevolume creep response are correlated. Attempts to correlate the steady state creep response ofthe cavern material to the potential for salt falls is not so straightforward, even though the hardsalt caverns clearly have a greater number of salt fall events. The presentation concludes witha summary of the analysis results.
2.0CREEP TESTING
Befcre analyzing the individual creep results, it is necessary to understand the different typesof creep testing and how the testing methodology afTects the test results. Regardless of thetesting methodology, we will use a uniform approach to analyze all of the test data. Thisapproach stems from the fundamental concept of creep as controlled by micromechanicalmechanisms, especially the three dominant mechanisms in the temperature and stress regimesrelevant to the available creep data. These mechanisms were defined through a deformationmechanism map [Munson, 1979]. In addition, the analysis specifically follows dictates of theMultimechanism Deformation (M-D) creep model developed by Munson and Dawson [1984].This model utilizes the techniques and data of standard or conventional creep tests forparameter evaluation [Munson, et al., 1989].
The standard creep test is one in which the specimen strain is measured as a fhnction of timefor imposed conditions of constant uniaxial stress and constant temperature. For geotechnicalapplications, the uniaxial stress is typical] y replaced by a triaxial compression stress condition,which suppresses fracture in geomatenals and more accurately duplicates the naturalconditions around underground openings. These standard creep tests produce most directly thetransient and steady state response of the material being tested. However, standard creep testsare lime consuming and costly. This has led some investigators to utilize “staged” tests in anattempt to increase data retrieval from a single specimen. (Henceforth, we use “incremental”rather than “staged” as the descriptive terminology for these tests to avoid confhsion withhistorical descriptions of the three stages of creep behavior). Various specialized creep testshave been developed. Normally for geologic materials, such tests are triaxial compressiontests in which either the stress or temperature, or both, are changed periodical] y in a step-wisefashion to give small time increments of creep at constant stress and temperature, all upon thesame specimen. Using -the concept of a transient creep curve [Munson and Dawson, 1982], theconsequences of these incremental stress and temperature changes can be examined.
Data from a standard creep testis shown in Figure 1. From raw creep results such as these it isrelatively easy to misinterpret the relevant behavior. However, if the derivative of the strainwith respect to time (instantaneous strain rate) is determined and then plotted against time, thecurve of Figure 2 is produced. The figure indicates that the strain rate diminishes with time,and eventually asymptotes to a steady state (cmstant) rate. Although there can still be someuncertainty in determining the exact asymptote in Figure 2, the resulting achievement of steadystate is clearly more apparent than from the raw data curve. However, in order to understandthe creep cu~e in greater detail, it is necessary to flmther reframe the plot of Figure 2. This isaccomplished by visualizing the creep strain as essentially involving two components, oneproduced by a steady state creep rate and one produced by a transient creep rate. We caneffectively separate these strains by using the steady state rate to normalize the instantaneousstrain rate and by introducing an internal state parameter which is a measure of the transientstrain. In contrast to the creep strain, which increases monotonically, the internal stateparameter may either increase or decrease in transient creep, but remains constant in steadystate creep. This plot of the normalized instantaneous strain rate against the internal stateparameter provides a significant insight into creep, especially when the plot includes bothwodchardening and recovery processes. This curve, as shown in Figure 3, is called the

“transient creep cume.” Actually, a family of t~ansient creep curves for various constantapplied stresses are shown in Figure 3 ~unson and Dawso~ 1982]. At any given applied
stress, for example cl, the strain rate of an initially undeformed specimen decreases with time,
0.035
0.03
0.025
0.02
= 0.015~G 0.01zzb 0.005
0
-0.005
-0.01
-0.015
/
‘ Stress DIfferenoa= 15 MPaConfining Pressure =15 MPa
(
o 20 40 60 80 100 120 140 160 180 200
Time, days
Figure 1. Raw Creep Data for a Weeks Island Specimen [Mellegard and Pfeifle, 1996].
or with an increase in the internal state parameter, ~, until the strain rate becomes theequilibrium or steady state strain rate. At this point, shown on the U1transient strain curve, thestrain rate and internal state parameter will remain constant. However, for a specimen that isinitially workhardened, the current state parameter value may be greater than the state
parameter value at steady state, i.e., to the right of the steady state point on the 61 transientstrain curve. With time, the state parameter of this specimen will decrease, and although thespecimen strain continues to increase, the state of the material will move backward up thetransient curve, to eventually attain the steady state condition. Then the strain rate will againbecome constant.
Transient strain curves were initial] y proposed by Munson and Dawson [1982] as a strategy totreat transient creep during stress and temperature changes. A hypothetical series of stress
increases and stress decreases such as might be generated in an incremental test are illustrated
10

in Figure 3. The strain rate history for each increment can be deduced from the figure. While,in theory, such changes can give information about the magnitude of the stress exponent and
5.OE-09
4.5E-09
4.OE-09
3.5E-09
Y
;- 3.OE-09
1?= 2.5E-09gm
1.5E-09
1.OE-09
5.OE-10
O.OE+OO
Specimen I.D.: WUBH3/7/2Stress Difference =15 MPa
Steady State Strain Rate = 9.73E-10 s-’
o 20 40 60 80 100 120 140 160 180
lime, days
Figure 2. Axial Strain Rate Asymptote to Steady State ~ellegard and Pfeifle, 1996].
the activation energy, they do not necessarily give the essential information about the steadystate creep condition as a fimction of stress and temperature. Creep rates are reported at thebeginning and end of each stress or temperature increment. Except for special conditions,these ending rates are not the steady state rates. Moreover, the ending rates are not unique.(Thlis could be demonstrated on the figure through construction of another hypothetical seriesof stress increases where the ending rates either decrease or increase, depending upon the exactstress-time conditions). Because the sequence and direction of stress and temperatureincrements are essential y random, many different scenarios are possible based on the actualtests.
As a hypothetical example of an incremental test, the sequence of stress changes shown inFigure 3 can be used to illustrate the specimen response adequately. The specimen is initially
loaded under G1. Afler some interval of decreasing transient strain rate, the stress is increased
11

\u,
u,I
Figure 3. Transient Creep Curves for Various Applied Stresses [Munson and Dawson, 1982].
to CJ2,with the subsequent abrupt increase in strain rate followed by a decreasing transient
strain rate. Afier an interval of time, the stress is fhrther raised to 03. Note that the strain ratesat each higher stress level still diminish with time, as one would expect, but they never become
steady state rates. From CJ3,the stress is lowered to CJ2,and while the rate decreases, it is stillnot in steady state by the time the stress is again firther reduced to al. However, this laststress decrease causes an unusually strong decrease in strain rate since the specimen internalstate is now on a recovery branch. This occurs because the workhardening and recoverybranches of the transient curve are of opposite curvature. The test ends, in this case, still on therecovery branch, with a strain rate less than the steady state creep rate. If we use the finalstrain rate reported for each of the increments, exactly as was done for some staged salt tests,then we will have four rates above the steady state rate and one below the steady state rate.None of these rates, however, will be the actual steady state rate, although one will be close.The crucial problem with the analysis of these kinds of incremental test data is that we do notknow the steady state rate, and therefore never quite know quantitatively how the reportedrates are related to steady state.
In all of the following discussion of the analysis, as well as the actual analysis of the creepdata, we want to keep the details of Figure 3 in our minds. This illustration is the clearestpossible method of keeping track of the complex series of events during any incremental creeptest. The figure represents not only the form of the experimental results of transient creep but,as we shall see, also the form of the mathematical description of creep.
12

3.0ANALYSIS STRATEGY
In addition to the empirical observations, as described above, it is equally possible, andperhaps more important, to make use of what is known about the general behavior of salt withrespect to achieving the steady state condition in order to formulate an analysis strategy. Wewill make extensive use our knowledge of the constitutive description of the creep response ofsalt in the following discussions. We will also use the well-documented, standard creep testresults that define the steady state creep response for a WIPP “clean” salt (99. 5+0A NaCl)[Munson, et al., 1989] as a baseline for judging the relative creep behavior of the domal salts.
Principles gained flom our understanding of the constitutive behavior of WIPP salt will formthe principal basis for the analysis strategy. Not only do the constitutive equations of the M-Dmodiel define the necessary material parameters, but also they permit the formulation of rulesof the analysis. In developing the constitutive description, we concern ourselves on]y with thetemperature and stress range encountered in mining and storage cavern operations, typicallylow temperature and low to moderately high stresses. For these conditions, the creep isenvisioned as arising horn the contributions of three appropriate micromechanical mechanismsas determined ilom the deformation mechanism-map [Munson, 1979]. These mechanisms are(1) a dislocation climb controlled creep mechanism at high temperatures and low stresses, (2)an empirical] y specified but undefined mechanism at low temperatures and low stresses, and(3) a dislocation slip controlled mechanism at high stresses [Munson, et al., 1989]. Thesemechanisms act in parallel, which means the individual steady state creep rates can be summedover the three mechanisms to give the total steady state creep rate, as follows:
The steady state creep rates for the individual mechanisms, respectively, are given by:
-Q [)nl
&=A, eRT &)–a)
-Q ()n2
E;,=A2eRT ‘*)–a)
()CT
1[ ]-Q, -Q, q~-o”Hk CT(;~,= -o B,em +B,em sinh
P
2
where the numerical subscripts refer to the appropriate mechanism, the A’s and B‘s arestructure factors, Q’s are activation energies, R is the universal gas constant, T is the absolute
temperature, p is the shear modulus, q is the stress constant, GOis a stress limit, and H is a
13

Heaviside step flmction with argument (~ -O). It has been shown ~unson, et al., 1989]through multiaxial experiments that the proper equivalent stress measure is c = [al -031.
The equivalent total strain rate is treated through a multiplier on the steady state rate, as
& ‘F;,3
where the multiplier involves three branches of the transient creep curve: workhardening,steady state, and recovery, respective y, as follows:
F ‘{1 7“c =&: 4
Here, A is the workhardening parameter, 8 is the recovery parameter, ~ is the state parameter,and e*t is the transient strain limit. The state parameter rate is given by
The transient strain limit is defined by
[)m
‘:= ‘“e” /4(1: 0)6
where KOand c are constants and m is a material constant.
The workhardening, A, and recovery, 8, parameters are described through linear finctions, asfollows:
/ \
[JA =aw+~wlog 0/#(l - co)
[Ja=~r+prlog o/f(l- 69)
14

where the a’s and ~’s are constants. Throughout these equations, although it is taken as zero
for our purposes here, @ is the damage parameter.
The governing principles of the analysis are:
(1) From the constitutive equations given above, use of Eq. 1 with Eqs. 2 define the shapeof the steady state creep response with stress. D~~erences in the steadj state response ofdlf%rent materials will be reflected as changes in the values of those parameters that are notjixed by theoretical considerations.
(2) Eq. 4 is the mathematical representation of the transient strain curves depictedgraphically in Figure 3, which produce a famil y of curves in stress. Moreover, the steady statestrti,n rate always increases as the stress is increased, as determined from the steady stateequations for the three mechanisms in Eqs. 2. In addition, the absolute strain value of the stateparameter at steady state creep, which is the transient strain limit given by Eq. 6, increases asthe stress increases. These observations can be interpreted in terms of incremental creep testresults. As can be determined, all of the possible transient strain and strain rate states for anystates of progressively increasing stress are above and to the lefi of the steady state condition inFigure 3. Therefore, just as the limit of any individual transient creep curve is the steady statecreep rate, the limit of creep along all of the family of curves is a steady state creep conditionso long as the stress changes progressively increase, Thus, we can state as a general principle,the iower bound of the collection of creep rates of incremental tests where the stress changesare always to progressively higher stresses tenah toward (qproaches) the steady state creeprate as ajhnction of stress.
(3) Decreases in the stress during incremental tests present a more difllcult situation. Infact, any given stress decrease may result in moving to the new transient strain curve eitherabove or below the steady state creep rate. Unless the duration of the increment is long, onemay not know with any certainty whether the creep rate is decreasing or increasing; i.e.,whether the steady state rate is being approached from above (workhardening) or below(recovery) in Figure 3. As a result, creep rates measured ajler a stress decrease general~ maybe dj$kdt to interpret and fiequentiy cannot be used in determining steady state conditions.As a result, to be conservative, in this analysis, increments after a stress drop are ignored.
(4) Temperature changes normally will not cause interpretation diflicuhies, except when atemperature &crease occurs when a specimen is very near or in steady state creep or when thetemperature decrease is marked. Temperature increases cause the strain rate to increase sothat even when the specimen is in steady state creep the new strain rate will always be initiallyabove the equilibrium condition or in workhardening. However, temperature decreases may
cause the new strain rate to fall well below the equilibrium condition or into a recoverycondition. Thus, one must be careful when utilizing abtafiom temperature decreases to assurethat the change did not induce a recovery condition.
Fundamentally, salt creep behavior has common micromechanical constitutive featuresregardless of the origin of the salt, all that differs is the exact value of the parameters. Inparticular, those critical parameters that primarily distinguish one salt material from another
15
salt material are the steady state responses as represented by the structure factors (A’s and B’s)and the transient strain rate limits (s*t) as represented by &. By using the analysis criteriagiven above and the known behavior from the well-documented tests of WIPP clean salt as abaseline response, it may be possible on the one hand to construct reasonable steady stateresponses for the domal salts. On the other hand, determination of the transient strain limitdepends critically upon having the complete transient strain curves, i.e., complete conventional
raw creep curves. In the absence of these curves, only rather uncertain estimates can be madefor values for this parameter. Oflen, the only recourse in this case is to estimate the transientstrain limit values based on the particle impurity level and the measured values fi-om the WIPPclean and argillaceous salts. Remaining parameters are either unaffected by or insensitive tothe specific salt material.
Some comment is necessary on the nature of the bound determined from incremental test data.This is a consequence of the fact that any bound formed by incremental data alone maybe stillwell removed from the actual steady state response. The uncertainty is such that the apparentbound will always be greater than the actual steady state response. Consequently,when theconstruction of the steady state response involves a series of tests that include both incrementaland conventional tests, the conventional tests will be the dominant data in the determination.When the database is solely composed of incremental test dat< caution must be used.
16

4.0 DOMAL SALT DATABASE
There exists a relatively sparse creep test database for eight Gulf Coast salt domes, five that areassc)ciated with the SPR. Most, but not all, of the creep data results on domal salt wereobtitined from incremental tests. The tests were all pefiormed under conditions of triaxialcompression. A summary of these tests for all eight sites is given in Table I. While thisappears to be a significant array of tests, some of the data from the incremental tests cannot beinstrumental in defining the bound and are therefore effectively not used in the analysis.
Table I. Summary of Creep Tests on Domal Salts.
Dome Specimen Identifiin~ Location Type of Test Notes
Type No. Dep~
Weeks Island, LA WI 1W12W13W14
West Hackberry, LA WHl
WH3WH4WH5WH6
Big Hill, TX BH1BH2BH3
Bayou Choctaw, LA BC1
Bryan Mound, TX BM1BM2BM3BM4BM5BM7BM6BM8BM9
Core - Borehole #3a66cc
Core - Well 106BCore - Well 108B
66
Core - Well 19A
Core - Well 107A&c
Core - Well 107C&c
Core - Well 108B66
Core - Well 107CL&66
684671678669691
1113
1666767
1072
786
12091209
764763
1013767767764764
ConventionalIncrement (2)ConventionalConventional
ConventionalConventionalConventionalConventionalIncrement (5)Increment (6)
Increment (4)Increment (4)Increment (5)
Increment (13)
Increment (2)ConventionalConventionalConventionalIncrement (6)Increment (2)Increment (3)Increment (2)Increment (14)
[1]
[2]
[3]
[4]
[3]
[5]
[3]
17

Table I. Summary of Creep Tests on Domal Salts (Cont.).
Dome Specimen Identifiin~ Location Type of Test Notes
Type No. Dep~(m)
BM1O Core - Well 113B 1288 Increment (10)
Jennings Dome, LA JDl Core - Hole LA-1 1197 Increment (5) [6]
Moss B1uff, TX Mvl Core – Hole 2 1021 Increment (4) [7]
Avery Island, LA (55) Underground 274 Conventional [8]
. Notes: [1] Mellegard and Pfeifle, 1996 [2] Wawersi~ et al., 1980b [3] Wawersik andZeuc~ 1984 [4] Wawersik, 1985 [5] Wawersik, et al., 1980a [6] Wawersik andZimmerer, 1994 [7] Wawersik, 1992 [8] DeVries, 1988 (55 tests)
Creep data available for each of the eight individual domal sites will be analyzed separately,before general comparisons are discussed. In presentation of the data, it should beremembered that creep data contains considerable uncertain y or scatter, typical] y as much as afactor of two, although sometimes more, among tests on the same material. The reported testdata of stress, temperature, and the final creep rate for a given increment for seven of the sitesare reproduced in Table II. These data will be used to generate the analysis for steady statecreep.
Table II. Creep Data from Tests on Domal Salts.
Dome Specimen Increment Increment Temp. Stress Change Notes
No. Stress Final Rate (“C) Direction (Table I)
(MPal (1O“’O/s)
Weeks Island WI 1 1 20.0 27.5 25 Constant [1]
W12 1 15 8.39 25 -2 15 391.0 90 Temp. up
W13 1 15 9.73 25 Constant
W14 1 10 0.665 25 Constant
18

Table II. Creep Data from Tests cm Domal Salts (Cent.).
Dome Specimen Increment Increment Temp. Stress Change Notes
No. Stress Final Rate (“C) Direction (Table I)
) (1O-’O/s)
West Hackberry WHl
WH3WH4
West Hackberry WH5
WH6
Big Hill BH1
BH2
BH3
Bayou Choctaw BC1
1111
12345123456
12341234123456
1
20.420.020.019.9
20.718.816.814.014.013.616.816.817.020.216.7
14.915.015.117.914.414.414.517.315.115.115.117.917.917.9
14.72345
14.712.814.712.6
94.7723.0119.0597.0
596.0130.0
20.80.30
38.088.0
248.0659.0163.0619.0275.0
103.0402.4137.8364.0119.0437.0221.0479.0142.0271.0132.3363.0834.0446.0
34.981.6
8.066.0
4.6
22602260
6060606080606080606060
6080606060806060607060607060
6080808080
Constant [2
ConstantConstantConstant
[3]Stress downStress downStress downTemp. up
Stress upTemp. upTemp. downStress upStress down
[4]
Temp. upTemp. downStress up
Temp. upTemp. downStress up
Temp. upTemp. downStress upTemp. upTemp. down
[3]Temp. upStress downStress upStress down
19

Table II. Creep Data from Tests on Domal Salts (Cont.).
Dome Specimen Increment Increment Temp. Stress Change Notes
No. Stress Final Rate CC) Direction (Table 1)
(MPa) OO’O/s]
Bryan Mound BM1
BM2BM3BM4
Bryan Mound BM5
BM6
BM7
BM8
BM9
678910111213
12111
1234561231212122456789
14.714.717.114.817.014.917.114.8
10.121.620.820.620.6
20.621.120.519.919.520.116.016.222.620.920.914.221.714.014.114.414.415.415.315.320.620.5
55.011.37
6.837.0
4.737.0
1.0
2.5222.0
9.027.512.4
92.041.027.087.0
969.049.028.127.866.921.255.916.0
110.011.026.027.0
6.07.4
24.04.7
43.091.4
8060606060606060
6060602222
222222601006060606022606060608080606080606080
Stress upTemp. downStress upStress downStress upStress downStress upStress down
[5]Stress upConstantConstantConstant
[3]Stress+deltaStress-deltaTemp. upTemp. upTemp. down
Stress+deltaStress up
Temp. up
Stress up
Temp. upStress+deltaTemp. downStress upTemp. upTemp. downStress upTemp. up
20

TabJe II. Creep Data fi-om Tests on Domal Salts (Cont.).
Dome Specimen Increment Increment Temp. Stress Change Notes
No. Stress Final Rate (“C) Direction (Table I)
(MPa) (1O-’O/s)
1011121314
BM1O 1
2345678910
Jennings Dome JDl 12345
Moss Bluff MBl 1234
20.522.124.524.524.517.3
17.217.117.217.219.719.619.619.519.6
17.416.317.319.719.7
16.016.119.519.5
22.032.896.0
365.014.0
108.5
232.0850.0128.0
29.685.0
328.056.3
1258.0331.6
14.29.4
22.034.8
4.4
74.2118.0214.0
52.1
6060608033.540
608060404060408060
4060606040
40606040
Temp. downStress upStress upTemp. upTemp. down
Temp. upTemp. upTemp. downTemp. downStress upTemp. upTemp. downTemp. upTemp. down
[6]St. down, T UpStress upStress upTemp. down
[7]Temp. upStress upTemp. down
Table 11 does not include the very extensive database on Avery Island salt ~eVries, 1988],primarily because of the extensive quantity of data in this database. These data are given laterin the section on the analysis of Avery Island salt behavior because it is easier to understandthem in the analysis context. It is sufficient to note here, that the creep tests on Avery Island
salt were all conventional tests and permit the evaluation of all of the parameters of the M-Dmodel, should it be necessary for the application.
21

(Page left intentionally blank)
22

5.0ANALYSIS OF CREEP DATA
In presenting the analysis of the reported dat~ we begin with Weeks Island and Avery Islandsalts because they represent the most complete data collection in terms of the M-D model andcan be compared extensively to the WIPP clean salt baseline. Then the remaining salt domedata are analyzed and compared to the extent possible to the WIPP clean salt baseline data.
5.1 WEEKS ISLAND (WI)
The Weeks Island salt dome geology and salt characteristics have been investigated for theSPR Project by Acres American [1977, 1979]. Petroleum storage is in the rooms and drifts ofan underground salt mine previously operated in the dome, and purchased for the SPR. Thesah was cored from the ground surface through shallow boreholes into the salt at severallocations in the dome and the core was petrographically examined. Grain diameters werelocally uniform, but varied from location to locatio~ ranging fkom 3.7 to 12.7 mm (O.12 to 0.5inches). The salt was unusually pure with a principal impurity content of 1 to 2°/0,consistingalmost entirely of anhydrite. Small amounts of clays, hydrogen sulfide, carbon dioxide andpetroleum products were detected. These geologic results have been summarized by Ortiz[1980]. A general geological description of the dome has been given by Neal, et al. [1993a].The dome is thought to have several spines separated by shear zones. These zones areapparent in the mine, primarily through concentrations of impurities, however, littleinfi~rmation is presented on their impurity content and distribution. As noted, the shear zoneshacl higher concentrations of impurities with sandstone and marly clays dispersed in the zone.
There is very little early creep information about the Weeks Island mine. In situ room closuremeasurements were made in a lower level room between 1961 and 1967 that gave anapproximate convergence rate of 12.7 mm (O.5 inches) per year [Ortiz, 1980]. Because theroom location and dimensions are not well specified, the closure cannot be used to determinethe relative creep response of the Weeks Island salt.
Recently Mellegard and Pfeifle [1996] tested four specimens of Weeks Island salt preparedfrom material taken from Well No. BH-3. The borehole was not especially deep, reachingfrom the ground surface just into the salt. These specimens were prepared and tested undercarefblly specified and controlled conditions. Even though a limited number of tests weremade, procedures used were sufficient to characterize nearly all of the nonthermal parametersof most relevant mechanism of the M-D model of creep (the exception is the recoveryparameter). Specific attention was given to defining the steady state response throughconventional creep tests. Although previous] y discussed, a conventional creep test in triaxialcompression involves initial pressurization of the specimen, followed by a more-or-lessinstantaneous increase in the axial force to the deviatoric stress value chosen for the test.Thlereafler, the stresses are held constant, with corrections for the changes in specimen crosssection with deformation. In a conventional creep test, the temperature is also held constant.When the specified load is achieved, both time and deformation are re-set to be zero and thespecimen axial and lateral (radial) deformations can then be measured as a fbnction of time toproduce the raw creep data, such as that shown in Figure 1. Here, both the axial and lateralstrains are plotted. In addition the strains produced by the application of the axial load are
23

measured and reported. Although not important for determining the steady state creepresponse, application strains have a bearing on evaluation of transient creep parameters.
Again as discussed previously, achievement of the steady state condition is diffhdt todetermine from the raw creep data, which often causes the reporting of transient creep rateserroneously as steady state rates. This difficulty is lessened if the first derivative of the rawdata (creep rate) is plotted as a fimction of time, as shown in Figure 2. From this plot, it isrelatively easy to determine whether the creep rate is approaching the steady state rate, and toaccurately estimate the asymptotic value which is the true steady state creep rate. Either asmoothed visual or exponential curve fitted to the experimental data of Figure 2 gives anasymptotic steady state rate of about 9.73 x 10¹⁰ /s. Steady state creep rates from the fourcreep tests are plotted in logarithmic form against the creep stress in Figure 4. The slope of thedata is just the parameter nz, while the intercept of the line on the ordinate axis is the structureparameter, A2. Basically, the structure factors for the other two mechanisms are determinedsimilarly, when there are sufllcient data to do SO. In our case, since there are insufllcient datato determine the other structure factors, we will assume that all structure factors change in thesame proportion as the change in A2 compared to the WIPP clean salt baseline.
In Figure 4, Weeks Island domal salt steady state creep data at 22°C are compared to the moreextensive data from clean WIPP bedded salt, both with about the same impurity content. Theline in the figure is actually determined ii-em an even more extensive creep database and fromindependent inputs from micromechanica] models that were used to establish the form andslope of the curve for the two mechanisms controlling salt creep for these conditions [Munson,et al., 1989]. The third mechanism dominant at higher temperatures is not involved here. As isapparent, Weeks Island data are very comparable to the WIPP dat~ except that they are offsetvertically, by a factor of about 0.50 (log -0.30), to apparently a somewhat smaller structurefactor value. However, when we consider the difference because of the temperature, 22°C vs.25°C, this itself causes a shift by a factor of 0.84 (log -0.0746). To compare data collected atdifferent temperatures, we will always need to make a temperature correction. Therefore, theactual offset due to the difference in materials is only a factor of 0.59 (log -0.23).
Although the values of the model constants given by Munson, et al. [1989] are independent ofboth stress and temperature, they are not independent of those affects due to differences inmaterial. However, whether or not the influence of temperature can be observed depends uponhow the data are presented. As a result, in plots such as Figure 4 for the same material, thedifferent temperatures will cause a shifl to produce a family of curves all with similarcharacteristics, but offset born each other. Specifically, in the logarithmic plots that we areusing here, differences caused by temperature will manifest themselves as an apparent changein intercept on the ordinate. Again, this observed temperature induced change does nottranslate into an actual change in the structure factors. On the other hand, however, in theseplots, material differences also appear as differences in the value of the intercept, which mustbe interpreted as a real difference in the value of structure factor, A. In order to determine thematerial affect, it is necessary to reduce the observed responses obtained in these plots of creepdata to an equivalent response at 25”C. Then, any difference between the reduced responseand the WIPP clean salt response at 25°C will be a true difference caused entirely by thematerial and can be quantified by the difference in the structure factors.
24

Tm.m2e.7. 1-
-5
-6
-7
-9
-10
-11
.WIPP
CLEAN SALT025°
MmmcMRD&Pmmm [1996]. WEEKSISLANDSALT
A
J 1 I I 1 I 1 1 I
-4.0 -3.8 -3.6 -3.4 -3.2 -3.0 -2.8 -2.6 -2.4
()Log f
—... .
Figure4. Steady State Response of Weeks Island and WIPP Salt Munson and Ehgartner,1997].
To determine the temperature corrections, we make use of the thermal activation terms for alltkee mechanisms of the M-D model, as given in Eqs. 2. When this is done, the calculated
multiplication factor to make the correction to 25°C for data generated at 22°C is 0.84 (and the
25

equivalent log is -0.0746), at 40”C is 2.247 (+0.3517), at 60”C is 5.908 (+0.7715), at 80”C is13.91 (+1.143), and at 100”C is 29.88 (+1.475).
In evaluating the steady state creep information from Weeks Island, we must discuss thequestion of uncertainty of individual datum and how this is modified by a larger collection ofdata. It is generally believed ~unson, et al., 1989] that the uncertainty in an individual steadystate creep rate determination is about a factor of two, or a log difference of+/- 0.30. Withinthis uncertainty, any of the Weeks Island data points would be indistinguishable from theWIPP data. However, as more data are considered, as with the four Weeks Island datum, thenature of the uncertain y changes. Larger collections of data will have close to a lognormaldistribution, with the bulk of the data concentrated nearer to the lowest possible value of creeprate. Thus, the best-fit line to a collection of data does not have an uncertainty as large as asingle datum. Even with the small amount of Weeks Island data presented here, the creep ratesare all uniformly lower than the best representation of the WIPP data. As a consequence, thkis why we believe the steady state rate of Weeks Island salt to be measurably less, although notmuch less, than WIPP clean salt.
Once the steady state creep rate has been determined for a given test, then Figure 1 can be used
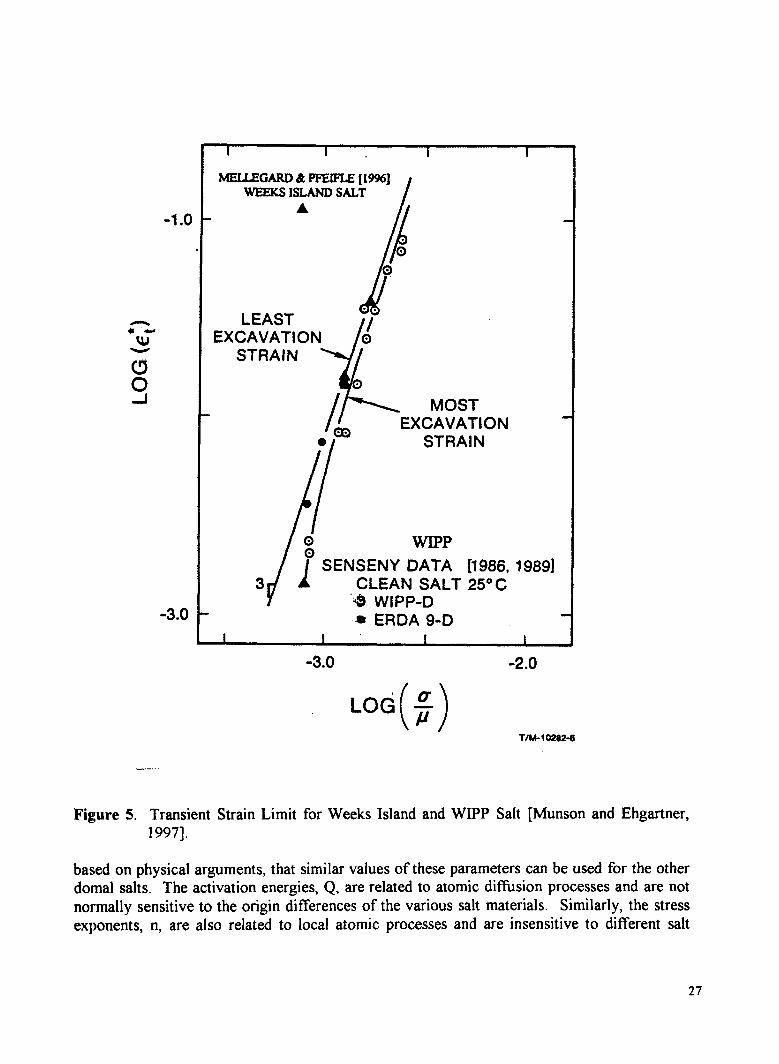
to determine transient strain limit, s*l. A line with the steady state slope is constructedasymptotic to the creep curve on the raw creep curve and the intercept of this line on theordinate (strain) gives the parameter. When these transient strain limit values are plotted inFigure 5 as a fimction of stress, the behavior appears essentially identical to that of the WIPPclean salt baseline. The intercept of the line in Figure 5 on the ordinate gives the value of theparameter Ko. This means that the & parameter value for Weeks Island salt remainsessentially unchanged from that for WIPP clean salt. Moreover, this is one of the parametersthat are sensitive to the type of salt, especial] y to impurity content. However, there is nomicromechanical model currently available that specifies how this parameter will change frommaterial to material.
The workhardening parameter is defined as the intercept on the ordinate axis of the logarithmicplot of strain rate verses the total strain. (Although it looks similar to Figure 2, the strain plotis a more sensitive and accurate method of determining the workhardening parameter). Theworkhardening data for Weeks Island salt are plotted in Figure 6 in comparison to the pureWIPP salt data. Based on Figure 6, to obtain a slightly better fit to the data, it would be
acceptable to change the workhardening parameter, A; however, it hardly seems justifiedconsidering the scatter in the data. In addition, the exact value of the parameter is notespecially critical. Thus, even though there is considerable scatter, the data comparisonsuggests that the Weeks Island data are within reasonable agreement to the WIPP data. As aresult, we will assume the same value for the Weeks Island salt as determined for the WIPPclean salt. In addition, where the data are insutlicient to permit parameter determination forthe other domal salts, the same value determined for the WIPP clean salt will also be assigned.
We must comment on the remainder of the M-D model parameters, even though they cannotbe evaluated from the current database. Actual] y, most of these constants are independent ofthe exact salt material being considered. This results from the fact that many of theseparameters are related to the salt properties and processes at an atomic level. We will assume,
26
-1.0
-3.0
—.-.
MELLEGARD& PFEIFLE[1996]WEEKSISLANDSALT
AII .
1}&o
LEAST “ “
d
/EXCAVATION o
STRAIN
.
//-=MOST
●mEXCAVATION -
STRAIN
/1
o WIPP
0 SENSENY DATA [1986, 1989]
3 1 CLEAN SALT 25° C*9 WIPP-D., ERDA 943
-3.0
()LOG ;
-2.0
TIM-102W?-6
Figure 5. Transient Strain Limit for Weeks Island and WIPP Salt Munson and Ehgartner,1997].
based on physical arwments, that similar values of these parameters can be used for the other
domal salts. The activation energies, Q, are related to atomic diffusion processes and are notnormally sensitive to the origin differences of the various salt materials. Similarly, the stressexponents, n, are also related to local atomic processes and are insensitive to different salt
27

materials. In this case we can be quite certain based on the physical models that describe themthat the values of these parameters do not change. As a result, the same values of Q’s and n’sthat were determined for WIPP clean salt will be used for Weeks Island salt, and for the otherdomal salts, as well.
10.0
8.0
d 6.0
4.0
2.0
0.0
.
MELLEGARD& PPEIPLE[19%]WEEKSISLANDSALT
A
I I 1 I
-3.0 -2.0
WIPP
CLEAN SALT
()Log ;Figure 6. Workhardening Response of Weeks Island and WIPP Salt [Munson and Ehgartner,
1997]
28

Values of the stress limit, 00, and the stress constant, q, are not, in general, sensitive to the saltmaterial, although they may be. In fact, stress related constants may be affected by secondphase impurities that strengthen the material. However, for the low stresses involved in mostof the data being analyzed, the influence of the third mechanism, which dominates at relativelylarge stresses, is not pronounced. Because the particle impurity amounts are quite small in thesalts we are dealing with in this report and the stresses are relatively low, little, if any,influence is expected on these parameters. -As a consequence, the values of these parameters,
CJO and q, from the WIPP clean salt will be used for Weeks Island and the other domal salts.
The value of m is a theoretical constant, independent of material. The non-critical value of c isrelated to an activation process and is assumed to remain unchanged with different materials.
5.2 AVERY ISLAND (AI)
The Avery Island dome is one of a series of domes formed along the gulf coast from theancient Luann salt formation. As such, it has many similarities with the other domal saltstreated in this paper. The dome has been mined over the many decades since shortly after theCivil War, with several different mine operators during its long history. The geology of thedome has been given by Kupfer [1963]. This indicates a relatively complex structure, with atkast two distinct splines. The southeastern spline is relatively uniform with the remnants ofthe anhydrite bedding forming uniform sharply dipping traces in a quite pure salt. In contrastthe northwest spline appears to have sharp] y folded remnants of the anhydrite bedding. Asshown by mining, between these two splines is a region of course salt which contains a majordiscontinuity.
Initiation of both the OffIce of Nuclear Waste Isolation (ONWI) programs for disposal ofcivilian reactor waste and the WIPP program for disposal of defense generated nuclear wasteresulted in the use of the Avery Island Mine for early underground studies in 1979. Thesestudies were in anticipation of disposal of radioactive wastes in other geologic salt domes orformations ~wing, 1981; Mellegard, 1983]. In addition to underground experiments, the minealso became a source of material for laboratory specimens. A number of cores were takenfiolm the floor of a room at the 274 m (900 fl) mining level to provide specimen stock fortesting [Mellegard, 1983]. This room is in the southeastern spline, but still near the horizontalcenter of the dome. Specimen stock was unusually clean, typically better than 98°/0 salt, withminor amounts of anhydrite and argillaceous (clay) at the grain boundaries. Some negativecrystal brine inclusions were also observed. Grain sizes averaged 7.5 mm (0.3 inches).
Frc)m these cores, a number of specimens were prepared for both creep and quasi-static testing.Results of these tests have been presented in a number of reports, primarily with analyses toobtain parameters for several constitutive models being considered by ONWI, with an eye toselecting the best model [Senseny, 1983; DeVries, 1988]. DeVries [1988] determined theparameters for these models, including the M-D model, using a statistical sofiware proceduredeveloped for fitting biomedical research data. Although a set of parameter values was
obtained for the M-D model using this procedure, the results are basically incompatible withthe micromechanical aspects of the model. As a result, these types of analysis packagesprobably should be avoided for salt creep data, and perhaps for creep data in general.
29
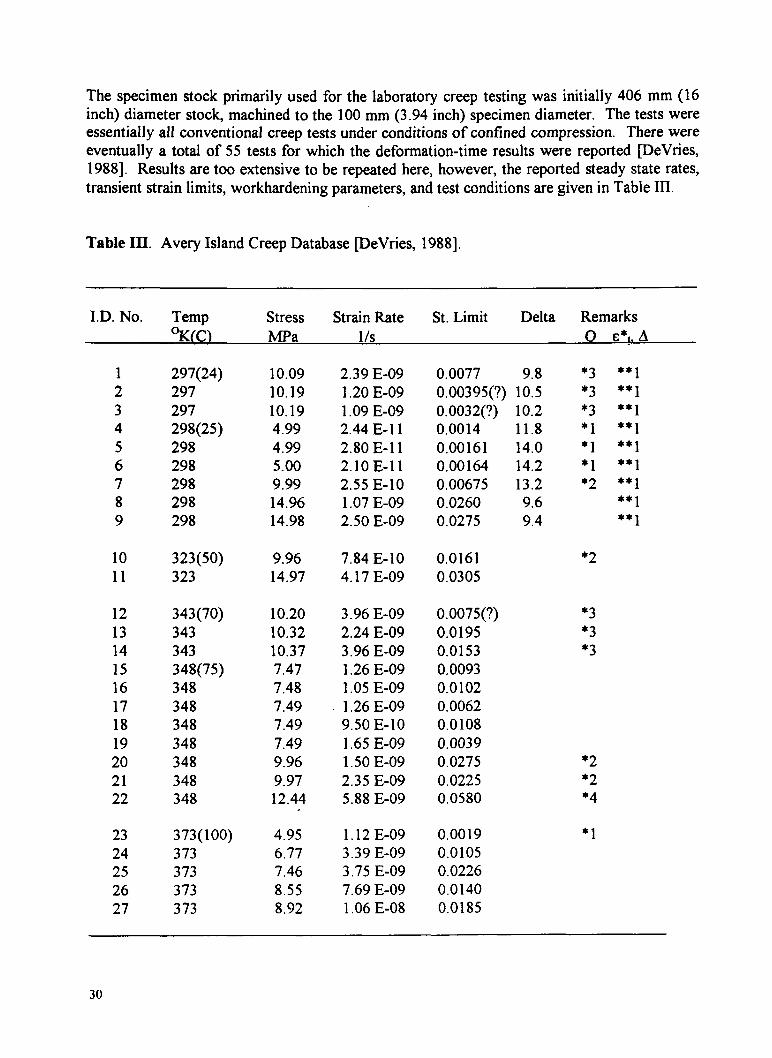
The specimen stock primarily used for the laboratory creep testing was initially 406 mm (16inch) diameter stock machined to the 100 mm (3.94 inch) specimen diameter. The tests wereessentially all conventional creep tests under conditions of confined compression. There wereeventually a total of 55 tests for which the deformation-time results were reported [DeVries,1988]. Results are too extensive to be repeated here, however, the reported steady state rates,transient strain limits, workhardening parameters, and test conditions are given in Table III.
Table III. Avery Island Creep Database ~eVries, 1988].
I.D. No. Temp Stress Strain Rate St. Limit Delta Remarks%(c) MPa 1/s o dt. A
123456789
1011
1213141516171819202122
2324252627
297(24)297297298(25)298298298298298
323(50)323
343(70)343343348(75)348348348348348348348
373(100)373373373373
10.0910.1910.194.994.995.009.9914.9614.98
9.9614.97
10.2010.3210.377.477.487.497.497.499.969.9712.44
4.956.777.468.558.92
2.39 E-091.20 E-091.09 E-092.44 E-112.80 E-112. IO E-112.55 E-101.07 E-092.50 E-09
7.84 E-104.17 E-09
3.96 E-092.24 E-093.96 E-091.26 E-091.05 E-091.26 E-099.50 E-101.65 E-091.50 E-092.35 E-095.88 E-09
1.12 E-093.39 E-093.75 E-097.69 E-091.06 E-08
0.0077 9.8 *3 **1
0.00395(?) 10.5 *3 **10.0032(9)0.00140.001610.001640.006750.02600.0275
0.01610.0305
0.0075(?)0.01950.01530.00930,01020.00620.01080.00390.02750.02250.0580
0.00190.01050.02260.01400.0185
10.2 *3 **1
11.8 *1 **1
14.0 *1 **1
14.2 *1 **1
13.2 *2 **19.6 **1
9.4 **1
*2
*3*3*3
*2*2*4
*1
30

Table III. Avery Island Creep Database [DeVries, 1988] (Cont.).
I.D. No. Temp Stress Strain Rate St. Limit Delta Remarks%(c) MPa 1/s Q E*1.A
373373373373373373373373373373373373373373373373373373373
423(150)423423423
473(200)473473473473
8.989.9110.1010.2210.2712.1012.3012.3512.3712.3912.4012.4612.4913.5713.7814.7016.8717.2019.96
2.994.906.778.82
3.474.716.676.789.86
1.15 E-081.44 E-081.62 E-081.08 E-081.53 E-082.50 E-084.74 E-083.71 E-083.38 E-082.93 E-083.1 OE-O82.90 E-084.02 E-083.16 E-082.81 E-085.58 E-08l.ll E-071.43 E-073.55 E-07
5.08 E-091.84 E-083.97 E-084.20 E-08
1.36 E-083.80 E-081.21 E-071.53 E-072.48 E-06
0.01750.05300.04200.03600.01700.03800.03400.04700.03500.04400.04100.03800.04700.06500.05450.07700.07000.07300.0710
0.00450.00500.03600.0440
0.02000.02250.04700.0270(?)0.0610
*2
*3*3*3
*4*4*4*4*4*4*4
*1
*]
q
* Strain rates from these tests were used to confirm the activation energies, Q, at four stresslevels, as denoted by the numbers in the remarks column.** Strain rates from these tests were used to determine the values of c*I and A.
31
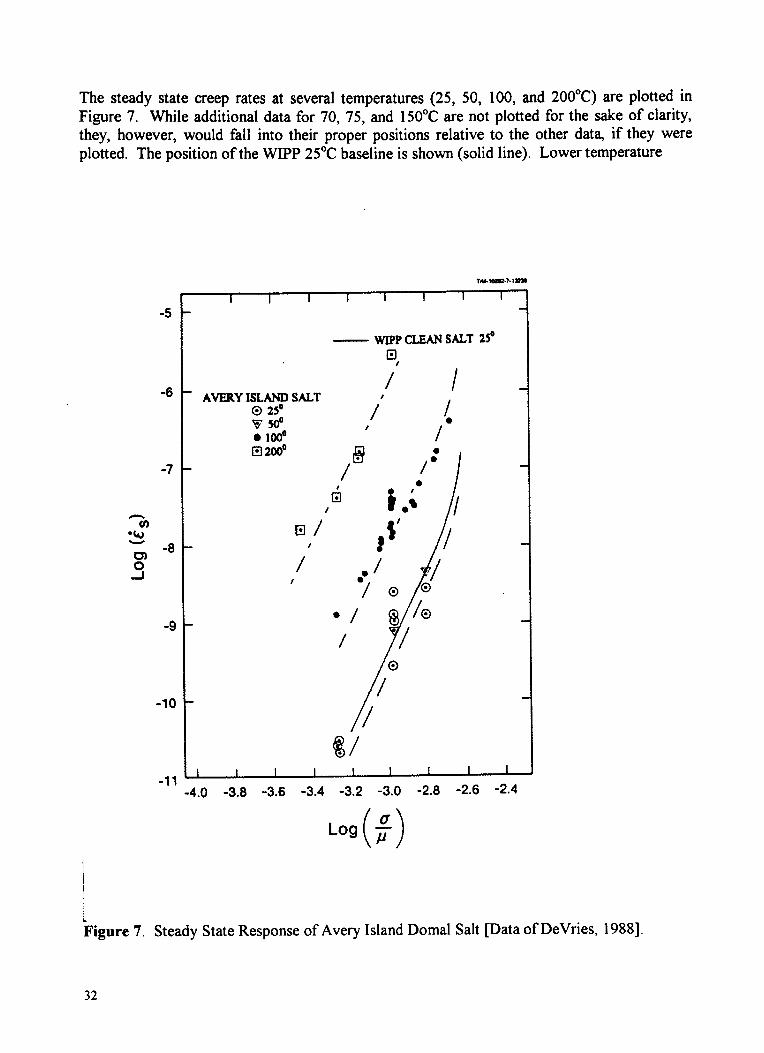
The steady state creep rates at several temperatures (25, 50, 100, and 200”C) are plotted inFigure 7. While additional data for 70, 75, and 150”C are not plotted for the sake of clarity,they, however, would fall into their proper positions relative to the other dat~ if they wereplotted. The position of the WIPP 25°C baseline is shown (solid line). Lower temperature
Tm.m?.lnm
-5
-6
-7
-m“Q
01-8
5
-9
-lo
-11
i I I I I I I I
WIPPCLEANSALT 25°❑,
/“ /AVERYISLANDSALT
029’VW
/’ (t
● 100° /
‘8/●
1 1 I I I I I I I-4.0 -3.8 -3.6 -3.4 -3.2 -3.0 -2.8 -2.6 ‘2.4
()Log ;
I
I
~igure 7. Steady State Response of Avery Island Domal Salt Data of DeVries, 1988].
32

data are consistent with the slope (5.0) of the WIPP baseline. It appears that the creep ofAvery Island salt is somewhat slower than the WTPP baseline, with an offset of a factor of 0.71(log -O. 149). The 50”C data are offset by a factor of 1.41 (log +0. 149) from the Avery Island25°C line to fall almost exactly on the WIPP baseline. The 100”C data are offset by a factor of33.1 (log +1.52) from the 25°C Avery Island line, which is just slightly greater than thecalculated temperature effect of a factor of 29.9 (log +1.475). A line (dot-dash) is also drawnthrough the 200”C dat~ however, the slope of this line (5.5) corresponds to the hightemperature mechanism rather than the low temperature mechanism.
%r;yp ~:;values for two mechanisms are given as 6.869x 10+12for A2 and 1.137x1O .values (B’s) for the third, high stress, mechanism can not be determined directly so they areestimated by proportion between the first two mechanisms and the WIPP baseline values.
Transient strain limits for the Avery Island salt are determined from the 25°C dat~ as plotted inFigure 8. They are consistent with the required WIPP baseline slope of 3, but are offsetupward to give an intercept KO of 1.342x10%. This indicates that Avery Island salt exhibitssignificantly greater transient strain than WIPP clean salt. In Figure 9, the experimental valuesof A are plotted against stress. While there is significant scatter, the data are not inconsistentwith the WIPP baseline data. As a result, we assume that the best-fit line has the same slope as
the WIPP baseline dat~ but with an offset to higher values of A. Appropriate a and ~parameter values are determined on this basis. Although the results are not shown here, theAvery Island data are consistent with the activation energies determined from a typicalArrlhenius plot for the WIPP baseline salt.
Most of the Avery Island salt parameter values for the M-D model have been determineddirectly from the data or are consistent with the required invariant or theoretical constantvalues from the WIPP baseline determination. The few parameters not either determineddirectly or required by the isothermal conditions are assumed to have the same values as thoseof the WIPP baseline salt. Because the Avery Island salt data are so extensive, the very goodagr~eement to the WIPP baseline salt, where such agreement is required, is especially pleasing.Further, such good agreement suggests the mechanical creep behavior of Avery Island salt iswell understood.
5.3) BIG HILL (BH)
The database for Big Hill salt is developed using stress and temperature change tests fromthree specimens ~awersik, 1985]. The specimens were prepared ilom recovered core fromtwo deep boreholes at the site. These boreholes were to become solutioning wells, specificallyWell 106B and Well 108B. The location of the specimens taken from these wells is given inTable 11. Grain sizes were from medium to quite large, ranging from 3.7 mm (O.12 inch) to 51mm (2.0 inch) with some cores having grains in excess of 100 mm (4.0 inch) in diameter.Alt bough the salt purity was probably high, visual examination suggested finely distributedanhydrite crystals in the specimens from Well 106B. Magorian and Neal [1988] described thegeology of the site in detail and reported insoluble contents based on density logs and x-rayanalysis. The calculated median of insoluble from all logged holes is 1.7’Yo, probablyanhydrite. Anhydrite content was greatest in Wells 11OA and 11OB. Core samples indicated
33

the occun-ence of anhydrite bands parallel to the dome edges. It was believed that insolublequantities decrease toward the edges of the dome.
Tm.11-lxn
WIPP CLEAN SALT 25°
I
dI
I
I AVERY ISLANDSALT
8 @ 25°
/
I
@@
8I
/
7
I I I 1-3.0 -2.0
()Log ;
Figure 8. Transient Strain Limit of Avery Island Domal Salt [Data of DeVries, 1988].
34

As discussed previously, the creep rates reported at the end of any stress interval do notnecessarily correspond to steady state creep. If the increments are all stress increases, then
perhaps the smallest creep rate observed may be either close to or at the minimum creep ratefor the final stress condition. A logarithmic plot of the final creep rates from each increment of
Tn.me.wnn
14.0
12.0
a 10.0
8.C
6.[
4.
1 I I i
WIPPCLEANSALT 25°
AVERY ISLAND S-T025°
\
I I I I
-3.0 -2.0
()Log ;
Figure 9. Delta Values of Avery Island Domal Salt [Data of DeVries, 1988].
35

these tests is given in Figure 10. A line parallel to the WIPP clean salt and just at the lowestobserved creep rate from the increment tests of the Big Hill salt, shows an offset from theWIPP clean salt baseline. As indicated in the figure, the difference in the rates can foundreadily by measuring the vertical separation between the arrows, either as a logarithmicdifference or as a ratio. Some offset is expected because of the difference in temperatures ofthe Big Hill and WIPP clean salt dat~ so to examine the true difference in creep response weneed to correct for the temperature effect, as previously discussed. The 60”C data are offset bya factor of 8.91 (a logarithmic value of +0.95), which is in excess of the expected temperaturecomection factor of 5.89 (log +0.77) by the amount of a factor of 1.5 (log +0.18). The 80”Cdata are in excess of the expected temperature corrected value by a factor of 2 (log +0.3 1). Asa result, the steady state creep rate of Big Hill appears to be somewhat greater than that ofWIPP pure salt, and indeed also greater than that of Weeks Island salt. If the boundingenvelop of data is indeed steady state, although there is no assurance of this from incrementaltest data, then the multiplication factor is 1.78 (log of +0.25). Thus, we suggest based on thecomparisons of the two temperatures that the creep of Big Hill salt is at least 1.65 times faster(between 1.5 and 1.78) than WIPP pure salt, although it could be less. The limited creep datafrom Big Hill does not permit evaluation of the other creep parameters.
5.4 WEST HACKBERRY (WH)
General studies of the West Hackberry dome reported by Magorian, et al. [1991] essentiallyconcentrated on the geologic characteristics of the dome. Dome impurity contents were notgiven.
Two separate studies of the creep of West Hackberry domal salt have been reported. In anearly study [Wawersik, et al., 1980b], a total of four specimens prepared from core take fromthe deep borehole of solutioning Well 6C were tested in conventional creep tests. Dissolutiontests on three separate core specimens gave an insoluble impurity content of 2.7 +/- 0.9 ‘A,primarily anhydrite. The impurities seemed to be in bands through the specimens. The grainsize was from 6 mm (0.25 inch) to 30 mm (1.2 inch). In these tests, we are reasonably assuredthat the final creep rates are the steady state rates. As shown in Figure 11, the creep rates ofWest Hackberry salt at 22°C are essentially identical to the baseline WIPP clean salt dat% atleast within the typical scatter. At 60”C, the offset from the baseline data is a factor of 4.68(log +0.67) which is only slightly less than the calculated temperature effect is a factor of 5.89(log +0.77). Certainly, these data suggest that West Hackberry creep is very comparable tothat of the WIPP clean salt and Weeks Island domal salt.
In a later study [Wawersik and Zeuch, 1984], two additional West Hackberry domal saltspecimens were prepared from the core taken from Well 108. Impurities and grain sizes werecomparable to the previous study. These specimens were subjected to incremental tests inwhich a large number of stress and temperature increments were made. Because of the largenumber of increments, the increment durations were quite short. Unfortunately, several of theincrements were after stress drops. As the earlier discussion indicates, it is extremely difficultto analyze multiple incremental creep data, which is made even more difficult if stress dropsare involved. The final creep rates at the end of each increment are plotted in Figure 12 andshow the extreme range of values, as expected, However, if the final creep rates from the
36

-5
-6
-7
-m‘Q
w)-8
3
-9
-lo
-11
I I I I I I I I
BIG HILL SALTo
: %Cl 80°
WPP CLEAN SALT 25°
Iv/
g$8/6/
k////I I I I 1 I 1 I I
-4.o -3.8 -3.6 -3.4 -3.2 -3.0 -2.8 -2.6 ‘2.4
()Log f
Figure 10. Steady State Creep Rates of Big Hill Domal Salt [Data of Wawersik, 1985].
37

TM--.7.1=
-m“w
u)
2
-5
-6
-7
-8
-9
-lo
-11
I
I I I I I 1 I I
WIPP CLEAN SALT 2S0
WEST HACKBERRY SALT022°● 6($
/1
●●
/
/
/
/
/
/
/
‘[1 I I I I I I I I
-4.0 -3,8 -3.6 -3.4 -3.2 -3.0 -2.8 -2.6 -2.4
()Log f
I
Figure 11. Conventional Test Steady State Creep Rates for West Hackberry [Data ofWawersik, et al., 1980b].
38

TM.W7. 199
-5
-6
-7
-m●Q
G ‘8
5-
-9
-10
-11
WPP UEAN SALT 2S0
WESTHACKBERRYSALT● 60°❑ ~o
(ACheckMarkDenotesa StrewDrop) I I
❑ ❉ ✏
/
I I I I 1 1 1 I 1
-4.0 -3.8 -3.6 -3.4 -3.2 -3.0 -2.8 -2.6 -2.4
()Log f
Figure 12. Incremental Test Creep Rates for West Hackberry [Data of Wawersik and Zeuch,1984].
39

stress drop increments, which are marked with a check, are ignored, as shown in Figure 13,then the remaining data should approach the steady state rates. When these stress drop data areeliminated, the 60”C results are reasonably consistent with those from the earlier studydiscussed above. However, the data appear to have considerable scatter, perhaps as a result ofdifficulty in determining strain rates over the short increment durations. Although theincremental test results required elimination of inappropriate stress drop increments, theremaining incremental test data support the analysis of the earlier data which suggests asimilarity between the responses of West Hackberry and WIPP clean salt creep.
5.5 MOSS BLUFF (MB)
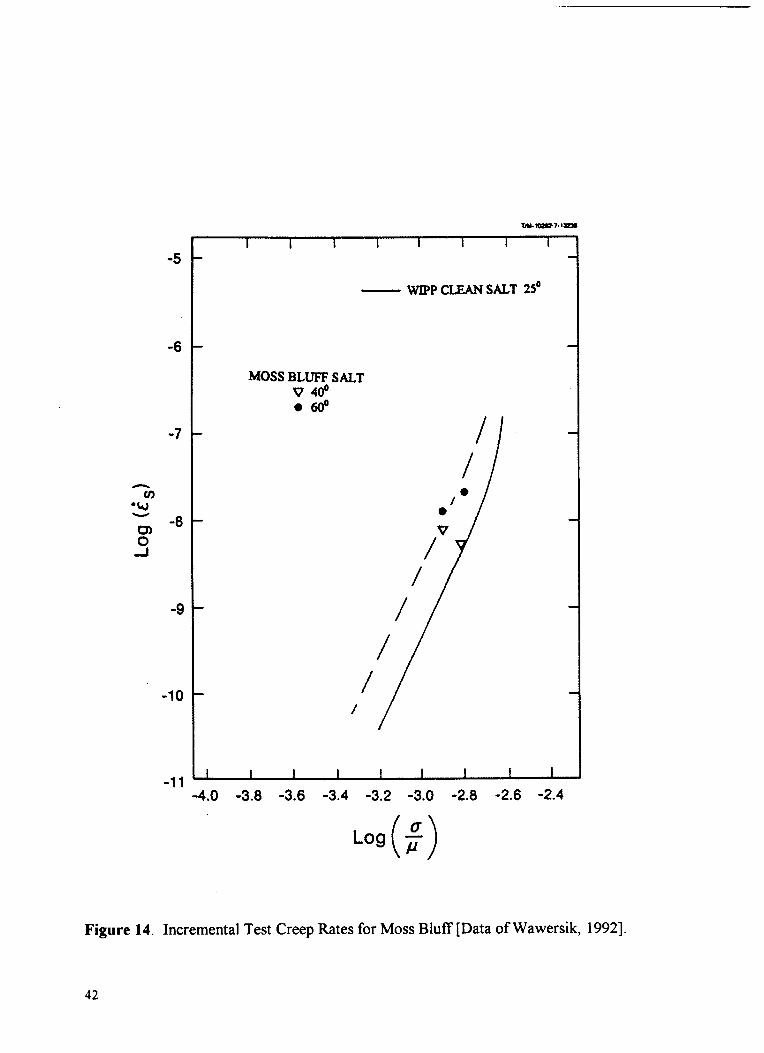
One specimen was prepared from core recovered from deep Borehole 2 at the Moss Bluffdome ~awersik, 1992]. Although an incremental test procedure was used, none of theincremental changes were stress drops. The average grain size of the specimen was 11 mm(0.4 inch). There was no indication of impurity content. The final creep rates for each of theincrements are plotted in Figure 14, where the response at 60°C is offset by a factor of about5.62 (log +0.75) fkom the baseline WIPP clean salt data. This is consistent with the calculatedtemperature shift of a factor of 5.89 (log +0.77). Explanation of the 40”C data points is not sostraightforward. While the one data point may suggest a much slower creep rate for MOSSBluff salt, it is possible that this is an erroneous data point. We will assume that the 60”C dataare the correct response, and as a result, MOSS Bluff salt steady state creep is essential yidentical to the WIPP clean salt baseline data.
5.6 BRYAN MOUND (BM)
The geologic structure of the dome has been reported by Neal, et al. [1994]. They alsoincluded some general mineralogical information, suggesting that the anhydrite content wasless than that in Big Hill. However, the shale content was thought to be greater than the domesto the east, which would encompass all of the other facilities of the SPR. The Bryan Moundspecimens were prepared from stock that was obtained from coring of the same deep holeseventually used for solutioning.. The specimens had a grain size range from 2 mm (0.08 inch)to 40 mm (1.6 inch), with an average grain size of about 8 mm (0.3 inch). The core alsoexhibited high angle dark bands or concentrations of anhydrite. Anhydrite concentrationdetermined from a limited dissolution analysis was given as about 6 ‘Yo.
B~an Mound was studied in two different efforts. The earlier study [Wawersi~ et al., 1980a]involved four separate specimens, three of which were tested using a conventional creepmethod. The remaining specimen was used for a bilevel incremental test in which the stresslevel was increased once. Sources of this earlier specimen material were Well 107A and Well107C. These tests should give steady state creep rates. Measured final creep rates (of the testor increment) are given in the plot of Figure 15. Although the results are somewhat confbsing,they suggest that Bryan Mound salt is much more creep resistant than the WIPP clean salt, aspreviously noted [Wawersik, et al., 1980a]. In fact, it was diflicult to fit these data because ofthe confbsing creep rate data at the higher stress. Although there is no reason to suspect this,the data almost suggest some error in temperature. In effect, we would have to essentially
discount two of the points to obtain consistent behavior in the data.
40

-5
-6
-7
-..
-8-w
u)
5
Figure 13.
-9
-lo
-11
I I 1 I I I I I
WIPP CLEAN SALT 25°
WEST HACKBE.RRYSALT● 60°a 80°
(WMI Strc8sDropIncrementsDeleted) /t
❑ $
/
.; “
/ c1
/
./
/
/
/
I I I I I I I I I
-4.0 -3.8 -3.6 -3.4 -3.2 -3.0 -2.8 -2.6 -2.4
()Log ;
Incremental Test Creep Rates for West Hackberry, Stress Drops Removed [Data ofWawersik and Zeuch, 1984].
41
-5
-6
-7
-m“u
~ -8
-1
-9
-lo
-11
I i I I I I I I
MOSS BLUFFv 40°● 60°
WXPPCLEAN SALT 25°
SALT
/
/
●✏
●
v
/
/
/
/
/
//
J I I I I I I I I
-4.0 -3.8 -3.6 -3.4 -3.2 -3.0 -2.8 -2.6 -2.4
()Log f
Figure 14. Incremental Test Creep Rates for Moss Bluff [Data of Wawersik, 1992]
42

-5
-6
-7
-m.U
m-8
3
-9
-lo
-11
.
I I I I I I I I
WIPP CLEAN SALT 25°
BRYAN MOUND SALT022°● 6(Y
//
I I I I I I I I I
-4.0 -3.8 -3.6 -3.4 -3.2 -3.0 -2.8 -2.6 ‘2”4
()Log ;
Figure 15. Conventional Test Steady State Creep Rates for Bryan Mound [Data of Wawersi~et al, 1980a].
43
We proceed under the assumption that the dashed fitted line is at least acceptable, which willreconfirmed partially later byadditional data. Then the22°C data areoffset byabout a factorof 0.12 (log -0.91) from the WIPP clean salt baseline. Even the 60°C data are offset by afactor of 0.45 (log -0.35) below the WIPP clean salt baseline. This supports the contentionthat Bryan Mound salt is more creep resistant. If we look only at the Bryan Mound dat~ thenthe 60”C data are offset above the 22°C data by only about a factor of 3.55 (log +0.55),somewhat less than the expected factor of 5.89 (log +0.77).
In the later study, six specimens cored from deep boreholes were tested. Material was againprimarily from Well 107C, with single specimens each from Well 108B and Well 113B. Thesespecimens were tested using the incremental testing procedure in both stress and temperature.In four of the specimens, relatively small numbers of increments were involved in any giventest, typically two. As a result, the final increment strain rates could be approaching the steadystate creep rate. However, in the other two of these specimens, a relatively large number ofincrements, up to 14, were used in each test, which suggests that most of the creep ratesdetermined for most individual increments can not be in steady state. On the positive side, allof the incremental stress changes for these tests were stress increases. We analyze these creeptests in two groups. Increment final creep rates for the first four specimens are plotted inFigure 16. Again, we take the smallest creep rates as the guide for determining the appropriatesteady state response. If we take the lower envelope of the rates as approaching the steady staterate, we can then construct a line parallel to the WIPP clean salt baseline data. If we consideronly the effects of temperature difference on the Bryan Mound data, then the 60”C data areoffset born the 22°C data by a factor of 3.16 (log +0.50) compared to a calculated factor of5.89 (log +0.77) and the 10O°C data are offset by a factor of 25.12 (log +1 ,40) compared to acalculated factor of 29.51 (log +1.47). In comparison to the WIPP clean salt baseline, theapparent steady state response for the 60”C Bryan Mound data is offset by a factor of 2.00 (log-0.30) from the baseline data, while the 22°C data are offset by about a factor of 6.03 (log -0.78) from the baseline.
We examine the results separately for the very complicated incremental tests performed on thefinal two specimens. These test results produce the final creep rates for each increment asplotted in Figure 17. There is considerable uncertainty in our ability to define steady statelimits for these data. Although, in fact, the 40”C and 80°C data appear to be in the properrelationship to the 60”C data if the very low creep rate data point at 40”C is eliminated.However, little more can be said about them. Because of the testing method, we hesitate togive an offset for the 80”C and 40”C data. Nevertheless, at 60”C for these two specimens, thedata appear to have an offset from the WIPP clean salt data baseline by about a factor of 2.34(log -0.37), which is essentially the same as the 60”C data from the four well-defined tests ofthis study. These offsets are also in agreement with the earlier 60°C data offset of a factor of0.45 (log -0.35) from the WIPP baseline, described previously and given in Figure 15.
Within the restrictions of the limited database, the necessary analysis assumptions, and theundoubted experimental uncertain y, the results of the two Bryan Mound studies are inessential agreement. From these results, it appears the 22°C steady state creep response ofBryan Mound salt is a factor of 0.13 to 0.17 (log of-0.90 to -0.78) more creep resistant thanWIPP clean salt, with an average calculated 25°C data offset by a factor of 0.17 (log-O.76).
44

-5
-6
-7
-a“u
m-8
2
-9
-lo
-11
I I I I i I I [
WIPP CLEAN SALT 25°
BRYANMOUND SALT022°● 6($v 100°
A
●
//
I I I I I I 1 I I
-4.0 -3.8 -3.6 -3.4 -3.2 -3.0 -2.8 -2.6 -2.4
()Log :
IFigure 16. Incremental Test Creep Rates for Bryan Mound [Data of Wawersik and Zeuch,
1984].
45

w
u)-8
3
-9
-10
-11 J
WIPP CLEAN SALT 25°
BRYAN MOUND SALTv 40°& 33.5°● 60°0 80°
/
Iv
●°●
/
/
/
I I I I I 1 I I
-4.0 -3.8 -3.6 -3.4 -3.2 -3.0 -2.8 -2.6 ‘2.4
()Log f
Figure 17. Incremental Test Creep Rates for Bryan Mound Data of Wawersik and Zeuch,1984].
46

-5
-6
-7
-m“u
m-8
5
-9
-lo
-11
i I I I I I I I
WIPP CLEAN SALT 25°
BAYOU CHOCTAW SALT● 6($•l 800
(ACheckMarkDenotesa Stresshp)
/’
B
-cl
1 1 I I I I I I I
-4.0 -3.8 -3.6 -3.4 -3.2 -3.0 -2.8 -2.6 -2.4
()Log f
Figure 18. Incremental Test Creep Rates for Bayou Choctaw [Data of Wawersik and Zeuch,1984].
47

-5
-6
-7
-a‘u
m -8
3
-9
-lo
-11
I I I I I I I I
WIPP CLEAN SALT 25°
JENNINGSDOMESALTv 400
0(ACheckMarkO&%cs a Stress kp)
I
1 I I I I I 1 I I
-4.o -3.8 -3.6 -3.4 -3.2 -3.0 -2.8 -2.6 ‘2s4
()Log ;
Figure 19. Incremental Test Creep Rates for Jennings Dome [Data of Wawersik andZimmerer, 1994].
48

5.7 BAYOU CHOCTAW (BC)
Neal, et al. [ 1993b] analyzed the geology of the Bayou Choctaw dome and reported on some ofthe mineralogy. Core taken down to 728 m (2390 R) from Well 101 was clear with 10 to 20mm (0.4 to 0.8 inch) diameter grains, and 1 mm (0.04 inch) gray anhydrite bands. Core from1446 m (4743 fi) was black with 5 mm (0.2 inch) crystals and about 5 ?40 anhydrite in wavybands.
The creep response from one specimen of Bayou Choctaw salt prepared from core obtainedfrom a deep borehole of Well 19A was determined using the incremental stress andtemperature change procedure ~awersik and Zeuch, 1984]. This material was mediumgrained, with the maximum grain size of 19 mm (0.75 inch) and with the principal impurity ofuniformly distributed anhydrite crystals. The anhydrite concentration in this specimenprobably was no more than 4.2 ‘Yo, based on dissolution of specimen remains. The finalincrement rates as reported are shown in Figure 18. Unfortunately, the incremental testsinvolved several stress drops. If the stress drop increment results are eliminated (we do notshow a plot of this), the 60”C minimum data are essential y identical to the 25°C WIPP cleansalt baseline. The 80”C data are consistent, being offset somewhat above the 22°C BayouChoctaw test results. As a consequence, the Bayou Choctaw material appears to be more creepresistant than the WIPP clean salt by about a factor of 0.17, and consequently is very similar tothe creep response of Bryan Mound.
5.8 JENNINGS DOME (JD)
A single specimen take from the deep borehole LA-1 at the Jennings dome was tested usingthe stress and temperature increment procedure [Wawersik and Zimmerer, 1994]. NOinformation is available on specimen grain size or on impurity content. The increment finalcreep rates are plotted in Figure 19. The data involves only one stress drop, which we do notconsider. The remaining 60°C Jennings Dome data agree well with 25°C WIPP clean saltbaseline, which indicates the Jennings Dome salt has a greater creep resistance, again by abouta factor of 0.17. While the 40°C data fall below the 60”C data, as they must to be consistent,one data point exhibits an extremely low creep rate.
49

(Page lefl intentionally blank)
50

6.0 DISCUSSION
Our analysis of the creep of the domal salts indicates that the well-defined creep tests on AveryIsland and Weeks Island salt produce essentially the same behavior as the WIPP clean saltcreep response. As a result, the M-D model appears to be an adequate description of domalsalts. Extending this concept, the forms suggested by the model can be used to determine thepossible steady state response envelope from the less well defined creep data of a number ofmaterials from other salt domes. In addition to conventional creep tests, these materials wereoften tested using incremental stress and temperature change methods that require an analysisbased on an understanding of transient creep response. Under certain circumstances, all thesetests can lead to a definition of the steady state creep behavior. Because all of the creep testswere conducted at relatively low stress and low temperature, we can characterize the creep interms of the structure factor of just one of the three mechanisms involved in salt creep. This isthe undefined or empirical mechanism with the structure factor A2. Values of the structurefactor can be used to evaluate the relative creep “resistance” of the various domal saltscompared to the WIPP clean salt creep baseline. In the discussion of individual creep dat~ theanal ysis of the domal salt creep data used temperature-corrected offsets to determine the mostprobable equivalent 25°C-creep response. The 25°C equivalent offset amounts are summarizedin Table IV. Here both the log 10 offset difference and the equivalent multiplication factor aregiven.
Table IV. Structure Factor Multiplication Factor from WIPP 25°C Pure Salt Baseline.
Temp. Factor Clean Sofl salt Hard SaltWIPP AI* WI MB WHBH BM BC JD
25°C Multiply by 1.0 0.71 0.59 1.0 1.23 1.29 0.17 0.17 0.17Loglo Differ. 0.00 -0.14 -0.23 0.00 +0.09 +0.1 1 -0.76 -0.77 -0.77
* Because Al could be evaluated directly, this factor applies to Az only.
In discussing the results of our analysis, one must remember that the database for any givensalt material is very sparse and often further confbsed by experimental peculiarities. Thesefacts leave considerable room for error in interpretation. As a result, no firm statements are
currently possible, even though we will deduce some possible conclusions. It appears fkom thetable that not only is there some variation between the individual results, but also there are tworelatively distinct groups of salt responses. Four of the salts fall within the expected
experimental uncertain y (about a factor of 2, or loglo difference Of+/- 0.30) Of the ~p cleansalt behavior. These salts are probably experimental y indistinguishable. However, three ofthe salts apparently fall beyond the uncertainty and form a distinct group of more creepresistant salts.
51

Indirect substantiation of the effect of differences in the creep response of domal salt is foundin the work of Ehgartner, et al. [1995] on loss of volume of petroleum storage caverns of theSPR. These results are produced from a CAVEMAN simulation methodology based on the M-D creep equations. The methodology generates a set of “effective” fitting parameters formaterial, geometry, pressurization, and stress in the cavern setting as determined from cavernfluid loss histories and can be used to predict “effective” SPR cavern creep rates. These rateshave been recently reported ~lnn, 1997 ] from an ullage study. The effective creep rates involume loss percentage per year (the same as a linear rate) are shown in Figure 20. Of the fourfacilities studied, Big Hill and West Hackberry show the highest creep volume loss rates;whereas, Bryan Mound and Bayou Choctaw show the lowest creep volume loss rates.
The reported volume creep rates certainly agree with the results suggested by Table IV. Wewould expect the cavern response to follow the laboratory creep responses. However, thevolume loss results also suggest that the Bryan Mound dome must contain two different salttypes, where Caverns BM 113, BM 114, BM1 15, and BM116 exhibit greater volume creepclosure rates that are comparable to Big Hill and West Hackberry caverns.
~ Why some apparently high purity salts have greater creep resistance than other high puritysalts is not known. Interestingly, the differences do not appear to form a continuous fimctionwith a gradation of behavior between the extremes. Rather, the effect seems discontinuous.Since most secondary strengthening agents, such as grain size, impurity contents, or secondphase quantities lead to continuous changes, it is not satis@ing to suggest simply thatmicromechanical agents lead to the observed behavior.
By applying ratios determined from the creep results, we can establish some suggested M-Dcreep parameters. However, the limited database permits only structure factors to bedetermined; all other parameters must be established on the basis of the WTPP clean saltdatabase and the logical extension of the WIPP parameters, considering how material variationcan affect the parameter. These results are given in Table V for WIPP clean salt, Weeks Islandsalt, the hard domal salts, and the soft domal salts. Those underlined quantities are extensionsof WIPP parameter values based on theoretical values, micromechanical model parametervalues, or atomistic models. The only parameter value that has no basis in the experimentaldata or a logical extension, and is therefore an assumed value, is the value of Ko, which mayindeed depend strong] y upon specific salt material. These assumed values are in parentheses inthe table. Unless more experimental information becomes available, K will be taken as eitherthe WIPP clean salt value (6.275x10+5), as given in Table V, or the WIPP argillaceous saltvalue (1. 783x1 0%), depending upon the impurity content of the domal salt. When one suspectsthat a given domal salt is acting similar to argillaceous salt, it may also be necessary toreconstruct the table using the WIPP argillaceous parameters as a baseline material. Except forG, the argillaceous creep parameters differ only slightly from the clean salt parameters. Theargillaceous parameters are given elsewhere [Munson, 1997].
Another comparison of interest is to attempt a correlation between the creep properties and thepropensity for caverns to produce salt falls. In a study of the cavern events leading to hangingstring damage and failure, Munson, et al. [1998] suggested that many of these events could beattributed to salt falls. The speculation at that time was that the propensity for the formation of
52

Table V. Suggested Parameter Values for the M-D Model.
SaltType+ Baseline soft Hard
WIPP WI AI Bfi WH, MB BM, BC, JDAve. Factor+ 1.00 0.59 0.71 -1.17 -0.17
Parameter
M GPa 12.4E GPa 31.0
v 0.25
Al 1/s 8.386sx10+22 4.948x10+22 1.137x10+22Q1 (Cal/mol) 25 ~ 252525
5.5;1 1/s 6.O86X1O*A2 1/s 9.672x10+12Qz (Cal/mol) 10nz 5.0B2 1/S 3.034X10⁻²
00 MPa 20.57
~ 5.335X10+33.0
: 6.275x10tic 0.009198
a -17.37
P -7.738
8 0.58
~
5.417X1O*5.706x10+*2~5.02.700x10-220.575.335X10+3~6.275x10+50.009198-17.37-7.7380.58
5.50.825x10%6.869x10+12105.02.1 55x’@2
20.575.335 X10+3~1.342x10ti0.009198-13.20
-7.738
0.58
03 0.0 0.0 0.0
9.812x10+22
~
7.121x10%11.32x10+12~5.03.550X10-2
20.575.335X10+3~(6.275x10+5)0.009198-17.37
-7.738
0.58
0.0
1.445X10+22
~
1.O49X1O*1.667x10+12~5.00.523x10220.575.335X10+3~(6.275x10+5)0.009198-17.37-7.7380.58
0.0
Bold numbers are determined from creep data for that specific salt dome material.Underlined values are theoretical micromechanism constants and are the same as WIPP clean
salt values.KOvalues in parentheses are assumptions.All other values are assumed to be the same as the WIPP salt values or adjusted from the WIPP
salt value in proportion to the Az value obtained experimental y for each individualdomal salt, except for Avery Island salt where Al can be determined directly.
Because the Multimechanism Deformation (M-D) model is used, the equations given in thisreport require a zero value of 0.
53

salt falls was related to the material properties of the cavern salt. Indeed, it was suggested thatthe amount of impurities in the cavern salt governed the formation of salt falls, in accordancewith the Multimechanism Deformation Coupled Fracture (MDCF) model [Chen, et al., 1992;1996]. When we compare the events cavern by caver~ with the results in Figure 20 it is clearthat most of the events occur in hard salt caverns; however, not all of them do. In BryanMound, a dome composed of two salt spines, with a soft salt spline, 41 of 45 events occur inwhat must be the predominantly hard salt caverns; the remaining four events are in caverns thatpossibly could be in soft salt. Bayou Choctaw, which is a dome of hard salt, has only oneevent. West Hackberry, a dome of soft salt, has experienced ten events, whereas, Big Hill, alsoa dome in sofi salt, has experienced only one event. In summary, it appears that 42 eventsoccurred in hard salt caverns and 15 events occurred in sof-t salt caverns. Clearly, there is onlya weak, if any, correlation between the propensity for events or salt falls and the steady statecreep behavior of the cavern salt. However, this lack of correlation could be a little misleadingbecause the principal influence of impurities is not on the steady state rate but on the transientstrain limit and fracture. Thus, impurity variations among the caverns might not be revealedby the differences in steady state creep rate. At this time, we do not have an accurate methodto determine the impurity levels of these caverns. Any fbrther statements would be speculation.
0.23
0.2
0.05
0
CAVERN NUMBER
ElWestMckberry
Figure 20. Caveman Calculated Volume Creep Rates for SPR Caverns [Linn, 1997].
54

7.0 CONCLUSIONS
The limited databases on salt creep from experimental studies of material from several saltdomes, including the five SPR facility sites, have been analyzed using the proceduresprescribed for the M-D model of salt creep. The M-D model was developed for the WIPPproject. Even though the database information is limited, the parameter values for each domalsalt have been established on the basis of the experimental dat~ theoretical values, materialbased extensions, or reasonable assumptions. Sufficient creep data are available from one SPRsite (Weeks Island) and for Avery Island salt to indicate that they are consistent with the M-Dmodel and the WIPP clean salt baseline. When all data are compared to the WIPP clean saltbaseline response, there appear to be two types of materials: a creep resistant or hard salt and asoft salt with creep similar to the baseline material. The table of suggested M-D modelparameters based on this analysis was generated and is available for potential fbture use.
Correlation of the steady state behavior to the propensity for hanging string damage from saltfall events in the SPR caverns, while significant, was not as marked as one might suppose. It isthought that the steady state creep behavior, as determined from this analysis, is less critical todetermining salt fall potential than the more sensitive transient strain limit as influence byimpurity content.
Perhaps the most significant result of the analysis is the potential for a limited number of creeptests on core obtained from potential cavern sites to give a good prediction of the cavernvolume creep behavior. This has always been suspected to be the case, however, the potentialis clearly demonstrated in this work and indicates the very interesting possible utilization of theavailable technology to anticipate cavern behavior prior to construction.

(Page left intentionally blank)

REFERENCES
Acres American, 1977. National Strategic Oil Storage Program, Weeks Island Mine –Geotechnical Study, Report for Gulf Interstate Engineering Co., (Contract FEA-1251-75),Acres American, Inc., Buffalo, NY.
Acres American, 1979. Strategic Petroleum Reserve, Weeks Island Mine - AdditionalGeotechnical Studies, Report for Parsons-Gllbane (Contract 1-SC-5822-4013), AcresAmerica~ Inc., Buffalo, NY.
Cha~ K. S., S.R. Bodner, A.F. FOSSUW and D.E. Munso~ 1992. A Constitutive Model forInelastic Flow and Damage Evolution in Solids under Triaxial Compression, Mech. of Mat.,14, 1-14.
Cha~ K. S., S.R. Bodner, D.E. Munson, and A.F. Fossum, 1996. Inelastic flow Behavior ofArgillaceous Salt, Int’1. J. Damage Mech., 5,292.
DeVries, K.L., 1988. Viscoplastic Laws for Avery Island Salt, Report for Stone Webster, RSI-0333, RE/SPEC, Inc., Rapid City, S.D.
Ehga.rtner, B., S. Ballard, M. Tavares, S. Yeh, T. Hinkebein, and R. Ostensen, 1995. APredictive Model for Pressurization of SPR Caverns, Fall Meeting Solution Mining ResearchInstitute, October 23-24, San Antonio, TX
Ewing, R. I., 1981. Test of a Radiant Heater in the Avery Island Salt Mine, SAND81-1305,Sandia National Laboratories, Albuquerque, NM.
Kupfer, D. H., 1963. Structure of Salt in Gulf Coast Domes, la Symp. on Salt, N. Ohio Geol.Sot. Cleveland, OH, pp. 104-123.
Lin~ J.K., 1997. Memorandum to R.E. Myers, November 25, 1997 with attachment on “SPRUllage Study” by B.L. Ehgartner, Sandia National Laboratories, Albuquerque, NM.
Magona~ T. R., and J.T. Neal, 1988. Strategic Petroleum Reserve (SPR) Additional GeologicSite Characterization Studies Big Hill Salt Dome, Texas, SAND88-2267, Sandia NationalLaboratories, Albuquerque, NM.
Magorian, T. R., J.T. Neal, S, Perkins, Q.J. Xiao, and K.O. Byrne, 1991. Strategic PetroleumReserve (SPR) Additional Geologic Site Characterization Studies West Hackberry Salt Dome,Louisian~ SAND90-0224, Sandia National Laboratories, Albuquerque, NM.
Mellegard, K. D., 1983. Quasi-Static Strength and Creep Characteristics of 100-mm-DiameterSpecimens of Salt from Avery Island, Louisian% Technical Report ONWI-250, Ofice ofNuclear Waste Isolation, Battelle, Columbus, OH.
57

Mellegard, K. D., and T.W. Pfeifle, 1996. Laboratory Creep test on Domal Salt from WeeksIsland, LouisianL Topical Report RSI-0756, RE/SPEC Inc., Rapid City, SD.
Munson, D. E., 1979. Preliminary Deformation-Mechanism Map for Salt (with Application toWIPP), SAND70-0079, Sandia National Laboratories, Albuquerque, NM.
Munson, D. E., and P.R. Dawson, 1982. A Transient Creep Model for Salt during StressLoading and Unloading, SAND82-0962, Sandia National Laboratories, Albuquerque, NM.
Munson, D. E., and P.R. Dawso~ 1984. Salt Constitutive Modeling using Mechanism Maps,Id Int’1. Conference on the Mechanical Behavior of Salt, Trans Tech Publications, Clausthal,Germany, pp. 931-939.
MunsoU D. E., A.F. Fossu~ and P.E. Senseny, 1989. Advances in Resolution ofDiscrepancies between Predicted and Measured In Situ WIPP Room Closures, SAND88-2948,Sandia National Laboratories, Albuquerque, NM.
Munson, D. E., 1997. Constitutive Model of the Creep of Rock Salt Applied to UndergroundRoom Closure, Int’1. J. Rock Mech. and Min. Sci. & Geomech. Abstr., 34 (2), 233-248.
Munson, D.E., and B.L. Ehgartner, 1997. Memorandum to J.K. Linn, July 11, 1997.“Comparison of Steady State Creep Response of Weeks Island and WIPP Salt,” SandiaNational Laboratories, Albuquerque, NM.
MunsoL D. E., M.A. Molecke, J.T. Neal, A.R. Sattler, and R.E. Myers, 1998. StrategicPetroleum Reserve Caverns Casing Damage Update 1997, SAND98-0090, Sandia NationalLaboratories, Albuquerque, NM.
Neal, J.T., T.R, Magorian, R.L. Thorns, W.J. Autin, R.P. McCulloh S. Denzler, and K.O.Byrne, 1993a. Anomalous Zones in Gulf Coast Salt Domes with Special Reference to BigHill, TX, and Weeks Island, LA SAND92-2283, Sandia National Laboratories, Albuquerque,NM.
Neal, J.R., T.R. Magorian, K.O. Byrne, and S. Denzler, 1993b. Strategic Petroleum Reserve(SPR) Additional Geologic Site “Characterization Studies Bayou Choctaw Salt Dome,Louisiana, SAND92-2284, Sandia National Laboratories, Albuquerque, NM.
Neal, J.R., T.R. Magorian, and S. Ahmad, 1994. Strategic Petroleum Reserve (SPR)Additional Geologic Site Characterization Studies Bryan Mound Salt Dome, Texas, SAND94-2331, Sandia National Laboratories, Albuquerque, NM.
Ortiz, T. S., 1980. Strategic Petroleum Reserve (SPR) Geological Summary Report WeeksIsland Salt Dome, SAND80- 1323, Sandia National Laboratories, Albuquerque, NM.
Senseny, P. E., 1983. Review of Constitutive Laws used to Describe the Creep of Salt, ONWI-295, OffIce of Nuclear Waste Isolation, Battelle Memorial Institute, Columbus, OH.
58

Senseny, P. E., 1983. Non-Associated Constitutive Laws for Low Porosity Rocks, Int’1 J.Numerical and Analytical Methods in Geomechanics, 7, 101-115.
Senseny, P.E. 1986. Triaxial Compression Creep Tests on Salt from the Waste Isolation PilotPlant, SAND85-7261, Sandia National Laboratories, Albuquerque, NM.
Senseny, P. E., 1989. Private communicatio~ Re/Spec Inc., Rapid City, SD. Now publishedas a report: Senseny, P. E., 1990. Creep of Salt from the ERDA-9 Borehole and the WIPPWorkings, SAND79-0076, Sandia National Laboratories, Albuquerque, NM).
Wawersik, W. R., D.J. Holcomb, D. W. Hannum, and H. S. Lauson, 1980a. Quasi-Static andCreep Data for Dome Salt from Bryan Mound, Texas, SAND80-1 434, Sandia NationalLaboratories, Albuquerque, NM.
Wawersi~ W.R., D.W. Hannum, and H.S. Lauson, 1980b. Compression and Extension Datafor Dome Salt from West Hackberry, Louisian~ SAND79-0688, Sandia National Laboratories,Albuquerque, NM.
Wawersi~ W.R., and D.H. Zeuc~ 1984. Creep and Creep Modeling of Three Domal Salts -A Comprehensive Update, SAND84-0568, Sandia National Laboratories, Albuquerque, NM.
Wawersilq W. R., 1985. Memorandum to R.R. Beasley, January 3, 1985, “CreepMeasurements on Big Hill Salt,” Sandia National Laboratories, Albuquerque, NM.
Wawersilq W. R., 1992. Indicator Tests for the Creep of Rock Salt from Borehole Moss Bluff2, Moss Bluff Dome, Texas, SAND92-2 122, Sandia National Laboratories, Albuquerque, NM.
Wawersi~ W.R., and D.J. Zimmerer, 1994. Triaxial Creep Measurements on Rock Salt fromthe Jennings Dome, Louisiana, Borehole LA-1, Core #8, SAND94- 1432, Sandia NationalLaboratories, Albuquerque, NM.
59

(Page lefi intentionally blank)
60

Distribution:
U.S. DOE SPR PMO (8)Strategic Petroleum Reserve900 Commerce Road EastNew Orleans, LA 70123Attn: G. B. Bemdsen, FE-443. 1
R. E. Myers, FE-4421 (5)N. Shourbaji, FE-4421J. Culbert, FE-443
U.S. Department of Energy (3)Strategic Petroleum Reserve1000 Independence Avenue SWWashington, D.C. 20585Attn: D. Johnson, FE-421
D. Buck FE-421
DynMcDermott (7)850 South ClearView ParkwayNew Orleans, LA 70123Attn: K. E. Mills, EF-20
G. Hughes, EF-22J. McHenry, EF-25J. Barrington,EF-31F. Tablada, EF BCH. Bakhtiari, EF BMJ. Sanner, EF WH
PB-KBB Inc.11767 Katy FreewayP.O. BOX 19672HoustOU TX 77224Attn: S. Raghuraman
Prof Michel AubertinEcole Polytechnique de MontrealP.O. Box 6079, Station Centre-villeMontreal, QuebecH3C 3A7CANADA
Prof. Pierre Berest (3)Laboratoire de Mecanique des SolidesEcole PolytechniquePalaiseauFMNCE 91128
Prof. M. Langer (3)Bundesanstah fir Geowissenschafien und
RohstoffePostfach510 153D-3063 1 HannoverGERMANY
Sandia Internal: (36)
MS 0431MS 0701MS 0701MS 0706MS 0706MS 0706MS 0751MS 9018MS 0899MS 0619
S. G. Varnado, 6200R. W. Lynch 6100W. R. Wawersik, 6100J.K.Linn,6113 (10)D. E. Munson, 6113 (10)6113 Staff (8)N. S.Brodsky,6114Central Technical Files, 8940-2Technical Library, 4916 (2)Review and Approval Desk15102, For DOE/OSTI
RWSPEC Inc.3824 Jet DriveRapid City, SD 57709-0725Attn: T. Pfeifle
61