and limiting factors in central and northeast oregon
TRANSCRIPT

BULL TROUT LIFE HISTORY, GENETICS, HABITAT NEEDS, AND LIMITING FACTORS IN CENTRAL AND NORTHEAST OREGON
U.S. Department of Energy Division of Fish and Wildlife Bonneville Power Administration
905 N.E. 11th Avenue Portland, OR 97232
Alan R. Hemmingsen David V. Buchanan
Oregon Department of Fish and Wildlife
2502 S.W. First Avenue P.O. Box 59
Portland, OR 97207
and Philip J. Howell
U.S. Forest Service
North Fork John Day Ranger District P.O. Box 158
Ukiah, OR 97880
Contract 94BI34342 Project 94-54
Annual Progress Report March 1996

ii
Abstract
To fulfill one objective of the present study, genetic characteristics of Oregon bull trout will be determined by analysis of mitochondrial and nuclear DNA. During 1995, we collected and sampled a total of 1,217 bull trout from 46 streams in the Columbia River Basin. DNA analysis of those samples will be conducted at University of Montana. We primarily sampled juvenile fish near natal areas to increase the likelihood of identifying discrete populations while minimizing risk of injury to large spawners. Fork lengths of all fish sampled ranged from 2.6 to 60.5 cm with a median of 12 cm. Eighty-four percent of all bull trout sampled were less than 19 cm while two percent were larger than 27 cm.
Bull trout were collected by several methods, mostly by
electrofishing. Eighty-six percent of all bull trout sampled were collected by electrofishing with a programmable waveform electrofisher. We observed injuries caused by electrofishing to 8% of that proportion. Based on preliminary analysis, no waveform combination used appeared less injurious than others. Highest voltages appeared less injurious than some that were lower. Frequency of electrofishing injury was significantly correlated to fork length over the range from 4 to 26 cm. There were indications for substantial risk for such injury to bull trout larger than 26 cm.
Other species found in association with bull trout included
chinook salmon Oncorhynchus tshawytscha, mountain whitefish Prosopium williamsoni, rainbow trout Oncorhynchus mykiss, sculpins Cottus spp., cutthroat trout Oncorhynchus clarki, non-native brook trout Salvelinus fontinalis, and tailed frogs Ascaphus truei. Rainbow trout was the species most frequently associated with bull trout. No injury or mortality was observed for any of the associated species captured.

iii
Table of Contents
Page I. Introduction..............................................1 II. Project Area..............................................1 III. Methods and Materials.....................................4 IV. Results and Discussion....................................5 V. Summary and Conclusions..................................16 VI. References...............................................17 Appendix A. Procedures for collection of tissue samples for DNA
analysis 18

1
Introduction Bull trout Salvelinus confluentus is a state and federal
“sensitive” species whose Oregon distribution includes portions of the Klamath Basin and several subbasins in the Columbia River Basin (Ratliff and Howell 1992). The U.S. Fish and Wildlife Service has determined that bull trout warrants listing as a federal threatened or endangered species but is precluded by other higher priority species. There is increased concern among state and federal management agencies for conservation of bull trout, which likely will depend on adequate protection and recovery strategies.
Knowledge of the population genetic structure is essential for
effective conservation of a species (Allendorf and Leary 1988; Meffe and Vrijenhoek 1988; Quattro and Vrijenhoek 1989). Effective conservation should preserve the genetic integrity of bull trout and the evolutionary processes that affect the species. Consequently, a description of the genetic characteristics of Oregon bull trout is needed. That description would identify populations, estimate the diversity within and among them, and help prioritize their evolutionary significance. Bull trout genetic characteristics will be determined by analysis of DNA rather than isozymes because a high proportion of polymorphisms cannot be detected by protein electrophoresis. That leads to an underestimation of variability between and within populations and to inaccurate estimates of genetic drift or gene flow between local populations. These problems can be substantially reduced by DNA analysis since variation can be described at the nucleotide level (Guyomard 1993). But an important feature of mitochondrial DNA is its maternal inheritance. Since the ratio of nuclear to mitochondrial nucleotide diversity depends on population parameters including sex ratio and female population size, nuclear and mitochondrial DNA analysis should be undertaken together (Guyomard 1993).
Population distinctions and estimates of genetic diversity
among bull trout have been reported (Leary et al. 1993; Williams et al. 1995), but those studies included only 6 streams from 4 Oregon river basins within the Columbia River drainage. This report summarizes the locations and collection of samples to determine the genetic characteristics of bull trout from additional Oregon river basins within the Columbia Basin through analysis of mitochondrial and nuclear DNA. It also presents an analysis of certain effects of those collection methods.
Project area We sampled bull trout from 46 streams in 11 river basins
(Table 1). Most samples came from streams in Oregon, but we also sampled bull trout from the N.F. Touchet River in Washington.

2
Those should provide a good geographical complement to other samples from Walla Walla and S.F. Wenaha drainages. Table 1. Streams within the Columbia Basin in Oregon where bull trout tissue samples for DNA analysis were collected in 1995. _________________________________________________________________ Basin Subbasin Stream _________________________________________________________________ Willamette River McKenzie River S.F. McKenzie Anderson Creeka Hood River Middle Fork Hood River Clear Branch Creek Compass Creek Deschutes River Metolius River Jack Creek Whitewater River Jefferson Creek Shitike Creek Shitike Creek Warm Springs River Warm Springs River John Day River Upper John Day River Indian Creek Call Creek Reynolds Creekb Roberts Creekb Deardorf Creekb Upper mainstemb Middle Fork John Day Granite Boulder Big Creek Clear Creek North Fork John Day River Baldy Creek Clear Creek
S.F. Desolation S.F. Trail Creek Umatilla River N.F. Umatilla River N.F. Umatilla River Walla Walla River Mill Creek Upper Mill Creek S.F. Walla Walla River S.F. Walla Walla River Touchet River N.F. Touchet Riverc

3
Table 1. Continued. _________________________________________________________________ Basin Subbasin Stream _________________________________________________________________ Malheur River N.F. Malheur River Swamp Creek M. F. Malheur River Meadow Fork of Big Powder River Upper Powder River Silver Creek North Powder River N.F. Powder River Pine Creek North Pine Creek Elk Creek Upper Pine Creek E.F. Pine Creek Grande Ronde River Upper Grande Ronde R. Clear Creek Limber Jim Creek Catherine Creek N.F. Catherine Indian Creek Indian Creek Minam River Elk Creek
Dobbin Creek Wallowa River Upper Lostine River Bear Creek Hurricane Creek Wenaha River S.F. Wenaha River W.F. Butte Creek Imnaha River Imnaha River N.F. Imnaha Little Sheep McCully Creek Big Sheep Lick Creek _________________________________________________________________ a Fish were collected in a downstream migrant trap. b Groups were sampled from a diversion trap. c Stream is located in Washington.

4
Methods and Materials
Bull trout from Anderson Creek were captured by a rotary screw trap (E.G. Solutions) set below a road culvert. Bull trout from Reynolds, Roberts, and Deardorff creeks as well as the upper mainstem John Day River (Table 1) were captured in irrigation diversion traps that were sampled daily from late spring through October. On Shitike Creek, Warm Springs River, and Whitewater River a standard bandwidth pulsed direct current electrofisher (Dirigo, Inc) was used. We collected most other bull trout with a single battery powered backpack electrofisher that produced pulsed direct current in variable band widths and frequencies (Smith Root, Inc; Model 12-A). Usually, one collector operated the electrofisher while moving upstream and another captured stunned fish with a dipnet. In some instances, another pair of collectors used a second electrofisher and similarly sampled another stream reach to reduce collection time. On Clear Branch, Compass, Shitike, Limber Jim and Clear (Grande Ronde Basin) creeks and Warm Springs River, a blocking net was stretched across the stream channel and one or two collectors electrofished downstream driving bull trout into the net. All electrofishing collections were from single-pass sampling. A few bull trout from S.F. Desolation Creek were captured by angling.
Target optimal and minimal sample sizes were 30 and 20 bull
trout per stream, respectively. Samples from each stream were intended to include at least two age classes, judged from existing length at age data. We began sampling 19 April on Anderson Creek (Willamette Basin) where protocols (Appendix A) were tested. Snowmelt delayed sampling in most other streams until late May in the Metolius subbasin streams and later in other locations.
We recorded shocker voltages and waveform modes used as well
as stream conductivity measured with a pocket-sized electronic meter. Sampling locations were logged into a global position recorder (Garmin model 45) and transferred to topographic maps later. Photographs of stream habitats and sampling methods were logged with date and time with a small 35-mm camera (Olympus Infinity Mini DLX).
All sampling equipment other than the electrofisher and
dipnets were contained in a day pack carried by one collector. This allowed sampling in remote areas by two individuals. Often, approach hikes greater than 2 km from trailheads were necessary. We used felt-soled wading boots worn over light-weight, durable chest waders (Travelwaders, OS Systems) which could be easily carried or worn to sampling sites. Access and sampling at certain locations in the Minam and Imnaha subbasins required multi-day trips using backpacks or horses for support.

5
Results and Discussion
We collected and sampled 1,217 bull trout from the 46 streams in the Columbia River Basin shown in Table 1. We intend to identify and characterize bull trout populations and targeted sampling on juvenile fish near natal areas for two reasons. First, such sampling should have minimized the occurrence of migrant fish from two or more populations being included in any given set of samples. We recognize that some fluvial adults may have been included in some sample sets, and that some juveniles sampled may have been progeny of such fluvial adults. However, we currently assume that sampling in the proximity of natal areas provides the greatest likelihood of identification of discrete populations. Second, we wanted to lower the risk of injury to spawners. We assumed that such fish, particularly large spawners, would not likely be near natal areas during summer and terminated sampling early in September.
Relationships between length, age, and maturation schedules
are not well defined for most Oregon bull trout. In Metolius River tributaries, bull trout age 3+ or less ranged from 2 to 18 cm between late April and early October (Ratliff 1992). In the Flathead River Basin, juvenile adfluvial bull trout were about 5-7 cm at age 1, 10-12 cm at age 2, and 15-17 cm at age 3. Eighty-four percent of all bull trout we sampled were less than 19 cm fork length (Figure 1). Adfluvial spawners in watersheds of the Intermountain West ranged from 30 to 90 cm (Pratt 1992; Kitano et al. 1994). Only two percent of all bull trout sampled were larger than 27 cm (Figure 1). Included in the total sampled but not plotted is one bull trout 60.5 cm from Whitewater River. Scales were collected from 1,180 fish sampled for age analysis later. Length data for bull trout from specific streams are shown in Table 2.

6
Figure 1. Bull trout captured and sampled for DNA analysis.
0 4 8 12 16 20 24 28 32 36 40 44 480
20
40
60
80
100
120
0
20
40
60
80
100
120
CapturedN=1,217
Fork length (cm)
Cumulative frequency
Num
ber
of b
ull
trout
Perc
enta
ge

7
Table 2. Length statistics of bull trout sampled for DNA analysis in 1995. Unless noted, all fish were captured by electrofishing. ______________________________________________________________________ Length (mm) Basin: ______________________________________________________ Population N Min Max Mean SD Median Willamette River: S.F. McKenzie R 21 49 411 95 86 60 Anderson Cra 30 26 120 71 31 85 Hood River: Clear Branch Cr 33 73 170 102 25 94 Compass Cr 19 203 264 239 20 240 Deschutes River: Jack Creek 31 33 161 80 34 85 Whitewater R 30 41 605 127 94 109 Jefferson Cr 30 31 155 73 35 73 Shitike Cr 29 68 118 81 10 80 Warm Springs R 27 43 97 51 10 50 John Day River: Indian Cr 16 89 215 161 48 183 Call Cr 32 72 377 145 54 130 Reynolds Crb 12 133 180 158 15 160 Roberts Crb 7 102 330 164 77 147 Deardorf Crb 2 185 246 216 43 216 Upper mainstemb 16 130 443 220 86 193 Granite Boulder Cr 25 80 205 116 34 108 Big Cr 30 56 167 120 31 126 Clear Cr 25 46 177 123 36 133 Baldy Cr 30 63 420 155 61 155 Clear Cr 30 86 190 126 22 125 S.F. Desolation Cr 17 90 222 156 31 158 S.F. Trail Cr 26 80 453 170 113 115 Umatilla River: N.F. Umatilla R 33 41 153 88 28 96

8
Table 2. Continued. ______________________________________________________________________ Length (mm) Basin: ______________________________________________________ Population N Min Max Mean SD Median ______________________________________________________________________ Walla Walla River: Mill Cr 30 46 255 93 45 100 S.F. Walla Walla R 32 41 360 119 67 100 N.F. Touchet R 32 61 214 141 35 142 Malheur River: Swamp Cr 31 87 228 151 31 159 Meadow Fork Big Cr 30 87 330 195 53 210 Powder River: Silver Cr 30 81 171 133 22 137 N.F. Powder R 30 75 198 136 38 140 Pine Creek: Elk Cr 30 87 224 137 31 138 E.F. Pine Cr 30 78 257 176 45 183 Grande Ronde River: Clear Cr 31 60 180 122 29 119 Limber Jim Cr 22 56 229 119 59 103 N.F. Catherine Cr 26 78 355 155 61 146 Indian Cr 29 64 174 113 33 118 Elk Cr 36 71 254 153 50 151
Dobbin Cr 31 62 223 126 31 125 Lostine R 25 69 186 114 26 114 Bear Cr 30 98 454 154 84 112 Hurricane Cr 30 87 283 154 60 140 S.F. Wenaha R 30 41 188 104 37 109 W.F. Butte Cr 26 63 342 119 58 127 Imnaha River: N.F. Imnaha R 31 60 275 180 55 198 McCully Cr 14 83 230 149 49 157 Lick Cr 30 92 410 168 60 155 ______________________________________________________________________ a Downstream migrants captured in a rotary screw trap. b Downstream migrants captured in diversion traps.
By targeting juvenile bull trout, we may have reduced the
estimated population genetic variance by reducing the number of age-classes sampled. We attempted to compensate by sampling within a range of lengths that may have included subadult fish as well as juveniles. We attempted to minimize the occurrence of siblings by extending the length of stream reach where sampling

9
occurred. The optimal sample size (30) was met or slightly exceeded in 27 of 46 cases (Table 2). We were unable to obtain the desired minimum sample size (20) in eight cases, four of which were diversion trap samples.
Ninety-three percent of all bull trout sampled were collected
by electrofishing (Table 3). Diversion traps captured downstream migrants from four streams associated with the upper mainstem John Day River as mentioned before. A rotary screw trap captured all bull trout sampled from Anderson Creek and one from S.F. McKenzie. Another S.F. McKenzie bull trout was captured by a trap net set in Cougar Reservoir by management biologists. We angled for 10 bull trout from upper S.F. Desolation Creek where the stream meanders through meadows. Biologists from the Confederated Tribes of the Warm Springs used a non-programmable waveform electrofisher that produced a standard bandwidth of pulsed direct current (DC) to capture 86 bull trout from Shitike Creek, Warm Springs River, and Whitewater River. All other bull trout (86 % of total), were captured with a programmable waveform electrofisher. With bull trout captured by that electrofisher, we evaluated injuries associated with collection. Table 3. Methods used to capture bull trout sampled. _________________________________________________________________ Bull trout captured ______________________ Method N % of total _________________________________________________________________ Programmable waveform electrofisher 1,052 86.4 (Smith-Root model 12-A) Non-programmable waveform electrofisher 86 7.1 (800 V Dirigo) Diversion trap 37 3.0 Rotary screw trap 31 2.5 Angling 10 0.8 Trap net 1 0.1 _____ Total 1,217 _________________________________________________________________
Electrofishing injuries were defined as quickly developing, externally visible dark bands usually posterior to the dorsal fin related to sub-dermal hemorrhage. We did not use X-ray analysis or monitor delayed mortality. Eight percent of the bull trout captured with the programmable waveform electrofisher had visible injury (Figure 2). Such electrofishing caused known mortality to only one 16-cm bull trout from Meadow Fork of Big Creek in the Malheur Basin.

10
Figure 2. Bull trout collected w ith a variable waveform electrofisher.
0 4 8 12 16 20 24 28 32 36 40 44 48-20
0
20
40
60
80
100Captured
Injured
N=1,052
N=84
Num
ber
of b
ull
trout
Fork length (cm)
The programmable waveform electrofisher can produce pulsed DC waves of standard, variable frequency, or variable pulse-width forms as well as gated bursts and continuous (non-pulsed) DC current. A standard pulsed waveform applies constant frequency and pulse width while switched on. A variable frequency waveform decreases over the frequency range chosen within a chosen period (sweep) of time; pulse width remains constant. The cycle repeats each time the switch is released. A variable pulse width is similar except that pulse width narrows over the range chosen within the sweep time; frequency remains constant. The Smith-Root model 12A allows 256 possibilities within the five waveform types, any of which can be operated at a variety of voltages. In theory, variable waveform types would minimize injury since either frequency or pulse width are diminished as a fish is pulled from the periphery of the electrical field towards the anode. Preferred settings were within those waveform types, although we also used settings within the standard pulsed waveform. Initially, we attempted to minimize frequency and voltage. Both were increased as necessary to effectively capture bull trout depending on field conditions. Throughout sampling, we used only 21 combinations of settings within three possible waveforms (Table 4). Our primary objective was to collect necessary samples, not thoroughly evaluate waveform possibilities. But we were able to query the data to examine the relative injury rate associated with certain waveforms and voltages.

11
Table 4. Pulsed direct current waveform combinations used to capture bull trout. Those used were various combinations of frequency, bandwidth, or sweep time values shown within each form. Asterisks denote most frequently used combinations within each waveform. ______________________________________________________________________ Number ________________ Frequency Width Sweep Waveform possible used (Hz) (ms) (sec) ___________________________________________________________________ Standard: 90 6 20 4 - 30* 6* 40 8 60 Variable frequency: 75 5 40-4 4 6 60-6* 6* 8 Variable width: 75 10 30* 4-0.2 2 45 6-0.3* 4 6 8* ______________________________________________________________________
First, we determined the proportions of bull trout both captured and injured with each waveform type. If a particular waveform was less injurious than others, the proportion that it injured should be less than the proportion that it captured. Only variable frequency waveforms produced that tendency (Figure 3). However, an underlying assumption is that injury is independent of fish size. This will be addressed later, but it should be noted that variable frequencies were used in situations where average fish length was relatively low. Furthermore, although those waveforms accounted for only 4% of the injuries, they may have been less preferred by collectors since they accounted for only 9% of bull trout captured. Variable bandwidth waveforms accounted for 57% of fish injured but were used to capture 54% of all bull trout sampled.

12
Per
cent
age
of to
tal
Captured
Injured
60
20
40
60
20
40
0
frequency Standard width
Figure 3. Proportion of bull trout collected at various waveform s.
Variable Variable
Next, we determined the proportions of bull trout both
captured and injured with each voltage regardless of waveform type. Like before, if a particular voltage was less injurious than others, the proportion that it injured should be less than the proportion that it captured. In addition, we expected to see increased proportions injured as voltage increased. Results were not as expected (Figure 4). In four of six cases, proportions injured were similar to proportions captured, and the second lowest voltage (600) produced the second highest injury percentage (24). Although we preferred low voltages, high streamflow and low conductivity sometimes required otherwise. Conductivities of 30 uS/cm or less were frequent; only Hurricane Creek and North Fork Imnaha River had conductivity greater than 100 uS/cm (Table 5).

13
Voltage
200 400 600 800 1000 1200
Per
cent
age
of to
tal
Captured
Injured
50
10
30
50
10
30
Figure 4. Proportion of bull trout collected at various voltages.
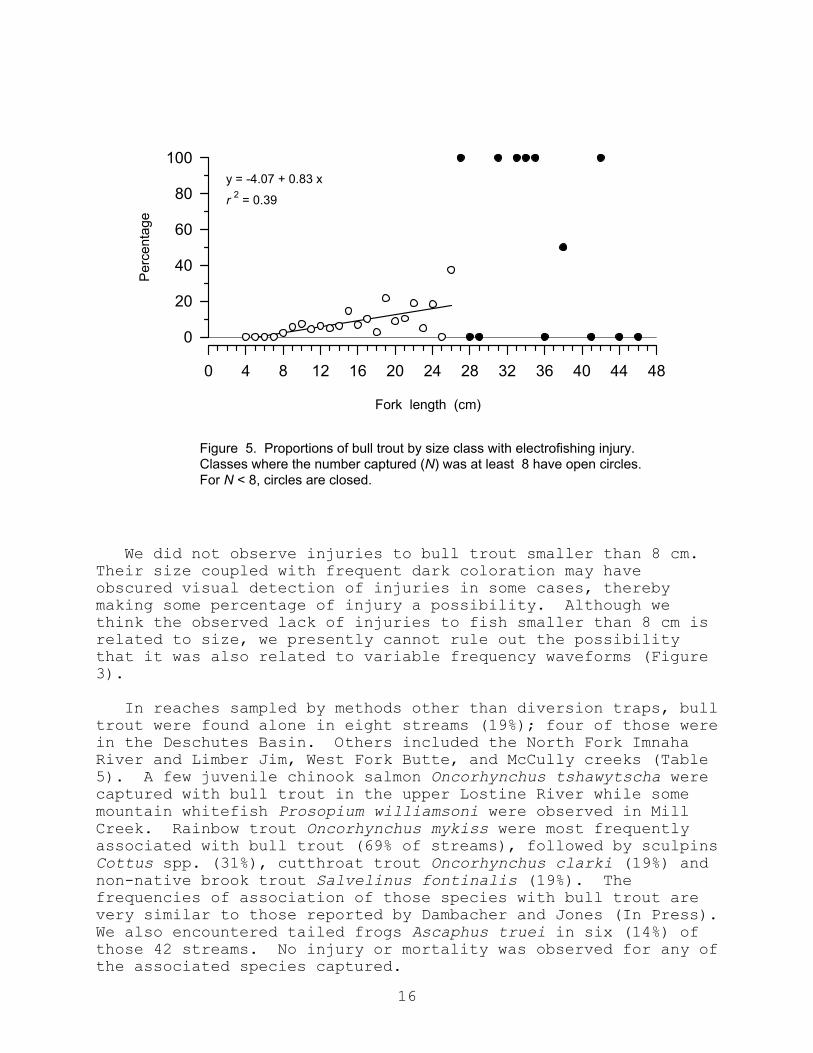
Finally, we tested the hypothesis that electrofishing injury would occur more frequently among larger than smaller bull trout. We determined the proportion of fish in each size class (1-cm increments) that were injured regardless of voltage or waveform setting. We considered only cases where the number of captured fish in each class was 8 or greater. There was a rather weak (r2 = 0.39) but significant (P = 0.0014) linear relationship over lengths from 4 to 26 cm (Figure 5). Only five bull trout in the 27-cm class were captured, and beyond that length there were only 1 or 2 in each class which contained fish. Because of those low numbers, we were unable to quantify the relationship for bull trout larger than 26 cm. However, 11 of 22 bull trout from 27 to 46 cm were injured, suggesting a substantial risk for injury by electrofishing to older bull trout. The low r2 indicates other factors also influenced the occurrence of injury. Two such factors probably include time spent by the fish in the electrical field and proximity to the anode when the current was first applied.

14
Table 5. Sampling dates, conductivities, and sympatric species associated with bull trout collected in 1995. ______________________________________________________________________ Sympatric speciesa Basin: Date Conductivity __________________________ Population sampled (uS/cm) Bt Co Ch Ct Rb Wh Tf ______________________________________________________________________ Willamette River: S.F. McKenzie R 30 Aug 40 X X Anderson Cr 19 Apr-25 May - X Hood River: Clear Branch Cr 05-08 Jun 30 X X X Compass Cr 06 Jun, 06 Jul 30 X X Deschutes River: Jack Creek 19-30 May 50 Whitewater R 21 Aug - Jefferson Cr 21 May-01 Jun 20 Shitike Cr 26 Jun 20 X X Warm Springs R 18 Jul - John Day River: Indian Cr 19 Jul 60 X X X Call Cr 20 Jul 30 X X Reynolds Crb 31 May-10 Jul - Roberts Crb 14 Jun-16 Aug - Deardorf Crb 19 Jun,18 Jul - Upper mainstemb 15 Jun-07 Aug - Granite Boulder 18 Jul 40 X X Big Cr 17 Jul 30 X Clear Cr 18 Jul 50 X X Baldy Cr 03 Aug - X X Clear Cr 17 Aug - X X S.F. Desolation Cr 27 Jul - X S.F. Trail Cr 04 Aug - X Umatilla River: N.F. Umatilla R 28-29 Jun 20 X X Walla Walla River: Mill Cr. 10,13 Jul 50 X X X S.F. Walla Walla R 11-12 Jul 30 X X N.F. Touchet R 05 Sep 30 X X Malheur River: Swamp Cr 25 Jul 20 X X Meadow Fk of Big Cr 24,26 Jul 30 X X X

15
Table 5. Continued. ______________________________________________________________________ Sympatric speciesa Basin: Date Conductivity __________________________ Population sampled (uS/cm) Bt Co Ch Ct Rb Wh Tf ______________________________________________________________________ Powder River: Silver Cr 16 Aug 50 X N.F. Powder R 15 Aug 20 X Pine Creek: Elk Cr (N. Pine) 17 Aug 60 X E.F. Pine Cr 18 Aug 70 X Grande Ronde River: Clear Cr 22 Jun 20 X Limber Jim Cr 20-21 Jun 40 N.F. Catherine Cr 28 Jul 30 X X Indian Cr 26-27 Jun 10 X X Elk Cr 01 Aug 10 X X
Dobbin Cr 03 Jul 10 Xc Lostine R 22 Aug 10 X X X X Bear Cr 02-03 Aug - X X X Hurricane Cr 23-24 Aug 160 X X S.F. Wenaha R 04 Aug 30 X X X W.F. Butte Cr 07 Sep 70 Imnaha River: N.F. Imnaha R 26 Jul 190 McCully Cr 26 Jul,03 Aug 20 Lick Cr 25 Jul 20 X X ______________________________________________________________________ a Bt = brook trout; Co = Cottus spp.; Ch = chinook salmon; Ct = cutthroat trout; Rb = rainbow trout;
Wh = mountain whitefish; Tf = tailed frog. b Traps were operated and sampled into October. c Rainbow trout were found in the Little Minam River from the confluence of Dobbin Creek upstream, not in Dobbin Creek itself.
16
Fork length (cm)
0 4 8 12 16 20 24 28 32 36 40 44 48
Per
cent
age
0
20
40
60
80
100
Figure 5. Proportions of bull trout by size class with electrofishing injury.Classes where the number captured (N) was at least 8 have open circles.For N < 8, circles are closed.
y = -4.07 + 0.83 x
r 2 = 0.39
We did not observe injuries to bull trout smaller than 8 cm. Their size coupled with frequent dark coloration may have obscured visual detection of injuries in some cases, thereby making some percentage of injury a possibility. Although we think the observed lack of injuries to fish smaller than 8 cm is related to size, we presently cannot rule out the possibility that it was also related to variable frequency waveforms (Figure 3).
In reaches sampled by methods other than diversion traps, bull
trout were found alone in eight streams (19%); four of those were in the Deschutes Basin. Others included the North Fork Imnaha River and Limber Jim, West Fork Butte, and McCully creeks (Table 5). A few juvenile chinook salmon Oncorhynchus tshawytscha were captured with bull trout in the upper Lostine River while some mountain whitefish Prosopium williamsoni were observed in Mill Creek. Rainbow trout Oncorhynchus mykiss were most frequently associated with bull trout (69% of streams), followed by sculpins Cottus spp. (31%), cutthroat trout Oncorhynchus clarki (19%) and non-native brook trout Salvelinus fontinalis (19%). The frequencies of association of those species with bull trout are very similar to those reported by Dambacher and Jones (In Press). We also encountered tailed frogs Ascaphus truei in six (14%) of those 42 streams. No injury or mortality was observed for any of the associated species captured.

17
Summary and Conclusions
We collected and sampled a total of 1,217 bull trout from 46
streams in the Columbia River Basin during 1995. For streams where samples were collected by methods other than diversion traps (42 cases), we successfully collected the necessary sample size (20-30 fish) in 38 cases. In the remaining four cases we sampled at least 14 bull trout in each. Diversion trap sample sizes (4 cases) ranged from two to 16. Mitochondrial and nuclear DNA analysis of samples to determine population distinctions will be conducted at University of Montana through 1996 and reported later. Sampling began 19 April on Anderson Creek in the Willamette Basin; it concluded 07 September on West Fork Butte Creek in the Grande Ronde Basin. The remoteness and complexity of habitats sampled for that collection required that sampling gear and collection procedures be lightweight, durable, easily transportable, and efficient. We believe that sampling protocols developed and refined during this study met those requirements and may be applied to similar sampling elsewhere.
Fork lengths of all fish sampled ranged from 2.6 to 60.5 cm
with a median of 12 cm. Eighty-four percent of all bull trout sampled were less than 19 cm while two percent were larger than 27 cm. Scales were collected for 1,180 bull trout 5 cm or larger for age analysis.
Eighty-six percent (1,052) of all bull trout sampled were
collected by electrofishing with a programmable waveform electrofisher. We observed injuries caused by electrofishing to 8% (84) of that number. No injuries associated with capture were seen on any other bull trout. Based on preliminary analysis, no waveform combination used appeared less injurious than others. Highest voltages appeared less injurious than some that were lower. Frequency of electrofishing injury was significantly correlated to fork length over the range from 4 to 26 cm. There were indications for substantial risk for such injury to bull trout larger than 26 cm. Given the complexity and remoteness of habitats, sampling and monitoring of bull trout populations by electrofishing likely will continue. We urge caution with such efforts, and suggest that sampling designs be well founded and schedules be timed to minimize encounters with larger, older individuals.

18
References Allendorf, F.W. and R.F. Leary. 1988. Conservation and
distribution of genetic variation in a polytypic species, the cutthroat trout. Conservation Biology 2:170-184.
Dambacher, J.M. and K.K. Jones. In Press. Stream habitat of
juvenile bull trout populations in Oregon, and benchmarks for habitat quality.
Guyomard, R. 1993. Methods to describe fish stocks. In: J.G.
Cloud and G.H. Thorgaard, eds. Conservation of salmonid fishes. Plenum Press, New York.
Kitano, S., K. Maekawa, S. Nakano, and K.D. Fausch. 1994.
Spawning behavior of bull trout in the upper Flathead drainage, Montana, with special reference to hybridization with brook trout. Transactions of the American Fisheries Society 123:988-992.
Leary, R.F., F. W. Allendorf, and S.H. Forbes. 1993.
Conservation genetics of bull trout in the Columbia and Klamath river drainages. Conservation Biology 7(4):856-865.
Meffe, G.K. and R.C. Vrijenhoek. 1988. Conservation genetics in
the management of desert fishes. Conservation Biology 2:157-169.
Pratt, K.L. 1992. A review of bull trout life history. In:
P.J. Howell and D.V. Buchanan, eds. Proceedings of the Gearhart Mountain bull trout workshop. Oregon Chapter of the American Fisheries Society, Corvallis, 5-9.
Quattro, J.M. and R.C. Vrijenhoek. 1989. Fitness differences
among remnant populations of the endangered Sonoran topminnow. Science 245:976-978.
Ratliff, D.E. 1992. Bull trout investigations in the Metolius
River-Lake Billy Chinook system. In: P.J. Howell and D.V. Buchanan, eds. Proceedings of the Gearhart Mountain bull trout workshop. Oregon Chapter of the American Fisheries Society, Corvallis, 37-44.
Ratliff, D.E. and P.J. Howell. 1992. The status of bull trout
populations in Oregon. In: P.J. Howell and D.V. Buchanan, eds. Proceedings of the Gearhart Mountain bull trout workshop. Oregon Chapter of the American Fisheries Society, Corvallis, 10-17.
Williams, R.N., R.P. Evans, and D.K. Shiozawa. 1995.
Mitochondrial DNA diversity in bull trout from the Columbia

19
River Basin. Idaho Bureau of Land Management Technical Bulletin 95-1, Boise.

20
Appendix A
Procedures for collection of tissue samples for DNA analysis.
Captured bull trout were carried in plastic buckets until they were sampled. A 9-l collapsible plastic bucket proved most useful, particularly in remote locations. Bull trout were anesthetized with a stock solution (10 g/l) of tricaine methansulfonate (MS-222), measured to fork length, then placed on a 25 x 15 x 1 cm piece of white plastic. From the caudal fin of bull trout 60 mm or larger, we cut two pieces of tissue each about the size of the cross-sectional area of a number 2 pencil. That size was necessary to insure a dried weight of at least 5 mg after storage in ethanol. Each piece of fin was then placed in a 2-ml cryopreservation vial filled with 95% ethanol and capped with a screw-on lid and O-ring seal. We numbered and labeled vials before going to the field to expedite sampling. All vials were kept in a storage rack fitted in a 25 x 14 x 5 cm plastic container covered with a snap-on lid secured with rubber bands. By taking two samples per fish, we produced duplicate sample sets from each stream. One set was shipped (United Parcel Service) to the University of Montana for mitochondrial and nuclear DNA analysis. The other was stored and archived at the ODFW lab in Corvallis. Fin samples from bull trout less than 60 mm were combined into a single vial with no duplication.
Scale samples were taken from all fish 50 mm or larger.
Previous investigations of Oregon bull trout indicated generally that scales from fish smaller than 50 mm lacked circuli (L. Borgerson, ODFW, personal communication). Visible sub-dermal hemorrhages associated with electrofishing were noted. Finally, we placed sampled bull trout in a plastic tub with fresh water for recovery from anesthesia, then returned them near sites of capture.