ancillary services: technical specifications, system …7 | p a g e d2.2 and d2.1, ancillary...
TRANSCRIPT

General rights Copyright and moral rights for the publications made accessible in the public portal are retained by the authors and/or other copyright owners and it is a condition of accessing publications that users recognise and abide by the legal requirements associated with these rights.
Users may download and print one copy of any publication from the public portal for the purpose of private study or research.
You may not further distribute the material or use it for any profit-making activity or commercial gain
You may freely distribute the URL identifying the publication in the public portal If you believe that this document breaches copyright please contact us providing details, and we will remove access to the work immediately and investigate your claim.
Downloaded from orbit.dtu.dk on: Apr 11, 2020
Ancillary services: technical specifications, system needs and costs. Deliverable D 2.2
Holttinen, Hannele ; Cutululis, Nicolaos Antonio; Gubina, Andrej ; Keane, Andrew ; Van Hulle, Frans
Publication date:2012
Document VersionPublisher's PDF, also known as Version of record
Link back to DTU Orbit
Citation (APA):Holttinen, H., Cutululis, N. A., Gubina, A., Keane, A., & Van Hulle, F. (2012). Ancillary services: technicalspecifications, system needs and costs. Deliverable D 2.2.
PROPRIETARY RIGHTS STATEMENT
This document contains information, which is proprietary to the “REserviceS” Consortium. Neither this document nor
the information contained herein shall be used, duplicated or communicated by any means to any third party, in whole
or in parts, except with prior written consent of the “REserviceS” consortium.
The sole responsibility for the content of this lies with the authors. It does not necessarily reflect the opinion of the
European Union. Neither the EACI nor the European Commission are responsible for any use that may be made of the
information contained therein.
Ancillary services: technical
specifications, system needs and costs
Deliverable D2.2
VTT, DTU, UCD, EWEA
November 2012
Agreement n.: IEE/11/814/SI2.616374
Duration April 2012 – September 2014
Co-ordinator: European Wind Energy Association
Supported by:

2 | P a g e
D2.2 and D2.1, Ancillary services: technical specifications, system needs and costs
Document information
Document Name: Ancillary services: technical specifications, system needs and costs
Document Number: Deliverable D2.2
Author: Hannele Holttinen, Juha Kiviluoma, VTT
Nicolaos Cutululis, DTU
Andrej Gubina, Andrew Keane, NUID UCD
Frans Van Hulle, XP Wind
Review: Florian Chapalain (EDSO4SG) - Jacques Merley (ERDF) - Carlos Costa
Rausa (Enel Distribuzione) - Pedro Godinho de Matos (EDP
Distribução) - Jesús Maria Martin Giraldo (Union Fenosa Distribución)
- Roberto Gonzalez (Ibderdrola Distribución) - Rafael Castaño Leal
(Endesa Distribución)
Iván Pineda (EWEA)
Sanna Uski-Joutsenvuo, Sisu Niskanen (VTT)
Diana Craciun (Fraunhofer IWES)
Paul Kreutzkamp (3E)
Gustav Quinonez Varela (Acciona)
Date: 10.12.2012
WP: WP2 Ancillary services requirements and potential sources
Task: Task 2.1, 2.2

3 | P a g e
D2.2 and D2.1, Ancillary services: technical specifications, system needs and costs
Table of contents
LIST OF ABBREVIATIONS .................................................................................................................... 5
SUMMARY ......................................................................................................................................... 6
1. INTRODUCTION .......................................................................................................................... 9
1.1. OBJECTIVES .................................................................................................................................. 9
2. ANCILLARY SERVICES ................................................................................................................ 11
2.1. BACKGROUND AND DEFINITIONS ..................................................................................................... 11 2.2. ANCILLARY SERVICE CATEGORIES ..................................................................................................... 14
2.2.1. Ancillary service categories according to EURELECTRIC ................................................. 15 2.2.2. Other ancillary services categorization ........................................................................... 15 2.2.3. Summary: Ancillary service categories adapted for REserviceS ...................................... 18
2.3. SERVICES RELATED TO MAINTAINING FREQUENCY ............................................................................... 19 2.4. SERVICES RELATED TO MAINTAINING VOLTAGE ................................................................................... 22
2.4.1. Overview ......................................................................................................................... 22 2.4.2. Voltage control in Distribution networks ........................................................................ 25
2.5. SYSTEM RESTORATION SERVICES ..................................................................................................... 27 2.5.1. Black start ....................................................................................................................... 27 2.5.2. Islanding operation ......................................................................................................... 28
2.6. OTHER SERVICES .......................................................................................................................... 30 2.7. SUMMARY OF RESERVICES CATEGORIES OF ANCILLARY SERVICES ........................................................... 32
3. SYSTEM NEEDS FOR ANCILLARY SERVICES ................................................................................ 33
3.1. SERVICES RELATED TO MAINTAINING FREQUENCY ............................................................................... 33 3.2. SERVICES RELATED TO MAINTAINING VOLTAGE ................................................................................... 37
3.2.1. Voltage setting of the reactive power sources in the network ....................................... 37 3.2.2. Influence of distribution-connected renewable generation on the voltage profile ........ 37 3.2.3. Reactive power: projected portfolio capability and system characteristics.................... 40 3.2.4. Dynamic Reactive Power Considerations ........................................................................ 42
3.3. OTHER SERVICES .......................................................................................................................... 45 3.4. SUMMARY OF SYSTEM NEEDS AT DIFFERENT PENETRATION LEVELS ......................................................... 45
4. COST STRUCTURE AND PROCUREMENT OF ANCILLARY SERVICES ............................................. 49
4.1. EXAMPLES FOR PROCURING THE SERVICES ......................................................................................... 49 4.1.1. Examples of current approaches to contract voltage support ........................................ 52
4.2. DIFFERENT WAYS OF PAYING FOR SERVICES ....................................................................................... 53 4.3. EXAMPLES OF EXISTING PRICES ....................................................................................................... 55 4.4. MODELLING COST STRUCTURES FOR ANCILLARY SERVICES ..................................................................... 58
4.4.1. Cost for providing Frequency control services ................................................................ 59 4.4.2. Cost for providing Voltage control services .................................................................... 59
REFERENCES ..................................................................................................................................... 61
APPENDIX 1. SUMMARY OF ENTSO-E SURVEY FOR RESERVES .......................................................... 66

4 | P a g e
D2.2 and D2.1, Ancillary services: technical specifications, system needs and costs
Acknowledgement
The consortium would like to thank the system operators that provided constructive feedback and
discussions for the completion of this Deliverable report.

5 | P a g e
D2.2 and D2.1, Ancillary services: technical specifications, system needs and costs
LIST OF ABBREVIATIONS
AGC Automatic Generation Control
AS Ancillary Services
BS Black Start
CR Contingency Reserve
DS Distribution system
DSO Distribution System Operator
ENTSO-E European Network of Transmission System Operators for Electricity
FCR Frequency Containment Reserve
FFR Fast Frequency Response
FoR studies The All Island TSO Facilitation of Renewable Studies (Eirgrid and SONI)
FRR Frequency Restoration Reserve
FRT Fault Ride-through
HV High Voltage
HVDC High Voltage Direct Current
LFSM Limited Frequency sensitive mode
MV Medium Voltage
NC Network Code, also may be called as grid code
NC RfG ENTSO-E Network Code for Requirements for Grid Connection Applicable
to all Generators
RoCoF Rate of Change of Frequency
RR Replacement Reserve
SS System Services
TS Transmission system
TSO Transmission System Operator

6 | P a g e
D2.2 and D2.1, Ancillary services: technical specifications, system needs and costs
SUMMARY
Ancillary services are grid support services required by the power systems (transmission
or distribution system operators TSOs or DSOs) to maintain integrity, stability and power
quality or the power system (transmission or distribution system). Ancillary services can
be provided by connected generators, controllable loads and/or network devices. Some
services are set as requirements in Grid Codes and some services are procured as
needed by TSOs and DSOs to keep the frequency and voltage of the power system within
operational limits or to recover the system in case of disturbance or failure.
There are different procurement and remuneration practices for Ancillary services, and
these practices are evolving. There are already markets for some services. Some services
are mandatory (not necessarily paid for) and some services are subject to payments
according to regulated (tariff) pricing or tendering process and competitive pricing.
It is foreseeable that also variable renewable generators, like wind and solar, will provide
ancillary services. This is needed from power system point of view in times of high wind
and solar production when conventional generators are at low level. From renewable
generators point of view providing ancillary services may add to their incomes in future.
In this report, different ancillary services are described and a table listing main services is
presented. While Chapter 2 is describing the services from (renewable) generators point
of view, Chapter 3 is considering future system needs for services with increased wind
and solar penetration. The table will be used as a starting point in the REServiceS project
to see how much these services would cost when provided from wind/PV (WP3/4), and
how often these services would be used in systems with higher penetrations of wind and
solar (WP5/6).
The main categories of frequency support, voltage support and restoration services were
selected as starting point for the table.
Main impacts of non-dispatchable renewables are due to increased variability and
uncertainty that will result in more balancing needs and impact frequency and voltage
control. Another important aspect is that during high wind and sunny hours, less
conventional units will be online to provide frequency support and inertia (as well as
voltage support and congestion management). Experience and study results so far show
that the electrical impacts of variable renewables are depending on local power system
characteristics and on network voltage levels. Solutions for frequency control and in
particular cases also for voltage management are very often of cross border nature.
There is experience from significant wind penetration levels from Denmark since year
2000 when wind power exceeded 10 % share of domestic electricity consumption, and
since several years from Spain, Portugal, Ireland and Germany. The first experiences from
PV integration emerge from Germany and Italy. However, there have been other changes
in frequency and voltage control also, making it difficult to get direct information about
how much the needs for frequency and voltage support have actually increased due to
additions of wind and solar power.
The main services in use today are voltage control and frequency control with different
time scales (the division proposed by ENTSO-E has been chosen) and black start for
system restoration. New services to reflect future needs are fast frequency response and
ramping margin for frequency support; fast reactive current injection during voltage dips
and for post fault voltage control; and islanding services related to restoration (Table).
The report lists current procurement practices and prices for several European countries,
as well as more detailed technical description of services reflecting the recently proposed

7 | P a g e
D2.2 and D2.1, Ancillary services: technical specifications, system needs and costs
ENTSO-E Network Code NC RfG as well as some illustrative examples from Grid Codes in
countries.
The cost structure for ancillary services chosen lists the possible costs in three
categories: cost for ability/capability (investment), readiness (cost for capacity reserved,
opportunity cost loosing energy that cannot be sold) and utilisation (actual provision of
the services). (Table below)
There can be additional costs from offering a service, related to compliance and testing
of the service quality, as well as from communication costs to monitor responses. TSOs
and DSOs will evaluate the performance of Ancillary service providers in relation to
declared availability and contracted provisioning.
The findings are based on surveying different ancillary services, their procurement and
pricing, and the system needs of services in future with higher levels of renewables.
Especially regarding quantified results on how renewables impact system needs for
ancillary services and costs for services from conventional generators, the information we
could obtain from literature and from system operators is still limited. Findings from on-
going work in Ireland regarding costs for services from different generators are not yet
included in this report and will be considered in the project as soon as the results
become available. Regarding wind and solar PV, and especially their combined impacts
on system needs, the task of making a full estimate is challenging. System services are

8 | P a g e
D2.2 and D2.1, Ancillary services: technical specifications, system needs and costs
there for the whole power system and quantified impacts from specifically selected types
of generation are difficult to extract. This report summarises the findings so far in tables,
for different penetration levels of wind and solar, that can be used as a starting point in
WP5/6 when estimating the impacts.

9 | P a g e
D2.2 and D2.1, Ancillary services: technical specifications, system needs and costs
1. INTRODUCTION
Transmission system operators (TSOs) and distribution system operators (DSOs) need a
variety of system services for a secure and reliable operation of the electrical power
system (system needs). Generators (and flexible loads, and in some cases network
connected devices) can provide these, so called, ancillary services (AS). Some services
are set as requirements in Grid Codes and some services are procured as needed by
TSOs and DSOs to keep the frequency and voltage of the power system within operational
limits or to recover the system in case of disturbance or failure.
Variable generation (predominantly wind and solar power generation) will impact the
system needs, but can also provide ancillary services. The variability and uncertainty in
power systems will increase with increasing levels of variable generation. This will
increase some system needs. As variable generation replaces conventional generation
from the system, at some point they should also take part in providing ancillary services
for operational, economic and security reasons. Moreover supply of ancillary services
may provide an additional revenue stream for renewable generators – and may in the
future result in penalties for those not delivering. This will apply to both high voltage
transmission system level connected larger renewable power plants, and distributed
generation connected in distribution networks.
This report is a compilation of Work Package 2 (WP2) findings, looking at the different
ancillary services. It provides an overview of system needs for ancillary services as well as
the general impacts that variable renewables will have on these needs, based on a
literature study. The various cost elements for ancillary services (for example, operation
and capacity reservation) are listed for different types of services. Differences in the
current practices in different countries are presented. Existing integration studies (mostly
wind) are reviewed to build an overview of needs for services for different RES
penetration levels, for different systems and for different ancillary services. This report
covers all ancillary services from the generator point of view that are critical in systems
with high share of variable renewables: voltage, frequency, and restoration services, both
at transmission and distribution system level. The analysis of the costs for providing AS
from conventional generation will be a separate document.
This report sets the framework for common approaches and definitions in the REserviceS
project, more specifically for the analyses of wind power and solar PV and their
capabilities and costs for providing services in future EU transmission and distribution
systems. The separate deliverable D2.1 pulls together the results from this report to form
the basis for the work in the REserviceS WPs 3 and 4.
1.1. Objectives
WP2 provides structure to the analysis part of the REserviceS project providing three
main outcomes:
In particular we may expect that:
A set of uniform definitions (types of reserves, services and costs). Power systems
all have different terminology for ancillary services. Each power system is unique
with its particular aspects that set the boundaries for requirements of system
services. There is currently collaboration between TSOs within ENTSO-E and
efforts to convert to similar terminology. However, there are still varying practices
in different member countries, and the different synchronous systems in Europe.
This report adopts a uniform terminology for the project partners and WPs in

10 | P a g e
D2.2 and D2.1, Ancillary services: technical specifications, system needs and costs
REserviceS. Current practices (generic options) are listed based on the
approaches developed for different grid codes and ancillary services practices in
Europe and specific issues at pan-European level are highlighted (for example
related to cross-border trading of the service such as capacity allocation for cross-
border primary reserve etc.). Approaches for quantification and modelling of
ancillary services were also studied (physical and cost). Cost models include
costs for ability, readiness and actual provision of the services. Market prices for
ancillary services were collected. This was performed where possible in
consultation with the European system operators (mainly through the ENTSO-E
WG on Ancillary Services).
Definition of the most relevant ancillary services for different RES penetration
levels. There is no existing publication or study that gives the whole picture
regarding the need for system services from the power system point of view for all
different services, different systems, and different RES penetration levels. In WP2
existing information was gathered, and a consensus was formed on which
services will become important at low, medium and high penetration levels of
wind and solar PV, for different systems in Europe.
Cost data for conventional generators for providing the ancillary services in the
study. To be able to compare the ancillary services from conventional and
renewable generators and to study their use in different system operational
states, this report presents an overview of the ancillary service provision costs
from different conventional generators, based on existing data, including prices
from ancillary service markets.
Outcomes of WP2 are basic approaches for assessing costs for ancillary services (D2.1,
for input to WP3 and 4) and costs from conventional generation ancillary services (D2.3,
for input to WP5 and 6).

11 | P a g e
D2.2 and D2.1, Ancillary services: technical specifications, system needs and costs
2. ANCILLARY SERVICES
This chapter presents introduction and definitions of ancillary services and existing
categorisation of services by EURELECTRIC, ENTSO-E and CIGRE. Based on these, the
selected ancillary service classes for this project are chosen.
2.1. Background and definitions
Controlling both frequency and voltage has always been a critical task in operating an
electrical power system. Following the liberalisation of the electricity sector, the System
Operator (SO) obtains these grid support services from other participants in the power
system. Since the liberalisation process has progressed independently in different
regions and each power system has its own specific characteristics, technical definitions
for these services vary considerably. Ancillary services have been defined differently,
depending on the electrical system and on the regulatory framework in which they are
implemented.
Definition for ancillary and system services: We use here the definitions from
(EURELECTRIC, 2004):
Ancillary services are all grid support services required by the transmission or
distribution system operator to maintain the integrity and stability of the
transmission or distribution system as well as the power quality. These needs can
be fulfilled by connected generators, controllable loads and/or network devices.
System services contain all services provided by a system (or a network) operator
to users connected to the system.
Ancillary services are provided from users to system operators, and system
services from operators to all users.
The system operator (SO) manages the ancillary services by obtaining contributions
(“elementary” ancillary services) from service producers (some of which follow from
regulatory or contract obligations); carrying out the technical management of the system,
while making sure there is a suitable level of security; adding its own share
(implementation of controls, load dispatching function) and thus elaborates the final
system services.
Ancillary services are related to capabilities of generators and loads to deliver specific
performances (responses etc.) in the point of connection to the network. Under the
different groups of ancillary services (like frequency, voltage, etc.) there are different
ancillary service products that generators can deliver to network operators to assist
network operation and management. In this report we use the term ancillary services in a
generic way; the detailed products will be dealt with in the next stages of the REserviceS
project.
12 | P a g e
D2.2 and D2.1, Ancillary services: technical specifications, system needs and costs
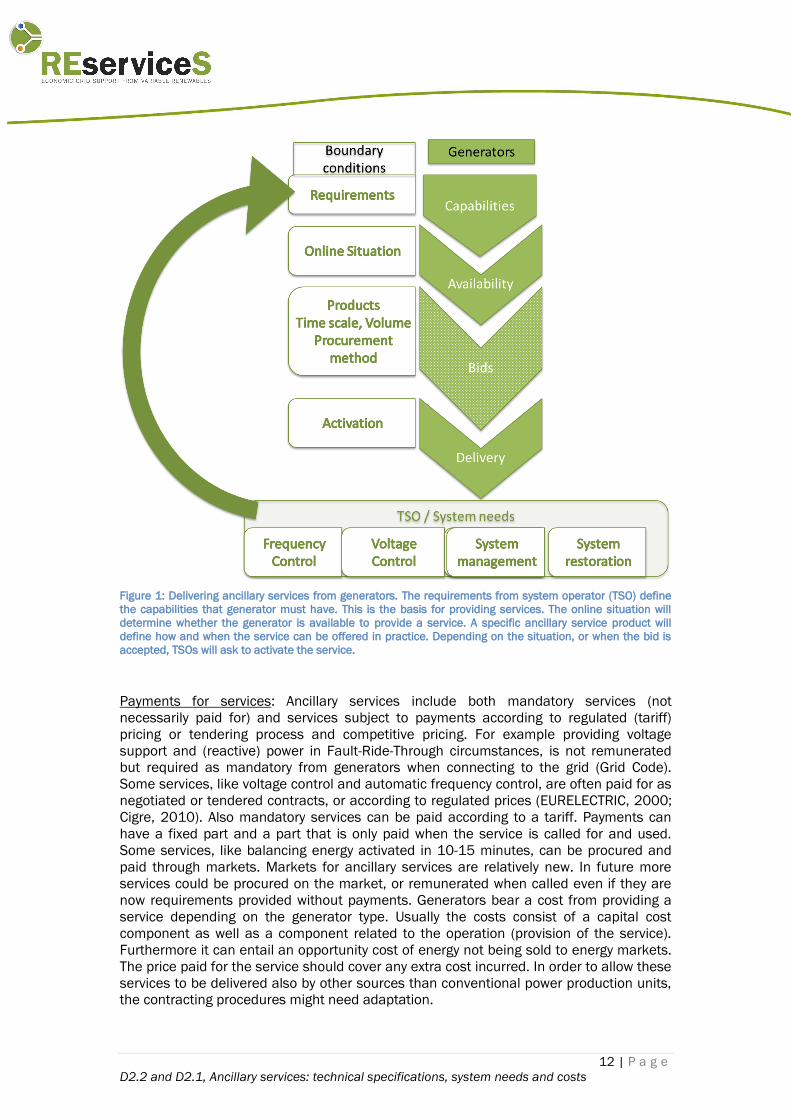
Figure 1: Delivering ancillary services from generators. The requirements from system operator (TSO) define
the capabilities that generator must have. This is the basis for providing services. The online situation will
determine whether the generator is available to provide a service. A specific ancillary service product will
define how and when the service can be offered in practice. Depending on the situation, or when the bid is
accepted, TSOs will ask to activate the service.
Payments for services: Ancillary services include both mandatory services (not
necessarily paid for) and services subject to payments according to regulated (tariff)
pricing or tendering process and competitive pricing. For example providing voltage
support and (reactive) power in Fault-Ride-Through circumstances, is not remunerated
but required as mandatory from generators when connecting to the grid (Grid Code).
Some services, like voltage control and automatic frequency control, are often paid for as
negotiated or tendered contracts, or according to regulated prices (EURELECTRIC, 2000;
Cigre, 2010). Also mandatory services can be paid according to a tariff. Payments can
have a fixed part and a part that is only paid when the service is called for and used.
Some services, like balancing energy activated in 10-15 minutes, can be procured and
paid through markets. Markets for ancillary services are relatively new. In future more
services could be procured on the market, or remunerated when called even if they are
now requirements provided without payments. Generators bear a cost from providing a
service depending on the generator type. Usually the costs consist of a capital cost
component as well as a component related to the operation (provision of the service).
Furthermore it can entail an opportunity cost of energy not being sold to energy markets.
The price paid for the service should cover any extra cost incurred. In order to allow these
services to be delivered also by other sources than conventional power production units,
the contracting procedures might need adaptation.

13 | P a g e
D2.2 and D2.1, Ancillary services: technical specifications, system needs and costs
Ancillary services at TSO/DSO level: Services can be procured by TSO or DSO and
delivered by generators at transmission level (to a TSO) or distribution level (to a DSO or
TSO). Some services available at transmission level are not currently used at distribution
level. Not all services are even relevant to be delivered from generation connected at
distribution level. However, it is possible that these will be required or offered in future,
due to increased system needs, increasing share of decentralised generation (also
reducing the possibility to rely exclusively on large generation) and possible connection
and reinforcement cost optimisation at distribution level. The means and costs for the
ancillary services at distribution and transmission level can also vary.
Services currently used and need for new ones: In addition to new ways of contracting
services, in future new services might be required. A list of currently available and proven
ancillary services is the starting point for the categories proposed in this report, but
potential future services are also listed where relevant.
Cross-border: Frequency management has the most significant and clear cross-border
character, as frequency is a global measure of the synchronous power system. However,
the frequency associated services are not always procured cross-border. For instance,
the need for automatic primary frequency reserve is determined at European level and
the responsibility to procure it is then allocated at national level, whereas the secondary
reserves are managed at national level and coordinated through control zone exchange
balance. Voltage management services are not by nature cross-border. However, they
become cross-border for example as a part of defence plan against large voltage collapse
managed by system operators. Services related to voltage control are always tradable
against network development and/or relocation of generation/consumption.
Ancillary services and requirements in Grid Codes: Requirements for capabilities for
generators, and demand appliances are presented in grid codes, or network codes as
they are called at ENTSO-E. These capabilities can be used to provide a service and are
regarded as essential for enabling delivery of sufficient services for the system. The
capabilities are usually not available all the time but depend on whether the generator is
on-line and generating at a level where a service can be provided. The services are
usually only called upon when needed – some services are used during normal operation
(continuous) and some services are provided for abnormal/emergency situations (event
driven). Network Codes only deal with constructive capabilities of generators/appliances,
with no prejudice for future actual use. The cost of the capabilities is a potentially
important driver in the development of the market for AS.
Grid codes also specify the conditions (voltage and frequency ranges) when the generator
needs to stay connected. In the ENTSO-E Network Code (NC) Requirements for Grid
Connection Applicable to all Generators (RfG), like in national codes, not all generators
(called Power Generating Modules or PGM) are required to have all the capabilities. The
requirements in NC RfG are distinguished into:
General requirements (for all types of PGM): also including requirements relevant
for wind and solar PV;
Specific requirements for Power Park Modules (PPM): specifically relevant for
wind and solar PV;
Specific requirements for AC connected offshore PPM: (requirements for HVDC
connected offshore PPM still to be drafted in a different NC document);
Specific requirements for synchronous PGM (in general not relevant for wind and
solar PV);

14 | P a g e
D2.2 and D2.1, Ancillary services: technical specifications, system needs and costs
Furthermore, the ENTSO-E NC RfG applies a classification system for generators
according to their impact on the system and classifies the generators as Type A, B, C and
D. This classification looks both to the size (capacity) of the PGM and to the voltage level
of connection (below or above 110 kV). The requirements in the NC are classified
according to these types. The capacity thresholds for categorising the generators differ
for the synchronous areas in Europe. In general, the requirements for capabilities are
increasing with the type of generator.
Table 1: Types of generators from ENTSO-E NC RfG.
Type A Type B Type C Type D
Connection
point
< 110 kV < 110 kV < 110 kV >110 kV
Lower capacity
threshold*
0.8 kW 0.1 – 1.5 MW 5 – 50 MW 15 – 75 MW
Upper capacity
threshold*
0.1 – 1.5 MW 5 – 50 MW 15 – 75 MW No limit
General
functionality
required for
system
operation (ref
Entso-E NC
RfG).
Logic interface
for
disconnecting.
Remote
operation
requirement by
the network
operator.
Controllable in
steps smaller
than 20% of
capacity.
Remote
operation
requirement by
the network
operator. TSO
decides about
reconnecting
after a network
disturbance.
Automatic set-
point control
(plus manually
if needed). May
be required to
provide inertia
— also
equivalent
performance if
not inherent.
Specific for
higher voltage
connected
generation to
allow stable
operation of
the
interconnected
network.
*Range for capacity depends on synchronous area in Europe (see ref. NC RfG)
2.2. Ancillary service categories
From studying the literature and discussions with system operators, it appears that there
is no uniform or “standardised” categorisation of ancillary services. This paragraph gives
a brief overview of some sources (EURELECTRIC, CIGRE, ENTSO-E). From there, it
proposes a categorisation that can be further used in the project, with the aim of keeping
the categories clear and simple, but to cover the most important ancillary services from
the point of renewable generators.
The categories are mainly looked at from the Transmission system point of view.
Currently, distribution systems mainly take part in voltage control. In the future, however,
there will be more possibilities, and needs, for the distribution system connected
generators to provide ancillary services, too.
15 | P a g e
D2.2 and D2.1, Ancillary services: technical specifications, system needs and costs
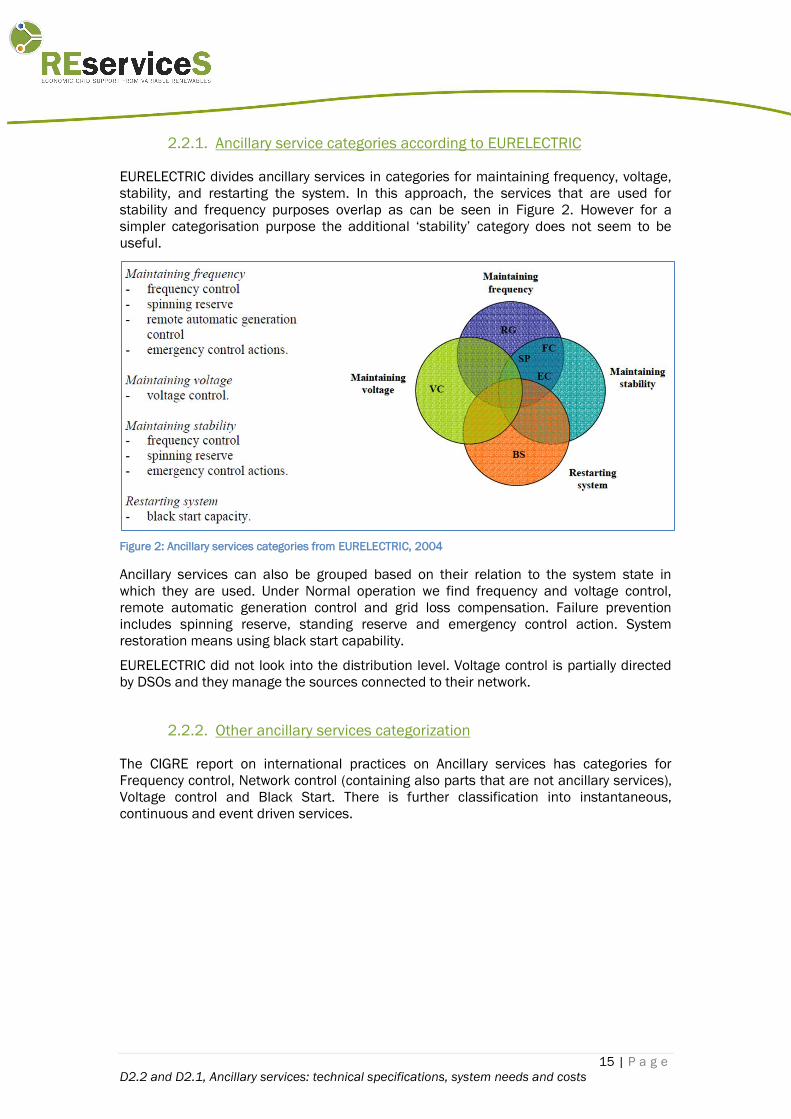
2.2.1. Ancillary service categories according to EURELECTRIC
EURELECTRIC divides ancillary services in categories for maintaining frequency, voltage,
stability, and restarting the system. In this approach, the services that are used for
stability and frequency purposes overlap as can be seen in Figure 2. However for a
simpler categorisation purpose the additional ‘stability’ category does not seem to be
useful.
Figure 2: Ancillary services categories from EURELECTRIC, 2004
Ancillary services can also be grouped based on their relation to the system state in
which they are used. Under Normal operation we find frequency and voltage control,
remote automatic generation control and grid loss compensation. Failure prevention
includes spinning reserve, standing reserve and emergency control action. System
restoration means using black start capability.
EURELECTRIC did not look into the distribution level. Voltage control is partially directed
by DSOs and they manage the sources connected to their network.
2.2.2. Other ancillary services categorization
The CIGRE report on international practices on Ancillary services has categories for
Frequency control, Network control (containing also parts that are not ancillary services),
Voltage control and Black Start. There is further classification into instantaneous,
continuous and event driven services.
16 | P a g e
D2.2 and D2.1, Ancillary services: technical specifications, system needs and costs
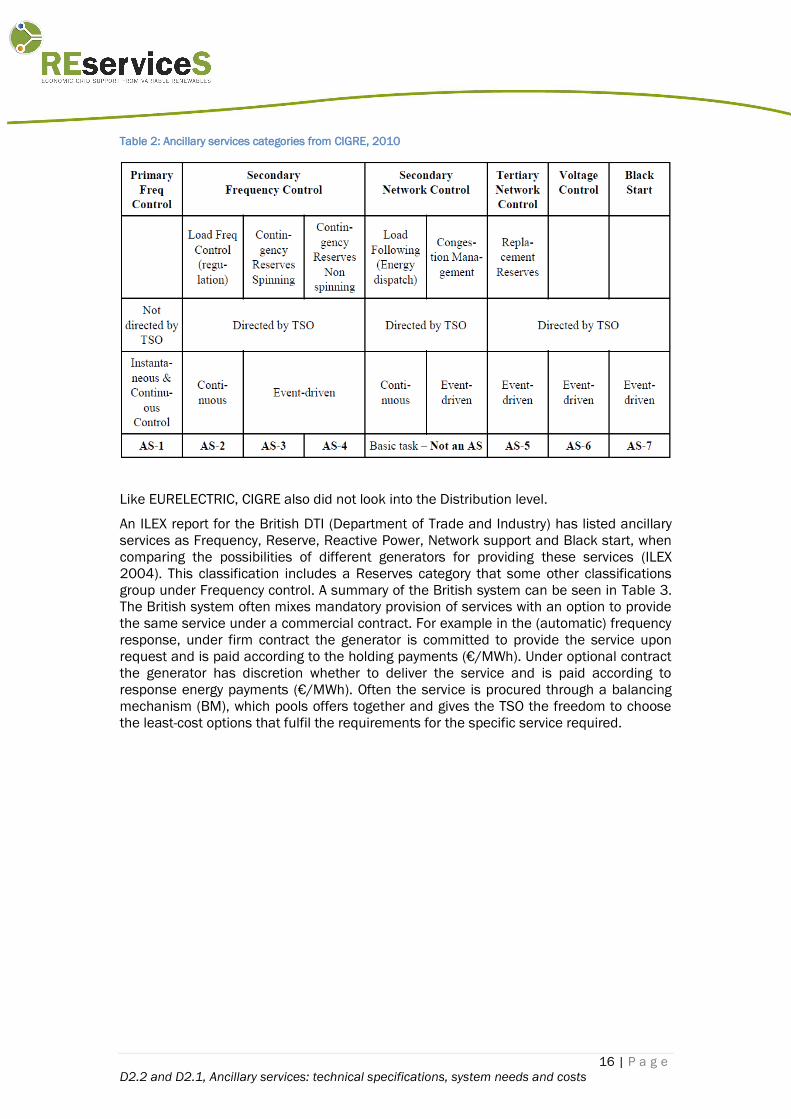
Table 2: Ancillary services categories from CIGRE, 2010
Like EURELECTRIC, CIGRE also did not look into the Distribution level.
An ILEX report for the British DTI (Department of Trade and Industry) has listed ancillary
services as Frequency, Reserve, Reactive Power, Network support and Black start, when
comparing the possibilities of different generators for providing these services (ILEX
2004). This classification includes a Reserves category that some other classifications
group under Frequency control. A summary of the British system can be seen in Table 3.
The British system often mixes mandatory provision of services with an option to provide
the same service under a commercial contract. For example in the (automatic) frequency
response, under firm contract the generator is committed to provide the service upon
request and is paid according to the holding payments (€/MWh). Under optional contract
the generator has discretion whether to deliver the service and is paid according to
response energy payments (€/MWh). Often the service is procured through a balancing
mechanism (BM), which pools offers together and gives the TSO the freedom to choose
the least-cost options that fulfil the requirements for the specific service required.
17 | P a g e
D2.2 and D2.1, Ancillary services: technical specifications, system needs and costs
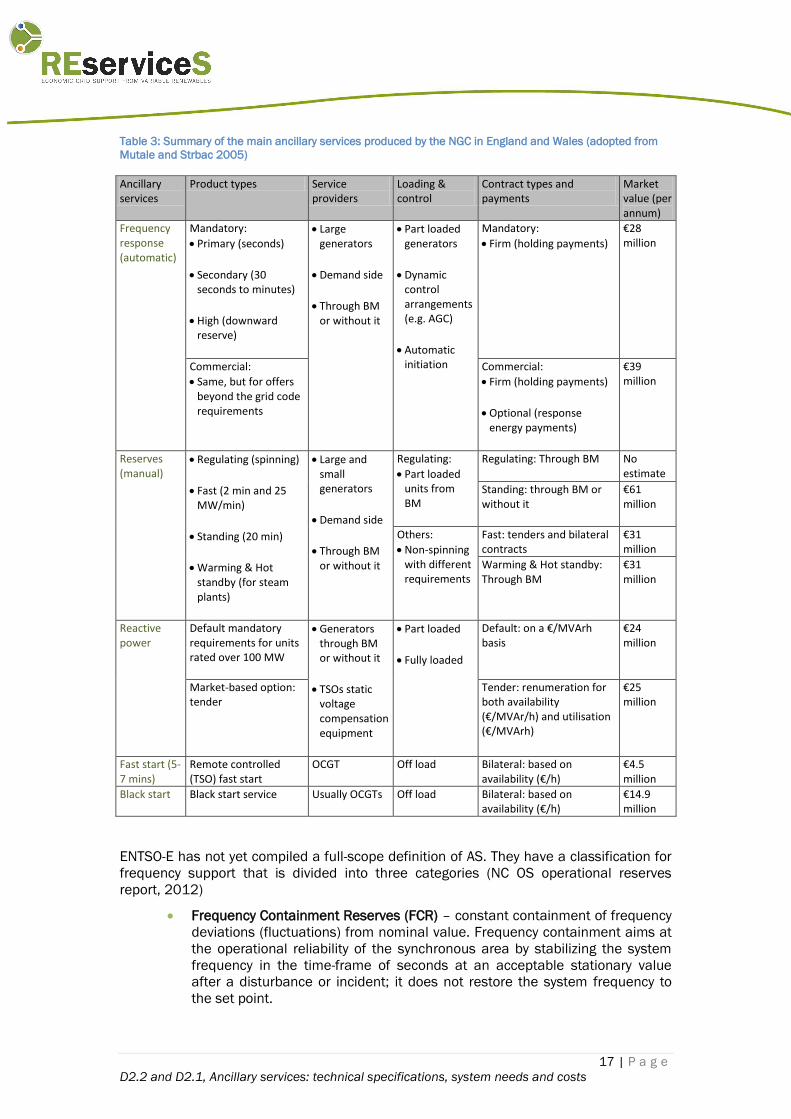
Table 3: Summary of the main ancillary services produced by the NGC in England and Wales (adopted from
Mutale and Strbac 2005)
Ancillary services
Product types Service providers
Loading & control
Contract types and payments
Market value (per annum)
Frequency response (automatic)
Mandatory:
Primary (seconds)
Secondary (30 seconds to minutes)
High (downward reserve)
Large generators
Demand side
Through BM or without it
Part loaded generators
Dynamic control arrangements (e.g. AGC)
Automatic initiation
Mandatory:
Firm (holding payments)
€28 million
Commercial:
Same, but for offers beyond the grid code requirements
Commercial:
Firm (holding payments)
Optional (response energy payments)
€39 million
Reserves (manual)
Regulating (spinning)
Fast (2 min and 25 MW/min)
Standing (20 min)
Warming & Hot standby (for steam plants)
Large and small generators
Demand side
Through BM or without it
Regulating:
Part loaded units from BM
Regulating: Through BM No estimate
Standing: through BM or without it
€61 million
Others:
Non-spinning with different requirements
Fast: tenders and bilateral contracts
€31 million
Warming & Hot standby: Through BM
€31 million
Reactive power
Default mandatory requirements for units rated over 100 MW
Generators through BM or without it
TSOs static voltage compensation equipment
Part loaded
Fully loaded
Default: on a €/MVArh basis
€24 million
Market-based option: tender
Tender: renumeration for both availability (€/MVAr/h) and utilisation (€/MVArh)
€25 million
Fast start (5-7 mins)
Remote controlled (TSO) fast start
OCGT Off load Bilateral: based on availability (€/h)
€4.5 million
Black start Black start service Usually OCGTs Off load Bilateral: based on availability (€/h)
€14.9 million
ENTSO-E has not yet compiled a full-scope definition of AS. They have a classification for
frequency support that is divided into three categories (NC OS operational reserves
report, 2012)
Frequency Containment Reserves (FCR) – constant containment of frequency
deviations (fluctuations) from nominal value. Frequency containment aims at
the operational reliability of the synchronous area by stabilizing the system
frequency in the time-frame of seconds at an acceptable stationary value
after a disturbance or incident; it does not restore the system frequency to
the set point.

18 | P a g e
D2.2 and D2.1, Ancillary services: technical specifications, system needs and costs
Frequency Restoration Reserves (FRR) – to restore frequency to the nominal
value after sudden system imbalance occurrence. Frequency restoration aims
to restore the system frequency in the time frame defined within the
synchronous area by releasing system wide activated frequency containment
reserves. For large interconnected systems, where a decentralised frequency
restoration control is implemented, frequency restoration also aims to restore
the balance between generation and load for each TSO, and consequently
restore power exchanges between TSOs to their set point.
Replacement Reserves (RR) – to restore the level of operating reserves.
Replacement reserves are activated manually and centrally at the TSO control
centre in case of observed or expected sustained activation of FRR and in the
absence of a market response. TSO can also use RR to anticipate on
expected imbalances.
These categories are processes, named after the purpose of the services, each including
several Ancillary services products. Balancing markets, operated by TSOs, are operated
during the delivery hour, as they have bids that can be activated in 10-15 minutes. This is
an example of already existing ancillary service market, for the manually activated part of
Frequency Restoration.
Figure 3: Classification of frequency control services by ENTSO-E (Operational reserve report June 2012).
2.2.3. Summary: Ancillary service categories adapted for REserviceS
Looking at the different definitions for which services can be included in under ancillary
services from (EURELECTRIC, 2004; Cigre, 2010; ILEX, 2004), three main groups of
services appear in all lists:
Frequency control – services related to the short-term balance of energy and
frequency of the power system; it includes automatic (primary/secondary)
and manual (tertiary) frequency regulation and operational reserves. This is
the main service provided by generators (online for automatic services and
online or offline for longer term activated services). It can also be provided
from flexible loads, and storage units.
Voltage control – services required for maintaining the power system voltage
within the prescribed bounds during normal operation and during

19 | P a g e
D2.2 and D2.1, Ancillary services: technical specifications, system needs and costs
disturbances by keeping the balance of generation and consumption of
reactive power. Voltage control includes reactive power supply (injection or
absorption) and can be provided by the dynamic sources (generators,
synchronous compensators) and static sources (capacitor banks, static
voltage controllers and FACTS devices, including, Unified Power Flow
Controller as well as network equipment like tap-changing transformers in the
substations and loads. In the event of a disturbance to the system, dynamic
reactive power response is required to maintain system stability. Network
reinforcements and reconfiguration will impact on the voltage control needed.
System restoration – services required to return electrical power system to
normal operation after a blackout; from the generator point of view it includes
mainly black start), and can in future also include islanding operation.
The subdivision of frequency control contains different terminology in the approaches of
EURELECTRIC, Cigre and the ILEX report. We adopt the division proposed by ENTSO-E
with Frequency Containment Reserves (automatic and local), Restoration Reserves
(automatic and manual) and Replacement Reserves (manual) (ENTSO-E LFC&R NC).
Some literature has Reserves as a separate category (like the ILEX report). We consider
that the ENTSO-E list of frequency control services will cover also frequency reserves.
While EURELECTRIC has stability as a different category, Eirgrid/SONI have in their DS3
Programme included Stability under Frequency and Voltage control. Following the system
needs analysis through several operating scenarios with high penetration renewables,
the Irish TSOs propose new system service products within three categories frequency
control, ramping and voltage control. These main categories are further explained in
Sections 2.3…2.5, where the services belonging to each of these categories are
described.
The technical specifications related to ancillary services are to a large extent based on
the requirements for capabilities, described in Grid Codes, or Network Codes as they are
called at ENTSO-E. In the present situation there is a high divergence amongst Grid Codes
in Europe. Consequently, requirements and their applicability are different in almost
every country. There is an on-going formal process (Third Package) of creation of Network
Codes that is intended to streamline the requirements in Europe. In the light of the
progressed stage of the first network code issued by ENTSO-E, REserviceS takes the
ENTSO-E Network Code for Requirements for Grid Connection Applicable to all Generators
(NC RfG) as a reference document, rather than taking requirements from all present Grid
Codes in Europe. The ENTSO-E NC intends to bring more consistency primarily for the
requirements relevant for cross-border system management. For REserviceS, this is most
useful for the frequency response capabilities, where the NC RfG contains quite detailed
specifications. However, the NC RfG leaves many of the requirements open for detailed
specification at national level. Sometimes the document gives some guidance for those
national specifications, but in many cases it leaves requirements open for specification
by the local TSO. This is particularly relevant for the reactive power capabilities. Therefore
in REserviceS we have to regard how these requirements are specified in national codes.
Finally, it should be remarked that the specifications in the ENTSO-E NC RfG have to be
regarded as preliminary before they reach the status of European law.
2.3. Services related to maintaining frequency
20 | P a g e
D2.2 and D2.1, Ancillary services: technical specifications, system needs and costs
Frequency control maintains the frequency within the given margins by (continuous)
modulation of active power. It has several time scales of operation that differ in their
response times in different systems. In the report we adopt the ENTSO-E classification:
Frequency Containment Reserve (FCR) or Primary Response: The automatic
response to frequency changes released increasingly with time over a period
of some seconds. As a generation resource it is a fast-action, automatic and
decentralised function e.g. of the turbine governor, that adjusts the power
output as a consequence of the system frequency deviation. With an instant
response and a full activation time of up to typically 30 s, it is activated
automatically and locally. In UK and Ireland the full activation time is faster
than for Central European system, 5-10 s. The response has to be maintained
for up to 15 minutes before it is released. The need is assessed collectively at
synchronous area level and the procurement duty is split amongst TSOs.
Frequency Restoration Reserve (FRR) or Secondary Response: Activation of
Frequency Restoration Reserve (FRR) modifies the active power set
points/adjustments of reserve providing units in the time-frame of seconds
up to typically 15 minutes after an incident. Activated centrally and has
automatically activated and manually activated parts. It is managed by each
TSO and coordinated through the control of transits between TSO’s area of
responsibility.
Replacement Reserve (RR) by Tertiary response: Manually activated,
activation time from 15 minutes to hours. Replacement reserves are
activated manually and centrally at the TSO control centre in case of
observed or expected sustained activation of FRR and in the absence of a
market response.
This division of services (reserves) also applies in cases of disturbances such as
contingencies (tripping off of a large generator or transmission line). After a disturbance
in the balance between generation and demand the following steps are performed:
1. Automatic procedures: Frequency Containment (0 – 30 sec) and automatic
Frequency Restoration (30 sec – 15 min).
2. Manual Procedures: manual Frequency Restoration and Replacement of
Frequency Restoration. Also balancing energy from market parties can be used
for longer term.
The time frame of frequency support is usually within the delivery hour. The energy
markets, day-ahead and intra-day can be used for balancing the supply and demand in
the time scales of hours and day ahead.
The automatic reserve will be delivered from spinning reserve and the manual reserve
can be either from spinning or from standing reserves. Spinning reserve means an
increase or decrease of generation or reduction in consumption that can be provided at
short notice, carried out by partially loaded generating units and interruptible consumers
(loads). Standing reserve involves increase in generation or a reduction in consumption
by those generating units that are not synchronously on-line, or by interruptible
consumers (loads).
System inertia is an important part of the power system response to frequency events, its
magnitude being proportional to the system's resilience to sudden change. It depends on
the physical characteristics of the power system, namely the types of generators in
operation and their own rotating masses that provide energy during the momentary
frequency dips. The more inertia a system can exhibit, the more resilient to events is its

21 | P a g e
D2.2 and D2.1, Ancillary services: technical specifications, system needs and costs
frequency. With an increasing penetration of non-synchronous generation in the system
(e.g. through HVDC connectors and through increasing converter connected generation
like wind and PV) there will be an increasing need for capabilities from generators to
supply very fast frequency response. This is already included in several present national
Grid Codes as well as in the ENTSO-E NC RfG. The network code requires additional
Active Power capability to limit the rate of change of frequency (RoCoF) in the system; this
ability could constitute a new ancillary service. Intelligent algorithms can be used to
provide synthetic inertia from wind generators (Mullane & O’Malley, 2005; Ruttledge et
al., 2012) and industry is offering technical solutions. PV can provide synthetic inertia
when it is run below maximum available power generation or in combination with a
storage unit e.g. a battery (van Wesenbeeck et al, 2009). A new service has been added
under Frequency control to account for this:
Fast Frequency Reserve: additional increase in active power (MW) output
from a generator (and/or reduction in demand) following a frequency event
that is available within 2 seconds of the start of the event and is sustained for
at least 15 seconds. Potential providers of these services include
conventional generators, demand customers with static under-frequency
relays, synchronous generators, and synchronous storage units. Also HVDC
interconnectors and some DFIG (Double-fed Induction Generator) and full-
converter type wind turbines with advanced control mechanisms (e.g.
providing an emulated inertial response) as well as PV systems that are run
below the maximum available electricity generation. (Option 2 of FFR in
Eirgrid and SONI 2012a)
As an additional category, for future needs we add:
Ramping service/Ramping margin: Imbalances between generation and
demand in both directions (upwards and downwards) are managed using
frequency response services (e.g. operating reserves) over very short
timeframes (seconds and minutes). Over longer timeframes, additional
factors can cause an imbalance which, if not managed, would result in
unacceptable frequency excursions. These factors include changes in
demand, wind generation, interconnector flows and generator availability. Potential providers of these services include conventional generators that are
not dispatched to their maximum output, storage devices, demand side
providers, solar PV and wind power plants that have been dispatched down.
In the future with the potential for implicit continuous gate closures,
interconnector participants with excess capacity for importing may also be
able to provide this service. (EirGrid and SONI, 2012a)

22 | P a g e
D2.2 and D2.1, Ancillary services: technical specifications, system needs and costs
Figure 4: Characteristic time scales of frequency control and the proposed new AS products (Source: EirGrid
and SONI, 2012b)
For interconnected power systems, different balancing areas and system operators can
share some of the reserves (Figure 5). This relates to cross-border delivery of the reserve
AS.
Figure 5: Frequency control and reserve sharing amongst the interconnected systems (Source: Amprion)
While the generators in distribution systems do not currently take part in frequency
control services, this is foreseen in the future. Today, the system operator (TSO) can
impose load shedding on the DSO in the presence of energy shortages in order to control
the frequency.
2.4. Services related to maintaining voltage
2.4.1. Overview
23 | P a g e
D2.2 and D2.1, Ancillary services: technical specifications, system needs and costs
System voltage is another key performance metric of the power system. Voltage is a local
measure, which differs in every power system node, both on transmission and
distribution level. Voltage is influenced by reactive power. Reactive power transmission
causes losses, and as reactive power can be more easily generated at the site where it is
needed, in general reactive power transmission is tried to be avoided.
The voltage levels of the power system nodes constitute the voltage profile of the power
system. The voltage profile must be maintained within prescribed ranges at every node
on the power system to maintain power quality, avoid damages to components (either
networks’ or customers’) in case of excessively high voltage and prevent malfunctions in
case of excessively low voltage, as well as maintain power system voltage stability.
This is achieved by a combination of three tools:
1. Preventing unnecessary transits of reactive power (mainly through requirements
for customers and pricing of reactive power transits);
2. Adding new network assets to support the active and reactive transits;
3. Balancing (dynamically) the generation and consumption of reactive power (i.e.
capacitive and inductive reactive power) in the voltage controlled nodes of the
system.
Control of voltage is tightly connected to reactive power control. Voltage can be controlled
through voltage control, reactive power control, power factor control or by a combination
of two of these, so they are often referred to as voltage/reactive power control.
The need for reactive power varies as demand varies and as the sources of generation
vary. As reactive power is not viable to be transmitted over long distances in transmission
network, its production is distributed across the system, usually closer to the locations
where it is needed. In some power system locations there may not be a strong link
between the need for active power and reactive power from the same sources (locations).
Reactive power support provision procurement rules should therefore incentivise reactive
capability across the widest possible active power range (Eirgrid and SONI 2012a).
As regards TSOs real time operations and operational planning, Voltage control has two
targets:
1. Voltage profile management and reactive power dispatch (steady state): The aim
is to keep the voltage profile close to the desired profile and within the tolerance
band margins with time frame of hours. This entails minimisation of the system
active power losses while keeping steady-state system security in the face of
possible contingencies.
2. Maintaining voltage stability (dynamic): This service controls the network voltages
in a dynamic time frame (seconds to minutes). The aim is to prevent a slow
voltage collapse event or limit its depth and extension in case of an incident (loss
of main, loss of generation unit).
Voltage stability is the ability of a power system to maintain steady acceptable voltages at
all network nodes in the system under normal operating conditions and after being
subjected to a disturbance (Kundur, 1994). Voltage stability is compromised when a
disturbance (e.g. network fault), variation in load or generation – including changes in
wind power – or change in other system conditions cause an unacceptable, progressive,
and uncontrollable decrease in voltage. The main factor causing voltage instability is the
inability of the power system to locally meet the demand, especially for the reactive
power at certain load bus in a certain moment. The reason may be that the reactive
source is too far or of insufficient capacity.
24 | P a g e
D2.2 and D2.1, Ancillary services: technical specifications, system needs and costs
While voltage instability is essentially a local phenomenon, its consequences may have a
widespread impact in case of voltage collapse. Voltage and transient stability issues are
interrelated and same mitigation measures apply (EirGgrid & SONI, 2012). The remedies
for improvement of voltage stability at the affected bus include: additional injection of
reactive power at or near of the identified bus; blocking of the distribution under load tap
changer feeding the affected bus; and reduction of load, which is the least desired
means. Therefore, additional reactive power sources will be needed at heavily loaded
buses in case of high penetration of RES in the power network, especially at the
distribution level.
To achieve the above control strategies, the following voltage control services are needed
to ensure that adequate voltage support is maintained in normal operation:
Steady-state Reactive Power/Voltage Control: Controlling voltage node profile
to a target value or within a target range. This control is commonly achieved
by injecting or absorbing reactive power at a voltage controlled node by
means of synchronous sources, static compensation, tap changing
transformers in the substations, transmission lines’ switching, virtual power
plants including demand facilities and if necessary load shedding. The system
operator dispatches the reactive power using the active and passive reactive
power sources that belong to different levels: generation, transmission and
distribution, using Optimal Power Flow methods. This type of services has a
similarity with the active power economic dispatch related to the
implementation of the hourly pool-based energy market.
Fast reactive current injection : Oriented towards system dynamic security
and voltage quality, it can be provided by spinning generators and
synchronous compensators, reactors and capacitors, Static VAR
Compensators (SVCs), HVDC (implemented with technology VSC) substations
and other FACTS devices, or other equipment capable of fast regulation. This
type of service can be considered analogous to active power reserve and
frequency-control services (primary and secondary AGC frequency regulation).
It is defined as the capability of a generator to deliver a reactive response
that shall be proportionate to the magnitude of the Voltage dip. Presently,
there are no examples of system services based on this capability, but
services based upon this capability may be needed much more often in the
future, when there will be more need for local voltage support from
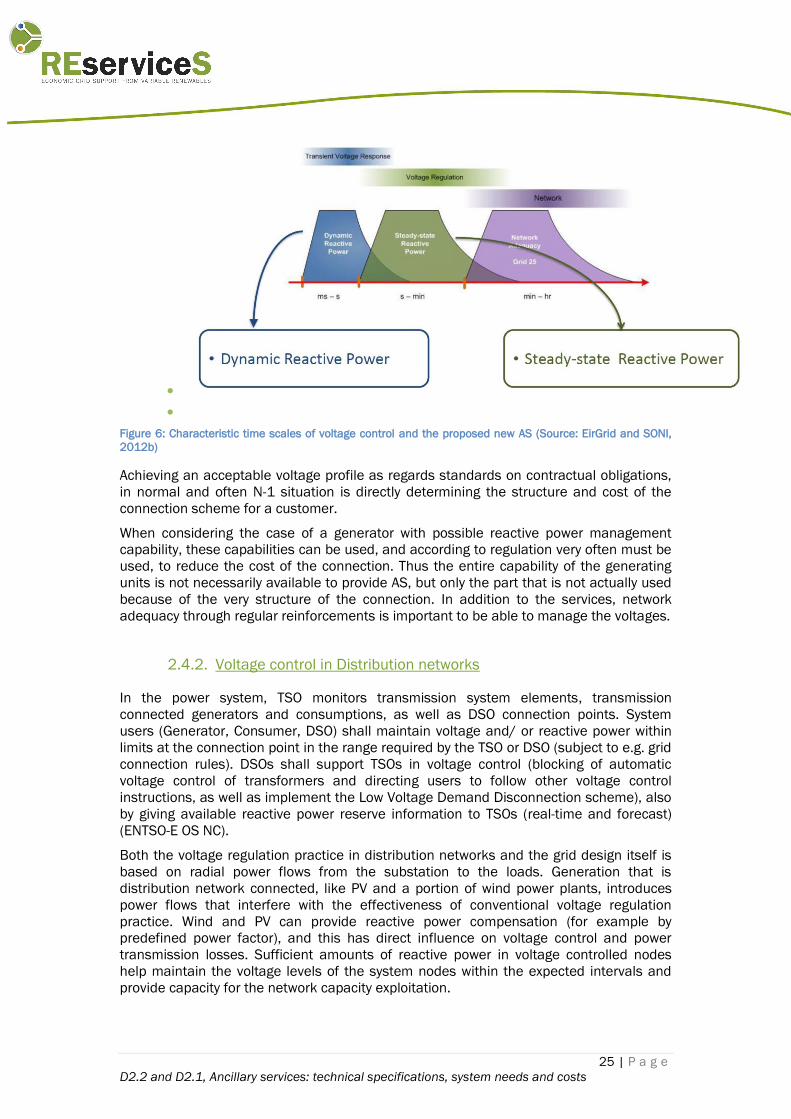
distributed generators. In Figure 6 fast reactive current injection is called
dynamic reactive power.
25 | P a g e
D2.2 and D2.1, Ancillary services: technical specifications, system needs and costs
Figure 6: Characteristic time scales of voltage control and the proposed new AS (Source: EirGrid and SONI,
2012b)
Achieving an acceptable voltage profile as regards standards on contractual obligations,
in normal and often N-1 situation is directly determining the structure and cost of the
connection scheme for a customer.
When considering the case of a generator with possible reactive power management
capability, these capabilities can be used, and according to regulation very often must be
used, to reduce the cost of the connection. Thus the entire capability of the generating
units is not necessarily available to provide AS, but only the part that is not actually used
because of the very structure of the connection. In addition to the services, network
adequacy through regular reinforcements is important to be able to manage the voltages.
2.4.2. Voltage control in Distribution networks
In the power system, TSO monitors transmission system elements, transmission
connected generators and consumptions, as well as DSO connection points. System
users (Generator, Consumer, DSO) shall maintain voltage and/ or reactive power within
limits at the connection point in the range required by the TSO or DSO (subject to e.g. grid
connection rules). DSOs shall support TSOs in voltage control (blocking of automatic
voltage control of transformers and directing users to follow other voltage control
instructions, as well as implement the Low Voltage Demand Disconnection scheme), also
by giving available reactive power reserve information to TSOs (real-time and forecast)
(ENTSO-E OS NC).
Both the voltage regulation practice in distribution networks and the grid design itself is
based on radial power flows from the substation to the loads. Generation that is
distribution network connected, like PV and a portion of wind power plants, introduces
power flows that interfere with the effectiveness of conventional voltage regulation
practice. Wind and PV can provide reactive power compensation (for example by
predefined power factor), and this has direct influence on voltage control and power
transmission losses. Sufficient amounts of reactive power in voltage controlled nodes
help maintain the voltage levels of the system nodes within the expected intervals and
provide capacity for the network capacity exploitation.

26 | P a g e
D2.2 and D2.1, Ancillary services: technical specifications, system needs and costs
Efficient reactive power compensation on the DSO network can be provided by on-load
tap changer (OLTC) transformers at substations, supplementary line regulators on
feeders, switched capacitor banks installed on HV/MV substations and coordinated
reactive power injection from generation connected to distribution level. Besides the
services, network adequacy through regular reinforcements is important to be able to
manage the voltages.
As wind and solar penetrations increase, the question of their contribution to the
provisions of reactive power support at a local level is raised. Especially in countries with
very high penetration of these renewable energy sources as they may remove traditional
regulating generation units from merit order.
However the question of the target of these provisions is still unresolved. Shall they
contribute mainly to the optimisation of connection costs, usually to the sole benefits of
the generator? Shall they contribute to the overall optimisation of Distribution Network
usually to the benefits of the consumers supporting most of the costs through grid access
tariffs? Shall they contribute to the needs of the TSO in optimizing its network
development costs and system security management? And in any case how shall it be
operated and what procurement strategy should be followed, including the pricing?
DSO voltage and power flow management services – wind and PV may
provide important services (e.g. voltage support or flow control; for PV see
EPIA, 2012) especially in stressed conditions, where wind and PV would be
suitable for such applications. Opportunities may improve with increased
wind and PV penetrations due to the higher collective availability. However it
is very dependent on the regulatory framework for connection scheme design.
The actually available capability for network optimisation is only what is left
after what has been used in minimizing the cost of the connection scheme.
Furthermore it must be noted that the situation is very asymmetrical
concerning the consumption and injection of reactive power on Distribution
Network. If DSO can deploy and operate without notable difficulties
compensation devices on their network, the deployment of reactors is not
presently industrially solved. Considering this reactive power absorption by
DG could be a real technical opportunity.
TSO reactive power – Following the increasing emphasis on distributed
renewable energy sources, high penetration levels of variable, asynchronous
generation will displace synchronous plant and may cause a challenging
scarcity of traditional ancillary service providers, notably in the area of
reactive power provision. Renewable generators must therefore increasingly
provide the reactive support necessary to operate the power system. It is
important to remember that it is inefficient to transfer reactive power across
large electrical distances, including across the transformation between
voltage levels. The effectiveness of distribution reactive power resources to
provide support at transmission level will thus not be possible in all instances.
It is highly dependent on the network impedance, and on the generation
resource and technology employed (Cuffe, Smith Keane, IEEE TSTE 2012).
Reactive power compensation at lower distribution voltages may diminish the
need for reactive power from transmission-connected generation. DG
connected at these levels can make a significant impact on the amount of
reactive power exchanged between the transmission and distribution
systems.
The ENTSO-E NC RfG described in section 2.4 are applicable to Type C generators (as
specified in Table 1), and thus are also applicable in some distribution networks.

27 | P a g e
D2.2 and D2.1, Ancillary services: technical specifications, system needs and costs
A consideration of the interaction between the local distribution priorities and system
level transmission issues is vital in the effective resolution of the provision of services
from distributed renewable resources.
In future, reactive power control for voltage management issues could be dealt with
through optimizing overall costs of distribution network, taking into account losses and
operational costs in addition to optimising connection costs. Last but not least DSOs and
TSOs are not used to addressing the same amount of connection points. TSOs are used
to directly monitor and control a limited number of facilities, and tend to favour remote
control solution that gives a strong control to operator, sometimes mitigating the solution
with local automatism when fast reaction is needed. DSOs are used to operate the
system with no or little monitoring and control of (very) numerous connected facilities,
they tend to prefer local automatism sometimes mitigated with simple monitor/control
interface for larger units.
Reactive power provision requirement by distributed generators to the DSO is not state-
of-the-art. However, there are several research and pilot projects carried out in order to
evaluate the benefits of reactive power control by distributed generation, in particular PV
(e.g. MetaPV, VSync, DG DemoNet-Validation, MorePV2Grid, DERri, and 7 MW-WEC-by-
11). The main objective of these projects is to evaluate whether reactive power supply on
distribution grid level can reduce the need for grid reinforcements and further increase
the hosting capacity for further generators.
2.5. System restoration services
There are two services that are considered under system restoration services: Black start
(BS) and Islanding operation.
2.5.1. Black start
Black start is used in the power system restoration phase, defined as “a set of actions
implemented after a disturbance with large-scale consequences to bring the system from
emergency or blackout system state back to normal state. Actions of restoration are
launched once the system is stabilised. Restoration of the system consists of a very
complex sequence of coordinated actions whose framework is studied and, as far as
possible, prepared in advance” (ENTSO-E OH, Policy 5, Appendix)
The restoration process has several stages: re-energisation from blackout, frequency
management and resynchronisation.
The re-energisation process can be implemented using two strategies. I) Top-down re-
energisation using external voltage sources when the grid is reenergised from a
neighbouring TSO, starting from the tie-lines. II) Bottom-up re-energisation based on
internal sources capabilities is done using units that provide the capability of controlling
voltage and speed/frequency during supplied isolated operation and stable operation in
an islanded network. Those units are referred to as having black start capabilities.
In general, all power stations need an electrical supply to start up: under normal
operation this supply would come from the transmission or distribution system; under
emergency conditions black start stations receive this electrical supply from small
auxiliary generating plant located on-site or in the case of pumped storage plants the
power can be supplied from a smaller “auxiliary” turbine (commonly a Francis turbine). In
this context, black start capability of a generator is defined as: The capability of a
generating unit to start up without an external power supply, called on as a means of
28 | P a g e
D2.2 and D2.1, Ancillary services: technical specifications, system needs and costs
restoring supplies following a major failure on all or part of the network. Black start
capability is usually considered at plant design. In power systems not all power stations
have, or are required to have, this black start capability.
Presently, wind and solar PV are not providing this service, and it is included in
REserviceS for a possible future service. In practice it has to be noted that during the
restoration process TSOs have even higher demands for reliability and will avoid any
components adding uncertainty. This means that for wind and solar, uncertainty and
variability should be limited during this time in order to be suitable/ eligible for this
service provision.
2.5.2. Islanding operation
The foremost prerequisite for island operation is defining the (potential) island operation
area, where the power balance (i.e. consumption and generation) could be possible to
realise during the whole period of island operation. Only when this feasibility is clear,
other island operation issues can be discussed.
Most of the current generators are not designed to perform in islanding conditions, as
separated from the main grid. This could be a future service from generators, especially
connected to distribution networks. The ability of islanded operation of distributed
generation would improve the reliability of the grid. For future islanding operation existing
regulatory, also technical and safety framework has to be carefully addressed (EConnect
2005).
In practice islanding operation can be realised by defining suitable sub-networks, called
cells (Figure 7), where power supply would depend entirely on distributed generators in
the cell. These cells would guarantee availability of electric power to a certain level. The
generators would need to have measures installed that could be activated in case of
islanding, being able to maintain stable frequency and voltage during islanding, also
keeping network impedance within range and phase symmetry, and capability to handle
fault currents. They would also need to be able to re-connect to main grid when in
synchronism.

29 | P a g e
D2.2 and D2.1, Ancillary services: technical specifications, system needs and costs
Figure 7. Example of cells in medium voltage network. (Overbeeke and Roberts, 2002)
The cells would need to provide several services to the system and/or to each other:
Reactive power (supply/absorption): In many cases it is more cost-effective to
ensure reactive power balance locally in the distribution grid, provided by the
DSO as a service.
Voltage control: every island should have an adequate source that provides
voltage support.
Negotiated power exchange: A capability to exchange power with
neighbouring cells; suitable actuators control the exchange; managed
operation of connections with adjacent cells (Overbeeke and Roberts, 2002)
Fault management: Faults are managed and isolated within a cell; effect will
not propagate to other cells (Overbeeke and Roberts, 2002)
Phase symmetry: Symmetry between phases may become an issue when
networks are operated at higher impedance levels. The optimal value of
network impedance will be determined by a trade-off between requirements
of voltage stability and absorption of flicker phenomena on one hand, and
limitations on fault level on the other hand.
Network impedance range, defined as:
High enough to limit fault level.
Low enough at harmonic frequencies and to supply starting currents, absorb load
variations and secure generator stability.
Security of supply/ connectivity: While the medium and low voltage networks
are constructed as meshed, they are operated in a radial fashion. To increase
30 | P a g e
D2.2 and D2.1, Ancillary services: technical specifications, system needs and costs
security of supply during islanding, cells can be interconnected using
connections open in normal operation, resulting in a meshed low or medium
voltage network. Power balance is primarily achieved on cell level, which
requires control of local generators/loads. If this is not possible, power is
transferred between cells on the same level. The next step is to involve cells
with larger geographic coverage on higher voltage levels, and failing that, they
make use of the top-level, transmission level cell. If required, cells on higher
level can co-ordinate efforts on lower levels using extensive systems for
monitoring and control.
Reconnection of DG: As small DGs are designed to connect automatically to
the network, small DG should be required to reconnect under the provision of
a progressive gradient of power over a reasonable amount of time. Namely,
while establishing power balance in an island, an important amount of
intentionally disconnected DG could automatically reconnect upon
reconnection of load a few minutes later, potentially unbalancing the system
in a critical phase.
The re-synchronising phase is very important, as has also been described in the black
start recovering process.
2.6. Other services
The ancillary services that we focus on in REServiceS project are the ones provided by
generators. This section lists services that have been left out.
Because we have focused on time frames close to power system operation and electricity
market daily developments, we have excluded long term reserves that are planned to
ensure long term capacity adequacy. This is a part of power system planning with its
timescale measured in years.
The ancillary services that are not further explored in REServiceS project because they
are not services provided by generators are:
Coordination of operating procedures between DSO and TSO (loss of mains
protection settings; prevention of system to ride through high RoCoF events
etc.).
Emergency control (EC) actions: Maintenance and use of special equipment
(e.g. power system stabilisers and dynamic braking resistors) to maintain a
secure transmission system.
Dynamic Stability Management: offline studies for voltage, rotor angle or
frequency stability:
Some system services can be handled with already listed ancillary services, even if they
are for different purpose:
Congestion management: Re-dispatch to prevent violations of the power flow
Operational Security Limits (ENTSO-E OS NC)
From generator point of view this service is technically similar to manually
activated frequency support services. Even if not for balancing but for load
flow management, TSOs could take these from manually activated Frequency
Restoration reserve, for example if wind and solar were bidding to balancing
markets.

31 | P a g e
D2.2 and D2.1, Ancillary services: technical specifications, system needs and costs
Grid loss compensation (GL): Compensating the transmission system losses.
This is part of voltage control service.

32 | P a g e
D2.2 and D2.1, Ancillary services: technical specifications, system needs and costs
2.7. Summary of REServiceS categories of ancillary services
The ancillary services categories, relevant for renewable generator point of view, are
presented in Table 4.
Table 4: Ancillary services relevant from renewable generators.
* The first row in the table refers to existing ancillary services and the second row to new
services.
A more detailed table with technical specifications and a comparison to existing ancillary
services in some EU countries are presented in Chapter 5 and Appendix 1.
33 | P a g e
D2.2 and D2.1, Ancillary services: technical specifications, system needs and costs
3. SYSTEM NEEDS FOR ANCILLARY SERVICES
This chapter presents a summary of findings regarding how renewables impact ancillary
services at different penetration levels and in different systems, from literature and
system operators. From this information, a consensus on what services will become
important at low, medium and high penetration levels of wind and solar PV for different
systems in Europe is made.
Renewables will also impact need for new grid infrastructure and the capacity adequacy
of the power systems – these impacts can be large, but as they are not related to
ancillary services in operation of the system, they are not discussed in this report. The
experience from Portugal show that there are no impacts on congestions if the system
operator has been able to implement grid reinforcements in time and limited the
connection of wind power plants to reflect the grid capability (Ribeiro, 2012). The
experience of Germany show that curtailments of wind are needed to manage
congestions in case of delayed grid reinforcements (Söder et al, 2007).
Another important impact not discussed further is the increased need for coordination
between TSOs and DSOs. Especially real-time monitoring and ability to control requires an
effort for providing the communication to small renewables plants. This is relevant also
for congestion management. Data exchange will be greatly expanded, and DSOs will also
be more involved.
This section aims at conclusions towards the needs for the identified categories of
services. How wind and PV impact the need of frequency and voltage support in the
system – how much frequency and voltage support is required without wind and PV and
with different levels of penetration? Impact on black start capability is briefly mentioned
as this has not been an issue so far. Information about the costs is presented when
available. The main impacts are summarised in tables. This gives information needed to
model how the needs of the system change in the systems with increasing non
synchronous system penetration in following work packages of REServiceS WP5/6, when
searching for more detailed information based on simulation results on how frequently
the services are needed regarding RES.
3.1. Services related to maintaining frequency
Main impacts of variable renewables are due to more variability and uncertainty that will
result in more balancing needs and can impact frequency control. Other important aspect
is that during high wind and sunny hours, less conventional units will be online to provide
frequency support and inertia (as well as voltage support and congestion management).
This is one reason for variable generation to participate in ancillary services, to avoid
curtailments due to keeping other generation online to provide services (unless loads or
network components can do it with smaller costs).
Experience and study results so far show that the impacts of variable renewables are
power system specific. For example the location of variable renewables versus load
centres and the existing network will influence required grid measures and operational
practices whereas existing flexibility of conventional generators will influence impacts on
balancing and frequency support. Using flexibility of neighbouring countries or regions
has been found as one major assumption influencing results of wind integration studies
because larger balancing areas have less impacts from renewables (Holttinen et al,
2009), For this reason, variable renewables impact the need for cross border trade of
ancillary services, obviously for the frequency related services and to a less extent for
voltage related services.
34 | P a g e
D2.2 and D2.1, Ancillary services: technical specifications, system needs and costs
There is experience from significant wind penetration levels from Denmark since year
2000 when wind power exceeded 10 % share of domestic electricity consumption, and
since several years from Spain, Portugal, Ireland and Germany. However, there have
been other changes in frequency control or balancing schemes also, making it difficult to
get direct information about how much the balancing needs have actually increased due
to additions of wind power. There is also experience of solar power (PV), mainly from
distribution networks but also some first transmission level impacts when the shares of
PV have exceeded 1-2 % in recent years in Germany, Italy and Spain. Experience from the
rapid PV additions show that the setting parameters can have impact on system needs:
initial parameters making PVs to trip at > 50.2 and < 49.7 Hz frequency could have led to
tens of GWs tripping at those frequencies and thus impacting the frequency reserves
(EPIA, 2012). The retrofitting of the about 315 000 PV systems in Germany is currently in
underway and will be finished within less than three years.
In the following the impact of variable RES on the need for reserves. The discussion will
almost exclusively discuss the impact of wind energy. This is due to the fact that PV only
recently reached levels that impact reserve design. Therefore most literature and in
particular investigation of the impact over a longer term are only elaborated for wind
energy.
One reason for operating reserves is to cover for the largest unit that can trip off. This is
usually more than 1000 MW and wind power plants would not directly impact that design
criteria for reserves. However, wind power will impact the reserve that is operating to
cover for load and generation unbalances. Experience of wind integration shows that
when reaching penetration levels of 5-10 %, an increase in the use of short term reserves
is observed, especially for reserves activated on a 10-15 minute, or longer time scale
(IPCC, 2011; Ribeiro, 2012). In Spain, the frequency control activating in 30 seconds has
not been impacted by wind power with about 15 % penetration level (Gil et al, 2000). The
same experience is from the other highest wind penetration countries Denmark and
Portugal: no significant frequency impacts have been observed that are the result of wind
power variation (Eto et al., 2010). So far, no new reserve capacity has been built
specifically for wind power (Söder et al., 2007). In Portugal and Spain, new pumped hydro
is planned to be built to increase the flexibility of the power system, mainly to avoid
curtailment of wind power (Estanqueiro et al., 2010; Ribeiro, 2012).
Impact of inadequate system services have mainly been seen as curtailments: In Spain,
curtailments of wind power due to inability to maintain power balancing have occurred
since 2008 (when penetration exceeded 10 %) and they have slowly been increasing (0.5
% of total wind generation curtailed due to insufficient operating reserve in 2010, with
>16 % penetration) (Holttinen et al, 2011). In Portugal, wind power has been providing
close to all load during some hours without the need of curtailments, due to access to
flexible hydro power (Ribeiro, 2012). In Denmark, the curtailments were reduced in 2005
after combined heat and power plants started flexible operation. In Denmark also the
minimum production levels used in thermal plants were lowered (Holttinen et al, 2009).
In Denmark, must run commitments of thermal power plants are related to stability and
voltage control. Options for further decrease must run units are currently investigated, to
reduce curtailment needs in the future without compromising system stability. In Spain,
too, there needs to be a minimum of manageable generation (mainly conventional)
presently that assures a sufficient level of provision of ancillary services.
Challenging situations seen in system operation so far are from high wind power
generation during low load situations, when instantaneous wind power penetration levels
exceed 50 %, as well as high wind power ramps during rare storm events. In Ireland some
curtailments have been due to concerns about low inertia (Dudurych, 2010) and
consequently susceptibility to instability in the system due to high instantaneous wind

35 | P a g e
D2.2 and D2.1, Ancillary services: technical specifications, system needs and costs
penetration and low system load. Currently, the issue of low inertia is unique to small
systems like Ireland and possible solutions are being investigated (EirGrid and SONI,
2010), including wind power plants providing ancillary services and flexible balancing
plants that can operate at low output levels and deliver stabilizing services. The reduction
of inertia leading to more pronounced frequency excursions has been studied for the
large UCTE system in de Haan et al, 2012.
In wind integration studies, impacts of wind power as well as possible mitigation methods
are presented. These studies are available from several European countries, as well as
some Europe wide studies (Tradewind: van Hulle 2009, EWIS: Winter 2011, Offshore
Grid: De Decker and Kreutzkamp 2011). The aspects studied, as well as the
methodologies and ways to present results vary. The studies often concentrate on the
mitigation methods needed to manage larger wind penetrations: improving exchange to
neighbouring countries (also in shorter time scales sharing balancing resources),
improving TSO tools to forecast wind generation and to manage variability closer to real-
time, improving flexibility of conventional generation and demand. Also the participation
of variable renewables to ancillary services is one option.
Integration studies have aimed to quantify the increase in short term reserves (usually
the ones activated in 10-15 minutes so manual FRR). Summary of estimates from
several integration study results on increases in operating reserve requirements (MW)
are shown from IEA Wind Task 25 in Figure 9. In Germany there are several studies
showing estimates of increase in reserve requirements (dena, 2005 Figure 9,
Dobschinski, 2010 Figure 8 and Figure 9, Haubrich, 2008).
Summary of estimates from several integration study results from IEA Wind Task 25 on
increases in balancing costs (€/MWh), are presented in Figure 10. Estimated increase in
balancing costs at wind penetrations of up to 20 % amounted to roughly 1–5 €/MWh of
wind power produced (Holttinen et al, 2012) ILEX 2004 study for Ireland provided
estimate of additional fuel costs in addition to costs of reserve provision required at
varying wind penetration (O’Malley, 2004).
Figure 8: Estimated increase of up and down operating reserve requirement in Germany due to wind power
(Dobschinski et al, 2010), assuming different forecast/uncertainty time horizon for the reserve allocation.
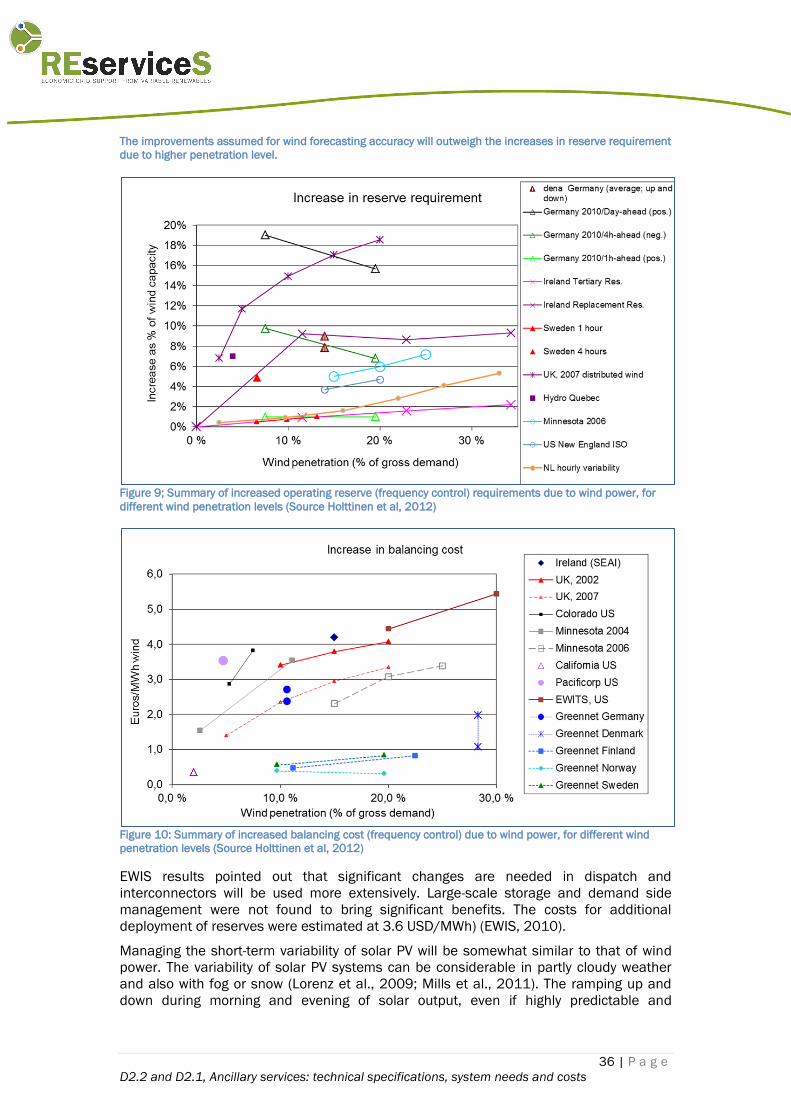
36 | P a g e
D2.2 and D2.1, Ancillary services: technical specifications, system needs and costs
The improvements assumed for wind forecasting accuracy will outweigh the increases in reserve requirement
due to higher penetration level.
Figure 9; Summary of increased operating reserve (frequency control) requirements due to wind power, for
different wind penetration levels (Source Holttinen et al, 2012)
Figure 10: Summary of increased balancing cost (frequency control) due to wind power, for different wind
penetration levels (Source Holttinen et al, 2012)
EWIS results pointed out that significant changes are needed in dispatch and
interconnectors will be used more extensively. Large-scale storage and demand side
management were not found to bring significant benefits. The costs for additional
deployment of reserves were estimated at 3.6 USD/MWh) (EWIS, 2010).
Managing the short-term variability of solar PV will be somewhat similar to that of wind
power. The variability of solar PV systems can be considerable in partly cloudy weather
and also with fog or snow (Lorenz et al., 2009; Mills et al., 2011). The ramping up and
down during morning and evening of solar output, even if highly predictable and

37 | P a g e
D2.2 and D2.1, Ancillary services: technical specifications, system needs and costs
sometimes coinciding with load ramping, can also impose a large variation for electrical
power systems with large amounts of solar PV energy (Denholm et al., 2009).
At increasingly high penetrations of solar PV and Concentrated Solar Power (CSP) without
thermal storage (>10% annual energy production), the net demand, that means demand
less solar production, will become increasingly low during the middle of the day when the
sun is shining, while the night time net demand will not be reduced by these solar
resources.
3.2. Services related to maintaining voltage
The impacts of wind and PV on voltage control differ for different grids. There are multiple
voltage levels in a distribution network and each will often have different characteristics.
Also the urban and rural grids are different. In a densely populated urban areas, load is
spatially concentrated and often supplied from several locations with adequate reactive
power sources, however much of the distribution lines are cabled. On the other hand,
rural demand is spatially dispersed, weakly connected and chronically underfed with
reactive power, leading to poor voltage profile.
3.2.1. Voltage setting of the reactive power sources in the network
With increasing the penetration of renewables, changes in voltage profiles will appear in
the power system. To maintain the voltage profiles close to the optimal profiles, the
voltage settings of the reactive power sources including large generators will need to be
recalculated. Their settings are determined by their influence in the network voltage
profile, dependent on the configuration of the network, position of the reactive power
source in the power system, and their capacity. Using extensive power flow calculations
and statistical analysis, the setting and the ranges for a particular reactive source can be
obtained to collectively bring about the optimal network voltage profile (Gubina and
Gubina, 1999).
3.2.2. Influence of distribution-connected renewable generation on the
voltage profile
In the distribution network, the volatility of renewable sources power generation leads to
varying of the voltage profile. This influence should be studied beforehand in the planning
phase of renewable source penetration and the mitigation measures should be
employed. In the radial line, typical in a distribution network, a reactive power source
could be installed to mitigate variations in voltage profile.
Due to its radial nature, the voltage level in a distribution network is generally decreasing
proportionally with the distance from the substation. With the connection of distributed
generation, various situations may be encountered regarding the voltage profile
influence. The voltage might be raised at the beginning or at the end of a distribution line.
In case or failure of an element of a distribution line, the customers would be
reconnected to another line, which may considerably change the voltage profile of a
reconnected line. With the connection of distributed generation on a radial line, power
would flow in the direction opposite to the normal flow, causing problems with protection
and changes in voltage profiles (e.g. voltage rise along the line instead of the expected
voltage drop).

38 | P a g e
D2.2 and D2.1, Ancillary services: technical specifications, system needs and costs
Voltage rise in distribution grids is an issue for PV integration (Widén et al., 2009).
Thomson and Infield (2007), however, show that in a typical urban UK network with a
very high PV penetration level (2,160 Wpeak on half of all houses), only small increases
in average network voltages occur.
RES as distributed generation can also improve voltages in certain places of the network,
especially at the end of a long radial line or far away from other reactive power sources,
thus supporting traditional voltage control means. Most units are connected to the
distribution grid with a power electronic inverter. Both the voltage-current relationship
and the power exchange are determined by the choice of the topology and control
strategy. A suitable choice of the hardware in combination with the implementation of a
smart control strategy could allow grid-connected inverters to offer a wide range of grid
supporting services. The improvement of the power quality is nowadays mainly taken
care of by so-called power quality conditioners (PCQ). These systems have the sole
purpose of improving the power quality in electrical grids. Distributed generators are
extremely fit to improve the power quality because they are connected to the grid via a
voltage-source inverter and are able to improve the power quality by injecting active
and/or reactive power in the grid. In contrast to the dedicated PQC-solutions, distributed
generators do not require energy storage since the energy delivered by the primary
energy source can be used for this purpose.
The reactive power sources may be remotely controlled by the DSO or be programmed to
act automatically. They might be embedded in the renewable source as well. Moreover,
the under-load tap changer’s voltage control should be adjusted to the changed situation
of active power load and lack of reactive power and to voltage stability problems.
Even though in particular in regard to reactive power provision PV can be a cost-effective
source, most studies and investigation where so far carried out for wind energy.
Therefore the following discussion of the role and impact of RES in voltage support
provision will almost exclusively focus on wind energy.
Following the integration of significant number of wind power plants onto the system the
online reactive power, both static and dynamic, available to the system operator to
manage voltage will fundamentally alter. The main three reasons are:
The wind power plants are located further from load centres than traditional
conventional plant. An analysis of the applications for wind power plant connections
in Ireland and Northern Ireland shows that over half the expected 6000 MW will
connect to the distribution network (the system up to 2005 had all the significant
active and reactive power sources directly connected to the transmission network).
The reactive power capability from wind power plant as defined in the All Island Grid
Code and typically to be found in globally available wind power plants has a reactive
power capability of 0.95 p.u. leading/lagging power factor at wind power outputs
greater than 50 %. This compares to conventional plants that are required to meet
wider ranges of 0.93 leading to 0.85 p.u. lagging (0.8 p.u. for some units in Northern
Ireland) power factor at their maximum MW output level and they can give even more
MVAr outputs at lower setpoints. Therefore, even if all generators on the system are
compliant with the required standards there is a potential reduction in aggregate
MVAr control capability with the addition of 6000 MW of wind power plants there is a
potential reduction in aggregate MVAr control capability.
With the increasing penetration of distributed RES, such as wind generation, the
nature of the reactive support will change. Instead of being predominantly provided
by synchronous generators, which have fast acting excitation systems and the ability
to provide constant reactive current during voltage disturbances, more and more will

39 | P a g e
D2.2 and D2.1, Ancillary services: technical specifications, system needs and costs
be provided by doubly fed induction generators, static compensators or static var
compensators depending on the nature of the wind power plant. This has
implications for the transient stability of the power system, for managing voltage
collapse phenomena especially at high load and low wind levels, and ultimately for
network design.
A review of the actual available reactive power on the Ireland and Northern Ireland power
system using the actual hour-to-hour dispatched output of each unit on the system
combined with their known reactive power capability curve shows that the available
lagging MVAr ranges between 2500 MVAr to just over 5000 MVAr. Comparing the 2010
with the 2020 model (Figure 11) using an annual duration curve, there is a noticeable
reduction in online synchronous reactive power available all through the year. When
transmission connected wind power plants are included there is an increase in the
available reactive power on the 2020 level, but it still does not meet the levels in 2010.
There is less capability to manage voltage in the 2020 power system with high
penetrations of wind power plant.
Figure 11: Duration curve for lagging MVAr capability curve for 2010 against 2020
Although it is difficult to quantify the full impact of the reduced and changing nature of
reactive power control on the management of voltage, the estimated levels will present
significant operational issues in the future. Systematic practices, tools and policies are
needed clearly reflecting the issues involved.
Potential challenges mirror in the reactive power duration curve for Dublin. As the largest
load centre in Ireland and Northern Ireland it has a ring network of seven 220 kV cables
supported by a meshed 110 kV overhead network. Traditionally, this network has high
voltage issues during low load periods when the cables are operated below their surge
impedance loading and the excess capacitive support needs to be actively managed.
Solutions used the combined use of leading MVAr from local transmission connected
generators and the switching out of some cables to reduce the charging are solutions
used. However, comparing the duration curve for available leading MVAr in 2010 and

40 | P a g e
D2.2 and D2.1, Ancillary services: technical specifications, system needs and costs
2020 (Fig. 9) shows that there will be on average a 400 MVAr reduction in leading MVAr
with the subsequent reduced capability to manage high voltage. Some of this will be
partly accounted for by increased load due to demand growth but this is unlikely to be
sufficient to fully compensate for this level of change.
Figure 12: Available leading MVAr in Dublin as measured in 2010 and as projected in 2020. (Source:
O’Sullivan et al, 2012)
3.2.3. Reactive power: projected portfolio capability and system
characteristics
The Irish study has assumed that as the generation portfolio evolves, the new
synchronous generation that is commissioned will provide the reactive power capability.
This means that existing generation, which has slightly better than Grid Code capabilities
in terms of lagging reactive power but poorer than Grid Code capabilities in terms of
leading reactive power, will be replaced with Grid Code compliant generation. In addition,
the level of installed synchronous generation is expected to fall by approximately 700
MW. Thus, as illustrated in Figure 13, the system capability for lagging reactive power is
expected to fall while the level of leading reactive power is expected to rise.

41 | P a g e
D2.2 and D2.1, Ancillary services: technical specifications, system needs and costs
Figure 13: Expected 2020 portfolio synchronous Reactive Power capability (MVAr) (Source: EirGrid and SONI,
2011)
Table 5 shows average available reactive power (i.e. from on-line generation) in 2010
and 2020 (with percentage increase/ decrease). Also shown are two wind cases, one
where it is assumed that only Transmission-connected wind (approximately 50%)
provides the Grid Code required levels of reactive power, and a second where it is
assumed that all wind provides the capability set out in Figure 13.
Table 5: System Reactive Power with different 2020 portfolio and windfarm capabilities (Source: EirGrid and
SONI, 2011)
According to average values and to the reactive power duration curves, Figure 14, the
level of available synchronous reactive power is expected to fall by 2020. If the wind
generation that displacing the synchronous generation provides an equivalent reactive
power service, this reduction can be somewhat offset.

42 | P a g e
D2.2 and D2.1, Ancillary services: technical specifications, system needs and costs
Figure 14: Reactive Power duration curve – evaluated from 2010 actual data and two modeled scenarios in
2020 (graph). (Source: EirGrid and SONI, 2011)
The European wide EWIS study listed additional measures needed to maintain system
security as faster protection schemes, more reactive power compensation devices, faster
ramping of other plants, and additional protection measures when using dynamic line
rating for increasing network capacity. Future wind plants need to be equipped with state-
of-the art FRT capability. The joint operation of the European network needs to be better
coordinated, and dedicated control centres for renewable sources should be
implemented similar to those in Spain (Morales et al., 2008; J. Rodriguez et al., 2008).
3.2.4. Dynamic Reactive Power Considerations
The All Island TSO Facilitation of Renewable Studies (a.k.a. FoR studies, EirGrid and SONI,
2010) indicated that at high system non synchronous penetration levels the transient
stability of the system will be significantly compromised (Figure 15). This arises since
with fewer on-line synchronous generating units there is a reduction in synchronising
torque – the forces that keep generators operating in unison. As the instantaneous
penetration of wind increases relative to system demand (and exports), the percentage of
contingencies with a critical clearance time (CCT) less than 200ms increases. Since
critical clearance time is a measure of the transient stability of the system (with higher
critical clearance time denoting greater stability), this means that the system becomes
less transiently stable at high wind penetrations relative to system demand.

43 | P a g e
D2.2 and D2.1, Ancillary services: technical specifications, system needs and costs
Figure 15: Percentage of contingencies causing Critical Clearance Times (CCT) lower than 200ms vs SNSP
(Source: EirGrid and SONI 2011)
However, the FoR studies also indicated that the provision of dynamic reactive power in a
measured fashion from network devices (e.g. synchronous compensators or wind farms)
during voltage disturbances could be used to mitigate many, if not all, of these issues
(Figure 16). The figure shows the impact of the mitigation strategies on the critical
clearance times of the contingencies studied. These results suggest that application of
the mitigation strategies substantially improves transient stability by increasing the
critical clearance time of the most onerous faults.
Figure 16: Impact of mitigation strategies for improving transient stability issues on Critical Clearance Times
(Source: EirGrid and SONI 2011)
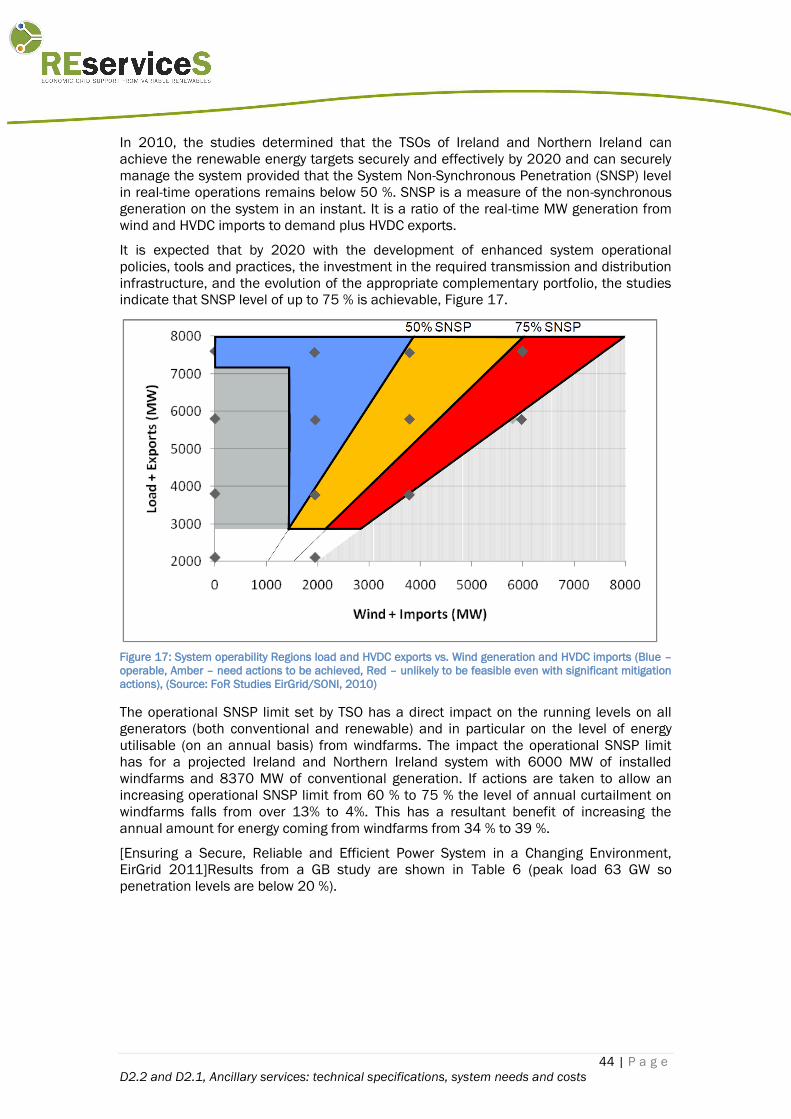
44 | P a g e
D2.2 and D2.1, Ancillary services: technical specifications, system needs and costs
In 2010, the studies determined that the TSOs of Ireland and Northern Ireland can
achieve the renewable energy targets securely and effectively by 2020 and can securely
manage the system provided that the System Non-Synchronous Penetration (SNSP) level
in real-time operations remains below 50 %. SNSP is a measure of the non-synchronous
generation on the system in an instant. It is a ratio of the real-time MW generation from
wind and HVDC imports to demand plus HVDC exports.
It is expected that by 2020 with the development of enhanced system operational
policies, tools and practices, the investment in the required transmission and distribution
infrastructure, and the evolution of the appropriate complementary portfolio, the studies
indicate that SNSP level of up to 75 % is achievable, Figure 17.
Figure 17: System operability Regions load and HVDC exports vs. Wind generation and HVDC imports (Blue –
operable, Amber – need actions to be achieved, Red – unlikely to be feasible even with significant mitigation
actions), (Source: FoR Studies EirGrid/SONI, 2010)
The operational SNSP limit set by TSO has a direct impact on the running levels on all
generators (both conventional and renewable) and in particular on the level of energy
utilisable (on an annual basis) from windfarms. The impact the operational SNSP limit
has for a projected Ireland and Northern Ireland system with 6000 MW of installed
windfarms and 8370 MW of conventional generation. If actions are taken to allow an
increasing operational SNSP limit from 60 % to 75 % the level of annual curtailment on
windfarms falls from over 13% to 4%. This has a resultant benefit of increasing the
annual amount for energy coming from windfarms from 34 % to 39 %.
[Ensuring a Secure, Reliable and Efficient Power System in a Changing Environment,
EirGrid 2011]Results from a GB study are shown in Table 6 (peak load 63 GW so
penetration levels are below 20 %).

45 | P a g e
D2.2 and D2.1, Ancillary services: technical specifications, system needs and costs
Table 6 – The total DNO reactive import (MVAr) from the transmission network in MVAr at peak for different
level penetration of DG and various power factors (p.f.).
*(Source Mutale and Strbac (2005)
3.3. Other services
1. Black start capability
So far there is neither experience nor studies on how wind/PV would impact system
restoration, a black start. Wind and solar may pose a potential threat to the system thus
risking a black out, but no evidence of this has been produced.
Retirement of conventional power plants will impact the ability of the system to restore. In
Spain for instance, black-start is performed by autonomous hydro power plants, which
are not considered as retiring due to additions of variable renewables.
2. Islanding
In case of disturbance, a power system section may suffer lack of active power. If in
island operation the survival of the island could be secured by activation of a
conventional or less conventional power unit equipped with voltage controller. High
penetration of RES in the grid considerably changes the islanding scheme. Due to
transient stability problem after islanding, a certain balance should be achieved between
conventional units and renewable sources in the island. That may be a difficult task in
the realm of high RES penetrations and, as a result, larger islands will be sought.
A reduced number of conventional units in the system due to increased RES generation
may make it challenging to find a suitable island. Additional measures including fast
acting controllers will be needed. A careful transient stability study should be conducted
for each new area with considerably increased RES penetration. The results may lead to
differently formed islands. There might be no island found and consequently a
conventional plant should be planned or fast reacting compensating devices should be
installed accordingly. The island should be provided by load rejection and even
generating sources rejection to maintain the equilibrium of production and consumption
and to maintain the frequency and voltage levels within the required tolerances.
3.4. Summary of system needs at different penetration levels
The impacts of wind/PV to system needs of frequency and voltage support are
summarised here for different penetration levels of wind/ solar. Table 7 shows the
penetration levels as average over the year (wind/ solar generation relative to total
electricity consumption).

46 | P a g e
D2.2 and D2.1, Ancillary services: technical specifications, system needs and costs
Table 8 shows penetration levels as during one hour (instant penetration level).
Studies show that combining different variable renewable sources will be beneficial in
smoothing the variability and decreasing overall uncertainty (Lund, 2006; Kavanagh et al
2011).
Table 7: Frequency and voltage control related impacts from wind power, estimated for different European
countries at 10 –20 – 30 – 40 % penetration levels from yearly electrical energy (gross demand) based on
experience (orange background) and studies (olive background)
5-15 % 15-25 % 25-35 % 35-45 %
ALL
No significant frequency
impacts have been observed
that are the result of wind
power variation (in some
countries curtailments of
wind in critical moments to
ensure adequacy of
frequency control/operating
reserves)
Ire
lan
d
Increase in operating
reserve requirements
estimated to be 2 % of
installed wind capacity for
hourly variability of wind and
4 % for 4-hourly variability of
wind.
The percentage of
contingencies with a critical
clearance time (CCT) less
than 200ms increases, and
thus the transient stability
of the system will be
significantly compromised.1
Enhanced sources of static
and dynamic reactive
power are needed – also
from wind turbines. SNSP
will be increased to 75 % to
enable 40 % wind
penetration with less than
10 % curtailment losses.
Curtailments are used to
limit non-synchronous
(mainly wind) generation to
max 50 % of the load (small
system size), total 1.2 % of
wind generation in 2010
(with 11 % wind
penetration).
De
nm
ark
Forecasting used to bid wind
power to day-ahead Nordic
electricity market, with
imbalance settlement for
wind power (2-3 €/MWh
extra cost)
Curtailment of wind
power is still very
rare, due to good
connections to
neighbouring
countries. Nordic
balancing market is
used for balancing.
1 Ensuring a Secure, Reliable and Efficient Power System in a Changing Environment, EirGrid and Soni 2011

47 | P a g e
D2.2 and D2.1, Ancillary services: technical specifications, system needs and costs
Sp
ain
Supervising and controlling
wind power in real time
(through control centres)
has reduced the number of
curtailments needed.
Curtailments due to
insufficient
balancing/frequency control
have started after >10 %
wind penetration.
Curtailments due to
insufficient
balancing/frequency
control have
increased year by
year, in 2010 this
was 0.5 % of total
wind power
generation (with >
16 % wind
penetration).
Stronger
interconnections
with the rest of
Europe needed to
minimise these
curtailments.
Curtailments due to
balancing expected
to increase.
Stronger
interconnections
needed to minimise
these curtailments.
Voltage control by
RES will help
integration and
reduce
curtailments. More
flexible thermal
units and higher
pumping capacity
would also reduce
them.
Po
rtu
ga
l
No curtailments of wind
power. Operating reserve
allocation has been
increased to cover wind
forecast errors. Reactive
power consumption in
transmission grid has
experienced a decrease due
to wind power installed in
distribution grid. Static
compensation devices have
been added to the grid to
enable managing high
voltages.
New pumped hydro
is planned to be
built to increase
the flexibility of the
power system,
mainly to avoid
curtailment of wind
power
Ge
rma
ny TSOs use intra-day markets
to manage part of the wind
power forecast errors from
day-ahead markets.

48 | P a g e
D2.2 and D2.1, Ancillary services: technical specifications, system needs and costs
Table 8: Frequency and voltage control related impacts from wind power, estimated for different European
countries at < 50 % ; 50 - 75% and 75 - 100% instant penetration level based on experience (orange
background and studies (olive background)
<50 % 50-75 % 75-100 % >100 %
Ire
lan
d
75% is seen as the upper
technical limit. Enhanced
sources of static and dynamic
reactive power are needed also
from wind turbines. Increasing
operational SNSP limit from 60
% to 75 % would result in annual
curtailment on wind farms
reduction from over 13 % to 4 %,
increasing the annual amount of
wind energy from 34 % to 39 %
(in this case, RoCoF-related
issues need to be resolved). With
the development of enhanced
system operational policies, tools
and practices, the investment in
the required transmission and
distribution infrastructure, and
the evolution of the appropriate
complementary portfolio, the
non-synchronous generation on
the system in an instant (SNSP)
level of up to 75 % is achievable.
De
nm
ark
Curtailment of wind power is
still very rare, due to good
connections to neighbouring
countries. Nordic balancing
market is used for balancing.
These situations have
occurred in West
Denmark several
times per year, and all
Denmark also. During
high wind low load,
always exporting.
Sp
ain
Most RES generators shall
comply with new grid code
(PO 12.2/ Entso-e NC RfG).
Interconnection compared to
installed capacity at the level
of central Europe. Higher
pumping capacity
significantly increased.
Demand response and
provision of ancillary services
needed.
Po
rtu
ga
l
No curtailments of wind
power.
No curtailments of wind power
has occurred in the moments
of 60-90 % of load from wind
power. This has been managed
with pumped hydro and
exports to Spain.

49 | P a g e
D2.2 and D2.1, Ancillary services: technical specifications, system needs and costs
4. COST STRUCTURE AND PROCUREMENT OF ANCILLARY SERVICES
Provision of ancillary services will usually incur costs for the generators. These will vary
for different generator types. This section aims for a common way of looking at costs for
RES and conventional generation.
The costs of an individual service will also depend on how the service is procured,
including eligibility to supply, and performance metric used to ensure the quality of the
service procured. For variable renewables the timing and duration of offers will be critical
as the forecast errors will increase with higher time horizons (like more than 6 hours
ahead). For PV and wind a market to contract services in hourly level (like every 2-6
hours) would enable participation. Also possibility to only bid for certain hours is
important – like PV cannot bid for night hours wind not during low wind hours.
Cost structure for a specific service can also imply how a service can be developed to a
market in foreseeable future – if costs are not generator or time dependent, a market will
give no benefits.
4.1. Examples for procuring the services
Examples of current approaches to contract frequency control services are presented in
Table 9. Also Appendix 1 lists procurement of frequency control services in European
countries, summarised from ENTSO-E questionnaire that was published as maps.
Another survey can be found in Rebours et al (2007).
Table 9: Example of how frequency control offers work in Denmark, Finland, Germany, Spain and Ireland
Reserve Type and Key
parameters2
Denmark Finland Germany Spain Ireland
(All Island)
Frequency
containment
reserve
(Primary
control
reserve)
Method of
procurement
Auction Partly yearly
auctions
and partly
hourly
market
Auction Mandatory Regulated
services via
bilateral
contracts
Gate closure
and duration
of the offer
Daily
auction in
4 hour
blocks,
day
before at
15:00
for the
hours in the
next
calendar
day until
20.00
o’clock
Weekly,
6 Days
before
--- ---
Minimum
Offer
0.1 MW normal
operation
0.1 MW and
disturbance
Min 1
MW
±1.5%
nominal
power
output
2 Irish GridCode, Operating Reserve is broken down into 4 time-scales: Primary Operating Reserve, Secondary
Operating Reserve, Tertiary Operating Reserve 1 and 2. All the reserves except Primary are expressed as the
additional MW output (and/or reduction in Demand) required compared to the pre-incident output (or
Demand), fully available and sustainable over the indicated period following a frequency event (Eirgrid 2011).
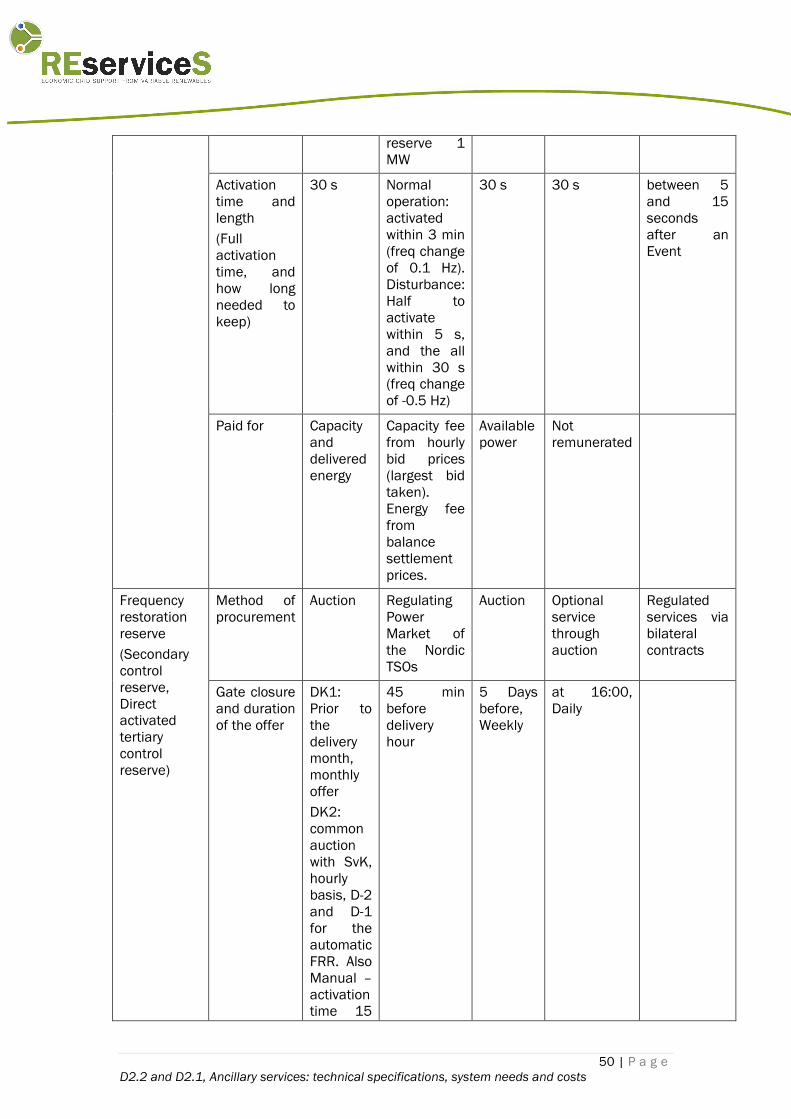
50 | P a g e
D2.2 and D2.1, Ancillary services: technical specifications, system needs and costs
reserve 1
MW
Activation
time and
length
(Full
activation
time, and
how long
needed to
keep)
30 s Normal
operation:
activated
within 3 min
(freq change
of 0.1 Hz).
Disturbance:
Half to
activate
within 5 s,
and the all
within 30 s
(freq change
of -0.5 Hz)
30 s 30 s between 5
and 15
seconds
after an
Event
Paid for Capacity
and
delivered
energy
Capacity fee
from hourly
bid prices
(largest bid
taken).
Energy fee
from
balance
settlement
prices.
Available
power
Not
remunerated
Frequency
restoration
reserve
(Secondary
control
reserve,
Direct
activated
tertiary
control
reserve)
Method of
procurement
Auction Regulating
Power
Market of
the Nordic
TSOs
Auction Optional
service
through
auction
Regulated
services via
bilateral
contracts
Gate closure
and duration
of the offer
DK1:
Prior to
the
delivery
month,
monthly
offer
DK2:
common
auction
with SvK,
hourly
basis, D-2
and D-1
for the
automatic
FRR. Also
Manual –
activation
time 15
45 min
before
delivery
hour
5 Days
before,
Weekly
at 16:00,
Daily

51 | P a g e
D2.2 and D2.1, Ancillary services: technical specifications, system needs and costs
min
Minimum
Offer
Min 10 MW Min 5
MW2
10 MW
Activation
time and
length
DK1: 15
min
DK2: 15
min
15 min, to
keep until
the end of
the hour
when called
(can be
asked to be
stopped
before the
end of the
hour)
15 min Starts in 20
s, full
deployment
in 15 min
Secondary :
15 to 90 s
Tertiary 1:
90 s to 5
min
Tertiary 2: 5
min to 20
min
Paid for DK2 -
Capacity
and
energy
delivered
for
automatic
and only
energy
delivered
for
manual
Energy
produced,
up/down
regulation
prices from
the
Regulating
Power
Market
Available
power
and
energy
produced
Availability
(reserve)
and usage
(energy)
Replacement
reserve
(Tertiary
regulation)
Method of
procurement
not
existing
not existing Auction Optional
service
through
auction
Regulated
services via
bilateral
contracts
Gate closure
and duration
of the offer
At 12:00,
Daily
15 min
before,
Intraday
15 minutes
notice before
dispatch
Offer Min 5
MW
10 MW
Activation
time
15 min and
maintained
for at least 2
consecutive
hours
Replacement
Reserve: 20
min to 4 h
Substitute
Reserve: 4 h
to 24 h
Paid for Available
power
and
energy
produced
Usage
(energy)
* Source: Twenties project, Fingrid and Entso-e operational reserves document Annex A.
52 | P a g e
D2.2 and D2.1, Ancillary services: technical specifications, system needs and costs
** Western Denmark (DK1) is part of the synchronous area of the former UCTE while
Eastern Denmark (DK2) is part of Nordel. Due to the technical differences between these
two synchronous zones they are handled separately.
*** The pooling of smaller units to reach this limit is permitted.
In addition to the procurement rules summarised in Table 9, there are procedures for
verification of compliance and data flow. Regarding the automatic services, the
regulation capacity of power plant equipment shall be verified by means of regulation
tests, and generator is usually responsible for the costs of the tests. Regarding data flow,
generator status information is required (e.g. in Finland every 3 minutes to TSO Fingrid,
and history data shall have to be stored for at least four days). If the reserve capacity
verified by means of measurements is lower than the bid, payment is only for the
capacity delivered, and there can be a compensation payment for capacity not supplied
(e.g. in Finland 30 per cent of the price for the hour for that bid) (Fingrid, 2012).
4.1.1. Examples of current approaches to contract voltage support
Examples of more detailed technical specifications and practices for the voltage control
services from different countries are presented in the following:
In Denmark, Germany and Spain, the provision of the reactive power for
voltage control services by conventional generators is mandatory. Generators
which provide reactive power in Germany and Denmark, do so via bilateral
agreements with their respective TSOs. In Germany, wind generators
(connected after January 2009) get a bonus for delivering reactive power,
while this is not true for PV generators. In Denmark this service is not
remunerated and for wind power, it became a requirement in the grid code of
2010. In Spain, special regime generators not involved in the active power
market are allowed to trade on a tendering market for the provision of
reactive power services. Over and above the basic remuneration there is
bonus/penalty system based on producing within a particular power factor
range depending on the load situation (Twenties, 2012).
Spain: voltage control mandatory for all conventional generation and non-
remunerated. In case of RES there is a power factor set-point of 1 that would
imply receiving a bonus or a penalisation if this power factor is not
maintained. TSO (REE) is able to send power factor set-points different than 1
to generators larger or equal to 10 MW. If this set-point is maintained, the
generator will receive a bonus and if it is not maintained, it will be penalised.
There is a proposal in the process of approval for allowing generators to have
voltage control in a similar scheme to the conventional generation, but with
bonuses and penalisations.
Portugal, on the DSO network, has capacitor banks installed on HV/MV
substations for grid loss compensation and voltage control. It has been
recently imposed that most of Distributed Generation on the DSO network
must have the possibility of injecting reactive power.
Great Britain: NGC procures reactive power through both market-based
tender processes and the default arrangements for all generators rated at
over 100 MW and default arrangements procure reactive power accordingly.

53 | P a g e
D2.2 and D2.1, Ancillary services: technical specifications, system needs and costs
The default arrangements remunerate generators for reactive power
according to utilisation on a €/MVArh basis. (Mutale and Strbac 2005).
Ireland: Eirgrid: Steady state reactive power is shaped as a product of
Reactive Power Capability. It is defined as the reactive power range (in MVAr)
that can be provided across the full range of active power output. Payment for
Reactive Power Capability will be based on a rate that is scaled by the ratio of
the active power output range (Maximum Generation – Minimum Generation)
to the Registered Capacity of the generator. It is proposed that payment is
based on the reactive capability, irrespective of the dispatched output of the
generator. Synchronous and non-synchronous sources as well as
synchronous compensators are eligible for this product. This re‐structured
product definition is illustrated in Figure 18 for a hypothetical 100 MW
generator. Payment will be based on a rate that is scaled by the ratio of the
active power output range (Maximum Generation – Minimum Generation) to
the Registered Capacity of the generator. The difference is shown between
what the plant can offer (red) and what TSO can use (blue). (Eirgrid and SONI,
2012a)
Figure 18: Reactive power capability: what a plant can offer and the TSO can use
In France, three sources of reactive power management are manageable by
Network Operators. Large generators connected to TSOs network are required
to provide reactive power management capability, either absorption or
injection according to their situation on the network. They can be used as
synchronous compensators. Taking into account their proper constraints of
stability the set points of operation are directly managed by the TSOs. The
TSOs operate compensation devices and in some cases reactors on its own
network and compensation devices are connected on the MV bus bars of
primary substation. They are operated by DSO within an agreement with the
TSO. Only the first one is considered an AS and is subject payment. Actual
delivery of service is periodically checked.
4.2. Different ways of paying for services

54 | P a g e
D2.2 and D2.1, Ancillary services: technical specifications, system needs and costs
The procurement and payments for the ancillary services are evolving and there are
currently different ways of paying for the services (and some services are considered
mandatory without payment). The ways of contracting and paying for the services can be
listed as:
Mandatory service with (or without) payment (mandatory offers or mandatory
provision)
Bilateral contracts
Tendering – offers, auction
Market-based
In Europe there are also hybrids of these ways (ENTSO-E, 2012a). Also packaging of
services is possible.
For voltage control, payments are often based on long contracts (annual, or monthly), but
some auctions are used (f.ex. England, where basic payment for capacity and operation
with auction/ offer mechanism operated on a semester base) (Raineri et al, 2006). Some
countries only pay for service that extends a mandatory range.
It should be noted that currently not all generators are able to bid/tender/offer all the
services, due to pre-qualifications that are restricting or too heavy or costly to be realised
by smaller producers.
There is already experience of cross border trade of services in the balancing market
(FRR manual) from the Nordic Regulating Power market. In the Central Europe system the
need for Frequency Containment Reserve is allocated between the countries.
CIGRE survey from 2010 lists some practices in use globally (Table 10). It can be seen
that for (automatic) frequency control, the energy part is mostly unpaid. In some
countries, the capacity part is not paid for the other ancillary services, but for most
services payments are used.
Table 10: Ancillary Service Procurement Methods, Capacity/ Availability vs. Energy/ Utilisation. (CIGRE, 2010)
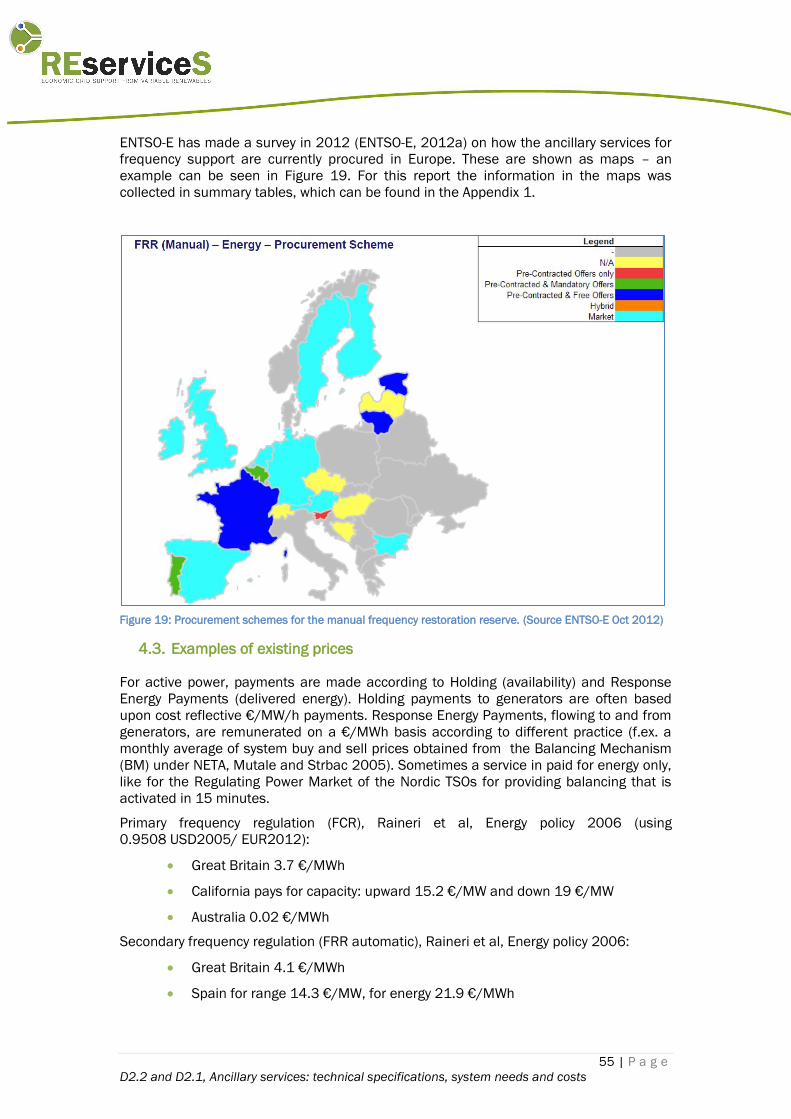
55 | P a g e
D2.2 and D2.1, Ancillary services: technical specifications, system needs and costs
ENTSO-E has made a survey in 2012 (ENTSO-E, 2012a) on how the ancillary services for
frequency support are currently procured in Europe. These are shown as maps – an
example can be seen in Figure 19. For this report the information in the maps was
collected in summary tables, which can be found in the Appendix 1.
Figure 19: Procurement schemes for the manual frequency restoration reserve. (Source ENTSO-E Oct 2012)
4.3. Examples of existing prices
For active power, payments are made according to Holding (availability) and Response
Energy Payments (delivered energy). Holding payments to generators are often based
upon cost reflective €/MW/h payments. Response Energy Payments, flowing to and from
generators, are remunerated on a €/MWh basis according to different practice (f.ex. a
monthly average of system buy and sell prices obtained from the Balancing Mechanism
(BM) under NETA, Mutale and Strbac 2005). Sometimes a service in paid for energy only,
like for the Regulating Power Market of the Nordic TSOs for providing balancing that is
activated in 15 minutes.
Primary frequency regulation (FCR), Raineri et al, Energy policy 2006 (using
0.9508 USD2005/ EUR2012):
Great Britain 3.7 €/MWh
California pays for capacity: upward 15.2 €/MW and down 19 €/MW
Australia 0.02 €/MWh
Secondary frequency regulation (FRR automatic), Raineri et al, Energy policy 2006:
Great Britain 4.1 €/MWh
Spain for range 14.3 €/MW, for energy 21.9 €/MWh
56 | P a g e
D2.2 and D2.1, Ancillary services: technical specifications, system needs and costs
California pays for capacity: 2.2 €/MW plus operation payment for real-time
dispatch
Argentina 2.2 €/MW plus operation payment as a fraction of spot price
Australia 0.03 €/MWh
Voltage control Raineri et al, Energy policy 2006:
Great Britain has rates for capacity between 0–0.55 €/MVArh and use 1.25
€/MVArh
Nordel only for use outside mandatory range (2.6 €/MVArh)
Australia 0.2 €/MVArh
German prices for holding capacity are available in https://www.regelleistung.net/ip/. It
contains tendering results for primary control, secondary control and minute reserve
markets.
GB standing reserve services for 2004/2005 (inflation adjusted to 2012 with 1.1825)
showed wide variations for both availability and utilisation. Availability prices ranged
between 2.64–22.41 €/MWh, with an average price of approximately 6.39 €/MW/h.
Similarly, wide ranges of utilisation prices were also witnessed of between 35–650
€/MWh with the largest grouping in the 123–264 €/MWh band (Mutale and Strbac
2005).
Regarding pricing, it is noteworthy that actual delivery of ancillary services is monitored
and a penalty is imposed in case of non-delivery in most countries.
Some TSOs publish their balancing needs monthly, e.g. UK/National Grid
(www.nationalgrid.com/uk/Electricity/Balancing/Summary/) and Finland/Fingrid
(payment for the part of Freq control that is tendered day ahead)
(www.fingrid.fi/portal/suomeksi/palvelut/jarjestelmapalvelut/taajuuden_yllapito/).
Finland hourly prices for automatic Frequency containment reserve for the part of
that is tendered day ahead (on average less than 10 MW/hour, max <100
MW/hour)
o 2012 (1.1.-5.8.) normal operation average 34.5 €/MW (max 560 €/MW)
o 2011 prices: normal operation average 14.9 €/MW (max 770 €/MW) and
disturbance reserve average 16.9 €/MW (max 745 €/MW)
Denmark (Jutland, DK1 Central European system) Primary frequency control:
o Capacity upregulation: 32.5 €/MW; downregulation: 3.42 €/MW
o Energy upregulation: 29.89 €/MWh; downregulation: 28.68 €/MWh
Denmark (Själland, DK2, Nordic system)
o Primary (FNR): Capacity upregulation 48.04€/MW; downregulation 32.19
€/MW. Energy upregulation 14.41 €/MW; downregulation 15.21 €/MW
o Secondary (FDR): Capacity upregulation 22.73 €/MW, Energy
upregulation 4.12 €/MWh.

57 | P a g e
D2.2 and D2.1, Ancillary services: technical specifications, system needs and costs
GB mandatory freq control July 2012: Average price primary 4.63£/MW/h
secondary 1.38 £/MW/h, high (?) 5.77£/MW/h
GB Short Term Operating Reserve July 2012: Average Contracted Availability
Payment £7.49 /MW/h, Average Contracted Utilsation Payment £199.89 /MWh,
for 3303.251 MWh
Nordic balancing market (Regulating power market of the 4 TSOs for 15 min
activated energy, bids one hour before delivery). Table 11 shows up- and down
regulation price differences from the day-ahead price.
Table 11. Average prices in the day-ahead and balancing (regulating) power markets (see also Figure 20).
Figure 20: Average price difference of up and down regulation and spot price in the Nordic Regulating power
market (spot price is day-ahead Elspot). Finland prices are for years 2004-2010 (Source: Holttinen &
Stenberg, 2011)
Elspot average Up regulation, Down regulation,
price, Finland average average
2004 27,68 1,15 -1,65
2005 30,53 2,85 -1,76
2006 48,57 2,96 -3,00
2007 30,01 3,14 -2,54
2008 51,02 3,79 -5,28
2009 36,98 2,68 -3,66
2010 56,64 4,38 -7,40
€/MWh
Average spot price (Finland) with average up/down
regulations
0
10
20
30
40
50
60
70
2004 2005 2006 2007 2008 2009 2010
€/MWh
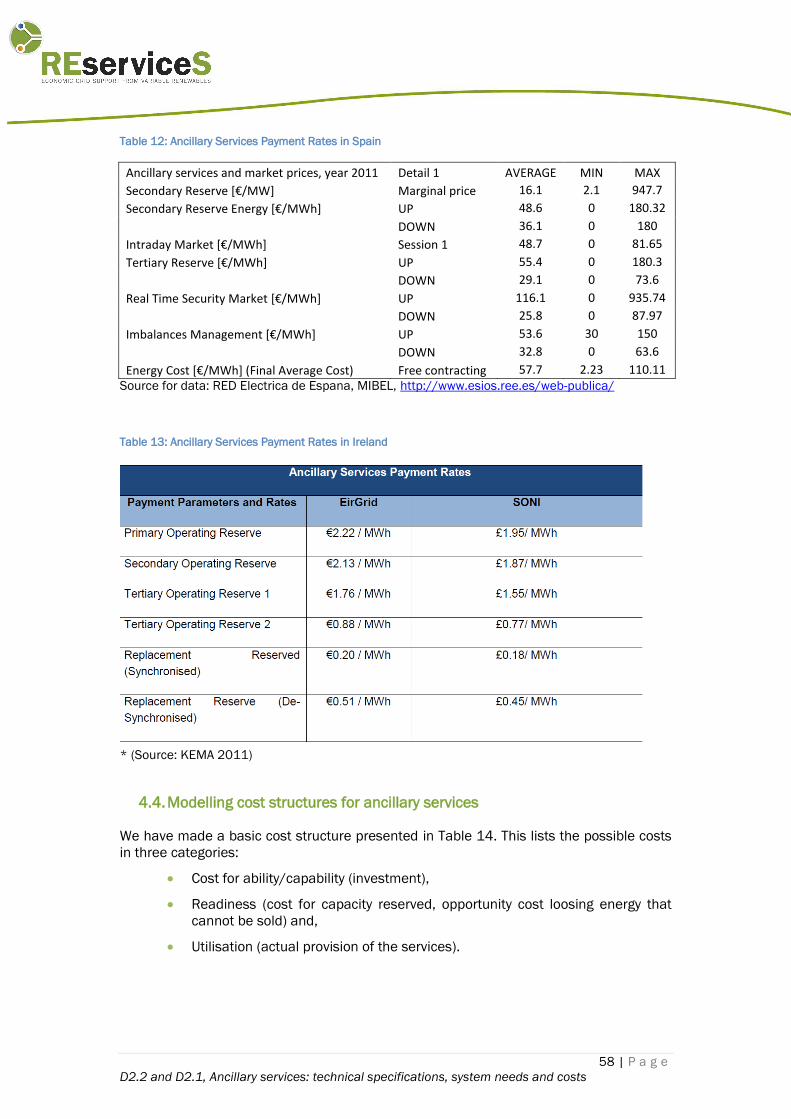
58 | P a g e
D2.2 and D2.1, Ancillary services: technical specifications, system needs and costs
Table 12: Ancillary Services Payment Rates in Spain
Ancillary services and market prices, year 2011 Detail 1 AVERAGE MIN MAX
Secondary Reserve [€/MW] Marginal price 16.1 2.1 947.7
Secondary Reserve Energy [€/MWh] UP 48.6 0 180.32
DOWN 36.1 0 180
Intraday Market [€/MWh] Session 1 48.7 0 81.65
Tertiary Reserve [€/MWh] UP 55.4 0 180.3
DOWN 29.1 0 73.6
Real Time Security Market [€/MWh] UP 116.1 0 935.74
DOWN 25.8 0 87.97
Imbalances Management [€/MWh] UP 53.6 30 150
DOWN 32.8 0 63.6
Energy Cost [€/MWh] (Final Average Cost) Free contracting 57.7 2.23 110.11 Source for data: RED Electrica de Espana, MIBEL, http://www.esios.ree.es/web-publica/
Table 13: Ancillary Services Payment Rates in Ireland
* (Source: KEMA 2011)
4.4. Modelling cost structures for ancillary services
We have made a basic cost structure presented in Table 14. This lists the possible costs
in three categories:
Cost for ability/capability (investment),
Readiness (cost for capacity reserved, opportunity cost loosing energy that
cannot be sold) and,
Utilisation (actual provision of the services).

59 | P a g e
D2.2 and D2.1, Ancillary services: technical specifications, system needs and costs
Table 14: Cost structure that is used as basis for all ancillary services
There can be additional costs from offering a service, related to compliance and testing
of the service quality, as well as from communication costs. TSOs and DSOs will evaluate
the performance of ancillary service providers in relation to declared availability and
contracted provisioning. Quality of the response from generating units to active and
reactive power set points and the response to reserve calls will be monitored.
4.4.1. Cost for providing Frequency control services
For frequency control services there is usually payment for Capacity (fixed) and/or energy
(as used). There is an opportunity cost of energy that cannot be sold to electricity
markets.
Frequency control cost components for the automatic services are listed in (Raineri et al,
2006) as Capacity (investment), Operation/generation cost (fuel), Opportunity cost and
Maintenance and lifetime reduction (based on survey from England, Spain, Nordel,
California, and Australia).
4.4.2. Cost for providing Voltage control services
Voltage control cost components are listed in (Raineri et al., 2006) as Capacity
(investment), Operation, Opportunity cost and Maintenance and lifetime reduction (based
on survey from England, Spain, Nordel, California, and Australia).
In many cases there is no explicit commercial cost associated with the supply or
absorption of reactive power. The cost of generating reactive power is mainly due to the
active losses in the generator and in the step up transformer caused by the reactive
power. These losses can be divided in Joule eddy, hysteresis and stray losses, and the
losses of the excitation system (Gil et al., 2000). From the transmission network point of
view the injected active and reactive power and the voltage in the high voltage bus
characterise the generation plant. The generator operator tries to minimise the
generation plant total losses while keeping the above constraints. The net result is that,
for a given injected active power, high side voltage and transformer tap, the generation
unit losses depends almost quadratically of the injected reactive power, with minimum
losses for a slightly capacitive power factor (Barquin et al., 1998). Fixed part and variable
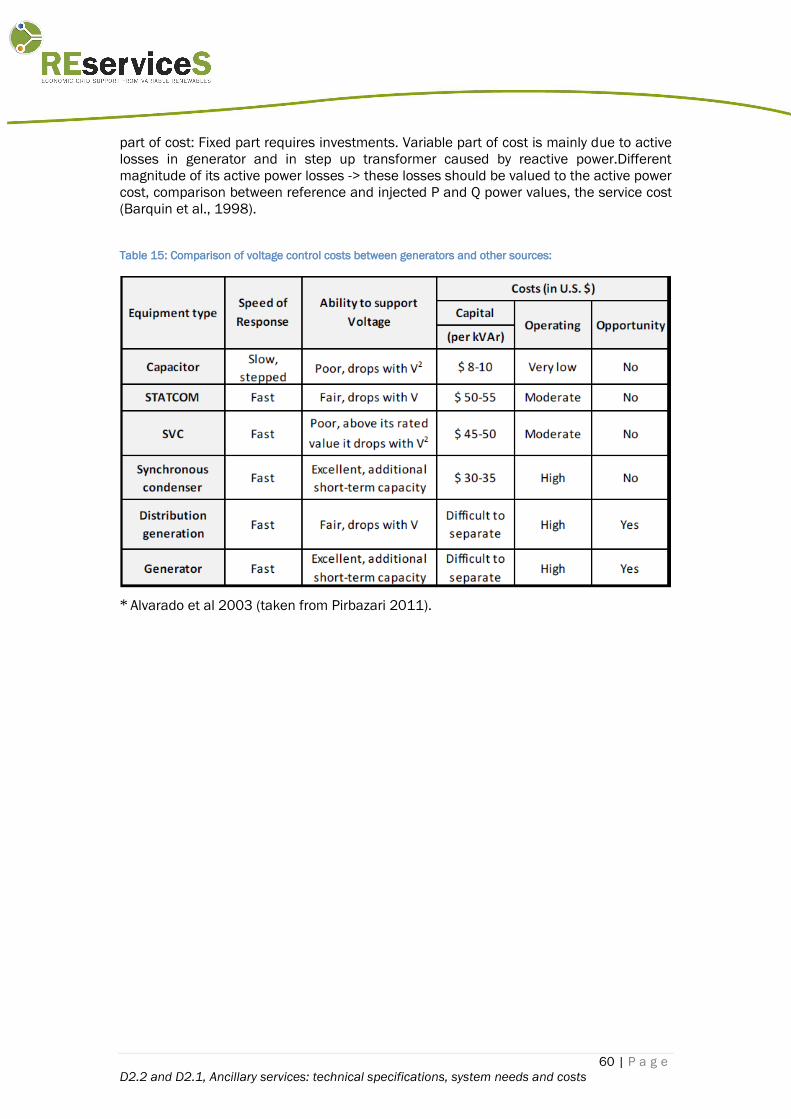
60 | P a g e
D2.2 and D2.1, Ancillary services: technical specifications, system needs and costs
part of cost: Fixed part requires investments. Variable part of cost is mainly due to active
losses in generator and in step up transformer caused by reactive power.Different
magnitude of its active power losses -> these losses should be valued to the active power
cost, comparison between reference and injected P and Q power values, the service cost
(Barquin et al., 1998).
Table 15: Comparison of voltage control costs between generators and other sources:
* Alvarado et al 2003 (taken from Pirbazari 2011).

61 | P a g e
D2.2 and D2.1, Ancillary services: technical specifications, system needs and costs
REFERENCES
ENTSO-E Network codes and supporting documents:
NC RfG: Network Code Requirements for Grid Connection (Submitted to ACER
13th July 2012), available at: https://www.entsoe.eu/resources/network-
codes/requirements-for-generators/ (31.10.2012)
o NC RfG Requirements in the context of present practices June, 2012
(input to comparison to practices in different EU countries)
LFC&R NC: Load-Frequency-Control & Reserves Network Code. Draft 14.09.12,
available at https://www.entsoe.eu/resources/network-codes/load-frequency-
control-reserves/ (31.10.2012)
o Ad Hoc team Operational Reserves Final Report 12.06.12
o Survey on Ancillary services procurement & balancing market design, Oct
2012 (the information in maps has been presented in tables in the
appendix of this document)
OS NC: Operational Security Network Code (draft 3rd Sept 2012), available at:
https://www.entsoe.eu/resources/network-codes/operational-security/
(31.10.2012)
OH: Operational Handbook, available at: https://www.entsoe.eu/resources/
publications/system-operations/operation-handbook/ (31.10.2012)
Survey on Ancillary Services Procurement & Balancing market design,
September 2012a, available at:
https://www.entsoe.eu/fileadmin/user_upload/_library/resources/BAL/121
022_Survey_on_AS_Procurement_and_EBM_design.pdf (6.11.2012)
Other references:
Alvarado F., Borissov B., Kirsch L., “Reactive Power as an identifiable ancillary
service‟, Laurits R. Christensen Associates Inc., March 18, 2003.
Barquín J., Soler D., Largo O., Relaño G., and de la Fuente I., On the Cost of
the Reactive Power Generation and Voltage Support Service, Proceedings of
the Bulk Power System Dynamics and Control IV – Restructuring, Santorini,
Greece, 24-28 August 1998.
Braun et al., Is the distribution grid ready to accept large-scale photovoltaic
deployment? State of the art, progress, and future prospects, Proc. of 26th
EU PVSEC, Hamburg, Germany 2011.
CIGRE, Ancillary Services: an overview of International Practices, CIGRE
Working Group C5.06, Oct. 2010.
Cuffe P., Smith P., Keane A., Transmission System Impact of Wind Energy
Harvesting Networks. IEEE Transactions on Sustainable Energy, Vol. 3, No. 4,
October 2012.
Econnect Ltd, Islanded Operation of Distribution Networks, DTI
DG/CG/00026/00/00, 2005, available at:
62 | P a g e
D2.2 and D2.1, Ancillary services: technical specifications, system needs and costs
http://webarchive.nationalarchives.gov.uk/20100919181607/http:/www.en
sg.gov.uk/assets/dgcg00026.pdf
De Decker J. and Kreutzkamp P., et al., Offshore Electricity Grid Infrastructure
in Europe A Techno-Economic Assessment, October 2011.
Dudurych I.M., Statistical analysis of frequency response of island power
system under increasing wind penetration, IEEE PES General Meeting 2010.
EirGrid Grid Code v.4.0,8.12.2012,
http://www.eirgrid.com/media/Grid%20Code%20Version%204.pdf
EirGrid and SONI, DS3: System Services Consultation – New Products and
Contractual Arrangements, EirGrid and SONI, June 2012a.
EirGrid and SONI, “DS3 System Services Review, Consultation Paper–New
Products”, presentation, 4th July 2012b.
EirGrid and SONI, Ensuring a Secure, Reliable and Efficient Power System in a
Changing Environment, EirGrid and SONI, June 2011.
EirGrid and SONI, All Island TSO Facilitation of Renewables Studies, EirGrid
and Soni, June 2010.
EPIA, Connecting the Sun – Solar photovoltaics on the road to large-scale grid
integration, Full Report, September 2012.
Eto J., J. Undrill, P. Mackin, R. Daschmans, B. Williams, B. Haney, R. Hunt, J.
Ellis, H. Illian, C. Martinez, M. O’Malley, K. Coughlin, and K.H. LaCommare,
Use of Frequency Response Metrics to Assess the Planning and Operating
Requirements for Reliable Integration of Variable Renewable Generation.
Lawrence Berkeley National Laboratory, Berkeley, CA, USA, 141 pp, 2010.
Estanqueiro A., Mateus C.B, and Pestana R., Operational experience of
extreme wind penetrations. In: 9th International Workshop on Large-Scale
Integration of Wind Power into Power Systems as well as on Transmission
Networks for Offshore Wind Power Plants, Quebec City, Canada, pp. 34-39,
18-19 October 2010.
EURELECTRIC, Ancillary Services. Unbundling Electricity Products – an
Emerging Market. EURELECTRIC Thermal Working Group, Ref: 2003-150-
0007, Feb. 2004.
Fingrid, 2012. Hourly market agreement and Application instructions,
available at
http://www.fingrid.fi/portal/in_english/services/system_services/maintenan
ce_of_frequency/
Gil A, de la Torre M, Dominguez T, Rivas R. Influence of wind energy forecast
in deterministic and probabilistic sizing of reserves. Proceedings of the 9th
International Workshop on Large-Scale Integration of Wind Power into Power
Systems as well as on Transmission Networks for Offshore Wind Power
Plants. Québec City, 18-19.10.2010. pp 83-88
Gubina F. and Gubina A.F. Investigation of voltage profiles in power system. V:
International Colloquium and Meeting SC-39 CIGRÉ, 07-12 November 1999,
Curitiba, Brazil.
Haubrich H.J., Gutachten zur Höhe des Regelenergiebedarfs. Gutachten im
Auftrag der Bundesnetzagentur für Elektrizität, Gas, Telekommunikation, Post

63 | P a g e
D2.2 and D2.1, Ancillary services: technical specifications, system needs and costs
und Eisen-bahnen, 2008 available at
http://www.bundesnetzagentur.de/cae/servlet/contentblob/102556/public
ationFile/5861/Gutachten%20zur%20H%C3%B6he%20des%20Regelenergie
bedarfes.pdf
van Hulle F, Integrating Wind – Developing Europe’s power market for the
large-scale integration of wind power, Final report of the Intelligent Energy
Europe research program TradeWind, February 2009.
Holttinen H., Meibom P., Orths A., van Hulle F., Lange B., O’Malley M., Pierik
J., Ummels B., Tande J.O., Estanqueiro A., Matos M., Gomez E., Söder L.,
Strbac G., Shakoor A., Ricardo J., Smith J.C., Milligan M., Ela E., “Design and
operation of power systems with large amounts of wind power” Final report,
IEA WIND Task 25, Phase one 2006-2008. Espoo, VTT. 200 p. + app. 29 p.
VTT Tiedotteita - Research Notes 2493. Available at
http://www.vtt.fi/inf/pdf/tiedotteet/2009/T2493.pdf
de Haan J.E.S, Aliano M., Frunt J., Kling W.L., Consideration of the load-
frequency control and performance of the continental European power
system during large imbalances. Proceedings of the 11th International
Workshop on Large-Scale Integration of Wind Power into Power Systems as
well as on Transmission Networks for Offshore Wind Power Plants. Lisbon,
13-15.11.2012. pp 514-519.
Holttinen H. Orths A.G., Eriksen P., et al., Currents of change, IEEE Power &
Energy Magazine, IEEE, USA. Vol. 9, No. 6, pp. 47-59, 2011.
Holttinen H. and Stenberg A., 2011. Wind power balancing costs for different
size actors in the Nordic electricity market. Conference proceedings of the
EWEA2011. EWEA. 2011, Brussels, Belgium, 14 - 17 March 2011
ILEX Energy Consulting, Ancillary Service Provision from Distributed
Generation, DTI Distributed Generation Programme, 2004.
IPCC, 2011. Sims R., P. Mercado, W. Krewitt, G. Bhuyan, D. Flynn, H.
Holttinen, G. Jannuzzi, S. Khennas, Y. Liu, M. O’Malley, L. J. Nilsson, J. Ogden,
K. Ogimoto, H. Outhred, Ø. Ulleberg, F. van Hulle, 2011: Integration of
Renewable Energy into Present and Future Energy Systems. In IPCC Special
Report on Renewable Energy Sources and Climate Change Mitigation [O.
Edenhofer, R. Pichs-Madruga, Y. Sokona, K. Seyboth, P. Matschoss, S.
Kadner, T. Zwickel, P. Eickemeier, G. Hansen, S. Schlömer, C. von Stechow
(eds)], Cambridge University Press, Cambridge, United Kingdom and New
York, NY, USA.
Kavanagh D., Keane A. and Flynn D., Challenges posed by the integration of
wave power onto the Irish power system. Proceedings of the 9th European
Wave and Tidal Energy Conference, Southampton, UK, 5–9th September,
2011.
KEMA Inc., System Services International Review, Market Update, 16010876,
London, November 24, 2011.
Kundur P., Power System Stability and Control, McGraw-Hill, 1994.
Kuzle I. and Sabolić D, Ancillary Services in the South East Europe,
Presentation in the 8th International conference on the European Energy
Market, 2011.

64 | P a g e
D2.2 and D2.1, Ancillary services: technical specifications, system needs and costs
Lund H., Large-scale integration of optimal combinations of PV, wind and
wave power into the electricity supply, Renewable Energy, pp. 503-515, Vol.
31/4, April 2006.
Miguélez E.L., Cortés I.E., Rodríguez L.R., Camino G.L., An overview of ancillary
services in Spain, Electric Power Systems Research, pp. 515-523, Volume 78,
Issue 3, 2008.
Mullane A. and O’Malley M.J., The Inertial Response of Induction-Machine-
Based Wind Turbines, IEEE TPWRS, Vol. 20, No. 3, August 2005.
Mutale J. and Strbac G. DISPOWER project Task 5.5: Development of contract
structures for ancillary services from distributed generation. University of
Manchester (2005).
O'Malley et al. Operating Reserve Requirements as Wind Power Penetration
Increases in the Irish Electricity System, 2004
http://www.seai.ie/Archive1/Files_Misc/IlexWindReserrev2FSFinal.pdf
O’Sullivan J., Coughlan Y., Rourke S., and Kamaluddin N., “Achieving the
Highest Levels of Wind Integration— A System Operator Perspective”, IEEE
Transactions on Sustainable Energy, Vol. 3, No. 4, October 2012
Van Overbeeke, F. and Roberts, V., "Active Networks as facilitators for
embedded generation", IQPC Conferencia sobre "Embedded Generation
within Distribution Networks", Londres. Enero. Y también el mismo trabajo se
presentó en la conferencia "Cogeneration and On-Site Power Production"
(COSPP), de Marzo-Abril, 2002. Available at:
http://nu.eltra.dk/dok/NUdok92.pdf
Pirbazari A.M., "Ancillary services definitions, markets and practices in the
world", 2010 IEEE/PES Transmission and Distribution Conference and
Exposition: Latin America, T and D-LA 2010, pp. 32, 2011.
Raineri R., Ríos S. and Schiele D., Technical and economic aspects of
ancillary services markets in the electric power industry: an international
comparison, Energy Policy, vol. 34, pp.1540-1555, 2006.
Rebours Y.G., Kirschen D.S., Trotignon M., Rossignol S., “A survey of
frequency and voltage control ancillary services - Part I: Technical features”,
IEEE Transactions on Power Systems, vol. 22(1), pp. 350-357, 2007.
RenewableUK, Position Paper on Inertia, 7th April 2011:
http://www.bwea.com/pdf/publications/RenewableUK_Inertia_Position_Pap
er.pdf
Ribeiro F., 2012. Impact of wind power in the Portuguese system operation.
Proceedings of the 11th International Workshop on Large-Scale Integration
of Wind Power into Power Systems as well as on Transmission Networks for
Offshore Wind Power Plants. Lisbon, 13-15.11.2012. pp 205-208.
Ruttledge L., Miller N.W., O'Sullivan J., Flynn D., "Frequency Response of
Power Systems With Variable Speed Wind Turbines," IEEE Transactions on
Sustainable Energy, vol.3, no.4, pp.683-691, Oct. 2012
SUPWIND project deliverable 8.1 – Assessment of market designs for energy
and ancillary services
65 | P a g e
D2.2 and D2.1, Ancillary services: technical specifications, system needs and costs
Söder L., Hofmann L., Orths A., Holttinen H., Wan Y.H., and Tuohy A.,
Experience from wind integration in some high penetration areas. IEEE
Transactions on Energy Conversion, 22(1), pp. 4-12, 2007.
Thomson M., and D.G. Infield (2007). Impact of widespread photovoltaics
generation on distribution systems. IET Renewable Power Generation, 1(1),
pp. 33-40.
vanWesenbeeck M. P. N, deHann S.W.H., Varela P., and Visscher K., Grid tied
converter with virtual kinetic storage Proc. IEEE Power, Tech Conf., Bucharest,
Romania, Jul. 2009
Widén J., E. Wäckelgård, and P.D. Lund (2009). Options for improving the
load matching capability of distributed photovoltaics: Methodology and
application to high-latitude data. Solar Energy, 83(11), pp. 1953-1966.
Winter W (ed.), European Wind Integration Study (EWIS) – Final Report.
http://www.wind-integration.eu/downloads/library/EWIS_Final_Report.pdf,
10.8.2011.

66 | P a g e
D2.2 and D2.1, Ancillary services: technical specifications, system needs and costs
APPENDIX 1. SUMMARY OF ENTSO-E SURVEY FOR RESERVES
Table 16. Summary of frequency control procurement procedures for Frequency containment reserve in European countries (Source: ENTSO-E, 2012a)

67 | P a g e
D2.2 and D2.1, Ancillary services: technical specifications, system needs and costs
Table 17. Summary of frequency control procurement procedures for Frequency restoration (automatic) reserve in European countries (Source: ENTSO-E, 2012a)

68 | P a g e
D2.2 and D2.1, Ancillary services: technical specifications, system needs and costs
Table 18. Summary of frequency control procurement procedures for Frequency restoration (manual) reserve in European countries (Source: ENTSO-E, 2012a)
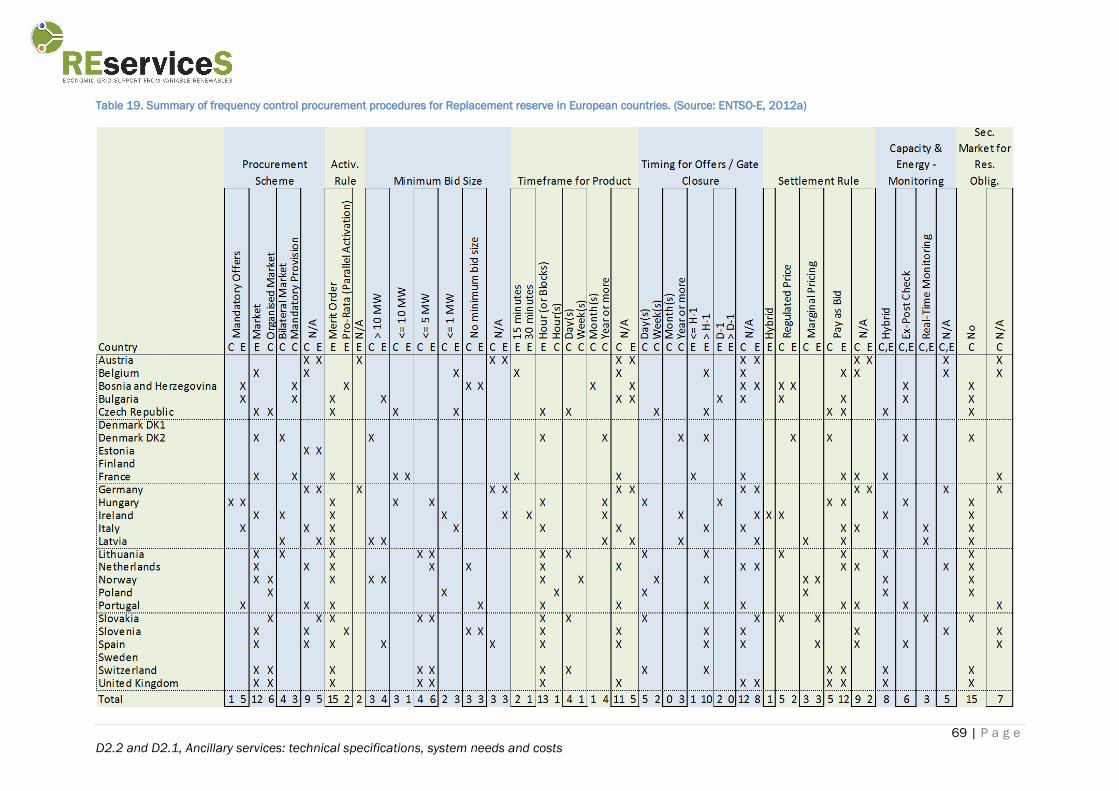
69 | P a g e
D2.2 and D2.1, Ancillary services: technical specifications, system needs and costs
Table 19. Summary of frequency control procurement procedures for Replacement reserve in European countries. (Source: ENTSO-E, 2012a)