anatomy of a post-starburst minor merger: a multi...
TRANSCRIPT

Anatomy of a post-starburst minor merger: a multi-wavelength WFC3 study of NGC 41501
R. Mark Crockett,2 Sugata Kaviraj,2,3 Joseph I. Silk,2 Bradley C. Whitmore,4 Robert W. O’Connell,5 MaxMutchler,4 Bruce Balick,6 Howard E. Bond,4 Daniela Calzetti,7 C. Marcella Carollo,8 Michael J. Disney,9
Michael A. Dopita,10 Jay A. Frogel,11 Donald N. B. Hall,12 Jon A. Holtzman,13 Randy A. Kimble,14
Patrick J. McCarthy,15 Francesco Paresce,16 Abhijit Saha,17 John T. Trauger,18 Alistair R. Walker,19 RogierA. Windhorst,20 Erick T. Young,21 Hyunjin Jeong22 and Sukyoung K. Yi22
ABSTRACT
We present a spatially-resolved near-UV/optical study, using the Wide Field Camera 3(WFC3) on board theHubble Space Telescope, of NGC 4150; a sub-L∗, early-type galaxy
1Based on observations with the NASA/ESA Hubble Space Telescope obtained at the Space Telescope Science Institute, whichis operated by the Association of Universities for Researchin Astronomy, Incorporated, under NASA contract NAS5-26555.
2Department of Physics, University of Oxford, Oxford OX1 3RH, United Kingdom; [email protected]
3Astrophysics Group, Imperial College London, South Kensington Campus, London SW7 2AZ, United Kingdom
4Space Telescope Science Institute, Baltimore, MD 21218
5Department of Astronomy, University of Virginia, Charlottesville, VA 22904-4325
6Department of Astronomy, University of Washington, Seattle, WA 98195-1580
7Department of Astronomy, University of Massachusetts, Amherst, MA 01003
8Department of Physics, ETH-Zurich, Zurich, 8093 Switzerland
9School of Physics and Astronomy, Cardiff University, Cardiff CF24 3AA, United Kingdom
10Research School of Astronomy & Astrophysics, The Australian National University, ACT 2611, Australia
11Association of Universities for Research in Astronomy, Washington, DC 20005
12Institute for Astronomy, University of Hawaii, Honolulu, HI 96822
13Department of Astronomy, New Mexico State University, Las Cruces, NM 88003
14NASA–Goddard Space Flight Center, Greenbelt, MD 20771
15Observatories of the Carnegie Institution of Washington, Pasadena, CA 91101-1292
16Istituto di Astrofisica Spaziale e Fisica Cosmica, INAF, ViaGobetti 101, 40129 Bologna, Italy
17National Optical Astronomy Observatories, Tucson, AZ 85726-6732
18NASA–Jet Propulsion Laboratory, Pasadena, CA 91109
19Cerro Tololo Inter-American Observatory, La Serena, Chile
20School of Earth and Space Exploration, Arizona State University, Tempe, AZ 85287-1404
21NASA–Ames Research Center, Moffett Field, CA 94035
22Department of Astronomy, Yonsei University, Seoul 120-749, Korea

– 2 –
(ETG) of around 6× 10⁹ M⊙, which has been observed as part of the WFC3 Early-ReleaseScience Programme. Previous work indicates that this galaxy has a large reservoir of molecu-lar hydrogen gas, exhibits a kinematically decoupled core (likely indication of recent merging)and strong, central Hβ absorption (indicative of young stars). While relatively uninspiring inits optical image, the core of NGC 4150 shows ubiquitous near-UV emission and remarkabledusty substructure. Our analysis shows this galaxy to lie inthe near-UVgreen valley, and itspixel-by-pixel photometry exhibits a narrow range of near-UV/optical colours that are similarto those of nearby E+A (post-starburst) galaxies, and lie between those of M83 (an activelystar-forming spiral) and the local quiescent ETG population. We parametrise the properties ofthe recent star formation (age, mass fraction, metallicityand internal dust content) in the NGC4150 pixels by comparing the observed near-UV/optical photometry to stellar models. The typ-ical age of the recent star formation (RSF) is around 0.9 Gyrs, consistent with the similarity ofthe near-UV colours to post-starburst systems, while the morphological structure of the youngcomponent supports the proposed merger scenario. The typical RSF metallicity, representativeof the metallicity of the gas fuelling star formation, is∼0.3 - 0.5 Z⊙. Assuming that this galaxyis a merger and that the gas is sourced mainly from the infalling companion, these metallicitiesplausibly indicate the gas-phase metallicity (GPM) of the accreted satellite. Comparison to thelocal mass-GPM relation suggests (crudely) that the mass ofthe accreted system is∼ 3 × 10⁸
M⊙, making NGC 4150 a 1:20 minor merger. A summation of the pixelRSF mass fractionsindicates that the RSF contributes∼ 2-3 percent of the stellar mass. This work reaffirms ourhypothesis that minor mergers play a significant role in the evolution of ETGs at late epochs.
Subject headings:Galaxies: Elliptical and Lenticular, Galaxies: Evolution, Ultraviolet: Galax-ies
1. Introduction
Over recent decades, a central topic in observational astrophysics has been the star formation histories(SFHs) of massive early-type (elliptical and lenticular) galaxies. Early-types host more than 50 per cent ofthe stellar mass density in the nearby universe and, given their dominance of the galaxy census, it is im-portant that we develop a thorough understanding of their formation and evolution. The broad-band opticalcolours of massive early-type galaxies are red and show a tight correlation with luminosity; more luminousgalaxies possessing redder colours. Since early-types arenot generally dusty, their optical colours imply thatthe bulk of the stellar population is old (> 3 Gyrs) and perhaps coeval (e.g., Bower et al. 1992, 1998; Elliset al. 1997; Stanford et al. 1998; Gladders et al. 1998; van Dokkum et al. 2000). The tight fundamental planeand the high alpha-enhancement ratios (e.g. Worthey et al. 1992; Carollo et al. 1993; Kodama & Arimoto1997; Trager et al. 2000) further suggest small ranges in theepoch and duration of ETG star formation.However, a significant drawback of optical colours is their insensitivity to moderate amounts of recent starformation (RSF). Indeed, high precision optical spectroscopy has consistently suggested extended periods ofstar formation lasting until a few Gyr ago in some ETGs and hasrecently demonstrated that the luminosity-

– 3 –
weighted ages of local ETGs have a large range and correlate with both velocity dispersion and environment(Trager et al. 2000; Nelan et al. 2005; Thomas et al. 2005; Graves et al. 2009; Scott et al. 2009; Thomas et al.2010). The currently accepted Lambda Cold Dark Matter (ΛCDM) paradigm suggests that this behavior isdue to gas infall and merger events that continue to recent times (Kaviraj et al. 2005), although some of thecold gas fueling star formation may be produced internally through stellar mass loss (e.g. Sarzi et al. 2006;Young 2005). Recent observational studies (e.g. Kaviraj etal. 2010; Kaviraj 2010) have highlighted the roleof minor mergersprogenitor mass ratios< 1:4) in the late-epoch (z< 1) evolution of ETGs.
An efficient way to pursue the problem of late star formation in ETGswithout the need for high S/Nspectroscopy is to employ rest-frame ultraviolet (UV; shortward of 3000 Å) imaging. While its impacton the optical spectrum is weak, small mass fractions (< 5 per cent) of young (< 0.5 Gyr old) stars canstrongly affect the near-UV (2000-3000Å) (Kaviraj 2008). Following thestudy by Yi et al. (2005), Kavirajet al. (2007c) comprehensively studied the UV properties ofa large sample (∼2100) of massive (Mr < 21)early-type galaxies in the nearby Universe (0< z< 0.11), by combining UV data from the GALEX mission(Martin et al. 2005) with optical data from the Sloan DigitalSky Survey (SDSS; Abazajian et al. 2009).When upper limits to the UV flux from evolved stellar stages are considered, e.g. extreme horizontal branch(EHB) stars which drive the ‘UV-upturn’ phenomenon typically observed in giant cluster ellipticals (Yiet al. 1999), 20-30 per cent of massive early-type galaxies are found to contain unambiguous signatures ofRSF, because their UV-optical SEDs cannot be produced by theEHB alone. It is worth noting that sinceupper limits to the UV flux from old stars are considered, the fraction of ‘star-forming’ ETGs becomes a(robust) lower limit. A more reliable result can be obtainedby studying the rest-frame UV properties ofETGs atz > 0.5, where the horizontal branch is not yet in place and the rest-frame UV becomes a morereliable indicator of the presence of young stars. By exploiting deep optical U and B-band data to trace therest-frame UV, Kaviraj et al. (2008) have demonstrated thatat these redshifts a negligible fraction of ETGsare consistent with purely passive ageing since high redshift, supporting the low redshift GALEX resultsand suggesting that RSF is a widespread phenomenon in the ETGpopulation over at least the last 8 billionyears. The mass fractions forming in the RSF events range from fractions of a percent to a few percent,with luminosity-weighted ages of∼ 300 - 500 Myrs (Kaviraj et al. 2007c). It is worth noting that the largespread (∼ 5 mags) in the NUV/optical colours cannot be reproduced by RSF driven solely byinternal stellarmass loss, pointing to an external origin for the gas that fuels that star formation. This seems consistent withrecent work that suggests that the RSF is driven by minor mergers.
TheHubble Space Telescope(HST) program exploited in this study extends and enhances these resultsby exploring thespatial distributionof young stars in early-type galaxies, which promises crucial insightsinto the processes that lead to star formation in early-typesystems. In this paper we use high resolutionNUV/optical photometry from the HST Wide Field Camera 3 (WFC3) toaccurately quantify the age, metal-licity, mass and spatial distribution of young stars in the early-type galaxy NGC 4150, with the aim ofconstraining the characteristics of the suspected merger event (e.g. age, mass-ratio) believed to have trig-gered the recent starburst.

– 4 –
1.1. The target galaxy: NGC 4150
The properties of NGC 4150 are detailed in Table 1. This galaxy was also one of the targets for theSAURON project (Bacon et al. 2001; de Zeeuw et al. 2002). NGC 4150 is characterised as a lenticular (S0)galaxy atαJ2000= 12h10m33s.67, δJ2000= +30◦24′05′′.9, which shows signs of RSF. Previous observationshave shown it to possess blue NUV/optical colours (Jeong et al. 2009), enhanced central Hβ absorption(Kuntschner et al. 2006), large quantities of molecular gas(Combes et al. 2007), and a kinematically decou-pled core (Krajnovic et al. 2008). The first two characteristics are indicative of RSF. The latter characteristicspoint towards a past merger with a less massive, gas-rich galaxy as the source of both the gas and the dis-turbed dynamics in the centre of NGC 4150, and as the trigger for the RSF.
Several authors (e.g., Huchra & Geller 1982; Kundu & Whitmore 2001) have associated NGC 4150with the Canes Venatici I group (also M94 group), the majority of whose member galaxies are within 2-8 Mpc of our Sun, with a median distance of∼4 Mpc (Makarova et al. 1998). However, the distancesestimated for NGC 4150 in the literature are somewhat largerthan this value. Tonry et al. (2001) calculateda distance modulus,µ = 30.69± 0.24 (d≈ 13± 1.5 Mpc) from measurements of I-band surface brightnessfluctuations (SBF), calibrated using Cepheid distances to other nearby galaxies. Jensen et al. (2003) laterupdated this value toµ = 30.53± 0.24 after re-calibrating the data using the Cepheid period - luminosityrelation of Udalski et al. (1999). Rekola et al. (2005) foundµ = 30.79± 0.2 (d≈ 14.4 Mpc) from R-bandSBF measurments, while Karachentsev et al. (2003) estimated µ ≈ 31.5 (d∼20 Mpc) from the turnovermagnitude of the globular cluster luminosity function (GCLF). Here we adopt the mean of the re-calibratedTonry et al. I-band (Jensen et al. 2003) and Rekola et al. R-band SBF distance estimates;µ = 30.66± 0.16(d = 13.55± 1.0 Mpc). This distance modulus is in good agreement with that derived by de Zeeuw et al.(2002) from the mean heliocentric velocity of the Coma I cloud (µ = 30.68; assumingH0 = 75 km s−1).Indeed, de Zeeuw et al. go on to associate NGC 4150 with this group of galaxies, which lies on the outskirtsof the Virgo cluster.
We have estimated the stellar mass of NGC 4150,M∗, from its Ks-band luminosity (Temi et al. 2009)using the stellar mass-to-light ratios derived by Bell et al. (2003). Bell et al. derivedM/L ratios for alarge sample of galaxies from the Two Micron All Sky Survey (2MASS) and the Sloan Digital Sky Survey(SDSS), and compared these with galaxy colours (see Bell et al. 2003, Appendix 2). From theseM/L -colour relations, and using the (B−V) colour of NGC 4150, we calculatedM∗/LKs = 0.6+0.3
−0.2, and henceM∗= 6.3+3.1
−2.1 × 10⁹ M⊙. NGC 4150 is unlikely to harbour an active galactic nucleus (AGN) as just a few (∼ 5)percent of local galaxies of this mass are classified as AGN (Kauffmann et al. 2003).
Temi et al. (2009) measured the star formation rate (SFR) in NGC 4150 to be∼ 4× 10⁻² M⊙ yr−1 fromSpitzer Space Telescope 24µm observations, and point out that this is greater (∼ ×4) than the rate at whichmass is being ejected from old stars. This suggests that stellar mass loss cannot provide sufficient material tosustain the current rate of star formation, and that cold gasmust have been accreted from outside the galaxythrough, for example, recent mergers.
The mass of this reservoir of cold, molecular hydrogen was computed by Welch & Sage (2003) andCombes et al. (2007) from measurements of CO emission. The two groups derived masses ofMH2 = 3.8×10⁷

– 5 –
M⊙ and 6.6 × 10⁷ M⊙ respectively, with much of the discrepancy between these two values being due todifferent CO-to-H2 conversion factors.
In the following sections we introduce new HST WFC3 observations of NGC 4150 and compare itsintegrated NUV/optical photometry with that of the nearby early-type galaxy population (§2), perform apixel-by-pixel analysis of the central region of the galaxy, estimating the age, mass, metallicity and extinc-tion of the young stellar populations (§3), and use our results to determine the star formation and assemblyhistory of this nearby lenticular galaxy (§4).
2. Observations, data reduction and preliminary analysis
Observations of NGC 4150 (see Table 2) were made using the newly installed Wide Field Camera 3(WFC3) on board the Hubble Space Telescope (HST). The observations formed part of an Early ReleaseScience Program (HST program 11360, PI: Robert O’Connell) led by the WFC3 Scientific Oversight Com-mittee. The main objective of this program is to study star formation in a range of different environments(early-type, quiescent and star-forming galaxies) in the local universe.
All data were downloaded from the HST archive23 at the Space Telescope Science Institute (STScI)via the on-the-fly recalibration (OTFR) pipeline, which implemented theCALWFC3software to bias, darkand flat-field correct the images. We further reduced the datalocally using theMULTIDRIZZLEsoftware(Koekemoer et al. 2002) to register individual exposures ina given filter, apply distortion corrections, maskout cosmic rays and other defects, and finally combine the exposures using thedrizzleimage reconstructiontechnique developed by Fruchter & Hook (2002). The data weredrizzled using the latest image distortioncoefficient tables (IDCTAB) downloaded from the WFC3 reference file website24.
Figure 1 shows a pseudo-colour (RGB) image of NGC 4150 created using the WFC3 UVISF814W, F555WandF438W frames for the red, green and blue channels respectively. Inthis optical image NGC 4150 ap-pears to be a typical S0 galaxy possessing a dominant bulge, albeit with obvious dust lanes towards its centre.The white boxes indicate the fields-of-view (FOVs) presented in Figure 2, which shows both pseudo-colourand monochrome images of the central region of NGC 4150. The RGB images in this case are a combina-tion of UVIS F657N (Hα+[N II] - red), F438W (green) andF225W (blue), while the greyscale images areunsharp-maskedversions of theF438W data. Unsharp-masking was performed by firstly median boxcarsmoothing theF438W image using a box of 50×50 pixels, before subtracting the smoothed image fromthe original. This had the effect of enhancing smaller scale structures, in particular the details of the dustdistribution in the centre of NGC 4150. Figure 3 shows greyscale versions of the UVIS observations of thegalaxy core through each of theNUV/optical filters.
Two issues are immediately obvious from the images in Fig. 2 and Fig. 3: (1) the unobscured areas of
23http://archive.stsci.edu/hst
24http://www.stsci.edu/hst/observatory/cdbs/SIfileInfo/WFC3/reftablequeryindex

– 6 –
the core of NGC 4150 are bright in theNUV / F225W (Fig. 3a), appearing blue in the colour compositeimages (Fig. 2a&b); and (2) there are significant amounts of dust, which forms a spiral-like structure andappears to rotate clockwise (North to West) in the plane of the galaxy disk. Some of this dust lies across theline-of-sight to the very centre and lower part of the galaxycore, blocking our view of this region at shorterwavelengths, as is well illustrated by the sequence of images in Figure 3.
Jeong et al. (2009) also observed NGC 4150 to have aNUV bright core andblue NUV- optical colours,albeit at much lower resolution (NUV PSF≈ 6′′) using the NASA GALEX25 (Galaxy Evolution Explorer)satellite (see Figure 4). UV flux is generally associated with two distinct stellar populations;young(∼< 1Gyr), massive stars, andold (∼>5 Gyr), low-mass, core helium burning (horizontal branch - HB) stars. Thelatter are believed to be responsible for theUV-upturnphenomenon in which evolved early-type galaxies,devoid of young stars, develop a strong UV-excess (Yi et al. 1997). UV-upturn is typically observed incluster elliptical galaxies, a signature of an old population (see O’Connell 1999, for a review). Since aUV-upturn requires a galaxy’s stellar population to have aged sufficiently to allow development of a strongextreme horizontal branch, we do not expect to observe this phenomenon in galaxies beyond z∼>1.5, whenthe universe was less than 5 Gyr old. However, NGC 4150 is effectively at z= 0, and hence we must considerthat UV-upturn is at least a possibility in this case.
By using the corollary evidence of a central, Hβ absorption “hotspot” of roughly 2′′ radius (Kuntschneret al. 2006) - indicative of young (< 2 Gyr) stars - and the detection of large quantities of molecular gas(Combes et al. 2007), - the fuel required to form new stars - Jeong et al. (2009) concluded that theNUV fluxin NGC 4150 is most likely dominated byyoungstars created during a recent period of star formation.
Utilising the exquisite resolution of our HST dataset we canadd a further,morphologicalargument. Wesee in Fig. 2b and, more clearly, in Fig. 3a that there is significant structure in theNUV image, owing notonly to attenuation by dust, but also to the presence of several bright knotsof NUV flux. If the flux wasattributable to old, low-mass stars one would expect theNUV image to be much smoother, similar to theoptical V (F555W) and I (F814W) images (disregarding dust attenuation) which effectively trace the oldstellar population in NGC 4150. These localised knots ofNUV flux, which exist only within about 3′′
(∼200 pc) of the centre, point towards a population ofyoungerstars as their source, the clumps of youngstars having not yet dispersed since their formation in the recent past.
Figure 5 shows a colour-magnitude diagram (CMD) on which we have plotted the integrated UVIS pho-tometry of NGC 4150 within 1 effective radius (Re f f ∼ 400 pixels) compared with the nearby early-typegalaxy (ETG) population identified by Kaviraj et al. (2007c)in SDSS DR3 and GALEX MIS data. Theblue horizontal line indicates the (NUV−V) colour of the strongest UV-upturn galaxy in the local Universe,NGC 4552, in which theNUV flux is dominated by HB stars that have evolved from the old, low-massstellar population. The (NUV−V) colour of NGC 4150 is significantly bluer than this empirical UV-upturnlimit, adding further support to the argument that it is due to recent star formation.
25http://www.galex.caltech.edu/

– 7 –
It is worth noting that there is a conspicuous lack of Hα emission26 coincident with theNUV knots, orindeed anywhere in the core of NGC 4150 (Fig. 3e&f). The continuum subtracted from the rawF657Nimage was estimated from an average of theF555W andF814W observations, which was scaled to matchthe F657N photometry of two K-type stars27 in the field. The lack of Hα emission suggests that there arefew, if any, very young stars (∼< 10 Myr) in the region and that the proposed burst of recent star formationended some time ago. The possibility that NGC 4150 is apost-starburstsystem is a point we return to inthe following sections.
3. Detailed analysis - photometry and parameter estimation
There are several means by which one might attempt to derive the star formation history of a targetgalaxy or stellar population. If the constituent stars are sufficiently resolved it may be possible to performphotometry on each in turn, and subsequently derive individual estimates for age, mass and metallicitythrough comparison with stellar models. Coeval populations are trivially identified by such analyses and itis possible to build up a detailed and spatially resolved picture of the star formation histories in such cases(e.g., Richardson et al. 2008; Sirianni et al. 2000; Buonanno et al. 1994).
Where individual stars are not resolved, one might fit model stellar populations to the integrated pho-tometry of open and/or globular clusters (GCs) within a target galaxy (e.g., Kaviraj et al. 2007b; Fall et al.2005). In such cases it is generally assumed that the stars within a given cluster formed at about the sametime and from the same cloud of gas, and hence they are modelled as simple stellar populations (SSPs) -coeval populations of stars of uniform metallicity. One canthen use the cluster age distribution to makeinferences as to the star formation history of the host galaxy. We perform such an analysis on the globularcluster population in NGC 4150 in a forthcoming paper (Kaviraj et al. in prep.), the results of which arecomplementary to those presented here.
An alternative method in cases where individual stars are not resolved is to perform photometry on apixel-by-pixelbasis before fitting stellar population models to each pixelin turn (e.g. Welikala et al. 2008;Jeong et al. 2007; Kassin et al. 2003; Eskridge et al. 2003; Conti et al. 2003). In this way one can build upa contiguous map of the properties of the stellar populationwithin a target galaxy. It is this method that weemploy in the following sections. While integrated photometry can detect thepresenceof different stellarpopulations, a pixel-by-pixel approach can also define their spatial distributionwithin the host galaxy. Thestructures revealed in these 2D maps provide vital clues as to where and how the constituent stars formed.
26A bright source of Hα emission is visible just North of the galaxy core in Fig. 3f. This is potentially ayoung globular cluster,one of a population of such objects in NGC 4150 that will be discussed more fully in a forthcoming paper (Kaviraj et al. in prep).
27K-type stars were chosen as they exhibit weak H-absorption lines. Conversely the A-type star visible to the South East ofthegalaxy core in Figs. 1 and 2 was rejected as stars of this type possess strong H-absorption features.

– 8 –
3.1. Pixel-by-pixel photometry
Pixel-by-pixel photometry of the core of NGC 4150 was carried out on the WFC3 UVIS observationstaken in 5 broadband filters;F225W, F336W, F438W, F555W&F814W. We have concentrated our effortson the galaxy core since this is where we observe significant levels of NUV flux, which is most likelyassociated with young stars.NUV photometry is crucial for the accurate determination of stellar ages (see§3.2) and hence we limit our analysis to those pixels withNUV (F225W) signal-to-noise (S/N) ratios greaterthan 5. Small x,y shifts were applied, where necessary, to align each of the drizzled images relative to theF438W frame, before 160×160 pixel square sections of each image were created (6.4′′ or 420 pc on eachside), centred roughly on the galaxy core. (The image sections displayed in Fig. 3 are in fact those usedin the following analysis.) The sky background in each imagewas measured from the median counts inseveralblank regions of sky to the NE and SW of the galaxy core, and well beyond the extent of its opticaldisk. These sky background levels were subtracted from eachof the WFC3 images prior to calculating thephotometry.
The sky-subtracted image sections were read into a custom-built C program which calculated the ABmagnitude28, photometric error and S/N ratio of each pixel, applying the zeropoints published on the WFC3webpages29. Photometric errors were calculated taking into consideration both the total number of photo-electrons collected by a given pixel over the course of an observation, and the readout noise associated withthe UVIS detectors - equations 1 and 2:
σX =√
FX + R2 (1)
merr,X = −2.5 logFX − σX
FX(2)
where FX is the total number of photoelectrons collected in a given pixel through bandpassX, R is thedetector readout noise (UVIS∼3 e−), σX is the 1 sigma uncertainty in the pixel electron counts as a result ofpoisson and readout noise, and merr,X is the associated magnitude error. The signal-ro-noise ratio was alsocalculated as S/N = FX / σX.
The AB magnitude, photometric error and S/N ratio for each pixel, in each of the five broadband filters,were output to a multi-column text file, while the photometryfor each filter was also output in the form ofindividual FITS images, with S/N thresholds of≥5.
Figures 6, 7 and 8 detail several qualitative analyses of theWFC3 photometry in the core of NGC 4150.Fig. 6 shows a map of the (NUV−V) colour created by subtracting theF555W photometry FITS image fromits F225W counterpart. Pixels with a S/N ratio less than 5 appear white in this map, having been assigned
28ABν = 0; fν = 3.63× 10⁻²⁰ ergs s−1 cm−2 Hz−1
29http://www.stsci.edu/hst/wfc3/phot zp lbn

– 9 –
a null value. (In practice the spatial extent of theusefulcolour map is limited exclusively by the S/N in theNUV (F225W) image. The S/N ratio of the individual pixels in this image drops below 5 atmuch shorterradial distance from the galaxy centre compared to the optical bands.)
Figs. 7 and 8 respectively show a colour distribution (NUV − V) and a colour-colour plot (NUV − Vvs B − V) of the core pixels in NGC 4150. In both cases the NGC 4150 photometry is compared withpixel colours from a star-forming region in M83 (also imagedwith WFC3 - Chandar et al. 2010; plottedin blue), and integrated colours of nearby ETGs (plotted in black; Kaviraj et al. 2007c). Additionally theintegrated colours of nearbyE+A galaxies- post-starburst, major-merger remnants with high mass-fractionsof recent (< 1 Gyr old) star-formation - are shown on the colour-colour diagram (plotted in green; Kavirajet al. 2007a).
The central colours of NGC 4150 are consistent with apost-starburststellar population, falling betweenthe currently star-forming M83 and the old, passively-evolving ETGs. This is in good agreement withour previous observation regarding the lack of significant Hα emission in the core of NGC 4150 (§2 andFig. 3e&f), which suggests that there are few, if any, very young stars (∼< 10 Myr) and that the starburstended some time ago.
Comparison with the integrated colours of E+A galaxies,‘bona-fide’ post-starburst systems, shows thatthese objects arebluer in the B − V (optical) colour while having similarNUV/optical colours to the thecentral pixels of NGC 4150. This can be explained as being dueto higher mass fractions (∼20-60 percent - Kaviraj et al. 2007a) of recent star-formation in the E+A galaxies. Larger mass fractions of RSFcan result in significantly bluer optical colours, while lower mass fractions have little or no effect at thesewavelengths. This points towards a lower mass-fraction of recent star-formation in NGC 4150 comparedwith E+A systems, and suggests that any merger event that may have triggered this star-formation was mostlikely a minor merger (component mass ratio< 1:4).
3.2. Parameter estimation
We estimated the values of parameters governing the star formation history (SFH) of NGC 4150 by com-paring its 5-band pixel photometry (NUV,U, B,V, I ) to a library of synthetic photometry, generated using alarge collection of model SFHs, specifically optimized for studying early-type galaxies at low redshift. Ourprimary aims were to explore the age of the last star formation event at thepixel-by-pixellevel, the fractionalmass of stars produced by this star formation, and the metallicity of the recently formed stars. As a resultof the fitting process we also recovered thetotal (internal and foreground) extinction for each pixel. As wedescribe below, our scheme decouples the most recent episode of star formation from that which createsthe bulk, underlying population. We choose a parametrisation for the model SFHs that both minimises thenumber of free parameters and captures the macroscopic elements of the star formation history of ETGs inthe low-redshift Universe.
Since the underlying stellar mass in ETGs forms at high redshift and over short timescales, we model thebulk stellar population using an instantaneous burst at high redshift. We put this first (primary) instantaneous

– 10 –
burst at z=3. Note that changing this to z=2, or even z=1, does not affect our conclusions about the RSF,because the first burst does not contribute to the UV. The metallicity of this underlying stellar populationis fixed at Z= Z⊙, since bulk stellar populations in ETGs are observed to be metal rich (Henry & Worthey1999). Past experience indicates that employing a metallicity distribution (e.g. Schawinski et al. 2007) doesnot alter the derived values of parameters compared to employing an old stellar population with a singlemetallicity (e.g. Kaviraj et al. 2007c).
A large body of recent evidence suggests that the star formation in these systems in thelocal Universe isdriven by minor mergers (see Kaviraj et al. 2010; Kaviraj 2010, and references therein). This star formationis bursty and we model the RSF episode using a second instantaneous burst, which is allowed to vary inage between 0.001 Gyrs and the look-back time correspondingto z = 3, and in mass fraction between 0and 1. Our parametrisation is similar to previous ones used to study elliptical galaxies at low redshifts (e.g.Ferreras & Silk 2000).
To build the library of synthetic photometry, the metallicity of the second instantaneous burst of starformation is allowed to vary in the range 0.04Z⊙ to 2.5Z⊙, while a value of dust extinction, parametrisedby E(B− V) in the range 0 to 1.0, is added to the combined model SFH. The dust model employed in thisstudy is the empirical dust prescription of Calzetti et al. (2000). Photometric predictions are generated bycombining each model SFH with the chosen metallicity and E(B−V) values and convolving with the stellarmodels of Yi et al. (2003) through the WFC3 filtersets. The uncertainties in the stellar models (which maycontribute to offsets from observational data e.g. Eisenstein et al. 2001; Yi2003; Maraston et al. 2009) aretaken to be 0.05 mags for the optical filters and 0.1 mags for theNUV passband. The model library contains∼ 750, 000 individual models.
The primary free parameters in this analysis are the age (t2), metallicity (Z2) and mass fraction (f2) of thesecond burst (the mass fraction of the primary burst is simply 1 − f2). A secondary parameter of interestis the overall dust properties of the system. In each case, the value of the free parameters are estimatedby comparing the photometry of each pixel to every model in the synthetic library, with the likelihood ofeach model (exp−χ2/2) calculated using the value ofχ2, computed in the standard way. From the jointprobability distribution, each parameter is marginalisedto extract its one-dimensional probability densityfunction (PDF). We take the median of this PDF as the best estimate of the parameter in question and the16 and 84 percentile values as the ‘one-sigma’ uncertainties on this estimate. In the analysis that follows wepresent these median parameter values and one-sigma uncertainties.
Note that the quality of thet2 fits depends critically on our access to the rest-frame UV, which hosts mostof the flux from hot, young main sequence stars. The leverage in t2 comes entirely from the UV/opticalcolours. Adding more long-wavelength (e.g. WFC3 IR) filtershas no impact on the estimation of RSFparameters. Prior experience with 2MASS and UKIDSS NIR dataindicates that addition of NIR filtersmakes the PDFsbroader, but does not change the median values of the parameters themselves. Muzzinet al. (2009) also found that inclusion of NIR data had littleor no effect on mean parameter values.

– 11 –
4. Results and Discussion
Figures 9&10 shows the results from our parameter fitting procedure in the form of both histogram plotsof the one-dimensional distributions of the median parameter values within pixels, and as two-dimensionalparameter maps. In each case the plots represent the parameters of the second andmost recentburst ofstar formation in a given pixel, while the underlying population is assumed to have formed at high redshift(z = 3) and be of solar metallicity (see§3.2). Below we discuss the results for each of the parameters(age, metallicity, extinction and mass-fraction) in turn,and offer our interpretation in the context of the starformation and merger history of NGC 4150.
4.1. Age
Figures 9a&b respectively show the 1D distribution and the 2D map of the age of the most recent burst ofstar-formation in the central pixels of NGC 4150. The age histogram reveals a narrow peak in the RSF agearound 0.9 Gyr30(1σ uncertainty of±0.12 Gyr), confirming NGC 4150 to be a post-starburst system as wasqualitatively suggested by the lack of Hα emission (Fig. 3) and the similarity ofNUV/optical colours of thecentral pixels to those of E+A galaxies (Fig. 6). We further interpret this age as that of an assumed mergerevent which we believe both supplied raw material to, and triggered, the recent starburst.
The RSF age map reveals further details. The vast majority ofpixels, as we know from the 1D histogramplot, have an age of 0.8 - 1.0 Gyr, which are plotted as light blue / turquoise on the 2D map. This Gyr oldpopulation forms a broad, spiral-like structure which appears to sweep clockwise from the SE (bottom left)around to the north and finally into the core of the galaxy. It is possible that this population actually formsa ring around the galaxy core, the southern part of which is hidden by dust. However, superimposed on thebroad Gyr old population is a narrow, clumpy stream of young stars ranging from∼500 Myr (dark blue)to ∼50 Myr (purple), which spirals from the NE (top left) clockwise into the galaxy core. The age of theRSF varies along this stream, becoming younger as it approaches the core, while the entire feature appearsto rotate in the same direction as the dust visible in the unsharp-maskedF438W-band image. The clumps(∼5 - 10 pc diameter) appear to be large clusters of young stars.It is possible that the 1 Gyr old populationformed in a similar way , the clusters having since dissolvedto form the more diffuse structure we see today.
4.2. Metallicity
The median pixel values and spatial distribution of the metallicity of the young stars are shown in Fig-ures 9c&d. The metallicity distribution shows a peak at sub-solar metallicity, with a median value of∼0.5Z⊙ and is truncated at 0.3 Z⊙ (1σ uncertainty of±0.13Z⊙). Note that our model library included metallicities
30To check the consistency of our technique, in Fig. 9 we compare the NGC 4150 pixel age distribution with that of a currentlystar forming region in M83. As one would expect we see a clear peak close to zero for the M83 distribution.

– 12 –
as low as 0.04 Z⊙.
From the 2D metallicity map there is a clear evidence for an increase in metallicity towards the centreof the galaxy, with values in the central region (yellow to red) ranging from roughly 1.0 to 1.7 Z⊙. Alongthe clumpy stream of young stars mentioned in§ 4.1, we see an increase in metallicity with decreasingage, with some of the highest metallicities measured being associated with the very youngest populationsof stars (∼30 - 100 Myrs - purple in age map). However, some pixels on the southern edge of the veryyoung (purple) feature near the centre of the age map have metallicities of between 0.3 - 0.7 Z⊙. Indeed theyoungest ‘pixel’, with an RSF age of just 4 Myr, has a metallicity of 0.29 Z⊙.
The Gyr old population (light blue/ turquoise in age map) which forms the broad, perhaps spiral,struc-ture we described in the previous section is of sub-solar metallicity, in the range of 0.3 - 0.7 Z⊙. However,there appears to be adistinct population of 0.8 - 1.0 Gyr stars, either side of the dust-obscured core, withgreater than solar metallicity (orange/red pixels either side of core in metallicity map, which appear lightblue/turquoise in age map). Note that the difference in metallicity between these populations (0.3 - 0.7 Z⊙
and 1.2 - 1.7 Z⊙) is significant when compared to the typical 1σ uncertainty of±0.13Z⊙. These two popu-lations clearly formed at around the same time, but must haveformed from two distinct sources of gas withdifferent metallicities. We propose that the broad, low-metallicity population formed from material accretedfrom a gas-rich satellite galaxy during a recent merger/interaction, while the higher-metallicity, central pop-ulation may have formed from metal-rich gas already presentin NGC 4150, which, due to gravitationaltorques induced by the merger/interaction, was caused to lose angular momentum and fall tothe galaxycentre.
Assuming that our hypothesis is correct, the truncated peakin the metallicity distribution (Fig. 9c) is thenrepresentative of the gas-phase metallicity of the galaxy that merged with NGC 4150 roughly 1 Gyr ago.From the mass-metallicity relation of Tremonti et al. (2004) we estimate the mass of the accreted galaxy tobe∼3×10⁸ M⊙, roughly 1/20 the mass of NGC 4150, and consistent with a minor merger. This is admittedlya very crude estimate. The extrapolated 1σ uncertainties from Tremonti et al. 2004, Fig.6 of yield massesfor the accreted galaxy in the range of 1 - 8×10⁸ M⊙, assuming Z= 0.5Z⊙. Combining these values withthe lower limit for the stellar mass of NGC 4150 from Table 1 (4.2×10⁹ M⊙) we find anupper limit for themerger component mass ratio of∼ 1:4.25, which is close to the threshold (1:4) but still consistent with aminor merger.
4.3. Extinction
Figures 9e&f show the distribution and map of extinction values for each of our fitted pixels. Note thatthe pixel-by-pixel photometry was not corrected for Galactic extinction (E(B − V) = 0.018; Schlegel et al.1998) prior to running the parameter estimation. The typical 1σ uncertainty on the fitted values of E(B−V)is ±0.035.
The most obvious (and again reassuring) observation from the extinction map is that it tends to trace thedust, with higher levels of extinction being associated with the dustier regions observed in Figs. 2&3. The

– 13 –
highest levels of extinction (E(B− V) ∼ 0.6 - 0.8) are associated with the most recently formed stars(∼30- 100 Myrs), which are found in the very core of the galaxy (purple in age map). However, we note thatthe central population of Gyr old stars, with super-solar metallicities, suffers significantly lower levels ofextinction (E(B− V) ∼ 0.1 - 0.3).
4.4. Mass Fraction
Figure 10 shows the mass distribution and map. Note that the mass fraction uncertainties are typicallylarger because the same UV colour may be consistent with a wide range of mass fractions. This is essentiallybecause as the mass fraction increases the young stellar component begins to dominate the SED, so that thenormalisation changes but the shape of the SED (which determines the colours) does not. While the UVcolour changes rapidly with age (regardless of the mass fraction) the mass fraction itself is more degenerate(See Fig. 1 of Kaviraj 2008). Typically the mass fraction errors are much better constrained for low valuesof mass fractions, which correspond to younger ages (f2,err = ±0.04 for f2 < 0.2; f2,err = ±0.1 for f2 > 0.2).
Weighting the pixel mass fractions by their uncertainties yields a typical of RSF mass fraction of around20 percent per pixel. We find that approximately 12 percent ofV-band galaxy light is contained within thefitted pixels in the core of NGC 4150, which further suggests (assuming a constant mass-to-light ratio forthe entire galaxy) that roughly 12 percent of the galaxy massis contained within these pixels. We thereforeestimate thetotal mass fraction of young stars in this galaxy to be around 2-3 percent.
Note that the typical values for the age (1 Gyr) and mass fraction (20 percent) of young stars in the centralpixels of NGC 4150 implies that the young stellar component contributes around 94 percent of the flux inF225W (NUV), and 64 percent of the flux inF555W (V) across the fitted region.
5. Conclusions
We have presented a spatially-resolved NUV/optical study of the early-type (S0) galaxy NGC 4150, usingnew HST WFC3 data. Previous work by other authors has shown this galaxy to have a stellar mass of around6×109 M⊙, roughly 5×10⁷ M⊙ of molecular hydrogen, a kinematically decoupled core (indicative of recentmerging) and strong, central Hβ absorption (indicative of young stars). While relatively uninspiring inits optical image (Fig. 1), the core of NGC 4150 shows ubiquitous NUV emission and remarkable dustysubstructure (Figs. 2 & 3). The galaxy lies in the UVgreen valley(Fig. 5) and its pixels exhibit a narrowrange of (NUV−V) colours that are similar to those of nearbypost-starburst(E+A) galaxies, and lie betweenthose of M83 (an actively star-forming spiral) and the localquiescent ETG population (Fig. 6).
We have parametrised the properties of the RSF (age, mass fraction, metallicity and internal dust content- Figs. 9 & 10) in the NGC 4150 pixels by comparing the observedNUV/optical photometry in five filters(F225W, F336W, F438W, F555W, F814W) to stellar models. The typical age of the RSF is around 0.9 Gyrs,consistent with the similarity of theNUV/optical colours to post-starburst systems. The RSF age map

– 14 –
reveals somewhat younger (∼50 - 500 Myr) substructure, including aclumpystream of stars spiraling intothe galaxy core.
We found the typical RSF metallicity - which is representative of the metallicity of the gas fuelling starformation - to be∼0.3 - 0.5 Z⊙, but note that within 0.75′′ of the galaxy centre the recently formed starshave metallicities in the range 1.0 to 1.7 Z⊙. We propose that the most central RSF may have been fuelled bymetal-richgas already present in NGC 4150 that was caused to fall into the galaxy centre as a result of themerger, while the surrounding stellar population formed from metal-poorgas accreted during the merger.Assuming this scenario to be correct, the lowest RSF metallicities (0.3 - 0.5 Z⊙) plausibly indicate the gas-phase metallicity (GPM) of the accreted galaxy. Comparisonto the local mass-GPM relation (Tremontiet al. 2004) suggests (crudely) that the mass of the accretedsystem is∼ 3 × 10⁸ M⊙, making NGC 4150 a1:20 minor merger. Summing the error-weighted mass fractions of RSF in each of the pixels, we found thatthe RSF contributes approximately 2-3 percent of the total stellar mass of the galaxy.
Since we have suggested that NGC 4150 experienced a galaxy merger in the recent past it is worthcommenting on the presence or otherwise of satellite galaxies. Although associated with the Coma I cloud,NGC 4150 is located in a very low density environment (Morganti et al. 2006), with no obvious companiongalaxies visible in deep survey observations (e.g. SDSS). Several galaxies, of much smaller angular sizethan NGC 4150, are observed along lines-of-sight projectedin and around the galaxy disk, but since noneshow evidence of gravitational disruption or tidal bridgesconnected to NGC 4150, all are identified asdistant, background galaxies. In our preferred scenario wehave proposed that NGC 4150 merged witha galaxy approximately 1/20 of its mass, around 1 Gyr ago. We estimate such a galaxy to have had anapparentB-band magnitude of∼15-16 (scaled from NGC 4150B-band magnitude), and we would certainlybe able to detect similar mass galaxies if they existed around NGC 4150 today. However, the apparentisolation of NGC 4150 does not rule out the merger scenario. For example, it may already have merged withall satellite galaxies that might otherwise have been detected in deep survey observations. Alternatively,peculiar velocities within the Coma I cloud may have caused NGC 4150 to move a significant distance fromonce nearby companions during the last Gyr. Ultimately, thecombined body of chemical, kinematical andmorphological evidence strongly supports a recent minor merger as the trigger for the RSF in NGC 4150.
This work reaffirms our hypothesis that minor mergers play a significant rolein the evolution of ETGs atlate epochs (e.g. see recent papers by Kaviraj et al. 2010; L´opez-Sanjuan et al. 2010). While many previousworks have relied upon integrated photometry of large samples of ETGs, this WFC3 study confirms thevalue of 2D analyses of individual, nearby systems in which the structure and morphology of the constituentstellar populations can be resolved. In a forthcoming paper(Kaviraj et al. in prep.) we will present a studyof the globular cluster (GC) population in NGC 4150 using ourWFC3 data, while future HST observationswill lead to similar investigations of several other nearby, early-type galaxies.
This paper is based on Early Release Science observations made by the WFC3 Scientific Oversight Com-mittee. We are grateful to the Director of the Space Telescope Science Institute for awarding Director’sDiscretionary time for this program. Support for Program numbers 11359/60 as provided by NASA througha grant from the Space Telescope Science Institute, which isoperated by the Association of Universities

– 15 –
for Research in Astronomy, Incorporated, under NASA contract NAS5-26555. RMC acknowledges fund-ing from STFC through research grant DBRPDV0. SK acknowledges a Research Fellowship from theRoyal Commission for the Exhibition of 1851, an Imperial College Research Fellowship, a Senior Re-search Fellowship from Worcester College Oxford and support from the BIPAC Institute at the Universityof Oxford. SKY was supported by the Korean government through the Korea Research Foundation Grant(KRF-C00156)and theKorea Science and Engineering Foundationgrant (No.20090078756).
REFERENCES
Abazajian, K. N., Adelman-McCarthy, J. K., Agueros, M. A.,et al. 2009, ApJS, 182, 543
Bacon, R., Copin, Y., Monnet, G., et al. 2001, MNRAS, 326, 23
Bell, E. F., McIntosh, D. H., Katz, N., & Weinberg, M. D. 2003,ApJS, 149, 289
Bower, R. G., Kodama, T., & Terlevich, A. 1998, MNRAS, 299, 1193
Bower, R. G., Lucey, J. R., & Ellis, R. S. 1992, MNRAS, 254, 589
Buonanno, R., Corsi, C. E., Buzzoni, A., et al. 1994, A&A, 290, 69
Calzetti, D., Armus, L., Bohlin, R. C., et al. 2000, ApJ, 533,682
Carollo, C. M., Danziger, I. J., & Buson, L. 1993, MNRAS, 265,553
Chandar, R., Whitmore, B. C., Kim, H., et al. 2010, ApJ, 719, 966
Combes, F., Young, L. M., & Bureau, M. 2007, MNRAS, 377, 1795
Conti, A., Connolly, A. J., Hopkins, A. M., et al. 2003, AJ, 126, 2330
de Zeeuw, P. T., Bureau, M., Emsellem, E., et al. 2002, MNRAS,329, 513
Eisenstein, D. J., Annis, J., Gunn, J. E., et al. 2001, AJ, 122, 2267
Ellis, R. S., Smail, I., Dressler, A., et al. 1997, ApJ, 483, 582
Eskridge, P. B., Frogel, J. A., Taylor, V. A., et al. 2003, ApJ, 586, 923
Fall, S. M., Chandar, R., & Whitmore, B. C. 2005, ApJL, 631, L133
Ferreras, I. & Silk, J. 2000, ApJL, 541, L37
Fruchter, A. S. & Hook, R. N. 2002, PASP, 114, 144
Gladders, M. D., Lopez-Cruz, O., Yee, H. K. C., & Kodama, T. 1998, ApJ, 501, 571
Graves, G. J., Faber, S. M., & Schiavon, R. P. 2009, ApJ, 698, 1590

– 16 –
Henry, R. B. C. & Worthey, G. 1999, PASP, 111, 919
Huchra, J. P. & Geller, M. J. 1982, ApJ, 257, 423
Jensen, J. B., Tonry, J. L., Barris, B. J., et al. 2003, ApJ, 583, 712
Jeong, H., Bureau, M., Yi, S. K., Krajnovic, D., & Davies, R.L. 2007, MNRAS, 376, 1021
Jeong, H., Yi, S. K., Bureau, M., et al. 2009, MNRAS, 398, 2028
Karachentsev, I. D., Sharina, M. E., Dolphin, A. E., et al. 2003, A&A, 398, 467
Kassin, S. A., Frogel, J. A., Pogge, R. W., Tiede, G. P., & Sellgren, K. 2003, AJ, 126, 1276
Kauffmann, G., Heckman, T. M., White, S. D. M., et al. 2003, MNRAS, 341, 54
Kaviraj, S. 2008, Modern Physics Letters A, 23, 153
Kaviraj, S. 2010, ArXiv e-prints
Kaviraj, S., Devriendt, J. E. G., Ferreras, I., & Yi, S. K. 2005, MNRAS, 360, 60
Kaviraj, S., Khochfar, S., Schawinski, K., et al. 2008, MNRAS, 388, 67
Kaviraj, S., Kirkby, L. A., Silk, J., & Sarzi, M. 2007a, MNRAS, 382, 960
Kaviraj, S., Rey, S.-C., Rich, R. M., Yoon, S.-J., & Yi, S. K. 2007b, MNRAS, 381, L74
Kaviraj, S., Schawinski, K., Devriendt, J. E. G., et al. 2007c, ApJS, 173, 619
Kaviraj, S., Tan, K., Ellis, R. S., & Silk, J. 2010, ArXiv e-prints
Kodama, T. & Arimoto, N. 1997, A&A, 320, 41
Koekemoer, A. M., Fruchter, A. S., Hook, R. N., & Hack, W. 2002, in The 2002 HST Calibration Work-shop : Hubble after the Installation of the ACS and the NICMOSCooling System, ed. S. Arribas,A. Koekemoer, & B. Whitmore, 337
Krajnovic, D., Bacon, R., Cappellari, M., et al. 2008, MNRAS, 390, 93
Kroupa, P., Tout, C. A., & Gilmore, G. 1993, MNRAS, 262, 545
Kundu, A. & Whitmore, B. C. 2001, AJ, 122, 1251
Kuntschner, H., Emsellem, E., Bacon, R., et al. 2006, MNRAS,369, 497
Lopez-Sanjuan, C., Balcells, M., Perez-Gonzalez, P. G., et al. 2010, ApJ, 710, 1170
Makarova, L., Karachentsev, I., Takalo, L. O., Heinaemaeki, P., & Valtonen, M. 1998, A&A Suppl., 128,459

– 17 –
Maraston, C., Nieves Colmenarez, L., Bender, R., & Thomas,D. 2009, A&A, 493, 425
Martin, D. C., Fanson, J., Schiminovich, D., et al. 2005, ApJL, 619, L1
Morganti, R., de Zeeuw, P. T., Oosterloo, T. A., et al. 2006, MNRAS, 371, 157
Muzzin, A., Marchesini, D., van Dokkum, P. G., et al. 2009, ApJ, 701, 1839
Nelan, J. E., Smith, R. J., Hudson, M. J., et al. 2005, ApJ, 632, 137
O’Connell, R. W. 1999, ARAA, 37, 603
Rekola, R., Richer, M. G., McCall, M. L., et al. 2005, MNRAS, 361, 330
Richardson, J. C., Ferguson, A. M. N., Johnson, R. A., et al. 2008, AJ, 135, 1998
Sarzi, M., Falcon-Barroso, J., Davies, R. L., et al. 2006, MNRAS, 366, 1151
Schawinski, K., Thomas, D., Sarzi, M., et al. 2007, MNRAS, 382, 1415
Schlegel, D. J., Finkbeiner, D. P., & Davis, M. 1998, ApJ, 500, 525
Scott, N., Cappellari, M., Davies, R. L., et al. 2009, MNRAS,398, 1835
Sirianni, M., Nota, A., Leitherer, C., De Marchi, G., & Clampin, M. 2000, ApJ, 533, 203
Stanford, S. A., Eisenhardt, P. R., & Dickinson, M. 1998, ApJ, 492, 461
Temi, P., Brighenti, F., & Mathews, W. G. 2009, ApJ, 695, 1
Thomas, D., Maraston, C., Bender, R., & Mendes de Oliveira, C. 2005, ApJ, 621, 673
Thomas, D., Maraston, C., Schawinski, K., Sarzi, M., & Silk,J. 2010, MNRAS, 404, 1775
Tonry, J. L., Dressler, A., Blakeslee, J. P., et al. 2001, ApJ, 546, 681
Trager, S. C., Faber, S. M., Worthey, G., & Gonzalez, J. J. 2000, AJ, 120, 165
Tremonti, C. A., Heckman, T. M., Kauffmann, G., et al. 2004, ApJ, 613, 898
Udalski, A., Soszynski, I., Szymanski, M., et al. 1999, ActaAstronomica, 49, 223
van Dokkum, P. G., Franx, M., Fabricant, D., Illingworth, G.D., & Kelson, D. D. 2000, ApJ, 541, 95
Welch, G. A. & Sage, L. J. 2003, ApJ, 584, 260
Welikala, N., Connolly, A. J., Hopkins, A. M., Scranton, R.,& Conti, A. 2008, ApJ, 677, 970
Worthey, G., Faber, S. M., & Gonzalez, J. J. 1992, ApJ, 398, 69
Yi, S., Demarque, P., & Oemler, Jr., A. 1997, ApJ, 486, 201

– 18 –
Yi, S., Lee, Y., Woo, J., et al. 1999, ApJ, 513, 128
Yi, S. K. 2003, ApJ, 582, 202
Yi, S. K., Kim, Y., & Demarque, P. 2003, ApJS, 144, 259
Yi, S. K., Yoon, S.-J., Kaviraj, S., et al. 2005, ApJL, 619, L111
Young, L. M. 2005, ApJ, 634, 258
This preprint was prepared with the AAS LATEX macros v5.2.

– 19 –
Table 1: Properties of NGC 4150
αJ2000 12h10m33s.67 1δJ2000 +30◦24′05′′.9 1Morphological type SA00(r)? 2Position angle 148◦ 1Inclination angle 58◦ 1vHeliocentric 219± 18 km s−1 1µ 30.66± 0.16 mag 3Galactic reddening E(B - V)= 0.018 mag 4MB -18.48 mag 5(B− V)e 0.83 mag 1LogLB (LB,⊙) 9.50 6LogLKs (LKs,⊙) 10.02 6M∗ 6.3+3.1
−2.1 × 10⁹ M⊙ 7MH2 3.8− 6.6× 10⁷ M⊙ 8, 9SFR24µm 4.0× 10⁻² M⊙ yr−1 6
(1) LEDA (http://leda.univ-lyon1.fr/); (2) NED (http://nedwww.ipac.caltech.edu/); (3) Distance modulus is mean of Jensen et al.(2003) and Rekola et al. (2005) SBF measurements; (4) From Schlegel et al. (1998); (5) AbsoluteB magnitude from de Zeeuw et al.(2002); (6) From Temi et al. (2009); (7) NGC 4150 stellar masscalculated usingM/L - colour relations from Bell et al. (2003) andassuming a Kroupa et al. (1993) IMF (NGC 4150:M∗/LKs = 0.6+0.3
−0.2); (8) Molecular hydrogen masses from Welch & Sage (2003)and (9) Combes et al. (2007)
Table 2: HST WFC3/UVIS observations of NGC 4150
Date Filter Exposure Time(s)
2009 Oct 30 F225W 32522009 Nov 09 F336W 24862009 Nov 09 F438W 21732009 Nov 09 F555W 14142009 Oct 30 F657N (Hα + [N II]) 25082009 Oct 30 F814W 2048

– 20 –
Fig. 1.— RGB image of local S0 galaxy NGC 4150 created from WFC3 UVIS F438W (Blue), F555W(Green) andF814W (Red) observations. The white squares indicate the fields-of-view shown in Fig. 2a&c(large box) and Fig. 2b&d (small box). North is up and East is to the left.

– 21 –
Fig. 2.— HST WFC3 images of NGC 4150 (fields-of-view indicated on Fig.1).(a&b): RGB images createdusingF225W (Blue), F438W (Green) andF657N (Red) WFC3 UVIS observations. The areas of the corenot obscured by dust are bright inF225W (NUV) indicative of a relatively young population of stars.(c&d):Unsharp-maskedF438W images revealing the distribution of dust. In all cases North is up and East is to theleft.

– 22 –
Fig. 3.— Individual bandpass HST WFC3/UVIS images of the core of NGC 4150. (a-f):F225W, F336W, F438W, F555W, F657N (Wide Hα+ [N II]), F657N minuscontinuum (which has the sameflux scaling asF657N), andF814W. Note the clear presence of structure in theNUV (F225W) image,indicative of recent star formation. Note also the lack of significant Hα emission in theF657N - continuumframe, suggesting that there are few very young stars of< 5 - 10 Myrs. All images oriented such that Northis up and East is to the left.
Fig. 4.— Comparison of GALEX and HST/WFC3 observations of NGC 4150, both taken in theNUV. TheGALEX NUV PSF (6′′) is ∼20,000 times larger in area than that of the properly drizzled WFC3 images(0.04′′). As a result the entire central region of NGC 4150, which we see in exquisite detail in the WFC3data, is completely unresolved by GALEX.
– 23 –
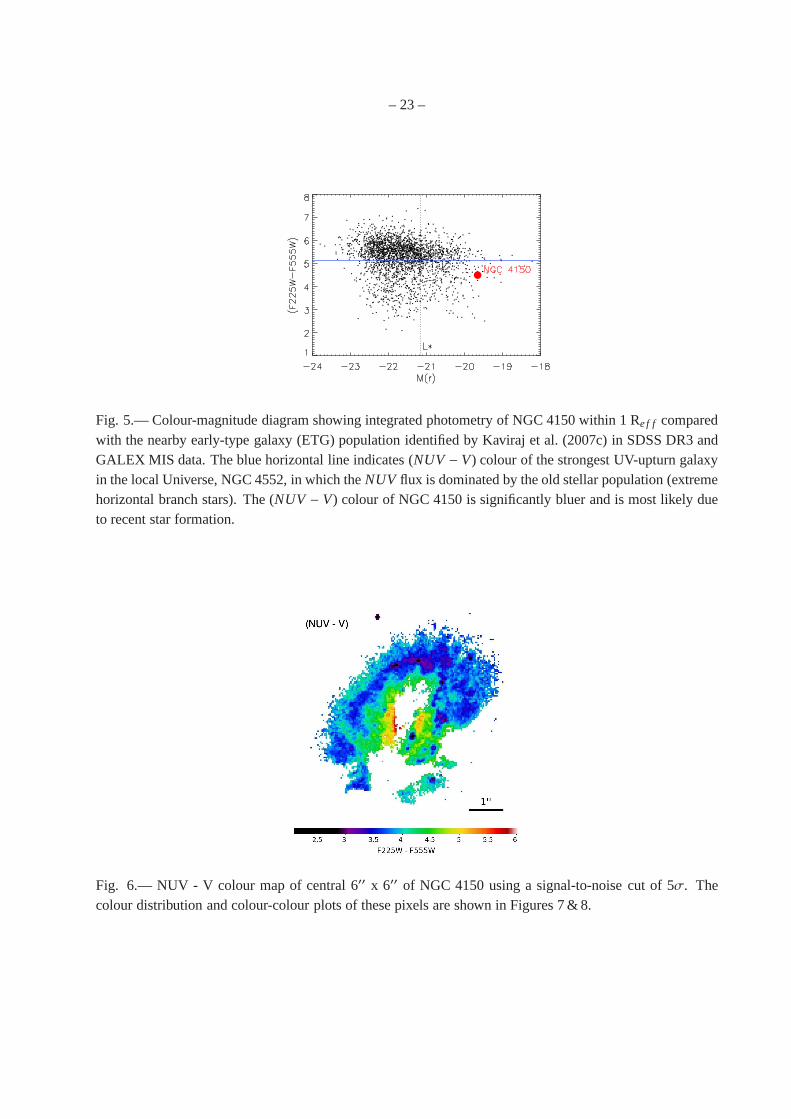
Fig. 5.— Colour-magnitude diagram showing integrated photometry of NGC 4150 within 1 Re f f comparedwith the nearby early-type galaxy (ETG) population identified by Kaviraj et al. (2007c) in SDSS DR3 andGALEX MIS data. The blue horizontal line indicates (NUV− V) colour of the strongest UV-upturn galaxyin the local Universe, NGC 4552, in which theNUV flux is dominated by the old stellar population (extremehorizontal branch stars). The (NUV − V) colour of NGC 4150 is significantly bluer and is most likely dueto recent star formation.
Fig. 6.— NUV - V colour map of central 6′′ x 6′′ of NGC 4150 using a signal-to-noise cut of 5σ. Thecolour distribution and colour-colour plots of these pixels are shown in Figures 7 & 8.

– 24 –
Fig. 7.— Colour distribution of pixels in the central regionof NGC 4150 (red) compared with pixel coloursfrom a star-forming region in M83 (blue - also imaged with WFC3) and integrated colours of nearby ETGs(black; Kaviraj et al. 2007c). The central colours of NGC 4150 are consistent with a post-starburst stellarpopulation, falling between the currently star-forming M83 and the old, passively-evolving ETGs. See alsoFig. 8
Fig. 8.— Colour-colour plots of pixels in the central regionof NGC 4150 (red) compared with pixel coloursfrom a star-forming region in M83 (blue - also imaged with WFC3), integrated colours of nearby ETGs(black; Kaviraj et al. 2007c), and integrated colours of nearby E+A galaxies (green; Kaviraj et al. 2007a)- post-starburst, major-merger remnants, with high mass-fractions of recent (< 1 Gyr) star-formation. Thecentral colours of NGC 4150 are consistent with a post-starburst stellar population, falling between thecurrently star-forming M83 and the old, passively-evolving ETGs in colour-colour space. Redder opticalcolours (F438W-F555W) than E+A galaxies suggest a lower mass-fraction of recent star-formation in NGC4150.

– 25 –
(a) (b)
(c) (d)
(e) (f)
Fig. 9.— Results of the parameter fitting routine shown as 1D pixel distributions and 2D maps. Fitting wasperformed on all pixels with signal-to-noise greater than 5in all five broadband filters. The spatial extent ofour parameter fitting was therefore limited by the depth of the NUV observations (see Fig. 6a). The errorbars on the histogram plots indicate the typical 1σ errors associated with the fitted parameters.(a&b): Ageof the most recent burst of star-formation in the central pixels of NGC 4150. (c&d): Metallicity of themost recent starburst in NGC 4150.(e&f): Extinction values for each of our fitted pixels. Note that thepixel-by-pixel photometry was not corrected for Galactic extinction (E(B-V)= 0.018; Schlegel et al. 1998)prior to running the parameter estimation. Furthermore, the 1D distribution is biased towards lower valuesof reddening, since, by setting a S/N limit of 5, we ignore pixels with high extinction. See text in § 4 for afull discussion of the parameter distributions and maps.

– 26 –
(a) (b)
Fig. 10.—(a): 1D distribution and(b): 2D map of stellar mass fraction (per pixel) of the most recent burstof star-formation in the central pixels of NGC 4150. The two error bars on the histogram plot indicate thetypical 1σ uncertainties on fitted mass fractions of less than 0.2 (small error bar) and greater than 0.2 (largeerror bar). See text for details.