analyzing financial statements - jones & bartlett · pdf fileassessing how the proposed...
TRANSCRIPT

Chapter 10
Analyzing Financial Statements
LEARNING OBJECTIVES
After studying this chapter, you should be able to do the following:
1. Describe the balanced scorecard and dashboard reporting.2. Describe the four key elements of dashboard reporting.3. Explain what the most important measure of financial success is.4. Explain what a health care firm’s primary financial objective should be.5. Describe the critical drivers of financial performance.6. Discuss relevant healthcare financial performance measures.7. Describe the hospital cost-index measure.
REAL-WORLD SCENARIO
Michael Dean has been recently appointed to the Board of Kenyon Medical Center, a 300-bed nonprofit community hospital. Mike is an attorney who specializes in labor law and is thefirm’s primary litigation expert in this area. He is reviewing the financial information that wassent to him this morning in preparation for his first board meeting this evening. His total fi-nancial package includes 28 pages of financial information consisting of current monthly in-come statements, a balance sheet, and other monthly actual-to-budget comparisons ofperformance with some selected financial ratios. Tonight’s meeting is a critical one becausethe board’s major item for discussion is related to a proposed bond issue to finance a majorhospital renovation. Mike recognizes that he has a fiduciary responsibility to protect the as-sets of the hospital and to ensure its continued financial viability, but he does not know howto determine if the hospital can afford to take on this additional debt. There is so much infor-mation and no apparent pattern as to what really is important. He is also concerned aboutassessing how the proposed financing would impact the hospital’s financial performance andthus, its ability to repay both interest and principal on the debt. He recently read a report on“Dashboard Reporting” and wonders if some structure like this would help him and otherboard members to get a better appreciation for the financial performance of the hospital.
201
42368_CH10_201_228 10/9/06 2:33 PM Page 201

The major purpose of this chapter is to introducesome analytical tools for evaluating the financial con-dition of health care entities. Think for a moment howconfusing and difficult it would be, without a key, toreach any conclusions about financial position fromany of the financial statements presented in Chapter 8.Unless your training is in business or finance, the state-ments may look like a mass of endless numbers withlittle meaning. In short, there may be too much infor-mation in most financial statements to be digested eas-ily by a general-purpose user.
During the last 25 years, there has been an explosionin the adoption and integration of information technol-ogy for financial reporting. Financial data are collected,analyzed, and distributed to decision makers in a moreaccurate and timely manner, and in greater quantitythan ever before. However, many people believe thatthe technology has not had a positive impact upon per-formance. While we have made important strides in thetechnology of information collection and distribution,we have failed to realize significant improvements inthe decision-making value of that information.
What accounts for the failure to take advantage ofinformation-technology advances? We think the answeris very clear and is one that most executives wouldreadily acknowledge. We have been using the technol-ogy to rapidly deliver data (and more of it) to decision-makers, but we have ignored the issue of informationrelevance. As a result, we have in many cases simplyused technology to deliver irrelevant or inappropriatedata more quickly. Bad data delivered more quickly isnot likely to improve performance in either the shortrun or the long run.
LEARNING OBJECTIVE 1
Describe the balanced scorecard and dash-board reporting.
The concept of “Balanced Scorecards” developed byRobert Kaplan and David Norton represents an attemptto enhance the value of information and exploit the ca-pability of information technology to deliver true valueto decision makers. Balanced scorecards, in theirstripped-down version, simply state that reporting shouldbe available on those key attributes affecting perfor-
mance. More data are of little value if they do not pro-vide information to a decision maker that can be used toimprove the performance of the firm. “Dashboard” re-porting is a natural subset of balanced scorecards and isbeing increasingly used in almost all sectors of the econ-omy to keep managers focused on critical areas that willaffect overall firm performance.
In 1988, one major company won a Vision Award is-sued by Business Finance for its dashboard reportingsystem. The company’s present dashboard system isintranet-based and replaced the company’s monthly200-page binder system that was sent to managers. Themix of 16 financial, operating, and human resourcemeasures is available online in a drill-down formatinto which managers can dig deeper if they desire. Thesystem is extremely easy to use and focuses on criticalperformance drivers.
WHAT IS REQUIRED TO DEVELOP ANEFFECTIVE FINANCIAL REPORTINGSYSTEM?
LEARNING OBJECTIVE 2
Describe the four key elements of dash-board reporting.
Assuming that many health care providers are in-terested in developing a dashboard reporting systemfor key executives and board members, what needs tobe done? In general, four critical questions must beanswered:
• What is most important to the firm’s success?• What are the critical drivers that influence per-
formance attainment?• What are the most relevant measures that reflect
critical driver relationships?• What relevant benchmarking data are available to
assess performance?
In the remainder of this chapter, we will answer thefour questions above with respect to financial perform-ance. We will then examine a specific hospital exampleto illustrate the definition and utilization of financial in-dicators to assess financial performance and to identifycritical opportunities for management intervention.
202 CHAPTER 10 ANALYZING FINANCIAL STATEMENTS
42368_CH10_201_228 10/9/06 2:33 PM Page 202

WHAT IS MOST IMPORTANT:SUSTAINABLE GROWTH
Understanding financial performance in any busi-ness requires some global or summary measure of fi-nancial success. For many health care organizationexecutives, this measure is often the operating margin(operating income divided by revenues). We believethat this measure is wrong and can be misleading inmany situations. For example, low operating marginsmay not always be bad and high operating marginsmay not always be good.
LEARNING OBJECTIVE 3
Explain what the most important measureof financial success is.
What should be the primary criterion for financialsuccess in health care organizations? We believe that afinancially successful organization is capable of gener-ating the resources needed to meet its mission. Thiscreates two immediate questions. First, what are re-sources? Second, what level of resources is needed tofulfill the mission? Economic resources that are ownedor controlled by a business firm are referred to as assetsand would include such items as supplies, equipment,buildings, and other factors of production that must bepresent to produce health services. Human resourcesare not usually shown as assets because the firm doesnot own an individual, but human resources also are re-quired in the production of products or services. Re-sources or assets owned by a health care organizationare shown in its balance sheet, which provides a listingof its assets and the pattern of financing used to acquirethose assets. The level of resources required by a healthcare organization depends largely on the range andquantity of health services envisioned in the missionstatement. In situations when there is no scientific stan-dard for resource requirements, benchmarking againstother health care organizations may be used to partiallyaddress the issue of resource need. A hospital or healthcare firm can find itself in a situation where it may havetoo little investment in assets to meet the productionneeds for services, or it may have excessive investmentin assets of a certain category.
Resources can be financed with either debt or equityfunds, as any balance sheet clearly shows. A finan-cially successful organization must therefore be capa-ble of generating the amount of funds through debtand/or equity that is needed to finance the requiredlevel of resources. Figure 10–1 depicts a simple bal-ance sheet illustrating these concepts. In this example,our health care organization needs to increase its in-vestment in assets, or resources, by $100 million overthe next seven years to fulfill its mission. This level offuture investment should be a by-product of the firm’sstrategic plan. A strategic plan should provide some in-formation about projected service levels, which in turnshould drive expected investment. Strategic financialplanning will be the topic of a later chapter. The rate ofannual compounded asset growth for the example inFigure 10–1 is approximately ten percent per year.This rate equals the average rate of asset growth inmany voluntary nonprofit hospitals during the last fiveyears. Although this growth rate may seem high, re-member that this rate incorporates replacement of as-sets at higher prices, acquisition of new technology,entry into new product lines requiring new investment,and increases in working capital such as accounts re-ceivable. The health care organization depicted inFigure 10–1 has chosen a financing mix of 50 percentequity and 50 percent debt. This means that sevenyears later, the target financing mix will be $100 mil-lion of debt and $100 million of equity to finance the$200 million investment in assets.
The principle of sustainable growth states that nobusiness entity can generate a growth rate in assets (tenpercent in our example) that is greater than its growthrate in equity (also ten percent in our example) for a pro-longed period. It may be possible to generate new assetgrowth of 15 percent for several years, when equitygrowth is only five percent, by changing the percentagesof equity and debt financing. There is no mystery in theprinciple of sustainable growth; it is not some esotericfinance concept that bears no relationship on reality.Any business will have its asset growth rates limited byits ability to generate new equity growth. To not believein the validity of this concept would imply that a firmcould always increase its percentage of debt financing toany level. There are no exceptions to this theorem. It isnot something that represents a nice target; it is a funda-mental principle of business from which no one is ex-empt. Some governmental health care organizations
What is Most Important: Sustainable Growth 203
42368_CH10_201_228 10/9/06 2:33 PM Page 203

may argue that they always generate growth rates in eq-uity less than their asset growth because they receivecapital funds directly from their governmental sponsors.Those transfers represent a transfer of equity and are apart of equity growth.
LEARNING OBJECTIVE 4
Explain what a health care firm’s primary fi-nancial objective should be.
There is no other financial objective that is more im-portant than equity growth for measuring long-term fi-nancial success in any business entity. Health careorganizations that expect low rates of equity growth inthe future most likely will not be able to provide thelevel of resources sufficient to meet their mission. Ifyour health care organization anticipates growth ratesin equity of only five percent over the next decade, itis almost certain that your asset growth potential willbe no greater than five percent. Although the objectiveis not to add assets or investments for the sake ofgrowth, health care organizations that remain viablemust add new investments. Health care organizationswith low rates of growth in equity most likely will ex-perience most of their asset growth in working-capitalareas, such as accounts receivable and supplies. Thesefirms will invest very little in renovation and replace-ment of existing plant and equipment, and very little innew capital required for entry into new markets. If theyare surrounded by firms that are not also experiencing
low equity growth rates, their market share will de-crease as their relative delivery capability deteriorates.
Growth rate in equity (GRIE) can be expressed asfollows:
�Chang
E
e
qu
in
ity
equity�� �
Ne
E
t
q
in
u
c
i
o
ty
me� ��
Ch
N
an
e
g
t
e
in
i
c
n
o
e
m
q
e
uity�
Most voluntary nonprofit health care organizationsdo not have a source of equity other than net income.This means that no transfers of funds from governmentor large restricted endowments exist to increase thefirm’s equity from the level of reported net income. Inthese situations, the term change in equity/net incomeequals one; therefore, GRIE can be defined as net in-come divided by equity, or return on equity (ROE).ROE is therefore the primary financial criterion thatshould be used to evaluate and target financial per-formance for voluntary nonprofit health care organiza-tions when transfers of new equity are not likely. ROEis also the primary financial criterion that should beused to evaluate and target financial performance fortaxable for-profit firms.
Return on equity can be factored into a number ofcomponents that help executives analyze and improvetheir ROE values. The following equation defines ROE:
ROE �
� �R
A
e
s
v
s
e
e
n
t
u
s
e�
� �A
E
s
q
s
u
e
it
t
y
s�
Operating income � Non-operating income�����
Revenue
204 CHAPTER 10 ANALYZING FINANCIAL STATEMENTS
Present Financial Position
Assets $100
Assets $200
Debt $ 50Equity 50 Total $ 100
Debt $ 100Equity 100 Total $ 200
Deb
t Pol
icy
Gro
wth
Rat
e
Pro
fitab
ility
Tar
get
Future Financial Position(7 Years Later)
Figure 10–1 Sustainable Growth (figures in millions)
42368_CH10_201_228 10/9/06 2:33 PM Page 204

LEARNING OBJECTIVE 5
Describe the critical drivers of financialperformance.
WHAT ARE THE CRITICAL DRIVERSOF PERFORMANCE?
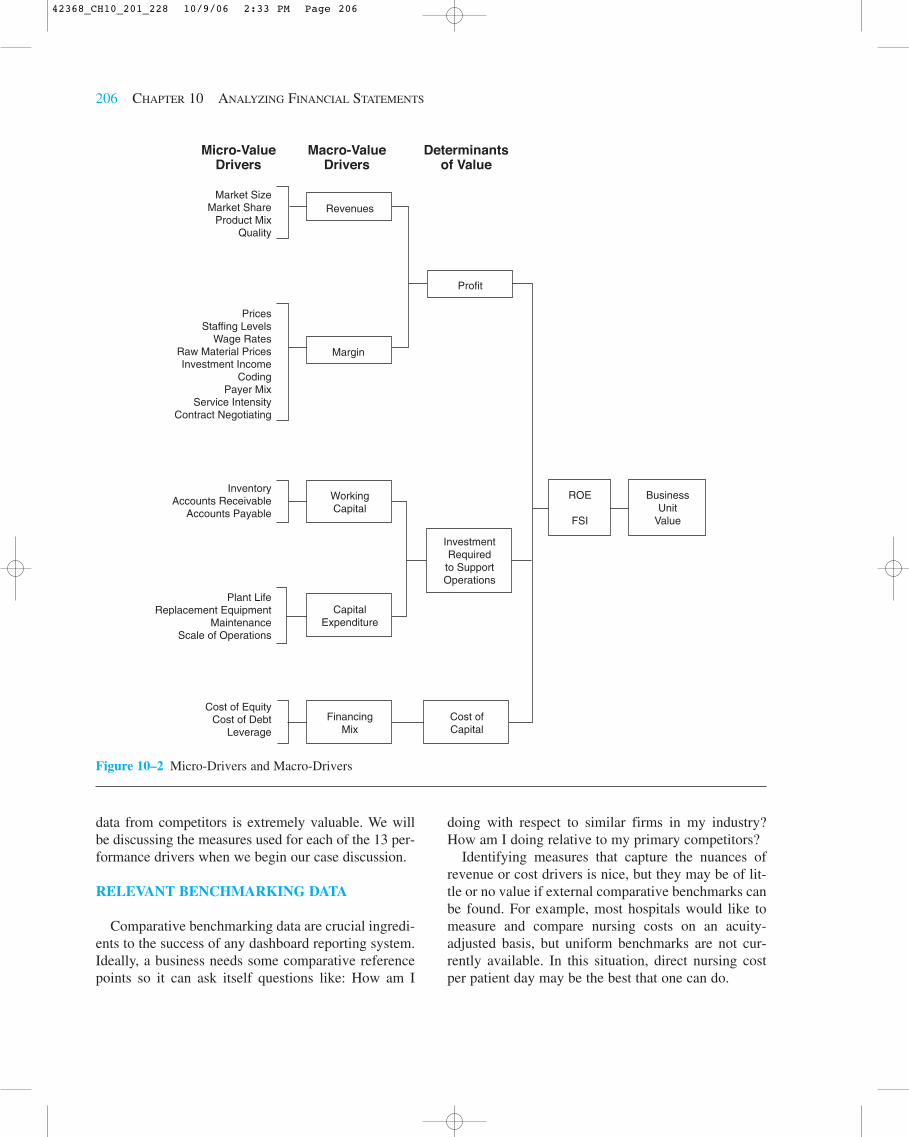
The previous formula for ROE tells us that there area variety of ways that an organization can improve itsROE. First, it can improve its operating margins(operating income divided by revenue). Second, it canincrease its non-operating gain ratio (non-operating in-come divided by revenue). Third, it can increase itstotal asset turnover (revenue divided by assets).Fourth, it can reduce its equity-financing ratio (equitydivided by assets). Operating margin improvement isan important strategy for improving ROE, but it is notthe only way that ROE can be increased and sustain-able growth achieved. Figure 10–2 depicts the criticalrelationships affecting financial performance in mosthealth care firms.
If we assume that return on equity, or business unitvalue, is the primary measure of financial perform-ance success, the schematic in Figure 10–2 providesa roadmap of the critical drivers of performance. Theschematic shows that the three primary determinantsof value are profit, investment, and cost of capital.These three primary determinants of value can be re-lated to a set of macro drivers, and then ultimately toa number of micro value drivers that will enable mea-surement and modeling for effective dashboardreporting.
It is important that every health care firm interestedin developing a set of measures to monitor and evalu-ate performance start with a model similar to the onedefined in Figure 10–2. Without this type of frame-work, many executives simply try to define a set ofmeasures from those that currently exist or could becreated. Defining measures without understanding keyrelationships can be dangerous. For example, reportingman-hours-per-discharge without adjusting for case-mix intensity can lead to erroneous conclusions andpotentially bad decisions. Know your business beforeyou determine how best to capture the essence of itsperformance.
LEARNING OBJECTIVE 6
Discuss relevant healthcare financial per-formance measures
MEASUREMENT OF CRITICAL VARIABLES
Understanding the relationships that drive perform-ance permits one to define performance measures thatfocus management attention on areas that need correc-tion. There is always a dilemma encountered in thedefinition of the measures that will be used for report-ing. First, the absolute number of measures used mustbe limited. The selected measures should have a highprobability of problem/opportunity detection. For ex-ample, in our sample hospital’s dashboard report, weassess the probability of a supply or drug cost problemby examining costs for four high-profile DRGs.Second, the measures should be naturally related to thekey driver map developed earlier (Figure 10–2). In thecase of our dashboard report, we identify 13 criticalperformance driver categories:
1. Market factors2. Pricing3. Coding4. Contract negotiation5. Overall cost6. Labor costs7. Supply costs8. Departmental costs9. Service intensity
10. Non-operating income11. Investment efficiency12. Plant obsolescence13. Capital position
Third, the selected measures should be capable ofexternal validation or benchmarking. Measuring cur-rent performance with past performance may be help-ful in some cases, but ideally comparative industrybenchmarks should be available.
Our “Hospital Dashboard” report contains 51 mea-sures that are related to the 13 critical performancedriver categories. Each of these measures can be relatedto external comparative data, as well as compared withindividual market area competitors. Benchmarking
Measurement of Critical Variables 205
42368_CH10_201_228 10/9/06 2:33 PM Page 205
data from competitors is extremely valuable. We willbe discussing the measures used for each of the 13 per-formance drivers when we begin our case discussion.
RELEVANT BENCHMARKING DATA
Comparative benchmarking data are crucial ingredi-ents to the success of any dashboard reporting system.Ideally, a business needs some comparative referencepoints so it can ask itself questions like: How am I
doing with respect to similar firms in my industry?How am I doing relative to my primary competitors?
Identifying measures that capture the nuances ofrevenue or cost drivers is nice, but they may be of lit-tle or no value if external comparative benchmarks canbe found. For example, most hospitals would like tomeasure and compare nursing costs on an acuity-adjusted basis, but uniform benchmarks are not cur-rently available. In this situation, direct nursing costper patient day may be the best that one can do.
206 CHAPTER 10 ANALYZING FINANCIAL STATEMENTS
Revenues
Profit
Margin
WorkingCapital
ROE
FSI
BusinessUnit
Value
InvestmentRequired
to SupportOperations
CapitalExpenditure
FinancingMix
Cost ofCapital
Market SizeMarket Share
Product MixQuality
InventoryAccounts Receivable
Accounts Payable
Cost of EquityCost of Debt
Leverage
Plant LifeReplacement Equipment
MaintenanceScale of Operations
PricesStaffing Levels
Wage RatesRaw Material PricesInvestment Income
CodingPayer Mix
Service IntensityContract Negotiating
Micro-ValueDrivers
Macro-ValueDrivers
Determinantsof Value
Figure 10–2 Micro-Drivers and Macro-Drivers
42368_CH10_201_228 10/9/06 2:33 PM Page 206

The measures that are used in our case example allowexternal comparisons and competitor comparisons be-cause the databases employed in the measure definitionare publicly available in the following sources:
• Medicare cost reports• Standard analytical outpatient file• MedPAR file
CASE EXAMPLE: ALPHA HEALTHCARE SYSTEM
For the remainder of this chapter, we will illustrate theuse of financial analysis techniques through a case ex-ample based on the fictitious Alpha Health Care System(AHCS). AHCS is a 170-bed acute-care facility with a20-bed skilled-nursing facility. Balance sheet and in-come statement data are presented in Tables 10–1 and10–2. Performance measures for AHCS, its closest com-petitor, and the U.S. median are presented in Table 10–3.
Overall Performance
Three measures of overall performance are identi-fied in Table 10–3:
1. Return on equity (ROE)2. Financial strength index (FSI)3. Total margin (TM)
High values are desirable for all three of these mea-sures. A quick review of the data in Table 10–3 revealsa strong position for AHCS when compared to U.S.medians. There may be some financial and operatingissues that need to be addressed if AHCS is to continueas a financially strong health care provider. Before wediscuss these measures, we will define them and com-pute values for 2007.
ROE �
� �1
1
6
5
0
,7
,5
9
5
3
9� � 9.8%
TM �
��118,2
1
9
5
2
,7
�
93
8,017�� 12.5%
Excess of Revenues over Expenses�����Operating Revenue � Non-operating Gains
Excess of Revenue over Expenses����
Net Assets
FSI � � � � �12.5
4.
�
0
4.0� � 2.13
� �
� � � �318
5
�
0
50� � 5.36
� �
� � � �50.0
50
�
.0
24.7� � 0.51
� �
� � � �9.0
9
�
.0
7.2� � 0.20
� 2.13 � 5.36 � 0.51 � 0.20 � 8.20
AHCS’s value for ROE is 9.8 percent, which indi-cates that the firm has a positive bottom line. A reviewof the data in Table 10–2 shows that AHCS has reportedsizable balances of both operating and non-operatingincome in 2007 and 2006. Also note in Table 10–2 the sizable increases in equity that resulted from unre-alized gains on investments ($2,171,000 in 2007 and$8,354,000 in 2006). While these gains will not impactnet income until the securities are sold, they did raisethe level of total equity at AHCS.
Total margin measures the return on revenue fromboth operating and non-operating sources. AHCS is re-alizing positive returns in both areas, but non-operatingreturns in 2007 were lower than those in 2006.
The final overall measure is the financial strengthindex (FSI). FSI attempts to measure the four areas offinancial position that collectively determine a firm’sfinancial strength:
• Profits – measured by total margin• Liquidity – measured by days’ cash-on-hand• Debt expense – measured by debt financing per-
centage• Age of physical facilities – measured by average
age of plant
Simply stated, firms that have high profits, lots ofcash, little debt, and new plants, have great financialstrength. Firms with losses, little cash, lots of debt, andold physical facilities will not be in business long.Each of the four measures is “normalized” around a
9.0 � Average Age of Plant����
9.0
50 � Debt Financing %���
50
Days Cash on Hand � 50���
50
Total Margin � 4.0���
4.0
Case Example: Alpha Health Care System 207
42368_CH10_201_228 10/9/06 2:33 PM Page 207

predefined average for the measure. This permits us toadd the four measures to create a composite indicator oftotal financial strength. AHCS has a very strong overallfinancial strength index (FSI) due primarily to its favor-able total margin position and its strong cash position.AHCS’s strong cash position is also a factor that impactstotal margin. In 2007, more than 50 percent of AHCS’stotal net income was derived from investment income.Debt levels at AHCS are also below normative values,which further enhances its overall financial strength.
A critical objective for AHCS in coming years willbe to maintain its current financial position. We will
now focus our attention on reviewing the 13 criticaldrivers of performance listed earlier to identify possi-ble areas of opportunity for AHCS.
Market Factors
There are many factors which influence the finan-cial performance of a health care provider, as theschematic in Figure 10–2 shows. Market factors playan important role in the final financial performance ofany business. There are six measures of market factorsidentified in Table 10–3 which are defined below:
208 CHAPTER 10 ANALYZING FINANCIAL STATEMENTS
Table 10–1 AHCS Balance Sheet, December 31, 2007 and 2006 (Data in Thousands)
2007 2006
AssetsCurrent assets
Cash and investments $ 3,124 $ 4,394Patient accounts receivable 21,447 16,094Inventory 2,122 3,254Other current assets 480 345
Total current assets $ 27,173 $ 24,087Assets for which use is limited
Capital improvements $ 87,608 $ 93,185Trustee-held funds 20,448 0Donor restricted 9,056 8,290
Total assets for which use is limited $117,112 $101,475Property, plant, and equipment
Property, plant, and equipment $113,416 $ 96,256Less accumulated depreciation 45,322 46,842Net property, plant, and equipment $ 68,094 $ 49,414
Other assets $792 $336Total assets $213,171 $175,312
Liabilities and net assetsLiabilities
Current liabilitiesAccounts payable $6,093 $ 5,531Accrued expenses 5,040 4,587Current installment of long-term debt 515 725Due to third-party payers 4,078 4,741
Total current liabilities $ 15,726 $ 15,584Long-term debt 36,068 15,047Other long-term liabilities 818 2,566
Total liabilities $52,612 $ 33,197Net Assets
Unrestricted $151,849 $134,271Restricted 8,710 7,844
Total net assets $160,559 $142,115Total liabilities and net assets $213,171 $175,312
42368_CH10_201_228 10/9/06 2:33 PM Page 208
Case Example: Alpha Health Care System 209
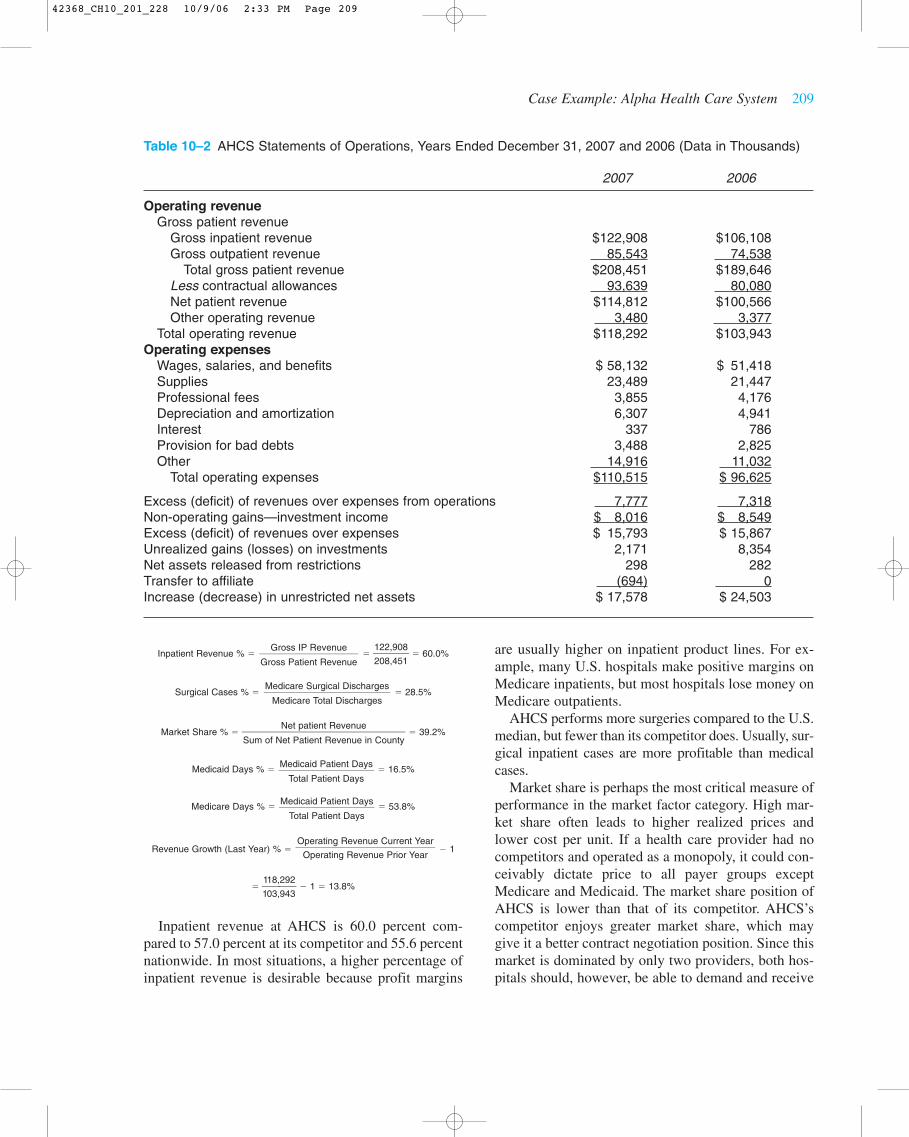
Table 10–2 AHCS Statements of Operations, Years Ended December 31, 2007 and 2006 (Data in Thousands)
2007 2006
Operating revenueGross patient revenue
Gross inpatient revenue $122,908 $106,108Gross outpatient revenue 85,543 74,538
Total gross patient revenue $208,451 $189,646Less contractual allowances 93,639 80,080Net patient revenue $114,812 $100,566Other operating revenue 3,480 3,377
Total operating revenue $118,292 $103,943Operating expenses
Wages, salaries, and benefits $ 58,132 $ 51,418Supplies 23,489 21,447Professional fees 3,855 4,176Depreciation and amortization 6,307 4,941Interest 337 786Provision for bad debts 3,488 2,825Other 14,916 11,032
Total operating expenses $110,515 $ 96,625
Excess (deficit) of revenues over expenses from operations 7,777 7,318Non-operating gains—investment income $ 8,016 $ 8,549Excess (deficit) of revenues over expenses $ 15,793 $ 15,867Unrealized gains (losses) on investments 2,171 8,354Net assets released from restrictions 298 282Transfer to affiliate (694) 0Increase (decrease) in unrestricted net assets $ 17,578 $ 24,503
Inpatient Revenue % � � �1
2
2
0
2
8
,
,
9
4
0
5
8
1� � 60.0%
Surgical Cases % � � 28.5%
Market Share % � � 39.2%
Medicaid Days % � � 16.5%
Medicare Days % � � 53.8%
Revenue Growth (Last Year) % � � 1
� �1
1
1
0
8
3
,
,
2
9
9
4
2
3� � 1 � 13.8%
Inpatient revenue at AHCS is 60.0 percent com-pared to 57.0 percent at its competitor and 55.6 percentnationwide. In most situations, a higher percentage ofinpatient revenue is desirable because profit margins
Operating Revenue Current Year����
Operating Revenue Prior Year
Medicaid Patient Days���
Total Patient Days
Medicaid Patient Days���
Total Patient Days
Net patient Revenue�����Sum of Net Patient Revenue in County
Medicare Surgical Discharges����
Medicare Total Discharges
Gross IP Revenue���Gross Patient Revenue
are usually higher on inpatient product lines. For ex-ample, many U.S. hospitals make positive margins onMedicare inpatients, but most hospitals lose money onMedicare outpatients.
AHCS performs more surgeries compared to the U.S.median, but fewer than its competitor does. Usually, sur-gical inpatient cases are more profitable than medicalcases.
Market share is perhaps the most critical measure ofperformance in the market factor category. High mar-ket share often leads to higher realized prices andlower cost per unit. If a health care provider had nocompetitors and operated as a monopoly, it could con-ceivably dictate price to all payer groups exceptMedicare and Medicaid. The market share position ofAHCS is lower than that of its competitor. AHCS’scompetitor enjoys greater market share, which maygive it a better contract negotiation position. Since thismarket is dominated by only two providers, both hos-pitals should, however, be able to demand and receive
42368_CH10_201_228 10/9/06 2:33 PM Page 209

210 CHAPTER 10 ANALYZING FINANCIAL STATEMENTS
Table 10–3 AHCS’s Critical Financial Measures of Performance, 2007
AHCS Competitor U.S. Median*
Overall measures Return on equity % 9.8 22.4 7.3Financial strength index 8.2 4.1 0.1Total margin % 12.5 17.4 3
Market factorsInpatient revenue % 60.0 57.0 55.6Surgical cases % 28.5 37.6 20.1Market share % 39.2 53.3 38.6Medicaid days % 16.5 5.2 10.2Medicare days % 53.8 57.7 54.6Revenue growth last year (%) 13.8 4.0 7.5
Pricing factorsMedicare charge per discharge (CMI�1.0) $12,754 $11,183 $12,513Medicare charge per visit (Relative Wt.�1.0) $215 $176 $217Routine room rate $501 $492 $660Chest x-ray (71020) $163 $84 $166
Coding factorsTwo year change in Medicare CMI % �3.1 6.0 0.4Medicare CMI 1.3466 1.6995 1.2469DRG 079/-(DRG 079 � DRG 089) 14.0 22.0 21.0DRG 475/-(DRG 475 � DRG 127) 6.0 16.0 12.0Injectable drugs without injection procedure % 94.9 31.5 34.8
Contract negotiation factorsMark-up % 189.0 200.0 220.0Nongovernment payer % 29.7 37.1 32.4Deduction % 44.9 41.2 54.5
Overall cost factorsHospital cost index 109.60 89.20 102.30Medicare cost per discharge (CMI�1.0) $6,666 $5,134 $5,586Medicare cost per visit (Relative Wt.�1.0) $67 $60 $71
Labor cost factorsNet patient revenue per FTE $116,418 $129,756 $107,397FTE’s per adjusted patient day 5.7 4.8 5.1Salary & benefits per FTE $58,936 $47,625 $43,252
Supply and drug cost factorsDRG 209 supply cost $5,721 $4,106 $4,493DRG 116 supply cost $6,418 $4,718 $5,780DRG 89 pharmacy cost $1,253 $611 $725DRG 79 pharmacy cost $2,682 $878 $1,179
Non-operating income factorsDays’ cash-on-hand 318 85 36Investment yield % 11.2 4.3 3.3Portfolio in equity % 47.8 n/a n/a
Service intensity factorsMedicare LOS (CMI�1.0) 4.4 2.6 4.0Medicare ancillary cost per discharge (CMI�1.0) $4,031 $3,271 $2,798
Departmental cost factorsDirect cost per routine day $295 $265 $273Direct cost per ICU/CCU day $782 $628 $649
continues
42368_CH10_201_228 10/9/06 2:33 PM Page 210

favorable contract terms because neither hospital hasthe capacity to service the entire market.
Market share increases also can provide significantimprovements in profits because of lower cost per unit.Table 10–3 shows an average cost per Medicare dis-charge at a case mix equal to 1.0 of $6,666. For the samedischarge, Medicare pays AHCS $5,623. The paymentnumber is not shown in Table 10–3, but was derivedelsewhere, producing an average loss of $1,043 ($5,623� $6,666). The data suggest that little or no profit mightbe realized from an increase in Medicare volume, givenAHCS’s relatively high cost structure. While cost isclearly a problem, which we will address shortly, mar-ket share increases for Medicare patients may still beprofitable. The critical question to be raised is: Whatwould the variable cost of increased volume be? Usuallya figure of 60 percent is assumed, but for this case, letus assume variable cost would be 80 percent, or $5,333(.80 � $6,666). This assumption, if accurate, wouldmean a marginal profit of $290 ($5,623 � $5,333) peradditional Medicare case with a case weight of 1.0.AHCS’s primary competitor currently treats 4500Medicare inpatients compared to 3800 at AHCS.Assuming an average case weight of 1.35 (AHCS’s cur-rent Medicare case-mix index), a transfer of ten percentof its competitor’s Medicare inpatient cases to AHCSwould result in a small increase in profit:
Medicare Marginal
Cases CMI Profit/Case Marginal Profit
450 � 1.35 � $290 � $176,175
Medicare and Medicaid percentages provide an in-dication of payer segment importance. Usually,Medicaid is perceived as a less desirable payer, whileMedicare in many hospitals is a desirable payer, espe-cially for acute inpatient care. AHCS appears to havean unfavorable relationship here. It has much higherMedicaid volume compared to its competitor and theU.S. median, while it has similar percentages of Medi-care. AHSC’s geographical location has placed itcloser to the Medicaid population than is its primarycompetitor. Losses on Medicaid patients are substan-tial and when combined with Medicare losses, a needis created for higher payments from the limitedprivate-payer base.
Revenue growth at AHCS is above both its com-petitor and the U.S. median. This is most likely a resultof AHCS’s greater growth in Medicaid volume. Whilerevenue growth is desirable, revenue growth in prof-itable product lines is critical. AHCS has experiencedgrowth in some less profitable lines such as Medicaid,and this has hurt overall profitability.
Case Example: Alpha Health Care System 211
Table 10–3 continued
AHCS Competitor U.S. Median*
Departmental cost factorsDirect administrative cost per adjusted patient day $313 $198 $201Direct capital cost per adjusted patient day $102 $94 $100Overhead cost % 35.1 23.9 33.0
Investment efficiency factorsDays in accounts receivable 68 57 59Inventory to net patient revenue % 1.8 2.9 1.9Revenue to net fixed assets 1.74 1.91 2.49
Plant obsolescence factorsAverage age of plant 7.2 8.3 9.3Two-year capital expenditure growth % 62.7 4.1 2.9
Capital position factorsDebt financing % 24.7 13.4 47.3Long-term debt to equity % 22.5 5.2 34.0Average cost of equity % 8.7 8.2 9.4Cash flow to total debt % 42.0 192.5 21.1Debt service coverage 21.1 n/a n/a
*U.S. Median dollar values are stated in a wage index of 0.9304; U.S. averages are for 2004.
42368_CH10_201_228 10/9/06 2:33 PM Page 211
Conclusions reached from our review of market fac-tors are:
• AHCS must concentrate growth strategies inproduct lines that are profitable, especially inpa-tient surgical areas.
• If market share enhancement is not feasible, costcutting must be pursued or unprofitable productlines must be eliminated.
• Reduced reliance on Medicaid business would bedesirable.
Pricing Factors
Pricing can still have a sizable influence on a healthcare firm’s profitability, even considering that manypayers have fixed-fee reimbursement schedules. Ofconcern to many is the price elasticity of health careservices. In simple terms, will volume drop if I raiseprices? This is a difficult question to answer, but inmany cases price elasticity is believed to be negligiblefor many health care services. If a health care firm’sprices are lower than those of its competitors’, theissue of price elasticity becomes of less importance.The first objective is, therefore, to determine if yourprices are above or below those of your competitors’.The four pricing measures are all developed from pub-lic data sets and are presented in Table 10–3. The datashow that AHCS has prices well above those of itscompetitor’s, but similar to the U.S. median.
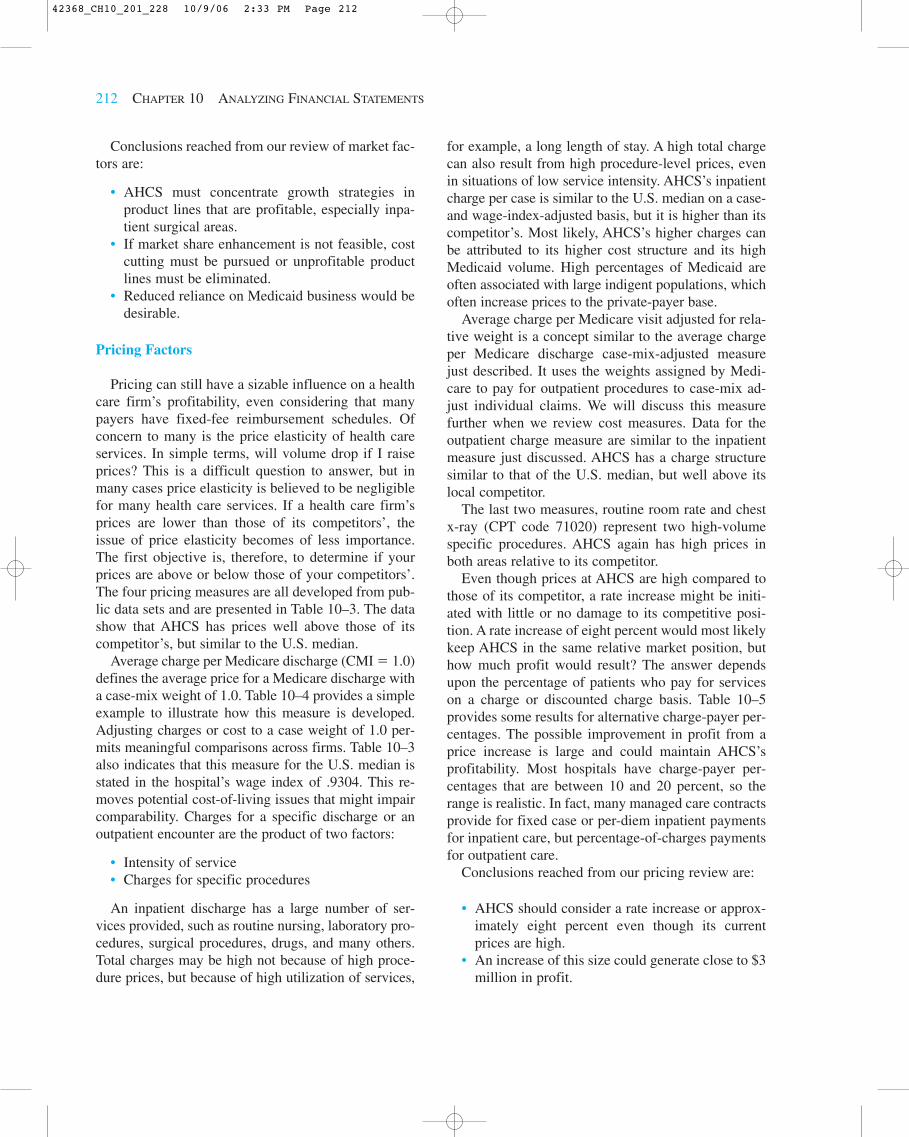
Average charge per Medicare discharge (CMI � 1.0)defines the average price for a Medicare discharge witha case-mix weight of 1.0. Table 10–4 provides a simpleexample to illustrate how this measure is developed.Adjusting charges or cost to a case weight of 1.0 per-mits meaningful comparisons across firms. Table 10–3also indicates that this measure for the U.S. median isstated in the hospital’s wage index of .9304. This re-moves potential cost-of-living issues that might impaircomparability. Charges for a specific discharge or anoutpatient encounter are the product of two factors:
• Intensity of service• Charges for specific procedures
An inpatient discharge has a large number of ser-vices provided, such as routine nursing, laboratory pro-cedures, surgical procedures, drugs, and many others.Total charges may be high not because of high proce-dure prices, but because of high utilization of services,
for example, a long length of stay. A high total chargecan also result from high procedure-level prices, evenin situations of low service intensity. AHCS’s inpatientcharge per case is similar to the U.S. median on a case-and wage-index-adjusted basis, but it is higher than itscompetitor’s. Most likely, AHCS’s higher charges canbe attributed to its higher cost structure and its highMedicaid volume. High percentages of Medicaid areoften associated with large indigent populations, whichoften increase prices to the private-payer base.
Average charge per Medicare visit adjusted for rela-tive weight is a concept similar to the average chargeper Medicare discharge case-mix-adjusted measurejust described. It uses the weights assigned by Medi-care to pay for outpatient procedures to case-mix ad-just individual claims. We will discuss this measurefurther when we review cost measures. Data for theoutpatient charge measure are similar to the inpatientmeasure just discussed. AHCS has a charge structuresimilar to that of the U.S. median, but well above itslocal competitor.
The last two measures, routine room rate and chestx-ray (CPT code 71020) represent two high-volumespecific procedures. AHCS again has high prices inboth areas relative to its competitor.
Even though prices at AHCS are high compared tothose of its competitor, a rate increase might be initi-ated with little or no damage to its competitive posi-tion. A rate increase of eight percent would most likelykeep AHCS in the same relative market position, buthow much profit would result? The answer dependsupon the percentage of patients who pay for serviceson a charge or discounted charge basis. Table 10–5provides some results for alternative charge-payer per-centages. The possible improvement in profit from aprice increase is large and could maintain AHCS’sprofitability. Most hospitals have charge-payer per-centages that are between 10 and 20 percent, so therange is realistic. In fact, many managed care contractsprovide for fixed case or per-diem inpatient paymentsfor inpatient care, but percentage-of-charges paymentsfor outpatient care.
Conclusions reached from our pricing review are:
• AHCS should consider a rate increase or approx-imately eight percent even though its currentprices are high.
• An increase of this size could generate close to $3million in profit.
212 CHAPTER 10 ANALYZING FINANCIAL STATEMENTS
42368_CH10_201_228 10/9/06 2:33 PM Page 212
Coding Factors
Coding can have a significant effect on the actualpayment received in almost every health care sector—from physician services to hospitals—and for almostevery type of payer—from self-pay to Medicare.Coding can also be a double-edged sword. Code tooaggressively or fraudulently, and you may be prose-cuted. Under-code patient services, and you will losesizable legitimate payments.
In our hospital dashboard of Table 10–3, we identifyfive primary coding measures that assess Medicare in-patient coding. Data for these measures are again pro-vided from publicly available sources.
Medicare case-mix index (CMI) indicates the aver-age complexity of Medicare inpatients seen. Table10–4 provides a simple example to illustrate the com-putation of a case-mix index. In that example, the aver-age case-mix index for the 30 patients was 1.2. AHCS
has a Medicare CMI of 1.3466, which is below its com-petitor’s value (1.6995) but above the U.S. median(1.2469). Of special interest is the two-year decline inAHCS’s Medicare case mix. This decline compares toa 6.0 percent increase at its primary competitor and 0.4percent increase nationally.
A more specific way to assess coding reasonable-ness is to review so-called DRG dyads. These are pairsof DRGs in which possible missed information in themedical records could affect DRG assignment. Wehave provided two DRG dyad measures in Table 10–3.The actual DRG measures and their relative weightsare presented in Table 10–6. Actual values from Table10–3 for both DRG dyads suggest that AHCS may beincorrectly coding its inpatient DRGs. The data showthat AHCS had reported lower frequencies of thehigher-weighted DRG than its primary competitor;they were also lower than the U.S. median. This couldbe further corroboration of coding issues at AHCS. Ofspecial interest is the DRG 475 and DRG 127 dyad. Inmany cases, a patient may be admitted with a heart at-tack, but also be experiencing respiratory problemsand be put on a ventilator. The case weight values inTable 10–6 show a significant difference in paymentfor DRG 127 when compared to DRG 475. Table 10–7shows the potential difference in payment if AHCShad a coding pattern similar to that of the U.S. AHCSmay be losing $139,032 ($1,190,493 � $1,051,461)on this one DRG dyad.
The last measure of coding is the percentage ofMedicare outpatient claims with an injectable drug pres-ent, but with no drug-administration code (injection
Case Example: Alpha Health Care System 213
Table 10–4 Illustration of Case-Mix Weighting
AggregateCase Number of Case Total
DRG Weight Cases Weight Charges
1 .80 10 8.00 $ 64,0002 1.20 10 12.00 96,0003 1.60 10 16.00 128,000
30 36.00 $288,000
Average charge per case � � $9,600
Average charge per case (CMI � 1.0) � �$9
1
,6
.2
00� � $8,000
Average case weight � �3
3
6
0� � 1.2
�$28
3
8
0
,000�
Table 10–5 Profit Resulting from Pricing Increase
Percentage of Charge Payers
10% 20%
Present gross charges $208,451,000 208,451,000� Charge payer % 10 20
Charge-driven revenue $20,845,100 $41,690,200� Rate increase % 8 8
Profit Change $ 1,667,608 $ 3,335,216
42368_CH10_201_228 10/9/06 2:33 PM Page 213

procedure) present. At AHCS, this situation was present94.9 percent of the times. Assuming Medicare pays $90per injection procedure, AHCS lost more than $40,000in this one area alone from Medicare-only patients.
The conclusion reached from our coding review is:
• AHCS appears to have coding problems. A reviewof current coding and billing procedures shouldbe undertaken.
Contract Negotiation Factors
A popular saying in many management circles is,“You don’t get what you deserve, but rather what younegotiate.” The same appears to be true in the largenumber of managed care contracts that health careproviders negotiate with health plans. The contractterms are especially important to most health careproviders because favorable terms often spell the dif-ference between financial success or failure. For mosthealth care providers, there is no opportunity to negoti-ate terms for Medicare and Medicaid payment. Theterms are fixed and are made on a take-it-or-leave-itbasis. The magnitude of patient volume in these twopayer categories makes it a must for most providers.
The real opportunity comes in negotiation of non-government-payer terms.
We have provided three measures for contract nego-tiation assessment. Collectively, these measures helpassess any possible weakness in current contract terms.The first measure is nongovernment-payers’ percent-age and represents the percentage of revenues not de-rived from Medicare or Medicaid patients. A highnumber indicates greater relative importance of effec-tive contract negotiation. AHCS has a relatively lowpercentage of nongovernment payers (29.7 percent)relative to the U.S. median (32.4 percent) and muchless than its competitor (37.1 percent).
The second measure reviewed is mark-up:
Markup � � �$
1
2
1
0
0
8
,5
,4
1
5
5
1� � 1.89
AHCS has relatively low mark-up ratios relative toboth its competitor and the U.S. median. Becauseprices at AHCS are above those of its competitor, thelower mark-up ratio signals higher costs at AHCS rel-ative to its competitor. Given this information, wewould expect the deduction percent measure to behigh:
Deduction % � � �$
$
2
9
0
3
8
,6
,4
3
5
9
1� � 44.9
The three contract negotiation measures suggest thatAHCS has contracts more favorable than does the av-erage U.S. hospital, but not as favorable as its primarycompetitor. In fact, most of AHCS’s contracts are dis-count from billed charges, which explains how AHCShas realized operating profitability with a high mix ofMedicaid patients and high costs. Charges at AHCS arecurrently 15 to 20 percent higher than those of its pri-mary competitor, but deduction percentages at bothhospitals are similar (44.9 and 41.2, respectively). Webelieve current contracts for both AHCS and its com-petitor must have similar rates of payment. AHCS’s
Contractual Allowances���Gross Patient Revenue
Gross Patient Revenue���
Total Expenses
214 CHAPTER 10 ANALYZING FINANCIAL STATEMENTS
Table 10–6 DRG Dyads
2006Relative
DRG Definition Weight
079 Respiratory infections with cc 1.6238089 Simple pneumonia with cc 1.0320096 Bronchitis and asthma with cc 3.6091097 Bronchitis and asthma without cc 1.0345475 Respiratory system diagnosis with 3.6091
ventilator support127 Heart failure and shock 1.0345
Table 10–7 Possible Payment Change Due to Coding
Expected Case Present ExpectedDRG Cases Cases Payment Payment Payment
127 138 129 $6,207 $856,566 $800,703475 9 18 21,655 194,895 389,790
$1,051,461 $1,190,493
42368_CH10_201_228 10/9/06 2:33 PM Page 214

competitor is realizing greater profit, primarily throughits lower cost structure.
Conclusions reached from our review of contractnegotiation factors are:
• AHCS and its competitor are most likely receiv-ing similar payment from managed care plans.
• Renegotiation of these contracts at similar ratescould be a problem, given AHCS’s competitor’sgreater market share and lower prices.
LEARNING OBJECTIVE 7
Describe the hospital cost-index measure.
COST POSITION – A NEW APPROACH
We indicated previously that we believe AHCS’sprimary area of opportunity is cost reduction. To betterassess relative cost positions, we will introduce a newconstruct for reviewing total hospital cost. This con-struct is further described in a July 2002 article pub-lished in Healthcare Financial Management, “TheHospital Cost Index: A New Way to Assess HospitalEfficiency.” Figure 10–3 provides a schematic of themethodology. Most hospitals currently use an adjusted-discharge or adjusted-patient-day output measure,which we believe to be flawed.
Problems with Adjusted-Discharge Measures of Cost
Most U.S. hospitals can divide their patient opera-tions into inpatient and outpatient areas. Gross patientrevenue is often subdivided along these lines. In thelast 20 years, outpatient activity has gone from under20 percent in most hospitals to close to 40 percent in2004. This dramatic increase in outpatient revenue hascaused more individuals to question the validity of in-corporating outpatient activity into a consolidatedmeasure of cost by using adjusted discharges or ad-justed patient days.
The critical measurement concept in an adjusted dis-charge or day measure is the weighting for outpatientrevenue. The usual methodology for defining adjusteddischarges or days is expressed as a formula:
Adjusted Discharges (days) � Inpatient Discharges (days)
� �1 � �Procedure Pricing
The computation of adjusted discharges is heavily in-fluenced by specific procedure prices in the hospital’sCharge Description Master (CDM). Some hospitals mayprice procedures with high outpatient utilization athigher levels to take advantage of the greater presence of“percentage of billed charges” payment arrangements.
Gross Outpatient Revenue����Gross Inpatient Revenue
Cost Position – A New Approach 215
Hospital Cost Index
Departmental Costs
Inpatient Cost Index
Medicare Costper Discharge(CMI � 1.0)
Outpatient Cost Index
Medicare Costper Visit
(RW � 1.0)
Figure 10–3 Analysis of Overall Cost
42368_CH10_201_228 10/9/06 2:33 PM Page 215
Other hospitals may keep high outpatient procedures atlower levels because of a large self-pay presence, imply-ing greater price elasticity. Some data suggest that themajority of hospitals overstate outpatient costs becauseof higher procedure prices. If this is so, hospitals withheavier percentages of outpatient activity or higher outpatient prices would have larger values for adjusteddischarges and, therefore, lower costs per adjusted dis-charge. This may partially explain why smaller hospitals,which often have greater percentages of outpatient rev-enue, have lower costs per adjusted discharge.
Output Differences
Another major factor that affects the comparabilityof cost measures using an adjusted-discharge basis isoutput differences. Even if there were only inpatientdischarges and no outpatient activity, discharges wouldnot be an ideal measure to make comparisons of costacross hospitals because of case-mix differences.Many cost-per-adjusted-discharge measures are fur-ther adjusted by dividing by the case-mix index of thehospital for the time period. There are two alternativecase-mix indexes that are often used:
• All-payer case-mix index• Medicare case-mix index
Obviously, the all-payer case-mix index will do abetter job of reflecting output differences than will aMedicare-only case-mix index. However, there is onemajor issue with the utilization of all-payer case-mix-index adjustments. You may be able to adjust your costfor case-mix effects, but will the external comparativecost measures be adjusted in similar fashion? Compe-titor data extracted from public files, such as MedicareCost Reports, will not have all-payer case-mix-indexvalues. For controlled subscriber-based benchmarkingservices, the all-payer case-mix-index adjustments maybe accurate, but the comparisons will be limited toother subscribing hospitals and will exclude specificcompetitor comparisons.
For the above reasons, Medicare case-mix-index ad-justments are often utilized in a number of comparativereports. In many cases, the Medicare case-mix index canremove cost variance and better isolate possible prob-lems. The Medicare case-mix-index adjustment will bean issue, however, when the non-Medicare patient pop-ulation differs dramatically from the Medicare patientpopulation. For example, a hospital that specialized inorthopedics and obstetrics would present problems.
Using the Medicare case-mix index would grossly over-state case-mix complexity because all of the obstetriccases, which would be lower-case weighted, howevernot applicable to Medicare claims.
Geographical Cost-of-Living Differences
The final area affecting the comparability of cost-per-adjusted-discharge measures is geographic cost-of-living differences. Hospitals in Oakland, California,have higher operating costs than do hospitals in ruralNorth Dakota. The usual method of adjustment is to di-vide the unadjusted cost measure by the local areacost-of-living index. This division would restate costsinto a cost-of-living index equal to 1.0. The wageindex used by Medicare is the most often-used indexand may be applied to total cost or some percentage oftotal cost. The rationale for a percentage is that someportion of hospital costs, e.g., supplies, may not be af-fected by cost-of-living differences. Medicare assumesthat the wage index affects 71 percent of total cost. Theremaining 29 percent is presumed not to be affected bywage variation.
Cost-of-living differences are important and the ad-justments can be easily handled. Of the three problemsaffecting cost comparability (procedure pricing, outputdifferences, and geographical cost-of-living differ-ences), cost-of-living differences can be resolved. Theproblems with procedure pricing and output differ-ences are still present in a CPAD measure, even aftercase-mix indexes have been applied.
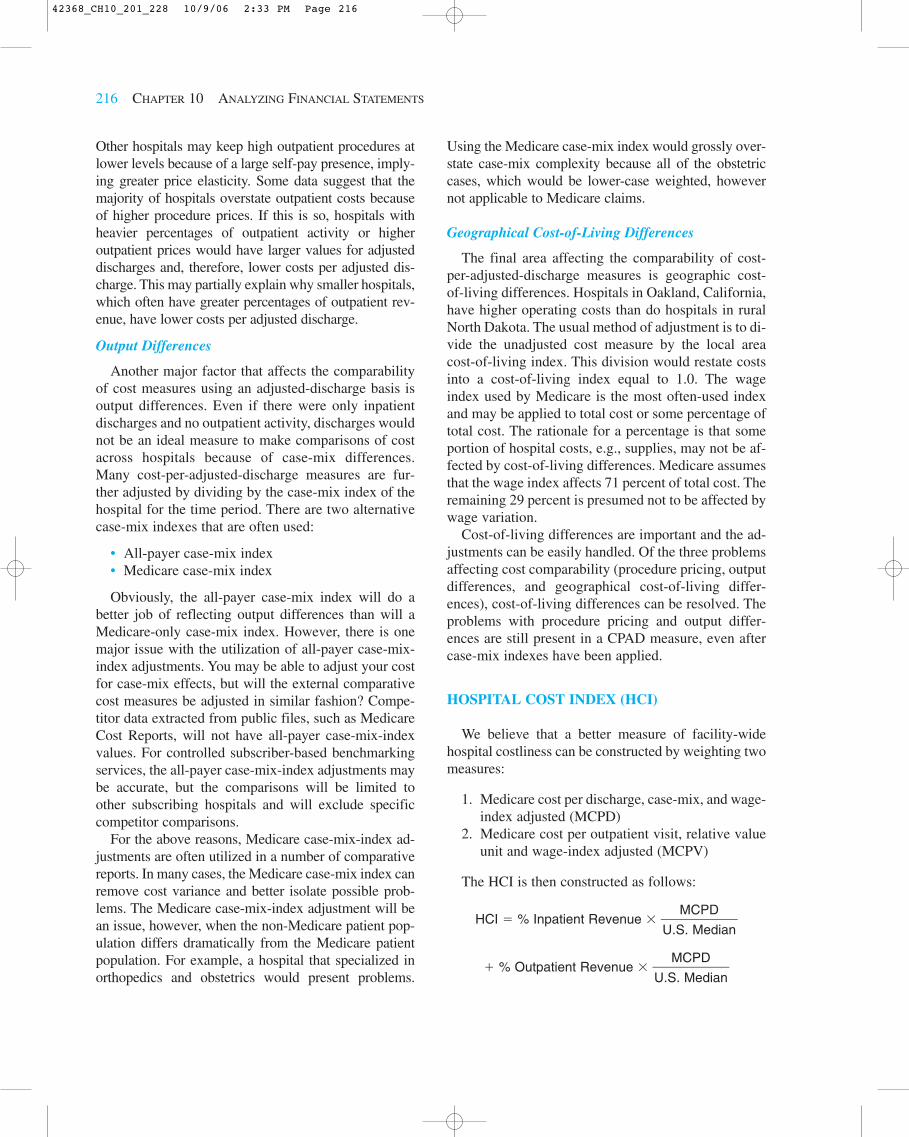
HOSPITAL COST INDEX (HCI)
We believe that a better measure of facility-widehospital costliness can be constructed by weighting twomeasures:
1. Medicare cost per discharge, case-mix, and wage-index adjusted (MCPD)
2. Medicare cost per outpatient visit, relative valueunit and wage-index adjusted (MCPV)
The HCI is then constructed as follows:
HCI � % Inpatient Revenue � �U.S
M
.
C
M
P
e
D
dian�
� % Outpatient Revenue � �U.S
M
.
C
M
P
e
D
dian�
216 CHAPTER 10 ANALYZING FINANCIAL STATEMENTS
42368_CH10_201_228 10/9/06 2:33 PM Page 216

Medicare Cost per Discharge (MCPD)
Medicare cost per discharge is a good reflection ofinpatient cost. Data for computing this measure can bederived from the following public-use files: Medparand Medicare Cost Reports. Each Medicare inpatientclaim is costed by using the relevant departmental ratioof cost-to-charge (DRCC) values derived from theMedicare Cost Report and applying them to chargesfrom the inpatient claim. The DRCC values are map-ped to specific revenue codes in the claims file.Finally, a Medicare-assigned wage index is used to re-state costs to an index of 1.0. This process results in aunique publicly available number for most hospitals inthe U.S.
The MCPD is not a perfect measure of relative in-patient costs, but we believe it is better than any otherpublicly available measure of cost or inpatient cost atthe facility level for several reasons. The output unit ismore comparable than any other. There is no applica-tion of outpatient-equivalent discharges to distort out-put similarity. The case-mix index used to adjust it isspecific to those patients and is not extended to non-Medicare patients. The cost measures are adjustedusing department-specific cost-to-charge ratios, notfacility-wide cost-to-charge ratios. Finally, the costsare adjusted for cost-of-living differences.
The major problem with MCPD is its comprehen-siveness. In short, the measure may or may not be re-flective of costs in other non-Medicare areas. Webelieve that this is not a major issue for the followingreasons. First, Medicare represents the largest payer formost hospitals: approximately 53 percent of all inpa-tient days and 44 percent of discharges. Second, with afixed payment per DRG, there is an incentive to keepcosts low. If costs are high in the Medicare area, theywill most likely be high in other non-Medicare areas.
Medicare Cost per Outpatient Visit (MCPV)
We use MCPV to assess costliness on the outpatientside of hospital operations. We can construct this mea-sure from public data—Medicare Outpatient Claimsand Medicare Cost Reports—which make its avail-ability a reality for most U.S. hospitals. To derive themeasure, we divide the cost per claim defined throughthe DRCC extensions by the relative value units of theclaim. We estimate RVUs based on the followingtaxonomy:
Line-Item Type RVU Assignment
APC APC weightFee schedule Fee schedule/nat’l price
per APC � 1.0Pass-through drug Avg. wholesale price/nat’l
and biologicals price per APC = 1.0Pass-through device Estimate payment/nat’l
price per APC = 1.0
We believe the introduction of the OutpatientProspective Payment System (OPPS) has provided anopportunity to adjust outpatient costs for relative-valueunit differences in a manner similar to case-mix-indexadjustment on the inpatient side. We do not know ofany other measure of facility-wide outpatient cost thatincorporates relative-value unit adjustment to this de-gree. Medical groups have used resource-based rela-tive value scales (RBRVS) measure, but these were notapplicable to hospital outpatient operations.
The MCPV is not a perfect measure of outpatientcostliness. Like the MCPD, the MCPV does not neces-sarily reflect cost for non-Medicare patients. Medicarepatients are, however, a significant percentage of totaloutpatient business (21 percent in 1999). Medicare alsopays on a fixed-fee basis now, so that is a strong incen-tive to keep costs low. If costs are high for Medicareoutpatients, it seems reasonable to conclude that theywould be high for other categories.
Merging the MCPD and the MCPV
The final step in the development of the HCI is tocombine the MCPD and MCPV. To combine these twomeasures, we must weight them by the percentage ofbusiness activity. The MCPD is, therefore, multipliedby the percentage of inpatient revenue, and the MCPVis multiplied by the percentage of outpatient revenue.The sum of inpatient revenue and outpatient revenuepercentages should equal 1.0. Data for these valueswill be taken from Medicare Cost Reports.
The final step is to “normalize” the MCPD andMCPV around some central value. We use the currentU.S. median values for both measures.
OVERALL COST FACTORS
Using the three measures just described (HCI, MCPD,and MCPV), we can see from Table 10–3 that AHCS isa high-cost hospital with respect to both its primary
Overall Cost Factors 217
42368_CH10_201_228 10/9/06 2:33 PM Page 217

competitor and the U.S. median. AHCS’s HCI is cur-rently at 109.6, which is 7.1 percent above the U.S. me-dian (102.3) and 22.9 percent above its primarycompetitor. The data also show us that AHCS has agreater opportunity for cost reduction in the inpatientarena where its cost per discharge on a case-mix basis issignificantly above both that of its competitor and theU.S. median.
Labor Cost Factors
Health care providers, in general, and hospitals inparticular are labor-intensive operations. More than 50percent of their costs are connected to staffing. To an-alyze labor costs, we have selected two measures ofproductivity and one measure of compensation.
Net Patient Revenue per FTE
� � �114
9
,8
8
1
6
2
.2
,000� � $116,418
FTEs per Adjusted Patient Day
�FTE � 365
Adjusted Patient Days
� 986.2 � �63
3
,
6
0
5
37� � 5.7
Salary and Benefits per FTE
� � �58,
9
1
8
2
6
3
.
,
2
000� � $58,936
Collectively, the labor cost measures suggest a prob-lem. Salary and fringe benefit costs are very high com-pared to the U.S. median and also high relative to thoseof its competitor. Fringe benefit costs do appear exces-sive. Much of this cost is directly related to a very ex-pensive “defined benefit” retirement plan, as well as avery liberal educational benefit program.
Labor productivity at AHCS is also worse on bothmeasures when compared to its competitor. Part of theissue at AHCS may be related to a very generous sickleave and vacation policy. Further in-depth analysisneeds to be directed to department-specific benchmarks.
Conclusions reached from our review of labor costfactors are:
• Compensation costs appear out of line with theU.S. median and costs of ACHS’s competitor.Fringe benefit costs appear out of line when com-
Salaries & Benefits���
FTEs
Net Patient Revenue���
FTEs
pared to any reasonable benchmark. AHCS shouldexplore the termination of its present retirementprogram and explore one that is of a comparablecost relative to other employers’ programs, espe-cially the program of its competitor.
• Labor productivity appears to be worse than com-petitor values. Comparative analysis at depart-mental levels should be initiated to determinewhere specific problems exist.
Supply and Drug Costs
Supply and drug costs can be significant factors fora large number of medical and surgical procedures. Themagnitude of total supply and drug costs is complicatedbecause of the underlying factors that influence cost.These particular costs are a product of the quantity usedand the price paid. Lower costs can be realized by ei-ther reducing the intensity of usage or reducing theprice paid. Lower prices can be realized through betterpurchasing contracts or using lower priced supplies ordrugs. The issue is often complicated by physician pref-erences. Health care executives can attempt to influ-ence physician behavior in supply or drug selection, butultimately, the physician will determine which drug orsupply item will be used and in what quantity.
We provide four measures of inpatient supply anddrug costs. Two of these measures define supply costsfor DRGs whose supply costs are usually sizable:
• DRG 209 – Major joint and limb attachment pro-cedures—lower extremity
• DRG 116 – Other permanent cardiac pacemaker,implant, or Automatic Implantable CardioverterDefibrillators (AICD).
Both measures indicate that AHCS has costs muchlarger than the U.S. median and also much larger thancompetitor values. While the variance exists, the ex-planation is not clear without further review. Possibleexplanations could be:
• Poorly-negotiated purchase contracts, which re-sult in higher prices
• Usage of more expensive supply items by physi-cians
Further review suggests that physician preference forhigher-priced supply items is the primary cause. Thisresults in a medical decision-making dilemma. Shouldphysicians use less costly supply items to improve thehospital’s bottom line, and would these lower-cost sup-ply items adversely affect patient care?
218 CHAPTER 10 ANALYZING FINANCIAL STATEMENTS
42368_CH10_201_228 10/9/06 2:33 PM Page 218

Two DRG drug cost measures are also reviewed:
• DRG 089 – Simple pneumonia and pleurisy• DRG 079 – Respiratory infections and inflamma-
tions
AHCS also appears to have higher drug costs thando the other two players in this analysis. Similar issuesfor supply costs also appear present with respect todrug usage.
Conclusions reached from our review of drug andsupply costs are:
• Supply and drug costs appear to be very high andresult primarily from physician preferences.
• Review of supply and drug costs with selectedphysicians should be undertaken with the desiredoutcome of supply and drug standardization.
Non-Operating Income
Many nonprofit health care providers, especiallyhospitals, derive a large percentage of their total net in-come from non-operating sources. The usual source ofnon-operating income for most hospitals is investmentincome. Data from Table 10–2 show this to be espe-cially true for AHCS.
We have defined three measures to assess perform-ance in the non-operating income area:
Days Cash on Hand �
� � 318
Investment Yield �
� �3$,8102146�
�
827,,167018
� � 11.2%
Portfolio in Equity �
� �3,124
43
�
,41
8
2
7,608� � 47.8%
AHCS has a very sizable investment in securities, asseen from its days’ cash-on-hand value of 318 days.Only investments that are not restricted by donors orthird parties are included. This explains why trustee-held funds ($20,448) and donor-restricted funds($9,056) are excluded.
In addition, AHCS has a very sizable percentage ofits investment in equities: 47.8 percent. This high per-centage of equity investment can increase yields, but
Equity Investment����Unrestricted Cash and Investments
Investment Income � Unrealized Gains (Losses)������
Unrestricted Cash and Investments
3,124 � 87,608���(110,515 � 6,307) / 365
Unrestricted Cash and Investments�����(Total Expenses � Depreciation) / 365
risk is also increased. Investment income includes bothinterest and dividend income, as well as realized gainsor losses on securities sold during the period.
Conclusions for AHCS with respect to its invest-ment portfolio are:
• Review current investment strategy and perhapsplace equity investment in funds that replicatebroad market segments, such as the Standard andPoor’s 500 or the Wilshire 5000.
• Determine if AHCS is willing to assume the rela-tively high risk of equity investments or whethera reduced reliance on equity funds is more con-sistent with projected needs for these funds.
Service Intensity
Service intensity is a critical driver of health carecost. Cost per encounter of service can be defined as:
�E
S
nc
e
o
rv
u
i
n
ce
te
s
rs� � �
S
I
e
n
r
p
v
u
ic
t
e
s
s� � Prices of Resources
Each of these three factors will drive total health carecosts. The first term (services/encounters) is referred toas service intensity. The two major drivers of serviceintensity for inpatient care are length of stay (LOS) andancillary service usage. We have, therefore, includedtwo measures to help assess service intensity:
• Medicare length of stay, case-mix-index adjusted• Medicare ancillary cost per discharge, case-mix-
index adjusted
Both of these measures are taken from Medicare dataand are case-mix adjusted to 1.0. The use of these mea-sures assures that there will be comparability acrosshospitals because the measures are “apple-to-apple”comparisons.
AHCS has a high LOS on a case-mix-adjusted basiswhen compared to the U.S. median. Its value is alsoabove that of its primary competitor’s. Its high lengthof stay is a reason its cost per discharge is so high.Please note that AHCS’s Medicare LOS unadjusted isactually 5.92, but its Medicare case-mix index was1.3466, which deflates the LOS to 4.4 on a case mix-adjusted basis. Significant opportunity exists for costreduction from further LOS declines.
Ancillary costs are also above the U.S. median andwarrant review. Prior discussion has already disclosedhigh prices paid for supply and drug items. This ismost likely the cause for the variance. It should also be
Overall Cost Factors 219
42368_CH10_201_228 10/9/06 2:33 PM Page 219

noted that a higher length of stay may not affect ancil-lary costs. Most of these services are not necessarilyrelated to LOS.
Table 10–8 documents the potential savings for oneDRG and illustrates the potential from LOS reductionand reduced drug usage.
Conclusions reached from our service intensity re-view are:
• AHCS has significant opportunity for major sav-ings in this area.
• Low levels of efficiency, especially LOS manage-ment, exist.
Departmental Cost Factors
We have included five measures of departmentalcost:
• Nursing Cost Measures1. Direct cost per routine day2. Direct cost per ICU/CCU day
• Overhead Measures / Adjusted Patient Day3. Administrative cost per adjusted patient day
4. Capital-related cost per adjusted patient day5. Overhead cost percentage
Direct costs of nursing for both routine care andICU/CCU care are high relative to the U.S. medianand the costs of ACHS’s competitor. These cost mea-sures include only the direct cost of the departmentand do not include overhead allocations. The cost dataare extracted from filed Medicare Cost Reports. Thehigh nursing cost values are somewhat surprising,given the high LOS at AHCS. Usually, nursing inten-sity is highest in the early days of care; and it wouldbe reasonable to expect higher costs per day of care inlow-LOS situations.
The three overhead measures of cost also suggestsome inefficiency. AHCS appears to have higher ad-ministrative and capital costs than the U.S. median re-flects and should be reviewed.
Conclusions reached from the review of departmen-tal cost factors are:
• AHCS has high direct nursing costs per day. Thisis a result of both a higher RN mix and highersalaries.
220 CHAPTER 10 ANALYZING FINANCIAL STATEMENTS
Table 10–8 DRG Savings Opportunities
DRG 478 (Other Vascular Proc w cc) AHCS Competitor U.S. Median
Discharges 38 46 43Medicare LOS 8.89 5.59 7.01Avg Routine LOS 7.13 4.59 4.93Avg ICU/CCU LOS 1.76 1.00 2.08
Routine care costs 3,996 3,515 2,813ICU/CCU costs 2,035 1,408 2,291
Subtotal 6,031 4,923 5,104Medical/surgical supplies 2,009 2,035 2,161Laboratory 1,288 889 636Operating room 6,227 4,674 2,555Radiology 1,011 1,494 797MRI 123 41 37Pharmacy 2,411 1,202 1,162Emergency room 102 53 86Cardiology 248 483 244Blood 145 313 183Physical/occupational therapy 564 103 139Inhalation therapy 211 91 134Other 943 766 522
Subtotal 15,282 12,144 8,656Grand Total 21,313 17,067 13,760
42368_CH10_201_228 10/9/06 2:33 PM Page 220
• Overhead costs at AHCS are high, especially inthe administration area. Reductions in administra-tive costs should be pursued.
Investment Efficiency Factors
As discussed earlier in this chapter, it is not theamount of profit realized that is of prime concern, butrather the amount of profit in relation to investment.For most health care providers, the three critical areasof control are plant, property, and equipment; accountsreceivable; and inventory. To assess performance inthese three areas, we have defined three measures thatassess the productivity of investment.
Days in Accounts Receivable �
� �114
2
,8
1
1
,4
2
4
/
7
365� � 68.2
Inventory to Net Patient Revenue � Inventory
Net Patient Revenue
� �1
2
1
,
4
1
,
2
8
2
12� � 1.8%
Revenue to Net Fixed Assets � � �1
6
1
8
8
,0
,2
9
9
4
2� � 1.74
AHCS has poor investment productivity with re-spect to both accounts receivable and fixed assets.Reductions in both categories could enhance the finan-cial performance of the firm significantly.
High values for receivables can be the result of manyfactors, but in general result from three primary causes:
• Payment delays by payers, especially commercialhealth plans
• Large balances of old accounts whose collectionis suspect
• Billing delays that prevent prompt invoicing ofprovided care
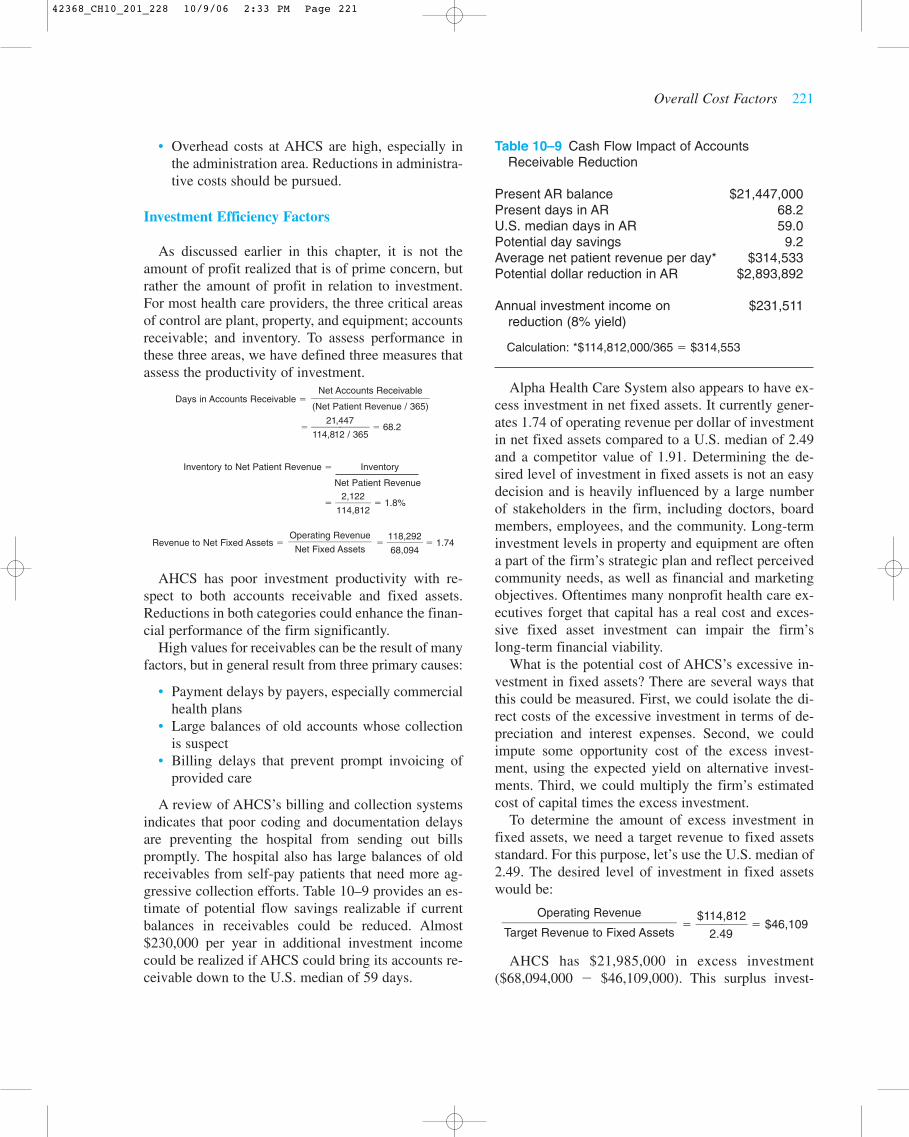
A review of AHCS’s billing and collection systemsindicates that poor coding and documentation delaysare preventing the hospital from sending out billspromptly. The hospital also has large balances of oldreceivables from self-pay patients that need more ag-gressive collection efforts. Table 10–9 provides an es-timate of potential flow savings realizable if currentbalances in receivables could be reduced. Almost$230,000 per year in additional investment incomecould be realized if AHCS could bring its accounts re-ceivable down to the U.S. median of 59 days.
Operating Revenue���
Net Fixed Assets
Net Accounts Receivable����(Net Patient Revenue / 365)
Alpha Health Care System also appears to have ex-cess investment in net fixed assets. It currently gener-ates 1.74 of operating revenue per dollar of investmentin net fixed assets compared to a U.S. median of 2.49and a competitor value of 1.91. Determining the de-sired level of investment in fixed assets is not an easydecision and is heavily influenced by a large numberof stakeholders in the firm, including doctors, boardmembers, employees, and the community. Long-terminvestment levels in property and equipment are oftena part of the firm’s strategic plan and reflect perceivedcommunity needs, as well as financial and marketingobjectives. Oftentimes many nonprofit health care ex-ecutives forget that capital has a real cost and exces-sive fixed asset investment can impair the firm’slong-term financial viability.
What is the potential cost of AHCS’s excessive in-vestment in fixed assets? There are several ways thatthis could be measured. First, we could isolate the di-rect costs of the excessive investment in terms of de-preciation and interest expenses. Second, we couldimpute some opportunity cost of the excess invest-ment, using the expected yield on alternative invest-ments. Third, we could multiply the firm’s estimatedcost of capital times the excess investment.
To determine the amount of excess investment infixed assets, we need a target revenue to fixed assetsstandard. For this purpose, let’s use the U.S. median of2.49. The desired level of investment in fixed assetswould be:
� �$11
2
4
.4
,8
9
12� � $46,109
AHCS has $21,985,000 in excess investment($68,094,000 � $46,109,000). This surplus invest-
Operating Revenue����Target Revenue to Fixed Assets
Overall Cost Factors 221
Table 10–9 Cash Flow Impact of AccountsReceivable Reduction
Present AR balance $21,447,000Present days in AR 68.2U.S. median days in AR 59.0Potential day savings 9.2Average net patient revenue per day* $314,533Potential dollar reduction in AR $2,893,892
Annual investment income on $231,511reduction (8% yield)
Calculation: *$114,812,000/365 � $314,553
42368_CH10_201_228 10/9/06 2:33 PM Page 221

ment represents 32.2 percent of AHCS’s present in-vestment in net fixed assets. Assuming that 32.2 per-cent of the firm’s depreciation and interest is notnecessary produces one estimate of annual cost:
.322 � ($6,307,000 � $337,000) � $2,139,368
Alternatively, we could assume a possible yield onrisk-free investment of 6.0 percent as our opportunitycost. This would produce an annual savings of$1,319,100 (.06 � $21,985,000).
No matter what method of cost savings is used,AHCS has a heavy cost associated with its excess in-vestment in fixed assets. Much of this surplus is a di-rect result of intense physician pressure to finance newinvestment in clinic facilities to support the integratednetwork of services provided by AHCS.
Conclusions reached from our investment efficiencyreview are:
• Receivables are very high at AHCS, primarily dueto poor coding and documentation. Reductions toU.S. medians could produce $231,511 in annualcash flow.
• Fixed asset investment at AHCS is $22 millionabove the U.S. median. This surplus investmentcould cost AHCS somewhere between $1.3 millionand $2.1 million annually. Tighter capital-expenditure review policies need to be implemen-ted to prevent this problem from getting worse.
Plant Obsolescence Factors
While excessive investment in fixed assets can im-pair the realization of reasonable return on investment,investment in old facilities and outdated technologycan be fatal. If a health care firm, especially a hospital,has old and outdated facilities, it will likely affect thequality of care rendered to its patients. It may also leadmedical staff to practice at facilities where they believethe welfare of their patients may be better served. Wehave defined two measures to assess the issue of plantobsolescence:
Average Age of Plant � � �4
6
5
,3
,3
0
2
7
2� � 7.2
2-Year Capital Expenditure�
Capital Expenditures
Growth Ratein Last 2 Years 48,124
Gross Fixed Assets �
76,714 � 62.7%
Two Years Ago
Accumulated Depreciation���
Depreciation Expense
AHCS has spent more on fixed assets than the U.S.median in the last two years, resulting in more state-of-the-art facilities. The data suggest that AHCS has anewer physical facility than does its competitor, whichmay give it a competitive advantage.
The conclusion regarding plant obsolescence is:
• AHCS has kept up with current technology andhas been replacing its current physical facilitiesand investing in new areas.
Capital Position
The last area of performance factors to be reviewed iscapital position. Successful firms have profitable opera-tions with reasonable levels of investment. They alsokeep their cost of financing at a reasonable level. Capitalfunds in any firm are provided from either debt or equity;and each has a cost. Debt has an explicit cost that can beeasily determined by either examining current financingdocuments or obtaining present bond market yields.Debt also affects the cost of equity capital. Higher levelsof debt or financial leverage increase the risk of businessfailure and lead to higher required returns for investedequity capital, irrespective of its source. A religious, gov-ernment, community, or investor-owned firm must ob-tain higher returns on its equity as it raises the level ofrisk through increased borrowing. We have identifiedfive measures of capital position:
Debt Financing % � �T
T
o
o
ta
ta
l L
l A
ia
s
b
s
il
e
it
t
ie
s
s� � �
2
5
1
2
3
,6
,1
1
7
2
1� � 24.7%
Long-Term Debt-to-Equity % � �Long-
E
T
q
e
u
r
i
m
ty
Debt� � �
1
3
6
6
0
,0
,5
6
5
8
9� � 22.5%
Risk FreeReturn on Average Cost �US Govt
� (Beta of Firm � Market-Risk Premium) � % 8.7%of Equity
Obligations
Cash Flow to Debt % � � �15,79
5
3
2,6
�
12
6,307� � 42.0%
Debt Service Coverage �
� � 21.1
AHCS has less financial leverage when compared toU.S. median values. It has borrowed extensively to fi-
15,793 � 6,307 � 337���
725 � 337
Net Income � Depreciation � Interest�����
Principal Payment � Interest
Net Income � Depreciation����
Total Liability
222 CHAPTER 10 ANALYZING FINANCIAL STATEMENTS
� �
42368_CH10_201_228 10/9/06 2:33 PM Page 222
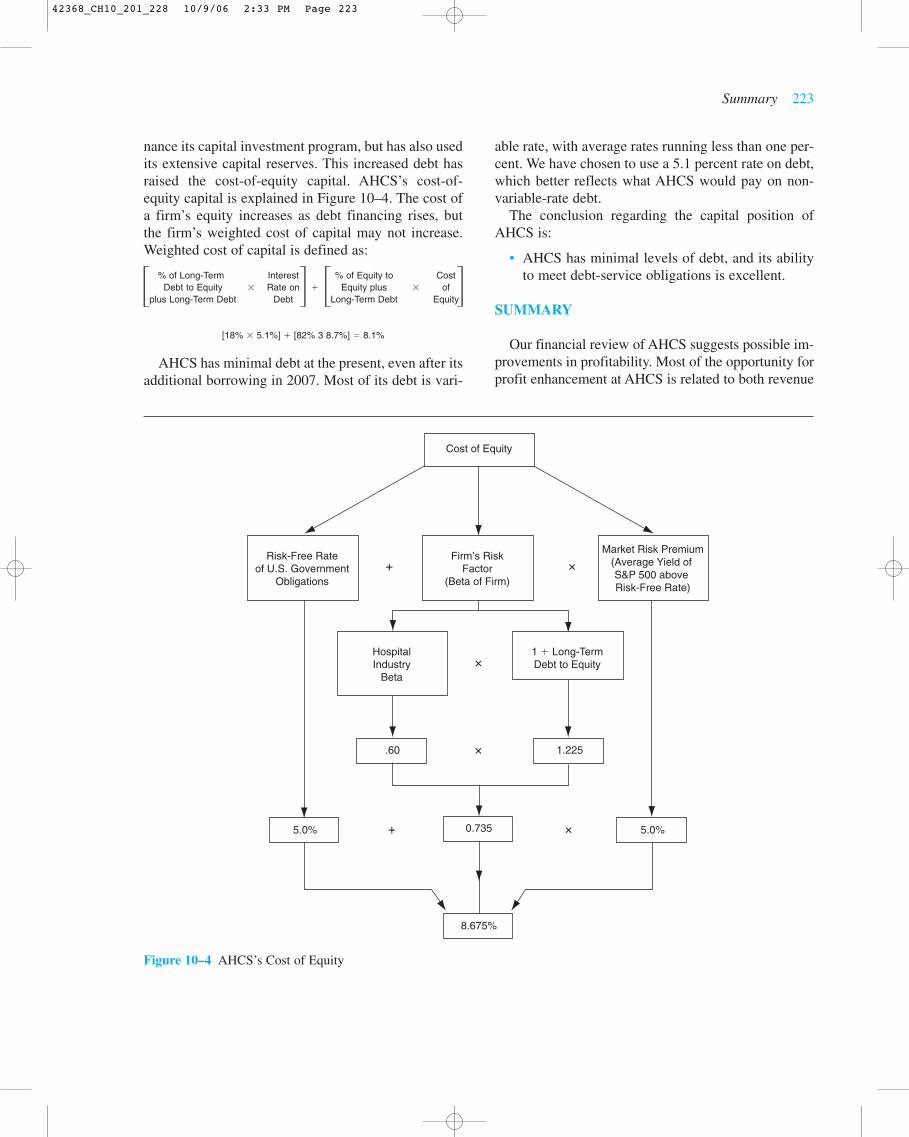
nance its capital investment program, but has also usedits extensive capital reserves. This increased debt hasraised the cost-of-equity capital. AHCS’s cost-of-equity capital is explained in Figure 10–4. The cost ofa firm’s equity increases as debt financing rises, butthe firm’s weighted cost of capital may not increase.Weighted cost of capital is defined as:
% of Long-Term Interest % of Equity to CostDebt to Equity � Rate on � Equity plus � of
plus Long-Term Debt Debt Long-Term Debt Equity
[18% � 5.1%] � [82% 3 8.7%] � 8.1%
AHCS has minimal debt at the present, even after itsadditional borrowing in 2007. Most of its debt is vari-
able rate, with average rates running less than one per-cent. We have chosen to use a 5.1 percent rate on debt,which better reflects what AHCS would pay on non-variable-rate debt.
The conclusion regarding the capital position ofAHCS is:
• AHCS has minimal levels of debt, and its abilityto meet debt-service obligations is excellent.
SUMMARY
Our financial review of AHCS suggests possible im-provements in profitability. Most of the opportunity forprofit enhancement at AHCS is related to both revenue
Summary 223
� � � �
Cost of Equity
.60
5.0% 5.0%
1.225
0.735
8.675%
Risk-Free Rateof U.S. Government
Obligations
HospitalIndustry
Beta
1 � Long-TermDebt to Equity
Firm’s RiskFactor
(Beta of Firm)
Market Risk Premium(Average Yield of S&P 500 above Risk-Free Rate)
� �
�
�
� �
Figure 10–4 AHCS’s Cost of Equity
42368_CH10_201_228 10/9/06 2:33 PM Page 223
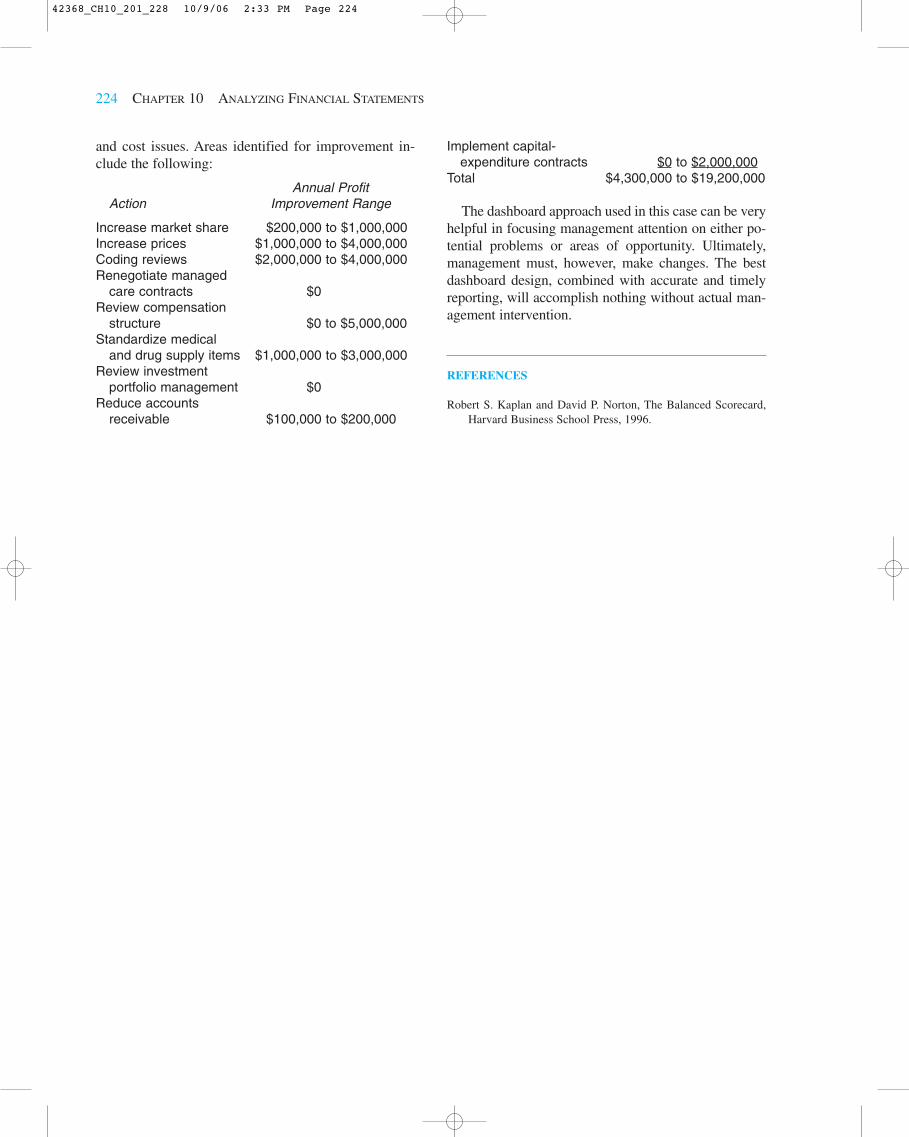
and cost issues. Areas identified for improvement in-clude the following:
Annual Profit Action Improvement Range
Increase market share $200,000 to $1,000,000Increase prices $1,000,000 to $4,000,000Coding reviews $2,000,000 to $4,000,000Renegotiate managed
care contracts $0Review compensation
structure $0 to $5,000,000Standardize medical
and drug supply items $1,000,000 to $3,000,000Review investment
portfolio management $0Reduce accounts
receivable $100,000 to $200,000
Implement capital-expenditure contracts $0 to $2,000,000
Total $4,300,000 to $19,200,000
The dashboard approach used in this case can be veryhelpful in focusing management attention on either po-tential problems or areas of opportunity. Ultimately,management must, however, make changes. The bestdashboard design, combined with accurate and timelyreporting, will accomplish nothing without actual man-agement intervention.
REFERENCES
Robert S. Kaplan and David P. Norton, The Balanced Scorecard,Harvard Business School Press, 1996.
224 CHAPTER 10 ANALYZING FINANCIAL STATEMENTS
42368_CH10_201_228 10/9/06 2:33 PM Page 224
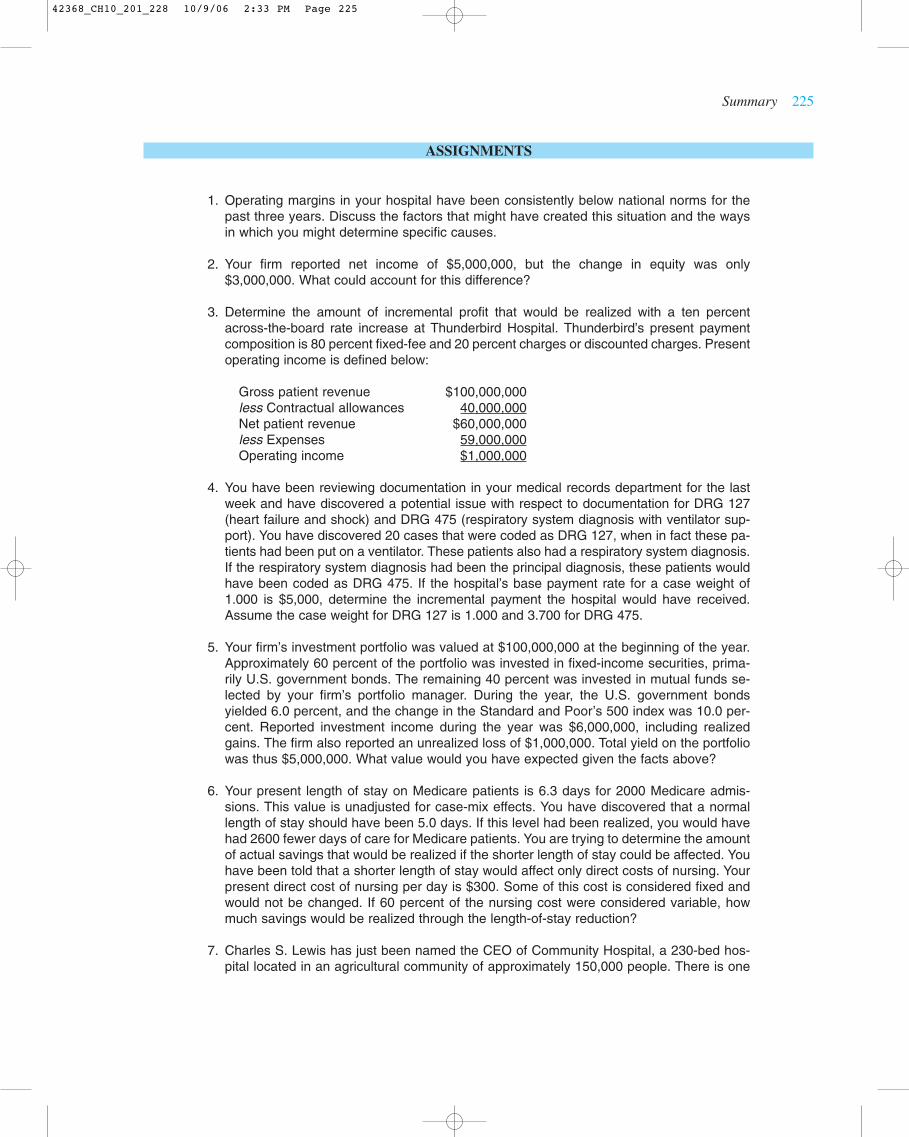
Summary 225
ASSIGNMENTS
1. Operating margins in your hospital have been consistently below national norms for thepast three years. Discuss the factors that might have created this situation and the waysin which you might determine specific causes.
2. Your firm reported net income of $5,000,000, but the change in equity was only$3,000,000. What could account for this difference?
3. Determine the amount of incremental profit that would be realized with a ten percentacross-the-board rate increase at Thunderbird Hospital. Thunderbird’s present paymentcomposition is 80 percent fixed-fee and 20 percent charges or discounted charges. Presentoperating income is defined below:
Gross patient revenue $100,000,000less Contractual allowances 40,000,000Net patient revenue $60,000,000less Expenses 59,000,000Operating income $1,000,000
4. You have been reviewing documentation in your medical records department for the lastweek and have discovered a potential issue with respect to documentation for DRG 127(heart failure and shock) and DRG 475 (respiratory system diagnosis with ventilator sup-port). You have discovered 20 cases that were coded as DRG 127, when in fact these pa-tients had been put on a ventilator. These patients also had a respiratory system diagnosis.If the respiratory system diagnosis had been the principal diagnosis, these patients wouldhave been coded as DRG 475. If the hospital’s base payment rate for a case weight of1.000 is $5,000, determine the incremental payment the hospital would have received.Assume the case weight for DRG 127 is 1.000 and 3.700 for DRG 475.
5. Your firm’s investment portfolio was valued at $100,000,000 at the beginning of the year.Approximately 60 percent of the portfolio was invested in fixed-income securities, prima-rily U.S. government bonds. The remaining 40 percent was invested in mutual funds se-lected by your firm’s portfolio manager. During the year, the U.S. government bondsyielded 6.0 percent, and the change in the Standard and Poor’s 500 index was 10.0 per-cent. Reported investment income during the year was $6,000,000, including realizedgains. The firm also reported an unrealized loss of $1,000,000. Total yield on the portfoliowas thus $5,000,000. What value would you have expected given the facts above?
6. Your present length of stay on Medicare patients is 6.3 days for 2000 Medicare admis-sions. This value is unadjusted for case-mix effects. You have discovered that a normallength of stay should have been 5.0 days. If this level had been realized, you would havehad 2600 fewer days of care for Medicare patients. You are trying to determine the amountof actual savings that would be realized if the shorter length of stay could be affected. Youhave been told that a shorter length of stay would affect only direct costs of nursing. Yourpresent direct cost of nursing per day is $300. Some of this cost is considered fixed andwould not be changed. If 60 percent of the nursing cost were considered variable, howmuch savings would be realized through the length-of-stay reduction?
7. Charles S. Lewis has just been named the CEO of Community Hospital, a 230-bed hos-pital located in an agricultural community of approximately 150,000 people. There is one
42368_CH10_201_228 10/9/06 2:33 PM Page 225

other similar-sized hospital in the community. C.S. Lewis has been told by his CFO, J.R.R.Tolkein, that the hospital is in excellent financial condition, but Mr. Lewis is not convinced.He has requested and received the summary financial statements presented in Table10–10.
You have been asked to help Mr. Lewis identify the trends in financial position for the hos-pital over the last five years. Please compute the values for the financial ratios describedin Chapter 10 and provide Mr. Lewis with your assessment of Community Hospital’s fi-nancial position.
226 CHAPTER 10 ANALYZING FINANCIAL STATEMENTS
Table 10–10 Summary Financial Information of Community Hospital* (2003–2007) (Data in Thousands)
2003 2004 2005 2006 2007
Balance sheet accountsCash & cash equivalents $ 34,402 $ 30,444 $ 45,848 $ 46,010 $ 73,711Patient accounts receivable 39,506 38,878 35,444 38,853 35,647Inventory 2,133 2,318 2,398 3,197 3,279Gross fixed assets 187,278 221,548 240,988 256,652 276,458Accumulated depreciation 73,227 79,523 89,324 101,007 113,851Net fixed assets 114,051 142,025 151,664 155,645 162,607Unrestricted capital funds 10,720 13,625 20,160 25,615 17,716Total assets $ 238,365 $ 265,784 $ 276,965 $ 287,193 $ 311,140Current maturities of LTD 111 1,794 1,431 2,211 1,143
Current liabilities $ 37,426 $ 38,492 $ 33,240 $ 31,699 $ 35,862Long-term debt 2,032 12,821 11,720 9,578 9,570Net assets $ 188,743 $ 204,262 $ 222,606 $ 237,022 $ 251,241
Income statement accountsNet patient revenue $208,861 $ 225,950 $ 244,976 $ 257,784 $ 282,461Other revenue 1,569 1,756 1,929 2,170 1,757Total operating revenue $ 210,430 $ 227,706 $ 246,905 $ 259,954 $ 284,218Total operating expenses $ 203,043 $ 219,768 $ 233,867 $ 254,382 $ 278,629Operating income 7,387 7,938 13,038 5,572 5,589plus Non-operating revenue 6,806 7,579 8,971 8,430 8,696Excess of revenue over expenses $ 14,193 $ 15,517 $ 22,009 $ 14,002 $ 14,285
Depreciation $ 10,588 $ 11,161 $ 11,659 $ 12,184 $ 12,524Interest 115 611 471 419 392
*Please note that not all asset and liability items are shown. The totals do not, therefore, foot to the individual accountvalues.
42368_CH10_201_228 10/9/06 2:33 PM Page 226

SOLUTIONS AND ANSWERS
1. Low operating margins are the result of either low prices or high costs. Low prices may bedifficult to change in either competitive markets or situations involving high percentages offixed-price payers, such as Medicare. High costs may result from excessive length of stay,poor productivity, or high salaries.
2. A transfer of funds from the entity may have taken place. This is often the case in investor-owned companies, because of the payment of dividends. It also may occur in a voluntaryentity because of corporate restructuring. Unrealized losses on the firm’s investment port-folio may have occurred.
3. The amount of incremental profit is equal to the percent of charge patients x price increase� present gross patient revenue, or $2,000,000. The increase in charges is $10,000,000,or 10 percent times $100,000,000. Of that amount, 20 percent, or $2,000,000, will be tocharge or discounted-charge payers.
4. The difference in payment would be 20 patients � $5,000 � (3.700 � 1.000), or $270,000.
5. The expected yield should have been $7,600,000:
Expected fixed-income yield � $60,000,000 � 6.0% � $3,600,000
Expected equity yield � $40,000,000 � 10% � $4,000,000
6. The estimated savings would be days saved � direct cost of nursing � variable cost per-centage (2,600 � $300 � 60%), or $468,000.
7. Only selected financial ratios for Community Hospital can be calculated for the period2003 through 2007. These values are shown in Table 10–11, Major observations thatwould result include the following:
• Present financial position at Community Hospital is strong. Current financial strength isa result of two primary factors: minimal levels of long-term debt and above-average totalmargins.
• The trend in margins is downward, however. The primary cause is an erosion of operating-income levels. Expenses have been growing more rapidly than revenues since 2005.
Summary 227
42368_CH10_201_228 10/9/06 2:33 PM Page 227

228 CHAPTER 10 ANALYZING FINANCIAL STATEMENTS
Table 10–11 Selected Financial Ratios
2003 2004 2005 2006 2007
OverallReturn on equity % 7.5 7.6 9.9 5.9 5.7Total margin % 6.5 6.6 8.6 5.2 4.9Financial strength index 2.2 1.9 3.1 2.2 2.3
Non-operating incomeDays’ cash-on-hand 86 77 108 108 125
Investment efficiencyDays in accounts receivable 69 63 53 55 46Revenue to net fixed assets 1.9 1.7 1.7 1.7 1.8
Plant obsolescenceAverage age of plant 6.9 7.1 7.7 8.3 9.1
Capital positionDebt financing % 20.8 23.1 19.6 17.5 19.3Cash flow to debt % 49.9 43.4 61.9 52.2 44.8
42368_CH10_201_228 10/9/06 2:33 PM Page 228