analyzing cyber incidents from a risk assessment perspective slides_cyber insurance risk... ·...
TRANSCRIPT

Analyzing Cyber Incidents from a Risk Assessment Perspective
Jay P. Kesan, Ph.D., J.D.Professor and H. Ross & Helen Workman Research Scholar
University of Illinois at Urbana-ChampaignAll work on SSRN, http://www.ssrn.com

Introduction

Cybersecurity Concern• Cybersecurity is tied to the health of the U.S. economy. Malicious
cyberattacks could throw the financial industry into chaos.• The World Economic Forum estimates that ineffective cybersecurity may cost the
world’s economy as much as $3 trillion by 2020.• Cybersecurity is also national security. Critical infrastructure systems, from
transportation to nuclear power, are vulnerable to cyberattacks.• Hospitals and police departments have been targeted with ransomware that severs
access to vital information. • The primary focus of our work is the private sector and on improving cyber
security in the private sector through market-oriented solutions.• Proper risk assessment and management can improve companies’
resilience against cyber risks through market-based solutions

Data Description and Methodology
Cyber Incident/Loss Data
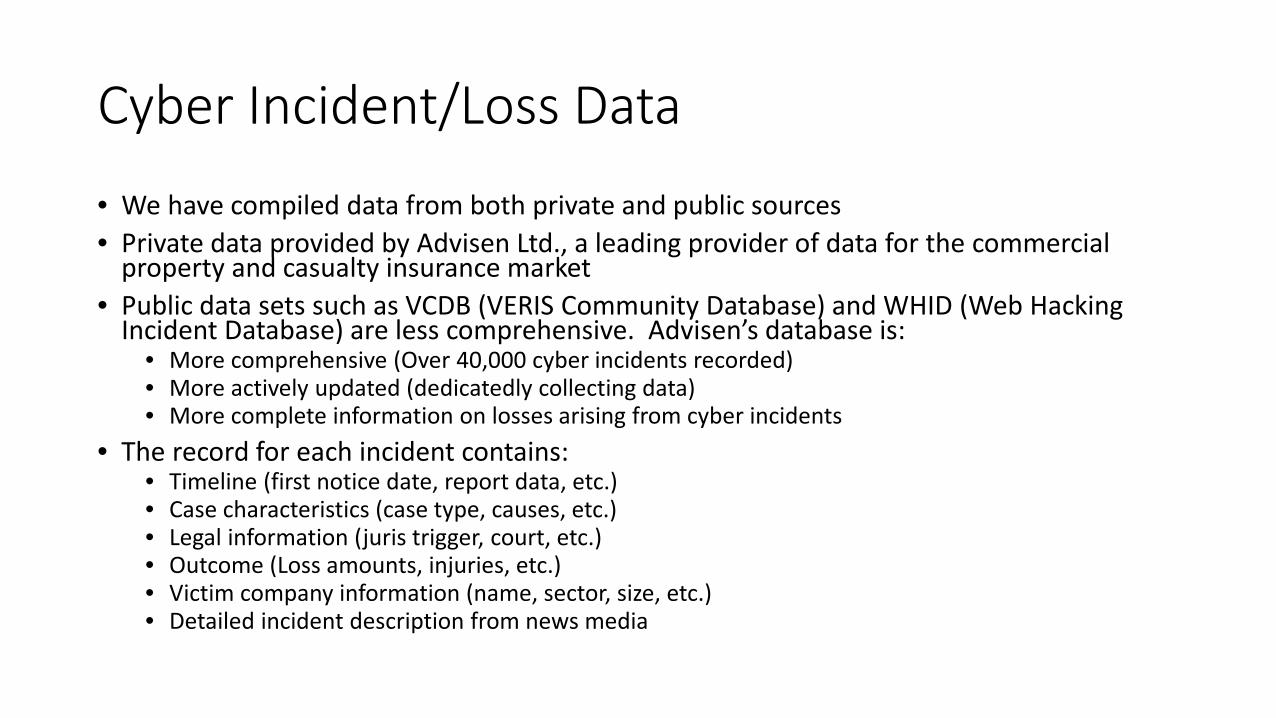
• We have compiled data from both private and public sources • Private data provided by Advisen Ltd., a leading provider of data for the commercial
property and casualty insurance market• Public data sets such as VCDB (VERIS Community Database) and WHID (Web Hacking
Incident Database) are less comprehensive. Advisen’s database is:• More comprehensive (Over 40,000 cyber incidents recorded)• More actively updated (dedicatedly collecting data)• More complete information on losses arising from cyber incidents
• The record for each incident contains:• Timeline (first notice date, report data, etc.)• Case characteristics (case type, causes, etc.) • Legal information (juris trigger, court, etc.) • Outcome (Loss amounts, injuries, etc.)• Victim company information (name, sector, size, etc.)• Detailed incident description from news media

Combining Cyber Incident Data with Company Financial Data• We link Advisen’s data with CompuStat, a database widely used in
corporate finance analysis• Over 1000+ companies from both databases are matched• Few studies try to explore the relation between cyber incidents and the
fundamentals of victim companies • With the combined data, we are able to study a number of interesting
research questions, such as: • What corporate financial factors affect the frequency of cyber incidents?• Does it matter how a company is positioned at the time of a cyber incident?• How big is the impact of cyber incidents on companies?• What are the types of impact – change in stock prices, loss of reputation, etc…

Cyber Risk and Incidents

Cyber Risk Overview
• We use a broad definition of cyber risk, which includes not only attacks performed by malicious actors, but also unintentional actions that relate to information systems and cause damage to an organization.
• e.g., Gitlab’s massive data loss in February
• Advisen’s dataset has 15 cyber incident categories based on incident cause:
1. Cyber Extortion 9. IT - Configuration/Implementation Errors2. Data - Malicious Breach 10. IT - Processing Errors3. Data - Physically Lost or Stolen 11. Network/Website Disruption4. Data - Unintentional Disclosure 12. Phishing, Spoofing, Social Engineering5. Denial of Service (DDOS)/System Disruption 13. Privacy - Unauthorized Contact or Disclosure6. Digital Breach/Identity Theft 14. Privacy - Unauthorized Data Collection7. Identity - Fraudulent Use/Account Access 15. Skimming, Physical Tampering8. Industrial Controls & Operations
Cyber Risk Overview (cont.)
0
1000
2000
3000
4000
5000
6000
2005 2006 2007 2008 2009 2010 2011 2012 2013 2014
Cyber incident Affected company
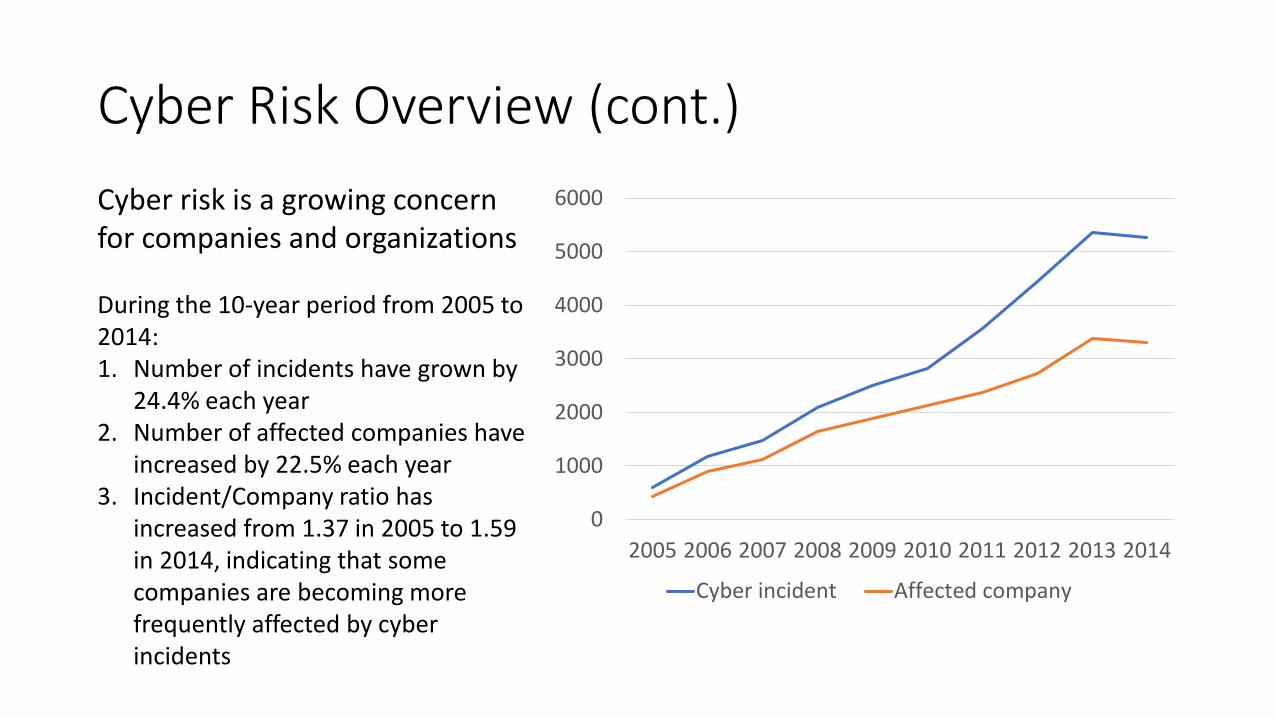
Cyber risk is a growing concern for companies and organizations
During the 10-year period from 2005 to 2014:1. Number of incidents have grown by
24.4% each year2. Number of affected companies have
increased by 22.5% each year 3. Incident/Company ratio has
increased from 1.37 in 2005 to 1.59 in 2014, indicating that some companies are becoming more frequently affected by cyber incidents

Cyber Incidents are Inevitable
• Cyber risk has many components, making it impossible to be eliminated within an organization
• Vulnerabilities in information systems (can be exploited by hackers)• Vulnerabilities involving people (insider threat, phishing)• Vulnerabilities in company operations (noncompliant data collecting or
disclosing procedures)• Etc…
• Hacking techniques are advancing• Israel researchers found a way to steal data from air-gapped computers using
the sound emitted by cooling fans
Cyber Incidents are Inevitable (cont.)
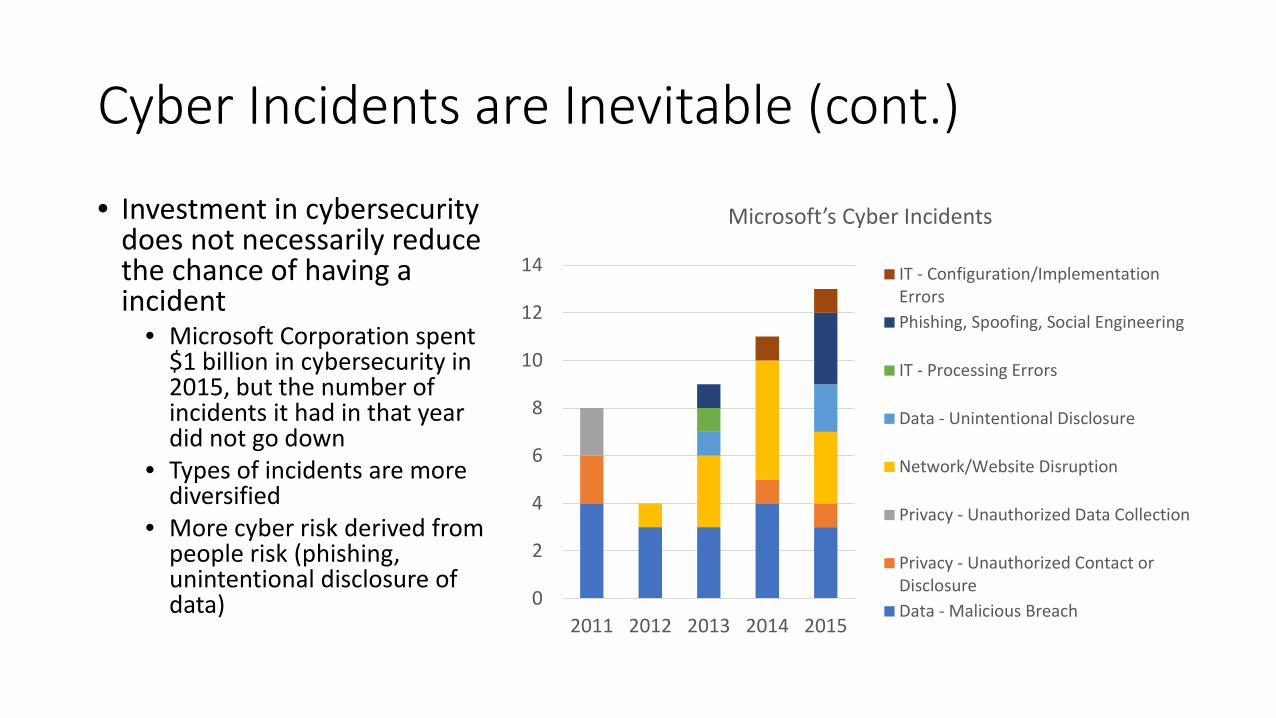
• Investment in cybersecurity does not necessarily reduce the chance of having a incident
• Microsoft Corporation spent $1 billion in cybersecurity in 2015, but the number of incidents it had in that year did not go down
• Types of incidents are more diversified
• More cyber risk derived from people risk (phishing, unintentional disclosure of data) 0
2
4
6
8
10
12
14
2011 2012 2013 2014 2015
Microsoft’s Cyber Incidents
IT - Configuration/ImplementationErrorsPhishing, Spoofing, Social Engineering
IT - Processing Errors
Data - Unintentional Disclosure
Network/Website Disruption
Privacy - Unauthorized Data Collection
Privacy - Unauthorized Contact orDisclosureData - Malicious Breach

Cyber Incident Outcomes
• Possible damage to reputation• Also result in various types of losses
First party losses
• Properties damaged or lost in cyber incidents• Direct financial damages (e.g., paid ransom)• Defense costs in lawsuits• Fines and penalties, which are paid by the
company for violating regulations.
Third party liabilities
• Physical injuries• Property damage• Loss of assets other than property• Loss of wages• Loss of business income• Loss of life• Pain and suffering• Plaintiff legal fees generated from lawsuits

Cyber Incident Outcomes (cont.)
• 3,895 loss amounts are recorded in Advisen’s dataset• About 1/3 (1273/3895 = 32.7%) of the cyber incidents do not result in any measurable losses• The log10-scaled losses follows a normal distribution with mean 5.41 and standard deviation 1.25
0
100
200
300
400
500
00.
5 11.
5 22.
5 33.
5 44.
5 55.
5 66.
5 77.
5 88.
5 99.
5 1010
.5 1111
.5 12M
ore
Loss Distribution
Losses Sample from normal distribution
1273
2622
No loss Loss

Cyber Incident Outcomes (cont.)• Difference in
frequency• Financial
damages (many) vs. loss of life (very few)
• Difference in loss distribution
• Financial damages (long tails) vs. Defense costs (short tails)
1788 8 34 33 16
756
0 12 321 19 21 5 1 4 1 11
Loss frequency

Cyber Insurance for Risk Management

Cyber Insurance
• Cyber insurance is a risk transference vehicle• Complement to cybersecurity enhancement• Help insured businesses quickly recover from cyber incidents
• The market is still in its infancy• U.S. penetration level of insureds is less than 15% (less than 1% in other
regions)• Less than 5% of small and medium sized businesses purchase cyber insurance
in the U.S.• The market is growing fast
• $1.7 billion written premium in 2015• 30% annual growth rate since 2011

Cyber Insurance Coverages and ExclusionsBasic Cyber Coverage
• Privacy Liability• Network Security Liability• Network Business Interruption• Cyber Extortion• Data Asset Restoration
Expanded Cyber Coverage• Dependent Business Interruption• System Failure• Supply Chain Interruption
Extension of Cyber Coverage• Cyber Related Property and Casualty Loss
Other Common Coverages• Computer Forensic Costs• Notifications and Additional Services to Affected
Individuals• Claims Expenses, Penalties, Defense, and
Settlement Costs
Typical Exclusions• Criminal Activities• Disregard for Computer Security• Loss of Internet Not Operated by You• Bodily Injury• Act of Terrorism/War• Contractual Liability

Issues With Cyber Insurance Market
• Problems with cyber insurance
Data scarcity
• Short history of collecting cyber incident data
• Takes time to improve this situation
Difficult to distinguish different
risk levels
• 50% of cyber insurance policies are using flat rates
• We can improve this through better risk assessment
Moral hazard and adverse selection
problem
• Insureds lack of incentive to improve cybersecurity
• Insurers increase premium rates for higher risk in portfolio
Issues with Cyber Insurance Market (cont.)
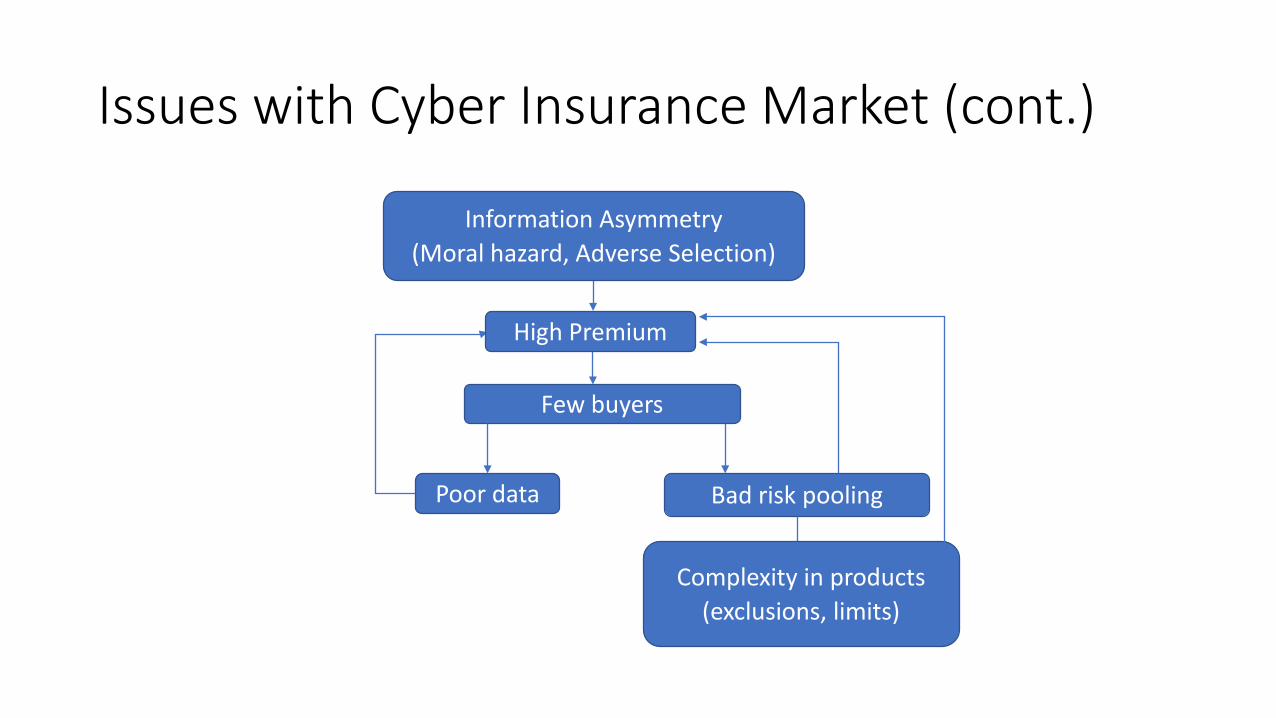
Few buyers
Poor data Bad risk pooling
Complexity in products(exclusions, limits)
Information Asymmetry (Moral hazard, Adverse Selection)
High Premium

Bridging Cyber Incidents and Insurance
Attributes of Cyber Incidents
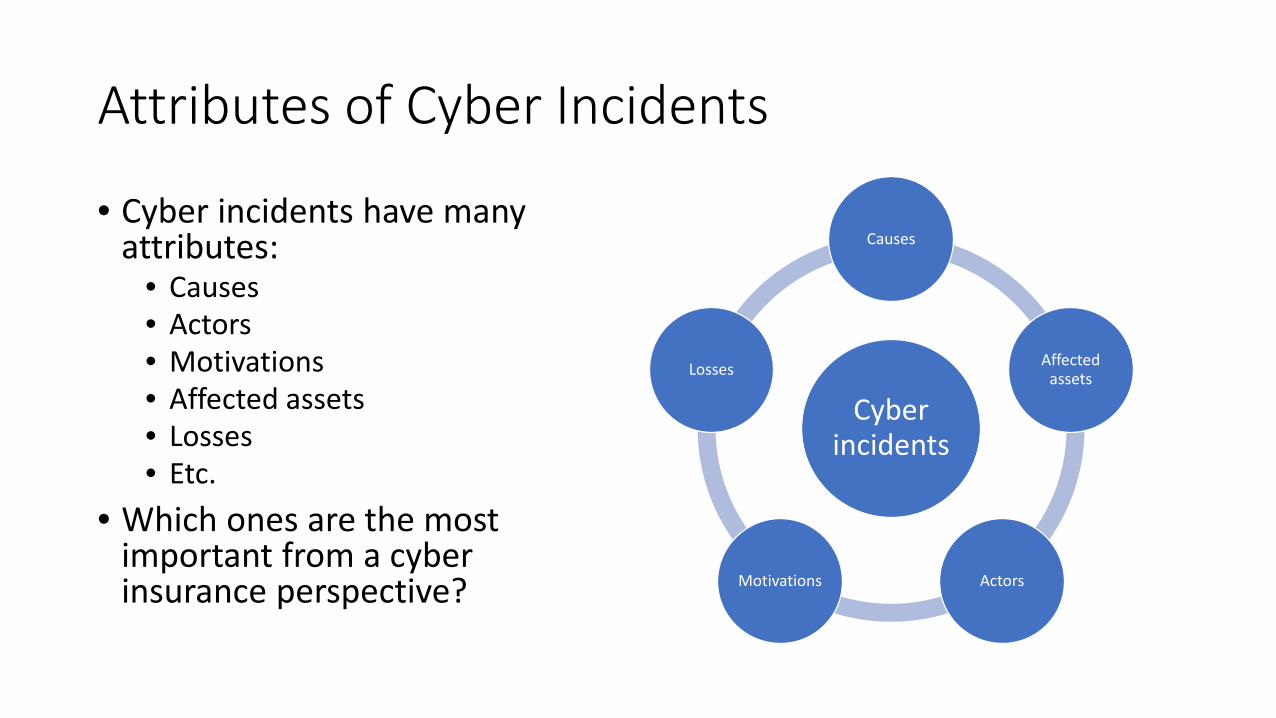
• Cyber incidents have many attributes:
• Causes• Actors• Motivations• Affected assets• Losses• Etc.
• Which ones are the most important from a cyber insurance perspective?
Cyber incidents
Causes
Affected assets
ActorsMotivations
Losses

From Incident to Claim
Incident occurs
Covered peril?
No Claim
Loss 1
Loss 2
Loss N
Claim
Yes
No
Any covered losses? Yes
No

From Insurance to Claim (cont.)
• Two layers of filters determine whether and how a claim will be triggered
1. If the peril (cause of incident) is covered (blue lines in figure)2. Among all the different types of losses resulted from an incident, which of
them are covered (green lines)• These are defined in insurance policies, and we assume there is no
ambiguity.• The remaining question is, how do incidents with different causes
relate to different types of losses (red lines in figure)• Different incidents all lead to similar types of losses, or• They are also different from each other in terms of loss types

Loss Frequency by Loss Type
FIN
ANCI
AL
DAM
AGES
OTH
ER
OTH
ER F
INES
PE
NAL
TIES
PLAI
NTI
FF LE
GAL
FE
ES E
XPEN
SES
LOSS
OF
ASSE
TS
PRO
PERT
Y 1ST
PART
YLO
W O
CCU
RREN
CE
LOSS
ES
Cyber ExtortionData - Malicious BreachData - Physically Lost or StolenData - Unintentional DisclosureDenial of Service (DDOS)/System DisruptionDigital Breach/Identity TheftIdentity - Fraudulent Use/Account AccessIndustrial Controls & OperationsIT - Configuration/Implementation ErrorsIT - Processing ErrorsNetwork/Website DisruptionPhishing, Spoofing, Social EngineeringPrivacy - Unauthorized Contact or DisclosurePrivacy - Unauthorized Data CollectionSkimming, Physical Tampering
• Darker color represents higher frequency of occurrence of the corresponding loss type (in column)
• Most Incidents result in financial damage
• Some incidents, such as unintentional disclosure of data very often bring many other types of losses
• Some incident types have similar loss profiles (e.g., Cyber extortion and Identity –Fraudulent Use/Account Access)

Grouping Similar Incidents
Given the fact that although some incidents have different causes, they are similar in terms of the losses that they result in, we try to group together different incident types with such similaritiesBenefits of grouping:• Highlights the similarity shared by different incident types in the same
group • No need to distinguish incidents if they pass both filters (peril and loss) and
result in similar insurance claims (applicable coverages)• Creates larger samples
• Very small sample sizes for some categories in original dataset, (e.g., only 8 records for DDoS incidents), is impractical for statistical analysis
Incident Type Clustering
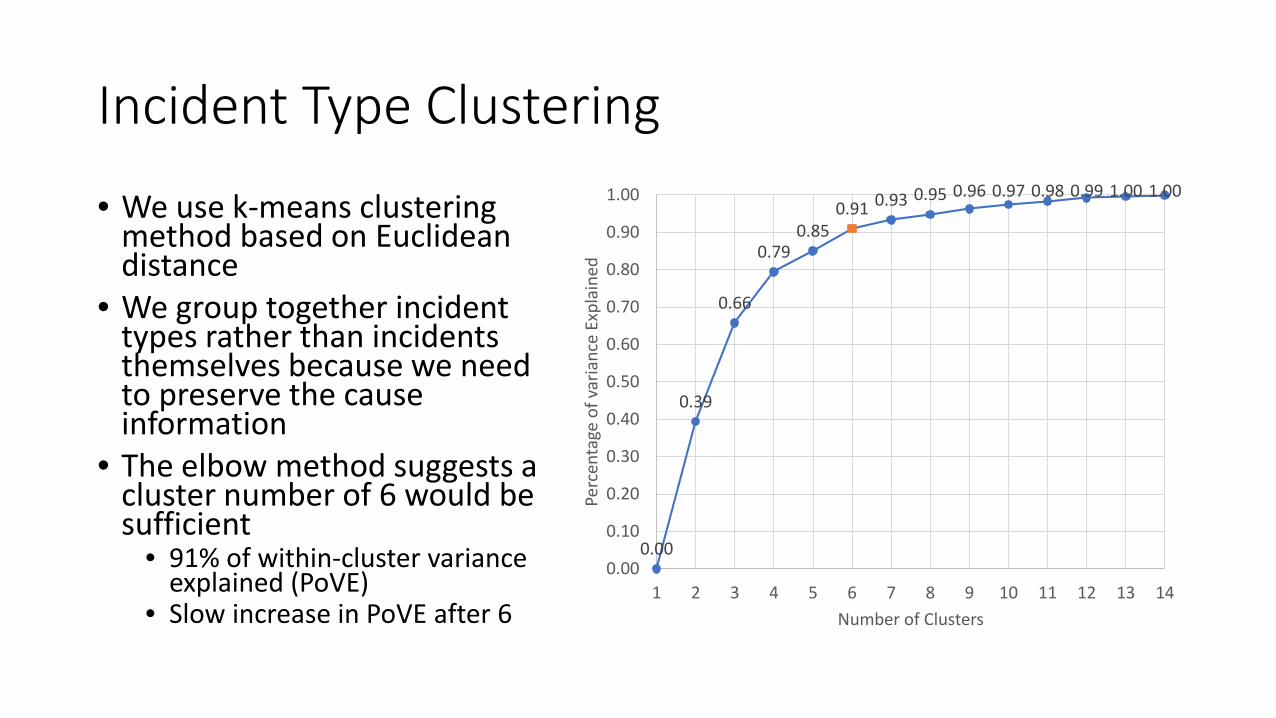
• We use k-means clustering method based on Euclidean distance
• We group together incident types rather than incidents themselves because we need to preserve the cause information
• The elbow method suggests a cluster number of 6 would be sufficient
• 91% of within-cluster variance explained (PoVE)
• Slow increase in PoVE after 6
0.00
0.39
0.66
0.790.85
0.91 0.93 0.95 0.96 0.97 0.98 0.99 1.00 1.00
0.00
0.10
0.20
0.30
0.40
0.50
0.60
0.70
0.80
0.90
1.00
1 2 3 4 5 6 7 8 9 10 11 12 13 14Pe
rcen
tage
of v
aria
nce
Expl
aine
dNumber of Clusters
Incident Type Clustering (cont.)
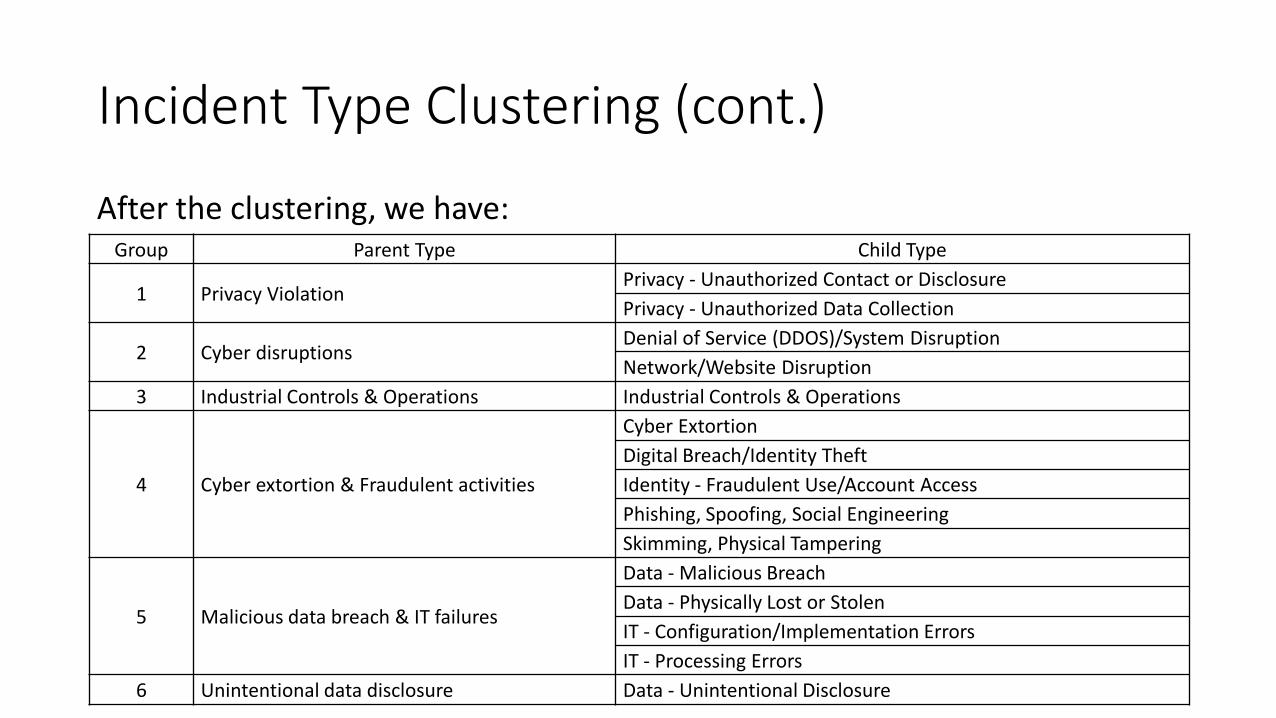
After the clustering, we have:Group Parent Type Child Type
1 Privacy ViolationPrivacy - Unauthorized Contact or DisclosurePrivacy - Unauthorized Data Collection
2 Cyber disruptionsDenial of Service (DDOS)/System DisruptionNetwork/Website Disruption
3 Industrial Controls & Operations Industrial Controls & Operations
4 Cyber extortion & Fraudulent activities
Cyber ExtortionDigital Breach/Identity TheftIdentity - Fraudulent Use/Account AccessPhishing, Spoofing, Social EngineeringSkimming, Physical Tampering
5 Malicious data breach & IT failures
Data - Malicious BreachData - Physically Lost or StolenIT - Configuration/Implementation ErrorsIT - Processing Errors
6 Unintentional data disclosure Data - Unintentional Disclosure

Incident Type Clustering (cont.)
• Losses associated with each parent type, darker color represents higher frequency of occurrence of the corresponding loss type (in column)
• Only three types of losses frequently appear (‘OTHER’ excluded), and they distribute differently for each of the six groups
• Unintentional data disclosure should be treated differently from other types of data breaches because it results more often in fines and penalties
FIN
ANCI
AL D
AMAG
ES A
MT
OTH
ER F
INES
PEN
ALTI
ES
PLAI
NTI
FF LE
GAL
FEE
S EX
PEN
SES
OTHE
R
LOW
OCC
URR
ENCE
LOSS
ES
Privacy Violation
Cyber disruptions
Industrial Controls & Operations
Cyber extortion & Fraudulent activities
Malicious data breach & IT failures
Unintentional data disclosure
Risk Assessment through Resampling

Objective and Assumptions
Objective: • Estimate the cyber incident rate in a group of companies (i.e., number of cyber
incidents per company in a given period)• In an insurance setting, number of possible claims arising from a pool of
policyholdersAssumptions: • Every incident results in a claim • Claims are all covered.• Portfolios are static (not changing in different years) • This analysis can be seen as the worst scenario; in actual insurer’s portfolio, the
rate is expected to be much lower

Data and Methodology
Generate a list of publicly traded companies in the U.S.• We choose public companies because their information can be easily
obtained, and we know the population size• Cyber insurance has a relatively higher penetration level among public
companies, so in actual insurer’s portfolios, we would expect to see lots of public companies as policyholders
• Further research will be carried out on whether public and private companies have different risk characteristics in terms of cyber-security
• Exchanges we considered include Nasdaq, NYSE and AMEX• 5700+ companies in total after removing duplications
• Different classes of stock or different divisions from the same company are seen as duplications.
• 6600+ companies before removal• Data source: NASDAQ(http://www.nasdaq.com/screening/companies-by-
name.aspx)
Data and Methodology
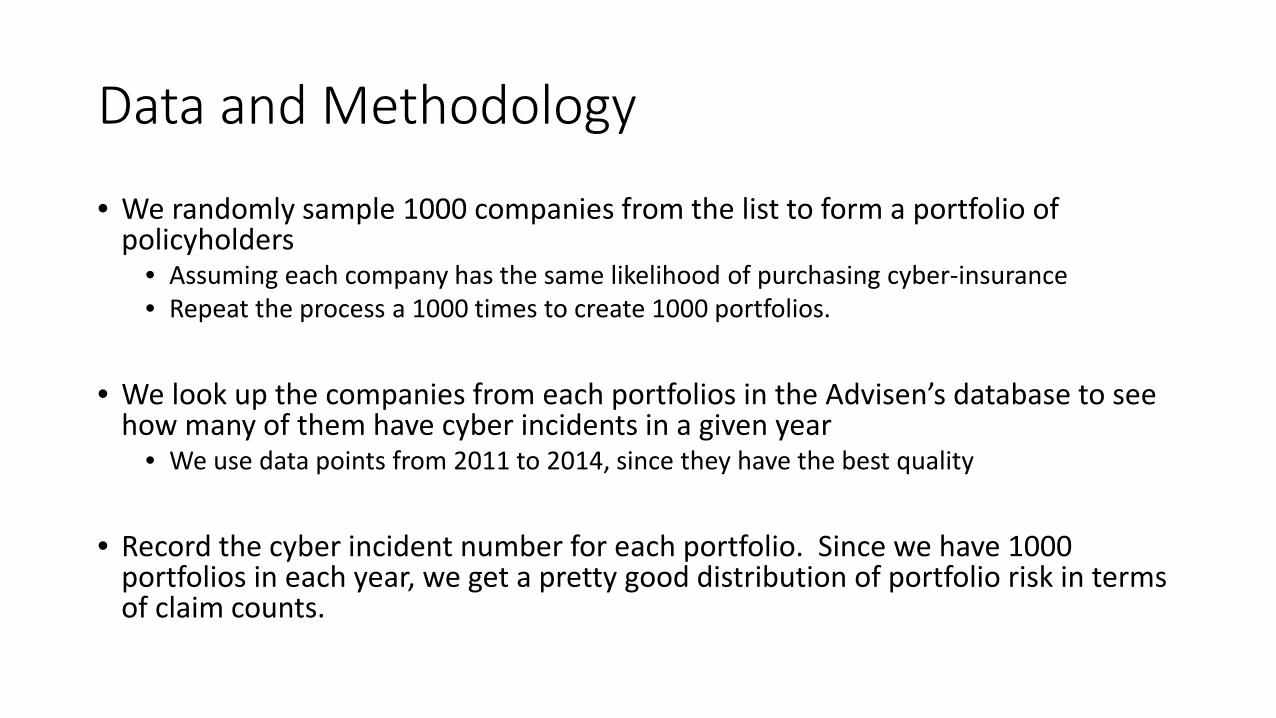
• We randomly sample 1000 companies from the list to form a portfolio of policyholders
• Assuming each company has the same likelihood of purchasing cyber-insurance• Repeat the process a 1000 times to create 1000 portfolios.
• We look up the companies from each portfolios in the Advisen’s database to see how many of them have cyber incidents in a given year
• We use data points from 2011 to 2014, since they have the best quality
• Record the cyber incident number for each portfolio. Since we have 1000 portfolios in each year, we get a pretty good distribution of portfolio risk in terms of claim counts.

Findings
050
100150200250300350
Freq
uenc
y (o
ut o
f 100
0 po
rtfo
lios)
Cyber Incident Rate in Each Portfolio
Cyber incident rate in different years
2011 2012 2013 2014

Findings
0
20
40
60
80
100
120
Freq
uenc
y (o
ut o
f 100
0 po
rtfo
lios)
Cyber Incident Rate in Each Portfolio
Cyber incident rate in different years
2011 2012 2013 2014

Cyber Incident Rate 2011 2012 2013 2014
Mean 2.06% 2.10% 2.68% 2.85%Standard Error 0.01% 0.01% 0.01% 0.02%Median 2.10% 2.10% 2.70% 2.80%Mode 2.20% 2.00% 2.60% 2.90%Standard Deviation 0.41% 0.44% 0.45% 0.47%Sample Variance 0.00% 0.00% 0.00% 0.00%Minimum 0.90% 0.80% 1.20% 1.60%Maximum 3.30% 3.70% 4.40% 4.50%Confidence Level(95.0%) 0.03% 0.03% 0.03% 0.03%
Findings• The rate is growing with
larger variance, so the portfolios are getting riskier.
• The main cyber incident rate for public companies is 2.8% in 2014
• The maximum rate is 4.5%; since the assumptions are made based on the worst scenario, we would expect that the claims from real-world insurer’s portfolio to be below this rate

Ongoing ResearchCyber incidents and business reputation

Different Opinions
• Cyber incidents are often believed to have negative impact on companies’ reputation
• Such belief is held by people on both sides of a company (i.e., managers and customers)
• In 2011, Experian, along with Ponemon Institute, surveyed over 800 senior-level individuals, and most of them agreed on that reputation is one of their most valuable assets, and a cyber incident like a data breach can do damage to it. They also estimate that the impact can last as long as a year
• In a survey conducted by OnePoll, 87% of 2000 respondents said that they were “not at all likely” or “not very likely” to do business with an organization that had suffered a data breach involving credit or debit card details. The numbers were slightly lower if home and email addresses and telephone numbers had been lost.

Different Opinions (cont.)
• Little empirical evidence is found to support the respondents’ statements in OnePoll’s survey that data breaches are going to hurt the customer loyalty of a business in a meaningful way
• If the majority of people stop doing business with companies that had data breaches, we would expect to see reductions in earnings for these companies
• 2013 Target data breach or 2014 Home Depot data breach did not have much impact on their earnings
• With the combined data from Advisen and CompuStat, we are able to gain more insights into how cyber incidents actually affect the reputation of a company.

Data
• Over 1000 companies can be found in both Advisen and CompuStat dataset• Among all the cyber incidents experienced by these companies, we choose
the ones with FIRST_NOTICE_DATE recorded (the date when incident is known to the public)
• Based on these dates, we search for the last quarterly earnings before the incident, and subsequent quarterly earnings reports after the incident (discard the ones with missing quarterly reports)
• To have a better control on the length of time between the date of incident and the date of next earnings, we divide these incidents into three groups:
• Taking place 2-3 months before the next earnings • Taking place 1-2 months before the next earnings • Taking place 0-1 months before the next earnings

Methodology• Goodwill as the proxy for reputation:
• Usually only has book value in mergers and acquisitions • Represents the amount of money that buyer is willing to pay for a company’s good
name• But we try to estimate it with excess earnings method, which is a common practice in
accounting• Because we only care about the change value in goodwill, some issues with this
method, such as choosing a proper capitalization rate is negligible• Other indicators as alternative references
• Earnings quality• Market to book ratio
• Control group – Other companies in the same industry which have similar characteristics but do not have cyber incidents in the same period
• Industry-wise effects (e.g., holiday season in retail industry)
Target Corp. as an Example
12/19/2013, 100
0102030405060708090
100
12/0
1/13
12/0
3/13
12/0
5/13
12/0
7/13
12/0
9/13
12/1
1/13
12/1
3/13
12/1
5/13
12/1
7/13
12/1
9/13
12/2
1/13
12/2
3/13
12/2
5/13
12/2
7/13
12/2
9/13
12/3
1/13
01/0
2/14
01/0
4/14
01/0
6/14
01/0
8/14
01/1
0/14
01/1
2/14
01/1
4/14
01/1
6/14
01/1
8/14
01/2
0/14
01/2
2/14
01/2
4/14
01/2
6/14
01/2
8/14
01/3
0/14
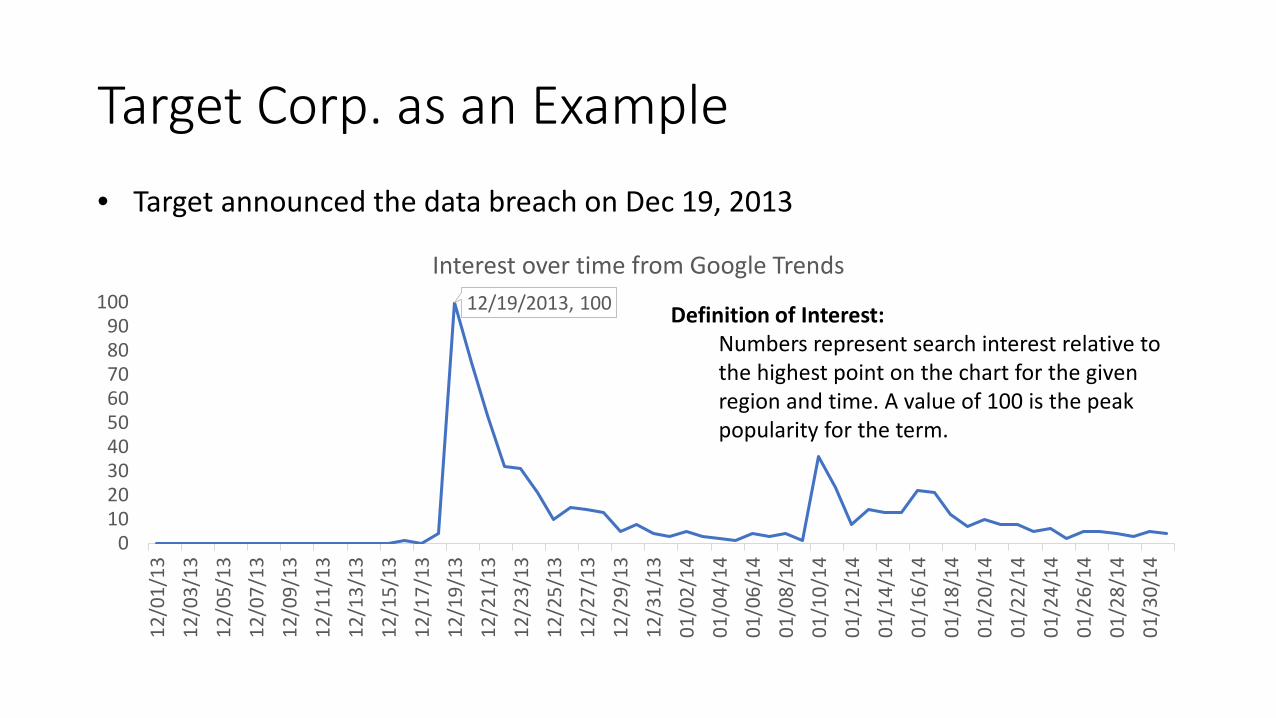
Interest over time from Google Trends
Definition of Interest:Numbers represent search interest relative to the highest point on the chart for the given region and time. A value of 100 is the peak popularity for the term.
• Target announced the data breach on Dec 19, 2013

Target Corp. as an Example (cont.)
61
61.5
62
62.5
63
63.5
64
12/0
4/13
12/0
5/13
12/0
6/13
12/0
9/13
12/1
0/13
12/1
1/13
12/1
2/13
12/1
3/13
12/1
6/13
12/1
7/13
12/1
8/13
12/1
9/13
12/2
0/13
12/2
3/13
12/2
4/13
12/2
6/13
12/2
7/13
12/3
0/13
12/3
1/13
01/0
2/14
01/0
3/14
Stock Price Movements around Announcement Date
Close
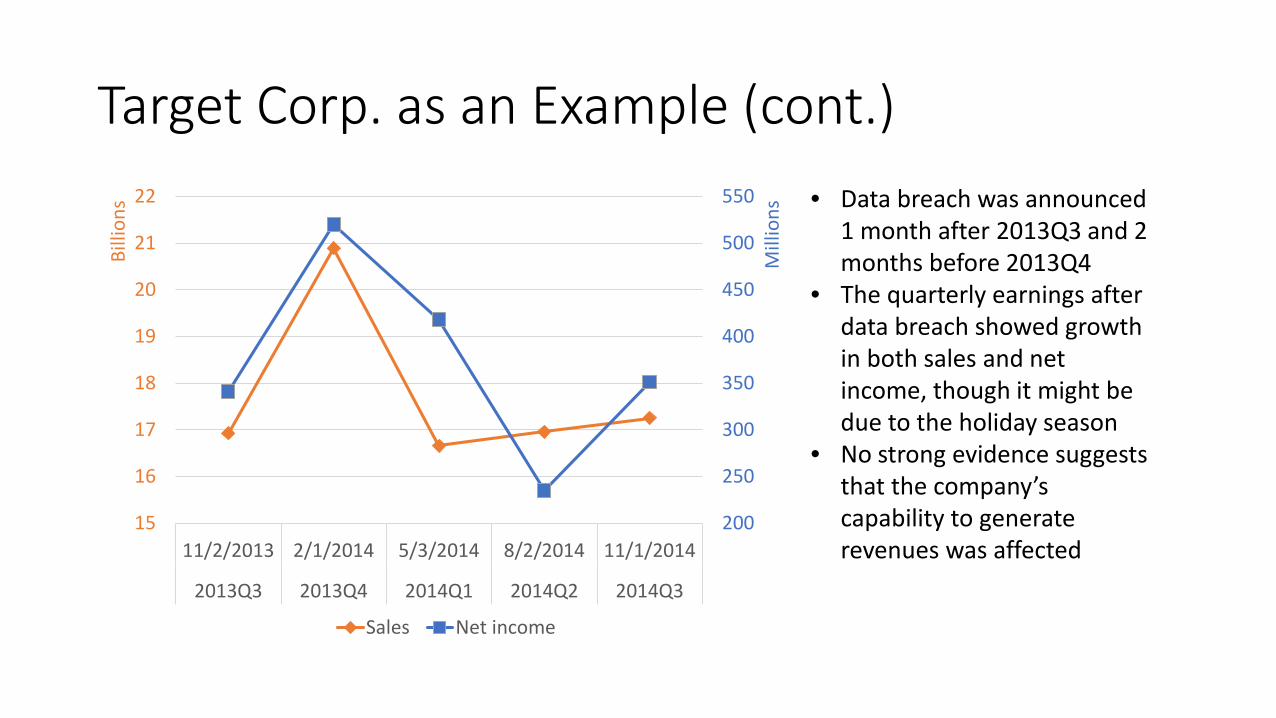
Target Corp. as an Example (cont.)• Data breach was announced
1 month after 2013Q3 and 2 months before 2013Q4
• The quarterly earnings after data breach showed growth in both sales and net income, though it might be due to the holiday season
• No strong evidence suggests that the company’s capability to generate revenues was affected
200
250
300
350
400
450
500
550
15
16
17
18
19
20
21
22
11/2/2013 2/1/2014 5/3/2014 8/2/2014 11/1/2014
2013Q3 2013Q4 2014Q1 2014Q2 2014Q3
Mill
ions
Billi
ons
Sales Net income
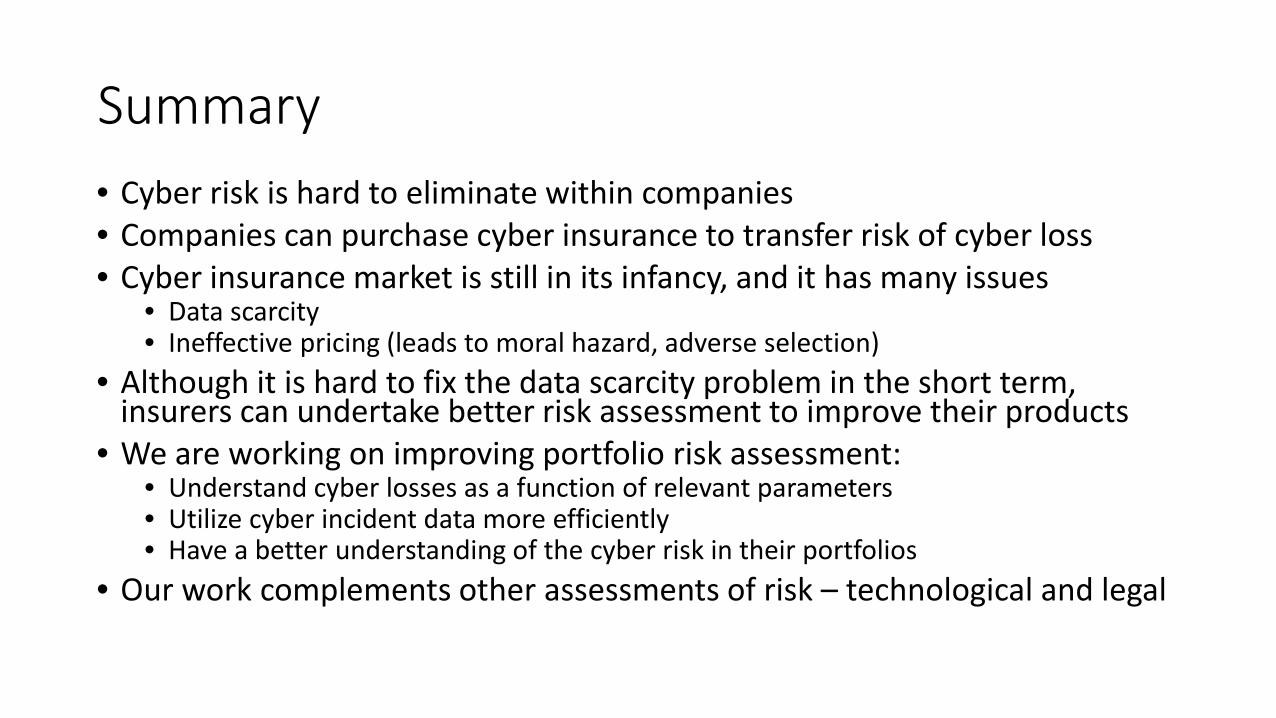
Summary• Cyber risk is hard to eliminate within companies• Companies can purchase cyber insurance to transfer risk of cyber loss• Cyber insurance market is still in its infancy, and it has many issues
• Data scarcity• Ineffective pricing (leads to moral hazard, adverse selection)
• Although it is hard to fix the data scarcity problem in the short term, insurers can undertake better risk assessment to improve their products
• We are working on improving portfolio risk assessment: • Understand cyber losses as a function of relevant parameters • Utilize cyber incident data more efficiently• Have a better understanding of the cyber risk in their portfolios
• Our work complements other assessments of risk – technological and legal

Recognizing the Team
Sachin Shetty (Co-PI)Associate Professor, Virginia Modeling, Analysis and Simulation Center, Old Dominion University
MD Ali Reza Al AminGraduate student, Virginia Modeling, Analysis and Simulation Center, Old Dominion University
Yu WangSoftware Developer, Virginia Modeling, Analysis and Simulation Center, Old Dominion University
Jay Kesan (PI)Professor, Law & ECE, University of Illinois
David M. Nicol (Co-PI)Professor, ECE, University of Illinois
Carol Hayes Postdoc, University of Illinois
Linfeng ZhangRes. Associate, University of Illinois

Thank you. Questions?