analyzing and forecasting railway data using linear data ... · analyzing and forecasting railway...
TRANSCRIPT

Analyzing and forecasting railway data using linear data analysis
E. T. Selig, G. M. Cardillo, E. Stephens & A. Smith Bentley Systems, Inc., USA and UK
Abstract
Railways collect enormous amounts of data about the current state and use of their assets. Data collection system for work recording, track and rail measurement, asset databases, track charts, GIS maps, operations (scheduling), and engineering are required to operate a railway. The data from each of these systems have value on their own, but when aggregated together and analyzed produce a formerly untapped information source. The analysis of railway data is not new. What is new is that railways can now put in practice a continuous, consistent and controlled action and planning across the entire railway by automation of the analysis. This paper discusses the new and patent pending Analysis and Forecasting engine. The Engine is one of four parts of a system specifically designed to address the four Information Technology challenges of Corridor Infrastructure Management – 1: integration, 2: visualization, 3: data management, and 4: data analysis. The systems’ integration capabilities enable the connection of different data sources into a combined and linked data source. It provides visualization tools to “see” information within a database of thousands of kilometres and terabytes of data. The system provides the necessary data maintenance tools for data import and alignment. The system provides processing tools and a database to efficiently store and maintain thousands of kilometres of data. The system enables railways to experiment and apply rules quickly and efficiently without needing to develop new software. The Analysis and Forecasting engine enables a simplified method for processing and analyzing the unified data. The four elements provide an enterprise-class Corridor Infrastructure Management (CIM) system to enable management of a reliable, safe, planned, and cost efficient railway.
© 2008 WIT PressWIT Transactions on The Built Environment, Vol 103, www.witpress.com, ISSN 1743-3509 (on-line)
Computers in Railways XI 25
doi:10.2495/CR080031

1 Background
Railways have become an increasingly complex business. Worldwide, there is a growing reliance on this efficient transportation mode, which must contend with limited resources to maintain a nonexpanding corridor infrastructure supporting increasing traffic. The syndrome of the railway pinch point [5] continues to constrict as fossil fuel costs rise, the world population increases, and societies continue to pursue efficiency and economic improvements. These contradictory demands can only be met by effective management of immense amounts of data and the extraction of quality, fit-to-purpose information [5]. Corridor Infrastructure Management (CIM) is an emerging approach using information for managing railway safety, reliability, and profitability under these railway industry challenges.
2 The practice of corridor infrastructure management
Corridor Infrastructure Management (CIM) is the practice of using information for managing a safe, reliable, and cost-efficient transportation corridor. CIM encompasses four elements: 1) Integration: correlation of asset, condition, finance, operations, and work
data onto the transportation network 2) Visualization: transformation of data into information through
visualisation 3) Data Management: evolutionary and low-impact data maintenance and
streamlined exchange of data between linear, geospatial, and hierarchy forms
4) Analysis: automated prediction, prioritisation, and planning of the type, time, and location of actions
2.1 Challenges in enabling effective analysis
There are several challenges in implementing CIM. The first challenge is to aggregate data that is dispersed across multiple data sources. Data in each data source can be stored in different coordinate systems including linear measures or geographically and stored in many formats. Often different data sources have different location accuracies, and data alignment and filtering tools are required. A second challenge is extracting useful information from a large and diverse dataset. Typically custom extraction analysis software is required and it is difficult to experiment with new ideas. The cost and effort involved in introducing new analysis tools is often prohibitive and results in the tools never being built. A third challenge is presenting the resulting information in a way that is understandable and accessible to a wide variety of users within a railroad. A fourth challenge is to leverage this new information in other enterprise information systems.
© 2008 WIT PressWIT Transactions on The Built Environment, Vol 103, www.witpress.com, ISSN 1743-3509 (on-line)
26 Computers in Railways XI

3 Technology enabling corridor infrastructure management
Bentley System’s Optram Enterprise Suite is a comprehensive Corridor Infrastructure Management (CIM) system. It enables railways to link corridor data, infrastructure management applications, and third-party enterprise applications for a complete decision support structure for rail corridor maintenance planning at optimal cost, reliability and safety. Figure 1 shows and example of Optram’s corridor data visualization. Optram visualization links diverse data to form a picture of information – in this example railway corridor infrastructure, earthworks (cuts and fills), left profile (top) track geometry roughness, the corresponding left profile mid-chord offset, production work, and measured curvature.
Figure 1: Example optram visualization.
The new Optram Enterprise release incorporates significant enhancements in information technology. Optram Enterprise now runs on the industry-standard Java Platform, Enterprise Edition (J2EE), a technology that delivers functionality for user and security management, program portability and scalability, efficient data distribution, and open-systems integration. J2EE expands many new capabilities necessary for effective integration with large and geographically distributed characteristics of railway organizations. Optram Enterprise still supports its flexible architecture where common software components can deployed on the web, as distributed application (n-tier
© 2008 WIT PressWIT Transactions on The Built Environment, Vol 103, www.witpress.com, ISSN 1743-3509 (on-line)
Computers in Railways XI 27

architecture), and as a desktop application (client server). These components form Optram building blocks for developing custom web pages and applications like single-click web page “dash boards” for management, simple work-reporting web pages, and in-field inspection or work-reporting applications. The distributed form enables efficient data flow and user interactivity among large numbers of users and remote users over low bandwidth networks. The desktop form allows users who are intermittently-disconnected from the network to take and collect information in the field. As enhancements are added to the common software, this flexible architecture means all applications benefit. Optram’s componentized and enterprise-scale architecture enables support of large railway organizations by providing tools for handling large data sets, tools for allowing many users to easily update and access data, and tools to integrate many railway data sources. Optram’s visualization capabilities allow users to quickly view and make decisions from information. Optram Analysis and Forecasting engine makes it possible to quickly develop new tools to evaluate data within this integrated, compressive, accurate, and up to date data source.
4 Components of the Optram Corridor Infrastructure Management (CIM) Systems
There are four elements required by Corridor Infrastructure Management (CIM) (see Figure 2):
1. Integration – Means to link, copy, and connect data from many systems. Systems can include Computer Aided Design (CAD), Documents, Condition Measurement, Inspection, Work Systems (EAM or CMMS), Geographical Information Systems (GIS), and Enterprise resources planning systems (ERP), in the form of data, databases, Video, and image.
2. Visualization – The display of data as information. Graphically showing large data sets as picture as well as reports summarizing numeric data.
3. Data Management – Tools enabling a single-location of easy and controlled updates to data
4. Analysis – Tools to assess, compare, and trend the unified data source to determine priorities, immediacy and costs.
5 Optram analysis and forecasting
The Optram Analysis and Forecasting module implements the Analysis element of CIM (US and EU Patents pending 2007). Included in the Optram Enterprise release 4.3 is a new Optram Analysis and Forecasting module. Optram Analysis and Forecasting module is a library of analysis, logical, and data alignment functions built specifically to process corridor information such as track measurements, events (like rail defects, work records), and asset data. Optram Analysis and Forecasting module is script-driven capability allowing users to tailor corridor data analysis to each railway’s unique data types, policies, asset degradation characteristics, and business processes. The Swedish national rail
© 2008 WIT PressWIT Transactions on The Built Environment, Vol 103, www.witpress.com, ISSN 1743-3509 (on-line)
28 Computers in Railways XI

system, Banverket, will be using Bentley’s Optram Analysis and Forecasting module and the underlining patent-pending Optram Linear Data Analysis (LDA) technology to calculate system-wide track quality index, visualize frequency component of the rail head wear, and forecast asset remaining life.
Analyze
Integrate
Manage
Visualization
Optra
Figure 2: Components of CIM.
Optram Analysis and Forecasting module allows railways to evolve and transition the analysis processes as the analysis demands requirements evolve or are transitions from other systems. Optram can be used as a base platform to manage and measure constantly changing processes within Corridor Infrastructure Management. Initially Optram’s key role may be to prioritize maintenance in a reactive fashion. Over time, scripts can be implemented to start performing "just in time" maintenance, leading in turn to scripts implementing a fully predictive maintenance regime. This migration of process can all be implemented on a common framework – Optram – without requiring any expensive software code changes. The improvement derived from changes in process can also be measured within Optram, as a history of track condition before and after maintenance is stored, and can be used to automatically derive an objective measure of maintenance performance.
5.1 How optram analysis and forecasting works
Figure 3 shows the process of the Optram Analysis and Forecasting engine. Users define scripts of functions that represent a business or railway engineering assessment. These scripts are usually built with expertise and best practices. User can select from a library of specialized functions designed to process linear data and to retrieve and store data. Users select script from the library and specify input data to be processed. The Optram Analysis and Forecasting engine processes the script over a portion of the railway or over the entire system. All processing takes place on the Optram application server improving run times and reducing network bandwidth.
© 2008 WIT PressWIT Transactions on The Built Environment, Vol 103, www.witpress.com, ISSN 1743-3509 (on-line)
Computers in Railways XI 29

OptramAnalysisEngine
Scripts• Defect Density• Rate of Change• Context• Predict Failure
OptramUnified
Database
Figure 3: Optram analysis and forecasting.
5.2 Applying analysis and forecasting
Analysis and Forecasting can be applied to a host of diverse railway applications. Some examples include:
• Predicting Areas of Rail Rolling Contact Fatigue (RCF) – Identify areas of high probably of RCF using the track and vehicle characteristics: (demonstrated by Douglas Young for Network Rail (Scotland) and described in [6] and described by Evans Iwnicki in [7])
• Focused Tamping – Pinpoint areas where tamping should be preformed and where tamping should not be preformed to save in tamping costs, work window time, ballast ware, and optimize overall system condition. (“Poster for Alliance Policy Board” shows 30% less tamping in [8] and as described in [9])
• Prioritizing Maintenance by Route Revenue – Use train revenue to calculate the most Maintenance on the most profitable routes.
• Calculating and Monitoring Composite Track Quality Indices (TQI) – Calculate measurable, uniform, and repeatable measures of condition over time and by location – (as described in [1] and AREMA guidelines)
• Assessing Work Effectiveness – Comparing work performed with change in condition and connecting with work crews.
5.3 Example analysis and forecasting scenario
The Optram Analysis and Forecasting module provides a powerful and flexible scripting engine that has a library of more than 60 data processing commands and growing with each release. The following example of locating areas with significant changes in Left Profile roughness is just one example of what can be done. While this is a simple example it could expanded to focus track surfacing (tamping).
© 2008 WIT PressWIT Transactions on The Built Environment, Vol 103, www.witpress.com, ISSN 1743-3509 (on-line)
30 Computers in Railways XI

5.3.1 Scenario summary In this example the following steps are performed:
1. Align – Align successive measurement surveys by the signature 2. Roughness – Calculate a running standard deviation of the Left Profile
1
)(1
2
−
−=
∑=
N
xxRx
N
ii
3. Trend – Calculate the rate of change in roughness over time
12
12
ttRR
D tt
−
−=
4. Threshold – Identify locations where most top improvements and worst degradation
5. Display – Areas of improve improvements and worst degradation
5.3.2 Scenario steps To demonstrate Optram Analysis and Forecasting we will use the data from two track geometry measurement surveys to identify areas where the track geometry rapidly degrades over time (high degradation rates). The two surveys were measured a year apart and loaded into the database prior to running the script. The visuals here are from the Optram Enterprise Explorer. Figure 4 shows the raw data from the measurement vehicle. The data being processed is Left Profile (Top) 25m mid-chord offset (MCO) measurement data. The blue plot is data from survey date 2007-05-13 and the red plot is from survey date 2006-05-14.
Figure 4: Raw data from data store.
The first step of processing is to align the surveys. Systematic and random errors in the measurement recording process result in successive (in this case one year apart) surveys that are shifted approximately 9 meters. The data shifts are commonly found to be up to 20 meters in some areas. Aligning the data is an important step when studying the changes between surveys. Alignment improves both calculation accuracy and visual appearance. Figure 5 shows both the unaligned and aligned surveys. The Optram script aligned the red (2006) survey to the blue (2007) survey. The Optram alignment
© 2008 WIT PressWIT Transactions on The Built Environment, Vol 103, www.witpress.com, ISSN 1743-3509 (on-line)
Computers in Railways XI 31
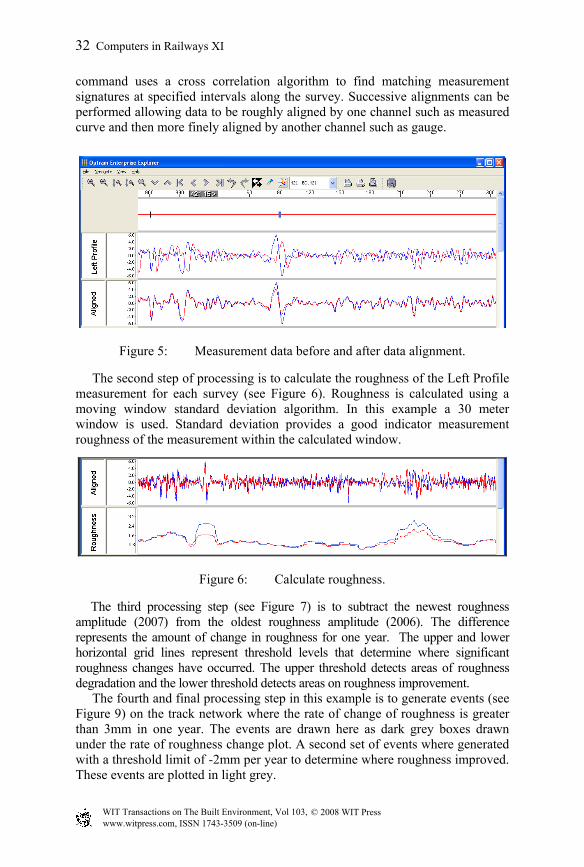
command uses a cross correlation algorithm to find matching measurement signatures at specified intervals along the survey. Successive alignments can be performed allowing data to be roughly aligned by one channel such as measured curve and then more finely aligned by another channel such as gauge.
Figure 5: Measurement data before and after data alignment.
The second step of processing is to calculate the roughness of the Left Profile measurement for each survey (see Figure 6). Roughness is calculated using a moving window standard deviation algorithm. In this example a 30 meter window is used. Standard deviation provides a good indicator measurement roughness of the measurement within the calculated window.
Figure 6: Calculate roughness.
The third processing step (see Figure 7) is to subtract the newest roughness amplitude (2007) from the oldest roughness amplitude (2006). The difference represents the amount of change in roughness for one year. The upper and lower horizontal grid lines represent threshold levels that determine where significant roughness changes have occurred. The upper threshold detects areas of roughness degradation and the lower threshold detects areas on roughness improvement. The fourth and final processing step in this example is to generate events (see Figure 9) on the track network where the rate of change of roughness is greater than 3mm in one year. The events are drawn here as dark grey boxes drawn under the rate of roughness change plot. A second set of events where generated with a threshold limit of -2mm per year to determine where roughness improved. These events are plotted in light grey.
© 2008 WIT PressWIT Transactions on The Built Environment, Vol 103, www.witpress.com, ISSN 1743-3509 (on-line)
32 Computers in Railways XI

Figure 7: Rate of change.
Figure 8: Event generation for threshold testing.
Figure 9 shows the multiple steps of processing in a single view. The view is also zoomed out to show 5 kilometres of data. The green events in the rate of change view represent where Left Profile roughness has improved between the 2 surveys. The added Tamping History view at the bottom shows a history of where work has been done. Notice that a significant amount of work was performed during September and October of 2006 in kilometres 12, 13, and 14 that correlate well with the locations of Left Profile roughness improvements. Also notice that other work records such as those in kilometre 15 are for May 2005 and therefore did not occur between our surveys.
Figure 9: Combined processing view.
2007
2006
© 2008 WIT PressWIT Transactions on The Built Environment, Vol 103, www.witpress.com, ISSN 1743-3509 (on-line)
Computers in Railways XI 33

6 Conclusions
• CIM Systems that can manage and maintain the large and diverse data of a railway require a significant investment. Once a CIM system is in place there are significant benefits by automating analysis and forecasting of the integrated data source.
• Quantitative measures of performance calculated automatically and directly from a unified railway data source can be used to make prioritization decisions available to both executives and front line crews.
• When the CIM system is in place the analysis and resulting benefits can be quickly developed, expanded and are limitless.
• The Optram Analysis and Forecasting provides flexible and evolving analysis of railway corridor data enabling Corridor Infrastructure Management (CIM)
References
[1] US Department of Transportation (DOT), Federal Railroad Administration (FRA), “Fractal Analysis of Geometry Data for Railroad Track Condition Assessment” – RR00-06, December 2000
[2] US Department of Transportation (DOT), Federal Railroad Administration (FRA), “Ground Penetrating Radar for Railroad Track Substructure Evaluation” - FRA/ORD-05/04, October 2005
[3] Theodore R. Sussmann, U.S. DOT/Volpe Center, Ted Selig, Optram, Inc., Vincent R. Terrill, Terrill Track Consultants, Ernest T. Selig, Ernest T. Selig, Inc. & Optram, Inc., “Enhanced Corridor Reliability Using a Track Information System and Special Condition Indicators”, International Heavy Haul Association, June 2001.
[4] Dr. Willem Ebersöhn, Amtrak, Michael Roney, Eric Magel, Fred Prahl, National Research Council of Canada, “Wheel/rail interface: A systems approach”, Railway Track and Structures, December 2002.
[5] Ted Selig, “Corridor Infrastructure Management – An Emerging Approach of Using Information for Improved Railway Safety, Reliability, and Profitability”, Bentley Systems, 16 January 2008
[6] Douglas Young, Information & Systems Manager, Network Rail (Scotland), “Pro-Active Management of RCF Through Improved Information Systems”, Asset Manager’s Forum, 18 February 2003
[7] Evans J, Iwnicki S.D, “Vehicle Dynamics and the Wheel/Rail Interface”, September 27, 2004
[8] Douglas Young, “Poster for Alliance Policy Board”, Network Rail Internal Presentation July 5, 2004.
[9] V. R. Terrill, T Selig, Dr. J P Hyslip, “A Visual Track Maintenance Management System”, Railway Engineering Conference London, April 30, 2003
© 2008 WIT PressWIT Transactions on The Built Environment, Vol 103, www.witpress.com, ISSN 1743-3509 (on-line)
34 Computers in Railways XI