analytics & mis planning for your internet retail store by manish chaturvedi
DESCRIPTION
TRANSCRIPT

N e w Y o r k | M e x i c o | L o n d o n | N a i r o b i | S y d n e y | N e w D e l h i | P a n a m a | S i n g a p o r e
Analytics & MIS Planning for Your Internet Retail Store

Agenda • Business Intelligence v/s Analytics
• Business Challenges faced by Retailers
• Who should be the consumers?
• Being strategic v/s tactical
• Retail KPIs

Analytics as the tool and BI as the output. BI is the enterprise strategy and analytics is the tactic that enables the strategy.

Retail Analytics – Top challenges rated by Retailers
33%
58%
50%
58%
47%
68%
47%
26%
57%
24%
10%
33%
Merchants don't getinformation fast enough to
react to differences betweenforecast vs actual sales
We don't know what customersentiment is until we can see it
in sales
We struggle to matchinventory to demand
Can't identify our bestcustomers to offer special
incentives to them while theyare shopping
Retail Winners Average Performers Laggards
42%
54%
63%
73%
74%
36%
41%
30%
27%
24%
22%
4%
7%
0%
2%
Reduced Shrink
Better "what if" modelingcapabilities
Higher customer retention
Rapid response to chargesin consumer demand
Improved promotioneffectiveness
Very Valuable Somewhat Valuable Not Very Valuable
Top challenges by Performance Level Opportunities from BI to overcome Business challenges

Importance of BI in Modern Retail
47% of mega-retailers have had a BI strategy in place for longer than 2 years
22% of higher end of mid-market retail
36% of lower end of mid-market retailVs Vs
2%
10%
14%
55%
19%
0%
1%
17%
27%
58%
Catalog/call centers
Mobile/mCommerce
eCommerce
Brick and Mortar stores
All channels can take equal benefit
2012 2011
Channels that can derive benefits from BI Y-o-Y
Source: RSR Research
58% of Winners say all channels can take equal benefit from BI investments
43% of mid-market retailers report that they dump data into Excel as their primary method for BI insights
Across the board, Winners provide more insights access to their stakeholders than their peers do

Organization
Top Influencers in Retail Chain
Strategic Management Team Operations Team

Business Insight for CXOs• Insights to fine tune the strategy
• Insights to influence tactical decisions
• Comparative Sales
• Sales Performance
• Trends
• Figures
• Contribution (by product group, product, customer group)
Dashboard for Business Insights
Gauge Charts− YTD , MTD, WTD ,daywise comparison of Net Sales, Charts− Open Balance snapshot, Sales Trend, New Customers,
Sales Contribution
Comparative Store Sales
Store wise Funnel chart
Store Sales Performance

Strategic Insight
Store Sales Performance• Trends
• Figures
• Statistics
• Top Performers
• Bottom Performers
Scatter Charts • Evaluation of Individual Store
performance• Sales by transactions• Store/Product/ Customer/ Salesperson-
− Top Performer− Bottom performer

Tactical Insight
Affinity Analysis
• What sells more with what
• Strategic Insight to determine promotions and combos
Product Affinity• Frequency trend
• Support %age
• Confidence %age
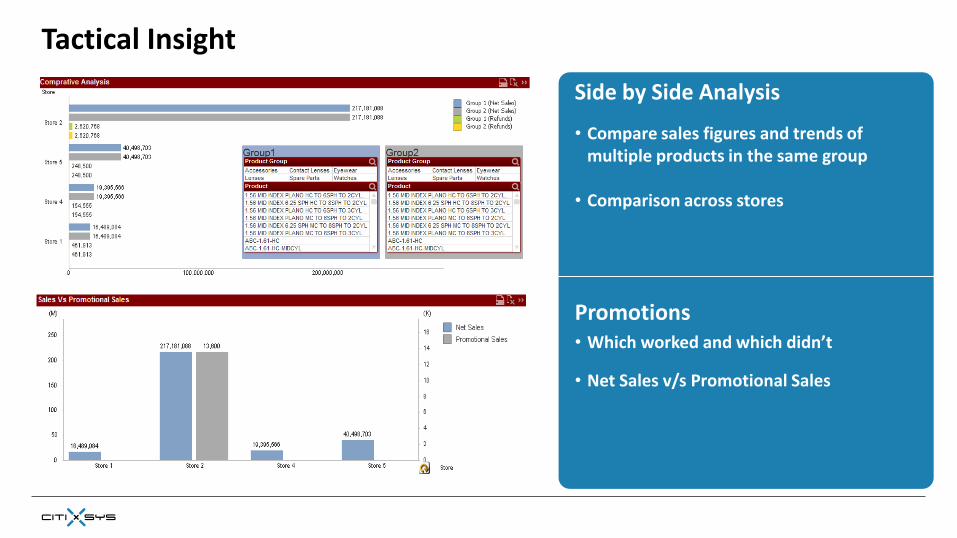
Tactical Insight
Side by Side Analysis
• Compare sales figures and trends of multiple products in the same group
• Comparison across stores
Promotions • Which worked and which didn’t
• Net Sales v/s Promotional Sales

Tactical Insight
Inventory Insight
• Product drill down to warehouse inventory
• Available Stock
• When to Reorder
• Stock Shrinkage
Benefits• No more Stock out situations
• Visibility of Best selling / worst selling product
• Loss due to excess stock
• Shrinkage Analysis – insight into possible pilferages

Retail KPIs – Sales
By Customers and Customer Groups
By Items and Item Groups
By Stores

Retail KPIs – Marketing
Promotions and their effectiveness
Affinity Analysis
Side by Side comparisons

Retail KPIs – Warehousing and Inventory Management
ABC Analysis
Shrinkage (read pilferage) Analysis
Non Moving Items

Retail KPIs – Finance
YTD Sales
YTD Gross Profit
ROTA

Lets see these dashboards in action…

Thank You
For more information:www.ivend.com